UNITED STATES
SECURITIES AND EXCHANGE COMMISSION
Washington, D.C. 20549
FORM N-CSR
Investment Company Act file number: 811-06113
The Caldwell & Orkin Funds, Inc.
(Exact name of registrant as specified in charter)
5185 Peachtree Parkway, Suite 370, Norcross, GA 30092-6541
(Address of principal executive offices) (Zip code)
Michael B. Orkin
5185 Peachtree Parkway, Suite 370, Norcross, GA 30092-6541
(Name and Address of Agent for Service)
Registrant’s Telephone Number, including Area Code: 678-533-7850
Date of fiscal year end: April 30
Date of reporting period: May 1, 2011 - October 31, 2011
Form N-CSR is to be used by management investment companies to file reports with the Commission not later than 10 days after the transmission to stockholders of any report that is required to be transmitted to stockholders under Rule 30e-1 under the Investment Company Act of 1940 (17 CFR 270.30e-1). The Commission may use the information provided on Form N-CSR in its regulatory, disclosure review, inspection, and policymaking roles.
A registrant is required to disclose the information specified by Form N-CSR, and the Commission will make this information public. A registrant is not required to respond to the collection of information contained in Form N-CSR unless the Form displays a currently valid Office of Management and Budget (“OMB”) control number. Please direct comments concerning the accuracy of the information collection burden estimate and any suggestions for reducing the burden to Secretary, Securities and Exchange Commission, 450 Fifth Street, NW, Washington, DC 20549-0609. The OMB has reviewed this collection of information under the clearance requirements of 44 U.S.C. ss. 3507.
Item 1. Report to Stockholders.

MARKET OPPORTUNITY FUND
TICKER SYMBOL: COAGX
| | |
| Semi-Annual Report | | October 31, 2011 (Unaudited) |
| | |
| | Caldwell & Orkin |
Table of Contents | | Market Opportunity Fund |
| October 31, 2011 | | |
| | |
| | | 1-800-467-7903 | www.CaldwellOrkinFunds.com |
| | |
Caldwell & Orkin | | |
Market Opportunity Fund | | Shareholder Letter |
| | |
| | | | |
| Investment Adviser | |  | | Shareholder Accounts |
| C&O Funds Advisor, Inc. | | | c/o ALPS Fund Services, Inc. |
| 5185 Peachtree Parkway, | | | P.O. Box 46256 |
| Suite 370 | | | Denver, Colorado 80201 |
| Norcross, Georgia | | | (800) 467-7903 |
| 30092-6541 | | | |
| (800) 237-7073 | | | |
| | |
| Dear Fellow Shareholder: | | | | December 15, 2011 |
The Caldwell & Orkin Market Opportunity Fund (the “Fund”) dipped -0.56% in the 6-month period ended October 31, 2011, bettering the performance of the S&P 500 Total Return Index (SP 500), which fell -7.11% during the same period. For the 12 months ended October 31, 2011, the Fund gained 1.19%, while the S&P 500 increased 8.09%. And, since commencement of active management on August 24, 1992 through October 31, 2011, the Fund has generated an 8.47% compound annual return, surpassing the S&P 500’s 8.08% compound annual return during the same period. The Fund’s total return from August 24, 1992 through April 30, 2011 has been 375.89%, compared to the S&P 500’s total return of 344.83%. Of course, past performance is no guarantee of future results. Please see standardized performance figures on page 6.
The Fund achieved these results while maintaining a very low market risk profile (see pages 8 and 9). Since we began actively managing the Fund on August 24, 1992, the Fund’s price movements have had virtually no correlation (2.10%) with the price movements of the S&P 500 as measured by R, the correlation coefficient. An S&P 500 Index fund has nearly a 100% correlation to the market in any given period. The Fund’s lack of correlation to the market indicates that its performance is not attributable to that of the index. Additionally, given the Fund’s low correlation to the S&P 500, deviations in Fund performance relative to the S&P 500’s performance are to be expected. (Statistical computations by Ned Davis Research, Inc.)
During the six month review period the Fund continued to generate return characteristics emblematic of a true long /short mutual fund, with a low correlation to the S&P 500. During the first five months (May 2011 through September 2011) the S&P 500 declined -16.26%, while the Fund was up 0.41%, significantly outperforming the index. The Fund outperformed the S&P 500 in all but one of these months (June 2011), and during that month it performed in line with the S&P 500 (-1.80% vs. -1.67% for the index). Additionally, from July 2011 through September 2011 the Fund generated a positive 3.15% return while the S&P 500 declined -13.87%. During October 2011 (the one month of positive market returns) the Fund underperformed relative to the S&P 500, -0.97% vs. 10.93%.
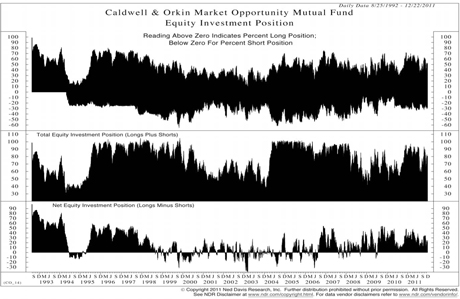
The Fund maintained a net-long invested position from May 1, 2011 through October 31, 2011. The long portfolio ranged from 37.72% to 66.10% of total assets, averaging 50.79%. During this period the longs underperformed the S&P 500, generating a total return of -12.37%. The Fund’s short positions ranged from 18.88% to 34.14% of total assets, averaging 27.44%. The shorts performed well, returning 14.05%, almost double the inverse of the S&P 500’s -7.11% decline. The Fund’s total invested position (excluding options) ranged from 54.51% to 93.44%, averaging 78.23%, while the net invested position (long equities minus short equities) ranged from 4.03% net-long to 38.76% net-long, averaging 23.35% net-long during the six-month period (see the Equity Investment Position Chart on page 10).
| | |
Semi-Annual Report (Unaudited) | October 31, 2011 | | 1 |
| | |
Caldwell & Orkin | | |
Market Opportunity Fund | | Shareholder Letter |
| | |
The fluctuation in the total invested position during the time period was the result of increased risk aversion due to market volatility. Both the net invested position and the total invested position hit their lowest point for the six-month period in early August as the market drawdown reached a crescendo. As the market rebounded in October 2011 the net and total invested positions were increased, ending the period at 32.33% and 85.17%, respectively.
On the long side of the portfolio we maintained a significant exposure (21.07%) at October 31 to utilities (electric-integrated, electric-transmission and independent power producers). Specifically, we purchased regulated electric utility companies with attractive dividend yields and defensive economic characteristics.
We also added to our technology exposure, increasing our holdings of Apple, Inc. (AAPL) given its integrated seamless technology, interactive interface, and leadership position in mobile connectivity devices (iPhone, iPad) that are fueling revenue and earnings growth. Additionally, we own Qualcomm Inc. (QCOM), a wireless communications equipment company that is benefitting from increased smartphone and tablet demand. At 11.93% companies with a technology focus (electronic components-semiconductors, computers, computers-memory devices, semiconductor components /integrated circuits, applications software and electronic forms) are our second-largest long exposure.
We closed the period with a 4.25% position in homebuilder-related firms as the inventory of new homes for sale has fallen to acceptable levels, while low mortgage rates have made home ownership cheaper than their rental equivalents. Furthermore, a Federal Housing Finance Authority plan to let investors purchase and rent distressed used-home inventory could alleviate house price pressure.
On the short side of the portfolio we have a 4.88% position in schools (for-profit education companies). In addition to the fundamental issues facing the industry (regulatory supervision, slowing enrollment growth, high default rates, poor student outcomes) is the likelihood that the federal government’s fiscal constraints will limit Pell Grant funding availability. The industry receives a substantial percentage of its revenues from Pell Grants. We also have a 5.18% short position in European banks and European country-focused exchange-traded funds (ETFs). This position is partially hedged such that the total net short position is 2.76%.
During the period six of our ten biggest winners were stocks we sold short. However, our biggest gain came from a call option position in Petrohawk Energy Corp (HK) thanks to the takeover of the company by BHP Billiton announced on July 15, 2011. The Fund also had gains in the long positions of NV Energy Inc. (NVE) and Apple Inc. (AAPL), among others. Three of the six short positions in our top ten winners were financials. Another top winner was a put option position in an emerging market financial company.
Our five biggest losers were all longs. Two of these positions (Goldcorp Inc. (GG) and Market Vectors Gold Miners (GDX)) are gold mining stocks that were hurt by the -20.22% peak-to-trough decline in gold prices during the period. While these positions have been reduced we still believe
| | |
2 | | 1-800-467-7903 | www.CaldwellOrkinFunds.com |
| | |
Caldwell & Orkin | | |
Market Opportunity Fund | | Shareholder Letter |
| | |
both have attractive prospects. Vertex Pharmaceuticals (VRTX), a past winner, was our second-largest losing position during the period. The stock was hurt by fears of new competitive entrants into the Hepatitis-C market.
Outlook
As we enter the second-half of the Fund’s fiscal year the markets are on a knife’s edge. The European Union is in jeopardy, its fate lying in the hands of policy makers forced to make choices that ask for either economic or cultural sacrifice, or both. The decision day is fast approaching as the spread of the debt rot has accelerated beyond Italy and Spain and into France and Germany.
It is difficult to handicap what decisions European policy makers will ultimately choose. “It’s obvious that the outcome of the clash between debt destruction and money printing is still in doubt,” wrote Jim Grant, editor of Grant’s Interest Rate Observer. “The markets can’t make up their minds. On Mondays, Wednesdays and Fridays – approximately – it’s head for the hills. On Tuesdays and Thursdays, it’s sound the all clear. On head-for-the-hills days, buy bonds. On all-clear days, buy stocks [and] gold.1”
In this environment of increased volatility the Fund is defensively invested, with a net-long invested position of 32.33% at October 31, 2011 and a 14.83% cash position. Further, over one-third of the fund’s long positions are in dividend-paying utility stocks.
Long before the financial crisis of 2008 we have been worried about the derivative exposure of U.S. (and global) financial institutions, and specifically counterparty risk. Counterparty risk is the risk that a person or institution who has entered into a financial contract will default on the obligation and fail to fulfill that side of the contractual agreement. It is a type of credit risk. Our concern with financial firms is that much of their riskier loans and operations are “hedged” by derivative contracts.
The Fund has very small derivative exposure through its use of put and call options (less than 1.50% of total net assets at October 31, 2011). The Fund and your Board of Directors is actively assessing the counterparty risk of our third party service providers, and we will take any necessary actions to ensure that shareholder assets are protected to the greatest extent possible.
Sincerely,
Michael B. Orkin, CFA
Portfolio Manager and Chief Investment Officer
1 Jim Grant, “Not Your Father’s Bundesbank,” Grant’s Interest Rate Observer, November 18, 2011.
| | |
Semi-Annual Report (Unaudited) | October 31, 2011 | | 3 |
| | |
Caldwell & Orkin | | |
Market Opportunity Fund | | Shareholder Letter |
| | |
Disclosure
The Fund’s investment objective is to provide long-term capital growth with a short-term focus on capital preservation. Our philosophy in managing the Fund is to focus on risk as well as return. We use active asset allocation - the opportunistic shifting of assets between long stock positions, short stock positions (selling borrowed stock and attempting to replace the borrowed securities in the future at a lower price), options, bonds and cash equivalents - to manage exposure to market risk (the risk that the broad market declines, taking good companies down with it). The Fund may hold up to 60% of its net assets in short positions at any time and also invest in options. Short positions and put options are employed with the intent of making money when those stocks we judge to be mispriced fall. When we use short positions or put options, the Fund’s portfolio is considered to be “hedged,” so that it is not fully exposed to the price movements and volatility of the broader market. Our asset allocation determinations are primarily based on our perception of risk in the marketplace. In summary, our goal is to make money over a full market cycle, but with less stomach churn.
The Fund’s disciplined investment philosophy and active management style typically leads to higher-than-average portfolio turnover. High turnover may have an unfavorable impact on the amount of taxable distributions paid to shareholders. Higher turnover may also result in higher brokerage costs for the Fund. The Fund’s turnover rate will typically exceed 100% per year, and will not be a limiting factor when we deem change appropriate. Fund holdings, industry and asset allocations are subject to change without notice. The Fund may or may not have a position in any of the companies mentioned in this commentary as of the date of this report.
An investment in the Fund involves risk, including the loss of principal. Additionally, there are certain risks inherent in investing in the Fund, including market risk, short sale risk, interest rate risk, business risk, small company risk, market valuation risk, political risk, and portfolio turnover risk. For a complete discussion of these risks, you may request a copy of the Fund’s prospectus by calling 800-237-7073. The Fund uses aggressive investment strategies (including short positions and options) that have the potential for yielding high returns; however, these strategies may also result in losses. Stocks sold short have unlimited risk. Investment return and principal value will fluctuate so that shares, when redeemed, may be worth more or less than their original cost. Options are not suitable for all investors.
Investors should expect that the Fund’s performance may fluctuate independently of stock market indices, such as the S&P 500 Total Return Index.
Distributed by ALPS Distributors, Inc., Member FINRA/SIPC
1290 Broadway, Suite 1100, Denver, CO 80203
| | |
4 | | 1-800-467-7903 | www.CaldwellOrkinFunds.com |
| | |
Caldwell & Orkin | | |
Market Opportunity Fund | | Shareholder Letter |
| | |
Statistical Risk Definitions:
Correlation Coefficient (R): R is a statistical measure of correlation. In this report, R is a measurement of investment risk that indicates how closely performance is linked to the broad market – it quantifies the degree to which a fund’s performance correlates with the performance of a benchmark. R can vary between 100% (perfect positive correlation) and –100% (perfect negative correlation). 0% represents no correlation. An R of 100% means that all movements of a fund are fully explained by movements in its benchmark index. Conversely, a low R indicates that very few of the fund’s movements are explained by movements in its benchmark index, and a negative R indicates a fund’s movements are inversely correlated with its benchmark index.
Coefficient of Determination (R-Square): R-Square, also represented as R2, is another measurement of investment risk that quantifies the degree to which a fund’s performance correlates with the performance of its benchmark index. R-Square is calculated by multiplying the Correlation Coefficient (R) by itself, and is therefore always positive. R-Square can vary between 0% (no correlation) and 100% (perfect correlation). The higher the value of R-Square, the greater the degree of correlation between the fund and its benchmark index. R-squared does not take into account the direction of the correlation (positive or negative), therefore R-Squared is not able to reflect inverse correlation between a fund and its benchmark index.
Beta: A measure of a fund’s sensitivity to market movements. Usually the higher betas represent riskier investments. When correlation is low, beta has minimal, if any, significance.
Standard deviation: A statistical measure of dispersion about an average, indicating the volatility of a fund’s total returns.
Sharpe Ratio: The Sharpe Ratio is calculated by subtracting the risk-free (T-bill) rate of return from a portfolio’s total return and then dividing this by its standard deviation. The resulting fraction can be thought of as return per unit of risk. The higher a portfolio’s Sharpe Ratio, the better the risk-adjusted performance.
Semi-variance: A measure of a fund’s downside (negative return) volatility relative to a benchmark. Lower numbers are associated with less risk.
Index Definition:
S&P 500 Total Return Index: The S&P 500 Total Return Index is a capitalization-weighted, unmanaged index of 500 large U.S. companies chosen for market size, liquidity and industry group representation and includes reinvested dividends. You cannot invest directly in an index.
| | |
Semi-Annual Report (Unaudited) | October 31, 2011 | | 5 |
| | |
Caldwell & Orkin | | |
Market Opportunity Fund | | Performance Summary |
| | October 31, 2011 |
| | | | |
Fiscal Year Ended April 30, | | C&O Market
Opportunity
Fund(1) | | S&P 500 Total
Return Index(2) |
1991 | | 1.25% | | 0.42% |
1992 | | 11.96% | | 14.03% |
1993* | | 15.09% | | 9.24% |
1993** | | 21.09% | | 9.18% |
1994 | | 16.48% | | 5.32% |
1995 | | -2.28% | | 17.47% |
1996 | | 31.80% | | 30.21% |
1997 | | 23.24% | | 25.13% |
1998 | | 25.77% | | 41.07% |
1999 | | 19.43% | | 21.82% |
2000 | | -0.02% | | 10.13% |
| | | | |
Fiscal Year Ended April 30, | | C&O Market
Opportunity
Fund(1) | | S&P 500 Total
Return Index(2) |
2001 | | 11.43% | | -12.97% |
2002 | | 1.88% | | -12.63% |
2003 | | 1.12% | | -13.31% |
2004 | | -3.55% | | 22.88% |
2005 | | -0.17% | | 6.34% |
2006 | | -2.74% | | 15.42% |
2007 | | 15.31% | | 15.24% |
2008 | | 17.92% | | -4.68% |
2009 | | 4.73% | | -35.31% |
2010 | | -7.40% | | 38.84% |
2011 | | 0.41% | | 17.22% |
| | | | |
Total Return Through October 31, 2011 | | | | |
6 months ended | | -0.56% | | -7.11% |
12 months ended | | 1.19% | | 8.09% |
Since 8/24/92 (3) | | 375.89% | | 344.83% |
| | | | |
Average Annual Returns Through
October 31, 2011 | | | | |
One Year | | 1.19% | | 8.09% |
Three Years | | -1.90% | | 11.41% |
Five Years | | 4.77% | | 0.25% |
Ten Years | | 1.93% | | 3.69% |
Fifteen Years | | 5.91% | | 5.77% |
Since 8/24/92 (3) | | 8.47% | | 8.08% |
Total annualized Fund operating expenses for the Fund’s fiscal year ended April 30, 2011 were 2.14%, or 1.29% before interest expenses and dividend expenses related to short sales. These figures include Acquired Fund Fees and Expenses of 0.09%. Additional information about the Fund’s fees and expenses is available in the Fund’s prospectus.
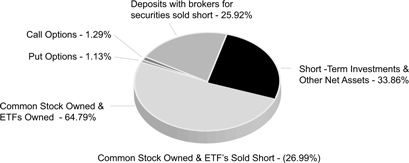
Net Asset Allocation
April 30, 2011
| | |
6 | | 1-800-467-7903 | www.CaldwellOrkinFunds.com |
| | |
Caldwell & Orkin | | |
Market Opportunity Fund | | Performance Summary |
| | October 31, 2011 |
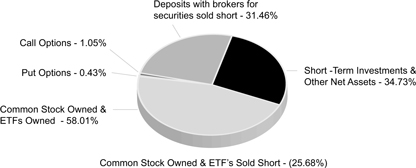
Net Asset Allocation
October 31, 2011
| 1 | The performance data quoted represents past performance. Past performance is no guarantee of future results. The investment return and principal value of an investment in the Fund will fluctuate so that an investor’s shares, when redeemed, may be worth more or less than their original cost. Current performance may be higher or lower than the performance data quoted. Please call 800-377-7073 or visit www.CaldwellOrkin.com for current month-end performance. The Fund’s performance assumes the reinvestment of dividends and capital gains, if any. Fund holdings, industry and asset allocations are subject to change without notice. The Fund may or may not have a position in any of the companies mentioned in this report as of the date of this report. See additional important disclosures on pages 4 and 5. |
| 2 | Investors should expect that the Fund’s performance may fluctuate independently of stock market indices, such as the S&P 500 Total Return index. The S&P 500 Total Return index is a widely recognized unmanaged index of 500 common stock prices adjusted to reflect the reinvestment of dividends and distributions. You may not invest directly in an index. |
| 3 | Effective August 24, 1992, the Fund changed its investment objective to provide long-term capital growth with a short-term focus on capital preservation through investment selection and asset allocation. Prior to that time, the Fund was passively managed and indexed to the largest 100 over-the-counter (OTC) stocks. |
| * | For the full fiscal year ended April 30, 1993. |
| ** | From August 24, 1992 through April 30, 1993 - the portion of the year using the active investment management style of C&O Funds Advisor, Inc., the manager of the Fund. |
| | |
Semi-Annual Report (Unaudited) | October 31, 2011 | | 7 |
| | |
Caldwell & Orkin | | |
Market Opportunity Fund | | Statistical Risk Profile |
| | October 31, 2011 |
| | | | | | | | | | |
| Ten Worst S&P 500 Total Return Days |
| Date | | C&O MOF | | S&P 500 | | Variance | | | | |
10/15/2008 | | -1.47% | | -9.02% | | 7.55% | | | | The Caldwell & Orkin Market Opportunity Fund outperformed the S&P 500 Total Return index on all ten of the ten worst days, and was positive on two of the ten days. |
12/1/2008 | | -1.58% | | -8.92% | | 7.34% | | | |
9/29/2008 | | -0.37% | | -8.78% | | 8.41% | | | |
10/9/2008 | | -2.12% | | -7.61% | | 5.49% | | | |
10/27/1997 | | -1.60% | | -6.89% | | 5.29% | | | |
8/31/1998 | | 0.42% | | -6.79% | | 7.21% | | | |
11/20/2008 | | 0.23% | | -6.70% | | 6.93% | | | |
8/8/2011 | | -0.63% | | -6.66% | | 6.03% | | | |
11/19/2008 | | -0.28% | | -6.10% | | 5.82% | | | |
10/22/2008 | | -1.11% | | -6.09% | | 4.98% | | | |
|
| Ten Worst S&P 500 Total Return Weeks |
| Week Ending | | C&O MOF | | S&P 500 | | Variance | | | | The Caldwell & Orkin Market Opportunity Fund outperformed the S&P 500 Total Return index in all ten of the ten worst weeks, and was positive in seven of those
weeks. |
10/10/2008 | | -2.71% | | -18.14% | | 15.43% | | |
9/21/2001 | | 1.63% | | -11.57% | | 13.20% | | |
4/14/2000 | | 4.51% | | -10.52% | | 15.03% | | |
10/3/2008 | | 1.83% | | -9.33% | | 11.16% | | |
11/21/2008 | | 0.56% | | -8.33% | | 8.89% | | |
7/19/2002 | | 0.65% | | -7.96% | | 8.61% | | |
8/5/2011 | | -0.77% | | -7.15% | | 6.38% | | |
3/6/2009 | | -0.88% | | -6.96% | | 6.08% | | |
7/12/2002 | | 1.01% | | -6.81% | | 7.82% | | |
2/20/2009 | | 0.20% | | -6.80% | | 7.00% | | |
|
| Ten Worst S&P 500 Total Return Months |
| Month | | C&O MOF | | S&P 500 | | Variance | | | | The Caldwell & Orkin Market Opportunity Fund outperformed the S&P 500 Total Return index in all ten of the ten worst months, and was positive in seven of those
months. |
10/31/2008 | | 3.42% | | -16.74% | | 20.16% | | |
8/31/1998 | | 3.12% | | -14.46% | | 17.58% | | |
9/30/2002 | | 2.10% | | -10.86% | | 12.96% | | |
2/28/2009 | | 0.30% | | -10.71% | | 11.01% | | |
2/28/2001 | | 4.78% | | -9.13% | | 13.91% | | |
9/30/2008 | | -0.42% | | -8.89% | | 8.47% | | |
6/30/2008 | | 4.84% | | -8.43% | | 13.27% | | |
1/31/2009 | | -0.73% | | -8.30% | | 7.57% | | |
9/30/2001 | | 3.29% | | -8.06% | | 11.35% | | |
5/31/2010 | | -2.55% | | -8.04% | | 5.49% | | |
Short selling began May 2, 1994. Past performance is no guarantee of future results. See additional important disclosures on pages 4 and 5. Computations by Ned Davis Research, Inc.
| | |
8 | | 1-800-467-7903 | www.CaldwellOrkinFunds.com |
| | |
Caldwell & Orkin | | |
Market Opportunity Fund | | Statistical Risk Profile |
| | October 31, 2011 |
Ten Worst Drawdowns
| | | | |
| Caldwell & Orkin Market Opportunity Fund |
| | |
| Date Range | | C&O MOF | | S&P 500 |
01/17/2008 - 05/07/2010 | | -15.71% | | -11.68% |
04/12/1999 - 11/23/1999 | | -13.24% | | 4.23% |
10/09/2002 - 05/25/2006 | | -13.12% | | 74.17% |
05/26/2000 - 06/07/2000 | | -8.15% | | 6.81% |
12/29/2000 - 01/19/2001 | | -8.06% | | 1.75% |
04/04/2001 - 03/11/2002 | | -7.98% | | 7.22% |
03/15/1993 - 04/26/1993 | | -7.83% | | -3.65% |
03/18/1994 - 02/03/1995 | | -7.68% | | 4.21% |
04/10/2007 - 05/24/2007 | | -7.14% | | 4.31% |
10/07/1998 - 11/05/1998 | | -6.41% | | 16.95% |
| | | | |
| S&P 500 Total Return Index |
| | |
| Date Range | | C&O MOF | | S&P 500 |
10/09/2007 - 03/09/2009 | | -0.61% | | -55.26% |
03/24/2000 - 10/09/2002 | | 28.57% | | -47.41% |
07/17/1998 - 08/31/1998 | | 4.02% | | -19.19% |
04/29/2011 - 10/03/2011 | | -1.12% | | -18.72% |
04/23/2010 - 07/02/2010 | | -1.52% | | -15.67% |
11/27/2002 - 03/11/2003 | | 2.19% | | -14.28% |
07/16/1999 - 10/15/1999 | | -0.45% | | -11.78% |
10/07/1997 - 10/27/1997 | | 0.18% | | -10.74% |
09/23/1998 - 10/08/1998 | | 2.02% | | -9.94% |
02/18/1997 - 04/11/1997 | | 2.72% | | -9.39% |
| | | | |
Statistical Risk Measurements 8/24/1992 through 10/31/2011 (daily data) |
| | | | | |
| | | C&O MOF | | S&P 500 |
Coefficient of Determination (R-Square) | | 0.04% | | 100.00% |
Correlation Coefficient “R” | | 2.10% | | 100.00% |
Beta | | 0.009 | | 1.000 |
Standard Deviation | | 0.51 | | 1.217 |
Sharpe Ratio | | 0.63 | | 0.33 |
Semi-Variance | | 0.13 | | 0.73 |
|
| Performance During the Last Three Market Downturns of 20% or More |
| | | C&O MOF | | S&P 500 |
| 01/06/2009 - 03/09/2009 | | -3.42% | | -27.19% |
| 10/09/2007 - 11/20/2008 | | 1.80% | | -50.73% |
| 01/04/2002 - 10/09/2002 | | 7.25% | | -32.95% |
Short selling began May 2, 1994. Past performance is no guarantee of future results. See additional important disclosures on pages 4 and 5. Computations by Ned Davis Research, Inc.
| | |
Semi-Annual Report (Unaudited) | October 31, 2011 | | 9 |
| | |
Caldwell & Orkin | | Growth of $10,000 |
Market Opportunity Fund | | Equity Investment Position Chart |
| | October 31, 2011 |
Caldwell & Orkin Market Opportunity Fund Versus S&P 500 Total Return Index
Since Commencement of Active Style of Investment Management Results of a Hypothetical $10,000 Investment August 24, 1992 through April 30, 2011
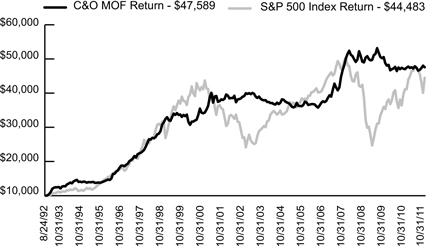
Past performance does not predict future performance. The returns do not reflect the deduction of taxes that a shareholder would pay on Fund distributions or the redemption of Fund shares. See additional disclosure on pages 4 and 5.
| | |
10 | | 1-800-467-7903 | www.CaldwellOrkinFunds.com |
| | |
Caldwell & Orkin | | |
Market Opportunity Fund | | Disclosure of Fund Expenses |
| | October 31, 2011 (Unaudited) |
We believe it is important for you to understand the impact of fees and expenses on your investment in the Fund. As a shareholder of the Fund, you incur two types of costs: (1) transaction costs related to the purchase and redemption of Fund shares, including redemption fees and brokerage commissions (if applicable); and (2) ongoing costs, including management fees, administrative expenses, portfolio transaction costs and other Fund expenses. A mutual fund’s ongoing costs are expressed as a percentage of its average net assets. This figure is known as the expense ratio. The following example is intended to help you understand your ongoing costs (in dollars and cents) of investing in the Fund and to compare these costs with the ongoing costs of investing in other mutual funds.
The below example is based on an investment of $1,000.00 invested at the beginning of the period and held for the entire period indicated, May 1, 2011 through October 31, 2011. The table below illustrates the Fund’s expenses in two ways:
Based on Actual Fund Returns
The first line of the table below provides information about actual account values and actual expenses. You may use the information in this line, together with the amount you invested, to estimate the expenses that you paid over the period. Simply divide your account value by $1,000 (for example, an $8,600 account value divided by $1,000 = 8.6), then multiply the result by the number in the first line under the heading entitled “Expenses Paid During Period” to estimate the expenses you paid on your account during this period.
Based on a Hypothetical 5% Return for Comparison Purposes
The second line of the table below provides information about hypothetical account values and hypothetical expenses based on the Fund’s actual expense ratio and an assumed rate of return of 5% per year before expenses, which is not the Fund’s actual return. The hypothetical account values and expenses may not be used to estimate the actual ending account balance or expenses you paid for the period. You may use this information to compare the ongoing costs of investing in the Fund and other funds. To do so, compare this 5% hypothetical example with the 5% hypothetical examples that appear in the shareholder reports of the other funds.
Please note that the expenses shown in the table are meant to highlight your ongoing costs only and do not reflect any transactional costs, such as redemption fees or brokerage commissions. Therefore, the second line of the table is useful in comparing ongoing costs only, and will not help you determine the relative total costs of owning different funds. In addition, if these transactional costs were included, your costs would have been higher.
| | | | | | | | | | | | | | | | |
| | | Beginning
Account Value
05/01/2011 | | | Ending
Account Value
10/31/2011 | | | Expense
Ratio1 | | | Expenses
Paid During
Period2 | |
Actual3 | | $ | 1,000.00 | | | $ | 994.40 | | | | 2.16% | | | $ | 10.83 | |
Hypothetical (5% return before expenses)4 | | $ | 1,000.00 | | | $ | 1,014.28 | | | | 2.16% | | | $ | 10.94 | |
| 1 | The annualized expense ratio reflects actual expenses from the Fund from 5/1/2011- 10/31/2011, as a percentage of average net assets for that period. |
| | |
Semi-Annual Report (Unaudited) | October 31, 2011 | | 11 |
| | |
Caldwell & Orkin | | |
Market Opportunity Fund | | Disclosure of Fund Expenses |
| | October 31, 2011 (Unaudited) |
| 2 | Expenses are equal to the Caldwell & Orkin Market Opportunity Fund’s annualized expense ratio of 2.16% multiplied by the average account value over the period, multiplied by the number of days in the most recent fiscal half year (184), divided by 366 (to reflect the half-year period.) |
| 3 | Excluding interest expense and dividend expense from short positions, your actual cost of investment in the Fund would be $6.28. |
| 4 | Excluding interest expense and dividend expense from short positions, your hypothetical cost of investment in the Fund would be $6.36. |
| | |
12 | | 1-800-467-7903 | www.CaldwellOrkinFunds.com |
| | |
Caldwell & Orkin | | |
Market Opportunity Fund | | Sector Diversification |
| | October 31, 2011 (Unaudited) |
The following table presents the Fund’s 10/31/2011 portfolio holdings by sector based on total net assets, sorted by net exposure (net long to net short).
| | | | | | | | |
| | | Long | | Short | | Total (a) | | Net (b) |
Electric - Integrated | | 15.66% | | | | 15.66% | | 15.66% |
Electronic Components - Semiconductors | | 4.13% | | | | 4.13% | | 4.13% |
Computers | | 3.25% | | -0.00%* | | 3.25% | | 3.25% |
Electric - Transmission | | 3.11% | | | | 3.11% | | 3.11% |
Independent Power Producer | | 2.30% | | | | 2.30% | | 2.30% |
Computers - Memory Devices | | 2.25% | | | | 2.25% | | 2.25% |
Building - Residential/Commercial | | 1.98% | | | | 1.98% | | 1.98% |
Retail - Apparel/Shoe | | 1.73% | | -0.21% | | 1.94% | | 1.52% |
Oil & Gas Drilling | | 1.25% | | | | 1.25% | | 1.25% |
Semiconductor Components/Integrated Circuits | | 1.23% | | | | 1.23% | | 1.23% |
Pipelines | | 1.20% | | | | 1.20% | | 1.20% |
Finance - Consumer Loans | | 1.16% | | | | 1.16% | | 1.16% |
Medical - Drugs | | 1.16% | | | | 1.16% | | 1.16% |
Apparel Manufacturers | | 1.10% | | | | 1.10% | | 1.10% |
Retail - Building Products | | 1.08% | | | | 1.08% | | 1.08% |
Building & Construction Products - Miscellaneous | | 1.04% | | | | 1.04% | | 1.04% |
Medical - HMO | | 1.04% | | | | 1.04% | | 1.04% |
Automotive-Cars Light Trucks | | 1.02% | | | | 1.02% | | 1.02% |
Reinsurance | | 0.93% | | | | 0.93% | | 0.93% |
Retail - Restaurants | | 0.90% | | | | 0.90% | | 0.90% |
Applications Software | | 0.74% | | | | 0.74% | | 0.74% |
Food - Retail | | 0.68% | | | | 0.68% | | 0.68% |
Retail - Discount | | 0.66% | | | | 0.66% | | 0.66% |
Beverages - Non-alcoholic | | 0.57% | | | | 0.57% | | 0.57% |
Medical Products | | 0.52% | | | | 0.52% | | 0.52% |
Retail - Jewelry | | 0.46% | | | | 0.46% | | 0.46% |
Hazardous Waste Disposal | | 0.45% | | | | 0.45% | | 0.45% |
Hotels & motels | | 0.44% | | | | 0.44% | | 0.44% |
Non-Hazardous Waste Disposal | | 0.42% | | | | 0.42% | | 0.42% |
Building - Heavy Construction | | 0.35% | | | | 0.35% | | 0.35% |
Electronic Forms | | 0.33% | | | | 0.33% | | 0.33% |
Oil & Gas Companies - Exploration & Production | | 0.31% | | | | 0.31% | | 0.31% |
Medical - Biomedical/Genetics | | 0.22% | | | | 0.22% | | 0.22% |
Transportation - Rail | | 0.69% | | -0.49% | | 1.18% | | 0.20% |
Gold Mining | | 0.17% | | | | 0.17% | | 0.17% |
Chemicals - Diversified | | 0.14% | | | | 0.14% | | 0.14% |
Retail - Major Department Stores | | 0.04% | | | | 0.04% | | 0.04% |
Diversified Manufacturing Operations | | 0.00%* | | | | 0.00%* | | 0.00%* |
Oil Field Machinery & Equipment | | 0.00%* | | | | 0.00%* | | 0.00%* |
Retail - Consumer Electronics | | | | 0.00%* | | 0.00%* | | 0.00%* |
Diversified Banking Institution | | 1.99% | | -1.99% | | 3.98% | | 0.00% |
Appliances | | | | -0.02% | | 0.02% | | -0.02% |
| | |
Semi-Annual Report (Unaudited) | October 31, 2011 | | 13 |
| | |
Caldwell & Orkin | | |
Market Opportunity Fund | | Sector Diversification |
| | October 31, 2011 (Unaudited) |
| | | | | | | | |
| | | Long | | Short | | Total (a) | | Net (b) |
Metal - Copper | | | | -0.07% | | 0.07% | | -0.07% |
Internet Infrastructure Software | | | | -0.15% | | 0.15% | | -0.15% |
E - Commerce/Products | | | | -0.19% | | 0.19% | | -0.19% |
Pharmacy Services | | | | -0.31% | | 0.31% | | -0.31% |
Footwear (Non-Athletic) & Related Apparel | | 0.30% | | -0.62% | | 0.92% | | -0.32% |
Savings and Loans/Thrifts - Eastern | | | | -0.36% | | 0.36% | | -0.36% |
Industrial Audio & Video Products | | | | -0.41% | | -0.41% | | -0.41% |
Transportation - Truck | | | | -0.44% | | 0.44% | | -0.44% |
Real Estate Management/Services | | | | -0.46% | | 0.46% | | -0.46% |
Semiconductor Equipment | | | | -0.49% | | 0.49% | | -0.49% |
Energy - Alternate Sources | | 0.04% | | -0.60% | | 0.64% | | -0.56% |
Medical - Outpatient/Home Medical Care | | | | -0.74% | | 0.74% | | -0.74% |
Coffee | | | | -0.97% | | 0.97% | | -0.97% |
E - Commerce/Services | | | | -0.97% | | 0.97% | | -0.97% |
Commercial Service/Financial | | | | -0.98% | | 0.98% | | -0.98% |
Medical - Hospitals | | | | -1.26% | | 1.26% | | -1.26% |
Electronic Devices | | | | -1.46% | | -1.46% | | -1.46% |
Retail - Sporting Goods | | | | -2.03% | | 2.03% | | -2.03% |
Commercial Banks - Non-U.S. | | 0.22% | | -3.55% | | 3.77% | | -3.33% |
Schools | | | | -4.88% | | 4.88% | | -4.88% |
Subtotal Common Stocks (long & short positions) | | 57.26% | | -23.65% | | 80.91% | | 33.61% |
| | | | | | | | |
Exchange Traded Fund - SPDR Gold Shares | | 0.45% | | | | 0.45% | | 0.45% |
Exchange Traded Fund - Country Fund - Russia | | | | 0.00%* | | 0.00%* | | 0.00%* |
Exchange Traded Fund - Market Vectors Gold Miners | | 0.30% | | | | 0.30% | | 0.30% |
Exchange Traded Fund - Country Fund - France | | | | -0.10% | | 0.10% | | -0.10% |
Exchange Traded Fund - Emerging Market - Equity | | | | -0.12% | | 0.12% | | -0.12% |
Exchange Traded Fund - Country Fund - Italy | | | | -0.19% | | 0.19% | | -0.19% |
Exchange Traded Fund - Country Fund - India | | | | -0.21% | | 0.21% | | -0.21% |
Exchange Traded Fund - Finance - Investment Fund | | | | -0.33% | | 0.33% | | -0.33% |
Exchange Traded Fund - Country Fund - Spain | | | | -0.52% | | 0.52% | | -0.52% |
Exchange Traded Fund - Sector Fund - Utility | | | | -0.56% | | 0.56% | | -0.56% |
Subtotal Exchange-Traded Funds (long & short positions) | | 0.75% | | -2.03% | | 2.78% | | -1.28% |
| | | | | | | | |
Subtotal Equities (long & short positions) | | 58.01% | | -25.68% | | 83.69% | | 32.33% |
| | | | | | | | |
Call Options | | 1.05% | | | | 1.05% | | |
Put Options | | 0.43% | | | | 0.43% | | |
Other Assets less Liabilities | | 14.83% | | | | 14.83% | | |
Total Portfolio Holdings | | 74.32% | | -25.68% | | 100.00% | | |
| * | Less than 0.005% of net assets. |
| (a) | Total exposure is Long exposure plus the absolute value of the Short exposure. |
| (b) | Net exposure is Long exposure less Short exposure. |
| | |
14 | | 1-800-467-7903 | www.CaldwellOrkinFunds.com |
| | |
Caldwell & Orkin | | |
Market Opportunity Fund | | Schedule of Investments |
| | October 31, 2011 (Unaudited) |
| | | | | | | | |
| | | Shares | | | Value (Note 1) | |
LONG INVESTMENTS (59.49%) | | | | | | | | |
COMMON STOCKS (57.26%) | | | | | | | | |
Apparel Manufacturers (1.10%) | | | | | | | | |
Coach, Inc. | | | 46,100 | | | $ | 2,999,727 | |
| | | | | | | | |
| | |
Applications Software (0.74%) | | | | | | | | |
Check Point Software Technologies, Ltd.1 | | | 35,000 | | | | 2,017,050 | |
| | | | | | | | |
| | |
Automotive - Cars Light Trucks (1.02%) | | | | | | | | |
Ford Motor Co.1 | | | 237,600 | | | | 2,775,168 | |
| | | | | | | | |
| | |
Beverages - Non - Alcoholic (0.57%) | | | | | | | | |
The Coca-Cola Co. | | | 22,800 | | | | 1,557,696 | |
| | | | | | | | |
| | |
Building - Heavy Construction (0.35%) | | | | | | | | |
Chicago Bridge & Iron Co. NV | | | 25,900 | | | | 947,422 | |
| | | | | | | | |
| | |
Building - Residential/Commercial (1.98%) | | | | | | | | |
KB Home | | | 292,600 | | | | 2,039,422 | |
Lennar Corp. - Class A | | | 109,600 | | | | 1,812,784 | |
Pulte Group, Inc.1 | | | 298,000 | | | | 1,543,640 | |
| | | | | | | | |
| | | | | | | 5,395,846 | |
| | | | | | | | |
| | |
Building & Construction Products - Miscellaneous (1.04%) | | | | | | | | |
Fortune Brands Home & Security, Inc.1 | | | 194,300 | | | | 2,823,179 | |
| | | | | | | | |
| | |
Chemicals - Diversified (0.14%) | | | | | | | | |
E.I. du Pont de Nemours & Co. | | | 8,100 | | | | 389,367 | |
| | | | | | | | |
| | |
Commercial Banks Non - U.S. (0.22%) | | | | | | | | |
Lloyds Banking Group PLC ADR1 | | | 283,800 | | | | 584,628 | |
| | | | | | | | |
| | |
Computers (3.25%) | | | | | | | | |
Apple, Inc.1 | | | 21,800 | | | | 8,824,204 | |
| | | | | | | | |
| | |
Computers - Memory Devices (2.25%) | | | | | | | | |
EMC Corp.1 | | | 107,100 | | | | 2,625,021 | |
OCZ Technology Group, Inc.1 | | | 190,200 | | | | 1,344,714 | |
SanDisk Corp.1 | | | 42,400 | | | | 2,148,408 | |
| | | | | | | | |
| | | | | | | 6,118,143 | |
| | | | | | | | |
| | |
Semi-Annual Report (Unaudited) | October 31, 2011 | | 15 |
| | |
Caldwell & Orkin | | |
Market Opportunity Fund | | Schedule of Investments |
| | October 31, 2011 (Unaudited) |
| | | | | | | | |
| | | Shares | | | Value (Note 1) | |
Diversified Banking Institution (1.99%) | | | | | | | | |
Barclays PLC Sponsored ADR | | | 122,300 | | | $ | 1,529,973 | |
Credit Suisse Group AG Sponsored ADR | | | 60,800 | | | | 1,761,376 | |
Deutsche Bank AG | | | 51,300 | | | | 2,124,333 | |
| | | | | | | | |
| | | | | | | 5,415,682 | |
| | | | | | | | |
| | |
Diversified Manufacturing Operations (0.00%)† | | | | | | | | |
Eaton Corp. | | | 100 | | | | 4,482 | |
| | | | | | | | |
| | |
Electric - Integrated (15.66%) | | | | | | | | |
American Electric Power Co., Inc. | | | 151,500 | | | | 5,950,920 | |
CMS Energy Corp. | | | 260,800 | | | | 5,429,856 | |
Edison International | | | 147,900 | | | | 6,004,740 | |
NV Energy, Inc. | | | 628,500 | | | | 10,081,140 | |
OGE Energy Corp. | | | 168,200 | | | | 8,702,668 | |
PPL Corp. | | | 218,260 | | | | 6,410,297 | |
| | | | | | | | |
| | | | | | | 42,579,621 | |
| | | | | | | | |
| | |
Electric - Transmission (3.11%) | | | | | | | | |
National Grid PLC Sponsored ADR | | | 168,700 | | | | 8,446,809 | |
| | | | | | | | |
| | |
Electronic Components - Semiconductors (4.13%) | | | | | | | | |
ARM Holdings PLC Sponsored ADR | | | 98,800 | | | | 2,775,292 | |
Avago Technologies, Ltd. | | | 73,100 | | | | 2,468,587 | |
Broadcom Corp. - Class A1 | | | 76,900 | | | | 2,775,321 | |
Intel Corp. | | | 15,800 | | | | 387,732 | |
Skyworks Solutions, Inc.1 | | | 142,000 | | | | 2,813,020 | |
| | | | | | | | |
| | | | | | | 11,219,952 | |
| | | | | | | | |
| | |
Electronic Forms (0.33%) | | | | | | | | |
Adobe Systems, Inc.1 | | | 30,300 | | | | 891,123 | |
| | | | | | | | |
| | |
Energy - Alternate Sources (0.04%) | | | | | | | | |
Clean Energy Fuels Corp.1 | | | 8,700 | | | | 102,834 | |
| | | | | | | | |
| | |
Finance - Consumer Loans (1.16%) | | | | | | | | |
SLM Corp. | | | 230,300 | | | | 3,148,201 | |
| | | | | | | | |
| | |
Food - Retail (0.68%) | | | | | | | | |
Whole Foods Market, Inc. | | | 25,500 | | | | 1,839,060 | |
| | | | | | | | |
| | |
16 | | 1-800-467-7903 | www.CaldwellOrkinFunds.com |
| | |
Caldwell & Orkin | | |
Market Opportunity Fund | | Schedule of Investments |
| | October 31, 2011 (Unaudited) |
| | | | | | | | |
| | | Shares | | | Value (Note 1) | |
Footwear (Non-Athletic) & Related Apparel (0.30%) | | | | | | | | |
Deckers Outdoor Corp.1 | | | 7,100 | | | $ | 818,204 | |
| | | | | | | | |
| | |
Gold Mining (0.17%) | | | | | | | | |
Goldcorp, Inc. | | | 9,600 | | | | 468,864 | |
| | | | | | | | |
| | |
Hazardous Waste Disposal (0.45%) | | | | | | | | |
Clean Harbors, Inc.1 | | | 21,200 | | | | 1,235,324 | |
| | | | | | | | |
| | |
Hotels & Motels (0.44%) | | | | | | | | |
Starwood Hotels & Resorts Worldwide, Inc. | | | 23,700 | | | | 1,187,607 | |
| | | | | | | | |
| | |
Independent Power Producer (2.30%) | | | | | | | | |
Calpine Corp.1 | | | 413,000 | | | | 6,265,210 | |
| | | | | | | | |
| | |
Medical - Biomedical/Genetics (0.22%) | | | | | | | | |
Vertex Pharmaceuticals, Inc.1 | | | 15,400 | | | | 609,686 | |
| | | | | | | | |
| | |
Medical - Drugs (1.16%) | | | | | | | | |
Johnson & Johnson | | | 48,800 | | | | 3,142,232 | |
| | | | | | | | |
| | |
Medical - HMO (1.04%) | | | | | | | | |
UnitedHealth Group, Inc. | | | 58,700 | | | | 2,817,013 | |
| | | | | | | | |
| | |
Medical Products (0.52%) | | | | | | | | |
CareFusion Corp.1 | | | 54,900 | | | | 1,405,440 | |
| | | | | | | | |
| | |
Non - Hazardous Waste Disposal (0.42%) | | | | | | | | |
Waste Connections, Inc. | | | 33,300 | | | | 1,133,865 | |
| | | | | | | | |
| | |
Oil & Gas Companies - Exploration & Production (0.31%) | | | | | | | | |
Chesapeake Energy Corp. | | | 10,100 | | | | 284,012 | |
Energy XXI Bermuda, Ltd.1 | | | 11,500 | | | | 337,755 | |
EOG Resources, Inc. | | | 100 | | | | 8,943 | |
QEP Resources, Inc. | | | 6,100 | | | | 216,855 | |
Southwestern Energy Co.1 | | | 100 | | | | 4,204 | |
| | | | | | | | |
| | | | | | | 851,769 | |
| | | | | | | | |
| | |
Oil & Gas Drilling (1.25%) | | | | | | | | |
Ensco PLC Sponsored ADR | | | 43,700 | | | | 2,170,142 | |
Noble Corp.1 | | | 17,900 | | | | 643,326 | |
| | |
Semi-Annual Report (Unaudited) | October 31, 2011 | | 17 |
| | |
Caldwell & Orkin | | |
Market Opportunity Fund | | Schedule of Investments |
| | October 31, 2011 (Unaudited) |
| | | | | | | | |
| | | Shares | | | Value (Note 1) | |
Oil & Gas Drilling (continued) | | | | | | | | |
Rowan Cos, Inc.1 | | | 16,600 | | | $ | 572,534 | |
| | | | | | | | |
| | | | | | | 3,386,002 | |
| | | | | | | | |
| | |
Oil Field Machinery & Equipment (0.00%)† | | | | | | | | |
National Oilwell Varco, Inc. | | | 100 | | | | 7,133 | |
| | | | | | | | |
| | |
Pipelines (1.20%) | | | | | | | | |
Enbridge, Inc. | | | 93,900 | | | | 3,259,269 | |
| | | | | | | | |
| | |
Reinsurance (0.93%) | | | | | | | | |
Greenlight Capital Re, Ltd. - Class A1 | | | 112,100 | | | | 2,525,613 | |
| | | | | | | | |
| | |
Retail - Apparel/Shoe (1.73%) | | | | | | | | |
Abercrombie & Fitch Co. - Class A | | | 24,300 | | | | 1,807,920 | |
ANN, Inc.1 | | | 100 | | | | 2,664 | |
Express, Inc. | | | 100 | | | | 2,259 | |
Limited Brands, Inc. | | | 23,900 | | | | 1,020,769 | |
Phillips-Van Heusen Corp. | | | 25,100 | | | | 1,867,691 | |
| | | | | | | | |
| | | | | | | 4,701,303 | |
| | | | | | | | |
| | |
Retail - Building Products (1.08%) | | | | | | | | |
Home Depot, Inc. | | | 82,200 | | | | 2,942,760 | |
| | | | | | | | |
| | |
Retail - Discount (0.66%) | | | | | | | | |
Costco Wholesale Corp. | | | 21,500 | | | | 1,789,875 | |
| | | | | | | | |
| | |
Retail - Jewelry (0.46%) | | | | | | | | |
Tiffany & Co. | | | 15,700 | | | | 1,251,761 | |
| | | | | | | | |
| | |
Retail - Major Department Store (0.04%) | | | | | | | | |
TJX Cos, Inc. | | | 2,000 | | | | 117,860 | |
| | | | | | | | |
| | |
Retail - Restaurants (0.90%) | | | | | | | | |
McDonald’s Corp. | | | 10,700 | | | | 993,495 | |
Panera Bread Co. - Class A1 | | | 4,700 | | | | 628,343 | |
Starbucks Corp. | | | 19,200 | | | | 812,928 | |
| | | | | | | | |
| | | | | | | 2,434,766 | |
| | | | | | | | |
| | |
Semiconductor Components/Integrated Circuits (1.23%) | | | | | | | | |
QUALCOMM, Inc. | | | 65,000 | | | | 3,354,000 | |
| | | | | | | | |
| | |
18 | | 1-800-467-7903 | www.CaldwellOrkinFunds.com |
| | |
Caldwell & Orkin | | |
Market Opportunity Fund | | Schedule of Investments |
| | October 31, 2011 (Unaudited) |
| | | | | | | | | | | | | | |
| | | | | | | | Shares | | | Value (Note 1) | |
| |
Transportation - Rail (0.69%) | | | | | | | | | | | | | | |
Kansas City Southern1 | | | | | | | | | 29,900 | | | $ | 1,888,783 | |
| | | | | | | | | | | | | | |
| | | | |
TOTAL COMMON STOCKS (Cost $145,235,881) | | | | | | | | | | | | | 155,674,533 | |
| |
| | | | |
EXCHANGE TRADED FUNDS (0.75%) | | | | | | | | | | | | | | |
Market Vectors Gold Miners ETF | | | | | | | | | 14,000 | | | | 823,620 | |
SPDR Gold Shares1 | | | | | | | | | 7,300 | | | | 1,221,582 | |
| | | | | | | | | | | | | | |
| | | | | | | | | | | | | 2,045,202 | |
| | | | | | | | | | | | | | |
| | | | |
TOTAL EXCHANGE TRADED FUNDS | | | | | | | | | | | | | | |
(Cost $2,147,119) | | | | | | | | | | | | | 2,045,202 | |
| |
| | | | |
| | | Expiration Date | | Exercise Price | | | Number of
Contracts | | | Value (Note 1) | |
PURCHASED OPTIONS (1.48%) | | | | | | | | | | | | | | |
PURCHASED CALL OPTIONS (1.05%) | | | | | | | | | | | | | | |
American Eagle Outfitters, Inc. | | November, 2011 | | | $14.00 | | | | 2,030 | | | | 50,750 | |
Apple, Inc. | | January, 2012 | | | 420.00 | | | | 495 | | | | 856,845 | |
Home Depot, Inc. | | January, 2012 | | | 34.00 | | | | 2,260 | | | | 648,620 | |
iShares MSCI Japan Index Fund 2011 | | December, 2011 | | | 10.00 | | | | 818 | | | | 7,362 | |
Sandridge Energy, Inc. | | December, 2011 | | | 11.00 | | | | 830 | | | | 6,640 | |
Skyworks Solutions | | January, 2012 | | | 22.50 | | | | 1,750 | | | | 280,000 | |
SLM Corp. | | January, 2012 | | | 14.00 | | | | 2,766 | | | | 298,728 | |
UnitedHealth Group | | January, 2012 | | | 48.00 | | | | 2,200 | | | | 627,000 | |
Vertex Pharmaceutical, Inc. | | January, 2012 | | | 48.00 | | | | 817 | | | | 85,785 | |
| | | | | | | | | | | | | | |
| | | | |
TOTAL PURCHASED CALL OPTIONS (Cost $4,074,201) | | | | | | | | | | | | | 2,861,730 | |
| | | | | | | | | | | | | | |
| | | | |
PURCHASED PUT OPTIONS (0.43%) | | | | | | | | | | | | | | |
Banco Santander | | December, 2011 | | | 11.00 | | | | 1,139 | | | | 261,970 | |
ICICI Bank, Ltd. | | December, 2011 | | | 47.00 | | | | 553 | | | | 522,585 | |
ICICI Bank, Ltd. | | January, 2012 | | | 35.00 | | | | 530 | | | | 97,520 | |
iShares MSCI Italy Index Fund | | December, 2011 | | | 13.00 | | | | 1,140 | | | | 79,800 | |
| | |
Semi-Annual Report (Unaudited) | October 31, 2011 | | 19 |
| | |
Caldwell & Orkin | | |
Market Opportunity Fund | | Schedule of Investments |
| | October 31, 2011 (Unaudited) |
| | | | | | | | | | | | | | | | |
| | | Expiration Date | | | Exercise
Price | | | Number of
Contracts | | | Value (Note 1) | |
| |
PURCHASED PUT OPTIONS (continued) | | | | | | | | | | | | | | | | |
iShares R2K Index Fund | | | November, 2011 | | | | $72.00 | | | | 350 | | | $ | 61,250 | |
SPDR S&P 500 | | | November, 2011 | | | | 123.00 | | | | 685 | | | | 148,645 | |
| | | | | | | | | | | | | | | | |
| | | | |
TOTAL PURCHASED PUT OPTIONS (Cost $1,112,593) | | | | | | | | | | | | | | | 1,171,770 | |
| | | | | | | | | | | | | | | | |
| | | | |
TOTAL PURCHASED OPTIONS (Cost $5,186,794) | | | | | | | | | | | | | | | 4,033,500 | |
| |
TOTAL LONG INVESTMENTS (Cost $152,569,794) | | | | | | | | | | | | | | | 161,753,235 | |
| |
| | | | | | | | | | |
| | | 7-Day Yield | | Shares | | | Value (Note 1) | |
| |
SHORT TERM INVESTMENTS (36.78%) | | | | | | | | | | |
MONEY MARKET FUNDS2 | | | | | | | | | | |
JPMorgan 100% U.S. Treasury Securities Money Market Fund | | 0.00%3 | | | 99,991,195 | | | | 99,991,195 | |
| | | |
TOTAL SHORT TERM INVESTMENTS (Cost $99,991,195) | | | | | | | | | 99,991,195 | |
| |
| | | |
TOTAL INVESTMENTS - (96.27%) (Cost $252,560,989) | | | | | | | | $ | 261,744,430 | |
| | |
Assets in Excess of Other Liabilities (3.73%) | | | | | | | 10,152,115 | |
| |
| | | |
NET ASSETS (100.00%) | | | | | | | | $ | 271,896,545 | |
| |
| | | |
| SCHEDULE OF SECURITIES SOLD SHORT | | | | Shares | | | Value (Note 1) | |
| |
COMMON STOCKS (-23.65%) | | | | | | | | | | |
Appliances (-0.02%) | | | | | | | | | | |
Whirlpool Corp. | | | | | (1,100 | ) | | $ | (55,891) | |
| | | | | | | | | | |
| | | |
Coffee (-0.97%) | | | | | | | | | | |
Green Mountain Coffee Roasters, Inc. | | | | | (40,500 | ) | | | (2,633,310) | |
| | | | | | | | | | |
| | |
20 | | 1-800-467-7903 | www.CaldwellOrkinFunds.com |
| | |
Caldwell & Orkin | | |
Market Opportunity Fund | | Schedule of Investments |
| | October 31, 2011 (Unaudited) |
| | | | | | | | |
| SCHEDULE OF SECURITIES SOLD SHORT (continued) | | Shares | | | Value (Note 1) | |
| |
Commercial Banks Non - U.S. (-3.55%) | | | | | | | | |
Banco Bilbao Vizcaya Argentaria SA Sponsored ADR | | | (263,300 | ) | | $ | (2,380,232) | |
Banco Bradesco SA ADR | | | (127,800 | ) | | | (2,325,960) | |
Banco Santander SA Sponsored ADR | | | (160,900 | ) | | | (1,377,304) | |
BBVA Banco Frances SA ADR | | | (13,300 | ) | | | (82,593) | |
Credicorp, Ltd. | | | (100 | ) | | | (10,878) | |
ICICI Bank, Ltd., Sponsored ADR | | | (78,000 | ) | | | (2,898,480) | |
Itau Unibanco Holding SA Preferred ADR | | | (100 | ) | | | (1,912) | |
Lloyds Banking Group PLC ADR | | | (283,800 | ) | | | (584,628) | |
| | | | | | | | |
| | | | | | | (9,661,987) | |
| | | | | | | | |
| | |
Commercial Service/Financial (-0.98%) | | | | | | | | |
Alliance Data Systems Corp. | | | (26,000 | ) | | | (2,663,440) | |
| | | | | | | | |
| | |
Computers (-0.00%)† | | | | | | | | |
Hewlett-Packard Co. | | | (100 | ) | | | (2,661) | |
| | | | | | | | |
| | |
Diversified Banking Institution (-1.99%) | | | | | | | | |
Barclays PLC Sponsored ADR | | | (122,300 | ) | | | (1,529,973) | |
Credit Suisse Group AG Sponsored ADR | | | (60,800 | ) | | | (1,761,376) | |
Deutsche Bank AG | | | (51,300 | ) | | | (2,124,333) | |
| | | | | | | | |
| | | | | | | (5,415,682) | |
| | | | | | | | |
| | |
E - Commerce/Products (-0.19%) | | | | | | | | |
Nutrisystem, Inc. | | | (42,400 | ) | | | (524,064) | |
| | | | | | | | |
| | |
E - Commerce/Services (-0.97%) | | | | | | | | |
Netflix, Inc. | | | (16,600 | ) | | | (1,362,528) | |
OpenTable, Inc. | | | (29,200 | ) | | | (1,280,712) | |
| | | | | | | | |
| | | | | | | (2,643,240) | |
| | | | | | | | |
| | |
Electronic Devices (-1.46%) | | | | | | | | |
Garmin, Ltd. | | | (66,800 | ) | | | (2,297,252) | |
Research In Motion, Ltd. | | | (82,500 | ) | | | (1,666,500) | |
| | | | | | | | |
| | | | | | | (3,963,752) | |
| | | | | | | | |
| | |
Energy - Alternate Sources (-0.60%) | | | | | | | | |
First Solar, Inc. | | | (32,800 | ) | | | (1,632,456) | |
| | | | | | | | |
| | |
Footwear (Non-Athletic) & Related Apparel (-0.62%) | | | | | | | | |
Skechers U.S.A., Inc. - Class A | | | (118,600 | ) | | | (1,691,236) | |
| | | | | | | | |
| | |
Semi-Annual Report (Unaudited) | October 31, 2011 | | 21 |
| | |
Caldwell & Orkin | | |
Market Opportunity Fund | | Schedule of Investments |
| | October 31, 2011 (Unaudited) |
| | | | | | | | |
| SCHEDULE OF SECURITIES SOLD SHORT (continued) | | Shares | | | Value (Note 1) | |
| |
Industrial Audio & Video Products (-0.41%) | | | | | | | | |
Dolby Laboratories, Inc. - Class A | | | (38,600 | ) | | $ | (1,128,664) | |
| | | | | | | | |
| | |
Internet Infrastructure Software (-0.15%) | | | | | | | | |
AsiaInfo-Linkage, Inc. | | | (39,400 | ) | | | (394,788) | |
| | | | | | | | |
| | |
Medical - Hospitals (-1.26%) | | | | | | | | |
Community Health Systems, Inc. | | | (171,100 | ) | | | (2,990,828) | |
Health Management Associates, Inc. - Class A | | | (48,300 | ) | | | (423,108) | |
| | | | | | | | |
| | | | | | | (3,413,936) | |
| | | | | | | | |
| | |
Medical - Outpatient/Home Medical Care (-0.74%) | | | | | | | | |
Amedisys, Inc. | | | (154,200 | ) | | | (2,024,646) | |
| | | | | | | | |
| | |
Metal - Copper (-0.07%) | | | | | | | | |
Freeport-McMoRan Copper & Gold, Inc. | | | (4,700 | ) | | | (189,222) | |
| | | | | | | | |
| | |
Pharmacy Services (-0.31%) | | | | | | | | |
Catalyst Health Solutions, Inc. | | | (15,400 | ) | | | (846,538) | |
| | | | | | | | |
| | |
Real Estate Management/Services (-0.46%) | | | | | | | | |
E-House China Holdings, Ltd., ADR | | | (158,700 | ) | | | (1,245,795) | |
| | | | | | | | |
| | |
Retail - Apparel/Shoe (-0.21%) | | | | | | | | |
Guess?, Inc. | | | (17,000 | ) | | | (560,830) | |
| | | | | | | | |
| | |
Retail - Consumer Electronics (-0.00%)† | | | | | | | | |
Best Buy Co., Inc. | | | (100 | ) | | | (2,623) | |
| | | | | | | | |
| | |
Retail - Sporting Goods (-2.03%) | | | | | | | | |
Cabela’s, Inc. | | | (109,800 | ) | | | (2,736,216) | |
Dick’s Sporting Goods, Inc. | | | (71,000 | ) | | | (2,775,390) | |
| | | | | | | | |
| | | | | | | (5,511,606) | |
| | | | | | | | |
| | |
Savings and Loans/Thrifts - Eastern (-0.36%) | | | | | | | | |
Hudson City Bancorp, Inc. | | | (157,900 | ) | | | (986,875) | |
| | | | | | | | |
| | |
Schools (-4.88%) | | | | | | | | |
Apollo Group, Inc. - Class A | | | (64,600 | ) | | | (3,058,810) | |
Career Education Corp. | | | (77,900 | ) | | | (1,256,527) | |
Corinthian Colleges, Inc. | | | (280,600 | ) | | | (535,946) | |
ITT Educational Services, Inc. | | | (43,500 | ) | | | (2,695,260) | |
| | |
22 | | 1-800-467-7903 | www.CaldwellOrkinFunds.com |
| | |
Caldwell & Orkin | | |
Market Opportunity Fund | | Schedule of Investments |
| | October 31, 2011 (Unaudited) |
| | | | | | | | |
| SCHEDULE OF SECURITIES SOLD SHORT (continued) | | Shares | | | Value (Note 1) | |
| |
| | |
Schools (continued) | | | | | | | | |
Strayer Education, Inc. | | | (33,100 | ) | | $ | (2,820,451) | |
The Washington Post Co. - Class B | | | (8,500 | ) | | | (2,891,360) | |
| | | | | | | | |
| | | | | | | (13,258,354) | |
| | | | | | | | |
| | |
Semiconductor Equipment (-0.49%) | | | | | | | | |
Veeco Instruments, Inc. | | | (49,800 | ) | | | (1,329,162) | |
| | | | | | | | |
| | |
Transportation - Rail (-0.49%) | | | | | | | | |
CSX Corp. | | | (60,000 | ) | | | (1,332,600) | |
| | | | | | | | |
| | |
Transportation - Truck (-0.44%) | | | | | | | | |
Forward Air Corp. | | | (36,700 | ) | | | (1,201,925) | |
| | | | | | | | |
| | |
TOTAL COMMON STOCKS (Proceeds $73,482,142) | | | | | | | (64,315,283) | |
| | | | | | | | |
| | |
EXCHANGE TRADED FUNDS (-2.03%) | | | | | | | | |
Country Fund - France (-0.10%) | | | | | | | | |
iShares MSCI France Index Fund | | | (12,300 | ) | | | (264,450) | |
| | | | | | | | |
| | |
Country Fund - India (-0.21%) | | | | | | | | |
WisdomTree India Earnings Fund | | | (28,300 | ) | | | (565,717) | |
| | | | | | | | |
| | |
Country Fund - Italy (-0.19%) | | | | | | | | |
iShares MSCI Italy Index Fund | | | (38,000 | ) | | | (513,000) | |
| | | | | | | | |
| | |
Country Fund - Russia (-0.00%)† | | | | | | | | |
Market Vectors Russia ETF | | | (100 | ) | | | (3,046) | |
| | | | | | | | |
| | |
Country Fund - Spain (-0.52%) | | | | | | | | |
iShares MSCI Spain Index Fund | | | (40,400 | ) | | | (1,423,696) | |
| | | | | | | | |
| | |
Emerging Market - Equity (-0.12%) | | | | | | | | |
iShares MSCI Emerging Markets Index Fund | | | (7,900 | ) | | | (322,320) | |
| | | | | | | | |
| | |
Finance - Investment Fund (-0.33%) | | | | | | | | |
The India Fund, Inc. | | | (35,900 | ) | | | (893,551) | |
| | | | | | | | |
| | |
Semi-Annual Report (Unaudited) | October 31, 2011 | | 23 |
| | |
Caldwell & Orkin | | |
Market Opportunity Fund | | Schedule of Investments |
| | October 31, 2011 (Unaudited) |
| | | | | | | | |
| SCHEDULE OF SECURITIES SOLD SHORT (continued) | | Shares | | | Value (Note 1) | |
| |
Sector Fund - Utility (-0.56%) | | | | | | | | |
Utilities Select Sector SPDR Fund | | | (44,000 | ) | | $ | (1,532,960) | |
| | | | | | | | |
| | |
TOTAL EXCHANGE TRADED FUNDS (Proceeds $6,001,161) | | | | | | | (5,518,740) | |
| | | | | | | | |
| | |
TOTAL SECURITIES SOLD SHORT (Proceeds $79,483,303) | | | | | | $ | (69,834,023) | |
| |
| † | Less than 0.005% of net assets. |
| 1 | Non-Income Producing Security. |
| 2 | A portion of the Money Market Fund assets are held as collateral for short sales activity. |
| 3 | Amount represents less than 0.005%. |
Common Abbreviations:
ADR - American Depositary Receipts
ETF - Exchange Traded Fund
Ltd. - Limited
MSCI - Morgan Stanley Capital International
NV - Naamloze Vennootschap is the Dutch term for a public limited liability corporation.
PLC - Public Limited Company
SA - Generally designates corporations in various countries, mostly those employing civil law.
SPDR - Standard & Poor’s Depositary Receipt
See accompanying notes to financial statements.
| | |
24 | | 1-800-467-7903 | www.CaldwellOrkinFunds.com |
| | |
Caldwell & Orkin | | |
Market Opportunity Fund | | Statement of Assets & Liabilities |
| | October 31, 2011 |
| | | | |
ASSETS | | | | |
Investments at value (cost $252,560,989) | | | $261,744,430 | |
Deposits with brokers for securities sold short | | | 85,536,423 | |
Receivables: | | | | |
Investment securities sold | | | 19,793,586 | |
Interest and dividends | | | 14,786 | |
Capital shares sold | | | 82,345 | |
Other assets | | | 77,928 | |
| | | | |
Total Assets | | | 367,249,498 | |
| | | | |
| |
LIABILITIES | | | | |
Securities sold short, not yet purchased (proceeds $79,483,303) | | | 69,834,023 | |
Payables: | | | | |
Investment securities purchased | | | 25,010,132 | |
Capital shares redeemed | | | 103,150 | |
Dividends payable - short sales | | | 50,053 | |
Investment advisory fee | | | 231,115 | |
Accrued expenses and other liabilities | | | 124,480 | |
| | | | |
Total Liabilities | | | 95,352,953 | |
| | | | |
| |
Total Net Assets | | | $271,896,545 | |
| | | | |
| |
COMPOSITION OF NET ASSETS | | | | |
Paid-in capital applicable to 13,956,297 shares outstanding; par value $0.10 per share; 30,000,000 shares authorized | | | $295,033,959 | |
Undistributed net investment loss | | | (1,877,752) | |
Accumulated net realized loss on investments | | | (40,092,383) | |
Net unrealized appreciation of investments | | | 18,832,721 | |
| | | | |
| | | $271,896,545 | |
| | | | |
| |
NET ASSET VALUE AND OFFERING/REDEMPTION PRICE PER SHARE | | | $19.48 | |
| | | | |
See accompanying notes to financial statements.
| | |
Semi-Annual Report (Unaudited) | October 31, 2011 | | 25 |
| | |
Caldwell & Orkin | | |
Market Opportunity Fund | | Statement of Operations |
| | For the Six Months Ended October 31, 2011 |
| | | | |
INVESTMENT INCOME | | | | |
Dividends (net of foreign withholding taxes of $16,197) | | | $1,264,683 | |
| | | | |
Total Investment Income | | | 1,264,683 | |
| | | | |
| |
EXPENSES | | | | |
Investment advisory fees (Note 2) | | | 1,434,370 | |
Dividend expense on securities sold short | | | 688,880 | |
Interest expense | | | 632,403 | |
Transfer agent fees | | | 101,688 | |
Administration and accounting fees (Note 2) | | | 91,584 | |
Professional fees | | | 60,225 | |
Directors’ fees and expenses | | | 32,584 | |
Blue sky servicing fees | | | 27,398 | |
Chief compliance officer expense | | | 22,623 | |
Shareholder report printing | | | 19,352 | |
Insurance expense | | | 17,740 | |
Custodian fees | | | 17,656 | |
Other expenses | | | 11,055 | |
| | | | |
Total Expenses before waiver | | | 3,157,558 | |
| | | | |
Less fees waived by Administrator (Note 2) | | | (15,123) | |
| | | | |
Total net expenses | | | 3,142,435 | |
| | | | |
Net Investment Loss | | | (1,877,752) | |
| | | | |
| |
REALIZED AND UNREALIZED GAIN (LOSS) ON INVESTMENTS | | | | |
Net realized loss on investments | | | (415,295) | |
Net realized gain on securities sold short | | | 7,985,278 | |
Change in unrealized appreciation/(depreciation) on investments | | | (11,920,888) | |
Change in unrealized appreciation/(depreciation) on securities sold short | | | 3,767,819 | |
| | | | |
NET REALIZED AND UNREALIZED LOSS ON INVESTMENTS | | | (583,086) | |
| | | | |
NET DECREASE IN NET ASSETS RESULTING FROM OPERATIONS | | | $(2,460,838) | |
| | | | |
See accompanying notes to financial statements.
| | |
26 | | 1-800-467-7903 | www.CaldwellOrkinFunds.com |
| | |
Caldwell & Orkin | | |
Market Opportunity Fund | | Statement of Changes in Net Assets |
| | |
| | | | | | | | |
| | | For the Six Months Ended October 31, 2011
(Unaudited) | | | For the Year Ended April 30, 2011 | |
DECREASE IN NET ASSETS FROM OPERATIONS: | | | | | | | | |
Net investment loss | | | $(1,877,752) | | | | $(5,064,477) | |
Net realized gain/(loss) on investments and securities sold short | | | 7,569,983 | | | | (10,477,045) | |
Change in net unrealized appreciation or (depreciation) of investments and securities sold short | | | (8,153,069) | | | | 16,050,985 | |
| | | | |
| | | (2,460,838) | | | | 509,463 | |
| | | | |
| |
DECREASE IN NET ASSETS FROM COMMON STOCK TRANSACTIONS: | | | | | |
Net proceeds from sale of shares | | | 24,656,231 | | | | 118,936,001 | |
Cost of shares redeemed | | | (83,093,813) | | | | (182,072,337) | |
Redemption fee proceeds (Note 1) | | | 70,898 | | | | 276,943 | |
| | | | |
Net decrease in net assets resulting from capital share transactions | | | (58,366,684) | | | | (62,859,393) | |
| | | | |
| | |
DECREASE IN NET ASSETS | | | (60,827,522) | | | | (62,349,930) | |
| | |
NET ASSETS | | | | | | | | |
Beginning of period | | | 332,724,067 | | | | 395,073,997 | |
| | | | |
End of period (including undistributed net investment income/(loss) of $(1,877,752) and $0, respectively) | | | $271,896,545 | | | | $332,724,067 | |
| | | | |
See accompanying notes to financial statements.
| | |
Semi-Annual Report (Unaudited) | October 31, 2011 | | 27 |
| | |
Caldwell & Orkin | | |
Market Opportunity Fund | | Financial Highlights |
| | |
For a capital share outstanding throughout each period.
| | | | | | | | | | | | | | | | | | | | | | | | |
| | | For the Six
Months
Ended
October 31,
2011
(Unaudited) | | | For the
Year Ended
April 30,
2011 | | | For the
Year Ended
April 30,
2010 | | | For the
Year Ended
April 30,
2009 | | | For the
Year Ended
April 30,
2008 | | | For the
Year Ended
April 30,
2007 | |
PER SHARE DATA: | | | | | | | | | | | | | | | | | | | | | | | | |
Net asset value, beginning of period | | | $19.59 | | | | $19.51 | | | | $21.24 | | | | $21.40 | | | | $18.68 | | | | $16.69 | |
Income/(loss) from investment operations: | | | | | | | | | | | | | | | | | | | | | | | | |
Net Investment income/(loss) | | | (0.13) | | | | (0.30) | | | | (0.16) | | | | 0.01 | | | | 0.20 | | | | 0.53 | |
Net realized and unrealized gain/(loss) on investments | | | 0.01 | | | | 0.36 | | | | (1.43) | | | | 0.94 | | | | 3.15 | | | | 1.99 | |
| | | | |
Total from Investment Operations | | | (0.12) | | | | 0.06 | | | | (1.59) | | | | 0.95 | | | | 3.35 | | | | 2.52 | |
| | | | |
| | | | | | |
LESS DISTRIBUTIONS: | | | | | | | | | | | | | | | | | | | | | | | | |
From net investment income | | | – | | | | – | | | | – | | | | (0.12) | | | | (0.37) | | | | (0.53) | |
From net realized gain on investments | | | – | | | | – | | | | (0.16) | | | | (1.02) | | | | (0.30) | | | | – | |
| | | | |
Total Distributions | | | – | | | | – | | | | (0.16) | | | | (1.14) | | | | (0.67) | | | | (0.53) | |
| | | | |
Redemption fee proceeds | | | 0.01 | | | | 0.02 | | | | 0.02 | | | | 0.03 | | | | 0.04 | | | | 0.001 | |
| | | | |
Net asset value, end of Period | | | $19.48 | | | | $19.59 | | | | $19.51 | | | | $21.24 | | | | $21.40 | | | | $18.68 | |
| | | | |
| | | | | | |
Total Return | | | (0.56%)2 | | | | 0.41% | | | | (7.40%) | | | | 4.73% | | | | 17.92% | | | | 15.31% | |
| | | | | | |
Ratios and Supplemental Data: | | | | | | | | | | | | | | | | | | | | | | | | |
Net assets, end of period (000’s) | | | $271,897 | | | | $332,724 | | | | $395,074 | | | | $302,930 | | | | $228,454 | | | | $135,337 | |
| | |
28 | | 1-800-467-7903 | www.CaldwellOrkinFunds.com |
| | |
Caldwell & Orkin | | |
Market Opportunity Fund | | Financial Highlights |
| | |
For a capital share outstanding throughout each period.
| | | | | | | | | | | | | | | | | | | | | | | | |
| | | For the Six
Months
Ended
October 31,
2011
(Unaudited) | | | For the
Year Ended
April 30,
2011 | | | For the
Year Ended
April 30,
2010 | | | For the
Year Ended
April 30,
2009 | | | For the
Year Ended
April 30,
2008 | | | For the
Year Ended
April 30,
2007 | |
Ratios to Average Net Assets: | | | | | | | | | | | | | | | | | | | | | | | | |
Management fees | | | 0.99%3 | | | | 0.97% | | | | 0.83% | | | | 0.83% | | | | 0.84% | | | | 0.87% | |
Administrative Fees | | | 0.26%3 | | | | 0.22% | | | | 0.20% | | | | 0.27% | | | | 0.24% | | | | 0.35% | |
| | | | |
Expenses before dividends on securities sold short and interest expense | | | 1.25%3 | | | | 1.19% | | | | 1.03% | | | | 1.10% | | | | 1.08% | | | | 1.22% | |
| | | | |
Interest expense | | | 0.44%3 | | | | 0.51% | | | | 0.31% | | | | 0.24% | | | | 0.18% | | | | 0.09% | |
Expenses from dividends on securities sold short | | | 0.47%3 | | | | 0.34% | | | | 0.29% | | | | 0.55% | | | | 1.02% | | | | 0.37% | |
| | | | |
Ratio of total expenses5 | | | 2.16%3,4 | | | | 2.04%4 | | | | 1.63%4 | | | | 1.89% | | | | 2.28% | | | | 1.68% | |
| | | | |
Ratio of net investment income/(loss) | | | (1.29%)3,4 | | | | (1.36%)4 | | | | (0.82%)4 | | | | (0.11%) | | | | 1.23% | | | | 2.64% | |
Portfolio turnover rate | | | 297%2 | | | | 493% | | | | 662% | | | | 879% | | | | 712% | | | | 529% | |
| 1 | Amount is less than $0.01. |
| 4 | The ratio of total expenses to average net assets and ratio of net investment income/(loss) include fees waived by Fund’s Administrator in the amount of 0.01%, 0.01% and less than 0.005%, respectively, for the periods ended October 31, 2011, April 30, 2011 and 2010, respectively. |
| 5 | The ratio of expenses to average net assets and net investment income to average net assets do not reflect the expenses of other investment companies. |
See accompanying notes to financial statements.
| | |
Semi-Annual Report (Unaudited) | October 31, 2011 | | 29 |
| | |
Caldwell & Orkin | | |
Market Opportunity Fund | | Notes to Financial Statements |
| | October 31, 2011 (Unaudited) |
The Caldwell & Orkin Market Opportunity Fund (the “Fund”) is the only active investment portfolio of The Caldwell & Orkin Funds, Inc. (“Caldwell & Orkin”), an open-end, diversified management investment company registered under the Investment Company Act of 1940, as amended (the “1940 Act”), and incorporated under the laws of the State of Maryland on August 15, 1989. Prior to June, 1992, Caldwell & Orkin’s name was The OTC Select-100 Fund, Inc. and consisted of only one portfolio, The OTC Select-100 Fund. The shareholders of The OTC Select-100 Fund subsequently approved changing the corporate name from The OTC Select-100 Fund, Inc. to The Caldwell & Orkin Funds, Inc. and to amend the investment objective and policies of The OTC Select-100 Fund. As a result of such amendment, The OTC Select-100 Fund was renamed and its assets and objectives were those of the Caldwell & Orkin Aggressive Growth Fund. In August, 1996, the Board of Directors of Caldwell & Orkin approved changing the name of the Caldwell & Orkin Aggressive Growth Fund to the Caldwell & Orkin Market Opportunity Fund. The Fund’s objectives are to provide long-term capital growth with a short-term focus on capital preservation through investment selection and asset allocation. The Fund seeks to outperform the stock market over the long-term, as measured by indices such as the S&P 500 Total Return index.
1. SUMMARY OF SIGNIFICANT ACCOUNTING POLICIES
Securities Valuation
Securities are stated at the closing price on the date at which the net asset value (“NAV”) is being determined. If the date of determination is not a trading date, the last bid price is used for a value instead. Debt securities, other than short-term investments, are valued at the price provided by an independent pricing service. Short-term investments having a maturity of 60 days or less at the time of the purchase are stated at amortized cost, which approximates market value. Any assets or securities for which market quotations are not readily available are valued at fair value as determined in good faith by or under the direction of the Fund’s Board of Directors in accordance with the Fund’s Fair Value Pricing Policy.
Fair Value Measurements
A three-tier hierarchy has been established to classify fair value measurements for disclosure purposes. Inputs refer broadly to the assumptions that market participants would use in pricing the asset or liability, including assumptions about risk. Inputs may be observable or unobservable. Observable inputs are inputs that reflect the assumptions market participants would use in pricing the asset or liability that are developed based on market data obtained from sources independent of the reporting entity. Unobservable inputs are inputs that reflect the reporting entity’s own assumptions about the assumptions market participants would use in pricing the asset or liability that are developed based on the best information available.
Various inputs are used in determining the value of the Fund’s investments as of the reporting period end. These inputs are categorized in the following hierarchy under applicable financial accounting standards:
| | |
Level 1 – | | Unadjusted quoted prices in active markets for identical assets or liabilities that the Fund has the ability to access. |
| | |
30 | | 1-800-467-7903 | www.CaldwellOrkinFunds.com |
| | |
Caldwell & Orkin | | |
Market Opportunity Fund | | Notes to Financial Statements |
| | October 31, 2011 (Unaudited) |
| | |
Level 2 – | | Observable inputs other than quoted prices included in Level 1 that are observable for the asset or liability either directly or indirectly. These inputs may include quoted prices for the identical instrument on an inactive market, prices for similar instruments, interest rates, prepayment speeds, credit risk, yield curves, default rates and similar data. |
Level 3 – | | Unobservable inputs for the asset or liability, to the extent relevant observable inputs are not available, representing the Fund’s own assumptions about the assumptions a market participant would use in valuing the asset or liability, and would be based on the best information available. |
The following is a summary of the inputs used as of October 31, 2011 in valuing the Fund’s investments carried at value:
| | | | | | | | | | | | | | | | |
Investments in Securities at Value* | | Level 1 - Quoted
Prices | | | Level 2 -Other Significant
Observable Inputs | | | Level 3 - Significant Unobservable
Inputs | | | Total | |
Common Stocks | | $ | 155,674,533 | | | $ | – | | | $ | – | | | $ | 155,674,533 | |
Exchange Traded Funds | | | 2,045,202 | | | | – | | | | – | | | | 2,045,202 | |
Purchased Call Options | | | 2,861,730 | | | | – | | | | – | | | | 2,861,730 | |
Purchased Put Options | | | 1,171,770 | | | | – | | | | – | | | | 1,171,770 | |
Short Term Investments | | | 99,991,195 | | | | – | | | | – | | | | 99,991,195 | |
TOTAL | | $ | 261,744,430 | | | $ | – | | | $ | – | | | $ | 261,744,430 | |
| |
Other Financial Instruments* | | | | | | | | | | | | | | | | |
Common Stocks Sold Short | | $ | (64,315,283) | | | $ | – | | | $ | – | | | $ | (64,315,283) | |
Exchange Traded Funds Sold Short | | | (5,518,740) | | | | – | | | | – | | | | (5,518,740) | |
TOTAL | | $ | (69,834,023) | | | $ | – | | | $ | – | | | $ | (69,834,023) | |
| |
During the six months ended October 31, 2011, there were no significant transfers between Level 1 and 2 securities. The Fund evaluates transfers into or out of Level 1 and Level 2 as of the end of the reporting period. All securities of the Fund were valued using Level 1 inputs during the six months ended October 31, 2011. Thus, a reconciliation of assets in which significant unobservable inputs (Level 3) is not applicable for the Fund.
* For detailed industry descriptions, see the accompanying Schedule of Investments.
Recent Accounting Pronouncements
In May 2011, the FASB issued ASU No. 2011-04 “Amendments to Achieve Common Fair Value Measurement and Disclosure Requirements” in GAAP and the International Financial Reporting Standards (“IFRSs”). ASU No. 2011-04 amends FASB ASC Topic 820, Fair Value Measurements and Disclosures, to establish common requirements for measuring fair value and for disclosing information about fair value measurements in accordance with GAAP and IFRSs. ASU No. 2011-04 is effective for fiscal years beginning after December 15, 2011 and for interim periods within those fiscal years. Management is currently evaluating the impact these amendments may have on the Fund’s financial statements.
| | |
Semi-Annual Report (Unaudited) | October 31, 2011 | | 31 |
| | |
Caldwell & Orkin | | |
Market Opportunity Fund | | Notes to Financial Statements |
| | October 31, 2011 (Unaudited) |
Derivatives
The following discloses the amounts related to the Fund’s use of derivative instruments and hedging activities.
The effect of derivative instruments on the Statement of Assets and Liabilities as of October 31, 2011:
Asset Derivatives
| | | | |
Derivatives not Accounted for as Hedging Instruments | | Statement of Assets and Liabilities Location | | Market Value |
Equity Contracts | | Investments, at value | | $ 4,033,500 |
TOTAL | | | | $ 4,033,500 |
|
The effect of derivative instruments on the Statement of Operations for the six months ended October 31, 2011:
| | | | | | |
Derivatives not Accounted for as Hedging Instruments | | Location of Gain/(Loss) On Derivatives Recognized in Income | | Realized Gain/(Loss)
On Derivatives
Recognized in Income | | Change in Unrealized
Gain/(Loss) On Derivatives Recognized in Income |
| | Net realized loss on investments | | $ 2,249,262 | | |
| | | |
Equity Contracts | | Change in unrealized appreciation / (depreciation) on investments | | | | $ (120,958) |
TOTAL | | | | $ 2,249,262 | | $ (120,958) |
|
Significant Ownership Concentration
At October 31, 2011, the Fund invested 36.78% of its total net assets in the JPMorgan 100% U.S. Treasury Securities Money Market Fund Capital Class (CJTXX). The Fund uses the money market instrument as a vehicle for holding collateral related to securities sold short. As stated in the Fund’s prospectus, the Fund will typically invest between 0% and 50% of net assets in money market securities and fixed income securities. This portion of the Fund’s portfolio includes cash equivalents (i.e., money market funds or U.S. treasury notes) and bonds (i.e., corporate or government bonds), although generally cash equivalents are emphasized more than bonds. The corporate bonds purchased may have any maturity and be of any rating or quality, as long as Fund management believes it is consistent with the Fund’s investment objective.
The JPMorgan 100% U.S. Treasury Securities Money Market Fund’s objective is to provide the highest possible level of current income while still maintaining liquidity and providing maximum safety of principal. The JPMorgan 100% U.S. Treasury Securities Money Market Fund invests its assets exclusively in obligations of the U.S. Treasury including treasury bills, bonds and notes.
| | |
32 | | 1-800-467-7903 | www.CaldwellOrkinFunds.com |
| | |
Caldwell & Orkin | | |
Market Opportunity Fund | | Notes to Financial Statements |
| | October 31, 2011 (Unaudited) |
Share Valuation
The NAV per share of the Fund is calculated by dividing the sum of the value of the securities held by the Fund, plus cash or other assets, minus all liabilities (including estimated accrued expenses) by the total number of shares outstanding for the Fund, rounded to the nearest cent. The Fund’s shares will not be priced on the days on which the New York Stock Exchange is closed for trading. The offering and redemption price per share for the Fund is equal to the Fund’s NAV per share.
The Fund charges a 2.00% redemption fee on shares held less than six months. These fees are deducted from the redemption proceeds otherwise payable to the shareholder. The Fund will retain the fee charged as paid-in capital and such fees become part of the Fund’s daily NAV calculation.
Securities Transactions and Related Investment Income
Securities transactions are accounted for on trade date. Dividend income is recorded on the ex-dividend date. Realized gains and losses from investment transactions are determined using the specific identification method. Interest income which includes amortization of premium and accretion of discount, is accrued as earned.
Cash
The Fund maintains cash available for the settlement of securities transactions and capital shares reacquired. Available cash is invested daily in money market instruments.
Income Taxes
The Fund intends to continue to comply with the requirements of the Internal Revenue Code applicable to regulated investment companies and to distribute all taxable income to their shareholders. Therefore, no federal income tax provision is required.
In order to avoid imposition of the excise tax applicable to regulated investment companies, the Fund intends to declare each year as dividends, in each calendar year, at least 98% of its net investment income (earned during the calendar year) and at least 98% of its net realized capital gains (earned during the twelve months ended October 31) plus undistributed amounts, if any, from prior years.
Net capital losses incurred after October 31 and within the taxable year are deemed to arise on the first business day of the Fund’s next taxable year.
Management has concluded that the Fund has taken no uncertain tax positions that require adjustment to the financial statements. The Fund files income tax returns in the U.S. federal jurisdiction and Georgia. The statue of limitations on the Fund’s federal and state tax filings remains open for the fiscal years ended April 30, 2008 through April 30, 2011.
| | |
Semi-Annual Report (Unaudited) | October 31, 2011 | | 33 |
| | |
Caldwell & Orkin | | |
Market Opportunity Fund | | Notes to Financial Statements |
| | October 31, 2011 (Unaudited) |
On December 22, 2010, the Regulated Investment Company Modernization Act of 2010 (the “Modernization Act”) was signed into law. The Modernization Act is the first major piece of legislation affecting regulated investment companies (“RICs”) since 1986 and it modernizes several of the federal income and excise tax provisions related to RICs. Some highlights of the enacted provisions are as follows:
| | ¡ | | New capital losses may now be carried forward indefinitely, and retain the character of the original loss. Under pre-enactment law, capital losses could be carried forward for eight years, and carried forward as short-term capital losses, irrespective of the character of the original loss. |
| | ¡ | | The Modernization Act contains simplification provisions, which are aimed at preventing disqualification of a RIC for “inadvertent” failures of the asset diversification and/or qualifying income tests. Additionally, the Modernization Act exempts RICs from the preferential dividend rule, and repealed the 60-day designation requirement for certain types of pay through income and gains. |
| | ¡ | | Finally, the Modernization Act contains several provisions aimed at preserving the character of distributions made by a RIC during the portion of its taxable year ending after October 31 or December 31, reducing the circumstances under which a RIC might be required to file amended Forms 1099 to restate previously reported distributions |
Use of Estimates
The preparation of financial statements in conformity with accounting principles generally accepted in the United States of America (“GAAP”) requires management to make estimates and assumptions that affect the reported amounts of assets and liabilities and disclosure of contingent assets and liabilities at the date of the financial statements and the reported amounts of revenues and expenses during the reporting period. Actual results could differ from those estimates.
Reclassification of Capital Accounts
GAAP requires that certain components of net assets relating to permanent differences be reclassified between financial and tax reporting. These reclassifications have no effect on net assets or net asset value per share. For the year ended April 30, 2011, the Fund increased accumulated net realized loss on investments by $192,761, decreased undistributed net investment loss by $5,064,477 and decreased paid-in capital by $4,871,716 due to certain permanent book and tax differences.
2. COMMITMENTS AND OTHER AGREEMENTS
The Fund has entered into a management agreement (the “Management Agreement”) with C&O Funds Advisor, Inc. (the “Adviser”) pursuant to which the Adviser provides space, facilities, equipment and personnel necessary to perform administrative and investment management services for the Fund. The Management Agreement provides that the Adviser is responsible for the actual management of the Fund’s portfolio. For such services and expenses assumed by the Adviser, the Fund pays a monthly advisory fee at incremental annual rates as follows:
| | |
34 | | 1-800-467-7903 | www.CaldwellOrkinFunds.com |
| | |
Caldwell & Orkin | | |
Market Opportunity Fund | | Notes to Financial Statements |
| | October 31, 2011 (Unaudited) |
| | |
| Advisory Fee | | Average Daily Net Assets |
1.00% | | Up to $250 million |
.90% | | In excess of $250 million but not greater than $500 million |
.80% | | In excess of $500 million |
The Adviser has agreed to reimburse the Fund to the extent necessary to prevent the Fund’s annual ordinary operating expenses (excluding taxes, expenses related to the execution of portfolio transactions and the investment activities of the Fund such as, for example, interest, dividend expenses on securities sold short, brokerage commissions and fees and expenses charged to the Fund by any investment company in which the Fund invests and extraordinary charges such as litigation costs) from exceeding 2.0% of the Fund’s average net assets (the “Expense Cap”). No reimbursement was required for the six months ended October 31, 2011.
C&O Funds Advisor, Inc. is a wholly-owned subsidiary of Caldwell & Orkin, Inc.
ALPS Distributors, Inc. (“ADI”) serves as distributor to the Fund. The Fund does not pay ADI for these services. ALPS Fund Services, Inc. (“ALPS”) provides fund accounting, fund administration, and transfer agency services to the Fund. The fees paid to ALPS for fund accounting and fund administration services are set at incremental annual rates as follows, and subject to a $160,000 annual minimum:
| | |
| Administration Fee | | Average Daily Net Assets |
.06% | | Between $0 - $500 million |
.03% | | Between $500 million - $1 billion |
.02% | | In excess of $1 billion |
In addition to the fee structure set forth above, an annual amount of $30,000 is waived against the administration fee, pursuant to a Distribution Fee Letter Agreement between the Adviser and ADI.
3. INVESTMENT PORTFOLIO TRANSACTIONS
Investment Purchases and Sales
For the six months ended October 31, 2011, purchases of investments and proceeds from sales of investments (excluding securities sold short and short-term investments) totaled $458,608,265 and $501,975,556 respectively.
Short Sales and Segregated Cash
Short sales are transactions in which the Fund sells a security it does not own, in anticipation of a decline in the market value of that security. To initiate such a transaction, the Fund must borrow the security to deliver to the buyer upon the short sale; the Fund is then obligated to replace the security borrowed by purchasing it in the open market at some later date, completing the transaction.
| | |
Semi-Annual Report (Unaudited) | October 31, 2011 | | 35 |
| | |
Caldwell & Orkin | | |
Market Opportunity Fund | | Notes to Financial Statements |
| | October 31, 2011 (Unaudited) |
The Fund will incur a loss if the market price of the security increases between the date of the short sale and the date on which the Fund replaces the borrowed security. The Fund will realize a gain if the security declines in value between those dates.
All short sales must be fully collateralized. The Fund maintains the collateral in segregated accounts consisting of cash and/or U.S. Government securities sufficient to collateralize the market value of its short positions. Typically, the segregated cash with brokers and other financial institutions exceeds the minimum required. Deposits with brokers for securities sold short are invested in money market instruments. Segregated cash is held at the custodian in the name of the broker per a tri-party agreement between the Fund, the custodian, and the broker.
The Fund may also sell short “against the box”, i.e., the Fund enters into a short sale as described above, while holding an offsetting long position in the same security which it sold short. If the Fund enters into a short sale against the box, it will segregate an equivalent amount of securities owned by the Fund as collateral while the short sale is outstanding.
The Fund limits the value of its short positions (excluding short sales “against the box”) to 60% of the Fund’s total net assets. At October 31, 2011, the Fund had approximately 26% of its total net assets in short positions.
For the six months ended October 31, 2011, the cost of investments purchased to cover short sales and the proceeds from investments sold short were $231,039,231 and $222,817,286 respectively.
4. CAPITAL SHARE TRANSACTIONS
Capital share transactions were as follows:
| | | | | | | | |
| | | For the Six Months Ended
October 31, 2011 | | | For the Year
Ended
April 30, 2011 | |
Shares sold | | | 1,274,358 | | | | 6,136,472 | |
Shares reacquired | | | (4,306,302) | | | | (9,395,772) | |
Net decrease in shares outstanding | | | (3,031,944) | | | | (3,259,300) | |
| | |
| | |
36 | | 1-800-467-7903 | www.CaldwellOrkinFunds.com |
| | |
Caldwell & Orkin | | |
Market Opportunity Fund | | Notes to Financial Statements |
| | October 31, 2011 (Unaudited) |
5. DISTRIBUTIONS TO SHAREHOLDERS
The Fund did not make any distributions during the year ended April 30, 2011.
Distributions paid in the amount of $3,262,646 during the year ended April 30, 2010 were paid from ordinary income for tax purposes.
As of April 30, 2011, the components of distributable earnings on a tax basis were as follows:
| | | | |
Total cost of investments | | $ | 306,711,202 | |
| | | | |
Gross tax unrealized appreciation | | $ | 22,875,320 | |
Gross tax unrealized depreciation | | | (7,120,653) | |
Net appreciation of foreign currency and derivatives | | | 5,881,462 | |
| | | | |
Net tax unrealized appreciation | | | 21,636,129 | |
Undistributed ordinary income | | | 0 | |
Accumulated capital losses | | | (39,412,876) | |
Post-October losses | | | (2,899,829) | |
| | | | |
Total accumulated earnings/(deficit) | | $ | (20,676,576) | |
| | | | |
At April 30, 2011, the Fund had a capital loss carryovers in the amounts of $13,975,845 and $25,437,031. Those loss carryovers expire April 30, 2018, and April 30, 2019, respectively.
On October 31, 2011, based on cost of $257,820,975 for federal income tax purposes, aggregate gross unrealized appreciation for all securities in which there is an excess of value over tax cost was $7,474,169 and aggregate gross unrealized depreciation for all securities in which there is an excess of tax cost over value was $3,550,714, resulting in net unrealized appreciation of $3,923,455.
Net investment income/(loss), net realized gains/(losses) and unrealized appreciation/(depreciation) differ for financial statement and tax purposes due to differing treatments of short term capital gains, nondeductible dividend expense and wash sale loss deferrals.
6. RELATED PARTY TRANSACTIONS
As of October 31, 2011, Caldwell & Orkin, Inc. and Michael B. Orkin had ownership of the Fund of 0.31% and 1.48%, respectively. Caldwell & Orkin, Inc. is 100% wholly owned by Michael B. Orkin.
7. SUBSEQUENT EVENTS
Management has performed a review for subsequent events through the date this report was issued. There were no other reportable events for the Fund as a result of their review
| | |
Semi-Annual Report (Unaudited) | October 31, 2011 | | 37 |
| | |
Caldwell & Orkin | | |
Market Opportunity Fund | | Additional Information |
| | October 31, 2011 (Unaudited) |
DIRECTOR APPROVAL OF THE INVESTMENT ADVISORY AGREEMENT
The Board of Directors of The Caldwell & Orkin Funds, Inc. (the “Board”) is responsible for overseeing management of the Caldwell & Orkin Market Opportunity Fund (the “Fund”). As required by law, on an annual basis the Board determines whether to continue the Fund’s management agreement (the “Management Agreement”) with C&O Funds Advisor, Inc. (the “Manager”), the manager of the Fund.
The Board considered the renewal of the current Management Agreement at an in-person meeting at the office of the Manager, Norcross, Georgia on June 15, 2011. Prior to the meeting, the Independent Directors and their independent legal counsel met in executive session and were fully briefed on required considerations contained in Section 15(c) of the Investment Company Act and judicial interpretations thereof. The Independent Chairman noted that (i) a copy of the Management Agreement; (ii) the Manager’s Form ADV; (iii) the consolidated financial statements of the Manager’s parent company; (iv) a memorandum from Paul, Hastings LLP (legal counsel to the Manager and the Fund) relevant to the continuance of the Management Agreement (including the issues and legal standards the Board should consider in evaluating whether to renew the Management Agreement); (v) a memorandum from C&O Funds Advisor, Inc. to the Board relevant to the Management Agreement; and (vi) other relevant materials (including data regarding the Fund’s performance record and the performance records of other funds in the long/short category; and information about the Fund’s expense ratio and management fees, and the expense ratios and management fees of other funds in the long/short category) had been reviewed and considered by the Independent Directors with advice of the Independent Directors’ counsel.
The Independent Directors and their independent legal counsel met without members of Fund management present to review the materials presented, and to discuss the investment management and administrative services provided by the Manager to the Fund, the income, expenses and profitability of the Manager related to the Fund and related information about the Fund. The Independent Directors and their independent legal counsel also met with management of the Manager in their consideration of renewal of the current Management Agreement. Throughout the deliberation process, the Independent Directors were advised by their independent counsel.
The Independent Directors considered many factors, none of which was considered a sole determining factor, and proceeded to specifically summarize the following:
| | (i) | The nature, extent, and quality of the services provided by the Manager. In this regard, the Board reviewed the services being provided by the Manager to the Fund including, without limitation, its investment advisory and administrative services since the Fund’s inception, its coordination of services and distribution efforts for the Fund over the years, and its provision of officers to the Fund (other than the Fund’s chief compliance officer) without additional compensation. After reviewing the foregoing information, the Board concluded that the quality, extent and nature of the services provided by the Manager were satisfactory and adequate for the Fund. |
| | |
38 | | 1-800-467-7903 | www.CaldwellOrkinFunds.com |
| | |
Caldwell & Orkin | | |
Market Opportunity Fund | | Additional Information |
| | October 31, 2011 (Unaudited) |
| | (ii) | The investment performance of the Fund and Manager. In this regard, the Board compared the performance of the Fund with the performance of a benchmark index and comparable funds managed by other advisers. In particular, the Board noted the Fund’s absolute and relative performance during the calendar and fiscal year ended December 31, 2010 and April 30, 2011. The Board also considered the consistency of the Manager’s management of the Fund with the Fund’s investment objective and policies, and long-term performance of the Fund. The Board highlighted in its discussion that the Fund continued to achieve its results while maintaining a lower statistical risk profile than the market and with price movements that correlated little with those of the S&P 500 Total Return index. Following further discussion, the Board concluded that the investment performance of the Fund and Manager was satisfactory and was consistent with the Fund’s objectives and policies. |
| | (iii) | The costs of the services to be provided and profits to be realized by the Manager and its affiliates from the relationship with the Fund. In this regard, the Board considered the Manager’s staffing, personnel and methods of operating; the financial condition of the Manager and the level of commitment to the Fund and the Manager by the principals of the Manager; the asset levels of the Fund; and the overall expenses of the Fund. The Board also considered potential benefits for the Manager in managing the Fund, including promotion of the Manager’s name, the ability for the Manager to place small accounts into the Fund, and the potential for the Manager to generate “soft dollars” (commission dollars used to purchase research and brokerage services) from Fund trades that may benefit the Manager’s clients other than the Fund. The Board then compared the fees and expenses of the Fund (including the management fee) to other funds similar to the Fund in terms of the type of fund, the style of investment management (including, in particular, the use of short selling as part of the Fund’s principal investment strategy) and the nature of the investment strategy and markets invested in by the Fund, among other factors. The Board reviewed data on the Fund’s management fees and the Fund’s operating expense ratio was still low compared to other funds with comparable objectives and strategies. Following this comparison and upon further consideration and discussion of the foregoing, the Board concluded that the fees to be paid to the Manager by the Fund were fair and reasonable. |
| | (iv) | The extent to which economies of scale would be realized as the Fund grows, and whether advisory fee levels reflect these economies of scale for the benefits of the Fund’s investors. In this regard, the Board considered the Fund’s fee arrangements with the Manager, the Fund’s fee arrangements with other service providers, and the expense cap included in the Management Agreement. The Board considered the Fund’s fee level break points, and noted that the Fund’s shareholders benefit from economies of scale as the Manager’s management fees are reduced as asset levels increase. Following further discussion of the Fund’s current asset levels and fee breakpoints, the Board determined that the Fund’s fee arrangements with the Manager reflect economies of scale for the benefit of Fund shareholders. |
| | |
Semi-Annual Report (Unaudited) | October 31, 2011 | | 39 |
| | |
Caldwell & Orkin | | |
Market Opportunity Fund | | Additional Information |
| | October 31, 2011 (Unaudited) |
Based upon its evaluation of the information, materials and factors described above as well as others (including the Board’s extensive knowledge of the Fund’s operations and the Manager’s involvement with the Fund), the Directors concluded (i) that the terms (including, without limitation, the fees) of the Management Agreement were reasonable and fair in light of the nature and quality of services performed by the Manager; (ii) that they were satisfied with the Manager’s services, personnel and investment strategy; and (iii) that it was in the best interest of the Fund and its shareholders to renew the Management Agreement.
| | |
40 | | 1-800-467-7903 | www.CaldwellOrkinFunds.com |
| | |
Caldwell & Orkin | | |
Market Opportunity Fund | | Additional Information |
| | October 31, 2011 (Unaudited) |
Information about the Board of Directors and officers* of the Fund as of October 31, 2011 is set forth below. The Statement of Additional Information (SAI) includes additional information about the Fund’s Directors and officers and is available free of charge, upon request, by calling (800) 237-7073. The address for each of the persons named below is 5185 Peachtree Parkway, Suite 370, Norcross, GA 30092-6541.
| | | | | | | | |
Name, (Age) and Position(s) Held with Fund | | Term of
Office and
Length of Time
Served1 | | Principal Occupation(s) During Past Five Years | | Number of Funds
in Fund Complex Overseen by
Director | | Other Directorships Held by
Director |
|
DISINTERESTED DIRECTORS |
| | | | |
Frederick T. Blumer (52) Chairman | | Since 1990 | | Mr. Blumer is the CEO of X-spand International, Inc. and was formerly Vice President of HUGHES Telematics, Inc. | | One | | None |
| | | | |
David L. Eager (69) Director | | Since 1992 | | Mr. Eager is a Partner at Eager, Davis & Holmes LLC, and was formerly Director for Product Development for Driehaus Capital Management and a Global Partner with William M. Mercer, Inc. | | One | | None |
| | | | |
James L. Underwood (61) Director | | Since 2006 | | Mr. Underwood is a Principal and shareholder of Windham Brannon PC, a Member of the Board of Managers of Windham Brannon Financial Group LLC, and was formerly President of Tarpley & Underwood, P.C. and Tarpley & Underwood Financial Advisors LLC. | | One | | None |
| * | The term “officer” means the president, vice president, secretary, treasurer, controller or any other officer who performs policy-making decisions. |
| 1 | Each Director serves until his / her successor is duly elected and qualified, or until his / her death, resignation or removal. |
| | |
Semi-Annual Report (Unaudited) | October 31, 2011 | | 41 |
| | |
Caldwell & Orkin | | |
Market Opportunity Fund | | Additional Information |
| | October 31, 2011 (Unaudited) |
| | | | | | | | |
Name, (Age) and Position(s) Held with Fund | | Term of
Office and
Length of
Time
Served1 | | Principal Occupation(s) During Past Five Years | | Number of Funds
in Fund Complex
Overseen by
Director | | Other
Directorships
Held by
Director |
INTERESTED DIRECTOR |
| Michael B. Orkin (52) 2 Director, President, Portfolio Manager | | Since 1990 | | Mr. Orkin is the CEO and sole shareholder of Caldwell & Orkin, Inc., of which the Adviser is a wholly-owned subsidiary. Mr. Orkin has been a portfolio manager at Caldwell & Orkin, Inc. since 1985, and is a Chartered Financial Analyst. | | One | | None |
|
OFFICERS WHO ARE NOT DIRECTORS |
David R. Bockel, Jr. (34)3 Treasurer & Ass’t Secretary Secretary & Ass’t Treasurer | | Since 2010
2006-2010 | | Mr. Bockel is an Assistant Portfolio Manager for Caldwell & Orkin, Inc., and is a Registered Representative of ALPS Distributors, Inc. | | N/A | | N/A |
William C. Horne (53)3 Chief Compliance Officer Treasurer | | Since 2004
2006-2010 | | Mr. Horne is the Director of Client Services and Chief Compliance Officer of Caldwell & Orkin, Inc., and is a Registered Representative of ALPS Distributors, Inc. | | N/A | | N/A |
| * | The term “officer” means the president, vice president, secretary, treasurer, controller or any other officer who performs policy-making decisions. |
| 1 | Each Director serves until his / her successor is duly elected and qualified, or until his / her death, resignation or removal. |
| 2 | Mr. Orkin is an interested person of the Fund by reason of his position with the Adviser. |
| 3 | Registered Representative of ALPS Distributors, Inc. |
| | |
42 | | 1-800-467-7903 | www.CaldwellOrkinFunds.com |
| | |
Caldwell & Orkin | | |
Market Opportunity Fund | | Additional Information |
| | October 31, 2011 (Unaudited) |
| | | | | | | | |
Name, (Age) and Position(s) Held with Fund | | Term of Office and Length of Time Served1 | | Principal
Occupation(s) During
Past Five Years | | Number of Funds in Fund Complex
Overseen by Director | | Other Directorships Held by Director |
OFFICERS WHO ARE NOT DIRECTORS (Continued) |
Paul F. Leone (48)2 Secretary | | Since 2010 | | Mr. Leone is Assistant General Counsel at ALPS Fund Services, Denver, Colorado. Prior to joining ALPS, Mr. Leone was Deputy Chief Compliance Officer at Old Mutual Capital, Denver, Colorado; General Counsel and Chief Compliance Officer at Wisconsin Capital Management, Madison, Wisconsin. | | N/A | | N/A |
Lauren Johnson (31) Assistant Treasurer | | Since 2009 | | Ms. Johnson joined ALPS Fund Services in September 2005 as a Fund Controller. Prior to joining ALPS, Ms. Johnson worked for Pricewaterhouse Coopers LLP. | | N/A | | N/A |
| * | The term “officer” means the president, vice president, secretary, treasurer, controller or any other officer who performs policy-making decisions. |
| 1 | Each Director serves until his / her successor is duly elected and qualified, or until his / her death, resignation or removal. |
| 2 | Registered Representative of ALPS Distributors, Inc. |
| | |
Semi-Annual Report (Unaudited) | October 31, 2011 | | 43 |
CALDWELL & ORKIN MARKET OPPORTUNITY FUND
Semi-Annual Report to Shareholders (unaudited)
| | | | |
BOARD OF DIRECTORS Frederick T. Blumer, Independent Chairman Michael B. Orkin, President David L. Eager James L. Underwood | | TRANSFER, REDEMPTION & DIVIDEND DISBURSING AGENT ALPS Fund Services, Inc. P.O. Box 46256 Denver, CO 80201 | | LEGAL COUNSEL Paul Hastings LLP 600 Peachtree Street, N.E. Suite 2400 Atlanta, GA 30308 |
INVESTMENT ADVISER C&O Funds Advisor, Inc. 5185 Peachtree Parkway Suite 370 Norcross, GA 30092-6541 | | CUSTODIAN JPMorgan Chase Bank, N.A. 1111 Polaris Parkway, Suite 3J Columbus, OH 43240 | | INDEPENDENT DIRECTORS’ COUNSEL Arnall Golden Gregory LLP 171 17th Street, NW, Suite 2100 Atlanta, GA 30363 |
| | |
DISTRIBUTOR ALPS Distributors, Inc. 1290 Broadway, Suite 1100 Denver, CO 80203 | | | | |
The Caldwell & Orkin Market Opportunity Fund’s (the “Fund”) portfolio may or may not have positions in any of the companies referenced in this Report to Shareholders as of any date after October 31, 2011. The commentary reflects the views of the portfolio manager (or Adviser) through the end of the period or through the date of this report, as the case may be. Of course, these views are subject to change as market and other conditions warrant. These financial statements are submitted for the general information of the Fund’s shareholders. They are not authorized for distribution to prospective investors unless preceded or accompanied by an effective Fund Prospectus.
Availability of Proxy Voting Policy & Procedures, Proxy Voting Record and Code of Ethics - A description of a) the policies and procedures the Fund uses to determine how to vote proxies relating to portfolio securities, b) how the Fund voted proxies relating to portfolio securities during the most recent 12-month period ended June 30, c) the Code of Ethics applicable to the principal officers of the Fund are available without charge, upon request, by calling toll-free (800) 237-7073, or on the Securities and Exchange Commission’s (the “Commission’s”) website at http://www.sec.gov.
Availability of Quarterly Portfolio Schedule - The Fund files its complete schedule of portfolio holdings with the Commission for the first and third quarters of each fiscal year on Form N-Q. The Fund’s Forms N-Q are available on the Commission’s website at http://www.sec.gov. The Fund’s Forms N-Q may be reviewed and copied at the Commission’s Public Reference Room in Washington, D.C. Information on the operation of the Public Reference Room may be obtained by calling 1-800 SEC-0330.
Fund Information - For information about the Fund please call (800) 237-7073 or visit the Fund’s website at www.CaldwellOrkinFunds.com.
Fund Listings - The Fund is listed in many newspapers as C&OMktOpp or CaldOrkMO. The Fund’s Quotation symbol is COAGX. The Fund’s CUSIP number is 128819307.
Caldwell & Orkin Market Opportunity Fund
5185 Peachtree Parkway, Suite 370
Norcross, GA 30092-6541
E-mail: Info@CaldwellOrkin.com
Not applicable to this report.
| Item 3. | Audit Committee Financial Expert. |
Not applicable to this report.
| Item 4. | Principal Accountant Fees and Services. |
Not applicable to this report.
| Item 5. | Audit Committee of Listed Registrants. |
Not applicable.
| Item 6. | Schedule of Investments. |
Schedule of Investments is included as part of the Report to Stockholders filed under Item 1 of this form.
| Item 7. | Disclosure of Proxy Voting Policies and Procedures for Closed-End Management Investment Companies. |
Not applicable.
| Item 8. | Portfolio Managers of Closed-End Management Investment Companies. |
Not applicable.
| Item 9. | Purchases of Equity Securities by Closed-End Management Investment Companies. |
Not applicable.
| Item 10. | Submission of Matters to Vote of Security Holders. |
There have been no material changes to the procedures by which shareholders may recommend nominees to the registrant’s board of trustees.
| Item 11. | Controls and Procedures. |
| | (a) | The registrant’s principal executive officer and principal financial officer have concluded that the registrant’s disclosure controls and procedures (as defined in Rule 30a-3(c) under the Investment Company Act of 1940, as amended) are effective based on their evaluation of these controls and procedures as of a date within 90 days of the filing date of this document. |
| | (b) | There was no change in the Registrant’s internal control over financial reporting (as defined in Rule 30a-3(d) under the Investment Company Act of 1940, as amended) during the second fiscal quarter of the period covered by this report that has materially affected, or is reasonably likely to materially affect, the Registrant’s internal control over financial reporting. |
| | (a)(2) | The certifications required by Rule 30a-2(a) of the Investment Company Act of 1940, as amended, and Section 302 of the Sarbanes-Oxley Act of 2002 are attached hereto as Ex99.Cert. |
| | (b) | The certifications by the registrant’s Principal Executive Officer and Principal Financial Officer, as required by Rule 30a-2(b) of the Investment Company Act of 1940, as amended, and Section 906 of the Sarbanes-Oxley Act of 2002 are attached hereto as Ex99.906Cert. |
3
SIGNATURES
Pursuant to the requirements of the Securities Exchange Act of 1934 and the Investment Company Act of 1940, the registrant has duly caused this report to be signed on its behalf by the undersigned, thereunto duly authorized.
| | |
| The Caldwell & Orkin Funds, Inc. |
| |
| By: | | /s/ Michael B. Orkin |
| | Michael B. Orkin |
| | President (Principal Executive Officer) |
| |
| Date: | | January 6, 2012 |
| |
| By: | | /s/ David R. Bockel, Jr. |
| | David R. Bockel, Jr. |
| | Treasurer (Principal Financial Officer) |
| |
| Date: | | January 6, 2012 |