UNITED STATES
SECURITIES AND EXCHANGE COMMISSION
Washington, D.C. 20549
FORM N-CSR
Investment Company Act file number: 811-06113
The Caldwell & Orkin Funds, Inc.
(Exact name of registrant as specified in charter)
5185 Peachtree Parkway, Suite 370, Norcross, GA 30092-6541
(Address of principal executive offices) (Zip code)
Michael B. Orkin
5185 Peachtree Parkway, Suite 370, Norcross, GA 30092-6541
(Name and Address of Agent for Service)
Registrant’s Telephone Number, including Area Code: 678-533-7850
Date of fiscal year end: April 30
Date of reporting period: May 1, 2010 - October 31, 2010
Form N-CSR is to be used by management investment companies to file reports with the Commission not later than 10 days after the transmission to stockholders of any report that is required to be transmitted to stockholders under Rule 30e-1 under the Investment Company Act of 1940 (17 CFR 270.30e-1). The Commission may use the information provided on Form N-CSR in its regulatory, disclosure review, inspection, and policymaking roles.
A registrant is required to disclose the information specified by Form N-CSR, and the Commission will make this information public. A registrant is not required to respond to the collection of information contained in Form N-CSR unless the Form displays a currently valid Office of Management and Budget (“OMB”) control number. Please direct comments concerning the accuracy of the information collection burden estimate and any suggestions for reducing the burden to Secretary, Securities and Exchange Commission, 450 Fifth Street, NW, Washington, DC 20549-0609. The OMB has reviewed this collection of information under the clearance requirements of 44 U.S.C. ss. 3507.
| Item 1. | Report to Stockholders. |

| | |
| | Caldwell & Orkin |
Table of Contents | | Market Opportunity Fund |
October 31, 2010 | | |
| | |
| | | 1-800-467-7903 | www.CaldwellOrkinFunds.com |
| | |
Caldwell & Orkin | | |
Market Opportunity Fund | | Shareholder Letter |
| | October 31, 2010 |
| | | | |
| Investment Adviser | |  | | Shareholder Accounts |
| C&O Funds Advisor, Inc. | | | c/o ALPS Fund Services, Inc. |
| 5185 Peachtree Parkway, | | | P.O. Box 46256 |
| Suite 370 | | | Denver, Colorado 80201 |
| Norcross, Georgia | | | (800) 467-7903 |
| 30092-6541 | | | |
| (800) 237-7073 | | | |
| | |
| Dear Fellow Shareholder: | | | | December 22, 2010 |
The Caldwell & Orkin Market Opportunity Fund (the “Fund”) dipped -1.33% in the 6-month period ended October 31, 2010. The S&P 500 Total Return Index (“S&P 500”) inched up 0.74% during the same period. For the 12 months ended October 31, 2010, the Fund slipped -3.49%, compared to a gain of 16.52% for the S&P 500. Since commencement of active management on August 24, 1992 through October 31, 2010, the Fund has generated an 8.88% compounded annual return, bettering the S&P 500’s 8.08% compounded annual return. The Fund’s total return from August 24, 1992 through October 31, 2010 has been 370.28%, compared to the S&P 500’s total return of 311.56%. Please see standardized performance figures on page 7.
The performance data quoted represents past performance. Past performance is no guarantee of future results. The investment return and principal value of an investment in the Fund will fluctuate so that an investor’s shares, when redeemed, may be worth more or less than their original cost. Current performance may be higher or lower than the performance data quoted. Please call 800-237-7073 or visit www.CaldwellOrkinFunds.com for current month-end performance. The Fund’s performance assumes the reinvestment of dividends and capital gains, if any.
Total annualized Fund operating expenses for the Fund’s fiscal year ended April 30, 2010 were 1.72%. Excluding interest and dividend expenses from securities sold short, the Fund’s operating expenses for the same period were 1.12%. Additional information about the Fund’s fees and expenses is available in the Fund’s prospectus.
The Fund has achieved these results while maintaining a low market risk profile and with little reliance on the movement of the stock market (see pages 7, 9, 10 and 11). Since we began actively managing the Fund on August 24, 1992, the Fund’s price movements have had virtually no correlation (0.39%) with the price movements of the S&P 500 as measured by R, the correlation coefficient. An S&P 500 index fund has nearly a 100% correlation to the market in any given period. The Fund’s lack of correlation to the index indicates that its performance is not attributable to that of the market. Additionally, given the Fund’s low correlation to the S&P 500, deviations in Fund performance relative to the S&P 500’s performance are to be expected. (Statistical computations by Ned Davis Research, Inc. (“NDR”)).
Management Discussion and Analysis
The Market Opportunity Fund opened the semi-annual period on May 1, 2010 68% invested and 36% net long. Technology companies represented our largest long sector focus (15%) - and within that sector, semiconductor firms were the largest industry concentration (8%) - followed by the communications (8%) and energy sectors (7%). The lion’s share of energy sector stocks (6%) were
| | |
Semi-Annual Report (Unaudited) | October 31, 2010 | | 1 |
| | |
Caldwell & Orkin | | |
Market Opportunity Fund | | Shareholder Letter |
| | October 31, 2010 |
in the exploration and production industries, and our major focus there was natural gas. On the short side of the portfolio, Alliance Data Systems Corp. (ADS), a private-label credit card company that caters to the sub-prime market was our largest single position (-1%). Emerging country exchange-traded funds (“ETFs”) and U.S. Treasury Bond ETFs were also relatively large short sector investments with each at -2%. We had 66 positions on the long side, and 22 on the short side. We also held 6% of the portfolio in high-grade corporate bonds.
A macro theme we’ve followed for many years has been the growth of government, corporate and personal debt, and its effect on the economy and the markets. Our nervousness about debt has taken on even more urgency given the issues facing the Eurozone, the U.S. government, and states and municipalities in the U.S. (many of which have resorted to selling off public buildings, slashing programs and releasing prisoners early to save money and raise cash to meet current obligations). We continue to worry about debt and remain vigilant about the U.S.’s ability to handle its financial obligations.
The first half of the Fund’s fiscal year was a rather lackluster time in the equity markets. As mentioned, the S&P 500 was up 0.74% for the six months, and the broader Wilshire 5000 Total Market Index was up just 0.48%. The Russell 2000 index fell -1.85%. The initial bullish overtones of the Federal Reserve’s (the “Fed”) historic easing campaign were somewhat overshadowed by a significant slowing of U.S. money supply growth, European debt crises, the BP oil disaster in the Gulf of Mexico, the housing crisis, a lackluster economic recovery and persistently high unemployment.
On April 6, market concerns about Greece grew significantly, reflected by investors selling Greek bonds and sending bond yields to 7.1%. Confidence was further shaken when on April 22 the European Union revealed that the Greek budget deficit in 2009 was 13.6% of gross domestic product (GDP), more than the Greek government’s estimate of 12.7%. Moody’s then lowered Greece’s government bond rating and said further downgrades were possible. The following day Greek Prime Minister George Papandreou said “the time has come” for Greece to request aid from the Eurozone and International Monetary Fund (“IMF”). On May 2, 2010 Greece reached a bailout deal with other Eurozone countries and the IMF.
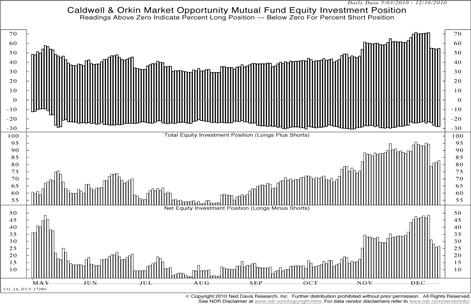
Greece may have become the poster-child of what could well happen throughout western civilization as European and the U.S. governments are forced to reduce debt levels and reign-in services while trying to stimulate economic growth. By late May the risk climate turned more negative as European debt crisis concerns mounted and economic liquidity fell. We reduced the Fund’s total and net exposure, and from mid-May through the end of the review period the Fund averaged 13% net long and 72% invested. While we did keep our net invested position relatively low during that timeframe, our total invested position did fluctuate quite a bit from a low of about 60% in the late-July / early-August timeframe, increasing to a high of 86% in late October (see the Equity Investment Position chart on page 11). Note that the net position reference represents long and short stock positions, and excludes options and corporate bonds.
The market suffered a setback during this period, with the S&P 500 falling -14.60% between April 26, 2010 and June 30, 2010. The Fund dipped -1.08% as the shorts kicked in, returning 20.52%.
On the long side, our best equity performer was Sybase, Inc. (SY), a software services company. That position, which was liquidated in mid-May when it was acquired by German business
| | |
2 | | 1-800-467-7903 | www.CaldwellOrkinFunds.com |
| | |
Caldwell & Orkin | | |
Market Opportunity Fund | | Shareholder Letter |
| | October 31, 2010 |
software company SAP AG, contributed 0.55% to overall Fund performance. Our worst-performing longs included Popular, Inc. (BPOP) and Helix Energy Solutions Group, Inc. (HLX). Collectively, the top five long contributors added 2.32% to performance, and our five worst-performing longs cost the Fund -1.79% in overall performance.
On the short side of the portfolio, our thematic play against the for-profit education industry paid off. Corinthian Colleges, Inc., (COCO) returned 1.12%, followed by ITT Educational Services, Inc. (ESI), Career Education Corp. (CECO) and Apollo Group, Inc. (APOL). Four of our best five short picks were education stocks, and collectively they contributed 2.37% to Fund performance.
The short positions that detracted most from Fund performance during the review period included Rackspace Hosting, Inc. (RAX), a web hosting and design concern, Veeco Instruments, Inc. (VECO), American Eagle Outfitters, Inc. (AEO), big-box retailer Best Buy, Inc. (BBY) and apparel manufacturer Under Armour, Inc. (UA). Collectively, our five worst-performing shorts cost the Fund -1.60% in overall performance.
During the six months ended October 31, 2010 the greatest portfolio positioning change in the long portfolio was in the technology sector. We opened May 1, 2010 with a 15% long tech sector allocation (8% of which was semiconductor industry related), and closed October 31 with a 4% tech position (2% in semis.) Additionally, our tech exposure on the short side went from -1% to -6% (semis went from 0% to -4%). Our semi focus on the long side was primarily smartphone-related, and on the short side mostly PC-related.
Another long sector we pulled back on was energy. The Fund’s long allocation went from a 7% position to a 3% position by October 31. The sector ran into some turbulence for a number of reasons including the BP oil spill, the resulting prospect for enhanced government regulation and oversight and falling natural gas prices. We used it as an opportunity to lock in gains. We are still bullish on natural gas, and since October 31 we’ve added to our long energy position. The day after the November elections President Obama twice mentioned natural gas as an energy source he would support. Other tailwinds for natural gas include the heavy switchover activity (particularly among utilities) away from coal and oil towards natural gas, a relatively low carbon emitting energy source, and a collective movement towards shifting to using energy sources produced in our own country.
The largest sector movement among the shorts was in the consumer non-cyclical sector. Non-cyclical stocks are generally defensive issues that do well in economic downturns since demand for their products and services continues regardless of the economy. This sector includes the for-profit education industry (listed as “Schools” in the Schedule of Investments). Our opening allocation to the sector May 1, 2010 was -2% (which included one very small education position), and we closed October 31, 2010 with a -10% sector allocation, of which -6% was to schools. Again, our shorts and put options in this area did well during the review period. Of note, The Washington Post Co. (WPO) appears in the Schedule of Investments under “Schools.” While WPO does indeed run a newspaper of the same name, we consider the company to be more of a for-profit education concern than a media conglomerate as the majority of their profits are derived from an education subsidiary (Kaplan). The newspaper side of the business is bleeding red ink.
| | |
Semi-Annual Report (Unaudited) | October 31, 2010 | | 3 |
| | |
Caldwell & Orkin | | |
Market Opportunity Fund | | Shareholder Letter |
| | October 31, 2010 |
We also increased exposure to the consumer cyclical sector, which includes retailers, in both the long and short portfolios. The long consumer cyclical allocation went from 4% to 10%, and the short allocation dropped from -1% to -5%. Similar to the technology holdings, each purchase and short was for stock-specific reasons.
In the communications sector, we added to the long side (going from 8% to 10%), particularly in the telecommunications industry (4% to 7%). Our major focus in this sector are companies revolving around the smartphone industry - cell phone manufacturers, cell phone tower operators, the components that go into cell phones, etc. The asset re-allocations on the long side during the period were beneficial for the Fund as the communications sector did well during the review period.
The Market Opportunity Fund closed the semi-annual period on October 31, 2010 positioned 46% long, -30% short (16% net long), 1% in put options, 1% in call options, 5% in corporate bonds and 17% in cash & equivalents. As detailed on pages 14 and 15, wireless equipment operators represented our largest long industry (4%), and schools were the greatest short industry exposure at -6%. Over the course of the six months ended October 31, 2010, the longs declined -3.44%, and the shorts returned 4.46%.
Outlook
Despite many headwinds, the U.S. economy is showing some signs of life. Ed Hyman’s ISI Group, Inc. has increased its forecast for real GDP growth in 2011 from below-trend 2.0% to above-trend 3.0%. After slogging through four quarters of negative real GDP growth between Q2 2008 and Q2 2009, the U.S. economy posted a positive quarterly growth rate of 1.60% in Q3 2009, and has remained in positive territory since. The economy grew a revised 2.52% in Q3 2010. Hyman cites several catalysts behind the forecast change: policy initiatives such as the Fed’s QE2, probable tax cut extensions, continued stock market gains and the easing of Eurozone financial strains with the European Central Bank buying sovereign bonds. But there are significant risks. A big risk is more tightening by the People’s Bank of China in response to inflation accelerating, putting a damper on stock prices around the world. Additional risks: housing prices in the U.S. remain depressed and unstable, the U.S. unemployment rate ticked up to 9.8% in November, the recurring Eurozone sovereign debt crises and the aforementioned state and local government budget woes.
Given QE2’s positive impact on money supply growth, a marginally improving economy and a more business-friendly policy outlook, we remain cyclically (shorter-term) bullish. However, behind this cyclical backdrop the secularly (longer-term) bearish reality of an over-leveraged economy remains.
On behalf of all of us at Caldwell & Orkin, I thank you for your continued support and wish you a happy and healthy New Year.
Sincerely,
Michael B. Orkin, CFA
Portfolio Manager and Chief Investment Officer
| | |
4 | | 1-800-467-7903 | www.CaldwellOrkinFunds.com |
| | |
Caldwell & Orkin | | |
Market Opportunity Fund | | Shareholder Letter |
| | October 31, 2010 |
Postscript
In managing the Fund for risk as well as return our goal is to make money over a full market cycle, which includes both bull market (rising) and bear market (falling) cycles, but with less stomach churn. NDR computed what they consider to be bull and bear market cycles for the S&P 500 going back to the Fund’s commencement of active management. NDR’s analysis shows that during the four full market cycles going back to 1992, the Fund has lagged the market during the bull phases, and outperformed during the bear phases, though not necessarily with positive returns. Importantly, the Fund has outperformed the S&P 500 during each of the four full market cycles. Notably, the Fund’s performance has had virtually no correlation (0.39%) to the performance of the S&P 500 as measured by R, the correlation coefficient. An S&P 500 index fund would have a correlation coefficient of nearly 100%. NDR’s analysis is available on the Fund’s website, www.CaldwellOrkinFunds.com under the “Risk Profile Data” tab.
The Fund’s investment objective is to provide long-term capital growth with a short-term focus on capital preservation. Our philosophy in managing the Fund is to focus on risk as well as return. We use active asset allocation - the opportunistic shifting of assets between long stock positions, short stock positions (selling borrowed stock and attempting to replace the borrowed securities in the future at a lower price), options, bonds and cash equivalents - to manage exposure to market risk (the risk that the broad market declines, taking good companies down with it). The Fund may hold up to 60% of its net assets in short positions at any time and also invest in options. Short positions and put options are employed with the intent of making money when those stocks we judge to be mispriced fall. When we use short positions or put options, the Fund’s portfolio is considered to be “hedged,” so that it is not fully exposed to the price movements and volatility of the broader market. Our asset allocation determinations are primarily based on our perception of risk in the marketplace. In summary, our goal is to make money over a full market cycle, but with less stomach churn.
The Fund’s disciplined investment philosophy and active management style typically leads to higher-than-average portfolio turnover. High turnover may have an unfavorable impact on the amount of taxable distributions paid to shareholders. Higher turnover may also result in higher brokerage costs for the Fund. The Fund’s turnover rate will typically exceed 100% per year, and will not be a limiting factor when we deem change appropriate. Fund holdings, industry and asset allocations are subject to change without notice. The Fund may or may not have a position in any of the companies mentioned in this commentary as of the date of this report.
An investment in the Fund involves risk, including the loss of principal. Additionally, there are certain risks inherent in investing in the Fund, including market risk, short sale risk, interest rate risk, business risk, small company risk, market valuation risk, political risk, and portfolio turnover risk. For a complete discussion of these risks, you may request a copy of the Fund’s prospectus by calling 800-237-7073. The Fund uses aggressive investment strategies (including short positions and options) that have the potential for yielding high returns; however, these strategies may also result in losses. Stocks sold short have unlimited risk. Investment return and principal value will fluctuate so that shares, when redeemed, may be worth more or less than their original cost. Options are not suitable for all investors.
Investors should expect that the Fund’s performance may fluctuate independently of stock market indices, such as the S&P 500 Total Return Index.
Distributed by ALPS Distributors, Inc., Member FINRA/SIPC
1290 Broadway, Suite 1100, Denver, CO 80203
| | |
Semi-Annual Report (Unaudited) | October 31, 2010 | | 5 |
| | |
Caldwell & Orkin | | |
Market Opportunity Fund | | Shareholder Letter |
| | October 31, 2010 |
Statistical Risk Definitions:
Correlation Coefficient (R): R is a statistical measure of correlation. In this report, R is a measurement of investment risk that indicates how closely performance is linked to the broad market – it quantifies the degree to which a fund’s performance correlates with the performance of a benchmark. R can vary between 100% (perfect positive correlation) and –100% (perfect negative correlation). 0% represents no correlation. An R of 100% means that all movements of a fund are fully explained by movements in its benchmark index. Conversely, a low R indicates that very few of the fund’s movements are explained by movements in its benchmark index, and a negative R indicates a fund’s movements are inversely correlated with its benchmark index.
Coefficient of Determination (R-Square): R-Square, also represented as R2, is another measurement of investment risk that quantifies the degree to which a fund’s performance correlates with the performance of its benchmark index. R-Square is calculated by multiplying the Correlation Coefficient (R) by itself, and is therefore always positive. R-Square can vary between 0% (no correlation) and 100% (perfect correlation). The higher the value of R-Square, the greater the degree of correlation between the fund and its benchmark index. R-squared does not take into account the direction of the correlation (positive or negative), therefore R-Squared is not able to reflect inverse correlation between a fund and its benchmark index.
Beta: A measure of a fund’s sensitivity to market movements. Usually the higher betas represent riskier investments. When correlation is low, beta has minimal, if any, significance.
Standard deviation: A statistical measure of dispersion about an average, indicating the volatility of a fund’s total returns.
Sharpe Ratio: The Sharpe Ratio is calculated by subtracting the risk-free (T-bill) rate of return from a portfolio’s total return and then dividing this by its standard deviation. The resulting fraction can be thought of as return per unit of risk. The higher a portfolio’s Sharpe Ratio, the better the risk-adjusted performance.
Semi-variance: A measure of a fund’s downside (negative return) volatility relative to a benchmark. Lower numbers are associated with less risk.
Index Definitions:
Russell 2000 Index: The Russell 2000 Index measures the performance of the small-cap segment of the U.S. equity universe. The Russell 2000 Index is a subset of the Russell 3000 Index representing approximately 10% of the total market capitalization of that index. It includes approximately 2000 of the smallest securities based on a combination of their market cap and current index membership. The Russell 2000 provides a comprehensive and unbiased small-cap barometer and is completely reconstituted annually.
S&P 500 Total Return Index: The S&P 500 Total Return Index is a capitalization-weighted, unmanaged index of 500 large U.S. companies chosen for market size, liquidity and industry group representation and includes reinvested dividends. You cannot invest directly in an index.
Wilshire 5000 Total Market Index: The Wilshire 5000 Total Market Index represents the broadest index for the U.S. equity market, measuring the performance of all U.S. equity securities with readily available price data.
You may not invest directly in an index.
Other Definition:
QE2: QE2 is the name Wall Street has given to the Federal Reserve’s second round of quantitative easing, a monetary policy whereby the Fed buys securities in the open market (in this case Treasury bonds) in an effort to stimulate the economy.
| | |
6 | | 1-800-467-7903 | www.CaldwellOrkinFunds.com |
| | |
Caldwell & Orkin | | |
Market Opportunity Fund | | Performance Summary |
| | October 31, 2010 (Unaudited) |
| | | | |
Fiscal Year Ended April 30, 2010 | | C&O Market Opportunity Fund(1) | | S&P 500 Total
Return Index(2) |
1991 | | 1.25% | | 0.42% |
1992 | | 11.96% | | 14.03% |
1993* | | 15.09% | | 9.24% |
1993** | | 21.09% | | 9.18% |
1994 | | 16.48% | | 5.32% |
1995 | | -2.28% | | 17.47% |
1996 | | 31.80% | | 30.21% |
1997 | | 23.24% | | 25.13% |
1998 | | 25.77% | | 41.07% |
1999 | | 19.43% | | 21.82% |
2000 | | -0.02% | | 10.13% |
| | | | |
Fiscal Year Ended April 30, 2010 | | C&O Market Opportunity Fund(1) | | S&P 500 Total Return Index(2) |
2001 | | 11.43% | | -12.97% |
2002 | | 1.88% | | -12.63% |
2003 | | 1.12% | | -13.31% |
2004 | | -3.55% | | 22.88% |
2005 | | -0.17% | | 6.34% |
2006 | | -2.74% | | 15.42% |
2007 | | 15.31% | | 15.24% |
2008 | | 17.92% | | -4.68% |
2009 | | 4.73% | | -35.31% |
2010 | | -7.40% | | 38.84% |
| | | | |
Total Return Through October 31, 2010 | | | | |
6 months ended | | -1.33% | | 0.74% |
12 months ended | | -3.49% | | 16.52% |
Since 8/24/92 (3) | | 370.28% | | 311.56% |
| | | | |
Average Annual Returns Through October 31, 2010 | | | | |
One Year | | -3.49% | | 16.52% |
Three Years | | -2.20% | | -6.49% |
Five Years | | 4.76% | | 1.73% |
Ten Years | | 2.64% | | -0.02% |
Since 8/24/92(3) | | 8.88% | | 8.08% |
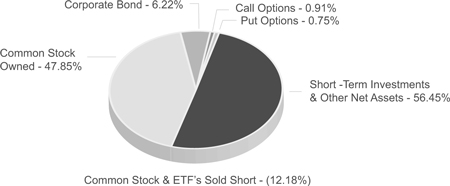
Net Asset Allocation
April 30, 2010
| | |
Semi-Annual Report (Unaudited) | October 31, 2010 | | 7 |
| | |
Caldwell & Orkin | | |
Market Opportunity Fund | | Performance Summary |
| | October 31, 2010 (Unaudited) |
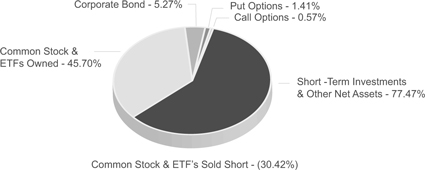
Net Asset Allocation
October 31, 2010
| 1 | The performance data quoted represents past performance. Past performance is no guarantee of future results. The investment return and principal value of an investment in the Fund will fluctuate so that an investor’s shares, when redeemed, may be worth more or less than their original cost. Current performance may be higher or lower than the performance data quoted. Please call 800-377-7073 or visit www.CaldwellOrkinFunds.com for current month-end performance. The Fund’s performance assumes the reinvestment of dividends and capital gains, if any. Fund holdings, industry and asset allocations are subject to change without notice. See additional important disclosures on page 5 and 6. |
Total annualized Fund operating expenses for the Fund’s fiscal year ended April 30, 2010 were 1.72%. Additional information about the Fund’s fees and expenses is available in the Fund’s prospectus.
Fund holdings, industry and asset allocations are subject to change without notice. The Fund may or may not have a position in any of the companies mentioned in this report as of the date of this report.
| 2 | Investors should expect that the Fund’s performance may fluctuate independently of stock market indices, such as the S&P 500 Total Return index. The S&P 500 Total Return index is a widely recognized unmanaged index of 500 common stock prices adjusted to reflect the reinvestment of dividends and distributions. You may not invest directly in an index. |
| 3 | Effective August 24, 1992, the Fund changed its investment objective to provide long-term capital growth with a short-term focus on capital preservation through investment selection and asset allocation. Prior to that time, the Fund was passively managed and indexed to the largest 100 over-the-counter (OTC) stocks. |
| * | For the full fiscal year ended April 30, 1993. |
| ** | From August 24, 1992 through April 30, 1993 - the portion of the year using the active investment management style of C&O Funds Advisor, Inc., the manager of the Fund. |
| | |
8 | | 1-800-467-7903 | www.CaldwellOrkinFunds.com |
| | |
Caldwell & Orkin | | |
Market Opportunity Fund | | Statistical Risk Profile |
| | October 31, 2010 |
| | | | | | | | | | |
| Ten Worst S&P 500 Total Return Days |
| Date | | C&O MOF | | S&P 500 | | Variance | | | | The Caldwell & Orkin Market Opportunity Fund outperformed the S&P 500 Total Return index
on all ten of the ten worst days, and was positive on three of the ten days. |
10/15/08 | | -1.47% | | -9.02% | | 7.55% | | |
12/1/08 | | -1.58% | | -8.92% | | 7.34% | | |
9/29/08 | | -0.37% | | -8.78% | | 8.41% | | |
10/9/08 | | -2.12% | | -7.61% | | 5.49% | | |
10/27/97 | | -1.60% | | -6.89% | | 5.29% | | |
8/31/98 | | 0.42% | | -6.79% | | 7.21% | | |
11/20/08 | | 0.23% | | -6.70% | | 6.93% | | |
11/19/08 | | -0.28% | | -6.10% | | 5.82% | | |
10/22/08 | | -1.11% | | -6.09% | | 4.98% | | |
4/14/00 | | 1.81% | | -5.82% | | 7.63% | | |
|
| Ten Worst S&P 500 Total Return Weeks |
| Week Ending | | C&O MOF | | S&P 500 | | Variance | | | | The Caldwell & Orkin Market Opportunity Fund outperformed the S&P 500 Total Return index
in all ten of the ten worst weeks, and was positive in seven of those weeks. |
10/10/08 | | -2.71% | | -18.14% | | 15.43% | | |
9/21/01 | | 1.63% | | -11.57% | | 13.20% | | |
4/14/00 | | 4.51% | | -10.52% | | 15.03% | | |
10/3/08 | | 1.83% | | -9.33% | | 11.16% | | |
11/21/08 | | 0.56% | | -8.33% | | 8.89% | | |
7/19/02 | | 0.65% | | -7.96% | | 8.61% | | |
3/6/09 | | -0.88% | | -6.96% | | 6.08% | | |
7/12/02 | | 1.01% | | -6.81% | | 7.82% | | |
2/20/09 | | 0.20% | | -6.80% | | 7.00% | | |
10/24/08 | | -0.28% | | -6.72% | | 6.44% | | |
|
| Ten Worst S&P 500 Total Return Months |
| Month | | C&O MOF | | S&P 500 | | Variance | | | | The Caldwell & Orkin Market Opportunity Fund outperformed the S&P 500 Total Return index
in all ten of the ten worst months, and was positive in seven of those months. |
10/31/08 | | 3.42% | | -16.74% | | 20.16% | | |
8/31/98 | | 3.12% | | -14.46% | | 17.58% | | |
9/30/02 | | 2.10% | | -10.86% | | 12.96% | | |
2/28/09 | | 0.30% | | -10.71% | | 11.01% | | |
2/28/01 | | 4.78% | | -9.13% | | 13.91% | | |
9/30/08 | | -0.42% | | -8.89% | | 8.47% | | |
6/30/08 | | 4.84% | | -8.43% | | 13.27% | | |
1/31/09 | | -0.73% | | -8.30% | | 7.57% | | |
9/30/01 | | 3.29% | | -8.06% | | 11.35% | | |
5/31/10 | | -2.55% | | -8.04% | | 5.49% | | |
Short selling began May 2, 1994. Past performance is no guarantee of future results. See additional important disclosures on page 5. Computations by Ned Davis Research, Inc.
| | |
Semi-Annual Report (Unaudited) | October 31, 2010 | | 9 |
| | |
Caldwell & Orkin | | |
Market Opportunity Fund | | Statistical Risk Profile |
| | October 31, 2010 |
| | | | |
| Caldwell & Orkin Market Opportunity Fund |
| | |
Date Range | | C&O MOF | | S&P 500 |
01/17/2008 - 05/07/2010 | | -15.71% | | -11.68% |
04/12/1999 - 11/23/1999 | | -13.24% | | 4.23% |
10/09/2002 - 05/25/2006 | | -13.12% | | 74.17% |
05/26/2000 - 06/07/2000 | | -8.15% | | 6.81% |
12/29/2000 - 01/19/2001 | | -8.06% | | 1.75% |
04/04/2001 - 03/11/2002 | | -7.98% | | 7.22% |
03/15/1993 - 04/26/1993 | | -7.83% | | -3.65% |
03/18/1994 - 02/03/1995 | | -7.68% | | 4.21% |
04/10/2007 - 05/24/2007 | | -7.14% | | 4.31% |
10/07/1998 - 11/05/1998 | | -6.41% | | 16.95% |
| | | | |
| S&P 500 Total Return Index |
| | |
Date Range | | C&O MOF | | S&P 500 |
10/09/2007 - 03/09/2009 | | -0.61% | | -55.26% |
03/24/2000 - 10/09/2002 | | 28.57% | | -47.41% |
07/17/1998 - 08/31/1998 | | 4.02% | | -19.19% |
04/23/2010 - 07/02/2010 | | -1.52% | | -15.67% |
11/27/2002 - 03/11/2003 | | 2.19% | | -14.28% |
07/16/1999 - 10/15/1999 | | -0.45% | | -11.78% |
10/07/1997 - 10/27/1997 | | 0.18% | | -10.74% |
09/23/1998 - 10/08/1998 | | 2.02% | | -9.94% |
02/18/1997 - 04/11/1997 | | 2.72% | | -9.39% |
07/19/2007 - 08/15/2007 | | 7.66% | | -9.30% |
| | | | |
| Statistical Risk Measurements |
| | | C&O MOF | | S&P 500 |
Coefficient of Determination (R-Square) | | 0.00% | | 100.00% |
Correlation Coefficient (R) | | 0.39% | | 100.00% |
Beta | | 0.002 | | 1.000 |
Standard Deviation | | 0.517 | | 1.209 |
Sharpe Ratio | | 0.65 | | 0.32 |
Semi-Variance(downside volatility) | | 0.13 | | 0.72 |
| | | | |
| Performance During the Last Three Market Downturns of 20% or More |
| | | C&O MOF | | S&P 500 |
| 01/06/2009 - 03/09/2009 | | -3.42% | | -27.19% |
| 10/09/2007 - 11/20/2008 | | 1.80% | | -50.73% |
| 01/04/2002 - 10/09/2002 | | 7.25% | | -32.95% |
Short selling began May 2, 1994. Past performance is no guarantee of future results. See additional important disclosures on pages 5 and 6. Computations by Ned Davis Research, Inc.
| | |
10 | | 1-800-467-7903 | www.CaldwellOrkinFunds.com |
| | |
Caldwell & Orkin | | Growth of $10,000 | |
Market Opportunity Fund | | Equity Investment Position Chart |
| | October 31, 2010 |
Caldwell & Orkin Market Opportunity Fund Versus S&P 500 Total Return Index
Since Commencement of Active Style of Investment Management Results of a Hypothetical $10,000 Investment August 24, 1992 through October 31, 2010
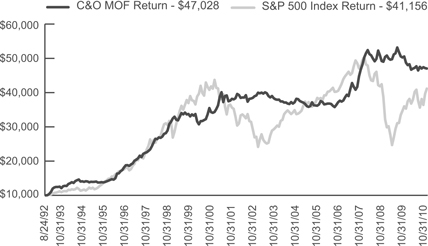
Past performance does not predict future performance. The returns do not reflect the deduction of taxes that a shareholder would pay on Fund distributions or the redemption of Fund shares. See additional disclosure on page 5.
| | |
Semi-Annual Report (Unaudited) | October 31, 2010 | | 11 |
| | |
Caldwell & Orkin | | |
Market Opportunity Fund | | Disclosure of Fund Expenses |
| | October 31, 2010 (Unaudited) |
We believe it is important for you to understand the impact of fees and expenses on your investment in the Fund. As a shareholder of the Fund, you incur two types of costs: (1) transaction costs related to the purchase and redemption of Fund shares, including redemption fees and brokerage commissions (if applicable); and (2) ongoing costs, including management fees, administrative expenses, portfolio transaction costs and other Fund expenses. A mutual fund’s ongoing costs are expressed as a percentage of its average net assets. This figure is known as the expense ratio. The following example is intended to help you understand your ongoing costs (in dollars and cents) of investing in the Fund and to compare these costs with the ongoing costs of investing in other mutual funds.
The below example is based on an investment of $1,000.00 invested at the beginning of the period and held for the entire period indicated, May 1, 2010 through October 31, 2010. The table below illustrates the Fund’s expenses in two ways:
Based on Actual Fund Returns
The first line of the table below provides information about actual account values and actual expenses. You may use the information in this line, together with the amount you invested, to estimate the expenses that you paid over the period. Simply divide your account value by $1,000 (for example, an $8,600 account value divided by $1,000 = 8.6), then multiply the result by the number in the first line under the heading entitled “Expenses Paid During Period” to estimate the expenses you paid on your account during this period.
Based on a Hypothetical 5% Return for Comparison Purposes
The second line of the table below provides information about hypothetical account values and hypothetical expenses based on the Fund’s actual expense ratio and an assumed rate of return of 5% per year before expenses, which is not the Fund’s actual return. The hypothetical account values and expenses may not be used to estimate the actual ending account balance or expenses you paid for the period. You may use this information to compare the ongoing costs of investing in the Fund and other funds. To do so, compare this 5% hypothetical example with the 5% hypothetical examples that appear in the shareholder reports of the other funds.
Please note that the expenses shown in the table are meant to highlight your ongoing costs only and do not reflect any transactional costs, such as redemption fees or brokerage commissions. Therefore, the second line of the table is useful in comparing ongoing costs only, and will not help you determine the relative total costs of owning different funds. In addition, if these transactional costs were included, your costs would have been higher.
| | | | | | | | | | |
| | | Beginning
Account Value 05/01/2010 | | Ending
Account Value 10/31/2010 | | | Expense Ratio1 | | Expenses
Paid During Period2 |
Actual3 | | $1,000.00 | | $ | 986.70 | | | 1.91% | | $9.56 |
Hypothetical (5% return before expenses)4 | | $1,000.00 | | $ | 1,015.58 | | | 1.91% | | $9.70 |
| 1 | The annualized expense ratio reflects actual expenses from the Fund from 5/1/2010- 10/31/2010, as a percentage of average net assets for that period. |
| 2 | Expenses are equal to the Caldwell & Orkin Market Opportunity Fund’s annualized expense ratio of 1.91% multiplied by the average account value over the period, multiplied by the number of days in the most recent fiscal half year (184), divided by 365 (to reflect the half-year period.) |
| 3 | Excluding interest expense and dividend expense from short positions, your actual cost of investment in the Fund would be $5.91 |
| 4 | Excluding interest expense and dividend expense from short positions, your hypothetical cost of investment in the Fund would be $6.01 |
| | |
12 | | 1-800-467-7903 | www.CaldwellOrkinFunds.com |
| | |
Caldwell & Orkin | | |
Market Opportunity Fund | | Sector Diversification |
| | October 31, 2010 |
The following table presents the Fund’s 10/31/2010 portfolio holdings by sector based on total net assets, sorted by net exposure (net long to net short).
| | | | | | | | |
| | | Long | | Short | | Totala | | Netb |
Wireless Equipment | | 4.24% | | | | 4.24% | | 4.24% |
Electric - Integrated | | 2.81% | | | | 2.81% | | 2.81% |
Hotels & Motels | | 1.72% | | | | 1.72% | | 1.72% |
Broadcast Services/Program | | 1.55% | | | | 1.55% | | 1.55% |
Retail - Auto Parts | | 1.46% | | | | 1.46% | | 1.46% |
Retail - Apparel/Shoe | | 2.29% | | -0.84% | | 3.13% | | 1.45% |
Auto-Cars/Light Trucks | | 1.44% | | | | 1.44% | | 1.44% |
Diversified Manufacturing Operations | | 1.27% | | | | 1.27% | | 1.27% |
Tools - Hand Held | | 1.18% | | | | 1.18% | | 1.18% |
Computers | | 1.98% | | -0.87% | | 2.85% | | 1.11% |
Telecom Services | | 1.11% | | | | 1.11% | | 1.11% |
Oil Field Machinery & Equipment | | 1.11% | | | | 1.11% | | 1.11% |
Industrial Audio & Video Products | | 1.05% | | | | 1.05% | | 1.05% |
Finance - Investment Banker/Broker | | 0.98% | | | | 0.98% | | 0.98% |
Building - Heavy Construction | | 0.98% | | | | 0.98% | | 0.98% |
Retail - Building Products | | 0.96% | | | | 0.96% | | 0.96% |
Auto/Truck Parts & Equipment | | 0.95% | | | | 0.95% | | 0.95% |
Gold Mining | | 0.93% | | | | 0.93% | | 0.93% |
Beverages - Non-alcoholic | | 0.84% | | | | 0.84% | | 0.84% |
Telephone - Integrated | | 0.81% | | | | 0.81% | | 0.81% |
Oil-Field Services | | 0.73% | | | | 0.73% | | 0.73% |
Brewery | | 0.73% | | | | 0.73% | | 0.73% |
Multi-Media | | 0.68% | | | | 0.68% | | 0.68% |
Engines - Internal Combustion | | 0.61% | | | | 0.61% | | 0.61% |
Oil & Gas Drilling | | 0.60% | | | | 0.60% | | 0.60% |
Diversified Financial Services | | 0.58% | | | | 0.58% | | 0.58% |
Oil Refining & Marketing | | 0.56% | | | | 0.56% | | 0.56% |
Medical - Drugs | | 0.56% | | | | 0.56% | | 0.56% |
Human Resources | | 0.55% | | | | 0.55% | | 0.55% |
Hazardous Waste Disposal | | 0.53% | | | | 0.53% | | 0.53% |
Semiconductor Components/Integrated Circuits | | 0.51% | | | | 0.51% | | 0.51% |
Cellular Telecommunications | | 0.51% | | | | 0.51% | | 0.51% |
Reinsurance | | 0.48% | | | | 0.48% | | 0.48% |
E-Commerce/Services | | 0.41% | | | | 0.41% | | 0.41% |
Retail - Home Furnishings | | 0.38% | | | | 0.38% | | 0.38% |
Apparel Manufacturers | | 0.33% | | | | 0.33% | | 0.33% |
Internet Infrastructure Software | | 0.23% | | | | 0.23% | | 0.23% |
Athletic Footwear | | 0.22% | | | | 0.22% | | 0.22% |
Electric - Transmission | | 0.21% | | | | 0.21% | | 0.21% |
Diversified Banking Institution | | 0.15% | | | | 0.15% | | 0.15% |
Coatings/Paint | | 0.11% | | | | 0.11% | | 0.11% |
Footwear (Non-Athletic) & Related Apparel | | 0.91% | | -0.81% | | 1.72% | | 0.10% |
Agricultural Chemicals | | 0.01% | | | | 0.01% | | 0.01% |
| | |
Semi-Annual Report (Unaudited) | October 31, 2010 | | 13 |
| | |
Caldwell & Orkin | | |
Market Opportunity Fund | | Sector Diversification |
| | October 31, 2010 (Unaudited) |
| | | | | | | | |
| | | Long | | Short | | Totala | | Netb |
Building - Residential/Commercial | | 0.60% | | -0.60% | | 1.20% | | 0.00% |
Airlines | | | | -0.09% | | 0.09% | | -0.09% |
Retail - Sporting Goods | | | | -0.17% | | 0.17% | | -0.17% |
Applications Software | | | | -0.18% | | 0.18% | | -0.18% |
Real Estate Operation/Development | | | | -0.22% | | 0.22% | | -0.22% |
Educational Software | | | | -0.31% | | 0.31% | | -0.31% |
Electronics - Military | | | | -0.42% | | 0.42% | | -0.42% |
Real Estate Management/Services | | | | -0.45% | | 0.45% | | -0.45% |
Retail - Appliances | | | | -0.47% | | 0.47% | | -0.47% |
Retail - Consumer Electronics | | | | -0.48% | | 0.48% | | -0.48% |
Commercial Services - Finance | | | | -0.48% | | 0.48% | | -0.48% |
Telecom Equipment Fiber Optics | | 0.32% | | -0.80% | | 1.12% | | -0.48% |
Commercial Banks - Non-U.S. | | | | -0.53% | | 0.53% | | -0.53% |
Commercial Banks - Central U.S. | | 0.47% | | -1.11% | | 1.58% | | -0.64% |
Building - Mobile Home/Manufactured Housing & RV | | | | -0.79% | | 0.78% | | -0.78% |
Retail - Computer Equipment | | | | -0.97% | | 0.97% | | -0.97% |
Web Hosting/Design | | 0.03% | | -1.05% | | 1.08% | | -1.02% |
Electronic Components - Semiconductors | | 1.47% | | -2.58% | | 4.05% | | -1.11% |
Semiconductor Equipment | | | | -1.55% | | 1.55% | | -1.55% |
Commercial Services | | | | -1.62% | | 1.62% | | -1.62% |
Super-Regional Banks - U.S. | | | | -1.76% | | 1.76% | | -1.76% |
Medical - Outpatient/Home Medical Care | | | | -1.98% | | 1.98% | | -1.98% |
Schools | | 0.33% | | -6.10% | | 6.44% | | -5.78% |
Subtotal Common Stocks (long & short positions) | | 43.47% | | -27.23% | | 70.70% | | 16.24% |
| | | | | | | | | |
Exchange Traded Fund - iShares MSCI Japan Index Fund | | 1.72% | | | | 1.72% | | 1.72% |
Exchange Traded Fund - SPDR Gold Shares | | 0.51% | | | | 0.51% | | 0.51% |
Exchange Traded Fund - Country Fund - India | | | | -0.00%* | | -0.00%* | | -0.00%* |
Exchange Traded Fund - Country Fund - Spain | | | | -1.02% | | 1.02% | | -1.02% |
Exchange Traded Fund - U.S. Treasury Bond Fund | | | | -1.03% | | 1.03% | | -1.03% |
Exchange Traded Fund - Country Fund - China | | | | -1.14% | | 1.14% | | -1.14% |
Subtotal Exchange-Traded Funds (long & short positions) | | 2.23% | | -3.19% | | 5.42% | | -0.96% |
| | | | | | | | | |
Subtotal Equities (long & short positions) | | 45.70% | | -30.42% | | 76.12% | | 15.28% |
| | | | | | | | |
Call Options | | 0.57% | | | | 0.57% | | |
Put Options | | 1.41% | | | | 1.41% | | |
Corporate Bonds | | 5.27% | | | | 5.27% | | |
Other Assets less Liabilities | | 16.63% | | | | 16.63% | | |
Total Portfolio Holdings | | 69.58% | | -30.42% | | 100.00% | | |
| | | | | | | | |
* Less than 0.005% of net assets.
(a) Total exposure is Long exposure plus the absolute value of the Short exposure.
(b) Net exposure is Long exposure less Short exposure.
| | |
14 | | 1-800-467-7903 | www.CaldwellOrkinFunds.com |
| | |
Caldwell & Orkin | | |
Market Opportunity Fund | | Schedule of Investments |
| | October 31, 2010 (Unaudited) |
| | | | | | | | |
| | | Shares | | | Value (Note 1) | |
LONG INVESTMENTS (52.95%) | | | | | | | | |
COMMON STOCKS (43.47%) | | | | | | | | |
Agricultural Chemicals (0.01%) | | | | | | | | |
Agrium, Inc. | | | 100 | | | $ | 8,851 | |
CF Industries Holdings, Inc. | | | 100 | | | | 12,253 | |
| | | | | | | | |
| | | | | | | 21,104 | |
| | | | | | | | |
| | |
Apparel Manufacturers (0.33%) | | | | | | | | |
Coach, Inc. | | | 25,500 | | | | 1,275,000 | |
| | | | | | | | |
| | |
Applications Software (0.00%)† | | | | | | | | |
Red Hat, Inc.1 | | | 100 | | | | 4,226 | |
Salesforce.com, Inc.1 | | | 100 | | | | 11,607 | |
| | | | | | | | |
| | | | | | | 15,833 | |
| | | | | | | | |
| | |
Athletic Footwear (0.22%) | | | | | | | | |
NIKE, Inc. - Class B | | | 10,400 | | | | 846,976 | |
| | | | | | | | |
| | |
Automotive - CarsLight Trucks (1.44%) | | | | | | | | |
Ford Motor Co.1 | | | 388,300 | | | | 5,486,679 | |
| | | | | | | | |
| | |
Automotive/Truck Parts & Equipment (0.95%) | | | | | | | | |
ArvinMeritor, Inc.1 | | | 30,300 | | | | 502,374 | |
Tenneco, Inc.1 | | | 57,100 | | | | 1,862,602 | |
WABCO Holdings, Inc.1 | | | 26,700 | | | | 1,239,414 | |
| | | | | | | | |
| | | | | | | 3,604,390 | |
| | | | | | | | |
| | |
Beverages - Non-Alcoholic (0.84%) | | | | | | | | |
PepsiCo, Inc. | | | 48,800 | | | | 3,186,640 | |
| | | | | | | | |
| | |
Brewery (0.73%) | | | | | | | | |
Anheuser-Busch InBev NV ADR | | | 44,500 | | | | 2,799,050 | |
| | | | | | | | |
| | |
Broadcast Services/Programming (1.55%) | | | | | | | | |
Discovery Communications, Inc. - Class A1 | | | 132,700 | | | | 5,919,747 | |
| | | | | | | | |
| | |
Building - Heavy Construction (0.98%) | | | | | | | | |
Chicago Bridge & Iron Co. NV1 | | | 148,400 | | | | 3,741,164 | |
| | | | | | | | |
| | |
Building - Residential/Commercial (0.60%) | | | | | | | | |
KB Home | | | 218,500 | | | | 2,296,435 | |
| | | | | | | | |
| | |
Semi-Annual Report (Unaudited) | October 31, 2010 | | 15 |
| | |
Caldwell & Orkin | | |
Market Opportunity Fund | | Schedule of Investments |
| | October 31, 2010 (Unaudited) |
| | | | | | | | |
| | | Shares | | | Value (Note 1) | |
| | |
Cellular Telecommunication (0.51%) | | | | | | | | |
Vodafone Group PLC ADR | | | 70,800 | | | $ | 1,947,708 | |
| | | | | | | | |
| | |
Coatings/Paint (0.11%) | | | | | | | | |
The Sherwin-Williams Co. | | | 5,500 | | | | 401,335 | |
| | | | | | | | |
| | |
Commercial Banks - Central U.S. (0.47%) | | | | | | | | |
Old National Bancorp | | | 188,400 | | | | 1,782,264 | |
| | | | | | | | |
| | |
Computers (1.98%) | | | | | | | | |
Apple, Inc.1 | | | 25,100 | | | | 7,551,837 | |
| | | | | | | | |
| | |
Diversified Banking Institution (0.15%) | | | | | | | | |
The Goldman Sachs Group, Inc. | | | 100 | | | | 16,095 | |
JPMorgan Chase & Co. | | | 14,900 | | | | 560,687 | |
| | | | | | | | |
| | | | | | | 576,782 | |
| | | | | | | | |
| | |
Diversified Financial Services (0.58%) | | | | | | | | |
CIT Group, Inc.1 | | | 51,000 | | | | 2,209,830 | |
| | | | | | | | |
| | |
Diversified Manufacturing Operations (1.27%) | | | | | | | | |
Eaton Corp. | | | 54,600 | | | | 4,850,118 | |
| | | | | | | | |
| | |
E-Commerce/Services (0.41%) | | | | | | | | |
Expedia, Inc. | | | 53,900 | | | | 1,560,405 | |
| | | | | | | | |
| | |
Electric - Integrated (2.81%) | | | | | | | | |
CMS Energy Corp. | | | 413,300 | | | | 7,596,454 | |
OGE Energy Corp. | | | 70,900 | | | | 3,130,944 | |
| | | | | | | | |
| | | | | | | 10,727,398 | |
| | | | | | | | |
| | |
Electric - Transmission (0.21%) | | | | | | | | |
National Grid PLC ADR | | | 16,600 | | | | 788,168 | |
| | | | | | | | |
| | |
Electronic Components - Semiconductors (1.47%) | | | | | | | | |
ARM Holdings PLC ADR | | | 169,000 | | | | 2,987,920 | |
Broadcom Corp. - Class A | | | 100 | | | | 4,074 | |
Skyworks Solutions, Inc.1 | | | 114,900 | | | | 2,632,359 | |
| | | | | | | | |
| | | | | | | 5,624,353 | |
| | | | | | | | |
| | |
16 | | 1-800-467-7903 | www.CaldwellOrkinFunds.com |
| | |
Caldwell & Orkin | | |
Market Opportunity Fund | | Schedule of Investments |
| | October 31, 2010 (Unaudited) |
| | | | | | | | |
| | | Shares | | | Value (Note 1) | |
Engines - Internal Combustion (0.61%) | | | | | | | | |
Cummins, Inc. | | | 26,200 | | | $ | 2,308,220 | |
| | | | | | | | |
| | |
Finance - Investment Banker/Broker (0.98%) | | | | | | | | |
MF Global Holdings, Ltd.1 | | | 478,500 | | | | 3,746,655 | |
| | | | | | | | |
| | |
Footwear (Non-Athletic) & Related Apparel (0.91%) | | | | | | | | |
Deckers Outdoor Corp.1 | | | 37,300 | | | | 2,167,130 | |
Skechers U.S.A., Inc.- Class A1 | | | 67,700 | | | | 1,316,088 | |
| | | | | | | | |
| | | | | | | 3,483,218 | |
| | | | | | | | |
| | |
Gold Mining (0.93%) | | | | | | | | |
Agnico-Eagle Mines, Ltd. | | | 20,800 | | | | 1,613,872 | |
Newmont Mining Corp. | | | 31,600 | | | | 1,923,492 | |
| | | | | | | | |
| | | | | | | 3,537,364 | |
| | | | | | | | |
| | |
Hazardous Waste Disposal (0.53%) | | | | | | | | |
Clean Harbors, Inc.1 | | | 28,900 | | | | 2,037,450 | |
| | | | | | | | |
| | |
Hotels & Motels (1.72%) | | | | | | | | |
Marriott International, Inc. - Class A | | | 115,100 | | | | 4,264,455 | |
Starwood Hotels & Resorts Worldwide, Inc. | | | 42,300 | | | | 2,290,122 | |
| | | | | | | | |
| | | | | | | 6,554,577 | |
| | | | | | | | |
| | |
Human Resources (0.55%) | | | | | | | | |
Manpower, Inc. | | | 38,200 | | | | 2,090,686 | |
| | | | | | | | |
| | |
Industrial Audio & Video Products (1.05%) | | | | | | | | |
Dolby Laboratories, Inc. - Class A1 | | | 65,200 | | | | 4,021,536 | |
| | | | | | | | |
| | |
Internet Infrastructure Software (0.23%) | | | | | | | | |
Akamai Technologies, Inc.1 | | | 17,100 | | | | 883,557 | |
| | | | | | | | |
| | |
Medical - Drugs (0.56%) | | | | | | | | |
Allergan, Inc. | | | 29,600 | | | | 2,143,336 | |
| | | | | | | | |
| | |
Multi-Media (0.68%) | | | | | | | | |
News Corp. - Class B | | | 111,600 | | | | 1,794,528 | |
The Walt Disney Co. | | | 22,100 | | | | 798,031 | |
| | | | | | | | |
| | | | | | | 2,592,559 | |
| | | | | | | | |
| | |
Semi-Annual Report (Unaudited) | October 31, 2010 | | 17 |
| | |
Caldwell & Orkin | | |
Market Opportunity Fund | | Schedule of Investments |
| | October 31, 2010 (Unaudited) |
| | | | | | | | |
| | | Shares | | | Value (Note 1) | |
Oil - Field Services (0.73%) | | | | | | | | |
Helix Energy Solutions Group, Inc.1 | | | 220,400 | | | $ | 2,796,876 | |
| | | | | | | | |
| | |
Oil & Gas Drilling (0.60%) | | | | | | | | |
Ensco PLC, ADR | | | 49,100 | | | | 2,275,294 | |
| | | | | | | | |
| | |
Oil Field Machinery & Equipment (1.11%) | | | | | | | | |
Cameron International Corp.1 | | | 96,900 | | | | 4,239,375 | |
| | | | | | | | |
| | |
Oil Refining & Marketing (0.56%) | | | | | | | | |
Frontier Oil Corp. | | | 161,400 | | | | 2,138,550 | |
| | | | | | | | |
| | |
Reinsurance (0.48%) | | | | | | | | |
Greenlight Capital Re, Ltd. - Class A1 | | | 64,000 | | | | 1,827,840 | |
| | | | | | | | |
| | |
Retail - Apparel/Shoe (2.29%) | | | | | | | | |
AnnTaylor Stores Corp.1 | | | 174,400 | | | | 4,063,520 | |
Limited Brands, Inc. | | | 104,800 | | | | 3,080,072 | |
Phillips-Van Heusen Corp. | | | 26,200 | | | | 1,607,108 | |
| | | | | | | | |
| | | | | | | 8,750,700 | |
| | | | | | | | |
| | |
Retail - Auto Parts (1.46%) | | | | | | | | |
Advance Auto Parts, Inc. | | | 65,700 | | | | 4,269,186 | |
PEP Boys-Manny Moe & Jack | | | 112,400 | | | | 1,313,956 | |
| | | | | | | | |
| | | | | | | 5,583,142 | |
| | | | | | | | |
| | |
Retail - Building Products (0.96%) | | | | | | | | |
Home Depot, Inc. | | | 118,900 | | | | 3,671,632 | |
| | | | | | | | |
| | |
Retail - Home Furnishings (0.38%) | | | | | | | | |
Pier 1 Imports, Inc.1 | | | 167,600 | | | | 1,454,768 | |
| | | | | | | | |
| | |
Schools (0.33%) | | | | | | | | |
Career Education Corp.1 | | | 71,500 | | | | 1,254,110 | |
| | | | | | | | |
| | |
Semiconductor Components/Integrated Circuits (0.51%) | | | | | | | | |
Atmel Corp.1 | | | 130,600 | | | | 1,157,116 | |
Cypress Semiconductor Corp.1 | | | 56,300 | | | | 793,830 | |
| | | | | | | | |
| | | | | | | 1,950,946 | |
| | | | | | | | |
| | |
18 | | 1-800-467-7903 | www.CaldwellOrkinFunds.com |
| | |
Caldwell & Orkin | | |
Market Opportunity Fund | | Schedule of Investments |
| | October 31, 2010 (Unaudited) |
| | | | | | | | | | | | | | | | |
| | | | | | | | | Shares | | | Value (Note 1) | |
| | |
Telecom Equipment Fiber Optics (0.32%) | | | | | | | | | |
Finisar Corp.1 | | | | | | | | | | | 71,400 | | | $ | 1,214,514 | |
| | | | | | | | | | | | | | | | |
| | |
Telecom Services (1.11%) | | | | | | | | | |
BCE, Inc. | | | | | | | | | | | 126,300 | | | | 4,232,313 | |
| | | | | | | | | | | | | | | | |
| | |
Telephone - Integrated (0.81%) | | | | | | | | | |
Verizon Communications, Inc. | | | | | | | | | | | 95,300 | | | | 3,094,391 | |
| | | | | | | | | | | | | | | | |
| | | | |
Tools - Hand Held (1.18%) | | | | | | | | | | | | | | | | |
Stanley Black & Decker, Inc. | | | | | | | | | | | 72,800 | | | | 4,511,416 | |
| | | | | | | | | | | | | | | | |
| | | | |
Web Hosting/Design (0.03%) | | | | | | | | | | | | | | | | |
Rackspace Hosting, Inc.1 | | | | | | | | | | | 4,000 | | | | 99,840 | |
| | | | | | | | | | | | | | | | |
| | | | |
Wireless Equipment (4.24%) | | | | | | | | | | | | | | | | |
American Tower Corp. - Class A1 | | | | | | | | | | | 90,100 | | | | 4,650,061 | |
Crown Castle International Corp.1 | | | | | | | | | | | 130,400 | | | | 5,622,848 | |
Motorola, Inc.1 | | | | | | | | | | | 145,600 | | | | 1,186,640 | |
SBA Communications Corp. - Class A1 | | | | | | | | | | | 120,500 | | | | 4,730,830 | |
| | | | | | | | | | | | | | | | |
| | | | | | | | | | | | | | | 16,190,379 | |
| | | | | | | | | | | | | | | | |
| | | | |
TOTAL COMMON STOCKS | | | | | | | | | | | | | | | | |
(Cost $152,055,186) | | | | | | | | | | | | | | | 165,898,460 | |
| | |
| | | | |
EXCHANGE TRADED FUNDS (2.23%) | | | | | | | | | | | | | | | | |
iShares MSCI Japan Index Fund | | | | | | | | | | | 656,800 | | | | 6,568,000 | |
SPDR Gold Shares1 | | | | | | | | | | | 14,700 | | | | 1,949,808 | |
| | | | | | | | | | | | | | | | |
| | | | | | | | | | | | | | | 8,517,808 | |
| | | | | | | | | | | | | | | | |
| | | | |
TOTAL EXCHANGE TRADED FUNDS | | | | | | | | | | | | | | | | |
(Cost $8,293,039) | | | | | | | | | | | | | | | 8,517,808 | |
| | |
| | | | |
| | | Expiration
Date | | | Exercise Price | | | Number of
Contracts | | | Value
(Note 1) | |
PURCHASED OPTIONS (1.98%) | | | | | | | | | | | | | | | | |
PURCHASED CALL OPTIONS (0.57%) | | | | | | | | | | | | | | | | |
ARM Holdings PLC ADR | | | April, 2011 | | | | $17.00 | | | | 1,361 | | | | 306,225 | |
Expedia, Inc. | | | November, 2010 | | | | 30.00 | | | | 4,530 | | | | 285,390 | |
Home Depot, Inc. | | | January, 2011 | | | | 30.00 | | | | 3,680 | | | | 688,160 | |
iShares MSCI Japan Index Fund | | | January, 2011 | | | | 10.00 | | | | 10,229 | | | | 358,015 | |
| | |
Semi-Annual Report (Unaudited) | October 31, 2010 | | 19 |
| | |
Caldwell & Orkin | | |
Market Opportunity Fund | | Schedule of Investments |
| | October 31, 2010 (Unaudited) |
| | | | | | | | | | | | | | | | |
| | | Expiration
Date | | | Exercise
Price | | | Number of
Contracts | | | Value (Note 1) | |
| | |
PURCHASED CALL OPTIONS (continued) | | | | | | | | | | | | | |
Verizon Communications, Inc. | | | January, 2011 | | | | $30.00 | | | | 1,188 | | | $ | 552,420 | |
| | | | | | | | | | | | | | | | |
| | | | |
TOTAL PURCHASED CALL OPTIONS | | | | | | | | | | | | | | | | |
(Cost $2,248,498) | | | | | | | | | | | | | | | 2,190,210 | |
| | | | | | | | | | | | | | | | |
| | | | |
PURCHASED PUT OPTIONS (1.41%) | | | | | | | | | | | | | | | | |
Alliance Data Systems Corp. | | | January, 2011 | | | | 65.00 | | | | 684 | | | | 471,960 | |
Alliance Data Systems Corp. | | | March, 2011 | | | | 65.00 | | | | 426 | | | | 353,580 | |
Amedisys, Inc. | | | October, 2010 | | | | 27.00 | | | | 4,040 | | | | 945,360 | |
Apollo Group, Inc. | | | January, 2011 | | | | 40.00 | | | | 897 | | | | 444,015 | |
Corinthian Colleges, Inc. | | | January, 2011 | | | | 6.00 | | | | 5,020 | | | | 652,600 | |
PowerShares QQQ Trust, Series I | | | November, 2010 | | | | 48.00 | | | | 2,475 | | | | 39,600 | |
Rackspace Hosting, Inc. | | | December, 2010 | | | | 25.00 | | | | 2,236 | | | | 469,560 | |
Research In Motion, Ltd. | | | December, 2010 | | | | 50.00 | | | | 875 | | | | 122,500 | |
SPDR S&P 500 ETF Trust | | | November, 2010 | | | | 118.00 | | | | 2,820 | | | | 555,540 | |
SPDR S&P 500 ETF Trust | | | November, 2010 | | | | 113.00 | | | | 2,255 | | | | 157,850 | |
Strayer Education, Inc. | | | January, 2011 | | | | 165.00 | | | | 241 | | | | 867,600 | |
Suntrust Banks, Inc. | | | January, 2011 | | | | 24.00 | | | | 2,130 | | | | 291,810 | |
| | | | | | | | | | | | | | | | |
| | | | |
TOTAL PURCHASED PUT OPTIONS | | | | | | | | | | | | | | | | |
(Cost $7,661,300) | | | | | | | | | | | | | | | 5,371,975 | |
| | | | | | | | | | | | | | | | |
| | | | |
TOTAL PURCHASED OPTIONS | | | | | | | | | | | | | | | | |
(Cost $9,909,798) | | | | | | | | | | | | | | | 7,562,185 | |
| | | | |
Description and Maturity Date | | | | | Coupon
Rate | | | Principal
Amount | | | Value
(Note 1) | |
CORPORATE BONDS (5.27%) | | | | | | | | | | | | | | | | |
Bank One Corp.
11/15/2011 | | | | | | | 5.900% | | | $ | 4,400,000 | | | | 4,619,899 | |
CBS Corp.
05/15/2011 | | | | | | | 6.625% | | | | 4,085,000 | | | | 4,209,682 | |
ConAgra Foods, Inc.
09/15/2011 | | | | | | | 6.750% | | | | 1,475,000 | | | | 1,548,809 | |
The Estee Lauder Cos., Inc.
11/01/2013 | | | | | | | 7.750% | | | | 2,000,000 | | | | 2,377,424 | |
| | |
20 | | 1-800-467-7903 | www.CaldwellOrkinFunds.com |
| | |
Caldwell & Orkin | | |
Market Opportunity Fund | | Schedule of Investments |
| | October 31, 2010 (Unaudited) |
| | | | | | | | | | | | |
Description and Maturity Date | | Coupon
Rate | | | Principal
Amount | | | Value (Note 1) | |
| | |
CORPORATE BONDS (continued) | | | | | | | | | | | | |
Hewlett-Packard Co.
03/01/2014 | | | 6.125% | | | $ | 4,400,000 | | | $ | 5,096,164 | |
Safeway, Inc.
08/15/2014 | | | 5.625% | | | | 2,000,000 | | | | 2,277,308 | |
| | | | | | | | | | | | |
| | | |
TOTAL CORPORATE BONDS (Cost $18,537,525) | | | | | | | | | | | 20,129,286 | |
| | |
| | | |
TOTAL LONG INVESTMENTS (Cost $188,795,548) | | | | | | | | | | | 202,107,739 | |
| | |
| | | |
| | | 7-Day Yield | | | Shares | | | Value (Note 1) | |
| | |
SHORT TERM INVESTMENTS (42.53%) | | | | | | | | | | | | |
MONEY MARKET FUNDS2 | | | | | | | | | | | | |
JPMorgan U.S. Treasury Plus
Money Market Fund | | | 0.03% | | | | 162,301,110 | | | | 162,301,110 | |
| | | |
TOTAL SHORT TERM INVESTMENTS (Cost $162,301,110) | | | | | | | | | | | 162,301,110 | |
| | |
| | | |
TOTAL INVESTMENTS - (95.48%) (Cost $351,096,658) | | | | | | | | | | $ | 364,408,849 | |
| | |
Assets in Excess of Other Liabilities (4.52%) | | | | | | | | 17,236,210 | |
| | |
| | | |
NET ASSETS (100.00%) | | | | | | | | | | $ | 381,645,059 | |
| | |
| | | |
| SCHEDULE OF SECURITIES SOLD SHORT | | | | | Shares | | | Value (Note 1) | |
| | |
COMMON STOCKS (-27.23%) | | | | | | | | | | | | |
Airlines (-0.09%) | | | | | | | | | | | | |
Delta Air Lines, Inc. | | | | | | | (25,100) | | | $ | (348,639) | |
| | | | | | | | | | | | |
| | | |
Applications Software (-0.18%) | | | | | | | | | | | | |
Nuance Communications, Inc. | | | | | | | (43,300) | | | | (680,243) | |
| | | | | | | | | | | | |
| |
Building - Mobile Home/Manufactured Housing & RV (-0.79%) | | | | | |
Thor Industries, Inc. | | | | | | | (95,100) | | | | (2,994,699) | |
| | | | | | | | | | | | |
| | |
Semi-Annual Report (Unaudited) | October 31, 2010 | | 21 |
| | |
Caldwell & Orkin | | |
Market Opportunity Fund | | Schedule of Investments |
| | October 31, 2010 (Unaudited) |
| | | | | | | | |
| SCHEDULE OF SECURITIES SOLD SHORT (continued) | | Shares | | | Value (Note 1) | |
| | |
Building - Residential/Commercial (-0.60%) | | | | | | | | |
Beazer Homes USA, Inc. | | | (372,000) | | | $ | (1,510,320) | |
Hovnanian Enterprises, Inc. - Class A | | | (218,100) | | | | (776,436) | |
| | | | | | | | |
| | | | | | | (2,286,756) | |
| | | | | | | | |
| | |
Commercial Banks - Central U.S. (-1.11%) | | | | | | | | |
Associated Banc-Corp. | | | (76,800) | | | | (973,056) | |
TCF Financial Corp. | | | (247,400) | | | | (3,255,784) | |
| | | | | | | | |
| | | | | | | (4,228,840) | |
| | | | | | | | |
| | |
Commercial Banks Non - U.S. (-0.53%) | | | | | | | | |
Banco Bilbao Vizcaya Argentaria SA ADR | | | (153,100) | | | | (2,013,265) | |
| | | | | | | | |
| | |
Commercial Services (-1.62%) | | | | | | | | |
Alliance Data Systems Corp. | | | (101,800) | | | | (6,181,296) | |
| | | | | | | | |
| | |
Commercial Services - Finance (-0.48%) | | | | | | | | |
Moody’s Corp. | | | (68,200) | | | | (1,845,492) | |
| | | | | | | | |
| | |
Computers (-0.87%) | | | | | | | | |
Research In Motion, Ltd. | | | (58,500) | | | | (3,331,575) | |
| | | | | | | | |
| | |
Educational Software (-0.31%) | | | | | | | | |
Blackboard, Inc. | | | (28,500) | | | | (1,189,590) | |
| | | | | | | | |
| | |
Electronic Components - Semiconductors (-2.58%) | | | | | | | | |
Altera Corp. | | | (59,600) | | | | (1,860,116) | |
Micron Technology, Inc. | | | (206,600) | | | | (1,708,582) | |
National Semiconductor Corp. | | | (306,600) | | | | (4,200,420) | |
Xilinx, Inc. | | | (77,300) | | | | (2,072,413) | |
| | | | | | | | |
| | | | | | | (9,841,531) | |
| | | | | | | | |
| | |
Electronics - Military (-0.42%) | | | | | | | | |
L-3 Communications Holdings, Inc. | | | (22,300) | | | | (1,609,837) | |
| | | | | | | | |
| | |
Footwear (Non-Athletic) & Related Apparel (-0.81%) | | | | | | | | |
Skechers U.S.A., Inc. - Class A | | | (158,600) | | | | (3,083,184) | |
| | | | | | | | |
| | |
Medical - Outpatient/Home Medical Care (-1.98%) | | | | | | | | |
Amedisys, Inc. | | | (297,500) | | | | (7,574,350) | |
| | | | | | | | |
| | |
22 | | 1-800-467-7903 | www.CaldwellOrkinFunds.com |
| | |
Caldwell & Orkin | | |
Market Opportunity Fund | | Schedule of Investments |
| | October 31, 2010 (Unaudited) |
| | | | | | | | |
| SCHEDULE OF SECURITIES SOLD SHORT (continued) | | Shares | | | Value (Note 1) | |
| | |
Real Estate Management/Services (-0.45%) | | | | | | | | |
E-House China Holdings, Ltd., ADR | | | (101,800) | | | $ | (1,701,078) | |
| | | | | | | | |
| | |
Real Estate Operation/Development (-0.22%) | | | | | | | | |
The St. Joe Co. | | | (42,300) | | | | (854,037) | |
| | | | | | | | |
| | |
Retail - Apparel/Shoe (-0.84%) | | | | | | | | |
The Buckle, Inc. | | | (42,700) | | | | (1,242,143) | |
J. Crew Group, Inc. | | | (60,900) | | | | (1,948,191) | |
| | | | | | | | |
| | | | | | | (3,190,334) | |
| | | | | | | | |
| | |
Retail - Appliances (-0.47%) | | | | | | | | |
hhgregg, Inc. | | | (78,200) | | | | (1,801,728) | |
| | | | | | | | |
| | |
Retail - Computer Equipment (-0.97%) | | | | | | | | |
GameStop Corp. - Class A | | | (189,100) | | | | (3,717,706) | |
| | | | | | | | |
| | |
Retail - Consumer Electronics (-0.48%) | | | | | | | | |
Best Buy Co., Inc. | | | (42,400) | | | | (1,822,352) | |
| | | | | | | | |
| | |
Retail - Sporting Goods (-0.17%) | | | | | | | | |
Cabela’s, Inc. | | | (35,000) | | | | (648,900) | |
| | | | | | | | |
| | |
Schools (-6.10%) | | | | | | | | |
Apollo Group, Inc. - Class A | | | (103,800) | | | | (3,890,424) | |
Career Education Corp. | | | (144,900) | | | | (2,541,546) | |
Corinthian Colleges, Inc. | | | (430,000) | | | | (2,244,600) | |
ITT Educational Services, Inc. | | | (63,900) | | | | (4,123,467) | |
Strayer Education, Inc. | | | (45,400) | | | | (6,348,282) | |
The Washington Post Co. - Class B | | | (10,300) | | | | (4,142,145) | |
| | | | | | | | |
| | | | | | | (23,290,464) | |
| | | | | | | | |
| | |
Semiconductor Equipment (-1.55%) | | | | | | | | |
Teradyne, Inc. | | | (130,400) | | | | (1,465,696) | |
Veeco Instruments, Inc. | | | (106,700) | | | | (4,465,395) | |
| | | | | | | | |
| | | | | | | (5,931,091) | |
| | | | | | | | |
| | |
Super - Regional Banks - U.S. (-1.76%) | | | | | | | | |
Capital One Financial Corp. | | | (73,700) | | | | (2,746,799) | |
SunTrust Banks, Inc. | | | (158,000) | | | | (3,953,160) | |
| | | | | | | | |
| | | | | | | (6,699,959) | |
| | | | | | | | |
| | |
Semi-Annual Report (Unaudited) | October 31, 2010 | | 23 |
| | |
Caldwell & Orkin | | |
Market Opportunity Fund | | Schedule of Investments |
| | October 31, 2010 (Unaudited) |
| | | | | | | | |
| SCHEDULE OF SECURITIES SOLD SHORT (continued) | | Shares | | | Value (Note 1) | |
| | |
Telecom Equipment Fiber Optics (-0.80%) | | | | | | | | |
Corning, Inc. | | | (166,500) | | | | $ (3,043,620) | |
| | | | | | | | |
| | |
Web Hosting/Design (-1.05%) | | | | | | | | |
Rackspace Hosting, Inc. | | | (160,200) | | | | (3,998,592) | |
| | | | | | | | |
| | |
EXCHANGE TRADED FUNDS (-3.19%) | | | | | | | | |
Country Fund - China (-1.14%) | | | | | | | | |
iShares FTSE/Xinhua China 25 Index Fund | | | (97,000) | | | | (4,363,060) | |
| | | | | | | | |
| | |
Country Fund - India (-0.00%)† | | | | | | | | |
WisdomTree India Earnings Fund | | | (100) | | | | (2,719) | |
| | | | | | | | |
| | |
Country Fund - Spain (-1.02%) | | | | | | | | |
iShares MSCI Spain Index Fund | | | (90,700) | | | | (3,894,658) | |
| | | | | | | | |
| | |
U.S. Treasury Bond Fund (-1.03%) | | | | | | | | |
iShares Barclays 1-3 Year Treasury Bond Fund | | | (23,100) | | | | (1,951,719) | |
iShares Barclays 7-10 Year Treasury Bond Fund | | | (19,900) | | | | (1,965,523) | |
| | | | | | | | |
| | | | | | | (3,917,242) | |
| | | | | | | | |
| | |
TOTAL SECURITIES SOLD SHORT (Proceeds $124,327,811) | | | | | | | $ (116,086,837) | |
| | |
| † | Less than 0.005% of net assets. |
| 1 | Non-Income Producing Security. |
| 2 | A portion of the Money Market Fund assets are held as collateral for short sales activity. |
Common Abbreviations:
ADR - American Depositary Receipts
ETF - Exchange Traded Fund
Ltd. - Limited
NV - Naamloze Vennootschap is the Dutch term for a public limited liability corporation.
PLC - Public Limited Company
SA - Generally designates corporations in various countries, mostly those employing civil law.
SPDR - Standard & Poor’s Depositary Receipt
See accompanying notes to financial statements.
| | |
24 | | 1-800-467-7903 | www.CaldwellOrkinFunds.com |
| | |
Caldwell & Orkin | | |
Market Opportunity Fund | | Statement of Assets & Liabilities |
| | October 31, 2010 |
| | | | |
ASSETS | | | | |
Investments at value (cost $351,096,658) | | | $364,408,849 | |
Deposits with brokers for securities sold short | | | 121,874,410 | |
Receivables: | | | | |
Investment securities sold | | | 32,206,127 | |
Interest and dividends | | | 418,384 | |
Capital shares sold | | | 342,686 | |
Other assets | | | 54,465 | |
| | | | |
Total Assets | | | 519,304,921 | |
| | | | |
| |
LIABILITIES | | | | |
Securities sold short, not yet purchased (proceeds $124,327,811) | | | 116,086,837 | |
Payables: | | | | |
Investment securities purchased | | | 21,005,402 | |
Capital shares redeemed | | | 123,858 | |
Dividends payable - short sales | | | 35,545 | |
Investment advisory fee | | | 313,536 | |
Accrued expenses and other liabilities | | | 94,684 | |
| | | | |
Total Liabilities | | | 137,659,862 | |
| | | | |
| |
Total Net Assets | | | $381,645,059 | |
| | | | |
| |
NET ASSETS | | | | |
Paid-in capital applicable to 19,822,573 shares outstanding; par value $0.10 per share; 30,000,000 shares authorized | | | $413,171,298 | |
Undistributed net investment loss | | | (2,520,036 | ) |
Accumulated net realized loss on investments | | | (50,559,368 | ) |
Net unrealized appreciation of investments | | | 21,553,165 | |
| | | | |
| | | $381,645,059 | |
| | | | |
| |
NET ASSET VALUE AND OFFERING/REDEMPTION PRICE PER SHARE | | | $19.25 | |
| | | | |
See accompanying notes to financial statements.
| | |
Semi-Annual Report (Unaudited) | October 31, 2010 | | 25 |
| | |
Caldwell & Orkin | | |
Market Opportunity Fund | | Statement of Operations |
| | For the Six Months Ended October 31, 2010 |
| | | | |
INVESTMENT INCOME | | | | |
Dividends (net of foreign withholding taxes of $15,997) | | | $569,812 | |
Interest | | | 623,379 | |
| | | | |
Total Investment Income | | | 1,193,191 | |
| | | | |
| |
EXPENSES | | | | |
Investment advisory fees (Note 2) | | | 1,875,375 | |
Dividend expense on securities sold short | | | 426,586 | |
Interest expense | | | 983,507 | |
Administration and accounting fees (Note 2) | | | 120,148 | |
Professional fees | | | 74,361 | |
Directors’ fees and expenses | | | 32,626 | |
Insurance expense | | | 7,532 | |
Transfer agent fees | | | 128,073 | |
Custodian fees | | | 17,195 | |
Blue sky servicing fees | | | 13,456 | |
Shareholder report printing | | | 15,943 | |
Chief compliance officer expense | | | 22,740 | |
Other expenses | | | 10,808 | |
| | | | |
Total Expenses before waiver | | | 3,728,350 | |
| | | | |
Less fees waived by Administrator (Note 2) | | | (15,123) | |
| | | | |
Total net expenses | | | 3,713,227 | |
| | | | |
Net Investment Loss | | | (2,520,036) | |
| | | | |
| |
REALIZED AND UNREALIZED GAIN (LOSS) ON INVESTMENTS | | | | |
Net realized loss on investments | | | (7,920,281) | |
Net realized loss on securities sold short | | | (5,646,527) | |
Change in unrealized appreciation/(depreciation) on investments | | | 2,195,593 | |
Change in unrealized appreciation/(depreciation) on securities sold short | | | 8,422,767 | |
| | | | |
NET REALIZED AND UNREALIZED LOSS ON INVESTMENTS | | | (2,948,448) | |
| | | | |
NET DECREASE IN NET ASSETS RESULTING FROM OPERATIONS | | | $(5,468,484) | |
| | | | |
See accompanying notes to financial statements.
| | |
26 | | 1-800-467-7903 | www.CaldwellOrkinFunds.com |
| | |
Caldwell & Orkin | | |
Market Opportunity Fund | | Statement of Changes in Net Assets |
| | | | | | | | |
| | | For the Six Months
Ended October 31, 2010
(Unaudited) | | | For the Year Ended
April 30, 2010 | |
| | |
INCREASE/(DECREASE) IN NET ASSETS FROM OPERATIONS: | | | | | | | | |
Net investment loss | | | $(2,520,036) | | | | $(3,278,286) | |
Net realized loss on investments and securities sold short | | | (13,566,808) | | | | (31,936,266) | |
Change in net unrealized appreciation or (depreciation) of investments and securities sold short | | | 10,618,360 | | | | 1,624,891 | |
| | | | |
| | | (5,468,484) | | | | (33,589,661) | |
| | | | |
| | |
DECREASE IN NET ASSETS FROM DISTRIBUTIONS TO STOCKHOLDERS FROM: | | | | | | | | |
Net realized gain on investments | | | – | | | | (3,262,646) | |
| | | | |
| | | – | | | | (3,262,646) | |
| | | | |
| | |
INCREASE/(DECREASE) IN NET ASSETS FROM COMMON STOCK TRANSACTIONS: | | | | | | | | |
Net proceeds from sale of shares | | | 62,368,805 | | | | 300,001,846 | |
Reinvested distributions | | | – | | | | 2,802,527 | |
Cost of shares redeemed | | | (70,438,739) | | | | (174,156,466) | |
Redemption fee proceeds (Note 1) | | | 109,480 | | | | 348,670 | |
| | | | |
Net increase/(decrease) in net assets resulting from capital share transactions | | | (7,960,454) | | | | 128,996,577 | |
| | | | |
| | |
INCREASE/(DECREASE) IN NET ASSETS | | | (13,428,938) | | | | 92,144,270 | |
| | |
NET ASSETS | | | | | | | | |
Beginning of period | | | 395,073,997 | | | | 302,929,727 | |
| | | | |
End of period (including undistributed net investment income/(loss) of $(2,520,036) and $0, respectively) | | | $381,645,059 | | | | $395,073,997 | |
| | | | |
See accompanying notes to financial statements.
| | |
Semi-Annual Report (Unaudited) | October 31, 2010 | | 27 |
| | |
Caldwell & Orkin | | |
Market Opportunity Fund | | Financial Highlights |
| | |
For a capital share outstanding throughout each period.
| | | | | | | | | | | | | | | | | | | | | | | | |
| | | For the Six
Months
Ended
October 31,
2010
(Unaudited) | | | For the
Year Ended
April 30,
2010 | | | For the
Year Ended
April 30,
2009 | | | For the
Year Ended
April 30,
2008 | | | For the Year Ended
April 30,
2007 | | | For the
Year Ended April 30, 2006 | |
| | |
PER SHARE DATA: | | | | | | | | | | | | | | | | | | | | | | | | |
Net asset value, beginning of period | | | $19.51 | | | | $21.24 | | | | $21.40 | | | | $18.68 | | | | $16.69 | | | | $17.35 | |
Income/(loss) from investment operations: | | | | | | | | | | | | | | | | | | | | | | | | |
Net Investment income/(loss) | | | (0.13) | | | | (0.16) | | | | 0.01 | | | | 0.20 | | | | 0.53 | | | | 0.28 | |
Net realized and unrealized gain/(loss) on investments | | | (0.14) | | | | (1.43) | | | | 0.94 | | | | 3.15 | | | | 1.99 | | | | (0.76) | |
| | | | |
Total from Investment Operations | | | (0.27) | | | | (1.59) | | | | 0.95 | | | | 3.35 | | | | 2.52 | | | | (0.48) | |
| | | | |
| | | | | | |
LESS DISTRIBUTIONS: | | | | | | | | | | | | | | | | | | | | | | | | |
From net investment income | | | – | | | | – | | | | (0.12) | | | | (0.37) | | | | (0.53) | | | | (0.19) | |
From net realized gain on investments | | | – | | | | (0.16) | | | | (1.02) | | | | (0.30) | | | | – | | | | – | |
| | | | |
Total Distributions | | | – | | | | (0.16) | | | | (1.14) | | | | (0.67) | | | | (0.53) | | | | (0.19) | |
| | | | |
Redemption fee proceeds | | | 0.01 | | | | 0.02 | | | | 0.03 | | | | 0.04 | | | | 0.00 | 1 | | | 0.01 | |
| | | | |
Net asset value, end of Period | | | $19.25 | | | | $19.51 | | | | $21.24 | | | | $21.40 | | | | $18.68 | | | | $16.69 | |
| | | | |
| | | | | | |
Total Return | | | (1.33%) | 2 | | | (7.40%) | | | | 4.73% | | | | 17.92% | | | | 15.31% | | | | (2.74%) | |
| | | | | | |
Ratios and Supplemental Data: | | | | | | | | | | | | | | | | | | | | | | | | |
Net assets, end of period (000’s) | | | $381,645 | | | | $395,074 | | | | $302,930 | | | | $228,454 | | | | $135,337 | | | | $153,127 | |
| | |
28 | | 1-800-467-7903 | www.CaldwellOrkinFunds.com |
| | |
Caldwell & Orkin | | |
Market Opportunity Fund | | Financial Highlights (Continued) |
For a capital share outstanding throughout each period.
| | | | | | | | | | | | | | | | | | | | | | | | |
| | | For the Six
Months
Ended
October 31,
2010
(Unaudited) | | | For the
Year Ended
April 30,
2010 | | | For the
Year Ended
April 30,
2009 | | | For the
Year Ended
April 30,
2008 | | | For the
Year Ended
April 30,
2007 | | | For the
Year Ended
April 30,
2006 | |
| | |
Ratios to Average Net Assets: | | | | | | | | | | | | | | | | | | | | | |
Management fees | | | 0.96%3 | | | | 0.83% | | | | 0.83% | | | | 0.84% | | | | 0.87% | | | | 0.86% | |
Administrative Fees | | | 0.22%3 | | | | 0.20% | | | | 0.27% | | | | 0.24% | | | | 0.35% | | | | 0.22% | |
| | | | |
Expenses before dividends on securities sold short and interest expense | | | 1.18%3 | | | | 1.03% | | | | 1.10% | | | | 1.08% | | | | 1.22% | | | | 1.08% | |
| | | | |
Interest expense | | | 0.51%3 | | | | 0.31% | | | | 0.24% | | | | 0.18% | | | | 0.09% | | | | 0.00% | |
Expenses from dividends on securities sold short | | | 0.22%3 | | | | 0.29% | | | | 0.55% | | | | 1.02% | | | | 0.37% | | | | 0.97% | |
| | | | |
Ratio of total expenses4 | | | 1.91%3,5 | | | | 1.63%5 | | | | 1.89% | | | | 2.28% | | | | 1.68% | | | | 2.05% | |
| | | | |
Ratio of net investment income/(loss) | | | (1.30%)3,5 | | | | (0.82%)5 | | | | (0.11%) | | | | 1.23% | | | | 2.64% | | | | 1.52% | |
Portfolio turnover rate | | | 259%2 | | | | 662% | | | | 879% | | | | 712% | | | | 529% | | | | 459% | |
See accompanying notes to financial statements.
| 1 | Amount is less than $0.01. |
| 4 | The ratio of expenses to average net assets and net investment income to average net assets do not reflect the expenses of other investment companies. |
| 5 | The ratio of total expenses to average net assets and ratio of net investment income/(loss) include fees waived by Fund’s Administrator that amounted to less than 0.005%. |
| | |
Semi-Annual Report (Unaudited) | October 31, 2010 | | 29 |
| | |
Caldwell & Orkin | | |
Market Opportunity Fund | | Notes to Financial Statements |
| | October 31, 2010 (Unaudited) |
The Caldwell & Orkin Market Opportunity Fund (the “Fund”) is the only active investment portfolio of The Caldwell & Orkin Funds, Inc. (“Caldwell & Orkin”), an open-end, diversified management investment company registered under the Investment Company Act of 1940, as amended (the “1940 Act”), and incorporated under the laws of the State of Maryland on August 15, 1989. Prior to June, 1992, Caldwell & Orkin’s name was The OTC Select-100 Fund, Inc. and consisted of only one portfolio, The OTC Select-100 Fund. The shareholders of The OTC Select-100 Fund subsequently approved changing the corporate name from The OTC Select-100 Fund, Inc. to The Caldwell & Orkin Funds, Inc. and to amend the investment objective and policies of The OTC Select-100 Fund. As a result of such amendment, The OTC Select-100 Fund was renamed and its assets and objectives were those of the Caldwell & Orkin Aggressive Growth Fund. In August, 1996, the Board of Directors of Caldwell & Orkin approved changing the name of the Caldwell & Orkin Aggressive Growth Fund to the Caldwell & Orkin Market Opportunity Fund. The Fund’s objectives are to provide long-term capital growth with a short-term focus on capital preservation through investment selection and asset allocation. The Fund seeks to outperform the stock market over the long-term, as measured by indices such as the S&P 500 Total Return index.
1. SUMMARY OF SIGNIFICANT ACCOUNTING POLICIES
Securities Valuation
Securities are stated at the closing price on the date at which the net asset value (“NAV”) is being determined. If the date of determination is not a trading date, the last bid price is used for a value instead. Debt securities, other than short-term investments, are valued at the price provided by an independent pricing service. Short-term investments having a maturity of 60 days or less at the time of the purchase are stated at amortized cost, which approximates market value. Any assets or securities for which market quotations are not readily available are valued at fair value as determined in good faith by or under the direction of the Fund’s Board of Directors in accordance with the Fund’s Fair Value Pricing Policy.
Fair Value Measurements
The Fund has adopted the Financial Accounting Standards Board (“FASB”) Accounting Standards Codification™ (“ASC”), and follows the provisions of ASC 820, “Fair Value Measurements and Disclosures” (“ASC 820”). In accordance with ASC 820, fair value is defined as the price that the Fund would receive upon selling an investment in a timely transaction to an independent buyer in the principal or most advantageous market of the investment. ASC 820 established a three-tier hierarchy to maximize the use of observable market data and minimize the use of unobservable inputs and to establish classification of fair value measurements for disclosure purposes. Inputs refer broadly to the assumptions that market participants would use in pricing the asset or liability, including assumptions about risk, for example, the risk inherent in a particular valuation technique used to measure fair value including such a pricing model and/or the risk inherent in the inputs to the valuation technique. Inputs may be observable or unobservable. Observable inputs are inputs that reflect the assumptions market participants would use in pricing the asset or liability developed based on market data obtained from sources independent of the reporting entity. Unobservable inputs are inputs that reflect the reporting entity’s own assumptions about the
| | |
30 | | 1-800-467-7903 | www.CaldwellOrkinFunds.com |
| | |
Caldwell & Orkin | | |
Market Opportunity Fund | | Notes to Financial Statements |
| | October 31, 2010 (Unaudited) |
assumptions market participants would use in pricing the asset or liability developed based on the best information available in the circumstances.
The three-tier hierarchy is summarized in the three broad Levels listed below:
| | |
Level 1 – | | Unadjusted quoted prices in active markets for identical assets or liabilities that the Fund has the ability to access. |
Level 2 – | | Observable inputs other than quoted prices included in Level 1 that are observable for the asset or liability either directly or indirectly. These inputs may include quoted prices for the identical instrument on an inactive market, prices for similar instruments, interest rates, prepayment speeds, credit risk, yield curves, default rates and similar data. |
Level 3 – | | Unobservable inputs for the asset or liability, to the extent relevant observable inputs are not available, representing the Fund’s own assumptions about the assumptions a market participant would use in valuing the asset or liability, and would be based on the best information available. |
The valuation techniques used by the Fund to measure fair value during the six months ended October 31, 2010 maximized the use of observable inputs and minimized the use of unobservable inputs. The Fund uses the value of investment securities, as of the end of each reporting period, in determining transfers in/out of Levels 1, 2 or 3.
The following is a summary of the inputs used as of October 31, 2010 in valuing the Fund’s investments carried at value:
| | | | | | | | | | | | | | | | |
Assets | | | | | | | | | | | | |
| Investments in Securities at Value* | | Level 1 - Quoted
Prices | | | Level 2 - Other
Significant
Observable
Inputs | | | Level 3 -
Significant
Unobservable
Inputs | | | Total | |
| | |
Common Stocks | | $ | 165,898,460 | | | $ | – | | | $ | – | | | $ | 165,898,460 | |
Exchange Traded Funds | | | 8,517,808 | | | | – | | | | – | | | | 8,517,808 | |
Purchased Call Options | | | 2,190,210 | | | | – | | | | – | | | | 2,190,210 | |
Purchased Put Options | | | 5,371,975 | | | | – | | | | – | | | | 5,371,975 | |
Corporate Bonds | | | – | | | | 20,129,286 | | | | – | | | | 20,129,286 | |
Short Term Investments | | | 162,301,110 | | | | – | | | | – | | | | 162,301,110 | |
| | |
TOTAL | | $ | 344,279,563 | | | $ | 20,129,286 | | | $ | – | | | $ | 364,408,849 | |
| | |
Liabilities | | | | | | | | | | | | | | | | |
Investments in Securities at Value* | | | | | | | | | | | | | | | | |
| | |
Common Stocks Sold Short | | $ | (103,909,158) | | | $ | – | | | $ | – | | | $ | (103,909,158) | |
Exchange Traded Funds Sold Short | | | (12,177,679) | | | | – | | | | – | | | | (12,177,679) | |
| | |
TOTAL | | $ | (116,086,837) | | | $ | – | | | $ | – | | | $ | (116,086,837) | |
| | |
All securities of the Fund were valued using either Level 1 or Level 2 inputs during the period ended October 31, 2010. Thus, a reconciliation of assets in which significant unobservable inputs (Level 3) were used is not applicable for this Fund.
| * | For detailed industry descriptions, see the accompanying Schedule of Investments. |
| | |
Semi-Annual Report (Unaudited) | October 31, 2010 | | 31 |
| | |
Caldwell & Orkin | | |
Market Opportunity Fund | | Notes to Financial Statements |
| | October 31, 2010 (Unaudited) |
Derivatives
The Fund follows the provisions of FASB ASC 815, “Disclosures about Derivative Instruments and Hedging Activities.” ASC 815 has established improved financial reporting about derivative instruments and hedging activities as it relates to disclosure associated with these types of investments. The following discloses the amounts related to the Fund’s use of derivative instruments and hedging activities.
The effect of derivative instruments on the Statement of Assets and Liabilities as of October 31, 2010:
Asset Derivatives
| | | | |
Derivatives not Accounted for as Hedging Instruments | | Statement of Assets and Liabilities Location | | Market Value |
Equity Contracts | | Investments, at value | | $ 7,562,185 |
TOTAL | | | | $ 7,562,185 |
| |
The effect of derivative instruments on the Statement of Operations for the six months ended October 31, 2010:
| | | | | | | | |
Derivatives not Accounted for as Hedging Instruments | | Location of Gain/(Loss) On Derivatives Recognized in Income | | Realized Gain/(Loss) On Derivatives Recognized in Income | | Change in Unrealized Gain/(Loss) On Derivatives Recognized in Income | |
| | Net realized loss on investments | | $ 794,646 | | | | |
| | | |
Equity Contracts | | Change in unrealized appreciation / (depreciation) on investments | | | | | $ (1,031,268) | |
TOTAL | | | | $ 794,646 | | | $ (1,031,268) | |
| | |
Significant Ownership Concentration
At October 31, 2010, the Fund invested 42.53% of its total net assets in the JPMorgan U.S. Treasury Plus Money Market Fund. The Fund uses the money market instrument as a vehicle for holding collateral related to securities sold short. As stated in the Fund’s prospectus, the Fund will typically invest between 0% and 50% of net assets in money market securities and fixed income securities. This portion of the Fund’s portfolio includes cash equivalents (i.e., money market funds or U.S. treasury notes) and bonds (i.e., corporate or government bonds), although generally cash equivalents are emphasized more than bonds. The corporate bonds purchased may have any maturity and be of any rating or quality, as long as Fund management believes it is consistent with the Fund’s investment objective.
| | |
32 | | 1-800-467-7903 | www.CaldwellOrkinFunds.com |
| | |
Caldwell & Orkin | | |
Market Opportunity Fund | | Notes to Financial Statements |
| | October 31, 2010 (Unaudited) |
The JPMorgan U.S. Treasury Plus Money Market Fund’s objective is to seek current income with liquidity and stability of principal. The JPMorgan U.S. Treasury Plus Money Market Fund invests exclusively in U.S. Treasury bills, notes and other obligations issued or guaranteed by the U.S. Treasury, and repurchase agreements collateralized by such obligations.
Share Valuation
The NAV per share of the Fund is calculated by dividing the sum of the value of the securities held by the Fund, plus cash or other assets, minus all liabilities (including estimated accrued expenses) by the total number of shares outstanding for the Fund, rounded to the nearest cent. The Fund’s shares will not be priced on the days on which the New York Stock Exchange is closed for trading. The offering and redemption price per share for the Fund is equal to the Fund’s NAV per share.
The Fund charges a 2.00% redemption fee on shares held less than six months. These fees are deducted from the redemption proceeds otherwise payable to the shareholder. The Fund will retain the fee charged as paid-in capital and such fees become part of the Fund’s daily NAV calculation.
Securities Transactions and Related Investment Income
Securities transactions are accounted for on trade date. Dividend income is recorded on the ex-dividend date and interest income is recorded as earned. Realized gains and losses from investment transactions are determined using the specific identification method.
Cash
The Fund maintains cash available for the settlement of securities transactions and capital shares reacquired. Available cash is invested daily in money market instruments.
Income Taxes
The Fund intends to continue to comply with the requirements of the Internal Revenue Code applicable to regulated investment companies and to distribute all taxable income to their shareholders. Therefore, no federal income tax provision is required.
In order to avoid imposition of the excise tax applicable to regulated investment companies, the Fund intends to declare each year as dividends, in each calendar year, at least 98% of its net investment income (earned during the calendar year) and at least 98% of its net realized capital gains (earned during the twelve months ended October 31) plus undistributed amounts, if any, from prior years.
Net capital losses incurred after October 31 and within the taxable year are deemed to arise on the first business day of the Fund’s next taxable year.
For the fiscal year ended April 30, 2010, the Fund made a distribution of $0.16 per share from ordinary income.
| | |
Semi-Annual Report (Unaudited) | October 31, 2010 | | 33 |
| | |
Caldwell & Orkin | | |
Market Opportunity Fund | | Notes to Financial Statements |
| | October 31, 2010 (Unaudited) |
The Fund follows ASC 740 “Income Taxes” (“ASC 740”), which requires that the financial statement effects of a tax position taken or expected to be taken in a tax return be recognized in the financial statements when it is more likely than not, based on the technical merits, that the position will be sustained upon examination. Management has concluded that the Fund has taken no uncertain tax positions that require adjustment to the financial statements to comply with the provisions of ASC 740. The Fund files income tax returns in the U.S. federal jurisdiction and Georgia. The statue of limitations on the Fund’s federal and state tax filings remains open for the fiscal years ended April 30, 2007 through April 30, 2010.
Use of Estimates
The preparation of financial statements in conformity with accounting principles generally accepted in the United States of America (“GAAP”) requires management to make estimates and assumptions that affect the reported amounts of assets and liabilities and disclosure of contingent assets and liabilities at the date of the financial statements and the reported amounts of revenues and expenses during the reporting period. Actual results could differ from those estimates.
Reclassification of Capital Accounts
GAAP requires that certain components of net assets relating to permanent differences be reclassified between financial and tax reporting. These reclassifications have no effect on net assets or net asset value per share. For the year ended April 30, 2010, the Fund increased accumulated net realized loss on investments by $190,139, decreased undistributed net investment income by $3,278,286, and decreased paid-in capital by $3,088,147 due to certain permanent book and tax differences.
2. COMMITMENTS AND OTHER AGREEMENTS
The Fund has entered into a management agreement (the “Management Agreement”) with C&O Funds Advisor, Inc. (the “Adviser”) pursuant to which the Adviser provides space, facilities, equipment and personnel necessary to perform administrative and investment management services for the Fund. The Management Agreement provides that the Adviser is responsible for the actual management of the Fund’s portfolio. For such services and expenses assumed by the Adviser, the Fund pays a monthly advisory fee at incremental annual rates as follows:
| | |
| Advisory Fee | | Average Daily Net Assets |
1.00% | | Up to $250 million |
.90% | | In excess of $250 million but not greater than $500 million |
.80% | | In excess of $500 million |
The Adviser has agreed to reimburse the Fund to the extent necessary to prevent the Fund’s annual ordinary operating expenses (excluding taxes, expenses related to the execution of portfolio transactions and the investment activities of the Fund such as, for example, interest, dividend expenses on securities sold short, brokerage commissions and fees and expenses charged to the Fund by any investment company in which the Fund invests and extraordinary charges such
| | |
34 | | 1-800-467-7903 | www.CaldwellOrkinFunds.com |
| | |
Caldwell & Orkin | | |
Market Opportunity Fund | | Notes to Financial Statements |
| | October 31, 2010 (Unaudited) |
as litigation costs) from exceeding 2.0% of the Fund’s average net assets (the “Expense Cap”). No reimbursement was required for the six months ended October 31, 2010.
C&O Funds Advisor, Inc. is a wholly-owned subsidiary of Caldwell & Orkin, Inc.
ALPS Distributors, Inc. (“ADI”) serves as distributor to the Fund. The Fund does not pay ADI for these services. ALPS Fund Services, Inc. (“ALPS”) provides fund accounting, fund administration, and transfer agency services to the Fund. The fees paid to ALPS for fund accounting and fund administration services are set at incremental annual rates as follows, and subject to a $160,000 annual minimum:
| | |
| Administration Fee | | Average Daily Net Assets |
.06% | | Between $0 - $500 million |
.03% | | Between $500 million - $1 billion |
.02% | | In excess of $1 billion |
In addition to the fee structure set forth above, an annual amount of $30,000 is waived against the administration fee, pursuant to a Distribution Fee Letter Agreement between the Adviser and ADI.
3. INVESTMENT PORTFOLIO TRANSACTIONS
Investment Purchases and Sales
For the six months ended October 31, 2010, purchases of investments and proceeds from sales of investments (excluding securities sold short and short-term investments) totaled $450,848,014, and $464,092,453, respectively.
Short Sales and Segregated Cash
Short sales are transactions in which the Fund sells a security it does not own, in anticipation of a decline in the market value of that security. To initiate such a transaction, the Fund must borrow the security to deliver to the buyer upon the short sale; the Fund is then obligated to replace the security borrowed by purchasing it in the open market at some later date, completing the transaction.
The Fund will incur a loss if the market price of the security increases between the date of the short sale and the date on which the Fund replaces the borrowed security. The Fund will realize a gain if the security declines in value between those dates.
All short sales must be fully collateralized. The Fund maintains the collateral in segregated accounts consisting of cash and/or U.S. Government securities sufficient to collateralize the market value of its short positions. Typically, the segregated cash with brokers and other financial institutions exceeds the minimum required. Deposits with brokers for securities sold short are invested in money market instruments. Segregated cash is held at the custodian in the name of the broker per a tri-party agreement between the Fund, the custodian, and the broker.
The Fund may also sell short “against the box”, i.e., the Fund enters into a short sale as described above, while holding an offsetting long position in the same security which it sold short. If the
| | |
Semi-Annual Report (Unaudited) | October 31, 2010 | | 35 |
| | |
Caldwell & Orkin | | |
Market Opportunity Fund | | Notes to Financial Statements |
| | October 31, 2010 (Unaudited) |
Fund enters into a short sale against the box, it will segregate an equivalent amount of securities owned by the Fund as collateral while the short sale is outstanding.
The Fund limits the value of its short positions (excluding short sales “against the box”) to 60% of the Fund’s total net assets. At October 31, 2010, the Fund had approximately 30% of its total net assets in short positions.
For the six months ended October 31, 2010, the cost of investments purchased to cover short sales and the proceeds from investments sold short were $351,014,674 and $280,259,572, respectively.
4. CAPITAL SHARE TRANSACTIONS
| | | | | | | | |
| | |
| | |
Capital share transactions were as follows: | | | | | | | | |
| | |
| | | For the Six Months Ended
October 31, 2010 | | | For the
Year Ended
April 30, 2010 | |
| | |
Shares sold | | | 3,223,949 | | | | 14,517,866 | |
Shares reinvested | | | – | | | | 143,279 | |
Shares reacquired | | | (3,648,917 | ) | | | (8,675,606) | |
| | |
Net increase/(decrease) in shares outstanding | | | (424,968 | ) | | | 5,985,539 | |
| | |
| | | | | | | | |
5. DISTRIBUTIONS TO SHAREHOLDERS | | | | | | | | |
| | |
On December 17, 2009, a distribution of $0.16 per share was declared. The dividend was paid on December 17, 2009, to shareholders of record on December 16, 2009.
The tax character of distributions paid for the fiscal year ended April 30, 2010 was as follows:
| | | | |
| | | 2010 | |
| | |
Distributions paid from: | | | | |
Ordinary income | | $ | 3,262,646 | |
Capital gains | | $ | 0 | |
Distribution classifications may differ from the Statement of Changes in Net Assets as a result of the treatment of short term capital gains as ordinary income for tax purposes.
| | |
36 | | 1-800-467-7903 | www.CaldwellOrkinFunds.com |
| | |
Caldwell & Orkin | | |
Market Opportunity Fund | | Notes to Financial Statements |
| | October 31, 2010 (Unaudited) |
As of April 30, 2010, the components of distributable earnings on a tax basis were as follows:
| | | | |
Total cost of investments | | $ | 363,729,878 | |
Gross tax unrealized appreciation | | | 16,546,157 | |
Gross tax unrealized depreciation | | | (6,894,915) | |
Net depreciation on derivatives | | | (181,792) | |
Net tax unrealized appreciation | | | 9,469,450 | |
Undistributed ordinary income | | | 0 | |
Accumulated capital losses | | | (13,975,845) | |
Post-October losses | | | (21,551,360) | |
Total distributable earnings | | | (35,527,205) | |
Total accumulated earnings | | | (26,057,755) | |
On October 31, 2010, based on cost of $357,032,975 for federal income tax purposes, aggregate gross unrealized appreciation for all securities in which there is an excess of value over tax cost was $11,530,093 and aggregate gross unrealized depreciation for all securities in which there is an excess of tax cost over value was $4,154,219, resulting in net unrealized appreciation of $7,375,874.
At April 30, 2010, the Fund had a capital loss in the amount of $13,975,845. This loss expires on April 30, 2018.
Net investment income / (loss), net realized gains / (losses) and unrealized appreciation / depreciation differ for financial statement and tax purposes due to differing treatments of short term capital gains, nondeductible dividend expense and wash sale loss deferrals.
6. RELATED PARTY TRANSACTIONS
As of October 31, 2010, Caldwell & Orkin, Inc. and Michael B. Orkin had ownership of the Fund of 0.21% and 1.29%, respectively. Caldwell & Orkin, Inc. is 100% wholly owned by Michael B. Orkin.
7. NEW ACCOUNTING PRONOUCEMENTS
In January 2010, the FASB issued Accounting Standards Update “Improving Disclosures about Fair Value Measurements” (“ASU”). The ASU requires enhanced disclosures about a) transfers into and out of Levels 1 and 2, and b) purchases, sales, issuances, and settlements on a gross basis relating to Level 3 measurements. The first disclosure is effective for the first reporting period beginning after December 15, 2009, and for interim periods within those fiscal years. There were no significant transfers in to and out of Levels 1 and 2 during the current period presented.
The second disclosure will become effective for fiscal years beginning after December 15, 2010, and for interim periods within those fiscal years. Management is currently evaluating the impact this disclosure may have on the Fund’s financial statements.
8. SUBSEQUENT EVENTS
Management has performed a review for subsequent events through the date this report was issued. There were no other reportable events for the Fund as a result of their review.
| | |
Semi-Annual Report (Unaudited) | October 31, 2010 | | 37 |
| | |
Caldwell & Orkin | | |
Market Opportunity Fund | | Additional Information |
Information about the Board of Directors and officers* of the Fund as of October 31, 2010 is set forth below. The Statement of Additional Information (SAI) includes additional information about the Fund’s Directors and officers and is available free of charge, upon request, by calling (800) 237-7073. The address for each of the persons named below is 5185 Peachtree Parkway, Suite 370, Norcross, GA 30092-6541.
| | | | | | | | |
Name, (Age) and
Position(s) Held with Fund | | Term of Office
and Length of
Time Served1 | | Principal Occupation(s) During Past Five Years | | Number of Funds in Fund Complex
Overseen by Director | | Other
Directorships Held by Director |
DISINTERESTED DIRECTORS |
Frederick T. Blumer (51) Chairman | | Since 1990 | | Mr. Blumer is Vice President of HUGHES Telematics, Inc., and was formerly the CEO of X-spand International, Inc. | | One | | None |
David L. Eager (68) Director | | Since 1992 | | Mr. Eager is a Partner at Eager, Davis & Holmes LLC, and was formerly Director for Product Development for Driehaus Capital Management and a Global Partner with William M. Mercer, Inc. | | One | | Veracity
Mutual Fund |
James L. Underwood (60) Director | | Since 2006 | | Mr. Underwood is the President of Tarpley & Underwood, P.C. and Tarpley & Underwood Financial Advisors LLC. | | One | | None |
* The term “officer” means the president, vice president, secretary, treasurer, controller or any other officer who performs policy-making decisions.
1 Each Director serves until his / her successor is duly elected and qualified, or until his / her death, resignation or removal.
| | |
38 | | 1-800-467-7903 | www.CaldwellOrkinFunds.com |
| | |
Caldwell & Orkin | | |
Market Opportunity Fund | | Additional Information |
| | October 31, 2010 |
| | | | | | | | |
Name, (Age) and Position(s) Held with Fund | | Term of Office and Length of Time Served1 | | Principal Occupation(s) During Past Five Years | | Number of Funds in Fund Complex
Overseen by Director | | Other Directorships Held by Director |
INTERESTED DIRECTOR |
Michael B. Orkin (51) 2 Director, President, Portfolio Manager | | Since 1990 | | Mr. Orkin is the CEO and sole shareholder of Caldwell & Orkin, Inc., of which the Adviser is a wholly-owned subsidiary. Mr. Orkin has been a portfolio manager at Caldwell & Orkin, Inc. since 1985, and is a Chartered Financial Analyst. | | One | | None |
OFFICERS WHO ARE NOT DIRECTORS |
William C. Horne (52)3 Chief Compliance Officer & Treasurer | | Since 2004 Since 2006 | | Mr. Horne is the Director of Client Services and Chief Compliance Officer of Caldwell & Orkin, Inc. | | N/A | | N/A |
Paul F. Leone (47)3 Secretary | | Since 2010 | | Mr. Leone is Assistant General Counsel at ALPS Fund Services, Denver, Colorado. Prior to joining ALPS, Mr. Leone was Deputy Chief Compliance Officer at Old Mutual Capital, Denver, Colorado; General Counsel and Chief Compliance Officer at Wisconsin Capital Management, Madison, Wisconsin. | | N/A | | N/A |
* The term “officer” means the president, vice president, secretary, treasurer, controller or any other officer who performs policy-making decisions.
1 Each Director serves until his / her successor is duly elected and qualified, or until his / her death, resignation or removal.
2 Mr. Orkin is an interested person of the Fund by reason of his position with the Adviser.
3 Registered Representative of ALPS Distributors, Inc.
| | |
Semi-Annual Report (Unaudited) | October 31, 2010 | | 39 |
| | |
Caldwell & Orkin | | |
Market Opportunity Fund | | Additional Information |
| | |
| | | | | | | | |
Name, (Age) and
Position(s) Held with Fund | | Term of Office
and Length of
Time Served1 | | Principal Occupation(s) During Past Five Years | | Number of Funds in Fund Complex
Overseen by Director | | Other
Directorships
Held by
Director |
OFFICERS WHO ARE NOT DIRECTORS (Continued) |
Lauren Johnson (30) Assistant Treasurer | | Since 2009 | | Ms. Johnson joined ALPS Fund Services in September 2005 as a Fund Controller. Prior to joining ALPS, Ms. Johnson worked for Pricewaterhouse Coopers LLP. | | N/A | | N/A |
David R. Bockel (33)2 Assistant Secretary | | Since 2006 | | Mr. Bockel is an Assistant Portfolio Manager for Caldwell & Orkin, Inc. | | N/A | | N/A |
* The term “officer” means the president, vice president, secretary, treasurer, controller or any other officer who performs policy-making decisions.
1 Each Director serves until his / her successor is duly elected and qualified, or until his / her death, resignation or removal.
2 Registered Representative of ALPS Distributors, Inc.
| | |
40 | | 1-800-467-7903 | www.CaldwellOrkinFunds.com |
CALDWELL & ORKIN MARKET OPPORTUNITY FUND
Semi-Annual Report to Shareholders (unaudited)
| | | | |
BOARD OF DIRECTORS Frederick T. Blumer, Independent Chairman Michael B. Orkin,President David L. Eager James L. Underwood | | TRANSFER, REDEMPTION & DIVIDEND DISBURSING AGENT ALPS Fund Services, Inc. P.O. Box 46256 Denver, CO 80201 | | LEGAL COUNSEL Paul, Hastings, Janofsky & Walker LLP 600 Peachtree Street, N.E. Suite 2400 Atlanta, GA 30308 |
| | |
INVESTMENT ADVISER C&O Funds Advisor, Inc. 5185 Peachtree Parkway Suite 370 Norcross, GA 30092-6541 | | CUSTODIAN JPMorgan Chase Bank, N.A. 1111 Polaris Parkway, Suite 3J Columbus, OH 43240 | | INDEPENDENT DIRECTORS’ COUNSEL Arnall Golden Gregory LLP 171 17th Street, NW, Suite 2100 Atlanta, GA 30363 |
DISTRIBUTOR ALPS Distributors, Inc. 1290 Broadway, Suite 1100 Denver, CO 80203 | | | | |
The Caldwell & Orkin Market Opportunity Fund’s (the “Fund”) portfolio may or may not have positions in any of the companies referenced in this Report to Shareholders as of any date after October 31, 2010. The commentary reflects the views of the portfolio manager (or Adviser) through the end of the period or through the date of this report, as the case may be. Of course, these views are subject to change as market and other conditions warrant. These financial statements are submitted for the general information of the Fund’s shareholders. They are not authorized for distribution to prospective investors unless preceded or accompanied by an effective Fund Prospectus.
Availability of Proxy Voting Policy & Procedures, Proxy Voting Record and Code of Ethics - A description of a) the policies and procedures the Fund uses to determine how to vote proxies relating to portfolio securities, b) how the Fund voted proxies relating to portfolio securities during the most recent 12-month period ended June 30, c) the Code of Ethics applicable to the principal officers of the Fund are available without charge, upon request, by calling toll-free (800) 237-7073, or on the Securities and Exchange Commission’s (the “Commission’s”) website at http://www.sec.gov.
Availability of Quarterly Portfolio Schedule - The Fund files its complete schedule of portfolio holdings with the Commission for the first and third quarters of each fiscal year on Form N-Q. The Fund’s Forms N-Q are available on the Commission’s website at http://www.sec.gov. The Fund’s Forms N-Q may be reviewed and copied at the Commission’s Public Reference Room in Washington, D.C. Information on the operation of the Public Reference Room may be obtained by calling 1-800 SEC-0330.
Fund Information - For information about the Fund please call (800) 237-7073 or visit the Fund’s website at www.CaldwellOrkinFunds.com.
Fund Listings - The Fund is listed in many newspapers as C&OMktOpp or CaldOrkMO. The Fund’s Quotation symbol is COAGX. The Fund’s CUSIP number is 128819307.
Caldwell & Orkin Market Opportunity Fund
5185 Peachtree Parkway, Suite 370
Norcross, GA 30092-6541
E-mail: Info@CaldwellOrkin.com
Not applicable to this report.
| Item 3. | Audit Committee Financial Expert. |
Not applicable to this report.
| Item 4. | Principal Accountant Fees and Services. |
Not applicable to this report.
| Item 5. | Audit Committee of Listed Registrants. |
Not applicable.
| Item 6. | Schedule of Investments. |
Schedule of Investments is included as part of the Report to Stockholders filed under Item 1 of this form.
| Item 7. | Disclosure of Proxy Voting Policies and Procedures for Closed-End Management Investment Companies. |
Not applicable.
| Item 8. | Portfolio Managers of Closed-End Management Investment Companies. |
Not applicable.
| Item 9. | Purchases of Equity Securities by Closed-End Management Investment Companies. |
Not applicable.
| Item 10. | Submission of Matters to Vote of Security Holders. |
There have been no material changes to the procedures by which shareholders may recommend nominees to the registrant’s board of trustees.
| Item 11. | Controls and Procedures. |
| | (a) | The registrant’s principal executive officer and principal financial officer have concluded that the registrant’s disclosure controls and procedures (as defined in Rule 30a-3(c) under the Investment Company Act of 1940, as amended) are effective based on their evaluation of these controls and procedures as of a date within 90 days of the filing date of this document. |
| | (b) | There was no change in the Registrant’s internal control over financial reporting (as defined in Rule 30a-3(d) under the Investment Company Act of 1940, as amended) during the second fiscal quarter of the period covered by this report that has materially affected, or is reasonably likely to materially affect, the Registrant’s internal control over financial reporting. |
| | |
| (a)(1) | | Not applicable. |
| |
| (a)(2) | | The certifications required by Rule 30a-2(a) of the Investment Company Act of 1940, as amended, and Section 302 of the Sarbanes-Oxley Act of 2002 are attached hereto as Ex99.Cert. |
| |
| (a)(3) | | Not applicable. |
| |
| (b) | | The certifications by the registrant’s Principal Executive Officer and Principal Financial Officer, as required by Rule 30a-2(b) of the Investment Company Act of 1940, as amended, and Section 906 of the Sarbanes-Oxley Act of 2002 are attached hereto as Ex99.906Cert. |
SIGNATURES
Pursuant to the requirements of the Securities Exchange Act of 1934 and the Investment Company Act of 1940, the registrant has duly caused this report to be signed on its behalf by the undersigned, thereunto duly authorized.
| | | | |
| The Caldwell & Orkin Funds, Inc. |
| | |
By: | | | | /s/ Michael B. Orkin |
| | | | Michael B. Orkin |
| | | | President (Principal Executive Officer) |
| | |
Date: | | | | January 3, 2011 |
| | |
By: | | | | /s/ William C. Horne |
| | | | William C. Horne |
| | | | Treasurer (Principal Financial Officer) |
| | |
Date: | | | | January 3, 2011 |