UNITED STATES
SECURITIES AND EXCHANGE COMMISSION
Washington, D.C. 20549
FORM N-CSR
CERTIFIED SHAREHOLDER REPORT OF REGISTERED MANAGEMENT
INVESTMENT COMPANIES
Investment Company Act file number: 811-06113
The Caldwell & Orkin Funds, Inc.
(Exact name of registrant as specified in charter)
5185 Peachtree Parkway, Suite 370, Norcross, GA 30092-6542
(Address of principal executive offices) (Zip code)
Michael B. Orkin
5185 Peachtree Parkway, Suite 370, Norcross, GA 30092-6542
(Name and Address of Agent for Service)
Registrant’s Telephone Number, including Area Code: 678-533-7850
Date of fiscal year end: April 30
Date of reporting period: May 1, 2009 – April 30, 2010
Form N-CSR is to be used by management investment companies to file reports with the Commission not later than 10 days after the transmission to stockholders of any report that is required to be transmitted to stockholders under Rule 30e-1 under the Investment Company Act of 1940 (17 CFR 270.30e-1). The Commission may use the information provided on Form N-CSR in its regulatory, disclosure review, inspection, and policymaking roles.
A registrant is required to disclose the information specified by Form N-CSR, and the Commission will make this information public. A registrant is not required to respond to the collection of information contained in Form N-CSR unless the Form displays a currently valid Office of Management and Budget ("OMB") control number. Please direct comments concerning the accuracy of the information collection burden estimate and any suggestions for reducing the burden to Secretary, Securities and Exchange Commission, 450 Fifth Street, NW, Washington, DC 20549-0609. The OMB has reviewed this collection of information under the clearance requirements of 44 U.S.C. ss. 3507.
| Item 1. | Reports to Stockholders. |
Caldwell & Orkin
Market Opportunity Fund
Annual Report
April 30, 2010
| | |
| 1 | | 1-800-467-7903 | www.CaldwellOrkinFunds.com |
| | |
Caldwell & Orkin Market Opportunity Fund | | Shareholder Letter |
April 30, 2010
| | | | |
Investment Adviser C&O Funds Advisor, Inc. 5185 Peachtree Parkway, Suite 370 Norcross, Georgia 30092-6541 (800) 237-7073 | |  | | Shareholder Accounts c/o ALPS Fund Services, Inc. P.O. Box 46256 Denver, Colorado 80201 (800) 467-7903 |
Dear Fellow Shareholder:
The Caldwell & Orkin Market Opportunity Fund (the “Fund”) dipped -2.19% in the 6-month period ended April 30, 2010. The S&P 500 Total Return index (“S&P 500”) gained 15.66% during the same period. For the 12 months ended April 30, 2010, the Fund lost -7.40%, while the S&P 500 increased 38.84%. And, since commencement of active management on August 24, 1992 through April 30, 2010, the Fund has generated a 9.23% compounded annual return, outpacing the S&P 500’s 8.28% compounded annual return during the same period. The Fund’s total return from August 24, 1992 through April 30, 2010 has been 376.63%, compared to the S&P’s total return of 308.54%. Of course, past performance is no guarantee of future results.
Importantly, the Fund has achieved these results while maintaining a low market risk profile and with little reliance on the movement of the stock market (see pages 10, 12, 13 and 14). Since we began actively managing the Fund on August 24, 1992, the Fund’s price movements have correlated very little (0.01%) with the price movements of the S&P 500. An S&P 500 index fund has nearly a 100% correlation to the market in any given period. The Fund’s lack of correlation to the market indicates that its performance is not attributable to that of the index. Additionally, given the Fund’s low correlation to the S&P 500, deviations in Fund performance relative to the S&P 500’s performance are to be expected. (Statistical computations by Ned Davis Research, Inc.)
| | |
| Annual Report | April 30, 2010 | | 2 |
| | |
Management Discussion & Analysis | | Caldwell & Orkin Market Opportunity Fund |
April 30, 2010
The Fund opened the annual period on May 1, 2009 positioned 43.55% long, -27.65% short (15.90% net long), 0.19% in put options, 0.06% in call options, 7.05% in corporate bonds and 21.50% in cash & equivalents. Emerging country exchange-traded funds (“ETFs”) represented our largest long concentration (4.58%), and commercial services – schools topped the short side (-5.67%). Among the emerging country ETFs, our larger concentrations were in China, Brazil, Canada, South Korea and Singapore, countries we felt would benefit from the unprecedented global monetary stimulus. There are several catalysts behind our short exposure to for-profit educational institutions. Some specifics:
| • | | A majority of the industry’s revenue comes from student loans accessed through the Federal government’s Title IV funding program. |
| • | | Recruiters on quota, working in boiler-room conditions, are hired to find students, with reports of some even resorting to homeless shelters. |
| • | | The enrollment growth rate has been several times that of regular higher-education institutions. |
| • | | The dropout rate and internal student loan default rate (loans directly with the schools) is near 50%. |
| • | | The quality of education is questionable, and students don’t get the education needed to secure high-enough paying jobs to repay their student loans. |
| • | | There are questions as to the validity of the course credits, and their transferability to other schools. |
| • | | In some cases, less than 10% of tuition dollars go to education, the rest going to marketing and executive pay. |
| • | | The government is reviewing its Title IV funding program, and is about to make recommendations regarding gainful employment standards. |
Steve Eisman, a portfolio manager at FrontPoint Financial Services Fund, gave a speech on May 26, 2010 titled “Subprime Goes to College” at the Ira Sohn Investment Research Conference. His presentation highlighted, among other things, the above points. In a nutshell, he explained how many for-profit education firms are to the field of higher education as sub-prime lenders were to banking.
Going into this review period it appeared that Washington’s recession-busting checkbook was working, though we continue to believe there will be long-term negative repercussions. Because of substantial total credit market debt, we maintain a view that we are in a secular (longer-term) bear market that began in 2000, and that the bear market will be punctuated by periodic, sharp cyclical (shorter-term) rallies - rallies that could last months or even years. We believe we’ve just seen such a rally, a rally whose roots were nourished by massive amounts of government stimulus.
Monetary / Economic Liquidity - the relationship between money supply growth and economic growth - is an important factor in causing financial assets to change in value, and an important factor in our investment process. In fact, in reading our client communications you’ll see the word “liquidity” frequently. When money supply growth outpaces the growth in the economy, the excess economic liquidity has to find a home, and typically (at least initially) it flows into liquid financial assets (stocks and bonds), driving the markets higher, before being absorbed into the broader economy. Conversely, when the economy becomes overheated, inflation typically increases and the April 30, 2010 Federal Reserve tightens, or raises, interest rates. Money supply then contracts relative to economic growth, and stocks and bonds are sold driving prices down.
| | |
| 3 | | 1-800-467-7903 | www.CaldwellOrkinFunds.com |
| | |
Caldwell & Orkin Market Opportunity Fund | | Management Discussion & Analysis |
April 30, 2010
Over the past year and a half, Fed monetary policy has been very accommodative, and beneficial for the markets. Since December 16, 2008, the federal funds target rate (the interest rate banks charge each other for loans) has been between 0.00% and 0.25%. This easy money policy has helped drive the markets higher.
This isn't just a U.S. phenomenon. Fiscal and monetary stimuli have been aggressively used to help jump-start economies around the world. In some emerging market economies, with extraordinary monetary and fiscal stimulus as catalysts, prospects looked stronger than they did in the U.S., and we initiated long positions to those economies through emerging market ETFs.
The first six months of this review period (May 1, 2009 through October 31, 2009) proved frustrating. The Fund dipped -5.32% during that time, and the S&P 500 rose 20.04%. Central to that frustration, at the close on June 11, 2009 the Fund was up 6.69% year-to-date. And even though we had already transitioned to a net long position by the market's March 2009 bottom, and our long selections performed well relative to the market, our short and put positions held back overall portfolio performance. Certain exposure in three of our long sectors – technology, natural gas and gaming – also contributed to underperformance during the market's setback in October, 2009. Overall however, our technology and natural gas exposure has been beneficial to performance.
On May 1, 2009, oil & gas - U.S. exploration and production represented 4.33% of the Fund's assets. By October 31, 2009 that allocation had risen to 6.96% - our largest long sector position with virtually all of the exposure focused on natural gas. We view natural gas as one of the cheapest, most readily available and proven answers to the climate change and energy independence issues. In addition to powering vehicles (particularly fleet transportation), natural gas can be used to generate electricity with significantly less carbon dioxide emissions. New extraction technology has greatly increased the amount of proven reserves in the U.S., however the hydraulic fracking technique used to extract the shale gas has been blamed for water contamination, a risk to the investment. Increased use of natural gas could lessen our dependence on energy imports, and unlike crude oil, natural gas is found in abundance in the U.S. One of the headwinds facing the natural gas industry has been the fact that it's comprised of smaller companies with limited lobbying force in Washington D.C., especially when compared to the lobby muscle of oil and coal conglomerates.
What began the period as our largest long allocation ended the fiscal half-year October 31, 2009 as our largest short allocation – emerging market ETFs, specifically China, South Korea and Taiwan. Many emerging economies experienced rapid growth thanks to extraordinarily stimulative monetary policies. With inflation rising the reversal of these expansionary monetary policies ensued and was our catalyst to adopt a bearish position to those countries.
Looking back, we called the 2009 turn in the markets generally correctly, and as stated earlier the Fund was up nicely through mid-June 2009. However, we were tripped up in June 2009 as the markets suffered roughly a 10% correction. While we had previously reduced many of our winning securities
| | |
| Annual Report | April 30, 2010 | | 4 |
| | |
Management Discussion & Analysis | | Caldwell & Orkin Market Opportunity Fund |
April 30, 2010
expecting a correction (the stocks that go up the most usually get hit the hardest in a correction), the correction went deeper than we expected. And, given the record amounts of leverage in the system, we positioned the Fund slightly net short.
Then the markets ran back up and we were whipsawed. Our risk controls kicked in and we quickly reversed to a net long positioning, but the volatility in our short positions overwhelmed that of our longs, and the Fund lacked positive momentum as the markets rebounded in July 2009.
Additional discussion about the first six months can be found in the Fund's Semi-Annual Report dated December 29, 2009, which is available at www.CaldwellOrkinFunds.com, or by calling 800-237-7073.
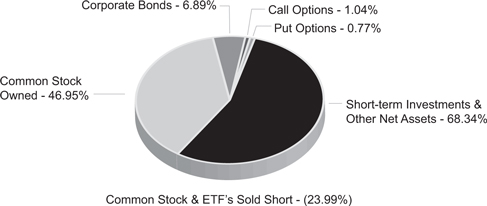
We opened the second half of the Fund's fiscal year on November 1, 2009 positioned 46.95% long, -23.99% short (22.96% net long), 0.77% in put options, 1.04% in call options, 6.89% in corporate bonds, and 20.36% in cash & equivalents. The market's ascent continued during the second half, with the S&P 500 gaining ground every month except January 2010. We maintained our secular bear / cyclical bull thesis, and the Fund was positioned net long throughout the period, though cautiously so, ranging from 17.55% to 52.53% net long, and averaging 34.79%. Our long positions did well, gaining 12.88%, but underperforming the S&P's 15.66% rise. Our shorts securities, which tend to be higher-beta (more volatile) names, got hit pretty hard, returning -25.96%.
In November, our longs lagged the market rally, rising only 2.32% compared to the S&P 500's 6.00% gain. The portfolio lost -1.44% overall in November, due to the short side returning -5.73%. The market cooled somewhat in December (the S&P rose 1.93%), but technology stocks outperformed, and our tech selections (many of which are focused on smart phones) and natural gas picks contributed to performance on the long side (the longs were up 4.36%). The short portfolio fell -4.86% during the month, but due to our net long positioning the overall portfolio was up 0.51%.
The Fund opened on January 2, 2010 with 72.95% invested and 30.05% net long. Our largest long sector exposure continued to be oil & gas exploration and production (5.98%), and the largest short sector focus was to medical – outpatient / home care companies (-2.43%). Our modestly bullish positioning and stock selection worked against us during January. The S&P 500 fell - -3.60% during the month, and the Fund lost -3.29%. Throughout January we raised cash and reduced the net long position. By month-end the Fund was 50.26% invested and 25.12% net long. Retail – apparel / shoe was the largest long sector by month-end, accounting for 4.66% of the portfolio. Commercial services topped the short sectors (-1.48%).
During February the market firmed. We increased our invested position, adding more longs than shorts. We closed the month 70.81% invested and 28.45% net long. The S&P 500 returned 3.10% in February, and the Fund gained 0.68%. The long side of the portfolio was up 3.24%, and the shorts were off -2.33%. The market continued its advance into March, and we put more cash to work, though we did pull back a bit towards month-end. The S&P moved up 6.03% in March, and the Fund gained 0.47%. Our longs did well, rising 4.93%, but the shorts got crushed, returning -10.43%. The fixed income markets dipped somewhat in March.
| | |
| 5 | | 1-800-467-7903 | www.CaldwellOrkinFunds.com |
| | |
Caldwell & Orkin Market Opportunity Fund | | Management Discussion & Analysis |
April 30, 2010
We opened in April 65.78% invested and 36.72% net long (34.22% cash). During the month the equity markets chilled a bit, but were still in positive. Our longs gained 2.67% compared to the S&P’s 1.58% rise, while the shorts returned -3.95%. The Fund was up 0.93% for the month thanks to our net long asset allocation.
In long/short investing there are several drivers for performance. There is, of course, picking the right stocks to buy or sell short. That’s the stock selection effect. Then there’s also the asset allocation mix of the portfolio, or the asset allocation effect. Over the past six months consumer discretionary stocks – especially retail apparel firms – were the largest long industry contributor to performance. We were overweight the sector relative to the S&P, and our stock selection was good. Our top contributor in that sector was Talbots (TLB). On the short side, materials did well, and our consumer discretionary shorts hurt. Fortunately we had significantly more long exposure to consumer discretionary names than short exposure over the last six months. Our best performing short was Transocean Ltd. (RIG).
For the fiscal year ended April 30, 2010, consumer discretionary was the top performing long sector, followed by telecommunication services. On the short side, materials, though slightly negative, was our best performing sector. Apple Inc. (AAPL) topped the long contributors, and Transocean Ltd. (RIG) led the short side.
There is no doubt that the recent results have been frustrating, something that has always been a part of our long-term performance. As significant shareholders ourselves, we feel the angst firsthand. In the 16 months December 31, 2008 through April 30, 2010, our long security selections have performed well (rising 34.90% vs. 35.38% for the S&P). But the higher-beta shorts underperformed during the rising market, returning -53.90%. Consequently, although we’ve been net long for most of the period, and the market has risen during that time, the Fund returned -4.61%.
Outlook
The world is a different place than it was a year ago. The economic crisis in Europe, which came to a head with the Greek debt crisis and triggered a trillion-dollar bailout package, has exposed the fractured economies throughout the Eurozone. In addition to Greece, Spain, Portugal, Italy and the U.K. are experiencing severe debt-to-gross domestic product (GDP) issues. On June 7, 2010, U.K. Prime Minister David Cameron warned the British people that the government’s deficit was “even worse” than thought - and the action needed to tackle it would be painful. He seemed to be preparing the Brits for the worst: “How we deal with these things will affect our economy, our society - indeed our whole way of life,” he said. Given the mounting debt situation in the U.S. (which has been exacerbated by bailouts and other government stimulus programs), our own “reality check” may be coming.
The social unrest unleashed after austerity measures were announced in Greece may be a harbinger of things to come. Just as markets around the world reacted positively to economic stimulation efforts, so too might they retract as a wave of belt-tightening sweeps across the global economic
| | |
| Annual Report | April 30, 2010 | | 6 |
| | |
Management Discussion & Analysis | | Caldwell & Orkin Market Opportunity Fund |
April 30, 2010
landscape. Given that consumer spending represents a significant portion of GDP (approximately 70% in the U.S.), it seems plausible to consider that any economic recovery will be challenged in an era of belt-tightening and government-imposed austerity programs. In the U.S. we may be witnessing a "jobless" recovery. While the unemployment rate dipped to 9.7% in May 2010 after peaking at 10.1% in October 2009, job growth (and income growth) remains tepid at best - especially when considering that a significant number of the jobs gained in May 2010 were temporary census-related positions that will go away within months. We do not see job growth as a formidable catalyst to jump-start the U.S. economy at this time.
As we close the fiscal year, oil & gas exploration & production remains our top long sector holding (5.52%). Our focus within this sector is natural gas, for the reasons discussed above. In the wake of the British Petroleum disaster in the Gulf of Mexico there has been a forced recognition in Washington (and with the investing public) of the benefits provided by natural gas over crude oil. More efficient and environmentally-friendly exploration methods also favor natural gas, and the nightly TV images of the spewing well and environmental clean-up, which will probably last well into the future, provide a constant reminder of the risk associated with one source of energy while at the same time highlighting the benefits of alternate sources.
As of April 30, 2010, emerging country ETFs are our largest short concentration (-2.37% collectively). Our concern focuses on those countries facing increasing inflation pressures resulting in a pullback in economic liquidity.
Constraints on economic liquidity have grown. As such, our cyclical bullish outlook has tempered. While there's currently some evidence of a recovery, there's still a good chance that we may well be in the eye of the hurricane. Ned Davis Research, Inc. has a telling chart of total credit market debt (private, corporate and government) as a percent of gross domestic product ("Debt/GDP Ratio"). In the quarter ended December 31, 1932, Debt/DGP Ratio peaked at 259.37%. At December 31, 2009 (the most recent data available), Debt/DGP Ratio stood at 362.65%, down slightly from its all-time peak of 372.99% reached in March 2009. The USA is levered to the hilt. We wonder if we'll hear the "reality check" talk come out of Washington anytime soon. In Europe we see governments exercising fiscal restraint, something Washington doesn't seem to have the political will or stomach to do.
Postscript
The equity markets suffered a bit of a setback after the April 30, 2010 close of the Fund's fiscal year, a period outside the scope of this Annual Report. Rising concerns about the European debt crisis and strength of the U.S. recovery sent the S&P down -7.99% in May, but the market recovered 2.41% through June 16, for a total post-April 30 decline of -5.77%. The Fund was off -2.51% in May, and was up 2.58% in June through June 16, for a post-April 30 increase of 0.01%. During this period the long side of the portfolio performed better than the market, dipping just -3.05%, and the shorts performed well, returning 5.51%. At the open on June 17 the Fund was 80.84% invested (19.16% in cash) and 20.65% net long.
| | |
| 7 | | 1-800-467-7903 | www.CaldwellOrkinFunds.com |
| | |
Caldwell & Orkin Market Opportunity Fund | | Management Discussion & Analysis |
April 30, 2010
Markets move in cycles. In managing the Fund, we strive to outperform over the course of a full market cycle, which includes both bull and bear market phases. Ned Davis Research, Inc. (“NDR”) has computed what they consider to be bull and bear market cycles for the S&P 500. Most of their definition focuses on a 20% market move in either direction. We present the NDR data for your review:
| | | | | | | | | | | | | | | | | | | | |
| Bull Market Phase | | | | Bear Market Phase | | | | Full Market Cycle |
Start Date | | MOF | | S&P | | | | Start Date** | | MOF | | S&P | | | | End Date*** | | MOF | | S&P |
8/24/1992* | | 210.84% | | 230.03% | | | | 7/17/1998 | | 4.02% | | -19.19% | | | | 8/31/1998 | | 223.35% | | 166.69% |
8/31/1998 | | 6.14% | | 62.88% | | | | 9/1/2000 | | 15.10% | | -35.71% | | | | 9/21/2001 | | 22.17% | | 4.72% |
9/21/2001 | | -5.72% | | 22.00% | | | | 3/19/2002 | | 10.02% | | -33.01% | | | | 10/9/2002 | | 3.73% | | -18.27% |
10/9/2002 | | 16.86% | | 119.38% | | | | 10/9/2007 | | -0.61% | | -55.26% | | | | 3/9/2009 | | 16.14% | | -1.85% |
| * | The first bull market phase began 10/11/1990, but the table begins with 8/24/1992, which coincides with commencement of active management of the Caldwell & Orkin Market Opportunity Fund. |
| ** | The bear market start date is the bull market’s end date. |
| *** | A full market cycle runs from the bull market start date to the full market cycle end date. |
On behalf of all of us at Caldwell & Orkin, I thank you for your continued support.
Sincerely,
Michael B. Orkin, CFA
Portfolio Manager and Chief Investment Officer
The Fund’s investment objective is to provide long-term capital growth with a short-term focus on capital preservation. We use active asset allocation - the opportunistic shifting of assets between long stock positions, short stock positions (selling borrowed stock and attempting to replace the borrowed securities in the future at a lower price), options, bonds and cash equivalents - to manage exposure to market risk (the risk that the broad market declines, taking good companies down with it). Short positions and put options are employed with the intent of making money when those stocks we judge to be overvalued fall. In summary, our goal is to make money over a full market cycle, but with less stomach churn. The Fund’s disciplined investment philosophy and active management style typically leads to higher-than-average portfolio turnover. High turnover may have an unfavorable impact on the amount of taxable distributions paid to shareholders. Higher turnover may also result in higher brokerage costs for the Fund. The Fund’s turnover rate will typically exceed 100% per year, and will not be a limiting factor when we deem change appropriate. Fund holdings, industry and asset allocations are subject to change without notice. The Fund may or may not have a position in any of the companies mentioned in this commentary as of the date of this report.
The performance data quoted represents past performance. Past performance is no guarantee of future results. The investment return and principal value of an investment in the Fund will fluctuate so that an investor’s shares, when redeemed, may be worth more or less than their original cost. Current performance may be higher or lower than the performance data quoted. Please call 800-237-7073 or visit www. CaldwellOrkinFunds.com for current month-end performance. The Fund’s performance assumes the reinvestment of dividends and capital gains, if any. Fund holdings, industry and asset allocations are subject to change without notice.
| | |
| Annual Report | April 30, 2010 | | 8 |
| | |
Management Discussion & Analysis | | Caldwell & Orkin Market Opportunity Fund |
April 30, 2010
Total annualized Fund operating expenses for the Fund's fiscal year ended April 30, 2010 were 1.63%. Additional information about the Fund's fees and expenses is available in the Fund's prospectus.
An investment in the Fund involves risk, including the loss of principal. Additionally, there are certain risks inherent in investing in the Fund, including market risk, short sale risk, interest rate risk, business risk, small company risk, market valuation risk, political risk, and portfolio turnover risk. The Fund uses aggressive investment strategies (including short positions and options) that have the potential for yielding high returns; however, these strategies may also result in losses. Stocks sold short have unlimited risk. Investment return and principal value will fluctuate so that shares, when redeemed, may be worth more or less than their original cost. Options are not suitable for all investors.
Investors should expect that the Fund's performance may fluctuate independently of stock market indices, such as the S&P 500 Total Return index. The S&P 500 Total Return index is a widely recognized unmanaged index of 500 common stock prices, adjusted to reflect the reinvestment of dividends and distributions. You may not invest directly in an index.
Portfolio Statistic Definitions:
Correlation Coefficient: A measurement of investment risk that quantifies the degree to which a fund's performance correlates with the performance of a benchmark.
Distributed by ALPS Distributors, Inc., Member FINRA/SIPC
1290 Broadway, Suite 1100, Denver, CO 80203
| | |
| 9 | | 1-800-467-7903 | www.CaldwellOrkinFunds.com |
| | |
Caldwell & Orkin Market Opportunity Fund | | Performance Summary |
April 30, 2010
| | | | | | | | | | | | |
Fiscal Year Ended April 30, | | C&O Market Opportunity
Fund(1) | | S&P 500 Total
Return Index(2) | | | | Fiscal Year Ended
April 30, | | C&O Market Opportunity
Fund(1) | | S&P 500 Total
Return Index(2) |
1991 | | 1.25% | | 0.42% | | | | 2001 | | 11.43% | | -12.97% |
1992 | | 11.96% | | 14.03% | | | | 2002 | | 1.88% | | -12.63% |
1993* | | 15.09% | | 9.24% | | | | 2003 | | 1.12% | | -13.31% |
1993** | | 21.09% | | 9.18% | | | | 2004 | | -3.55% | | 22.88% |
1994 | | 16.48% | | 5.32% | | | | 2005 | | -0.17% | | 6.34% |
1995 | | -2.28% | | 17.47% | | | | 2006 | | -2.74% | | 15.42% |
1996 | | 31.80% | | 30.21% | | | | 2007 | | 15.31% | | 15.24% |
1997 | | 23.24% | | 25.13% | | | | 2008 | | 17.92% | | -4.68% |
1998 | | 25.77% | | 41.07% | | | | 2009 | | 4.73% | | -35.31% |
1999 | | 19.43% | | 21.82% | | | | 2010 | | -7.40% | | 38.84% |
2000 | | -0.02% | | 10.13% | | | | | | | | |
| | | | | | | | | | | | |
| | | | | | | |
Total Return Through April 30, 2010 | | | | | | | | Average Annual
Returns Through
April 30, 2010 | | | | |
6 months ended | | -2.19% | | 15.66% | | | | One Year | | -7.40% | | 38.84% |
12 months ended | | -7.40% | | 38.84% | | | | Three Years | | 4.57% | | -5.05% |
Since 8/24/92(3) | | 376.63% | | 308.54% | | | | Five Years | | 5.10% | | 2.63% |
| | | | | | | | Ten Years | | 3.55% | | -0.19% |
| | | | | | | | Since 8/24/92(3) | | 9.23% | | 8.28% |
October 31, 2009
| | |
| Annual Report | April 30, 2010 | | 10 |
| | |
Performance Summary | | Caldwell & Orkin Market Opportunity Fund |
April 30, 2010
April 30, 2010
| 1 | The performance data quoted represents past performance. Past performance is no guarantee of future results. The investment return and principal value of an investment in the Fund will fluctuate so that an investor's shares, when redeemed, may be worth more or less than their original cost. Current performance may be higher or lower than the performance data quoted. Please call 800-377-7073 or visit www.CaldwellOrkinFunds.com for current month-end performance. The Fund's performance assumes the reinvestment of dividends and capital gains, if any. Fund holdings, industry and asset allocations are subject to change without notice. See additional important disclosures on page 8 and 9. |
Total annualized Fund operating expenses for the Fund's fiscal year ended April 30, 2010 were 1.63%. Additional information about the Fund's fees and expenses is available in the Fund's prospectus.
Fund holdings, industry and asset allocations are subject to change without notice. The Fund may or may not have a position in any of the companies mentioned in this report as of the date of this report.
| 2 | Investors should expect that the Fund's performance may fluctuate independently of stock market indices, such as the S&P 500 Total Return index. The S&P 500 Total Return index is a widely recognized unmanaged index of 500 common stock prices adjusted to reflect the reinvestment of dividends and distributions. You may not invest directly in an index. |
| 3 | Effective August 24, 1992, the Fund changed its investment objective to provide long-term capital growth with a short-term focus on capital preservation through investment selection and asset allocation. Prior to that time, the Fund was passively managed and indexed to the largest 100 over-the-counter (OTC) stocks. |
| * | For the full fiscal year ended April 30, 1993. |
| ** | From August 24, 1992 through April 30, 1993 - the portion of the year using the active investment management style of C&O Funds Advisor, Inc., the manager of the Fund. |
| | |
| 11 | | 1-800-467-7903 | www.CaldwellOrkinFunds.com |
| | |
Caldwell & Orkin Market Opportunity Fund | | Statistical Risk Profile |
April 30, 2010
| | | | | | | | |
| Ten Worst S&P 500 Total Return Days |
| Date | | C&O MOF | | S&P 500 | | Variance | | |
| 10/15/08 | | -1.47% | | -9.02% | | 7.55% | | |
| 12/1/08 | | -1.58% | | -8.92% | | 7.34% | | The Caldwell & Orkin Market Opportunity Fund outperformed the S&P 500 Total Return index on all ten of the ten worst days, and was positive on three of the ten days. |
| 9/29/08 | | -0.37% | | -8.78% | | 8.41% | |
| 10/9/08 | | -2.12% | | -7.61% | | 5.49% | |
| 10/27/97 | | -1.60% | | -6.89% | | 5.29% | |
| 8/31/98 | | 0.42% | | -6.79% | | 7.21% | |
| 11/20/08 | | 0.23% | | -6.70% | | 6.93% | |
| 11/19/08 | | -0.28% | | -6.10% | | 5.82% | |
| 10/22/08 | | -1.11% | | -6.09% | | 4.98% | |
| 4/14/00 | | 1.81% | | -5.82% | | 7.63% | |
|
| Ten Worst S&P 500 Total Return Weeks |
| Week Ending | | C&O MOF | | S&P 500 | | Variance | | |
| 10/10/08 | | -2.71% | | -18.14% | | 15.43% | | |
| 9/21/01 | | 1.63% | | -11.57% | | 13.20% | | The Caldwell & Orkin Market Opportunity Fund outperformed the S&P 500 Total Return index in all ten of the ten worst weeks, and was positive in seven of those weeks. |
| 4/14/00 | | 4.51% | | -10.52% | | 15.03% | |
| 10/3/08 | | 1.83% | | -9.33% | | 11.16% | |
| 11/21/08 | | 0.56% | | -8.33% | | 8.89% | |
| 7/19/02 | | 0.65% | | -7.96% | | 8.61% | |
| 3/6/09 | | -0.88% | | -6.96% | | 6.08% | |
| 7/12/02 | | 1.01% | | -6.81% | | 7.82% | |
| 2/20/09 | | 0.20% | | -6.80% | | 7.00% | |
| 10/24/08 | | -0.28% | | -6.72% | | 6.44% | |
|
| Ten Worst S&P 500 Total Return Months |
| Month | | C&O MOF | | S&P 500 | | Variance | | |
| 10/31/08 | | 3.42% | | -16.74% | | 20.16% | | |
| 8/31/98 | | 3.12% | | -14.46% | | 17.58% | | The Caldwell & Orkin Market Opportunity Fund outperformed the S&P 500 Total Return index in all ten of the ten worst months, and was positive in eight of those months. |
| 9/30/02 | | 2.10% | | -10.86% | | 12.96% | |
| 2/28/09 | | 0.30% | | -10.71% | | 11.01% | |
| 2/28/01 | | 4.78% | | -9.13% | | 13.91% | |
| 9/30/08 | | -0.42% | | -8.89% | | 8.47% | |
| 6/30/08 | | 4.84% | | -8.43% | | 13.27% | |
| 1/31/09 | | -0.73% | | -8.30% | | 7.57% | |
| 9/30/01 | | 3.29% | | -8.06% | | 11.35% | |
| 11/30/00 | | 6.92% | | -7.91% | | 14.83% | |
Short selling began May 2, 1994. Past performance is no guarantee of future results. See additional important disclosures on page 4. Computations by Ned Davis Research, Inc.
| | |
| Annual Report | April 30, 2010 | | 12 |
| | |
Statistical Risk Profile | | Caldwell & Orkin Market Opportunity Fund |
April 30, 2010
Ten Worst Drawdowns
| | | | | | | | | | | | |
| Caldwell & Orkin Market Opportunity Fund | | | | S&P 500 Total Return Index |
| Date Range | | C&O MOF | | S&P 500 | | | | Date Range | | C&O MOF | | S&P 500 |
01/17/2008 - 2/8/2010 | | -14.75% | | -16.38% | | | | 10/9/2007 - 3/9/2009 | | -0.61% | | -55.26% |
4/12/1999 - 11/23/1999 | | -13.24% | | 4.23% | | | | 3/24/2000 - 10/9/2002 | | 28.57% | | -47.41% |
10/9/2002 - 5/25/2006 | | -13.12% | | 74.17% | | | | 7/17/1998 - 8/31/1998 | | 4.02% | | -19.19% |
5/26/2000 - 6/7/2000 | | -8.15% | | 6.81% | | | | 11/27/2002 - 3/11/2003 | | 2.19% | | -14.28% |
12/29/2000 - 1/19/2001 | | -8.06% | | 1.75% | | | | 7/16/1999 - 10/15/1999 | | -0.45% | | -11.78% |
4/4/2001 - 3/11/2002 | | -7.98% | | 7.22% | | | | 10/7/1997 - 10/27/1997 | | 0.18% | | -10.74% |
3/15/1993 - 4/26/1993 | | -7.83% | | -3.65% | | | | 9/23/1998 - 10/8/1998 | | 2.02% | | -9.94% |
3/18/1994 - 2/3/1995 | | -7.68% | | 4.21% | | | | 2/18/1997 - 4/11/1997 | | 2.72% | | -9.39% |
4/10/2007 - 5/24/2007 | | -7.14% | | 4.31% | | | | 7/19/2007 - 8/15/2007 | | 7.66% | | -9.30% |
10/7/1998 - 11/5/1998 | | -6.41% | | 16.95% | | | | 12/31/1999 - 2/25/2000 | | 0.58% | | -9.14% |
| | | | |
| Statistical Risk Measurements | | | | |
| | | C&O MOF | | S&P 500 |
Correlation Coefficient (R-Squared) | | 0.01% | | 100.00% |
Beta | | -0.04 | | 1.00 |
Standard Deviation | | 0.52 | | 1.21 |
Sharpe Ratio | | 0.68 | | 0.33 |
Semi-Variance (downside volatility) | | 0.13 | | 0.71 |
|
| Performance During the Last Three Market Downturns of 20% or More |
| | | C&O MOF | | S&P 500 |
January 6, 2009 through March 9, 2009 | | -3.42% | | -27.19% |
October 9, 2007 through November 20, 2008 | | 1.80% | | -50.73% |
January 4, 2002 through October 9, 2002 | | 7.25% | | -32.95% |
Short selling began May 2, 1994. Past performance is no guarantee of future results. See additional important disclosures on pages 8 & 9. Computations by Ned Davis Research, Inc.
Definitions:
Correlation Coefficient: A measurement of investment risk that quantifies the degree to which a fund's performance correlates with the performance of a benchmark.
Beta: A measure of a fund's sensitivity to market movements. Usually the higher betas represent riskier investments. When correlation is low, beta has minimal, if any, significance.
Standard deviation: A statistical measure of dispersion about an average, indicating the volatility of a fund's total returns.
Semi-variance: A measure of a fund's downside (negative return) volatility relative to a benchmark. Lower numbers are associated with less risk.
| | |
| 13 | | 1-800-467-7903 | www.CaldwellOrkinFunds.com |
| | |
Caldwell & Orkin Market Opportunity Fund | | Growth of $10,000 |
April 30, 2010
Caldwell & Orkin Market Opportunity Fund Versus S&P 500 Total Return Index
Since Commencement of Active Style of Investment Management Results
of a Hypothetical $10,000 Investment August 24, 1992 through April 30, 2010
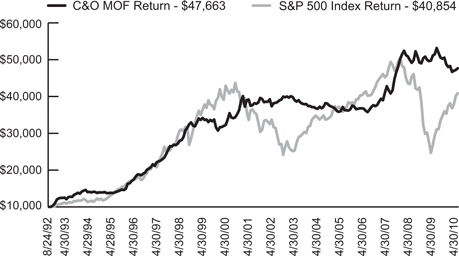
Past performance does not predict future performance. The returns do not reflect the deduction of taxes that a shareholder would pay on Fund distributions or the redemption of Fund shares. See additional disclosure on pages 8 and 9.
Caldwell & Orkin Market Opportunity Fund Equity Investment Position
Readings Above Zero Indicate Percent Long Position – Below Zero for Percent Short Position
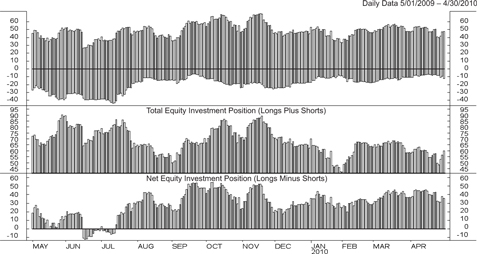
Chart courtesy of Ned Davis Research, Inc.
| | |
| Annual Report | April 30, 2010 | | 14 |
| | |
Disclosure of Fund Expenses (Unaudited) | | Caldwell & Orkin Market Opportunity Fund |
April 30, 2010
We believe it is important for you to understand the impact of fees and expenses on your investment in the Fund. As a shareholder of the Fund, you incur two types of costs: (1) transaction costs related to the purchase and redemption of Fund shares, including redemption fees and brokerage commissions (if applicable); and (2) ongoing costs, including management fees, administrative expenses, portfolio transaction costs and other Fund expenses. A mutual fund’s ongoing costs are expressed as a percentage of its average net assets. This figure is known as the expense ratio. The following example is intended to help you understand your ongoing costs (in dollars and cents) of investing in the Fund and to compare these costs with the ongoing costs of investing in other mutual funds.
The below example is based on an investment of $1,000.00 invested at the beginning of the period and held for the entire period indicated, November 1, 2009 through April 30, 2010. The table below illustrates the Fund’s expenses in two ways:
Based on Actual Fund Returns
The first line of the table below provides information about actual account values and actual expenses. You may use the information in this line, together with the amount you invested, to estimate the expenses that you paid over the period. Simply divide your account value by $1,000 (for example, an $8,600 account value divided by $1,000 = 8.6), then multiply the result by the number in the first line under the heading entitled “Expenses Paid During Period” to estimate the expenses you paid on your account during this period.
Based on a Hypothetical 5% Return for Comparison Purposes
The second line of the table below provides information about hypothetical account values and hypothetical expenses based on the Fund’s actual expense ratio and an assumed rate of return of 5% per year before expenses, which is not the Fund’s actual return. The hypothetical account values and expenses may not be used to estimate the actual ending account balance or expenses you paid for the period. You may use this information to compare the ongoing costs of investing in the Fund and other funds. To do so, compare this 5% hypothetical example with the 5% hypothetical examples that appear in the shareholder reports of the other funds.
Please note that the expenses shown in the table are meant to highlight your ongoing costs only and do not reflect any transactional costs, such as redemption fees or brokerage commissions. Therefore, the second line of the table is useful in comparing ongoing costs only, and will not help you determine the relative total costs of owning different funds. In addition, if these transactional costs were included, your costs would have been higher.
| | | | | | | | |
| | | Beginning Account Value 11/01/09 | | Ending Account Value 4/30/10 | | Annualized Expense Ratio2 | | Expenses Paid
During Period1
11/01/09 to 4/30/10 |
Actual Fund Return3 | | $1,000.00 | | $978.10 | | 1.85% | | $9.07 |
Hypothetical Fund Return4 | | $1,000.00 | | $1,015.63 | | 1.85% | | $9.24 |
| | |
1 | | Expenses are equal to the Caldwell & Orkin Market Opportunity Fund’s annualized expense ratio of 1.85%, multiplied by the average account value over the period, multiplied by the number of days in the most recent fiscal half-year (181)/365 (to reflect the half-year period.) |
2 | | The annualized expense ratio reflects actual expenses of the Fund from 11/1/09 – 4/30/10, as a percentage of average net assets for that period. |
3 | | Excluding interest expense and dividend expense from short positions, your actual cost of investment in the Fund would be $5.47. |
4 | | Excluding interest expense and dividend expense from short positions, your hypothetical cost of investment in the Fund would be $5.58. |
| | |
| 15 | | 1-800-467-7903 | www.CaldwellOrkinFunds.com |
| | |
Caldwell & Orkin Market Opportunity Fund | | Sector Diversification (Unaudited) |
April 30, 2010
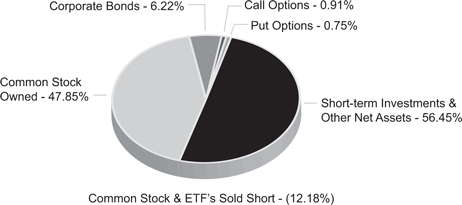
The following table presents the Fund’s 4/30/2010 portfolio holdings by sector based on total net assets, sorted by net exposure (net long to net short).
| | | | | | | | |
| | | Long | | Short | | Totala | | Netb |
Oil Comp - Exploration & Production | | 5.52% | | | | 5.52% | | 5.52% |
Electronic Components - Semiconductors | | 5.37% | | | | 5.37% | | 5.37% |
Applications Software | | 2.95% | | | | 2.95% | | 2.95% |
Wireless Equipment | | 2.48% | | | | 2.48% | | 2.48% |
Building Production - Wood | | 2.10% | | | | 2.10% | | 2.10% |
Retail - Building Products | | 1.99% | | | | 1.99% | | 1.99% |
Semiconductor Equipment | | 1.97% | | | | 1.97% | | 1.97% |
Food - Miscellaneous/Diversified | | 1.43% | | | | 1.43% | | 1.43% |
Beverages - Non-alcoholic | | 1.35% | | | | 1.35% | | 1.35% |
Networking Products | | 1.17% | | | | 1.17% | | 1.17% |
Non-hazardous Waste Disposal | | 1.08% | | | | 1.08% | | 1.08% |
Semiconductor Components | | 1.04% | | | | 1.04% | | 1.04% |
Computers | | 2.04% | | -1.01% | | 3.05% | | 1.03% |
Commercial Banks - Southern U.S. | | 1.03% | | | | 1.03% | | 1.03% |
Multimedia | | 1.03% | | | | 1.03% | | 1.03% |
Auto-Cars/Light Trucks | | 1.01% | | | | 1.01% | | 1.01% |
REITS - Mortgage | | 1.01% | | | | 1.01% | | 1.01% |
Finance - Credit Card | | 0.99% | | | | 0.99% | | 0.99% |
Enterprise Software/Services | | 0.97% | | | | 0.97% | | 0.97% |
Web Portals/ISP | | 0.96% | | | | 0.96% | | 0.96% |
Finance - Auto Loans | | 0.95% | | | | 0.95% | | 0.95% |
Oil Refining & Marketing | | 0.82% | | | | 0.82% | | 0.82% |
Oil-Field Services | | 0.79% | | | | 0.79% | | 0.79% |
Human Resources | | 0.77% | | | | 0.77% | | 0.77% |
Financial Guarantee Ins | | 0.67% | | | | 0.67% | | 0.67% |
Multi-line Insurance | | 0.64% | | | | 0.64% | | 0.64% |
Diversified Banking Institution | | 0.63% | | | | 0.63% | | 0.63% |
E-Commerce/Services | | 0.62% | | | | 0.62% | | 0.62% |
Auto/Truck Parts & Equipment | | 0.58% | | | | 0.58% | | 0.58% |
Telecom Services | | 0.52% | | | | 0.52% | | 0.52% |
Cosmetics & Toiletries | | 0.51% | | | | 0.51% | | 0.51% |
Engineering/R&D Services | | 0.43% | | | | 0.43% | | 0.43% |
Software Tools | | 0.42% | | | | 0.42% | | 0.42% |
Gold Mining | | 0.39% | | | | 0.39% | | 0.39% |
Radio | | 0.32% | | | | 0.32% | | 0.32% |
Internet Infrastructure Software | | 0.28% | | | | 0.28% | | 0.28% |
Broadcast Services/Program | | 0.25% | | | | 0.25% | | 0.25% |
Building /Residential & Commercial | | 0.20% | | | | 0.20% | | 0.20% |
| | |
| Annual Report | April 30, 2010 | | 16 |
| | |
Sector Diversification (Unaudited) | | Caldwell & Orkin Market Opportunity Fund |
April 30, 2010
| | | | | | | | |
| | | Long | | Short | | Totala | | Netb |
Retail - Restaurants | | 0.14% | | | | 0.14% | | 0.14% |
Real Estate Management/Services | | 0.43% | | -0.43% | | 0.86% | | 0.00% |
Batteries/Battery System | | | | -0.00%* | | -0.00%* | | -0.00%* |
Commercial Banks - Non-U.S. | | | | -0.00%* | | -0.00%* | | -0.00%* |
Exchange Traded Fund - Country Fund - Korea | | | | -0.00%* | | -0.00%* | | -0.00%* |
Exchange Traded Fund - Geo Focus - Equity | | | | -0.00%* | | -0.00%* | | -0.00%* |
Educational Software | | | | -0.10% | | 0.10% | | -0.10% |
Exchange Traded Fund - Country Fund - Brazil | | | | -0.16% | | 0.16% | | -0.16% |
Schools | | | | -0.30% | | 0.30% | | -0.30% |
Entertainment Software | | | | -0.38% | | 0.38% | | -0.38% |
Super-Regional Banks - U.S. | | | | -0.47% | | 0.47% | | -0.47% |
Commercial Banks - Western U.S. | | | | -0.52% | | -0.52% | | -0.52% |
Metal - Copper | | | | -0.80% | | 0.80% | | -0.80% |
Web Hosting/Design | | | | -0.80% | | 0.80% | | -0.80% |
Commercial Services - Finance | | | | -0.96% | | 0.96% | | -0.96% |
Exchange Traded Fund - Country Fund - China | | | | -1.00% | | 1.00% | | -1.00% |
Commercial Services | | | | -1.13% | | 1.13% | | -1.13% |
Exchange Traded Fund - Country Fund - India | | | | -1.21% | | 1.21% | | -1.21% |
Retail - Apparel/Shoe | | | | -1.21% | | 1.21% | | -1.21% |
Exchange Traded Fund - U.S. Treasury Bond Fund | | | | -1.70% | | 1.70% | | -1.70% |
Subtotal Equities (long & short positions) | | 47.85% | | -12.18% | | 60.03% | | 35.67% |
| | | | |
Call Options | | 0.91% | | | | | | |
Put Options | | 0.75% | | | | | | |
Corporate Bonds | | 6.22% | | | | | | |
Other Assets less Liabilities | | 32.09% | | | | | | |
Total Portfolio Holdings | | 87.82% | | -12.18% | | 100.00% | | |
| * | Less than 0.005% of net assets. |
| (a) | Total exposure is Long exposure plus the absolute value of the Short exposure. |
| (b) | Net exposure is Long exposure less Short exposure. |
| | |
| 17 | | 1-800-467-7903 | www.CaldwellOrkinFunds.com |
| | |
Caldwell & Orkin Market Opportunity Fund | | Schedule of Investments |
April 30, 2010
| | | | | |
| | | Shares | | Value (Note 1) |
LONG INVESTMENTS (55.73%) | | | | | |
COMMON STOCKS (47.85%) | | | | | |
Applications Software (2.95%) | | | | | |
Microsoft Corp. | | 276,100 | | $ | 8,432,094 |
Red Hat, Inc.1 | | 40,700 | | | 1,215,709 |
Salesforce.com, Inc.1 | | 23,300 | | | 1,994,480 |
| | | | | |
| | | | | 11,642,283 |
| | | | | |
| | |
Auto/Truck Parts & Equipment (0.58%) | | | | | |
ArvinMeritor, Inc.1 | | 42,600 | | | 652,632 |
Tenneco, Inc.1 | | 64,300 | | | 1,657,011 |
| | | | | |
| | | | | 2,309,643 |
| | | | | |
| | |
Auto-Cars/Light Trucks (1.01%) | | | | | |
Ford Motor Co.1 | | 305,800 | | | 3,981,516 |
| | | | | |
| | |
Beverages - Non-alcoholic (1.35%) | | | | | |
PepsiCo, Inc. | | 81,800 | | | 5,334,996 |
| | | | | |
| | |
Broadcast Services/Program (0.25%) | | | | | |
Discovery Communications, Inc.1 | | 25,400 | | | 982,980 |
| | | | | |
| | |
Building Production - Wood (2.10%) | | | | | |
Masco Corp. | | 510,100 | | | 8,278,923 |
| | | | | |
| | |
Building/Residential & Commercial (0.20%) | | | | | |
Standard Pacific Corp.1 | | 123,000 | | | 788,430 |
| | | | | |
| | |
Commercial Banks - Southern U.S. (1.03%) | | | | | |
Popular, Inc.1 | | 1,030,000 | | | 4,058,200 |
| | | | | |
| | |
Computers (2.04%) | | | | | |
Apple, Inc.1 | | 15,100 | | | 3,942,912 |
Hewlett-Packard Co. | | 79,100 | | | 4,110,827 |
| | | | | |
| | | | | 8,053,739 |
| | | | | |
| | |
Cosmetics & Toiletries (0.51%) | | | | | |
The Procter & Gamble Co. | | 32,300 | | | 2,007,768 |
| | | | | |
| | |
Diversified Banking Institution (0.63%) | | | | | |
Citigroup, Inc.1 | | 442,200 | | | 1,932,414 |
JPMorgan Chase & Co. | | 12,700 | | | 540,766 |
| | | | | |
| | | | | 2,473,180 |
| | | | | |
| | |
| Annual Report | April 30, 2010 | | 18 |
| | |
Schedule of Investments | | Caldwell & Orkin Market Opportunity Fund |
April 30, 2010
| | | | | |
| | | Shares | | Value (Note 1) |
E-Commerce/Services (0.62%) | | | | | |
Liberty Media Corp. - Interactive1 | | 160,400 | | $ | 2,465,348 |
| | | | | |
| | |
Electronic Components - Semiconductors (5.37%) | | | | | |
ARM Holdings PLC | | 221,000 | | | 2,526,030 |
Cree, Inc.1 | | 53,300 | | | 3,902,093 |
Intel Corp. | | 204,700 | | | 4,673,301 |
Micron Technology, Inc.1 | | 370,000 | | | 3,459,500 |
Skyworks Solutions, Inc.1 | | 201,000 | | | 3,384,840 |
Xilinx, Inc. | | 126,900 | | | 3,271,482 |
| | | | | |
| | | | | 21,217,246 |
| | | | | |
| | |
Engineering/R&D Services (0.43%) | | | | | |
McDermott International, Inc.1 | | 61,300 | | | 1,680,233 |
| | | | | |
| | |
Enterprise Software/Services (0.97%) | | | | | |
Sybase, Inc.1 | | 88,200 | | | 3,826,116 |
| | | | | |
| | |
Finance - Auto Loans (0.95%) | | | | | |
AmeriCredit Corp.1 | | 157,200 | | | 3,763,368 |
| | | | | |
| | |
Finance - Credit Card (0.99%) | | | | | |
American Express Co. | | 84,700 | | | 3,906,364 |
| | | | | |
| | |
Financial Guarantee Ins (0.67%) | | | | | |
Radian Group, Inc. | | 186,500 | | | 2,646,435 |
| | | | | |
| | |
Food - Miscellaneous/Diversified (1.43%) | | | | | |
General Mills, Inc. | | 79,100 | | | 5,630,338 |
| | | | | |
| | |
Gold Mining (0.39%) | | | | | |
Agnico-Eagle Mines, Ltd. | | 12,200 | | | 770,552 |
Newmont Mining Corp. | | 14,000 | | | 785,120 |
| | | | | |
| | | | | 1,555,672 |
| | | | | |
| | |
Human Resources (0.77%) | | | | | |
Robert Half International, Inc. | | 110,800 | | | 3,033,704 |
| | | | | |
| | |
Internet Infrastructure Software (0.28%) | | | | | |
Akamai Technologies, Inc.1 | | 28,700 | | | 1,114,421 |
| | | | | |
| | |
| 19 | | 1-800-467-7903 | www.CaldwellOrkinFunds.com |
| | |
Caldwell & Orkin Market Opportunity Fund | | Schedule of Investments |
April 30, 2010
| | | | | |
| | | Shares | | Value (Note 1) |
Multi-line Insurance (0.64%) | | | | | |
Genworth Financial, Inc. - Class A1 | | 153,000 | | $ | 2,527,560 |
| | | | | |
| | |
Multimedia (1.03%) | | | | | |
News Corp. | | 120,100 | | | 2,136,579 |
The Walt Disney Co. | | 52,400 | | | 1,930,416 |
| | | | | |
| | | | | 4,066,995 |
| | | | | |
Networking Products (1.17%) | | | | | |
Cisco Systems, Inc.1 | | 172,400 | | | 4,641,008 |
| | | | | |
| | |
Non-hazardous Waste Disposal (1.08%) | | | | | |
Republic Services, Inc. | | 138,100 | | | 4,285,243 |
| | | | | |
| | |
Oil Comp - Exploration & Production (5.52%) | | | | | |
Chesapeake Energy Corp. | | 20,300 | | | 483,140 |
Comstock Resources, Inc.1 | | 121,100 | | | 3,882,466 |
Devon Energy Corp. | | 18,000 | | | 1,211,940 |
Forest Oil Corp.1 | | 115,200 | | | 3,375,360 |
Pioneer Natural Resources Co. | | 31,900 | | | 2,045,747 |
Range Resources Corp. | | 24,900 | | | 1,189,224 |
Rosetta Resources, Inc.1 | | 30,200 | | | 751,980 |
St Mary Land & Exploration Co. | | 42,800 | | | 1,722,272 |
Swift Energy Co.1 | | 84,700 | | | 3,064,446 |
Ultra Petroleum Corp.1 | | 85,200 | | | 4,070,004 |
| | | | | |
| �� | | | | 21,796,579 |
| | | | | |
| | |
Oil Refining & Marketing (0.82%) | | | | | |
Frontier Oil Corp. | | 212,900 | | | 3,236,080 |
| | | | | |
| | |
Oil-Field Services (0.79%) | | | | | |
Helix Energy Solutions Group, Inc.1 | | 215,100 | | | 3,136,158 |
| | | | | |
| | |
Radio (0.32%) | | | | | |
Sirius XM Radio, Inc.1 | | 1,084,000 | | | 1,279,120 |
| | | | | |
| | |
Real Estate Management/Services (0.43%) | | | | | |
E-House China Holdings, Ltd. | | 101,800 | | | 1,711,258 |
| | | | | |
| | |
REITS - Mortgage (1.01%) | | | | | |
MFA Financial, Inc. | | 562,000 | | | 3,995,820 |
| | | | | |
| | |
| Annual Report | April 30, 2010 | | 20 |
| | |
Schedule of Investments | | Caldwell & Orkin Market Opportunity Fund |
April 30, 2010
| | | | | |
| | | Shares | | Value (Note 1) |
Retail - Building Products (1.99%) | | | | | |
Home Depot, Inc. | | 111,700 | | $ | 3,937,425 |
Lowe’s Cos., Inc. | | 144,700 | | | 3,924,264 |
| | | | | |
| | | | | 7,861,689 |
| | | | | |
| | |
Retail-Restaurants (0.14%) | | | | | |
Starbucks Corp. | | 21,800 | | | 566,364 |
| | | | | |
| | |
Semiconductor Components (1.04%) | | | | | |
Atmel Corp.1 | | 161,600 | | | 879,104 |
Cypress Semiconductor Corp.1 | | 252,200 | | | 3,250,858 |
| | | | | |
| | | | | 4,129,962 |
| | | | | |
| | |
Semiconductor Equipment (1.97%) | | | | | |
ASML Holding N.V. | | 116,200 | | | 3,795,092 |
Teradyne, Inc.1 | | 325,900 | | | 3,985,757 |
| | | | | |
| | | | | 7,780,849 |
| | | | | |
| | |
Software Tools (0.42%) | | | | | |
VMware, Inc. - Class A1 | | 26,600 | | | 1,639,624 |
| | | | | |
| | |
Telecom Services (0.52%) | | | | | |
BCE, Inc. | | 68,200 | | | 2,052,820 |
| | | | | |
| | |
Web Portals/ISP (0.96%) | | | | | |
Google, Inc. - Class A1 | | 7,200 | | | 3,783,168 |
| | | | | |
| | |
Wireless Equipment (2.48%) | | | | | |
American Tower Corp.1 | | 96,700 | | | 3,946,327 |
Crown Castle International Corp.1 | | 117,300 | | | 4,439,805 |
SBA Communications Corp.1 | | 40,300 | | | 1,425,411 |
| | | | | |
| | | | | 9,811,543 |
| | | | | |
| | |
TOTAL COMMON STOCKS | | | | | |
(Cost $178,148,700) | | | | | 189,052,743 |
| | | | | |
| | | | | | | | | | |
| | | Expiration
Date | | Exercise Price | | Number of Contracts | | Value (Note 1) |
PURCHASED OPTIONS (1.66%) | | | | | | | | | | |
PURCHASED CALL OPTIONS (0.91%) | | | | | | | | | | |
American Tower Corp. | | July, 2010 | | $ | 42.50 | | 850 | | $ | 110,500 |
Chico’s FAS, Inc. | | May, 2010 | | | 15.00 | | 3,663 | | | 274,725 |
| | |
| 21 | | 1-800-467-7903 | www.CaldwellOrkinFunds.com |
| | |
Caldwell & Orkin Market Opportunity Fund | | Schedule of Investments |
April 30, 2010
| | | | | | | | | | | |
| | | Expiration Date | | Exercise Price | | Number of Contracts | | Value (Note 1) |
PURCHASED CALL OPTIONS (CONTINUED) | | | | | | | | | | | |
Cisco Systems, Inc. | | July, 2010 | | $ | 27.00 | | | 5,932 | | $ | 729,636 |
Comstock Resources, Inc. | | June, 2010 | | | 35.00 | | | 1,707 | | | 221,910 |
Google, Inc., Class A | | June, 2010 | | | 550.00 | | | 162 | | | 174,960 |
Manpower, Inc. | | June, 2010 | | | 60.00 | | | 65 | | | 6,370 |
Masco Corp. | | July, 2010 | | | 17.50 | | | 6,565 | | | 426,725 |
Microsoft Corp. | | October, 2010 | | | 30.00 | | | 6,440 | | | 1,461,880 |
QUALCOMM, Inc. | | July, 2010 | | | 48.00 | | | 3,300 | | | 16,500 |
Verizon Communications, Inc. | | January, 2011 | | | 30.00 | | | 1,188 | | | 158,004 |
| | | | | | | | | | | |
| | | | |
TOTAL PURCHASED CALL OPTIONS | | | | | | | | | | | |
(Cost $5,637,312) | | | | | | | | | | | 3,581,210 |
| | | | | | | | | | | |
| | | | |
PURCHASED PUT OPTIONS (0.75%) | | | | | | | | | | | |
Alliance Data Systems | | January, 2011 | | | 65.00 | | | 894 | | | 384,420 |
Powershares QQQ | | May, 2010 | | | 50.00 | | | 9,600 | | | 1,200,000 |
SPDR S&P 500 ETF Trust | | May, 2010 | | | 121.00 | | | 3,670 | | | 1,134,030 |
Zions Bancorporation | | July, 2010 | | | 28.00 | | | 978 | | | 249,390 |
| | | | | | | | | | | |
| | | | |
TOTAL PURCHASED PUT OPTIONS | | | | | | | | | | | |
(Cost $2,228,083) | | | | | | | | | | | 2,967,840 |
| | | | | | | | | | | |
| | | | |
TOTAL PURCHASED OPTIONS | | | | | | | | | | | |
(Cost $7,865,395) | | | | | | | | | | | 6,549,050 |
| | | | | | | | | | | |
| | | | |
Description and Maturity Date | | | | Coupon Rate | | Principal
Amount | | Value (Note 1) |
CORPORATE BONDS (6.22%) | | | | | | | | | | | |
Bank One Corp. | | | | | | | | | | | |
11/15/2011 | | | | | 5.900% | | $ | 4,400,000 | | $ | 4,680,628 |
CBS Corp. | | | | | | | | | | | |
05/15/2011 | | | | | 6.625% | | | 4,085,000 | | | 4,279,515 |
ConAgra Foods, Inc. | | | | | | | | | | | |
09/15/2011 | | | | | 6.750% | | | 1,475,000 | | | 1,577,539 |
The Estee Lauder Cos., Inc. | | | | | | | | | | | |
11/01/2013 | | | | | 7.750% | | | 2,000,000 | | | 2,334,148 |
The Goldman Sachs Group, Inc. | | | | | | | | | | | |
01/15/2011 | | | | | 6.875% | | | 4,360,000 | | | 4,514,069 |
Hewlett-Packard Co. | | | | | | | | | | | |
03/01/2014 | | | | | 6.125% | | | 4,400,000 | | | 5,000,763 |
Safeway, Inc. | | | | | | | | | | | |
08/15/2014 | | | | | 5.625% | | | 2,000,000 | | | 2,194,974 |
| | |
| Annual Report | April 30, 2010 | | 22 |
| | |
Schedule of Investments | | Caldwell & Orkin Market Opportunity Fund |
April 30, 2010
| | | | | | | |
| | | | | | | Value (Note 1) |
TOTAL CORPORATE BONDS | | | | | | | |
(Cost $23,052,736) | | | | | | $ | 24,581,636 |
| | | |
TOTAL LONG INVESTMENTS | | | | | | | |
(Cost $209,066,831) | | | | | | | 220,183,429 |
| | | | | | | |
| | | |
| | | 7-Day
Yield | | Shares | | Value (Note 1) |
SHORT TERM INVESTMENTS (50.91%) | | | | | | | |
| | | |
Money Market Funds2 | | | | | | | |
JPMorgan U.S. Treasury Plus Money Market Fund | | 0.02% | | 201,123,875 | | $ | 201,123,875 |
| | | |
TOTAL SHORT TERM INVESTMENTS | | | | | | | |
(Cost $201,123,875) | | | | | | | 201,123,875 |
| | | | | | | |
| | | |
TOTAL INVESTMENTS - (106.64%) | | | | | | | |
(Cost $410,190,706) | | | | | | $ | 421,307,304 |
| | | |
Liabilities in Excess of Other Assets (-6.64%) | | | | | | | (26,233,307) |
| | | | | | | |
| | | |
NET ASSETS (100.00%) | | | | | | $ | 395,073,997 |
| | | | | | | |
| | | |
| SCHEDULE OF SECURITIES SOLD SHORT | | | | Shares | | Value (Note 1) |
COMMON STOCKS (8.11%) | | | | | | | |
Batteries/Battery System 0.00%† | | | | | | | |
Energizer Holdings, Inc. | | | | (100) | | $ | (6,110) |
| | | | | | | |
| | | |
Commercial Banks - Non U.S. 0.00%† | | | | | | | |
ICICI Bank, Ltd. | | | | (100) | | | (4,252) |
| | | | | | | |
| | | |
Commercial Banks - Western U.S. (0.52%) | | | | | | | |
Zions Bancorporation | | | | (71,200) | | | (2,045,576) |
| | | | | | | |
| | | |
Commercial Services (1.13%) | | | | | | | |
Alliance Data Systems Corp. | | | | (59,400) | | | (4,458,564) |
| | | | | | | |
| | | |
Commercial Services - Finance (0.96%) | | | | | | | |
Moody’s Corp. | | | | (153,300) | | | (3,789,576) |
| | | | | | | |
| | |
| 23 | | 1-800-467-7903 | www.CaldwellOrkinFunds.com |
| | |
Caldwell & Orkin Market Opportunity Fund | | Schedule of Investments |
April 30, 2010
| | | | | |
| | | Shares | | Value (Note 1) |
COMMON STOCKS (continued) | | | | | |
Computers (1.01%) | | | | | |
Research In Motion, Ltd. | | (56,200) | | $ | (4,000,878) |
| | | | | |
| | |
Educational Software (0.10%) | | | | | |
Blackboard, Inc. | | (9,500) | | | (404,225) |
| | | | | |
| | |
Entertainment Software (0.38%) | | | | | |
Take-Two Interactive Software, Inc. | | (137,200) | | | (1,491,364) |
| | | | | |
| | |
Metal - Copper (0.80%) | | | | | |
Freeport-McMoRan Copper & Gold, Inc. | | (41,800) | | | (3,157,154) |
| | | | | |
| | |
Real Estate Management/Services (0.43%) | | | | | |
E-House China Holdings, Ltd. | | (101,800) | | | (1,711,258) |
| | | | | |
| | |
Retail - Apparel/Shoe (1.21%) | | | | | |
Abercrombie & Fitch Co. - Class A | | (18,100) | | | (791,513) |
Urban Outfitters, Inc. | | (105,800) | | | (3,968,558) |
| | | | | |
| | | | | (4,760,071) |
| | | | | |
| | |
Schools (0.30%) | | | | | |
Apollo Group, Inc. - Class A | | (20,700) | | | (1,188,387) |
| | | | | |
| | |
Super-Regional Banks - U.S. (0.47%) | | | | | |
Capital One Financial Corp. | | (42,500) | | | (1,844,925) |
| | | | | |
| | |
Web Hosting/Design (0.80%) | | | | | |
Rackspace Hosting, Inc. | | (175,900) | | | (3,157,405) |
| | | | | |
| | |
EXCHANGE TRADED FUNDS (4.07%) | | | | | |
Country Fund - Brazil (0.16%) | | | | | |
iShares MSCI Brazil Index Fund | | (8,600) | | | (621,780) |
| | | | | |
| | |
Country Fund - China (1.00%) | | | | | |
iShares FTSE/Xinhua China 25 Index Fund | | (96,800) | | | (3,951,376) |
| | | | | |
| | |
Country Fund - India (1.21%) | | | | | |
WisdomTree India Earnings Fund | | (205,700) | | | (4,784,582) |
| | | | | |
| | |
| Annual Report | April 30, 2010 | | 24 |
| | |
Schedule of Investments | | Caldwell & Orkin Market Opportunity Fund |
April 30, 2010
| | | | | |
| | | Shares | | Value (Note 1) |
EXCHANGE TRADED FUNDS (continued) | | | | | |
Country Fund - Korea 0.00%† | | | | | |
iShares MSCI South Korea Index Fund | | (100) | | $ | (5,193) |
| | | | | |
| | |
Geo Focus - Equity 0.00%† | | | | | |
iShares MSCI Taiwan Index Fund | | (100) | | | (1,270) |
| | | | | |
| | |
U.S. Treasury Bond Fund (1.70%) | | | | | |
iShares Barclays 1-3 Year Treasury Bond Fund | | (26,300) | | | (2,197,102) |
iShares Barclays 7-10 Year Treasury Bond Fund | | (49,900) | | | (4,526,928) |
| | | | | |
| | | | | (6,724,030) |
| | | | | |
TOTAL SECURITIES SOLD SHORT | | | | | |
(Proceeds $47,926,183) | | | | $ | (48,107,976) |
| | | | | |
Common Abbreviations:
ETF - Exchange Traded Fund.
SPDR - Standard & Poor’s depositary receipt.
| † | Less than 0.005% of net assets. |
| 1 | Non-Income Producing Security. |
| 2 | A portion of the Money Market Fund assets are held as collateral for short sales activity. |
| | |
| 25 | | 1-800-467-7903 | www.CaldwellOrkinFunds.com |
| | |
Caldwell & Orkin Market Opportunity Fund | | Statement of Assets & Liabilities |
April 30, 2010
| | | |
ASSETS | | | |
Investments at value (cost $410,190,706) | | $ | 421,307,304 |
Deposit with brokers for securities sold short | | | 38,666,584 |
Receivables: | | | |
Investment securities sold | | | 22,117,090 |
Interest and dividends | | | 628,135 |
Capital shares sold | | | 577,330 |
Other assets | | | 33,213 |
| | | |
Total Assets | | | 483,329,656 |
| | | |
| |
LIABILITIES | | | |
Securities sold short, not yet purchased (proceeds $47,926,183) | | | 48,107,976 |
Payables: | | | |
Investment securities purchased | | | 38,690,949 |
Capital shares redeemed | | | 921,314 |
Dividends payable - short sales | | | 51,142 |
Investment advisory fee | | | 327,164 |
Accrued expenses and other liabilities | | | 157,114 |
| | | |
Total Liabilities | | | 88,255,659 |
| | | |
Total Net Assets | | $ | 395,073,997 |
| | | |
| |
NET ASSETS | | | |
Accumulated net realized loss on investments | | $ | (36,992,560) |
Net unrealized appreciation of investments | | | 10,934,805 |
Paid-in capital applicable to 20,247,541 shares outstanding; par value $0.10 per share; 30,000,000 shares authorized | | | 421,131,752 |
| | | |
| |
| | $ | 395,073,997 |
| | | |
| |
NET ASSET VALUE AND OFFERING / REDEMPTION PRICE PER SHARE | | $ | 19.51 |
| | | |
See accompanying notes to financial statements.
| | |
| Annual Report | April 30, 2010 | | 26 |
| | |
Statement of Operations | | Caldwell & Orkin Market Opportunity Fund |
For the Year Ended April 30, 2010
| | | |
INVESTMENT INCOME | | | |
Dividends (net of foreign withholding taxes of $2,545) | | $ | 1,971,142 |
Interest | | | 1,256,366 |
| | | |
Total Investment Income | | | 3,227,508 |
| | | |
| |
EXPENSES | | | |
Investment advisory fees (Note 2) | | | 3,315,954 |
Dividend expense on securities sold short | | | 1,155,622 |
Interest expense | | | 1,234,846 |
Administration and accounting fees (Note 2) | | | 178,134 |
Professional fees | | | 124,102 |
Directors’ fees and expenses | | | 70,635 |
Insurance expense | | | 13,229 |
Transfer agent fees | | | 211,982 |
Custodian fees | | | 52,800 |
Blue sky servicing fees | | | 58,448 |
Shareholder report printing | | | 49,096 |
Chief compliance officer expense | | | 45,800 |
Other expenses | | | 8,790 |
| | | |
Total Expenses before waiver | | | 6,519,438 |
| | | |
Less fees waived by Administrator (Note 2) | | | (13,644) |
| | | |
Total net expenses | | | 6,505,794 |
| | | |
Net Investment loss | | | (3,278,286) |
| | | |
| |
REALIZED AND UNREALIZED GAIN (LOSS) ON INVESTMENTS | | | |
Net realized loss on investments | | | (13,530,890) |
Net realized loss on securities sold short | | | (18,405,376) |
Change in unrealized appreciation/(depreciation) on investments | | | (4,380,553) |
Change in unrealized appreciation/(depreciation) on securities sold short | | | 6,005,444 |
| | | |
| |
NET REALIZED AND UNREALIZED LOSS ON INVESTMENTS | | | (30,311,375) |
| | | |
| |
NET DECREASE IN NET ASSETS RESULTING FROM OPERATIONS | | $ | (33,589,661) |
| | | |
See accompanying notes to financial statements.
| | |
| 27 | | 1-800-467-7903 | www.CaldwellOrkinFunds.com |
| | |
Caldwell & Orkin Market Opportunity Fund | | Statements of Changes in Net Assets |
| | | | | | | |
| | | Year Ended
April 30, 2010 | | | Year Ended April 30, 2009 |
Increase/(decrease) in net assets from operations: | | | | | | | |
Net investment loss | | $ | (3,278,286 | ) | | $ | (247,410) |
Net realized gain/(loss) on investments and securities sold short | | | (31,936,266 | ) | | | 1,594,739 |
Change in net unrealized appreciation or depreciation of investments and securities sold short | | | 1,624,891 | | | | 8,999,772 |
| | | |
| | | (33,589,661 | ) | | | 10,347,101 |
| | | |
| | |
Decrease in net assets from distributions to stockholders from: | | | | | | | |
Net investment income | | | – | | | | (1,175,996) |
Net realized gain on investments | | | (3,262,646 | ) | | | (10,378,647) |
| | | |
| | | (3,262,646 | ) | | | (11,554,643) |
| | | |
| | |
Increase in net assets from common stock transactions: | | | | | | | |
Net proceeds from sale of shares | | | 300,001,846 | | | | 178,951,609 |
Reinvested distributions | | | 2,802,527 | | | | 10,655,648 |
Cost of shares redeemed | | | (174,156,466 | ) | | | (114,310,895) |
Redemption fee proceeds (Note 1) | | | 348,670 | | | | 386,570 |
| | | |
Net increase in net assets resulting from capital share transactions | | | 128,996,577 | | | | 75,682,932 |
| | | |
| | |
INCREASE IN NET ASSETS | | | 92,144,270 | | | | 74,475,390 |
| | |
Net Assets | | | | | | | |
Beginning of year | | | 302,929,727 | | | | 228,454,337 |
| | | |
End of year (including net investment income of $0 and $0, respectively) | | $ | 395,073,997 | | | $ | 302,929,727 |
| | | |
See accompanying notes to financial statements.
| | |
| Annual Report | April 30, 2010 | | 28 |
| | |
Financial Highlights | | Caldwell & Orkin Market Opportunity Fund |
For a capital share outstanding throughout each year.
| | | | | | | | | | | | |
| | | Year Ended April 30, | | |
| Per Share Data | | 2010 | | 2009 | | 2008 | | 2007 | | 2006 |
| | |
| | | | | | |
Net asset value, beginning of year | | $21.24 | | $21.40 | | $18.68 | | $16.69 | | $17.35 | | |
Income/(loss) from investment operations: | | | | | | | | | | | | |
Net investment income/(loss) | | (0.16) | | 0.01 | | 0.20 | | 0.53 | | 0.28 | | |
Net realized and unrealized gain/(loss) on investments | | (1.43) | | 0.94 | | 3.15 | | 1.99 | | (0.76) | | |
| | |
Total from investment operations | | (1.59) | | 0.95 | | 3.35 | | 2.52 | | (0.48) | | |
| | |
| | | | | | |
Less Distributions: | | | | | | | | | | | | |
From net investment income | | – | | (0.12) | | (0.37) | | (0.53) | | (0.19) | | |
From net realized gain on investments | | (0.16) | | (1.02) | | (0.30) | | 0.00 | | 0.00 | | |
| | |
Total distributions | | (0.16) | | (1.14) | | (0.67) | | (0.53) | | (0.19) | | |
| | |
Redemption fee proceeds | | 0.02 | | 0.03 | | 0.04 | | 0.00* | | 0.01 | | |
| | |
Net asset value, end of year | | $19.51 | | $21.24 | | $21.40 | | $18.68 | | $16.69 | | |
| | |
| | | | | | |
Total Return | | (7.40%) | | 4.73% | | 17.92% | | 15.31% | | (2.74%) | | |
| | | | | | |
Ratios and Supplemental Data: | | | | | | | | | | | | |
Net assets, end of year (in 000’s) | | $395,074 | | $302,930 | | $228,454 | | $135,337 | | $153,127 | | |
Ratios to Average Net Assets: | | | | | | | | | | | | |
Management fees | | 0.83% | | 0.83% | | 0.84% | | 0.87% | | 0.86% | | |
Administrative fees | | 0.20% | | 0.27% | | 0.24% | | 0.35% | | 0.22% | | |
| | |
Expenses before dividends on securities sold short and interest expense | | 1.03% | | 1.10% | | 1.08% | | 1.22% | | 1.08% | | |
Interest expense | | 0.31% | | 0.24% | | 0.18% | | 0.09% | | 0.00% | | |
Expenses from dividends on securities sold short | | 0.29% | | 0.55% | | 1.02% | | 0.37% | | 0.97% | | |
| | |
Ratio of total expenses** | | 1.63%*** | | 1.89% | | 2.28% | | 1.68% | | 2.05% | | |
| | |
Ratio of net investment income/(loss) | | (0.82%)*** | | (0.11%) | | 1.23% | | 2.64% | | 1.52% | | |
Portfolio turnover rate | | 662% | | 879% | | 712% | | 529% | | 459% | | |
See accompanying notes to financial statements.
| * | Amount is less than $0.01. |
| ** | The ratio of expense to average net assets and net investment income to average net assets do not reflect the expenses of other investment companies. |
| *** | The ratio of total expenses to average net assets and ratio of net investment income/(loss) include fees waived by Fund’s Administrator that amounted to less than 0.005%. |
| | |
| 29 | | 1-800-467-7903 | www.CaldwellOrkinFunds.com |
| | |
Caldwell & Orkin Market Opportunity Fund | | Notes to Financial Statements |
April 30, 2010
The Caldwell & Orkin Market Opportunity Fund (the “Fund”) is the only active investment portfolio of The Caldwell & Orkin Funds, Inc. (“Caldwell & Orkin”), an open-end, diversified management investment company registered under the Investment Company Act of 1940, as amended (the “1940 Act”), and incorporated under the laws of the State of Maryland on August 15, 1989. Prior to June, 1992, Caldwell & Orkin’s name was The OTC Select-100 Fund, Inc. and consisted of only one portfolio, The OTC Select-100 Fund. The shareholders of The OTC Select-100 Fund subsequently approved changing the corporate name from The OTC Select-100 Fund, Inc. to The Caldwell & Orkin Funds, Inc. and to amend the investment objective and policies of The OTC Select-100 Fund. As a result of such amendment, The OTC Select-100 Fund was renamed and its assets and objectives were those of the Caldwell & Orkin Aggressive Growth Fund. In August, 1996, the Board of Directors of Caldwell & Orkin approved changing the name of the Caldwell & Orkin Aggressive Growth Fund to the Caldwell & Orkin Market Opportunity Fund. The Fund’s objectives are to provide long-term capital growth with a short-term focus on capital preservation through investment selection and asset allocation. The Fund seeks to outperform the stock market over the long-term, as measured by indices such as the S&P 500 Total Return index.
1. SUMMARY OF SIGNIFICANT ACCOUNTING POLICIES
Securities Valuation
Securities are stated at the closing price on the date at which the net asset value (“NAV”) is being determined. If the date of determination is not a trading date, the last bid price is used for a value instead. Debt securities, other than short-term investments, are valued at the price provided by an independent pricing service. Short-term investments having a maturity of 60 days or less at the time of the purchase are stated at amortized cost, which approximates market value. Any assets or securities for which market quotations are not readily available are valued at fair value as determined in good faith by or under the direction of the Fund’s Board of Directors in accordance with the Fund’s Fair Value Pricing Policy.
Fair Value Measurements
The Fund has adopted the Financial Accounting Standards Board (“FASB”) Accounting Standards Codification™ (“ASC”), issued in June 2009. The Fund follows the provisions of ASC 820, “Fair Value Measurements and Disclosures” (“ASC 820”). In accordance with ASC 820, fair value is defined as the price that the Fund would receive upon selling an investment in a timely transaction to an independent buyer in the principal or most advantageous market of the investment. ASC 820 established a three-tier hierarchy to maximize the use of observable market data and minimize the use of unobservable inputs and to establish classification of fair value measurements for disclosure purposes. Inputs refer broadly to the assumptions that market participants would use in pricing the asset or liability, including assumptions about risk, for example, the risk inherent in a particular valuation technique used to measure fair value including such a pricing model and/or the risk inherent in the inputs to the valuation technique. Inputs may be observable or unobservable. Observable inputs are inputs that reflect the assumptions market participants would use in pricing the asset or liability developed based on market data obtained from sources independent of the reporting entity. Unobservable inputs are inputs that reflect the reporting entity’s own assumptions about the assumptions market participants would use in pricing the asset or liability developed based on the best information available in the circumstances.
| | |
| Annual Report | April 30, 2010 | | 30 |
| | |
Notes to Financial Statements | | Caldwell & Orkin Market Opportunity Fund |
April 30, 2010
The three-tier hierarchy is summarized in the three broad Levels listed below:
| | | | |
Level 1 | | – | | unadjusted quoted prices in active markets for identical assets or liabilities that the Fund has the ability to access. |
| | |
Level 2 | | – | | Observable inputs other than quoted prices included in Level 1 that are observable for the asset or liability either directly or indirectly. These inputs may include quoted prices for the identical instrument on an inactive market, prices for similar instruments, interest rates, prepayment speeds, credit risk, yield curves, default rates and similar data. |
| | |
Level 3 | | – | | Unobservable inputs for the asset or liability, to the extent relevant observable inputs are not available, representing the Fund’s own assumptions about the assumptions a market participant would use in valuing the asset or liability, and would be based on the best information available. |
The valuation techniques used by the Fund to measure fair value during the fiscal year ended April 30, 2010 maximized the use of observable inputs and minimized the use of unobservable inputs.
The following is a summary of the inputs used as of April 30, 2010 in valuing the Fund’s investments carried at value:
| | | | | | | | | | | | | |
Investments in Securities at Value* | | Level 1 - Quoted Prices | | | Level 2 - Other
Significant
Observable Inputs | | Level 3 - Significant
Unobservable
Inputs | | Total |
| |
Common Stocks | | $ | 189,052,743 | | | $ | - | | $ | - | | $ | 189,052,743 |
Purchased Call Options | | | 3,581,210 | | | | - | | | - | | | 3,581,210 |
Purchased Put Options | | | 2,967,840 | | | | - | | | - | | | 2,967,840 |
Corporate Bonds | | | - | | | | 24,581,636 | | | - | | | 24,581,636 |
Money Market Fund | | | 201,123,875 | | | | - | | | - | | | 201,123,875 |
| |
TOTAL | | $ | 396,725,668 | | | $ | 24,581,636 | | $ | - | | $ | 421,307,304 |
| |
| | | | |
Other Financial Instruments | | | | | | | | | | | | | |
| |
Securities Sold Short | | | (48,107,976 | ) | | $ | - | | $ | - | | $ | (48,107,976) |
| |
TOTAL | | $ | (48,107,976 | ) | | $ | - | | $ | - | | $ | (48,107,976) |
| |
All securities of the Fund were valued using either Level 1 or Level 2 inputs during the period ended April 30, 2010. Thus, a reconciliation of assets in which significant unobservable inputs (Level 3) were used is not applicable for this Fund.
* For detailed industry descriptions, see the accompanying Schedule of Investments.
| | |
| 31 | | 1-800-467-7903 | www.CaldwellOrkinFunds.com |
| | |
Caldwell & Orkin Market Opportunity Fund | | Notes to Financial Statements |
April 30, 2010
Derivatives
The Fund follows the provisions of FASB ASC 815, “Disclosures about Derivative Instruments and Hedging Activities.” ASC 815 has established improved financial reporting about derivative instruments and hedging activities as it relates to disclosure associated with these types of investments. The following discloses the amounts related to the Fund’s use of derivative instruments and hedging activities.
The effect of derivative instruments on the Statement of Assets and Liabilities as of April 30, 2010:
| | | | | | | | | |
| | | Asset Derivatives | | | | | | |
Derivatives not Accounted for as Hedging Instruments | | Statement of Assets and Liabilities Location | | | | Market Value | | |
Equity Contracts | | Investments, at value | | | | $ | 6,549,050 | | |
TOTAL | | | | | | $ | 6,549,050 | | |
The effect of derivative instruments on the Statement of Operations for the fiscal year ended April 30, 2010:
| | | | | | |
Derivatives not Accounted for as Hedging Instruments | | Location of Gain/ (Loss) On Derivatives Recognized in Income | | Realized Gain/(Loss) On Derivatives Recognized in Income | | Change in Unrealized
Gain/(Loss) On Derivatives
Recognized in Income |
| | Net realized loss | | | | |
| | on investments | | $ (27,646,777) | | |
| | | |
| | Change in unrealized | | | | |
| | appreciation / | | | | |
| | (depreciation) on | | | | |
Equity Contracts | | investments | | | | $ (1,220,055) |
TOTAL | | | | $ (27,646,777) | | $ (1,220,055) |
Significant Ownership Concentration
At April 30, 2010, the Fund invested 50.91% of its total net assets in the JPMorgan U.S. Treasury Plus Money Market Fund. The Fund uses the money market instrument as a vehicle for holding collateral related to securities sold short. As stated in the Fund’s prospectus, the Fund will typically invest between 0% and 50% of net assets in money market securities and fixed income securities. This portion of the Fund’s portfolio includes cash equivalents (i.e., money market funds or U.S. treasury notes) and bonds (i.e., corporate or government bonds), although generally cash equivalents are emphasized more than bonds. The corporate bonds purchased may have any maturity and be of any rating or quality, as long as Fund management believes it is consistent with the Fund’s investment objective.
The JPMorgan U.S. Treasury Plus Money Market Fund’s objective is to seek current income with liquidity and stability of principal. The JPMorgan U.S. Treasury Plus Money Market Fund invests exclusively in U.S. Treasury bills, notes and other obligations issued or guaranteed by the U.S. Treasury, and repurchase agreements collateralized by such obligations.
| | |
| Annual Report | April 30, 2010 | | 32 |
| | |
Notes to Financial Statements | | Caldwell & Orkin Market Opportunity Fund |
April 30, 2010
Share Valuation
The NAV per share of the Fund is calculated by dividing the sum of the value of the securities held by the Fund, plus cash or other assets, minus all liabilities (including estimated accrued expenses) by the total number of shares outstanding for the Fund, rounded to the nearest cent. The Fund’s shares will not be priced on the days on which the New York Stock Exchange is closed for trading. The offering and redemption price per share for the Fund is equal to the Fund’s NAV per share.
The Fund charges a 2.00% redemption fee on shares held less than six months. These fees are deducted from the redemption proceeds otherwise payable to the shareholder. The Fund will retain the fee charged as paid-in capital and such fees become part of the Fund’s daily NAV calculation.
Securities Transactions And Related Investment Income
Securities transactions are accounted for on trade date. Dividend income is recorded on the ex-dividend date and interest income is recorded as earned. Realized gains and losses from investment transactions are determined using the specific identification method.
Cash
The Fund maintains cash available for the settlement of securities transactions and capital shares reacquired. Available cash is invested daily in money market instruments.
Income Taxes
The Fund intends to continue to comply with the requirements of the Internal Revenue Code applicable to regulated investment companies and to distribute all taxable income to their shareholders. Therefore, no federal income tax provision is required.
In order to avoid imposition of the excise tax applicable to regulated investment companies, the Fund intends to declare each year as dividends, in each calendar year, at least 98% of its net investment income (earned during the calendar year) and at least 98% of its net realized capital gains (earned during the twelve months ended October 31) plus undistributed amounts, if any, from prior years.
Net capital losses incurred after October 31 and within the taxable year are deemed to arise on the first business day of the Fund’s next taxable year.
For the fiscal year ended April 30, 2010, the Fund made a distribution of $0.16 per share from ordinary income.
| | |
| 33 | | 1-800-467-7903 | www.CaldwellOrkinFunds.com |
| | |
Caldwell & Orkin Market Opportunity Fund | | Notes to Financial Statements |
April 30, 2010
The Fund follows ASC 740 “Income Taxes” (“ASC 740”), which requires that the financial statement effects of a tax position taken or expected to be taken in a tax return be recognized in the financial statements when it is more likely than not, based on the technical merits, that the position will be sustained upon examination. Management has concluded that the Fund has taken no uncertain tax positions that require adjustment to the financial statements to comply with the provisions of ASC 740. The Fund files income tax returns in the U.S. federal jurisdiction and Georgia. The statue of limitations on the Fund’s federal and state tax filings remains open for the fiscal years ended April 30, 2007 through April 30, 2010.
Use of Estimates
The preparation of financial statements in conformity with accounting principles generally accepted in the United States of America (“GAAP”) requires management to make estimates and assumptions that affect the reported amounts of assets and liabilities and disclosure of contingent assets and liabilities at the date of the financial statements and the reported amounts of revenues and expenses during the reporting period. Actual results could differ from those estimates.
Reclassification of Capital Accounts
GAAP requires that certain components of net assets relating to permanent differences be reclassified between financial and tax reporting. These reclassifications have no effect on net assets or net asset value per share. For the year ended April 30, 2010, the Fund increased accumulated net realized loss on investments by $190,139, decreased undistributed net investment income by $3,278,286, and decreased paid-in capital by $3,088,147 due to certain permanent book and tax differences.
2. COMMITMENTS AND OTHER AGREEMENTS
The Fund has entered into a management agreement (the “Management Agreement”) with C&O Funds Advisor, Inc. (the “Adviser”) pursuant to which the Adviser provides space, facilities, equipment and personnel necessary to perform administrative and investment management services for the Fund. The Management Agreement provides that the Adviser is responsible for the actual management of the Fund’s portfolio. For such services and expenses assumed by the Adviser, the Fund paid a monthly advisory fee at incremental annual rates as follows, through December 17, 2009:
| | |
| Advisory Fee | | Average Daily Net Assets |
| |
| .90% | | Up to $100 million |
| .80% | | In excess of $100 million but not greater than $200 million |
| .70% | | In excess of $200 million but not greater than $300 million |
| .60% | | In excess of $300 million but not greater than $500 million |
| .50% | | In excess of $500 million |
| | |
| Annual Report | April 30, 2010 | | 34 |
| | |
Notes to Financial Statements | | Caldwell & Orkin Market Opportunity Fund |
April 30, 2010
On December 18, 2009, at a Special Meeting of Shareholders of the Fund, shareholders approved an amendment to the Fund’s Management Agreement. Effective December 18, 2009, the Fund paid a monthly advisory fee at incremental annual rates as follows:
| | |
| Advisory Fee | | Average Daily Net Assets |
1.00% | | Up to $250 million |
| .90% | | In excess of $250 million but not greater than $500 million |
| .80% | | In excess of $500 million |
The Adviser has agreed to reimburse the Fund to the extent necessary to prevent the Fund’s annual ordinary operating expenses (excluding taxes, expenses related to the execution of portfolio transactions and the investment activities of the Fund such as, for example, interest, dividend expenses on securities sold short, brokerage commissions and fees and expenses charged to the Fund by any investment company in which the Fund invests and extraordinary charges such as litigation costs) from exceeding 2.0% of the Fund’s average net assets (the “Expense Cap”). No reimbursement was required for the fiscal year ended April 30, 2010.
C&O Funds Advisor, Inc. is a wholly-owned subsidiary of Caldwell & Orkin, Inc.
Effective November 16, 2009, ALPS Distributors, Inc. (“ADI”) replaced IFS Fund Distributors, Inc. (“IFS”) as the distributor to the Fund. The Fund does not pay ADI or IFS for these services.
Also effective November 16, 2009, ALPS Fund Services, Inc. (“ALPS”) began providing fund accounting and fund administration services to the Fund. The fees paid to ALPS for fund accounting and fund administration services are set at incremental annual rates as follows, and subject to a $160,000 annual minimum:
| | |
| Administration Fee | | Average Daily Net Assets |
.06% | | Between $0 - $500 million |
| .03% | | Between $500 million - $1 billion |
| .02% | | In excess of $1 billion |
In addition to the fee structure set forth above, an annual amount of $30,000 is waived against the administration fee, pursuant to a Distribution Fee Letter Agreement between the Adviser and ADI.
Prior to the transition to ALPS in November, 2009, JPMorgan provided accounting services to the Fund. Fees paid to both JPMorgan and ALPS for accounting and administration services during the year ended April 30, 2010, are presented under Administration and accounting fees on the Statement of Operations.
Effective February 16, 2010, ALPS replaced JPMorgan as the Fund’s transfer agent.
| | |
| 35 | | 1-800-467-7903 | www.CaldwellOrkinFunds.com |
| | |
Caldwell & Orkin Market Opportunity Fund | | Notes to Financial Statements |
April 30, 2010
3. INVESTMENT PORTFOLIO TRANSACTIONS
Investment Purchases and Sales
For the fiscal year ended April 30, 2010, purchases of investments and proceeds from sales of investments (excluding securities sold short and short-term investments) totaled $1,365,149,600, and $1,361,501,834, respectively.
Short Sales and Segregated Cash
Short sales are transactions in which the Fund sells a security it does not own, in anticipation of a decline in the market value of that security. To initiate such a transaction, the Fund must borrow the security to deliver to the buyer upon the short sale; the Fund is then obligated to replace the security borrowed by purchasing it in the open market at some later date, completing the transaction.
The Fund will incur a loss if the market price of the security increases between the date of the short sale and the date on which the Fund replaces the borrowed security. The Fund will realize a gain if the security declines in value between those dates.
All short sales must be fully collateralized. The Fund maintains the collateral in segregated accounts consisting of cash and/or U.S. Government securities sufficient to collateralize the market value of its short positions. Typically, the segregated cash with brokers and other financial institutions exceeds the minimum required. Deposits with brokers for securities sold short are invested in money market instruments. Segregated cash is held at the custodian in the name of the broker per a tri-party agreement between the Fund, the custodian, and the broker.
The Fund may also sell short “against the box”, i.e., the Fund enters into a short sale as described above, while holding an offsetting long position in the same security which it sold short. If the Fund enters into a short sale against the box, it will segregate an equivalent amount of securities owned by the Fund as collateral while the short sale is outstanding.
The Fund limits the value of its short positions (excluding short sales “against the box”) to 60% of the Fund’s total net assets. At April 30, 2010, the Fund had approximately 12% of its total net assets in short positions.
For the fiscal year ended April 30, 2010, the cost of investments purchased to cover short sales and the proceeds from investments sold short were $701,963,960 and $608,360,758, respectively.
| | |
| Annual Report | April 30, 2010 | | 36 |
| | |
Notes to Financial Statements | | Caldwell & Orkin Market Opportunity Fund |
April 30, 2010
4. CAPITAL SHARE TRANSACTIONS
Capital share transactions were as follows:
| | | | | | | | | | | | |
| | | | | Year ended
April 30, 2010 | | | | | Year ended
April 30, 2009 | | | |
Shares sold | | | | 14,517,866 | | | | | 8,400,395 | | | |
Shares reinvested | | | | 143,279 | | | | | 517,013 | | | |
Shares reacquired | | | | (8,675,606 | ) | | | | (5,329,601 | ) | | |
| | |
Net increase in shares outstanding | | | | 5,985,539 | | | | | 3,587,807 | | | |
| | |
5. DISTRIBUTIONS TO SHAREHOLDERS
On December 17, 2009, a distribution of $0.16 per share was declared. The dividend was paid on December 17, 2009, to shareholders of record on December 16, 2009.
The tax character of distributions paid for the fiscal year ended April 30, 2010 was as follows:
| | | | | |
| | | 2010 | | |
Distributions paid from: | | | | | |
Ordinary income | | $ | 3,262,646 | | |
Capital gains | | $ | 0 | | |
Distribution classifications may differ from the Statement of Changes in Net Assets as a result of the treatment of short term capital gains as ordinary income for tax purposes.
As of April 30, 2010, the components of distributable earnings on a tax basis were as follows:
| | | | | | | | |
Total cost of investments | | | | $ | 363,729,878 | | | |
| | |
Gross tax unrealized appreciation | | | | | 16,546,157 | | | |
Gross tax unrealized depreciation | | | | | (6,894,915 | ) | | |
Net depreciation on derivatives | | | | | (181,792 | ) | | |
| | |
Net tax unrealized appreciation | | | | | 9,469,450 | | | |
| | |
Undistributed ordinary income | | | | | 0 | | | |
Accumulated capital losses | | | | | (13,975,845 | ) | | |
Post-October losses | | | | | (21,551,360 | ) | | |
| | |
Total distributable earnings | | | | | (35,527,205 | ) | | |
| | |
Total accumulated earnings | | | | | (26,057,755 | ) | | |
| | |
At April 30, 2010, the Fund had a capital loss in the amount of $13,975,845. This loss expires on April 30, 2018.
Net investment income / (loss), net realized gains / (losses) and unrealized appreciation / depreciation differ for financial statement and tax purposes due to differing treatments of short term capital gains, nondeductible dividend expense and wash sale loss deferrals.
| | |
| 37 | | 1-800-467-7903 | www.CaldwellOrkinFunds.com |
| | |
Caldwell & Orkin Market Opportunity Fund | | Notes to Financial Statements |
April 30, 2010
6. RELATED PARTY TRANSACTIONS
As of April 30, 2010, Caldwell & Orkin, Inc. and Michael B. Orkin had ownership of the Fund of 0.20% and 1.36%, respectively.
7. NEW ACCOUNTING PRONOUCEMENTS
In January 2010, the FASB issued Accounting Standards Update “Improving Disclosures about Fair Value Measurements” that requires additional disclosures regarding fair value measurements. Certain required disclosures are effective for interim and annual reporting periods beginning after December 15, 2009, and other required disclosures are effective for fiscal years beginning after December 15, 2010, and for interim periods within those fiscal years. Management is currently evaluating the impact it will have on its financial statement disclosures.
8. SUBSEQUENT EVENTS
Management has performed a review for subsequent events through the date this report was issued. There were no other reportable events for the Fund as a result of their review.
| | |
| Annual Report | April 30, 2010 | | 38 |
| | |
Report of Independent Registered Public Accounting Firm | | Caldwell & Orkin Market Opportunity Fund |
April 30, 2010
To the Shareholders and Board of Directors
The Caldwell & Orkin Funds, Inc.
We have audited the accompanying statement of assets and liabilities, including the schedule of investments, of the Caldwell & Orkin Market Opportunity Fund, a series of The Caldwell & Orkin Funds, Inc., as of April 30, 2010, and the related statement of operations for the year then ended, the statement of changes in net assets for each of the two years in the period then ended and the financial highlights for each of the five years in the period then ended. These financial statements and financial highlights are the responsibility of the Fund’s management. Our responsibility is to express an opinion on these financial statements and financial highlights based on our audits.
We conducted our audits in accordance with the standards of the Public Company Accounting Oversight Board (United States). Those standards require that we plan and perform the audit to obtain reasonable assurance about whether the financial statements and financial highlights are free of material misstatement. The Fund is not required to have, nor were we engaged to perform, an audit of its internal control over financial reporting. Our audit included consideration of internal control over financial reporting as a basis for designing audit procedures that are appropriate in the circumstances, but not for the purpose of expressing an opinion on the effectiveness of the Fund’s internal control over financial reporting. Accordingly, we express no such opinion. An audit includes examining, on a test basis, evidence supporting the amounts and disclosures in the financial statements. Our procedures included confirmation of securities owned as of April 30, 2010, by correspondence with the custodian and brokers or by other appropriate auditing procedures where replies from brokers were not received. An audit also includes assessing the accounting principles used and significant estimates made by management, as well as evaluating the overall financial statement presentation. We believe that our audits provide a reasonable basis for our opinion.
In our opinion, the financial statements and financial highlights referred to above present fairly, in all material respects, the financial position of the Caldwell & Orkin Market Opportunity Fund as of April 30, 2010, the results of its operations for the year then ended, the changes in its net assets for each of the two years in the period then ended and its financial highlights for each of the five years in the period then ended, in conformity with accounting principles generally accepted in the United States of America.
TAIT, WELLER & BAKER LLP
Philadelphia, Pennsylvania
June 23, 2010
| | |
| 39 | | 1-800-467-7903 | www.CaldwellOrkinFunds.com |
| | |
Caldwell & Orkin Market Opportunity Fund | | Proxy Results |
April 30, 2010
Special Meeting of Shareholders
On December 18, 2009, a Special Meeting of Shareholders (the “Meeting”) of the Fund was held at the offices of C&O Funds Advisor, Inc. (the “Manager”) to approve an amendment to the management agreement with the Manager (the “Proposal”).
At the Meeting, shareholders considered several factors in voting on the Proposal, including: (i) the change in 1994 in the Fund’s investment style from long-only to long/short, and the consequent increase in the Manager’s workload and responsibility since the implementation of the Fund’s current management fee; (ii) the current and proposed management fees as compared to those of other long/short funds; (iii) the favorable performance of the Fund; and (iv) the long tenure of the Fund’s portfolio manager.
Shares represented at the Meeting in person or by proxy constituted 51.49% of the Fund’s outstanding shares entitled to be voted and a quorum necessary for the transaction of business. The Proposal was approved by the affirmative vote of a “majority of the outstanding voting securities” (as defined in the Investment Company Act of 1940, as amended) of the Fund, meaning the lessor of (i) 67% or more of the shares represented at the Meeting, if the holders of more than 50% of the outstanding shares were represented, or (ii) more than 50% of the outstanding shares of the Fund.
In tallying shareholder votes, abstentions and “broker non-votes” (i.e., shares held by brokers or nominees where (i) the beneficial owner has not voted and (ii) the broker holding the shares does not have discretionary authority to vote on the particular matter) were counted as shares that are present for purposes of determining the presence of a quorum but were not included in determining votes for or against the Proposal. As a result, abstentions and broker non-votes are treated as a vote against any proposal where the required vote is a percentage of the shares outstanding. Therefore, with respect to the Proposal, abstentions and broker non-votes had the effect of a vote “against” the Proposal. Shares voted in favor, shares voted against and shares abstaining with respect to the Proposal were as follows:
| | | | |
FOR | | AGAINST | | ABSTAIN |
9,698,046 | | 760,050 | | 225,279 |
| | |
| Annual Report | April 30, 2010 | | 40 |
| | |
Additional Information (Unaudited) | | Caldwell & Orkin Market Opportunity Fund |
April 30, 2010
Information about the Board of Directors and officers* of the Fund as of April 30, 2010 is set forth below. The Statement of Additional Information (SAI) includes additional information about the Fund’s Directors and officers and is available free of charge, upon request, by calling (800) 237-7073. The address for each of the persons named below is 5185 Peachtree Parkway, Suite 370, Norcross, GA 30092-6541.
| | | | | | | | |
Name, (Age) and Position(s) Held with Fund | | Term of Office
and Length of
Time Served 1 | | Principal Occupation(s) During Past Five Years | | Number of Funds in Fund Complex
Overseen by Director | | Other Directorships
Held by Director |
| | | | |
DISINTERESTED DIRECTORS | | | | | | | | |
| | | | |
Frederick T. Blumer (51) Chairman | | Since 1990 | | Mr. Blumer is Vice President of HUGHES Telematics, Inc., and was formerly the CEO of X-spand International, Inc. | | One | | None |
| | | | |
David L. Eager (67) Director | | Since 1992 | | Mr. Eager is a Partner at Eager, Davis & Holmes LLC, and was formerly Director for Product Development for Driehaus Capital Management and a Global Partner with William M. Mercer, Inc. | | One | | Veracity Mutual Fund |
| | | | |
James L. Underwood (59) Director | | Since 2006 | | Mr. Underwood is the President of Tarpley & Underwood, P.C. and Tarpley & Underwood Financial Advisors LLC. | | One | | None |
| | | | |
INTERESTED DIRECTOR | | | | | | | | |
| | | | |
Michael B. Orkin (50) 2 Director, President, Portfolio Manager | | Since 1990 | | Mr. Orkin is the CEO and sole shareholder of Caldwell & Orkin, Inc., of which the Adviser is a wholly-owned subsidiary. Mr. Orkin has been a portfolio manager at Caldwell & Orkin, Inc. since 1985, and is a Chartered Financial Analyst. | | One | | None |
| | |
| 41 | | 1-800-467-7903 | www.CaldwellOrkinFunds.com |
| | |
Caldwell & Orkin Market Opportunity Fund | | Additional Information (Unaudited) |
April 30, 2010
| | | | | | | | |
Name, (Age) and Position(s) Held with Fund | | Term of Office
and Length of
Time Served 1 | | Principal Occupation(s) During Past Five Years | | Number of Funds in Fund Complex
Overseen by Director | | Other Directorships
Held by Director |
OFFICERS WHO ARE NOT DIRECTORS | | | | |
William C. Horne (52) Chief Compliance Officer & Treasurer | | Since 2004 Since 2006 | | Mr. Horne is the Director of Client Services and Chief Compliance Officer of Caldwell & Orkin, Inc. | | N/A | | N/A |
Paul F. Leone (46) Secretary | | Since 2010 | | Mr. Leone is Assistant General Counsel at ALPS Fund Services, Denver, Colorado. Prior to joining ALPS, Mr. Leone was Deputy Chief Compliance Officer at Old Mutual Capital, Denver, Colorado; General Counsel and Chief Compliance Officer at Wisconsin Capital Management, Madison Wisconsin. | | N/A | | N/A |
Lauren Johnson (29) Assistant Treasurer | | Since 2009 | | Ms. Johnson joined ALPS Fund Services in September 2005 as a Fund Controller. Prior to joining ALPS, Ms. Johnson worked for Pricewaterhouse Coopers LLP. | | N/A | | N/A |
David R. Bockel (33) Assistant Secretary | | Since 2006 | | Mr. Bockel is an Assistant Portfolio Manager for Caldwell & Orkin, Inc. | | N/A | | N/A |
| * | The term “officer” means the president, vice president, secretary, treasurer, controller or any other officer who performs policy-making decisions. |
| 1 | Each Director serves until his / her successor is duly elected and qualified, or until his / her death, resignation or removal. |
| 2 | Mr. Orkin is an interested person of the Fund by reason of his position with the Adviser. |
| | |
| Annual Report | April 30, 2010 | | 42 |
CALDWELL & ORKIN MARKET OPPORTUNITY FUND
Annual Report to Shareholders (unaudited)
| | | | |
| BOARD OF DIRECTORS | | TRANSFER, REDEMPTION | | LEGAL COUNSEL |
Frederick T. Blumer, | | & DIVIDEND | | Paul, Hastings, Janofsky |
Independent Chairman | | DISBURSING AGENT | | & Walker LLP |
Michael B. Orkin, President | | ALPS Fund Services, Inc. | | 600 Peachtree Street, N.E. |
David L. Eager | | P.O. Box 46256 | | Suite 2400 |
James L. Underwood | | Denver, CO 80201 | | Atlanta, GA 30308 |
| | |
| INVESTMENT ADVISER | | CUSTODIAN | | INDEPENDENT |
C&O Funds Advisor, Inc. | | JPMorgan Chase Bank, N.A. | | DIRECTORS’ COUNSEL |
5185 Peachtree Parkway | | 1111 Polaris Parkway, Suite 3J | | Arnall Golden Gregory LLP |
Suite 370 | | Columbus, OH 43240 | | 171 17th Street, NW, |
Norcross, GA 30092-6541 | | | | Suite 2100 |
| DISTRIBUTOR | | INDEPENDENT REGISTERED PUBLIC ACCOUNTING FIRM | | Atlanta, GA 30363 |
ALPS Distributors, Inc. | | Tait, Weller & Baker LLP | | |
1290 Broadway, Suite 1100 | | 1818 Market Street, Suite 2400 | | |
Denver, CO 80203 | | Philadelphia, PA 19103-3638 | | |
The Caldwell & Orkin Market Opportunity Fund’s (the “Fund”) portfolio may or may not have positions in any of the companies referenced in this Report to Shareholders as of any date after April 30, 2010. The commentary reflects the views of the portfolio manager (or Adviser) through the end of the period or through the date of this report, as the case may be. Of course, these views are subject to change as market and other conditions warrant. These financial statements are submitted for the general information of the Fund’s shareholders. They are not authorized for distribution to prospective investors unless preceded or accompanied by an effective Fund Prospectus.
Availability of Proxy Voting Policy & Procedures, Proxy Voting Record and Code of Ethics - A description of a) the policies and procedures the Fund uses to determine how to vote proxies relating to portfolio securities, b) how the Fund voted proxies relating to portfolio securities during the most recent 12-month period ended June 30, c) the Code of Ethics applicable to the principal officers of the Fund are available without charge, upon request, by calling toll-free (800) 237-7073, or on the Securities and Exchange Commission’s (the “Commission’s”) website at http://www.sec.gov.
Availability of Quarterly Portfolio Schedule - The Fund files its complete schedule of portfolio holdings with the Commission for the first and third quarters of each fiscal year on Form N-Q. The Fund’s Forms N-Q are available on the Commission’s website at http://www.sec.gov. The Fund’s Forms N-Q may be reviewed and copied at the Commission’s Public Reference Room in Washington, D.C. Information on the operation of the Public Reference Room may be obtained by calling 1-800 SEC-0330.
Fund Information - For information about the Fund please call (800) 237-7073 or visit the Fund’s website at www.CaldwellOrkinFunds.com. For information about a specific Fund account, please call Shareholder Services at (800) 467-7903.
Fund Listings - The Fund is listed in many newspapers as C&OMktOpp or CaldOrkMO. The Fund’s Quotation symbol is COAGX. The Fund’s CUSIP number is 128819307.
Caldwell & Orkin Market Opportunity Fund
5185 Peachtree Parkway, Suite 370
Norcross, GA 30092-6541
E-mail: Info@CaldwellOrkin.com
| | (a) | As of the end of the period covered by this report, the registrant has adopted a Supplemental Code of Ethics that applies to the registrant’s principal executive officer, principal financial officer, principal accounting officer or controller, or persons performing similar functions, regardless of whether these individuals are employed by the registrant or a third party (the “Supplemental Code of Ethics”). |
| | (c) | During the period covered by this report, no amendments were made to the provisions of the Supplemental Code of Ethics adopted in 2(a) above. |
| | (d) | During the period covered by this report, no implicit or explicit waivers to the provisions of the Supplemental Code of Ethics adopted in 2(a) above were granted. |
| | (f) | A copy of the registrant’s Supplemental Code of Ethics is filed as an exhibit hereto. The registrant undertakes to provide a copy of the Supplemental Code of Ethics to any person, without charge upon written request to the registrant at its address at 5185 Peachtree Parkway, Suite 370, Norcross, GA 30092-6541. |
| Item 3. | Audit Committee Financial Expert. |
(a)(1) The registrant’s Board of Directors has determined that one audit committee financial expert serves on its audit committee.
(a)(2) James L. Underwood, an Independent Director of the registrant, is the registrant’s audit committee financial expert.
(a)(3) N/A
| Item 4. | Principal Accountant Fees and Services. |
| | (a) | Audit Fees: For the registrant’s fiscal years ended April 30, 2010 and April 30, 2009, the aggregate fees billed to the registrant for professional services rendered by the principal accountant for the audit of the registrant’s annual financial statements were $25,000 and $24,500, respectively. |
| | (a) | Audit-Related Fees: For the Registrant’s fiscal years ended April 30, 2010 and April 30, 2009, aggregate fees of $0 and $0, respectively, were billed to the registrant for assurance and related services by the principal accountant for certain audit-related communications to the registrant’s audit committee. For the registrant’s fiscal years ended April 30, 2010 and April 30, 2009, the aggregate fees of $0 and $0 were billed to the registrant’s investment adviser, and any entity controlling, controlled by, or under common control with the investment adviser that provides ongoing services for the registrant for assurance and related services by the principal accountant that are reasonably related to the performance of the audit of the registrant’s financial statements and are not reported under paragraph (a) of this Item. |
| | (c) | Tax Fees: For the Registrant’s fiscal years ended April 30, 2010 and April 30, 2009, aggregate fees of $3,500, and $3,000, respectively, were billed for professional services rendered by the principal accountant for tax services. For the registrant’s fiscal years ended April 30, 2010 and April 30, 2009, aggregate fees of $0 and $0, respectively, were billed to the investment adviser and any entity controlling, controlled by, or under common control with the investment adviser that provides ongoing services to the registrant. |
| | (c) | All Other Fees: In registrant’s fiscal years ended April 30, 2010 and April 30, 2009, the aggregate fees $3,350 and $3,350, respectively, were billed to registrant by the principal accountant for cursory reviews of the registrant’s October 31, 2009 and October 31, 2008 semi-annual reports, and agreed upon procedures related to review of anti-money laundering procedures. For the registrant’s fiscal years ended April 30, 2010 and April 30, 2009, the aggregate fees of $0 and $0 were billed to the investment adviser and any entity controlling, controlled by, or under common control with the investment adviser that provides ongoing services to the registrant for services other than the services reported in paragraph (a) through (c). |
| | (e)(1) | Audit Committee Pre-Approval Policies and Procedures: The registrant’s Audit Committee pre-approves any audit or non-audit services provided by the independent auditors to the registrant, and pre-approves, if applicable, any non-audit services provided by the independent auditors to the registrant’s investment adviser, or any entity controlling, controlled by, or under common control with the |
| | investment adviser that provides ongoing services to the registrant if the engagement relates directly to the operations and financial reporting of the registrant. |
| | (e)(2) | The percentage of services described in each of paragraphs (b) through (d) of this Item that were approved by the audit committee pursuant to paragraph (c)(7)(i)(C) of Rule 2-01 of Regulation S-X is 100%. |
| | (g) | Aggregate Non-Audit Fees: In registrant’s fiscal years ended April 30, 2010 and April 30, 2009, the aggregate non-audit fees $3,350 and $3,350 were billed to the registrant by the registrant’s accountant for cursory reviews of the registrant’s October 31, 2009 and October 31, 2008 semi-annual reports and agreed upon procedures related to review of anti-money laundering procedures. In registrant’s fiscal years ended April 30, 2010 and April 30, 2009, the aggregate non-audit fees of $0 and $0 were billed to the investment adviser and any entity controlling, controlled by, or under common control with the investment adviser that provides ongoing services to the registrant. |
| Item 5. | Audit Committee of Listed Registrants. |
Not applicable.
| Item 6. | Schedule of Investments. |
Schedule of Investments is included as part of the Report to Stockholders filed under Item 1 of this form.
| Item 7. | Disclosure of Proxy Voting Policies and Procedures for Closed-End Management Investment Companies. |
Not applicable.
| Item 8. | Portfolio Managers of Closed-End Management Investment Companies. |
Not applicable.
| Item 9. | Purchases of Equity Securities by Closed-End Management Investment Companies and Affiliated Issuers. |
Not applicable.
| Item 10. | Submission of Matters to a Vote of Security Holders. |
There have been no material changes to the procedures by which shareholders may recommend nominees to the registrant’s board of trustees.
| Item 11. | Controls and Procedures. |
| | (a) | The registrant’s principal executive officer and principal financial officer have concluded that the registrant’s disclosure controls and procedures (as defined in Rule 30a-3(c) under the Investment Company Act of 1940, as amended) are effective based on their evaluation of these controls and procedures as of a date within 90 days of the filing date of this document. |
| | (b) | There was no change in the registrant's internal control over financial reporting (as defined in Rule 30a-3(d) under the Investment Company Act of 1940, as amended) during the second fiscal quarter of the period covered by this report that has materially affected, or is reasonably likely to materially affect, the registrant's internal control over financial reporting. |
| | (a)(1) | The code of ethics that applies to the registrant’s principal executive officer and principal financial officer is attached hereto as Ex.12.A.1. |
| | (a)(2) | The certifications required by Rule 30a-2(a) of the Investment Company Act of 1940, as amended, and Section 302 of the Sarbanes- Oxley Act of 2002 are attached hereto as Ex99.Cert. |
| | (b) | The certifications by the registrant’s Principal Executive Officer and Principal Financial Officer, as required by Rule 30a-2(b) of the Investment Company Act of 1940, as amended, and Section 906 of the Sarbanes-Oxley Act of 2002 are attached hereto as Ex99.906Cert. |
SIGNATURES
Pursuant to the requirements of the Securities Exchange Act of 1934 and the Investment Company Act of 1940, the registrant has duly caused this report to be signed on its behalf by the undersigned, thereunto duly authorized.
| | |
| The Caldwell & Orkin Funds, Inc. |
| |
| By: | | /s/ Michael B. Orkin |
| | Michael B. Orkin |
| | President (Principal Executive Officer) |
| |
| Date: | | July 9, 2010 |
| |
| By: | | /s/ William C. Horne |
| | William C. Horne |
| | Treasurer (Principal Financial Officer) |
| |
| Date: | | July 9, 2010 |