UNITED STATES
SECURITIES AND EXCHANGE COMMISSION
Washington, D.C. 20549
FORM N-CSR
CERTIFIED SHAREHOLDER REPORT OF REGISTERED MANAGEMENT
INVESTMENT COMPANIES
Investment Company Act file number: 811-06113
The Caldwell & Orkin Funds, Inc.
(Exact name of registrant as specified in charter)
5185 Peachtree Parkway, Suite 370, Norcross, GA 30092-6542
(Address of principal executive offices) (Zip code)
Michael B. Orkin
5185 Peachtree Parkway, Suite 370, Norcross, GA 30092-6541
(Name and Address of Agent for Service)
Registrant’s Telephone Number, including Area Code: 678-533-7850
Date of fiscal year end: April 30
Date of reporting period: May 1, 2010 – April 30, 2011
Form N-CSR is to be used by management investment companies to file reports with the Commission not later than 10 days after the transmission to stockholders of any report that is required to be transmitted to stockholders under Rule 30e-1 under the Investment Company Act of 1940 (17 CFR 270.30e-1). The Commission may use the information provided on Form N-CSR in its regulatory, disclosure review, inspection, and policymaking roles.
A registrant is required to disclose the information specified by Form N-CSR, and the Commission will make this information public. A registrant is not required to respond to the collection of information contained in Form N-CSR unless the Form displays a currently valid Office of Management and Budget (“OMB”) control number. Please direct comments concerning the accuracy of the information collection burden estimate and any suggestions for reducing the burden to Secretary, Securities and Exchange Commission, 450 Fifth Street, NW, Washington, DC 20549-0609. The OMB has reviewed this collection of information under the clearance requirements of 44 U.S.C. ss. 3507.
| Item 1. | Reports to Stockholders. |
| | | | |
| | | Caldwell & Orkin | |
| |
| Table of Contents | | | Market Opportunity Fund | |
April 30, 2011
|
| 1-800-467-7903 | www.CaldwellOrkinFunds.com |
| | |
Caldwell & Orkin Market Opportunity Fund | | Shareholder Letter |
| | April 30, 2011 |
| | | | | | |
Investment Adviser | | | |  | | Shareholder Accounts |
C&O Funds Advisor, Inc. | | | | | c/o ALPS Fund Services, Inc. |
5185 Peachtree Parkway, | | | | | P.O. Box 46256 |
Suite 370 | | | | | Denver, Colorado 80201 |
Norcross, Georgia | | | | | (800) 467-7903 |
30092-6541 | | | | | |
(800) 237-7073 | | | | | |
| | |
Dear Fellow Shareholder: | | June 21, 2011 |
The Caldwell & Orkin Market Opportunity Fund (the “Fund” or “MOF”) rose 1.77% in the 6-month period ended April 30, 2011. The S&P 500 Total Return Index (S&P 500) gained 16.36% during the same period. For the 12 months ended April 30, 2011, the Fund gained 0.41%, while the S&P 500 increased 17.22%. And, since commencement of active management on August 24, 1992 through April 30, 2011, the Fund has generated an 8.73% compound annual return, in line with the S&P 500’s 8.74% compound annual return during the same period. The Fund’s total return from August 24, 1992 through April 30, 2011 has been 378.58%, compared to the S&P 500’s total return of 378.88%. Of course, past performance is no guarantee of future results. Please see standardized performance figures on page 6.
Importantly, the Fund has achieved these long-term results while maintaining a low market–risk profile (significantly less volatility) and with little reliance on the movement of the stock market (see pages 6, 8, 9 and 10). Since we began actively managing the Fund on August 24, 1992, the Fund’s price movements have had virtually no correlation (1.03%) with the price movements of the S&P 500 as measured by R, the correlation coefficient. An S&P 500 Index fund has nearly a 100% correlation to the market in any given period. The Fund’s lack of correlation to the market indicates that its performance is not attributable to that of the index. Additionally, given the Fund’s low correlation to the S&P 500, deviations in Fund performance relative to the S&P 500’s performance are to be expected. (Statistical computations by Ned Davis Research, Inc.)
Markets move in cycles. In managing the Fund, we strive to outperform over the course of a full market cycle, which includes both bull and bear market phases. Historically, toward the end of the bull market phase of a full market cycle the Fund’s long-term performance has dipped below the S&P 500’s performance. Conversely, the Fund has surpassed the S&P 500 during the bear phase. Ned Davis Research, Inc. (“NDR”) has computed bull and bear market cycles for the S&P 500. Most of their definition focuses on a 20% market move in either direction. Thus far, the Market Opportunity Fund has outperformed the S&P 500 over the course of the last four full market cycles. Importantly, as mentioned above, the Fund has achieved its long-term results with less volatility (what we refer to as “stomach churn”) than the S&P 500. We present the NDR data for your review:
| | | | | | | | | | | | | | | | | | | | | | | | |
| Bull Market Phase | | | | Bear Market Phase | | | | Full Market Cycle | |
| Start Date | | MOF | | S&P | | | Start Date** | | MOF | | S&P | | | End Date*** | | MOF | | | S&P | |
8/24/1992* | | 210.84% | | 230.03% | | | 7/17/1998 | | 4.02% | | -19.19% | | | 8/31/1998 | | | 223.35 | % | | | 166.69 | % |
8/31/1998 | | 6.14% | | 62.88% | | | 9/1/2000 | | 15.10% | | -35.71% | | | 9/21/2001 | | | 22.17 | % | | | 4.72 | % |
9/21/2001 | | -5.72% | | 22.00% | | | 3/19/2002 | | 10.02% | | -33.01% | | | 10/9/2002 | | | 3.73 | % | | | -18.27 | % |
10/9/2002 | | 16.86% | | 119.38% | | | 10/9/2007 | | -0.61% | | -55.26% | | | 3/9/2009 | | | 16.14 | % | | | -1.85 | % |
| * | The first bull market phase began 10/11/1990, but the table begins with 8/24/1992, which coincides with commencement of active management of the Caldwell & Orkin Market Opportunity Fund. |
| ** | The bear market start date is the bull market’s end date. |
| *** | A full market cycle runs from the bull market start date to the full market cycle end date. |
| | |
Annual Report | April 30, 2011 | | 1 |
| | |
Caldwell & Orkin Market Opportunity Fund | | Shareholder Letter |
| | April 30, 2011 |
Management Discussion and Analysis
For the year-ended April 30, 2011 the Fund generated return characteristics emblematic of a true long/short mutual fund with low correlation to the S&P 500. During the months experiencing negative market performance (May, June and August 2010) the Fund significantly outperformed relative to the S&P 500. During the months experiencing positive market performance (July, September, October and December 2010, and January, February and April of 2011) the Fund underperformed relative to the S&P 500. The market was essentially flat in November 2010 and March 2011. The Fund outperformed the S&P 500 in November 2010 and underperformed in March 2011. Notably, during the April 23, 2010 through July 2, 2010 market setback, the S&P 500 fell -15.67% while the Fund dipped a mere -1.52%, further illustrating the Fund’s flexibility, low correlation and ability to minimize risk.
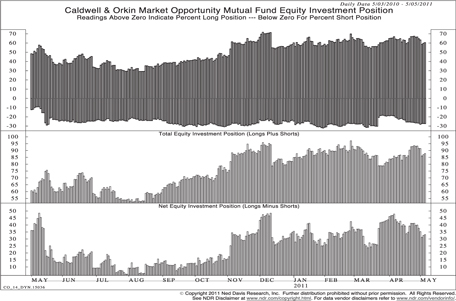
From April 30, 2010 through April 30, 2011 the Fund maintained a net long invested position. The gross long exposure increased from 47.85% to 64.79%, averaging 50.21%. During this time period the long portfolio underperformed the S&P 500, generating a total return of 10.94%. The Fund’s short position also increased from 12.18% to 26.99%, averaging 25.44%. The short portfolio outperformed the inverse return of the S&P 500 (-17.22%), generating a total return of -10.33%.
Overall, the Fund’s total invested position increased from 67.91% to 94.20%, averaging 75.64%. The Fund’s net invested position (long equities minus short equities) increased slightly from 35.67% net long to 37.80% net long, averaging 24.77% net long during the fiscal year.
The total invested position during the time period was the result of increasing both longs and shorts. On the long side we added exposure to electric-integrated utilities. Specifically, we purchased regulated electric utilities with attractive dividend yields, defensive economic characteristics and earnings growth potential through easing regulatory oversight. At 6.48% utilities are currently our largest long exposure. We also slightly increased our exposure to energy exploration and production (from 5.52% to 6.49%) as we continue to foresee the need for increased investment in our nation’s energy infrastructure while domestic resource utilization becomes a political (and practical) reality. Rising energy prices are but one catalyst for our purchase of railroad companies, which now make up 3.63% of the portfolio. A combination of rising fuel costs and a more efficiently run railroad network has made the relative cost of this mode of transportation more attractive. Additionally, increased coal usage and rising automobile production are beneficial to rail car usage. We also purchased new positions in Medical-HMO shares that are a beneficiary of state budget cuts. In an effort to slash costs, states like Florida and Texas have voted to switch their Medicare and Medicaid programs from a fee-for-service based approach to a managed care service platform, increasing enrollments (revenues) for HMO providers. The Fund’s exposure to Medical-HMOs is 3.59%.
On the short side of the portfolio we increased our exposure to emerging market exchange-traded funds (ETFs) from 2.37% to 5.56%, as accelerating inflation remains a headwind for the financial markets where we have exposure. We also increased our exposure to Schools (for-profit education) to 5.38%. At the start of the period we had almost no exposure to the group, but the fundamental issues facing the industry (regulatory supervision, slowing enrollment growth, high default rates, poor student outcomes, etc.) have only grown larger in their windshield of obfuscation.
| | |
2 | | 1-800-467-7903 | www.CaldwellOrkinFunds.com |
| | |
Caldwell & Orkin Market Opportunity Fund | | Shareholder Letter |
| | April 30, 2011 |
During the period, eight of our 10 biggest winners were longs. Gains in our largest single position, Vertex Pharmaceuticals (VRTX), led the way as the company received positive trial results on Telaprevir (a drug to treat Hepatitis C) and early clinical data on a drug for Cystic Fibrosis generated investor enthusiasm. The Fund also had gains in technology stocks ARM Holdings (ARMH) and Skyworks (SWKS), two semiconductor makers benefitting from the growth in mobile devices. Investments in various industrial stocks like Tenneco Inc. (TEN) and Eaton Corp. (ETN) also helped the Fund’s performance. The two shorts in our top 10 performers were both for-profit education stocks.
Four out of five of our biggest losers were shorts. The single long investment in this group was Popular Inc. (BPOP), a Puerto Rican bank holding company. We purchased BPOP with the expectation that the company would use its $1 billion deferred tax asset (DFA) to pursue attractive FDIC asset purchases in the state of Florida. When it became clear management was failing to execute on their plan we sold our position. Two of the four worst-performing shorts were technology stocks with promotional management teams and questionable growth outlooks. While they are still fundamentally potential short candidates, they are no longer in the portfolio. We still have exposure to the other two shorts, though the positions have been significantly reduced.
Outlook
This fiscal year begins much like the one that preceded it, with the winding down of Federal Reserve quantitative easing, the threat of default hanging over certain member states of the European Union and accelerating inflation hamstringing growth in the emerging markets. Added risks include the economic fallout from the earthquake and tsunami that struck Japan in March 2011, continued unrest and civil war in North Africa and the Middle East and a fiscal policy headwind after years of unsustainable deficit spending. Thus far the equity markets have been resilient in the face of these risks, but will the same hold true after the Fed’s second round of quantitative easing (QE2) is “completed” on June 30, 2011?
In the spring and early summer of 2010 we learned that the U.S. economy was not yet healthy enough to grow without Fed assistance. Job growth and manufacturing activity has since improved, but the housing market remains an economic drag, and the number of underemployed Americans remains elevated. At the same time, consumer prices are rising. On the whole, the economy appears in better form, but the cumbersome debt load that catalyzed the Great Recession and has governed the snail’s-pace growth of this recovery has become more burdensome than when this ugly episode first began.
At April 30, 2011 the Fund was almost fully invested (94.20%). Since then we’ve pulled back somewhat (80.50% as of the date of this letter), cognizant that there is still some time before the scheduled June 30, 2011 end of the Fed’s QE2 asset purchase initiative. Should expansionary monetary policy slow considerably post QE2 (not unlikely given the debt load) and should other factors turn less supportive, the Fund will likely be repositioned in a more defensive posture.
Sincerely,
Michael B. Orkin, CFA
Portfolio Manager and Chief Investment Officer
| | |
Annual Report | April 30, 2011 | | 3 |
| | |
Caldwell & Orkin Market Opportunity Fund | | Shareholder Letter |
| | April 30, 2011 |
Disclosure
The Fund’s investment objective is to provide long-term capital growth with a short-term focus on capital preservation. Our philosophy in managing the Fund is to focus on risk as well as return. We use active asset allocation - the opportunistic shifting of assets between long stock positions, short stock positions (selling borrowed stock and attempting to replace the borrowed securities in the future at a lower price), options, bonds and cash equivalents - to manage exposure to market risk (the risk that the broad market declines, taking good companies down with it). The Fund may hold up to 60% of its net assets in short positions at any time and also invest in options. Short positions and put options are employed with the intent of making money when those stocks we judge to be mispriced fall. When we use short positions or put options, the Fund’s portfolio is considered to be “hedged,” so that it is not fully exposed to the price movements and volatility of the broader market. Our asset allocation determinations are primarily based on our perception of risk in the marketplace. In summary, our goal is to make money over a full market cycle, but with less stomach churn.
The Fund’s disciplined investment philosophy and active management style typically leads to higher-than-average portfolio turnover. High turnover may have an unfavorable impact on the amount of taxable distributions paid to shareholders. Higher turnover may also result in higher brokerage costs for the Fund. The Fund’s turnover rate will typically exceed 100% per year, and will not be a limiting factor when we deem change appropriate. Fund holdings, industry and asset allocations are subject to change without notice. The Fund may or may not have a position in any of the companies mentioned in this commentary as of the date of this report.
An investment in the Fund involves risk, including the loss of principal. Additionally, there are certain risks inherent in investing in the Fund, including market risk, short sale risk, interest rate risk, business risk, small company risk, market valuation risk, political risk, and portfolio turnover risk. For a complete discussion of these risks, you may request a copy of the Fund’s prospectus by calling 800-237-7073. The Fund uses aggressive investment strategies (including short positions and options) that have the potential for yielding high returns; however, these strategies may also result in losses. Stocks sold short have unlimited risk. Investment return and principal value will fluctuate so that shares, when redeemed, may be worth more or less than their original cost. Options are not suitable for all investors.
Investors should expect that the Fund’s performance may fluctuate independently of stock market indices, such as the S&P 500 Total Return Index.
Distributed by ALPS Distributors, Inc., Member FINRA/SIPC
1290 Broadway, Suite 1100, Denver, CO 80203
| | |
4 | | 1-800-467-7903 | www.CaldwellOrkinFunds.com |
| | |
Caldwell & Orkin Market Opportunity Fund | | Shareholder Letter |
| | April 30, 2011 |
Statistical Risk Definitions:
Correlation Coefficient (R): R is a statistical measure of correlation. In this report, R is a measurement of investment risk that indicates how closely performance is linked to the broad market – it quantifies the degree to which a fund’s performance correlates with the performance of a benchmark. R can vary between 100% (perfect positive correlation) and –100% (perfect negative correlation). 0% represents no correlation. An R of 100% means that all movements of a fund are fully explained by movements in its benchmark index. Conversely, a low R indicates that very few of the fund’s movements are explained by movements in its benchmark index, and a negative R indicates a fund’s movements are inversely correlated with its benchmark index.
Coefficient of Determination (R-Square): R-Square, also represented as R2, is another measurement of investment risk that quantifies the degree to which a fund’s performance correlates with the performance of its benchmark index. R-Square is calculated by multiplying the Correlation Coefficient (R) by itself, and is therefore always positive. R-Square can vary between 0% (no correlation) and 100% (perfect correlation). The higher the value of R-Square, the greater the degree of correlation between the fund and its benchmark index. R-squared does not take into account the direction of the correlation (positive or negative), therefore R-Squared is not able to reflect inverse correlation between a fund and its benchmark index.
Beta: A measure of a fund’s sensitivity to market movements. Usually the higher betas represent riskier investments. When correlation is low, beta has minimal, if any, significance.
Standard deviation: A statistical measure of dispersion about an average, indicating the volatility of a fund’s total returns.
Sharpe Ratio: The Sharpe Ratio is calculated by subtracting the risk-free (T-bill) rate of return from a portfolio’s total return and then dividing this by its standard deviation. The resulting fraction can be thought of as return per unit of risk. The higher a portfolio’s Sharpe Ratio, the better the risk-adjusted performance.
Semi-variance: A measure of a fund’s downside (negative return) volatility relative to a benchmark. Lower numbers are associated with less risk.
Index Definition:
S&P 500 Total Return Index: The S&P 500 Total Return Index is a capitalization-weighted, unmanaged index of 500 large U.S. companies chosen for market size, liquidity and industry group representation and includes reinvested dividends. You cannot invest directly in an index.
Other Definition:
QE2: QE2 is the name Wall Street has given to the Federal Reserve’s second round of quantitative easing, a monetary policy whereby the Fed buys securities in the open market (in this case Treasury bonds) in an effort to stimulate the economy.
| | |
Annual Report | April 30, 2011 | | 5 |
| | |
Caldwell & Orkin Market Opportunity Fund | | Performance Summary |
| | April 30, 2011 |
| | | | |
Fiscal Year Ended April 30, | | C&O Market Opportunity Fund(1) | | S&P 500 Total Return Index(2) |
1991 | | 1.25% | | 0.42% |
1992 | | 11.96% | | 14.03% |
1993* | | 15.09% | | 9.24% |
1993** | | 21.09% | | 9.18% |
1994 | | 16.48% | | 5.32% |
1995 | | -2.28% | | 17.47% |
1996 | | 31.80% | | 30.21% |
1997 | | 23.24% | | 25.13% |
1998 | | 25.77% | | 41.07% |
1999 | | 19.43% | | 21.82% |
2000 | | -0.02% | | 10.13% |
| | | | |
Total Return Through April 30, 2011 | | | | |
6 months ended | | 1.77% | | 16.36% |
12 months ended | | 0.41% | | 17.22% |
Since 8/24/92(3) | | 378.58% | | 378.88% |
| | | | |
Fiscal Year Ended April 30, | | C&O Market Opportunity Fund(1) | | S&P 500 Total Return Index(2) |
2001 | | 11.43% | | -12.97% |
2002 | | 1.88% | | -12.63% |
2003 | | 1.12% | | -13.31% |
2004 | | -3.55% | | 22.88% |
2005 | | -0.17% | | 6.34% |
2006 | | -2.74% | | 15.42% |
2007 | | 15.31% | | 15.24% |
2008 | | 17.92% | | -4.68% |
2009 | | 4.73% | | -35.31% |
2010 | | -7.40% | | 38.84% |
2011 | | 0.41% | | 17.22% |
| | | | |
Average Annual Returns Through April 30, 2011 | | | | |
One Year | | 0.41% | | 17.22% |
Three Years | | -0.88% | | 1.73% |
Five Years | | 5.78% | | 2.95% |
Ten Years | | 2.48% | | 2.82% |
Since 8/24/92(3) | | 8.73% | | 8.74% |
Total annualized Fund operating expenses for the Fund’s fiscal year ended April 30, 2011 were 2.04%, or 1.19% before interest expenses and dividend expenses related to short sales. This figure does not include Acquired Fund Fees and Expenses. Additional information about the Fund’s fees and expenses is available in the Fund’s prospectus.
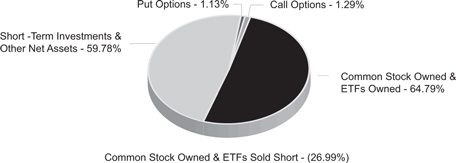
Net Asset Allocation
April 30, 2011
| | |
6 | | 1-800-467-7903 | www.CaldwellOrkinFunds.com |
| | |
Caldwell & Orkin Market Opportunity Fund | | Performance Summary |
| | April 30, 2011 |
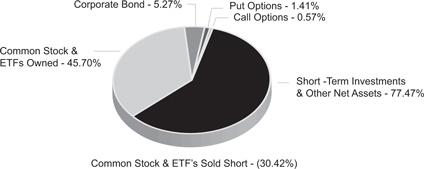
Net Asset Allocation
October 31, 2010
| 1 | The performance data quoted represents past performance. Past performance is no guarantee of future results. The investment return and principal value of an investment in the Fund will fluctuate so that an investor’s shares, when redeemed, may be worth more or less than their original cost. Current performance may be higher or lower than the performance data quoted. Please call 800-377-7073 or visit www.CaldwellOrkin.com for current month-end performance. The Fund’s performance assumes the reinvestment of dividends and capital gains, if any. Fund holdings, industry and asset allocations are subject to change without notice. See additional important disclosures on pages 4 and 5. |
Fund holdings, industry and asset allocations are subject to change without notice. The Fund may or may not have a position in any of the companies mentioned in this report as of the date of this report.
| 2 | Investors should expect that the Fund’s performance may fluctuate independently of stock market indices, such as the S&P 500 Total Return index. The S&P 500 Total Return index is a widely recognized unmanaged index of 500 common stock prices adjusted to reflect the reinvestment of dividends and distributions. You may not invest directly in an index. |
| 3 | Effective August 24, 1992, the Fund changed its investment objective to provide long-term capital growth with a short-term focus on capital preservation through investment selection and asset allocation. Prior to that time, the Fund was passively managed and indexed to the largest 100 over-the- counter (OTC) stocks. |
| * | For the full fiscal year ended April 30, 1993. |
| ** | From August 24, 1992 through April 30, 1993 - the portion of the year using the active investment management style of C&O Funds Advisor, Inc., the manager of the Fund. |
| | |
Annual Report | April 30, 2011 | | 7 |
| | |
Caldwell & Orkin Market Opportunity Fund | | Statistical Risk Profile |
| | April 30, 2011 |
| | | | | | | | |
| Ten Worst S&P 500 Total Return Days |
| Date | | C&O MOF | | S&P 500 | | Variance | | The Caldwell & Orkin
Market Opportunity Fund
outperformed the S&P 500
Total Return index on all ten
of the ten worst days, and
was positive on three of the
ten days. |
10/15/08 | | -1.47% | | -9.02% | | 7.55% | |
12/1/08 | | -1.58% | | -8.92% | | 7.34% | |
9/29/08 | | -0.37% | | -8.78% | | 8.41% | |
10/9/08 | | -2.12% | | -7.61% | | 5.49% | |
10/27/97 | | -1.60% | | -6.89% | | 5.29% | |
8/31/98 | | 0.42% | | -6.79% | | 7.21% | |
11/20/08 | | 0.23% | | -6.70% | | 6.93% | |
11/19/08 | | -0.28% | | -6.10% | | 5.82% | |
10/22/08 | | -1.11% | | -6.09% | | 4.98% | |
4/14/00 | | 1.81% | | -5.82% | | 7.63% | |
| | | | | | | | |
| Ten Worst S&P 500 Total Return Weeks |
| Week Ending | | C&O MOF | | S&P 500 | | Variance | | The Caldwell & Orkin
Market Opportunity Fund
outperformed the S&P 500
Total Return index in all ten
of the ten worst weeks, and
was positive in seven of
those weeks. |
10/10/08 | | -2.71% | | -18.14% | | 15.43% | |
9/21/01 | | 1.63% | | -11.57% | | 13.20% | |
4/14/00 | | 4.51% | | -10.52% | | 15.03% | |
10/3/08 | | 1.83% | | -9.33% | | 11.16% | |
11/21/08 | | 0.56% | | -8.33% | | 8.89% | |
7/19/02 | | 0.65% | | -7.96% | | 8.61% | |
3/6/09 | | -0.88% | | -6.96% | | 6.08% | |
7/12/02 | | 1.01% | | -6.81% | | 7.82% | |
2/20/09 | | 0.20% | | -6.80% | | 7.00% | |
10/24/08 | | -0.28% | | -6.72% | | 6.44% | |
| | | | | | | | |
| Ten Worst S&P 500 Total Return Months |
Month | | C&O MOF | | S&P 500 | | Variance | | The Caldwell & Orkin Market Opportunity Fund outperformed the S&P 500 Total Return index in all ten of the ten worst months, and was positive in seven of those months. |
10/31/08 | | 3.42% | | -16.74% | | 20.16% | |
8/31/98 | | 3.12% | | -14.46% | | 17.58% | |
9/30/02 | | 2.10% | | -10.86% | | 12.96% | |
2/28/09 | | 0.30% | | -10.71% | | 11.01% | |
2/28/01 | | 4.78% | | -9.13% | | 13.91% | |
9/30/08 | | -0.42% | | -8.89% | | 8.47% | |
6/30/08 | | 4.84% | | -8.43% | | 13.27% | |
1/31/09 | | -0.73% | | -8.30% | | 7.57% | |
9/30/01 | | 3.29% | | -8.06% | | 11.35% | |
5/31/10 | | -2.55% | | -8.04% | | 5.49% | |
Short selling began May 2, 1994. Past performance is no guarantee of future results. See additional important disclosures on pages 4 and 5. Computations by Ned Davis Research, Inc.
| | |
8 | | 1-800-467-7903 | www.CaldwellOrkinFunds.com |
| | |
Caldwell & Orkin Market Opportunity Fund | | Statistical Risk Profile |
| | April 30, 2011 |
| | | | | | | | | | | | | | | | | | | | |
| Ten Worst Drawdowns | |
| Caldwell & Orkin Market Opportunity Fund | | | | | S&P 500 Total Return Index | |
| Date Range | | C&O MOF | | | S&P 500 | | | | Date Range | | C&O MOF | | | S&P 500 | |
01/17/2008 - 05/07/2010 | | | -15.71% | | | | -11.68% | | | | 10/09/2007 - 03/09/2009 | | | -0.61% | | | | -55.26% | |
04/12/1999 - 11/23/1999 | | | -13.24% | | | | 4.23% | | | | 03/24/2000 - 10/09/2002 | | | 28.57% | | | | -47.41% | |
10/09/2002 - 05/25/2006 | | | -13.12% | | | | 74.17% | | | | 07/17/1998 - 08/31/1998 | | | 4.02% | | | | -19.19% | |
05/26/2000 - 06/07/2000 | | | -8.15% | | | | 6.81% | | | | 04/23/2010 - 07/02/2010 | | | -1.52% | | | | -15.67% | |
12/29/2000 - 01/19/2001 | | | -8.06% | | | | 1.75% | | | | 11/27/2002 - 03/11/2003 | | | 2.19% | | | | -14.28% | |
04/04/2001 - 03/11/2002 | | | -7.98% | | | | 7.22% | | | | 07/16/1999 - 10/15/1999 | | | -0.45% | | | | -11.78% | |
03/15/1993 - 04/26/1993 | | | -7.83% | | | | -3.65% | | | | 10/07/1997 - 10/27/1997 | | | 0.18% | | | | -10.74% | |
03/18/1994 - 02/03/1995 | | | -7.68% | | | | 4.21% | | | | 09/23/1998 - 10/08/1998 | | | 2.02% | | | | -9.94% | |
04/10/2007 - 05/24/2007 | | | -7.14% | | | | 4.31% | | | | 02/18/1997 - 04/11/1997 | | | 2.72% | | | | -9.39% | |
10/07/1998 - 11/05/1998 | | | -6.41% | | | | 16.95% | | | | 07/19/2007 - 08/15/2007 | | | 7.66% | | | | -9.30% | |
| | | | |
Statistical Risk Measurements 8/24/1992 through 4/30/2011 (daily data) |
| | |
| | | C&O MOF | | S&P 500 |
Coefficient of Determination (R-Square) | | 0.01% | | 100.00% |
Correlation Coefficient (R) | | 1.03% | | 100.00% |
Beta | | 0.004 | | 1.000 |
Standard Deviation | | 0.513 | | 1.200 |
Sharpe Ratio | | 0.66 | | 0.36 |
Semi-Variance (downside volatility) | | 0.13 | | 0.71 |
| | | | |
| Performance During the Last Three Market Downturns of 20% or More |
| | | C&O MOF | | S&P 500 |
01/06/2009 - 03/09/2009 | | -3.42% | | -27.19% |
10/09/2007 - 11/20/2008 | | 1.80% | | -50.73% |
01/04/2002 - 10/09/2002 | | 7.25% | | -32.95% |
Short selling began May 2, 1994. Past performance is no guarantee of future results. See additional important disclosures on pages 4 and 5. Computations by Ned Davis Research, Inc.
| | |
Annual Report | April 30, 2011 | | 9 |
| | |
Caldwell & Orkin Market Opportunity Fund | | Growth of $10,000 |
| | April 30, 2011 |
Caldwell & Orkin Market Opportunity Fund Versus S&P 500 Total Return Index
Since Commencement of Active Style of Investment Management Results of a Hypothetical $10,000 Investment August 24, 1992 through April 30, 2011
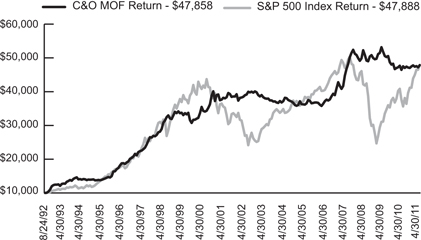
Past performance does not predict future performance. The returns do not reflect the deduction of taxes that a shareholder would pay on Fund distributions or the redemption of Fund shares. See additional disclosure on pages 4 and 5.
| | |
10 | | 1-800-467-7903 | www.CaldwellOrkinFunds.com |
| | |
Caldwell & Orkin Market Opportunity Fund | | Disclosure of Fund Expenses |
| | April 30, 2011 (Unaudited) |
We believe it is important for you to understand the impact of fees and expenses on your investment in the Fund. As a shareholder of the Fund, you incur two types of costs: (1) transaction costs related to the purchase and redemption of Fund shares, including redemption fees and brokerage commissions (if applicable); and (2) ongoing costs, including management fees, administrative expenses, portfolio transaction costs and other Fund expenses. A mutual fund’s ongoing costs are expressed as a percentage of its average net assets. This figure is known as the expense ratio. The following example is intended to help you understand your ongoing costs (in dollars and cents) of investing in the Fund and to compare these costs with the ongoing costs of investing in other mutual funds.
The below example is based on an investment of $1,000.00 invested at the beginning of the period and held for the entire period indicated, November 1, 2010 through April 30, 2011. The table below illustrates the Fund’s expenses in two ways:
Based on Actual Fund Returns
The first line of the table below provides information about actual account values and actual expenses. You may use the information in this line, together with the amount you invested, to estimate the expenses that you paid over the period. Simply divide your account value by $1,000 (for example, an $8,600 account value divided by $1,000 = 8.6), then multiply the result by the number in the first line under the heading entitled “Expenses Paid During Period” to estimate the expenses you paid on your account during this period.
Based on a Hypothetical 5% Return for Comparison Purposes
The second line of the table below provides information about hypothetical account values and hypothetical expenses based on the Fund’s actual expense ratio and an assumed rate of return of 5% per year before expenses, which is not the Fund’s actual return. The hypothetical account values and expenses may not be used to estimate the actual ending account balance or expenses you paid for the period. You may use this information to compare the ongoing costs of investing in the Fund and other funds. To do so, compare this 5% hypothetical example with the 5% hypothetical examples that appear in the shareholder reports of the other funds.
Please note that the expenses shown in the table are meant to highlight your ongoing costs only and do not reflect any transactional costs, such as redemption fees or brokerage commissions. Therefore, the second line of the table is useful in comparing ongoing costs only, and will not help you determine the relative total costs of owning different funds. In addition, if these transactional costs were included, your costs would have been higher.
| | | | | | | | |
| | | Beginning Account Value 11/01/2010 | | Ending Account Value 04/30/2011 | | Expense Ratio1 | | Expenses Paid During Period2 |
Actual3 | | $1,000.00 | | $ 1,017.70 | | 2.18% | | $10.91 |
Hypothetical (5% return before expenses)4 | | $1,000.00 | | $ 1,013.98 | | 2.18% | | $10.89 |
| 1 | The annualized expense ratio reflects actual expenses from the Fund from 11/1/2010-4/30/2011, as a percentage of average net assets for that period. |
| 2 | Expenses are equal to the Caldwell & Orkin Market Opportunity Fund’s annualized expense ratio of 2.18% multiplied by the average account value over the period, multiplied by the number of days in the most recent fiscal half year (181), divided by 365 (to reflect the half- year period.) |
| | |
Annual Report | April 30, 2011 | | 11 |
| | |
Caldwell & Orkin Market Opportunity Fund | | Disclosure of Fund Expenses |
| | April 30, 2011 (Unaudited) |
| 3 | Excluding interest expense and dividend expense from short positions, your actual cost of investment in the Fund would be $6.00 |
| 4 | Excluding interest expense and dividend expense from short positions, your hypothetical cost of investment in the Fund would be $6.01 |
| | |
12 | | 1-800-467-7903 | www.CaldwellOrkinFunds.com |
| | |
Caldwell & Orkin Market Opportunity Fund | | Sector Diversification |
| | April 30, 2011 (Unaudited) |
The following table presents the Fund’s 4/30/2011 portfolio holdings by sector based on total net assets, sorted by net exposure (net long to net short).
| | | | | | | | | | | | | | | | |
| | | Long | | | Short | | | Total (a) | | | Net (b) | |
Electric - Integrated | | | 6.49 | % | | | | | | | 6.49 | % | | | 6.49 | % |
Oil Companies - Exploration & Production | | | 6.11 | % | | | | | | | 6.11 | % | | | 6.11 | % |
Transportation - Rail | | | 3.63 | % | | | | | | | 3.63 | % | | | 3.63 | % |
Medical - HMO | | | 3.59 | % | | | | | | | 3.59 | % | | | 3.59 | % |
Medical - Biomedical/Genetics | | | 3.14 | % | | | | | | | 3.14 | % | | | 3.14 | % |
Retail - Building Products | | | 2.58 | % | | | | | | | 2.58 | % | | | 2.58 | % |
Oil - Field Services | | | 2.17 | % | | | | | | | 2.17 | % | | | 2.17 | % |
Retail - Auto Parts | | | 2.09 | % | | | | | | | 2.09 | % | | | 2.09 | % |
Electronic Components - Semiconductors | | | 1.81 | % | | | | | | | 1.81 | % | | | 1.81 | % |
Non-Hazardous Waste Disposal | | | 1.64 | % | | | | | | | 1.64 | % | | | 1.64 | % |
Diversified Banking Institution | | | 1.59 | % | | | | | | | 1.59 | % | | | 1.59 | % |
Cellular Telecommunication | | | 1.45 | % | | | | | | | 1.45 | % | | | 1.45 | % |
Medical Products | | | 1.29 | % | | | | | | | 1.29 | % | | | 1.29 | % |
Beverages - Non-alcoholic | | | 1.18 | % | | | | | | | 1.18 | % | | | 1.18 | % |
Reinsurance | | | 1.16 | % | | | | | | | 1.16 | % | | | 1.16 | % |
Applications Software | | | 1.15 | % | | | | | | | 1.15 | % | | | 1.15 | % |
Super-Regional Banks - U.S. | | | 1.14 | % | | | | | | | 1.14 | % | | | 1.14 | % |
Building - Heavy Construction | | | 1.13 | % | | | | | | | 1.13 | % | | | 1.13 | % |
Oil & Gas Drilling | | | 1.08 | % | | | | | | | 1.08 | % | | | 1.08 | % |
Human Resources | | | 1.07 | % | | | | | | | 1.07 | % | | | 1.07 | % |
Electric - Transmission | | | 1.03 | % | | | | | | | 1.03 | % | | | 1.03 | % |
Airlines | | | 1.00 | % | | | | | | | 1.00 | % | | | 1.00 | % |
Industrial Gases | | | 0.93 | % | | | | | | | 0.93 | % | | | 0.93 | % |
Physical Therapy/Rehab Centers | | | 0.93 | % | | | | | | | 0.93 | % | | | 0.93 | % |
Hazardous Waste Disposal | | | 0.85 | % | | | | | | | 0.85 | % | | | 0.85 | % |
Diversified Financial Services | | | 0.82 | % | | | | | | | 0.82 | % | | | 0.82 | % |
Automotive-Cars Light Trucks | | | 0.81 | % | | | | | | | 0.81 | % | | | 0.81 | % |
Multi-Media | | | 0.62 | % | | | | | | | 0.62 | % | | | 0.62 | % |
Wireless Equipment | | | 0.59 | % | | | | | | | 0.59 | % | | | 0.59 | % |
Machinery-Construction/Mining | | | 0.58 | % | | | | | | | 0.58 | % | | | 0.58 | % |
Engines - Internal Combustion | | | 0.57 | % | | | | | | | 0.57 | % | | | 0.57 | % |
Gold Mining | | | 0.53 | % | | | | | | | 0.53 | % | | | 0.53 | % |
Enterprise Software/Services | | | 0.52 | % | | | | | | | 0.52 | % | | | 0.52 | % |
Diversified Manufacturing Operations | | | 0.51 | % | | | | | | | 0.51 | % | | | 0.51 | % |
Engineering/R&D Services | | | 0.51 | % | | | | | | | 0.51 | % | | | 0.51 | % |
Retail - Gardening Products | | | 0.50 | % | | | | | | | 0.50 | % | | | 0.50 | % |
Commerical Service/Financial | | | 0.45 | % | | | -0.00 | %* | | | 0.45 | % | | | 0.45 | % |
Telecommunication Equipment | | | 0.44 | % | | | | | | | 0.44 | % | | | 0.44 | % |
Computers-Memory Devices | | | 0.43 | % | | | | | | | 0.43 | % | | | 0.43 | % |
Broadcast Services/Programming | | | 0.43 | % | | | | | | | 0.43 | % | | | 0.43 | % |
Retail - Drug Store | | | 0.42 | % | | | | | | | 0.42 | % | | | 0.42 | % |
Chemicals - Diversified | | | 0.41 | % | | | | | | | 0.41 | % | | | 0.41 | % |
Retail - Restaurants | | | 0.40 | % | | | | | | | 0.40 | % | | | 0.40 | % |
Semiconductor Components/Integrated Circuits | | | 0.37 | % | | | | | | | 0.37 | % | | | 0.37 | % |
| | |
Annual Report | April 30, 2011 | | 13 |
| | |
Caldwell & Orkin Market Opportunity Fund | | Sector Diversification |
| | April 30, 2011 (Unaudited) |
| | | | | | | | | | | | | | | | |
| | | Long | | | Short | | | Total (a) | | | Net (b) | |
Aerospace/Defense | | | 0.32% | | | | | | | | 0.32% | | | | 0.32% | |
Telecom Services | | | 0.25% | | | | | | | | 0.25% | | | | 0.25% | |
Rental Auto/Equipment | | | 0.22% | | | | | | | | 0.22% | | | | 0.22% | |
Metal - Aluminum | | | 0.20% | | | | | | | | 0.20% | | | | 0.20% | |
Networking Products | | | 0.19% | | | | | | | | 0.19% | | | | 0.19% | |
Automotive/Truck Parts & Equipment | | | 0.13% | | | | | | | | 0.13% | | | | 0.13% | |
Real Estate Management/Services | | | | | | | -0.37% | | | | 0.37% | | | | -0.37% | |
Educational Software | | | | | | | -0.41% | | | | 0.41% | | | | -0.41% | |
Paper & Related Products | | | | | | | -0.41% | | | | 0.41% | | | | -0.41% | |
Steel - Producers | | | | | | | -0.48% | | | | 0.48% | | | | -0.48% | |
Internet Infrastructure Software | | | | | | | -0.50% | | | | 0.50% | | | | -0.50% | |
Recreational Centers | | | | | | | -0.58% | | | | 0.58% | | | | -0.58% | |
Appliances | | | | | | | -0.71% | | | | 0.71% | | | | -0.71% | |
Computers | | | 0.99% | | | | -1.71% | | | | 2.70% | | | | -0.72% | |
Footwear (Non-Athletic) & Related Apparel | | | | | | | -0.86% | | | | 0.86% | | | | -0.86% | |
Retail - Apparel/Shoe | | | | | | | -0.96% | | | | 0.96% | | | | -0.96% | |
Industrial Audio & Video Products | | | | | | | -1.00% | | | | 1.00% | | | | -1.00% | |
Medical - Outpatient/Home Medical Care | | | | | | | -1.04% | | | | 1.04% | | | | -1.04% | |
Commerical Banks - Non-U.S. | | | | | | | -3.07% | | | | 3.07% | | | | -3.07% | |
Schools | | | | | | | -5.38% | | | | 5.38% | | | | -5.38% | |
Subtotal Common Stocks (long & short positions) | | | 62.44% | | | | -17.48% | | | | 79.92% | | | | 44.96% | |
| | | | |
Exchange Traded Fund - SPDR Gold Shares | | | 1.27% | | | | | | | | 1.27% | | | | 1.27% | |
Exchange Traded Fund - Market Vectors Gold Miners | | | 1.08% | | | | | | | | 1.08% | | | | 1.08% | |
Exchange Traded Fund - Country Fund - Thailand | | | | | | | -0.25% | | | | 0.25% | | | | -0.25% | |
Exchange Traded Fund - Emerging Market - Equity | | | | | | | -0.55% | | | | 0.55% | | | | -0.55% | |
Exchange Traded Fund - Country Fund - Brazil | | | | | | | -0.63% | | | | 0.63% | | | | -0.63% | |
Exchange Traded Fund - Country Fund - Singapore | | | | | | | -0.66% | | | | 0.66% | | | | -0.66% | |
Exchange Traded Fund - Country Fund - India | | | | | | | -1.01% | | | | 1.01% | | | | -1.01% | |
Exchange Traded Fund - Country Fund - Spain | | | | | | | -1.16% | | | | 1.16% | | | | -1.16% | |
Exchange Traded Fund - Country Fund - Hong Kong | | | | | | | -1.17% | | | | 1.17% | | | | -1.17% | |
Exchange Traded Fund - Country Fund - China | | | | | | | -1.29% | | | | 1.29% | | | | -1.29% | |
Exchange Traded Fund - U.S. Treasury Bond Fund | | | | | | | -2.79% | | | | 2.79% | | | | -2.79% | |
Subtotal Exchange - Traded Funds (long & short positions) | | | 2.35% | | | | -9.51% | | | | 11.86% | | | | -7.16% | |
Subtotal Equities (long & short positions) | | | 64.79% | | | | -26.99% | | | | 91.78% | | | | 37.80% | |
| | | | |
Call Options | | | 1.29% | | | | | | | | 1.29% | | | | | |
Put Options | | | 1.13% | | | | | | | | 1.13% | | | | | |
Other Assets less Liabilities | | | 5.80% | | | | | | | | 5.80% | | | | | |
Total Portfolio Holdings | | | 73.01% | | | | -26.99% | | | | 100.00% | | | | | |
* Less than 0.005% of net assets.
(a) Total exposure is Long exposure plus the absolute value of the Short exposure.
(b) Net exposure is Long exposure less Short exposure.
| | |
14 | | 1-800-467-7903 | www.CaldwellOrkinFunds.com |
| | |
Caldwell & Orkin Market Opportunity Fund | | Schedule of Investments |
| | April 30, 2011 |
| | | | | | | | |
| | | Shares | | | Value (Note 1) | |
LONG INVESTMENTS (67.21%) | | | | | | | | |
COMMON STOCKS (62.44%) | | | | | | | | |
Aerospace/Defense (0.32%) | | | | | | | | |
The Boeing Co. | | | 13,200 | | | $ | 1,053,096 | |
| | | | | | | | |
| | |
Airlines (1.00%) | | | | | | | | |
Southwest Airlines Co. | | | 282,500 | | | | 3,319,375 | |
| | | | | | | | |
| | |
Applications Software (1.15%) | | | | | | | | |
Check Point Software Technologies, Ltd.1 | | | 69,500 | | | | 3,817,635 | |
| | | | | | | | |
| | |
Automotive - Cars Light Trucks (0.81%) | | | | | | | | |
Ford Motor Co.1 | | | 174,200 | | | | 2,694,874 | |
| | | | | | | | |
| | |
Automotive/Truck Parts & Equipment (0.13%) | | | | | | | | |
Tenneco, Inc.1 | | | 9,500 | | | | 438,995 | |
| | | | | | | | |
| | |
Beverages - Non-Alcoholic (1.18%) | | | | | | | | |
The Coca-Cola Co. | | | 58,000 | | | | 3,912,680 | |
| | | | | | | | |
| | |
Broadcast Services/Programming (0.43%) | | | | | | | | |
Discovery Communications, Inc. - Class A1 | | | 32,000 | | | | 1,416,320 | |
| | | | | | | | |
| | |
Building - Heavy Construction (1.13%) | | | | | | | | |
Chicago Bridge & Iron Co. NV | | | 93,000 | | | | 3,770,220 | |
| | | | | | | | |
| | |
Cellular Telecommunication (1.45%) | | | | | | | | |
MetroPCS Communications, Inc.1 | | | 20,300 | | | | 341,649 | |
Vodafone Group PLC Sponsored ADR | | | 153,600 | | | | 4,472,832 | |
| | | | | | | | |
| | | | | | | 4,814,481 | |
| | | | | | | | |
| | |
Chemicals - Diversified (0.41%) | | | | | | | | |
E.I. du Pont de Nemours & Co. | | | 23,900 | | | | 1,357,281 | |
| | | | | | | | |
| | |
Commercial Service/Financial (0.45%) | | | | | | | | |
Automatic Data Processing, Inc. | | | 27,500 | | | | 1,494,625 | |
| | | | | | | | |
| | |
Computers (0.99%) | | | | | | | | |
Apple, Inc.1 | | | 9,500 | | | | 3,308,185 | |
| | | | | | | | |
| | |
Annual Report | April 30, 2011 | | 15 |
| | |
Caldwell & Orkin Market Opportunity Fund | | Schedule of Investments |
| | April 30, 2011 |
| | | | | | | | |
| | | Shares | | | Value (Note 1) | |
Computers - Memory Devices (0.43%) | | | | | | | | |
EMC Corp.1 | | | 50,400 | | | $ | 1,428,336 | |
| | | | | | | | |
| | |
Diversified Banking Institution (1.59%) | | | | | | | | |
Citigroup, Inc.1 | | | 645,500 | | | | 2,962,845 | |
JPMorgan Chase & Co. | | | 51,200 | | | | 2,336,256 | |
| | | | | | | | |
| | | | | | | 5,299,101 | |
| | | | | | | | |
| | |
Diversified Financial Services (0.82%) | | | | | | | | |
CIT Group, Inc.1 | | | 64,100 | | | | 2,721,686 | |
| | | | | | | | |
| | |
Diversified Manufacturing Operations (0.51%) | | | | | | | | |
Eaton Corp. | | | 31,500 | | | | 1,686,195 | |
| | | | | | | | |
| | |
Electric - Integrated (6.49%) | | | | | | | | |
CMS Energy Corp. | | | 521,100 | | | | 10,317,780 | |
Edison International | | | 51,600 | | | | 2,026,332 | |
OGE Energy Corp. | | | 105,100 | | | | 5,588,167 | �� |
PPL Corp. | | | 133,260 | | | | 3,655,322 | |
| | | | | | | | |
| | | | | | | 21,587,601 | |
| | | | | | | | |
| | |
Electric - Transmission (1.03%) | | | | | | | | |
National Grid PLC Sponsored ADR | | | 67,000 | | | | 3,439,110 | |
| | | | | | | | |
| | |
Electronic Components - Semiconductors (1.81%) | | | | | | | | |
ARM Holdings PLC Sponsored ADR | | | 36,900 | | | | 1,160,874 | |
Micron Technology, Inc.1 | | | 148,000 | | | | 1,670,920 | |
Netlogic Microsystems, Inc.1 | | | 17,800 | | | | 767,714 | |
Skyworks Solutions, Inc.1 | | | 76,700 | | | | 2,412,982 | |
| | | | | | | | |
| | | | | | | 6,012,490 | |
| | | | | | | | |
| | |
Engineering/R&D Services (0.51%) | | | | | | | | |
KBR, Inc. | | | 44,600 | | | | 1,711,302 | |
| | | | | | | | |
| | |
Engines - Internal Combustion (0.57%) | | | | | | | | |
Cummins, Inc. | | | 15,800 | | | | 1,898,844 | |
| | | | | | | | |
| | |
Enterprise Software/Services (0.52%) | | | | | | | | |
Oracle Corp. | | | 48,300 | | | | 1,741,215 | |
| | | | | | | | |
| | |
Gold Mining (0.53%) | | | | | | | | |
Barrick Gold Corp. | | | 9,800 | | | | 499,898 | |
| | |
16 | | 1-800-467-7903 | www.CaldwellOrkinFunds.com |
| | |
Caldwell & Orkin Market Opportunity Fund | | Schedule of Investments |
| | April 30, 2011 |
| | | | | | | | |
| | | Shares | | | Value (Note 1) | |
Gold Mining (continued) | | | | | | | | |
Goldcorp, Inc. | | | 22,700 | | | $ | 1,267,341 | |
| | | | | | | | |
| | | | | | | 1,767,239 | |
| | | | | | | | |
| | |
Hazardous Waste Disposal (0.85%) | | | | | | | | |
Clean Harbors, Inc.1 | | | 28,900 | | | | 2,846,650 | |
| | | | | | | | |
| | |
Human Resources (1.07%) | | | | | | | | |
Manpower, Inc. | | | 53,700 | | | | 3,557,625 | |
| | | | | | | | |
| | |
Industrial Gases (0.93%) | | | | | | | | |
Airgas, Inc. | | | 44,400 | | | | 3,083,580 | |
| | | | | | | | |
| | |
Machinery - Construction/Mining (0.58%) | | | | | | | | |
Caterpillar, Inc. | | | 16,700 | | | | 1,927,347 | |
| | | | | | | | |
| | |
Medical - Biomedical/Genetics (3.14%) | | | | | | | | |
Vertex Pharmaceuticals, Inc.1 | | | 190,100 | | | | 10,459,302 | |
| | | | | | | | |
| | |
Medical - HMO (3.59%) | | | | | | | | |
Aetna, Inc. | | | 42,400 | | | | 1,754,512 | |
AMERIGROUP Corp.1 | | | 61,000 | | | | 4,166,300 | |
Healthspring, Inc.1 | | | 118,400 | | | | 4,912,416 | |
UnitedHealth Group, Inc. | | | 22,500 | | | | 1,107,675 | |
| | | | | | | | |
| | | | | | | 11,940,903 | |
| | | | | | | | |
| | |
Medical Products (1.29%) | | | | | | | | |
CareFusion Corp.1 | | | 146,400 | | | | 4,299,768 | |
| | | | | | | | |
| | |
Metal - Aluminum (0.20%) | | | | | | | | |
Alcoa, Inc. | | | 39,200 | | | | 666,400 | |
| | | | | | | | |
| | |
Multi-Media (0.62%) | | | | | | | | |
The Walt Disney Co. | | | 48,100 | | | | 2,073,110 | |
| | | | | | | | |
| | |
Networking Products (0.19%) | | | | | | | | |
Juniper Networks, Inc.1 | | | 16,400 | | | | 628,612 | |
| | | | | | | | |
| | |
Non-Hazardous Waste Disposal (1.64%) | | | | | | | | |
IESI-BFC, Ltd. | | | 71,500 | | | | 1,811,810 | |
| | |
Annual Report | April 30, 2011 | | 17 |
| | |
Caldwell & Orkin Market Opportunity Fund | | Schedule of Investments |
| | April 30, 2011 |
| | | | | | | | |
| | | Shares | | | Value (Note 1) | |
Non-Hazardous Waste Disposal (continued) | | | | | | | | |
Waste Connections, Inc. | | | 118,800 | | | $ | 3,655,476 | |
| | | | | | | | |
| | | | | | | 5,467,286 | |
| | | | | | | | |
| | |
Oil - Field Services (2.17%) | | | | | | | | |
Global Industries, Ltd.1 | | | 36,000 | | | | 354,960 | |
Halliburton Co. | | | 70,300 | | | | 3,548,744 | |
Weatherford International, Ltd.1 | | | 154,000 | | | | 3,323,320 | |
| | | | | | | | |
| | | | | | | 7,227,024 | |
| | | | | | | | |
| | |
Oil Companies - Exploration & Production (6.11%) | | | | | | | | |
Comstock Resources, Inc.1 | | | 49,600 | | | | 1,590,176 | |
Devon Energy Corp. | | | 18,700 | | | | 1,701,700 | |
Energy XXI Bermuda, Ltd.1 | | | 58,400 | | | | 2,117,000 | |
Petrohawk Energy Corp.1 | | | 140,800 | | | | 3,803,008 | |
QEP Resources, Inc. | | | 90,400 | | | | 3,862,792 | |
Southwestern Energy Co.1 | | | 80,300 | | | | 3,521,958 | |
Ultra Petroleum Corp.1 | | | 73,800 | | | | 3,748,302 | |
| | | | | | | | |
| | | | | | | 20,344,936 | |
| | | | | | | | |
| | |
Oil & Gas Drilling (1.08%) | | | | | | | | |
Ensco PLC Sponsored ADR | | | 60,300 | | | | 3,595,086 | |
| | | | | | | | |
| | |
Physical Therapy/Rehab Centers (0.93%) | | | | | | | | |
Healthsouth Corp.1 | | | 120,600 | | | | 3,090,978 | |
| | | | | | | | |
| | |
Reinsurance (1.16%) | | | | | | | | |
Greenlight Capital Re, Ltd. - Class A1 | | | 136,800 | | | | 3,850,920 | |
| | | | | | | | |
| | |
Rental Auto/Equipment (0.22%) | | | | | | | | |
Hertz Global Holdings, Inc.1 | | | 41,800 | | | | 719,378 | |
| | | | | | | | |
| | |
Retail - Auto Parts (2.09%) | | | | | | | | |
Advance Auto Parts, Inc. | | | 77,300 | | | | 5,060,058 | |
Copart, Inc.1 | | | 42,000 | | | | 1,905,540 | |
| | | | | | | | |
| | | | | | | 6,965,598 | |
| | | | | | | | |
| | |
Retail - Building Products (2.58%) | | | | | | | | |
Home Depot, Inc. | | | 137,400 | | | | 5,103,036 | |
Lowe’s Cos., Inc. | | | 132,100 | | | | 3,467,625 | |
| | | | | | | | |
| | | | | | | 8,570,661 | |
| | | | | | | | |
| | |
18 | | 1-800-467-7903 | www.CaldwellOrkinFunds.com |
| | |
Caldwell & Orkin Market Opportunity Fund | | Schedule of Investments |
| | April 30, 2011 |
| | | | | | | | |
| | | Shares | | | Value (Note 1) | |
Retail - Drug Store (0.42%) | | | | | | | | |
Walgreen Co. | | | 32,500 | | | $ | 1,388,400 | |
| | | | | | | | |
| | |
Retail - Gardening Products (0.50%) | | | | | | | | |
Tractor Supply Co. | | | 26,900 | | | | 1,664,303 | |
| | | | | | | | |
| | |
Retail - Restaurants (0.40%) | | | | | | | | |
Starbucks Corp. | | | 36,400 | | | | 1,317,316 | |
| | | | | | | | |
| | |
Semiconductor Components/Integrated Circuits (0.37%) | | | | | | | | |
Atmel Corp.1 | | | 79,500 | | | | 1,216,350 | |
| | | | | | | | |
| | |
Super - Regional Banks - U.S. (1.14%) | | | | | | | | |
Capital One Financial Corp. | | | 69,400 | | | | 3,798,262 | |
| | | | | | | | |
| | |
Telecom Services (0.25%) | | | | | | | | |
BCE, Inc. | | | 21,900 | | | | 819,717 | |
| | | | | | | | |
| | |
Telecommunication Equipment (0.44%) | | | | | | | | |
Sonus Networks, Inc.1 | | | 374,900 | | | | 1,477,106 | |
| | | | | | | | |
| | |
Transportation - Rail (3.63%) | | | | | | | | |
Kansas City Southern1 | | | 74,300 | | | | 4,317,573 | |
Norfolk Southern Corp. | | | 64,500 | | | | 4,816,860 | |
Union Pacific Corp. | | | 28,600 | | | | 2,959,242 | |
| | | | | | | | |
| | | | | | | 12,093,675 | |
| | | | | | | | |
| | |
Wireless Equipment (0.59%) | | | | | | | | |
QUALCOMM, Inc. | | | 34,700 | | | | 1,972,348 | |
| | | | | | | | |
| | |
TOTAL COMMON STOCKS | | | | | | | | |
(Cost $186,429,939) | | | | | | | 207,753,527 | |
| | |
EXCHANGE TRADED FUNDS (2.35%) | | | | | | | | |
Market Vectors Gold Miners ETF | | | 57,800 | | | | 3,592,848 | |
SPDR Gold Shares1 | | | 27,600 | | | | 4,205,136 | |
| | | | | | | | |
| | | | | | | 7,797,984 | |
| | | | | | | | |
| | |
TOTAL EXCHANGE TRADED FUNDS | | | | | | | | |
(Cost $6,984,907) | | | | | | | 7,797,984 | |
| | |
Annual Report | April 30, 2011 | | 19 |
| | |
Caldwell & Orkin Market Opportunity Fund | | Schedule of Investments |
| | April 30, 2011 |
| | | | | | | | | | | | | | |
| | | Expiration Date | | Exercise Price | | | Number of
Contracts | | | Value (Note 1) | |
PURCHASED OPTIONS (2.42%) | | | | | | | | | | | | | | |
PURCHASED CALL OPTIONS (1.29%) | | | | | | | | | | | | | | |
Advance Auto Parts | | June, 2011 | | | $65.00 | | | | 1,922 | | | $ | 509,330 | |
Apple, Inc. | | July, 2011 | | | 330.00 | | | | 445 | | | | 1,239,325 | |
Capital One Financial Corp. | | June, 2011 | | | 50.00 | | | | 1,340 | | | | 703,500 | |
Healthspring, Inc. | | June, 2011 | | | 40.00 | | | | 1,528 | | | | 412,560 | |
Home Depot, Inc. | | May, 2011 | | | 31.00 | | | | 597 | | | | 367,155 | |
National Grid PLC | | June, 2011 | | | 45.00 | | | | 842 | | | | 496,780 | |
Vertex Pharmaceuticals, Inc. | | July, 2011 | | | 35.00 | | | | 279 | | | | 571,950 | |
| | | | | | | | | | | | | | |
| | | | |
TOTAL PURCHASED CALL OPTIONS | | | | | | | | | | | | | | |
(Cost $2,724,021) | | | | | | | | | | | | | 4,300,600 | |
| | | | | | | | | | | | | | |
| | | | |
PURCHASED PUT OPTIONS (1.13%) | | | | | | | | | | | | | | |
Aeropostale, Inc. | | July, 2011 | | | 25.00 | | | | 649 | | | | 81,125 | |
Blackboard, Inc. | | July, 2011 | | | 50.00 | | | | 610 | | | | 286,700 | |
iShares MSCI Brazil Index Fund | | June, 2011 | | | 76.00 | | | | 1,330 | | | | 267,330 | |
ITT Educational Services, Inc. | | July, 2011 | | | 75.00 | | | | 657 | | | | 476,325 | |
Oil Services HOLDRs Trust | | July, 2011 | | | 160.00 | | | | 941 | | | | 691,635 | |
PowerShares QQQ NASDAQ 100 Index Fund | | May, 2011 | | | 57.00 | | | | 7,885 | | | | 197,125 | |
PowerShares QQQ NASDAQ 100 Index Fund | | June, 2011 | | | 59.00 | | | | 3,550 | | | | 479,250 | |
SPDR S&P 500 Trust | | May, 2011 | | | 133.00 | | | | 3,790 | | | | 208,450 | |
SPDR S&P 500 Trust | | June, 2011 | | | 136.00 | | | | 1,715 | | | | 445,900 | |
The St Joe Co. | | September, 2011 | | | 25.00 | | | | 272 | | | | 61,200 | |
Strayer Education, Inc. | | October, 2011 | | | 125.00 | | | | 96 | | | | 132,480 | |
Urban Outfitters, Inc. | | June, 2011 | | | 35.00 | | | | 1,100 | | | | 418,000 | |
| | | | | | | | | | | | | | |
| | | | |
TOTAL PURCHASED PUT OPTIONS | | | | | | | | | | | | | | |
(Cost $6,354,435) | | | | | | | | | | | | | 3,745,520 | |
| | | | | | | | | | | | | | |
| | | | |
TOTAL PURCHASED OPTIONS | | | | | | | | | | | | | | |
(Cost $9,078,456) | | | | | | | | | | | | | 8,046,120 | |
TOTAL LONG INVESTMENTS | | | | | | | | | | | | | | |
(Cost $202,493,302) | | | | | | | | | | | | | 223,597,631 | |
| | |
20 | | 1-800-467-7903 | www.CaldwellOrkinFunds.com |
| | |
Caldwell & Orkin Market Opportunity Fund | | Schedule of Investments |
| | April 30, 2011 |
| | | | | | | | | | |
| | | 7-Day Yield | | Shares | | | Value (Note 1) | |
SHORT TERM INVESTMENTS (29.71%) | | | | | | | | | | |
MONEY MARKET FUNDS2 | | | | | | | | | | |
JPMorgan U.S. Treasury Plus Money Market Fund | | 0.00% 3 | | | 98,868,238 | | | $ | 98,868,238 | |
| | | |
TOTAL SHORT TERM INVESTMENTS | | | | | | | | | | |
(Cost $98,868,238) | | | | | | | | | 98,868,238 | |
| | | |
TOTAL INVESTMENTS - (96.92%) | | | | | | | | | | |
(Cost $301,361,540) | | | | | | | | $ | 322,465,869 | |
| | | |
Assets in Excess of Other Liabilities (3.08%) | | | | | | | | | 10,258,198 | |
| | | |
NET ASSETS (100.00%) | | | | | | | | $ | 332,724,067 | |
| | | |
| SCHEDULE OF SECURITIES SOLD SHORT | | | | Shares | | | Value (Note 1) | |
SECURITIES SOLD SHORT (-26.99%) | | | | | | | | | | |
COMMON STOCKS (-17.48%) | | | | | | | | | | |
Appliances (-0.71%) | | | | | | | | | | |
Whirlpool Corp. | | | | | (27,500 | ) | | $ | (2,369,950) | |
| | | | | | | | | | |
| | | |
Commercial Banks Non - U.S. (-3.07%) | | | | | | | | | | |
Banco Bilbao Vizcaya Argentaria SA Sponsored ADR | | | | | (173,600 | ) | | | (2,223,816) | |
Banco Santander SA Sponsored ADR | | | | | (299,300 | ) | | | (3,711,320) | |
ICICI Bank, Ltd., Sponsored ADR | | | | | (84,800 | ) | | | (4,273,920) | |
| | | | | | | | | | |
| | | | | | | | | (10,209,056) | |
| | | | | | | | | | |
| | | |
Commercial Service/Financial (-0.00%)† | | | | | | | | | | |
Alliance Data Systems Corp. | | | | | (100 | ) | | | (9,500) | |
| | | | | | | | | | |
| | | |
Computers (-1.71%) | | | | | | | | | | |
Hewlett-Packard Co. | | | | | (40,400 | ) | | | (1,630,948) | |
Research In Motion, Ltd. | | | | | (83,400 | ) | | | (4,057,410) | |
| | | | | | | | | | |
| | | | | | | | | (5,688,358) | |
| | | | | | | | | | |
| | | |
Educational Software (-0.41%) | | | | | | | | | | |
Blackboard, Inc. | | | | | (28,500 | ) | | | (1,371,135) | |
| | | | | | | | | | |
| | | |
Footwear (Non-Athletic) & Related Apparel (-0.86%) | | | | | | | | | | |
Skechers U.S.A., Inc. - Class A | | | | | (150,100 | ) | | | (2,859,405) | |
| | | | | | | | | | |
| | |
Annual Report | April 30, 2011 | | 21 |
| | |
Caldwell & Orkin Market Opportunity Fund | | Schedule of Investments |
| | April 30, 2011 |
| | | | | | | | |
| SCHEDULE OF SECURITIES SOLD SHORT (continued) | | Shares | | | Value (Note 1) | |
Industrial Audio & Video Products (-1.00%) | | | | | | | | |
Dolby Laboratories, Inc. - Class A | | | (66,700) | | | $ | (3,339,002) | |
| | | | | | | | |
| | |
Internet Infrastructure Software (-0.50%) | | | | | | | | |
AsiaInfo-Linkage, Inc. | | | (88,700) | | | | (1,676,430) | |
| | | | | | | | |
| | |
Medical -Outpatient/Home Medical Care (-1.04%) | | | | | | | | |
Amedisys, Inc. | | | (104,300) | | | | (3,475,276) | |
| | | | | | | | |
| | |
Paper & Related Products (-0.41%) | | | | | | | | |
Schweitzer-Mauduit International, Inc. | | | (26,400) | | | | (1,368,576) | |
| | | | | | | | |
| | |
Real Estate Management/Services (-0.37%) | | | | | | | | |
E-House China Holdings, Ltd., ADR | | | (101,800) | | | | (1,216,510) | |
| | | | | | | | |
| | |
Recreational Centers (-0.58%) | | | | | | | | |
Life Time Fitness, Inc. | | | (49,000) | | | | (1,916,880) | |
| | | | | | | | |
| | |
Retail - Apparel/Shoe (-0.96%) | | | | | | | | |
Urban Outfitters, Inc. | | | (101,400) | | | | (3,190,044) | |
| | | | | | | | |
| | |
Schools (-5.38%) | | | | | | | | |
Apollo Group, Inc. - Class A | | | (89,600) | | | | (3,586,688) | |
Career Education Corp. | | | (54,100) | | | | (1,179,921) | |
Corinthian Colleges, Inc. | | | (672,500) | | | | (2,992,625) | |
ITT Educational Services, Inc. | | | (43,900) | | | | (3,148,947) | |
Strayer Education, Inc. | | | (26,600) | | | | (3,295,208) | |
The Washington Post Co. - Class B | | | (8,500) | | | | (3,705,150) | |
| | | | | | | | |
| | | | | | | (17,908,539) | |
| | | | | | | | |
| | |
Steel - Producers (-0.48%) | | | | | | | | |
AK Steel Holding Corp. | | | (100) | | | | (1,625) | |
United States Steel Corp. | | | (33,100) | | | | (1,579,201) | |
| | | | | | | | |
| | | | | | | (1,580,826) | |
| | | | | | | | |
| | |
TOTAL COMMON STOCKS | | | | | | | | |
(Proceeds $64,859,127) | | | | | | | 58,179,487 | |
| | | | | | | | |
| | |
EXCHANGE TRADED FUNDS (-9.51%) | | | | | | | | |
Country Fund - Brazil (-0.63%) | | | | | | | | |
iShares MSCI Brazil Index Fund | | | (27,100) | | | | (2,106,212) | |
| | | | | | | | |
| | |
Country Fund - China (-1.29%) | | | | | | | | |
iShares FTSE China 25 Index Fund | | | (95,000) | | | | (4,294,950) | |
| | | | | | | | |
| | |
22 | | 1-800-467-7903 | www.CaldwellOrkinFunds.com |
| | |
Caldwell & Orkin Market Opportunity Fund | | Schedule of Investments |
| | April 30, 2011 |
| | | | | | | | |
SCHEDULE OF SECURITIES SOLD SHORT (continued) | | Shares | | | Value
(Note 1) | |
Country Fund - Hong Kong (-1.17%) | | | | | | | | |
iShares MSCI Hong Kong Index Fund | | | (201,000 | ) | | $ | (3,891,360) | |
| | | | | | | | |
| | |
Country Fund - India (-1.01%) | | | | | | | | |
WisdomTree India Earnings Fund | | | (135,100 | ) | | | (3,363,990) | |
| | | | | | | | |
| | |
Country Fund - Singapore (-0.66%) | | | | | | | | |
iShares MSCI Singapore Index Fund | | | (152,600 | ) | | | (2,205,070) | |
| | | | | | | | |
| | |
Country Fund - Spain (-1.16%) | | | | | | | | |
iShares MSCI Spain Index Fund | | | (84,100 | ) | | | (3,851,780) | |
| | | | | | | | |
| | |
Country Fund - Thailand (-0.25%) | | | | | | | | |
iShares MSCI Thailand Index Fund | | | (11,400 | ) | | | (815,328) | |
| | | | | | | | |
| | |
Emerging Market - Equity (-0.55%) | | | | | | | | |
iShares MSCI Emerging Markets Index Fund | | | (36,500 | ) | | | (1,825,000) | |
| | | | | | | | |
| | |
U.S. Treasury Bond Fund (-2.79%) | | | | | | | | |
iShares Barclays 1-3 Year Treasury Bond Fund | | | (45,800 | ) | | | (3,853,154) | |
iShares Barclays 7-10 Year Treasury Bond Fund | | | (41,200 | ) | | | (3,892,164) | |
iShares Barclays 20 + Year Treasury Bond Fund | | | (16,300 | ) | | | (1,530,570) | |
| | | | | | | | |
| | | | | | | (9,275,888) | |
| | | | | | | | |
| | |
TOTAL EXCHANGE TRADED FUNDS | | | | | | | | |
(Proceeds $30,831,399) | | | | | | | 31,629,578 | |
| | | | | | | | |
| | |
TOTAL SECURITIES SOLD SHORT (Proceeds $95,690,526) | | | | | | $ | (89,809,065) | |
| † | Less than 0.005% of net assets. |
| 1 | Non-Income Producing Security. |
| 2 | A portion of the Money Market Fund assets are held as collateral for short sales activity. |
| 3 | Amount represents less than 0.005%. |
Common Abbreviations:
ADR - American Depositary Receipts
ETF - Exchange Traded Fund
FTSE - Financial Times Stock Exchange
Ltd. - Limited
MSCI - Morgan Stanley Capital International
NV - Naamloze Vennootschap is the Dutch term for a public limited liability corporation.
PLC - Public Limited Company
SA - Generally designates corporations in various countries, mostly those employing civil law.
SPDR - Standard & Poor’s Depositary Receipt
See accompanying notes to financial statements.
| | |
Annual Report | April 30, 2011 | | 23 |
| | |
Caldwell & Orkin Market Opportunity Fund | | Statement of Assets & Liabilities |
| | April 30, 2011 |
| | | | |
ASSETS | | | | |
Investments at value (cost $301,361,540) | | | $322,465,869 | |
Deposits with brokers for securities sold short | | | 86,239,031 | |
Receivables: | | | | |
Investment securities sold | | | 18,863,895 | |
Interest and dividends | | | 27,215 | |
Capital shares sold | | | 270,132 | |
Other assets | | | 47,073 | |
| | | | |
Total Assets | | | 427,913,215 | |
| | | | |
| |
LIABILITIES | | | | |
Securities sold short, not yet purchased (proceeds $95,690,526) | | | 89,809,065 | |
Payables: | | | | |
Investment securities purchased | | | 4,293,821 | |
Capital shares redeemed | | | 561,794 | |
Dividends payable-short sales | | | 131,909 | |
Investment advisory fee | | | 266,477 | |
Accrued expenses and other liabilities | | | 126,082 | |
| | | | |
Total Liabilities | | | 95,189,148 | |
| | | | |
| |
Total Net Assets | | | $332,724,067 | |
| | | | |
| |
COMPOSITION OF NET ASSETS | | | | |
Paid-in capital applicable to 16,988,241 shares outstanding; par value $0.10 per share; 30,000,000 shares authorized | | | $353,400,643 | |
Accumulated net realized loss on investments | | | (47,662,366) | |
Net unrealized appreciation of investments | | | 26,985,790 | |
| | | | |
| | | $332,724,067 | |
| | | | |
| |
NET ASSET VALUE AND OFFERING/REDEMPTION PRICE PER SHARE | | | $19.59 | |
| | | | |
See accompanying notes to financial statements.
| | |
24 | | 1-800-467-7903 | www.CaldwellOrkinFunds.com |
| | |
Caldwell & Orkin Market Opportunity Fund | | Statement of Operations |
| | For the Year Ended April 30, 2011 |
| | | | |
INVESTMENT INCOME | | | | |
Dividends (net of foreign withholding taxes of $28,951) | | | $1,830,676 | |
Interest | | | 688,177 | |
| | | | |
Total Investment Income | | | 2,518,853 | |
| | | | |
| |
EXPENSES | | | | |
Investment advisory fees (Note 2) | | | 3,596,187 | |
Interest expense | | | 1,903,513 | |
Dividend expense on securities sold short | | | 1,251,422 | |
Transfer agent fees | | | 254,017 | |
Administration and accounting fees (Note 2) | | | 231,919 | |
Professional fees | | | 125,269 | |
Directors’ fees and expenses | | | 64,094 | |
Chief compliance officer expense | | | 45,000 | |
Blue sky servicing fees | | | 41,702 | |
Shareholder report printing | | | 33,990 | |
Custodian fees | | | 32,624 | |
Insurance expense | | | 15,213 | |
Other expenses | | | 18,379 | |
| | | | |
Total Expenses before waiver | | | 7,613,329 | |
| | | | |
Less fees waived by Administrator (Note 2) | | | (29,999) | |
| | | | |
Total net expenses | | | 7,583,330 | |
| | | | |
Net Investment Loss | | | (5,064,477) | |
| | | | |
| |
REALIZED AND UNREALIZED GAIN (LOSS) ON INVESTMENTS | | | | |
Net realized gain on investments | | | 6,755,688 | |
Net realized loss on securities sold short | | | (17,232,733) | |
Change in unrealized appreciation/(depreciation) on investments | | | 9,987,731 | |
Change in unrealized appreciation/(depreciation) on securities sold short | | | 6,063,254 | |
| | | | |
NET REALIZED AND UNREALIZED GAIN ON INVESTMENTS | | | 5,573,940 | |
| | | | |
NET INCREASE IN NET ASSETS RESULTING FROM OPERATIONS | | | $509,463 | |
| | | | |
See accompanying notes to financial statements.
| | |
Annual Report | April 30, 2011 | | 25 |
| | |
Caldwell & Orkin Market Opportunity Fund | | Statements of Changes in Net Assets |
| | | | | | | | |
| | | For the Year Ended
April 30, 2011 | | | For the Year Ended
April 30, 2010 | |
| | | | |
INCREASE IN NET ASSETS FROM OPERATIONS: | | | | | | | | |
Net investment loss | | | $(5,064,477) | | | | $(3,278,286) | |
Net realized loss on investments and securities sold short | | | (10,477,045) | | | | (31,936,266) | |
Change in net unrealized appreciation or (depreciation) of investments and securities sold short | | | 16,050,985 | | | | 1,624,891 | |
| | | | |
| | | 509,463 | | | | (33,589,661) | |
| | | | |
|
DECREASE IN NET ASSETS FROM DISTRIBUTIONS TO STOCKHOLDERS FROM: | |
Net realized gain on investments | | | – | | | | (3,262,646) | |
| | | | |
| | | – | | | | (3,262,646) | |
| | | | |
|
INCREASE/(DECREASE) IN NET ASSETS FROM COMMON STOCK TRANSACTIONS: | |
Net proceeds from sale of shares | | | 118,936,001 | | | | 300,001,846 | |
Reinvested distributions | | | – | | | | 2,802,527 | |
Cost of shares redeemed | | | (182,072,337) | | | | (174,156,466) | |
Redemption fee proceeds (Note 1) | | | 276,943 | | | | 348,670 | |
| | | | |
Net increase/(decrease) in net assets resulting from capital share transactions | | | (62,859,393) | | | | 128,996,577 | |
| | | | |
| | |
INCREASE/(DECREASE) IN NET ASSETS | | | (62,349,930) | | | | 92,144,270 | |
| | |
NET ASSETS | | | | | | | | |
Beginning of year | | | 395,073,997 | | | | 302,929,727 | |
| | | | |
End of year (including undistributed net investment income/(loss) of $0 and $0, respectively) | | | $332,724,067 | | | | $395,073,997 | |
| | | | |
See accompanying notes to financial statements.
| | |
26 | | 1-800-467-7903 | www.CaldwellOrkinFunds.com |
| | |
Caldwell & Orkin Market Opportunity Fund | | Financial Highlights |
| | |
For a capital share outstanding throughout each year.
| | | | | | | | | | | | | | | | | | | | |
| | | For the
Year Ended
April 30,
2011 | | | For the
Year Ended
April 30,
2010 | | | For the
Year Ended
April 30,
2009 | | | For the
Year Ended
April 30,
2008 | | | For the
Year Ended
April 30,
2007 | |
PER SHARE DATA: | | | | | | | | | | | | | | | | | | | | |
Net asset value, beginning of year | | | $19.51 | | | | $21.24 | | | | $21.40 | | | | $18.68 | | | | $16.69 | |
Income/(loss) from investment operations: | | | | | | | | | | | | | | | | | | | | |
Net Investment income/(loss) | | | (0.30) | | | | (0.16) | | | | 0.01 | | | | 0.20 | | | | 0.53 | |
Net realized and unrealized gain/(loss) on investments | | | 0.36 | | | | (1.43) | | | | 0.94 | | | | 3.15 | | | | 1.99 | |
| | | | |
Total from Investment Operations | | | 0.06 | | | | (1.59) | | | | 0.95 | | | | 3.35 | | | | 2.52 | |
| | | | |
| | | | | |
LESS DISTRIBUTIONS: | | | | | | | | | | | | | | | | | | | | |
From net investment income | | | – | | | | – | | | | (0.12) | | | | (0.37) | | | | (0.53) | |
From net realized gain on investments | | | – | | | | (0.16) | | | | (1.02) | | | | (0.30) | | | | – | |
| | | | |
Total Distributions | | | – | | | | (0.16) | | | | (1.14) | | | | (0.67) | | | | (0.53) | |
| | | | |
Redemption fee proceeds | | | 0.02 | | | | 0.02 | | | | 0.03 | | | | 0.04 | | | | 0.001 | |
| | | | |
Net asset value, end of Year | | | $19.59 | | | | $19.51 | | | | $21.24 | | | | $21.40 | | | | $18.68 | |
| | | | |
| | | | | |
Total Return | | | 0.41% | | | | (7.40%) | | | | 4.73% | | | | 17.92% | | | | 15.31% | |
| | | | | |
Ratios and Supplemental Data: | | | | | | | | | | | | | | | | | | | | |
Net assets, end of year (000’s) | | | $332,724 | | | | $395,074 | | | | $302,930 | | | | $228,454 | | | | $135,337 | |
| | |
Annual Report | April 30, 2011 | | 27 |
| | |
Caldwell & Orkin Market Opportunity Fund | | Financial Highlights (continued) |
| | |
For a capital share outstanding throughout each year.
| | | | | | | | | | | | | | | | | | | | |
| | | For the
Year Ended
April 30,
2011 | | | For the
Year Ended
April 30,
2010 | | | For the
Year Ended
April 30,
2009 | | | For the
Year Ended
April 30,
2008 | | | For the
Year Ended
April 30,
2007 | |
| | | | |
Ratios to Average Net Assets: | | | | | | | | | | | | | | | | | | | | |
Management fees | | | 0.97% | | | | 0.83% | | | | 0.83% | | | | 0.84% | | | | 0.87% | |
Administrative Fees | | | 0.22% | | | | 0.20% | | | | 0.27% | | | | 0.24% | | | | 0.35% | |
| | | | |
Expenses before dividends on securities sold short and interest expense | | | 1.19% | | | | 1.03% | | | | 1.10% | | | | 1.08% | | | | 1.22% | |
Interest expense | | | 0.51% | | | | 0.31% | | | | 0.24% | | | | 0.18% | | | | 0.09% | |
Expenses from dividends on securities sold short | | | 0.34% | | | | 0.29% | | | | 0.55% | | | | 1.02% | | | | 0.37% | |
| | | | |
Ratio of total expenses2 | | | 2.04%3 | | | | 1.63%3 | | | | 1.89% | | | | 2.28% | | | | 1.68% | |
| | | | |
Ratio of net investment income/(loss) | | | (1.36%)3 | | | | (0.82%)3 | | | | (0.11%) | | | | 1.23% | | | | 2.64% | |
Portfolio turnover rate | | | 493% | | | | 662% | | | | 879% | | | | 712% | | | | 529% | |
| 1 | Amount is less than $0.01. |
| 2 | The ratio of expenses to average net assets and net investment income to average net assets do not reflect the expenses of other investment companies. |
| 3 | The ratio of total expenses to average net assets and ratio of net investment income/(loss) include fees waived by Fund’s Administrator in the amount of 0.01% and less than 0.005%, respectively, for the years ended April 30, 2011 and 2010, respectively. |
See accompanying notes to financial statements.
| | |
28 | | 1-800-467-7903 | www.CaldwellOrkinFunds.com |
| | |
Caldwell & Orkin Market Opportunity Fund | | Notes to Financial Statements |
| | April 30, 2011 |
The Caldwell & Orkin Market Opportunity Fund (the “Fund”) is the only active investment portfolio of The Caldwell & Orkin Funds, Inc. (“Caldwell & Orkin”), an open-end, diversified management investment company registered under the Investment Company Act of 1940, as amended (the “1940 Act”), and incorporated under the laws of the State of Maryland on August 15, 1989. Prior to June, 1992, Caldwell & Orkin’s name was The OTC Select-100 Fund, Inc. and consisted of only one portfolio, The OTC Select-100 Fund. The shareholders of The OTC Select-100 Fund subsequently approved changing the corporate name from The OTC Select-100 Fund, Inc. to The Caldwell & Orkin Funds, Inc. and to amend the investment objective and policies of The OTC Select-100 Fund. As a result of such amendment, The OTC Select-100 Fund was renamed and its assets and objectives were those of the Caldwell & Orkin Aggressive Growth Fund. In August, 1996, the Board of Directors of Caldwell & Orkin approved changing the name of the Caldwell & Orkin Aggressive Growth Fund to the Caldwell & Orkin Market Opportunity Fund. The Fund’s objectives are to provide long-term capital growth with a short-term focus on capital preservation through investment selection and asset allocation. The Fund seeks to outperform the stock market over the long-term, as measured by indices such as the S&P 500 Total Return index.
1. SUMMARY OF SIGNIFICANT ACCOUNTING POLICIES
Securities Valuation
Securities are stated at the closing price on the date at which the net asset value (“NAV”) is being determined. If the date of determination is not a trading date, the last bid price is used for a value instead. Debt securities, other than short-term investments, are valued at the price provided by an independent pricing service. Short-term investments having a maturity of 60 days or less at the time of the purchase are stated at amortized cost, which approximates market value. Any assets or securities for which market quotations are not readily available are valued at fair value as determined in good faith by or under the direction of the Fund’s Board of Directors in accordance with the Fund’s Fair Value Pricing Policy.
Fair Value Measurements
A three-tier hierarchy has been established to classify fair value measurements for disclosure purposes. Inputs refer broadly to the assumptions that market participants would use in pricing the asset or liability, including assumptions about risk. Inputs may be observable or unobservable. Observable inputs are inputs that reflect the assumptions market participants would use in pricing the asset or liability that are developed based on market data obtained from sources independent of the reporting entity. Unobservable inputs are inputs that reflect the reporting entity’s own assumptions about the assumptions market participants would use in pricing the asset or liability that are developed based on the best information available.
Various inputs are used in determining the value of the Fund’s investments as of the reporting period end. These inputs are categorized in the following hierarchy under applicable financial accounting standards:
| | |
Level 1 – | | Unadjusted quoted prices in active markets for identical assets or liabilities that the Fund has the ability to access. |
| | |
Annual Report | April 30, 2011 | | 29 |
| | |
Caldwell & Orkin Market Opportunity Fund | | Notes to Financial Statements |
| | April 30, 2011 |
| | |
Level 2 – | | Observable inputs other than quoted prices included in Level 1 that are observable for the asset or liability either directly or indirectly. These inputs may include quoted prices for the identical instrument on an inactive market, prices for similar instruments, interest rates, prepayment speeds, credit risk, yield curves, default rates and similar data. |
Level 3 – | | Unobservable inputs for the asset or liability, to the extent relevant observable inputs are not available, representing the Fund’s own assumptions about the assumptions a market participant would use in valuing the asset or liability, and would be based on the best information available. |
The following is a summary of the inputs used as of April 30, 2011 in valuing the Fund’s investments carried at value:
| | | | | | | | | | | | | | | | |
Investments in Securities at Value* | | Level 1 - Quoted
Prices | | | Level 2 - Other
Significant Observable
Inputs | | | Level 3 - Significant Unobservable
Inputs | | | Total | | |
| |
Common Stocks | | $ | 207,753,527 | | | $ | – | | | $ | – | | | $207,753,527 | | |
Exchange Traded Funds | | | 7,797,984 | | | | – | | | | – | | | 7,797,984 | | |
Purchased Call Options | | | 4,300,600 | | | | – | | | | – | | | 4,300,600 | | |
Purchased Put Options | | | 3,745,520 | | | | – | | | | – | | | 3,745,520 | | |
Short Term Investments | | | 98,868,238 | | | | – | | | | – | | | 98,868,238 | | |
| |
TOTAL | | $ | 322,465,869 | | | $ | – | | | $ | – | | | $322,465,869 | | |
| |
Other Financial Insturments* | | | | | | | | | | | | | | | | |
| |
Common Stocks Sold Short | | $ | (58,179,487 | ) | | $ | – | | | $ | – | | | $(58,179,487) | | |
Exchange Traded Funds Sold Short | | | (31,629,578 | ) | | | – | | | | – | | | (31,629,578) | | |
| |
TOTAL | | $ | (89,809,065 | ) | | $ | – | | | $ | – | | | $(89,809,065) | | |
| |
All securities of the Fund were valued using Level 1 inputs during the year ended April 30, 2011. Thus, a reconciliation of assets in which significant unobservable inputs (Level 3) were used is not applicable for this Fund.
* For detailed industry descriptions, see the accompanying Schedule of Investments.
Recent Accounting Pronouncements
In January 2010, the FASB issued Accounting Standards Update “Improving Disclosures about Fair Value Measurements” (“ASU”). The ASU requires enhanced disclosures about a) transfers into and out of Levels 1 and 2, and b) purchases, sales, issuances, and settlements on a gross basis relating to Level 3 measurements. There were no significant transfers in to and out of Levels 1 and 2 during the current period presented. Additional disclosure surrounding the activity in Level 3 fair value measurement will also be effective for fiscal years beginning after December 15, 2010. Management is currently evaluating the impact on the Fund’s financial statements.
In May 2011, the FASB issued ASU No. 2011-04 “Amendments to Achieve Common Fair Value Measurement and Disclosure Requirements” in GAAP and the International Financial Reporting Standards (“IFRSs”). ASU No. 2011-04 amends FASB ASC Topic 820, Fair Value Measurements and Disclosures, to establish common requirements for measuring fair value and for disclosing information about fair value measurements in accordance with GAAP and IFRSs. ASU No. 2011-04 is effective for fiscal years beginning after December 15, 2011 and for interim periods within those fiscal years. Management is currently evaluating the impact these amendments may have on the Fund’s financial statements.
| | |
30 | | 1-800-467-7903 | www.CaldwellOrkinFunds.com |
| | |
Caldwell & Orkin Market Opportunity Fund | | Notes to Financial Statements |
| | April 30, 2011 |
Derivatives
The following discloses the amounts related to the Fund’s use of derivative instruments and hedging activities.
The effect of derivative instruments on the Statement of Assets and Liabilities as of April 30, 2011:
Asset Derivatives
| | | | | | | | |
Derivatives not Accounted for as Hedging Instruments | | Statement of Assets and Liabilities Location | | Market Value | | | |
| |
Equity Contracts | | Investments, at value | | $ | 8,046,120 | | | |
| |
TOTAL | | | | $ | 8,046,120 | | | |
| |
The effect of derivative instruments on the Statement of Operations for the year ended April 30, 2011:
| | | | | | | | |
Derivatives not Accounted for as Hedging Instruments | | Location of Gain/(Loss) On Derivatives Recognized in Income | | Realized Gain/(Loss)
On Derivatives
Recognized in Income | | Change in Unrealized
Gain/(Loss) On
Derivatives Recognized
in Income | | |
| |
Equity Contracts | | Net realized loss on investments Change in unrealized appreciation / (depreciation) on investments | | $ (10,143,947) | | $ 284,009 | | |
| |
TOTAL | | | | $ (10,143,947) | | $ 284,009 | | |
| |
Significant Ownership Concentration
At April 30, 2011, the Fund invested 29.71% of its total net assets in the JPMorgan U.S. Treasury Plus Money Market Fund. The Fund uses the money market instrument as a vehicle for holding collateral related to securities sold short. As stated in the Fund’s prospectus, the Fund will typically invest between 0% and 50% of net assets in money market securities and fixed income securities. This portion of the Fund’s portfolio includes cash equivalents (i.e., money market funds or U.S. treasury notes) and bonds (i.e., corporate or government bonds), although generally cash equivalents are emphasized more than bonds. The corporate bonds purchased may have any maturity and be of any rating or quality, as long as Fund management believes it is consistent with the Fund’s investment objective.
The JPMorgan U.S. Treasury Plus Money Market Fund’s objective is to seek current income with liquidity and stability of principal. The JPMorgan U.S. Treasury Plus Money Market Fund invests exclusively in U.S. Treasury bills, notes and other obligations issued or guaranteed by the U.S. Treasury, and repurchase agreements collateralized by such obligations.
| | |
Annual Report | April 30, 2011 | | 31 |
| | |
Caldwell & Orkin Market Opportunity Fund | | Notes to Financial Statements |
| | April 30, 2011 |
Share Valuation
The NAV per share of the Fund is calculated by dividing the sum of the value of the securities held by the Fund, plus cash or other assets, minus all liabilities (including estimated accrued expenses) by the total number of shares outstanding for the Fund, rounded to the nearest cent. The Fund’s shares will not be priced on the days on which the New York Stock Exchange is closed for trading. The offering and redemption price per share for the Fund is equal to the Fund’s NAV per share.
The Fund charges a 2.00% redemption fee on shares held less than six months. These fees are deducted from the redemption proceeds otherwise payable to the shareholder. The Fund will retain the fee charged as paid-in capital and such fees become part of the Fund’s daily NAV calculation.
Securities Transactions and Related Investment Income
Securities transactions are accounted for on trade date. Dividend income is recorded on the ex-dividend date. Realized gains and losses from investment transactions are determined using the specific identification method. Interest income which includes amortization of premium and accretion of discount, is accrued as earned.
Cash
The Fund maintains cash available for the settlement of securities transactions and capital shares reacquired. Available cash is invested daily in money market instruments.
Income Taxes
The Fund intends to continue to comply with the requirements of the Internal Revenue Code applicable to regulated investment companies and to distribute all taxable income to their shareholders. Therefore, no federal income tax provision is required.
In order to avoid imposition of the excise tax applicable to regulated investment companies, the Fund intends to declare each year as dividends, in each calendar year, at least 98% of its net investment income (earned during the calendar year) and at least 98% of its net realized capital gains (earned during the twelve months ended October 31) plus undistributed amounts, if any, from prior years.
Net capital losses incurred after October 31 and within the taxable year are deemed to arise on the first business day of the Fund’s next taxable year.
Management has concluded that the Fund has taken no uncertain tax positions that require adjustment to the financial statements. The Fund files income tax returns in the U.S. federal jurisdiction and Georgia. The statue of limitations on the Fund’s federal and state tax filings remains open for the fiscal years ended April 30, 2008 through April 30, 2011.
| | |
32 | | 1-800-467-7903 | www.CaldwellOrkinFunds.com |
| | |
Caldwell & Orkin Market Opportunity Fund | | Notes to Financial Statements |
| | April 30, 2011 |
Use of Estimates
The preparation of financial statements in conformity with accounting principles generally accepted in the United States of America (“GAAP”) requires management to make estimates and assumptions that affect the reported amounts of assets and liabilities and disclosure of contingent assets and liabilities at the date of the financial statements and the reported amounts of revenues and expenses during the reporting period. Actual results could differ from those estimates.
Reclassification of Capital Accounts
GAAP requires that certain components of net assets relating to permanent differences be reclassified between financial and tax reporting. These reclassifications have no effect on net assets or net asset value per share. For the year ended April 30, 2011, the Fund increased accumulated net realized loss on investments by $192,761, decreased undistributed net investment loss by $5,064,477 and decreased paid-in capital by $4,871,716 due to certain permanent book and tax differences.
2. COMMITMENTS AND OTHER AGREEMENTS
The Fund has entered into a management agreement (the “Management Agreement”) with C&O Funds Advisor, Inc. (the “Adviser”) pursuant to which the Adviser provides space, facilities, equipment and personnel necessary to perform administrative and investment management services for the Fund. The Management Agreement provides that the Adviser is responsible for the actual management of the Fund’s portfolio. For such services and expenses assumed by the Adviser, the Fund pays a monthly advisory fee at incremental annual rates as follows:
| | |
| Advisory Fee | | Average Daily Net Assets |
1.00% | | Up to $250 million |
.90% | | In excess of $250 million but not greater than $500 million |
.80% | | In excess of $500 million |
The Adviser has agreed to reimburse the Fund to the extent necessary to prevent the Fund’s annual ordinary operating expenses (excluding taxes, expenses related to the execution of portfolio transactions and the investment activities of the Fund such as, for example, interest, dividend expenses on securities sold short, brokerage commissions and fees and expenses charged to the Fund by any investment company in which the Fund invests and extraordinary charges such as litigation costs) from exceeding 2.0% of the Fund’s average net assets (the “Expense Cap”). No reimbursement was required for the year ended April 30, 2011.
C&O Funds Advisor, Inc. is a wholly-owned subsidiary of Caldwell & Orkin, Inc.
ALPS Distributors, Inc. (“ADI”) serves as distributor to the Fund. The Fund does not pay ADI for these services. ALPS Fund Services, Inc. (“ALPS”) provides fund accounting, fund administration, and transfer agency services to the Fund. The fees paid to ALPS for fund accounting and fund administration services are set at incremental annual rates as follows, and subject to a $160,000 annual minimum:
| | |
Annual Report | April 30, 2011 | | 33 |
| | |
Caldwell & Orkin Market Opportunity Fund | | Notes to Financial Statements |
| | April 30, 2011 |
| | |
| Administration Fee | | Average Daily Net Assets |
.06% | | Between $0 - $500 million |
.03% | | Between $500 million - $1 billion |
.02% | | In excess of $1 billion |
In addition to the fee structure set forth above, an annual amount of $30,000 is waived against the administration fee, pursuant to a Distribution Fee Letter Agreement between the Adviser and ADI.
3. INVESTMENT PORTFOLIO TRANSACTIONS
Investment Purchases and Sales
For the year ended April 30, 2011, purchases of investments and proceeds from sales of investments (excluding securities sold short and short-term investments) totaled $962,793,513 and $987,098,006 respectively.
Short Sales and Segregated Cash
Short sales are transactions in which the Fund sells a security it does not own, in anticipation of a decline in the market value of that security. To initiate such a transaction, the Fund must borrow the security to deliver to the buyer upon the short sale; the Fund is then obligated to replace the security borrowed by purchasing it in the open market at some later date, completing the transaction.
The Fund will incur a loss if the market price of the security increases between the date of the short sale and the date on which the Fund replaces the borrowed security. The Fund will realize a gain if the security declines in value between those dates.
All short sales must be fully collateralized. The Fund maintains the collateral in segregated accounts consisting of cash and/or U.S. Government securities sufficient to collateralize the market value of its short positions. Typically, the segregated cash with brokers and other financial institutions exceeds the minimum required. Deposits with brokers for securities sold short are invested in money market instruments. Segregated cash is held at the custodian in the name of the broker per a tri-party agreement between the Fund, the custodian, and the broker.
The Fund may also sell short “against the box”, i.e., the Fund enters into a short sale as described above, while holding an offsetting long position in the same security which it sold short. If the Fund enters into a short sale against the box, it will segregate an equivalent amount of securities owned by the Fund as collateral while the short sale is outstanding.
The Fund limits the value of its short positions (excluding short sales “against the box”) to 60% of the Fund’s total net assets. At April 30, 2011, the Fund had approximately 27% of its total net assets in short positions.
For the year ended April 30, 2011, the cost of investments purchased to cover short sales and the proceeds from investments sold short were $560,530,716 and $591,062,327 respectively.
| | |
34 | | 1-800-467-7903 | www.CaldwellOrkinFunds.com |
| | |
Caldwell & Orkin Market Opportunity Fund | | Notes to Financial Statements |
| | April 30, 2011 |
4. CAPITAL SHARE TRANSACTIONS
Capital share transactions were as follows:
| | | | | | | | |
| | | For the
Year Ended April 30, 2011 | | | For the
Year Ended
April 30, 2010 | |
Shares sold | | | 6,136,472 | | | | 14,517,866 | |
Shares reinvested | | | – | | | | 143,279 | |
Shares reacquired | | | (9,395,772) | | | | (8,675,606) | |
| | |
Net increase/(decrease) in shares outstanding | | | (3,259,300) | | | | 5,985,539 | |
| | |
5. DISTRIBUTIONS TO SHAREHOLDERS
The Fund did not make any distributions during the year ended April 30, 2011.
Distributions paid in the amount of $3,262,646 during the year ended April 30, 2009 were paid from ordinary income for tax purposes.
As of April 30, 2011, the components of distributable earnings on a tax basis were as follows:
| | | | |
Total cost of investments | | | $ 306,711,202 | |
| | | | |
Gross tax unrealized appreciation | | | $ 22,875,320 | |
Gross tax unrealized depreciation | | | (7,120,653) | |
Net appreciation of foreign currency and derivatives | | | 5,881,462 | |
| | | | |
Net tax unrealized appreciation | | | 21,636,129 | |
Undistributed ordinary income | | | 0 | |
Accumulated capital losses | | | (39,412,876) | |
Post-October losses | | | (2,899,829) | |
| | | | |
Total accumulated earnings/(deficit) | | | $ (20,676,576) | |
| | | | |
At April 30, 2011, the Fund had a capital loss carryovers in the amounts of $13,975,845 and $25,437,031. Those loss carryovers expire April 30, 2018, and April 30, 2019, respectively.
Net investment income / (loss), net realized gains / (losses) and unrealized appreciation /(depreciation) differ for financial statement and tax purposes due to differing treatments of short term capital gains, nondeductible dividend expense and wash sale loss deferrals.
6. RELATED PARTY TRANSACTIONS
As of April 30, 2011, Caldwell & Orkin, Inc. and Michael B. Orkin had ownership of the Fund of 0.25% and 1.69%, respectively. Caldwell & Orkin, Inc. is 100% wholly owned by Michael B. Orkin.
7. SUBSEQUENT EVENTS
Management has performed a review for subsequent events through the date this report was issued. There were no other reportable events for the Fund as a result of their review.
| | |
Annual Report | April 30, 2011 | | 35 |
| | |
Caldwell & Orkin Market Opportunity Fund | | Report of Independent Registered Public Accounting Firm |
| | |
To the Shareholders and Board of Directors
The Caldwell & Orkin Funds, Inc.
We have audited the accompanying statement of assets and liabilities, including the schedule of investments of the Caldwell & Orkin Market Opportunity Fund, a series of shares of The Caldwell & Orkin Funds, Inc., (the “Fund”), as of April 30, 2011, and the related statement of operations for the year then ended, the statements of changes in net assets for each of the two years in the period then ended, and the financial highlights for each of the five years in the period then ended. These financial statements and financial highlights are the responsibility of the Fund’s management. Our responsibility is to express an opinion on these financial statements and financial highlights based on our audits.
We conducted our audits in accordance with the standards of the Public Company Accounting Oversight Board (United States). Those standards require that we plan and perform the audit to obtain reasonable assurance about whether the financial statements and financial highlights are free of material misstatement. The Fund is not required to have, nor were we engaged to perform, an audit of the Fund’s internal control over financial reporting. Our audits included consideration of internal control over financial reporting as a basis for designing audit procedures that are appropriate in the circumstances, but not for the purpose of expressing an opinion on the effectiveness of the Fund’s internal control over financial reporting. Accordingly, we express no such opinion. An audit includes examining, on a test basis, evidence supporting the amounts and disclosures in the financial statements. Our procedures included confirmation of securities owned as of April 30, 2011, by correspondence with the custodian and brokers or by other appropriate auditing procedures where replies from brokers were not received. An audit also includes assessing the accounting principles used and significant estimates made by management, as well as evaluating the overall financial statement presentation. We believe that our audits provide a reasonable basis for our opinion.
In our opinion, the financial statements and financial highlights referred to above present fairly, in all material respects, the financial position of the Caldwell & Orkin Market Opportunity Fund as of April 30, 2011, the results of its operations for the year then ended, the changes in its net assets for each of the two years in the period then ended, and its financial highlights for each of the five years in the period then ended, presented in conformity with accounting principles generally accepted in the United States of America.
TAIT, WELLER & BAKER LLP
Philadelphia, Pennsylvania
June 21, 2011
| | |
36 | | 1-800-467-7903 | www.CaldwellOrkinFunds.com |
| | |
Caldwell & Orkin Market Opportunity Fund | | Additional Information |
| | April 30, 2011 (Unaudited) |
Information about the Board of Directors and officers* of the Fund as of April 30, 2011 is set forth below. The Statement of Additional Information (SAI) includes additional information about the Fund’s Directors and officers and is available free of charge, upon request, by calling (800) 237-7073. The address for each of the persons named below is 5185 Peachtree Parkway, Suite 370, Norcross, GA 30092-6541.
| | | | | | | | |
Name, (Age) and Position(s) Held with Fund | | Term of Office and Length of Time Served1 | | Principal Occupation(s) During Past Five Years | | Number of Funds in Fund Complex Overseen by Director | | Other Directorships Held by Director |
DISINTERESTED DIRECTORS |
Frederick T. Blumer (52) Chairman | | Since 1990 | | Mr. Blumer is Vice President of HUGHES Telematics, Inc., and was formerly the CEO of X-spand International, Inc. | | One | | None |
David L. Eager (68) Director | | Since 1992 | | Mr. Eager is a Partner at Eager, Davis & Holmes LLC, and was formerly Director for Product Development for Driehaus Capital Management and a Global Partner with William M. Mercer, Inc. | | One | | None |
James L. Underwood (60) Director | | Since 2006 | | Mr. Underwood is a Principal and shareholder of Windham Brannon PC, a Member of the Board of Managers of Windham Brannon Financial Group LLC, and was formerly President of Tarpley & Underwood, P.C. and Tarpley & Underwood Financial Advisors LLC. | | One | | None |
| * | The term “officer” means the president, vice president, secretary, treasurer, controller or any other officer who performs policy-making decisions. |
| 1 | Each Director serves until his / her successor is duly elected and qualified, or until his / her death, resignation or removal. |
| | |
Annual Report | April 30, 2011 | | 37 |
| | |
Caldwell & Orkin Market Opportunity Fund | | Additional Information |
| | April 30, 2011 (Unaudited) |
| | | | | | | | |
Name, (Age) and Position(s) Held with Fund | | Term of Office and Length of Time Served1 | | Principal Occupation(s) During Past Five Years | �� | Number of Funds in Fund Complex Overseen by Director | | Other Directorships Held by Director |
INTERESTED DIRECTOR | | | | | | | | |
Michael B. Orkin (51) 2 Director, President, Portfolio Manager | | Since 1990 | | Mr. Orkin is the CEO and sole shareholder of Caldwell & Orkin, Inc., of which the Adviser is a wholly-owned subsidiary. Mr. Orkin has been a portfolio manager at Caldwell & Orkin, Inc. since 1985, and is a Chartered Financial Analyst. | | One | | None |
| | |
OFFICERS WHO ARE NOT DIRECTORS | | | | |
David R. Bockel, Jr. (34)3 Treasurer & Ass’t Secretary Secretary & Ass’t Treasurer | | Since 2010 2006-2010 | | Mr. Bockel is an Assistant Portfolio Manager for Caldwell & Orkin, Inc., and is a Registered Representative of ALPS Distributors, Inc. | | N/A | | N/A |
William C. Horne (53)3 Chief Compliance Officer Treasurer | | Since 2004 2006-2010 | | Mr. Horne is the Director of Client Services and Chief Compliance Officer of Caldwell & Orkin, Inc., and is a Registered Representative of ALPS Distributors, Inc. | | N/A | | N/A |
| * | The term “officer” means the president, vice president, secretary, treasurer, controller or any other officer who performs policy-making decisions. |
| 1 | Each Director serves until his / her successor is duly elected and qualified, or until his / her death, resignation or removal. |
| 2 | Mr. Orkin is an interested person of the Fund by reason of his position with the Adviser. |
| 3 | Registered Representative of ALPS Distributors, Inc. |
| | |
38 | | 1-800-467-7903 | www.CaldwellOrkinFunds.com |
| | |
Caldwell & Orkin Market Opportunity Fund | | Additional Information |
| | April 30, 2011 (Unaudited) |
| | | | | | | | |
Name, (Age) and Position(s) Held with Fund | | Term of Office and Length of Time Served1 | | Principal Occupation(s) During Past Five Years | | Number of Funds in
Fund Complex Overseen by Director | | Other Directorships Held by Director |
OFFICERS WHO ARE NOT DIRECTORS (Continued) | | |
Paul F. Leone (47)2 Secretary | | Since 2010 | | Mr. Leone is Assistant General Counsel at ALPS Fund Services, Denver, Colorado. Prior to joining ALPS, Mr. Leone was Deputy Chief Compliance Officer at Old Mutual Capital, Denver, Colorado; General Counsel and Chief Compliance Officer at Wisconsin Capital Management, Madison, Wisconsin. | | N/A | | N/A |
Lauren Johnson (30) Assistant Treasurer | | Since 2009 | | Ms. Johnson joined ALPS Fund Services in September 2005 as a Fund Controller. Prior to joining ALPS, Ms. Johnson worked for Pricewaterhouse Coopers LLP. | | N/A | | N/A |
| * | The term “officer” means the president, vice president, secretary, treasurer, controller or any other officer who performs policy-making decisions. |
| 1 | Each Director serves until his / her successor is duly elected and qualified, or until his / her death, resignation or removal. |
| 2 | Registered Representative of ALPS Distributors, Inc. |
| | |
Annual Report | April 30, 2011 | | 39 |
THIS PAGE INTENTIONALLY LEFT BLANK
CALDWELL & ORKIN MARKET OPPORTUNITY FUND
Annual Report to Shareholders (unaudited)
| | | | |
BOARD OF DIRECTORS Frederick T. Blumer, Independent Chairman Michael B. Orkin, President David L. Eager James L. Underwood | | TRANSFER, REDEMPTION & DIVIDEND DISBURSING AGENT ALPS Fund Services, Inc. P.O. Box 46256 Denver, CO 80201 | | LEGAL COUNSEL Paul, Hastings, & Walker LLP 600 Street, N.E. Suite 2400 Atlanta, GA 30308 |
| | |
INVESTMENT ADVISER C&O Funds Advisor, Inc. 5185 Peachtree Parkway Suite 370 Norcross, GA 30092-6541 DISTRIBUTOR ALPS Distributors, Inc. 1290 Broadway, Suite 1100 Denver, CO 80203 | | CUSTODIAN JPMorgan Chase Bank, N.A. 1111 Polaris Parkway, Suite 3J Columbus, OH 43240 INDEPENDENT REGISTERED PUBLIC ACCOUNTING FIRM Tait, Weller & Baker LLP 1818 Market Street, Suite 2400 Philadelphia, PA 19103-3638 | | INDEPENDENT DIRECTORS’ COUNSEL Arnall Golden Gregory LLP 171 17th Street, NW, Suite 2100 Atlanta, GA 30363 |
| | | |
The Caldwell & Orkin Market Opportunity Fund’s (the “Fund”) portfolio may or may not have positions in any of the companies referenced in this Report to Shareholders as of any date after April 30, 2011. The commentary reflects the views of the portfolio manager (or Adviser) through the end of the period or through the date of this report, as the case may be. Of course, these views are subject to change as market and other conditions warrant. These financial statements are submitted for the general information of the Fund’s shareholders. They are not authorized for distribution to prospective investors unless preceded or accompanied by an effective Fund Prospectus.
Availability of Proxy Voting Policy & Procedures, Proxy Voting Record and Code of Ethics - A description of a) the policies and procedures the Fund uses to determine how to vote proxies relating to portfolio securities, b) how the Fund voted proxies relating to portfolio securities during the most recent 12-month period ended June 30, c) the Code of Ethics applicable to the principal officers of the Fund are available without charge, upon request, by calling toll-free (800) 237-7073, or on the Securities and Exchange Commission’s (the “Commission’s”) website at http://www.sec.gov.
Availability of Quarterly Portfolio Schedule - The Fund files its complete schedule of portfolio holdings with the Commission for the first and third quarters of each fiscal year on Form N-Q. The Fund’s Forms N-Q are available on the Commission’s website at http://www.sec.gov. The Fund’s Forms N-Q may be reviewed and copied at the Commission’s Public Reference Room in Washington, D.C. Information on the operation of the Public Reference Room may be obtained by calling 1-800 SEC-0330.
Fund Information - For information about the Fund please call (800) 237-7073 or visit the Fund’s website at www.CaldwellOrkinFunds.com. For information about a specific Fund account, please call Shareholder Services at (800) 467-7903.
Fund Listings - The Fund is listed in many newspapers as C&OMktOpp or CaldOrkMO. The Fund’s Quotation symbol is COAGX. The Fund’s CUSIP number is 128819307.
Caldwell & Orkin Market Opportunity Fund
5185 Peachtree Parkway, Suite 370
Norcross, GA 30092-6541
E-mail: Info@CaldwellOrkin.com
| | (a) | As of the end of the period covered by this report, the registrant has adopted a Supplemental Code of Ethics that applies to the registrant’s principal executive officer, principal financial officer, principal accounting officer or controller, or persons performing similar functions, regardless of whether these individuals are employed by the registrant or a third party (the “Supplemental Code of Ethics”). |
| | (c) | During the period covered by this report, no amendments were made to the provisions of the Supplemental Code of Ethics adopted in 2(a) above. |
| | (d) | During the period covered by this report, no implicit or explicit waivers to the provisions of the Supplemental Code of Ethics adopted in 2(a) above were granted. |
| | (f) | A copy of the registrant’s Supplemental Code of Ethics is filed as an exhibit hereto. The registrant undertakes to provide a copy of the Supplemental Code of Ethics to any person, without charge upon written request to the registrant at its address at 5185 Peachtree Parkway, Suite 370, Norcross, GA 30092-6541. |
| Item 3. | Audit Committee Financial Expert. |
| | (a)(1) | The registrant’s Board of Directors has determined that one audit committee financial expert serves on its audit committee. |
| | (a)(2) | James L. Underwood, an Independent Director of the registrant, is the registrant’s audit committee financial expert. |
| Item 4. | Principal Accountant Fees and Services. |
| | (a) | Audit Fees: For the registrant’s fiscal years ended April 30, 2011 and April 30, 2010, the aggregate fees billed to the registrant for professional services rendered by the principal accountant for the audit of the registrant’s annual financial statements were $26,000 and $25,000, respectively. |
| | (b) | Audit-Related Fees: For the Registrant’s fiscal years ended April 30, 2011 and April 30, 2010, aggregate fees of $0 and $0, respectively, were billed to the registrant for assurance and related services by the principal accountant for certain audit-related communications to the registrant’s audit committee. For the registrant’s fiscal years ended April 30, 2011 and April 30, 2010, the aggregate fees of $0 and $0 were billed to the registrant’s investment adviser, and any entity controlling, controlled by, or under common control with the investment adviser that provides ongoing services for the registrant for assurance and related services by the principal accountant that are reasonably related to the performance of the audit of the registrant’s financial statements and are not reported under paragraph (a) of this Item. |
| | (c) | Tax Fees: For the Registrant’s fiscal years ended April 30, 2011 and April 30, 2010, aggregate fees of $2,500, and $3,500, respectively, were billed for professional services rendered by the principal accountant for tax services. For the registrant’s fiscal years ended April 30, 2011 and April 30, 2010, aggregate fees of $0 and $0, respectively, were billed to the investment adviser and any entity controlling, controlled by, or under common control with the investment adviser that provides ongoing services to the registrant. |
| | (d) | All Other Fees: In registrant’s fiscal years ended April 30, 2011 and April 30, 2010, the aggregate fees $3,450 and $3,350, respectively, were billed to registrant by the principal accountant for cursory reviews of the registrant’s October 31, 2010 and October 31, 2009 semi-annual reports, and agreed upon procedures related to review of anti-money laundering procedures. For the registrant’s fiscal years ended April 30, 2011 and April 30, 2010, the aggregate fees of $0 and $0 were billed to the investment adviser and any entity controlling, controlled by, or under common control with the investment adviser that provides ongoing services to the registrant for services other than the services reported in paragraph (a) through (c). |
| | (e)(1) | Audit Committee Pre-Approval Policies and Procedures: The registrant’s Audit Committee pre-approves any audit or non-audit services provided by the independent auditors to the registrant, and pre-approves, if applicable, any non-audit services provided by the independent auditors to the registrant’s investment adviser, or any entity controlling, controlled by, or under common control with the investment adviser that provides ongoing services to the registrant if the engagement relates directly to the operations and financial reporting of the registrant. |
| | (e)(2) | The percentage of services described in each of paragraphs (b) through (d) of this Item that were approved by the audit committee pursuant to paragraph (c)(7)(i)(C) of Rule 2-01 of Regulation S-X is 100%. |
| | (g) | Aggregate Non-Audit Fees: In registrant’s fiscal years ended April 30, 2011 and April 30, 2010, the aggregate non-audit fees $3,450 and $3,350 were billed to the registrant by the registrant’s accountant for cursory reviews of the registrant’s October 31, 2010 and October 31, 2009 semi-annual reports and agreed upon procedures related to review of anti-money laundering procedures. In registrant’s fiscal years ended April 30, 2011 and April, 2010, the aggregate non-audit fees of $0 and $0 were billed to the investment adviser and any entity controlling, controlled by, or under common control with the investment adviser that provides ongoing services to the registrant. |
| Item 5. | Audit Committee of Listed Registrants. |
Not applicable.
| Item 6. | Schedule of Investments. |
Schedule of Investments is included as part of the Report to Stockholders filed under Item 1 of this form.
| Item 7. | Disclosure of Proxy Voting Policies and Procedures for Closed-End Management Investment Companies. |
Not applicable.
| Item 8. | Portfolio Managers of Closed-End Management Investment Companies. |
Not applicable.
| Item 9. | Purchases of Equity Securities by Closed-End Management Investment Companies and Affiliated Issuers. |
Not applicable.
| Item 10. | Submission of Matters to a Vote of Security Holders. |
There have been no material changes to the procedures by which shareholders may recommend nominees to the registrant’s board of trustees.
| Item 11. | Controls and Procedures. |
| | (a) | The registrant’s principal executive officer and principal financial officer have concluded that the registrant’s disclosure controls and procedures (as defined in Rule 30a-3(c) under the Investment Company Act of 1940, as amended) are |
| | effective based on their evaluation of these controls and procedures as of a date within 90 days of the filing date of this document. |
| | (b) | There was no change in the registrant's internal control over financial reporting (as defined in Rule 30a-3(d) under the Investment Company Act of 1940, as amended) during the second fiscal quarter of the period covered by this report that has materially affected, or is reasonably likely to materially affect, the registrant's internal control over financial reporting. |
| | (a)(1) | Registrant’s Code of Ethics for Senior Financial Officers, which is the subject of the disclosure required by Item 2 of Form N-CSR, was filed as Exhibit 12(a)(1) to the Registrant’s Certified Shareholder Report on Form N-CSR, File No. 811-06113, on July 7, 2010. |
| | (a)(2) | The certifications required by Rule 30a-2(a) of the Investment Company Act of 1940, as amended, and Section 302 of the Sarbanes-Oxley Act of 2002 are attached hereto as Ex 99.Cert. |
| | (b) | The certifications by the registrant’s Principal Executive Officer and Principal Financial Officer, as required by Rule 30a-2(b) of the Investment Company Act of 1940, as amended, and Section 906 of the Sarbanes-Oxley Act of 2002 are attached hereto as Ex99.906Cert. |
SIGNATURES
Pursuant to the requirements of the Securities Exchange Act of 1934 and the Investment Company Act of 1940, the registrant has duly caused this report to be signed on its behalf by the undersigned, thereunto duly authorized.
| | |
| The Caldwell & Orkin Funds, Inc. |
| |
| By: | | /s/ Michael B. Orkin |
| | Michael B. Orkin |
| | President (Principal Executive Officer) |
| |
| Date: | | July 6, 2011 |
| |
| By: | | /s/ David R. Bockel, Jr. |
| | David R. Bockel, Jr. |
| | Treasurer (Principal Financial Officer) |
| |
| Date: | | July 6, 2011 |