UNITED STATES
SECURITIES AND EXCHANGE COMMISSION
Washington, D.C. 20549
FORM N-CSR
CERTIFIED SHAREHOLDER REPORT OF REGISTERED MANAGEMENT
INVESTMENT COMPANIES
Investment Company Act file number: 811-06113
The Caldwell & Orkin Funds, Inc.
(Exact name of registrant as specified in charter)
5185 Peachtree Parkway, Suite 370, Norcross, GA 30092-6542
(Address of principal executive offices) (Zip code)
Michael B. Orkin
5185 Peachtree Parkway, Suite 370, Norcross, GA 30092-6541
(Name and Address of Agent for Service)
Registrant’s Telephone Number, including Area Code: 678-533-7850
Date of fiscal year end: April 30
Date of reporting period: May 1, 2012 – April 30, 2013
Form N-CSR is to be used by management investment companies to file reports with the Commission not later than 10 days after the transmission to stockholders of any report that is required to be transmitted to stockholders under Rule 30e-1 under the Investment Company Act of 1940 (17 CFR 270.30e-1). The Commission may use the information provided on Form N-CSR in its regulatory, disclosure review, inspection, and policymaking roles.
A registrant is required to disclose the information specified by Form N-CSR, and the Commission will make this information public. A registrant is not required to respond to the collection of information contained in Form N-CSR unless the Form displays a currently valid Office of Management and Budget (“OMB”) control number. Please direct comments concerning the accuracy of the information collection burden estimate and any suggestions for reducing the burden to Secretary, Securities and Exchange Commission, 450 Fifth Street, NW, Washington, DC 20549-0609. The OMB has reviewed this collection of information under the clearance requirements of 44 U.S.C. ss. 3507.
| Item 1. | Reports to Stockholders. |
| | |
| Table of Contents | | Caldwell & Orkin Market Opportunity Fund |
| | |
| | | 1-800-467-7903 | www.CaldwellOrkinFunds.com |
| | |
Caldwell & Orkin | | |
| Market Opportunity Fund | | Shareholder Letter |
April 30, 2013 (Unaudited)
| | | | |
Investment Adviser C&O Funds Advisor, Inc. 5185 Peachtree Parkway, Suite 370 Norcross, Georgia 30092-6541 (800) 237-7073 | |  | | Shareholder Accounts c/o ALPS Fund Services, Inc. P.O. Box 46256 Denver, Colorado 80201 (800) 467-7903 |
Dear Fellow Shareholder:
The Caldwell & Orkin Market Opportunity Fund (the “Fund”) rose 6.00% in the 6-month period ended April 30, 2013. The S&P 500 Total Return Index (“S&P 500”) gained 14.42% during the same period. For the 12 months ended April 30, 2013, the Fund gained 11.72%, while the S&P 500 increased 16.89%. And, since commencement of active management on August 24, 1992 through April 30, 2013, the Fund has generated an 8.70% compound annual return compared to the S&P 500’s 8.92% compound annual return during the same period. The Fund’s total return from August 24, 1992 through April 30, 2013 has been 461.16%, compared to the S&P 500’s total return of 486.39%. Of course, past performance is no guarantee of future results.
Importantly, the Fund has achieved these results while maintaining a low market risk profile and with little reliance on the movement of the stock market (see pages 6, 8, 9 and 10). Since we began actively managing the Fund on August 24, 1992, the Fund’s price movements have had virtually no correlation (5.97%) with the price movements of the S&P 500 as measured by R, the correlation coefficient. An S&P 500 Index fund has nearly a 100% correlation to the market in any given period. The Fund’s lack of correlation to the market indicates that its performance is not attributable to that of the index. Additionally, given the Fund’s low correlation to the S&P 500, deviations in Fund performance relative to the S&P 500’s performance are to be expected. (Statistical computations by Ned Davis Research, Inc.)
Management Discussion and Analysis
For the year-ended April 30, 2013 the Fund continued to generate return characteristics emblematic of a true long/short mutual fund with low correlation to the S&P 500. During the two months experiencing negative market performance (May 2012 and October 2012) the Fund significantly outperformed relative to the S&P 500, gaining 2.32% versus -7.75% for the S&P 500. During the months experiencing positive market performance (June – September 2012 and November 2012 – April 2013) the Fund underperformed relative to the S&P 500, gaining 9.15% versus 26.71% for the index.
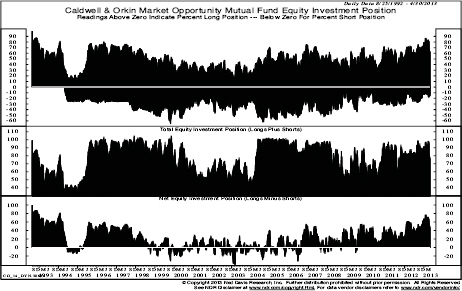
From April 30, 2012 through April 30, 2013 the Fund maintained a net-long invested position (see the Equity Investment Position chart on page 10). The Fund’s gross long exposure at period-end was 65.59%, and it fluctuated throughout the year from a low of 49.63% to a high of 86.6%, averaging 67.94%. During this time period the long portfolio outperformed the S&P 500, returning 22.02%. The Fund’s gross short exposure ended the period at -13.49%, fluctuating throughout the year from a low of -9.67% to a high of -27.29%, averaging -17.74%. The short portfolio underperformed the inverse of the S&P 500, returning of -23.35%. The Fund’s net invested
| | |
Annual Report | April 30, 2013 | | 1 |
| | |
Caldwell & Orkin | | |
| Market Opportunity Fund | | Shareholder Letter |
April 30, 2013 (Unaudited)
position (longs minus shorts) ended the period at 52.10% net long, fluctuating from 24.87% to 76.51%, and averaging 50.21%. The Fund’s total invested position (longs plus absolute value of the shorts plus puts and calls) ended the period at 79.08%, fluctuating from 69.63% to 98.48%.
The Fund’s asset allocation fluctuations throughout the year are generally the result of risk control measures. Specifically looking at asset allocation shifts last year, we briefly reduced our long positions in May 2012 and October, and reduced the shorts from November - December 2012.
On the long side we maintained our exposure to homebuilding and building products companies, as well as oil & gas pipeline companies, while we increased our exposure to financials. The fundamental improvement in the housing market (driven by record low housing inventory and mortgage rates, improving employment, pent-up demand, the high cost of renting, etc.) has accelerated since we first became bullish in late-2011. Positive housing fundamentals are leading to improving consumer balance sheets and an increase in employment and construction activity. Homebuilders and related building products companies currently make up our largest exposure on the long side (homebuilders (10.04%), retail-building products (3.69%) and building & construction products (2.97%)), as these companies stand to directly benefit from improved housing market fundamentals. Meanwhile, oil & gas pipelines are our single largest industry exposure on the long side (10.66%), giving us exposure to increasing domestic energy production and usage while minimizing exploration and pricing risk, with the added benefit of producing income.
On the short side of the portfolio we significantly reduced our overall exposure. For-profit education remains our largest short industry exposure at -3.63%.
During the period all 10 of our biggest winners were longs. Stocks in homebuilding and homebuilding-related industries made up the majority of the top ten. Homebuilders Standard Pacific Corp. (SPF), PulteGroup, Inc. (PHM) and Lennar Corp. (LEN) are benefitting from improvements in order growth and home prices. Building products company Fortune Brands Home & Security, Inc. (FBHS) and building products retailers Lumber Liquidators Holdings (LL), Home Depot Inc. (HD) and The Sherwin Williams Co. (SHW) benefitted from these trends as well. Investments in Plains All American Pipeline, L.P. (PAA), CMS Energy Corp. (CMS) and Lion’s Gate Entertainment (LGF) also helped the Fund’s performance.
Four out of five of our biggest losers were shorts. Among these shorts were a specialty coffee company, an Internet content provider, a mobile communications company and a hospital operator. While these stocks could still fundamentally be potential short candidates, they are no longer in the portfolio. O’Reilly Automotive Inc. (ORLY) was the only long in the bottom five biggest losers. The stock came under pressure from weakening sales as consumers began purchasing newer cars. ORLY is no longer in the portfolio.
Outlook
This fiscal year begins in the midst of a significant financial market rally fueled by economic liquidity being provided by aggressive monetary policy from the Federal Reserve. A solid housing market recovery is also underway. Together, improvement in home prices and equity markets have propelled consumer net worth (CNW) higher. With less housing loan detritus on their books,
| | |
2 | | 1-800-467-7903 | www.CaldwellOrkinFunds.com |
| | |
Caldwell & Orkin | | |
| Market Opportunity Fund | | Shareholder Letter |
April 30, 2013 (Unaudited)
banks are opening their doors to resume the practice of lending once again. These are all signs that domestic economic growth is beginning to accelerate from its long, slow slumber.
The paradox of this growth acceleration is that a shift in accommodative Fed policy could be nigh. If economic growth accelerates and employment continues to improve, inflation could become a concern, leading the Fed to become less accommodative. In this environment the significant net long positioning the Fund maintained throughout last calendar year would likely be reduced, if not reversed.
For now, the Fund is bullishly positioned with a total invested position at May 31, 2013 of 74.73% and a net-long position of 48.37% (which we recently reduced). Should economic growth accelerate, Treasury rates rise considerably or inflation pressures begin to build, the Fund will very likely be repositioned in a more defensive posture.
Markets move in cycles. Our goal in managing the Fund is to outperform over the course of a full market cycle, which includes both bull and bear market phases. Ned Davis Research, Inc. (“NDR”) has computed what they consider to be bull and bear market cycles for the S&P 500. Most of their definition focuses on a 20% market move in either direction. The Fund has outperformed in four out of the last five full market cycles. The NDR data is shown below:
| | | | | | | | | | | | | | | | | | | | |
| Bull Market Phase | | | | Bear Market Phase | | | | Full Market Cycle |
| Start Date | | MOF | | S&P | | | | Start Date** | | MOF | | S&P | | | | End Date*** | | MOF | | S&P |
8/24/1992* | | 210.84% | | 230.03% | | | | 7/17/1998 | | 4.02% | | -19.19% | | | | 8/31/1998 | | 223.35% | | 166.69% |
8/31/1998 | | 6.14% | | 62.88% | | | | 9/1/2000 | | 15.10% | | -35.71% | | | | 9/21/2001 | | 22.17% | | 4.72% |
9/21/2001 | | -5.72% | | 22.00% | | | | 3/19/2002 | | 10.02% | | -33.01% | | | | 10/9/2002 | | 3.73% | | -18.27% |
10/9/2002 | | 16.86% | | 119.38% | | | | 10/9/2007 | | -0.61% | | -55.26% | | | | 3/9/2009 | | 16.14% | | -1.85% |
3/9/2009 | | -1.63% | | 111.33% | | | | 4/29/2011 | | 0.47% | | -18.72% | | | | 10/3/2011 | | -1.17% | | 71.76% |
| * | The first bull market phase began 10/11/1990, but the table begins with 8/24/1992, which coincides with commencement of active management of the Caldwell & Orkin Market Opportunity Fund. |
| ** | The bear market start date is the bull market’s end date. |
| *** | A full market cycle runs from the bull market start date to the full market cycle end date. |
Sincerely,
Michael B. Orkin, CFA
Portfolio Manager and Chief Investment Officer
| | |
Annual Report | April 30, 2013 | | 3 |
| | |
Caldwell & Orkin | | |
| Market Opportunity Fund | | Shareholder Letter |
April 30, 2013 (Unaudited)
Disclosure
The Fund’s investment objective is to provide long-term capital growth with a short-term focus on capital preservation. Our philosophy in managing the Fund is to focus on risk as well as return. We use active asset allocation - the opportunistic shifting of assets between long stock positions, short stock positions (selling borrowed stock and attempting to replace the borrowed securities in the future at a lower price), options, bonds and cash equivalents - to manage exposure to market risk (the risk that the broad market declines, taking good companies down with it). The Fund may hold up to 60% of its net assets in short positions at any time and also invest in options. Short positions and put options are employed with the intent of making money when those stocks we judge to be mispriced fall. When we use short positions or put options, the Fund’s portfolio is considered to be “hedged,” so that it is not fully exposed to the price movements and volatility of the broader market. Our asset allocation determinations are primarily based on our perception of risk in the marketplace. In summary, our goal is to make money over a full market cycle, but with less stomach churn.
The Fund’s disciplined investment philosophy and active management style typically leads to higher-than-average portfolio turnover. High turnover may have an unfavorable impact on the amount of taxable distributions paid to shareholders. Higher turnover may also result in higher brokerage costs for the Fund. The Fund’s turnover rate will typically exceed 100% per year, and will not be a limiting factor when we deem change appropriate. Fund holdings, industry and asset allocations are subject to change without notice. The Fund may or may not have a position in any of the companies mentioned in this commentary as of the date of this report.
An investment in the Fund involves risk, including the loss of principal. Additionally, there are certain risks inherent in investing in the Fund, including market risk, short sale risk, interest rate risk, business risk, small company risk, market valuation risk, political risk, and portfolio turnover risk. For a complete discussion of these risks, you may request a copy of the Fund’s prospectus by calling 800-237-7073. The Fund uses aggressive investment strategies (including short positions and options) that have the potential for yielding high returns; however, these strategies may also result in losses. Stocks sold short have unlimited risk. Investment return and principal value will fluctuate so that shares, when redeemed, may be worth more or less than their original cost. Options are not suitable for all investors.
Investors should expect that the Fund’s performance may fluctuate independently of stock market indices, such as the S&P 500 Total Return Index.
Distributed by ALPS Distributors, Inc., Member FINRA/SIPC
1290 Broadway, Suite 1100, Denver, CO 80203
| | |
4 | | 1-800-467-7903 | www.CaldwellOrkinFunds.com |
| | |
Caldwell & Orkin | | |
| Market Opportunity Fund | | Shareholder Letter |
April 30, 2013 (Unaudited)
Statistical Risk Definitions:
Correlation Coefficient (R): R is a statistical measure of correlation. In this report, R is a measurement of investment risk that indicates how closely performance is linked to the broad market – it quantifies the degree to which a fund’s performance correlates with the performance of a benchmark. R can vary between 100% (perfect positive correlation) and –100% (perfect negative correlation). 0% represents no correlation. An R of 100% means that all movements of a fund are fully explained by movements in its benchmark index. Conversely, a low R indicates that very few of the fund’s movements are explained by movements in its benchmark index, and a negative R indicates a fund’s movements are inversely correlated with its benchmark index.
Coefficient of Determination (R-Square): R-Square, also represented as R2, is another measurement of investment risk that quantifies the degree to which a fund’s performance correlates with the performance of its benchmark index. R-Square is calculated by multiplying the Correlation Coefficient (R) by itself, and is therefore always positive. R-Square can vary between 0% (no correlation) and 100% (perfect correlation). The higher the value of R-Square, the greater the degree of correlation between the fund and its benchmark index. R-squared does not take into account the direction of the correlation (positive or negative), therefore R-Squared is not able to reflect inverse correlation between a fund and its benchmark index.
Beta: A measure of a fund’s sensitivity to market movements. Usually the higher betas represent riskier investments. When correlation is low, beta has minimal, if any, significance.
Standard deviation: A statistical measure of dispersion about an average, indicating the volatility of a fund’s total returns.
Sharpe Ratio: The Sharpe Ratio is calculated by subtracting the risk-free (T-bill) rate of return from a portfolio’s total return and then dividing this by its standard deviation. The resulting fraction can be thought of as return per unit of risk. The higher a portfolio’s Sharpe Ratio, the better the risk-adjusted performance.
Semi-variance: A measure of a fund’s downside (negative return) volatility relative to a benchmark. Lower numbers are associated with less risk.
Index Definition:
S&P 500 Total Return Index: The S&P 500 Total Return Index is a capitalization-weighted, unmanaged index of 500 large U.S. companies chosen for market size, liquidity and industry group representation and includes reinvested dividends. You cannot invest directly in an index.
| | |
Annual Report | April 30, 2013 | | 5 |
| | |
Caldwell & Orkin | | |
| Market Opportunity Fund | | Performance Summary |
April 30, 2013
| | | | |
Fiscal Year Ended April 30, | | C&O Market
Opportunity Fund(1) | | S&P 500 Total
Return Index(2) |
1993* | | 15.09% | | 9.24% |
1993** | | 21.09% | | 9.18% |
1994 | | 16.48% | | 5.32% |
1995 | | -2.28% | | 17.47% |
1996 | | 31.80% | | 30.21% |
1997 | | 23.24% | | 25.13% |
1998 | | 25.77% | | 41.07% |
1999 | | 19.43% | | 21.82% |
2000 | | -0.02% | | 10.13% |
2001 | | 11.43% | | -12.97% |
2002 | | 1.88% | | -12.63% |
| | | | |
Total Return Through April 30, 2013 | | | | |
6 months ended | | 6.00% | | 14.42% |
12 months ended | | 11.72% | | 16.89% |
Since 8/24/92(3) | | 461.16% | | 486.39% |
| | | | |
Fiscal Year Ended April 30, | | C&O Market
Opportunity Fund(1) | | S&P 500 Total
Return Index(2) |
2003 | | 1.12% | | -13.31% |
2004 | | -3.55% | | 22.88% |
2005 | | -0.17% | | 6.34% |
2006 | | -2.74% | | 15.42% |
2007 | | 15.31% | | 15.24% |
2008 | | 17.92% | | -4.68% |
2009 | | 4.73% | | -35.31% |
2010 | | -7.40% | | 38.84% |
2011 | | 0.41% | | 17.22% |
2012 | | 4.95% | | 4.76% |
2013 | | 11.72% | | 16.89% |
| | | | |
Average Annual Returns Through April 30, 2013 | | | | |
One Year | | 11.72% | | 16.89% |
Three Years | | 5.59% | | 12.80% |
Five Years | | 2.69% | | 5.21% |
Ten Years | | 3.81% | | 7.88% |
Fifteen Years | | 4.70% | | 4.33% |
Twenty Years | | 7.97% | | 8.77% |
Since 8/24/92(3) | | 8.70% | | 8.93% |
Total annualized Fund operating expenses for the Fund’s fiscal year ended April 30, 2013 were 1.99%, or 1.27% before interest expenses and dividend expenses related to short sales. These figures exclude Acquired Fund Fees and Expenses of 0.03%. Additional information about the Fund’s fees and expenses is available in the Fund’s prospectus.
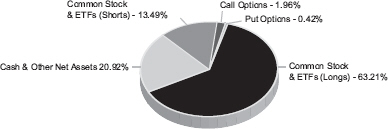
Net Asset Allocation
April 30, 2013†
| | |
6 | | 1-800-467-7903 | www.CaldwellOrkinFunds.com |
| | |
Caldwell & Orkin | | |
| Market Opportunity Fund | | Performance Summary |
April 30, 2013
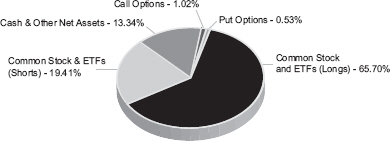
Net Asset Allocation
October 31, 2012†
| 1 | The performance data quoted represents past performance. Past performance is no guarantee of future results. The investment return and principal value of an investment in the Fund will fluctuate so that an investor’s shares, when redeemed, may be worth more or less than their original cost. Current performance may be higher or lower than the performance data quoted. Please call 800-377-7073 or visit www.caldwellorkinfunds.com for current month-end performance. The Fund’s performance assumes the reinvestment of dividends and capital gains, if any. Fund holdings, industry and asset allocations are subject to change without notice. The Fund may or may not have a position in any of the companies mentioned in this report as of the date of this report. See additional important disclosures on pages 4 and 5. |
| 2 | Investors should expect that the Fund’s performance may fluctuate independently of stock market indices, such as the S&P 500 Total Return index. The S&P 500 Total Return index is a widely recognized unmanaged index of 500 common stock prices adjusted to reflect the reinvestment of dividends and distributions. You may not invest directly in an index. |
| 3 | Effective August 24, 1992, the Fund changed its investment objective to provide long-term capital growth with a short-term focus on capital preservation through investment selection and asset allocation. Prior to that time, the Fund was passively managed and indexed to the largest 100 over-the-counter (OTC) stocks. |
| † | As a percentage of net assets plus the absolute value of securities sold short. |
| * | For the full fiscal year ended April 30, 1993. |
| ** | From August 24, 1992 through April 30, 1993 - the portion of the year using the active investment management style of C&O Funds Advisor, Inc., the manager of the Fund. |
| | |
Annual Report | April 30, 2013 | | 7 |
| | |
Caldwell & Orkin | | |
| Market Opportunity Fund | | Statistical Risk Profile |
April 30, 2013
| | | | | | | | |
| Ten Worst S&P 500 Total Return Days |
Date | | C&O MOF | | S&P 500 | | Variance | | The Caldwell & Orkin Market Opportunity Fund outperformed the S&P 500 Total Return index on all ten of the ten worst days, and was positive on two of the ten days. |
| 10/15/2008 | | -1.47% | | -9.02% | | 7.55% | |
| 12/1/2008 | | -1.58% | | -8.92% | | 7.34% | |
| 9/29/2008 | | -0.37% | | -8.78% | | 8.41% | |
| 10/9/2008 | | -2.12% | | -7.61% | | 5.49% | |
| 10/27/1997 | | -1.60% | | -6.89% | | 5.29% | |
| 8/31/1998 | | 0.42% | | -6.79% | | 7.21% | |
| 11/20/2008 | | 0.23% | | -6.70% | | 6.93% | |
| 8/8/2011 | | -0.63% | | -6.66% | | 6.03% | |
| 11/19/2008 | | -0.28% | | -6.10% | | 5.82% | |
| 10/22/2008 | | -1.11% | | -6.09% | | 4.98% | |
|
| Ten Worst S&P 500 Total Return Weeks |
Week Ending | | C&O MOF | | S&P 500 | | Variance | | The Caldwell & Orkin Market Opportunity Fund outperformed the S&P 500 Total Return index in all ten of the ten worst weeks, and was positive in seven of those weeks. |
| 10/10/2008 | | -2.71% | | -18.14% | | 15.43% | |
| 9/21/2001 | | 1.63% | | -11.57% | | 13.20% | |
| 4/14/2000 | | 4.51% | | -10.52% | | 15.03% | |
| 10/3/2008 | | 1.83% | | -9.33% | | 11.16% | |
| 11/21/2008 | | 0.56% | | -8.33% | | 8.89% | |
| 7/19/2002 | | 0.65% | | -7.96% | | 8.61% | |
| 8/5/2011 | | -0.77% | | -7.15% | | 6.38% | |
| 3/6/2009 | | -0.88% | | -6.96% | | 6.08% | |
| 7/12/2002 | | 1.01% | | -6.81% | | 7.82% | |
| 2/20/2009 | | 0.20% | | -6.80% | | 7.00% | |
|
| Ten Worst S&P 500 Total Return Months |
Month | | C&O MOF | | S&P 500 | | Variance | | The Caldwell & Orkin Market Opportunity Fund outperformed the S&P 500 Total Return index in all ten of the ten worst months, and was positive in seven of those months. |
| 10/31/2008 | | 3.42% | | -16.74% | | 20.16% | |
| 8/31/1998 | | 3.12% | | -14.46% | | 17.58% | |
| 9/30/2002 | | 2.10% | | -10.86% | | 12.96% | |
| 2/28/2009 | | 0.30% | | -10.71% | | 11.01% | |
| 2/28/2001 | | 4.78% | | -9.13% | | 13.91% | |
| 9/30/2008 | | -0.42% | | -8.89% | | 8.47% | |
| 6/30/2008 | | 4.84% | | -8.43% | | 13.27% | |
| 1/31/2009 | | -0.73% | | -8.30% | | 7.57% | |
| 9/30/2001 | | 3.29% | | -8.06% | | 11.35% | |
| 5/31/2010 | | -2.55% | | -8.04% | | 5.49% | |
Short selling began May 2, 1994. Past performance is no guarantee of future results. See additional important disclosures on pages 4 and 5. Computations by Ned Davis Research, Inc.
| | |
8 | | 1-800-467-7903 | www.CaldwellOrkinFunds.com |
| | |
Caldwell & Orkin | | |
| Market Opportunity Fund | | Statistical Risk Profile |
April 30, 2013
| | | | | | | | | | | | | | |
| Ten Worst Drawdowns | |
| Caldwell & Orkin Market Opportunity Fund | | | | S&P 500 Total Return Index | | | | |
Date Range | | C&O MOF | | S&P 500 | | | Date Range | | C&O MOF | | | S&P 500 | |
01/17/2008 - 05/07/2010 | | -15.71% | | -11.68% | | | 10/09/2007 - 03/09/2009 | | -0.61% | | | -55.26% | |
04/12/1999 - 11/23/1999 | | -13.24% | | 4.23% | | | 03/24/2000 - 10/09/2002 | | 28.57% | | | -47.41% | |
10/09/2002 - 05/25/2006 | | -13.12% | | 74.17% | | | 07/17/1998 - 08/31/1998 | | 4.02% | | | -19.19% | |
05/26/2000 - 06/07/2000 | | -8.15% | | 6.81% | | | 04/29/2011 - 10/03/2011 | | 0.47% | | | -18.72% | |
12/29/2000 - 01/19/2001 | | -8.06% | | 1.75% | | | 04/23/2010 - 07/02/2010 | | -1.52% | | | -15.67% | |
04/04/2001 - 03/11/2002 | | -7.98% | | 7.22% | | | 11/27/2002 - 03/11/2003 | | 2.19% | | | -14.28% | |
03/15/1993 - 04/26/1993 | | -7.83% | | -3.65% | | | 07/16/1999 - 10/15/1999 | | -0.45% | | | -11.78% | |
03/18/1994 - 02/03/1995 | | -7.68% | | 4.21% | | | 10/07/1997 - 10/27/1997 | | 0.18% | | | -10.74% | |
04/10/2007 - 05/24/2007 | | -7.14% | | 4.31% | | | 09/23/1998 - 10/08/1998 | | 2.02% | | | -9.94% | |
10/07/1998 - 11/05/1998 | | -6.41% | | 16.95% | | | 04/02/2012 - 06/01/2012 | | -1.27% | | | -9.63% | |
| | | | | | | | |
Statistical Risk Measurements 8/24/1992 through 4/30/13 (daily data) |
| | | |
| | | C&O MOF | | S&P 500 | | | |
Coefficient of Determination (R-Square) | | 0.36% | | | 100.00% | | | |
Correlation Coefficient “R” | | 5.97% | | | 100.00% | | | |
Beta | | 0.026 | | | 1.000 | | | |
Standard Deviation | | 0.518 | | | 1.198 | | | |
Sharpe Ratio | | 0.69 | | | 0.38 | | | |
Semi-Variance | | 0.13 | | | 0.71 | | | |
| | | |
| Performance During the Last Three Market Downturns of 20% or More | | | | | | | |
| | | |
| | | C&O MOF | | S&P 500 | | | |
01/06/2009 - 03/09/2009 | | -3.42% | | | -27.19 | % | | |
10/09/2007 - 11/20/2008 | | 1.80% | | | -50.73 | % | | |
01/04/2002 - 10/09/2002 | | 7.25% | | | -32.95 | % | | |
Short selling began May 2, 1994. Past performance is no guarantee of future results. See additional important disclosures on pages 4 and 5. Computations by Ned Davis Research, Inc.
| | |
Annual Report | April 30, 2013 | | 9 |
| | |
Caldwell & Orkin | | |
| Market Opportunity Fund | | Growth of $10,000 |
April 30, 2013
Caldwell & Orkin Market Opportunity Fund Versus S&P 500 Total Return Index
Since Commencement of Active Style of Investment Management Results of a Hypothetical $10,000 Investment August 24, 1992 through April 30, 2013.
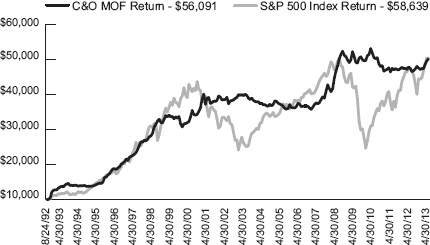
Past performance does not predict future performance. The returns do not reflect the deduction of taxes that a shareholder would pay on Fund distributions or the redemption of Fund shares. See additional disclosure on pages 4 and 5.
| | |
10 | | 1-800-467-7903 | www.CaldwellOrkinFunds.com |
| | |
Caldwell & Orkin | | |
| Market Opportunity Fund | | Disclosure of Fund Expenses |
April 30, 2013 (Unaudited)
We believe it is important for you to understand the impact of fees and expenses on your investment in the Fund. As a shareholder of the Fund, you incur two types of costs: (1) transaction costs related to the purchase and redemption of Fund shares, including redemption fees and brokerage commissions (if applicable); and (2) ongoing costs, including management fees, administrative expenses, portfolio transaction costs and other Fund expenses. A mutual fund’s ongoing costs are expressed as a percentage of its average net assets. This figure is known as the expense ratio. The following example is intended to help you understand your ongoing costs (in dollars and cents) of investing in the Fund and to compare these costs with the ongoing costs of investing in other mutual funds.
The below example is based on an investment of $1,000.00 invested at the beginning of the period and held for the entire period indicated, November 1, 2012 through April 30, 2013. The table below illustrates the Fund’s expenses in two ways:
Based on Actual Fund Returns
The first line of the table below provides information about actual account values and actual expenses. You may use the information in this line, together with the amount you invested, to estimate the expenses that you paid over the period. Simply divide your account value by $1,000 (for example, an $8,600 account value divided by $1,000 = 8.6), then multiply the result by the number in the first line under the heading entitled “Expenses Paid During Period” to estimate the expenses you paid on your account during this period.
Based on a Hypothetical 5% Return for Comparison Purposes
The second line of the table below provides information about hypothetical account values and hypothetical expenses based on the Fund’s actual expense ratio and an assumed rate of return of 5% per year before expenses, which is not the Fund’s actual return. The hypothetical account values and expenses may not be used to estimate the actual ending account balance or expenses you paid for the period. You may use this information to compare the ongoing costs of investing in the Fund and other funds. To do so, compare this 5%hypothetical example with the 5% hypothetical examples that appear in the shareholder reports of the other funds.
Please note that the expenses shown in the table are meant to highlight your ongoing costs only and do not reflect any transactional costs, such as redemption fees or brokerage commissions. Therefore, the second line of the table is useful in comparing ongoing costs only, and will not help you determine the relative total costs of owning different funds. In addition, if these transactional costs were included, your costs would have been higher.
| | |
Annual Report | April 30, 2013 | | 11 |
| | |
Caldwell & Orkin | | |
| Market Opportunity Fund | | Disclosure of Fund Expenses |
April 30, 2013 (Unaudited)
| | | | | | | | | | | | | | | | | | | | |
| | | Beginning Account Value 11/01/2012 | | Ending Account Value 04/30/2013 | | Expense Ratio1 | | Expenses Paid During Period2 |
Actual3 | | | $ | 1,000.00 | | | | $ | 1,060.00 | | | 1.88% | | | | $9.60 | |
Hypothetical (5% return before expenses)4 | | | $ | 1,000.00 | | | | $ | 1,015.47 | | | 1.88% | | | | $9.39 | |
| 1 | The annualized expense ratio reflects actual expenses from the Fund from November 1, 2012 through April 30, 2013, as a percentage of average net assets for that period. |
| 2 | Expenses are equal to the Caldwell & Orkin Market Opportunity Fund’s annualized expense ratio of 1.88% multiplied by the average account value over the period, multiplied by the number of days in the most recent fiscal half year (181), divided by 365 (to reflect the half-year period.) |
| 3 | Excluding interest expense and dividend expense from short positions, your actual cost of investment in the Fund would be $6.44. |
| 4 | Excluding interest expense and dividend expense from short positions, your hypothetical cost of investment in the Fund would be $6.31. |
| | |
12 | | 1-800-467-7903 | www.CaldwellOrkinFunds.com |
| | |
Caldwell & Orkin | | |
| Market Opportunity Fund | | Sector Diversification |
April 30, 2013 (Unaudited)
The following table presents the Caldwell & Orkin Market Opportunity Fund’s 4/30/2013 portfolio holdings by sector based on total net assets, sorted by net exposure (net long to net short).
| | | | | | | | | | | | | | | | |
| | | Long | | | Short | | | Total (1) | | | Net (2) | |
Pipelines | | | 10.66% | | | | | | | | 10.66% | | | | 10.66% | |
Building - Residential /Commercial | | | 10.04% | | | | | | | | 10.04% | | | | 10.04% | |
Electric - Integrated | | | 5.76% | | | | | | | | 5.76% | | | | 5.76% | |
Retail - Building Products | | | 3.69% | | | | | | | | 3.69% | | | | 3.69% | |
Building & Construction Products - Miscellaneous | | | 2.97% | | | | | | | | 2.97% | | | | 2.97% | |
Food - Confectionery | | | 2.02% | | | | | | | | 2.02% | | | | 2.02% | |
Real Estate Investment Trust - Diversified | | | 1.78% | | | | | | | | 1.78% | | | | 1.78% | |
Building Production - Cement/Aggregate | | | 1.54% | | | | | | | | 1.54% | | | | 1.54% | |
Commercial Services | | | 1.51% | | | | -0.09% | | | | 1.60% | | | | 1.42% | |
Finance - Mortgage Loan/Banker | | | 1.42% | | | | | | | | 1.42% | | | | 1.42% | |
Private Equity | | | 1.42% | | | | | | | | 1.42% | | | | 1.42% | |
Cosmetics & Toiletries | | | 1.29% | | | | | | | | 1.29% | | | | 1.29% | |
Financial Guarantee Insurance | | | 1.29% | | | | | | | | 1.29% | | | | 1.29% | |
Aerospace/Defense | | | 1.13% | | | | | | | | 1.13% | | | | 1.13% | |
Motion Pictures & Services | | | 1.11% | | | | | | | | 1.11% | | | | 1.11% | |
Automotive - Cars/Light Trucks | | | 1.06% | | | | | | | | 1.06% | | | | 1.06% | |
Reinsurance | | | 1.04% | | | | | | | | 1.04% | | | | 1.04% | |
Chemicals - Diversified | | | 1.02% | | | | | | | | 1.02% | | | | 1.02% | |
Coatings/Paint | | | 1.01% | | | | | | | | 1.01% | | | | 1.01% | |
Transportation - Rail | | | 1.00% | | | | | | | | 1.00% | | | | 1.00% | |
Textile - Home Furnishings | | | 0.99% | | | | | | | | 0.99% | | | | 0.99% | |
Real Estate Investment Trust - Mortgage | | | 0.94% | | | | | | | | 0.94% | | | | 0.94% | |
Footwear (Non-Athletic) & Related Apparel | | | 0.80% | | | | | | | | 0.80% | | | | 0.80% | |
Retail - Jewelry | | | 0.69% | | | | | | | | 0.69% | | | | 0.69% | |
Food - Miscellaneous/Diversified | | | 0.64% | | | | | | | | 0.64% | | | | 0.64% | |
Radio | | | 0.61% | | | | | | | | 0.61% | | | | 0.61% | |
Rental Auto/Equipment | | | 0.52% | | | | | | | | 0.52% | | | | 0.52% | |
Broadcast Services/Programming | | | 0.51% | | | | | | | | 0.51% | | | | 0.51% | |
Web Portals/ISP | | | 0.51% | | | | | | | | 0.51% | | | | 0.51% | |
Distribution/Wholesale | | | 0.49% | | | | | | | | 0.49% | | | | 0.49% | |
Automotive - Truck Parts & Equipment | | | 0.23% | | | | | | | | 0.23% | | | | 0.23% | |
Retail - Restaurants | | | 0.20% | | | | | | | | 0.20% | | | | 0.20% | |
Engineering/R&D Services | | | 0.00%* | | | | | | | | 0.00% | * | | | 0.00% | * |
Finance - Investment Banking/Brokerage | | | 0.00%* | | | | | | | | 0.00% | * | | | 0.00% | * |
Gold Mining | | | 0.00%* | | | | | | | | 0.00% | * | | | 0.00% | * |
Property/Casualty Insurance | | | | | | | -0.05% | | | | 0.05% | | | | -0.05% | |
Medical - Hospitals | | | | | | | -0.10% | | | | 0.10% | | | | -0.10% | |
Internet Infrastructure Software | | | | | | | -0.21% | | | | 0.21% | | | | -0.21% | |
Computers | | | | | | | -0.23% | | | | 0.23% | | | | -0.23% | |
Multi-Media | | | 0.00%* | | | | -0.25% | | | | 0.25% | | | | -0.25% | |
Retail - Computer Equipment | | | | | | | -0.29% | | | | 0.29% | | | | -0.29% | |
| | |
Annual Report | April 30, 2013 | | 13 |
| | |
Caldwell & Orkin | | |
| Market Opportunity Fund | | Sector Diversification |
April 30, 2013 (Unaudited)
| | | | | | | | | | | | |
| | | Long | | Short | | Total (1) | | | Net (2) | |
E-Commerce/Products | | | | -0.41% | | | 0.41% | | | | -0.41% | |
E-Commerce/Services | | | | -0.41% | | | 0.41% | | | | -0.41% | |
Computers - Integrated Systems | | | | -0.42% | | | 0.42% | | | | -0.42% | |
Retail - Apparel/Shoe | | 1.06% | | -2.04% | | | 3.10% | | | | -0.98% | |
Electronic Devices | | | | -1.03% | | | 1.03% | | | | -1.03% | |
Medical - Outpatient/Home Medical Care | | | | -1.13% | | | 1.13% | | | | -1.13% | |
Retail - Automobile | | | | -2.05% | | | 2.05% | | | | -2.05% | |
Schools | | | | -3.63% | | | 3.63% | | | | -3.63% | |
Subtotal Common Stocks (long & short positions) | | 60.95% | | -12.34% | | | 73.29% | | | | 48.61% | |
| | | | | | | | | | | | |
Country Exchange-Traded Funds | | 0.21% | | | | | 0.21% | | | | 0.21% | |
Emerging Country Exchange-Traded Funds | | 2.05% | | -1.15% | | | 3.20% | | | | 0.90% | |
Subtotal Exchange-Traded Funds (long & short positions) | | 2.26% | | -1.15% | | | 3.41% | | | | 1.11% | |
| | | | | | | | | | | | |
Subtotal Equities (long & short positions) | | 63.21% | | -13.49% | | | 76.70% | | | | 49.72% | |
| | | | | | | | | | | | |
Call Options | | 1.96% | | | | | 1.96% | | | | | |
Put Options | | 0.42% | | | | | 0.42% | | | | | |
Other Assets less Liabilities | | 20.92% | | | | | 20.92% | | | | | |
Total Portfolio Holdings | | 86.51% | | -13.49% | | | 100.00% | | | | | |
| * | Less than 0.005% of net assets. |
| (1) | Total exposure is Long exposure plus the absolute value of the Short exposure. |
| (2) | Net exposure is Long exposure less Short exposure. |
| | |
14 | | 1-800-467-7903 | www.CaldwellOrkinFunds.com |
| | |
Caldwell & Orkin | | |
| Market Opportunity Fund | | Schedule of Investments |
April 30, 2013
| | | | | | | | |
| | | Shares | | | Value (Note 1) | |
LONG INVESTMENTS (65.59%) | | | | | | | | |
COMMON STOCKS (60.95%) | | | | | | | | |
Aerospace/Defense (1.13%) | | | | | | | | |
Spirit Aerosystems Holdings, Inc. - Class A1 | | | 147,100 | | | $ | 2,940,529 | |
| | | | | | | | |
| | |
Automotive - Cars/Light Trucks (1.06%) | | | | | | | | |
Toyota Motor Corp., Sponsored ADR | | | 23,800 | | | | 2,767,940 | |
| | | | | | | | |
| | |
Automotive - Truck Parts & Equipment (0.23%) | | | | | | | | |
Delphi Automotive PLC | | | 12,900 | | | | 596,109 | |
| | | | | | | | |
| | |
Broadcast Services/Programming (0.51%) | | | | | | | | |
Discovery Communications, Inc. - Class A1 | | | 16,800 | | | | 1,324,176 | |
| | | | | | | | |
| | |
Building - Residential/Commercial (10.04%) | | | | | | | | |
DR Horton, Inc. | | | 113,400 | | | | 2,957,472 | |
Lennar Corp. - Class A | | | 130,000 | | | | 5,358,600 | |
M/I Homes, Inc.1 | | | 54,300 | | | | 1,335,780 | |
Meritage Homes Corp.1 | | | 64,300 | | | | 3,137,197 | |
Pulte Group, Inc.1 | | | 223,200 | | | | 4,684,968 | |
The Ryland Group, Inc. | | | 13,600 | | | | 612,816 | |
Standard Pacific Corp.1 | | | 418,600 | | | | 3,788,330 | |
Toll Brothers, Inc.1 | | | 126,200 | | | | 4,329,922 | |
| | | | | | | | |
| | | | | | | 26,205,085 | |
| | | | | | | | |
| | |
Building & Construction Products - Miscellaneous (2.97%) | | | | | | | | |
Fortune Brands Home & Security, Inc. | | | 107,100 | | | | 3,897,369 | |
Owens Corning1 | | | 65,400 | | | | 2,750,724 | |
Trex Co., Inc.1 | | | 22,400 | | | | 1,090,432 | |
| | | | | | | | |
| | | | | | | 7,738,525 | |
| | | | | | | | |
| | |
Building Production - Cement/Aggregate (1.54%) | | | | | | | | |
Eagle Materials, Inc. | | | 59,400 | | | | 4,024,350 | |
| | | | | | | | |
| | |
Chemicals - Diversified (1.02%) | | | | | | | | |
PPG Industries, Inc. | | | 18,000 | | | | 2,648,520 | |
| | | | | | | | |
| | |
Coatings/Paint (1.01%) | | | | | | | | |
The Sherwin-Williams Co. | | | 14,400 | | | | 2,636,784 | |
| | | | | | | | |
| | |
Commercial Services (1.51%) | | | | | | | | |
Quanta Services, Inc.1 | | | 143,100 | | | | 3,932,388 | |
| | | | | | | | |
| | |
Annual Report | April 30, 2013 | | 15 |
| | |
Caldwell & Orkin | | |
| Market Opportunity Fund | | Schedule of Investments |
April 30, 2013
| | | | | | | | |
| | | Shares | | | Value (Note 1) | |
Cosmetics & Toiletries (1.29%) | | | | | | | | |
The Estee Lauder Cos., Inc. - Class A | | | 48,600 | | | $ | 3,370,410 | |
| | | | | | | | |
| | |
Distribution/Wholesale (0.49%) | | | | | | | | |
Beacon Roofing Supply, Inc.1 | | | 33,400 | | | | 1,273,542 | |
| | | | | | | | |
| | |
Electric - Integrated (5.76%) | | | | | | | | |
American Electric Power Co., Inc. | | | 112,100 | | | | 5,765,303 | |
CMS Energy Corp. | | | 309,600 | | | | 9,269,424 | |
| | | | | | | | |
| | | | | | | 15,034,727 | |
| | | | | | | | |
| | |
Engineering/R&D Services (0.00%)† | | | | | | | | |
Jacobs Engineering Group, Inc.1 | | | 100 | | | | 5,048 | |
| | | | | | | | |
| | |
Finance - Investment Banking/Brokerage (0.00%)† | | | | | | | | |
Nomura Holdings, Inc., ADR | | | 100 | | | | 819 | |
| | | | | | | | |
| | |
Finance - Mortgage Loan/Banker (1.42%) | | | | | | | | |
Nationstar Mortgage Holdings, Inc.1 | | | 52,500 | | | | 1,930,425 | |
Walter Investment Management Corp.1 | | | 52,500 | | | | 1,761,900 | |
| | | | | | | | |
| | | | | | | 3,692,325 | |
| | | | | | | | |
| | |
Financial Guarantee Insurance (1.29%) | | | | | | | | |
MGIC Investment Corp.1 | | | 338,600 | | | | 1,828,440 | |
Radian Group, Inc. | | | 128,900 | | | | 1,540,355 | |
| | | | | | | | |
| | | | | | | 3,368,795 | |
| | | | | | | | |
| | |
Food - Confectionery (2.02%) | | | | | | | | |
The Hershey Co. | | | 59,000 | | | | 5,260,440 | |
| | | | | | | | |
| | |
Food - Miscellaneous/Diversified (0.64%) | | | | | | | | |
Unilever N.V., NY Registered Shares | | | 39,100 | | | | 1,660,968 | |
| | | | | | | | |
| | |
Footwear (Non-Athletic) & Related Apparel (0.80%) | | | | | | | | |
Deckers Outdoor Corp.1 | | | 38,000 | | | | 2,094,560 | |
| | | | | | | | |
| | |
Gold Mining (0.00%)† | | | | | | | | |
Agnico-Eagle Mines, Ltd. | | | 100 | | | | 3,229 | |
| | | | | | | | |
| | |
Motion Pictures & Services (1.11%) | | | | | | | | |
Lions Gate Entertainment Corp.1 | | | 116,700 | | | | 2,895,327 | |
| | | | | | | | |
| | |
16 | | 1-800-467-7903 | www.CaldwellOrkinFunds.com |
| | |
Caldwell & Orkin | | |
| Market Opportunity Fund | | Schedule of Investments |
April 30, 2013
| | | | | | | | |
| | | Shares | | | Value (Note 1) | |
Multi-Media (0.00%)† | | | | | | | | |
The Walt Disney Co. | | | 100 | | | $ | 6,284 | |
| | | | | | | | |
| | |
Pipelines (10.66%) | | | | | | | | |
Crosstex Energy, Inc. | | | 78,100 | | | | 1,437,821 | |
Enbridge, Inc. | | | 191,200 | | | | 9,101,120 | |
Kinder Morgan, Inc. | | | 227,200 | | | | 8,883,520 | |
Plains All American Pipeline LP | | | 146,200 | | | | 8,394,804 | |
| | | | | | | | |
| | | | | | | 27,817,265 | |
| | | | | | | | |
| | |
Private Equity (1.42%) | | | | | | | | |
Blackstone Group LP | | | 180,600 | | | | 3,711,330 | |
KKR & Co. LP | | | 100 | | | | 2,100 | |
| | | | | | | | |
| | | | | | | 3,713,430 | |
| | | | | | | | |
| | |
Radio (0.61%) | | | | | | | | |
Sirius XM Radio, Inc. | | | 491,100 | | | | 1,596,075 | |
| | | | | | | | |
| | |
Real Estate Investment Trust - Diversified (1.78%) | | | | | | | | |
American Tower Corp. | | | 13,900 | | | | 1,167,461 | |
Plum Creek Timber Co., Inc. | | | 37,700 | | | | 1,943,058 | |
Weyerhaeuser Co. | | | 50,400 | | | | 1,537,704 | |
| | | | | | | | |
| | | | | | | 4,648,223 | |
| | | | | | | | |
| | |
Real Estate Investment Trust - Mortgage (0.94%) | | | | | | | | |
Colony Financial, Inc. | | | 60,400 | | | | 1,346,920 | |
Starwood Property Trust, Inc. | | | 40,200 | | | | 1,105,098 | |
| | | | | | | | |
| | | | | | | 2,452,018 | |
| | | | | | | | |
| | |
Reinsurance (1.04%) | | | | | | | | |
Berkshire Hathaway, Inc. - Class B1 | | | 25,400 | | | | 2,700,528 | |
| | | | | | | | |
| | |
Rental Auto/Equipment (0.52%) | | | | | | | | |
Hertz Global Holdings, Inc.1 | | | 56,600 | | | | 1,362,928 | |
| | | | | | | | |
| | |
Retail - Apparel/Shoe (1.06%) | | | | | | | | |
Urban Outfitters, Inc.1 | | | 66,700 | | | | 2,764,048 | |
| | | | | | | | |
| | |
Retail - Building Products (3.69%) | | | | | | | | |
Home Depot, Inc. | | | 53,300 | | | | 3,909,555 | |
Lowe’s Cos., Inc. | | | 107,700 | | | | 4,137,834 | |
Lumber Liquidators Holdings, Inc.1 | | | 19,400 | | | | 1,590,024 | |
| | | | | | | | |
| | | | | | | 9,637,413 | |
| | | | | | | | |
| | |
Annual Report | April 30, 2013 | | 17 |
| | |
Caldwell & Orkin | | |
| Market Opportunity Fund | | Schedule of Investments |
April 30, 2013
| | | | | | | | |
| | | Shares | | | Value (Note 1) | |
Retail - Jewelry (0.69%) | | | | | | | | |
Tiffany & Co. | | | 24,500 | | | $ | 1,805,160 | |
| | | | | | | | |
| | |
Retail - Restaurants (0.20%) | | | | | | | | |
Panera Bread Co. - Class A1 | | | 2,900 | | | | 513,967 | |
| | | | | | | | |
| | |
Textile - Home Furnishings (0.99%) | | | | | | | | |
Mohawk Industries, Inc.1 | | | 23,400 | | | | 2,594,592 | |
| | | | | | | | |
| | |
Transportation - Rail (1.00%) | | | | | | | | |
Kansas City Southern | | | 23,900 | | | | 2,606,773 | |
| | | | | | | | |
| | |
Web Portals/ISP (0.51%) | | | | | | | | |
Yahoo!, Inc.1 | | | 54,200 | | | | 1,340,366 | |
| | | | | | | | |
| | |
TOTAL COMMON STOCKS (Cost $129,479,367) | | | | | | | 159,033,666 | |
| |
| | |
EXCHANGE-TRADED FUNDS (2.26%) | | | | | | | | |
Country Exchange-Traded Funds (0.21%) | | | | | | | | |
WisdomTree® Japan Hedged Equity Fund | | | 11,200 | | | | 532,672 | |
| | | | | | | | |
| | |
Emerging Country Exchange-Traded Funds (2.05%) | | | | | | | | |
iShares® MSCI Mexico Capped Investable Market Index Fund | | | 73,900 | | | | 5,346,665 | |
iShares® MSCI Thailand Capped Investable Market Index Fund | | | 100 | | | | 9,500 | |
Market Vectors® Vietnam ETF | | | 100 | | | | 1,951 | |
| | | | | | | | |
| | | | | | | 5,358,116 | |
| | | | | | | | |
| | |
TOTAL EXCHANGE-TRADED FUNDS (Cost $5,741,639) | | | | | | | 5,890,788 | |
| |
| | | | | | | | | | | | | | |
| | | Expiration Date | | Exercise Price | | | Number of Contracts | | | Value (Note 1) | |
PURCHASED OPTIONS (2.38%) | | | | | | | | | | | | | | |
PURCHASED CALL OPTIONS (1.96%) | | | | | | | | | | | | | | |
Eagle Materials, Inc. | | July, 2013 | | | $65.00 | | | | 1,350 | | | | 850,500 | |
Fortune Brands Home & Security, Inc. | | June, 2013 | | | 35.00 | | | | 2,344 | | | | 656,320 | |
Lennar Corp. - Class A | | May, 2013 | | | 40.00 | | | | 2,559 | | | | 475,974 | |
Lennar Corp. - Class A | | August, 2013 | | | 40.00 | | | | 2,070 | | | | 745,200 | |
| | |
18 | | 1-800-467-7903 | www.CaldwellOrkinFunds.com |
| | |
Caldwell & Orkin | | |
| Market Opportunity Fund | | Schedule of Investments |
April 30, 2013
| | | | | | | | | | | | | | |
| | | Expiration
Date | | Exercise
Price | | | Number of
Contracts | | | Value (Note 1) | |
PURCHASED CALL OPTIONS (continued) | | | | | | | | | | | | | | |
Nationstar Mortgage Holdings, Inc. | | July, 2013 | | | $35.00 | | | | 857 | | | | $ 308,520 | |
PulteGroup, Inc. | | July, 2013 | | | 19.00 | | | | 5,200 | | | | 1,300,000 | |
Toll Brothers, Inc. | | June, 2013 | | | 35.00 | | | | 2,843 | | | | 398,020 | |
Trex Co., Inc. | | July, 2013 | | | 45.00 | | | | 476 | | | | 242,760 | |
Walter Investment Management Corp. | | June, 2013 | | | 35.00 | | | | 731 | | | | 138,890 | |
| | | | | | | | | | | | | | |
| | | | |
TOTAL PURCHASED CALL OPTIONS (Cost $4,950,133) | | | | | | | | | | | | | 5,116,184 | |
| | | | | | | | | | | | | | |
| | | | |
PURCHASED PUT OPTIONS (0.42%) | | | | | | | | | | | | | | |
Amedisys, Inc. | | June, 2013 | | | 12.00 | | | | 3,503 | | | | 910,780 | |
Herbalife, Ltd. | | May, 2013 | | | 40.00 | | | | 200 | | | | 41,000 | |
ITT Educational Services, Inc. | | July, 2013 | | | 20.00 | | | | 428 | | | | 141,240 | |
| | | | | | | | | | | | | | |
| | | | |
TOTAL PURCHASED PUT OPTIONS (Cost $972,540) | | | | | | | | | | | | | 1,093,020 | |
| | | | | | | | | | | | | | |
| | | | |
TOTAL PURCHASED OPTIONS (Cost $5,922,673) | | | | | | | | | | | | | 6,209,204 | |
TOTAL LONG INVESTMENTS (Cost $141,143,679) | | | | | | | | | | | | | 171,133,658 | |
| | | | | | | | | | |
| | | 7-Day Yield | | Shares | | | Value (Note 1) | |
SHORT TERM INVESTMENTS (36.02%) | | | | | | | | | | |
MONEY MARKET FUNDS2 | | | | | | | | | | |
JPMorgan 100% U.S. Treasury Securities Money Market Fund | | 0.00% 3 | | | 93,976,317 | | | | 93,976,317 | |
| | | | | | | | | | |
| | | |
TOTAL SHORT TERM INVESTMENTS (Cost $93,976,317) | | | | | | | | | 93,976,317 | |
| | | |
TOTAL INVESTMENTS - (101.61%) (Cost $235,119,996) | | | | | | | | $ | 265,109,975 | |
| | | |
Liabilities in Excess of Other Assets (-1.61%) | | | | | | | | | (4,194,134 | ) |
| | | |
NET ASSETS (100.00%) | | | | | | | | $ | 260,915,841 | |
| | | | | | | | | | | |
| | |
Annual Report | April 30, 2013 | | 19 |
| | |
Caldwell & Orkin | | |
| Market Opportunity Fund | | Schedule of Investments |
April 30, 2013
| | | | | | | | |
| SCHEDULE OF SECURITIES SOLD SHORT | | Shares | | | Value
(Note 1) | |
COMMON STOCKS (-12.34%) | | | | | | | | |
Commercial Services (-0.09%) | | | | | | | | |
HMS Holdings Corp. | | | (9,600 | ) | | $ | (242,016 | ) |
| | | | | | | | |
| | |
Computers (-0.23%) | | | | | | | | |
Hewlett-Packard Co. | | | (29,300 | ) | | | (603,580 | ) |
| | | | | | | | |
| | |
Computers - Integrated Systems (-0.42%) | | | | | | | | |
Teradata Corp. | | | (21,700 | ) | | | (1,108,219 | ) |
| | | | | | | | |
| | |
E - Commerce/Products (-0.41%) | | | | | | | | |
Amazon.com, Inc. | | | (1,900 | ) | | | (482,239 | ) |
MercadoLibre, Inc. | | | (5,700 | ) | | | (573,363 | ) |
Nutrisystem, Inc. | | | (100 | ) | | | (810 | ) |
| | | | | | | | |
| | | | | | | (1,056,412 | ) |
| | | | | | | | |
| | |
E - Commerce/Services (-0.41%) | | | | | | | | |
SouFun Holdings, Ltd., ADR | | | (42,200 | ) | | | (1,079,898 | ) |
| | | | | | | | |
| | |
Electronic Devices (-1.03%) | | | | | | | | |
Garmin, Ltd. | | | (76,700 | ) | | | (2,690,636 | ) |
| | | | | | | | |
| | |
Internet Infrastructure Software (-0.21%) | | | | | | | | |
F5 Networks, Inc. | | | (7,000 | ) | | | (535,010 | ) |
| | | | | | | | |
| | |
Medical - Hospitals (-0.10%) | | | | | | | | |
Health Management Associates, Inc. - Class A | | | (23,500 | ) | | | (270,015 | ) |
| | | | | | | | |
| | |
Medical - Outpatient/Home Medical Care (-1.13%) | | | | | | | | |
Amedisys, Inc. | | | (294,200 | ) | | | (2,953,768 | ) |
| | | | | | | | |
| | |
Multi-Media (-0.25%) | | | | | | | | |
Thomson Reuters Corp. | | | (19,400 | ) | | | (649,706 | ) |
| | | | | | | | |
| | |
Property/Casualty Insurance (-0.05%) | | | | | | | | |
Amtrust Financial Services, Inc. | | | (4,100 | ) | | | (129,806 | ) |
| | | | | | | | |
| | |
Retail - Apparel/Shoe (-2.04%) | | | | | | | | |
Aeropostale, Inc. | | | (184,500 | ) | | | (2,704,770 | ) |
Guess?, Inc. | | | (94,900 | ) | | | (2,626,832 | ) |
| | | | | | | | |
| | | | | | | (5,331,602 | ) |
| | | | | | | | |
| | |
20 | | 1-800-467-7903 | www.CaldwellOrkinFunds.com |
| | |
Caldwell & Orkin | | |
| Market Opportunity Fund | | Schedule of Investments |
April 30, 2013
| | | | | | | | |
| SCHEDULE OF SECURITIES SOLD SHORT (continued) | | Shares | | | Value (Note 1) | |
Retail - Automobile (-2.05%) | | | | | | | | |
Group 1 Automotive, Inc. | | | (44,200) | | | $ | (2,673,216) | |
Sonic Automotive, Inc. - Class A | | | (121,300) | | | | (2,667,387) | |
| | | | | | | | |
| | | | | | | (5,340,603) | |
| | | | | | | | |
| | |
Retail - Computer Equipment (-0.29%) | | | | | | | | |
GameStop Corp. - Class A | | | (21,300) | | | | (743,370) | |
| | | | | | | | |
| | |
Schools (-3.63%) | | | | | | | | |
American Public Education, Inc. | | | (40,200) | | | | (1,347,906) | |
Apollo Group, Inc. - Class A | | | (97,700) | | | | (1,794,749) | |
Career Education Corp. | | | (154,500) | | | | (338,355) | |
Corinthian Colleges, Inc. | | | (293,100) | | | | (586,200) | |
ITT Educational Services, Inc. | | | (150,500) | | | | (2,755,655) | |
K12, Inc. | | | (23,800) | | | | (606,186) | |
Strayer Education, Inc. | | | (43,000) | | | | (2,036,480) | |
| | | | | | | | |
| | | | | | | (9,465,531) | |
| | | | | | | | |
| | |
TOTAL COMMON STOCKS (Proceeds $36,645,639) | | | | | | | (32,200,172) | |
| | |
EXCHANGE-TRADED FUNDS (-1.15%) | | | | | | | | |
Emerging Country Exchange-Traded Funds (-1.15%) | | | | | | | | |
iShares® MSCI Brazil Index Fund | | | (46,600) | | | | (2,569,990) | |
iShares® MSCI Turkey Index Fund | | | (5,800) | | | | (424,618) | |
| | | | | | | | |
| | | | | | | (2,994,608) | |
| | | | | | | | |
| | |
TOTAL EXCHANGE-TRADED FUNDS (Proceeds $2,870,697) | | | | | | | (2,994,608) | |
| | |
TOTAL SECURITIES SOLD SHORT (Proceeds $39,516,336) | | | | | | $ | (35,194,780) | |
| |
| | |
Annual Report | April 30, 2013 | | 21 |
| | |
Caldwell & Orkin | | |
| Market Opportunity Fund | | Schedule of Investments |
April 30, 2013
| † | Less than 0.005% of net assets. |
| 1 | Non-Income Producing Security. |
| 2 | A portion of the Money Market Fund assets are held as collateral for short sales activity. |
| 3 | Amount represents less than 0.005%. |
Common Abbreviations:
ADR - American Depositary Receipts
ETF - Exchange Traded Fund
LP - Limited Partnership
Ltd. - Limited
MSCI - Morgan Stanley Capital International
N.V. - Naamloze Vennootschap is the Dutch term for a public limited liability corporation
PLC - Public Limited Company
| | |
| See accompanying notes to financial statements. | | |
22 | | 1-800-467-7903 | www.CaldwellOrkinFunds.com |
| | |
Caldwell & Orkin | | |
| Market Opportunity Fund | | Statement of Assets & Liabilities |
April 30, 2013
| | | | |
ASSETS | | | | |
Investments at value (cost $235,119,996) | | | $265,109,975 | |
Deposits with brokers for securities sold short | | | 41,173,232 | |
Receivables: | | | | |
Investment securities sold | | | 3,853,012 | |
Dividends | | | 236,975 | |
Capital shares sold | | | 373,692 | |
Other assets | | | 16,610 | |
| | | | |
Total Assets | | | 310,763,496 | |
| | | | |
| |
LIABILITIES | | | | |
Securities sold short, not yet purchased (proceeds $39,516,336) | | | 35,194,780 | |
Payables: | | | | |
Investment securities purchased | | | 14,202,522 | |
Capital shares redeemed | | | 16,162 | |
Dividends payable - short sales | | | 124,132 | |
Investment advisory fee | | | 211,015 | |
Accrued expenses and other liabilities | | | 99,044 | |
| | | | |
Total Liabilities | | | 49,847,655 | |
| | | | |
| |
Net Assets | | | $260,915,841 | |
| | | | |
| |
COMPOSITION OF NET ASSETS | | | | |
Paid-in capital applicable to 11,361,052 shares outstanding; par value $0.10 per share; 30,000,000 shares authorized | | | $237,758,167 | |
Undistributed net investment loss | | | (312,429) | |
Accumulated net realized loss on investments and securities sold short | | | (10,841,432) | |
Net unrealized appreciation of investments and securities sold short | | | 34,311,535 | |
| | | | |
| | | $260,915,841 | |
| | | | |
| |
NET ASSET VALUE AND OFFERING/REDEMPTION PRICE PER SHARE | | | $22.97 | |
| | | | |
| | |
| See accompanying notes to financial statements. | | |
Annual Report | April 30, 2013 | | 23 |
| | |
Caldwell & Orkin | | |
| Market Opportunity Fund | | Statement of Operations |
For the Year Ended April 30, 2013
| | | | |
INVESTMENT INCOME | | | | |
Dividends (net of foreign withholding taxes of $47,002) | | | $2,820,235 | |
| | | | |
Total Investment Income | | | 2,820,235 | |
| | | | |
| |
EXPENSES | | | | |
Investment advisory fees (Note 2) | | | 2,502,687 | |
Interest expense | | | 1,155,591 | |
Dividend expense on securities sold short | | | 666,279 | |
Administration and accounting fees (Note 2) | | | 167,126 | |
Transfer agent fees | | | 162,162 | |
Professional fees | | | 91,467 | |
Insurance expense | | | 64,695 | |
Directors’ fees and expenses | | | 64,331 | |
Blue sky servicing fees | | | 44,229 | |
Chief compliance officer expense | | | 36,363 | |
Custodian fees | | | 27,600 | |
Shareholder report printing | | | 23,316 | |
Other expenses | | | 18,524 | |
| | | | |
Total Expenses before waiver | | | 5,024,370 | |
Less fees waived by Administrator (Note 2) | | | (29,999) | |
| | | | |
Total net expenses | | | 4,994,371 | |
| | | | |
Net Investment Loss | | | (2,174,136) | |
| | | | |
| |
REALIZED AND UNREALIZED GAIN/(LOSS) ON INVESTMENTS | | | | |
Net realized gain on investments | | | 28,380,403 | |
Net realized loss on securities sold short | | | (6,613,537) | |
Change in unrealized appreciation on investments | | | 10,695,315 | |
Change in unrealized depreciation on securities sold short | | | (2,627,720) | |
| | | | |
NET REALIZED AND UNREALIZED GAIN ON INVESTMENTS AND SECURITIES SOLD SHORT | | | 29,834,461 | |
| | | | |
NET INCREASE IN NET ASSETS RESULTING FROM OPERATIONS | | | $27,660,325 | |
| | | | |
| | |
See accompanying notes to financial statements. | | |
24 | | 1-800-467-7903 | www.CaldwellOrkinFunds.com |
| | |
Caldwell & Orkin | | |
| Market Opportunity Fund | | Statements of Changes in Net Assets |
| | | | | | | | |
| | | For the Year Ended
April 30, 2013 | | | For the Year Ended
April 30, 2012 | |
| | | | |
INCREASE/(DECREASE) IN NET ASSETS FROM OPERATIONS: | | | | | | | | |
Net investment loss | | | $(2,174,136) | | | | $(3,491,305) | |
Net realized gain on investments and securities sold short | | | 21,766,866 | | | | 15,328,262 | |
Change in net unrealized appreciation/(depreciation) of investments and securities sold short | | | 8,067,595 | | | | (741,850) | |
| | | | |
| | | 27,660,325 | | | | 11,095,107 | |
| | | | |
| | |
DECREASE IN NET ASSETS FROM COMMON STOCK TRANSACTIONS: | | | | | | | | |
Net proceeds from sale of shares | | | 47,493,893 | | | | 45,960,719 | |
Cost of shares redeemed | | | (66,216,547) | | | | (137,975,481) | |
Redemption fee proceeds (Note 1) | | | 71,124 | | | | 102,634 | |
| | | | |
Net decrease in net assets resulting from capital share transactions | | | (18,651,530) | | | | (91,912,128) | |
| | | | |
| | |
INCREASE/(DECREASE) IN NET ASSETS | | | 9,008,795 | | | | (80,817,021) | |
| | |
NET ASSETS | | | | | | | | |
Beginning of year | | | 251,907,046 | | | | 332,724,067 | |
| | | | |
End of year (including undistributed net
investment loss of $(312,429) and $(1,009,949), respectively) | | | $260,915,841 | | | | $251,907,046 | |
| | | | |
| | |
See accompanying notes to financial statements. | | |
Annual Report | April 30, 2013 | | 25 |
| | |
Caldwell & Orkin | | |
| Market Opportunity Fund | | Financial Highlights |
For a capital share outstanding throughout each year.
| | | | | | | | | | |
| | | For the
Year Ended
April 30,
2013 | | For the
Year Ended
April 30,
2012 | | For the
Year Ended
April 30,
2011 | | For the
Year Ended
April 30,
2010 | | For the
Year Ended
April 30,
2009 |
|
PER SHARE DATA: | | | | | | | | | | |
Net asset value, beginning of year | | $20.56 | | $19.59 | | $19.51 | | $21.24 | | $21.40 |
Income/(loss) from investment operations: | | | | | | | | | | |
Net Investment income/(loss) | | (0.20) | | (0.28) | | (0.30) | | (0.16) | | 0.01 |
Net realized and unrealized gain/(loss) on investments | | 2.60 | | 1.24 | | 0.36 | | (1.43) | | 0.94 |
| | |
Total from Investment Operations | | 2.40 | | 0.96 | | 0.06 | | (1.59) | | 0.95 |
| | |
| | | | | |
LESS DISTRIBUTIONS: | | | | | | | | | | |
From net investment income | | – | | – | | – | | – | | (0.12) |
From net realized gain on investments | | – | | – | | – | | (0.16) | | (1.02) |
| | |
Total Distributions | | – | | – | | – | | (0.16) | | (1.14) |
| | |
Redemption fee proceeds | | 0.01 | | 0.01 | | 0.02 | | 0.02 | | 0.03 |
| | |
Net asset value, end of year | | $22.97 | | $20.56 | | $19.59 | | $19.51 | | $21.24 |
| | |
| | | | | |
Total Return | | 11.72% | | 4.95% | | 0.41% | | (7.40%) | | 4.73% |
| | | | | |
Ratios and Supplemental Data: | | | | | | | | | | |
Net assets, end of year (000’s) | | $260,916 | | $251,907 | | $332,724 | | $395,074 | | $302,930 |
Ratios to Average Net Assets: | | | | | | | | | | |
Management fees | | 1.00% | | 0.99% | | 0.97% | | 0.83% | | 0.83% |
Administrative fees | | 0.27% | | 0.27% | | 0.22% | | 0.20% | | 0.27% |
| | |
Expenses before dividends on securities sold short and interest expense | | 1.27% | | 1.26% | | 1.19% | | 1.03% | | 1.10% |
Interest expense | | 0.46% | | 0.43% | | 0.51% | | 0.31% | | 0.24% |
Expenses from dividends on securities sold short | | 0.26% | | 0.43% | | 0.34% | | 0.29% | | 0.55% |
| | |
Ratio of total expenses(1) | | 1.99%(2) | | 2.12%(2) | | 2.04%(2) | | 1.63%(2) | | 1.89% |
| | |
Ratio of net investment loss | | (0.87%)(2) | | (1.27%)(2) | | (1.36%)(2) | | (0.82%)(2) | | (0.11%) |
Portfolio turnover rate | | 352% | | 517% | | 493% | | 662% | | 879% |
| (1) | The ratio of expenses to average net assets and net investment income/(loss) to average net assets do not reflect the expenses of other investment companies. |
| (2) | The ratio of total expenses to average net assets and ratio of net investment income/(loss) include fees waived by Fund’s Administrator in the amount of less than 0.01%, 0.01%, 0.01% and less than 0.005%, respectively, for the years ended April 30, 2013, 2012, 2011 and 2010, respectively. |
See accompanying notes to financial statements.
| | |
26 | | 1-800-467-7903 | www.CaldwellOrkinFunds.com |
| | |
Caldwell & Orkin | | |
| Market Opportunity Fund | | Notes to Financial Statements |
April 30, 2013
The Caldwell & Orkin Market Opportunity Fund (the “Fund”) is the only active investment portfolio of The Caldwell & Orkin Funds, Inc. (“Caldwell & Orkin”), an open-end, diversified management investment company registered under the Investment Company Act of 1940, as amended (the “1940 Act”), and incorporated under the laws of the State of Maryland on August 15, 1989. Prior to June, 1992, Caldwell & Orkin’s name was The OTC Select-100 Fund, Inc. and consisted of only one portfolio, The OTC Select-100 Fund. The shareholders of The OTC Select-100 Fund subsequently approved changing the corporate name from The OTC Select-100 Fund, Inc. to The Caldwell & Orkin Funds, Inc. and to amend the investment objective and policies of The OTC Select-100 Fund. As a result of such amendment, The OTC Select-100 Fund was renamed and its assets and objectives were those of the Caldwell & Orkin Aggressive Growth Fund. In August, 1996, the Board of Directors of Caldwell & Orkin approved changing the name of the Caldwell & Orkin Aggressive Growth Fund to the Caldwell & Orkin Market Opportunity Fund. The Fund’s investment objective is to provide long-term capital growth with a short-term focus on capital preservation. C&O Funds Advisor, Inc. (the “Adviser”) uses a catalyst-driven, multi-dimensional, disciplined investment process focusing on active asset allocation, security selection and surveillance to achieve the Fund’s investment objective. The Adviser’s philosophy in managing the Fund is to focus on risk as well as return.
1. SUMMARY OF SIGNIFICANT ACCOUNTING POLICIES
Use of Estimates
The preparation of financial statements in conformity with accounting principles generally accepted in the United States of America (“GAAP”) requires management to make estimates and assumptions that affect the reported amounts of assets and liabilities and disclosure of contingent assets and liabilities at the date of the financial statements and the reported amounts of revenues and expenses during the reporting period. Actual results could differ from those estimates.
Securities Valuation
Securities are stated at the closing price on the date at which the net asset value (“NAV”) is being determined. If the date of determination is not a trading date, or the closing price is not otherwise available, the last bid price is used for a value instead. Debt securities, other than short-term investments, are valued at the price provided by an independent pricing service. Short-term investments having a maturity of 60 days or less at the time of the purchase are stated at amortized cost, which approximates market value. Any assets or securities for which market quotations are not readily available are valued at fair value as determined in good faith by or under the direction of the Fund’s Board of Directors in accordance with the Fund’s Fair Value Pricing Policy.
Fair Value Measurements
A three-tier hierarchy has been established to classify fair value measurements for disclosure purposes. Inputs refer broadly to the assumptions that market participants would use in pricing the asset or liability, including assumptions about risk. Inputs may be observable or unobservable. Observable inputs are inputs that reflect the assumptions market participants would use in pricing
| | |
Annual Report | April 30, 2013 | | 27 |
| | |
Caldwell & Orkin | | |
| Market Opportunity Fund | | Notes to Financial Statements |
April 30, 2013
the asset or liability that are developed based on market data obtained from sources independent of the reporting entity. Unobservable inputs are inputs that reflect the reporting entity’s own assumptions about the assumptions market participants would use in pricing the asset or liability that are developed based on the best information available.
Various inputs are used in determining the value of the Fund’s investments as of the reporting period end. These inputs are categorized in the following hierarchy under applicable financial accounting standards:
| | |
Level 1 – | | Unadjusted quoted prices in active markets for identical, unrestricted assets or liabilities that the Fund has the ability to access at measurement date. |
| |
Level 2 – | | Quoted prices which are not active quoted prices for similar assets or liabilities in active markets or inputs other than quoted process that are observable (either directly or indirectly) for substantially the full term of the asset of liability; and |
| |
Level 3 – | | Significant unobservable prices or inputs (including the Fund’s own assumptions in determining the fair value of investments) where there is little or no market for the asset or liability at the measurement date. |
The following is a summary of the inputs used as of April 30, 2013 in valuing the Fund’s investments carried at value:
| | | | | | | | | | | | | | | | |
Investments in Securities at Value* | | Level 1 - Quoted Prices | | | Level 2 -Other Significant Observable Inputs | | | Level 3 - Significant Unobservable Inputs | | | Total | |
Common Stocks | | $ | 159,033,666 | | | $ | – | | | $ | – | | | $ | 159,033,666 | |
Exchange Traded Funds | | | 5,890,788 | | | | – | | | | – | | | | 5,890,788 | |
Purchased Options | | | 4,179,494 | | | | 2,029,710 | | | | – | | | | 6,209,204 | |
Short Term Investments | | | 93,976,317 | | | | – | | | | – | | | | 93,976,317 | |
| |
TOTAL | | $ | 263,080,265 | | | $ | 2,029,710 | | | $ | – | | | $ | 265,109,975 | |
| |
| | | | |
| Other Financial Instruments* | | | | | | | | | | | | |
Liabilities | | | | | | | | | | | | | | | | |
Securities Sold Short | | | | | | | | | | | | | | | | |
Common Stocks | | $ | (32,200,172 | ) | | $ | – | | | $ | – | | | $ | (32,200,172) | |
Exchange Traded Funds | | | (2,994,608 | ) | | | – | | | | – | | | | (2,994,608) | |
| |
TOTAL | | $ | (35,194,780 | ) | | $ | – | | | $ | – | | | $ | (35,194,780) | |
| |
During the fiscal year ended April 30, 2013, there were no transfers between Level 1 and 2 securities. The Fund evaluates transfers into or out of all levels as of the end of the reporting period. All securities of the Fund were valued using either Level 1 or Level 2 inputs during the year ended April 30, 2013. Thus, a reconciliation of assets in which significant unobservable inputs (Level 3) were used is not applicable.
* For detailed industry descriptions, see the accompanying Schedule of Investments.
| | |
28 | | 1-800-467-7903 | www.CaldwellOrkinFunds.com |
| | |
Caldwell & Orkin | | |
| Market Opportunity Fund | | Notes to Financial Statements |
April 30, 2013
Recent Accounting Pronouncements
In December 2011, the FASB issued ASU NO. 2011-11 “Disclosures about Offsetting Assets and Liabilities” to expand current disclosure requirements on the offsetting of certain assets and liabilities. The new disclosures will be required for investments and derivative financial instruments subject to master netting or similar agreements which are eligible for offset in the Statements of Assets and Liabilities and will require an entity to disclose both gross and net information about such investments and transactions in the financial statements. The guidance is effective for financial statements with fiscal years beginning on or after January 1, 2013, and interim periods within those fiscal years. Management is evaluating the impact of this guidance on the Funds’ financial statement disclosures.
Use of Derivatives
Derivative Instruments and Hedging Activities: The following discloses the Fund’s use of derivative instruments and hedging activities. The Fund’s investment objective not only permits the Fund to purchase investment securities, it also allows the Fund to enter into various types of derivative contracts, purchased and written options. In doing so, the Fund will employ strategies in differing combinations to permit it to increase, decrease, or change the level or types of exposure to market factors. Central to those strategies are features inherent to derivatives that make them more attractive for this purpose than equity or debt securities; they require little or no initial cash investment, they can focus exposure on only certain selected risk factors, and they may not require the ultimate receipt or delivery of the underlying security (or securities) to the contract holder. This may allow the Fund to pursue its objective more quickly and efficiently than if it were to make direct purchases or sales of securities capable of affecting a similar response to market factors.
Market Risk Factors: In pursuit of their investment objectives, certain Funds may seek to use derivatives to increase or decrease their exposure to the following market risk factors:
Equity Risk: Equity risk relates to the change in value of equity securities as they relate to increases or decreases in the general market.
Purchasing Put and Call Options: The Fund may invest in options on securities and indices, and use such securities either to hedge risk or enhance the long positions in the Fund’s portfolio.
By purchasing a put option, the purchaser obtains the right (but not the obligation) to sell the option’s underlying instrument at a fixed strike price. In return for this right, the purchaser pays the current market price for the option (known as the option premium). Options have various types of underlying instruments, including specific securities, indices of securities prices, and futures contracts. The purchaser may terminate its position in a put option by allowing it to expire or by exercising the option. If the option is allowed to expire, the purchaser will lose the entire premium. If the option is exercised, the purchaser completes the sale of the underlying instrument at the strike price. A purchaser may also terminate a put option position by closing it out in the secondary market at its current price, if a liquid secondary market exists. The buyer of a typical put option can expect to realize a gain if security prices fall. However, if the underlying instrument’s
| | |
Annual Report | April 30, 2013 | | 29 |
| | |
Caldwell & Orkin | | |
| Market Opportunity Fund | | Notes to Financial Statements |
April 30, 2013
price does not fall enough to offset the cost of purchasing the option, a put buyer can expect to suffer a loss (limited to the amount of the premium, plus related transaction costs).
The features of call options are essentially the same as those of put options, except that the purchaser of a call option obtains the right to purchase, rather than sell, the underlying instrument at the option’s strike price. A call buyer typically attempts to participate in potential price increases of the underlying instrument with risk limited to the cost of the option if security prices fall. At the same time, the buyer can expect to suffer a loss if security prices do not rise sufficiently to offset the cost of the option.
Writing Put and Call Options: The writer of a put or call option takes the opposite side of the transaction from the option’s purchaser. In return for receipt of the premium, the writer assumes the obligation to pay the strike price for the option’s underlying instrument if the other party to the option chooses to exercise it. The writer may seek to terminate a position in a put option before exercise by closing out the option in the secondary market at its current price. If the secondary market is not liquid for a put option, however, the writer must continue to be prepared to pay the strike price while the option is outstanding, regardless of price changes. When writing an option on a futures contract, the Fund will be required to make margin payments to an FCM as described above for futures contracts.
If security prices rise, a put writer would generally expect to profit, although its gain would be limited to the amount of the premium it received. If security prices remain the same over time, it is likely that the writer will also profit, because it should be able to close out the option at a lower price. If security prices fall, the put writer would expect to suffer a loss. This loss should be less than the loss from purchasing the underlying instrument directly, however, because the premium received for writing the option should mitigate the effects of the decline.
Writing a call option obligates the writer to sell or deliver the option’s underlying instrument, in return for the strike price, upon exercise of the option. The characteristics of writing call options are similar to those of writing put options, except that writing calls generally is a profitable strategy if the price of the underlying security remains the same or falls. Through receipt of the option premium, a call writer mitigates some of the effects of a price decline. At the same time, because a call writer must be prepared to deliver the underlying instrument in return for the strike price, even if its current value is greater, a call writer gives up some ability to participate in security price increases.
The Fund did not transact in any written options during the year ended April 30, 2013.
The following discloses the amounts related to the Fund’s use of derivative instruments and hedging activities.
| | |
30 | | 1-800-467-7903 | www.CaldwellOrkinFunds.com |
| | |
Caldwell & Orkin | | |
| Market Opportunity Fund | | Notes to Financial Statements |
April 30, 2013
The effect of derivative instruments on the Statement of Assets and Liabilities as of April 30, 2013:
| | | | | | | | |
| | | |
| Asset Derivatives | | | | | | | |
| | | |
Derivatives not Accounted for as Hedging Instruments | | Statement of Assets and
Liabilities Location | | Market Value | | | |
Purchased Options | | Investments, at value | | $ | 6,209,204 | | | |
|
TOTAL | | | | $ | 6,209,204 | | | |
|
The effect of derivative instruments on the Statement of Operations for the year ended April 30, 2013:
| | | | | | |
Derivatives not Accounted for as Hedging Instruments | | Location of Gain/(Loss) On Derivatives Recognized in Income | | Realized Gain/(Loss) On Derivatives Recognized in Income | | Change in Unrealized Gain/(Loss) On Derivatives Recognized in Income |
| | Net realized gain on investments | | $ 3,830,555 | | |
| | | |
Purchased Options | | Change in unrealized depreciation on investments | | | | $ (310,388) |
|
TOTAL | | | | $ 3,830,555 | | $ (310,388) |
|
Significant Ownership Concentration
At April 30, 2013, the Fund invested 36.02% total net assets in the JPMorgan 100% U.S. Treasury Securities Money Market Fund Capital Class (CJTXX). The Fund uses the money market instrument as a vehicle for holding collateral related to securities sold short. As stated in the Fund’s prospectus, the Fund will typically invest between 0% and 50% of net assets in money market securities and fixed income securities. This portion of the Fund’s portfolio includes cash equivalents (i.e., money market funds or U.S. treasury notes) and bonds (i.e., corporate or government bonds), although generally cash equivalents are emphasized more than bonds. The corporate bonds purchased may have any maturity and be of any rating or quality, as long as Fund management believes it is consistent with the Fund’s investment objective.
The JPMorgan 100% U.S. Treasury Securities Money Market Fund’s objective is to provide the highest possible level of current income while still maintaining liquidity and providing maximum safety of principal. The JPMorgan 100% U.S. Treasury Securities Money Market Fund invests its assets exclusively in obligations of the U.S. Treasury including treasury bills, bonds and notes.
Fund management considers investments in securities sold short to be part of managed assets, thereby reducing the Fund’s available cash balance. If the absolute value of securities sold short was added to the Fund’s total long positions as of April 30, 2013, total investments would equal 79.08%, as a percentage of net assets. This would result in cash equivalents representing 20.92% of net assets, vs. the 36.02% that is disclosed on the Schedule of Investments. This better illustrates the Fund’s net cash exposure as of April 30, 2013.
| | |
Annual Report | April 30, 2013 | | 31 |
| | |
Caldwell & Orkin | | |
| Market Opportunity Fund | | Notes to Financial Statements |
April 30, 2013
Share Valuation
The NAV per share of the Fund is calculated by dividing the sum of the value of the securities held by the Fund, plus cash or other assets, minus all liabilities (including estimated accrued expenses) by the total number of shares outstanding for the Fund, rounded to the nearest cent. The Fund’s shares will not be priced on the days on which the New York Stock Exchange is closed for trading. The offering and redemption price per share for the Fund is equal to the Fund’s NAV per share.
The Fund charges a 2.00% redemption fee on shares held less than six months. These fees are deducted from the redemption proceeds otherwise payable to the shareholder. The Fund will retain the fee charged as paid-in capital and such fees become part of the Fund’s daily NAV calculation. For the year ended April 30, 2013, the Fund recorded $71,124 in redemption fee proceeds.
Securities Transactions and Related Investment Income
Securities transactions are accounted for on trade date. Dividend income is recorded on the ex-dividend date. Realized gains and losses from investment transactions are determined using the specific identification method. Interest income which includes amortization of premium and accretion of discount, is accrued as earned.
Cash
The Fund maintains cash available for the settlement of securities transactions and capital shares reacquired. Available cash is invested daily in money market instruments.
Income Taxes
The Fund intends to continue to comply with the requirements of the Internal Revenue Code of 1986, as amended, applicable to regulated investment companies and to distribute all taxable income to their shareholders. Therefore, no federal income tax provision is required.
In order to avoid imposition of the excise tax applicable to regulated investment companies, the Fund intends to declare each year as dividends, in each calendar year, at least 98% of its net investment income (earned during the calendar year) and at least 98% of its net realized capital gains (earned during the twelve months ended October 31) plus undistributed amounts, if any, from prior years.
As of and during the period ended April 30, 2013, the Fund did not have a liability for any unrecognized tax benefits. The Fund files U.S. federal, state, and local tax returns as required. The Fund’s tax returns are subject to examination by the relevant tax authorities until expiration of the applicable statute of limitations which is generally three years after the filing of the tax return. Tax returns for open years have incorporated no uncertain tax positions that require a provision for income taxes.
| | |
32 | | 1-800-467-7903 | www.CaldwellOrkinFunds.com |
| | |
Caldwell & Orkin | | |
| Market Opportunity Fund | | Notes to Financial Statements |
April 30, 2013
2. COMMITMENTS AND OTHER AGREEMENTS
The Fund has entered into a management agreement (the “Management Agreement”) with the Adviser pursuant to which the Adviser provides space, facilities, equipment and personnel necessary to perform administrative and investment management services for the Fund. The Management Agreement provides that the Adviser is responsible for the actual management of the Fund’s portfolio. For such services and expenses assumed by the Adviser, the Fund pays a monthly advisory fee at incremental annual rates as follows:
| | |
Advisory Fee | | Average Daily Net Assets |
|
1.00% | | Up to $250 million |
0.90% | | In excess of $250 million but not greater than $500 million |
0.80% | | In excess of $500 million |
The Adviser has agreed to reimburse the Fund to the extent necessary to prevent the Fund’s annual ordinary operating expenses (excluding taxes, expenses related to the execution of portfolio transactions and the investment activities of the Fund such as, for example, interest, dividend expenses on securities sold short, brokerage commissions and fees and expenses charged to the Fund by any investment company in which the Fund invests and extraordinary charges such as litigation costs) from exceeding 2.00% of the Fund’s average net assets (the “Expense Cap”). No reimbursement was required for the year ended April 30, 2013.
C&O Funds Advisor, Inc. is a wholly-owned subsidiary of Caldwell & Orkin, Inc.
ALPS Distributors, Inc. (“ADI”) serves as distributor to the Fund. The Fund does not pay ADI for these services.
ALPS Fund Services, Inc. (“ALPS”) provides fund accounting, fund administration, compliance and transfer agency services to the Fund. The fees paid to ALPS for fund accounting and fund administration services are set at incremental annual rates as follows, and subject to a $160,000 annual minimum:
| | |
Administration Fee | | Average Daily Net Assets |
|
0.06% | | Between $0 - $500 million |
0.03% | | Between $500 million - $1 billion |
0.02% | | In excess of $1 billion |
The Fund pays ALPS an annual fee of $30,000, made in monthly installments, for services provided pursuant to the Chief Compliance Officer Services Agreement, which became effective October 1, 2012. Prior to October 1, 2012, the Chief Compliance Officer for the Fund was employed by Advisor. The Fund also pays an annual fee of $30,000 to ALPS, in addition to per account charges and other out of pocket expenses, related to transfer agency services.
In addition to the fee structure set forth above, an annual amount of $30,000 is waived against the administration fee, pursuant to a Distribution Fee Letter Agreement between the Adviser and ADI.
| | |
Annual Report | April 30, 2013 | | 33 |
| | |
Caldwell & Orkin | | |
| Market Opportunity Fund | | Notes to Financial Statements |
April 30, 2013
3. INVESTMENT PORTFOLIO TRANSACTIONS
Purchases and sales of securities, excluding securities sold short and short-term investments during the fiscal year ended April 30, 2013 were as follows:
| | | | |
| Fund | | Purchases | | Sales |
|
Caldwell & Orkin Market Opportunity Fund | | $ 610,514,186 | | $ 658,009,802 |
Short Sales and Segregated Cash
Short sales are transactions in which the Fund sells a security it does not own, in anticipation of a decline in the market value of that security. To initiate such a transaction, the Fund must borrow the security to deliver to the buyer upon the short sale; the Fund is then obligated to replace the security borrowed by purchasing it in the open market at some later date, completing the transaction.
The Fund will incur a loss if the market price of the security increases between the date of the short sale and the date on which the Fund replaces the borrowed security. The Fund will realize a gain if the security declines in value between those dates.
All short sales must be fully collateralized. The Fund maintains the collateral in segregated accounts consisting of cash and/or U.S. Government securities sufficient to collateralize the market value of its short positions. Typically, the segregated cash with brokers and other financial institutions exceeds the minimum required. Deposits with brokers for securities sold short are invested in money market instruments. Segregated cash is held at the custodian in the name of the broker per a tri-party agreement between the Fund, the custodian, and the broker.
The Fund may also sell short “against the box”, i.e., the Fund enters into a short sale as described above, while holding an offsetting long position in the same security which it sold short. If the Fund enters into a short sale against the box, it will segregate an equivalent amount of securities owned by the Fund as collateral while the short sale is outstanding.
The Fund limits the value of its short positions (excluding short sales “against the box”) to 60% of the Fund’s total net assets. At April 30, 2013, the Fund had approximately 13% of its total net assets in short positions.
For the year ended April 30, 2013, the cost of investments purchased to cover short sales and the proceeds from investments sold short were $244,861,229 and $255,111,896, respectively.
| | |
34 | | 1-800-467-7903 | www.CaldwellOrkinFunds.com |
| | |
Caldwell & Orkin | | |
| Market Opportunity Fund | | Notes to Financial Statements |
April 30, 2013
4. CAPITAL SHARE TRANSACTIONS
Capital share transactions were as follows:
| | | | | | | | |
| | | For the Year Ended April 30, 2013 | | | For the Year Ended April 30, 2012 | |
Shares sold | | | 2,223,683 | | | | 2,346,715 | |
Shares reacquired | | | (3,115,853) | | | | (7,081,734) | |
| |
Net decrease in shares outstanding | | | (892,170) | | | | (4,735,019) | |
| |
5. TAX BASIS INFORMATION
The Fund did not make any distributions during the years ended April 30, 2012 and 2013.
As of April 30, 2013, the components of distributable earnings on a tax basis were as follows:
| | | | |
Total Cost of Investments | | $ | 239,067,157 | |
| | | | |
Gross Tax Unrealized Appreciation | | $ | 28,793,679 | |
Gross Tax Unrealized Depreciation | | | (2,750,861) | |
Net Appreciation of Securities Sold Short | | | 4,321,556 | |
| | | | |
Net Tax Unrealized Appreciation | | | 30,364,374 | |
Other Cumulative Effect of Timing Differences | | | (312,429) | |
Accumulated Capital Losses | | | (6,894,271) | |
| | | | |
Total Accumulated Earnings | | $ | 23,157,674 | |
| | | | |
At April 30, 2013, the Fund had capital loss carryovers in the amounts of $6,894,271, expiring April 30, 2019.
Capital loss carryovers used during the period ended April 30, 2013 were $18,823,383.
The Fund elects to defer to the period ending April 30, 2014, late year ordinary losses in the amount of $312,429.
GAAP requires that certain components of net assets relating to permanent differences be reclassified between financial and tax reporting. These reclassifications have no effect on net assets or net asset value per share. For the year ended April 30, 2013, the Fund increased accumulated net realized loss on investments by $218,473, decreased undistributed net investment loss by $2,871,656 and decreased paid-in capital by $2,653,183 due to certain permanent book and tax differences. Included in the amounts reclassified was a net operating loss of $2,650,127.
Net investment income/(loss), net realized gains/(losses) and unrealized appreciation/(depreciation) differ for financial statement and tax purposes due to differing treatments of, nondeductible dividend expense, commodity adjustments (SPDR Gold Trust), investments in partnerships and certain other investments.
| | |
Annual Report | April 30, 2013 | | 35 |
| | |
Caldwell & Orkin | | |
| Market Opportunity Fund | | Notes to Financial Statements |
April 30, 2013
6. RELATED PARTY TRANSACTIONS
As of April 30, 2013, Caldwell & Orkin, Inc. and Michael B. Orkin had ownership of the Fund of 0.41% and 3.29%, respectively. Caldwell & Orkin, Inc. is 100% wholly owned by Michael B. Orkin.
Under the Trust’s organizational documents, its officers and Trustees are indemnified against certain liability arising out of the performance of their duties to the Trust. Additionally, in the normal course of business, the Trust enters into contracts with service providers that may contain general indemnification clauses, which may permit indemnification to the extent permissible under applicable law. The Trust’s maximum exposure under these arrangements is unknown, as this would involve future claims that may be made against the Trust that have not yet occurred.
7. DIRECTOR COMPENSATION
The Fund pays each Director who is not affiliated with the Adviser an annual fee of $9,000 per year plus $2,500 for each in-person meeting attended and $1,500 for each other meeting attended. The Fund pays the Independent Chairman an annual fee of $13,000 per year, plus $4,250 for each in-person meeting attended and $2,250 for each other meeting attended. The Fund pays the Director serving as Chairman of the Audit Committee an additional annual fee of $2,500. In addition, the Independent Director responsible for reviewing the Code of Ethics and Personal Trading Reports for each quarterly meeting is paid an additional fee of $250 per meeting. The annual fees are payable in four equal quarterly installments and are paid as of the date of each quarterly Board meeting. The Fund also reimburses Directors’ actual out-of-pocket expenses relating to attendance at meetings. Effective June 1997, the Board of Directors agreed to receive their compensation entirely in shares of the Fund. Accordingly, each Director who is not affiliated with the Adviser receives shares of the Fund with a value equal to the cash compensation they would have otherwise received.
| | |
36 | | 1-800-467-7903 | www.CaldwellOrkinFunds.com |
| | |
Caldwell & Orkin | | Report of Independent Registered |
| Market Opportunity Fund | | Public Accounting Firm |
April 30, 2013
To the Shareholders and Board of Directors
The Caldwell & Orkin Funds, Inc.
We have audited the accompanying statement of assets and liabilities, including the schedule of investments of the Caldwell & Orkin Market Opportunity Fund, a series of shares of The Caldwell & Orkin Funds, Inc., (the “Fund”), as of April 30, 2013, and the related statement of operations for the year then ended, the statements of changes in net assets for each of the two years in the period then ended, and the financial highlights for each of the five years in the period then ended. These financial statements and financial highlights are the responsibility of the Fund’s management. Our responsibility is to express an opinion on these financial statements and financial highlights based on our audits.
We conducted our audits in accordance with the standards of the Public Company Accounting Oversight Board (United States). Those standards require that we plan and perform the audit to obtain reasonable assurance about whether the financial statements and financial highlights are free of material misstatement. The Fund is not required to have, nor were we engaged to perform, an audit of the Fund’s internal control over financial reporting. Our audits included consideration of internal control over financial reporting as a basis for designing audit procedures that are appropriate in the circumstances, but not for the purpose of expressing an opinion on the effectiveness of the Fund’s internal control over financial reporting. Accordingly, we express no such opinion. An audit includes examining, on a test basis, evidence supporting the amounts and disclosures in the financial statements. Our procedures included confirmation of securities owned as of April 30, 2013, by correspondence with the custodian and brokers or by other appropriate auditing procedures where replies from brokers were not received. An audit also includes assessing the accounting principles used and significant estimates made by management, as well as evaluating the overall financial statement presentation. We believe that our audits provide a reasonable basis for our opinion.
In our opinion, the financial statements and financial highlights referred to above present fairly, in all material respects, the financial position of the Caldwell & Orkin Market Opportunity Fund as of April 30, 2013, the results of its operations for the year then ended, the changes in its net assets for each of the two years in the period then ended, and its financial highlights for each of the five years in the period then ended, presented in conformity with accounting principles generally accepted in the United States of America.
TAIT, WELLER & BAKER LLP
Philadelphia, Pennsylvania
June 26, 2013
| | |
Annual Report | April 30, 2013 | | 37 |
| | |
Caldwell & Orkin | | |
| Market Opportunity Fund | | Additional Information |
April 30, 2013 (Unaudited)
Information about the Board of Directors and officers* of the Fund as of April 30, 2013 is set forth below. The Statement of Additional Information (SAI) includes additional information about the Fund’s Directors and officers and is available free of charge, upon request, by calling (800) 237-7073. The address for each of the persons named below is 5185 Peachtree Parkway, Suite 370, Norcross, GA 30092-6541.
| | | | | | | | |
Name, (Age) and Position(s) Held with Fund | | Term of Office and Length of Time Served1 | | Principal Occupation(s) During Past Five Years | | Number of Funds in Fund Complex Overseen by Director | | Other Directorships Held by Director |
DISINTERESTED DIRECTORS | | |
| Frederick T. Blumer (53) Chairman | | Since 1990 | | Mr. Blumer is the CEO of Vehcon, Inc. and was formerly CEO of X-spand International, Inc. and was formerly Vice President of HUGHES Telematics, Inc. | | One | | None |
David L. Eager (70) Director | | Since 1992 | | Mr. Eager is a Partner at Eager, Davis & Holmes LLC, and was formerly Director for Product Development for Driehaus Capital Management and a Global Partner with William M. Mercer, Inc. | | One | | None |
| James L. Underwood (63) Director and Audit Committee Chairman | | Since 2006 | | Mr. Underwood is a Principal and shareholder of Windham Brannon, a Member of the Board of Managers of Windham Brannon Financial Group LLC, and was formerly President of Tarpley & Underwood, P.C. and Tarpley & Underwood Financial Advisors LLC. | | One | | None |
| * | The term “officer” means the president, vice president, secretary, treasurer, controller or any other officer who performs policy-making decisions. |
| 1 | Each Director serves until his / her successor is duly elected and qualified, or until his / her death, resignation or removal. |
| | |
38 | | 1-800-467-7903 | www.CaldwellOrkinFunds.com |
| | |
Caldwell & Orkin | | |
| Market Opportunity Fund | | Additional Information |
April 30, 2013 (Unaudited)
| | | | | | | | |
Name, (Age) and Position(s) Held with Fund | | Term of Office and Length of Time Served1 | | Principal Occupation(s) During Past Five Years | | Number of Funds in Fund Complex Overseen
by Director | | Other Directorships Held by Director |
INTERESTED DIRECTOR | | | | |
Michael B. Orkin (53)2 Director, President, Portfolio Manager | | Since 1990 | | Mr. Orkin is the CEO and sole shareholder of Caldwell & Orkin, Inc., of which the Adviser is a wholly-owned subsidiary. Mr. Orkin has been a portfolio manager at Caldwell & Orkin, Inc. since 1985, and is a Chartered Financial Analyst. | | One | | None |
OFFICERS WHO ARE NOT DIRECTORS | | |
| David R. Bockel, Jr. (36)3 Treasurer & Ass’t Secretary Secretary & Ass’t Treasurer | | Since 2010 2006-2010 | | Mr. Bockel is an Assistant Portfolio Manager for Caldwell & Orkin, Inc., and is a Registered Representative of ALPS Distributors, Inc. | | N/A | | N/A |
Lucas Foss (35)3 Chief Compliance Officer | | Since 20124 | | Mr. Foss is Deputy Chief Compliance Officer of ALPS Fund Services. Mr. Foss served as a Compliance Manager for ALPS from January 2010 until August 2012 and a Senior Compliance Analyst from June 2006 until December 2009. Prior to joining ALPS, Mr. Foss held positions at Bisys Hedge Fund Services and Deutsche Asset Management. Mr. Foss is a Certified Securities Compliance Professional (CSCP) and a Registered Representative of ALPS Distributors, Inc. Mr. Foss also serves as Chief Compliance Officer of the Wakefield Alternative Series Trust, the ALPS Series Trust, Boulder Growth & Income Fund, Boulder Total Return Fund, First Opportunity Fund, Inc., and The Denali Fund Inc. | | N/A | | N/A |
| * | The term “officer” means the president, vice president, secretary, treasurer, controller or any other officer who performs policy-making decisions. |
| 1 | Each Director serves until his / her successor is duly elected and qualified, or until his / her death, resignation or removal. |
| 2 | Mr. Orkin is an interested person of the Fund by reason of his position with the Adviser. |
| 3 | Registered Representative of ALPS Distributors, Inc. |
| 4 | Effective October 1, 2012, William C. Horne resigned as Chief Compliance Officer of the Fund. Lucas Foss was appointed as Chief Compliance Officer of the Fund to fill the vacancy of Mr. Horne’s resignation, effective as of October 1, 2012. |
| | |
Annual Report | April 30, 2013 | | 39 |
| | |
Caldwell & Orkin | | |
| Market Opportunity Fund | | Additional Information |
April 30, 2013 (Unaudited)
| | | | | | | | |
Name, (Age) and Position(s) Held with Fund | | Term of Office and Length of Time Served1 | | Principal Occupation(s) During Past Five Years | | Number of Funds in Fund Complex Overseen by Director | | Other
Directorships
Held by Director |
OFFICERS WHO ARE NOT DIRECTORS (Continued) | | |
Rhonda A. Mills (47)2 Secretary | | Since 2011 | | Ms. Mills is Vice President and Associate Counsel of ALPS Fund Services, Inc. Prior to joining ALPS in 2011, Ms. Mills served in house with Old Mutual Capital, Inc. in Denver, CO as Counsel, from 2006 through 2009, and as a consultant, through Mills Law, LLC, from 2010 – 2011. Ms. Mills is a Registered Representative of ALPS Distributors, Inc. | | N/A | | N/A |
Lauren Johnson (32) Assistant Treasurer | | Since 2009 | | Ms. Johnson is Vice President and serves as a Fund Controller for ALPS Fund Services, Inc. She joined ALPS in 2005 as a Fund Controller. Prior to joining ALPS, Ms. Johnson worked for Pricewaterhouse Coopers LLP. | | N/A | | N/A |
| * | The term “officer” means the president, vice president, secretary, treasurer, controller or any other officer who performs policy-making decisions. |
| 1 | Each Director serves until his / her successor is duly elected and qualified, or until his / her death, resignation or removal. |
| 2 | Registered Representative of ALPS Distributors, Inc. |
| | |
40 | | 1-800-467-7903 | www.CaldwellOrkinFunds.com |
CALDWELL & ORKIN MARKET OPPORTUNITY FUND
Annual Report to Shareholders
| | | | |
BOARD OF DIRECTORS Frederick T. Blumer, Independent Chairman Michael B. Orkin, President David L. Eager James L. Underwood | | TRANSFER, REDEMPTION & DIVIDEND DISBURSING AGENT ALPS Fund Services, Inc. P.O. Box 46256 Denver, CO 80201 | | LEGAL COUNSEL Paul Hastings LLP 600 Peachtree Street, N.E. Suite 2400 Atlanta, GA 30308 |
INVESTMENT ADVISER C&O Funds Advisor, Inc. 5185 Peachtree Parkway Suite 370 Norcross, GA 30092-6541 | | CUSTODIAN JPMorgan Chase Bank, N.A. 1111 Polaris Parkway, Suite 3J Columbus, OH 43240 | | INDEPENDENT DIRECTORS’ COUNSEL Arnall Golden Gregory LLP 171 17th Street, NW, Suite 2100 Atlanta, GA 30363 |
| | |
DISTRIBUTOR ALPS Distributors, Inc. 1290 Broadway, Suite 1100 Denver, CO 80203 | | | | |
The Caldwell & Orkin Market Opportunity Fund’s (the “Fund”) portfolio may or may not have positions in any of the companies referenced in this Report to Shareholders as of any date after April 30, 2013. The commentary reflects the views of the portfolio manager (or Adviser) through the end of the period or through the date of this report, as the case may be. Of course, these views are subject to change as market and other conditions warrant. These financial statements are submitted for the general information of the Fund’s shareholders. They are not authorized for distribution to prospective investors unless preceded or accompanied by an effective Fund Prospectus.
Availability of Proxy Voting Policy & Procedures, Proxy Voting Record and Code of Ethics - A description of a) the policies and procedures the Fund uses to determine how to vote proxies relating to portfolio securities, b) how the Fund voted proxies relating to portfolio securities during the most recent 12-month period ended June 30, c) the Code of Ethics applicable to the principal officers of the Fund are available without charge, upon request, by calling toll-free (800) 237-7073, or on the Securities and Exchange Commission’s (the “Commission’s”) website at http://www.sec.gov.
Availability of Quarterly Portfolio Schedule - The Fund files its complete schedule of portfolio holdings with the Commission for the first and third quarters of each fiscal year on Form N-Q. The Fund’s Forms N-Q are available on the Commission’s website at http://www.sec.gov. The Fund’s Forms N-Q may be reviewed and copied at the Commission’s Public Reference Room in Washington, D.C. Information on the operation of the Public Reference Room may be obtained by calling 1-800 SEC-0330.
Fund Information - For information about the Fund please call (800) 237-7073 or visit the Fund’s website at www.CaldwellOrkinFunds.com.
Fund Listings - The Fund is listed in many newspapers as C&OMktOpp or CaldOrkMO. The Fund’s Quotation symbol is COAGX. The Fund’s CUSIP number is 128819307.
Caldwell & Orkin Market Opportunity Fund
5185 Peachtree Parkway, Suite 370
Norcross, GA 30092-6541
E-mail: Info@CaldwellOrkin.com
| | (a) | As of the end of the period covered by this report, the registrant has adopted a Code of Ethics that applies to the registrant’s principal executive officer, principal financial officer, principal accounting officer or controller, or persons performing similar functions, regardless of whether these individuals are employed by the registrant or a third party (the “Code of Ethics”). |
| | (c) | During the period covered by this report, the registrant adopted a restated Code of Ethics, a copy of which is filed as an exhibit hereto. |
| | (d) | During the period covered by this report, no implicit or explicit waivers to the provisions of the Code of Ethics adopted in 2(a) above were granted. |
| | (f) | A copy of the registrant’s Code of Ethics is filed as an exhibit hereto. The registrant undertakes to provide a copy of the Code of Ethics to any person, without charge upon written request to the registrant at its address at 5185 Peachtree Parkway, Suite 370, Norcross, GA 30092-6541. |
| Item 3. | Audit Committee Financial Expert. |
| | (a)(1) | The registrant’s Board of Directors has determined that one audit committee financial expert serves on its audit committee. |
| | (a)(2) | James L. Underwood, an Independent Director of the registrant, is the registrant’s audit committee financial expert. |
| Item 4. | Principal Accountant Fees and Services. |
| | (a) | Audit Fees: For the registrant’s fiscal years ended April 30, 2013 and April 30, 2012, the aggregate fees billed to the registrant for professional services rendered by the principal accountant for the audit of the registrant’s annual financial statements were $26,800 and $26,800, respectively. |
| | (b) | Audit-Related Fees: For the Registrant’s fiscal years ended April 30, 2013 and April 30, 2012, aggregate fees of $0 and $0, respectively, were billed to the registrant for assurance and related services by the principal accountant for certain audit-related communications to the registrant’s audit committee. For the registrant’s fiscal years ended April 30, 2013 and April 30, 2012, the aggregate fees of $0 and $0 were billed to the registrant’s investment adviser, and any entity controlling, controlled by, or under common control with the investment adviser that provides ongoing services for the registrant for assurance and related services by the principal accountant that are reasonably related to the performance of the audit of the registrant’s financial statements and are not reported under paragraph (a) of this Item. |
| | (c) | Tax Fees: For the Registrant’s fiscal years ended April 30, 2013 and April 30, 2012, aggregate fees of $2,600 and $2,600, respectively, were billed for professional services rendered by the principal accountant for tax services. For the registrant’s fiscal years ended April 30, 2013 and April 30, 2012, aggregate fees of $0 and $0, respectively, were billed to the investment adviser and any entity controlling, controlled by, or under common control with the investment adviser that provides ongoing services to the registrant. |
| | (d) | All Other Fees: In registrant’s fiscal years ended April 30, 2013 and April 30, 2012, the aggregate fees $1,200 and $3,450, respectively, were billed to registrant by the principal accountant for cursory reviews of the registrant’s October 31, 2012 and October 31, 2011 semi-annual reports, and agreed upon procedures related to review of anti-money laundering procedures (for the 2012 fiscal year only). For the registrant’s fiscal years ended April 30, 2013 and April 30, 2012, the aggregate fees of $0 and $0 were billed to the investment adviser and any entity controlling, controlled by, or under common control with the investment adviser that provides ongoing services to the registrant for services other than the services reported in paragraph (a) through (c). |
| | (e)(1) | Audit Committee Pre-Approval Policies and Procedures: The registrant’s Audit Committee pre-approves any audit or non-audit services provided by the independent auditors to the registrant, and pre-approves, if applicable, any non-audit services provided by the independent auditors to the registrant’s investment adviser, or any entity controlling, controlled by, or under common control with the investment adviser that provides ongoing services to the registrant if the engagement relates directly to the operations and financial reporting of the registrant. |
| | (e)(2) | The percentage of services described in each of paragraphs (b) through (d) of this Item that were approved by the audit committee pursuant to paragraph (c)(7)(i)(C) of Rule 2-01 of Regulation S-X is 100%. |
| | (g) | Aggregate Non-Audit Fees: In registrant’s fiscal years ended April 30, 2013 and April 30, 2012, the aggregate non-audit fees $,1,200 and $3,450 were billed to the registrant by the registrant’s accountant for cursory reviews of the registrant’s October 31, 2012 and October 31, 2011
semi-annual reports and agreed upon procedures related to review of anti-money laundering procedures (for fiscal year 2012 only). In registrant’s fiscal years ended April 30, 2013 and April, 2012, the aggregate non-audit fees of $0 and $0 were billed to the investment adviser and any entity controlling, controlled by, or under common control with the investment adviser that provides ongoing services to the registrant. |
| Item 5. | Audit Committee of Listed Registrants. |
Not applicable.
| Item 6. | Schedule of Investments. |
Schedule of Investments is included as part of the Report to Stockholders filed under Item 1 of this form.
| Item 7. | Disclosure of Proxy Voting Policies and Procedures for Closed-End Management Investment Companies. |
Not applicable.
| Item 8. | Portfolio Managers of Closed-End Management Investment Companies. |
Not applicable.
| Item 9. | Purchases of Equity Securities by Closed-End Management Investment Companies and Affiliated Issuers. |
Not applicable.
| Item 10. | Submission of Matters to a Vote of Security Holders. |
There have been no material changes to the procedures by which shareholders may recommend nominees to the registrant’s board of trustees.
| Item 11. | Controls and Procedures. |
| | (a) | The registrant’s principal executive officer and principal financial officer have concluded that the registrant’s disclosure controls and procedures (as defined in Rule 30a-3(c) under the Investment Company Act of 1940, as amended) are |
| | effective based on their evaluation of these controls and procedures as of a date within 90 days of the filing date of this document. |
| | (b) | There was no change in the registrant’s internal control over financial reporting (as defined in
Rule 30a-3(d) under the Investment Company Act of 1940, as amended) during the second fiscal quarter of the period covered by this report that has materially affected, or is reasonably likely to materially affect, the registrant’s internal control over financial reporting. |
| | (a)(1) | The code of ethics that applies to the registrant’s principal executive officer and principal financial officer is attached hereto as Ex.12.A.1. |
| | (a)(2) | The certifications required by Rule 30a-2(a) of the Investment Company Act of 1940, as amended, and Section 302 of the Sarbanes-Oxley Act of 2002 are attached hereto as Ex 99.Cert. |
| | (b) | The certifications by the registrant’s Principal Executive Officer and Principal Financial Officer, as required by Rule 30a-2(b) of the Investment Company Act of 1940, as amended, and Section 906 of the Sarbanes-Oxley Act of 2002 are attached hereto as Ex99.906Cert. |
SIGNATURES
Pursuant to the requirements of the Securities Exchange Act of 1934 and the Investment Company Act of 1940, the registrant has duly caused this report to be signed on its behalf by the undersigned, thereunto duly authorized.
The Caldwell & Orkin Funds, Inc.
| | |
| By: | | /s/ Michael B. Orkin |
| | Michael B. Orkin |
| | President (Principal Executive Officer) |
| |
| Date: | | July 5, 2013 |
| |
| By: | | /s/ David R. Bockel, Jr. |
| | David R. Bockel, Jr. |
| | Treasurer (Principal Financial Officer) |
| |
| Date: | | July 5, 2013 |