UNITED STATES
SECURITIES AND EXCHANGE COMMISSION
Washington, D.C. 20549
FORM N-CSRS
CERTIFIED SHAREHOLDER REPORT OF REGISTERED
MANAGEMENT INVESTMENT COMPANIES
Investment Company Act file number 811-06113
The Caldwell & Orkin Funds, Inc.
(Exact name of registrant as specified in charter)
5185 Peachtree Parkway, Suite 370
Norcross, GA 30092-6541
(Address of principal executive offices) (Zip code)
Michael B. Orkin
5185 Peachtree Parkway, Suite 370
Norcross, GA 30092-6541
(Name and address of agent for service)
Copies to:
Wade Bridge
Ultimus Fund Solutions, LLC
225 Pictoria Drive, Suite 450
Cincinnati, OH 45246
Registrant’s telephone number, including area code: 1-678-533-7850
Date of fiscal year end: April 30
Date of reporting period: October 31, 2016
Item 1. Reports to Stockholders.
| | |
Table of Contents | | Caldwell & Orkin Market Opportunity Fund |
| October 31, 2016 (Unaudited) | | |
| | |
Caldwell & Orkin Market Opportunity Fund | | Shareholder Letter |
| | October 31, 2016 (Unaudited) |
| | | | |
Investment Adviser C&O Funds Advisor, Inc. 5185 Peachtree Parkway, Suite 370 Norcross, Georgia 30092-6541 (800) 237-7073 | |  | | Shareholder Accounts c/o Ultimus Fund Solutions, LLC P.O. Box 46707 Cincinnati, OH 45246-0707 (800) 467-7903 |
Dear Fellow Shareholder:
The Caldwell & Orkin Market Opportunity Fund’s (the “Fund”) investment objective is to provide long-term capital growth with a short-term focus on capital preservation. In other words, we manage for risk as well as return. Our investment process includes both macro (top-down) analysis and stock selection (bottom-up). Our macro analysis informs our net equity exposure while our stock selection helps us determine what stocks will help us reach this exposure. The Fund is actively managed, with the goal of outperforming the market over a full-market cycle (inclusive of both a bull cycle and a bear cycle) with less risk.
Management Discussion and Analysis
The Fund fell -3.66% in the 6-month period ended October 31, 2016. The S&P 500 Total Return Index (the “Index” or the “S&P 500”) rose 4.06% during the same period. For the 12 months ended October 31, 2016, the Fund fell -11.35%, while the S&P 500 increased 4.51%. And, since August 24, 1992 through October 31, 2016, the Fund has generated a 7.33% compound average annual return, compared to the S&P 500’s 9.20%. Importantly, the Fund has achieved these results while maintaining a low market risk profile and with little reliance on the movement of the stock market (see pages 7, 9 and 10). The Fund’s price movements have had virtually no correlation (0.090) with the price movements of the S&P 500 as measured by R, the correlation coefficient (Statistical computations by Ned Davis Research, Inc.). Of course, past performance is no guarantee of future results.
During the six-month period, political risk was introduced to the equity markets with the vote of the British to leave the European Union (“Brexit”). The Brexit result caused a global downturn in equity markets. The S&P 500 fell -5.34% from 2,113 on June 23rd to 2,000 on June 27th. During this period the Fund was up 0.93%, an excess return of 6.27%.
The Brexit decision was quickly met with monetary stimulus from the European Central Bank (“ECB”) and additional (record) monetary stimulus from the Bank of England (“BoE”). As such, the sharp downturn in global financial markets was short-lived. The S&P 500 had fully recovered its losses by July 8th and closed the fiscal period at 2,126.
For the fiscal period ended October 31, 2016, the Fund’s gross long exposure ranged from 23.3% to 53.8%, averaging 42.1%. During the period the long portfolio underperformed the
| | |
| 2 | | 1-800-467-7903 | www.CaldwellOrkin.com |
| | |
Caldwell & Orkin Market Opportunity Fund | | Shareholder Letter |
| | October 31, 2016 (Unaudited) |
Index, generating a total return of -1.33%. The Fund’s gross short exposure ranged from 9.9% to 32.2%, averaging 20.8%. The short portfolio underperformed the reverse return of the Index, generating a total return of -18.03%. Overall, for the fiscal period the Fund’s total invested position ranged from 47.4% to 75.7%, averaging 62.9%. The Fund’s net invested position ranged from 0.0% net-long to 41.9% net-long, averaging 21.3% net-long.
The Fund entered the fiscal period 24.0% net-long in equities and Exchange-Traded Funds (“ETFs”) and ended the period 5.8% net-long in equities and ETFs. The decrease in the net positioning was the result of both a decrease in the long portfolio and an increase in the short portfolio. The long portfolio remains broadly diversified. At 11.5%, technology is our largest long exposure, including a diverse mix of hardware, software, social media companies, and Internet retailers. At 3.8%, energy is our second largest exposure with a concentration in energy infrastructure and U.S. shale-based drilling and exploration companies.
The short side of the portfolio remains broadly diversified as well. At 8.3%, U.S. Treasury bond ETFs are our largest exposure followed by a 2.6% position in auto retailers.
During the period, 6 of our 10 biggest winners came from the short side of the portfolio. These six contributors consisted of a peer-to-peer lender, a deep-water driller, a for-profit education company, a hospital operator, a high-end furniture retailer and an electronics retailer. WhiteWave Foods, Inc. (WWAV), an organic dairy food company, was our largest contributor on the long side. During the fiscal period the company was acquired by Danone SA. Longs in the technology sector, including Microsoft Corporation (MSFT), Applied Materials, Inc. (AMAT) and Amazon.com, Inc. (AMZN), were also top contributors.
Four of our five biggest losers were shorts. A short in a real-estate e-commerce company was our largest detractor while shorts in a for-profit education company, a motorcycle retailer and a deep-water driller were also among our worst performers. A long in carbonated beverage company National Beverage Corp. (FIZZ) is no longer in the portfolio.
| | | | |
| Semi-Annual Report | October 31, 2016 | | | 3 | |
| | |
Caldwell & Orkin Market Opportunity Fund | | Shareholder Letter |
| | October 31, 2016 (Unaudited) |
Outlook
With the Presidential election in November, the United States joined Britain in voting against the status quo and in favor of nativism. While it is too early to determine what impact our nation’s new policy direction will ultimately have on economic growth, it seems clear that the long-favored action of supporting markets with robust doses of monetary stimulus, of cheapening capital for the sake of those who control it, is coming to an end.
Markets move in cycles. In managing the Fund, we strive to outperform over the course of a full-market cycle, which includes both bull and bear market phases. Ned Davis Research, Inc. (“NDR”) has computed what they consider to be bull and bear market cycles for the S&P 500. Most of their definition focuses on a 20% market move in either direction. We present the NDR data for your review:
| | | | | | | | | | | | | | | | | | | | | | | | | | | | | | | | | | | | | | | | |
| Bull Market Phase | | | | | | Bear Market Phase | | | | | | Full Market Cycle | |
| Start Date | | MOF | | | S&P | | | | | | Start Date** | | | MOF | | | S&P | | | | | | End Date*** | | | MOF | | | S&P | |
| 8/24/1992* | | | 212.19 | % | | | 230.03 | % | | | | | | | 7/17/1998 | | | | 4.01 | % | | | -19.19 | % | | | | | | | 8/31/1998 | | | | 224.71 | % | | | 166.69 | % |
| 8/31/1998 | | | 6.02 | % | | | 62.88 | % | | | | | | | 9/1/2000 | | | | 14.71 | % | | | -35.71 | % | | | | | | | 9/21/2001 | | | | 21.61 | % | | | 4.72 | % |
| 9/21/2001 | | | -5.75 | % | | | 22.00 | % | | | | | | | 3/19/2002 | | | | 9.97 | % | | | -33.01 | % | | | | | | | 10/9/2002 | | | | 3.65 | % | | | -18.27 | % |
| 10/9/2002 | | | 16.21 | % | | | 119.38 | % | | | | | | | 10/9/2007 | | | | 2.20 | % | | | -55.26 | % | | | | | | | 3/9/2009 | | | | 18.77 | % | | | -1.85 | % |
| 3/9/2009 | | | -2.47 | % | | | 111.33 | % | | | | | | | 4/29/2011 | | | | 0.46 | % | | | -18.72 | % | | | | | | | 10/3/2011 | | | | -2.02 | % | | | 71.76 | % |
| 10/3/2011 | | | 26.13 | % | | | 108.67 | % | | | | | | | 7/20/2015 | | | | 2.38 | % | | | -13.02 | % | | | | | | | 2/11/2016 | | | | 29.12 | % | | | 81.50 | % |
| * | The first bull market phase began 10/11/1990, but the table begins with 8/24/1992, which coincides with commencement of active management of the Caldwell & Orkin Market Opportunity Fund (“MOF”). |
| ** | The bear market start date is the bull market’s end date. |
| *** | A full market cycle runs from the bull market start date to the full market cycle end date. |
Sincerely,
Michael B. Orkin, CFA
Portfolio Manager and Chief Investment Officer
The performance data quoted represents past performance. Past performance is no guarantee of future results. The investment return and principal value of an investment in the Fund will fluctuate so that an investor’s shares, when redeemed, may be worth more or less than their original cost. Current performance may be higher or lower than the performance data quoted. Please call 800-377-7073 or visit www.CaldwellOrkin.com for current month-end performance.
| | | | |
| 4 | | | 1-800-467-7903 | www.CaldwellOrkin.com | |
| | |
Caldwell & Orkin Market Opportunity Fund | | Shareholder Letter |
| | October 31, 2016 (Unaudited) |
Disclosure
The Fund’s investment objective is to provide long-term capital growth with a short-term focus on capital preservation. Our philosophy in managing the Fund is to focus on risk as well as return. We use an investment philosophy based upon sophisticated exploitation of the low-risk anomaly. The low-risk anomaly stands in direct contradiction to the conventional beliefs of Efficient Market Hypothesis stating that high risk is equated with higher return. Caldwell and Orkin takes the opposite view – we believe that lower risk can result in higher return. The Fund may hold up to 60% of its net assets in short positions at any time and also invest in options. Short positions and put options are employed with the intent of making money when those stocks we judge to be mispriced fall. When we use short positions or put options, the Fund’s portfolio is considered to be “hedged,” so that it is not fully exposed to the price movements and volatility of the broader market. Our asset allocation determinations are primarily based on our perception of risk in the marketplace. In summary, our goal is to make money over a full market cycle, but with less stomach churn.
The Fund’s disciplined investment philosophy and active management style typically leads to higher-than-average portfolio turnover. High turnover may have an unfavorable impact on the amount of taxable distributions paid to shareholders. Higher turnover may also result in higher brokerage costs for the Fund. The Fund’s turnover rate will typically exceed 100% per year, and will not be a limiting factor when we deem change appropriate. Fund holdings, industry and asset allocations are subject to change without notice. The Fund may or may not have a position in any of the companies mentioned in this commentary as of the date of this report.
An investment in the Fund involves risk, including the loss of principal. Additionally, there are certain risks inherent in investing in the Fund, including market risk, short sale risk, interest rate risk, business risk, small company risk, market valuation risk, political risk, and portfolio turnover risk. For a complete discussion of these risks, you may request a copy of the Fund’s prospectus by calling 800-237-7073. The Fund uses aggressive investment strategies (including short positions and options) that have the potential for yielding high returns; however, these strategies may also result in losses. Stocks sold short have unlimited risk. Investment return and principal value will fluctuate so that shares, when redeemed, may be worth more or less than their original cost. Options are not suitable for all investors.
Investors should expect that the Fund’s performance may fluctuate independently of stock market indices, such as the S&P 500 Total Return Index.
| | | | |
| Semi-Annual Report | October 31, 2016 | | | 5 | |
| | |
Caldwell & Orkin Market Opportunity Fund | | Shareholder Letter |
| | October 31, 2016 (Unaudited) |
Statistical Risk Definitions:
Correlation Coefficient (R): R is a statistical measure of correlation. In this report, R is a measurement of investment risk that indicates how closely performance is linked to the broad market – it quantifies the degree to which a fund’s performance correlates with the performance of a benchmark. R can vary between 1.000 (perfect positive correlation) and -1.000 (perfect negative correlation). 0.000 represents no correlation. An R of 1.000 means that all movements of a fund are fully explained by movements in its benchmark index. Conversely, a low R indicates that very few of the fund’s movements are explained by movements in its benchmark index, and a negative R indicates a fund’s movements are inversely correlated with its benchmark index.
Coefficient of Determination (R-Square): R-Square, also represented as R2, is another measurement of investment risk that quantifies the degree to which a fund’s performance correlates with the performance of its benchmark index. R-Square is calculated by multiplying the Correlation Coefficient (R) by itself, and is therefore always positive. R-Square can vary between 0.000 (no correlation) and 1.000 (perfect correlation). The higher the value of R-Square, the greater the degree of correlation between the fund and its benchmark index. R-squared does not take into account the direction of the correlation (positive or negative), therefore R-Squared is not able to reflect inverse correlation between a fund and its benchmark index.
Beta: A measure of a fund’s sensitivity to market movements. Usually the higher betas represent riskier investments. When correlation is low, beta has minimal, if any, significance.
Standard deviation: A statistical measure of dispersion about an average, indicating the volatility of a fund’s total returns.
Sharpe Ratio: The Sharpe Ratio is calculated by subtracting the risk-free (T-bill) rate of return from a portfolio’s total return and then dividing this by its standard deviation. The resulting fraction can be thought of as return per unit of risk. The higher a portfolio’s Sharpe Ratio, the better the risk-adjusted performance.
Semi-variance: A measure of a fund’s downside (negative return) volatility relative to a benchmark. Lower numbers are associated with less risk.
Index Definition:
S&P 500 Total Return Index: The S&P 500 Total Return Index is a capitalization-weighted, unmanaged index of 500 large U.S. companies chosen for market size, liquidity and industry group representation and includes reinvested dividends. You cannot invest directly in an index.
| | |
| 6 | | 1-800-467-7903 | www.CaldwellOrkin.com |
| | |
Caldwell & Orkin Market Opportunity Fund | | Performance Summary |
| | October 31, 2016 (Unaudited) |
| | | | | | | | | | | | | | | | | | | | | | |
Fiscal
Year Ended
April 30, | | C&O Market
Opportunity
Fund(1) | | | S&P 500 Total
Return Index(2) | | | | | | Fiscal
Year Ended
April 30, | | C&O Market
Opportunity
Fund(1) | | | S&P 500 Total
Return Index(2) | |
1993** | | | 21.09% | | | | 9.18% | | | | | | | 2005 | | | -0.17% | | | | 6.34% | |
1994 | | | 16.48% | | | | 5.32% | | | | | | | 2006 | | | -2.74% | | | | 15.42% | |
1995 | | | -2.28% | | | | 17.47% | | | | | | | 2007 | | | 15.31% | | | | 15.24% | |
1996 | | | 31.80% | | | | 30.21% | | | | | | | 2008 | | | 17.92% | | | | -4.68% | |
1997 | | | 23.24% | | | | 25.13% | | | | | | | 2009 | | | 4.73% | | | | -35.31% | |
1998 | | | 25.77% | | | | 41.07% | | | | | | | 2010 | | | -7.40% | | | | 38.84% | |
1999 | | | 19.43% | | | | 21.82% | | | | | | | 2011 | | | 0.41% | | | | 17.22% | |
2000 | | | -0.02% | | | | 10.13% | | | | | | | 2012 | | | 4.95% | | | | 4.76% | |
2001 | | | 11.43% | | | | -12.97% | | | | | | | 2013 | | | 11.72% | | | | 16.89% | |
2002 | | | 1.88% | | | | -12.63% | | | | | | | 2014 | | | -6.92% | | | | 20.44% | |
2003 | | | 1.12% | | | | -13.31% | | | | | | | 2015 | | | 10.68% | | | | 12.98% | |
2004 | | | -3.55% | | | | 22.88% | | | | | | | 2016 | | | -0.56% | | | | 1.21% | |
| | | | | | | | | | | | | | | | | | | | | | |
Total Return
Through
October 31, 2016 | | | | | | | | | | | Average Annual
Returns Through
October 31, 2016 | | | | | | |
6 months ended | | | -3.66% | | | | 4.06% | | | | | | | One Year | | | -11.35% | | | | 4.51% | |
12 months ended | | | -11.35% | | | | 4.51% | | | | | | | Three Years | | | 1.26% | | | | 8.84% | |
Since 8/24/92(3) | | | 453.89% | | | | 740.29% | | | | | | | Five Years | | | 3.08% | | | | 13.57% | |
| | | | | | | | | | | | | | | Ten Years | | | 3.92% | | | | 6.70% | |
| | | | | | | | | | | | | | Fifteen Years | | | 2.31% | | | | 6.88% | |
| | | | | | | | | | | | | | Twenty Years | | | 5.19% | | | | 7.66% | |
| | | | | | | | | | | | | | Since 8/24/92(3) | | | 7.33% | | | | 9.20% | |
| 1 | The performance data quoted represents past performance. Past performance is no guarantee of future results. The investment return and principal value of an investment in the Fund will fluctuate so that an investor’s shares, when redeemed, may be worth more or less than their original cost. Current performance may be higher or lower than the performance data quoted. Please call 800-377-7073 or visit www.CaldwellOrkin.com for current month-end performance. The Fund’s performance assumes the reinvestment of dividends and capital gains, if any. Fund holdings, industry and asset allocations are subject to change without notice. The Fund may or may not have a position in any of the companies mentioned in this report as of the date of this report. See additional important disclosures on pages 5 and 6. |
| 2 | Investors should expect that the Fund’s performance may fluctuate independently of stock market indices, such as the S&P 500 Total Return index. The S&P 500 Total Return index is a widely recognized unmanaged index of 500 common stock prices adjusted to reflect the reinvestment of dividends and distributions. You may not invest directly in an index. |
| 3 | Effective August 24, 1992, the Fund changed its investment objective to provide long-term capital growth with a short-term focus on capital preservation through investment selection and asset allocation. Prior to that time, the Fund was passively managed and indexed to the largest 100 over-the-counter (OTC) stocks. |
| ** | From August 24, 1992 through April 30, 1993 – the portion of the year using the active investment management style of C&O Funds Advisor, Inc., the manager of the Fund. |
| | | | |
| Semi-Annual Report | October 31, 2016 | | | 7 | |
| | |
Caldwell & Orkin Market Opportunity Fund | | Performance Summary Net Asset Allocation |
| | October 31, 2016 (Unaudited) |
Total annualized Fund operating expenses for the Fund’s fiscal year ended April 30, 2016 were 2.95%, or 1.37% before interest expenses and dividend expenses related to short sales. These figures exclude Acquired Fund Fees and Expenses of 0.02%. Additional information about the Fund’s fees and expenses is available in the Fund’s prospectus.
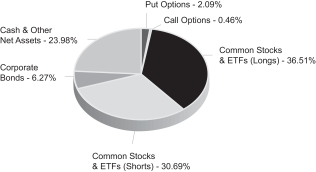
Net Asset Allocation*
October 31, 2016
Net Asset Allocation*
April 30, 2016
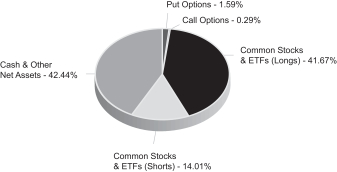
| * | As a percentage of net assets plus the absolute value of securities sold short. |
| | |
| 8 | | 1-800-467-7903 | www.CaldwellOrkin.com |
| | |
Caldwell & Orkin Market Opportunity Fund | | Statistical Risk Profile |
| | October 31, 2016 (Unaudited) |
| | | | | | | | | | | | | | |
| Ten Worst S&P 500 TR Days | | | |
| Date | | COAGX | | | S&P 500 | | | Variance | | | |
10/15/2008 | | | -1.47% | | | | -9.02% | | | | 7.55% | | | |
12/1/2008 | | | -1.58% | | | | -8.92% | | | | 7.34% | | | The Caldwell & Orkin Market
Opportunity Fund
outperformed the S&P 500
Total Return Index on all ten of
the ten worst days, and was
positive on two of the ten days. |
9/29/2008 | | | -0.37% | | | | -8.78% | | | | 8.41% | | |
10/9/2008 | | | -2.12% | | | | -7.61% | | | | 5.49% | | |
10/27/1997 | | | -1.60% | | | | -6.89% | | | | 5.29% | | |
8/31/1998 | | | 0.42% | | | | -6.79% | | | | 7.21% | | |
11/20/2008 | | | 0.23% | | | | -6.70% | | | | 6.93% | | | |
8/8/2011 | | | -0.63% | | | | -6.66% | | | | 6.03% | | | |
11/19/2008 | | | -0.28% | | | | -6.10% | | | | 5.82% | | | |
10/22/2008 | | | -1.11% | | | | -6.09% | | | | 4.98% | | | |
| |
| Ten Worst S&P 500 TR Weeks | | | |
| Week Ending | | COAGX | | | S&P 500 | | | Variance | | | |
10/10/2008 | | | -2.71% | | | | -18.14% | | | | 15.43% | | | |
9/21/2001 | | | 1.62% | | | | -11.57% | | | | 13.19% | | | The Caldwell & Orkin Market
Opportunity Fund
outperformed the S&P 500
Total Return Index in all ten of
the ten worst weeks, and was
positive in seven of those weeks. |
4/14/2000 | | | 4.51% | | | | -10.52% | | | | 15.03% | | |
10/3/2008 | | | 1.82% | | | | -9.33% | | | | 11.15% | | |
11/21/2008 | | | 0.55% | | | | -8.33% | | | | 8.88% | | |
7/19/2002 | | | 0.64% | | | | -7.96% | | | | 8.60% | | |
8/5/2011 | | | -0.78% | | | | -7.15% | | | | 6.37% | | | |
3/6/2009 | | | -0.88% | | | | -6.96% | | | | 6.08% | | | |
7/12/2002 | | | 1.02% | | | | -6.81% | | | | 7.83% | | | |
2/20/2009 | | | 0.19% | | | | -6.80% | | | | 6.99% | | | |
| |
| Ten Worst S&P 500 TR Months | | | |
| Month | | COAGX | | | S&P 500 | | | Variance | | | |
10/31/2008 | | | 2.86% | | | | -16.74% | | | | 19.60% | | | |
8/31/1998 | | | 3.11% | | | | -14.46% | | | | 17.57% | | | The Caldwell & Orkin Market
Opportunity Fund
outperformed the S&P 500
Total Return Index in all ten of
the ten worst months, and was
positive in seven of those months. |
9/30/2002 | | | 2.10% | | | | -10.86% | | | | 12.96% | | |
2/28/2009 | | | 0.29% | | | | -10.71% | | | | 11.00% | | |
2/28/2001 | | | 4.78% | | | | -9.13% | | | | 13.91% | | |
9/30/2008 | | | -0.42% | | | | -8.89% | | | | 8.47% | | |
6/30/2008 | | | 4.84% | | | | -8.43% | | | | 13.27% | | | |
1/31/2009 | | | -0.73% | | | | -8.30% | | | | 7.57% | | | |
9/30/2001 | | | 3.28% | | | | -8.06% | | | | 11.34% | | | |
5/31/2010 | | | -2.56% | | | | -8.04% | | | | 5.48% | | | |
Short selling began May 2, 1994. Past performance is no guarantee of future results. See additional important disclosures on pages 5 and 6. Computations by Ned Davis Research, Inc.
| | | | |
| Semi-Annual Report | October 31, 2016 | | | 9 | |
| | |
Caldwell & Orkin Market Opportunity Fund | | Statistical Risk Profile |
| | October 31, 2016 (Unaudited) |
Ten Worst Drawdowns
| | | | | | | | |
| Caldwell & Orkin Market Opportunity Fund | |
| | |
| Date Range | | C&O MOF | | | S&P 500 TR | |
1/17/2008 - 5/7/2010 | | | -15.68 | % | | | -11.68 | % |
4/12/1999 - 11/23/1999 | | | -13.30 | % | | | 4.23 | % |
2/2/2016 - 10/19/2016 | | | -13.16 | % | | | 14.40 | % |
10/9/2002 - 5/25/2006 | | | -12.82 | % | | | 74.17 | % |
5/17/2013 - 4/11/2014 | | | -10.22 | % | | | 10.82 | % |
3/18/1994 - 5/22/1995 | | | -10.03 | % | | | 14.95 | % |
5/26/2000 - 6/7/2000 | | | -8.14 | % | | | 6.81 | % |
12/29/2000 - 1/19/2001 | | | -8.06 | % | | | 1.75 | % |
4/4/2001 - 3/11/2002 | | | -8.03 | % | | | 7.22 | % |
3/15/1993 - 4/26/1993 | | | -7.83 | % | | | -3.65 | % |
| | | | | | | | |
| S&P 500 Total Return Index | |
| | |
| Date Range | | C&O MOF | | | S&P 500 TR | |
10/9/2007 - 3/9/2009 | | | 2.20 | % | | | -55.26 | % |
3/24/2000 - 10/9/2002 | | | 28.03 | % | | | -47.41 | % |
7/17/1998 - 8/31/1998 | | | 4.01 | % | | | -19.19 | % |
4/29/2011 - 10/3/2011 | | | 0.46 | % | | | -18.72 | % |
4/23/2010 - 7/2/2010 | | | -1.47 | % | | | -15.67 | % |
11/27/2002 - 3/11/2003 | | | 2.18 | % | | | -14.28 | % |
5/21/2015 - 2/11/2016 | | | 5.26 | % | | | -12.85 | % |
7/16/1999 - 10/15/1999 | | | -0.47 | % | | | -11.78 | % |
10/7/1997 - 10/27/1997 | | | 0.16 | % | | | -10.74 | % |
9/23/1998 - 10/8/1998 | | | 2.03 | % | | | -9.94 | % |
| | | | | | | | |
| Risk Statistics | | | |
| | | C&O MOF | | | S&P 500 TR | |
Coefficient of Determination (R-Square) | | | 0.008 | | | | 1.000 | |
Correlation Coefficient “R” | | | 0.087 | | | | 1.000 | |
Beta | | | 0.039 | | | | 1.000 | |
Standard Deviation | | | 0.518 | | | | 1.159 | |
Sharpe Ratio | | | 0.57 | | | | 0.43 | |
Semi-Variance | | | 0.13 | | | | 0.65 | |
| |
| Performance During Market Drawdowns of 20% or More | | | |
| | |
| Date Range | | C&O MOF | | | S&P 500 TR | |
1/6/2009 - 3/9/2009 | | | -3.43 | % | | | -27.19 | % |
10/9/2007 - 11/20/2008 | | | 4.27 | % | | | -50.73 | % |
1/4/2002 - 10/9/2002 | | | 7.20 | % | | | -32.95 | % |
3/24/2000 - 9/21/2001 | | | 23.52 | % | | | -35.65 | % |
Short selling began May 2, 1994. Past performance is no guarantee of future results. See additional important disclosures on pages 5 and 6. Computations by Ned Davis Research, Inc.
| | |
| 10 | | 1-800-467-7903 | www.CaldwellOrkin.com |
| | |
Caldwell & Orkin Market Opportunity Fund | | Growth of $10,000 |
| | October 31, 2016 (Unaudited) |
Caldwell & Orkin Market Opportunity Fund (“C&O MOF”) versus S&P500 Total Return Index
Results of a Hypothetical $10,000 investment November 1, 2006 through October 31, 2016
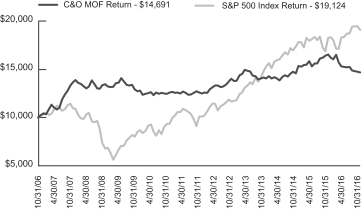
Past performance does not predict future performance. The returns do not reflect the deduction of taxes that a shareholder would pay on Fund distributions or the redemption of Fund shares. See additional disclosure on pages 5 and 6.
| | | | |
| Semi-Annual Report | October 31, 2016 | | | 11 | |
| | |
Caldwell & Orkin Market Opportunity Fund | | Disclosure of Fund Expenses |
| | October 31, 2016 (Unaudited) |
We believe it is important for you to understand the impact of fees and expenses on your investment in the Fund. As a shareholder of the Fund, you incur two types of costs: (1) transaction costs related to the purchase and redemption of Fund shares, including redemption fees and brokerage commissions (if applicable); and (2) ongoing costs, including management fees, administrative expenses-, transaction costs and other Fund expenses. A mutual fund’s ongoing costs are expressed as a percentage of its average net assets. This figure is known as the expense ratio. The following example is intended to help you understand your ongoing costs (in dollars and cents) of investing in the Fund and to compare these costs with the ongoing costs of investing in other mutual funds.
The below example is based on an investment of $1,000.00 invested at the beginning of the period and held for the entire period indicated, May 1, 2016 through October 31, 2016. The table below illustrates the Fund’s expenses in two ways:
Based on Actual Fund Returns
The first line of the table below provides information about actual account values and actual expenses. You may use the information in this line, together with the amount you invested, to estimate the expenses that you paid over the period. Simply divide your account value by $1,000 (for example, an $8,600 account value divided by $1,000 = 8.6), then multiply the result by the number in the first line under the heading entitled “Expenses Paid During Period” to estimate the expenses you paid on your account during this period.
Based on a Hypothetical 5% Return for Comparison Purposes
The second line of the table below provides information about hypothetical account values and hypothetical expenses based on the Fund’s actual expense ratio and an assumed rate of return of 5% per year before expenses, which is not the Fund’s actual return. The hypothetical account values and expenses may not be used to estimate the actual ending account balance or expenses you paid for the period. You may use this information to compare the ongoing costs of investing in the Fund and other funds. To do so, compare this 5% hypothetical example with the 5% hypothetical examples that appear in the shareholder reports of the other funds.
Please note that the expenses shown in the table are meant to highlight your ongoing costs only and do not reflect any transactional costs, such as redemption fees or brokerage commissions. Therefore, the second line of the table is useful in comparing ongoing costs only, and will not help you determine the relative total costs of owning different funds. In addition, if these transactional costs were included, your costs would have been higher.
| | |
| 12 | | 1-800-467-7903 | www.CaldwellOrkin.com |
| | |
Caldwell & Orkin Market Opportunity Fund | | Disclosure of Fund Expenses |
| | October 31, 2016 (Unaudited) |
| | | | | | | | | | | | | | | | |
| | | Beginning Account Value May 1, 2016 | | | Ending Account Value October 31, 2016 | | | Expenses Paid During Period (1) | | | Annualized Net Expense Ratio(2) | |
Caldwell & Orkin Market Opportunity Fund | | | | | | | | | |
Actual(3) | | $ | 1,000.00 | | | $ | 963.40 | | | $ | 10.38 | | | | 2.10 | % |
Hypothetical(4) | | $ | 1,000.00 | | | $ | 1,014.63 | | | $ | 10.65 | | | | 2.10 | % |
| 1 | The annualized net expense ratio reflects actual expenses from the Fund from May 1, 2016 through October 31, 2016, as a percentage of average net assets for that period. |
| 2 | Expenses are equal to the Fund’s annualized net expense ratio of 2.10% multiplied by the average account value over the period, multiplied by the number of days in the most recent fiscal half year (184), divided by 365 (to reflect the halfyear period.) |
| 3 | Excluding interest expense and dividend expense from short positions, the net expense ratio is 1.35%; your actual cost of investment in the Fund would be $6.68. |
| 4 | Hypothetical assumes 5% annual return before net expenses. Excluding interest expense and dividend expense from short positions, the net expense ratio is 1.35%; your hypothetical cost of investment in the Fund would be $6.87. |
| | | | |
| Semi-Annual Report | October 31, 2016 | | | 13 | |
| | |
Caldwell & Orkin Market Opportunity Fund | | Sector Diversification |
| | October 31, 2016 (Unaudited) |
The following table presents the Caldwell & Orkin Market Opportunity Fund’s October 31, 2016 portfolio holdings by sector based on total net assets, sorted by net exposure (net long to net short).
| | | | | | | | | | | | | | | | |
| Sector | | Long | | | Short | | | Total(1) | | | Net(2) | |
Oil & Gas Exploration & Production | | | 2.77% | | | | | | | | 2.77% | | | | 2.77% | |
Aerospace & Defense | | | 2.87% | | | | -0.89% | | | | 3.76% | | | | 1.98% | |
Systems Software | | | 1.97% | | | | | | | | 1.97% | | | | 1.97% | |
Semiconductors | | | 1.96% | | | | | | | | 1.96% | | | | 1.96% | |
Computer Hardware | | | 1.79% | | | | | | | | 1.79% | | | | 1.79% | |
Managed Health Care | | | 1.70% | | | | | | | | 1.70% | | | | 1.70% | |
Semiconductor Equipment | | | 1.47% | | | | | | | | 1.47% | | | | 1.47% | |
Movies & Entertainment | | | 1.44% | | | | | | | | 1.44% | | | | 1.44% | |
Apparel Retail | | | 1.43% | | | | | | | | 1.43% | | | | 1.43% | |
Home Entertainment Software | | | 1.37% | | | | | | | | 1.37% | | | | 1.37% | |
Soft Drinks | | | 1.36% | | | | | | | | 1.36% | | | | 1.36% | |
Wireless Telecommunication Services | | | 1.31% | | | | | | | | 1.31% | | | | 1.31% | |
Specialty Chemicals | | | 1.28% | | | | | | | | 1.28% | | | | 1.28% | |
Renewable Electricity | | | 1.11% | | | | | | | | 1.11% | | | | 1.11% | |
Internet Retail | | | 1.03% | | | | | | | | 1.03% | | | | 1.03% | |
Broadcasting | | | 1.00% | | | | | | | | 1.00% | | | | 1.00% | |
Restaurants & Food Service | | | 0.69% | | | | | | | | 0.69% | | | | 0.69% | |
Water Utilities | | | 0.62% | | | | | | | | 0.62% | | | | 0.62% | |
Housewares & Specialties | | | 0.50% | | | | | | | | 0.50% | | | | 0.50% | |
Industrial Conglomerates | | | 0.49% | | | | | | | | 0.49% | | | | 0.49% | |
Distillers & Vintners | | | 0.40% | | | | | | | | 0.40% | | | | 0.40% | |
Environmental & Facilities Services | | | 0.40% | | | | | | | | 0.40% | | | | 0.40% | |
Technology Hardware, Storage & Peripherals | | | 0.40% | | | | | | | | 0.40% | | | | 0.40% | |
Health Care Facilities | | | 0.82% | | | | -0.69% | | | | 1.51% | | | | 0.13% | |
Industrial Machinery | | | 1.39% | | | | -1.28% | | | | 2.67% | | | | 0.11% | |
Apparel, Accessories & Luxury | | | 0.01% | | | | | | | | 0.01% | | | | 0.01% | |
Application Software | | | 0.01% | | | | | | | | 0.01% | | | | 0.01% | |
Construction Materials | | | 0.01% | | | | | | | | 0.01% | | | | 0.01% | |
Diversified Support Services | | | 0.01% | | | | | | | | 0.01% | | | | 0.01% | |
Hypermarkets & Super Centers | | | 0.01% | | | | | | | | 0.01% | | | | 0.01% | |
Oil & Gas Equipment & Services | | | 0.01% | | | | | | | | 0.01% | | | | 0.01% | |
General Merchandise Stores | | | 1.29% | | | | -1.28% | | | | 2.57% | | | | 0.01% | |
| | |
| 14 | | 1-800-467-7903 | www.CaldwellOrkin.com |
| | |
Caldwell & Orkin Market Opportunity Fund | | Sector Diversification |
| | October 31, 2016 (Unaudited) |
| | | | | | | | | | | | | | | | |
| Sector | | Long | | | Short | | | Total(1) | | | Net(2) | |
Food Retail* | | | | | | | 0.00% | | | | 0.00% | | | | 0.00% | |
Motorcycle Manufacturers* | | | | | | | 0.00% | | | | 0.00% | | | | 0.00% | |
Diversified Banks | | | 0.62% | | | | -0.70% | | | | 1.32% | | | | -0.08% | |
Trading Companies & Distributors | | | | | | | -0.18% | | | | 0.18% | | | | -0.18% | |
Homefurnishing Retail | | | | | | | -0.24% | | | | 0.24% | | | | -0.24% | |
Electronic Equipment & Instruments | | | | | | | -0.30% | | | | 0.30% | | | | -0.30% | |
Internet Software & Services | | | 1.51% | | | | -1.95% | | | | 3.46% | | | | -0.44% | |
Specialty Stores | | | | | | | -0.45% | | | | 0.45% | | | | -0.45% | |
Computer & Electronics Retail | | | | | | | -0.58% | | | | 0.58% | | | | -0.58% | |
Life & Health Insurance | | | | | | | -0.62% | | | | 0.62% | | | | -0.62% | |
Oil & Gas Drilling | | | 0.56% | | | | -1.28% | | | | 1.84% | | | | -0.72% | |
Packaged Foods & Meats | | | 0.31% | | | | -1.09% | | | | 1.40% | | | | -0.78% | |
Trucking | | | | | | | -0.91% | | | | 0.91% | | | | -0.91% | |
Electrical Components & Equipment | | | | | | | -0.95% | | | | 0.95% | | | | -0.95% | |
Automotive Retail | | | | | | | -1.09% | | | | 1.09% | | | | -1.09% | |
Consumer Finance | | | | | | | -1.18% | | | | 1.18% | | | | -1.18% | |
Footwear | | | | | | | -1.20% | | | | 1.20% | | | | -1.20% | |
Education Services | | | | | | | -1.50% | | | | 1.50% | | | | -1.50% | |
Asset Management & Custody Banks | | | | | | | -1.99% | | | | 1.99% | | | | -1.99% | |
Residential REITs | | | | | | | -2.06% | | | | 2.06% | | | | -2.06% | |
Subtotal Common Stocks
(long & short positions) | | | 35.92% | | | | -22.41% | | | | 58.33% | | | | 13.51% | |
| | | | | | | | | | | | | | | | |
Exchange-Traded Funds – Gold | | | 0.59% | | | | | | | | 0.59% | | | | 0.59% | |
Exchange-Traded Funds – Country Fund – South Africa* | | | | | | | 0.00% | | | | 0.00% | | | | 0.00% | |
Exchange-Traded Funds – United States Treasury Bonds | | | | | | | -8.28% | | | | 8.28% | | | | -8.28% | |
Subtotal Exchange-Traded Funds
(long & short positions) | | | 0.59% | | | | -8.28% | | | | 8.87% | | | | -7.69% | |
| | | | | | | | | | | | | | | | |
| | | | |
| Semi-Annual Report | October 31, 2016 | | | 15 | |
| | |
Caldwell & Orkin Market Opportunity Fund | | Sector Diversification |
| | October 31, 2016 (Unaudited) |
| | | | | | | | | | | | | | | | |
| Sector | | Long | | | Short | | | Total(1) | | | Net(2) | |
Put Options | | | 2.09% | | | | | | | | 2.09% | | | | 2.09% | |
Call Options | | | 0.46% | | | | | | | | 0.46% | | | | 0.46% | |
Corporate Bonds | | | 6.27% | | | | | | | | 6.27% | | | | 6.27% | |
Other Assets in Excess of Liabilities | | | 23.98% | | | | | | | | 23.98% | | | | 23.98% | |
Total Portfolio Holdings | | | 69.31% | | | | -30.69% | | | | 100.00% | | | | | |
| 1 | Total exposure is Long exposure plus the absolute value of the Short exposure. |
| 2 | Net exposure is Long exposure less Short exposure. |
| * | Less than 0.005% of net assets. |
| | |
| 16 | | 1-800-467-7903 | www.CaldwellOrkin.com |
| | |
Caldwell & Orkin Market Opportunity Fund | | Schedule of Investments |
| | October 31, 2016 (Unaudited) |
| | | | | | | | | | |
| | | | | Shares | | | Fair Value | |
COMMON STOCKS – LONG – 35.92% | | | | | | | | |
| | Aerospace & Defense – 2.87% | | | | | | | | |
| | Northrop Grumman Corp. | | | 10,500 | | | $ | 2,404,500 | |
| | Raytheon Co. | | | 12,600 | | | | 1,721,286 | |
| | | | | | | | | | |
| | | | | | | | | 4,125,786 | |
| | | | | | | | | | |
| | Apparel Retail – 1.43% | | | | | | | | |
| | TJX Cos., Inc./The | | | 27,800 | | | | 2,050,250 | |
| | | | | | | | | | |
| | Apparel, Accessories & Luxury – 0.01% | | | | | | | | |
| | Ralph Lauren Corp. | | | 100 | | | | 9,810 | |
| | | | | | | | | | |
| | Application Software – 0.01% | | | | | | | | |
| | Adobe Systems, Inc.* | | | 100 | | | | 10,751 | |
| | | | | | | | | | |
| | Broadcasting – 1.00% | | | | | | | | |
| | CBS Corp.– Class B | | | 25,300 | | | | 1,432,486 | |
| | | | | | | | | | |
| | Computer Hardware – 1.79% | | | | | | | | |
| | Apple, Inc. | | | 22,600 | | | | 2,566,004 | |
| | | | | | | | | | |
| | Construction Materials – 0.01% | | | | | | | | |
| | Vulcan Materials Co. | | | 100 | | | | 11,320 | |
| | | | | | | | | | |
| | Distillers & Vintners – 0.40% | | | | | | | | |
| | Constellation Brands, Inc. – Class A | | | 3,400 | | | | 568,208 | |
| | | | | | | | | | |
| | Diversified Banks – 0.62% | | | | | | | | |
| | HDFC Bank Ltd. | | | 12,600 | | | | 891,828 | |
| | | | | | | | | | |
| | Diversified Support Services – 0.01% | | | | | | | | |
| | Cintas Corp. | | | 100 | | | | 10,667 | |
| | | | | | | | | | |
| | Environmental & Facilities Services – 0.40% | | | | | | | | |
| | Republic Services, Inc. | | | 10,800 | | | | 568,404 | |
| | | | | | | | | | |
| | General Merchandise Stores – 1.29% | | | | | | | | |
| | Ollie’s Bargain Outlet Holdings, Inc.* | | | 67,600 | | | | 1,848,860 | |
| | | | | | | | | | |
| | Health Care Facilities – 0.82% | | | | | | | | |
| | Surgical Care Affiliates, Inc. * | | | 27,400 | | | | 1,172,446 | |
| | | | | | | | | | |
| | Home Entertainment Software – 1.37% | | | | | | | | |
| | Electronic Arts, Inc.* | | | 25,000 | | | | 1,963,000 | |
| | | | | | | | | | |
| | Housewares & Specialties – 0.50% | | | | | | | | |
| | Newell Brands, Inc. | | | 15,000 | | | | 720,300 | |
| | | | | | | | | | |
See accompanying notes to financial statements.
| | | | |
| Semi-Annual Report | October 31, 2016 | | | 17 | |
| | |
Caldwell & Orkin Market Opportunity Fund | | Schedule of Investments |
| | October 31, 2016 (Unaudited) |
| | | | | | | | | | |
| | | | | Shares | | | Fair Value | |
| | Hypermarkets & Super Centers – 0.01% | | | | | | | | |
| | Costco Wholesale Corp. | | | 100 | | | $ | 14,787 | |
| | | | | | | | | | |
| | Industrial Conglomerates – 0.49% | | | | | | | | |
| | General Electric Co. | | | 24,400 | | | | 710,040 | |
| | | | | | | | | | |
| | Industrial Machinery – 1.39% | | | | | | | | |
| | Illinois Tool Works, Inc. | | | 8,500 | | | | 965,345 | |
| | Xylem, Inc. | | | 21,200 | | | | 1,024,596 | |
| | | | | | | | | | |
| | | | | | | | | 1,989,941 | |
| | | | | | | | | | |
| | Internet Retail – 1.03% | | | | | | | | |
| | Amazon.com, Inc.* | | | 1,875 | | | | 1,480,912 | |
| | | | | | | | | | |
| | Internet Software & Services – 1.51% | | | | | | | | |
| | Facebook, Inc. – Class A* | | | 16,500 | | | | 2,161,335 | |
| | | | | | | | | | |
| | Managed Health Care – 1.70% | | | | | | | | |
| | UnitedHealth Group, Inc. | | | 17,300 | | | | 2,445,009 | |
| | | | | | | | | | |
| | Movies & Entertainment – 1.44% | | | | | | | | |
| | Time Warner, Inc. | | | 18,200 | | | | 1,619,618 | |
| | Walt Disney Co./The | | | 4,800 | | | | 444,912 | |
| | | | | | | | | | |
| | | | | | | | | 2,064,530 | |
| | | | | | | | | | |
| | Oil & Gas Drilling – 0.56% | | | | | | | | |
| | Patterson-UTI Energy, Inc. | | | 35,600 | | | | 800,288 | |
| | | | | | | | | | |
| | Oil & Gas Equipment & Services – 0.01% | | | | | | | | |
| | Baker Hughes, Inc. | | | 100 | | | | 5,540 | |
| | Halliburton Co. | | | 100 | | | | 4,600 | |
| | U.S. Silica Holdings, Inc. | | | 100 | | | | 4,619 | |
| | | | | | | | | | |
| | | | | | | | | 14,759 | |
| | | | | | | | | | |
| | Oil & Gas Exploration & Production – 2.77% | | | | | | | | |
| | Concho Resources, Inc.* | | | 4,000 | | | | 507,760 | |
| | Diamondback Energy, Inc.* | | | 3,900 | | | | 356,031 | |
| | Oasis Petroleum, Inc.* | | | 54,900 | | | | 575,901 | |
| | Pioneer Natural Resources Co. | | | 5,500 | | | | 984,610 | |
| | QEP Resources, Inc. | | | 27,000 | | | | 433,890 | |
| | RSP Permian, Inc.* | | | 100 | | | | 3,610 | |
| | Whiting Petroleum Corp.* | | | 134,500 | | | | 1,108,280 | |
| | | | | | | | | | |
| | | | | | | | | 3,970,082 | |
| | | | | | | | | | |
| | Packaged Foods & Meats – 0.31% | | | | | | | | |
| | Kraft Heinz Co./The | | | 5,000 | | | | 444,750 | |
| | | | | | | | | | |
See accompanying notes to financial statements.
| | |
| 18 | | 1-800-467-7903 | www.CaldwellOrkin.com |
| | |
Caldwell & Orkin Market Opportunity Fund | | Schedule of Investments |
| | October 31, 2016 (Unaudited) |
| | | | | | | | | | |
| | | | | Shares | | | Fair Value | |
| | Renewable Electricity – 1.11% | | | | | | | | |
| | TerraForm Power, Inc. – Class A | | | 128,400 | | | $ | 1,593,444 | |
| | | | | | | | | | |
| | Restaurants & Food Service – 0.69% | | | | | | | | |
| | Aramark | | | 26,600 | | | | 990,318 | |
| | | | | | | | | | |
| | Semiconductor Equipment – 1.47% | | | | | | | | |
| | Applied Materials, Inc. | | | 56,400 | | | | 1,640,112 | |
| | Lam Research Corp. | | | 4,900 | | | | 474,614 | |
| | | | | | | | | | |
| | | | | | | | | 2,114,726 | |
| | | | | | | | | | |
| | Semiconductors – 1.96% | | | | | | | | |
| | Broadcom Ltd. | | | 9,500 | | | | 1,617,660 | |
| | NVIDIA Corp. | | | 16,900 | | | | 1,202,604 | |
| | | | | | | | | | |
| | | | | | | | | 2,820,264 | |
| | | | | | | | | | |
| | Soft Drinks – 1.36% | | | | | | | | |
| | PepsiCo, Inc. | | | 18,200 | | | | 1,951,040 | |
| | | | | | | | | | |
| | Specialty Chemicals – 1.28% | | | | | | | | |
| | Albemarle Corp. | | | 22,000 | | | | 1,838,100 | |
| | | | | | | | | | |
| | Systems Software – 1.97% | | | | | | | | |
| | Microsoft Corp. | | | 47,200 | | | | 2,828,224 | |
| | | | | | | | | | |
| | Technology Hardware, Storage & Peripherals – 0.40% | | | | | |
| | Hewlett Packard Enterprise Co. | | | 25,700 | | | | 577,479 | |
| | | | | | | | | | |
| | Water Utilities – 0.62% | | | | | | | | |
| | American Water Works Co., Inc. | | | 12,100 | | | | 895,884 | |
| | | | | | | | | | |
| | Wireless Telecommunication Services – 1.31% | | | | | | | | |
| | T-Mobile US, Inc. * | | | 37,900 | | | | 1,884,767 | |
| | | | | | | | | | |
| | |
TOTAL COMMON STOCKS – LONG | | | | | | | | |
(Cost $48,758,510) | | | | | | | 51,540,799 | |
EXCHANGE-TRADED FUNDS – LONG – 0.59% | | | | | | | | |
| | SPDR Gold Shares* | | | 6,900 | | | | 841,386 | |
| | | | | | | | | | |
| | |
TOTAL EXCHANGE-TRADED FUNDS – LONG | | | | | | | | |
(Cost $743,375) | | | | | | | 841,386 | |
See accompanying notes to financial statements.
| | | | |
| Semi-Annual Report | October 31, 2016 | | | 19 | |
| | |
Caldwell & Orkin Market Opportunity Fund | | Schedule of Investments |
| | October 31, 2016 (Unaudited) |
| | | | | | | | | | |
| | | | | Contracts | | | Fair Value | |
PURCHASED CALL OPTIONS – 0.46% | | | | | | | | |
| | Blackberry Ltd., Call @ $10, Expiring January 2017 | | | 525 | | | $ | 1,575 | |
| | SPDR Gold Shares, Call @ $125, Expiring January 2017 | | | 234 | | | | 55,926 | |
| | TerraForm Power, Inc., Call @ $12.50, Expiring January 2017 | | | 1,850 | | | | 266,400 | |
| | Viacom, Inc., Call @ $35, Expiring March 2017 | | | 420 | | | | 176,400 | |
| | Vulcan Materials Co., Call @ $120, Expiring January 2017 | | | 585 | | | | 163,800 | |
| | | | | | | | | | |
| | |
TOTAL PURCHASED CALL OPTIONS | | | | | | | | |
(Cost $1,150,037) | | | | | | | 664,101 | |
PURCHASED PUT OPTIONS – 2.09% | | | | | | | | |
| | Alliance Data Systems Corp., Put @ $210, Expiring December 2016 | | | 215 | | | | 275,200 | |
| | Arctic Cat, Inc., Put @ $17.50, Expiring December 2016 | | | 655 | | | | 176,850 | |
| | Bridgepoint Education, Inc., Put @ $8, Expiring November 2016 | | | 765 | | | | 94,860 | |
| | Career Education Corp., Put @ $6, Expiring January 2017 | | | 2,839 | | | | 70,975 | |
| | Conn’s, Inc., Put @ $5, Expiring January 2017 | | | 3,338 | | | | 16,690 | |
| | Control4 Corp., Put @ $10, Expiring January 2017 | | | 694 | | | | 48,580 | |
| | Control4 Corp., Put @ $12.50, Expiring April 2017 | | | 234 | | | | 63,180 | |
| | Deckers Outdoor Corp., Put @ $52.50, Expiring January 2017 | | | 680 | | | | 251,600 | |
| | Fossil Group, Inc., Put @ $30, Expiring March 2017 | | | 110 | | | | 53,900 | |
| | Harley-Davidson, Inc., Put @ $47.50, Expiring January 2017 | | | 850 | | | | 58,650 | |
| | Harley-Davidson, Inc., Put @ $50, Expiring January 2017 | | | 1,119 | | | | 108,543 | |
| | ITT Educational Services, Inc., Put @ $2, Expiring January 2017 | | | 2,960 | | | | 586,080 | |
| | ITT Educational Services, Inc., Put @ $2, Expiring January 2018 | | | 4,153 | | | | 822,294 | |
| | Tempur Sealy International, Inc., Put @ $55, Expiring December 2016 | | | 167 | | | | 47,595 | |
| | Tesla Motors, Inc., Put @ $210, Expiring January 2017 | | | 67 | | | | 145,055 | |
| | Zillow Group, Inc., Put @ $30, Expiring January 2017 | | | 338 | | | | 39,546 | |
| | Zillow Group, Inc., Put @ $35, Expiring February 2017 | | | 333 | | | | 133,200 | |
| | | | | | | | | | |
| | |
TOTAL PURCHASED PUT OPTIONS | | | | | | | | |
(Cost $3,327,465) | | | | | | | 2,992,798 | |
| | | |
| | | | | Par Value | | | | |
| CORPORATE BONDS – 6.27% | | | | | | | | |
| | Caterpillar Financial Services Corp., 1.000%, 11/25/2016 | | $ | 3,600,000 | | | | 3,601,012 | |
| | Procter & Gamble Co./The, 0.750%, 11/4/2016 | | | 5,400,000 | | | | 5,399,984 | |
| | | | | | | | | | |
| | |
TOTAL CORPORATE BONDS | | | | | | | | |
(Cost $9,001,318) | | | | | | | 9,000,996 | |
See accompanying notes to financial statements.
| | |
| 20 | | 1-800-467-7903 | www.CaldwellOrkin.com |
| | |
Caldwell & Orkin Market Opportunity Fund | | Schedule of Investments |
| | October 31, 2016 (Unaudited) |
| | | | | | | | | | |
| | | | | Shares | | | Fair Value | |
MONEY MARKET SECURITIES – 50.62% | | | | | | | | |
| | First American Treasury Obligations Fund – Class Z, 0.22%(a) | | | 72,633,505 | | | $ | 72,633,505 | |
| | | | | | | | | | |
| | |
TOTAL MONEY MARKET SECURITIES | | | | | | | | |
(Cost $72,633,505) | | | | | | | 72,633,505 | |
TOTAL INVESTMENTS – 95.95% | | | | | | | | |
(Cost $135,614,210) | | | | | | | 137,673,585 | |
| | |
Other Assets in Excess of Liabilities – 4.05% | | | | | | | 5,809,405 | |
| | |
NET ASSETS – 100.00% | | | | | | $ | 143,482,990 | |
| (a) | Rate disclosed is the seven day effective yield as of October 31, 2016. |
| * | Non-income producing security. |
The sub-industries shown on the schedule of investments are based on the Global Industry Classification Standard, or GICS® (“GICS”). The GICS was developed by and/or is the exclusive property of MSCI, Inc. and Standard & Poor Financial Services LLC (“S&P”). GICS is a service mark of MSCI, Inc. and S&P and has been licensed for use by Ultimus Asset Services, LLC.
| | | | | | | | | | |
| SCHEDULE OF SECURITIES SOLD SHORT | | Shares | | | Fair Value | |
COMMON STOCKS–SHORT – (22.41)% | | | | | | | | |
| | Aerospace & Defense – (0.89)% | | | | | | | | |
| | Boeing Co./The | | | (9,000 | ) | | $ | (1,281,870 | ) |
| | | | | | | | | | |
| | Asset Management & Custody Banks – (1.99)% | | | | | | | | |
| | Franklin Resources, Inc. | | | (40,200 | ) | | | (1,353,132 | ) |
| | Waddell & Reed Financial, Inc. – Class A | | | (40,000 | ) | | | (628,800 | ) |
| | WisdomTree Investments, Inc. | | | (101,200 | ) | | | (868,296 | ) |
| | | | | | | | | | |
| | | | | | | | | (2,850,228 | ) |
| | | | | | | | | | |
| | Automotive Retail – (1.09)% | | | | | | | | |
| | CarMax, Inc.* | | | (31,400 | ) | | | (1,568,116 | ) |
| | | | | | | | | | |
| | Computer & Electronics Retail – (0.58)% | | | | | | | | |
| | Sonic Automotive, Inc. – Class A | | | (46,500 | ) | | | (832,350 | ) |
| | | | | | | | | | |
| | Consumer Finance – (1.18)% | | | | | | | | |
| | Credit Acceptance Corp.* | | | (9,200 | ) | | | (1,693,720 | ) |
| | | | | | | | | | |
| | Diversified Banks – (0.70)% | | | | | | | | |
| | Westpac Banking Corp. | | | (43,200 | ) | | | (1,002,240 | ) |
| | | | | | | | | | |
See accompanying notes to financial statements.
| | | | |
| Semi-Annual Report | October 31, 2016 | | | 21 | |
| | |
Caldwell & Orkin Market Opportunity Fund | | Schedule of Investments |
| | October 31, 2016 (Unaudited) |
| | | | | | | | | | |
| | | Shares | | | Fair Value | |
| | Education Services – (1.50)% | | | | | | | | |
| | Bridgepoint Education, Inc.* | | | (82,500 | ) | | $ | (557,700 | ) |
| | Career Education Corp.* | | | (100 | ) | | | (719 | ) |
| | DeVry Education Group, Inc. | | | (70,100 | ) | | | (1,591,270 | ) |
| | | | | | | | | | |
| | | | | | | | | (2,149,689 | ) |
| | | | | | | | | | |
| | Electrical Components & Equipment – (0.95)% | | | | | | | | |
| | Acuity Brands, Inc. | | | (6,100 | ) | | | (1,363,777 | ) |
| | | | | | | | | | |
| | Electronic Equipment & Instruments – (0.30)% | | | | | | | | |
| | Control4 Corp.* | | | (37,500 | ) | | | (423,375 | ) |
| | | | | | | | | | |
| | Food Retail – (0.00)%(a) | | | | | | | | |
| | Sprouts Farmers Market, Inc.* | | | (100 | ) | | | (2,215 | ) |
| | | | | | | | | | |
| | Footwear – (1.20)% | | | | | | | | |
| | Deckers Outdoor Corp.* | | | (33,100 | ) | | | (1,727,489 | ) |
| | | | | | | | | | |
| | General Merchandise Stores – (1.28)% | | | | | | | | |
| | Big Lots, Inc. | | | (42,300 | ) | | | (1,835,820 | ) |
| | | | | | | | | | |
| | Health Care Facilities – (0.69)% | | | | | | | | |
| | Community Health Systems, Inc.* | | | (70,100 | ) | | | (370,128 | ) |
| | LifePoint Health, Inc.* | | | (10,400 | ) | | | (622,440 | ) |
| | | | | | | | | | |
| | | | | | | | | (992,568 | ) |
| | | | | | | | | | |
| | Homefurnishing Retail – (0.24)% | | | | | | | | |
| | Aaron’s, Inc. | | | (13,700 | ) | | | (338,527 | ) |
| | | | | | | | | | |
| | Industrial Machinery – (1.28)% | | | | | | | | |
| | Snap-on, Inc. | | | (11,900 | ) | | | (1,833,790 | ) |
| | | | | | | | | | |
| | Internet Software & Services – (1.95)% | | | | | | | | |
| | Endurance International Group Holdings, Inc.* | | | (91,200 | ) | | | (670,320 | ) |
| | Zillow Group, Inc.* | | | (64,300 | ) | | | (2,123,829 | ) |
| | | | | | | | | | |
| | | | | | | | | (2,794,149 | ) |
| | | | | | | | | | |
| | Life & Health Insurance – (0.62)% | | | | | | | | |
| | Primerica, Inc. | | | (16,300 | ) | | | (891,610 | ) |
| | | | | | | | | | |
| | Motorcycle Manufacturers – (0.00)%(a) | | | | | | | | |
| | Harley-Davidson, Inc. | | | (100 | ) | | | (5,702 | ) |
| | | | | | | | | | |
| | Oil & Gas Drilling – (1.28)% | | | | | | | | |
| | Seadrill Ltd.* | | | (196,700 | ) | | | (418,971 | ) |
| | Transocean Ltd.* | | | (147,000 | ) | | | (1,412,670 | ) |
| | | | | | | | | | |
| | | | | | | | | (1,831,641 | ) |
| | | | | | | | | | |
See accompanying notes to financial statements.
| | |
| 22 | | 1-800-467-7903 | www.CaldwellOrkin.com |
| | |
Caldwell & Orkin Market Opportunity Fund | | Schedule of Investments |
| | October 31, 2016 (Unaudited) |
| | | | | | | | | | |
| | | Shares | | | Fair Value | |
| | Packaged Foods & Meats – (1.09)% | | | | | | | | |
| | Post Holdings, Inc.* | | | (20,500 | ) | | $ | (1,562,715 | ) |
| | | | | | | | | | |
| | Residential REITs – (2.06)% | | | | | | | | |
| | AvalonBay Communities, Inc. | | | (7,700 | ) | | | (1,318,086 | ) |
| | Equity Residential | | | (26,600 | ) | | | (1,642,550 | ) |
| | | | | | | | | | |
| | | | | | | | | (2,960,636 | ) |
| | | | | | | | | | |
| | Specialty Stores – (0.45)% | | | | | | | | |
| | Signet Jewelers Ltd. | | | (4,200 | ) | | | (341,292 | ) |
| | Tractor Supply Co. | | | (4,800 | ) | | | (300,624 | ) |
| | | | | | | | | | |
| | | | | | | | | (641,916 | ) |
| | | | | | | | | | |
| | Trading Companies & Distributors – (0.18)% | | | | | | | | |
| | Fastenal Co. | | | (6,800 | ) | | | (265,064 | ) |
| | | | | | | | | | |
| | Trucking – (0.91)% | | | | | | | | |
| | Avis Budget Group, Inc. | | | (40,300 | ) | | | (1,304,108 | ) |
| | | | | | | | | | |
| | |
TOTAL COMMON STOCKS – SHORT | | | | | | | | |
(Proceeds Received $35,371,274) | | | | | | | (32,153,315 | ) |
EXCHANGE-TRADED FUNDS – SHORT – (8.28)% | | | | | | | | |
| | iShares 1-3 Year Treasury Bond ETF | | | (42,400 | ) | | | (3,601,880 | ) |
| | iShares 20+ Year Treasury Bond ETF | | | (21,900 | ) | | | (2,874,375 | ) |
| | iShares 3-7 Year Treasury Bond ETF | | | (14,200 | ) | | | (1,783,804 | ) |
| | iShares MSCI South Africa Index Fund | | | (100 | ) | | | (5,530 | ) |
| | iShares Short Treasury Bond ETF | | | (32,700 | ) | | | (3,611,388 | ) |
| | | | | | | | | | |
| | |
TOTAL EXCHANGE-TRADED FUNDS – SHORT | | | | | | | | |
(Proceeds Received $11,939,066) | | | | | | | (11,876,977 | ) |
TOTAL SECURITIES SOLD SHORT – (30.69)% | | | | | | | | |
(Proceeds Received $47,310,340) | | | | | | $ | (44,030,292 | ) |
| * | Non-dividend expense producing security. |
The sub-industries shown on the schedule of investments are based on the Global Industry Classification Standard, or GICS® (“GICS”). The GICS was developed by and/or is the exclusive property of MSCI, Inc. and Standard & Poor Financial Services LLC (“S&P”). GICS is a service mark of MSCI, Inc. and S&P and has been licensed for use by Ultimus Asset Services, LLC.
See accompanying notes to financial statements.
| | | | |
| Semi-Annual Report | October 31, 2016 | | | 23 | |
| | |
Caldwell & Orkin Market Opportunity Fund | | Statement of Assets and Liabilities |
| | October 31, 2016 (Unaudited) |
| | | | |
ASSETS | | | | |
Investments, at value (cost $135,614,210) (Note 1) | | $ | 137,673,585 | |
Deposit held by broker for securities sold short (Note 3) | | | 48,326,640 | |
Receivables: | | | | |
Investments sold | | | 2,764,382 | |
Capital shares sold | | | 55,793 | |
Dividends and interest | | | 60,771 | |
Other assets | | | 53,209 | |
| | | | |
Total assets | | | 188,934,380 | |
| | | | |
| |
LIABILITIES | | | | |
Securities sold short, at value (proceeds $47,310,340) | | | 44,030,292 | |
Payables: | | | | |
Investment securities purchased | | | 1,097,746 | |
Dividends payable - short sales | | | 25,421 | |
Capital shares redeemed | | | 46,491 | |
Accrued expenses: | | | | |
Investment advisory fee (Note 2) | | | 131,868 | |
Custodian fees | | | 4,731 | |
Professional fees | | | 15,901 | |
Administration and accounting fees (Note 2) | | | 10,231 | |
Directors fees and expenses (Note 6) | | | 318 | |
Other operating expenses | | | 88,391 | |
| | | | |
Total liabilities | | | 45,451,390 | |
| | | | |
| |
Net Assets | | $ | 143,482,990 | |
| | | | |
| |
Net Assets Consist of: | | | | |
Paid-in capital | | $ | 148,981,636 | |
Accumulated net investment loss | | | (2,454,460 | ) |
Accumulated net realized loss on investments and securities sold short | | | (8,383,609 | ) |
Net unrealized appreciation on investments and securities sold short | | | 5,339,423 | |
| | | | |
Net Assets | | $ | 143,482,990 | |
| | | | |
Shares outstanding, par value $0.10 per share
(30,000,000 authorized shares) | | | 6,904,824 | |
| | | | |
| |
Net Asset Value, Offering Price and Redemption Price Per Share* (Note 1) | | | $20.78 | |
| | | | |
| * | Redemption price may differ from NAV if redemption fee is applied. |
See accompanying notes to financial statements.
| | |
| 24 | | 1-800-467-7903 | www.CaldwellOrkin.com |
| | |
Caldwell & Orkin Market Opportunity Fund | | Statement of Operations |
| | For the Six Months Ended October 31, 2016 (Unaudited) |
| | | | |
INVESTMENT INCOME | | | | |
Dividends | | $ | 615,537 | |
Interest | | | 97,009 | |
| | | | |
Total Investment Income | | | 712,546 | |
| | | | |
| |
EXPENSES | | | | |
Investment advisory fees (Note 2) | | | 947,258 | |
Interest expense | | | 395,226 | |
Dividend expense on securities sold short | | | 310,129 | |
Administration and accounting fees (Note 2) | | | 79,916 | |
Other operating expenses | | | 55,166 | |
Professional fees | | | 46,486 | |
Director’s fees and expenses (Note 6) | | | 45,490 | |
Transfer agent fees (Note 2) | | | 30,387 | |
Insurance expense | | | 24,189 | |
Registration and filing fees | | | 23,143 | |
Chief compliance officer expense (Note 2) | | | 15,436 | |
Custodian fees | | | 12,351 | |
Shareholder report printing | | | 8,247 | |
Pricing expenses | | | 4,686 | |
| | | | |
Total Expenses | | | 1,998,110 | |
Less fees reduced by Administrator (Note 2) | | | (14,465 | ) |
| | | | |
Net expenses | | | 1,983,645 | |
| | | | |
Net Investment Loss | | | (1,271,099 | ) |
| | | | |
| |
REALIZED AND UNREALIZED GAIN (LOSS) ON INVESTMENTS | | | | |
Net realized gain (loss) from: | | | | |
Investments | | | 4,991,914 | |
Purchased options | | | (3,799,619 | ) |
Securities sold short | | | 350,665 | |
| | | | |
Net realized gain | | | 1,542,960 | |
| | | | |
Change in unrealized appreciation (depreciation) on: | | | | |
Investments | | | (4,294,085 | ) |
Purchased options | | | 1,074,471 | |
Securities sold short | | | (4,004,193 | ) |
| | | | |
Net change in unrealized appreciation (depreciation) | | | (7,223,807 | ) |
| | | | |
NET REALIZED AND UNREALIZED LOSS ON INVESTMENTS | | | (5,680,847 | ) |
| | | | |
NET DECREASE IN NET ASSETS RESULTING FROM OPERATIONS | | $ | (6,951,946 | ) |
| | | | |
See accompanying notes to financial statements.
| | | | |
| Semi-Annual Report | October 31, 2016 | | | 25 | |
| | |
Caldwell & Orkin Market Opportunity Fund | | Statements of Changes In Net Assets |
| | |
| | | | | | | | |
| | | For the Six Months Ended October 31, 2016 | | | For the Year Ended April 30, 2016 | |
| | | (Unaudited | ) | | | | |
| |
INCREASE (DECREASE) IN NET ASSETS FROM OPERATIONS: | | | | | |
Net investment loss | | $ | (1,271,099 | ) | | $ | (3,483,128 | ) |
Net realized gain (loss) on investments, purchased options and securities sold short | | | 1,542,960 | | | | (1,635,830 | ) |
Change in unrealized appreciation (depreciation) of investments, purchased options and securities sold short | | | (7,223,807 | ) | | | (1,629,639 | ) |
| | | | |
NET DECREASE IN NET ASSETS RESULTING FROM OPERATIONS | | | (6,951,946 | ) | | | (6,748,597 | ) |
| | | | |
|
DISTRIBUTIONS TO SHAREHOLDERS FROM: | |
Net realized gain on investments (Note 4) | | | – | | | | (10,125,493 | ) |
| | | | |
Total Distributions | | | – | | | | (10,125,493 | ) |
| | | | |
|
CAPITAL SHARE TRANSACTIONS: | |
Proceeds from sale of shares | | | 14,189,885 | | | | 126,098,676 | |
Reinvested distributions | | | – | | | | 7,336,522 | |
Redemption fee proceeds (Note 1) | | | 14,979 | | | | 57,689 | |
Cost of shares redeemed | | | (72,098,103 | ) | | | (37,226,116 | ) |
| | | | |
Net Increase (Decrease) in net assets
resulting from capital share transactions | | | (57,893,239 | ) | | | 96,266,771 | |
| | | | |
INCREASE (DECREASE) IN NET ASSETS | | | (64,845,185 | ) | | | 79,392,681 | |
| | | | |
NET ASSETS | | | | | | | | |
Beginning of period | | | 208,328,175 | | | | 128,935,494 | |
| | | | |
End of period* | | $ | 143,482,990 | | | $ | 208,328,175 | |
| | | | |
* Including Accumulated Net Investment Loss: | | $ | (2,454,460 | ) | | $ | (1,183,361 | ) |
| | | | |
CAPITAL SHARE ACTIVITY | | | | | | | | |
Shares sold | | | 664,178 | | | | 5,343,343 | |
Reinvested distributions | | | – | | | | 320,093 | |
Shares redeemed | | | (3,417,767 | ) | | | (1,626,041 | ) |
| | | | |
Net Increase (Decrease) in Capital Shares | | | (2,753,589 | ) | | | 4,037,395 | |
| | | | |
Shares Outstanding, Beginning of period | | | 9,658,413 | | | | 5,621,018 | |
| | | | |
Shares Outstanding, End of period | | | 6,904,824 | | | | 9,658,413 | |
| | | | |
See accompanying notes to financial statements.
| | |
| 26 | | 1-800-467-7903 | www.CaldwellOrkin.com |
| | |
Caldwell & Orkin Market Opportunity Fund | | Financial Highlights |
| | |
For a share outstanding during each of the periods presented.
| | | | | | | | | | | | | | | | | | | | | | | | |
| | | For the
Six Months
Ended
October 31,
2016 | | | For the
Year
Ended
April 30,
2016 | | | For the
Year
Ended
April 30,
2015 | | | For the
Year
Ended
April 30,
2014 | | | For the
Year
Ended
April 30,
2013 | | | For the
Year
Ended
April 30,
2012 | |
| | | (Unaudited) | | | | | | | | | | | | | | | | | | | | | |
Net Asset Value, Beginning of Period | | | $21.57 | | | | $22.94 | | | | $20.88 | | | | $22.97 | | | | $20.56 | | | | $19.59 | |
| | | | |
Income (loss) from investment operations: | | | | | | | | | | | | | | | | | | | | | |
Net investment loss | | | (0.14) | (a) | | | (0.36) | | | | (0.49) | | | | (0.29) | | | | (0.20) | | | | (0.28) | |
Net realized and unrealized gain (loss) on investments and options contracts | | | (0.65) | | | | 0.30 | | | | 2.71 | | | | (1.30) | | | | 2.60 | | | | 1.24 | |
| | | | |
Total from Investment Operations | | | (0.79) | | | | (0.06) | | | | 2.22 | | | | (1.59) | | | | 2.40 | | | | 0.96 | |
| | | | |
| | | | | |
Less Distributions to Shareholders From: | | | | | | | | | | | | | | | | | | | | | |
Net realized gains on investments | | | – | | | | (1.32) | | | | (0.17) | | | | (0.51) | | | | – | | | | – | |
| | | | |
Total distributions | | | – | | | | (1.32) | | | | (0.17) | | | | (0.51) | | | | – | | | | – | |
| | | | |
| | | | | | |
Paid in Capital: | | | | | | | | | | | | | | | | | | | | | | | | |
Paid in capital from redemption fees (Note 1) | | | – | (b) | | | 0.01 | | | | 0.01 | | | | 0.01 | | | | 0.01 | | | | 0.01 | |
| | | | |
Net Asset Value, End of Period | | | $20.78 | | | | $21.57 | | | | $22.94 | | | | $20.88 | | | | $22.97 | | | | $20.56 | |
| | | | |
| | | | | | |
Total Return(c) | | | (3.66% | )(d) | | | (0.56%) | | | | 10.68% | | | | 6.92% | | | | 11.72% | | | | 4.95% | |
See accompanying notes to financial statements.
| | | | |
| Semi-Annual Report | October 31, 2016 | | | 27 | |
| | |
Caldwell & Orkin Market Opportunity Fund | | Financial Highlights |
| | |
For a share outstanding during each of the periods presented.
| | | | | | | | | | | | | | | | | | | | | | | | |
| | | For the
Six Months
Ended
October 31,
2016 | | | For the
Year
Ended
April 30,
2016 | | | For the
Year
Ended
April 30,
2015 | | | For the
Year
Ended
April 30,
2014 | | | For the
Year
Ended
April 30,
2013 | | | For the
Year
Ended
April 30,
2012 | |
| | | (Unaudited) | | | | | | | | | | | | | | | | | | | | | |
Ratios and Supplemental Data: | | | | | | | | | | | | | | | | | | | | | |
Net Assets, End of Period (in thousands) | | | $143,483 | | | | $208,328 | | | $ | 128,935 | | | $ | 165,472 | | | $ | 260,916 | | | $ | 251,907 | |
Ratios to Average Net Assets: | | | | | | | | | | | | | | | | | | | | | | | | |
Management fees | | | 1.00% | (e) | | | 1.00% | | | | 1.00% | | | | 1.00% | | | | 1.00% | | | | 0.99% | |
Administrative and other expenses | | | 0.35% | (e) | | | 0.37% | | | | 0.44% | | | | 0.29% | | | | 0.27% | | | | 0.27% | |
| | | | |
Expenses before dividends on securities sold short and interest expense | | | 1.35% | (e) | | | 1.37% | | | | 1.44% | | | | 1.29% | | | | 1.27% | | | | 1.26% | |
Interest expense | | | 0.42% | (e) | | | 0.85% | | | | 0.63% | | | | 0.30% | | | | 0.46% | | | | 0.43% | |
Expenses from dividends on securities sold short | | | 0.33% | (e) | | | 0.73% | | | | 0.57% | | | | 0.14% | | | | 0.26% | | | | 0.43% | |
| | | | |
Ratio of total expenses | | | 2.10% | (e) | | | 2.95% | | | | 2.64% | | | | 1.73% | | | | 1.99% | | | | 2.12% | |
| | | | |
Ratio of net investment loss | | | (1.34%) | (e) | | | (2.06%) | | | | (1.80%) | | | | (0.98%) | | | | (0.87%) | | | | (1.27%) | |
Portfolio Turnover Rate | | | 258% | (d) | | | 415% | | | | 434% | | | | 657% | | | | 352% | | | | 517% | |
| (a) | Calculated using average shares outstanding. |
| (b) | Rounds to less than $0.005 per share. |
| (c) | Total return in the above table represents the rate that the investor would have earned or lost on an investment in the Fund, assuming reinvestment of dividends. |
See accompanying notes to financial statements.
| | |
| 28 | | 1-800-467-7903 | www.CaldwellOrkin.com |
| | |
Caldwell & Orkin Market Opportunity Fund | | Notes to Financial Statements |
| | October 31, 2016 (Unaudited) |
The Caldwell & Orkin Market Opportunity Fund (the “Fund”) is the only investment portfolio of The Caldwell & Orkin Funds, Inc. (“Caldwell & Orkin”), an open-end, diversified management investment company registered under the Investment Company Act of 1940, as amended (the “1940 Act”), and incorporated under the laws of the State of Maryland on August 15, 1989. Prior to June, 1992, Caldwell & Orkin’s name was The OTC Select-100 Fund, Inc. and consisted of only one portfolio, The OTC Select-100 Fund. The shareholders of The OTC Select-100 Fund subsequently approved changing the corporate name from The OTC Select-100 Fund, Inc. to The Caldwell & Orkin Funds, Inc. and to amend the investment objective and policies of The OTC Select-100 Fund. As a result of such amendment, The OTC Select-100 Fund was renamed and its assets and objectives were those of the Caldwell & Orkin Aggressive Growth Fund. In August, 1996, the Board of Directors of Caldwell & Orkin approved changing the name of the Caldwell & Orkin Aggressive Growth Fund to the Caldwell & Orkin Market Opportunity Fund. The Fund’s investment objective is to provide long-term capital growth with a short-term focus on capital preservation. C&O Funds Advisor, Inc. (the “Adviser”) uses a catalyst-driven, multi-dimensional, disciplined investment process focusing on active asset allocation, security selection and surveillance to achieve the Fund’s investment objective. The Adviser’s philosophy in managing the Fund is to focus on risk as well as return. The Adviser utilizes an investment philosophy based upon sophisticated exploitation of the low-risk anomaly. The low-risk anomaly stands in direct contradiction to the conventional beliefs of Efficient Market Hypothesis stating that high risk is equated with higher return. The Adviser takes the opposite view — we believe that lower risk can result in higher return.
1. SUMMARY OF SIGNIFICANT ACCOUNTING POLICIES
Use of Estimates
The preparation of financial statements in conformity with accounting principles generally accepted in the United States of America (“GAAP”) requires management to make estimates and assumptions that affect the reported amounts of assets and liabilities and disclosure of contingent assets and liabilities at the date of the financial statements and the reported amounts of revenues and expenses during the reporting period. Actual results could differ from those estimates.
Securities Valuation
Securities are stated at the closing price on the date at which the net asset value (“NAV”) is being determined. If the date of determination is not a trading date, or the closing price is not otherwise available, the last bid price is used for a value instead. Debt securities, other than short-term investments, are typically valued at the price provided by an independent pricing service. Any assets or securities for which market quotations are not readily available are valued at fair value as determined in good faith by or under the direction of the Fund’s Board of Directors in accordance with the Fund’s Fair Value Pricing Policy.
| | | | |
| Semi-Annual Report | October 31, 2016 | | | 29 | |
| | |
Caldwell & Orkin Market Opportunity Fund | | Notes to Financial Statements |
| | October 31, 2016 (Unaudited) |
Fair Value Measurements
A three-tier hierarchy has been established to classify fair value measurements for disclosure purposes. Inputs refer broadly to the assumptions that market participants would use in pricing the asset or liability, including assumptions about risk. Inputs may be observable or unobservable. Observable inputs are inputs that reflect the assumptions market participants would use in pricing the asset or liability that are developed based on market data obtained from sources independent of the reporting entity. Unobservable inputs are inputs that reflect the reporting entity’s own assumptions about the assumptions market participants would use in pricing the asset or liability that are developed based on the best information available.
Various inputs are used in determining the value of the Fund’s investments as of the reporting period end. These inputs are categorized in the following hierarchy under applicable financial accounting standards:
| Level 1 — | Unadjusted quoted prices in active markets for identical, unrestricted assets or liabilities that the Fund has the ability to access at measurement date. |
| Level 2 — | Quoted prices which are not active quoted prices for similar assets or liabilities in active markets or inputs other than quoted prices that are observable (either directly or indirectly) for substantially the full term of the asset of liability. |
| Level 3 — | Significant unobservable prices or inputs (including the Fund’s own assumptions in determining the fair value of investments) where there is little or no market for the asset or liability at the measurement date. |
The following is a summary of the inputs used as of October 31, 2016 in valuing the Fund’s investments and other financial instruments:
| | | | | | | | | | | | | | | | |
| Investments in Securities* | | Level 1 | | | Level 2 | | | Level 3 | | | Total | |
Common Stocks | | $ | 51,540,799 | | | $ | — | | | $ | — | | | $ | 51,540,799 | |
Exchange-Traded Funds | | | 841,386 | | | | — | | | | — | | | | 841,386 | |
Purchased Options | | | | | | | | | | | | | | | — | |
Call Options | | | 664,101 | | | | — | | | | — | | | | 664,101 | |
Put Options | | | 2,992,798 | | | | — | | | | — | | | | 2,992,798 | |
Corporate Bonds | | | — | | | | 9,000,996 | | | | — | | | | 9,000,996 | |
Money Market Funds | | | 72,633,505 | | | | — | | | | — | | | | 72,633,505 | |
Total | | $ | 128,672,589 | | | $ | 9,000,996 | | | $ | — | | | $ | 137,673,585 | |
| | | | | | | | | | | | | | | | | |
| | | | |
| Other Financial Instruments* | | | | | | | | | | | | |
Liabilities | | | | | | | | | | | | | | | | |
Securities Sold Short | | | | | | | | | | | | | | | | |
Common Stocks | | $ | (32,153,315 | ) | | $ | — | | | $ | — | | | $ | (32,153,315 | ) |
Exchange-Traded Funds | | $ | (11,876,977 | ) | | $ | — | | | $ | — | | | $ | (11,876,977 | ) |
Total | | $ | (44,030,292 | ) | | $ | — | | | $ | — | | | $ | (44,030,292 | ) |
| | | | | | | | | | | | | | | | | |
| | |
| 30 | | 1-800-467-7903 | www.CaldwellOrkin.com |
| | |
Caldwell & Orkin Market Opportunity Fund | | Notes to Financial Statements |
| | October 31, 2016 (Unaudited) |
Transfers into and out of Levels 1 and 2 as of October 31, 2016 were as follows:
| | | | | | | | | | | | | | | | |
| | | Level 1 | | | Level 2 | |
| | | Transfer In | | | Transfer (Out) | | | Transfer In | | | Transfer (Out) | |
Purchased Call Options | | $ | 9,975 | | | $ | — | | | $ | — | | | $ | (9,975 | ) |
Purchased Put Options | | | 1,057,200 | | | | — | | | | — | | | | (1,057,200 | ) |
Total | | $ | 1,067,175 | | | $ | — | | | $ | — | | | $ | (1,067,175 | ) |
| | | | | | | | | | | | | | | | | |
All securities of the Fund were valued using either Level 1 or Level 2 inputs during the six months ended October 31, 2016.
| * | For detailed industry descriptions, see the accompanying Schedule of Investments. |
Use of Derivatives
Derivative Instruments and Hedging Activities: The Fund’s investment objective not only permits the Fund to purchase investment securities, it also allows the Fund to enter into various types of derivative contracts, including purchased and written options. In doing so, the Fund will employ strategies in differing combinations to permit it to increase, decrease, or change the level or types of exposure to market factors. Central to those strategies are features inherent to derivatives that make them more attractive for this purpose than equity or debt securities; they require little or no initial cash investment; they can focus exposure on only certain selected risk factors; and they may not require the ultimate receipt or delivery of the underlying security (or securities) to the contract holder. This may allow the Fund to pursue its objective more quickly and efficiently than if it were to make direct purchases or sales of securities capable of affecting a similar response to market factors.
Market Risk Factors: In pursuit of its investment objectives, the Fund may seek to use derivatives to increase or decrease its exposure to the following market risk factors:
Equity Risk: Equity risk relates to the change in value of equity securities as they relate to increases or decreases in the general market.
Purchasing Put and Call Options: The Fund may invest in options on securities and indices, and use such securities either to hedge risk or enhance the long positions in the Fund’s portfolio.
By purchasing a put option, the purchaser obtains the right (but not the obligation) to sell the option’s underlying instrument at a fixed strike price. In return for this right, the purchaser pays the current market price for the option (known as the option premium). Options have various types of underlying instruments, including specific securities, indices of securities prices, and futures contracts. The purchaser may terminate its position in a put option by allowing it to expire or by exercising the option. If the option is allowed to expire, the purchaser will lose the entire premium. If the option is exercised, the purchaser completes the
| | | | |
| Semi-Annual Report | October 31, 2016 | | | 31 | |
| | |
Caldwell & Orkin Market Opportunity Fund | | Notes to Financial Statements |
| | October 31, 2016 (Unaudited) |
sale of the underlying instrument at the strike price. A purchaser may also terminate a put option position by closing it out in the secondary market at its current price, if a liquid secondary market exists. The buyer of a typical put option can expect to realize a gain if security prices fall. However, if the underlying instrument’s price does not fall enough to offset the cost of purchasing the option, a put buyer can expect to suffer a loss (limited to the amount of the premium, plus related transaction costs).
The features of call options are essentially the same as those of put options, except that the purchaser of a call option obtains the right to purchase, rather than sell, the underlying instrument at the option’s strike price. A call buyer typically attempts to participate in potential price increases of the underlying instrument with risk limited to the cost of the option if security prices fall. At the same time, the buyer can expect to suffer a loss if security prices do not rise sufficiently to offset the cost of the option.
Writing Put and Call Options: The writer of a put or call option takes the opposite side of the transaction from the option’s purchaser. In return for receipt of the premium, the writer assumes the obligation to pay the strike price for the option’s underlying instrument if the other party to the option chooses to exercise it. The writer may seek to terminate a position in a put option before exercise by closing out the option in the secondary market at its current price. If the secondary market is not liquid for a put option, however, the writer must continue to be prepared to pay the strike price while the option is outstanding, regardless of price changes.
If security prices rise, a put writer would generally expect to profit, although its gain would be limited to the amount of the premium it received. If security prices remain the same over time, it is likely that the writer will also profit, because it should be able to close out the option at a lower price. If security prices fall, the put writer would expect to suffer a loss. This loss should be less than the loss from purchasing the underlying instrument directly, however, because the premium received for writing the option should mitigate the effects of the decline.
Writing a call option obligates the writer to sell or deliver the option’s underlying instrument, in return for the strike price, upon exercise of the option. The characteristics of writing call options are similar to those of writing put options, except that writing calls generally is a profitable strategy if the price of the underlying security remains the same or falls. Through receipt of the option premium, a call writer mitigates some of the effects of a price decline. At the same time, because a call writer must be prepared to deliver the underlying instrument in return for the strike price, even if its current value is greater, a call writer gives up some ability to participate in security price increases.
The Fund did not transact in any written options during the six months ended October 31, 2016.
The following discloses the amounts related to the Fund’s use of derivative instruments and hedging activities.
| | |
| 32 | | 1-800-467-7903 | www.CaldwellOrkin.com |
| | |
Caldwell & Orkin Market Opportunity Fund | | Notes to Financial Statements |
| | October 31, 2016 (Unaudited) |
The effect of derivative instruments on the Statement of Assets and Liabilities as of October 31, 2016:
| | | | | | | | |
Asset Derivatives Derivatives not Accounted for as Hedging
Instruments | | Statement of Assets
and Liabilities | | | Market Value | |
Purchased Options (Equity Contracts) | | | Investments, at value | | | $ | 3,656,899 | |
Total | | | | | | $ | 3,656,899 | |
| | | | | | | | | |
The effect of derivative instruments on the Statement of Operations for the six months ended October 31, 2016:
| | | | | | | | | | |
Derivatives not
Accounted for as
Hedging Instruments | | Location of
Gain/(Loss) on Derivatives
Recognized in
Income | | Net Realized
Gain/(Loss) from Derivatives Recognized in
Income | | | Change in Unrealized
Appreciation/
(Depreciation) on
Derivatives
Recognized in
Income | |
Purchased Options | | | | | | | | | | |
(Equity Contracts) | | Net realized loss from purchased options | | $ | (3,799,619 | ) | | | | |
| | | Change in unrealized appreciation on purchased options | | | | | | $ | (1,074,471 | ) |
Total | | | | $ | (3,799,619 | ) | | $ | (1,074,471 | ) |
| | | | | | | | | | | |
The Fund’s average monthly contracts for the purchased options is 23,976 for the six months ended October 31, 2016.
Significant Ownership Concentration
At October 31, 2016, the Fund invested 50.62% of its total net assets in the First American Treasury Obligations Fund — Class Z (FUZXX) (the “Money Market Fund”). The financial statements of the Money Market Fund, including the portfolio of investments, are included in the First American Treasury Obligations Fund’s (Class Z) annual report and can be found at www.firstamericanfunds.com and should be read in conjunction with the Fund’s financial statements. The Fund uses the Money Market Fund as a vehicle for holding collateral related to securities sold short. As stated in the Fund’s prospectus, the Fund will typically invest between 0% and 50% of net assets in money market securities and fixed income securities. This portion of the Fund’s portfolio includes cash equivalents (i.e., money market funds or U.S. Treasury Bills) and bonds (i.e., corporate or government bonds), although generally cash equivalents are emphasized more than bonds. The corporate bonds purchased may have any maturity and be of any rating or quality, as long as Fund management believes it is consistent with the Fund’s investment objective.
| | | | |
| Semi-Annual Report | October 31, 2016 | | | 33 | |
| | |
Caldwell & Orkin Market Opportunity Fund | | Notes to Financial Statements |
| | October 31, 2016 (Unaudited) |
The Money Market Fund seeks to provide maximum current income and daily liquidity by purchasing U.S. Treasury obligations securities and repurchase agreements collateralized by such obligations.
Fund management considers investments in securities sold short to be part of managed assets, thereby reducing the Fund’s available cash balance. If the absolute value of securities sold short was added to the Fund’s total long positions as of October 31, 2016, total investments would equal 76.02%, as a percentage of net assets. This would result in cash equivalents representing 23.98% of net assets, vs. the 19.93% that is disclosed on the Schedule of Investments. This better illustrates the Fund’s net cash exposure as of October 31, 2016.
Share Valuation
The net asset value (“NAV”) per share of the Fund is calculated by dividing the sum of the value of the securities held by the Fund, plus cash or other assets, minus all liabilities (including estimated accrued expenses) by the total number of shares outstanding for the Fund, rounded to the nearest cent. The Fund’s shares will not be priced on the days on which the New York Stock Exchange is closed for trading. The offering and redemption price per share for the Fund is equal to the Fund’s NAV per share.
The Fund charges a 2.00% redemption fee on shares held less than 90 days. These fees are deducted from the redemption proceeds otherwise payable to the shareholder. The Fund will retain the fee charged as paid-in capital and such fees become part of the Fund’s daily NAV calculation. For the six month period and year ended October 31, 2016 and April 30, 2016, the Fund recorded $14,979 and $57,689, respectively, in redemption fee proceeds.
Securities Transactions and Related Investment Income
The Fund follows industry practice and records securities transactions on trade date for financial reporting purposes. Dividend income is recorded on the ex-dividend date. Realized gains and losses from investment transactions are determined using the specific identification method. Interest income, which includes amortization of premium and accretion of discount, is accrued as earned.
Cash
The Fund maintains cash available for the settlement of securities transactions and capital shares reacquired. Available cash is typically invested daily in money market instruments.
Income Taxes
The Fund has qualified and intends to continue to qualify with the requirements of the Internal Revenue Code of 1986, as amended, applicable to regulated investment companies
| | |
| 34 | | 1-800-467-7903 | www.CaldwellOrkin.com |
| | |
Caldwell & Orkin Market Opportunity Fund | | Notes to Financial Statements |
| | October 31, 2016 (Unaudited) |
and to distribute all taxable income to its shareholders. Therefore, no federal income tax provision is required.
In order to avoid imposition of the excise tax applicable to regulated investment companies, the Fund also intends to declare each year as dividends, in each calendar year, at least 98% of its net investment income (earned during the calendar year) and at least 98.2% of its net realized capital gains (earned during the twelve months ended October 31) plus undistributed amounts, if any, from prior years.
The Fund recognizes the tax benefits or expenses of uncertain tax positions only when the position is more likely than not to be sustained, assuming examination by tax authorities. Management has analyzed the company’s tax positions and concluded that no liability for unrecognized tax benefits or expenses should be recorded related to uncertain tax positions taken on returns filed for open tax years (2013, 2014, and 2015) or expected to be taken in the company’s 2016 tax returns. The company identifies its major tax jurisdictions as U.S. federal, Georgia and Maryland, and foreign jurisdictions where the company makes significant investments; however, the company is not aware of any tax positions for which it is reasonably possible that the total amounts of unrecognized tax benefits or expenses will change materially in the next 12 months.
2. AGREEMENTS WITH AFFILIATES
The Fund has entered into a Management Agreement with the Adviser pursuant to which the Adviser provides space, facilities, equipment and personnel necessary to perform administrative and investment management services for the Fund. The Management Agreement provides that the Adviser is responsible for the management of the Fund’s portfolio. For such services and expenses assumed by the Adviser, the Fund pays a monthly advisory fee at incremental annual rates as follows:
| | |
| Advisory Fee | | Average Daily Net Assets |
1.00% | | Up to $250 million |
0.90% | | In excess of $250 million but not greater than $500 million |
0.80% | | In excess of $500 million |
The Adviser has agreed to waive its fees and to reimburse the Fund to the extent necessary to prevent the Fund’s annual ordinary operating expenses (excluding taxes, expenses related to the execution of portfolio transactions and the investment activities of the Fund such as, for example, interest, dividend expenses on securities sold short, brokerage commissions, and fees and expenses charged to the Fund by any investment company in which the Fund invests and extraordinary charges such as litigation costs) from exceeding 2.00% of the Fund’s average net assets. No fee waiver or expense reimbursement by the Adviser was required for the six months ended October 31, 2016.
The Adviser, Inc. is a wholly-owned subsidiary of Caldwell & Orkin, Inc. Certain Directors and Officers of the Fund are also officers of the Adviser.
| | | | |
| Semi-Annual Report | October 31, 2016 | | | 35 | |
| | |
Caldwell & Orkin Market Opportunity Fund | | Notes to Financial Statements |
| | October 31, 2016 (Unaudited) |
Ultimus Fund Solutions, LLC (“Ultimus”) provides fund accounting, fund administration and transfer agency services under a Master Services Agreement to the Fund. The Fund pays Ultimus fees for its services under the Master Services Agreement. In addition, the Fund pays out-of-pocket expenses including, but not limited to postage, supplies and costs of pricing the Fund’s securities. Prior to October 24, 2016, ALPS Fund Services, Inc. (“ALPS”) provided fund accounting, fund administration and transfer agency services to the Fund. The Fund paid ALPS for its services in accordance with various service agreements. Prior to October 24, 2016, ALPS waived an annual amount of $30,000 against the administration fee.
Under a Compliance Consulting Agreement with the Fund, Ultimus provides the Fund with a Chief Compliance Officer along with support services. The Fund pays Ultimus an annual fee to provide these services. Prior to October 24, 2016, the Fund paid ALPS an annual compliance fee, made in monthly installments, for its services rendered.
Ultimus Fund Distributors, LLC (the “Distributor”) serves as distributor to the Fund. The Fund does not pay the Distributor for these services. The Distributor is a wholly-owned subsidiary of Ultimus. Prior to October 24, 2016, ALPS Distributors, Inc. (“ADI”) served as distributor to the Fund. The Fund did not pay ADI for these services.
Certain officers of the Fund are also officers of Ultimus and the Distributor.
3. INVESTMENT PORTFOLIO TRANSACTIONS
During the six months ended October 31, 2016, the Fund purchased $215,799,922 and sold $241,917,628 of securities, excluding securities sold short and short-term investments.
Short Sales and Segregated Cash
Short sales are transactions in which the Fund sells a security it does not own, in anticipation of a decline in the market value of that security. To initiate such a transaction, the Fund must borrow the security to deliver to the buyer upon the short sale; the Fund is then obligated to replace the security borrowed by purchasing it in the open market at some later date, completing the transaction.
The Fund will incur a loss if the market price of the security increases between the date of the short sale and the date on which the Fund replaces the borrowed security. The Fund will realize a gain if the security declines in value between those dates.
All short sales must be fully collateralized. The Fund maintains the collateral in segregated accounts consisting of cash and/or U.S. Government securities sufficient to collateralize the market value of its short positions. Typically, the segregated cash with brokers and other financial institutions exceeds the minimum required. Deposits with brokers for securities sold short are invested in money market instruments. Segregated cash is held at the custodian in the name of the broker per a tri-party agreement between the Fund, the custodian, and the broker.
| | |
| 36 | | 1-800-467-7903 | www.CaldwellOrkin.com |
| | |
Caldwell & Orkin Market Opportunity Fund | | Notes to Financial Statements |
| | October 31, 2016 (Unaudited) |
The Fund may also sell short “against the box”, i.e., the Fund enters into a short sale as described above, while holding an offsetting long position in the same security which it sold short. If the Fund enters into a short sale against the box, it will segregate an equivalent amount of securities owned by the Fund as collateral while the short sale is outstanding.
The Fund limits the value of its short positions (excluding short sales “against the box”) to 60% of the Fund’s net assets. At October 31, 2016, the Fund had approximately 22% of its net assets in short positions.
For the six month ended October 31, 2016, the cost of investments purchased to cover short sales and the proceeds from investments sold short were $118,912,388 and $130,055,455, respectively.
4. TAX BASIS INFORMATION
The tax character of the distributions paid by the Fund during the year ended April 30, 2016 was as follows:
| | | | |
| Distributions Paid From: | | 2016 | |
Ordinary Income | | $ | 7,125,425 | |
Long-term capital gains | | | 3,000,068 | |
Total | | $ | 10,125,493 | |
| | | | | |
As of April 30, 2016, the components of distributable earnings on a tax basis were as follows:
| | | | |
Total Cost of Investments | | $ | 197,547,699 | |
Total Cost of Securities Sold Short | | | (36,465,800 | ) |
| | | | |
Gross Unrealized Appreciation | | $ | 3,156,105 | |
Gross Unrealized Depreciation | | | (3,263,413 | ) |
Net Appreciation of Securities Sold Short | | | 7,284,240 | |
| | | | |
Net Unrealized Appreciation | | | 7,176,932 | |
Other Cumulative Effect of Timing Differences | | | (5,723,632 | ) |
| | | | |
Total Accumulated Earnings | | $ | 1,453,300 | |
| | | | |
At April 30, 2016, the Fund had no capital loss carryforwards.
As of October 31, 2016, based on cost of $142,016,808 for federal income tax purposes, aggregate gross unrealized appreciation for all securities in which there is an excess of value over tax cost was $2,203,182 and aggregate gross unrealized depreciation for all securities in which there is an excess of tax cost over value was $(2,250,057), resulting in net unrealized depreciation of $(46,875).
| | | | |
| Semi-Annual Report | October 31, 2016 | | | 37 | |
| | |
Caldwell & Orkin Market Opportunity Fund | | Notes to Financial Statements |
| | October 31, 2016 (Unaudited) |
The Fund elects to defer to the year ending April 30, 2017, late year capital losses (recognized during the period November 1, 2015 — April 30, 2016) in the amount of $4,337,372.
The Fund elects to defer to the year ending April 30, 2017, late year ordinary losses (recognized during the period November 1, 2015 — April 30, 2016) in the amount of $1,183,361.
GAAP requires that certain components of net assets relating to permanent differences be reclassified between financial and tax reporting. These reclassifications have no effect on net assets or NAV per share. For the year ended April 30, 2016, the Fund increased accumulated net realized loss on investments by $167,140, decreased undistributed net investment loss by $2,299,767 and decreased paid-in capital by $2,132,627. These reclassifications are due to investments in partnerships, commodities, nondeductible dividend expenses and certain other temporary and permanent book and tax reclassifications.
Net investment income/(loss), net realized gains/(losses) and unrealized appreciation/ (depreciation) differ for financial statement and tax purposes due to differing treatments of nondeductible dividend expense, commodity adjustments (SPDR Gold Trust), investments in partnerships and certain other investments. Included in the amount reclassified to paid-in-capital was a net operating loss of $2,132,629.
5. RELATED PARTY TRANSACTIONS
As of October 31, 2016, Caldwell & Orkin, Inc. and Michael B. Orkin owned of record and beneficially 1.15% and 5.99%, respectively, of the outstanding shares of the Fund. Caldwell & Orkin, Inc. is 100% wholly owned by Michael B. Orkin.
Under the Fund’s organizational documents, its officers and directors are indemnified against certain liability arising out of the performance of their duties to the Fund. Additionally, in the normal course of business, the Fund enters into contracts with service providers that may contain general indemnification clauses, which may permit indemnification to the extent permissible under applicable law. The Fund’s maximum exposure under these arrangements is unknown, as this would involve future claims that may be made against the Fund that have not yet occurred.
6. DIRECTOR COMPENSATION
The Fund pays each Director, other than the Independent Chairman, who is not affiliated with the Adviser an annual fee of $15,000 per year, plus $3,500 for each in-person meeting attended and $1,500 for each other meeting attended. The Fund pays the Independent Chairman an annual fee of $19,000 per year, plus $5,250 for each in-person meeting attended and $3,250 for each other meeting attended. The Fund pays the Director serving as Chairman of the Audit Committee an additional annual fee of $2,500. In addition, the Independent Director responsible for reviewing the Code of Ethics and Personal Trading Reports for each quarterly meeting is paid an additional fee of $250 per meeting.
| | |
| 38 | | 1-800-467-7903 | www.CaldwellOrkin.com |
| | |
Caldwell & Orkin Market Opportunity Fund | | Notes to Financial Statements |
| | October 31, 2016 (Unaudited) |
The Fund also reimburses Directors for actual out-of-pocket expenses relating to attendance at meetings. Effective June 1997, the Board of Directors agreed to receive their compensation entirely in shares of the Fund. Accordingly, each Director who is not affiliated with the Adviser receives shares of the Fund with a value equal to the cash compensation they would have otherwise received.
7. SUBSEQUENT EVENTS
Management of the Fund has evaluated the need for disclosures and/or adjustments resulting from subsequent events through the date these financial statements were issued. Based upon this evaluation, management has determined there were no additional items requiring adjustment of the financial statements or additional disclosure.
| | | | |
| Semi-Annual Report | October 31, 2016 | | | 39 | |
| | |
Caldwell & Orkin Market Opportunity Fund | | Additional Information |
| | October 31, 2016 (Unaudited) |
DIRECTOR APPROVAL OF THE INVESTMENT ADVISORY AGREEMENT
The Board of Directors of The Caldwell & Orkin Funds, Inc. (the “Board”) is responsible for overseeing management of the Caldwell & Orkin Market Opportunity Fund (the “Fund”). As required by law, on an annual basis the Board determines whether to continue the Fund’s management agreement (the “Management Agreement”) with C&O Funds Advisor, Inc., the manager of the Fund (the “Manager”).
The Board considered the renewal of the Management Agreement at an in-person meeting at the office of the Manager on June 16, 2016. Prior to the meeting, the Independent Directors and their independent legal counsel met in executive session and were fully briefed on required considerations contained in Section 15(c) of the Investment Company Act, as amended, and judicial interpretations thereof. The Independent Chairman noted that (i) a copy of the Management Agreement; (ii) the Manager’s Form ADV; (iii) the Manager’s financial statements; (iv) a memorandum from Paul, Hastings LLP (legal counsel to the Manager and the Fund) relevant to the continuance of the Management Agreement (including the issues and legal standards the Board should consider in evaluating whether to renew the Management Agreement); (v) a memorandum from the Manager to the Board relevant to the Management Agreement; and (vi) other relevant materials (including data regarding the Fund’s performance record and the performance records of other funds in the long/short category and information about the Fund’s expense ratio and management fees, and the expense ratios and management fees of other funds in the long/short category) had been reviewed and considered by the Independent Directors with advice of the Independent Directors’ counsel.
The Independent Directors and their independent legal counsel met without members of Fund management present to review the materials presented, and to discuss the investment management and administrative services provided by the Manager to the Fund, the income, expenses and profitability of the Manager related to the Fund and related information about the Fund. The Independent Directors and their independent legal counsel also met with management of the Manager in their consideration of renewal of the Management Agreement.
| | (i) | The nature, extent, and quality of the services provided by the Manager. In this regard, the Board reviewed the services being provided by the Manager to the Fund including, without limitation, its investment advisory and administrative services since the Fund’s inception, its coordination of services and distribution efforts for the Fund over the years, and its provision of various officers to the Fund without additional compensation. After reviewing the foregoing information, the Board concluded that the quality, extent and nature of the services provided by the Manager were satisfactory and adequate for the Fund. |
| | (ii) | The investment performance of the Fund and Manager. In this regard, the Board compared the performance of the Fund with the performance of comparable |
| | |
| 40 | | 1-800-467-7903 | www.CaldwellOrkin.com |
| | |
Caldwell & Orkin Market Opportunity Fund | | Additional Information |
| | October 31, 2016 (Unaudited) |
| | funds managed by other advisers. In particular, the Board noted the Fund’s absolute and relative performance during various periods for the calendar and fiscal years ended December 31, 2015 and April 30, 2016, respectively. The Board also considered the consistency of the Manager’s management of the Fund with the Fund’s investment objective and policies, and long-term performance of the Fund. Following further discussion, the Board concluded that the investment performance of the Fund and Manager was satisfactory and was consistent with the Fund’s objectives and policies. |
| | (iii) | The costs of the services to be provided and profits to be realized by the Manager and its affiliates from the relationship with the Fund. In this regard, the Board considered the Manager’s staffing, personnel and methods of operating; the financial condition of the Manager and the level of commitment to the Fund and the Manager by the principals of the Manager; the asset levels of the Fund; and the overall expenses of the Fund. The Board also considered potential benefits for the Manager in managing the Fund, including promotion of the Manager’s name, the ability for the Manager to place small accounts into the Fund, and the potential for the Manager to generate “soft dollars” (commission dollars used to purchase research and brokerage services) from Fund trades that may benefit the Manager’s clients other than the Fund. The Board then compared the fees and expenses of the Fund to other funds similar to the Fund in terms of the type of fund, the style of investment management (including, in particular, the use of short selling as part of the Fund’s principal investment strategy) and the nature of the investment strategy and markets invested in by the Fund, among other factors. The Board reviewed data on the Fund’s management fees, noting that the Fund’s net operating expense ratio was low compared to other funds with comparable objectives and strategies. Following this comparison and upon further consideration and discussion of the foregoing, the Board concluded that the fees to be paid to the Manager by the Fund were fair and reasonable. |
| | (iv) | The extent to which economies of scale would be realized as the Fund grows, and whether advisory fee levels reflect these economies of scale for the benefits of the Fund’s investors. In this regard, the Board considered the Fund’s fee arrangements with the Manager, the Fund’s fee arrangements with other service providers, and the expense cap included in the Management Agreement. The Board considered the Fund’s fee level break points, and noted that the Fund’s shareholders benefit from economies of scale as the Manager’s management fees are reduced as asset levels increase. Following further discussion of the Fund’s current asset levels and fee breakpoints, the Board determined that the Fund’s fee arrangements with the Manager reflect economies of scale for the benefit of Fund shareholders. |
| | | | |
| Semi-Annual Report | October 31, 2016 | | | 41 | |
| | |
Caldwell & Orkin Market Opportunity Fund | | Additional Information |
| | October 31, 2016 (Unaudited) |
Based upon its evaluation of the information, materials and factors described above, as well as others (including the Board’s extensive knowledge of the Fund’s operations and the Manager’s involvement with the Fund), the Directors concluded (i) that the terms (including, without limitation, the fees) of the Management Agreement were reasonable and fair in light of the nature and quality of services performed by the Manager; (ii) that they were satisfied with the Manager’s services, personnel and investment strategy; and (iii) that it was in the best interest of the Fund and its shareholders to renew the Management Agreement. Throughout the deliberation process, the Independent Directors were advised by their independent counsel.
| | |
| 42 | | 1-800-467-7903 | www.CaldwellOrkin.com |
CALDWELL & ORKIN MARKET OPPORTUNITY FUND
Semi-Annual Report to Shareholders
| | | | |
BOARD OF DIRECTORS | | TRANSFER, REDEMPTION | | LEGAL COUNSEL |
| Frederick T. Blumer, | | & DIVIDEND | | Paul Hastings LLP |
| Independent Chairman | | DISBURSING AGENT | | 1170 Peachtree Street, N.E., |
| Michael B. Orkin, President | | Ultimus Fund Solutions, LLC | | Suite 100, |
| David L. Eager | | P.O. Box 46707 | | Atlanta, GA 30309 |
| James L. Underwood | | Cincinnati, OH 45246-0707 | | |
| | | | INDEPENDENT |
INVESTMENT ADVISER | | CUSTODIAN | | DIRECTORS’ COUNSEL |
| C&O Funds Advisor, Inc. | | U.S. Bank N.A. | | Arnall Golden Gregory LLP |
| 5185 Peachtree Parkway | | 1555 N. Rivercenter Dr. | | 171 17th Street, NW, |
| Suite 370 | | MK-WI-5302 | | Suite 2100 |
| Norcross, GA 30092-6541 | | Milwaukee, WI 53212 | | Atlanta, GA 30363 |
| | |
DISTRIBUTOR | | | | |
| Ultimus Fund Distributors, LLC | | | | |
| 225 Pictoria Drive, Suite 450 | | | | |
| Cincinnati, OH 45246 | | | | |
The Caldwell & Orkin Market Opportunity Fund’s (the “Fund”) portfolio may or may not have positions in any of the companies referenced in this Report to Shareholders as of any date after October 31, 2016. The commentary reflects the views of the investment manager through the end of the period or through the date of this report, as the case may be. Of course, these views are subject to change as market and other conditions warrant. These financial statements are submitted for the general information of the Fund’s shareholders. They are not authorized for distribution to prospective investors unless preceded or accompanied by an effective Fund Prospectus.
Availability of Proxy Voting Policy & Procedures, Proxy Voting Record and Code of Ethics - A description of a) the policies and procedures the Fund uses to determine how to vote proxies relating to portfolio securities, b) how the Fund voted proxies relating to portfolio securities during the most recent 12-month period ended June 30, and c) the Code of Ethics applicable to the principal officers of the Fund are available without charge, upon request, by calling toll-free (800) 237-7073, or on the Securities and Exchange Commission’s (the “Commission’s”) website at http://www.sec.gov.
Availability of Quarterly Portfolio Schedule - The Fund files its complete schedule of portfolio holdings with the Commission for the first and third quarters of each fiscal year on Form N-Q. The Fund’s Forms N-Q are available on the Commission’s website at http://www.sec.gov. The Fund’s Forms N-Q may be reviewed and copied at the Commission’s Public Reference Room in Washington, D.C. Information on the operation of the Public Reference Room may be obtained by calling 1-800 SEC-0330.
Fund Information - For more information about the Fund please call (800) 237-7073 or visit the Fund’s website at www.CaldwellOrkinFunds.com.
Fund Listings - The Fund is listed in many newspapers as C&OMktOpp or CaldOrkMO. The Fund’s Quotation symbol is COAGX. The Fund’s CUSIP number is 128819307.
Caldwell & Orkin Market Opportunity Fund
5185 Peachtree Parkway, Suite 370
Norcross, GA 30092-6541
E-mail: Info@CaldwellOrkin.com
Item 2. Code of Ethics.
Not applicable to semiannual reports.
Item 3. Audit Committee Financial Expert.
Not applicable to semiannual reports.
Item 4. Principal Accountant Fees and Services.
Not applicable to semiannual reports.
Item 5. Audit Committee of Listed Registrants.
Not applicable.
Item 6. Schedule of Investments.
(a) Included as part of the report to Stockholders filed under Item 1 of this Form.
(b) Not applicable.
Item 7. Disclosure of Proxy Voting Policies and Procedures for Closed-End Management Investment Companies.
Not applicable.
Item 8. Portfolio Managers of Closed-End Management Investment Companies.
Not applicable.
Item 9. Purchases of Equity Securities by Closed-End Management Investment Company and Affiliated Purchasers.
Not applicable.
Item 10. Submission of Matters to a Vote of Security Holders.
None.
Item 11. Controls and Procedures.
(a) The registrant’s Principal Executive Officer and Principal Financial Officer have concluded that the registrant’s disclosure controls and procedures (as defined in Rule 30a-3(c) under the Act) are effective in design and operation and are sufficient to form the basis of the certifications required by Rule 30a-2 under the Act, based on their evaluation of these disclosure controls and procedures within 90 days of the filing of this report on Form N-CSR.
(b) There were no changes in the registrant’s internal control over financial reporting (as defined in Rule 30a-3(d) under the Act (17 CFR 270.30a-3(d)) that occurred during the second fiscal quarter of the period covered by this report that have materially affected or are reasonably likely to materially affect, the registrant’s internal control over financial reporting.
Item 12. Exhibits.
(a)(1) Not applicable.
(a)(2) Certifications pursuant to Rule 30a-2(a) are attached hereto.
(a)(3) Not applicable.
(b) Certifications pursuant to Rule 30a-2(b) are furnished herewith.
SIGNATURES
Pursuant to the requirements of the Securities Exchange Act of 1934 and the Investment Company Act of 1940, the registrant has duly caused this report to be signed on its behalf by the undersigned, thereunto duly authorized.
(Registrant) The Caldwell & Orkin Funds, Inc.
| | |
| By (Signature and Title) | | /s/ Michael B. Orkin |
| | Michael B. Orkin, President and Principal Executive Officer |
Pursuant to the requirements of the Securities Exchange Act of 1934 and the Investment Company Act of 1940, this report has been signed below by the following persons on behalf of the registrant and in the capacities and on the dates indicated.
| | |
| By (Signature and Title) | | /s/ Michael B. Orkin |
| | Michael B. Orkin, President and Principal Executive Officer |
| | |
| By (Signature and Title) | | /s/ David R. Bockel, Jr. |
| | David R. Bockel, Jr., Treasurer and Principal Financial Officer |