UNITED STATES
SECURITIES AND EXCHANGE COMMISSION
Washington, D.C. 20549
FORM N-CSRS
CERTIFIED SHAREHOLDER REPORT OF REGISTERED
MANAGEMENT INVESTMENT COMPANIES
Investment Company Act file number :811-06113
The Caldwell & Orkin Funds, Inc.
(Exact name of registrant as specified in charter)
100 S. Ashley Drive, Suite 895
Tampa, Florida 33602
(Address of principal executive offices) (Zip code)
Derek Pilecki
100 S. Ashley Drive, Suite 895
Tampa, Florida 33602
(Name and address of agent for service)
Copies to:
Benjamin Mollozzi
Ultimus Fund Solutions, LLC
225 Pictoria Drive, Suite 450
Cincinnati, OH 45246
Registrant’s telephone number, including area code:1-813-282-7870
Date of fiscal year end:April 30
Date of reporting period:October 31, 2019
Item 1. Reports to Stockholders.
Beginning on January 1, 2021, as permitted by regulations adopted by the Securities and Exchange Commission, paper copies of the Fund’s shareholder reports will no longer be sent by mail, unless you specifically request paper copies of the reports from the Fund or from your financial intermediary such as a broker-dealer or bank. Instead, the reports will be made available on a website, and you will be notified by mail each time a report is posted and provided with a website link to access the report.
If you already elected to receive shareholder reports electronically, you will not be affected by this change and you need not take any action. You may elect to receive shareholder reports and other communications from the Fund electronically by contacting the Fund at (800) 467-7903 or, if you own these shares through a financial intermediary, you may contact your financial intermediary.
You may elect to receive all future reports in paper free of charge. You can inform the Fund that you wish to continue receiving paper copies of your shareholder reports by contacting the Fund at (800) 467-7903 If you own shares through a financial intermediary, you may contact your financial intermediary or follow instructions included with this disclosure to elect to continue to receive paper copies of your shareholder reports. Your election to receive reports in paper will apply to all funds held with the fund complex or at your financial intermediary.
Table of Contents | Caldwell & Orkin -
Gator Capital Long/Short Fund |
October 31, 2019 (Unaudited) | |
| | |
Management’s Discussion of Fund Performance | 2 |
Investment Results | 9 |
Fund Holdings | 10 |
Schedule of Investments | 11 |
Schedule of Securities Sold Short | 15 |
Statement of Assets and Liabilities | 18 |
Statement of Operations | 19 |
Statements of Changes in Net Assets | 20 |
Financial Highlights | 21 |
Notes to Financial Statements | 22 |
Disclosure of Fund Expenses | 29 |
Director Approval of the Investment Advisory Agreement | 30 |
Privacy Policy Disclosure | 32 |
Caldwell & Orkin -
Gator Capital Long/Short Fund | Management’s Discussion
of Fund Performance |
| | October 31, 2019 (Unaudited) |
Dear Fellow Shareholder:
The Caldwell & Orkin – Gator Capital Long/Short Fund (the “Fund”) declined 1.15% over the six month period ending on October 31, 2019. The S&P 500 Total Return Index (the “S&P 500”) gained 4.16% and the Eurekahedge Long Short Equities Hedge Fund Index (the “Eurekahedge Index”) gained 0.19% during the same period. For the 12 month period ending October 31, 2019, the Fund gained 4.94% while the S&P 500 increased by 14.33% and the Eurekahedge Index gained 3.90%.
Past performance is no guarantee of future results. Please see the standardized performance on page9.
Management Discussion and Analysis
The Fund has lagged slightly to start the fiscal year. The Fund has had a headwind of lower interest rates through October. Many of our portfolio companies will likely do better in a higher interest rate environment.
The top five contributors during the six month period ended October 31, 2019, were Blackstone Group (long), OneMain Financial (long), Caesars Entertainment (long), KKR & Co. (long), and Semgroup (long).
The top five detractors during the six months were SunCoke Energy (long), BlackBerry (long), Entercom Communications (long), Tesla (short), and Invitation Homes (short).
We ended the period with gross long exposure of 88% and gross short exposure of 50% for a total gross exposure of 136% and a net exposure of 38%.
Outlook
The equity markets have had a strong run in 2019. We are finding many attractively priced stocks and believe the stock market will eventually recognize the value we see.
We continue to believe the economy is strong. We point to the robust employment numbers as evidence of the economy’s strength. While we are monitoring the trade negotiations with China, we believe the strong rhetoric is simply posturing and will not have a lasting impact on economic growth. We also think the Fed is ready to support the economy with easing monetary policy if needed.
To help you understand our current thoughts on the regional bank sector, we have also included a copy of our investment thesis on a subset of banks that we label “Growth Banks” and Western Alliance Bancorporation.
We are working hard with our research-oriented investment approach. It is our objective to make the Fund successful in helping you compound your wealth in the years to come.
Sincerely,
Derek S. Pilecki, CFA
Portfolio Manager
2 | 1-800-467-7903 | https://gatorcapital.com/mutual-funds/gator-capital-long-short-fund/ |
Caldwell & Orkin -
Gator Capital Long/Short Fund | Management’s Discussion
of Fund Performance |
| | October 31, 2019 (Unaudited) |
Opportunity in Growth Banks
Regional bank stocks have had a challenging period over the last 16 months. As shown in the chart below, between June 2018 and September 30, the S&P Regional Banks Select Industry Index declined by 13% and trailed the S&P 500 Index by 26%. This trend has continued and from June 2018 to the decline and trailing percentages have increased to 18% and 27%, respectively.
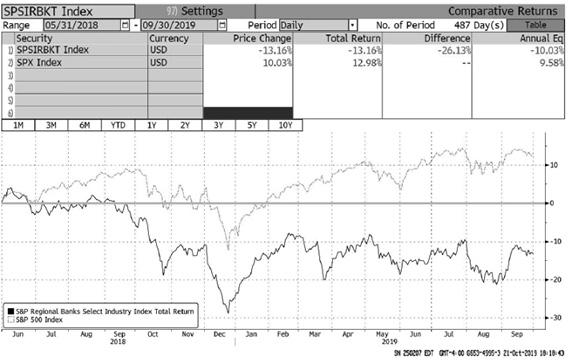
Source: Bloomberg
During this time, the median bank in this index increased earnings by 10%. Banks are expected to continue to grow earnings going forward. Using Regions Financial (or “RF”) as an example of a generic regional bank, RF’s forward price-to-earnings (“P/E”) multiple has declined from 13.6x to 9.5x. On a price-to-tangible book (“P/TB”) basis, RF’s multiple has declined from 2.1x to 1.4x. This type of decline in valuation is consistent across RF’s peers.
We believe there are three main drivers for the poor performance of regional banks:
1) Change in the outlook for future interest rates,
2) Negative sentiment regarding the economy leading to credit risk fears, and
3) Poor relative strength in a stock market driven increasingly by momentum.
Semi-Annual Report | October 31, 2019 | 3 |
Caldwell & Orkin -
Gator Capital Long/Short Fund | Management’s Discussion
of Fund Performance |
| | October 31, 2019 (Unaudited) |
While we see the merits of each of these issues, we also believe there are several positive factors that offset these negatives, such as continued easing of regulatory environment, strong capital discipline within the industry, and a prolonged economic cycle due to the lack of imbalances in the banking industry. Also, we believe market sentiment around regional bank stocks will change when the Fed signals it is done cutting rates.
We like sifting through industries that have gone through tough periods in the stock market, especially ones with which we are familiar. We like to look at companies that had the worst stock price performance to see if there are fundamental reasons for the declines or whether the stock prices are down in sympathy with the rest of the group.
In this new era of the stock market being driven by exchange-traded funds (or “ETFs”) and momentum, we think stocks with individually good investment cases get driven to levels where they are mispriced when they are included in a sector or industry that is out-of-favor with stock market investors. One area that we currently think is mispriced is a group of banks that had high levels of organic growth over the past 5 to 10 years. We call this group of banks “Growth Banks”.
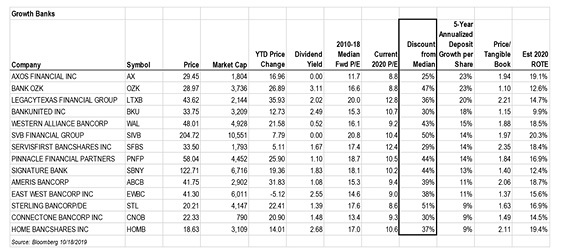
The 14 Growth Banks grouped together above share some similar characteristics. They have demonstrated the ability to grow organically. They have all grown deposits per share by at least 9% over the past 5 years. Their stock market valuations have declined dramatically since June 2018. The banks in this group trade at 25% to 50% discount to their historical median valuations. These banks range in market capitalization value (or “market cap(s)”) between $1 billion and $10 billion. We prefer smaller banks like the members of this group because they can grow faster.
How to Identify Growth Banks
We believe the most valuable banks are the ones with high profitability that can generate loan growth and deposit growth organically. We believe the banking industry can grow loans and deposits at a rate equal to nominal GDP. So, if economic growth averages 2.0% and inflation is 2.0%, then nominal GDP should average around 4.0%. If the banking industry matches this,
4 | 1-800-467-7903 | https://gatorcapital.com/mutual-funds/gator-capital-long-short-fund/ |
Caldwell & Orkin -
Gator Capital Long/Short Fund | Management’s Discussion
of Fund Performance |
| | October 31, 2019 (Unaudited) |
then 4.0% is our baseline for an average bank. Since banks generate returns on equity (“ROE”) between 10% and 20%, they only need to retain a portion of their earnings to achieve average growth. In the last few years, banks have been disciplined in returning their excess capital to shareholders through dividends and share repurchases. However, we believe a better use of capital would be to grow their core businesses faster. We try to identify banks that have some specialty that allows them to achieve above average industry growth through loan and deposit generation.
We identify Growth Banks by looking at the increase in the loans per share and deposits per share over an extended period of time. By looking at these metrics on a per share basis, we are adjusting for capital actions by banks. We are not fazed by banks who grow loans and deposits by issuing shares to buy other banks. On the other hand, if a bank is able to buy other banks at attractive prices, their per share metrics may improve. Looking at these metrics on a per share basis also gives banks who repurchase shares regularly a benefit in their numbers.
Over the last five years, of banks with market caps above $300 million, the median bank has grown deposits per share at 6.2% per year. If we restrict this bank universe to banks with market caps above $10 billion, the median is 7.2% per year. We suspect most readers are surprised by these growth rates. We are, too, especially when you consider the extremely high multiples investors are paying consumer packaged goods (or “CPG”) companies with low single digit growth rates. Put simply, this group of banks grow at 6% and have 10x P/Es, but CPG companies grow 2% and trade at 25x P/Es.
Growth Banks are less dependent on near-term net interest margins
Growth banks are less dependent on changes in net interest margins for earnings growth over a 3-5 year timeframe than slow growing banks. But, this is the opposite of what we have seen reflected in stock prices over the last 14 months. We have seen the growth banks respond more negatively to the outlook for net interest margin compression than their slower growing peers. Since early June 2018, the median stock price of this group of 14 Growth Banks has declined 28.8%, but the SPDR S&P Regional Banking ETF has only declined 19.8%.
Aren’t the Growth Banks Asset Sensitive?
We believe the main reason this group of Growth Banks has underperformed is because they tend to be asset sensitive. They are asset sensitive because they grow their commercial and industrial (C&I) loan portfolios and these loans tend to carry floating rates. In addition, a few of these banks have a history of growing their more valuable non-interest bearing deposits. Although non-interest bearing deposits are more valuable, banks with large amounts of non-interest bearing deposits are naturally more asset sensitive.
With the Growth Banks down because of interest rates, we have to ask whether we can own them despite declining rates? Or, do we need to wait until we think interest rates have bottomed? At what point do they get too inexpensive in the face of declining rates? We may be at the point where the Fed is done cutting rates following the expected October rate cut and these Growth Banks may be too inexpensive at the same time.
Semi-Annual Report | October 31, 2019 | 5 |
Caldwell & Orkin -
Gator Capital Long/Short Fund | Management’s Discussion
of Fund Performance |
| | October 31, 2019 (Unaudited) |
Is Credit the Problem for Growth Banks?
In addition to asset sensitivity, we believe some investors are avoiding these Growth Banks because they perceive these banks have higher-than-average credit risk. The short story goes something like this: “We’ve had 10 years of economic expansion, so a downturn is around the corner. The banks who are most likely to get hurt in the downturn are the ones who grew the fastest into the downturn and have the least seasoned loan portfolio.” There’s a lot to unpack in this short thesis;
1) We are on the verge of an economic downturn,
2) Banks will be the ones who suffer the most during said downturn, and
3) Loan growth comes from the banks who have the weakest underwriting.
We are sympathetic to this argument. We think loan portfolios are difficult to analyze as outside investors. Also, credit issues are asymmetric against shareholders. Our approach to combat this issue is to go slowly in entering new positions and to avoid the banks with the most obvious risks in their loan portfolios such as concentrations of construction and land loans. We meet with management teams to gauge their appetite for credit risk. We also study their history of credit results. So, we view credit as the largest area of study for these Growth Banks.
Case Study: Western Alliance Bank
Western Alliance Bank (or “WAL”) is a fast-growing regional bank headquartered in Phoenix. The bank also has significant presence in Las Vegas, San Diego, and San Jose. WAL has grown tangible book value (“TBV”) at an annual rate of 22.8% since 2013. The bank is able to grow TBV so quickly because it earns a higher-than-average net interest margin. The bank also grows loans and deposits at a fast pace.
| | 1. | Fast-Growing Regional Bank |
| | a. | National lending businesses – Western Alliance has developed several national lending businesses. These are Homeowners Associations, Mortgage Banking Warehouse Lines, Resort Finance, Public & Non-Profit Finance, and Hotel Franchise lending. |
| | b. | Branch-light footprint – Western Alliance is built as a modern regional bank with only 47 branches. The average Western Alliance branch has $475 million in deposits. This compares favorably to the average bank branch for the industry at just over $100 million. We believe the banking industry is trending towards Western Alliance’s branch model. |
| | c. | Technology banking – Similar to SVB Financial, which we wrote about in our April 2019 letter, Western Alliance has a thriving technology banking business. Through their 2015 acquisition of Bridge Capital, Western Alliance attracts deposits from start-up companies in the SF Bay Area. Western Alliance also provides capital call |
6 | 1-800-467-7903 | https://gatorcapital.com/mutual-funds/gator-capital-long-short-fund/ |
Caldwell & Orkin -
Gator Capital Long/Short Fund | Management’s Discussion
of Fund Performance |
| | October 31, 2019 (Unaudited) |
loans to venture capital and private equity firms. Capital call loans allow these firms to manage the timing of calling capital from their investors. There have been few losses in this business.
| | 2. | Best-in-Class Operating Metrics – Western Alliance has“best in class” operating metrics.The following comparisons are with peer mid-cap banks headquartered in the western states.Return on assets (“ROA”) of 2.08% compared to peers at 1.34%, ROE of 20.4% compared to peers of 14.8%, efficiency ratio of 42.9% compared to peers of 55.6%, and net interest margin of 4.66% compared to peers of 4.15%.Other metrics are at peer levels such as loan-to-deposit ratio of 90% compared to peers at 92%, tangible common equity to tangible assets of 10.2% compared to peers at 10.3%, and non-performing assets at 0.53% compared to peers at 0.52%. |
| | 3. | Low Valuation – Western Alliance’s current valuation is 9.8x 2019 earnings per share (“EPS”) and 9.3x 2020 EPS.This is inexpensive compared to peers and compared to Western Alliance’s own history.Peers currently trade at 13.5x 2019 EPS and 12.8x 2020 EPS.Between 2012 and 2018, Western Alliance traded in a range of 12x and 20x forward EPS.We think Western Alliance should trade at valuations comparable to the best banks, which is 15x in the current environment and we believe will be higher when general bank valuations recover. |
| | 4. | Strong Deposit Franchise – Western Alliance has a strong deposit franchise with 40% non-interest bearing deposits.Despite rapid loan growth, WAL has been able to keep its loan-to-deposit ratio below 90%.Western Alliance is generating deposits through some of its niche businesses like Homeowners Association (or “HOA”) banking. |
| | 5. | Diversified Loan Portfolio –Western Alliance has a diversified loan portfolio with 45% in commercial and industrial lending, 35% in commercial real estate, 11% in construction and land, and 9% in residential mortgage.The loan portfolio is also diversified geographically with 50% in National Business Lines, 20% in Arizona, 20% in California, and 10% in Nevada. |
| | 6. | Low Expense Base – Western Alliance has a low efficiency ratio of 42.9%.Peers operate with a median 56% efficiency ratio.Western Alliance has a low efficiency ratio due to its branch-light footprint,its higher than average loan rates, and a pay-for-performance culture.In banking, the management teams and the investment community use efficiency ratio instead of operating margins.The efficiency ratio is the inverse of the operating margin. |
| | 7. | Potential Geographic Expansion – WAL has expanded geographically over the past ten years and we expect them to selectively expand their footprint in the coming year.When WAL expands geographically, they usually buy a smaller bank in the expansion city and use it as a platform to jump-start their growth.They successfully executed this strategy with the Bridge Capital acquisition in the SF Bay Area in 2015 and Centennial Bank in Orange County in 2013.We would expect Western Alliance to expand its footprint to Seattle, Denver, and Dallas over the next 5 to 10 years. |
Semi-Annual Report | October 31, 2019 | 7 |
Caldwell & Orkin -
Gator Capital Long/Short Fund | Management’s Discussion
of Fund Performance |
| | October 31, 2019 (Unaudited) |
| | 8. | Comfortable Capital Level –Western Alliance operates with a tangible commonequity-to-tangible asset ratio of 10.2%.This is higher than its larger peers and gives the bank some cushion.Western Alliance also generates capital at a high rate, so it is less constrained when considering growth opportunities.Because the stock has underperformed over the last 18 months, Western Alliance has used some excess capital to repurchase shares. |
| | 9. | Regional Bank Valuations – Regional bank valuations are attractive generally.Regional banks are trading at alarger-than-normal discount to the broader stock market.Usually regional banks trade at 80% of the broad stock market’s price-to-earnings ratio, but banks currently trade at 55% of the broader market.As the regional bank sector returns to a more historical relationship with the broader market valuation, we believe Western Alliance will regain its premium valuation. |
Concerns:
| | 1. | Credit was Weak in GFC – During the Great Financial Crisis (or “GFC”), Western Alliance struggled with credit issues.The bank was able to manage its way through the issues.Heading into the GFC, Western Alliance had 70% of its loan portfolio concentrated in Nevada.Some investors will wait to own Western Alliance until it successfully navigates a recession. |
| | 2. | Asset Sensitivity – Western Alliance is asset sensitive, so it has benefited from rising interest rates.With interest rates declining and expectations for further declines, Western Alliance will see a decline in its net interest margin of about 5 bps for every 25 bps cut in the Fed Funds rate. |
| | 3. | Hotel Franchise Portfolio – Western Alliance has a $1.2 billion loan portfolio to franchisees of major hotel brands.The average yield on this portfolio is 12%,the bank istaking some risk to earn this type of yield.This is an additional risk factor for the bank. |
We own a position in Western Alliance Bancorporation. We think the bank’s valuation will recover when the interest rate cycle turns. In the meantime, the bank is posting double-digit organic loan and deposit growth.
8 | 1-800-467-7903 | https://gatorcapital.com/mutual-funds/gator-capital-long-short-fund/ |
Caldwell & Orkin -
Gator Capital Long/Short Fund | Investment Results |
| | October 31, 2019 (Unaudited) |
Average Annual Total Returns(a) as ofOctober 31, 2019 |
| | Six Months | One Year | Three Year | Five Year | Ten Year |
Caldwell & Orkin - Gator Capital Long/Short Fund | -1.15% | 4.94% | -0.26% | -0.05% | 1.21% |
S&P 500 Total Return Index(b) | 4.16% | 14.33% | 14.91% | 10.78% | 13.70% |
Eurekahedge Long Short Equities Hedge Fund Index(c) | 0.19% | 3.90% | 4.86% | 4.26% | 5.64% |
| | | | | | |
Total annualized Fund operating expenses for the Fund is 3.27% as described in the Prospectus, dated August 28, 2019. This amount includes Acquired Fund Fees and Expenses, as well as interest and dividend expenses related to short sales, which if excluded would result in an annual operating expense rate of 2.00%. Additional information about the Fund’s current fees and expenses for the six months ended October 31, 2019 is contained in the Financial Highlights. |
(a) | Return figures reflect any change in price per share and assume the reinvestment of all distributions. The Fund’s returns reflect any fee reductions during the applicable period. If such fee reductions had not occurred, the quoted performance would have been lower. The table does not reflect the deduction of taxes. The Fund’s returns represent past performance and do not guarantee future results. Total returns for periods less than one year are not annualized. |
(b) | Investors should expect that the Fund’s performance may fluctuate independently of stock market indices, such as the S&P 500 Total Return Index. The S&P 500 Total Return Index is a widely recognized unmanaged index of 500 common stock prices adjusted to reflect the reinvestment of dividends and distributions. You may not invest directly in an index. |
(c) | The Eurekahedge Long Short Equities Hedge Fund Index is an unmanaged index comprised of long/short equity hedge funds. According to its sponsor, Eurekahedge Pte. Ltd., the Eurekahedge Index is an equally weighted index of 1028 constituent funds designed to provide a broad measure of the performance of underlying hedge fund managers. The returns of the Eurekahedge Index do not include sales charges or fees, which would lower performance. You may not invest directly in an index. |
You should consider the Fund’s investment objectives, risks, charges and expenses carefully before you invest. The Fund’s prospectus contain important information about the Fund’s investment objectives, potential risks, management fees, charges and expenses, and other information and should be read carefully before investing. You may obtain a current copy of the Fund’s prospectus or performance data current to the most recent month by calling (800) 467-7903.
The Fund is distributed by Ultimus Fund Distributors, LLC, member FINRA/SIPC.
Semi-Annual Report | October 31, 2019 | 9 |
Caldwell & Orkin -
Gator Capital Long/Short Fund | Fund Holdings |
| | October 31, 2019 (Unaudited) |
Net Sector Exposure
October 31, 2019*

* | Sector weightings are calculated as a percentage of net assets and include short positions.Portfolio holdings are subject to change. |
The Caldwell & Orkin - Gator Capital Long/Short Fund’s (the “Fund”) investment objective is to provide long-term capital growth with a short-term focus on capital preservation.
Availability of Portfolio Schedule – (Unaudited)
The Fund files a complete schedule of portfolio holdings with the Securities and Exchange Commission (“SEC”) for the first and third quarters of each fiscal year within sixty days after the end of the period. The Fund’s portfolio holdings are available on the SEC’s website at www.sec.gov.
10 | 1-800-467-7903 | https://gatorcapital.com/mutual-funds/gator-capital-long-short-fund/ |
Caldwell & Orkin -
Gator Capital Long/Short Fund | Schedule of Investments |
| | October 31, 2019 (Unaudited) |
| | Shares | | | Fair Value | |
COMMON STOCKS — LONG — 84.74% | | | | | | | | |
Asset Management & Custody Banks — 7.53% | | | | | | | | |
Ameriprise Financial, Inc. | | | 2,500 | | | $ | 377,225 | |
BrightSphere Investment Group, Inc. | | | 15,900 | | | | 156,138 | |
KKR & Company, Inc., Class A | | | 23,000 | | | | 663,089 | |
Victory Capital Holdings, Inc. | | | 23,300 | | | | 362,548 | |
| | | | | | | | 1,559,000 | |
Broadcasting — 0.54% | | | | | | | | |
Entercom Communications Corporation, Class A | | | 32,000 | | | | 111,360 | |
| | | | | | | | | |
Casinos & Gaming — 5.54% | | | | | | | | |
Las Vegas Sands Corporation | | | 6,000 | | | | 371,040 | |
Melco Resorts & Entertainment Ltd. - ADR | | | 20,000 | | | | 430,800 | |
MGM Resorts International | | | 12,000 | | | | 342,000 | |
| | | | | | | | 1,143,840 | |
Communications Equipment — 0.85% | | | | | | | | |
Juniper Networks, Inc. | | | 7,000 | | | | 173,740 | |
| | | | | | | | | |
Consumer Finance — 11.07% | | | | | | | | |
Ally Financial, Inc. | | | 13,000 | | | | 398,190 | |
Capital One Financial Corporation | | | 4,700 | | | | 438,275 | |
Navient Corporation | | | 12,750 | | | | 175,568 | |
OneMain Holdings, Inc. | | | 16,500 | | | | 659,999 | |
SLM Corporation | | | 46,000 | | | | 388,240 | |
Synchrony Financial | | | 6,500 | | | | 229,905 | |
| | | | | | | | 2,290,177 | |
Diversified Banks — 4.40% | | | | | | | | |
Barclays plc, Sponsored - ADR | | | 59,000 | | | | 509,170 | |
Wells Fargo & Company | | | 7,800 | | | | 402,714 | |
| | | | | | | | 911,884 | |
Diversified Capital Markets — 4.75% | | | | | | | | |
Credit Suisse Group AG - ADR | | | 42,000 | | | | 519,960 | |
Deutsche Bank AG | | | 30,000 | | | | 217,500 | |
UBS Group AG | | | 20,729 | | | | 243,980 | |
| | | | | | | | 981,440 | |
Homebuilding — 2.82% | | | | | | | | |
Lennar Corporation, Class A | | | 9,800 | | | | 584,080 | |
| | | | | | | | | |
See accompanying notes which are an integral part of these financial statements.
Semi-Annual Report | October 31, 2019 | 11 |
Caldwell & Orkin -
Gator Capital Long/Short Fund |
Schedule of Investments
|
| | October 31, 2019 (Unaudited) |
| | Shares | | | Fair Value | |
Hotels Resorts & Cruise Lines — 1.48% | | | | | | | | |
BBX Capital Corporation | | | 68,595 | | | $ | 306,620 | |
| | | | | | | | | |
Household Products — 0.11% | | | | | | | | |
Spectrum Brands Holdings, Inc. | | | 450 | | | | 22,595 | |
| | | | | | | | | |
Internet Software & Services — 2.74% | | | | | | | | |
IAC/InterActiveCorp(a) | | | 2,500 | | | | 568,125 | |
| | | | | | | | | |
Investment Banking & Brokerage — 9.40% | | | | | | | | |
Charles Schwab Corporation (The) | | | 11,250 | | | | 457,988 | |
E*TRADE Financial Corporation | | | 6,600 | | | | 275,814 | |
Goldman Sachs Group, Inc. (The) | | | 2,100 | | | | 448,098 | |
Interactive Brokers Group, Inc., Class A | | | 1,500 | | | | 71,355 | |
Morgan Stanley | | | 5,000 | | | | 230,250 | |
Raymond James Financial, Inc. | | | 2,500 | | | | 208,725 | |
Stifel Financial Corporation | | | 1,400 | | | | 78,372 | |
TD Ameritrade Holding Corporation | | | 4,500 | | | | 172,710 | |
| | | | | | | | 1,943,312 | |
Life & Health Insurance — 2.11% | | | | | | | | |
Lincoln National Corporation | | | 4,400 | | | | 248,512 | |
Primerica, Inc. | | | 1,500 | | | | 189,270 | |
| | | | | | | | 437,782 | |
Movies & Entertainment — 0.10% | | | | | | | | |
Viacom, Inc., Class B | | | 1,000 | | | | 21,560 | |
| | | | | | | | | |
Multi-Sector Holdings — 3.58% | | | | | | | | |
Berkshire Hathaway, Inc., Class B(a) | | | 1,900 | | | | 403,902 | |
Jefferies Financial Group, Inc. | | | 18,000 | | | | 336,060 | |
| | | | | | | | 739,962 | |
Oil & Gas Storage & Transportation — 1.56% | | | | | | | | |
SemGroup Corporation, Class A | | | 20,000 | | | | 322,000 | |
| | | | | | | | | |
Packaged Foods & Meats — 0.55% | | | | | | | | |
B&G Foods, Inc. | | | 5,250 | | | | 81,637 | |
Dean Foods Company | | | 34,000 | | | | 33,320 | |
| | | | | | | | 114,957 | |
Property & Casualty Insurance — 2.38% | | | | | | | | |
Ambac Financial Group, Inc.(a) | | | 24,000 | | | | 492,000 | |
See accompanying notes which are an integral part of these financial statements.
12 | 1-800-467-7903 | https://gatorcapital.com/mutual-funds/gator-capital-long-short-fund/ |
Caldwell & Orkin -
Gator Capital Long/Short Fund |
Schedule of Investments
|
| | October 31, 2019 (Unaudited) |
| | Shares | | | Fair Value | |
Real Estate Services — 0.41% | | | | | | | | |
Cushman & Wakefield plc(a) | | | 4,500 | | | $ | 83,925 | |
| | | | | | | | | |
Regional Banks — 16.28% | | | | | | | | |
BankUnited, Inc. | | | 12,000 | | | | 411,600 | |
Cadence Bancorporation | | | 5,250 | | | | 80,745 | |
CIT Group, Inc. | | | 2,700 | | | | 115,803 | |
Citizens Financial Group, Inc. | | | 15,500 | | | | 544,981 | |
ConnectOne Bancorp, Inc. | | | 13,000 | | | | 315,640 | |
FNB Corporation | | | 20,000 | | | | 241,200 | |
OFG Bancorp | | | 6,000 | | | | 121,860 | |
Simmons First National Corporation, Class A | | | 2,000 | | | | 47,840 | |
Sterling Bancorp | | | 19,500 | | | | 383,175 | |
SunTrust Banks, Inc. | | | 3,200 | | | | 218,688 | |
SVB Financial Group(a) | | | 1,500 | | | | 332,220 | |
Synovus Financial Corporation | | | 3,000 | | | | 101,610 | |
Western Alliance Bancorporation | | | 9,200 | | | | 453,836 | |
| | | | | | | | 3,369,198 | |
Retail REITs — 2.21% | | | | | | | | |
Seritage Growth Properties, Class A | | | 4,800 | | | | 208,752 | |
Site Centers Corporation | | | 16,000 | | | | 248,480 | |
| | | | | | | | 457,232 | |
Specialized Consumer Services — 0.24% | | | | | | | | |
H&R Block, Inc. | | | 2,000 | | | | 49,980 | |
| | | | | | | | | |
Specialty Chemicals — 0.57% | | | | | | | | |
Axalta Coating Systems Ltd.(a) | | | 4,000 | | | | 117,960 | |
| | | | | | | | | |
Steel — 1.13% | | | | | | | | |
SunCoke Energy, Inc.(a) | | | 44,000 | | | | 232,760 | |
| | | | | | | | | |
Systems Software — 0.71% | | | | | | | | |
BlackBerry Ltd.(a) | | | 28,000 | | | | 147,280 | |
| | | | | | | | | |
Technology Hardware Storage & Peripherals — 1.38% | | | | | | | | |
Dell Technologies, Inc., Class C(a) | | | 4,000 | | | | 211,560 | |
Hewlett Packard Enterprise Company | | | 4,500 | | | | 73,845 | |
| | | | | | | | 285,405 | |
See accompanying notes which are an integral part of these financial statements.
Semi-Annual Report | October 31, 2019 | 13 |
Caldwell & Orkin -
Gator Capital Long/Short Fund |
Schedule of Investments
|
| | October 31, 2019 (Unaudited) |
| | Shares | | | Fair Value | |
Thrifts & Mortgage Finance — 0.30% | | | | | | | | |
MGIC Investment Corporation | | | 4,500 | | | $ | 61,695 | |
| | | | | | | | | |
Total Common Stocks — Long(Cost $17,780,142) | | | | | | | 17,529,869 | |
PREFERRED STOCKS — LONG — 1.84% | | | | | | | | |
Financials — 1.84% | | | | | | | | |
Federal National Mortgage Association, Series R, 7.63%(a) | | | 17,500 | | | | 184,888 | |
Federal National Mortgage Association, Series T, 8.25%(a) | | | 17,500 | | | | 196,000 | |
| | | | | | | | | |
Total Preferred Stocks — Long(Cost $362,220) | | | | | | | 380,888 | |
WARRANTS — LONG — 1.72% | | | | | | | | |
American International Group, Inc., Expires 01/19/21, Strike Price $44(a) | | | 28,500 | | | | 339,150 | |
Zions Bancorp NA, Expires 05/22/20, Strike Price $35(a) | | | 1,100 | | | | 17,215 | |
| | | | | | | | | |
Total Warrants — Long(Cost $409,265) | | | | | | | 356,365 | |
MONEY MARKET FUNDS — 8.65% | | | | | | | | |
First American Treasury Obligations Fund - Class X, 1.73%(b) | | | 1,790,586 | | | | 1,790,586 | |
| | | | | | | | | |
Total Money Market Funds(Cost $1,790,586) | | | | | | | 1,790,586 | |
Total Investments — 96.95%(Cost $20,342,213) | | | | | | | 20,057,708 | |
| | | | | | | | | |
Other Assets in Excess of Liabilities — 3.05% | | | | | | | 631,499 | |
NET ASSETS — 100.00% | | | | | | $ | 20,689,207 | |
(a) | Non-income producing security. |
(b) | Rate disclosed is the seven day effective yield as of October 31, 2019. |
ADR- American Depositary Receipt.
The sub-industries shown on the schedule of investments are based on the Global Industry Classification Standard, or GICS® (“GICS”).The GICS was developed by and/or is the exclusive property of MSCI, Inc. and Standard & Poor’s Financial Services LLC (“S&P”).GICS is a service mark of MSCI, Inc. and S&P and has been licensed for use by Ultimus Fund Solutions, LLC.
See accompanying notes which are an integral part of these financial statements.
14 | 1-800-467-7903 | https://gatorcapital.com/mutual-funds/gator-capital-long-short-fund/ |
Caldwell & Orkin -
Gator Capital Long/Short Fund | Schedule of Securities Sold Short |
| | October 31, 2019 (Unaudited) |
| | Shares | | | Fair Value | |
COMMON STOCKS — SHORT — (35.29)% | | | | | | | | |
Automobile Manufacturers — (1.98)% | | | | | | | | |
Tesla, Inc.(a) | | | (1,300 | ) | | $ | (409,396 | ) |
| | | | | | | | | |
Biotechnology — (1.93)% | | | | | | | | |
China Biologic Products Holdings, Inc.(a) | | | (3,500 | ) | | | (399,140 | ) |
| | | | | | | | | |
Consumer Finance — (0.74)% | | | | | | | | |
LendingClub Corporation(a) | | | (12,129 | ) | | | (153,311 | ) |
| | | | | | | | | |
Data Processing & Outsourced Services — (1.47)% | | | | | | | | |
Western Union Company (The) | | | (12,100 | ) | | | (303,226 | ) |
| | | | | | | | | |
Electronic Manufacturing Services — (1.40)% | | | | | | | | |
Celestica, Inc.(a) | | | (40,000 | ) | | | (288,800 | ) |
| | | | | | | | | |
Health Care Distributors — (0.94)% | | | | | | | | |
Patterson Companies, Inc. | | | (11,400 | ) | | | (195,282 | ) |
| | | | | | | | | |
Industrial REITs — (1.53)% | | | | | | | | |
Duke Realty Corporation | | | (9,000 | ) | | | (316,260 | ) |
| | | | | | | | | |
Interactive Media & Services — (0.94)% | | | | | | | | |
Zillow Group, Inc., Class C(a) | | | (6,000 | ) | | | (195,420 | ) |
| | | | | | | | | |
Regional Banks — (11.59)% | | | | | | | | |
Columbia Banking System, Inc. | | | (4,500 | ) | | | (176,850 | ) |
Commerce Bancshares, Inc. | | | (2,100 | ) | | | (135,156 | ) |
Community Bank System, Inc. | | | (3,600 | ) | | | (244,008 | ) |
CVB Financial Corporation | | | (7,000 | ) | | | (145,460 | ) |
Glacier Bancorp, Inc. | | | (3,000 | ) | | | (126,960 | ) |
Heritage Financial Corporation | | | (3,000 | ) | | | (82,590 | ) |
Lakeland Financial Corporation | | | (5,100 | ) | | | (237,405 | ) |
NBT Bancorp, Inc. | | | (4,125 | ) | | | (163,969 | ) |
South State Corporation | | | (3,800 | ) | | | (299,668 | ) |
Southside Bancshares, Inc. | | | (5,625 | ) | | | (193,781 | ) |
See accompanying notes which are an integral part of these financial statements.
Semi-Annual Report | October 31, 2019 | 15 |
Caldwell & Orkin -
Gator Capital Long/Short Fund |
Schedule of Securities Sold Short
|
| | October 31, 2019 (Unaudited) |
| | Shares | | | Fair Value | |
Regional Banks — (11.59)%- continued | | | | | | | | |
Trustmark Corporation | | | (5,250 | ) | | $ | (180,180 | ) |
UMB Financial Corporation | | | (3,400 | ) | | | (221,884 | ) |
United Bankshares, Inc. | | | (4,875 | ) | | | (192,758 | ) |
| | | | | | | | (2,400,669 | ) |
Residential REITs — (4.19)% | | | | | | | | |
American Homes 4 Rent, Class A | | | (13,500 | ) | | | (357,345 | ) |
Invitation Homes, Inc. | | | (16,500 | ) | | | (508,035 | ) |
| | | | | | | | (865,380 | ) |
Thrifts & Mortgage Finance — (8.58)% | | | | | | | | |
Capitol Federal Financial, Inc. | | | (22,000 | ) | | | (313,940 | ) |
Meridian Bancorp, Inc. | | | (21,750 | ) | | | (425,429 | ) |
Northfield Bancorp, Inc. | | | (15,750 | ) | | | (267,908 | ) |
Northwest Bancshares, Inc. | | | (14,250 | ) | | | (240,398 | ) |
Provident Financial Services, Inc. | | | (6,500 | ) | | | (162,175 | ) |
Washington Federal, Inc. | | | (10,000 | ) | | | (364,600 | ) |
| | | | | | | | (1,774,450 | ) |
Total Common Stocks—Short(Proceeds Received $7,072,579) | | | | | | | (7,301,334 | ) |
EXCHANGE-TRADED FUNDS — SHORT —(9.72)% | | | | | | | | |
Direxion Daily Financial Bear 3X Shares | | | (8,000 | ) | | | (261,440 | ) |
Direxion Daily FTSE China Bear 3X Shares | | | (3,705 | ) | | | (184,842 | ) |
Direxion Daily FTSE China Bull 3X Shares | | | (7,975 | ) | | | (144,029 | ) |
Direxion Daily Gold Miners Bear 3X Shares | | | (15,000 | ) | | | (102,150 | ) |
Direxion Daily Gold Miners Bull 3X Shares | | | (13,575 | ) | | | (428,291 | ) |
Direxion Daily Junior Gold Minors Index Bull 3X Shares | | | (4,612 | ) | | | (320,257 | ) |
Direxion Daily Junior Gold Minors Index Bear 3X Shares | | | (7,361 | ) | | | (98,637 | ) |
Direxion Daily S&P Oil & Gas Exp. & Prod. Bear 3X Shares | | | (4,980 | ) | | | (441,976 | ) |
Direxion Daily S&P Oil & Gas Exp. & Prod. Bull 3x Shares | | | (10,872 | ) | | | (29,354 | ) |
| | | | | | | | | |
Total Exchange-Traded Funds—Short(Proceeds Received $2,678,728) | | | | | | | (2,010,976 | ) |
See accompanying notes which are an integral part of these financial statements.
16 | 1-800-467-7903 | https://gatorcapital.com/mutual-funds/gator-capital-long-short-fund/ |
Caldwell & Orkin -
Gator Capital Long/Short Fund |
Schedule of Securities Sold Short
|
| | October 31, 2019 (Unaudited) |
| | Shares | | | Fair Value | |
EXCHANGE-TRADED NOTES — SHORT —(5.59)% | | | | | | | | |
VelocityShares 3x Inverse Crude Oil ETN | | | (30,261 | ) | | $ | (165,528 | ) |
VelocityShares 3x Inverse Natural Gas ETN | | | (1,875 | ) | | | (217,200 | ) |
VelocityShares 3x Inverse Silver ETN | | | (12,290 | ) | | | (192,584 | ) |
VelocityShares 3x Long Crude Oil ETN | | | (5,410 | ) | | | (54,803 | ) |
VelocityShares 3x Long Natural Gas ETN | | | (7,200 | ) | | | (113,760 | ) |
VelocityShares 3x Long Silver ETN | | | (4,170 | ) | | | (411,996 | ) |
Total Exchange-Traded Notes— Short(Proceeds Received $1,891,535) | | | | | | | (1,155,871 | ) |
TOTAL SECURITIES SOLD SHORT—(50.60)% (Proceeds Received $11,642,842) | | | | | | $ | (10,468,181 | ) |
(a) | Non-income producing security. |
The sub-industries shown on the schedule ofsecurities sold short are based on the Global Industry Classification Standard, or GICS® (“GICS”).The GICS was developed by and/or is the exclusive property of MSCI, Inc. and Standard & Poor’s Financial Services LLC (“S&P”).GICS is a service mark of MSCI, Inc. and S&P and has been licensed for use by Ultimus Fund Solutions, LLC.
See accompanying notes which are an integral part of these financial statements.
Semi-Annual Report | October 31, 2019 | 17 |
Caldwell & Orkin -
Gator Capital Long/Short Fund | Statement of Assets and Liabilities |
| | October 31, 2019 (Unaudited) |
Assets | | | | |
Investments is securities at fair value (cost $20,342,213) | | $ | 20,057,708 | |
Deposit held by broker for securities sold short | | | 11,339,593 | |
Receivable for investments sold | | | 422,379 | |
Dividends and interest receivable | | | 15,928 | |
Tax reclaims receivable | | | 7,582 | |
Prepaid expenses | | | 24,197 | |
Total Assets | | | 31,867,387 | |
| | | | | |
Liabilities | | | | |
Securities sold short, at value (proceeds received $11,642,842) | | | 10,468,181 | |
Payable for fund shares redeemed | | | 102,771 | |
Payable for investments purchased | | | 564,524 | |
Payable for dividends declared on short sales | | | 6,797 | |
Payable to Adviser | | | 11,002 | |
Payable to Administrator | | | 8,410 | |
Other accrued expenses | | | 16,495 | |
Total Liabilities | | | 11,178,180 | |
| | | | | |
Net Assets | | $ | 20,689,207 | |
| | | | | |
Net Assets consist of: | | | | |
Paid-in capital | | | 24,542,222 | |
Accumulated deficit | | | (3,853,015 | ) |
Net Assets | | $ | 20,689,207 | |
| | | | | |
Shares outstanding, par value $0.10 per share (30,000,000 authorized shares) | | | 1,003,456 | |
| | | | | |
Net asset value, offering price and redemption price per share(a) | | $ | 20.62 | |
(a) | Redemption price may differ from net asset value if redemption fee is applied. |
See accompanying notes which are an integral part of these financial statements.
18 | 1-800-467-7903 | https://gatorcapital.com/mutual-funds/gator-capital-long-short-fund/ |
Caldwell & Orkin -
Gator Capital Long/Short Fund | Statement of Operations |
For the six months ended October 31, 2019 (Unaudited) |
Investment Income | | | | |
Dividend income | | $ | 281,712 | |
Interest income | | | 22,395 | |
Total investment income | | | 304,107 | |
| | | | | |
Expenses | | | | |
Investment Advisory fees | | | 108,445 | |
Legal | | | 25,848 | |
Directors fees and expenses | | | 18,730 | |
Registration | | | 17,467 | |
Miscellaneous | | | 15,816 | |
Fund accounting | | | 11,420 | |
Administration | | | 10,873 | |
Audit and tax preparation | | | 10,558 | |
Compliance services | | | 10,055 | |
Report printing | | | 7,894 | |
Custodian | | | 5,448 | |
Transfer agent | | | 5,261 | |
Insurance | | | 3,145 | |
Sub transfer agent fees | | | 2,674 | |
Pricing | | | 1,663 | |
Interest | | | 32,611 | |
Dividend expense on securities sold short | | | 113,844 | |
Total expenses | | | 401,752 | |
Fees contractually waived by Adviser | | | (39,135 | ) |
Net operating expenses | | | 362,617 | |
Net investment loss | | | (58,510 | ) |
| | | | | |
Net Realized and Change in Unrealized Gain (Loss) on Investments | | | | |
Net realized gain from: | | | | |
Investments | | | 477,717 | |
Securities sold short | | | (38,852 | ) |
Foreign currency transactions | | | (52 | ) |
Change in unrealized depreciation on: | | | | |
Investments | | | (727,519 | ) |
Securities sold short | | | 27,794 | |
Foreign currency transactions | | | 141 | |
Net realized and change in unrealized loss on investments and securities sold short | | | (260,771 | ) |
Net decrease in net assets resulting from operations | | $ | (319,281 | ) |
See accompanying notes which are an integral part of these financial statements.
Semi-Annual Report | October 31, 2019 | 19 |
Caldwell & Orkin -
Gator Capital Long/Short Fund | Statements of Changes in Net Assets |
| | |
| | | For the Six
Months Ended
October 31, 2019
(Unaudited) | | | For the Year Ended
April 30, 2019 | |
Increase (Decrease) in Net Assets due to: | | | | | | | | |
Operations | | | | | | | | |
Net investment loss | | $ | (58,510 | ) | | $ | (316,123 | ) |
Net realized gain on investments, securities sold short and foreign currency translations | | | 438,813 | | | | 425,184 | |
Net change in unrealized depreciation of investments, securities sold short and foreign currency translations | | | (699,584 | ) | | | (902,674 | ) |
Net decrease in net assets resulting from operations | | | (319,281 | ) | | | (793,613 | ) |
| | | | | | | | | |
Capital Transactions | | | | | | | | |
Proceeds from shares sold | | | 116,838 | | | | 975,619 | |
Amount paid for shares redeemed | | | (2,380,447 | ) | | | (26,695,781 | ) |
Proceeds from redemption fees (Note 1) | | | 192 | | | | 1,013 | |
Net decrease in net assets resulting from capital transactions | | | (2,263,417 | ) | | | (25,719,149 | ) |
Total Decrease in Net Assets | | | (2,582,698 | ) | | | (26,512,762 | ) |
| | | | | | | | | |
Net Assets | | | | | | | | |
Beginning of period | | | 23,271,905 | | | | 49,784,667 | |
End of period | | $ | 20,689,207 | | | $ | 23,271,905 | |
| | | | | | | | | |
Share Transactions | | | | | | | | |
Shares sold | | | 5,876 | | | | 47,546 | |
Shares redeemed | | | (118,077 | ) | | | (1,347,903 | ) |
Net decrease in shares outstanding | | | (112,201 | ) | | | (1,300,357 | ) |
See accompanying notes which are an integral part of these financial statements.
20 | 1-800-467-7903 | https://gatorcapital.com/mutual-funds/gator-capital-long-short-fund/ |
Caldwell & Orkin -
Gator Capital Long/Short Fund | Financial Highlights |
| | |
For a share outstanding during each period.
| | For the
Six Months
Ended
October 31,
2019
(Unaudited) | | | For the
Year
Ended
April 30,
2019 | | | For the
Year
Ended
April 30,
2018 | | | For the
Year
Ended
April 30,
2017 | | | For the
Year
Ended
April 30,
2016 | | | For the
Year
Ended
April 30,
2015 | |
Selected Per Share Data | | | | | | | | | | | | | | | | | | | | | | | | |
Net asset value, beginning of period | | $ | 20.86 | | | $ | 20.61 | | | $ | 20.72 | | | $ | 21.57 | | | $ | 22.94 | | | $ | 20.88 | |
Investment operations: | | | | | | | | | | | | | | | | | | | | | | | | |
Net investment income | | | (0.08 | ) | | | (0.19 | )(a) | | | (0.24 | )(a) | | | (0.25 | ) | | | (0.36 | ) | | | (0.49 | ) |
Net realized and unrealized gain (loss) on investments | | | (0.16 | ) | | | 0.44 | (b) | | | 0.13 | (b) | | | (0.60 | ) | | | 0.30 | | | | 2.71 | |
Total from investment operations | | | (0.24 | ) | | | 0.25 | | | | (0.11 | ) | | | (0.85 | ) | | | (0.06 | ) | | | 2.22 | |
| | | | | | | | | | | | | | | | | | | | | | | | | |
Less distributions to shareholders from: | | | | | | | | | | | | | | | | | | | | | | | | |
Net realized gains | | | — | | | | — | | | | — | | | | — | | | | (1.32 | ) | | | (0.17 | ) |
Total distributions | | | — | | | | — | | | | — | | | | — | | | | (1.32 | ) | | | (0.17 | ) |
| | | | | | | | | | | | | | | | | | | | | | | | | |
Paid in capital from redemption fees | | | — | (c) | | | — | (c) | | | — | (c) | | | — | (c) | | | 0.01 | | | | 0.01 | |
Net asset value, end of period | | $ | 20.62 | | | $ | 20.86 | | | $ | 20.61 | | | $ | 20.72 | | | $ | 21.57 | | | $ | 22.94 | |
| | | | | | | | | | | | | | | | | | | | | | | | | |
Total Return(d) | | | (1.15 | )%(e) | | | 1.21 | % | | | (0.53 | )% | | | (3.94 | )% | | | (0.56 | )% | | | 10.68 | % |
| | | | | | | | | | | | | | | | | | | | | | | | | |
Ratios and Supplemental Data: | | | | | | | | | | | | | | | | | | | | | | | | |
Net assets, end of period (000 omitted) | | $ | 20,689 | | | $ | 23,272 | | | $ | 49,785 | | | $ | 116,610 | | | $ | 208,328 | | | $ | 128,935 | |
Ratios to Average Net Assets: | | | | | | | | | | | | | | | | | | | | | | | | |
Ratio of net expenses to average net assets(f) | | | 3.35 | %(g) | | | 3.19 | % | | | 2.41 | % | | | 2.00 | % | | | 2.95 | % | | | 2.64 | % |
Ratio of expenses to average net assets before waiver by Adviser | | | 3.71 | %(g) | | | 3.31 | % | | | 2.41 | % | | | 2.00 | % | | | 2.95 | % | | | 2.64 | % |
Ratio of net investment loss to average net assets | | | (0.54 | )%(g) | | | (0.92 | )% | | | (1.19 | )% | | | (1.18 | )% | | | (2.06 | )% | | | (1.80 | )% |
Portfolio Turnover Rate | | | 23 | %(e) | | | 240 | % | | | 531 | % | | | 500 | % | | | 415 | % | | | 434 | % |
(a) | Calculated using average shares outstanding. |
(b) | The amount shown for a share outstanding throughout the period does not accord with the change in aggregate gains and losses in the portfolio of securities during the period because of timing of sales and purchases of fund shares in relation to fluctuating market values during the period. |
(c) | Rounds to less than $0.005 per share. |
(d) | Total return in the above table represents the rate that the investor would have earned or lost on an investment in the Fund, assuming reinvestment of distributions. |
(f) | Excluding dividend and interest expense, the ratios of net expenses to average net assets were 2.00% for the six months ended October 31, 2019 and 2.00%, 1.85%, 1.40%, 1.37% and 1.44% for the fiscal years ended April 30, 2019, 2018, 2017, 2016 and 2015, respectively. |
See accompanying notes which are an integral part of these financial statements.
Semi-Annual Report | October 31, 2019 | 21 |
Caldwell & Orkin -
Gator Capital Long/Short Fund | Notes to Financial Statements |
| | October 31, 2019(Unaudited) |
1. ORGANIZATION
The Caldwell & Orkin - Gator Capital Long/Short Fund (the “Fund”), formerly the Caldwell & Orkin Market Opportunity Fund, is the only investment portfolio of The Caldwell & Orkin Funds, Inc. (the “Company”), an open-end, diversified management investment company registered under the Investment Company Act of 1940, as amended (the “1940 Act”), and incorporated under the laws of the State of Maryland on August 15, 1989. The Fund’s investment objective is to provide long-term capital growth with a short-term focus on capital preservation. Gator Capital Management, LLC (the “Adviser”), the Fund’s investment adviser, uses a fundamental driven, multi-dimensional investment process focusing on active allocation, security selection and surveillance to achieve the Fund’s investment objective.
2. SUMMARY OF SIGNIFICANT ACCOUNTING POLICIES
The Fund is an investment company and follows accounting and reporting guidance under Financial Accounting Standards Board Accounting Standards Codification (“ASC”) Topic 946, “Financial Services-Investment Companies”. The following is a summary of significant accounting policies followed by the Fund in the preparation of its financial statements. These policies are in conformity with generally accepted accounting principles in the United States of America (“GAAP”).
Use of Estimates
The preparation of financial statements in conformity with GAAP requires management to make estimates and assumptions that affect the reported amounts of assets and liabilities and disclosure of contingent assets and liabilities at the date of the financial statements and the reported amounts of revenues and expenses during the reporting period. Actual results could differ from those estimates.
Securities Valuation
Securities are stated at the closing price on the date at which the net asset value (“NAV”) is being determined. If the date of determination is not a trading date, or the closing price is not otherwise available, the last bid price is used for a fair value instead. Debt securities are valued at the price provided by an independent pricing service. Any assets or securities for which market quotations are not readily available are valued at fair value as determined in good faith by or under the direction of the Fund’s Board of Directors (the “Board”) in accordance with the Fund’s Fair Value Pricing Policy.
Securities Transactions and Related Investment Income
The Fund follows industry practice and records securities transactions on trade date for financial reporting purposes. Dividend income is recorded on the ex-dividend date. Realized gains and losses from investment transactions are determined using the specific identification method. Interest income which includes amortization of premium and accretion of discount, is accrued as earned.
22 | 1-800-467-7903 | https://gatorcapital.com/mutual-funds/gator-capital-long-short-fund/ |
Caldwell & Orkin -
Gator Capital Long/Short Fund | Notes to Financial Statements |
| | October 31, 2019(Unaudited) |
Fair Value Measurements
A three-tier hierarchy has been established to classify fair value measurements for disclosure purposes. Inputs refer broadly to the assumptions that market participants would use in pricing the asset or liability, including assumptions about risk. Inputs may be observable or unobservable. Observable inputs are inputs that reflect the assumptions market participants would use in pricing the asset or liability that are developed based on market data obtained from sources independent of the reporting entity. Unobservable inputs are inputs that reflect the reporting entity’s own assumptions about the assumptions market participants would use in pricing the asset or liability that are developed based on the best information available.
Various inputs are used in determining the value of the Fund’s investments. These inputs are summarized in the three broad levels listed below.
● | Level 1 – unadjusted quoted prices in active markets for identical investments and/or registered investment companies where the value per share is determined and published and is the basis for current transactions for identical assets or liabilities at the valuation date |
● | Level 2 – quoted prices which are not active quoted prices for similar assets or liabilities in active markets or inputs other than quoted process that are observable (either directly or indirectly) for substantially the full term of the asset of liability |
● | Level 3 – significant unobservable inputs (including the Fund’s own assumptions in determining fair value of investments based on the best information available) |
The inputs used to measure fair value may fall into different levels of the fair value hierarchy. In such cases, for disclosure purposes, the level in the fair value hierarchy which is reported, is determined based on the lowest level input that is significant to the fair value measurement in its entirety.
The following is a summary of the inputs used as of October 31, 2019 in valuing the Fund’s investments carried at value:
Investments in Securities* | | Level 1 | | | Level 2 | | | Level 3 | | | Total | |
Assets | | | | | | | | | | | | | | | | |
Common Stocks | | $ | 17,529,869 | | | $ | — | | | $ | — | | | $ | 17,529,869 | |
Preferred Stock | | | 380,888 | | | | — | | | | — | | | | 380,888 | |
Warrants | | | 356,365 | | | | — | | | | — | | | | 356,365 | |
Money Market Funds | | | 1,790,586 | | | | — | | | | — | | | | 1,790,586 | |
Total | | $ | 20,057,708 | | | $ | — | | | $ | — | | | $ | 20,057,708 | |
Liabilities | | | | | | | | | | | | | | | | |
Securities Sold Short | | | | | | | | | | | | | | | | |
Common Stocks | | $ | (7,301,334 | ) | | $ | — | | | $ | — | | | $ | (7,301,334 | ) |
Exchange-Traded Funds | | | (2,010,976 | ) | | | | | | | | | | | (2,010,976 | ) |
Exchange-Traded Notes | | | (1,155,871 | ) | | | — | | | | — | | | | (1,155,871 | ) |
Total | | $ | (10,468,181 | ) | | $ | — | | | $ | — | | | $ | (10,468,181 | ) |
* | For detailed industry descriptions, see the accompanying Schedule of Investments. |
Semi-Annual Report | October 31, 2019 | 23 |
Caldwell & Orkin -
Gator Capital Long/Short Fund |
Notes to Financial Statements
|
| | October 31, 2019(Unaudited) |
The Fund did not hold any assets at any time during the reporting period in which significant unobservable inputs were used in determining fair value; therefore, no reconciliation of Level 3 securities is included for this reporting period.
Share Valuation
The NAV per share of the Fund is calculated by dividing the sum of the value of the securities held by the Fund, plus cash or other assets, minus all liabilities (including estimated accrued expenses) by the total number of shares outstanding for the Fund, rounded to the nearest cent. The Fund’s shares will not be priced on the days on which the New York Stock Exchange is closed for trading. The offering and redemption price per share for the Fund is equal to the Fund’s NAV per share.
The Fund charges a 2.00% redemption fee on shares held less than 90 days. These fees are deducted from the redemption proceeds otherwise payable to the shareholder. The Fund will retain the fee charged as paid-in capital and such fees become part of the Fund’s daily NAV calculation. For the six months ended October 31, 2019, the Fund recorded $192 in redemption fee proceeds.
Federal Income Taxes
The Fund makes no provision for federal income tax or excise tax. The Fund has qualified and intends to qualify each year as a regulated investment company (“RIC”) under subchapter M of the Internal Revenue Code of 1986, as amended, by complying with the requirements applicable to RICs and by distributing substantially all of its taxable income. The Fund also intends to distribute sufficient net investment income and net capital gains, if any, so that it will not be subject to excise tax on undistributed income and gains. If the required amount of net investment income or gains is not distributed, the Fund could incur a tax expense.
The Fund may be subject to taxes imposed by countries in which it invests. Such taxes are generally based on income and/or capital gains earned or repatriated. Taxes are accrued and applied to net investment income, net realized gains and unrealized appreciation as such income and/or gains are earned.
The Fund recognizes tax benefits or expenses of uncertain tax positions only when the position is “more likely than not” to be sustained assuming examination by tax authorities. Management of the Fund has reviewed tax positions taken in tax years that remain subject to examination by all major tax jurisdictions, including federal (i.e., the previous three tax year ends and the interim tax period since then, as applicable) and has concluded that no provision for unrecognized tax benefits or expenses is required in these financial statements and does not expect this to change over the next twelve months. The Fund recognizes interest and penalties, if any, related to unrecognized tax benefits as income tax expense in the Statement of Operations. During the period, the Fund did not incur any interest or penalties.
24 | 1-800-467-7903 | https://gatorcapital.com/mutual-funds/gator-capital-long-short-fund/ |
Caldwell & Orkin -
Gator Capital Long/Short Fund |
Notes to Financial Statements
|
| | October 31, 2019(Unaudited) |
3. FEES AND OTHER TRANSACTIONS WITH AFFILIATES ANDOTHER SERVICE PROVIDERS
The Fund has entered into a management agreement (the “Management Agreement”) with the Adviser pursuant to which the Adviser provides space, facilities, equipment and personnel necessary to perform administrative and investment management services for the Fund. The Management Agreement provides that the Adviser is responsible for the management of the Fund’s portfolio. For such services and expenses assumed by the Adviser, the Fund pays a monthly advisory fee at incremental annual rates as follows:
Advisory Fee | Average Daily Net Assets |
1.00% | Up to $250 million |
0.90% | In excess of $250 million but not greater than $500 million |
0.80% | In excess of $500 million |
The Adviser has agreed to reimburse the Fund to the extent necessary to prevent the Fund’s annual ordinary operating expenses (excluding taxes, expenses related to the execution of portfolio transactions and the investment activities of the Fund such as, for example, interest, dividend expenses on securities sold short, brokerage commissions and fees and expenses charged to the Fund by any investment company in which the Fund invests and extraordinary charges such as litigation costs) from exceeding 2.00% of the Fund’s average net assets. For the six months ended October 31, 2019, the Adviser waived fees in the amount of $39,135 for the Fund. During the six months ended October 31, 2019, the Adviser earned $108,445 from the Fund, before the waiver described above.
Ultimus Fund Solutions, LLC (the “Administrator”) provides fund accounting, fund administration and transfer agent services under a Master Services Agreement to the Fund. The Fund pays the Administrator fees for its services under the Master Services Agreement. In addition, the Fund pays out-of-pocket expenses including, but not limited to postage, supplies and costs of pricing the Fund’s securities. For the six months ended October 31, 2019, the Administrator earned fees of $10,873 for administration services, $11,420 for fund accounting services, $5,261 for transfer agent services.
Under a Compliance Consulting Agreement with the Fund, the Administrator provides the Fund with a Chief Compliance Officer along with support services. The Fund pays the Administrator an annual fee to provide these services. For the six months ended October 31, 2019, the Administrator earned fees of $10,055 for compliance services.
Ultimus Fund Distributors, LLC (the “Distributor”) serves as distributor to the Fund. The Fund does not pay the Distributor for these services. The Distributor is a wholly-owned subsidiary of the Administrator.
Certain officers of the Fund are also officers of the Administrator and the Distributor.
Semi-Annual Report | October 31, 2019 | 25 |
Caldwell & Orkin -
Gator Capital Long/Short Fund |
Notes to Financial Statements
|
| | October 31, 2019(Unaudited) |
4. DIRECTOR COMPENSATION
The Fund pays each Director, in cash, an annual fee of $8,000 per year, plus $1,500 for each in-person meeting attended and $1,000 for each telephonic meeting attended. The Fund also reimburses Directors’ actual out-of-pocket expenses relating to attendance at meetings.
5. INVESTMENT PORTFOLIO TRANSACTIONS
During the six months ended October 31, 2019, the Fund purchased $6,756,730 and sold $9,322,522 of securities, excluding securities sold short and short-term investments. There were no purchases or sales of long-term U.S. government obligations during the six months ended October 31, 2019.
Short Sales and Segregated Cash
Short sales are transactions in which the Fund sells a security it does not own, in anticipation of a decline in the market value of that security. To initiate such a transaction, the Fund must borrow the security to deliver to the buyer upon the short sale; the Fund is then obligated to replace the security borrowed by purchasing it in the open market at some later date, completing the transaction.
The Fund will incur a loss if the market price of the security increases between the date of the short sale and the date on which the Fund replaces the borrowed security. The Fund will realize a gain if the security declines in value between those dates.
All short sales must be fully collateralized. The Fund maintains the collateral in segregated accounts consisting of cash and/or U.S. Government securities sufficient to collateralize the market value of its short positions. Typically, the segregated cash with brokers and other financial institutions exceeds the minimum required. Deposits with brokers for securities sold short are invested in money market instruments. Segregated cash is held at the custodian in the name of the broker per a tri-party agreement between the Fund, the custodian, and the broker.
The Fund may also sell short “against the box”, i.e., the Fund enters into a short sale as described above, while holding an offsetting long position in the same security which it sold short. If the Fund enters into a short sale against the box, it will segregate an equivalent amount of securities owned by the Fund as collateral while the short sale is outstanding.
The Fund limits the value of its short positions (excluding short sales “against the box”) to 60% of the Fund’s total net assets. At October 31, 2019, the Fund had approximately 51% of its total net assets in short positions.
For the six months ended October 31, 2019, the cost of investments purchased to cover short sales and the proceeds from investments sold short were $2,891,107 and $4,452,330, respectively.
26 | 1-800-467-7903 | https://gatorcapital.com/mutual-funds/gator-capital-long-short-fund/ |
Caldwell & Orkin -
Gator Capital Long/Short Fund |
Notes to Financial Statements
|
| | October 31, 2019(Unaudited) |
6. FEDERAL TAX INFORMATION
As of October 31, 2019, the net unrealized appreciation (depreciation) of investments, including short securities, for tax purposes was as follows:
Gross unrealized appreciation | | $ | 2,562,746 | |
Gross unrealized depreciation | | | (2,748,456 | ) |
Net unrealized depreciation on investments | | $ | (185,710 | ) |
Tax cost of investments | | $ | 9,775,237 | |
At April 30, 2019, the components of distributable earnings (accumulated losses) on a tax basis were as follows:
Accumulated capital and other losses | | $ | (4,047,732 | ) |
Unrealized appreciation | | | 513,998 | |
| | | $ | (3,533,734 | ) |
The difference between book basis and tax basis unrealized appreciation is attributable primarily to the tax deferral of wash losses and investments in partnerships and certain other investments.
Certain capital losses incurred after October 31, and within the current taxable year, are deemed to arise on the first business day of the Fund’s following taxable year. Late year Ordinary Losses incurred after December 31 are deemed to arise on the first business day of the Fund’s following taxable year. For the tax year ended April 30, 2019, the Fund deferred $239,944 in Qualified Late Year Ordinary Losses.
As of April 30, 2019, the Fund has available for tax purposes an unused capital loss carryforward of $3,807,788 of short-term capital losses with no expiration, which is available to offset against future taxable net capital gains.
7. COMMITMENTS AND CONTINGENCIES
Under the Fund’s organizational documents, its officers and directors are indemnified against certain liability arising out of the performance of their duties to the Fund. Additionally, in the normal course of business, the Fund enters into contracts with service providers that may contain general indemnification clauses, which may permit indemnification to the extent permissible under applicable law. The Fund’s maximum exposure under these arrangements is unknown, as this would involve future claims that may be made against the Fund that have not yet occurred.
Semi-Annual Report | October 31, 2019 | 27 |
Caldwell & Orkin -
Gator Capital Long/Short Fund |
Notes to Financial Statements
|
| | October 31, 2019(Unaudited) |
8. SUBSEQUENT EVENTS
Management of the Fund has evaluated the need for disclosures and/or adjustments resulting from subsequent events through the date at which these financial statements were issued. Based upon this evaluation, management has determined there were no items requiring adjustment of the financial statements or additional disclosure.
28 | 1-800-467-7903 | https://gatorcapital.com/mutual-funds/gator-capital-long-short-fund/ |
Caldwell & Orkin -
Gator Capital Long/Short Fund | Disclosure of Fund Expenses |
| | October 31, 2019 (Unaudited) |
We believe it is important for you to understand the impact of fees and expenses on your investment in the Fund. As a shareholder of the Fund, you incur two types of costs: (1) transaction costs related to the purchase and redemption of Fund shares, including redemption fees and brokerage commissions (if applicable); and (2) ongoing costs, including management fees, administrative expenses, portfolio transaction costs and other Fund expenses. A mutual fund’s ongoing costs are expressed as a percentage of its average net assets. This figure is known as the expense ratio. The following example is intended to help you understand your ongoing costs (in dollars and cents) of investing in the Fund and to compare these costs with the ongoing costs of investing in other mutual funds.
The below example is based on an investment of $1,000 invested at the beginning of the period and held for the entire period indicated, May 1, 2019 through October 31, 2019. The table below illustrates the Fund’s expenses in two ways:
Based on Actual Fund Returns
The first line of the table below provides information about actual account values and actual expenses. You may use the information in this line, together with the amount you invested, to estimate the expenses that you paid over the period. Simply divide your account value by $1,000 (for example, an $8,600 account value divided by $1,000 = 8.6), then multiply the result by the number in the first line under the heading entitled “Expenses Paid During Period” to estimate the expenses you paid on your account during this period.
Based on a Hypothetical 5% Return for Comparison Purposes
The second line of the table below provides information about hypothetical account values and hypothetical expenses based on the Fund’s actual expense ratio and an assumed rate of return of 5% per year before expenses, which is not the Fund’s actual return. The hypothetical account values and expenses may not be used to estimate the actual ending account balance or expenses you paid for the period. You may use this information to compare the ongoing costs of investing in the Fund and other funds. To do so, compare this 5% hypothetical example with the 5% hypothetical examples that appear in the shareholder reports of the other funds.
Expenses shown in the table are meant to highlight your ongoing costs only and do not reflect any transactional costs. Therefore, the second line of the table below is useful in comparing ongoing costs only and will not help you determine the relative costs of owning different funds. In addition, if transaction costs were included, your costs would have been higher.
| | Beginning
Account Value
May 1, 2019 | Ending
Account Value
October 31, 2019 | Expenses
Paid During
the Period(a) | Annualized
Expense
Ratio |
Actual | $1,000.00 | $ 988.50 | $16.77 | 3.35% |
Hypothetical(b) | $1,000.00 | $ 1,008.34 | $16.94 | 3.35% |
(a) | Expenses are equal to the Fund’s annualized expense ratios, multiplied by the average account value over the period, multiplied by 184/365 (to reflect the one-half year period). |
(b) | Hypothetical assumes 5% annual return before expenses. |
Semi-Annual Report | October 31, 2019 | 29 |
Caldwell & Orkin -
Gator Capital Long/Short Fund | Director Approval of the
Investment Advisory Agreement |
| | October 31, 2019 (Unaudited) |
At an in-person meeting held on June 5, 2019, at which all of the Directors were present, the Board, including the Directors who are not “interested persons,” as defined by the Investment Company Act of 1940 (the “1940 Act”), of the Company (the “Independent Directors”), voting separately, reviewed and approved the investment advisory agreement with the Adviser (the “Management Agreement”). In the course of their deliberations, the Board and the Independent Directors were advised by legal counsel. The Board received and reviewed a substantial amount of information provided by the Adviser in response to requests of the Board and legal counsel.
In considering the approval of the Management Agreement and reaching their conclusions with respect thereto, the Board was briefed by counsel on its fiduciary duties and responsibilities in reviewing and approving the Management Agreement and the types of information that should be reviewed by them and their responsibilities in making an informed decision regarding the approval of the Management Agreement. The Board also reviewed and analyzed various factors that they determined were relevant, including: (1) the nature, extent and quality of the services to be provided by the Adviser to the Fund and the Adviser’s experience managing registered investment companies; (2) the performance of the Adviser in managing investments for other investment company clients or managed account clients; (3) the costs of the services to be provided and profits to be realized by the Adviser from its relationship with the Fund, as well as fee rates charged by the Adviser and other advisers for comparable strategies; (4) the extent to which economies of scale may be realized as the Fund grows and whether management fee levels reflect these economies of scale for the benefit of the Fund’s investors; (5) other benefits to be derived by the Adviser from its relationship with the Fund; and (6) the likely effects of the Management Agreement on the Fund and its shareholders. The Board’s analysis of the foregoing factors included, but was not limited to, the following:
Nature, Extent and Quality of Services. The Board reviewed the operating and investment advisory services provided by the Adviser to the Fund, including, without limitation, its investment advisory services, its coordination of services for the Fund among the Fund’s service providers, its compliance procedures and practices, its efforts to promote the Fund and assist in its distribution and its provision of officers for the Company. Based on the foregoing information, the Board concluded that the nature, extent and quality of the management and advisory services provided by the Adviser were appropriate for the Fund.
Performance of the Fund and the Adviser. The Board reviewed the investment performance of the Adviser in managing investments for the Fund on an absolute basis and also compared the performance of the Fund with the performance of the peer group funds managed by other advisors. In particular, the Board noted the Fund’s improved year-to-date performance, which was 12.53%, and the fact that the Fund outperformed its peer group and its secondary benchmark over the same period. The Board also considered the consistency of the Manager’s management of the Fund with the Fund’s investment objective and policies, and long-term performance of the Fund. After evaluating the performance of the Adviser and the Fund in such capacities, the Board concluded that the performance of the Adviser and the Fund was satisfactory.
30 | 1-800-467-7903 | https://gatorcapital.com/mutual-funds/gator-capital-long-short-fund/ |
Caldwell & Orkin -
Gator Capital Long/Short Fund | Director Approval of the
Investment Advisory Agreement |
| | October 31, 2019 (Unaudited) |
Cost of Services and Projected Profits of the Adviser with respect to the Fund. In analyzing the cost of services and the profitability that the Adviser derives from its relationship with the Fund, the Board considered that continuing the Management Agreement would result in no changes to the fees charged to the Fund, and that the services provided in exchange for such fees would be appropriate. The Board also considered the Adviser’s staffing, personnel and methods of operating; the financial condition of the Adviser and the level of commitment to the Fund and the Adviser by the principals of the Adviser; the asset level of the Fund; and the overall fees and expenses of the Fund.
The Board then reviewed the fees and expenses of the Fund, and then compared them to other funds similar in terms of the type of fund, the style of investment management, the size of the fund and the nature of the fund’s investment strategy, among other factors. The Board noted that the management fee charged by the Adviser is below the average charged by its peers and that the Fund’s expense ratio was in-line with the average of its peers. The Board also considered the expense limitation provisions within the Management Agreement and the financial capacity of the Adviser to fulfill its obligations under the Management Agreement. Following these comparisons and considerations and upon further discussion of the foregoing, the Board concluded that the fees paid to the Adviser by the Fund under the Management Agreement are appropriate and within the range of what would have been negotiated at arm’s length.
Economies of Scale. Following discussion of the Fund’s asset level, expectations for growth, levels of fees and the expense limitation agreement, the Board determined that the Fund’s fee arrangement was appropriate, and that the Fund’s overall fee structure provided for savings and protection for shareholders at lower asset levels through the Fund’s expense limitation agreement that is part of the Management Agreement.
Other Benefits Derived by the Adviser from its Relationship with the Fund. The Board considered that (other than the advisory fee) there are no material “fall-out” or ancillary benefits that accrue to the Adviser as a result of its relationship with the Fund. Based on the foregoing information, the Board concluded that such potential benefits are immaterial to its consideration and approval of the Management Agreement.
After full consideration of the above factors as well as other factors, the Board unanimously concluded that the terms of the Management Agreement were fair and reasonable and approved the Management Agreement for a one-year renewal period.
Semi-Annual Report | October 31, 2019 | 31 |
CUSTOMERPRIVACY NOTICE |
FACTS | WHAT DOES CALDWELL & ORKIN FUNDS, INC. DO WITH YOUR PERSONAL INFORMATION? |
| | |
Why? | Financial companies choose how they share your personal information. Federal law gives consumers the right to limit some but not all sharing. Federal law also requires us to tell you how we collect, share, and protect your personal information. Please read this notice carefully to understand what we do. |
| | |
What? | The types of personal information we collect and share depend on the product or service you have with us. This information can include: ■ Social Security number ■ Assets ■ Retirement Assets ■ Transaction History ■ Checking Account Information ■ Purchase History ■ Account Balances ■ Account Transactions ■ Wire Transfer Instructions When you areno longer our customer, we continue to share your information as described in this notice. |
| | |
How? | All financial companies need to share your personal information to run their everyday business. In the section below, we list the reasons financial companies can share their customers’ personal information; the reasons Caldwell & Orkin Funds, Inc. chooses to share; and whether you can limit this sharing. |
| | | | |
Reasons we can share your personal information | Does Caldwell & Orkin Funds, Inc. share? | Can you limit this sharing? |
For our everyday business purposes –
Such as to process your transactions, maintain your account(s), respond to court orders and legal investigations, or report to credit bureaus | Yes | No |
For our marketing purposes –
to offer our products and services to you | Yes | No |
For joint marketing with other financial companies | No | We don’t share |
For our affiliates’ everyday business purposes –
information about your transactions and experiences | No | No |
For our affiliates’ everyday business purposes –
information about your creditworthiness | No | We don’t share |
For nonaffiliates to market to you | No | We don’t share |
For our affiliates’ marketing purposes | Yes | Yes* |
| | |
Questions? | Call (800) 467-7903 |
| | |
To limit our sharing | *Call (813) 282-7870 Please note:
If you are anew customer, we can begin sharing your information 30 days from the date we sent this notice. When you areno longer our customer, we continue to share your information as described in this notice. However, you can contact us at any time to limit our sharing. |
32 | 1-800-467-7903 | https://gatorcapital.com/mutual-funds/gator-capital-long-short-fund/ |
Page 2 | |
Who we are |
Who is providing this notice? | Caldwell & Orkin Funds, Inc. Caldwell & Orkin - Gator Capital Long/Short Fund Ultimus Fund Distributors, LLC (Distributor) Ultimus Fund Solutions, LLC (Administrator) |
What we do |
How does Caldwell & Orkin Funds, Inc. protect my personal information? | To protect your personal information from unauthorized access and use, we use security measures that comply with federal law. These measures include computer safeguards and secured files and buildings. Our service providers are held accountable for adhering to strict policies and procedures to prevent any misuse of your nonpublic personal information. |
How does Caldwell & Orkin Funds, Inc. collect my personal information? | We collect your personal information, for example, when you ■ Open an account ■ Provide account information ■ Give us your contact information ■ Make deposits or withdrawals from your account ■ Make a wire transfer ■ Tell us where to send the money ■ Tell us who receives the money ■ Show your government-issued ID ■ Show your driver’s license We also collect your personal information from other companies. |
Why can’t I limit all sharing? | Federal law gives you the right to limit only ■ Sharing for affiliates’ everyday business purposes – information about your creditworthiness ■ Affiliates from using your information to market to you ■ Sharing for nonaffiliates to market to you State laws and individual companies may give you additional rights to limit sharing. |
| | |
Definitions |
Affiliates | Companies related by common ownership or control. They can be financial and nonfinancial companies. ■ Gator Capital Management, LLCthe investment adviser to Caldwell & Orkin Funds, Inc., could be deemed an affiliate. |
Nonaffiliates | Companies not related by common ownership or control. They can be financial and nonfinancial companies ■Caldwell & Orkin Funds, Inc. does not share with nonaffiliates so they can market to you. |
Joint marketing | A formal agreement between nonaffiliated financial companies that together market financial products or services to you. ■Caldwell & Orkin Funds, Inc. does not jointly market. |
Semi-Annual Report | October 31, 2019 | 33 |
CALDWELL & ORKIN -Gator Capital Long/Short Fund |
Semi-Annual Report to Shareholders |
BOARD OF DIRECTORS Frederick T. Blumer,
Independent Chairman Derek Pilecki, President Bevin E. Newton Rhett E. Ingerick | TRANSFER, REDEMPTION
& DIVIDEND
DISBURSING AGENT Ultimus Fund Solutions, LLC
P.O. Box 46707
Cincinnati, OH 45246-0707 | LEGAL COUNSEL Kilpatrick Townsend & Stockton LLP 1001 West Fourth Street Winston-Salem, NC 27101-2400 |
INVESTMENT ADVISER Gator Capital Management, LLC 100 S. Ashley Drive, Suite 895 Tampa, FL 33602 | CUSTODIAN U.S. Bank, N.A.
425 Walnut St.
Cincinnati, OH 45202
| |
DISTRIBUTOR Ultimus Fund Distributors, LLC
225 Pictoria Drive, Suite 450
Cincinnati, OH 45246 | | |
The Caldwell & Orkin - Gator Capital Long/Short Fund’s (the “Fund”) portfolio may or may not have positions in any of the companies referenced in this Report to Shareholders as of any date after October 31, 2019. The commentary reflects the views of the investment manager through the end of the period or through the date of this report, as the case may be. Of course, these views are subject to change as market and other conditions warrant. These financial statements are submitted for the general information of the Fund’s shareholders.They are not authorized for distribution to prospective investors unless preceded or accompanied by an effective Fund Prospectus.
Availability of Proxy Voting Policy & Procedures, Proxy Voting Record and Code of Ethics -A description of a) the policies and procedures the Fund uses to determine how to vote proxies relating to portfolio securities, b) how the Fund voted proxies relating to portfolio securities during the most recent 12-month period ended June 30, and c) the Code of Ethics applicable to the principal officers of the Fund are available without charge, upon request, by calling toll- free (800) 467-7903, or on the Securities and Exchange Commission’s (the “Commission’s”) website at http://www.sec.gov.
Fund Information - For more information about the Fund please call (800) 467-7903 or visit the Fund’s website athttps://gatorcapital.com/mutual-funds/gator-capital-long-short-fund/.
Gator Capital Management, LLC
100 S. Ashley Drive, Suite 895
Tampa, Fl 33602
Item 2. Code of Ethics.
Not applicable to semiannual reports.
Item 3. Audit Committee Financial Expert.
Not applicable to semiannual reports.
Item 4. Principal Accountant Fees and Services.
Not applicable to semiannual reports.
Item 5.Audit Committee of Listed Registrants.
Not applicable.
Item 6.Investments.
(a) Included as part of the report to Stockholders filed under Item 1 of this Form.
(b) Not applicable.
Item 7. Disclosure of Proxy Voting Policies and Procedures for Closed-End Management Investment Companies.
Not applicable.
Item 8. Portfolio Managers of Closed-End Management Investment Companies.
Not applicable.
Item 9. Purchases of Equity Securities by Closed-End Management Investment Company and Affiliated Purchasers.
Not applicable.
Item 10. Submission of Matters to a Vote of Security Holders.
None.
Item 11. Controls and Procedures.
(a) The registrant’s Principal Executive Officer and Principal Financial Officer have concluded that the registrant's disclosure controls and procedures (as defined in Rule 30a-3(c) under the Act) are effective in design and operation and are sufficient to form the basis of the certifications required by Rule 30a-2 under the Act, based on their evaluation of these disclosure controls and procedures within 90 days of the filing of this report on Form N-CSR.
(b) There were no changes in the registrant’s internal control over financial reporting (as defined in Rule 30a-3(d) under the Act (17 CFR 270.30a-3(d)) that occurred during the second fiscal quarter of the period covered by this report that have materially affected or are reasonably likely to materially affect, the registrant’s internal control over financial reporting.
Item 12. Disclosure of Securities Lending Activities for Closed-End Management Investment Companies.
Not applicable.
Item 13. Exhibits.
(a)(1) Not applicable.
(a)(2) Certifications pursuant to Rule 30a-2(a) are attached hereto.
(a)(3) Not applicable.
(a)(4) Not applicable.
(b) Certifications pursuant to Rule 30a-2(b) are furnished herewith.
SIGNATURES
Pursuant to the requirements of the Securities Exchange Act of 1934 and the Investment Company Act of 1940, the registrant has duly caused this report to be signed on its behalf by the undersigned, thereunto duly authorized.
| (Registrant) | The Caldwell & Orkin Funds, Inc. | |
| | | |
| By (Signature and Title) | /s/ Derek Pilecki | |
| | | Derek Pilecki, President and Principal Executive Officer | |
| | | | |
| Date | 12/31/2019 | | |
Pursuant to the requirements of the Securities Exchange Act of 1934 and the Investment Company Act of 1940, this report has been signed below by the following persons on behalf of the registrant and in the capacities and on the dates indicated.
| By (Signature and Title) | /s/ Derek Pilecki | |
| | | Derek Pilecki, President and Principal Executive Officer | |
| | | | |
| Date | 12/31/2019 | | |
| | | | |
| By (Signature and Title) | /s/ Erik Anderson | |
| | | Erik Anderson, Treasurer and Principal Financial Officer | |
| | | | |
| Date | 12/31/2019 | | |