UNITED STATES
SECURITIES AND EXCHANGE COMMISSION
Washington, D.C. 20549
FORM N-CSRS
CERTIFIED SHAREHOLDER REPORT OF REGISTERED
MANAGEMENT INVESTMENT COMPANIES
Investment Company Act file number: 811-06113
The Caldwell & Orkin Funds, Inc.
(Exact name of registrant as specified in charter)
100 S. Ashley Drive, Suite 895
Tampa, Florida 33602
(Address of principal executive offices) (Zip code)
Derek Pilecki
100 S. Ashley Drive, Suite 895
Tampa, Florida 33602
(Name and address of agent for service)
Copies to:
Benjamin Mollozzi
Ultimus Fund Solutions, LLC
225 Pictoria Drive, Suite 450
Cincinnati, OH 45246
Registrant's telephone number, including area code: 1-813-282-7870
Date of fiscal year end: April 30
Date of reporting period: October 31, 2020
Item 1. Reports to Stockholders.
Beginning on January 1, 2021, as permitted by regulations adopted by the Securities and Exchange Commission, paper copies of the Fund’s shareholder reports will no longer be sent by mail, unless you specifically request paper copies of the reports from the Fund or from your financial intermediary such as a broker-dealer or bank. Instead, the reports will be made available on a website, and you will be notified by mail each time a report is posted and provided with a website link to access the report.
If you already elected to receive shareholder reports electronically, you will not be affected by this change and you need not take any action. You may elect to receive shareholder reports and other communications from the Fund electronically by contacting the Fund at (800) 467-7903 or, if you own these shares through a financial intermediary, you may contact your financial intermediary.
You may elect to receive all future reports in paper free of charge. You can inform the Fund that you wish to continue receiving paper copies of your shareholder reports by contacting the Fund at (800) 467-7903 If you own shares through a financial intermediary, you may contact your financial intermediary or follow instructions included with this disclosure to elect to continue to receive paper copies of your shareholder reports. Your election to receive reports in paper will apply to all funds held with the fund complex or at your financial intermediary.
Table of Contents | Caldwell & Orkin -
Gator Capital Long/Short Fund |
October 31, 2020 (Unaudited) | |
| | |
Management’s Discussion of Fund Performance | 2 |
Investment Results | 9 |
Fund Holdings | 10 |
Schedule of Investments | 11 |
Schedule of Securities Sold Short | 15 |
Statement of Assets and Liabilities | 17 |
Statement of Operations | 18 |
Statements of Changes in Net Assets | 19 |
Financial Highlights | 20 |
Notes to Financial Statements | 21 |
Disclosure of Fund Expenses | 29 |
Director Approval of the Investment Advisory Agreement | 30 |
Privacy Policy Disclosure | 32 |
Caldwell & Orkin -
Gator Capital Long/Short Fund | Management’s Discussion
of Fund Performance |
| | October 31, 2020 (Unaudited) |
December 1, 2020
Dear Fellow Shareholder:
The Caldwell & Orkin – Gator Capital Long/Short Fund (the “Fund”) increased 26.30% over the six-month period ending on October 31, 2020. The S&P 500 Total Return Index (“S&P 500”) increased 13.29% during the same period. For the 12-month period ending April 30, 2020, the Fund declined 6.84% while the S&P 500 increased by 9.71%.
Past performance is no guarantee of future results.
Management Discussion and Analysis
The Fund outperformed to begin the fiscal year. The Fund’s exposure to Financial stocks was the main contributor to the performance.
The top five equity contributors during the first half of the 2021 fiscal year were Realogy (long), PennyMac Financial Services (long), OneMain Financial (long), Ally Financial, (long), and Ameriprise Financial (long).
The top five equity detractors during the first half of the 2021 fiscal year were Ambac (long), Citigroup (long), Duke Realty (short), Lakeland Financial (long), and MBIA (long).
We ended the first half of the 2021 fiscal year with gross long exposure of 98% and gross short exposure of 25% for a total gross exposure of 124% and a net exposure of 70%.
Outlook
Here’s a closer look at the Fund’s portfolio by sub-industry.
Long Positions
Mortgage Banking & Mortgage Insurance – Mortgage banking companies during the six month. PennyMac Financial Services (“PFSI”) was up 69.6%. Mortgage spreads continued to stay wide. We hold this position as we expect PFSI to post strong results again in 2021.
Financial Guaranty – We continue to hold our positions in Fannie Mae preferreds and Ambac although both positions lagged in the period. Neither company had noteworthy news. We expect both names to garner more attention as they approach their respective catalysts in Q4 & Q1.
Capital Markets – We continue to own positions in MS, GS, CS & BCS as we believe the low price-to-tangible book valuations of these firms does not reflect the attractive returns they are earning.
Regional Banks – We continue to add to our positions in regional banks. We explore the compelling opportunity we see in regional banks later in this letter.
Consumer Finance – Our positions in consumer finance companies performed well in the period. We continue to hold these positions as we think their credit losses will be less than market expectations. The consumer remains surprisingly strong. We expect that consumer finance companies will benefit from higher government stimulus spending.
2 | 1-800-467-7903 | https://gatorcapital.com/mutual-funds/gator-capital-long-short-fund/ |
Caldwell & Orkin -
Gator Capital Long/Short Fund | Management’s Discussion
of Fund Performance |
| | October 31, 2020 (Unaudited) |
Short Positions
High-Multiple Regional Banks – Our high-multiple bank shorts added value. These are well-run banks but trade at the very highest valuations of their bank peers. We believe these names will underperform if regional bank stocks rally.
Extreme Valuation Presents Opportunity in Regional Banks
We believe there is a “once in a decade” opportunity in regional bank stocks.
As you know, regional bank stocks have significantly lagged the broader market in 2020. Through September 30th, the S&P Regional Banks Select Industry Index declined 36.75% vs. the S&P 500 Index rising 5.57%. This poor 2020 performance comes after regional banks lagged the broader market over the previous three years. From 2017 to 2019, regional banks returned only 11% vs. the S&P 500 Index’s 52% return.
This long-term underperformance of regional bank stocks created the current opportunity that we see.
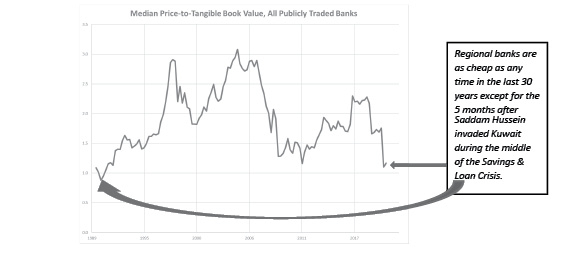
Industry Valuations at S&L Crisis Levels
Regional bank valuations are very compelling. Currently, 100 of the 186 banks, with deposits of at least $3 billion, trade below tangible book value. At the end of 2017, only 6 banks traded below tangible book value.
The median price-to-tangible book value of all publicly traded banks is 1.1x. This is lower than the valuations during the Great Financial Crisis (“GFC”). The only time in the last 30 years with lower bank valuations was during the stock market break in late 1990 when Saddam Hussain invaded Kuwait during the height of the Savings & Loan Crisis (“S&L Crisis”). From August 1990 to January 1991, regional banks traded at 0.9x tangible book.
Source: S&P Global Market Intelligence
Semi-Annual Report | October 31, 2020 | 3 |
Caldwell & Orkin -
Gator Capital Long/Short Fund | Management’s Discussion
of Fund Performance |
| | October 31, 2020 (Unaudited) |
We think the median regional bank valuation can easily reach 1.5x tangible book in the current interest rate environment. As recently as 2016 to 2018, the median regional bank traded at 2.2x tangible book. In 1998, and from 2004 to 2007, the median regional bank traded close to 3x tangible book. We don’t think regional banks will reach those valuations due to increased capital requirements and increased competitive intensity. But, as credit quality concerns abate, we think regional banks can rally.
Another way to evaluate how attractive regional bank valuations are is to look at the implied deposit premiums of banks versus where M&A transactions historically have been priced. This view of value makes sense because most investors look to deposits as the franchise value of a bank. To measure value, investors look at deposit premiums. Since 2016, the average deposit premium for acquired banks with more than $3 billion of deposits was 14%. Currently, only 3 of the 186 banks with deposits greater than $3 billion trade for a deposit premium of 14% or greater. At the end of 2017, 49 of 148 banks traded with deposit premiums above 14%. So, almost all banks trade below where they would trade in an M&A transaction.
Credit Risk in a Pandemic Economy
The fundamental cause of poor performance for bank stocks this year is investors fear of credit risk. When the economy started to shut down in March, the floor dropped out from under bank stock prices. But, credit losses haven’t appeared in the banks’ financial statements so far. We think the banks are going to have significantly lower credit losses in this credit cycle compared to the GFC or the S&L Crisis in the early 1990s.
The main reason for lower credit losses is better underwriting during this cycle. We believe the bank regulators stopped banks from making many marginal loans. We also think the annual banking stress tests have forced banks to restrict risk taking. This has positioned banks with much lower risk loan portfolios than past cycles.
Additional reasons for lower credit losses include:
| | ● | A strong economy before the sudden shutdown |
| | ● | Quick reactions by businesses and consumers to conserve cash |
| | ● | Speedy government action to provide stimulus and forbearance |
There are two wrinkles that make the low level of credit losses indistinct. First, loan forbearance and deferrals obscure how many customers are able to make payments. The bank regulators directed banks to generously grant loan forbearance and deferrals. Many customers took the offers of help even though they had the ability to pay. At the end of Q2, the median bank had 15% of their loan portfolios in deferral. This high level of deferral made it difficult for many investors to get comfortable with the underlying credit risk. Investors were unsure if large numbers of these customers were going to default and cause losses. During Q3, many banks gave updates on customer payment trends as deferrals expired. These banks report that the number of customers getting a second deferral dropped on average from mid-teens to mid-single-digit levels.
4 | 1-800-467-7903 | https://gatorcapital.com/mutual-funds/gator-capital-long-short-fund/ |
Caldwell & Orkin -
Gator Capital Long/Short Fund | Management’s Discussion
of Fund Performance |
| | October 31, 2020 (Unaudited) |
The second wrinkle that made the low level of credit losses difficult for investors to see is the implementation of a new accounting methodology for loan losses, which is called Current Expected Credit Losses (“CECL”) Methodology. Under CECL, a bank has to provide for lifetime loan loss reserves when they make a loan. Then, each quarter, the bank has to adjust their CECL reserves for changes to their economic forecast. (Note - Most banks outsource their economic forecast to an independent firm such as Moody’s.) So, when the banks reported their Q1 earnings, it was their first earnings report using CECL. They had to use significantly worse economic forecasts in setting their loan loss provisions for Q1 than they did when they set their initial reserve on January 2nd. We think investors will be surprised as banks will have to keep building their loan loss reserves in Q3 and Q4 as a result of CECL forcing them to provide large reserves in Q1 & Q2.
Other Headwinds for Banks
Credit risk is not the only current headwind for regional banks. While there are several others, we think each is manageable. We also think the current stock prices of the banks overly discount these issues.
ZIRP – “Zero Interest Rate Policy” is a strong headwind for banks because there is pressure on loan earnings. Because many banks already have deposit costs close to zero, they cannot offset the lower loan yields with lower deposit costs. We see banks instituting loan floors to protect themselves from low rates. Some banks earn substantial loan yields because they have a niche.
Banks with weaker deposit franchises or banks with high loan-to-deposit ratios actually benefit from the current environment. They can replace high-cost funding with low-cost deposits.
We expect low-interest rates for an extended period. The Federal Reserve kept interest rates at zero from 2008 to 2015. Although we do not think the current economy is as bad as the GFC, we do think the Federal Reserve has changed its tolerance of inflation. We could easily see interest rates staying at zero for five years in this cycle. We acknowledge low-interest rates will limit bank returns and valuations for the next several years, but we believe the current valuations overly discount this headwind.
Bank Investors Torched – The community of institutional investors who focus on bank stocks has struggled this year. Many bank stock investors focus on small-cap banks with less liquidity. We observed forced selling by this group of investors from March to September as these funds had to raise cash to meet investor redemptions. In talking with other bank investors, there is consensus that bank stocks are cheap, but everyone is already fully invested. This community is looking for new capital to put to work.
Limited Loan Growth – After the revolving line of credit draws in March, loan growth has been tepid. We think this a demand problem rather than a supply problem. Although banks tightened credit standards in 2020, they still want to make new loans. With the economic uncertainty caused by the pandemic and the high levels of liquidity offered by the capital markets, bank customers are not seeking bank loans.
Semi-Annual Report | October 31, 2020 | 5 |
Caldwell & Orkin -
Gator Capital Long/Short Fund | Management’s Discussion
of Fund Performance |
| | October 31, 2020 (Unaudited) |
Election Risk – At first glance, it would seem the banking industry would have downside risk to a Biden Administration due to the potential for higher regulation. But, the S&P Regional Banks Select Industry Index is actually down 7% since Trump’s election in 2016 despite rallying 35% in the first four months immediately after the election. How much worse could the banks perform than they did under the Trump administration?
The bullish case for banks under Biden:
| | 1. | There is less pressure on the Federal Reserve to keep interest rates low |
| | 2. | Stronger economic recovery as we get a federal government plan to snuff out the virus |
| | 3. | Less economic volatility from on-again, off-again trade wars with China |
| | 4. | Biden turns out to be surprisingly bank-agnostic. We see evidence of this from the decades of credit card company campaign contributions to Biden during his time as a senator from Delaware. |
M&A is on Slower – The banking M&A environment has slowed since the pandemic started. There are several reasons
| | 1. | Potential acquirers are more internally focused |
| | 2. | Acquirers are shy about buying another bank’s loan portfolio with the uncertain economy |
| | 3. | Sellers have not adjusted price expectations for the decline in stock prices |
| | 4. | Acquirers do not have the currency to make acquisitions. |
We think there may be defensive M&A in the current environment where bank management teams know they need to sell. There may be some low-premium, merger of equal deals where two similar banks merge to cut costs and both participate in a bank stock recovery. We saw an example of a low premium deal with the announcement of the First Citizens/CIT deal last week. We think a full-scale regional bank M&A environment will not return until late 2021 or 2022.
Positives for Banks
Although there are headwinds for regional banks, there are also some positives in the current environment.
Awash in Deposits – Since March, the banking system has become awash in deposits. This has been driven on a micro-level by corporations and consumers keeping more cash than normal in their checking accounts because of the economic uncertainty. On a macro level, the Fed engaging in Quantitative Easing replaces bonds held by investors with cash, which finds its way into bank deposits. Regional banks have been able to use these deposits to replace other higher-cost borrowings and to improve their loan-to-deposit ratios. We expect the high level of deposits to remain in the banking system for an extended period.
6 | 1-800-467-7903 | https://gatorcapital.com/mutual-funds/gator-capital-long-short-fund/ |
Caldwell & Orkin -
Gator Capital Long/Short Fund | Management’s Discussion
of Fund Performance |
| | October 31, 2020 (Unaudited) |
Levered to Recovery Trade – We expect regional banks to outperform as stock market investors gain confidence that the economy is recovering as people return to the workplace and normal activities resume. We call this the “Recovery Trade.” Generally, stocks of companies most impacted by the economy shuttering down are grouped together in the Recovery Trade. These include retail shopping centers, hotels, restaurants, airlines, cruise lines, and casinos. Year-to-date, this group of stocks has massively underperformed the market. We see this group outperform on days where there is positive news about a possible vaccination. We believe that out of these groups regional banks have the least impaired businesses. The regional banks have remained profitable while most of the businesses in the other industry groups reported substantial losses and increased their debt and/or sold equity at dilutive prices to offset their cash losses.
Expense Cutting Opportunity – Banks have been cutting expenses for several years. With strong deposit growth during sheltering-in-place, banks are seeing further opportunities to cut expenses. We think this will initially focus on more branch consolidation. But, we think bank cost-cutting will quickly move to the back office in terms of both headcount and real estate. In recent weeks, we have seen a handful of banks announce they were cutting 15-20% of their branches.
Return of Stock Repurchases – Bank stock valuations are very cheap. Banks continue to make money and build capital, and loan demand is weak. This would be an opportune time to use their excess capital to repurchase stock. We are beginning to see several banks with assets below $10 billion announce resumptions of their buybacks. We think this is good news for investors and expect this trend to expand through the end of the year. We anticipate bank regulators will allow larger banks to restart their repurchase programs in early 2021.
Secular Issues
Banks have long been average market performers. There are some obvious long-term secular issues with banks. They are exposed to asymmetric risk to the downside in the form of credit risk. The industry is competitive, and the competitive intensity is increasing. FinTech is a persistent threat. We don’t think these issues are dealbreakers for the current opportunity, but they reinforce that the current opportunity is more a trade versus a permanent investment opportunity.
Increasing Competitive Intensity – The banking industry is increasing in competitive intensity. There are several reasons for increasing competition including:
| | ● | The removal of interstate branching restrictions |
| | ● | Consumer lending products have consolidated nationally |
| | ● | Traditional non-bank firms such as brokerage houses providing banking services |
| | ● | Technology providers allow smaller banks to benefit from scale |
This increase in competitive intensity will keep a cap on margins long-term for banks.
Semi-Annual Report | October 31, 2020 | 7 |
Caldwell & Orkin -
Gator Capital Long/Short Fund | Management’s Discussion
of Fund Performance |
| | October 31, 2020 (Unaudited) |
Encroachment by FinTech – Financial Technology firms are encroaching on various aspects of the banking business. Examples are prepaid products, mortgage banking, and consumer loan origination. We believe these products are not disrupting the banking business as a whole, but they are chipping away at the profitable edges of banking.
Narrow Business Lines – Regional banks are not as diversified as they were 30 years ago. Since that time, consumer lending products such as credit cards, student loans, and mortgages have consolidated to the large national players such as JP Morgan Chase, Bank of America, and Wells Fargo. Regional banks are left with commercial real estate lending and middle market C&I lending. This lack of diversification makes banks more cyclical. This cyclical aspect is somewhat offset by strong banking regulators limiting the credit risk that banks can take.
Regional banks with the most opportunity
Growth banks – Several regional banks with historically higher organic growth rates trade for little valuation premium to the broader universe of regional banks. Banks like CNOB, PNFP, AX & WTFC trade in-line with regional banks, but they have grown faster than the industry. At some point, we believe the market will again place a growth premium on these banks. Plus, these banks tend to compound tangible book value at a faster rate than peers.
Very inexpensive banks – There are dozens of banks that are trading between 50% and 80% of tangible book value. Largely, these banks have been profitable throughout 2020. Besides credit fears, we believe these banks are cheap because too much investor capital has left the sector.
Puerto Rico banks – As we wrote in our July investor letter, the Puerto Rico banks trade cheap compared to the mainland U.S. bank. This is despite significant consolidation on the island and a potentially strong Puerto Rico economy. We like all three banks in Puerto Rico: BPOP, FBP & OFG.
We are working hard to position the portfolio where we see the most attractive opportunities.
Sincerely,
Derek S. Pilecki, CFA
Portfolio Manager
The performance data quoted represents past performance. Past performance is no guarantee of future results. The investment returns and principal value of an investment in the Fund will fluctuate so that an investor’s shares, when redeemed, may be worth more or less than their original cost. Current performance may be higher or lower than the performance data quoted. Please call 800-467-7903 or visit www.CaldwellOrkin.com for current month-end performance.
The Fund is distributed by Ultimus Fund Distributors, LLC, member FINRA/SIPC.
8 | 1-800-467-7903 | https://gatorcapital.com/mutual-funds/gator-capital-long-short-fund/ |
Caldwell & Orkin -
Gator Capital Long/Short Fund | Investment Results |
| | October 31, 2020 (Unaudited) |
Average Annual Total Returns(a) as of October 31, 2020 |
| Six Months | One Year | Three Year | Five Year | Ten Year |
Caldwell & Orkin - Gator Capital Long/Short Fund | 26.30% | (6.84)% | (2.21)% | (3.90)% | 0.85% |
S&P 500 Total Return Index (b) | 13.29% | 9.71% | 10.42% | 11.71% | 13.01% |
Eurekahedge Long Short Equities Hedge Fund Index (c) | 11.84% | 8.63% | 3.96% | 5.26% | 5.57% |
| | | | | | |
Total annualized Fund operating expenses for the Fund was 3.61% as described in the Prospectus, dated August 28, 2020. This amount includes Acquired Fund Fees and Expenses, as well as interest and dividend expenses related to short sales, which if excluded would result in an annual operating expense rate of 2.00%. Additional information about the Fund’s current fees and expenses for the six months ended October 31, 2020 is contained in the Financial Highlights. |
(a) | Return figures reflect any change in price per share and assume the reinvestment of all distributions. The Fund’s returns reflect any fee reductions during the applicable period. If such fee reductions had not occurred, the quoted performance would have been lower. The table does not reflect the deduction of taxes. The Fund’s returns represent past performance and do not guarantee future results. The Fund’s returns represent past performance and do not guarantee future results. Total returns for periods less than one year are not annualized. |
(b) | Investors should expect that the Fund’s performance may fluctuate independently of stock market indices, such as the S&P 500 Total Return Index. The S&P 500 Total Return Index is a widely recognized unmanaged index of 500 common stock prices adjusted to reflect the reinvestment of dividends and distributions. You may not invest directly in an index. |
(c) | The Eurekahedge Long Short Equities Hedge Fund Index is an unmanaged index comprised of long/short equity hedge funds. According to its sponsor, Eurekahedge Pte. Ltd., the Eurekahedge Index is an equally weighted index of 849 constituent funds designed to provide a broad measure of the performance of underlying hedge fund managers. The returns of the Eurekahedge Index do not include sales charges or fees, which would lower performance. You may not invest directly in an index. |
You should consider the Fund’s investment objectives, risks, charges and expenses carefully before you invest. The Fund’s prospectus contain important information about the Fund’s investment objectives, potential risks, management fees, charges and expenses, and other information and should be read carefully before investing. You may obtain a current copy of the Fund’s prospectus or performance data current to the most recent month by calling (800) 467-7903.
The Fund is distributed by Ultimus Fund Distributors, LLC, member FINRA/SIPC.
Semi-Annual Report | October 31, 2020 | 9 |
Caldwell & Orkin -
Gator Capital Long/Short Fund | Fund Holdings |
| | October 31, 2020 (Unaudited) |
Net Sector Exposure
October 31, 2020*

* | Sector weightings are calculated as a percentage of net assets and include short positions. Portfolio holdings are subject to change. |
The Caldwell & Orkin - Gator Capital Long/Short Fund’s (the “Fund”) investment objective is to provide long-term capital growth with a short-term focus on capital preservation.
Availability of Portfolio Schedule – (Unaudited)
The Fund files its complete schedule of portfolio holdings with the Securities and Exchange Commission (the “SEC”) for the first and third quarters of each fiscal year as an exhibit to its reports on Form N-PORT, within sixty days after the end of the period. The Fund’s Form N-PORT reports are available at the SEC’s website at www.sec.gov.
10 | 1-800-467-7903 | https://gatorcapital.com/mutual-funds/gator-capital-long-short-fund/ |
Caldwell & Orkin -
Gator Capital Long/Short Fund | Schedule of Investments |
| | October 31, 2020 (Unaudited) |
| | Shares | | | Fair Value | |
COMMON STOCKS — LONG — 96.73% | | | | | | | | |
Application Software — 0.88% | | | | | | | | |
BlackBerry Ltd.(a) | | | 28,000 | | | $ | 125,720 | |
| | | | | | | | | |
Banks — 24.38% | | | | | | | | |
Ameris Bancorp | | | 5,900 | | | | 172,870 | |
Axos Financial, Inc.(a) | | | 5,900 | | | | 160,833 | |
BankUnited, Inc. | | | 14,000 | | | | 353,500 | |
CIT Group, Inc. | | | 7,600 | | | | 223,820 | |
Citizens Financial Group, Inc. | | | 10,500 | | | | 286,125 | |
ConnectOne Bancorp, Inc. | | | 9,400 | | | | 145,042 | |
Dime Community Bancshares, Inc. | | | 10,900 | | | | 137,885 | |
First BanCorp. | | | 62,800 | | | | 407,572 | |
Flushing Financial Corp. | | | 12,100 | | | | 154,759 | |
OFG Bancorp | | | 21,400 | | | | 307,946 | |
Pinnacle Financial Partners, Inc. | | | 4,300 | | | | 196,897 | |
Popular, Inc. | | | 7,000 | | | | 295,400 | |
Sterling Bancorp | | | 19,500 | | | | 260,910 | |
Western Alliance Bancorp | | | 9,200 | | | | 379,040 | |
| | | | | | | | 3,482,599 | |
Broadcasting — 1.79% | | | | | | | | |
ViacomCBS, Inc., Class B | | | 8,958 | | | | 255,930 | |
| | | | | | | | | |
Casinos & Gaming — 4.38% | | | | | | | | |
Las Vegas Sands Corp. | | | 6,000 | | | | 288,360 | |
Melco Resorts & Entertainment Ltd. - ADR | | | 12,000 | | | | 193,440 | |
MGM Resorts International | | | 7,000 | | | | 143,990 | |
| | | | | | | | 625,790 | |
Coal Mining — 1.22% | | | | | | | | |
SunCoke Energy, Inc. | | | 50,000 | | | | 174,500 | |
| | | | | | | | | |
Communications Equipment — 1.38% | | | | | | | | |
Juniper Networks, Inc. | | | 10,000 | | | | 197,200 | |
| | | | | | | | | |
Computer Hardware & Storage — 0.45% | | | | | | | | |
Hewlett Packard Enterprise Co. | | | 7,500 | | | | 64,800 | |
| | | | | | | | | |
See accompanying notes which are an integral part of these financial statements.
Semi-Annual Report | October 31, 2020 | 11 |
Caldwell & Orkin -
Gator Capital Long/Short Fund |
Schedule of Investments
|
| | October 31, 2020 (Unaudited) |
| | Shares | | | Fair Value | |
Consumer Finance — 16.37% | | | | | | | | |
Alliance Data Systems Corp. | | | 3,000 | | | $ | 154,620 | |
Ally Financial, Inc. | | | 13,000 | | | | 346,840 | |
Capital One Financial Corp. | | | 4,600 | | | | 336,168 | |
Navient Corp. | | | 45,300 | | | | 362,853 | |
OneMain Holdings, Inc. | | | 13,599 | | | | 474,470 | |
SLM Corp. | | | 38,000 | | | | 349,220 | |
Synchrony Financial | | | 12,600 | | | | 315,252 | |
| | | | | | | | 2,339,423 | |
Diversified Banks — 5.66% | | | | | | | | |
Barclays PLC, Sponsored - ADR | | | 59,000 | | | | 326,270 | |
Citigroup, Inc. | | | 5,300 | | | | 219,526 | |
Deutsche Bank AG | | | 28,500 | | | | 263,625 | |
| | | | | | | | 809,421 | |
Fabricated Metal & Hardware — 1.26% | | | | | | | | |
Ampco-Pittsburgh Corp.(a) | | | 41,622 | | | | 181,056 | |
| | | | | | | | | |
Institutional Brokerage — 9.92% | | | | | | | | |
Credit Suisse Group AG - ADR | | | 42,000 | | | | 395,220 | |
Goldman Sachs Group, Inc. (The) | | | 1,500 | | | | 283,560 | |
Interactive Brokers Group, Inc., Class A | | | 3,700 | | | | 176,009 | |
Jefferies Financial Group, Inc. | | | 16,500 | | | | 321,915 | |
Morgan Stanley | | | 5,000 | | | | 240,750 | |
| | | | | | | | 1,417,454 | |
Investment Companies — 0.88% | | | | | | | | |
BBX Capital, Inc.(a) | | | 36,380 | | | | 125,511 | |
| | | | | | | | | |
Life Insurance — 1.08% | | | | | | | | |
Lincoln National Corp. | | | 4,400 | | | | 154,440 | |
| | | | | | | | | |
Local Tv & Radio Broadcast — 0.55% | | | | | | | | |
Entercom Communications Corp., Class A | | | 52,000 | | | | 78,000 | |
| | | | | | | | | |
Lodging — 2.07% | | | | | | | | |
Bluegreen Vacations Holding Corp.(a) | | | 36,380 | | | | 296,497 | |
| | | | | | | | | |
See accompanying notes which are an integral part of these financial statements.
12 | 1-800-467-7903 | https://gatorcapital.com/mutual-funds/gator-capital-long-short-fund/ |
Caldwell & Orkin -
Gator Capital Long/Short Fund |
Schedule of Investments
|
| | October 31, 2020 (Unaudited) |
| | Shares | | | Fair Value | |
Mortgage Finance — 4.56% | | | | | | | | |
Anworth Mortgage Asset Corp. | | | 158,500 | | | $ | 259,940 | |
MGIC Investment Corp. | | | 28,900 | | | | 290,734 | |
New Residential Investment Corp. | | | 13,500 | | | | 101,250 | |
| | | | | | | | 651,924 | |
P&C Insurance — 3.87% | | | | | | | | |
Ambac Financial Group, Inc.(a) | | | 18,700 | | | | 229,636 | |
NMI Holdings, Inc., Class A(a) | | | 15,000 | | | | 322,350 | |
| | | | | | | | 551,986 | |
Professional Services — 0.97% | | | | | | | | |
H&R Block, Inc. | | | 8,000 | | | | 138,080 | |
| | | | | | | | | |
Real Estate Services — 4.46% | | | | | | | | |
Cushman & Wakefield PLC(a) | | | 3,000 | | | | 35,160 | |
Realogy Holdings Corp.(a) | | | 54,000 | | | | 602,640 | |
| | | | | | | | 637,800 | |
Retail REITs — 1.19% | | | | | | | | |
Seritage Growth Properties, Class A(a) | | | 4,800 | | | | 61,104 | |
Site Centers Corp. | | | 16,000 | | | | 108,960 | |
| | | | | | | | 170,064 | |
Technology Hardware Storage & Peripherals — 1.69% | | | | | | | | |
Dell Technologies, Inc., Class C(a) | | | 4,000 | | | | 241,040 | |
| | | | | | | | | |
Wealth Management — 7.72% | | | | | | | | |
Ameriprise Financial, Inc. | | | 2,500 | | | | 402,075 | |
Boston Private Financial Holdings, Inc. | | | 23,700 | | | | 146,466 | |
Charles Schwab Corp. (The) | | | 13,501 | | | | 555,026 | |
| | | | | | | | 1,103,567 | |
Total Common Stocks — Long (Cost $15,945,207) | | | | | | | 13,822,802 | |
PREFERRED STOCKS — LONG — 1.83% | | | | | | | | |
Specialty Finance — 1.83% | | | | | | | | |
Federal National Mortgage Association (a) | | | 9,625 | | | | 133,306 | |
Federal National Mortgage Association, Series T, 8.25% (a) | | | 17,500 | | | | 128,800 | |
| | | | | | | | | |
Total Preferred Stocks — Long (Cost $341,772) | | | | | | | 262,106 | |
See accompanying notes which are an integral part of these financial statements.
Semi-Annual Report | October 31, 2020 | 13 |
Caldwell & Orkin -
Gator Capital Long/Short Fund |
Schedule of Investments
|
| | October 31, 2020 (Unaudited) |
| | Shares | | | Fair Value | |
WARRANTS — LONG — 0.39% | | | | | | | | |
American International Group, Inc., Expires 01/19/21, Strike Price $44(a) | | | 28,500 | | | $ | 6,612 | |
Ampco-Pittsburgh Corp., Expires 08/01/25, Strike Price $6(a) | | | 91,000 | | | | 49,149 | |
| | | | | | | | | |
Total Warrants — Long (Cost $426,477) | | | | | | | 55,761 | |
MONEY MARKET FUNDS — 0.53% | | | | | | | | |
First American Treasury Obligations Fund, Class X, 0.05%(b) | | | 76,236 | | | | 76,236 | |
| | | | | | | | | |
Total Money Market Funds (Cost $76,236) | | | | | | | 76,236 | |
Total Investments — 99.48% (Cost $16,789,692) | | | | | | | 14,216,905 | |
| | | | | | | | | |
Other Assets in Excess of Liabilities — 0.52% | | | | | | | 74,252 | |
NET ASSETS — 100.00% | | | | | | $ | 14,291,157 | |
(a) | Non-income producing security. |
(b) | Rate disclosed is the seven day effective yield as of October 31, 2020. |
ADR - American Depositary Receipt.
ETF - Exchange-Traded Fund
See accompanying notes which are an integral part of these financial statements.
14 | 1-800-467-7903 | https://gatorcapital.com/mutual-funds/gator-capital-long-short-fund/ |
Caldwell & Orkin -
Gator Capital Long/Short Fund | Schedule of Securities Sold Short |
| | October 31, 2020 (Unaudited) |
| | Shares | | | Fair Value | |
COMMON STOCKS — SHORT — (21.02)% | | | | | | | | |
Banks — (10.96)% | | | | | | | | |
City Holding Co. | | | (2,301 | ) | | $ | (139,048 | ) |
Commerce Bancshares, Inc. | | | (2,200 | ) | | | (136,950 | ) |
Community Bank System, Inc. | | | (1,350 | ) | | | (78,287 | ) |
CVB Financial Corp. | | | (10,000 | ) | | | (175,000 | ) |
Glacier Bancorp, Inc. | | | (1,000 | ) | | | (35,800 | ) |
Independent Bank Corp. | | | (2,000 | ) | | | (114,580 | ) |
Lakeland Financial Corp. | | | (3,000 | ) | | | (153,390 | ) |
NBT Bancorp, Inc. | | | (800 | ) | | | (21,904 | ) |
Park National Corp. | | | (1,700 | ) | | | (155,805 | ) |
Southside Bancshares, Inc. | | | (3,500 | ) | | | (94,360 | ) |
Stock Yards Bancorp, Inc. | | | (3,200 | ) | | | (122,304 | ) |
Tompkins Financial Corp. | | | (1,700 | ) | | | (95,183 | ) |
United Bankshares, Inc. | | | (4,500 | ) | | | (118,035 | ) |
Westamerica Bancorp | | | (2,400 | ) | | | (125,688 | ) |
| | | | | | | | (1,566,334 | ) |
Consumer Finance — (0.83)% | | | | | | | | |
American Express Co. | | | (1,300 | ) | | | (118,612 | ) |
| | | | | | | | | |
Industrial Reit — (1.99)% | | | | | | | | |
Duke Realty Corp. | | | (7,500 | ) | | | (284,925 | ) |
| | | | | | | | | |
Mortgage Finance — (1.82)% | | | | | | | | |
Rocket Cos, Inc., Class A(a) | | | (14,250 | ) | | | (259,778 | ) |
| | | | | | | | | |
P&C Insurance — (3.00)% | | | | | | | | |
Lemonade, Inc.(a) | | | (5,500 | ) | | | (276,595 | ) |
Palomar Holdings, Inc.(a) | | | (1,700 | ) | | | (151,589 | ) |
| | | | | | | | (428,184 | ) |
Private Equity — (1.76)% | | | | | | | | |
Blackstone Group LP (The), Class A | | | (5,000 | ) | | | (252,100 | ) |
| | | | | | | | | |
Specialty Reit — (0.66)% | | | | | | | | |
Iron Mountain, Inc. | | | (3,600 | ) | | | (93,816 | ) |
| | | | | | | | | |
Total Common Stocks — Short (Proceeds Received $3,090,149) | | | | | | | (3,003,749 | ) |
See accompanying notes which are an integral part of these financial statements.
Semi-Annual Report | October 31, 2020 | 15 |
Caldwell & Orkin -
Gator Capital Long/Short Fund |
Schedule of Securities Sold Short
|
| | October 31, 2020 (Unaudited) |
| | Shares | | | Fair Value | |
EXCHANGE-TRADED FUNDS — SHORT — (3.72)% | | | | | | | | |
Direxion Daily Financial Bear 3X Shares | | | (8,000 | ) | | $ | (117,520 | ) |
Direxion Shares ETF Trust Direxion Daily Regional Banks Bull 3X Shares | | | (6,300 | ) | | | (414,981 | ) |
| | | | | | | | | |
Total Exchange-Traded Funds (Cost $(627,881)) | | | | | | | (532,501 | ) |
TOTAL SECURITIES SOLD SHORT — (24.74)% (Proceeds Received $3,718,030) | | | | | | $ | (3,536,250 | ) |
(a) | Non-income producing security. |
ETF - Exchange-Traded Fund
See accompanying notes which are an integral part of these financial statements.
16 | 1-800-467-7903 | https://gatorcapital.com/mutual-funds/gator-capital-long-short-fund/ |
Caldwell & Orkin -
Gator Capital Long/Short Fund | Statement of Assets and Liabilities |
| | October 31, 2020 (Unaudited) |
Assets | | | | |
Investments is securities at fair value (cost $16,789,692) | | $ | 14,216,905 | |
Deposit held by broker for securities sold short | | | 3,634,266 | |
Receivable for fund shares sold | | | 1 | |
Dividends and interest receivable | | | 16,918 | |
Tax reclaims receivable | | | 1,601 | |
Prepaid expenses | | | 19,533 | |
Total Assets | | | 17,889,224 | |
| | | | | |
Liabilities | | | | |
Bank overdraft | | | 1,312 | |
Securities sold short, at value (proceeds received $3,718,030) | | | 3,536,250 | |
Payable for dividends declared on short sales | | | 2,443 | |
Payable to Adviser | | | 4,360 | |
Payable to Administrator | | | 12,752 | |
Payable to trustees | | | 148 | |
Other accrued expenses | | | 40,802 | |
Total Liabilities | | | 3,598,067 | |
| | | | | |
Net Assets | | $ | 14,291,157 | |
| | | | | |
Net Assets consist of: | | | | |
Paid-in capital | | | 19,550,537 | |
Accumulated deficit | | | (5,259,380 | ) |
Net Assets | | $ | 14,291,157 | |
| | | | | |
Shares outstanding, par value $0.10 per share (30,000,000 authorized shares) | | | 743,954 | |
| | | | | |
Net asset value, offering price and redemption price per share(a) | | $ | 19.21 | |
(a) | Redemption price may differ from net asset value if redemption fee is applied. |
See accompanying notes which are an integral part of these financial statements.
Semi-Annual Report | October 31, 2020 | 17 |
Caldwell & Orkin -
Gator Capital Long/Short Fund | Statement of Operations |
For the six months ended October 31, 2020 (Unaudited) |
Investment Income | | | | |
Dividend income (net of foreign taxes withheld of $1,081) | | $ | 304,318 | |
Interest income | | | 118 | |
Total investment income | | | 304,436 | |
| | | | | |
Expenses | | | | |
Investment Advisory fees | | | 67,694 | |
Legal | | | 21,048 | |
Miscellaneous | | | 18,918 | |
Director’s fees and expenses | | | 18,148 | |
Registration | | | 12,588 | |
Audit and tax preparation | | | 9,220 | |
Compliance Services | | | 9,209 | |
Fund accounting | | | 7,353 | |
Administration | | | 7,245 | |
Report printing | | | 5,963 | |
Insurance | | | 5,158 | |
Transfer agent | | | 5,042 | |
Custodian | | | 4,666 | |
Sub transfer agent fees | | | 1,637 | |
Pricing | | | 1,311 | |
Interest | | | 46,473 | |
Dividend expense on securities sold short | | | 34,699 | |
Total expenses | | | 276,372 | |
Fees contractually waived and expenses reimbursed by Adviser | | | (59,225 | ) |
Net operating expenses | | | 217,147 | |
Net investment income | | | 87,289 | |
| | | | | |
Net Realized and Change in Unrealized Gain (Loss) on Investments | | | | |
Net realized gain from: | | | | |
Investments | | | 493,805 | |
Securities sold short | | | 323,209 | |
Foreign currency transactions | | | 9 | |
Change in unrealized appreciation (depreciation) on: | | | | |
Investments | | | 2,235,950 | |
Securities sold short | | | (39,082 | ) |
Foreign currency translations | | | 92 | |
Net realized and change in unrealized gain on investments and securities sold short | | | 3,013,983 | |
Net increase in net assets resulting from operations | | $ | 3,101,272 | |
See accompanying notes which are an integral part of these financial statements.
18 | 1-800-467-7903 | https://gatorcapital.com/mutual-funds/gator-capital-long-short-fund/ |
Caldwell & Orkin -
Gator Capital Long/Short Fund | Statements of Changes in Net Assets |
| | |
| | | For the Six
Months Ended
October 31, 2020
(Unaudited) | | | For the Year Ended
April 30, 2020 | |
Increase (Decrease) in Net Assets due to: | | | | | | | | |
Operations | | | | | | | | |
Net investment income (loss) | | $ | 87,289 | | | $ | (195,361 | ) |
Net realized gain on investments, securities sold short and foreign currency translations | | | 817,023 | | | | 1,251,055 | |
Net change in unrealized appreciation (depreciation) of investments, securities sold short and foreign currency translations | | | 2,196,960 | | | | (6,177,738 | ) |
Net increase (decrease) in net assets resulting from operations | | | 3,101,272 | | | | (5,122,044 | ) |
| | | | | | | | | |
Capital Transactions | | | | | | | | |
Proceeds from shares sold | | | 172,565 | | | | 343,089 | |
Amount paid for shares redeemed | | | (1,241,874 | ) | | | (6,234,398 | ) |
Proceeds from redemption fees (Note 1) | | | 93 | | | | 549 | |
Net decrease in net assets resulting from capital transactions | | | (1,069,216 | ) | | | (5,890,760 | ) |
Total Increase (Decrease) in Net Assets | | | 2,032,056 | | | | (11,012,804 | ) |
| | | | | | | | | |
Net Assets | | | | | | | | |
Beginning of period | | | 12,259,101 | | | | 23,271,905 | |
End of period | | $ | 14,291,157 | | | $ | 12,259,101 | |
| | | | | | | | | |
Share Transactions | | | | | | | | |
Shares sold | | | 9,608 | | | | 19,315 | |
Shares redeemed | | | (71,494 | ) | | | (329,132 | ) |
Net decrease in shares outstanding | | | (61,886 | ) | | | (309,817 | ) |
See accompanying notes which are an integral part of these financial statements.
Semi-Annual Report | October 31, 2020 | 19 |
Caldwell & Orkin -
Gator Capital Long/Short Fund | Financial Highlights |
| | |
For a share outstanding during each period
| | For the
Six Months
Ended
October 31,
2020
(Unaudited) | | | For the
Year
Ended
April 30,
2020 | | | For the
Year
Ended
April 30,
2019 | | | For the
Year
Ended
April 30,
2018 | | | For the
Year
Ended
April 30,
2017 | | | For the
Year
Ended
April 30,
2016 | |
Selected Per Share Data | | | | | | | | | | | | | | | | | | | | | | | | |
Net asset value, beginning of period | | $ | 15.21 | | | $ | 20.86 | | | $ | 20.61 | | | $ | 20.72 | | | $ | 21.57 | | | $ | 22.94 | |
Investment operations: | | | | | | | | | | | | | | | | | | | | | | | | |
Net investment income | | | 0.11 | | | | (0.20 | )(a) | | | (0.19 | )(a) | | | (0.24 | )(a) | | | (0.25 | ) | | | (0.36 | ) |
Net realized and unrealized gain (loss) on investments | | | 3.89 | | | | (5.45 | ) | | | 0.44 | (b) | | | 0.13 | (b) | | | (0.60 | ) | | | 0.30 | |
Total from investment operations | | | 4.00 | | | | (5.65 | ) | | | 0.25 | | | | (0.11 | ) | | | (0.85 | ) | | | (0.06 | ) |
| | | | | | | | | | | | | | | | | | | | | | | | | |
Less distributions to shareholders from: | | | | | | | | | | | | | | | | | | | | | | | | |
Net realized gains | | | — | | | | — | | | | — | | | | — | | | | — | | | | (1.32 | ) |
Total distributions | | | — | | | | — | | | | — | | | | — | | | | — | | | | (1.32 | ) |
| | | | | | | | | | | | | | | | | | | | | | | | | |
Paid in capital from redemption fees | | | — | (c) | | | — | (c) | | | — | (c) | | | — | (c) | | | — | (c) | | | 0.01 | |
Net asset value, end of period | | $ | 19.21 | | | $ | 15.21 | | | $ | 20.86 | | | $ | 20.61 | | | $ | 20.72 | | | $ | 21.57 | |
| | | | | | | | | | | | | | | | | | | | | | | | | |
Total Return(d) | | | 26.30 | %(e) | | | (27.09 | )% | | | 1.21 | % | | | (0.53 | )% | | | (3.94 | )% | | | (0.56 | )% |
| | | | | | | | | | | | | | | | | | | | | | | | | |
Ratios and Supplemental Data: | | | | | | | | | | | | | | | | | | | | | | | | |
Net assets, end of period (000 omitted) | | $ | 14,291 | | | $ | 12,259 | | | $ | 23,272 | | | $ | 49,785 | | | $ | 116,610 | | | $ | 208,328 | |
Ratios to Average Net Assets: | | | | | | | | | | | | | | | | | | | | | | | | |
Ratio of net expenses to average net assets(f) | | | 3.20 | %(g) | | | 3.60 | % | | | 3.19 | % | | | 2.41 | % | | | 2.00 | % | | | 2.95 | % |
Ratio of expenses to average net assets before waiver by Adviser | | | 4.07 | %(g) | | | 4.08 | % | | | 3.31 | % | | | 2.41 | % | | | 2.00 | % | | | 2.95 | % |
Ratio of net investment income (loss) to average net assets | | | 1.28 | %(g) | | | (1.00 | )% | | | (0.92 | )% | | | (1.19 | )% | | | (1.18 | )% | | | (2.06 | )% |
Portfolio Turnover Rate | | | 20 | %(e) | | | 87 | % | | | 240 | % | | | 531 | % | | | 500 | % | | | 415 | % |
(a) | Calculated using average shares outstanding. |
(b) | The amount shown for a share outstanding throughout the period does not accord with the change in aggregate gains and losses in the portfolio of securities during the period because of timing of sales and purchases of fund shares in relation to fluctuating market values during the period. |
(c) | Rounds to less than $0.005 per share. |
(d) | Total return in the above table represents the rate that the investor would have earned or lost on an investment in the Fund, assuming reinvestment of distributions. |
(f) | Excluding dividend and interest expense, the ratios of net expenses to average net assets were 2.00% for the six months ended October 31, 2020 and 2.00%, 2.00%, 1.85%, 1.40% and 1.37% for the fiscal years ended April 30, 2020, 2019, 2018, 2017 and 2016, respectively. |
See accompanying notes which are an integral part of these financial statements.
20 | 1-800-467-7903 | https://gatorcapital.com/mutual-funds/gator-capital-long-short-fund/ |
Caldwell & Orkin -
Gator Capital Long/Short Fund | Notes to Financial Statements |
| | October 31, 2020 (Unaudited) |
1. ORGANIZATION
The Caldwell & Orkin - Gator Capital Long/Short Fund (the “Fund”), formerly the Caldwell & Orkin Market Opportunity Fund, is the only investment portfolio of The Caldwell & Orkin Funds, Inc. (the “Company”), an open-end, diversified management investment company registered under the Investment Company Act of 1940, as amended (the “1940 Act”), and incorporated under the laws of the State of Maryland on August 15, 1989. The Fund’s investment objective is to provide long-term capital growth with a short-term focus on capital preservation. Gator Capital Management, LLC (the “Adviser”), the Fund’s investment adviser, uses a fundamental driven, multi-dimensional investment process focusing on active allocation, security selection and surveillance to achieve the Fund’s investment objective.
2. SUMMARY OF SIGNIFICANT ACCOUNTING POLICIES
The Fund is an investment company and follows accounting and reporting guidance under Financial Accounting Standards Board Accounting Standards Codification (“ASC”) Topic 946, “Financial Services-Investment Companies.” The following is a summary of significant accounting policies followed by the Fund in the preparation of its financial statements. These policies are in conformity with generally accepted accounting principles in the United States of America (“GAAP”).
Use of Estimates
The preparation of financial statements in conformity with GAAP requires management to make estimates and assumptions that affect the reported amounts of assets and liabilities and disclosure of contingent assets and liabilities at the date of the financial statements and the reported amounts of revenues and expenses during the reporting period. Actual results could differ from those estimates.
Securities Valuation
Securities are stated at the closing price on the date at which the net asset value (“NAV”) is being determined. If the date of determination is not a trading date, or the closing price is not otherwise available, the last bid price is used for a fair value instead. Debt securities are valued at the price provided by an independent pricing service. Any assets or securities for which market quotations are not readily available are valued at fair value as determined in good faith by or under the direction of the Fund’s Board of Directors (the “Board”) in accordance with the Fund’s Fair Value Pricing Policy.
Securities Transactions and Related Investment Income
The Fund follows industry practice and records securities transactions on trade date for financial reporting purposes. Dividend income is recorded on the ex-dividend date. Realized gains and losses from investment transactions are determined using the specific identification method. Interest income which includes amortization of premium and accretion of discount, is accrued as earned.
Semi-Annual Report | October 31, 2020 | 21 |
Caldwell & Orkin -
Gator Capital Long/Short Fund | Notes to Financial Statements |
| | October 31, 2020 (Unaudited) |
Fair Value Measurements
A three-tier hierarchy has been established to classify fair value measurements for disclosure purposes. Inputs refer broadly to the assumptions that market participants would use in pricing the asset or liability, including assumptions about risk. Inputs may be observable or unobservable. Observable inputs are inputs that reflect the assumptions market participants would use in pricing the asset or liability that are developed based on market data obtained from sources independent of the reporting entity. Unobservable inputs are inputs that reflect the reporting entity’s own assumptions about the assumptions market participants would use in pricing the asset or liability that are developed based on the best information available.
Various inputs are used in determining the value of the Fund’s investments. These inputs are summarized in the three broad levels listed below.
● | Level 1 – unadjusted quoted prices in active markets for identical investments and/or registered investment companies where the value per share is determined and published and is the basis for current transactions for identical assets or liabilities at the valuation date |
● | Level 2 – quoted prices which are not active quoted prices for similar assets or liabilities in active markets or inputs other than quoted process that are observable (either directly or indirectly) for substantially the full term of the asset of liability |
● | Level 3 – significant unobservable inputs (including the Fund’s own assumptions in determining fair value of investments based on the best information available) |
The inputs used to measure fair value may fall into different levels of the fair value hierarchy. In such cases, for disclosure purposes, the level in the fair value hierarchy which is reported, is determined based on the lowest level input that is significant to the fair value measurement in its entirety.
The following is a summary of the inputs used as of October 31, 2020 in valuing the Fund’s investments carried at value:
Investments in Securities* | | Level 1 | | | Level 2 | | | Level 3 | | | Total | |
Assets | | | | | | | | | | | | | | | | |
Common Stocks | | $ | 13,822,802 | | | $ | — | | | $ | — | | | $ | 13,822,802 | |
Preferred Stock | | | 262,106 | | | | — | | | | — | | | | 262,106 | |
Warrants | | | 6,612 | | | | 49,149 | | | | — | | | | 55,761 | |
Money Market Funds | | | 76,236 | | | | — | | | | — | | | | 76,236 | |
Total | | $ | 14,167,756 | | | $ | 49,149 | | | $ | — | | | $ | 14,216,905 | |
Liabilities | | | | | | | | | | | | | | | | |
Securities Sold Short | | | | | | | | | | | | | | | | |
Common Stocks | | $ | (3,003,749 | ) | | $ | — | | | $ | — | | | $ | (3,003,749 | ) |
Exchange-Traded Funds | | | (532,501 | ) | | | — | | | | — | | | | (532,501 | ) |
Exchange-Traded Notes | | | — | | | | — | | | | — | | | | — | |
Total | | $ | (3,536,250 | ) | | $ | — | | | $ | — | | | $ | (3,536,250 | ) |
22 | 1-800-467-7903 | https://gatorcapital.com/mutual-funds/gator-capital-long-short-fund/ |
Caldwell & Orkin -
Gator Capital Long/Short Fund |
Notes to Financial Statements
|
| | October 31, 2020 (Unaudited) |
Share Valuation
The NAV per share of the Fund is calculated by dividing the sum of the value of the securities held by the Fund, plus cash or other assets, minus all liabilities (including estimated accrued expenses) by the total number of shares outstanding for the Fund, rounded to the nearest cent. The Fund’s shares will not be priced on the days on which the New York Stock Exchange is closed for trading. The offering and redemption price per share for the Fund is equal to the Fund’s NAV per share.
The Fund charges a 2.00% redemption fee on shares held less than 90 days. These fees are deducted from the redemption proceeds otherwise payable to the shareholder. The Fund will retain the fee charged as paid-in capital and such fees become part of the Fund’s daily NAV calculation. For the six months ended October 31, 2020 the Fund recorded $93 in redemption fee proceeds.
Federal Income Taxes
The Fund makes no provision for federal income tax or excise tax. The Fund has qualified and intends to qualify each year as a regulated investment company (“RIC”) under subchapter M of the Internal Revenue Code of 1986, as amended, by complying with the requirements applicable to RICs and by distributing substantially all of its taxable income. The Fund also intends to distribute sufficient net investment income and net capital gains, if any, so that it will not be subject to excise tax on undistributed income and gains. If the required amount of net investment income or gains is not distributed, the Fund could incur a tax expense.
The Fund may be subject to taxes imposed by countries in which it invests. Such taxes are generally based on income and/or capital gains earned or repatriated. Taxes are accrued and applied to net investment income, net realized gains and unrealized appreciation as such income and/or gains are earned.
The Fund recognizes tax benefits or expenses of uncertain tax positions only when the position is “more likely than not” to be sustained assuming examination by tax authorities. Management of the Fund has reviewed tax positions taken in tax years that remain subject to examination by all major tax jurisdictions, including federal (i.e., the previous three tax year ends and the interim tax period since then, as applicable) and has concluded that no provision for unrecognized tax benefits or expenses is required in these financial statements and does not expect this to change over the next twelve months. The Fund recognizes interest and penalties, if any, related to unrecognized tax benefits as income tax expense in the Statement of Operations. During the year, the Fund did not incur any interest or penalties.
3. FEES AND OTHER TRANSACTIONS WITH AFFILIATES AND OTHER SERVICE PROVIDERS
The Fund has entered into a management agreement (the “Management Agreement”) with the Adviser pursuant to which the Adviser provides space, facilities, equipment and personnel necessary to perform administrative and investment management services for the Fund. The
Semi-Annual Report | October 31, 2020 | 23 |
Caldwell & Orkin -
Gator Capital Long/Short Fund |
Notes to Financial Statements
|
| | October 31, 2020 (Unaudited) |
Management Agreement provides that the Adviser is responsible for the management of the Fund’s portfolio. For such services and expenses assumed by the Adviser, the Fund pays a monthly advisory fee at incremental annual rates as follows:
Advisory Fee | Average Daily Net Assets |
1.00% | Up to $250 million |
0.90% | In excess of $250 million but not greater than $500 million |
0.80% | In excess of $500 million |
The Adviser has agreed to reimburse the Fund to the extent necessary to prevent the Fund’s annual ordinary operating expenses (excluding taxes, expenses related to the execution of portfolio transactions and the investment activities of the Fund such as, for example, interest, dividend expenses on securities sold short, brokerage commissions and fees and expenses charged to the Fund by any investment company in which the Fund invests and extraordinary charges such as litigation costs) from exceeding 2.00% of the Fund’s average net assets. For the six months ended October 31, 2020, the Adviser waived fees and reimbursed expenses in the amount of $59,225 for the Fund. During the six months ended October 31, 2020, the Adviser earned $67,694 from the Fund, before the waiver described above.
Ultimus Fund Solutions, LLC (the “Administrator”) provides fund accounting, fund administration and transfer agency services under a Master Services Agreement to the Fund. The Fund pays the Administrator fees for its services under the Master Services Agreement. In addition, the Fund pays out-of-pocket expenses including, but not limited to postage, supplies and costs of pricing the Fund’s securities. For the six months ended October 31, 2020, the Administrator earned fees of $7,245 for administration services, $7,353 for fund accounting services, and $5,042 for transfer agent services.
Ultimus Fund Distributors, LLC (the “Distributor”) serves as distributor to the Fund. The Fund does not pay the Distributor for these services. The Distributor is a wholly-owned subsidiary of the Administrator.
Certain officers of the Fund are also officers of the Administrator and the Distributor.
4. DIRECTOR COMPENSATION
The Fund pays each Director, in cash, an annual fee of $8,000 per year, plus $1,500 for each in-person meeting attended and $1,000 for each telephonic meeting attended. The Fund also reimburses Directors’ actual out-of-pocket expenses relating to attendance at meetings.
5. INVESTMENT PORTFOLIO TRANSACTIONS
During the six months ended October 31, 2020, the Fund purchased $3,248,103 and sold $2,627,281 of securities, excluding securities sold short and short-term investments.
24 | 1-800-467-7903 | https://gatorcapital.com/mutual-funds/gator-capital-long-short-fund/ |
Caldwell & Orkin -
Gator Capital Long/Short Fund |
Notes to Financial Statements
|
| | October 31, 2020 (Unaudited) |
Short Sales and Segregated Cash
Short sales are transactions in which the Fund sells a security it does not own, in anticipation of a decline in the market value of that security. To initiate such a transaction, the Fund must borrow the security to deliver to the buyer upon the short sale; the Fund is then obligated to replace the security borrowed by purchasing it in the open market at some later date, completing the transaction.
The Fund will incur a loss if the market price of the security increases between the date of the short sale and the date on which the Fund replaces the borrowed security. The Fund will realize a gain if the security declines in value between those dates.
All short sales must be fully collateralized. The Fund maintains the collateral in segregated accounts consisting of cash and/or U.S. Government securities sufficient to collateralize the market value of its short positions. Typically, the segregated cash with brokers and other financial institutions exceeds the minimum required. Deposits with brokers for securities sold short are invested in money market instruments. Segregated cash is held at the custodian in the name of the broker per a tri-party agreement between the Fund, the custodian, and the broker.
The Fund may also sell short “against the box”, i.e., the Fund enters into a short sale as described above, while holding an offsetting long position in the same security which it sold short. If the Fund enters into a short sale against the box, it will segregate an equivalent amount of securities owned by the Fund as collateral while the short sale is outstanding.
The Fund limits the value of its short positions (excluding short sales “against the box”) to 60% of the Fund’s total net assets. At October 31, 2020, the Fund had approximately 25% of its total net assets in short positions.
For the six months ended October 31, 2020, the cost of investments purchased to cover short sales and the proceeds from investments sold short were $5,261,311 and $4,223,940, respectively.
6. FEDERAL TAX INFORMATION
As of October 31, 2020, the net unrealized appreciation (depreciation) of investments, including short securities, for tax purposes was as follows:
Gross unrealized appreciation | | $ | 957,832 | |
Gross unrealized depreciation | | | (3,902,912 | ) |
Net unrealized depreciation on investments | | $ | (2,945,080 | ) |
Tax cost of investments | | $ | 13,625,735 | |
Semi-Annual Report | October 31, 2020 | 25 |
Caldwell & Orkin -
Gator Capital Long/Short Fund |
Notes to Financial Statements
|
| | October 31, 2020 (Unaudited) |
At April 30, 2020, the Fund’s most recent fiscal year end, the components of accumulated earnings (deficit) on a tax basis were as follows:
Accumulated capital and other losses | | $ | (3,218,704 | ) |
Unrealized depreciation | | | (5,141,948 | ) |
| | | $ | (8,360,652 | ) |
The difference between book basis and tax basis unrealized appreciation is attributable primarily to the tax deferral of wash losses and investments in partnerships and certain other investments.
Certain capital losses incurred after October 31, and within the current taxable year, are deemed to arise on the first business day of the Fund’s following taxable year. Late year Ordinary Losses incurred after December 31 are deemed to arise on the first business day of the Fund’s following taxable year. For the tax year ended April 30, 2020, the Fund deferred $77,600 in Qualified Late Year Ordinary Losses.
As of April 30, 2020, the Fund has available for tax purposes an unused capital loss carryforward of $2,999,322 of short-term capital losses and $141,782 of long-term capital losses with no expiration, which are available to offset against future taxable net capital gains.
7. COMMITMENTS AND CONTINGENCIES
Under the Fund’s organizational documents, its officers and directors are indemnified against certain liability arising out of the performance of their duties to the Fund. Additionally, in the normal course of business, the Fund enters into contracts with service providers that may contain general indemnification clauses, which may permit indemnification to the extent permissible under applicable law. The Fund’s maximum exposure under these arrangements is unknown, as this would involve future claims that may be made against the Fund that have not yet occurred.
8. MARKET RISK
Market risk is the risk that the value of the securities in the Fund’s portfolio may decline due to daily fluctuations in the securities markets that are generally beyond the Manager’s control, including fluctuation in interest rates, the quality of the Fund’s investments, economic conditions and general market conditions. Certain market events could increase volatility and exacerbate market risk, and could result in trading halts, such as changes in governments’ economic policies, political turmoil, environmental events, trade disputes, terrorism, military action and epidemics, pandemics or other public health issues. Any of the foregoing market events can adversely affect the economies of one or more countries or the entire global economy, certain industries or individual issuers, and capital and security markets in ways that cannot necessarily be foreseen or quickly addressed.
26 | 1-800-467-7903 | https://gatorcapital.com/mutual-funds/gator-capital-long-short-fund/ |
Caldwell & Orkin -
Gator Capital Long/Short Fund |
Notes to Financial Statements
|
| | October 31, 2020 (Unaudited) |
As shown with the novel coronavirus disease that has recently emerged (COVID-19), market events (including public health crises and concerns) can have a profound economic and business effect that results in cancellations and disruptions to supply chains and customer activity, disruption and displacement of one or more sectors or industries, closing of borders and imposition of travel restrictions and quarantines, general public concern and uncertainty and, in extreme cases, exchange trading halts due to rapidly falling prices. Further, the impact of COVID-19 has caused significant volatility and declines in global financial markets, including the U.S. financial markets. The duration and lasting impact of the COVID-19 outbreak is unclear and may not be fully known for some time.
Market events such as these and other types of market events may cause significant declines in the values and liquidity of many securities and other instruments, and significant disruptions to global business activity and financial markets. Turbulence in financial markets, and reduced liquidity in equity, credit and fixed income markets may negatively affect many issuers both domestically and around the world, and can result in trading halts, any of which could have an adverse impact on the Fund. During periods of market volatility, security prices (including securities held by the Fund) could change drastically and rapidly and therefore adversely affect the Fund.
9. LIQUIDTY RISK MANAGEMENT PROGRAM
The Fund has adopted and implemented a written liquidity risk management program as required by Rule 22e-4 (the “Liquidity Rule”) under the Investment Company Act. The program is reasonably designed to assess and manage the Fund’s liquidity risk, taking into consideration, among other factors, the Fund’s investment strategy and the liquidity of its portfolio investments during normal and reasonably foreseeable stressed conditions; its short and long-term cash flow projections; and its cash holdings and access to other funding sources. The Funds’ Board of Directors approved the appointment of a committee to serve as Liquidity Program Administrator (LPA), which committee includes representatives from the Fund’s investment manager. The LPA is responsible for the program’s administration and oversight and for reporting to the Board on at least an annual basis regarding the program’s operation and effectiveness. The Liquidity Assessment written report that was presented to the Board of Directors at the June 15, 2020 Board meeting covered the period from June 1, 2019 to December 31, 2019 (the “Review Period”).
During the Review Period, the Fund did not experience unusual stress or disruption to its operations related to purchase and redemption activity. Also, during the Review Period, the Fund held adequate levels of cash and highly liquid investments to meet shareholder redemption activities in accordance with applicable requirements. During the Review Period, the Fund did not hold illiquid securities and the Fund was not required to establish a highly liquid investment minimum. The Report concluded that the Fund takes many factors into consideration when determining the best methods for managing the liquidity of the portfolio and that the Fund’s liquidity risk management program operated appropriately during the Review Period.
Semi-Annual Report | October 31, 2020 | 27 |
Caldwell & Orkin -
Gator Capital Long/Short Fund |
Notes to Financial Statements
|
| | October 31, 2020 (Unaudited) |
10. SUBSEQUENT EVENTS
Management of the Fund has evaluated the need for disclosures and/or adjustments resulting from subsequent events through the date at which these financial statements were issued. Based upon this evaluation, management has determined there were no items requiring adjustment of the financial statements or additional disclosure.
28 | 1-800-467-7903 | https://gatorcapital.com/mutual-funds/gator-capital-long-short-fund/ |
Caldwell & Orkin -
Gator Capital Long/Short Fund | Disclosure of Fund Expenses |
| | October 31, 2020 (Unaudited) |
We believe it is important for you to understand the impact of fees and expenses on your investment in the Fund. As a shareholder of the Fund, you incur two types of costs: (1) transaction costs related to the purchase and redemption of Fund shares, including redemption fees and brokerage commissions (if applicable); and (2) ongoing costs, including management fees, administrative expenses, portfolio transaction costs and other Fund expenses. A mutual fund’s ongoing costs are expressed as a percentage of its average net assets. This figure is known as the expense ratio. The following example is intended to help you understand your ongoing costs (in dollars and cents) of investing in the Fund and to compare these costs with the ongoing costs of investing in other mutual funds.
The below example is based on an investment of $1,000 invested at the beginning of the period and held for the entire period indicated, May 1, 2020 through October 31, 2020. The table below illustrates the Fund’s expenses in two ways:
Based on Actual Fund Returns
The first line of the table below provides information about actual account values and actual expenses. You may use the information in this line, together with the amount you invested, to estimate the expenses that you paid over the period. Simply divide your account value by $1,000 (for example, an $8,600 account value divided by $1,000 = 8.6), then multiply the result by the number in the first line under the heading entitled “Expenses Paid During Period” to estimate the expenses you paid on your account during this period.
Based on a Hypothetical 5% Return for Comparison Purposes
The second line of the table below provides information about hypothetical account values and hypothetical expenses based on the Fund’s actual expense ratio and an assumed rate of return of 5% per year before expenses, which is not the Fund’s actual return. The hypothetical account values and expenses may not be used to estimate the actual ending account balance or expenses you paid for the period. You may use this information to compare the ongoing costs of investing in the Fund and other funds. To do so, compare this 5% hypothetical example with the 5% hypothetical examples that appear in the shareholder reports of other funds.
Expenses shown in the table are meant to highlight your ongoing costs only and do not reflect any transactional costs. Therefore, the second line of the table below is useful in comparing ongoing costs only and will not help you determine the relative costs of owning different funds. In addition, if transaction costs were included, your costs would have been higher.
| | Beginning
Account Value
May 1, 2020 | Ending
Account Value
October 31, 2020 | Expenses
Paid During
the Period(a) | Annualized
Expense
Ratio |
Actual | $1,000.00 | $1,263.00 | $18.23 | 3.20% |
Hypothetical(b) | $1,000.00 | $1,009.09 | $16.19 | 3.20% |
(a) | Expenses are equal to the Fund’s annualized expense ratios, multiplied by the average account value over the period, multiplied by 184/365 (to reflect the one-half year period). |
(b) | Hypothetical assumes 5% annual return before expenses. |
Semi-Annual Report | October 31, 2020 | 29 |
Caldwell & Orkin -
Gator Capital Long/Short Fund | Director Approval of the
Investment Advisory Agreement |
| | October 31, 2020 (Unaudited) |
At a telephonic meeting held on June 15, 2020 in reliance on the exemptive order issued by the U.S. Securities and Exchange Commission (the “SEC”) granting relief from certain provisions of the 1940 Act, including certain in-person voting requirements, at which all of the Directors were present, the Board, including the Directors who are not “interested persons,” as defined by the Investment Company Act of 1940, as amended (the “1940 Act”), of the Company (the “Independent Directors”), voting separately, reviewed and approved the investment advisory agreement with the Adviser (the “Management Agreement”). In the course of their deliberations, the Board was advised by legal counsel. The Board received and reviewed a substantial amount of information provided by the Adviser in response to requests of the Board and legal counsel.
In considering the approval of the Management Agreement and reaching their conclusions with respect thereto, the Board was briefed by counsel on its fiduciary duties and responsibilities in reviewing and approving the Management Agreement and the types of information that should be reviewed by them and their responsibilities in making an informed decision regarding the approval of the Management Agreement. The Board also reviewed and analyzed various factors that the Directors determined were relevant, including: (1) the nature, extent and quality of the services to be provided by the Adviser to the Fund and the Adviser’s experience managing registered investment companies; (2) the performance of the Adviser in managing investments for other investment company clients or managed account clients; (3) the costs of the services to be provided and profits to be realized by the Adviser from its relationship with the Fund, as well as fee rates charged by the Adviser and other advisers for comparable strategies; (4) the extent to which economies of scale may be realized as the Fund grows and whether management fee levels reflect these economies of scale for the benefit of the Fund’s investors; and (5) other benefits to be derived by the Adviser from its relationship with the Funds. The Board’s analysis of the foregoing factors included, but was not limited to, the following:
Nature, Extent and Quality of Services. The Board reviewed the operating and investment advisory services provided by the Advisor to the Fund, including, without limitation, its investment advisory services, its coordination of services for the Fund among the Fund’s service providers, its compliance procedures and practices, its efforts to promote the Fund and assist in its distribution and its provision of officers for the Company. Based on the foregoing information, the Board concluded that the nature, extent and quality of the management and advisory services provided by the Advisor were appropriate for the Fund.
Performance of the Fund and the Adviser. The Board reviewed the investment performance of the Advisor in managing investments for the Fund on an absolute basis and also compared the performance of the Fund with the performance of a peer group of funds managed by other advisors and with the Fund’s benchmarks. The Board also considered the consistency of the Advisor’s management of the Fund with the Fund’s investment objective and policies, and long-term performance of the Fund (since the
30 | 1-800-467-7903 | https://gatorcapital.com/mutual-funds/gator-capital-long-short-fund/ |
Caldwell & Orkin -
Gator Capital Long/Short Fund | Director Approval of the
Investment Advisory Agreement |
| | October 31, 2020 (Unaudited) |
Advisor began providing management services). After evaluating the performance of the Advisor and the Fund in such capacities, the Board concluded that the performance of the Advisor and the Fund was satisfactory.
Cost of Services and Projected Profits of the Adviser with respect to the Fund. In analyzing the cost of services and the profitability that the Advisor derives from its relationship with the Fund, the Board considered that continuing the Advisory Agreement would result in no changes to the fees charged to the Fund, and that the services provided in exchange for such fees would be appropriate. The Board also considered the Advisor’s staffing, personnel and methods of operating; the financial condition of the Advisor and the level of commitment to the Fund and the Advisor by the principals of the Advisor; the asset level of the Fund; and the overall fees and expenses of the Fund.
The Board then reviewed the fees and expenses of the Fund and compared them to other funds similar to the Fund in terms of style of investment management, size of the fund and the nature of the fund’s investment strategy, among other factors. The Board noted that the management fee charged by the Advisor is below the average charged by the comparative funds shown, while the Fund’s expense ratio was higher than the average of the funds. The Board also considered the expense limitation provisions within the Advisory Agreement and the financial capacity of the Advisor to fulfill its obligations under the Advisory Agreement. Following these comparisons and considerations and upon further discussion of the foregoing, the Board concluded that the fees paid to the Advisor by the Fund under the Advisory Agreement are appropriate and within the range of what would have been negotiated at arm’s length.
Economies of Scale. Following discussion of the Fund’s asset level, expectations for growth, levels of fees and the expense limitation agreement within the Advisory Agreement, the Board determined that the Fund’s fee arrangement was appropriate, and that the Fund’s overall fee structure provided for savings and protection for shareholders, particularly at lower asset levels.
Other Benefits Derived by the Adviser from its Relationship with the Fund. The Board considered that (other than the advisory fee) there are no material “fall-out” or ancillary benefits that accrue to the Advisor as a result of its relationship with the Fund. Based on the foregoing information, the Board concluded that such potential benefits are immaterial to its consideration and approval of the Advisory Agreement.
After considering the above factors as well as other factors, the Board unanimously concluded that the terms of the Management Agreement were fair and reasonable and approved the Management Agreement for a one-year renewal period.
Semi-Annual Report | October 31, 2020 | 31 |
CUSTOMER PRIVACY NOTICE |
FACTS | WHAT DOES CALDWELL & ORKIN FUNDS, INC. DO WITH YOUR PERSONAL INFORMATION? |
| | |
Why? | Financial companies choose how they share your personal information. Federal law gives consumers the right to limit some but not all sharing. Federal law also requires us to tell you how we collect, share, and protect your personal information. Please read this notice carefully to understand what we do. |
| | |
What? | The types of personal information we collect and share depend on the product or service you have with us. This information can include: ■ Social Security number ■ Assets ■ Retirement Assets ■ Transaction History ■ Checking Account Information ■ Purchase History ■ Account Balances ■ Account Transactions ■ Wire Transfer Instructions When you are no longer our customer, we continue to share your information as described in this notice. |
| | |
How? | All financial companies need to share your personal information to run their everyday business. In the section below, we list the reasons financial companies can share their customers’ personal information; the reasons Caldwell & Orkin Funds, Inc. chooses to share; and whether you can limit this sharing. |
| | | | |
Reasons we can share your personal information | Does Caldwell & Orkin Funds, Inc. share? | Can you limit this sharing? |
For our everyday business purposes –
Such as to process your transactions, maintain your account(s), respond to court orders and legal investigations, or report to credit bureaus | Yes | No |
For our marketing purposes –
to offer our products and services to you | Yes | No |
For joint marketing with other financial companies | No | We don’t share |
For our affiliates’ everyday business purposes –
information about your transactions and experiences | No | No |
For our affiliates’ everyday business purposes –
information about your creditworthiness | No | We don’t share |
For nonaffiliates to market to you | No | We don’t share |
For our affiliates’ marketing purposes | Yes | Yes* |
| | |
Questions? | Call (800) 467-7903 |
| | |
To limit our sharing | *Call (813) 282-7870 Please note:
If you are a new customer, we can begin sharing your information 30 days from the date we sent this notice. When you are no longer our customer, we continue to share your information as described in this notice. However, you can contact us at any time to limit our sharing. |
32 | 1-800-467-7903 | https://gatorcapital.com/mutual-funds/gator-capital-long-short-fund/ |
Page 2 | |
Who we are |
Who is providing this notice? | Caldwell & Orkin Funds, Inc. Caldwell & Orkin - Gator Capital Long/Short Fund Ultimus Fund Distributors, LLC (Distributor) Ultimus Fund Solutions, LLC (Administrator) |
What we do |
How does Caldwell & Orkin Funds, Inc. protect my personal information? | To protect your personal information from unauthorized access and use, we use security measures that comply with federal law. These measures include computer safeguards and secured files and buildings. Our service providers are held accountable for adhering to strict policies and procedures to prevent any misuse of your nonpublic personal information. |
How does Caldwell & Orkin Funds, Inc. collect my personal information? | We collect your personal information, for example, when you ■ Open an account ■ Provide account information ■ Give us your contact information ■ Make deposits or withdrawals from your account ■ Make a wire transfer ■ Tell us where to send the money ■ Tell us who receives the money ■ Show your government-issued ID ■ Show your driver’s license We also collect your personal information from other companies. |
Why can’t I limit all sharing? | Federal law gives you the right to limit only ■ Sharing for affiliates’ everyday business purposes – information about your creditworthiness ■ Affiliates from using your information to market to you ■ Sharing for nonaffiliates to market to you State laws and individual companies may give you additional rights to limit sharing. |
| | |
Definitions |
Affiliates | Companies related by common ownership or control. They can be financial and nonfinancial companies. ■ Gator Capital Management, LLC the investment adviser to Caldwell & Orkin Funds, Inc., could be deemed an affiliate. |
Nonaffiliates | Companies not related by common ownership or control. They can be financial and nonfinancial companies ■ Caldwell & Orkin Funds, Inc. does not share with nonaffiliates so they can market to you. |
Joint marketing | A formal agreement between nonaffiliated financial companies that together market financial products or services to you. ■ Caldwell & Orkin Funds, Inc. does not jointly market. |
Semi-Annual Report | October 31, 2020 | 33 |
CALDWELL & ORKIN - Gator Capital Long/Short Fund |
Semi-Annual Report to Shareholders |
BOARD OF DIRECTORS Frederick T. Blumer,
Independent Chairman Derek Pilecki, President Bevin E. Newton Rhett E. Ingerick | TRANSFER, REDEMPTION
& DIVIDEND
DISBURSING AGENT Ultimus Fund Solutions, LLC
P.O. Box 46707
Cincinnati, OH 45246-0707 | LEGAL COUNSEL Kilpatrick Townsend & Stockton LLP 1001 West Fourth Street Winston-Salem, NC 27101-2400 |
INVESTMENT ADVISER Gator Capital Management, LLC 100 S. Ashley Drive, Suite 895 Tampa, FL 33602 | CUSTODIAN U.S. Bank, N.A.
425 Walnut St.
Cincinnati, OH 45202
| |
DISTRIBUTOR Ultimus Fund Distributors, LLC
225 Pictoria Drive, Suite 450
Cincinnati, OH 45246 | | |
The Caldwell & Orkin - Gator Capital Long/Short Fund’s (the “Fund”) portfolio may or may not have positions in any of the companies referenced in this Report to Shareholders as of any date after October 31, 2020. The commentary reflects the views of the investment manager through the end of the period or through the date of this report, as the case may be. Of course, these views are subject to change as market and other conditions warrant. These financial statements are submitted for the general information of the Fund’s shareholders. They are not authorized for distribution to prospective investors unless preceded or accompanied by an effective Fund Prospectus.
Availability of Proxy Voting Policy & Procedures, Proxy Voting Record and Code of Ethics - A description of a) the policies and procedures the Fund uses to determine how to vote proxies relating to portfolio securities, b) how the Fund voted proxies relating to portfolio securities during the most recent 12-month period ended June 30, and c) the Code of Ethics applicable to the principal officers of the Fund are available without charge, upon request, by calling toll- free (800) 467-7903, or on the Securities and Exchange Commission’s (the “Commission’s”) website at http://www.sec.gov.
Fund Information - For more information about the Fund please call (800) 467-7903 or visit the Fund’s website at https://gatorcapital.com/mutual-funds/gator-capital-long-short-fund/.
Gator Capital Management, LLC
100 S. Ashley Drive, Suite 895
Tampa, Fl 33602
Item 2. Code of Ethics.
Not applicable to semiannual reports.
Item 3. Audit Committee Financial Expert.
Not applicable to semiannual reports.
Item 4. Principal Accountant Fees and Services.
Not applicable to semiannual reports.
Item 5. Audit Committee of Listed Registrants.
Not applicable.
Item 6. Investments.
(a) Included as part of the report to Stockholders filed under Item 1 of this Form.
(b) Not applicable.
Item 7. Disclosure of Proxy Voting Policies and Procedures for Closed-End Management Investment Companies.
Not applicable.
Item 8. Portfolio Managers of Closed-End Management Investment Companies.
Not applicable.
Item 9. Purchases of Equity Securities by Closed-End Management Investment Company and Affiliated Purchasers.
Not applicable.
Item 10. Submission of Matters to a Vote of Security Holders.
None.
Item 11. Controls and Procedures.
(a) The registrant's Principal Executive Officer and Principal Financial Officer have concluded that the registrant's disclosure controls and procedures (as defined in Rule 30a-3(c) under the Act) are effective in design and operation and are sufficient to form the basis of the certifications required by Rule 30a-2 under the Act, based on their evaluation of these disclosure controls and procedures within 90 days of the filing of this report on Form N-CSR.
(b) There were no changes in the registrant's internal control over financial reporting (as defined in Rule 30a-3(d) under the Act (17 CFR 270.30a-3(d)) that occurred during the period covered by this report that have materially affected or are reasonably likely to materially affect, the registrant's internal control over financial reporting.
Item 12. Disclosure of Securities Lending Activities for Closed-End Management Investment Companies.
Not applicable.
Item 13. Exhibits.
(a)(1) Not applicable.
(a)(2) Certifications pursuant to Rule 30a-2(a) are attached hereto.
(a)(3) Not applicable.
(a)(4) Not applicable.
(b) Certifications pursuant to Rule 30a-2(b) are furnished herewith.
SIGNATURES
Pursuant to the requirements of the Securities Exchange Act of 1934 and the Investment Company Act of 1940, the registrant has duly caused this report to be signed on its behalf by the undersigned, thereunto duly authorized.
| (Registrant) | The Caldwell & Orkin Funds, Inc. | |
| | | | |
| By (Signature and Title) | /s/ Derek Pilecki | |
| | | Derek Pilecki, President and Principal Executive Officer | |
| | | | |
| Date | 12/23/2020 | | |
Pursuant to the requirements of the Securities Exchange Act of 1934 and the Investment Company Act of 1940, this report has been signed below by the following persons on behalf of the registrant and in the capacities and on the dates indicated.
| By (Signature and Title) | /s/ Derek Pilecki | |
| | | Derek Pilecki, President and Principal Executive Officer | |
| | | | |
| Date | 12/23/2020 | | |
| | | | |
| By (Signature and Title) | /s/ Zachary P. Richmond | |
| | | Zachary P. Richmond, Treasurer and Principal Financial Officer | |
| | | | |
| Date | 12/23/2020 | | |