UNITED STATES
SECURITIES AND EXCHANGE COMMISSION
Washington, D.C. 20549
FORM N-CSRS
CERTIFIED SHAREHOLDER REPORT OF REGISTERED
MANAGEMENT INVESTMENT COMPANIES
Investment Company Act file number : 811-06113
The Caldwell & Orkin Funds, Inc.
(Exact name of registrant as specified in charter)
100 S. Ashley Drive, Suite 895
Tampa, Florida 33602
(Address of principal executive offices) (Zip code)
Derek Pilecki
100 S. Ashley Drive, Suite 895
Tampa, Florida 33602
(Name and address of agent for service)
Copies to:
Benjamin Mollozzi
Ultimus Fund Solutions, LLC
225 Pictoria Drive, Suite 450
Cincinnati, OH 45256
Registrant’s telephone number, including area code: 1-813-282-7870
Date of fiscal year end: April 30
Date of reporting period: October 31, 2018
Item 1. Reports to Stockholders.

Table of Contents | Caldwell & Orkin
Market Opportunity Fund |
October 31, 2018 (Unaudited) | |
Investment Results | 2 |
Fund Holdings | 3 |
Schedule of Investments | 4 |
Statement of Assets & Liabilities | 13 |
Statement of Operations | 14 |
Statements of Changes in Net Assets | 15 |
Financial Highlights | 16 |
Notes to Financial Statements | 17 |
Disclosure of Fund Expenses | 24 |
Privacy Policy Disclosure | 26 |
Caldwell & Orkin
Market Opportunity Fund |
Investment Results
|
| | October 31, 2018 (Unaudited) |
Average Annual Total Returns(a) as of October 31, 2018 |
| | Six Months | One Year | Three Year | Five Year | Ten Year |
Caldwell & Orkin Market Opportunity Fund | -4.66% | -4.33% | -5.71% | -0.37% | 0.38% |
S&P 500 Total Return Index(b) | 3.40% | 7.35% | 11.52% | 11.34% | 13.24% |
| | | | | | |
Total annualized Fund operating expenses for the Fund is 2.54% as described in the Prospectus, dated August 28, 2018. This amount includes Acquired Fund Fees and Expenses, as well as interest and dividend expenses related to short sales, which if excluded would result in an annual operating expense rate of 1.85%. Additional information about the Fund’s current fees and expenses for the six months ended October 31, 2018 is contained in the Financial Highlights. |
(a) | Return figures reflect any change in price per share and assume the reinvestment of all distributions. The Fund’s returns reflect any fee reductions during the applicable period. If such fee reductions had not occurred, the quoted performance would have been lower. Total returns for periods less than one year are not annualized. |
(b) | Investors should expect that the Fund’s performance may fluctuate independently of stock market indices, such as the S&P 500 Total Return index. The S&P 500 Total Return index is a widely recognized unmanaged index of 500 common stock prices adjusted to reflect the reinvestment of dividends and distributions. You may not invest directly in an index. |
You should consider the Fund’s investment objectives, risks, charges and expenses carefully before you invest. The Fund’s prospectus contain important information about the Fund’s investment objectives, potential risks, management fees, charges and expenses, and other information and should be read carefully before investing. You may obtain a current copy of the Fund’s prospectus or performance data current to the most recent month by calling 1-800-467-7903.
The Fund is distributed by Ultimus Fund Distributors, LLC, member FINRA/SIPC.
2 | 1-800-467-7903 | www.CaldwellOrkin.com |
Caldwell & Orkin
Market Opportunity Fund |
Fund Holdings
|
| | October 31, 2018 (Unaudited) |
Net Sector Exposure
October 31, 2018*
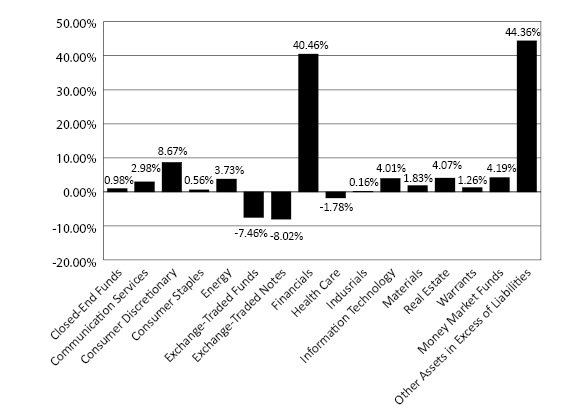
* | Sector weightings are calculated as a percentage of net assets and include short positions. Portfolio holdings are subject to change. |
The Caldwell & Orkin Market Opportunity Fund’s (the “Fund”) investment objective is to provide long-term capital growth with a short-term focus on capital preservation.
Availability of Portfolio Schedule – (Unaudited)
The Fund will file its complete schedule of portfolio holdings with the Securities and Exchange Commission (“SEC”) for the first and third quarter of each fiscal year on Form N-Q. The Fund’s Forms N-Q will be available at the SEC’s website at www.sec.gov.
Semi-Annual Report | October 31, 2018 | 3 |
Caldwell & Orkin
Market Opportunity Fund |
Schedule of Investments
|
| | October 31, 2018 (Unaudited) |
| | Shares | | | Fair Value | |
COMMON STOCKS — LONG — 83.57% | | | | | | | | |
Airlines — 1.16% | | | | | | | | |
American Airlines Group, Inc. | | | 11,400 | | | $ | 399,912 | |
| | | | | | | | | |
Apparel Accessories & Luxury Goods — 0.70% | | | | | | | | |
PVH Corporation | | | 2,000 | | | | 241,580 | |
| | | | | | | | | |
Application Software — 1.00% | | | | | | | | |
Adobe Systems, Inc.(a) | | | 1,400 | | | | 344,064 | |
| | | | | | | | | |
Asset Management & Custody Banks — 14.76% | | | | | | | | |
Ameriprise Financial, Inc. | | | 2,500 | | | | 318,100 | |
Ares Management Corporation | | | 21,210 | | | | 415,928 | |
Blackstone Group LP (The) | | | 15,900 | | | | 514,524 | |
BrightSphere Investment Group plc | | | 38,000 | | | | 433,200 | |
Federated Investors, Inc., Class B | | | 18,000 | | | | 444,060 | |
Invesco Ltd. | | | 32,000 | | | | 694,720 | |
Janus Henderson Group plc | | | 26,000 | | | | 638,820 | |
KKR & Company, Inc., Class A | | | 28,800 | | | | 681,120 | |
Legg Mason, Inc. | | | 24,000 | | | | 677,280 | |
Pzena Investment Management, Inc., Class A | | | 6,000 | | | | 60,360 | |
Victory Capital Holdings, Inc.(a) | | | 1,565 | | | | 12,207 | |
Waddell & Reed Financial, Inc., Class A | | | 9,000 | | | | 171,630 | |
| | | | | | | | 5,061,949 | |
Automobile Manufacturers — 1.04% | | | | | | | | |
General Motors Company | | | 9,750 | | | | 356,753 | |
| | | | | | | | | |
Automotive Retail — 1.80% | | | | | | | | |
Carvana Company(a) | | | 3,900 | | | | 151,125 | |
Group 1 Automotive, Inc. | | | 5,600 | | | | 323,344 | |
Sonic Automotive, Inc., Class A | | | 8,000 | | | | 144,960 | |
| | | | | | | | 619,429 | |
Broadcasting — 0.95% | | | | | | | | |
Entercom Communications Corporation, Class A | | | 38,000 | | | | 246,620 | |
Gray Television, Inc.(a) | | | 4,500 | | | | 77,895 | |
| | | | | | | | 324,515 | |
Casinos & Gaming — 5.08% | | | | | | | | |
Caesars Entertainment Corporation(a) | | �� | 55,500 | | | | 476,745 | |
Las Vegas Sands Corporation | | | 6,000 | | | | 306,180 | |
See accompanying notes which are an integral part of these financial statements.
4 | 1-800-467-7903 | www.CaldwellOrkin.com |
Caldwell & Orkin
Market Opportunity Fund |
Schedule of Investments
|
| | October 31, 2018 (Unaudited) |
| | Shares | | | Fair Value | |
Casinos & Gaming — 5.08% - continued | | | | | | | | |
Melco Resorts & Entertainment Ltd. - ADR | | | 27,000 | | | $ | 449,010 | |
MGM Resorts International | | | 19,000 | | | | 506,920 | |
| | | | | | | | 1,738,855 | |
Communications Equipment — 0.17% | | | | | | | | |
Juniper Networks, Inc. | | | 2,000 | | | | 58,540 | |
| | | | | | | | | |
Consumer Finance — 5.15% | | | | | | | | |
Ally Financial, Inc. | | | 18,000 | | | | 457,380 | |
Navient Corporation | | | 19,500 | | | | 225,810 | |
OneMain Holdings, Inc.(a) | | | 17,500 | | | | 499,100 | |
SLM Corporation(a) | | | 12,000 | | | | 121,680 | |
Synchrony Financial | | | 16,000 | | | | 462,080 | |
| | | | | | | | 1,766,050 | |
Diversified Capital Markets — 2.61% | | | | | | | | |
Credit Suisse Group AG - ADR | | | 22,500 | | | | 290,925 | |
Deutsche Bank AG | | | 30,000 | | | | 293,100 | |
UBS Group AG | | | 22,416 | | | | 311,582 | |
| | | | | | | | 895,607 | |
Diversified Support Services — 1.39% | | | | | | | | |
Cintas Corporation | | | 2,600 | | | | 472,862 | |
| | | | | | | | | |
Fertilizers & Agricultural Chemicals — 0.23% | | | | | | | | |
Nutrien Ltd. | | | 1,500 | | | | 79,395 | |
| | | | | | | | | |
Food Retail — 0.09% | | | | | | | | |
Kroger Company (The) | | | 1,000 | | | | 29,760 | |
| | | | | | | | | |
Health Care REITs — 0.57% | | | | | | | | |
Senior Housing Properties Trust | | | 12,000 | | | | 192,840 | |
| | | | | | | | | |
Home Entertainment Software — 0.60% | | | | | | | | |
Activision Blizzard, Inc. | | | 3,000 | | | | 207,150 | |
| | | | | | | | | |
Home Improvement Retail — 1.03% | | | | | | | | |
Home Depot, Inc. (The) | | | 2,000 | | | | 351,760 | |
| | | | | | | | | |
Homebuilding — 1.80% | | | | | | | | |
Lennar Corporation, Class A | | | 14,100 | | | | 606,018 | |
See accompanying notes which are an integral part of these financial statements.
Semi-Annual Report | October 31, 2018 | 5 |
Caldwell & Orkin
Market Opportunity Fund |
Schedule of Investments
|
| | October 31, 2018 (Unaudited) |
| | Shares | | | Fair Value | |
Homebuilding — 1.80% - continued | | | | | | | | |
Lennar Corporation, Class B | | | 282 | | | $ | 10,087 | |
| | | | | | | | 616,105 | |
Hotel & Resort REITs — 0.25% | | | | | | | | |
RLJ Lodging Trust | | | 4,500 | | | | 87,480 | |
| | | | | | | | | |
Hotels Resorts & Cruise Lines — 1.20% | | | | | | | | |
BBX Capital Corporation | | | 70,595 | | | | 412,981 | |
| | | | | | | | | |
Internet Software & Services — 2.24% | | | | | | | | |
Etsy, Inc.(a) | | | 6,500 | | | | 276,380 | |
IAC/InterActiveCorp(a) | | | 2,500 | | | | 491,475 | |
| | | | | | | | 767,855 | |
Investment Banking & Brokerage — 3.96% | | | | | | | | |
Charles Schwab Corporation (The) | | | 7,500 | | | | 346,800 | |
Cowen, Inc., Class A(a) | | | 8,000 | | | | 118,400 | |
E*TRADE Financial Corporation | | | 7,200 | | | | 355,824 | |
Stifel Financial Corporation | | | 9,000 | | | | 411,480 | |
TD Ameritrade Holding Corporation | | | 2,400 | | | | 124,128 | |
| | | | | | | | 1,356,632 | |
Mortgage REITs — 0.15% | | | | | | | | |
New Residential Investment Corporation | | | 2,800 | | | | 50,064 | |
| | | | | | | | | |
Multi-Sector Holdings — 0.28% | | | | | | | | |
Jefferies Financial Group, Inc. | | | 4,500 | | | | 96,615 | |
| | | | | | | | | |
Office Services & Supplies — 0.46% | | | | | | | | |
Knoll, Inc. | | | 8,000 | | | | 158,800 | |
| | | | | | | | | |
Oil & Gas Refining & Marketing — 2.08% | | | | | | | | |
EnLink Midstream Partners LP | | | 20,000 | | | | 303,200 | |
Phillips 66 | | | 4,000 | | | | 411,280 | |
| | | | | | | | 714,480 | |
Oil & Gas Storage & Transportation — 1.65% | | | | | | | | |
SemGroup Corporation, Class A | | | 17,000 | | | | 314,330 | |
Teekay Corporation | | | 38,000 | | | | 251,940 | |
| | | | | | | | 566,270 | |
Other Diversified Financial Services — 1.24% | | | | | | | | |
Voya Financial, Inc. | | | 9,750 | | | | 426,660 | |
See accompanying notes which are an integral part of these financial statements.
6 | 1-800-467-7903 | www.CaldwellOrkin.com |
Caldwell & Orkin
Market Opportunity Fund |
Schedule of Investments
|
| | October 31, 2018 (Unaudited) |
| | Shares | | | Fair Value | |
Packaged Foods & Meats — 1.36% | | | | | | | | |
B&G Foods, Inc. | | | 8,250 | | | $ | 214,830 | |
Dean Foods Company | | | 32,000 | | | | 255,680 | |
| | | | | | | | 470,510 | |
Property & Casualty Insurance — 1.55% | | | | | | | | |
Ambac Financial Group, Inc.(a) | | | 25,896 | | | | 532,940 | |
| | | | | | | | | |
Real Estate Services — 2.86% | | | | | | | | |
CBRE Group, Inc., Class A(a) | | | 6,750 | | | | 271,958 | |
Cushman & Wakefield plc(a) | | | 12,000 | | | | 195,120 | |
Realogy Holdings Corporation | | | 27,000 | | | | 514,890 | |
| | | | | | | | 981,968 | |
Regional Banks — 14.93% | | | | | | | | |
Banc of California, Inc. | | | 24,000 | | | | 382,800 | |
BankUnited, Inc. | | | 17,000 | | | | 562,700 | |
CIT Group, Inc. | | | 4,500 | | | | 213,210 | |
Citizens Financial Group, Inc. | | | 13,000 | | | | 485,550 | |
ConnectOne Bancorp, Inc. | | | 16,000 | | | | 331,680 | |
Fifth Third Bancorp | | | 9,000 | | | | 242,910 | |
First Hawaiian, Inc. | | | 16,000 | | | | 396,480 | |
First Horizon National Corporation | | | 21,000 | | | | 338,940 | |
FNB Corporation | | | 24,000 | | | | 283,920 | |
Hope Bancorp, Inc. | | | 28,500 | | | | 412,680 | |
Huntington Bancshares, Inc. | | | 6,000 | | | | 85,980 | |
KeyCorp | | | 16,500 | | | | 299,640 | |
Regions Financial Corporation | | | 4,500 | | | | 76,365 | |
Sterling Bancorp | | | 26,212 | | | | 471,292 | |
TCF Financial Corporation | | | 12,400 | | | | 258,912 | |
Zions Bancorporation | | | 6,000 | | | | 282,300 | |
| | | | | | | | 5,125,359 | |
Restaurants — 0.94% | | | | | | | | |
Bloomin' Brands, Inc. | | | 1,500 | | | | 29,925 | |
Starbucks Corporation | | | 5,000 | | | | 291,350 | |
| | | | | | | | 321,275 | |
Retail REITs — 0.39% | | | | | | | | |
Whitestone REIT | | | 10,000 | | | | 134,600 | |
| | | | | | | | | |
Specialized Consumer Services — 0.31% | | | | | | | | |
H&R Block, Inc. | | | 4,000 | | | | 106,160 | |
See accompanying notes which are an integral part of these financial statements.
Semi-Annual Report | October 31, 2018 | 7 |
Caldwell & Orkin
Market Opportunity Fund |
Schedule of Investments
|
| | October 31, 2018 (Unaudited) |
| | Shares | | | Fair Value | |
Specialty Chemicals — 1.01% | | | | | | | | |
Axalta Coating Systems Ltd.(a) | | | 14,000 | | | $ | 345,520 | |
| | | | | | | | | |
Specialty Stores — 0.31% | | | | | | | | |
Sally Beauty Holdings, Inc.(a) | | | 6,000 | | | | 106,860 | |
| | | | | | | | | |
Steel — 0.59% | | | | | | | | |
SunCoke Energy, Inc.(a) | | | 18,000 | | | | 201,600 | |
| | | | | | | | | |
Systems Software — 2.73% | | | | | | | | |
BlackBerry Ltd.(a) | | | 32,000 | | | | 296,000 | |
Microsoft Corporation | | | 6,000 | | | | 640,860 | |
| | | | | | | | 936,860 | |
Technology Hardware Storage & Peripherals — 2.31% | | | | | | | | |
Apple, Inc. | | | 3,000 | | | | 656,580 | |
Hewlett Packard Enterprise Company | | | 9,000 | | | | 137,250 | |
| | | | | | | | 793,830 | |
Thrifts & Mortgage Finance — 0.64% | | | | | | | | |
MGIC Investment Corporation(a) | | | 18,000 | | | | 219,780 | |
| | | | | | | | | |
Total Common Stocks — Long (Cost $29,066,911) | | | | | | | 28,672,225 | |
CLOSED-END FUNDS — LONG — 0.98% | | | | | | | | |
PGIM Global Short Duration High Yield Fund, Inc. | | | 25,400 | | | | 337,312 | |
| | | | | | | | | |
Total Closed-End Funds — Long (Cost $366,315) | | | | | | | 337,312 | |
WARRANTS — LONG — 1.26% | | | | | | | | |
American International Group, Inc., Expires 01/19/21, Strike Price $44 | | | 37,500 | | | | 300,000 | |
PNC Financial Services Group, Expires 12/31/18, Strike Price $67 | | | 2,100 | | | | 131,313 | |
| | | | | | | | | |
Total Warrants — Long (Cost $690,911) | | | | | | | 431,313 | |
See accompanying notes which are an integral part of these financial statements.
8 | 1-800-467-7903 | www.CaldwellOrkin.com |
Caldwell & Orkin
Market Opportunity Fund |
Schedule of Investments
|
| | October 31, 2018 (Unaudited) |
| | Shares | | | Fair Value | |
MONEY MARKET FUNDS — 4.19% | | | | | | | | |
First American Treasury Obligations Fund - Class X, 2.09%(b) | | | 1,437,356 | | | $ | 1,437,356 | |
| | | | | | | | | |
Total Money Market Funds
(Cost $1,437,356) | | | | | | | 1,437,356 | |
Total Investments — 90.00%
(Cost $31,561,493) | | | | | | | 30,878,206 | |
| | | | | | | | | |
Other Assets in Excess of Liabilities — 10.00% | | | | | | | 3,435,886 | |
NET ASSETS — 100.00% | | | | | | $ | 34,314,092 | |
(a) | Non-income producing security. |
(b) | Rate disclosed is the seven day effective yield as of October 31, 2018. |
ADR - American Depositary Receipt.
REIT - Real Estate Investment Trust
The sub-industries shown on the schedule of investments are based on the Global Industry Classification Standard, or GICS® (“GICS”). The GICS was developed by and/or is the exclusive property of MSCI, Inc. and Standard & Poor’s Financial Services LLC (“S&P”). GICS is a service mark of MSCI, Inc. and S&P and has been licensed for use by Ultimus Fund Solutions, LLC.
See accompanying notes which are an integral part of these financial statements.
Semi-Annual Report | October 31, 2018 | 9 |
Caldwell & Orkin
Market Opportunity Fund |
Schedule of Investments
|
| | October 31, 2018 (Unaudited) |
SCHEDULE OF SECURITIES SOLD SHORT | | Shares | | | Fair Value | |
COMMON STOCKS — SHORT — (18.88)% | | | | | | | | |
Apparel Retail — (1.89)% | | | | | | | | |
Foot Locker, Inc. | | | (13,800 | ) | | $ | (650,532 | ) |
| | | | | | | | | |
Asset Management & Custody Banks — (1.02)% | | | | | | | | |
Hamilton Lane, Inc., Class A | | | (9,090 | ) | | | (348,874 | ) |
| | | | | | | | | |
Automobile Manufacturers — (1.28)% | | | | | | | | |
Tesla, Inc.(a) | | | (1,300 | ) | | | (438,517 | ) |
| | | | | | | | | |
Biotechnology — (1.03)% | | | | | | | | |
China Biologic Products Holdings, Inc.(a) | | | (5,300 | ) | | | (352,132 | ) |
| | | | | | | | | |
Communications Equipment — (1.00)% | | | | | | | | |
Finisar Corporation(a) | | | (20,600 | ) | | | (343,814 | ) |
| | | | | | | | | |
Construction Machinery & Heavy Trucks — (1.10)% | | | | | | | | |
Caterpillar, Inc. | | | (3,100 | ) | | | (376,092 | ) |
| | | | | | | | | |
Electronic Manufacturing Services — (1.21)% | | | | | | | | |
Celestica, Inc.(a) | | | (40,000 | ) | | | (415,200 | ) |
| | | | | | | | | |
Environmental & Facilities Services — (1.76)% | | | | | | | | |
ABM Industries, Inc. | | | (10,000 | ) | | | (307,500 | ) |
Stericycle, Inc.(a) | | | (5,900 | ) | | | (294,823 | ) |
| | | | | | | | (602,323 | ) |
Health Care Distributors — (0.75)% | | | | | | | | |
Patterson Companies, Inc. | | | (11,400 | ) | | | (257,412 | ) |
| | | | | | | | | |
Home Furnishing Retail — (0.81)% | | | | | | | | |
Bed Bath & Beyond, Inc. | | | (20,200 | ) | | | (277,548 | ) |
| | | | | | | | | |
Life & Health Insurance — (0.50)% | | | | | | | | |
Athene Holding Ltd., Class A(a) | | | (3,750 | ) | | | (171,450 | ) |
| | | | | | | | | |
Personal Products — (0.89)% | | | | | | | | |
Edgewell Personal Care Company(a) | | | (6,400 | ) | | | (307,072 | ) |
See accompanying notes which are an integral part of these financial statements.
10 | 1-800-467-7903 | www.CaldwellOrkin.com |
Caldwell & Orkin
Market Opportunity Fund |
Schedule of Investments
|
| | October 31, 2018 (Unaudited) |
| | Shares | | | Fair Value | |
Regional Banks — (2.74)% | | | | | | | | |
Berkshire Hills Bancorp, Inc. | | | (4,550 | ) | | $ | (151,834 | ) |
Columbia Banking System, Inc. | | | (600 | ) | | | (22,254 | ) |
Heritage Financial Corporation | | | (10,684 | ) | | | (349,580 | ) |
Old National Bancorp | | | (4,000 | ) | | | (71,400 | ) |
UMB Financial Corporation | | | (4,400 | ) | | | (280,940 | ) |
Univest Corporation of Pennsylvania | | | (2,607 | ) | | | (65,071 | ) |
| | | | | | | | (941,079 | ) |
Restaurants — (2.36)% | | | | | | | | |
Dave & Buster's Entertainment, Inc. | | | (8,500 | ) | | | (506,175 | ) |
Restaurant Brands International, Inc. | | | (5,500 | ) | | | (301,235 | ) |
| | | | | | | | (807,410 | ) |
Thrifts & Mortgage Finance — (0.54)% | | | | | | | | |
Northfield Bancorp, Inc. | | | (1,505 | ) | | | (19,821 | ) |
Territorial Bancorp, Inc. | | | (6,100 | ) | | | (166,164 | ) |
| | | | | | | | (185,985 | ) |
Total Common Stocks — Short (Proceeds Received $6,861,146) | | | | | | | (6,475,440 | ) |
EXCHANGE-TRADED FUNDS — SHORT — (7.46)% | | | | | | | | |
Direxion Daily FTSE China Bear 3X Shares | | | (3,705 | ) | | | (264,167 | ) |
Direxion Daily FTSE China Bull 3X Shares | | | (7,975 | ) | | | (141,875 | ) |
Direxion Daily Gold Miners Bear 3X Shares | | | (15,000 | ) | | | (527,550 | ) |
Direxion Daily Gold Miners Bull 3X Shares | | | (13,575 | ) | | | (179,869 | ) |
Direxion Daily Junior Gold Minors Index Bear 3X Shares | | | (7,361 | ) | | | (554,651 | ) |
Direxion Daily Junior Gold Minors Index Bull 3X Shares | | | (23,063 | ) | | | (165,362 | ) |
Direxion Daily S&P Oil & Gas Exp. & Prod. Bear 3X Shares | | | (56,000 | ) | | | (488,320 | ) |
Direxion Daily S&P Oil & Gas Exp. & Prod. Bull 3x Shares | | | (10,872 | ) | | | (238,423 | ) |
| | | | | | | | | |
Total Exchange-Traded Funds — Short (Proceeds Received $2,572,544) | | | | | | | (2,560,217 | ) |
EXCHANGE-TRADED NOTES — SHORT — (8.02)% | | | | | | | | |
VelocityShares 3x Inverse Crude Oil ETN | | | (30,261 | ) | | | (217,577 | ) |
VelocityShares 3x Inverse Gold ETN | | | (7,474 | ) | | | (406,361 | ) |
VelocityShares 3x Inverse Natural Gas ETN | | | (15,243 | ) | | | (215,231 | ) |
VelocityShares 3x Inverse Silver ETN | | | (12,290 | ) | | | (446,742 | ) |
VelocityShares 3x Long Crude Oil ETN | | | (5,410 | ) | | | (164,843 | ) |
VelocityShares 3x Long Gold ETN | | | (4,450 | ) | | | (368,727 | ) |
See accompanying notes which are an integral part of these financial statements.
Semi-Annual Report | October 31, 2018 | 11 |
Caldwell & Orkin
Market Opportunity Fund |
Schedule of Investments
|
| | October 31, 2018 (Unaudited) |
| | Shares | | | Fair Value | |
EXCHANGE-TRADED NOTES — SHORT — (8.02)% - continued | | | | | | | | |
VelocityShares 3x Long Natural Gas ETN | | | (7,900 | ) | | $ | (681,611 | ) |
VelocityShares 3x Long Silver ETN | | | (4,170 | ) | | | (249,533 | ) |
| | | | | | | | | |
Total Exchange-Traded Notes — Short (Proceeds Received $2,720,779) | | | | | | | (2,750,625 | ) |
TOTAL SECURITIES SOLD SHORT — (34.36)% (Proceeds Received $12,154,469) | | | $ | (11,786,282 | ) |
(a) | Non-income producing security. |
(b) | Rate disclosed is the seven day effective yield as of October 31, 2018. |
ADR - American Depositary Receipt.
REIT - Real Estate Investment Trust
The sub-industries shown on the schedule of investments are based on the Global Industry Classification Standard, or GICS® (“GICS”). The GICS was developed by and/or is the exclusive property of MSCI, Inc. and Standard & Poor’s Financial Services LLC (“S&P”). GICS is a service mark of MSCI, Inc. and S&P and has been licensed for use by Ultimus Fund Solutions, LLC.
See accompanying notes which are an integral part of these financial statements.
12 | 1-800-467-7903 | www.CaldwellOrkin.com |
Caldwell & Orkin
Market Opportunity Fund |
Statement of Assets and Liabilities
|
| | October 31, 2018 (Unaudited) |
Assets | | | | |
Investments is securities at fair value (cost $31,561,493) | | $ | 30,878,206 | |
Deposit held by broker for securities sold short | | | 11,738,013 | |
Receivable for fund shares sold | | | 255 | |
Receivable for investments sold | | | 3,521,444 | |
Dividends and interest receivable | | | 46,944 | |
Tax reclaims receivable | | | 2,032 | |
Prepaid expenses | | | 15,574 | |
Total Assets | | | 46,202,468 | |
| | | | | |
Liabilities | | | | |
Securities sold short, at value (proceeds received $12,154,469) | | | 11,786,282 | |
Payable for fund shares redeemed | | | 49,568 | |
Payable for dividends declared on short sales | | | 10,650 | |
Payable to Adviser | | | 31,950 | |
Payable to Administrator | | | 6,650 | |
Other accrued expenses | | | 3,276 | |
Total Liabilities | | | 11,888,376 | |
| | | | | |
Net Assets | | $ | 34,314,092 | |
| | | | | |
Net Assets consist of: | | | | |
Paid-in capital | | $ | 39,238,127 | |
Accumulated deficit | | | (4,924,035 | ) |
Net Assets | | $ | 34,314,092 | |
| | | | | |
Shares outstanding, par value $0.10 per share (30,000,000 authorized shares) | | | 1,746,662 | |
| | | | | |
Net asset value, offering price and redemption price per share(a) | | $ | 19.65 | |
(a) | Redemption price may differ from net asset value if redemption fee is applied. |
See accompanying notes which are an integral part of these financial statements.
Semi-Annual Report | October 31, 2018 | 13 |
Caldwell & Orkin
Market Opportunity Fund |
Statement of Operations
|
| | For the Six Months Ended October 31, 2018 (Unaudited) |
Investment Income | | | | |
Dividend income | | $ | 482,782 | |
Total investment income | | | 482,782 | |
| | | | | |
Expenses | | | | |
Investment Advisory | | | 217,579 | |
Interest | | | 137,945 | |
Dividend expense on securities sold short | | | 77,735 | |
Legal | | | 43,884 | |
Sub transfer agent | | | 20,508 | |
Directors | | | 19,611 | |
Fund accounting | | | 16,075 | |
Custodian | | | 14,994 | |
Administration | | | 14,888 | |
Report printing | | | 12,000 | |
Transfer agent | | | 10,711 | |
Audit | | | 10,600 | |
Miscellaneous | | | 15,655 | |
Total expenses | | | 612,185 | |
Net investment loss | | | (129,403 | ) |
| | | | | |
Net Realized and Change in Unrealized Gain (Loss) on Investments | | | | |
Net realized gain (loss) from: | | | | |
Investments | | | 1,407,896 | |
Securities sold short | | | (160,603 | ) |
Change in unrealized depreciation on: | | | | |
Investments | | | (2,712,394 | ) |
Securities sold short | | | (95,243 | ) |
Net realized and unrealized gain (loss) on investmentS and securities sold short | | | (1,560,344 | ) |
Net decrease in net assets resulting from operations | | $ | (1,689,747 | ) |
See accompanying notes which are an integral part of these financial statements.
14 | 1-800-467-7903 | www.CaldwellOrkin.com |
Caldwell & Orkin
Market Opportunity Fund |
Statements of Changes in Net Assets
|
| | | For the Six
Months Ended
October 31, 2018
(Unaudited) | | | For the Year Ended
April 30, 2018(a) | |
Increase (Decrease) in Net Assets due to: | | | | | | | | |
Operations | | | | | | | | |
Net investment loss | | $ | (129,403 | ) | | $ | (991,128 | ) |
Net realized gain on investments and securities sold short | | | 1,247,293 | | | | 2,239,013 | |
Net change in unrealized depreciation of investments and securities sold short | | | (2,807,637 | ) | | | (2,283,128 | ) |
Net decrease in net assets resulting from operations | | | (1,689,747 | ) | | | (1,035,243 | ) |
| | | | | | | | | |
Capital Transactions |
Proceeds from shares sold | | | 847,358 | | | | 5,866,467 | |
Amount paid for shares redeemed | | | (14,629,145 | ) | | | (71,669,354 | ) |
Proceeds from redemption fees (Note 1) | | | 959 | | | | 12,923 | |
Net decrease in net assets resulting from capital transactions | | | (13,780,828 | ) | | | (65,789,964 | ) |
Total Decrease in Net Assets | | | (15,470,575 | ) | | | (66,825,207 | ) |
| | | | | | | | | |
Net Assets | | | | | | | | |
Beginning of period | | | 49,784,667 | | | | 116,609,874 | |
End of period | | $ | 34,314,092 | | | $ | 49,784,667 | |
| | | | | | | | | |
Share Transactions | | | | | | | | |
Shares sold | | | 40,974 | | | | 286,524 | |
Shares redeemed | | | (710,326 | ) | | | (3,497,522 | ) |
Net decrease in shares outstanding | | | (669,352 | ) | | | (3,210,998 | ) |
(a) | As of April 30, 2018, accumulated net investment loss was $(286,589). |
See accompanying notes which are an integral part of these financial statements.
Semi-Annual Report | October 31, 2018 | 15 |
Caldwell & Orkin
Market Opportunity Fund |
Financial Highlights
|
For a share outstanding during each period.
| | For the
Six Months
Ended
October 31,
2018
(Unaudited) | | | For the
Year
Ended
April 30,
2018 | | | For the
Year
Ended
April 30,
2017 | | | For the
Year
Ended
April 30,
2016 | | | For the
Year
Ended
April 30,
2015 | | | For the
Year
Ended
April 30,
2014 | |
Selected Per Share Data | | | | | | | | | | | | | | | | | | | | | | | | |
Net asset value, beginning of period | | $ | 20.61 | | | $ | 20.72 | | | $ | 21.57 | | | $ | 22.94 | | | $ | 20.88 | | | $ | 22.97 | |
Investment operations: | | | | | | | | | | | | | | | | | | | | | | | | |
Net investment income (loss) | | | (0.06 | )(a) | | | (0.24 | )(a) | | | (0.25 | )(a) | | | (0.36 | ) | | | (0.49 | ) | | | (0.29 | ) |
Net realized and unrealized gain (loss) on investments | | | (0.90 | ) | | | 0.13 | (b) | | | (0.60 | ) | | | 0.30 | | | | 2.71 | | | | (1.30 | ) |
Total from investment operations | | | (0.96 | ) | | | (0.11 | ) | | | (0.85 | ) | | | (0.06 | ) | | | 2.22 | | | | (1.59 | ) |
| | | | | | | | | | | | | | | | | | | | | | | | | |
Less distributions to shareholders from: | | | | | | | | | | | | | | | | | | | | | | | | |
Net realized gains | | | — | | | | — | | | | — | | | | (1.32 | ) | | | (0.17 | ) | | | (0.51 | ) |
Total distributions | | | — | | | | — | | | | — | | | | (1.32 | ) | | | (0.17 | ) | | | (0.51 | ) |
| | | | | | | | | | | | | | | | | | | | | | | | | |
Paid in capital from redemption fees | | | — | (c) | | | — | (c) | | | — | (c) | | | 0.01 | | | | 0.01 | | | | 0.01 | |
Net asset value, end of period | | $ | 19.65 | | | $ | 20.61 | | | $ | 20.72 | | | $ | 21.57 | | | $ | 22.94 | | | $ | 20.88 | |
| | | | | | | | | | | | | | | | | | | | | | | | | |
Total Return(d) | | | (4.66 | )%(e) | | | (0.53 | )% | | | (3.94 | )% | | | (0.56 | )% | | | 10.68 | % | | | (6.92 | )% |
| | | | | | | | | | | | | | | | | | | | | | | | | |
Ratios and Supplemental Data: | | | | | | | | | | | | | | | | | | | | | | | | |
Net assets, end of period (000 omitted) | | $ | 34,314 | | | $ | 49,785 | | | $ | 116,610 | | | $ | 208,328 | | | $ | 128,935 | | | $ | 165,472 | |
Ratios to Average Net Assets: | | | | | | | | | | | | | | | | | | | | | | | | |
Management fees | | | 1.00 | %(f) | | | 1.00 | % | | | 1.00 | % | | | 1.00 | % | | | 1.00 | % | | | 1.00 | % |
Administrative and other expenses | | | 0.82 | %(f) | | | 0.85 | % | | | 0.40 | % | | | 0.37 | % | | | 0.44 | % | | | 0.29 | % |
Expenses before dividends on securities sold short and interest expense | | | 1.82 | %(f) | | | 1.85 | % | | | 1.40 | % | | | 1.37 | % | | | 1.44 | % | | | 1.29 | % |
Interest expense | | | 0.64 | %(f) | | | 0.19 | % | | | 0.31 | % | | | 0.85 | % | | | 0.63 | % | | | 0.30 | % |
Expenses from dividends on securities sold short | | | 0.36 | %(f) | | | 0.37 | % | | | 0.29 | % | | | 0.73 | % | | | 0.57 | % | | | 0.14 | % |
Ratio of total net expenses | | | 2.82 | %(f) | | | 2.41 | % | | | 2.00 | % | | | 2.95 | % | | | 2.64 | % | | | 1.73 | % |
Ratio of net investment loss | | | (0.60 | )%(f) | | | (1.19 | )% | | | (1.18 | )% | | | (2.06 | )% | | | (1.80 | )% | | | (0.98 | )% |
Portfolio Turnover Rate | | | 81 | %(e) | | | 531 | % | | | 500 | % | | | 415 | % | | | 434 | % | | | 657 | % |
(a) | Calculated using average shares outstanding. |
(b) | The amount shown for a share outstanding throughout the period does not accord with the change in aggregate gains and losses in the portfolio of securities during the period because of timing of sales and purchases of fund shares in relation to fluctuating market values during the period. |
(c) | Rounds to less than $0.005 per share. |
(d) | Total return in the above table represents the rate that the investor would have earned or lost on an investment in the Fund, assuming reinvestment of distributions. |
See accompanying notes which are an integral part of these financial statements.
16 | 1-800-467-7903 | www.CaldwellOrkin.com |
Caldwell & Orkin
Market Opportunity Fund |
Notes to Financial Statements
|
| | October 31, 2018 (Unaudited) |
1. ORGANIZATION
The Caldwell & Orkin Market Opportunity Fund (the “Fund”) is the only investment portfolio of The Caldwell & Orkin Funds, Inc. (the “Company”), an open-end, diversified management investment company registered under the Investment Company Act of 1940, as amended (the “1940 Act”), and incorporated under the laws of the State of Maryland on August 15, 1989. The Fund’s investment objective is to provide long-term capital growth with a short-term focus on capital preservation. Gator Capital Management, LLC (the “Adviser”), the Fund’s investment adviser, uses a fundamental-driven, multi-dimensional investment process focusing on active allocation, security selection and surveillance to achieve the Fund’s investment objective.
2. SUMMARY OF SIGNIFICANT ACCOUNTING POLICIES
The Fund is an investment company and follows accounting and reporting guidance under Financial Accounting Standards Board Accounting Standards Codification (“ASC”) Topic 946, “Financial Services-Investment Companies”. The following is a summary of significant accounting policies consistently followed by the Fund in the preparation of its financial statements. The policies are in conformity with accounting principles generally accepted in the United States of America (“GAAP”).
Use of Estimates
The preparation of financial statements in conformity with GAAP requires management to make estimates and assumptions that affect the reported amounts of assets and liabilities and disclosure of contingent assets and liabilities at the date of the financial statements and the reported amounts of revenues and expenses during the reporting period. Actual results could differ from those estimates.
Securities Valuation
Securities are stated at the closing price on the date at which the net asset value (“NAV”) is being determined. If the date of determination is not a trading date, or the closing price is not otherwise available, the last bid price is used for a fair value instead. Debt securities are valued at the price provided by an independent pricing service. Any assets or securities for which market quotations are not readily available are valued at fair value as determined in good faith by or under the direction of the Fund’s Board of Directors (the “Board”) in accordance with the Fund’s Fair Value Pricing Policy.
Securities Transactions and Related Investment Income
The Fund follows industry practice and records securities transactions on trade date for financial reporting purposes. Dividend income is recorded on the ex-dividend date. Realized gains and losses from investment transactions are determined using the specific identification method. Interest income which includes amortization of premium and accretion of discount, is accrued as earned.
Semi-Annual Report | October 31, 2018 | 17 |
Caldwell & Orkin
Market Opportunity Fund |
Notes to Financial Statements
|
| | October 31, 2018 (Unaudited) |
Fair Value Measurements
A three-tier hierarchy has been established to classify fair value measurements for disclosure purposes. Inputs refer broadly to the assumptions that market participants would use in pricing the asset or liability, including assumptions about risk. Inputs may be observable or unobservable. Observable inputs are inputs that reflect the assumptions market participants would use in pricing the asset or liability that are developed based on market data obtained from sources independent of the reporting entity. Unobservable inputs are inputs that reflect the reporting entity’s own assumptions about the assumptions market participants would use in pricing the asset or liability that are developed based on the best information available.
Various inputs are used in determining the value of the Fund’s investments as of the reporting period end. These inputs are categorized in the following hierarchy under applicable financial accounting standards:
Level 1 – | Unadjusted quoted prices in active markets for identical investments and/or registered investment companies where the value per share is determined and published and is the basis for current transactions for identical assets or liabilities at the valuation date. |
Level 2 – | Quoted prices which are not active quoted prices for similar assets or liabilities in active markets or inputs other than quoted process that are observable (either directly or indirectly) for substantially the full term of the asset of liability. |
Level 3 – | Significant unobservable prices or inputs (including the Fund’s own assumptions in determining the fair value of investments) where there is little or no market for the asset or liability at the measurement date. |
The following is a summary of the inputs used as of October 31, 2018 in valuing the Fund’s investments carried at value:
Investments in Securities* | | Level 1 | | | Level 2 | | | Level 3 | | | Total | |
Assets | | | | | | | | | | | | | | | | |
Common Stocks | | $ | 28,672,225 | | | $ | — | | | $ | — | | | $ | 28,672,225 | |
Closed-end Funds | | | 337,312 | | | | — | | | | — | | | | 337,312 | |
Warrants | | | 431,313 | | | | — | | | | — | | | | 431,313 | |
Money Market Fund | | | 1,437,356 | | | | — | | | | — | | | | 1,437,356 | |
Total | | $ | 30,878,206 | | | $ | — | | | $ | — | | | $ | 30,878,206 | |
Liabilities | | | | | | | | | | | | | | | | |
Securities Sold Short | | | | | | | | | | | | | | | | |
Common Stocks | | $ | (6,475,440 | ) | | $ | — | | | $ | — | | | $ | (6,475,440 | ) |
Exchange-Traded Funds | | | (2,560,217 | ) | | | — | | | | — | | | | (2560217 | ) |
Exchange-Traded Notes | | | (2,750,625 | ) | | | — | | | | — | | | | (2750625 | ) |
Total | | $ | (11,786,282 | ) | | $ | — | | | $ | — | | | $ | (11,786,282 | ) |
* | For detailed industry descriptions, see the accompanying Schedule of Investments. |
18 | 1-800-467-7903 | www.CaldwellOrkin.com |
Caldwell & Orkin
Market Opportunity Fund |
Notes to Financial Statements
|
| | October 31, 2018 (Unaudited) |
The Fund did not hold any assets at any time during the reporting period in which significant unobservable inputs were used in determining fair value; therefore, no reconciliation of Level 3 securities is included for this reporting period.
Use of Derivatives
Derivative Instruments and Hedging Activities: The following discloses the Fund’s use of derivative instruments and hedging activities. The Fund’s investment objective not only permits the Fund to purchase investment securities, it also allows the Fund to enter into various types of derivative contracts, such as purchased and written options. In doing so, the Fund will employ strategies in differing combinations to permit it to increase, decrease, or change the level or types of exposure to market factors. Central to those strategies are features inherent to derivatives that make them more attractive for this purpose than equity or debt securities; they require little or no initial cash investment, they can focus exposure on only certain selected risk factors, and they may not require the ultimate receipt or delivery of the underlying security (or securities) to the contract holder. This may allow the Fund to pursue its objective more quickly and efficiently than if it were to make direct purchases or sales of securities capable of affecting a similar response to market factors.
Market Risk Factors: In pursuit of its investment objectives, the Fund may seek to use derivatives to increase or decrease their exposure to the following market risk factors:
Equity Risk: Equity risk relates to the change in value of equity securities as they relate to increases or decreases in the general market.
Significant Ownership Concentration
October 31, 2018, 2018, the Fund invested 4.19% of total net assets in the First American Treasury Obligations Fund – Class X (FXFXX) (the “Money Market Fund”). The financial statements of the Money Market Fund, including the portfolio of investments, are included in the First American Treasury Obligations Fund’s (Class X) annual report and can be found at www.firstamericanfunds.com and should be read in conjunction with the Fund’s financial statements. The Fund uses the money market instruments, such as the Money Market Fund, as a vehicle for holding collateral related to securities sold short. As stated in the Fund’s prospectus, the Fund will typically invest between 0% and 50% of net assets in money market securities and fixed income securities. This portion of the Fund’s portfolio includes cash equivalents (i.e., money market funds or U.S. treasury notes) and bonds (i.e., corporate or government bonds), although generally cash equivalents are emphasized more than bonds. The corporate bonds purchased may have any maturity and be of any rating or quality, as long as Fund management believes it is consistent with the Fund’s investment objective.
The Money Market Fund seeks to provide maximum current income and daily liquidity by purchasing U.S. Treasury securities and repurchase agreements collateralized by such obligations.
Semi-Annual Report | October 31, 2018 | 19 |
Caldwell & Orkin
Market Opportunity Fund |
Notes to Financial Statements
|
| | October 31, 2018 (Unaudited) |
Share Valuation
The NAV per share of the Fund is calculated by dividing the sum of the value of the securities held by the Fund, plus cash or other assets, minus all liabilities (including estimated accrued expenses) by the total number of shares outstanding for the Fund, rounded to the nearest cent. The Fund’s shares will not be priced on the days on which the New York Stock Exchange is closed for trading. The offering and redemption price per share for the Fund is equal to the Fund’s NAV per share.
The Fund charges a 2.00% redemption fee on shares held less than 90 days. These fees are deducted from the redemption proceeds otherwise payable to the shareholder. The Fund will retain the fee charged as paid-in capital and such fees become part of the Fund’s daily NAV calculation. For the six months ended October 31, 2018, the Fund recorded $959 in redemption fee proceeds.
Federal Income Taxes
The Fund makes no provision for federal income tax or excise tax. The Fund has qualified and intends to qualify each year as a regulated investment company (“RIC”) under subchapter M of the Internal Revenue Code of 1986, as amended, by complying with the requirements applicable to RICs and by distributing substantially all of its taxable income. The Fund also intends to distribute sufficient net investment income and net capital gains, if any, so that it will not be subject to excise tax on undistributed income and gains. If the required amount of net investment income or gains is not distributed, the Fund could incur a tax expense.
The Fund may be subject to taxes imposed by countries in which it invests. Such taxes are generally based on income and/or capital gains earned or repatriated. Taxes are accrued and applied to net investment income, net realized gains and unrealized appreciation as such income and/or gains are earned.
The Fund recognizes tax benefits or expenses of uncertain tax positions only when the position is “more likely than not” to be sustained assuming examination by tax authorities. Management of the Fund has reviewed tax positions taken in tax years that remain subject to examination by all major tax jurisdictions, including federal (i.e., the previous three tax year ends and the interim tax period since then, as applicable) and has concluded that no provision for unrecognized tax benefits or expenses is required in these financial statements and does not expect this to change over the next twelve months. The Fund recognizes interest and penalties, if any, related to unrecognized tax benefits as income tax expense in the Statement of Operations. During the year, the Fund did not incur any interest or penalties.
3. | FEES AND OTHER TRANSACTIONS WITH AFFILIATES AND OTHER SERVICE PROVIDERS |
The Fund has entered into a management agreement (the “Management Agreement”) with the Adviser pursuant to which the Adviser provides space, facilities, equipment and personnel necessary to perform administrative and investment management services for the Fund. The
20 | 1-800-467-7903 | www.CaldwellOrkin.com |
Caldwell & Orkin
Market Opportunity Fund |
Notes to Financial Statements
|
| | October 31, 2018 (Unaudited) |
Management Agreement provides that the Adviser is responsible for the management of the Fund’s portfolio. For such services and expenses assumed by the Adviser, the Fund pays a monthly advisory fee at incremental annual rates as follows:
Advisory Fee | Average Daily Net Assets |
1.00% | Up to $250 million |
0.90% | In excess of $250 million but not greater than $500 million |
0.80% | In excess of $500 million |
The Adviser has agreed to reimburse the Fund to the extent necessary to prevent the Fund’s annual ordinary operating expenses (excluding taxes, expenses related to the execution of portfolio transactions and the investment activities of the Fund such as, for example, interest, dividend expenses on securities sold short, brokerage commissions and fees and expenses charged to the Fund by any investment company in which the Fund invests and extraordinary charges such as litigation costs) from exceeding 2.00% of the Fund’s average net assets. No fee waiver or reimbursement by the Adviser was required for the six months ended October 31, 2018. During the six months ended October 31, 2018, the Adviser earned $217,579 from the Fund.
Ultimus Fund Solutions, LLC (“the Administrator”) provides fund accounting, fund administration and transfer agency services under a Master Services Agreement to the Fund. The Fund pays the Administrator fees for its services under the Master Services Agreement. In addition, the Fund pays out-of-pocket expenses including, but not limited to postage, supplies and costs of pricing the Fund’s securities. For the six months ended October 31, 2018, the Administrator earned fees of $14,888 for administration services, $16,075 for fund accounting services and $10,711 for transfer agent services.
Under a Compliance Consulting Agreement with the Fund, the Administrator provides the Fund with a Chief Compliance Officer along with support services. The Fund pays the Administrator an annual fee to provide these services. For the six months ended October 31, 2018, the Administrator earned fees of $10,000 for compliance services.
Ultimus Fund Distributors, LLC (the “Distributor”) serves as distributor to the Fund. The Fund does not pay the Distributor for these services. The Distributor is a wholly-owned subsidiary of the Administrator.
Certain officers of the Fund are also officers of the Administrator and the Distributor.
4. DIRECTOR COMPENSATION
The Fund pays each Director, in cash, an annual fee of $8,000 per year, plus $1,500 for each in-person meeting attended and $1,000 for each telephonic meeting attended. The Fund also reimburses Directors’ actual out-of-pocket expenses relating to attendance at meetings. Prior to November 11, 2017, each Director received an annual fee of $15,000 per year, plus $3,500 for each in-person meeting attended and $1,500 for each telephonic meeting attended. Until May 18, 2018, the Directors received their compensation entirely in shares of the Fund (i.e., Directors received shares of the Fund with a value equal to the cash compensation they would have otherwise received).
Semi-Annual Report | October 31, 2018 | 21 |
Caldwell & Orkin
Market Opportunity Fund |
Notes to Financial Statements
|
| | October 31, 2018 (Unaudited) |
5. INVESTMENT PORTFOLIO TRANSACTIONS
During the six months ended October 31, 2018, the Fund purchased $40,756,132 and sold $42,921,018 of securities, excluding securities sold short and short-term investments.
Short Sales and Segregated Cash
Short sales are transactions in which the Fund sells a security it does not own, in anticipation of a decline in the market value of that security. To initiate such a transaction, the Fund must borrow the security to deliver to the buyer upon the short sale; the Fund is then obligated to replace the security borrowed by purchasing it in the open market at some later date, completing the transaction.
The Fund will incur a loss if the market price of the security increases between the date of the short sale and the date on which the Fund replaces the borrowed security. The Fund will realize a gain if the security declines in value between those dates.
All short sales must be fully collateralized. The Fund maintains the collateral in segregated accounts consisting of cash and/or U.S. Government securities sufficient to collateralize the market value of its short positions. Typically, the segregated cash with brokers and other financial institutions exceeds the minimum required. Deposits with brokers for securities sold short are invested in money market instruments. Segregated cash is held at the custodian in the name of the broker per a tri-party agreement between the Fund, the custodian, and the broker.
The Fund may also sell short “against the box”, i.e., the Fund enters into a short sale as described above, while holding an offsetting long position in the same security which it sold short. If the Fund enters into a short sale against the box, it will segregate an equivalent amount of securities owned by the Fund as collateral while the short sale is outstanding.
The Fund limits the value of its short positions (excluding short sales “against the box”) to 60% of the Fund’s total net assets. At October 31, 2018, the Fund had approximately 34% of its total net assets in short positions.
For the six months ended October 31, 2018, the cost of investments purchased to cover short sales and the proceeds from investments sold short were $8,730,471 and $11,330,931, respectively.
6. FEDERAL TAX INFORMATION
As of October 31, 2018, the net unrealized appreciation (depreciation) of investments, including short securities, for tax purposes was as follows:
Gross unrealized appreciation | | $ | 1,390,524 | |
Gross unrealized depreciation | | | (3,700,159 | ) |
Net unrealized depreciation | | $ | (2,309,635 | ) |
22 | 1-800-467-7903 | www.CaldwellOrkin.com |
Caldwell & Orkin
Market Opportunity Fund |
Notes to Financial Statements
|
| | October 31, 2018 (Unaudited) |
At October 31, 2018, the aggregate cost of securities for federal income tax purposes was $21,401,559 for the Fund.
As of April 30, 2018, the components of distributable earnings on a tax basis were as follows:
Accumulated capital and other losses | | $ | (3,732,291 | ) |
Unrealized appreciation | | | 498,003 | |
| | | $ | (3,234,288 | ) |
The difference between book basis and tax basis unrealized appreciation was attributable primarily to the tax deferral of wash losses and investments in partnerships and certain other investments.
Certain capital losses incurred after October 31, and within the current taxable year, are deemed to arise on the first business day of the Fund’s following taxable year. For the tax year ended April 30, 2018, the Fund deferred $286,589 in Qualified Late Year Ordinary Losses.
As of April 30, 2018, the Fund has available for tax purposes an unused capital loss carryforward of $3,445,702 of short-term capital losses with no expiration, which is available to offset against future taxable net capital gains.
GAAP requires that certain components of net assets relating to permanent differences be reclassified between financial and tax reporting. These reclassifications have no effect on net assets or net asset value per share. For the year ended April 30, 2018, the Fund increased accumulated net realized loss on investments by $34,887, increased accumulated net investment loss by $1,090,745 and decreased paid-in capital by $1,125,632. These reclassifications are due to investments in partnerships, commodities, nondeductible dividend expenses and certain other temporary and permanent book and tax reclassifications.
7. COMMITMENTS AND CONTINGENCIES
Under the Fund’s organizational documents, its officers and directors are indemnified against certain liability arising out of the performance of their duties to the Fund. Additionally, in the normal course of business, the Fund enters into contracts with service providers that may contain general indemnification clauses, which may permit indemnification to the extent permissible under applicable law. The Fund’s maximum exposure under these arrangements is unknown, as this would involve future claims that may be made against the Fund that have not yet occurred.
8. SUBSEQUENT EVENTS
Management of the Fund has evaluated the need for disclosures and/or adjustments resulting from subsequent events through the date these financial statements were issued. Based upon this evaluation, management has determined there were no additional items requiring adjustment of the financial statements or additional disclosure.
Semi-Annual Report | October 31, 2018 | 23 |
Caldwell & Orkin
Market Opportunity Fund |
Disclosure of Fund Expenses
|
| | October 31, 2018 (Unaudited) |
Summary of Fund Expenses (Unaudited)
We believe it is important for you to understand the impact of fees and expenses on your investment in the Fund. As a shareholder of the Fund, you incur two types of costs: (1) transaction costs related to the purchase and redemption of Fund shares, including redemption fees and brokerage commissions (if applicable); and (2) ongoing costs, including management fees, administrative expenses, portfolio transaction costs and other Fund expenses. A mutual fund’s ongoing costs are expressed as a percentage of its average net assets. This figure is known as the expense ratio. The following example is intended to help you understand your ongoing costs (in dollars and cents) of investing in the Fund and to compare these costs with the ongoing costs of investing in other mutual funds.
The below example is based on an investment of $1,000 invested at the beginning of the period and held for the entire period indicated, May 1, 2018 through October 31, 2018. The table below illustrates the Fund’s expenses in two ways:
Based on Actual Fund Returns
The first line of the table below provides information about actual account values and actual expenses. You may use the information in this line, together with the amount you invested, to estimate the expenses that you paid over the period. Simply divide your account value by $1,000 (for example, an $8,600 account value divided by $1,000 = 8.6), then multiply the result by the number in the first line under the heading entitled “Expenses Paid During Period” to estimate the expenses you paid on your account during this period.
Based on a Hypothetical 5% Return for Comparison Purposes
The second line of the table below provides information about hypothetical account values and hypothetical expenses based on the Fund’s actual expense ratio and an assumed rate of return of 5% per year before expenses, which is not the Fund’s actual return. The hypothetical account values and expenses may not be used to estimate the actual ending account balance or expenses you paid for the period. You may use this information to compare the ongoing costs of investing in the Fund and other funds. To do so, compare this 5% hypothetical example with the 5% hypothetical examples that appear in the shareholder reports of the other funds.
Please note that the expenses shown in the table are meant to highlight your ongoing costs only and do not reflect any transactional costs, such as redemption fees or brokerage commissions. Therefore, the second line of the table is useful in comparing ongoing costs only, and will not help you determine the relative total costs of owning different funds. In addition, if these transactional costs were included, your costs would have been higher.
24 | 1-800-467-7903 | www.CaldwellOrkin.com |
Caldwell & Orkin
Market Opportunity Fund |
Disclosure of Fund Expenses
|
| | October 31, 2018 (Unaudited) |
| | | Beginning
Account Value
May 1, 2018 | | Ending
Account Value
October 31, 2018 | | Expenses
Paid During
Period(a) | | Annualized
Expense
Ratio |
Actual | | $1,000.00 | | $ 953.40 | | $13.88 | | 2.82% |
Hypothetical (b) | | $1,000.00 | | $ 1,010.99 | | $14.29 | | 2.82% |
(a) | Expenses are equal to the Fund’s annualized expense ratios, multiplied by the average account value over the period, multiplied by 184/365 (to reflect the one-half year period). |
(b) | Hypothetical assumes 5% annual return before expenses. |
Semi-Annual Report | October 31, 2018 | 25 |
CUSTOMER PRIVACY NOTICE |
| |
FACTS | WHAT DOES CALDWELL & ORKIN FUNDS, INC. DO WITH YOUR PERSONAL INFORMATION? |
| | |
Why? | Financial companies choose how they share your personal information. Federal law gives consumers the right to limit some but not all sharing. Federal law also requires us to tell you how we collect, share, and protect your personal information. Please read this notice carefully to understand what we do. |
| | |
What? | The types of personal information we collect and share depend on the product or service you have with us. This information can include: ■ Social Security number ■ Assets ■ Retirement Assets ■ Transaction History ■ Checking Account Information ■ Purchase History ■ Account Balances ■ Account Transactions ■ Wire Transfer Instructions When you are no longer our customer, we continue to share your information as described in this notice. |
| | |
How? | All financial companies need to share your personal information to run their everyday business. In the section below, we list the reasons financial companies can share their customers’ personal information; the reasons Caldwell & Orkin Funds Inc. chooses to share; and whether you can limit this sharing. |
| | | | |
Reasons we can share your personal information | Does Caldwell & Orkin Funds, Inc. share? | Can you limit this sharing? |
For our everyday business purposes –
Such as to process your transactions, maintain your account(s), respond to court orders and legal investigations, or report to credit bureaus | Yes | No |
For our marketing purposes –
to offer our products and services to you | Yes | No |
For joint marketing with other financial companies | No | We don’t share |
For our affiliates’ everyday business purposes –
information about your transactions and experiences | No | No |
For our affiliates’ everyday business purposes –
information about your creditworthiness | No | We don’t share |
For nonaffiliates to market to you | No | We don’t share |
For our affiliates’ marketing purposes | Yes | Yes* |
| | |
Questions? | Call (800) 467-7903 |
| | | | |
To limit our sharing | *Call (813) 282-7870 Please note: If you are a new customer, we can begin sharing your information 30 days from the date we sent this notice. When you are no longer our customer, we continue to share your information as described in this notice. However, you can contact us at any time to limit our sharing. |
26 | 1-800-467-7903 | www.CaldwellOrkin.com |
Page 2 | |
Who we are |
Who is providing this notice? | Caldwell & Orkin Funds, Inc. Caldwell & Orkin Market Opportunity Fund Ultimus Fund Distributors, LLC (Distributor) Ultimus Fund Solutions, LLC (Administrator) |
What we do |
How does Caldwell & Orkin Funds, Inc. protect my personal information? | To protect your personal information from unauthorized access and use, we use security measures that comply with federal law. These measures include computer safeguards and secured files and buildings. Our service providers are held accountable for adhering to strict policies and procedures to prevent any misuse of your nonpublic personal information. |
How does Caldwell & Orkin Funds, Inc. collect my personal information? | We collect your personal information, for example, when you ■ Open an account ■ Provide account information ■ Give us your contact information ■ Make deposits or withdrawals from your account ■ Make a wire transfer ■ Tell us where to send the money ■ Tell us who receives the money ■ Show your government-issued ID ■ Show your driver’s license We also collect your personal information from other companies. |
Why can’t I limit all sharing? | Federal law gives you the right to limit only ■ Sharing for affiliates’ everyday business purposes – information about your creditworthiness ■ Affiliates from using your information to market to you ■ Sharing for nonaffiliates to market to you State laws and individual companies may give you additional rights to limit sharing. |
| | |
Definitions |
Affiliates | Companies related by common ownership or control. They can be financial and nonfinancial companies. ■ Gator Capital Management, LLC the investment adviser to Caldwell & Orkin Funds, Inc., could be deemed an affiliate. |
Nonaffiliates | Companies not related by common ownership or control. They can be financial and nonfinancial companies ■ Caldwell & Orkin Funds, Inc. does not share with nonaffiliates so they can market to you. |
Joint marketing | A formal agreement between nonaffiliated financial companies that together market financial products or services to you. ■ Caldwell & Orkin Funds, Inc. does not jointly market. |
Semi-Annual Report | October 31, 2018 | 27 |
This Page is Intentionally Left Blank.
This Page is Intentionally Left Blank.
CALDWELL & ORKIN MARKET OPPORTUNITY FUND |
Semi-Annual Report to Shareholders |
BOARD OF DIRECTORS Frederick T. Blumer,
Independent Chairman Derek Pilecki, President Bevin E. Newton Rhett E. Ingerick | TRANSFER, REDEMPTION
& DIVIDEND
DISBURSING AGENT Ultimus Fund Solutions, LLC
P.O. Box 46707
Cincinnati, OH 45246-0707 | LEGAL COUNSEL Kilpatrick Townsend & Stockton LLP 1001 West Fourth Street Winston-Salem, NC 27101-2400 |
| | | |
INVESTMENT ADVISER Gator Capital Management, LLC 100 S. Ashley Drive, Suite 895 Tampa, FL 33602 | CUSTODIAN U.S. Bank, N.A.
425 Walnut St.
Cincinnati, OH 45202 | |
| | | |
DISTRIBUTOR Ultimus Fund Distributors, LLC
225 Pictoria Drive, Suite 450
Cincinnati, OH 45246 | | |
The Caldwell & Orkin Market Opportunity Fund’s (the “Fund”) portfolio may or may not have positions in any of the companies referenced in this Report to Shareholders as of any date after October 31, 2018. These financial statements are submitted for the general information of the Fund’s shareholders. They are not authorized for distribution to prospective investors unless preceded or accompanied by an effective Fund Prospectus.
Availability of Proxy Voting Policy & Procedures, Proxy Voting Record and Code of Ethics - A description of a) the policies and procedures the Fund uses to determine how to vote proxies relating to portfolio securities, b) how the Fund voted proxies relating to portfolio securities during the most recent 12-month period ended June 30, and c) the Code of Ethics applicable to the principal officers of the Fund are available without charge, upon request, by calling toll-free (800) 467-7903, or on the Securities and Exchange Commission’s (the “Commission’s”) website at http://www.sec.gov.
Fund Information - For more information about the Fund please call (800) 467-7903 or visit the Fund’s website at https://caldwellorkin.com.
Gator Capital Management, LLC
100 S. Ashley Drive, Suite 895
Tampa, Fl 33602
Item 2. Code of Ethics.
Not applicable to semiannual reports.
Item 3. Audit Committee Financial Expert.
Not applicable to semiannual reports.
Item 4. Principal Accountant Fees and Services.
Not applicable to semiannual reports.
Item 5. Audit Committee of Listed Registrants.
Not applicable.
Item 6. Schedule of Investments.
(a) Included as part of the report to Stockholders filed under Item 1 of this Form.
(b) Not applicable.
Item 7. Disclosure of Proxy Voting Policies and Procedures for Closed-End Management Investment Companies.
Not applicable.
Item 8. Portfolio Managers of Closed-End Management Investment Companies.
Not applicable.
Item 9. Purchases of Equity Securities by Closed-End Management Investment Company and Affiliated Purchasers.
Not applicable.
Item 10. Submission of Matters to a Vote of Security Holders.
None.
Item 11. Controls and Procedures.
(a) The registrant’s Principal Executive Officer and Principal Financial Officer have concluded that the registrant's disclosure controls and procedures (as defined in Rule 30a-3(c) under the Act) are effective in design and operation and are sufficient to form the basis of the certifications required by Rule 30a-2 under the Act, based on their evaluation of these disclosure controls and procedures within 90 days of the filing of this report on Form N-CSR.
(b) There were no changes in the registrant’s internal control over financial reporting (as defined in Rule 30a-3(d) under the Act (17 CFR 270.30a-3(d)) that occurred during the second fiscal quarter of the period covered by this report that have materially affected or are reasonably likely to materially affect, the registrant’s internal control over financial reporting.
Item 12. Disclosure of Securities Lending Activities for Closed-End Investment Companies.
Not applicable.
Item 13. Exhibits.
(a)(1) Not applicable.
(a)(2) Certifications pursuant to Rule 30a-2(a) are attached hereto.
(a)(3) Not applicable.
(b) Certifications pursuant to Rule 30a-2(b) are furnished herewith.
SIGNATURES
Pursuant to the requirements of the Securities Exchange Act of 1934 and the Investment Company Act of 1940, the registrant has duly caused this report to be signed on its behalf by the undersigned, thereunto duly authorized.
| (Registrant) | | The Caldwell & Orkin Funds, Inc. | |
| | | | |
| By (Signature and Title) | /s/ Derek Pilecki | |
| | | Derek Pilecki, President and Principal Executive Officer |
| | | | |
| Date | 1/4/2019 | | |
Pursuant to the requirements of the Securities Exchange Act of 1934 and the Investment Company Act of 1940, this report has been signed below by the following persons on behalf of the registrant and in the capacities and on the dates indicated.
| By (Signature and Title) | /s/ Derek Pilecki | |
| | | Derek Pilecki, President and Principal Executive Officer |
| | | |
| Date | 1/4/2019 | |
| | | |
| By (Signature and Title) | /s/ Erik Anderson | |
| | | Erik Anderson, Treasurer and Principal Financial Officer |
| | | | |
| Date | 1/4/2019 | | |