Washington, D.C. 20549
Michael B. Orkin
Form N-CSR is to be used by management investment companies to file reports with the Commission not later than 10 days after the transmission to stockholders of any report that is required to be transmitted to stockholders under Rule 30e-1 under the Investment Company Act of 1940 (17 CFR 270.30e-1). The Commission may use the information provided on Form N-CSR in its regulatory, disclosure review, inspection, and policymaking roles.
A registrant is required to disclose the information specified by Form N-CSR, and the Commission will make this information public. A registrant is not required to respond to the collection of information contained in Form N‑CSR unless the Form displays a currently valid Office of Management and Budget ("OMB") control number. Please direct comments concerning the accuracy of the information collection burden estimate and any suggestions for reducing the burden to Secretary, Securities and Exchange Commission, 450 Fifth Street, NW, Washington, DC 20549-0609. The OMB has reviewed this collection of information under the clearance requirements of 44 U.S.C. §. 3507.
| | Caldwell & Orkin |
| Table of Contents | Market Opportunity Fund |
October 31, 2015
| Shareholder Letter | 2 |
| Performance Summary | 7 |
| Statistical Risk Profile | 9 |
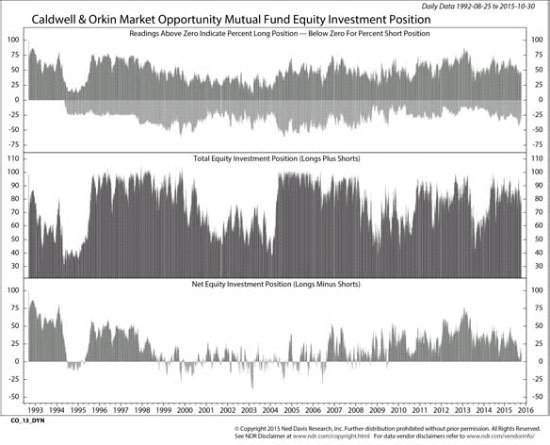
| Growth of $10,000 | Equity Investment Position Chart | 11 |
| Disclosure of Fund Expenses | 12 |
| Sector Diversification | 14 |
| Schedule of Investments | 16 |
| Statement of Assets & Liabilities | 26 |
| Statement of Operations | 27 |
| Statements of Changes in Net Assets | 28 |
| Financial Highlights | 29 |
| Notes to Financial Statements | 31 |
| Additional Information | 41 |
| Caldwell & Orkin | |
| Market Opportunity Fund | Shareholder Letter |
October 31, 2015 (Unaudited)
Investment Adviser
C&O Funds Advisor, Inc.
5185 Peachtree Parkway,
Suite 370
Norcross, Georgia
30092‐6541
(800) 237‐7073 |  | Shareholder Accounts
c/o ALPS Fund Services, Inc.
P.O. Box 46256
Denver, Colorado 80201
(800) 467‐7903 |
Dear Fellow Shareholder:
The Caldwell & Orkin Market Opportunity Fund’s (the “Fund”) investment objective is to provide long term capital growth with a short‐term focus on capital preservation. In other words, we manage for risk as well as return. Our investment process includes both macro (top‐down) analysis and stock selection (bottom‐up). Our macro analysis informs our net equity exposure while our stock selection helps us determine what stocks will help us reach this exposure. The Fund is actively managed, with the goal of outperforming the market over a full‐market cycle (inclusive of both a bull cycle and a bear cycle) with less risk.
Management Discussion and Analysis
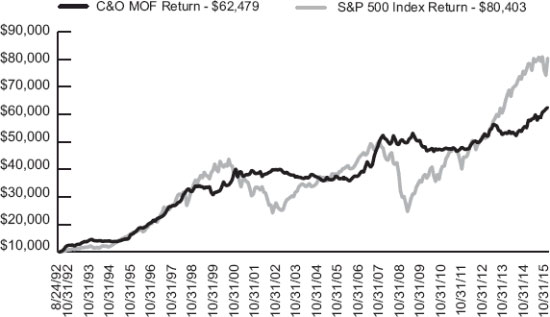
The Fund rose 8.02% in the 6‐month period ended October 31, 2015. The S&P 500 Total Return Index (the Index) rose 0.77% during the same period. For the 12 months ended October 31, 2015, the Fund gained 13.42%, while the S&P 500 increased 5.20%. And, since August 24, 1992 through October 31, 2015, the Fund has generated an 8.22% compound annual return, compared to the S&P 500’s 9.40%. Importantly, the Fund has achieved these results while maintaining a low market risk profile and with little reliance on the movement of the stock market (see pages 7, 9, 10 and 11). The Fund’s price movements have had virtually no correlation (0.090) with the price movements of the S&P 500 as measured by R, the correlation coefficient (Statistical computations by Ned Davis Research, Inc.). Of course past performance is no guarantee of future results.
During the six‐month period the equity markets repeated the pattern of volatility that investors experienced in 2014. The S&P 500 plunged ‐12% from 2,128 on July 20th to 1,867 on August 25th, but recovered back to 2,079 by the end of October. With an average net‐long position of only 21% the Fund was able to considerably outperform the Index during the period. This outperformance was the result of our macro indicators leading to a reduction in our net invested position and our stock selection leading to the outperformance of the short side of the portfolio.
The Fund’s flexibility contributed favorably to performance during the period. The gross long exposure ranged from 38.8% to 62.4%, averaging 52.4%. During the period the long portfolio underperformed the Index, generating a total return of ‐0.01%. The Fund’s gross short position ranged from 19.5% to 44.3%, averaging 31.0%. The short portfolio significantly outperformed the inverse return of the Index, generating a total return of 24.34%. Overall, the Fund’s total invested position ranged from 66.0% to 95.9%, averaging 83.3%. The Fund’s net invested position ranged from 1.1% net‐long to 38.6% netlong, averaging 21.5% net‐long.
| 2 | 1-800-467-7903 | www.CaldwellOrkin.com |
| Caldwell & Orkin | |
| Market Opportunity Fund | Shareholder Letter |
October 31, 2015 (Unaudited)
The Fund entered the period 32.0% net‐long and ended the period 14.1% net‐long. The decrease in the net positioning was the result of both a reduction in the long portfolio and an increase in the short portfolio. The long portfolio remains broadly diversified. At 8.7%, technology is our largest long exposure. The portfolio is invested in a diverse mix of hardware, software, social media and Internet search companies. At 7.5%, retail is our second largest sector exposure. Though slow, the improvement in consumer finances is steady. The Fund’s retail exposure is weighted towards “ath‐leisure” trends in footwear and apparel.
The short side of the portfolio remains broadly diversified as well. At 4.4%, equities exposed to Brazil are our largest exposure followed by a 3.4% position in industrial manufacturing companies.
During the period 7 of our 10 biggest winners came from the short side of the portfolio. These seven contributors consisted of deep‐water oil drilling contractors, an electronics retailer and an organic grocer. A long position in Facebook Inc. (FB) was our single largest contributor. The social media company is benefitting from increased advertising revenue as they use the data supplied by their customers for targeted advertising on their platform. A long in Internet search and media company Alphabet, Inc. (GOOGL) was also a top contributor.
Our fiver biggest losers were a mix of three longs and two shorts. Longs in Kinder Morgan, Inc. (KMI) and Amedisys Inc. (AMED) are no longer in the portfolio. Shoe maker Skechers U.S.A., Inc. continues its robust growth, however, the stock was weak after the company missed bullish street estimates in its most recent quarter. A short in an automotive software company that was acquired during the period was one of our largest detractors. The other short, a retail and fashion accessories company, produced better‐than‐expected results during the period. This short is no longer in the portfolio.
Outlook
Recent dislocations in the high‐yield credit markets are an indication that leverage has once again been accumulated to levels that pose a risk to the health of the economy. When used appropriately, leverage can be a growth‐enhancing economic tool. When abused, it can be as destructive as the most venomous cobra. For the last seven years, central banks around the world have tried to combat the destructive forces of leverage with monetary policies that have made it easier and cheaper for corporations and governments to issue debt. This has left the global financial system dangerously exposed to potential disclocations.
Markets move in cycles. In managing the Fund, we strive to outperform over the course of a full‐market cycle, which includes both bull and bear market phases. Ned Davis Research, Inc. (“NDR”) has computed what they consider to be bull and bear market cycles for the S&P 500. Most of their definition focuses on a 20% market move in either direction. We present the NDR data for your review:
| Bull Market Phase |
| Start Date | | MOF | | | | S&P | |
| 8/24/1992* | | | 212.19 | % | | | 230.03 | % |
| 8/31/1998 | | | 6.02 | % | | | 62.88 | % |
| 9/21/2001 | | ‐5.75 | % | | | 22.00 | % |
| 10/9/2002 | | | 16.21 | % | | | 119.38 | % |
| 3/9/2009 | | ‐2.47 | % | | | 111.33 | % |
| Bear Market Phase |
Start Date** | | MOF | | | | S&P | |
| 7/17/1998 | | | 4.01 | % | | | ‐19.19 | % |
| 9/1/2000 | | | 14.71 | % | | | ‐35.71 | % |
| 3/19/2002 | | | 9.97 | % | | | ‐33.01 | % |
| 10/9/2007 | | | 2.20 | % | | | ‐55.26 | % |
| 4/29/2011 | | | 0.46 | % | | | ‐18.72 | % |
| Full Market Cycle |
End Date*** | | MOF | | | | S&P | |
| 8/31/1998 | | | 224.71 | % | | | 166.69 | % |
| 9/21/2001 | | | 21.61 | % | | | 4.72 | % |
| 10/9/2002 | | | 3.65 | % | | ‐18.27 | % |
| 3/9/2009 | | | 18.77 | % | | ‐1.85 | % |
| 10/3/2011 | | ‐2.02 | % | | | 71.76 | % |
| Semi-Annual Report | October 31, 2015 | 3 |
| Caldwell & Orkin | |
| Market Opportunity Fund | Shareholder Letter |
October 31, 2015 (Unaudited)
| * | The first bull market phase began 10/11/1990, but the table begins with 8/24/1992, which coincides with commencement of active management of the Caldwell & Orkin Market Opportunity Fund. |
| ** | The bear market start date is the bull market’s end date. |
| *** | A full market cycle runs from the bull market start date to the full market cycle end date. |
Sincerely,
Michael B. Orkin, CFA
Portfolio Manager and Chief Investment Officer
The performance data quoted represents past performance. Past performance is no guarantee of future results. The investment return and principal value of an investment in the Fund will fluctuate so that an investor’s shares, when redeemed, may be worth more or less than their original cost. Current performance may be higher or lower than the performance data quoted. Please call 800‐377‐7073 or visit www.CaldwellOrkin.com for current month‐end performance. To see the most current performance as of 10/31/2015, please see page 7 of this semi‐annual report.
| 4 | 1-800-467-7903 | www.CaldwellOrkin.com |
| Caldwell & Orkin | |
| Market Opportunity Fund | Shareholder Letter |
October 31, 2015 (Unaudited)
Disclosure
The Fund’s investment objective is to provide long-term capital growth with a short-term focus on capital preservation. Our philosophy in managing the Fund is to focus on risk as well as return. We use an investment philosophy based upon sophisticated exploitation of the low-risk anomaly. The low-risk anomaly stands in direct contradiction to the conventional beliefs of Efficient Market Hypothesis stating that high risk is equated with higher return. Caldwell and Orkin takes the opposite view – we believe that lower risk can result in higher return. The Fund may hold up to 60% of its net assets in short positions at any time and also invest in options. Short positions and put options are employed with the intent of making money when those stocks we judge to be mispriced fall. When we use short positions or put options, the Fund’s portfolio is considered to be “hedged,” so that it is not fully exposed to the price movements and volatility of the broader market. Our asset allocation determinations are primarily based on our perception of risk in the marketplace. In summary, our goal is to make money over a full market cycle, but with less stomach churn.
The Fund’s disciplined investment philosophy and active management style typically leads to higher-than-average portfolio turnover. High turnover may have an unfavorable impact on the amount of taxable distributions paid to shareholders. Higher turnover may also result in higher brokerage costs for the Fund. The Fund’s turnover rate will typically exceed 100% per year, and will not be a limiting factor when we deem change appropriate. Fund holdings, industry and asset allocations are subject to change without notice. The Fund may or may not have a position in any of the companies mentioned in this commentary as of the date of this report.
An investment in the Fund involves risk, including the loss of principal. Additionally, there are certain risks inherent in investing in the Fund, including market risk, short sale risk, interest rate risk, business risk, small company risk, market valuation risk, political risk, and portfolio turnover risk. For a complete discussion of these risks, you may request a copy of the Fund’s prospectus by calling 800-237-7073. The Fund uses aggressive investment strategies (including short positions and options) that have the potential for yielding high returns; however, these strategies may also result in losses. Stocks sold short have unlimited risk. Investment return and principal value will fluctuate so that shares, when redeemed, may be worth more or less than their original cost. Options are not suitable for all investors.
Investors should expect that the Fund’s performance may fluctuate independently of stock market indices, such as the S&P 500 Total Return Index.
Distributed by ALPS Distributors, Inc., Member FINRA/SIPC
1290 Broadway, Suite 1100, Denver, CO 80203
| Semi-Annual Report | October 31, 2015 | 5 |
| Caldwell & Orkin | |
| Market Opportunity Fund | Shareholder Letter |
October 31, 2015 (Unaudited)
Statistical Risk Definitions:
Correlation Coefficient (R): R is a statistical measure of correlation. In this report, R is a measurement of investment risk that indicates how closely performance is linked to the broad market – it quantifies the degree to which a fund’s performance correlates with the performance of a benchmark. R can vary between 1.000 (perfect positive correlation) and -1.000 (perfect negative correlation). 0.000 represents no correlation. An R of 1.000 means that all movements of a fund are fully explained by movements in its benchmark index. Conversely, a low R indicates that very few of the fund’s movements are explained by movements in its benchmark index, and a negative R indicates a fund’s movements are inversely correlated with its benchmark index.
Coefficient of Determination (R-Square): R-Square, also represented as R2, is another measurement of investment risk that quantifies the degree to which a fund’s performance correlates with the performance of its benchmark index. R-Square is calculated by multiplying the Correlation Coefficient (R) by itself, and is therefore always positive. R-Square can vary between 0.000 (no correlation) and 1.000 (perfect correlation). The higher the value of R-Square, the greater the degree of correlation between the fund and its benchmark index. R-squared does not take into account the direction of the correlation (positive or negative), therefore R-Squared is not able to reflect inverse correlation between a fund and its benchmark index.
Beta: A measure of a fund’s sensitivity to market movements. Usually the higher betas represent riskier investments. When correlation is low, beta has minimal, if any, significance.
Standard deviation: A statistical measure of dispersion about an average, indicating the volatility of a fund’s total returns.
Sharpe Ratio: The Sharpe Ratio is calculated by subtracting the risk-free (T-bill) rate of return from a portfolio’s total return and then dividing this by its standard deviation. The resulting fraction can be thought of as return per unit of risk. The higher a portfolio’s Sharpe Ratio, the better the risk-adjusted performance.
Semi-variance: A measure of a fund’s downside (negative return) volatility relative to a benchmark. Lower numbers are associated with less risk.
Index Definition:
S&P 500 Total Return Index: The S&P 500 Total Return Index is a capitalization-weighted, unmanaged index of 500 large U.S. companies chosen for market size, liquidity and industry group representation and includes reinvested dividends. You cannot invest directly in an index.
| 6 | 1-800-467-7903 | www.CaldwellOrkin.com |
| Caldwell & Orkin | |
| Market Opportunity Fund | Performance Summary |
October 31, 2015 (Unaudited)
Fiscal Year
Ended
April 30, | | C&O Market Opportunity Fund(1) | | S&P 500 Total Return Index(2) |
| | 1993* | | 15.09% | | | 9.24% | |
| | 1993** | | 21.09% | | | 9.18% | |
| | 1994 | | 16.48% | | | 5.32% | |
| | 1995 | | ‐2.28% | | | 17.47% | |
| | 1996 | | 31.80% | | | 30.21% | |
| | 1997 | | 23.24% | | | 25.13% | |
| | 1998 | | 25.77% | | | 41.07% | |
| | 1999 | | 19.43% | | | 21.82% | |
| | 2000 | | ‐0.02% | | | 10.13% | |
| | 2001 | | 11.43% | | | ‐12.97% | |
| | 2002 | | 1.88% | | | ‐12.63% | |
| | 2003 | | 1.12% | | | ‐13.31% | |
Total Return Through October 31, 2015 | | | | | | |
| 6 months ended | | 8.02% | | | 0.77% | |
| 12 months ended | | 13.42% | | | 5.20% | |
Since 8/24/92(3) | | 524.79% | | | 704.03% | |
Fiscal Year
Ended
April 30, | | C&O Market Opportunity Fund(1) | | S&P 500 Total Return Index(2) |
| 2004 | | ‐3.55% | | | 22.88% | |
| 2005 | | ‐0.17% | | | 6.34% | |
| 2006 | | ‐2.74% | | | 15.42% | |
| 2007 | | 15.31% | | | 15.24% | |
| 2008 | | 17.92% | | | ‐4.68% | |
| 2009 | | 4.73% | | | ‐35.31% | |
| 2010 | | ‐7.40% | | | 38.84% | |
| 2011 | | 0.41% | | | 17.22% | |
| 2012 | | 4.95% | | | 4.76% | |
| 2013 | | 11.72% | | | 16.89% | |
| 2014 | | ‐6.92% | | | 20.44% | |
| 2015 | | 10.68% | | | 12.98% | |
Average Annual Returns Through October 31, 2015 | | | | | | |
| One Year | | 13.42% | | | 5.20% | |
| Three Years | | 5.66% | | | 16.20% | |
| Five Years | | 5.85% | | | 14.33% | |
| Ten Years | | 5.30% | | | 7.85% | |
| Fifteen Years | | 3.70% | | | 4.55% | |
| Twenty Years | | 7.55% | | | 8.59% | |
Since 8/24/92(3) | | 8.22% | | | 9.40% | |
| 1 | The performance data quoted represents past performance. Past performance is no guarantee of future results. The investment return and principal value of an investment in the Fund will fluctuate so that an investor’s shares, when redeemed, may be worth more or less than their original cost. Current performance may be higher or lower than the performance data quoted. Please call 800-377-7073 or visit www.CaldwellOrkin.com for current month-end performance. The Fund’s performance assumes the reinvestment of dividends and capital gains, if any. Fund holdings, industry and asset allocations are subject to change without notice. The Fund may or may not have a position in any of the companies mentioned in this report as of the date of this report. See additional important disclosures on pages 5 and 6. |
| 2 | Investors should expect that the Fund’s performance may fluctuate independently of stock market indices, such as the S&P 500 Total Return index. The S&P 500 Total Return index is a widely recognized unmanaged index of 500 common stock prices adjusted to reflect the reinvestment of dividends and distributions. You may not invest directly in an index. |
| 3 | Effective August 24, 1992, the Fund changed its investment objective to provide long-term capital growth with a short-term focus on capital preservation through investment selection and asset allocation. Prior to that time, the Fund was passively managed and indexed to the largest 100 over-the-counter (OTC) stocks. |
| Semi-Annual Report | October 31, 2015 | 7 |
| Caldwell & Orkin | |
| Market Opportunity Fund | Performance Summary |
October 31, 2015 (Unaudited)
| † | As a percentage of net assets plus the absolute value of securities sold short. |
| * | For the full fiscal year ended April 30, 1993. |
| ** | From August 24, 1992 through April 30, 1993 - the portion of the year using the active investment management style of C&O Funds Advisor, Inc., the manager of the Fund. |
Total annualized Fund operating expenses for the Fund’s fiscal year ended April 30, 2015 were 2.66%, or 1.46% before interest expenses and dividend expenses related to short sales. These figures exclude Acquired Fund Fees and Expenses of 0.02%. Additional information about the Fund’s fees and expenses is available in the Fund’s prospectus.
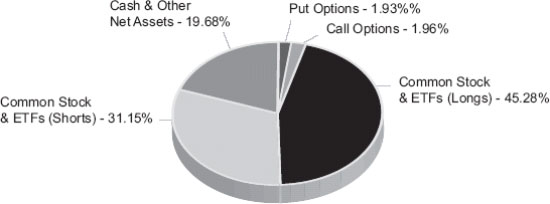
Net Asset Allocation
October 31, 2015†
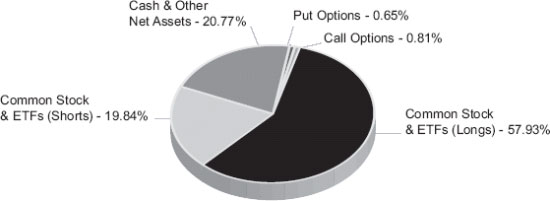
Net Asset Allocation
April 30, 2015†
| 8 | 1-800-467-7903 | www.CaldwellOrkin.com |
| Caldwell & Orkin | |
| Market Opportunity Fund | Statistical Risk Profile |
October 31, 2015 (Unaudited)
| Ten Worst S&P 500 Total Return Days | |
| Date | | C&O MOF | | | S&P 500 | | | Variance | | | |
| 10/15/2008 | | ‐1.47% | | | ‐9.02% | | | 7.55% | | The Caldwell & Orkin Market Opportunity Fund outperformed the S&P 500 Total Return index on all ten of the ten worst days, and was positive on two of the ten days. | |
| 12/1/2008 | | ‐1.58% | | | ‐8.92% | | | 7.34% | | |
| 9/29/2008 | | ‐0.37% | | | ‐8.78% | | | 8.41% | |
| 10/9/2008 | | ‐2.12% | | | ‐7.61% | | | 5.49% | |
| 10/27/1997 | | ‐1.60% | | | ‐6.89% | | | 5.29% | |
| 8/31/1998 | | 0.42% | | | ‐6.79% | | | 7.21% | |
| 11/20/2008 | | 0.23% | | | ‐6.70% | | | 6.93% | |
| 8/8/2011 | | ‐0.63% | | | ‐6.66% | | | 6.03% | |
| 11/19/2008 | | ‐0.28% | | | ‐6.10% | | | 5.82% | |
| 10/22/2008 | | ‐1.11% | | | ‐6.09% | | | 4.98% | | | |
| Ten Worst S&P 500 Total Return Weeks | |
| Week Ending | | C&O MOF | | | S&P 500 | | | Variance | | | |
| 10/10/2008 | | ‐2.71% | | | ‐18.14% | | | 15.43% | | The Caldwell & Orkin Market Opportunity Fund outperformed the S&P 500 Total Return index in all ten of the ten worst weeks, and was positive in seven of those weeks. | |
| 9/21/2001 | | 1.62% | | | ‐11.57% | | | 13.19% | |
| 4/14/2000 | | 4.51% | | | ‐10.52% | | | 15.03% | |
| 10/3/2008 | | 1.82% | | | ‐9.33% | | | 11.15% | |
| 11/21/2008 | | 0.55% | | | ‐8.33% | | | 8.88% | |
| 7/19/2002 | | 0.64% | | | ‐7.96% | | | 8.60% | |
| 8/5/2011 | | ‐0.78% | | | ‐7.15% | | | 6.37% | |
| 3/6/2009 | | ‐0.88% | | | ‐6.96% | | | 6.08% | |
| 7/12/2002 | | 1.02% | | | ‐6.81% | | | 7.83% | |
| 2/20/2009 | | 0.19% | | | ‐6.80% | | | 6.99% | | | |
| Ten Worst S&P 500 Total Return Months | |
| Month | | C&O MOF | | | S&P 500 | | | Variance | | | |
| 10/31/2008 | | 2.86% | | | ‐16.74% | | | 19.60% | | The Caldwell & Orkin Market Opportunity Fund outperformed the S&P 500 Total Return index in all ten of the ten worst months, and was positive in seven of those months. | |
| 8/31/1998 | | 3.11% | | | ‐14.46% | | | 17.57% | |
| 9/30/2002 | | 2.10% | | | ‐10.86% | | | 12.96% | |
| 2/28/2009 | | 0.29% | | | ‐10.71% | | | 11.00% | |
| 2/28/2001 | | 4.78% | | | ‐9.13% | | | 13.91% | |
| 9/30/2008 | | ‐0.42% | | | ‐8.89% | | | 8.47% | |
| 6/30/2008 | | 4.84% | | | ‐8.43% | | | 13.27% | |
| 1/31/2009 | | ‐0.73% | | | ‐8.30% | | | 7.57% | |
| 9/30/2001 | | 3.28% | | | ‐8.06% | | | 11.34% | |
| 5/31/2010 | | ‐2.56% | | | ‐8.04% | | | 5.48% | | | |
Short selling began May 2, 1994. Past performance is no guarantee of future results. See additional important disclosures on pages 5 and 6. Computations by Ned Davis Research, Inc.
| Semi-Annual Report | October 31, 2015 | 9 |
| Caldwell & Orkin | |
| Market Opportunity Fund | Statistical Risk Profile |
October 31, 2015 (Unaudited)
| Ten Worst Drawdowns | | |
| Caldwell & Orkin Market Opportunity Fund | | S&P 500 Total Return Index |
| Date Range | C&O MOF | S&P 500 | | Date Range | C&O MOF | S&P 500 |
01/17/2008 ‐ 05/07/2010 | ‐15.68% | ‐11.68% | | 10/09/2007 ‐ 03/09/2009 | 2.20% | ‐55.26% |
04/12/1999 ‐ 11/23/1999 | ‐13.30% | 4.23% | | 03/24/2000 ‐ 10/09/2002 | 28.03% | ‐47.41% |
10/09/2002 ‐ 05/25/2006 | ‐12.82% | 74.17% | | 07/17/1998 ‐ 08/31/1998 | 4.01% | ‐19.19% |
05/17/2013 ‐ 04/11/2014 | ‐10.22% | 10.82% | | 04/29/2011 ‐ 10/03/2011 | 0.46% | ‐18.72% |
03/18/1994 ‐ 05/22/1995 | ‐10.03% | 14.95% | | 04/23/2010 ‐ 07/02/2010 | ‐1.47% | ‐15.67% |
05/26/2000 ‐ 06/07/2000 | ‐8.14% | 6.81% | | 11/27/2002 ‐ 03/11/2003 | 2.18% | ‐14.28% |
12/29/2000 ‐ 01/19/2001 | ‐8.06% | 1.75% | | 05/21/2015 ‐ 08/25/2015 | 3.97% | ‐11.90% |
04/04/2001 ‐ 03/11/2002 | ‐8.03% | 7.22% | | 07/16/1999 ‐ 10/15/1999 | ‐0.47% | ‐11.78% |
03/15/1993 ‐ 04/26/1993 | ‐7.83% | ‐3.65% | | 10/07/1997 ‐ 10/27/1997 | 0.16% | ‐10.74% |
04/10/2007 ‐ 05/24/2007 | ‐7.14% | 4.31% | | 09/23/1998 ‐ 10/08/1998 | 2.03% | ‐9.94% |
Statistical Risk Measurements
8/24/1992 through 10/31/15 (daily data) | | | | | | |
| | | C&O MOF | | S&P 500 |
Coefficient of Determination (R‐Square) | | | 0.008 | | | 1.000 |
| Correlation Coefficient "R" | | | 0.090 | | | 1.000 |
| Beta | | | 0.040 | | | 1.000 |
| Standard Deviation | | | 0.521 | | | 1.162 |
| Sharpe Ratio | | | 0.66 | | | 0.43 |
Semi‐Variance | | | 0.13 | | | 0.66 |
| Performance During Market Downturns of 20% or More | |
| | | C&O MOF | | S&P 500 |
01/06/2009 ‐ 03/09/2009 | | ‐3.43% | | | ‐27.19% | |
10/09/2007 ‐ 11/20/2008 | | 4.27% | | | ‐50.73% | |
01/04/2002 ‐ 10/09/2002 | | 7.20% | | | ‐32.95% | |
03/24/2000 ‐ 09/21/2001 | | 23.52% | | | ‐35.65% | |
Short selling began May 2, 1994. Past performance is no guarantee of future results. See additional important disclosures on pages 5 and 6. Computations by Ned Davis Research, Inc.
| 10 | 1-800-467-7903 | www.CaldwellOrkin.com |
| Caldwell & Orkin | |
| Market Opportunity Fund | Growth of $10,000 |
October 31, 2015 (Unaudited)
Caldwell & Orkin Market Opportunity Fund Versus S&P 500 Total Return Index
Since Commencement of Active Style of Investment Management Results of a Hypothetical $10,000 Investment August 24, 1992 through October 31, 2015.
Past performance does not predict future performance. The returns do not reflect the deduction of taxes that a shareholder would pay on Fund distributions or the redemption of Fund shares. See additional disclosure on pages 5 and 6.
| Semi-Annual Report | October 31, 2015 | 11 |
| Caldwell & Orkin | |
| Market Opportunity Fund | Disclosure of Fund Expenses |
October 31, 2015 (Unaudited)
We believe it is important for you to understand the impact of fees and expenses on your investment in the Fund. As a shareholder of the Fund, you incur two types of costs: (1) transaction costs related to the purchase and redemption of Fund shares, including redemption fees and brokerage commissions (if applicable); and (2) ongoing costs, including management fees, administrative expenses, portfolio transaction costs and other Fund expenses. A mutual fund’s ongoing costs are expressed as a percentage of its average net assets. This figure is known as the expense ratio. The following example is intended to help you understand your ongoing costs (in dollars and cents) of investing in the Fund and to compare these costs with the ongoing costs of investing in other mutual funds.
The below example is based on an investment of $1,000.00 invested at the beginning of the period and held for the entire period indicated, May 1, 2015 through October 31, 2015. The table below illustrates the Fund’s expenses in two ways:
Based on Actual Fund Returns
The first line of the table below provides information about actual account values and actual expenses. You may use the information in this line, together with the amount you invested, to estimate the expenses that you paid over the period. Simply divide your account value by $1,000 (for example, an $8,600 account value divided by $1,000 = 8.6), then multiply the result by the number in the first line under the heading entitled “Expenses Paid During Period” to estimate the expenses you paid on your account during this period.
Based on a Hypothetical 5% Return for Comparison Purposes
The second line of the table below provides information about hypothetical account values and hypothetical expenses based on the Fund’s actual expense ratio and an assumed rate of return of 5% per year before expenses, which is not the Fund’s actual return. The hypothetical account values and expenses may not be used to estimate the actual ending account balance or expenses you paid for the period. You may use this information to compare the ongoing costs of investing in the Fund and other funds. To do so, compare this 5% hypothetical example with the 5% hypothetical examples that appear in the shareholder reports of the other funds.
Please note that the expenses shown in the table are meant to highlight your ongoing costs only and do not reflect any transactional costs, such as redemption fees or brokerage commissions. Therefore, the second line of the table is useful in comparing ongoing costs only, and will not help you determine the relative total costs of owning different funds. In addition, if these transactional costs were included, your costs would have been higher.
| 12 | 1-800-467-7903 | www.CaldwellOrkin.com |
| Caldwell & Orkin | |
| Market Opportunity Fund | Disclosure of Fund Expenses |
October 31, 2015 (Unaudited)
| | | Beginning Account Value 05/01/2015 | | | Ending Account Value 10/31/2015 | | | Expense Ratio1 | | | Expenses Paid During Period2 | |
Actual3 | | $ | 1,000.00 | | | $ | 1,080.60 | | | | 2.96 | % | | $ | 15.48 | |
Hypothetical (5% return before expenses)4 | | $ | 1,000.00 | | | $ | 1,010.26 | | | | 2.96 | % | | $ | 14.96 | |
| 1 | The annualized expense ratio reflects actual expenses from the Fund from May 1, 2015 through October 31, 2015, as a percentage of average net assets for that period. |
| 2 | Expenses are equal to the Caldwell & Orkin Market Opportunity Fund's annualized expense ratio of 2.96% multiplied by the average account value over the period, multiplied by the number of days in the most recent fiscal half year (184), divided by 366 (to reflect the half-year period.) |
| 3 | Excluding interest expense and dividend expense from short positions the expense ratio is 1.44%, your actual cost of investment in the Fund would be $7.53. |
| 4 | Excluding interest expense and dividend expense from short positions the expense ratio is 1.44%, your hypothetical cost of investment in the Fund would be $7.30. |
| Semi-Annual Report | October 31, 2015 | 13 |
| Caldwell & Orkin | |
| Market Opportunity Fund | Sector Diversification |
October 31, 2015 (Unaudited)
The following table presents the Caldwell & Orkin Market Opportunity Fund’s October 31, 2015 portfolio holdings by sector based on total net assets, sorted by net exposure (net long to net short).
| | | Long | | | Short | | | Total(1) | | | Net(2) |
| | | | | | | | | | | | |
Retail ‐ Apparel/Shoe | | 5.01% | | | | | | 5.01% | | | 5.01% |
| Aerospace/Defense | | 4.82% | | | | | | 4.82% | | | 4.82% |
| Cable/Satellite TV | | 2.98% | | | | | | 2.98% | | | 2.98% |
Non‐Hazardous Waste Disposal | | 2.88% | | | | | | 2.88% | | | 2.88% |
Food ‐ Miscellaneous/Diversified | | 2.54% | | | | | | 2.54% | | | 2.54% |
Retail ‐ Drug Store | | 2.29% | | | | | | 2.29% | | | 2.29% |
Internet Content ‐ Entertainment | | 1.96% | | | | | | 1.96% | | | 1.96% |
| Computers | | 1.96% | | | | | | 1.96% | | | 1.96% |
Retail ‐ Building Products | | 1.56% | | | | | | 1.56% | | | 1.56% |
Retail ‐ Discount | | 1.50% | | | | | | 1.50% | | | 1.50% |
| Web Portals/Internet Service Providers | | 1.47% | | | | | | 1.47% | | | 1.47% |
E ‐ Commerce/Products | | 1.35% | | | | | | 1.35% | | | 1.35% |
| Diversified Manufacturing Operations | | 1.05% | | | | | | 1.05% | | | 1.05% |
| Home Decoration Products | | 0.96% | | | | | | 0.96% | | | 0.96% |
| Infrastructure Software | | 0.96% | | | | | | 0.96% | | | 0.96% |
Beverages ‐ Wine/Spirits | | 0.93% | | | | | | 0.93% | | | 0.93% |
Retail ‐ Restaurants | | 0.83% | | | | | | 0.83% | | | 0.83% |
Textile ‐ Home Furnishings | | 0.80% | | | | | | 0.80% | | | 0.80% |
Building Production ‐ Cement/Aggregate | | 0.78% | | | | | | 0.78% | | | 0.78% |
Electric ‐ Integrated | | 0.74% | | | | | | 0.74% | | | 0.74% |
Food ‐ Retail | | 2.00% | | | ‐1.34% | | | 3.34% | | | 0.66% |
Retail ‐ Auto Parts | | 0.82% | | | ‐0.19% | | | 1.01% | | | 0.63% |
Building Production ‐ Wood | | 0.62% | | | | | | 0.62% | | | 0.62% |
Electronic Components ‐ Semiconductors | | 0.58% | | | | | | 0.58% | | | 0.58% |
| Internet Media | | 0.49% | | | | | | 0.49% | | | 0.49% |
Retail ‐ Jewelry | | 0.49% | | | | | | 0.49% | | | 0.49% |
| Multimedia | | 0.42% | | | | | | 0.42% | | | 0.42% |
Retail ‐ Perfume & Cosmetics | | 0.40% | | | | | | 0.40% | | | 0.40% |
| Private Equity | | 0.39% | | | | | | 0.39% | | | 0.39% |
| Tobacco | | 0.32% | | | | | | 0.32% | | | 0.32% |
Medical ‐ HMO | | 0.25% | | | | | | 0.25% | | | 0.25% |
| Broadcast Services/Programming | | 0.18% | | | | | | 0.18% | | | 0.18% |
Finance ‐ Investment Banker/Broker | | 0.17% | | | | | | 0.17% | | | 0.17% |
| Commercial Service/Financial | | 0.36% | | | ‐0.20% | | | 0.56% | | | 0.16% |
Oil & Gas Companies ‐ Exploration & Production | | 0.01% | | | | | | 0.01% | | | 0.01% |
E ‐ Marketing/Information | | | | | ‐0.18% | | | 0.18% | | | ‐0.18% |
Medical ‐ Drugs | | | | | ‐0.22% | | | 0.22% | | | ‐0.22% |
| 14 | 1-800-467-7903 | www.CaldwellOrkin.com |
| Caldwell & Orkin | |
| Market Opportunity Fund | Sector Diversification |
October 31, 2015 (Unaudited)
| | | Long | | | Short | | | Total(1) | | | Net(2) |
Retail ‐ Appliances | | | | | ‐0.27% | | | 0.27% | | | ‐0.27% |
| Web Hosting/Design | | | | | ‐0.30% | | | 0.30% | | | ‐0.30% |
Instruments ‐ Controls | | | | | ‐0.31% | | | 0.31% | | | ‐0.31% |
Steel ‐ Producers | | | | | ‐0.33% | | | 0.33% | | | ‐0.33% |
| Electronic Devices | | | | | ‐0.72% | | | 0.72% | | | ‐0.72% |
Apparel ‐ Manufacturers | | | | | ‐0.73% | | | 0.73% | | | ‐0.73% |
| Distribution/Wholesale | | | | | ‐0.82% | | | 0.82% | | | ‐0.82% |
Machinery ‐ Tools & Related Products | | | | | ‐0.83% | | | 0.83% | | | ‐0.83% |
| Automobiles | | | | | ‐1.32% | | | 1.32% | | | ‐1.32% |
Machinery ‐ Construction & Mining | | | | | ‐1.86% | | | 1.86% | | | ‐1.86% |
| Investment Management/Advisory Services | | | | | ‐1.92% | | | 1.92% | | | ‐1.92% |
Transportation ‐ Rail | | | | | ‐1.95% | | | 1.95% | | | ‐1.95% |
Machinery ‐ Farm | | | | | ‐1.99% | | | 1.99% | | | ‐1.99% |
| Schools | | | | | ‐2.04% | | | 2.04% | | | ‐2.04% |
| Oil & Gas Drilling | | | | | ‐2.87% | | | 2.87% | | | ‐2.87% |
Commercial Banks Non ‐ U.S. | | 0.40% | | | ‐3.36% | | | 3.76% | | | ‐2.96% |
E ‐ Commerce/Services | | | | | ‐3.07% | | | 3.07% | | | ‐3.07% |
| Subtotal Common Stocks (long & short positions) | | 45.27% | | | ‐26.83% | | | 72.10% | | | 18.44% |
Commercial Banks Non ‐ U.S. | | | | | ‐0.76% | | | 0.76% | | | ‐0.76% |
| Subtotal Preferred Stocks (long & short positions) | | | | | ‐0.76% | | | 0.76% | | | ‐0.76% |
Exchange‐Traded Funds ‐ U.S. Treasury Inflation Protected Bond Fund | | 0.01% | | | | | | 0.01% | | | 0.01% |
Exchange‐Traded Funds ‐ High Yield Bond Fund | | | | | ‐0.50% | | | 0.50% | | | ‐0.50% |
Exchange‐Traded Funds ‐ Finance Exchange‐Traded Funds | | | | | ‐0.97% | | | 0.97% | | | ‐0.97% |
Exchange‐Traded Funds ‐ Emerging Country Exchange ‐ Traded Funds | | | | | ‐0.99% | | | 0.99% | | | ‐0.99% |
Exchange‐Traded Funds ‐ Corporate/Preferred ‐High Yield | | | | | ‐1.09% | | | 1.09% | | | ‐1.09% |
Subtotal Exchange‐Traded Funds (long & short positions) | | 0.01% | | | ‐3.56% | | | 3.57% | | | ‐3.55% |
| Subtotal Equities (long & short positions) | | 45.28% | | | ‐31.15% | | | 76.43% | | | 14.13% |
| Call Options | | 1.96% | | | | | | 1.96% | | | |
| Put Options | | 1.93% | | | | | | 1.93% | | | |
| Other Assets less Liabilities | | 19.68% | | | | | | 19.68% | | | |
| Total Portfolio Holdings | | 68.85% | | | ‐31.15% | | | 100% | | | |
| (1) | Total exposure is Long exposure plus the absolute value of the Short exposure. |
| (2) | Net exposure is Long exposure less Short exposure. |
| Semi-Annual Report | October 31, 2015 | 15 |
Caldwell & Orkin
Market Opportunity Fund | Schedule of Investments |
October 31, 2015 (Unaudited)
| | | Shares | | | Value
(Note 1) | |
| LONG INVESTMENTS (49.17%) | | | | | | |
| COMMON STOCKS (45.27%) | | | | | | |
| Aerospace/Defense (4.82%) | | | | | | |
| General Dynamics Corp. | | | 12,000 | | | $ | 1,782,960 | |
| Lockheed Martin Corp. | | | 13,700 | | | | 3,011,671 | |
| Northrop Grumman Corp. | | | 4,600 | | | | 863,650 | |
| Raytheon Co. | | | 27,900 | | | | 3,275,460 | |
| | | | | | | | 8,933,741 | |
| | | | | | | | | |
| Beverages ‐ Wine/Spirits (0.93%) | | | | | | | | |
| Constellation Brands, Inc. ‐ Class A | | | 12,800 | | | | 1,725,440 | |
| | | | | | | | | |
| Broadcast Services/Programming (0.18%) | | | | | | | | |
| World Wrestling Entertainment, Inc. ‐ Class A | | | 18,300 | | | | 326,289 | |
| | | | | | | | | |
| Building Production ‐ Cement/Aggregate (0.78%) | | | | | | | | |
| Martin Marietta Materials, Inc. | | | 4,300 | | | | 667,145 | |
| Vulcan Materials Co. | | | 8,100 | | | | 782,298 | |
| | | | | | | | 1,449,443 | |
| | | | | | | | | |
| Building Production ‐ Wood (0.62%) | | | | | | | | |
| Masco Corp. | | | 39,900 | | | | 1,157,100 | |
| | | | | | | | | |
| Cable/Satellite TV (2.98%) | | | | | | | | |
| Comcast Corp. ‐ Class A | | | 88,200 | | | | 5,523,084 | |
| | | | | | | | | |
| Commercial Banks Non ‐ U.S. (0.40%) | | | | | | | | |
| HDFC Bank, Ltd. ‐ ADR | | | 12,000 | | | | 733,680 | |
| | | | | | | | | |
| Commercial Service/Financial (0.36%) | | | | | | | | |
Manhattan Associates, Inc.1 | | | 9,100 | | | | 662,935 | |
| | | | | | | | | |
| Computers (1.96%) | | | | | | | | |
| Apple, Inc. | | | 30,400 | | | | 3,632,800 | |
| | | | | | | | | |
| Diversified Manufacturing Operations (1.05%) | | | | | | | | |
| General Electric Co. | | | 12,300 | | | | 355,716 | |
| Honeywell International, Inc. | | | 15,300 | | | | 1,580,184 | |
| | | | | | | | 1,935,900 | |
See accompanying notes to financial statements.
| 16 | 1-800-467-7903 | www.CaldwellOrkin.com |
Caldwell & Orkin
Market Opportunity Fund | Schedule of Investments |
October 31, 2015 (Unaudited)
| | | Shares | | | Value
(Note 1) | |
| E ‐ Commerce/Products (1.35%) | | | | | | |
Amazon.com, Inc.1 | | | 4,000 | | | $ | 2,503,600 | |
| | | | | | | | | |
| Electric ‐ Integrated (0.74%) | | | | | | | | |
| Dominion Resources, Inc. | | | 19,300 | | | | 1,378,599 | |
| | | | | | | | | |
| Electronic Components ‐ Semiconductors (0.58%) | | | | | | | | |
| ARM Holdings PLC, Sponsored ADR | | | 22,500 | | | | 1,067,175 | |
| | | | | | | | | |
| Finance ‐ Investment Banker/Broker (0.17%) | | | | | | | | |
| Virtu Financial, Inc. ‐ Class A | | | 13,000 | | | | 314,600 | |
| | | | | | | | | |
| Food ‐ Miscellaneous/Diversified (2.54%) | | | | | | | | |
| General Mills, Inc. | | | 26,400 | | | | 1,534,104 | |
| The Kraft Heinz Co. | | | 21,000 | | | | 1,637,370 | |
| Mondelez International, Inc. ‐ Class A | | | 33,100 | | | | 1,527,896 | |
| | | | | | | | 4,699,370 | |
| | | | | | | | | |
| Food ‐ Retail (2.00%) | | | | | | | | |
| The Kroger Co. | | | 97,800 | | | | 3,696,840 | |
| | | | | | | | | |
| Home Decoration Products (0.96%) | | | | | | | | |
| Newell Rubbermaid, Inc. | | | 41,800 | | | | 1,773,574 | |
| | | | | | | | | |
| Infrastructure Software (0.96%) | | | | | | | | |
| Microsoft Corp. | | | 33,700 | | | | 1,773,968 | |
| | | | | | | | | |
| Internet Content ‐ Entertainment (1.96%) | | | | | | | | |
Facebook, Inc. ‐ Class A1 | | | 32,100 | | | | 3,273,237 | |
Twitter, Inc.1 | | | 12,300 | | | | 350,058 | |
| | | | | | | | 3,623,295 | |
| | | | | | | | | |
| Internet Media (0.49%) | | | | | | | | |
LinkedIn Corp. ‐ Class A1 | | | 3,800 | | | | 915,306 | |
| | | | | | | | | |
| Medical ‐ HMO (0.25%) | | | | | | | | |
| UnitedHealth Group, Inc. | | | 4,000 | | | | 471,120 | |
| | | | | | | | | |
| Multimedia (0.42%) | | | | | | | | |
| The Walt Disney Co. | | | 6,800 | | | | 773,432 | |
See accompanying notes to financial statements.
| Semi-Annual Report | October 31, 2015 | 17 |
Caldwell & Orkin
Market Opportunity Fund | Schedule of Investments |
October 31, 2015 (Unaudited)
| | | Shares | | | Value
(Note 1) | |
| Non‐Hazardous Waste Disposal (2.88%) | | | | | | |
| Republic Services, Inc. | | | 34,800 | | | $ | 1,522,152 | |
| Waste Management, Inc. | | | 71,000 | | | | 3,816,960 | |
| | | | | | | | 5,339,112 | |
| | | | | | | | | |
| Oil & Gas Companies ‐ Exploration & Production (0.01%) | | | | | | | | |
Concho Resources, Inc.1 | | | 100 | | | | 11,591 | |
| EOG Resources, Inc. | | | 100 | | | | 8,585 | |
| | | | | | | | 20,176 | |
| | | | | | | | | |
| Private Equity (0.39%) | | | | | | | | |
| Blackstone Group LP, 19.830% | | | 21,600 | | | | 714,096 | |
| | | | | | | | | |
| Retail ‐ Apparel/Shoe (5.01%) | | | | | | | | |
| American Eagle Outfitters, Inc. | | | 94,600 | | | | 1,445,488 | |
Express, Inc.1 | | | 119,400 | | | | 2,304,420 | |
| Foot Locker, Inc. | | | 26,500 | | | | 1,795,375 | |
Kate Spade & Co.1 | | | 76,700 | | | | 1,378,299 | |
| Nike, Inc. ‐ Class B | | | 5,900 | | | | 773,077 | |
Skechers U.S.A., Inc. ‐ Class A1 | | | 50,700 | | | | 1,581,840 | |
| | | | | | | | 9,278,499 | |
| | | | | | | | | |
| Retail ‐ Auto Parts (0.82%) | | | | | | | | |
| Advance Auto Parts, Inc. | | | 7,700 | | | | 1,527,911 | |
| | | | | | | | | |
| Retail ‐ Building Products (1.56%) | | | | | | | | |
| The Home Depot, Inc. | | | 23,400 | | | | 2,893,176 | |
| | | | | | | | | |
| Retail ‐ Discount (1.50%) | | | | | | | | |
| Target Corp. | | | 36,000 | | | | 2,778,480 | |
| | | | | | | | | |
| Retail ‐ Drug Store (2.29%) | | | | | | | | |
| CVS Health Corp. | | | 42,900 | | | | 4,237,662 | |
| | | | | | | | | |
| Retail ‐ Jewelry (0.49%) | | | | | | | | |
| Signet Jewelers, Ltd. | | | 6,000 | | | | 905,640 | |
| | | | | | | | | |
| Retail ‐ Perfume & Cosmetics (0.40%) | | | | | | | | |
Ulta Salon Cosmetics & Fragrance, Inc.1 | | | 4,300 | | | | 748,028 | |
See accompanying notes to financial statements.
| 18 | 1-800-467-7903 | www.CaldwellOrkin.com |
Caldwell & Orkin
Market Opportunity Fund | Schedule of Investments |
October 31, 2015 (Unaudited)
| | | Shares | | | Value
(Note 1) | |
| Retail ‐ Restaurants (0.83%) | | | | | | |
| Starbucks Corp. | | | 24,500 | | | $ | 1,532,965 | |
| | | | | | | | | |
| Textile ‐ Home Furnishings (0.80%) | | | | | | | | |
Mohawk Industries, Inc.1 | | | 7,600 | | | | 1,485,800 | |
| | | | | | | | | |
| Tobacco (0.32%) | | | | | | | | |
| Reynolds American, Inc. | | | 12,300 | | | | 594,336 | |
| | | | | | | | | |
| Web Portals/Internet Service Providers (1.47%) | | | | | | | | |
Alphabet, Inc. ‐ Class A1 | | | 3,700 | | | | 2,728,343 | |
| | | | | | | | | |
| TOTAL COMMON STOCKS (Cost $79,584,118) | | | | | | | 83,855,515 | |
| | | | | | | | | |
| EXCHANGE‐TRADED FUNDS (0.01%) | | | | | | | | |
| U.S. Treasury Inflation Protected Bond Fund (0.01%) | | | | | | | | |
iShares® TIPS Bond ETF | | | 100 | | | | 11,096 | |
| | | | | | | | | |
| TOTAL EXCHANGE‐TRADED FUNDS (Cost $11,426) | | | | | | | 11,096 | |
| | Expiration
Date | | Exercise
Price | | | Number of
Contracts | | | Value
(Note 1) | |
| PURCHASED OPTIONS (3.89%) | | | | | | | | | | |
| PURCHASED CALL OPTIONS (1.96%) | | | | | | | | | | |
| Alphabet, Inc. ‐ Class A | January, 2016 | | $ | 650.00 | | | | 84 | | | | 803,880 | |
| Blackberry, Ltd. | January, 2017 | | | 10.00 | | | | 525 | | | | 31,500 | |
| Comcast Corp. ‐ Class A | January, 2016 | | | 57.50 | | | | 1,570 | | | | 981,250 | |
| CVS Health Corp. | January, 2016 | | | 110.00 | | | | 620 | | | | 27,900 | |
| Domino's Pizza, Inc. | December, 2015 | | | 115.00 | | | | 140 | | | | 18,480 | |
| Facebook, Inc. ‐ Class A | December, 2015 | | | 90.00 | | | | 200 | | | | 269,000 | |
| Facebook, Inc. ‐ Class A | December, 2015 | | | 97.50 | | | | 715 | | | | 551,980 | |
iShares® MSCI Germany ETF | January, 2016 | | | 29.00 | | | | 245 | | | | 3,675 | |
| Kate Spade & Co. | January, 2016 | | | 21.00 | | | | 1,177 | | | | 111,815 | |
| Masco Corp. | January, 2016 | | | 26.00 | | | | 650 | | | | 195,000 | |
| Mohawk Industries, Inc. | February, 2016 | | | 200.00 | | | | 95 | | | | 98,325 | |
| Skechers U.S.A., Inc. ‐ Class A | January, 2016 | | | 45.00 | | | | 978 | | | | 24,450 | |
SPDR® Gold Shares | December, 2015 | | | 110.00 | | | | 375 | | | | 74,625 | |
| Target Corp. | January, 2016 | | | 80.00 | | | | 625 | | | | 100,625 | |
See accompanying notes to financial statements.
| Semi-Annual Report | October 31, 2015 | 19 |
| Caldwell & Orkin | |
| Market Opportunity Fund | Schedule of Investments |
October 31, 2015 (Unaudited)
| | Expiration
Date | | Exercise
Price | | | Number of
Contracts | | | Value
(Note 1) | |
| PURCHASED CALL OPTIONS (continued) | | | | | | | | | | |
| Waste Management, Inc. | January, 2016 | | $ | 52.50 | | | | 1,650 | | | $ | 334,950 | |
TOTAL PURCHASED CALL OPTIONS (Cost $3,579,275) | | | | | | | | | | | | 3,627,455 | |
| PURCHASED PUT OPTIONS (1.93%) | | | | | | | | | | | | | |
| Conn's, Inc. | April, 2016 | | | 26.00 | | | | 618 | | | | 482,040 | |
| Control4 Corp. | January, 2016 | | | 10.00 | | | | 578 | | | | 202,300 | |
| DeVry Education Group, Inc. | February, 2016 | | | 30.00 | | | | 410 | | | | 274,700 | |
| Franklin Resources, Inc. | April, 2016 | | | 40.00 | | | | 370 | | | | 75,850 | |
| The Fresh Market, Inc. | December, 2015 | | | 30.00 | | | | 431 | | | | 218,948 | |
| Harley‐Davidson, Inc. | January, 2016 | | | 60.00 | | | | 308 | | | | 324,940 | |
iShares® iBoxx $High Yield Corporate Bond ETF | December, 2015 | | | 90.00 | | | | 218 | | | | 112,270 | |
| ITT Educational Services, Inc. | January, 2016 | | | 4.00 | | | | 864 | | | | 117,504 | |
| Keurig Green Mountain, Inc. | December, 2015 | | | 50.00 | | | | 340 | | | | 149,940 | |
| Michael Kors Holdings, Ltd. | January, 2016 | | | 45.00 | | | | 291 | | | | 206,610 | |
| MoneyGram International, Inc. | November, 2015 | | | 10.00 | | | | 264 | | | | 9,240 | |
| Transocean, Ltd. | January, 2016 | | | 14.00 | | | | 1,755 | | | | 236,925 | |
| Whole Foods Market, Inc. | January, 2016 | | | 33.00 | | | | 1,584 | | | | 655,776 | |
| Zillow Group, Inc. ‐ Class A | January, 2016 | | | 25.00 | | | | 790 | | | | 82,950 | |
| Zillow Group, Inc. ‐ Class A | January, 2016 | | | 30.00 | | | | 946 | | | | 283,800 | |
| Zillow Group, Inc. ‐ Class C | January, 2016 | | | 75.00 | | | | 346 | | | | 134,940 | |
| | | | | | | | | | | | | | |
TOTAL PURCHASED PUT OPTIONS (Cost $3,286,963) | | | | | | | | | | | | 3,568,733 | |
| | | | | | | | | | | | | | |
| TOTAL PURCHASED OPTIONS (Cost $6,866,238) | | | | | | | | | | | | 7,196,188 | |
| TOTAL LONG INVESTMENTS (Cost $86,461,782) | | | | | | | | | | | | 91,062,799 | |
| | | 7-Day Yield | | | Shares | | | Value
(Note 1) | |
| SHORT TERM INVESTMENTS (50.52%) | | | | | | | | | |
MONEY MARKET FUNDS2 | | | | | | | | | |
| JPMorgan 100% U.S. Treasury Securities Money Market Fund - Capital Shares | | | 0.00 | %* | | | 93,584,167 | | | | 93,584,167 | |
See accompanying notes to financial statements.
| 20 | 1-800-467-7903 | www.CaldwellOrkin.com |
| Caldwell & Orkin | |
| Market Opportunity Fund | Schedule of Investments |
October 31, 2015 (Unaudited)
| | | | | Value
(Note 1) | |
| SHORT TERM INVESTMENTS (continued) | | | | | |
| TOTAL SHORT TERM INVESTMENTS (Cost $93,584,167) | | | | $ | 93,584,167 | |
| | | | | | | |
| TOTAL INVESTMENTS ‐ (99.69%) (Cost $180,045,949) | | | | $ | 184,646,966 | |
| | | | | | | |
| Assets in Excess of Other Liabilities (0.31%) | | | | | 581,966 | |
| | | | | | | |
| NET ASSETS (100.00%) | | | | $ | 185,228,932 | |
| | | | | | | |
| SCHEDULE OF SECURITIES SOLD SHORT (‐31.15%) | Shares | | | Value
(Note 1) | |
| COMMON STOCKS (‐26.83%) | | | | | | |
Apparel ‐ Manufacturers (‐0.73%) | | | | | | |
| Michael Kors Holdings, Ltd. | | | (35,000 | ) | | $ | (1,352,400 | ) |
| | | | | | | | | |
Automobiles (‐1.32%) | | | | | | | | |
| Harley‐Davidson, Inc. | | | (23,800 | ) | | | (1,176,910 | ) |
| Navistar International Corp. | | | (102,600 | ) | | | (1,261,980 | ) |
| | | | | | | | (2,438,890 | ) |
Commercial Banks Non ‐ U.S. (‐3.36%) | | | | | | | | |
| Australia & New Zealand Banking Group, Ltd. ‐ Sponsored ADR | | | (34,400 | ) | | | (672,864 | ) |
| Bancolombia SA, Sponsored ADR | | | (75,000 | ) | | | (2,596,500 | ) |
| Itau Unibanco Holding SA ‐ Class H, Sponsored Preferred ADR | | | (247,700 | ) | | | (1,696,745 | ) |
| Westpac Banking Corp. ‐ Sponsored ADR | | | (56,300 | ) | | | (1,259,431 | ) |
| | | | | | | | (6,225,540 | ) |
Commercial Service/Financial (‐0.20%) | | | | | | | | |
| MoneyGram International, Inc. | | | (36,100 | ) | | | (364,971 | ) |
| | | | | | | | | |
Distribution/Wholesale (‐0.82%) | | | | | | | | |
| Fastenal Co. | | | (39,000 | ) | | | (1,527,240 | ) |
| | | | | | | | | |
E ‐ Commerce/Services (‐3.07%) | | | | | | | | |
| Angie's List, Inc. | | | (102,500 | ) | | | (792,325 | ) |
| Etsy, Inc. | | | (164,800 | ) | | | (1,796,320 | ) |
See accompanying notes to financial statements.
| Semi-Annual Report | October 31, 2015 | 21 |
| Caldwell & Orkin | |
| Market Opportunity Fund | Schedule of Investments |
October 31, 2015 (Unaudited)
| SCHEDULE OF SECURITIES SOLD SHORT (‐31.15%) (continued) | | Shares | | | Value
(Note 1) | |
| E ‐ Commerce/Services (continued) | | | | | | |
| TrueCar, Inc. | | | (22,800 | ) | | $ | (139,992 | ) |
| Zillow Group, Inc. ‐ Class A | | | (86,200 | ) | | | (2,655,822 | ) |
| Zillow Group, Inc. ‐ Class C | | | (11,000 | ) | | | (304,590 | ) |
| | | | | | | | (5,689,049 | ) |
E ‐ Marketing/Information (‐0.18%) | | | | | | | | |
| Liquidity Services, Inc. | | | (39,900 | ) | | | (326,781 | ) |
| | | | | | | | | |
Electronic Devices (‐0.72%) | | | | | | | | |
| Garmin, Ltd. | | | (37,500 | ) | | | (1,330,125 | ) |
| | | | | | | | | |
Food ‐ Retail (‐1.34%) | | | | | | | | |
| Sprouts Farmers Market, Inc. | | | (46,400 | ) | | | (945,632 | ) |
| Whole Foods Market, Inc. | | | (51,500 | ) | | | (1,542,940 | ) |
| | | | | | | | (2,488,572 | ) |
Instruments ‐ Controls (‐0.31%) | | | | | | | | |
| Control4 Corp. | | | (86,700 | ) | | | (567,018 | ) |
| | | | | | | | | |
Investment Management/Advisory Services (‐1.93%) | | | | | | | | |
| Franklin Resources, Inc. | | | (54,400 | ) | | | (2,217,344 | ) |
| Waddell & Reed Financial, Inc. ‐ Class A | | | (36,500 | ) | | | (1,348,310 | ) |
| | | | | | | | (3,565,654 | ) |
Machinery ‐ Construction & Mining (‐1.86%) | | | | | | | | |
| Caterpillar, Inc. | | | (21,100 | ) | | | (1,540,089 | ) |
| Joy Global, Inc. | | | (111,100 | ) | | | (1,908,698 | ) |
| | | | | | | | (3,448,787 | ) |
Machinery ‐ Farm (‐1.99%) | | | | | | | | |
| AGCO Corp. | | | (45,300 | ) | | | (2,192,067 | ) |
| Deere & Co. | | | (19,200 | ) | | | (1,497,600 | ) |
| | | | | | | | (3,689,667 | ) |
Machinery ‐ Tools & Related Products (‐0.83%) | | | | | | | | |
| Kennametal, Inc. | | | (54,900 | ) | | | (1,543,788 | ) |
| | | | | | | | | |
Medical ‐ Drugs (‐0.22%) | | | | | | | | |
| Valeant Pharmaceuticals International, Inc. | | | (4,400 | ) | | | (412,588 | ) |
See accompanying notes to financial statements.
| 22 | 1-800-467-7903 | www.CaldwellOrkin.com |
| Caldwell & Orkin | |
| Market Opportunity Fund | Schedule of Investments |
October 31, 2015 (Unaudited)
| SCHEDULE OF SECURITIES SOLD SHORT (‐31.15%) (continued) | | Shares | | | Value
(Note 1) | |
Oil & Gas Drilling (‐2.87%) | | | | | | |
| Diamond Offshore Drilling, Inc. | | | (75,200 | ) | | $ | (1,494,976 | ) |
| North Atlantic Drilling, Ltd. | | | (120,000 | ) | | | (99,060 | ) |
| Seadrill, Ltd. | | | (286,900 | ) | | | (1,856,243 | ) |
| Transocean, Ltd. | | | (117,900 | ) | | | (1,866,357 | ) |
| | | | | | | | (5,316,636 | ) |
Retail ‐ Appliances (‐0.27%) | | | | | | | | |
| Conn's, Inc. | | | (26,800 | ) | | | (508,396 | ) |
| | | | | | | | | |
Retail ‐ Auto Parts (‐0.19%) | | | | | | | | |
| Aaron's, Inc. | | | (14,600 | ) | | | (360,182 | ) |
| | | | | | | | | |
Schools (‐2.04%) | | | | | | | | |
| American Public Education, Inc. | | | (21,500 | ) | | | (467,195 | ) |
| Bridgepoint Education, Inc. | | | (77,400 | ) | | | (599,850 | ) |
| Capella Education Co. | | | (7,800 | ) | | | (352,170 | ) |
| Career Education Corp. | | | (150,900 | ) | | | (544,749 | ) |
| DeVry Education Group, Inc. | | | (40,600 | ) | | | (956,536 | ) |
| ITT Educational Services, Inc. | | | (257,300 | ) | | | (849,090 | ) |
| | | | | | | | (3,769,590 | ) |
Steel ‐ Producers (‐0.33%) | | | | | | | | |
| Gerdau SA, Sponsored ADR | | | (444,800 | ) | | | (618,272 | ) |
| | | | | | | | | |
Transportation ‐ Rail (‐1.95%) | | | | | | | | |
| CSX Corp. | | | (54,500 | ) | | | (1,470,955 | ) |
| Norfolk Southern Corp. | | | (26,700 | ) | | | (2,136,801 | ) |
| | | | | | | | (3,607,756 | ) |
Web Hosting/Design (‐0.30%) | | | | | | | | |
| Endurance International Group Holdings, Inc. | | | (41,200 | ) | | | (549,196 | ) |
| | | | | | | | | |
| TOTAL COMMON STOCKS (Proceeds $61,849,500) | | | | | | | (49,701,098 | ) |
See accompanying notes to financial statements.
| Semi-Annual Report | October 31, 2015 | 23 |
| Caldwell & Orkin | |
| Market Opportunity Fund | Schedule of Investments |
October 31, 2015 (Unaudited)
| SCHEDULE OF SECURITIES SOLD SHORT (‐31.15%) (continued) | | Shares | | | Value
(Note 1) | |
| Web Hosting/Design (continued) | | | | | | |
| PREFERRED STOCKS (‐0.76%) | | | | | | |
Commercial Banks Non ‐ U.S. (‐0.76%) | | | | | | |
| Banco Bradesco SA ‐ ADR | | | (258,700 | ) | | $ | (1,407,328 | ) |
| | | | | | | | | |
| TOTAL PREFERRED STOCKS (Proceeds $1,723,605) | | | | | | | (1,407,328 | ) |
| | | | | | | | | |
| EXCHANGE‐TRADED FUNDS (‐3.56%) | | | | | | | | |
Corporate/Preferred ‐ High Yield (‐1.10%) | | | | | | | | |
iShares® iBoxx $ High Yield Corporate Bond ETF | | | (23,700 | ) | | | (2,028,009 | ) |
| | | | | | | | | |
Emerging Country Exchange ‐ Traded Funds (‐0.99%) | | | | | | | | |
iShares® MSCI Brazil Capped ETF | | | (76,600 | ) | | | (1,751,842 | ) |
Market Vectors® Russia ETF | | | (4,800 | ) | | | (80,208 | ) |
| | | | | | | | (1,832,050 | ) |
| | | | | | | | | |
Finance Exchange‐Traded Funds (‐0.97%) | | | | | | | | |
PowerShares® Senior Loan Portfolio ETF | | | (78,500 | ) | | | (1,805,500 | ) |
| | | | | | | | | |
High Yield Bond Fund (‐0.50%) | | | | | | | | |
SPDR® Barclays High Yield Bond ETF | | | (25,200 | ) | | | (919,044 | ) |
| | | | | | | | | |
| TOTAL EXCHANGE‐TRADED FUNDS (Proceeds $7,156,308) | | | | | | | (6,584,603 | ) |
| | | | | | | | | |
| TOTAL SECURITIES SOLD SHORT (Proceeds $70,729,413) | | | | | | $ | (57,693,029 | ) |
| 1 | Non-Income Producing Security. |
| 2 | A portion of the Money Market Fund's assets are held as collateral for short sales activity. As of October 31, 2015, the amount held as collateral was $30,000,000. |
See accompanying notes to financial statements.
| 24 | 1-800-467-7903 | www.CaldwellOrkin.com |
| Caldwell & Orkin | |
| Market Opportunity Fund | Schedule of Investments |
October 31, 2015 (Unaudited)
Common Abbreviations:
ADR - American Depositary Receipts.
ETF - Exchange-Traded Fund.
LP - Limited Partnership.
Ltd. - Limited.
MSCI - Morgan Stanley Capital International.
PLC - Public Limited Company.
SA - Generally designates corporations in various countries, mostly those employing the civil law.
SPDR - Standard and Poor's Depositary Receipt.
TIPS - Treasury Inflation Protected Securities.
See accompanying notes to financial statements.
| Semi-Annual Report | October 31, 2015 | 25 |
| Caldwell & Orkin | |
| Market Opportunity Fund | Statement of Assets & Liabilities |
October 31, 2015 (Unaudited)
| ASSETS | | | |
| Investments at value (cost $180,045,949) | | $ | 184,646,966 | |
| Cash | | | 923,110 | |
| Deposits with brokers for securities sold short | | | 60,320,092 | |
| Receivables: | | | | |
| Investment securities sold | | | 10,213,367 | |
| Dividends | | | 70,753 | |
| Capital shares sold | | | 2,136,262 | |
| Other assets | | | 50,072 | |
| Total Assets | | | 258,360,622 | |
| | | | | |
| LIABILITIES | | | | |
| Securities sold short, not yet purchased (proceeds $70,729,413) | | | 57,693,029 | |
| Payables: | | | | |
| Investment securities purchased | | | 15,169,500 | |
| Capital shares redeemed | | | 3,968 | |
| Dividends payable ‐ short sales | | | 52,220 | |
| Investment advisory fee | | | 129,379 | |
| Accrued expenses and other liabilities | | | 83,594 | |
| Total Liabilities | | | 73,131,690 | |
| | | | | |
| Net Assets | | $ | 185,228,932 | |
| | | | | |
| COMPOSITION OF NET ASSETS | | | | |
| Paid‐in capital applicable to 7,473,351 shares outstanding; par value $0.10 per share; 30,000,000 shares authorized | | $ | 158,535,624 | |
| Accumulated net investment loss | | | (1,430,550 | ) |
| Accumulated net realized gain on investments and securities sold short | | | 10,486,457 | |
| Net unrealized appreciation of investments and securities sold short | | | 17,637,401 | |
| Net Assets | | $ | 185,228,932 | |
| | | | | |
| NET ASSET VALUE AND OFFERING/REDEMPTION PRICE PER SHARE | | $ | 24.79 | |
See accompanying notes to financial statements.
| 26 | 1-800-467-7903 | www.CaldwellOrkin.com |
| Caldwell & Orkin | |
| Market Opportunity Fund | Statement of Operations |
For the Six Months Ended October 31, 2015 (Unaudited)
| INVESTMENT INCOME | | | |
| Dividends | | $ | 618,453 | |
| Total Investment Income | | | 618,453 | |
| | | | | |
| EXPENSES | | | | |
| Investment advisory fees (Note 2) | | | 691,384 | |
| Interest expense | | | 658,410 | |
| Dividend expense on securities sold short | | | 398,086 | |
| Administration and accounting fees (Note 2) | | | 84,660 | |
| Transfer agent fees | | | 64,563 | |
| Directors' fees and expenses | | | 45,647 | |
| Professional fees | | | 37,926 | |
| Insurance expense | | | 23,679 | |
| Blue sky servicing fees | | | 15,646 | |
| Chief compliance officer expense | | | 15,534 | |
| Custodian fees | | | 11,263 | |
| Shareholder report printing | | | 8,701 | |
| Other expenses | | | 8,627 | |
| Total Expenses before waiver | | | 2,064,126 | |
| Less fees waived by Administrator (Note 2) | | | (15,123 | ) |
| Total net expenses | | | 2,049,003 | |
| Net Investment Loss | | | (1,430,550 | ) |
| | | | | |
| REALIZED AND UNREALIZED GAIN/(LOSS) ON INVESTMENTS | | | | |
| Net realized gain on investments | | | 2,965,745 | |
| Net realized gain on purchased options | | | 2,418,797 | |
| Net realized gain on securities sold short | | | 3,100,021 | |
| Change in unrealized depreciation on investments | | | (2,125,567 | ) |
| Change in unrealized appreciation on purchased options | | | 381,995 | |
| Change in unrealized appreciation on securities sold short | | | 5,188,104 | |
| NET REALIZED AND UNREALIZED GAIN ON INVESTMENTS AND SECURITIES SOLD SHORT | | | 11,929,095 | |
| NET INCREASE IN NET ASSETS RESULTING FROM OPERATIONS | | $ | 10,498,545 | |
See accompanying notes to financial statements.
| Semi-Annual Report | October 31, 2015 | 27 |
| Caldwell & Orkin | |
| Market Opportunity Fund | Statements of Changes in Net Assets |
| | | For the Six Months Ended October 31, 2015 (Unaudited) | | | For the Year Ended
April 30, 2015 | |
| INCREASE/(DECREASE) IN NET ASSETS FROM OPERATIONS: | | | | |
| Net investment loss | | $ | (1,430,550 | ) | | $ | (2,466,298 | ) |
| Net realized gain on investments, purchased options and securities sold short | | | 8,484,563 | | | | 10,050,536 | |
| Change in net unrealized appreciation of investments, purchased options and securities sold short | | | 3,444,532 | | | | 6,671,523 | |
| | | | 10,498,545 | | | | 14,255,761 | |
| | | | | | | | | |
| DECREASE IN NET ASSETS FROM DISTRIBUTIONS TO STOCKHOLDERS FROM: | | | | | | | | |
| Net realized gain on investments | | | – | | | | (970,482 | ) |
| Total Distributions | | | – | | | | (970,482 | ) |
| | | | | | | | | |
| INCREASE/(DECREASE) IN NET ASSETS FROM COMMON STOCK TRANSACTIONS: | |
| Net proceeds from sale of shares | | | 58,450,142 | | | | 15,030,083 | |
| Reinvested distributions | | | – | | | | 854,216 | |
| Cost of shares redeemed | | | (12,661,162 | ) | | | (65,742,896 | ) |
| Redemption fee proceeds (Note 1) | | | 5,913 | | | | 36,897 | |
| Net increase/(decrease) in net assets resulting from capital share transactions | | | 45,794,893 | | | | (49,821,700 | ) |
| | | | | | | | | |
| INCREASE/(DECREASE) IN NET ASSETS | | | 56,293,438 | | | | (36,536,421 | ) |
| | | | | | | | | |
| NET ASSETS | | | | | | | | |
| Beginning of period | | | 128,935,494 | | | | 165,471,915 | |
| End of period (including accumulated net investment loss of $(1,430,550) and $0, respectively) | | $ | 185,228,932 | | | $ | 128,935,494 | |
See accompanying notes to financial statements.
| 28 | 1-800-467-7903 | www.CaldwellOrkin.com |
| Caldwell & Orkin | |
| Market Opportunity Fund | Financial Highlights |
For a capital share outstanding throughout each period.
| | | For the Six Months Ended October 31, 2015 (Unaudited) | | | For the Year Ended April 30, 2015 | | | For the Year Ended April 30, 2014 | | | For the Year Ended April 30, 2013 | | | For the Year Ended April 30, 2012 | | | For the Year Ended April 30, 2011 | |
| PER SHARE DATA: | | | | | | | | | | | | | | | | | | |
| Net asset value, beginning of period | | $ | 22.94 | | | $ | 20.88 | | | $ | 22.97 | | | $ | 20.56 | | | $ | 19.59 | | | $ | 19.51 | |
| Income/(loss) from investment operations: | | | | | | | | | | | | | | | | | | | | | | | | |
| Net Investment loss | | | (0.19 | ) | | | (0.49 | ) | | | (0.29 | ) | | | (0.20 | ) | | | (0.28 | ) | | | (0.30 | ) |
| Net realized and unrealized gain/(loss) on investments | | | 2.04 | | | | 2.71 | | | | (1.30 | ) | | | 2.60 | | | | 1.24 | | | | 0.36 | |
| Total from Investment Operations | | | 1.85 | | | | 2.22 | | | | (1.59 | ) | | | 2.40 | | | | 0.96 | | | | 0.06 | |
| | | | | | | | | | | | | | | | | | | | | | | | | |
| LESS DISTRIBUTIONS: | | | | | | | | | | | | | | | | | | | | | | | | |
| From net realized gain on investments | | | – | | | | (0.17 | ) | | | (0.51 | ) | | | – | | | | – | | | | – | |
| Total Distributions | | | – | | | | (0.17 | ) | | | (0.51 | ) | | | – | | | | – | | | | – | |
| Redemption fee proceeds | | | 0.00 | (1) | | | 0.01 | | | | 0.01 | | | | 0.01 | | | | 0.01 | | | | 0.02 | |
| Net asset value, end of period | | $ | 24.79 | | | $ | 22.94 | | | $ | 20.88 | | | $ | 22.97 | | | $ | 20.56 | | | $ | 19.59 | |
| | | | | | | | | | | | | | | | | | | | | | | | | |
| Total Return | | | 8.06 | %(2) | | | 10.68 | % | | | (6.92 | %) | | | 11.72 | % | | | 4.95 | % | | | 0.41 | % |
See accompanying notes to financial statements.
| Semi-Annual Report | October 31, 2015 | 29 |
| Caldwell & Orkin | |
| Market Opportunity Fund | Financial Highlights |
For a capital share outstanding throughout each period.
| | | For the Six Months Ended October 31, 2015 (Unaudited) | | | For the Year Ended April 30, 2015 | | | For the Year Ended April 30, 2014 | | | For the Year Ended April 30, 2013 | | | For the Year Ended April 30, 2012 | | | For the Year Ended April 30, 2011 | |
| Ratios and Supplemental Data: | | | | | | | | | | | | | | | | | | |
| Net assets, end of period (000’s) | | $ | 185,229 | | | $ | 128,935 | | | $ | 165,472 | | | $ | 260,916 | | | $ | 251,907 | | | $ | 332,724 | |
| Ratios to Average Net Assets: | | | | | | | | | | | | | | | | | | | | | | | | |
| Management fees | | | 1.00 | %(3) | | | 1.00 | % | | | 1.00 | % | | | 1.00 | % | | | 0.99 | % | | | 0.97 | % |
| Administrative fees | | | 0.44 | %(3) | | | 0.44 | % | | | 0.29 | % | | | 0.27 | % | | | 0.27 | % | | | 0.22 | % |
| Expenses before dividends on securities sold short and interest expense | | | 1.44 | %(3) | | | 1.44 | % | | | 1.29 | % | | | 1.27 | % | | | 1.26 | % | | | 1.19 | % |
| Interest expense | | | 0.95 | %(3) | | | 0.63 | % | | | 0.30 | % | | | 0.46 | % | | | 0.43 | % | | | 0.51 | % |
| Expenses from dividends on securities sold short | | | 0.57 | %(3) | | | 0.57 | % | | | 0.14 | % | | | 0.26 | % | | | 0.43 | % | | | 0.34 | % |
Ratio of total expenses(4)(5) | | | 2.96 | %(3) | | | 2.64 | % | | | 1.73 | % | | | 1.99 | % | | | 2.12 | % | | | 2.04 | % |
Ratio of net investment
loss(4)(5) | | | (2.07 | %)(3) | | | (1.80 | %) | | | (0.98 | %) | | | (0.87 | %) | | | (1.27 | %) | | | (1.36 | %) |
| Portfolio turnover rate | | | 195 | %(2) | | | 434 | % | | | 657 | % | | | 352 | % | | | 517 | % | | | 493 | % |
(1) | Amount is less than $0.01. |
(4) | The ratio of expenses to average net assets and net investment income/(loss) to average net assets do not reflect the expenses of other investment companies. |
(5) | The ratio of total expenses to average net assets and ratio of net investment loss include fees waived by Fund's Administrator in the amount of 0.02%, 0.02%, 0.01%, 0.01%, 0.01%, 0.01%, respectively, for the period/years ended October 31, 2015, April 30, 2015, 2014, 2013, 2012 and 2011, respectively. |
See accompanying notes to financial statements.
| 30 | 1-800-467-7903 | www.CaldwellOrkin.com |
Caldwell & Orkin
Market Opportunity Fund | Notes to Financial Statements |
October 31, 2015 (Unaudited)
The Caldwell & Orkin Market Opportunity Fund (the “Fund”) is the only active investment portfolio of The Caldwell & Orkin Funds, Inc. (“Caldwell & Orkin”), an open‐end, diversified management investment company registered under the Investment Company Act of 1940, as amended (the “1940 Act”), and incorporated under the laws of the State of Maryland on August 15, 1989. Prior to June, 1992, Caldwell & Orkin’s name was The OTC Select‐100 Fund, Inc. and consisted of only one portfolio, The OTC Select‐100 Fund. The shareholders of The OTC Select‐100 Fund subsequently approved changing the corporate name from The OTC Select‐100 Fund, Inc. to The Caldwell & Orkin Funds, Inc. and to amend the investment objective and policies of The OTC Select‐100 Fund. As a result of such amendment, The OTC Select‐100 Fund was renamed and its assets and objectives were those of the Caldwell & Orkin Aggressive Growth Fund. In August, 1996, the Board of Directors of Caldwell & Orkin approved changing the name of the Caldwell & Orkin Aggressive Growth Fund to the Caldwell & Orkin Market Opportunity Fund. The Fund’s investment objective is to provide long‐term capital growth with a short‐term focus on capital preservation. C&O Funds Advisor, Inc. (the “Adviser”) uses a catalyst‐driven, multi‐dimensional, disciplined investment process focusing on active asset allocation, security selection and surveillance to achieve the Fund’s investment objective. The Adviser’s philosophy in managing the Fund is to focus on risk as well as return. The Adviser utilizes an investment philosophy based upon sophisticated exploitation of the low‐risk anomaly. The low‐risk anomaly stands in direct contradiction to the conventional beliefs of Efficient Market Hypothesis stating that high risk is equated with higher return. Caldwell and Orkin takes the opposite view – we believe that lower risk can result in higher return.
1. SUMMARY OF SIGNIFICANT ACCOUNTING POLICIES
Use of Estimates
The preparation of financial statements in conformity with accounting principles generally accepted in the United States of America (“GAAP”) requires management to make estimates and assumptions that affect the reported amounts of assets and liabilities and disclosure of contingent assets and liabilities at the date of the financial statements and the reported amounts of revenues and expenses during the reporting period. Actual results could differ from those estimates.
Securities Valuation
Securities are stated at the closing price on the date at which the net asset value (“NAV”) is being determined. If the date of determination is not a trading date, or the closing price is not otherwise available, the last bid price is used for a value instead. Debt securities, other than short‐term investments, are valued at the price provided by an independent pricing service. Any assets or securities for which market quotations are not readily available are valued at fair value as determined in good faith by or under the direction of the Fund’s Board of Directors in accordance with the Fund’s Fair Value Pricing Policy.
Fair Value Measurements
A three‐tier hierarchy has been established to classify fair value measurements for disclosure purposes. Inputs refer broadly to the assumptions that market participants would use in pricing the asset or liability, including assumptions about risk. Inputs may be observable or unobservable. Observable inputs are inputs that reflect the assumptions market participants would use in pricing the asset or liability that are developed based on market data obtained from sources independent of the reporting entity. Unobservable inputs are inputs that reflect the reporting entity’s own assumptions about the assumptions market participants would use in pricing the asset or liability that are developed based on the best information available.
| Semi-Annual Report | October 31, 2015 | 31 |
Caldwell & Orkin
Market Opportunity Fund | Notes to Financial Statements |
October 31, 2015 (Unaudited)
Various inputs are used in determining the value of the Fund’s investments as of the reporting period end. These inputs are categorized in the following hierarchy under applicable financial accounting standards:
| Level 1 – | Unadjusted quoted prices in active markets for identical, unrestricted assets or liabilities that the Fund has the ability to access at measurement date. |
| | |
| Level 2 – | Quoted prices which are not active quoted prices for similar assets or liabilities in active markets or inputs other than quoted process that are observable (either directly or indirectly) for substantially the full term of the asset of liability. |
| | |
| Level 3 – | Significant unobservable prices or inputs (including the Fund’s own assumptions in determining the fair value of investments) where there is little or no market for the asset or liability at the measurement date. |
The following is a summary of the inputs used as of October 31, 2015 in valuing the Fund’s investments carried at value:
| | | | | | | | | | | | | |
Investments in Securities at
Value* | | Level 1 - Quoted
Prices | | | Level 2 - Other
Significant
Observable
Inputs | | | Level 3 -
Significant
Unobservable
Inputs | | | Total | |
| Common Stocks | | $ | 83,855,515 | | | $ | – | | | $ | – | | | $ | 83,855,515 | |
| Exchange‐Traded Funds | | | 11,096 | | | | – | | | | – | | | | 11,096 | |
| Purchased Options | | | | | | | | | | | | | | | | |
| Call Options | | | 3,428,780 | | | | 198,675 | | | | – | | | | 3,627,455 | |
| Put Options | | | 1,254,181 | | | | 2,314,552 | | | | – | | | | 3,568,733 | |
| Short Term Investments | | | 93,584,167 | | | | – | | | | – | | | | 93,584,167 | |
| TOTAL | | $ | 182,133,739 | | | $ | 2,513,227 | | | $ | – | | | $ | 184,646,966 | |
| | | | | | | | | | | | | | | | | |
| Other Financial Instruments* | | | | | | | | | | | | | | | | |
| Liabilities | | | | | | | | | | | | | | | | |
| Securities Sold Short | | | | | | | | | | | | | | | | |
| Common Stocks | | $ | (49,701,098 | ) | | $ | – | | | $ | – | | | $ | (49,701,098 | ) |
| Preferred Stock | | | (1,407,328 | ) | | | – | | | | – | | | | (1,407,328 | ) |
| Exchange‐Traded Funds | | | (6,584,603 | ) | | | – | | | | – | | | | (6,584,603 | ) |
| TOTAL | | $ | (57,693,029 | ) | | $ | – | | | $ | – | | | $ | (57,693,029 | ) |
During the six months ended October 31, 2015, there were no transfers between Level 1 and 2 securities. The Fund evaluates transfers into or out of all levels as of the end of the reporting period.
| 32 | 1-800-467-7903 | www.CaldwellOrkin.com |
Caldwell & Orkin
Market Opportunity Fund | Notes to Financial Statements |
October 31, 2015 (Unaudited)
All securities of the Fund were valued using either Level 1 or Level 2 inputs during the six months ended October 31, 2015.
| * | For detailed industry descriptions, see the accompanying Schedule of Investments. |
Use of Derivatives
Derivative Instruments and Hedging Activities: The following discloses the Fund’s use of derivative instruments and hedging activities. The Fund’s investment objective not only permits the Fund to purchase investment securities, it also allows the Fund to enter into various types of derivative contracts, purchased and written options. In doing so, the Fund will employ strategies in differing combinations to permit it to increase, decrease, or change the level or types of exposure to market factors. Central to those strategies are features inherent to derivatives that make them more attractive for this purpose than equity or debt securities; they require little or no initial cash investment, they can focus exposure on only certain selected risk factors, and they may not require the ultimate receipt or delivery of the underlying security (or securities) to the contract holder. This may allow the Fund to pursue its objective more quickly and efficiently than if it were to make direct purchases or sales of securities capable of affecting a similar response to market factors.
Market Risk Factors: In pursuit of their investment objectives, certain Funds may seek to use derivatives to increase or decrease their exposure to the following market risk factors:
Equity Risk: Equity risk relates to the change in value of equity securities as they relate to increases or decreases in the general market.
Purchasing Put and Call Options: The Fund may invest in options on securities and indices, and use such securities either to hedge risk or enhance the long positions in the Fund’s portfolio.
By purchasing a put option, the purchaser obtains the right (but not the obligation) to sell the option’s underlying instrument at a fixed strike price. In return for this right, the purchaser pays the current market price for the option (known as the option premium). Options have various types of underlying instruments, including specific securities, indices of securities prices, and futures contracts. The purchaser may terminate its position in a put option by allowing it to expire or by exercising the option. If the option is allowed to expire, the purchaser will lose the entire premium. If the option is exercised, the purchaser completes the sale of the underlying instrument at the strike price. A purchaser may also terminate a put option position by closing it out in the secondary market at its current price, if a liquid secondary market exists. The buyer of a typical put option can expect to realize a gain if security prices fall. However, if the underlying instrument’s price does not fall enough to offset the cost of purchasing the option, a put buyer can expect to suffer a loss (limited to the amount of the premium, plus related transaction costs).
The features of call options are essentially the same as those of put options, except that the purchaser of a call option obtains the right to purchase, rather than sell, the underlying instrument at the option’s strike price. A call buyer typically attempts to participate in potential price increases of the underlying instrument with risk limited to the cost of the option if security prices fall. At the same time, the buyer can expect to suffer a loss if security prices do not rise sufficiently to offset the cost of the option.
| Semi-Annual Report | October 31, 2015 | 33 |
Caldwell & Orkin
Market Opportunity Fund | Notes to Financial Statements |
October 31, 2015 (Unaudited)
Writing Put and Call Options: The writer of a put or call option takes the opposite side of the transaction from the option’s purchaser. In return for receipt of the premium, the writer assumes the obligation to pay the strike price for the option’s underlying instrument if the other party to the option chooses to exercise it. The writer may seek to terminate a position in a put option before exercise by closing out the option in the secondary market at its current price. If the secondary market is not liquid for a put option, however, the writer must continue to be prepared to pay the strike price while the option is outstanding, regardless of price changes. When writing an option on a futures contract, the Fund will be required to make margin payments to an FCM as described above for futures contracts.
If security prices rise, a put writer would generally expect to profit, although its gain would be limited to the amount of the premium it received. If security prices remain the same over time, it is likely that the writer will also profit, because it should be able to close out the option at a lower price. If security prices fall, the put writer would expect to suffer a loss. This loss should be less than the loss from purchasing the underlying instrument directly, however, because the premium received for writing the option should mitigate the effects of the decline.
Writing a call option obligates the writer to sell or deliver the option’s underlying instrument, in return for the strike price, upon exercise of the option. The characteristics of writing call options are similar to those of writing put options, except that writing calls generally is a profitable strategy if the price of the underlying security remains the same or falls. Through receipt of the option premium, a call writer mitigates some of the effects of a price decline. At the same time, because a call writer must be prepared to deliver the underlying instrument in return for the strike price, even if its current value is greater, a call writer gives up some ability to participate in security price increases.
The Fund did not transact in any written options during the fiscal six months ended October 31, 2015.
The following discloses the amounts related to the Fund’s use of derivative instruments and hedging activities.
The effect of derivative instruments on the Statement of Assets and Liabilities as of October 31, 2015:
| Asset Derivatives | | | | | |
| Derivatives not Accounted for as Hedging Instruments | | Statement of Assets and
Liabilities Location | | Market Value | |
| Purchased Options (Equity Contracts) | | Investments, at value | | $ | 7,196,188 | |
| Total | | | | $ | 7,196,188 | |
| 34 | 1-800-467-7903 | www.CaldwellOrkin.com |
Caldwell & Orkin
Market Opportunity Fund | Notes to Financial Statements |
October 31, 2015 (Unaudited)
The effect of derivative instruments on the Statement of Operations for the fiscal six months ended October 31, 2015:
Derivatives not
Accounted for as
Hedging Instruments | Location of Gain/(Loss)
On Derivatives
Recognized in Income | | Realized Gain/(Loss) on Derivatives Recognized in Income | | | Change in Unrealized
Gain/(Loss) on Derivatives Recognized in Income | |
| Purchased Options (Equity Contracts) | Net realized gain on purchased options | | $ | 2,418,797 | | | | |
| | Change in unrealized appreciation on purchased options | | | | | | $ | 381,995 | |
| Total | | | $ | 2,418,797 | | | $ | 381,995 | |
The Fund’s average notational value for the purchased options is $6,166 for the period ended October 31, 2015.
Significant Ownership Concentration
At October 31, 2015, the Fund invested 50.52% total net assets in the JPMorgan 100% U.S. Treasury Securities Money Market Fund Capital Class (CJTXX). The financial statements of the Money Market Fund, including the portfolio of investments, are included in the JPMorgan 100% U.S. Treasury Securities Money Market Fund Capital Class Fund’s annual report and can be found at www.jpmorganfunds.com and should be read in conjunction with the Fund’s financial statements. The Fund uses the money market instrument as a vehicle for holding collateral related to securities sold short. As stated in the Fund’s prospectus, the Fund will typically invest between 0% and 50% of net assets in money market securities and fixed income securities. This portion of the Fund’s portfolio includes cash equivalents (i.e., money market funds or U.S. treasury notes) and bonds (i.e., corporate or government bonds), although generally cash equivalents are emphasized more than bonds. The corporate bonds purchased may have any maturity and be of any rating or quality, as long as Fund management believes it is consistent with the Fund’s investment objective.
The JPMorgan 100% U.S. Treasury Securities Money Market Fund’s objective is to provide the highest possible level of current income while still maintaining liquidity and providing maximum safety of principal. The JPMorgan 100% U.S. Treasury Securities Money Market Fund invests its assets exclusively in obligations of the U.S. Treasury including treasury bills, bonds and notes.
Fund management considers investments in securities sold short to be part of managed assets, thereby reducing the Fund’s available cash balance. If the absolute value of securities sold short was added to the Fund’s total long positions as of October 31, 2015, total investments would equal 84.22%, as a percentage of net assets. This would result in cash equivalents representing 15.78% of net assets, vs. the 50.52% that is disclosed on the Schedule of Investments. This better illustrates the Fund’s net cash exposure as of October 31, 2015.
| Semi-Annual Report | October 31, 2015 | 35 |
Caldwell & Orkin
Market Opportunity Fund | Notes to Financial Statements |
October 31, 2015 (Unaudited)
Share Valuation
The NAV per share of the Fund is calculated by dividing the sum of the value of the securities held by the Fund, plus cash or other assets, minus all liabilities (including estimated accrued expenses) by the total number of shares outstanding for the Fund, rounded to the nearest cent. The Fund’s shares will not be priced on the days on which the New York Stock Exchange is closed for trading. The offering and redemption price per share for the Fund is equal to the Fund’s NAV per share.
The Fund charges a 2.00% redemption fee on shares held less than six months. These fees are deducted from the redemption proceeds otherwise payable to the shareholder. The Fund will retain the fee charged as paid‐in capital and such fees become part of the Fund’s daily NAV calculation. For the fiscal six months ended October 31, 2015, the Fund recorded $5,913 in redemption fee proceeds.
Securities Transactions and Related Investment Income
Securities transactions are accounted for on trade date. Dividend income is recorded on the ex‐dividend date. Realized gains and losses from investment transactions are determined using the specific identification method. Interest income which includes amortization of premium and accretion of discount, is accrued as earned.
Cash
The Fund maintains cash available for the settlement of securities transactions and capital shares reacquired. Available cash is invested daily in money market instruments.
Income Taxes
The Fund intends to continue to comply with the requirements of the Internal Revenue Code of 1986, as amended, applicable to regulated investment companies and to distribute all taxable income to their shareholders. Therefore, no federal income tax provision is required.
In order to avoid imposition of the excise tax applicable to regulated investment companies, the Fund intends to declare each year as dividends, in each calendar year, at least 98% of its net investment income (earned during the calendar year) and at least 98.2% of its net realized capital gains (earned during the twelve months ended October 31) plus undistributed amounts, if any, from prior years.
The Fund recognizes the tax benefits of uncertain tax positions only when the position is more likely than not to be sustained, assuming examination by tax authorities. Management has analyzed the company’s tax positions and concluded that no liability for unrecognized tax benefits should be recorded related to uncertain tax positions taken on returns filed for open tax years (2012, 2013, and 2014) or expected to be taken in the company’s 2015 tax returns. The company identifies its major tax jurisdictions as U.S. federal, Georgia and Maryland, and foreign jurisdictions where the company makes significant investments; however, the company is not aware of any tax positions for which it is reasonably possible that the total amounts of unrecognized tax benefits will change materially in the next 12 months.
| 36 | 1-800-467-7903 | www.CaldwellOrkin.com |
Caldwell & Orkin
Market Opportunity Fund | Notes to Financial Statements |
October 31, 2015 (Unaudited)
2. COMMITMENTS AND OTHER AGREEMENTS
The Fund has entered into a management agreement (the “Management Agreement”) with the Adviser pursuant to which the Adviser provides space, facilities, equipment and personnel necessary to perform administrative and investment management services for the Fund. The Management Agreement provides that the Adviser is responsible for the actual management of the Fund’s portfolio. For such services and expenses assumed by the Adviser, the Fund pays a monthly advisory fee at incremental annual rates as follows:
| Advisory Fee | Average Daily Net Assets |
| 1.00% | Up to $250 million |
| 0.90% | In excess of $250 million but not greater than $500 million |
| 0.80% | In excess of $500 million |
The Adviser has agreed to reimburse the Fund to the extent necessary to prevent the Fund’s annual ordinary operating expenses (excluding taxes, expenses related to the execution of portfolio transactions and the investment activities of the Fund such as, for example, interest, dividend expenses on securities sold short, brokerage commissions and fees and expenses charged to the Fund by any investment company in which the Fund invests and extraordinary charges such as litigation costs) from exceeding 2.00% of the Fund’s average net assets (the “Expense Cap”). No reimbursement was required for the fiscal six months ended October 31, 2015.
C&O Funds Advisor, Inc. is a wholly‐owned subsidiary of Caldwell & Orkin, Inc.
ALPS Distributors, Inc. (“ADI”) serves as distributor to the Fund. The Fund does not pay ADI for these services.
ALPS Fund Services, Inc. (“ALPS”) provides fund accounting, fund administration, compliance and transfer agency services to the Fund. The fees paid to ALPS for fund accounting and fund administration services are set at incremental annual rates and subject to an annual minimum.
The Fund pays ALPS an annual fee, made in monthly installments, for services provided pursuant to the Chief Compliance Officer Services Agreement, which became effective October 1, 2012. Prior to October 1, 2012, the Chief Compliance Officer for the Fund was employed by Advisor.
The Fund also pays an annual fee to ALPS, in addition to per account charges and other out of pocket expenses, related to transfer agency services.
In addition to the fee structure set forth above, an annual amount of $30,000 is waived against the administration fee.
| Semi-Annual Report | October 31, 2015 | 37 |
Caldwell & Orkin
Market Opportunity Fund | Notes to Financial Statements |
October 31, 2015 (Unaudited)
3. INVESTMENT PORTFOLIO TRANSACTIONS
Purchases and sales of securities, excluding securities sold short and short‐term investments during the fiscal six months ended October 31, 2015 were as follows:
| Fund | | Purchases | | | Sales | |
| Caldwell & Orkin Market Opportunity Fund | | $ | 151,015,923 | | | $ | 142,649,873 | |
Short Sales and Segregated Cash
Short sales are transactions in which the Fund sells a security it does not own, in anticipation of a decline in the market value of that security. To initiate such a transaction, the Fund must borrow the security to deliver to the buyer upon the short sale; the Fund is then obligated to replace the security borrowed by purchasing it in the open market at some later date, completing the transaction.
The Fund will incur a loss if the market price of the security increases between the date of the short sale and the date on which the Fund replaces the borrowed security. The Fund will realize a gain if the security declines in value between those dates.
All short sales must be fully collateralized. The Fund maintains the collateral in segregated accounts consisting of cash and/or U.S. Government securities sufficient to collateralize the market value of its short positions. Typically, the segregated cash with brokers and other financial institutions exceeds the minimum required. Deposits with brokers for securities sold short are invested in money market instruments. Segregated cash is held at the custodian in the name of the broker per a tri‐party agreement between the Fund, the custodian, and the broker.
The Fund may also sell short “against the box”, i.e., the Fund enters into a short sale as described above, while holding an offsetting long position in the same security which it sold short. If the Fund enters into a short sale against the box, it will segregate an equivalent amount of securities owned by the Fund as collateral while the short sale is outstanding.
The Fund limits the value of its short positions (excluding short sales “against the box”) to 60% of the Fund’s total net assets. At October 31, 2015, the Fund had approximately 27% of its total net assets in short positions.
For the fiscal six months ended October 31, 2015, the cost of investments purchased to cover short sales and the proceeds from investments sold short were $60,269,686 and $100,687,573, respectively.
| 38 | 1-800-467-7903 | www.CaldwellOrkin.com |
Caldwell & Orkin
Market Opportunity Fund | Notes to Financial Statements |
October 31, 2015 (Unaudited)
4. CAPITAL SHARE TRANSACTIONS
Capital share transactions were as follows:
| | | For the
Six Months Ended
October 31, 2015 | | | For the
Year Ended
April 30, 2015 | |
| Shares sold | | | 2,383,039 | | | | 662,412 | |
| Shares reinvested | | | – | | | | 37,433 | |
| Shares reacquired | | | (530,706 | ) | | | (3,003,597 | ) |
| Net increase/(decrease) in shares outstanding | | | 1,852,333 | | | | (2,303,752 | ) |
5. TAX BASIS INFORMATION
The tax character of the distributions paid by the Fund during the years ended April 30, 2015 and April 30, 2014 were as follows:
| Distributions Paid From: | | 2015 | | | 2014 | |
| Ordinary Income | | $ | – | | | $ | – | |
| Long‐term capital gains | | | 970,482 | | | | 5,045,803 | |
| Total | | $ | 970,482 | | | $ | 5,045,803 | |
As of April 30, 2015, the components of distributable earnings on a tax basis were as follows:
| Total Cost of Investments | | $ | 105,081,186 | |
| Gross Tax Unrealized Appreciation | | $ | 2,973,567 | |
| Gross Tax Unrealized Depreciation | | | (1,938,681 | ) |
| Net Appreciation of Securities Sold Short | | | 7,848,280 | |
| Net Tax Unrealized Appreciation | | | 8,883,166 | |
| Other Cumulative Effect of Timing Differences | | | (110,647 | ) |
| Accumulated Capital Gains | | | 296,819 | |
| Undistributed Ordinary Income | | | 7,125,425 | |
| Total Accumulated Earnings | | $ | 16,194,763 | |
At April 30, 2015, the Fund had no capital loss carryovers.
On October 31, 2015, based on cost of $182,252,130 for federal income tax purposes, aggregate gross unrealized appreciation for all securities in which there is an excess of value over tax cost was $5,752,900 and aggregate gross unrealized depreciation for all securities in which there is an excess of tax cost over value was $(3,358,064), resulting in net unrealized appreciation of $2,394,836.
GAAP requires that certain components of net assets relating to permanent differences be reclassified between financial and tax reporting. These reclassifications have no effect on net assets or net asset value per share. For the year ended April 30, 2015, the Fund decreased accumulated net realized gain on investments by $3,503,700, decreased undistributed net investment loss by $3,504,172 and decreased paid‐in capital by $472. These reclassifications are due to investments in partnerships, commodities, nondeductible dividend expenses and certain other temporary and permanent book and tax reclassifications.
| Semi-Annual Report | October 31, 2015 | 39 |
Caldwell & Orkin
Market Opportunity Fund | Notes to Financial Statements |
October 31, 2015 (Unaudited)
Net investment income/(loss), net realized gains/(losses) and unrealized appreciation/ (depreciation) differ for financial statement and tax purposes due to differing treatments of, nondeductible dividend expense, commodity adjustments (SPDR Gold Trust), investments in partnerships and certain other investments.
6. RELATED PARTY TRANSACTIONS
As of October 31, 2015, Caldwell & Orkin, Inc. and Michael B. Orkin had ownership of the Fund of 0.99% and 5.28%, respectively. Caldwell & Orkin, Inc. is 100% wholly owned by Michael B. Orkin.
Under the Fund’s organizational documents, its officers and directors are indemnified against certain liability arising out of the performance of their duties to the Fund. Additionally, in the normal course of business, the Fund enters into contracts with service providers that may contain general indemnification clauses, which may permit indemnification to the extent permissible under applicable law. The Fund’s maximum exposure under these arrangements is unknown, as this would involve future claims that may be made against the Fund that have not yet occurred.
7. DIRECTOR COMPENSATION
The Fund pays each Director, other than the Independent Chairman, who is not affiliated with the Adviser an annual fee of $15,000 per year, plus $3,500 for each in‐person meeting attended and $1,500 for each other meeting attended. The Fund pays the Independent Chairman an annual fee of $19,000 per year, plus $5,250 for each in‐person meeting attended and $3,250 for each other meeting attended. The Fund pays the Director serving as Chairman of the Audit Committee an additional annual fee of $2,500. In addition, the Independent Director responsible for reviewing the Code of Ethics and Personal Trading Reports for each quarterly meeting is paid an additional fee of $250 per meeting.
The Fund also reimburses Directors’ actual out‐of‐pocket expenses relating to attendance at meetings. Effective June 1997, the Board of Directors agreed to receive their compensation entirely in shares of the Fund. Accordingly, each Director who is not affiliated with the Adviser receives shares of the Fund with a value equal to the cash compensation they would have otherwise received.
| 40 | 1-800-467-7903 | www.CaldwellOrkin.com |
| Caldwell & Orkin | |
| Market Opportunity Fund | Additional Information |
| | October 31, 2015 (Unaudited) |
DIRECTOR APPROVAL OF THE INVESTMENT ADVISORY AGREEMENT
The Board of Directors of The Caldwell & Orkin Funds, Inc. (the “Board”) is responsible for overseeing management of the Caldwell & Orkin Market Opportunity Fund (the “Fund”). As required by law, on an annual basis the Board determines whether to continue the Fund’s management agreement (the “Management Agreement”) with C&O Funds Advisor, Inc., the manager of the Fund (the “Manager”).
The Board considered the renewal of the current Management Agreement at an in-person meeting at the office of the Manager, Norcross, Georgia on June 18, 2015. Prior to the meeting, the Independent Directors and their independent legal counsel met in executive session and were fully briefed on required considerations contained in Section 15(c) of the Investment Company Act, as amended, and judicial interpretations thereof. The Independent Chairman noted that (i) a copy of the Management Agreement; (ii) the Manager’s Form ADV; (iii) the consolidated financial statements of the Manager’s parent company; (iv) a memorandum from Paul, Hastings LLP (legal counsel to the Manager and the Fund) relevant to the continuance of the Management Agreement (including the issues and legal standards the Board should consider in evaluating whether to renew the Management Agreement); (v) a memorandum from C&O Funds Advisor, Inc. to the Board relevant to the Management Agreement; and (vi) other relevant materials (including data regarding the Fund’s performance record and the performance records of other funds in the long/short category and information about the Fund’s expense ratio and management fees, and the expense ratios and management fees of other funds in the long/short category) had been reviewed and considered by the Independent Directors with advice of the Independent Directors’ counsel.
The Independent Directors and their independent legal counsel met without members of Fund management present to review the materials presented, and to discuss the investment management and administrative services provided by the Manager to the Fund, the income, expenses and profitability of the Manager related to the Fund and related information about the Fund. The Independent Directors and their independent legal counsel also met with management of the Manager in their consideration of renewal of the current Management Agreement. Throughout the deliberation process, the Independent Directors were advised by their independent counsel.
| (i) | The nature, extent, and quality of the services provided by the Manager. In this regard, the Board reviewed the services being provided by the Manager to the Fund including, without limitation, its investment advisory and administrative services since the Fund’s inception, its coordination of services and distribution efforts for the Fund over the years, and its provision of various of officers to the Fund without additional compensation. After reviewing the foregoing information, the Board concluded that the quality, extent and nature of the services provided by the Manager were satisfactory and adequate for the Fund. |
| | |
| (ii) | The investment performance of the Fund and Manager. In this regard, the Board compared the performance of the Fund with the performance of comparable funds managed by other advisers. In particular, the Board noted the Fund’s absolute and relative performance during various periods for the calendar and fiscal years ended December 31, 2014 and April 30, 2015, respectively. The Board also considered the consistency of the Manager’s management of the Fund with the Fund’s investment objective and policies, and long‐term performance of the Fund. The Board highlighted in its discussion that the Fund continued to achieve its results while historically maintaining a lower statistical risk profile than the market and with price movements that correlated little with those of the S&P 500. Following further discussion, the Board concluded that the investment performance of the Fund and Manager was satisfactory and was consistent with the Fund’s objectives and policies. |
| Semi-Annual Report | October 31, 2015 | 41 |
| Caldwell & Orkin | |
| Market Opportunity Fund | Additional Information |
| | October 31, 2015 (Unaudited) |
| (iii) | The costs of the services to be provided and profits to be realized by the Manager and its affiliates from the relationship with the Fund. In this regard, the Board considered the Manager’s staffing, personnel and methods of operating; the financial condition of the Manager and the level of commitment to the Fund and the Manager by the principals of the Manager; the asset levels of the Fund; and the overall expenses of the Fund. The Board also considered potential benefits for the Manager in managing the Fund, including promotion of the Manager’s name, the ability for the Manager to place small accounts into the Fund, and the potential for the Manager to generate “soft dollars” (commission dollars used to purchase research and brokerage services) from Fund trades that may benefit the Manager’s clients other than the Fund. The Board then compared the fees and expenses of the Fund (including the management fee) to other funds similar to the Fund in terms of the type of fund, the style of investment management (including, in particular, the use of short selling as part of the Fund’s principal investment strategy) and the nature of the investment strategy and markets invested in by the Fund, among other factors. The Board reviewed data on the Fund’s management fees, noting that the Fund’s operating expense ratio was still low compared to other funds with comparable objectives and strategies. Following this comparison and upon further consideration and discussion of the foregoing, the Board concluded that the fees to be paid to the Manager by the Fund were fair and reasonable. |
| | |
| (iv) | The extent to which economies of scale would be realized as the Fund grows, and whether advisory fee levels reflect these economies of scale for the benefits of the Fund’s investors. In this regard, the Board considered the Fund’s fee arrangements with the Manager, the Fund’s fee arrangements with other service providers, and the expense cap included in the Management Agreement. The Board considered the Fund’s fee level break points, and noted that the Fund’s shareholders benefit from economies of scale as the Manager’s management fees are reduced as asset levels increase. Following further discussion of the Fund’s current asset levels and fee breakpoints, the Board determined that the Fund’s fee arrangements with the Manager reflect economies of scale for the benefit of Fund shareholders. |
Based upon its evaluation of the information, materials and factors described above, as well as others (including the Board’s extensive knowledge of the Fund’s operations and the Manager’s involvement with the Fund), the Directors concluded (i) that the terms (including, without limitation, the fees) of the Management Agreement were reasonable and fair in light of the nature and quality of services performed by the Manager; (ii) that they were satisfied with the Manager’s services, personnel and investment strategy; and (iii) that it was in the best interest of the Fund and its shareholders to renew the Management Agreement.
| 42 | 1-800-467-7903 | www.CaldwellOrkin.com |
| Caldwell & Orkin | |
| Market Opportunity Fund | Additional Information |
| | October 31, 2015 (Unaudited) |
Information about the Board of Directors and officers* of the Fund as of October 31, 2015 is set forth below. The Statement of Additional Information (SAI) includes additional information about the Fund’s Directors and officers and is available free of charge, upon request, by calling (800) 237‐7073. The address for each of the persons named below is 5185 Peachtree Parkway, Suite 370, Norcross, GA 30092‐6541.
Name, (Age) and
Position(s) Held
with Fund | Term of Office
and Length of
Time Served1 | Principal
Occupation(s) During
Past Five Years | Number of Funds
in Fund Complex
Overseen by Director | Other
Directorships
Held by Director |
| DISINTERESTED DIRECTORS |
Frederick T. Blumer (55)
Chairman | Since 1990 | Mr. Blumer is the CEO of Vehcon, Inc. and was formerly CEO of X-spand International, Inc. and was formerly Vice President of HUGHES Telematics, Inc. | One | None |
David L. Eager (72)
Director | Since 1992 | Mr. Eager is a Partner at Eager, Davis & Holmes LLC, and was formerly Director for Product Development for Driehaus Capital Management and a Global Partner with William M. Mercer, Inc. | One | None |
James L. Underwood (64)
Director and Audit
Committee Chairman | Since 2006 | Mr. Underwood is the Founder and Sole Owner of Underwood Advisors, LLC, an Estate and Financial Planning firm and was formerly a Principal and Shareholder in Windham Brannon P.C. and a member of the Board of Managers of Windham Brannon Financial Group, LLC. Prior to that he was the President of Tarpley & Underwood, P.C. and of Tarpley & Underwood Financial Advisors, LLC. | One | None |
| * | The term “officer” means the president, vice president, secretary, treasurer, controller or any other officer who performs policy-making decisions. |
| 1 | Each Director serves until his / her successor is duly elected and qualified, or until his / her death, resignation or removal. |
| Semi-Annual Report | October 31, 2015 | 43 |
| Caldwell & Orkin | |
| Market Opportunity Fund | Additional Information |
| | October 31, 2015 (Unaudited) |
Name, (Age) and
Position(s) Held
with Fund | Term of Office
and Length of
Time Served1 | Principal
Occupation(s) During
Past Five Years | Number of Funds
in Fund Complex
Overseen by Director | Other��
Directorships
Held by Director |
| INTERESTED DIRECTOR |
Michael B. Orkin (55)2
Director, President,
Portfolio Manager | Since 1990 | Mr. Orkin is the CEO and sole shareholder of Caldwell & Orkin, Inc., of which the Adviser is a wholly‐owned subsidiary. Mr. Orkin has been a portfolio manager at Caldwell & Orkin, Inc. since 1985, and is a Chartered Financial Analyst. | One | None |
| OFFICERS WHO ARE NOT DIRECTORS |
David R. Bockel, Jr. (38)3
Treasurer & Ass’t
Secretary
Secretary & Ass’t
Treasurer | Since 2010 2006‐2010 | Mr. Bockel is a Portfolio Manager for Caldwell & Orkin, Inc., and is a Registered Representative of ALPS Distributors, Inc. | N/A | N/A |
| * | The term “officer” means the president, vice president, secretary, treasurer, controller or any other officer who performs policy-making decisions. |
| 1 | Each Director serves until his / her successor is duly elected and qualified, or until his / her death, resignation or removal. |
| 2 | Mr. Orkin is an interested person of the Fund by reason of his position with the Adviser. |
| 3 | Registered Representative of ALPS Distributors, Inc. |
| 44 | 1-800-467-7903 | www.CaldwellOrkin.com |
| Caldwell & Orkin | |
| Market Opportunity Fund | Additional Information |
| | October 31, 2015 (Unaudited) |
Name, (Age) and
Position(s) Held with Fund | Term of Office
and Length of
Time Served1 | Principal
Occupation(s) During
Past Five Years | Number of Funds
in Fund Complex
Overseen by Director | Other
Directorships
Held by Director |
| OFFICERS WHO ARE NOT DIRECTORS (Continued) |
Melanie H. Zimdars (39)2
Chief Compliance
Officer | Since 20153 | Ms. Zimdars has over 15 years of experience within the financial services industry and currently serves as Vice President and Deputy Chief Compliance Officer at ALPS Fund Services, Inc. In this role she is the Chief Compliance Officer (“CCO”) for the ALPS ETF Trust, Broadview Funds Trust, PowerShares QQQ Trust, BLDRS Index Funds Trust, Elkhorn ETF Trust and Whitebox Mutual Funds. Prior to joining ALPS in September 2009, Ms. Zimdars served as Principal Financial Officer, Treasurer and Secretary for the Wasatch Funds from February 2007 to December 2008. While serving in these roles, she also worked closely with the Advisor’s and Funds’ CCO to conduct compliance reviews, forensic testing and risk assessments to ensure that all policies and procedures within the Compliance Programs were being adhered to while timely reporting any findings to the independent Board of Directors. From November 2006 to February 2007, she served as Assistant Treasurer for the Wasatch Funds and served as a Senior Compliance Officer for Wasatch Advisors, Inc. since 2005. Ms. Zimdars received a Bachelor of Science in finance from the University of Wisconsin‐La Crosse. | N/A | N/A |
| * | The term “officer” means the president, vice president, secretary, treasurer, controller or any other officer who performs policy-making decisions. |
| 1 | Each Director serves until his / her successor is duly elected and qualified, or until his / her death, resignation or removal. |
| 2 | Registered Representative of ALPS Distributors, Inc. |
| 3 | Effective December 10, 2015, Melanie Zimdars was appointed Chief Compliance Officer of the Fund. |
| Semi-Annual Report | October 31, 2015 | 45 |
| Caldwell & Orkin | |
| Market Opportunity Fund | Additional Information |
| | October 31, 2015 (Unaudited) |
Name, (Age) and
Position(s) Held
with Fund | Term of Office
and Length of
Time Served1 | Principal
Occupation(s) During
Past Five Years | Number of Funds
in Fund Complex
Overseen by Director | Other
Directorships
Held by Director |
| OFFICERS WHO ARE NOT DIRECTORS (Continued) |
Abigail J. Murray (40)
Secretary | Since 2015 | Ms. Murray joined ALPS in April 2015. She is currently Vice President and Senior Counsel of ALPS. Prior to joining ALPS, Ms. Murray was an Attorney and Managing Member at Murray & Rouvina PLC from 2014 to 2015 and an Associate with Vedder Price P.C. from 2007 to 2014. Ms. Murray is also the Secretary of ALPS ETF Trust, Clough Global Allocation Fund, Clough Global Equity Fund, Clough Global Opportunities Fund, Clough Funds Trust and RiverNorth Opportunities Fund, Inc. | N/A | N/A |
Erich Rettinger (30)3
Assistant Treasurer | Since 2013 | Mr. Rettinger serves as a Fund Controller for ALPS Fund Services, Inc. He joined ALPS in 2007 in the Fund Accounting department. | N/A | N/A |
| * | The term “officer” means the president, vice president, secretary, treasurer, controller or any other officer who performs policy-making decisions. |
| 1 | Each Director serves until his / her successor is duly elected and qualified, or until his / her death, resignation or removal. |
| 2 | Registered Representative of ALPS Distributors, Inc. |
| 3 | Effective December 5, 2013 Erich Rettinger was appointed as Assistant Treasurer of the Fund. |
| 46 | 1-800-467-7903 | www.CaldwellOrkin.com |
Intentionally Left Blank
| CALDWELL & ORKIN MARKET OPPORTUNITY FUND |
| Annual Report to Shareholders |
BOARD OF DIRECTORS
Frederick T. Blumer,
Independent Chairman
Michael B. Orkin, President
David L. Eager
James L. Underwood | TRANSFER, REDEMPTION
& DIVIDEND
DISBURSING AGENT
ALPS Fund Services, Inc.
P.O. Box 46256
Denver, CO 80201 | LEGAL COUNSEL
Paul Hastings LLP
1170 Peachtree Street, N.E.,
Suite 100,
Atlanta, GA 30309 |
| | | INDEPENDENT |
INVESTMENT ADVISER
C&O Funds Advisor, Inc.
5185 Peachtree Parkway
Suite 370
Norcross, GA 30092-6541 | CUSTODIAN
JPMorgan Chase Bank, N.A.
1111 Polaris Parkway, Suite 3J
Columbus, OH 43240 | DIRECTORS’ COUNSEL
Arnall Golden Gregory LLP
171 17th Street, NW,
Suite 2100
Atlanta, GA 30363 |
| | | |
DISTRIBUTOR
ALPS Distributors, Inc.
1290 Broadway, Suite 1100
Denver, CO 80203 | | |
The Caldwell & Orkin Market Opportunity Fund’s (the “Fund”) portfolio may or may not have positions in any of the companies referenced in this Report to Shareholders as of any date after October 31, 2015. The commentary reflects the views of the portfolio manager (or Adviser) through the end of the period or through the date of this report, as the case may be. Of course, these views are subject to change as market and other conditions warrant. These financial statements are submitted for the general information of the Fund’s shareholders. They are not authorized for distribution to prospective investors unless preceded or accompanied by an effective Fund Prospectus.
Availability of Proxy Voting Policy & Procedures, Proxy Voting Record and Code of Ethics - A description of a) the policies and procedures the Fund uses to determine how to vote proxies relating to portfolio securities, b) how the Fund voted proxies relating to portfolio securities during the most recent 12-month period ended June 30, c) the Code of Ethics applicable to the principal officers of the Fund are available without charge, upon request, by calling toll-free (800) 237-7073, or on the Securities and Exchange Commission’s (the “Commission’s”) website at http://www.sec.gov.
Availability of Quarterly Portfolio Schedule - The Fund files its complete schedule of portfolio holdings with the Commission for the first and third quarters of each fiscal year on Form N-Q. The Fund’s Forms N-Q are available on the Commission’s website at http://www.sec.gov. The Fund’s Forms N-Q may be reviewed and copied at the Commission’s Public Reference Room in Washington, D.C. Information on the operation of the Public Reference Room may be obtained by calling 1-800 SEC-0330.
Fund Information - For information about the Fund please call (800) 237-7073 or visit the Fund’s website at www.CaldwellOrkinFunds.com.
Fund Listings - The Fund is listed in many newspapers as C&OMktOpp or CaldOrkMO. The Fund’s Quotation symbol is COAGX. The Fund’s CUSIP number is 128819307.
Caldwell & Orkin Market Opportunity Fund
5185 Peachtree Parkway, Suite 370
Norcross, GA 30092-6541
E-mail: Info@CaldwellOrkin.com
Not applicable to semiannual reports.
Not applicable to semiannual reports.
Not applicable to semiannual reports.
Not applicable.
Schedule of Investments is included as part of the Report to Stockholders filed under Item 1 of this form.
Not applicable.
Not applicable.
Not applicable.
There have been no material changes to the procedures by which shareholders may recommend nominees to the registrant’s board of trustees.
Pursuant to the requirements of the Securities Exchange Act of 1934 and the Investment Company Act of 1940, the registrant has duly caused this report to be signed on its behalf by the undersigned, thereunto duly authorized.
The Caldwell & Orkin Funds, Inc.
Pursuant to the requirements of the Securities Exchange Act of 1934 and the Investment Company Act of 1940, the registrant has duly caused this report to be signed on its behalf by the undersigned, thereunto duly authorized.