UNITED STATES
SECURITIES AND EXCHANGE COMMISSION
Washington, D.C. 20549
FORM N-CSR
CERTIFIED SHAREHOLDER REPORT OF REGISTERED
MANAGEMENT INVESTMENT COMPANIES
Investment Company Act file number 811-06114
Cavanal Hill Funds
(Exact name of registrant as specified in charter)
| Citi Fund Services Ohio, Inc., 4400 Easton Commons, Suite 200, Columbus, OH 43219 |
| (Address of principal executive offices) | (Zip code) |
Citi Fund Services Ohio, Inc., 4400 Easton Commons, Suite 200, Columbus, OH 43219
(Name and address of agent for service)
Registrant’s telephone number, including area code: 1-800-762-7085
Date of fiscal year end: 8/31
Date of reporting period: 8/31/22
Item 1. Reports to Stockholders.

Annual Report
August 31, 2022
U.S. Treasury Fund
Government Securities Money Market Fund
Limited Duration Fund
Moderate Duration Fund
Bond Fund
Strategic Enhanced Yield Fund
Ultra Short Tax-Free Income Fund
Mid Cap Diverse Leadership Fund
Opportunistic Fund
World Energy Fund
Hedged Income Fund
On January 1, 2021, as permitted by regulations adopted by the Securities and Exchange Commission, paper copies of the Fund’s annual and semi-annual shareholder reports will no longer be sent by mail, unless you specifically request paper copies of the reports from the Fund or from your financial intermediary, such as a broker-dealer or bank. Instead, the reports will be made available on the Fund’s website (www.cavanalhillfunds.com), and you will be notified by mail each time a report is posted and provided with a website link to access the report.
If you already elected to receive shareholder reports electronically, you will not be affected by this change and you need not take any action. You may elect to receive shareholder reports and other communications from the Fund electronically anytime by contacting your financial intermediary (such as a broker-dealer or bank) or, if you are a direct investor, by calling (800) 762-7085.
You may elect to receive all future reports in paper free of charge. If you invest through a financial intermediary, you can contact your financial intermediary to request that you continue to receive paper copies of your shareholder reports. If you invest directly with the Fund you can call (800) 762-7085 to let the Fund know you wish to continue receiving paper copies of your shareholder reports. Your election to receive reports in paper will apply to all funds held in your account if you invest through your financial intermediary or all funds held with the fund complex if you invest directly with the Fund.
Table of Contents
Management Discussion of Fund Performance
3
Statements of Assets and Liabilities
22
Statements of Operations
26
Statements of Changes in Net Assets
30
Schedules of Portfolio Investments
36
Notes to the Financial Statements
66
Financial Highlights
76
Report of Independent Registered Public Accounting Firm
98
Additional Fund Information
100
A description of the policies and procedures that the Fund uses to determine how to vote proxies relating to the portfolio securities and information during the most recent 12-month period ended June 30th is available without charge, upon request, by calling 1-800-762-7085 or on the Securities and Exchange Commission’s website at http://www.sec.gov.
A complete schedule of each non-Money Market Fund’s portfolio holdings for the first and third fiscal quarter of each fiscal year is filed with the Securities and Exchange Commission on Form N-PORT. The Money Market Funds file completed Schedules of Portfolio Holdings with the Securities and Exchange Commission on Form N-NMFP. Schedules of Portfolio Holdings for the funds are available without charge on the Securities and Exchange Commission’s website at http://www.sec.gov. In addition, the schedules may be reviewed and copied at the Securities and Exchange Commission’s Public Reference Room in Washington D.C. Information on the operation of the Public Reference Room may be obtained by calling 1-800-SEC-0330.
This report is authorized for distribution to prospective investors only when preceded or accompanied by a prospectus or summary prospectus. An investor should consider the Fund’s investment objectives, risks, and charges and expenses carefully before investing or sending money. This and other important information about the investment company can be found in the Fund’s prospectus or summary prospectus. To obtain a prospectus or summary prospectus, please call 1-800-762-7085. Please read the prospectus carefully before investing.
Cavanal Hill Distributors, Inc., member FINRA, serves as the distributor for the Cavanal Hill Funds.
Shares of the Funds are not deposits or obligations of, or guaranteed or endorsed by, BOKF, NA, any of its affiliates or the Distributor. Shares are NOT FDIC INSURED, nor are they insured by any other government agency. An investment in the Funds involves investment risk, including possible loss of principal.
This document may contain “forward-looking statements” within the meaning of the Private Securities Litigation Reform Act of 1995, Section 27A of the Securities Act and Section 21E of the Securities Exchange Act. Forward-looking statements give our current expectations of forecasts of future events. They include statements regarding our anticipated future operating and financial performance. Although we believe the expectations and statements reflected in these and other forward-looking statements are reasonable, we can give no assurance they will prove to have been correct. They can be affected by inaccurate assumptions, by inaccurate information from third parties, or by known or unknown risks and uncertainties.
Glossary of Terms
Bloomberg 1-Year Municipal Bond Index includes bonds with a minimum credit rating of BAA3, are issued as part of a deal of at least $50 million, have an amount outstanding of at least $5 million, and have maturities of 1 to 2 years.
Bloomberg Asset-Backed Securities (ABS) Index includes pass-through, bullet, and controlled amortization structures. The ABS Index includes only the senior class of each ABS issue and the ERISA-eligible B and C tranche.
Bloomberg U.S. Aggregate Bond Index measures the investment-grade, USD-denominated, fixed-rate taxable bond market, including Treasuries, government-related and corporate securities, MBS (agency fixed-rate and hybrid ARM pass-through), ABS, and CMBS.
Bloomberg U.S. CMBS Investment Grade Index measures the market of U.S. Agency and US Non-Agency conduit and fusion CMBS deals with a minimum current deal size of $300m. The index is divided into two subcomponents: the U.S. Aggregate-eligible component, which contains bonds that are ERISA eligible under the underwriter’s exemption, and the non-US Aggregate-eligible component, which consists of bonds that are not ERISA eligible.
Bloomberg U.S. Corporate High Yield Bond Index measures the USD-denominated, high-yield, fixed-rate corporate bond market. Securities are classified as high yield if the middle rating of Moody’s, Fitch and S&P is Ba1/BB+/ BB+ or below. Bonds from issuers with an emerging markets (EM) country of risk, based on Barclays EM country definition, are excluded.
Bloomberg U.S. Corporate Investment-Grade Index covers all publicly issued U.S. corporate, non-corporate and specified foreign debentures and secured notes that meet the specified maturity, liquidity, and quality requirements, to qualify, bonds must be SEC-registered.
Bloomberg U.S. Intermediate Aggregate Bond Index is representative of investment-grade debt issues with maturities from one year up to (but not including) 10 years.
Bloomberg U.S. Mortgage-Backed Securities tracks agency mortgage pass-through securities (no longer incorporates hybrid ARM) guaranteed by Ginnie Mae (GNMA), Mae (FNMA), and Freddie Mac (FHLMC). The index is constructed by grouping individual TBA-deliverable MBS pools into aggregates or generics based on program, coupon and vintage.
Bloomberg U.S. Treasury 20+ Year Index measures U.S. dollar-denominated, fixed-rate, nominal debt issued by the US Treasury with 20+ years to maturity. Treasury bills are excluded by the maturity constraint, but are part of a separate Short Treasury Index.
Bloomberg U.S. Treasury Index is an index of the public obligations of the U.S. Treasury with a remaining maturity of one year or more are non-convertible and are denominated in U.S. dollars. Securities must be rated investment-grade (Baa3/BBB- or higher) by at least two of the following ratings agencies: Moody’s, S&P, and Fitch. If only two of the three agencies rate the security, the lower rating is used to determine index eligibility. If only one of the three agencies rates a security, the rating must be investment grade.
CBOE S&P 500 BuyWrite Index is designed to show the hypothetical performance of a portfolio that engages in a buywrite strategy using S&P 500 index call options.
Hedge Fund Research, Inc. (HFR) utilizes a UCITSIII compliant methodology to construct the HFRX Hedge Fund Indices. The methodology is based on defined and predetermined rules and objective criteria to select and rebalance components to maximize representation of the Hedge Fund Universe. HFRX Indices utilize state-of-the-art quantitative techniques and analysis; multi-level screening, cluster analysis, Monte-Carlo simulations, and optimization techniques ensure that each Index is a pure representation of its corresponding investment focus.
ICE BofA Merrill Lynch 1-5 Year U.S. Corporate/Government Index is comprised of investment-grade government and corporate debt securities with maturities between one- and five-years.
MSCI World Energy Index captures the large- and mid-cap segments across 23 developed markets and includes securities classified in the energy sector per Global Industry Classification Standard.
Russell 1000® Index is designed to represent the performance of companies within specific sectors of the Russell 1000® Index. Methodology equally weights securities within each sector, mitigating security specific risk an offering balanced exposure to particular sectors.
Russell 2000® Index is designed to represent the performance of companies within specific sectors of the Russell 2000® Index. Methodology equally weights securities within each sector, mitigating security specific risk and offering balanced exposure to particular sectors.
Russell 3000® Index is designed to represent the performance of companies within specific sectors of the Russell 3000® Index. Methodology equally weights securities within each sector, mitigating security specific risk and offering balanced exposure to particular sectors.
Russell 3000® Growth Index is a market capitalization weighted index based on the Russell 3000® Index. The Russell 3000® Growth Index includes companies that display signs of above average growth, exhibit higher price-to-book, and forecasted earnings.
Russell 3000® Value Index is a market capitalization weighted equity index maintained by the Russell Investment Group and based on the Russell 3000® Index, included in the index are stocks from the Russell 3000 with lower price-to-book ratios and lower expected growth rates.
Russell Midcap® Index tracks the performance of the mid-cap segment of the U.S. equity universe. The Russell Midcap® Index is a subset of the Russell 1000® Index. It includes approximately 800 of the smallest securities based on a combination of their market cap and current index membership. The Russell Midcap® Index represents approximately 27% of the total market capitalization of the Russell 1000 companies.
Secured Overnight Financing Rate (SOFR) is a measure of the cost of borrowing cash overnight collateralized by Treasury securities, the benchmark is fully transaction based, founded on a robust underlying market–actual transaction level data is provided by Bank of New York Mellon and an affiliate of the Depository Trust & Clearing Corporation, DTCC Solutions LLC.
Securities Industry and Financial Markets Association (SIFMA) Municipal Swap Index is produced by Municipal Market Data (MMD), which is a 7-day high-grade market index comprised of tax-exempt variable rate demand obligations (VRDO’s) from MMD’s extensive database. SIFMA is a leading securities industry trade group representing securities firms, banks, and asset management companies in the U.S. and Hong Kong.
Standard & Poor 500 Index (S&P 500 Index) is regarded as a gauge of the U.S. equities market; this index includes 500 leading companies in leading industries of the U.S. economy. Although the S&P 500 focuses on the large-cap segment of the market, with approximately 75% coverage of U.S. equities, it is also an ideal proxy for the total market.
The above indices are unmanaged and do not reflect the deduction of the expenses associated with a mutual fund, such as investment management and fund accounting fees. The Fund’s performance reflects the deduction of fees for these services, but does not reflect the deduction of taxes that a shareholder would pay on fund distributions or the redemption of fund shares. Investors cannot invest directly in an index.
Gross Domestic Product (GDP) measures the market value of the goods and services produced by labor and property within the respective country/economic region.
Yield to Worst (YTW) is lowest potential bond yield received without the issuer defaulting, it assumes the worst-case scenario, or earliest redemption possible under terms of the bond.
Organization of Petroleum Exporting Countries (OPEC) is a permanent intergovernmental organization of 14 oil-exporting developing nations that coordinates and unifies the petroleum policies of its Member Countries.
Money Market Funds (Unaudited)
Investment Concerns
You could lose money by investing in the funds. Although each Fund seeks to preserve the value of your investment at $1.00 per share, it cannot guarantee it will do so. An investment in the funds is not insured or guaranteed by the Federal Deposit Insurance Corporation or any other government agency. The sponsor has no legal obligation to provide financial support to the funds, and you should not expect that the sponsor will provide financial support to the funds at any time.
Market Conditions
The skies finally cleared for the money market fund industry this year as the Federal Open Market Committee (FOMC) began to roll back the monetary accommodation triggered by the COVID 19 pandemic in March 2020. In March 2022, the FOMC raised the federal funds target rate range 25 basis points (0.25%) to 0.25 - 0.50%. It continued to raise rates at each subsequent meeting, including 75-basis-point moves in June and July. The Crane 100 Money Fund Index ended August at 2%, the highest level since June 2019. Additional interest rate hikes are expected as current inflation expectations far exceed those of only six months ago.
Russia’s unanticipated invasion of Ukraine in February had severe macroeconomic shocks for Europe, particularly as it concerned energy. But it did not deter the FOMC from raising short-term rates.
Before beginning to raise rates in early 2022, the Fed anchored interest rates near zero making it difficult to generate yield. The Securities and Exchange Commission (SEC) is expected to announce its final rule regarding new money market reforms in October. While the full effect is yet unknown, some large money market sponsors are urging the SEC to modify the proposed rule.
The U.S. Treasury Fund and the Government Securities Money Market Fund
Both of our money market funds had short weighted average maturities (WAM’s) going into the current rising rate environment. This allows each interest rate increase to be quickly reflected in portfolio yields. In the Government Securities Money Market Fund, we also maintained an allocation to Secured Overnight Financing Rate (SOFR) floating rate notes, which also quickly reflect interest rate moves. According to Money Fund Intelligence, the weighted average maturity for taxable money market funds was 18 days at the end of August, down from 36 days at the start of the year and the lowest level ever.
While interest rates were anchored near zero, earning any yield at all was a struggle, and with expenses taken into consideration, most money market funds yielded zero or almost zero until the FOMC began its interest rate increase campaign. We believed that rates would rise in 2022, and toward the end of 2021 we began preparing the funds for that possibility, with very sizable amounts of cash in overnight repurchase agreements and floating rate notes. Once the FOMC began raising rates in March, we kept maturities short so as to seek to capture each subsequent increase quickly.*
While interest rates were almost zero, we occasionally extended duration out the curve but there was little value to be had. Keeping the portfolios relatively short prepared them for rising rates.*
Overnight repurchase agreements and floating rate notes quickly reflected rising rates. This summer, our Government Securities Money Market Fund began investing in repo with the Federal Reserve Bank of New York, which has a somewhat higher interest rate than many corporate issuers.*
Longer duration securities, purchased before interest rates began going up, acted as a drag on returns once levels started rising.*
Outlook
Over the near term, markets reflect the assumption that interest rates will keep rising into next year, and we share that assumption. The FOMC still has work to do on the inflationary front, and more increases will be required.
| 1 | For additional information, please refer to the Glossary of Terms. |
| * | The composition of the Funds’ portfolio is subject to change. |
The performance data quoted represents past performance and does not guarantee future results. The investment return and principal value of an investment will fluctuate so that an investor’s shares, when redeemed, may be worth more or less than their original cost. Current performance may be lower or higher than the performance quoted. For performance data current to the most recent month end, please call 1-800-762-7085 or visit www.cavanalhillfunds.com.
Limited Duration Fund (Unaudited)
Fund Goal
We pursue a strategy of broad diversification in order to benefit from investments in both corporate and government fixed-income securities as well as mortgage-backed securities (MBS) and asset-backed securities (ABS), with the Fund maintaining a dollar-weighted average duration of no longer than 3.5 years.
For the year ended August 31, 2022, the Limited Duration Fund A Shares (at NAV) returned -5.63%; Investor Shares returned -5.72%, while the Institutional Shares returned -5.51%. The Fund’s benchmark, the ICE BofA Merrill Lynch 1-5 Year U.S. Corporate/Government Index1 posted a total return of -5.82%.
Market Conditions
The 12-month period ended August 31, 2022 provided a stark contrast to the year prior in the financial markets. The highest inflation readings seen in a generation pushed the Federal Reserve to reverse course and begin implementing more restrictive monetary policy. In the face of tighter Fed policy, nearly all financial assets suffered steep declines over the period.
With the backdrop of high inflation and rising rates, fixed income assets delivered historically poor returns. Credit spreads also widened during the period as economic growth weakened, causing credit sectors to underperform. Conservatively positioned portfolios with respect to both duration and credit exposure (short duration and higher credit quality) provided the best opportunity to outperform.
Fund Strategy
The Fund maintained a shorter duration than its benchmark during the year, which was the primary driver of its modest outperformance versus the benchmark as interest rates rose sharply. Though the Fund maintained a high quality bias, the benchmark is heavily underweighted to government sectors so any overweight to credit sectors resulted in headwinds as credit spreads widened during the period. The Fund had fairly large allocations to the non-agency residential mortgage-backed securities and non-agency asset-backed securities sectors, which modestly detracted as both sectors experienced spread widening.*
We expect economic growth and inflation to slow over the near to medium term. Accordingly, we believe it is wise to move portfolios into higher credit quality and more liquid securities and we continue to do so. We also favor selectively adding to duration as interest rates have risen significantly. We believe the Fund should perform well in a slowing growth and slowing inflation environment.*
Outlook
With the Fed already well into its rate-hiking campaign and further increases priced into the market, we believe that most of the price declines on the longer end of the yield curve should now be behind us. The Fed is increasing interest rates in an economy that has already decelerated and the lagged nature of the impact from rising interest rates portends a more significant slowdown ahead.
Though inflation readings remain very high, the relatively aggressive tightening of monetary policy from the Fed should eventually be effective at bringing inflation down. The strong U.S. dollar combined with deceleration in rate-sensitive sectors of the economy (housing and autos) should have a strong deflationary impact over the near and medium term.
With economic growth weakening and the Fed following through on its goal of getting inflation back down to 2%, the environment for fixed income assets appears very constructive. With interest rates near their highest levels in more than a decade, expected returns from fixed income look relatively attractive. If the economy does indeed slow further and if inflation recedes, then there also appears to be the potential for price appreciation.
| 1 | For additional information, please refer to the Glossary of Terms. |
| * | The composition of the Funds’ portfolio is subject to change. |
The performance data quoted represents past performance and does not guarantee future results. The investment return and principal value of an investment will fluctuate so that an investor’s shares, when redeemed, may be worth more or less than their original cost. Current performance may be lower or higher than the performance quoted. For performance data current to the most recent month end, please call 1-800-762-7085 or visit www.cavanalhillfunds.com.
Limited Duration Fund (Unaudited)
Index Description
The performance of the Limited Duration Fund is measured against the ICE BofA Merrill Lynch 1-5 Year U.S. Corporate/Government Index, an unmanaged index that is comprised of investment-grade government and corporate debt securities with maturities between one- and five-years. The index does not reflect the deduction of the expenses associated with a mutual fund, such as investment management and fund accounting fees. The Fund’s performance reflects the deduction of fees for these services, but does not reflect the deduction of taxes that a shareholder would pay on fund distributions or the redemption of fund shares. Investors cannot invest directly in an index.
Investment Risks
Fixed income securities are subject to interest rate risks. The principal value of a bond falls when interest rates rise and rise when interest rates fall. During periods of rising interest rates, the value of a bond investment is at greater risk than during periods of stable or falling rates. Short-term investment-grade bonds offer less risk and generally a lower rate of return than longer-term higher-yielding bonds. Bond funds will tend to experience smaller fluctuations in value than stock funds. However, investors in any bond fund should anticipate fluctuations in price, especially for longer-term issues and in environments of changing interest rates.
For a complete description of these and other risks associated with investing in a mutual fund, please refer to the Funds’ prospectus.
Value of a $10,000 Investment
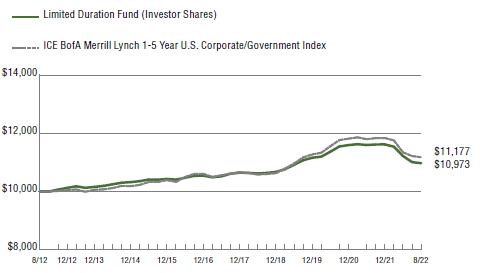
The growth of $10,000 investment chart represents a hypothetical investment in the indicated share class versus a similar investment in the Fund’s benchmark, and represents the reinvestment of distributions and capital gains.
| Average Annual Total Return |
| For the periods ended 8/31/2022 | | 1 Year | | | 5 years | | | 10 Year | |
| A Shares (at NAV)1 | | | (5.63)% | | | | 0.58% | | | | 0.97% | |
| A Shares (with 2.00% maximum load)1 | | | (7.54)% | | | | 0.16% | | | | 0.77% | |
| Investor Shares | | | (5.72)% | | | | 0.54% | | | | 0.93% | |
| Institutional Shares | | | (5.51)% | | | | 0.80% | | | | 1.19% | |
| ICE BofA ML 1-5 Year US Corporate/Government Index | | | (5.82)% | | | | 0.89% | | | | 1.12% | |
| Lipper Short Investment Grade Debt Funds Average2 | | | (4.54)% | | | | 0.99% | | | | 1.11% | |
| | | | | | | | | | | | | |
| Expense Ratios | | | | | | | | | | | | |
| | | | | | | | | | | | Gross | |
| A Shares | | | | | | | | | | | 0.86% | |
| Investor Shares | | | | | | | | | | | 1.01% | |
| Institutional Shares | | | | | | | | | | | 0.76% | |
The performance data quoted represents past performance and does not guarantee future results. The investment return and principal value of an investment will fluctuate so that an investor’s shares, when redeemed, may be worth more or less than their original cost. Current performance may be lower or higher than the performance quoted. For performance data current to the most recent month end, please call 1-800-762-7085 or visit www.cavanalhillfunds.com.
Investment performance for the Fund’s classes reflects fee waivers that have been in effect during the applicable periods. Without such waivers, the performance would have been lower. Contractual fee waivers are in effect through December 31, 2022.
The above expense ratios are from the Funds’ prospectus dated December 28, 2021. Additional information pertaining to the Funds’ expense ratios for the year ended August 31, 2022 can be found in the Financial Highlights.
| 1 | Class A Shares are subject to a 1.00% Maximum Deferred Sales Charge on shares purchased without an initial sales charge and redeemed within 12 months of purchase. Performance data does not reflect the Maximum Deferred Sales Charge. If reflected, one year performance quoted would be lower. This performance reflects the Fund’s no-Load Investor class (“Investor Shares”) for periods prior to May 2, 2011 for the A Shares. The A Shares began presenting performance linked to the Investor Class in September of 2011. Unlike Institutional Shares, Investor Shares and A Shares bear a 12b-1 fee of 0.25%. Investor Shares and Institutional Shares are subject to a Shareholder Servicing Fee of 0.25%, whereas the Shareholder Servicing Fee for A Shares is 0.10%. As indicated in the table, A Shares are also subject to a sales charge (Load). Each of these differences is reflected in the performance information. Accordingly, had the A Shares of the Fund been offered for periods before May 2, 2011, the performance information would have been different as a result of differing annual operating expenses. |
| 2 | The Lipper Mutual Funds Average is an equally weighted average of the mutual funds within their respective Lipper classification, adjusted for reinvestment of capital gains distributions and income dividends. |
Moderate Duration Fund (Unaudited)
Fund Goal
We pursue a strategy of broad diversification in order to benefit from investments in both corporate and government fixed-income securities as well as mortgage-backed securities (MBS) and asset-backed securities (ABS), with the Fund maintaining a dollar-weighted average duration of no longer than five years.
For the year ended August 31, 2022, the Moderate Duration Fund A Shares (at NAV) returned -8.54%; Investor Shares returned -8.63%, while the Institutional Shares returned -8.31%. The Fund’s benchmark, the Bloomberg U.S. Intermediate Aggregate Bond Index1, showed total return of -8.76%.
Market Conditions
The 12-month period ended August 31, 2022 provided a stark contrast to the year prior in the financial markets. The highest inflation readings seen in a generation pushed the Federal Reserve to reverse course and begin implementing more restrictive monetary policy. In the face of tighter Fed policy, nearly all financial assets suffered steep declines over the period.
With the backdrop of high inflation and rising rates, fixed income assets delivered historically poor returns. Credit spreads also widened during the period as economic growth weakened, causing credit sectors to underperform. Conservatively positioned portfolios with respect to both duration and credit exposure (short duration and higher credit quality) provided the best opportunity to outperform.
Fund Strategy
The Fund maintained a shorter duration than its benchmark during the year, which was the primary driver of its modest outperformance versus the benchmark as interest rates rose sharply. Though the Fund maintained a high quality bias, the benchmark is heavily underweighted to government sectors so any overweight to credit sectors resulted in headwinds as credit spreads widened during the period. The Fund had fairly large allocations to the taxable municipal and non-agency asset-backed securities sectors, which modestly detracted as both sectors experienced spread widening.*
We expect economic growth and inflation to slow over the near to medium term. Accordingly, we believe it is wise to move portfolios into higher credit quality and more liquid securities and we continue to do so. We also favor selectively adding to duration as interest rates have risen significantly. We believe the Fund should perform well in a slowing growth and slowing inflation environment.*
Outlook
With the Fed already well into its rate-hiking campaign and further increases priced into the market, we believe that most of the price declines on the longer end of the yield curve should now be behind us. The Fed is increasing interest rates in an economy that has already decelerated and the lagged nature of the impact from rising interest rates portends a more significant slowdown ahead.
Though inflation readings remain very high, the relatively aggressive tightening of monetary policy from the Fed should eventually be effective at bringing inflation down. The strong U.S. dollar combined with deceleration in rate-sensitive sectors of the economy (housing and autos) should have a strong deflationary impact over the near and medium term.
With economic growth weakening and the Fed following through on its goal of getting inflation back down to 2%, the environment for fixed income assets appears very constructive. With interest rates near their highest levels in more than a decade, expected returns from fixed income look relatively attractive. If the economy does indeed slow further and if inflation recedes, then there also appears to be the potential for price appreciation.
| 1 | For additional information, please refer to the Glossary of Terms. |
| * | The composition of the Funds’ portfolio is subject to change. |
The performance data quoted represents past performance and does not guarantee future results. The investment return and principal value of an investment will fluctuate so that an investor’s shares, when redeemed, may be worth more or less than their original cost. Current performance may be lower or higher than the performance quoted. For performance data current to the most recent month end, please call 1-800-762-7085 or visit www.cavanalhillfunds.com.
Moderate Duration Fund (Unaudited)
Index Description
The performance of the Moderate Duration Fund is measured against the Bloomberg U.S. Intermediate Aggregate Bond Index, an unmanaged index that is representative of investment-grade debt issues with maturities from one year up to (but not including) 10 years. The index does not reflect the deduction of the expenses associated with a mutual fund, such as investment management and fund accounting fees. The Fund’s performance reflects the deduction of fees for these services, but does not reflect the deduction of taxes that a shareholder would pay on fund distributions or the redemption of fund shares. Investors cannot invest directly in an index.
Investment Risks
Fixed income securities are subject to interest rate risks. The principal value of a bond falls when interest rates rise and rise when interest rates fall. During periods of rising interest rates, the value of a bond investment is at greater risk than during periods of stable or falling rates. Intermediate-term investment-grade bonds offer less risk and generally a lower rate of return than longer-term higher-yielding bonds. Bond funds will tend to experience smaller fluctuations in value than stock funds. However, investors in any bond fund should anticipate fluctuations in price, especially for longer-term issues and in environments of changing interest rates.
For a complete description of these and other risks associated with investing in a mutual fund, please refer to the Fund’s prospectus.
Value of a $10,000 Investment
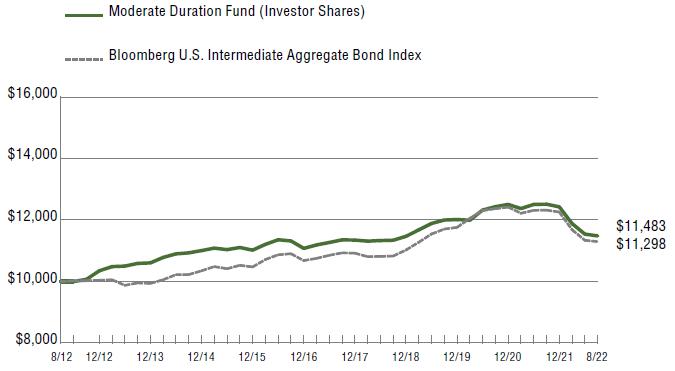
The growth of $10,000 investment chart represents a hypothetical investment in the indicated share class versus a similar investment in the Fund’s benchmark, and represents the reinvestment of distributions and capital gains.
| Average Annual Total Return |
| For the periods ended 8/31/2022 | | 1 Year | | | 5 years | | | 10 Year | |
| A Shares (at NAV)1 | | | (8.54)% | | | | 0.19% | | | | 1.43% | |
| A Shares (with 2.00% maximum load)1 | | | (10.37)% | | | | (0.20)% | | | | 1.22% | |
| Investor Shares | | | (8.63)% | | | | 0.17% | | | | 1.39% | |
| Institutional Shares | | | (8.31)% | | | | 0.44% | | | | 1.66% | |
| Bloomberg U.S. Intermediate Aggregate Bond Index | | | (8.76)% | | | | 0.58% | | | | 1.23% | |
| Lipper Short-Intermediate Investment Grade Debt Funds Average2 | | | (6.18)% | | | | 0.82% | | | | 1.10% | |
| | | | | | | | | | | | | |
| Expense Ratios |
| | | | | | | | | | | | Gross | |
| A Shares | | | | | | | | | | | 1.15% | |
| Investor Shares | | | | | | | | | | | 1.29% | |
| Institutional Shares | | | | | | | | | | | 1.04% | |
The performance data quoted represents past performance and does not guarantee future results. The investment return and principal value of an investment will fluctuate so that an investor’s shares, when redeemed, may be worth more or less than their original cost. Current performance may be lower or higher than the performance quoted. For performance data current to the most recent month end, please call 1-800-762-7085 or visit www.cavanalhillfunds.com.
Investment performance for the Fund’s classes reflects fee waivers that have been in effect during the applicable periods. Without such waivers, the performance would have been lower. Contractual fee waivers are in effect through December 31, 2022.
The above expense ratios are from the Funds’ prospectus dated December 28, 2021. Additional information pertaining to the Funds’ expense ratios for the year ended August 31, 2022 can be found in the Financial Highlights.
| 1 | Class A Shares are subject to a 1.00% Maximum Deferred Sales Charge on shares purchased without an initial sales charge and redeemed within 12 months of purchase. Performance data does not reflect the Maximum Deferred Sales Charge. If reflected, one year performance quoted would be lower. This performance reflects the Fund’s no-Load Investor class (“Investor Shares”) for periods prior to May 2, 2011 for the A Shares. The A Shares began presenting performance linked to the Investor Class in September of 2011. Unlike Institutional Shares, Investor Shares and A Shares bear a 12b-1 fee of 0.25%. Investor Shares and Institutional Shares are subject to a Shareholder Servicing Fee of 0.25%, whereas the Shareholder Servicing Fee for A Shares is 0.10%. As indicated in the table, A Shares are also subject to a sales charge (Load). Each of these differences is reflected in the performance information. Accordingly, had the A Shares of the Fund been offered for periods before May 2, 2011, the performance information would have been different as a result of differing annual operating expenses. |
| 2 | The Lipper Mutual Funds Average is an equally weighted average of the mutual funds within their respective Lipper classification, adjusted for reinvestment of capital gains distributions and income dividends. |
Bond Fund (Unaudited)
Fund Goal
We pursue a strategy of broad diversification in order to benefit from investments in both corporate and government fixed-income securities as well as mortgage-backed securities (MBS) and asset-backed securities (ABS), with the Fund maintaining a dollar-weighted average maturity of three years or more and generally no longer than 10 years.
For the year ended August 31, 2022, the Bond Fund A Shares (at NAV) returned -11.63%; the Investor Shares returned -11.63%; and the Institutional Shares returned -11.35%. The Fund’s benchmark, the Bloomberg U.S. Aggregate Bond Index1, showed a total return of -11.52%.
Market Conditions
The 12-month period ended August 31, 2022 provided a stark contrast to the year prior in the financial markets. The highest inflation readings seen in a generation pushed the Federal Reserve to reverse course and begin implementing more restrictive monetary policy. In the face of tighter Fed policy, nearly all financial assets suffered steep declines over the period.
With the backdrop of high inflation and rising rates, fixed income assets delivered historically poor returns. Credit spreads also widened during the period as economic growth weakened, causing credit sectors to underperform. Conservatively positioned portfolios with respect to both duration and credit exposure (short duration and higher credit quality) provided the best opportunity to outperform.
Fund Strategy
The Fund maintained a shorter duration than its benchmark during the year, which helped mitigate the underperformance versus the benchmark, as interest rates rose sharply. Though the Fund maintained a high quality bias, the benchmark is heavily underweighted to government sectors so any overweight to credit sectors resulted in headwinds as credit spreads widened during the period. The Fund had fairly large allocations to the taxable municipal and non-agency asset-backed securities sectors, which modestly detracted as both sectors experienced spread widening.*
We expect economic growth and inflation to slow over the near to medium term. Accordingly, we believe it is wise to move portfolios into higher credit quality and more liquid securities and we continue to do so. We also favor selectively adding to duration as interest rates have risen significantly. We believe the Fund should perform well in a slowing growth and slowing inflation environment.*
Outlook
With the Fed already well into its rate-hiking campaign and further increases priced into the market, we believe that most of the price declines on the longer end of the yield curve should now be behind us. The Fed is increasing interest rates in an economy that has already decelerated and the lagged nature of the impact from rising interest rates portends a more significant slowdown ahead.
Though inflation readings remain very high, the relatively aggressive tightening of monetary policy from the Fed should eventually be effective at bringing inflation down. The strong U.S. dollar combined with deceleration in rate-sensitive sectors of the economy (housing and autos) should have a strong deflationary impact over the near and medium term.
With economic growth weakening and the Fed following through on its goal of getting inflation back down to 2%, the environment for fixed income assets appears very constructive. With interest rates near their highest levels in more than a decade, expected returns from fixed income look relatively attractive. If the economy does indeed slow further and if inflation recedes, then there also appears to be the potential for price appreciation.
| 1 | For additional information, please refer to the Glossary of Terms. |
| * | The composition of the Funds’ portfolio is subject to change. |
The performance data quoted represents past performance and does not guarantee future results. The investment return and principal value of an investment will fluctuate so that an investor’s shares, when redeemed, may be worth more or less than their original cost. Current performance may be lower or higher than the performance quoted. For performance data current to the most recent month end, please call 1-800-762-7085 or visit www.cavanalhillfunds.com.
Bond Fund (Unaudited)
Index Description
The performance of the Bond Fund is measured against the Bloomberg U.S. Aggregate Bond Index, an unmanaged index that is a market value-weighted performance benchmark for investment-grade fixed-rate debt issues, including government, corporate, asset-backed and mortgage-backed securities, with maturities of at least one year. The index does not reflect the deduction of the expenses associated with a mutual fund, such as investment management and fund accounting fees. The Fund’s performance reflects the deduction of fees for these value-added services, but does not reflect the deduction of taxes that a shareholder would pay on fund distributions or the redemption of fund shares. Investors cannot invest directly in an index.
Investment Risks
Fixed income securities are subject to interest rate risks. The principal value of a bond falls when interest rates rise and rise when interest rates fall. During periods of rising interest rates, the value of a bond investment is at greater risk than during periods of stable or falling rates. Bond funds will tend to experience smaller fluctuations in value than stock funds. However, investors in any bond fund should anticipate fluctuations in price, especially for longer-term issues and in environments of changing interest rates.
For a complete description of these and other risks associated with investing in a mutual fund, please refer to the Fund’s prospectus.
Value of a $10,000 Investment
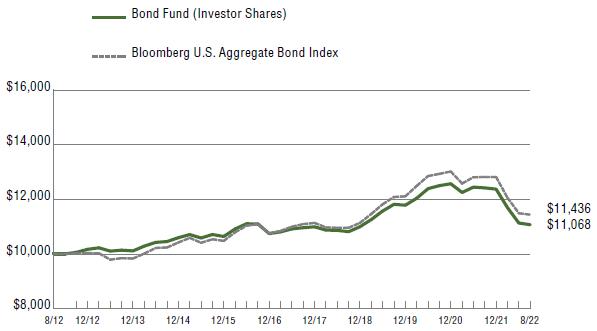
The growth of $10,000 investment chart represents a hypothetical investment in the indicated share class versus a similar investment in the Fund’s benchmark, and represents the reinvestment of distributions and capital gains.
| Average Annual Total Return | | | | | | |
| For the periods ended 8/31/2022 | | 1 Year | | 5 years | | 10 Year |
| A Shares (at NAV)1 | | (11.63)% | | 0.07% | | 1.04% |
| A Shares (with 2.00% maximum load)1 | | (13.36)% | | (0.33)% | | 0.84% |
| Investor Shares | | (11.63)% | | 0.04% | | 1.02% |
| Institutional Shares | | (11.35)% | | 0.31% | | 1.27% |
| Bloomberg U.S. Aggregate Bond Index | | (11.52)% | | 0.52% | | 1.35% |
| Lipper Core Bond Funds Average2 | | (11.94)% | | 0.52% | | 1.38% |
| | | | | | | |
| Expense Ratios | | | | | | |
| | | | | | | Gross |
| A Shares | | | | | | 0.82% |
| Investor Shares | | | | | | 0.97% |
| Institutional Shares | | | | | | 0.72% |
The performance data quoted represents past performance and does not guarantee future results. The investment return and principal value of an investment will fluctuate so that an investor’s shares, when redeemed, may be worth more or less than their original cost. Current performance may be lower or higher than the performance quoted. For performance data current to the most recent month end, please call 1-800-762-7085 or visit www.cavanalhillfunds.com.
Investment performance for the Fund’s classes reflects fee waivers that have been in effect during the applicable periods. Without such waivers, the performance would have been lower. Contractual fee waivers are in effect through December 31, 2022.
The above expense ratios are from the Funds’ prospectus dated December 28, 2021. Additional information pertaining to the Funds’ expense ratios for the year ended August 31, 2022 can be found in the Financial Highlights.
| 1 | Class A Shares are subject to a 1.00% Maximum Deferred Sales Charge on shares purchased without an initial sales charge and redeemed within 12 months of purchase. Performance data does not reflect the Maximum Deferred Sales Charge. If reflected, one year performance quoted would be lower. This performance reflects the Fund’s no-Load Investor class (“Investor Shares”) for periods prior to May 2, 2011 for the A Shares. The A Shares began presenting performance linked to the Investor Class in September of 2011. Unlike Institutional Shares, Investor Shares and A Shares bear a 12b-1 fee of 0.25%. Investor Shares and Institutional Shares are subject to a Shareholder Servicing Fee of 0.25%, whereas the Shareholder Servicing Fee for A Shares is 0.10%. As indicated in the table, A Shares are also subject to a sales charge (Load). Each of these differences is reflected in the performance information. Accordingly, had the A Shares of the Fund been offered for periods before May 2, 2011, the performance information would have been different as a result of differing annual operating expenses. |
| 2 | The Lipper Mutual Funds Average is an equally weighted average of the mutual funds within their respective Lipper classification, adjusted for reinvestment of capital gains distributions and income dividends. |
Strategic Enhanced Yield Fund (Unaudited)
Fund Goal
We pursue a strategy of broad diversification in order to achieve optimal risk-adjusted return by tapping into multi-sector opportunities created by market inefficiencies. We focus on out-of-favor sectors, searching for individual securities that we believe are likely to outperform the market. The Fund typically has a substantial allocation to mortgage- backed securities and other securitized products. We have the freedom to invest in a broad range of credit ratings and durations.
For the year ended August 31, 2022, the Strategic Enhanced Yield Fund A Shares (at NAV) returned -9.91% the Investor Shares returned -9.93% and the Institutional Shares returned -9.78%. The Fund’s benchmark, the Bloomberg U.S. Aggregate Bond Index1, showed a total return of -11.52%.
Market Conditions
The 12-month period ended August 31, 2022 provided a stark contrast to the year prior in the financial markets. The highest inflation readings seen in a generation pushed the Federal Reserve to reverse course and begin implementing more restrictive monetary policy. In the face of tighter Fed policy, nearly all financial assets suffered steep declines over the period.
With the backdrop of high inflation and rising rates, fixed income assets delivered historically poor returns. Credit spreads also widened during the period as economic growth weakened, causing credit sectors to underperform. Conservatively positioned portfolios with respect to both duration and credit exposure (short duration and higher credit quality) provided the best opportunity to outperform.
Fund Strategy
The Fund maintained a shorter duration than its benchmark during the year, which was the primary driver of its outperformance versus the benchmark as interest rates rose sharply. The Fund had a heavy weighting to the non-agency mortgage-backed securities and non-agency asset-backed securities markets. It also has a large allocation to the corporate sector. These allocations were headwinds as all three sectors experienced spread widening.*
We expect economic growth and inflation to slow over the near to medium term. Accordingly, we believe it is wise to move portfolios into higher credit quality and more liquid securities and we continue to do so. We also favor selectively adding to duration as interest rates have risen significantly. We believe the Fund should perform well in a slowing growth and slowing inflation environment.*
Outlook
With the Fed already well into its rate-hiking campaign and further increases priced into the market, we believe that most of the price declines on the longer end of the yield curve should now be behind us. The Fed is increasing interest rates in an economy that has already decelerated and the lagged nature of the impact from rising interest rates portends a more significant slowdown ahead.
Though inflation readings remain very high, the relatively aggressive tightening of monetary policy from the Fed should eventually be effective at bringing inflation down. The strong U.S. dollar combined with deceleration in rate-sensitive sectors of the economy (housing and autos) should have a strong deflationary impact over the near and medium term.
With economic growth weakening and the Fed following through on its goal of getting inflation back down to 2%, the environment for fixed income assets appears very constructive. With interest rates near their highest levels in more than a decade, expected returns from fixed income look relatively attractive. If the economy does indeed slow further and if inflation recedes, then there also appears to be the potential for price appreciation.
| 1 | For additional information, please refer to the Glossary of Terms. |
| * | The composition of the Funds’ portfolio is subject to change. |
The performance data quoted represents past performance and does not guarantee future results. The investment return and principal value of an investment will fluctuate so that an investor’s shares, when redeemed, may be worth more or less than their original cost. Current performance may be lower or higher than the performance quoted. For performance data current to the most recent month end, please call 1-800-762-7085 or visit www.cavanalhillfunds.com.
Strategic Enhanced Yield Fund (Unaudited)
Index Description
The performance of the Strategic Enhanced Yield Fund is measured against the Bloomberg U.S. Aggregate Bond Index, an unmanaged index that is a market value-weighted performance benchmark for investment-grade fixed-rate debt issues, including government, corporate, asset-backed and mortgage-backed securities, with maturities of at least one year. The index does not reflect the deduction of the expenses associated with a mutual fund, such as investment management and fund accounting fees. The Fund’s performance reflects the deduction of fees for these value-added services, but does not reflect the deduction of taxes that a shareholder would pay on fund distributions or the redemption of fund shares. Investors cannot invest directly in an index.
Investment Risks
Fixed income securities are subject to interest rate risks. The principal value of a bond falls when interest rates rise and rise when interest rates fall. During periods of rising interest rates, the value of a bond investment is at greater risk than during periods of stable or falling rates. Short-term investment-grade bonds offer less risk and generally a lower rate of return than longer-term higher-yielding bonds. Bond funds will tend to experience smaller fluctuations in value than stock funds. However, investors in any bond fund should anticipate fluctuations in price, especially for longer-term issues and in environments of changing interest rates. High-yield bonds have a higher risk of default or other adverse credit events, but have the potential to pay higher earnings over investment-grade bonds. The higher risk of default, or the inability of the creditor to repay its debt, is the primary reason for the higher interest rates on high-yield bonds.
For a complete description of these and other risks associated with investing in a mutual fund, please refer to the Fund’s prospectus.
Value of a $10,000 Investment
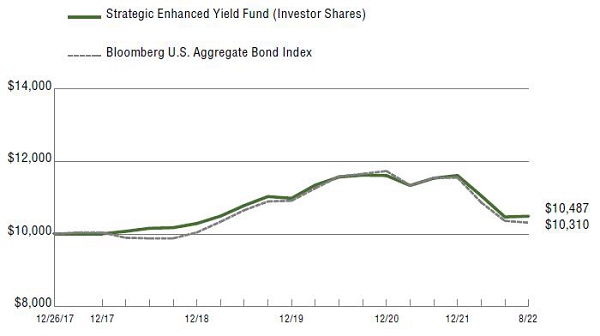
The growth of $10,000 investment chart represents a hypothetical investment in the indicated share class versus a similar investment in the Fund’s benchmark, and represents the reinvestment of distributions and capital gains.
| Average Annual Total Return | | | | |
| For the periods ended 8/31/2022 | | 1 Year | | Since
Inception
(12/26/2017) |
| A Shares (at NAV)1 | | (9.91)% | | 0.95% |
| A Shares (with 2.00% maximum load)1 | | (11.70)% | | 0.52% |
| Investor Shares | | (9.93)% | | 1.02% |
| Institutional Shares | | (9.78)% | | 1.18% |
| Bloomberg U.S. Aggregate Bond Index | | (11.52)% | | 0.65% |
| Lipper Multi-Sector Income Funds Average2 | | (9.69)% | | 1.14% |
| Expense Ratios | | | | |
| | | | | Gross |
| A Shares | | | | 1.53% |
| Investor Shares | | | | 1.67% |
| Institutional Shares | | | | 1.43% |
The performance data quoted represents past performance and does not guarantee future results. The investment return and principal value of an investment will fluctuate so that an investor’s shares, when redeemed, may be worth more or less than their original cost. Current performance may be lower or higher than the performance quoted. For performance data current to the most recent month end, please call 1-800-762-7085 or visit www.cavanalhillfunds.com.
Investment performance for the Fund’s classes reflects fee waivers that have been in effect during the applicable periods. Without such waivers, the performance would have been lower. Contractual fee waivers are in effect through December 31, 2022.
The above expense ratios are from the Funds’ prospectus dated December 28, 2021. Additional information pertaining to the Funds’ expense ratios for the year ended August 31, 2022 can be found in the Financial Highlights.
| 1 | Class A Shares are subject to a 1.00% Maximum Deferred Sales Charge on shares purchased without an initial sales charge and redeemed within 12 months of purchase. Performance data does not reflect the Maximum Deferred Sales Charge. If reflected, one year performance quoted would be lower. |
| 2 | The Lipper Mutual Funds Average is an equally weighted average of the mutual funds within their respective Lipper classification, adjusted for reinvestment of capital gains distributions and income dividends. Since inception value calculated from December 31, 2017. |
Ultra Short Tax-Free Income Fund (Unaudited)
Fund Goal
We seek to generate current income that is exempt from federal income taxes by investing primarily in a diversified portfolio of municipal securities, with at least 65% of the Fund’s assets invested in securities that are rated within the three highest long-term or highest short-term rating categories at the time of purchase. The Fund normally maintains a dollar-weighted average maturity of one day to one year.
For the year ended August 31, 2022, the Ultra Short Tax-Free Fund A Shares (at NAV) returned -0.85%; the Investor Shares returned -0.95% and the Institutional Shares returned -0.74%. The Fund’s benchmark, the Bloomberg 1-Year Municipal Bond Index1, showed a total return of -1.59%.
Market Conditions
The Federal Reserve’s pledge to fight the rising inflation rate was the biggest economic story for the period. Price stability is one of the Fed’s mandates and the central bank was faced with a consumer price index (CPI) that increased steadily during the year, ultimately hitting a year-over-year increase of 9.1% in June, the largest gain since the end of 1981. Although the reading fell to 8.5% in July, it is still well above the Fed’s target of 2% inflation.
In response to the rampant increase in inflation, the Fed announced at the beginning of 2022 that it would begin raising the overnight lending rate and initiated an aggressive tightening cycle at the March meeting of the Federal Open Market Committee. The rate hikes at subsequent meetings brought the total increase to 2.25% through the end of the Fund’s fiscal year. In addition to price stability, the Fed’s other mandate is full employment and that aspect of the economy continued to be quite strong. The unemployment rate ended the period at 3.7% and nonfarm payrolls grew by a monthly average of 487,000 through the year.
The short end of the municipal market responded as expected to the Fed’s aggressive tightening, as yields moved considerably higher throughout the period. The SIFMA index, which is an average of yields on variable rate demand notes (VRDNs), started the period at a paltry 0.02%, but began rising in the spring of 2022 and ultimately reached 1.83% in August, the highest level since April 2020. The fixed rate portion in the short end of the muni market also rose dramatically in the period, as yields in the one-year maturity range moved up about 200 basis points (2.0%).
Although the Russian invasion of Ukraine initially rattled global financial markets, it ultimately had very little impact on the short end of the muni market.
While the rapid rise in rates caused some uneasiness in early 2022 in the short end of the muni market, investors eventually appreciated higher yields after enduring the low-rate environment of recent years. Buying opportunities surfaced throughout the year as rates rose. The VRDN yields rose in conjunction with the Fed’s tightening cycle and investors were also able to lock in fixed-rate paper at attractive levels as rates rose.
The biggest challenge in a rising rate environment is deciding how aggressive to be in purchasing fixed paper. VRDNs provide a nice alternative for investors while they wait on fixed-rate opportunities, as variable rates tend to rise with either a daily or weekly reset.
Fund Strategy
The Fund’s relatively short duration proved to be very effective for the period as the Fund outperformed the benchmark. The mix of VRDNs and fixed-rate paper was a successful strategy in a rising rate environment.*
Outlook
The Fed has maintained its stance of continuing to raise rates until the inflation rate shows signs of getting closer to the 2% target. We expect yields in the short end of the muni market to move higher in conjunction with the overnight lending rate.
The Fund will continue to look for opportunities to lock in fixed-rate paper at attractive levels, while maintaining a core position of VRDNs, as those rates can be expected to reset higher as the Fed maintains its tightening cycle.
| 1 | For additional information, please refer to the Glossary of Terms. |
| * | The composition of the Funds’ portfolio is subject to change. |
The performance data quoted represents past performance and does not guarantee future results. The investment return and principal value of an investment will fluctuate so that an investor’s shares, when redeemed, may be worth more or less than their original cost. Current performance may be lower or higher than the performance quoted. For performance data current to the most recent month end, please call 1-800-762-7085 or visit www.cavanalhillfunds.com.
Ultra Short Tax-Free Income Fund (Unaudited)
Index Description
The performance of the Ultra Short Tax-Free Fund is measured against the Bloomberg 1-Year Municipal Bond Index, an unmanaged index that includes bonds with a minimum credit rating of BAA3, are issued as part of a deal of at least $50 million, have an amount outstanding of at least $5 million, and have maturities of 1 to 2 years. The index does not reflect the deduction of the expenses associated with a mutual fund, such as investment management and fund accounting fees. The Fund’s performance reflects the deduction of fees for these value-added services, but does not reflect the deduction of taxes that a shareholder would pay on fund distributions or the redemption of fund shares. Investors cannot invest directly in an index.
Investment Risks
Fixed income securities are subject to interest rate risks. The principal value of a bond falls when interest rates rise and rise when interest rates fall. During periods of rising interest rates, the value of a bond investment is at greater risk than during periods of stable or falling rates. Short-term investment-grade bonds offer less risk and generally a lower rate of return than longer-term higher yielding bonds. Bond funds will tend to experience smaller fluctuations in value than stock funds. However, investors in any bond fund should anticipate fluctuations in price, especially for longer-term issues and in environments of changing interest rates. The Fund’s income may be subject to certain state and local taxes and, depending on one’s tax status, to the federal alternative minimum tax.
For a complete description of these and other risks associated with investing in a mutual fund, please refer to the Fund’s prospectus.
Value of a $10,000 Investment
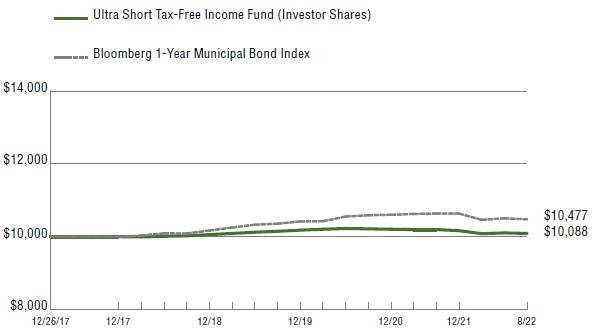
The growth of $10,000 investment chart represents a hypothetical investment in the indicated share class versus a similar investment in the Fund’s benchmark, and represents the reinvestment of distributions and capital gains.
| Average Annual Total Return | | | | |
| For the periods ended 8/31/2022 | | 1 Year | | Since
Inception
(12/26/2017) |
| A Shares (at NAV)1 | | (0.85)% | | (0.01)% |
| A Shares (with 2.00% maximum load)1 | | (1.83)% | | (0.22)% |
| Investor Shares | | (0.95)% | | 0.19% |
| Institutional Shares | | (0.74)% | | 0.49% |
| Bloomberg 1-Year Municipal Bond Index | | (1.59)% | | 1.00% |
| Lipper Short Municipal Debt Funds Average2 | | (2.75)% | | 0.67% |
| Expense Ratios | | | | |
| | | | | Gross |
| A Shares | | | | 0.92% |
| Investor Shares | | | | 1.07% |
| Institutional Shares | | | | 0.82% |
The performance data quoted represents past performance and does not guarantee future results. The investment return and principal value of an investment will fluctuate so that an investor’s shares, when redeemed, may be worth more or less than their original cost. Current performance may be lower or higher than the performance quoted. For performance data current to the most recent month end, please call 1-800-762-7085 or visit www.cavanalhillfunds.com.
Investment performance for the Fund’s classes reflects fee waivers that have been in effect during the applicable periods. Without such waivers, the performance would have been lower. Contractual fee waivers are in effect through December 31, 2022.
The above expense ratios are from the Funds’ prospectus dated December 28, 2021. Additional information pertaining to the Funds’ expense ratios for the year ended August 31, 2022 can be found in the Financial Highlights.
| 1 | Class A Shares are subject to a 1.00% Maximum Deferred Sales Charge on shares purchased without an initial sales charge and redeemed within 12 months of purchase. Performance data does not reflect the Maximum Deferred Sales Charge. If reflected, one year performance quoted would be lower. |
| 2 | The Lipper Mutual Funds Average is an equally weighted average of the mutual funds within their respective Lipper classification, adjusted for reinvestment of capital gains distributions and income dividends. Since inception value calculated from December 31, 2017. |
Mid Cap Diverse Leadership Fund (Unaudited)
Fund Goal
We seek to provide positive investment return, net of taxes, by investing at least 80% of net assets in a diversified portfolio of common stocks of Mid Cap U.S. companies that demonstrate governance diversity and leadership. The Fund defines mid-cap securities as those that are included in the Russell MidCap® Index1 at the time of purchase.
For the year ended August 31, 2022, the Mid Cap Diverse Leadership Fund A Shares (at NAV) returned -9.33%; C Shares returned -9.97% and Investor Shares returned -9.32%, while the Institutional Shares returned -9.05%. The Fund’s benchmark, the Russell MidCap® Index1, showed total return of -14.82%.
Market Conditions
During the Fund’s fiscal year, from September 2021 through August 2022, the dominant themes included persistent and rising inflation, concerns regarding central banks pivoting on monetary policy and beginning to aggressively raise interest rates, and ongoing shortages of global goods and labor.
Despite earlier expectations that inflation would be transitory, the Federal Reserve finally admitted that rising prices were persisting. Consequently, in 2022, the Fed pivoted hard and played an aggressive game of catch-up. In addition to quantitative tightening by reducing assets from its balance sheet, the Fed’s four interest rate hikes from March through July raised the federal funds rate from near zero in January to a range of 2.25% to 2.50% by July, with another 0.75-percentage-point hike anticipated for September.
The economic recovery that was still strong late in 2021 gave way to two consecutive quarters of declining real U.S. gross domestic product in the first half of 2022. Despite a robust U.S. labor market and ongoing strength in consumer spending, the uneven global economic recovery was hampered by the impact of ongoing supply chain disruptions and a persistent COVID-19-related labor shortage.
The Russian invasion of Ukraine sent alreadysoaring oil prices even higher. This exacerbated the economic slowdown already underway outside the U.S. along with global inflationary forces.
In this historically difficult environment, value stocks and mega-cap stocks outperformed. On a sector basis, energy stocks outperformed, rising 75% for the annual period through August 31, 2022, in stark contrast to the 11% decline in the S&P 500 Index. Utilities, a classic defensive sector, also did well, gaining 11%. On the flip side, small caps and growth stocks underperformed. Among sectors, communication services stocks trailed significantly, declining 35%.
Fund Strategy
The surge in inflationary pressures and the Federal Reserve’s actions to contain it were the main drivers of financial markets for the end of 2021 and the first half of 2022. In addition, the Russian invasion of Ukraine only added to problems as a significant amount of global energy supply was taken off line, driving oil and natural gas prices higher. Our exposure to the energy sector during this period served as a tailwind and our preference for highquality, profitable businesses though the market downturn helped to reduce some of the potential drawdowns seen in riskier parts of the market.*
From a market cap perspective, we are in line with the benchmark. Our sector allocations varied significantly over the past 12 months; but, as a whole, we leaned on over-weights to technology, consumer discretionary, financials, and industrials. Conversely, we had under-weights to materials, utilities, communication services, and health care. Sector performance reversed course during the early 2022 market sell-off with consumer sensitive and technology industries turning especially negative. Overall, we benefited from the technology and industrial overweights but the underweights in other sectors were more punitive. In total, about 27 basis points (0.27%) of performance were detracted versus the benchmark due to sector allocations.
Our style allocation generated positive performance over the past 12 months. Owning more valueoriented stocks, with lower earnings multiples relative to the benchmark, contributed around 50 basis points. Likewise, a bias towards higherquality, lower-risk names added another 20 basis points. In terms of detractors, the benchmark’s cap-weighting methodology helped to shield it from some of the market volatility relative to the fund. This subtracted around 20 basis points. However, in total, style allocations added roughly 70 basis points for the year.
We managed our exposure to the cyclical areas of the market, including the energy and industrials sectors, as the economy continued to rebound after the pandemic shutdowns. In particular, our top individual contributor was an energy stock that jumped as oil and gas prices surged higher in 2022. As well, stocks in the technology and semiconductor industries added to performance. Stock selection was the biggest factor in the past 12 months of outperformance. Holding on to high-quality assets in this down-market environment helped to add more than 500 basis points versus the benchmark.
Stocks that were highly sensitive to consumer spending and those with the highest valuations produced the greatest drag on the portfolio over the past year. However, the bulk of that underperformance came in the market sell-off, when growth companies were punished the most in response to interest rate hikes.
Outlook
Macroeconomic data will likely continue to slow from here. However, the U.S. still appears to be in a better position than other markets. The primary source of uncertainty is over where the struggle between the economy, inflation, and the Fed will eventually land. Until more clarity arrives on that subject, we are maintaining a fairly neutral sector weighting. In terms of factor themes, however, we are maintaining our preference for high quality companies going forward.*
| 1 | For additional information, please refer to the Glossary of Terms. |
| * | The composition of the Funds’ portfolio is subject to change. |
The performance data quoted represents past performance and does not guarantee future results. The investment return and principal value of an investment will fluctuate so that an investor’s shares, when redeemed, may be worth more or less than their original cost. Current performance may be lower or higher than the performance quoted. For performance data current to the most recent month end, please call 1-800-762-7085 or visit www.cavanalhillfunds.com.
Mid Cap Diverse Leadership Fund (Unaudited)
Index Description
The performance of the Mid Cap Diverse Leadership Fund is measured against the Russell Midcap® Index, which tracks the performance of the mid-cap segment of the U.S. equity universe. The Russell Midcap® Index is a subset of the Russell 1000® Index. It includes approximately 800 of the smallest securities based on a combination of their market cap and current index membership. The Russell Midcap® Index represents approximately 27% of the total market capitalization of the Russell 1000 companies. The index is unmanaged and does not reflect the deduction of the expenses associated with a mutual fund, such as investment management and fund accounting fees. The Fund’s performance reflects the deduction of fees for these services, but does not reflect the deduction of taxes that a shareholder would pay on fund distributions or the redemption of fund shares. Investor cannot invest directly in an index.
Investment Risks
Equity securities (stocks) are more volatile and carry more risk than other forms of investments, including investments in high-grade fixed income securities. The value of the Fund’s investments may decline due to an increase in interest rates. In general, the longer a security’s maturity, the greater the interest rate risk. The Fund’s yield may decrease due to a decline in interest rates. International investing involves increased risk and volatility. Mid- and small-cap companies may be more vulnerable to adverse business or economic developments.
For a complete description of these and other risks associated with investing in a mutual fund, please refer to the Fund’s prospectus.
Value of a $10,000 Investment

The growth of $10,000 investment chart represents a hypothetical investment in the indicated share class versus a similar investment in the Fund’s benchmark, and represents the reinvestment of distributions and capital gains.
| Average Annual Total Return |
| For the periods ended 8/31/2022 | | 1 Year | | 5 Years | | Since
Inception
(12/30/2016) |
| A Shares (at NAV)1 | | (9.33)% | | 8.83% | | 8.48% |
| A Shares (with 2.00% maximum load)1 | | (11.16)% | | 8.39% | | 8.10% |
| C Shares1 | | (9.97)% | | 8.01% | | 7.55% |
| Investor Shares | | (9.32)% | | 8.80% | | 8.44% |
| Institutional Shares | | (9.05)% | | 9.11% | | 8.71% |
| Russell MidCap Index | | (14.82)% | | 9.17% | | 9.65% |
| Lipper Mid-Cap Core Funds Average2 | | (9.01)% | | 7.72% | | 7.91% |
| | | | | | | |
| Expense Ratios |
| | | | | | | Gross |
| A Shares | | | | | | 12.13% |
| C Shares | | | | | | 13.03% |
| Investor Shares | | | | | | 12.28% |
| Institutional Shares | | | | | | 12.03% |
The performance data quoted represents past performance and does not guarantee future results. The investment return and principal value of an investment will fluctuate so that an investor’s shares, when redeemed, may be worth more or less than their original cost. Current performance may be lower or higher than the performance quoted. For performance data current to the most recent month end, please call 1-800-762-7085 or visit www.cavanalhillfunds.com.
Investment performance for the Fund’s classes reflects fee waivers that have been in effect during the applicable periods. Without such waivers, the performance would have been lower. Contractual fee waivers are in effect through December 31, 2022.
The above expense ratios are from the Funds’ prospectus dated December 28, 2021. Additional information pertaining to the Funds’ expense ratios for the year ended August 31, 2022 can be found in the Financial Highlights.
| 1 | Class A Shares and C Shares are subject to a 1.00% Maximum Deferred Sales Charge on shares purchased without an initial sales charge and redeemed within 12 months of purchase. Performance data does not reflect the Maximum Deferred Sales Charge. If reflected, one year performance quoted would be lower. |
| 2 | The Lipper Mutual Funds Average is an equally weighted average of the mutual funds within their respective Lipper classification, adjusted for reinvestment of capital gains distributions and income dividends. Since inception value calculated from December 31, 2016. |
Opportunistic Fund (Unaudited)
Fund Goal
We pursue positive investment returns by opportunistically investing in equities, real estate investment trusts (REITs), fixed income securities, preferred stocks, exchange traded funds (ETFs), which may include leveraged and inverse ETFs, options, commodities, and money market funds. The Fund's management team will consider all asset classes and may invest in domestic as well as international securities. The team pursues investment opportunities with the most attractive risk/return profiles.
For the year ended August 31, 2022, the Opportunistic Fund’s A Shares (at NAV) returned -18.79%; the C Shares returned -19.41%; the Investor Shares returned -18.75%, and the Institutional Shares returned -18.53%. The Fund’s benchmarks, the S&P 500 Index1 and the HFRX Equity Hedge Index1, posted total returns of -11.23% and -0.78%, for the same time period.
Market Conditions
During the Fund’s fiscal year, from September 2021 through August 2022, the dominant themes included persistent and rising inflation, concerns regarding central banks pivoting on monetary policy and beginning to aggressively raise interest rates, and ongoing shortages of global goods and labor.
Despite earlier expectations that inflation would be transitory, the Federal Reserve finally admitted that rising prices were persisting. Consequently, in 2022, the Fed pivoted hard and played an aggressive game of catch-up. The Fed’s four interest rate hikes from March through July raised the federal funds rate from near zero in January to a range of 2.25% to 2.50% by July, with another 0.75-percentage-point hike anticipated for September. Additionally, the Fed initiated its quantitative tightening program and began reducing assets from its balance sheet.
The economic recovery that was still strong late in 2021 gave way to two consecutive quarters of declining real U.S. gross domestic product in the first half of 2022. Despite a robust U.S. labor market and ongoing strength in consumer spending, the uneven global economic recovery was hampered by the impact of ongoing supply chain disruptions and a persistent COVID-19-related labor shortage.
The Russian invasion of Ukraine sent alreadysoaring oil prices even higher. This exacerbated the economic slowdown already underway outside the U.S. along with global inflationary forces.
In this historically difficult environment, value stocks and mega-cap stocks outperformed. On a sector basis, energy stocks outperformed, rising 75% for the annual period through August 31, 2022, in stark contrast to the 11% decline in the S&P 500 Index. Utilities, a classic defensive sector, also did well, gaining 11%.
On the flip side, small caps and growth stocks underperformed. Among sectors, communication services stocks trailed significantly, declining 35%.
Fund Strategy
We believe attractive investment opportunities often arise where Wall Street research is lacking. We use bottom-up research to identify opportunities and we adjust the Fund’s level of exposure to risk assets accordingly, which can lead to fluctuations of the Fund’s net risk exposure over time.*
We may use ETFs to hedge the Fund’s long positions, and we may use options on indices or ETFs to hedge a portion of the portfolio. When opportunities are scarce, we also may raise cash to lower our net market exposure. We track and modulate the Fund’s stock market exposure based on our view of market conditions and investment opportunities.*
The institutional shares of the Fund returned -18.53% for the year, compared with the Fund’s benchmark, the HFRX Equity Hedge Index, which declined less than 1%. The Fund’s peers evidently neutralized their market exposure, as reflected by a generally flat return for the 12-month period.*
We increased market exposure during the back half of calendar 2021 while decreasing it during the course of calendar 2022. Additionally, we positioned the Fund defensively with regard to market capitalization, beta (market risk exposure), and sector allocations. The Fund’s defensive positioning was a major headwind during the two-month-long bear market rally that began in June 2022. However, that headwind then reversed as the market began to sell off in mid-August.*
The greatest positive impact on performance came from our large overweight to energy, along with stock selection in energy and technology.*
In terms of negative factors, our overweight to software and stock selection in higher-beta (more volatile), low-to-no-profitability stocks were problematic.*
Outlook
We believe the risk/reward balance is skewed to the downside. The Fed’s continued hawkish monetary stance, including continued quantitative tightening, provides a headwind for stocks. Meanwhile, earnings estimates have remained relatively buoyant over the past nine months despite significant accelerating risks to the economy.
Overall, we remain bearish on the stock market. Thus, the Fund remains defensively positioned while maintaining a healthy cash balance, both to lower market exposure and to provide capital for future purchases once opportunities arise.
| 1 | For additional information, please refer to the Glossary of Terms. |
| * | The composition of the Funds’ portfolio is subject to change. |
The performance data quoted represents past performance and does not guarantee future results. The investment return and principal value of an investment will fluctuate so that an investor’s shares, when redeemed, may be worth more or less than their original cost. Current performance may be lower or higher than the performance quoted. For performance data current to the most recent month end, please call 1-800-762-7085 or visit www.cavanalhillfunds.com.
Opportunistic Fund (Unaudited)
Index Description
The performance of the Opportunistic Fund is measured against the S&P 500 Index and the HFRX Equity Hedge Index. The S&P 500 is regarded as a gauge of the U.S. equities market, this index includes 500 leading companies in leading industries of the U.S. economy. Although the S&P 500 focuses on the large-cap segment of the market, with approximately 75% coverage of U.S. equities, it is also an ideal proxy for the total market. The Hedge Fund Research, Inc. (HFR) utilizes a UCITSIII compliant methodology to construct the HFRX Hedge Fund Indices. The methodology is based on defined and predetermined rules and objective criteria to select and rebalance components to maximize representation of the Hedge Fund Universe. HFRX Indices utilize state-of-theart quantitative techniques and analysis; multi-level screening, cluster analysis, Monte-Carlo simulations and optimization techniques ensure that each Index is a pure representation of its corresponding investment focus. These indices are unmanaged and do not reflect the deduction of expenses associated with a mutual fund, such as investment management and fund accounting fees. The Fund’s performance reflects the deduction of fees for these services, but does not reflect the deduction of taxes that a shareholder would pay on fund distributions or the redemption of fund shares. Investors cannot invest directly in an index.
Investment Risks
Equity securities (stocks) are more volatile and carry more risk than other forms of investments, including investments in high-grade fixed income securities. Investments in the Fund are subject to the risks related to direct investment in real estate, such as real estate risk, regulatory risks, concentration risk, and diversification risk. Fixed income securities are subject to interest rate risks. The principal value of a bond falls when interest rates rise and rise when interest rates fall. During periods of rising interest rates, the value of a bond investment is at greater risk than during periods of stable or falling rates. International investing involves increased risk and volatility. Mid- and small-cap companies may be more vulnerable to adverse business or economic developments. The ETFs in which the Funds invest are subject to the risks applicable to the types of securities and investments used by the ETFs. Because an ETF charges its own fees and expenses, Fund shareholders will indirectly bear these costs. The use of leverage in an ETF can magnify any price movements, resulting in high volatility. An inverse ETF seeks to provide returns that are the opposite of the underlying referenced financial asset, index, or commodity’s returns. Exposure to commodities may subject the Fund to greater volatility than investments in traditional securities.
For a complete description of these and other risks associated with investing in a mutual fund, please refer to the Fund’s prospectus.
Value of a $10,000 Investment

The growth of $10,000 investment chart represents a hypothetical investment in the indicated share class versus a similar investment in the Fund’s benchmark, and represents the reinvestment of distributions and capital gains.
Average Annual Total Return
| For the periods ended 8/31/2022 | | | 1 Year | | | | 5 years | | | | Since
Inception
(9/1/11) | |
| A Shares (at NAV)1 | | | (18.79)% | | | | 1.40% | | | | 5.07% | |
| A Shares (with 2.00% maximum load)1 | | | (20.44)% | | | | 0.99% | | | | 4.86% | |
| C Shares1 | | | (19.41)% | | | | 0.63% | | | | 4.44% | |
| Investor Shares | | | (18.75)% | | | | 1.41% | | | | 5.04% | |
| Institutional Shares | | | (18.53)% | | | | 1.67% | | | | 5.35% | |
| S&P 500 Index | | | (11.23)% | | | | 11.82% | | | | 13.64% | |
| HFRX Equity Hedge Index | | | (0.78)% | | | | 3.63% | | | | 2.92% | |
| Lipper Absolute Return Funds Average2 | | | (6.90)% | | | | 1.79% | | | | 2.06% | |
| Expense Ratios | | | |
| | | Gross | |
| A Shares | | | 1.76% | |
| C Shares | | | 2.66% | |
| Investor Shares | | | 1.87% | |
| Institutional Shares | | | 1.64% | |
The performance data quoted represents past performance and does not guarantee future results. The investment return and principal value of an investment will fluctuate so that an investor’s shares, when redeemed, may be worth more or less than their original cost. Current performance may be lower or higher than the performance quoted. For performance data current to the most recent month end, please call 1-800-762-7085 or visit www.cavanalhillfunds.com.
Investment performance for the Fund’s classes reflects fee waivers that have been in effect during the applicable periods. Without such waivers, the performance would have been lower. Contractual fee waivers are in effect through December 31, 2022.
The above expense ratios are from the Funds’ prospectus dated December 28, 2021. Additional information pertaining to the Funds’ expense ratios for the year ended August 31, 2022 can be found in the Financial Highlights.
| 1 | Class A Shares and C Shares are subject to a 1.00% Maximum Deferred Sales Charge on shares purchased without an initial sales charge and redeemed within 12 months of purchase. Performance data does not reflect the Maximum Deferred Sales Charge. If reflected, one year performance quoted would be lower. Class C Shares performance reflects the Fund’s no- Load Investor class (“Investor Shares”) for periods prior to December 31, 2014. Unlike Investor Shares, which bear a 12b-1 fee of 0.25%, C Shares bear a 12b-1 fee of 1.00%. This difference is reflected in the performance information. Accordingly, had the C Shares of the Fund been offered for periods prior to December 31, 2014, the performance information would have been different as a result of differing annual operating expenses. |
| 2 | The Lipper Mutual Funds Average is an equally weighted average of the mutual funds within their respective Lipper classification, adjusted for reinvestment of capital gains distributions and income dividends. Since inception value calculated from August 31, 2011. |
World Energy Fund (Unaudited)
Fund Goal
We seek to provide growth and income by primarily investing net assets in a wide range of energy- related financial instruments issued in the U.S. and markets around the world.
For the year ended August 31, 2022, the World Energy Fund’s A Shares (at NAV) posted a total return of 43.54%; the C Shares returned 42.42%; the Investor Shares returned 43.38% and the Institutional Shares posted a total return of 43.81%. The Fund’s benchmarks, the S&P 500 Index1 and the MSCI World Energy Index1 returned -11.23% and 55.70%, respectively.
Oil Market Backdrop
During the past year, we experienced a global economic recovery as activities normalized, with people returning to work and resuming travel. However, the restart from COVID lockdowns was uneven, and it revealed that global supply chains were unprepared. Travel rebounded, with domestic flights approaching pre-COVID levels after a 90%+ reduction in passenger volumes when COVID shut the world down in 2020.
Economic activity was strong, particularly in the first half of the fiscal year, and despite a decline in the real U.S. gross domestic product in the first half of calendar 2022, the global economy grew overall, leading to an increase in demand for oil products.
Inflation soared to 40-year highs during the period. Year-over-year inflation peaked above 9% in June 2022 and remains elevated despite recent signs of easing. This resulted from a combination of aggressive fiscal and monetary stimulus programs introduced in 2020, pent up consumer demand, and global supply chain disruptions exacerbated by China’s zero-COVID policy and the Russian invasion of Ukraine in February 2022.
After being slow to respond, assuming that inflation would be transitory, the Federal Reserve has played an aggressive game of catch-up in 2022, with the fastest rate hike in decades, with four rate increases from March through July for a total of 225 basis points (2.25 percentage points) thus far. An additional 75-basis-point hike is anticipated for September.
Crude oil and natural gas prices were robust, providing a solid backdrop for energy-related equities. The current economic recovery, uneven as it is, has been a tailwind for demand for fossil fuels, particularly given the significant impact of the Russian invasion of Ukraine on commodity prices. The interruption of Russian oil and natural gas exports to Europe has created a regional energy crisis, particularly in Germany, which is highly dependent on Russian natural gas.
During the year, the energy sector outperformed the broader market. Bonds had a rough year, with the Bloomberg U.S. Aggregate Bond Index off significantly. Accordingly, despite strong returns among our investments in fossil fuels, the weak performance of bonds and alternative energy stocks within the Fund detracted significantly from relative returns during the year.
Fund Strategy
The Fund is able to invest in a variety of instruments, including common stocks and fixed income securities. We allocate the Fund’s assets in search of the best opportunities based on our view of commodity prices and the relative attractiveness of the energy sector’s various subsectors.*
We were aggressively positioned for most of the year. However, that has left us with about 5%-10% allocated to fixed income, which underperformed energy equities significantly. While the Bloomberg U.S. Aggregate Bond Index was down 11% in the period, the Russell 3000 Energy Index returned more than 71%.*
Alternative energy also detracted from performance. Wind and solar were hit with sell-offs during the year as it became clear that the energy transition in Europe from fossil fuels to wind/solar/hydrogen had become somewhat of a disaster, leaving little backup as power costs in the region soared. In addition, input costs for wind and solar manufacturers increased during a challenging year as the global supply chain didn’t function normally.*
Overall, in a banner year for fossil fuels, our investments in alternatives and fixed income significantly detracted from relative performance.*
On the positive side, our investments in oil and gas exploration and production companies as well as service companies provided positive absolute returns for the year.*
Outlook
We anticipate continued volatility. However, we remain bullish on energy, particularly fossil fuel stocks. The market still faces challenges, and a recession would depress demand for fossil fuels, which is a major risk. In the event of a severe global recession, we would expect lower fossil fuel prices on dampened demand.
Looking ahead, we still see value in fossil fuel stocks. We also believe there is considerable opportunity in alternatives, namely wind, solar, hydrogen, and electric vehicles (EVs), including lithium and other components that go into EVs.
In terms of the portfolio’s positioning, we are overweight services as well as exploration and production companies. We are also maintaining a 12% allocation to alternative energy stocks as they benefit from the decarbonization of the global economy.
| 1 | For additional information, please refer to the Glossary of Terms. |
| * | The composition of the Funds’ portfolio is subject to change. |
The performance data quoted represents past performance and does not guarantee future results. The investment return and principal value of an investment will fluctuate so that an investor’s shares, when redeemed, may be worth more or less than their original cost. Current performance may be lower or higher than the performance quoted. For performance data current to the most recent month end, please call 1-800-762-7085 or visit www.cavanalhillfunds.com.
World Energy Fund (Unaudited)
Index Description
The World Energy Fund performance is measured against the S&P 500 Index and the MSCI World Energy Index. The S&P 500 Index is regarded as a gauge of the U.S. equities market; this index includes 500 leading companies in leading industries of the U.S. economy. Although the S&P 500 focuses on the large-cap segment of the market, with approximately 75% coverage of U.S. equities, it is also an ideal proxy for the total market. The MSCI World Energy Index captures the large- and mid-cap segments across 23 developed markets and includes securities classified in the energy sector per Global Industry Classification Standard. These indexes are unmanaged and do not reflect the deduction of expenses associated with a mutual fund, such as investment management and fund accounting fees. The Fund’s performance reflects the deduction of fees for these services, but does not reflect the deduction of taxes that a shareholder would pay on fund distributions or the redemption of fund shares. Investors cannot invest directly in an index.
Investment Risks
Equity securities (stocks) are more volatile and carry more risk than other forms of investments, including investments in below investment-grade fixed income securities. Fixed income securities are subject to interest rate risks. The principal value of a bond falls when interest rates rise and rise when interest rates fall. During periods of rising interest rates, the value of a bond investment is at greater risk than during periods of stable or falling rates. The Fund invests in foreign and emerging market securities, which involves certain risks such as currency volatility, political and social instability, and reduced market liquidity. Midand small-cap companies may be more vulnerable to adverse business or economic developments. Concentration in energy-related industry securities may present more risks than would be the case with funds that diversify investments in numerous industries and sectors of the economy. A downturn in the energy sectors would have a larger impact on the Fund than on a fund that does not concentrate in these industries. Energy sector securities can be significantly affected by events related to political developments, energy conservation, commodity prices, and tax and government regulations. The performance of securities in the Fund may, at times, lag the performance of companies in other sectors or the broader market as a whole. Emerging market investing may be subject to additional economic, political, liquidity, and currency risks not associated with more developed countries.
For a complete description of these and other risks associated with investing in a mutual fund, please refer to the Fund’s prospectus.
Value of a $10,000 Investment

The growth of $10,000 investment chart represents a hypothetical investment in the indicated share class versus a similar investment in the Fund’s benchmark, and represents the reinvestment of distributions and capital gains.
Average Annual Total Return
| | | | Since |
| | | | Inception |
| For the periods ended 8/31/2022 | 1 Year | 5 years | (2/3/2014) |
| A Shares (at NAV)1 | 43.54% | 10.83% | 3.97% |
| A Shares (with 2.00% maximum load)1 | 40.68% | 10.39% | 3.73% |
| C Shares1 | 42.42% | 10.01% | 3.20% |
| Investor Shares | 43.38% | 10.82% | 3.96% |
| Institutional Shares | 43.81% | 11.13% | 4.25% |
| S&P 500 Index | (11.23)% | 11.82% | 12.17% |
| MSCI World Energy Index | 55.70% | 8.24% | 3.01% |
| Lipper Global Natural Resources Funds Average2 | 28.93% | 7.50% | 1.30% |
| | | | |
| Expense Ratios | | | |
| | | | Gross |
| A Shares | | | 1.83% |
| C Shares | | | 2.74% |
| Investor Shares | | | 1.96% |
| Institutional Shares | | | 1.69% |
The performance data quoted represents past performance and does not guarantee future results. The investment return and principal value of an investment will fluctuate so that an investor’s shares, when redeemed, may be worth more or less than their original cost. Current performance may be lower or higher than the performance quoted. For performance data current to the most recent month end, please call 1-800-762-7085 or visit www.cavanalhillfunds.com.
Investment performance for the Fund’s classes reflects fee waivers that have been in effect during the applicable periods. Without such waivers, the performance would have been lower. Contractual fee waivers are in effect through December 31, 2022.
The above expense ratios are from the Funds’ prospectus dated December 28, 2021. Additional information pertaining to the Funds’ expense ratios for the year ended August 31, 2022 can be found in the Financial Highlights.
| | 1 | Class A Shares and C Shares are subject to a 1.00% Maximum Deferred Sales Charge on shares purchased without an initial sales charge and redeemed within 12 months of purchase. Performance data does not reflect the Maximum Deferred Sales Charge. If reflected, one year performance quoted would be lower. |
| | 2 | The Lipper Mutual Funds Average is an equally weighted average of the mutual funds within their respective Lipper classification, adjusted for reinvestment of capital gains distributions and income dividends. Since inception value calculated from January 31, 2014. |
Hedged Income Fund (Unaudited)
Fund Goal
We seek current income with the potential for longterm capital appreciation with less volatility than the broad equity market. The Fund invests primarily in dividend-paying equity securities and it will also seek to generate income through option premiums by writing (selling) call options. The Fund will buy index and ETF put options in order to seek to reduce volatility and provide downside market protection.
For the year ended August 31, 2022, the Hedged Income Fund’s A Shares (at NAV) returned -6.51%; the Investor Shares returned -6.47% and the Institutional Shares posted a total return of -6.31%. The Fund’s benchmark the CBOE S&P 500 BuyWrite Index1 and S&P 500 Index returned -6.60% and -11.23%, respectively, during the same period.
Market Conditions
During the Fund’s fiscal year, from September 2021 through August 2022, the dominant themes included persistent and rising inflation, concerns regarding central banks pivoting on monetary policy and beginning to aggressively raise interest rates, and ongoing shortages of global goods and labor.
Despite earlier expectations that inflation would be transitory, the Federal Reserve finally admitted that rising prices were persisting. Consequently, in 2022, the Fed pivoted hard and played an aggressive game of catch-up. The Fed’s four interest rate hikes from March through July raised the federal funds rate from near zero in January to a range of 2.25% to 2.50% by July, with another 0.75-percentage-point hike anticipated for September. Additionally, the Fed initiated its quantitative tightening program and began reducing assets from its balance sheet.
The economic recovery that was still strong late in 2021 gave way to two consecutive quarters of declining real U.S. gross domestic product in the first half of 2022. Despite a robust U.S. labor market and ongoing strength in consumer spending, the uneven global economic recovery was hampered by the impact of ongoing supply chain disruptions and a persistent COVID-19-related labor shortage.
The Russian invasion of Ukraine sent alreadysoaring oil prices even higher. This exacerbated the economic slowdown already underway outside the U.S. along with global inflationary forces.
In this historically difficult environment, value stocks and mega-cap stocks outperformed. On a sector basis, energy stocks outperformed, rising 75% for the annual period through August 31, 2022, in stark contrast to the 11% decline in the S&P 500 Index. Utilities, a classic defensive sector, also did well, gaining 11%. On the flip side, small caps and growth stocks underperformed. Among sectors, communication services stocks trailed significantly, declining 35%.
Fund Strategy
The Fund seeks to provide income in the form of dividends and covered call writing on the portfolio’s stock positions. Additionally, the Fund seeks to limit downside volatility with protective puts on broad market indexes and selected securities. The Fund targets companies that have consistent and sustainable dividends, a strong track record of and future ability to increase the dividend, a proven history of predictable cash flows that increase over time, and barriers to competition.*
The Fund’s institutional shares had a total return of -6.31% for the year, which was essentially in line with the CBOE BuyWrite Monthly Index. The Fund’s put options significantly protected it against the market decline of calendar 2022. Additionally, the Fund’s value/high dividend yield focus contributed to performance relative to the benchmark and the broader S&P 500 Index, especially during calendar 2022.*
Large overweights to energy, pharmaceuticals, and beverages had the greatest positive impact on performance, along with not owning the largest technology and communications stocks, which fared poorly.
The greatest negative impact on performance came from stock selection in the consumer discretionary, financials, and health care sectors.*
Outlook
We believe the risk/reward balance is skewed to the downside. The Fed’s continued hawkish monetary stance, including continued quantitative tightening, provides a headwind for stocks. Meanwhile, earnings estimates have remained relatively buoyant over the past nine months despite significant accelerating risks to the economy.
We remain bearish on the stock market. Thus, the Fund remains positioned defensively, with a lower underlying beta (level of exposure to market risk) than in the previous year.
| 1 | For additional information, please refer to the Glossary of Terms. |
| * | The composition of the Funds’ portfolio is subject to change. |
The performance data quoted represents past performance and does not guarantee future results. The investment return and principal value of an investment will fluctuate so that an investor’s shares, when redeemed, may be worth more or less than their original cost. Current performance may be lower or higher than the performance quoted. For performance data current to the most recent month end, please call 1-800-762-7085 or visit www.cavanalhillfunds.com.
Hedged Income Fund (Unaudited)
Index Description
The CBOE S&P 500 BuyWrite Index is designed to show the hypothetical performance of a portfolio that engages in a buy-write strategy using S&P 500 index call options. The S&P 500 Index is regarded as a gauge of the U.S. equities market, this index includes 500 leading companies in leading industries of the U.S. economy. Although the S&P 500 focuses on the large-cap segment of the market, with approximately 75% coverage of U.S. equities, it is also an ideal proxy for the total market. The Fund’s performance reflects the deduction of fees for these services, but does not reflect the deduction of taxes that a shareholder would pay on fund distributions or the redemption of fund shares. Investors cannot invest directly in an index.
Investment Risks
Equity securities (stocks) are more volatile and carry more risk than other forms of investments, including investments in below investment-grade fixed income securities. Fixed income securities are subject to interest rate risks. The principal value of a bond falls when interest rates rise and rise when interest rates fall. Mid- and small-cap companies may be more vulnerable to adverse business or economic developments. Although intended to limit or reduce investment risk, hedging strategies may also limit or reduce the potential for profit. There is no assurance that hedging strategies will be successful. Investing in derivative instruments involves risks that may be different from or greater than the risks associated with investing directly in securities or other traditional investments. By writing covered call options, a fund will not benefit from any potential increases in the value of a fund asset above the exercise price, but will bear the risk of declines in the value of the asset. Writing call options may expose a fund to additional costs. Writing of covered call options are also subject to the risk that the counterparty to the transaction will not fulfill its obligations. When the Fund purchases a put option on a security or index it may lose the entire premium paid if the underlying security or index does not decrease in value. The Fund is also exposed to default by the put writer who may be unwilling or unable to perform its contractual obligations to the Fund. The fund’s investment in dividend-paying stocks could cause the fund to underperform similar funds that invest without consideration of a company’s track record of paying dividends. Stock of companies with a history of paying dividends may not participate in a broad market advance to the same degree as most other stocks.
For a complete description of these and other risks associated with investing in a mutual fund, please refer to the Fund’s prospectus.
Value of a $10,000 Investment

The growth of $10,000 investment chart represents a hypothetical investment in the indicated share class versus a similar investment in the Fund’s benchmark, and represents the reinvestment of distributions and capital gains.
Average Annual Total Return
| | | Since |
| | | Inception |
| For the periods ended 8/31/2022 | 1 Year | (12/28/2020) |
| A Shares (at NAV)1 | (6.51)% | 1.01% |
| A Shares (with 2.00% maximum load)1 | (8.37)% | (0.18)% |
| Investor Shares | (6.47)% | 1.05% |
| Institutional Shares | (6.31)% | 1.28% |
| S&P 500 Index | (11.23)% | 5.02% |
| CBOE S&P 500 BuyWrite Index | (6.60)% | 4.33% |
| Lipper Options Arbitrage/Options Strategies Funds Average2 | (7.09)% | 1.02% |
| | | |
| Expense Ratios | | |
| | | Gross |
| A Shares | | 2.11% |
| Investor Shares | | 2.26% |
| Institutional Shares | | 2.01% |
The performance data quoted represents past performance and does not guarantee future results. The investment return and principal value of an investment will fluctuate so that an investor’s shares, when redeemed, may be worth more or less than their original cost. Current performance may be lower or higher than the performance quoted. For performance data current to the most recent month end, please call 1-800-762-7085 or visit www.cavanalhillfunds.com.
Investment performance for the Fund’s classes reflects fee waivers that have been in effect during the applicable periods. Without such waivers, the performance would have been lower. Contractual fee waivers are in effect through December 31, 2022.
The above expense ratios are from the Funds’ prospectus dated December 28, 2021. Additional information pertaining to the Funds’ expense ratios for the year ended August 31, 2022 can be found in the Financial Highlights.
| 1 | Class A Shares is subject to a 1.00% Maximum Deferred Sales Charge on shares purchased without an initial sales charge and redeemed within 12 months of purchase. Performance data does not reflect the Maximum Deferred Sales Charge. If reflected, one year performance quoted would be lower. |
| 2 | The Lipper Mutual Funds Average is an equally weighted average of the mutual funds within their respective Lipper classification, adjusted for reinvestment of capital gains distributions and income dividends. Since inception value calculated from December 31, 2020. |
| Statements of Assets and Liabilities | |
| August 31, 2022 | |
| | | U.S. Treasury
Fund | | | Government
Securities Money
Market Fund | |
| Assets: | | | | | | |
| Investments, at cost | | $ | 178,658,329 | | | $ | 1,356,988,881 | |
| Investments, at value | | | 178,658,329 | | | | 1,356,988,881 | |
| Repurchase agreements, at value/cost | | | 770,000,000 | | | | 815,000,000 | |
| Total Investments | | | 948,658,329 | | | | 2,171,988,881 | |
| Cash | | | — | | | | 722 | |
| Interest and dividends receivable | | | 280,414 | | | | 2,430,194 | |
| Receivable for capital shares reinvested | | | 297 | | | | 574,134 | |
| Prepaid expenses and other assets | | | 21,226 | | | | 42,653 | |
| Total Assets | | | 948,960,266 | | | | 2,175,036,584 | |
| Liabilities: | | | | | | | | |
| Distributions payable | | | 1,239,063 | | | | 3,301,466 | |
| Accrued expenses and other payables: | | | | | | | | |
| Investment advisory fees | | | 43,437 | | | | 89,792 | |
| Administration fees | | | 43,437 | | | | 89,792 | |
| Distribution fees | | | 191,556 | | | | 76,365 | |
| Custodian fees | | | 8,688 | | | | 17,960 | |
| Trustee fees | | | 2,785 | | | | 5,885 | |
| Fund accounting and compliance fees | | | 21,354 | | | | 42,236 | |
| Transfer agent fees | | | 12,149 | | | | 20,773 | |
| Shareholder servicing fees | | | 195,866 | | | | 135,293 | |
| Other accrued liabilities | | | 72,227 | | | | 142,327 | |
| Total Liabilities | | | 1,830,562 | | | | 3,921,889 | |
| Net Assets | | $ | 947,129,704 | | | $ | 2,171,114,695 | |
| Composition of Net Assets: | | | | | | | | |
| Shares of beneficial interest, at par | | $ | 9,471 | | | $ | 21,719 | |
| Additional paid-in capital | | | 947,122,362 | | | | 2,171,095,444 | |
| Total distributable earnings/(loss) | | | (2,129 | ) | | | (2,468 | ) |
| Net Assets | | $ | 947,129,704 | | | $ | 2,171,114,695 | |
| Net Assets: | | | | | | | | |
| Administrative Shares | | $ | 830,907,807 | | | $ | 666,205,845 | |
| Service Shares | | | 56,429,823 | | | | — | |
| Institutional Shares | | | 49,457,471 | | | | 122,079,711 | |
| Select Shares | | | 10,334,603 | | | | 1,048,440,088 | |
| Premier Shares | | | — | | | | 334,389,051 | |
| Total | | $ | 947,129,704 | | | $ | 2,171,114,695 | |
| Shares Outstanding: | | | | | | | | |
| ($0.00001 par value per share, unlimited number of shares authorized) | | | | | | | | |
| Administrative Shares | | | 830,907,051 | | | | 666,543,882 | |
| Service Shares | | | 56,429,959 | | | | — | |
| Institutional Shares | | | 49,458,601 | | | | 122,160,456 | |
| Select Shares | | | 10,334,455 | | | | 1,048,756,544 | |
| Premier Shares | | | — | | | | 334,427,987 | |
| Total | | | 947,130,066 | | | | 2,171,888,869 | |
| Net Asset Value, offering price & redemption price per share: | | | | | | | | |
| Administrative Shares | | $ | 1.00 | | | $ | 1.00 | |
| Service Shares | | $ | 1.00 | | | $ | — | |
| Institutional Shares | | $ | 1.00 | | | $ | 1.00 | |
| Select Shares | | $ | 1.00 | | | $ | 1.00 | |
| Premier Shares | | $ | — | | | $ | 1.00 | |
See notes to financial statements.
| Statements of Assets and Liabilities | |
| August 31, 2022 | Continued |
| | | Limited Duration
Fund | | | Moderate
Duration Fund | | | Bond Fund | | | Strategic
Enhanced Yield
Fund | |
| Assets: | | | | | | | | | | | | |
| Investments, at cost | | $ | 47,223,816 | | | $ | 20,544,668 | | | $ | 135,900,718 | | | $ | 10,541,157 | |
| Investments in affiliates, at cost | | | 1,667,001 | | | | 816,231 | | | | 6,466,384 | | | | 456,996 | |
| Total Investments, at cost | | | 48,890,817 | | | | 21,360,899 | | | | 142,367,102 | | | | 10,998,153 | |
| Investments, at value | | | 42,940,512 | | | | 18,870,523 | | | | 123,417,705 | | | | 9,585,820 | |
| Investments in affiliates, at value | | | 1,667,001 | | | | 816,231 | | | | 6,466,384 | | | | 456,996 | |
| Total Investments, at value | | | 44,607,513 | | | | 19,686,754 | | | | 129,884,089 | | | | 10,042,816 | |
| Cash | | | — | | | | — | | | | — | | | | 634 | |
| Interest and dividends receivable | | | 189,249 | | | | 105,835 | | | | 633,283 | | | | 49,896 | |
| Receivable for capital shares issued | | | 61,277 | | | | 12,652 | | | | 21,184 | | | | — | |
| Receivable for capital shares reinvested | | | 48,558 | | | | 19,857 | | | | 80,113 | | | | 17,875 | |
| Receivable for investments sold | | | — | | | | 1,548 | | | | — | | | | — | |
| Receivable from adviser | | | — | | | | 3,396 | | | | — | | | | 4,481 | |
| Receivable from fees waived or reimbursed | | | — | | | | — | | | | — | | | | 1,509 | |
| Prepaid expenses and other assets | | | 22,026 | | | | 21,164 | | | | 25,060 | | | | 7,692 | |
| Total Assets | | | 44,928,623 | | | | 19,851,206 | | | | 130,643,729 | | | | 10,124,903 | |
| Liabilities: | | | | | | | | | | | | | | | | |
| Distributions payable | | | 88,500 | | | | 36,162 | | | | 276,188 | | | | 36,034 | |
| Payable for investments purchased | | | — | | | | — | | | | 57,182 | | | | — | |
| Payable for capital shares redeemed | | | 7,208 | | | | 1,044 | | | | 4,220 | | | | 4,588 | |
| Accrued expenses and other payables: | | | | | | | | | | | | | | | | |
| Investment advisory fees | | | 5,886 | | | | 11,997 | | | | 22,249 | | | | 7,839 | |
| Administration fees | | | 3,139 | | | | 1,358 | | | | 8,899 | | | | 717 | |
| Distribution fees | | | 1,060 | | | | 657 | | | | 254 | | | | 147 | |
| Custody fees | | | 392 | | | | 170 | | | | 1,112 | | | | 90 | |
| Trustee fees | | | 140 | | | | 51 | | | | 305 | | | | 28 | |
| Fund accounting and compliance fees | | | 4,500 | | | | 2,335 | | | | 5,109 | | | | 1,356 | |
| Transfer agent fees | | | 13,590 | | | | 9,922 | | | | 12,210 | | | | 10,059 | |
| Shareholder servicing fees | | | 2,369 | | | | 310 | | | | 1,308 | | | | — | |
| Other accrued liabilities | | | 4,920 | | | | 1,383 | | | | 6,732 | | | | 1,073 | |
| Total Liabilities | | | 131,704 | | | | 65,389 | | | | 395,768 | | | | 61,931 | |
| Net Assets | | $ | 44,796,919 | | | $ | 19,785,817 | | | $ | 130,247,961 | | | $ | 10,062,972 | |
| Composition of Net Assets: | | | | | | | | | | | | | | | | |
| Shares of beneficial interest, at par | | $ | 50 | | | $ | 20 | | | $ | 151 | | | $ | 11 | |
| Additional paid-in capital | | | 54,555,054 | | | | 26,883,211 | | | | 145,939,856 | | | | 12,306,591 | |
| Total distributable earnings/(loss) | | | (9,758,185 | ) | | | (7,097,414 | ) | | | (15,692,046 | ) | | | (2,243,630 | ) |
| Net Assets | | $ | 44,796,919 | | | $ | 19,785,817 | | | $ | 130,247,961 | | | $ | 10,062,972 | |
| Net Assets: | | | | | | | | | | | | | | | | |
| Investor Shares | | $ | 2,335,996 | | | $ | 2,887,844 | | | $ | 1,129,195 | | | $ | 527,587 | |
| Institutional Shares | | | 39,818,321 | | | | 16,714,857 | | | | 129,062,035 | | | | 9,376,839 | |
| A Shares | | | 2,642,602 | | | | 183,116 | | | | 56,731 | | | | 158,546 | |
| Total | | $ | 44,796,919 | | | $ | 19,785,817 | | | $ | 130,247,961 | | | $ | 10,062,972 | |
| Shares Outstanding: | | | | | | | | | | | | | | | | |
| ($0.00001 par value per share, unlimited number of shares authorized) | | | | | | | | | | | | | | | | |
| Investor Shares | | | 259,527 | | | | 297,919 | | | | 130,710 | | | | 57,429 | |
| Institutional Shares | | | 4,427,269 | | | | 1,723,849 | | | | 14,977,388 | | | | 1,034,564 | |
| A Shares | | | 293,406 | | | | 18,882 | | | | 6,567 | | | | 17,487 | |
| Total | | | 4,980,202 | | | | 2,040,650 | | | | 15,114,665 | | | | 1,109,480 | |
| Net Asset Value, offering price & redemption price per share: | | | | | | | | | | | | | | | | |
| Investor Shares | | $ | 9.00 | | | $ | 9.69 | | | $ | 8.64 | | | $ | 9.19 | |
| Institutional Shares | | $ | 8.99 | | | $ | 9.70 | | | $ | 8.62 | | | $ | 9.06 | |
| A Shares | | $ | 9.01 | | | $ | 9.70 | | | $ | 8.64 | | | $ | 9.07 | |
| Maximum Sales Charge: | | | | | | | | | | | | | | | | |
| A Shares | | | 2.00 | % | | | 2.00 | % | | | 2.00 | % | | | 2.00 | % |
| Maximum Offering Price per share(net asset value / (100%-maximum sales charge) of net asset value adjusted to the nearest cent): | | | | | | | | | | | | | | | | |
| A Shares | | $ | 9.19 | | | $ | 9.90 | | | $ | 8.82 | | | $ | 9.26 | |
See notes to financial statements.
| Statements of Assets and Liabilities | |
| August 31, 2022 | Continued |
| | | Ultra Short Tax-
FreeIncome Fund | | | Mid Cap Diverse
Leadership Fund | | | Opportunistic
Fund | |
| Assets: | | | | | | | | | |
| Investments, at cost | | $ | 27,870,356 | | | $ | 2,316,409 | | | $ | 41,723,647 | |
| Investments in affiliates, at cost | | | 20,027 | | | | 40,468 | | | | 3,531,733 | |
| Total Investments, at cost | | | 27,890,383 | | | | 2,356,877 | | | | 45,255,380 | |
| Investments, at value | | | 27,635,130 | | | | 2,309,339 | | | | 42,102,938 | |
| Investments in affiliates, at value | | | 20,027 | | | | 40,468 | | | | 3,531,733 | |
| Total Investments, at value | | | 27,655,157 | | | | 2,349,807 | | | | 45,634,671 | |
| Interest and dividends receivable | | | 222,110 | | | | 2,635 | | | | 74,657 | |
| Receivable for capital shares issued | | | — | | | | — | | | | 3,536 | |
| Receivable for capital shares reinvested | | | 840 | | | | — | | | | — | |
| Receivable from adviser | | | 3,456 | | | | 1,162 | | | | 11,075 | |
| Receivable from fees waived or reimbursed | | | 209 | | | | 498 | | | | 506 | |
| Prepaid expenses and other assets | | | 7,411 | | | | 12,341 | | | | 33,757 | |
| Total Assets | | | 27,889,183 | | | | 2,366,443 | | | | 45,758,202 | |
| Liabilities: | | | | | | | | | | | | |
| Distributions payable | | | 14,080 | | | | — | | | | — | |
| Payable for investments purchased | | | 1,006,525 | | | | — | | | | — | |
| Payable for capital shares redeemed | | | 128,838 | | | | — | | | | 31,942 | |
| Accrued expenses and other payables: | | | | | | | | | | | | |
| Investment advisory fees | | | 10,761 | | | | 3,645 | | | | 36,003 | |
| Administration fees | | | 1,843 | | | | 169 | | | | 3,388 | |
| Distribution fees | | | 31 | | | | 98 | | | | 698 | |
| Custody fees | | | 230 | | | | 21 | | | | 424 | |
| Trustee fees | | | 69 | | | | 6 | | | | 137 | |
| Fund accounting and compliance fees | | | 1,473 | | | | 240 | | | | 1,097 | |
| Transfer agent fees | | | 9,661 | | | | 12,313 | | | | 15,505 | |
| Other accrued liabilities | | | 1,663 | | | | 211 | | | | 4,291 | |
| Total Liabilities | | | 1,175,174 | | | | 16,703 | | | | 93,485 | |
| Net Assets | | $ | 26,714,009 | | | $ | 2,349,740 | | | $ | 45,664,717 | |
| Composition of Net Assets: | | | | | | | | | | | | |
| Shares of beneficial interest, at par | | $ | 27 | | | $ | 2 | | | $ | 34 | |
| Additional paid-in capital | | | 26,949,451 | | | | 2,247,070 | | | | 53,502,992 | |
| Total distributable earnings/(loss) | | | (235,469 | ) | | | 102,668 | | | | (7,838,309 | ) |
| Net Assets | | $ | 26,714,009 | | | $ | 2,349,740 | | | $ | 45,664,717 | |
| Net Assets: | | | | | | | | | | | | |
| Investor Shares | | $ | 103,470 | | | $ | 190,023 | | | $ | 951,348 | |
| Institutional Shares | | | 26,566,188 | | | | 1,982,964 | | | | 43,335,653 | |
| A Shares | | | 44,351 | | | | 151,710 | | | | 1,093,190 | |
| C Shares | | | — | | | | 25,043 | | | | 284,526 | |
| Total | | $ | 26,714,009 | | | $ | 2,349,740 | | | $ | 45,664,717 | |
| Shares Outstanding: | | | | | | | | | | | | |
| ($0.00001 par value per share, unlimited number of shares authorized) | | | | | | | | | | | | |
| Investor Shares | | | 10,483 | | | | 15,137 | | | | 71,529 | |
| Institutional Shares | | | 2,678,001 | | | | 157,250 | | | | 3,215,654 | |
| A Shares | | | 4,486 | | | | 11,980 | | | | 81,865 | |
| C Shares | | | — | | | | 2,049 | | | | 22,117 | |
| Total | | | 2,692,970 | | | | 186,416 | | | | 3,391,165 | |
| Net Asset Value, offering price & redemption price per share: | | | | | | | | | | | | |
| Investor Shares | | $ | 9.87 | | | $ | 12.55 | | | $ | 13.30 | |
| Institutional Shares | | $ | 9.92 | | | $ | 12.61 | | | $ | 13.48 | |
| A Shares | | $ | 9.89 | | | $ | 12.66 | | | $ | 13.35 | |
| C Shares | | $ | — | | | $ | 12.22 | | | $ | 12.86 | |
| Maximum Sales Charge: | | | | | | | | | | | | |
| A Shares | | | 1.00 | % | | | 2.00 | % | | | 2.00 | % |
| Maximum Offering Price per share(net asset value / (100%-maximum sales charge) of net asset value adjusted to the nearest cent): | | $ | 9.99 | | | $ | 12.92 | | | $ | 13.62 | |
| A Shares | | | | | | | | | | | | |
See notes to financial statements.
| Statements of Assets and Liabilities | |
| August 31, 2022 | Concluded |
| | | World Energy
Fund | | | Hedged Income
Fund | |
| Assets: | | | | | | |
| Investments, at cost | | $ | 53,418,760 | | | $ | 36,611,222 | |
| Investments in affiliates, at cost | | | 712,430 | | | | 941,095 | |
| Total Investments, at cost | | | 54,131,190 | | | | 37,552,317 | |
| Investments, at value | | | 69,906,548 | | | | 35,037,557 | |
| Investments in affiliates, at value | | | 712,430 | | | | 941,095 | |
| Total Investments, at value | | | 70,618,978 | | | | 35,978,652 | |
| Interest and dividends receivable | | | 246,497 | | | | 117,782 | |
| Receivable for capital shares issued | | | 36,895 | | | | 42,000 | |
| Receivable for investments sold | | | 1,461,555 | | | | — | |
| Receivable from adviser | | | 7,786 | | | | — | |
| Prepaid expenses and other assets | | | 16,183 | | | | 8,883 | |
| Total Assets | | | 72,387,894 | | | | 36,147,317 | |
| | | | | | | | | |
| Liabilities: | | | | | | | | |
| Written Options (Premiums received $0 and $1,830,686, respectively) | | | — | | | | 812,631 | |
| Payable for investments purchased | | | 1,507,490 | | | | — | |
| Payable for capital shares redeemed | | | 52,708 | | | | 1,944 | |
| Accrued expenses and other payables: | | | | | | | | |
| Investment advisory fees | | | 34,414 | | | | 45,663 | |
| Administration fees | | | 4,588 | | | | 2,400 | |
| Distribution fees | | | 9,589 | | | | 453 | |
| Custody fees | | | 574 | | | | 300 | |
| Trustee fees | | | 160 | | | | 87 | |
| Fund accounting and compliance fees | | | 1,516 | | | | 868 | |
| Transfer agent fees | | | 15,696 | | | | 9,663 | |
| Shareholder servicing fees | | | 5,279 | | | | 266 | |
| Other accrued liabilities | | | 4,418 | | | | 1,776 | |
| Total Liabilities | | | 1,636,432 | | | | 876,051 | |
| Net Assets | | $ | 70,751,462 | | | $ | 35,271,266 | |
| | | | | | | | | |
| Composition of Net Assets: | | | | | | | | |
| Shares of beneficial interest, at par | | $ | 57 | | | $ | 36 | |
| Additional paid-in capital | | | 74,397,161 | | | | 36,987,759 | |
| Total distributable earnings/(loss) | | | (3,645,756 | ) | | | (1,716,529 | ) |
| Net Assets | | $ | 70,751,462 | | | $ | 35,271,266 | |
| | | | | | | | | |
| Net Assets: | | | | | | | | |
| Investor Shares | | $ | 25,003,125 | | | $ | 308,816 | |
| Institutional Shares | | | 37,865,815 | | | | 33,177,612 | |
| A Shares | | | 3,169,811 | | | | 1,784,838 | |
| C Shares | | | 4,712,711 | | | | — | |
| Total | | $ | 70,751,462 | | | $ | 35,271,266 | |
| | | | | | | | | |
| Shares Outstanding: | | | | | | | | |
| ($0.00001 par value per share, unlimited number of shares authorized) | | | | | | | | |
| Investor Shares | | | 1,997,016 | | | | 31,112 | |
| Institutional Shares | | | 3,021,260 | | | | 3,340,764 | |
| A Shares | | | 253,732 | | | | 180,159 | |
| C Shares | | | 380,967 | | | | — | |
| Total | | | 5,652,975 | | | | 3,552,035 | |
| | | | | | | | | |
| Net Asset Value, offering price & redemption price per share: | | | | | | | | |
| Investor Shares | | $ | 12.52 | | | $ | 9.93 | |
| Institutional Shares | | $ | 12.53 | | | $ | 9.93 | |
| A Shares | | $ | 12.49 | | | $ | 9.91 | |
| C Shares | | $ | 12.37 | | | $ | — | |
| | | | | | | | | |
| Maximum Sales Charge: | | | | | | | | |
| A Shares | | | 2.00 | % | | | 2.00 | % |
| | | | | | | | | |
| Maximum Offering Price per share(net asset value / (100%-maximum sales charge) of net asset value adjusted to the nearest cent): | | | | | | | | |
| A Shares | | $ | 12.74 | | | $ | 10.11 | |
See notes to financial statements.
| Statements of Operations | |
| August 31, 2022 | |
| | | U.S. Treasury
Fund | | | Government
Securities Money
Market Fund | |
| Investment Income: | | | | | | | | |
| Interest income | | $ | 3,901,325 | | | $ | 9,100,876 | |
| Dividend income | | | 605,122 | | | | 1,621,500 | |
| Total income | | | 4,506,447 | | | | 10,722,376 | |
| | | | | | | | | |
| Expenses: | | | | | | | | |
| Investment advisory fees | | | 478,346 | | | | 1,046,613 | |
| Administration fees | | | 478,346 | | | | 1,046,613 | |
| Distribution fees - Administrative Shares | | | 2,094,091 | | | | 1,645,598 | |
| Distribution fees - Service Shares | | | 122,683 | | | | — | |
| Distribution fees - Premier Shares | | | — | | | | 1,612,203 | |
| Shareholder servicing fees - Administrative Shares | | | 2,093,655 | | | | 1,638,981 | |
| Shareholder servicing fees - Service Shares | | | 122,683 | | | | — | |
| Shareholder servicing fees - Institutional Shares | | | 149,806 | | | | 344,277 | |
| Shareholder servicing fees - Select Shares | | | 25,079 | | | | 2,436,938 | |
| Shareholder servicing fees - Premier Shares | | | — | | | | 806,101 | |
| Fund accounting and compliance fees | | | 211,814 | | | | 461,009 | |
| Transfer agent fees | | | 65,006 | | | | 112,900 | |
| Custodian fees | | | 95,673 | | | | 209,256 | |
| Trustee fees | | | 39,241 | | | | 83,233 | |
| Professional fees | | | 139,790 | | | | 276,183 | |
| Printing fees | | | 7,904 | | | | 17,782 | |
| Registration fees | | | 31,413 | | | | 221,764 | |
| Other expenses | | | 123,648 | | | | 201,241 | |
| | | | | | | | | |
| Total expenses before fee and expense reductions | | | 6,279,178 | | | | 12,160,692 | |
| | | | | | | | | |
| Investment advisory fees waived/expenses reimbursed by Investment Adviser | | | (3,702,097 | ) | | | (3,340,403 | ) |
| Distribution fees waived - Administrative Shares | | | — | | | | (855,702 | ) |
| Distribution fees waived - Service Shares | | | (73,610 | ) | | | — | |
| Distribution fees waived - Premier Shares | | | — | | | | (1,450,990 | ) |
| Shareholder servicing fees waived - Service Shares | | | (73,603 | ) | | | — | |
| Shareholder servicing fees waived - Institutional Shares | | | (101,850 | ) | | | (234,107 | ) |
| Shareholder servicing fees waived - Select Shares | | | (25,079 | ) | | | (2,436,938 | ) |
| Shareholder servicing fees waived - Premier Shares | | | — | | | | (806,101 | ) |
| | | | | | | | | |
| Net expenses | | | 2,302,939 | | | | 3,036,451 | |
| | | | | | | | | |
| Net investment income/(loss) | | | 2,203,508 | | | | 7,685,925 | |
| | | | | | | | | |
| Realized/Unrealized Gains/(Losses) on Investments: | | | | | | | | |
| Net realized gains/(losses) from unaffiliated investments | | | (168 | ) | | | (6,707 | ) |
| Net realized/unrealized gains/(losses) on investments | | | (168 | ) | | | (6,707 | ) |
| Change in net assets resulting from operations | | $ | 2,203,340 | | | $ | 7,679,218 | |
See notes to financial statements.
| Statements of Operations | |
| August 31, 2022 | Continued |
| | Limited Duration
Fund | | | Moderate
Duration Fund | | | Bond Fund | | | Strategic
Enhanced Yield
Fund | |
| Investment Income: | | | | | | | | | | | | |
| Interest income | | $ | 1,404,736 | | | $ | 491,766 | | | $ | 3,007,398 | | | $ | 547,312 | |
| Dividend income | | | — | | | | — | | | | — | | | | 20,812 | |
| Dividend income from affiliates | | | 12,753 | | | | 4,428 | | | | 30,409 | | | | 1,547 | |
| Total income | | | 1,417,489 | | | | 496,194 | | | | 3,037,807 | | | | 569,671 | |
| | | | | | | | | | | | | | | | | |
| Expenses: | | | | | | | | | | | | | | | | |
| Investment advisory fees | | | 98,006 | | | | 45,140 | | | | 226,484 | | | | 80,963 | |
| Administration fees | | | 52,270 | | | | 18,056 | | | | 90,594 | | | | 12,954 | |
| Distribution fees - Investor Shares | | | 6,795 | | | | 8,248 | | | | 3,096 | | | | 1,940 | |
| Distribution fees - A Shares | | | 7,013 | | | | 639 | | | | 185 | | | | 657 | |
| Shareholder servicing fees - Investor Shares | | | 6,795 | | | | 8,248 | | | | 3,096 | | | | 1,940 | |
| Shareholder servicing fees - Institutional Shares | | | 149,536 | | | | 47,538 | | | | 279,820 | | | | 37,884 | |
| Shareholder servicing fees - A Shares | | | 2,805 | | | | 255 | | | | 74 | | | | 263 | |
| Fund accounting and compliance fees | | | 49,538 | | | | 30,278 | | | | 54,644 | | | | 18,320 | |
| Transfer agent fees | | | 96,045 | | | | 84,892 | | | | 91,909 | | | | 83,137 | |
| Custodian fees | | | 6,354 | | | | 2,222 | | | | 11,241 | | | | 1,597 | |
| Trustee fees | | | 2,926 | | | | 1,084 | | | | 4,950 | | | | 980 | |
| Professional fees | | | 10,849 | | | | 3,954 | | | | 17,426 | | | | 3,345 | |
| Printing fees | | | 5,602 | | | | 2,771 | | | | 4,469 | | | | 3,852 | |
| Registration fees | | | 45,358 | | | | 40,703 | | | | 41,144 | | | | 43,569 | |
| Other expenses | | | 8,385 | | | | 4,793 | | | | 10,724 | | | | 4,591 | |
| | | | | | | | | | | | | | | | | |
| Total expenses before fee and expense reductions | | | 548,277 | | | | 298,821 | | | | 839,856 | | | | 295,992 | |
| | | | | | | | | | | | | | | | | |
| Investment advisory fees waived/expenses reimbursed by Investment Adviser | | | (1,728 | ) | | | (126,155 | ) | | | (1,955 | ) | | | (136,871 | ) |
| Administration fees waived | | | (1,728 | ) | | | (491 | ) | | | (1,955 | ) | | | (372 | ) |
| Shareholder servicing fees waived - Investor Shares | | | (6,795 | ) | | | (7,978 | ) | | | (3,097 | ) | | | (1,907 | ) |
| Shareholder servicing fees waived - Institutional Shares | | | (138,619 | ) | | | (44,738 | ) | | | (277,599 | ) | | | (31,339 | ) |
| Shareholder servicing fees waived - A Shares | | | (2,292 | ) | | | (65 | ) | | | (74 | ) | | | (95 | ) |
| | | | | | | | | | | | | | | | | |
| Net expenses | | | 397,115 | | | | 119,394 | | | | 555,176 | | | | 125,408 | |
| | | | | | | | | | | | | | | | | |
| Net investment income/(loss) | | | 1,020,374 | | | | 376,800 | | | | 2,482,631 | | | | 444,263 | |
| | | | | | | | | | | | | | | | | |
| Realized/Unrealized Gains/(Losses) on Investments: | | | | | | | | | | | | | | | | |
| Net realized gains/(losses) from unaffiliated investments | | | (465,156 | ) | | | (265,468 | ) | | | (979,869 | ) | | | (703,588 | ) |
| Change in unrealized appreciation/(depreciation) on unaffiliated investments | | | (4,142,455 | ) | | | (2,097,032 | ) | | | (15,380,049 | ) | | | (1,353,067 | ) |
| Net realized/unrealized gains/(losses) on investments | | | (4,607,611 | ) | | | (2,362,500 | ) | | | (16,359,918 | ) | | | (2,056,655 | ) |
| Change in net assets resulting from operations | | $ | (3,587,237 | ) | | $ | (1,985,700 | ) | | $ | (13,877,287 | ) | | $ | (1,612,392 | ) |
See notes to financial statements.
| Statements of Operations | |
| August 31, 2022 | Continued |
| | | Ultra Short Tax-
Free Income Fund | | | Mid Cap Diverse
Leadership Fund | | | Opportunistic
Fund | | | World Energy
Fund | |
| Investment Income: | | | | | | | | | | | | |
| Interest income | | $ | 143,408 | | | $ | — | | | $ | 261,483 | | | $ | 116,207 | |
| Dividend income | | | — | | | | 39,478 | | | | 858,125 | | | | 1,613,021 | |
| Dividend income from affiliates | | | 1,218 | | | | 289 | | | | 14,671 | | | | 3,596 | |
| Foreign tax withholding | | | — | | | | — | | | | (3,043 | ) | | | (30,001 | ) |
| Total income | | | 144,626 | | | | 39,767 | | | | 1,131,236 | | | | 1,702,823 | |
| | | | | | | | | | | | | | | | | |
| Expenses: | | | | | | | | | | | | | | | | |
| Investment advisory fees | | | 43,959 | | | | 17,592 | | | | 574,231 | | | | 330,480 | |
| Administration fees | | | 23,445 | | | | 2,559 | | | | 54,046 | | | | 44,064 | |
| Distribution fees - Investor Shares | | | 260 | | | | 3,174 | | | | 3,310 | | | | 45,743 | |
| Distribution fees - A Shares | | | 81 | | | | 380 | | | | 3,282 | | | | 10,429 | |
| Distribution fees - C Shares | | | — | | | | 270 | | | | 3,252 | | | | 40,577 | |
| Shareholder servicing fees - Investor Shares | | | 260 | | | | 3,174 | | | | 3,310 | | | | 45,743 | |
| Shareholder servicing fees - Institutional Shares | | | 72,922 | | | | 4,374 | | | | 161,486 | | | | 71,383 | |
| Shareholder servicing fees - A Shares | | | 33 | | | | 152 | | | | 1,313 | | | | 4,171 | |
| Shareholder servicing fees - C Shares | | | — | | | | 67 | | | | 813 | | | | 10,144 | |
| Fund accounting and compliance fees | | | 18,773 | | | | 3,084 | | | | 16,442 | | | | 14,761 | |
| Transfer agent fees | | | 80,722 | | | | 100,894 | | | | 116,919 | | | | 114,919 | |
| Custodian fees | | | 2,924 | | | | 320 | | | | 6,671 | | | | 5,475 | |
| Trustee fees | | | 1,714 | | | | 179 | | | | 2,973 | | | | 2,770 | |
| Professional fees | | | 5,974 | | | | 568 | | | | 10,721 | | | | 8,971 | |
| Printing fees | | | 2,172 | | | | 3,088 | | | | 15,623 | | | | 14,830 | |
| Registration fees | | | 42,565 | | | | 55,087 | | | | 50,354 | | | | 57,266 | |
| Other expenses | | | 5,580 | | | | 4,308 | | | | 8,516 | | | | 7,185 | |
| | | | | | | | | | | | | | | | | |
| Total expenses before fee and expense reductions | | | 301,384 | | | | 199,270 | | | | 1,033,262 | | | | 828,911 | |
| | | | | | | | | | | | | | | | | |
| Investment advisory fees waived/expenses reimbursed by Investment Adviser | | | (126,491 | ) | | | (161,682 | ) | | | (183,822 | ) | | | (141,041 | ) |
| Administration fees waived | | | (149 | ) | | | (68 | ) | | | (2,217 | ) | | | (422 | ) |
| Shareholder servicing fees waived - Investor Shares | | | (260 | ) | | | (3,174 | ) | | | (3,295 | ) | | | (32,015 | ) |
| Shareholder servicing fees waived - Institutional Shares | | | (71,593 | ) | | | (4,373 | ) | | | (158,006 | ) | | | (52,021 | ) |
| Shareholder servicing fees waived - A Shares | | | (33 | ) | | | (152 | ) | | | (937 | ) | | | (2,834 | ) |
| Shareholder servicing fees waived - C Shares | | | — | | | | (67 | ) | | | (475 | ) | | | (6,867 | ) |
| | | | | | | | | | | | | | | | | |
| Net expenses | | | 102,858 | | | | 29,754 | | | | 684,510 | | | | 593,711 | |
| | | | | | | | | | | | | | | | | |
| Net investment income/(loss) | | | 41,768 | | | | 10,013 | | | | 446,726 | | | | 1,109,112 | |
| | | | | | | | | | | | | | | | | |
| Realized/Unrealized Gains/(Losses) on Investments: | | | | | | | | | | | | | | | | |
| Net realized gains/(losses) from unaffiliated investments | | | (138 | ) | | | 145,947 | | | | (7,952,662 | ) | | | 2,458,560 | |
| Change in unrealized appreciation/(depreciation) on unaffiliated investments | | | (251,564 | ) | | | (323,767 | ) | | | (6,048,563 | ) | | | 11,611,800 | |
| Net realized/unrealized gains/(losses) on investments | | | (251,702 | ) | | | (177,820 | ) | | | (14,001,225 | ) | | | 14,070,360 | |
| Change in net assets resulting from operations | | $ | (209,934 | ) | | $ | (167,807 | ) | | $ | (13,554,499 | ) | | $ | 15,179,472 | |
See notes to financial statements.
| Statements of Operations | |
| August 31, 2022 | Concluded |
| | | Hedged Income
Fund | |
| Investment Income: | | | |
| Dividend income | | $ | 1,019,256 | |
| Dividend income from affiliates | | | 3,628 | |
| Foreign tax withholding | | | (4,004 | ) |
| Total income | | | 1,018,880 | |
| | | | | |
| Expenses: | | | | |
| Investment advisory fees | | | 246,007 | |
| Administration fees | | | 24,601 | |
| Distribution fees - Investor Shares | | | 1,366 | |
| Distribution fees - A Shares | | | 4,368 | |
| Shareholder servicing fees - Investor Shares | | | 1,366 | |
| Shareholder servicing fees - Institutional Shares | | | 71,142 | |
| Shareholder servicing fees - A Shares | | | 1,747 | |
| Fund accounting and compliance fees | | | 9,396 | |
| Transfer agent fees | | | 90,565 | |
| Custodian fees | | | 3,077 | |
| Trustee fees | | | 1,796 | |
| Professional fees | | | 5,728 | |
| Printing fees | | | 2,698 | |
| Registration fees | | | 52,676 | |
| Other expenses | | | 5,256 | |
| | | | | |
| Total expenses before fee and expense reductions | | | 521,789 | |
| | | | | |
| Investment advisory fees waived/expenses reimbursed by Investment Adviser | | | (106,375 | ) |
| Administration fees waived | | | (401 | ) |
| Shareholder servicing fees waived - Investor Shares | | | (1,052 | ) |
| Shareholder servicing fees waived - Institutional Shares | | | (68,053 | ) |
| Shareholder servicing fees waived - A Shares | | | (1,640 | ) |
| | | | | |
| Net expenses | | | 344,268 | |
| | | | | |
| Net investment income/(loss) | | | 674,612 | |
| | | | | |
| Realized/Unrealized Gains/(Losses) on Investments: | | | | |
| Net realized gains/(losses) from unaffiliated investments | | | (481,289 | ) |
| Net realized gains/(losses) from written options contracts | | | (377,150 | ) |
| Change in unrealized appreciation/(depreciation) on unaffiliated investments | | | (2,895,852 | ) |
| Change in unrealized appreciation/(depreciation) on written options contracts | | | 1,002,949 | |
| Net realized/unrealized gains/(losses) on investments | | | (2,751,342 | ) |
| Change in net assets resulting from operations | | $ | (2,076,730 | ) |
See notes to financial statements.
| Statements of Changes in Net Assets | |
| August 31, 2022 | |
| | U.S. Treasury Fund | | | Government Securities
Money Market Fund | |
| | | Year Ended
August 31, 2022 | | | Year Ended
August 31, 2021 | | | Year Ended
August 31, 2022 | | | Year Ended
August 31, 2021 | |
| From Investment Activities: | | | | | | | | | | | | |
| Operations: | | | | | | | | | | | | |
| Net investment income/(loss) | | $ | 2,203,508 | | | $ | 48,864 | | | $ | 7,685,925 | | | $ | 195,559 | |
| Net realized gains/(losses) from investment transactions | | | (168 | ) | | | (1,972 | ) | | | (6,707 | ) | | | 399 | |
| Change in net assets resulting from operations | | | 2,203,340 | | | | 46,892 | | | | 7,679,218 | | | | 195,958 | |
| Distributions to Shareholders: | | | | | | | | | | | | | | | | |
| Administrative Shares | | | (1,749,036 | ) | | | (41,704 | ) | | | (1,669,478 | ) | | | (58,100 | ) |
| Service Shares | | | (184,272 | ) | | | (1,220 | ) | | | — | | | | — | |
| Institutional Shares | | | (209,132 | ) | | | (3,444 | ) | | | (380,181 | ) | | | (12,698 | ) |
| Select Shares | | | (61,057 | ) | | | (2,422 | ) | | | (4,329,024 | ) | | | (94,404 | ) |
| Premier Shares | | | — | | | | — | | | | (1,306,844 | ) | | | (30,362 | ) |
| Change in net assets from shareholder distributions | | | (2,203,497 | ) | | | (48,790 | ) | | | (7,685,527 | ) | | | (195,564 | ) |
| Change in net assets from capital transactions | | | (33,840,465 | ) | | | (152,194,154 | ) | | | 316,902,768 | | | | (188,138,583 | ) |
| Change in net assets | | | (33,840,622 | ) | | | (152,196,052 | ) | | | 316,896,459 | | | | (188,138,189 | ) |
| Net Assets: | | | | | | | | | | | | | | | | |
| Beginning of year | | | 980,970,326 | | | | 1,133,166,378 | | | | 1,854,218,236 | | | | 2,042,356,425 | |
| End of year | | $ | 947,129,704 | | | $ | 980,970,326 | | | $ | 2,171,114,695 | | | $ | 1,854,218,236 | |
| Capital Share Transactions*: | | | | | | | | | | | | | | | | |
| Administrative Shares | | | | | | | | | | | | | | | | |
| Issued | | | 1,678,622,267 | | | | 4,606,057,041 | | | | 953,834,098 | | | | 916,035,796 | |
| Reinvested | | | 523 | | | | 12 | | | | 9,474 | | | | 329 | |
| Redeemed | | | (1,730,087,789 | ) | | | (4,711,823,303 | ) | | | (866,420,293 | ) | | | (945,428,589 | ) |
| Change in Administrative Shares | | | (51,464,999 | ) | | | (105,766,250 | ) | | | 87,423,279 | | | | (29,392,464 | ) |
| Service Shares | | | | | | | | | | | | | | | | |
| Issued | | | 148,007,474 | | | | 78,450,592 | | | | — | | | | — | |
| Redeemed | | | (126,039,925 | ) | | | (68,569,209 | ) | | | — | | | | — | |
| Change in Service Shares | | | 21,967,549 | | | | 9,881,383 | | | | — | | | | — | |
| Institutional Shares | | | | | | | | | | | | | | | | |
| Issued | | | 224,497,009 | | | | 205,458,514 | | | | 584,293,451 | | | | 363,901,504 | |
| Reinvested | | | — | | | | — | | | | 17,777 | | | | 557 | |
| Redeemed | | | (236,069,899 | ) | | | (226,897,914 | ) | | | (586,580,544 | ) | | | (405,162,237 | ) |
| Change in Institutional Shares | | | (11,572,890 | ) | | | (21,439,400 | ) | | | (2,269,316 | ) | | | (41,260,176 | ) |
| Select Shares | | | | | | | | | | | | | | | | |
| Issued | | | 157,631,817 | | | | 50,675,972 | | | | 1,428,279,436 | | | | 2,027,156,309 | |
| Redeemed | | | (150,401,941 | ) | | | (85,545,859 | ) | | | (1,245,473,587 | ) | | | (2,108,767,940 | ) |
| Change in Select Shares | | | 7,229,876 | | | | (34,869,887 | ) | | | 182,805,849 | | | | (81,611,631 | ) |
| Premier Shares | | | | | | | | | | | | | | | | |
| Issued | | | — | | | | — | | | | 1,052,142,156 | | | | 792,829,359 | |
| Reinvested | | | — | | | | — | | | | 1,287,632 | | | | 29,909 | |
| Redeemed | | | — | | | | — | | | | (1,004,486,832 | ) | | | (828,733,579 | ) |
| Change in Premier Shares | | | — | | | | — | | | | 48,942,956 | | | | (35,874,311 | ) |
| Change in shares: | | | (33,840,464 | ) | | | (152,194,154 | ) | | | 316,902,768 | | | | (188,138,582 | ) |
| * | Share transactions are at net assets value of $1.00 per share. |
See notes to financial statements.
| Statements of Changes in Net Assets | |
| August 31, 2022 | Continued |
| | | Limited Duration Fund | | | Moderate Duration Fund | |
| | | Year Ended
August 31, 2022 | | | Year Ended
August 31, 2021 | | | Year Ended
August 31, 2022 | | | Year Ended
August 31, 2021 | |
| From Investment Activities: | | | | | | | | | | | | |
| Operations: | | | | | | | | | | | | |
| Net investment income/(loss) | | $ | 1,020,374 | | | $ | 1,303,350 | | | $ | 376,800 | | | $ | 486,561 | |
| Net realized gains/(losses) from investment transactions | | | (465,156 | ) | | | (140,871 | ) | | | (265,468 | ) | | | 312,998 | |
| Change in unrealized appreciation/(depreciation) on investments | | | (4,142,455 | ) | | | (592,555 | ) | | | (2,097,032 | ) | | | (422,172 | ) |
| Change in net assets resulting from operations | | | (3,587,237 | ) | | | 569,924 | | | | (1,985,700 | ) | | | 377,387 | |
| Distributions to Shareholders: | | | | | | | | | | | | | | | | |
| Investor Shares | | | (43,079 | ) | | | (52,512 | ) | | | (50,038 | ) | | | (63,330 | ) |
| Institutional Shares | | | (1,075,264 | ) | | | (1,404,418 | ) | | | (336,629 | ) | | | (442,376 | ) |
| A Shares | | | (44,280 | ) | | | (25,481 | ) | | | (3,815 | ) | | | (5,552 | ) |
| Change in net assets from shareholder distributions | | | (1,162,623 | ) | | | (1,482,411 | ) | | | (390,482 | ) | | | (511,258 | ) |
| Change in net assets from capital transactions | | | (34,002,430 | ) | | | (12,793,067 | ) | | | (3,399,115 | ) | | | (5,218,938 | ) |
| Change in net assets | | | (38,752,290 | ) | | | (13,705,554 | ) | | | (5,775,297 | ) | | | (5,352,809 | ) |
| Net Assets: | | | | | | | | | | | | | | | | |
| Beginning of year | | | 83,549,209 | | | | 97,254,763 | | | | 25,561,114 | | | | 30,913,923 | |
| End of year | | $ | 44,796,919 | | | $ | 83,549,209 | | | $ | 19,785,817 | | | $ | 25,561,114 | |
| Capital Transactions: | | | | | | | | | | | | | | | | |
| Investor Shares | | | | | | | | | | | | | | | | |
| Proceeds from shares issued | | $ | 11,269 | | | $ | 555,021 | | | $ | 220,100 | | | $ | 902,876 | |
| Dividends reinvested | | | 41,806 | | | | 51,176 | | | | 50,038 | | | | 62,614 | |
| Cost of shares redeemed | | | (807,602 | ) | | | (1,220,569 | ) | | | (867,266 | ) | | | (952,226 | ) |
| Change in net assets from Investor Shares | | | (754,527 | ) | | | (614,372 | ) | | | (597,128 | ) | | | 13,264 | |
| Institutional Shares | | | | | | | | | | | | | | | | |
| Proceeds from shares issued | | | 16,752,816 | | | | 28,467,762 | | | | 1,883,193 | | | | 7,093,665 | |
| Dividends reinvested | | | 606,576 | | | | 836,063 | | | | 164,140 | | | | 234,317 | |
| Cost of shares redeemed | | | (50,654,500 | ) | | | (43,353,128 | ) | | | (4,676,574 | ) | | | (12,629,495 | ) |
| Change in net assets from Institutional Shares | | | (33,295,108 | ) | | | (14,049,303 | ) | | | (2,629,241 | ) | | | (5,301,513 | ) |
| A Shares | | | | | | | | | | | | | | | | |
| Proceeds from shares issued | | | 290,622 | | | | 1,906,563 | | | | 25 | | | | 92,756 | |
| Dividends reinvested | | | 44,279 | | | | 25,481 | | | | 3,815 | | | | 5,550 | |
| Cost of shares redeemed | | | (287,696 | ) | | | (61,436 | ) | | | (176,586 | ) | | | (28,995 | ) |
| Change in net assets from A Shares | | | 47,205 | | | | 1,870,608 | | | | (172,746 | ) | | | 69,311 | |
| Change in net assets resulting from capital transactions: | | $ | (34,002,430 | ) | | $ | (12,793,067 | ) | | $ | (3,399,115 | ) | | $ | (5,218,938 | ) |
| Share Transactions: | | | | | | | | | | | | | | | | |
| Investor Shares | | | | | | | | | | | | | | | | |
| Issued | | | 1,187 | | | | 56,914 | | | | 21,305 | | | | 83,767 | |
| Reinvested | | | 4,477 | | | | 5,251 | | | | 4,904 | | | | 5,814 | |
| Redeemed | | | (85,460 | ) | | | (125,227 | ) | | | (83,755 | ) | | | (88,700 | ) |
| Change in Investor Shares | | | (79,796 | ) | | | (63,062 | ) | | | (57,546 | ) | | | 881 | |
| Institutional Shares | | | | | | | | | | | | | | | | |
| Issued | | | 1,770,616 | | | | 2,920,107 | | | | 181,904 | | | | 657,583 | |
| Reinvested | | | 64,665 | | | | 85,839 | | | | 16,084 | | | | 21,751 | |
| Redeemed | | | (5,403,133 | ) | | | (4,448,272 | ) | | | (456,243 | ) | | | (1,171,550 | ) |
| Change in Institutional Shares | | | (3,567,852 | ) | | | (1,442,326 | ) | | | (258,255 | ) | | | (492,216 | ) |
| A Shares | | | | | | | | | | | | | | | | |
| Issued | | | 30,037 | | | | 195,637 | | | | 3 | | | | 8,573 | |
| Reinvested | | | 4,747 | | | | 2,617 | | | | 372 | | | | 515 | |
| Redeemed | | | (30,469 | ) | | | (6,298 | ) | | | (16,926 | ) | | | (2,686 | ) |
| Change in A Shares | | | 4,315 | | | | 191,956 | | | | (16,551 | ) | | | 6,402 | |
| Change in shares: | | | (3,643,333 | ) | | | (1,313,432 | ) | | | (332,352 | ) | | | (484,933 | ) |
See notes to financial statements.
| Statements of Changes in Net Assets | |
| August 31, 2022 | Continued |
| | | Bond Fund | | | Strategic Enhanced Yield Fund | |
| | | Year Ended August 31, 2022 | | | Year Ended August 31, 2021 | | | Year Ended August 31, 2022 | | | Year Ended August 31, 2021 | |
| From Investment Activities: | | | | | | | | | | | | |
| Operations: | | | | | | | | | | | | |
| Net investment income/(loss) | | $ | 2,482,631 | | | $ | 1,999,977 | | | $ | 444,263 | | | $ | 497,072 | |
| Net realized gains/(losses) from investment transactions | | | (979,869 | ) | | | 1,265,527 | | | | (703,588 | ) | | | (589,858 | ) |
| Change in unrealized appreciation/(depreciation) on investments | | | (15,380,049 | ) | | | (2,642,919 | ) | | | (1,353,067 | ) | | | 165,891 | |
| Change in net assets resulting from operations | | | (13,877,287 | ) | | | 622,585 | | | | (1,612,392 | ) | | | 73,105 | |
| | | | | | | | | | | | | | | | | |
| Distributions to Shareholders: | | | | | | | | | | | | | | | | |
| Investor Shares | | | (25,319 | ) | | | (29,969 | ) | | | (20,396 | ) | | | (64,540 | ) |
| Institutional Shares | | | (2,582,656 | ) | | | (2,027,698 | ) | | | (437,694 | ) | | | (825,434 | ) |
| A Shares | | | (1,520 | ) | | | (1,514 | ) | | | (6,659 | ) | | | (31,480 | ) |
| Change in net assets from shareholder distributions | | | (2,609,495 | ) | | | (2,059,181 | ) | | | (464,749 | ) | | | (921,454 | ) |
| Change in net assets from capital transactions | | | 36,779,451 | | | | 14,836,905 | | | | (9,488,193 | ) | | | 2,570,720 | |
| Change in net assets | | | 20,292,669 | | | | 13,400,309 | | | | (11,565,334 | ) | | | 1,722,371 | |
| | | | | | | | | | | | | | | | | |
| Net Assets: | | | | | | | | | | | | | | | | |
| Beginning of year | | | 109,955,292 | | | | 96,554,983 | | | | 21,628,306 | | | | 19,905,935 | |
| End of year | | $ | 130,247,961 | | | $ | 109,955,292 | | | $ | 10,062,972 | | | $ | 21,628,306 | |
| | | | | | | | | | | | | | | | | |
| Capital Transactions: | | | | | | | | | | | | | | | | |
| Investor Shares | | | | | | | | | | | | | | | | |
| Proceeds from shares issued | | $ | 38,538 | | | $ | 41,484 | | | $ | 4,816 | | | $ | 294,750 | |
| Dividends reinvested | | | 25,319 | | | | 29,905 | | | | 20,393 | | | | 64,365 | |
| Cost of shares redeemed | | | (194,231 | ) | | | (986,906 | ) | | | (532,997 | ) | | | (1,323,607 | ) |
| Change in net assets from Investor Shares | | | (130,374 | ) | | | (915,517 | ) | | | (507,788 | ) | | | (964,492 | ) |
| Institutional Shares | | | | | | | | | | | | | | | | |
| Proceeds from shares issued | | | 55,317,752 | | | | 29,547,900 | | | | 4,994,688 | | | | 14,958,770 | |
| Dividends reinvested | | | 622,019 | | | | 381,885 | | | | 265,982 | | | | 526,427 | |
| Cost of shares redeemed | | | (19,030,180 | ) | | | (14,186,205 | ) | | | (13,511,894 | ) | | | (12,505,491 | ) |
| Change in net assets from Institutional Shares | | | 36,909,591 | | | | 15,743,580 | | | | (8,251,224 | ) | | | 2,979,706 | |
| A Shares | | | | | | | | | | | | | | | | |
| Proceeds from shares issued | | | 29,202 | | | | 55,291 | | | | 24 | | | | 669,546 | |
| Dividends reinvested | | | 1,520 | | | | 1,514 | | | | 6,660 | | | | 31,480 | |
| Cost of shares redeemed | | | (30,488 | ) | | | (47,963 | ) | | | (735,865 | ) | | | (145,520 | ) |
| Change in net assets from A Shares | | | 234 | | | | 8,842 | | | | (729,181 | ) | | | 555,506 | |
| Change in net assets resulting from capital transactions: | | $ | 36,779,451 | | | $ | 14,836,905 | | | $ | (9,488,193 | ) | | $ | 2,570,720 | |
| | | | | | | | | | | | | | | | | |
| Share Transactions: | | | | | | | | | | | | | | | | |
| Investor Shares | | | | | | | | | | | | | | | | |
| Issued | | | 4,214 | | | | 4,147 | | | | 476 | | | | 27,710 | |
| Reinvested | | | 2,725 | | | | 2,987 | | | | 2,065 | | | | 6,112 | |
| Redeemed | | | (20,095 | ) | | | (98,661 | ) | | | (52,982 | ) | | | (127,382 | ) |
| Change in Investor Shares | | | (13,156 | ) | | | (91,527 | ) | | | (50,441 | ) | | | (93,560 | ) |
| Institutional Shares | | | | | | | | | | | | | | | | |
| Issued | | | 6,062,396 | | | | 2,958,738 | | | | 506,971 | | | | 1,429,340 | |
| Reinvested | | | 68,147 | | | | 38,292 | | | | 27,093 | | | | 50,755 | |
| Redeemed | | | (2,051,876 | ) | | | (1,419,135 | ) | | | (1,390,504 | ) | | | (1,213,434 | ) |
| Change in Institutional Shares | | | 4,078,667 | | | | 1,577,895 | | | | (856,440 | ) | | | 266,661 | |
| A Shares | | | | | | | | | | | | | | | | |
| Issued | | | 2,954 | | | | 5,479 | | | | 3 | | | | 62,698 | |
| Reinvested | | | 162 | | | | 151 | | | | 678 | | | | 3,036 | |
| Redeemed | | | (3,242 | ) | | | (4,836 | ) | | | (71,774 | ) | | | (13,966 | ) |
| Change in A Shares | | | (126 | ) | | | 794 | | | | (71,093 | ) | | | 51,768 | |
| Change in shares: | | | 4,065,385 | | | | 1,487,162 | | | | (977,974 | ) | | | 224,869 | |
See notes to financial statements.
| Statements of Changes in Net Assets | |
| August 31, 2022 | Continued |
| | | Ultra Short Tax-Free Income Fund | | | Mid Cap Diverse Leadership Fund | |
| | | Year Ended
August 31, 2022 | | | Year Ended
August 31, 2021 | | | Year Ended
August 31, 2022 | | | Year Ended
August 31, 2021 | |
| From Investment Activities: | | | | | | | | | | | | |
| Operations: | | | | | | | | | | | | |
| Net investment income/(loss) | | $ | 41,768 | | | $ | (16,840 | ) | | $ | 10,013 | | | $ | 430 | |
| Net realized gains/(losses) from investment transactions | | | (138 | ) | | | (80 | ) | | | 145,947 | | | | 189,918 | |
| Change in unrealized appreciation/(depreciation) on investments | | | (251,564 | ) | | | (6,362 | ) | | | (323,767 | ) | | | 185,726 | |
| Change in net assets resulting from operations | | | (209,934 | ) | | | (23,282 | ) | | | (167,807 | ) | | | 376,074 | |
| | | | | | | | | | | | | | | | | |
| Distributions to Shareholders: | | | | | | | | | | | | | | | | |
| Investor Shares | | | (56 | ) | | | — | | | | (122,399 | ) | | | (13,093 | ) |
| Institutional Shares | | | (42,794 | ) | | | (2,633 | ) | | | (66,951 | ) | | | (74,855 | ) |
| A Shares | | | (23 | ) | | | — | | | | (6,006 | ) | | | (12,792 | ) |
| C Shares | | | — | | | | — | | | | (1,043 | ) | | | (5,233 | ) |
| Change in net assets from shareholder distributions | | | (42,873 | ) | | | (2,633 | ) | | | (196,399 | ) | | | (105,973 | ) |
| Change in net assets from capital transactions | | | (5,666,684 | ) | | | (6,850,742 | ) | | | 1,329,793 | | | | 161,977 | |
| Change in net assets | | | (5,919,491 | ) | | | (6,876,657 | ) | | | 965,587 | | | | 432,078 | |
| | | | | | | | | | | | | | | | | |
| Net Assets: | | | | | | | | | | | | | | | | |
| Beginning of year | | | 32,633,500 | | | | 39,510,157 | | | | 1,384,153 | | | | 952,075 | |
| End of year | | $ | 26,714,009 | | | $ | 32,633,500 | | | $ | 2,349,740 | | | $ | 1,384,153 | |
| | | | | | | | | | | | | | | | | |
| Capital Transactions: | | | | | | | | | | | | | | | | |
| Investor Shares | | | | | | | | | | | | | | | | |
| Proceeds from shares issued | | $ | 89 | | | $ | 898 | | | $ | 3,155,422 | | | $ | 40,353 | |
| Dividends reinvested | | | 56 | | | | — | | | | 122,399 | | | | 13,004 | |
| Cost of shares redeemed | | | (383 | ) | | | (433,780 | ) | | | (3,119,269 | ) | | | (85,076 | ) |
| Change in net assets from Investor Shares | | | (238 | ) | | | (432,882 | ) | | | 158,552 | | | | (31,719 | ) |
| Institutional Shares | | | | | | | | | | | | | | | | |
| Proceeds from shares issued | | | 2,094,894 | | | | 2,960,837 | | | | 1,605,817 | | | | 267,454 | |
| Dividends reinvested | | | 3,420 | | | | 253 | | | | 62,749 | | | | 74,351 | |
| Cost of shares redeemed | | | (7,792,909 | ) | | | (9,378,987 | ) | | | (523,659 | ) | | | (132,543 | ) |
| Change in net assets from Institutional Shares | | | (5,694,595 | ) | | | (6,417,897 | ) | | | 1,144,907 | | | | 209,262 | |
| A Shares | | | | | | | | | | | | | | | | |
| Proceeds from shares issued | | | 29,696 | | | | 6,457 | | | | 24,219 | | | | 6,375 | |
| Dividends reinvested | | | 22 | | | | — | | | | 6,006 | | | | 12,792 | |
| Cost of shares redeemed | | | (1,569 | ) | | | (6,420 | ) | | | (4,902 | ) | | | (28,927 | ) |
| Change in net assets from A Shares | | | 28,149 | | | | 37 | | | | 25,323 | | | | (9,760 | ) |
| C Shares | | | | | | | | | | | | | | | | |
| Proceeds from shares issued | | | — | | | | — | | | | 6,210 | | | | 55,118 | |
| Dividends reinvested | | | — | | | | — | | | | 1,043 | | | | 5,232 | |
| Cost of shares redeemed | | | — | | | | — | | | | (6,242 | ) | | | (66,156 | ) |
| Change in net assets from C Shares | | | — | | | | — | | | | 1,011 | | | | (5,806 | ) |
| Change in net assets resulting from capital transactions | | $ | (5,666,684 | ) | | $ | (6,850,742 | ) | | $ | 1,329,793 | | | $ | 161,977 | |
| | | | | | | | | | | | | | | | | |
| Share Transactions: | | | | | | | | | | | | | | | | |
| Investor Shares | | | | | | | | | | | | | | | | |
| Issued | | | 9 | | | | 82 | | | | 218,492 | | | | 2,993 | |
| Reinvested | | | 6 | | | | — | | | | 8,941 | | | | 1,095 | |
| Redeemed | | | (39 | ) | | | (43,442 | ) | | | (220,537 | ) | | | (6,713 | ) |
| Change in Investor Shares | | | (24 | ) | | | (43,360 | ) | | | 6,896 | | | | (2,625 | ) |
| Institutional Shares | | | | | | | | | | | | | | | | |
| Issued | | | 210,484 | | | | 295,788 | | | | 117,249 | | | | 20,060 | |
| Reinvested | | | 242 | | | | 25 | | | | 4,596 | | | | 6,251 | |
| Redeemed | | | (781,970 | ) | | | (936,954 | ) | | | (39,776 | ) | | | (10,712 | ) |
| Change in Institutional Shares | | | (571,244 | ) | | | (641,141 | ) | | | 82,069 | | | | 15,599 | |
| A Shares | | | | | | | | | | | | | | | | |
| Shares Issued | | | 2,985 | | | | 646 | | | | 1,771 | | | | 534 | |
| Reinvested | | | 2 | | | | — | | | | 437 | | | | 1,070 | |
| Redeemed | | | (158 | ) | | | (643 | ) | | | (347 | ) | | | (2,255 | ) |
| Change in A Shares | | | 2,829 | | | | 3 | | | | 1,861 | | | | (651 | ) |
| C Shares | | | | | | | | | | | | | | | | |
| Shares Issued | | | — | | | | — | | | | 488 | | | | 4,766 | |
| Reinvested | | | — | | | | — | | | | 78 | | | | 449 | |
| Redeemed | | | — | | | | — | | | | (466 | ) | | | (5,509 | ) |
| Change in C Shares | | | — | | | | — | | | | 100 | | | | (294 | ) |
| Change in shares: | | | (568,439 | ) | | | (684,498 | ) | | | 90,926 | | | | 12,029 | |
See notes to financial statements.
| Statements of Changes in Net Assets | |
| August 31, 2022 | Continued |
| | | Opportunistic Fund | | | World Energy Fund | |
| | | Year Ended
August 31, 2022 | | | Year Ended
August 31, 2021 | | | Year Ended
August 31, 2022 | | | Year Ended
August 31, 2021 | |
| From Investment Activities: | | | | | | | | | | | | |
| Operations: | | | | | | | | | | | | |
| Net investment income/(loss) | | $ | 446,726 | | | $ | 477,794 | | | $ | 1,109,112 | | | $ | 366,721 | |
| Net realized gains/(losses) from investment transactions | | | (7,952,662 | ) | | | 3,732,056 | | | | 2,458,560 | | | | 1,852,240 | |
| Change in unrealized appreciation/(depreciation) on investments | | | (6,048,563 | ) | | | 4,451,747 | | | | 11,611,800 | | | | 3,612,155 | |
| Change in net assets resulting from operations | | | (13,554,499 | ) | | | 8,661,597 | | | | 15,179,472 | | | | 5,831,116 | |
| | | | | | | | | | | | | | | | | |
| Distributions to Shareholders: | | | | | | | | | | | | | | | | |
| Investor Shares | | | (49,301 | ) | | | (11,761 | ) | | | (317,594 | ) | | | (67,985 | ) |
| Institutional Shares | | | (2,292,163 | ) | | | (303,158 | ) | | | (541,066 | ) | | | (172,313 | ) |
| A Shares | | | (44,392 | ) | | | (5,948 | ) | | | (63,255 | ) | | | (47,053 | ) |
| C Shares | | | (8,783 | ) | | | (388 | ) | | | (42,779 | ) | | | (25,498 | ) |
| Change in net assets from shareholder distributions | | | (2,394,639 | ) | | | (321,255 | ) | | | (964,694 | ) | | | (312,849 | ) |
| Change in net assets from capital transactions | | | (16,196,533 | ) | | | 35,766,525 | | | | 28,684,398 | | | | 8,771,925 | |
| Change in net assets | | | (32,145,671 | ) | | | 44,106,867 | | | | 42,899,176 | | | | 14,290,192 | |
| | | | | | | | | | | | | | | | | |
| Net Assets: | | | | | | | | | | | | | | | | |
| Beginning of year | | | 77,810,388 | | | | 33,703,521 | | | | 27,852,286 | | | | 13,562,094 | |
| End of year | | $ | 45,664,717 | | | $ | 77,810,388 | | | $ | 70,751,462 | | | $ | 27,852,286 | |
| | | | | | | | | | | | | | | | | |
| Capital Transactions: | | | | | | | | | | | | | | | | |
| Investor Shares | | | | | | | | | | | | | | | | |
| Proceeds from shares issued | | $ | 120,089 | | | $ | 3,310,414 | | | $ | 31,810,076 | | | $ | 5,212,987 | |
| Dividends reinvested | | | 49,301 | | | | 11,444 | | | | 317,360 | | | | 66,224 | |
| Cost of shares redeemed | | | (3,534,195 | ) | | | (294,047 | ) | | | (17,548,706 | ) | | | (2,686,075 | ) |
| Change in net assets from Investor Shares | | | (3,364,805 | ) | | | 3,027,811 | | | | 14,578,730 | | | | 2,593,136 | |
| Institutional Shares | | | | | | | | | | | | | | | | |
| Proceeds from shares issued | | | 10,231,974 | | | | 40,860,617 | | | | 33,008,856 | | | | 14,547,307 | |
| Dividends reinvested | | | 1,254,755 | | | | 112,692 | | | | 419,586 | | | | 113,672 | |
| Cost of shares redeemed | | | (24,242,171 | ) | | | (8,030,738 | ) | | | (19,436,098 | ) | | | (7,484,500 | ) |
| Change in net assets from Institutional Shares | | | (12,755,442 | ) | | | 32,942,571 | | | | 13,992,344 | | | | 7,176,479 | |
| A Shares | | | | | | | | | | | | | | | | |
| Proceeds from shares issued | | | 173,387 | | | | 19,456 | | | | 3,028,302 | | | | 1,852,753 | |
| Dividends reinvested | | | 44,036 | | | | 5,745 | | | | 63,116 | | | | 47,053 | |
| Cost of shares redeemed | | | (298,797 | ) | | | (214,387 | ) | | | (3,345,308 | ) | | | (2,503,045 | ) |
| Change in net assets from A Shares | | | (81,374 | ) | | | (189,186 | ) | | | (253,890 | ) | | | (603,239 | ) |
| C Shares | | | | | | | | | | | | | | | | |
| Proceeds from shares issued | | | 2,870 | | | | 250 | | | | 1,446,540 | | | | 76,500 | |
| Dividends reinvested | | | 8,783 | | | | 387 | | | | 42,590 | | | | 25,382 | |
| Cost of shares redeemed | | | (6,566 | ) | | | (15,308 | ) | | | (1,121,916 | ) | | | (496,333 | ) |
| Change in net assets from C Shares | | | 5,087 | | | | (14,671 | ) | | | 367,214 | | | | (394,451 | ) |
| Change in net assets resulting from capital transactions: | | $ | (16,196,534 | ) | | $ | 35,766,525 | | | $ | 28,684,398 | | | $ | 8,771,925 | |
| | | | | | | | | | | | | | | | | |
| Share Transactions: | | | | | | | | | | | | | | | | |
| Investor Shares | | | | | | | | | | | | | | | | |
| Issued | | | 7,187 | | | | 194,709 | | | | 2,778,942 | | | | 609,948 | |
| Reinvested | | | 3,069 | | | | 692 | | | | 28,654 | | | | 8,505 | |
| Redeemed | | | (212,100 | ) | | | (17,769 | ) | | | (1,586,455 | ) | | | (326,937 | ) |
| Change in Investor Shares | | | (201,844 | ) | | | 177,632 | | | | 1,221,141 | | | | 291,516 | |
| Institutional Shares | | | | | | | | | | | | | | | | |
| Issued | | | 649,147 | | | | 2,451,512 | | | | 2,959,442 | | | | 1,621,434 | |
| Reinvested | | | 77,257 | | | | 6,889 | | | | 38,796 | | | | 13,922 | |
| Redeemed | | | (1,683,372 | ) | | | (486,784 | ) | | | (1,735,811 | ) | | | (891,472 | ) |
| Change in Institutional Shares | | | (956,968 | ) | | | 1,971,617 | | | | 1,262,427 | | | | 743,884 | |
| A Shares | | | | | | | | | | | | | | | | |
| Issued | | | 10,885 | | | | 1,210 | | | | 286,867 | | | | 239,500 | |
| Reinvested | | | 2,735 | | | | 354 | | | | 5,923 | | | | 6,065 | |
| Redeemed | | | (19,201 | ) | | | (13,862 | ) | | | (288,992 | ) | | | (299,163 | ) |
| Change in A Shares | | | (5,581 | ) | | | (12,298 | ) | | | 3,798 | | | | (53,598 | ) |
| C Shares | | | | | | | | | | | | | | | | |
| Issued | | | 189 | | | | 17 | | | | 124,853 | | | | 9,518 | |
| Reinvested | | | 562 | | | | 24 | | | | 3,988 | | | | 3,480 | |
| Redeemed | | | (420 | ) | | | (1,130 | ) | | | (101,005 | ) | | | (62,947 | ) |
| Change in C Shares | | | 331 | | | | (1,089 | ) | | | 27,836 | | | | (49,949 | ) |
| Change in shares: | | | (1,164,062 | ) | | | 2,135,862 | | | | 2,515,202 | | | | 931,853 | |
See notes to financial statements.
| Statements of Changes in Net Assets | |
| August 31, 2022 | Concluded |
| | | Hedged Income Fund | |
| | | Year Ended August 31, 2022 | | | For the period
Dec. 28, 2020(a)
through Aug. 31, 2021 | |
| From Investment Activities: | | | | | | |
| Operations: | | | | | | |
| Net investment income/(loss) | | $ | 674,612 | | | $ | 204,903 | |
| Net realized gains/(losses) from investment transactions | | | (858,439 | ) | | | (437,605 | ) |
| Change in unrealized appreciation/(depreciation) on investments | | | (1,892,903 | ) | | | 1,337,293 | |
| Change in net assets resulting from operations | | | (2,076,730 | ) | | | 1,104,591 | |
| | | | | | | | | |
| Distributions to Shareholders: | | | | | | | | |
| Investor Shares | | | (10,989 | ) | | | (4,957 | ) |
| Institutional Shares | | | (579,966 | ) | | | (109,507 | ) |
| A Shares | | | (33,527 | ) | | | (5,444 | ) |
| Change in net assets from shareholder distributions | | | (624,482 | ) | | | (119,908 | ) |
| Change in net assets from capital transactions | | | 11,784,372 | | | | 25,203,423 | |
| Change in net assets | | | 9,083,160 | | | | 26,188,106 | |
| | | | | | | | | |
| Net Assets: | | | | | | | | |
| Beginning of year | | | 26,188,106 | | | | — | |
| End of year | | $ | 35,271,266 | | | $ | 26,188,106 | |
| | | | | | | | | |
| Capital Transactions: | | | | | | | | |
| Investor Shares | | | | | | | | |
| Proceeds from shares issued | | $ | 211,824 | | | $ | 1,514,710 | |
| Dividends reinvested | | | 10,988 | | | | 4,957 | |
| Cost of shares redeemed | | | (1,287,615 | ) | | | (113,901 | ) |
| Change in net assets from Investor Shares | | | (1,064,803 | ) | | | 1,405,766 | |
| Institutional Shares | | | | | | | | |
| Proceeds from shares issued | | | 14,567,900 | | | | 23,430,996 | |
| Dividends reinvested | | | 106,536 | | | | 26,296 | |
| Cost of shares redeemed | | | (2,049,979 | ) | | | (1,316,880 | ) |
| Change in net assets from Institutional Shares | | | 12,624,457 | | | | 22,140,412 | |
| A Shares | | | | | | | | |
| Proceeds from shares issued | | | 1,118,043 | | | | 1,652,709 | |
| Dividends reinvested | | | 32,708 | | | | 4,822 | |
| Cost of shares redeemed | | | (926,033 | ) | | | (286 | ) |
| Change in net assets from A Shares | | | 224,718 | | | | 1,657,245 | |
| Change in net assets resulting from capital transactions: | | $ | 11,784,372 | | | $ | 25,203,423 | |
| | | | | | | | | |
| Share Transactions: | | | | | | | | |
| Investor Shares | | | | | | | | |
| Issued | | | 20,287 | | | | 143,072 | |
| Reinvested | | | 1,063 | | | | 465 | |
| Redeemed | | | (123,208 | ) | | | (10,567 | ) |
| Change in Investor Shares | | | (101,858 | ) | | | 132,970 | |
| Institutional Shares | | | | | | | | |
| Issued | | | 1,399,840 | | | | 2,250,424 | |
| Reinvested | | | 10,323 | | | | 2,493 | |
| Redeemed | | | (198,643 | ) | | | (123,673 | ) |
| Change in Institutional Shares | | | 1,211,520 | | | | 2,129,244 | |
| A Shares | | | | | | | | |
| Issued | | | 108,174 | | | | 157,741 | |
| Reinvested | | | 3,174 | | | | 458 | |
| Redeemed | | | (89,360 | ) | | | (28 | ) |
| Change in A Shares | | | 21,988 | | | | 158,171 | |
| Change in shares: | | | 1,131,650 | | | | 2,420,385 | |
| (a) | Commencement of operations December 28, 2020. |
See notes to financial statements.
| Schedule of Portfolio Investments | U.S. Treasury Fund |
| August 31, 2022 | |
Shares or
Principal
Amount | | | Security Description | | Amortized
Cost or Value | |
| U.S. Treasury Obligations (10.6%) | | | |
| U.S. Treasury Bills | | | |
| $ | 100,000,000 | | | 0.09%, 10/6/22(a) | | $ | 99,991,104 | |
| Total U.S. Treasury Obligations (Cost $99,991,104) | | | 99,991,104 | |
Repurchase Agreements (81.3%)
| | 90,000,000 | | | Bank of Montreal, 2.22%, 9/1/22, (Purchased on 8/31/22, proceeds at maturity $90,005,550, Collateralized by various U.S. Treasury Obligations, (0.88% - 2.75%), (4/30/23 - 9/30/26), fair value of $91,800,014) | | | 90,000,000 | |
| | 100,000,000 | | | Credit Agricole CIB, 2.2%, 9/1/22, (Purchased on 8/31/22, proceeds at maturity $100,006,111, Collateralized by U.S. Treasury Obligation, (2.75%), (8/15/47), fair value of $102,000,077) | | | 100,000,000 | |
| | 180,000,000 | | | Fixed Income Clearing Corporation - Bank of New York Mellon, 2.26%, 9/1/22, (Purchased on 8/31/22, proceeds at maturity $180,011,300, Collateralized by U.S. Treasury Obligation, (1.63%), (2/15/26), fair value of $183,600,040) | | | 180,000,000 | |
| | 140,000,000 | | | Fixed Income Clearing Corporation - State Street Bank & Trust Co., 2.23%, 9/1/22, (Purchased on 8/31/22, proceeds at maturity $140,008,672, Collateralized by various U.S. Treasury Obligations, (2.00% - 2.50%), (5/15/24 - 2/15/50), fair value of $142,800,014) | | | 140,000,000 | |
Repurchase Agreements, continued:
| $ | 90,000,000 | | | Goldman Sachs & Co., 2.22%, 9/1/22, (Purchased on 8/31/22, proceeds at maturity $90,005,550, Collateralized by U.S. Treasury Obligation, (2.25%), (12/31/23), fair value of $91,800,008) | | $ | 90,000,000 | |
| | 40,000,000 | | | Nomura Securities International, Inc., 2.26%, 9/1/22, (Purchased on 8/31/22, proceeds at maturity $40,002,511, Collateralized by various U.S. Treasury Obligations, (0.25% - 2.13%), (9/30/24 - 5/31/25), fair value of $40,800,043) | | | 40,000,000 | |
| | 130,000,000 | | | RBC Dominion Securities, Inc., 2.23%, 9/1/22, (Purchased on 8/31/22, proceeds at maturity $130,008,053, Collateralized by various U.S. Treasury Obligations, (0.13% - 4.25%), (12/31/24 - 8/15/52), fair value of $132,600,145) | | | 130,000,000 | |
| | Total Repurchase Agreements (Cost $770,000,000) | | | 770,000,000 | |
Investment Companies (8.3%)
| | 5,667,225 | | | BlackRock Liquidity Funds T-Fund, Institutional Class, 2.04%(b) | | | 5,667,225 | |
| | 73,000,000 | | | Goldman Sachs Financial Square Treasury Obligations Fund, 2.22%(b) | | | 73,000,000 | |
| Total Investment Companies (Cost $78,667,225) | | | 78,667,225 | |
| Total Investments (Cost $948,658,329)(c) — 100.2% | | | 948,658,329 | |
| Liabilities in excess of other assets — (0.2)% | | | (1,528,625 | ) |
| Net Assets - 100.0% | | $ | 947,129,704 | |
| (a) | Zero coupon bond. The rate presented on the Schedule of Portfolio Investments is the rate in effect at August 31, 2022. |
| (b) | Money market investment. The rate presented on the Schedule of Portfolio Investments is the rate in effect at August 31, 2022. |
| (c) | Cost and value for federal income tax and financial reporting purposes are the same. |
See notes to financial statements.
| Schedule of Portfolio Investments | Government Securities Money Market Fund |
| August 31, 2022 | |
Shares or Principal
Amount | | | Security Description | | | Amortized
Cost or Value | |
| U.S. Government Agency Securities (23.6%) | |
| Federal Farm Credit Bank | | | | |
| $ | 200,000,000 | | | 2.30% (SOFR + 1 bps), 3/3/23 | | $ | 199,994,904 | |
| | 70,000,000 | | | 2.32% (SOFR + 3 bps), 3/23/23, Callable 12/23/22 @ 100 * | | | 70,000,000 | |
| | | | | | | | 269,994,904 | |
| Federal Home Loan Bank | | | | |
| | 22,000,000 | | | 0.09%, 10/18/22 (a) | | | 21,997,415 | |
| | 170,000,000 | | | 2.30% (SOFR + 1 bps), 9/6/22 | | | 170,000,000 | |
| | 50,000,000 | | | 2.32% (SOFR + 3 bps), 1/19/23 | | | 50,000,000 | |
| | | | | | | | 241,997,415 | |
Total U.S. Government Agency Securities (Cost $511,992,319) | | | 511,992,319 | |
| | | | | | | | | |
| U.S. Treasury Obligations (32.2%) |
| U.S. Treasury Bills | | | | |
| | 100,000,000 | | | 0.09%, 10/6/22(a) | | | 99,990,205 | |
| | 600,000,000 | | | 0.48%, 9/1/22(a) | | | 600,000,000 | |
| Total U.S. Treasury Obligations (Cost $699,990,205) | | | 699,990,205 | |
| | | | | | | | | |
| Repurchase Agreements (37.5%) |
| | 10,000,000 | | | Bank of Montreal, 2.22%, 9/1/22, (Purchased on 8/31/22, proceeds at maturity $10,000,617, Collateralized by U.S. Treasury Obligation, (2.00%), (5/31/24), fair value of $10,200,075) | | | 10,000,000 | |
| | 50,000,000 | | | Credit Agricole CIB, 2.2%, 9/1/22, (Purchased on 8/31/22, proceeds at maturity $50,003,056, Collateralized by various U.S. Treasury Obligations, (1.00% - 2.13%), (2/15/41 - 2/15/46), fair value of $51,000,139) | | | 50,000,000 | |
| | 250,000,000 | | | Federal Reserve Bank of New York, 2.3%, 9/1/22, (Purchased on 8/31/22, proceeds at maturity $250,015,972, Collateralized by U.S. Treasury Obligation, (1.75%), (11/15/29), fair value of $250,016,044) | | | 250,000,000 | |
| 160,000,000 | | | Fixed Income Clearing Corporation - Bank of New York Mellon, 2.26%, 9/1/22, (Purchased on 8/31/22, proceeds at maturity $160,010,044, Collateralized by U.S. Treasury Obligation, (1.63%), (2/15/26), fair value of $163,200,025) | | | 160,000,000 | |
Shares or Principal
Amount | | | Security Description | | | Amortized
Cost or
Value | |
| Repurchase Agreements, continued: | | | | |
| $ | 125,000,000 | | | Fixed Income Clearing Corporation - State Street Bank & Trust Co., 2.23%, 9/1/22, (Purchased on 8/31/22, proceeds at maturity $125,007,743, Collateralized by various U.S. Treasury Obligations, (2.00% - 3.38%), (4/30/24 - 2/15/50), fair value of $127,500,069) | | $ | 125,000,000 | |
| | 10,000,000 | | | Goldman Sachs & Co., 2.22%, 9/1/22, (Purchased on 8/31/22, proceeds at maturity $10,000,617, Collateralized by various U.S. Treasury Obligations, (0.00%), (11/15/22 - 5/15/39), fair value of $10,200,000) | | | 10,000,000 | |
| | 100,000,000 | | | Nomura Securities International, Inc., 2.26%, 9/1/22, (Purchased on 8/31/22, proceeds at maturity $100,006,278, Collateralized by various U.S. Treasury Obligations, (1.13% - 3.25%), (4/30/24 - 9/30/26), fair value of $102,000,063) | | | 100,000,000 | |
| | 110,000,000 | | | RBC Dominion Securities, Inc., 2.23%, 9/1/22, (Purchased on 8/31/22, proceeds at maturity $110,006,814, Collateralized by various U.S. Government Agency Obligations and U.S. Treasury Obligations, (0.00% - 4.50%), (9/30/22 - 8/20/52), fair value of $112,200,023) | | | 110,000,000 | |
| Total Repurchase Agreements (Cost $815,000,000) | | | 815,000,000 | |
| | | | | |
| Investment Companies (6.7%) | | | | |
| | 4,006,357 | | | BlackRock Liquidity Funds T-Fund, Institutional Class, 2.04%(b). | | | 4,006,357 | |
| | 38,000,000 | | | Goldman Sachs Financial Square Treasury Obligations Fund, 2.22%(b) | | | 38,000,000 | |
| | 103,000,000 | | | Invesco Short-Term Investments Trust, Government & Agency Portfolio, Institutional Class, 2.23%(b) | | | 103,000,000 | |
| Total Investment Companies (Cost $145,006,357) | | | 145,006,357 | |
| | | | | |
| Total Investments (Cost $2,171,988,881)(c) - 100.0% | | | 2,171,988,881 | |
| Liabilities in excess of other assets — 0.0%^ | | | (874,186 | ) |
| Net Assets - 100.0% | | $ | 2,171,114,695 | |
| (a) | Zero coupon bond. The rate presented on the Schedule of Portfolio Investments is the rate in effect at August 31, 2022. |
| (b) | Money market investment. The rate presented on the Schedule of Portfolio Investments is the rate in effect at August 31, 2022. |
| (c) | Cost and value for federal income tax and financial reporting purposes are the same |
| * | Represents next call date. Additional subsequent call dates and amounts may apply to this security. |
| ^ | Represents less than 0.05%. |
| SOFR | Secured Overnight Financing Rate |
See notes to financial statements.
| Schedule of Portfolio Investments | Limited Duration Fund |
| August 31, 2022 | |
| Shares or Principal Amount | | | Security Description | | | Value | |
| Asset Backed Securities (34.4%) | | | | |
| $ | 197,042 | | | Bayview Financial Mortgage Pass-Through Trust, Series 2005-C, Class M3, 4.09% (US0001M + 65 bps), 6/28/44, Callable 9/28/22 @ 100* | | $ | 197,276 | |
| | 636,553 | | | CDC Mortgage Capital Trust, Series 2002-HE1, Class A, 3.06% (US0001M + 62 bps), 1/25/33, Callable 9/25/22 @ 100* | | | 624,466 | |
| | 672,982 | | | CIT Mortgage Loan Trust, Series 2007-1, Class 1A, 3.79% (US0001M + 135 bps), 10/25/37, Callable 1/25/23 @ 100*(a) | | | 670,787 | |
| | 16 | | | Citigroup Mortgage Loan Trust, Inc., Series 2005-WF1, Class A5, 5.01%, 11/25/34, Callable 9/25/22 @ 100*(b) | | | 16 | |
| | 672,861 | | | CLI Funding VIII LLC, Series 2021-1A, Class B, 2.38%, 2/18/46, Callable 3/18/23 @ 100*(a) | | | 582,436 | |
| | 228 | | | Countrywide Asset-Backed Certificates, Series 2002-S1, Class A5, 6.46%, 5/25/32, Callable 9/25/22 @ 100*(b)(c) | | | 226 | |
| | 116,454 | | | Countrywide Asset-Backed Certificates, Series 2005-12, Class M2, 3.18% (US0001M + 49 bps), 2/25/36, Callable 9/25/22 @ 100* | | | 116,329 | |
| | 1,350,948 | | | Driven Brands Funding LLC, Series 2019-2A, Class A2, 3.98%, 10/20/49, Callable 10/20/24 @ 100*(a) | | | 1,235,164 | |
| | 806,000 | | | Flexential Issuer, Series 2021-1A, Class A2, 3.25%, 11/27/51, Callable 11/25/25 @ 100* | | | 747,313 | |
| | 457,984 | | | Fremont Home Loan Trust, Series 2004-3, Class 10A1, 5.46% (US0001M + 188 bps), 11/25/34, Callable 9/25/22 @ 100* | | | 347,984 | |
| | 1,450,195 | | | Goodgreen Trust, Series 2021-1A, Class A, 2.63%, 4/15/55, Callable 10/15/32 @ 100*(a) | | | 1,300,535 | |
| | 345,000 | | | Hi-Fi Music Ip Issuer II L.P, Series 2022-1A, Class A2, 3.94%, 2/1/62, Callable 11/1/22 @ 100* | | | 316,409 | |
| | 22 | | | IMC Home Equity Loan Trust, Series 1998-1, Class A6, 7.02%, 6/20/29(b)(c) | | | 21 | |
| | 777,150 | | | Jack In The Box Funding LLC, Series 2022-1A, Class A2I, 3.45%, 2/26/52, Callable 2/25/25 @ 100* | | | 713,735 | |
| | 155,684 | | | Lendingpoint Asset Securitization Trust, Series 2021-A, Class A, 1.00%, 12/15/28, Callable 1/15/23 @ 100*(a) | | | 154,716 | |
| | 297,743 | | | NMEF Funding LLC, Series 2021-A, Class A2, 0.81%, 12/15/27, Callable 8/15/23 @ 100* | | | 291,874 | |
| | 1,583,325 | | | NovaStar Mortgage Funding Trust, Series 2003-2, Class M2, 5.22% (US0001M + 278 bps), 9/25/33, Callable 9/25/22 @ 100* | | | 1,598,242 | |
| | 354,562 | | | RAAC Trust, Series 2007-SP1, Class M1, 3.30% (US0001M + 86 bps), 3/25/37, Callable 9/25/22 @ 100* | | | 352,804 | |
| | 76,772 | | | Residential Asset Mortgage Products, Inc., Series 2002-RS2, Class AI5, 6.03%, 3/25/32, Callable 9/25/22 @ 100* | | | 70,816 | |
| | 1,614 | | | Saxon Asset Securities Trust, Series 2003-3, Class AF6, 4.23%, 12/25/33, Callable 9/25/22 @ 100*(b)(c) | | | 1,541 | |
| | 1,535,792 | | | Sonic Capital LLC, Series 2021-1A, Class A2I, 2.19%, 8/20/51, Callable 8/20/25 @ 100*(a) | | | 1,280,072 | |
| | 51,907 | | | Soundview Home Equity Loan Trust, Series 2005-B, Class M2, 6.23%, 5/25/35, Callable 9/25/22 @ 100*(b)(c) | | | 47,728 | |
| | 606,187 | | | Structured Asset Investment Loan Trust, Series 2003-BC2, Class A1, 3.12% (US0001M + 68 bps), 4/25/33, Callable 9/25/22 @ 100* | | | 602,770 | |
| Shares or Principal Amount | | | Security Description | | | Value | |
| Asset Backed Securities, continued: | | | | |
| $ | 771,432 | | | Structured Asset Investment Loan Trust, Series 2005-HE3, Class M1, 3.16% (US0001M + 72 bps), 9/25/35, Callable 9/25/22 @ 100* | | $ | 763,199 | |
| | 189,958 | | | Structured Asset Securities Corp Mortgage Pass-Through Certificates, Series 2004-6XS, Class A5A, 6.03%, 3/25/34, Callable 9/25/22 @ 100*(b)(c) | | | 187,173 | |
| | 1,326,500 | | | Taco Bell Funding LLC, Series 2016-1A, Class A23, 4.97%, 7/25/35, Callable 5/25/23 @ 100*(a) | | | 1,314,418 | |
| | 560,168 | | | Textainer Marine Containers VII, Ltd., Series 2020-1A, Class A, 2.73%, 8/21/45, Callable 8/21/45 @ 100*(a) | | | 520,698 | |
| | 846,375 | | | Wendy's Funding LLC, Series 2019-1A, Class A2I, 3.78%, 6/15/49, Callable 3/15/24 @ 100*(a) | | | 795,632 | |
| | 648,450 | | | ZAXBY'S Funding LLC, Series 2021-1A, Class A2, 3.24%, 7/30/51, Callable 7/30/25 @ 100*(a) | | | 554,087 | |
| Total Asset Backed Securities (Cost $16,716,348) | | | 15,388,467 | |
| | | | | | | | | |
| Mortgage Backed Securities† (3.25%) | | | | |
| Alt-A - Adjustable Rate Mortgage Backed Securities (0.8%) | | | | |
| | 80,003 | | | Bear Stearns Alternative Trust, Series 2006-1, Class 21A2, 3.30%, 2/25/36, Callable 9/25/22 @ 100*(b) | | | 62,905 | |
| | 9,052 | | | Bear Stearns Alternative Trust, Series 2005-5, Class 26A1, 4.04%, 7/25/35, Callable 9/25/22 @ 100*(b) | | | 6,941 | |
| | 10,079 | | | Countrywide Alternative Loan Trust, Series 2005-24, Class 1A1, 2.17% (12MTA + 131 bps), 7/20/35, Callable 9/19/22 @ 100* | | | 8,396 | |
| | 1,008 | | | Deutsche Mortgage Securities, Inc., Series 2006-ABR, Class A1B1, 2.54% (US0001M + 10 bps), 10/25/36, Callable 9/25/22 @ 100* | | | 858 | |
| | 1,873 | | | Deutsche Mortgage Securities, Inc., Series 2003- 4XS, Class A6A, 5.32%, 10/25/33, Callable 9/25/22 @ 100*(b)(c) | | | 1,787 | |
| | 3,441 | | | Deutsche Mortgage Securities, Inc., Series 2006-AB4, Class A1A, 6.00%, 10/25/36, Callable 9/25/22 @ 100*(b) | | | 3,053 | |
| | 3,321 | | | First Horizon Alternative Mortgage Securities, Series 2004-AA3, Class A1, 3.73%, 9/25/34, Callable 9/25/22 @ 100*(b) | | | 3,110 | |
| | 15,496 | | | Master Adjustable Rate Mortgage Trust, Series 2004-13, Class 2A1, 2.86%, 4/21/34, Callable 9/21/22 @ 100*(b) | | | 14,972 | |
| | 237,013 | | | Nomura Asset Acceptance Corp, Series 2005-AR4, Class 3A1, 3.42%, 8/25/35, Callable 9/25/22 @ 100*(b) | | | 237,456 | |
| | 26,211 | | | Residential Accredit Loans, Inc., Series 2004-QA4, Class NB21, 3.23%, 9/25/34, Callable 9/25/22 @ 100*(b) | | | 25,569 | |
| | 13,728 | | | Residential Accredit Loans, Inc., Series 2006-QA1, Class A21, 4.59%, 1/25/36, Callable 9/25/22 @ 100*(b) | | | 11,158 | |
| | | | | | | | 376,205 | |
| Alt-A - Fixed Rate Mortgage Backed Securities (1.1%) | | | | |
| | 10,555 | | | Chaseflex Trust, Series 2005-1, Class 2A4, 5.50%, 2/25/35, Callable 9/25/22 @ 100* | | | 8,323 | |
See notes to financial statements.
| Schedule of Portfolio Investments | Limited Duration Fund |
| August 31, 2022 | Continued |
Shares or
Principal
Amount | | | Security Description | | Value | |
| Mortgage Backed Securities†, continued: | | | |
| Alt-A - Fixed Rate Mortgage Backed Securities, continued: | | | | |
| $ | 14,744 | | | Citigroup Mortgage Alternative Loan Trust, Series 2006-A3, Class 1A5, 6.00%, 7/25/36, Callable 9/25/22 @ 100* | | $ | 12,947 | |
| | 372 | | | Countrywide Alternative Loan Trust, Series 2004-12CB, Class 1A1, 5.00%, 7/25/19, Callable 9/25/22 @ 100* | | | 357 | |
| | 12,681 | | | Countrywide Alternative Loan Trust, Series 2005-J13, Class 2A3, 5.50%, 11/25/35, Callable 9/25/22 @ 100* | | | 9,588 | |
| | 15,798 | | | Countrywide Alternative Loan Trust, Series 2006-2CB, Class A3, 5.50%, 3/25/36, Callable 9/25/22 @ 100* | | | 7,651 | |
| | 16,774 | | | Countrywide Alternative Loan Trust, Series 2006-31CB, Class A16, 6.00%, 11/25/36, Callable 9/25/22 @ 100* | | | 11,053 | |
| | 16,134 | | | Countrywide Alternative Loan Trust, Series 2006-43CB, Class 1A4, 6.00%, 2/25/37, Callable 9/25/22 @ 100* | | | 9,949 | |
| | 118,433 | | | Countrywide Alternative Loan Trust, Series 2006-J8, Class A2, 6.00%, 2/25/37, Callable 9/25/22 @ 100* | | | 59,578 | |
| | 55,378 | | | Countrywide Alternative Loan Trust, Series 2004-J8, Class 2A1, 7.00%, 8/25/34, Callable 9/25/22 @ 100* | | | 47,859 | |
| | 113 | | | Master Alternative Loans Trust, Series 2004-3, Class 1A1, 5.00%, 3/25/19, Callable 9/25/22 @ 100* | | | 107 | |
| | 705 | | | Master Alternative Loans Trust, Series 2005-1, Class 5A1, 5.50%, 1/25/20, Callable 5/25/23 @ 100*. | | | 612 | |
| | 3,003 | | | Master Alternative Loans Trust, Series 2004-3, Class 3A1, 6.00%, 4/25/34, Callable 9/25/22 @ 100* | | | 2,846 | |
| | 261,093 | | | Master Alternative Loans Trust, Series 2004-3, Class 5A1, 6.50%, 3/25/34, Callable 9/25/22 @ 100* | | | 242,926 | |
| | 19,131 | | | Master Alternative Loans Trust, Series 2004-1, Class 3A1, 7.00%, 1/25/34, Callable 9/25/22 @ 100* | | | 18,120 | |
| | 2,805 | | | Master Alternative Loans Trust, Series 2004-3, Class 8A1, 7.00%, 4/25/34, Callable 9/25/22 @ 100* | | | 2,662 | |
| | 101 | | | Residential Accredit Loans, Inc., Series 2004-QS13, Class CB, 5.00%, 9/25/19, Callable 9/25/22 @ 100* | | | 103 | |
| | 5,571 | | | Residential Accredit Loans, Inc., Series 2004-QS6, Class A1, 5.00%, 5/25/19, Callable 9/25/22 @ 100* | | | 5,199 | |
| | 22,762 | | | Residential Accredit Loans, Inc., Series 2006-QS6, Class 1A2, 6.00%, 6/25/36, Callable 9/25/22 @ 100* | | | 19,364 | |
| | 40,574 | | | Residential Asset Securitization Trust, Series 2006-A9CB, Class A5, 6.00%, 9/25/36, Callable 9/25/23 @ 100* | | | 14,765 | |
| | 24,883 | | | Residential Asset Securitization Trust, Series 2007-A5, Class 2A3, 6.00%, 5/25/37, Callable 9/25/22 @ 100* | | | 16,082 | |
| | 8,092 | | | Wells Fargo Mortgage Backed Securities Trust, Series 2005-1, Class 2A3, 5.50%, 2/25/35, Callable 9/25/22 @ 100* | | | 7,710 | |
| | | | | | | | 497,801 | |
Shares or
Principal
Amount | | | Security Description | | Value | |
| Mortgage Backed Securities†, continued: | | | |
| Prime Adjustable Rate Mortgage Backed Securities (4.1%) | | | | |
| $ | 253 | | | Adjustable Rate Mortgage Trust, Series 2005-1, Class 2A22, 3.28%, 5/25/35(b) | | $ | 251 | |
| | 327,920 | | | American Home Mortgage Investment Trust, Series 2006-2, Class 3A2, 6.70%, 6/25/36, Callable 9/25/22 @ 100*(b)(c) | | | 61,869 | |
| | 309,487 | | | Banc of America Funding Corp., Series 2015-R3, Class 4A1, 2.59% (US0001M + 15 bps), 3/27/37(a) | | | 306,587 | |
| | 5,002 | | | Bank of America Mortgage Securities, Series 2006-A, Class 2A1, 2.76%, 2/25/36, Callable 9/25/22 @ 100*(b) | | | 4,698 | |
| | 2,735 | | | Bank of America Mortgage Securities, Series 2006-B, Class 2A1, 3.01%, 11/20/46, Callable 9/20/22 @ 100*(b) | | | 2,493 | |
| | 4,048 | | | Bank of America Mortgage Securities, Series 2004-E, Class 1A1, 3.31%, 6/25/34, Callable 9/25/22 @ 100*(b) | | | 3,827 | |
| | 4,790 | | | Bank of America Mortgage Securities, Series 2003-H, Class 2A3, 3.98%, 9/25/33, Callable 9/25/22 @ 100*(b) | | | 4,477 | |
| | 4,621 | | | Bear Stearns Adjustable Rate Mortgage Trust, Series 2004-6, Class 1A1, 2.75%, 9/25/34, Callable 9/25/22 @ 100*(b) | | | 4,175 | |
| | 2,938 | | | Bear Stearns Adjustable Rate Mortgage Trust, Series 2004-10, Class 15A1, 2.82%, 1/25/35, Callable 9/25/22 @ 100*(b) | | | 2,823 | |
| | 10,546 | | | Bear Stearns Adjustable Rate Mortgage Trust, Series 2006-4, Class 1A1, 3.34%, 10/25/36, Callable 9/25/22 @ 100*(b) | | | 9,675 | |
| | 3,822 | | | Bear Stearns Adjustable Rate Mortgage Trust, Series 2005-9, Class A1, 5.23% (H15T1Y + 230 bps), 10/25/35, Callable 9/25/22 @ 100* | | | 3,718 | |
| | 5,314 | | | Bear Stearns Mortgage Securities, Inc., Series 1997-6, Class 1A, 6.34%, 3/25/31, Callable 9/25/22 @ 100*(b) | | | 5,273 | |
| | 9,147 | | | Chase Mortgage Finance Corp., Series 2007-A2, Class 10A1, 3.72%, 7/25/37, Callable 9/25/22 @ 100*(b) | | | 7,991 | |
| | 5,153 | | | Citigroup Mortgage Loan Trust, Inc., Series 2005-3, Class 2A2A, 3.74%, 8/25/35(b) | | | 5,092 | |
| | 3,276 | | | Countrywide Home Loans, Series 2003-60, Class 2A1, 2.12%, 2/25/34, Callable 9/25/22 @ 100*(b) | | | 3,056 | |
| | 6,784 | | | Countrywide Home Loans, Series 2003-58, Class 2A2, 2.51%, 2/19/34, Callable 9/19/22 @ 100*(b) | | | 692 | |
| | 225 | | | Countrywide Home Loans, Series 2003-42, Class 1A1, 3.99%, 9/25/33, Callable 9/25/22 @ 100*(b) | | | 192 | |
| | 24,247 | | | Credit Suisse First Boston Mortgage Securities Corp., Series 2002-AR28, Class CB3, 2.65%, 11/25/32, Callable 9/25/22 @ 100*(b) | | | 13,496 | |
| | 20,879 | | | Credit Suisse First Boston Mortgage Securities Corp., Series 2004-AR7, Class 2A1, 3.51%, 11/25/34, Callable 9/25/22 @ 100*(b) | | | 21,012 | |
| | 5,448 | | | First Horizon Mortgage Pass-Through Trust, Series 2005-AR4, Class 2A1, 3.29%, 10/25/35, Callable 9/25/22 @ 100*(b) | | | 5,233 | |
| | 31,728 | | | GMAC Mortgage Corp. Loan Trust, Series 2005-AR6, Class 3A1, 2.89%, 11/19/35, Callable 9/19/22 @
100*(b) | | | 29,749 | |
See notes to financial statements.
| Schedule of Portfolio Investments | Limited Duration Fund |
| August 31, 2022 | Continued |
Shares or
Principal
Amount | | | Security Description | | Value | |
| Mortgage Backed Securities†, continued: | | | |
| Prime Adjustable Rate Mortgage Backed Securities, continued: | | | | |
| $ | 4,779 | | | GSR Mortgage Loan Trust, Series 2005-AR7, Class 2A1, 3.06%, 11/25/35, Callable 9/25/22 @ 100*(b) | | $ | 4,751 | |
| | 16,294 | | | GSR Mortgage Loan Trust, Series 2005-AR2, Class 1A2, 3.19%, 4/25/35, Callable 9/25/22 @ 100*(b) | | | 15,199 | |
| | 60,892 | | | Harborview Mortgage Loan Trust, Series 2004-10, Class 3A1B, 2.96%, 1/19/35, Callable 9/19/22 @ 100*(b) | | | 56,706 | |
| | 3,132 | | | Harborview Mortgage Loan Trust, Series 2005-14, Class 3A1A, 3.26%, 12/19/35, Callable 9/19/22 @ 100*(b) | | | 2,938 | |
| | 19,138 | | | Indymac Index Mortgage Loan Trust, Series 2006-AR13, Class A1, 3.34%, 7/25/36, Callable 9/25/22 @ 100*(b) | | | 15,284 | |
| | 32,225 | | | Indymac Index Mortgage Loan Trust, Series 2006-AR19, Class 1A2, 3.34%, 8/25/36, Callable 9/25/22 @ 100*(b) | | | 26,181 | |
| | 9,125 | | | Indymac Index Mortgage Loan Trust, Series 2004-AR4, Class 1A, 3.50%, 8/25/34, Callable 9/25/22 @ 100*(b) | | | 8,649 | |
| | 19,734 | | | Indymac Index Mortgage Loan Trust, Series 2004-AR4, Class 3A, 3.69%, 8/25/34, Callable 9/25/22 @ 100*(b) | | | 18,987 | |
| | 1,481 | | | JPMorgan Mortgage Trust, Series 2006-A5, Class 3A4, 3.51%, 8/25/36, Callable 9/25/22 @ 100*(b) | | | 1,261 | |
| | 475,901 | | | LSTAR Securities Investment, Ltd., Series 2021-1, Class A, 4.17% (US0001M + 180 bps), 2/1/26, Callable 2/1/23 @ 100*(a) | | | 467,572 | |
| | 600,000 | | | Mello Warehouse Securitization Trust, Series 2021-2, Class C, 3.54% (US0001M + 110 bps), 4/25/55, Callable 4/25/24 @ 100*(a) | | | 587,341 | |
| | 717 | | | Merrill Lynch Mortgage Investors Trust, Series 2004-A1, Class 2A2, 2.34%, 2/25/34, Callable 11/25/23 @ 100*(b) | | | 687 | |
| | 6,565 | | | Merrill Lynch Mortgage Investors Trust, Series 2004-1, Class 2A2, 2.71%, 12/25/34, Callable 9/25/22 @ 100*(b) | | | 6,324 | |
| | 7,245 | | | Merrill Lynch Mortgage Investors Trust, Series 2004-A2, Class 1A, 3.68%, 7/25/34, Callable 5/25/25 @ 100*(b) | | | 6,980 | |
| | 1,817 | | | Morgan Stanley Mortgage Loan Trust, Series 2004-6AR, Class 3A, 3.71%, 8/25/34, Callable 1/25/26 @ 100*(b) | | | 1,797 | |
| | 5,116 | | | Morgan Stanley Mortgage Loan Trust, Series 2004-6AR, Class 2A2, 3.72%, 8/25/34, Callable 12/25/22 @ 100*(b) | | | 5,071 | |
| | 2,130 | | | Structured Adjustable Rate Mortgage Loan Trust, Series 2004-1, Class 3A1, 2.94%, 2/25/34, Callable 9/25/22 @ 100*(b) | | | 2,015 | |
| | 20,692 | | | Structured Adjustable Rate Mortgage Loan Trust, Series 2004-18, Class 1A2, 3.15%, 12/25/34, Callable 9/25/22 @ 100*(b) | | | 19,006 | |
| | 5,755 | | | Structured Asset Mortgage Investments, Inc., Series 2005-AR7, Class 1A1, 2.81%, 12/27/35, Callable 9/25/22 @ 100*(b) | | | 5,831 | |
| | 10,185 | | | Structured Asset Securities Corp., Series 2003-24A, Class 1A3, 3.77%, 7/25/33, Callable 9/25/22 @ 100*(b) | | | 10,093 | |
Shares or
Principal
Amount | | | Security Description | | Value | |
Mortgage Backed Securities†, continued: | | | |
| Prime Adjustable Rate Mortgage Backed Securities, continued: | | | |
| $ | 42,662 | | | Washington Mutual Mortgage Pass-Through Certificates, Series 2006-AR14, Class 1A1, 2.59%, 11/25/36, Callable 9/25/22 @ 100*(b) | | $ | 39,618 | |
| | 3,254 | | | Washington Mutual Mortgage Pass-Through Certificates, Series 2004-AR3, Class A2, 3.10%, 6/25/34, Callable 9/25/22 @ 100*(b) | | | 3,084 | |
| | 4,264 | | | Washington Mutual Mortgage Pass-Through Certificates, Series 2004-AR10, Class A1B, 3.28% (US0001M + 84 bps), 7/25/44, Callable 9/25/22 @ 100* | | | 3,958 | |
| | 6,830 | | | Washington Mutual Mortgage Pass-Through Certificates, Series 2006-AR10, Class 1A2, 3.47%, 9/25/36, Callable 9/25/22 @ 100*(b) | | | 6,403 | |
| | 1,177 | | | Washington Mutual Mortgage Pass-Through Certificates, Series 2006-AR8, Class 1A1, 3.69%, 8/25/46, Callable 9/25/22 @ 100*(b) | | | 1,095 | |
| | | | | | | | 1,819,210 | |
| Prime Fixed Mortgage Backed Securities (11.7%) | | | | |
| | 510,482 | | | Angel Oak Mortgage Trust, Series 2021-5, Class A1, 0.95%, 7/25/66, Callable 9/25/23 @ 100*(a)(b) | | | 451,702 | |
| | 619,412 | | | Angel Oak Mortgage Trust, Series 2019-6, Class A1, 2.62%, 11/25/59, Callable 9/25/22 @ 100*(a)(b) | | | 606,648 | |
| | 10,552 | | | Citigroup Mortgage Loan Trust, Inc., Series 2003-1, Class WA2, 6.50%, 6/25/31, Callable 9/25/22 @ 100* | | | 10,247 | |
| | 62,651 | | | Citigroup Mortgage Loan Trust, Inc., Series 2004-NCM2, Class 1CB2, 6.75%, 8/25/34, Callable 9/25/22 @ 100* | | | 59,114 | |
| | 12,164 | | | Citigroup Mortgage Loan Trust, Inc., Series 2004-NCM2, Class 2CB3, 8.00%, 8/25/34, Callable 9/25/22 @ 100* | | | 12,278 | |
| | 3,481 | | | Credit Suisse First Boston Mortgage Securities Corp., Series 2004-7, Class 5A1, 5.00%, 10/25/19, Callable 9/25/22 @ 100* | | | 3,325 | |
| | 57,421 | | | Credit Suisse First Boston Mortgage Securities Corp., Series 2003-23, Class 1A11, 6.00%, 10/25/33 | | | 53,833 | |
| | 10,145 | | | Credit Suisse First Boston Mortgage Securities Corp., Series 2003-8, Class 5A1, 6.50%, 4/25/33, Callable 9/25/22 @ 100* | | | 9,970 | |
| | 15,434 | | | Credit Suisse First Boston Mortgage Securities Corp., Series 2003-1, Class 1A1, 7.00%, 2/25/33, Callable 9/25/22 @ 100* | | | 15,331 | |
| | 34,826 | | | Credit Suisse First Boston Mortgage Securities Corp., Series 2002-10, Class 2B1, 7.50%, 5/25/32, Callable 9/25/22 @ 100* | | | 10,783 | |
| | 186,003 | | | Credit Suisse First Boston Mortgage Securities Corp., Series 2002-34, Class 1A1, 7.50%, 12/25/32, Callable 9/25/22 @ 100* | | | 178,556 | |
| | 593,030 | | | GS Mortgage-Backed Securities, Series 2022-PJ1, Class AB, 2.50%, 5/28/52, Callable 5/28/52 @ 100*(a)(b) | | | 533,704 | |
| | 478,008 | | | GS Mortgage-Backed Securities Corp. Trust, Series 2019-PJ2, Class A8, 4.00%, 11/25/49, Callable 11/25/25 @ 100*(a)(b) | | | 464,485 | |
| | 16,696 | | | GSR Mortgage Loan Trust, Series 2003-3F, Class 2A1, 4.50%, 4/25/33, Callable 9/25/22 @ 100* | | | 15,338 | |
See notes to financial statements.
| Schedule of Portfolio Investments | Limited Duration Fund |
| August 31, 2022 | Continued |
Shares or
Principal
Amount | | | Security Description | | Value | |
Mortgage Backed Securities†, continued: | | | | |
Prime Fixed Mortgage Backed Securities, continued: | | | | |
| $ | 20,347 | | | GSR Mortgage Loan Trust, Series 2005-8F, Class 3A4, 6.00%, 11/25/35, Callable 11/25/27 @ 100* | | $ | 9,876 | |
| | 555,180 | | | JPMorgan Mortgage Trust, Series 2020-4, Class A3A, 2.50%, 11/25/50, Callable 10/25/40 @ 100*(a)(b) | | | 480,703 | |
| | 433,432 | | | JPMorgan Mortgage Trust, Series 2017-2, Class A4, 3.00%, 5/25/47, Callable 11/25/30 @ 100*(a)(b) | | | 383,718 | |
| | 9,462 | | | Lehman Mortgage Trust, Series 2005-3, Class 1A3, 5.50%, 1/25/36, Callable 9/25/22 @ 100* | | | 5,734 | |
| | 1,550,000 | | | NewRez Warehouse Securitization Trust, Series 2021-1, Class D, 3.84% (US0001M + 140 bps), 5/25/55, Callable 5/25/24 @ 100*(a) | | | 1,514,612 | |
| | 4,358 | | | Residential Funding Mortgage Securities I, Series 2005-S7, Class A1, 5.50%, 11/25/35, Callable 9/25/22 @ 100* | | | 3,686 | |
| | 12,468 | | | Residential Funding Mortgage Securities I, Series 2003-S9, Class A1, 6.50%, 3/25/32, Callable 9/25/22 @ 100* | | | 12,077 | |
| | 59,957 | | | Structured Asset Mortgage Investments, Inc., Series 1999-2, Class 3A, 6.75%, 5/25/29, Callable 9/25/22 @ 100* | | | 57,704 | |
| | 368,058 | | | Verus Securitization Trust, Series 2020-1, Class A1, 2.42%, 1/25/60, Callable 12/25/22 @ 100*(a)(b) | | | 358,549 | |
| | | | | | | | 5,251,973 | |
| Subprime Mortgage Backed Securities (1.8%) | | | | |
| | 139,239 | | | Towd Point Mortgage Trust, Series 2017-1, Class A1, 2.75%, 10/25/56, Callable 9/25/23 @ 100*(a)(b) | | | 138,044 | |
| | 273,389 | | | Towd Point Mortgage Trust, Series 2017-2, Class A1, 2.75%, 4/25/57, Callable 12/25/23 @ 100*(a)(b) | | | 271,221 | |
| | 382,701 | | | Towd Point Mortgage Trust, Series 2017-6, Class A1, 2.75%, 10/25/57, Callable 11/25/25 @ 100*(a)(b) | | | 371,728 | |
| | | | | | | | 780,993 | |
| U.S. Government Agency Mortgage Backed Securities (13.0%) | | | | |
| | 169,051 | | | Fannie Mae, Series 2013-68, Class 10A1, 1.00%, 3/25/42 | | | 146,174 | |
| | 11,533 | | | Fannie Mae, 1.67% (US0012M + 132 bps), 1/1/35, Pool #805386 | | | 11,610 | |
| | 45,174 | | | Fannie Mae, Series 2012-31, Class PA, 2.00%, 4/25/41 | | | 44,172 | |
| | 5,435 | | | Fannie Mae, Series 2012-51, Class EB, 2.00%, 1/25/40 | | | 5,426 | |
| | 46,680 | | | Fannie Mae, Series 2012-96, Class PD, 2.00%, 7/25/41 | | | 46,145 | |
| | 132,662 | | | Fannie Mae, Series 2013-18, Class 10A1, 2.00%, 12/25/42 | | | 122,344 | |
| | 8 | | | Fannie Mae, 2.08% (H15T1Y + 192 bps), 12/1/22, Pool #303247 | | | 8 | |
| | 89,150 | | | Fannie Mae, Series 2013-73, Class 10A1, 2.25%, 6/25/42 | | | 84,931 | |
| | 90,277 | | | Fannie Mae, Series 2013-74, Class 10A1, 2.25%, 6/25/42(b) | | | 87,158 | |
| | 66,690 | | | Fannie Mae, Series 2011-118, Class 10A1, 3.00%, 11/25/41 | | | 63,820 | |
Shares or
Principal
Amount | | | Security Description | | Value | |
Mortgage Backed Securities†, continued: | | | | |
Prime Fixed Mortgage Backed Securities, continued: | | | | |
| $ | 138,520 | | | Fannie Mae, Series 2014-1, Class AB, 3.00%, 6/25/43 | | $ | 135,007 | |
| | 502,568 | | | Fannie Mae, Series 2018-83, Class LC, 3.00%, 11/25/48 | | | 476,989 | |
| | 678 | | | Fannie Mae, 3.18% (H15T1Y + 216 bps), 6/1/32, Pool #725286 | | | 676 | |
| | 591,801 | | | Fannie Mae, Series 2003-W14, Class 2A, 3.84%, 1/25/43, Callable 9/25/22 @ 100*(b) | | | 571,166 | |
| | 22,593 | | | Fannie Mae, 4.29% (H15T1Y + 229 bps), 2/1/30, Pool #556998 | | | 22,473 | |
| | 387,628 | | | Fannie Mae, Series 2003-W16, Class AF5, 4.40%, 11/25/33, Callable 9/25/22 @ 100*(b)(c) | | | 372,414 | |
| | 2,716 | | | Fannie Mae, Series 2001-W4, Class AF6, 5.11%, 1/25/32, Callable 9/25/22 @ 100*(b)(c) | | | 2,759 | |
| | 4,798 | | | Fannie Mae, Series 2001-W2, Class AF6, 6.09%, 10/25/31, Callable 9/25/22 @ 100*(b)(c) | | | 4,900 | |
| | 6,257 | | | Fannie Mae, Series 2001-W1, Class AF6, 6.40%, 7/25/31, Callable 9/25/22 @ 100*(b)(c) | | | 6,982 | |
| | 1,000 | | | Fannie Mae, Series 1996-42, Class LL, 7.50%, 9/25/26 | | | 1,024 | |
| | 744,166 | | | Fannie Mae Grantor Trust, Series 2003-T4, Class 2A5, 4.52%, 9/26/33, Callable 9/26/22 @ 100*(b)(c) | | | 732,316 | |
| | 924,739 | | | Fannie Mae REMIC Trust, Series 2004-W10, Class A6, 5.75%, 8/25/34, Callable 9/25/22 @ 100* | | | 934,225 | |
| | 48,381 | | | Freddie Mac, Series 4146, Class 10A1, 1.50%, 10/15/42 | | | 46,914 | |
| | 424,403 | | | Freddie Mac, Series 4220, Class KC, 1.50%, 5/15/32 | | | 406,774 | |
| | 67,029 | | | Freddie Mac, Series 3982, Class MD, 2.00%, 5/15/39 | | | 65,240 | |
| | 129,471 | | | Freddie Mac, Series 4019, Class GB, 2.00%, 12/15/41 | | | 122,290 | |
| | 229,533 | | | Freddie Mac, Series 4272, Class YG, 2.00%, 11/15/26 | | | 225,810 | |
| | 2,779 | | | Freddie Mac, 2.29% (US0006M + 154 bps), 4/1/36, Pool #1N0148 | | | 2,826 | |
| | 117,257 | | | Freddie Mac, Series 3913, Class PC, 2.50%, 3/15/41 | | | 114,825 | |
| | 395,736 | | | Freddie Mac, Series 4374, Class GA, 3.00%, 9/15/36 | | | 381,309 | |
| | 274,425 | | | Freddie Mac, Series T-67, Class 1A1C, 3.22%, 3/25/36, Callable 9/25/22 @ 100*(b) | | | 279,740 | |
| | 2,184 | | | Freddie Mac, 4.00%, 9/1/33, Pool #N31025 | | | 2,155 | |
| | 24 | | | Freddie Mac, Series 1474, Class E, 7.00%, 2/15/23, Callable 9/15/22 @ 100* | | | 24 | |
| | 1,243 | | | Government National Mortgage Assoc., 1.75% (H15T1Y + 150 bps), 12/20/27, Pool #80141 | | | 1,234 | |
| | 4,086 | | | Government National Mortgage Assoc., 1.75% (H15T1Y + 150 bps), 11/20/29, Pool #876947 | | | 3,976 | |
| | 323,384 | | | Government National Mortgage Assoc., Series 2013-69, 2.00%, 9/20/42 | | | 295,213 | |
| | 108 | | | Government National Mortgage Assoc., 2.62% (H15T1Y + 150 bps), 1/20/23, Pool #8123 | | | 107 | |
| | 932 | | | Government National Mortgage Assoc., 2.62% (H15T1Y + 150 bps), 1/20/25, Pool #8580 | | | 930 | |
| | 1,449 | | | Government National Mortgage Assoc., 2.62% (H15T1Y + 150 bps), 1/20/25, Pool #8585 | | | 1,447 | |
See notes to financial statements.
| Schedule of Portfolio Investments | Limited Duration Fund |
| August 31, 2022 | Continued |
Shares or
Principal
Amount | | | Security Description | | Value | |
| Mortgage Backed Securities†, continued: | | | | |
| U.S. Government Agency Mortgage Backed Securities, continued: | | | | |
| $ | 621 | | | Government National Mortgage Assoc., 2.62% (H15T1Y + 150 bps), 3/20/26, Pool #8832 | | $ | 612 | |
| | 1,153 | | | Government National Mortgage Assoc., 2.62% (H15T1Y + 150 bps), 3/20/29, Pool #80263 | | | 1,138 | |
| | 6,710 | | | Government National Mortgage Assoc., 2.87% (H15T1Y + 150 bps), 5/20/34, Pool #80916 | | | 6,672 | |
| | 63 | | | Government National Mortgage Assoc., 6.50%, 12/15/25, Pool #414856 | | | 67 | |
| | 20 | | | Government National Mortgage Assoc., 7.00%, 4/20/24, Pool #1655 | | | 20 | |
| | 21 | | | Government National Mortgage Assoc., 7.00%, 11/20/26, Pool #2320 | | | 22 | |
| | 95 | | | Government National Mortgage Assoc., 7.50%, 3/15/24, Pool #376439 | | | 95 | |
| | | | | | | | 5,832,159 | |
| Total Mortgage Backed Securities (Cost $15,711,827) | | | 14,558,341 | |
| Corporate Bonds (12.5%) | | | | |
Aerospace & Defense (2.2%) | | | | |
| | 920,000 | | | Boeing Co. (The), 7.95%, 8/15/24 | | | 965,673 | |
| Banks (2.5%) | | | | |
| | 1,057,740 | | | Southtrust Bank/Georgia, 7.74%, 5/15/25 | | | 1,137,946 | |
| Capital Markets (2.3%) | | | | |
| | 1,116,000 | | | Goldman Sachs Group, Inc. (The), 1.30%, 11/15/24, Callable 11/15/22 @ 100 * | | | 1,040,362 | |
| | 2,000,000 | | | Lehman Brothers Holdings, Inc., 6.00%, 7/19/12, MTN (d) | | | 8,000 | |
| | | | | | | | 1,048,362 | |
| Insurance (1.4%) | | | | |
| | 670,000 | | | Athene Global Funding, 1.72%, 1/7/25 (a) | | | 620,485 | |
| IT Services (2.4%) | | | | |
| | 1,206,000 | | | Western Union Co. (The), 1.35%, 3/15/26, Callable 2/15/26 @ 100 * | | | 1,068,756 | |
| Tobacco (1.7%) | | | | |
| | 806,000 | | | BAT Capital Corp., 3.22%, 9/6/26, Callable 7/6/26 @ 100 * | | | 753,950 | |
| Total Corporate Bonds (Cost $7,136,463) | | | 5,595,172 | |
| | | | | | | | | |
| Taxable Municipal Bonds (3.5%) | | | | |
| Georgia (2.9%) | | | | |
| | 1,285,000 | | | State of Georgia, Build America Bonds, GO, Series H, 4.50%, 11/1/25 | | | 1,302,825 | |
| Pennsylvania (0.6%) | | | | |
| | 250,000 | | | Philadelphia Authority for Industrial Development Revenue, 3.96%, 4/15/26 | | | 247,380 | |
| Total Taxable Municipal Bonds (Cost $1,600,512) | | | 1,550,205 | |
| | | | | |
| U.S. Government Agency Securities (6.0%) | | | | |
| Federal Farm Credit Banks | | | | |
| | 1,000,000 | | | 1.23%, 9/10/29, Callable 9/14/22 @ 100 * | | | 851,104 | |
| | 400,000 | | | 2.31% (SOFR + 2 bps), 7/13/23 | | | 399,950 | |
| | 475,000 | | | 2.34% (SOFR + 5 bps), 2/13/24 | | | 474,930 | |
| | 350,000 | | | 2.35% (SOFR + 6 bps), 10/8/24 | | | 349,934 | |
| | | | | | | | 2,075,918 | |
| Federal Home Loan Banks | | | | |
| | 35,000 | | | 0.90%, 8/27/26, Callable 2/27/23 @ 100 * | | | 31,450 | |
| | 370,000 | | | 1.00%, 6/30/25, Callable 9/30/22 @ 100 *(b) | | | 348,792 | |
| | 249,000 | | | 3.63%, 7/26/24, Callable 1/26/23 @ 100 * | | | 248,085 | |
| | | | | | | | 628,327 | |
| Total U.S. Government Agency Securities (Cost $2,875,453) | | | 2,704,245 | |
Shares or Principal
Amount | | | Security Description | | Value | |
U.S. Treasury Obligations (7.0%) | | | |
U.S. Treasury Notes | | | | |
| $ | 1,700,000 | | | 2.50%, 5/15/24 | | $ | 1,673,437 | |
| | 1,000,000 | | | 2.75%, 7/31/27 | | | 974,766 | |
| | 500,000 | | | 3.00%, 6/30/24 | | | 495,879 | |
| Total U.S. Treasury Obligations (Cost $3,183,214) | | | 3,144,082 | |
| | | | | |
Investment in Affiliates (3.7%) | | | | |
| | 1,667,001 | | | Cavanal Hill Government Securities Money Market Fund, Select Shares, 1.92%(e) | | | 1,667,001 | |
| Total Investment in Affiliates (Cost $1,667,000) | | | 1,667,001 | |
| | | | | | | | | |
| Total Investments (Cost $48,890,817)(f) — 99.6% | | | 44,607,513 | |
| Other assets in excess of liabilities — 0.4% | | | 189,406 | |
| Net Assets - 100.0% | | $ | 44,796,919 | |
| Schedule of Portfolio Investments | Limited Duration Fund |
| August 31, 2022 | Concluded |
| | (a) | Represents a restricted security, purchased under Rule 144A, Section 4(2), which is exempt from registration under the Securities Act of 1933, as amended. The security has been deemed liquid according to the policies and procedures adopted by the Board of Trustees. |
| | (b) | The rate for certain asset-backed and mortgage-backed securities may vary based on factors relating to the pool of assets underlying the security. The rate presented is the rate in effect at August 31, 2022. |
| | (c) | Step Bond: Coupon rate is set for an initial period and then increased to a higher coupon rate at a specified date. The rate shown is the rate in effect at August 31, 2022. |
| | (d) | Issuer has defaulted on the payment of interest. |
| | (e) | Money market investment. The rate presented on the Schedule of Portfolio Investments is the rate in effect at August 31, 2022. |
| | (f) | Represents cost for financial reporting purposes. The cost for tax reporting purposes can be found in Note 6 in the Notes to Financial Statements. |
| | * | Represents next call date. Additional subsequent call dates and amounts may apply to this security. |
| | † | Mortgage backed securities are classified based on the characteristics of their underlying collateral, the fixed vs. variable nature of the obligations, and the credit standing of the mortgagors. The fixed or variable rate nature of securities interest payments to which the fund is entitled may not coincide with the payment nature of the collateral underlying the securities. |
| 12MTA | 12 Month Treasury Average |
| GO | General Obligation |
| H15T1Y | 1 Year Treasury Constant Maturity Rate |
| LIBOR | London Interbank Offered Rate |
| MTN | Medium Term Note |
| REMIC | Real Estate Mortgage Investment Conduits |
| SOFR | Secured Overnight Financing Rate |
| US0001M | 1 Month US Dollar LIBOR |
| US0006M | 6 Month US Dollar LIBOR |
| US0012M | 12 Month US Dollar LIBOR |
See notes to financial statements.
| Schedule of Portfolio Investments | Moderate Duration Fund |
| August 31, 2022 | |
Shares or
Principal
Amount | | | Security Description | | Value | |
| Asset Backed Securities (16.4%) | | | | |
| $ | 250,000 | | | Amur Equipment Finance Receivables X LLC, Series 2022-1A, Class C, 2.37%, 4/20/28, Callable 9/20/25 @ 100*(a) | | $ | 232,079 | |
| | 322,192 | | | CLI Funding VI LLC, Series 2020-3A, Class A, 2.07%, 10/18/45, Callable 11/18/22 @ 100*(a) | | | 289,265 | |
| | 118,100 | | | CLI Funding VIII LLC, Series 2022-1A, Class A1, 2.72%, 1/18/47, Callable 1/18/24 @ 100*(a) | | | 105,177 | |
| | 248,125 | | | DB Master Finance LLC, Series 2021-1A, Class A2I, 2.05%, 11/20/51, Callable 5/20/24 @ 100*(a) | | | 216,167 | |
| | 271,563 | | | Domino's Pizza Master Issuer LLC, Series 2021-1A, Class A2I, 2.66%, 4/25/51, Callable 10/25/25 @ 100*(a) | | | 233,346 | |
| | 280,000 | | | Flexential Issuer, Series 2021-1A, Class A2, 3.25%, 11/27/51, Callable 11/25/25 @ 100*(a) | | | 259,612 | |
| | 250,000 | | | Hi-Fi Music Ip Issuer II L.P, Series 2022-1A, Class A2, 3.94%, 2/1/62, Callable 11/1/22 @ 100*(a) | | | 229,282 | |
| | 286,807 | | | Longtrain Leasing III LLC, Series 2015-1A, Class A2, 4.06%, 1/15/45, Callable 1/15/25 @ 100*(a) | | | 268,235 | |
| | 160,703 | | | MVW LLC, Series 2019-2A, Class A, 2.22%, 10/20/38, Callable 5/20/25 @ 100*(a) | | | 150,758 | |
| | 250,000 | | | Sabey Data Center Issuer LLC, Series 2020-1, Class A2, 3.81%, 4/20/45, Callable 11/20/23 @ 100*(a) | | | 239,597 | |
| | 236,733 | | | Textainer Marine Containers VII, Ltd., Series 2A, Class A, 2.23%, 4/20/46, Callable 4/20/23 @ 100*(a) | | | 209,722 | |
| | 300,000 | | | Vantage Data Centers LLC, Series 2020-1A, Class A2, 1.65%, 9/15/45, Callable 9/15/23 @ 100*(a) | | | 267,841 | |
| | 238,216 | | | VR Funding LLC, Series 2020-1A, Class A, 2.79%, 11/15/50, Callable 11/15/23 @ 100*(a) | | | 214,285 | |
| | 228,750 | | | Wendy's Funding LLC, Series 2019-1A, Class A2I, 3.78%, 6/15/49, Callable 3/15/24 @ 100*(a) | | | 215,036 | |
| | 147,768 | | | Willis Engine Structured Trust VI, Series 2021-A, Class A, 3.10%, 5/15/46, Callable 5/15/29 @ 100*(a) | | | 115,006 | |
| Total Asset Backed Securities (Cost $3,608,363) | | | 3,245,408 | |
| | | | | | | | | |
| Mortgage Backed Securities† (12.2%) | | | |
| Alt-A - Fixed Rate Mortgage Backed Securities (1.3%) | | | | |
| | 44,924 | | | Chaseflex Trust, Series 2005-2, Class 1A1, 6.00%, 6/25/35, Callable 9/25/22 @ 100* | | | 33,507 | |
| | 2,688 | | | Countrywide Alternative Loan Trust, Series 2005- 3CB, Class 1A4, 5.25%, 3/25/35, Callable 9/25/22 @ 100* | | | 2,377 | |
| | 7,989 | | | Countrywide Alternative Loan Trust, Series 2004- 5CB, Class 1A1, 6.00%, 5/25/34, Callable 9/25/22 @ 100* | | | 7,535 | |
| | 62,333 | | | Countrywide Alternative Loan Trust, Series 2006-J8, Class A2, 6.00%, 2/25/37, Callable 9/25/22 @ 100* | | | 31,357 | |
| | 6,470 | | | Master Alternative Loans Trust, Series 2004-1, Class 4A1, 5.50%, 2/25/34, Callable 9/25/22 @ 100* | | | 6,189 | |
Shares or
Principal
Amount | | Security Description | | | Value | |
| Mortgage Backed Securities†, continued: | | | | |
| Alt-A - Fixed Rate Mortgage Backed Securities, continued: | | | | |
| $ | 3,768 | | | Master Alternative Loans Trust, Series 2004-13, Class 12A1, 5.50%, 12/25/19, Callable 9/25/22 @ 100* | | $ | 2,900 | |
| | 7,511 | | | Master Alternative Loans Trust, Series 2004-4, Class 1A1, 5.50%, 5/25/34, Callable 9/25/22 @ 100* | | | 7,218 | |
| | 148 | | | Master Alternative Loans Trust, Series 2005-1, Class 5A1, 5.50%, 1/25/20, Callable 5/25/23 @ 100* | | | 129 | |
| | 13,745 | | | Master Alternative Loans Trust, Series 2004-6, Class 7A1, 6.00%, 7/25/34, Callable 9/25/22 @ 100* | | | 12,973 | |
| | 6,508 | | | Master Alternative Loans Trust, Series 2003-7, Class 6A1, 6.50%, 12/25/33, Callable 9/25/22 @ 100* | | | 6,229 | |
| | 11,847 | | | Master Alternative Loans Trust, Series 2004-4, Class 8A1, 6.50%, 5/25/34, Callable 9/25/22 @ 100* | | | 11,399 | |
| | 21,240 | | | Master Alternative Loans Trust, Series 2004-6, Class 6A1, 6.50%, 7/25/34, Callable 9/25/22 @ 100* | | | 20,582 | |
| | 409 | | | Nomura Asset Acceptance Corp., Series 2005- WF1, Class 2A5, 5.66%, 3/25/35, Callable 9/25/22 @ 100*(b)(c) | | | 401 | |
| | 33,107 | | | Ocwen Residential MBS Corp., Series 1998-R1, Class B1, 3.12%, 10/25/40, Callable 9/25/22 @ 100*(a)(b) | | | 22,121 | |
| | 2 | | | Residential Accredit Loans, Inc., Series 2003-QS18, Class A1, 5.00%, 9/25/18, Callable 9/25/22 @ 100* | | | 2 | |
| | 21,036 | | | Residential Accredit Loans, Inc., Series 2006- QS12, Class 1A2, 6.50%, 9/25/36, Callable 9/25/22 @ 100* | | | 11,199 | |
| | 34,652 | | | Residential Asset Securitization Trust, Series 2005-A14, Class A5, 5.50%, 12/25/35, Callable 9/25/22 @ 100* | | | 19,336 | |
| | 40,022 | | | Residential Asset Securitization Trust, Series 2006-A8, Class 1A1, 6.00%, 8/25/36, Callable 9/25/22 @ 100* | | | 28,693 | |
| | 33,251 | | | Washington Mutual Mortgage Pass-Through Certificates, Series 2005-6, Class 1CB, 6.50%, 8/25/35, Callable 9/25/22 @ 100* | | | 29,929 | |
| | | | | | | | 254,076 | |
| Prime Adjustable Rate Mortgage Backed Securities (2.6%) | | | | |
| | 4,531 | | | Banc of America Funding Trust, Series 2004-B, Class 5A1, 2.95%, 11/20/34, Callable 9/20/22@ 100*(b) | | | 4,442 | |
| | 1,156 | | | Bear Stearns ARM Trust, Series 2003-7, Class 4A, 2.80%, 10/25/33, Callable 9/25/22 @ 100*(b) | | | 1,195 | |
| | 2,938 | | | Bear Stearns ARM Trust, Series 2004-9, Class 12A3, 3.02%, 11/25/34, Callable 9/25/22 @ 100*(b) | | | 2,980 | |
| | 10,192 | | | CHL Mortgage Pass-Through Trust, Series 2004-2, Class 2A1, 2.74%, 2/25/34, Callable 9/25/22 @ 100*(b) | | | 9,159 | |
| | 9,706 | | | HomeBanc Mortgage Trust, Series 2006-1, Class 1A1, 2.60%, 4/25/37, Callable 9/25/22 @ 100*(b) | | | 8,204 | |
| | 2,754 | | | JPMorgan Mortgage Trust, Series 2006-A2, Class 2A1, 2.96% (US0003M + 101 bps), 4/25/36, Callable 9/25/22 @ 100* | | | 2,567 | |
See notes to financial statements.
| Schedule of Portfolio Investments | Moderate Duration Fund |
| August 31, 2022 | Continued |
Shares or
Principal
Amount | | | Security Description | | Value | |
Mortgage Backed Securities†, continued:
| Prime Adjustable Rate Mortgage Backed Securities, continued: |
| $ | 15,777 | | | JPMorgan Mortgage Trust, Series 2005-A1, Class 3A4, 3.04%, 2/25/35, Callable 9/25/22 @ 100*(b) | | $ | 15,100 | |
| | 14,073 | | | JPMorgan Mortgage Trust, Series 2006-A6, Class 1A4L, 3.64%, 10/25/36, Callable 9/25/22 @ 100*(b) | | | 11,158 | |
| | 184,841 | | | JPMorgan Mortgage Trust, Series 2005-A6, Class 3A3, 3.99%, 9/25/35, Callable 9/25/22 @ 100*(b) | | | 175,584 | |
| | 165,779 | | | LSTAR Securities Investment, Ltd., Series 2019-4, Class A1, 5.87% (US0001M + 350 bps), 5/1/24(a) | | | 162,878 | |
| | 128,537 | | | WinWater Mortgage Loan Trust, Series 2014-1, Class A1, 3.91%, 6/20/44, Callable 9/20/22 @ 100*(a)(b) | | | 124,193 | |
| | | | | | | | 517,460 | |
| Prime Fixed Mortgage Backed Securities (3.7%) |
| | 2,256 | | | American Home Mortgage Investment Trust, Series 2005-2, Class 5A1, 5.56%, 9/25/35, Callable 9/25/22 @ 100*(b)(c) | | | 1,966 | |
| | 76,921 | | | Angel Oak Mortgage Trust, Series 2019-5, Class A1, 2.59%, 10/25/49, Callable 9/25/22 @ 100*(a)(b) | | | 74,277 | |
| | 12,501 | | | Chase Mortgage Finance Corp., Series 2007-S2, Class 2A1, 5.50%, 3/25/37, Callable 9/25/22 @ 100* | | | 6,897 | |
| | 5,405 | | | Citigroup Mortgage Loan Trust, Inc., Series 2005-1, Class 3A1, 6.50%, 4/25/35 | | | 5,246 | |
| | 5,122 | | | Citigroup Mortgage Loan Trust, Inc., Series 2004-NCM1, Class 1A3, 6.75%, 7/25/34, Callable 9/25/22 @ 100* | | | 4,953 | |
| | 449 | | | Countrywide Home Loans, Series 2004-J6, Class 1A2, 5.25%, 8/25/24, Callable 9/25/22 @ 100* | | | 441 | |
| | 6,541 | | | Countrywide Home Loans, Series 2005-29, Class A1, 5.75%, 12/25/35, Callable 9/25/22 @100* | | | 3,722 | |
| | 4,023 | | | Credit Suisse First Boston Mortgage Securities Corp., Series 2004-1, Class 4A1, 5.00%, 12/31/99, Callable 9/25/22 @ 100* | | | 3,740 | |
| | 10,187 | | | Credit Suisse First Boston Mortgage Securities Corp., Series 2003-27, Class 8A1, 6.00%, 11/25/33, Callable 9/25/22 @ 100* | | | 9,789 | |
| | 220,549 | | | Flagstar Mortgage Trust, Series 2021-4, Class A5, 2.50%, 6/1/51, Callable 1/25/42 @ 100*(a)(b) | | | 198,347 | |
| | 12,397 | | | Galton Funding Mortgage Trust, Series 2017-1, Class A21, 3.50%, 7/25/56, Callable 9/25/23 @ 100*(a)(b) | | | 11,830 | |
| | 126,653 | | | GS Mortgage-Backed Securities Corp. Trust, Series 2020-PJ3, Class A14, 3.00%, 10/25/50, Callable 6/25/31 @ 100*(a)(b) | | | 112,443 | |
| | 134,785 | | | GSR Mortgage Loan Trust, Series 2004-13F, Class 2A1, 4.25%, 11/25/34, Callable 9/25/22 @ 100* | | | 125,808 | |
| | 98 | | | GSR Mortgage Loan Trust, Series 2004-10F, Class 2A4, 5.00%, 8/25/19, Callable 9/25/22 @ 100* | | | 98 | |
| | 449 | | | GSR Mortgage Loan Trust, Series 2003-2F, Class 3A1, 6.00%, 3/25/32, Callable 9/25/22 @ 100* | | | 432 | |
Shares or
Principal
Amount | | | Security Description | | Value | |
Mortgage Backed Securities†, continued:
| Prime Fixed Mortgage Backed Securities, continued: | | | | |
| $ | 1,070 | | | Prime Mortgage Trust, Series 2004-CL1, Class 1A1, 6.00%, 2/25/34, Callable 9/25/22 @ 100* | | $ | 1,041 | |
| | 23,383 | | | RAMP Trust, Series 2005-SL2, Class A3, 7.00%, 2/25/32, Callable 9/25/28 @ 100* | | | 19,242 | |
| | 7,439 | | | Structured Asset Mortgage Investments, Inc., Series 1999-2, Class 3A, 6.75%, 5/25/29, Callable 9/25/22 @ 100* | | | 7,160 | |
| | 43 | | | Structured Asset Securities Corp., Series 1997-2, Class 2A4, 7.25%, 3/28/30, Callable 9/28/22 @ 100* | | | 42 | |
| | 701 | | | Washington Mutual Mortgage Pass-Through Certificates, Series 2003-S11, Class 1A, 5.00%, 11/25/33, Callable 9/25/22 @ 100* | | | 678 | |
| | 242 | | | Washington Mutual Mortgage Pass-Through Certificates, Series 2004-RA1, Class 2A, 7.00%, 3/25/34, Callable 10/25/22 @ 100* | | | 237 | |
| | 157,605 | | | Wells Fargo Mortgage Backed Securities Trust, Series 2021-2, Class A3, 2.50%, 6/25/51, Callable 10/25/35 @ 100*(a)(b) | | | 141,740 | |
| | | | | | | | 730,129 | |
| Subprime Mortgage Backed Securities (0.6%) |
| | 35,911 | | | Towd Point Mortgage Trust, Series 2018-1, Class A1, 3.00%, 1/25/58, Callable 6/25/25 @ 100*(a)(b) | | | 35,077 | |
| | 93,226 | | | Towd Point Mortgage Trust, Series 2018-2, Class A1, 3.25%, 3/25/58, Callable 11/25/26 @ 100*(a)(b) | | | 91,256 | |
| | | | | | | | 126,333 | |
U.S. Government Agency Mortgage Backed Securities (4.0%)
| | 1,740 | | | Fannie Mae, 2.11% (US0012M + 186 bps), 1/1/37, Pool #906675 | | | 1,729 | |
| | 60,310 | | | Fannie Mae, Series 2010-100, Class LA, 2.50%, 7/25/40 | | | 57,998 | |
| | 53,408 | | | Fannie Mae, Series 2014-61, Class P, 2.50%, 7/25/44 | | | 50,866 | |
| | 26,555 | | | Fannie Mae, Series 2015-12, Class PC, 2.50%,7/25/44 | | | 25,939 | |
| | 110,089 | | | Fannie Mae, Series 2015-59, Class LM, 3.00%, 7/25/45 | | | 104,290 | |
| | 1,390 | | | Fannie Mae, 3.03% (US0012M + 162 bps), 9/1/33, Pool #739372 | | | 1,378 | |
| | 146,076 | | | Fannie Mae, Series 2018-M12, Class A1, 3.55%, 2/25/30 | | | 145,692 | |
| | 86 | | | Fannie Mae, 6.00%, 4/1/35, Pool #735503 | | | 91 | |
| | 598 | | | Fannie Mae, Series 2001-55, Class PC, 6.50%, 10/25/31 | | | 632 | |
| | 8,965 | | | Fannie Mae, Series 2003-W2, Class 1A2, 7.00%, 7/25/42, Callable 9/25/22 @ 100* | | | 9,678 | |
| | 314 | | | Fannie Mae, Series 2002-T1, Class A3, 7.50%, 11/25/31, Callable 9/25/22 @ 100* | | | 336 | |
| | 59,392 | | | Freddie Mac, Series 4220, Class KC, 1.50%, 5/15/32 | | | 56,925 | |
| | 36,292 | | | Freddie Mac, Series 4076, Class QC, 2.00%, 11/15/41 | | | 35,090 | |
| | 47,047 | | | Freddie Mac, Series 4461, Class EA, 2.00%,7/15/37 | | | 45,696 | |
| | 177,726 | | | Freddie Mac, Series 3908, Class B, 2.50%, 6/15/39 | | | 165,978 | |
| | 7,334 | | | Freddie Mac, 5.37% (H15T1Y + 228 bps), 8/1/34, Pool #755230 | | | 7,187 | |
See notes to financial statements.
| Schedule of Portfolio Investments | Moderate Duration Fund |
| August 31, 2022 | Continued |
Shares or
Principal
Amount | | | Security Description | | Value | |
Mortgage Backed Securities†, continued:
U.S. Government Agency Mortgage Backed Securities, continued:
| $ | 18 | | | Freddie Mac, Series 1379, Class H, 7.00%, 10/15/22, Callable 9/15/22 @ 100* | | $ | 19 | |
| | 286 | | | Freddie Mac, Series 1714, Class K, 7.00%, 4/15/24, Callable 9/15/22 @ 100* | | | 290 | |
| | 611 | | | Freddie Mac, Series 1904, Class D, 7.50%, 10/15/26, Callable 9/15/22 @ 100* | | | 637 | |
| | 69,297 | | | Government National Mortgage Assoc., Series 2013-69, 2.00%, 9/20/42 | | | 63,260 | |
| | 6,338 | | | Government National Mortgage Assoc., Series 2010-98, Class MG, 3.00%, 8/20/39 | | | 6,324 | |
| | 3,450 | | | Government National Mortgage Assoc., 7.00%, 3/15/26, Pool #419128 | | | 3,454 | |
| | 39 | | | Government National Mortgage Assoc., 7.00%, 3/20/27, Pool #2394 | | | 40 | |
| | 115 | | | Government National Mortgage Assoc., 8.00%, 10/20/24, Pool #1884 | | | 116 | |
| | 28 | | | Government National Mortgage Assoc., 8.00%, 2/20/26, Pool #2171 | | | 29 | |
| | 668 | | | Government National Mortgage Assoc., 8.00%, 4/20/26, Pool #2205 | | | 684 | |
| | 2,286 | | | Government National Mortgage Assoc., 8.00%, 5/20/26, Pool #2219 | | | 2,357 | |
| | | | | | | | 786,715 | |
| Total Mortgage Backed Securities (Cost $2,606,543) | | | 2,414,713 | |
| | | | | |
Corporate Bonds (24.9%)
| Aerospace & Defense (2.1%) | | | |
| | 450,000 | | | Boeing Co. (The), 3.25%, 2/1/28, Callable 12/1/27 @ 100 * | | | 409,406 | |
| Airlines (1.1%) | | | | |
| | 212,839 | | | United Airlines Pass Through Trust, Series 2020-1, Class A, 5.88%, 4/15/29 | | | 213,096 | |
| Banks (3.1%) | | | | |
| | 510,000 | | | Bank of America Corp., 1.90% (SOFR + 153 bps), 7/23/31, Callable 7/23/30 @ 100, MTN * | | | 402,644 | |
| | 250,000 | | | Wells Fargo & Co., 2.88% (SOFR + 143 bps), 10/30/30, Callable 10/30/29 @ 100, MTN * | | | 219,753 | |
| | | | 622,397 | |
| Capital Markets (1.4%) | | | | |
| | 290,000 | | | Goldman Sachs Group, Inc., 3.50%, 11/16/26, Callable 11/16/25 @ 100 * | | | 278,705 | |
| Diversified Telecommunication Services (1.5%) | | | | |
| | 310,000 | | | AT&T, Inc., 4.35%, 3/1/29, Callable 12/1/28 @ 100 * | | | 302,407 | |
| Electric Utilities (1.3%) | | | | |
| | 275,000 | | | Entergy Mississippi LLC, 3.25%, 12/1/27, Callable 9/1/27 @ 100 * | | | 256,273 | |
| Electrical Equipment (1.1%) | | | | |
| | 250,000 | | | Emerson Electric Co., 2.20%, 12/21/31, Callable 9/21/31 @ 100 * | | | 212,950 | |
| Financial Services (0.3%) | | | | |
| | 59,308 | | | JBG/Rockville NCI Campus LLC, Series 2010-A, 3.90%, 7/15/23 (a) | | | 59,603 | |
| Food Products (1.4%) | | | | |
| | 300,000 | | | Mars, Inc., 3.20%, 4/1/30, Callable 1/1/30 @ 100 *(a) | | | 279,562 | |
| Health Care Providers & Services (2.8%) | | | | |
| | 225,000 | | | Ascension Health, Series B, 2.53%, 11/15/29, Callable 8/15/29 @ 100 * | | | 201,372 | |
| | 370,000 | | | Sutter Health, 3.70%, 8/15/28, Callable 5/15/28 @ 100 * | | | 354,305 | |
| | | | | | | | 555,677 | |
Shares or
Principal
Amount | | | Security Description | | Value | |
Corporate Bonds, continued:
| Hotels, Restaurants & Leisure (1.3%) | | | |
| $ | 270,000 | | | Hyatt Hotels Corp., 4.38%, 9/15/28, Callable 6/15/28 @ 100 * | | $ | 255,449 | |
| Household Durables (2.0%) | | | | |
| | 400,000 | | | Harman International Industries, Inc., 4.15%, 5/15/25, Callable 2/15/25 @ 100 * | | | 397,144 | |
| Insurance (1.5%) | | | | |
| | 300,000 | | | Jackson National Life Global Funding, 2.65%, 6/21/24 (a) | | | 290,666 | |
| Oil, Gas & Consumable Fuels (1.8%) | | | | |
| | 380,000 | | | HF Sinclair Corp., 2.63%, 10/1/23 (a) | | | 368,719 | |
| Semiconductors & Semiconductor Equipment (2.2%) | | | | |
| | 24,000 | | | Broadcom, Inc., 3.19%, 11/15/36, Callable 8/15/36 @ 100 *(a) | | | 17,933 | |
| | 451,000 | | | Broadcom, Inc., 4.15%, 11/15/30, Callable 8/15/30 @ 100 * | | | 412,705 | |
| | | | | | | | 430,638 | |
| Total Corporate Bonds (Cost $5,555,980) | | | 4,932,692 | |
| | | | | |
Taxable Municipal Bonds (11.0%)
| Alabama (1.5%) | | | |
| 300,000 | | | The Water Works Board of the City of Birmingham Revenue, 2.60%, 1/1/27 | | | 284,934 | |
| Arizona (1.2%) | | | | |
| 250,000 | | | City of Glendale Arizona, Certificate participation, 0.90%, 7/1/24 | | | 236,013 | |
| Colorado (1.4%) | | | | |
| 150,000 | | | Colorado Housing and Finance Authority Revenue, Series I-1, Class I, 0.86%, 11/1/23, GNMA | | | 144,852 | |
| 150,000 | | | Colorado Housing and Finance Authority Revenue, Series I-1, Class I, 1.11%, 5/1/25, GNMA | | | 139,284 | |
| | | | | | | 284,136 | |
| New York (2.7%) | | | | |
| 300,000 | | | New York City Housing Development Corp. Revenue, Series L, 2.84%, 11/1/28, Continuously Callable @100 | | | 271,748 | |
| 300,000 | | | New York City Transitional Finance Authority Revenue, 2.63%, 11/1/29 | | | 268,897 | |
| | | | | | | 540,645 | |
| Rhode Island (2.0%) | | | | |
| 400,000 | | | Rhode Island Convention Center Authority Revenue, 3.15%, 5/15/25 | | | 390,358 | |
| Texas (1.4%) | | | | |
| 300,000 | | | Midland County Fresh Water Supply District No. 1 Revenue, 2.37%, 9/15/26 | | | 282,713 | |
| Wisconsin (0.8%) | | | | |
| 165,000 | | | Public Financial Authority Revenue, 4.45%, 10/1/25, Insured by: AGC | | | 164,723 | |
| Total Taxable Municipal Bonds (Cost $2,318,576) | | | 2,183,522 | |
U.S. Government Agency Securities (6.8%)
| Federal Farm Credit Banks | | | |
| | 240,000 | | | 1.32%, 9/9/30, Callable 9/14/22 @ 100 * | | | 200,602 | |
| | 250,000 | | | 2.32%, 1/26/32, Callable 1/26/23 @ 100 * | | | 220,190 | |
| | | | | | | | 420,792 | |
| Federal Home Loan Banks | | | | |
| | 250,000 | | | 0.88%, 8/16/28, Callable 11/16/22 @ 100 *(b) | | | 221,862 | |
| | 200,000 | | | 1.38%, 10/28/31, Callable 10/28/22 @ 100 *(b) | | | 171,393 | |
| | 225,000 | | | 2.50%, 4/25/25, Callable 10/25/22 @ 100 *(b) | | | 222,254 | |
See notes to financial statements.
| Schedule of Portfolio Investments | Moderate Duration Fund |
| August 31, 2022 | Concluded |
Shares or
Principal
Amount | | | Security Description | | Value | |
U.S. Government Agency Securities, continued:
| Federal Home Loan Banks, continued: | |
| $ | 300,000 | | | 3.63%, 7/26/24, Callable 1/26/23 @ 100 * | | $ | 298,897 | |
| | | | | | | | 914,406 | |
| Total U.S. Government Agency Securities (Cost $1,385,449) | | | 1,335,198 | |
| | | | | |
| U.S. Treasury Obligations (24.1%) | | | | |
| U.S. Treasury Notes | | | | |
| | 1,471,000 | | | 1.25%, 8/15/31 | | | 1,255,579 | |
Shares or
Principal
Amount | | | Security Description | | Value | |
| U.S. Treasury Obligations, continued: | |
| U.S. Treasury Notes, continued: | | | |
| $ | 2,327,000 | | | 2.00%, 4/30/24 | | $ | 2,273,007 | |
| | 1,082,000 | | | 2.25%, 2/15/27 | | | 1,031,873 | |
| | 200,000 | | | 3.13%, 8/31/29 | | | 198,531 | |
| Total U.S. Treasury Obligations (Cost $5,069,757) | | | 4,758,990 | |
| | | | | | | | | |
| Investment in Affiliates (4.1%) | | | | |
| | 816,231 | | | Cavanal Hill Government Securities Money Market Fund, Select Shares, 1.92%(d) | | | 816,231 | |
| Total Investment in Affiliates (Cost $816,231) | | | 816,231 | |
| | | | | | | | | |
| Total Investments (Cost $21,360,899)(e) — 99.5% | | | 19,686,754 | |
| Other assets in excess of liabilities — 0.5% | | | 99,063 | |
| Net Assets - 100.0% | | $ | 19,785,817 | |
| (a) | Represents a restricted security, purchased under Rule 144A, Section 4(2), which is exempt from registration under the Securities Act of 1933, as amended. The security has been deemed liquid according to the policies and procedures adopted by the Board of Trustees. |
| (b) | The rate for certain asset-backed and mortgage-backed securities may vary based on factors relating to the pool of assets underlying the security. The rate presented is the rate in effect at August 31, 2022. |
| (c) | Step Bond: Coupon rate is set for an initial period and then increased to a higher coupon rate at a specified date. The rate shown is the rate in effect at August 31, 2022. |
| (d) | Money market investment. The rate presented on the Schedule of Portfolio Investments is the rate in effect at August 31, 2022. |
| (e) | Represents cost for financial reporting purposes. The cost for tax reporting purposes can be found in Note 6 in the Notes to Financial Statements. |
| * | Represents next call date. Additional subsequent call dates and amounts may apply to this security. |
| † | Mortgage backed securities are classified based on the characteristics of their underlying collateral, the fixed vs. variable nature of the obligations, and the credit standing of themortgagors. The fixed or variable rate nature of securities interest payments to which the fund is entitled may not coincide with the payment nature of the collateral underlying the securities. |
| AGC | Assured Guaranty Corporation |
| GNMA | Government National Mortgage Association |
| H15T1Y | 1 Year Treasury Constant Maturity Rate |
| LIBOR | London Interbank Offered Rate |
| MTN | Medium Term Note |
| SOFR | Secured Overnight Financing Rate |
| US0001M | 1 Month US Dollar LIBOR |
| US0003M | 3 Month US Dollar LIBOR |
| US0012M | 12 Month US Dollar LIBOR |
| Schedule of Portfolio Investments | Bond Fund |
| August 31, 2022 | |
Shares or
Principal
Amount | | | Security Description | | Value | |
| Asset Backed Securities (12.8%) | | | | |
| $ | 825,000 | | | Aligned Data Centers Issuer LLC, Series 2021-1A, Class A2, 1.94%, 8/15/46, Callable 8/15/24 @ 100*(a) | | $ | 729,370 | |
| | 17,333 | | | Bear Stearns Asset Backed Securities, Inc., Series 2003-AC7, Class A1, 5.50%, 1/25/34, Callable 9/25/22 @ 100*(b)(c) | | | 15,344 | |
| | 524,873 | | | BRE Grand Islander Timeshare Issuer LLC, Series 2019-A, Class B, 3.78%, 9/26/33, Callable 4/25/26 @ 100*(a) | | | 499,578 | |
| | 1,100,000 | | | CoreVest American Finance Trust, Series 2021-2, Class B, 2.38%, 7/15/54, Callable 7/15/31 @ 100*(a) | | | 885,790 | |
| | 992,500 | | | DB Master Finance LLC, Series 2021-1A, Class A2I, 2.05%, 11/20/51, Callable 5/20/24 @ 100*(a) | | | 864,670 | |
| | 98,750 | | | Domino's Pizza Master Issuer LLC, Series 2021-1A, Class A2I, 2.66%, 4/25/51, Callable 10/25/25 @ 100*(a) | | | 84,853 | |
| | 1,490,000 | | | Flexential Issuer, Series 2021-1A, Class A2, 3.25%, 11/27/51, Callable 11/25/25 @ 100*(a) | | | 1,381,509 | |
| | 1,500,000 | | | Hi-Fi Music Ip Issuer II L.P, Series 2022-1A, Class A2, 3.94%, 2/1/62, Callable 11/1/22 @ 100*(a) | | | 1,375,690 | |
| | 975,332 | | | Horizon Aircraft Finance III, Ltd., Series 2019-2, Class A, 3.43%, 11/15/39(a) | | | 839,609 | |
| | 668,250 | | | Jack In The Box Funding LLC, Series 2022-1A, Class A2I, 3.45%, 2/26/52, Callable 2/25/25 @ 100*(a) | | | 613,721 | |
| | 928,477 | | | Longtrain Leasing III LLC, Series 2015-1A, Class A2, 4.06%, 1/15/45, Callable 1/15/25 @ 100*(a) | | | 868,355 | |
| | 707,444 | | | MVW LLC, Series 2019-2A, Class A, 2.22%, 10/20/38, Callable 5/20/25 @ 100*(a) | | | 663,661 | |
| | 1 | | | RAAC, Series 2004-SP1, Class AI4, 5.29%, 8/25/27, Callable 9/25/22 @ 100*(b) | | | 1 | |
| | 515,000 | | | Sabey Data Center Issuer LLC, Series 2020-1, Class A2, 3.81%, 4/20/45, Callable 11/20/23 @ 100*(a) | | | 493,570 | |
| | 1,038,800 | | | Sonic Capital LLC, Series 2020-1A, Class A2I, 3.85%, 1/20/50, Callable 1/20/24 @ 100*(a) | | | 954,761 | |
| | 916,750 | | | Stack Infrastructure Issuer LLC, Series 2019-1A, Class A2, 4.54%, 2/25/44, Callable 2/25/23 @ 100*(a) | | | 913,203 | |
| | 20,549 | | | Structured Asset Securities Corp., Series 2003-AL2, Class A, 3.36%, 1/25/31, Callable 9/25/22 @ 100*(a) | | | 19,110 | |
| | 644,875 | | | Taco Bell Funding LLC, Series 2018-1A, Class A2II, 4.94%, 11/25/48, Callable 11/25/25 @ 100*(a) | | | 627,507 | |
| | 817,160 | | | Textainer Marine Containers VIII, Ltd., Series 2A-A, Class A, 2.10%, 9/20/45, Callable 9/20/22 @ 100*(a) | | | 734,478 | |
| | 921,156 | | | TIF Funding II LLC, Series 2021-1A, Class A, 1.65%, 2/20/46, Callable 2/20/23 @ 100*(a) | | | 788,586 | |
| | 479,308 | | | TRP-TRIP Rail Master Funding LLC, Series 2021-2, Class A, 2.15%, 6/19/51, Callable 6/17/23 @ 100*(a) | | | 424,939 | |
| | 93,053 | | | VR Funding LLC, Series 2020-1A, Class A, 2.79%, 11/15/50, Callable 11/15/23 @ 100*(a) | | | 83,705 | |
Shares or
Principal
Amount | | | Security Description | | Value | |
| Asset Backed Securities, continued: | | | |
| $ | 1,098,000 | | | Wendy's Funding LLC, Series 2019-1A, Class A2I, 3.78%, 6/15/49, Callable 3/15/24 @ 100*(a) | | $ | 1,032,172 | |
| | 699,207 | | | Willis Engine Structured Trust III, Series 17, Class A, 4.69%, 8/15/42, Callable 7/15/27 @ 100*(a)(b) | | | 606,718 | |
| | 886,608 | | | Willis Engine Structured Trust VI, Series 2021-A, Class A, 3.10%, 5/15/46, Callable 5/15/29 @ 100*(a) | | | 690,036 | |
| | 524,700 | | | ZAXBY'S Funding LLC, Series 2021-1A, Class A2, 3.24%, 7/30/51, Callable 7/30/25 @ 100*(a) | | | 448,345 | |
| Total Asset Backed Securities (Cost $18,538,019) | | | 16,639,281 | |
| | | | | | | | | |
| Mortgage Backed Securities† (10.9%) | | | | |
| Alt-A - Adjustable Rate Mortgage Backed Securities (0.0%^) | | | | |
| | 53,526 | | | Bear Stearns Alternative-A Trust, Series 2006-6, Class 32A1, 3.54%, 11/25/36, Callable 8/25/25 @ 100*(b) | | | 30,906 | |
| | 2,972 | | | JPMorgan Alternative Loan Trust, Series 2006-S4, Class A6, 6.21%, 12/25/36, Callable 9/25/22 @ 100*(b)(c) | | | 2,860 | |
| | | | | | | | 33,766 | |
| Alt-A - Fixed Rate Mortgage Backed Securities (1.1%) | | | | |
| | 6,542 | | | Bank of America Alternative Loan Trust, Series 2006-4, Class CB1, 6.50%, 5/25/46, Callable 9/25/22 @ 100* | | | 5,912 | |
| | 26,955 | | | Chaseflex Trust, Series 2005-2, Class 1A1, 6.00%, 6/25/35, Callable 9/25/22 @ 100* | | | 20,104 | |
| | 20,785 | | | Chaseflex Trust, Series 2007-1, Class 1A3, 6.50%, 2/25/37, Callable 9/25/22 @ 100* | | | 8,610 | |
| | 44,011 | | | Countrywide Alternative Loan Trust, Series 2005- 46CB, Class A3, 5.50%, 10/25/35, Callable 9/25/22 @ 100* | | | 34,021 | |
| | 6,091 | | | Countrywide Alternative Loan Trust, Series 2004- 22CB, Class 1A1, 6.00%, 10/25/34, Callable 9/25/22 @ 100* | | | 5,964 | |
| | 21,373 | | | Countrywide Alternative Loan Trust, Series 2006- 8T1, Class 1A4, 6.00%, 4/25/36, Callable 9/25/22 @ 100* | | | 11,909 | |
| | 147,870 | | | Countrywide Alternative Loan Trust, Series 2007 9T1, Class 1A7, 6.00%, 5/25/37, Callable 9/25/22 @ 100* | | | 82,499 | |
| | 175,271 | | | Countrywide Alternative Loan Trust, Series 2006- 36T2, Class 2A4, 6.25%, 12/25/36, Callable 9/25/22 @ 100* | | | 90,957 | |
| | 12,502 | | | Master Alternative Loans Trust, Series 2005-3, Class 1A1, 5.50%, 4/25/35, Callable 11/25/23 @ 100* | | | 11,629 | |
| | 35,978 | | | Master Alternative Loans Trust, Series 2004-3, Class 3A1, 6.00%, 4/25/34, Callable 9/25/22 @ 100* | | | 34,097 | |
| | 13,386 | | | Master Alternative Loans Trust, Series 2005-3, Class 7A1, 6.00%, 4/25/35, Callable 9/25/26 @ 100* | | | 11,679 | |
| | 732 | | | Master Alternative Loans Trust, Series 2003-7, Class 5A1, 6.25%, 11/25/33, Callable 9/25/22 @ 100* | | | 698 | |
| | 5,886 | | | Master Alternative Loans Trust, Series 2004-3, Class 2A1, 6.25%, 4/25/34, Callable 9/25/22 @ 100* | | | 5,670 | |
See notes to financial statememts.
| Schedule of Portfolio Investments | Bond Fund |
| August 31, 2022 | Continued |
Shares or
Principal
Amount | | | Security Description | | Value | |
| Mortgage Backed Securities†, continued: | | | |
| Alt-A - Fixed Rate Mortgage Backed Securities, continued: | | | |
| $ | 13,745 | | | Master Alternative Loans Trust, Series 2004-6, Class 7A1, 6.00%, 7/25/34, Callable 9/25/22 @ 100* | | $ | 12,973 | |
| | 1,058,947 | | | Morgan Stanley Bank of America Merrill Lynch Trust, Series 2013-C11, Class A3, 3.96%, 8/15/46, Callable 8/15/23 @ 100* | | | 1,055,336 | |
| | | | | | | | 1,392,058 | |
| Prime Adjustable Rate Mortgage Backed Securities (2.7%) | | | | |
| | 428,111 | | | GS Mortgage-Backed Securities Trust, Series 2021-GR2, Class A6, 2.50%, 2/25/52, Callable 10/25/35 @ 100*(a)(b) | | | 386,359 | |
| | 915,254 | | | GS Mortgage-Backed Securities Trust, Series 2021-PJ7, Class A8, 2.50%, 1/25/52, Callable 7/25/38 @ 100*(a)(b) | | | 823,693 | |
| | 3,643 | | | JPMorgan Mortgage Trust, Series 2006-A4, Class 3A1, 3.28%, 6/25/36, Callable 9/25/22 @ 100*(b) | | | 2,728 | |
| | 111,956 | | | JPMorgan Mortgage Trust, Series 2005-A6, Class 2A4, 4.24%, 8/25/35, Callable 9/25/22 @ 100*(b) | | | 107,485 | |
| | 789,423 | | | LSTAR Securities Investment, Ltd., Series 2019-4, Class A1, 5.87% (US0001M + 350 bps), 5/1/24(a) | | | 775,608 | |
| | 500,000 | | | Mello Warehouse Securitization Trust, Series 2021-1, Class A, 2.32% (US0001M + 70 bps), 2/25/55, Callable 2/25/24 @ 100*(a) | | | 488,438 | |
| | 175,000 | | | Mello Warehouse Securitization Trust, Series 2021-1, Class 21-C, 2.72% (US0001M + 110 bps), 2/25/55, Callable 2/25/24 @ 100*(a) | | | 170,123 | |
| | 9,706 | | | Merrill Lynch Mortgage Investors Trust, Series 2004-HB1, Class A3, 2.48%, 4/25/29, Callable 9/25/22 @ 100*(b) | | | 8,978 | |
| | 881,912 | | | Starwood Mortgage Residential Trust, Series 2021-5, Class A1, 1.92%, 9/25/66, Callable 10/25/24 @ 100*(a)(b) | | | 783,355 | |
| | 3,725 | | | Structured Adjustable Rate Mortgage Loan Trust, Series 2006-5, Class 4A1, 3.25%, 6/25/36, Callable 9/25/22 @ 100*(b) | | | 2,611 | |
| | | | | | | | 3,549,378 | |
| Prime Fixed Mortgage Backed Securities (4.2%) | | | | |
| | 319,659 | | | Arroyo Mortgage Trust, Series 2019-3, Class A1, 2.96%, 10/25/48, Callable 9/25/22 @ 100*(a)(b) | | | 302,360 | |
| | 2,335 | | | Chase Mortgage Finance Corp., Series 2002-S4, Class A23, 6.25%, 3/25/32, Callable 9/25/22 @ 100* | | | 2,130 | |
| | 99,742 | | | Chaseflex Trust, Series 2006-2, Class A5, 4.44%, 9/25/36, Callable 9/25/22 @ 100*(b) | | | 90,757 | |
| | 1,276,697 | | | CIM Trust, Series 2021-J2, Class A4, 2.50%, 4/25/51, Callable 3/25/44 @ 100*(a)(b) | | | 1,148,180 | |
| | 14,699 | | | Citigroup Mortgage Loan Trust, Inc., Series 2005-1, Class 3A1, 6.50%, 4/25/35 | | | 14,265 | |
| | 2,000 | | | Countrywide Home Loans, Series 2004-8, Class 1A3, 5.50%, 7/25/34, Callable 9/25/22 @ 100* | | | 1,906 | |
| | 3,200 | | | Countrywide Home Loans, Series 2004-18, Class A1, 6.00%, 10/25/34, Callable 9/25/22 @ 100* | | | 3,056 |
| | 3,069 | | | Countrywide Home Loans, Series 2004-21, Class A10, 6.00%, 11/25/34, Callable 9/25/22 @ 100* | | | 2,947 | |
Shares or
Principal
Amount | | | Security Description | | Value | |
| Mortgage Backed Securities†, continued: | | | |
| Prime Fixed Mortgage Backed Securities, continued: | | | |
| $ | 92,162 | | | Credit Suisse First Boston Mortgage Securities Corp., Series 2005-9, Class 3A1, 6.00%, 10/25/35, Callable 9/25/22 @ 100* | | $ | 34,043 | |
| | 103 | | | First Nationwide Trust, Series 2001-3, Class 1A1, 6.75%, 8/21/31 | | | 98 | |
| | 810 | | | GMAC Mortgage Corp. Loan Trust, Series 2003- GH2, Class A4, 5.50%, 10/25/33, Callable 9/25/22 @ 100*(b)(c) | | | 796 | |
| | 915,328 | | | GS Mortgage-Backed Securities Trust 2022-Mm1, Series 2022-MM1, Class A8, 2.50%, 7/25/52, Callable 2/25/32 @ 100*(a)(b) | | | 822,615 | |
| | 13,089 | | | JPMorgan Mortgage Trust, Series 2006-A2, Class 3A2, 2.75%, 4/25/36, Callable 9/25/22 @ 100*(b) | | | 11,452 | |
| | 1,049,304 | | | JPMorgan Mortgage Trust, Series 2019-6, Class A5, 3.50%, 12/25/49, Callable 7/25/28 @ 100*(a)(b) | | | 996,135 | |
| | 17,305 | | | JPMorgan Mortgage Trust, Series 2004-S2, Class 4A5, 6.00%, 11/25/34, Callable 9/25/22 @ 100* | | | 16,033 | |
| | 868,752 | | | Mello Mortgage Capital Acceptance Trust, Series 2021-MTG2, Class A10, 2.50%, 6/1/51, Callable 11/25/37 @ 100*(a)(b) | | | 783,588 | |
| | 3,759 | | | Nomura Asset Acceptance Corp., Series 2003-A1, Class A2, 6.00%, 5/25/33, Callable 9/25/22 @ 100* | | | 3,624 | |
| | 87,360 | | | RAAC, Series 2004-SP2, Class A22, 6.00%, 1/25/32, Callable 9/25/22 @ 100* | | | 79,025 | |
| | 36,540 | | | TBW Mortgage Backed Pass-Through Certificates, Series 2006-2, Class 7A1, 7.00%, 7/25/36, Callable 9/25/22 @ 100* | | | 5,576 | |
| | 163,651 | | | Washington Mutual Mortgage Pass-Through Certificates, Series 2005-3, Class 1CB5, 5.50%, 5/25/35, Callable 9/25/22 @ 100* | | | 146,563 | |
| | 3,476 | | | Washington Mutual Mortgage Pass-Through Certificates, Series 2004-CB1, Class 4A, 6.00%, 6/25/34, Callable 9/25/22 @ 100* | | | 3,379 | |
| | 21,699 | | | Washington Mutual Mortgage Pass-Through Certificates, Series 2004-RA1, Class 2A, 7.00%, 3/25/34, Callable 10/25/22 @ 100* | | | 21,249 | |
| | 700,468 | | | Wells Fargo Mortgage Backed Securities Trust, Series 2021-2, Class A3, 2.50%, 6/25/51, Callable 10/25/35 @ 100*(a)(b) | | | 629,956 | |
| | 252,965 | | | Wells Fargo Mortgage Backed Securities Trust, Series 2019-3, Class A1, 3.50%, 7/25/49, Callable 9/25/23 @ 100*(a)(b) | | | 234,924 | |
| | 106,497 | | | WinWater Mortgage Loan Trust, Series 2015-1, Class A1, 3.50%, 1/20/45, Callable 9/20/22 @ 100*(a)(b) | | | 101,064 | |
| | | | | | | | 5,455,721 | |
| Subprime Mortgage Backed Securities (0.5%) | | | | |
| | 233,448 | | | Towd Point Mortgage Trust, Series 2017-6, Class A1, 2.75%, 10/25/57, Callable 11/25/25 @ 100*(a)(b) | | | 226,754 | |
| | 95,764 | | | Towd Point Mortgage Trust, Series 2018-1, Class A1, 3.00%, 1/25/58, Callable 6/25/25 @ 100*(a)(b) | | | 93,539 | |
| | 264,139 | | | Towd Point Mortgage Trust, Series 2018-2, Class A1, 3.25%, 3/25/58, Callable 11/25/26 @ 100*(a)(b) | | | 258,560 | |
| | | | | | | | 578,853 | |
See notes to financial statememts.
| Schedule of Portfolio Investments | Bond Fund |
| August 31, 2022 | Continued |
Shares or
Principal
Amount | | | Security Description | | Value | |
| Mortgage Backed Securities†, continued: | |
| U.S. Government Agency Mortgage Backed Securities (2.4%) | |
| $ | 207,871 | | | Fannie Mae, Series 2012-111, Class EC, 2.00%, 12/25/41 | | $ | 194,629 | |
| | 111,224 | | | Fannie Mae, Series 2013-23, Class AB, 2.00%, 2/25/43 | | | 104,731 | |
| | 412,713 | | | Fannie Mae, Series 2020-54, Class TA, 2.00%, 5/25/43 | | | 394,589 | |
| | 140,805 | | | Fannie Mae, Series 2012-30, Class CB, 2.25%, 10/25/41 | | | 134,509 | |
| | 8,469 | | | Fannie Mae, 2.43% (H15T1Y + 231 bps), 12/1/27, Pool #422279 | | | 8,350 | |
| | 157,952 | | | Fannie Mae, Series 2, Class JD, 2.50%, 2/25/50 | | | 144,029 | |
| | 100,782 | | | Fannie Mae, Series 2010-100, Class LA, 2.50%, 7/25/40 | | | 96,918 | |
| | 166,219 | | | Fannie Mae, Series 2012-111, Class QC, 2.50%, 5/25/42 | | | 158,015 | |
| | 40,056 | | | Fannie Mae, Series 2014-61, Class P, 2.50%, 7/25/44 | | | 38,150 | |
| | 219,842 | | | Fannie Mae, Series 2014-33, Class PE, 3.00%, 4/25/43 | | | 214,662 | |
| | 220,947 | | | Fannie Mae, Series 2015-59, Class LM, 3.00%, 7/25/45 | | | 209,309 | |
| | 496,659 | | | Fannie Mae, Series 2018-M12, Class A1, 3.55%, 2/25/30 | | | 495,353 | |
| | 10,628 | | | Fannie Mae, Series 2002-W11, Class AF5, 4.98%, 11/25/32, Callable 9/25/22 @ 100*(b)(c) | | | 10,393 | |
| | 186 | | | Fannie Mae, 5.00%, 8/1/33, Pool #730856 | | | 194 | |
| | 91 | | | Fannie Mae, 5.00%, 7/1/35, Pool #832198 | | | 95 | |
| | 131 | | | Fannie Mae, 5.50%, 2/1/33, Pool #683351 | | | 137 | |
| | 79 | | | Fannie Mae, 5.50%, 9/1/34, Pool #725773 | | | 84 | |
| | 1,134 | | | Fannie Mae, Series 1998-36, Class ZB, 6.00%, 7/18/28 | | | 1,178 | |
| | 337 | | | Fannie Mae, Series 1993-82, Class H, 7.00%, 5/25/23 | | | 338 | |
| | 21,030 | | | Fannie Mae Whole Loan, Series 2003-W6, Class 6A, 3.36%, 8/25/42, Callable 9/25/22 @ 100*(b) | | | 20,648 | |
| | 77,683 | | | Freddie Mac, Series 4019, Class GB, 2.00%, 12/15/41 | | | 73,374 | |
| | 86,253 | | | Freddie Mac, Series 4461, Class EA, 2.00%, 7/15/37 | | | 83,776 | |
| | 175,769 | | | Freddie Mac, Series 3913, Class PC, 2.50%, 3/15/41 | | | 172,123 | |
| | 1,395 | | | Freddie Mac, 3.13% (H15T1Y + 213 bps), 4/1/24, Pool #409624 | | | 1,382 | |
| | 100,356 | | | Freddie Mac, Series 3721, Class PE, 3.50%, 9/15/40 | | | 97,926 | |
| | 37,472 | | | Freddie Mac, Series 3780, Class MK, 3.50%, 10/15/40 | | | 36,596 | |
| | 296 | | | Freddie Mac, Series 2610, Class VB, 5.50%, 7/15/24 | | | 299 | |
| | 190 | | | Freddie Mac, 6.00%, 7/1/35, Pool #A36085 | | | 197 | |
| | 917 | | | Freddie Mac, Series 2148, Class ZA, 6.00%, 4/15/29 | | | 953 | |
| | 525 | | | Freddie Mac, 6.50%, 2/1/36, Pool #G08113 | | | 563 | |
| | 6,176 | | | Freddie Mac, Series 2036, Class PD, 6.50%, 3/15/28 | | | 6,525 | |
| | 150,143 | | | Government National Mortgage Assoc., Series 2013-69, 2.00%, 9/20/42 | | | 137,063 | |
| | 234,315 | | | Government National Mortgage Assoc., Series 2009-94, Class KB, 3.00%, 9/16/39 | | | 229,284 | |
Shares or
Principal
Amount | | | Security Description | | Value | |
| Mortgage Backed Securities†, continued: | | | |
| U.S. Government Agency Mortgage Backed Securities, continued: | | | |
| $ | 89,997 | | | Government National Mortgage Assoc., Series 2011-46, Class GJ, 3.25%, 1/16/41(b) | | $ | 88,063 | |
| | 11,981 | | | Government National Mortgage Assoc., Series 2009-93, Class HG, 4.00%, 9/16/39 | | | 11,990 | |
| | 220 | | | Government National Mortgage Assoc., 7.00%, 9/15/23, Pool #347688 | | | 220 | |
| | 2,896 | | | Government National Mortgage Assoc., 7.00%, 7/15/29, Pool #490215 | | | 2,986 | |
| | 677 | | | Government National Mortgage Assoc., 7.50%, 11/15/23, Pool #354701 | | | 680 | |
| | | | | | | | 3,170,311 | |
| Total Mortgage Backed Securities (Cost $15,287,705) | | | 14,180,087 | |
| Corporate Bonds (23.8%) | | | | |
| Aerospace & Defense (1.2%) | | | | |
| | 1,750,000 | | | Boeing Co. (The), 3.25%, 2/1/28, Callable 12/1/27 @ 100 * | | | 1,592,134 | |
| Airlines (1.5%) | | | | | |
| | 1,100,418 | | | Alaska Airlines 2020-1, 4.80%, 2/15/29 (a) | | | 1,087,096 | |
| | 856,269 | | | United Airlines Pass Through Trust, Series 2020-1, Class A, 5.88%, 4/15/29 | | | 857,303 | |
| | | | | | | | 1,944,399 | |
| Banks (3.2%) | | | | | |
| | 2,475,000 | | | Bank of America Corp., 3.31% (SOFR + 158 bps), 4/22/42, Callable 4/22/41 @ 100 * | | | 1,946,375 | |
| | 1,350,000 | | | JPMorgan Chase & Co., 2.52% (SOFR + 204 bps), 4/22/31, Callable 4/22/30 @ 100 * | | | 1,144,641 | |
| | 1,350,000 | | | Wells Fargo & Co., 3.07% (SOFR + 253 bps), 4/30/41, Callable 4/30/40 @ 100 * | | | 1,037,136 | |
| | | | | | | | 4,128,152 | |
| Beverages (0.6%) | | | | |
| | 800,000 | | | PepsiCo, Inc., 2.75%, 3/19/30, Callable 12/19/29 @ 100 * | | | 733,027 | |
| Capital Markets (1.2%) | | | | |
| | 1,600,000 | | | Goldman Sachs Group, Inc., 3.50%, 11/16/26, Callable 11/16/25 @ 100 * | | | 1,537,682 | |
| Diversified Financial Services (0.6%) | | | | |
| | 850,000 | | | Korea Development Bank, 2.75%, 3/19/23 | | | 846,175 | |
| Electric Utilities (0.7%) | | | | |
| | 1,000,000 | | | Entergy Mississippi LLC, 3.25%, 12/1/27, Callable 9/1/27 @ 100 * | | | 931,902 | |
| Electrical Equipment (0.8%) | | | | |
| | 1,250,000 | | | Emerson Electric Co., 2.20%, 12/21/31, Callable 9/21/31 @ 100 * | | | 1,064,748 | |
| Equity Real Estate Investment Trusts (0.8%) | | | | |
| | 1,100,000 | | | SBA Tower Trust, 1.88%, 7/15/50, Callable 1/15/25 @ 100 *(a) | | | 991,235 | |
| Financial Services (0.1%) | | | | |
| | 88,962 | | | JBG/Rockville NCI Campus LLC, Series 2010-A, 3.90%, 7/15/23 (a) | | | 89,405 | |
| Food Products (1.6%) | | | | |
| | 1,059,000 | | | Conagra Brands, Inc., 4.60%, 11/1/25, Callable 9/1/25 @ 100 * | | | 1,058,579 | |
| | 320,000 | | | Mars, Inc., 0.88%, 7/16/26, Callable 6/16/26 @ 100 *(a) | | | 283,894 | |
| | 825,000 | | | Mars, Inc., 3.20%, 4/1/30, Callable 1/1/30 @ 100 *(a) | | | 768,797 | |
| | | | | | | | 2,111,270 | |
| Health Care Providers & Services (2.4%) | | | | |
| | 1,000,000 | | | Ascension Health, Series B, 2.53%, 11/15/29, Callable 8/15/29 @ 100 * | | | 894,986 | |
See notes to financial statememts
Schedule of Portfolio Investments August 31, 2022 | Bond Fund Continued |
Shares or
Principal
Amount | | | Security Description | | Value | |
| Corporate Bonds, continued: | | | |
| Health Care Providers & Services, continued: | | | | |
| $ | 655,000 | | | Montefiore Medical Center, 2.15%, 10/20/26, Callable 4/20/26 @ 100 * | | $ | 638,531 | |
| | 1,050,000 | | | Partners Healthcare Syst, Inc., Series 2020, 3.19%, 7/1/49, Callable 1/1/49 @ 100 * | | | 809,418 | |
| | 890,000 | | | Sutter Health, 3.70%, 8/15/28, Callable 5/15/28 @ 100 * | | | 852,248 | |
| | | | | | | | 3,195,183 | |
| Hotels, Restaurants & Leisure (1.8%) | | | | |
| | 1,115,000 | | | Hyatt Hotels Corp., 4.38%, 9/15/28, Callable 6/15/28 @ 100 * | | | 1,054,910 | |
| | 345,000 | | | Royal Caribbean Cruises, 5.25%, 11/15/22 | | | 344,930 | |
| | 1,200,000 | | | Starbucks Corp., 3.75%, 12/1/47, Callable 6/1/47 @ 100 * | | | 977,082 | |
| | | | | | | | 2,376,922 | |
| Household Durables (0.9%) | | | | |
| | 1,120,000 | | | Harman International Industries, Inc., 4.15%, 5/15/25, Callable 2/15/25 @ 100 * | | | 1,112,004 | |
| Insurance (0.8%) | | | | |
| | 1,100,000 | | | Jackson National Life Global Funding, 2.65%, 6/21/24 (a) | | | 1,065,777 | |
| Interactive Media & Services (0.9%) | | | | |
| | 1,300,000 | | | Meta Platforms, Inc., 3.85%, 8/15/32, Callable 5/15/32 @ 100 * | | | 1,226,099 | |
| IT Services (1.5%) | | | | |
| | 1,200,000 | | | International Business Machines Corp., 3.50%, 5/15/29 | | | 1,134,810 | |
| | 770,000 | | | Western Union Co. (The), 6.20%, 11/17/36 | | | 764,391 | |
| | | | | | | | 1,899,201 | |
| Oil, Gas & Consumable Fuels (1.4%) | | | | |
| | 1,000,000 | | | HF Sinclair Corp., 2.63%, 10/1/23 (a) | | | 970,312 | |
| | 900,000 | | | Marathon Oil Corp., 4.40%, 7/15/27, Callable 4/15/27 @ 100 * | | | 875,279 | |
| | | | | | | | 1,845,591 | |
| Semiconductors & Semiconductor Equipment (1.8%) | | | | |
| | 97,000 | | | Broadcom, Inc., 3.19%, 11/15/36, Callable 8/15/36 @ 100 *(a) | | | 72,479 | |
| | 2,178,000 | | | Broadcom, Inc., 4.15%, 11/15/30, Callable 8/15/30 @ 100 * | | | 1,993,062 | |
| | 325,000 | | | Intel Corp., 3.25%, 11/15/49, Callable 5/15/49 @ 100 * | | | 242,825 | |
| | | | | | | | 2,308,366 | |
| Total Corporate Bonds (Cost $35,345,240) | | | 30,999,272 | |
| | | | | |
| Taxable Municipal Bonds (9.8%) | | | | |
| Kentucky (0.5%) | | | | |
| | 750,000 | | | Lexington-Fayette Urban County Airport Board Corp. Revenue, 2.84%, 7/1/31 | | | 664,426 | |
| Michigan (1.0%) | | | | |
| | 410,000 | | | Michigan State Housing Development Authority Revenue, Series B, 2.72%, 10/1/35, Continuously Callable @100 | | | 374,170 | |
| | 1,000,000 | | | Michigan State Housing Development Authority Revenue, Series B, 3.49%, 12/1/40, Continuously Callable @100 | | | 864,522 | |
| | | | | | | | 1,238,692 | |
| Oklahoma (2.4%) | | | | |
| | 500,000 | | | Grand River Dam Authority Revenue, Series B, 4.55%, 6/1/39, Continuously Callable @100 | | | 487,108 | |
| | 735,000 | | | Oklahoma Capitol Improvement Authority Revenue, 5.12%, 7/1/25 | | | 748,198 | |
Shares or
Principal
Amount | | | Security Description | | Value | |
| Taxable Municipal Bonds, continued: | | | | |
| Oklahoma, continued: | | | | |
| $ | 450,000 | | | The University of Oklahoma Revenue, Series C, 2.45%, 7/1/32, Continuously Callable @100 | | $ | 371,174 | |
| | 1,650,000 | | | University of Oklahoma Health Sciences Center General Revenue, Series A, 3.87%, 7/1/32, Continuously Callable @100 | | | 1,576,383 | |
| | | | | | | | 3,182,863 | |
| Oregon (0.6%) | | | | |
| | 1,000,000 | | | State of Oregon, GO, Series O, 1.70%, 8/1/32, Continuously Callable @100 | | | 805,225 | |
| Pennsylvania (0.9%) | | | | |
| | 1,110,000 | | | City of Bethlehem Lehigh and Northampton Countries, GO, Series C, 5.15%, 11/1/34, Pre-refunded 11/1/24 @ 100, AGM | | | 1,142,014 | |
| Texas (3.0%) | | | | |
| | 1,000,000 | | | Arlington Independent School District, GO, 5.00%, 2/15/26, PSF-GTD | | | 1,040,121 | |
| | 1,000,000 | | | Arlington Independent School District, GO, 5.00%, 2/15/27, PSF-GTD | | | 1,049,663 | |
| | 1,250,000 | | | Northwest Independent School District, GO, 1.78%, 2/15/31, Continuously Callable @100, TX PERMANENT SCHOOL FUND GUARANTEED | | | 1,050,548 | |
| | 785,000 | | | Texas Transportation Commission State Highway Fund Revenue, 5.18%, 4/1/30 | | | 827,904 | |
| | | | | | | | 3,968,236 | |
| Washington (1.4%) | | | | |
| | 1,200,000 | | | County of King WA Sewer Revenue, Series B, 1.86%, 1/1/33, Continuously Callable @100 | | | 963,327 | |
| | 1,070,000 | | | Pierce County School District No 10 Tacoma, GO, 1.90%, 12/1/33, SCH BD GTY | | | 847,276 | |
| | | | | | | | 1,810,603 | |
| Total Taxable Municipal Bonds (Cost $14,317,977) | | | 12,812,059 | |
| | | | | |
| U.S. Government Agency Securities (11.3%) | | | | |
| Federal Farm Credit Banks | | | | |
| | 750,000 | | | 1.32%, 9/9/30, Callable 9/14/22 @ 100 * | | | 626,882 | |
| | 1,565,000 | | | 2.13%, 4/19/34, Callable 9/14/22 @ 100 * | | | 1,299,925 | |
| | 1,408,000 | | | 2.15%, 3/7/36, Callable 9/14/22 @ 100 * | | | 1,135,379 | |
| | 1,350,000 | | | 2.23%, 3/12/35, Callable 9/14/22 @ 100 * | | | 1,106,323 | |
| | 1,150,000 | | | 2.32%, 1/26/32, Callable 1/26/23 @ 100 * | | | 1,012,874 | |
| | 1,220,000 | | | 2.75%, 2/2/37, Callable 2/2/23 @ 100 * | | | 1,024,994 | |
| | | | | | | | 6,206,377 | |
| Federal Home Loan Banks | | | | |
| | 1,100,000 | | | 1.00%, 10/29/29, Callable 10/29/22 @ 100 *(b) | | | 970,683 | |
| | 1,000,000 | | | 1.00%, 2/11/36, Callable 11/11/22 @ 100 *(b) | | | 780,978 | |
| | 1,345,000 | | | 1.25%, 10/8/30, Callable 9/14/22 @ 100 * | | | 1,111,970 | |
| | 3,000,000 | | | 1.25%, 3/24/33, Callable 9/24/22 @ 100 *(b) | | | 2,564,333 | |
| | 1,170,000 | | | 1.50%, 2/25/36, Callable 11/25/22 @ 100 *(b) | | | 917,708 | |
| | | | | | | | 6,345,672 | |
| Federal Home Loan Mortgage Corporation | | | | |
| | 932,025 | | | Series 4893, 2.50%, 5/15/49 | | | 865,578 | |
| Federal National Mortgage Association | | | | |
| | 923,513 | | | Series 2018-94, 3.50%, 1/25/49 | | | 898,178 | |
| | 489,173 | | | Series 2022-35, 4.00%, 3/25/47 | | | 487,114 | |
| | | | | | | | 1,385,292 | |
| Total U.S. Government Agency Securities (Cost $15,331,297) | | | 14,802,919 | |
| | | | | |
| U.S. Treasury Obligations (26.1%) | | | | |
| U.S. Treasury Bonds | | | | |
| | 6,570,000 | | | 1.75%, 8/15/41 | | | 4,902,349 | |
| | 9,815,000 | | | 2.00%, 8/15/51 | | | 7,405,724 | |
| | | | | | | | 12,308,073 | |
See notes to financial statements.
Schedule of Portfolio Investments
August 31, 2022 | Bond Fund
Concluded |
Shares or
Principal
Amount | | | Security Description | | Value | |
| U.S. Treasury Obligations, continued: | | | | |
| U.S. Treasury Notes | | | | |
| $ | 8,529,000 | | | 1.13%, 2/15/31 | | $ | 7,272,638 | |
| | 5,110,000 | | | 2.00%, 4/30/24 | | | 4,991,432 | |
| | 8,490,000 | | | 2.25%, 2/15/27 | | | 8,096,674 | |
| | 1,325,000 | | | 3.13%, 8/31/29 | | | 1,315,270 | |
| | | | | | | | 21,676,014 | |
| Total U.S. Treasury Obligations (Cost $37,080,480) | | | 33,984,087 | |
Shares or
Principal
Amount | | | Security Description | | Value | |
| Investment in Affiliates (5.0%) | | | | |
| | 6,466,384 | | | Cavanal Hill Government Securities Money Market Fund, Select Shares, 1.92%(d) | | $ | 6,466,384 | |
| Total Investment in Affiliates (Cost $6,466,384) | | | 6,466,384 | |
| | | | | |
| Total Investments (Cost $142,367,102)(e) - 99.7% | | | 129,884,089 | |
| Other assets in excess of liabilities — 0.3% | | | 363,872 | |
| Net Assets - 100.0% | | $ | 130,247,961 | |
| (a) | Represents a restricted security, purchased under Rule 144A, Section 4(2), which is exempt from registration under the Securities Act of 1933, as amended. The security has been deemed liquid according to the policies and procedures adopted by the Board of Trustees. |
| (b) | The rate for certain asset-backed and mortgage-backed securities may vary based on factors relating to the pool of assets underlying the security. The rate presented is the rate in effect at August 31, 2022. |
| (c) | Step Bond: Coupon rate is set for an initial period and then increased to a higher coupon rate at a specified date. The rate shown is the rate in effect at August 31, 2022. |
| (d) | Money market investment. The rate presented on the Schedule of Portfolio Investments is the rate in effect at August 31, 2022. |
| (e) | Represents cost for financial reporting purposes. The cost for tax reporting purposes can be found in Note 6 in the Notes to Financial Statements. |
| * | Represents next call date. Additional subsequent call dates and amounts may apply to this security. |
| ^ | Represents less than 0.05%. |
| † | Mortgage backed securities are classified based on the characteristics of their underlying collateral, the fixed vs. variable nature of the obligations, and the credit standing of the mortgagors. The fixed or variable rate nature of securities interest payments to which the fund is entitled may not coincide with the payment nature of the collateral underlying the securities. |
| AGM | Assured Guaranty Municipal Corporation |
| GO | General Obligation |
| H15T1Y | 1 Year Treasury Constant Maturity Rate |
| LIBOR | London Interbank Offered Rate |
| PSF-GTD | Public School Fund Guaranteed |
| SCH BD GTY | School Board Guaranty |
| SOFR | Secured Overnight Financing Rate |
| US0001M | 1 Month US Dollar LIBOR |
See notes to financial statements.
Schedule of Portfolio Investments August 31, 2022 | Strategic Enhanced Yield Fund |
Shares or
Principal
Amount | | | Security Description | | Value | |
| Asset Backed Securities (15.9%) | | | | |
| $ | 372,188 | | | AB Issuer LLC, Series 2021-1, Class A2, 3.73%, 7/30/51, Callable 1/30/26 @ 100*(a) | | $ | 328,168 | |
| | 49,540 | | | ABFC Trust, Series 2005-AQ1, Class A6, 4.40%, 1/25/35, Callable 9/25/22 @ 100*(b)(c) | | | 48,695 | |
| | 600,000 | | | Amur Equipment Finance Receivables LLC, Series 2021-1A, Class E, 4.13%, 3/20/28, Callable 12/20/24 @ 100*(d) | | | 547,779 | |
| | 252,258 | | | Bayview Commercial Asset Trust, Series 2004-3, Class A1, 2.81% (US0001M + 56 bps), 1/25/35, Callable 9/25/22 @ 100*(a) | | | 250,297 | |
| | 14,477 | | | Centex Home Equity Loan Trust, Series 2002-A, Class AF6, 5.54%, 1/25/32, Callable 9/25/22 @ 100* | | | 14,408 | |
| | 13,828 | | | GSAA Home Equity Trust, Series 2005-1, Class M1, 5.80%, 11/25/34, Callable 9/25/22 @ 100*(b)(c) | | | 13,738 | |
| | 84,509 | | | GSAMP Trust, Series 2006-HE1, Class M1, 3.03% (US0001M + 39 bps), 1/25/36, Callable 9/25/22 @ 100* | | | 84,167 | |
| | 24,293 | | | Master Asset Backed Securities Trust, Series 2004-FRE1, Class M6, 4.54% (US0001M + 210 bps), 7/25/34, Callable 9/25/22 @ 100* | | | 24,266 | |
| | 286,375 | | | Neighborly Issuer LLC, Series 2021-1A, Class A2, 3.58%, 4/30/51, Callable 10/30/26 @ 100*(a) | | | 247,807 | |
| | 13,986 | | | Residential Asset Mortgage, Series 2004-RS12, Class MI1, 5.56%, 12/25/34, Callable 9/25/22 @ 100*(b)(c) | | | 13,913 | |
| | 22,238 | | | Residential Asset Securities Corp., Series 2004-KS8, Class MI1, 5.34%, 9/25/34, Callable 9/25/22 @ 100*(b) | | | 21,823 | |
| Total Asset Backed Securities (Cost $1,732,453) | | | 1,595,061 | |
| | | | | |
| Mortgage Backed Securities† (43.8%) | | | | |
| Alt-A - Fixed Rate Mortgage Backed Securities (6.5%) | | | | |
| | 16,476 | | | Bear Stearns Asset-Backed Securities Trust, Series 2004-AC3, Class A1, 5.25%, 6/25/34, Callable 9/25/22 @ 100*(b)(c) | | | 15,862 | |
| | 11,165 | | | Countrywide Alternative Loan Trust, Series 2004-16CB, Class 1A1, 5.50%, 7/25/34, Callable 9/25/22 @ 100* | | | 10,744 | |
| | 11,756 | | | Countrywide Alternative Loan Trust, Series 2004-16CB, Class 3A1, 5.50%, 8/25/34, Callable 9/25/22 @ 100* | | | 11,394 | |
| | 81,355 | | | Countrywide Alternative Loan Trust, Series 2003-22CB, Class 1A1, 5.75%, 12/25/33, Callable 9/25/22 @ 100* | | | 77,241 | |
| | 24,778 | | | Countrywide Alternative Loan Trust, Series 2004-16CB, Class 4A3, 6.00%, 8/25/34, Callable 9/25/22 @ 100* | | | 24,538 | |
| | 23,558 | | | Countrywide Alternative Loan Trust, Series 2004-J2, Class 2A1, 6.50%, 3/25/34, Callable 9/25/22 @ 100* | | | 22,713 | |
| | 6,979 | | | Master Alternative Loans Trust, Series 2004-11, Class 6A1, 5.50%, 10/25/34, Callable 9/25/22 @ 100* | | | 6,736 | |
| | 69,217 | | | Master Alternative Loans Trust, Series 2004-7, Class 1A1, 5.50%, 7/25/34, Callable 9/25/22 @ 100* | | | 67,102 | |
| | 102,270 | | | Master Alternative Loans Trust, Series 2003-3, Class 2A5, 6.00%, 5/25/33, Callable 9/25/22 @ 100* | | | 98,071 | |
Shares or
Principal
Amount | | | Security Description | | Value | |
| Mortgage Backed Securities†, continued: | | | | |
| Alt-A - Fixed Rate Mortgage Backed Securities, continued: | | | | |
| $ | 25,183 | | | Master Alternative Loans Trust, Series 2004-5, Class 2A1, 6.00%, 6/25/34, Callable 9/25/22 @ 100* | | $ | 24,437 | |
| | 217,000 | | | Residential Asset Securitization Trust, Series 2003-A7, Class A8, 5.00%, 7/25/33, Callable 9/25/22 @ 100* | | | 216,362 | |
| | 65,000 | | | Residential Asset Securitization Trust, Series 2003-A10, Class A2, 5.20%, 9/25/33, Callable 9/25/22 @ 100* | | | 60,936 | |
| | 17,396 | | | Structured Asset Securities Corp., Series 2004-4XS, Class A3A, 5.13%, 2/25/34, Callable 9/25/22 @ 100*(b)(c) | | | 16,613 | |
| | | | | | | | 652,749 | |
| Prime Adjustable Rate Mortgage Backed Securities (14.4%) | | | | |
| | 41,880 | | | Citigroup Mortgage Loan Trust, Inc., Series 2004-UST1, Class A5, 2.87%, 8/25/34, Callable 9/25/22 @ 100*(b) | | | 41,171 | |
| | 74,847 | | | Impac Secured Assets CMN Owner Trust, Series 2003-3, Class A1, 5.20%, 8/25/33, Callable 9/25/22 @ 100*(b) | | | 71,375 | |
| | 248,668 | | | LSTAR Securities Investment, Ltd., Series 2019-4, Class A1, 5.87% (US0001M + 350 bps), 5/1/24(a) | | | 244,317 | |
| | 557,784 | | | LSTAR Securities Investment, Ltd., Series 2019-4, Class A2, 6.87% (US0001M + 250 bps), 5/1/24(a) | | | 508,978 | |
| | 500,000 | | | Mello Warehouse Securitization Trust, Series 2021-1, Class G, 6.00% (US0001M + 438 bps), 2/25/55, Callable 2/25/24 @ 100*(a) | | | 490,598 | |
| | 24,835 | | | Structured Adjustable Rate Mortgage Loan Trust, Series 2004-12, Class 3A2, 3.06%, 9/25/34, Callable 9/25/22 @ 100*(b) | | | 24,416 | |
| | 28,481 | | | Structured Adjustable Rate Mortgage Loan Trust, Series 2004-8, Class 3A, 3.72%, 7/25/34, Callable 9/25/22 @ 100*(b) | | | 27,692 | |
| | 41,198 | | | WinWater Mortgage Loan Trust, Series 2014-1, Class A1, 3.91%, 6/20/44, Callable 9/20/22 @100*(a)(b) | | | 39,806 | |
| | | | | | | | 1,448,353 | |
| Prime Fixed Mortgage Backed Securities (16.8%) | | | | |
| | 94,228 | | | Alternative Loan Trust, Series 2004-18CB, Class 4A1, 5.50%, 9/25/34, Callable 9/25/22 @100* | | | 90,827 | |
| | 8,272 | | | Banc of America Funding Trust, Series 2004-3,Class 1A9, 5.50%, 10/25/34, Callable 9/25/22 @ 100* | | | 7,895 | |
| | 352,356 | | | Brean Asset Backed Securities Trust, Series 2021-RM1, Class M1, 1.60%, 10/25/63, Callable 9/25/27 @ 100*(d) | | | 276,737 | |
| | 6,444 | | | Citicorp Mortgage Securities Trust, Series 2006-3,Class 1A19, 5.75%, 6/25/36, Callable 9/25/22 @ 100* | | | 5,800 | |
| | 7,616 | | | Citicorp Mortgage Securities Trust, Series 2006-3,Class 1A3, 6.25%, 6/25/36, Callable 9/25/22 @ 100* | | | 6,983 | |
| | 93,577 | | | Countrywide Home Loans, Series 2005-6, Class 1A3, 5.15%, 4/25/35, Callable 9/25/22 @ 100* | | | 91,808 | |
| | 10,000 | | | Countrywide Home Loans, Series 2004-10, Class A4, 5.25%, 7/25/34, Callable 9/25/22 @ 100* | | | 9,481 | |
| | 60,000 | | | Countrywide Home Loans, Series 2004-4, Class A4, 5.25%, 5/25/34, Callable 9/25/22 @ 100* | | | 59,652 | |
See notes to financial statements.
Schedule of Portfolio Investments August 31, 2022 | Strategic Enhanced Yield Fund Continued |
Shares or
Principal
Amount | | | Security Description | | Value | |
| Mortgage Backed Securities†, continued: | | | | |
| Prime Fixed Mortgage Backed Securities, continued: | | | | |
| $ | 28,000 | | | Countrywide Home Loans, Series 2004-9, Class A5, 5.25%, 6/25/34, Callable 9/25/22 @ 100* | | $ | 27,996 | |
| | 136,000 | | | Countrywide Home Loans, Series 2005-5, Class A4, 5.40%, 3/25/35, Callable 9/25/22 @ 100* | | | 135,231 | |
| | 89,181 | | | Countrywide Home Loans, Series 2004-4, Class A9, 5.50%, 5/25/34, Callable 9/25/22 @ 100* | | | 82,761 | |
| | 32,000 | | | Countrywide Home Loans, Series 2004-8, Class 1A3, 5.50%, 7/25/34, Callable 9/25/22 @ 100* | | | 30,497 | |
| | 32,000 | | | Countrywide Home Loans, Series 2004-8, Class 1A7, 5.75%, 7/25/34, Callable 9/25/22 @ 100* | | | 30,627 | |
| | 43,688 | | | GMAC Mortgage Loan Trust, Series 2004-J2, Class A8, 5.75%, 6/25/34, Callable 9/25/22 @ 100* | | | 42,277 | |
| | 79,169 | | | GSR Mortgage Loan Trust, Series 2004-10F, Class 6A1, 5.00%, 9/25/34, Callable 9/25/22 @ 100* | | | 76,508 | |
| | 255,000 | | | Mello Warehouse Securitization Trust, Series 2021-2, Class F, 7.19% (US0001M + 475 bps), 4/25/55, Callable 4/25/24 @ 100*(a) | | | 251,342 | |
| | 415,000 | | | NewRez Warehouse Securitization Trust, Series 2021-1, Class F, 7.69% (US0001M + 525 bps), 5/25/55, Callable 5/25/24 @ 100*(a) | | | 412,167 | |
| | 48,000 | | | WaMu Mortgage Pass-Through Certificate, Series 2004-RS1, Class A3, 5.50%, 11/25/33, Callable 9/25/22 @ 100* | | | 45,668 | |
| | | | | | | | 1,684,257 | |
| U.S. Government Agency Mortgage Backed Securities (6.1%) | | | | |
| | 39,964 | | | Fannie Mae, Series 2013-56, Class GM, 2.00%, 8/25/41 | | | 37,684 | |
| | 70,554 | | | Fannie Mae, Series 2003-W14, Class 2A, 3.84%,1/25/43, Callable 9/25/22 @ 100*(b) | | | 68,094 | |
| | 151,493 | | | Fannie Mae, Series 2003-W13, Class AF5, 4.83%, 10/25/33, Callable 9/25/22 @ 100*(b)(c) | | | 155,642 | |
| | 96,508 | | | Fannie Mae, Series 2002-W11, Class AF5, 4.98%, 11/25/32, Callable 9/25/22 @ 100*(b)(c) | | | 94,377 | |
| | 110,336 | | | Fannie Mae, Series 2004-W3, Class A8, 5.50%, 5/25/34, Callable 9/25/22 @ 100* | | | 110,654 | |
| | 52,241 | | | Fannie Mae, Series 240, Class 11, 9.00%, 9/25/23 | | | 53,281 | |
| | 67,903 | | | Fannie Mae, Series 250, Class 11, 9.00%,10/25/23 | | | 69,397 | |
| | 28,649 | | | Freddie Mac, Series 2017-SC01, Class 2A, 3.50%, 12/25/46, Callable 4/25/31 @ 100* | | | 27,489 | |
| | | | | | | | 616,618 | |
| Total Mortgage Backed Securities (Cost $4,617,651) | | | 4,401,977 | |
Shares or
Principal
Amount | | | Security Description | | Value | |
| Corporate Bonds (26.9%) | | | | |
| Airlines (4.0%) | | | |
| $ | 292,980 | | | Alaska Airlines Pass Through Trust, Class B, 8.00%, 8/15/25 (a) | | $ | 296,483 | |
| | 108,424 | | | American Airlines Pass-Through Trust, Class A, 4.95%, 7/15/24 | | | 106,593 | |
| | | | | | | | 403,076 | |
| Banks (3.5%) | | | | |
| | 200,000 | | | Citigroup, Inc., 4.00% (H15T5Y + 360 bps), 12/31/99, Callable 12/10/25 @ 100 * | | | 175,060 | |
| | 200,000 | | | Wells Fargo & Co., 3.90% (H15T5Y + 345 bps), 12/31/99, Callable 3/15/26 @ 100 * | | | 176,750 | |
| | | | | | | | 351,810 | |
| Capital Markets (1.6%) | | | |
| | 200,000 | | | The Goldman Sachs Group, Inc., 3.80% (H15T5Y + 297 bps), 12/31/99, Callable 5/10/26 @ 100* | | | 165,500 | |
| Chemicals (3.7%) | | | |
| | 400,000 | | | Monsanto Co., 5.50%, 7/30/35 | | | 371,515 | |
| Oil, Gas & Consumable Fuels (2.6%) | | | | |
| | 26,000 | | | ONEOK, Inc., 5.85%, 1/15/26, Callable 12/15/25 @ 100 * | | | 26,688 | |
| | 225,000 | | | ONEOK, Inc., 6.35%, 1/15/31, Callable 10/15/30 @ 100 * | | | 235,374 | |
| | | | | | | | 262,062 | |
| Sovereign Bond (3.7%) | | | | |
| | 450,000 | | | International Bank for Reconstruction & Development, 2.70%, 12/28/37, Callable 12/28/22 @ 100 * | | | 372,775 | |
| Technology Hardware, Storage & Peripherals (2.1%) | | | | |
| | 209,000 | | | Hewlett Packard Enterprise Co., 6.35%, 10/15/45, Callable 4/15/45 @ 100 * | | | 209,462 | |
| Tobacco (5.7%) | | | | |
| | 180,000 | | | Altria Group, Inc., 5.95%, 2/14/49, Callable 8/14/48 @ 100 * | | | 164,345 | |
| | 156,000 | | | Philip Morris International, Inc., 6.38%, 5/16/38 | | | 161,945 | |
| | 227,000 | | | Reynolds American, Inc., 8.13%, 5/1/40 | | | 246,636 | |
| | | | | | | | 572,926 | |
| Total Corporate Bonds (Cost $3,252,044) | | | 2,709,126 | |
| | | | | |
| U.S. Treasury Obligations (8.7%) | | | | |
| U.S. Treasury Bonds | | | | |
| | 1,200,000 | | | 1.88%, 2/15/51 | | | 879,656 | |
| Total U.S. Treasury Obligations (Cost $939,009) | | | 879,656 | |
| | | | | |
| Investment in Affiliates (4.5%) | | | | |
| | 456,996 | | | Cavanal Hill Government Securities Money Market Fund, Select Shares, 1.92%(e) | | | 456,996 | |
| Total Investment in Affiliates (Cost $456,996) | | | 456,996 | |
| | | | | |
| Total Investments (Cost $10,998,153)(f) — 99.8% | | | 10,042,816 | |
| Other assets in excess of liabilities — 0.2% | | | 20,156 | |
| Net Assets - 100.0% | | $ | 10,062,972 | |
| (a) | Represents a restricted security, purchased under Rule 144A, Section 4(2), which is exempt from registration under the Securities Act of 1933, as amended. The security has been deemed liquid according to the policies and procedures adopted by the Board of Trustees. |
| (b) | The rate for certain asset-backed and mortgage-backed securities may vary based on factors relating to the pool of assets underlying the security. The rate presented is the rate in effect at August 31, 2022. |
| (c) | Step Bond: Coupon rate is set for an initial period and then increased to a higher coupon rate at a specified date. The rate shown is the rate in effect at August 31, 2022. |
| (d) | Represents a restricted security, purchased under Rule 144A, Section 4(2), which is exempt from registration under the Securities Act of 1933, as amended. The security has been deemed illiquid according to the policies and procedures adopted by the Board of Trustees. At August 31, 2022, illiquid securities were 8.2% of the Fund's net assets. |
| (e) | Money market investment. The rate presented on the Schedule of Portfolio Investments is the rate in effect at August 31, 2022. |
See notes to financial statements.
Schedule of Portfolio Investments August 31, 2022 | Strategic Enhanced Yield Fund Concluded |
| (f) | Represents cost for financial reporting purposes. The cost for tax reporting purposes can be found in Note 6 in the Notes to Financial Statements. |
| * | Represents next call date. Additional subsequent call dates and amounts may apply to this security. |
| † | Mortgage backed securities are classified based on the characteristics of their underlying collateral, the fixed vs. variable nature of the obligations, and the credit standing of the mortgagors. The fixed or variable rate nature of securities interest payments to which the fund is entitled may not coincide with the payment nature of the collateral underlying the securities. |
| H15T5Y | 5 Year Treasury Constant Maturity Rate |
| LIBOR | London Interbank Offered Rate |
| US0001M | 1 Month US Dollar LIBOR |
See notes to financial statements.
| Schedule of Portfolio Investments | Ultra Short Tax-Free Income Fund |
| August 31, 2022 | |
Shares or
Principal
Amount | | | Security Description | | Value | |
| Municipal Bonds (103.4%) | | | | |
| Colorado (1.7%) | | | | |
| $ | 450,000 | | | City of Colorado Springs CO Utilities System Revenue, Series C, 1.66%, 11/1/40, Continuously Callable @100(a) | | $ | 450,000 | |
| Illinois (10.3%) | | | | |
| | 300,000 | | | Cook County School District No 81 Schiller Park, GO, 5.00%, 12/1/23 | | | 309,135 | |
| | 405,000 | | | Cook County School District No 88 Bellwood, GO, 4.00%, 12/1/22, BAM | | | 406,519 | |
| | 170,000 | | | Grundy Kendall & Will Counties Community High School District No 111 Minooka, GO, 4.00%, 5/1/23 | | | 171,588 | |
| | 130,000 | | | Henry County Community Unit School District No 229 Kewanee, GO, Series B, 3.00%, 12/1/22, AGM | | | 130,186 | |
| | 200,000 | | | Henry County Community Unit School District No 229 Kewanee, GO, Series B, 3.00%, 12/1/23, AGM | | | 201,089 | |
| | 100,000 | | | Sangamon Logan & Menard Counties Community Unit School Dist No 15 Williamsville, GO, 5.00%, 12/1/22, BAM | | | 100,634 | |
| | 345,000 | | | Village of Franklin Park IL, GO, 3.00%, 7/1/23, AGM | | | 346,402 | |
| | 230,000 | | | Village of Libertyville IL, GO, Series A, 3.00%, 12/15/22 | | | 230,286 | |
| | 250,000 | | | Village of Libertyville IL, GO, Series A, 3.00%, 12/15/23 | | | 251,082 | |
| | 175,000 | | | Village of Libertyville IL, GO, Series B, 4.00%, 5/1/23 | | | 176,600 | |
| | 170,000 | | | West Chicago Park District, GO, Series B, 3.00%, 12/1/22, BAM | | | 170,290 | |
| | 250,000 | | | Yorkville-Bristol Sanitation District, GO, 5.00%,12/15/23, AGM | | | 257,648 | |
| | | | | | | | 2,751,459 | |
| Indiana (3.8%) | | | | |
| | 500,000 | | | Indianapolis-Marion County Public Library, GO, 3.00%, 7/1/23, ST INTERCEPT(b) | | | 500,596 | |
| | 510,000 | | | Lafayette School Corp., GO, 3.00%, 1/15/23, ST INTERCEPT | | | 510,711 | |
| | | | | | | | 1,011,307 | |
| Iowa (1.9%) | | | | |
| | 510,000 | | | East Mills Community School District, GO, 5.00%, 5/1/23, BAM | | | 518,842 | |
| Kansas (1.6%) | | | | |
| | 155,000 | | | City of Olathe KS, GO, Series 233, 3.00%, 10/1/23 | | | 156,077 | |
| | 265,000 | | | County of Pottawatomie KS, GO, Series A, 4.00%, 10/1/22 | | | 265,548 | |
| | | | | | | | 421,625 | |
| Kentucky (14.9%) | | | | |
| | 380,000 | | | Bowling Green Independent School District Finance Corp. Revenue, 4.00%, 11/1/22, ST INTERCEPT | | | 380,906 | |
| | 200,000 | | | Kentucky Association of Counties Finance Corp. Revenue, 2.00%, 2/1/23 | | | 199,316 | |
| | 985,000 | | | Kentucky Interlocal School Transportation Association, Certificate participation, 1.25%, 3/1/23, ST INTERCEPT | | | 975,099 | |
| | 555,000 | | | Kentucky State Property & Building Commission Revenue, 5.00%, 8/1/23 | | | 567,600 | |
| | 395,000 | | | Leslie County School District Finance Corp. Revenue, 1.00%, 12/1/22, ST INTERCEPT | | | 392,977 | |
Shares or
Principal
Amount | | | Security Description | | Value | |
| Municipal Bonds, continued: | | | | |
| Kentucky, continued: | | | | |
| $ | 485,000 | | | Mason County School District Finance Corp. Revenue, 2.00%, 9/1/22, ST INTERCEPT | | $ | 485,009 | |
| | 615,000 | | | Mason County School District Finance Corp. Revenue, 2.00%, 9/1/23, ST INTERCEPT | | | 611,010 | |
| | 355,000 | | | Pulaski County School District Finance Corp. Revenue, 3.00%, 4/1/23, ST INTERCEPT | | | 355,755 | |
| | | | | | | | 3,967,672 | |
| Louisiana (3.7%) | | | | |
| | 1,000,000 | | | Louisiana Public Facilities Authority Revenue, Series B-3, 1.60%, 7/1/47, Continuously Callable @100(a) | | | 1,000,000 | |
| Lousiana (1.3%) | | | | |
| | 350,000 | | | East Baton Rouge Parish Industrial Development Board, Inc. Revenue, Series A, 1.01%, 8/1/35, Continuously Callable @100(a) | | | 350,000 | |
| Michigan (3.9%) | | | | |
| | 150,000 | | | Central Michigan University Revenue, 5.00%, 10/1/23 | | | 153,656 | |
| | 295,000 | | | Charter Township of Brownstown MI, GO, 4.00%, 5/1/23 | | | 298,068 | |
| | 285,000 | | | City of Gibraltar MI, GO, 3.00%, 11/1/23, BAM | | | 286,626 | |
| | 300,000 | | | Ludington Area School District, GO, 5.00%, 11/1/22, BAM | | | 301,081 | |
| | | | | | | | 1,039,431 | |
| Mississippi (5.1%) | | | | |
| | 100,000 | | | County of Jackson MS Revenue, 1.00%, 6/1/23, Callable 10/3/22 @ 100*(a) | | | 100,000 | |
| | 400,000 | | | Mississippi Business Finance Corp. Revenue, 1.00%, 11/1/35, Callable 10/3/22 @ 100*(a) | | | 400,000 | |
| | 850,000 | | | Mississippi Business Finance Corp. Revenue, Series C, 1.00%, 12/1/30, Callable 10/3/22 @100*(a) | | | 850,000 | |
| | | | | | | | 1,350,000 | |
| Missouri (2.6%) | | | | |
| | 200,000 | | | County of Dunklin MO Revenue, 3.00%, 12/1/22. | | | 200,287 | |
| | 185,000 | | | Nixa Public Schools, Certificate participation, 4.00%, 4/1/23 | | | 186,580 | |
| | 300,000 | | | Polk County Reorganized School District No 1, GO, 4.00%, 3/1/23 | | | 302,245 | |
| | | | | | | | 689,112 | |
| Nevada (2.0%) | | | | |
| | 525,000 | | | Washoe County School District, GO, Series A, 5.00%, 6/1/23 | | | 535,385 | |
| North Dakota (0.7%) | | | | |
| | 200,000 | | | City of Horace ND, GO, 3.00%, 5/1/23 | | | 198,439 | |
| Ohio (11.6%) | | | | |
| | 180,000 | | | American Municipal Power, Inc. Revenue, 2.00%, 3/2/23 | | | 179,120 | |
| | 350,000 | | | American Municipal Power, Inc. Revenue, 3.50%, 6/22/23 | | | 350,982 | |
| | 300,000 | | | City of Garfield Heights OH, GO, 3.88%, 6/15/23 | | | 300,605 | |
| | 645,000 | | | County of Miami OH, GO, 3.25%, 7/27/23 | | | 644,108 | |
| | 600,000 | | | County of Trumbull OH, GO, 3.63%, 7/20/23 | | | 601,587 | |
| | 525,000 | | | Village of Bratenahl OH, GO, 3.25%, 8/10/23 | | | 522,930 | |
| | 500,000 | | | Village of Oakwood OH / Cuyahoga County, GO, 4.00%, 9/14/23(b) | | | 505,634 | |
| | | | | | | | 3,104,966 | |
| Pennsylvania (2.2%) | | | | |
| | 580,000 | | | Borough of Lewistown PA, GO, 4.00%, 12/15/23, BAM | | | 591,270 | |
See notes to financial statements.
| Schedule of Portfolio Investments | Ultra Short Tax-Free Income Fund |
| August 31, 2022 | Concluded |
Shares or
Principal
Amount | | | Security Description | | Value | |
| Municipal Bonds, continued: | | | | |
| Rhode Island (1.1%) | | | | |
| $ | 300,000 | | | Rhode Island Health And Educational Building Corp., GO, 4.00%, 5/15/23, AGM | | $ | 303,246 | |
| Tennessee (4.7%) | | | | |
| | 255,000 | | | County of Fayette TN, GO, 2.00%, 3/1/23 | | | 254,383 | |
| | 1,000,000 | | | Montgomery County Public Building Authority Revenue, 1.71%, 11/1/27, Callable 10/1/22 @ 100*(a) | | | 1,000,000 | |
| | | | | | | | 1,254,383 | |
| Texas (27.1%) | | | | |
| | 780,000 | | | Austin Texas Hotel Occupancy Tax Revenue, 1.70%, 11/15/29, Continuously Callable @100(a) | | | 780,000 | |
| | 290,000 | | | Barbers Hill Independent School District, GO, 5.00%, 2/15/23 | | | 293,289 | |
| | 195,000 | | | Brazoria County Municipal Utility District No 28, GO, Series A, 2.00%, 9/1/23, BAM | | | 193,591 | |
| | 420,000 | | | Broaddus Independent School District, GO, Series A, 4.00%, 2/15/23, PSF-GTD | | | 423,018 | |
| | 215,000 | | | City of Austin Texas Revenue, 5.00%, 11/15/22, Continuously Callable @100, AGM | | | 215,479 | |
| | 300,000 | | | City of Edinburg Texas, GO, 5.00%, 3/1/23, AGM | | | 303,928 | |
| | 100,000 | | | City of Elgin Texas, GO, 4.00%, 7/15/23, AGM | | | 101,345 | |
| | 100,000 | | | City of Elgin Texas, GO, 4.00%, 7/15/23, AGM | | | 101,345 | |
| | 375,000 | | | City of Haltom City Texas, GO, Series A, 5.00%, 2/1/23 | | | 379,018 | |
| | 220,000 | | | City of Talty TX, GO, 3.00%, 3/15/23, AGM | | | 220,451 | |
| | 400,000 | | | East Cedar Creek Fresh Water Supply District Revenue, 3.00%, 1/1/23, AGM | | | 400,755 | |
| | 265,000 | | | Fort Bend County Municipal Utility District No 130, GO, 2.00%, 9/1/22, AGM | | | 265,004 | |
| | 180,000 | | | Fort Bend County Municipal Utility District No 139, GO, 4.00%, 3/1/23, AGM | | | 181,312 | |
| | 220,000 | | | Fulshear Municipal Utility District No 3A, GO, 4.00%, 9/1/23, AGM | | | 223,078 | |
Shares or
Principal
Amount | | | Security Description | | Value | |
| Municipal Bonds, continued: | | | | |
| Texas, continued: | | | | |
| $ | 675,000 | | | Galveston County Municipal Utility District No 56, GO, 4.50%, 12/1/22, AGM | | $ | 678,322 | |
| | 170,000 | | | Grand Mission Municipal Utility District No 1, GO, 3.00%, 9/1/22, AGM | | | 170,007 | |
| | 375,000 | | | Harris County Municipal Utility District No 278, GO, 4.00%, 9/1/23, BAM | | | 380,357 | |
| | 570,000 | | | Harris County Municipal Utility District No 287, GO, 2.00%, 9/1/22, AGM | | | 570,007 | |
| | 200,000 | | | Harris County Municipal Utility District No 449, GO, 3.00%, 9/1/22, AGM | | | 200,008 | |
| | 450,000 | | | Harris County Municipal Utility District No 449, GO, 3.00%, 9/1/23, AGM | | | 451,937 | |
| | 250,000 | | | Kaufman County Municipal Utility District No 14, GO, 2.00%, 3/1/23, AGM | | | 248,389 | |
| | 300,000 | | | San Patricio Municipal Water District Revenue, 3.00%, 7/10/23, AGM | | | 301,172 | |
| | 165,000 | | | Sienna Plantation Municipal Utility District No 12, GO, 3.00%, 9/1/22, AGM | | | 165,007 | |
| | | | | | | | 7,246,819 | |
| Washington (1.3%) | | | | |
| | 340,000 | | | State of Washington, Certificate Participation, Series B, 5.00%, 7/1/23 | | | 347,215 | |
| Wisconsin (1.9%) | | | | |
| | 250,000 | | | City of Fond Du Lac WI Waterworks System Revenue, 4.00%, 9/1/22 | | | 250,017 | |
| | 250,000 | | | County of Eau Claire WI, GO, Series A, 4.00%, 9/1/23 | | | 253,942 | |
| | | | | | | | 503,959 | |
| Total Municipal Bonds (Cost $27,870,356) | | | 27,635,130 | |
| | | | | |
| Investment in Affiliates (0.1%) | | | | |
| | 20,027 | | | Cavanal Hill Government Securities Money Market Fund, Select Shares, 1.92%(c) | | | 20,027 | |
| | | | | | | | | |
| Total Investment in Affiliates (Cost $20,027) | | | 20,027 | |
| | | | | |
| Total Investments (Cost $27,890,383)(d) - 103.5% | | | 27,655,157 | |
| Liabilities in excess of other assets — (3.5)% | | | (941,148 | ) |
| Net Assets - 100.0% | | $ | 26,714,009 | |
| (a) | Interest rate is determined by the Remarketing Agent. The rate presented is the rate in effect at August 31, 2022. |
| (b) | Security purchased on a when-issued or delayed basis for which the fund has not taken delivery as of August 31, 2022. |
| (c) | Money market investment. The rate presented on the Schedule of Portfolio Investments is the rate in effect at August 31, 2022. |
| (d) | Represents cost for financial reporting purposes. The cost for tax reporting purposes can be found in Note 6 in the Notes to Financial Statements. |
| * | Represents next call date. Additional subsequent call dates and amounts may apply to this security. |
| AGM | Assured Guaranty Municipal Corporation |
| BAM | Build America Mutual Assurance Company |
| GO | General Obligation |
| PSF-GTD | Public School Fund Guaranteed |
See notes to financial statements.
| Schedule of Portfolio Investments | Mid Cap Diverse Leadership Fund |
| August 31, 2022 | |
| Shares | | | Security Description | | Value | |
| Common Stocks (98.3%) | | | | |
| Aerospace & Defense (0.6%) | | | | |
| | 275 | | | Mercury Systems, Inc.(a) | | $ | 13,236 | |
| Air Freight & Logistics (0.9%) | | | | |
| | 23 | | | Expeditors International of Washington, Inc. | | | 2,366 | |
| | 439 | | | Gxo Logistics, Inc.(a) | | | 19,483 | |
| | | | | | | | 21,849 | |
| Airlines (0.1%) | | | | |
| | 279 | | | JetBlue Airways Corp.(a) | | | 2,173 | |
| Auto Components (0.4%) | | | | |
| | 282 | | | BorgWarner, Inc. | | | 10,631 | |
| Banks (3.2%) | | | | |
| | 190 | | | East West Bancorp, Inc. | | | 13,712 | |
| | 2,420 | | | Regions Financial Corp. | | | 52,442 | |
| | 99 | | | Webster Financial Corp. | | | 4,658 | |
| | 51 | | | Wintrust Financial Corp. | | | 4,301 | |
| | | | | | | | 75,113 | |
| Biotechnology (2.4%) | | | | |
| | 134 | | | Exact Sciences Corp.(a) | | | 4,764 | |
| | 489 | | | Neurocrine Biosciences, Inc.(a) | | | 51,164 | |
| | | | | | | | 55,928 | |
| Capital Markets (3.1%) | | | | |
| | 183 | | | LPL Financial Holdings, Inc. | | | 40,503 | |
| | 33 | | | MSCI, Inc., Class A | | | 14,825 | |
| | 306 | | | Nasdaq, Inc. | | | 18,216 | |
| | | | | | | | 73,544 | |
| Chemicals (3.9%) | | | | |
| | 192 | | | Albemarle Corp. | | | 51,448 | |
| | 457 | | | Axalta Coating Systems, Ltd.(a) | | | 11,768 | |
| | 251 | | | Celanese Corp., Class A | | | 27,826 | |
| | | | | | | | 91,042 | |
| Commercial Services & Supplies (0.2%) | | | | |
| | 108 | | | Stericycle, Inc.(a) | | | 5,410 | |
| Communications Equipment (1.2%) | | | | |
| | 229 | | | Arista Networks, Inc.(a) | | | 27,452 | |
| Consumer Finance (1.5%) | | | | |
| | 1,101 | | | Synchrony Financial | | | 36,058 | |
| Containers & Packaging (1.6%) | | | | |
| | 190 | | | AptarGroup, Inc. | | | 19,534 | |
| | 86 | | | Ball Corp. | | | 4,800 | |
| | 246 | | | Berry Global Group, Inc.(a) | | | 13,365 | |
| | | | | | | | 37,699 | |
| Diversified Financial Services (0.6%) | | | | |
| | 223 | | | Voya Financial, Inc. | | | 13,721 | |
| Electric Utilities (0.2%) | | | | |
| | 91 | | | Alliant Energy Corp. | | | 5,555 | |
| Electrical Equipment (2.0%) | | | | |
| | 96 | | | Acuity Brands, Inc. | | | 15,737 | |
| | 415 | | | nVent Electric PLC | | | 13,678 | |
| | 120 | | | Regal-Beloit Corp. | | | 16,511 | |
| | | | | | | | 45,926 | |
| Electronic Equipment, Instruments & Components (1.4%) | | | | |
| | 199 | | | CDW Corp. | | | 33,969 | |
| Energy Equipment & Services (2.3%) | | | | |
| | 2,161 | | | Baker Hughes Co. | | | 54,587 | |
| Entertainment (1.2%) | | | | |
| | 2,577 | | | Playtika Holding Corp.(a) | | | 27,136 | |
| Equity Real Estate Investment Trusts (REITs) (6.8%) | | | | |
| | 593 | | | Duke Realty Corp. | | | 34,898 | |
| | 151 | | | Extra Space Storage, Inc. | | | 30,008 | |
| | 1,299 | | | Healthpeak Properties, Inc. | | | 34,099 | |
| | 780 | | | Welltower, Inc. | | | 59,787 | |
| | | | | | | | 158,792 | |
| Food & Staples Retailing (0.2%) | | | | |
| | 165 | | | US Foods Holding Corp.(a) | | | 5,052 | |
| Shares | | | Security Description | | Value | |
| Common Stocks, continued: | | | | |
| Food Products (2.1%) | | | | |
| 269 | | | Conagra Brands, Inc. | | $ | 9,248 | |
| 232 | | | Darling Ingredients, Inc.(a) | | | 17,646 | |
| 297 | | | Kellogg Co. | | | 21,604 | |
| | | | | | | 48,498 | |
| Health Care Equipment & Supplies (4.2%) | | | | |
| 306 | | | Hologic, Inc.(a) | | | 20,674 | |
| 136 | | | IDEXX Laboratories, Inc.(a) | | | 47,276 | |
| 100 | | | West Pharmaceutical Services, Inc. | | | 29,669 | |
| | | | | | | 97,619 | |
| Health Care Providers & Services (2.5%) | | | | |
| 99 | | | DaVita Healthcare Partners, Inc.(a) | | | 8,444 | |
| 385 | | | Encompass Health Corp. | | | 18,699 | |
| 1,228 | | | Oak Street Health, Inc.(a) | | | 32,174 | |
| | | | | | | 59,317 | |
| Hotels, Restaurants & Leisure (2.6%) | | | | |
| 188 | | | Aramark | | | 6,713 | |
| 436 | | | Hilton Worldwide Holdings, Inc. | | | 55,529 | |
| | | | | | | 62,242 | |
| Household Products (1.5%) | | | | |
| 243 | | | The Clorox Co. | | | 35,075 | |
| Independent Power and Renewable Electricity Producers (0.6%) | | | | |
| 572 | | | AES Corp. | | | 14,557 | |
| Insurance (4.7%) | | | | |
| 290 | | | Brighthouse Financial, Inc.(a) | | | 13,790 | |
| 72 | | | Principal Financial Group, Inc. | | | 5,383 | |
| 51 | | | Reinsurance Group of America, Inc. | | | 6,393 | |
| 759 | | | The Hartford Financial Services Group, Inc. | | | 48,811 | |
| 926 | | | Unum Group | | | 35,049 | |
| | | | | | | 109,426 | |
| Interactive Media & Services (0.2%) | | | | |
| 80 | | | ZoomInfo Technologies, Inc.(a) | | | 3,634 | |
| Internet & Direct Marketing Retail (1.7%) | | | | |
| 380 | | | Etsy, Inc.(a) | | | 40,132 | |
| IT Services (5.7%) | | | | |
| 359 | | | Akamai Technologies, Inc.(a) | | | 32,410 | |
| 956 | | | Genpact, Ltd. | | | 44,913 | |
| 820 | | | Switch, Inc., Class A | | | 27,839 | |
| 872 | | | Teradata Corp.(a) | | | 28,689 | |
| | | | | | | 133,851 | |
| Life Sciences Tools & Services (1.7%) | | | | |
| 39 | | | Bio-Rad Laboratories, Inc., Class A(a) | | | 18,916 | |
| 71 | | | Waters Corp.(a) | | | 21,201 | |
| | | | | | | 40,117 | |
| Machinery (5.5%) | | | | |
| 399 | | | Allison Transmission Holdings, Inc. | | | 14,468 | |
| 1,020 | | | Gates Industrial Corp. PLC(a) | | | 10,935 | |
| 469 | | | Otis Worldwide Corp. | | | 33,871 | |
| 970 | | | Pentair PLC | | | 43,165 | |
| 201 | | | The Timken Co. | | | 12,661 | |
| 168 | | | The Toro Co. | | | 13,932 | |
| | | | | | | 129,032 | |
| Media (1.6%) | | | | |
| 16 | | | Cable One, Inc. | | | 18,160 | |
| 89 | | | New York Times Co. | | | 2,714 | |
| 647 | | | The Interpublic Group of Cos., Inc. | | | 17,883 | |
| | | | | | | 38,757 | |
| Mortgage Real Estate Investment Trusts (REITs) (1.5%) | | | | |
| 2,952 | | | AGNC Investment Corp. | | | 34,488 | |
| Multiline Retail (1.2%) | | | | |
| 725 | | | Kohl's Corp. | | | 20,604 | |
| 516 | | | Nordstrom, Inc. | | | 8,829 | |
| | | | | | | 29,433 | |
See notes to financial statements.
| Schedule of Portfolio Investments | Mid Cap Diverse Leadership Fund |
| August 31, 2022 | Concluded |
| Shares | | | Security Description | | Value | |
| Common Stocks, continued: | | | | |
| Multi-Utilities (3.8%) | | | | |
| 2,083 | | | CenterPoint Energy, Inc. | | $ | 65,677 | |
| 228 | | | MDU Resources Group, Inc. | | | 6,874 | |
| 261 | | | Public Service Enterprise Group, Inc. | | | 16,798 | |
| | | | | | | 89,349 | |
| Oil, Gas & Consumable Fuels (3.4%) | | | | |
| 1,431 | | | EQT Corp. | | | 69,190 | |
| 195 | | | ONEOK, Inc. | | | 11,940 | |
| | | | | | | 81,130 | |
| Professional Services (3.9%) | | | | |
| 328 | | | Booz Allen Hamilton Holding Corp. | | | 31,390 | |
| 185 | | | Leidos Holdings, Inc. | | | 17,584 | |
| 331 | | | ManpowerGroup, Inc. | | | 24,269 | |
| 127 | | | Science Applications International Corp. | | | 11,566 | |
| 43 | | | Verisk Analytics, Inc. | | | 8,048 | |
| | | | | | | 92,857 | |
| Real Estate Management & Development (0.6%) | | | | |
| 80 | | | Jones Lang LaSalle, Inc.(a) | | | 13,840 | |
| Semiconductors & Semiconductor Equipment (2.4%) | | | | |
| 197 | | | Azenta, Inc. | | | 10,384 | |
| 661 | | | ON Semiconductor Corp.(a) | | | 45,457 | |
| | | | | | | 55,841 | |
| Software (4.5%) | | | | |
| 142 | | | Citrix Systems, Inc. | | | 14,594 | |
| 271 | | | Dropbox, Inc., Class A(a) | | | 5,797 | |
| 648 | | | Fortinet, Inc.(a) | | | 31,551 | |
| 107 | | | Hubspot, Inc.(a) | | | 36,063 | |
| 290 | | | Informatica, Inc., Class A(a) | | | 6,400 | |
| Shares | | | Security Description | | Value | |
| Common Stocks, continued: | | | | |
| Software, continued: | | | | |
| 161 | | | Zendesk, Inc.(a) | | $ | 12,360 | |
| | | | | | | 106,765 | |
| Specialty Retail (1.2%) | | | | |
| 22 | | | O'Reilly Automotive, Inc.(a) | | | 15,337 | |
| 51 | | | RH(a) | | | 13,051 | |
| | | | | | | 28,388 | |
| Technology Hardware, Storage & Peripherals (2.7%) | | | | |
| 349 | | | HP, Inc. | | | 10,020 | |
| 1,241 | | | Western Digital Corp.(a) | | | 52,444 | |
| | | | | | | 62,464 | |
| Textiles, Apparel & Luxury Goods (3.3%) | | | | |
| 965 | | | Hanesbrands, Inc. | | | 8,405 | |
| 167 | | | Lululemon Athletica, Inc.(a) | | | 50,093 | |
| 517 | | | Tapestry, Inc. | | | 17,956 | |
| | | | | | | 76,454 | |
| Thrifts & Mortgage Finance (0.3%) | | | | |
| 831 | | | Rocket Cos., Inc., Class A | | | 6,565 | |
| Trading Companies & Distributors (0.5%) | | | | |
| 306 | | | Air Lease Corp. | | | 11,126 | |
| Water Utilities (0.6%) | | | | |
| 91 | | | American Water Works Co., Inc. | | | 13,509 | |
| Total Common Stocks (Cost $2,316,409) | | | 2,309,339 | |
| | | | | |
| Investment in Affiliates (1.7%) | | | | |
| 40,468 | | | Cavanal Hill Government Securities Money Market Fund, Select Shares, 1.92%(b) | | | 40,468 | |
| Total Investment in Affiliates (Cost $40,468) | | | 40,468 | |
| Total Investments (Cost $2,356,877)(c) - 100.0% | | | 2,349,807 | |
| Liabilities in excess of other assets — 0.0%^ | | | (67 | ) |
| Net Assets - 100.0% | | $ | 2,349,740 | |
| (a) | Non-income producing security. |
| (b) | Money market investment. The rate presented on the Schedule of Portfolio Investments is the rate in effect at August 31, 2022. |
| (c) | Represents cost for financial reporting purposes. The cost for tax reporting purposes can be found in Note 6 in the Notes to Financial Statements. |
| ^ | Represents less than 0.05%. |
See notes to financial statements.
| Schedule of Portfolio Investments | Opportunistic Fund |
| August 31, 2022 | |
| Shares | | | Security Description | | Value | |
| Common Stocks (92.2%) | | | | |
| Aerospace & Defense (4.1%) | | | | |
| | 3,419 | | | General Dynamics Corp. | | $ | 782,711 | |
| | 12,073 | | | Raytheon Technologies Corp. | | | 1,083,552 | |
| | | | | | | | 1,866,263 | |
| Automobiles (1.3%) | | | | |
| | 2,244 | | | Tesla, Inc.(a) | | | 618,469 | |
| Beverages (8.9%) | | | | |
| | 12,876 | | | Brown-Forman Corp., Class B | | | 936,085 | |
| | 3,775 | | | Constellation Brands, Inc., Class A. | | | 928,839 | |
| | 16,264 | | | Molson Coors Beverage Co., Class B | | | 840,361 | |
| | 7,905 | | | PepsiCo, Inc. | | | 1,361,794 | |
| | | | | | | | 4,067,079 | |
| Biotechnology (1.4%) | | | | |
| | 4,714 | | | AbbVie, Inc. | | | 633,844 | |
| Chemicals (1.1%) | | | | |
| | 8,092 | | | Corteva, Inc. | | | 497,092 | |
| Construction & Engineering (1.8%) | | | | |
| | 11,372 | | | AECOM | | | 831,862 | |
| Diversified Financial Services (2.2%) | | | | |
| | 3,556 | | | Berkshire Hathaway, Inc., Class B(a) | | | 998,525 | |
| Electric Utilities (4.5%) | | | | |
| | 10,941 | | | American Electric Power Co., Inc. | | | 1,096,288 | |
| | 24,708 | | | FirstEnergy Corp. | | | 977,202 | |
| | | | | | | | 2,073,490 | |
| Food & Staples Retailing (2.5%) | | | | |
| | 2,205 | | | Costco Wholesale Corp. | | | 1,151,231 | |
| Health Care Equipment & Supplies (1.9%) | | | | |
| | 9,733 | | | Medtronic PLC | | | 855,725 | |
| Health Care Providers & Services (9.1%) | | | | |
| | 9,888 | | | CVS Health Corp. | | | 970,507 | |
| | 2,526 | | | Elevance Health, Inc. | | | 1,225,388 | |
| | 3,113 | | | McKesson Corp. | | | 1,142,471 | |
| | 1,559 | | | UnitedHealth Group, Inc. | | | 809,636 | |
| | | | | | | | 4,148,002 | |
| Household Products (1.8%) | | | | |
| | 9,883 | | | Church & Dwight Co., Inc. | | | 827,306 | |
| Insurance (2.7%) | | | | |
| | 10,886 | | | American International Group, Inc. | | | 563,350 | |
| | 6,801 | | | Prudential Financial, Inc. | | | 651,196 | |
| | | | | | | | 1,214,546 | |
| Interactive Media & Services (3.6%) | | | | |
| | 10,121 | | | Alphabet, Inc., Class C(a) | | | 1,104,707 | |
| | 3,385 | | | Meta Platforms, Inc., Class A(a) | | | 551,518 | |
| | | | | | | | 1,656,225 | |
| Internet & Direct Marketing Retail (3.6%) | | | | |
| | 13,001 | | | Amazon.com, Inc.(a) | | | 1,648,137 | |
| IT Services (3.7%) | | | | |
| | 2,388 | | | Accenture PLC, Class A | | | 688,842 | |
| | 3,040 | | | MasterCard, Inc., Class A | | | 986,085 | |
| | | | | | | | 1,674,927 | |
| Machinery (1.7%) | | | | |
| | 8,907 | | | Westinghouse Air Brake Technologies Corp. | | | 780,699 | |
| Oil, Gas & Consumable Fuels (7.1%) | | | | |
| | 27,352 | | | Cameco Corp. | | | 797,311 | |
| | 14,588 | | | Devon Energy Corp. | | | 1,030,204 | |
| | 7,960 | | | Exxon Mobil Corp. | | | 760,896 | |
| | 2,539 | | | Pioneer Natural Resources Co. | | | 642,926 | |
| | | | | | | | 3,231,337 | |
| Pharmaceuticals (7.3%) | | | | |
| | 13,088 | | | AstraZeneca PLC ADR | | | 816,429 | |
| | 2,202 | | | Eli Lilly & Co. | | | 663,309 | |
| | 7,403 | | | Johnson & Johnson | | | 1,194,400 | |
| | 7,531 | | | Merck & Co., Inc. | | | 642,846 | |
| | | | | | | | 3,316,984 | |
| Shares | | | Security Description | | Value | |
| Common Stocks, continued: | | | | |
| Semiconductors & Semiconductor Equipment (2.0%) | | | | |
| | 1,846 | | | Broadcom, Inc. | | $ | 921,357 | |
| Software (9.7%) | | | | |
| | 7,570 | | | Microsoft Corp. | | | 1,979,328 | |
| | 2,083 | | | Palo Alto Networks, Inc.(a) | | | 1,159,835 | |
| | 3,059 | | | Salesforce, Inc.(a) | | | 477,571 | |
| | 20,970 | | | Tenable Holdings, Inc.(a) | | | 830,622 | |
| | | | | | | | 4,447,356 | |
| Technology Hardware, Storage & Peripherals (7.5%) | | | | |
| | 15,121 | | | Apple, Inc. | | | 2,377,323 | |
| | 36,105 | | | Pure Storage, Inc.(a) | | | 1,045,962 | |
| | | | | | | | 3,423,285 | |
| Wireless Telecommunication Services (2.7%) | | | | |
| | 8,469 | | | T-Mobile US, Inc.(a) | | | 1,219,197 | |
| Total Common Stocks (Cost $41,723,647) | | | 42,102,938 | |
| | | | | |
| Investment in Affiliates (7.7%) | | | | |
| | 3,531,733 | | | Cavanal Hill Government Securities Money Market Fund, Select Shares, 1.92%(b) | | | 3,531,733 | |
| Total Investment in Affiliates (Cost $3,531,733) | | | 3,531,733 | |
| | | | | |
| Total Investments (Cost $45,255,380)(c) - 99.9% | | | 45,634,671 | |
| Other assets in excess of liabilities — 0.1% | | | 30,046 | |
| Net Assets - 100.0% | | $ | 45,664,717 | |
See notes to financial statements.
| Schedule of Portfolio Investments | Opportunistic Fund |
| August 31, 2022 | Concluded |
| (a) | Non-income producing security. |
| (b) | Money market investment. The rate presented on the Schedule of Portfolio Investments is the rate in effect at August 31, 2022. |
| (c) | Represents cost for financial reporting purposes. The cost for tax reporting purposes can be found in Note 6 in the Notes to Financial Statements. |
| ADR | American Depositary Receipt |
See notes to financial statements.
Schedule of Portfolio Investments August 31, 2022 | World Energy Fund |
Shares or
Principal
Amount | | | Security Description | | Value | |
| Common Stocks (91.3%) | | | | |
| Chemicals (4.1%) | | | | |
| | 5,000 | | | Albemarle Corp. | | $ | 1,339,758 | |
| | 2,000 | | | Linde PLC. | | | 565,720 | |
| | 30,000 | | | Livent Corp.(a) | | | 965,400 | |
| | | | | | | | 2,870,878 | |
| Construction & Engineering (1.5%) | | | | |
| | 15,000 | | | Ameresco, Inc.(a) | | | 1,032,750 | |
| Electric Utilities (0.1%) | | | | |
| | 46 | | | ALLETE, Inc. | | | 2,722 | |
| | 104 | | | Duke Energy Corp. | | | 11,119 | |
| | 24 | | | Eversource Energy | | | 2,152 | |
| | 79 | | | Fortis, Inc. | | | 3,485 | |
| | 11 | | | IDACORP, Inc. | | | 1,202 | |
| | 31 | | | MGE Energy, Inc. | | | 2,387 | |
| | 356 | | | NextEra Energy, Inc. | | | 30,281 | |
| | 66 | | | Otter Tail Corp. | | | 4,986 | |
| | 144 | | | The Southern Co. | | | 11,098 | |
| | 23 | | | Xcel Energy, Inc. | | | 1,708 | |
| | | | | | | | 71,140 | |
| Electrical Equipment (3.8%) | | | | |
| | 110,000 | | | Ballard Power Systems, Inc.(a) | | | 858,000 | |
| | 30,000 | | | Bloom Energy Corp., Class A(a) | | | 762,300 | |
| | 20,000 | | | Plug Power, Inc.(a) | | | 560,800 | |
| | 60,000 | | | Vestas Wind Systems A/S ADR | | | 497,400 | |
| | | | | | | | 2,678,500 | |
| Energy Equipment & Services (12.4%) | | | | |
| | 320 | | | Baker Hughes Co. | | | 8,083 | |
| | 68,326 | | | Halliburton Co. | | | 2,058,663 | |
| | 85,000 | | | Patterson-UTI Energy, Inc. | | | 1,266,500 | |
| | 80,502 | | | Schlumberger NV | | | 3,071,151 | |
| | 30,778 | | | Tenaris SA ADR | | | 840,855 | |
| | 30,000 | | | Valaris, Ltd.(a) | | | 1,529,400 | |
| | | | | | | | 8,774,652 | |
| Gas Utilities (0.0%^) | | | | |
| | 34 | | | Brookfield Infrastructure Corp., Class A | | | 1,618 | |
| | 20 | | | Chesapeake Utilities Corp. | | | 2,526 | |
| | 81 | | | National Fuel & Gas Co. | | | 5,773 | |
| | | | | | | | 9,917 | |
| Independent Power and Renewable Electricity Producers (0.0%^) | | | | |
| | 132 | | | Ormat Technologies, Inc. | | | 12,339 | |
| | 15 | | | Sunnova Energy International, Inc.(a) | | | 378 | |
| | 86 | | | TransAlta Corp. | | | 807 | |
| | | | | | | | 13,524 | |
| Multi-Utilities (0.1%) | | | | |
| | 40 | | | CMS Energy Corp. | | | 2,702 | |
| | 341 | | | Dominion Resources, Inc. | | | 27,894 | |
| | 61 | | | DTE Energy Co. | | | 7,951 | |
| | 460 | | | National Grid PLC ADR | | | 29,067 | |
| | 152 | | | Sempra Energy | | | 25,075 | |
| | 36 | | | WEC Energy Group, Inc. | | | 3,713 | |
| | | | | | | | 96,402 | |
| Oil, Gas & Consumable Fuels (68.0%) | | | | |
| | 60,000 | | | APA Corp. | | | 2,346,600 | |
| | 55,000 | | | BP PLC ADR | | | 1,696,200 | |
| | 40,000 | | | Cameco Corp. | | | 1,166,000 | |
| | 1,577 | | | Canadian Natural Resources, Ltd. | | | 86,435 | |
| | 8,000 | | | Cheniere Energy, Inc. | | | 1,281,440 | |
| | 23,000 | | | Chesapeake Energy Corp. | | | 2,311,270 | |
| | 2,864 | | | Chevron Corp. | | | 452,684 | |
| | 70,000 | | | Comstock Resources, Inc.(a) | | | 1,372,000 | |
| | 25,139 | | | ConocoPhillips | | | 2,751,464 | |
| | 30,000 | | | Continental Resources, Inc. | | | 2,094,900 | |
Shares or
Principal
Amount | | | Security Description | | Value | |
| Common Stocks, continued: | | | | |
| Oil, Gas & Consumable Fuels, continued: | | | | |
| | 60,000 | | | Coterra Energy, Inc. | | $ | 1,854,600 | |
| | 41,000 | | | Devon Energy Corp. | | | 2,895,420 | |
| | 12,000 | | | Diamondback Energy, Inc. | | | 1,599,360 | |
| | 31,740 | | | Enbridge, Inc. | | | 1,308,323 | |
| | 62 | | | EOG Resources, Inc. | | | 7,521 | |
| | 39,516 | | | Exxon Mobil Corp. | | | 3,777,334 | |
| | 15,000 | | | Hess Corp. | | | 1,811,700 | |
| | 105,000 | | | Marathon Oil Corp. | | | 2,686,950 | |
| | 13,317 | | | Marathon Petroleum Corp. | | | 1,341,688 | |
| | 70,000 | | | Occidental Petroleum Corp. | | | 4,970,042 | |
| | 19,189 | | | ONEOK, Inc. | | | 1,174,942 | |
| | 7,990 | | | Phillips 66 | | | 714,785 | |
| | 11,000 | | | Pioneer Natural Resources Co. | | | 2,785,420 | |
| | 3,116 | | | Shell PLC ADR | | | 165,086 | |
| | 92,000 | | | Suncor Energy, Inc. | | | 2,973,440 | |
| | 25,610 | | | TC Energy Corp. | | | 1,234,402 | |
| | 5,023 | | | The Williams Cos., Inc. | | | 170,933 | |
| | 9,008 | | | Valero Energy Corp. | | | 1,055,017 | |
| | | | | | | | 48,085,956 | |
| Semiconductors & Semiconductor Equipment (1.2%) | | | | |
| | 3,200 | | | SolarEdge Technologies, Inc.(a) | | | 883,104 | |
| Water Utilities (0.1%) | | | | |
| | 211 | | | American States Water Co. | | | 17,506 | |
| | 294 | | | American Water Works Co., Inc. | | | 43,644 | |
| | 38 | | | California Water Service Group | | | 2,224 | |
| | 419 | | | Essential Utilities, Inc. | | | 20,594 | |
| | 49 | | | Middlesex Water Co. | | | 4,350 | |
| | 11 | | | The York Water Co. | | | 484 | |
| | | | | | | | 88,802 | |
| Total Common Stocks (Cost $47,811,755) | | | 64,605,625 | |
| | | | | | | | | |
| Corporate Bonds (5.4%) | | | | |
| Energy Equipment & Services (2.3%) | | | | |
| $ | 650,000 | | | Halliburton Co., 4.85%, 11/15/35, Callable 5/15/35 @ 100 * | | | 619,578 | |
| | 400,000 | | | Schlumberger Holdings Corp., 3.90%, 5/17/28, Callable 2/17/28 @ 100 *(b) | | | 383,116 | |
| | 600,000 | | | Valaris, Ltd., 8.25%, 4/30/28, Callable 4/30/23 @ 104 * | | | 601,500 | |
| | | | | | | | 1,604,194 | |
| Oil, Gas & Consumable Fuels (3.1%) | | | | |
| | 1,100,000 | | | Baker Hughes Holdings LLC / Baker Hughes Co-Obligor, Inc., 3.34%, 12/15/27, Callable 9/15/27 @ 100 * | | | 1,030,668 | |
| | 725,000 | | | Enbridge, Inc., 1.60%, 10/4/26, Callable 9/4/26 @ 100 * | | | 645,549 | |
| | 550,000 | | | Matador Resources Co., 5.88%, 9/15/26, Callable 9/23/22 @ 103 * | | | 538,367 | |
| | | | | | | | 2,214,584 | |
| Total Corporate Bonds (Cost $4,012,006) | | | 3,818,778 | |
| | | | | |
| Investment Companies (2.1%) | | | | |
| | 8,500 | | | Direxion Daily S&P Oil & Gas Exp. & Prod. Bull 2X Shares | | | 1,482,145 | |
| Total Investment Companies (Cost $1,594,999) | | | 1,482,145 | |
See notes to financial statements.
| Schedule of Portfolio Investments | World Energy Fund |
| August 31, 2022 | Concluded |
Shares or
Principal
Amount | | | Security Description | | Value | |
| Investment in Affiliates (1.0%) | | | | |
| | 712,430 | | | Cavanal Hill Government Securities Money Market Fund, Select Shares, 1.92%(c) | | $ | 712,430 | |
| Total Investment in Affiliates (Cost $712,430) | | | 712,430 | |
| | | | | |
| Total Investments (Cost $54,131,190)(d) - 99.8% | | | 70,618,978 | |
| Other assets in excess of liabilities — 0.2% | | | 132,484 | |
| Net Assets - 100.0% | | $ | 70,751,462 | |
The Adviser has determined that 42.8% of the Fund’s net assets comprise securities of issuers which are either foreign domiciled or derive more than 50% of its assets, revenue or income outside of the United States.
| (a) | Non-income producing security. |
| (b) | Represents a restricted security, purchased under Rule 144A, Section 4(2), which is exempt from registration under the Securities Act of 1933, as amended. The security has been deemed liquid according to the policies and procedures adopted by the Board of Trustees. |
| (c) | Money market investment. The rate presented on the Schedule of Portfolio Investments is the rate in effect at August 31, 2022. |
| (d) | Represents cost for financial reporting purposes. The cost for tax reporting purposes can be found in Note 6 in the Notes to Financial Statements. |
| * | Represents next call date. Additional subsequent call dates and amounts may apply to this security. |
| ^ | Represent less than 0.05%. |
| ADR | American Depositary Receipt |
See notes to financial statements.
| Schedule of Portfolio Investments | Hedged Income Fund |
| August 31, 2022 | |
| Shares | | | Security Description | | Value | |
| Common Stocks+ (97.1%) | | | | |
| Aerospace & Defense (2.5%) | | | | |
| | 9,800 | | | Raytheon Technologies Corp. | | $ | 879,550 | |
| Beverages (8.6%) | | | | |
| | 9,000 | | | PepsiCo, Inc. | | | 1,550,430 | |
| | 24,200 | | | The Coca-Cola Co. | | | 1,493,382 | |
| | | | | | | | 3,043,812 | |
| Biotechnology (4.9%) | | | | |
| | 12,800 | | | AbbVie, Inc. | | | 1,721,088 | |
| Capital Markets (6.1%) | | | | |
| | 1,700 | | | BlackRock, Inc. | | | 1,132,863 | |
| | 12,000 | | | Morgan Stanley. | | | 1,022,640 | |
| | | | | | | | 2,155,503 | |
| Chemicals (3.4%) | | | | |
| | 23,500 | | | Dow, Inc. | | | 1,198,500 | |
| Communications Equipment (3.0%) | | | | |
| | 23,600 | | | Cisco Systems, Inc. | | | 1,055,392 | |
| Containers & Packaging (2.7%) | | | | |
| | 7,000 | | | Packaging Corp. of America. | | | 958,440 | |
| Diversified Telecommunication Services (3.6%) | | | | |
| | 30,700 | | | Verizon Communications, Inc. | | | 1,283,567 | |
| Electric Utilities (13.2%) | | | | |
| | 16,300 | | | American Electric Power Co., Inc. | | | 1,633,260 | |
| | 18,000 | | | Duke Energy Corp. | | | 1,924,380 | |
| | 27,300 | | | FirstEnergy Corp. | | | 1,079,715 | |
| | | | | | | | 4,637,355 | |
| Electrical Equipment (2.5%) | | | | |
| | 10,900 | | | Emerson Electric Co. | | | 890,966 | |
| Electronic Equipment, Instruments & Components (2.5%) | | | | |
| | 25,200 | | | Corning, Inc. | | | 864,864 | |
| Equity Real Estate Investment Trusts (REITs) (6.2%) | | | | |
| | 6,200 | | | Crown Castle International Corp. | | | 1,059,146 | |
| | 36,900 | | | STAG Industrial, Inc. | | | 1,136,520 | |
| | | | | | | | 2,195,666 | |
| Health Care Equipment & Supplies (3.0%) | | | | |
| | 12,100 | | | Medtronic PLC | | | 1,063,832 | |
| Hotels, Restaurants & Leisure (2.6%) | | | | |
| | 3,600 | | | McDonald's Corp. | | | 908,208 | |
| Shares | | | Security Description | | Value | |
| Common Stocks+, continued: | | | | |
| Household Products (2.3%) | | | | |
| | 5,900 | | | The Procter & Gamble Co. | | $ | 813,846 | |
| Oil, Gas & Consumable Fuels (12.7%) | | | | |
| | 20,900 | | | ONEOK, Inc. | | | 1,279,707 | |
| | 18,800 | | | Phillips 66 | | | 1,681,848 | |
| | 30,300 | | | TotalEnergies SE ADR | | | 1,530,453 | |
| | | | | | | | 4,492,008 | |
| Pharmaceuticals (7.7%) | | | | |
| | 18,500 | | | AstraZeneca PLC ADR | | | 1,154,030 | |
| | 18,100 | | | Merck & Co., Inc. | | | 1,545,016 | |
| | | | | | | | 2,699,046 | |
| Semiconductors & Semiconductor Equipment (3.5%) | | | | |
| | 2,500 | | | Broadcom, Inc. | | | 1,247,775 | |
| Specialty Retail (2.7%) | | | | |
| | 3,300 | | | The Home Depot, Inc. | | | 951,786 | |
| Trading Companies & Distributors (3.4%) | | | | |
| | 15,100 | | | MSC Industrial Direct Co., Inc. | | | 1,196,071 | |
| Total Common Stocks (Cost $35,133,745) | | | 34,257,275 | |
| | | | | | | | | |
| Purchased Options (2.2%)^ | | | | |
| | 104 | | | American Electric Power Co., Inc. | | | 3,640 | |
| | 120 | | | Duke Energy Corp. | | | 8,040 | |
| | 60 | | | PepsiCo, Inc. | | | 2,520 | |
| | 55 | | | SPDR S&P 500 ETF Trust | | | 56,320 | |
| | 393 | | | SPDR S&P 500 ETF Trust | | | 626,442 | |
| | 40 | | | SPDR S&P 500 ETF Trust | | | 58,240 | |
| | 170 | | | The Coca-Cola Co. | | | 4,080 | |
| | 200 | | | Verizon Communications, Inc. | | | 21,000 | |
| Total Purchased Options (Cost $1,477,477) | | | 780,282 | |
| | | | | | | | | |
| Investment in Affiliates (2.7%) | | | | |
| | 941,095 | | | Cavanal Hill Government Securities Money Market Fund, Select Shares, 1.92%(a) | | | 941,095 | |
| Total Investment in Affiliates (Cost $941,095) | | | 941,095 | |
| | | | | |
| Total Investments (Cost $37,552,317)(b) - 102.0% | | | 35,978,652 | |
| Liabilities in excess of other assets — (2.0)% | | | (707,386 | ) |
| Net Assets - 100.0% | | $ | 35,271,266 | |
| (a) | Money market investment. The rate presented on the Schedule of Portfolio Investments is the rate in effect at August 31, 2022. |
| (b) | Represents cost for financial reporting purposes. The cost for tax reporting purposes can be found in Note 6 in the Notes to Financial Statements. |
| + | All or a portion of each common stock has been pledged as collateral for outstanding call options written. |
| ADR | American Depositary Receipt |
| ^ | See Options table below for more details. |
See notes to financial statements.
| Schedule of Portfolio Investments | Hedged Income Fund |
| August 31, 2022 | Concluded |
At August 31, 2022, the Fund's exchange traded options purchased were as follows:
| Description | | Put/ Call | | Strike Price | | Expiration
Date | | Contracts | | Notional
Amount(a) | | | Fair Value | |
| | | | | | | | | | | | | | | | | |
| American Electric Power Co., Inc. | | Put | | 80.00 USD | | 11/18/22 | | 104 | | $ | 8,320 | | | $ | 3,640 | |
| Duke Energy Corp. | | Put | | 97.50 USD | | 10/21/22 | | 120 | | | 11,700 | | | | 8,040 | |
| PepsiCo, Inc. | | Put | | 140.00 USD | | 10/21/22 | | 60 | | | 8,400 | | | | 2,520 | |
| SPDR S&P 500 ETF Trust | | Put | | 365.00 USD | | 12/16/22 | | 55 | | | 20,075 | | | | 56,320 | |
| SPDR S&P 500 ETF Trust | | Put | | 385.00 USD | | 12/16/22 | | 393 | | | 151,305 | | | | 626,442 | |
| SPDR S&P 500 ETF Trust | | Put | | 360.00 USD | | 3/17/23 | | 40 | | | 14,400 | | | | 58,240 | |
| The Coca-Cola Co. | | Put | | 50.00 USD | | 11/18/22 | | 170 | | | 8,500 | | | | 4,080 | |
| Verizon Communications, Inc. | | Put | | 40.00 USD | | 10/21/22 | | 200 | | | 8,000 | | | | 21,000 | |
| Total (Cost $1,477,477) | | | | | | | | | | | | | | $ | 780,282 | |
At August 31, 2022, the Fund's exchange traded options written were as follows:
| Description | | Put/ Call | | Strike Price | | Expiration
Date | | Contracts | | Notional
Amount(a) | | | Fair Value | |
| | | | | | | | | | | | | | | |
| Abbvie, Inc. | | Call | | 125.00 USD | | 6/16/23 | | 6 | | $ | 750 | | | $ | (10,500 | ) |
| Abbvie, Inc. | | Call | | 115.00 USD | | 1/19/24 | | 90 | | | 10,350 | | | | (238,500 | ) |
| American Electric Power Co., Inc. | | Call | | 100.00 USD | | 9/16/22 | | 63 | | | 6,300 | | | | (13,104 | ) |
| American Electric Power Co., Inc. | | Call | | 90.00 USD | | 11/18/22 | | 96 | | | 8,640 | | | | (112,320 | ) |
| AstraZeneca PLC Spons ADR | | Call | | 70.00 USD | | 9/16/22 | | 181 | | | 12,670 | | | | (905 | ) |
| BlackRock, Inc. | | Call | | 650.00 USD | | 9/16/22 | | 17 | | | 11,050 | | | | (59,194 | ) |
| Broadcom, Inc. | | Call | | 550.00 USD | | 9/16/22 | | 25 | | | 13,750 | | | | (5,125 | ) |
| Cisco Systems, Inc. | | Call | | 50.00 USD | | 9/30/22 | | 230 | | | 11,500 | | | | (1,840 | ) |
| Corning, Inc. | | Call | | 36.00 USD | | 9/16/22 | | 246 | | | 8,856 | | | | (8,610 | ) |
| Crown Castle International Corp. | | Call | | 185.00 USD | | 9/16/22 | | 61 | | | 11,285 | | | | (915 | ) |
| Dow, Inc. | | Call | | 67.50 USD | | 9/16/22 | | 176 | | | 11,880 | | | | (704 | ) |
| Dow, Inc. | | Call | | 57.50 USD | | 10/21/22 | | 53 | | | 3,048 | | | | (3,233 | ) |
| Duke Energy Corp. | | Call | | 110.00 USD | | 9/16/22 | | 176 | | | 19,360 | | | | (10,560 | ) |
| Emerson Electric Co. | | Call | | 85.00 USD | | 9/16/22 | | 106 | | | 9,010 | | | | (9,540 | ) |
| FirstEnergy Corp. | | Call | | 41.00 USD | | 9/16/22 | | 267 | | | 10,947 | | | | (6,675 | ) |
| McDonald's Corp. | | Call | | 260.00 USD | | 9/16/22 | | 36 | | | 9,360 | | | | (4,644 | ) |
| Medtronic PLC | | Call | | 100.00 USD | | 9/16/22 | | 118 | | | 11,800 | | | | (708 | ) |
| Merck Co., Inc. | | Call | | 85.00 USD | | 9/16/22 | | 150 | | | 12,750 | | | | (27,150 | ) |
| Merck Co., Inc. | | Call | | 95.00 USD | | 9/16/22 | | 27 | | | 2,565 | | | | (81 | ) |
| Morgan Stanley | | Call | | 82.50 USD | | 9/16/22 | | 117 | | | 9,653 | | | | (48,555 | ) |
| MSC Industrial Direct Co., Inc. | | Call | | 80.00 USD | | 9/16/22 | | 150 | | | 12,000 | | | | (16,500 | ) |
| ONEOK, Inc. | | Call | | 65.00 USD | | 9/16/22 | | 125 | | | 8,125 | | | | (5,000 | ) |
| ONEOK, Inc. | | Call | | 67.50 USD | | 10/21/22 | | 79 | | | 5,333 | | | | (6,320 | ) |
| PepsiCo, Inc. | | Call | | 180.00 USD | | 9/23/22 | | 88 | | | 15,840 | | | | (6,336 | ) |
| Phillips 66 | | Call | | 95.00 USD | | 9/16/22 | | 40 | | | 3,800 | | | | (4,800 | ) |
| Phillips 66 | | Call | | 85.00 USD | | 9/23/22 | | 144 | | | 12,240 | | | | (95,040 | ) |
| Raytheon Technologies | | Call | | 100.00 USD | | 9/16/22 | | 95 | | | 9,500 | | | | (1,045 | ) |
| The Coca-Cola Co. | | Call | | 66.00 USD | | 9/2/22 | | 30 | | | 1,980 | | | | (30 | ) |
| The Coca-Cola Co. | | Call | | 57.50 USD | | 11/18/22 | | 186 | | | 10,695 | | | | (107,880 | ) |
| The Home Depot, Inc. | | Call | | 330.00 USD | | 9/16/22 | | 33 | | | 10,890 | | | | (396 | ) |
| The Procter Gamble Co. | | Call | | 155.00 USD | | 9/16/22 | | 58 | | | 8,990 | | | | (58 | ) |
| TotalEnergies SE - Spon ADR | | Call | | 57.50 USD | | 9/16/22 | | 303 | | | 17,423 | | | | (6,363 | ) |
| Total (Premiums $(1,830,686)) | | | | | | | | | | | | | | $ | (812,631 | ) |
| (a) | Notional amount is expressed as the number of contracts multiplied by the strike price of the underlying asset. |
| Balances Reported in the Statements of Assets and Liabilities for Options Written | | Value | |
| Options Written | | $ | (812,631 | ) |
See notes to financial statements.
Notes to the Financial Statements
August 31, 2022
The Cavanal Hill Funds (the “Trust”) was organized on October 1, 1987, as a Massachusetts business trust, and is registered under the Investment Company Act of 1940, as amended (the “1940 Act”), as an open-end investment company. The Trust meets the definition of an investment company and follows the accounting and reporting guidance under Financial Accounting Standards Board (“FASB”) Accounting Standards Codification (“ASC”) Topic 946, “Financial Services - Investment Companies”. As of August 31, 2022, the Trust offered shares of U.S. Treasury Fund and Government Securities Money Market Fund (each referred to as a “Money Market Fund” and collectively, the “Money Market Funds”), Limited Duration Fund, Moderate Duration Fund, Bond Fund, Strategic Enhanced Yield Fund, Ultra Short Tax-Free Income Fund, Mid Cap Diverse Leadership Fund, Opportunistic Fund, World Energy Fund, and Hedged Income Fund (each referred to as a “Fund” and collectively, “the Funds”). Each Fund is registered as a diversified portfolio of the Trust, with the exception of the Hedged Income Fund, which is non-diversified. The Limited Duration Fund, Moderate Duration Fund, Bond Fund, Strategic Enhanced Yield Fund, Ultra Short Tax-Free Income Fund, Mid Cap Diverse Leadership Fund, Opportunistic Fund, World Energy Fund, and Hedged Income Fund are each authorized to issue an unlimited number of shares in three classes of shares: No-Load Investor Shares (the “Investor Shares”), Institutional Shares, and A Shares. The Mid Cap Diverse Leadership Fund, Opportunistic Fund, and World Energy Fund are also authorized to issue an unlimited number of C Shares. The Money Market Funds are authorized to issue an unlimited number of shares in the following classes: Administrative Shares, Institutional Shares, and Select Shares. In addition, the U.S. Treasury Fund is authorized to issue an unlimited number of Service Shares and the Government Securities Money Market Fund is authorized to issue an unlimited number of Premier Shares. Each class of shares for each of the Funds has identical rights and privileges except with respect to distribution (Rule 12b-1 of the 1940 Act) and shareholder servicing fees, voting rights on matters affecting a single class of shares, and the exchange privileges of each class of shares.
Under the Trust’s organizational documents, its officers and trustees are indemnified against certain liabilities arising out of the performance of their duties to the Trust. In addition, in the normal course of business, the Trust enters into contracts with its vendors and others that provide for general indemnifications. The Trust’s maximum exposure under these arrangements is unknown as this would involve future claims that may be made against the Trust. However, based on experience, the Trust expects that risk of loss to be remote.
| 2. | Significant Accounting Policies: |
The following is a summary of significant accounting policies followed by the Trust in the preparation of its financial statements. The policies are in conformity with accounting principles generally accepted in the United States of America (“U.S. GAAP”). The presentation of financial statements in conformity with U.S. GAAP requires management to make estimates and assumptions that affect the reported amounts of assets and liabilities and disclosure of contingent assets and liabilities at the date of the financial statements and the reported amounts of income and expenses for the period. Actual results could differ from those estimates.
Fair Value Measurements:
The Trust has a three-tier fair value hierarchy that is dependent upon the various “inputs” used to determine the value of the Funds’ investments. These inputs are summarized in the three broad levels listed below:
| ● | Level 1 – quoted prices in active markets for identical assets |
| | | |
| ● | Level 2 – other observable significant inputs (including quoted prices of similar securities, interest rates, prepayment speeds, credit risk, etc.) |
| | | |
| ● | Level 3 – significant unobservable inputs (including the Funds’ own assumptions in determining the fair value of investments) |
The inputs or methodology used for valuing securities are not necessarily an indication of the risk associated with investing in those securities. For example, money market securities are valued using amortized cost, in accordance with rules under the 1940 Act. Generally, amortized cost approximates the current fair value of a security, but since this valuation is not obtained from a quoted price in an active market, such securities are reflected as Level 2 in the fair value hierarchy.
When determining the fair value of the Funds’ investments, additional consideration is given to those assets or liabilities that have experienced a significant decrease in the volume or level of activity or to circumstances that indicate that a transaction is not orderly. In cases where market prices for portfolio securities are not readily available or where prices provided by pricing services are believed not to reflect current value, a Pricing Committee established by the Board of Trustees (the “Board”) determines in good faith, subject to Trust procedures, the fair value of such portfolio securities. Examples of the types of securities that may be fair valued include securities halted or suspended from trading, thinly traded or illiquid securities, high-yield securities and fixed-income securities held in amounts less than their normal unit of trading.
The following is a summary categorization, as of August 31, 2022, of each Fund’s investments in the fair value hierarchy:
| Fund | | LEVEL 1 -
Quoted Prices | | | LEVEL 2 -
Other
Significant
Observable
Inputs | | | LEVEL 3 -
Significant
Unobservable
Inputs | | | Total | |
| U.S. Treasury Fund | | | | | | | | | | | | | | | | |
| U.S. Treasury Obligations | | $ | — | | | $ | 99,991,104 | | | $ | — | | | $ | 99,991,104 | |
| Repurchase Agreements | | | — | | | | 770,000,000 | | | | — | | | | 770,000,000 | |
| Investment Companies | | | 78,667,225 | | | | — | | | | — | | | | 78,667,225 | |
| Total Investments | | | 78,667,225 | | | | 869,991,104 | | | | — | | | | 948,658,329 | |
| | | | | | | | | | | | | | | | | |
| Government Securities Money Market Fund | | | | | | | | | | | | | | | | |
| U.S. Government Agency Securities | | | — | | | | 511,992,319 | | | | — | | | | 511,992,319 | |
| U.S. Treasury Obligations | | | — | | | | 699,990,205 | | | | — | | | | 699,990,205 | |
| Repurchase Agreements | | | — | | | | 815,000,000 | | | | — | | | | 815,000,000 | |
| Investment Companies | | | 145,006,357 | | | | — | | | | — | | | | 145,006,357 | |
| Total Investments | | | 145,006,357 | | | | 2,026,982,524 | | | | — | | | | 2,171,988,881 | |
Notes to the Financial Statements
August 31, 2022
| Fund | | LEVEL 1-
Quoted Prices | | | LEVEL 2 - Other
Significant
Observable
Inputs | | | LEVEL 3 - Significant
Unobservable
Inputs | | | Total | |
| Limited Duration Fund | | | | | | | | | | | | |
| Asset Backed Securities | | $ | — | | | $ | 15,388,467 | | | $ | — | | | $ | 15,388,467 | |
| Mortgage Backed Securities1 | | | — | | | | 14,558,341 | | | | — | | | | 14,558,341 | |
| Corporate Bonds2 | | | — | | | | 5,595,172 | | | | — | | | | 5,595,172 | |
| Taxable Municipal Bonds3 | | | — | | | | 1,550,205 | | | | — | | | | 1,550,205 | |
| U.S. Government Agency Securities | | | — | | | | 2,704,245 | | | | — | | | | 2,704,245 | |
| U.S. Treasury Obligations | | | — | | | | 3,144,082 | | | | — | | | | 3,144,082 | |
| Investment in Affiliates | | | 1,667,001 | | | | — | | | | — | | | | 1,667,001 | |
| Total Investments | | | 1,667,001 | | | | 42,940,512 | | | | — | | | | 44,607,513 | |
| | | | | | | | | | | | | | | | | |
| Moderate Duration Fund | | | | | | | | | | | | | | | | |
| Asset Backed Securities | | | — | | | | 3,245,408 | | | | — | | | | 3,245,408 | |
| Mortgage Backed Securities1 | | | — | | | | 2,414,713 | | | | — | | | | 2,414,713 | |
| Corporate Bonds2 | | | — | | | | 4,932,692 | | | | — | | | | 4,932,692 | |
| Taxable Municipal Bonds3 | | | — | | | | 2,183,522 | | | | — | | | | 2,183,522 | |
| U.S. Government Agency Securities | | | — | | | | 1,335,198 | | | | — | | | | 1,335,198 | |
| U.S. Treasury Obligations | | | — | | | | 4,758,990 | | | | — | | | | 4,758,990 | |
| Investment in Affiliates | | | 816,231 | | | | — | | | | — | | | | 816,231 | |
| Total Investments | | | 816,231 | | | | 18,870,523 | | | | — | | | | 19,686,754 | |
| | | | | | | | | | | | | | | | | |
| Bond Fund | | | | | | | | | | | | | | | | |
| Asset Backed Securities | | | — | | | | 16,639,281 | | | | — | | | | 16,639,281 | |
| Mortgage Backed Securities1 | | | — | | | | 14,180,087 | | | | — | | | | 14,180,087 | |
| Corporate Bonds2 | | | — | | | | 30,999,272 | | | | — | | | | 30,999,272 | |
| Taxable Municipal Bonds3 | | | — | | | | 12,812,059 | | | | — | | | | 12,812,059 | |
| U.S. Government Agency Securities | | | — | | | | 14,802,919 | | | | — | | | | 14,802,919 | |
| U.S. Treasury Obligations | | | — | | | | 33,984,087 | | | | — | | | | 33,984,087 | |
| Investment in Affiliates | | | 6,466,384 | | | | — | | | | — | | | | 6,466,384 | |
| Total Investments | | | 6,466,384 | | | | 123,417,705 | | | | — | | | | 129,884,089 | |
| | | | | | | | | | | | | | | | | |
| Strategic Enhanced Yield Fund | | | | | | | | | | | | | | | | |
| Asset Backed Securities | | | — | | | | 1,595,061 | | | | — | | | | 1,595,061 | |
| Mortgage Backed Securities1 | | | — | | | | 4,401,977 | | | | — | | | | 4,401,977 | |
| Corporate Bonds2 | | | — | | | | 2,709,126 | | | | — | | | | 2,709,126 | |
| U.S. Treasury Obligations | | | — | | | | 879,656 | | | | — | | | | 879,656 | |
| Investment in Affiliates | | | 456,996 | | | | — | | | | — | | | | 456,996 | |
| Total Investments | | | 456,996 | | | | 9,585,820 | | | | — | | | | 10,042,816 | |
| | | | | | | | | | | | | | | | | |
| Ultra Short Tax-Free Income Fund | | | | | | | | | | | | | | | | |
| Municipal Bonds3 | | | — | | | | 27,635,130 | | | | — | | | | 27,635,130 | |
| Investment in Affiliates | | | 20,027 | | | | — | | | | — | | | | 20,027 | |
| Total Investments | | | 20,027 | | | | 27,635,130 | | | | — | | | | 27,655,157 | |
| | | | | | | | | | | | | | | | | |
| Mid Cap Diverse Leadership Fund | | | | | | | | | | | | | | | | |
| Common Stocks2 | | | 2,309,339 | | | | — | | | | — | | | | 2,309,339 | |
| Investment in Affiliates | | | 40,468 | | | | — | | | | — | | | | 40,468 | |
| Total Investments | | | 2,349,807 | | | | — | | | | — | | | | 2,349,807 | |
| | | | | | | | | | | | | | | | | |
| Opportunistic Fund | | | | | | | | | | | | | | | | |
| Common Stocks2 | | | 42,102,938 | | | | — | | | | — | | | | 42,102,938 | |
| Investment in Affiliates | | | 3,531,733 | | | | — | | | | — | | | | 3,531,733 | |
| Total Investments | | | 45,634,671 | | | | — | | | | — | | | | 45,634,671 | |
| | | | | | | | | | | | | | | | | |
| World Energy Fund | | | | | | | | | | | | | | | | |
| Common Stocks2 | | | 64,605,625 | | | | — | | | | — | | | | 64,605,625 | |
| Corporate Bonds2 | | | — | | | | 3,818,778 | | | | — | | | | 3,818,778 | |
| Investment Companies | | | 1,482,145 | | | | — | | | | — | | | | 1,482,145 | |
| Investment in Affiliates | | | 712,430 | | | | — | | | | — | | | | 712,430 | |
| Total Investments | | | 66,800,200 | | | | 3,818,778 | | | | — | | | | 70,618,978 | |
| | | | | | | | | | | | | | | | | |
| Hedged Income Fund | | | | | | | | | | | | | | | | |
| Common Stocks2 | | | 34,257,275 | | | | — | | | | — | | | | 34,257,275 | |
| Purchased Options | | | — | | | | 780,282 | | | | — | | | | 780,282 | |
| Investment in Affiliates | | | 941,095 | | | | — | | | | — | | | | 941,095 | |
| Written Options | | | — | | | | (812,631 | ) | | | — | | | | (812,631 | ) |
| Total Investments | | | 35,198,370 | | | | 32,349 | | | | | | | | 35,166,021 | |
| 1 | Please see the Schedule of Portfolio investments for Mortgage Backed Securities classification. |
| 2 | Please see the Schedule of Portfolio Investments for Industry classification. |
| 3 | Please see the Schedule of Portfolio Investments for State classification. |
Notes to the Financial Statements
August 31, 2022
Securities Valuation:
The Money Market Funds, which operate as government funds, are eligible and have elected to use the amortized cost method of valuation pursuant to Rule 2a-7 under the 1940 Act. This involves valuing an instrument at its cost initially and thereafter assuming a constant accretion or amortization to maturity of any discount or premium, respectively, regardless of the impact of fluctuating interest rates on the market value of the instrument. This method may result in periods during which value, as determined by amortized cost, is higher or lower than the price each Money Market Fund would receive if it sold the investment. The value of securities in the Money Market Funds can be expected to vary inversely with changes in prevailing interest rates.
The following is an overview of how securities are valued in the Limited Duration Fund, Moderate Duration Fund, Bond Fund, Strategic Enhanced Yield Fund, Ultra Short Tax-Free Income Fund, Mid Cap Diverse Leadership Fund, Opportunistic Fund, World Energy Fund, and Hedged Income Fund (the “Variable Net Asset Value Funds”).
Equity securities are valued at the closing price on the exchange or market where the security is principally traded (except for those traded on Nasdaq, which will be valued at the Nasdaq Official Closing Price). If there have been no sales for the day on any exchange or market, the security is valued at the latest available bid price on the exchange or market where the security is principally traded. Equity securities are typically categorized as Level 1 in the fair value hierarchy.
Fixed-income securities are valued using matrix pricing as determined by an independent pricing service approved by the Board. Fixed-income securities are valued using various inputs including new issue data, benchmark yields, reported trades, broker/dealer quotes, issuer spreads, two-sided markets, benchmark securities, bids, offers, reference data and industry and market events, and are typically categorized as Level 2 in the fair value hierarchy. In addition to the inputs noted for fixed-income securities, asset-backed and mortgage-backed securities are valued using principal payment and collateral performance information, and are typically categorized as Level 2 in the fair value hierarchy.
Short-term fixed-income securities purchased with 60 days or fewer to maturity and of sufficient credit quality are generally valued at amortized cost, which approximates current value, and are typically categorized as Level 2 in the fair value hierarchy.
Open-end mutual fund investments and exchange-traded funds are valued at the most recently calculated net asset value, and are typically categorized as Level 1 in the fair value hierarchy.
Repurchase agreements are valued at original cost, and are typically categorized as Level 2 in the fair value hierarchy.
Options are generally valued at the average of the closing bid and ask quotations on the principal exchange on which the option is traded, which are then typically categorized as Level 1 in the fair value hierarchy. For options where market quotations are not readily available, fair value procedures as described below may be applied.
Other assets and securities for which market quotations are not readily available, or are deemed unreliable are valued at fair value as determined in good faith by the Trustees or persons acting on the behalf of the Trustees. Fair value pricing may be used for significant events such as securities whose trading has been suspended, whose price has become stale or for which there is no currently available price at the close of the exchange. Depending on the source and relative significance of valuation inputs, these instruments may be classified as Level 2 or Level 3 in the fair value hierarchy.
Securities Sold Short:
The Funds may enter into short sales. Short sales are transactions in which a fund sells a security it does not own. To complete such a transaction, the Fund must borrow the security to make delivery to the buyer. The Fund is then obligated to replace the security borrowed by purchasing the security at the market price at the time of replacement. The price at such time may be more or less than the price at which the security was sold by the Fund.
Until the security is replaced, the Fund is required to pay the lender amounts equal to any dividends that accrue during the period of the loan. Dividends declared on open short positions are recorded on ex-date as dividend expense. To borrow the security, the Fund also may be required to pay a fee, which is shown as interest expense. The Fund records a liability for securities sold short and records an asset equal to the proceeds received. The amount of the liability is subsequently marked to market to reflect the market value of the securities sold short. The proceeds of the short sale may be retained by the broker, to the extent necessary to meet the margin requirements, until the short position is closed. A gain, limited to the price at which the Fund sold the security short, or a loss, unlimited in size, is recognized upon the close of a short sale.
None of the Funds shall sell securities short (unless it owns or has the right to obtain securities equivalent in kind and amount to the securities sold short or has segregated with the Custodian an amount of cash or liquid assets to cover the short position), however, this policy does not prevent the Funds from entering into short positions in foreign currency, futures contracts, options, forward contracts, swaps, caps, floors, collars and other financial instruments.
The Funds did not engage in short sales during the year ending August 31, 2022.
Options Contracts:
Each of the Funds, except U.S. Treasury Fund and the Government Securities Money Market Fund, may write (sell) covered call options and purchase options to hedge (or reduce) its exposure to a portfolio asset or risk, to obtain leverage for the portfolio, to manage cash and/or as a substitute for taking a position in the reference asset or to gain exposure to certain asset classes. An option gives the purchaser of the option the right to buy, and a writer has the obligation to sell, the underlying security at the stated exercise price at any time prior to the expiration of the option, regardless of the market price of the security. The premium paid to the writer is consideration for undertaking the obligations under the option contract. Options purchased by the Fund will be valued at the last sale price, or in the absence of such a price, at the latest available bid price. The Funds may also purchase index options. Index options (or options on securities indices) are similar in many respects to options on securities, except that an index option gives the holder the right to receive, upon exercise, cash instead of securities, if the closing value of the securities index upon which the option is based is greater than the exercise price of the option.
Notes to the Financial Statements
August 31, 2022
Purchasing options is a specialized investment technique that entails the possibility of a complete loss of the amounts paid as premiums to writers of options. The Funds can purchase options and index options provided that their total investment in such options immediately after such purchase does not exceed 5% of its total assets.
The Hedged Income Fund engaged in purchased and written options activity during the year ending August 31, 2022 detailed below.
Purchased Options Contracts—The Fund pays a premium which is included in “Investments, at value” on the Statements of Assets and Liabilities and marked to market to reflect the current value of the option. Premiums paid for purchasing options that expire are treated as realized losses. When a put option is exercised or closed, premiums paid for purchasing options are offset against proceeds to determine the realized gain/loss on the transaction. The Fund bears the risk of loss of the premium and change in value should the counterparty not perform under the contract.
Written Options Contracts—The Fund receives a premium which is recorded as a liability and is subsequently adjusted to the current value of the options written. Premiums received from writing options that expire are treated as realized gains. Premiums received from writing options that are either exercised or closed are offset against the proceeds received or the amount paid on the transaction to determine realized gains or losses. The risk associated with writing an option is that the Fund bears the market risk of an unfavorable change in the price of an underlying asset and is required to buy or sell an underlying asset under the contractual terms of the option at a price different from the current value. For the period ended August 31, 2022, the monthly average notional amount for written options contracts was $(283) thousand. Realized gains and losses are reported as “Net realized gains/(losses) from written options contracts” on the Statements of Operations.
Summary of Derivative Instruments
The following is a summary of the fair values of derivative instruments on the Statements of Assets and Liabilities, categorized by risk exposure, as of August 31, 2022:
| | | Asset Derivatives | | | Liability Derivatives | |
| | | Statement of Assets | | | | | Statement of Assets | | | |
| Primary Risk Exposure | | and Liabilities Location | | Total Fair Value | | | and Liabilities Location | | Total Fair Value | |
| Equity Risk | | | | | | | | | | | | |
| Options Contracts | | | | $ | — | | | Written Options Contracts | | $ | 812,631 | |
| Primary Risk Exposure | | Location of
Gains/(Losses)
on Derivatives
Recognized | | Realized
Gains/(Losses)
on Derivatives
Recognized | | | Change in
Net Unrealized
Appreciation/
Depreciation
on Derivatives
Recognized | |
| Equity Risk | | | | | | | | |
| Options Contracts | | Net realized gains/(losses) from written options contracts/Change in unrealized appreciation/(depreciation) on written options contracts | | $ | (377,150 | ) | | $ | 1,002,949 | |
Security Transactions and Related Income:
For all purposes other than financial reporting, security transactions are accounted for no later than one business day following the trade date. For financial reporting purposes, however, security transactions are accounted for on the trade date on the last business day of the reporting period. Interest income is recognized on an accrual basis and includes, where applicable, the amortization of premium and accretion of discount. Dividend income is recorded on the ex-dividend date or for certain foreign dividends, when the Funds become aware of such dividends declared. Gains or losses realized from sales of securities are determined using the specific identification method by comparing the identified cost of the security lot sold with the net sales proceeds. Securities purchased or sold on a when-issued or delayed delivery basis may be settled a month or more after the trade date.
Real Estate Investment Trusts:
Some of the Variable Net Asset Value Funds may invest in real estate investment trusts (“REITs”) which report information on the source of their distributions annually. Certain distributions received from REITs during the year, which are known to be a return of capital, are recorded as a reduction to the cost of the individual REIT. A REIT may focus on particular types of projects, such as apartment complexes or shopping centers, or on particular geographic regions, or both. An investment in a REIT may be subject to certain risks similar to those associated with direct ownership of real estate, including: declines in the value of real estate; risks related to general and local economic conditions, overbuilding and competition; increases in property taxes and operating expenses; and variations in rental income.
Restricted Securities:
A restricted security is a security that has been purchased through a private offering and cannot be resold to the general public without prior registration under the Securities Act of 1933 (the “1933 Act”) or pursuant to the resale limitations provided by Rule 144 under the 1933 Act or an exemption from the registration requirements of the 1933 Act. Whether a restricted security is illiquid is determined pursuant to guidelines established by the Board. Not all restricted securities are considered illiquid. The illiquid, restricted securities held as of August 31, 2022 are identified below:
| Security | | Acquisition Date | | Acquisition
Cost | | | Principal
Amount | | | Fair
Value | |
| Strategic Enhanced Yield Fund: | | | | | | | | | | | | | | |
| Amur Equipment Finance Receivables LLC, Series 2021-1A, E, 4.13%, 3/20/28 | | 4/14/21 | | $ | 599,953 | | | $ | 600,000 | | | $ | 547,779 | |
| Brean Asset Backed Securities Trust, Series 2021-RM1, M1, 1.60%, 10/25/63 | | 3/25/21 | | | 321,998 | | | | 352,356 | | | | 276,737 | |
Notes to the Financial Statements
August 31, 2022
Repurchase Agreements:
The Funds may invest in repurchase agreements with financial institutions such as member banks of the Federal Deposit Insurance Corporation (FDIC) or from registered broker/dealers that Cavanal Hill Investment Management, Inc. (the “Adviser”) deems creditworthy under guidelines approved by the Board, subject to the seller’s agreement to repurchase such securities at a mutually agreed-upon date and price. The repurchase price generally equals the price paid by the Fund plus interest negotiated on the basis of current short-term rates, which may be more or less than the rate on the underlying securities collateral. The seller under a repurchase agreement is required to maintain the value of collateral held pursuant to the agreement at not less than the repurchase price (including accrued interest). Securities subject to repurchase agreements are held by each Fund’s custodian, another qualified sub-custodian, or in the Federal Reserve book-entry system. Master Repurchase Agreements (“MRA”) permit the Fund, under certain circumstances, including an event of default (such as bankruptcy or insolvency), to offset receivables under the MRA with collateral posted by the counterparty and create one net payment due to or from the Fund. However, bankruptcy or insolvency laws of a particular jurisdiction may impose restrictions on or prohibitions against such a right of offset in the event of the MRA counterparty’s bankruptcy or insolvency. Pursuant to the terms of the MRA, the Fund receives securities as collateral with a market value in excess of the repurchase price to be received by the Fund upon the maturity of the transaction. Upon a bankruptcy or insolvency of the MRA counterparty, the Fund would recognize a liability with respect to such excess collateral to reflect the Fund’s obligation under bankruptcy law to return the excess to the counterparty.
Distributions to Shareholders:
Distributions from net investment income are declared daily and paid monthly for the Money Market Funds, Limited Duration Fund, Moderate Duration Fund, Bond Fund, Strategic Enhanced Yield Fund and Ultra Short Tax-Free Income Fund. Distributions from net investment income are declared and paid quarterly for the Mid Cap Diverse Leadership Fund, Opportunistic Fund, World Energy Fund, and Hedged Income Fund. Net realized capital gains, if any, are declared and distributed at least annually.
The character of income and gains distributed is determined in accordance with income tax regulations which may differ from U.S. GAAP. These “book/ tax” differences are either considered temporary or permanent in nature. To the extent that these differences are permanent in nature (e.g., reclassification of bond discount and premium, gain/loss on principal payments from mortgage-backed securities, and distributions), such amounts are reclassified within the composition of net assets based on their federal tax-basis treatment. Temporary differences do not require reclassification (e.g., wash sales). To the extent that distributions from net investment income and net realized gains exceed net investment income and net realized gains for tax purposes, they are reported as distributions of capital.
Allocations:
Expenses that directly relate to a specific Fund are charged directly to that Fund. Class-specific expenses are charged directly to the class incurring the expense. Other operating expenses of the Funds are prorated to each Fund on the basis of relative net assets or another appropriate method. Income, expenses (other than expenses attributable to a specific share class), and realized and unrealized gains and losses on investments are allocated to each class of shares based on its relative net assets or another appropriate basis.
| 3. | Fees and Transactions with Related and Other Parties: |
The Adviser, a wholly-owned subsidiary of BOKF, NA (“BOKF”), serves as the Funds’ investment adviser. Under the terms of the Investment Advisory Agreement between the Adviser and the Trust, the Adviser is entitled to receive fees based on a percentage of the average daily net assets of each Fund according to the following schedule:
| Fund | | Annual Advisory Fee
(as a percentage of
net assets) | | Annual Expense
Limitations* |
| U.S. Treasury Fund | | 0.05% | | |
| Government Securities Money Market Fund | | 0.05% | | |
| Limited Duration Fund | | 0.15% | | |
| Moderate Duration Fund | | 0.20% | | 0.49% |
| Bond Fund | | 0.20% | | |
| Strategic Enhanced Yield Fund | | 0.50% | | 0.76% |
| Ultra Short Tax-Free Income Fund | | 0.15% | | 0.35% |
| Mid Cap Diverse Leadership Fund | | 0.55% | | 0.81% |
| Opportunistic Fund | | 0.85% | | 1.00% |
| World Energy Fund | | 0.60% | | 0.90% |
| Hedged Income Fund | | 0.80% | | 1.10% |
| | * | The Adviser has contractually agreed to waive fees or reimburse expenses so that expenses do not exceed the percentage of average daily net assets, plus class-specific fees, through December 31, 2022. |
Notes to the Financial Statements
August 31, 2022
The Adviser serves as the Funds’ administrator. Under the terms of the Administration Agreement between the Adviser and the Trust, the Adviser is entitled to receive fees based on a percentage of the average daily net assets of each Fund according to the following schedule:
| Fund | | Annual Administration Fee
(as a percentage of
net assets) |
| U.S. Treasury Fund | | 0.05% |
| Government Securities Money Market Fund | | 0.05% |
| Limited Duration Fund | | 0.08% |
| Moderate Duration Fund | | 0.08% |
| Bond Fund | | 0.08% |
| Fund | | Annual Administration Fee
(as a percentage of
net assets) |
| Strategic Enhanced Yield Fund | | 0.08% |
| Ultra Short Tax-Free Income Fund | | 0.08% |
| Mid Cap Diverse Leadership Fund | | 0.08% |
| Opportunistic Fund | | 0.08% |
| World Energy Fund | | 0.08% |
| Hedged Income Fund | | 0.08% |
Investment Sub-Advisory Services are provided to the Hedged Income Fund by Lavaca Capital, LLC (“Lavaca” or the “Sub-Adviser”) pursuant to an Investment Sub- Advisory Agreement. The Sub-Adviser, subject to the general supervision of the Board, is responsible for providing hedging services to the Hedged Income Fund. The Sub-Adviser is paid half of the fees payable to the Adviser for the services provided to the Hedged Income Fund.
Under a Sub-Administration Agreement, the Administrator pays Citi Fund Services Ohio, Inc. (“Citi”) to perform certain administrative duties for the Trust. Fees paid to Citi by the Administrator for sub-administration services are paid out of its administration fees and are not an additional charge to the Funds. For the year ending August 31, 2022, Citi was paid $775,874 by the Administrator. Citi serves the Trust as fund accountant and makes an employee available to serve as the Funds’ Chief Compliance Officer (the “CCO”). Citi receives additional fees for its services as fund accountant and CCO which are paid by the Funds.
BOKF serves the Trust as custodian for which it is paid a fee of up to 0.01% of each Fund’s average daily net assets. As custodian, BOKF is also entitled to any out-of- pocket expenses incurred.
FIS Investor Services, LLC (“FIS”) serves as transfer agent to the Trust and receives a fee for its services as transfer agent.
Certain officers of the Trust are affiliated with Citi, the Adviser, the distributor (see below) and/or BOKF. These persons are paid no fees directly by the Trust for serving as officers of the Trust.
Cavanal Hill Distributors, Inc. (“CHD”), an affiliate of the Adviser, provides distribution services to the Funds pursuant to a Distribution Agreement between the Trust and CHD. The Trust has adopted a Distribution and Shareholder Services Plan in accordance with Rule 12b-1 under the 1940 Act, pursuant to which the Funds are authorized to pay or reimburse CHD a periodic amount, calculated at an annual rate not to exceed 0.25% of the average daily net asset value of the Administrative, Investor, Service and A Shares, 0.50% of the Premier Shares, and 1.00% of the C Shares, and may be used by CHD to pay banks, including BOKF, broker dealers and other institutions. For the year ending August 31, 2022, BOKF received $2,944,475 under the agreement. CHD contractually agreed to waive 0.15% of such fee paid by the Service Shares and 0.45% of such fee paid by the Premier Shares of the Money Market Funds and 0.13% of such fee paid by the Administrative Shares of the Government Securities Money Market Fund through December 31, 2022.
The Funds have entered into shareholder servicing agreements with BOKF, a broker-dealer affiliate and various service organizations. Services included in the servicing agreements are assisting in processing purchase, exchange and redemption requests; transmitting and receiving funds in connection with customer orders to purchase, exchange or redeem shares; and providing periodic statements. Shareholder servicing fees are incurred on a class level basis (where applicable). In consideration for these services, the service organizations received a fee from the Funds, computed daily and paid monthly, at an annual rate up to 0.25% for the Administrative, Institutional, Investor, Select, Service, Premier Shares and C Shares and up to 0.10% for the A Shares of the average daily net assets of the Funds’ shares held by the service organizations’ customers. For the year ending August 31, 2022, BOKF received net shareholder servicing fees of $3,934,061. For shareholder purchases made through BOKF, BOKF has contractually agreed to waive 0.25%, 0.15%, 0.17% and 0.25% of such fees paid by the Select, Service, Institutional and Premier Shares, respectively, of the Money Market Funds and 0.25%, 0.25%, 0.10% and 0.25% of such fees paid by the Institutional, Investor, A, and C Shares, respectively, of the Variable Net Asset Value Funds through December 31, 2022. The affiliate waivers result in reduction of the Shareholder Servicing Fee paid by all affiliated purchasers of a class.
From time to time, the Funds’ service providers may provide fee reductions and waivers in order to assist one or more of the Funds in maintaining more competitive expense ratios. Such reductions may be contractual, as disclosed in the Funds’ statutory prospectus, or voluntary and, as such, may occur on an ad hoc basis. No such reductions are subject to recoupment in subsequent fiscal periods, and voluntary reductions and waivers may be terminated at any time. Amounts reduced or waived under these arrangements are identified on the accompanying Statements of Operations.
Notes to the Financial Statements
August 31, 2022
Affiliated Transactions:
A summary of each Fund’s investment in an affiliated money market fund (Government Securities Money Market Fund, Select Shares) for the year ending August 31, 2022 is noted below:
| | | Fair Value | | | | | | | | | Fair Value | | | Shares as of | | | Dividend | |
| Fund | | 8/31/21 | | | Purchases | | | Sales | | | 8/31/22 | | | 8/31/22 | | | Income | |
| Limited Duration Fund | | $ | 4,256,770 | | | $ | 57,041,220 | | | $ | (59,630,989 | ) | | $ | 1,667,001 | | | | 1,667,001 | | | $ | 12,753 | |
| Moderate Duration Fund | | | 1,478,458 | | | | 8,376,907 | | | | (9,039,134 | ) | | | 816,231 | | | | 816,231 | | | | 4,428 | |
| Bond Fund | | | 2,305,878 | | | | 66,164,329 | | | | (62,003,823 | ) | | | 6,466,384 | | | | 6,466,384 | | | | 30,409 | |
| Strategic Enhanced Yield Fund | | | 1,318,672 | | | | 10,363,550 | | | | (11,225,226 | ) | | | 456,996 | | | | 456,996 | | | | 1,547 | |
| Ultra Short Tax-Free Income Fund | | | 95,418 | | | | 16,849,940 | | | | (16,925,331 | ) | | | 20,027 | | | | 20,027 | | | | 1,218 | |
| Mid Cap Diverse Leadership Fund | | | 36,118 | | | | 4,660,042 | | | | (4,655,692 | ) | | | 40,468 | | | | 40,468 | | | | 289 | |
| Opportunistic Fund | | | 1,326,656 | | | | 66,805,851 | | | | (64,600,774 | ) | | | 3,531,733 | | | | 3,531,733 | | | | 14,671 | |
| World Energy Fund | | | 439,196 | | | | 46,784,433 | | | | (46,511,199 | ) | | | 712,430 | | | | 712,430 | | | | 3,596 | |
| Hedged Income Fund | | | 524,599 | | | | 17,407,868 | | | | (16,991,372 | ) | | | 941,095 | | | | 941,095 | | | | 3,628 | |
| | | $ | 11,781,765 | | | $ | 294,454,140 | | | $ | (291,583,540 | ) | | $ | 14,652,365 | | | | 14,652,365 | | | $ | 72,539 | |
| 4. | Purchases and Sales of Securities: |
Purchases and sales of securities (excluding short-term securities and long-term U.S. government securities) for the year ending August 31, 2022 were as follows:
| Fund | | Purchases | | | Sales | |
| Limited Duration Fund | | $ | 11,881,627 | | | $ | 37,724,792 | |
| Moderate Duration Fund | | | 3,001,706 | | | | 7,082,704 | |
| Bond Fund | | | 30,770,331 | | | | 26,452,516 | |
| Strategic Enhanced Yield Fund | | | 144,289 | | | | 7,383,217 | |
| Ultra Short Tax-Free Income Fund | | | 26,261,651 | | | | 31,826,735 | |
| Mid Cap Diverse Leadership Fund | | | 6,220,411 | | | | 4,995,639 | |
| Opportunistic Fund | | | 165,263,168 | | | | 184,382,250 | |
| World Energy Fund | | | 131,042,731 | | | | 102,469,554 | |
| Hedged Income Fund | | | 17,316,793 | | | | 5,498,371 | |
Purchases and sales of long-term U.S. government securities for the year ending August 31, 2022 were as follows:
| Fund | | Purchases | | | Sales | |
| Limited Duration Fund | | $ | 18,088,183 | | | $ | 25,113,157 | |
| Moderate Duration Fund | | | 3,322,212 | | | | 1,854,938 | |
| Bond Fund | | | 43,376,982 | | | | 14,890,385 | |
| Strategic Enhanced Yield Fund | | | 2,601,713 | | | | 4,077,675 | |
| 5. | Credit Risk and Other Risk Considerations: |
The Ultra Short Tax-Free Income Fund invests primarily in debt instruments of municipal issuers. The issuers’ ability to meet their obligations may be affected by economic developments in a specific industry, sector or locale.
The Limited Duration Fund, Moderate Duration Fund, Bond Fund and Strategic Enhanced Yield Fund are each invested in mortgage-related, fixed-income instruments. Mortgage-backed securities are subject to prepayment risk and credit risk of mortgagors and may be sensitive to changes in prevailing interest rates. When interest rates rise, the value of fixed-income securities generally declines.
Mid Cap Diverse Leadership Fund invests primarily in a diversified portfolio of common stocks of Mid Cap U.S. companies which may be subject to higher price volatility and lower trade volumes; as such, the fund’s share price can fall because of weakness in the stock markets, a particular industry, or specific holdings. Stock markets can decline for many reasons, including adverse political or economic developments, changes in investor psychology, or heavy institutional selling.
The World Energy Fund’s concentration in securities in energy-related industries may present more risks than would be the case with funds that diversify investments in numerous industries and sectors of the economy. Energy-related securities can be significantly affected by world events relating to political developments, energy conservation, commodity prices, and tax and government regulations. The Fund is also subject to foreign investment risk which is associated with higher transaction costs, delayed settlements, currency controls or adverse economic and political developments. Foreign securities may be affected by incomplete or inaccurate financial information on companies. There is a risk of loss attributable to social upheavals, unfavorable governmental or political actions, seizure of foreign deposits, changes in tax or trade statutes, and governmental collapse and war. These risks are more significant in emerging markets.
Hedged Income Fund invests primarily in dividend paying equity securities, with at least 80% of its net assets in income generating equity securities and equity- related instruments traded on U.S. exchanges. The Fund is subject to market risk in which market value of a security may move up and down, sometimes rapidly and unpredictably. The Fund also invests in call and put options that involve risks different from, or possibly greater than, the risks associated with investing directly in securities, including leverage risk, tracking risk and counterparty default risk. The risk of potential losses if equity markets or an individual equity security do not move as expected and the potential for greater losses than if these techniques had not been used. By writing covered call options, a fund will not benefit from any potential increases in the value of a fund asset above the exercise price, but will bear the risk of declines in the value of the asset. As the seller (writer) of a call option, the Fund will tend to lose money if the value of the reference index or security rises above the strike price. As the buyer of a put option, the Fund risks losing the entire premium invested if the value of the reference index or security is above the put strike at maturity. Writing of covered call options are also subject to the risk that the counterparty to the transaction will not fulfill its obligations.
| Notes to the Financial Statements |
| August 31, 2022 |
The outbreak and spread of a novel coronavirus (COVID-19), which was declared a pandemic by the World Health Organization in March of 2020, continues to cause considerable uncertainty for global financial markets and economies. Efforts to limit the spread of COVID-19, including shut-downs, travel restrictions and quarantines resulted in lower consumer activity, diminished demand for a wide range of products and services and disruption in manufacturing and supply chains. These measures could also result in disruptions to the services provided to the Funds. Government actions to mitigate the economic impact of the pandemic led to an expansion of government deficits and debt, the consequences of which are not yet known. The ultimate extent and duration of the pandemic remains difficult to predict, as does the long-term impact on global economies, financial markets, market sectors and market participants. As the situation continues to develop, COVID-19 could adversely affect investment valuation, liquidity and performance for the Funds.
London Interbank Offering Rate (“LIBOR”) Risk: Certain investments held by the Funds may pay or receive interest at floating rates based on LIBOR. The United Kingdom Financial Conduct Authority has announced that it will stop compelling banks to submit rates for many LIBOR settings after December 31, 2021, and for certain other commonly-used U.S. dollar LIBOR settings after June 30, 2023. The transition away from LIBOR could result in increased volatility and uncertainty in markets tied to LIBOR. The elimination of LIBOR may adversely affect the market for, or value of, specific securities or payments linked to LIBOR rates, the availability or terms of borrowing or refinancing, or the effectiveness of hedging strategies. To the extent that the Fund’s investments have maturities which extend beyond 2023, the applicable interest rates might be subject to change if there is a transition from the LIBOR reference rate. These risks may also apply with respect to changes in connection with other interbank offering rates (e.g., SOFR) and a wide range of other index levels, rates and values that are treated as “benchmarks” and are the subject of recent regulatory reform.
It is the policy of each Fund to continue to qualify as a regulated investment company by complying with the provisions available to regulated investment companies, as defined under Subchapter M of the Internal Revenue Code, and to make distributions from net investment income and from net realized capital gains sufficient to relieve it from all, or substantially all, federal income taxes. Accordingly, no provisions for federal income taxes are required in the financial statements.
Management of the Funds has reviewed tax positions taken in tax years that remain subject to examination by tax authorities (i.e., the last three tax year ends and any interim tax period since then, as applicable). Management has determined that there are no uncertain tax positions that would require the Funds to record a tax liability and, therefore, there is no impact to the Funds’ financial statements.
The Funds may be subject to foreign taxes on dividends and realized capital gains. The Funds accrue such taxes, as applicable, based on their current interpretation of tax rules in the foreign markets in which they invest.
At August 31, 2022, the cost basis of securities including derivatives for federal income tax purposes, gross unrealized appreciation, gross unrealized depreciation and net unrealized appreciation/(depreciation) were as follows:
| Fund | | Tax Cost of
Securities | | | Unrealized
Appreciation | | | Unrealized
Depreciation | | | Net Unrealized
Appreciation/
(Depreciation) | |
| Limited Duration Fund | | $ | 48,886,393 | | | $ | 37,970 | | | $ | (4,316,850 | ) | | $ | (4,278,880 | ) |
| Moderate Duration Fund | | | 21,341,004 | | | | 22,749 | | | | (1,676,999 | ) | | | (1,654,250 | ) |
| Bond Fund | | | 142,323,282 | | | | 55,412 | | | | (12,494,605 | ) | | | (12,439,193 | ) |
| Strategic Enhanced Yield Fund | | | 11,187,485 | | | | 5,828 | | | | (1,150,497 | ) | | | (1,144,669 | ) |
| Ultra Short Tax-Free Income Fund | | | 27,890,383 | | | | 582 | | | | (235,808 | ) | | | (235,226 | ) |
| Mid Cap Diverse Leadership Fund | | | 2,415,147 | | | | 235,795 | | | | (301,135 | ) | | | (65,340 | ) |
| Opportunistic Fund | | | 45,422,763 | | | | 2,797,611 | | | | (2,585,703 | ) | | | 211,908 | |
| World Energy Fund | | | 55,920,632 | | | | 16,993,296 | | | | (2,294,950 | ) | | | 14,698,346 | |
| Hedged Income Fund | | | 37,625,818 | | | | 2,536,027 | | | | (3,165,137 | ) | | | (629,110 | ) |
The tax characteristics of distributions paid to shareholders during fiscal years ending August 31, 2022 and 2021 were as follows:
| | | Distributions Paid From: | | | | | | | | | | |
| 2022 | | Net
Investment
Income | | | Net Long-
Term Gains | | | Total
Taxable
Distributions | | | Tax-Exempt
Distributions | | | Total
Distributions
Paid* | |
| U.S. Treasury Fund | | $ | 964,434 | | | $ | — | | | $ | 964,434 | | | $ | — | | | $ | 964,434 | |
| Government Securities Money Market Fund | | | 4,399,373 | | | | 399 | | | | 4,399,772 | | | | — | | | | 4,399,772 | |
| Limited Duration Fund | | | 1,166,487 | | | | — | | | | 1,166,487 | | | | — | | | | 1,166,487 | |
| Moderate Duration Fund | | | 406,575 | | | | — | | | | 406,575 | | | | — | | | | 406,575 | |
| Bond Fund | | | 2,595,738 | | | | — | | | | 2,595,738 | | | | — | | | | 2,595,738 | |
| Strategic Enhanced Yield Fund | | | 468,181 | | | | — | | | | 468,181 | | | | — | | | | 468,181 | |
| Ultra Short Tax-Free Income Fund | | | 2,238 | | | | — | | | | 2,238 | | | | 26,555 | | | | 28,793 | |
| Mid Cap Diverse Leadership Fund | | | 94,051 | | | | 102,348 | | | | 196,399 | | | | — | | | | 196,399 | |
| Opportunistic Fund | | | 1,285,367 | | | | 1,109,272 | | | | 2,394,639 | | | | — | | | | 2,394,639 | |
| World Energy Fund | | | 964,694 | | | | — | | | | 964,694 | | | | — | | | | 964,694 | |
| Hedged Income Fund | | | 624,482 | | | | — | | | | 624,482 | | | | — | | | | 624,482 | |
| | * | Total distributions paid may differ from that disclosed in the Statements of Changes in Net Assets because distributions are recognized when actually paid for tax purposes. |
| Notes to the Financial Statements |
| August 31, 2022 |
| | | Distributions Paid From: | | | | | | | | | | |
| 2021 | | Net
Investment
Income | | | Net Long-
Term Gains | | | Total
Taxable
Distributions | | | Tax-Exempt
Distributions | | | Total
Distributions
Paid* | |
| U.S. Treasury Fund | | $ | 59,587 | | | $ | — | | | $ | 59,587 | | | $ | — | | | $ | 59,587 | |
| Government Securities Money Market Fund | | | 215,303 | | | | — | | | | 215,303 | | | | — | | | | 215,303 | |
| Limited Duration Fund | | | 1,529,096 | | | | — | | | | 1,529,096 | | | | — | | | | 1,529,096 | |
| Moderate Duration Fund | | | 496,622 | | | | — | | | | 496,622 | | | | — | | | | 496,622 | |
| Bond Fund | | | 1,955,442 | | | | — | | | | 1,955,442 | | | | — | | | | 1,955,442 | |
| Strategic Enhanced Yield Fund | | | 899,544 | | | | 7,094 | | | | 906,638 | | | | — | | | | 906,638 | |
| Ultra Short Tax-Free Income Fund | | | — | | | | — | | | | — | | | | 8,617 | | | | 8,617 | |
| Mid Cap Diverse Leadership Fund | | | 35,700 | | | | 70,273 | | | | 105,973 | | | | — | | | | 105,973 | |
| Opportunistic Fund | | | 321,255 | | | | — | | | | 321,255 | | | | — | | | | 321,255 | |
| World Energy Fund | | | 312,849 | | | | — | | | | 312,849 | | | | — | | | | 312,849 | |
| Hedged Income Fund | | | 119,908 | | | | — | | | | 119,908 | | | | — | | | | 119,908 | |
| * | Total distributions paid may differ from that disclosed in the Statements of Changes in Net Assets because distributions are recognized when actually paid for tax purposes. |
As of August 31, 2022, the components of accumulated earnings/(deficit) on a tax basis were as follows:
| Fund | | Undistributed
Ordinary
Income/Tax
Exempt Income | | | Undistributed
Long-Term
Capital Gains | | | Accumulated
Earnings | | | Distributions
Payable | | | Accumulated
Capital and
Other Losses* | | | Unrealized
Appreciation/
(Depreciation)** | | | Total
Accumulated
Earnings/
(Deficit) | |
| U.S. Treasury Fund | | $ | 1,239,074 | | | $ | — | | | $ | 1,239,074 | | | $ | (1,239,063 | ) | | $ | (2,140 | ) | | $ | — | | | $ | (2,129 | ) |
| Government Securities Money Market Fund | | | 3,305,705 | | | | — | | | | 3,305,705 | | | | (3,301,466 | ) | | | (6,707 | ) | | | — | | | | (2,468 | ) |
| Limited Duration Fund | | | 142,911 | | | | — | | | | 142,911 | | | | (88,500 | ) | | | (5,533,716 | ) | | | (4,278,880 | ) | | | (9,758,185 | ) |
| Moderate Duration Fund | | | 87,480 | | | | — | | | | 87,480 | | | | (36,162 | ) | | | (5,494,482 | ) | | | (1,654,250 | ) | | | (7,097,414 | ) |
| Bond Fund | | | 272,471 | | | | — | | | | 272,471 | | | | (276,188 | ) | | | (3,249,136 | ) | | | (12,439,193 | ) | | | (15,692,046 | ) |
| Strategic Enhanced Yield Fund | | | 36,111 | | | | — | | | | 36,111 | | | | (36,034 | ) | | | (1,099,038 | ) | | | (1,144,669 | ) | | | (2,243,630 | ) |
| Ultra Short Tax-Free Income Fund | | | 14,169 | | | | — | | | | 14,169 | | | | (14,080 | ) | | | (332 | ) | | | (235,226 | ) | | | (235,469 | ) |
| Mid Cap Diverse Leadership Fund | | | 22,138 | | | | 145,870 | | | | 168,008 | | | | — | | | | — | | | | (65,340 | ) | | | 102,668 | |
| Opportunistic Fund | | | 21,572 | | | | — | | | | 21,572 | | | | — | | | | (8,071,789 | ) | | | 211,908 | | | | (7,838,309 | ) |
| World Energy Fund | | | 247,808 | | | | — | | | | 247,808 | | | | — | | | | (18,591,910 | ) | | | 14,698,346 | | | | (3,645,756 | ) |
| Hedged Income Fund | | | 135,125 | | | | — | | | | 135,125 | | | | — | | | | (1,335,105 | ) | | | (629,110 | ) | | | (1,829,090 | ) |
| * | See below for post-October losses and capital loss carryforwards. |
| ** | The differences between book-basis and tax-basis unrealized appreciation/(depreciation) is attributable primarily to tax deferral of losses on wash sale, straddles, and the difference between book and tax amortization methods for premium and market discounts. |
At August 31, 2022, the following Funds had capital loss carryforwards as summarized in the tables below. The Board does not intend to authorize a distribution of any realized gain for the Funds until any applicable CLCF has been offset.
Capital loss carryforwards not subject to expiration:
| Fund | | Short-Term
Amount | | | Long-Term
Amount | | | Total | |
| U.S. Treasury Fund | | $ | (2,140 | ) | | $ | – | | | $ | (2,140 | ) |
| Government Securities Money Market Fund | | | (6,707 | ) | | | – | | | | (6,707 | ) |
| Limited Duration Fund | | | (757,390 | ) | | | (4,776,326 | ) | | | (5,533,716 | ) |
| Moderate Duration Fund | | | (969,611 | ) | | | (4,524,871 | ) | | | (5,494,482 | ) |
| Bond Fund | | | (2,134,476 | ) | | | (1,114,660 | ) | | | (3,249,136 | ) |
| Strategic Enhanced Yield Fund | | | (786,525 | ) | | | (312,513 | ) | | | (1,099,038 | ) |
| Ultra Short Tax-Free Income Fund | | | (332 | ) | | | – | | | | (332 | ) |
| Opportunistic Fund | | | (8,071,789 | ) | | | – | | | | (8,071,789 | ) |
| World Energy Fund | | | (18,591,910 | ) | | | – | | | | (18,591,910 | ) |
| Hedged Income Fund | | | (1,335,105 | ) | | | – | | | | (1,335,105 | ) |
To the extent that these carryforwards are used to offset future capital gains, it is probable that the gains that are offset will not be distributed to shareholders.
| Notes to the Financial Statements |
| August 31, 2022 |
| 7. | Recent Regulatory Pronouncements: |
The SEC adopted Rule 18f-4 and Rule 2a-5 under the 1940 Act. Rule 18f-4 governs the use of derivatives by registered investment companies, and Rule 2a-5 governs fair value determinations. The Funds, as applicable, complied with both rules by their compliance dates of August 19, 2022 and September 8, 2022 for Rule 18f-4 and Rule 2a-5, respectively. Management believes these rules will not have a significant impact on the Funds’ operations and will not impact the Funds’ beginning net assets, current period results from operations, or any prior period information presented in the financial statements.
Management has evaluated the need for disclosures and/or adjustments resulting from subsequent events through the date the financial statements were issued. Based on this evaluation, no additional disclosures and/or adjustments were required as of August 31, 2022, except as noted below:
On October 17, 2022, a Special Meeting of Shareholders was held to approve LM Capital Group, LLC ("LM Capital") as Sub-Adviser to the Strategic Enhanced Yield Fund. The Sub-Advisory agreement will become effective on December 28, 2022.
Financial Highlights
For a share of capital stock outstanding throughout the periods indicated.
| | | | | | Change in Net Assets
Resulting From Operations: | |
| | | Net Asset
Value,
Beginning of
Period | | | Net
Investment
Income
(Loss) | | | Total from
Investment
Activities | |
| U.S. Treasury Fund | | | | | | | | | |
| Administrative Shares | | | | | | | | | |
| Year Ended August 31, 2022 | | $ | 1.000 | | | $ | 0.002 | | | $ | 0.002 | |
| Year Ended August 31, 2021 | | | 1.000 | | | | — | | | | — | |
| Year Ended August 31, 2020 | | | 1.000 | | | | 0.010 | | | | 0.010 | |
| Year Ended August 31, 2019 | | | 1.000 | | | | 0.020 | | | | 0.020 | |
| Year Ended August 31, 2018 | | | 1.000 | | | | 0.009 | | | | 0.009 | |
| Service Shares | | | | | | | | | | | | |
| Year Ended August 31, 2022 | | | 1.000 | | | | 0.003 | | | | 0.003 | |
| Year Ended August 31, 2021 | | | 1.000 | | | | — | | | | — | |
| Year Ended August 31, 2020 | | | 1.000 | | | | 0.010 | | | | 0.010 | |
| Year Ended August 31, 2019 | | | 1.000 | | | | 0.020 | | | | 0.020 | |
| Year Ended August 31, 2018 | | | 1.000 | | | | 0.011 | | | | 0.011 | |
| Institutional Shares | | | | | | | | | | | | |
| Year Ended August 31, 2022 | | | 1.000 | | | | 0.003 | | | | 0.003 | |
| Year Ended August 31, 2021 | | | 1.000 | | | | — | | | | — | |
| Year Ended August 31, 2020 | | | 1.000 | | | | 0.010 | | | | 0.010 | |
| Year Ended August 31, 2019 | | | 1.000 | | | | 0.020 | | | | 0.020 | |
| Year Ended August 31, 2018 | | | 1.000 | | | | 0.012 | | | | 0.012 | |
| Select Shares | | | | | | | | | | | | |
| Year Ended August 31, 2022 | | | 1.000 | | | | 0.004 | | | | 0.004 | |
| Year Ended August 31, 2021 | | | 1.000 | | | | — | | | | — | |
| Year Ended August 31, 2020 | | | 1.000 | | | | 0.010 | | | | 0.010 | |
| Year Ended August 31, 2019 | | | 1.000 | | | | 0.020 | | | | 0.020 | |
| December 26, 2017(e) through August 31, 2018 | | | 1.000 | | | | 0.010 | | | | 0.010 | |
| (a) | Annualized for periods less than one year. |
| (b) | Not annualized for periods less than one year. |
| (c) | During the period, certain fees were waived. If such fee waivers had not occurred, the ratios would have been as indicated. |
| (d) | Reflects a voluntary waiver of certain fund expenses in effect during the period relating to the enhancement of certain annualized net yields for the fund. For the year ended August 31, 2022, the effect of such voluntary waivers was a reduction in the ratio of net expenses to average net assets equivalent to 0.42%, 0.18%, 0.12%, and 0.05% for Administrative Shares, Service Shares, Institutional Shares, and Select Shares, respectively. For the year ended August 31, 2021, the effect of such voluntary waivers was a reduction in the ratio of net expenses to average net assets equivalent to 0.62%, 0.32%, 0.19%, and 0.10% for Administrative Shares, Service Shares, Institutional Shares, and Select Shares, respectively. For the year ended August 31, 2020, the effect of such voluntary waivers was a reduction in the ratio of net expenses to average net assets equivalent to 0.16%, 0.03%, and 0.01% for Administrative Shares, Service Shares, and Institutional Shares, respectively. |
| (e) | Commencement of operations. |
Amounts designated as “—” are 0 or have been rounded to 0.
| Less Dividends From: | | | | | | | | | | | | Ratios/Supplemental Data:(a) | |
Dividends
from Net
Investment
Income | | | Distributions
from Net
Realized
Gains from
Investments | | | Total
Dividends and
Distributions | | | Net Asset
Value, End
of
Period | | | Total
Return(b) | | | Net Assets End
of Period
(000s) | | | Ratio of Net
Expenses to
Average Net
Assets | | | Ratio of Net
Investment
Income
(Loss) to
Average
Net Assets | | | Ratio of Gross
Expenses to
Average
Net Assets(c) | |
| | | | | | | | | | | | | | | | | | | | | | | | | | |
| $ | (0.002 | ) | | $ | — | | | $ | (0.002 | ) | | $ | 1.000 | | | | 0.20 | % | | $ | 830,908 | | | | 0.25 | %(d) | | | 0.21 | % | | | 0.67 | % |
| | — | | | | — | | | | — | | | | 1.000 | | | | — | % | | | 882,438 | | | | 0.06 | %(d) | | | — | % | | | 0.68 | % |
| | (0.010 | ) | | | — | | | | (0.010 | ) | | | 1.000 | �� | | | 0.55 | % | | | 988,206 | | | | 0.51 | %(d) | | | 0.57 | % | | | 0.67 | % |
| | (0.020 | ) | | | — | | | | (0.020 | ) | | | 1.000 | | | | 1.63 | % | | | 864,882 | | | | 0.69 | % | | | 1.62 | % | | | 0.69 | % |
| | (0.009 | ) | | | — | | | | (0.009 | ) | | | 1.000 | | | | 0.79 | % | | | 957,502 | | | | 0.67 | % | | | 0.77 | % | | | 0.67 | % |
| | | | | | | | | | | | | | | | | | | | | | | | | | | | | | | | | | | |
| | (0.003 | ) | | | — | | | | (0.003 | ) | | | 1.000 | | | | 0.30 | % | | | 56,430 | | | | 0.20 | %(d) | | | 0.38 | % | | | 0.67 | % |
| | — | | | | — | | | | — | | | | 1.000 | | | | — | % | | | 34,447 | | | | 0.06 | %(d) | | | — | % | | | 0.68 | % |
| | (0.010 | ) | | | — | | | | (0.010 | ) | | | 1.000 | | | | 0.71 | % | | | 24,566 | | | | 0.34 | %(d) | | | 0.78 | % | | | 0.67 | % |
| | (0.020 | ) | | | — | | | | (0.020 | ) | | | 1.000 | | | | 1.93 | % | | | 79,927 | | | | 0.39 | % | | | 1.93 | % | | | 0.69 | % |
| | (0.011 | ) | | | — | | | | (0.011 | ) | | | 1.000 | | | | 1.09 | % | | | 33,720 | | | | 0.37 | % | | | 1.11 | % | | | 0.67 | % |
| | | | | | | | | | | | | | | | | | | | | | | | | | | | | | | | | | | |
| | (0.003 | ) | | | — | | | | (0.003 | ) | | | 1.000 | | | | 0.34 | % | | | 49,457 | | | | 0.14 | %(d) | | | 0.35 | % | | | 0.42 | % |
| | — | | | | — | | | | — | | | | 1.000 | | | | — | % | | | 60,980 | | | | 0.07 | %(d) | | | 0.01 | % | | | 0.43 | % |
| | (0.010 | ) | | | — | | | | (0.010 | ) | | | 1.000 | | | | 0.81 | % | | | 82,420 | | | | 0.24 | %(d) | | | 0.82 | % | | | 0.42 | % |
| | (0.020 | ) | | | — | | | | (0.020 | ) | | | 1.000 | | | | 2.05 | % | | | 94,055 | | | | 0.27 | % | | | 2.04 | % | | | 0.44 | % |
| | (0.012 | ) | | | — | | | | (0.012 | ) | | | 1.000 | | | | 1.21 | % | | | 97,238 | | | | 0.25 | % | | | 1.13 | % | | | 0.42 | % |
| | | | | | | | | | | | | | | | | | | | | | | | | | | | | | | | | | | |
| | (0.004 | ) | | | — | | | | (0.004 | ) | | | 1.000 | | | | 0.37 | % | | | 10,335 | | | | 0.13 | %(d) | | | 0.61 | % | | | 0.42 | % |
| | — | | | | — | | | | — | | | | 1.000 | | | | 0.01 | % | | | 3,105 | | | | 0.08 | %(d) | | | 0.01 | % | | | 0.43 | % |
| | (0.010 | ) | | | — | | | | (0.010 | ) | | | 1.000 | | | | 0.88 | % | | | 37,975 | | | | 0.17 | % | | | 0.94 | % | | | 0.42 | % |
| | (0.020 | ) | | | — | | | | (0.020 | ) | | | 1.000 | | | | 2.14 | % | | | 58,826 | | | | 0.19 | % | | | 2.13 | % | | | 0.44 | % |
| | (0.010 | ) | | | — | | | | (0.010 | ) | | | 1.000 | | | | 0.99 | % | | | 51,839 | | | | 0.17 | % | | | 1.46 | % | | | 0.42 | % |
Financial Highlights
For a share of capital stock outstanding throughout the periods indicated.
| | | | | | Change in Net Assets
Resulting From Operations: | |
| | | Net Asset
Value,
Beginning of
Period | | | Net
Investment
Income
(Loss) | | | Total from
Investment
Activities | |
| Government Securities Money Market Fund | | | | | | | | | |
| Administrative Shares | | | | | | | | | |
| Year Ended August 31, 2022 | | $ | 1.000 | | | $ | 0.003 | | | $ | 0.003 | |
| Year Ended August 31, 2021 | | | 1.000 | | | | — | | | | — | |
| Year Ended August 31, 2020 | | | 1.000 | | | | 0.010 | | | | 0.010 | |
| Year Ended August 31, 2019 | | | 1.000 | | | | 0.020 | | | | 0.020 | |
| Year Ended August 31, 2018 | | | 1.000 | | | | 0.009 | | | | 0.009 | |
| Institutional Shares | | | | | | | | | | | | |
| Year Ended August 31, 2022 | | | 1.000 | | | | 0.004 | | | | 0.004 | |
| Year Ended August 31, 2021 | | | 1.000 | | | | — | | | | — | |
| Year Ended August 31, 2020 | | | 1.000 | | | | 0.010 | | | | 0.010 | |
| Year Ended August 31, 2019 | | | 1.000 | | | | 0.020 | | | | 0.020 | |
| Year Ended August 31, 2018 | | | 1.000 | | | | 0.012 | | | | 0.012 | |
| Select Shares | | | | | | | | | | | | |
| Year Ended August 31, 2022 | | | 1.000 | | | | 0.004 | | | | 0.004 | |
| Year Ended August 31, 2021 | | | 1.000 | | | | — | | | | — | |
| Year Ended August 31, 2020 | | | 1.000 | | | | 0.010 | | | | 0.010 | |
| Year Ended August 31, 2019 | | | 1.000 | | | | 0.020 | | | | 0.020 | |
| Year Ended August 31, 2018 | | | 1.000 | | | | 0.013 | | | | 0.013 | |
| Premier Shares | | | | | | | | | | | | |
| Year Ended August 31, 2022 | | | 1.000 | | | | 0.004 | | | | 0.004 | |
| Year Ended August 31, 2021 | | | 1.000 | | | | — | | | | — | |
| Year Ended August 31, 2020 | | | 1.000 | | | | 0.010 | | | | 0.010 | |
| Year Ended August 31, 2019 | | | 1.000 | | | | 0.020 | | | | 0.020 | |
| Year Ended August 31, 2018 | | | 1.000 | | | | 0.012 | | | | 0.012 | |
| (a) | Annualized for periods less than one year. |
| (b) | Not annualized for periods less than one year. |
| (c) | During the period, certain fees were waived. If such fee waivers had not occurred, the ratios would have been as indicated. |
| (d) | Reflects a voluntary waiver of certain fund expenses in effect during the period relating to the enhancement of certain annualized net yields for the fund. For the year ended August 31, 2022, the effect of such voluntary waivers was a reduction in the ratio of net expenses to average net assets equivalent to 0.32%, 0.13%, 0.07%, and 0.10% for Administrative Shares, Institutional Shares, Select Shares, and Premier Shares, respectively. For the year ended August 31, 2021, the effect of such voluntary waivers was a reduction in the ratio of net expenses to average net assets equivalent to 0.49%, 0.19%, 0.12%, and 0.16% for Administrative Shares, Institutional Shares, Select Shares, and Premier Shares, respectively. For the year ended August 31, 2020, the effect of such voluntary waivers was a reduction in the ratio of net expenses to average net assets equivalent to 0.11% and 0.01% for Administrative Shares and Institutional Shares, respectively. The reduction in the ratio of net expenses to average net assets for Select Shares and Premier Shares was less than 0.005%. |
Amounts designated as “—” are 0 or have been rounded to 0.
| Less Dividends From: | | | | | | | | | | | | Ratios/Supplemental Data:(a) | |
Dividends
from Net
Investment
Income | | | Distributions
from Net
Realized
Gains from
Investments | | | Total
Dividends and
Distributions | | | Net Asset
Value,
End of
Period | | | Total
Return(b) | | | Net Assets
End of
Period
(000s) | | | Ratio of Net
Expenses to
Average Net
Assets | | | Ratio of Net
Investment
Income
(Loss) to
Average
Net Assets | | | Ratio of Gross
Expenses to
Average
Net Assets(c) | |
| | | | | | | | | | | | | | | | | | | | | | | | | | |
| $ | (0.003 | ) | | $ | — | | | $ | (0.003 | ) | | $ | 1.000 | | | | 0.28 | % | | $ | 666,206 | | | | 0.22 | %(d) | | | 0.25 | % | | | 0.67 | % |
| | — | | | | — | | | | — | | | | 1.000 | | | | 0.01 | % | | | 578,785 | | | | 0.07 | %(d) | | | 0.01 | % | | | 0.69 | % |
| | (0.010 | ) | | | — | | | | (0.010 | ) | | | 1.000 | | | | 0.62 | % | | | 608,177 | | | | 0.44 | %(d) | | | 0.58 | % | | | 0.68 | % |
| | (0.020 | ) | | | — | | | | (0.020 | ) | | | 1.000 | | | | 1.77 | % | | | 489,932 | | | | 0.56 | % | | | 1.77 | % | | | 0.69 | % |
| | (0.009 | ) | | | — | | | | (0.009 | ) | | | 1.000 | | | | 0.91 | % | | | 538,798 | | | | 0.57 | % | | | 0.88 | % | | | 0.70 | % |
| | | | | | | | | | | | | | | | | | | | | | | | | | | | | | | | | | | |
| | (0.004 | ) | | | — | | | | (0.004 | ) | | | 1.000 | | | | 0.37 | % | | | 122,080 | | | | 0.12 | %(d) | | | 0.28 | % | | | 0.43 | % |
| | — | | | | — | | | | — | | | | 1.000 | | | | 0.01 | % | | | 124,349 | | | | 0.08 | %(d) | | | 0.01 | % | | | 0.44 | % |
| | (0.010 | ) | | | — | | | | (0.010 | ) | | | 1.000 | | | | 0.82 | % | | | 165,610 | | | | 0.25 | %(d) | | | 0.76 | % | | | 0.43 | % |
| | (0.020 | ) | | | — | | | | (0.020 | ) | | | 1.000 | | | | 2.06 | % | | | 94,595 | | | | 0.27 | % | | | 2.05 | % | | | 0.44 | % |
| | (0.012 | ) | | | — | | | | (0.012 | ) | | | 1.000 | | | | 1.20 | % | | | 102,020 | | | | 0.28 | % | | | 1.13 | % | | | 0.45 | % |
| | | | | | | | | | | | | | | | | | | | | | | | | | | | | | | | | | | |
| | (0.004 | ) | | | — | | | | (0.004 | ) | | | 1.000 | | | | 0.41 | % | | | 1,048,440 | | | | 0.10 | %(d) | | | 0.44 | % | | | 0.43 | % |
| | — | | | | — | | | | — | | | | 1.000 | | | | 0.01 | % | | | 865,637 | | | | 0.07 | %(d) | | | 0.01 | % | | | 0.44 | % |
| | (0.010 | ) | | | — | | | | (0.010 | ) | | | 1.000 | | | | 0.89 | % | | | 947,249 | | | | 0.18 | %(d) | | | 0.84 | % | | | 0.43 | % |
| | (0.020 | ) | | | — | | | | (0.020 | ) | | | 1.000 | | | | 2.14 | % | | | 988,003 | | | | 0.19 | % | | | 2.13 | % | | | 0.44 | % |
| | (0.013 | ) | | | — | | | | (0.013 | ) | | | 1.000 | | | | 1.28 | % | | | 800,991 | | | | 0.20 | % | | | 1.30 | % | | | 0.45 | % |
| | | | | | | | | | | | | | | | | | | | | | | | | | | | | | | | | | | |
| | (0.004 | ) | | | — | | | | (0.004 | ) | | | 1.000 | | | | 0.38 | % | | | 334,389 | | | | 0.12 | %(d) | | | 0.41 | % | | | 0.93 | % |
| | — | | | | — | | | | — | | | | 1.000 | | | | 0.01 | % | | | 285,447 | | | | 0.07 | %(d) | | | 0.01 | % | | | 0.94 | % |
| | (0.010 | ) | | | — | | | | (0.010 | ) | | | 1.000 | | | | 0.84 | % | | | 321,321 | | | | 0.23 | %(d) | | | 0.75 | % | | | 0.93 | % |
| | (0.020 | ) | | | — | | | | (0.020 | ) | | | 1.000 | | | | 2.09 | % | | | 233,659 | | | | 0.24 | % | | | 2.08 | % | | | 0.94 | % |
| | (0.012 | ) | | | — | | | | (0.012 | ) | | | 1.000 | | | | 1.23 | % | | | 105,598 | | | | 0.25 | % | | | 1.26 | % | | | 0.95 | % |
Financial Highlights
For a share of capital stock outstanding throughout the periods indicated.
| | | | | | Change in Net Assets
Resulting From Operations: | |
| | | Net Asset
Value,
Beginning of
Period | | | Net
Investment
Income
(Loss) | | | Net
Realized and
Unrealized
Gains
(Losses)
on Investments | | | Total from
Investment
Activities | |
| Limited Duration Fund | | | | | | | | | | | | |
| Investor Shares | | | | | | | | | | | | |
| Year Ended August 31, 2022 | | $ | 9.70 | | | $ | 0.13 | | | $ | (0.68 | ) | | $ | (0.55 | ) |
| Year Ended August 31, 2021 | | | 9.79 | | | | 0.12 | | | | (0.07 | ) | | | 0.05 | |
| Year Ended August 31, 2020 | | | 9.62 | | | | 0.17 | | | | 0.17 | | | | 0.34 | |
| Year Ended August 31, 2019 | | | 9.41 | | | | 0.21 | | | | 0.21 | | | | 0.42 | |
| Year Ended August 31, 2018 | | | 9.61 | | | | 0.16 | | | | (0.15 | ) | | | 0.01 | |
| Institutional Shares | | | | | | | | | | | | | | | | |
| Year Ended August 31, 2022 | | | 9.69 | | | | 0.15 | | | | (0.68 | ) | | | (0.53 | ) |
| Year Ended August 31, 2021 | | | 9.79 | | | | 0.14 | | | | (0.08 | ) | | | 0.06 | |
| Year Ended August 31, 2020 | | | 9.62 | | | | 0.19 | | | | 0.18 | | | | 0.37 | |
| Year Ended August 31, 2019 | | | 9.40 | | | | 0.23 | | | | 0.23 | | | | 0.46 | |
| Year Ended August 31, 2018 | | | 9.60 | | | | 0.19 | | | | (0.16 | ) | | | 0.03 | |
| A Shares | | | | | | | | | | | | | | | | |
| Year Ended August 31, 2022 | | | 9.70 | | | | 0.12 | | | | (0.66 | ) | | | (0.54 | ) |
| Year Ended August 31, 2021 | | | 9.80 | | | | 0.12 | | | | (0.08 | ) | | | 0.04 | |
| Year Ended August 31, 2020 | | | 9.62 | | | | 0.17 | | | | 0.18 | | | | 0.35 | |
| Year Ended August 31, 2019 | | | 9.41 | | | | 0.21 | | | | 0.21 | | | | 0.42 | |
| Year Ended August 31, 2018 | | | 9.61 | | | | 0.16 | | | | (0.15 | ) | | | 0.01 | |
| (a) | Annualized for periods less than one year, except for Portfolio Turnover. |
| (b) | Not annualized for periods less than one year. |
| (c) | During the period, certain fees were waived. If such fee waivers had not occurred, the ratios would have been as indicated. |
| (d) | Portfolio turnover is calculated on the basis of the Fund, as a whole, without distinguishing between the classes of shares issued. |
Amounts designated as “—” are 0 or have been rounded to 0.
| Less Dividends From: | | | | | | | | | | | | Ratios/Supplemental Data:(a) | |
Dividends
from Net
Investment
Income | | | Distributions
from Net
Realized
Gains from
Investments | | | Total
Dividends and
Distributions | | | Net Asset
Value,
End of
Period | | | Total Return
(Excludes
Sales
Charge)(b) | | | Net Assets
End of
Period
(000s) | | | Ratio of Net
Expenses to
Average Net
Assets | | | Ratio of Net
Investment
Income
(Loss) to
Average
Net Assets | | | Ratio of Gross
Expenses to
Average
Net Assets(c) | | | Portfolio
Turnover(d) | |
| | | | | | | | | | | | | | | | | | | | | | | | | | | | | |
| $ | (0.15 | ) | | $ | — | | | $ | (0.15 | ) | | $ | 9.00 | | | | (5.72 | )% | | $ | 2,336 | | | | 0.82 | % | | | 1.38 | % | | | 1.08 | % | | | 49 | % |
| | (0.14 | ) | | | — | | | | (0.14 | ) | | | 9.70 | | | | 0.52 | % | | | 3,290 | | | | 0.76 | % | | | 1.24 | % | | | 1.01 | % | | | 74 | % |
| | (0.17 | ) | | | — | | | | (0.17 | ) | | | 9.79 | | | | 3.62 | % | | | 3,941 | | | | 0.69 | % | | | 1.76 | % | | | 0.94 | % | | | 89 | % |
| | (0.21 | ) | | | — | | | | (0.21 | ) | | | 9.62 | | | | 4.56 | % | | | 4,126 | | | | 0.74 | % | | | 2.19 | % | | | 0.98 | % | | | 34 | % |
| | (0.21 | ) | | | — | | | | (0.21 | ) | | | 9.41 | | | | 0.07 | % | | | 8,642 | | | | 0.80 | % | | | 1.63 | % | | | 0.99 | % | | | 70 | % |
| | | | | | | | | | | | | | | | | | | | | | | | | | | | | | | | | | | | | | | |
| | (0.17 | ) | | | — | | | | (0.17 | ) | | | 8.99 | | | | (5.51 | )% | | | 39,818 | | | | 0.59 | % | | | 1.58 | % | | | 0.83 | % | | | 49 | % |
| | (0.16 | ) | | | — | | | | (0.16 | ) | | | 9.69 | | | | 0.65 | % | | | 77,455 | | | | 0.52 | % | | | 1.47 | % | | | 0.76 | % | | | 74 | % |
| | (0.20 | ) | | | — | | | | (0.20 | ) | | | 9.79 | | | | 3.87 | % | | | 92,362 | | | | 0.44 | % | | | 1.98 | % | | | 0.69 | % | | | 89 | % |
| | (0.24 | ) | | | — | | | | (0.24 | ) | | | 9.62 | | | | 4.94 | % | | | 114,269 | | | | 0.48 | % | | | 2.45 | % | | | 0.73 | % | | | 34 | % |
| | (0.23 | ) | | | — | | | | (0.23 | ) | | | 9.40 | | | | 0.37 | % | | | 87,618 | | | | 0.49 | % | | | 1.99 | % | | | 0.74 | % | | | 70 | % |
| | | | | | | | | | | | | | | | | | | | | | | | | | | | | | | | | | | | | | | |
| | (0.15 | ) | | | — | | | | (0.15 | ) | | | 9.01 | | | | (5.63 | )% | | | 2,643 | | | | 0.84 | % | | | 1.37 | % | | | 0.93 | % | | | 49 | % |
| | (0.14 | ) | | | — | | | | (0.14 | ) | | | 9.70 | | | | 0.42 | % | | | 2,804 | | | | 0.76 | % | | | 1.22 | % | | | 0.86 | % | | | 74 | % |
| | (0.17 | ) | | | — | | | | (0.17 | ) | | | 9.80 | | | | 3.73 | % | | | 952 | | | | 0.68 | % | | | 1.72 | % | | | 0.79 | % | | | 89 | % |
| | (0.21 | ) | | | — | | | | (0.21 | ) | | | 9.62 | | | | 4.57 | % | | | 585 | | | | 0.72 | % | | | 2.20 | % | | | 0.83 | % | | | 34 | % |
| | (0.21 | ) | | | — | | | | (0.21 | ) | | | 9.41 | | | | 0.13 | % | | | 588 | | | | 0.74 | % | | | 1.65 | % | | | 0.84 | % | | | 70 | % |
Financial Highlights
For a share of capital stock outstanding throughout the periods indicated.
|
| | | | | Change in Net Assets |
| | | | | | Resulting From Operations: |
| | | Net Asset
Value,
Beginning of
Period | | | Net
Investment
Income
(Loss) | | | Net
Realized and
Unrealized
Gains
(Losses)
on Investment | | | Total from
Investment
Activities | |
| Moderate Duration Fund | | | | | | | | | | | | |
| Investor Shares | | | | | | | | | | | | |
| Year Ended August 31, 2022 | | $ | 10.77 | | | $ | 0.15 | | | $ | (1.07 | ) | | $ | (0.92 | ) |
| Year Ended August 31, 2021 | | | 10.81 | | | | 0.16 | | | | (0.03 | ) | | | 0.13 | |
| Year Ended August 31, 2020 | | | 10.64 | | | | 0.19 | | | | 0.17 | | | | 0.36 | |
| Year Ended August 31, 2019 | | | 10.31 | | | | 0.24 | | | | 0.32 | | | | 0.56 | |
| Year Ended August 31, 2018 | | | 10.48 | | | | 0.16 | | | | (0.17 | ) | | | (0.01 | ) |
| Institutional Shares | | | | | | | | | | | | | | | | |
| Year Ended August 31, 2022 | | | 10.77 | | | | 0.18 | | | | (1.07 | ) | | | (0.89 | ) |
| Year Ended August 31, 2021 | | | 10.82 | | | | 0.19 | | | | (0.04 | ) | | | 0.15 | |
| Year Ended August 31, 2020 | | | 10.65 | | | | 0.22 | | | | 0.16 | | | | 0.38 | |
| Year Ended August 31, 2019 | | | 10.31 | | | | 0.26 | | | | 0.34 | | | | 0.60 | |
| Year Ended August 31, 2018 | | | 10.48 | | | | 0.19 | | | | (0.17 | ) | | | 0.02 | |
| A Shares | | | | | | | | | | | | | | | | |
| Year Ended August 31, 2022 | | | 10.77 | | | | 0.15 | | | | (1.06 | ) | | | (0.91 | ) |
| Year Ended August 31, 2021 | | | 10.82 | | | | 0.16 | | | | (0.04 | ) | | | 0.12 | |
| Year Ended August 31, 2020 | | | 10.65 | | | | 0.19 | | | | 0.17 | | | | 0.36 | |
| Year Ended August 31, 2019 | | | 10.31 | | | | 0.24 | | | | 0.33 | | | | 0.57 | |
| Year Ended August 31, 2018 | | | 10.48 | | | | 0.16 | | | | (0.16 | ) | | | — | |
| (a) | Annualized for periods less than one year, except for Portfolio Turnover. |
| (b) | Not annualized for periods less than one year. |
| (c) | During the period, certain fees were waived. If such fee waivers had not occurred, the ratios would have been as indicated. |
| (d) | Portfolio turnover is calculated on the basis of the Fund, as a whole, without distinguishing between the classes of shares issued. |
| (e) | The net expense ratio shown for the period reflects the expense limitation agreement which became effective on December 26, 2018. |
Amounts designated as “—” are 0 or have been rounded to 0.
| Less Dividends From: | | | | | | | | | | | | | | | Ratios/Supplemental Data:(a) |
Dividends from Net Investment Income | | | Distributions from Net Realized Gains from Investments | | | Total
Dividends and Distributions | | | Net Asset Value,
End of Period | | | Total Return (Excludes Sales
Charge)(b) | | | Net Assets End of
Period (000s) | | | Ratio of Net Expenses to Average Net
Assets | | | Ratio of Net Investment Income (Loss) to Average Net Assets | | | Ratio of Gross Expenses to
Average
Net Assets(c) | | | Portfolio
Turnover(d) | |
| | | | | | | | | | | | | | | | | | | | | | | | | | | | | | | | | | | | | | | |
| $ | (0.16 | ) | | $ | — | | | $ | (0.16 | ) | | $ | 9.69 | | | | (8.63 | )% | | $ | 2,888 | | | | 0.74 | % | | | 1.46 | % | | | 1.53 | % | | | 29 | % |
| | (0.17 | ) | | | — | | | | (0.17 | ) | | | 10.77 | | | | 1.21 | % | | | 3,828 | | | | 0.74 | % | | | 1.49 | % | | | 1.29 | % | | | 64 | % |
| | (0.19 | ) | | | — | | | | (0.19 | ) | | | 10.81 | | | | 3.40 | % | | | 3,835 | | | | 0.74 | % | | | 1.79 | % | | | 1.29 | % | | | 83 | % |
| | (0.23 | ) | | | — | | | | (0.23 | ) | | | 10.64 | | | | 5.54 | % | | | 4,271 | | | | 0.83 | %(e) | | | 2.26 | % | | | 1.26 | % | | | 25 | % |
| | (0.16 | ) | | | — | | | | (0.16 | ) | | | 10.31 | | | | (0.07 | )% | | | 5,102 | | | | 1.14 | % | | | 1.49 | % | | | 1.35 | % | | | 28 | % |
| | | | | | | | | | | | | | | | | | | | | | | | | | | | | | | | | | | | | | | |
| | (0.18 | ) | | | — | | | | (0.18 | ) | | | 9.70 | | | | (8.31 | )% | | | 16,715 | | | | 0.49 | % | | | 1.71 | % | | | 1.29 | % | | | 29 | % |
| | (0.20 | ) | | | — | | | | (0.20 | ) | | | 10.77 | | | | 1.37 | % | | | 21,351 | | | | 0.49 | % | | | 1.73 | % | | | 1.04 | % | | | 64 | % |
| | (0.21 | ) | | | — | | | | (0.21 | ) | | | 10.82 | | | | 3.66 | % | | | 26,765 | | | | 0.49 | % | | | 2.02 | % | | | 1.04 | % | | | 83 | % |
| | (0.26 | ) | | | — | | | | (0.26 | ) | | | 10.65 | | | | 5.90 | % | | | 23,463 | | | | 0.58 | %(e) | | | 2.51 | % | | | 1.01 | % | | | 25 | % |
| | (0.19 | ) | | | — | | | | (0.19 | ) | | | 10.31 | | | | 0.22 | % | | | 24,883 | | | | 0.85 | % | | | 1.78 | % | | | 1.10 | % | | | 28 | % |
| | | | | | | | | | | | | | | | | | | | | | | | | | | | | | | | | | | | | | | |
| | (0.16 | ) | | | — | | | | (0.16 | ) | | | 9.70 | | | | (8.54 | )% | | | 183 | | | | 0.74 | % | | | 1.44 | % | | | 1.38 | % | | | 29 | % |
| | (0.17 | ) | | | — | | | | (0.17 | ) | | | 10.77 | | | | 1.11 | % | | | 382 | | | | 0.74 | % | | | 1.49 | % | | | 1.15 | % | | | 64 | % |
| | (0.19 | ) | | | — | | | | (0.19 | ) | | | 10.82 | | | | 3.40 | % | | | 314 | | | | 0.74 | % | | | 1.79 | % | | | 1.14 | % | | | 83 | % |
| | (0.23 | ) | | | — | | | | (0.23 | ) | | | 10.65 | | | | 5.63 | % | | | 381 | | | | 0.85 | %(e) | | | 2.24 | % | | | 1.11 | % | | | 25 | % |
| | (0.17 | ) | | | — | | | | (0.17 | ) | | | 10.31 | | | | (0.03 | )% | | | 634 | | | | 1.10 | % | | | 1.53 | % | | | 1.20 | % | | | 28 | % |
Financial Highlights
For a share of capital stock outstanding throughout the periods indicated.
| | | | | | Change in Net Assets Resulting From Operations: | |
| | | Net Asset Value, Beginning of Period | | | Net Investment Income (Loss) | | | Net Realized and Unrealized Gains (Losses) on Investments | | | Total from Investment Activities | |
| Bond Fund | | | | | | | | | | | | |
| Investor Shares | | | | | | | | | | | | |
| Year Ended August 31, 2022 | | $ | 9.98 | | | $ | 0.18 | | | $ | (1.33 | ) | | $ | (1.15 | ) |
| Year Ended August 31, 2021 | | | 10.12 | | | | 0.17 | | | | (0.13 | ) | | | 0.04 | |
| Year Ended August 31, 2020 | | | 9.82 | | | | 0.19 | | | | 0.30 | | | | 0.49 | |
| Year Ended August 31, 2019 | | | 9.22 | | | | 0.21 | | | | 0.60 | | | | 0.81 | |
| Year Ended August 31, 2018 | | | 9.55 | | | | 0.18 | | | | (0.31 | ) | | | (0.13 | ) |
| Institutional Shares | | | | | | | | | | | | | | | | |
| Year Ended August 31, 2022 | | | 9.95 | | | | 0.20 | | | | (1.32 | ) | | | (1.12 | ) |
| Year Ended August 31, 2021 | | | 10.10 | | | | 0.19 | | | | (0.14 | ) | | | 0.05 | |
| Year Ended August 31, 2020 | | | 9.80 | | | | 0.21 | | | | 0.31 | | | | 0.52 | |
| Year Ended August 31, 2019 | | | 9.20 | | | | 0.23 | | | | 0.61 | | | | 0.84 | |
| Year Ended August 31, 2018 | | | 9.52 | | | | 0.20 | | | | (0.29 | ) | | | (0.09 | ) |
| A Shares | | | | | | | | | | | | | | | | |
| Year Ended August 31, 2022 | | | 9.98 | | | | 0.18 | | | | (1.33 | ) | | | (1.15 | ) |
| Year Ended August 31, 2021 | | | 10.12 | | | | 0.17 | | | | (0.13 | ) | | | 0.04 | |
| Year Ended August 31, 2020 | | | 9.82 | | | | 0.19 | | | | 0.30 | | | | 0.49 | |
| Year Ended August 31, 2019 | | | 9.21 | | | | 0.21 | | | | 0.62 | | | | 0.83 | |
| Year Ended August 31, 2018 | | | 9.54 | | | | 0.18 | | | | (0.31 | ) | | | (0.13 | ) |
| (a) | Annualized for periods less than one year, except for Portfolio Turnover. |
| (b) | Not annualized for periods less than one year. |
| (c) | During the period, certain fees were waived. If such fee waivers had not occurred, the ratios would have been as indicated. |
| (d) | Portfolio turnover is calculated on the basis of the Fund, as a whole, without distinguishing between the classes of shares issued. |
Amounts designated as “—” are 0 or have been rounded to 0.
| Less Dividends From: | | | | | | | | | | | | Ratios/Supplemental Data:(a) | |
Dividends from Net Investment Income | | | Distributions from Net Realized Gains from Investments | | | Total Dividends and Distributions | | | Net Asset Value,
End of
Period | | | Total Return
(Excludes
Sales
Charge)(b) | | | Net Assets End of
Period (000s) | | | Ratio of Net Expenses to
Average Net
Assets | | | Ratio of Net Investment Income (Loss) to Average Net Assets | | | Ratio of Gross
Expenses to
Average
Net Assets(c) | | | Portfolio
Turnover(d) | |
| | |
| $ | (0.19 | ) | | $ | — | | | $ | (0.19 | ) | | $ | 8.64 | | | | (11.63 | )% | | $ | 1,129 | | | | 0.74 | % | | | 1.93 | % | | | 0.99 | % | | | 38 | % |
| | (0.18 | ) | | | — | | | | (0.18 | ) | | | 9.98 | | | | 0.36 | % | | | 1,435 | | | | 0.72 | % | | | 1.70 | % | | | 0.97 | % | | | 47 | % |
| | (0.19 | ) | | | — | | | | (0.19 | ) | | | 10.12 | | | | 5.07 | % | | | 2,383 | | | | 0.73 | % | | | 1.86 | % | | | 0.98 | % | | | 65 | % |
| | (0.21 | ) | | | — | | | | (0.21 | ) | | | 9.82 | | | | 8.96 | % | | | 1,862 | | | | 0.77 | % | | | 2.24 | % | | | 0.99 | % | | | 33 | % |
| | | | | | | | | | | | | | | | | | | | | | | | | | | | | | | | | | | | | | | |
| | (0.20 | ) | | | — | | | | (0.20 | ) | | | 9.22 | | | | (1.33 | )% | | | 5,641 | | | | 0.76 | % | | | 1.91 | % | | | 0.99 | % | | | 29 | % |
| | (0.21 | ) | | | — | | | | (0.21 | ) | | | 8.62 | | | | (11.35 | )% | | | 129,062 | | | | 0.49 | % | | | 2.19 | % | | | 0.74 | % | | | 38 | % |
| | (0.20 | ) | | | — | | | | (0.20 | ) | | | 9.95 | | | | 0.51 | % | | | 108,453 | | | | 0.47 | % | | | 1.95 | % | | | 0.72 | % | | | 47 | % |
| | (0.22 | ) | | | — | | | | (0.22 | ) | | | 10.10 | | | | 5.34 | % | | | 94,112 | | | | 0.48 | % | | | 2.14 | % | | | 0.73 | % | | | 65 | % |
| | (0.24 | ) | | | — | | | | (0.24 | ) | | | 9.80 | | | | 9.28 | % | | | 101,925 | | | | 0.49 | % | | | 2.51 | % | | | 0.74 | % | | | 33 | % |
| | (0.23 | ) | | | — | | | | (0.23 | ) | | | 9.20 | | | | (0.97 | )% | | | 96,022 | | | | 0.49 | % | | | 2.17 | % | | | 0.74 | % | | | 29 | % |
| | | | | | | | | | | | | | | | | | | | | | | | | | | | | | | | | | | | | | | |
| | (0.19 | ) | | | — | | | | (0.19 | ) | | | 8.64 | | | | (11.63 | )% | | | 57 | | | | 0.74 | % | | | 1.93 | % | | | 0.84 | % | | | 38 | % |
| | (0.18 | ) | | | — | | | | (0.18 | ) | | | 9.98 | | | | 0.36 | % | | | 67 | | | | 0.72 | % | | | 1.70 | % | | | 0.82 | % | | | 47 | % |
| | (0.19 | ) | | | — | | | | (0.19 | ) | | | 10.12 | | | | 5.07 | % | | | 60 | | | | 0.73 | % | | | 1.91 | % | | | 0.83 | % | | | 65 | % |
| | (0.22 | ) | | | — | | | | (0.22 | ) | | | 9.82 | | | | 9.11 | % | | | 136 | | | | 0.74 | % | | | 2.27 | % | | | 0.84 | % | | | 33 | % |
| | (0.20 | ) | | | — | | | | (0.20 | ) | | | 9.21 | | | | (1.32 | )% | | | 126 | | | | 0.74 | % | | | 1.92 | % | | | 0.84 | % | | | 29 | % |
Financial Highlights
For a share of capital stock outstanding throughout the periods indicated.
| | | | | | Change in Net Assets
Resulting From Operations: | |
| | | Net Asset
Value,
Beginning of
Period | | | Net
Investment
Income
(Loss)(b) | | | Net
Realized and
Unrealized
Gains
(Losses)
on Investments | | | Total from
Investment
Activities | |
| Strategic Enhanced Yield Fund | | | | | | | | | | | | | | | | |
| Investor Shares | | | | | | | | | | | | | | | | |
| Year Ended August 31, 2022 | | $ | 10.49 | | | $ | 0.25 | | | $ | (1.28 | ) | | $ | (1.03 | ) |
| Year Ended August 31, 2021 | | | 10.82 | | | | 0.18 | | | | (0.16 | ) | | | 0.02 | |
| Year Ended August 31, 2020 | | | 10.70 | | | | 0.19 | | | | 0.28 | | | | 0.47 | |
| Year Ended August 31, 2019 | | | 10.10 | | | | 0.29 | | | | 0.60 | | | | 0.89 | |
| December 26, 2017(f) through August 31, 2018 | | | 10.00 | | | | 0.21 | | | | (0.01 | ) | | | 0.20 | |
| Institutional Shares | | | | | | | | | | | | | | | | |
| Year Ended August 31, 2022 | | | 10.35 | | | | 0.27 | | | | (1.27 | ) | | | (1.00 | ) |
| Year Ended August 31, 2021 | | | 10.67 | | | | 0.21 | | | | (0.15 | ) | | | 0.06 | |
| Year Ended August 31, 2020 | | | 10.56 | | | | 0.21 | | | | 0.27 | | | | 0.48 | |
| Year Ended August 31, 2019 | | | 9.97 | | | | 0.31 | | | | 0.59 | | | | 0.90 | |
| December 26, 2017(f) through August 31, 2018 | | | 10.00 | | | | 0.21 | | | | (0.02 | ) | | | 0.19 | |
| A Shares | | | | | | | | | | | | | | | | |
| Year Ended August 31, 2022 | | | 10.35 | | | | 0.24 | | | | (1.25 | ) | | | (1.01 | ) |
| Year Ended August 31, 2021 | | | 10.67 | | | | 0.18 | | | | (0.15 | ) | | | 0.03 | |
| Year Ended August 31, 2020 | | | 10.56 | | | | 0.20 | | | | 0.25 | | | | 0.45 | |
| Year Ended August 31, 2019 | | | 9.96 | | | | 0.28 | | | | 0.60 | | | | 0.88 | |
| December 26, 2017(f) through August 31, 2018 | | | 10.00 | | | | 0.19 | | | | (0.03 | ) | | | 0.16 | |
| (a) | Annualized for periods less than one year, except for Portfolio Turnover. |
| (b) | Calculated using average shares. |
| (c) | Not annualized for periods less than one year. |
| (d) | During the period, certain fees were waived. If such fee waivers had not occurred, the ratios would have been as indicated. |
| (e) | Portfolio turnover is calculated on the basis of the Fund, as a whole, without distinguishing between the classes of shares issued. |
| (f) | Commencement of operations. |
Amounts designated as “—” are 0 or have been rounded to 0.
| | Less Dividends From: | | | | | | | | | | | | | | | Ratios/Supplemental Data:(a) | |
| | Dividends
from Net
Investment
Income | | | | Distributions
from Net
Realized
Gains from
Investments | | | | Total
Dividends and
Distributions | | | | Net Asset
Value,
End of
Period | | | | Total Return
(Excludes
Sales
Charge)(c) | | | | Net Assets
End of
Period
(000s) | | | | Ratio of Net
Expenses to
Average Net
Assets | | | | Ratio of Net
Investment
Income
(Loss) to
Average
Net Assets | | | | Ratio of Gross
Expenses to
Average
Net Assets(d) | | | | Portfolio
Turnover(e) | |
| | | | | | | | | | | | | | | | | | | | | | | | | | | | | | | | | | | | | | | |
| $ | (0.27 | ) | | $ | — | | | $ | (0.27 | ) | | $ | 9.19 | | | | (9.93 | )% | | $ | 528 | | | | 1.01 | % | | | 2.51 | % | | | 2.07 | % | | | 18 | % |
| | (0.17 | ) | | | (0.18 | ) | | | (0.35 | ) | | | 10.49 | | | | 0.22 | % | | | 1,132 | | | | 1.01 | % | | | 1.67 | % | | | 1.66 | % | | | 129 | % |
| | (0.20 | ) | | | (0.15 | ) | | | (0.35 | ) | | | 10.82 | | | | 4.47 | % | | | 2,178 | | | | 1.01 | % | | | 1.82 | % | | | 2.05 | % | | | 96 | % |
| | (0.29 | ) | | | — | | | | (0.29 | ) | | | 10.70 | | | | 8.96 | % | | | 1,546 | | | | 1.01 | % | | | 2.79 | % | | | 3.16 | % | | | 59 | % |
| | (0.10 | ) | | | — | | | | (0.10 | ) | | | 10.10 | | | | 2.05 | % | | | 4 | | | | 1.01 | % | | | 3.01 | % | | | 13.65 | % | | | 20 | % |
| | | | | | | | | | | | | | | | | | | | | | | | | | | | | | | | | | | | | | | |
| | (0.29 | ) | | | — | | | | (0.29 | ) | | | 9.06 | | | | (9.78 | )% | | | 9,377 | | | | 0.76 | % | | | 2.77 | % | | | 1.82 | % | | | 18 | % |
| | (0.20 | ) | | | (0.18 | ) | | | (0.38 | ) | | | 10.35 | | | | 0.55 | % | | | 19,579 | | | | 0.76 | % | | | 2.01 | % | | | 1.42 | % | | | 129 | % |
| | (0.22 | ) | | | (0.15 | ) | | | (0.37 | ) | | | 10.67 | | | | 4.66 | % | | | 17,335 | | | | 0.76 | % | | | 2.00 | % | | | 1.77 | % | | | 96 | % |
| | (0.31 | ) | | | — | | | | (0.31 | ) | | | 10.56 | | | | 9.21 | % | | | 6,370 | | | | 0.76 | % | | | 3.02 | % | | | 3.23 | % | | | 59 | % |
| | (0.22 | ) | | | — | | | | (0.22 | ) | | | 9.97 | | | | 1.87 | % | | | 984 | | | | 0.76 | % | | | 3.11 | % | | | 13.40 | % | | | 20 | % |
| | | | | | | | | | | | | | | | | | | | | | | | | | | | | | | | | | | | | | | |
| | (0.27 | ) | | | — | | | | (0.27 | ) | | | 9.07 | | | | (9.91 | )% | | | 159 | | | | 1.01 | % | | | 2.43 | % | | | 1.83 | % | | | 18 | % |
| | (0.17 | ) | | | (0.18 | ) | | | (0.35 | ) | | | 10.35 | | | | 0.30 | % | | | 917 | | | | 1.01 | % | | | 1.75 | % | | | 1.52 | % | | | 129 | % |
| | (0.19 | ) | | | (0.15 | ) | | | (0.34 | ) | | | 10.67 | | | | 4.41 | % | | | 393 | | | | 1.01 | % | | | 1.94 | % | | | 1.97 | % | | | 96 | % |
| | (0.28 | ) | | | — | | | | (0.28 | ) | | | 10.56 | | | | 9.05 | % | | | 468 | | | | 1.01 | % | | | 2.82 | % | | | 4.02 | % | | | 59 | % |
| | (0.20 | ) | | | — | | | | (0.20 | ) | | | 9.96 | | | | 1.60 | % | | | 390 | | | | 1.01 | % | | | 2.87 | % | | | 13.50 | % | | | 20 | % |
Financial Highlights
For a share of capital stock outstanding throughout the periods indicated.
| | | | | | | Change in Net Assets
Resulting From Operations: | |
| | | | Net Asset
Value,
Beginning of
Period | | | | Net
Investment
Income
(Loss) | | | | Net
Realized and
Unrealized
Gains
(Losses)
on Investments | | | | Total from
Investment
Activities | |
| Ultra Short Tax-Free Income Fund | | | | | | | | | | | | | | | | |
Investor Shares
| | | | | | | | | | | | | | | | |
| Year Ended August 31, 2022 | | $ | 9.97 | | | $ | (0.01 | )(e) | | $ | (0.09 | ) | | $ | (0.10 | ) |
| Year Ended August 31, 2021 | | | 10.00 | | | | (0.03 | )(e) | | | — | | | | (0.03 | ) |
| Year Ended August 31, 2020 | | | 10.00 | | | | 0.06 | | | | — | | | | 0.06 | |
| Year Ended August 31, 2019 | | | 9.98 | | | | 0.11 | | | | 0.02 | | | | 0.13 | |
| December 26, 2017(g) through August 31, 2018 | | | 10.00 | | | | 0.03 | | | | (0.02 | ) | | | 0.01 | |
| Institutional Shares | | | | | | | | | | | | | | | | |
| Year Ended August 31, 2022 | | | 10.01 | | | | 0.01 | (e) | | | (0.08 | ) | | | (0.07 | ) |
| Year Ended August 31, 2021 | | | 10.01 | | | | — | (e) | | | — | | | | — | |
| Year Ended August 31, 2020 | | | 10.01 | | | | 0.09 | | | | — | | | | 0.09 | |
| Year Ended August 31, 2019 | | | 10.00 | | | | 0.14 | | | | 0.01 | | | | 0.15 | |
| December 26, 2017(g) through August 31, 2018 | | | 10.00 | | | | 0.07 | | | | — | | | | 0.07 | |
| A Shares | | | | | | | | | | | | | | | | |
| Year Ended August 31, 2022 | | | 9.98 | | | | — | (e) | | | (0.09 | ) | | | (0.09 | ) |
| Year Ended August 31, 2021 | | | 10.01 | | | | (0.03 | )(e) | | | — | | | | (0.03 | ) |
| Year Ended August 31, 2020 | | | 10.01 | | | | 0.06 | | | | — | | | | 0.06 | |
| Year Ended August 31, 2019 | | | 10.01 | | | | 0.03 | | | | 0.01 | | | | 0.04 | |
| December 26, 2017(g) through August 31, 2018 | | | 10.00 | | | | — | | | | 0.01 | | | | 0.01 | |
| (a) | Annualized for periods less than one year, except for Portfolio Turnover. |
| (b) | Not annualized for periods less than one year. |
| (c) | During the period, certain fees were waived. If such fee waivers had not occurred, the ratios would have been as indicated. |
| (d) | Portfolio turnover is calculated on the basis of the Fund, as a whole, without distinguishing between the classes of shares issued. |
| (e) | Calculated using average shares. |
| (f) | The net expense ratio shown for the period reflects the expense limitation agreement in effect as of December 26, 2018 and the higher limit in effect prior to that date. |
| (g) | Commencement of operations. |
Amounts designated as “—” are 0 or have been rounded to 0.
| Less Dividends From: | | | | | | | | | | | | Ratios/Supplemental Data:(a) |
Dividends
from Net
Investment
Income | | | Distributions
from Net
Realized
Gains from
Investments | | | Total
Dividends and
Distributions | | | Net Asset
Value,
End of
Period | | | Total Return
(Excludes
Sales
Charge)(b) | | | Net Assets
End of
Period
(000s) | | | Ratio of Net
Expenses to
Average Net
Assets | | | Ratio of Net
Investment
Income
(Loss) to
Average
Net Assets | | | Ratio of Gross
Expenses to
Average
Net Assets(c) | | | Portfolio
Turnover(d) | |
| | | | | | | | | | | | | | | | | | | | | | | | | | | | | | | | | | | | | | | |
| $ | — | | | $ | — | | | $ | — | | | $ | 9.87 | | | | (0.95 | )% | | $ | 103 | | | | 0.60 | % | | | (0.10 | )% | | | 1.28 | % | | | 96 | % |
| | — | | | | — | | | | — | | | | 9.97 | | | | (0.30 | )% | | | 105 | | | | 0.60 | % | | | (0.28 | )% | | | 1.07 | % | | | 130 | % |
| | (0.06 | ) | | | — | | | | (0.06 | ) | | | 10.00 | | | | 0.64 | % | | | 539 | | | | 0.60 | % | | | 0.53 | % | | | 1.16 | % | | | 129 | % |
| | (0.11 | ) | | | — | | | | (0.11 | ) | | | 10.00 | | | | 1.35 | % | | | 175 | | | | 0.66 | %(f) | | | 1.12 | % | | | 1.59 | % | | | 135 | % |
| | (0.03 | ) | | | — | | | | (0.03 | ) | | | 9.98 | | | | 0.14 | % | | | 71 | | | | 0.81 | % | | | 0.71 | % | | | 2.36 | % | | | 155 | % |
| | | | | | | | | | | | | | | | | | | | | | | | | | | | | | | | | | | | | | | |
| | (0.02 | ) | | | — | | | | (0.02 | ) | | | 9.92 | | | | (0.74 | )% | | | 26,566 | | | | 0.35 | % | | | 0.14 | % | | | 1.03 | % | | | 96 | % |
| | — | | | | — | | | | — | | | | 10.01 | | | | 0.01 | % | | | 32,512 | | | | 0.35 | % | | | (0.04 | )% | | | 0.82 | % | | | 130 | % |
| | (0.09 | ) | | | — | | | | (0.09 | ) | | | 10.01 | | | | 0.89 | % | | | 38,955 | | | | 0.35 | % | | | 0.81 | % | | | 0.92 | % | | | 129 | % |
| | (0.14 | ) | | | — | | | | (0.14 | ) | | | 10.01 | | | | 1.50 | % | | | 20,529 | | | | 0.41 | %(f) | | | 1.38 | % | | | 1.34 | % | | | 135 | % |
| | (0.07 | ) | | | — | | | | (0.07 | ) | | | 10.00 | | | | 0.65 | % | | | 11,595 | | | | 0.56 | % | | | 0.96 | % | | | 2.11 | % | | | 155 | % |
| | | | | | | | | | | | | | | | | | | | | | | | | | | | | | | | | | | | | | | |
| | — | | | | — | | | | — | | | | 9.89 | | | | (0.85 | )% | | | 44 | | | | 0.60 | % | | | (0.04 | )% | | | 1.16 | % | | | 96 | % |
| | — | | | | — | | | | — | | | | 9.98 | | | | (0.30 | )% | | | 17 | | | | 0.60 | % | | | (0.28 | )% | | | 0.92 | % | | | 130 | % |
| | (0.06 | ) | | | — | | | | (0.06 | ) | | | 10.01 | | | | 0.64 | % | | | 17 | | | | 0.60 | % | | | 0.65 | % | | | 1.04 | % | | | 129 | % |
| | (0.04 | ) | | | — | | | | (0.04 | ) | | | 10.01 | | | | 0.36 | % | | | 21 | | | | 0.66 | %(f) | | | 1.07 | % | | | 1.44 | % | | | 135 | % |
| | — | | | | — | | | | — | | | | 10.01 | | | | 0.10 | % | | | — | | | | 0.81 | % | | | 0.71 | % | | | 2.21 | % | | | 155 | % |
Financial Highlights
For a share of capital stock outstanding throughout the periods indicated.
| �� | | | | | | Change in Net Assets
Resulting From Operations: | |
| | | Net Asset
Value,
Beginning of
Period | | | Net
Investment
Income
(Loss) | | | Net
Realized and
Unrealized
Gains
(Losses)
on Investments | | | Total from
Investment
Activities | |
| Mid Cap Diverse Leadership Fund | | | | | | | | | | | | | | | | |
| Investor Shares | | | | | | | | | | | | | | | | |
| Year Ended August 31, 2022 | | $ | 14.46 | | | $ | 0.02 | (e) | | $ | (1.32 | ) | | $ | (1.30 | ) |
| Year Ended August 31, 2021 | | | 11.40 | | | | (0.01 | )(e) | | | 4.26 | | | | 4.25 | |
| Year Ended August 31, 2020 | | | 11.24 | | | | 0.06 | (e) | | | 0.58 | | | | 0.64 | |
| Year Ended August 31, 2019 | | | 11.90 | | | | 0.03 | (e) | | | (0.29 | ) | | | (0.26 | ) |
| Year Ended August 31, 2018 | | | 10.33 | | | | 0.05 | (e) | | | 1.57 | | | | 1.62 | |
| Institutional Shares | | | | | | | | | | | | | | | | |
| Year Ended August 31, 2022 | | | 14.50 | | | | 0.07 | (e) | | | (1.33 | ) | | | (1.26 | ) |
| Year Ended August 31, 2021 | | | 11.41 | | | | 0.01 | (e) | | | 4.29 | | | | 4.30 | |
| Year Ended August 31, 2020 | | | 11.25 | | | | 0.08 | (e) | | | 0.60 | | | | 0.68 | |
| Year Ended August 31, 2019 | | | 11.92 | | | | 0.06 | (e) | | | (0.29 | ) | | | (0.23 | ) |
| Year Ended August 31, 2018 | | | 10.36 | | | | 0.08 | (e) | | | 1.57 | | | | 1.65 | |
| A Shares | | | | | | | | | | | | | | | | |
| Year Ended August 31, 2022 | | | 14.57 | | | | 0.03 | (e) | | | (1.34 | ) | | | (1.31 | ) |
| Year Ended August 31, 2021 | | | 11.46 | | | | (0.02 | )(e) | | | 4.32 | | | | 4.30 | |
| Year Ended August 31, 2020 | | | 11.31 | | | | 0.06 | (e) | | | 0.58 | | | | 0.64 | |
| Year Ended August 31, 2019 | | | 11.97 | | | | 0.03 | (e) | | | (0.28 | ) | | | (0.25 | ) |
| Year Ended August 31, 2018 | | | 10.39 | | | | 0.05 | (e) | | | 1.58 | | | | 1.63 | |
| C Shares | | | | | | | | | | | | | | | | |
| Year Ended August 31, 2022 | | | 14.14 | | | | (0.07 | )(e) | | | (1.29 | ) | | | (1.36 | ) |
| Year Ended August 31, 2021 | | | 11.20 | | | | (0.10 | )(e) | | | 4.19 | | | | 4.09 | |
| Year Ended August 31, 2020 | | | 11.06 | | | | (0.03 | )(e) | | | 0.60 | | | | 0.57 | |
| Year Ended August 31, 2019 | | | 11.68 | | | | — | (e) | | | (0.25 | ) | | | (0.25 | ) |
| Year Ended August 31, 2018 | | | 10.28 | | | | — | (e) | | | 1.40 | | | | 1.40 | |
| (a) | Annualized for periods less than one year, except for Portfolio Turnover. |
| (b) | Not annualized for periods less than one year. |
| (c) | During the period, certain fees were waived. If such fee waivers had not occurred, the ratios would have been as indicated. |
| (d) | Portfolio turnover is calculated on the basis of the Fund, as a whole, without distinguishing between the classes of shares issued. |
| (e) | Calculated using average shares. |
Amounts designated as “—” are 0 or have been rounded to 0.
| Less Dividends From: | | | | | | | | | | | | | | | Ratios/Supplemental Data:(a) | |
Dividends
from Net
Investment
Income | | | Distributions
from Net
Realized
Gains from
Investments | | | Total
Dividends and
Distributions | | | Net Asset
Value,
End of
Period | | | Total Return
(Excludes
Sales
Charge)(b) | | | Net Assets
End of
Period
(000s) | | | Ratio of Net
Expenses to
Average Net
Assets | | | Ratio of Net
Investment
Income
(Loss) to
Average
Net Assets | | | Ratio of Gross
Expenses to
Average
Net Assets(c) | | | Portfolio
Turnover(d) | |
| | | | | | | | | | | | | | | | | | | | | | | | | | | | | |
| $ | (0.05 | ) | | $ | (0.56 | ) | | $ | (0.61 | ) | | $ | 12.55 | | | | (9.32 | )% | | $ | 190 | | | | 1.06 | % | | | 0.11 | % | | | 6.36 | % | | | 171 | % |
| | (0.08 | ) | | | (1.11 | ) | | | (1.19 | ) | | | 14.46 | | | | 39.69 | % | | | 119 | | | | 1.06 | % | | | (0.09 | )% | | | 12.28 | % | | | 79 | % |
| | (0.05 | ) | | | (0.43 | ) | | | (0.48 | ) | | | 11.40 | | | | 5.73 | % | | | 124 | | | | 1.06 | % | | | 0.51 | % | | | 13.27 | % | | | 90 | % |
| | (0.03 | ) | | | (0.37 | ) | | | (0.40 | ) | | | 11.24 | | | | (1.59 | )% | | | 114 | | | | 1.06 | % | | | 0.27 | % | | | 8.26 | % | | | 106 | % |
| | (0.05 | ) | | | — | | | | (0.05 | ) | | | 11.90 | | | | 15.67 | % | | | 624 | | | | 1.06 | % | | | 0.45 | % | | | 5.32 | % | | | 74 | % |
| | | | | | | | | | | | | | | | | | | | | | | | | | | | | | | | | | | | | | | |
| | (0.07 | ) | | | (0.56 | ) | | | (0.63 | ) | | | 12.61 | | | | (9.05 | )% | | | 1,983 | | | | 0.81 | % | | | 0.48 | % | | | 6.11 | % | | | 171 | % |
| | (0.10 | ) | | | (1.11 | ) | | | (1.21 | ) | | | 14.50 | | | | 40.08 | % | | | 1,090 | | | | 0.81 | % | | | 0.12 | % | | | 12.03 | % | | | 79 | % |
| | (0.09 | ) | | | (0.43 | ) | | | (0.52 | ) | | | 11.41 | | | | 6.05 | % | | | 680 | | | | 0.81 | % | | | 0.76 | % | | | 13.02 | % | | | 90 | % |
| | (0.07 | ) | | | (0.37 | ) | | | (0.44 | ) | | | 11.25 | | | | (1.32 | )% | | | 809 | | | | 0.81 | % | | | 0.53 | % | | | 9.22 | % | | | 106 | % |
| | (0.09 | ) | | | — | | | | (0.09 | ) | | | 11.92 | | | | 15.97 | % | | | 1,355 | | | | 0.81 | % | | | 0.73 | % | | | 7.35 | % | | | 74 | % |
| | | | | | | | | | | | | | | | | | | | | | | | | | | | | | | | | | | | | | | |
| | (0.04 | ) | | | (0.56 | ) | | | (0.60 | ) | | | 12.66 | | | | (9.33 | )% | | | 152 | | | | 1.06 | % | | | 0.20 | % | | | 6.21 | % | | | 171 | % |
| | (0.08 | ) | | | (1.11 | ) | | | (1.19 | ) | | | 14.57 | | | | 39.88 | % | | | 147 | | | | 1.06 | % | | | (0.12 | )% | | | 12.13 | % | | | 79 | % |
| | (0.06 | ) | | | (0.43 | ) | | | (0.49 | ) | | | 11.46 | | | | 5.62 | % | | | 123 | | | | 1.06 | % | | | 0.51 | % | | | 13.12 | % | | | 90 | % |
| | (0.04 | ) | | | (0.37 | ) | | | (0.41 | ) | | | 11.31 | | | | (1.50 | )% | | | 382 | | | | 1.06 | % | | | 0.28 | % | | | 10.07 | % | | | 106 | % |
| | (0.05 | ) | | | — | | | | (0.05 | ) | | | 11.97 | | | | 15.68 | % | | | 364 | | | | 1.06 | % | | | 0.46 | % | | | 6.24 | % | | | 74 | % |
| | | | | | | | | | | | | | | | | | | | | | | | | | | | | | | | | | | | | | | |
| | — | | | | (0.56 | ) | | | (0.56 | ) | | | 12.22 | | | | (9.97 | )% | | | 25 | | | | 1.81 | % | | | (0.55 | )% | | | 7.11 | % | | | 171 | % |
| | (0.04 | ) | | | (1.11 | ) | | | (1.15 | ) | | | 14.14 | | | | 38.80 | % | | | 28 | | | | 1.81 | % | | | (0.79 | )% | | | 13.03 | % | | | 79 | % |
| | — | | | | (0.43 | ) | | | (0.43 | ) | | | 11.20 | | | | 5.12 | % | | | 25 | | | | 1.81 | % | | | (0.24 | )% | | | 14.02 | % | | | 90 | % |
| | — | | | | (0.37 | ) | | | (0.37 | ) | | | 11.06 | | | | (1.51 | )% | | | — | | | | 1.81 | % | | | — | % | | | 2.06 | % | | | 106 | % |
| | — | | | | — | | | | — | | | | 11.68 | | | | 13.62 | % | | | — | | | | 1.81 | % | | | — | % | | | 27.23 | % | | | 74 | % |
Financial Highlights
For a share of capital stock outstanding throughout the periods indicated.
| | | | | | Change in Net Assets Resulting From Operations: | |
| | | Net Asset Value, Beginning of Period | | | Net
Investment
Income
(Loss) | | | Net
Realized and
Unrealized
Gains
(Losses)
on Investments | | | Total from
Investment
Activities | |
| Opportunistic Fund | | | | | | | | | | | | |
| Investor Shares | | | | | | | | | | | | |
| Year Ended August 31, 2022 | | $ | 16.88 | | | $ | 0.07 | (e) | | $ | (3.16 | ) | | $ | (3.09 | ) |
| Year Ended August 31, 2021 | | | 13.78 | | | | 0.10 | (e) | | | 3.06 | | | | 3.16 | |
| Year Ended August 31, 2020 | | | 12.83 | | | | 0.11 | | | | 0.96 | | | | 1.07 | |
| Year Ended August 31, 2019 | | | 15.43 | | | | 0.13 | | | | (1.65 | ) | | | (1.52 | ) |
| Year Ended August 31, 2018 | | | 14.90 | | | | 0.04 | (e) | | | 1.28 | | | | 1.32 | |
| Institutional Shares | | | | | | | | | | | | | | | | |
| Year Ended August 31, 2022 | | | 17.10 | | | | 0.10 | (e) | | | (3.19 | ) | | | (3.09 | ) |
| Year Ended August 31, 2021 | | | 13.95 | | | | 0.14 | (e) | | | 3.10 | | | | 3.24 | |
| Year Ended August 31, 2020 | | | 12.98 | | | | 0.13 | | | | 0.99 | | | | 1.12 | |
| Year Ended August 31, 2019 | | | 15.61 | | | | 0.17 | | | | (1.68 | ) | | | (1.51 | ) |
| Year Ended August 31, 2018 | | | 15.05 | | | | 0.08 | (e) | | | 1.30 | | | | 1.38 | |
| A Shares | | | | | | | | | | | | | | | | |
| Year Ended August 31, 2022 | | | 16.95 | | | | 0.07 | (e) | | | (3.18 | ) | | | (3.11 | ) |
| Year Ended August 31, 2021 | | | 13.83 | | | | 0.09 | (e) | | | 3.10 | | | | 3.19 | |
| Year Ended August 31, 2020 | | | 12.88 | | | | 0.10 | | | | 0.96 | | | | 1.06 | |
| Year Ended August 31, 2019 | | | 15.48 | | | | 0.13 | | | | (1.65 | ) | | | (1.52 | ) |
| Year Ended August 31, 2018 | | | 14.95 | | | | 0.04 | (e) | | | 1.28 | | | | 1.32 | |
| C Shares | | | | | | | | | | | | | | | | |
| Year Ended August 31, 2022 | | | 16.37 | | | | (0.05 | )(e) | | | (3.06 | ) | | | (3.11 | ) |
| Year Ended August 31, 2021 | | | 13.42 | | | | (0.03 | )(e) | | | 3.00 | | | | 2.97 | |
| Year Ended August 31, 2020 | | | 12.51 | | | | 0.02 | | | | 0.92 | | | | 0.94 | |
| Year Ended August 31, 2019 | | | 15.07 | | | | 0.02 | | | | (1.60 | ) | | | (1.58 | ) |
| Year Ended August 31, 2018 | | | 14.65 | | | | (0.08 | )(e) | | | 1.25 | | | | 1.17 | |
| (a) | Annualized for periods less than one year, except for Portfolio Turnover. |
| (b) | Not annualized for periods less than one year. |
| (c) | During the period, certain fees were waived. If such fee waivers had not occurred, the ratios would have been as indicated. |
| (d) | Portfolio turnover is calculated on the basis of the Fund, as a whole, without distinguishing between the classes of shares issued. |
| (e) | Calculated using average shares. |
| (f) | The net expense ratio shown for the period reflects the expense limitation agreement which became effective on December 26, 2018. |
Amounts designated as “—” are 0 or have been rounded to 0.
| Less Dividends From: | | | | | | | | | | | | Ratios/Supplemental Data:(a) | |
Dividends from Net Investment Income | | | Distributions from Net Realized Gains from Investments | | | Total Dividends and Distributions | | | Net Asset Value,
End of Period | | | Total Return (Excludes Sales Charge)(b) | | | Net Assets End of
Period (000s) | | | Ratio of Net Expenses to Average Net Assets | | | Ratio of Net Investment Income (Loss) to Average Net Assets | | | Ratio of Gross Expenses to Average Net Assets(c) | | | Portfolio Turnover(d) | |
| | | | | | | | | | | | | | | | | | | | | | | | | | | | | |
| $ | (0.11 | ) | | $ | (0.38 | ) | | $ | (0.49 | ) | | $ | 13.30 | | | | (18.75 | )% | | $ | 951 | | | | 1.25 | % | | | 0.44 | % | | | 1.77 | % | | | 260 | % |
| | (0.06 | ) | | | — | | | | (0.06 | ) | | | 16.88 | | | | 22.97 | % | | | 4,616 | | | | 1.25 | % | | | 0.59 | % | | | 1.77 | % | | | 265 | % |
| | (0.12 | ) | | | — | | | | (0.12 | ) | | | 13.78 | | | | 8.46 | % | | | 1,319 | | | | 1.25 | % | | | 0.83 | % | | | 2.01 | % | | | 240 | % |
| | (0.15 | ) | | | (0.93 | ) | | | (1.08 | ) | | | 12.83 | | | | (9.28 | )% | | | 3,118 | | | | 1.37 | %(f) | | | 0.97 | % | | | 1.89 | % | | | 183 | % |
| | (0.04 | ) | | | (0.75 | ) | | | (0.79 | ) | | | 15.43 | | | | 9.08 | % | | | 2,097 | | | | 1.64 | % | | | 0.25 | % | | | 1.85 | % | | | 157 | % |
| | | | | | | | | | | | | | | | | | | | | | | | | | | | | | | | | | | | | | | |
| | (0.15 | ) | | | (0.38 | ) | | | (0.53 | ) | | | 13.48 | | | | (18.53 | )% | | | 43,336 | | | | 1.00 | % | | | 0.68 | % | | | 1.52 | % | | | 260 | % |
| | (0.09 | ) | | | — | | | | (0.09 | ) | | | 17.10 | | | | 23.27 | % | | | 71,356 | | | | 1.00 | % | | | 0.85 | % | | | 1.54 | % | | | 265 | % |
| | (0.15 | ) | | | — | | | | (0.15 | ) | | | 13.95 | | | | 8.74 | % | | | 30,697 | | | | 1.00 | % | | | 1.03 | % | | | 1.77 | % | | | 240 | % |
| | (0.19 | ) | | | (0.93 | ) | | | (1.12 | ) | | | 12.98 | | | | (9.10 | )% | | | 34,492 | | | | 1.13 | %(f) | | | 1.22 | % | | | 1.64 | % | | | 183 | % |
| | (0.07 | ) | | | (0.75 | ) | | | (0.82 | ) | | | 15.61 | | | | 9.45 | % | | | 45,659 | | | | 1.35 | % | | | 0.55 | % | | | 1.60 | % | | | 157 | % |
| | | | | | | | | | | | | | | | | | | | | | | | | | | | | | | | | | | | | | | |
| | (0.11 | ) | | | (0.38 | ) | | | (0.49 | ) | | | 13.35 | | | | (18.79 | )% | | | 1,093 | | | | 1.25 | % | | | 0.44 | % | | | 1.62 | % | | | 260 | % |
| | (0.07 | ) | | | — | | | | (0.07 | ) | | | 16.95 | | | | 23.05 | % | | | 1,482 | | | | 1.25 | % | | | 0.55 | % | | | 1.66 | % | | | 265 | % |
| | (0.11 | ) | | | — | | | | (0.11 | ) | | | 13.83 | | | | 8.37 | % | | | 1,380 | | | | 1.25 | % | | | 0.79 | % | | | 1.87 | % | | | 240 | % |
| | (0.15 | ) | | | (0.93 | ) | | | (1.08 | ) | | | 12.88 | | | | (9.24 | )% | | | 1,898 | | | | 1.37 | %(f) | | | 0.98 | % | | | 1.74 | % | | | 183 | % |
| | (0.04 | ) | | | (0.75 | ) | | | (0.79 | ) | | | 15.48 | | | | 9.09 | % | | | 2,032 | | | | 1.63 | % | | | 0.26 | % | | | 1.70 | % | | | 157 | % |
| | | | | | | | | | | | | | | | | | | | | | | | | | | | | | | | | | | | | | | |
| | (0.02 | ) | | | (0.38 | ) | | | (0.40 | ) | | | 12.86 | | | | (19.41 | )% | | | 285 | | | | 2.00 | % | | | (0.31 | )% | | | 2.52 | % | | | 260 | % |
| | (0.02 | ) | | | — | | | | (0.02 | ) | | | 16.37 | | | | 22.11 | % | | | 357 | | | | 2.00 | % | | | (0.20 | )% | | | 2.56 | % | | | 265 | % |
| | (0.03 | ) | | | — | | | | (0.03 | ) | | | 13.42 | | | | 7.58 | % | | | 307 | | | | 2.00 | % | | | 0.03 | % | | | 2.77 | % | | | 240 | % |
| | (0.05 | ) | | | (0.93 | ) | | | (0.98 | ) | | | 12.51 | | | | (9.95 | )% | | | 343 | | | | 2.15 | %(f) | | | 0.19 | % | | | 2.64 | % | | | 183 | % |
| | — | | | | (0.75 | ) | | | (0.75 | ) | | | 15.07 | | | | 8.22 | % | | | 598 | | | | 2.41 | % | | | (0.52 | )% | | | 2.60 | % | | | 157 | % |
Financial Highlights
For a share of capital stock outstanding throughout the periods indicated.
| | | | | | Change in Net Assets Resulting From Operations: | |
| | | Net Asset Value, Beginning of Period | | | Net Investment Income (Loss) | | | Net Realized and Unrealized Gains (Losses) on Investments | | | Total from Investment Activities | |
| World Energy Fund | | | | | | | | | | | | |
| Investor Shares | | | | | | | | | | | | |
| Year Ended August 31, 2022 | | $ | 8.89 | | | $ | 0.20 | | | $ | 3.62 | | | $ | 3.82 | |
| Year Ended August 31, 2021 | | | 6.16 | | | | 0.13 | | | | 2.71 | | | | 2.84 | |
| Year Ended August 31, 2020 | | | 6.71 | | | | 0.10 | | | | (0.51 | ) | | | (0.41 | ) |
| Year Ended August 31, 2019 | | | 9.49 | | | | 0.15 | | | | (2.82 | ) | | | (2.67 | ) |
| Year Ended August 31, 2018 | | | 8.06 | | | | 0.06 | (f) | | | 1.41 | | | | 1.47 | |
| Institutional Shares | | | | | | | | | | | | | | | | |
| Year Ended August 31, 2022 | | | 8.89 | | | | 0.23 | | | | 3.63 | | | | 3.86 | |
| Year Ended August 31, 2021 | | | 6.16 | | | | 0.14 | | | | 2.72 | | | | 2.86 | |
| Year Ended August 31, 2020 | | | 6.72 | | | | 0.13 | | | | (0.53 | ) | | | (0.40 | ) |
| Year Ended August 31, 2019 | | | 9.51 | | | | 0.17 | | | | (2.83 | ) | | | (2.66 | ) |
| Year Ended August 31, 2018 | | | 8.07 | | | | 0.09 | (f) | | | 1.42 | | | | 1.51 | |
| A Shares | | | | | | | | | | | | | | | | |
| Year Ended August 31, 2022 | | | 8.86 | | | | 0.20 | | | | 3.62 | | | | 3.82 | |
| Year Ended August 31, 2021 | | | 6.15 | | | | 0.13 | | | | 2.70 | | | | 2.83 | |
| Year Ended August 31, 2020 | | | 6.70 | | | | 0.11 | | | | (0.52 | ) | | | (0.41 | ) |
| Year Ended August 31, 2019 | | | 9.49 | | | | 0.15 | | | | (2.83 | ) | | | (2.68 | ) |
| Year Ended August 31, 2018 | | | 8.06 | | | | 0.07 | (f) | | | 1.41 | | | | 1.48 | |
| C Shares | | | | | | | | | | | | | | | | |
| Year Ended August 31, 2022 | | | 8.78 | | | | 0.13 | | | | 3.57 | | | | 3.70 | |
| Year Ended August 31, 2021 | | | 6.10 | | | | 0.08 | | | | 2.67 | | | | 2.75 | |
| Year Ended August 31, 2020 | | | 6.64 | | | | 0.05 | | | | (0.51 | ) | | | (0.46 | ) |
| Year Ended August 31, 2019 | | | 9.39 | | | | 0.09 | | | | (2.79 | ) | | | (2.70 | ) |
| Year Ended August 31, 2018 | | | 8.00 | | | | — | (f) | | | 1.40 | | | | 1.40 | |
| (a) | Annualized for periods less than one year, except for Portfolio Turnover. |
| (b) | Not annualized for periods less than one year. |
| (c) | During the period, certain fees were waived. If such fee waivers had not occurred, the ratios would have been as indicated. |
| (d) | Portfolio turnover is calculated on the basis of the Fund, as a whole, without distinguishing between the classes of shares issued. |
| (e) | The net expense ratio shown for the period reflects the expense limitation agreement which became effective on December 26, 2018. |
| (f) | Calculated using average shares. |
Amounts designated as “—” are 0 or have been rounded to 0.
| Less Dividends From: | | | | | | | | | | | | Ratios/Supplemental Data:(a) | |
Dividends from Net Investment Income | | | Distributions from Net Realized Gains from Investments | | | Total Dividends and Distributions | | | Net Asset Value,
End of Period | | | Total Return (Excludes Sales Charge)(b) | | | Net Assets End of
Period (000s) | | | Ratio of Net Expenses to Average Net Assets | | | Ratio of Net Investment Income (Loss) to Average Net Assets | | | Ratio of Gross Expenses to Average Net Assets(c) | | | Portfolio Turnover(d) | |
| | | | | | | | | | | | | | | | | | | | | | | | | | | | | |
| $ | (0.19 | ) | | $ | — | | | $ | (0.19 | ) | | $ | 12.52 | | | | 43.38 | % | | $ | 25,003 | | | | 1.15 | % | | | 1.99 | % | | | 1.57 | % | | | 192 | % |
| | (0.11 | ) | | | — | | | | (0.11 | ) | | | 8.89 | | | | 46.49 | % | | | 6,895 | | | | 1.15 | % | | | 1.69 | % | | | 1.96 | % | | | 174 | % |
| | (0.14 | ) | | | — | | | | (0.14 | ) | | | 6.16 | | | | (6.19 | )% | | | 2,984 | | | | 1.15 | % | | | 1.68 | % | | | 2.18 | % | | | 191 | % |
| | (0.11 | ) | | | — | | | | (0.11 | ) | | | 6.71 | | | | (28.27 | )% | | | 3,079 | | | | 1.25 | %(e) | | | 1.56 | % | | | 1.68 | % | | | 145 | % |
| | (0.04 | ) | | | — | | | | (0.04 | ) | | | 9.49 | | | | 18.27 | % | | | 7,964 | | | | 1.39 | % | | | 0.66 | % | | | 1.56 | % | | | 130 | % |
| | | | | | | | | | | | | | | | | | | | | | | | | | | | | | | | | | | | | | | |
| | (0.22 | ) | | | — | | | | (0.22 | ) | | | 12.53 | | | | 43.81 | % | | | 37,866 | | | | 0.90 | % | | | 2.16 | % | | | 1.34 | % | | | 192 | % |
| | (0.13 | ) | | | — | | | | (0.13 | ) | | | 8.89 | | | | 46.78 | % | | | 15,641 | | | | 0.90 | % | | | 1.88 | % | | | 1.69 | % | | | 174 | % |
| | (0.16 | ) | | | — | | | | (0.16 | ) | | | 6.16 | | | | (5.91 | )% | | | 6,254 | | | | 0.90 | % | | | 1.82 | % | | | 1.89 | % | | | 191 | % |
| | (0.13 | ) | | | — | | | | (0.13 | ) | | | 6.72 | | | | (28.12 | )% | | | 11,163 | | | | 0.97 | %(e) | | | 1.88 | % | | | 1.43 | % | | | 145 | % |
| | (0.07 | ) | | | — | | | | (0.07 | ) | | | 9.51 | | | | 18.71 | % | | | 37,696 | | | | 1.12 | % | | | 0.97 | % | | | 1.31 | % | | | 130 | % |
| | | | | | | | | | | | | | | | | | | | | | | | | | | | | | | | | | | | | | | |
| | (0.19 | ) | | | — | | | | (0.19 | ) | | | 12.49 | | | | 43.54 | % | | | 3,170 | | | | 1.15 | % | | | 1.88 | % | | | 1.47 | % | | | 192 | % |
| | (0.12 | ) | | | — | | | | (0.12 | ) | | | 8.86 | | | | 46.33 | % | | | 2,216 | | | | 1.15 | % | | | 1.54 | % | | | 1.83 | % | | | 174 | % |
| | (0.14 | ) | | | — | | | | (0.14 | ) | | | 6.15 | | | | (6.13 | )% | | | 1,867 | | | | 1.15 | % | | | 1.66 | % | | | 2.02 | % | | | 191 | % |
| | (0.11 | ) | | | — | | | | (0.11 | ) | | | 6.70 | | | | (28.35 | )% | | | 2,485 | | | | 1.21 | %(e) | | | 1.67 | % | | | 1.53 | % | | | 145 | % |
| | (0.05 | ) | | | — | | | | (0.05 | ) | | | 9.49 | | | | 18.37 | % | | | 6,302 | | | | 1.34 | % | | | 0.72 | % | | | 1.41 | % | | | 130 | % |
| | | | | | | | | | | | | | | | | | | | | | | | | | | | | | | | | | | | | | | |
| | (0.11 | ) | | | — | | | | (0.11 | ) | | | 12.37 | | | | 42.42 | % | | | 4,713 | | | | 1.90 | % | | | 1.13 | % | | | 2.35 | % | | | 192 | % |
| | (0.07 | ) | | | — | | | | (0.07 | ) | | | 8.78 | | | | 45.25 | % | | | 3,101 | | | | 1.90 | % | | | 0.94 | % | | | 2.74 | % | | | 174 | % |
| | (0.08 | ) | | | — | | | | (0.08 | ) | | | 6.10 | | | | (6.89 | )% | | | 2,458 | | | | 1.90 | % | | | 0.87 | % | | | 2.91 | % | | | 191 | % |
| | (0.05 | ) | | | — | | | | (0.05 | ) | | | 6.64 | | | | (28.82 | )% | | | 3,688 | | | | 1.95 | %(e) | | | 0.97 | % | | | 2.43 | % | | | 145 | % |
| | (0.01 | ) | | | — | | | | (0.01 | ) | | | 9.39 | | | | 17.51 | % | | | 6,115 | | | | 2.11 | % | | | (0.05 | )% | | | 2.31 | % | | | 130 | % |
Financial Highlights
For a share of capital stock outstanding throughout the periods indicated.
| | | | | | Change in Net Assets Resulting From Operations: | |
| | | Net Asset Value, Beginning of Period | | | Net Investment Income (Loss)(b) | | | Net Realized and Unrealized Gains (Losses) on Investments | | | Total from Investment Activities | |
| Hedged Income Fund | | | | | | | | | | | | |
| Investor Shares | | | | | | | | | | | | |
| Year Ended August 31, 2022 | | $ | 10.81 | | | $ | 0.19 | | | $ | (0.88 | ) | | $ | (0.69 | ) |
| December 28, 2020(f) through August 31, 2021 | | | 10.00 | | | | 0.14 | | | | 0.74 | | | | 0.88 | |
| Institutional Shares | | | | | | | | | | | | | | | | |
| Year Ended August 31, 2022 | | | 10.82 | | | | 0.23 | | | | (0.91 | ) | | | (0.68 | ) |
| December 28, 2020(f) through August 31, 2021 | | | 10.00 | | | | 0.15 | | | | 0.75 | | | | 0.90 | |
| A Shares | | | | | | | | | | | | | | | | |
| Year Ended August 31, 2022 | | | 10.80 | | | | 0.20 | | | | (0.90 | ) | | | (0.70 | ) |
| December 28, 2020(f) through August 31, 2021 | | | 10.00 | | | | 0.14 | | | | 0.74 | | | | 0.88 | |
| (a) | Annualized for periods less than one year, except for Portfolio Turnover. |
| (b) | Calculated using average shares. |
| (c) | Not annualized for periods less than one year. |
| (d) | During the period, certain fees were waived. If such fee waivers had not occurred, the ratios would have been as indicated. |
| (e) | Portfolio turnover is calculated on the basis of the Fund, as a whole, without distinguishing between the classes of shares issued. |
| (f) | Commencement of operations. |
Amounts designated as “—” are 0 or have been rounded to 0.
| Less Dividends From: | | | | | | | | | | | | Ratios/Supplemental Data:(a) | |
Dividends from Net Investment Income | | | Distributions from Net Realized Gains from Investments | | | Total Dividends and Distributions | | | Net Asset Value,
End of Period | | | Total Return (Excludes Sales Charge)(c) | | | Net Assets End of Period (000s) | | | Ratio of Net Expenses to Average Net Assets | | | Ratio of Net Investment Income (Loss) to Average Net Assets | | | Ratio of Gross Expenses to Average Net Assets(d) | | | Portfolio Turnover(e) | |
| | | | | | | | | | | | | | | | | | | | | | | | | | | | | |
| $ | (0.19 | ) | | $ | — | | | $ | (0.19 | ) | | $ | 9.93 | | | | (6.47 | )% | | $ | 309 | | | | 1.35 | % | | | 1.86 | % | | | 1.98 | % | | | 18 | % |
| | (0.07 | ) | | | — | | | | (0.07 | ) | | | 10.81 | | | | 8.79 | % | | | 1,438 | | | | 1.35 | % | | | 1.90 | % | | | 2.26 | % | | | 23 | % |
| | | | | | | | | | | | | | | | | | | | | | | | | | | | | | | | | | | | | | | |
| | (0.21 | ) | | | — | | | | (0.21 | ) | | | 9.93 | | | | (6.31 | )% | | | 33,178 | | | | 1.10 | % | | | 2.21 | % | | | 1.69 | % | | | 18 | % |
| | (0.08 | ) | | | — | | | | (0.08 | ) | | | 10.82 | | | | 9.04 | % | | | 23,042 | | | | 1.10 | % | | | 2.14 | % | | | 2.01 | % | | | 23 | % |
| | | | | | | | | | | | | | | | | | | | | | | | | | | | | | | | | | | | | | | |
| | (0.19 | ) | | | — | | | | (0.19 | ) | | | 9.91 | | | | (6.51 | )% | | | 1,785 | | | | 1.35 | % | | | 1.94 | % | | | 1.75 | % | | | 18 | % |
| | (0.08 | ) | | | — | | | | (0.08 | ) | | | 10.80 | | | | 8.77 | % | | | 1,709 | | | | 1.35 | % | | | 1.88 | % | | | 2.11 | % | | | 23 | % |

| | KPMG LLP |
| | Suite 500 |
| | 191 West Nationwide Blvd. |
| | Columbus, OH 43215-2568 |
Report of Independent Registered Public Accounting Firm
To the Shareholders and Board of Trustees
Cavanal Hill Funds:
Opinion on the Financial Statements
We have audited the accompanying statements of assets and liabilities of the Funds listed in the Appendix (collectively, the Funds), including the schedules of portfolio investments, as of August 31, 2022, the related statements of operations, the statements of changes in net assets, and the related notes (collectively, the financial statements) and the financial highlights for the years or periods listed in the Appendix. In our opinion, the financial statements and financial highlights present fairly, in all material respects, the financial position of the Funds as of August 31, 2022, the results of their operations, the changes in their net assets, and the financial highlights for each of the years or periods listed in the Appendix, in conformity with U.S. generally accepted accounting principles.
Basis for Opinion
These financial statements and financial highlights are the responsibility of the Funds' management. Our responsibility is to express an opinion on these financial statements and financial highlights based on our audits. We are a public accounting firm registered with the Public Company Accounting Oversight Board (United States) (PCAOB) and are required to be independent with respect to the Funds in accordance with the U.S. federal securities laws and the applicable rules and regulations of the Securities and Exchange Commission and the PCAOB.
We conducted our audits in accordance with the standards of the PCAOB. Those standards require that we plan and perform the audit to obtain reasonable assurance about whether the financial statements and financial highlights are free of material misstatement, whether due to error or fraud. Our audits included performing procedures to assess the risks of material misstatement of the financial statements and financial highlights, whether due to error or fraud, and performing procedures that respond to those risks. Such procedures included examining, on a test basis, evidence regarding the amounts and disclosures in the financial statements and financial highlights. Such procedures also included confirmation of securities owned as of August 31, 2022, by correspondence with custodians and brokers or by other appropriate auditing procedures. Our audits also included evaluating the accounting principles used and significant estimates made by management, as well as evaluating the overall presentation of the financial statements and financial highlights. We believe that our audits provide a reasonable basis for our opinion.

We have served as the auditor of one or more Cavanal Hill Funds investment companies since 1990.
Columbus, Ohio
October 28, 2022
| | KPMG LLP, a Delaware limited liability partnership and a member firm of the KPMG global organization of independent member firms affiliated with KPMG International Limited, a private English company limited by guarantee. |
Appendix
| Fund | Financial Statement | Period |
| | | |
| U.S. Treasury Fund | |
| | Statement of Operations | Year ended August 31, 2022. |
| | Statements of Changes in Net Assets | Two years ended August 31, 2022. |
| | Financial Highlights | Five years ended August 31, 2022. |
| | | |
| Government Securities Money Market Fund | |
| | Statement of Operations | Year ended August 31, 2022. |
| | Statements of Changes in Net Assets | Two years ended August 31, 2022. |
| | Financial Highlights | Five years ended August 31, 2022. |
| | | |
| Limited Duration Fund | |
| | Statement of Operations | Year ended August 31, 2022. |
| | Statements of Changes in Net Assets | Two years ended August 31, 2022. |
| | Financial Highlights | Five years ended August 31, 2022. |
| | | |
| Moderate Duration Fund | |
| | Statement of Operations | Year ended August 31, 2022. |
| | Statements of Changes in Net Assets | Two years ended August 31, 2022. |
| | Financial Highlights | Five years ended August 31, 2022. |
| | | |
| Bond Fund | |
| | Statement of Operations | Year ended August 31, 2022. |
| | Statements of Changes in Net Assets | Two years ended August 31, 2022. |
| | Financial Highlights | Five years ended August 31, 2022. |
| | | |
| Strategic Enhanced Yield Fund | |
| | Statement of Operations | Year ended August 31, 2022. |
| | Statements of Changes in Net Assets | Two years ended August 31, 2022. |
| | Financial Highlights | Four years ended August 31, 2022 and for the period December 26, 2017 (commencement of operations) through August 31, 2018. |
| | | |
| Ultra Short Tax-Free Income Fund | |
| | Statement of Operations | Year ended August 31, 2022. |
| | Statements of Changes in Net Assets | Two years ended August 31, 2022. |
| | Financial Highlights | Four years ended August 31, 2022 and for the period December 26, 2017 (commencement of operations) through August 31, 2018. |
| | | |
| Mid Cap Diverse Leadership Fund | |
| | Statement of Operations | Year ended August 31, 2022. |
| | Statements of Changes in Net Assets | Two years ended August 31, 2022. |
| | Financial Highlights | Five years ended August 31, 2022. |
| | | |
| Opportunistic Fund | | |
| | Statement of Operations | Year ended August 31, 2022. |
| | Statements of Changes in Net Assets | Two years ended August 31, 2022. |
| | Financial Highlights | Five years ended August 31, 2022. |
| | | |
| World Energy Fund | | |
| | Statement of Operations | Year ended August 31, 2022. |
| | Statements of Changes in Net Assets | Two years ended August 31, 2022. |
| | Financial Highlights | Five years ended August 31, 2022. |
| | | |
| Hedged Income Fund | | |
| | Statement of Operations | Year ended August 31, 2022. |
| | Statements of Changes in Net Assets | Year ended August 31, 2022 and for the period December 28, 2020 (commencement of operations) through August 31, 2021. |
| | Financial Highlights | Year ended August 31, 2022 and for the period December 28, 2020 (commencement of operations) through August 31, 2021 |
Additional Fund Information (Unaudited)
August 31, 2022
Notification of Sources of Distributions Pursuant to Rule 19a-1 under the Investment Company Act of 1940:
As noted in the table below, during the fiscal year ending August 31, 2022, certain Funds made distributions to shareholders from net income in excess of that which was earned for book purposes (capital sources).* Distributions are not anticipated to exceed earnings for U.S. income tax purposes. As of August 31, 2022, the sources of these distributions were as follows (amounts represent dollars per share):
| | | Investor Shares | | | Institutional Shares | | | Class A | |
| Fund | | Net
Income | | | Capital
Sources | | | Total
Distributions | | | Net
Income | | | Capital
Sources | | | Total
Distributions | | | Net
Income | | | Capital
Sources | | | Total
Distributions | |
| Limited Duration Fund | | | 0.13819 | | | | 0.01139 | | | | 0.14958 | | | | 0.15793 | | | | 0.01301 | | | | 0.17094 | | | | 0.13672 | | | | 0.01126 | | | | 0.14798 | |
| Bond Fund | | | 0.18548 | | | | 0.00566 | | | | 0.19114 | | | | 0.20744 | | | | 0.00633 | | | | 0.21377 | | | | 0.18543 | | | | 0.00566 | | | | 0.19109 | |
| Strategic Enhanced Yield Fund | | | 0.25890 | | | | 0.01189 | | | | 0.27079 | | | | 0.27873 | | | | 0.01280 | | | | 0.29153 | | | | 0.25547 | | | | 0.01173 | | | | 0.26720 | |
| * | Capital gains and losses from periodic repayment of bond principal are recognized as income for book purposes but, for U.S. income tax purposes, are distributed to shareholders from net capital gains. 'Final 2022 tax information for the Funds will be mailed to shareholders next year by January 31, 2023. Accordingly, shareholders should not use the information provided in this notice for tax reporting purposes. |
Other Federal Income Tax Information:
For the year ended August 31, 2022, a portion of the ordinary income distributions paid by the Funds may be qualified dividend income. The Funds intend to designate the maximum amount allowable. Complete information will be reported in conjunction with the 2022 Form 1099-DIV.
For corporate shareholders, the following percentage of the total ordinary income distributions paid during the fiscal year ended August 31, 2022, qualify for the corporate dividends received deduction for the following Funds:
| Fund | | Percentage | |
| Mid Cap Diverse Leadership Fund | | | 22.71 | % |
| Opportunistic Fund | | | 52.89 | % |
| World Energy Fund | | | 96.06 | % |
| Hedged Income Fund | | | 12.78 | % |
For the year ended August 31, 2022, the following Funds paid dividends, a portion of which may be subject to a maximum tax rate of 23.8%:
| Fund | | Percentage | |
| Mid Cap Diverse Leadership Fund | | | 22.71 | % |
| Opportunistic Fund | | | 65.77 | % |
| World Energy Fund | | | 100.00 | % |
| Hedged Income Fund | | | 18.61 | % |
The Ultra Short Tax-Free Income Fund designated $26,555 of its income distributions as tax-exempt distributions for the year ended August 31, 2022.
The accompanying table below details distributions designated from long-term capital gains for the following funds for the fiscal year ended August 31, 2022:
| Fund* | | Amount | |
| Government Securities Money Market Fund | | $ | 399 | |
| Mid Cap Diverse Leadership Fund | | | 102,348 | |
| Opportunistic Fund | | | 1,109,272 | |
| * | Long-term capital gain distributions are subject to a federal tax rate of 20%. |
For the year ended August 31, 2022, certain Funds designate the maximum amount allowable but not less than the following amounts as a short-term capital gain dividend in accordance with Section 871(k)(2) and 881(e) of the Internal Revenue Code:
| Fund | | Amount | |
| Mid Cap Diverse Leadership Fund | | $ | 81,838 | |
| Opportunistic Fund | | | 613,642 | |
| Additional Fund Information (Unaudited) | Continued |
August 31, 2022
For the year ended August 31, 2022, certain Funds designate the maximum amount allowable but not less than the following amounts as interest-related dividends in accordance with Section 871(k)(1) and 881(e) of the Internal Revenue Code:
| Fund | | Amount | |
| U.S. Treasury Fund | | $ | 964,434 | |
| Government Securities Money Market Fund | | | 4,399,059 | |
| Limited Duration Fund | | | 1,124,802 | |
| Moderate Duration Fund | | | 341,322 | |
| Bond Fund | | | 2,124,113 | |
| Strategic Enhanced Yield Fund | | | 462,293 | |
| Ultra Short Tax-Free Income Fund | | | 233 | |
| Mid Cap Diverse Leadership Fund | | | 75 | |
| Opportunistic Fund | | | 204,734 | |
| World Energy Fund | | | 43,659 | |
| Hedged Income Fund | | | 1,906 | |
| Additional Fund Information (Unaudited) | Continued |
August 31, 2022
REVIEW AND APPROVAL OF THE FUNDS’ ADVISORY AGREEMENT
The Trust’s investment advisory agreement (the “Advisory Agreement”) with Cavanal Hill Investment Management, Inc. (the “Adviser”) was formally considered and approved by the Board of Trustees at a meeting held on July 28, 2022. The Trustees reviewed extensive material throughout the year in connection with their consideration of the Advisory Agreement. In connection with such approval, the Trustees reviewed data produced by an independent provider of mutual fund data (as assembled by the Funds’ sub-administrator) which provided comparisons to industry averages for comparable funds for advisory fees and total fund expenses. The information provided to the Trustees at the meeting also included a report from an independent evaluator of brokerage practices and best execution. The Board was assisted in its review by independent legal counsel, as well as Counsel to the Funds, which provided a memorandum detailing the legal standards for review of the Advisory Agreement. The Board received a detailed presentation by the Adviser, which included a fund-by-fund analysis of performance and profitability. The Board also deliberated outside the presence of management and the Adviser.
In their deliberations, each Trustee attributed different weights to various factors involved in an analysis of whether the Investment Advisory Agreement should be amended and continued, and no factor alone was considered determinative. The Trustees, including a majority of independent Trustees, determined that the overall arrangement between the Trust and the Adviser, as provided in the Advisory Agreement, was fair and reasonable and that the continuance of the Advisory Agreement was in the best interests of each Fund and its shareholders.
The matters addressed below were considered and discussed by the Trustees in reaching their conclusions:
Nature, Extent and Quality of Services Provided by the Adviser
The Trustees received and considered information regarding the nature, extent, and quality of the services provided to each Fund under the Advisory Agreement. The Trustees took into account information furnished throughout the year at Board meetings, as well as materials furnished specifically in connection with the annual review process. The Adviser’s senior management and portfolio managers presented information to the Trustees at Board meetings and discussed the Funds’ performance and the Funds’ investment objectives, strategies and outlook. The Trustees considered the background and experience of the Adviser’s senior management and the expertise of investment personnel of the Adviser responsible for the day-to-day management of each Fund. The Trustees also considered the Adviser’s research and portfolio management capabilities, oversight of day-to-day Fund operations, including fund accounting and administration, shareholder communications, regulatory and other reporting, and assistance in meeting legal and regulatory requirements. Materials provided throughout the year covered matters such as compliance of portfolio managers and other management personnel with the code of ethics and the adherence to fair pricing procedures. Consideration was given to the overall performance of the Adviser in light of the economy. The Trustees concluded that the nature, extent, and quality of services under the Advisory Agreement were appropriate and consistent with industry norms.
Investment Performance
Investment performance reports and related financial information for the Funds were discussed throughout the year and were presented in association with the renewal. The Trustees considered performance results of each Fund in absolute terms and relative to each Fund’s peer group as reported by Lipper. One, three, five and ten-year performance data was presented. The Trustees discussed with the Adviser the performance goals and the actual results achieved in managing the Funds as well as the effect of market conditions on the Funds.
The Cavanal Hill Government Securities Money Market Fund ended the period at $2,238,371,304.27, up 13% from a year earlier; the Cavanal Hill US Treasury Fund totaled $938,797,371.77, down 8%. Lipper peer group rankings for the Cavanal Hill Government Securities Money Market Fund were as follows: Administrative Class, 65; Institutional Class, 60; Premium Class, 57; Select Class, 47. Peer rakings for the Cavanal Hill US Treasury Fund were as follows: Administrative Class, 96; Institutional Class, 75; Select Class, 61; and Service Class, 81.
The Limited Duration Fund Institutional share class was in the 79th percentile in its peer group for the one-year period. The relatively conservative positioning of the fund was mildly positive for the fund. However, the duration was mildly longer than peers, hurting performance in a rising rate environment. The Moderate Duration Fund Institutional share class was in the 86th percentile in its peer group for the oneyear period. The fund's duration, by design, is at the very high end of its peer group. This was the main reason for underperformance during the past year. The Bond Fund Institutional share class was in the 51st percentile for the one-year period. The fund was conservatively positioned, but the strong performance of credit over the first 3 quarters of the year was enough to outweigh the shorter than peer duration. The Strategic Enhanced Yield Fund Institutional share class was in the 46th percentile for the one-year period. Though the fund was hindered by its longer duration versus peers during the time period, its relatively conservative credit positioning allowed it to keep pace with peers. The Ultra Short Tax-Free Income Fund was in the 20th percentile (28/140) of the Lipper Short Municipal Fund group for the year. The Fund's outperformance was due to the short duration; the investment mix of variable rate demand notes (VRDNs) and fixed rate paper positively impacted performance, as rates in the short end of the muni market rose dramatically beginning in 2022.
The Institutional class shares of the Opportunistic Fund was in the 91st percentile its peer group for the one-year period. As of May 31, 2022, the Institutional class shares of the World Energy Fund had a Morningstar percentile ranking of 70th for the one-year period. The Fund was the 7% Fund in the category for both the 3- and 5-year periods. Note that Lipper does not have an Energy category, so we compare Fund performance to the Morningstar Energy category. As of May 31, 2022, the fund was a 5-star Morningstar fund. The Mid Cap Diverse Leadership Fund's out-performance is relative to the Mid Cap Core Lipper peer group. Highly volatile, low-quality, small-cap stocks produced some of the lowest returns over the one-year period ended May 31, 2022 due to concerns over a slowing economy, rising inflation, and less fiscal and monetary support from government's worldwide. Speculative names that had been bolstered by the workfrom-home environment seen during the COVID-19 lockdowns also sold off as restrictions were lifted and people returned to workplaces. The fund was positioned in, generally speaking, higher quality, less volatile stocks compared to the Lipper peer group where many peers have greater exposure to small caps and lower quality stocks. The fund's more conservative approach and lack of small cap stocks during this period added to performance, especially in Q4 2021 and in the market sell-off in Ql of 2022. The institutional share class ranks at the 20th percentile for the 1-year period. As of May 31, 2022, the fund was a 4-star Morningstar fund.
The Hedged Income Fund YTD return as of 5/31/22 was -1.1%, which compared to a benchmark return (CBOE S&P 500 BuyWrite Monthly Index) of 2.5%. The Fund's cyclical bias, lack of ownership of the five largest stocks, and puts (relative to the benchmark which does not own any), all detracted from performance during the first six months of the year. These same factors were in turn, additive to performance for the final six months of the year. This unfavorable performance comparison is to be expected given the fast-rising rally in equity markets YTD which included few pullbacks. Over the years, the Funds have received numerous Lipper Fund Awards in recognition of outstanding performance. Based on their review, and in light of market conditions, the Trustees were satisfied that the performance of each of the Funds was within an acceptable range.
| Additional Fund Information (Unaudited) | Continued |
August 31, 2022
Cost of Services and Profits Realized by Cavanal Hill Investment Management, Inc. and its Affiliates
The Trustees also considered peer group comparable information with respect to the investment advisory fees charged by the Adviser to each of the Funds. Information on voluntary fee waivers was presented and considered. The Trustees reviewed administration, custody and distributor fees received, respectively, by the Adviser and its affiliates, BOKF, NA and Cavanal Hill Distributors, Inc. and selling agreement fees earned by BOKF, NA and BOKFS, Inc. The Trustees also considered the fallout benefits to the Adviser of soft dollars based on presentations to the Board. The Trustees also reviewed profitability information provided by the Adviser with respect to investment advisory, administration, distribution and custody services to each Fund. The Trustees recognized that the data presented was not audited and represents the Adviser’s determination of its and its affiliates’ revenues from the contractual services provided to the Funds, less expenses of providing such services. Expenses include direct and indirect costs and were calculated using an allocation methodology developed by the Adviser. In reviewing the analysis, attention was given to the methodology followed in allocating costs to the Funds, it being recognized that allocation methodologies are inherently subjective and various allocation methodologies may each be reasonable while producing different results. In reviewing and discussing such analysis, management discussed with the Trustees its belief that costs incurred in establishing and maintaining the infrastructure necessary to support mutual fund operations conducted by the Adviser affect the expenses allocated to the Funds in determining its profitability, as well as the fact that the level of profits, to a certain extent, reflected operational cost savings and efficiencies initiated by management. The Trustees also took into account the need to meet regulatory and compliance requirements resulting from the Sarbanes-Oxley Act, SEC and other regulatory requirements. The Trustees also recognized that it is difficult to make comparisons of profitability from fund investment advisory contracts, because comparative information is not generally publicly available and is affected by numerous factors, including the structure of the particular adviser, the types of funds it manages, its business mix, and numerous assumptions regarding allocations. However, the Lipper peer group report reflected that investment advisory fees charged by the Adviser were generally in line with median fees. The investment advisory fees, net of waivers and expenses, with respect to the Funds, were equal to or below the median for all fund classes. The Trustees analyzed the fees paid to the Adviser in light of performance and the services provided, and in light of profitability to the Adviser. Based on their review, the Trustees concluded that the fees paid to, and the profitability of, Cavanal Hill Investment Management, Inc. under the Advisory Agreement was not unreasonable in light of the services and benefits provided to each Fund.
Economies of Scale
Finally, the Trustees considered whether fee levels reflect economies of scale and whether economies of scale would be produced by the growth of the Trust’s assets. The Trustees concluded that the Funds had not yet attained sufficient size to realize material economies of scale. The Trustees further concluded that current asset levels of the Funds did not warrant formal contractual breakpoints. The Trustees determined that their review of potential economies of scale supported their decision to approve the Advisory Agreement.
| Additional Fund Information (Unaudited) | Continued |
August 31, 2022
OPERATION AND IMPLEMENTATION OF THE LIQUIDITY RISK MANAGEMENT PROGRAM
In compliance with Rule 22e-4 under the Investment Company Act of 1940, as amended (the “Liquidity Rule”), the Cavanal Hill Funds (the “Trust”) has adopted and implemented a liquidity risk management program (the “Program”) for each series of the Trust, exclusive of the money market funds (each a “Fund” and collectively the “Funds”), which is reasonably designed to assess and manage the Funds’ liquidity risk. Liquidity risk is the risk that a Fund could not meet redemption requests without significant dilution of remaining investors’ interests in the Fund. The Trust’s Board of Trustees (the “Board”) previously approved the Program and the designation of the Cavanal Hill Liquidity Risk Management Oversight Committee as the Administrator of the Program, subject to the oversight of the Board. The Cavanal Hill Liquidity Risk Management Oversight Committee includes investment, compliance and administration representatives.
The Administrator provided its annual report, dated June 1, 2022 (“Liquidity Report”), to the Board in board meeting materials for the Trust’s July 28, 2022 board meeting. The Liquidity Report assessed the adequacy and effectiveness of the Program. The Liquidity Report addressed the key components of the Program, including (i) the Fund’s investment strategy and liquidity of investments during both normal and reasonably foreseeable stressed conditions (including market volatility related to COVID-19), (ii) short-term and long-term cash flow projections, (iii) any liquidity events or applicable highly liquid investment minimums and (iv) classification of portfolio holdings into one of four liquidity categories. The Administrator also reported on filings of Forms N-PORT and N-Liquid with the SEC, including confirmation that none of the Funds exceeded the 15% illiquid security limit.
As reflected in the Liquidity Report, the Program is operating as intended and is an effective tool in implementing the requirements of the Liquidity Rule. Each Fund’s liquidity risk continues to be appropriate in light of the Fund’s investment objective and strategies. No changes to the Program were recommended.
| Additional Fund Information (Unaudited) | Continued |
August 31, 2022
U.S. Treasury Fund:
| Security Allocation | | Percentage of
Net Assets | |
| U.S. Treasury Obligations | | | 10.6 | % |
| Repurchase Agreements | | | 81.3 | % |
| Investment Companies | | | 8.3 | % |
| Liabilities in excess of other assets | | | (0.2 | )% |
| Total | | | 100.0 | % |
Government Securities Money Market Fund:
| Security Allocation | | Percentage of
Net Assets | |
| U.S. Government Agency Securities | | | 23.6 | % |
| U.S. Treasury Obligations | | | 32.2 | % |
| Repurchase Agreements | | | 37.5 | % |
| Investment Companies | | | 6.7 | % |
| Total | | | 100.0 | % |
Limited Duration Fund:
| Security Allocation | | Percentage of
Net Assets | |
| Asset Backed Securities | | | 34.4 | % |
| Mortgage Backed Securities | | | 32.5 | % |
| Corporate Bonds | | | 12.5 | % |
| Taxable Municipal Bonds | | | 3.5 | % |
| U.S. Government Agency Securities | | | 6.0 | % |
| U.S. Treasury Obligations | | | 7.0 | % |
| Investment in Affiliates | | | 3.7 | % |
| Other assets in excess of liabilities | | | 0.4 | % |
| Total | | | 100.0 | % |
Moderate Duration Fund:
| Security Allocation | | Percentage of
Net Assets | |
| Asset Backed Securities | | | 16.4 | % |
| Mortgage Backed Securities | | | 12.2 | % |
| Corporate Bonds | | | 24.9 | % |
| Taxable Municipal Bonds | | | 11.0 | % |
| U.S. Government Agency Securities | | | 6.8 | % |
| U.S. Treasury Obligations | | | 24.1 | % |
| Investment in Affiliates | | | 4.1 | % |
| Other assets in excess of liabilities | | | 0.5 | % |
| Total | | | 100.0 | % |
Bond Fund:
| Security Allocation | | Percentage of
Net Assets | |
| Asset Backed Securities | | | 12.8 | % |
| Mortgage Backed Securities | | | 10.9 | % |
| Corporate Bonds | | | 23.8 | % |
| Taxable Municipal Bonds | | | 9.8 | % |
| U.S. Government Agency Securities | | | 11.3 | % |
| U.S. Treasury Obligations | | | 26.1 | % |
| Investment in Affiliates | | | 5.0 | % |
| Other assets in excess of liabilities | | | 0.3 | % |
| Total | | | 100.0 | % |
Strategic Enhanced Yield Fund:
| Security Allocation | | Percentage of
Net Assets | |
| Asset Backed Securities | | | 15.9 | % |
| Mortgage Backed Securities | | | 43.8 | % |
| Corporate Bonds | | | 26.9 | % |
| U.S. Treasury Obligations | | | 8.7 | % |
| Investment in Affiliates | | | 4.5 | % |
| Other assets in excess of liabilities | | | 0.2 | % |
| Total | | | 100.0 | % |
Ultra Short Tax-Free Income Fund:
| Security Allocation | | Percentage of
Net Assets | |
| Municipal Bonds | | | 103.4 | % |
| Investment in Affiliates | | | 0.1 | % |
| Liabilities in excess of other assets | | | (3.5 | )% |
| Total | | | 100.0 | % |
Mid Cap Diverse Leadership Fund:
| Security Allocation | | Percentage of
Net Assets | |
| Common Stocks | | | 98.3 | % |
| Investment in Affiliates | | | 1.7 | % |
| Total | | | 100.0 | % |
Opportunistic Fund:
| Security Allocation | | Percentage of
Net Assets | |
| Common Stocks | | | 92.2 | % |
| Investment in Affiliates | | | 7.7 | % |
| Other assets in excess of liabilities | | | 0.1 | % |
| Total | | | 100.0 | % |
World Energy Fund:
| Security Allocation | | Percentage of
Net Assets | |
| Common Stocks | | | 91.3 | % |
| Corporate Bonds | | | 5.4 | % |
| Investment Companies | | | 2.1 | % |
| Investment in Affiliates | | | 1.0 | % |
| Other assets in excess of liabilities | | | 0.2 | % |
| Total | | | 100.0 | % |
Hedged Income Fund:
| Security Allocation | | Percentage of
Net Assets | |
| Common Stocks | | | 97.1 | % |
| Purchased Options | | | 2.2 | % |
| Investment in Affiliates | | | 2.7 | % |
| Liabilities in excess of other assets | | | (2.0 | )% |
| Total | | | 100.0 | % |
| Additional Fund Information (Unaudited) | Continued |
August 31, 2022
Trustees and Officers of Cavanal Hill Funds
The following table sets forth certain information about each of the Trust’s Officers.
| Name and Age | | Position(s) Held
with the Trust | | Term of Office;
and Length of
Time Served | | Principal Occupation(s)
During the Past 5 Years | | Number of
Portfolios in
Fund Complex
Overseen | | Other
Directorships
Held by Trustee |
| Officers | | | | | | | | | | |
Bill King
(1959) | | President, Assistant Secretary | | Indefinite,
5/20 — Present | | From 2016 to present, President and CEO of Cavanal Hill Distributors, Inc. Since 2013, national sales manager of Cavanal Hill Investment Management, Inc. | | N/A | | N/A |
| | | | | | | | | | | |
Denise Lewis
(1963) | | Treasurer | | Indefinite,
7/22 — Present | | From 08/20 to present, SVP of Citi Fund Services Ohio, Inc. | | N/A | | N/A |
| | | | | | | | | | | |
Charles Booth
(1960) | | Chief Compliance Officer,
Anti-Money Laundering Officer and Disaster Recovery Plan Business Operations Manager | | Indefinite,
5/15 — Present | | From 2007 to present, Director of Citi Fund Services Ohio, Inc., CCO Services. From 1988 to present, Account Manager, Manager of Financial Administration, SVP of Compliance of Citi Fund Services Ohio, Inc. | | N/A | | N/A |
| | | | | | | | | | | |
Cheryl Briggs
(1960) | | Vice President and Secretary | | Indefinite,
4/15 — Present | | From March 2015 to present, Officer, Cavanal Hill Funds Administrator. From November 2008 to March 2015, Executive Assistant for Institutional Wealth Management at BOKF, NA. | | N/A | | N/A |
For interested officers, Mr. King and Ms. Briggs, positions held with affiliated persons or principal underwriters of the Trust are provided above. For interested Trustees, the information is listed in the following table:
| Name | | Positions Held With Affiliated Persons Or Principal Underwriters Of The Funds |
Scott Grauer
(1964) | | BOK Financial, Executive Vice President, Wealth Management Division; BOKFS, Chief Executive Officer. Mr. Grauer is also Chairman of the Board of BOKFS, CHD, CHIM and affiliated advisers, BOK Financial Asset Management and BOK Financial Private Wealth, Inc., and serves as an officer or as a member of the board for other BOK Financial subsidiaries. |
| Additional Fund Information (Unaudited) | Continued |
August 31, 2022
Trustees and Officers of Cavanal Hill Funds
The following table sets forth certain information about each of the Trust’s Trustees.
| Name and Age | | Position(s) Held
with the Trust | | Term of Office;
and Length of
Time Served | | Principal Occupation(s)
During the Past 5 Years | | Number of
Portfolios in
Fund Complex
Overseen | | Other
Directorships
Held by Trustee
During the Past
5 Years* |
| Independent Trustees: | | | | | | | | | | |
William H. Wilson Jr.
(1958 ) | | Trustee, Chairman | | Indefinite, 5/08—Present | | Ownership interest and/or executive positions with Sage Partners and Lonestar Ecology | | 11 | | N/A |
| | | | | | | | | | | |
Jennifer Wheeler
(1972) | | Trustee | | Indefinite, 11/16—Present | | Counsel to the American Fidelity Insurance Company; Shareholder, McAfee & Taft | | 11 | | N/A |
| | | | | | | | | | | |
| Interested Trustees: | | | | | | | | | | |
Scott Grauer**
(1964) | | Trustee | | Indefinite, 1/10—Present | | From July 2008 to present, Executive Vice President, Wealth Management Division, BOKF; from 1991 to present, CEO, BOK Financial Securities, Inc. | | 11 | | N/A |
| * | Directorships held in (1) any other investment companies registered under the 1940 Act, (2) any company with a class of securities registered pursuant to Section 12 of the Securities Exchange Act of 1934, as amended (the “Exchange Act”) or (3) any company subject to the requirements of Section 15(d) of the Exchange Act. |
| ** | Mr. Grauer is treated by the Funds as an “interested person” (as defined in Section 2(a)(19) of the 1940 Act) of the Funds. Mr. Grauer is an “interested person” because he is an Executive Vice President of BOK Financial, the parent of Cavanal Hill Distributors, Inc. (“CHD”) and the indirect parent of Cavanal Hill Investment Management, Inc. (“CHIM”). Mr. Grauer is also Chairman of the Board of BOKFS, CHD, CHIM and affiliated advisers, BOK Financial Asset Management, Inc. and BOK Financial Private Wealth, and serves as an officer or as a member of the board for other BOK Financial subsidiaries. |
The Funds’ Statement of Additional Information includes additional information about the Trustees and Officers. The Statement of Additional Information may be obtained by calling 1-800-762-7085.
| Additional Fund Information (Unaudited) | Continued |
August 31, 2022
As a shareholder of the Cavanal Hill Funds, you incur two types of costs: (1) transaction costs, including sales charges (loads) on purchases, reinvested dividends, or other distributions; and exchange fees; (2) ongoing costs, including management fees; distribution fees; and other Fund expenses. This example is intended to help you understand your ongoing costs (in dollars) of investing in the Cavanal Hill Funds and to compare these costs with the ongoing costs of investing in other mutual funds. The example is based on an investment of $1,000 invested at the beginning of the period and held for the entire period from March 1, 2022 through August 31, 2022.
Actual Expenses
The table below provides information about actual account values and actual expenses. You may use the information below, together with the amount you invested, to estimate the expenses that you paid over the period. Simply divide your account value by $1,000 (for example, an $8,600 account value divided by $1,000=8.6), then multiply the result by the number in the table under the heading entitled “Expense Paid During Period” to estimate the expenses you paid on your account during this period.
| | | Beginning
Account Value
3/1/22 | | | Ending
Account Value
8/31/22 | | | Expenses Paid
During Period
3/1/22 - 8/31/22 | | | Expense Ratio
During Period*
3/1/22 - 8/31/22 | |
| U.S. Treasury Fund | | | | | | | | | | | | |
| Administrative Shares | | $ | 1,000.00 | | | $ | 1,002.00 | | | $ | 2.62 | | | | 0.52 | % |
| Service Shares | | | 1,000.00 | | | | 1,003.00 | | | | 1.62 | | | | 0.32 | % |
| Institutional Shares | | | 1,000.00 | | | | 1,003.40 | | | | 1.16 | | | | 0.23 | % |
| Select Shares | | | 1,000.00 | | | | 1,003.70 | | | | 0.81 | | | | 0.16 | % |
| Government Securities Money Market Fund | | | | | | | | | | | | | | | | |
| Administrative Shares | | | 1,000.00 | | | | 1,002.70 | | | | 2.07 | | | | 0.41 | % |
| Institutional Shares | | | 1,000.00 | | | | 1,003.70 | | | | 1.16 | | | | 0.23 | % |
| Select Shares | | | 1,000.00 | | | | 1,004.00 | | | | 0.81 | | | | 0.16 | % |
| Premier Shares | | | 1,000.00 | | | | 1,003.80 | | | | 1.06 | | | | 0.21 | % |
| Limited Duration Fund | | | | | | | | | | | | | | | | |
| Investor Shares | | | 1,000.00 | | | | 964.70 | | | | 4.51 | | | | 0.91 | % |
| Institutional Shares | | | 1,000.00 | | | | 965.70 | | | | 3.42 | | | | 0.69 | % |
| A Shares | | | 1,000.00 | | | | 964.60 | | | | 4.65 | | | | 0.94 | % |
| Moderate Duration Fund | | | | | | | | | | | | | | | | |
| Investor Shares | | | 1,000.00 | | | | 942.40 | | | | 3.62 | | | | 0.74 | % |
| Institutional Shares | | | 1,000.00 | | | | 944.60 | | | | 2.40 | | | | 0.49 | % |
| A Shares | | | 1,000.00 | | | | 943.40 | | | | 3.62 | | | | 0.74 | % |
| Bond Fund | | | | | | | | | | | | | | | | |
| Investor Shares | | | 1,000.00 | | | | 920.20 | | | | 3.58 | | | | 0.74 | % |
| Institutional Shares | | | 1,000.00 | | | | 921.20 | | | | 2.37 | | | | 0.49 | % |
| A Shares | | | 1,000.00 | | | | 920.20 | | | | 3.58 | | | | 0.74 | % |
| Strategic Enhanced Yield Fund | | | | | | | | | | | | | | | | |
| Investor Shares | | | 1,000.00 | | | | 934.80 | | | | 4.93 | | | | 1.01 | % |
| Institutional Shares | | | 1,000.00 | | | | 934.90 | | | | 3.71 | | | | 0.76 | % |
| A Shares | | | 1,000.00 | | | | 934.80 | | | | 4.93 | | | | 1.01 | % |
| Ultra Short Tax-Free Income Fund | | | | | | | | | | | | | | | | |
| Investor Shares | | | 1,000.00 | | | | 996.50 | | | | 3.02 | | | | 0.60 | % |
| Institutional Shares | | | 1,000.00 | | | | 997.50 | | | | 1.76 | | | | 0.35 | % |
| A Shares | | | 1,000.00 | | | | 997.50 | | | | 3.02 | | | | 0.60 | % |
| Mid Cap Diverse Leadership Fund | | | | | | | | | | | | | | | | |
| Investor Shares | | | 1,000.00 | | | | 929.50 | | | | 5.16 | | | | 1.06 | % |
| Institutional Shares | | | 1,000.00 | | | | 930.50 | | | | 3.94 | | | | 0.81 | % |
| A Shares | | | 1,000.00 | | | | 929.10 | | | | 5.15 | | | | 1.06 | % |
| C Shares | | | 1,000.00 | | | | 925.80 | | | | 8.79 | | | | 1.81 | % |
| Opportunistic Fund | | | | | | | | | | | | | | | | |
| Investor Shares | | | 1,000.00 | | | | 877.90 | | | | 5.92 | | | | 1.25 | % |
| Institutional Shares | | | 1,000.00 | | | | 879.30 | | | | 4.74 | | | | 1.00 | % |
| A Shares | | | 1,000.00 | | | | 877.70 | | | | 5.92 | | | | 1.25 | % |
| C Shares | | | 1,000.00 | | | | 874.20 | | | | 9.45 | | | | 2.00 | % |
| World Energy Fund | | | | | | | | | | | | | | | | |
| Investor Shares | | | 1,000.00 | | | | 1,104.40 | | | | 6.10 | | | | 1.15 | % |
| Institutional Shares | | | 1,000.00 | | | | 1,104.70 | | | | 4.77 | | | | 0.90 | % |
| A Shares | | | 1,000.00 | | | | 1,103.60 | | | | 6.10 | | | | 1.15 | % |
| C Shares | | | 1,000.00 | | | | 1,100.00 | | | | 10.06 | | | | 1.90 | % |
| Additional Fund Information (Unaudited) | Continued |
August 31, 2022
| | | Beginning
Account Value
3/1/22 | | | Ending
Account Value
8/31/22 | | | Expenses Paid
During Period
3/1/22 - 8/31/22 | | | Expense Ratio
During Period*
3/1/22 - 8/31/22 | |
| Hedged Income Fund | | | | | | | | | | | | |
| Investor Shares | | | 1,000.00 | | | | 971.40 | | | | 6.71 | | | | 1.35 | % |
| Institutional Shares | | | 1,000.00 | | | | 971.50 | | | | 5.47 | | | | 1.10 | % |
| A Shares | | | 1,000.00 | | | | 971.20 | | | | 6.71 | | | | 1.35 | % |
| * | Expenses are equal to the Portfolio's annualized expense ratio multiplied by the average account value over the period multiplied by 184/365 (to reflect the one-half year period). |
| Additional Fund Information (Unaudited) | Continued |
August 31, 2022
Hypothetical Example for Comparison Purposes
The table below provides information about hypothetical account values and hypothetical expenses based on each of the Cavanal Hill Funds’ actual expense ratio and an assumed rate of return of 5% per year before expenses, which is not the Fund’s actual return. The hypothetical account values and expense may not be used to estimate actual ending account balance or expense you paid for the period. You may use this information to compare this 5% hypothetical example with the 5% hypothetical examples that appear in the shareholder reports of other funds.
Please note that the expenses shown in the table are meant to highlight your ongoing costs only and do not reflect any transactional costs, such as sales charges (loads), or exchange fees. Therefore, the table is useful in comparing ongoing costs only, and will not help you determine the relative total costs of owning different funds. In addition, if these transactional costs were included, your costs would have been higher.
| | | Beginning
Account Value
3/1/22 | | | Ending
Account Value
8/31/22 | | | Expenses Paid
During Period
3/1/22 - 8/31/22 | | | Expense Ratio
During Period*
3/1/22 - 8/31/22 | |
| U.S. Treasury Fund | | | | | | | | | | | | |
| Administrative Shares | | $ | 1,000.00 | | | $ | 1,022.58 | | | $ | 2.65 | | | | 0.52 | % |
| Service Shares | | | 1,000.00 | | | | 1,023.59 | | | | 1.63 | | | | 0.32 | % |
| Institutional Shares | | | 1,000.00 | | | | 1,024.05 | | | | 1.17 | | | | 0.23 | % |
| Select Shares | | | 1,000.00 | | | | 1,024.40 | | | | 0.82 | | | | 0.16 | % |
| Government Securities Money Market Fund | | | | | | | | | | | | | | | | |
| Administrative Shares | | | 1,000.00 | | | | 1,023.14 | | | | 2.09 | | | | 0.41 | % |
| Institutional Shares | | | 1,000.00 | | | | 1,024.05 | | | | 1.17 | | | | 0.23 | % |
| Select Shares | | | 1,000.00 | | | | 1,024.40 | | | | 0.82 | | | | 0.16 | % |
| Premier Shares | | | 1,000.00 | | | | 1,024.15 | | | | 1.07 | | | | 0.21 | % |
| Limited Duration Fund | | | | | | | | | | | | | | | | |
| Investor Shares | | | 1,000.00 | | | | 1,020.62 | | | | 4.63 | | | | 0.91 | % |
| Institutional Shares | | | 1,000.00 | | | | 1,021.73 | | | | 3.52 | | | | 0.69 | % |
| A Shares | | | 1,000.00 | | | | 1,020.47 | | | | 4.79 | | | | 0.94 | % |
| Moderate Duration Fund | | | | | | | | | | | | | | | | |
| Investor Shares | | | 1,000.00 | | | | 1,021.48 | | | | 3.77 | | | | 0.74 | % |
| Institutional Shares | | | 1,000.00 | | | | 1,022.74 | | | | 2.50 | | | | 0.49 | % |
| A Shares | | | 1,000.00 | | | | 1,021.48 | | | | 3.77 | | | | 0.74 | % |
| Bond Fund | | | | | | | | | | | | | | | | |
| Investor Shares | | | 1,000.00 | | | | 1,021.48 | | | | 3.77 | | | | 0.74 | % |
| Institutional Shares | | | 1,000.00 | | | | 1,022.74 | | | | 2.50 | | | | 0.49 | % |
| A Shares | | | 1,000.00 | | | | 1,021.48 | | | | 3.77 | | | | 0.74 | % |
| Strategic Enhanced Yield Fund | | | | | | | | | | | | | | | | |
| Investor Shares | | | 1,000.00 | | | | 1,020.11 | | | | 5.14 | | | | 1.01 | % |
| Institutional Shares | | | 1,000.00 | | | | 1,021.37 | | | | 3.87 | | | | 0.76 | % |
| A Shares | | | 1,000.00 | | | | 1,020.11 | | | | 5.14 | | | | 1.01 | % |
| Ultra Short Tax-Free Income Fund | | | | | | | | | | | | | | | | |
| Investor Shares | | | 1,000.00 | | | | 1,022.18 | | | | 3.06 | | | | 0.60 | % |
| Institutional Shares | | | 1,000.00 | | | | 1,023.44 | | | | 1.79 | | | | 0.35 | % |
| A Shares | | | 1,000.00 | | | | 1,022.18 | | | | 3.06 | | | | 0.60 | % |
| Mid Cap Diverse Leadership Fund | | | | | | | | | | | | | | | | |
| Investor Shares | | | 1,000.00 | | | | 1,019.86 | | | | 5.40 | | | | 1.06 | % |
| Institutional Shares | | | 1,000.00 | | | | 1,021.12 | | | | 4.13 | | | | 0.81 | % |
| A Shares | | | 1,000.00 | | | | 1,019.86 | | | | 5.40 | | | | 1.06 | % |
| C Shares | | | 1,000.00 | | | | 1,016.08 | | | | 9.20 | | | | 1.81 | % |
| Opportunistic Fund | | | | | | | | | | | | | | | | |
| Investor Shares | | | 1,000.00 | | | | 1,018.90 | | | | 6.36 | | | | 1.25 | % |
| Institutional Shares | | | 1,000.00 | | | | 1,020.16 | | | | 5.09 | | | | 1.00 | % |
| A Shares | | | 1,000.00 | | | | 1,018.90 | | | | 6.36 | | | | 1.25 | % |
| C Shares | | | 1,000.00 | | | | 1,015.12 | | | | 10.16 | | | | 2.00 | % |
| World Energy Fund | | | | | | | | | | | | | | | | |
| Investor Shares | | | 1,000.00 | | | | 1,019.41 | | | | 5.85 | | | | 1.15 | % |
| Institutional Shares | | | 1,000.00 | | | | 1,020.67 | | | | 4.58 | | | | 0.90 | % |
| A Shares | | | 1,000.00 | | | | 1,019.41 | | | | 5.85 | | | | 1.15 | % |
| C Shares | | | 1,000.00 | | | | 1,015.63 | | | | 9.65 | | | | 1.90 | % |
| Additional Fund Information (Unaudited) | Concluded |
August 31, 2022
| | | Beginning
Account Value
3/1/22 | | | Ending
Account Value
8/31/22 | | | Expenses Paid
During Period
3/1/22 - 8/31/22 | | | Expense Ratio
During Period*
3/1/22 - 8/31/22 | |
| Hedged Income Fund | | | | | | | | | | | | |
| Investor Shares | | | 1,000.00 | | | | 1,018.40 | | | | 6.87 | | | | 1.35 | % |
| Institutional Shares | | | 1,000.00 | | | | 1,019.66 | | | | 5.60 | | | | 1.10 | % |
| A Shares | | | 1,000.00 | | | | 1,018.40 | | | | 6.87 | | | | 1.35 | % |
| * | Expenses are equal to the Portfolio's annualized expense ratio multiplied by the average account value over the period multiplied by 184/365 (to reflect the one-half year period). |

Ann-08/22
Item 2. Code of Ethics.
(a) The registrant has adopted a code of ethics that applies to the registrant’s principal executive officer, principal financial officer, principal accounting officer or controller, or persons performing similar functions. This code of ethics is included as an Exhibit.
(b) During the period covered by the report, with respect to the registrant's code of ethics that applies to its principal executive officer, principal financial officer, principal accounting officer or controller, or persons performing similar functions, there have been no amendments to, nor any waivers granted from, a provision that relates to any element of the code of ethics definition enumerated in paragraph (b) of this Item 2.
Item 3. Audit Committee Financial Expert.
3(a)(1) The registrant’s board of directors has determined that the registrant has at least one audit committee financial expert serving on its audit committee.
3(a)(2) The audit committee financial expert is William H. Wilson Jr. who is “independent” for purposes of this Item 3 of Form N-CSR.
Item 4. Principal Accountant Fees and Services.
| | | 2022 | | | 2021 | |
| (a) Audit Fees | | $ | 172,175 | | | $ | 179,300 | |
| (b) Audit-Related Fees | | $ | 42,000 | | | $ | 40,000 | |
| (c) Tax Fees* | | $ | 59,355 | | | $ | 55,590 | |
| (d) All Other Fees | | $ | - | | | $ | - | |
| * | Related to preparation of federal income, excise tax returns, state tax return and review of capital gain distribution calculations. |
4(e)(1)
The Audit Committee may pre-approve at any regularly scheduled Audit Committee meeting audit, audit-related, tax and other non-audit services to be rendered or that may be rendered by the Auditor to the Funds and certain non-audit services to be rendered by the Auditor to the Advisor which require pre-approval by the Audit Committee. In connection with such pre-approvals, the Auditor, or a Fund officer, with the assistance of the Auditor, shall provide the Audit Committee with a report containing information about each type of service to be pre-approved at the meeting.
4(e)(2)
2022 – 0%
2021 – 0%
4(f) Not Applicable
4(g)
2022 – $101,355
2021 – $95,590
4(h) Not Applicable
4(i) Not Applicable
4(j) Not Applicable
Item 5. Audit Committee of Listed Registrants.
Not applicable.
Item 6. Investments.
(a) The schedules of investments are included as part of the report to shareholders filed under Item 1of this form.
(b) Not applicable.
Item 7. Disclosure of Proxy Voting Policies and Procedures for Closed-End Management Investment Companies.
Not applicable
Item 8. Portfolio Managers of Closed-End Management Investment Companies.
Not applicable
Item 9. Purchases of Equity Securities by Closed-End Management Investment Company and Affiliated Purchasers.
Not applicable.
Item 10. Submission of Matters to a Vote of Security Holders.
The Nomination Committee will consider and evaluate nominee candidates properly submitted by shareholders on the same basis as it considers and evaluates candidates recommended by other sources.
Item 11. Controls and Procedures.
(a) The registrant’s principal executive officer and principal financial officer have concluded, based on their evaluation of the registrant's disclosure controls and procedures as conducted within 90 days of the filing date of this report, that these disclosure controls and procedures are adequately designed and are operating effectively to ensure that information required to be disclosed by the registrant on Form N-CSR is recorded, processed, summarized and reported within the time periods specified in the Securities and Exchange Commission’s rules and forms.
(b) There were no changes in the registrant’s internal control over financial reporting (as defined in Rule 30a-3(d) under the Act (17 CFR 270.30a-3(d)) that occurred during the period covered by this report that have materially affected or are reasonably likely to materially affect, the registrant’s internal control over financial reporting.
Item 12. Disclosure of Securities Lending Activities for Closed-End Management Investment Companies.
Not applicable.
Item 13. Exhibits.
SIGNATURES
Pursuant to the requirements of the Securities Exchange Act of 1934 and the Investment Company Act of 1940, the registrant has duly caused this report to be signed on its behalf by the undersigned, thereunto duly authorized.
(Registrant) Cavanal Hill Funds
| By (Signature and Title)* | /s/ Bill King | |
| | Bill King, President (Principal Executive Officer) | |
Date October 28, 2022
Pursuant to the requirements of the Securities Exchange Act of 1934 and the Investment Company Act of 1940, this report has been signed below by the following persons on behalf of the registrant and in the capacities and on the dates indicated.
| By (Signature and Title)* | /s/ Bill King | |
| | Bill King, President (Principal Executive Officer) | |
Date October 28, 2022
| By (Signature and Title)* | /s/ Denise Lewis | |
| | Denise Lewis, Treasurer (Principal Financial Officer) | |
Date October 28, 2022