UNITED STATES
SECURITIES AND EXCHANGE COMMISSION
Washington, D.C. 20549
FORM N-CSR
CERTIFIED SHAREHOLDER REPORT OF REGISTERED
MANAGEMENT INVESTMENT COMPANIES
| Investment Company Act file number | 811-06114 | |
| (Exact name of registrant as specified in charter) | |
| Citi Fund Services Ohio, Inc., 4400 Easton Commons, Suite 200, Columbus, OH 43219 | |
| (Address of principal executive offices) (Zip code) | |
| Citi Fund Services Ohio, Inc., 4400 Easton Commons, Suite 200, Columbus, OH 43219 | |
| (Name and address of agent for service) | |
Registrant’s telephone number, including area code:1-800-762-7085
Date of fiscal year end: 8/31
Date of reporting period: 8/31/19
| Item 1. | | Reports to Stockholders. |

Annual Report
August 31, 2019
U.S. Treasury Fund
Government Securities Money Market Fund
Limited Duration Fund
Moderate Duration Fund
Bond Fund
Strategic Enhanced Yield Fund
Ultra Short Tax-Free Income Fund
Active Core Fund
Mid Cap Core Equity Fund
Opportunistic Fund
World Energy Fund
Beginning on January 1, 2021, as permitted by regulations adopted by the Securities and Exchange Commission, paper copies of the Fund’s annual and semi-annual shareholder reports will no longer be sent by mail, unless you specifically request paper copies of the reports. Instead, the reports will be made available on the Fund’s website (www.cavanalhillfunds.com), and you will be notified by mail each time a report is posted and provided with a website link to access the report.
If you already elected to receive shareholder reports electronically, you will not be affected by this change and you need not take any action. You may elect to receive shareholder reports and other communications from the Fund electronically anytime by contacting your financial intermediary (such as a broker-dealer or bank) or, if you are a direct investor, by calling (800) 762-7085.
Beginning on January 1, 2019, you may elect to receive all future reports in paper free of charge. If you invest through a financial intermediary, you can contact your financial intermediary to request that you continue to receive paper copies of your shareholder reports. If you invest directly with the Fund you can call (800) 762-7085 to let the Fund know you wish to continue receiving paper copies of your shareholder reports. Your election to receive reports in paper will apply to all funds held in your account if you invest through your financial intermediary or all funds held with the fund complex if you invest directly with the Fund.
Table of Contents
A description of the policies and procedures that the Fund uses to determine how to vote proxies relating to the portfolio securities and information during the most recent 12-month period ended June 30 is available without charge, upon request, by calling 1-800-762-7085 or on the Securities and Exchange Commission’s website at http://www.sec.gov.
A complete schedule of each Fund’s portfolio holdings for the first and third fiscal quarter of each fiscal year is filed with the Securities and Exchange Commission on Form N-PORT and is available on the Securities and Exchange Commission’s website at http://www.sec.gov. In addition, the schedules may be reviewed and copied at the Securities and Exchange Commission’s Public Reference Room in Washington D.C. Information on the operation of the Public Reference Room may be obtained by calling 1-800-SEC-0330.
This report is authorized for distribution to prospective investors only when preceded or accompanied by a prospectus or summary prospectus. An investor should consider the Fund’s investment objectives, risks, and charges and expenses carefully before investing or sending money. This and other important information about the investment company can be found in the Fund’s prospectus or summary prospectus. To obtain a prospectus or summary prospectus, please call 1-800-762-7085. Please read the prospectus carefully before investing.
Cavanal Hill Distributors, Inc., member FINRA, serves as the distributor for the Cavanal Hill Funds.
Shares of the Funds are not deposits or obligations of, or guaranteed or endorsed by, BOKF, NA, any of its affiliates or the Distributor. Shares are NOT FDIC INSURED, nor are they insured by any other government agency. An investment in the Funds involves investment risk, including possible loss of principal.
This document may contain “forward-looking statements” within the meaning of the Private Securities Litigation Reform Act of 1995, Section 27A of the Securities Act and Section 21E of the Securities Exchange Act. Forward-looking statements give our current expectations of forecasts of future events. They include statements regarding our anticipated future operating and financial performance. Although we believe the expectations and statements reflected in these and other forward-looking statements are reasonable, we can give no assurance they will prove to have been correct. They can be affected by inaccurate assumptions, by inaccurate information from third parties, or by known or unknown risks and uncertainties.
Cavanal Hill Money Market Funds (Unaudited)
Investment Risks
You could lose money by investing in the Funds. Although the Funds seeks to preserve the value of your investment at $1.00 per share, it cannot guarantee it will do so. The Funds may impose a fee upon sale of your shares or may temporarily suspend your ability to sell shares if the Funds’ liquidity falls below required minimums because of market conditions or other factors. An investment in the Funds is not insured or guaranteed by the Federal Deposit Insurance Corporation or any other government agency. The Funds’ sponsor has no legal obligation to provide financial support to the Funds, and you should not expect that the sponsor will provide financial support to the Funds at any time.
Market Conditions
For much of the period, markets believed the Federal Open Market Committee (FOMC) would continue its campaign of gradually raising the federal funds target rate into the reasonably foreseeable future. However, 2019 saw sentiment change, due to trade tensions with China and Mexico, the Treasury yield curve inversion, and fears of economic softening. As a result, investors faced a changing environment, in which it became increasingly likely that rates might fall.
During the Funds’ fiscal year, the FOMC raised interest rates twice: in September 2018 and December 2018. The federal funds target rate stayed at 2.25%-2.50% after the December move, and was lowered 25 basis points (0.25%) to 2% - 2.25% in July 2019.
The Cavanal Hill U.S. Treasury Fund and the Cavanal Hill Government Securities Money Market Fund
We kept maturities relatively short in our money market funds for the portion of the year in which it appeared that interest rates would continue to climb. This helped the Funds quickly adjust to higher rates. Overnight repurchase agreements, in particular, immediately reflected higher levels after FOMC rate hikes. As 2019 progressed, however, we added some longer-term positions, such as coupon Treasuries, to help lock in higher yields for a longer period. A dearth of higher-yielding agency debt meant that the Government Securities Money Market Fund tended to have substantial Treasury positions at times.*
In September 2018, both money market funds began using Fixed Income Clearing Corp-sponsored repurchase agreements (repos), which considerably broadened our list of available repo dealers. In fact, by mid-2019, FICC was the single largest repo counterparty used by money market funds nationwide.*
The financial industry’s initiative to move away from London Interbank Offered Rate1continued, as Secured Overnight Financing1 (SOFR)-based floaters became more popular and accepted in the money market fund industry. Our Government Securities Money Market Fund purchased a number of SOFR-based floaters during the period.*
As of August 1, 2019, nationwide money market fund assets YTD had risen by $408.6 billion, up 12.7%.
OUTLOOK
Maintaining high-credit quality and liquidity remain the primary objectives of our money market funds. In our opinion, the Federal Reserve Board’s approach to interest rate policy going forward will be of paramount importance to investors. We do not expect the FOMC to raise rates in the near future, and believe they may well lower rates somewhat further. Against this backdrop, we will continue to position our portfolios to reflect our view of the upcoming yield environment. We believe our current maturity positioning is appropriate considering our expectations, and intend to adjust each Fund’s weighted average maturity and portfolio mix as necessary.*
| 1 | London Interbank Offered Rate (LIBOR)is a daily reference rate based on the interest rates at which banks borrow unsecured funds from other banks in the London wholesale money market.Secured Overnight Financing Rate(SOFR) is a measure of the cost of borrowing cash overnight collateralized by Treasury securities, the benchmark is fully transaction-based, founded on a robust underlying market-actual transaction level data is provided by Bank of New York Mellon and an affiliate of the Depository Trust & Clearing Corporation, DTCC Solutions LLC. |
| * | The composition of the Funds’ portfolio is subject to change. |
The performance data quoted represents past performance and does not guarantee future results. The investment return and principal value of an investment will fluctuate so that an investor’s shares, when redeemed, may be worth more or less than their original cost. Current performance may be lower or higher than the performance quoted. For performance data current to the most recent month end, please call 1-800-762-7085 or visit www.cavanalhillfunds.com.
The Cavanal Hill Limited Duration Fund(Unaudited)
Fund Goal
We pursue a strategy of broad diversification in order to benefit from investments in both corporate and government fixed-income securities as well as mortgage-backed securities (MBS) and asset-backed securities (ABS), with the Fund maintaining a dollar-weighted average duration of no longer than 3.5 years.
For the 12-month period ended August 31, 2019, the Limited Duration Fund A Shares (at NAV) returned 4.57%; Investor Shares returned 4.56%, while the Institutional Shares returned 4.94%. The Fund’s benchmark, the ICE BofA Merrill Lynch 1-5 Year U.S. Corporate/Government Index posted a total return of 5.99%.
Market Conditions
U.S. fixed income markets posted strong returns over the past 12 months, with the Bloomberg Barclays U.S. Aggregate Bond Index1returning 10.17%. The performance was remarkable given the low absolute level of interest rates. We saw large declines in Treasury yields across the curve, with the 2-year yield down 112 basis points (1.12%), the 5-year yield down 135 basis points (1.35%), the 10-year yield down 136 basis points (1.36%), and the 30-year yield down 105 basis points (1.05%). The continued strength in the U.S. dollar and the weakness in commodities led to further declines in inflation expectations, with the 10-year Treasury Inflation-Protected Securities breakeven rate falling 55 basis points (0.55%), ending the period at 1.54%.
Despite significant weakness in December 2018, corporate bonds were a star performer, with the corporate1 portion of the Aggregate bond index returning 13.33%. However, the Baa-rated portion of the Aggregate bond index returned 13.94%; high-yield corporate bonds did not fare as well, with only a 6.56% return for the Bloomberg Barclays U.S. Corporate High Yield Index1. This reflects the move by investors to the relative “safety” of investment-grade credit.
Outside of corporate credit, the returns were driven by duration. The commercial mortgage-backed securities1 portion of the Aggregate index, which shares characteristics of corporate credit, returned 10.72%. In contrast, the asset-backed securities1portion returned only 5.54% (low-duration assets), and the mortgage-backed securities1 (MBS) portion returned just 7.06% (negative convexity).
The Federal Reserve Board (the Fed) increased the federal funds rate by 0.25% in September 2018 and then another 0.25% in December 2018. The Fed has since reversed course, taking one of the hikes back in July 2019 and another 0.25% in September 2019. Though the Fed has given up on its rate hike cycle, U.S. rates remain high relative to other developed economies, contributing to the U.S. dollar’s strength.
FUND STRATEGY
We remained modestly long in the Fund. We maintained the higher-quality bias versus the benchmark as we continued to underweight Baa-rated securities. We also remained significantly underweight to the corporate sector.*
The Fund’s Institutional Shares underperformed the ICE BofA Merrill Lynch 1-5 Year U.S. Corporate/ Government Index by 105 basis points (1.05%) for the period, driven largely by the underweighting of corporate bonds, and the Baa-sector in particular. Baa-rated bonds outperformed the overall fixed-income market significantly for the year, so any underweight would have been difficult to overcome, and our exposure to the sector is very low. The Fund’s longer duration provided some help, but this was completely overwhelmed by the portfolio’s lack of corporate credit risk.*
Our large allocations to the securitized sector (agency and non-agency ABS/MBS) were a hindrance. The prepayment risk embedded in most of these securities can cause them to underperform in times of interest rate volatility.*
OUTLOOK
The Fed’s two interest rate hikes in the back half of 2018 now appear to be errors, with one hike taken back in July 2019, and the other reversed in September 2019. The extra rate hikes have warped the yield curve, causing multiple inversions across various maturities. The Fed seems relatively unconcerned with the shape of the curve and has not been inclined to lower rates quickly. The yield on the 30-year Treasury is lower than the Fed’s short-term policy rate, indicating monetary policy is currently restrictive. Restrictive monetary policy leads to slower growth and lower inflation.
While the reason for a potential oncoming recession may be classic in the sense that the Fed was too aggressive and appears to have inadvertently hastened the onset of the slowdown, we believe the outcomes are certain to be unique. Given the benign outlook priced into corporate credit and the equity market, both look to be candidates for rapid price declines.
Navigating credit risk is likely to be the largest driver of performance over the coming year. Yields are low, credit spreads are tight, and we believe the odds of the U.S. economy going into a recession are rising rapidly. Our goal is to stay very high quality and highly liquid in the portfolio, to be prepared for the any turbulence.*
| 1 | Bloomberg Barclays U.S. Aggregate Bond Indexmeasures the investment-grade, USD-denominated, fixed-rate taxable bond market, including Treasuries, government-related and corporate securities. MBS (agency fixed-rate and hybrid ARM passthroughs), ABS, and CMBS.Bloomberg Barclays U.S. Intermediate Aggregate Bond Indexrepresents securities in the intermediate maturity range from one year up to (but not including) 10 years. The securities in the index are SEC registered, taxable, and USD denominated. The index covers the U.S. investment-grade fixed-bond market, with index components for government and corporate securities, mortgage pass-through securities, and asset-backed securities. These major sectors are subdivided into more specific indexes that are calculated and reported on a regular basis.Bloomberg Barclays Corporate Investment Grade Indexcovers USD-denominated, investment-grade, fixed-rate, taxable securities sold by industrial, utility and financial issuers. It includes publicly issued U.S. corporate and foreign debentures and secured notes that meet specified maturity, liquidity, and quality requirements. Securities in the index roll up to the U.S. Credit and U.S. Aggregate indices.Bloomberg Barclays U.S. Corporate High Yield Bond Indexmeasures the USD-denominated, high-yield, fixed-rate corporate bond market. Securities are classified as high yield if the middle rating of Moody’s, Fitch and S&P is Ba1/BB+/BB+ or below. Bonds from issuers with an emerging markets (EM) country of risk, based on Barclays EM country definition, are excluded.Bloomberg Barclays U.S. Mortgage-Backed Securitiestracks agency mortgage pass-through securities (no longer incorporates hybrid ARM) guaranteed by Ginnie Mae (GNMA), Mae (FNMA), and Freddie Mac (FHLMC). The index is constructed by grouping individual TBA-deliverable MBS pools into aggregates or generics based on program, coupon and vintage. These indexes are unmanaged and do not reflect the fees and expenses associated with a mutual fund. An investor cannot invest directly in an index. |
| * | The composition of the Fund’s portfolio is subject to change. |
The performance data quoted represents past performance and does not guarantee future results. The investment return and principal value of an investment will fluctuate so that an investor’s shares, when redeemed, may be worth more or less than their original cost. Current performance may be lower or higher than the performance quoted. For performance data current to the most recent month end, please call 1-800-762-7085 or visit www.cavanalhillfunds.com.
The Cavanal Hill Limited Duration Fund(Unaudited)
Index Description
The performance of the Limited Duration Fund is measured against the ICE BofA Merrill Lynch 1-5 Year U.S. Corporate/Government Index, an unmanaged index that is comprised of investment-grade government and corporate debt securities with maturities between one- and five-years. The index does not reflect the deduction of the expenses associated with a mutual fund, such as investment management and fund accounting fees. The Fund’s performance reflects the deduction of fees for these services, but does not reflect the deduction of taxes that a shareholder would pay on fund distributions or the redemption of fund shares. Investors cannot invest directly in an index.
Investment Risks
Fixed income securities are subject to interest rate risks. The principal value of a bond falls when interest rates rise and rise when interest rates fall. During periods of rising interest rates, the value of a bond investment is at greater risk than during periods of stable or falling rates. Short-term investment-grade bonds offer less risk and generally a lower rate of return than longer-term higher-yielding bonds. Bond funds will tend to experience smaller fluctuations in value than stock funds. However, investors in any bond fund should anticipate fluctuations in price, especially for longer-term issues and in environments of changing interest rates.
For a complete description of these and other risks associated with investing in a mutual fund, please refer to the Funds’ prospectus.
Value of a $10,000 Investment
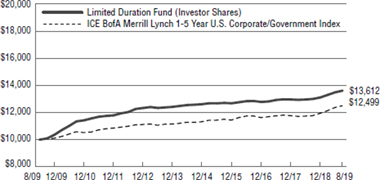
The growth of $10,000 investment chart represents a hypothetical investment in the indicated share class versus a similar investment in the Fund’s benchmark, and represents the reinvestment of distributions and capital gains.
Average Annual Total Return
| For the periods ended 8/31/19 | 1 Year | 5 Year | 10 Year |
| A Shares (at NAV)1 | 4.57% | 1.60% | 3.16% |
| A Shares (with 2.00% maximum load)1 | 2.50% | 1.19% | 2.95% |
| Investor Shares | 4.56% | 1.57% | 3.13% |
| Institutional Shares | 4.94% | 1.88% | 3.42% |
| ICE BofA Merrill Lynch 1-5 Year U.S. Corporate/Government Index | 5.99% | 2.04% | 2.26% |
| Lipper Short Investment Grade Debt Funds Average2 | 4.26% | 1.68% | 2.21% |
Expense Ratio
| | Gross |
| A Shares | 0.84% |
| Investor Shares | 0.99% |
| Institutional Shares | 0.74% |
The performance data quoted represents past performance and does not guarantee future results. The investment return and principal value of an investment will fluctuate so that an investor’s shares, when redeemed, may be worth more or less than their original cost. Current performance may be lower or higher than the performance quoted. For performance data current to the most recent month end, please call 1-800-762-7085 or visit www.cavanalhillfunds.com.
Investment performance for the Fund’s classes reflects fee waivers that have been in effect during the applicable periods. Without such waivers, the performance would have been lower. Contractual fee waivers are in effect through December 31, 2019.
The above expense ratios are from the Funds’ prospectus dated December 26, 2018. Additional information pertaining to the Funds’ expense ratios for the year ended August 31, 2019 can be found in the Financial Highlights.
| 1 | Class A Shares are subject to a 1.00% Maximum Deferred Sales Charge on shares purchased without an initial sales charge and redeemed within 12 months of purchase. Performance data does not reflect the Maximum Deferred Sales Charge. If reflected, one year performance quoted would be lower. This performance reflects the Fund’s no-Load Investor class (“Investor Shares”) for periods prior to May 2, 2011 for the A Shares. The A Shares began presenting performance linked to the Investor Class in September of 2011. Unlike Institutional Shares, Investor Shares and A Shares bear a 12b-1 fee of 0.25%. Investor Shares and Institutional Shares are subject to a Shareholder Servicing Fee of 0.25%, whereas the Shareholder Servicing Fee for A Shares is 0.10%. As indicated in the table, A Shares are also subject to a sales charge (Load). Each of these differences is reflected in the performance information. Accordingly, had the A Shares of the Fund been offered for periods before May 2, 2011, the performance information would have been different as a result of differing annual operating expenses. |
| 2 | The Lipper Mutual Funds Average is an equally weighted average of the mutual funds within their respective Lipper classification, adjusted for reinvestment of capital gains distributions and income dividends. |
The Cavanal Hill Moderate Duration Fund(Unaudited)
Fund Goal
We pursue a strategy of broad diversification in order to benefit from investments in both corporate and government fixed-income securities as well as mortgage-backed securities (MBS) and asset-backed securities (ABS), with the Fund maintaining a dollar-weighted average duration of no longer than 5 years.
For the 12-month period ended August 31, 2019, the Moderate Duration Fund A Shares (at NAV) returned 5.63%; Investor Shares returned 5.54%, while the Institutional Shares returned 5.90%. The Fund’s benchmark, the Bloomberg Barclays U.S. Intermediate Aggregate Bond Index, showed total return of 7.82%.
Market Conditions
U.S. fixed income markets posted strong returns over the past 12 months, with the Bloomberg Barclays U.S. Aggregate Bond Index1returning 10.17%. The performance was remarkable given the low absolute level of interest rates. We saw large declines in Treasury yields across the curve, with the 2-year yield down 112 basis points (1.12%), the 5-year yield down 135 basis points (1.35%), the 10-year yield down 136 basis points (1.36%), and the 30-year yield down 105 basis points (1.05%). The continued strength in the U.S. dollar and the weakness in commodities led to further declines in inflation expectations, with the 10-year Treasury Inflation-Protected Securities breakeven rate falling 55 basis points (0.55%), ending the period at 1.54%.
Despite significant weakness in December 2018, corporate bonds were a star performer, with the corporate1 portion of the Aggregate bond index returning 13.33%. However, the Baa-rated portion of the Aggregate bond index returned 13.94%; high-yield corporate bonds did not fare as well, with only a 6.56% return for the Bloomberg Barclays U.S. Corporate High Yield Index1. This reflects the move by investors to the relative “safety” of investment-grade credit.
Outside of corporate credit, the returns were driven by duration. The commercial mortgage-backed securities1 portion of the Aggregate index, which shares characteristics of corporate credit, returned 10.72%. In contrast, the asset-backed securities1portion returned only 5.54% (low-duration assets), and the mortgage-backed securities1 (MBS) portion returned just 7.06% (negative convexity).
The Federal Reserve Board (the Fed) increased the federal funds rate by 0.25% in September 2018 and then another 0.25% in December 2018. The Fed has since reversed course, taking one of the hikes back in July 2019 and another 0.25% in September 2019. Though the Fed has given up on its rate hike cycle, U.S. rates remain high relative to other developed economies, contributing to the U.S. dollar’s strength.
FUND STRATEGY
We remained modestly short in the Fund versus our benchmark. We maintained the higher-quality bias versus the benchmark as we continued to underweight Baa-rated securities. We also remained significantly underweight to the corporate sector. The Fund’s Institutional Shares underperformed Bloomberg Barclays U.S. Intermediate Aggregate Bond Index by 192 basis points (1.92%) for the period.*
Largely the underweighting of corporate bonds, and in particular, the Baa-sector, drove the Fund’s underperformance. The Baa-rated portion of the Aggregate Bond Index returned over 13% for the year, so any underweight would have been difficult to overcome, and our exposure to the sector is very low. The Fund’s shorter duration position was a headwind, though this factor was much less significant than the portfolio’s lack of exposure to corporate bonds.*
Our large allocations to the securitized sector (agency and non-agency ABS/MBS) were a hindrance. The prepayment risk embedded in most of these securities can cause them to underperform in times of interest rate volatility.*
OUTLOOK
The Fed’s two interest rate hikes in the back half of 2018 now appear to be errors, with one hike taken back in July 2019, and the other reversed in September 2019. The extra rate hikes have warped the yield curve, causing multiple inversions across various maturities. The Fed seems relatively unconcerned with the shape of the curve and has not been inclined to lower rates quickly. The yield on the 30-year Treasury is lower than the Fed’s short-term policy rate, indicating monetary policy is currently restrictive. Restrictive monetary policy leads to slower growth and lower inflation.
While the reason for a potential oncoming recession may be classic in the sense that the Fed was too aggressive and appears to have inadvertently hastened the onset of the slowdown, we believe the outcomes are certain to be unique. Given the benign outlook priced into corporate credit and the equity market, both look to be candidates for rapid price declines.
Navigating credit risk is likely to be the largest driver of performance over the coming year. Yields are low, credit spreads are tight, and we believe the odds of the U.S. economy going into a recession are rising rapidly. Our goal is to stay very high quality and highly liquid in the portfolio, to be prepared for the any turbulence.*
| 1 | Bloomberg Barclays U.S. Aggregate Bond Indexmeasures the investment-grade, USD-denominated, fixed-rate taxable bond market, including Treasuries, government-related and corporate securities. MBS (agency fixed-rate and hybrid ARM passthroughs), ABS, and CMBS.Bloomberg Barclays U.S. Intermediate Aggregate Bond Indexrepresents securities in the intermediate maturity range from one year up to (but not including) 10 years. The securities in the index are SEC registered, taxable, and USD denominated. The index covers the U.S. investment-grade fixed-bond market, with index components for government and corporate securities, mortgage pass-through securities, and asset-backed securities. These major sectors are subdivided into more specific indexes that are calculated and reported on a regular basis.Bloomberg Barclays Corporate Investment Grade Indexcovers USD-denominated, investment-grade, fixed-rate, taxable securities sold by industrial, utility and financial issuers. It includes publicly issued U.S. corporate and foreign debentures and secured notes that meet specified maturity, liquidity, and quality requirements. Securities in the index roll up to the U.S. Credit and U.S. Aggregate indices.Bloomberg Barclays U.S. Corporate High Yield Bond Indexmeasures the USD-denominated, high-yield, fixed-rate corporate bond market. Securities are classified as high yield if the middle rating of Moody’s, Fitch and S&P is Ba1/BB+/BB+ or below. Bonds from issuers with an emerging markets (EM) country of risk, based on Barclays EM country definition, are excluded.Bloomberg Barclays U.S. Mortgage-Backed Securitiestracks agency mortgage pass-through securities (no longer incorporates hybrid ARM) guaranteed by Ginnie Mae (GNMA), Mae (FNMA), and Freddie Mac (FHLMC). The index is constructed by grouping individual TBA-deliverable MBS pools into aggregates or generics based on program, coupon and vintage. These indexes are unmanaged and do not reflect the fees and expenses associated with a mutual fund. An investor cannot invest directly in an index. |
| * | The composition of the Fund’s portfolio is subject to change. |
The performance data quoted represents past performance and does not guarantee future results. The investment return and principal value of an investment will fluctuate so that an investor’s shares, when redeemed, may be worth more or less than their original cost. Current performance may be lower or higher than the performance quoted. For performance data current to the most recent month end, please call 1-800-762-7085 or visit www.cavanalhillfunds.com.
The Cavanal Hill Moderate Duration Fund(Unaudited)
Index Description
The performance of the Moderate Duration Fund is measured against the Bloomberg Barclays U.S. Intermediate Aggregate Bond Index, an unmanaged index that is representative of investment-grade debt issues with maturities from one year up to (but not including) 10 years. The index does not reflect the deduction of the expenses associated with a mutual fund, such as investment management and fund accounting fees. The Fund’s performance reflects the deduction of fees for these services, but does not reflect the deduction of taxes that a shareholder would pay on fund distributions or the redemption of fund shares. Investors cannot invest directly in an index.
Investment Risks
Fixed income securities are subject to interest rate risks. The principal value of a bond falls when interest rates rise and rise when interest rates fall. During periods of rising interest rates, the value of a bond investment is at greater risk than during periods of stable or falling rates. Intermediate-term investment-grade bonds offer less risk and generally a lower rate of return than longer-term higher-yielding bonds. Bond funds will tend to experience smaller fluctuations in value than stock funds. However, investors in any bond fund should anticipate fluctuations in price, especially for longer-term issues and in environments of changing interest rates.
For a complete description of these and other risks associated with investing in a mutual fund, please refer to the Fund’s prospectus.
Value of a $10,000 Investment
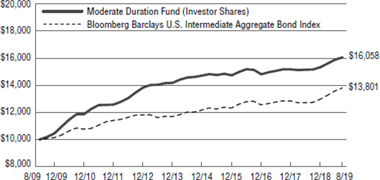
The growth of $10,000 investment chart represents a hypothetical investment in the indicated share class versus a similar investment in the Fund’s benchmark, and represents the reinvestment of distributions and capital gains.
Average Annual Total Return
| For the periods ended 8/31/19 | 1 Year | 5 Year | 10 Year |
| A Shares (at NAV)1 | 5.63% | 1.89% | 4.89% |
| A Shares (with 2.00% maximum load)1 | 3.53% | 1.47% | 4.68% |
| Investor Shares | 5.54% | 1.84% | 4.85% |
| Institutional Shares | 5.90% | 2.13% | 5.13% |
| Bloomberg Barclays U.S. Intermediate Aggregate Bond Index | 7.82% | 2.70% | 3.27% |
| Lipper Short-Intermediate Investment Grade Debt Funds Average2 | 5.38% | 1.86% | 2.79% |
Expense Ratio
| | Gross |
| A Shares | 1.20% |
| Investor Shares | 1.35% |
| Institutional Shares | 1.10% |
The performance data quoted represents past performance and does not guarantee future results. The investment return and principal value of an investment will fluctuate so that an investor’s shares, when redeemed, may be worth more or less than their original cost. Current performance may be lower or higher than the performance quoted. For performance data current to the most recent month end, please call 1-800-762-7085 or visit www.cavanalhillfunds.com.
Investment performance for the Fund’s classes reflects fee waivers that have been in effect during the applicable periods. Without such waivers, the performance would have been lower. Contractual fee waivers are in effect through December 31, 2019.
The above expense ratios are from the Funds’ prospectus dated December 26, 2018. Additional information pertaining to the Funds’ expense ratios for the year ended August 31, 2019 can be found in the Financial Highlights.
| 1 | Class A Shares are subject to a 1.00% Maximum Deferred Sales Charge on shares purchased without an initial sales charge and redeemed within 12 months of purchase. Performance data does not reflect the Maximum Deferred Sales Charge. If reflected, one year performance quoted would be lower. This performance reflects the Fund’s no-Load Investor class (“Investor Shares”) for periods prior May 2, 2011 for the A Shares. The A Shares began presenting performance linked to the Investor Class in September of 2011. Unlike Institutional Shares, Investor Shares and A Shares bear a 12b-1 fee of 0.25%. Investor Shares and Institutional Shares are subject to a Shareholder Servicing Fee of 0.25%, whereas the Shareholder Servicing Fee for A Shares is 0.10%. As indicated in the table, A Shares are also subject to a sales charge (Load). Each of these differences is reflected in the performance information. Accordingly, had the A Shares of the Fund been offered for periods before May 2, 2011, the performance information would have been different as a result of differing annual operating expenses. | |
| 2 | The Lipper Mutual Funds Average is an equally weighted average of the mutual funds within their respective Lipper classification, adjusted for reinvestment of capital gains distributions and income dividends. |
The Cavanal Hill Bond Fund(Unaudited)
Fund Goal
We pursue a strategy of broad diversification in order to benefit from investments in both corporate and government fixed-income securities as well as mortgage-backed securities (MBS) and asset-backed securities (ABS), with the Fund maintaining a dollar-weighted average maturity of three years or more, and generally no longer than 10 years.
For the 12-month period ended August 31, 2019, the Bond Fund A Shares (at NAV) returned 9.11%; the Investor Shares returned 8.96%; and the Institutional Shares returned 9.28%. The Fund’s benchmark, the Bloomberg Barclays U.S. Aggregate Bond Index, showed a total return of 10.17%.
Market Conditions
U.S. fixed income markets posted strong returns over the past 12 months, with the Bloomberg Barclays U.S. Aggregate Bond Index1returning 10.17%. The performance was remarkable given the low absolute level of interest rates. We saw large declines in Treasury yields across the curve, with the 2-year yield down 112 basis points (1.12%), the 5-year yield down 135 basis points (1.35%), the 10-year yield down 136 basis points (1.36%), and the 30-year yield down 105 basis points (1.05%). The continued strength in the U.S. dollar and the weakness in commodities led to further declines in inflation expectations, with the 10-year Treasury Inflation-Protected Securities breakeven rate falling 55 basis points (0.55%), ending the period at 1.54%.
Despite significant weakness in December 2018, corporate bonds were a star performer, with the corporate1 portion of the Aggregate bond index returning 13.33%. However, the Baa-rated portion of the Aggregate bond index returned 13.94%; high-yield corporate bonds did not fare as well, with only a 6.56% return for the Bloomberg Barclays U.S. Corporate High Yield Index1. This reflects the move by investors to the relative “safety” of investment-grade credit.
Outside of corporate credit, the returns were driven by duration. The commercial mortgage-backed securities1 portion of the Aggregate index, which shares characteristics of corporate credit, returned 10.72%. In contrast, the asset-backed securities1portion returned only 5.54% (low-duration assets), and the mortgage-backed securities1 (MBS) portion returned just 7.06% (negative convexity).
The Federal Reserve Board (the Fed) increased the federal funds rate by 0.25% in September 2018 and then another 0.25% in December 2018. The Fed has since reversed course, taking one of the hikes back in July 2019 and another 0.25% in September 2019. Though the Fed has given up on its rate hike cycle, U.S. rates remain high relative to other developed economies, contributing to the U.S. dollar’s strength.
FUND STRATEGY
We remained modestly short in the Fund versus our benchmark. We maintained the higher-quality bias versus the benchmark as we continued to underweight Baa-rated securities. We also remained significantly underweight to the corporate sector. The Fund’s Institutional Shares underperformed the Bloomberg Barclays U.S. Aggregate Bond Index by 89 basis points (0.89%) for the period.*
Largely the underweighting of corporate bonds, and in particular, the Baa-sector, drove the Fund’s underperformance. The Baa-rated portion of the Aggregate Bond Index returned over 13% for the year, so any underweight would have been difficult to overcome, and our exposure to the sector is very low. The Fund’s shorter duration position was a headwind, though this factor was much less significant than the portfolio’s lack of exposure to corporate bonds.*
Our large allocations to the securitized sector (agency and non-agency ABS/MBS) were a hindrance. The prepayment risk embedded in most of these securities can cause them to underperform in times of interest rate volatility.*
OUTLOOK
The Fed’s two interest rate hikes in the back half of 2018 now appear to be errors, with one hike taken back in July 2019, and the other reversed in September 2019. The extra rate hikes have warped the yield curve, causing multiple inversions across various maturities. The Fed seems relatively unconcerned with the shape of the curve and has not been inclined to lower rates quickly. The yield on the 30-year Treasury is lower than the Fed’s short-term policy rate, indicating monetary policy is currently restrictive. Restrictive monetary policy leads to slower growth and lower inflation.
While the reason for a potential oncoming recession may be classic in the sense that the Fed was too aggressive and appears to have inadvertently hastened the onset of the slowdown, we believe the outcomes are certain to be unique. Given the benign outlook priced into corporate credit and the equity market, both look to be candidates for rapid price declines.
Navigating credit risk is likely to be the largest driver of performance over the coming year. Yields are low, credit spreads are tight, and we believe the odds of the U.S. economy going into a recession are rising rapidly. Our goal is to stay very high quality and highly liquid in the portfolio, to be prepared for the any turbulence.*
| 1 | Bloomberg Barclays U.S. Aggregate Bond Indexmeasures the investment-grade, USD-denominated, fixed-rate taxable bond market, including Treasuries, government-related and corporate securities. MBS (agency fixed-rate and hybrid ARM passthroughs), ABS, and CMBS.Bloomberg Barclays U.S. Intermediate Aggregate Bond Indexrepresents securities in the intermediate maturity range from one year up to (but not including) 10 years. The securities in the index are SEC registered, taxable, and USD denominated. The index covers the U.S. investment-grade fixed-bond market, with index components for government and corporate securities, mortgage pass-through securities, and asset-backed securities. These major sectors are subdivided into more specific indexes that are calculated and reported on a regular basis.Bloomberg Barclays Corporate Investment Grade Indexcovers USD-denominated, investment-grade, fixed-rate, taxable securities sold by industrial, utility and financial issuers. It includes publicly issued U.S. corporate and foreign debentures and secured notes that meet specified maturity, liquidity, and quality requirements. Securities in the index roll up to the U.S. Credit and U.S. Aggregate indices.Bloomberg Barclays U.S. Corporate High Yield Bond Indexmeasures the USD-denominated, high-yield, fixed-rate corporate bond market. Securities are classified as high yield if the middle rating of Moody’s, Fitch and S&P is Ba1/BB+/BB+ or below. Bonds from issuers with an emerging markets (EM) country of risk, based on Barclays EM country definition, are excluded.Bloomberg Barclays U.S. Mortgage-Backed Securitiestracks agency mortgage pass-through securities (no longer incorporates hybrid ARM) guaranteed by Ginnie Mae (GNMA), Mae (FNMA), and Freddie Mac (FHLMC). The index is constructed by grouping individual TBA-deliverable MBS pools into aggregates or generics based on program, coupon and vintage. These indexes are unmanaged and do not reflect the fees and expenses associated with a mutual fund. An investor cannot invest directly in an index. |
| * | The composition of the Fund’s portfolio is subject to change. |
The performance data quoted represents past performance and does not guarantee future results. The investment return and principal value of an investment will fluctuate so that an investor’s shares, when redeemed, may be worth more or less than their original cost. Current performance may be lower or higher than the performance quoted. For performance data current to the most recent month end, please call 1-800-762-7085 or visit www.cavanalhillfunds.com.
The Cavanal Hill Bond Fund(Unaudited)
Index Description
The performance of the Bond Fund is measured against the Bloomberg Barclays U.S. Aggregate Bond Index, an unmanaged index that is a market value-weighted performance benchmark for investment-grade fixed-rate debt issues, including government, corporate, asset-backed and mortgage-backed securities, with maturities of at least one year. The index does not reflect the deduction of the expenses associated with a mutual fund, such as investment management and fund accounting fees. The Fund’s performance reflects the deduction of fees for these value-added services, but does not reflect the deduction of taxes that a shareholder would pay on fund distributions or the redemption of fund shares. Investors cannot invest directly in an index.
Investment Risks
Fixed income securities are subject to interest rate risks. The principal value of a bond falls when interest rates rise and rise when interest rates fall. During periods of rising interest rates, the value of a bond investment is at greater risk than during periods of stable or falling rates. Bond funds will tend to experience smaller fluctuations in value than stock funds. However, investors in any bond fund should anticipate fluctuations in price, especially for longer-term issues and in environments of changing interest rates.
For a complete description of these and other risks associated with investing in a mutual fund, please refer to the Fund’s prospectus.
Value of a $10,000 Investment
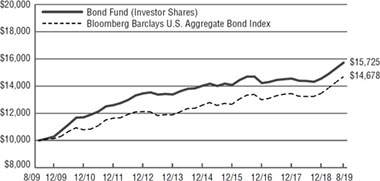
The growth of $10,000 investment chart represents a hypothetical investment in the indicated share class versus a similar investment in the Fund’s benchmark, and represents the reinvestment of distributions and capital gains.
| Average Annual Total Return | | | |
| For the periods ended 8/31/19 | 1 Year | 5 Year | 10 Year |
| A Shares (at NAV)1 | 9.11% | 2.49% | 4.65% |
| A Shares (with 2.00% maximum load)1 | 6.91% | 2.07% | 4.44% |
| Investor Shares | 8.96% | 2.49% | 4.63% |
| Institutional Shares | 9.28% | 2.72% | 4.88% |
| Bloomberg Barclays U.S. Aggregate Bond Index | 10.17% | 3.35% | 3.91% |
| Lipper Core Bond Funds Average2 | 9.43% | 3.00% | 4.08% |
| | | | |
| Expense Ratio | | | |
| | | | Gross |
| A Shares | | | 0.84% |
| Investor Shares | | | 0.99% |
| Institutional Shares | | | 0.74% |
The performance data quoted represents past performance and does not guarantee future results. The investment return and principal value of an investment will fluctuate so that an investor’s shares, when redeemed, may be worth more or less than their original cost. Current performance may be lower or higher than the performance quoted. For performance data current to the most recent month end, please call 1-800-762-7085 or visit www.cavanalhillfunds.com.
Investment performance for the Fund’s classes reflects fee waivers that have been in effect during the applicable periods. Without such waivers, the performance would have been lower. Contractual fee waivers are in effect through December 31, 2019.
The above expense ratios are from the Funds’ prospectus dated December 26, 2018. Additional information pertaining to the Funds’ expense ratios for the year ended August 31, 2019 can be found in the Financial Highlights.
| 1 | Class A Shares are subject to a 1.00% Maximum Deferred Sales Charge on shares purchased without an initial sales charge and redeemed within 12 months of purchase. Performance data does not reflect the Maximum Deferred Sales Charge. If reflected, one year performance quoted would be lower. This performance reflects the Fund’s no-Load Investor class (“Investor Shares”) for periods prior to May 2, 2011 for the A Shares. The A Shares began presenting performance linked to the Investor Class in September of 2011. Unlike Institutional Shares, Investor Shares and A Shares bear a 12b-1 fee of 0.25%. Investor Shares and Institutional Shares are subject to a Shareholder Servicing Fee of 0.25%, whereas the Shareholder Servicing Fee for A Shares is 0.10%. As indicated in the table, A Shares are also subject to a sales charge (Load). Each of these differences is reflected in the performance information. Accordingly, had the A Shares of the Fund been offered for periods before May 2, 2011, the performance information would have been different as a result of differing annual operating expenses. |
| 2 | The Lipper Mutual Funds Average is an equally weighted average of the mutual funds within their respective Lipper classification, adjusted for reinvestment of capital gains distributions and income dividends. |
The Cavanal Hill Strategic Enhanced Yield Fund (Unaudited)
Fund Goal
The Fund is designed to be an opportunistic, multi-sector fixed income investment. The investment team attempts to shift allocations into areas that we believe provide the best risk/reward profiles. The Fund typically has a meaningful allocation to mortgage-backed securities and other securitized products, and the Fund has the freedom to invest in a broad range of credit ratings and durations.
For the 12-month period ended August 31, 2019, the Strategic Enhanced Yield Fund A Shares (at NAV) returned 9.05% the Investor Shares returned 8.96% and the Institutional Shares returned 9.21% The Fund’s benchmark, the Bloomberg Barclays U.S. Aggregate Bond Index, showed a total return of 10.17%.
Market Conditions
U.S. fixed income markets posted strong returns over the past 12 months, with the Bloomberg Barclays U.S. Aggregate Bond Index1returning 10.17%. The performance was remarkable given the low absolute level of interest rates. We saw large declines in Treasury yields across the curve, with the 2-year yield down 112 basis points (1.12%), the 5-year yield down 135 basis points (1.35%), the 10-year yield down 136 basis points (1.36%), and the 30-year yield down 105 basis points (1.05%). The continued strength in the U.S. dollar and the weakness in commodities led to further declines in inflation expectations, with the 10-year Treasury Inflation-Protected Securities breakeven rate falling 55 basis points (0.55%), ending the period at 1.54%.
Despite significant weakness in December 2018, corporate bonds were a star performer, with the corporate1 portion of the Aggregate bond index returning 13.33%. However, the Baa-rated portion of the Aggregate bond index returned 13.94%; high-yield corporate bonds did not fare as well, with only a 6.56% return for the Bloomberg Barclays U.S. Corporate High Yield Index1. This reflects the move by investors to the relative “safety” of investment-grade credit.
Outside of corporate credit, the returns were driven by duration. The commercial mortgage-backed securities1 portion of the Aggregate index, which shares characteristics of corporate credit, returned 10.72%. In contrast, the asset-backed securities1portion returned only 5.54% (low-duration assets), and the mortgage-backed securities1 (MBS) portion returned just 7.06% (negative convexity).
The Federal Reserve Board (the Fed) increased the federal funds rate by 0.25% in September 2018 and then another 0.25% in December 2018. The Fed has since reversed course, taking one of the hikes back in July 2019 and another 0.25% in September 2019. Though the Fed has given up on its rate hike cycle, U.S. rates remain high relative to other developed economies, contributing to the U.S. dollar’s strength.
Fund Strategy
Given our below-consensus view of economic prospects, we had a long duration position and were heavily underweight the corporate sector. We continued to have a heavy weighting to non-agency MBS/ABS, preferring the credit risk in that sector to the corporate sector.*
The Fund’s Institutional Shares underperformed the Bloomberg Barclays U.S. Aggregate Bond Index, by 96 basis points (0.96%) this year, driven by the large underweight to the corporate sector, in particular the Baa-rated portion. Our long duration position was a tailwind as rates fell, but it was not enough to make up for the corporate underweight. The Baa-rated portion of the Aggregate Bond Index returned over 13% for the period, a very difficult number to overcome.*
Our large allocation to the securitized sector at the expense of corporates was also a headwind. The prepayment risk embedded in the securities will often cause them to underperform during times of interest rate volatility.*
Outlook
The Fed’s two interest rate hikes in the back half of 2018 now appear to be errors, with one hike taken back in July 2019, and the other reversed in September 2019. The extra rate hikes have warped the yield curve, causing multiple inversions across various maturities. The Fed seems relatively unconcerned with the shape of the curve and has not been inclined to lower rates quickly. The yield on the 30-year Treasury is lower than the Fed’s short-term policy rate, indicating monetary policy is currently restrictive. Restrictive monetary policy leads to slower growth and lower inflation.
While the reason for a potential oncoming recession may be classic in the sense that the Fed was too aggressive and appears to have inadvertently hastened the onset of the slowdown, we believe the outcomes are certain to be unique. Given the benign outlook priced into corporate credit and the equity market, both look to be candidates for rapid price declines.
Navigating credit risk is likely to be the largest driver of performance over the coming year. Yields are low, credit spreads are tight, and we believe the odds of the U.S. economy going into a recession are rising rapidly. Our goal is to stay very high quality and highly liquid in the portfolio, to be prepared for the any turbulence.*
| 1 | Bloomberg Barclays U.S. Aggregate Bond Indexmeasures the investment-grade, USD-denominated, fixed-rate taxable bond market, including Treasuries, government-related and corporate securities. MBS (agency fixed-rate and hybrid ARM passthroughs), ABS, and CMBS.Bloomberg Barclays U.S. Intermediate Aggregate Bond Indexrepresents securities in the intermediate maturity range from one year up to (but not including) 10 years. The securities in the index are SEC registered, taxable, and USD denominated. The index covers the U.S. investment-grade fixed-bond market, with index components for government and corporate securities, mortgage pass-through securities, and asset-backed securities. These major sectors are subdivided into more specific indexes that are calculated and reported on a regular basis.Bloomberg Barclays Corporate Investment Grade Indexcovers USD-denominated, investment-grade, fixed-rate, taxable securities sold by industrial, utility and financial issuers. It includes publicly issued U.S. corporate and foreign debentures and secured notes that meet specified maturity, liquidity, and quality requirements. Securities in the index roll up to the U.S. Credit and U.S. Aggregate indices.Bloomberg Barclays U.S. Corporate High Yield Bond Indexmeasures the USD-denominated, high-yield, fixed-rate corporate bond market. Securities are classified as high yield if the middle rating of Moody’s, Fitch and S&P is Ba1/BB+/BB+ or below. Bonds from issuers with an emerging markets (EM) country of risk, based on Barclays EM country definition, are excluded.Bloomberg Barclays U.S. Mortgage-Backed Securitiestracks agency mortgage pass-through securities (no longer incorporates hybrid ARM) guaranteed by Ginnie Mae (GNMA), Mae (FNMA), and Freddie Mac (FHLMC). The index is constructed by grouping individual TBA-deliverable MBS pools into aggregates or generics based on program, coupon and vintage. These indexes are unmanaged and do not reflect the fees and expenses associated with a mutual fund. An investor cannot invest directly in an index. |
| * | The composition of the Fund’s portfolio is subject to change. |
The performance data quoted represents past performance and does not guarantee future results. The investment return and principal value of an investment will fluctuate so that an investor’s shares, when redeemed, may be worth more or less than their original cost. Current performance may be lower or higher than the performance quoted. For performance data current to the most recent month end, please call 1-800-762-7085 or visit www.cavanalhillfunds.com.
The Cavanal Hill Strategic Enhanced Yield Fund (Unaudited)
Index Description
The performance of the Strategic Enhanced Yield Fund is measured against the Bloomberg Barclays U.S. Aggregate Bond Index, an unmanaged index that is a market value-weighted performance benchmark for investment-grade fixed-rate debt issues, including government, corporate, asset-backed and mortgage-backed securities, with maturities of at least one year. The index does not reflect the deduction of the expenses associated with a mutual fund, such as investment management and fund accounting fees. The Fund’s performance reflects the deduction of fees for these value-added services, but does not reflect the deduction of taxes that a shareholder would pay on fund distributions or the redemption of fund shares. Investors cannot invest directly in an index.
Investment Risks
Fixed income securities are subject to interest rate risks. The principal value of a bond falls when interest rates rise and rise when interest rates fall. During periods of rising interest rates, the value of a bond investment is at greater risk than during periods of stable or falling rates. Short-term investment-grade bonds offer less risk and generally a lower rate of return than longer-term higher-yielding bonds. Bond funds will tend to experience smaller fluctuations in value than stock funds. However, investors in any bond fund should anticipate fluctuations in price, especially for longer-term issues and in environments of changing interest rates. High-yield bonds have a higher risk of default or other adverse credit events, but have the potential to pay higher earnings over investment-grade bonds. The higher risk of default, or the inability of the creditor to repay its debt, is the primary reason for the higher interest rates on high-yield bonds.
For a complete description of these and other risks associated with investing in a mutual fund, please refer to the Fund’s prospectus.
Value of a $10,000 Investment
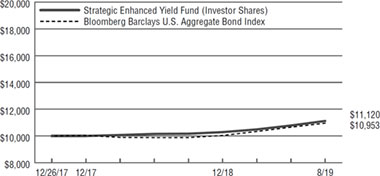
The growth of $10,000 investment chart represents a hypothetical investment in the indicated share class versus a similar investment in the Fund’s benchmark, and represents the reinvestment of distributions and capital gains.
| Average Annual Total Return | | |
| | | Since |
| | | Inception |
| For the periods ended 8/31/19 | 1 Year | (12/26/17) |
| A Shares (at NAV)1 | 9.05% | 6.29% |
| A Shares (with 2.00% maximum load)1 | 6.90% | 5.05% |
| Investor Shares | 8.96% | 6.53% |
| Institutional Shares | 9.21% | 6.56% |
| Bloomberg Barclays U.S. Aggregate Bond Index | 10.17% | 5.57% |
| Lipper Multi-Sector Income Funds Average2 | 6.88% | 3.96% |
| | | |
| Expense Ratio | | |
| | | Gross |
| A Shares | | 13.50% |
| Investor Shares | | 13.65% |
| Institutional Shares | | 13.40% |
The performance data quoted represents past performance and does not guarantee future results. The investment return and principal value of an investment will fluctuate so that an investor’s shares, when redeemed, may be worth more or less than their original cost. Current performance may be lower or higher than the performance quoted. For performance data current to the most recent month end, please call 1-800-762-7085 or visit www.cavanalhillfunds.com.
Investment performance for the Fund’s classes reflects fee waivers that have been in effect during the applicable periods. Without such waivers, the performance would have been lower. Contractual fee waivers are in effect through December 31, 2019.
The above expense ratios are from the Funds’ prospectus dated December 26, 2018. Additional information pertaining to the Funds’ expense ratios for the year ended August 31, 2019 can be found in the Financial Highlights.
| 1 | Class A Shares are subject to a 1.00% Maximum Deferred Sales Charge on shares purchased without an initial sales charge and redeemed within 12 months of purchase. Performance data does not reflect the Maximum Deferred Sales Charge. If reflected, one year performance quoted would be lower. |
| 2 | The Lipper Mutual Funds Average is an equally weighted average of the mutual funds within their respective Lipper classification, adjusted for reinvestment of capital gains distributions and income dividends. Since inception value calculated from December 31, 2017. |
The Cavanal Hill Ultra Short Tax-Free Fund (Unaudited)
Fund Goal
The goal of the Fund is to generate current income that is exempt from federal income taxes by investing primarily in a diversified portfolio of municipal securities. To pursue its objective, this Fund invests in securities exempt from federal taxes and consists of a mix of Variable Rate Demand Notes (VRDN), which provide daily or weekly liquidity, as well as fixed rate paper; the Fund will have a weighted average maturity of one year or less.
For the 12-month period ended August 31, 2019, the Ultra Short Tax-Free Fund A Shares (at NAV) returned 0.36%; the Investor Shares returned 1.35% and the Institutional Shares returned 1.50%. The Fund’s benchmark, the Bloomberg Barclays 1-Year Municipal Bond Index, showed a total return of 2.66%.
Market Conditions
It was a tale of two halves for the 12-month period ended August 31, 2019: The first half was one of optimism about the economy, as the U.S. gross domestic product (GDP)1 had grown an annualized 3.5% in the second quarter of 2018, followed by 2.9% in the third quarter. The Federal Reserve Board (the Fed) raised the overnight lending rate for the fourth time in 2018 at the December Federal Open Market Committee (FOMC) meeting and indicated that there would be more hikes in 2019.
The tone of both the market and the Fed changed once the calendar flipped to 2019. Fourth-quarter GDP, released in late January, dropped to 1.1%. The U.S.-China trade war caused further uncertainty and a flight to quality in fixed income markets. The Fed responded by indicating that not only was it unlikely to raise rates in 2019, but a cut was now likely. The Fed held off on the cut until the July 31 FOMC meeting, despite pressure from President Trump.
Yields in the short end of the municipal bond market tracked the Treasury market’s downward move as the 12-month period progressed, as yields in the 1-year fixed-rate maturity range fell about 100 basis points (1.00%) from their peak in early November.
The key opportunities in the short end of the muni market came early in the period, as yields on 1-year fixed-rate bonds reached their early November peak, before declining steadily for the rest of the period.
The variable rate demand note (VRDN) market was more volatile than usual, but it provided periodic buying opportunities: The SIMFA Index1 rate, an average of VRDN yields, peaked in late April before falling about 100 basis points (1.00%). It made another dramatic move higher in late June, followed by yields hitting their low point for the year in early July.
Deploying cash in the short end of the muni market was challenging not only due to a falling rate environment in fixed-rate securities, but also from a record pace of inflows into municipal bond funds, which created strong demand for new issuance and kept yields suppressed, especially relative to taxable alternatives.
Fund Strategy
The Fund maintained a mix of fixed-rate and variable-rate bonds throughout the period. At times during the period, it proved to be effective as VRDN rates spiked, but overall, it was ineffective relative to the Fund’s benchmark because of our shorter duration.*
Outlook
The Fed has indicated it will continue to lower the overnight lending rate if needed in the coming months. The Fed is always “data dependent,” but the trade war is clearly an important issue that both the Fed and market participants will be watching closely. Most economists see the trade war as a drag on the economy, so if it drags out, that will most likely force the Fed to continue to cut rates. However, a resolution in the near future could provide a boost for the economy and allow the Fed to pause the easing cycle. The short end of the muni market will move in conjunction with the Treasury market, so any Fed moves will affect yields on fixed-rate bonds as well as VRDNs.
The Fund will look to take advantage of any buying opportunities when they arise to extend the duration. Although the market expects the Fed to continue to cut rates, the supply/demand dynamic is a big driver in the short end of the municipal market and could present windows to help lock in attractive fixed-rate yields. Purchasing fixed-rate securities will also enable the Fund to lighten its exposure to VRDNs, whose yields will be affected by Fed rate cuts.*
| 1 | Gross Domestic Product (GDP)measures the market value of the goods and services produced by labor and property within the respective country/economic region.Securities Industry and Financial Markets Association (SIFMA) Municipal Swap Index, produced by Municipal Market Data (MMD), which is a 7-day high-grade market index comprised of tax-exempt variable rated demand obligations (VRDO’s) from MMD’s extensive database. SIFMA is a leading securities industry trade group representing securities firms, banks, and asset management companies in the U.S. and Hong Kong. |
| * | The composition of the Fund’s portfolio is subject to change. |
The performance data quoted represents past performance and does not guarantee future results. The investment return and principal value of an investment will fluctuate so that an investor’s shares, when redeemed, may be worth more or less than their original cost. Current performance may be lower or higher than the performance quoted. For performance data current to the most recent month end, please call 1-800-762-7085 or visit www.cavanalhillfunds.com.
The Cavanal Hill Ultra Short Tax-Free Fund (Unaudited)
Index Description
The performance of the Ultra Short Tax-Free Fund is measured against the Bloomberg Barclays 1-Year Municipal Bond Index, an unmanaged index that includes bonds with a minimum credit rating of BAA3, are issued as part of a deal of at least $50 million, have an amount outstanding of at least $5 million, and have maturities of 1 to 2 years. The index does not reflect the deduction of the expenses associated with a mutual fund, such as investment management and fund accounting fees. The Fund’s performance reflects the deduction of fees for these value-added services, but does not reflect the deduction of taxes that a shareholder would pay on fund distributions or the redemption of fund shares. Investors cannot invest directly in an index.
Investment Risks
Fixed income securities are subject to interest rate risks. The principal value of a bond falls when interest rates rise and rise when interest rates fall. During periods of rising interest rates, the value of a bond investment is at greater risk than during periods of stable or falling rates. Short-term investment-grade bonds offer less risk and generally a lower rate of return than longer-term higher yielding bonds. Bond funds will tend to experience smaller fluctuations in value than stock funds. However, investors in any bond fund should anticipate fluctuations in price, especially for longer-term issues and in environments of changing interest rates. The Fund’s income may be subject to certain state and local taxes and, depending on one’s tax status, to the federal alternative minimum tax.
For a complete description of these and other risks associated with investing in a mutual fund, please refer to the Fund’s prospectus.
Value of a $10,000 Investment
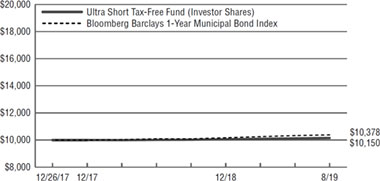
The growth of $10,000 investment chart represents a hypothetical investment in the indicated share class versus a similar investment in the Fund’s benchmark, and represents the reinvestment of distributions and capital gains.
| Average Annual Total Return | | |
| | | Since |
| | | Inception |
| For the periods ended 8/31/19 | 1 Year | (12/26/17) |
| A Shares (at NAV)1 | 0.36% | 0.28% |
| A Shares (with 1.00% maximum load)1 | -0.63% | -0.32% |
| Investor Shares | 1.35% | 0.89% |
| Institutional Shares | 1.50% | 1.28% |
| Bloomberg Barclays 1-Year Municipal Bond Index | 2.66% | 2.23% |
| Lipper Short Municipal Debt Funds Average2 | 3.01% | 2.28% |
| | | |
| Expense Ratio | | |
| | | Gross |
| A Shares | | 2.21% |
| Investor Shares | | 2.36% |
| Institutional Shares | | 2.11% |
The performance data quoted represents past performance and does not guarantee future results. The investment return and principal value of an investment will fluctuate so that an investor’s shares, when redeemed, may be worth more or less than their original cost. Current performance may be lower or higher than the performance quoted. For performance data current to the most recent month end, please call 1-800-762-7085 or visit www.cavanalhillfunds.com.
Investment performance for the Fund’s classes reflects fee waivers that have been in effect during the applicable periods. Without such waivers, the performance would have been lower. Contractual fee waivers are in effect through December 31, 2019.
The above expense ratios are from the Funds’ prospectus dated December 26, 2018. Additional information pertaining to the Funds’ expense ratios for the year ended August 31, 2019 can be found in the Financial Highlights.
| 1 | Class A Shares are subject to a 1.00% Maximum Deferred Sales Charge on shares purchased without an initial sales charge and redeemed within 12 months of purchase. Performance data does not reflect the Maximum Deferred Sales Charge. If reflected, one year performance quoted would be lower. |
| 2 | The Lipper Mutual Funds Average is an equally weighted average of the mutual funds within their respective Lipper classification, adjusted for reinvestment of capital gains distributions and income dividends. Since inception value calculated from December 31, 2017. |
The Cavanal Hill Active Core Fund (Unaudited)
Fund Goal
We seek to construct a balanced portfolio of equities and bonds that is broadly diversified to attempt to control risk. Our diversification strategy is multi-dimensional across stock and bond asset classes, growth and value styles, and small capitalization and large capitalization stocks.
For the 12-month period ended August 31, 2019, the Active Core Fund A Shares (at NAV) posted a total return of 3.59%; the C Shares returned 2.87%; the Investor Shares returned 3.67%, and the Institutional Shares returned 4.00%. The Fund’s benchmarks, the Russell 1000® Index and the Bloomberg Barclays U.S. Aggregate Bond Index, returned 2.49% and 10.17%, respectively.
Market Conditions
U.S. economic growth has remained positive, with quarterly annualized growth of 3.5% in the second quarter of 2018, followed by 2.9% in the third quarter. Although manufacturing activity has slowed substantially, unemployment remains very low and wages have increased.
Equity markets pulled back sharply in the fourth quarter of 2018 on fears that the U.S. Federal Reserve Board (the Fed) would tighten too much in the face of slower economic growth and rising trade tension. However, early in 2019, the Fed signaled its intent to be more accommodative, which boosted markets. The Fed went further in July with a 0.25% rate cut, with another cut in September 2019.
Trade issues were a major swing factor for the year. Repeatedly, signs of progress on a deal with China, or lack thereof, moved markets significantly. Foreign economies have slowed more than the U.S., leading to more stimulative policies than the U.S. Brexit also remains a market concern. The strengthening U.S. dollar and weakness in oil prices created more volatility.
U.S. equities fared better than international equities. U.S. growth stocks outperformed value stocks, while large- and mid-cap stocks posted better results than small- and micro-caps, which struggled to perform well over sustained periods. Despite brief “risk-on” rallies, the over-arching theme has been to sell small-cap stocks and buy mega caps in search of stability. Despite some market shifts, the primary theme was a preference for lower-risk, more defensive stocks over high-beta1, cyclical ones.
Fund Strategy
We maintained a diversified portfolio, continuing to emphasize equities, which made up approximately 45.9% of the Fund’s portfolio at the end of the 12-month period, compared with 50.4% at the end of August 2018. Fixed-income securities represented approximately 44.2% of the portfolio, compared with 40.6% at the end of August 2018. The rest of the Fund was in cash and mutual funds.*
Within the equity portfolio, we continued to invest in a variety of domestic U.S. and international stocks, including developed and emerging market stocks, which generally posted muted performance for the period. Within the U.S. market, large-cap stocks outperformed mid- and small-cap stocks, and growth stocks continued to outperform value stocks. The Russell 3000® Growth Index1rose 3.09% versus the total return of -0.56% for the Russell 3000® Value Index1. We maintained broad style exposure, investing in large- and mid-cap stocks within the core value and growth styles. We also held a modest allocation to non-U.S. stocks. *
Within fixed income, we maintained a higher-quality bias versus the benchmark as we continued to underweight Baa-rated securities. We also remained significantly underweight to the corporate sector. The Fund’s fixed income portion underperformed its index, driven largely by the underweighting of corporate bonds, and the Baa-sector in particular, which performed very strongly. Our large allocations to the securitized sector (agency and non-agency ABS/MBS) detracted. The prepayment risk embedded in most of these securities can cause them to underperform in times of interest rate volatility. The MBS1 portion of the Aggregate Bond Index returned only 7.06% versus 10.17% for the index overall.*
Outlook
Economic growth slowed in the U.S. and globally in 2019. The Fed’s recent willingness to cut rates points to potential economic weakness. The U.S.-China trade dispute is unresolved. The 2020 presidential campaign will complicate matters further. This environment appears to be challenging for equity returns. We believe that themes surrounding growth, profitability, and quality will perform well. However, we expect higher volatility and more muted returns. Therefore, we believe it best to reduce risk and exposure to market volatility.
While the reason for a potential recession may be classic in the sense that the Fed was too aggressive and may have inadvertently hastened the onset of the slowdown, the outcomes are certain to be unique. Given the benign outlook priced into corporate credit and the equity market, both are at risk of rapid price declines.
Navigating credit risk is likely to be critically important. Yields are low, credit spreads are tight, and we believe the odds of the U.S. economy going into a recession are rising rapidly. Our goal is to stay very high quality and highly liquid in the portfolio.*
| 1 | Betais a measure of the volatility, or systematic risk, of a security or a portfolio in comparison to the market as a whole, beta is used in the capital asset pricing model, which calculates the expected return of an asset based on its beta and expected market returns.Russell 3000® Growth Indexis a market capitalization weighted index based on the Russell 3000® Index. The Russell 3000®Growth Index includes companies that display signs of above average growth, exhibit higher price-to-book, and forecasted earnings.Russell 3000® Value Indexis a market capitalization weighted equity index maintained by the Russell Investment Group and based on the Russell 3000® Index, included in the index are stocks from the Russell 3000 with lower price-to-book ratios and lower expected growth rates.Bloomberg Barclays U.S. Mortgage-Backed Securitiestracks agency mortgage pass-through securities (no longer incorporates hybrid ARM) guaranteed by Ginnie Mae (GNMA), Mae (FNMA), and Freddie Mac (FHLMC). The index is constructed by grouping individual TBA-deliverable MBS pools into aggregates or generics based on program, coupon and vintage. These indexes are unmanaged and do not reflect the fees and expenses associated with a mutual fund. An investor cannot invest directly in an index. |
| * | The composition of the Fund’s portfolio is subject to change. |
The performance data quoted represents past performance and does not guarantee future results. The investment return and principal value of an investment will fluctuate so that an investor’s shares, when redeemed, may be worth more or less than their original cost. Current performance may be lower or higher than the performance quoted. For performance data current to the most recent month end, please call 1-800-762-7085 or visit www.cavanalhillfunds.com.
The Cavanal Hill Active Core Fund(Unaudited)
Index Description
The performance of the Active Core Fund is measured against the Russell 1000® Index and the Bloomberg Barclays U.S. Aggregate Bond Index. The Russell 1000® Index, which measures the performance of the large-cap segment of the U.S. equity universe, is a subset of the Russell 3000® Index and includes approximately 1,000 of the largest securities based on a combination of their market cap and current index membership. The Russell 1000® Index represents approximately 92% of the Russell 3000® Index. The Bloomberg Barclays U.S. Aggregate Bond Index is a market value-weighted performance benchmark for investment-grade fixed-rate debt issues, including government, corporate, asset-backed and mortgage-backed securities, with maturities of at least one year. These indexes are unmanaged and do not reflect the deduction of expenses associated with a mutual fund, such as investment management and fund accounting fees. The Fund’s performance reflects the deduction of fees for these services, but does not reflect the deduction of taxes that a shareholder would pay on fund distributions or the redemption of fund shares. Investors cannot invest directly in an index.
Investment Risks
Equity securities (stocks) are more volatile and carry more risk than other forms of investments, including investments in high-grade fixed income securities. Fixed income securities are subject to interest rate risks. The principal value of a bond falls when interest rates rise and rise when interest rates fall. During periods of rising interest rates, the value of a bond investment is at greater risk than during periods of stable or falling rates. The Fund invests in foreign and emerging market securities, which involves certain risks such as currency volatility, political and social instability, and reduced market liquidity. Mid- and small-cap companies may be more vulnerable to adverse business or economic developments. Because an ETF charges its own fees and expenses, Fund shareholders will indirectly bear these costs. The use of leverage in an ETF can magnify any price movements, resulting in high volatility. An inverse ETF seeks to provide returns that are the opposite of the underlying referenced financial asset, index, or commodity’s returns. Exposure to commodities may subject the Fund to greater volatility than investments in traditional securities.
For a complete description of these and other risks associated with investing in a mutual fund, please refer to the Fund’s prospectus.
Value of a $10,000 Investment
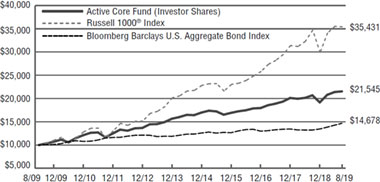
The growth of $10,000 investment chart represents a hypothetical investment in the indicated share class versus a similar investment in the Fund’s benchmark, and represents the reinvestment of distributions and capital gains.
| Average Annual Total Return | | | |
| For the periods ended 8/31/19 | 1 Year | 5 Year | 10 Year |
| A Shares (at NAV)1 | 3.59% | 5.13% | 7.92% |
| A Shares (with 2.00% maximum load)1 | 1.49% | 4.71% | 7.71% |
| C Shares1 | 2.87% | 4.44% | 7.58% |
| Investor Shares | 3.67% | 5.22% | 7.98% |
| Institutional Shares | 4.00% | 5.45% | 8.23% |
| Russell 1000® Index | 2.49% | 9.85% | 13.49% |
| Bloomberg Barclays U.S. Aggregate Bond Index | 10.17% | 3.35% | 3.91% |
| Lipper Mixed-Asset Target Allocation Moderate Funds Average2 | 2.98% | 4.32% | 7.21% |
| | | | |
| Expense Ratio | | | |
| | | | Gross |
| A Shares | | | 1.24% |
| C Shares | | | 2.14% |
| Investor Shares | | | 1.39% |
| Institutional Shares | | | 1.14% |
The performance data quoted represents past performance and does not guarantee future results. The investment return and principal value of an investment will fluctuate so that an investor’s shares, when redeemed, may be worth more or less than their original cost. Current performance may be lower or higher than the performance quoted. For performance data current to the most recent month end, please call 1-800-762-7085 or visit www.cavanalhillfunds.com.
Investment performance for the Fund’s classes reflects fee waivers that have been in effect during the applicable periods. Without such waivers, the performance would have been lower. Contractual fee waivers are in effect through December 31, 2019.
The above expense ratios are from the Funds’ prospectus dated December 26, 2018. Additional information pertaining to the Funds’ expense ratios for the year ended August 31, 2019 can be found in the Financial Highlights.
| 1 | Class A Shares and C Shares are subject to a 1.00% Maximum Deferred Sales Charge on shares purchased without an initial sales charge and redeemed within 12 months of purchase. Performance data does not reflect the Maximum Deferred Sales Charge. If reflected, one year performance quoted would be lower. Class A Shares and Class C Shares performance reflects the Fund’s no-Load Investor class (“Investor Shares”) for periods prior May 2, 2011 and December 31, 2014, respectively. The A Shares and C Shares began presenting performance linked to the Investor Class in September of 2011 and since inception, respectively. Unlike Institutional Shares, Investor Shares and A Shares bear a 12b-1 fee of 0.25%, and C Shares bear a 12b-1 fee of 1.00%. Investor Shares, Institutional Shares and C Shares are subject to a Shareholder Servicing Fee of 0.25%, whereas the Shareholder Servicing Fee for A Shares is 0.10%. As indicated in the table, A Shares are also subject to a sales charge (Load). Each of these differences are reflected in the performance information. Accordingly, had A Shares and C Shares of the Fund been offered for periods May 2, 2011 and December 31, 2014, respectively, the performance information would have been different as a result of differing annual operating expenses. |
| 2 | The Lipper Mutual Funds Average is an equally weighted average of the mutual funds within their respective Lipper classification, adjusted for reinvestment of capital gains distributions and income dividends. |
The Cavanal Hill Mid Cap Core Equity Fund(Unaudited)
Fund Goal
We seek to provide total return, net of taxes, by investing at least 80% of net assets in a diversified portfolio of common stocks of mid-cap U.S. companies. The Fund defines Mid-Cap securities as those that are included in the Russell MidCap® Index at the time of purchase.
For the 12-month period ended August 31, 2019, the Mid Cap Core Equity Fund’s A Shares (at NAV) posted a total return of -1.50%; the C Shares returned -1.51%; the Investor Shares returned -1.59% and the Institutional Shares posted a total return of -1.32%. The Fund’s benchmark, the Russell MidCap® Index returned 0.54%.
Markets were strong over this period so any cash holdings were a drag on performance. In terms of specific stocks and sectors, homebuilders and retail/apparel stocks were the primary reason for the Fund’s relative underperformance.*
Market Conditions
U.S. economic growth has remained positive, with quarterly annualized growth of 3.1% in the first quarter of 2019, followed by 2.0% in the second quarter. Manufacturing activity has slowed substantially, but unemployment remains very low and wages have increased.
Equity markets pulled back sharply in the fourth quarter of 2018 on fears that the U.S. Federal Reserve Board (the Fed) would tighten too much in the face of slower economic growth and rising trade tension. However, early in 2019, the Fed signaled its intent to be more accommodative, which boosted markets. The Fed went further in July with a 0.25% rate cut, with another cut in September 2019.
Trade issues were a major swing factor for the year. Repeatedly, signs of progress on a deal with China, or lack thereof, moved markets significantly. The strengthening U.S. dollar and weakness in oil prices created more volatility.
U.S. equities fared better than international equities. U.S. growth stocks tended to outperform value stocks. Large- and mid-cap stocks also posted better results than small- and micro-caps. Despite some market shifts, the primary theme was a preference for lower-risk, more defensive stocks over high-beta1, cyclical ones. Utilities and consumer staples led while materials and energy lagged. Overall, investors sought safety in defensive, large-and mega-cap growth stocks.
Foreign economies have slowed more than the U.S., leading to more stimulative policies than the U.S. Brexit remains a market concern along with U.S.- China trade tensions.
Cyclical, higher-risk areas of the market lagged, with the energy and materials sectors trailing by a wide margin. Healthcare was hurt by potential fallout from the 2020 election. Small caps struggled to perform well over sustained periods. Despite brief “risk-on” rallies, the over-arching theme has been to sell small-cap stocks and buy mega caps in search of stability.
FUND STRATEGY
This year we sought exposure to areas that would benefit from continued economic activity, but that are less sensitive to a cyclical slowdown. We are in line with the benchmark in terms of market cap. We leaned on sector overweights to technology and industrials, with a slight overweight to healthcare. Conversely, we had underweights to utilities, financials, and consumer discretionary. Overall, sector allocation netted out close to zero. Utilities were surprisingly strong, and an underweight in that sector had a more negative impact.*
Our style allocation, on the other hand, contributed. Exposure to growth, lower risk, and momentum themes was positive. A tilt toward more profitable companies hurt performance, but in total, style allocations added 133 basis points (1.33%).*
Despite the negative sentiment in healthcare caused by 2020 election pressures, our stock picks in that sector contributed and our technology stocks performed well. We had more difficulties in cyclical, value sectors, including energy, financials, and industrials, where trade, tariffs, and Fed policies separated winners from losers. All in all, the Institutional Shares underperformed the benchmark by 1.86%.*
Sector overweights to industrials and technology contributed the most. They benefited as the market favored lower-risk, higher-growth stocks. The leading individual contributions came from technology as investors bid up Match Group, Fiserv, and Cadence Design Systems.*
Sector underweights to discretionary and materials had the most negative influence. The U.S.-China trade dispute hurt these sectors, leading to uncertain prospects. The decline in oil prices hurt mid-cap energy stocks.*
OUTLOOK
Economic growth slowed in the U.S. and globally in 2019. U.S. housing remains lackluster, manufacturing activity has slowed, and foreign economies are on even shakier ground. The Fed’s willingness to cut rates earlier than expected points to potential economic weakness. The U.S.-China trade dispute is unresolved. The 2020 presidential campaign will complicate matters further. This environment appears to be challenging for equity returns, especially as markets are near all-time highs. We believe that themes surrounding growth, profitability, and quality will continue to outperform. However, we expect higher volatility and more muted returns.
A more accommodative Fed may help to bolster markets, but we believe that it is prudent to favor high-quality, lower-risk, more-profitable companies. We will seek a more opportunistic environment early in 2020. However, for now, we believe it best to reduce risk and exposure to market volatility.
| 1 | Betais a measure of the volatility, or systematic risk, of a security or a portfolio in comparison to the market as a whole, beta is used in the capital asset pricing model, which calculates the expected return of an asset based on its beta and expected market returns. |
| * | The composition of the Fund’s portfolio is subject to change. Please refer to the Fund’s Schedule of Portfolio Investments for additional information regarding specific holdings. |
The performance data quoted represents past performance and does not guarantee future results. The investment return and principal value of an investment will fluctuate so that an investor’s shares, when redeemed, may be worth more or less than their original cost. Current performance may be lower or higher than the performance quoted. For performance data current to the most recent month end, please call 1-800-762-7085 or visit www.cavanalhillfunds.com.
The Cavanal Hill Mid Cap Core Equity Fund(Unaudited)
Index Description
The performance of the Mid Cap Core Equity Fund is measured against the Russell Midcap® Index, which tracks the performance of the mid-cap segment of the U.S. equity universe. The Russell Midcap® Index is a subset of the Russell 1000® Index. It includes approximately 800 of the smallest securities based on a combination of their market cap and current index membership. The Russell Midcap® Index represents approximately 27% of the total market capitalization of the Russell 1000 companies. The index is unmanaged and does not reflect the deduction of the expenses associated with a mutual fund, such as investment management and fund accounting fees. The Fund’s performance reflects the deduction of fees for these services, but does not reflect the deduction of taxes that a shareholder would pay on fund distributions or the redemption of fund shares. Investor cannot invest directly in an index.
Investment Risks
Equity securities (stocks) are more volatile and carry more risk than other forms of investments, including investments in high-grade fixed income securities. The value of the Fund’s investments may decline due to an increase in interest rates. In general, the longer a security’s maturity, the greater the interest rate risk. The Fund’s yield may decrease due to a decline in interest rates. International investing involves increased risk and volatility. Mid- and small-cap companies may be more vulnerable to adverse business or economic developments.
For a complete description of these and other risks associated with investing in a mutual fund, please refer to the Fund’s prospectus.
Value of a $10,000 Investment

The growth of $10,000 investment chart represents a hypothetical investment in the indicated share class versus a similar investment in the Fund’s benchmark, and represents the reinvestment of distributions and capital gains.
| Average Annual Total Return | | |
| | | Since |
| | | Inception |
| For the periods ended 8/31/19 | 1 Year | (12/30/16) |
| A Shares (at NAV)1 | -1.50% | 6.53% |
| A Shares (with 2.00% maximum load)1 | -3.44% | 5.74% |
| C Shares1 | -1.51% | 5.39% |
| Investor Shares | -1.59% | 6.47% |
| Institutional Shares | -1.32% | 6.68% |
| Russell MidCap® Index | 0.54% | 9.97% |
| Lipper Mid-Cap Core Funds Average2 | -3.42% | 6.41% |
| | | |
| Expense Ratio | | |
| | | Gross |
| A Shares | | 6.24% |
| C Shares | | 27.23% |
| Investor Shares | | 5.32% |
| Institutional Shares | | 7.35% |
The performance data quoted represents past performance and does not guarantee future results. The investment return and principal value of an investment will fluctuate so that an investor’s shares, when redeemed, may be worth more or less than their original cost. Current performance may be lower or higher than the performance quoted. For performance data current to the most recent month end, please call 1-800-762-7085 or visit www.cavanalhillfunds.com.
Investment performance for the Fund’s classes reflects fee waivers that have been in effect during the applicable periods. Without such waivers, the performance would have been lower. Contractual fee waivers are in effect through December 31, 2019.
The above expense ratios are from the Funds’ prospectus dated December 26, 2018. Additional information pertaining to the Funds’ expense ratios for the year ended August 31, 2019 can be found in the Financial Highlights.
| 1 | Class A Shares and C Shares are subject to a 1.00% Maximum Deferred Sales Charge on shares purchased without an initial sales charge and redeemed within 12 months of purchase. Performance data does not reflect the Maximum Deferred Sales Charge. If reflected, one year performance quoted would be lower. |
| 2 | The Lipper Mutual Funds Average is an equally weighted average of the mutual funds within their respective Lipper classification, adjusted for reinvestment of capital gains distributions and income dividends. |
The Cavanal Hill Opportunistic Fund(Unaudited)
Fund Goal
We pursue positive investment returns by opportunistically investing in equities, real estate investment trusts (REITs), fixed income securities, preferred stocks, ETFs (exchange traded funds, which may include leveraged and inverse ETFs), options, commodities, and money market funds. The Fund’s management team will consider all asset classes and may invest in domestic as well as international securities. The team pursues investment opportunities with the most attractive risk/return profiles.
For the 12-month period ended August 31, 2019, the Opportunistic Fund’s A Shares (at NAV) returned -9.24%; the C Shares returned -9.95%; the Investor Shares returned -9.28%, and the Institutional Shares returned -9.10%. The Fund’s benchmarks, the S&P 500 Index and the HFRX Equity Hedge Index, posted total returns of 2.92% and -3.85%, respectively.
Market Conditions
The backdrop to financial market performance for the fiscal year ended August 31, 2019 was one of continued U.S. economic growth, but with hints of a slowdown, influenced by slowing global growth, exacerbated by U.S.-China trade tensions. Market sentiment was both heavily influenced by and affected central bank policy; a late 2018 spike in volatility led the U.S. Federal Reserve Board (the Fed) to adopt a more dovish stance. Early in 2019, the Fed sent a clear signal that it would be more accommodative. The Fed took a step further in July, with a quarter-point interest rate cut, reversing course from the monetary tightening it began in December 2015. These more dovish signals drove positive equity returns for 2019 year to date.
FUND STRATEGY
We believe attractive investment opportunities often arise where Wall Street research is lacking. We use bottom-up research to identify opportunities and we adjust the Fund’s level of exposure to risk assets accordingly, which can lead to fluctuations of the Fund’s net risk exposure over time.*
We may use ETFs to hedge the Fund’s long positions, and we may use options on indices or ETFs to hedge a portion of the portfolio. When opportunities are scarce, we also may raise cash to lower our net market exposure. We track and modulate the Fund’s stock market exposure based on our view of market conditions and investment opportunities.*
We were much more tactical than earlier in the current expansion, now at a record duration. The Fund increased its net equity holdings late in the fourth quarter of 2018, which hurt performance. We also took advantage of downside volatility at year-end 2018 to position for a rebound, which occurred early in 2019. As the year progressed, we reduced our net equity exposure significantly.*
We concentrated our equity exposure primarily on cyclically sensitive sectors, with a mix of value and growth stocks. The Fund bought higher-yielding corporate debt and preferred securities to provide a foundation for some income and protection from equity volatility. We also held a higher level of cash for much of the year in anticipation of more volatility.*
The Fund underperformed the HFRX Equity Hedge Index for the one-year period. The primary reason was the Fund’s tactical asset allocation in the fourth quarter of 2018. As we increased our long equity position, the Federal Reserve Board Chairman Powell made comments related to interest rate expectations that were viewed negatively, leading to equity market turmoil.*
Typically, much of the Fund’s equity allocation goes to small- and mid-cap stocks, which underperformed dramatically in late 2018. The healthcare sector was particularly challenging as most of our exposure was in specialty pharmaceuticals that develop new drugs and therapies to counter chronic or orphan diseases. These are typically higher-risk, small-cap companies. A few electronic gaming stocks detracted on negative news regarding competitive threats.*
Offsetting that, information technology stocks had the largest positive impact on performance. Numerous semiconductor and software stocks, including firms focused on cyber security threats, contributed. The largest individual stock contributors included a small waste-management services company that agreed to be acquired, and an online dating and matchmaking firm.*
A few corporate bond holdings generated double-digit returns from lower interest rates and tighter credit spreads. This included a U.S. petroleum refining company and a firm providing technology to the global rail industry.*
OUTLOOK
Despite strong equity market returns for 2019 year-to-date, we see recent volatility as a warning. The market is benefiting from the Fed’s shift toward lower interest rates.
Earnings per share have come under pressure. Going forward, earnings growth could be turbulent based in part on a tough comparison with 2018, when profits were boosted by the tax cut. Bolstering stock valuations is the unhealthy global bond market, where $13 trillion+ of debt carries a negative interest rate.
Risks include U.S.-China trade tensions, the 2020 U.S. election, and Middle East risks. Corporate managers are also likely reigning in investment because of the near-term lack of clarity.
| * | The composition of the Fund’s portfolio is subject to change. |
The performance data quoted represents past performance and does not guarantee future results. The investment return and principal value of an investment will fluctuate so that an investor’s shares, when redeemed, may be worth more or less than their original cost. Current performance may be lower or higher than the performance quoted. For performance data current to the most recent month end, please call 1-800-762-7085 or visit www.cavanalhillfunds.com.
The Cavanal Hill Opportunistic Fund(Unaudited)
Index Description
The performance of the Opportunistic Fund is measured against the S&P 500 Index and the HFRX Equity Hedge Index. The S&P 500 is regarded as a gauge of the U.S. equities market, this index includes 500 leading companies in leading industries of the U.S. economy. Although the S&P 500 focuses on the large-cap segment of the market, with approximately 75% coverage of U.S. equities, it is also an ideal proxy for the total market. The Hedge Fund Research, Inc. (HFR) utilizes a UCITSIII compliant methodology to construct the HFRX Hedge Fund Indices. The methodology is based on defined and predetermined rules and objective criteria to select and rebalance components to maximize representation of the Hedge Fund Universe. HFRX Indices utilize state-of-the-art quantitative techniques and analysis; multi-level screening, cluster analysis, Monte-Carlo simulations and optimization techniques ensure that each Index is a pure representation of its corresponding investment focus. These indices are unmanaged and do not reflect the deduction of expenses associated with a mutual fund, such as investment management and fund accounting fees. The Fund’s performance reflects the deduction of fees for these services, but does not reflect the deduction of taxes that a shareholder would pay on fund distributions or the redemption of fund shares. Investors cannot invest directly in an index.
Investment Risks
Equity securities (stocks) are more volatile and carry more risk than other forms of investments, including investments in high-grade fixed income securities. Investments in the Fund are subject to the risks related to direct investment in real estate, such as real estate risk, regulatory risks, concentration risk, and diversification risk. Fixed income securities are subject to interest rate risks. The principal value of a bond falls when interest rates rise and rise when interest rates fall. During periods of rising interest rates, the value of a bond investment is at greater risk than during periods of stable or falling rates. International investing involves increased risk and volatility. Mid- and small-cap companies may be more vulnerable to adverse business or economic developments. The ETFs in which the Funds invest are subject to the risks applicable to the types of securities and investments used by the ETFs. Because an ETF charges its own fees and expenses, Fund shareholders will indirectly bear these costs. The use of leverage in an ETF can magnify any price movements, resulting in high volatility. An inverse ETF seeks to provide returns that are the opposite of the underlying referenced financial asset, index, or commodity’s returns. Exposure to commodities may subject the Fund to greater volatility than investments in traditional securities.
For a complete description of these and other risks associated with investing in a mutual fund, please refer to the Fund’s prospectus.
Value of a $10,000 Investment
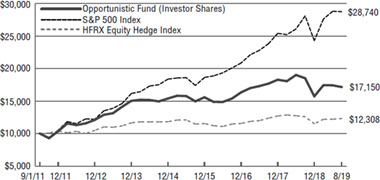
The growth of $10,000 investment chart represents a hypothetical investment in the indicated share class versus a similar investment in the Fund’s benchmark, and represents the reinvestment of distributions and capital gains.
| Average Annual Total Return | | | |
| | | | Since |
| | | | Inception |
| For the periods ended 8/31/19 | 1 Year | 5 Year | (9/1/11) |
| A Shares (at NAV)1 | -9.24% | 2.39% | 7.02% |
| A Shares (with 2.00% maximum load)1 | -11.08% | 1.98% | 6.76% |
| C Shares1 | -9.95% | 1.67% | 6.52% |
| Investor Shares | -9.28% | 2.38% | 6.98% |
| Institutional Shares | -9.10% | 2.64% | 7.29% |
| S&P 500 Index | 2.92% | 10.11% | 14.11% |
| HFRX Equity Hedge Index | -3.85% | 0.83% | 1.88% |
| Lipper Absolute Return Funds Average2 | 1.00% | 1.55% | 2.43% |
| | | | |
| Expense Ratio | | | |
| | | | Gross |
| A Shares | | | 1.73% |
| C Shares | | | 2.63% |
| Investor Shares | | | 1.88% |
| Institutional Shares | | | 1.63% |
The performance data quoted represents past performance and does not guarantee future results. The investment return and principal value of an investment will fluctuate so that an investor’s shares, when redeemed, may be worth more or less than their original cost. Current performance may be lower or higher than the performance quoted. For performance data current to the most recent month end, please call 1-800-762-7085 or visit www.cavanalhillfunds.com.
Investment performance for the Fund’s classes reflects fee waivers that have been in effect during the applicable periods. Without such waivers, the performance would have been lower. Contractual fee waivers are in effect through December 31, 2019.
The above expense ratios are from the Funds’ prospectus dated December 26, 2018. Additional information pertaining to the Funds’ expense ratios for the year ended August 31, 2019 can be found in the Financial Highlights.
Certain returns shown include monies received by the Fund in respect to one-time class action settlements. As a result, the Fund’s total returns for those periods were higher than they would have been had the Fund not received the payments.
| 1 | Class A Shares and C Shares are subject to a 1.00% Maximum Deferred Sales Charge on shares purchased without an initial sales charge and redeemed within 12 months of purchase. Performance data does not reflect the Maximum Deferred Sales Charge. If reflected, one year performance quoted would be lower. Class C Shares performance reflects the Fund’s no-Load Investor class (“Investor Shares”) for periods prior to December 31, 2014. Unlike Investor Shares, which bear a 12b-1 fee of 0.25%, C Shares bear a 12b-1 fee of 1.00%. This difference is reflected in the performance information. Accordingly, had the C Shares of the Fund been offered for periods prior to December 31, 2014, the performance information would have been different as a result of differing annual operating expenses. |
| 2 | The Lipper Mutual Funds Average is an equally weighted average of the mutual funds within their respective Lipper classification, adjusted for reinvestment of capital gains distributions and income dividends. Since inception value calculated from August 31, 2011. |
The Cavanal Hill World Energy Fund(Unaudited)
Fund Goal
We seek to provide growth and income by primarily investing net assets in a wide range of energy related financial instruments issued in the U.S. and markets around the world. Investments typically include a combination of common stock, bonds and exchange traded funds (“ETFs”) but may also include other asset types that are related to energy industry activities. The team pursues investment opportunities with attractive risk/return profiles.
Ability to invest in any proportion
0 to 100% Equity
0 to 100% Fixed Income
0 to 25% Master Limited Partnership
For the 12-month period ended August 31, 2019, the World Energy Fund’s A Shares (at NAV) posted a total return of -28.35%; the C Shares returned -28.82%; the Investor Shares returned -28.27% and the Institutional Shares posted a total return of -28.12%. The Fund’s benchmarks, the S&P 500 Index and the MSCI World Energy Index returned 2.92% and -17.46%, respectively.
The Fund underperformed the MSCI World Energy Index largely because of its allocation to stocks in the alternative energy space, exploration and production, and oil field service industries. This was partly offset by the Fund’s allocation to fixed income assets and cash.*
The Fund also trailed the large-cap Russell 1000® Energy Index1, which returned -21.98%, and outperformed the small-cap Russell 2000® Energy Index1, which returned -48.86%.
Oil Market Backdrop
Oil prices struggled globally during the past 12 months, with the commodities falling in price by more than 20%. Despite renewed production cuts from OPEC2+ Russia in December 2018, oil prices remained under pressure due to global trade concerns as well as slowing global growth.
Market participants were pessimistic about near-term oil prices largely because of demand-supply related to compliance with the OPEC+ Russia production cuts as well as slowing demand growth driven by weakening economic activity, exacerbated by the US-China trade war. Longer-date crude oil prices were also subdued as investors view continued future excess supply from U.S. shale reserves.
Additionally, crude oil that had been discounted in the Permian basin due to limited takeaway capacity is perking back up as new pipeline capacity is being added to the Permian basin, which could flood an already oversaturated market. Further, 2020 is expected to be a year of significant global supply growth, particularly in the Golden Triangle–Gulf of Mexico, western Africa, and eastern Brazil–as well as the North Sea.
Compounding this further, with sanctions against Iran having reduced Iranian exports by well over 1 million barrels per day, any easing of tensions between Iran and the West could lead to this supply being added back to the market, further flooding an already well-supplied market.
FUND STRATEGY*
The Fund is able to invest in a variety of instruments, including common stocks, fixed income securities, and master limited partnerships (MLPs). We allocate the Fund’s assets in search of the best opportunities based on our view of commodity prices and the relative attractiveness of the energy sector’s various subsectors.*
At the beginning of the fiscal year, the Fund was positioned fairly bullishly based on our view that OPEC+ production cuts were likely and would support prices. Early in 2019, we moved to a more defensive position as global demand slowed due in part to the US-China trade war.*
As a result, the Fund is now positioned as follows compared with the Russell 3000® Energy Index1:
| ● | Underweight integrated oil & gas, typical of a diversified fund; |
| ● | Underweight oil & gas drilling, equipment, and services, as we believe there exists too much drilling and service capacity globally; |
| ● | Underweight exploration and production companies as we are focused on companies that we believe can generate free cash flow and that have strong balance sheets. |
| ● | Overweight refining, as we believe refineries are likely to benefit from the IMO 2020 (International Maritime Organization) shipping regulations; |
| ● | Overweight midstream assets as we see increasing domestic production of oil and gas, and the need to transport that production to consuming regions; |
| ● | We continue to have a substantial (mid-teens percentage) allocation to alternative energy based on long-term trends. However, we have reduced our investments to wind energy because of uncertainty related to the U.S.-China trade dispute. |
| ● | We also have a substantial defensive allocation to utilities. These stocks’ dividends should provide stability to the Fund should economic conditions deteriorate. |
| ● | Finally, we have about 11% of our assets in cash and fixed income as a defensive move. |
OUTLOOK
We believe Brent crude is likely to average $55-75 a barrel over the next few years. Lower prices would increase our interest in oil-related equities, while prices above that range would likely lead us to reduce risk.*
We see opportunities in the refining sector as IMO 2020 (International Maritime Organization) regulations reduce the demand for high-sulfur fuel oils and increase demand for low-sulfur products. The midstream space is attractive as valuations have declined and the transportation of natural gas, crude oil, and refined products offers attractive growth opportunities. We continue to see opportunities in alternative energy related to the electrification of the automobile industry.*
| 1 | Russell 1000®, 2000® and 3000® Energy Indexesare designed to represent the performance of companies within specific sectors of the Russell 1000®, 2000® and 3000® Indices. These indexes are unmanaged and do not reflect the fees and expenses associated with a mutual fund. An investor cannot invest directly in an index. |
| 2 | Organization of the Petroleum Exporting Countries (“OPEC”)is a permanent intergovernmental organization of 14 oil-exporting developing nations that coordinates and unifies the petroleum policies of its Member Countries. |
| * | The composition of the Fund’s portfolio is subject to change. |
The performance data quoted represents past performance and does not guarantee future results. The investment return and principal value of an investment will fluctuate so that an investor’s shares, when redeemed, may be worth more or less than their original cost. Current performance may be lower or higher than the performance quoted. For performance data current to the most recent month end, please call 1-800-762-7085 or visit www.cavanalhillfunds.com.
The Cavanal Hill World Energy Fund(Unaudited)
Index Description
The World Energy Fund performance is measured against the S&P 500 Index and the MSCI World Energy Index. The S&P 500 Index is regarded as a gauge of the U.S. equities market; this index includes 500 leading companies in leading industries of the U.S. economy. Although the S&P 500 focuses on the large-cap segment of the market, with approximately 75% coverage of U.S. equities, it is also an ideal proxy for the total market. The MSCI World Energy Index captures the large- and mid-cap segments across 23 developed markets and includes securities classified in the energy sector per Global Industry Classification Standard. These indexes are unmanaged and do not reflect the deduction of expenses associated with a mutual fund, such as investment management and fund accounting fees. The Fund’s performance reflects the deduction of fees for these services, but does not reflect the deduction of taxes that a shareholder would pay on fund distributions or the redemption of fund shares. Investors cannot invest directly in an index.
Investment Risks
Equity securities (stocks) are more volatile and carry more risk than other forms of investments, including investments in below investment-grade fixed income securities. Fixed income securities are subject to interest rate risks. The principal value of a bond falls when interest rates rise and rise when interest rates fall. During periods of rising interest rates, the value of a bond investment is at greater risk than during periods of stable or falling rates. The Fund invests in foreign and emerging market securities, which involves certain risks such as currency volatility, political and social instability, and reduced market liquidity. Mid- and small-cap companies may be more vulnerable to adverse business or economic developments. Concentration in energy-related industry securities may present more risks than would be the case with funds that diversify investments in numerous industries and sectors of the economy. A downturn in the energy sectors would have a larger impact on the Fund than on a fund that does not concentrate in these industries. Energy sector securities can be significantly affected by events related to political developments, energy conservation, commodity prices, and tax and government regulations. The performance of securities in the Fund may, at times, lag the performance of companies in other sectors or the broader market as a whole. Emerging market investing may be subject to additional economic, political, liquidity, and currency risks not associated with more developed countries.
For a complete description of these and other risks associated with investing in a mutual fund, please refer to the Fund’s prospectus.
Value of a $10,000 Investment
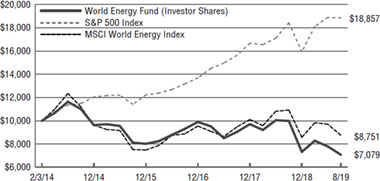
The growth of $10,000 investment chart represents a hypothetical investment in the indicated share class versus a similar investment in the Fund’s benchmark, and represents the reinvestment of distributions and capital gains.
| Average Annual Total Return | | | |
| | | | Since |
| | | | Inception |
| For the periods ended 8/31/19 | 1 Year | 5 Year | (2/3/14) |
| A Shares (at NAV)1 | -28.35% | -9.48% | -6.00% |
| A Shares (with 2.00% maximum load)1 | -29.76% | -9.84% | -6.34% |
| C Shares1 | -28.82% | -10.12% | -6.68% |
| Investor Shares | -28.27% | -9.49% | -6.01% |
| Institutional Shares | -28.12% | -9.22% | -5.74% |
| S&P 500 Index | 2.92% | 10.11% | 12.05% |
| MSCI World Energy Index | -17.46% | -6.26% | -2.37% |
| Lipper Global Natural Resources Funds Average2 | -15.50% | -7.35% | -4.42% |
| | | | |
| Expense Ratio | | | |
| | | | Gross |
| A Shares | | | 1.42% |
| C Shares | | | 2.32% |
| Investor Shares | | | 1.57% |
| Institutional Shares | | | 1.32% |
The performance data quoted represents past performance and does not guarantee future results. The investment return and principal value of an investment will fluctuate so that an investor’s shares, when redeemed, may be worth more or less than their original cost. Current performance may be lower or higher than the performance quoted. For performance data current to the most recent month end, please call 1-800-762-7085 or visit www.cavanalhillfunds.com.
Investment performance for the Fund’s classes reflects fee waivers that have been in effect during the applicable periods. Without such waivers, the performance would have been lower. Contractual fee waivers are in effect through December 31, 2019.
The above expense ratios are from the Funds’ prospectus dated December 26, 2018. Additional information pertaining to the Funds’ expense ratios for the year ended August 31, 2019 can be found in the Financial Highlights.
| 1 | Class A Shares and C Shares are subject to a 1.00% Maximum Deferred Sales Charge on shares purchased without an initial sales charge and redeemed within 12 months of purchase. Performance data does not reflect the Maximum Deferred Sales Charge. If reflected, one year performance quoted would be lower. |
| 2 | The Lipper Mutual Funds Average is an equally weighted average of the mutual funds within their respective Lipper classification, adjusted for reinvestment of capital gains distributions and income dividends. Since inception value calculated from January 31, 2014. |
| Statements of Assets and Liabilities |
| August 31, 2019 |
| | | U.S. Treasury
Fund | | | Government
Securities
Money Market | |
| Assets: | | | | |
| Investments, at cost | | $ | 383,325,328 | | | $ | 810,775,266 | |
| Investments, at value | | | 383,325,328 | | | | 810,775,266 | |
| Repurchase agreements, at value/cost | | | 665,000,000 | | | | 875,000,000 | |
| Total Investments | | | 1,048,325,328 | | | | 1,685,775,266 | |
| Interest and dividends receivable | | | 1,458,791 | | | | 3,297,027 | |
| Receivable for capital shares reinvested | | | 384 | | | | 373,746 | |
| Receivable for investments matured | | | 50,000,000 | | | | 120,000,000 | |
| Prepaid expenses and other assets | | | 22,343 | | | | 150,537 | |
| Total Assets | | | 1,099,806,846 | | | | 1,809,596,576 | |
| | | | | | | | | |
| Liabilities: | | | | | | | | |
| Distributions payable | | | 1,452,111 | | | | 2,866,423 | |
| Accrued expenses and other payables: | | | | | | | | |
| Investment advisory fees | | | 47,287 | | | | 76,360 | |
| Administration fees | | | 47,287 | | | | 76,360 | |
| Distribution fees | | | 198,442 | | | | 59,406 | |
| Custodian fees | | | 9,458 | | | | 15,273 | |
| Trustee fees | | | 1,234 | | | | 2,253 | |
| Fund accounting and compliance fees | | | 22,536 | | | | 35,092 | |
| Transfer agent fees | | | 6,679 | | | | 10,177 | |
| Shareholder servicing fees | | | 204,624 | | | | 95,567 | |
| Other accrued liabilities | | | 126,214 | | | | 170,323 | |
| Total Liabilities | | | 2,115,872 | | | | 3,407,234 | |
| Net Assets | | $ | 1,097,690,974 | | | $ | 1,806,189,342 | |
| | | | | | | | | |
| Composition of Net Assets: | | | | | | | | |
| Shares of beneficial interest, at par | | $ | 10,977 | | | $ | 18,070 | |
| Additional paid-in capital | | | 1,097,677,368 | | | | 1,806,163,704 | |
| Total distributable earnings/(loss) | | | 2,629 | | | | 7,568 | |
| Net Assets | | $ | 1,097,690,974 | | | $ | 1,806,189,342 | |
| | | | | | | | | |
| Net Assets: | | | | | | | | |
| Administrative Shares | | $ | 864,882,416 | | | $ | 489,931,680 | |
| Service Shares | | | 79,927,183 | | | | — | |
| Institutional Shares | | | 94,055,387 | | | | 94,595,482 | |
| Select Shares | | | 58,825,988 | | | | 988,002,994 | |
| Premier Shares | | | — | | | | 233,659,186 | |
| Total | | $ | 1,097,690,974 | | | $ | 1,806,189,342 | |
| | | | | | | | | |
| Shares Outstanding: | | | | | | | | |
| ($0.00001 par value per share, unlimited number of shares authorized) | | | | | | | | |
| Administrative Shares | | | 864,814,571 | | | | 490,266,620 | |
| Service Shares | | | 79,941,954 | | | | — | |
| Institutional Shares | | | 94,106,212 | | | | 94,675,604 | |
| Select Shares | | | 58,825,839 | | | | 988,314,173 | |
| Premier Shares | | | — | | | | 233,697,083 | |
| Total | | | 1,097,688,576 | | | | 1,806,953,480 | |
| | | | | | | | | |
| Net Asset Value, offering price & redemption price per share: | | | | | | | | |
| Administrative Shares | | $ | 1.00 | | | $ | 1.00 | |
| Service Shares | | $ | 1.00 | | | $ | — | |
| Institutional Shares | | $ | 1.00 | | | $ | 1.00 | |
| Select Shares | | $ | 1.00 | | | $ | 1.00 | |
| Premier Shares | | $ | — | | | $ | 1.00 | |
See notes to financial statements
| Statements of Assets and Liabilities | |
| August 31, 2019 | Continued |
| | | Limited
Duration Fund | | | Moderate
Duration Fund | | | Bond Fund | | | Strategic
Enhanced Yield
Fund | |
| Assets: | | | | | | | | |
| Investments, at cost | | $ | 115,009,871 | | | $ | 26,606,015 | | | $ | 98,164,672 | | | $ | 7,437,532 | |
| Investments in affiliates, at cost | | | 5,044,235 | | | | 1,055,296 | | | | 1,405,699 | | | | 766,036 | |
| Total Investments, at cost | | | 120,054,106 | | | | 27,661,311 | | | | 99,570,371 | | | | 8,203,568 | |
| Investments, at value | | | 114,924,230 | | | | 27,010,228 | | | | 102,165,010 | | | | 7,732,973 | |
| Investments in affiliates, at value | | | 5,044,235 | | | | 1,055,296 | | | | 1,405,699 | | | | 766,036 | |
| Total Investments, at value | | | 119,968,465 | | | | 28,065,524 | | | | 103,570,709 | | | | 8,499,009 | |
| Interest and dividends receivable | | | 473,974 | | | | 146,897 | | | | 511,810 | | | | 26,464 | |
| Receivable for capital shares issued | | | 81,902 | | | | 601 | | | | 30,663 | | | | 6,476 | |
| Receivable for capital shares reinvested | | | 87,553 | | | | 30,926 | | | | 53,230 | | | | 7,761 | |
| Receivable for investments sold | | | 838 | | | | — | | | | — | | | | — | |
| Receivable from advisor | | | — | | | | 4,958 | | | | — | | | | 13,211 | |
| Prepaid expenses and other assets | | | 22,065 | | | | 20,299 | | | | 21,986 | | | | 8,669 | |
| Total Assets | | | 120,634,797 | | | | 28,269,205 | | | | 104,188,398 | | | | 8,561,590 | |
| | | | | | | | | | | | | | | | | |
| Liabilities: | | | | | | | | | | | | | | | | |
| Distributions payable | | | 257,466 | | | | 56,133 | | | | 213,099 | | | | 18,188 | |
| Payable for investments purchased | | | 1,331,198 | | | | — | | | | — | | | | 146,609 | |
| Payable for capital shares redeemed | | | 7,868 | | | | 77,354 | | | | 1,615 | | | | 2,491 | |
| Accrued expenses and other payables: | | | | | | | | | | | | | | | | |
| Investment advisory fees | | | 15,102 | | | | 4,770 | | | | 17,606 | | | | 3,305 | |
| Administration fees | | | 8,054 | | | | 1,908 | | | | 7,042 | | | | 529 | |
| Distribution fees | | | 994 | | | | 979 | | | | 400 | | | | 421 | |
| Custodian fees | | | 1,007 | | | | 239 | | | | 880 | | | | 66 | |
| Trustee fees | | | 151 | | | | 34 | | | | 128 | | | | 8 | |
| Fund accounting and compliance fees | | | 6,196 | | | | 3,157 | | | | 4,660 | | | | 994 | |
| Transfer agent fees | | | 8,670 | | | | 4,970 | | | | 5,745 | | | | 4,537 | |
| Shareholder servicing fees | | | 6,843 | | | | 934 | | | | 1,927 | | | | 113 | |
| Other accrued liabilities | | | 11,877 | | | | 3,483 | | | | 11,761 | | | | 245 | |
| Total Liabilities | | | 1,655,426 | | | | 153,961 | | | | 264,863 | | | | 177,506 | |
| Net Assets | | $ | 118,979,371 | | | $ | 28,115,244 | | | $ | 103,923,535 | | | $ | 8,384,084 | |
| | | | | | | | | | | | | | | | | |
| Composition of Net Assets: | | | | | | | | | | | | | | | | |
| Shares of beneficial interest, at par | | $ | 124 | | | $ | 26 | | | $ | 106 | | | $ | 8 | |
| Additional paid-in capital | | | 125,405,819 | | | | 33,198,636 | | | | 104,580,068 | | | | 7,947,574 | |
| Total distributable earnings/(loss) | | | (6,426,572 | ) | | | (5,083,418 | ) | | | (656,639 | ) | | | 436,502 | |
| Net Assets | | $ | 118,979,371 | | | $ | 28,115,244 | | | $ | 103,923,535 | | | $ | 8,384,084 | |
| | | | | | | | | | | | | | | | | |
| Net Assets: | | | | | | | | | | | | | | | | |
| Investor Shares | | $ | 4,125,548 | | | $ | 4,271,426 | | | $ | 1,861,769 | | | $ | 1,546,065 | |
| Institutional Shares | | | 114,269,282 | | | | 23,463,261 | | | | 101,925,293 | | | | 6,370,064 | |
| A Shares | | | 584,541 | | | | 380,557 | | | | 136,473 | | | | 467,955 | |
| Total | | $ | 118,979,371 | | | $ | 28,115,244 | | | $ | 103,923,535 | | | $ | 8,384,084 | |
| | | | | | | | | | | | | | | | | |
| Shares Outstanding: | | | | | | | | | | | | | | | | |
| ($0.00001 par value per share, unlimited number of shares authorized) | | | | | | | | | | | | | | | | |
| Investor Shares | | | 428,684 | | | | 401,296 | | | | 189,552 | | | | 144,459 | |
| Institutional Shares | | | 11,883,982 | | | | 2,203,740 | | | | 10,404,697 | | | | 603,108 | |
| A Shares | | | 60,735 | | | | 35,741 | | | | 13,903 | | | | 44,315 | |
| Total | | | 12,373,401 | | | | 2,640,777 | | | | 10,608,152 | | | | 791,882 | |
| | | | | | | | | | | | | | | | | |
| Net Asset Value, offering price & redemption price per share: | | | | | | | | | | | | | | | | |
| Investor Shares | | $ | 9.62 | | | $ | 10.64 | | | $ | 9.82 | | | $ | 10.70 | |
| Institutional Shares | | $ | 9.62 | | | $ | 10.65 | | | $ | 9.80 | | | $ | 10.56 | |
| A Shares | | $ | 9.62 | | | $ | 10.65 | | | $ | 9.82 | | | $ | 10.56 | |
| Maximum Sales Charge: | | | | | | | | | | | | | | | | |
| A Shares | | | 2.00 | % | | | 2.00 | % | | | 2.00 | % | | | 2.00 | % |
| Maximum Offering Price per share(net asset value / (100%-maximum sales charge) of net asset value adjusted to the nearest cent): | | | | | | | | | | | | | | | | |
| A Shares | | $ | 9.82 | | | $ | 10.87 | | | $ | 10.02 | | | $ | 10.78 | |
See notes to financial statements
| Statements of Assets and Liabilities | |
| August 31, 2019 | Continued |
| | | Ultra Short
Tax-Free
Income Fund | | Active Core
Fund | | Mid Cap Core
Equity Fund | | Opportunistic
Fund |
| Assets: | | | | | | | | |
| Investments, at cost | | $ | 21,424,978 | | | $ | 35,817,252 | | | $ | 1,069,690 | | | $ | 29,016,289 | |
| Investments in affiliates, at cost | | | 123,186 | | | | 2,938,055 | | | | 51,148 | | | | 10,658,540 | |
| Total Investments, at cost | | | 21,548,164 | | | | 38,755,307 | | | | 1,120,838 | | | | 39,674,829 | |
| Investments, at value | | | 21,439,322 | | | | 45,146,970 | | | | 1,231,864 | | | | 30,062,646 | |
| Investments in affiliates, at value | | | 123,186 | | | | 2,743,085 | | | | 51,148 | | | | 10,658,540 | |
| Total Investments, at value | | | 21,562,508 | | | | 47,890,055 | | | | 1,283,012 | | | | 40,721,186 | |
| Interest and dividends receivable | | | 107,253 | | | | 143,809 | | | | 1,128 | | | | 128,946 | |
| Receivable for capital shares issued | | | 74,985 | | | | 7,808 | | | | — | | | | 4,579 | |
| Receivable for capital shares reinvested | | | 1,765 | | | | — | | | | — | | | | — | |
| Receivable for investments sold | | | — | | | | 72,012 | | | | — | | | | — | |
| Receivable from advisor | | | 9,763 | | | | — | | | | 13,326 | | | | 13,107 | |
| Prepaid expenses and other assets | | | 8,829 | | | | 25,547 | | | | 14,619 | | | | 32,980 | |
| Total Assets | | | 21,765,103 | | | | 48,139,231 | | | | 1,312,085 | | | | 40,900,798 | |
| | | | | | | | | | | | | | | | | |
| Liabilities: | | | | | | | | | | | | | | | | |
| Distributions payable | | | 21,710 | | | | — | | | | — | | | | — | |
| Payable for investments purchased | | | 1,006,776 | | | | 77,148 | | | | — | | | | 1,001,194 | |
| Payable for capital shares redeemed | | | 469 | | | | — | | | | — | | | | 405 | |
| Accrued expenses and other payables: | | | | | | | | | | | | | | | | |
| Investment advisory fees | | | 2,586 | | | | 14,170 | | | | 607 | | | | 28,872 | |
| Administration fees | | | 1,379 | | | | 3,239 | | | | 88 | | | | 2,717 | |
| Distribution fees | | | 42 | | | | 1,184 | | | | 105 | | | | 1,394 | |
| Custodian fees | | | 172 | | | | 405 | | | | 11 | | | | 340 | |
| Trustee fees | | | 19 | | | | 57 | | | | 2 | | | | 45 | |
| Fund accounting and compliance fees | | | 765 | | | | 3,422 | | | | 222 | | | | 896 | |
| Transfer agent fees | | | 3,938 | | | | 6,131 | | | | 5,364 | | | | 7,862 | |
| Shareholder servicing fees | | | 21 | | | | 37 | | | | 17 | | | | 689 | |
| Other accrued liabilities | | | 1,268 | | | | 5,842 | | | | 230 | | | | 4,936 | |
| Total Liabilities | | | 1,039,145 | | | | 111,635 | | | | 6,646 | | | | 1,049,350 | |
| Net Assets | | $ | 20,725,958 | | | $ | 48,027,596 | | | $ | 1,305,439 | | | $ | 39,851,448 | |
| | | | | | | | | | | | | | | | | |
| Composition of Net Assets: | | | | | | | | | | | | | | | | |
| Shares of beneficial interest, at par | | $ | 21 | | | $ | 35 | | | $ | 1 | | | $ | 31 | |
| Additional paid-in capital | | | 20,708,010 | | | | 37,420,550 | | | | 1,123,928 | | | | 42,436,412 | |
| Total distributable earnings/(loss) | | | 17,927 | | | | 10,607,011 | | | | 181,510 | | | | (2,584,995 | ) |
| Net Assets | | $ | 20,725,958 | | | $ | 48,027,596 | | | $ | 1,305,439 | | | $ | 39,851,448 | |
| | | | | | | | | | | | | | | | | |
| Net Assets: | | | | | | | | | | | | | | | | |
| Investor Shares | | $ | 175,335 | | | $ | 4,632,049 | | | $ | 114,382 | | | $ | 3,117,837 | |
| Institutional Shares | | | 20,529,213 | | | | 42,574,411 | | | | 809,143 | | | | 34,492,179 | |
| A Shares | | | 21,410 | | | | 767,416 | | | | 381,902 | | | | 1,898,271 | |
| C Shares | | | — | | | | 53,720 | | | | 12 | | | | 343,161 | |
| Total | | $ | 20,725,958 | | | $ | 48,027,596 | | | $ | 1,305,439 | | | $ | 39,851,448 | |
| | | | | | | | | | | | | | | | | |
| Shares Outstanding: | | | | | | | | | | | | | | | | |
| ($0.00001 par value per share, unlimited number of shares authorized) | | | | | | | | | | | | | | | | |
| Investor Shares | | | 17,536 | | | | 343,333 | | | | 10,173 | | | | 243,036 | |
| Institutional Shares | | | 2,051,213 | | | | 3,145,482 | | | | 71,900 | | | | 2,657,031 | |
| A Shares | | | 2,140 | | | | 57,048 | | | | 33,774 | | | | 147,410 | |
| C Shares | | | — | | | | 4,000 | | | | 1 | | | | 27,440 | |
| Total | | | 2,070,889 | | | | 3,549,863 | | | | 115,848 | | | | 3,074,917 | |
| | | | | | | | | | | | | | | | | |
| Net Asset Value, offering price & redemption price per share(a): | | | | | | | | | | | | | | | | |
| Investor Shares | | $ | 10.00 | | | $ | 13.49 | | | $ | 11.24 | | | $ | 12.83 | |
| Institutional Shares | | $ | 10.01 | | | $ | 13.54 | | | $ | 11.25 | | | $ | 12.98 | |
| A Shares | | $ | 10.01 | | | $ | 13.45 | | | $ | 11.31 | | | $ | 12.88 | |
| C Shares | | $ | — | | | $ | 13.43 | | | $ | 11.06 | | | $ | 12.51 | |
| Maximum Sales Charge: | | | | | | | | | | | | | | | | |
| A Shares | | | 1.00 | % | | | 2.00 | % | | | 2.00 | % | | | 2.00 | % |
| Maximum Offering Price per share(net asset value / (100%-maximum sales charge) of net asset value adjusted to the nearest cent): | | | | | | | | | | | | | | | | |
| A Shares | | $ | 10.11 | | | $ | 13.72 | | | $ | 11.54 | | | $ | 13.14 | |
| (a) | Per share amounts may not recalculate due to rounding of net assets and shares outstanding. |
See notes to financial statements
| Statements of Assets and Liabilities | |
| August 31, 2019 | Concluded |
| | | World Energy | |
| | | Fund | |
| Assets: | | |
| Investments, at cost | | $ | 19,662,071 | |
| Investments in affiliates, at cost | | | 531,505 | |
| Total Investments, at cost | | | 20,193,576 | |
| Investments, at value | | | 19,798,796 | |
| Investments in affiliates, at value | | | 531,505 | |
| Total Investments, at value | | | 20,330,301 | |
| Interest and dividends receivable | | | 150,222 | |
| Receivable from advisor | | | 12,191 | |
| Prepaid expenses and other assets | | | 14,262 | |
| Total Assets | | | 20,506,976 | |
| | | | | |
| Liabilities: | | | | |
| Payable for capital shares redeemed | | | 59,673 | |
| Accrued expenses and other payables: | | | | |
| Investment advisory fees | | | 11,908 | |
| Administration fees | | | 1,588 | |
| Distribution fees | | | 4,384 | |
| Custodian fees | | | 198 | |
| Trustee fees | | | 37 | |
| Fund accounting and compliance fees | | | 630 | |
| Transfer agent fees | | | 7,040 | |
| Shareholder servicing fees | | | 697 | |
| Other accrued liabilities | | | 5,907 | |
| Total Liabilities | | | 92,062 | |
| Net Assets | | $ | 20,414,914 | |
| | | | | |
| Composition of Net Assets: | | | | |
| Shares of beneficial interest, at par | | $ | 30 | |
| Additional paid-in capital | | | 42,774,225 | |
| Total distributable earnings/(loss) | | | (22,359,341 | ) |
| Net Assets | | $ | 20,414,914 | |
| | | | | |
| Net Assets: | | | | |
| Investor Shares | | $ | 3,078,867 | |
| Institutional Shares | | | 11,163,348 | |
| A Shares | | | 2,485,157 | |
| C Shares | | | 3,687,542 | |
| Total | | $ | 20,414,914 | |
| | | | | |
| Shares Outstanding: | | | | |
| ($0.00001 par value per share, unlimited number of shares authorized) | | | | |
| Investor Shares | | | 459,049 | |
| Institutional Shares | | | 1,661,265 | |
| A Shares | | | 370,862 | |
| C Shares | | | 555,657 | |
| Total | | | 3,046,833 | |
| | | | | |
| Net Asset Value, offering price & redemption price per share: | | | | |
| Investor Shares | | $ | 6.71 | |
| Institutional Shares | | $ | 6.72 | |
| A Shares | | $ | 6.70 | |
| C Shares | | $ | 6.64 | |
| Maximum Sales Charge: | | | | |
| A Shares | | | 2.00 | % |
| Maximum Offering Price per share(net asset value / (100%-maximum sales charge) of net asset value adjusted to the nearest cent): | | | | |
| A Shares | | $ | 6.84 | |
See notes to financial statements
| Statements of Operations |
| Year Ended August 31, 2019 |
| | | U.S. Treasury Fund | | | Government Securities Money Market | |
| Investment Income: | | | | | | | | |
| Interest income | | $ | 26,072,825 | | | $ | 35,929,455 | |
| Dividend income | | | 2,779,527 | | | | 3,997,987 | |
| Total income | | | 28,852,352 | | | | 39,927,442 | |
| | | | | | | | | |
| Expenses: | | | | | | | | |
| Investment advisory fees | | | 624,983 | | | | 858,580 | |
| Administration fees | | | 624,983 | | | | 858,580 | |
| Distribution fees - Administrative Shares | | | 2,646,262 | | | | 1,422,743 | |
| Distribution fees - Service Shares | | | 96,558 | | | | — | |
| Distribution fees - Premier Shares | | | — | | | | 775,621 | |
| Shareholder servicing fees - Administrative Shares | | | 2,645,221 | | | | 1,378,719 | |
| Shareholder servicing fees - Service Shares | | | 96,558 | | | | — | |
| Shareholder servicing fees - Institutional Shares | | | 232,844 | | | | 265,866 | |
| Shareholder servicing fees - Select Shares | | | 149,162 | | | | 2,216,356 | |
| Shareholder servicing fees - Premier Shares | | | — | | | | 387,811 | |
| Fund accounting and compliance fees | | | 287,319 | | | | 395,498 | |
| Transfer agent fees | | | 79,966 | | | | 133,196 | |
| Custodian fees | | | 124,433 | | | | 170,817 | |
| Trustee fees | | | 66,053 | | | | 89,943 | |
| Professional fees | | | 259,880 | | | | 351,634 | |
| Printing fees | | | 67,129 | | | | 60,203 | |
| Registration fees | | | 35,281 | | | | 244,035 | |
| Other expenses | | | 150,602 | | | | 179,173 | |
| | | | | | | | | |
| Total expenses before fee and expense reductions | | | 8,187,234 | | | | 9,788,775 | |
| | | | | | | | | |
| Distribution fees waived - Administrative Shares | | | — | | | | (739,819 | ) |
| Distribution fees waived - Service Shares | | | (57,935 | ) | | | — | |
| Distribution fees waived - Premier Shares | | | — | | | | (698,062 | ) |
| Shareholder servicing fees waived - Service Shares | | | (57,917 | ) | | | — | |
| Shareholder servicing fees waived - Institutional Shares | | | (158,288 | ) | | | (182,692 | ) |
| Shareholder servicing fees waived - Select Shares | | | (149,162 | ) | | | (2,216,356 | ) |
| Shareholder servicing fees waived - Premier Shares | | | — | | | | (387,811 | ) |
| | | | | | | | | |
| Net expenses | | | 7,763,932 | | | | 5,564,035 | |
| | | | | | | | | |
| Net investment income | | | 21,088,420 | | | | 34,363,407 | |
| | | | | | | | | |
| Realized/Unrealized Gains/(Losses) on Investments: | | | | | | | | |
| Net realized gains/(losses) from unaffiliated investments | | | 10,772 | | | | — | |
| Net realized/unrealized gains/(losses) on investments | | | 10,772 | | | | — | |
| Change in net assets resulting from operations | | $ | 21,099,192 | | | $ | 34,363,407 | |
See notes to financial statements
| Statements of Operations | |
| Year Ended August 31, 2019 | Continued |
| | | Limited Duration Fund | | | Moderate Duration Fund | | | Bond Fund | | | Strategic Enhanced Yield Fund | |
| Investment Income: | | | | | | | | | | | | | | | | |
| Interest income | | $ | 3,058,927 | | | $ | 842,782 | | | $ | 3,025,799 | | | $ | 181,775 | |
| Dividend income | | | 167 | | | | 55 | | | | 134 | | | | 7 | |
| Dividend income from affiliates | | | 136,930 | | | | 26,333 | | | | 68,788 | | | | 8,483 | |
| Total income | | | 3,196,024 | | | | 869,170 | | | | 3,094,721 | | | | 190,265 | |
| | | | | | | | | | | | | | | | | |
| Expenses: | | | | | | | | | | | | | | | | |
| Investment advisory fees | | | 163,799 | | | | 56,225 | | | | 205,994 | | | | 25,005 | |
| Administration fees | | | 87,360 | | | | 22,490 | | | | 82,398 | | | | 4,001 | |
| Distribution fees - Investor Shares | | | 19,438 | | | | 11,079 | | | | 11,593 | | | | 2,363 | |
| Distribution fees - A Shares | | | 1,358 | | | | 1,089 | | | | 322 | | | | 1,060 | |
| Shareholder servicing fees - Investor Shares | | | 19,438 | | | | 11,079 | | | | 11,593 | | | | 2,363 | |
| Shareholder servicing fees - Institutional Shares | | | 252,200 | | | | 58,112 | | | | 245,575 | | | | 9,080 | |
| Shareholder servicing fees - A Shares | | | 543 | | | | 436 | | | | 129 | | | | 424 | |
| Fund accounting and compliance fees | | | 71,427 | | | | 35,185 | | | | 54,812 | | | | 10,626 | |
| Transfer agent fees | | | 102,138 | | | | 57,276 | | | | 67,522 | | | | 55,367 | |
| Custodian fees | | | 9,153 | | | | 2,635 | | | | 9,614 | | | | 361 | |
| Trustee fees | | | 5,728 | | | | 1,413 | | | | 5,412 | | | | 241 | |
| Professional fees | | | 22,421 | | | | 5,980 | | | | 22,089 | | | | 637 | |
| Printing fees | | | 6,779 | | | | 2,454 | | | | 5,292 | | | | 1,502 | |
| Registration fees | | | 45,166 | | | | 24,976 | | | | 44,298 | | | | 49,399 | |
| Other expenses | | | 9,704 | | | | 4,318 | | | | 10,078 | | | | 2,405 | |
| | | | | | | | | | | | | | | | | |
| Total expenses before fee and expense reductions | | | 816,652 | | | | 294,747 | | | | 776,721 | | | | 164,834 | |
| | | | | | | | | | | | | | | | | |
| Investment advisory fees waived/expenses reimbursed by Investment Adviser | | | (3,109 | ) | | | (53,342 | ) | | | (1,678 | ) | | | (111,933 | ) |
| Administration fees waived | | | (3,109 | ) | | | (577 | ) | | | (1,678 | ) | | | (182 | ) |
| Shareholder servicing fees waived - Investor Shares | | | (18,505 | ) | | | (10,160 | ) | | | (10,148 | ) | | | (1,627 | ) |
| Shareholder servicing fees waived - Institutional Shares | | | (250,721 | ) | | | (54,074 | ) | | | (243,219 | ) | | | (9,079 | ) |
| Shareholder servicing fees waived - A Shares | | | (543 | ) | | | (148 | ) | | | (129 | ) | | | (424 | ) |
| | | | | | | | | | | | | | | | | |
| Net expenses | | | 540,665 | | | | 176,446 | | | | 519,869 | | | | 41,589 | |
| | | | | | | | | | | | | | | | | |
| Net investment income | | | 2,655,359 | | | | 692,724 | | | | 2,574,852 | | | | 148,676 | |
| | | | | | | | | | | | | | | | | |
| Realized/Unrealized Gains/(Losses) on Investments: | | | | | | | | | | | | | | | | |
| Net realized gains/(losses) from unaffiliated investments | | | 115,115 | | | | (137,745 | ) | | | (624,074 | ) | | | 142,966 | |
| Change in unrealized appreciation/(depreciation) on unaffiliated investments | | | 2,574,885 | | | | 997,325 | | | | 7,185,953 | | | | 295,407 | |
| Net realized/unrealized gains/(losses) on investments | | | 2,690,000 | | | | 859,580 | | | | 6,561,879 | | | | 438,373 | |
| Change in net assets resulting from operations | | $ | 5,345,359 | | | $ | 1,552,304 | | | $ | 9,136,731 | | | $ | 587,049 | |
See notes to financial statements
| Statements of Operations | |
| Year Ended August 31, 2019 | Continued |
| | | Ultra Short Tax-Free Income Fund | | | Active Core Fund | | | Mid Cap Core Equity Fund | | | Opportunistic Fund | |
| Investment Income: | | | | | | | | | | | | | | | | |
| Interest income | | $ | 234,827 | | | $ | 681,531 | | | $ | — | | | $ | 434,661 | |
| Dividend income | | | 5 | | | | 508,997 | | | | 18,154 | | | | 431,197 | |
| Dividend income from affiliates | | | 7,422 | | | | 36,081 | | | | 1,348 | | | | 152,332 | |
| Foreign tax withholding | | | — | | | | (795 | ) | | | — | | | | (9,749 | ) |
| Total income | | | 242,254 | | | | 1,225,814 | | | | 19,502 | | | | 1,008,441 | |
| | | | | | | | | | | | | | | | | |
| Expenses: | | | | | | | | | | | | | | | | |
| Investment advisory fees | | | 20,243 | | | | 169,028 | | | | 8,035 | | | | 365,212 | |
| Administration fees | | | 10,796 | | | | 38,635 | | | | 1,169 | | | | 34,373 | |
| Distribution fees - Investor Shares | | | 187 | | | | 11,737 | | | | 489 | | | | 5,493 | |
| Distribution fees - A Shares | | | 17 | | | | 2,597 | | | | 851 | | | | 4,826 | |
| Distribution fees - C Shares | | | — | | | | 589 | | | | — | | | | 4,513 | |
| Shareholder servicing fees - Investor Shares | | | 186 | | | | 11,737 | | | | 489 | | | | 5,493 | |
| Shareholder servicing fees - Institutional Shares | | | 33,534 | | | | 106,253 | | | | 2,312 | | | | 95,968 | |
| Shareholder servicing fees - A Shares | | | 7 | | | | 1,039 | | | | 341 | | | | 1,930 | |
| Shareholder servicing fees - C Shares | | | — | | | | 147 | | | | — | | | | 1,128 | |
| Fund accounting and compliance fees | | | 7,541 | | | | 40,173 | | | | 2,653 | | | | 11,647 | |
| Transfer agent fees | | | 50,223 | | | | 76,313 | | | | 63,938 | | | | 101,161 | |
| Custodian fees | | | 1,264 | | | | 4,659 | | | | 144 | | | | 4,114 | |
| Trustee fees | | | 664 | | | | 2,547 | | | | 82 | | | | 2,267 | |
| Professional fees | | | 2,601 | | | | 10,887 | | | | 395 | | | | 9,942 | |
| Printing fees | | | 1,592 | | | | 10,842 | | | | 1,445 | | | | 11,205 | |
| Registration fees | | | 49,368 | | | | 54,068 | | | | 50,334 | | | | 50,227 | |
| Other expenses | | | 2,877 | | | | 6,603 | | | | 2,740 | | | | 6,262 | |
| | | | | | | | | | | | | | | | | |
| Total expenses before fee and expense reductions | | | 181,100 | | | | 547,854 | | | | 135,417 | | | | 715,761 | |
| | | | | | | | | | | | | | | | | |
| Investment advisory fees waived/expenses reimbursed by Investment Adviser | | | (91,862 | ) | | | (4,140 | ) | | | (119,264 | ) | | | (113,518 | ) |
| Administration fees waived | | | (154 | ) | | | (1,056 | ) | | | (31 | ) | | | (3,185 | ) |
| Shareholder servicing fees waived - Investor Shares | | | (186 | ) | | | (11,584 | ) | | | (322 | ) | | | (4,122 | ) |
| Shareholder servicing fees waived - Institutional Shares | | | (33,361 | ) | | | (105,287 | ) | | | (2,312 | ) | | | (94,217 | ) |
| Shareholder servicing fees waived - A Shares | | | (7 | ) | | | (334 | ) | | | (341 | ) | | | (1,506 | ) |
| Shareholder servicing fees waived - C Shares | | | — | | | | (147 | ) | | | — | | | | (793 | ) |
| | | | | | | | | | | | | | | | | |
| Net expenses | | | 55,530 | | | | 425,306 | | | | 13,147 | | | | 498,420 | |
| | | | | | | | | | | | | | | | | |
| Net investment income | | | 186,724 | | | | 800,508 | | | | 6,355 | | | | 510,021 | |
| Realized/Unrealized Gains/(Losses) on Investments: | | | | | | | | | | | | | | | | |
| Net realized gains/(losses) from unaffiliated investments | | | (114 | ) | | | 2,096,219 | | | | 62,916 | | | | (3,659,015 | ) |
| Net realized gains/(losses) from securities held short | | | — | | | | — | | | | — | | | | (57,974 | ) |
| Change in unrealized appreciation/(depreciation) on unaffiliated investments | | | 17,304 | | | | (1,154,008 | ) | | | (205,354 | ) | | | (1,864,917 | ) |
| Change in unrealized appreciation/(depreciation) on affiliated investments | | | — | | | | (204,919 | ) | | | — | | | | — | |
| Net realized/unrealized gains/(losses) on investments | | | 17,190 | | | | 737,292 | | | | (142,438 | ) | | | (5,581,906 | ) |
| Change in net assets resulting from operations | | $ | 203,914 | | | $ | 1,537,800 | | | $ | (136,083 | ) | | $ | (5,071,885 | ) |
See notes to financial statements
| Statements of Operations | |
| Year Ended August 31, 2019 | Concluded |
| | | World Energy | |
| | | Fund | |
| Investment Income: | | | | |
| Interest income | | $ | 206,831 | |
| Dividend income | | | 943,164 | |
| Dividend income from affiliates | | | 19,835 | |
| Foreign tax withholding | | | (51,519 | ) |
| Total income | | | 1,118,311 | |
| | | | | |
| Expenses: | | | | |
| Investment advisory fees | | | 235,629 | |
| Administration fees | | | 31,417 | |
| Distribution fees - Investor Shares | | | 12,027 | |
| Distribution fees - A Shares | | | 11,269 | |
| Distribution fees - C Shares | | | 47,391 | |
| Shareholder servicing fees - Investor Shares | | | 12,027 | |
| Shareholder servicing fees - Institutional Shares | | | 63,033 | |
| Shareholder servicing fees - A Shares | | | 4,508 | |
| Shareholder servicing fees - C Shares | | | 11,848 | |
| Fund accounting and compliance fees | | | 11,441 | |
| Transfer agent fees | | | 90,810 | |
| Custodian fees | | | 3,424 | |
| Trustee fees | | | 2,222 | |
| Professional fees | | | 10,639 | |
| Printing fees | | | 13,192 | |
| Registration fees | | | 55,960 | |
| Other expenses | | | 6,530 | |
| | | | | |
| Total expenses before fee and expense reductions | | | 623,367 | |
| | | | | |
| Investment advisory fees waived/expenses reimbursed by Investment Adviser | | | (102,565 | ) |
| Administration fees waived | | | (498 | ) |
| Shareholder servicing fees waived - Investor Shares | | | (7,970 | ) |
| Shareholder servicing fees waived - Institutional Shares | | | (49,286 | ) |
| Shareholder servicing fees waived - A Shares | | | (3,802 | ) |
| Shareholder servicing fees waived - C Shares | | | (8,602 | ) |
| | | | | |
| Net expenses | | | 450,644 | |
| | | | | |
| Net investment income | | | 667,667 | |
| | | | | |
| Realized/Unrealized Gains/(Losses) on Investments: | | | | |
| Net realized gains/(losses) from unaffiliated investments | | | (7,740,435 | ) |
| Change in unrealized appreciation/(depreciation) on unaffiliated investments | | | (7,371,021 | ) |
| Net realized/unrealized gains/(losses) on investments | | | (15,111,456 | ) |
| Change in net assets resulting from operations | | $ | (14,443,789 | ) |
See notes to financial statements
Statements of Changes in Net Assets
August 31, 2019
| | | U.S. Treasury Fund | | | Government Securities
Money Market | |
| | | Year Ended
August 31,2019 | | | Year Ended
August 31,2018 | | | Year Ended
August 31,2019 | | | Year Ended
August 31,2018 | |
| From Investment Activities: | | | | | | | | | | | | | | | | |
| Operations: | | | | | | | | | | | | | | | | |
| Net investment income | | $ | 21,088,420 | | | $ | 10,631,498 | | | $ | 34,363,407 | | | $ | 17,283,395 | |
| Net realized gains/(losses) from investment transactions | | | 10,772 | | | | (10,120 | ) | | | — | | | | (6 | ) |
| Change in net assets resulting from operations | | | 21,099,192 | | | | 10,621,378 | | | | 34,363,407 | | | | 17,283,389 | |
| | | | | | | | | | | | | | | | | |
| Distributions to Shareholders(a): | | | | | | | | | | | | | | | | |
| Administrative Shares | | | (17,181,019 | ) | | | (7,909,238 | ) | | | (10,092,260 | ) | | | (5,306,769 | ) |
| Service Shares | | | (741,693 | ) | | | (345,379 | ) | | | — | | | | — | |
| Institutional Shares | | | (1,896,830 | ) | | | (1,792,864 | ) | | | (2,176,602 | ) | | | (1,571,051 | ) |
| Select Shares | | | (1,267,099 | ) | | | (582,939 | ) | | | (18,858,032 | ) | | | (9,173,616 | ) |
| Premier Shares | | | — | | | | — | | | | (3,229,224 | ) | | | (1,230,984 | ) |
| Change in net assets from shareholder distributions | | | (21,086,641 | ) | | | (10,630,420 | ) | | | (34,356,118 | ) | | | (17,282,420 | ) |
| Change in net assets from capital transactions | | | (42,620,314 | ) | | | (157,051,595 | ) | | | 258,775,119 | | | | (33,603,994 | ) |
| Change in net assets | | | (42,607,763 | ) | | | (157,060,637 | ) | | | 258,782,408 | | | | (33,603,025 | ) |
| | | | | | | | | | | | | | | | | |
| Net Assets(a): | | | | | | | | | | | | | | | | |
| Beginning of year | | | 1,140,298,737 | | | | 1,297,359,374 | | | | 1,547,406,934 | | | | 1,581,009,959 | |
| End of year | | $ | 1,097,690,974 | | | $ | 1,140,298,737 | | | $ | 1,806,189,342 | | | $ | 1,547,406,934 | |
| | | | | | | | | | | | | | | | | |
| Capital Transactions*: | | | | | | | | | | | | | | | | |
| Administrative Shares | | | | | | | | | | | | | | | | |
| Issued | | | 5,009,184,128 | | | | 3,205,966,139 | | | | 2,390,322,609 | | | | 805,803,941 | |
| Reinvested | | | 5,126 | | | | 2,557 | | | | 70,913 | | | | 47,642 | |
| Redeemed | | | (5,101,819,112 | ) | | | (3,305,661,848 | ) | | | (2,439,261,293 | ) | | | (953,838,261 | ) |
| Change in Administrative Shares | | | (92,629,858 | ) | | | (99,693,152 | ) | | | (48,867,771 | ) | | | (147,986,678 | ) |
| Service Shares | | | | | | | | | | | | | | | | |
| Issued | | | 139,916,888 | | | | 88,423,606 | | | | — | | | | — | |
| Redeemed | | | (93,709,639 | ) | | | (85,371,841 | ) | | | — | | | | — | |
| Change in Service Shares | | | 46,207,249 | | | | 3,051,765 | | | | — | | | | — | |
| Institutional Shares | | | | | | | | | | | | | | | | |
| Issued | | | 198,383,622 | | | | 395,049,099 | | | | 428,071,230 | | | | 919,075,704 | |
| Reinvested | | | — | | | | — | | | | 52,215 | | | | 26,554 | |
| Redeemed | | | (201,567,508 | ) | | | (507,298,964 | ) | | | (435,548,474 | ) | | | (998,792,501 | ) |
| Change in Institutional Shares | | | (3,183,886 | ) | | | (112,249,865 | ) | | | (7,425,029 | ) | | | (79,690,243 | ) |
| Select Shares(b) | | | | | | | | | | | | | | | | |
| Issued | | | 111,932,977 | | | | 124,722,398 | | | | 1,817,182,763 | | | | 1,401,145,341 | |
| Reinvested | | | — | | | | — | | | | — | | | | — | |
| Redeemed | | | (104,946,797 | ) | | | (72,882,739 | ) | | | (1,630,173,786 | ) | | | (1,240,378,001 | ) |
| Change in Select Shares | | | 6,986,180 | | | | 51,839,659 | | | | 187,008,977 | | | | 160,767,340 | |
| Premier Shares | | | | | | | | | | | | | | | | |
| Issued | | | — | | | | — | | | | 902,526,564 | | | | 613,187,466 | |
| Reinvested | | | — | | | | — | | | | 3,126,897 | | | | 1,179,591 | |
| Redeemed | | | — | | | | — | | | | (777,593,013 | ) | | | (581,061,469 | ) |
| Change in Premier Shares | | | — | | | | — | | | | 128,060,448 | | | | 33,305,588 | |
| Change in shares: | | | (42,620,315 | ) | | | (157,051,593 | ) | | | 258,776,625 | | | | (33,603,993 | ) |
| (a) | Prior year distribution character information and accumulated net investment income/(distributions in excess of net investment income) has been modified or removed to conform with current year Regulation S-X presentation changes. See Note 7 in Notes to Financial Statements. |
| (b) | U.S. Treasury Select Shares commencement of operations December 26, 2017. |
*Share transactions are at net assets value of $1.00 per share.
See notes to financial statements
| Statements of Changes in Net Assets | |
| August 31, 2019 | Continued |
| | | Limited Duration Fund | | | Moderate Duration Fund | |
| | | Year Ended
August 31, 2019 | | | Year Ended
August 31, 2018 | | | Year Ended
August 31, 2019 | | | Year Ended
August 31, 2018 | |
| From Investment Activities: | | | | | | | | | | | | | | | | |
| Operations: | | | | | | | | | | | | | | | | |
| Net investment income | | $ | 2,655,359 | | | $ | 1,847,482 | | | $ | 692,724 | | | $ | 638,565 | |
| Net realized gains/(losses) from investment transactions | | | 115,115 | | | | (429,875 | ) | | | (137,745 | ) | | | (357,171 | ) |
| Change in unrealized appreciation/(depreciation) on investments | | | 2,574,885 | | | | (1,103,526 | ) | | | 997,325 | | | | (295,595 | ) |
| Change in net assets resulting from operations | | | 5,345,359 | | | | 314,081 | | | | 1,552,304 | | | | (14,201 | ) |
| | | | | | | | | | | | | | | | | |
| Distributions to Shareholders(a): | | | | | | | | | | | | | | | | |
| Investor Shares | | | (175,084 | ) | | | (258,800 | ) | | | (99,264 | ) | | | (126,262 | ) |
| Institutional Shares | | | (2,542,628 | ) | | | (2,049,971 | ) | | | (578,450 | ) | | | (514,419 | ) |
| A Shares | | | (12,277 | ) | | | (20,810 | ) | | | (9,646 | ) | | | (11,637 | ) |
| Change in net assets from shareholder distributions | | | (2,729,989 | ) | | | (2,329,581 | ) | | | (687,360 | ) | | | (652,318 | ) |
| Change in net assets from capital transactions | | | 19,516,031 | | | | (174,879 | ) | | | (3,368,234 | ) | | | (14,151,023 | ) |
| Change in net assets | | | 22,131,401 | | | | (2,190,379 | ) | | | (2,503,290 | ) | | | (14,817,542 | ) |
| | | | | | | | | | | | | | | | | |
| Net Assets(a): | | | | | | | | | | | | | | | | |
| Beginning of year | | | 96,847,970 | | | | 99,038,349 | | | | 30,618,534 | | | | 45,436,076 | |
| End of year | | $ | 118,979,371 | | | $ | 96,847,970 | | | $ | 28,115,244 | | | $ | 30,618,534 | |
| | | | | | | | | | | | | | | | | |
| Capital Transactions: | | | | | | | | | | | | | | | | |
| Investor Shares | | | | | | | | | | | | | | | | |
| Proceeds from shares issued | | $ | 159,347 | | | $ | 1,151,657 | | | $ | 515,655 | | | $ | 738,680 | |
| Dividends reinvested | | | 102,513 | | | | 184,810 | | | | 98,132 | | | | 125,171 | |
| Cost of shares redeemed | | | (4,933,689 | ) | | | (8,095,460 | ) | | | (1,577,844 | ) | | | (5,984,712 | ) |
| Change in net assets from Investor Shares | | | (4,671,829 | ) | | | (6,758,993 | ) | | | (964,057 | ) | | | (5,120,861 | ) |
| Institutional Shares | | | | | | | | | | | | | | | | |
| Proceeds from shares issued | | | 38,225,262 | | | | 30,591,167 | | | | 3,818,919 | | | | 4,673,777 | |
| Dividends reinvested | | | 767,722 | | | | 712,098 | | | | 279,390 | | | | 274,041 | |
| Cost of shares redeemed | | | (14,789,391 | ) | | | (24,093,619 | ) | | | (6,238,490 | ) | | | (13,642,778 | ) |
| Change in net assets from Institutional Shares | | | 24,203,593 | | | | 7,209,646 | | | | (2,140,181 | ) | | | (8,694,960 | ) |
| A Shares | | | | | | | | | | | | | | | | |
| Proceeds from shares issued | | | 85,880 | | | | 458,585 | | | | 17,897 | | | | 24,149 | |
| Dividends reinvested | | | 12,258 | | | | 20,793 | | | | 9,610 | | | | 11,637 | |
| Cost of shares redeemed | | | (113,871 | ) | | | (1,104,910 | ) | | | (291,503 | ) | | | (370,988 | ) |
| Change in net assets from A Shares | | | (15,733 | ) | | | (625,532 | ) | | | (263,996 | ) | | | (335,202 | ) |
| Change in net assets resulting from capital transactions: | | $ | 19,516,031 | | | $ | (174,879 | ) | | $ | (3,368,234 | ) | | $ | (14,151,023 | ) |
| | | | | | | | | | | | | | | | | |
| Share Transactions: | | | | | | | | | | | | | | | | |
| Investor Shares | | | | | | | | | | | | | | | | |
| Issued | | | 16,882 | | | | 121,709 | | | | 49,507 | | | | 71,449 | |
| Reinvested | | | 10,828 | | | | 19,517 | | | | 9,424 | | | | 12,108 | |
| Redeemed | | | (517,552 | ) | | | (856,142 | ) | | | (152,486 | ) | | | (579,102 | ) |
| Change in Investor Shares | | | (489,842 | ) | | | (714,916 | ) | | | (93,555 | ) | | | (495,545 | ) |
| Institutional Shares | | | | | | | | | | | | | | | | |
| Issued | | | 4,048,393 | | | | 3,235,208 | | | | 365,378 | | | | 452,178 | |
| Reinvested | | | 81,026 | | | | 75,313 | | | | 26,818 | | | | 26,488 | |
| Redeemed | | | (1,564,154 | ) | | | (2,543,990 | ) | | | (601,444 | ) | | | (1,318,246 | ) |
| Change in Institutional Shares | | | 2,565,265 | | | | 766,531 | | | | (209,248 | ) | | | (839,580 | ) |
| A Shares | | | | | | | | | | | | | | | | |
| Issued | | | 9,011 | | | | 47,900 | | | | 1,743 | | | | 2,334 | |
| Reinvested | | | 1,294 | | | | 2,194 | | | | 924 | | | | 1,126 | |
| Redeemed | | | (12,101 | ) | | | (116,432 | ) | | | (28,383 | ) | | | (35,790 | ) |
| Change in A Shares | | | (1,796 | ) | | | (66,338 | ) | | | (25,716 | ) | | | (32,330 | ) |
| Change in shares: | | | 2,073,627 | | | | (14,723 | ) | | | (328,519 | ) | | | (1,367,455 | ) |
| (a) | Prior year distribution character information and accumulated net investment income/(distributions in excess of net investment income) has been modified or removed to conform with current year Regulation S-X presentation changes. See Note 7 in Notes to Financial Statements. |
See notes to financial statements
| Statements of Changes in Net Assets | |
| August 31, 2019 | Continued |
| | | Bond Fund | | | Strategic Enhanced Yield Fund | |
| | | Year Ended
August 31, 2019 | | | Year Ended
August 31, 2018 | | | Year Ended
August 31, 2019 | | | For the period
Dec. 26, 2017(a)
through
Aug. 31, 2018 | |
| From Investment Activities: | | | | | | | | | | | | | | | | |
| Operations: | | | | | | | | | | | | | | | | |
| Net investment income | | $ | 2,574,852 | | | $ | 2,404,970 | | | $ | 148,676 | | | $ | 21,033 | |
| Net realized gains/(losses) from investment transactions | | | (624,074 | ) | | | (1,491,956 | ) | | | 142,966 | | | | (1,615 | ) |
| Change in unrealized appreciation/(depreciation) on investments | | | 7,185,953 | | | | (2,366,352 | ) | | | 295,407 | | | | 34 | |
| Change in net assets resulting from operations | | | 9,136,731 | | | | (1,453,338 | ) | | | 587,049 | | | | 19,452 | |
| | | | | | | | | | | | | | | | | |
| Distributions to Shareholders(b): | | | | | | | | | | | | | | | | |
| Investor Shares | | | (106,237 | ) | | | (149,365 | ) | | | (26,464 | ) | | | (43 | ) |
| Institutional Shares | | | (2,523,607 | ) | | | (2,549,345 | ) | | | (110,333 | ) | | | (14,512 | ) |
| A Shares | | | (2,989 | ) | | | (2,744 | ) | | | (11,968 | ) | | | (7,030 | ) |
| Change in net assets from shareholder distributions | | | (2,632,833 | ) | | | (2,701,454 | ) | | | (148,765 | ) | | | (21,585 | ) |
| Change in net assets from capital transactions | | | (4,368,962 | ) | | | (21,141,496 | ) | | | 6,567,124 | | | | 1,380,809 | |
| Change in net assets | | | 2,134,936 | | | | (25,296,288 | ) | | | 7,005,408 | | | | 1,378,676 | |
| | | | | | | | | | | | | | | | | |
| Net Assets(b): | | | | | | | | | | | | | | | | |
| Beginning of year | | | 101,788,599 | | | | 127,084,887 | | | | 1,378,676 | | | | — | |
| End of year | | $ | 103,923,535 | | | $ | 101,788,599 | | | $ | 8,384,084 | | | $ | 1,378,676 | |
| | | | | | | | | | | | | | | | | |
| Capital Transactions: | | | | | | | | | | | | | | | | |
| Investor Shares | | | | | | | | | | | | | | | | |
| Proceeds from shares issued | | $ | 1,621,418 | | | $ | 672,466 | | | $ | 1,655,467 | | | $ | 4,111 | |
| Dividends reinvested | | | 35,051 | | | | 79,156 | | | | 24,981 | | | | 42 | |
| Cost of shares redeemed | | | (5,648,642 | ) | | | (2,157,185 | ) | | | (228,362 | ) | | | — | |
| Change in net assets from Investor Shares | | | (3,992,173 | ) | | | (1,405,563 | ) | | | 1,452,086 | | | | 4,153 | |
| Institutional Shares | | | �� | | | | | | | | | | | | | |
| Proceeds from shares issued | | | 25,953,347 | | | | 29,289,097 | | | | 5,533,691 | | | | 985,980 | |
| Dividends reinvested | | | 577,938 | | | | 789,135 | | | | 27,996 | | | | 1,485 | |
| Cost of shares redeemed | | | (26,910,378 | ) | | | (49,768,482 | ) | | | (497,929 | ) | | | (2,116 | ) |
| Change in net assets from Institutional Shares | | | (379,093 | ) | | | (19,690,250 | ) | | | 5,063,758 | | | | 985,349 | |
| A Shares | | | | | | | | | | | | | | | | |
| Proceeds from shares issued | | | 12 | | | | 25,434 | | | | 39,415 | | | | 384,302 | |
| Dividends reinvested | | | 2,989 | | | | 2,744 | | | | 11,968 | | | | 7,030 | |
| Cost of shares redeemed | | | (697 | ) | | | (73,861 | ) | | | (103 | ) | | | (25 | ) |
| Change in net assets from A Shares | | | 2,304 | | | | (45,683 | ) | | | 51,280 | | | | 391,307 | |
| Change in net assets resulting from capital transactions: | | $ | (4,368,962 | ) | | $ | (21,141,496 | ) | | $ | 6,567,124 | | | $ | 1,380,809 | |
| | | | | | | | | | | | | | | | | |
| Share Transactions: | | | | | | | | | | | | | | | | |
| Investor Shares | | | | | | | | | | | | | | | | |
| Issued | | | 169,129 | | | | 72,346 | | | | 163,718 | | | | 409 | |
| Reinvested | | | 3,745 | | | | 8,503 | | | | 2,422 | | | | 4 | |
| Redeemed | | | (595,195 | ) | | | (233,956 | ) | | | (22,094 | ) | | | — | |
| Change in Investor Shares | | | (422,321 | ) | | | (153,107 | ) | | | 144,046 | | | | 413 | |
| Institutional Shares | | | | | | | | | | | | | | | | |
| Issued | | | 2,807,436 | | | | 3,146,045 | | | | 551,192 | | | | 98,814 | |
| Reinvested | | | 61,833 | | | | 84,798 | | | | 2,760 | | | | 149 | |
| Redeemed | | | (2,906,379 | ) | | | (5,346,061 | ) | | | (49,593 | ) | | | (214 | ) |
| Change in Institutional Shares | | | (37,110 | ) | | | (2,115,218 | ) | | | 504,359 | | | | 98,749 | |
| A Shares | | | | | | | | | | | | | | | | |
| Issued | | | 1 | | | | 2,758 | | | | 3,970 | | | | 38,463 | |
| Reinvested | | | 319 | | | | 295 | | | | 1,188 | | | | 707 | |
| Redeemed | | | (73 | ) | | | (7,824 | ) | | | (10 | ) | | | (3 | ) |
| Change in A Shares | | | 247 | | | | (4,771 | ) | | | 5,148 | | | | 39,167 | |
| Change in shares: | | | (459,184 | ) | | | (2,273,096 | ) | | | 653,553 | | | | 138,329 | |
| (a) | Commencement of operations December 26, 2017. |
| (b) | Prior year distribution character information and accumulated net investment income/(distributions in excess of net investment income) has been modified or removed to conform with current year Regulation S-X presentation changes. See Note 7 in Notes to Financial Statements. |
See notes to financial statements
| Statements of Changes in Net Assets | |
| August 31, 2019 | Continued |
| | | Ultra Short Tax-Free Income Fund | | | Active Core Fund | |
| | | Year Ended
August 31, 2019 | | | For the period
Dec. 26, 2017(a)
through
Aug. 31, 2018 | | | Year Ended
August 31, 2019 | | | Year Ended
August 31, 2018 | |
| From Investment Activities: | | | | | | | | | | | | | | | | |
| Operations: | | | | | | | | | | | | | | | | |
| Net investment income | | $ | 186,724 | | | $ | 54,478 | | | $ | 800,508 | | | $ | 830,037 | |
| Net realized gains/(losses) from investment transactions | | | (114 | ) | | | 3 | | | | 2,096,219 | | | | 2,393,315 | |
| Change in unrealized appreciation/(depreciation) on investments | | | 17,304 | | | | (2,960 | ) | | | (1,358,927 | ) | | | 1,262,079 | |
| Change in net assets resulting from operations | | | 203,914 | | | | 51,521 | | | | 1,537,800 | | | | 4,485,431 | |
| | | | | | | | | | | | | | | | | |
| Distributions to Shareholders(b): | | | | | | | | | | | | | | | | |
| Investor Shares | | | (839 | ) | | | (248 | ) | | | (337,670 | ) | | | (311,703 | ) |
| Institutional Shares | | | (185,894 | ) | | | (54,230 | ) | | | (3,052,196 | ) | | | (2,792,395 | ) |
| A Shares | | | (77 | ) | | | — | | | | (92,874 | ) | | | (88,985 | ) |
| C Shares | | | — | | | | — | | | | (4,432 | ) | | | (3,592 | ) |
| Change in net assets from shareholder distributions | | | (186,810 | ) | | | (54,478 | ) | | | (3,487,172 | ) | | | (3,196,675 | ) |
| Change in net assets from capital transactions | | | 9,042,524 | | | | 11,669,287 | | | | (3,669,361 | ) | | | (610,920 | ) |
| Change in net assets | | | 9,059,628 | | | | 11,666,330 | | | | (5,618,733 | ) | | | 677,836 | |
| | | | | | | | | | | | | | | | | |
| Net Assets(b): | | | | | | | | | | | | | | | | |
| Beginning of year | | | 11,666,330 | | | | — | | | | 53,646,329 | | | | 52,968,493 | |
| End of year | | $ | 20,725,958 | | | $ | 11,666,330 | | | $ | 48,027,596 | | | $ | 53,646,329 | |
| | | | | | | | | | | | | | | | | |
| Capital Transactions: | | | | | | | | | | | | | | | | |
| Investor Shares | | | | | | | | | | | | | | | | |
| Proceeds from shares issued | | $ | 129,217 | | | $ | 121,009 | | | $ | 148,519 | | | $ | 368,976 | |
| Dividends reinvested | | | 697 | | | | 145 | | | | 336,958 | | | | 310,343 | |
| Cost of shares redeemed | | | (25,798 | ) | | | (49,990 | ) | | | (983,480 | ) | | | (737,797 | ) |
| Change in net assets from Investor Shares | | | 104,116 | | | | 71,164 | | | | (498,003 | ) | | | (58,478 | ) |
| Institutional Shares | | | | | | | | | | | | | | | | |
| Proceeds from shares issued | | | 13,135,209 | | | | 14,244,137 | | | | 1,188,754 | | | | 1,919,513 | |
| Dividends reinvested | | | 17,727 | | | | 5,760 | | | | 3,041,329 | | | | 2,782,049 | |
| Cost of shares redeemed | | | (4,235,906 | ) | | | (2,651,794 | ) | | | (6,744,012 | ) | | | (5,194,005 | ) |
| Change in net assets from Institutional Shares | | | 8,917,030 | | | | 11,598,103 | | | | (2,513,929 | ) | | | (492,443 | ) |
| A Shares | | | | | | | | | | | | | | | | |
| Proceeds from shares issued | | | 21,301 | | | | 20 | | | | 230,245 | | | | 102,236 | |
| Dividends reinvested | | | 77 | | | | — | | | | 92,874 | | | | 88,984 | |
| Cost of shares redeemed | | | — | | | | — | | | | (964,930 | ) | | | (247,576 | ) |
| Change in net assets from A Shares | | | 21,378 | | | | 20 | | | | (641,811 | ) | | | (56,356 | ) |
| C Shares | | | | | | | | | | | | | | | | |
| Proceeds from shares issued | | | — | | | | — | | | | 1,667 | | | | 125 | |
| Dividends reinvested | | | — | | | | — | | | | 4,432 | | | | 3,593 | |
| Cost of shares redeemed | | | — | | | | — | | | | (21,717 | ) | | | (7,361 | ) |
| Change in net assets from C Shares | | | — | | | | — | | | | (15,618 | ) | | | (3,643 | ) |
| Change in net assets resulting from capital transactions: | | $ | 9,042,524 | | | $ | 11,669,287 | | | $ | (3,669,361 | ) | | $ | (610,920 | ) |
| | | | | | | | | | | | | | | | | |
| Share Transactions: | | | | | | | | | | | | | | | | |
| Investor Shares | | | | | | | | | | | | | | | | |
| Issued | | | 12,922 | | | | 12,119 | | | | 11,332 | | | | 26,693 | |
| Reinvested | | | 70 | | | | 15 | | | | 27,588 | | | | 22,669 | |
| Redeemed | | | (2,584 | ) | | | (5,006 | ) | | | (75,919 | ) | | | (53,614 | ) |
| Change in Investor Shares | | | 10,408 | | | | 7,128 | | | | (36,999 | ) | | | (4,252 | ) |
| Institutional Shares | | | | | | | | | | | | | | | | |
| Issued | | | 1,313,082 | | | | 1,424,414 | | | | 89,417 | | | | 138,952 | |
| Reinvested | | | 1,772 | | | | 576 | | | | 247,583 | | | | 202,542 | |
| Redeemed | | | (423,451 | ) | | | (265,180 | ) | | | (510,165 | ) | | | (374,394 | ) |
| Change in Institutional Shares | | | 891,403 | | | | 1,159,810 | | | | (173,165 | ) | | | (32,900 | ) |
| A Shares | | | | | | | | | | | | | | | | |
| Issued | | | 2,130 | | | | 2 | | | | 17,514 | | | | 7,313 | |
| Reinvested | | | 8 | | | | — | | | | 7,685 | | | | 6,520 | |
| Redeemed | | | — | | | | — | | | | (75,171 | ) | | | (17,852 | ) |
| Change in A Shares | | | 2,138 | | | | 2 | | | | (49,972 | ) | | | (4,019 | ) |
| C Shares | | | | | | | | | | | | | | | | |
| Issued | | | — | | | | — | | | | 126 | | | | 9 | |
| Reinvested | | | — | | | | — | | | | 368 | | | | 263 | |
| Redeemed | | | — | | | | — | | | | (1,741 | ) | | | (533 | ) |
| Change in C Shares | | | — | | | | — | | | | (1,247 | ) | | | (261 | ) |
| Change in shares: | | | 903,949 | | | | 1,166,940 | | | | (261,383 | ) | | | (41,432 | ) |
| (a) | Commencement of operations December 26, 2017. |
| (b) | Prior year distribution character information and accumulated net investment income/(distributions in excess of net investment income) has been modified or removed to conform with current year Regulation S-X presentation changes. See Note 7 in Notes to Financial Statements. |
See notes to financial statements
| Statements of Changes in Net Assets | |
| August 31, 2019 | Continued |
| | | Mid Cap Core Equity Fund | | | Opportunistic Fund | |
| | | Year Ended
August 31, 2019 | | | Year Ended
August 31, 2018 | | | Year Ended
August 31, 2019 | | | Year Ended
August 31, 2018 | |
| From Investment Activities: | | | | | | | | | | | | | | | | |
| Operations: | | | | | | | | | | | | | | | | |
| Net investment income | | $ | 6,355 | | | $ | 16,453 | | | $ | 510,021 | | | $ | 241,566 | |
| Net realized gains/(losses) from investment transactions | | | 62,916 | | | | 19,657 | | | | (3,716,989 | ) | | | 3,182,184 | |
| Change in unrealized appreciation/(depreciation) on investments | | | (205,354 | ) | | | 332,199 | | | | (1,864,917 | ) | | | 859,113 | |
| Change in net assets resulting from operations | | | (136,083 | ) | | | 368,309 | | | | (5,071,885 | ) | | | 4,282,863 | |
| | | | | | | | | | | | | | | | | |
| Distributions to Shareholders(a): | | | | | | | | | | | | | | | | |
| Investor Shares | | | (5,613 | ) | | | (3,483 | ) | | | (143,817 | ) | | | (152,943 | ) |
| Institutional Shares | | | (44,019 | ) | | | (12,257 | ) | | | (3,342,344 | ) | | | (2,239,212 | ) |
| A Shares | | | (12,664 | ) | | | (1,408 | ) | | | (150,601 | ) | | | (105,642 | ) |
| C Shares | | | — | | | | — | | | | (33,113 | ) | | | (30,595 | ) |
| Change in net assets from shareholder distributions | | | (62,296 | ) | | | (17,148 | ) | | | (3,669,875 | ) | | | (2,528,392 | ) |
| Change in net assets from capital transactions | | | (839,797 | ) | | | (117,634 | ) | | | (1,793,327 | ) | | | 4,462,459 | |
| Change in net assets | | | (1,038,176 | ) | | | 233,527 | | | | (10,535,087 | ) | | | 6,216,930 | |
| | | | | | | | | | | | | | | | | |
| Net Assets(a): | | | | | | | | | | | | | | | | |
| Beginning of year | | | 2,343,615 | | | | 2,110,088 | | | | 50,386,535 | | | | 44,169,605 | |
| End of year | | $ | 1,305,439 | | | $ | 2,343,615 | | | $ | 39,851,448 | | | $ | 50,386,535 | |
| | | | | | | | | | | | | | | | | |
| Capital Transactions: | | | | | | | | | | | | | | | | |
| Investor Shares | | | | | | | | | | | | | | | | |
| Proceeds from shares issued | | $ | 19,874 | | | $ | 1,057,901 | | | $ | 2,115,616 | | | $ | 370,584 | |
| Dividends reinvested | | | 5,613 | | | | 3,483 | | | | 138,441 | | | | 149,017 | |
| Cost of shares redeemed | | | (497,751 | ) | | | (717,263 | ) | | | (892,198 | ) | | | (1,543,340 | ) |
| Change in net assets from Investor Shares | | | (472,264 | ) | | | 344,121 | | | | 1,361,859 | | | | (1,023,739 | ) |
| Institutional Shares | | | | | | | | | | | | | | | | |
| Proceeds from shares issued | | | 421,550 | | | | — | | | | 8,230,508 | | | | 11,973,471 | |
| Dividends reinvested | | | 19,231 | | | | 6,045 | | | | 1,377,887 | | | | 1,829,561 | |
| Cost of shares redeemed | | | (846,450 | ) | | | (469,009 | ) | | | (12,809,479 | ) | | | (7,950,375 | ) |
| Change in net assets from Institutional Shares | | | (405,669 | ) | | | (462,964 | ) | | | (3,201,084 | ) | | | 5,852,657 | |
| A Shares | | | | | | | | | | | | | | | | |
| Proceeds from shares issued | | | 87,588 | | | | 266,803 | | | | 500,386 | | | | 420,322 | |
| Dividends reinvested | | | 3,201 | | | | 1,408 | | | | 150,562 | | | | 105,642 | |
| Cost of shares redeemed | | | (52,653 | ) | | | (9,882 | ) | | | (442,077 | ) | | | (899,382 | ) |
| Change in net assets from A Shares | | | 38,136 | | | | 258,329 | | | | 208,871 | | | | (373,418 | ) |
| C Shares | | | | | | | | | | | | | | | | |
| Proceeds from shares issued | | | — | | | | 16 | | | | 17,461 | | | | 125,022 | |
| Dividends reinvested | | | — | | | | — | | | | 33,113 | | | | 30,595 | |
| Cost of shares redeemed | | | — | | | | (257,136 | ) | | | (213,547 | ) | | | (148,658 | ) |
| Change in net assets from C Shares | | | — | | | | (257,120 | ) | | | (162,973 | ) | | | 6,959 | |
| Change in net assets resulting from capital transactions: | | $ | (839,797 | ) | | $ | (117,634 | ) | | $ | (1,793,327 | ) | | $ | 4,462,459 | |
| | | | | | | | | | | | | | | | | |
| Share Transactions: | | | | | | | | | | | | | | | | |
| Investor Shares | | | | | | | | | | | | | | | | |
| Issued | | | 1,805 | | | | 95,660 | | | | 162,074 | | | | 24,305 | |
| Reinvested | | | 583 | | | | 309 | | | | 11,533 | | | | 10,062 | |
| Redeemed | | | (44,645 | ) | | | (61,467 | ) | | | (66,483 | ) | | | (100,388 | ) |
| Change in Investor Shares | | | (42,257 | ) | | | 34,502 | | | | 107,124 | | | | (66,021 | ) |
| Institutional Shares | | | | | | | | | | | | | | | | |
| Issued | | | 39,657 | | | | — | | | | 606,688 | | | | 779,146 | |
| Reinvested | | | 1,976 | | | | 542 | | | | 114,018 | | | | 122,146 | |
| Redeemed | | | (83,425 | ) | | | (42,188 | ) | | | (989,515 | ) | | | (517,691 | ) |
| Change in Institutional Shares | | | (41,792 | ) | | | (41,646 | ) | | | (268,809 | ) | | | 383,601 | |
| A Shares | | | | | | | | | | | | | | | | |
| Issued | | | 7,837 | | | | 25,169 | | | | 36,850 | | | | 27,557 | |
| Reinvested | | | 321 | | | | 125 | | | | 12,528 | | | | 7,108 | |
| Redeemed | | | (4,817 | ) | | | (827 | ) | | | (33,213 | ) | | | (58,662 | ) |
| Change in A Shares | | | 3,341 | | | | 24,467 | | | | 16,165 | | | | (23,997 | ) |
| C Shares | | | | | | | | | | | | | | | | |
| Issued | | | — | | | | — | | | | 1,381 | | | | 8,356 | |
| Reinvested | | | — | | | | — | | | | 2,863 | | | | 2,110 | |
| Redeemed | | | — | | | | (24,606 | ) | | | (16,481 | ) | | | (9,926 | ) |
| Change in C Shares | | | — | | | | (24,606 | ) | | | (12,237 | ) | | | 540 | |
| Change in shares: | | | (80,708 | ) | | | (7,283 | ) | | | (157,757 | ) | | | 294,123 | |
| (a) | Prior year distribution character information and accumulated net investment income/(distributions in excess of net investment income) has been modified or removed to conform with current year Regulation S-X presentation changes. See Note 7 in Notes to Financial Statements. |
See notes to financial statements
| Statements of Changes in Net Assets | |
| August 31, 2019 | Concluded |
| | | World Energy Fund | |
| | | Year Ended
August 31, 2019 | | | Year Ended
August 31, 2018 | |
| From Investment Activities: | | | | | | | | |
| Operations: | | | | | | | | |
| Net investment income | | $ | 667,667 | | | $ | 446,123 | |
| Net realized gains/(losses) from investment transactions | | | (7,740,435 | ) | | | 2,501,270 | |
| Change in unrealized appreciation/(depreciation) on investments | | | (7,371,021 | ) | | | 5,797,620 | |
| Change in net assets resulting from operations | | | (14,443,789 | ) | | | 8,745,013 | |
| | | | | | | | | |
| Distributions to Shareholders(a): | | | | | | | | |
| Investor Shares | | | (68,358 | ) | | | (33,476 | ) |
| Institutional Shares | | | (424,612 | ) | | | (253,387 | ) |
| A Shares | | | (64,428 | ) | | | (38,506 | ) |
| C Shares | | | (29,005 | ) | | | (6,916 | ) |
| Change in net assets from shareholder distributions | | | (586,403 | ) | | | (332,285 | ) |
| Change in net assets from capital transactions | | | (22,632,860 | ) | | | 1,572,526 | |
| Change in net assets | | | (37,663,052 | ) | | | 9,985,254 | |
| | | | | | | | | |
| Net Assets(a): | | | | | | | | |
| Beginning of year | | | 58,077,966 | | | | 48,092,712 | |
| End of year | | $ | 20,414,914 | | | $ | 58,077,966 | |
| | | | | | | | | |
| Capital Transactions: | | | | | | | | |
| Investor Shares | | | | | | | | |
| Proceeds from shares issued | | $ | 661,007 | | | $ | 5,187,439 | |
| Dividends reinvested | | | 67,407 | | | | 33,143 | |
| Cost of shares redeemed | | | (3,680,283 | ) | | | (7,889,268 | ) |
| Change in net assets from Investor Shares | | | (2,951,869 | ) | | | (2,668,686 | ) |
| Institutional Shares | | | | | | | | |
| Proceeds from shares issued | | | 5,042,691 | | | | 19,350,868 | |
| Dividends reinvested | | | 281,395 | | | | 164,221 | |
| Cost of shares redeemed | | | (22,109,388 | ) | | | (12,040,470 | ) |
| Change in net assets from Institutional Shares | | | (16,785,302 | ) | | | 7,474,619 | |
| A Shares | | | | | | | | |
| Proceeds from shares issued | | | 82,191 | | | | 4,199,302 | |
| Dividends reinvested | | | 64,192 | | | | 38,390 | |
| Cost of shares redeemed | | | (2,313,662 | ) | | | (6,449,024 | ) |
| Change in net assets from A Shares | | | (2,167,279 | ) | | | (2,211,332 | ) |
| C Shares | | | | | | | | |
| Proceeds from shares issued | | | 32,116 | | | | 208,969 | |
| Dividends reinvested | | | 28,922 | | | | 6,898 | |
| Cost of shares redeemed | | | (789,448 | ) | | | (1,237,942 | ) |
| Change in net assets from C Shares | | | (728,410 | ) | | | (1,022,075 | ) |
| Change in net assets resulting from capital transactions: | | $ | (22,632,860 | ) | | $ | 1,572,526 | |
| | | | | | | | | |
| Share Transactions: | | | | | | | | |
| Investor Shares | | | | | | | | |
| Issued | | | 87,795 | | | | 558,356 | |
| Reinvested | | | 8,656 | | | | 3,589 | |
| Redeemed | | | (476,439 | ) | | | (879,232 | ) |
| Change in Investor Shares | | | (379,988 | ) | | | (317,287 | ) |
| Institutional Shares | | | | | | | | |
| Issued | | | 641,465 | | | | 2,073,112 | |
| Reinvested | | | 36,286 | | | | 17,694 | |
| Redeemed | | | (2,979,832 | ) | | | (1,324,105 | ) |
| Change in Institutional Shares | | | (2,302,081 | ) | | | 766,701 | |
| A Shares | | | | | | | | |
| Issued | | | 9,748 | | | | 483,108 | |
| Reinvested | | | 8,320 | | | | 4,170 | |
| Redeemed | | | (311,502 | ) | | | (671,605 | ) |
| Change in A Shares | | | (293,434 | ) | | | (184,327 | ) |
| C Shares | | | | | | | | |
| Issued | | | 3,863 | | | | 22,514 | |
| Reinvested | | | 3,931 | | | | 777 | |
| Redeemed | | | (103,489 | ) | | | (138,450 | ) |
| Change in C Shares | | | (95,695 | ) | | | (115,159 | ) |
| Change in shares: | | | (3,071,198 | ) | | | 149,928 | |
| (a) | Prior year distribution character information and accumulated net investment income/(distributions in excess of net investment income) has been modified or removed to conform with current year Regulation S-X presentation changes. See Note 7 in Notes to Financial Statements. |
See notes to financial statements
| Schedule of Portfolio Investments | U.S. Treasury Fund |
| August 31, 2019 | |
Principal
Amount | | | Security Description | | Amortized
Cost | |
| | | | | |
| U.S. Treasury Obligations (20.9%) | | | | |
| U.S. Treasury Notes | | | | |
| $ | 80,000,000 | | | 1.00%, 11/30/19 | | $ | 79,802,507 | |
| | 40,000,000 | | | 1.25%, 10/31/19 | | | 39,921,750 | |
| | 60,000,000 | | | 1.50%, 11/30/19 | | | 59,851,131 | |
| | 50,000,000 | | | 2.01% (USBMMY3M + 5 bps), 10/31/19 | | | 50,007,640 | |
| Total U.S. Treasury Obligations | | | 229,583,028 | |
| | | | | |
| Repurchase Agreements (60.6%) | | | | |
| | 45,000,000 | | | Bank of Montreal, 2.10%, 9/3/19, (Purchased on 8/30/19, proceeds at maturity $45,010,500, Collateralized by various U.S. Treasury Obligations, (0.00% -3.63%), (1/2/20 - 2/15/47), fair value of $45,900,028) | | | 45,000,000 | |
| | 140,000,000 | | | Credit Agricole CIB, 2.12%, 9/3/19, (Purchased on 8/30/19, proceeds at maturity $140,032,978, Collateralized by U.S. Treasury Obligation, (3.13%), (8/15/44), fair value of $142,800,084) | | | 140,000,000 | |
| | 90,000,000 | | | Fixed Income Clearing Corporation - Bank of New York Mellon, 2.12%, 9/3/19, (Purchased on 8/30/19, proceeds at maturity $90,021,200, Collateralized by U.S. Treasury Obligation, (2.88%), (9/30/23), fair value of $91,800,088) | | | 90,000,000 | |
| | 250,000,000 | | | Fixed Income Clearing Corporation - State Street Bank & Trust Co., 2.14%, 9/3/19, (Purchased on 8/30/19, proceeds at maturity $250,059,444, Collateralized by various U.S. Treasury Obligations, (2.14%), (1/15/21 - 6/15/22), fair value of $255,005,157) | | | 250,000,000 | |
Principal
Amount | | | Security Description | | Amortized
Cost | |
| | | | |
| Repurchase Agreements, continued: | | | |
| $ | 30,000,000 | | | Goldman Sachs & Co., 2.12%, 9/3/19, (Purchased on 8/30/19, proceeds at maturity $30,007,067, Collateralized by various U.S. Treasury Obligations, (0.00% - 1.88%), (12/15/20 - 8/15/36), fair value of $30,600,000) | | $ | 30,000,000 | |
| | 50,000,000 | | | Mizuho Securities USA LLC, 2.12%, 9/3/19, (Purchased on 8/30/19, proceeds at maturity $50,011,778, Collateralized by various U.S. Treasury Obligations, (0.63% - 6.25%), (1/15/20- 5/15/49), fair value of $51,000,031) | | | 50,000,000 | |
| | 50,000,000 | | | Nomura Securities International, Inc., 2.14%, 9/3/19, (Purchased on 8/30/19, proceeds at maturity $50,011,889, Collateralized by various U.S. Treasury Obligations, (0.00% - 2.75%), (2/20/20- 8/15/49), fair value of $51,000,000) | | | 50,000,000 | |
| | 10,000,000 | | | Royal Bank of Canada New York, 2.06%, 9/3/19, (Purchased on 8/30/19, proceeds at maturity $10,002,289, Collateralized by U.S. Treasury Obligation, (2.50%), (1/31/24), fair value of $10,200,054) | | | 10,000,000 | |
| Total Repurchase Agreements | | | 665,000,000 | |
| | | | | | | | | |
| Investment Companies (14.0%) | | | | |
| | 67,000,000 | | | BlackRock Liquidity Funds T-Fund, Institutional Class, 1.98% | | | 67,000,000 | |
| | 20,000,000 | | | Goldman Sachs Financial Square Treasury Obligations Fund, 1.97% | | | 20,000,000 | |
| | 66,742,300 | | | Invesco Short-Term Investments Trust, Treasury Portfolio, Institutional Class, 1.98% | | | 66,742,300 | |
| Total Investment Companies | | | 153,742,300 | |
| | | | | | | | | |
| Total Investments (Cost $1,048,325,328)(a) - 95.5% | | | 1,048,325,328 | |
| Other assets in excess of liabilities — 4.5% | | | 49,365,646 | |
| Net Assets - 100.0% | | $ | 1,097,690,974 | |
| (a) | Cost and value for federal income tax and financial reporting purposes are the same. |
USBMMY3M 3 Month Treasury Bill Rate
See notes to financial statements
| Schedule of Portfolio Investments | Government Securities Money Market Fund |
| August 31, 2019 | |
Principal
Amount | | | Security Description | | Amortized
Cost | |
| | | | |
| U.S. Government Agency Securities (13.3%) | | | |
| Federal Home Loan Bank | | | | |
| $ | 60,000,000 | | | 2.12% (SOFR ), 12/11/19 | | $ | 60,000,000 | |
| | 11,000,000 | | | 2.15% (SOFR + 3 bps), 3/27/20 | | | 11,000,000 | |
| | 80,000,000 | | | 2.15% (SOFR + 4 bps), 6/19/20 | | | 80,000,000 | |
| | 49,000,000 | | | 2.23% (SOFR + 7 bps), 3/27/20 | | | 49,000,000 | |
| | | | | | | | 200,000,000 | |
| Federal Home Loan Mortgage Corporation | | | | |
| | 40,000,000 | | | 2.22% (SOFR + 6 bps), 4/6/20 | | | 40,000,000 | |
| Total U.S. Government Agency Securities | | | 240,000,000 | |
| | | | | | | | | |
| U.S. Treasury Obligations (15.5%) | | | | |
| U.S. Treasury Notes | | | | | |
| | 60,000,000 | | | 0.88%, 9/15/19 | | | 59,961,400 | |
| | 70,000,000 | | | 1.00%, 11/15/19 | | | 69,783,751 | |
| | 110,000,000 | | | 1.00%, 11/30/19 | | | 109,728,448 | |
| | 40,000,000 | | | 2.01% (USBMMY3M + 5 bps), 10/31/19 | | | 40,006,112 | |
| Total U.S. Treasury Obligations | | | 279,479,711 | |
| | | | | | | | | |
| Repurchase Agreements (48.4%) | | | | |
| | 10,000,000 | | | Bank of Montreal, 2.10%, 9/3/19, (Purchased on 8/30/19, proceeds at maturity $10,002,333, Collateralized by various U.S. Treasury Obligations, (0.00% -3.63%), (1/2/20 - 5/15/47), fair value of $10,200,009) | | | 10,000,000 | |
| | 140,000,000 | | | Credit Agricole CIB, 2.12%, 9/3/19, (Purchased on 8/30/19, proceeds at maturity $140,032,978, Collateralized by U.S. Treasury Obligation, (3.13%), (8/15/44), fair value of $142,800,084) | | | 140,000,000 | |
| | 160,000,000 | | | Fixed Income Clearing Corporation - Bank of New York Mellon, 2.12%, 9/3/19, (Purchased on 8/30/19, proceeds at maturity $160,037,689, Collateralized by various U.S. Treasury Obligations, (1.88% - 2.88%), (2/28/22 - 9/30/23), fair value of $163,200,027) | | | 160,000,000 | |
| | 370,000,000 | | | Fixed Income Clearing Corporation - State Street Bank & Trust Co., 2.14%, 9/3/19, (Purchased on 8/30/19, proceeds at maturity $370,087,978, Collateralized by various U.S. Treasury Obligations, (2.14%), (1/15/21 - 6/15/22), fair value of $377,400,457) | | | 370,000,000 | |
Principal
Amount | | | Security Description | | Amortized
Cost | |
| | | | | |
| Repurchase Agreements, continued: | | | | |
| $ | 40,000,000 | | | Goldman Sachs & Co., 2.13%, 9/3/19, (Purchased on 8/30/19, proceeds at maturity $40,009,467, Collateralized by various U.S. Government Agency Obligations, (0.00% - 7.25%), (10/10/19- 5/15/30), fair value of $40,800,043) | | $ | 40,000,000 | |
| | 50,000,000 | | | Mizuho Securities USA LLC, 2.12%, 9/3/19, (Purchased on 8/30/19, proceeds at maturity $50,011,778, Collateralized by various U.S. Treasury Obligations, (2.88% - 3.13%), (2/15/42- 5/15/49), fair value of $51,000,002) | | | 50,000,000 | |
| | 85,000,000 | | | Nomura Securities International, Inc., 2.14%, 9/3/19, (Purchased on 8/30/19, proceeds at maturity $85,020,211, Collateralized by various U.S. Treasury Obligations, (0.00% - 3.38%), (11/14/19- 11/15/48), fair value of $86,700,068) | | | 85,000,000 | |
| | 10,000,000 | | | Royal Bank of Canada New York, 2.07%, 9/3/19, (Purchased on 8/30/19, proceeds at maturity $10,002,300, Collateralized by various U.S. Government Agency Obligations and U.S. Treasuries, (0.00% - 3.13%), (6/18/20 - 6/5/29), fair value of $10,200,000) | | | 10,000,000 | |
| | 10,000,000 | | | Wells Fargo Securities LLC, 2.10%, 9/3/19, (Purchased on 8/30/19, proceeds at maturity $10,002,333, Collateralized by U.S. Government Agency Obligations, (0.00%), (3/15/31), fair value of $10,200,380) | | | 10,000,000 | |
| Total Repurchase Agreements | | | 875,000,000 | |
| | | | | | | | | |
| Investment Companies (16.1%) | | | | |
| | 64,000,000 | | | BlackRock Liquidity Funds FedFund Portfolio, Institutional Class, 1.92% | | | 64,000,000 | |
| | 130,000,000 | | | Federated Government Obligations Fund, Premier Class, 2.02% | | | 130,000,000 | |
| | 97,295,555 | | | Invesco Short-Term Investments Trust, Government & Agency Portfolio, Institutional Class, 2.02% | | | 97,295,555 | |
| Total Investment Companies | | | 291,295,555 | |
| | | | | | | | | |
| Total Investments (Cost $1,685,775,266)(a) - 93.3% | | | 1,685,775,266 | |
| Other assets in excess of liabilities — 6.7% | | | 120,414,076 | |
| Net Assets - 100.0% | | $ | 1,806,189,342 | |
| (a) | Cost and value for federal income tax and financial reporting purposes are the same. |
| SOFR | Secured Overnight Financing Rate |
| USBMMY3M | 3 Month Treasury Bill Rate |
See notes to financial statements
| Schedule of Portfolio Investments | Limited Duration Fund |
| August 31, 2019 | |
Shares or
Principal
Amount | | | Security Description | | Value | |
| | | | | | | | |
| Asset Backed Securities (6.5%) | | | | |
| $ | 1,886,554 | | | AccessLex Institute, Series 2007-1, Class C, 2.68% (US0003M + 40 bps), 10/25/35* | | $ | 1,600,153 | |
| | 1,038,616 | | | Cazenovia Creek Funding II LLC, Series 2018-1A, Class A, 3.56%, 7/15/30*(a) | | | 1,046,042 | |
| | 1,974 | | | Citigroup Mortgage Loan Trust, Inc., Series 2005-WF1, Class A5, 5.01%, 11/25/34*(b) | | | 1,994 | |
| | 385 | | | Countrywide Asset-Backed Certificates, Series 2002-S1, Class A5, 6.46%, 5/25/32*(b) | | | 385 | |
| | 5,226 | | | Countrywide Home Equity Loan Trust, Series 2004-C, Class C, 2.42% (US0001M + 22 bps), 1/15/34* | | | 5,187 | |
| | 1,119,779 | | | Fannie Mae Grantor Trust, Series 2003-T4, Class 2A5, 4.62%, 9/26/33*(b) | | | 1,261,583 | |
| | 461,543 | | | Fremont Home Loan Trust, Series 2004-3, Class 10A1, 4.02% (US0001M + 188 bps), 11/25/34* | | | 228,646 | |
| | 209 | | | IMC Home Equity Loan Trust, Series 1998-1, Class A6, 7.02%, 6/20/29*(b) | | | 210 | |
| | 860,507 | | | New Century Home Equity Loan Trust, Series 2005-A, Class A4W, 4.68%, 8/25/35*(b) | | | 876,615 | |
| | 7,613 | | | Raspro Trust, Series 2005-1A, Class G, 2.79% (US0003M + 40 bps), 3/23/24(c) | | | 7,605 | |
| | 153,006 | | | Residential Asset Mortgage Products, Inc., Series 2002-RS2, Class AI5, 6.03%, 3/25/32* | | | 160,547 | |
| | 7,050 | | | Saxon Asset Securities Trust, Series 2003-3, Class AF6, 4.71%, 12/25/33*(b) | | | 7,144 | |
| | 134,127 | | | Soundview Home Equity Loan Trust, Series 2005-B, Class M2, 6.22%, 5/25/35*(b) | | | 128,050 | |
| | 477,064 | | | Structured Asset Investment Loan, Series 2004-10, Class A4, 3.15% (US0001M + 100 bps), 11/25/34* | | | 477,884 | |
| | 946,384 | | | Structured Asset Securities Corp Mortgage Pass-Through Certificates, Series 2004-6XS, Class A5A, 6.03%, 3/25/34*(b) | | | 970,336 | |
| | 1,055,852 | | | Sun Trust Student Loan Trust, Series 2006-1A, Class B, 2.53% (US0003M + 27 bps), 10/28/37*(a) | | | 947,847 | |
| Total Asset Backed Securities | | | 7,720,228 | |
| | | | | | | | | |
| Mortgage Backed Securities† (48.0%) | | | | |
| Alt-A - Adjustable Rate Mortgage Backed Securities (1.5%) | | | | |
| | 12,523 | | | Bear Stearns Alternative Trust, Series 2005-5, Class 26A1, 3.92%, 7/25/35*(b) | | | 11,024 | |
| | 121,298 | | | Bear Stearns Alternative Trust, Series 2006-1, Class 21A2, 4.03%, 2/25/36*(b) | | | 104,850 | |
| | 23,807 | | | Countrywide Alternative Loan Trust, Series 2005-24, Class 1A1, 3.79% (12MTA + 131 bps), 7/20/35* | | | 20,178 | |
| | 1,833 | | | Deutsche Mortgage Securities, Inc., Series 2006-ABR, Class A1B1, 2.25% (US0001M + 10 bps), 10/25/36* | | | 1,389 | |
Shares or
Principal
Amount | | | Security Description | | Value | |
| | |
| Mortgage Backed Securities†, continued: | |
| Alt-A - Adjustable Rate Mortgage Backed Securities, continued: | | | | |
| $ | 13,953 | | | Deutsche Mortgage Securities, Inc., Series 2003-4XS, Class 10A1, 5.32% (US0003M + 119 bps), 10/25/33* | | $ | 14,049 | |
| | 6,222 | | | Deutsche Mortgage Securities, Inc., Series 2006-AB4, Class A1A, 6.00%, 10/25/36*(b) | | | 5,982 | |
| | 9,559 | | | First Horizon Alternative Mortgage Securities, Series 2004-AA3, Class A1, 4.11%, 9/25/34*(b) | | | 9,527 | |
| | 33,499 | | | Master Adjustable Rate Mortgage Trust, Series 2004-13, Class 2A1, 4.85%, 4/21/34*(b) | | | 34,623 | |
| | 1,299,836 | | | Nomura Asset Acceptance Corp., Series 2005-AR4, Class 3A1, 4.67%, 8/25/35*(b) | | | 1,310,364 | |
| | 243,396 | | | RBSSP Resecuritization Trust, Series 2009-5, Class 13A4, 2.73% (US0001M + 50 bps), 8/26/37(c) | | | 242,156 | |
| | 45,028 | | | Residential Accredit Loans, Inc., Series 2004-QA4, Class NB21, 4.72%, 9/25/34*(b) | | | 45,283 | |
| | 25,753 | | | Residential Accredit Loans, Inc., Series 2006-QA1, Class A21, 4.91%, 1/25/36*(b) | | | 23,230 | |
| | | | | | | | 1,822,655 | |
| Alt-A - Fixed Rate Mortgage Backed Securities (0.8%) | | | | |
| | 16,043 | | | Chaseflex Trust, Series 2005-1, Class 2A4, 5.50%, 2/25/35* | | | 14,572 | |
| | 27,582 | | | Citigroup Mortgage Alternative Loan Trust, Series 2006-A3, Class 1A5, 6.00%, 7/25/36* | | | 27,544 | |
| | 2,119 | | | Countrywide Alternative Loan Trust, Series 2004-12CB, Class 1A1, 5.00%, 7/25/19* | | | 2,115 | |
| | 20,596 | | | Countrywide Alternative Loan Trust, Series 2005-J13, Class 2A3, 5.50%, 11/25/35* | | | 18,742 | |
| | 22,781 | | | Countrywide Alternative Loan Trust, Series 2006-2CB, Class A3, 5.50%, 3/25/36* | | | 16,661 | |
| | 23,790 | | | Countrywide Alternative Loan Trust, Series 2006-31CB, Class A16, 6.00%, 11/25/36* | | | 20,279 | |
| | 23,898 | | | Countrywide Alternative Loan Trust, Series 2006-43CB, Class 1A4, 6.00%, 2/25/37* | | | 20,062 | |
| | 157,170 | | | Countrywide Alternative Loan Trust, Series 2006-J8, Class A2, 6.00%, 2/25/37* | | | 110,181 | |
| | 73,423 | | | Countrywide Alternative Loan Trust, Series 2004-J8, Class 2A1, 7.00%, 8/25/34* | | | 77,517 | |
| | 56,263 | | | First Horizon Alternative Mortgage Securities, Series 2006-FA3, Class A6, 6.00%, 7/25/36* | | | 43,888 | |
| | 1,932 | | | Master Adjustable Rate Mortgage Trust, Series 2005-3, Class 4A1, 5.50%, 3/25/20* | | | 1,927 | |
| | 2,051 | | | Master Alternative Loans Trust, Series 2005-1, Class 5A1, 5.50%, 1/25/20* | | | 2,133 | |
See notes to financial statements
| Schedule of Portfolio Investments | Limited Duration Fund |
| August 31, 2019 | Continued |
Shares or
Principal
Amount | | | Security Description | | Value | |
| | |
| Mortgage Backed Securities†, continued: | |
| Alt-A - Fixed Rate Mortgage Backed Securities, continued: | | | | |
| $ | 4,693 | | | Master Alternative Loans Trust, Series 2004-3, Class 3A1, 6.00%, 4/25/34* | | $ | 5,050 | |
| | 405,026 | | | Master Alternative Loans Trust, Series 2004-3, Class 5A1, 6.50%, 3/25/34* | | | 449,152 | |
| | 21,627 | | | Master Alternative Loans Trust, Series 2004-1, Class 3A1, 7.00%, 1/25/34* | | | 23,111 | |
| | 3,975 | | | Master Alternative Loans Trust, Series 2004-3, Class 8A1, 7.00%, 4/25/34* | | | 4,435 | |
| | 1,781 | | | Residential Accredit Loans, Inc., Series 2003-QS14, Class A1, 5.00%, 7/25/18 | | | 1,741 | |
| | 1,652 | | | Residential Accredit Loans, Inc., Series 2004-QS13, Class CB, 5.00%, 9/25/19* | | | 1,648 | |
| | 6,891 | | | Residential Accredit Loans, Inc., Series 2004-QS6, Class A1, 5.00%, 5/25/19* | | | 6,667 | |
| | 41,110 | | | Residential Accredit Loans, Inc., Series 2006-QS6, Class 1A2, 6.00%, 6/25/36* | | | 38,357 | |
| | 45,796 | | | Residential Asset Securitization Trust, Series 2006-A9CB, Class A5, 6.00%, 9/25/36* | | | 26,038 | |
| | 34,624 | | | Residential Asset Securitization Trust, Series 2007-A5, Class 2A3, 6.00%, 5/25/37* | | | 29,671 | |
| | 21,435 | | | Wells Fargo Mortgage Backed Securities Trust, Series 2005-1, Class 2A3, 5.50%, 2/25/35* | | | 21,494 | |
| | | | | | | | 962,985 | |
| Prime Adjustable Rate Mortgage Backed Securities (1.5%) | | | | |
| | 47,517 | | | Adjustable Rate Mortgage Trust, Series 2004-4, Class 1A1, 4.02%, 3/25/35*(b) | | | 46,808 | |
| | 7,330 | | | Adjustable Rate Mortgage Trust, Series 2005-1, Class 2A22, 4.69%, 5/25/35(b) | | | 7,508 | |
| | 344,141 | | | American Home Mortgage Investment Trust, Series 2006-2, Class 3A2, 6.70%, 6/25/36*(b) | | | 123,919 | |
| | 6,943 | | | Bank of America Mortgage Securities, Series 2006-B, Class 2A1, 4.36%, 11/20/46(b) | | | 6,806 | |
| | 10,725 | | | Bank of America Mortgage Securities, Series 2006-A, Class 2A1, 4.46%, 2/25/36*(b) | | | 10,049 | |
| | 9,989 | | | Bank of America Mortgage Securities, Series 2003-H, Class 2A3, 4.67%, 9/25/33*(b) | | | 10,017 | |
| | 5,663 | | | Bank of America Mortgage Securities, Series 2004-E, Class 1A1, 4.83%, 6/25/34*(b) | | | 5,724 | |
| | 9,645 | | | Bear Stearns Adjustable Rate Mortgage Trust, Series 2005-9, Class A1, 4.27% (H15T1Y + 230 bps), 10/25/35* | | | 9,871 | |
| | 8,234 | | | Bear Stearns Adjustable Rate Mortgage Trust, Series 2004-6, Class 1A1, 4.40%, 9/25/34*(b) | | | 8,054 | |
| | 5,764 | | | Bear Stearns Adjustable Rate Mortgage Trust, Series 2004-10, Class 15A1, 4.71%, 1/25/35*(b) | | | 5,893 | |
| | 31,702 | | | Bear Stearns Adjustable Rate Mortgage Trust, Series 2006-4, Class 1A1, 4.75%, 10/25/36*(b) | | | 31,066 | |
Shares or
Principal
Amount | | | Security Description | | Value | |
| | |
| Mortgage Backed Securities†, continued: | |
| Prime Adjustable Rate Mortgage Backed Securities, continued: | | | | |
| $ | 28,774 | | | Bear Stearns Mortgage Securities, Inc., Series 1997-6, Class 1A, 6.28%, 3/25/31*(b) | | $ | 28,648 | |
| | 17,293 | | | Chase Mortgage Finance Corp., Series 2007-A2, Class 10A1, 3.77%, 7/25/37*(b) | | | 15,601 | |
| | 15,738 | | | Citigroup Mortgage Loan Trust, Inc., Series 2005-3, Class 2A2A, 4.59%, 8/25/35(b) | | | 15,918 | |
| | 326,842 | | | Coast Savings & Loan Association, Series 1992-1, Class A, 3.11%, 7/25/22*(b) | | | 331,981 | |
| | 280 | | | Countrywide Home Loans, Series 2003-42, Class 1A1, 3.99%, 9/25/33*(b) | | | 258 | |
| | 16,067 | | | Countrywide Home Loans, Series 2004-12, Class 10A1, 4.15%, 8/25/34*(b) | | | 16,103 | |
| | 12,788 | | | Countrywide Home Loans, Series 2003-58, Class 2A2, 4.69%, 2/19/34*(b) | | | 13,080 | |
| | 5,311 | | | Countrywide Home Loans, Series 2003-60, Class 2A1, 4.74%, 2/25/34*(b) | | | 5,359 | |
| | 37,993 | | | Credit Suisse First Boston Mortgage Securities Corp., Series 2004-AR7, Class 2A1, 4.41%, 11/25/34*(b) | | | 39,163 | |
| | 39,140 | | | Credit Suisse First Boston Mortgage Securities Corp., Series 2002-AR28, Class CB3, 4.56%, 11/25/32*(b) | | | 17,920 | |
| | 14,557 | | | First Horizon Mortgage Pass-Through Trust, Series 2005-AR4, Class 2A1, 4.16%, 10/25/35*(b) | | | 14,126 | |
| | 81,746 | | | GMAC Mortgage Corp. Loan Trust, Series 2005-AR6, Class 3A1, 4.14%, 11/19/35*(b) | | | 78,004 | |
| | 42,334 | | | GSR Mortgage Loan Trust, Series 2005-AR2, Class 1A2, 4.45%, 4/25/35*(b) | | | 43,014 | |
| | 19,292 | | | GSR Mortgage Loan Trust, Series 2005-AR7, Class 2A1, 4.68%, 11/25/35*(b) | | | 19,408 | |
| | 82,541 | | | Harborview Mortgage Loan Trust, Series 2004-10, Class 3A1B, 4.27%, 1/19/35*(b) | | | 82,525 | |
| | 10,743 | | | Harborview Mortgage Loan Trust, Series 2005-14, Class 3A1A, 4.82%, 12/19/35*(b) | | | 10,627 | |
| | 24,079 | | | Indymac Index Mortgage Loan Trust, Series 2006-AR25, Class 4A2, 3.50%, 9/25/36*(b) | | | 23,824 | |
| | 30,504 | | | Indymac Index Mortgage Loan Trust, Series 2006-AR13, Class A1, 3.72%, 7/25/36*(b) | | | 26,310 | |
| | 46,841 | | | Indymac Index Mortgage Loan Trust, Series 2006-AR19, Class 1A2, 3.94%, 8/25/36*(b) | | | 38,020 | |
| | 16,085 | | | Indymac Index Mortgage Loan Trust, Series 2004-AR4, Class 1A, 4.10%, 8/25/34*(b) | | | 16,228 | |
| | 33,405 | | | Indymac Index Mortgage Loan Trust, Series 2004-AR4, Class 3A, 4.38%, 8/25/34*(b) | | | 33,270 | |
| | 3,224 | | | JPMorgan Mortgage Trust, Series 2006-A5, Class 3A4, 4.21%, 8/25/36*(b) | | | 2,986 | |
See notes to financial statements
| Schedule of Portfolio Investments | Limited Duration Fund |
| August 31, 2019 | Continued |
Shares or
Principal
Amount | | | Security Description | | Value | |
| | | | | |
| Mortgage Backed Securities†, continued: | | | |
| Prime Adjustable Rate Mortgage Backed Securities, continued: | | | | |
| $ | 3,432 | | | JPMorgan Mortgage Trust, Series 2005-A4, Class 3A1, 4.37%, 7/25/35*(b) | | $ | 3,461 | |
| | 1,710 | | | Merrill Lynch Mortgage Investors Trust, Series 2004-A1, Class 2A2, 4.59%, 2/25/34*(b) | | | 1,728 | |
| | 12,204 | | | Merrill Lynch Mortgage Investors Trust, Series 2004-A2, Class 1A, 4.82%, 7/25/34*(b) | | | 12,422 | |
| | 14,058 | | | MLCC Mortgage Investors, Inc., Series 2004-1, Class 2A2, 4.23%, 12/25/34*(b) | | | 14,244 | |
| | 15,980 | | | Morgan Stanley Mortgage Loan Trust, Series 2004-6AR, Class 3A, 4.36%, 8/25/34*(b) | | | 16,286 | |
| | 18,768 | | | Morgan Stanley Mortgage Loan Trust, Series 2004-6AR, Class 2A2, 4.72%, 8/25/34*(b) | | | 18,941 | |
| | 41,194 | | | Structured Adjustable Rate Mortgage Loan Trust, Series 2004-18, Class 1A2, 4.25%, 12/25/34*(b) | | | 40,246 | |
| | 83,174 | | | Structured Adjustable Rate Mortgage Loan Trust, Series 2004-4, Class 1A1, 4.65%, 4/25/34*(b) | | | 83,212 | |
| | 3,424 | | | Structured Adjustable Rate Mortgage Loan Trust, Series 2004-1, Class 3A1, 4.70%, 2/25/34*(b) | | | 3,518 | |
| | 10,628 | | | Structured Asset Mortgage Investments, Inc., Series 2005-AR7, Class 1A1, 4.04%, 12/27/35*(b) | | | 11,747 | |
| | 24,444 | | | Structured Asset Securities Corp., Series 2003-24A, Class 1A3, 4.41%, 7/25/33*(b) | | | 24,909 | |
| | 268,329 | | | Thornburg Mortgage Securities Trust, Series 2007-4, Class 3A1, 4.06%, 9/25/37*(b) | | | 269,951 | |
| | 3,995 | | | Wachovia Mortgage Loan Trust LLC, Series 2005-A, Class 4A2, 4.85%, 8/20/35*(b). | | | 372 | |
| | 12,337 | | | Washington Mutual, Series 2006-AR10, Class 1A2, 3.81%, 9/25/36*(b) | | | 11,839 | |
| | 2,187 | | | Washington Mutual, Series 2006-AR8, Class 1A1, 3.88%, 8/25/46*(b) | | | 2,098 | |
| | 7,901 | | | Washington Mutual, Series 2004-AR3, Class A2, 4.50%, 6/25/34*(b) | | | 8,101 | |
| | 10,744 | | | Washington Mutual Mortgage Pass-Through Certificates, Series 2004-AR10, Class A1B, 2.57% (US0001M + 42 bps), 7/25/44* | | | 10,806 | |
| | 78,848 | | | Washington Mutual Mortgage Pass-Through Certificates, Series 2006-AR14, Class 1A1, 3.61%, 11/25/36*(b) | | | 75,240 | |
| | 4,276 | | | Wells Fargo Mortgage Backed Securities Trust, Series 2004-EE, Class 3A1, 4.82%, 12/25/34*(b) | | | 4,413 | |
| | 9,009 | | | Wells Fargo Mortgage Backed Securities Trust, Series 2004-I, Class 1A1, 4.89%, 7/25/34*(b) | | | 9,366 | |
Shares or
Principal
Amount | | | Security Description | | Value | |
| | | | | |
| Mortgage Backed Securities†, continued: | | | |
| Prime Adjustable Rate Mortgage Backed Securities, continued: | | | | |
| $ | 2,390 | | | Wells Fargo Mortgage Backed Securities Trust, Series 2006-AR8, Class 2A4, 4.89%, 4/25/36*(b) | | $ | 2,415 | |
| | 8,987 | | | Wells Fargo Mortgage Backed Securities Trust, Series 2005-AR16, Class 1A1, 4.97%, 8/25/33*(b) | | | 9,052 | |
| | 6,189 | | | Wells Fargo Mortgage Backed Securities Trust, Series 2004-H, Class A1, 5.00%, 6/25/34*(b) | | | 6,365 | |
| | 4,495 | | | Wells Fargo Mortgage Backed Securities Trust, Series 2005-AR9, Class 3A1, 5.02%, 6/25/34*(b) | | | 4,687 | |
| | 22,745 | | | Wells Fargo Mortgage Backed Securities Trust, Series 2005-AR1, Class 1A1, 5.08%, 2/25/35*(b) | | | 23,496 | |
| | | | | | | | 1,807,003 | |
| Prime Fixed Mortgage Backed Securities (21.9%) | | | | |
| | 317,444 | | | Agate Bay Mortgage Trust, Series, Inc. 2015-7, Class A6, 3.00%, 10/25/45*(b)(c) | | | 316,485 | |
| | 1,752,633 | | | Citigroup Mortgage Loan Trust, Inc., Series 2014-C, Class A, 3.25%, 2/25/54*(b)(c) | | | 1,751,385 | |
| | 18,910 | | | Citigroup Mortgage Loan Trust, Inc., Series 2003-1, Class WA2, 6.50%, 6/25/31* | | | 19,554 | |
| | 106,951 | | | Citigroup Mortgage Loan Trust, Inc., Series 2004-NCM2, Class 1CB2, 6.75%, 8/25/34* | | | 115,777 | |
| | 18,731 | | | Citigroup Mortgage Loan Trust, Inc., Series 2004-NCM2, Class 2CB3, 8.00%, 8/25/34* | | | 20,932 | |
| | 6,903 | | | Credit Suisse First Boston Mortgage Securities Corp., Series 2004-7, Class 5A1, 5.00%, 10/25/19* | | | 6,979 | |
| | 107,914 | | | Credit Suisse First Boston Mortgage Securities Corp., Series 2003-23, Class 1A11, 6.00%, 10/25/33 | | | 112,386 | |
| | 36,303 | | | Credit Suisse First Boston Mortgage Securities Corp., Series 2003-8, Class 5A1, 6.50%, 4/25/33* | | | 38,262 | |
| | 25,047 | | | Credit Suisse First Boston Mortgage Securities Corp., Series 2003-1, Class 1A1, 7.00%, 2/25/33* | | | 27,805 | |
| | 68,075 | | | Credit Suisse First Boston Mortgage Securities Corp., Series 2002-10, Class 2B1, 7.50%, 5/25/32* | | | 39,000 | |
| | 112,091 | | | Credit Suisse First Boston Mortgage Securities Corp., Series 2002-34, Class 1A1, 7.50%, 12/25/32* | | | 127,197 | |
| | 1,876,510 | | | Credit Suisse Mortgage Trust, Series 2015-3, Class A9, 3.50%, 3/25/45*(b)(c) | | | 1,899,298 | |
| | 1,684,664 | | | EverBank Mortgage Loan Trust, Series 2018-1, Class A4, 3.50%, 2/25/48*(b)(c) | | | 1,708,422 | |
| | 3,068,899 | | | Flagstar Mortgage Trust, Series 2017-1, Class 1A5, 3.50%, 3/25/47*(b)(c) | | | 3,127,520 | |
| | 147,675 | | | Galton Funding Mortgage Trust, Series 2018-1, Class A43, 3.50%, 11/25/57*(b) (c) | | | 149,661 | |
| | 55,381 | | | GSR Mortgage Loan Trust, Series 2003-3F, Class 2A1, 4.50%, 4/25/33* | | | 54,985 | |
See notes to financial statements
| Schedule of Portfolio Investments | Limited Duration Fund |
| August 31, 2019 | Continued |
Shares or
Principal
Amount | | | Security Description | | Value | |
| | | | | |
| Mortgage Backed Securities†, continued: | | | |
| Prime Fixed Mortgage Backed Securities, continued: | | | | |
| $ | 5,745 | | | GSR Mortgage Loan Trust, Series 2005-8F, Class 7A1, 5.50%, 10/25/20* | | $ | 5,673 | |
| | 27,520 | | | GSR Mortgage Loan Trust, Series 2005-8F, Class 3A4, 6.00%, 11/25/35* | | | 20,595 | |
| | 2,343,602 | | | JPMorgan Mortgage Trust, Series 2017-2, Class A4, 3.00%, 5/25/47*(b)(c) | | | 2,365,837 | |
| | 1,785,096 | | | JPMorgan Mortgage Trust, Series 2017-3, Class 1A5, 3.50%, 8/25/47*(b)(c) | | | 1,813,572 | |
| | 1,534,272 | | | JPMorgan Mortgage Trust, Series 2018-1, Class A5, 3.50%, 6/25/48*(b)(c) | | | 1,558,747 | |
| | 13,647 | | | Lehman Mortgage Trust, Series 2005-3, Class 1A3, 5.50%, 1/25/36* | | | 11,550 | |
| | 1,329,666 | | | MFRA Trust, Series 2017-RPL1, Class A1, 2.59%, 2/25/57*(b)(c) | | | 1,323,466 | |
| | 1,569,516 | | | Onslow Bay Financial LLC, Series 2018- EXP2, Class 1A1, 4.00%, 11/25/48*(b) (c) | | | 1,582,961 | |
| | 2,439 | | | Prime Mortgage Trust, Series 2005-2, Class 1A3, 5.25%, 7/25/20* | | | 2,447 | |
| | 1,331,118 | | | PSMC Trust, Series 2018-1, Class A3, 3.50%, 2/25/48*(b)(c) | | | 1,352,352 | |
| | 10,352 | | | Residential Funding Mortgage Securities I, Series 2005-S7, Class A1, 5.50%, 11/25/35* | | | 9,923 | |
| | 17,950 | | | Residential Funding Mortgage Securities I, Series 2003-S9, Class A1, 6.50%, 3/25/32* | | | 18,662 | |
| | 1,501,312 | | | Sequoia Mortgage Trust, Series 2018-5, Class A4, 3.50%, 5/25/48*(b)(c) | | | 1,530,665 | |
| | 884,265 | | | Sequoia Mortgage Trust, Series 2018-CH1, Class A10, 4.00%, 2/25/48*(b)(c) | | | 897,844 | |
| | 814,572 | | | Sequoia Mortgage Trust, Series 2018-CH2, Class A12, 4.00%, 6/25/48*(b)(c) | | | 824,912 | |
| | 107,076 | | | Structured Asset Mortgage Investments, Inc., Series 1999-2, Class 3A, 6.75%, 5/25/29* | | | 114,799 | |
| | 1,099,913 | | | Verus Securitization Trust, Series 2017-SG1A, Class A1, 2.69%, 11/25/47*(b)(c) | | | 1,096,346 | |
| | 1,853,536 | | | Verus Securitization Trust, Series 2018-INV2, Class A1FX, 4.15%, 10/25/58*(b) (c) | | | 1,890,904 | |
| | 5,357 | | | Washington Mutual, Series 2003-S4, Class 4A1, 4.00%, 2/25/32* | | | 5,593 | |
| | 1,460 | | | Washington Mutual Mortgage Pass-Through Certificates, Series 2004-CB4, Class 22A, 6.00%, 12/25/19* | | | 1,455 | |
| | | | | | | | 25,943,951 | |
| Subprime Mortgage Backed Securities (4.1%) | | | | |
| | 994,501 | | | Towd Point Mortgage Trust, Series 2016-1, Class A1B, 2.75%, 2/25/55*(b)(c) | | | 998,253 | |
| | 953,165 | | | Towd Point Mortgage Trust, Series 2017-1, Class A1, 2.75%, 10/25/56*(b)(c) | | | 958,598 | |
| | 1,824,076 | | | Towd Point Mortgage Trust, Series 2017-2, Class A1, 2.75%, 4/25/57*(b)(c) | | | 1,839,881 | |
| | 1,122,596 | | | Towd Point Mortgage Trust, Series 2017-6, Class A1, 2.75%, 10/25/57*(b)(c) | | | 1,137,719 | |
| | | | | | | | 4,934,451 | |
Shares or
Principal
Amount | | | Security Description | | Value | |
| | | | | | | | | |
| Mortgage Backed Securities†, continued: | | | | |
| U.S. Government Agency Mortgage Backed Securities (18.2%) | | | | |
| $ | 439,674 | | | Fannie Mae, Series 2013-68, Class 10A1, 1.00%, 3/25/42 | | $ | 433,933 | |
| | 279,540 | | | Fannie Mae, Series 2012-31, Class PA, 2.00%, 4/25/41 | | | 279,770 | |
| | 635,135 | | | Fannie Mae, Series 2012-51, Class EB, 2.00%, 1/25/40 | | | 637,971 | |
| | 660,560 | | | Fannie Mae, Series 2012-96, Class PD, 2.00%, 7/25/41 | | | 660,254 | |
| | 517,377 | | | Fannie Mae, Series 2013-18, Class 10A1, 2.00%, 12/25/42 | | | 516,901 | |
| | 287,137 | | | Fannie Mae, Series 2013-68, Class LE, 2.00%, 4/25/43 | | | 284,315 | |
| | 372,751 | | | Fannie Mae, Series 2011-126, Class ED, 2.25%, 4/25/40 | | | 374,180 | |
| | 210,201 | | | Fannie Mae, Series 2013-73, Class 10A1, 2.25%, 6/25/42 | | | 212,003 | |
| | 355,497 | | | Fannie Mae, Series 2013-74, Class 10A1, 2.25%, 6/25/42(b) | | | 357,277 | |
| | 54,474 | | | Fannie Mae, Series 2012-2, Class 10A1, 2.50%, 5/25/41 | | | 55,074 | |
| | 164,698 | | | Fannie Mae, Series 2011-118, Class 10A1, 3.00%, 11/25/41 | | | 170,326 | |
| | 90,750 | | | Fannie Mae, Series 2011-124, Class 10A1, 3.00%, 9/25/29 | | | 91,063 | |
| | 623,930 | | | Fannie Mae, Series 2014-1, Class AB, 3.00%, 6/25/43 | | | 645,136 | |
| | 4,595 | | | Fannie Mae, 4.35% (H15T1Y + 187 bps), 12/1/22, Pool #303247 | | | 4,667 | |
| | 18,578 | | | Fannie Mae, 4.44% (US0012M + 132 bps), 1/1/35, Pool #805386 | | | 19,248 | |
| | 778,336 | | | Fannie Mae, Series 2003-W16, Class AF5, 4.49%, 11/25/33*(b) | | | 836,467 | |
| | 1,031,062 | | | Fannie Mae, Series 2003-W14, Class 2A, 4.62%, 1/25/43*(b) | | | 1,078,783 | |
| | 2,351,432 | | | Fannie Mae, Series 2003-W12, Class 3A, 4.69%, 3/25/43*(b) | | | 2,446,859 | |
| | 3,729 | | | Fannie Mae, 4.69% (H15T1Y + 216 bps), 6/1/32, Pool #725286 | | | 3,840 | |
| | 45,216 | | | Fannie Mae, 4.70% (H15T1Y + 229 bps), 2/1/30, Pool #556998 | | | 46,359 | |
| | 2,725,000 | | | Fannie Mae, Series 2004-W3, Class A7, 5.50%, 5/25/34* | | | 3,085,587 | |
| | 17,906 | | | Fannie Mae, Series 2001-W4, Class AF6, 5.61%, 1/25/32*(b) | | | 18,909 | |
| | 1,319 | | | Fannie Mae, Series 1992-129, Class L, 6.00%, 7/25/22 | | | 1,373 | |
| | 17,353 | | | Fannie Mae, Series 2001-W2, Class AF6, 6.59%, 10/25/31*(b) | | | 18,412 | |
| | 10,551 | | | Fannie Mae, Series 2001-W1, Class AF6, 6.90%, 7/25/31*(b) | | | 12,399 | |
| | 50 | | | Fannie Mae, Series 1991-108, Class J, 7.00%, 9/25/21 | | | 52 | |
| | 282 | | | Fannie Mae, Series 1992-195, Class C, 7.50%, 10/25/22 | | | 295 | |
| | 1,000 | | | Fannie Mae, Series 1996-42, Class LL, 7.50%, 9/25/26 | | | 1,101 | |
| | 266,217 | | | Freddie Mac, Series 4146, Class 10A1, 1.50%, 10/15/42 | | | 268,966 | |
See notes to financial statements
| Schedule of Portfolio Investments | Limited Duration Fund |
| August 31, 2019 | Continued |
Shares or
Principal
Amount | | | Security Description | | Value | |
| | | | | |
| Mortgage Backed Securities†, continued: | | | |
| U.S. Government Agency Mortgage Backed Securities, continued: | | | | |
| $ | 1,126,529 | | | Freddie Mac, Series 4220, Class KC, 1.50%, 5/15/32 | | $ | 1,114,163 | |
| | 829,031 | | | Freddie Mac, Series 4039, Class ME, 2.00%, 12/15/40(b) | | | 829,158 | |
| | 243,032 | | | Freddie Mac, Series 3982, Class MD, 2.00%, 5/15/39 | | | 242,892 | |
| | 410,003 | | | Freddie Mac, Series 4019, Class GB, 2.00%, 12/15/41 | | | 410,164 | |
| | 619,958 | | | Freddie Mac, Series 4030, Class DA, 2.00%, 2/15/41 | | | 619,329 | |
| | 858,963 | | | Freddie Mac, Series 4079, Class WA, 2.00%, 8/15/40 | | | 855,249 | |
| | 1,094,768 | | | Freddie Mac, Series 4272, Class YG, 2.00%, 11/15/26 | | | 1,100,578 | |
| | 336,673 | | | Freddie Mac, Series 4408, Class GA, 2.00%, 9/15/41 | | | 336,813 | |
| | 81,412 | | | Freddie Mac, Series 3890, Class BA, 2.50%, 11/15/40 | | | 82,067 | |
| | 580,252 | | | Freddie Mac, Series 3913, Class PC, 2.50%, 3/15/41 | | | 587,887 | |
| | 699,297 | | | Freddie Mac, Series 4312, Class 10A1, 2.50%, 12/15/41 | �� | | 708,797 | |
| | 60,310 | | | Freddie Mac, Series 3752, Class JA, 2.75%, 4/15/40 | | | 60,412 | |
| | 123,289 | | | Freddie Mac, Series 4017, Class MA, 3.00%, 3/15/41 | | | 126,482 | |
| | 742,482 | | | Freddie Mac, Series 4374, Class GA, 3.00%, 9/15/36 | | | 772,021 | |
| | 516,903 | | | Freddie Mac, Series T-67, Class 1A1C, 3.90%, 3/25/36*(b) | | | 527,611 | |
| | 16,096 | | | Freddie Mac, 4.00%, 9/1/33, Pool #N31025 | | | 16,717 | |
| | 17,351 | | | Freddie Mac, Series 3819, Class JP, 4.00%, 8/15/39 | | | 17,318 | |
| | 4,418 | | | Freddie Mac, 4.26% (US0006M + 154 bps), 4/1/36, Pool #1N0148 | | | 4,564 | |
| | 208,012 | | | Freddie Mac, Series 3688, Class HQ, 6.00%, 11/15/21 | | | 211,739 | |
| | 2,000 | | | Freddie Mac, Series 2454, Class LL, 6.25%, 4/15/32 | | | 2,020 | |
| | 351 | | | Freddie Mac, Series 180, Class H, 6.50%, 9/15/21* | | | 354 | |
| | 534 | | | Freddie Mac, Series 1163, Class JA, 7.00%, 11/15/21* | | | 542 | |
| | 1,054 | | | Freddie Mac, Series 1474, Class E, 7.00%, 2/15/23* | | | 1,112 | |
| | 1,332 | | | Freddie Mac, Series 1310, Class J, 8.00%, 6/15/22* | | | 1,409 | |
| | 924 | | | Freddie Mac, Series 1312, Class I, 8.00%, 7/15/22* | | | 981 | |
| | 376,289 | | | Government National Mortgage Assoc., Series 2013-69, Class 10A1, 2.00%, 9/20/42 | | | 368,071 | |
| | 16,325 | | | Government National Mortgage Assoc., Series 2012-14, Class PE, 3.00%, 11/20/40* | | | 16,310 | |
Shares or
Principal
Amount | | | Security Description | | Value | |
| | | | | |
| Mortgage Backed Securities†, continued: | | | |
| U.S. Government Agency Mortgage Backed Securities, continued: | | | | |
| $ | 13,453 | | | Government National Mortgage Assoc., 3.88% (H15T1Y + 150 bps), 5/20/34, Pool #80916 | | $ | 13,999 | |
| | 2,392 | | | Government National Mortgage Assoc., 4.00% (H15T1Y + 150 bps), 1/20/23, Pool #8123 | | | 2,430 | |
| | 3,397 | | | Government National Mortgage Assoc., 4.00% (H15T1Y + 150 bps), 1/20/25, Pool #8580 | | | 3,485 | |
| | 4,754 | | | Government National Mortgage Assoc., 4.00% (H15T1Y + 150 bps), 1/20/25, Pool #8585 | | | 4,877 | |
| | 1,807 | | | Government National Mortgage Assoc., 4.00% (H15T1Y + 150 bps), 3/20/26, Pool #8832 | | | 1,823 | |
| | 3,664 | | | Government National Mortgage Assoc., 4.00% (H15T1Y + 150 bps), 3/20/29, Pool #80263 | | | 3,691 | |
| | 1,376 | | | Government National Mortgage Assoc., 4.13% (H15T1Y + 150 bps), 12/20/21, Pool #8889 | | | 1,389 | |
| | 2,468 | | | Government National Mortgage Assoc., 4.13% (H15T1Y + 150 bps), 12/20/27, Pool #80141 | | | 2,549 | |
| | 5,468 | | | Government National Mortgage Assoc., 4.13% (H15T1Y + 150 bps), 11/20/29, Pool #876947 | | | 5,483 | |
| | 111 | | | Government National Mortgage Assoc., 6.50%, 12/15/25, Pool #414856 | | | 122 | |
| | 91 | | | Government National Mortgage Assoc., 7.00%, 4/20/24, Pool #1655 | | | 96 | |
| | 34 | | | Government National Mortgage Assoc., 7.00%, 11/20/26, Pool #2320 | | | 34 | |
| | 279 | | | Government National Mortgage Assoc., 7.50%, 3/15/24, Pool #376439 | | | 285 | |
| | | | | | | | 21,616,543 | |
| Total Mortgage Backed Securities | | | 57,087,588 | |
| | | | | |
| Corporate Bonds (12.5%) | | | | |
| Banks (4.7%) | | | | |
| | 1,450,000 | | | Bank of America Corp., 3.55% (US0003M + 78 bps), 3/5/24, Callable 3/5/23 @ 100* | | | 1,515,455 | |
| | 1,500,000 | | | Mizuho Financial Group, Inc., 2.95%, 2/28/22 | | | 1,527,343 | |
| | 1,000,000 | | | Mizuho Financial Group, Inc., 3.55%, 3/5/23 | | | 1,044,520 | |
| | 1,500,000 | | | Wells Fargo & Co., 2.63%, 7/22/22 | | | 1,525,295 | |
| | | | | | | | 5,612,613 | |
| Capital Markets (0.0%) | | | | |
| | 2,000,000 | | | Lehman Brothers Holdings, Inc., 6.00%, 7/19/12, MTN (d) | | | 27,000 | |
| Diversified Telecommunication Services (1.5%) | | | | |
| | 1,743,000 | | | AT&T, Inc., 2.80%, 2/17/21, Callable 1/17/21 @ 100* | | | 1,757,693 | |
| Interactive Media & Services (2.6%) | | | | |
| | 3,000,000 | | | Baidu, Inc., 3.88%, 9/29/23, Callable 8/29/23 @ 100* | | | 3,146,895 | |
| Sovereign Bond (1.3%) | | | | |
| | 500,000 | | | Export-Import Bank of Korea, 2.13%, 1/25/20 | | | 500,120 | |
See notes to financial statements
| Schedule of Portfolio Investments | Limited Duration Fund |
| August 31, 2019 | Concluded |
Shares or
Principal
Amount | | | Security Description | | Value | |
| | | | |
| Corporate Bonds†, continued: | | | |
| Sovereign Bond, continued: | | | | |
| $ | 1,050,000 | | | Export-Import Bank of Korea, 2.25%, 1/21/20 | | $ | 1,050,525 | |
| | | | | | | | 1,550,645 | |
| Tobacco (2.0%) | | | | |
| | 2,150,000 | | | Altria Group, Inc., 4.40%, 2/14/26, Callable 12/14/25 @ 100* | | | 2,356,944 | |
| Trading Companies & Distributors (0.4%) | | | | |
| | 447,000 | | | Aviation Capital Group LLC, 7.13%, 10/15/20 (c) | | | 470,667 | |
| Total Corporate Bonds | | | 14,922,457 | |
| | | | | | | | | |
| Taxable Municipal Bonds (2.1%) | | | | |
| Delaware (0.8%) | | | | |
| | 1,000,000 | | | State of Delaware, Build America Bonds, GO, Series D, 5.60%, 10/1/29, Continuously Callable @100 | | | 1,002,770 | |
| Georgia (1.3%) | | | | | | | |
| | 1,340,000 | | | State of Georgia, Build America Bonds, GO, Series H, 4.50%, 11/1/25 | | | 1,450,604 | |
| Total Taxable Municipal Bonds | | | 2,453,374 | |
Shares or
Principal
Amount | | | Security Description | | Value | |
| | | | |
| U.S. Treasury Obligations (27.5%) | | | |
| U.S. Treasury Notes | | | | |
| $ | 7,208,000 | | | 1.50%, 11/30/19 | | $ | 7,198,427 | |
| | 12,000,000 | | | 1.75%, 7/31/24 | | | 12,199,219 | |
| | 5,500,000 | | | 2.25%, 2/29/20 | | | 5,508,594 | |
| | 2,000,000 | | | 2.63%, 7/15/21 | | | 2,038,984 | |
| | 5,200,000 | | | 2.88%, 8/15/28 | | | 5,795,359 | |
| Total U.S. Treasury Obligations | | | 32,740,583 | |
| | | | | | | | | |
| Investment in Affiliates (4.2%) | | | | |
| | 5,044,235 | | | Cavanal Hill Government Securities Money Market Fund, Select Shares, 1.95%(e) | | | 5,044,235 | |
| Total Investment in Affiliates | | | 5,044,235 | |
| | | | | | | | | |
| Total Investment (Cost $120,054,106)(f) - 100.8% | | | 119,968,465 | |
| Liabilities in excess of other assets—(0.8)% | | | (989,094 | ) |
| Net Assets - 100.0% | | $ | 118,979,371 | |
| (a) | Represents a restricted security, purchased under Rule 144A, Section 4(2), which is exempt from registration under the Securities Act of 1933, as amended. The security has been deemed illiquid according to the policies and procedures adopted by the Board of Trustees. At August 31, 2019, illiquid securities were 1.7% of the Fund’s net assets. |
| (b) | The rate for certain asset-backed and mortgage-backed securities may vary based on factors relating to the pool of assets underlying the security. The rate presented is the rate in effect at August 31, 2019. |
| (c) | Represents a restricted security, purchased under Rule 144A, Section 4(2), which is exempt from registration under the Securities Act of 1933, as amended. The security has been deemed liquid according to the policies and procedures adopted by the Board of Trustees. |
| (d) | Issuer has defaulted on the payment of interest. |
| (e) | Money market investment. The rate presented on the Schedule of Portfolio Investments is the rate in effect at August 31, 2019. |
| (f) | Represents cost for financial reporting purposes. The cost for tax reporting purposes can be found in Note 6 in the Notes to Financial Statements. |
| * | Represents next call date. Additional subsequent call dates and amounts may apply to this security. |
| † | Mortgage backed securities are classified based on the characteristics of their underlying collateral, the fixed vs. variable nature of the obligations, and the credit standing of the mortgagors. The fixed or variable rate nature of securities interest payments to which the fund is entitled may not coincide with the payment nature of the collateral underlying the securities. |
| 12MTA | 12 Month Treasury Average |
| GO | General Obligation |
| H15T1Y | 1 Year Treasury Constant Maturity Rate |
| LIBOR | London Interbank Offered Rate |
| MTN | Medium Term Note |
| US0001M | 1 Month US Dollar LIBOR |
| US0003M | 3 Month US Dollar LIBOR |
| US0006M | 6 Month US Dollar LIBOR |
| US0012M | 12 Month US Dollar LIBOR |
See notes to financial statements
| Schedule of Portfolio Investments | Moderate Duration Fund |
| August 31, 2019 | |
| | | | | |
Shares or
Principal
Amount | | | Security Description | | Value | |
| | | | | |
| Asset Backed Securities (3.8%) | | | | |
| $ | 327,003 | | | AccessLex Institute, Series 2007-1, Class C, 2.68% (US0003M + 40 bps), 10/25/35* | | $ | 277,359 | |
| | 9,828 | | | Aegis Asset Backed Securities Trust, Series 2004-4, Class A1, 2.87% (US0001M + 72 bps), 10/25/34* | | | 9,827 | |
| | 2,027 | | | Raspro Trust, Series 2005-1A, Class G, 2.79% (US0003M + 40 bps), 3/23/24(a) | | | 2,025 | |
| | 570,000 | | | SLM Student Loan Trust, Series 2012-7, Class B, 3.95% (US0001M + 180 bps), 9/25/43* | | | 557,834 | |
| | 201,925 | | | Vantage Data Centers Issuer LLC, Series 2018-1A, Class A2, 4.07%, 2/16/43*(a) | | | 210,006 | |
| Total Asset Backed Securities | | | 1,057,051 | |
| | | | | | | | | |
| Mortgage Backed Securities† (34.4%) | | |
| Alt-A - Fixed Rate Mortgage Backed Securities (3.6%) |
| | 2,629 | | | Bank of America Alternative Loan Trust, Series 2005-9, Class 5A1, 5.50%, 10/25/20* | | | 2,573 | |
| | 67,918 | | | Chaseflex Trust, Series 2005-2, Class 1A1, 6.00%, 6/25/35* | | | 66,143 | |
| | 274,106 | | | Corevest American Finance Trust, Series 2019-1, Class A, 3.32%, 3/15/52 | | | 286,290 | |
| | 4,716 | | | Countrywide Alternative Loan Trust, Series 2005-3CB, Class 1A4, 5.25%, 3/25/35* | | | 4,711 | |
| | 15,460 | | | Countrywide Alternative Loan Trust, Series 2004-5CB, Class 1A1, 6.00%, 5/25/34* | | | 16,215 | |
| | 82,721 | | | Countrywide Alternative Loan Trust, Series 2006-J8, Class A2, 6.00%, 2/25/37* | | | 57,990 | |
| | 66,240 | | | Deutsche Alternative-A Securities, Inc. Mortgage Loan Trust, Series 2006-AB2, Class A3, 5.23%, 6/25/36*(b) | | | 64,805 | |
| | 14,013 | | | Master Alternative Loans Trust, Series 2004-1, Class 4A1, 5.50%, 2/25/34* | | | 14,646 | |
| | 4,930 | | | Master Alternative Loans Trust, Series 2004-13, Class 12A1, 5.50%, 12/25/19* | | | 4,589 | |
| | 19,966 | | | Master Alternative Loans Trust, Series 2004-4, Class 1A1, 5.50%, 5/25/34* | | | 21,473 | |
| | 431 | | | Master Alternative Loans Trust, Series 2005-1, Class 5A1, 5.50%, 1/25/20* | | | 448 | |
| | 47,879 | | | Master Alternative Loans Trust, Series 2004-6, Class 10A1, 6.00%, 7/25/34* | | | 51,529 | |
| | 22,253 | | | Master Alternative Loans Trust, Series 2004-6, Class 7A1, 6.00%, 7/25/34* | | | 23,201 | |
| | 8,471 | | | Master Alternative Loans Trust, Series 2003-7, Class 6A1, 6.50%, 12/25/33* | | | 8,840 | |
| | 20,638 | | | Master Alternative Loans Trust, Series 2004-4, Class 8A1, 6.50%, 5/25/34* | | | 22,241 | |
| | 33,289 | | | Master Alternative Loans Trust, Series 2004-6, Class 6A1, 6.50%, 7/25/34* | | | 36,261 | |
| | 9,535 | | | Nomura Asset Acceptance Corp., Series 2005-AP1, Class 2A5, 4.86%, 2/25/35*(b) | | | 9,804 | |
| | 3,573 | | | Nomura Asset Acceptance Corp., Series 2005-WF1, Class 2A5, 5.16%, 3/25/35*(b) | | | 3,732 | |
Shares or
Principal
Amount | | | Security Description | | Value | |
| |
| Mortgage Backed Securities†, continued: |
| Alt-A - Fixed Rate Mortgage Backed Securities, continued: |
| $ | 34,247 | | | Nomura Asset Acceptance Corp., Series 2005-AP2, Class A5, 5.48%, 5/25/35*(b) | | $ | 25,534 | |
| | 93,172 | | | Nomura Asset Acceptance Corp., Series 2006-AF1, Class 1A2, 6.16%, 5/25/36*(b) | | | 35,963 | |
| | 46,453 | | | Ocwen Residential MBS Corp., Series 1998-R1, Class B1, 3.88%, 10/25/40*(a) (b) | | | 44,703 | |
| | 218 | | | Residential Accredit Loans, Inc., Series 2003-QS18, Class A1, 5.00%, 9/25/18* | | | 175 | |
| | 10,436 | | | Residential Accredit Loans, Inc., Series 2005-QS2, Class A1, 5.50%, 2/25/35* | | | 10,713 | |
| | 8,046 | | | Residential Accredit Loans, Inc., Series 2006-QS18, Class 3A3, 5.75%, 12/25/21* | | | 7,757 | |
| | 14,814 | | | Residential Accredit Loans, Inc., Series 2006-QS5, Class A9, 6.00%, 5/25/36* | | | 14,243 | |
| | 30,663 | | | Residential Accredit Loans, Inc., Series 2006-QS12, Class 1A2, 6.50%, 9/25/36* | | | 22,398 | |
| | 48,636 | | | Residential Asset Securitization Trust, Series 2005-A14, Class A5, 5.50%, 12/25/35* | | | 39,247 | |
| | 66,022 | | | Residential Asset Securitization Trust, Series 2006-A8, Class 1A1, 6.00%, 8/25/36* | | | 58,631 | |
| | 63,148 | | | Washington Mutual Mortgage Pass-Through Certificates, Series 2005-6, Class 1CB, 6.50%, 8/25/35* | | | 61,026 | |
| | | | | | | 1,015,881 | |
| Prime Adjustable Rate Mortgage Backed Securities (2.5%) |
| | 9,692 | | | Bank of America Funding Corp., Series 2004-B, Class 5A1, 4.62%, 11/20/34*(b) | | | 9,551 | |
| | 10,250 | | | Bear Stearns Mortgage Trust, Series 2004-9, Class 12A3, 4.41%, 11/25/34*(b) | | | 10,315 | |
| | 3,712 | | | Bear Stearns Mortgage Trust, Series 2003-7, Class 4A, 4.66%, 10/25/33*(b) | | | 3,893 | |
| | 11,815 | | | Countrywide Home Loans, Series 2004-2, Class 2A1, 3.49%, 2/25/34*(b) | | | 11,305 | |
| | 8,926 | | | Countrywide Home Loans, Series 2004-12, Class 10A1, 4.15%, 8/25/34*(b) | | | 8,946 | |
| | 17,467 | | | HomeBanc Mortgage Trust, Series 2006-1, Class 1A1, 3.69%, 4/25/37*(b) | | | 15,362 | |
| | 278,233 | | | JPMorgan Mortgage Trust, Series 2014-5, Class A1, 2.98%, 10/25/29*(a)(b) | | | 282,058 | |
| | 6,208 | | | JPMorgan Mortgage Trust, Series 2006-A2, Class 2A1, 4.24% (US0003M + 101 bps), 4/25/36* | | | 6,103 | |
| | 30,514 | | | JPMorgan Mortgage Trust, Series 2006-A6, Class 1A4L, 4.27%, 10/25/36*(b) | | | 27,494 | |
| | 317,089 | | | JPMorgan Mortgage Trust, Series 2005-A6, Class 3A3, 4.32%, 9/25/35*(b) | | | 299,673 | |
| | 38,632 | | | JPMorgan Mortgage Trust, Series 2005-A1, Class 3A4, 4.74%, 2/25/35*(b) | | | 39,864 | |
| | 1,997 | | | Wachovia Mortgage Loan Trust LLC, Series 2005-A, Class 4A2, 4.85%, 8/20/35*(b) | | | 186 | |
See notes to financial statements
| Schedule of Portfolio Investments | Moderate Duration Fund |
| August 31, 2019 | Continued |
| | | |
Shares or
Principal
Amount | | | Security Description | | Value | |
| |
| Mortgage Backed Securities†, continued: |
| Prime Adjustable Rate Mortgage Backed Securities, continued: |
| $ | 1,378 | | | Wells Fargo Mortgage Backed Securities Trust, Series 2004-E, Class A1, 5.07%, 5/25/34*(b) | | $ | 1,428 | |
| | | | | | | | 716,178 | |
| Prime Fixed Mortgage Backed Securities (7.5%) |
| | 8,472 | | | American Home Mortgage Investment Trust, Series 2005-2, Class 5A1, 5.06%, 9/25/35*(b) | | | 8,226 | |
| | 16,910 | | | Chase Mortgage Finance Corp., Series 2007-S2, Class 2A1, 5.50%, 3/25/37* | | | 13,245 | |
| | 10,685 | | | Citigroup Mortgage Loan Trust, Inc., Series 2005-1, Class 3A1, 6.50%, 4/25/35 | | | 11,301 | |
| | 9,158 | | | Citigroup Mortgage Loan Trust, Inc., Series 2004-NCM1, Class 1A3, 6.75%, 7/25/34* | | | 10,360 | |
| | 5,511 | | | Countrywide Alternative Loan Trust, Series 2003-J3, Class 2A1, 6.25%, 12/25/33* | | | 5,676 | |
| | 3,079 | | | Countrywide Home Loans, Series 2004-J6, Class 1A2, 5.25%, 8/25/24* | | | 3,057 | |
| | 10,812 | | | Countrywide Home Loans, Series 2005-29, Class A1, 5.75%, 12/25/35* | | | 9,337 | |
| | 1,207 | | | Credit Suisse First Boston Mortgage Securities Corp., Series 2004-1, Class 4A1, 5.00%, 2/25/19* | | | 1,253 | |
| | 24,706 | | | Credit Suisse First Boston Mortgage Securities Corp., Series 2003-27, Class 8A1, 6.00%, 11/25/33* | | | 26,421 | |
| | 9,516 | | | Credit Suisse First Boston Mortgage Securities Corp., Series 2003-8, Class 5A1, 6.50%, 4/25/33* | | | 10,029 | |
| | 251,387 | | | Credit Suisse Mortgage Trust, Series 2017-HL2, Class A3, 3.50%, 10/25/47*(a)(b) | | | 256,176 | |
| | 276,225 | | | Flagstar Mortgage Trust, Series 2018-5, Class A7, 4.00%, 9/25/48*(b) | | | 279,717 | |
| | 138,676 | | | Galton Funding Mortgage Trust, Series 2017-1, Class A21, 3.50%, 7/25/56*(b) | | | 141,014 | |
| | 266,493 | | | GSR Mortgage Loan Trust, Series 2004-13F, Class 2A1, 4.25%, 11/25/34* | | | 273,886 | |
| | 122 | | | GSR Mortgage Loan Trust, Series 2004-10F, Class 2A4, 5.00%, 9/25/49* | | | 121 | |
| | 885 | | | GSR Mortgage Loan Trust, Series 2003-2F, Class 3A1, 6.00%, 3/25/32* | | | 945 | |
| | 227,118 | | | JPMorgan Mortgage Trust, Series 2017-4, Class A6, 3.00%, 11/25/48*(a)(b) | | | 229,808 | |
| | 28,830 | | | Morgan Stanley Mortgage Loan Trust, Series 2004-3, Class 3A, 6.00%, 4/25/34* | | | 30,855 | |
| | 2,517 | | | Prime Mortgage Trust, Series 2004-CL1, Class 1A1, 6.00%, 2/25/34* | | | 2,691 | |
| | 268,060 | | | PSMC Trust, Series 2018-2, Class A3, 3.50%, 6/25/48(a)(b) | | | 273,348 | |
| | 61,114 | | | Residential Asset Mortgage Products, Inc., Series 2005-SL2, Class A3, 7.00%, 2/25/32* | | | 59,207 | |
| | 247,068 | | | Sequoia Mortgage Trust, Series 2017-CH1, Class A11, 3.50%, 8/25/47*(a)(b) | | | 248,566 | |
| | 183,612 | | | Sequoia Mortgage Trust, Series 2018-8, Class A4, 4.00%, 11/25/48*(a)(b) | | | 185,061 | |
Shares or
Principal
Amount | | | Security Description | | Value | |
| |
| Mortgage Backed Securities†, continued: |
| Prime Fixed Mortgage Backed Securities, continued: |
| $ | 13,286 | | | Structured Asset Mortgage Investments, Inc., Series 1999-2, Class 3A, 6.75%, 5/25/29* | | $ | 14,244 | |
| | 146 | | | Structured Asset Securities Corp., Series 1997-2, Class 2A4, 7.25%, 3/28/30* | | | 161 | |
| | 1,676 | | | Washington Mutual Mortgage Pass-Through Certificates, Series 2003-S11, Class 1A, 5.00%, 11/25/33* | | | 1,738 | |
| | 802 | | | Washington Mutual Mortgage Pass-Through Certificates, Series 2004-RA1, Class 2A, 7.00%, 3/25/34* | | | 860 | |
| | | | | | | 2,097,303 | |
| Subprime Mortgage Backed Securities (1.3%) |
| | 112,602 | | | Towd Point Mortgage Trust, Series 2018-1, Class A1, 3.00%, 1/25/58*(a)(b) | | | 114,514 | |
| | 241,256 | | | Towd Point Mortgage Trust, Series 2018-2, Class A1, 3.25%, 3/25/58*(a)(b) | | | 246,690 | |
| | | | | | | | 361,204 | |
| U.S. Government Agency Mortgage Backed Securities (19.5%) |
| | 54,959 | | | Fannie Mae, Series 2013-68, Class 10A1, 1.00%, 3/25/42 | | | 54,242 | |
| | 304 | | | Fannie Mae, Series 1992-45, Class F, 1.54% (T7Y ), 4/25/22 | | | 303 | |
| | 147,197 | | | Fannie Mae, Series 2012-10, Class TA, 2.00%, 3/25/38 | | | 147,667 | |
| | 331,166 | | | Fannie Mae, Series 2012-30, Class BA, 2.00%, 6/25/41 | | | 331,294 | |
| | 321,384 | | | Fannie Mae, Series 2012-8, Class KA, 2.00%, 6/25/41 | | | 321,334 | |
| | 86,230 | | | Fannie Mae, Series 2013-18, Class 10A1, 2.00%, 12/25/42 | | | 86,150 | |
| | 105,101 | | | Fannie Mae, Series 2013-73, Class 10A1, 2.25%, 6/25/42 | | | 106,001 | |
| | 142,199 | | | Fannie Mae, Series 2013-74, Class 10A1, 2.25%, 6/25/42(b) | | | 142,912 | |
| | 143,525 | | | Fannie Mae, Series 2010-100, Class LA, 2.50%, 7/25/40 | | | 145,266 | |
| | 27,237 | | | Fannie Mae, Series 2012-2, Class 10A1, 2.50%, 5/25/41 | | | 27,537 | |
| | 265,140 | | | Fannie Mae, Series 2014-61, Class P, 2.50%, 7/25/44 | | | 269,249 | |
| | 413,022 | | | Fannie Mae, Series 2015-12, Class PC, 2.50%, 7/25/44 | | | 415,878 | |
| | 267,035 | | | Fannie Mae, Series 2017-M5, Class A1, 2.74%, 4/25/29 | | | 278,696 | |
| | 152,346 | | | Fannie Mae, Series 2011-118, Class 10A1, 3.00%, 11/25/41 | | | 157,552 | |
| | 22,687 | | | Fannie Mae, Series 2011-124, Class 10A1, 3.00%, 9/25/29 | | | 22,766 | |
| | 317,476 | | | Fannie Mae, Series 2012-50, Class LG, 3.00%, 9/25/40 | | | 319,145 | |
| | 334,489 | | | Fannie Mae, Series 2015-59, Class LM, 3.00%, 7/25/45 | | | 348,665 | |
| | 242,753 | | | Fannie Mae, Series 2018-M12, Class A1, 3.55%, 2/25/30 | | | 266,932 | |
See notes to financial statements
| Schedule of Portfolio Investments | Moderate Duration Fund |
| August 31, 2019 | Continued |
Shares or
Principal
Amount | | | Security Description | | Value | |
| |
| Mortgage Backed Securities†, continued: |
| U.S. Government Agency Mortgage Backed Securities, continued: |
| $ | 1,854 | | | Fannie Mae, 4.29% (US0012M + 162 bps), 9/1/33, Pool #739372 | | $ | 1,912 | |
| | 2,008 | | | Fannie Mae, 4.86% (US0012M + 186 bps), 1/1/37, Pool #906675 | | | 2,139 | |
| | 1,066 | | | Fannie Mae, 4.88% (H15T1Y + 250 bps), 7/1/23, Pool #224951 | | | 1,077 | |
| | 165 | | | Fannie Mae, 6.00%, 4/1/35, Pool #735503 | | | 189 | |
| | 517 | | | Fannie Mae, Series 1990-89, Class K, 6.50%, 7/25/20 | | | 523 | |
| | 1,321 | | | Fannie Mae, Series 2001-55, Class PC, 6.50%, 10/25/31 | | | 1,515 | |
| | 12,484 | | | Fannie Mae, Series 2003-W2, Class 1A2, 7.00%, 7/25/42* | | | 14,720 | |
| | 531 | | | Fannie Mae, Series 2002-T1, Class A3, 7.50%, 11/25/31* | | | 630 | |
| | 1,326 | | | Fannie Mae, Series 1992-31, Class M, 7.75%, 3/25/22 | | | 1,393 | |
| | 404 | | | Fannie Mae, Series G-32, Class L, 8.00%, 10/25/21 | | | 421 | |
| | 64 | | | Fannie Mae, Series G-32, Class N, 8.10%, 10/25/21 | | | 66 | |
| | 417 | | | Fannie Mae, Series 1991-66, Class J, 8.13%, 6/25/21 | | | 432 | |
| | 78 | | | Fannie Mae, Series 1991-18, Class H, 8.50%, 3/25/21 | | | 80 | |
| | 48 | | | Fannie Mae, Series G-7, Class E, 8.90%, 3/25/21 | | | 49 | |
| | 24 | | | Fannie Mae, Series 1990-62, Class G, 9.00%, 6/25/20 | | | 24 | |
| | 63 | | | Freddie Mac, Series 1222, Class P, 1.33%(T10Y - 40 bps), 3/15/22* | | | 63 | |
| | 66,554 | | | Freddie Mac, Series 4146, Class 10A1, 1.50%, 10/15/42 | | | 67,241 | |
| | 157,648 | | | Freddie Mac, Series 4220, Class KC, 1.50%, 5/15/32 | | | 155,918 | |
| | 154,543 | | | Freddie Mac, Series 3936, Class LA, 2.00%, 6/15/40 | | | 156,105 | |
| | 186,869 | | | Freddie Mac, Series 4408, Class GA, 2.00%, 9/15/41 | | | 186,947 | |
| | 124,743 | | | Freddie Mac, Series 4461, Class EA, 2.00%, 7/15/37 | | | 124,501 | |
| | 248,964 | | | Freddie Mac, Series 4129, Class PA, 2.50%, 7/15/42 | | | 253,938 | |
| | 127,039 | | | Freddie Mac, Series 4312, Class 10A1, 2.50%, 12/15/41 | | | 128,765 | |
| | 191,001 | | | Freddie Mac, Series 4316, Class JY, 3.00%, 1/15/44 | | | 200,540 | |
| | 151,961 | | | Freddie Mac, Series 4332, Class NH, 3.00%, 9/15/43 | | | 155,795 | |
| | 212,421 | | | Freddie Mac, Series 4374, Class GA, 3.00%, 9/15/36 | | | 220,872 | |
| | 15,264 | | | Freddie Mac, 5.37% (H15T1Y + 228 bps), 8/1/34, Pool #755230 | | | 15,535 | |
| | 1,161 | | | Freddie Mac, Series 1136, Class H, 6.00%, 9/15/21* | | | 1,189 | |
Shares or
Principal
Amount | | | Security Description | | Value | |
| |
| Mortgage Backed Securities†, continued: |
| U.S. Government Agency Mortgage Backed Securities, continued: |
| $ | 2,000 | | | Freddie Mac, Series 2454, Class LL, 6.25%, 4/15/32 | | $ | 2,020 | |
| | 674 | | | Freddie Mac, Series 1128, Class IB, 7.00%, 8/15/21* | | | 688 | |
| | 1,651 | | | Freddie Mac, Series 1379, Class H, 7.00%, 10/15/22* | | | 1,726 | |
| | 1,441 | | | Freddie Mac, Series 1714, Class K, 7.00%, 4/15/24* | | | 1,550 | |
| | 110 | | | Freddie Mac, Series 1052, Class G, 7.50%, 3/15/21* | | | 112 | |
| | 1,712 | | | Freddie Mac, Series 1904, Class D, 7.50%, 10/15/26* | | | 1,909 | |
| | 277 | | | Freddie Mac, Series 1119, Class H, 7.75%, 8/15/21* | | | 287 | |
| | 2,202 | | | Freddie Mac, Series 1281, Class I, 8.00%, 5/15/22* | | | 2,314 | |
| | 3,153 | | | Freddie Mac, Series 1310, Class J, 8.00%, 6/15/22* | | | 3,335 | |
| | 17 | | | Freddie Mac, Series 138, Class E, 8.07%, 7/15/21* | | | 17 | |
| | 53,722 | | | Government National Mortgage Assoc., Series 2013-104, Class DC, 2.00%, 4/20/40 | | | 53,634 | |
| | 80,633 | | | Government National Mortgage Assoc., Series 2013-69, Class 10A1, 2.00%, 9/20/42 | | | 78,872 | |
| | 87,819 | | | Government National Mortgage Assoc., Series 2010-69, Class MC, 2.50%, 4/20/40 | | | 88,155 | |
| | 48,381 | | | Government National Mortgage Assoc., Series 2010-98, Class CH, 3.00%, 10/20/39 | | | 48,945 | |
| | 62,821 | | | Government National Mortgage Assoc., Series 2010-98, Class MG, 3.00%, 8/20/39 | | | 63,801 | |
| | 5,763 | | | Government National Mortgage Assoc., 7.00%, 3/15/26, Pool #419128 | | | 5,771 | |
| | 90 | | | Government National Mortgage Assoc., 7.00%, 3/20/27, Pool #2394 | | | 100 | |
| | 1,008 | | | Government National Mortgage Assoc., 8.00%, 5/15/23, Pool #343406 | | | 1,010 | |
| | 582 | | | Government National Mortgage Assoc., 8.00%, 10/20/24, Pool #1884 | | | 623 | |
| | 65 | | | Government National Mortgage Assoc., 8.00%, 2/20/26, Pool #2171 | | | 71 | |
| | 155 | | | Government National Mortgage Assoc., 8.00%, 3/20/26, Pool #2187 | | | 167 | |
| | 1,675 | | | Government National Mortgage Assoc., 8.00%, 4/20/26, Pool #2205 | | | 1,804 | |
| | 4,190 | | | Government National Mortgage Assoc., 8.00%, 5/20/26, Pool #2219 | | | 4,571 | |
| | | | | | | | 5,495,650 | |
| Total Mortgage Backed Securities | | | 9,686,216 | |
| |
| Corporate Bonds (19.6%)Banks (2.5%) |
| | 385,000 | | | Bank of America Corp., 3.55% (US0003M + 78 bps), 3/5/24, Callable 3/5/23 @ 100* | | | 402,379 | |
| | 290,000 | | | Wells Fargo & Co., 3.00%, 10/23/26 | | | 301,353 | |
| | | | | | | | 703,732 | |
See notes to financial statements
| Schedule of Portfolio Investments | Moderate Duration Fund |
| August 31, 2019 | Continued |
Shares or
Principal
Amount | | Security Description | | Value | |
| |
| Corporate Bonds, continued: |
| Beverages (1.1%) |
| $ | 300,000 | | | Keurig Dr Pepper, Inc., 3.55%, 5/25/21 | | $ | 307,197 | |
| Biotechnology (1.2%) |
| | 350,000 | | | Amgen, Inc., 2.20%, 5/11/20 | | | 349,973 | |
| Capital Markets (3.5%) |
| | 290,000 | | | Goldman Sachs Group, Inc., 3.50%, 11/16/26, Callable 11/16/25 @ 100 * | | | 303,670 | |
| | 925,350 | | | Preferred Term Securities XX, Class B2, 2.57% (US0003M + 45 bps), 3/22/38, Callable 10/25/19 @ 100 *(a) | | | 694,013 | |
| | | | | | | | 997,683 | |
| Diversified Financial Services (1.3%) |
| | 350,000 | | | BP Capital Markets America, Inc., 2.75%, 5/10/23 | | | 358,554 | |
| Diversified Telecommunication Services (1.7%) |
| | 360,000 | | | AT&T, Inc., 5.25%, 3/1/37, Callable 9/1/36 @ 100 * | | | 426,681 | |
| | 39,000 | | | Qwest Corp., Series MBIA, 6.88%, 9/15/33, Callable 10/10/19 @ 100 * | | | 39,146 | |
| | | | | | | | 465,827 | |
| Equity Real Estate Investment Trusts (0.9%) |
| | 239,248 | | | JBG/Rockville NCI Campus LLC, Series 2010-A, 3.90%, 7/15/23 (a) | | | 246,462 | |
| Food Products (1.3%) |
| | 350,000 | | | Campbell Soup Co., 3.95%, 3/15/25, Callable 1/15/25 @ 100 * | | | 370,479 | |
| Hotels, Restaurants & Leisure (1.5%) |
| | 420,000 | | | Royal Caribbean Cruises, Ltd., 2.65%, 11/28/20 | | | 421,104 | |
| Industrial Conglomerates (1.3%) |
| | 375,000 | | | General Electric Co., 3.10%, 1/9/23 | | | 376,106 | |
| Insurance (1.1%) |
| | 300,000 | | | Jackson National Life Global Funding, 2.65%, 6/21/24 (a) | | | 306,167 | |
| Multiline Retail (0.9%) |
| | 250,000 | | | Macys Retail Holdings, Inc., 2.88%, 2/15/23, Callable 11/15/22 @ 100 * | | | 245,696 | |
| Technology Hardware, Storage & Peripherals (1.3%) |
| | 350,000 | | | Apple, Inc., 3.20%, 5/11/27, Callable 2/11/27 @ 100 * | | | 374,906 | |
| Total Corporate Bonds 5,523,886 |
| |
| Taxable Municipal Bonds (6.9%) |
| Illinois (1.8%) |
| | 500,000 | | | Rosemont Illinois State, GO, Series A, 2.76%, 12/1/19, Insured by: MAC | | | 499,770 | |
Shares or
Principal
Amount | | | Security Description | | Value | |
| | | | | |
| Taxable Municipal Bonds, continued: | | | | |
| Missouri (0.6%) | | | | |
| $ | 165,000 | | | Hanley Road Corridor Transnational Development Missouri Transnational Tax Revenue, Build America Bonds, GO, 7.50%, 10/1/39, Continuously Callable @100 | | $ | 165,619 | |
| Rhode Island (1.5%) | | | | |
| | 400,000 | | | Rhode Island Convention Center Authority Revenue, 3.15%, 5/15/25 | | | 422,272 | |
| South Carolina (1.3%) | | | | |
| | 350,000 | | | South Carolina Public Service Authority Revenue, Series D, 2.39%, 12/1/23 | | | 352,706 | |
| Wisconsin (1.7%) | | | | |
| | 465,000 | | | Public Financial Authority Wisconsin Revenue, 4.45%, 10/1/25, Insured by: AGC | | | 495,801 | |
| Total Taxable Municipal Bonds | | | 1,936,168 | |
| | | | | | | | | |
| U.S. Government Agency Securities (2.9%) | | | | |
| Federal Home Loan Bank | | | | |
| | 275,000 | | | 2.05%, 8/26/21, Callable 11/26/19 @ 100 * | | | 275,031 | |
| | 275,000 | | | 2.26%, 10/4/22, Callable 10/4/19 @ 100 * | | | 275,078 | |
| | | | | | | | 550,109 | |
| Freddie Mac | | | | |
| | 275,000 | | | 2.55%, 6/6/22 | | | 275,007 | |
| Total U.S. Government Agency Securities | | | 825,116 | |
| | | | | |
| U.S. Treasury Obligations (28.4%) | | | | |
| U.S. Treasury Inflation Indexed Notes | | | | |
| | 1,148,157 | | | 0.38%, 7/15/25 | | | 1,176,646 | |
| U.S. Treasury Notes | | | | |
| | 2,586,000 | | | 1.50%, 11/30/19 | | | 2,582,564 | |
| | 570,000 | | | 2.00%, 4/30/24 | | | 584,918 | |
| | 1,720,000 | | | 2.25%, 2/29/20 | | | 1,722,688 | |
| | 1,814,000 | | | 2.25%, 2/15/27 | | | 1,914,975 | |
| | | | | | | | 6,805,145 | |
| Total U.S. Treasury Obligations | | | 7,981,791 | |
| | | | | | | | | |
| Investment in Affiliates (3.8%) | | | | |
| | 1,055,296 | | | Cavanal Hill Government Securities Money Market Fund, Select Shares, 1.95%(c) | | | 1,055,296 | |
| Total Investment in Affiliates | | | 1,055,296 | |
| | | | | | | | | |
| Total Investments (Cost $27,661,311)(d) - 99.8% | | | 28,065,524 | |
| Other assets in excess of liabilities — 0.2% | | | 49,720 | |
| Net Assets - 100.0% | | $ | 28,115,244 | |
See notes to financial statements
| Schedule of Portfolio Investments | Moderate Duration Fund |
| August 31, 2019 | Concluded |
| (a) | Represents a restricted security, purchased under Rule 144A, Section 4(2), which is exempt from registration under the Securities Act of 1933, as amended. The security has been deemed liquid according to the policies and procedures adopted by the Board of Trustees. |
| (b) | The rate for certain asset-backed and mortgage-backed securities may vary based on factors relating to the pool of assets underlying the security. The rate presented is the rate in effect at August 31, 2019. |
| (c) | Money market investment. The rate presented on the Schedule of Portfolio Investments is the rate in effect at August 31, 2019. |
| (d) | Represents cost for financial reporting purposes. The cost for tax reporting purposes can be found in Note 6 in the Notes to Financial Statements. |
| * | Represents next call date. Additional subsequent call dates and amounts may apply to this security. |
| † | Mortgage backed securities are classified based on the characteristics of their underlying collateral, the fixed vs. variable nature of the obligations, and the credit standing of the mortgagors. The fixed or variable rate nature of securities interest payments to which the fund is entitled may not coincide with the payment nature of the collateral underlying the securities. |
| AGC | Assured Guaranty Corporation |
| GO | General Obligation |
| H15T1Y | 1 Year Treasury Constant Maturity Rate |
| LIBOR | London Interbank Offered Rate |
| MAC | Municipal Assurance Corporation |
| T10Y | 10 Year Treasury Constant Maturity Rate |
| T7Y | 7 Year Treasury Constant Maturity Rate |
| US0001M | 1 Month US Dollar LIBOR |
| US0003M | 3 Month US Dollar LIBOR |
| US0012M | 12 Month US Dollar LIBOR |
See notes to financial statements
| Schedule of Portfolio Investments | Bond Fund |
| August 31, 2019 | |
Shares or Principal Amount | | | Security Description | | Value | |
| | | | | |
| Asset Backed Securities (4.2%) | | | | |
| $ | 1,031,316 | | | AccessLex Institute, Series 2007-1, Class C, 2.68% (US0003M + 40 bps), 10/25/35* | | $ | 874,750 | |
| | 833,892 | | | American Credit Acceptance Receivables Trust, Series 2017-4, Class C, 2.94%, 1/10/24*(a) | | | 835,906 | |
| | 25,914 | | | Bear Stearns Asset Backed Securities, Inc., Series 2003-AC7, Class A1, 5.50%, 1/25/34*(b) | | | 26,893 | |
| | 498,374 | | | Corevest American Finance Trust, Series 2019-1, Class A, 3.32%, 3/15/52(a) | | | 520,526 | |
| | 304 | | | RAAC, Series 2004-SP1, Class AI4, 5.29%, 8/25/27*(b) | | | 306 | |
| | 945,250 | | | Stack Infrastructure Issuer LLC, Series 2019-1A, Class A2, 4.54%, 2/25/44*(a) | | | 998,530 | |
| | 50,960 | | | Structured Asset Securities Corp., Series 2003-AL2, Class A, 3.36%, 1/25/31(a) | | | 50,835 | |
| | 477,222 | | | UBS Commercial Mortgage Trust, Series 2018-C10, Class A1, 3.18%, 5/15/51 | | | 486,869 | |
| | 502,350 | | | Vantage Data Centers Issuer LLC, Series 2018-1A, Class A2, 4.07%, 2/16/43*(a) | | | 522,453 | |
| Total Asset Backed Securities | | | 4,317,068 | |
| | | | | | | | | |
| Mortgage Backed Securities† (34.0%) | | | | |
| Alt-A - Adjustable Rate Mortgage Backed Securities (0.1%) | | | | |
| | 73,780 | | | Bear Stearns Alternative-A Trust, Series 2006-6, Class 32A1, 3.94%, 11/25/36*(b) | | | 60,848 | |
| | 18,492 | | | JPMorgan Alternative Loan Trust, Series 2006-S4, Class A6, 5.71%, 12/25/36*(b) | | | 18,334 | |
| | | | | | | | 79,182 | |
| Alt-A - Fixed Rate Mortgage Backed Securities (1.1%) | | | | |
| | 15,263 | | | Bank of America Alternative Loan Trust, Series 2005-9, Class 1CB3, 5.50%, 10/25/35* | | | 15,592 | |
| | 19,088 | | | Bank of America Alternative Loan Trust, Series 2006-4, Class CB1, 6.50%, 5/25/46* | | | 20,045 | |
| | 40,672 | | | Chaseflex Trust, Series 2005-2, Class 1A1, 6.00%, 6/25/35* | | | 39,609 | |
| | 26,770 | | | Chaseflex Trust, Series 2007-1, Class 1A3, 6.50%, 2/25/37* | | | 15,795 | |
| | 75,398 | | | Countrywide Alternative Loan Trust, Series 2005-46CB, Class A3, 5.50%, 10/25/35* | | | 71,769 | |
| | 62,238 | | | Countrywide Alternative Loan Trust, Series 2006-8T1, Class 2A3, 5.50%, 4/25/36* | | | 60,442 | |
| | 11,471 | | | Countrywide Alternative Loan Trust, Series 2004-22CB, Class 1A1, 6.00%, 10/25/34* | | | 11,792 | |
| | 28,784 | | | Countrywide Alternative Loan Trust, Series 2006-8T1, Class 1A4, 6.00%, 4/25/36* | | | 22,935 | |
| | 205,750 | | | Countrywide Alternative Loan Trust, Series 2007-9T1, Class 1A7, 6.00%, 5/25/37* | | | 145,038 | |
| | 210,474 | | | Countrywide Alternative Loan Trust, Series 2006-36T2, Class 2A4, 6.25%, 12/25/36* | | | 142,651 | |
| | 17,553 | | | Master Alternative Loans Trust, Series 2003-8, Class 3A1, 5.50%, 12/25/33* | | | 18,104 | |
| | 3,976 | | | Master Alternative Loans Trust, Series 2004-13, Class 8A1, 5.50%, 1/25/25* | | | 4,019 | |
| | 32,742 | | | Master Alternative Loans Trust, Series 2005-3, Class 1A1, 5.50%, 4/25/35* | | | 33,539 | |
Shares or Principal Amount | | | Security Description | | Value | |
| | | | |
| Mortgage Backed Securities†, continued: | | | |
| Alt-A - Fixed Rate Mortgage Backed Securities, continued: | | | | |
| $ | 56,214 | | | Master Alternative Loans Trust, Series 2004-3, Class 3A1, 6.00%, 4/25/34* | | $ | 60,489 | |
| | 59,848 | | | Master Alternative Loans Trust, Series 2004-6, Class 10A1, 6.00%, 7/25/34* | | | 64,411 | |
| | 22,253 | | | Master Alternative Loans Trust, Series 2004-6, Class 7A1, 6.00%, 7/25/34* | | | 23,201 | |
| | 24,473 | | | Master Alternative Loans Trust, Series 2005-3, Class 7A1, 6.00%, 4/25/35* | | | 25,734 | |
| | 4,694 | | | Master Alternative Loans Trust, Series 2003-7, Class 5A1, 6.25%, 11/25/33* | | | 5,027 | |
| | 12,065 | | | Master Alternative Loans Trust, Series 2004-3, Class 2A1, 6.25%, 4/25/34* | | | 13,002 | |
| | 21,162 | | | Residential Accredit Loans, Inc., Series 2006-QS5, Class A9, 6.00%, 5/25/36* | | | 20,348 | |
| | 238,865 | | | Residential Asset Securitization Trust, Series 2005-A9, Class A3, 5.50%, 7/25/35* | | | 205,323 | |
| | 136,786 | | | Residential Asset Securitization Trust, Series 2006-A2, Class A3, 6.00%, 5/25/36* | | | 97,912 | |
| | | | | | | | 1,116,777 | |
| Prime Adjustable Rate Mortgage Backed Securities (1.4%) | | | | |
| | 1,155,737 | | | JPMorgan Mortgage Trust, Series 2014-5, Class A1, 2.98%, 10/25/29*(a)(b) | | | 1,171,628 | |
| | 8,793 | | | JPMorgan Mortgage Trust, Series 2006-A4, Class 3A1, 4.49%, 6/25/36*(b) | | | 7,799 | |
| | 264,831 | | | JPMorgan Mortgage Trust, Series 2005-A6, Class 2A4, 4.56%, 8/25/35*(b) | | | 268,668 | |
| | 25,743 | | | MLCC Mortgage Investors, Inc., Series 2004-HB1, Class A3, 4.13%, 4/25/29*(b) | | | 25,645 | |
| | 6,825 | | | Structured Adjustable Rate Mortgage Loan Trust, Series 2006-5, Class 4A1, 4.09%, 6/25/36*(b) | | | 5,853 | |
| | 999 | | | Wachovia Mortgage Loan Trust LLC, Series 2005-A, Class 4A2, 4.85%, 8/20/35*(b) | | | 93 | |
| | | | | | | | 1,479,686 | |
| Prime Fixed Mortgage Backed Securities (10.6%) | | | | |
| | 3,025 | | | Chase Mortgage Finance Corp., Series 2002-S4, Class A23, 6.25%, 3/25/32* | | | 3,138 | |
| | 171,259 | | | Chaseflex Trust, Series 2006-2, Class A5, 4.65%, 9/25/36*(b) | | | 172,934 | |
| | 29,058 | | | Citigroup Mortgage Loan Trust, Inc., Series 2005-1, Class 3A1, 6.50%, 4/25/35 | | | 30,734 | |
| | 49,198 | | | Countrywide Home Loans, Series 2005-J1, Class 1A8, 5.50%, 2/25/35* | | | 50,192 | |
| | 8,102 | | | Countrywide Home Loans, Series 2004-18, Class A1, 6.00%, 10/25/34* | | | 8,576 | |
| | 9,389 | | | Countrywide Home Loans, Series 2004-21, Class A10, 6.00%, 11/25/34* | | | 10,043 | |
| | 93,413 | | | Countrywide Home Loans, Series 2007-J3, Class A10, 6.00%, 7/25/37* | | | 68,300 | |
| | 5,000 | | | Countrywide Home Loans Mortgage Pass, Series 2004-8, Class 1A3, 5.50%, 7/25/34* | | | 5,290 | |
| | 111,985 | | | Credit Suisse First Boston Mortgage Securities Corp., Series 2005-9, Class 3A1, 6.00%, 10/25/35* | | | 61,371 | |
See notes to financial statements
| Schedule of Portfolio Investments | Bond Fund |
| August 31, 2019 | Continued |
| Shares or Principal Amount | | | Security Description | | Value | |
| | | | | |
| Mortgage Backed Securities†, continued: | | | | |
| Prime Fixed Mortgage Backed Securities, continued: | | | | |
| $ | 984 | | | Credit Suisse Mortgage Capital Certificates, Series 2006-8, Class 1A1, 4.50%, 10/25/21* | | $ | 941 | |
| | 217,582 | | | Deephaven Residential Mortgage Trust, Series 2018-2A, Class A1, 3.48%, 4/25/58*(a)(b) | | | 219,697 | |
| | 126 | | | First Nationwide Trust, Series 2001-3, Class 1A1, 6.75%, 8/21/31 | | | 132 | |
| | 673,720 | | | Flagstar Mortgage Trust, Series 2018-5, Class A7, 4.00%, 9/25/48*(a)(b) | | | 682,237 | |
| | 2,584 | | | GMAC Mortgage Corp. Loan Trust, Series 2003-GH2, Class A4, 5.50%, 10/25/33*(b) | | | 2,661 | |
| | 924,262 | | | GS Mortgage-Backed Securities Trust, Series 2018-RPL1, Class A1A, 3.75%, 10/25/57*(a) | | | 955,190 | |
| | 958,153 | | | JPMorgan Mortgage Trust, Series 2017-4, Class A6, 3.00%, 11/25/48*(a)(b) | | | 969,501 | |
| | 452,081 | | | JPMorgan Mortgage Trust, Series 2017-3, Class 1A5, 3.50%, 8/25/47*(a)(b) | | | 459,293 | |
| | 29,693 | | | JPMorgan Mortgage Trust, Series 2006-A2, Class 3A2, 4.38%, 4/25/36*(b) | | | 27,200 | |
| | 29,714 | | | JPMorgan Mortgage Trust, Series 2004-S2, Class 4A5, 6.00%, 11/25/34* | | | 30,223 | |
| | 36,169 | | | Morgan Stanley Mortgage Loan Trust, Series 2004-3, Class 3A, 6.00%, 4/25/34* | | | 38,708 | |
| | 9,599 | | | Nomura Asset Acceptance Corp., Series 2003-A1, Class A2, 6.00%, 5/25/33* | | | 10,054 | |
| | 863,234 | | | Onslow Bay Financial LLC, Series 2018- EXP2, Class 1A1, 4.00%, 11/25/48*(a)(b) | | | 870,629 | |
| | 897,789 | | | PSMC Trust, Series 2018-2, Class A3, 3.50%, 6/25/48(a)(b) | | | 915,499 | |
| | 161,465 | | | RAAC, Series 2004-SP2, Class A22, 6.00%, 1/25/32* | | | 163,883 | |
| | 878,967 | | | Sequoia Mortgage Trust, Series 2017-7, Class A4, 3.50%, 10/25/47*(a)(b) | | | 895,098 | |
| | 947,094 | | | Sequoia Mortgage Trust, Series 2017-CH1, Class A11, 3.50%, 8/25/47*(a)(b) | | | 952,834 | |
| | 889,103 | | | Sequoia Mortgage Trust, Series 2018-3, Class A4, 3.50%, 3/25/48*(a)(b) | | | 903,819 | |
| | 446,041 | | | Sequoia Mortgage Trust, Series 2018-6, Class A4, 4.00%, 7/25/48*(a)(b) | | | 450,408 | |
| | 753,096 | | | Sequoia Mortgage Trust, Series 2018-8, Class A4, 4.00%, 11/25/48*(a)(b) | | | 759,039 | |
| | 37,889 | | | TBW Mortgage Backed Pass-Through Certificates, Series 2006-2, Class 7A1, 7.00%, 7/25/36* | | | 10,490 | |
| | 283,172 | | | Washington Mutual Mortgage Pass-Through Certificates, Series 2005-3, Class 1CB5, 5.50%, 5/25/35* | | | 283,946 | |
| | 9,065 | | | Washington Mutual Mortgage Pass-Through Certificates, Series 2004-CB1, Class 4A, 6.00%, 6/25/34* | | | 9,785 | |
| | 72,016 | | | Washington Mutual Mortgage Pass-Through Certificates, Series 2004-RA1, Class 2A, 7.00%, 3/25/34* | | | 77,276 | |
Shares or Principal Amount | | | Security Description | | Value | |
| | | | | |
| Mortgage Backed Securities†, continued: | | | | |
| Prime Fixed Mortgage Backed Securities, continued: | | | | |
| $ | 2,792 | | | Wells Fargo Mortgage Backed Securities Trust, Series 2007-16, Class 1A1, 6.00%, 12/28/37* | | $ | 2,798 | |
| | 893,184 | | | WinWater Mortgage Loan Trust, Series 2015-1, Class A1, 3.50%, 1/20/45*(a)(b) | | | 909,546 | |
| | | | | | | | 11,011,465 | |
| Subprime Mortgage Backed Securities (1.6%) | | | | |
| | 684,783 | | | Towd Point Mortgage Trust, Series 2017-6, Class A1, 2.75%, 10/25/57*(a)(b) | | | 694,009 | |
| | 300,271 | | | Towd Point Mortgage Trust, Series 2018-1, Class A1, 3.00%, 1/25/58*(a)(b) | | | 305,370 | |
| | 683,560 | | | Towd Point Mortgage Trust, Series 2018-2, Class A1, 3.25%, 3/25/58*(a)(b) | | | 698,956 | |
| | | | | | | | 1,698,335 | |
| U.S. Government Agency Mortgage Backed Securities (19.2%) | | | | |
| | 253,363 | | | Fannie Mae, Series 2010-102, Class PE, 2.00%, 9/25/40 | | | 253,563 | |
| | 245,329 | | | Fannie Mae, Series 2012-10, Class TA, 2.00%, 3/25/38 | | | 246,112 | |
| | 413,729 | | | Fannie Mae, Series 2012-111, Class EC, 2.00%, 12/25/41 | | | 414,132 | |
| | 782,876 | | | Fannie Mae, Series 2012-30, Class BA, 2.00%, 6/25/41 | | | 783,180 | |
| | 792,918 | | | Fannie Mae, Series 2012-83, Class AH, 2.00%, 11/25/41 | | | 792,191 | |
| | 465,640 | | | Fannie Mae, Series 2013-18, Class 10A1, 2.00%, 12/25/42 | | | 465,211 | |
| | 333,650 | | | Fannie Mae, Series 2013-23, Class AB, 2.00%, 2/25/43 | | | 333,668 | |
| | 413,897 | | | Fannie Mae, Series 2012-30, Class CB, 2.25%, 10/25/41 | | | 417,612 | |
| | 210,201 | | | Fannie Mae, Series 2013-73, Class 10A1, 2.25%, 6/25/42 | | | 212,003 | |
| | 177,749 | | | Fannie Mae, Series 2013-74, Class 10A1, 2.25%, 6/25/42(b) | | | 178,639 | |
| | 239,838 | | | Fannie Mae, Series 2010-100, Class LA, 2.50%, 7/25/40 | | | 242,746 | |
| | 409,569 | | | Fannie Mae, Series 2012-111, Class QC, 2.50%, 5/25/42 | | | 416,809 | |
| | 54,474 | | | Fannie Mae, Series 2012-2, Class 10A1, 2.50%, 5/25/41 | | | 55,074 | |
| | 198,855 | | | Fannie Mae, Series 2014-61, Class P, 2.50%, 7/25/44 | | | 201,937 | |
| | 987,077 | | | Fannie Mae, Series 2017-M5, Class A1, 2.74%, 4/25/29 | | | 1,030,181 | |
| | 164,698 | | | Fannie Mae, Series 2011-118, Class 10A1, 3.00%, 11/25/41 | | | 170,326 | |
| | 22,687 | | | Fannie Mae, Series 2011-124, Class 10A1, 3.00%, 9/25/29 | | | 22,766 | |
| | 809,288 | | | Fannie Mae, Series 2014-33, Class PE, 3.00%, 4/25/43 | | | 832,866 | |
| | 205,570 | | | Fannie Mae, Series 2014-72, Class KA, 3.00%, 10/25/44 | | | 209,788 | |
| | 671,317 | | | Fannie Mae, Series 2015-59, Class LM, 3.00%, 7/25/45 | | | 699,768 | |
See notes to financial statements
| Schedule of Portfolio Investments | Bond Fund |
| August 31, 2019 | Continued |
| Shares or Principal Amount | | | Security Description | | Value | |
| | | | | |
| Mortgage Backed Securities†, continued: | | | | |
| U.S. Government Agency Mortgage Backed Securities, continued: | | | | |
| $ | 695,226 | | | Fannie Mae, Series 2016-10, Class BA, 3.00%, 3/25/46(b) | | $ | 724,428 | |
| | 825,361 | | | Fannie Mae, Series 2018-M12, Class A1, 3.55%, 2/25/30 | | | 907,570 | |
| | 934,700 | | | Fannie Mae, Series 2018-M13, Class A1, 3.82%, 3/25/30(b) | | | 1,046,734 | |
| | 58,303 | | | Fannie Mae, Series 2012-16, Class K, 4.00%, 10/25/41 | | | 61,538 | |
| | 19,148 | | | Fannie Mae, 4.91% (H15T1Y + 231 bps), 12/1/27, Pool #422279 | | | 19,654 | |
| | 446 | | | Fannie Mae, 5.00%, 8/1/33, Pool #730856 | | | 496 | |
| | 195 | | | Fannie Mae, 5.00%, 7/1/35, Pool #832198 | | | 217 | |
| | 270 | | | Fannie Mae, 5.50%, 2/1/33, Pool #683351 | | | 301 | |
| | 159 | | | Fannie Mae, 5.50%, 9/1/34, Pool #725773 | | | 180 | |
| | 2,452 | | | Fannie Mae, Series 1998-36, Class ZB, 6.00%, 7/18/28 | | | 2,714 | |
| | 1,000 | | | Fannie Mae, Series 1994-51, Class LL, 6.75%, 3/25/24 | | | 1,078 | |
| | 6,674 | | | Fannie Mae, Series 1993-82, Class H, 7.00%, 5/25/23 | | | 7,063 | |
| | 2,408 | | | Fannie Mae, Series 1991-171, Class J, 8.00%, 12/25/21 | | | 2,528 | |
| | 40,013 | | | Fannie Mae Whole Loan, Series 2003-W6, Class 6A, 4.45%, 8/25/42*(b) | | | 41,146 | |
| | 19,374 | | | Fannie Mae Whole Loan, Series 2002-W11, Class AF5, 5.48%, 11/25/32*(b) | | | 20,503 | |
| | 146,419 | | | Freddie Mac, Series 4146, Class 10A1, 1.50%, 10/15/42 | | | 147,931 | |
| | 309,086 | | | Freddie Mac, Series 3936, Class LA, 2.00%, 6/15/40 | | | 312,209 | |
| | 161,047 | | | Freddie Mac, Series 3997, Class AE, 2.00%, 4/15/40 | | | 162,304 | |
| | 246,002 | | | Freddie Mac, Series 4019, Class GB, 2.00%, 12/15/41 | | | 246,099 | |
| | 996,014 | | | Freddie Mac, Series 4031, Class PA, 2.00%, 3/15/42 | | | 991,670 | |
| | 934,150 | | | Freddie Mac, Series 4137, Class GA, 2.00%, 2/15/42 | | | 930,692 | |
| | 207,906 | | | Freddie Mac, Series 4461, Class EA, 2.00%, 7/15/37 | | | 207,502 | |
| | 869,798 | | | Freddie Mac, Series 3913, Class PC, 2.50%, 3/15/41 | | | 881,242 | |
| | 253,725 | | | Freddie Mac, Series 4009, Class PK, 2.50%, 6/15/41* | | | 260,198 | |
| | 951,043 | | | Freddie Mac, Series 4129, Class PA, 2.50%, 7/15/42 | | | 970,044 | |
| | 541,956 | | | Freddie Mac, Series 4312, Class 10A1, 2.50%, 12/15/41 | | | 549,318 | |
| | 286,502 | | | Freddie Mac, Series 4316, Class JY, 3.00%, 1/15/44 | | | 300,809 | |
| | 300,939 | | | Freddie Mac, Series 4348, Class A, 3.00%, 6/15/39 | | | 309,560 | |
| | 536,017 | | | Freddie Mac, Series 4374, Class GA, 3.00%, 9/15/36 | | | 557,341 | |
| Shares or Principal Amount | | | Security Description | | Value | |
| | | | | |
| Mortgage Backed Securities†, continued: | | | | |
| U.S. Government Agency Mortgage Backed Securities, continued: | | | | |
| $ | 215,230 | | | Freddie Mac, Series 3721, Class PE, 3.50%, 9/15/40 | | $ | 227,760 | |
| | 74,749 | | | Freddie Mac, Series 3780, Class MK, 3.50%, 10/15/40 | | | 78,084 | |
| | 5,213 | | | Freddie Mac, 4.63% (H15T1Y + 213 bps), 4/1/24, Pool #409624 | | | 5,268 | |
| | 1,575 | | | Freddie Mac, Series 2610, Class VB, 5.50%, 7/15/24 | | | 1,662 | |
| | 225 | | | Freddie Mac, 6.00%, 7/1/35, Pool #A36085 | | | 248 | |
| | 2,099 | | | Freddie Mac, Series 2148, Class ZA, 6.00%, 4/15/29 | | | 2,334 | |
| | 1,209 | | | Freddie Mac, 6.50%, 2/1/36, Pool #G08113 | | | 1,421 | |
| | 14,422 | | | Freddie Mac, Series 2036, Class PD, 6.50%, 3/15/28 | | | 16,093 | |
| | 543 | | | Freddie Mac, Series 2278, Class H, 6.50%, 1/15/31 | | | 555 | |
| | 2,325 | | | Freddie Mac, Series 1281, Class I, 8.00%, 5/15/22* | | | 2,443 | |
| | 174,705 | | | Government National Mortgage Assoc., Series 2013-69, Class 10A1, 2.00%, 9/20/42 | | | 170,890 | |
| | 580,458 | | | Government National Mortgage Assoc., Series 2009-94, Class KB, 3.00%, 9/16/39 | | | 606,507 | |
| | 213,633 | | | Government National Mortgage Assoc., Series 2011-46, Class GJ, 3.25%, 1/16/41(b) | | | 221,809 | |
| | 1,007,285 | | | Government National Mortgage Assoc., Series 2019-85, Class MP, 3.50%, 6/20/49 | | | 1,039,110 | |
| | 38,014 | | | Government National Mortgage Assoc., Series 2009-93, Class HG, 4.00%, 9/16/39 | | | 39,599 | |
| | 2,758 | | | Government National Mortgage Assoc., 7.00%, 9/15/23, Pool #347688 | | | 2,872 | |
| | 10,500 | | | Government National Mortgage Assoc., 7.00%, 7/15/29, Pool #490215 | | | 11,574 | |
| | 4,343 | | | Government National Mortgage Assoc., 7.50%, 11/15/23, Pool #354701 | | | 4,599 | |
| | 305 | | | Government National Mortgage Assoc., 9.00%, 7/15/21, Pool #308511 | | | 305 | |
| | | | | | | | 20,074,774 | |
| Total Mortgage Backed Securities | | | 35,460,219 | |
| | | | | | | | | |
| Corporate Bonds (18.8%) | | | | |
| Banks (3.9%) | | | | |
| | 1,320,000 | | | Bank of America Corp., 3.55% (US0003M + 78 bps), 3/5/24, Callable 3/5/23 @ 100 * | | | 1,379,587 | |
| | 1,315,000 | | | BB&T Corp., 2.15%, 2/1/21, Callable 1/1/21 @ 100 * | | | 1,317,238 | |
| | | | | | | | | |
| | 1,300,000 | | | Wells Fargo & Co., 3.00%, 10/23/26 | | | 1,350,893 | |
| | | | | | | | 4,047,718 | |
| Beverages (0.8%) | | | | |
| | 745,000 | | | Keurig Dr Pepper, Inc., 4.42%, 5/25/25, Callable 3/25/25 @ 100 * | | | 814,939 | |
| Capital Markets (1.5%) | | | | |
| | 1,300,000 | | | Goldman Sachs Group, Inc., 3.50%, 11/16/26, Callable 11/16/25 @ 100 * | | | 1,361,276 | |
See notes to financial statements
| Schedule of Portfolio Investments | Bond Fund |
| August 31, 2019 | Continued |
Shares or Principal Amount | | | Security Description | | | Value | |
| | | | | |
| Corporate Bonds, continued: | | | | |
| Capital Markets, continued: | | | | |
| $ | 200,000 | | | Intercontinental Exchange, Inc., 3.10%, 9/15/27, Callable 6/15/27 @ 100 * | | $ | 211,957 | |
| | | | | | | | 1,573,233 | |
| Diversified Financial Services (1.4%) | | | | |
| | 600,000 | | | BP Capital Markets America, Inc., 2.75%, 5/10/23 | | | 614,664 | |
| | 850,000 | | | Korea Development Bank, 2.75%, 3/19/23 | | | 873,562 | |
| | | | | | | | 1,488,226 | |
| Diversified Telecommunication Services (1.6%) | | | | |
| | 1,250,000 | | | AT&T, Inc., 5.25%, 3/1/37, Callable 9/1/36 @ 100 * | | | 1,481,531 | |
| | 107,000 | | | Qwest Corp., 6.88%, 9/15/33, Callable 10/10/19 @ 100 * | | | 107,259 | |
| | 118,000 | | | Qwest Corp., Series MBIA, 6.88%, 9/15/33, Callable 10/10/19 @ 100 * | | | 118,442 | |
| | | | | | | | 1,707,232 | |
| Equity Real Estate Investment Trusts (0.4%) | | | | |
| | 358,872 | | | JBG/Rockville NCI Campus LLC, Series 2010-A, 3.90%, 7/15/23 (a) | | | 369,693 | |
| Food Products (2.3%) | | | | |
| | 1,025,000 | | | Campbell Soup Co., 3.95%, 3/15/25, Callable 1/15/25 @ 100 * | | | 1,084,974 | |
| | 1,150,000 | | | Conagra Brands, Inc., 4.85%, 11/1/28, Callable 8/1/28 @ 100 * | | | 1,316,986 | |
| | | | | | | | 2,401,960 | |
| Health Care Providers & Services (1.0%) | | | | |
| | 1,060,000 | | | Montefiore Medical Center, 2.15%, 10/20/26, Callable 4/20/26 @ 100 * | | | 1,055,829 | |
| Hotels, Restaurants & Leisure (0.4%) | | | | |
| | 345,000 | | | Royal Caribbean Cruises, 5.25%, 11/15/22 | | | 375,853 | |
| Industrial Conglomerates (1.1%) | | | | |
| | 1,120,000 | | | General Electric Co., 3.10%, 1/9/23 | | | 1,123,304 | |
| Insurance (1.1%) | | | | |
| | 1,100,000 | | | Jackson National Life Global Funding, 2.65%, 6/21/24 (a) | | | 1,122,613 | |
| IT Services (1.0%) | | | | |
| | 1,000,000 | | | International Business Machines Corp., 3.50%, 5/15/29 | | | 1,084,899 | |
| Multiline Retail (0.9%) | | | | |
| | 1,010,000 | | | Macys Retail Holdings, Inc., 2.88%, 2/15/23, Callable 11/15/22 @ 100 * | | | 992,613 | |
| Technology Hardware, Storage & Peripherals (1.4%) | | | | |
| | 1,300,000 | | | Apple, Inc., 3.20%, 5/11/27, Callable 2/11/27 @ 100 * | | | 1,392,510 | |
| Total Corporate Bonds | | | 19,550,622 | |
| | | | | | | | | |
| Taxable Municipal Bonds (8.5%) | | | | |
| Georgia (2.4%) | | | | |
| | 2,235,000 | | | State of Georgia, Build America Bonds, GO, Series H, 4.50%, 11/1/25 | | | 2,419,476 | |
| Missouri (0.2%) | | | | |
| | 235,000 | | | Hanley Road Corridor Transnational Development Missouri Transnational Tax Revenue, Build America Bonds, GO, 7.50%, 10/1/39, Continuously Callable @100 | | | 235,881 | |
Shares or
Principal
Amount | | | Security Description | | Value | |
| | | | | |
| Taxable Municipal Bonds, continued: | | | | |
| New York (1.3%) | | | | |
| $ | 1,260,000 | | | New York City Transitional Finance Authority Revenue, Series F-3, 3.21%, 5/1/29, Continuously Callable @100 | | $ | 1,356,806 | |
| Oklahoma (2.2%) | | | | |
| | 500,000 | | | Grand River Dam Authority Revenue, Series B, 4.55%, 6/1/39, Continuously Callable @100 | | | 550,580 | |
| | 1,650,000 | | | University of Oklahoma Health Sciences Center General Revenue, Series A, 3.87%, 7/1/32, Continuously Callable @100 | | | 1,809,423 | |
| | | | | | | | 2,360,003 | |
| Pennsylvania (1.2%) | | | | |
| | 1,110,000 | | | City of Bethlehem Lehigh and Northampton Countries, GO, Series C, 5.15%, 11/1/34, Continuously Callable @100, AGM | | | 1,240,481 | |
| Utah (1.2%) | | | | |
| | 1,175,000 | | | Central Utah Water Conservancy District Taxable Water Conservancy Revenue, Build America Bonds, GO, 5.70%, 10/1/40, Continuously Callable @100 | | | 1,198,806 | |
| Total Taxable Municipal Bonds | | | 8,811,453 | |
| | | | | | | | | |
| U.S. Government Agency Securities (2.9%) | | | | |
| Federal Farm Credit Bank | | | | |
| | 1,000,000 | | | 2.25%, 11/26/24, Callable 11/26/19 @ 100 * | | | 999,600 | |
| Federal Home Loan Bank | | | | |
| | 1,000,000 | | | 2.05%, 8/26/21, Callable 11/26/19 @ 100 * | | | 1,000,114 | |
| Freddie Mac | | | | |
| | 1,000,000 | | | 2.50%, 6/9/21 (b)(c) | | | 1,000,146 | |
| Total U.S. Government Agency Securities | | | 2,999,860 | |
| | | | | | | | | |
| U.S. Treasury Obligations (29.9%) | | | | |
| U.S. Treasury Bonds | | | | |
| | 11,945,000 | | | 2.25%, 8/15/46 | | | 12,645,369 | |
| U.S. Treasury Inflation Indexed Notes | | | | |
| | 4,134,661 | | | 0.38%, 7/15/25 | | | 4,237,253 | |
| U.S. Treasury Notes | | | | |
| | 7,321,000 | | | 1.50%, 11/30/19 | | | 7,311,277 | |
| | 2,602,000 | | | 2.25%, 2/29/20 | | | 2,606,066 | |
| | 4,003,000 | | | 2.25%, 2/15/27 | | | 4,225,823 | |
| | | | | | | | 14,143,166 | |
| Total U.S. Treasury Obligations | | | 31,025,788 | |
| | | | | | | | | |
| Investment in Affiliates (1.4%) | | | | |
| | 1,405,699 | | | Cavanal Hill Government Securities Money Market Fund, Select Shares, 1.95%(d) | | | 1,405,699 | |
| Total Investment in Affiliates | | | 1,405,699 | |
| | | | | | | | | |
| Total Investments (Cost $99,570,371)(e) - 99.7% | | | 103,570,709 | |
| Other assets in excess of liabilities — 0.3% | | | 352,826 | |
| Net Assets - 100.0% | | $ | 103,923,535 | |
See notes to financial statements
| Schedule of Portfolio Investments | Bond Fund |
| August 31, 2019 | Concluded |
| (a) | Represents a restricted security, purchased under Rule 144A, Section 4(2), which is exempt from registration under the Securities Act of 1933, as amended. The security has been deemed liquid according to the policies and procedures adopted by the Board of Trustees. |
| (b) | The rate for certain asset-backed and mortgage-backed securities may vary based on factors relating to the pool of assets underlying the security. The rate presented is the rate in effect at August 31, 2019. |
| (c) | Step Bond: Coupon rate is set for an initial period and then increased to a higher coupon rate at a specified date. The rate shown is the rate in effect at August 31, 2019. |
| (d) | Money market investment. The rate presented on the Schedule of Portfolio Investments is the rate in effect at August 31, 2019. |
| (e) | Represents cost for financial reporting purposes. The cost for tax reporting purposes can be found in Note 6 in the Notes to Financial Statements. |
| * | Represents next call date. Additional subsequent call dates and amounts may apply to this security. |
| † | Mortgage backed securities are classified based on the characteristics of their underlying collateral, the fixed vs. variable nature of the obligations, and the credit standing of the mortgagors. The fixed or variable rate nature of securities interest payments to which the fund is entitled may not coincide with the payment nature of the collateral underlying the securities. |
| AGM | Assured Guaranty Municipal Corporation |
| GO | General Obligation |
| H15T1Y | 1 Year Treasury Constant Maturity Rate |
| LIBOR | London Interbank Offered Rate |
| US0003M | 3 Month US Dollar LIBOR |
See notes to financial statements
| Schedule of Portfolio Investments | Strategic Enhanced Yield Fund |
| August 31, 2019 | |
Shares or
Principal
Amount | | | Security Description | | Value | |
| |
| Asset Backed Securities (8.1%) |
| $ | 38,397 | | | Bayview Financial Mortgage Pass, Series 2005-D, Class AF4, 5.50%, 12/28/35*(a) | | $ | 38,461 | |
| | 57,534 | | | Bayview Opportunity Master Fund Trust, Series 2017-RT1, Class A1, 3.00%, 3/28/57*(a)(b) | | | 58,449 | |
| | 45,454 | | | Centex Home Equity Loan Trust, Series 2002-A, Class AF6, 5.54%, 1/25/32* | | | 46,438 | |
| | 76,852 | | | Centex Home Equity Loan Trust, Series 2005-A, Class AF5, 5.78%, 1/25/35*(a) | | | 76,926 | |
| | 18,216 | | | Countrywide Asset-Backed Certificates Trust, Series 2004-13, Class AF5B, 5.10%, 5/25/35*(a) | | | 18,441 | |
| | 134,744 | | | CWABS Asset-Backed Certificates Trust, Series 2005-11, Class AF4, 5.21%, 3/25/34*(a) | | | 136,188 | |
| | 4,755 | | | Equity One Mortgage Pass, Series 2003-4, Class AF5, 6.20%, 10/25/34*(a) | | | 4,738 | |
| | 50,000 | | | GSAA Home Equity Trust, Series 2005-1, Class M1, 5.29%, 11/25/34*(a) | | | 51,247 | |
| | 41,579 | | | Residential Asset Mortgage, Series 2004- RS12, Class MI1, 5.69%, 12/25/34*(a) | | | 43,017 | |
| | 49,423 | | | Residential Asset Securities Corp., Series 2004-KS8, Class MI1, 5.34%, 9/25/34*(a) | | | 51,964 | |
| | 149,272 | | | Specialty Underwriting & Residential Finance, Series 2003-BC4, Class A3B, 4.79%, 11/25/34*(a) | | | 155,230 | |
| Total Asset Backed Securities | | | 681,099 | |
| | | | | | | | | |
| Mortgage Backed Securities† (48.3%) |
| Alt-A - Fixed Rate Mortgage Backed Securities (12.9%) |
| | 32,907 | | | Bear Stearns Asset-Backed Securities I Trust, Series 2004-AC3, Class A1, 5.75%, 6/25/34*(a) | | | 34,892 | |
| | 29,165 | | | Countrywide Alternative Loan Trust, Series 2004-16CB, Class 1A1, 5.50%, 7/25/34* | | | 30,514 | |
| | 31,183 | | | Countrywide Alternative Loan Trust, Series 2004-16CB, Class 3A1, 5.50%, 8/25/34* | | | 32,588 | |
| | 149,173 | | | Countrywide Alternative Loan Trust, Series 2003-22CB, Class 1A1, 5.75%, 12/25/33* | | | 155,569 | |
| | 63,654 | | | Countrywide Alternative Loan Trust, Series 2004-16CB, Class 4A3, 6.00%, 8/25/34* | | | 65,472 | |
| | 50,051 | | | Countrywide Alternative Loan Trust, Series 2004-J2, Class 2A1, 6.50%, 3/25/34* | | | 52,541 | |
| | 21,703 | | | MASTR Alternative Loans Trust, Series 2004-11, Class 6A1, 5.50%, 10/25/34* | | | 22,733 | |
| | 155,829 | | | MASTR Alternative Loans Trust, Series 2004-7, Class 1A1, 5.50%, 7/25/34* | | | 164,295 | |
| | 175,739 | | | MASTR Alternative Loans Trust, Series 2003-3, Class 2A5, 6.00%, 5/25/33* | | | 189,370 | |
| | 62,722 | | | MASTR Alternative Loans Trust, Series 2004-5, Class 2A1, 6.00%, 6/25/34* | | | 66,067 | |
| | 164,000 | | | Residential Asset Securitization Trust, Series 2003-A7, Class A8, 5.00%, 7/25/33* | | | 166,566 | |
Shares or
Principal
Amount | | | Security Description | | Value | |
| |
| Mortgage Backed Securities†, continued: |
| Alt-A - Fixed Rate Mortgage Backed Securities, continued: | | | |
| $ | 70,000 | | | Residential Asset Securitization Trust, Series 2003-A10, Class A2, 5.20%, 9/25/33* | | $ | 72,520 | |
| | 29,670 | | | Structured Asset Securities Corp., Series 2004-4XS, Class A3A, 5.20%, 2/25/34*(a) | | | 31,188 | |
| | | | | | | | 1,084,315 | |
| Prime Adjustable Rate Mortgage Backed Securities (4.6%) | | | |
| | 90,693 | | | Citigroup Mortgage Loan Trust, Inc., Series 2004-UST1, Class A5, 4.34%, 8/25/34*(a) | | | 91,617 | |
| | 13,251 | | | Citigroup Mortgage Loan Trust, Inc., Series 2004-RR2, Class A2, 4.96%, 5/25/34(a)(b) | | | 13,672 | |
| | 149,134 | | | Impac Secured Assets CMN Owner Trust, Series 2003-3, Class A1, 4.94%, 8/25/33*(a) | | | 154,415 | |
| | 48,963 | | | Structured Adjustable Rate Mortgage Loan Trust, Series 2004-8, Class 3A, 4.41%, 7/25/34*(a) | | | 49,358 | |
| | 76,865 | | | Structured Adjustable Rate Mortgage Loan Trust, Series 2004-12, Class 3A2, 4.47%, 9/25/34*(a) | | | 78,384 | |
| | | | | | | | 387,446 | |
| Prime Fixed Mortgage Backed Securities (21.9%) | | | |
| | 27,238 | | | Banc of America Funding Trust, Series 2004-3, Class 1A9, 5.50%, 10/25/34* | | | 29,302 | |
| | 12,846 | | | Citicorp Mortgage Securities Trust, Series 2006-3, Class 1A19, 5.75%, 6/25/36* | | | 13,072 | |
| | 15,182 | | | Citicorp Mortgage Securities Trust, Series 2006-3, Class 1A3, 6.25%, 6/25/36* | | | 15,633 | |
| | 72,000 | | | Countrywide Home Loans, Series 2005-6, Class 1A3, 5.15%, 4/25/35* | | | 74,176 | |
| | 56,000 | | | Countrywide Home Loans, Series 2004-10, Class A4, 5.25%, 7/25/34* | | | 56,647 | |
| | 100,000 | | | Countrywide Home Loans, Series 2004-4, Class A4, 5.25%, 5/25/34* | | | 102,196 | |
| | 119,000 | | | Countrywide Home Loans, Series 2005-5, Class A4, 5.40%, 3/25/35* | | | 121,331 | |
| | 94,625 | | | Countrywide Home Loans, Series 2004-4, Class A9, 5.50%, 5/25/34* | | | 99,022 | |
| | 64,000 | | | Countrywide Home Loans Mortgage Pass, Series 2004-9, Class A5, 5.25%, 6/25/34* | | | 65,316 | |
| | 67,000 | | | Countrywide Home Loans Mortgage Pass, Series 2004-8, Class 1A3, 5.50%, 7/25/34* | | | 70,887 | |
| | 58,000 | | | Countrywide Home Loans Mortgage Pass, Series 2004-8, Class 1A7, 5.75%, 7/25/34* | | | 62,068 | |
| | 153,475 | | | Credit Suisse Mortgage Trust, Series 2013-IVR2, Class AD, 1.55%, 4/25/43*(a)(b) | | | 144,582 | |
| | 103,208 | | | Credit Suisse Mortgage Trust, Series 2015-3, Class A9, 3.50%, 3/25/45*(a)(b) | | | 104,461 | |
| | 96,827 | | | Flagstar Mortgage Trust, Series 2017-2, Class A5, 3.50%, 10/25/47*(a)(b) | | | 98,556 | |
| | 64,792 | | | GMAC Mortgage Loan Trust, Series 2004- J2, Class A8, 5.75%, 6/25/34* | | | 67,102 | |
See notes to financial statements
| Schedule of Portfolio Investments | Strategic Enhanced Yield Fund |
| August 31, 2019 | Concluded |
Shares or
Principal
Amount | | | Security Description | | Value | |
| | | | | |
| Mortgage Backed Securities†, continued: | |
| Prime Fixed Mortgage Backed Securities, continued: |
| $ | 180,350 | | | GSR Mortgage Loan Trust, Series 2004-10F, Class 6A1, 5.00%, 9/25/34* | | $ | 182,463 | |
| | 99,394 | | | JPMorgan Mortgage Trust, Series 2017-3, Class 1A6, 3.00%, 8/25/47*(a)(b) | | | 100,124 | |
| | 60,738 | | | JPMorgan Mortgage Trust, Series 2017-1, Class A5, 3.50%, 1/25/47*(a)(b) | | | 61,438 | |
| | 127,289 | | | Sequoia Mortgage Trust, Series 2013-4, Class A3, 1.55%, 4/25/43*(a) | | | 122,323 | |
| | 47,701 | | | Sequoia Mortgage Trust, Series 2017-1, Class A4, 3.50%, 2/25/47*(a)(b) | | | 48,494 | |
| | 132,395 | | | Verus Securitization Trust, Series 2018-INV2, Class A1FX, 4.15%, 10/25/58*(a)(b) | | | 135,065 | |
| | 51,000 | | | WaMu Mortgage Pass, Series 2004-RS1, Class A3, 5.50%, 11/25/33* | | | 52,793 | |
| | | | | | | | 1,827,051 | |
| U.S. Government Agency Mortgage Backed Securities (8.9%) |
| | 149,871 | | | Fannie Mae, Series 2013-56, Class GM, 2.00%, 8/25/41 | | | 151,808 | |
| | 122,922 | | | Fannie Mae, Series 2003-W14, Class 2A, 4.62%, 1/25/43*(a) | | | 128,612 | |
| | 166,470 | | | Fannie Mae, Series 2004-W3, Class A8, 5.50%, 5/25/34* | | | 187,757 | |
| | 93,301 | | | Freddie Mac, Series 4664, Class TC, 3.00%, 6/15/41 | | | 94,267 | |
| | 178,499 | | | Freddie Mac, Series 2017-SC01, Class 2A, 3.50%, 12/25/46* | | | 183,956 | |
| | | | | | | | 746,400 | |
| Total Mortgage Backed Securities | | | 4,045,212 | |
| | | | | | | | | |
Shares or
Principal
Amount | | | Security Description | | Value | |
| | | | | | | | | |
| Corporate Bonds (4.5%) |
| Diversified Telecommunication Services (1.2%) |
| $ | 82,000 | | | AT&T, Inc., 5.25%, 3/1/37, Callable 9/1/36 @ 100 * | | $ | 97,188 | |
| Tobacco (3.3%) |
| | 125,000 | | | Altria Group, Inc., 5.95%, 2/14/49, Callable 8/14/48 @ 100 * | | | 160,468 | |
| | 86,000 | | | Philip Morris International, Inc., 6.38%, 5/16/38 | | | 117,971 | |
| | | | | | | | 278,439 | |
| Total Corporate Bonds | | 375,627 | |
| | | | | | | | | |
| U.S. Treasury Obligations (31.4%) |
| U.S. Treasury Bonds |
| | 650,000 | | | 3.00%, 8/15/48 | | | 797,824 | |
| U.S. Treasury Notes |
| | 200,000 | | | 1.38%, 9/30/23 | | | 199,664 | |
| | 800,000 | | | 1.75%, 7/31/24 | | | 813,281 | |
| | 736,000 | | | 2.88%, 8/15/28 | | | 820,266 | |
| | | | | | | | 1,833,211 | |
| Total U.S. Treasury Obligations | | 2,631,035 | |
| | | | | | | | | |
| Investment in Affiliates (9.1%) | | | |
| | 766,036 | | | Cavanal Hill Government Securities Money Market Fund, Select Shares, 1.95%(c) | | | 766,036 | |
| Total Investment in Affiliates | | 766,036 | |
| | | | | | | | | |
| Total Investments (Cost $8,203,568)(d) - 101.4% | | 8,499,009 | |
| Liabilities in excess of other assets — (1.4)% | | (114,925 | ) |
| Net Assets - 100.0% | $ | 8,384,084 | |
| (a) | The rate for certain asset-backed and mortgage-backed securities may vary based on factors relating to the pool of assets underlying the security. The rate presented is the rate in effect at August 31, 2019. |
| (b) | Represents a restricted security, purchased under Rule 144A, Section 4(2), which is exempt from registration under the Securities Act of 1933, as amended. The security has been deemed liquid according to the policies and procedures adopted by the Board of Trustees. |
| (c) | Money market investment. The rate presented on the Schedule of Portfolio Investments is the rate in effect at August 31, 2019. |
| (d) | Represents cost for financial reporting purposes. The cost for tax reporting purposes can be found in Note 6 in the Notes to Financial Statements. |
| * | Represents next call date. Additional subsequent call dates and amounts may apply to this security. |
| † | Mortgage backed securities are classified based on the characteristics of their underlying collateral, the fixed vs. variable nature of the obligations, and the credit standing of the mortgagors. The fixed or variable rate nature of securities interest payments to which the fund is entitled may not coincide with the payment nature of the collateral underlying the securities. |
See notes to financial statements
| Schedule of Portfolio Investments | Ultra Short Tax-Free Income Fund |
| August 31, 2019 | |
Shares or
Principal
Amount | | | Security Description | | Value | |
| | | | | | | |
| Municipal Bonds (103.4%) |
| Alaska (3.9%) | | | |
| $ | 800,000 | | | Valdez Alaska Marine Terminal Revenue, Series C, 1.33%, 12/1/29, Continuously Callable @100, Insured by: GTY(a) | | $ | 800,000 | |
| Colorado (3.1%) | | | |
| | 650,000 | | | City of Colorado Springs, Colorado Variable Rate Demand Utilities System Improvement Revenue, Series C, 1.35%, 11/1/40, Continuously Callable @100, Barclays Bank(a) | | | 650,000 | |
| Florida (6.6%) | | | |
| | 800,000 | | | Florida State Municipal Power Agency Revenue, Series C, 1.38%, 10/1/35, Continuously Callable @100, Enhanced by: LOC(a) | | | 800,000 | |
| | 550,000 | | | Palm Beach County Revenue, 1.38%, 7/1/32, Callable 10/1/19 @ 100, Northern Trust Co*(a) | | | 550,000 | |
| | | | | | | | 1,350,000 | |
| Georgia (2.4%) | | | |
| | 500,000 | | | Georgia Private Colleges & Universities Authority Revenue, Series B-3, 1.29%, 9/1/35, Continuously Callable @100(a) | | | 500,000 | |
| Illinois (12.3%) | | | |
| | 105,000 | | | Adams County School District No 172, GO, 4.00%, 2/1/20, BAM | | | 106,037 | |
| | 700,000 | | | Channahon Illinois, Morris Hospital Revenue, 1.37%, 12/1/34, Continuously Callable @100, U.S. Bank NA(a) | | | 700,000 | |
| | 250,000 | | | City of Chicago Illinois Waterworks Revenue, 5.00%, 11/1/19 | | | 251,425 | |
| | 235,000 | | | Cook County School District No 130 Blue Island, GO, 5.00%, 12/1/19, AGC | | | 237,127 | |
| | 300,000 | | | Cook County School District No 148 Dolton, GO, 5.00%, 12/1/19 | | | 302,397 | |
| | 250,000 | | | Hancock County Community Consolidated School District No 328 Hamilton, GO, 3.00%, 12/1/19 | | | 251,048 | |
| | 700,000 | | | Illinois State Finance Authority Revenue, Series C, 1.34%, 2/15/33, Continuously Callable @100, Enhanced by: LOC(a) | | | 700,000 | |
| | | | | | | | 2,548,034 | |
| Indiana (2.4%) | | | |
| | 500,000 | | | Brownsburg 1999 School Building Corp. Revenue, 2.50%, 4/10/20, Continuously Callable @100 | | | 500,605 | |
| Kansas (2.4%) | | | |
| | 500,000 | | | Riley County Unified School District No 383 Manhattan-Ogden, GO, 3.00%, 9/1/20 | | | 507,505 | |
| Louisiana (2.3%) | | | |
| | 485,000 | | | Louisiana Public Facilities Authority Revenue, Series B-3, 1.34%, 7/1/47, Continuously Callable @100, BNY(a) | | | 485,000 | |
| Michigan (2.4%) | | | |
| | 500,000 | | | Bishop International Airport Authority, GO, 3.13%, 12/1/19 | | | 502,345 | |
Shares or
Principal
Amount | | | Security Description | | Value | |
| | | | | | | | | |
| Municipal Bonds, continued: |
| Minnesota (4.7%) |
| $ | 230,000 | | | City of Jordan Minnesota, GO, Series B, 2.00%, 2/1/20 | | $ | 230,745 | |
| | 735,000 | | | Clearbrook-Gonvick Independent School District No 2311, GO, Series A, 2.00%, 2/1/20, SD CRED PROG | | | 737,770 | |
| | | | | | | | 968,515 | |
| Mississippi (3.4%) |
| | 700,000 | | | Mississippi State Business Finance Commission Gulf Opportunity Zone Revenue, Series C, 1.35%, 12/1/30, Callable 10/1/19 @ 100, Insured by: GTY*(a) | | | 700,000 | |
| Missouri (2.5%) |
| | 520,000 | | | Health and Educational Facilities Authority of the State of Missouri Revenue, 1.40%, 2/1/31, Continuously Callable @100, BAM(a) | | | 520,000 | |
| Nevada (3.9%) |
| | 800,000 | | | County of Clark Nevada Industrial Development Revenue, Series A, 1.38%, 12/1/39, Continuously Callable @100, BAM(a) | | | 800,000 | |
| Ohio (15.5%) |
| | 499,000 | | | American Municipal Power, Inc. Revenue, 2.25%, 8/13/20 | | | 502,403 | |
| | 500,000 | | | City of Akron Ohio Income Tax Revenue, 3.50%, 12/10/19 | | | 503,010 | |
| | 500,000 | | | City of Parma Heights Ohio, GO, 2.50%, 4/9/20 | | | 503,660 | |
| | 700,000 | | | City of Vandalia Ohio, GO, 2.13%, 9/2/20 | | | 705,411 | |
| | 500,000 | | | City of Whitehall Ohio Revenue, 3.50%, 12/11/19 | | | 502,435 | |
| | 200,000 | | | County of Belmont Ohio, GO, 3.00%, 1/29/20 | | | 201,288 | |
| | 300,000 | | | County of Lake Ohio, GO, 2.25%, 4/4/20 | | | 301,596 | |
| | | | | | | | 3,219,803 | |
| Oklahoma (2.4%) |
| | 130,000 | | | Caddo County Governmental Building Authority Revenue, 5.00%, 9/1/19 | | | 130,009 | |
| | 115,000 | | | Cleveland County Educational Facilities Authority Revenue, 4.00%, 9/1/20 | | | 118,222 | |
| | 150,000 | | | Pontotoc County Educational Facilities Authority Revenue, 5.00%, 9/1/19 | | | 150,014 | |
| | 100,000 | | | Tulsa County Industrial Authority Revenue, 5.00%, 9/1/19 | | | 100,008 | |
| | | | | | | | 498,253 | |
| Oregon (2.7%) |
| | 565,000 | | | Salem Hospital Facility Authority Revenue, Series B, 1.34%, 8/15/34, Continuously Callable @100, U.S. Bank NA(a) | | | 565,000 | |
| Pennsylvania (2.4%) |
| | 500,000 | | | Philadelphia Pennsylvania, GO, Series B, 1.35%, 8/1/31, Continuously Callable @100, Barclays Bank(a) | | | 500,000 | |
| South Carolina (2.1%) |
| | 425,000 | | | Lexington County Health Services District, Inc. Revenue, 5.00%, 11/1/19 | | | 427,491 | |
See notes to financial statements
| Schedule of Portfolio Investments | Ultra Short Tax-Free Income Fund |
| August 31, 2019 | Concluded |
Shares or
Principal
Amount | | | Security Description | | Value | |
| | | | | |
| Municipal Bonds, continued: | |
| Tennessee (5.3%) | | | | |
| $ | 600,000 | | | Clarksville Tennessee Public Building Authority Revenue, 1.40%, 1/1/33, Callable 10/1/19 @ 100, BAM*(a) | | $ | 600,000 | |
| | 500,000 | | | Montgomery Country Public Building Authority Revenue, 1.40%, 2/1/36, Callable 10/1/19 @ 100, Bank of America*(a) | | | 500,000 | |
| | | | | | | | 1,100,000 | |
| Texas (15.1%) |
| | 400,000 | | | Austin Texas Hotel Occupancy Tax Revenue, 1.36%, 11/15/29, Continuously Callable @100, JPM(a) | | | 400,000 | |
| | 800,000 | | | City of Houston Texas Airport System Revenue, 1.37%, 7/1/30, Continuously Callable @100, Barclays Bank(a) | | | 800,000 | |
| | 400,000 | | | Fort Bend Country Municipal Utility District No 137, GO, 3.00%, 9/1/19, BAM | | | 400,016 | |
| | 215,000 | | | Fort Bend County Municipal Utility District No 134D, GO, 4.00%, 9/1/20, AGM | | | 220,616 | |
| | 500,000 | | | Gulf Coast Waste Disposal Authority Revenue, 1.33%, 6/1/20, Continuously Callable @100(a) | | | 500,000 | |
| | 105,000 | | | Harris County Municipal Utility District No 374, 2.00%, 9/1/19 | | | 105,001 | |
| | | | | | | | | |
Shares or
Principal
Amount | | | Security Description | | | Value | |
| |
| Municipal Bonds, continued: |
| Texas, continued: | | | |
| $ | 285,000 | | | Montgomery County Municipal Utility District No 18, 2.00%, 3/1/20 | | $ | 286,143 | |
| | 125,000 | | | Paseo del Este Municipal Utility District No 10, 4.00%, 8/15/20 | | | 128,238 | |
| | 100,000 | | | Remington Municipal Utility District No 1, 3.00%, 9/1/20, AGM | | | 101,749 | |
| | 195,000 | | | Trophy Club Municipal Utility District No 1, 3.00%, 9/1/19 | | | 195,008 | |
| | | | | | | | 3,136,771 | |
| Wisconsin (2.2%) |
| | 460,000 | | | Wisconsin Health & Educational Facilities Authority Revenue, 1.39%, 3/1/36, Callable 10/1/19 @ 100, JPM*(a) | | | 460,000 | |
| Wyoming (3.4%) |
| | 700,000 | | | County of Lincoln Wyoming Revenue, 1.33%, 10/1/44, Continuously Callable @100, Exxon Mobil Corp.(a) | | | 700,000 | |
| Total Municipal Bonds | | 21,439,322 | |
| | | | | | | | | |
| Investment in Affiliates (0.6%) |
| | 123,186 | | | Cavanal Hill Government Securities Money Market Fund, Select Shares, 1.95%(b) | | | 123,186 | |
| Total Investment in Affiliates | | 123,186 | |
| | | | | | | | | |
| Total Investments (Cost $21,548,164)(c) - 104.0% | | 21,562,508 | |
| Liabilities in excess of other assets — (4.0)% | | (836,550 | ) |
| Net Assets - 100.0% | $ | 20,725,958 | |
| (a) | Interest rate is determined by the Remarketing Agent. The rate presented is the rate in effect at August 31, 2019. |
| (b) | Money market investment. The rate presented on the Schedule of Portfolio Investments is the rate in effect at August 31, 2019. |
| (c) | Represents cost for financial reporting purposes. The cost for tax reporting purposes can be found in Note 6 in the Notes to Financial Statements. |
| * | Represents next call date. Additional subsequent call dates and amounts may apply to this security. |
| AGC | Assured Guaranty Corporation |
| AGM | Assured Guaranty Municipal Corporation |
| BAM | Build America Mutual Assurance Company |
| BNY | Bank of New York Mellon |
| GO | General Obligation |
| GTY | Guarantor Agreement |
| JPM | J.P. Morgan Chase Bank |
| LOC | Letter of Credit |
See notes to financial statements
| Schedule of Portfolio Investments | Active Core Fund |
August 31, 2019
Shares or Principal Amount | | | Security Description | | Value | |
| | | | | |
| Common Stocks (45.9%) | | | |
| Aerospace & Defense (1.3%) | | | | |
| | 198 | | | BWX Technologies, Inc. | | $ | 11,722 | |
| | 351 | | | General Dynamics Corp. | | | 67,136 | |
| | 40 | | | HEICO Corp. | | | 5,787 | |
| | 42 | | | HEICO Corp., Class A | | | 4,635 | |
| | 734 | | | L3Harris Technologies, Inc. | | | 155,174 | |
| | 149 | | | Lockheed Martin Corp. | | | 57,232 | |
| | 148 | | | Northrop Grumman Corp. | | | 54,445 | |
| | 341 | | | Raytheon Co. | | | 63,194 | |
| | 515 | | | Spirit AeroSystems Holdings, Inc., Class A | | | 41,509 | |
| | 8 | | | Teledyne Technologies, Inc.(a) | | | 2,469 | |
| | 278 | | | The Boeing Co. | | | 101,217 | |
| | 28 | | | TransDigm Group, Inc. | | | 15,073 | |
| | 135 | | | United Technologies Corp. | | | 17,582 | |
| | 117 | | | Vectrus, Inc.(a) | | | 4,734 | |
| | | | | | | | 601,909 | |
| Air Freight & Logistics (0.1%) | | | | |
| | 639 | | | Expeditors International of Washington, Inc. | | | 45,433 | |
| Airlines (0.1%) | | | | |
| | 582 | | | Delta Air Lines, Inc. | | | 33,675 | |
| | 609 | | | JetBlue Airways Corp.(a) | | | 10,548 | |
| | 141 | | | Southwest Airlines Co. | | | 7,377 | |
| | 182 | | | United Continental Holdings, Inc.(a) | | | 15,344 | |
| | | | | | | | 66,944 | |
| Auto Components (0.1%) | | | | |
| | 895 | | | Gentex Corp. | | | 23,807 | |
| | 196 | | | Lear Corp. | | | 22,003 | |
| | | | | | | | 45,810 | |
| Banks (2.7%) | | | | |
| | 4,939 | | | Bank of America Corp. | | | 135,872 | |
| | 190 | | | BankUnited, Inc. | | | 6,034 | |
| | 1,719 | | | BB&T Corp. | | | 81,910 | |
| | 222 | | | Citigroup, Inc. | | | 14,286 | |
| | 183 | | | Comerica, Inc. | | | 11,282 | |
| | 684 | | | Commerce Bancshares, Inc. | | | 39,036 | |
| | 388 | | | Cullen/Frost Bankers, Inc. | | | 32,208 | |
| | 587 | | | East West Bancorp, Inc. | | | 24,143 | |
| | 60 | | | First Citizens Bancshares, Inc. | | | 26,676 | |
| | 541 | | | First Horizon National Corp. | | | 8,564 | |
| | 98 | | | First Republic Bank | | | 8,793 | |
| | 721 | | | HSBC Holdings PLC ADR | | | 25,884 | |
| | 3,776 | | | JPMorgan Chase & Co. | | | 414,832 | |
| | 69 | | | M&T Bank Corp. | | | 10,088 | |
| | 137 | | | PacWest Bancorp. | | | 4,669 | |
| | 1,127 | | | People’s United Financial, Inc. | | | 16,195 | |
| | 95 | | | Preferred Bank/Los Angeles CA | | | 4,746 | |
| | 164 | | | SunTrust Banks, Inc. | | | 10,088 | |
| | 141 | | | SVB Financial Group(a) | | | 27,441 | |
| | 508 | | | The PNC Financial Services Group, Inc. | | | 65,496 | |
| | 2,601 | | | U.S. Bancorp. | | | 137,047 | |
| | 1,674 | | | Umpqua Holdings Corp. | | | 26,299 | |
| | 2,831 | | | Wells Fargo & Co. | | | 131,840 | |
| | 484 | | | Western Alliance Bancorp. | | | 21,015 | |
| | | | | | | | 1,284,444 | |
| Beverages (0.9%) | | | | |
| | 10 | | | Molson Coors Brewing Co., Class B | | | 514 | |
| | 227 | | | Monster Beverage Corp.(a) | | | 13,318 | |
| | 1,841 | | | PepsiCo, Inc. | | | 251,720 | |
| | 11 | | | The Boston Beer Co, Inc., Class A(a) | | | 4,823 | |
Shares or Principal Amount | | | Security Description | | Value | |
| | | | | |
| Common Stocks, continued: | | | |
| Beverages, continued: | | | | |
| | 3,009 | | | The Coca-Cola Co. | | $ | 165,615 | |
| | | | | | | | 435,990 | |
| Biotechnology (1.1%) | | | | |
| | 871 | | | AbbVie, Inc. | | | 57,260 | |
| | 612 | | | Amgen, Inc. | | | 127,674 | |
| | 84 | | | BioSpecifics Technologies Corp.(a) | | | 4,627 | |
| | 414 | | | Celgene Corp.(a) | | | 40,075 | |
| | 84 | | | Eagle Pharmaceuticals, Inc.(a) | | | 4,737 | |
| | 2,522 | | | Exelixis, Inc.(a) | | | 50,062 | |
| | 1,829 | | | Gilead Sciences, Inc. | | | 116,214 | |
| | 250 | | | Ionis Pharmaceuticals, Inc.(a) | | | 15,803 | |
| | 1,283 | | | Moderna, Inc.(a) | | | 20,182 | |
| | 48 | | | Regeneron Pharmaceuticals, Inc.(a) | | | 13,922 | |
| | 480 | | | United Therapeutics Corp.(a) | | | 39,629 | |
| | 294 | | | Vertex Pharmaceuticals, Inc.(a) | | | 52,926 | |
| | | | | | | | 543,111 | |
| Building Products (0.3%) | | | | |
| | 392 | | | Allegion PLC | | | 37,738 | |
| | 157 | | | Armstrong World Industries, Inc. | | | 14,989 | |
| | 242 | | | Builders FirstSource, Inc.(a) | | | 4,707 | |
| | 70 | | | CSW Industrials, Inc. | | | 4,775 | |
| | 154 | | | Lennox International, Inc. | | | 39,081 | |
| | 129 | | | Patrick Industries, Inc.(a) | | | 4,662 | |
| | 128 | | | Resideo Technologies, Inc.(a) | | | 1,764 | |
| | 74 | | | Simpson Manufacturing Co, Inc. | | | 4,751 | |
| | 55 | | | Trex Co, Inc.(a) | | | 4,704 | |
| | | | | | | | 117,171 | |
| Capital Markets (1.5%) | | | | |
| | 298 | | | Ameriprise Financial, Inc. | | | 38,436 | |
| | 131 | | | BlackRock, Inc. | | | 55,355 | |
| | 649 | | | CME Group, Inc. | | | 141,022 | |
| | 87 | | | Cohen & Steers, Inc. | | | 4,692 | |
| | 289 | | | E*Trade Financial Corp. | | | 12,063 | |
| | 209 | | | Eaton Vance Corp. | | | 9,012 | |
| | 109 | | | FactSet Research Systems, Inc. | | | 29,658 | |
| | 263 | | | GAMCO Investors, Inc., Class A | | | 4,647 | |
| | 328 | | | Intercontinental Exchange, Inc. | | | 30,661 | |
| | 576 | | | LPL Financial Holdings, Inc. | | | 43,171 | |
| | 62 | | | Moody’s Corp. | | | 13,366 | |
| | 154 | | | Morgan Stanley | | | 6,389 | |
| | 78 | | | Morningstar, Inc. | | | 12,603 | |
| | 368 | | | MSCI, Inc., Class A | | | 86,345 | |
| | 523 | | | Nasdaq, Inc. | | | 52,216 | |
| | 114 | | | Northern Trust Corp. | | | 10,024 | |
| | 288 | | | S&P Global, Inc. | | | 74,935 | |
| | 139 | | | SEI Investments Co. | | | 7,994 | |
| | 88 | | | Stifel Financial Corp. | | | 4,701 | |
| | 136 | | | T. Rowe Price Group, Inc | | | 15,044 | |
| | 490 | | | The Bank of New York Mellon Corp. | | | 20,609 | |
| | 704 | | | The Charles Schwab Corp. | | | 26,942 | |
| | 44 | | | The Goldman Sachs Group, Inc. | | | 8,972 | |
| | 355 | | | Virtu Financial, Inc., Class A | | | 6,674 | |
| | 168 | | | Westwood Holdings Group, Inc. | | | 4,612 | |
| | | | | | | | 720,143 | |
| Chemicals (0.7%) | | | | |
| | 370 | | | Advanced Emissions Solutions, Inc. | | | 4,669 | |
| | 211 | | | AdvanSix, Inc.(a) | | | 4,714 | |
| | 159 | | | Air Products & Chemicals, Inc. | | | 35,921 | |
| | 663 | | | Axalta Coating Systems, Ltd.(a) | | | 19,147 | |
| | 847 | | | CF Industries Holdings, Inc. | | | 40,817 | |
| | 47 | | | Chase Corp. | | | 4,710 | |
| | 295 | | | Chemours Co. | | | 4,180 | |
See notes to financial statements
| Schedule of Portfolio Investments | Active Core Fund |
| August 31, 2019 | Continued |
Shares or Principal Amount | | | Security Description | | Value | |
| | | | | |
| Common Stocks, continued: | | | |
| Chemicals, continued: | | | | |
| | 1 | | | Corteva, Inc. | | $ | 29 | |
| | 771 | | | Dow, Inc. | | | 32,868 | |
| | 371 | | | Ecolab, Inc. | | | 76,541 | |
| | 62 | | | Ingevity Corp.(a) | | | 4,723 | |
| | 53 | | | International Flavors & Fragrances, Inc. | | | 5,817 | |
| | 337 | | | LyondellBasell Industries NV, Class A | | | 26,077 | |
| | 30 | | | Quaker Chemical Corp. | | | 4,766 | |
| | 127 | | | RPM International, Inc. | | | 8,594 | |
| | 38 | | | The Sherwin-Williams Co. | | | 20,017 | |
| | 135 | | | Trinseo SA | | | 4,737 | |
| | 334 | | | Westlake Chemical Corp. | | | 19,569 | |
| | | | | | | | 317,896 | |
| Commercial Services & Supplies (0.6%) | | | | |
| | 525 | | | Cintas Corp. | | | 138,496 | |
| | 4,214 | | | Covanta Holding Corp. | | | 72,481 | |
| | 268 | | | Kimball International, Inc., Class B | | | 4,703 | |
| | 604 | | | Waste Management, Inc. | | | 72,087 | |
| | | | | | | | 287,767 | |
| Communications Equipment (0.7%) | | | | |
| | 447 | | | Arista Networks, Inc.(a) | | | 101,299 | |
| | 4,599 | | | Cisco Systems, Inc. | | | 215,280 | |
| | 11 | | | Motorola Solutions, Inc. | | | 1,990 | |
| | 157 | | | Palo Alto Networks, Inc.(a) | | | 31,968 | |
| | | | | | | | 350,537 | |
| Construction & Engineering (0.0%) | | | | |
| | 275 | | | AECOM Technology Corp.(a) | | | 9,757 | |
| | 422 | | | Sterling Construction Co, Inc.(a) | | | 4,722 | |
| | | | | | | | 14,479 | |
| Consumer Finance (0.3%) | | | | |
| | 403 | | | American Express Co. | | | 48,510 | |
| | 60 | | | Credit Acceptance Corp.(a) | | | 27,159 | |
| | 188 | | | Discover Financial Services | | | 15,034 | |
| | 196 | | | Enova International, Inc.(a) | | | 4,684 | |
| | 521 | | | Santander Consumer USA Holdings, Inc. | | | 13,603 | |
| | 402 | | | Synchrony Financial | | | 12,884 | |
| | 34 | | | World Acceptance Corp.(a) | | | 4,519 | |
| | | | | | | | 126,393 | |
| Containers & Packaging (0.3%) | | | | |
| | 227 | | | AptarGroup, Inc. | | | 27,744 | |
| | 1,150 | | | Berry Plastics Group, Inc.(a) | | | 45,011 | |
| | 467 | | | Packaging Corp. of America | | | 46,971 | |
| | 99 | | | Sonoco Products Co. | | | 5,663 | |
| | 116 | | | UFP Technologies, Inc.(a) | | | 4,846 | |
| | | | | | | | 130,235 | |
| Distributors (0.1%) | | | | |
| | 144 | | | Core-Mark Holding Co, Inc. | | | 4,664 | |
| | 133 | | | Genuine Parts Co. | | | 12,009 | |
| | 95 | | | Pool Corp. | | | 18,656 | |
| | | | | | | | 35,329 | |
| Diversified Consumer Services (0.2%) | | | | |
| | 130 | | | Bright Horizons Family Solutions, Inc.(a) | | | 21,457 | |
| | 14 | | | Graham Holdings Co., Class B | | | 9,857 | |
| | 176 | | | K12, Inc.(a) | | | 4,638 | |
| | 695 | | | ServiceMaster Global Holdings, Inc.(a) | | | 39,642 | |
| | | | | | | | 75,594 | |
| Diversified Financial Services (0.4%) | | | | |
| | 794 | | | Berkshire Hathaway, Inc., Class B(a) | | | 161,508 | |
| | 285 | | | Jefferies Financial Group, Inc. | | | 5,312 | |
| | 752 | | | Voya Financial, Inc. | | | 37,089 | |
| | | | | | | | 203,909 | |
Shares or Principal Amount | | | Security Description | | Value | |
| | | | | |
| Common Stocks, continued: | | | |
| Diversified Telecommunication Services (0.5%) | | | | |
| | 4,151 | | | AT&T, Inc | | $ | 146,364 | |
| | 1,725 | | | Verizon Communications, Inc. | | | 100,326 | |
| | | | | | | | 246,690 | |
| Electric Utilities (0.7%) | | | | |
| | 240 | | | Alliant Energy Corp. | | | 12,588 | |
| | 176 | | | Eversource Energy | | | 14,103 | |
| | 162 | | | Exelon Corp. | | | 7,656 | |
| | 338 | | | NextEra Energy, Inc. | | | 74,049 | |
| | 1,476 | | | OGE Energy Corp. | | | 63,276 | |
| | 545 | | | Pinnacle West Capital Corp. | | | 51,944 | |
| | 83 | | | Portland General Electric Co. | | | 4,722 | |
| | 1,936 | | | PPL Corp. | | | 57,209 | |
| | 495 | | | Spark Energy, Inc., Class A | | | 4,683 | |
| | 592 | | | Xcel Energy, Inc. | | | 38,018 | |
| | | | | | | | 328,248 | |
| Electrical Equipment (0.2%) | | | | |
| | 134 | | | AMETEK, Inc. | | | 11,515 | |
| | 1,235 | | | Emerson Electric Co. | | | 73,593 | |
| | 150 | | | Regal-Beloit Corp. | | | 10,635 | |
| | | | | | | | 95,743 | |
| Electronic Equipment, Instruments & Components (0.7%) | | | | |
| | 549 | | | Amphenol Corp., Class A | | | 48,059 | |
| | 1,169 | | | CDW Corp. | | | 135,019 | |
| | 2,308 | | | Corning, Inc. | | | 64,278 | |
| | 97 | | | Insight Enterprises, Inc.(a) | | | 4,662 | |
| | 374 | | | Keysight Technologies, Inc.(a) | | | 36,226 | |
| | 50 | | | Tech Data Corp.(a) | | | 4,637 | |
| | 908 | | | Trimble Inc.(a) | | | 34,068 | |
| | | | | | | | 326,949 | |
| Energy Equipment & Services (0.1%) | | | | |
| | 431 | | | Apergy Corp.(a) | | | 11,197 | |
| | 184 | | | Cactus, Inc., Class A(a) | | | 4,686 | |
| | 101 | | | Helmerich & Payne, Inc. | | | 3,797 | |
| | 789 | | | Liberty Oilfield Services, Inc., Class A | | | 8,498 | |
| | | | | | | | 28,178 | |
| Entertainment (1.0%) | | | | |
| | 204 | | | Cinemark Holdings, Inc. | | | 7,785 | |
| | 270 | | | Netflix, Inc.(a) | | | 79,313 | |
| | 760 | | | Take-Two Interactive Software(a) | | | 100,297 | |
| | 24 | | | The Madison Square Garden Co., Class A(a) | | | 6,056 | |
| | 1,980 | | | The Walt Disney Co. | | | 271,774 | |
| | | | | | | | 465,225 | |
| Equity Real Estate Investment Trusts (2.3%) | | | | |
| | 1,211 | | | American Homes 4 Rent, Class A | | | 30,977 | |
| | 257 | | | American Tower Corp. | | | 59,159 | |
| | 622 | | | Apartment Investment & Management Co. | | | 31,722 | |
| | 76 | | | AvalonBay Communities, Inc. | | | 16,155 | |
| | 672 | | | Brixmor Property Group, Inc. | | | 12,385 | |
| | 855 | | | Brookfield Property REIT, Inc., Class A | | | 16,091 | |
| | 1,402 | | | Chesapeake Lodging Trust | | | 36,102 | |
| | 58 | | | CoreSite Realty Corp. | | | 6,738 | |
| | 591 | | | Crown Castle International Corp. | | | 85,795 | |
| | 1,725 | | | CubeSmart | | | 61,910 | |
| | 740 | | | Digital Reality Trust, Inc. | | | 91,487 | |
| | 431 | | | Douglas Emmett, Inc. | | | 18,188 | |
| | 1,795 | | | Duke Realty Corp. | | | 59,720 | |
| | 999 | | | Empire State Realty Trust, Inc. | | | 14,046 | |
| | 483 | | | Equity Commonwealth | | | 16,258 | |
| | 281 | | | Equity LifeStyle Properties, Inc. | | | 37,856 | |
| | 636 | | | Equity Residential | | | 53,907 | |
See notes to financial statements
| Schedule of Portfolio Investments | Active Core Fund |
| August 31, 2019 | Continued |
Shares or Principal Amount | | | Security Description | | Value | |
| | | | | |
| Common Stocks, continued: | | | |
| Equity Real Estate Investment Trusts, continued: | | | | |
| | 38 | | | Essex Property Trust, Inc. | | $ | 12,208 | |
| | 655 | | | Extra Space Storage, Inc. | | | 79,858 | |
| | 2,780 | | | Host Hotels & Resorts, Inc. | | | 44,591 | |
| | 653 | | | JBG SMITH Properties | | | 24,984 | |
| | 916 | | | Lamar Advertising Co. | | | 70,211 | |
| | 452 | | | Lexington Realty Trust | | | 4,696 | |
| | 46 | | | Mid-America Apartment Communities, Inc. | | | 5,827 | |
| | 487 | | | Prologis, Inc. | | | 40,723 | |
| | 26 | | | PS Business Parks, Inc. | | | 4,670 | |
| | 384 | | | Public Storage | | | 101,661 | |
| | 162 | | | Realty Income Corp. | | | 11,957 | |
| | 290 | | | RLJ Lodging Trust | | | 4,701 | |
| | 59 | | | Ryman Hospitality Properties, Inc. | | | 4,700 | |
| | 181 | | | Simon Property Group, Inc. | | | 26,958 | |
| | 135 | | | SL Green Realty Corp. | | | 10,830 | |
| | 275 | | | The GEO Group, Inc. | | | 4,719 | |
| | 399 | | | Vici Properties, Inc. | | | 8,842 | |
| | 217 | | | Weingarten Realty Investors | | | 5,748 | |
| | 234 | | | Xenia Hotels & Resorts, Inc. | | | 4,729 | |
| | | | | | | | 1,121,109 | |
| Food & Staples Retailing (0.7%) | | | | |
| | 328 | | | Costco Wholesale Corp. | | | 96,681 | |
| | 122 | | | Ingles Markets, Inc., Class A | | | 4,743 | |
| | 429 | | | SpartanNash Co. | | | 4,620 | |
| | 732 | | | Sysco Corp. | | | 54,410 | |
| | 649 | | | US Foods Holding Corp.(a) | | | 26,252 | |
| | 186 | | | Walgreens Boots Alliance, Inc. | | | 9,521 | |
| | 1,372 | | | Wal-Mart Stores, Inc. | | | 156,766 | |
| | | | | | | | 352,993 | |
| Food Products (0.8%) | | | | |
| | 108 | | | Conagra Brands, Inc. | | | 3,063 | |
| | 349 | | | General Mills, Inc. | | | 18,776 | |
| | 1,271 | | | Hormel Foods Corp. | | | 54,157 | |
| | 51 | | | John B Sanfilippo & Son, Inc. | | | 4,723 | |
| | 480 | | | Kellogg Co. | | | 30,144 | |
| | 26 | | | Lamb Weston Holdings, Inc. | | | 1,830 | |
| | 33 | | | Lancaster Colony Corp. | | | 4,815 | |
| | 72 | | | McCormick & Co. | | | 11,727 | |
| | 2,563 | | | Mondelez International, Inc., Class A | | | 141,528 | |
| | 85 | | | The Hershey Co. | | | 13,471 | |
| | 1,231 | | | Tyson Foods, Inc., Class A | | | 114,532 | |
| | | | | | | | 398,766 | |
| Gas Utilities (0.2%) | | | | |
| | 96 | | | Atmos Energy Corp. | | | 10,582 | |
| | 50 | | | Chesapeake Utilities Corp. | | | 4,729 | |
| | 104 | | | New Jersey Resources Corp. | | | 4,757 | |
| | 51 | | | ONE Gas, Inc. | | | 4,672 | |
| | 1,108 | | | UGI Corp. | | | 53,927 | |
| | | | | | | | 78,667 | |
| Health Care Equipment & Supplies (1.6%) | | | | |
| | 971 | | | Abbott Laboratories | | | 82,846 | |
| | 64 | | | ABIOMED, Inc.(a) | | | 12,356 | |
| | 114 | | | Align Technology, Inc.(a) | | | 20,875 | |
| | 1,111 | | | Baxter International, Inc. | | | 97,711 | |
| | 219 | | | Becton, Dickinson & Co. | | | 55,608 | |
| | 138 | | | Boston Scientific Corp.(a) | | | 5,897 | |
| | 608 | | | Danaher Corp. | | | 86,391 | |
| | 388 | | | Edwards Lifesciences Corp.(a) | | | 86,074 | |
| | 603 | | | Hill-Rom Holdings, Inc. | | | 64,931 | |
| | 1,002 | | | Hologic, Inc.(a) | | | 49,469 | |
| | 56 | | | Intuitive Surgical, Inc.(a) | | | 28,635 | |
Shares or Principal Amount | | | Security Description | | Value | |
| | | | | |
| Common Stocks, continued: | | | |
| Health Care Equipment & Supplies, continued: | | | | |
| | 776 | | | Medtronic PLC | | $ | 83,723 | |
| | 83 | | | ResMed, Inc. | | | 11,562 | |
| | 196 | | | Stryker Corp. | | | 43,249 | |
| | 142 | | | Teleflex, Inc. | | | 51,677 | |
| | 14 | | | The Cooper Cos., Inc. | | | 4,337 | |
| | | | | | | | 785,341 | |
| Health Care Providers & Services (0.8%) | | | | |
| | 72 | | | Amedisys, Inc.(a) | | | 9,267 | |
| | 168 | | | Anthem, Inc | | | 43,935 | |
| | 122 | | | Centene Corp.(a) | | | 5,688 | |
| | 96 | | | Chemed Corp. | | | 41,225 | |
| | 244 | | | Covetrus, Inc.(a) | | | 3,243 | |
| | 29 | | | HCA Healthcare, Inc. | | | 3,486 | |
| | 138 | | | Henry Schein, Inc.(a) | | | 8,504 | |
| | 39 | | | LHC Group, Inc.(a) | | | 4,622 | |
| | 201 | | | Molina Healthcare, Inc.(a) | | | 26,186 | |
| | 73 | | | National Research Corp. | | | 4,674 | |
| | 144 | | | Premier, Inc., Class A(a) | | | 5,077 | |
| | 107 | | | Quest Diagnostics, Inc. | | | 10,954 | |
| | 331 | | | RadNet, Inc.(a) | | | 4,604 | |
| | 292 | | | Select Medical Holdings Corp.(a) | | | 4,736 | |
| | 94 | | | The Ensign Group, Inc. | | | 4,691 | |
| | 828 | | | UnitedHealth Group, Inc. | | | 193,751 | |
| | 25 | | | Universal Health Services, Inc., Class B | | | 3,615 | |
| | | | | | | | 378,258 | |
| Health Care Technology (0.1%) | | | | |
| | 438 | | | Veeva Systems, Inc.(a) | | | 70,246 | |
| Hotels, Restaurants & Leisure (1.3%) | | | | |
| | 281 | | | Bloomin’ Brands, Inc. | | | 5,069 | |
| | 209 | | | Carnival Corp. | | | 9,213 | |
| | 820 | | | Darden Restaurants, Inc. | | | 99,204 | |
| | 403 | | | Dunkin’ Brands Group, Inc. | | | 33,223 | |
| | 982 | | | Hilton Worldwide Holdings, Inc. | | | 90,707 | |
| | 85 | | | Hyatt Hotels Corp., Class A | | | 6,133 | |
| | 151 | | | Marriott International, Inc., Class A | | | 19,035 | |
| | 506 | | | McDonald’s Corp. | | | 110,293 | |
| | 236 | | | Six Flags Entertainment Corp | | | 13,964 | |
| | 1,664 | | | Starbucks Corp. | | | 160,676 | |
| | 2,074 | | | Wendy’s Co. (The) | | | 45,628 | |
| | 290 | | | Yum! Brands, Inc. | | | 33,866 | |
| | | | | | | | 627,011 | |
| Household Durables (0.2%) | | | | |
| | 1,286 | | | Garmin, Ltd. | | | 104,898 | |
| Household Products (1.1%) | | | | |
| | 177 | | | Central Garden & Pet Co.(a) | | | 4,676 | |
| | 662 | | | Church & Dwight Co., Inc. | | | 52,814 | |
| | 983 | | | Colgate-Palmolive Co. | | | 72,889 | |
| | 941 | | | Energizer Holdings, Inc. | | | 36,229 | |
| | 201 | | | Kimberly-Clark Corp. | | | 28,363 | |
| | 734 | | | The Clorox Co. | | | 116,089 | |
| | 1,961 | | | The Procter & Gamble Co. | | | 235,772 | |
| | | | | | | | 546,832 | |
| Independent Power and Renewable Electricity Producers (0.0%) | | | | |
| | 859 | | | AES Corp. | | | 13,168 | |
| Industrial Conglomerates (0.4%) | | | | |
| | 164 | | | 3M Co. | | | 26,522 | |
| | 61 | | | Carlisle Cos., Inc. | | | 8,843 | |
| | 670 | | | Honeywell International, Inc. | | | 110,295 | |
| | 89 | | | Roper Technologies, Inc. | | | 32,642 | |
| | | | | | | | 178,302 | |
| Insurance (1.4%) | | | | |
| | 434 | | | Aflac, Inc. | | | 21,778 | |
See notes to financial statements
| Schedule of Portfolio Investments | Active Core Fund |
| August 31, 2019 | Continued |
Shares or Principal Amount | | | Security Description | | Value | |
| | | | | |
| Common Stocks, continued: | | | |
| Insurance, continued: | | | | |
| | 220 | | | AON PLC | | $ | 42,867 | |
| | 108 | | | Arthur J. Gallagher & Co. | | | 9,797 | |
| | 698 | | | Assured Guaranty, Ltd. | | | 29,700 | |
| | 156 | | | Athene Holdings, Ltd.(a) | | | 6,062 | |
| | 599 | | | Brighthouse Financial, Inc.(a) | | | 21,121 | |
| | 268 | | | Chubb, Ltd. | | | 41,883 | |
| | 219 | | | Cincinnati Financial Corp. | | | 24,635 | |
| | 129 | | | Erie Indemnity Co., Class A | | | 28,291 | |
| | 132 | | | First American Financial | | | 7,715 | |
| | 1,213 | | | FNF Group | | | 53,299 | |
| | 79 | | | Globe Life, Inc. | | | 7,052 | |
| | 170 | | | Lincoln National Corp. | | | 8,990 | |
| | 387 | | | Marsh & McLennan Cos., Inc. | | | 38,657 | |
| | 199 | | | National General Holdings Corp. | | | 4,692 | |
| | 199 | | | Principal Financial Group, Inc. | | | 10,591 | |
| | 379 | | | Prudential Financial, Inc. | | | 30,354 | |
| | 647 | | | The Allstate Corp. | | | 66,246 | |
| | 147 | | | The Hanover Insurance Group, Inc. | | | 19,573 | |
| | 385 | | | The Hartford Financial Services Group, Inc. | | | 22,438 | |
| | 1,096 | | | The Progressive Corp. | | | 83,077 | |
| | 386 | | | Travelers Companies, Inc. | | | 56,727 | |
| | 194 | | | Universal Insurance Holdings, Inc. | | | 4,850 | |
| | 69 | | | Willis Towers Watson PLC | | | 13,660 | |
| | | | | | | | 654,055 | |
| Interactive Media & Services (1.3%) | | | | |
| | 101 | | | Alphabet, Inc., Class A(a) | | | 120,244 | |
| | 137 | | | Alphabet, Inc., Class C(a) | | | 162,770 | |
| | 1,038 | | | Facebook, Inc., Class A(a) | | | 192,724 | |
| | 83 | | | IAC/InterActiveCorp.(a) | | | 21,135 | |
| | 1,092 | | | Match Group, Inc | | | 92,602 | |
| | 819 | | | QuinStreet, Inc.(a) | | | 9,378 | |
| | 384 | | | Twitter, Inc.(a) | | | 16,378 | |
| | 140 | | | Yelp, Inc.(a) | | | 4,691 | |
| | | | | | | | 619,922 | |
| Internet & Direct Marketing Retail (0.9%) | | | | |
| | 151 | | | Amazon.com, Inc.(a) | | | 268,221 | |
| | 31 | | | Booking Holdings, Inc.(a) | | | 60,959 | |
| | 567 | | | eBay, Inc. | | | 22,844 | |
| | 403 | | | Expedia, Inc. | | | 52,430 | |
| | 160 | | | Wayfair, Inc., Class A(a) | | | 18,038 | |
| | | | | | | | 422,492 | |
| IT Services (2.8%) | | | | |
| | 376 | | | Accenture PLC, Class A | | | 74,512 | |
| | 328 | | | Automatic Data Processing, Inc. | | | 55,708 | |
| | 556 | | | Booz Allen Hamilton Holding Corp. | | | 41,984 | |
| | 259 | | | Broadridge Financial Solutions, Inc. | | | 33,525 | |
| | 269 | | | Cognizant Technology Solutions Corp., Class A | | | 16,514 | |
| | 89 | | | CSG System International, Inc. | | | 4,795 | |
| | 117 | | | Fidelity National Information Services, Inc. | | | 15,938 | |
| | 1,793 | | | Fiserv, Inc.(a) | | | 191,743 | |
| | 50 | | | FleetCor Technologies, Inc.(a) | | | 14,920 | |
| | 70 | | | Jack Henry & Associates, Inc. | | | 10,147 | |
| | 119 | | | Leidos Holdings, Inc. | | | 10,396 | |
| | 902 | | | MasterCard, Inc., Class A | | | 253,795 | |
| | 48 | | | Okta, Inc.(a) | | | 6,072 | |
| | 350 | | | Paychex, Inc. | | | 28,595 | |
| | 683 | | | Paypal Holdings, Inc.(a) | | | 74,481 | |
| | 565 | | | The Western Union Co. | | | 12,498 | |
| | 571 | | | Total System Services, Inc. | | | 76,640 | |
Shares or Principal Amount | | | Security Description | | Value | |
| | | | | |
| Common Stocks, continued: | | | |
| IT Services, continued: | | | | |
| | 102 | | | TTEC Holdings, Inc. | | $ | 4,785 | |
| | 892 | | | VeriSign, Inc.(a) | | | 181,834 | |
| | 1,333 | | | Visa, Inc., Class A | | | 241,032 | |
| | | | | | | | 1,349,914 | |
| Leisure Products (0.1%) | | | | |
| | 388 | | | Hasbro, Inc. | | | 42,862 | |
| | 166 | | | YETI Holdings, Inc.(a) | | | 4,690 | |
| | | | | | | | 47,552 | |
| Life Sciences Tools & Services (0.7%) | | | | |
| | 708 | | | Agilent Technologies, Inc. | | | 50,346 | |
| | 222 | | | Charles River Laboratories International, Inc.(a) | | | 29,126 | |
| | 30 | | | Illumina, Inc.(a) | | | 8,440 | |
| | 262 | | | Iqvia Holdings, Inc.(a) | | | 40,649 | |
| | 89 | | | Mettler-Toledo International, Inc.(a) | | | 58,454 | |
| | 168 | | | PRA Health Sciences, Inc.(a) | | | 16,605 | |
| | 310 | | | Thermo Fisher Scientific, Inc. | | | 88,989 | |
| | 186 | | | Waters Corp.(a) | | | 39,412 | |
| | | | | | | | 332,021 | |
| Machinery (0.7%) | | | | |
| | 2,272 | | | Allison Transmission Holdings, Inc. | | | 100,946 | |
| | 147 | | | Crane Co. | | | 11,207 | |
| | 105 | | | DMC Global, Inc. | | | 4,560 | |
| | 1,036 | | | Fortive Corp. | | | 73,452 | |
| | 423 | | | Graco, Inc. | | | 19,276 | |
| | 308 | | | Illinois Tool Works, Inc. | | | 46,157 | |
| | 140 | | | Ingersoll-Rand PLC | | | 16,953 | |
| | 143 | | | ITT, Inc. | | | 8,140 | |
| | 277 | | | Meritor, Inc.(a) | | | 4,659 | |
| | 157 | | | PACCAR, Inc. | | | 10,293 | |
| | 291 | | | The Timken Co. | | | 11,692 | |
| | 343 | | | The Toro Co. | | | 24,699 | |
| | | | | | | | 332,034 | |
| Media (0.4%) | | | | |
| | 41 | | | Cable One, Inc. | | | 53,202 | |
| | 991 | | | CBS Corp., Class B | | | 41,681 | |
| | 4 | | | Charter Communications, Inc., Class A(a) | | | 1,638 | |
| | 743 | | | Comcast Corp., Class A | | | 32,885 | |
| | 347 | | | Cumulus Media, Inc., Class A(a) | | | 4,719 | |
| | 326 | | | Discovery Communications, Inc., Class A(a) | | | 8,998 | |
| | 509 | | | Fox Corp., Class A | | | 16,884 | |
| | 222 | | | GCI Liberty, Inc., Class A(a) | | | 13,817 | |
| | 315 | | | Gray Television, Inc.(a) | | | 4,820 | |
| | 329 | | | Msg Networks, Inc., Class A(a) | | | 5,396 | |
| | 128 | | | Omnicom Group, Inc. | | | 9,736 | |
| | 162 | | | Saga Communications, Inc., Class A | | | 4,623 | |
| | 197 | | | TechTarget, Inc.(a) | | | 4,677 | |
| | | | | | | | 203,076 | |
| Metals & Mining (0.2%) | | | | |
| | 276 | | | Reliance Steel & Aluminum Co. | | | 26,835 | |
| | 209 | | | Schnitzer Steel Industries, Inc. | | | 4,627 | |
| | 1,644 | | | Steel Dynamics, Inc. | | | 44,389 | |
| | | | | | | | 75,851 | |
| Mortgage Real Estate Investment Trusts (0.1%) | | | | |
| | 1,184 | | | AGNC Investment Corp. | | | 17,606 | |
| | 1,062 | | | Annaly Capital Management, Inc. | | | 8,815 | |
| | | | | | | | 26,421 | |
| Multiline Retail (0.2%) | | | | |
| | 376 | | | Dollar General Corp. | | | 58,691 | |
| | 140 | | | Dollar Tree, Inc.(a) | | | 14,214 | |
See notes to financial statements
| Schedule of Portfolio Investments | Active Core Fund |
| August 31, 2019 | Continued |
Shares or Principal Amount | | | Security Description | | Value | |
| | | | | |
| Common Stocks, continued: | | | |
| Multiline Retail, continued: | | | | |
| | 201 | | | Kohl’s Corp. | | $ | 9,499 | |
| | 160 | | | Target Corp. | | | 17,126 | |
| | | | | | | | 99,530 | |
| Multi-Utilities (0.4%) | | | | |
| | 61 | | | Black Hills Corp. | | | 4,679 | |
| | 1,014 | | | CenterPoint Energy, Inc. | | | 28,078 | |
| | 124 | | | Consolidated Edison, Inc. | | | 11,024 | |
| | 72 | | | DTE Energy Co. | | | 9,336 | |
| | 430 | | | MDU Resources Group, Inc. | | | 11,563 | |
| | 65 | | | NorthWestern Corp. | | | 4,709 | |
| | 660 | | | Public Service Enterprise Group, Inc. | | | 39,909 | |
| | 1,041 | | | WEC Energy Group, Inc. | | | 99,696 | |
| | | | | | | | 208,994 | |
| Oil, Gas & Consumable Fuels (1.3%) | | | | |
| | 3,146 | | | Cabot Oil & Gas Corp. | | | 53,859 | |
| | 454 | | | Chevron Corp. | | | 53,445 | |
| | 489 | | | ConocoPhillips | | | 25,516 | |
| | 1,149 | | | Continental Resources, Inc.(a) | | | 33,551 | |
| | 242 | | | CVR Energy, Inc. | | | 9,627 | |
| | 145 | | | Delek US Holdings, Inc. | | | 4,749 | |
| | 836 | | | EOG Resources, Inc. | | | 62,022 | |
| | 245 | | | Equitrans Midstream Corp. | | | 3,305 | |
| | 721 | | | Exxon Mobil Corp. | | | 49,374 | |
| | 532 | | | HollyFrontier Corp. | | | 23,600 | |
| | 536 | | | Marathon Petroleum Corp. | | | 26,377 | |
| | 408 | | | Murphy Oil Corp. | | | 7,438 | |
| | 96 | | | NACCO Industries, Inc., Class A | | | 4,779 | |
| | 1,678 | | | Noble Energy, Inc. | | | 37,889 | |
| | 467 | | | Occidental Petroleum Corp. | | | 20,305 | |
| | 580 | | | ONEOK, Inc. | | | 41,342 | |
| | 1,241 | | | PBF Energy, Inc. | | | 29,412 | |
| | 248 | | | Pioneer Natural Resources Co. | | | 30,608 | |
| | 1,733 | | | The Williams Cos., Inc. | | | 40,899 | |
| | 731 | | | TOTAL SA ADR | | | 36,492 | |
| | 412 | | | Valero Energy Corp. | | | 31,015 | |
| | | | | | | | 625,604 | |
| Paper & Forest Products (0.0%) | | | | |
| | 325 | | | Domtar Corp. | | | 10,709 | |
| Personal Products (0.1%) | | | | |
| | 48 | | | Medifast, Inc. | | | 4,798 | |
| | 126 | | | The Estee Lauder Cos., Inc., Class A | | | 24,947 | |
| | 70 | | | USANA Health Sciences, Inc.(a) | | | 4,758 | |
| | | | | | | | 34,503 | |
| Pharmaceuticals (1.9%) | | | | |
| | 942 | | | Bristol-Myers Squibb Co. | | | 45,282 | |
| | 400 | | | Elanco Animal Health, Inc.(a) | | | 10,408 | |
| | 414 | | | Innoviva, Inc.(a) | | | 4,798 | |
| | 2,838 | | | Johnson & Johnson | | | 364,286 | |
| | 2,066 | | | Merck & Co., Inc. | | | 178,647 | |
| | 5,888 | | | Pfizer, Inc. | | | 209,318 | |
| | 695 | | | Zoetis, Inc. | | | 87,862 | |
| | | | | | | | 900,601 | |
| Professional Services (0.2%) | | | | |
| | 169 | | | IHS Markit, Ltd.(a) | | | 11,088 | |
| | 143 | | | Kforce, Inc. | | | 4,653 | |
| | 134 | | | ManpowerGroup, Inc. | | | 10,953 | |
| | 1,487 | | | Robert Half International, Inc. | | | 79,510 | |
| | 94 | | | Verisk Analytics, Inc., Class A | | | 15,185 | |
| | | | | | | | 121,389 | |
| Real Estate Management & Development (0.1%) | | | | |
| | 439 | | | CBRE Group, Inc., Class A(a) | | | 22,947 | |
| | 74 | | | Consolidated-Tomoka Land Co. | | | 4,724 | |
Shares or Principal Amount | | | Security Description | | Value | |
| | | | | |
| Common Stocks, continued: | | | |
| Real Estate Management & Development, continued: | | | | |
| | 184 | | | Re/MAX Holdings, Inc. | | $ | 4,723 | |
| | 202 | | | The RMR Group, Inc., Class A | | | 9,411 | |
| | | | | | | | 41,805 | |
| Road & Rail (0.2%) | | | | |
| | 281 | | | Old Dominion Freight Line, Inc. | | | 46,017 | |
| | 91 | | | Ryder System, Inc. | | | 4,383 | |
| | 253 | | | Schneider National, Inc., Class B | | | 4,918 | |
| | 378 | | | Union Pacific Corp. | | | 61,221 | |
| | | | | | | | 116,539 | |
| Semiconductors & Semiconductor Equipment (1.3%) | | | | |
| | 1,020 | | | Advanced Micro Devices, Inc.(a) | | | 32,079 | |
| | 266 | | | Applied Materials, Inc. | | | 12,773 | |
| | 209 | | | Broadcom, Inc. | | | 59,072 | |
| | 89 | | | Cirrus Logic, Inc.(a) | | | 4,774 | |
| | 129 | | | Diodes, Inc.(a) | | | 4,715 | |
| | 689 | | | Intel Corp. | | | 32,665 | |
| | 85 | | | KLA-Tencor Corp. | | | 12,572 | |
| | 868 | | | Lam Research Corp. | | | 182,722 | |
| | 581 | | | Maxim Integrated Products, Inc. | | | 31,688 | |
| | 1,113 | | | Micron Technology, Inc.(a) | | | 50,386 | |
| | 169 | | | Nanometrics, Inc.(a) | | | 4,612 | |
| | 57 | | | NVIDIA Corp. | | | 9,548 | |
| | 558 | | | ON Semiconductor Corp.(a) | | | 9,932 | |
| | 528 | | | QUALCOMM, Inc. | | | 41,063 | |
| | 854 | | | Texas Instruments, Inc. | | | 105,683 | |
| | 424 | | | Versum Materials, Inc. | | | 22,048 | |
| | 139 | | | Xilinx, Inc. | | | 14,464 | |
| | | | | | | | 630,796 | |
| Software (3.4%) | | | | |
| | 522 | | | Adobe Systems, Inc.(a) | | | 148,514 | |
| | 100 | | | Alarm.com Holdings, Inc.(a) | | | 4,760 | |
| | 47 | | | ANSYS, Inc.(a) | | | 9,708 | |
| | 1,710 | | | Cadence Design Systems, Inc.(a) | | | 117,101 | |
| | 895 | | | Citrix Systems, Inc. | | | 83,217 | |
| | 108 | | | Elastic NV(a) | | | 9,492 | |
| | 1,199 | | | Fortinet, Inc.(a) | | | 94,937 | |
| | 412 | | | Intuit, Inc. | | | 118,804 | |
| | 291 | | | Manhattan Associates, Inc.(a) | | | 24,045 | |
| | 6,320 | | | Microsoft Corp. | | | 871,275 | |
| | 858 | | | Oracle Corp. | | | 44,667 | |
| | 124 | | | Progress Software Corp. | | | 4,685 | |
| | 58 | | | Qualys, Inc.(a) | | | 4,618 | |
| | 450 | | | Salesforce.com, Inc.(a) | | | 70,232 | |
| | 250 | | | SolarWinds Corp.(a) | | | 4,255 | |
| | 164 | | | Workday, Inc.(a) | | | 29,074 | |
| | | | | | | | 1,639,384 | |
| Specialty Retail (1.0%) | | | | |
| | 46 | | | Advance Auto Parts, Inc. | | | 6,346 | |
| | 31 | | | AutoZone, Inc.(a) | | | 34,152 | |
| | 70 | | | Burlington Stores, Inc.(a) | | | 14,174 | |
| | 130 | | | Genesco, Inc.(a) | | | 4,638 | |
| | 388 | | | Lowe’s Cos., Inc. | | | 43,534 | |
| | 210 | | | O’Reilly Automotive, Inc.(a) | | | 80,590 | |
| | 453 | | | Ross Stores, Inc. | | | 48,023 | |
| | 153 | | | Shoe Carnival, Inc. | | | 4,703 | |
| | 111 | | | Sleep Number Corp.(a) | | | 4,644 | |
| | 853 | | | The Home Depot, Inc. | | | 194,407 | |
| | 715 | | | The TJX Cos., Inc. | | | 39,304 | |
| | 62 | | | Ulta Beauty, Inc.(a) | | | 14,739 | |
| | 29 | | | Winmark Corp. | | | 4,713 | |
| | | | | | | | 493,967 | |
See notes to financial statements
| Schedule of Portfolio Investments | Active Core Fund |
| August 31, 2019 | Continued |
Shares or Principal Amount | | | Security Description | | Value | |
| | | | | |
| Common Stocks, continued: | | | |
| Technology Hardware, Storage & Peripherals (2.1%) | | | | |
| $ | 4,406 | | | Apple, Inc. | | $ | 919,709 | |
| | 129 | | | Dell Technologies, Inc., Class C(a) | | | 6,647 | |
| | 3,718 | | | HP, Inc. | | | 68,002 | |
| | 247 | | | NCR Corp.(a) | | | 7,783 | |
| | 184 | | | NetApp, Inc. | | | 8,843 | |
| | | | | | | | 1,010,984 | |
| Textiles, Apparel & Luxury Goods (0.3%) | | | | |
| | 45 | | | Columbia Sportswear Co. | | | 4,221 | |
| | 32 | | | Deckers Outdoor Corp.(a) | | | 4,718 | |
| | 783 | | | NIKE, Inc., Class B | | | 66,164 | |
| | 67 | | | Oxford Industries, Inc. | | | 4,675 | |
| | 134 | | | Ralph Lauren Corp. | | | 11,838 | |
| | 554 | | | VF Corp. | | | 45,400 | |
| | | | | | | | 137,016 | |
| Thrifts & Mortgage Finance (0.1%) | | | | |
| | 632 | | | New York Community Bancorp, Inc. | | | 7,293 | |
| | 2,317 | | | Oritani Financial Corp. | | | 39,690 | |
| | 209 | | | Radian Group, Inc. | | | 4,713 | |
| | | | | | | | 51,696 | |
| Tobacco (0.3%) | | | | |
| | 1,931 | | | Altria Group, Inc. | | | 84,462 | |
| | 1,021 | | | Philip Morris International, Inc. | | | 73,604 | |
| | | | | | | | 158,066 | |
| Trading Companies & Distributors (0.3%) | | | | |
| | 671 | | | Fastenal Co. | | | 20,546 | |
| | 1,238 | | | H&E Equipment Services, Inc. | | | 30,071 | |
| | 1,186 | | | HD Supply Holdings, Inc.(a) | | | 46,147 | |
| | 697 | | | MSC Industrial Direct Co., Inc., Class A | | | 47,131 | |
| | 71 | | | Watsco, Inc. | | | 11,612 | |
| | | | | | | | 155,507 | |
| Water Utilities (0.0%) | | | | |
| | 51 | | | American States Water Co. | | | 4,719 | |
| | 145 | | | American Water Works Co., Inc. | | | 18,461 | |
| | | | | | | | 23,180 | |
| Wireless Telecommunication Services (0.0%) | | | | |
| | 222 | | | T-Mobile US, Inc.(a) | | | 17,327 | |
| Total Common Stocks | | | 22,090,653 | |
| | | | | |
| Asset Backed Securities (2.1%) | | | | |
| | 201,232 | | | AccessLex Institute, Series 2007-1, Class C, 2.68% (US0003M + 40 bps), 10/25/35* | | | 170,683 | |
| | 9,660 | | | Aegis Asset Backed Securities Trust, Series 2004-4, Class A1, 2.87% (US0001M + 72 bps), 10/25/34* | | | 9,659 | |
| | 147,668 | | | Saxon Asset Securities Trust, Series 2003-3, Class A5, 4.71%, 12/25/33*(b) | | | 151,362 | |
| | 210,000 | | | SLM Student Loan Trust, Series 2012-7, Class B, 3.95% (US0001M + 180 bps), 9/25/43* | | | 205,518 | |
| | 199,000 | | | Stack Infrastructure Issuer LLC, Series 2019-1A, Class A2, 4.54%, 2/25/44*(c) | | | 210,216 | |
| | 93,813 | | | UBS Commercial Mortgage Trust, Series 2018-C10, Class A1, 3.18%, 5/15/51 | | | 95,709 | |
| | 147,750 | | | Vantage Data Centers Issuer LLC, Series 2018-1A, Class A2, 4.07%, 2/16/43*(c) | | | 153,663 | |
| Total Asset Backed Securities | | | 996,810 | |
Shares or Principal Amount | | | Security Description | | Value | |
| | | | | |
| Mortgage Backed Securities† (14.5%) | | | |
| Alt-A - Adjustable Rate Mortgage Backed Securities (0.4%) | | | | |
| $ | 195,610 | | | Bear Stearns Alternative-A Trust, Series 2007-2, Class 2A1, 3.91%, 4/25/37*(b) | | $ | 169,015 | |
| | 2,834 | | | Deutsche Mortgage Securities, Inc., Series 2003-4XS, Class 10A1, 5.32% (US0003M + 119 bps), 10/25/33* | | | 2,853 | |
| | | | | | | | 171,868 | |
| Alt-A - Fixed Rate Mortgage Backed Securities (1.4%) | | | | |
| | 51,058 | | | Bank of America Alternative Loan Trust, Series 2005-10, Class 1CB4, 5.50%, 11/25/35* | | | 52,267 | |
| | 67,340 | | | Citi Mortgage Alternative Loan Trust, Series 2007-A2, Class 1A5, 6.00%, 2/25/37* | | | 67,538 | |
| | 24,393 | | | Countrywide Alternative Loan Trust, Series 2005-53T2, Class 2A4, 5.50%, 11/25/35* | | | 19,031 | |
| | 31,119 | | | Countrywide Alternative Loan Trust, Series 2006-8T1, Class 2A3, 5.50%, 4/25/36* | | | 30,221 | |
| | 11,289 | | | Countrywide Alternative Loan Trust, Series 2006-41CB, Class 2A4, 6.00%, 1/25/37* | | | 9,638 | |
| | 18,848 | | | Countrywide Alternative Loan Trust, Series 2004-J2, Class 2A1, 6.50%, 3/25/34* | | | 19,785 | |
| | 144 | | | Countrywide Alternative Loan Trust, Series 2005-J3, Class 3A1, 6.50%, 9/25/34* | | | 141 | |
| | 77,023 | | | Deutsche Alternative-A Securities, Inc. Mortgage Loan Trust, Series 2006-AB2, Class A3, 5.23%, 6/25/36*(b) | | | 75,354 | |
| | 5,987 | | | Master Alternative Loans Trust, Series 2004-6, Class 10A1, 6.00%, 7/25/34* | | | 6,443 | |
| | 36,626 | | | Master Alternative Loans Trust, Series 2004-8, Class 5A1, 6.00%, 9/25/34* | | | 38,080 | |
| | 80,650 | | | Master Alternative Loans Trust, Series 2004-3, Class 5A1, 6.50%, 3/25/34* | | | 89,438 | |
| | 34,653 | | | Nomura Asset Acceptance Corp., Series 2005-AP1, Class 2A5, 4.86%, 2/25/35*(b) | | | 35,631 | |
| | 19,790 | | | Nomura Asset Acceptance Corp., Series 2005-AP2, Class A5, 5.48%, 5/25/35*(b) | | | 14,755 | |
| | 151,002 | | | Nomura Asset Acceptance Corp., Series 2006-AF1, Class 1A2, 6.16%, 5/25/36*(b) | | | 58,284 | |
| | 10,581 | | | Residential Accredit Loans, Inc., Series 2006-QS5, Class A9, 6.00%, 5/25/36* | | | 10,174 | |
| | 63,697 | | | Residential Asset Securitization Trust, Series 2005-A9, Class A3, 5.50%, 7/25/35* | | | 54,753 | |
| | 39,082 | | | Residential Asset Securitization Trust, Series 2006-A2, Class A3, 6.00%, 5/25/36* | | | 27,975 | |
| | 41,671 | | | Washington Mutual Mortgage Pass-Through Certificates, Series 2005-5, Class CB14, 5.50%, 7/25/35* | | | 40,778 | |
| | | | | | | | 650,286 | |
See notes to financial statements
| Schedule of Portfolio Investments | Active Core Fund |
| August 31, 2019 | Continued |
Shares or Principal Amount | | | Security Description | | Value | |
| | | | | |
| Mortgage Backed Securities†, continued: | | | |
| Prime Adjustable Rate Mortgage Backed Securities (0.4%) | | | | |
| $ | 9,057 | | | Bear Stearns Adjustable Rate Mortgage Trust, Series 2004-6, Class 2A2, 3.99%, 9/25/34*(b) | | $ | 7,831 | |
| | 8,823 | | | Chase Mortgage Finance Corp., Series 2007-A2, Class 10A1, 3.77%, 7/25/37*(b) | | | 7,960 | |
| | 184,840 | | | JPMorgan Mortgage Trust, Series 2014-5, Class A1, 2.98%, 10/25/29*(b)(c) | | | 187,381 | |
| | | | | | | | 203,172 | |
| Prime Fixed Mortgage Backed Securities (3.6%) | | | | |
| | 202,126 | | | American Home Mortgage Investment Trust, Series 2005-2, Class 5A4C, 5.41%, 9/25/35*(b) | | | 153,021 | |
| | 24,084 | | | Banc of America Funding Trust, Series 2006-4, Class A14, 6.00%, 7/25/36* | | | 23,035 | |
| | 14,360 | | | Citigroup Mortgage Loan Trust, Inc., Series 2005-2, Class 1A4, 4.38%, 5/25/35*(b) | | | 14,586 | |
| | 102,016 | | | Citigroup Mortgage Loan Trust, Inc., Series 2004-NCM1, Class 1A2, 6.50%, 7/25/34* | | | 117,281 | |
| | 193,431 | | | COLT Mortgage Loan Trust, Series 2018-2, Class A1, 3.47%, 7/27/48*(b)(c) | | | 194,496 | |
| | 36,998 | | | Countrywide Home Loans, Series 2005-22, Class 2A1, 3.98%, 11/25/35*(b) | | | 33,358 | |
| | 29,519 | | | Countrywide Home Loans, Series 2005-J1, Class 1A8, 5.50%, 2/25/35* | | | 30,115 | |
| | 33,362 | | | Countrywide Home Loans, Series 2007-J3, Class A10, 6.00%, 7/25/37* | | | 24,393 | |
| | 42,000 | | | Credit Suisse First Boston Mortgage Securities Corp., Series 2005-1, Class 2A1, 5.50%, 2/25/35* | | | 40,880 | |
| | 25,050 | | | Credit Suisse Mortgage Capital Certificates, Series 2006-2, Class 3A1, 6.50%, 3/25/36* | | | 12,456 | |
| | 91,667 | | | Galton Funding Mortgage Trust, Series 2017-1, Class A21, 3.50%, 7/25/56*(b)(c) | | | 93,212 | |
| | 180,985 | | | JPMorgan Mortgage Trust, Series 2017-4, Class A6, 3.00%, 11/25/48*(b)(c) | | | 183,128 | |
| | 17,544 | | | Lehman Mortgage Trust, Series 2005-3, Class 2A3, 5.50%, 1/25/36* | | | 17,891 | |
| | 172,647 | | | Onslow Bay Financial LLC, Series 2018- EXP2, Class 1A1, 4.00%, 11/25/48*(b)(c) | | | 174,126 | |
| | 178,707 | | | PSMC Trust, Series 2018-2, Class A3, 3.50%, 6/25/48(b)(c) | | | 182,232 | |
| | 17,091 | | | Residential Asset Mortgage Products, Inc., Series 2004-SL1, Class A7, 7.00%, 11/25/31* | | | 18,473 | |
| | 90,592 | | | Sequoia Mortgage Trust, Series 2017-CH1, Class A11, 3.50%, 8/25/47*(b)(c) | | | 91,141 | |
| | 161,655 | | | Sequoia Mortgage Trust, Series 2018-3, Class A4, 3.50%, 3/25/48*(b)(c) | | | 164,331 | |
| | 136,275 | | | Sequoia Mortgage Trust, Series 2018-8, Class A4, 4.00%, 11/25/48*(b)(c) | | | 137,350 | |
| | 431 | | | Washington Mutual, Series 2003-S4, Class 4A1, 4.00%, 2/25/32* | | | 450 | |
Shares or Principal Amount | | | Security Description | | Value | |
| | | | | |
| Mortgage Backed Securities†, continued: | | | |
| Prime Fixed Mortgage Backed Securities, continued: | | | | |
| $ | 8,396 | | | Wells Fargo Mortgage Backed Securities Trust, Series 2006-11, Class A8, 6.00%, 9/25/36* | | $ | 8,253 | |
| | | | | | | | 1,714,208 | |
| Subprime Mortgage Backed Securities (0.7%) | | | | |
| | 123,486 | | | Towd Point Mortgage Trust, Series 2017-6, Class A1, 2.75%, 10/25/57*(b)(c) | | | 125,149 | |
| | 75,068 | | | Towd Point Mortgage Trust, Series 2018-1, Class A1, 3.00%, 1/25/58*(b)(c) | | | 76,343 | |
| | 140,733 | | | Towd Point Mortgage Trust, Series 2018-2, Class A1, 3.25%, 3/25/58*(b)(c) | | | 143,902 | |
| | | | | | | | 345,394 | |
| U.S. Government Agency Mortgage Backed Securities (8.0%) | | | | |
| | 73,279 | | | Fannie Mae, Series 2013-68, Class 10A1, 1.00%, 3/25/42 | | | 72,322 | |
| | 73,988 | | | Fannie Mae, Series 2012-10, Class TA, 2.00%, 3/25/38 | | | 74,224 | |
| | 94,853 | | | Fannie Mae, Series 2013-18, Class 10A1, 2.00%, 12/25/42 | | | 94,765 | |
| | 169,147 | | | Fannie Mae, Series 2013-23, Class AB, 2.00%, 2/25/43 | | | 169,156 | |
| | 105,101 | | | Fannie Mae, Series 2013-73, Class 10A1, 2.25%, 6/25/42 | | | 106,001 | |
| | 177,749 | | | Fannie Mae, Series 2013-74, Class 10A1, 2.25%, 6/25/42(b) | | | 178,639 | |
| | 13,618 | | | Fannie Mae, Series 2012-2, Class 10A1, 2.50%, 5/25/41 | | | 13,769 | |
| | 157,274 | | | Fannie Mae, Series 2015-71, Class PD, 2.50%, 3/25/43 | | | 158,998 | |
| | 119,852 | | | Fannie Mae, Series 2017-43, Class PA, 2.50%, 6/25/47 | | | 123,543 | |
| | 195,508 | | | Fannie Mae, Series 2017-M5, Class A1, 2.74%, 4/25/29 | | | 204,045 | |
| | 124,482 | | | Fannie Mae, Series 2010-99, Class JU, 3.00%, 8/25/40 | | | 128,347 | |
| | 41,998 | | | Fannie Mae, Series 2011-118, Class 10A1, 3.00%, 11/25/41 | | | 43,433 | |
| | 11,344 | | | Fannie Mae, Series 2011-124, Class 10A1, 3.00%, 9/25/29 | | | 11,383 | |
| | 141,614 | | | Fannie Mae, Series 2015-46, Class MD, 3.00%, 5/25/43 | | | 145,413 | |
| | 130,989 | | | Fannie Mae, Series 2015-59, Class LM, 3.00%, 7/25/45 | | | 136,540 | |
| | 213,623 | | | Fannie Mae, Series 2018-M12, Class A1, 3.55%, 2/25/30 | | | 234,902 | |
| | 188,929 | | | Fannie Mae, Series 2018-M13, Class A1, 3.82%, 3/25/30(b) | | | 211,575 | |
| | 29,152 | | | Fannie Mae, Series 2012-16, Class K, 4.00%, 10/25/41 | | | 30,769 | |
| | 14,535 | | | Fannie Mae, 4.50%, 4/1/35, Pool #814522 | | | 15,682 | |
| | 13,230 | | | Fannie Mae, 5.50%, 10/1/35, Pool #838584 | | | 14,285 | |
| | 1,132 | | | Fannie Mae, 6.00%, 5/1/35, Pool #357778 | | | 1,260 | |
| | 3,000 | | | Fannie Mae, Series 1999-18, Class LL, 6.50%, 4/18/29 | | | 3,336 | |
| | 73,210 | | | Freddie Mac, Series 4146, Class 10A1, 1.50%, 10/15/42 | | | 73,966 | |
See notes to financial statements
| Schedule of Portfolio Investments | Active Core Fund |
| August 31, 2019 | Continued |
Shares or Principal Amount | | | Security Description | | Value | |
| | | | | |
| Mortgage Backed Securities†, continued: | | | |
| U.S. Government Agency Mortgage Backed Securities, continued: | | | |
| $ | 61,775 | | | Freddie Mac, Series 4408, Class GA, 2.00%, 9/15/41 | | $ | 61,800 | |
| | 74,689 | | | Freddie Mac, Series 4129, Class PA, 2.50%, 7/15/42 | | | 76,181 | |
| | 111,888 | | | Freddie Mac, Series 4312, Class 10A1, 2.50%, 12/15/41 | | | 113,408 | |
| | 99,007 | | | Freddie Mac, Series 4395, Class PA, 2.50%, 4/15/37 | | | 100,322 | |
| | 137,282 | | | Freddie Mac, Series 4316, Class JY, 3.00%, 1/15/44 | | | 144,138 | |
| | 90,282 | | | Freddie Mac, Series 4348, Class A, 3.00%, 6/15/39 | | | 92,868 | |
| | 159,858 | | | Freddie Mac, Series 4486, Class PA, 3.00%, 3/15/44 | | | 166,065 | |
| | 172,394 | | | Freddie Mac, Series 4668, Class KA, 3.00%, 1/15/55 | | | 180,713 | |
| | 9,825 | | | Freddie Mac, 4.06% (H15T1Y + 172 bps), 6/1/28, Pool #605508 | | | 9,859 | |
| | 1,347 | | | Freddie Mac, 5.50%, 1/1/35, Pool #A30935 | | | 1,521 | |
| | 13,594 | | | Freddie Mac, Series 1443, Class I, 7.50%, 12/15/22* | | | 14,345 | |
| | 185,345 | | | Freddie Mac Pass-Through Certificates, Series KJ17, Class A1, 2.40%, 10/25/24 | | | 188,677 | |
| | 21,674 | | | Government National Mortgage Assoc., Series 2013-104, Class DC, 2.00%, 4/20/40 | | | 21,639 | |
| | 73,914 | | | Government National Mortgage Assoc., Series 2013-69, Class 10A1, 2.00%, 9/20/42 | | | 72,300 | |
| | 149,640 | | | Government National Mortgage Assoc., Series 2016-141, Class PA, 2.25%, 8/20/46 | | | 154,703 | |
| | 194,476 | | | Government National Mortgage Assoc., Series 2019-85, Class MP, 3.50%, 6/20/49 | | | 200,620 | |
| | 804 | | | Government National Mortgage Assoc., 6.00%, 2/20/26, Pool #2166 | | | 873 | |
| | 38,886 | | | Government National Mortgage Assoc., 6.31%, 3/20/33, Pool #612258 | | | 42,074 | |
| | 4,799 | | | Government National Mortgage Assoc., 7.00%, 7/15/29, Pool #492747 | | | 5,194 | |
| | | | | | | | 3,893,653 | |
| Total Mortgage Backed Securities | | | 6,978,581 | |
| | | | | |
| Corporate Bonds (7.1%) | | | | |
| Banks (1.4%) | | | | |
| | 440,000 | | | Bank of America Corp., 3.55% (US0003M + 78 bps), 3/5/24, Callable 3/5/23 @ 100 * | | | 459,862 | |
| | 250,000 | | | Wells Fargo & Co., 3.00%, 10/23/26 | | | 259,787 | |
| | | | | | | | 719,649 | |
| Beverages (0.4%) | | | | |
| | 155,000 | | | Keurig Dr Pepper, Inc., 4.42%, 5/25/25, Callable 3/25/25 @ 100 * | | | 169,551 | |
| Capital Markets (0.8%) | | | | |
| | 250,000 | | | Goldman Sachs Group, Inc., 3.50%, 11/16/26, Callable 11/16/25 @ 100 * | | | 261,784 | |
| | 185,070 | | | Preferred Term Securities XX, Class B2, 2.86% (US0003M + 45 bps), 3/22/38, Callable 10/25/19 @ 100 *(c) | | | 138,802 | |
| | | | | | | | 400,586 | |
Shares or Principal Amount | | | Security Description | | Value | |
| | | | | |
| Corporate Bonds, continued: | | | |
| Diversified Financial Services (0.7%) | | | | |
| $ | 325,000 | | | BP Capital Markets America, Inc., 2.75%, 5/10/23 | | $ | 332,943 | |
| Diversified Telecommunication Services (0.7%) | | | | |
| | 270,000 | | | AT&T, Inc., 5.25%, 3/1/37, Callable 9/1/36 @ 100 * | | | 320,011 | |
| Food Products (1.0%) | | | | |
| | 175,000 | | | Campbell Soup Co., 3.95%, 3/15/25, Callable 1/15/25 @ 100 * | | | 185,239 | |
| | 250,000 | | | Conagra Brands, Inc., 4.85%, 11/1/28, Callable 8/1/28 @ 100 * | | | 286,302 | |
| | | | | | | | 471,541 | |
| Hotels, Restaurants & Leisure (0.2%) | | | | |
| | 85,000 | | | Royal Caribbean Cruises, 5.25%, 11/15/22 | | | 92,602 | |
| Industrial Conglomerates (0.5%) | | | | |
| | 230,000 | | | General Electric Co., 3.10%, 1/9/23 | | | 230,679 | |
| Insurance (0.4%) | | | | |
| | 200,000 | | | Jackson National Life Global Funding, 2.65%, 6/21/24 (c) | | | 204,111 | |
| Multiline Retail (0.5%) | | | | |
| | 220,000 | | | Macys Retail Holdings, Inc., 2.88%, 2/15/23, Callable 11/15/22 @ 100 * | | | 216,213 | |
| Technology Hardware, Storage & Peripherals (0.5%) | | | | |
| | 225,000 | | | Apple, Inc., 3.20%, 5/11/27, Callable 2/11/27 @ 100 * | | | 241,011 | |
| Total Corporate Bonds | | | 3,398,897 | |
| | | | | |
| Taxable Municipal Bonds (5.0%) | | | | |
| Illinois (0.9%) | | | | |
| | 150,000 | | | Northern Illinois Municipal Power Agency Power Project Revenue, Build America Bonds, GO, 6.29%, 1/1/21, Continuously Callable @100 | | | 150,416 | |
| | 300,000 | | | Rosemont Illinois State, GO, Series A, 2.76%, 12/1/19, Insured by: MAC | | | 299,862 | |
| | | | | | | | 450,278 | |
| Michigan (1.1%) | | | | |
| | 240,000 | | | County of Jackson Michigan, GO, 3.73%, 12/1/30, Continuously Callable @100 | | | 264,929 | |
| | 210,000 | | | Houghton-Portage Township School District, GO, Series B, 2.70%, 5/1/25, Insured by: Q-SBLF | | | 217,470 | |
| | | | | | | | 482,399 | |
| Missouri (0.2%) | | | | |
| | 100,000 | | | Hanley Road Corridor Transnational Development Missouri Transnational Tax Revenue, Build America Bonds, GO, 7.50%, 10/1/39, Continuously Callable @100 | | | 100,375 | |
| | Ohio (0.7%) | | | | | | | |
| | 330,000 | | | County of Cuyahoga Ohio Revenue, 3.48%, 7/1/32, Continuously Callable @100 | | | 359,402 | |
| Rhode Island (0.5%) | | | | |
| | 225,000 | | | Rhode Island Convention Center Authority Revenue, 3.15%, 5/15/25 | | | 237,528 | |
| South Carolina (0.5%) | | | | |
| | 220,000 | | | South Carolina Public Service Authority Revenue, Series D, 2.39%, 12/1/23 | | | 221,701 | |
See notes to financial statements
| Schedule of Portfolio Investments | Active Core Fund |
| August 31, 2019 | Concluded |
Shares or Principal Amount | | | Security Description | | Value | |
| | | | | |
| Taxable Municipal Bonds, continued: | | | | |
| Texas (0.8%) | | | | |
| $ | 360,000 | | | County of Burnet Texas, GO, 4.20%, 3/1/34, Continuously Callable @100 | | $ | 383,846 | |
| Wisconsin (0.3%) | | | | |
| | 140,000 | | | Wisconsin State, Build America Bonds, GO, Series D, 5.10%, 5/1/41, Continuously Callable @100 | | | 146,969 | |
| Total Taxable Municipal Bonds | | | 2,382,498 | |
| | | | | |
| U.S. Government Agency Securities (1.4%) | | | | |
| Fannie Mae | | | | |
| | 185,000 | | | 2.50%, 12/27/32, Callable 9/27/19 @ 100 *(b) | | | 184,733 | |
| Federal Farm Credit Bank | | | | |
| | 225,000 | | | 2.25%, 11/26/24, Callable 11/26/19 @ 100 * | | | 224,910 | |
| Freddie Mac | | | | |
| | 250,000 | | | 2.50%, 6/9/21 (b)(d) | | | 250,036 | |
| | 3,485 | | | Series 2302, 6.50%, 4/15/31 | | | 3,866 | |
| | | | | | | | 253,902 | |
| Total U.S. Government Agency Securities | | | 663,545 | |
| | | | | |
| U.S. Treasury Obligations (14.1%) | | | | |
| U.S. Treasury Bonds | | | | |
| | 2,405,000 | | | 2.25%, 8/15/46 | | | 2,546,011 | |
Shares or Principal Amount | | | Security Description | | Value | |
| | | | |
| U.S. Treasury Obligations, continued: | | | |
| U.S. Treasury Inflation Indexed Notes | | | | |
| $ | 833,845 | | | 0.38%, 7/15/25 | | $ | 854,535 | |
| U.S. Treasury Notes | | | | |
| | 1,476,000 | | | 1.50%, 11/30/19 | | | 1,474,040 | |
| | 425,000 | | | 2.00%, 4/30/24 | | | 436,123 | |
| | 625,000 | | | 2.25%, 2/29/20 | | | 625,977 | |
| | 804,000 | | | 2.25%, 2/15/27 | | | 848,754 | |
| | | | | | | | 3,384,894 | |
| Total U.S. Treasury Obligations | | | 6,785,440 | |
| | | | | | | | | |
| Investment Companies (3.9%) | | | | |
| | 17,930 | | | iShares MSCI EAFE Index Fund ETF | | | 1,133,355 | |
| | 17,845 | | | iShares MSCI Emerging Markets Index Fund ETF | | | 717,191 | |
| Total Investment Companies | | | 1,850,546 | |
| Investment in Affiliates (5.7%) | | | | |
| | 2,249,789 | | | Cavanal Hill Government Securities Money | | | | |
| | | | | Market Fund, Select Shares, 1.95%(e) | | | 2,249,789 | |
| | 73,409 | | | Cavanal Hill World Energy Fund, Institutional Shares | | | 493,296 | |
| Total Investment in Affiliates | | | 2,743,085 | |
| | | | | |
| Total Investments (Cost $38,755,307)(f) - 99.7% | | | 47,890,055 | |
| Other assets in excess of liabilities — 0.3% | | | 137,541 | |
| Net Assets - 100.0% | | $ | 48,027,596 | |
| (a) | Non-income producing security. |
| (b) | The rate for certain asset-backed and mortgage-backed securities may vary based on factors relating to the pool of assets underlying the security. The rate presented is the rate in effect at August 31, 2019. |
| (c) | Represents a restricted security, purchased under Rule 144A, Section 4(2), which is exempt from registration under the Securities Act of 1933, as amended. The security has been deemed liquid according to the policies and procedures adopted by the Board of Trustees. |
| (d) | Step Bond: Coupon rate is set for an initial period and then increased to a higher coupon rate at a specified date. The rate shown is the rate in effect at August 31, 2019. |
| (e) | Money market investment. The rate presented on the Schedule of Portfolio Investments is the rate in effect at August 31, 2019. |
| (f) | Represents cost for financial reporting purposes. The cost for tax reporting purposes can be found in Note 6 in the Notes to Financial Statements. |
| * | Represents next call date. Additional subsequent call dates and amounts may apply to this security. |
| † | Mortgage backed securities are classified based on the characteristics of their underlying collateral, the fixed vs. variable nature of the obligations, and the credit standing of the mortgagors. The fixed or variable rate nature of securities interest payments to which the fund is entitled may not coincide with the payment nature of the collateral underlying the securities. |
| ADR | American Depositary Receipt |
| ETF | Exchange Traded Fund |
| GO | General Obligation |
| H15T1Y | 1 Year Treasury Constant Maturity Rate |
| LIBOR | London Interbank Offered Rate |
| MAC | Municipal Assurance Corporation |
| Q-SBLF | Qualified School Bond Loan Fund |
| REIT | Real Estate Investment Trust |
| US0001M | 1 Month US Dollar LIBOR |
| US0003M | 3 Month US Dollar LIBOR |
See notes to financial statements
| Schedule of Portfolio Investments | Mid Cap Core Equity Fund |
| August 31, 2019 | |
| Shares | | | Security Description | | Value | |
| | | | |
| Common Stocks (94.4%) | | | |
| Aerospace & Defense (2.8%) | | | | |
| | 122 | | | L3Harris Technologies, Inc. | | $ | 25,792 | |
| | 140 | | | Spirit AeroSystems Holdings, Inc., Class A | | | 11,284 | |
| | | | | | | | 37,076 | |
| Air Freight & Logistics (0.2%) | | | | |
| | 31 | | | Expeditors International of Washington, Inc. | | | 2,204 | |
| Airlines (0.3%) | | | | |
| | 48 | | | United Continental Holdings, Inc.(a) | | | 4,047 | |
| Auto Components (1.0%) | | | | |
| | 238 | | | Gentex Corp. | | | 6,331 | |
| | 57 | | | Lear Corp. | | | 6,399 | |
| | | | | | | | 12,730 | |
| Banks (3.0%) | | | | |
| | 48 | | | Comerica, Inc. | | | 2,959 | |
| | 154 | | | Commerce Bancshares, Inc. | | | 8,790 | |
| | 93 | | | Cullen/Frost Bankers, Inc. | | | 7,720 | |
| | 119 | | | East West Bancorp, Inc. | | | 4,894 | |
| | 7 | | | First Citizens Bancshares, Inc. | | | 3,112 | |
| | 33 | | | SVB Financial Group(a) | | | 6,422 | |
| | 128 | | | Western Alliance Bancorp | | | 5,558 | |
| | | | | | | | 39,455 | |
| Biotechnology (1.7%) | | | | |
| | 506 | | | Exelixis, Inc.(a) | | | 10,044 | |
| | 286 | | | Moderna, Inc.(a) | | | 4,499 | |
| | 94 | | | United Therapeutics Corp.(a) | | | 7,761 | |
| | | | | | | | 22,304 | |
| Building Products (1.5%) | | | | |
| | 91 | | | Allegion PLC | | | 8,761 | |
| | 16 | | | Armstrong World Industries, Inc. | | | 1,528 | |
| | 36 | | | Lennox International, Inc. | | | 9,136 | |
| | | | | | | | 19,425 | |
| Capital Markets (3.9%) | | | | |
| | 76 | | | E*Trade Financial Corp. | | | 3,172 | |
| | 68 | | | Eaton Vance Corp. | | | 2,932 | |
| | 32 | | | FactSet Research Systems, Inc. | | | 8,707 | |
| | 123 | | | LPL Financial Holdings, Inc. | | | 9,218 | |
| | 68 | | | MSCI, Inc., Class A | | | 15,954 | |
| | 84 | | | Nasdaq, Inc. | | | 8,387 | |
| | 37 | | | SEI Investments Co. | | | 2,128 | |
| | | | | | | | 50,498 | |
| Chemicals (0.9%) | | | | |
| | 175 | | | Axalta Coating Systems, Ltd.(a) | | | 5,054 | |
| | 79 | | | Chemours Co. | | | 1,119 | |
| | 40 | | | RPM International, Inc. | | | 2,707 | |
| | 40 | | | Westlake Chemical Corp. | | | 2,344 | |
| | | | | | | | 11,224 | |
| Commercial Services & Supplies (1.7%) | | | | |
| | 86 | | | Cintas Corp. | | | 22,687 | |
| Communications Equipment (1.4%) | | | | |
| | 79 | | | Arista Networks, Inc.(a) | | | 17,903 | |
| Consumer Finance (0.3%) | | | | |
| | 10 | | | Credit Acceptance Corp.(a) | | | 4,526 | |
| Containers & Packaging (2.0%) | | | | |
| | 39 | | | AptarGroup, Inc. | | | 4,767 | |
| | 204 | | | Berry Plastics Group, Inc.(a) | | | 7,985 | |
| Shares | | | Security Description | | Value | |
| | | | | |
| Common Stocks, continued: | | | |
| Containers & Packaging, continued: | | | | |
| | 134 | | | Packaging Corp. of America | | $ | 13,477 | |
| | | | | | | | 26,229 | |
| Distributors (0.4%) | | | | |
| | 25 | | | Pool Corp. | | | 4,910 | |
| Diversified Consumer Services (1.3%) | | | | |
| | 34 | | | Bright Horizons Family Solutions, Inc.(a) | | | 5,612 | |
| | 201 | | | ServiceMaster Global Holdings, Inc.(a) | | | 11,465 | |
| | | | | | | | 17,077 | |
| Diversified Financial Services (0.6%) | | | | |
| | 162 | | | Voya Financial, Inc. | | | 7,990 | |
| Electric Utilities (1.7%) | | | | |
| | 288 | | | OGE Energy Corp. | | | 12,347 | |
| | 348 | | | PPL Corp. | | | 10,283 | |
| | | | | | | | 22,630 | |
| Electrical Equipment (0.2%) | | | | |
| | 39 | | | Regal-Beloit Corp. | | | 2,765 | |
| Electronic Equipment, Instruments & Components (1.5%) | | | | |
| | 164 | | | CDW Corp. | | | 18,942 | |
| Energy Equipment & Services (0.1%) | | | | |
| | 53 | | | Apergy Corp.(a) | | | 1,377 | |
| Entertainment (1.8%) | | | | |
| | 169 | | | Take-Two Interactive Software(a) | | | 22,303 | |
| | 4 | | | The Madison Square Garden Co., Class A(a) | | | 1,009 | |
| | | | | | | | 23,312 | |
| Equity Real Estate Investment Trusts (8.6%) | | | | |
| | 351 | | | American Homes 4 Rent, Class A | | | 8,979 | |
| | 87 | | | Apartment Investment & Management Co. | | | 4,437 | |
| | 160 | | | Brookfield Property REIT, Inc., Class A | | | 3,011 | |
| | 15 | | | CoreSite Realty Corp. | | | 1,743 | |
| | 482 | | | CubeSmart | | | 17,298 | |
| | 114 | | | Douglas Emmett, Inc. | | | 4,811 | |
| | 429 | | | Duke Realty Corp. | | | 14,272 | |
| | 200 | | | Empire State Realty Trust, Inc. | | | 2,812 | |
| | 92 | | | Equity Commonwealth | | | 3,097 | |
| | 81 | | | Equity LifeStyle Properties, Inc. | | | 10,912 | |
| | 171 | | | Extra Space Storage, Inc. | | | 20,847 | |
| | 541 | | | Host Hotels & Resorts, Inc. | | | 8,678 | |
| | 77 | | | JBG SMITH Properties | | | 2,946 | |
| | 70 | | | Lamar Advertising Co. | | | 5,366 | |
| | 35 | | | SL Green Realty Corp. | | | 2,808 | |
| | | | | | | | 112,017 | |
| Food & Staples Retailing (0.4%) | | | |
| | 114 | | | US Foods Holding Corp.(a) | | | 4,611 | |
| Food Products (2.0%) | | | |
| | 297 | | | Hormel Foods Corp. | | | 12,655 | |
| | 38 | | | Kellogg Co. | | | 2,386 | |
| | 123 | | | Tyson Foods, Inc., Class A | | | 11,444 | |
| | | | | | | | 26,485 | |
| Gas Utilities (0.9%) | | | | |
| | 251 | | | UGI Corp. | | | 12,216 | |
| Health Care Equipment & Supplies (3.3%) | | | | |
| | 7 | | | ABIOMED, Inc.(a) | | | 1,351 | |
| | 33 | | | Align Technology, Inc.(a) | | | 6,043 | |
| | 65 | | | Hill-Rom Holdings, Inc. | | | 6,999 | |
| | 287 | | | Hologic, Inc.(a) | | | 14,169 | |
See notes to financial statements
| Schedule of Portfolio Investments | Mid Cap Core Equity Fund |
| August 31, 2019 | Continued |
| Shares | | | Security Description | | Value | |
| | | | | | | |
| Common Stocks, continued: | | | |
| Health Care Equipment & Supplies, continued: | | | | |
| | 41 | | | Teleflex, Inc. | | $ | 14,921 | |
| | | | | | | | 43,483 | |
| Health Care Providers & Services (1.3%) | | | | |
| | 13 | | | Chemed Corp. | | | 5,583 | |
| | 42 | | | Henry Schein, Inc.(a) | | | 2,588 | |
| | 49 | | | Molina Healthcare, Inc.(a) | | | 6,384 | |
| | 28 | | | Quest Diagnostics, Inc. | | | 2,866 | |
| | | | | | | | 17,421 | |
| Health Care Technology (1.1%) | | | | |
| | 90 | | | Veeva Systems, Inc.(a) | | | 14,434 | |
| Hotels, Restaurants & Leisure (3.6%) | | | | |
| | 103 | | | Darden Restaurants, Inc. | | | 12,461 | |
| | 50 | | | Dunkin’ Brands Group, Inc. | | | 4,122 | |
| | 293 | | | Hilton Worldwide Holdings, Inc. | | | 27,064 | |
| | 62 | | | Six Flags Entertainment Corp. | | | 3,669 | |
| | | | | | | | 47,316 | |
| Household Durables (0.7%) | | | | |
| | 110 | | | Garmin, Ltd. | | | 8,973 | |
| Household Products (1.0%) | | | | |
| | 119 | | | Church & Dwight Co., Inc. | | | 9,494 | |
| | 23 | | | The Clorox Co. | | | 3,638 | |
| | | | | | | | 13,132 | |
| Independent Power and Renewable Electricity Producers (0.3%) | | | | |
| | 227 | | | AES Corp. | | | 3,480 | |
| Insurance (3.5%) | | | | |
| | 162 | | | Assured Guaranty, Ltd. | | | 6,893 | |
| | 163 | | | Brighthouse Financial, Inc.(a) | | | 5,747 | |
| | 58 | | | Cincinnati Financial Corp. | | | 6,524 | |
| | 37 | | | Erie Indemnity Co., Class A | | | 8,115 | |
| | 192 | | | FNF Group | | | 8,437 | |
| | 45 | | | Principal Financial Group, Inc. | | | 2,395 | |
| | 39 | | | The Hanover Insurance Group, Inc. | | | 5,193 | |
| | 50 | | | The Hartford Financial Services Group, Inc. | | | 2,914 | |
| | | | | | | | 46,218 | |
| Interactive Media & Services (1.6%) | | | | |
| | 199 | | | Match Group, Inc. | | | 16,875 | |
| | 101 | | | Twitter, Inc.(a) | | | 4,308 | |
| | | | | | | | 21,183 | |
| Internet & Direct Marketing Retail (0.7%) | | | | |
| | 37 | | | Expedia, Inc. | | | 4,814 | |
| | 43 | | | Wayfair, Inc., Class A(a) | | | 4,848 | |
| | | | | | | | 9,662 | |
| IT Services (6.5%) | | | | |
| | 325 | | | Fiserv, Inc.(a) | | | 34,755 | |
| | 135 | | | Total System Services, Inc. | | | 18,120 | |
| | 158 | | | VeriSign, Inc.(a) | | | 32,208 | |
| | | | | | | | 85,083 | |
| Leisure Products (0.8%) | | | | |
| | 91 | | | Hasbro, Inc. | | | 10,053 | |
| Life Sciences Tools & Services (2.0%) | | | | |
| | 74 | | | Agilent Technologies, Inc. | | | 5,262 | |
| | 34 | | | Charles River Laboratories International, Inc.(a) | | | 4,461 | |
| | 11 | | | Mettler-Toledo International, Inc.(a) | | | 7,225 | |
| | 41 | | | Waters Corp.(a) | | | 8,687 | |
| | | | | | | | 25,635 | |
| Shares | | | Security Description | | Value | |
| | | | | | | | | |
| Common Stocks, continued: | | | | |
| Machinery (3.1%) | | | | |
| | 485 | | | Allison Transmission Holdings, Inc. | | $ | 21,549 | |
| | 38 | | | Crane Co. | | | 2,897 | |
| | 113 | | | Graco, Inc. | | | 5,149 | |
| | 77 | | | The Timken Co. | | | 3,094 | |
| | 100 | | | The Toro Co. | | | 7,201 | |
| | | | | | | | 39,890 | |
| Media (1.5%) | | | | |
| | 8 | | | Cable One, Inc. | | | 10,381 | |
| | 215 | | | CBS Corp., Class B | | | 9,043 | |
| | | | | | | | 19,424 | |
| Metals & Mining (1.2%) | | | | |
| | 34 | | | Reliance Steel & Aluminum Co. | | | 3,306 | |
| | 470 | | | Steel Dynamics, Inc. | | | 12,690 | |
| | | | | | | | 15,996 | |
| Mortgage Real Estate Investment Trusts (0.6%) | | | | |
| | 368 | | | AGNC Investment Corp. | | | 5,472 | |
| | 279 | | | Annaly Capital Management, Inc. | | | 2,316 | |
| | | | | | | | 7,788 | |
| Multiline Retail (0.6%) | | | | |
| | 27 | | | Dollar General Corp. | | | 4,214 | |
| | 37 | | | Dollar Tree, Inc.(a) | | | 3,757 | |
| | | | | | | | 7,971 | |
| Multi-Utilities (1.9%) | | | | |
| | 109 | | | CenterPoint Energy, Inc. | | | 3,018 | |
| | 113 | | | MDU Resources Group, Inc. | | | 3,039 | |
| | 151 | | | Public Service Enterprise Group, Inc. | | | 9,131 | |
| | 94 | | | WEC Energy Group, Inc. | | | 9,002 | |
| | | | | | | | 24,190 | |
| Oil, Gas & Consumable Fuels (3.0%) | | | | |
| | 726 | | | Cabot Oil & Gas Corp. | | | 12,428 | |
| | 312 | | | Continental Resources, Inc.(a) | | | 9,110 | |
| | 52 | | | HollyFrontier Corp. | | | 2,307 | |
| | 107 | | | Murphy Oil Corp. | | | 1,951 | |
| | 84 | | | ONEOK, Inc. | | | 5,988 | |
| | 337 | | | PBF Energy, Inc. | | | 7,987 | |
| | | | | | | | 39,771 | |
| Paper & Forest Products (0.2%) | | | | |
| | 86 | | | Domtar Corp. | | | 2,834 | |
| Professional Services (1.8%) | | | | |
| | 437 | | | Robert Half International, Inc. | | | 23,366 | |
| Real Estate Management & Development (0.5%) | | | | |
| | 116 | | | CBRE Group, Inc., Class A(a) | | | 6,063 | |
| Road & Rail (1.0%) | | | | |
| | 76 | | | Old Dominion Freight Line, Inc. | | | 12,446 | |
| Semiconductors & Semiconductor Equipment (3.0%) | | | | |
| | 88 | | | Advanced Micro Devices, Inc.(a) | | | 2,768 | |
| | 150 | | | Lam Research Corp. | | | 31,577 | |
| | 148 | | | ON Semiconductor Corp.(a) | | | 2,634 | |
| | 17 | | | Xilinx, Inc. | | | 1,769 | |
| | | | | | | | 38,748 | |
| Software (6.0%) | | | | |
| | 459 | | | Cadence Design Systems, Inc.(a) | | | 31,431 | |
| | 216 | | | Citrix Systems, Inc. | | | 20,084 | |
| | 266 | | | Fortinet, Inc.(a) | | | 21,061 | |
| | 77 | | | Manhattan Associates, Inc.(a) | | | 6,363 | |
| | | | | | | | 78,939 | |
See notes to financial statements
| Schedule of Portfolio Investments | Mid Cap Core Equity Fund |
| August 31, 2019 | Concluded |
| Shares | | | Security Description | | Value | |
| | | | |
| Common Stocks, continued: | | | |
| Specialty Retail (1.6%) | | | | |
| | 3 | | | AutoZone, Inc.(a) | | $ | 3,305 | |
| | 18 | | | Burlington Stores, Inc.(a) | | | 3,645 | |
| | 25 | | | O’Reilly Automotive, Inc.(a) | | | 9,594 | |
| | 17 | | | Ulta Beauty, Inc.(a) | | | 4,041 | |
| | | | | | | | 20,585 | |
| Textiles, Apparel & Luxury Goods (0.2%) | | | | |
| | 33 | | | Ralph Lauren Corp. | | | 2,915 | |
| Trading Companies & Distributors (1.2%) | | | | |
| | 220 | | | HD Supply Holdings, Inc.(a) | | | 8,561 | |
| | 55 | | | MSC Industrial Direct Co., Inc., Class A | | | 3,719 | |
| | 19 | | | Watsco, Inc. | | | 3,107 | |
| | | | | | | | 15,387 | |
| Water Utilities (0.4%) | | | | |
| | 38 | | | American Water Works Co., Inc. | | | 4,838 | |
| Total Common Stocks | | | 1,231,864 | |
| Shares | | | Security Description | | Value | |
| | | | | | | | | |
| Investment in Affiliates (3.9%) | | | | |
| | 51,148 | | | Cavanal Hill Government Securities Money Market Fund, Select Shares, 1.95%(b) | | $ | 51,148 | |
| Total Investment in Affiliates | | | 51,148 | |
| | | | | | | | | |
| Total Investments (Cost $1,120,838)(c) - 98.3% | | | 1,283,012 | |
| Other assets in excess of liabilities — 1.7% | | | 22,427 | |
| Net Assets - 100.0% | | $ | 1,305,439 | |
| (a) | Non-income producing security. |
| (b) | Money market investment. The rate presented on the Schedule of Portfolio Investments is the rate in effect at August 31, 2019. |
| (c) | Represents cost for financial reporting purposes. The cost for tax reporting purposes can be found in Note 6 in the Notes to Financial Statements. |
REIT Real Estate Investment Trust
See notes to financial statements
| Schedule of Portfolio Investments | Opportunistic Fund |
| August 31, 2019 | |
Shares or
Principal
Amount | | | Security Description | | Value | |
| | | | | |
| Common Stocks (39.0%) | | | |
| Aerospace & Defense (2.0%) | | | | |
| | 2,110 | | | Northrop Grumman Corp. | | $ | 776,206 | |
| Airlines (2.0%) | | | | |
| | 13,735 | | | Delta Air Lines, Inc. | | | 794,707 | |
| Biotechnology (1.0%) | | | | |
| | 5,060 | | | BioMarin Pharmaceutical, Inc.(a) | | | 379,804 | |
| Commercial Services & Supplies (6.5%) | | | | |
| | 30,265 | | | Advanced Disposal Services, Inc., Class I(a) | | | 981,191 | |
| | 94,537 | | | Covanta Holding Corp. | | | 1,626,036 | |
| | | | | | | | 2,607,227 | |
| Communications Equipment (3.7%) | | | | |
| | 3,935 | | | Palo Alto Networks, Inc.(a) | | | 801,245 | |
| | 28,000 | | | Radware, Ltd.(a) | | | 684,600 | |
| | | | | | | | 1,485,845 | |
| Diversified Telecommunication Services (2.3%) | | | | |
| | 25,701 | | | AT&T, Inc. | | | 906,217 | |
| Electronic Equipment, Instruments & Components (2.5%) | | | | |
| | 17,590 | | | Corning, Inc. | | | 489,882 | |
| | 10,285 | | | FLIR Systems, Inc. | | | 506,741 | |
| | | | | | | | 996,623 | |
| Entertainment (1.5%) | | | | |
| | 11,850 | | | Activision Blizzard, Inc. | | | 599,610 | |
| Health Care Technology (1.0%) | | | | |
| | 6,920 | | | Teladoc Health, Inc.(a) | | | 400,530 | |
| Interactive Media & Services (4.1%) | | | | |
| | 740 | | | Alphabet, Inc., Class C(a) | | | 879,193 | |
| | 46,600 | | | Snap, Inc., Class A(a) | | | 737,678 | |
| | | | | | | | 1,616,871 | |
| Internet & Direct Marketing Retail (1.2%) | | | | |
| | 280 | | | Amazon.com, Inc.(a) | | | 497,361 | |
| Life Sciences Tools & Services (2.6%) | | | | |
| | 189,236 | | | Pacific Biosciences of California, Inc.(a) | | | 1,050,260 | |
| Oil, Gas & Consumable Fuels (2.4%) | | | | |
| | 11,950 | | | Marathon Petroleum Corp. | | | 588,060 | |
| | 15,102 | | | The Williams Cos., Inc. | | | 356,407 | |
| | | | | | | | 944,467 | |
| Pharmaceuticals (1.2%) | | | |
| | 157,111 | | | MediWound, Ltd.(a) | | | 494,900 | |
| Semiconductors & Semiconductor Equipment (2.4%) | | | | |
| | 72,788 | | | Everspin Technologies, Inc.(a) | | | 492,047 | |
| | 4,310 | | | Mellanox Technologies, Ltd.(a) | | | 461,386 | |
| | | | | | | | 953,433 | |
| Software (2.6%) | | | | |
| | 22,660 | | | Tenable Holdings, Inc.(a) | | | 516,648 | |
| | 6,510 | | | Zendesk, Inc.(a) | | | 522,102 | |
| | | | | | | | 1,038,750 | |
| Total Common Stocks | | | 15,542,811 | |
| | | | | | | | | |
| Convertible Preferred Stocks (5.6%) | | | | |
| Chemicals (1.5%) | | | | |
| | 13,500 | | | International Flavor & Fragrances, 6.00%, | | | 592,245 | |
| Household Products (4.1%) | | | | |
| | 18,554 | | | Energizer Holdings, Inc., Series A, 7.50%, | | | 1,644,255 | |
| Total Convertible Preferred Stocks | | | 2,236,500 | |
Shares or
Principal
Amount | | | Security Description | | Value | |
| | | | | |
| Mortgage Backed Securities† (2.9%) | | | |
| Prime Fixed Mortgage Backed Securities (2.9%) | | | | |
| $ | 1,130,051 | | | Onslow Bay Financial LLC, Series 2018- | | | | |
| | | | | EXP2, 1A1, 4.00%, 11/25/48*(b)(c) | | $ | 1,139,732 | |
| Total Mortgage Backed Securities | | | 1,139,732 | |
| | | | | | | | | |
| Corporate Bonds (14.9%) | | | | |
| Banks (1.3%) | | | | |
| | 500,000 | | | Bank of America Corp., Series G, 2.94% (US0003M + 66 bps), 7/21/21, Callable 7/21/20 @ 100 * | | | 501,492 | |
| Diversified Financial Services (2.2%) | | | | |
| | 858,000 | | | BP Capital Markets America, Inc., 4.50%, 10/1/20 | | | 880,443 | |
| Food & Staples Retailing (2.5%) | | | | |
| | 981,000 | | | Walmart, Inc., 2.57% (US0003M + 23 bps), 6/23/21 | | | 983,336 | |
| Machinery (2.2%) | | | | |
| | 792,000 | | | Wabtec Corp., 4.70%, 9/15/28, Callable 6/15/28 @ 100 * | | | 883,918 | |
| Oil, Gas & Consumable Fuels (3.3%) | | | | |
| | 620,000 | | | HollyFrontier Corp., 5.88%, 4/1/26, Callable 1/1/26 @ 100 * | | | 689,890 | |
| | 620,000 | | | Noble Energy, Inc., 4.15%, 12/15/21, Callable 9/15/21 @ 100 * | | | 640,246 | |
| | | | | | | | 1,330,136 | |
| Semiconductors & Semiconductor Equipment (3.4%) | | | | |
| | 1,290,000 | | | Marvell Technology Group, Ltd., 4.20%, 6/22/23, Callable 5/22/23 @ 100 * | | | 1,361,001 | |
| Total Corporate Bonds | | | 5,940,326 | |
| | | | | | | | | |
| U.S. Treasury Obligations (9.0%) | | | | |
| U.S. Treasury Notes | | | | |
| | 720,000 | | | 1.88%, 12/31/19 | | | 719,775 | |
| | 720,000 | | | 2.25%, 2/29/20 | | | 721,125 | |
| | 720,000 | | | 2.38%, 4/30/20 | | | 722,363 | |
| | 720,000 | | | 2.50%, 5/31/20 | | | 723,375 | |
| | 720,000 | | | 2.50%, 6/30/20 | | | 723,965 | |
| Total U.S. Treasury Obligations | | | 3,610,603 | |
| | | | | | | | | |
| Investment Companies (4.0%) | | | | |
| | 43,615 | | | Direxion Daily S&P 500 Bear 3X Shares ETF | | | 795,538 | |
| | 25,940 | | | ProShares UltraShort S&P500 ETF | | | 797,136 | |
| Total Investment Companies | | | 1,592,674 | |
| | | | | | | | | |
| Investment in Affiliates (26.8%) | | | | |
| | 5,329,540 | | | Cavanal Hill Government Securities Money Market Fund, Select Shares, 1.95%(d) | | | 5,329,540 | |
| | 5,329,000 | | | Cavanal Hill US Treasury Fund, Institutional Shares, 1.87%(d) | | | 5,329,000 | |
| Total Investment in Affiliates | | | 10,658,540 | |
| | | | | | | | | |
| Total Investments (Cost $39,674,829)(e) - 102.2% | | | 40,721,186 | |
| Liabilities in excess of other assets — (2.2)% | | | (869,738 | ) |
| Net Assets - 100% | $ | 39,851,448 | |
See notes to financial statements
| Schedule of Portfolio Investments | Opportunistic Fund |
| August 31, 2019 | Concluded |
| (a) | Non-income producing security. |
| (b) | The rate for certain asset-backed and mortgage-backed securities may vary based on factors relating to the pool of assets underlying the security. The rate presented is the rate in effect at August 31, 2019. |
| (c) | Represents a restricted security, purchased under Rule 144A, Section 4(2), which is exempt from registration under the Securities Act of 1933, as amended. The security has been deemed liquid according to the policies and procedures adopted by the Board of Trustees. |
| (d) | Money market investment. The rate presented on the Schedule of Portfolio Investments is the rate in effect at August 31, 2019. |
| (e) | Represents cost for financial reporting purposes. The cost for tax reporting purposes can be found in Note 6 in the Notes to Financial Statements. |
| * | Represents next call date. Additional subsequent call dates and amounts may apply to this security. |
| † | Mortgage backed securities are classified based on the characteristics of their underlying collateral, the fixed vs. variable nature of the obligations, and the credit standing of the mortgagors. The fixed or variable rate nature of securities interest payments to which the fund is entitled may not coincide with the payment nature of the collateral underlying the securities. |
| ETF | Exchange Traded Fund |
| LIBOR | London Interbank Offered Rate |
| US0003M | 3 Month US Dollar LIBOR |
See notes to financial statements
| Schedule of Portfolio Investments | World Energy Fund |
| August 31, 2019 | |
Shares or
Principal
Amount | | | Security Description | | Value | |
| | | | | | | | | |
| Common Stocks (88.6%) | | | | |
| Airlines (1.4%) | | | | |
| | 5,000 | | | Delta Air Lines, Inc. | | $ | 289,300 | |
| Auto Components (2.0%) | | | | |
| | 5,000 | | | Aptiv PLC | | | 415,850 | |
| Chemicals (3.3%) | | | | |
| | 10,000 | | | W.R. Grace & Co. | | | 677,100 | |
| Commercial Services & Supplies (3.4%) | | | | |
| | 40,000 | | | Covanta Holding Corp. | | | 688,000 | |
| Electric Utilities (1.9%) | | | | |
| | 190 | | | ALLETE, Inc. | | | 16,289 | |
| | 1,115 | | | Duke Energy Corp. | | | 103,405 | |
| | 738 | | | NextEra Energy, Inc. | | | 161,680 | |
| | 101 | | | Otter Tail Corp. | | | 5,113 | |
| | 70 | | | Pinnacle West Capital Corp. | | | 6,672 | |
| | 1,501 | | | The Southern Co. | | | 87,448 | |
| | | | | | | | 380,607 | |
| Electrical Equipment (1.8%) | | | | |
| | 15,000 | | | Vestas Wind Systems A/S ADR | | | 367,500 | |
| Energy Equipment & Services (5.6%) | | | | |
| | 2,638 | | | Halliburton Co. | | | 49,700 | |
| | 1,264 | | | Helmerich & Payne, Inc. | | | 47,514 | |
| | 20,610 | | | Schlumberger, Ltd. | | | 668,382 | |
| | 17,386 | | | Tenaris SA ADR | | | 376,233 | |
| | | | | | | | 1,141,829 | |
| Equity Real Estate Investment Trusts (1.6%) | | | | |
| | 10,000 | | | Getty Realty Corp. | | | 317,600 | |
| Gas Utilities (0.3%) | | | | |
| | 172 | | | Atmos Energy Corp. | | | 18,961 | |
| | 61 | | | Chesapeake Utilities Corp. | | | 5,769 | |
| | 104 | | | National Fuel & Gas Co. | | | 4,861 | |
| | 98 | | | Northwest Natural Holding Co. | | | 6,993 | |
| | 89 | | | ONE Gas, Inc. | | | 8,153 | |
| | 109 | | | Southwest Gas Holdings, Inc. | | | 9,944 | |
| | 126 | | | Spire, Inc. | | | 10,697 | |
| | | | | | | | 65,378 | |
| Household Products (1.5%) | | | | |
| | 8,000 | | | Energizer Holdings, Inc. | | | 308,000 | |
| Independent Power and Renewable Electricity Producers (0.3%) | | | | |
| | 871 | | | AES Corp. | | | 13,352 | |
| | 295 | | | Atlantica Yield PLC | | | 7,018 | |
| | 369 | | | NRG Energy, Inc. | | | 13,432 | |
| | 160 | | | Ormat Technologies, Inc. | | | 11,883 | |
| | 635 | | | Vistra Energy Corp. | | | 15,843 | |
| | | | | | | | 61,528 | |
| Multi-Utilities (2.4%) | | | | |
| | 70 | | | Consolidated Edison, Inc. | | | 6,223 | |
| | 2,273 | | | Dominion Resources, Inc. | | | 176,452 | |
| | 120 | | | DTE Energy Co. | | | 15,559 | |
| | 675 | | | MDU Resources Group, Inc. | | | 18,151 | |
| | 2,641 | | | National Grid PLC ADR | | | 138,151 | |
| | 858 | | | Sempra Energy | | | 121,519 | |
| | 80 | | | WEC Energy Group, Inc. | | | 7,662 | |
| | | | | | | | 483,717 | |
| Oil, Gas & Consumable Fuels (54.6%) | | | | |
| | 23,979 | | | BP PLC ADR | | | 886,024 | |
| | 3,795 | | | Chevron Corp. | | | 446,747 | |
| | 41 | | | CNOOC, Ltd. ADR | | | 6,078 | |
| | 12,105 | | | ConocoPhillips | | | 631,639 | |
| | 3,000 | | | Diamondback Energy, Inc. | | | 294,240 | |
Shares or
Principal
Amount | | | Security Description | | Value | |
| | | | | |
| Common Stocks, continued: | | | |
| Oil, Gas & Consumable Fuels, continued: | | | | |
| | 20,215 | | | Enbridge, Inc. | | $ | 676,394 | |
| | 5,054 | | | EOG Resources, Inc. | | | 374,956 | |
| | 10,466 | | | Exxon Mobil Corp. | | | 716,712 | |
| | 14,062 | | | Kinder Morgan, Inc. | | | 285,037 | |
| | 33,000 | | | Marathon Oil Corp. | | | 390,720 | |
| | 19,446 | | | Marathon Petroleum Corp. | | | 956,938 | |
| | 21,000 | | | Noble Energy, Inc. | | | 474,180 | |
| | 6,281 | | | ONEOK, Inc. | | | 447,710 | |
| | 8,626 | | | Pembina Pipeline Corp. | | | 316,315 | |
| | 7,873 | | | Phillips 66 | | | 776,514 | |
| | 2,500 | | | Pioneer Natural Resources Co. | | | 308,550 | |
| | 4,623 | | | Royal Dutch Shell PLC ADR, Class A | | | 257,039 | |
| | 16,327 | | | TC Energy Corp. | | | 836,596 | |
| | 14,000 | | | The Williams Cos., Inc. | | | 330,400 | |
| | 8,334 | | | TOTAL SA ADR | | | 416,033 | |
| | 13,961 | | | Valero Energy Corp. | | | 1,050,983 | |
| | 9,000 | | | Viper Energy Partners LP | | | 260,730 | |
| | | | | | | | 11,140,535 | |
| Semiconductors & Semiconductor Equipment (5.7%) | | | | |
| | 38,000 | | | Infineon Technologies AG ADR | | | 655,880 | |
| | 5,000 | | | NXP Semiconductors NV | | | 510,700 | |
| | | | | | | | 1,166,580 | |
| Water Utilities (2.8%) | | | | |
| | 695 | | | American States Water Co. | | | 64,308 | |
| | 2,823 | | | American Water Works Co., Inc. | | | 359,425 | |
| | 3,213 | | | Aqua America, Inc. | | | 142,304 | |
| | 86 | | | SJW Group | | | 5,876 | |
| | | | | | | | 571,913 | |
| Total Common Stocks | | | 18,075,437 | |
| | | | | | | | | |
| Corporate Bonds (8.4%) | | | | |
| Energy Equipment & Services (2.2%) | | | | |
| | 325,000 | | | Transocean, Inc., 6.80%, 3/15/38 | | | 214,500 | |
| | 321,000 | | | Valaris PLC, 8.00%, 1/31/24, Callable 10/31/23 @ 100 * | | | 224,700 | |
| | | | | | | | 439,200 | |
| Oil, Gas & Consumable Fuels (6.2%) | | | | |
| | 350,000 | | | Callon Petroleum Co., 6.13%, 10/1/24, Callable 10/10/19 @ 105 * | | | 339,500 | |
| | 400,000 | | | Oasis Petroleum, Inc., 6.88%, 3/15/22, Callable 10/10/19 @ 100 * | | | 372,000 | |
| | 200,000 | | | Suncor Energy, Inc., 3.60%, 12/1/24, Callable 9/1/24 @ 100 * | | | 210,809 | |
| | 500,000 | | | Whiting Petroleum Corp., 6.63%, 1/15/26, Callable 10/15/25 @ 100 * | | | 361,850 | |
| | | | | | | | 1,284,159 | |
| Total Corporate Bonds | | | 1,723,359 | |
| | | | | | | | | |
| Investment in Affiliates (2.6%) | | | | |
| | 531,505 | | | Cavanal Hill Government Securities Money Market Fund, Select Shares, 1.95%(a) | | | 531,505 | |
| Total Investment in Affiliates | | | 531,505 | |
| | | | | | | | | |
| Total Investments (Cost $20,193,576)(b) - 99.6% | | | 20,330,301 | |
| Other assets in excess of liabilities — 0.4% | | | 84,613 | |
| Net Assets - 100% | | $ | 20,414,914 | |
See notes to financial statements
| Schedule of Portfolio Investments | World Energy Fund |
| August 31, 2019 | Concluded |
The Advisor has determined that 47.6% of the Fund’s net assets comprise securities of issuers which are either foreign domiciled or derive more than 50% of its assets, revenue or income outside of the United States.
| (a) | Non-income producing security. |
| (a) | Money market investment. The rate presented on the Schedule of Portfolio Investments is the rate in effect at August 31, 2019. |
| (b) | Represents cost for financial reporting purposes. The cost for tax reporting purposes can be found in Note 6 in the Notes to Financial Statements. |
| * | Represents next call date. Additional subsequent call dates and amounts may apply to this security. |
| ADR | American Depositary Receipt |
See notes to financial statements
Notes to Financial Statements
August 31, 2019
The Cavanal Hill Funds (the “Trust”) was organized on October 1, 1987, as a Massachusetts business trust, and is registered under the Investment Company Act of 1940, as amended (the “1940 Act”), as an open-end investment company. The Trust meets the definition of an investment company and follows the accounting and reporting guidance under Financial Accounting Standards Board (“FASB”) Accounting Standards Codification (“ASC”) Topic 946, “Financial Services - Investment Companies”. As of August 31, 2019, the Trust offered shares of U.S. Treasury Fund and Government Securities Money Market Fund (each referred to as a “Money Market Fund” and collectively, the “Money Market Funds”), Limited Duration Fund, Moderate Duration Fund, Bond Fund, Strategic Enhanced Yield Fund, Ultra Short Tax-Free Income Fund, Active Core Fund, Mid Cap Core Equity Fund, Opportunistic Fund, and World Energy Fund (each referred to as a “Fund” and collectively, “the Funds”). Each Fund is registered as a diversified portfolio of the Trust. The Limited Duration Fund, Moderate Duration Fund, Bond Fund, Strategic Enhanced Yield Fund, Ultra Short Tax-Free Income Fund, Active Core Fund, Mid Cap Core Equity Fund, Opportunistic Fund, and World Energy Fund are each authorized to issue an unlimited number of shares in three classes of shares: No-Load Investor Shares (the “Investor Shares”), Institutional Shares and A Shares. The Active Core Fund, Mid Cap Core Equity Fund, Opportunistic Fund, and World Energy Fund are also authorized to issue an unlimited number of C Shares. The Money Market Funds are authorized to issue an unlimited number of shares in the following classes: Administrative Shares, Institutional Shares and Select Shares. In addition, the U.S. Treasury Fund is authorized to issue an unlimited number of Service Shares and the Government Securities Money Market Fund is authorized to issue an unlimited number of Premier Shares. Each class of shares for each of the Funds has identical rights and privileges except with respect to distribution (Rule 12b-1 of the 1940 Act) and shareholder servicing fees, voting rights on matters affecting a single class of shares, and the exchange privileges of each class of shares.
Under the Trust’s organizational documents, its officers and trustees are indemnified against certain liabilities arising out of the performance of their duties to the Trust. In addition, in the normal course of business, the Trust enters into contracts with its vendors and others that provide for general indemnifications. The Trust’s maximum exposure under these arrangements is unknown as this would involve future claims that may be made against the Trust. However, based on experience, the Trust expects that risk of loss to be remote.
| 2. | Significant Accounting Policies: |
The following is a summary of significant accounting policies followed by the Trust in the preparation of its financial statements. The policies are in conformity with accounting principles generally accepted in the United States of America (“U.S. GAAP”). The presentation of financial statements in conformity with U.S. GAAP requires management to make estimates and assumptions that affect the reported amounts of assets and liabilities and disclosure of contingent assets and liabilities at the date of the financial statements and the reported amounts of income and expenses for the period. Actual results could differ from those estimates.
Fair Value Measurements:
The Trust has a three-tier fair value hierarchy that is dependent upon the various “inputs” used to determine the value of the Funds’ investments. These inputs are summarized in the three broad levels listed below:
| ● | Level 1 – quoted prices in active markets for identical assets |
| ● | Level 2 – other observable significant inputs (including quoted prices of similar securities, interest rates, prepayment speeds, credit risk, etc.) |
| ● | Level 3 – significant unobservable inputs (including the Funds’ own assumptions in determining the fair value of investments) |
The inputs or methodology used for valuing securities are not necessarily an indication of the risk associated with investing in those securities. For example, money market securities are valued using amortized cost, in accordance with rules under the 1940 Act. Generally, amortized cost approximates the current fair value of a security, but since this valuation is not obtained from a quoted price in an active market, such securities are reflected as Level 2 in the fair value hierarchy.
When determining the fair value of the Funds’ investments, additional consideration is given to those assets or liabilities that have experienced a significant decrease in the volume or level of activity or to circumstances that indicate that a transaction is not orderly. In cases where market prices for portfolio securities are not readily available or where prices provided by pricing services are believed not to reflect current value, a Pricing Committee established by the Board of Trustees (the “Board”) determines in good faith, subject to Trust procedures, the fair value of such portfolio securities. Examples of the types of securities that may be fair valued include securities halted or suspended from trading, thinly traded or illiquid securities, high-yield securities and fixed-income securities held in amounts less than their normal unit of trading.
The following is a summary categorization, as of August 31, 2019, of each Fund’s investments in the fair value hierarchy:
| Fund | | LEVEL 1 -
Quoted Prices | | | LEVEL 2 -
Other Significant
Observable Inputs | | | LEVEL 3 -
Significant
Unobservable Inputs | | | Total | |
| U.S. Treasury Fund | | | | | | | | | | | | |
| U.S. Treasury Obligations | | $ | — | | | $ | 229,583,028 | | | $ | — | | | $ | 229,583,028 | |
| Repurchase Agreements | | | — | | | | 665,000,000 | | | | — | | | | 665,000,000 | |
| Investment Companies | | | 153,742,300 | | | | — | | | | — | | | | 153,742,300 | |
| Total Investments | | | 153,742,300 | | | | 894,583,028 | | | | — | | | | 1,048,325,328 | |
| | | | | | | | | | | | | | | | | |
| Government Securities Money Market | | | | | | | | | | | | | | | | |
| U.S. Government Agency Securities | | | — | | | | 240,000,000 | | | | — | | | $ | 240,000,000 | |
| U.S. Treasury Obligations | | | — | | | | 279,479,711 | | | | — | | | | 279,479,711 | |
| Repurchase Agreements | | | — | | | | 875,000,000 | | | | — | | | | 875,000,000 | |
| Investment Companies | | | 291,295,555 | | | | — | | | | — | | | | 291,295,555 | |
| Total Investments | | | 291,295,555 | | | | 1,394,479,711 | | | | — | | | | 1,685,775,266 | |
Notes to Financial Statements
August 31, 2019
| Fund | | LEVEL 1 -
Quoted Prices | | | LEVEL 2 -
Other Significant
Observable Inputs | | | LEVEL 3 -
Significant Unobservable Inputs | | | Total | |
| Limited Duration Fund | | | | | | | | | | | | |
| Asset Backed Securities | | $ | — | | | $ | 7,720,228 | | | $ | — | | | $ | 7,720,228 | |
| Mortgage Backed Securities1 | | | — | | | | 57,087,588 | | | | — | | | | 57,087,588 | |
| Corporate Bonds2 | | | — | | | | 14,922,457 | | | | — | | | | 14,922,457 | |
| Taxable Municipal Bonds3 | | | — | | | | 2,453,374 | | | | — | | | | 2,453,374 | |
| U.S. Treasury Obligations | | | — | | | | 32,740,583 | | | | — | | | | 32,740,583 | |
| Investment in Affiliates | | | 5,044,235 | | | | — | | | | — | | | | 5,044,235 | |
| Total Investments | | | 5,044,235 | | | | 114,924,230 | | | | — | | | | 119,968,465 | |
| | | | | | | | | | | | | | | | | |
| Moderate Duration Fund | | | | | | | | | | | | | | | | |
| Asset Backed Securities | | | — | | | | 1,057,051 | | | | — | | | | 1,057,051 | |
| Mortgage Backed Securities1 | | | — | | | | 9,686,216 | | | | — | | | | 9,686,216 | |
| Corporate Bonds2 | | | — | | | | 5,523,886 | | | | — | | | | 5,523,886 | |
| Taxable Municipal Bonds3 | | | — | | | | 1,936,168 | | | | — | | | | 1,936,168 | |
| U.S. Government Agency Securities | | | — | | | | 825,116 | | | | — | | | | 825,116 | |
| U.S. Treasury Obligations | | | — | | | | 7,981,791 | | | | — | | | | 7,981,791 | |
| Investment in Affiliates | | | 1,055,296 | | | | — | | | | — | | | | 1,055,296 | |
| Total Investments | | | 1,055,296 | | | | 27,010,228 | | | | — | | | | 28,065,524 | |
| | | | | | | | | | | | | | | | | |
| Bond Fund | | | | | | | | | | | | | | | | |
| Asset Backed Securities | | | — | | | | 4,317,068 | | | | — | | | | 4,317,068 | |
| Mortgage Backed Securities1 | | | — | | | | 35,460,219 | | | | — | | | | 35,460,219 | |
| Corporate Bonds2 | | | — | | | | 19,550,622 | | | | — | | | | 19,550,622 | |
| Taxable Municipal Bonds3 | | | — | | | | 8,811,453 | | | | — | | | | 8,811,453 | |
| U.S. Government Agency Securities | | | — | | | | 2,999,860 | | | | — | | | | 2,999,860 | |
| U.S. Treasury Obligations | | | — | | | | 31,025,788 | | | | — | | | | 31,025,788 | |
| Investment in Affiliates | | | 1,405,699 | | | | — | | | | — | | | | 1,405,699 | |
| Total Investments | | | 1,405,699 | | | | 102,165,010 | | | | — | | | | 103,570,709 | |
| | | | | | | | | | | | | | | | | |
| Strategic Enhanced Yield Fund | | | | | | | | | | | | | | | | |
| Asset Backed Securities | | | — | | | | 681,099 | | | | — | | | | 681,099 | |
| Mortgage Backed Securities1 | | | — | | | | 4,045,212 | | | | — | | | | 4,045,212 | |
| Corporate Bonds2 | | | — | | | | 375,627 | | | | — | | | | 375,627 | |
| U.S. Treasury Obligations | | | — | | | | 2,631,035 | | | | — | | | | 2,631,035 | |
| Investment in Affiliates | | | 766,036 | | | | — | | | | — | | | | 766,036 | |
| Total Investments | | | 766,036 | | | | 7,732,973 | | | | — | | | | 8,499,009 | |
| | | | | | | | | | | | | | | | | |
| Ultra Short Tax-Free Income Fund | | | | | | | | | | | | | | | | |
| Municipal Bonds3 | | | — | | | | 21,439,322 | | | | — | | | | 21,439,322 | |
| Investment in Affiliates | | | 123,186 | | | | — | | | | — | | | | 123,186 | |
| Total Investments | | | 123,186 | | | | 21,439,322 | | | | — | | | | 21,562,508 | |
| | | | | | | | | | | | | | | | | |
| Active Core Fund | | | | | | | | | | | | | | | | |
| Common Stocks2 | | | 22,090,653 | | | | — | | | | — | | | | 22,090,653 | |
| Asset Backed Securities | | | — | | | | 996,810 | | | | — | | | | 996,810 | |
| Mortgage Backed Securities1 | | | — | | | | 6,978,581 | | | | — | | | | 6,978,581 | |
| Corporate Bonds2 | | | — | | | | 3,398,897 | | | | — | | | | 3,398,897 | |
| Taxable Municipal Bonds3 | | | — | | | | 2,382,498 | | | | — | | | | 2,382,498 | |
| U.S. Government Agency Securities | | | — | | | | 663,545 | | | | — | | | | 663,545 | |
| U.S. Treasury Obligations | | | — | | | | 6,785,440 | | | | — | | | | 6,785,440 | |
| Investment Companies | | | 1,850,546 | | | | — | | | | — | | | | 1,850,546 | |
| Investment in Affiliates | | | 2,743,085 | | | | — | | | | — | | | | 2,743,085 | |
| Total Investments | | | 26,684,284 | | | | 21,205,771 | | | | — | | | | 47,890,055 | |
| | | | | | | | | | | | | | | | | |
| Mid Cap Core Equity Fund | | | | | | | | | | | | | | | | |
| Common Stocks2 | | | 1,231,864 | | | | — | | | | — | | | | 1,231,864 | |
| Investment in Affiliates | | | 51,148 | | | | — | | | | — | | | | 51,148 | |
| Total Investments | | | 1,283,012 | | | | — | | | | — | | | | 1,283,012 | |
| | | | | | | | | | | | | | | | | |
| Opportunistic Fund | | | | | | | | | | | | | | | | |
| Common Stocks2 | | | 15,542,811 | | | | — | | | | — | | | | 15,542,811 | |
| Convertible Preferred Stocks | | | 2,236,500 | | | | — | | | | — | | | | 2,236,500 | |
| Mortgage Backed Securities1 | | | — | | | | 1,139,732 | | | | — | | | | 1,139,732 | |
| Corporate Bonds2 | | | — | | | | 5,940,326 | | | | — | | | | 5,940,326 | |
| U.S. Treasury Obligations | | | — | | | | 3,610,603 | | | | — | | | | 3,610,603 | |
| Investment Companies | | | 1,592,674 | | | | — | | | | — | | | | 1,592,674 | |
| Investment in Affiliates | | | 10,658,540 | | | | — | | | | — | | | | 10,658,540 | |
| Total Investments | | | 30,030,525 | | | | 10,690,661 | | | | — | | | | 40,721,186 | |
Notes to Financial Statements
August 31, 2019
| Fund | | LEVEL 1 -
Quoted Prices | | | LEVEL 2 -
Other Significant
Observable Inputs | | | LEVEL 3 -
Significant
Unobservable Inputs | | | Total | |
| World Energy Fund | | | | | | | | | | | | |
| Common Stocks2 | | $ | 18,075,437 | | | $ | — | | | | — | | | $ | 18,075,437 | |
| Corporate Bonds2 | | | — | | | | 1,723,359 | | | | — | | | | 1,723,359 | |
| Investment in Affiliates | | | 531,505 | | | | — | | | | — | | | | 531,505 | |
| Total Investments | | | 18,606,942 | | | | 1,723,359 | | | | — | | | | 20,330,301 | |
| 1 | Please see the Schedule of Portfolio investments for Mortgage Backed Securities classification. |
| 2 | Please see the Schedule of Portfolio Investments for Industry classification. |
| 3 | Please see the Schedule of Portfolio Investments for State classification. |
Securities Valuation:
The Money Market Funds, which operate as government funds, are eligible and have elected to use the amortized cost method of valuation pursuant to Rule 2a-7 under the 1940 Act. This involves valuing an instrument at its cost initially and thereafter assuming a constant accretion or amortization to maturity of any discount or premium, respectively, regardless of the impact of fluctuating interest rates on the market value of the instrument. This method may result in periods during which value, as determined by amortized cost, is higher or lower than the price each Money Market Fund would receive if it sold the investment. The value of securities in the Money Market Funds can be expected to vary inversely with changes in prevailing interest rates.
The following is an overview of how securities are valued in the Limited Duration Fund, Moderate Duration Fund, Bond Fund, Strategic Enhanced Yield Fund, Ultra Short Tax-Free Income Fund, Active Core Fund, Mid Cap Core Equity Fund, Opportunistic Fund, and World Energy Fund (the “Variable Net Asset Value Funds”).
Equity securities are valued at the closing price on the exchange or market where the security is principally traded (except for those traded on Nasdaq, which will be valued at the Nasdaq Official Closing Price). If there have been no sales for the day on any exchange or market, the security is valued at the latest available bid price on the exchange or market where the security is principally traded. Equity securities are typically categorized as Level 1 in the fair value hierarchy.
Fixed-income securities are valued using matrix pricing as determined by an independent pricing service approved by the Board. Fixed-income securities are valued using various inputs including new issue data, benchmark yields, reported trades, broker/dealer quotes, issuer spreads, two-sided markets, benchmark securities, bids, offers, reference data and industry and market events, and are typically categorized as Level 2 in the fair value hierarchy. In addition to the inputs noted for fixed-income securities, asset-backed and mortgage-backed securities are valued using principal payment and collateral performance information, and are typically categorized as Level 2 in the fair value hierarchy.
Short-term fixed-income securities purchased with 60 days or fewer to maturity and of sufficient credit quality are generally valued at amortized cost, which approximates current value, and are typically categorized as Level 2 in the fair value hierarchy.
Open-end mutual fund investments and exchange-traded funds are valued at the most recently calculated net asset value, and are typically categorized as Level 1 in the fair value hierarchy.
Repurchase agreements are valued at original cost, and are typically categorized as Level 2 in the fair value hierarchy.
Exchange-traded options and exchange-traded notes are valued at the closing price from the exchange, and are typically categorized as Level 1 in the fair value hierarchy.
Securities Sold Short:
The Funds may enter into short sales. Short sales are transactions in which a fund sells a security it does not own. To complete such a transaction, the Fund must borrow the security to make delivery to the buyer. The Fund is then obligated to replace the security borrowed by purchasing the security at the market price at the time of replacement. The price at such time may be more or less than the price at which the security was sold by the Fund.
Until the security is replaced, the Fund is required to pay the lender amounts equal to any dividends that accrue during the period of the loan. Dividends declared on open short positions are recorded on ex-date as dividend expense. To borrow the security, the Fund also may be required to pay a fee, which is shown as interest expense. The Fund records a liability for securities sold short and records an asset equal to the proceeds received. The amount of the liability is subsequently marked to market to reflect the market value of the securities sold short. The proceeds of the short sale may be retained by the broker, to the extent necessary to meet the margin requirements, until the short position is closed. A gain, limited to the price at which the Fund sold the security short, or a loss, unlimited in size, is recognized upon the close of a short sale.
None of the Funds shall sell securities short (unless it owns or has the right to obtain securities equivalent in kind and amount to the securities sold short or has segregated with the Custodian an amount of cash or liquid assets to cover the short position), however, this policy does not prevent the Funds from entering into short positions in foreign currency, futures contracts, options, forward contracts, swaps, caps, floors, collars and other financial instruments.
The Opportunistic Fund engaged in limited short sale activity during the period ended August 31, 2019; no short securities were held as of August 31, 2019.
Purchased Call Options:
Each of the Funds, except U.S. Treasury Fund and the Government Securities Money Market Fund, may purchase options to hedge (or reduce) its exposure to a portfolio asset or risk, to obtain leverage for the portfolio, to manage cash and/or as a substitute for taking a position in the reference asset or to gain exposure to certain asset classes. An option gives the purchaser of the option the right to buy, and a writer has the obligation to sell, the underlying security at the stated exercise price at any time prior to the expiration of the option, regardless of the market price of the security. The premium paid to the writer is consideration for undertaking the obligations under the option contract. Options purchased by the Fund will be valued at the last sale price, or in the absence of such a price, at the latest available bid price. The Funds may also purchase index options. Index options (or options on securities indices) are similar in many respects to options on securities, except that an index option gives theholder the right to receive, upon exercise, cash instead of securities, if the closing value of the securities index upon which the option is based is greater than the exercise price of the option.
Notes to Financial Statements
August 31, 2019
Purchasing options is a specialized investment technique that entails the possibility of a complete loss of the amounts paid as premiums to writers of options. The Funds can purchase options and index options provided that their total investment in such options immediately after such purchase does not exceed 5% of its total assets.
The Funds did not engage in purchased options activity during the period ending August 31, 2019.
Security Transactions and Related Income:
For all purposes other than financial reporting, security transactions are accounted for no later than one business day following the trade date. For financial reporting purposes, however, security transactions are accounted for on the trade date on the last business day of the reporting period. Interest income is recognized on an accrual basis and includes, where applicable, the amortization of premium and accretion of discount. Dividend income is recorded on the ex-dividend date or for certain foreign dividends, when the Funds become aware of such dividends declared. Gains or losses realized from sales of securities are determined using the specific identification method by comparing the identified cost of the security lot sold with the net sales proceeds.
Restricted Securities:
A restricted security is a security that has been purchased through a private offering and cannot be resold to the general public without prior registration under the Securities Act of 1933 (the “1933 Act”) or pursuant to the resale limitations provided by Rule 144 under the 1933 Act or an exemption from the registration requirements of the 1933 Act. Whether a restricted security is illiquid is determined pursuant to guidelines established by the Board. Not all restricted securities are considered illiquid. The illiquid, restricted securities held as of August 31, 2019 are identified below:
| Security | | Acquisition
Date | | Acquisition
Cost | | | Principal
Amount | | | Fair
Value | |
| Limited Duration Fund: | | | | | | | | | | | |
| Cazenovia Creek Funding II LLC, Series 2018-1A, Class A, 3.56%, 7/15/30 | | 8/22/18 | | $ | 1,038,513 | | | $ | 1,038,616 | | | $ | 1,046,042 | |
| Sun Trust Student Loan Trust, Series 2006-1A, Class B, 2.53%, 10/28/37 | | 5/26/17 and 4/11/18 | | | 969,224 | | | | 1,055,852 | | | | 947,847 | |
Repurchase Agreements:
The Funds may invest in repurchase agreements with financial institutions such as member banks of the Federal Deposit Insurance Corporation (FDIC) or from registered broker/dealers that Cavanal Hill Investment Management, Inc. (the “Adviser”) deems creditworthy under guidelines approved by the Board, subject to the seller’s agreement to repurchase such securities at a mutually agreed-upon date and price. The repurchase price generally equals the price paid by the Fund plus interest negotiated on the basis of current short-term rates, which may be more or less than the rate on the underlying securities collateral. The seller under a repurchase agreement is required to maintain the value of collateral held pursuant to the agreement at not less than the repurchase price (including accrued interest). Securities subject to repurchase agreements are held by each Fund’s custodian, another qualified sub-custodian, or in the Federal Reserve book-entry system. Master Repurchase Agreements (“MRA”) permit the Fund, under certain circumstances, including an event of default (such as bankruptcy or insolvency), to offset receivables under the MRA with collateral posted by the counterparty and create one net payment due to or from the Fund. However, bankruptcy or insolvency laws of a particular jurisdiction may impose restrictions on or prohibitions against such a right of offset in the event of the MRA counterparty’s bankruptcy or insolvency. Pursuant to the terms of the MRA, the Fund receives securities as collateral with a market value in excess of the repurchase price to be received by the Fund upon the maturity of the transaction. Upon a bankruptcy or insolvency of the MRA counterparty, the Fund would recognize a liability with respect to such excess collateral to reflect the Fund’s obligation under bankruptcy law to return the excess to the counterparty.
Distributions to Shareholders:
Distributions from net investment income are declared daily and paid monthly for the Money Market Funds, Limited Duration Fund, Moderate Duration Fund, Bond Fund, Strategic Enhanced Yield Fund and Ultra Short Tax-Free Income Fund. Distributions from net investment income are declared and paid quarterly for the Active Core Fund, Mid Cap Core Equity Fund, Opportunistic Fund, and World Energy Fund. Net realized capital gains, if any, are declared and distributed at least annually.
The character of income and gains distributed is determined in accordance with income tax regulations which may differ from U.S. GAAP. These “book/ tax” differences are either considered temporary or permanent in nature. To the extent that these differences are permanent in nature (e.g., reclassification of bond discount and premium, gain/loss on principal payments from mortgage-backed securities, and distributions), such amounts are reclassified within the composition of net assets based on their federal tax-basis treatment. Temporary differences do not require reclassification (e.g., wash sales). To the extent that distributions from net investment income and net realized gains exceed net investment income and net realized gains for tax purposes, they are reported as distributions of capital.
Allocations:
Expenses that directly relate to a specific Fund are charged directly to that Fund. Class-specific expenses are charged directly to the class incurring the expense. Other operating expenses of the Funds are prorated to each Fund on the basis of relative net assets or another appropriate method. Income, expenses (other than expenses attributable to a specific share class), and realized and unrealized gains and losses on investments are allocated to each class of shares based on its relative net assets or another appropriate basis.
Notes to Financial Statements
August 31, 2019
| 3. | Fees and Transactions with Related and Other Parties: |
The Adviser, a wholly-owned subsidiary of BOKF, NA (“BOKF”), serves as the Funds’ investment adviser. Under the terms of the Investment Advisory Agreement between the Adviser and the Trust, the Adviser is entitled to receive fees based on a percentage of the average daily net assets of each Fund according to the following schedule:
| Fund | | Annual Advisory Fee (as a percentage of net assets) | | Annual Expense Limitations* |
| U.S. Treasury Fund | | 0.05% | | |
| Government Securities Money Market Fund | | 0.05% | | |
| Limited Duration Fund | | 0.15% | | |
| Moderate Duration Fund | | 0.20% | | 0.49% |
| Bond Fund | | 0.20% | | |
| Strategic Enhanced Yield Fund | | 0.50% | | 0.76%** |
| Ultra Short Tax-Free Income Fund | | 0.15% | | 0.35%** |
| Active Core Fund | | 0.35% | | |
| Mid Cap Core Equity Fund | | 0.55% | | 0.81%** |
| Opportunistic Fund | | 0.85% | | 1.00% |
| World Energy Fund | | 0.60% | | 0.90% |
| * | Effective December 26, 2018, the Adviser has contractually agreed to waive fees or reimburse expenses so that expenses do not exceed the percentage of average daily net assets, plus class-specific fees, through December 31, 2019. |
| ** | Prior to December 26, 2018, the Adviser had contractually agreed to waive fees or reimburse expenses so that expenses do not exceed 0.76%, 0.56%, and 0.81%, respectively, of average daily net assets, plus class-specific fees, applicable to Strategic Enhanced Yield Fund, Ultra Short Tax-Free Income Fund, and Mid Cap Core Equity Fund, respectively. |
The Adviser serves as the Funds’ administrator. Under the terms of the Administration Agreement between the Adviser and the Trust, the Adviser is entitled to receive fees based on a percentage of the average daily net assets of each Fund according to the following schedule:
| Fund | | Annual Administration Fee (as a percentage of net assets) |
| U.S. Treasury Fund | | 0.05% |
| Government Securities Money Market Fund | | 0.05% |
| Limited Duration Fund | | 0.08% |
| Moderate Duration Fund | | 0.08% |
| Bond Fund | | 0.08% |
| Strategic Enhanced Yield Fund | | 0.08% |
| Ultra Short Tax-Free Income Fund | | 0.08% |
| Active Core Fund | | 0.08% |
| Mid Cap Core Equity Fund | | 0.08% |
| Opportunistic Fund | | 0.08% |
| World Energy Fund | | 0.08% |
Under a Sub-Administration Agreement, the Administrator pays Citi Fund Services Ohio, Inc. (“Citi”) to perform certain administrative duties for the Trust. Fees paid to Citi by the Administrator for sub-administration services are paid out of its administration fees and are not an additional charge to the Funds. For the year ending August 31, 2019, Citi was paid $734,834 by the Administrator. Citi serves the Trust as fund accountant and makes an employee available to serve as the Funds’ Chief Compliance Officer (the “CCO”). Citi receives additional fees for its services as fund accountant and CCO which are paid by the Funds.
BOKF serves the Trust as custodian for which it is paid a fee of up to 0.01% of each Fund’s average daily net assets. As custodian, BOKF is also entitled to any out-of-pocket expenses incurred.
FIS Investor Services, LLC (“FIS”) serves as transfer agent to the Trust and receives a fee for its services as transfer agent.
Certain officers of the Trust are affiliated with Citi, the Adviser, the distributor (see below) and/or BOKF. These persons are paid no fees directly by the Trust for serving as officers of the Trust.
Cavanal Hill Distributors, Inc. (“CHD”), an affiliate of the Adviser, provides distribution services to the Funds pursuant to a Distribution Agreement between the Trust and CHD. The Trust has adopted a Distribution and Shareholder Services Plan in accordance with Rule 12b-1 under the 1940 Act, pursuant to which the Funds are authorized to pay or reimburse CHD a periodic amount, calculated at an annual rate not to exceed 0.25% of the average daily net asset value of the Administrative, Investor, Service and A Shares, 0.50% of the Premier Shares, and 1.00% of the C Shares, and may be used by CHD to pay banks, including BOKF, broker dealers and other institutions. For the year ending August 31, 2019, BOKF received $3,373,055 under the agreement. CHD contractually agreed to waive 0.15% of such fee paid by the Service Shares and 0.45% of such fee paid by the Premier Shares of the Money Market Funds and 0.13% of such fee paid by the Administrative Shares of the Government Securities Money Market Fund through December 31, 2019.
Notes to Financial Statements
August 31, 2019
The Funds have entered into shareholder servicing agreements with BOKF, a broker-dealer affiliate and various service organizations. Services included in the servicing agreements are assisting in processing purchase, exchange and redemption requests; transmitting and receiving funds in connection with customer orders to purchase, exchange or redeem shares; and providing periodic statements. Shareholder servicing fees are incurred on a class level basis (where applicable). In consideration for these services, the service organizations received a fee from the Funds, computed daily and paid monthly, at an annual rate up to 0.25% for the Administrative, Institutional, Investor, Select, Service, Premier Shares and C Shares and up to 0.10% for the A Shares of the average daily net assets of the Funds’ shares held by the service organizations’ customers. For the year ending August 31, 2019, BOKF received net shareholder servicing fees of $4,254,935. For shareholder purchases made through BOKF, BOKF has contractually agreed to waive 0.25%, 0.15%, 0.17% and 0.25% of such fees paid by the Select, Service, Institutional and Premier Shares, respectively, of the Money Market Funds and 0.25%, 0.25%, 0.10% and 0.25% of such fees paid by the Institutional, Investor, A, and C Shares, respectively, of the Variable Net Asset Value Funds through December 31, 2019. The affiliate waivers result in reduction of the Shareholder Servicing Fee paid by all affiliated purchasers of a class.
From time to time, the Funds’ service providers may provide fee reductions and waivers in order to assist one or more of the Funds in maintaining more competitive expense ratios. Such reductions may be contractual, as disclosed in the Funds’ statutory prospectus, or voluntary and, as such, may occur on an ad hoc basis. No such reductions are subject to recoupment in subsequent fiscal periods, and voluntary reductions and waivers may be terminated at any time. Amounts reduced or waived under these arrangements are identified on the accompanying Statement of Operations.
Affiliated Transactions:
A summary of each Fund’s investment in an affiliated money market fund (Government Securities Money Market Fund, Select Shares) for the period ending August 31, 2019 is noted below:
| Fund | | Fair Value
8/31/18 | | | Purchases | | | Sales | | | Net Change in
Unrealized
Appreciation/
(Depreciation) | | | Fair Value
8/31/19 | | | Shares
as of
8/31/19 | | | Dividend Income | | | Net
Realized
Gains/
(Losses) | |
| Limited Duration Fund | | $ | 3,395,393 | | | $ | 53,215,324 | | | $ | (51,566,482 | ) | | $ | — | | | $ | 5,044,235 | | | | 5,044,235 | | | $ | 136,930 | | | $ | — | |
| Moderate Duration Fund | | | 1,114,485 | | | | 11,807,293 | | | | (11,866,482 | ) | | | — | | | | 1,055,296 | | | | 1,055,296 | | | | 26,333 | | | | — | |
| Bond Fund | | | 2,725,193 | | | | 41,070,074 | | | | (42,389,568 | ) | | | — | | | | 1,405,699 | | | | 1,405,699 | | | | 68,788 | | | | — | |
| Strategic Enhanced Yield Fund | | | 129,758 | | | | 7,560,794 | | | | (6,924,516 | ) | | | — | | | | 766,036 | | | | 766,036 | | | | 8,483 | | | | — | |
| Ultra Short Tax-Free Income Fund | | | 84,184 | | | | 15,244,541 | | | | (15,205,539 | ) | | | — | | | | 123,186 | | | | 123,186 | | | | 7,422 | | | | — | |
| Active Core Fund | | | 771,330 | | | | 15,313,487 | | | | (13,835,028 | ) | | | — | | | | 2,249,789 | | | | 2,249,789 | | | | 26,418 | | | | — | |
| Mid Cap Core Equity Fund | | | 63,541 | | | | 1,177,873 | | | | (1,190,266 | ) | | | — | | | | 51,148 | | | | 51,148 | | | | 1,348 | | | | — | |
| Opportunistic Fund | | | 1,856,545 | | | | 45,828,288 | | | | (42,355,293 | ) | | | — | | | | 5,329,540 | | | | 5,329,540 | | | | 88,949 | | | | — | |
| World Energy Fund | | | 904,508 | | | | 24,561,525 | | | | (24,934,528 | ) | | | — | | | | 531,505 | | | | 531,505 | | | | 19,835 | | | | — | |
| | | $ | 11,044,937 | | | $ | 215,779,199 | | | $ | (210,267,702 | ) | | $ | — | | | $ | 16,556,434 | | | | 16,556,434 | | | $ | 384,506 | | | $ | — | |
A summary of the Opportunistic Fund’s investment in an affiliated fund (U.S. Treasury Fund, Institutional Shares) for the year ending August 31, 2019 is noted below:
| Fund | | Fair Value
8/31/18 | | | Purchases | | | Sales | | | Net Change in
Unrealized
Appreciation/
(Depreciation) | | | Fair Value 8/31/19 | | | Shares
as of
8/31/19 | | | Dividend
Income | | | Net
Realized
Gains/
(Losses) | |
| Opportunistic Fund | | $ | — | | | $ | 5,329,000 | | | $ | — | | | $ | — | | | $ | 5,329,000 | | | | 5,329,000 | | | $ | 63,383 | | | $ | — | |
| | | $ | — | | | $ | 5,329,000 | | | $ | — | | | $ | — | | | $ | 5,329,000 | | | | 5,329,000 | | | $ | 63,383 | | | $ | — | |
A summary of the Active Core Fund’s investment in an affiliated fund (World Energy Fund, Institutional Shares) for the period ending August 31, 2019 is noted below:
| Fund | | Fair Value
8/31/18 | | | Purchases | | | Sales | | | Net Change in
Unrealized
Appreciation/
(Depreciation) | | | Fair Value
8/31/19 | | | Shares
as of
8/31/19 | | | Dividend
Income | | | Net
Realized
Gains/
(Losses) | |
| Active Core Fund | | $ | 698,215 | | | $ | — | | | $ | — | | | $ | (204,919 | ) | | $ | 493,296 | | | | 73,409 | | | $ | 9,663 | | | $ | — | |
| | | $ | 698,215 | | | $ | — | | | $ | — | | | $ | (204,919 | ) | | $ | 493,296 | | | | 73,409 | | | $ | 9,663 | | | $ | — | |
| 4. | Purchases and Sales of Securities: |
Purchases and sales of securities (excluding short-term securities and long-term U.S. government securities) for the year ending August 31, 2019 were as follows:
| Fund | | Purchases | | | Sales | |
| Limited Duration Fund | | $ | 31,190,264 | | | $ | 19,006,754 | |
| Moderate Duration Fund | | | 3,129,555 | | | | 3,796,674 | |
| Bond Fund | | | 19,275,639 | | | | 10,191,366 | |
| Strategic Enhanced Yield Fund | | | 4,000,186 | | | | 684,097 | |
| Ultra Short Tax-Free Income Fund | | | 20,601,987 | | | | 12,730,000 | |
| Active Core Fund | | | 15,779,151 | | | | 21,433,279 | |
| Mid Cap Core Equity Fund | | | 1,474,303 | | | | 2,336,595 | |
| Opportunistic Fund | | | 61,930,984 | | | | 76,146,481 | |
| World Energy Fund | | | 55,366,722 | | | | 77,450,477 | |
Notes to Financial Statements
August 31, 2019
Purchases and sales of long-term U.S. government securities for the year ending August 31, 2019 were as follows:
| Fund | | Purchases | | | Sales | |
| Limited Duration Fund | | $ | 25,237,878 | | | $ | 11,348,847 | |
| Moderate Duration Fund | | | 2,986,547 | | | | 5,526,926 | |
| Bond Fund | | | 12,109,724 | | | | 27,001,764 | |
| Strategic Enhanced Yield Fund | | | 4,670,879 | | | | 1,891,161 | |
| Active Core Fund | | | 3,193,603 | | | | 5,532,942 | |
| Opportunistic Fund | | | 2,158,284 | | | | 957,913 | |
| 5. | Credit Risk and Other Risk Considerations: |
The Ultra Short Tax-Free Income Fund invests primarily in debt instruments of municipal issuers. The issuers’ ability to meet their obligations may be affected by economic developments in a specific industry, sector or locale.
The Limited Duration Fund, Moderate Duration Fund, Bond Fund, Strategic Enhanced Yield Fund and Active Core Fund are each invested in mortgage-related, fixedincome instruments. Mortgage-backed securities are subject to prepayment risk and credit risk of mortgagors and may be sensitive to changes in prevailing interest rates. When interest rates rise, the value of fixed-income securities generally declines.
Mid Cap Core Equity Fund invests primarily in a diversified portfolio of common stocks of Mid Cap U.S. companies which are subject to foreign investment risk; as with stock, fund’s share price can fall because of weakness in the stock markets, a particular industry, or specific holdings. Stock markets can decline for many reasons, including adverse political or economic developments, changes in investor psychology, or heavy institutional selling.
The World Energy Fund’s concentration in securities in energy-related industries may present more risks than would be the case with funds that diversify investments in numerous industries and sectors of the economy. Energy-related securities can be significantly affected by events relating to political developments, energy conservation, commodity prices, and tax and government regulations.
It is the policy of each Fund to continue to qualify as a regulated investment company by complying with the provisions available to regulated investment companies, as defined under Subchapter M of the Internal Revenue Code, and to make distributions from net investment income and from net realized capital gains sufficient to relieve it from all, or substantially all, federal income taxes. Accordingly, no provisions for federal income taxes are required in the financial statements.
Management of the Funds has reviewed tax positions taken in tax years that remain subject to examination by tax authorities (i.e., the last three tax year ends and any interim tax period since then, as applicable). Management has determined that there are no uncertain tax positions that would require the Funds to record a tax liability and, therefore, there is no impact to the Funds’ financial statements.
The Funds may be subject to foreign taxes on dividends and realized capital gains. The Funds accrue such taxes, as applicable, based on their current interpretation of tax rules in the foreign markets in which they invest.
At August 31, 2019, the cost basis for federal income tax purposes, gross unrealized appreciation, gross unrealized depreciation and net unrealized appreciation/ (depreciation) were as follows:
| Fund | | Tax Cost of
Securities | | | Unrealized
Appreciation | | | Unrealized
Depreciation | | | Net Unrealized
Appreciation/
(Depreciation) | |
| Limited Duration | | $ | 120,047,546 | | | $ | 1,876,125 | | | $ | (1,955,206 | ) | | $ | (79,081 | ) |
| Moderate Duration Fund | | | 27,646,431 | | | | 707,366 | | | | (288,273 | ) | | | 419,093 | |
| Bond Fund | | | 99,809,872 | | | | 4,348,058 | | | | (587,221 | ) | | | 3,760,837 | |
| Strategic Enhanced Yield Fund | | | 8,203,979 | | | | 299,037 | | | | (4,007 | ) | | | 295,030 | |
| Ultra Short Tax-Free Income Fund | | | 21,548,164 | | | | 14,591 | | | | (247 | ) | | | 14,344 | |
| Active Core Fund | | | 38,946,948 | | | | 9,966,394 | | | | (1,023,287 | ) | | | 8,943,107 | |
| Mid Cap Core Equity Fund | | | 1,152,119 | | | | 222,545 | | | | (91,652 | ) | | | 130,893 | |
| Opportunistic Fund | | | 39,667,378 | | | | 2,518,175 | | | | (1,464,367 | ) | | | 1,053,808 | |
| World Energy Fund | | | 21,474,450 | | | | 1,416,551 | | | | (2,560,700 | ) | | | (1,144,149 | ) |
Notes to Financial Statements
August 31, 2019
The tax characteristics of distributions paid to shareholders during the fiscal years ending August 31, 2019 and 2018 were as follows:
| | | Distributions Paid From: | | | | | | | | | | | | | |
| 2019 | | Net
Investment
Income | | | Net Long-
Term Gains | | | Total Taxable
Distributions | | | Tax-Exempt
Distributions | | | Total
Distributions
Paid* | |
| U.S. Treasury Fund | | $ | 20,975,068 | | | $ | — | | | $ | 20,975,068 | | | $ | — | | | $ | 20,975,068 | |
| Government Securities Money Market Fund | | | 33,698,534 | | | | — | | | | 33,698,534 | | | | — | | | | 33,698,534 | |
| Limited Duration Fund | | | 2,662,026 | | | | — | | | | 2,662,026 | | | | — | | | | 2,662,026 | |
| Moderate Duration Fund | | | 687,948 | | | | — | | | | 687,948 | | | | — | | | | 687,948 | |
| Bond Fund | | | 2,628,976 | | | | — | | | | 2,628,976 | | | | — | | | | 2,628,976 | |
| Strategic Enhanced Yield Fund | | | 133,968 | | | | — | | | | 133,968 | | | | — | | | | 133,968 | |
| Ultra Short Tax-Free Income Fund | | | 18,068 | | | | — | | | | 18,068 | | | | 157,976 | | | | 176,044 | |
| Active Core Fund | | | 817,820 | | | | 2,669,352 | | | | 3,487,172 | | | | — | | | | 3,487,172 | |
| Mid Cap Core Equity Fund | | | 9,453 | | | | 52,843 | | | | 62,296 | | | | — | | | | 62,296 | |
| Opportunistic Fund | | | 1,740,711 | | | | 1,929,164 | | | | 3,669,875 | | | | — | | | | 3,669,875 | |
| World Energy Fund | | | 586,403 | | | | — | | | | 586,403 | | | | — | | | | 586,403 | |
| * | Total distributions paid may differ from that disclosed in the Statements of Changes in Net Assets because distributions are recognized when actually paid for tax purposes. |
| | | Distributions Paid From: | | | | | | | | | | | | | |
| 2018 | | Net
Investment
Income | | | Net Long-
Term Gains | | | Total Taxable
Distributions | | | Tax-Exempt
Distributions | | | Total
Distributions
Paid* | |
| U.S. Treasury Fund | | $ | 9,776,979 | | | $ | — | | | $ | 9,776,979 | | | $ | — | | | $ | 9,776,979 | |
| Government Securities Money Market Fund | | | 15,905,245 | | | | — | | | | 15,905,245 | | | | — | | | | 15,905,245 | |
| Limited Duration Fund | | | 2,278,075 | | | | — | | | | 2,278,075 | | | | — | | | | 2,278,075 | |
| Moderate Duration Fund | | | 645,477 | | | | — | | | | 645,477 | | | | — | | | | 645,477 | |
| Bond Fund | | | 2,687,602 | | | | — | | | | 2,687,602 | | | | — | | | | 2,687,602 | |
| Strategic Enhanced Yield Fund | | | 18,194 | | | | — | | | | 18,194 | | | | — | | | | 18,194 | |
| Ultra Short Tax-Free Income Fund | | | 2,491 | | | | — | | | | 2,491 | | | | 41,044 | | | | 43,535 | |
| Active Core Fund | | | 852,946 | | | | 2,343,729 | | | | 3,196,675 | | | | — | | | | 3,196,675 | |
| Mid Cap Core Equity Fund | | | 16,803 | | | | 345 | | | | 17,148 | | | | — | | | | 17,148 | |
| Opportunistic Fund | | | 1,850,264 | | | | 678,128 | | | | 2,528,392 | | | | — | | | | 2,528,392 | |
| World Energy Fund | | | 332,285 | | | | — | | | | 332,285 | | | | — | | | | 332,285 | |
| * | Total distributions paid may differ from that disclosed in the Statements of Changes in Net Assets because distributions are recognized when actually paid for tax purposes. |
As of August 31, 2019, the components of accumulated earnings/(deficit) on a tax basis were as follows:
| Fund | | Undistributed
Ordinary
Income/Tax
Exempt Income | | | Undistributed
Long-Term
Capital Gains | | | Accumulated
Earnings | | | Distributions
Payable | | | Accumulated Capital and
Other Losses* | | | Unrealized
Appreciation
(Depreciation)** | | | Total
Accumulated
Earnings/
(Deficit) | |
| U.S. Treasury Fund | | $ | 1,455,024 | | | $ | — | | | $ | 1,455,024 | | | $ | (1,452,111 | ) | | $ | (284 | ) | | $ | — | | | $ | 2,629 | |
| Government Securities Money Market Fund | | | 2,873,997 | | | | — | | | | 2,873,997 | | | | (2,866,423 | ) | | | (6 | ) | | | — | | | | 7,568 | |
| Limited Duration Fund | | | 308,093 | | | | — | | | | 308,093 | | | | (257,466 | ) | | | (6,398,118 | ) | | | (79,081 | ) | | | (6,426,572 | ) |
| Moderate Duration Fund | | | 74,284 | | | | — | | | | 74,284 | | | | (56,133 | ) | | | (5,520,662 | ) | | | 419,093 | | | | (5,083,418 | ) |
| Bond Fund | | | 237,785 | | | | — | | | | 237,785 | | | | (213,099 | ) | | | (4,442,162 | ) | | | 3,760,837 | | | | (656,639 | ) |
| Strategic Enhanced Yield Fund | | | 147,178 | | | | 12,482 | | | | 159,660 | | | | (18,188 | ) | | | — | | | | 295,030 | | | | 436,502 | |
| Ultra Short Tax-Free Income Fund | | | 25,408 | | | | — | | | | 25,408 | | | | (21,710 | ) | | | (115 | ) | | | 14,344 | | | | 17,927 | |
| Active Core Fund | | | 162,628 | | | | 1,501,276 | | | | 1,663,904 | | | | — | | | | — | | | | 8,943,107 | | | | 10,607,011 | |
| Mid Cap Core Equity Fund | | | 892 | | | | 49,725 | | | | 50,617 | | | | — | | | | — | | | | 130,893 | | | | 181,510 | |
| Opportunistic Fund | | | 78,186 | | | | — | | | | 78,186 | | | | — | | | | (3,716,989 | ) | | | 1,053,808 | | | | (2,584,995 | ) |
| World Energy Fund | | | 124,692 | | | | — | | | | 124,692 | | | | — | | | | (21,339,884 | ) | | | (1,144,149 | ) | | | (22,359,341 | ) |
| * | See below for post-October losses and capital loss carryforwards. |
| ** | The differences between book-basis and tax-basis unrealized appreciation/(depreciation) is attributable primarily to tax deferral of losses on wash sales and the difference between book and tax amortization methods for premium and market discounts. |
Notes to Financial Statements
August 31, 2019
At August 31, 2019, the following Funds had capital loss carryforwards as summarized in the tables below.
Capital loss carryforwards not subject to expiration:
| Fund | | Short-Term
Amount | | | Long-Term
Amount | | | | Total | |
| U.S. Treasury Fund | | $ | 284 | | | $ | — | | | $ | 284 | |
| Government Securities Money Market Fund | | | 6 | | | | — | | | | 6 | |
| Limited Duration Fund | | | — | | | | 6,398,118 | | | | 6,398,118 | |
| Moderate Duration Fund | | | 1,002,314 | | | | 4,518,348 | | | | 5,520,662 | |
| Bond Fund | | | 1,028,046 | | | | 3,414,116 | | | | 4,442,162 | |
| Ultra Short Tax-Free Income Fund | | | 115 | | | | — | | | | 115 | |
| Opportunistic Fund | | | 3,716,989 | | | | — | | | | 3,716,989 | |
| World Energy Fund | | | 21,319,748 | | | | 20,136 | | | | 21,339,884 | |
To the extent that these carryforwards are used to offset future capital gains, it is probable that the gains that are offset will not be distributed to shareholders.
During the year ended August 31, 2019, the following Funds had utilized capital loss carryforwards to offset capital gains:
| Fund | | Amount | |
| U.S. Treasury Fund | | $ | 10,772 | |
| Limited Duration Fund | | | 138,410 | |
| Bond Fund | | | 39,307 | |
| Strategic Enhanced Yield Fund | | | 858 | |
| 7. | Recent Accounting Pronouncements: |
In March 2017, FASB issued Accounting Standards Update No. 2017-08 (“ASU 2017-08”), “Receivables—Nonrefundable Fees and Other Costs (Subtopic 310-20): Premium Amortization on Purchased Callable Debt Securities.” ASU 2017-08 changed the amortization period for purchased non-contingently callable debt securities held at a premium. Specifically, it required the premium to be amortized to the earliest call date. ASU 2017-08 does not require an accounting change for securities held at a discount, which continues to accrete to maturity. The Funds will adopt ASU 2017-08 on a modified retrospective basis as of September 1, 2019. The adoption of ASU 2017-08 will not materially impact the Funds’ financial statements.
In August 2018, FASB issued Accounting Standards Update No. 2018-13, “Disclosure Framework - Changes to the Disclosure Requirements for Fair Value Measurement” (“ASU 2018-13”). This update makes certain removals from, changes to and additions to existing disclosure requirements for fair value measurement. In addition, the amendments clarify that materiality is an appropriate consideration when evaluating disclosure requirements. ASU 2018-13 is effective for financial statements issued for fiscal years beginning after December 15, 2019, and interim periods within those fiscal years. As permitted, the Funds have early adopted ASU 2018-13 with the financial statements prepared as of August 31, 2019.
In August 2018, the SEC adopted amendments to certain financial statement disclosure requirements to conform them to GAAP for investment companies. These amendments made certain removals from, changes to and additions to existing disclosure requirements under Regulation S-X. The Funds’ adoption of these amendments, effective with the financial statements prepared as of August 31, 2019, had no effect on the Funds’ net assets or results of operations. As a result of adopting these amendments, the distributions to shareholders in the August 31, 2018 Statements of Changes in Net Assets presented herein have been reclassified to conform to the current year presentation, which includes all distributions to each class of shareholders, other than tax basis return of capital distributions, in one line item. Prior to adoption of these amendments, the distributions to shareholders in the August 31, 2018 Statements of Changes in Net Assets appeared as follows:
Notes to Financial Statements
August 31, 2019
| | | | | | | | | | | | | | | | | | | | | | | | | | | | | | | | | | | | | | | | | | | | | |
| | | U.S. Treasury Fund | | | Government Securities Money Market | | | Limited Duration Fund | | | Moderate Duration Fund | | | Bond Fund | | | Strategic Enhanced Yield Fund | | | Ultra Short Tax-Free Income Fund | | | Active Core Fund | | | Mid Cap Core Equity Fund | | | Opportunistic Fund | | | World Energy Fund | |
| | | Year Ended August 31, 2018 | | | For the period December 26, 2017(a)through August 31, 2018 | | | Year Ended August 31, 2018 | |
| Distributions to Shareholders: | | | | | | | | | | | | | | | | | | | | | | | | | | | | | | | | | | | | | | | | | | | | |
| From net investment income: | | | | | | | | | | | | | | | | | | | | | | | | | | | | | | | | | | | | | | | | | | | | |
| Administrative Shares | | $ | (7,909,238 | ) | | $ | (5,306,769 | ) | | $ | — | | | $ | — | | | $ | — | | | $ | — | | | $ | — | | | $ | — | | | $ | — | | | $ | — | | | $ | — | |
| Service Shares | | | (345,379 | ) | | | — | | | | — | | | | — | | | | — | | | | — | | | | — | | | | — | | | | — | | | | — | | | | — | |
| Select Shares | | | (582,939 | ) | | | (9,173,616 | ) | | | — | | | | — | | | | — | | | | — | | | | — | | | | — | | | | — | | | | — | | | | — | |
| Premier Shares | | | — | | | | (1,230,984 | ) | | | — | | | | — | | | | — | | | | — | | | | — | | | | — | | | | — | | | | — | | | | — | |
| Investor Shares | | | — | | | | — | | | | (258,800 | ) | | | (126,262 | ) | | | (149,365 | ) | | | (43 | ) | | | (248 | ) | | | (73,639 | ) | | | (3,292 | ) | | | (6,346 | ) | | | (33,476 | ) |
| Institutional Shares | | | (1,792,864 | ) | | | (1,571,051 | ) | | | (2,049,971 | ) | | | (514,419 | ) | | | (2,549,345 | ) | | | (14,512 | ) | | | (54,230 | ) | | | (755,671 | ) | | | (11,969 | ) | | | (198,767 | ) | | | (253,387 | ) |
| A Shares | | | — | | | | — | | | | (20,810 | ) | | | (11,637 | ) | | | (2,744 | ) | | | (7,030 | ) | | | — | | | | (20,522 | ) | | | (1,346 | ) | | | (5,649 | ) | | | (38,506 | ) |
| C Shares | | | — | | | | — | | | | — | | | | — | | | | — | | | | — | | | | — | | | | (416 | ) | | | — | | | | — | | | | (6,916 | ) |
| | | | (10,630,420 | ) | | | (17,282,420 | ) | | | (2,329,581 | ) | | | (652,318 | ) | | | (2,701,454 | ) | | | (21,585 | ) | | | (54,478 | ) | | | (850,248 | ) | | | (16,607 | ) | | | (210,762 | ) | | | (332,285 | ) |
| From net realized gains: | | | | | | | | | | | | | | | | | | | | | | | | | | | | | | | | | | | | | | | | | | | | |
| Investor Shares | | | — | | | | — | | | | — | | | | — | | | | — | | | | — | | | | — | | | | (238,064 | ) | | | (191 | ) | | | (146,597 | ) | | | — | |
| Institutional Shares | | | — | | | | — | | | | — | | | | — | | | | — | | | | — | | | | — | | | | (2,036,724 | ) | | | (288 | ) | | | (2,040,445 | ) | | | — | |
| A Shares | | | — | | | | — | | | | — | | | | — | | | | — | | | | — | | | | — | | | | (68,463 | ) | | | (62 | ) | | | (99,993 | ) | | | — | |
| C Shares | | | — | | | | — | | | | — | | | | — | | | | — | | | | — | | | | — | | | | (3,176 | ) | | | — | | | | (30,595 | ) | | | — | |
| | | | — | | | | — | | | | — | | | | — | | | | — | | | | — | | | | — | | | | (2,346,427 | ) | | | (541 | ) | | | (2,317,630 | ) | | | — | |
| Change in net assets from shareholder distributions: | | $ | (10,630,420 | ) | | $ | (17,282,420 | ) | | $ | (2,329,581 | ) | | $ | (652,318 | ) | | $ | (2,701,454 | ) | | $ | (21,585 | ) | | $ | (54,478 | ) | | $ | (3,196,675 | ) | | $ | (17,148 | ) | | $ | (2,528,392 | ) | | $ | (332,285 | ) |
Accumulated net investment
income | | $ | 1,134 | | | $ | 285 | | | $ | 49,411 | | | $ | 14,637 | | | $ | 14,644 | | | $ | 345 | | | $ | 3,781 | | | $ | 161,506 | | | $ | 2,573 | | | $ | 170,754 | | | $ | 80,499 | |
| (a) | Commencement of operations. |
Management has evaluated the need for disclosures and/or adjustments resulting from subsequent events through the date the financial statements were issued.
Based on this evaluation, no additional disclosures and/or adjustments were required as of August 31, 2019.
(This page had been intentionally left blank)
Financial Highlights
For a share of capital stock outstanding throughout the periods indicated.
| | | | | | Change in Net Assets
Resulting From Operations: | | | Less Dividends From: |
| | | Net Asset
Value,
Beginning of
Period | | Net
Investment
Income
(Loss) | | Total from
Investment
Activities | | Dividends
from Net
Investment
Income | | Distributions
from Net
Realized
Gains from
Investments | | Total
Dividends and
Distributions |
| U.S. Treasury Fund | | | | | | | | | | | | | | | | | | | | | | | | |
| Administrative Shares | | | | | | | | | | | | | | | | | | | | | | | | |
| Year Ended August 31, 2019 | | | $1.000 | | | $ | 0.020 | | | $ | 0.020 | | | $ | (0.020 | ) | | $ | — | | | $ | (0.020 | ) |
| Year Ended August 31, 2018 | | | 1.000 | | | | 0.009 | | | | 0.009 | | | | (0.009 | ) | | | — | | | | (0.009 | ) |
| Year Ended August 31, 2017 | | | 1.000 | | | | 0.001 | | | | 0.001 | | | | (0.001 | ) | | | — | | | | (0.001 | ) |
| Year Ended August 31, 2016 | | | 1.000 | | | | — | | | | — | | | | — | | | | — | | | | — | |
| Year Ended August 31, 2015 | | | 1.000 | | | | — | | | | — | | | | — | | | | — | | | | — | |
| Service Shares | | | | | | | | | | | | | | | | | | | | | | | | |
| Year Ended August 31, 2019 | | | 1.000 | | | | 0.020 | | | | 0.020 | | | | (0.020 | ) | | | — | | | | (0.020 | ) |
| Year Ended August 31, 2018 | | | 1.000 | | | | 0.011 | | | | 0.011 | | | | (0.011 | ) | | | — | | | | (0.011 | ) |
| Year Ended August 31, 2017 | | | 1.000 | | | | 0.003 | | | | 0.003 | | | | (0.003 | ) | | | — | | | | (0.003 | ) |
| Year Ended August 31, 2016 | | | 1.000 | | | | — | | | | — | | | | — | | | | — | | | | — | |
| Year Ended August 31, 2015 | | | 1.000 | | | | — | | | | — | | | | — | | | | — | | | | — | |
| Institutional Shares | | | | | | | | | | | | | | | | | | | | | | | | |
| Year Ended August 31, 2019 | | | 1.000 | | | | 0.020 | | | | 0.020 | | | | (0.020 | ) | | | — | | | | (0.020 | ) |
| Year Ended August 31, 2018 | | | 1.000 | | | | 0.012 | | | | 0.012 | | | | (0.012 | ) | | | — | | | | (0.012 | ) |
| Year Ended August 31, 2017 | | | 1.000 | | | | 0.004 | | | | 0.004 | | | | (0.004 | ) | | | — | | | | (0.004 | ) |
| Year Ended August 31, 2016 | | | 1.000 | | | | — | | | | — | | | | — | | | | — | | | | — | |
| Year Ended August 31, 2015 | | | 1.000 | | | | — | | | | — | | | | — | | | | — | | | | — | |
| Select Shares | | | | | | | | | | | | | | | | | | | | | | | | |
| Year Ended August 31, 2019 | | | 1.000 | | | | 0.020 | | | | 0.020 | | | | (0.020 | ) | | | — | | | | (0.020 | ) |
| December 26, 2017(d) through August 31, 2018 | | | 1.000 | | | | 0.010 | | | | 0.010 | | | | (0.010 | ) | | | — | | | | (0.010 | ) |
| | | | | | | | | | | | | | | | | | | | | | | | | |
| Government Securities Money Market Fund | | | | | | | | | | | | | | | | | | | | | | | | |
| Administrative Shares | | | | | | | | | | | | | | | | | | | | | | | | |
| Year Ended August 31, 2019 | | | 1.000 | | | | 0.020 | | | | 0.020 | | | | (0.020 | ) | | | — | | | | (0.020 | ) |
| Year Ended August 31, 2018 | | | 1.000 | | | | 0.009 | | | | 0.009 | | | | (0.009 | ) | | | — | | | | (0.009 | ) |
| Year Ended August 31, 2017 | | | 1.000 | | | | 0.001 | | | | 0.001 | | | | (0.001 | ) | | | — | | | | (0.001 | ) |
| Year Ended August 31, 2016 | | | 1.000 | | | | — | | | | — | | | | — | | | | — | | | | — | |
| Year Ended August 31, 2015 | | | 1.000 | | | | — | | | | — | | | | — | | | | — | | | | — | |
| Institutional Shares | | | | | | | | | | | | | | | | | | | | | | | | |
| Year Ended August 31, 2019 | | | 1.000 | | | | 0.020 | | | | 0.020 | | | | (0.020 | ) | | | — | | | | (0.020 | ) |
| Year Ended August 31, 2018 | | | 1.000 | | | | 0.012 | | | | 0.012 | | | | (0.012 | ) | | | — | | | | (0.012 | ) |
| Year Ended August 31, 2017 | | | 1.000 | | | | 0.004 | | | | 0.004 | | | | (0.004 | ) | | | — | | | | (0.004 | ) |
| Year Ended August 31, 2016 | | | 1.000 | | | | — | | | | — | | | | — | | | | — | | | | — | |
| Year Ended August 31, 2015 | | | 1.000 | | | | — | | | | — | | | | — | | | | — | | | | — | |
| Select Shares | | | | | | | | | | | | | | | | | | | | | | | | |
| Year Ended August 31, 2019 | | | 1.000 | | | | 0.020 | | | | 0.020 | | | | (0.020 | ) | | | — | | | | (0.020 | ) |
| Year Ended August 31, 2018 | | | 1.000 | | | | 0.013 | | | | 0.013 | | | | (0.013 | ) | | | — | | | | (0.013 | ) |
| September 15, 2016(d) through August 31, 2017 | | | 1.000 | | | | 0.005 | | | | 0.005 | | | | (0.005 | ) | | | — | | | | (0.005 | ) |
| Premier Shares | | | | | | | | | | | | | | | | | | | | | | | | |
| Year Ended August 31, 2019 | | | 1.000 | | | | 0.020 | | | | 0.020 | | | | (0.020 | ) | | | — | | | | (0.020 | ) |
| Year Ended August 31, 2018 | | | 1.000 | | | | 0.012 | | | | 0.012 | | | | (0.012 | ) | | | — | | | | (0.012 | ) |
| Year Ended August 31, 2017 | | | 1.000 | | | | 0.004 | | | | 0.004 | | | | (0.004 | ) | | | — | | | | (0.004 | ) |
| Year Ended August 31, 2016 | | | 1.000 | | | | — | | | | — | | | | — | | | | — | | | | — | |
| Year Ended August 31, 2015 | | | 1.000 | | | | — | | | | — | | | | — | | | | — | | | | — | |
| (a) | Not annualized for periods less than one year. |
| (b) | Annualized for periods less than one year. |
| (c) | During the period, certain fees were waived. If such fee waivers had not occurred, the ratios would have been as indicated. |
| (d) | Commencement of operations. |
Amounts designated as “—” are 0 or have been rounded to 0.
| | | | | | | | | | | | | Ratios/Supplemental Data:(b) |
Net Asset
Value, End of
Period | | Total
Return(a) | | Net Assets End
of Period (000s) | | Ratio of Net
Expenses to
Average Net
Assets | | Ratio of Net
Investment Income
(Loss) to Average
Net Assets | | Ratio of Gross
Expenses to Average
Net Assets(c) |
| | | | | | | | | | | | | | | | | | | | | | | |
| | | | | | | | | | | | | | | | | | | | | | | |
| | | | | | | | | | | | | | | | | | | | | | | |
| | $1.000 | | | | 1.63 | % | | $ | 864,882 | | | | 0.69 | % | | | 1.62 | % | | | 0.69 | % |
| | 1.000 | | | | 0.79 | % | | | 957,502 | | | | 0.67 | % | | | 0.77 | % | | | 0.67 | % |
| | 1.000 | | | | 0.08 | % | | | 1,057,228 | | | | 0.53 | % | | | 0.08 | % | | | 0.73 | % |
| | 1.000 | | | | 0.01 | % | | | 1,310,795 | | | | 0.22 | % | | | 0.01 | % | | | 0.79 | % |
| | 1.000 | | | | — | % | | | 1,299,328 | | | | 0.07 | % | | | — | % | | | 0.86 | % |
| | | | | | | | | | | | | | | | | | | | | | | |
| | 1.000 | | | | 1.93 | % | | | 79,927 | | | | 0.39 | % | | | 1.93 | % | | | 0.69 | % |
| | 1.000 | | | | 1.09 | % | | | 33,720 | | | | 0.37 | % | | | 1.11 | % | | | 0.67 | % |
| | 1.000 | | | | 0.25 | % | | | 30,662 | | | | 0.37 | % | | | 0.22 | % | | | 0.73 | % |
| | 1.000 | | | | 0.01 | % | | | 44,780 | | | | 0.23 | % | | | — | % | | | 0.79 | % |
| | 1.000 | | | | — | % | | | 42,966 | | | | 0.07 | % | | | — | % | | | 0.86 | % |
| | | | | | | | | | | | | | | | | | | | | | | |
| | 1.000 | | | | 2.05 | % | | | 94,055 | | | | 0.27 | % | | | 2.04 | % | | | 0.44 | % |
| | 1.000 | | | | 1.21 | % | | | 97,238 | | | | 0.25 | % | | | 1.13 | % | | | 0.42 | % |
| | 1.000 | | | | 0.35 | % | | | 209,469 | | | | 0.27 | % | | | 0.35 | % | | | 0.48 | % |
| | 1.000 | | | | 0.03 | % | | | 219,856 | | | | 0.21 | % | | | 0.02 | % | | | 0.54 | % |
| | 1.000 | | | | — | % | | | 110,133 | | | | 0.07 | % | | | — | % | | | 0.61 | % |
| | | | | | | | | | | | | | | | | | | | | | | |
| | 1.000 | | | | 2.14 | % | | | 58,826 | | | | 0.19 | % | | | 2.13 | % | | | 0.44 | % |
| | 1.000 | | | | 0.99 | % | | | 51,839 | | | | 0.17 | % | | | 1.46 | % | | | 0.42 | % |
| | | | | | | | | | | | | | | | | | | | | | | |
| | | | | | | | | | | | | | | | | | | | | | | |
| | | | | | | | | | | | | | | | | | | | | | | |
| | 1.000 | | | | 1.77 | % | | | 489,932 | | | | 0.56 | % | | | 1.77 | % | | | 0.69 | % |
| | 1.000 | | | | 0.91 | % | | | 538,798 | | | | 0.57 | % | | | 0.88 | % | | | 0.70 | % |
| | 1.000 | | | | 0.14 | % | | | 686,821 | | | | 0.49 | % | | | 0.13 | % | | | 0.72 | % |
| | 1.000 | | | | 0.01 | % | | | 945,475 | | | | 0.27 | % | | | 0.01 | % | | | 0.80 | % |
| | 1.000 | | | | 0.01 | % | | | 942,950 | | | | 0.10 | % | | | 0.01 | % | | | 0.86 | % |
| | | | | | | | | | | | | | | | | | | | | | | |
| | 1.000 | | | | 2.06 | % | | | 94,595 | | | | 0.27 | % | | | 2.05 | % | | | 0.44 | % |
| | 1.000 | | | | 1.20 | % | | | 102,020 | | | | 0.28 | % | | | 1.13 | % | | | 0.45 | % |
| | 1.000 | | | | 0.38 | % | | | 181,637 | | | | 0.27 | % | | | 0.32 | % | | | 0.47 | % |
| | 1.000 | | | | 0.05 | % | | | 756,948 | | | | 0.24 | % | | | 0.04 | % | | | 0.55 | % |
| | 1.000 | | | | 0.01 | % | | | 583,051 | | | | 0.10 | % | | | 0.01 | % | | | 0.61 | % |
| | | | | | | | | | | | | | | | | | | | | | | |
| | 1.000 | | | | 2.14 | % | | | 988,003 | | | | 0.19 | % | | | 2.13 | % | | | 0.44 | % |
| | 1.000 | | | | 1.28 | % | | | 800,991 | | | | 0.20 | % | | | 1.30 | % | | | 0.45 | % |
| | 1.000 | | | | 0.45 | % | | | 640,260 | | | | 0.19 | % | | | 0.48 | % | | | 0.47 | % |
| | | | | | | | | | | | | | | | | | | | | | | |
| | 1.000 | | | | 2.09 | % | | | 233,659 | | | | 0.24 | % | | | 2.08 | % | | | 0.94 | % |
| | 1.000 | | | | 1.23 | % | | | 105,598 | | | | 0.25 | % | | | 1.26 | % | | | 0.95 | % |
| | 1.000 | | | | 0.41 | % | | | 72,292 | | | | 0.24 | % | | | 0.43 | % | | | 0.97 | % |
| | 1.000 | | | | 0.07 | % | | | 15,874 | | | | 0.22 | % | | | 0.06 | % | | | 1.05 | % |
| | 1.000 | | | | 0.01 | % | | | 3,365 | | | | 0.10 | % | | | 0.01 | % | | | 1.11 | % |
Financial Highlights
For a share of capital stock outstanding throughout the periods indicated.
| | | | | | | Change in Net Assets Resulting From Operations: | | Less Dividends From: |
| | | Net Asset
Value,
Beginning of
Period | | Net
Investment
Income
(Loss) | | Net Realized
and
Unrealized
Gains
(Losses) on
Investments | | Total from
Investment
Activities | | Dividends
from Net
Investment
Income | | Distributions
from Net
Realized
Gains from
Investments | | Total
Dividends and
Distributions |
| | | | | | | | | | | | | | | | | | | | | | | | | | | | | |
| Limited Duration Fund | | | | | | | | | | | | | | | | | | | | | | | | | | | | |
| Investor Shares | | | | | | | | | | | | | | | | | | | | | | | | | | | | |
| Year Ended August 31, 2019 | | $ | 9.41 | | | $ | 0.21 | | | $ | 0.21 | | | $ | 0.42 | | | $ | (0.21 | ) | | $ | — | | | $ | (0.21 | ) |
| Year Ended August 31, 2018 | | | 9.61 | | | | 0.16 | | | | (0.15 | ) | | | 0.01 | | | | (0.21 | ) | | | — | | | | (0.21 | ) |
| Year Ended August 31, 2017 | | | 9.60 | | | | 0.08 | | | | 0.05 | | | | 0.13 | | | | (0.12 | ) | | | — | | | | (0.12 | ) |
| Year Ended August 31, 2016 | | | 9.60 | | | | 0.08 | | | | 0.03 | | | | 0.11 | | | | (0.11 | ) | | | — | | | | (0.11 | ) |
| Year Ended August 31, 2015 | | | 9.62 | | | | 0.08 | | | | (0.01 | ) | | | 0.07 | | | | (0.09 | ) | | | — | | | | (0.09 | ) |
| Institutional Shares | | | | | | | | | | | | | | | | | | | | | | | | | | | | |
| Year Ended August 31, 2019 | | | 9.40 | | | | 0.23 | | | | 0.23 | | | | 0.46 | | | | (0.24 | ) | | | — | | | | (0.24 | ) |
| Year Ended August 31, 2018 | | | 9.60 | | | | 0.19 | | | | (0.16 | ) | | | 0.03 | | | | (0.23 | ) | | | — | | | | (0.23 | ) |
| Year Ended August 31, 2017 | | | 9.59 | | | | 0.11 | | | | 0.05 | | | | 0.16 | | | | (0.15 | ) | | | — | | | | (0.15 | ) |
| Year Ended August 31, 2016 | | | 9.59 | | | | 0.11 | | | | 0.03 | | | | 0.14 | | | | (0.14 | ) | | | — | | | | (0.14 | ) |
| Year Ended August 31, 2015 | | | 9.61 | | | | 0.10 | | | | (0.01 | ) | | | 0.09 | | | | (0.11 | ) | | | — | | | | (0.11 | ) |
| A Shares | | | | | | | | | | | | | | | | | | | | | | | | | | | | |
| Year Ended August 31, 2019 | | | 9.41 | | | | 0.21 | | | | 0.21 | | | | 0.42 | | | | (0.21 | ) | | | — | | | | (0.21 | ) |
| Year Ended August 31, 2018 | | | 9.61 | | | | 0.16 | | | | (0.15 | ) | | | 0.01 | | | | (0.21 | ) | | | — | | | | (0.21 | ) |
| Year Ended August 31, 2017 | | | 9.60 | | | | 0.09 | | | | 0.05 | | | | 0.14 | | | | (0.13 | ) | | | — | | | | (0.13 | ) |
| Year Ended August 31, 2016 | | | 9.60 | | | | 0.08 | | | | 0.04 | | | | 0.12 | | | | (0.12 | ) | | | — | | | | (0.12 | ) |
| Year Ended August 31, 2015 | | | 9.62 | | | | 0.08 | | | | (0.01 | ) | | | 0.07 | | | | (0.09 | ) | | | — | | | | (0.09 | ) |
| (a) | Not annualized for periods less than one year. |
| (b) | Annualized for periods less than one year, except for Portfolio Turnover. |
| (c) | During the period, certain fees were waived. If such fee waivers had not occurred, the ratios would have been as indicated. |
| (d) | Portfolio turnover is calculated on the basis of the Fund, as a whole, without distinguishing between the classes of shares issued. |
Amounts designated as “—” are 0 or have been rounded to 0.
| | | | | | | | | | | | | Ratios/Supplemental Data:(b) |
Net Asset
Value, End
of Period | | Total Return
(Excludes Sales
Charge)(a) | | Net Assets
End of Period
(000s) | | Ratio of Net
Expenses to
Average Net
Assets | | Ratio of Net
Investment
Income
(Loss) to
Average Net
Assets | | Ratio of
Gross
Expenses to
Average Net
Assets(c) | | Portfolio
Turnover(d) |
| | | | | | | | | | | | | | | | | | | | | | | | | | | |
| | | | | | | | | | | | | | | | | | | | | | | | | | | |
| | | | | | | | | | | | | | | | | | | | | | | | | | | |
| $ | 9.62 | | | | 4.56 | % | | $ | 4,126 | | | | 0.74 | % | | | 2.19 | % | | | 0.98 | % | | | 34 | % |
| | 9.41 | | | | 0.07 | % | | | 8,642 | | | | 0.80 | % | | | 1.63 | % | | | 0.99 | % | | | 70 | % |
| | 9.61 | | | | 1.37 | % | | | 15,691 | | | | 0.74 | % | | | 0.89 | % | | | 1.08 | % | | | 69 | % |
| | 9.60 | | | | 1.19 | % | | | 36,878 | | | | 0.69 | % | | | 0.87 | % | | | 1.29 | % | | | 80 | % |
| | 9.60 | | | | 0.71 | % | | | 44,030 | | | | 0.67 | % | | | 0.82 | % | | | 1.42 | % | | | 39 | % |
| | | | | | | | | | | | | | | | | | | | | | | | | | | |
| | 9.62 | | | | 4.94 | % | | | 114,269 | | | | 0.48 | % | | | 2.45 | % | | | 0.73 | % | | | 34 | % |
| | 9.40 | | | | 0.37 | % | | | 87,618 | | | | 0.49 | % | | | 1.99 | % | | | 0.74 | % | | | 70 | % |
| | 9.60 | | | | 1.68 | % | | | 82,109 | | | | 0.43 | % | | | 1.22 | % | | | 0.83 | % | | | 69 | % |
| | 9.59 | | | | 1.48 | % | | | 89,098 | | | | 0.39 | % | | | 1.16 | % | | | 1.04 | % | | | 80 | % |
| | 9.59 | | | | 0.97 | % | | | 105,478 | | | | 0.42 | % | | | 1.06 | % | | | 1.17 | % | | | 39 | % |
| | | | | | | | | | | | | | | | | | | | | | | | | | | |
| | 9.62 | | | | 4.57 | % | | | 585 | | | | 0.72 | % | | | 2.20 | % | | | 0.83 | % | | | 34 | % |
| | 9.41 | | | | 0.13 | % | | | 588 | | | | 0.74 | % | | | 1.65 | % | | | 0.84 | % | | | 70 | % |
| | 9.61 | | | | 1.43 | % | | | 1,238 | | | | 0.68 | % | | | 0.97 | % | | | 0.93 | % | | | 69 | % |
| | 9.60 | | | | 1.23 | % | | | 1,635 | | | | 0.64 | % | | | 0.96 | % | | | 1.14 | % | | | 80 | % |
| | 9.60 | | | | 0.72 | % | | | 7,996 | | | | 0.67 | % | | | 0.81 | % | | | 1.27 | % | | | 39 | % |
Financial Highlights
For a share of capital stock outstanding throughout the periods indicated.
| | | | | | | Change in Net Assets Resulting From Operations: | | Less Dividends From: |
| | | Net Asset
Value,
Beginning of
Period | | Net
Investment
Income
(Loss) | | Net Realized
and
Unrealized
Gains
(Losses) on
Investments | | Total from Investment Activities | | Dividends from Net Investment Income | | Distributions from Net Realized Gains from Investments | | Total Dividends and Distributions |
| | | | | | | | | | | | | | | | | | | | | | | | | | | | | |
| Moderate Duration Fund | | | | | | | | | | | | | | | | | | | | | | | | | | | | |
| Investor Shares | | | | | | | | | | | | | | | | | | | | | | | | | | | | |
| Year Ended August 31, 2019 | | $ | 10.31 | | | | $0.24 | | | $ | 0.32 | | | $ | 0.56 | | | $ | (0.23 | ) | | $ | — | | | $ | (0.23 | ) |
| Year Ended August 31, 2018 | | | 10.48 | | | | 0.16 | | | | (0.17 | ) | | | (0.01 | ) | | | (0.16 | ) | | | — | | | | (0.16 | ) |
| Year Ended August 31, 2017 | | | 10.60 | | | | 0.09 | | | | (0.02 | ) | | | 0.07 | | | | (0.19 | ) | | | — | | | | (0.19 | ) |
| Year Ended August 31, 2016 | | | 10.53 | | | | 0.14 | | | | 0.08 | | | | 0.22 | | | | (0.15 | ) | | | — | | | | (0.15 | ) |
| Year Ended August 31, 2015 | | | 10.54 | | | | 0.12 | | | | (0.01 | ) | | | 0.11 | | | | (0.12 | ) | | | — | | | | (0.12 | ) |
| Institutional Shares | | | | | | | | | | | | | | | | | | | | | | | | | | | | |
| Year Ended August 31, 2019 | | | 10.31 | | | | 0.26 | | | | 0.34 | | | | 0.60 | | | | (0.26 | ) | | | — | | | | (0.26 | ) |
| Year Ended August 31, 2018 | | | 10.48 | | | | 0.19 | | | | (0.17 | ) | | | 0.02 | | | | (0.19 | ) | | | — | | | | (0.19 | ) |
| Year Ended August 31, 2017 | | | 10.60 | | | | 0.12 | | | | (0.02 | ) | | | 0.10 | | | | (0.22 | ) | | | — | | | | (0.22 | ) |
| Year Ended August 31, 2016 | | | 10.53 | | | | 0.17 | | | | 0.08 | | | | 0.25 | | | | (0.18 | ) | | | — | | | | (0.18 | ) |
| Year Ended August 31, 2015 | | | 10.55 | | | | 0.15 | | | | (0.02 | ) | | | 0.13 | | | | (0.15 | ) | | | — | | | | (0.15 | ) |
| A Shares | | | | | | | | | | | | | | | | | | | | | | | | | | | | |
| Year Ended August 31, 2019 | | | 10.31 | | | | 0.24 | | | | 0.33 | | | | 0.57 | | | | (0.23 | ) | | | — | | | | (0.23 | ) |
| Year Ended August 31, 2018 | | | 10.48 | | | | 0.16 | | | | (0.16 | ) | | | — | | | | (0.17 | ) | | | — | | | | (0.17 | ) |
| Year Ended August 31, 2017 | | | 10.58 | | | | 0.10 | | | | (0.01 | ) | | | 0.09 | | | | (0.19 | ) | | | — | | | | (0.19 | ) |
| Year Ended August 31, 2016 | | | 10.52 | | | | 0.15 | | | | 0.06 | | | | 0.21 | | | | (0.15 | ) | | | — | | | | (0.15 | ) |
| Year Ended August 31, 2015 | | | 10.54 | | | | 0.12 | | | | (0.02 | ) | | | 0.10 | | | | (0.12 | ) | | | — | | | | (0.12 | ) |
| (a) | Not annualized for periods less than one year. |
| (b) | Annualized for periods less than one year, except for Portfolio Turnover. |
| (c) | During the period, certain fees were waived. If such fee waivers had not occurred, the ratios would have been as indicated. |
| (d) | Portfolio turnover is calculated on the basis of the Fund, as a whole, without distinguishing between the classes of shares issued. |
| (e) | The net expense ratio shown for the period reflects the current expense limitation which became effective on December 26, 2018. |
| (f) | During the year ended August 30, 2015, the Investor Class received monies related to a correction of an error. The corresponding impact to the total return, net expenses to average net assets ratio and net investment income to average net assets ratio was 0.09%, (0.07)% and 0.07%, respectively, for Moderate Duration Fund. |
Amounts designated as “—” are 0 or have been rounded to 0.
| | | | | | | | | | | | | Ratios/Supplemental Data:(b) |
Net Asset
Value, End
of Period | | Total Return
(Excludes
Sales
Charge)(a) | | Net Assets
End of Period
(000s) | | Ratio of Net
Expenses to
Average Net
Assets | | Ratio of Net
Investment
Income (Loss)
to Average Net
Assets | | Ratio of
Gross
Expenses to
Average Net
Assets(c) | | Portfolio
Turnover(d) |
| | | | | | | | | | | | | | | | | | | | | | | | | | | |
| | | | | | | | | | | | | | | | | | | | | | | | | | | |
| | | | | | | | | | | | | | | | | | | | | | | | | | | |
| $ | 10.64 | | | | 5.54 | % | | $ | 4,271 | | | | 0.83 | %(e) | | | 2.26 | % | | | 1.26 | % | | | 25 | % |
| | 10.31 | | | | (0.07 | )% | | | 5,102 | | | | 1.14 | % | | | 1.49 | % | | | 1.35 | % | | | 28 | % |
| | 10.48 | | | | 0.69 | % | | | 10,375 | | | | 0.89 | % | | | 0.93 | % | | | 1.24 | % | | | 87 | % |
| | 10.60 | | | | 2.09 | % | | | 14,176 | | | | 0.79 | % | | | 1.24 | % | | | 1.34 | % | | | 129 | % |
| | 10.53 | | | | 1.04 | %(f) | | | 17,009 | | | | 0.78 | %(f) | | | 1.18 | %(f) | | | 1.55 | % | | | 57 | % |
| | | | | | | | | | | | | | | | | | | | | | | | | | | |
| | 10.65 | | | | 5.90 | % | | | 23,463 | | | | 0.58 | %(e) | | | 2.51 | % | | | 1.01 | % | | | 25 | % |
| | 10.31 | | | | 0.22 | % | | | 24,883 | | | | 0.85 | % | | | 1.78 | % | | | 1.10 | % | | | 28 | % |
| | 10.48 | | | | 0.99 | % | | | 34,078 | | | | 0.60 | % | | | 1.22 | % | | | 0.99 | % | | | 87 | % |
| | 10.60 | | | | 2.39 | % | | | 52,057 | | | | 0.49 | % | | | 1.52 | % | | | 1.09 | % | | | 129 | % |
| | 10.53 | | | | 1.24 | % | | | 28,295 | | | | 0.60 | % | | | 1.37 | % | | | 1.30 | % | | | 57 | % |
| | | | | | | | | | | | | | | | | | | | | | | | | | | |
| | 10.65 | | | | 5.63 | % | | | 381 | | | | 0.85 | %(e) | | | 2.24 | % | | | 1.11 | % | | | 25 | % |
| | 10.31 | | | | (0.03 | )% | | | 634 | | | | 1.10 | % | | | 1.53 | % | | | 1.20 | % | | | 28 | % |
| | 10.48 | | | | 0.92 | % | | | 983 | | | | 0.85 | % | | | 0.93 | % | | | 1.09 | % | | | 87 | % |
| | 10.58 | | | | 2.03 | % | | | 2,123 | | | | 0.74 | % | | | 1.30 | % | | | 1.19 | % | | | 129 | % |
| | 10.52 | | | | 0.99 | % | | | 17,489 | | | | 0.85 | % | | | 1.15 | % | | | 1.40 | % | | | 57 | % |
Financial Highlights
For a share of capital stock outstanding throughout the periods indicated.
| | | | | | | Change in Net Assets Resulting From Operations: | | Less Dividends From: |
| | | Net Asset
Value,
Beginning of
Period | | Net
Investment
Income
(Loss) | | Net Realized
and
Unrealized
Gains
(Losses) on
Investments | | Total from
Investment
Activities | | Dividends
from Net
Investment
Income | | Distributions
from Net
Realized
Gains from
Investments | | Total
Dividends and
Distributions |
| | | | | | | | | | | | | | | | | | | | | | | | | | | | | |
| Bond Fund | | | | | | | | | | | | | | | | | | | | | | | | | | | | |
| Investor Shares | | | | | | | | | | | | | | | | | | | | | | | | | | | | |
| Year Ended August 31, 2019 | | | $9.22 | | | | $0.21 | | | | $0.60 | | | | $0.81 | | | | $(0.21 | ) | | | $ — | | | | $(0.21 | ) |
| Year Ended August 31, 2018 | | | 9.55 | | | | 0.18 | | | | (0.31 | ) | | | (0.13 | ) | | | (0.20 | ) | | | — | | | | (0.20 | ) |
| Year Ended August 31, 2017 | | | 9.77 | | | | 0.09 | | | | (0.15 | ) | | | (0.06 | ) | | | (0.14 | ) | | | (0.02 | ) | | | (0.16 | ) |
| Year Ended August 31, 2016 | | | 9.56 | | | | 0.15 | | | | 0.24 | | | | 0.39 | | | | (0.18 | ) | | | — | | | | (0.18 | ) |
| Year Ended August 31, 2015 | | | 9.57 | | | | 0.15 | | | | — | | | | 0.15 | | | | (0.16 | ) | | | — | | | | (0.16 | ) |
| Institutional Shares | | | | | | | | | | | | | | | | | | | | | | | | | | | | |
| Year Ended August 31, 2019 | | | 9.20 | | | | 0.23 | | | | 0.61 | | | | 0.84 | | | | (0.24 | ) | | | — | | | | (0.24 | ) |
| Year Ended August 31, 2018 | | | 9.52 | | | | 0.20 | | | | (0.29 | ) | | | (0.09 | ) | | | (0.23 | ) | | | — | | | | (0.23 | ) |
| Year Ended August 31, 2017 | | | 9.75 | | | | 0.12 | | | | (0.16 | ) | | | (0.04 | ) | | | (0.17 | ) | | | (0.02 | ) | | | (0.19 | ) |
| Year Ended August 31, 2016 | | | 9.54 | | | | 0.18 | | | | 0.23 | | | | 0.41 | | | | (0.20 | ) | | | — | | | | (0.20 | ) |
| Year Ended August 31, 2015 | | | 9.57 | | | | 0.18 | | | | (0.02 | ) | | | 0.16 | | | | (0.19 | ) | | | — | | | | (0.19 | ) |
| A Shares | | | | | | | | | | | | | | | | | | | | | | | | | | | | |
| Year Ended August 31, 2019 | | | 9.21 | | | | 0.21 | | | | 0.62 | | | | 0.83 | | | | (0.22 | ) | | | — | | | | (0.22 | ) |
| Year Ended August 31, 2018 | | | 9.54 | | | | 0.18 | | | | (0.31 | ) | | | (0.13 | ) | | | (0.20 | ) | | | — | | | | (0.20 | ) |
| Year Ended August 31, 2017 | | | 9.75 | | | | 0.09 | | | | (0.13 | ) | | | (0.04 | ) | | | (0.15 | ) | | | (0.02 | ) | | | (0.17 | ) |
| Year Ended August 31, 2016 | | | 9.55 | | | | 0.15 | | | | 0.23 | | | | 0.38 | | | | (0.18 | ) | | | — | | | | (0.18 | ) |
| Year Ended August 31, 2015 | | | 9.58 | | | | 0.16 | | | | (0.02 | ) | | | 0.14 | | | | (0.17 | ) | | | — | | | | (0.17 | ) |
| (a) | Not annualized for periods less than one year. |
| (b) | Annualized for periods less than one year, except for Portfolio Turnover. |
| (c) | During the period, certain fees were waived. If such fee waivers had not occurred, the ratios would have been as indicated. |
| (d) | Portfolio turnover is calculated on the basis of the Fund, as a whole, without distinguishing between the classes of shares issued. |
| (e) | During the year ended August 31, 2015, the Investor Class received monies related to a correction of an error. The corresponding impact to the total return, net expenses to average net assets ratio and net investment income to average net assets ratio was 0.10%, (0.16)% and 0.16%, respectively, for Bond Fund. |
Amounts designated as “—” are 0 or have been rounded to 0.
| | | | | | | | | | | | | |
| | | | | | | | | | | | | Ratios/Supplemental Data:(b) |
Net Asset
Value, End
of Period | | Total Return
(Excludes
Sales
Charge)(a) | | Net Assets
End of Period
(000s) | | Ratio of Net
Expenses to
Average Net
Assets | | Ratio of Net
Investment
Income (Loss)
to Average Net
Assets | | Ratio of
Gross
Expenses to
Average Net
Assets(c) | | Portfolio
Turnover(d) |
| | | | | | | | | | | | | | | | | | | | | | | | | | | |
| | | | | | | | | | | | | | | | | | | | | | | | | | | |
| | | | | | | | | | | | | | | | | | | | | | | | | | | |
| $9.82 | | | | 8.96 | % | | | $1,862 | | | | 0.77 | % | | | 2.24 | % | | | 0.99 | % | | | 33 | % |
| | 9.22 | | | | (1.33 | )% | | | 5,641 | | | | 0.76 | % | | | 1.91 | % | | | 0.99 | % | | | 29 | % |
| | 9.55 | | | | (0.57 | )% | | | 7,305 | | | | 0.71 | % | | | 1.01 | % | | | 1.06 | % | | | 79 | % |
| | 9.77 | | | | 4.11 | % | | | 11,279 | | | | 0.68 | % | | | 1.52 | % | | | 1.26 | % | | | 107 | % |
| | 9.56 | | | | 1.61 | %(e) | | | 8,167 | | | | 0.54 | %(e) | | | 1.82 | %(e) | | | 1.43 | % | | | 83 | % |
| | | | | | | | | | | | | | | | | | | | | | | | | | | |
| | 9.80 | | | | 9.28 | % | | | 101,925 | | | | 0.49 | % | | | 2.51 | % | | | 0.74 | % | | | 33 | % |
| | 9.20 | | | | (0.97 | )% | | | 96,022 | | | | 0.49 | % | | | 2.17 | % | | | 0.74 | % | | | 29 | % |
| | 9.52 | | | | (0.41 | )% | | | 119,604 | | | | 0.44 | % | | | 1.28 | % | | | 0.81 | % | | | 79 | % |
| | 9.75 | | | | 4.39 | % | | | 155,660 | | | | 0.41 | % | | | 1.79 | % | | | 1.01 | % | | | 107 | % |
| | 9.54 | | | | 1.68 | % | | | 99,270 | | | | 0.48 | % | | | 1.90 | % | | | 1.18 | % | | | 83 | % |
| | | | | | | | | | | | | | | | | | | | | | | | | | | |
| | 9.82 | | | | 9.11 | % | | | 136 | | | | 0.74 | % | | | 2.27 | % | | | 0.84 | % | | | 33 | % |
| | 9.21 | | | | (1.32 | )% | | | 126 | | | | 0.74 | % | | | 1.92 | % | | | 0.84 | % | | | 29 | % |
| | 9.54 | | | | (0.45 | )% | | | 176 | | | | 0.69 | % | | | 1.03 | % | | | 0.91 | % | | | 79 | % |
| | 9.75 | | | | 4.02 | % | | | 277 | | | | 0.66 | % | | | 1.62 | % | | | 1.11 | % | | | 107 | % |
| | 9.55 | | | | 1.42 | % | | | 1,058 | | | | 0.73 | % | | | 1.68 | % | | | 1.28 | % | | | 83 | % |
Financial Highlights
For a share of capital stock outstanding throughout the periods indicated.
| | | | | | | | | | | |
| | | | | | | Change in Net Assets Resulting From Operations: | | Less Dividends From: |
| | | Net Asset
Value,
Beginning of
Period | | Net
Investment
Income
(Loss) | | Net Realized
and Unrealized
Gains (Losses)
on Investments | | Total from
Investment
Activities | | Dividends
from Net
Investment
Income | | Distributions
from Net
Realized
Gains from
Investments | | Total
Dividends and
Distributions |
| Strategic Enhanced Yield Fund | | | | | | | | | | | | | | | | | | | | | | | | | | | | |
| Investor Shares | | | | | | | | | | | | | | | | | | | | | | | | | | | | |
| Year Ended August 31, 2019 | | | $10.10 | | | | $0.29 | (f) | | | $0.60 | | | | $0.89 | | | | $(0.29 | ) | | | $— | | | | $(0.29 | ) |
| December 26, 2017(e) through August 31, 2018 | | | 10.00 | | | | 0.21 | (f) | | | (0.01 | ) | | | 0.20 | | | | (0.10 | ) | | | — | | | | (0.10 | ) |
| Institutional Shares | | | | | | | | | | | | | | | | | | | | | | | | | | | | |
| Year Ended August 31, 2019 | | | 9.97 | | | | 0.31 | (f) | | | 0.59 | | | | 0.90 | | | | (0.31 | ) | | | — | | | | (0.31 | ) |
| December 26, 2017(e) through August 31, 2018 | | | 10.00 | | | | 0.21 | (f) | | | (0.02 | ) | | | 0.19 | | | | (0.22 | ) | | | — | | | | (0.22 | ) |
| A Shares | | | | | | | | | | | | | | | | | | | | | | | | | | | | |
| Year Ended August 31, 2019 | | | 9.96 | | | | 0.28 | (f) | | | 0.60 | | | | 0.88 | | | | (0.28 | ) | | | — | | | | (0.28 | ) |
| December 26, 2017(e) through August 31, 2018 | | | 10.00 | | | | 0.19 | (f) | | | (0.03 | ) | | | 0.16 | | | | (0.20 | ) | | | — | | | | (0.20 | ) |
| (a) | Not annualized for periods less than one year. |
| (b) | Annualized for periods less than one year, except for Portfolio Turnover. |
| (c) | During the period, certain fees were waived. If such fee waivers had not occurred, the ratios would have been as indicated. |
| (d) | Portfolio turnover is calculated on the basis of the Fund, as a whole, without distinguishing between the classes of shares issued. |
| (e) | Commencement of operations. |
| (f) | Calculated using average shares |
Amounts designated as “—” are 0 or have been rounded to 0.
| | | | | | | | | | | | | |
| | | | | | | | | | | | | Ratios/Supplemental Data:(b) |
Net Asset
Value, End
of Period | | Total Return
(Excludes
Sales
Charge)(a) | | Net
Assets
End of
Period
(000s) | | Ratio of Net
Expenses to
Average Net
Assets | | Ratio of Net
Investment
Income (Loss)
to Average
Net Assets | | Ratio of Gross
Expenses to
Average Net
Assets(c) | | Portfolio
Turnover(d) |
| | | | | | | | | | | | | | | | | | | | | | | | | | | |
| | | | | | | | | | | | | | | | | | | | | | | | | | | |
| $10.70 | | | | 8.96 | % | | | $1,546 | | | | 1.01 | % | | | 2.79 | % | | | 3.16 | % | | | 59 | % |
| | | | | | | | | | | | | | | | | | | | | | | | | | | |
| | 10.10 | | | | 2.05 | % | | | 4 | | | | 1.01 | % | | | 3.01 | % | | | 13.65 | % | | | 20 | % |
| | | | | | | | | | | | | | | | | | | | | | | | | | | |
| | 10.56 | | | | 9.21 | % | | | 6,370 | | | | 0.76 | % | | | 3.02 | % | | | 3.23 | % | | | 59 | % |
| | | | | | | | | | | | | | | | | | | | | | | | | | | |
| | 9.97 | | | | 1.87 | % | | | 984 | | | | 0.76 | % | | | 3.11 | % | | | 13.40 | % | | | 20 | % |
| | | | | | | | | | | | | | | | | | | | | | | | | | | |
| | 10.56 | | | | 9.05 | % | | | 468 | | | | 1.01 | % | | | 2.82 | % | | | 4.02 | % | | | 59 | % |
| | | | | | | | | | | | | | | | | | | | | | | | | | | |
| | 9.96 | | | | 1.60 | % | | | 390 | | | | 1.01 | % | | | 2.87 | % | | | 13.50 | % | | | 20 | % |
Financial Highlights
For a share of capital stock outstanding throughout the periods indicated.
| | | | | | Change in Net Assets Resulting From Operations: | | Less Dividends From: |
| | | Net Asset Value, Beginning of Period | | Net Investment Income (Loss) | | Net Realized and Unrealized Gains (Losses) on Investments | | Total from
Investment
Activities | | Dividends
from Net
Investment
Income | | Distributions
from Net
Realized
Gains from
Investments | | Total
Dividends and
Distributions |
| | | | | | | | | | | | | | | | | | | | | | |
| Ultra Short Tax-Free Income Fund | | | | | | | | | | | | | | | | | | | | | | | | | | | | |
| Investor Shares | | | | | | | | | | | | | | | | | | | | | | | | | | | | |
| Year Ended August 31, 2019 | | | $9.98 | | | | $0.11 | | | | $0.02 | | | | $0.13 | | | | $(0.11 | ) | | $ | — | | | | $(0.11 | ) |
| December 26, 2017(f) through August 31, 2018 | | | 10.00 | | | | 0.03 | | | | (0.02 | ) | | | 0.01 | | | | (0.03 | ) | | | — | | | | (0.03 | ) |
| Institutional Shares | | | | | | | | | | | | | | | | | | | | | | | | | | | | |
| Year Ended August 31, 2019 | | | 10.00 | | | | 0.14 | | | | 0.01 | | | | 0.15 | | | | (0.14 | ) | | | — | | | | (0.14 | ) |
| December 26, 2017(f) through August 31, 2018 | | | 10.00 | | | | 0.07 | | | | — | | | | 0.07 | | | | (0.07 | ) | | | — | | | | (0.07 | ) |
| A Shares | | | | | | | | | | | | | | | | | | | | | | | | | | | | |
| Year Ended August 31, 2019 | | | 10.01 | | | | 0.03 | | | | 0.01 | | | | 0.04 | | | | (0.04 | ) | | | — | | | | (0.04 | ) |
| December 26, 2017(f) through August 31, 2018 | | | 10.00 | | | | — | | | | 0.01 | | | | 0.01 | | | | — | | | | — | | | | — | |
| (a) | Not annualized for periods less than one year. |
| (b) | Annualized for periods less than one year, except for Portfolio Turnover. |
| (c) | During the period, certain fees were waived. If such fee waivers had not occurred, the ratios would have been as indicated. |
| (d) | Portfolio turnover is calculated on the basis of the Fund, as a whole, without distinguishing between the classes of shares issued. |
| (e) | The net expense ratio shown for the period reflects the current expense limitation in effect as of December 26, 2018 and the higher limit in effect prior to that date. |
| (f) | Commencement of operations. |
Amounts designated as “—” are 0 or have been rounded to 0.
| | | | | | | | | | Ratios/Supplemental Data:(b) |
Net Asset
Value, End of Period | | Total Return (Excludes Sales Charge)(a) | | Net Assets End of Period (000s) | | Ratio of Net Expenses to Average Net Assets | | Ratio of Net Investment Income (Loss) to Average Net Assets | | Ratio of Gross Expenses to Average Net Assets(c) | | Portfolio
Turnover(d) |
| | | | | | | | | | | | | | | | | | | | |
| | | | | | | | | | | | | | | | | | | | |
| | | | | | | | | | | | | | | | | | | | |
| $10.00 | | | | 1.35 | % | | | $175 | | | | 0.66 | %(e) | | | 1.12 | % | | | 1.59 | % | | | 135 | % |
| | | | | | | | | | | | | | | | | | | | | | | | | | | |
| | 9.98 | | | | 0.14 | % | | | 71 | | | | 0.81 | % | | | 0.71 | % | | | 2.36 | % | | | 155 | % |
| | | | | | | | | | | | | | | | | | | | | | | | | | | |
| | 10.01 | | | | 1.50 | % | | | 20,529 | | | | 0.41 | %(e) | | | 1.38 | % | | | 1.34 | % | | | 135 | % |
| | | | | | | | | | | | | | | | | | | | | | | | | | | |
| | 10.00 | | | | 0.65 | % | | | 11,595 | | | | 0.56 | % | | | 0.96 | % | | | 2.11 | % | | | 155 | % |
| | | | | | | | | | | | | | | | | | | | | | | | | | | |
| | 10.01 | | | | 0.36 | % | | | 21 | | | | 0.66 | %(e) | | | 1.07 | % | | | 1.44 | % | | | 135 | % |
| | | | | | | | | | | | | | | | | | | | | | | | | | | |
| | 10.01 | | | | 0.10 | % | | | — | | | | 0.81 | % | | | 0.71 | % | | | 2.21 | % | | | 155 | % |
Financial Highlights
For a share of capital stock outstanding throughout the periods indicated.
| | | | | | | Change in Net Assets Resulting From Operations: | | Less Dividends From: |
| | | Net Asset Value, Beginning of Period | | Net Investment Income (Loss) | | Net Realized and Unrealized Gains (Losses) on Investments | | Total from
Investment
Activities | | Dividends
from Net
Investment
Income | | Distributions
from Net
Realized
Gains from
Investments | | Total
Dividends and
Distributions |
| | | | | | | | | | | | | | | |
| Active Core Fund | | | | | | | | | | | | | | | | | | | | | | | | | | | | |
| Investor Shares | | | | | | | | | | | | | | | | | | | | | | | | | | | | |
| Year Ended August 31, 2019 | | | $14.04 | | | | $0.19 | | | | $0.21 | | | | $0.40 | | | | $(0.19 | ) | | | $(0.76 | ) | | | $(0.95 | ) |
| Year Ended August 31, 2018 | | | 13.72 | | | | 0.18 | | | | 0.95 | | | | 1.13 | | | | (0.19 | ) | | | (0.62 | ) | | | (0.81 | ) |
| Year Ended August 31, 2017 | | | 13.35 | | | | 0.17 | | | | 0.76 | | | | 0.93 | | | | (0.17 | ) | | | (0.39 | ) | | | (0.56 | ) |
| Year Ended August 31, 2016 | | | 13.38 | | | | 0.23 | | | | 0.58 | | | | 0.81 | | | | (0.22 | ) | | | (0.62 | ) | | | (0.84 | ) |
| Year Ended August 31, 2015 | | | 14.29 | | | | 0.20 | | | | (0.10 | ) | | | 0.10 | | | | (0.19 | ) | | | (0.82 | ) | | | (1.01 | ) |
| Institutional Shares | | | | | | | | | | | | | | | | | | | | | | | | | | | | |
| Year Ended August 31, 2019 | | | 14.08 | | | | 0.23 | | | | 0.22 | | | | 0.45 | | | | (0.23 | ) | | | (0.76 | ) | | | (0.99 | ) |
| Year Ended August 31, 2018 | | | 13.76 | | | | 0.22 | | | | 0.94 | | | | 1.16 | | | | (0.22 | ) | | | (0.62 | ) | | | (0.84 | ) |
| Year Ended August 31, 2017 | | | 13.39 | | | | 0.20 | | | | 0.77 | | | | 0.97 | | | | (0.21 | ) | | | (0.39 | ) | | | (0.60 | ) |
| Year Ended August 31, 2016 | | | 13.39 | | | | 0.23 | | | | 0.61 | | | | 0.84 | | | | (0.22 | ) | | | (0.62 | ) | | | (0.84 | ) |
| Year Ended August 31, 2015 | | | 14.33 | | | | 0.23 | | | | (0.12 | ) | | | 0.11 | | | | (0.23 | ) | | | (0.82 | ) | | | (1.05 | ) |
| A Shares | | | | | | | | | | | | | | | | | | | | | | | | | | | | |
| Year Ended August 31, 2019 | | | 13.98 | | | | 0.16 | | | | 0.23 | | | | 0.39 | | | | (0.16 | ) | | | (0.76 | ) | | | (0.92 | ) |
| Year Ended August 31, 2018 | | | 13.67 | | | | 0.18 | | | | 0.94 | | | | 1.12 | | | | (0.19 | ) | | | (0.62 | ) | | | (0.81 | ) |
| Year Ended August 31, 2017 | | | 13.31 | | | | 0.17 | | | | 0.76 | | | | 0.93 | | | | (0.18 | ) | | | (0.39 | ) | | | (0.57 | ) |
| Year Ended August 31, 2016 | | | 13.32 | | | | 0.20 | | | | 0.60 | | | | 0.80 | | | | (0.19 | ) | | | (0.62 | ) | | | (0.81 | ) |
| Year Ended August 31, 2015 | | | 14.27 | | | | 0.20 | | | | (0.13 | ) | | | 0.07 | | | | (0.20 | ) | | | (0.82 | ) | | | (1.02 | ) |
| C Shares | | | | | | | | | | | | | | | | | | | | | | | | | | | | |
| Year Ended August 31, 2019 | | | 13.98 | | | | 0.09 | | | | 0.21 | | | | 0.30 | | | | (0.09 | ) | | | (0.76 | ) | | | (0.85 | ) |
| Year Ended August 31, 2018 | | | 13.65 | | | | 0.07 | | | | 0.96 | | | | 1.03 | | | | (0.08 | ) | | | (0.62 | ) | | | (0.70 | ) |
| Year Ended August 31, 2017 | | | 13.31 | | | | 0.08 | | | | 0.74 | | | | 0.82 | | | | (0.09 | ) | | | (0.39 | ) | | | (0.48 | ) |
| Year Ended August 31, 2016 | | | 13.31 | | | | 0.10 | | | | 0.61 | | | | 0.71 | | | | (0.09 | ) | | | (0.62 | ) | | | (0.71 | ) |
| December 31, 2014(f) through August 31, 2015 | | | 13.59 | | | | 0.10 | | | | (0.34 | ) | | | (0.24 | ) | | | (0.04 | ) | | | — | | | | (0.04 | ) |
| | | | | | | | | | | | | | | | | | | | | | | | | | | | | |
| (a) | Not annualized for periods less than one year. |
| (b) | Annualized for periods less than one year, except for Portfolio Turnover. |
| (c) | During the period, certain fees were waived. If such fee waivers had not occurred, the ratios would have been as indicated. |
| (d) | Portfolio turnover is calculated on the basis of the Fund, as a whole, without distinguishing between the classes of shares issued. |
| (e) | During the year ended August 31, 2015, the Investor Class received monies related to a correction of an error. The corresponding impact to the total return, net expenses to average net assets ratio and net investment income to average net assets ratio was 0.14%, (0.18)% and 0.18%, respectively, for Active Core Fund. |
| (f) | Commencement of operations. |
Amounts designated as “—” are 0 or have been rounded to 0.
| | | | | | | | | | Ratios/Supplemental Data:(b) |
Net Asset
Value, End
of Period | | Total Return
(Excludes
Sales
Charge)(a) | | Net
Assets
End of
Period
(000s) | | Ratio of Net
Expenses
to Average Net
Assets | | Ratio of Net
Investment
Income (Loss)
to Average
Net Assets | | Ratio of Gross
Expenses to
Average Net
Assets(c) | | Portfolio
Turnover(d) |
| | | | | | | | | | | | | |
| | | | | | | | | | | | | | | | | | | | | | | | | | | |
| | | | | | | | | | | | | | | | | | | | | | | | | | | |
| $13.49 | | | | 3.67 | % | | | $4,632 | | | | 1.10 | % | | | 1.44 | % | | | 1.36 | % | | | 41 | % |
| | 14.04 | | | | 8.46 | % | | | 5,340 | | | | 1.07 | % | | | 1.32 | % | | | 1.32 | % | | | 37 | % |
| | 13.72 | | | | 7.24 | % | | | 5,275 | | | | 0.98 | % | | | 1.28 | % | | | 1.37 | % | | | 55 | % |
| | 13.35 | | | | 6.36 | % | | | 7,921 | | | | 0.88 | % | | | 1.52 | % | | | 1.52 | % | | | 69 | % |
| | 13.38 | | | | 0.59 | %(e) | | | 11,490 | | | | 0.74 | %(e) | | | 1.57 | %(e) | | | 1.70 | % | | | 60 | % |
| | | | | | | | | | | | | | | | | | | | | | | | | | | |
| | 13.54 | | | | 4.00 | % | | | 42,574 | | | | 0.85 | % | | | 1.69 | % | | | 1.11 | % | | | 41 | % |
| | 14.08 | | | | 8.70 | % | | | 46,738 | | | | 0.81 | % | | | 1.57 | % | | | 1.07 | % | | | 37 | % |
| | 13.76 | | | | 7.50 | % | | | 46,101 | | | | 0.73 | % | | | 1.52 | % | | | 1.12 | % | | | 55 | % |
| | 13.39 | | | | 6.62 | % | | | 53,077 | | | | 0.62 | % | | | 1.79 | % | | | 1.27 | % | | | 69 | % |
| | 13.39 | | | | 0.63 | % | | | 52,775 | | | | 0.71 | % | | | 1.61 | % | | | 1.45 | % | | | 60 | % |
| | | | | | | | | | | | | | | | | | | | | | | | | | | |
| | 13.45 | | | | 3.59 | % | | | 767 | | | | 1.17 | % | | | 1.38 | % | | | 1.21 | % | | | 41 | % |
| | 13.98 | | | | 8.41 | % | | | 1,496 | | | | 1.17 | % | | | 1.22 | % | | | 1.17 | % | | | 37 | % |
| | 13.67 | | | | 7.20 | % | | | 1,518 | | | | 0.98 | % | | | 1.28 | % | | | 1.22 | % | | | 55 | % |
| | 13.31 | | | | 6.33 | % | | | 1,391 | | | | 0.87 | % | | | 1.57 | % | | | 1.37 | % | | | 69 | % |
| | 13.32 | | | | 0.32 | % | | | 421 | | | | 0.99 | % | | | 1.34 | % | | | 1.58 | % | | | 60 | % |
| | | | | | | | | | | | | | | | | | | | | | | | | | | |
| | 13.43 | | | | 2.87 | % | | | 54 | | | | 1.85 | % | | | 0.69 | % | | | 2.11 | % | | | 41 | % |
| | 13.98 | | | | 7.70 | % | | | 73 | | | | 1.84 | % | | | 0.54 | % | | | 2.07 | % | | | 37 | % |
| | 13.65 | | | | 6.32 | % | | | 75 | | | | 1.73 | % | | | 0.57 | % | | | 2.12 | % | | | 55 | % |
| | 13.31 | | | | 5.61 | % | | | 67 | | | | 1.62 | % | | | 0.78 | % | | | 2.27 | % | | | 69 | % |
| | | | | | | | | | | | | | | | | | | | | | | | | | | |
| | 13.31 | | | | (1.80 | )% | | | 55 | | | | 1.86 | % | | | 0.45 | % | | | 2.60 | % | | | 60 | % |
Financial Highlights
For a share of capital stock outstanding throughout the periods indicated.
| | | | | | | | | | | | | | | | | | | | | | |
| | | | | | | Change in Net Assets Resulting From
Operations: | | Less Dividends From: |
| | | Net Asset
Value,
Beginning of
Period | | Net
Investment
Income
(Loss) | | Net Realized
and Unrealized
Gains (Losses)
on Investments | | Total from
Investment
Activities | | Dividends
from Net
Investment
Income | | Distributions
from Net
Realized
Gains from
Investments | | Total
Dividends and
Distributions |
| Mid Cap Core Equity Fund | | | | | | | | | | | | | | | | | | | | | | | | | | | | |
| Investor Shares | | | | | | | | | | | | | | | | | | | | | | | | | | | | |
| Year Ended August 31, 2019 | | | $11.90 | | | | $0.03 | (f) | | | $(0.29 | ) | | | $(0.26 | ) | | | $(0.03 | ) | | | $(0.37 | ) | | | $(0.40 | ) |
| Year Ended August 31, 2018 | | | 10.33 | | | | 0.05 | (f) | | | 1.57 | | | | 1.62 | | | | (0.05 | ) | | | — | | | | (0.05 | ) |
| December 30, 2016(e) through August 31, 2017 | | | 10.00 | | | | 0.07 | | | | 0.32 | | | | 0.39 | | | | (0.06 | ) | | | — | | | | (0.06 | ) |
| Institutional Shares | | | | | | | | | | | | | | | | | | | | | | | | | | | | |
| Year Ended August 31, 2019 | | | 11.92 | | | | 0.06 | (f) | | | (0.29 | ) | | | (0.23 | ) | | | (0.07 | ) | | | (0.37 | ) | | | (0.44 | ) |
| Year Ended August 31, 2018 | | | 10.36 | | | | 0.08 | (f) | | | 1.57 | | | | 1.65 | | | | (0.09 | ) | | | — | | | | (0.09 | ) |
| December 30, 2016(e) through August 31, 2017 | | | 10.00 | | | | 0.04 | | | | 0.34 | | | | 0.38 | | | | (0.02 | ) | | | — | | | | (0.02 | ) |
| A Shares | | | | | | | | | | | | | | | | | | | | | | | | | | | | |
| Year Ended August 31, 2019 | | | 11.97 | | | | 0.03 | (f) | | | (0.28 | ) | | | (0.25 | ) | | | (0.04 | ) | | | (0.37 | ) | | | (0.41 | ) |
| Year Ended August 31, 2018 | | | 10.39 | | | | 0.05 | (f) | | | 1.58 | | | | 1.63 | | | | (0.05 | ) | | | — | | | | (0.05 | ) |
| December 30, 2016(e) through August 31, 2017 | | | 10.00 | | | | 0.02 | | | | 0.37 | | | | 0.39 | | | | — | | | | — | | | | — | |
| C Shares | | | | | | | | | | | | | | | | | | | | | | | | | | | | |
| Year Ended August 31, 2019 | | | 11.68 | | | | — | (f) | | | (0.25 | ) | | | (0.25 | ) | | | — | | | | (0.37 | ) | | | (0.37 | ) |
| Year Ended August 31, 2018 | | | 10.28 | | | | — | (f) | | | 1.40 | | | | 1.40 | | | | — | | | | — | | | | — | |
| December 30, 2016(e) through August 31, 2017 | | | 10.00 | | | | 0.02 | | | | 0.26 | | | | 0.28 | | | | — | | | | — | | | | — | |
| (a) | Not annualized for periods less than one year. |
| (b) | Annualized for periods less than one year, except for Portfolio Turnover. |
| (c) | During the period, certain fees were waived. If such fee waivers had not occurred, the ratios would have been as indicated. |
| (d) | Portfolio turnover is calculated on the basis of the Fund, as a whole, without distinguishing between the classes of shares issued. |
| (e) | Commencement of operations. |
| (f) | Calculated using average shares. |
Amounts designated as “—” are 0 or have been rounded to 0.
| | | | | | | | | | | | | | | | | | | | |
| | | | | | | | | | | | | Ratios/Supplemental Data:(b) |
Net Asset
Value, End
of Period | | Total Return
(Excludes
Sales
Charge)(a) | | Net
Assets
End of
Period
(000s) | | Ratio of Net
Expenses to
Average Net
Assets | | Ratio of Net
Investment
Income (Loss)
to Average
Net Assets | | Ratio of Gross
Expenses to
Average Net
Assets(c) | | Portfolio
Turnover(d) |
| | | | | | | | | | | | | | | | | | | | | | | | | | | |
| | | | | | | | | | | | | | | | | | | | | | | | | | | |
| | | | | | | | | | | | | | | | | | | | | | | | | | | |
| | $11.24 | | | | (1.59 | )% | | | $114 | | | | 1.06 | % | | | 0.27 | % | | | 8.26 | % | | | 106 | % |
| | 11.90 | | | | 15.67 | % | | | 624 | | | | 1.06 | % | | | 0.45 | % | | | 5.32 | % | | | 74 | % |
| | | | | | | | | | | | | | | | | | | | | | | | | | | |
| | 10.33 | | | | 3.84 | % | | | 185 | | | | 1.06 | % | | | 0.72 | % | | | 16.40 | % | | | 45 | % |
| | | | | | | | | | | | | | | | | | | | | | | | | | | |
| | 11.25 | | | | (1.32 | )% | | | 809 | | | | 0.81 | % | | | 0.53 | % | | | 9.22 | % | | | 106 | % |
| | 11.92 | | | | 15.97 | % | | | 1,355 | | | | 0.81 | % | | | 0.73 | % | | | 7.35 | % | | | 74 | % |
| | | | | | | | | | | | | | | | | | | | | | | | | | | |
| | 10.36 | | | | 3.84 | % | | | 1,610 | | | | 0.81 | % | | | 0.81 | % | | | 9.65 | % | | | 45 | % |
| | | | | | | | | | | | | | | | | | | | | | | | | | | |
| | 11.31 | | | | (1.50 | )% | | | 382 | | | | 1.06 | % | | | 0.28 | % | | | 10.07 | % | | | 106 | % |
| | 11.97 | | | | 15.68 | % | | | 364 | | | | 1.06 | % | | | 0.46 | % | | | 6.24 | % | | | 74 | % |
| | | | | | | | | | | | | | | | | | | | | | | | | | | |
| | 10.39 | | | | 3.90 | % | | | 62 | | | | 1.06 | % | | | 0.45 | % | | | 14.98 | % | | | 45 | % |
| | | | | | | | | | | | | | | | | | | | | | | | | | | |
| | 11.06 | | | | (1.51 | )% | | | — | | | | 1.81 | % | | | — | % | | | 2.06 | % | | | 106 | % |
| | 11.68 | | | | 13.62 | % | | | — | | | | 1.81 | % | | | — | % | | | 27.23 | % | | | 74 | % |
| | | | | | | | | | | | | | | | | | | | | | | | | | | |
| | 10.28 | | | | 2.80 | % | | | 253 | | | | 1.81 | % | | | 3.73 | % | | | 25.73 | % | | | 45 | % |
Financial Highlights
For a share of capital stock outstanding throughout the periods indicated.
| | | | | | | | | | | | | | | | | | | | | | |
| | | | | | | Change in Net Assets Resulting From
Operations: | | Less Dividends From: | | | | |
| | | Net Asset
Value,
Beginning
of Period | | Net
Investment
Income
(Loss) | | Net Realized
and Unrealized
Gains (Losses)
on Investments | | Total from
Investment
Activities | | Dividends
from Net
Investment
Income | | Distributions
from Net
Realized
Gains from
Investments | | Total
Dividends and
Distributions |
| Opportunistic Fund | | | | | | | | | | | | | | | | | | | | | | | | | | | | |
| Investor Shares | | | | | | | | | | | | | | | | | | | | | | | | | | | | |
| Year Ended August 31, 2019 | | | $15.43 | | | | $0.13 | | | | $(1.65 | ) | | | $(1.52 | ) | | | $(0.15 | ) | | | $(0.93 | ) | | | $(1.08 | ) |
| Year Ended August 31, 2018 | | | 14.90 | | | | 0.04 | (f) | | | 1.28 | | | | 1.32 | | | | (0.04 | ) | | | (0.75 | ) | | | (0.79 | ) |
| Year Ended August 31, 2017 | | | 12.86 | | | | (0.02 | ) | | | 2.08 | | | | 2.06 | | | | (0.02 | ) | | | — | | | | (0.02 | ) |
| Year Ended August 31, 2016 | | | 13.66 | | | | 0.03 | | | | (0.47 | ) | | | (0.44 | ) | | | (0.02 | ) | | | (0.34 | ) | | | (0.36 | ) |
| Year Ended August 31, 2015 | | | 13.85 | | | | (0.02 | ) | | | 0.21 | | | | 0.19 | | | | — | | | | (0.38 | ) | | | (0.38 | ) |
| Institutional Shares | | | | | | | | | | | | | | | | | | | | | | | | | | | | |
| Year Ended August 31, 2019 | | | 15.61 | | | | 0.17 | | | | (1.68 | ) | | | (1.51 | ) | | | (0.19 | ) | | | (0.93 | ) | | | (1.12 | ) |
| Year Ended August 31, 2018 | | | 15.05 | | | | 0.08 | (f) | | | 1.30 | | | | 1.38 | | | | (0.07 | ) | | | (0.75 | ) | | | (0.82 | ) |
| Year Ended August 31, 2017 | | | 12.99 | | | | 0.03 | | | | 2.08 | | | | 2.11 | | | | (0.05 | ) | | | — | | | | (0.05 | ) |
| Year Ended August 31, 2016 | | | 13.78 | | | | 0.06 | | | | (0.47 | ) | | | (0.41 | ) | | | (0.04 | ) | | | (0.34 | ) | | | (0.38 | ) |
| Year Ended August 31, 2015 | | | 13.95 | | | | (0.01 | ) | | | 0.23 | | | | 0.22 | | | | (0.01 | ) | | | (0.38 | ) | | | (0.39 | ) |
| A Shares | | | | | | | | | | | | | | | | | | | | | | | | | | | | |
| Year Ended August 31, 2019 | | | 15.48 | | | | 0.13 | | | | (1.65 | ) | | | (1.52 | ) | | | (0.15 | ) | | | (0.93 | ) | | | (1.08 | ) |
| Year Ended August 31, 2018 | | | 14.95 | | | | 0.04 | (f) | | | 1.28 | | | | 1.32 | | | | (0.04 | ) | | | (0.75 | ) | | | (0.79 | ) |
| Year Ended August 31, 2017 | | | 12.90 | | | | (0.01 | ) | | | 2.07 | | | | 2.06 | | | | (0.01 | ) | | | — | | | | (0.01 | ) |
| Year Ended August 31, 2016 | | | 13.70 | | | | 0.03 | | | | (0.47 | ) | | | (0.44 | ) | | | (0.02 | ) | | | (0.34 | ) | | | (0.36 | ) |
| Year Ended August 31, 2015 | | | 13.89 | | | | (0.02 | ) | | | 0.21 | | | | 0.19 | | | | — | | | | (0.38 | ) | | | (0.38 | ) |
| C Shares | | | | | | | | | | | | | | | | | | | | | | | | | | | | |
| Year Ended August 31, 2019 | | | 15.07 | | | | 0.02 | | | | (1.60 | ) | | | (1.58 | ) | | | (0.05 | ) | | | (0.93 | ) | | | (0.98 | ) |
| Year Ended August 31, 2018 | | | 14.65 | | | | (0.08 | )(f) | | | 1.25 | | | | 1.17 | | | | — | | | | (0.75 | ) | | | (0.75 | ) |
| Year Ended August 31, 2017 | | | 12.73 | | | | (0.02 | ) | | | 1.94 | | | | 1.92 | | | | — | | | | — | | | | — | |
| Year Ended August 31, 2016 | | | 13.60 | | | | 0.01 | | | | (0.54 | ) | | | (0.53 | ) | | | — | | | | (0.34 | ) | | | (0.34 | ) |
| December 31, 2014(g) through August 31, 2015 | | | 13.60 | | | | (0.01 | ) | | | 0.01 | | | | — | | | | — | | | | — | | | | — | |
| (a) | Not annualized for periods less than one year. |
| (b) | Annualized for periods less than one year, except for Portfolio Turnover. |
| (c) | During the period, certain fees were waived. If such fee waivers had not occurred, the ratios would have been as indicated. |
| (d) | Portfolio turnover is calculated on the basis of the Fund, as a whole, without distinguishing between the classes of shares issued. |
| (e) | The net expense ratio shown for the period reflects the current expense limitation which became effective on December 26, 2018. |
| (f) | Calculated using average shares. |
| (g) | Commencement of operations. |
Amounts designated as “-” are 0 or have been rounded to 0.
| | | | | | | | | | | | | | | | | | | | |
| | | | | | | | | | | | | Ratios/Supplemental Data:(b) |
Net Asset Value, End of Period | | Total Return (Excludes Sales Charge)(a) | | Net Assets End of Period (000s) | | Ratio of Net Expenses to Average Net Assets | | Ratio of Net Investment Income (Loss) to Average Net Assets | | Ratio of Gross Expenses to Average Net Assets(c) | | Portfolio Turnover(d) |
| | | | | | | | | | | | | | | | | | | | | | | | | | | |
| | | | | | | | | | | | | | | | | | | | | | | | | | | |
| | | | | | | | | | | | | | | | | | | | | | | | | | | |
| | $12.83 | | | | (9.28 | )% | | | $3,118 | | | | 1.37 | %(e) | | | 0.97 | % | | | 1.89 | % | | | 183 | % |
| | 15.43 | | | | 9.08 | % | | | 2,097 | | | | 1.64 | % | | | 0.25 | % | | | 1.85 | % | | | 157 | % |
| | 14.90 | | | | 15.99 | % | | | 3,009 | | | | 1.60 | % | | | (0.10 | )% | | | 1.81 | % | | | 227 | % |
| | 12.86 | | | | (3.33 | )% | | | 2,451 | | | | 1.45 | % | | | 0.22 | % | | | 1.66 | % | | | 266 | % |
| | 13.66 | | | | 1.35 | % | | | 1,292 | | | | 1.77 | % | | | (0.31 | )% | | | 2.49 | % | | | 249 | % |
| | | | | | | | | | | | | | | | | | | | | | | | | | | |
| | 12.98 | | | | (9.10 | )% | | | 34,492 | | | | 1.13 | %(e) | | | 1.22 | % | | | 1.64 | % | | | 183 | % |
| | 15.61 | | | | 9.45 | % | | | 45,659 | | | | 1.35 | % | | | 0.55 | % | | | 1.60 | % | | | 157 | % |
| | 15.05 | | | | 16.27 | % | | | 38,266 | | | | 1.31 | % | | | 0.18 | % | | | 1.56 | % | | | 227 | % |
| | 12.99 | | | | (3.03 | )% | | | 33,056 | | | | 1.16 | % | | | 0.45 | % | | | 1.41 | % | | | 266 | % |
| | 13.78 | | | | 1.55 | % | | | 23,034 | | | | 1.52 | % | | | (0.03 | )% | | | 2.31 | % | | | 249 | % |
| | | | | | | | | | | | | | | | | | | | | | | | | | | |
| | 12.88 | | | | (9.24 | )% | | | 1,898 | | | | 1.37 | %(e) | | | 0.98 | % | | | 1.74 | % | | | 183 | % |
| | 15.48 | | | | 9.09 | % | | | 2,032 | | | | 1.63 | % | | | 0.26 | % | | | 1.70 | % | | | 157 | % |
| | 14.95 | | | | 15.96 | % | | | 2,321 | | | | 1.56 | % | | | (0.06 | )% | | | 1.66 | % | | | 227 | % |
| | 12.90 | | | | (3.29 | )% | | | 2,275 | | | | 1.41 | % | | | 0.17 | % | | | 1.51 | % | | | 266 | % |
| | 13.70 | | | | 1.34 | % | | | 3,400 | | | | 1.77 | % | | | (0.31 | )% | | | 2.33 | % | | | 249 | % |
| | | | | | | | | | | | | | | | | | | | | | | | | | | |
| | 12.51 | | | | (9.95 | )% | | | 343 | | | | 2.15 | %(e) | | | 0.19 | % | | | 2.64 | % | | | 183 | % |
| | 15.07 | | | | 8.22 | % | | | 598 | | | | 2.41 | % | | | (0.52 | )% | | | 2.60 | % | | | 157 | % |
| | 14.65 | | | | 15.08 | % | | | 573 | | | | 2.34 | % | | | (0.84 | )% | | | 2.56 | % | | | 227 | % |
| | 12.73 | | | | (3.99 | )% | | | 442 | | | | 2.18 | % | | | (0.55 | )% | | | 2.41 | % | | | 266 | % |
| | | | | | | | | | | | | | | | | | | | | | | | | | | |
| | 13.60 | | | | — | % | | | 186 | | | | 2.52 | % | | | (0.85 | )% | | | 3.42 | % | | | 249 | % |
Financial Highlights
For a share of capital stock outstanding throughout the periods indicated.
| | | | | | | | | | | | | | | | | | | | | | |
| | | | | | | Change in Net Assets Resulting From
Operations: | | Less Dividends From: |
| | | Net Asset
Value,
Beginning
of Period | | Net
Investment
Income
(Loss) | | Net Realized
and Unrealized
Gains (Losses)
on Investments | | Total from
Investment
Activities | | Dividends
from Net
Investment
Income | | Distributions
from Net
Realized
Gains from
Investments | | Return of
Capital |
| World Energy Fund | | | | | | | | | | | | | | | | | | | | | | | | | | | | |
| Investor Shares | | | | | | | | | | | | | | | | | | | | | | | | | | | | |
| Year Ended August 31, 2019 | | $9.49 | | | $0.15 | | | $(2.82 | ) | | $(2.67 | ) | | $(0.11 | ) | | $ | — | | | $ | — | |
| Year Ended August 31, 2018 | | | 8.06 | | | | 0.06 | (f) | | | 1.41 | | | | 1.47 | | | | (0.04 | ) | | | — | | | | — | |
| Year Ended August 31, 2017 | | | 8.63 | | | | 0.08 | | | | (0.58 | ) | | | (0.50 | ) | | | (0.06 | ) | | | — | | | | (0.01 | ) |
| Year Ended August 31, 2016 | | | 8.58 | | | | 0.10 | | | | 0.04 | | | | 0.14 | | | | (0.09 | ) | | | — | | | | — | |
| Year Ended August 31, 2015 | | | 11.61 | | | | 0.07 | | | | (2.98 | ) | | | (2.91 | ) | | | (0.06 | ) | | | (0.06 | ) | | | — | |
| Institutional Shares | | | | | | | | | | | | | | | | | | | | | | | | | | | | |
| Year Ended August 31, 2019 | | | 9.51 | | | | 0.17 | | | | (2.83 | ) | | | (2.66 | ) | | | (0.13 | ) | | | — | | | | — | |
| Year Ended August 31, 2018 | | | 8.07 | | | | 0.09 | (f) | | | 1.42 | | | | 1.51 | | | | (0.07 | ) | | | — | | | | — | |
| Year Ended August 31, 2017 | | | 8.65 | | | | 0.11 | | | | (0.59 | ) | | | (0.48 | ) | | | (0.08 | ) | | | — | | | | (0.02 | ) |
| Year Ended August 31, 2016 | | | 8.59 | | | | 0.12 | | | | 0.05 | | | | 0.17 | | | | (0.11 | ) | | | — | | | | — | |
| Year Ended August 31, 2015 | | | 11.62 | | | | 0.10 | | | | (2.98 | ) | | | (2.88 | ) | | | (0.08 | ) | | | (0.07 | ) | | | — | |
| A Shares | | | | | | | | | | | | | | | | | | | | | | | | | | | | |
| Year Ended August 31, 2019 | | | 9.49 | | | | 0.15 | | | | (2.83 | ) | | | (2.68 | ) | | | (0.11 | ) | | | — | | | | — | |
| Year Ended August 31, 2018 | | | 8.06 | | | | 0.07 | (f) | | | 1.41 | | | | 1.48 | | | | (0.05 | ) | | | — | | | | — | |
| Year Ended August 31, 2017 | | | 8.63 | | | | 0.09 | | | | (0.59 | ) | | | (0.50 | ) | | | (0.06 | ) | | | — | | | | (0.01 | ) |
| Year Ended August 31, 2016 | | | 8.59 | | | | 0.10 | | | | 0.03 | | | | 0.13 | | | | (0.09 | ) | | | — | | | | — | |
| Year Ended August 31, 2015 | | | 11.61 | | | | 0.08 | | | | (2.98 | ) | | | (2.90 | ) | | | (0.06 | ) | | | (0.06 | ) | | | — | |
| C Shares | | | | | | | | | | | | | | | | | | | | | | | | | | | | |
| Year Ended August 31, 2019 | | | 9.39 | | | | 0.09 | | | | (2.79 | ) | | | (2.70 | ) | | | (0.05 | ) | | | — | | | | — | |
| Year Ended August 31, 2018 | | | 8.00 | | | | — | (f) | | | 1.40 | | | | 1.40 | | | | (0.01 | ) | | | — | | | | — | |
| Year Ended August 31, 2017 | | | 8.57 | | | | 0.02 | | | | (0.58 | ) | | | (0.56 | ) | | | (0.01 | ) | | | — | | | | — | |
| Year Ended August 31, 2016 | | | 8.53 | | | | 0.05 | | | | 0.03 | | | | 0.08 | | | | (0.04 | ) | | | — | | | | — | |
| Year Ended August 31, 2015 | | | 11.58 | | | | 0.04 | | | | (3.00 | ) | | | (2.96 | ) | | | (0.03 | ) | | | (0.06 | ) | | | — | |
| (a) | Not annualized for periods less than one year. |
| (b) | Annualized for periods less than one year, except for Portfolio Turnover. |
| (c) | During the period, certain fees were waived. If such fee waivers had not occurred, the ratios would have been as indicated. |
| (d) | Portfolio turnover is calculated on the basis of the Fund, as a whole, without distinguishing between the classes of shares issued. |
| (e) | The net expense ratio shown for the period reflects the current expense limitation which became effective on December 26, 2018. |
| (f) | Calculated using average shares. |
Amounts designated as “—” are 0 or have been rounded to 0.
| | | | | | | | | | | | | | | | | | | | | | | | |
| | | | | | | | | | | | | | | | | Ratios/Supplemental Data:(b) |
Total
Dividends and
Distributions | | Net Asset
Value, End
of Period | | Total Return
(Excludes
Sales
Charge)(a) | | Net Assets
End of Period
(000s) | | Ratio of Net
Expenses to
Average Net
Assets | | Ratio of Net
Investment
Income (Loss)
to Average
Net Assets | | Ratio of Gross
Expenses to
Average Net
Assets(c) | | Portfolio Turnover(d) |
| | | | | | | | | | | | | | | | | | | | | | | | | | | | | | | |
| | | | | | | | | | | | | | | | | | | | | | | | | | | | | | | |
| | | | | | | | | | | | | | | | | | | | | | | | | | | | | | | |
| $ | (0.11 | ) | | | $6.71 | | | | (28.27 | )% | | $ | 3,079 | | | | 1.25 | %(e) | | | 1.56 | % | | | 1.68 | % | | | 145 | % |
| | (0.04 | ) | | | 9.49 | | | | 18.27 | % | | | 7,964 | | | | 1.39 | % | | | 0.66 | % | | | 1.56 | % | | | 130 | % |
| | (0.07 | ) | | | 8.06 | | | | (5.87 | )% | | | 9,316 | | | | 1.33 | % | | | 0.90 | % | | | 1.53 | % | | | 103 | % |
| | (0.09 | ) | | | 8.63 | | | | 1.66 | % | | | 10,177 | | | | 1.29 | % | | | 1.22 | % | | | 1.55 | % | | | 150 | % |
| | (0.12 | ) | | | 8.58 | | | | (25.17 | )% | | | 6,419 | | | | 1.28 | % | | | 0.85 | % | | | 1.71 | % | | | 167 | % |
| | | | | | | | | | | | | | | | | | | | | | | | | | | | | | | |
| | (0.13 | ) | | | 6.72 | | | | (28.12 | )% | | | 11,163 | | | | 0.97 | %(e) | | | 1.88 | % | | | 1.43 | % | | | 145 | % |
| | (0.07 | ) | | | 9.51 | | | | 18.71 | % | | | 37,696 | | | | 1.12 | % | | | 0.97 | % | | | 1.31 | % | | | 130 | % |
| | (0.10 | ) | | | 8.07 | | | | (5.69 | )% | | | 25,809 | | | | 1.01 | % | | | 1.24 | % | | | 1.28 | % | | | 103 | % |
| | (0.11 | ) | | | 8.65 | | | | 2.09 | % | | | 26,214 | | | | 0.96 | % | | | 1.48 | % | | | 1.30 | % | | | 150 | % |
| | (0.15 | ) | | | 8.59 | | | | (24.96 | )% | | | 28,873 | | | | 1.00 | % | | | 1.15 | % | | | 1.46 | % | | | 167 | % |
| | | | | | | | | | | | | | | | | | | | | | | | | | | | | | | |
| | (0.11 | ) | | | 6.70 | | | | (28.35 | )% | | | 2,485 | | | | 1.21 | %(e) | | | 1.67 | % | | | 1.53 | % | | | 145 | % |
| | (0.05 | ) | | | 9.49 | | | | 18.37 | % | | | 6,302 | | | | 1.34 | % | | | 0.72 | % | | | 1.41 | % | | | 130 | % |
| | (0.07 | ) | | | 8.06 | | | | (5.84 | )% | | | 6,836 | | | | 1.26 | % | | | 0.96 | % | | | 1.38 | % | | | 103 | % |
| | (0.09 | ) | | | 8.63 | | | | 1.59 | % | | | 8,644 | | | | 1.22 | % | | | 1.26 | % | | | 1.40 | % | | | 150 | % |
| | (0.12 | ) | | | 8.59 | | | | (25.07 | )% | | | 11,901 | | | | 1.26 | % | | | 0.88 | % | | | 1.56 | % | | | 167 | % |
| | | | | | | | | | | | | | | | | | | | | | | | | | | | | | | |
| | (0.05 | ) | | | 6.64 | | | | (28.82 | )% | | | 3,688 | | | | 1.95 | %(e) | | | 0.97 | % | | | 2.43 | % | | | 145 | % |
| | (0.01 | ) | | | 9.39 | | | | 17.51 | % | | | 6,115 | | | | 2.11 | % | | | (0.05 | )% | | | 2.31 | % | | | 130 | % |
| | (0.01 | ) | | | 8.00 | | | | (6.59 | )% | | | 6,131 | | | | 2.01 | % | | | 0.23 | % | | | 2.28 | % | | | 103 | % |
| | (0.04 | ) | | | 8.57 | | | | 0.99 | % | | | 7,726 | | | | 1.97 | % | | | 0.52 | % | | | 2.30 | % | | | 150 | % |
| | (0.09 | ) | | | 8.53 | | | | (25.68 | )% | | | 7,217 | | | | 2.04 | % | | | 0.09 | % | | | 2.46 | % | | | 167 | % |
Report of Independent Registered Public Accounting Firm
August 31, 2019
To the Shareholders and Board of Trustees of
Cavanal Hill Funds:
Opinion on the Financial Statements
We have audited the accompanying statements of assets and liabilities of the Funds listed in the Appendix (collectively the “Funds”) including the schedules of portfolio investments, as of August 31, 2019, the related statements of operations, the statements of changes in net assets, and the related notes (collectively, the financial statements) and the financial highlights for the years or periods listed in the Appendix. In our opinion, the financial statements and financial highlights present fairly, in all material respects, the financial position of each of the Funds as of August 31, 2019, the results of its operations, the changes in its net assets, and the financial highlights for each of the years or periods listed in the Appendix, in conformity with U.S. generally accepted accounting principles.
Basis for Opinion
These financial statements and financial highlights are the responsibility of the Funds’ management. Our responsibility is to express an opinion on these financial statements and financial highlights based on our audits. We are a public accounting firm registered with the Public Company Accounting Oversight Board (United States) (PCAOB) and are required to be independent with respect to the Funds in accordance with the U.S. federal securities laws and the applicable rules and regulations of the Securities and Exchange Commission and the PCAOB.
We conducted our audits in accordance with the standards of the PCAOB. Those standards require that we plan and perform the audit to obtain reasonable assurance about whether the financial statements and financial highlights are free of material misstatement, whether due to error or fraud. Our audits included performing procedures to assess the risks of material misstatement of the financial statements and financial highlights, whether due to error or fraud, and performing procedures that respond to those risks. Such procedures included examining, on a test basis, evidence regarding the amounts and disclosures in the financial statements and financial highlights. Such procedures also included confirmation of securities owned as of August 31, 2019, by correspondence with custodians and brokers or by other appropriate auditing procedures. Our audits also included evaluating the accounting principles used and significant estimates made by management, as well as evaluating the overall presentation of the financial statements and financial highlights. We believe that our audits provide a reasonable basis for our opinion.

We have served as the auditor of one or more Cavanal Hill Funds investment companies since 1990.
Columbus, Ohio
October 25, 2019
Appendix
| Fund | Financial Statement | Period |
| | | |
| U.S Treasury Fund | | |
| | Statement of Operations Statements of Changes in Net Assets Financial Highlights | Year ended August 31, 2019. Two years ended August 31, 2019. Five years ended August 31, 2019. |
| | | |
| Government Securities Money Market Fund | |
| | Statement of Operations Statements of Changes in Net Assets Financial Highlights | Year ended August 31, 2019. Two years ended August 31, 2019. Five years ended August 31, 2019. |
| | | |
| Limited Duration Fund | | |
| | Statement of Operations Statements of Changes in Net Assets Financial Highlights | Year ended August 31, 2019.
Two years ended August 31, 2019.
Five years ended August 31, 2019. |
| | | |
| Moderate Duration Fund | | |
| | Statement of Operations Statements of Changes in Net Assets Financial Highlights | Year ended August 31, 2019.
Two years ended August 31, 2019.
Five years ended August 31, 2019. |
| | | |
| Bond Fund | | |
| | Statement of Operations
Statements of Changes in Net Assets
Financial Highlights | Year ended August 31, 2019.
Two years ended August 31, 2019.
Five years ended August 31, 2019. |
| | | |
| Strategic Enhanced Yield Fund | | |
| | Statement of Operations
Statements of Changes in Net Assets | Year ended August 31, 2019.
Year ended August 31, 2019 and for the period December 26, 2017
(commencement of operations) through August 31, 2018. |
| | Financial Highlights | Year ended August 31, 2019 and for the period December 26, 2017
(commencement of operations) through August 31, 2018. |
| | | |
| Ultra Short Tax-Free Income Fund | |
| | Statement of Operations | Year ended August 31, 2019. |
| | Statements of Changes in Net Assets | Year ended August 31, 2019 and for the period December 26, 2017 |
| | | (commencement of operations) through August 31, 2018. |
| | Financial Highlights | Year ended August 31, 2019 and for the period December 26, 2017 |
| | | (commencement of operations) through August 31, 2018. |
| Active Core Fund | | |
| | Statement of Operations | Year ended August 31, 2019. |
| | Statements of Changes in Net Assets | Two years ended August 31, 2019. |
| | Financial Highlights | Five years ended August 31, 2019. |
| Mid Cap Core Equity Fund | | |
| | Statement of Operations | Year ended August 31, 2019. |
| | Statements of Changes in Net Assets | Two years ended August 31, 2019. |
| | Financial Highlights | Two years ended August 31, 2019 and for the period December 30, 2016
(commencement of operations) through August 31, 2017. |
| Opportunistic Fund | | |
| | Statement of Operations | Year ended August 31, 2019. |
| | Statements of Changes in Net Assets | Two years ended August 31, 2019. |
| | Financial Highlights | Five years ended August 31, 2019. |
| World Energy Fund | | |
| | Statement of Operations | Year ended August 31, 2019. |
| | Statements of Changes in Net Assets | Two years ended August 31, 2019. |
| | Financial Highlights | Five years ended August 31, 2019. |
Additional Fund Information (Unaudited)
August 31, 2019
Results of Shareholder Votes:
A Special Meeting of Shareholders of the U.S. Treasury Fund was held on November 14, 2018. The following is a summary of the shareholder voting results approved at the meeting: Approval of the revision of the Fund’s Fundamental Investment Restriction to remove the 10% cap on investment company securities.
| | | Shares Voted | | % of Voted | | % of Total |
| For Approval | | 543,141,011.25 | | | 90.244 | % | | 47.631 | % |
| Against Approval | | 22,522,022.00 | | | 3.742 | % | | 1.975 | % |
| Abstain | | 36,193,603.00 | | | 6.014 | % | | 3.174 | % |
| Total | | 601,856,636.25 | | | 100.000 | % | | 52.780 | % |
Other Federal Income Tax Information:
For the year ended August 31, 2019, a portion of the ordinary income distributions paid by the Funds may be qualified dividend income. The Funds intend to designate the maximum amount allowable. Complete information will be reported in conjunction with the 2019 Form 1099-DIV.
For corporate shareholders, the following percentage of the total ordinary income distributions paid during the fiscal year ended August 31, 2019, qualify for the corporate dividends received deduction for the following Funds:
| Fund | | Percentage |
| Active Core Fund | | 49.32% |
| Mid Cap Core Equity Fund | | 100.00% |
| Opportunistic Fund | | 45.66% |
| World Energy Fund | | 76.21% |
For the year ended August 31, 2019, the following Funds paid dividends, a portion of which may be subject to a maximum tax rate of 23.8%:
| Fund | | Percentage |
| Active Core Fund | | 59.02% |
| Mid Cap Core Equity Fund | | 100.00% |
| Opportunistic Fund | | 50.30% |
| World Energy Fund | | 100.00% |
The Ultra Short Tax-Free Income Fund designated $157,976 of its income distributions as tax-exempt distributions for the year ended August 31, 2019.
The accompanying table below details distributions designated from long-term capital gains for the following funds for the fiscal year ended August 31, 2019:
| Fund* | | Amount |
| Active Core Fund | | $ | 2,669,352 |
| Mid Cap Core Equity Fund | | | 52,843 |
| Opportunistic Fund | | | 1,929,164 |
| * | Long-term capital gain distributions are subject to a federal tax rate of 20%. |
For the year ended August 31, 2019, certain Funds designate the maximum amount allowable but not less than the following amounts as a short-term capital gain dividend in accordance with Section 871(k)(2) and 881(e) of the Internal Revenue Code:
| Fund | | Amount |
| Ultra Short Tax-Free Income Fund | | $ | 3 |
| Active Core Fund | | | 15,418 |
| Opportunistic Fund | | | 1,137,450 |
For the year ended August 31, 2019, certain Funds designate the maximum amount allowable but not less than the following amounts as interest-related dividends in accordance with Section 871(k)(1) and 881(e) of the Internal Revenue Code:
| Fund | | Amount |
| U.S. Treasury Fund | | $ | 20,707,620 |
| Government Securities Money Market Fund | | | 33,131,648 |
| Limited Duration Fund | | | 2,662,026 |
| Moderate Duration Fund | | | 687,948 |
| Bond Fund | | | 2,425,516 |
| Strategic Enhanced Yield Fund | | | 133,968 |
| Active Core Fund | | | 416,666 |
| Mid Cap Core Equity Fund | | | 599 |
| Opportunistic Fund | | | 387,807 |
| World Energy Fund | | | 73,180 |
Additional Fund Information(Unaudited)
August 31, 2019 | Continued |
REVIEW AND APPROVAL OF THE FUNDS’ ADVISORY AGREEMENT
The Trust’s investment advisory agreement (the “Advisory Agreement”) with Cavanal Hill Investment Management, Inc. (the “Adviser”) was formally considered and approved by the Board of Trustees at meetings held on July 30-31, 2019. The Trustees reviewed extensive material throughout the year in connection with their consideration of the Advisory Agreement. In connection with such approval, the Trustees, reviewed data produced by an independent provider of mutual fund data (as assembled by the Funds’ sub-administrator) which provided comparisons to industry averages for comparable funds for advisory fees and total fund expenses. The information provided to the Trustees at the meeting also included a report from an independent evaluator of brokerage practices and best execution. The Board was assisted in its review by independent legal counsel, as well as Counsel to the Funds, which provided a memorandum detailing the legal standards for review of the Advisory Agreement. The Board received a detailed presentation by the Adviser, which included a fund-by-fund analysis of performance and profitability. The Board also deliberated outside the presence of management and the Adviser.
In their deliberations, each Trustee attributed different weights to various factors involved in an analysis of whether the Investment Advisory Agreement should be amended and continued, and no factor alone was considered determinative. The Trustees, including a majority of independent Trustees, determined that the overall arrangement between the Trust and the Adviser, as provided in the Advisory Agreement, was fair and reasonable and that the continuance of the Advisory Agreement, as so amended, was in the best interests of each Fund and its shareholders.
The matters addressed below were considered and discussed by the Trustees in reaching their conclusions:
Nature, Extent and Quality of Services Provided by the Adviser
The Trustees received and considered information regarding the nature, extent, and quality of the services provided to each Fund under the Advisory Agreement. The Trustees took into account information furnished throughout the year at Board meetings, as well as materials furnished specifically in connection with the annual review process. The Adviser’s senior management and portfolio managers presented information to the Trustees at Board meetings and discussed the Funds’ performance and the Funds’ investment objectives, strategies and outlook. The Trustees considered the background and experience of the Adviser’s senior management and the expertise of investment personnel of the Adviser responsible for the day-to-day management of each Fund. The Trustees also considered the Adviser’s research and portfolio management capabilities, oversight of day-to-day Fund operations, including fund accounting and administration, shareholder communications, regulatory and other reporting, and assistance in meeting legal and regulatory requirements. Materials provided throughout the year covered matters such as compliance of portfolio managers and other management personnel with the code of ethics and the adherence to fair pricing procedures. Consideration was given to the overall performance of the Adviser in light of the economy. The Trustees concluded that the nature, extent, and quality of services under the Advisory Agreement were appropriate and consistent with industry norms.
Investment Performance
Investment performance reports and related financial information for the Funds were discussed throughout the year and were presented in association with the renewal. The Trustees considered performance results of each Fund in absolute terms and relative to each Fund’s peer group as reported by Lipper. One, three, five and ten-year performance data was presented. The Trustees discussed with the Adviser the performance goals and the actual results achieved in managing the Funds as well as the effect of market conditions on the Funds. All share classes of the U.S. Treasury Fund were in the third quartile for the one, three, five and ten-year periods ending May 31, 2019, with the exception of the one, three and ten-year performance of the Institutional share class and the one-year performance of the Select share class, which were in the second quartile. all share classes of the Government Securities Fund were in the second quartile for the one, three, five and ten-year periods ending May 31, 2019, with the exception of the one-year period for the Administrative and Institutional share classes, which were in the third quartile, at 55 and 51 percent, respectively. Performance for each of the Fixed Income Fund share classes that have been in existence for that period are in the first quartile. All share classes of the Limited Duration Fund were in the second quartile for the one, three and five-year periods ending May 31, 2019, with the exception of the three and five-year periods for the Investor and A share classes. The peer group for the Limited Duration Fund is a bit longer duration and credit was a drag to performance. all share classes of the Moderate Duration Fund were in the second quartile for the one, three and five-year periods ending May 31, 2019, with the exception of the three-year period for the Investor and A share classes and the 5-year period for the Investor share class which were in the third quartile, at 59, 52 and 51 percent, respectively. The Bond Fund performance was negatively affected by lower exposure to credit and a slightly lower duration than the peer group. All share classes of the Bond Fund were in the fourth quartile for the one, three and five-year periods ended May 31, 2019, with the exception of the one-year period for the Investor and Institutional share classes and the five-year period for the Institutional share class, which were in the third quartile. In its first year, performance for the Ultra Short Tax-Free Income Fund was in the fourth quartile for all share classes as of May 31, 2019. The Fund’s investment mix of variable rate demand notes and fixed rate paper negatively influenced performance, as the shorter duration versus the peer group proved detrimental when rates fell sharply in 2019. The Strategic Enhanced Yield Fund first year performance was in the top quartile for all share classes as of May 31, 2019. The Opportunistic Fund underperformed in the one-year period due to asset allocation positioning in the second half of calendar year 2018, with all share classes in the fourth quartile. All share classes of the Opportunistic Fund were in the top quartile for the three and five-year periods ending May 31, 2019, with the exception of the three-year period for the C share class, which was in the second quartile. All share classes of the Active Core were in the second quartile for the one, three, five and ten-year period ending May 31, 2019, with the exception of the three-year period for the Investor, C and A share classes, which were in the third quartile. The World Energy Fund share class performance for the one and three-year periods was in the fourth quartile, with the five-year performance in the third quartile for the period ending May 31, 2019, though Lipper does not have an energy category. The World Energy Fund’s performance was in line with its Morningstar energy peer group. The one-year ending May 31, 2019 performance for the Mid Cap Core Equity share classes was in in the second quartile, other than the C share class, which was in the third quartile. Over the years, the Funds have received numerous Lipper Fund Awards in recognition of outstanding performance. Based on their review, and in light of market conditions, the Trustees were satisfied that the performance of each of the Funds was within an acceptable range.
Additional Fund Information(Unaudited)
August 31, 2019 | Continued |
Cost of Services and Profits Realized by Cavanal Hill Investment Management, Inc. and its Affiliates
The Trustees also considered peer group comparable information with respect to the investment advisory fees charged by the Adviser to each of the Funds. Information on voluntary fee waivers was presented and considered. The Trustees reviewed administration, custody and distributor fees received, respectively, by the Adviser and its affiliates, BOKF, NA and Cavanal Hill Distributors, Inc. and selling agreement fees earned by BOKF, NA and BOKFS, Inc. The Trustees also considered the fallout benefits to the Adviser of soft dollars based on presentations to the Board. The Trustees also reviewed profitability information provided by the Adviser with respect to investment advisory, administration, distribution and custody services to each Fund. The Trustees recognized that the data presented was not audited and represents the Adviser’s determination of its and its affiliates’ revenues from the contractual services provided to the Funds, less expenses of providing such services. Expenses include direct and indirect costs and were calculated using an allocation methodology developed by the Adviser. In reviewing the analysis, attention was given to the methodology followed in allocating costs to the Funds, it being recognized that allocation methodologies are inherently subjective and various allocation methodologies may each be reasonable while producing different results. In reviewing and discussing such analysis, management discussed with the Trustees its belief that costs incurred in establishing and maintaining the infrastructure necessary to support mutual fund operations conducted by the Adviser affect the expenses allocated to the Funds in determining its profitability, as well as the fact that the level of profits, to a certain extent, reflected operational cost savings and efficiencies initiated by management. The Trustees also took into account the need to meet regulatory and compliance requirements resulting from the Sarbanes-Oxley Act, SEC and other regulatory requirements. The Trustees also recognized that it is difficult to make comparisons of profitability from fund investment advisory contracts, because comparative information is not generally publicly available and is affected by numerous factors, including the structure of the particular adviser, the types of funds it manages, its business mix, and numerous assumptions regarding allocations. However, the Lipper peer group report reflected that investment advisory fees charged by the Adviser were generally in line with median fees. With the exception of the Opportunistic Fund, the investment advisory fees, net of waivers and expenses, with respect to the Funds, were below the median for all fund classes. The Trustees analyzed the fees paid to the Adviser in light of performance and the services provided, and in light of profitability to the Adviser. Based on their review, the Trustees concluded that the fees paid to, and the profitability of, Cavanal Hill Investment Management, Inc. under the Advisory Agreement was not unreasonable in light of the services and benefits provided to each Fund.
Economies of Scale
Finally, the Trustees considered whether fee levels reflect economies of scale and whether economies of scale would be produced by the growth of the Trust’s assets. The Trustees concluded that the Funds had not yet attained sufficient size to realize material economies of scale. The Trustees further concluded that current asset levels of the Funds did not warrant formal contractual breakpoints. The Trustees determined that their review of potential economies of scale supported their decision to approve the Advisory Agreement.
| Additional Fund Information(Unaudited) | Continued |
| August 31, 2019 | |
| U.S. Treasury Fund: | | | | |
| Security Allocation | | Percentage of
Net Assets |
| U.S. Treasury Obligations | | | 20.9 | % | |
| Repurchase Agreements | | | 60.6 | % | |
| Investment Companies | | | 14.0 | % | |
| Other assets in excess of liabilities | | | 4.5 | % | |
| Total | | | 100.0 | % | |
| Government Securities Money Market Fund: |
| Security Allocation | | Percentage of
Net Assets |
| U.S. Government Agency Securities | | | 13.3 | % | |
| U.S. Treasury Obligations | | | 15.5 | % | |
| Repurchase Agreements | | | 48.4 | % | |
| Investment Companies | | | 16.1 | % | |
| Other assets in excess of liabilities | | | 6.7 | % | |
| Total | | | 100.0 | % | |
| Limited Duration Fund: | | | | |
| Security Allocation | | Percentage of
Net Assets |
| Asset Backed Securities | | | 6.5 | % | |
| Mortgage Backed Securities | | | 48.0 | % | |
| Corporate Bonds | | | 12.5 | % | |
| Taxable Municipal Bonds | | | 2.1 | % | |
| U.S. Treasury Obligations | | | 27.5 | % | |
| Investment in Affiliates | | | 4.2 | % | |
| Liabilities in excess of other assets | | | (0.8 | )% | |
| Total | | | 100.0 | % | |
| Moderate Duration Fund: | | | | |
| Security Allocation | | Percentage of
Net Assets |
| Asset Backed Securities | | | 3.8 | % | |
| Mortgage Backed Securities | | | 34.4 | % | |
| Corporate Bonds | | | 19.6 | % | |
| Taxable Municipal Bonds | | | 6.9 | % | |
| U.S. Government Agency Securities | | | 2.9 | % | |
| U.S. Treasury Obligations | | | 28.4 | % | |
| Investment in Affiliates | | | 3.8 | % | |
| Other assets in excess of liabilities | | | 0.2 | % | |
| Total | | | 100.0 | % | |
| Bond Fund: | | | | |
| Security Allocation | | Percentage of
Net Assets |
| Asset Backed Securities | | | 4.2 | % | |
| Mortgage Backed Securities | | | 34.0 | % | |
| Corporate Bonds | | | 18.8 | % | |
| Taxable Municipal Bonds | | | 8.5 | % | |
| U.S. Government Agency Securities | | | 2.9 | % | |
| U.S. Treasury Obligations | | | 29.9 | % | |
| Investment in Affiliates | | | 1.4 | % | |
| Other assets in excess of liabilities | | | 0.3 | % | |
| Total | | | 100.0 | % | |
| Strategic Enhanced Yield Fund: | | | | |
| Security Allocation | | Percentage of Net Assets |
| Asset Backed Securities | | | 8.1 | % | |
| Mortgage Backed Securities | | | 48.3 | % | |
| Corporate Bonds | | | 4.5 | % | |
| U.S. Treasury Obligations | | | 31.4 | % | |
| Investment in Affiliates | | | 9.1 | % | |
| Liabilities in excess of other assets | | | (1.4 | )% | |
| Total | | | 100.0 | % | |
| Ultra Short Tax-Free Income Fund: | | | | |
| Security Allocation | | Percentage of
Net Assets |
| Municipal Bonds | | | 103.4 | % | |
| Investment in Affiliates | | | 0.6 | % | |
| Liabilities in excess of other assets | | | (4.0 | )% | |
| Total | | | 100.0 | % | |
| Active Core Fund: | | | | |
| Security Allocation | | Percentage of
Net Assets |
| Common Stocks | | | 45.9 | % | |
| Asset Backed Securities | | | 2.1 | % | |
| Mortgage Backed Securities | | | 14.5 | % | |
| Corporate Bonds | | | 7.1 | % | |
| Taxable Municipal Bonds | | | 5.0 | % | |
| U.S. Government Agency Securities | | | 1.4 | % | |
| U.S. Treasury Obligations | | | 14.1 | % | |
| Investment Companies | | | 3.9 | % | |
| Investment in Affiliates | | | 5.7 | % | |
| Other assets in excess of liabilities | | | 0.3 | % | |
| Total | | | 100.0 | % | |
| Mid Cap Core Equity Fund: | | | | |
| Security Allocation | | Percentage of
Net Assets |
| Common Stocks | | | 94.4 | % | |
| Investment in Affiliates | | | 3.9 | % | |
| Other assets in excess of liabilities | | | 1.7 | % | |
| Total | | | 100.0 | % | |
| Opportunistic Fund: | | | | |
| Security Allocation | | Percentage of
Net Assets |
| Common Stocks | | | 39.0 | % | |
| Convertible Preferred Stocks | | | 5.6 | % | |
| Mortgage Backed Securities | | | 2.9 | % | |
| Corporate Bonds | | | 14.9 | % | |
| U.S. Treasury Obligations | | | 9.0 | % | |
| Investment Companies | | | 4.0 | % | |
| Investment in Affiliates | | | 26.8 | % | |
| Liabilities in excess of other assets | | | (2.2 | )% | |
| Total | | | 100.0 | % | |
| World Energy Fund: | | | | |
| Security Allocation | | Percentage of
Net Assets |
| Common Stocks | | | 88.6 | % | |
| Corporate Bonds | | | 8.4 | % | |
| Investment in Affiliates | | | 2.6 | % | |
| Other assets in excess of liabilities | | | 0.4 | % | |
| Total | | | 100.0 | % | |
| Additional Fund Information(Unaudited) | Continued |
| August 31, 2019 | |
Trustees and Officers of Cavanal Hill Funds
The following table sets forth certain information about each of the Trust’s Officers.
| Name and Age | | Position(s) Held
with the Trust | | Term of Office;
and Length of
Time Served | | Principal Occupation(s)
During Past 5 Years | | Number of
Portfolios in
Fund Complex
Overseen | | Other
Directorships
Held By Trustee |
James L. Huntzinger
(1950) | | President, Assistant Secretary | | Indefinite, 6/08 — Present | | From 2002 to present, Chief Investment Officer for BOK Financial | | N/A | | N/A |
| | | | | | | | | | | |
Joel B. Engle
(1965) | | Treasurer | | Indefinite, 1/17 — Present | | From 2007 to present, SVP of Citi Fund Services Ohio, Inc. | | N/A | | N/A |
| | | | | | | | | | | |
Charles Booth
(1960) | | Chief Compliance Officer, Anti-Money Laundering Officer and Disaster Recovery Plan Business Operations Manager | | Indefinite, 5/15 — Present | | From 2007 to present, Director of Citi Fund Services Ohio, Inc., CCO Services. From 1988 to present, Account Manager, Manager of Financial Administration, SVP of Compliance of Citi Fund Services Ohio, Inc. | | N/A | | N/A |
| | | | | | | | | | | |
Cheryl Briggs
(1960) | | Vice President and Secretary | | Indefinite 4/15 — Present | | From March 2015 to present, Officer, Cavanal Hill Funds Administrator. From November 2008 to March 2015, Executive Assistant for Institutional Wealth Management at BOKF | | N/A | | N/A |
For interested officers, Mr. Huntzinger and Ms. Briggs positions held with affiliated persons or principal underwriters of the Trust are provided above. For interested Trustees, the information is listed in the following table:
| Name | | Positions Held With Affiliated Persons Or Principal Underwriters Of The Funds |
| Scott Grauer (1964) | | BOK Financial, Executive Vice President, Wealth Management Division; BOKFS, Chief Executive Officer. Mr. Grauer is also Chairman of the Board of BOKFS, Cavanal Hill Investment Management, Inc. and affiliated advisers, BOK Financial Asset Management, Inc. and BOK Financial Private Wealth, Inc. and serves in an officer capacity or as a member of the board for other BOK Financial subsidiaries. |
The following table sets forth certain information about each of the Trust’s Trustees.
| Additional Fund Information(Unaudited) | Continued |
| August 31, 2019 | |
Trustees and Officers of Cavanal Hill Funds
| Name and Age | | Position(s) Held
with the Trust | | Term of Office;
and Length of
Time Served | | Principal Occupation(s)
During Past 5 Years | | Number of
Portfolios in
Fund Complex
Overseen by
Trustee | | Other
Directorships
Held By Trustee
During The Past
5 Years* |
| Independent Trustees: | | | | | | |
William H. Wilson Jr.
(1958 ) | | Trustee, Chairman | | Indefinite, 5/08—Present | | Ownership interest and/or executive positions with Sage Partners and Lonestar Ecology | | 11 | | None |
| | | | | | | | | | | |
Jennifer Wheeler
(1972 ) | | Trustee | | Indefinite, 11/16—Present | | Counsel to the American Fidelity Insurance Company | | 11 | | N/A |
| | | | | | | | | | | |
| Interested Trustees: | | | | |
Scott Grauer**
(1964) | | Trustee | | Indefinite, 1/10—Present | | From July 2008 to present, Executive Vice President, Wealth Management Division, BOK Financial; from 1991 to present, CEO, BOKFS, Inc. | | 11 | | None |
| * | Directorships held in (1) any other investment companies registered under the 1940 Act, (2) any company with a class of securities registered pursuant to Section 12 of the Securities Exchange Act of 1934, as amended (the “Exchange Act”) or (3) any company subject to the requirements of Section 15(d) of the Exchange Act. |
| ** | Mr. Grauer is treated by the Funds as an “interested person” (as defined in Section 2(a)(19) of the 1940 Act) of the Funds. Mr. Grauer is an “interested person” because he is an Executive Vice President of BOK Financial, the indirect parent of Cavanal Hill Investment Management, Inc. and the Chief Investment Officer of BOKFS, Inc., the distributor of the Trust. Mr. Grauer is also Chairman of the Board of BOKFS, Cavanal Hill Investment Management, Inc. and affiliated advisers, BOK Financial Asset Management, Inc. and BOK Financial Private Wealth, Inc. and serves in an officer capacity as a member of the board for other BOK Financial subsidiaries. |
The Funds’ Statement of Additional Information includes additional information about the Trustees and Officers. The Statement of Additional Information may be obtained by calling 1-800-762-7085.
| Additional Fund Information(Unaudited) | Continued |
August 31, 2019
As a shareholder of the Cavanal Hill Funds, you incur two types of costs: (1) transaction costs, including sales charges (loads) on purchases, reinvested dividends, or other distributions; and exchange fees; (2) ongoing costs, including management fees; distribution fees; and other Fund expenses. This example is intended to help you understand your ongoing costs (in dollars) of investing in the Cavanal Hill Funds and to compare these costs with the ongoing costs of investing in other mutual funds.
The Example is based on an investment of $1,000 invested at the beginning of the period and held for the entire period from March 1, 2019 through August 31, 2019.
Actual Expenses
The table below provides information about actual account values and actual expenses. You may use the information below, together with the amount you invested, to estimate the expenses that you paid over the period. Simply divide your account value by $1,000 (for example, an $8,600 account value divided by $1,000 = 8.6), then multiply the result by the number in the table under the heading entitled “Expenses Paid During Period” to estimate the expenses you paid on your account during this period.
| | | Beginning
Account Value
3/1/19 | | Ending Account
Value
8/31/19 | | Expenses Paid
During Period
3/1/19 - 8/31/19 | | Expense Ratio
During Period*
3/1/19 - 8/31/19 |
| U.S. Treasury Fund | | | | | | | | | | | | | | | | |
| Administrative Shares | | | $1,000.00 | | | | $1,008.40 | | | | $3.49 | | | | 0.69 | % |
| Service Shares | | | 1,000.00 | | | | 1,009.90 | | | | 2.03 | | | | 0.40 | % |
| Institutional Shares | | | 1,000.00 | | | | 1,010.50 | | | | 1.42 | | | | 0.28 | % |
| Select Shares | | | 1,000.00 | | | | 1,010.90 | | | | 1.01 | | | | 0.20 | % |
| Government Securities Money Market Fund | | | | | | | | | | | | | | | | |
| Administrative Shares | | | 1,000.00 | | | | 1,009.20 | | | | 2.84 | | | | 0.56 | % |
| Institutional Shares | | | 1,000.00 | | | | 1,010.70 | | | | 1.37 | | | | 0.27 | % |
| Select Shares | | | 1,000.00 | | | | 1,011.10 | | | | 0.96 | | | | 0.19 | % |
| Premier Shares | | | 1,000.00 | | | | 1,010.80 | | | | 1.22 | | | | 0.24 | % |
| Limited Duration Fund | | | | | | | | | | | | | | | | |
| Investor Shares | | | 1,000.00 | | | | 1,030.80 | | | | 3.74 | | | | 0.73 | % |
| Institutional Shares | | | 1,000.00 | | | | 1,033.20 | | | | 2.41 | | | | 0.47 | % |
| A Shares | | | 1,000.00 | | | | 1,030.80 | | | | 3.69 | | | | 0.72 | % |
| Moderate Duration Fund | | | | | | | | | | | | | | | | |
| Investor Shares | | | 1,000.00 | | | | 1,040.60 | | | | 3.81 | | | | 0.74 | % |
| Institutional Shares | | | 1,000.00 | | | | 1,041.80 | | | | 2.52 | | | | 0.49 | % |
| A Shares | | | 1,000.00 | | | | 1,040.50 | | | | 3.81 | | | | 0.74 | % |
| Bond Fund | | | | | | | | | | | | | | | | |
| Investor Shares | | | 1,000.00 | | | | 1,073.30 | | | | 3.87 | | | | 0.74 | % |
| Institutional Shares | | | 1,000.00 | | | | 1,074.80 | | | | 2.51 | | | | 0.48 | % |
| A Shares | | | 1,000.00 | | | | 1,073.40 | | | | 3.82 | | | | 0.73 | % |
| Strategic Enhanced Yield Fund | | | | | | | | | | | | | | | | |
| Investor Shares | | | 1,000.00 | | | | 1,077.50 | | | | 5.29 | | | | 1.01 | % |
| Institutional Shares | | | 1,000.00 | | | | 1,078.70 | | | | 3.98 | | | | 0.76 | % |
| A Shares | | | 1,000.00 | | | | 1,078.40 | | | | 5.29 | | | | 1.01 | % |
| Ultra Short Tax-Free Income Fund | | | | | | | | | | | | | | | | |
| Investor Shares | | | 1,000.00 | | | | 1,007.20 | | | | 3.04 | | | | 0.60 | % |
| Institutional Shares | | | 1,000.00 | | | | 1,008.40 | | | | 1.77 | | | | 0.35 | % |
| A Shares | | | 1,000.00 | | | | 1,004.60 | | | | 3.03 | | | | 0.60 | % |
| Active Core Fund | | | | | | | | | | | | | | | | |
| Investor Shares | | | 1,000.00 | | | | 1,053.60 | | | | 5.54 | | | | 1.07 | % |
| Institutional Shares | | | 1,000.00 | | | | 1,054.70 | | | | 4.25 | | | | 0.82 | % |
| A Shares | | | 1,000.00 | | | | 1,053.30 | | | | 6.06 | | | | 1.17 | % |
| C Shares | | | 1,000.00 | | | | 1,049.10 | | | | 9.40 | | | | 1.82 | % |
| Mid Cap Core Equity Fund | | | | | | | | | | | | | | | | |
| Investor Shares | | | 1,000.00 | | | | 1,026.50 | | | | 5.41 | | | | 1.06 | % |
| Institutional Shares | | | 1,000.00 | | | | 1,027.30 | | | | 4.14 | | | | 0.81 | % |
| A Shares | | | 1,000.00 | | | | 1,026.70 | | | | 5.41 | | | | 1.06 | % |
| C Shares | | | 1,000.00 | | | | 1,029.80 | | | | - | | | | 0.00 | % |
| Opportunistic Fund | | | | | | | | | | | | | | | | |
| Investor Shares | | | 1,000.00 | | | | 981.20 | | | | 6.24 | | | | 1.25 | % |
| Institutional Shares | | | 1,000.00 | | | | 982.10 | | | | 5.00 | | | | 1.00 | % |
| A Shares | | | 1,000.00 | | | | 981.40 | | | | 6.24 | | | | 1.25 | % |
| C Shares | | | 1,000.00 | | | | 977.50 | | | | 9.97 | | | | 2.00 | % |
| World Energy Fund | | | | | | | | | | | | | | | | |
| Investor Shares | | | 1,000.00 | | | | 850.90 | | | | 5.37 | | | | 1.15 | % |
| Institutional Shares | | | 1,000.00 | | | | 851.10 | | | | 4.20 | | | | 0.90 | % |
| A Shares | | | 1,000.00 | | | | 849.80 | | | | 5.36 | | | | 1.15 | % |
| C Shares | | | 1,000.00 | | | | 847.40 | | | | 8.85 | | | | 1.90 | % |
| * | Expenses are equal to the Portfolio’s annualized expense ratio multiplied by the average account value over the period multiplied by 184/365 (to reflect the one-half year period). |
| Additional Fund Information(Unaudited) | Concluded |
August 31, 2019
Hypothetical Example for Comparison Purposes
The table below provides information about hypothetical account values and hypothetical expenses based on each of the Cavanal Hill Funds’ actual expense ratio and an assumed rate of return of 5% per year before expenses, which is not the Fund’s actual return. The hypothetical account values and expenses may not be used to estimate the actual ending account balance or expenses you paid for the period. You may use this information to compare this 5% hypothetical example with the 5% hypothetical examples that appear in the shareholder reports of other funds.
Please note that the expenses shown in the table are meant to highlight your ongoing costs only and do not reflect any transactional costs, such as sales charges (loads), or exchange fees. Therefore, the table is useful in comparing ongoing costs only, and will not help you determine the relative total costs of owning different funds. In addition, if these transactional costs were included, your costs would have been higher.
| | | Beginning
Account Value
3/1/19 | | Ending Account
Value
8/31/19 | | Expenses Paid
During Period
3/1/19 - 8/31/19 | | Expense Ratio
During Period*
3/1/19 - 8/31/19 |
| U.S. Treasury Fund | | | | | | | | |
| Administrative Shares | | $1,000.00 | | | $ | 1,021.73 | | | $3.52 | | | | 0.69 | % |
| Service Shares | | | 1,000.00 | | | | 1,023.19 | | | | 2.04 | | | | 0.40 | % |
| Institutional Shares | | | 1,000.00 | | | | 1,023.79 | | | | 1.43 | | | | 0.28 | % |
| Select Shares | | | 1,000.00 | | | | 1,024.20 | | | | 1.02 | | | | 0.20 | % |
| Government Securities Money Market Fund | | | | | | | | | | | | | | | | |
| Administrative Shares | | | 1,000.00 | | | | 1,022.38 | | | | 2.85 | | | | 0.56 | % |
| Institutional Shares | | | 1,000.00 | | | | 1,023.84 | | | | 1.38 | | | | 0.27 | % |
| Select Shares | | | 1,000.00 | | | | 1,024.25 | | | | 0.97 | | | | 0.19 | % |
| Premier Shares | | | 1,000.00 | | | | 1,024.00 | | | | 1.22 | | | | 0.24 | % |
| Limited Duration Fund | | | | | | | | | | | | | | | | |
| Investor Shares | | | 1,000.00 | | | | 1,021.53 | | | | 3.72 | | | | 0.73 | % |
| Institutional Shares | | | 1,000.00 | | | | 1,022.84 | | | | 2.40 | | | | 0.47 | % |
| A Shares | | | 1,000.00 | | | | 1,021.58 | | | | 3.67 | | | | 0.72 | % |
| Moderate Duration Fund | | | | | | | | | | | | | | | | |
| Investor Shares | | | 1,000.00 | | | | 1,021.48 | | | | 3.77 | | | | 0.74 | % |
| Institutional Shares | | | 1,000.00 | | | | 1,022.74 | | | | 2.50 | | | | 0.49 | % |
| A Shares | | | 1,000.00 | | | | 1,021.48 | | | | 3.77 | | | | 0.74 | % |
| Bond Fund | | | | | | | | | | | | | | | | |
| Investor Shares | | | 1,000.00 | | | | 1,021.48 | | | | 3.77 | | | | 0.74 | % |
| Institutional Shares | | | 1,000.00 | | | | 1,022.79 | | | | 2.45 | | | | 0.48 | % |
| A Shares | | | 1,000.00 | | | | 1,021.53 | | | | 3.72 | | | | 0.73 | % |
| Strategic Enhanced Yield Fund | | | | | | | | | | | | | | | | |
| Investor Shares | | | 1,000.00 | | | | 1,020.11 | | | | 5.14 | | | | 1.01 | % |
| Institutional Shares | | | 1,000.00 | | | | 1,021.37 | | | | 3.87 | | | | 0.76 | % |
| A Shares | | | 1,000.00 | | | | 1,020.11 | | | | 5.14 | | | | 1.01 | % |
| Ultra Short Tax-Free Income Fund | | | | | | | | | | | | | | | | |
| Investor Shares | | | 1,000.00 | | | | 1,022.18 | | | | 3.06 | | | | 0.60 | % |
| Institutional Shares | | | 1,000.00 | | | | 1,023.44 | | | | 1.79 | | | | 0.35 | % |
| A Shares | | | 1,000.00 | | | | 1,022.18 | | | | 3.06 | | | | 0.60 | % |
| Active Core Fund | | | | | | | | | | | | | | | | |
| Investor Shares | | | 1,000.00 | | | | 1,019.81 | | | | 5.45 | | | | 1.07 | % |
| Institutional Shares | | | 1,000.00 | | | | 1,021.07 | | | | 4.18 | | | | 0.82 | % |
| A Shares | | | 1,000.00 | | | | 1,019.31 | | | | 5.96 | | | | 1.17 | % |
| C Shares | | | 1,000.00 | | | | 1,016.03 | | | | 9.25 | | | | 1.82 | % |
| Mid Cap Core Equity Fund | | | | | | | | | | | | | | | | |
| Investor Shares | | | 1,000.00 | | | | 1,019.86 | | | | 5.40 | | | | 1.06 | % |
| Institutional Shares | | | 1,000.00 | | | | 1,021.12 | | | | 4.13 | | | | 0.81 | % |
| A Shares | | | 1,000.00 | | | | 1,019.86 | | | | 5.40 | | | | 1.06 | % |
| C Shares | | | 1,000.00 | | | | 1,025.21 | | | | - | | | | 0.00 | % |
| Opportunistic Fund | | | | | | | | | | | | | | | | |
| Investor Shares | | | 1,000.00 | | | | 1,018.90 | | | | 6.36 | | | | 1.25 | % |
| Institutional Shares | | | 1,000.00 | | | | 1,020.16 | | | | 5.09 | | | | 1.00 | % |
| A Shares | | | 1,000.00 | | | | 1,018.90 | | | | 6.36 | | | | 1.25 | % |
| C Shares | | | 1,000.00 | | | | 1,015.12 | | | | 10.16 | | | | 2.00 | % |
| World Energy Fund | | | | | | | | | | | | | | | | |
| Investor Shares | | | 1,000.00 | | | | 1,019.41 | | | | 5.85 | | | | 1.15 | % |
| Institutional Shares | | | 1,000.00 | | | | 1,020.67 | | | | 4.58 | | | | 0.90 | % |
| A Shares | | | 1,000.00 | | | | 1,019.41 | | | | 5.85 | | | | 1.15 | % |
| C Shares | | | 1,000.00 | | | | 1,015.63 | | | | 9.65 | | | | 1.90 | % |
| * | Expenses are equal to the Portfolio’s annualized expense ratio multiplied by the average account value over the period multiplied by 184/365 (to reflect the one-half year period). |
(This page had been intentionally left blank)
(This page had been intentionally left blank)
(This page had been intentionally left blank)

Ann-08/19
(a) The registrant has adopted a code of ethics that applies to the registrant’s principal executive officer, principal financial officer, principal accounting officer or controller, or persons performing similar functions. This code of ethics is included as an Exhibit.
(b) During the period covered by the report, with respect to the registrant’s code of ethics that applies to its principal executive officer, principal financial officer, principal accounting officer or controller, or persons performing similar functions, there have been no amendments to, nor any waivers granted from, a provision that relates to any element of the code of ethics definition enumerated in paragraph (b) of this Item 2.
| Item 3. | Audit Committee Financial Expert. |
3(a)(1) The registrant’s board of directors has determined that the registrant has at least one audit committee financial expert serving on its audit committee.
3(a)(2) The audit committee financial expert is William H. Wilson Jr. who is “independent” for purposes of this Item 3 of Form N-CSR.
| Item 4. | Principal Accountant Fees and Services. |
| | | |
| | 2019 | 2018 |
| (a)Audit Fees | $150,400 | $146,800 |
| (b)Audit-Related Fees | $45,500 | $44,600 |
| (c)Tax Fees* | $47,635 | $53,970 |
| (d)All Other Fees | $ - | $ - |
*Related to preparation of federal income, excise tax returns, state tax return and review of capital gain distribution calculations.
4(e)(1)
The Audit Committee may pre-approve at any regularly scheduled Audit Committee meeting audit, audit-related, tax and other non-audit services to be rendered or that may be rendered by the Auditor to the Funds and certain non-audit services to be rendered by the Auditor to the Advisor which require pre-approval by the Audit Committee. In connection with such pre-approvals, the Auditor, or a Fund officer, with the assistance of the Auditor, shall provide the Audit Committee with a report containing information about each type of service to be pre-approved at the meeting.
4(e)(2)
2019 – 100%
2018 – 100%
4(f) Not Applicable
4(g)
2019 – $93,135
2018 – $98,570
4(h) Not Applicable
| Item 5. | Audit Committee of Listed Registrants. |
Not applicable.
(a) The schedules of investments are included as part of the report to shareholders filed under Item 1of this form.
(b) Not applicable.
| Item 7. | Disclosure of Proxy Voting Policies and Procedures for Closed-End Management Investment Companies. |
Not applicable
| Item 8. | Portfolio Managers of Closed-End Management Investment Companies. |
Not applicable
| Item 9. | Purchases of Equity Securities by Closed-End Management Investment Company and Affiliated Purchasers. |
Not applicable.
| Item 10. | Submission of Matters to a Vote of Security Holders. |
The Nomination Committee will consider and evaluate nominee candidates properly submitted by shareholders on the same basis as it considers and evaluates candidates recommended by other sources.
| Item 11. | Controls and Procedures. |
(a) The registrant’s principal executive officer and principal financial officer have concluded, based on their evaluation of the registrant’s disclosure controls and procedures as conducted within 90 days of the filing date of this report, that these disclosure controls and procedures are adequately designed and are operating effectively to ensure that information required to be disclosed by the registrant on Form N-CSR is recorded, processed, summarized and reported within the time periods specified in the Securities and Exchange Commission’s rules and forms.
(b) There were no changes in the registrant’s internal control over financial reporting (as defined in Rule 30a-3(d) under the Act (17 CFR 270.30a-3(d)) that occurred during the period covered by this report that have materially affected or are reasonably likely to materially affect, the registrant’s internal control over financial reporting.
| Item 12. | Disclosure of Securities Lending Activities for Closed-End Management Investment Companies. |
Not applicable.
| (a)(1) | The code of ethics that is the subject of the disclosure required by Item 2 is attached hereto. |
| (a)(2) | Certifications pursuant to Rule 30a-2(a) are attached hereto. |
| (b) | Certifications pursuant to Rule 30a-2(b) are furnished herewith. |
SIGNATURES
Pursuant to the requirements of the Securities Exchange Act of 1934 and the Investment Company Act of 1940, the registrant has duly caused this report to be signed on its behalf by the undersigned, thereunto duly authorized.
| (Registrant) | | Cavanal Hill Funds |
| By (Signature and Title)* | | /s/ James L. Huntzinger |
| | | James L. Huntzinger, President (Principal Executive Officer) |
Date October 28, 2019
Pursuant to the requirements of the Securities Exchange Act of 1934 and the Investment Company Act of 1940, this report has been signed below by the following persons on behalf of the registrant and in the capacities and on the dates indicated.
| By (Signature and Title)* | | /s/ James L. Huntzinger |
| | | James L. Huntzinger, President (Principal Executive Officer) |
Date October 28, 2019
| By (Signature and Title)* | | /s/ Joel B. Engle |
| | | Joel B. Engle, Treasurer (Principal Financial Officer) |
Date October 28, 2019