SECURITIES AND EXCHANGE COMMISSION
REGISTERED MANAGEMENT INVESTMENT COMPANIES
The Parnassus Income Trust
One Market--Steuart Tower #1600, San Francisco, California 94105
(Name and address of agent for service)

Yours truly, Jerome L. Dodson President |
| 1 | ||
Average Annual Total Returns | Parnassus Equity | Lipper Equity Income | S&P 500 | |||||||
for periods ended December 31, 2004 | Income Fund | Fund Average | Index | |||||||
| One Year | 9.30% | 12.81% | 10.88% | |||||||
| Three Years | 6.79% | 6.15% | 3.58% | |||||||
| Five Years | 7.33% | 4.48% | (2.29%) | |||||||
| Ten Years | 12.60% | 11.26% | 12.04% | |||||||
| 2 | ||
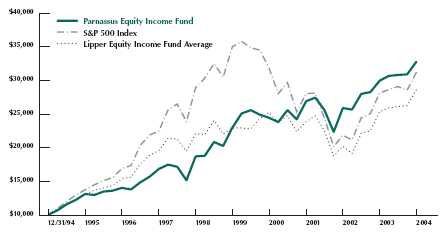
Value on December 31, 2004 of $10,000 invested on December 31, 1994 | ||||
Equity Income Fund | $ | 32,766 | ||
S&P 500 Index | $ | 31,196 | ||
Lipper Equity Income Fund Average | $ | 28,590 | ||
PORTFOLIO COMPOSITION AT DECEMBER 31, 2004(1) | ||||
| Banking | 13.89 | % | ||
| Printing and Publishing | 11.63 | % | ||
| Insurance | 9.70 | % | ||
| Medical Equipment | 7.17 | % | ||
| Utilities | 6.66 | % | ||
| Computers and Software | 6.47 | % | ||
| Packaged Foods | 5.58 | % | ||
| Industrial | 5.38 | % | ||
| Financial Services | 5.21 | % | ||
| Pharmaceuticals | 4.58 | % | ||
| Office Equipment | 3.12 | % | ||
| Health Care Services | 2.93 | % | ||
| Telecommunications | 2.73 | % | ||
| Services | 2.02 | % | ||
| Entertainment | 1.93 | % | ||
| Retail | 1.78 | % | ||
| Auto Parts | 1.74 | % | ||
| Natural Gas | 1.60 | % | ||
| Semiconductors | 1.32 | % | ||
| Apparel | 1.30 | % | ||
| Consumer Products | 1.15 | % | ||
| Real Estate Investment Trust | 1.00 | % | ||
| Chemicals | 0.40 | % | ||
| Machinery | 0.00 | % | ||
| Short-Term Securities | 0.71 | % | ||
| (1) | Portfolio composition is based on total securities, rather than net assets, and excludes short-term securities received as collateral from securities lending. |
| 3 | ||
| 4 | ||
| 5 | ||
| 6 | ||
Company | Donation | |||
| AFLAC | $ | 1,000,000 | ||
| Baxter | Medications | |||
| Boston Scientific | $ | 100,000 | ||
| Cisco Systems | $ | 2,500,000 | ||
| General Mills | $ | 1,000,000 | ||
| Hewlett Packard | $ | 3,000,000 | ||
| Home Depot | $ | 500,000 | ||
| Intel Corporation | $ | 1,000,000 | ||
| Johnson & Johnson | $ | 2,000,000 | ||
| J.P. Morgan | $ | 3,000,000 | ||
| McKesson Corporation | Match Employee Donations | |||
| Medtronic | Match Employee Donations | |||
| Pfizer | $ | 35,000,000 | ||
| Quest Diagnostics | $ | 250,000 | ||
| Sovereign Bancorp | $ | 50,000 | ||
| 3M Corporation | $ | 1,500,000 | ||
| Toys “R” Us | $ | 1,000,000 | ||
| Verizon | $ | 1,000,000 | ||
| Watson Pharmaceuticals | Medications | |||
| Wells Fargo | $ | 1,400,000 | ||
Yours truly, Todd C. Ahlsten Portfolio Manager |
| 7 | ||
Average Annual Total Returns | Parnassus | Lipper A-Rated Bond | Lehman Government/ | |||||||
for periods ended December 31,2004 | Fixed-Income Fund | Fund Average | Corporate Bond Index | |||||||
| One Year | 2.05% | 4.07% | 4.19% | |||||||
| Three Years | 6.43% | 5.83% | 6.59% | |||||||
| Five Years | 6.96% | 7.00% | 8.00% | |||||||
| Ten Years | 7.21% | 7.16% | 7.80% | |||||||
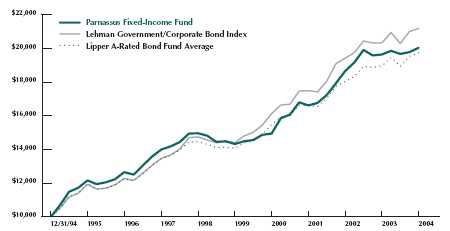
Value on December 31, 2004 of $10,000 invested on December 31, 1994 | ||||
Fixed-Income Fund | $ | 20,056 | ||
Lehman Government/ Corporate Bond Index | $ | 21,197 | ||
Lipper A-Rated Bond Fund Average | $ | 19,750 | ||
| 8 | ||
PORTFOLIO COMPOSITION AT DECEMBER 31, 2004 (1) | ||||
Long-Term Securities: | ||||
| Long-Term U.S. Government and Agency Securities | 21.80 | % | ||
| Natural Gas | 5.21 | % | ||
| Financial Services | 4.37 | % | ||
| Insurance | 4.09 | % | ||
| Retail | 1.24 | % | ||
Short-Term Securities: | ||||
| Short-Term U.S. Government and Agency Securities | 59.89 | % | ||
| Other Short-Term Securities | 3.40 | % | ||
(1) Portfolio composition is based on total securities, rather than net assets.
Yours truly, Todd C. Ahlsten Portfolio Manager |
| 9 | ||
Average Annual Total Returns | Parnassus California | Lipper California Municipal | Lehman Municipal | |||||||
for periods ended December 31, 2004 | Tax-Exempt Fund | Bond Fund Average | Bond Index | |||||||
| One Year | 2.73% | 4.34% | 4.48% | |||||||
| Three Years | 5.06% | 5.44% | 6.44% | |||||||
| Five Years | 5.96% | 6.52% | 7.20% | |||||||
| Ten Years | 6.56% | 6.43% | 7.06% | |||||||
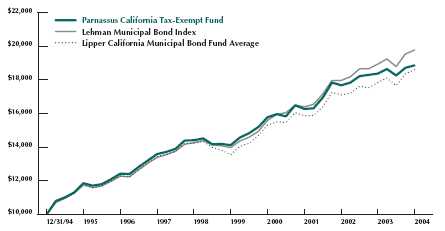
Value on December 31, 2004 of $10,000 invested on December 31, 1994 | ||||
| California Tax-Exempt Fund | $ | 18,872 | ||
| Lehman Municipal Bond Index | $ | 19,777 | ||
| Lipper California Municipal Bond Fund Average | $ | 18,610 | ||
| 10 | ||
PORTFOLIO COMPOSITION AT DECEMBER 31, 2004 (1) | ||||
| Infrastructure Improvements | 30.42 | % | ||
| Environment | 19.98 | % | ||
| Public Transportation | 14.49 | % | ||
| General Obligation | 13.21 | % | ||
| Education | 9.09 | % | ||
| Housing | 5.27 | % | ||
| Health Care Services | 3.54 | % | ||
| Short-Term Securities | 4.00 | % | ||
California should not have a repeat of 2003’s budget crisis that caused rating agencies to downgrade California General Obligation (G.O.) bonds. Since the beginning of 2004, California has made good progress in its fiscal management as reflected in the bond rating. The California G.O. bonds rating went up three notches from BBB to A since the beginning of 2004. Going forward, we expect inflation to accelerate and rates to increase in 2005. As a result, we plan to keep a short duration which should cushion the portfolio if rates jump. Depending on the shape of the yield curve and economic factors, we will adjust the duration and credit quality of the fund, accordingly, to maximize returns.
Yours truly, Ben Liao Portfolio Manager |
| 11 | ||
Beginning | Ending | |||||||||
Account Value | Account Value | Expenses Paid | ||||||||
Fund | July 1, 2004 | December 31, 2004 | During Period* | |||||||
Equity Income Fund: Actual | $1,000.00 | $1,062.80 | $6.01 | |||||||
Hypothetical (5% before expenses) | $1,000.00 | $1,019.30 | $5.89 | |||||||
Fixed-Income Fund: Actual | $1,000.00 | $1,018.87 | $4.36 | |||||||
Hypothetical (5% before expenses) | $1,000.00 | $1,020.81 | $4.37 | |||||||
California Tax-Exempt Fund: Actual | $1,000.00 | $1,033.47 | $3.53 | |||||||
Hypothetical (5% before expenses) | $1,000.00 | $1,021.67 | $3.51 | |||||||
| * | Expenses are equal to the fund’s annualized expense ratio of 1.16%, 0.86%, and 0.69% for Equity Income Fund, Fixed-Income Fund and California Tax-Exempt Fund, respectively, multiplied by the average account value over the period, multiplied by 184/366 (to reflect the one-half year period). |
| 12 | ||

| 13 | ||
Shares | Common Stocks | Percent of Net Assets | Market Value | ||||||
APPAREL | |||||||||
| 400,000 | Ross Stores Inc. | 1.3 | % | $ | 11,548,000 | ||||
AUTO PARTS | |||||||||
| 350,000 | Genuine Parts Co. 2 | 1.7 | % | $ | 15,421,000 | ||||
BANKING | |||||||||
| 600,000 | AmSouth BanCorporation 2 | 15,540,000 | |||||||
| 855,000 | J.P. Morgan Chase & Co. | 33,353,550 | |||||||
| 400,000 | New York Community BanCorp Inc. 2 | 8,228,000 | |||||||
| 250,000 | North Fork BanCorporation Inc. | 7,212,500 |
| ||||||
| 50,000 | Sovereign BanCorp Inc. 2 | 1,127,500 | |||||||
| 255,000 | Washington Mutual Inc. | 10,781,400 | |||||||
| 710,000 | Wells Fargo & Co. | 44,126,500 | |||||||
| 13.5 | % | $ | 120,369,450 | ||||||
CHEMICALS | |||||||||
| 332,100 | Wellman Inc. 2 | 0.4 | % | $ | 3,550,149 | ||||
COMPUTERS | |||||||||
| 1,300,000 | Hewlett-Packard Co. | 3.1 | % | $ | 27,261,000 | ||||
CONSUMER PRODUCTS | |||||||||
| 200,000 | Colgate-Palmolive Co. | 1.2 | % | $ | 10,232,000 | ||||
ENTERTAINMENT | |||||||||
| 520,000 | Cedar Fair, L.P. 2 | 1.9 | % | $ | 17,108,000 | ||||
FINANCIAL SERVICES | |||||||||
| 325,000 | Charles Schwab Corp. | 3,887,000 | |||||||
| 30,000 | Fannie Mae | 2,136,300 | |||||||
| 500,000 | GATX Corp. | 14,780,000 | |||||||
| 25,000 | H&R Block Inc. 2 | 1,225,000 | |||||||
| 275,000 | SLM Corp. | 14,682,250 | |||||||
| 300,000 | Synovus Financial Corp. 2 | 8,574,000 | |||||||
| 5.1 | % | $ | 45,284,550 | ||||||
HEALTH CARE SERVICES | |||||||||
| 300,000 | Laboratory Corp. of | ||||||||
America Holdings 1,2 | 14,946,000 | ||||||||
| 50,000 | McKesson Corp. | 1,573,000 | |||||||
| 100,000 | Quest Diagnostics 2 | 9,555,000 | |||||||
| 2.9 | % | $ | 26,074,000 | ||||||
INDUSTRIAL | |||||||||
| 300,000 | 3M Co. | 24,621,000 | |||||||
| 225,000 | Stanley Works 2 | 11,022,750 | |||||||
| 125,000 | Teleflex Inc. | 6,492,500 | |||||||
| 200,000 | WD-40 Co. 2 | 5,682,000 | |||||||
| 5.4 | % | $ | 47,818,250 | ||||||
INSURANCE | |||||||||
| 425,000 | Aflac Inc. | 16,932,000 | |||||||
| 100,000 | Lincoln National Corp. | 4,668,000 | |||||||
| 200,000 | Montpelier Re Holdings Ltd. | 7,690,000 | |||||||
| 200,000 | Renaissance Re Holdings Ltd. | 10,416,000 | |||||||
| 325,000 | The St. Paul Travelers Companies Inc. | 12,047,750 |
| ||||||
| 5.8 | % | $ | 51,753,750 | ||||||
INSURANCE BROKER | |||||||||
| 700,000 | Arthur J. Gallagher & Co. 2 | 2.5 | % | $ | 22,750,000 | ||||
MEDICAL EQUIPMENT | |||||||||
| 425,000 | Boston Scientific Corp. 1 | 15,108,750 | |||||||
| 400,000 | Invitrogen Corp. 1 | 26,852,000 | |||||||
| 40,000 | Medtronic Inc. | 1,986,800 | |||||||
| 4.9 | % | $ | 43,947,550 | ||||||
OFFICE EQUIPMENT | |||||||||
| 600,000 | Pitney Bowes Inc. | 3.1 | % | $ | 27,768,000 | ||||
PACKAGED FOODS | |||||||||
| 675,000 | General Mills Inc. | 33,554,250 | |||||||
| 350,000 | H.J. Heinz Co. | 13,646,500 | |||||||
| 50,000 | The J.M. Smucker Co. 2 | 2,353,500 | |||||||
| 5.5 | % | $ | 49,554,250 | ||||||
PHARMACEUTICALS | |||||||||
| 125,000 | Forest Laboratories Inc. 1,2 | 5,607,500 | |||||||
| 200,000 | Johnson & Johnson | 12,684,000 | |||||||
| 650,000 | Pfizer Inc. | 17,478,500 | |||||||
| 150,000 | Watson Pharmaceuticals Inc.1 | 4,921,500 | |||||||
| 4.6 | % | $ | 40,691,500 | ||||||
| 14 | ||
Shares | Common Stocks | Percent of Net Assets | Market Value | ||||||
PRINTING | |||||||||
| 100,000 | Ennis Inc. | 0.2 | % | $ | 1,925,000 | ||||
PUBLISHING | |||||||||
| 25,000 | E.W. Scripps Co. | 1,207,000 | |||||||
| 500,000 | Gannett Co. Inc. | 40,850,000 | |||||||
| 485,000 | Knight-Ridder Inc. 2 | 32,465,900 | |||||||
| 225,000 | The McGraw-Hill Companies Inc. | 20,596,500 | |||||||
| 150,000 | Tribune Co. | 6,321,000 | |||||||
| 11.3 | % | $ | 101,440,400 | ||||||
REAL ESTATE | |||||||||
INVESTMENT TRUST | |||||||||
| 325,000 | Maguire Properties Inc. | 1.0 | % | $ | 8,924,500 | ||||
RETAIL | |||||||||
| 30,000 | Home Depot Inc. | 0.1 | % | $ | 1,282,200 | ||||
SEMICONDUCTORS | |||||||||
| 5,000 | Intel Corp. | 0.0 | % | $ | 116,950 | ||||
SERVICES | |||||||||
| 1,300,000 | The ServiceMaster Co. | 2.0 | % | $ | 17,927,000 | ||||
SOFTWARE | |||||||||
| 200,000 | Cadence Design Systems Inc. 1 | 2,762,000 | |||||||
| 150,000 | Intuit Inc. 1,2 | 6,601,500 | |||||||
| 1,300,000 | Mentor Graphics Corp.1,2 | 19,877,000 | |||||||
| 3.3 | % | $ | 29,240,500 | ||||||
TELECOMMUNICATIONS | |||||||||
| 750,000 | Cisco Systems Inc. 1 | 14,475,000 | |||||||
| 300,000 | Nokia OYJ (ADR) 2 | 4,701,000 | |||||||
| 125,000 | Verizon Communications Inc. | 5,063,750 | |||||||
| 2.7 | % | $ | 24,239,750 | ||||||
UTILITIES | |||||||||
| 350,000 | AGL Resources Inc. | 11,634,000 | |||||||
| 150,000 | Energen Corp. | 8,842,500 | |||||||
| 280,000 | KeySpan Corp. 2 | 11,046,000 | |||||||
| 150,000 | Kinder Morgan Inc. | 10,969,500 | |||||||
| 400,000 | Oneok Inc. | 11,368,000 | |||||||
| 25,000 | Questar Corp. | 1,274,000 | |||||||
| 100,000 | UGI Corp. | 4,091,000 | |||||||
| 6.6 | % | $ | 59,225,000 | ||||||
Total investment in common stocks | |||||||||
| (cost $723,756,924) | 90.1 | % | $ | 805,452,749 | |||||
Shares | Preferred Stocks | ||||||||
| 350,000 | Baxter International 2 | ||||||||
Preferred 7.000%, convertible 02/16/06 | $ | 19,761,000 | |||||||
| 55,439 | First Republic | ||||||||
Preferred 8.875%, Series B, callable 12/30/06 | 1,548,966 | ||||||||
| 50,000 | KeySpan Corp. | ||||||||
Preferred 8.750%, convertible 05/16/06 | 2,608,500 |
| |||||||
| 325,000 | ONEOK, Inc. 2 | ||||||||
Preferred 8.500%, convertible 02/16/06 | 11,602,500 | ||||||||
| 175,000 | St. Paul Co. | ||||||||
Preferred 9.000%, convertible 08/16/05 | 11,721,500 | ||||||||
| 275,000 | Toys R Us | ||||||||
Preferred 6.250%, convertible 08/16/05 | 14,575,000 | ||||||||
| 55,000 | Zions BanCorp. 2 | ||||||||
Preferred 8.000%, callable 09/01/07 | 1,507,000 | ||||||||
Total investment in preferred stocks | |||||||||
| (cost $53,940,799) | 7.1 | % | $ | 63,324,466 | |||||
| 15 | ||
Principal Amount $ | Convertible Bonds | Percent of Net Assets | Market Value | ||||||
| 2,000,000 | Brocade Communications | ||||||||
2.000%, due 01/01/07 | $ | 1,900,000 | |||||||
| 1,000,000 | ETrade Group | ||||||||
6.000%, due 02/01/07 | 1,021,250 | ||||||||
| 1,000,000 | RadiSys Corp. | ||||||||
5.500%, due 08/15/07 | 1,001,250 | ||||||||
| 10,000,000 | TriQuint Semiconductor | ||||||||
4.000%, due 03/01/07 | 9,675,000 | ||||||||
Total investment in convertible bonds | |||||||||
| (cost $13,261,039) | 1.5 | % | $ | 13,597,500 | |||||
Total investment in stocks and convertible bonds | |||||||||
(cost, $790,958,762) | 98.7 | % | $ | 882,374,715 | |||||
Principal Amount $ | Short-Term Investments | Percent of Net Assets | Market Value | ||||||
Registered Investment | |||||||||
Companies— | |||||||||
Money Market Funds | |||||||||
| 94,698 | Goldman Sachs FS | ||||||||
Government Fund | |||||||||
variable rate 1.930% | $ | 94,698 | |||||||
| 5,864,362 | Janus Government Fund | ||||||||
variable rate 2.190% | 5,864,362 | ||||||||
| 114,130 | Scudder Government Fund | ||||||||
variable rate 1.910% | 114,130 | ||||||||
| 0.7 | % | $ | 6,073,190 | ||||||
Community Development | |||||||||
Loans 3 | |||||||||
100,000 | Boston Community Loan Fund | ||||||||
2.000%, matures 06/30/05 | 97,041 | ||||||||
100,000 | Vermont Community Loan Fund | ||||||||
2.000%, matures 04/16/05 | 98,275 | ||||||||
| 0.0 | % | $ | 195,316 | ||||||
| 16 | ||
Principal Amount $ | Short-Term Investments | Percent of Net Assets | Market Value | ||||||
Securities Purchased | |||||||||
with Cash Collateral from | |||||||||
Securities Lending | |||||||||
Commercial Paper | |||||||||
| 10,000,000 | Four Winds Funding DCP | ||||||||
2.601% equivalent; matures 01/03/05 | 1.1 | % | $ | 9,996,389 | |||||
Floating Rate Securities | |||||||||
| 10,000,000 | First Tennessee Bank MTN | ||||||||
variable rate 2.330%, | |||||||||
matures 06/07/05 | $ | 9,997,980 | |||||||
| 5,000,000 | Lehman Brothers MTN | ||||||||
variable rate 2.403%, | |||||||||
matures 05/16/05 | 5,000,000 | ||||||||
| 5,000,000 | Morgan Stanley | ||||||||
Dean Witter CP | |||||||||
variable rate 2.393%, | |||||||||
matures 02/18/05 | 5,000,000 | ||||||||
| 5,000,000 | Morgan Stanley | ||||||||
Dean Witter CP | |||||||||
variable rate 2.393%, | |||||||||
matures 08/19/05 | 5,000,000 | ||||||||
| 2.8 | % | $ | 24,997,980 | ||||||
Master Note | |||||||||
| 5,000,000 | Bear Stearns & Co. | ||||||||
Master Note Agreement | |||||||||
variable rate 2.463% | |||||||||
matures 01/05/05 | 0.5 | % | $ | 5,000,000 | |||||
Repurchase Agreements | |||||||||
| 20,000,000 | Bank of America | ||||||||
Securities LLC | |||||||||
| Triparty Repurchase | |||||||||
| Agreement | |||||||||
| (Repurchase agreement | |||||||||
| with The Bank of New York | |||||||||
| dated 12/31/04, | |||||||||
| effective yield is 2.360%, | |||||||||
| matures 01/03/05, | |||||||||
| Collateral: | |||||||||
| CIT Group Inc., | |||||||||
| 2.140%, 09/20/07; | |||||||||
| Westfield Capital Corp. Ltd., | |||||||||
| 5.125%, 11/15/14; | |||||||||
| total par value $21,014,621, | |||||||||
| total market value | |||||||||
$20,915,898) | $ | 20,000,000 | |||||||
| 70,000,000 | Dresdner Kleinwort Benson | ||||||||
| Triparty Repurchase | |||||||||
| Agreement | |||||||||
| (Repurchase agreement | |||||||||
| with J.P. Morgan Chase Bank | |||||||||
| dated 12/31/04, | |||||||||
| effective yield is 2.360%, | |||||||||
| matures 01/03/05, | |||||||||
| Collateral: | |||||||||
| General Electric Corp., | |||||||||
| 2.615%, 03/15/05; | |||||||||
| Citigroup, Inc, | |||||||||
| 2.440%, 09/01/05; | |||||||||
| total par value $73,475,500, | |||||||||
| total market value | |||||||||
$73,501,509) | 70,000,000 | ||||||||
| 17 | ||
Principal | Percent of | ||||||||
Amount $ | Short-Term Investments | Net Assets | Market Value | ||||||
| 27,685,813 | Lehman Brothers | ||||||||
| Triparty Repurchase | |||||||||
| Agreement | |||||||||
| (Repurchase agreement | |||||||||
| with J.P.Morgan Chase Bank | |||||||||
| dated 12/31/04, | |||||||||
| effective yield is 2.383%, | |||||||||
| matures 01/03/05, | |||||||||
| Collateral: | |||||||||
| ARC 2002 AIO CMO, | |||||||||
| 6.000%, 02/25/05 - 05/25/05; | |||||||||
| BSCMS 2001-TOP2 X1 CMO, | |||||||||
| 0.635%, 02/15/35; | |||||||||
| FUNCM 1999-C2 IO CMO, | |||||||||
| 0.653%, 06/15/31; | |||||||||
| GMACC 1998-C1 X CMO, | |||||||||
| 0.308%, 05/15/30; | |||||||||
| IMSA 1999-2 A9 CMO, | |||||||||
| 9.000%, 01/25/30; | |||||||||
| IRWHE 2003-1 AIO CMO, | |||||||||
| 10.000%, 09/25/05; | |||||||||
| LBUBS 2001-C3 X CMO, | |||||||||
| 0.981%, 06/15/36; | |||||||||
| MSC 1998-HF1 X CMO, | |||||||||
| 0.919%, 03/15/30; | |||||||||
| PNCMS 1999-9 AX2 CMO, | |||||||||
| 7.500%, 10/25/29; | |||||||||
| SARM 2004-5 5AX CMO, | |||||||||
| 5.000%, 03/25/14; | |||||||||
| SAIL 2004-6 ASIO CMO, | |||||||||
| 0.000%, 06/25/09; | |||||||||
| SASC 2001-2004 CMO, | |||||||||
| 4.500%-8.500%, | |||||||||
| 05/25/05-01/25/34; | |||||||||
| SMART 1991-1993 CMO, | |||||||||
| 0.000%, 05/25/08-02/25/24; | |||||||||
| TMST 2001-1 X CMO, | |||||||||
| 0.000%,10/25/41; | |||||||||
| total market value | |||||||||
$28,464,602) | $ | 27,685,813 | |||||||
| Total repurchase agreements | |||||||||
| (cost $117,685,813) | 13.2 | % | $ | 117,685,813 | |||||
Total securities | |||||||||
purchased with cash | |||||||||
collateral from | |||||||||
securities lending | |||||||||
(cost $157,680,182) | 17.6 | % | $ | 157,680,182 | |||||
Total short-term | |||||||||
securities | |||||||||
(cost $163,948,688) | 18.3 | % | $ | 163,948,688 | |||||
Total securities | |||||||||
(cost $954,907,450) | 117.0 | % | $ | 1,046,323,403 | |||||
Payable upon return of | |||||||||
securities loaned | - 17.6 | % | (157,680,182 | ) | |||||
Other assets and | |||||||||
liabilities - net | 0.6 | % | 5,771,427 | ||||||
Total net assets | 100.0 | % | $ | 894,414,648 | |||||
| 1 | These securities are non-income producing. |
| 2 | This security or partial position of this security was on loan at December 31,2004 (Note1). The total value of securities on loan at December 31,2004 was $152,388,459. |
| 3 | Market value adjustments have been applied to these securities to reflect early withdrawal/call penalties. |
| Fund holdings will vary over time. | |
| Fund shares are not FDIC insured. | |
| ARC | Amortizing Residential Collateral Trust |
| BSCMS | Bear Stearns Commercial Mortgage Securities |
| FUNCM | First Union - Chase Commercial Mortgage |
| GMACC | GMAC Commercial Mortgage Securities Inc. |
| IMSA | Impac Secured Assets CMN Owner Trust |
| IRWHE | Irwin Home Equity |
| LBUBS | LB-UBS Commercial Mortgage Trust |
| MSC | Morgan Stanley Capital |
| PNCMS | PNC Mortgage Securities Corp. |
| SARM | Structured Adjustable Rate Mortgage Loan Trust |
| SAIL | Structured Asset Investment Loan Trust |
| SASC | Structured Asset Securities Corp. |
| SMART | Structured Mortgage Asset Residential Trust |
| TMST | Thornburg Mortgage Securities Trust |
| 18 | ||
STATEMENT OF ASSETS AND LIABILITIES
DECEMBER 31, 2004
Assets | ||||
| Investments in securities, at market value | ||||
(identified cost $790,958,762) | $ | 882,374,715 | ||
| Temporary investments in short-term securities | ||||
(at cost, which approximates market value) | 46,262,875 | |||
| Repurchase agreements | ||||
(at cost, which approximates market value) | 117,685,813 | |||
| Cash | 4,925,960 | |||
| Receivables: | ||||
Dividends and interest | 1,279,729 | |||
Securities sold | 5,810 | |||
Capital shares sold | 1,335,248 | |||
| Other assets | 2,870 | |||
Total assets | $ | 1,053,873,020 | ||
Liabilities | ||||
| Payable upon return of securities loaned | 157,680,182 | |||
| Capital shares redeemed | 997,984 | |||
| Fees payable to Parnassus Investments | 562,964 | |||
| Accounts payable and accrued expenses | 217,242 | |||
Total liabilities | $ | 159,458,372 | ||
Net assets (equivalent to $25.00 per share | ||||
based on 35,780,567 shares of capital | ||||
stock outstanding) | $ | 894,414,648 | ||
Net assets consist of | ||||
| Undistributed net investment income | 266,831 | |||
| Unrealized appreciation on securities | 91,415,953 | |||
| Overdistributed net realized gain | (4,326,895 | ) | ||
| Capital paid-in | 807,058,759 | |||
Total net assets | $ | 894,414,648 | ||
Computation of net asset value and | ||||
offering price per share | ||||
| Net asset value and redemption price per share | ||||
($894,414,648 divided by 35,780,567 shares) | $ | 25.00 | ||
Investment income | ||||
| Dividends | $ | 16,485,897 | ||
| Interest | 2,814,827 | |||
| Securities lending | 259,125 | |||
| Other income | 11,567 | |||
Total investment income | $ | 19,571,416 | ||
Expenses | ||||
| Investment advisory fees (Note 5) | 4,860,166 | |||
| Transfer agent fees (Note 5) | 291,932 | |||
| Fund accounting and administration fees (Note 5) | 405,688 | |||
| Service provider fees | 1,304,367 | |||
| Reports to shareholders | 311,065 | |||
| Registration fees and expenses | 80,674 | |||
| Custody fees | 43,487 | |||
| Professional fees | 173,906 | |||
| Trustee fees and expenses | 29,527 | |||
| Other expenses | 167,620 | |||
Total expenses | $ | 7,668,432 | ||
Fees paid indirectly (Note 5) | (25,170 | ) | ||
Net expenses | 7,643,262 | |||
Net investment income | $ | 11,928,154 | ||
Realized and unrealized gain on investments | ||||
| Net realized gain (loss) from securities | ||||
transactions | $ | 20,107,046 | ||
| Net change in unrealized appreciation | ||||
(depreciation) of securities | 38,007,995 | |||
| Net realized and unrealized gain (loss) | ||||
on securities | $ | 58,115,041 | ||
Net increase in net assets resulting | ||||
from operations | $ | 70,043,195 | ||
| 19 | ||
STATEMENTS OF CHANGES IN NET ASSETS
YEARS ENDED DECEMBER 31, 2004
AND DECEMBER 31, 2003
YEAR ENDED | YEAR ENDED | ||||||
From operations | |||||||
| Net investment income | $ | 11,928,154 | $ | 8,804,899 | |||
| Net realized gain (loss) from | |||||||
securities transactions | 20,107,046 | 5,870,431 | |||||
| Net change in unrealized | |||||||
appreciation (depreciation) | |||||||
of securities | 38,007,995 | 53,310,045 | |||||
| Increase in net assets | |||||||
resulting from operations | $ | 70,043,195 | $ | 67,985,375 | |||
Dividends to shareholders | |||||||
| From net investment income | (17,436,082 | ) | (10,160,220 | ) | |||
| From realized capital gains | (21,462,046 | ) | — | ||||
Increase in net assets from | |||||||
capital share transactions | 233,020,302 | 298,994,695 | |||||
Increase in net assets | $ | 264,165,369 | $ | 356,819,850 | |||
Net assets | |||||||
| Beginning of period | 630,249,279 | 273,429,429 | |||||
| End of period | |||||||
(including undistributed | |||||||
(overdistributed) net | |||||||
investment income | |||||||
of $266,831 in 2004 | |||||||
and $318,960 in 2003) | $ | 894,414,648 | $ | 630,249,279 | |||
| 20 | ||
THE PARNASSUS INCOME TRUST
PORTFOLIO OF INVESTMENTS BY INDUSTRY CLASSIFICATION, DECEMBER 31, 2004
Principal | Percent of | ||||||||
Amount $ | Corporate Bonds | Net Assets | Market Value | ||||||
FINANCIAL SERVICES | |||||||||
| 500,000 | Bank One Corp. | ||||||||
Notes, 6.000%, | |||||||||
due 02/17/09 | $ | 534,459 | |||||||
| 500,000 | Goldman Sachs Group | ||||||||
Notes, 6.650%, | |||||||||
due 05/15/09 | 551,737 | ||||||||
| 500,000 | Wells Fargo | ||||||||
Financial, Inc. | |||||||||
Notes, 6.850%, | |||||||||
due 07/15/09 | 560,853 | ||||||||
| 4.3 | % | $ | 1,647,049 | ||||||
RETAIL | |||||||||
| 400,000 | Target Corp. | ||||||||
Notes, 7.500%, | |||||||||
due 08/15/10 | 1.2 | % | $ | 467,650 | |||||
Total investment in | |||||||||
corporate bonds | |||||||||
(cost $1,886,178) | 5.5 | % | $ | 2,114,699 | |||||
Principal | U.S. Government | Percent of | |||||||
Amount $ | Agency Securities | Net Assets | Market Value | ||||||
| 1,000,000 | Federal Home | ||||||||
Loan Bank | |||||||||
5.000%, due 05/28/15 | $ | 993,226 | |||||||
| 2,000,000 | Federal Home Loan | ||||||||
Mortgage Corporation | |||||||||
6.250%, due 03/05/12 | 2,091,054 | ||||||||
| 3,000,000 | Federal National | ||||||||
Mortgage Association | |||||||||
5.125%, due 04/22/13 | 3,012,108 | ||||||||
Total investment in | |||||||||
U.S. Government | |||||||||
Agency securities | |||||||||
(cost $6,088,641) | 16.0 | % | $ | 6,096,388 | |||||
Total investments in | |||||||||
corporate bonds and U.S. | |||||||||
Government securities | |||||||||
(cost $7,974,819) | 21.5 | % | $ | 8,211,087 | |||||
Shares | Preferred Stocks | ||||||||
| 55,000 | ONEOK, Inc. | ||||||||
Preferred 8.500%, | |||||||||
due 02/16/06 | $ | 1,963,500 | |||||||
| 23,000 | St. Paul Co. | ||||||||
Preferred 9.000%, | |||||||||
due 08/16/05 | 1,540,540 | ||||||||
Total investment in | |||||||||
preferred stocks | |||||||||
(cost $3,379,873) | 9.2 | % | $ | 3,504,040 | |||||
Total long-term | |||||||||
securities | |||||||||
(cost, $11,354,692) | 30.7 | % | $ | 11,715,127 | |||||
| 21 | ||
PORTFOLIO OF INVESTMENTS BY INDUSTRY CLASSIFICATION, DECEMBER 31, 2004 — CONTINUED
Principal | Percent of | ||||||||
Amount $ | Short-Term Investments | Net Assets | Market Value | ||||||
U.S. Government Agency | |||||||||
Discount Notes | |||||||||
| 3,000,000 | Federal Home Loan | ||||||||
Mortgage Corporation | |||||||||
Zero Coupon, | |||||||||
2.030% equivalent, | |||||||||
matures 01/18/05 | $ | 2,997,293 | |||||||
| 3,000,000 | Federal National | ||||||||
Mortgage Association | |||||||||
Zero Coupon | |||||||||
2.166% equivalent, | |||||||||
matures 01/05/05 | 2,999,467 | ||||||||
| 14,000,000 | Federal National | ||||||||
Mortgage Association | |||||||||
Zero Coupon | |||||||||
2.324% equivalent, | |||||||||
matures 02/02/05 | 13,972,498 | ||||||||
| 2,600,000 | Federal National | ||||||||
Mortgage Association | |||||||||
Zero Coupon | |||||||||
2.330% equivalent, | |||||||||
matures 02/22/05 | 2,591,250 | ||||||||
| 59.1 | % | $ | 22,560,508 | ||||||
Registered Investment Companies— | |||||||||
Money Market Funds | |||||||||
| 283,173 | Goldman Sachs FS | ||||||||
Government Fund | |||||||||
variable rate 1.930% | $ | 283,173 | |||||||
| 992,767 | Janus Government Fund | ||||||||
variable rate 2.190% | 992,767 | ||||||||
| 1,269 | Scudder Government | ||||||||
Fund | |||||||||
variable rate 1.910% | 1,268 | ||||||||
| 3.3 | % | $ | 1,277,208 | ||||||
Total short-term securities | |||||||||
(cost $23,837,716) | 62.4 | % | $ | 23,837,716 | |||||
Total securities | |||||||||
(cost $35,192,408) | 93.1 | % | $ | 35,552,843 | |||||
Other assets and liabilities - net | 6.9 | % | 2,651,944 | ||||||
Total net assets | 100.0 | % | $ | 38,204,787 | |||||
| 22 | ||
Assets | ||||
| Investments in securities, at market value | ||||
(identified cost $11,354,692) | $ | 11,715,127 | ||
| Temporary investments in short-term securities | ||||
(at cost, which approximates market value) | 23,837,716 | |||
| Cash | 2,322,414 | |||
| Receivables: | ||||
Interest | 122,235 | |||
Capital shares sold | 236,526 | |||
| Other assets | 721 | |||
Total assets | $ | 38,234,739 | ||
Liabilities | ||||
| Fees payable to Parnassus Investments | 17,576 | |||
| Accounts payable and accrued expenses | 12,376 | |||
Total liabilities | $ | 29,952 | ||
Net assets (equivalent to $15.87 | ||||
per share based on 2,406,845 | ||||
shares of capital stock outstanding) | $ | 38,204,787 | ||
Net assets consist of | ||||
| Undistributed net investment income | $ | — | ||
| Unrealized appreciation on securities | 360,435 | |||
| Accumulated net realized gain | — | |||
| Capital paid-in | 37,844,352 | |||
Total net assets | $ | 38,204,787 | ||
Computation of net asset value and | ||||
offering price per share | ||||
| Net asset value and offering price per share | ||||
($38,204,787 divided by 2,406,845 shares) | $ | 15.87 | ||
STATEMENT OF OPERATIONS | |||
YEAR ENDED DECEMBER 31, 2004 |
Investment income | ||||
| Interest | $ | 850,745 | ||
| Dividends | 176,531 | |||
Total investment income | $ | 1,027,276 | ||
Expenses | ||||
| Investment advisory fees (Note 5) | 182,102 | |||
| Transfer agent fees (Note 5) | 51,229 | |||
| Fund accounting and administration fees (Note 5) | 20,433 | |||
| Service provider fees (Note 5) | 32,620 | |||
| Reports to shareholders | 17,433 | |||
| Registration fees and expenses | 22,956 | |||
| Professional fees | 14,156 | |||
| Custody fees | 4,224 | |||
| Trustee fees and expenses | 1,275 | |||
| Other expenses | 8,073 | |||
Total expenses before fee waiver | $ | 354,501 | ||
Fees waived by Parnassus Investments (Note 5) | (83,059 | ) | ||
Net expenses | $ | 271,442 | ||
Net investment income | $ | 755,834 | ||
Realized and unrealized gain (loss) | ||||
on investments | ||||
| Net realized gain (loss) from securities transactions | $ | 161,083 | ||
| Net change in unrealized appreciation | ||||
(depreciation) of securities | (168,658 | ) | ||
Net realized and unrealized gain (loss) | ||||
on securities | $ | (7,575 | ) | |
Net increase in net assets resulting | ||||
from operations | $ | 748,259 |
| 23 | ||
STATEMENTS OF CHANGES IN NET ASSETS
YEARS ENDED DECEMBER 31, 2004
AND DECEMBER 31, 2003
YEAR ENDED | YEAR ENDED | ||||||
From operations | |||||||
| Net investment income | $ | 755,834 | $ | 991,077 | |||
| Net realized gain (loss) | |||||||
from securities transactions | 161,083 | 549,369 | |||||
| Net change in unrealized | |||||||
appreciation (depreciation) | |||||||
of securities | (168,658 | ) | (289,739 | ) | |||
| Increase in net assets | |||||||
resulting from operations | $ | 748,259 | $ | 1,250,707 | |||
Dividends to shareholders | |||||||
| From net investment income | (755,834 | ) | (1,060,578 | ) | |||
| From realized capital gains | (222,827 | ) | (135,873 | ) | |||
| Return of capital | (71,829 | ) | — | ||||
Increase in net assets from | |||||||
capital share transactions | 4,409,201 | 14,951,960 | |||||
Increase in net assets | $ | 4,106,970 | $ | 15,006,216 | |||
Net assets | |||||||
| Beginning of period | 34,097,817 | 19,091,601 | |||||
| End of period | |||||||
(including undistributed | |||||||
net investment income of | |||||||
$0 in 2004 and $0 in 2003) | $ | 38,204,787 | $ | 34,097,817 | |||
| 24 | ||
Principal | Percent of | ||||||||
Amount $ | Municipal Bonds | Net Assets | Market Value | ||||||
EDUCATION | |||||||||
| 300,000 | Folsom School District | ||||||||
FGIC Insured, 5.600%, due 08/01/11 | $ | 330,561 | |||||||
| 450,000 | Los Altos School District | ||||||||
5.250%, due 08/01/10 | 505,516 | ||||||||
| 440,000 | Los Angeles Unified | ||||||||
School District | |||||||||
FGIC Insured, 5.500%, due 07/01/13 | 500,773 | ||||||||
| 450,000 | Morgan Hill Unified | ||||||||
School District | |||||||||
FGIC Insured, 4.900%, due 08/01/13 | 487,958 | ||||||||
| 410,000 | Sacramento City Unified School District | ||||||||
5.750%, due 07/01/17 | 473,960 | ||||||||
| 9.0 | % | $ | 2,298,768 | ||||||
ENVIRONMENT | |||||||||
Fixed Rate | |||||||||
| 400,000 | California State Department | ||||||||
of Water Resources | |||||||||
5.125%, due 12/01/16 | $ | 432,500 | |||||||
| 1,100,000 | California State Department | ||||||||
of Water Resources | |||||||||
5.500%, due 05/01/09 | 1,218,646 | ||||||||
| 500,000 | Central Coast Water Authority | ||||||||
AMBAC Insured, 5.000%, | |||||||||
due 10/01/16 | 524,895 | ||||||||
| 200,000 | City of Los Angeles | ||||||||
FGIC Insured, 5.000%, | |||||||||
due 06/01/11 | 217,648 | ||||||||
| 315,000 | Los Angeles County Public | ||||||||
Works Financing Authority | |||||||||
5.500%, due 10/01/12 | 344,909 | ||||||||
| 500,000 | San Francisco City & | ||||||||
County Public Utilities Commission | |||||||||
MBIA Insured, 3.000%, | |||||||||
due 10/01/06 | 507,035 | ||||||||
| 1,000,000 | San Francisco City & | ||||||||
County Public Utilities Commission | |||||||||
MBIA Insured, 5.000%, | |||||||||
due 10/01/09 | 1,106,790 | ||||||||
17.0 | % | $ | 4,352,423 | ||||||
Variable Rate | |||||||||
| 700,000 | California State Department | ||||||||
of Water Resources | |||||||||
variable rate 2.000%, | |||||||||
due 05/01/22 | 2.7 | % | $ | 700,000 | |||||
19.7 | % | $ | 5,052,423 | ||||||
| 25 | ||
PORTFOLIO OF INVESTMENTS BY INDUSTRY CLASSIFICATION, DECEMBER 31, 2004 — CONTINUED
Principal | Percent of | ||||||||
Amount $ | Municipal Bonds | Net Assets | Market Value | ||||||
GENERAL OBLIGATION | |||||||||
| 300,000 | City of Oakland | ||||||||
FGIC Insured, 5.500%, | |||||||||
due 12/15/11 | $ | 324,729 | |||||||
| 1,000,000 | State of California | ||||||||
6.600%, due 02/01/09 | 1,142,780 | ||||||||
| 700,000 | State of California | ||||||||
6.100%, due 10/1/09 | 798,147 | ||||||||
| 1,000,000 | State of California | ||||||||
5.000%, due 03/01/08 | 1,075,060 | ||||||||
13.1 | % | $ | 3,340,716 | ||||||
HEALTH CARE SERVICES | |||||||||
| 400,000 | California Health Facilities | ||||||||
Financing Authority | |||||||||
AMBAC Insured, 5.000%, | |||||||||
due 10/01/08 | 438,616 | ||||||||
| 415,000 | Loma Linda Hospital | ||||||||
AMBAC Insured, 4.850%, | |||||||||
due 12/01/10 | 457,674 | ||||||||
3.5 | % | $ | 896,290 | ||||||
HOUSING | |||||||||
| 1,000,000 | ABAG Finance Authority | ||||||||
for Nonprofit Corps | |||||||||
4.250%, due 11/15/12 | 1,033,040 | ||||||||
| 275,000 | Los Angeles Community | ||||||||
Redevelopment Agency | |||||||||
MBIA Insured, 5.000%, | |||||||||
due 07/01/13 | 300,003 | ||||||||
5.2 | % | $ | 1,333,043 | ||||||
INFRASTRUCTURE | |||||||||
IMPROVEMENTS | |||||||||
| 500,000 | California Infrastructure | ||||||||
& Economic | |||||||||
Development Bank | |||||||||
5.000%, due 10/01/12 | 560,875 | ||||||||
| 1,000,000 | California State Public | ||||||||
Works Board | |||||||||
FSA Insured, 5.375%, | |||||||||
due 10/01/13 | 1,127,540 | ||||||||
| 960,000 | California State Public | ||||||||
Works Board | |||||||||
5.500%, due 12/01/09 | 1,070,554 | ||||||||
| 910,000 | California Statewide Communities | ||||||||
Development Authority | |||||||||
ACA Insured, 4.500%, | |||||||||
due 08/01/10 | 950,995 | ||||||||
| 1,000,000 | Indian Wells | ||||||||
Redevelopment Agency | |||||||||
AMBAC Insured, 4.500%, | |||||||||
due 09/01/11 | 1,082,950 | ||||||||
| 600,000 | La Quinta Redevelopment | ||||||||
Agency Tax Allocation | |||||||||
MBIA Insured, 7.300%, | |||||||||
due 09/01/11 | 745,974 | ||||||||
| 350,000 | Metropolitan Water | ||||||||
District of Southern California | |||||||||
5.250%, due 07/01/15 | 377,720 | ||||||||
| 450,000 | Oakland Redevelopment Agency | ||||||||
3.400%, due 09/01/09 | 455,994 | ||||||||
| 860,000 | Rialto Redevelopment Agency | ||||||||
4.000%, due 09/01/07 | 883,762 | ||||||||
| 425,000 | Rialto Redevelopment Agency | ||||||||
4.500%, due 09/01/13 | 436,730 | ||||||||
30.1 | % | $ | 7,693,094 | ||||||
| 26 | ||
Principal | Percent of | ||||||||
Amount $ | Municipal Bonds | Net Assets | Market Value | ||||||
PUBLIC TRANSPORTATION | |||||||||
| 1,000,000 | Contra Costa | ||||||||
Transportation Authority | |||||||||
FGIC Insured, 4.000%, | |||||||||
due 03/01/09 | $ | 1,059,240 | |||||||
| 325,000 | Los Angeles County | ||||||||
Metropolitan | |||||||||
Transportation Authority | |||||||||
AMBAC Insured, 5.500%, | |||||||||
due 07/01/10 | 368,651 | ||||||||
| 250,000 | Los Angeles County | ||||||||
Metropolitan | |||||||||
Transportation Authority | |||||||||
AMBAC Insured, | |||||||||
5.000%, due 07/01/13 | 271,647 | ||||||||
| 390,000 | San Francisco Bay Area | ||||||||
Rapid Transit District | |||||||||
5.500%, due 07/01/07 | 419,921 | ||||||||
| 400,000 | San Francisco Bay Area | ||||||||
Rapid Transit District | |||||||||
5.250%, due 07/01/13 | 437,528 | ||||||||
| 1,000,000 | San Francisco City & | ||||||||
County Airports | |||||||||
Commission | |||||||||
FGIC Insured, 5.000%, | |||||||||
due 05/01/10 | 1,108,560 | ||||||||
| 14.3 | % | $ | 3,665,547 | ||||||
Total investments | |||||||||
in municipal bonds | |||||||||
(cost, $23,382,272) | 94.9 | % | $ | 24,279,881 | |||||
| Principal | Percent of | ||||||||
| Amount $ | Short-Term Investments | Net Assets | Market Value | ||||||
| �� | |||||||||
| Registered Investment Companies— | |||||||||
| Money Market Funds | |||||||||
| 251,948 | California Investment | ||||||||
| Trust Tax Free Fund | |||||||||
| variable rate 1.150% | $ | 251,948 | |||||||
| 303,462 | Goldman Sachs California | ||||||||
| Tax-Exempt Fund | |||||||||
| variable rate 1.070% | |||||||||
| 303,462 | |||||||||
| 453,465 | Highmark California | ||||||||
| Tax-Exempt Fund | |||||||||
| variable rate 1.450% | 453,757 | ||||||||
| Total investment in | |||||||||
| short-term securities | |||||||||
| (cost $1,009,167) | 3.9 | % | $ | 1,009,167 | |||||
| Total securities | |||||||||
| (cost $24,391,439) | 98.8 | % | $ | 25,289,048 | |||||
| Other assets and liabilities - net | 1.2 | % | 304,755 | ||||||
| Total net assets | 100.0 | % | $ | 25,593,803 | |||||
| ABAG | The Association of Bay Area Governments | |||||
| ACA | ACA Financial Guaranty Corp. | |||||
| AMBAC | American Municipal Bond Assurance Corp. | |||||
| FGIC | Financial Guaranty Insurance Co. | |||||
| FSA | Financial Security Assistance | |||||
| MBIA | Municipal Bond Investors Assurance Corp. | |||||
| 27 | ||
Assets | ||||
| Investments in securities, at market value | ||||
(identified cost $23,382,272) | $ | 24,279,881 | ||
| Temporary investments in short-term securities | ||||
(at cost, which approximates market value) | 1,009,167 | |||
| Receivables: | ||||
Interest | 326,507 | |||
| Other assets | 502 | |||
Total assets | $ | 25,616,057 | ||
Liabilities | ||||
| Fees payable to Parnassus Investments | 11,092 | |||
| Accounts payable and accrued expenses | 11,162 | |||
Total liabilities | $ | 22,254 | ||
Net assets (equivalent to $17.10 | ||||
per share based on 1,496,888 shares | ||||
of capital stock outstanding) | $ | 25,593,803 | ||
Net assets consist of | ||||
| Undistributed net investment income | $ | 5,021 | ||
| Unrealized appreciation on securities | 897,609 | |||
| Accumulated net realized gain | — | |||
| Capital paid-in | 24,691,173 | |||
Total net assets | $ | 25,593,803 | ||
Computation of net asset value and | ||||
offering price per share | ||||
| Net asset value and offering price per share | ||||
($25,593,803 divided by 1,496,888 shares) | $ | 17.10 | ||
STATEMENT OF OPERATIONS | |||
YEAR ENDED DECEMBER 31, 2004 |
Investment income | ||||
| Interest | $ | 882,912 | ||
Total investment income | $ | 882,912 | ||
Expenses | ||||
| Investment advisory fees (Note 5) | 126,605 | |||
| Transfer agent fees (Note 5) | 11,620 | |||
| Fund accounting and administration fees (Note 5) | 14,399 | |||
| Service provider fees (Note 5) | 21,806 | |||
| Reports to shareholders | 4,545 | |||
| Registration fees and expenses | 2,962 | |||
| Professional fees | 9,064 | |||
| Custody fees | 2,151 | |||
| Trustee fees and expenses | 905 | |||
| Other expenses | 11,397 | |||
Total expenses before fee waiver | $ | 205,454 | ||
Fees waived by Parnassus Investments (Note 5) | (36,904 | ) | ||
Net expenses | $ | 168,550 | ||
Net investment income | $ | 714,362 | ||
Realized and unrealized gain (loss) | ||||
on investments | ||||
| Net realized gain (loss) from securities transactions | $ | — | ||
| Net change in unrealized appreciation | ||||
(depreciation) of securities | $ | (36,967 | ) | |
Net realized and unrealized gain | ||||
(loss) on securities | $ | (36,967 | ) | |
Net increase in net assets resulting | ||||
from operations | $ | 677,395 | ||
| 28 | ||
STATEMENTS OF CHANGES IN NET ASSETS | ||||||||
YEARS ENDED DECEMBER 31, 2004 | ||||||||
AND DECEMBER 31, 2003 | ||||||||
YEAR ENDED | YEAR ENDED | ||||||
From operations | |||||||
| Net investment income | $ | 714,362 | $ | 800,948 | |||
| Net realized gain (loss) from | |||||||
securities transactions | — | 271,953 | |||||
| Net change in unrealized | |||||||
appreciation (depreciation) | |||||||
of securities | (36,967 | ) | (84,210 | ) | |||
| Increase in net assets | |||||||
resulting from operations | $ | 677,395 | $ | 988,691 | |||
Dividends to shareholders | |||||||
| From net investment income | (718,553 | ) | (807,627 | ) | |||
| From realized capital gains | (22,133 | ) | (250,346 | ) | |||
Increase (decrease) in net | |||||||
assets from capital share | |||||||
transactions | 832,566 | (1,269,019 | ) | ||||
Increase (decrease) in | |||||||
net assets | $ | 769,275 | $ | (1,338,301 | ) | ||
Net assets | |||||||
| Beginning of period | 24,824,528 | 26,162,829 | |||||
| End of period | |||||||
(including undistributed | |||||||
net investment income | |||||||
of $5,021 in 2004 and | |||||||
$9,817 in 2003) | $ | 25,593,803 | $ | 24,824,528 | |||
| 29 | ||
Investment Income and Expenses: Dividend income is recognized on the ex-dividend date and interest income is recognized on an accrual basis. Discounts and premiums on securities purchased are amortized over the lives of the respective securities using the constant yield method, which approximates the interest method. Expenses are recorded on an accrual basis.
Securities Lending: The Equity Income Fund lends its securities to approved financial institutions to earn additional income and receives cash and/or securities as collateral to secure the loans. Collateral is maintained at not less than 102% of the value of loaned securities. Although the risk of lending is mitigated by the collateral, the fund could experience a delay in recovering securities and a possible loss of income or value if the borrower fails to return them.
| 30 | ||
EQUITY INCOME FUND | FIXED-INCOME FUND |
| CALIFORNIA TAX-EXEMPT FUND | ||||||||||||||||
2004 | 2003 | 2004 | 2003 | 2004 | 2003 | ||||||||||||||
| Distributions paid from: | |||||||||||||||||||
Ordinary income | $ | 21,011,990 | $ | 10,160,220 | $ | 755,834 | $ | 1,060,578 | $ | — | $ | — | |||||||
Tax-exempt income | — | — | — | — | 719,079 | 807,627 | |||||||||||||
Long-term capital gains | 17,886,138 | — | 222,827 | 135,873 | 21,607 | 250,346 | |||||||||||||
| $ | 38,898,128 | $ | 10,160,220 | $ | 978,661 | $ | 1,196,451 | $ | 740,686 | $ | 1,057,973 | ||||||||
Return of capital | — | — | 71,829 | — | — | — | |||||||||||||
| Total distributions | $ | 38,898,128 | $ | 10,160,220 | $ | 1,050,490 | $ | 1,196,451 | $ | 740,686 | $ | 1,057,973 | |||||||
EQUITY INCOME FUND | FIXED-INCOME FUND | CALIFORNIA TAX-EXEMPT FUND | ||||||||
| Cost of investment | $ | 791,807,705 | $ | 11,354,692 | $ | 23,309,254 | ||||
| Unrealized appreciation | $ | 94,468,632 | $ | 526,258 | $ | 979,291 | ||||
| Unrealized depreciation | (3,901,622 | ) | (165,823 | ) | (8,664 | ) | ||||
| Net unrealized appreciation (depreciation) | $ | 90,567,010 | $ | 360,435 | $ | 970,627 | ||||
| Distributable earnings - ordinary income | $ | 17,875,780 | $ | 755,834 | $ | — | ||||
| Distributable earnings - tax-exempt income | — | — | 713,239 | |||||||
| Distributable earnings - long-term capital gains | 17,886,138 | 161,083 | — | |||||||
| Undistributed - ordinary income | $ | 66,591 | $ | — | $ | — | ||||
| Undistributed earnings - tax-exempt income | — | — | 935 | |||||||
| Undistributed earnings - long-term capital gains | — | — | — |
| 31 | ||
NOTES TO FINANCIAL STATEMENTS - CONTINUED
UNDISTRIBUTED NET | UNDISTRIBUTED NET | CAPITAL | ||||||||
FUND | INVESTMENT INCOME | REALIZED GAIN (LOSS) | PAID-IN | |||||||
| Equity Income Fund | $ | 5,455,799 | $ | (5,455,799 | ) | $ | — | |||
| Fixed-Income Fund | $ | 6,904 | $ | 64,925 | $ | (71,829 | ) | |||
| California Tax-Exempt Fund | $ | (605 | ) | $ | 526 | $ | 79 | |||
YEAR ENDED DECEMBER 31, 2004 | YEAR ENDED DECEMBER 31, 2003 | ||||||||||||
Shares | Amount | Shares | Amount | ||||||||||
| Shares sold | 16,399,818 | $ | 399,938,907 | 21,806,608 | $ | 464,928,454 | |||||||
| Shares issued through dividend reinvestment | 1,493,344 | 36,552,477 | 416,260 | 9,370,176 | |||||||||
| Shares repurchased | (8,375,092 | ) | (203,471,082 | ) | (8,855,314 | ) | (175,303,935 | ) | |||||
Net increase (decrease) | 9,518,070 | $ | 233,020,302 | 13,367,554 | $ | 298,994,695 | |||||||
YEAR ENDED DECEMBER 31, 2004 | YEAR ENDED DECEMBER 31, 2003 | ||||||||||||
Shares | Amount | Shares | Amount | ||||||||||
| Shares sold | 772,208 | $ | 12,333,370 | 1,416,444 | $ | 21,276,069 | |||||||
| Shares issued through dividend reinvestment | 57,474 | 913,210 | 63,100 | 1,017,411 | |||||||||
| Shares repurchased | (554,100 | ) | (8,837,379 | ) | (550,524 | ) | (7,341,520 | ) | |||||
Net increase (decrease) | 275,582 | $ | 4,409,201 | 929,020 | $ | 14,951,960 | |||||||
YEAR ENDED DECEMBER 31, 2004 | YEAR ENDED DECEMBER 31, 2003 | ||||||||||||
Shares | Amount | Shares | Amount | ||||||||||
| Shares sold | 245,943 | $ | 4,209,312 | 416,172 | $ | 7,158,418 | |||||||
| Shares issued through dividend reinvestment | 38,113 | 649,799 | 54,377 | 933,074 | |||||||||
| Shares repurchased | (235,836 | ) | (4,026,545 | ) | (543,745 | ) | (9,360,511 | ) | |||||
Net increase (decrease) | 48,220 | $ | 832,566 | (73,196 | ) | $ | (1,269,019 | ) | |||||
| 32 | ||
THE PARNASSUS INCOME TRUST
4. Purchases and Sales of Securities
Purchases | Sales | ||||||
| Equity Income Fund | $ | 1,000,602,312 | $ | 561,779,882 | |||
| Fixed-Income Fund | $ | 3,379,872 | $ | 5,230,817 | |||
| California Tax-Exempt Fund | $ | 514,895 | $ | — | |||
Equity Income Fund: 0.75% of the first $30,000,000, 0.70% of the next $70,000,000 and 0.65% of the amount above $100,000,000. Fixed-Income Fund and California Tax-Exempt Fund: 0.50% of the first $200,000,000, 0.45% of the next $200,000,000 and 0.40% of the amount above $400,000,000. For the year ended December 31, 2004, Parnassus Investments has contractually agreed to reduce its investment advisory fee through May 1, 2005 to the extent necessary to limit total operating expenses to 0.87% of net assets for the Fixed-Income Fund and 0.75% of net assets for the California Tax-Exempt Fund.
As a result of fee waivers, including additional voluntary waivers of 0.12% for Fixed-Income Fund and 0.08% for California Tax-Exempt Fund, the following were actually charged in 2004. For the Fixed-Income Fund, the investment advisory fee was 0.27%. Parnassus Investments received net advisory fees totaling $99,043 from the Fixed-Income Fund for the year ended December 31, 2004. For the California Tax-Exempt Fund, the investment advisory fee was 0.35%. Parnassus Investments received net advisory fees totaling $89,701 from the California Tax-Exempt Fund for the year ended December 31, 2004.
Parnassus Investments receives fees under terms of a separate agreement which provides for furnishing transfer agent and fund accounting and administration services to the funds. The transfer agent fee was $2.70 per month per account plus any out-of-pocket expenses. The funds pay the monthly fee based on the number of accounts on record at month-end. Through July 31, 2004, the fund accounting and administration fee was $27,123 per month. Beginning on August 1, 2004, the fund accounting and administration fee was changed to reflect annual rates determined on net assets for all funds managed by Parnassus Investments and was allocated based on respective fund net assets. The annualized fund accounting and administration services fee was 0.07% of average net assets under this new agreement for the period August 1, 2004, through December 31, 2004.
Parnassus Investments may also arrange for third parties to provide certain services, including account maintenance, record-keeping and other personal services to their clients who invest in the funds. For these services, the funds may pay service providers an aggregate service fee on investment accounts at a rate not to exceed 0.25% per annum of average daily net assets.
The Equity Income Fund paid commissions on portfolio transactions to third-party broker-dealers as part of directed brokerage arrangements. Under these arrangements, the fund earned credits on trades executed by such brokers to pay for fund expenses. These expense reimbursements are included in the statement of operations as fees paid indirectly. These arrangements were discontinued during 2004.
| 33 | ||
NOTES TO FINANCIAL STATEMENTS - CONTINUED
6. Geographic and Industry Concentration Risk Factors
Equity Income Fund | 2004 |
| 2003 |
| 2002 |
| 2001 |
| 2000 | |||||||
| Net asset value at beginning of year | $ | 24.00 | $ | 21.20 | $ | 22.50 | $ | 21.48 | $ | 23.13 | ||||||
| Income (loss) from investment operations: | ||||||||||||||||
| Net investment income | 0.40 | 0.44 | 0.49 | 0.67 | 0.33 | |||||||||||
| Net realized and unrealized gain (loss) on securities | 1.79 | 2.85 | (1.32 | ) | 1.43 | 1.06 | ||||||||||
Total income (loss) from investment operations | 2.19 | 3.29 | (0.83 | ) | 2.10 | 1.39 | ||||||||||
| Distributions: | ||||||||||||||||
| Dividends from net investment income | (0.56 | ) | (0.49 | ) | (0.29 | ) | (0.45 | ) | (0.36 | ) | ||||||
| Distributions from net realized gains | (0.63 | ) | — | (0.18 | ) | (0.63 | ) | (2.68 | ) | |||||||
Total distributions | (1.19 | ) | (0.49 | ) | (0.47 | ) | (1.08 | ) | (3.04 | ) | ||||||
| Net asset value at end of year | $ | 25.00 | $ | 24.00 | $ | 21.20 | $ | 22.50 | $ | 21.48 | ||||||
Total return | 9.30 | % | 15.69 | % | (3.69 | %) | 9.97 | % | 6.36 | % | ||||||
| Ratios/supplemental data: | ||||||||||||||||
| Ratio of gross expenses to average net assets | 1.04 | % | 0.96 | % | 1.03 | % | 1.18 | % | 1.15 | % | ||||||
| Ratio of net expenses to average net assets | 1.04 | % | 0.95 | % | 0.96 | % | 1.00 | % | 0.97 | % | ||||||
| Ratio of net investment income to average net assets | 1.63 | % | 1.95 | % | 2.29 | % | 3.10 | % | 1.34 | % | ||||||
| Portfolio turnover rate | 79.88 | % | 79.21 | % | 42.01 | % | 86.78 | % | 97.42 | % | ||||||
| Net assets, end of year (000’s) | $ | 894,415 | $ | 630,249 | $ | 273,429 | $ | 85,501 | $ | 55,421 | ||||||
| 34 | ||
Fixed-Income Fund | 2004 |
| 2003 |
| 2002 |
| 2001 |
| 2000 |
| ||||||
| Net asset value at beginning of year | $ | 16.00 | $ | 15.88 | $ | 14.94 | $ | 14.19 | $ | 14.49 | ||||||
| Income (loss) from investment operations: | ||||||||||||||||
| Net investment income | 0.33 | 0.58 | 0.82 | 0.87 | 0.89 | |||||||||||
| Net realized and unrealized gain (loss) on securities | (0.01 | ) | 0.26 | 0.95 | 0.72 | (0.29 | ) | |||||||||
Total income (loss) from investment operations | 0.32 | 0.84 | 1.77 | 1.59 | 0.60 | |||||||||||
| Distributions: | ||||||||||||||||
| Dividends from net investment income | (0.33 | ) | (0.65 | ) | (0.83 | ) | (0.84 | ) | (0.90 | ) | ||||||
| Distributions from net realized gains | (0.09 | ) | (0.07 | ) | — | — | — | |||||||||
| Return of capital | (0.03 | ) | — | — | — | — | ||||||||||
Total distributions | (0.45 | ) | (0.72 | ) | (0.83 | ) | (0.84 | ) | (0.90 | ) | ||||||
| Net asset value at end of year | $ | 15.87 | $ | 16.00 | $ | 15.88 | $ | 14.94 | $ | 14.19 | ||||||
Total return | 2.05 | % | 5.30 | % | 12.20 | % | 11.31 | % | 4.32 | % | ||||||
| Ratios/supplemental data: | ||||||||||||||||
| Ratio of gross expenses to average net assets | 0.97 | % | 0.92 | % | 1.08 | % | 1.15 | % | 1.13 | % | ||||||
| Ratio of net expenses to average net assets | 0.75 | % | 0.62 | % | 0.81 | % | 0.83 | % | 0.78 | % | ||||||
| Ratio of net investment income to average net assets | 2.08 | % | 3.59 | % | 5.36 | % | 5.84 | % | 6.18 | % | ||||||
| Portfolio turnover rate | 24.38 | % | 125.74 | % | 59.00 | % | 21.19 | % | 19.19 | % | ||||||
| Net assets, end of year (000’s) | $ | 38,205 | $ | 34,098 | $ | 19,092 | $ | 12,947 | $ | 10,309 | ||||||
California Tax-Exempt Fund | 2004 |
| 2003 |
| 2002 |
| 2001 |
| 2000 |
| ||||||
| Net asset value at beginning of year | $ | 17.14 | $ | 17.19 | $ | 16.61 | $ | 16.90 | $ | 15.82 | ||||||
| Income (loss) from investment operations: | ||||||||||||||||
| Net investment income | 0.48 | 0.53 | 0.59 | 0.70 | 0.72 | |||||||||||
| Net realized and unrealized gain (loss) on securities | (0.02 | ) | 0.12 | 0.83 | (0.18 | ) | 1.10 | |||||||||
Total income (loss) from investment operations | 0.46 | 0.65 | 1.42 | 0.52 | 1.82 | |||||||||||
| Distributions: | ||||||||||||||||
| Dividends from net investment income | (0.48 | ) | (0.53 | ) | (0.59 | ) | (0.70 | ) | (0.71 | ) | ||||||
| Distributions from net realized gains | (0.02 | ) | (0.17 | ) | (0.25 | ) | (0.11 | ) | (0.03 | ) | ||||||
Total distributions | (0.50 | ) | (0.70 | ) | (0.84 | ) | (0.81 | ) | (0.74 | ) | ||||||
| Net asset value at end of year | $ | 17.10 | $ | 17.14 | $ | 17.19 | $ | 16.61 | $ | 16.90 | ||||||
Total return | 2.73 | % | 3.88 | % | 8.66 | % | 3.09 | % | 11.75 | % | ||||||
| Ratios/supplemental data: | ||||||||||||||||
| Ratio of gross expenses to average net assets | 0.81 | % | 0.83 | % | 0.95 | % | 0.85 | % | 0.77 | % | ||||||
| Ratio of net expenses to average net assets | 0.67 | % | 0.62 | % | 0.73 | % | 0.65 | % | 0.52 | % | ||||||
| Ratio of net investment income to average net assets | 2.82 | % | 3.08 | % | 3.45 | % | 4.19 | % | 4.27 | % | ||||||
| Portfolio turnover rate | — | 16.16 | % | 41.73 | % | 23.14 | % | 8.13 | % | |||||||
| Net assets, end of year (000’s) | $ | 25,594 | $ | 24,825 | $ | 26,163 | $ | 18,891 | $ | 17,186 | ||||||
| 35 | ||
ADDITIONAL INFORMATION (UNAUDITED)
BOARD OF TRUSTEES AND OFFICERS
INDEPENDENT TRUSTEES§
|
|
|
| Portfolios |
|
|
|
|
| in the Fund | Other |
| Position(s) | Term of Office |
| Complex | Directorships |
| Held with | and Length of | Principal Occupation(s) | Overseen | Held by |
Name, Address and Age | Funds | Service | During Past 5 Years | by Trustee | Trustee |
| Herbert A. Houston | Trustee | Indefinite | Health-care consultant and | 4 | None |
| One Market - | owner of several small businesses; | ||||
| Steuart Tower | Since 1992 | Chief Executive Officer of the | |||
| Suite 1600 | for Income | Haight Ashbury Free Clinics, Inc. | |||
| San Francisco, | Trust | from 1987 to 1998; Trustee of | |||
| California 94105 | Since 1998 | the Parnassus Fund since 1998 | |||
| Age 61 | for Parnassus | and the Parnassus Income Trust | |||
Fund | since inception. | ||||
| Jeanie S. Joe | Trustee | Indefinite | President of Geo/Resource | 4 | None |
| One Market - | Consultants, a geotechnical and | ||||
| Steuart Tower | Since | environmental consulting firm, | |||
| Suite 1600 | October | since 1995; director and secretary | |||
| San Francisco, | 2004 | of Telecommunication Consumer | |||
| California 94105 | Protection Fund Corporation. | ||||
| Age 57 | |||||
| Donald V. Potter | Trustee | Indefinite | President and owner of | 4 | None |
| One Market - | Windermere Associates, | ||||
| Steuart Tower | Since 2002 | a consulting firm specializing | |||
| Suite 1600 | in business strategy, since 1984. | ||||
| San Francisco, | |||||
| California 94105 | |||||
| Age 59 |
| 36 | ||
ADDITIONAL INFORMATION (UNAUDITED) - CONTINUED
BOARD OF TRUSTEES AND OFFICERS - CONTINUED
INTERESTED TRUSTEE†
Portfolios | |||||
in the Fund | Other | ||||
Position(s) | Term of Office | Complex | Directorships | ||
Held with | and Length of | Principal Occupation(s) | Overseen | Held by | |
Name, Address and Age | Funds | Service | During Past 5 Years | by Trustee | Trustee |
Jerome L. Dodson†† | President | Indefinite | President and Trustee of the | 4 | None |
| One Market - | and | Parnassus Fund and the Parnassus | |||
| Steuart Tower | Trustee | Since 1992 | Income Trust since their inceptions; | ||
| Suite 1600 | for Income | President and Director of | |||
| San Francisco, | Trust | Parnassus Investments since June | |||
| California 94105 | Since 1984 | 1984; portfolio manager of the | |||
| Age 61 | for the | Parnassus Fund since its inception. | |||
Parnassus | |||||
Fund |
OFFICERS (OTHER THAN JEROME L. DODSON) | |||
Position(s) | Term of Office | ||
Held with | and Length of | ||
Name, Address and Age | Funds | Service | Principal Occupation(s) During Past 5 Years |
| Debra A. Early | Vice | Indefinite | Vice President, Chief Financial Officer and Treasurer of |
| One Market - | President | Parnassus Investments since 2004. Formerly, Senior | |
| Steuart Tower | and | Since | Manager at PricewaterhouseCoopers LLP October 1992 to |
| Suite 1600 | Treasurer | December | November 2004. |
| San Francisco, | 2004 | ||
| California 94105 | |||
| Age 40 | |||
| Todd Ahlsten | Vice | Indefinite | Vice President, Financial Analyst and Director of Research |
| One Market - | President | at Parnassus Investments since 1995. | |
| Steuart Tower | Since 2001 | ||
| Suite 1600 | |||
| San Francisco, | |||
| California 94105 | |||
| Age 32 | |||
| 37 | ||
Position(s) | Term of Office | ||
Held with | and Length of | ||
Name, Address and Age | Funds | Service | Principal Occupation(s) During Past 5 Years |
| Richard D. | Secretary | Indefinite | Attorney specializing in business law in private practice. |
| Silberman | |||
| One Market - | Since 1986 | ||
| Steuart Tower | |||
| Suite 1600 | |||
| San Francisco, | |||
| California 94105 | |||
| Age 67 | |||
| Stephen J. Dodson* | Chief | Indefinite | Financial Analyst with Morgan Stanley 1999-2001. Associate |
| One Market - | Compliance | with Advent International, a venture capital firm 2001-2002. | |
| Steuart Tower | Officer and | Since 2002 | Executive Vice President and Chief Operating Officer of |
| Suite 1600 | Assistant | Parnassus Investments 2002-Present. | |
| San Francisco, | Secretary | ||
| California 94105 | |||
| Age 27 |
| 38 | ||
Total Shares | Total Shares | Total Percentage | ||||||||
Voted “For” | Withheld | Voted “For”* | ||||||||
| Jerome L. Dodson | 29,287,335.70 | 925,063.19 | 96.9 | % | ||||||
| Herbert A. Houston | 29,283,798.26 | 928,600.63 | 96.9 | % | ||||||
| Donald V. Potter | 29,286,345.61 | 926,053.28 | 96.9 | % | ||||||
| Jeanie S. Joe | 29,288,659.45 | 923,739.44 | 96.9 | % | ||||||
Approval of Amendment to By-laws of The Parnassus Income Trust | |||||||||||||
to Change Mandatory Retirement Age: | |||||||||||||
Total Shares | Total Shares | Total Percentage | Total Shares | ||||||||||
Voted “For” | Voted “Against” | Voted “For”* | Abstained | ||||||||||
| 27,601,885.47 | 1,823,393.34 | 91.4 | % | 787,120.10 | |||||||||
*The Total Percentage Voted For is of the shares cast at the meeting. | |||||||||||||
| 39 | ||

| The Parnassus Income Trust | ||
| | | |
| Date: February 10, 2005 | By: | /s/ Jerome L. Dodson |
Jerome L. Dodson President | ||
| | | |
| Date: February 10, 2005 | By: | /s/ Jerome L. Dodson |
Jerome L. Dodson President | ||
| Title | ||
| | | |
| Date: February 10, 2005 | By: �� | /s/ Debra Early |
Debra Early Vice President | ||
| Title | ||