PARNASSUS INCOME FUNDS
UNITED STATES
SECURITIES AND EXCHANGE COMMISSION
Washington, D.C. 20549
FORM N-CSR
CERTIFIED SHAREHOLDER REPORT OF
REGISTERED MANAGEMENT INVESTMENT COMPANIES
Investment Company Act file number: 811-06673
Parnassus Income Funds
(Exact name of registrant as specified in charter)
One Market—Steuart Tower #1600, San Francisco, California 94105
(Address of principal executive offices) (Zip code)
Debra A. Early
Parnassus Income Funds
One Market—Steuart Tower #1600, San Francisco, California 94105
(Name and address of agent for service)
Registrant’s telephone number, including area code: (415) 778-0200
Date of fiscal year end: December 31
Date of reporting period: December 31, 2006
| Item 1: | Report to Shareholders |


| | |
Parnassus Equity Income Fund–Investor Shares | | (PRBLX) |
| |
Parnassus Equity Income Fund–Institutional Shares | | (PRILX) |
| |
Parnassus Fixed-Income Fund | | (PRFIX) |
| |
Parnassus California Tax-Exempt Fund | | (PRCLX) |
TABLE OF CONTENTS

THE PARNASSUS INCOME FUNDS
February 12, 2007
DEAR SHAREHOLDER:
Enclosed is your annual report for the Parnassus Income Funds: the Equity Income Fund, the Fixed-Income Fund and the California Tax-Exempt Fund. Portfolio manager Todd Ahlsten wrote the reports for the Equity Income Fund and the Fixed-Income Fund, and portfolio manager Ben Allen wrote the report for the California Tax-Exempt Fund. They will give you some interesting background on the management of the funds this year.
Parnassus in the Community
At Parnassus we practice what we preach, which translates into Parnassus giving back to the community. We maintain a two-for-one matching program, contributing two dollars for each dollar donated by an employee to a charity. Our employees are also given two paid days a year to volunteer for a non-profit of their choosing. This past November we held our first Parnassus in the Community Day. Staff members spent half a day planting trees in San Francisco with Friends of the Urban Forest. While most people think of San Francisco as a lush, scenic California city, tree coverage is about half the average for American cities. We wanted to play our part in brightening the concrete landscape.
Here’s a photo from that day.

| | | | |
| | The Parnassus Income Funds Ÿ December 31, 2006 | | 1 |
New Staff Member
As we have been growing in assets and introducing new funds, we have moved to strengthen our research team. Pearle Lee joined Parnassus as a senior research analyst at the start of 2007. Pearle brings an impressive set of credentials to Parnassus, and we are looking forward to the value she will add to our investment team. Formerly with Soros Fund Management, Pearle also worked previously for IRG, a boutique investment bank in Hong Kong, and BT Wolfensohn in their merger and acquisitions practice in New York. She holds an MBA degree from Harvard Business School and an undergraduate degree from Yale University. Pearle is a native of San Francisco and attended Lowell High School with Stephen. She is a certified scuba diver and spends many weekends sharpening her tennis game.
Shareholder Reports
If you own one of the Parnassus Mutual Funds through a brokerage firm, such as Schwab or Fidelity, you may have stopped receiving our quarterly shareholder reports for the March 31 and September 30 quarters. These firms no longer send out the March and September quarterlies – only the annual and semiannual reports. We post all our shareholder reports online at www.parnassus.com, but if you want copies of these reports mailed to you, we can add you to our mailing list. Go to www.parnassus.com/reports or call us at (800) 999–3505 and ask to be added to our shareholder reports mailing list.
Thank you for being an investor with Parnassus.
Yours truly,
| | |
 | |  |
| Jerome L. Dodson | | Stephen J. Dodson |
| |
| President | | Executive Vice President and Chief Operating Officer |
| | | | |
| 2 | | The Parnassus Income Funds Ÿ December 31, 2006 | | |
THE EQUITY INCOME FUND
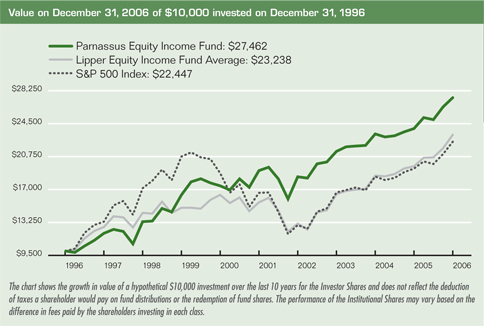
As of December 31, 2006, the total return of the Equity Income Fund – Investor Shares for the year was 14.70%. This compares to a gain of 15.79% for the S&P 500 Index (“S&P 500”) and a return of 18.45% for the average equity income fund followed by Lipper, Inc. For the fourth quarter, the Fund was up 3.99% for the Investor Shares versus 6.70% for the S&P 500 and 7.05% for the Lipper index. While we slightly underperformed relative to the S&P 500 for the year, our long-term record remains excellent. The Fund’s five- and ten-year results beat the S&P 500 for each period.
The table below compares the performance of the Fund with the performance of the S&P 500 and the Lipper Equity Income Fund Average over four different time periods.
Average Annual Total Returns
for periods ended December 31, 2006
| | | | | | | | | | | | |
| | | One
Year | | | Three
Years | | | Five
Years | | | Ten
Years | |
| EQUITY INCOME FUND – | | | | | | | | | | | | |
Investor Shares | | 14.70 | % | | 8.76 | % | | 7.47 | % | | 10.63 | % |
Lipper Equity Income Fund Average | | 18.45 | % | | 12.34 | % | | 8.69 | % | | 8.90 | % |
S&P 500 Index | | 15.79 | % | | 10.45 | % | | 6.19 | % | | 8.42 | % |
Returns shown in the table are for the Fund’s Investor Shares. The total return for the Equity Income Fund – Institutional Shares from inception (April 28, 2006) was 7.46%. The performance of Institutional Shares will differ from that shown for the Investor Shares to the extent that the Classes do not have the same expenses or inception date. Returns presented for less than one year are not annualized. Performance data quoted represent past performance and are no guarantee of future returns. Current performance may be lower or higher than the performance data quoted, and current performance information to the most recent month-end is on the Parnassus website (www.parnassus.com). Before investing, an investor should carefully consider the investment objectives, risks, charges and expenses of the Fund and should read the prospectus which contains this information. The prospectus is on the Parnassus website or you can get one by calling (800) 999–3505. Investment return and principal value will fluctuate, so that an investor’s shares, when redeemed, may be worth more or less than their original cost. Returns shown in the table do not reflect the deduction of taxes a shareholder would pay in fund distributions or redemption of shares. The S&P 500 Index is an unmanaged index of common stocks, and it is not possible to invest directly in an index. An index doesn’t take expenses into account, but mutual fund returns do. On March 3, 1998, the Fund changed its investment objective from a balanced portfolio to an equity income portfolio.
| | | | |
| | The Parnassus Income Funds Ÿ Equity Income Fund | | 3 |
2006 Analysis
The Fund generated a solid 14.70% return for shareholders during 2006. Despite higher interest rates, a slumping housing market, and high energy prices, the economy was resilient, and strong corporate earnings pushed stock prices higher. Fortunately, we positioned the portfolio for a growing economy early in the year, finding many high-returning investment opportunities in the technology, financial and consumer product sectors.
Our research team is constantly working to identify good businesses with talented management teams that trade at undervalued prices. During the year, I took over 20 airline trips to visit companies. The education I received from these trips was invaluable.
Despite our 14.7% gain for the year, we slightly underperformed relative to the S&P 500. Strong performance from the integrated oil and gas sector gave the S&P 500 a 1.4% advantage versus the Fund during 2006. While we made up some ground compared to the index in other industries, we couldn’t quite overcome the big gains from large oil stocks.
As socially responsible investors, we avoid buying the large energy companies such as Exxon Mobil, Chevron and ConocoPhillips because of their poor environmental records. Instead, we try to identify oil and natural gas companies that have more positive environmental policies. With this framework, we strive to make investments across the entire energy industry, including upstream and downstream operators. This includes socially responsible companies that explore, produce, transport, refine and market energy products.
| | | | |
| 4 | | The Parnassus Income Funds Ÿ Equity Income Fund | | |
While we owned several energy stocks, the large oil companies outside our socially responsible universe did best. Exxon Mobil, for example, saw its stock price soar 36.4% for the year. In contrast, our largest energy investment, Apache Corporation, was essentially flat during 2006. Our energy investments failed to keep pace because they sell more natural gas and less oil than the larger companies. While crude oil prices were flat for the year at a lofty $61 per barrel, natural gas prices declined 44% during 2006. An unusually warm start to the winter season was the biggest reason that natural gas prices fell. Since heating is a big source of natural gas demand, prices fell and our energy stocks underperformed relative to the market.
December was an especially tough month for natural gas prices. Amazingly, there were several days when it was warmer in New York than in San Francisco. In fact, on a cold December morning here in the Bay Area, I slipped on some ice while boarding the ferry in Tiburon, almost losing my mobile phone in the blue depths of the Bay. I have never seen ice there in the three years I’ve lived in Tiburon. Slightly embarrassed, I sat down inside the ferry as we headed across the bay. After grabbing a cup of coffee to warm up, I checked my Blackberry to see how the Fund was doing. I saw that Apache’s stock price was plunging due to balmy Northeastern weather. High temperatures in the Big Apple meant reduced demand for natural gas. This weather trend remained constant through the year-end resulting in the warmest December since 1957 according to Barrons. In fact, the national average temperature was a whopping 4.5 degrees higher in December 2006 than the previous year. As a result, natural gas prices dropped 29% during the month. While I didn’t hear complaints about the warm weather from my friends in the Northeast, it wasn’t helping the Fund’s performance.
That said, I feel our energy investments are well positioned to boost our returns in 2007. First of all, they are now trading at absolute bargain prices. Apache, for example, is valued at a price-to-earnings (PE) multiple of only 8 versus 11 for Exxon Mobil. In addition, Apache is finding oil and gas at a much faster pace than Exxon. Second, while global warming is a real issue, temperatures in the Northeast have been unsustainably high this year, so any reversion even close to historical averages would boost natural gas demand. Finally, if oil prices tumble in 2007, the 2006 pattern for energy stocks could reverse and our natural gas investments could outperform the big oil companies. As a result, despite the headwind we faced in the energy sector in 2006, I am optimistic about our prospects for 2007 and proud of the Fund’s 14.70% return this past year.
Company Analysis
The Fund had only one stock that hurt our NAV significantly. eBay had a tough year as its shares declined 30.4% from $43.22 to $30.07, reducing the Fund’s share price by 22¢. We bought eBay after watching the stock fall from the mid-$40s, where it closed the year in 2005. We had long admired the company because its business enjoyed a phenomenon that economists call the network effect. In short,
| | | | |
| | The Parnassus Income Funds Ÿ Equity Income Fund | | 5 |
much of eBay’s value lies in the fact that it attracts new buyers and sellers because of its enormous existing user base, which currently numbers 212 million. This virtuous cycle makes it difficult for a new entrant to threaten eBay.
Unfortunately, the stock tumbled during 2006, because of slowing growth in eBay’s core auction business. In addition, PayPal’s growth rate declined and eBay faced the perception that Google was moving into many of its markets. We sold almost all of our shares after deciding that eBay’s long-term growth prospects did not justify its valuation. Furthermore, we were concerned that growth in Asia would be more difficult, given the aggressive expansion strategies of some local competitors.
Ten stocks added at least 13¢, to the Fund’s NAV for the year. Cisco Systems was our biggest winner in 2006, adding 35¢ to the Fund’s share price, as the stock jumped 59.6% from $17.12 to $27.33 by year-end. Cisco grew faster than investors anticipated, beating Wall Street’s estimates for revenue in each of the four quarters in 2006. The better than expected growth came from virtually all geographic segments and product lines, including Cisco’s exciting collection of consumer products.
Frankly, while I thought Cisco would have a good 2006, I didn’t think it would be this spectacular. My decision to buy shares in Cisco was based on the strategy of owning excellent businesses at reasonable prices. When we bought Cisco, the stock was trading at a price-to-earnings ratio roughly in-line with the overall stock market. The market was telling us that Cisco was just an average company. However, as senior analyst Ben Allen analyzed the company (financials, competitive positioning, corporate citizenship, etc.), he came to a dramatically different conclusion: Cisco was a great company that deserved a premium valuation. Eventually, as Cisco generated outstanding earnings during the year, other investors came to the same conclusion which pushed the stock price much higher.
There was some other exciting news coming from Cisco this year. The company announced that they are partnering with the Oakland A’s to build the team a new ballpark in Fremont, California, a city just north of Silicon Valley. This facility, dubbed Cisco Field, will showcase new Cisco products (and hopefully generate enough revenue for the A’s to retain more of their young stars!). Ben Allen and I are looking forward to making some important due diligence trips to watch the A’s when Cisco Field opens, perhaps as early as 2010.
Canon, the well-known Japanese company that is a leading maker of digital cameras and copiers, added 27¢ to the Fund’s share price, as its stock soared 46.3% for the year from $38.68 to $56.59. Raj Sharma, managing director of Polestar Investment Research, brought this international investment idea to our attention in the fall of 2005. After extensive work led by Mr. Sharma, we determined that Canon, with a strong portfolio of new products, was deeply undervalued. The stock jumped higher, as sales were very strong in 2006, especially for the company’s digital cameras. We have sold about 70% of our position, now that Canon’s stock has reached our intrinsic value target.
| | | | |
| 6 | | The Parnassus Income Funds Ÿ Equity Income Fund | | |
J.P. Morgan Chase’s stock jumped 21.1% for the year from $39.86 to $48.30 per share and boosted the Fund’s NAV by 20¢. The company reported very strong earnings growth during 2006 driven by its investment banking division. CEO Jamie Dimon has done a good job not only growing the business, but also controlling costs.
New York-based Tower Group, Inc., a property and casualty insurance company that sells policies to small businesses was a big winner for the Fund. The stock jumped 31% from our average cost of $23.71 to $31.07 by year-end and boosted our NAV by 20¢. The company is managed by talented CEO Michael Lee. I had a group meeting with Mr. Lee in April and was very impressed with the company’s business plan. Tower is growing profits rapidly by selling insurance policies to small businesses that are underserved by large insurance companies. These premiums are typically around $2,000 per customer and Tower is very profitable, due to its efficient operations and strict underwriting standards. The company seems set for another record year, as a recently announced acquisition will expand Tower’s business into new cities.
ONEOK was our largest energy winner for the year, as its stock rose a whopping 61.6% from $26.69 to $43.12 per share, adding 20¢ for the Fund’s price. This Oklahoma-based company focuses on buying, processing, transporting, storing and marketing natural gas liquids (NGLs). The company had solid earnings during 2006, based on higher utility rates, and a growing natural gas gathering and processing business. ONEOK had a great year, and the business is now listed on Fortune Magazine’s list of 100 Fastest Growing Companies.
| | | | |
| | The Parnassus Income Funds Ÿ Equity Income Fund | | 7 |
Long-time holding WD-40 boosted the Fund’s price by 20¢, as its stock jumped 30.8% to $34.87 from $26.65 per share. The company, led by a hardworking Australian named Garry Ridge, reported strong sales across all product lines during 2006. Apparently, all sorts of things squeak outside the U.S.A. as sales of WD-40 have been very strong overseas. The company will spend $1 million during 2007 to build an operation in China. I am looking forward to a meeting with WD-40’s CFO, Mike Irwin, set for late January to obtain an update on the business.
IBM added 15¢ to the NAV, as its shares moved up 18.2% during 2006, climbing from $82.20 to $97.15 per share. The stock began the year depressed due to lower than expected bookings for IBM’s services business. One of our talented senior analysts, Lori Keith, did an outstanding review of the company, so we bought more shares during early 2006, thinking IBM was set for a strong year. Her analysis was right on the mark, as the company completed a restructuring of its services segment during the year and bookings began to improve. Under current CEO Sam Palmisano, IBM also shed an underperforming PC business, focused more on operational efficiencies across business units, and placed a greater emphasis on leading technologies such as Service Oriented Architecture (SOA) software. IBM made a number of software acquisitions in 2006, making software the fastest growing of IBM’s three business segments. We also like the positioning of IBM’s hardware business, as the company enjoys a leading market share in the server and blade markets. Strong growth trends in storage should continue, as companies shift towards digitizing huge amounts of data.
Going forward and for the longer term, we believe IBM will be able to deliver continued margin expansion, as a greater proportion of its business comes from its high margin software group. Furthermore, the company is continuing to make operational improvements in its services segment. Because of this margin expansion, the company should be able to turn a 6-8% increase in sales into a 10-12% increase in income.
Sysco Corporation, the country’s largest distributor of food and supplies to restaurants and other food outlets, had a great year for the Fund. The company’s share price climbed 18.4% from $31.05 to $36.76 and boosted our NAV by 15¢. Sysco had record sales during 2006 based on its vast network of distribution routes and strong customer marketing programs. I smile whenever I see a Sysco truck driving down the road.
Baxter, a leading pharmaceutical and medical device company, added 13¢ to the Fund’s share price as its stock rose 23.2% from $37.65 to our average selling price of $46.39. We bought the stock back in 2003, when the company’s bioscience division was struggling due to industry overcapacity and low prices. The profits from this segment, which sells products that treat immune disorders and hemophilia, have bounced back. We sold our shares when Baxter’s stock hit our intrinsic value target.
Our final significant winner for 2006 was Energen Corporation, an Alabama-based company that owns a utility and also explores for oil and gas. The stock climbed
| | | | |
| 8 | | The Parnassus Income Funds Ÿ Equity Income Fund | | |
28.7% from $36.16 to $46.94 during the year and added 13¢ to our Fund’s price. High crude oil prices were the main driver that pushed the stock higher. The company is also succeeding in finding more oil and gas in an environmentally sustainable way.
Strategy for 2007
While final numbers are not yet in, the economy likely grew about 2% in the fourth quarter of 2006, as compared to 5.6% during the first quarter of 2006. The economy is slowing due to higher interest rates, a slumping housing market, and lofty energy prices. In addition, many consumers face adjustable rate mortgage payments that will likely move higher over the next year. This burden on the consumer could limit economic growth, as consumer spending equates to about two-thirds of the national economy. Fortunately, energy prices have started to fall and the job market remains strong with the unemployment rate at 4.5%. In addition, Federal Reserve Chairman Ben Bernanke is doing a good job managing interest rates. He seems to have set the Federal Funds Rate high enough at 5.25% to slow inflation, but low enough to avoid sending the economy into recession. As a result, our team is anticipating moderate 1%-2% economic growth for the year.
I am very excited about the portfolio going into 2007. We currently own a collection of good businesses that trade at undervalued prices. Also, our analysts are continually searching for new investments that will do well given current economic conditions. With the S&P 500 trading at a price-earnings ratio of only 16 times projected earnings, the market appears to be slightly undervalued. Since we think that S&P 500 companies can grow earnings at least 5% during 2007, and that the Federal Reserve is probably done raising interest rates, the market seems set to continue its ascent in 2007.
An interesting stock market pattern also points to positive gains for 2007. Since 1939, the S&P 500 has risen every year during the third year of a president’s term. That’s a long time for a cycle to work. In fact, it started when my great grandfather August Ahlsten, a man whom the family claims ran over 30 miles one day to pay his taxes, was still farming in Minnesota. This pattern is not only long-lived but also very profitable. The return for the S&P 500 during the third year of a president’s term has been around 18% annually, almost double its long-term average. While there are several theories on why stocks have gone up 16 times in a row during the third year of a president’s term, one explanation makes the most sense: administrations tend to boost spending to stimulate the economy a year before elections to gain popularity with voters. It will be interesting to see if the winning streak continues in 2007, since President Bush can’t run for re-election, and the Democrats, who now control the House and Senate, will promote their own agenda.
Based on our economic view and company-specific research, the Fund remains overweight in healthcare, technology and the consumer discretionary sectors. Our team has found companies in these sectors that are undervalued and have business opportunities to grow earnings despite a slowing economy. We are also positioned
| | | | |
| | The Parnassus Income Funds Ÿ Equity Income Fund | | 9 |
to avoid significant housing sector exposure. The Fund is slightly underweight in energy but has been adding to our exposure as oil and natural gas prices have been declining. This has caused some energy stocks to be undervalued. Our biggest underweight position remains in financial services because high short-term interest rates are squeezing the amount of money banks make on loans. We also have a large underweight position in industrial companies due to our belief that the economy is slowing. Based on these industry allocations and our portfolio of good companies, our investment team is optimistic about 2007.
Social Notes
After spending Thanksgiving with his family in New York, Senior Analyst Matthew Gershuny headed south to Bradenton, Florida to visit management at Gevity HR, Inc.’s (Gevity) corporate headquarters. Matt’s trip, the conclusion to several weeks of background work, supported his investment thesis – that this attractively valued, high return, moderate risk company should soon see the reward from its growth initiatives. He was also impressed by the company’s workplace and its social strengths in governance and shareholder stewardship.
Gevity began when four founders cleared off a workbench in a Florida garage in 1984, bought a photocopier, and began a staffing operation. Their enterprise grew to the point that they sold the business in 1993 to Craig Capital, an investment group. Under the new ownership, the company expanded its service offerings and geographic locations in the mid-1990s, and went public in 1997 to raise capital for further national expansion. Today, the company provides a comprehensive, out-sourced human resource solution to small and mid-sized businesses. Gevity acts as a full-service human resource department, providing recruiting, hiring and firing, payroll administration, tax management, risk management, benefits administration and human resources consultation. Gevity’s 1,050 employees, operating through 40 offices in 13 states, service 8,200 clients and 137,000 client employees.
Gevity’s services can materially improve the quality of clients’ workplaces and benefits packages. The company’s clients, who are generally small firms, have access to human resource and benefit services generally equated with much larger organizations. Specifically, client employees benefit from implementing Gevity’s cutting edge and best-in-class human resource practices, as well as from taking advantage of its multiple, competitively priced, high quality health coverage and retirement plan options.
Matt noted during his facility visit that one employee described Gevity’s CEO, Eric Vonk, as a “Possibilitarian” due to his positive management style and strong vision. Matt also learned of an interesting annual event at Gevity. Each March 4th, all employees (except for a skeletal staff) are allowed the day off as long as they commit to doing something that they have always wanted to do. “March Forth,” as it is known internally, is also referred to as “Dream Day” and examples of what people have done include spending the day with grandparents, taking piano lessons and getting engaged (yes, this actually happened once!). Gevity is attempting to have clients participate in this plan as well.
| | | | |
| 10 | | The Parnassus Income Funds Ÿ Equity Income Fund | | |
All of this might bode well for Gevity associates, but Gevity is also working hard and making sustainable, responsible decisions for their clients and shareholders. Gevity was an early adopter of a CRM (customer relationship management) computerized system, and is now reaping the rewards of that successful implementation. We are heartened by the fact that Gevity was the first in its industry to improve transparency in its accounting procedures, now reporting in terms of “net” revenue rather than “gross” revenue. The latter was an unhelpful combination of salaries, wages, certain payroll taxes and administration service fees. Gevity continues to pay dividends, at a 1.6% yield, and in 2005 bought back over $50 million of its own shares. The company currently has an active buyback program in place.
Four Parnassus Funds recently bought 238,000 shares of the company. Gevity’s good corporate governance, excellent workplace and shareholder-friendly actions, make the company a valuable addition to our socially responsible portfolio.
Thank you for investing in the Parnassus Equity Income Fund.
|
| Yours truly, |
|
 |
| Todd C. Ahlsten |
|
| Portfolio Manager |
| | | | |
| | The Parnassus Income Funds Ÿ Equity Income Fund | | 11 |
THE FIXED - INCOME FUND
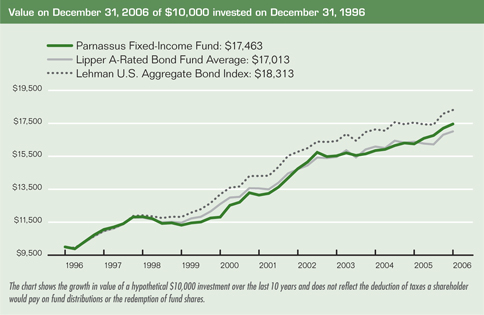
As of December 31, 2006, the net asset value per share (NAV) of the Fixed-Income Fund was $16.11, so after taking dividends into account, the total return for the year was 7.45%. This compares to a gain of 3.85% for the average A-Rated bond fund followed by Lipper, Inc. and a return of 4.33% for the Lehman U.S. Aggregate Bond Index. Based on this strong performance, I’m pleased to report that our return for the year placed us #2 out of 173 funds in our category followed by Lipper*. The Fund had a great year because we expected rates to rise and positioned the portfolio accordingly. In addition, our convertible bond investments boosted the Fund’s performance during 2006.
Our longer-term returns are also excellent as the Fund’s three-, five- and ten-year returns beat the Lipper A-rated Bond Average for every period. For the fourth quarter, the Fund was up 1.50% versus 1.21% for the Lipper index and 1.24% for the Lehman U.S. Aggregate Bond Index.
Below is a table that compares the performance of the Fund with the Lehman U.S Aggregate Bond Index and the average A-Rated bond fund followed by Lipper. Average annual total returns are for the one-, three-, five-, and ten-year periods.
Average Annual Total Returns
for periods ended December 31, 2006
| | | | | | | | | | | | |
| | | One
Year | | | Three
Years | | | Five
Years | | | Ten
Years | |
FIXED-INCOME FUND | | 7.45 | % | | 3.99 | % | | 5.85 | % | | 5.73 | % |
Lipper A-Rated Bond Fund Average* | | 3.85 | % | | 3.36 | % | | 4.84 | % | | 5.61 | % |
Lehman U.S. Aggregate Bond Index | | 4.33 | % | | 3.70 | % | | 5.06 | % | | 6.24 | % |
Performance data quoted represent past performance and are no guarantee of future returns. Current performance may be lower or higher than the performance data quoted, and current performance information is on the Parnassus website (www.parnassus.com). Before investing, an investor should carefully consider the investment objectives, risks, charges and expenses of the Fund and should read the prospectus which contains this information. The prospectus is on the Parnassus website or you can get one by calling (800) 999–3505. Investment return and principal value will fluctuate, so that an investor’s shares, when redeemed, may be worth more or less than their original cost. Returns shown in the table do not reflect the deduction of taxes a shareholder would pay in fund distributions or redemption of shares. The Lehman U.S. Aggregate Bond Index and the Lehman Government/Corporate Bond Index are unmanaged index of bonds, and it is not possible to invest directly in an index. An index doesn’t take expenses into account, but mutual fund returns do. To provide better alignment with the overall investment objective of the Fund, the Lehman U.S. Aggregate Bond Index replaced the Lehman Government/Corporate Bond Index. The returns for the Lehman Government/Corporate Bond Index for the one-, three-, five- and ten-year periods were 3.78%, 3.44%, 5.17% and 6.26%, respectively.
| * | For the one-, three-, five- and ten-year periods ended December 31, 2006 based on the Lipper A-Rated Bond Fund Average, the Parnassus Fixed-Income Fund placed #2 out of 173 funds, #27 out of 155 funds, #13 out of 118 funds and #28 out of 62 funds, respectively. |
| | | | |
| 12 | | The Parnassus Income Funds Ÿ Fixed-Income Fund | | |
2006 Analysis
The Fund had a great year, as our return of 7.45% almost doubled the 3.85% that our peers earned in 2006. Two major portfolio decisions made 2006 a stellar year for our shareholders. First, we anticipated that interest rates would rise due to investors’ concerns over growing inflation. Since bond prices fall when interest rates rise, we held few long-term bonds, which are more sensitive to rate increases than short-term bonds. Instead, we purchased a large amount of short-term bonds for the Fund, because they offered attractive yields and less risk.
Our analysis proved correct, as the 10-year Treasury rate spiked from 4.39% at the beginning of the year to 5.25% by June, due to concerns that a strong economy would stoke inflation. Many of our peers suffered losses during this period because long-term bond prices declined. As the 10-year rate climbed past 5%, we started buying longer-term bonds, based on our view that rates were reaching a peak. This move increased our gain during the second half of the year, as the 10-year rate fell from 5.25% in June to 4.71% by year-end.
The second reason for our strong year is that our convertible bond investments increased in value. The fortunes of convertible bonds are typically more linked to a company’s stock price than interest rate movements. Because we invested in the bonds of companies that performed well in the stock market, we generated strong returns for the Fund in spite of the rising rate environment.
| | | | |
| | The Parnassus Income Funds Ÿ Fixed-Income Fund | | 13 |
Strategy
Senior analyst Ben Allen and I meet weekly to discuss our view on interest rates and the economy. We are confident that Federal Reserve Chairman Ben Bernanke is doing a good job, balancing investors’ concerns over inflation and economic growth. At 5.25%, the Federal Funds Rate seems high enough to tame inflation, but low enough to accommodate economic growth. That said, we are watching economic developments and comments from the Federal Reserve very closely. The minutes of the most recent Federal Open Market Committee meeting indicate that the Federal Reserve is still worried about potentially higher inflation. At the same time, we note that economic growth is indeed decelerating, caused in part by a slowdown in residential real estate, which should reduce inflationary pressure. Since concerns over higher inflation and slowing economic growth seem to offset each other, we expect the Federal Funds Rate to stay at 5.25% for at least the next six months.
Moving to longer-term rates, we feel that the 10-year Treasury rate could rise from its current level of 4.62%, as recession fears fade and the economy strengthens. While the Fund remains defensively positioned with a high proportion of short-term bonds, we are looking to add longer-term bonds as the 10-year Treasury rate approaches 5%. In addition, our team is constantly searching for attractive convertible bonds to boost the Fund’s performance.
We are working hard to have another great year in 2007. Thank you for investing in the Parnassus Fixed-Income Fund.
| | | |
Fixed-Income Fund at December 31, 2006 (percentage of net assets) | | | |
| Portfolio Composition | | | |
Long-term Securities: | | | |
Long-term U.S. Government and Agency Securities | | 22.26 | % |
Financials | | 14.84 | % |
Information Technology | | 14.63 | % |
Healthcare | | 4.59 | % |
Utilities | | 2.07 | % |
Consumer | | 0.69 | % |
Short-term Securities: | | | |
Short-term U.S. Government Agency Securities | | 35.08 | % |
Other Short-term Investments, and Assets and Liabilities | | 5.84 | % |
Portfolio characteristics and holdings are subject to change periodically.
|
Yours truly, |
|
|
Todd C. Ahlsten |
|
Portfolio Manager |
| | | | |
| 14 | | The Parnassus Income Funds Ÿ Fixed-Income Fund | | |
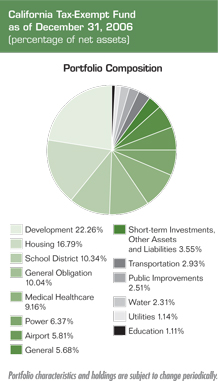
THE CALIFORNIA TAX - EXEMPT FUND
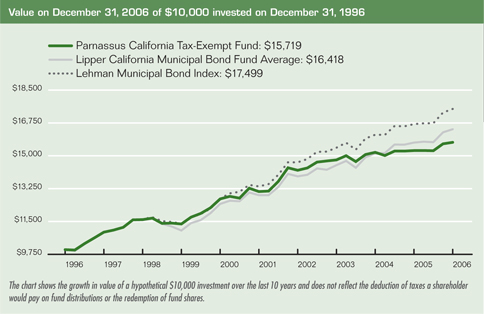
As of December 31, 2006, the net asset value per share (NAV) of the California Tax-Exempt Fund was $16.56. Taking dividends into account, the total return for 2006 was a gain of 2.88%. This compares to a gain of 4.54% for the average California municipal bond fund followed by Lipper, Inc. The average duration of the California Tax-Exempt Fund was 3.4 years during the quarter, versus 6.1 years for the Lehman Municipal Bond Index. Simply put, duration measures how much in percentage terms a bond price will move for a 1% change in interest rates.
Below you will find a table that compares our total average annual returns to various indices over the past one-, three-, five- and ten-year periods. The 30-day SEC yield for December 2006 was 3.05%.
Average Annual Total Returns
for periods ended December 31, 2006
| | | | | | | | | | | | |
| | | One
Year | | | Three
Years | | | Five
Years | | | Ten
Years | |
CALIFORNIA TAX-EXEMPT FUND | | 2.88 | % | | 2.07 | % | | 3.72 | % | | 4.63 | % |
Lipper California Municipal Bond Fund Average | | 4.54 | % | | 4.30 | % | | 4.99 | % | | 5.14 | % |
Lehman Municipal Bond Index | | 4.84 | % | | 4.28 | % | | 5.53 | % | | 5.75 | % |
Performance data quoted represent past performance and are no guarantee of future returns. Current performance may be lower or higher than the performance data quoted, and current performance information is on the Parnassus website (www.parnassus.com). Before investing, an investor should carefully consider the investment objectives, risks, charges and expenses of the Fund and should carefully read the prospectus which contains this information. The prospectus is on the Parnassus website or you can get one by calling (800) 999–3505. Investment return and principal value will fluctuate, so that an investor’s shares, when redeemed, may be worth more or less than their original cost. Returns shown in the table do not reflect the deduction of taxes a shareholder would pay on fund distributions or redemption of shares. The Lehman Municipal Bond Index is an unmanaged index of fixed-income securities and it is not possible to invest directly in an index. An index doesn’t take expenses into account, but mutual fund returns do.
2006 Analysis
The Fund made a gain of 2.88% during 2006, while maintaining a defensive posture throughout the year in anticipation of rising interest rates. Consistent with our 2006 outlook, the 10-year Treasury rate rose during 2006, from 4.39% to 4.71%. Since bond prices fall when rates increase, we benefited from having few long-term bonds in our portfolio. However, short-term interest rates increased even more than long-term rates, which reduced the returns of our short-term bonds. Because the Fund had a relatively high proportion of short-term bonds, we underperformed relative to our peers in 2006.
| | | | |
| | The Parnassus Income Funds Ÿ California Tax-Exempt Fund | | 15 |
Outlook
As we begin 2007, an analysis of recent economic data reveals a mixed economic picture. On the one hand, we see evidence of increased inflation, which could exert upward pressure on interest rates. The biggest potential cause of higher inflation in 2007 appears to be a strong labor market. The unemployment rate has hit a five year low at only 4.5%. Surprisingly, it now takes just over seven weeks for the average unemployed person to find a job—this is the lowest this statistic has been in over five years. A potential offset to the hot labor market is the cooling housing market. We expect that more normal home price appreciation will remove some excess spending in the economy, as homeowners make fewer discretionary purchases with home equity loans. This real estate effect should dampen consumer demand, and therefore reduce inflation in 2007.
| | | | |
| 16 | | The Parnassus Income Funds Ÿ California Tax-Exempt Fund | | |
In light of this mixed economic outlook, our team predicts that the Federal Reserve Board, led by Chairman Ben Bernanke, will not change the short-term interest rate for at least six months. With the short-term rate at 5.25%, the Fed is stemming inflation, while accommodating moderate economic growth. Additionally, we think that the 10-year Treasury rate will probably continue its recent rise back toward 5%, as investors no longer worry that a recession is imminent.
Finally, I am closely monitoring Governor Schwarzenegger’s recently announced initiatives, including his efforts to mandate universal healthcare for Californians. At first glance, these proposals do not appear to seriously threaten California’s financial health, so they should not affect the credit rating of our California state bonds. As always, we are searching for opportunities to boost the Fund’s income and returns, while avoiding excessive risk to your capital.
Thank you for investing in the Fund.
Yours truly,
|
|
 |
Ben Allen Portfolio Manager |
| | | | |
| | The Parnassus Income Funds Ÿ California Tax-Exempt Fund | | 17 |
FUND EXPENSES (UNAUDITED)
As a shareholder of the funds, you incur ongoing costs, which include portfolio-management fees, administrative fees, shareholder reports, and other fund expenses. The funds do not charge transaction fees, so you do not incur transaction costs such as sales charges (loads) on purchase payments, reinvested dividends, or other distributions; redemption fees; and exchange fees. The information on this page is intended to help you understand your ongoing costs of investing in the funds and to compare these costs with the ongoing costs of investing in other mutual funds.
The following example is based on an investment of $1,000 invested at the beginning of the most recent six-month period and held for the period of July 1, 2006 through December 31, 2006.
Actual Expenses
In the example below, the first line for each fund provides information about actual account values and actual expenses. You may use the information in this line, together with the amount you invested, to estimate the expenses that you paid over the period. Simply divide your account value by $1,000 (for example, $8,600 account value divided by $1,000 = 8.6), then multiple the result by the number in the first line under the heading entitled “Expenses Paid During Period” to estimate the expenses you paid on your account during this period.
Hypothetical Example for Comparison Purposes
The second line of each fund provides information about hypothetical account values and hypothetical expenses based on the fund’s expense ratio and an assumed rate of return of 5% per year before expenses, which is not the fund’s actual return. You may compare the ongoing costs of investing in the fund with other mutual funds by comparing this 5% hypothetical example and the 5% hypothetical examples that appear in the shareholder reports of other funds. The hypothetical account values and expenses may not be used to estimate the actual ending account balance or expenses you paid for the period.
| | | | |
| 18 | | The Parnassus Income Funds Ÿ December 31, 2006 | | |
Please note that the expenses shown in the table are meant to highlight only your ongoing costs in these funds. Therefore, the second line of each fund is useful in comparing only ongoing costs and will not help you determine the relative total costs of owning other mutual funds, which may include transactional costs such as loads.
| | | | | | | | | |
| | | Beginning
Account Value
July 1, 2006 | | Ending
Account Value
December 31, 2006 | | Expenses
Paid During
Period* |
Equity Income Fund – Investor Shares Actual Hypothetical (5% before expenses) | | $
$ | 1,000.00
1,000.00 | | $
$ | 1,210.70
1,020.21 | | $
$ | 5.52
5.04 |
Equity Income Fund – Institutional Shares Actual Hypothetical (5% before expenses) | | $
$ | 1,000.00
1,000.00 | | $
$ | 1,213.04
1,021.27 | | $
$ | 4.35
3.97 |
Fixed-Income Fund Actual Hypothetical (5% before expenses) | | $
$ | 1,000.00
1,000.00 | | $
$ | 1,085.04
1,021.42 | | $
$ | 3.94
3.82 |
California Tax-Exempt Fund Actual Hypothetical (5% before expenses) | | $
$ | 1,000.00
1,000.00 | | $
$ | 1,059.61
1,021.78 | | $
$ | 3.53
3.47 |
| * | Expenses are equal to the fund’s annualized expense ratio of 0.99%, 0.78%, 0.75%, and 0.68% for Equity Income Fund – Investor Shares, Equity Income Fund – Institutional Shares, Fixed-Income Fund and California Tax-Exempt Fund, respectively, multiplied by the average account value over the period, multiplied by 184/365 (to reflect the one-half year period). |
| | | | |
| | The Parnassus Income Funds Ÿ December 31, 2006 | | 19 |
REPORT OF INDEPENDENT REGISTERED PUBLIC ACCOUNTING FIRM
To the Shareholders and Board of Trustees of the Parnassus Income Funds:
We have audited the accompanying statements of assets and liabilities including the portfolios of investments of the Parnassus Income Funds (the “Trust”), (comprising Equity Income Fund, Fixed-Income Fund and California Tax-Exempt Fund) as of December 31, 2006, and the related statements of operations for the year then ended, the statements of changes in net assets for each of the two years in the period then ended, and the financial highlights for each of the periods presented. These financial statements and financial highlights are the responsibility of the Trust’s management. Our responsibility is to express an opinion on these financial statements and financial highlights based on our audits.
We conducted our audits in accordance with the standards of the Public Company Accounting Oversight Board (United States). Those standards require that we plan and perform the audit to obtain reasonable assurance about whether the financial statements and financial highlights are free of material misstatement. The Trust is not required to have, nor were we engaged to perform, an audit of its internal control over financial reporting. Our audits included consideration of internal control over financial reporting as a basis for designing audit procedures that are appropriate in the circumstances, but not for the purpose of expressing an opinion on the effectiveness of the Trust’s internal control over financial reporting. Accordingly we express no such opinion. An audit also includes examining, on a test basis, evidence supporting the amounts and disclosures in the financial statements, assessing the accounting principles used and significant estimates made by management, as well as evaluating the overall financial statement presentation. Our procedures included confirmation of securities owned as of December 31, 2006, by correspondence with the custodian. We believe that our audits provide a reasonable basis for our opinion.
In our opinion, the financial statements and financial highlights referred to above present fairly, in all material respects, the financial position of each of the funds constituting the Parnassus Income Funds as of December 31, 2006, the results of their operations for the year then ended, the changes in their net assets for each of the two years in the period then ended, and the financial highlights for each of the periods presented, in conformity with accounting principles generally accepted in the United States of America.

San Francisco, California
February 2, 2007
| | | | |
| 20 | | The Parnassus Income Funds Ÿ December 31, 2006 | | |
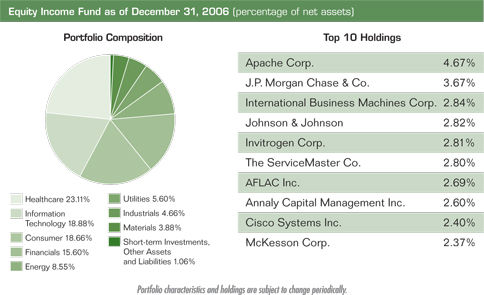
THE EQUITY INCOME FUND
Portfolio of Investments by Industry Classification
as of December 31, 2006
| | | | | | | | |
| Shares | | Common Stocks | | Percent of
Net Assets | | | Market Value |
| | Apparel | | | | | | |
| 25,000 | | Coach Inc.1 | | 0.1 | % | | $ | 1,074,000 |
| | | | | | | | |
| | Biotechnology | | | | | | |
| 100,000 | | Amgen Inc.1 | | | | | $ | 6,831,000 |
| 220,000 | | Genentech Inc.1 | | | | | | 17,848,600 |
| 425,000 | | Invitrogen Corp.1, 2 | | | | | | 24,050,750 |
| 229,000 | | Sigma-Aldrich Corp.2 | | | | | | 17,797,880 |
| | | | | | | | |
| | | | 7.8 | % | | $ | 66,528,230 |
| | | | | | | | |
| | Chemicals | | | | | | |
| 300,000 | | Rohm & Haas Co. | | 1.8 | % | | $ | 15,336,000 |
| | | | | | | | |
| | Computers | | | | | | |
| 100,000 | | Seagate Technology 2 | | | | | $ | 2,650,000 |
| 250,000 | | International Business Machines Corp. | | | | | | 24,287,500 |
| 65,000 | | SanDisk Corp.1, 2 | | | | | | 2,796,950 |
| | | | | | | | |
| | | | 3.5 | % | | $ | 29,734,450 |
| | | | | | | | |
| | Cosmetics & Personal Care | | | | | | |
| 200,000 | | Proctor & Gamble Co. | | 1.5 | % | | $ | 12,854,000 |
| | | | | | | | |
| | Data Processing | | | | | | |
| 100,000 | | Fiserv Inc.1 | | 0.6 | % | | $ | 5,242,000 |
| | | | | | | | |
| | Electric Motors | | | | | | |
| 3,700 | | Baldor Electric Co.2 | | 0.0 | % | | $ | 123,654 |
| | | | | | | | |
| | Entertainment | | | | | | |
| 300,000 | | Cedar Fair, LP 2 | | 1.0 | % | | $ | 8,346,000 |
| | | | | | | | |
| | Financial Services | | | | | | |
| 125,000 | | Commerce Bancorp Inc.2 | | | | | $ | 4,408,750 |
| 650,000 | | J.P. Morgan Chase & Co. | | | | | | 31,395,000 |
| 175,000 | | SLM Corp. | | | | | | 8,534,750 |
| 155,000 | | Wachovia Corp. | | | | | | 8,827,250 |
| 400,000 | | Wells Fargo & Co. | | | | | | 14,224,000 |
| | | | | | | | |
| | | | 7.9 | % | | $ | 67,389,750 |
| | | | | | | | |
| | Food Products | | | | | | |
| 50,000 | | McCormick & Co., Inc.2 | | | | | $ | 1,928,000 |
| 400,000 | | Sysco Corp.2 | | | | | | 14,704,000 |
| | | | | | | | |
| | | | 1.9 | % | | $ | 16,632,000 |
| | | | | | | | |
| | | | |
| | The accompanying notes are an integral part of these financial statements. | | 21 |
THE EQUITY INCOME FUND
Portfolio of Investments by Industry Classification
as of December 31, 2006 continued
| | | | | | | | |
| Shares | | Common Stocks | | Percent of
Net Assets | | | Market Value |
| | Healthcare Products | | | | | | |
| 50,000 | | Cytyc Corp.1 | | | | | $ | 1,415,000 |
| 215,000 | | Dentsply International Inc. | | | | | | 6,417,750 |
| 365,000 | | Johnson & Johnson | | | | | | 24,097,300 |
| 50,000 | | St. Jude Medical Inc.1 | | | | | | 1,828,000 |
| 575,000 | | STERIS Corp. | | | | | | 14,472,750 |
| | | | | | | | |
| | | | 5.6 | % | | $ | 48,230,800 |
| | | | | | | | |
| | Healthcare Services | | | | | | |
| 500,000 | | Chemed Corp. | | | | | $ | 18,490,000 |
| 550,000 | | IMS Health Inc.2 | | | | | | 15,114,000 |
| 50,000 | | Quest Diagnostics2 | | | | | | 2,650,000 |
| | | | | | | | |
| | | | 4.2 | % | | $ | 36,254,000 |
| | | | | | | | |
| | Home Products | | | | | | |
| 400,000 | | WD-40 Co.2 | | 1.6 | % | | $ | 13,948,000 |
| | | | | | | | |
| | Industrial Manufacturing | | | | | | |
| 165,000 | | 3M Co. | | | | | $ | 12,858,450 |
| 135,000 | | Teleflex Inc.2 | | | | | | 8,715,600 |
| | | | | | | | |
| | | | 2.5 | % | | $ | 21,574,050 |
| | | | | | | | |
| | Insurance | | | | | | |
| 500,000 | | AFLAC Inc. | | | | | $ | 23,000,000 |
| 575,000 | | Tower Group Inc.2 | | | | | | 17,865,250 |
| | | | | | | | |
| | | | 4.8 | % | | $ | 40,865,250 |
| | | | | | | | |
| | Internet | | | | | | |
| 25,000 | | eBay Inc.1 | | | | | $ | 751,750 |
| 82,311 | | Yahoo! Inc.1 | | | | | | 2,102,223 |
| | | | | | | | |
| | | | 0.3 | % | | $ | 2,853,973 |
| | | | | | | | |
| | Leisure Manufacturing | | | | | | |
| 100,000 | | Harley-Davidson Inc.2 | | 0.8 | % | | $ | 7,047,000 |
| | | | | | | | |
| | Machinery | | | | | | |
| 134,800 | | Graco Inc. | | 0.6 | % | | $ | 5,340,777 |
| | | | | | | | |
| | Medical Equipment | | | | | | |
| 10,000 | | Gen-Probe Inc.1, 2 | | | | | $ | 523,700 |
| 200,000 | | Patterson Cos., Inc.1, 2 | | | | | | 7,102,000 |
| | | | | | | | |
| | | | 0.9 | % | | $ | 7,625,700 |
| | | | | | | | |
| | | | |
| 22 | | The accompanying notes are an integral part of these financial statements. | | |
| | | | | | | | |
| Shares | | Common Stocks | | Percent of Net Assets | | | Market Value |
| | Natural Gas | | | | | | |
| 150,000 | | Energen Corp. | | | | | $ | 7,041,000 |
| 230,000 | | ONEOK Inc. | | | | | | 9,917,600 |
| 500,000 | | Southern Union Co.2 | | | | | | 13,975,000 |
| 175,000 | | XTO Energy Inc. | | | | | | 8,233,750 |
| | | | | | | | |
| | | | 4.6 | % | | $ | 39,167,350 |
| | | | | | | | |
| | Networking Products | | | | | | |
| 750,000 | | Cisco Systems Inc.1 | | 2.4 | % | | $ | 20,497,500 |
| | | | | | | | |
| | Office Equipment | | | | | | |
| 175,000 | | Canon Inc. (ADR)2 | | 1.2 | % | | $ | 9,903,250 |
| | | | | | | | |
| | Oil & Gas | | | | | | |
| 600,000 | | Apache Corp. | | | | | $ | 39,906,000 |
| 125,000 | | Sunoco Inc. | | | | | | 7,795,000 |
| 335,000 | | Valero Energy Corp. | | | | | | 17,138,600 |
| | | | | | | | |
| | | | 7.6 | % | | $ | 64,839,600 |
| | | | | | | | |
| | Pharmaceuticals | | | | | | |
| 125,000 | | Cardinal Health Inc.2 | | | | | $ | 8,053,750 |
| 300,000 | | Endo Pharmaceuticals1, 2 | | | | | | 8,274,000 |
| 400,000 | | McKesson Corp. | | | | | | 20,280,000 |
| 775,000 | | Pfizer Inc. | | | | | | 20,072,500 |
| | | | | | | | |
| | | | 6.6 | % | | $ | 56,680,250 |
| | | | | | | | |
| | Professional Services | | | | | | |
| 150,000 | | Gevity HR Inc.2 | | 0.4 | % | | $ | 3,553,500 |
| | | | | | | | |
| | Real Estate Investment Trusts | | | | | | |
| 1,600,000 | | Annaly Capital Management Inc.2 | | 2.6 | % | | $ | 22,256,000 |
| | | | | | | | |
| | Retail | | | | | | |
| 850,000 | | Foot Locker Inc. | | | | | $ | 18,640,500 |
| 335,000 | | Lowe’s Cos., Inc. | | | | | | 10,435,250 |
| 25,000 | | Ross Stores Inc.2 | | | | | | 732,500 |
| 275,000 | | Target Corp. | | | | | | 15,688,750 |
| 700,000 | | Tuesday Morning Corp.2 | | | | | | 10,885,000 |
| 215,000 | | Walgreen Co. | | | | | | 9,866,350 |
| 200,000 | | Whole Foods Market Inc. | | | | | | 9,386,000 |
| | | | | | | | |
| | | | 8.9 | % | | $ | 75,634,350 |
| | | | | | | | |
| | Semiconductor Capital Equipment | | | | | | |
| 100,000 | | Applied Materials Inc. | | 0.2 | % | | $ | 1,845,000 |
| | | | | | | | |
| | | | |
| | The accompanying notes are an integral part of these financial statements. | | 23 |
THE EQUITY INCOME FUND
Portfolio of Investments by Industry Classification
as of December 31, 2006 continued
| | | | | | | | |
| Shares | | Common Stocks | | Percent of Net Assets | | | Market Value |
| | Semiconductors | | | | | | |
| 675,000 | | Electro Scientific Industries Inc.1, 2 | | | | | $ | 13,594,500 |
| 800,000 | | Intel Corp. | | | | | | 16,200,000 |
| 375,000 | | Microchip Technology 2 | | | | | | 12,262,500 |
| 540,658 | | O2Micro International Ltd. (ADR)1, 2 | | | | | | 4,622,626 |
| 100,000 | | Taiwan Semiconductor Manufacturing Co. Ltd. (ADR) 2 | | | | | | 1,093,000 |
| 200,000 | | Texas Instruments Inc. | | | | | | 5,760,000 |
| | | | | | | | |
| | | | 6.3 | % | | $ | 53,532,626 |
| | | | | | | | |
| | Software | | | | | | |
| 75,000 | | Autodesk Inc.2 | | | | | $ | 3,034,500 |
| 300,000 | | Citrix Systems Inc.2 | | | | | | 8,115,000 |
| 25,000 | | Hyperion Solutions Corp.1 | | | | | | 898,500 |
| 125,000 | | Symantec Corp.1 | | | | | | 2,606,250 |
| 100,000 | | TIBCO Software Inc.1, 2 | | | | | | 944,000 |
| | | | | | | | |
| | | | 1.8 | % | | $ | 15,598,250 |
| | | | | | | | |
| | Services | | | | | | |
| 1,825,000 | | The ServiceMaster Co.2 | | 2.8 | % | | $ | 23,925,750 |
| | | | | | | | |
| | Telecommunications | | | | | | |
| 125,000 | | QUALCOMM Inc. | | 0.6 | % | | $ | 4,723,750 |
| | | | | | | | |
| | Transportation | | | | | | |
| 120,000 | | United Parcel Service Inc. | | 1.1 | % | | $ | 8,997,600 |
| | | | | | | | |
| | Utilities | | | | | | |
| 215,000 | | Northwest Natural Gas Co.2 | | | | | $ | 9,124,600 |
| 250,000 | | Otter Tail Corp.2 | | | | | | 7,790,000 |
| | | | | | | | |
| | | | 2.0 | % | | $ | 16,914,600 |
| | | | | | | | |
| | Total investment in common stocks (cost $755,097,304) | | 96.5 | % | | $ | 825,069,010 |
| | | | | | | | |
| | | | |
| 24 | | The accompanying notes are an integral part of these financial statements. | | |
| | | | | | | | |
Principal Amount $ | | Convertible Bonds | | Percent of Net Assets | | | Market Value |
| | Air Transport | | | | | | |
| 4,000,000 | | ExpressJet Holdings Inc.2 | | | | | | |
| | 4.250%, due 08/01/2023 | | 0.5 | % | | $ | 3,775,000 |
| | | | | | | | |
| | Semiconductors | | | | | | |
| 10,000,000 | | Agere Systems Inc.2 | | | | | | |
| | 6.500%, due 12/15/2009 | | 1.2 | % | | $ | 10,175,000 |
| | | | | | | | |
| | Software | | | | | | |
| 3,586,000 | | Mentor Graphics Corp.2 | | | | | | |
| | 7.018%, due 08/06/2023 | | 0.4 | % | | $ | 3,705,412 |
| | | | | | | | |
| | Total investment in convertible bonds (cost $16,915,124) | | 2.1 | % | | $ | 17,655,412 |
| | | | | | | | |
| | | |
| Shares | | Preferred Stocks | | | | | |
| | Banks | | | | | | |
| 55,439 | | First Republic Preferred Capital Corp. | | | | | | |
| | Preferred 8.875%, Series B, | | | | | | |
| | callable 02/05/2007 | | | | | $ | 1,439,751 |
| 55,000 | | Zions Capital Trust B2 | | | | | | |
| | Preferred 8.000%, | | | | | | |
| | callable 09/01/2007 | | | | | | 1,401,951 |
| | Total investment in preferred stock (cost $2,819,747) | | 0.3 | % | | $ | 2,841,702 |
| | | | | | | | |
| | Total investments in stocks and convertible bonds (cost $774,832,175) | | 98.9 | % | | $ | 845,566,124 |
| | | | | | | | |
| | | | |
| | The accompanying notes are an integral part of these financial statements. | | 25 |
THE EQUITY INCOME FUND
Portfolio of Investments by Industry Classification
as of December 31, 2006 continued
| | | | | | | | |
Principal
Amount $ | | Short-Term Investments | | Percent of
Net Assets | | | Market Value |
| | Certificates of Deposit 3 | | | | | | |
| 100,000 | | Community Bank of the Bay | | | | | | |
| | 4.350%, matures 08/24/2007 | | 0.0 | % | | $ | 97,425 |
| | | | | | | | |
| | Registered Investment Companies—Money Market Funds | | | | | | |
| 1,057,721 | | Evergreen U.S. Government Fund | | | | | | |
| | variable rate, 5.020% | | | | | $ | 1,057,721 |
| 1 | | Janus Government Fund | | | | | | |
| | variable rate, 5.210% | | | | | | 1 |
| 7,391,194 | | SSGA U.S. Government Fund | | | | | | |
| | variable rate, 4.910% | | | | | | 7,391,194 |
| | | | | | | | |
| | | | 1.0 | % | | $ | 8,448,916 |
| | | | | | | | |
| | Community Development Loans3 | | | | | | |
| 100,000 | | Boston Community Loan Fund | | | | | | |
| | 2.000%, matures 06/30/2007 | | | | | $ | 97,042 |
| 100,000 | | Ecologic Finance | | | | | | |
| | 2.000%, matures 01/25/2007 | | | | | | 99,606 |
| 100,000 | | Vermont Community Loan Fund | | | | | | |
| | 2.000%, matures 04/16/2007 | | | | | | 98,274 |
| | | | | | | | |
| | | | 0.1 | % | | $ | 294,922 |
| | | | | | | | |
| | Certificate of Deposit Account Registry Service (CDARS)3 | | | | | | |
| 500,000 | | CDARS agreement with Community Bank of the Bay,
dated 10/26/2006, due 10/25/2007, 4.736% | | | | | | |
| | Participating depository institutions: Associated Bank, NA, par 78,692; | | | | | | |
| | Community Bank of Missouri, par 93,500; | | | | | | |
| | Community National Bank, par 47,608; | | | | | | |
| | F&M Bank & Trust Co., par 93,500; | | | | | | |
| | First National Bank of Central Alabama, par 93,500; | | | | | | |
| | Peoples State Bank, par 93,500;
(cost $483,682) | | | | | $ | 483,682 |
| | | | |
| 26 | | The accompanying notes are an integral part of these financial statements. | | |
| | | | | | | | | |
Principal
Amount $ | | Short-Term Investments | | Percent of
Net Assets | | | Market Value | |
| 500,000 | | CDARS agreement with Community Bank of the Bay,
dated 12/14/2006, due 12/13/2007, 4.640% | | | | | | | |
| | Participating depository institutions: Bank of Montgomery, par 32,500; | | | | | | | |
| | Central Bank & Trust Co., par 93,500; | | | | | | | |
| | Grand Bank, par 93,500; | | | | | | | |
| | Rocky Mountain Bank, par 93,500; | | | | | | | |
| | Seaway National Bank of Chicago, par 93,500; | | | | | | | |
| | Shorebank, par 93,500;
(cost $480,986) | | | | | | 480,986 | |
| | | | | | | | | |
| | | | 0.1 | % | | $ | 964,668 | |
| | | | | | | | | |
| | Securities Purchased with Cash Collateral from Securities Lending | | | | | | | |
| | | |
| | Registered Investment Companies | | | | | | | |
| 120,732,072 | | State Street Navigator Securities Lending Prime Portfolio, | | | | | | | |
| | variable rate, 5.260% | | 14.1 | % | | $ | 120,732,072 | |
| | | | | | | | | |
| | Total short-term securities (cost $130,538,003) | | 15.3 | % | | $ | 130,538,003 | |
| | | | | | | | | |
| | Total securities (cost $905,370,178) | | 114.2 | % | | $ | 976,104,127 | |
| | | | | | | | | |
| | Payable upon return of securities loaned | | –14.1 | % | | $ | (120,732,072 | ) |
| | Other assets and liabilities – net | | – 0.1 | % | | | (797,958 | ) |
| | | | | | | | | |
| | Total net assets | | 100.0 | % | | $ | 854,574,097 | |
| | | | | | | | | |
| 1 | These securities are non-income producing. |
| 2 | This security or partial position of this security was on loan at December 31, 2006. The total value of the securities on loan at December 31, 2006 was $117,607,651. |
| 3 | Market value adjustments have been applied to these securities to reflect early withdrawal. |
Fund holdings will vary over time.
Fund shares are not FDIC insured.
| | | | |
| | The accompanying notes are an integral part of these financial statements. | | 27 |
THE EQUITY INCOME FUND
Statement of Assets and Liabilities
December 31, 2006
| | | |
Assets | | | |
| |
Investments in long-term securities, at market value
(cost $774,832,175) | | $ | 845,566,124 |
Investments in short-term securities
(at cost which approximates market value) | | | 130,538,003 |
Cash | | | 493,770 |
Receivables: | | | |
Dividends and interest | | | 1,015,363 |
Capital shares sold | | | 354,084 |
Other assets | | | 97,627 |
| | | |
Total assets | | $ | 978,064,971 |
Liabilities | | | |
| |
Payable upon return of loaned securities | | | 120,732,072 |
Capital shares redeemed | | | 1,348,988 |
Fees payable to Parnassus Investments | | | 835,740 |
Accounts payable and accrued expenses | | | 574,074 |
| | | |
Total liabilities | | $ | 123,490,874 |
| | | |
Net assets | | $ | 854,574,097 |
| |
Net assets consist of | | | |
| |
Undistributed net investment income | | | 1,288,403 |
Unrealized appreciation on securities | | | 70,733,949 |
Accumulated net realized gain | | | 8,372,630 |
Capital paid-in | | | 774,179,115 |
| | | |
Total net assets | | $ | 854,574,097 |
| |
Computation of net asset value and offering price per share | | | |
| |
| Net asset value and redemption price per share | | | |
Investor Shares ($808,103,537 divided by 32,548,657 shares) | | $ | 24.83 |
Institutional Shares ($46,470,560 divided by 1,869,492 shares) | | $ | 24.86 |
| | | | |
| 28 | | The accompanying notes are an integral part of these financial statements. | | |
THE EQUITY INCOME FUND
Statement of Operations
Year ended December 31, 2006
| | | | |
Investment income | | | | |
Dividends (net of foreign tax witholding of $66,507) | �� | $ | 14,330,401 | |
Interest | | | 3,697,936 | |
Securities lending | | | 86,349 | |
| | | | |
Total investment income | | $ | 18,114,686 | |
| |
| Expenses | | | | |
| |
Investment advisory fees (note 5) | | | 5,537,370 | |
Transfer agent fees (note 5) | | | | |
Investor Shares | | | 386,980 | |
Institutional Shares | | | 1,615 | |
Fund administration (note 5) | | | 594,467 | |
Service provider fees – Investor Shares (note 5) | | | 1,581,114 | |
Reports to shareholders | | | 321,466 | |
Registration fees and expenses | | | 20,236 | |
Custody fees | | | 70,076 | |
Professional fees | | | 167,343 | |
Trustee fees and expenses | | | 40,911 | |
Other expenses | | | 137,637 | |
| | | | |
Total expenses | | $ | 8,859,215 | |
Fees waived by Parnassus Investments (note 5) | | | (569,090 | ) |
Expense offset (note 6) | | | (7,898 | ) |
| | | | |
Net expenses | | $ | 8,282,227 | |
| | | | |
Net investment income | | $ | 9,832,459 | |
| |
| Realized and unrealized gain on investments | | | | |
| |
Net realized gain from securities transactions | | $ | 83,280,336 | |
Net change in unrealized appreciation of securities | | | 23,296,908 | |
| | | | |
Net realized and unrealized gain on securities | | $ | 106,577,244 | |
| | | | |
Net increase in net assets resulting from operations | | $ | 116,409,703 | |
| | | | |
| | The accompanying notes are an integral part of these financial statements. | | 29 |
THE EQUITY INCOME FUND
Statement of Changes in Net Assets
| | | | | | | | |
| | | Year Ended
December 31, 2006 | | | Year Ended
December 31, 2005 | |
| Income (loss) from operations | | | | | | | | |
| | |
Net investment income | | $ | 9,832,459 | | | $ | 15,372,528 | |
Net realized gain fromsecurities transactions | | | 83,280,336 | | | | 54,405,759 | |
Net change in unrealized appreciation (depreciation) | | | 23,296,908 | | | | (43,978,912 | ) |
| | | | | | | | |
Increase in net assets resulting from operations | | $ | 116,409,703 | | | $ | 25,799,375 | |
| Distributions | | | | | | | | |
From net investment income | | | | | | | | |
Investor Shares | | | (43,443,631 | ) | | | (31,885,584 | ) |
Institutional Shares* | | | (2,221,529 | ) | | | — | |
From net realized capital gains | | | | | | | | |
Investor Shares | | | (40,399,809 | ) | | | (29,345,893 | ) |
Institutional Shares* | | | (1,873,539 | ) | | | — | |
| | | | | | | | |
Distributions to shareholders | | $ | (87,938,508 | ) | | $ | (61,231,477 | ) |
| | |
| From capital share transactions | | | | | | | | |
| | |
Investor Shares | | | (128,706,831 | ) | | | 47,861,166 | |
Institutional Shares* | | | 47,966,021 | | | | — | |
Increase (decrease) in net assets fromcapital share transactions | | | (80,740,810 | ) | | | 47,861,166 | |
| | | | | | | | |
Increase (decrease) in net assets | | $ | (52,269,615 | ) | | $ | 12,429,064 | |
| Net assets | | | | | | | | |
Beginning of year | | | 906,843,712 | | | | 894,414,648 | |
End of year
(including undistributed net investment income of $1,288,403 and $2,628,318 respectively) | | $ | 854,574,097 | | | $ | 906,843,712 | |
| * | For the period April 28, 2006 (inception of Institutional Shares) through December 31, 2006. |
| | | | |
| 30 | | The accompanying notes are an integral part of these financial statements. | | |
THE FIXED - INCOME FUND
Portfolio of Investments by Industry Classification
as of December 31, 2006
| | | | | | | | |
| Shares | | Common Stocks | | Percent of
Net Assets | | | Market Value |
| | Natural Gas | | | | | | |
| 30,000 | | ONEOK Inc. | | | | | $ | 1,293,600 |
| | | | | | | | |
| | Total investment in common stock (cost $759,304) | | 2.1 | % | | $ | 1,293,600 |
| | | | | | | | |
| | | |
Principal
Amount $ | | Corporate Bonds | | | | | |
| | Biotechnology | | | | | | |
| 3,000,000 | | Genentech Inc.1 | | | | | | |
| | Notes, 4.750%, due 07/15/2015 | | 4.6 | % | | $ | 2,871,999 |
| | | | | | | | |
| | Financial Services | | | | | | |
| 2,000,000 | | American Express Co.1 | | | | | | |
| | Notes, 5.500%, due 09/12/2016 | | | | | $ | 2,015,912 |
| 500,000 | | Bank One Corp. | | | | | | |
| | Notes, 6.000%, due 02/17/2009 | | | | | | 506,244 |
| 500,000 | | Goldman Sachs Group Inc. | | | | | | |
| | Notes, 6.650%, due 05/15/2009 | | | | | | 516,202 |
| 1,500,000 | | Goldman Sachs Group Inc.1 | | | | | | |
| | Notes, 5.750%, due 10/01/2016 | | | | | | 1,523,489 |
| 2,000,000 | | Merrill Lynch & Co., Inc.1 | | | | | | |
| | Notes, 6.500%, due 07/15/2018 | | | | | | 2,151,858 |
| 500,000 | | Wells Fargo Financial Inc. | | | | | | |
| | Notes, 6.850%, due 07/15/2009 | | | | | | 517,307 |
| 2,000,000 | | Wells Fargo & Co.1 | | | | | | |
| | Notes, 5.125%, due 09/15/2016 | | | | | | 1,954,320 |
| | | | | | | | |
| | | | 14.8 | % | | $ | 9,185,332 |
| | | | | | | | |
| | Networking Products | | | | | | |
| 2,800,000 | | Cisco Systems Inc. | | | | | | |
| | Notes, 5.500%, due 02/22/2016 | | 4.5 | % | | $ | 2,801,786 |
| | | | | | | | |
| | Retail | | | | | | |
| 400,000 | | Target Corp. | | | | | | |
| | Notes, 7.500%, due 08/15/2010 | | 0.7 | % | | $ | 429,458 |
| | | | | | | | |
| | Total investments in corporate bonds (cost $15,022,377) | | 24.6 | % | | $ | 15,288,575 |
| | | | | | | | |
| | | | |
| | The accompanying notes are an integral part of these financial statements. | | 31 |
THE FIXED - INCOME FUND
Portfolio of Investments by Industry Classification
as of December 31, 2006 continued
| | | | | | | | |
Principal
Amount $ | | Convertible Bonds | | Percent of
Net Assets | | | Market Value |
| | Computers | | | | | | |
| 1,500,000 | | Maxtor Corp.1 | | | | | | |
| | Notes, 6.800%, due 04/30/2010 | | 2.7 | % | | $ | 1,672,500 |
| | | | | | | | |
| | Electronics | | | | | | |
| 1,000,000 | | Cymer Inc.1 | | | | | | |
| | Notes, 3.500%, due 02/15/2009 | | 1.7 | % | | $ | 1,047,500 |
| | | | | | | | |
| | Internet | | | | | | |
| 250,000 | | Yahoo! Inc. | | | | | | |
| | Notes, Zero Coupon, due 04/01/2008 | | 0.6 | % | | $ | 323,750 |
| | | | | | | | |
| | Semiconductors | | | | | | |
| 3,500,000 | | Intel Corp.1 | | | | | | |
| | Notes, 2.950%, due 12/15/2035 | | 5.1 | % | | $ | 3,167,500 |
| | | | | | | | |
| | Total investments in convertible bonds (cost $5,873,605) | | 10.1 | % | | $ | 6,211,250 |
| | | | | | | | |
| | | |
| | | U.S. Government Agency Securities | | | | | |
| 2,000,000 | | Fannie Mae | | | | | | |
| | Notes, 5.250%, due 01/15/2009 | | | | | $ | 2,008,556 |
| 3,000,000 | | Fannie Mae | | | | | | |
| | Notes, 5.125%, due 04/22/2013 | | | | | | 2,949,006 |
| 3,000,000 | | Federal Farm Credit Bank | | | | | | |
| | Notes, 5.410%, due 11/07/2016 | | | | | | 2,989,467 |
| 1,000,000 | | Federal Home Loan Bank System | | | | | | |
| | Notes, 5.000%, due 05/28/2015 | | | | | | 969,984 |
| 2,000,000 | | Federal Home Loan Bank System | | | | | | |
| | Notes, 5.500%, due 11/07/2016 | | | | | | 2,002,700 |
| 1,000,000 | | Federal Home Loan Bank System | | | | | | |
| | Notes, 5.200%, due 08/13/2013 | | | | | | 983,076 |
| 2,000,000 | | Freddie Mac | | | | | | |
| | Notes, 6.000%, due 09/19/2016 | | | | | | 1,998,098 |
| | | | | | | | |
| | Total investments in U.S. government agency bonds (cost $14,049,649) | | 22.3 | % | | $ | 13,900,887 |
| | | | | | | | |
| | Total investment in common stocks and bonds (cost $35,704,935) | | 59.1 | % | | $ | 36,694,312 |
| | | | | | | | |
| | | | |
| 32 | | The accompanying notes are an integral part of these financial statements. | | |
| | | | | | | | |
Principal
Amount $ | | Short-Term Investments | | Percent of
Net Assets | | | Market Value |
| | U.S. Government Agency Discount Notes | | | | | | |
| 5,500,000 | | Federal Home Loan | | | | | | |
| | Mortgage Corporation | | | | | | |
| | Zero Coupon, 5.09% equivalent, | | | | | | |
| | matures 01/02/2007 | | | | | $ | 5,499,222 |
| 7,500,000 | | Federal Home Loan | | | | | | 7,491,517 |
| | Mortgage Corporation | | | | | | |
| | Zero Coupon, 5.09% equivalent, | | | | | | |
| | matures 01/09/2007 | | | | | | |
| 9,000,000 | | Federal Home Loan | | | | | | 8,940,890 |
| | Mortgage Corporation | | | | | | |
| | Zero Coupon, 5.14% equivalent, | | | | | | |
| | matures 02/16/2007 | | | | | | |
| | | | | | | | |
| | | | 35.1 | % | | $ | 21,931,629 |
| | | | | | | | |
| | Registered Investment Companies—Money Market Funds | | | | | | |
| 1,057,721 | | Evergreen U.S. Government Fund | | | | | | |
| | variable rate, 5.020% | | | | | $ | 1,057,721 |
| 2,323,912 | | Janus Government Fund | | | | | | |
| | variable rate, 5.210% | | | | | | 2,323,912 |
| 5,121 | | SSGA U.S. Government Fund | | | | | | |
| | variable rate, 4.910% | | | | | | 5,121 |
| | | | | | | | |
| | | | 5.4 | % | | $ | 3,386,754 |
| | | | | | | | |
| | | | |
| | The accompanying notes are an integral part of these financial statements. | | 33 |
THE FIXED - INCOME FUND
Portfolio of Investments by Industry Classification
as of December 31, 2006 concluded
| | | | | | | | | |
Principal
Amount $ | | Short-Term Investments | | Percent of
Net Assets | | | Market Value | |
| | Securities Purchased with Cash Collateral from Securities Lending | | | | | | | |
| | Registered Investment Companies | | | | | | | |
| 6,874,550 | | State Street Navigator Securities Lending Prime Portfolio | | | | | | | |
| | variable rate, 5.260% | | 11.0 | % | | $ | 6,874,550 | |
| | | | | | | | | |
| | Total short-term securities (cost $32,192,933) | | 51.5 | % | | $ | 32,192,933 | |
| | | | | | | | | |
| | Total securities (cost $67,897,868) | | 110.6 | % | | $ | 68,887,245 | |
| | | | | | | | | |
| | Payable upon return of securities loaned | | –11.0 | % | | $ | (6,874,550 | ) |
| | Other assets and liabilities – net | | 0.4 | % | | $ | 507,420 | |
| | | | | | | | | |
| | Total net assets | | 100.0 | % | | $ | 62,520,115 | |
| | | | | | | | | |
| 1 | This security or partial position of this security was on loan at December 31, 2006. The total value of the securities on loan at December 31, 2006 was $6,729,640. |
Fund holdings will vary over time.
Fund shares are not FDIC insured.
| | | | |
| 34 | | The accompanying notes are an integral part of these financial statements. | | |
THE FIXED - INCOME FUND
Statement of Assets and Liabilities
December 31, 2006
| | | | |
Assets | | | | |
| |
Investments in long-term securities, at market value
(cost $35,704,935) | | $ | 36,694,312 | |
Investments in short-term securities
(at cost which approximates market value) | | | 32,192,933 | |
Cash | | | 20,996 | |
Receivables: | | | | |
Interest | | | 536,681 | |
Capital shares sold | | | 32,266 | |
Other assets | | | 17,931 | |
| | | | |
Total assets | | $ | 69,495,119 | |
| |
Liabilities | | | | |
| |
Payable upon return of loaned securities | | | 6,874,550 | |
Capital shares redeemed | | | 25,750 | |
Fees payable to Parnassus Investments | | | 39,494 | |
Accounts payable and accrued expenses | | | 35,210 | |
| | | | |
Total liabilities | | $ | 6,975,004 | |
| | | | |
Net assets | | $ | 62,520,115 | |
| |
Net assets consist of | | | | |
| |
Undistributed net investment income | | | 11,757 | |
Unrealized appreciation on securities | | | 989,377 | |
Accumulated net realized loss | | | (210 | ) |
Capital paid-in | | | 61,519,191 | |
| | | | |
Total net assets | | $ | 62,520,115 | |
| |
Computation of net asset value and offering price per share | | | | |
| |
Net asset value and redemption price per share
($62,520,115 divided by 3,879,672 shares) | | $ | 16.11 | |
| | | | |
| | The accompanying notes are an integral part of these financial statements. | | 35 |
THE FIXED - INCOME FUND
Statement of Operations
Year ended December 31, 2006
| | | | |
Investment income | | | | |
| |
Dividends | | $ | 58,578 | |
Interest | | | 2,469,238 | |
Securities lending | | | 22,510 | |
| | | | |
Total investment income | | $ | 2,550,326 | |
| |
Expenses | | | | |
| |
Investment advisory fees (note 5) | | | 261,369 | |
Transfer agent fees (note 5) | | | 60,497 | |
Fund administration (note 5) | | | 36,919 | |
Service provider fees (note 5) | | | 49,464 | |
Reports to shareholders | | | 30,252 | |
Registration fees and expenses | | | 11,054 | |
Custody fees | | | 6,258 | |
Professional fees | | | 14,844 | |
Trustee fees and expenses | | | 2,070 | |
Other expenses | | | 9,475 | |
| | | | |
Total expenses | | $ | 482,202 | |
Fees waived by Parnassus Investments (note 5) | | | (85,648 | ) |
Expense offset (note 6) | | | (4,578 | ) |
| | | | |
Net expenses | | $ | 391,976 | |
| | | | |
Net investment income | | $ | 2,158,350 | |
Realized and unrealized gain on investments | | | | |
| |
Net realized gain from securities transactions | | $ | 702,413 | |
Net change in unrealized appreciation of securities | | | 868,923 | |
| | | | |
Net realized and unrealized gain on securities | | $ | 1,571,336 | |
| | | | |
Net increase in net assets resulting from operations | | $ | 3,729,686 | |
| | | | |
| 36 | | The accompanying notes are an integral part of these financial statements. | | |
THE FIXED - INCOME FUND
Statement of Changes in Net Assets
| | | | | | | | |
| | | Year Ended
December 31, 2006 | | | Year Ended
December 31, 2005 | |
Income (loss) from operations | | | | | | | | |
| | |
Net investment income | | $ | 2,158,350 | | | $ | 1,251,779 | |
Net realized gain (loss) from securities transactions | | | 702,413 | | | | (8,879 | ) |
Net change in unrealized appreciation (depreciation) | | | 868,923 | | | | (239,981 | ) |
| | | | | | | | |
Increase in net assets resulting from operations | | $ | 3,729,686 | | | $ | 1,002,919 | |
| | |
Distributions | | | | | | | | |
| | |
From net investment income | | | (2,464,220 | ) | | | (1,263,108 | ) |
From net realized capital gains | | | (376,117 | ) | | | — | |
| | | | | | | | |
Distributions to shareholders | | $ | (2,840,337 | ) | | $ | (1,263,108 | ) |
| | |
From capital share transactions | | | | | | | | |
| | |
Increase in net assets from capital share transactions | | | 15,752,152 | | | | 7,934,016 | |
| | | | | | | | |
Increase in net assets | | $ | 16,641,501 | | | $ | 7,673,827 | |
| | |
Net assets | | | | | | | | |
| | |
Beginning of year | | | 45,878,614 | | | | 38,204,787 | |
End of year
(including undistributed net investment income of $11,757 and $0 respectively) | | $ | 62,520,115 | | | $ | 45,878,614 | |
| | | | |
| | The accompanying notes are an integral part of these financial statements. | | 37 |
THE CALIFORNIA TAX - EXEMPT FUND
Portfolio of Investments by Industry Classification
as of December 31, 2006
| | | | | | | | |
Principal
Amount $ | | Municipal Bonds | | Percent of
Net Assets | | | Market
Value |
| | Airport | | | | | | |
| 1,000,000 | | San Francisco City & County | | | | | | |
| | Airport Commission | | | | | | |
| | FGIC Insured, | | | | | | |
| | 5.000%, due 05/01/2010 | | 5.8 | % | | $ | 1,043,770 |
| | | | | | | | |
| | Development | | | | | | |
| 500,000 | | California Infrastructure & Economic Development Bank | | | | | | |
| | 5.000%, due 10/01/2012 | | | | | $ | 537,065 |
| 600,000 | | La Quinta Redevelopment Agency Tax Allocation MBIA Insured, | | | | | | |
| | 7.300%, due 09/01/2011 | | | | | | 691,884 |
| 860,000 | | Rialto Redevelopment Agency | | | | | | |
| | 4.000%, due 09/01/2007 | | | | | | 859,020 |
| 425,000 | | Rialto Redevelopment Agency | | | | | | |
| | 4.500%, due 09/01/2013 | | | | | | 437,495 |
| 625,000 | | San Mateo Redevelopment Agency XLCA Insured, | | | | | | |
| | 4.200%, due 08/01/2023 | | | | | | 630,813 |
| 800,000 | | State of California | | | | | | |
| | 5.000%, due 07/01/2016 | | | | | | 843,351 |
| | | | | | | | |
| | | | 22.3 | % | | $ | 3,999,628 |
| | | | | | | | |
| | Education | | | | | | |
| 200,000 | | Sweetwater Union High School District | | | | | | |
| | 4.250%, due 09/01/2017 | | 1.1 | % | | $ | 198,974 |
| | | | | | | | |
| | General | | | | | | |
| 1,000,000 | | ABAG Finance Authority for Nonprofit Corps | | | | | | |
| | 4.250%, due 11/15/2012 | | 5.7 | % | | $ | 1,020,250 |
| | | | | | | | |
| ` | | General Obligation | | | | | | |
| 1,000,000 | | State of California | | | | | | |
| | 6.600%, due 02/01/2009 | | | | | $ | 1,059,430 |
| 700,000 | | State of California | | | | | | |
| | 6.100%, due 10/01/2009 | | | | | | 743,561 |
| | | | | | | | |
| | | | 10.0 | % | | $ | 1,802,991 |
| | | | | | | | |
| | | | |
| 38 | | The accompanying notes are an integral part of these financial statements. | | |
| | | | | | | | |
Principal
Amount $ | | Municipal Bonds | | Percent of
Net Assets | | | Market Value |
| | Housing | | | | | | |
| 1,000,000 | | California State Public Works Board FSA Insured, | | | | | | |
| | 5.375%, due 10/01/2013 | | | | | $ | 1,088,570 |
| 960,000 | | California State Public Works Board | | | | | | |
| | 5.500%, due 12/01/2009 | | | | | | 1,008,825 |
| 910,000 | | California Statewide Communities Development Authority ACA Insured, 4.500%, | | | | | | |
| | due 08/01/2010 | | | | | | 918,345 |
| | | | | | | | |
| | | | 16.8 | % | | $ | 3,015,740 |
| | | | | | | | |
| | Medical Healthcare | | | | | | |
| 300,000 | | California Health Facilities Financing Authority | | | | | | |
| | 5.000%, due 07/01/2009 | | | | | $ | 308,121 |
| 395,000 | | County of San Diego | | | | | | |
| | 5.000%, due 09/01/2008 | | | | | | 402,339 |
| 500,000 | | Loma Linda Hospital | | | | | | |
| | 4.500%, due 12/01/2018 | | | | | | 501,440 |
| 415,000 | | Loma Linda Hospital AMBAC Insured, | | | | | | |
| | 4.850%, due 12/01/2010 | | | | | | 433,127 |
| | | | | | | | |
| | | | 9.2 | % | | $ | 1,645,027 |
| | | | | | | | |
| | Public Improvements | | | | | | |
| 450,000 | | Linda Fire Protection District | | | | | | |
| | 4.400%, 05/01/2014 | | 2.5 | % | | $ | 450,329 |
| | | | | | | | |
| | Power | | | | | | |
| 1,100,000 | | California State Department of Water Resources | | | | | | |
| | 5.500%, due 05/01/2009 | | 6.4 | % | | $ | 1,145,155 |
| | | | | | | | |
| | | |
| | School District | | | | | | |
| 450,000 | | Los Altos School District | | | | | | |
| | 5.250%, due 08/01/2010 | | | | | $ | 475,925 |
| 440,000 | | Los Angeles Unified School District FGIC Insured, | | | | | | |
| | 5.500%, due 07/01/2013 | | | | | | 468,389 |
| 450,000 | | Morgan Hill Unified School District FGIC Insured, | | | | | | |
| | 4.900%, due 08/01/2013 | | | | | | 474,651 |
| 410,000 | | Sacramento City Unified School District | | | | | | |
| | 5.750%, due 07/01/2017 | | | | | | 439,245 |
| | | | | | | | |
| | | | 10.3 | % | | $ | 1,858,210 |
| | | | | | | | |
| | | | |
| | The accompanying notes are an integral part of these financial statements. | | 39 |
THE CALIFORNIA TAX - EXEMPT FUND
Portfolio of Investments by Industry Classification
as of December 31, 2006 continued
| | | | | | | | |
Principal
Amount$ | | Municipal Bonds | | Percent of
Net Assets | | | Market Value |
| | Transportation | | | | | | |
| 250,000 | | Los Angeles County Metropolitan Transportation Authority AMBAC Insured, | | | | | | |
| | 5.000%, due 07/01/2013 | | | | | $ | 257,668 |
| 260,000 | | San Francisco Bay Area Transit Finance Authority Prerefunded | | | | | | |
| | 5.250%, due 07/01/2013 | | | | | | 269,141 |
| | | | | | | | |
| | | | 2.9 | % | | $ | 526,809 |
| | | | | | | | |
| | Utilities | | | | | | |
| 200,000 | | City of Los Angeles FGIC Insured, | | | | | | |
| | 5.000%, due 06/01/2011 | | 1.1 | % | | $ | 206,070 |
| | | | | | | | |
| | Water | | | | | | |
| 215,000 | | California State Department of Water Resources | | | | | | |
| | 5.125%, due 12/01/2016 | | | | | $ | 223,523 |
| 185,000 | | California State Department of Water Resources | | | | | | |
| | 5.125%, due 12/01/2016 | | | | | | 191,777 |
| | | | | | | | |
| | | | 2.3 | % | | $ | 415,300 |
| | | | | | | | |
| | Total investments in municipal bonds (cost $17,161,717) | | 96.4 | % | | $ | 17,328,253 |
| | | | | | | | |
| | | | |
| 40 | | The accompanying notes are an integral part of these financial statements. | | |
| | | | | | | | |
Principal
Amount $ | | Short-Term Investments | | Percent of
Net Assets | | | Market Value |
| | | |
| | Registered Investment Companies—Money Market Funds | | | | | | |
| 411,806 | | California Investment Trust Tax Free Fund | | | | | | |
| | variable rate, 3.050% | | 2.3 | % | | $ | 411,806 |
| | | | | | | | |
| | Total short-term securities | | | | | | |
| | (cost $411,806) | | 2.3 | % | | $ | 411,806 |
| | | | | | | | |
| | Total securities | | | | | | |
| | (cost $17,573,523) | | 98.7 | % | | $ | 17,740,059 |
| | | | | | | | |
| | Other assets and liabilities – net | | 1.3 | % | | $ | 225,189 |
| | | | | | | | |
| | Total net assets | | 100.0 | % | | $ | 17,965,248 |
| | | | | | | | |
Fund holdings will vary over time.
Fund shares are not FDIC insured.
Glossary of Terms
| | |
| ABAG | | The Association of Bay Area Governments |
| |
| ACA | | ACA Capital Holdings, Inc. |
| |
| AMBAC | | American Municipal Bond Assurance Corp. |
| |
| FGIC | | Financial Guaranty Insurance Co. |
| |
| FSA | | Financial Security Assistance |
| |
| MBIA | | Municipal Bond Investors Assurance Corp. |
| |
| XLCA | | XL Capital Assurance Inc. |
| | | | |
| | The accompanying notes are an integral part of these financial statements. | | 41 |
THE CALIFORNIA TAX - EXEMPT FUND
Statement of Assets and Liabilities
December 31, 2006
| | | |
Assets | | | |
| |
Investments in municipal bonds, at market value
(cost $17,161,717) | | $ | 17,328,253 |
Investments in short-term securities
(at cost which approximates market value) | | | 411,806 |
Receivables: | | | |
Interest | | | 258,819 |
Other assets | | | 2,670 |
| | | |
Total assets | | $ | 18,001,548 |
| |
Liabilities | | | |
Capital shares redeemed | | | 5,020 |
Fees payable to Parnassus Investments | | | 15,912 |
Professional fees payable | | | 6,617 |
Service provider fees payable | | | 1,356 |
Accounts payable and accrued expenses | | | 7,395 |
| | | |
Total liabilities | | $ | 36,300 |
| | | |
Net assets | | $ | 17,965,248 |
| |
Net assets consist of | | | |
Undistributed net investment income | | | 3,127 |
Unrealized appreciation on securities | | | 166,536 |
Capital paid-in | | | 17,795,585 |
| | | |
Total net assets | | $ | 17,965,248 |
| |
Computation of net asset value and offering price per share | | | |
| |
Net asset value and redemption price per share
($17,965,248 divided by 1,084,641 shares) | | $ | 16.56 |
| | | | |
| 42 | | The accompanying notes are an integral part of these financial statements. | | |
THE CALIFORNIA TAX - EXEMPT FUND
Statement of Operations
Year ended December 31, 2006
| | | | |
Investment income | | | | |
| |
Interest | | $ | 754,450 | |
| | | | |
Total investment income | | $ | 754,450 | |
| |
Expenses | | | | |
Investment advisory fees (note 5) | | | 96,689 | |
Transfer agent fees (note 5) | | | 11,264 | |
Fund administration (note 5) | | | 13,659 | |
Service provider fees (note 5) | | | 22,547 | |
Reports to shareholders | | | 8,253 | |
Registration fees and expenses | | | 556 | |
Custody fees | | | 2,056 | |
Professional fees | | | 9,710 | |
Trustee fees and expenses | | | 976 | |
Other expenses | | | 10,200 | |
| | | | |
Total expenses | | $ | 175,910 | |
Fees waived by Parnassus Investments (note 5) | | | (44,432 | ) |
| | | | |
Net expenses | | $ | 131,478 | |
| | | | |
Net investment income | | $ | 622,972 | |
| |
Realized and unrealized gain (loss) on investments | | | | |
| |
Net realized gain from securities transactions | | $ | 4,290 | |
Net change in unrealized depreciation of securities | | | (88,365 | ) |
| | | | |
Net realized and unrealized loss on securities | | $ | (84,075 | ) |
| | | | |
Net increase in net assets resulting from operations | | $ | 538,897 | |
| | | | |
| | The accompanying notes are an integral part of these financial statements. | | 43 |
THE CALIFORNIA TAX - EXEMPT FUND
Statement of Changes in Net Assets
| | | | | | | | |
| | | Year Ended
December 31, 2006 | | | Year Ended
December 31, 2005 | |
Income (loss) from operations | | | | | | | | |
| | |
Net investment income | | $ | 622,972 | | | $ | 698,676 | |
Net realized gain from securities transactions | | | 4,290 | | | | 80,253 | |
Net change in unrealized depreciation | | | (88,365 | ) | | | (642,709 | ) |
| | | | | | | | |
Increase in net assets resulting from operations | | $ | 538,897 | | | $ | 136,220 | |
| | |
Distributions | | | | | | | | |
| | |
From net investment income | | | (621,030 | ) | | | (698,991 | ) |
From net realized capital gains | | | (14,896 | ) | | | (69,608 | ) |
| | | | | | | | |
Distributions to shareholders | | $ | (635,926 | ) | | $ | (768,599 | ) |
| | |
From capital share transactions | | | | | | | | |
| | |
Decrease in net assets from capital share transactions | | | (3,572,434 | ) | | | (3,326,713 | ) |
| | | | | | | | |
Decrease in net assets | | $ | (3,669,463 | ) | | $ | (3,959,092 | ) |
| | |
Net assets | | | | | | | | |
| | |
Beginning of year | | | 21,634,711 | | | | 25,593,803 | |
End of year
(including undistributed net investment income of $3,127 and $959 respectively) | | $ | 17,965,248 | | | $ | 21,634,711 | |
| | | | |
| 44 | | The accompanying notes are an integral part of these financial statements. | | |
NOTES TO FINANCIAL STATEMENTS
1. Organization and Significant Accounting Policies
The Parnassus Income Funds (the “Trust”), formerly The Parnassus Income Trust, organized on August 8,1990 as a Massachusetts Business Trust, is registered under the Investment Company Act of 1940 as a diversified, open-end investment management company comprised of three separate funds (the “funds”), each offering separate shares. The Trust began operations effective August 31,1992.
Securities Valuations
Equity securities that are listed or traded on a national securities exchange are stated at market value, based on recorded closing sales on the exchange or on the Nasdaq’s National Market System official closing price. In the absence of a recorded sale, and for over-the-counter securities, equity securities are stated at the mean between the last recorded bid and asked prices. Long-term, fixed-income securities are valued each business day using prices based on procedures established by independent pricing services and approved by the Board of Trustees (the”Trustees”). Fixed-income securities with an active market are valued at the “bid” price where such quotes are readily available from brokers and dealers, and are representative of the actual market for such securities. Other fixed-income securities experiencing a less active market are valued as determined by the pricing services based on methods which include consideration of trading in securities of comparable yield, quality, coupon, maturity and type, as well as indications as to values from dealers and other market data without exclusive reliance upon quoted prices or over-the-counter prices, since such valuations are believed to reflect more accurately the value of such securities. Short-term investments in U.S. Government Agency discount notes, certificates of deposit, community development loans and other community development investments are valued at amortized cost, which approximates market value. Investments in registered investment companies are valued at their net asset value.
Investments where market quotations are not readily available are priced at their fair value, in accordance with procedures established by the Trustees. In determining fair value, the Trustees may consider a variety of information including, but not limited to, the following: price based upon a multiple of earnings or sales, fundamental analytical data and an evaluation of market conditions. A valuation adjustment is applied to certificates of deposit, community development loans and other community investments as an estimate of potential penalties for early withdrawal.
Federal Income Taxes
The Trust intends to comply with the requirements of the Internal Revenue Code applicable to regulated investment companies and to distribute all taxable and tax-exempt income to shareholders. Therefore, no federal income tax provision is required. Income distributions and capital-gain distributions are determined in accordance with income tax regulations, which may differ from accounting principles generally accepted in the United States of America.
Securities Transactions
Securities transactions are recorded on the date the securities are purchased or sold (trade date). Realized gains and losses on securities transactions are determined on the basis of first-in, first-out for both financial statement and federal income tax purposes.
NOTES TO FINANCIAL STATEMENTS CONTINUED
Dividends to Shareholders
Distributions to shareholders are recorded on the record date. The Equity Income Fund pays income dividends quarterly and capital-gain dividends annually. The Fixed-Income and California Tax-Exempt Funds pay income dividends monthly and capital-gain dividends annually.
Investment Income and Expenses
Dividend income is recognized on the ex-dividend date and interest income is recognized on an accrual basis. Discounts and premiums on securities purchased are amortized over the lives of the respective securities using the constant yield method, which approximates the interest method. Expenses are recorded on an accrual basis.
Income and expenses (other than investment advisory fees and class-specific expenses) and realized and unrealized gains and losses are allocated daily among the various share classes based on their relative shares outstanding. Investment advisory fees are based on the fund’s average daily net assets and are allocated among the share classes based on relative net assets. Class-specific fees and expenses, such as transfer agency fees and service provider fees, are charged directly to the respective share class.
Securities Lending
The Equity Income Fund and the Fixed-Income Fund lend securities to approved financial institutions to earn additional income and receive cash and/or securities as collateral to secure the loans. Collateral is maintained at not less than 102% of the value of loaned securities. Although the risk of lending is mitigated by the collateral, the funds could experience a delay in recovering securities and a possible loss of income or value if the borrower fails to return them.
CDARS Program
As part of our community development investment program, the Equity Income Fund has entered into an agreement for fund investments through the Certificate of Deposit Account Registry Service (“CDARS”) network. The CDARS network allows members to place funds in time deposits with depository institutions whose accounts are insured by the Federal Deposit Insurance Corporation (“FDIC”). Provisions stipulate that participating institutions are FDIC insured, however, in the event of default or bankruptcy by any party to the agreement, the proceeds of the investment may be delayed or subject to legal proceedings and are subject to FDIC limits.
Organizational Costs
Parnassus Investments bears all organizational expenses for new classes of shares, including the Equity Income Fund – Institutional Shares.
Use of Estimates
The preparation of financial statements in conformity with accounting principles generally accepted in the United States of America requires management to make estimates and assumptions that affect the reported amounts of assets and liabilities at the date of the financial statements and the reported amounts of revenues and expenses during the reporting period. Actual results could differ from those estimates.
New Accounting Pronouncements
In June 2006, the Financial Accounting Standards Board (FASB) issued FASB Interpretation No. 48 – Accounting for Uncertainty in Income Taxes — an interpretation of FASB Statement No.109, which establishes a minimum threshold for income tax benefits to be recognized in financial statements. These tax benefits must meet a”more likely than not” threshold, which means that based on technical merits, they have a more than 50% likelihood of being sustained upon examination by the tax authority. Tax benefits meeting this threshold will be measured as the largest amount of tax benefit that is greater than 50% likely of being realized upon ultimate settlement with the tax authority. FASB Interpretation No. 48 is effective for periods beginning after December 15, 2006, and was adopted by the funds on January 1, 2007. The adoption will have no effect on the funds’ financial statements.
In addition, in September 2006, Statement of Financial Accounting Standards No.157, Fair Value Measurements (SFAS 157), was issued and is effective for fiscal years beginning after November 15, 2007. SFAS 157 defines fair value, establishes a framework for measuring fair value and expands disclosures about fair value measurements. Management is currently evaluating the impact the adoption of SFAS 157 will have on the fund’s financial statement disclosures.
2. Tax Matters and Distributions
The tax character of distributions paid during the years ended December 31, 2006 and 2005, were as follows:
| | | | | | | | | | | | | | | | | | |
| | | Equity Income Fund | | Fixed- Income Fund | | California Tax- Exempt Fund |
Distributions Paid from: | | 2006 | | 2005 | | 2006 | | 2005 | | 2006 | | 2005 |
Ordinary income | | $ | 45,345,165 | | $ | 31,885,584 | | $ | 2,464,696 | | $ | 1,251,779 | | $ | — | | $ | — |
Tax-exempt income | | | — | | | — | | | — | | | — | | | 620,804 | | | 698,991 |
Long-term capital gains | | | 42,593,343 | | | 29,345,893 | | | 375,641 | | | — | | | 15,122 | | | 69,608 |
Total Distributions | | $ | 87,938,508 | | $ | 61,231,477 | | $ | 2,840,337 | | $ | 1,251,779 | | $ | 635,926 | | $ | 768,599 |
NOTES TO FINANCIAL STATEMENTS CONTINUED
At December 31, 2006, the cost of investments in securities, net unrealized appreciation (depreciation), distributable earnings, and undistributed earnings, for income tax purposes were as follows:
| | | | | | | | | | | | |
| | | Equity Income Fund | | | Fixed- Income Fund | | | California Tax-
Exempt Fund | |
Cost of investment | | $ | 775,526,180 | | | $ | 35,704,935 | | | $ | 17,161,717 | |
Unrealized appreciation | | | 79,087,101 | | | | 1,263,092 | | | | 381,201 | |
Unrealized depreciation | | | (9,048,057 | ) | | | (273,715 | ) | | | (214,665 | ) |
Net unrealized appreciation | | $ | 70,039,944 | | | $ | 989,377 | | | $ | 166,536 | |
Distributable earnings – ordinary income | | $ | 44,146,107 | | | $ | 2,476,453 | | | $ | — | |
Distributable earnings – tax-exempt income | | $ | — | | | $ | — | | | $ | 622,972 | |
Distributable earnings – long-term capital gains | | $ | 49,390,328 | | | $ | 375,641 | | | $ | 4,290 | |
Undistributed earnings – ordinary income | | $ | — | | | $ | 11,757 | | | $ | — | |
Undistributed earnings – tax-exempt income | | $ | — | | | $ | — | | | $ | 3,127 | |
Undistributed earnings – long-term capital gains | | $ | 9,066,635 | | | $ | — | | | $ | — | |
Net investment income differs for financial statements and tax purposes primarily due to income recognition differences for partnership investments. Net realized gains differ for financial statements and tax purposes primarily due to differing treatments of wash sales and partnership allocations.
The Fixed-Income Fund incurred $210 of post-October capital losses as of December 31, 2006, which are deferred until 2007 for tax purposes.
Permanent differences incurred during the year ended December 31, 2006, resulting from differences in book and tax accounting, have been reclassified at year-end to undistributed net investment income, undistributed net realized gain/loss and capital paid-in were as follows:
| | | | | | | | | | |
Fund | | Increase in
Undistributed Net
Investment
Income | | Decreae in
Undistributed
Net Realized
Gain/Loss | | | Capital
Paid-in |
Equity Income Fund | | $ | 34,492,786 | | $ | (34,492,786 | ) | | $ | — |
Fixed-Income Fund | | $ | 317,627 | | $ | (317,627 | ) | | $ | — |
California Tax-Exempt Fund | | $ | 226 | | $ | (226 | ) | | $ | — |
3. Capital Stock
Equity Income Fund: The Equity Income Fund offers two classes of shares, Investor Shares and Institutional Shares. The shares differ by service provider fees which are only incurred by Investor Shares and transfer agency fees. As of December 31, 2006, there were an unlimited number of authorized shares of capital stock, no par value. Paid-in capital aggregated $774,179,115. Transactions in capital stock (shares) were as follows:
| | | | | | | | | | | | | | |
| | | Year Ended December 31, 2006 | | | Year Ended December 31, 2005 | |
| | | Shares | | | Amount | | | Shares | | | Amount | |
| Investor Shares: | | | | | | | | | | | | | | |
Shares sold | | 4,315,687 | | | $ | 109,922,407 | | | 10,778,103 | | | $ | 265,932,798 | |
Shares issued through dividend reinvestment | | 3,180,687 | | | | 81,316,576 | | | 2,436,068 | | | | 59,492,176 | |
Shares repurchased | | (12,704,220 | ) | | | (319,945,814 | ) | | (11,238,235 | ) | | | (277,563,808 | ) |
Net (decrease) increase | | (5,207,846 | ) | | $ | (128,706,831 | ) | | 1,975,936 | | | $ | 47,861,166 | |
| | | |
| | | | | | | | | Period Ended December 31, 2006 | |
| | | | | | | | | Shares | | | Amount | |
| Institutional Shares:(a) | | | | | | | | | | | | | | |
Shares sold | | | | | | | | | 1,836,237 | | | $ | 47,056,910 | |
Shares issued through dividend reinvestment | | | | | | | | | 158,817 | | | | 4,060,327 | |
Shares repurchased | | | | | | | | | (125,562 | ) | | | (3,151,216 | ) |
Net increase | | | | | | | | | 1,869,492 | | | $ | 47,966,021 | |
| (a) | For the period April 28, 2006 (inception of institutional shares) through December 31, 2006. |
NOTES TO FINANCIAL STATEMENTS CONTINUED
Fixed-Income Fund: As of December 31, 2006, there were an unlimited number of authorized shares of capital stock, no par value. Paid-in capital aggregated $61,519,191. Transactions in capital stock (shares) were as follows:
| | | | | | | | | | | | | | |
| | | Year Ended December 31, 2006 | | | Year Ended December 31, 2005 | |
| | | Shares | | | Amount | | | Shares | | | Amount | |
Shares sold | | 1,534,155 | | | $ | 24,754,494 | | | 1,090,481 | | | $ | 17,334,116 | |
Shares issued through dividend reinvestment | | 155,252 | | | | 2,503,607 | | | 69,617 | | | | 1,105,286 | |
Shares repurchased | | (715,147 | ) | | | (11,505,949 | ) | | (661,531 | ) | | | (10,505,386 | ) |
Net increase | | 974,260 | | | $ | 15,752,152 | | | 498,567 | | | $ | 7,934,016 | |
California Tax-Exempt Fund: As of December 31, 2006, there were an unlimited number of authorized shares of capital stock, no par value. Paid-in capital aggregated $17,795,585. Transactions in capital stock (shares) were as follows:
| | | | | | | | | | | | | | |
| | | Year Ended December 31, 2006 | | | Year Ended December 31, 2005 | |
| | | Shares | | | Amount | | | Shares | | | Amount | |
Shares sold | | 109,049 | | | $ | 1,808,073 | | | 137,761 | | | $ | 2,324,658 | |
Shares issued through dividend reinvestment | | 33,780 | | | | 559,043 | | | 40,694 | | | | 684,185 | |
Shares repurchased | | (358,511 | ) | | | (5,939,550 | ) | | (375,019 | ) | | | (6,335,556 | ) |
Net decrease | | (215,682 | ) | | $ | (3,572,434 | ) | | (196,564 | ) | | $ | (3,326,713 | ) |
4. Purchases and Sales of Securities
Purchases and proceeds from sales of securities, excluding short-term securities, for the year ended December 31, 2006 were as follows:
| | | | | | |
| | | Purchases | | Sales |
Equity Income Fund | | $ | 954,600,472 | | $ | 1,112,698,141 |
Fixed-Income Fund | | $ | 31,112,795 | | $ | 8,312,510 |
California Tax-Exempt Fund | | $ | 1,757,059 | | $ | 5,312,537 |
5. Investment Advisory Agreement and Transactions with Affiliates
Under terms of an agreement which provides for furnishing investment management and advice to the funds, Parnassus Investments is entitled to receive fees payable monthly, based on each fund’s average daily net assets for the month, at the following annual rates:
Equity Income Fund: 0.75% of the first $30,000,000, 0.70% of the next $70,000,000 and 0.65% of the amount above $100,000,000. Fixed-Income Fund and California Tax-Exempt Fund: 0.50% of the first $200,000,000, 0.45% of the next $200,000,000 and 0.40% of the amount above $400,000,000. For the year ended December 31, 2006, Parnassus Investments has contractually agreed to reduce its investment advisory fee through May 1, 2007 to the extent necessary to limit total operating expenses to 0.99% of net assets for the Equity Income Fund – Investor Shares, 0.78% of net assets for the Equity Income Fund – Institutional Shares, 0.87% of net assets for the Fixed-Income Fund and 0.75% of net assets for the California Tax-Exempt Fund.
As a result of fee waivers, including additional voluntary waivers of 0.12% for Fixed-Income Fund and 0.07% for California Tax-Exempt Fund, the following were actually charged for the year ended December 31, 2006. For the Equity Income Fund, the investment advisory fee was 0.60% and Parnassus Investments earned net advisory fees totaling $4,968,280. For the Fixed-Income Fund, the investment advisory fee was 0.34% and Parnassus Investments received net advisory fees totaling $175,721. For the California Tax-Exempt Fund, the investment advisory fee was 0.27% and Parnassus Investments received net advisory fees totaling $52,257.
Parnassus Investments receives fees under terms of a separate agreement which provides for furnishing transfer agent and fund administration services to the funds. The transfer agent fee was $2.70 per month per account plus any out-of-pocket expenses. The funds pay the monthly fee based on the number of accounts on record at each month-end. The fund administration reflects annual rates based on net assets for all funds managed by Parnassus Investments and was allocated based on respective fund net assets. The fund administration services fee was 0.07% of average net assets under this new agreement for the year ended December 31, 2006.
Parnassus Investments may also arrange for third parties to provide certain services, including account maintenance, recordkeeping and other personal services to their clients who invest in the funds. For these services, the funds may pay service providers an aggregate service fee on investment accounts at a rate not to exceed 0.25% per annum of average daily net assets. The Equity Income Fund – Institutional Shares does not incur service provider fees.
Jerome L. Dodson is the president of the Trust and is the president and majority stockholder of Parnassus Investments.
NOTES TO FINANCIAL STATEMENTS CONTINUED
6. Expense Offset Arrangement
The funds have entered into an arrangement with the custodian whereby credits realized as a result of uninvested cash balances are used to reduce a portion of the custodian fees. During the year ended December 31, 2006, the custodian fees were reduced as indicated in the statement of operations.
7. Geographic and Industry Concentration Risk Factors
The California Tax-Exempt Fund primarily invests in debt obligations issued by the State of California and its political subdivisions, agencies and public authorities to obtain funds for various public purposes. There are certain risks arising from the concentration of investments in California municipal securities. The California Tax-Exempt Fund is more susceptible to factors adversely affecting issuers of California municipal securities than a fund that is not concentrated in these issuers to the same extent. Uncertain economic conditions or governmental developments may affect the ability of California municipal securities issuers to meet their financial obligations.
8. Financial Highlights
Selected data for each share of capital stock outstanding, total return and ratios/supplemental data for each of the five years ended December 31are as follows:
Equity Income Fund – Investor Shares
| | | | | | | | | | | | | | | | | | | | |
| | | 2006 | | | 2005 | | | 2004 | | | 2003 | | | 2002 | |
Net asset value at beginning of year | | $ | 24.02 | | | $ | 25.00 | | | $ | 24.00 | | | $ | 21.20 | | | $ | 22.50 | |
Income (loss) from operations: | | | | | | | | | | | | | | | | | | | | |
Net investment income(c) | | | 0.30 | | | | 0.41 | | | | 0.40 | | | | 0.44 | | | | 0.49 | |
Net realized and unrealized gain (loss) on securities | | | 3.23 | | | | 0.24 | | | | 1.79 | | | | 2.85 | | | | (1.32 | ) |
Total from investment operations | | | 3.53 | | | | 0.65 | | | | 2.19 | | | | 3.29 | | | | (0.83 | ) |
Distributions: | | | | | | | | | | | | | | | | | | | | |
Dividends from net investment income | | | (1.38 | ) | | | (0.85 | ) | | | (0.56 | ) | | | (0.49 | ) | | | (0.29 | ) |
Distributions from net realized gains | | | (1.34 | ) | | | (0.78 | ) | | | (0.63 | ) | | | — | | | | (0.18 | ) |
Total distributions | | | (2.72 | ) | | | (1.63 | ) | | | (1.19 | ) | | | (0.49 | ) | | | (0.47 | ) |
Net asset value at end of year | | $ | 24.83 | | | $ | 24.02 | | | $ | 25.00 | | | $ | 24.00 | | | $ | 21.20 | |
Total return | | | 14.70 | % | | | 2.62 | % | | | 9.30 | % | | | 15.69 | % | | | (3.69 | %) |
Ratios/supplemental data: | | | | | | | | | | | | | | | | | | | | |
Ratio of gross expenses to average net assets | | | 1.06 | % | | | 1.07 | % | | | 1.04 | % | | | 0.96 | % | | | 1.03 | % |
Ratio of net expenses to average net assets (net of waiver and credit offset arrangements) | | | 0.99 | %(d) | | | 0.99 | % | | | 1.04 | % | | | 0.95 | % | | | 0.96 | % |
Ratio of net investment income to average net assets | | | 1.17 | % | | | 1.63 | % | | | 1.63 | % | | | 1.95 | % | | | 2.29 | % |
Portfolio turnover rate | | | 116.75 | % | | | 109.54 | % | | | 79.88 | % | | | 79.21 | % | | | 42.01 | % |
Net assets, end of year (000s) | | $ | 808,104 | | | $ | 906,844 | | | $ | 894,415 | | | $ | 630,249 | | | $ | 273,429 | |
NOTES TO FINANCIAL STATEMENTS CONTINUED
Equity Income Fund – Institutional Shares
| | | | |
| | | 2006(e) | |
Net asset value at beginning of period | | $ | 25.59 | |
Income from operations: | | | | |
Net investment income(c) | | | 0.19 | |
Net realized and unrealized gain on securities | | | 1.73 | |
Total from investment operations | | | 1.92 | |
Distributions: | | | | |
Dividends from net investment income | | | (1.31 | ) |
Distributions from net realized gains | | | (1.34 | ) |
Total distributions | | | (2.65 | ) |
Net asset value at end of period | | $ | 24.86 | |
Total return | | | 7.46 | %(a) |
Ratios/supplemental data: | | | | |
Ratio of gross expenses to average net assets | | | 0.85 | %(b) |
Ratio of net expenses to average net assets (net of waiver and credit offset arrangements) | | | 0.78 | %(b)(d) |
Ratio of net investment income to average net assets | | | 1.10 | %(b) |
Portfolio turnover rate | | | 116.75 | % |
Net assets, end of period (000s) | | $ | 46,471 | |
Fixed-Income Fund
| | | | | | | | | | | | | | | | | | | | |
| | | 2006 | | | 2005 | | | 2004 | | | 2003 | | | 2002 | |
Net asset value at beginning of year | | $ | 15.79 | | | $ | 15.87 | | | $ | 16.00 | | | $ | 15.88 | | | $ | 14.94 | |
Income (loss) from operations: | | | | | | | | | | | | | | | | | | | | |
Net investment income(c) | | | 0.67 | | | | 0.48 | | | | 0.33 | | | | 0.58 | | | | 0.82 | |
Net realized and unrealized gain (loss) on securities | | | 0.49 | | | | (0.08 | ) | | | (0.01 | ) | | | 0.26 | | | | 0.95 | |
Total from investment operations | | | 1.16 | | | | 0.40 | | | | 0.32 | | | | 0.84 | | | | 1.77 | |
Distributions: | | | | | | | | | | | | | | | | | | | | |
Dividends from net investment income | | | (0.74 | ) | | | (0.48 | ) | | | (0.33 | ) | | | (0.65 | ) | | | (0.83 | ) |
Distributions from net realized gains | | | (0.10 | ) | | | — | | | | (0.09 | ) | | | (0.07 | ) | | | — | |
Return of capital | | | — | | | | — | | | | (0.03 | ) | | | — | | | | — | |
Total distributions | | | (0.84 | ) | | | (0.48 | ) | | | (0.45 | ) | | | (0.72 | ) | | | (0.83 | ) |
Net asset value at end of year | | $ | 16.11 | | | $ | 15.79 | | | $ | 15.87 | | | $ | 16.00 | | | $ | 15.88 | |
Total return | | | 7.45 | % | | | 2.55 | % | | | 2.05 | % | | | 5.30 | % | | | 12.20 | % |
Ratios/supplemental data: | | | | | | | | | | | | | | | | | | | | |
Ratio of gross expenses to average net assets | | | 0.92 | % | | | 1.01 | % | | | 0.97 | % | | | 0.92 | % | | | 1.08 | % |
Ratio of net expenses to average net assets (net of waiver and credit offset arrangements) | | | 0.75 | %(d) | | | 0.75 | % | | | 0.75 | % | | | 0.62 | % | | | 0.81 | % |
Ratio of net investment income to average net assets | | | 4.13 | % | | | 3.03 | % | | | 2.08 | % | | | 3.59 | % | | | 5.36 | % |
Portfolio turnover rate | | | 41.27 | % | | | 34.08 | % | | | 24.38 | % | | | 125.74 | % | | | 59.00 | % |
Net assets, end of year (000s) | | $ | 62,520 | | | $ | 45,879 | | | $ | 38,205 | | | $ | 34,098 | | | $ | 19,092 | |
NOTES TO FINANCIAL STATEMENTS CONTINUED
California Tax-Exempt Fund
| | | | | | | | | | | | | | | | | | | | |
| | | 2006 | | | 2005 | | | 2004 | | | 2003 | | | 2002 | |
Net asset value at beginning of year | | $ | 16.64 | | | $ | 17.10 | | | $ | 17.14 | | | $ | 17.19 | | | $ | 16.61 | |
Income (loss) from operations: | | | | | | | | | | | | | | | | | | | | |
Net investment income(c) | | | 0.53 | | | | 0.50 | | | | 0.48 | | | | 0.53 | | | | 0.59 | |
Net realized and unrealized gain (loss) on securities | | | (0.06 | ) | | | (0.40 | ) | | | (0.02 | ) | | | 0.12 | | | | 0.83 | |
Total from investment operations | | | 0.47 | | | | 0.10 | | | | 0.46 | | | | 0.65 | | | | 1.42 | |
Distributions: | | | | | | | | | | | | | | | | | | | | |
Dividends from net investment income | | | (0.54 | ) | | | (0.51 | ) | | | (0.48 | ) | | | (0.53 | ) | | | (0.59 | ) |
Distributions from net realized gains | | | (0.01 | ) | | | (0.05 | ) | | | (0.02 | ) | | | (0.17 | ) | | | (0.25 | ) |
Total distributions | | | (0.55 | ) | | | (0.56 | ) | | | (0.50 | ) | | | (0.70 | ) | | | (0.84 | ) |
Net asset value at end of year | | $ | 16.56 | | | $ | 16.64 | | | $ | 17.10 | | | $ | 17.14 | | | $ | 17.19 | |
Total return | | | 2.88 | % | | | 0.62 | % | | | 2.73 | % | | | 3.88 | % | | | 8.66 | % |
Ratios/supplemental data: | | | | | | | | | | | | | | | | | | | | |
Ratio of gross expenses to average net assets | | | 0.91 | % | | | 0.91 | % | | | 0.81 | % | | | 0.83 | % | | | 0.95 | % |
Ratio of net expenses to average net assets (net of waiver and credit offset arrangements) | | | 0.68 | %(d) | | | 0.68 | % | | | 0.67 | % | | | 0.62 | % | | | 0.73 | % |
Ratio of net investment income to average net assets | | | 3.22 | % | | | 3.01 | % | | | 2.82 | % | | | 3.08 | % | | | 3.45 | % |
Portfolio turnover rate | | | 9.29 | % | | | 13.18 | % | | | — | | | | 16.16 | % | | | 41.73 | % |
Net assets, end of year (000s) | | $ | 17,965 | | | $ | 21,635 | | | $ | 25,594 | | | $ | 24,825 | | | $ | 26,163 | |
| (a) | Not annualized for period less than one year. |
| (c) | Net investment income per share is based on average daily shares outstanding. |
| (d) | For the year ended December 31, 2006, Parnassus Investments has contractually limited expenses to an annualized rate of 0.99% for the Equity Income Fund – Investor Shares, 0.87% for the Fixed-Income Fund and 0.75% for the California Tax-Exempt Fund. Parnassus Investments has also voluntarily limited additional expenses for the Fixed-Income Fund and the California Tax-Exempt Fund (see note 5 for details). For the Equity Income Fund – Institutional Shares, Parnassus has contractually limited expenses to an annualized rate of 0.78% for the period, April 28, 2006 (inception) through December 31, 2006. |
| (e) | The Equity Income Fund – Institutional Shares commenced operations on April 28, 2006 and the period shown is from April 28, 2006 through December 31, 2006. |
ADDITIONAL INFORMATION (UNAUDITED)
Board of Trustees and Officers
Independent Trustees§
| | |
| Name | | Herbert A. Houston |
| |
| Age | | 63 |
| |
| Address | | One Market – Steuart Tower, Suite 1600 |
| | San Francisco, California 94105 |
| |
| Position(s) Held with Funds | | Trustee |
| |
| Term of Office and Length of Service | | Indefinite. Since 1992 for Parnassus Income |
| | Funds. Since 1998 for Parnassus Funds. |
| |
| Principal Occupation(s) During Past 5 Years | | Healthcare consultant and owner of several small businesses; Chief Executive Officer of the Haight Ashbury Free Clinics, Inc. from 1987 to 1998. |
| |
| Portfolios in the Fund Complex Overseen by Trustee | | Seven |
| |
| Other Directorships Held by Trustee | | None |
| |
| Name | | Jeanie S. Joe |
| |
| Age | | 59 |
| |
| Address | | One Market – Steuart Tower, Suite 1600 |
| | San Francisco, California 94105 |
| |
| Position(s) Held with Funds | | Trustee |
| |
| Term of Office and Length of Service | | Indefinite. Since October 2004. |
| |
| Principal Occupation(s) During Past 5 Years | | President of Geo/Resource Consultants, a geotechnical and environmental consulting firm, since 1995; director and secretary of Telecommunication Consumer Protection Fund Corporation. |
| |
| Portfolios in the Fund Complex Overseen by Trustee | | Seven |
| |
| Other Directorships Held by Trustee | | None |
| § | “Independent” trustees are trustees who are not deemed to be “interested persons” of the funds as defined in the Investment Company Act of 1940. |
ADDITIONAL INFORMATION (UNAUDITED) CONTINUED
| | |
| Name | | Donald V. Potter |
| |
| Age | | 61 |
| |
| Address | | One Market – Steuart Tower, Suite 1600 |
| | San Francisco, California 94105 |
| |
| Position(s) Held with Funds | | Trustee |
| |
| Term of Office and Length of Service | | Indefinite. Since 2002. |
| |
| Principal Occupation(s) During Past 5 Years | | President and owner of Windermere Associates, a consulting firm specializing in business strategy, since 1984. |
| |
| Portfolios in the Fund Complex Overseen by Trustee | | Seven |
| |
| Other Directorships Held by Trustee | | None |
| |
Interested Trustee† | | |
| |
| Name | | Jerome L. Dodson†† |
| |
| Age | | 63 |
| |
| Address | | One Market – Steuart Tower, Suite 1600 |
| | San Francisco, California 94105 |
| |
| Position(s) Held with Funds | | President and Trustee |
| |
| Term of Office and Length of Service | | Indefinite. Since 1992 for Parnassus Income |
| | Funds. Since 1984 for the Parnassus Funds. |
| |
| Principal Occupation(s) During Past 5 Years | | President and Trustee of the Parnassus Funds and the Parnassus Income Funds since their inceptions; President and Director of Parnassus Investments since June 1984. |
| |
| Portfolios in the Fund Complex Overseen by Trustee | | Seven |
| |
| Other Directorships Held by Trustee | | None |
| † | An “interested” trustee is a trustee who is deemed to be an “interested person” of the funds, as defined in the Investment Company Act of 1940. Jerome L. Dodson is an interested person of the funds because of his ownership in the funds’ investment adviser and because he is an officer of the Trusts. |
| †† | Jerome L. Dodson is the father of Stephen J. Dodson, the Assistant Secretary of the funds. |
Additional information about the fund’s Board of Trustees is available in the Statement of Additional Information. The Statement of Additional information is available without charge on the Securities and Exchange Commission’s website (www.sec.gov) or by calling us at (800) 999-3505.
Board of Trustees and Officers — continued
Officers (other than Jerome L. Dodson)
| | |
| Name | | Debra A. Early |
| |
| Age | | 42 |
| |
| Address | | One Market – Steuart Tower, Suite 1600 |
| | San Francisco, California 94105 |
| |
| Position(s) Held with Funds | | Chief Compliance Officer and Treasurer |
| |
| Term of Office and Length of Service | | Indefinite. Since December 2004. |
| |
| Principal Occupation(s) During Past 5 Years | | Treasurer of Parnassus Funds and Parnassus Income Funds since 2004 and Chief Compliance Officer since July 2005. Vice President and Chief Financial Officer of Parnassus Investments since 2004. Senior Manager at PricewaterhouseCoopers LLP October 1992 to November 2004. |
| |
| Name | | Todd Ahlsten |
| |
| Age | | 34 |
| |
| Address | | One Market – Steuart Tower, Suite 1600 |
| | San Francisco, California 94105 |
| |
| Position(s) Held with Funds | | Vice President |
| |
| Term of Office and Length of Service | | Indefinite. Since 2001. |
| |
| Principal Occupation(s) During Past 5 Years | | Financial Analyst and Director of Research at Parnassus Investments since 1995. Portfolio manager of the Equity Income Fund and Fixed- Income Fund since May 2001. |
ADDITIONAL INFORMATION (UNAUDITED) CONCLUDED
| | |
| Name | | Richard D. Silberman |
| |
| Age | | 69 |
| |
| Address | | One Market – Steuart Tower, Suite 1600 |
| | San Francisco, California 94105 |
| |
| Position(s) Held with Funds | | Secretary |
| |
| Term of Office and Length of Service | | Indefinite. Since 1986. |
| |
| Principal Occupation(s) During Past 5 Years | | Retired business lawyer. |
| |
| Name | | Stephen J.Dodson* |
| |
| Age | | 29 |
| |
| Address | | One Market – Steuart Tower, Suite 1600 |
| | San Francisco, California 94105 |
| |
| Position(s) Held with Funds | | Assistant Secretary |
| |
| Term of Office and Length of Service | | Indefinite. Since 2002. |
| |
| Principal Occupation(s) During Past 5 Years | | Financial Analyst with Morgan Stanley 1999-2001. Associate with Advent International, a venture capital firm 2001-2002. Executive Vice President and Chief Operating Officer of Parnassus Investments 2002-Present. |
| * | Stephen J. Dodson is the son of Jerome L. Dodson, the President and a trustee of the funds. |
Proxy Disclosures
Parnassus proxy voting policies and procedures are available, without charge, on our website (www.parnassus.com), on the Securities and Exchange Commission’s website (www.sec.gov), and by calling us at (800) 999-3505. The funds file a proxy voting record with the Securities and Exchange Commission for the 12 months ended June 30. The most recent report is available by calling Parnassus or obtaining on either the Securities and Exchange Commission’s website or our Parnassus website.
Quarterly Portfolio Schedule
The funds file their complete schedule of portfolio holdings with the Securities and Exchange Commission for the first and third quarters of each fiscal year on Form N-Q. The quarterly portfolio holdings are available on the Securities and Exchange Commission’s website (www.sec.gov). The funds’ Form N-Q may also be reviewed and copied at the Securities and Exchange Commission’s Public Reference Room in Washington, DC, and information on the operation of the Public Reference Room may be obtained by calling (800) SEC-0330.
Federal Income Tax Information
For the year ended December 31, 2006, the following percentages of ordinary income distributed by the funds that qualify for the individual qualified dividend income deduction (QDI) and the corporate dividends received deduction (DRD) are as follows:
| | | | | | |
| | | QDI | | | DRD | |
Parnassus Equity Income Fund | | 21.03 | % | | 21.28 | % |
Parnassus Fixed-Income Fund | | 1.13 | % | | 1.13 | % |
The distribution from net investment income for the California Tax-Exempt Fund will be treated as exempt income for federal income tax purposes at 100%.

Item 2: Code of Ethics
The registrant has adopted a code of ethics dated July 22, 2003 that applies to the registrant’s principal executive officer (President) and principal financial officer (Treasurer) for the fiscal year ending December 31, 2006. During the fiscal year ending December 31, 2006 there were no amendments to any provisions of this code of ethics.
Item 3: Audit Committee Financial Expert
The Board of Trustees of the Parnassus Income Funds determined that Donald Potter, Chairman of the board’s Audit Committee, qualified as an “audit committee financial expert” as defined by Form N-CSR. The Trustee’s decision was based on Mr. Potter’s understanding of generally accepted accounting principles (GAAP), experience applying GAAP, familiarity with internal controls and procedures for financial reporting and understanding of audit committee functions. He gained this knowledge from thirty years of experience as a strategy consultant for major corporations while working at McKinsey & Co. Management Consultants and at his own firm, Windermere Associates. He also spent four years working as a financial executive for a Fortune 500 company. He served as Chairman of the Audit Committee of Media Arts Group and has also served on the Audit Committees of DLJ Direct and Peer Foods. Mr. Potter is a graduate of Harvard Business School where he was named a Baker Scholar for finishing in the top 5% of his class. Mr. Potter is an independent trustee.
Item 4: Principal Accountant Fees and Services
(a) Audit Fees
The aggregate fees billed for professional services rendered by the principal accountant for the audit of the registrant’s annual financial statements or services that are normally provided by the accountant in connection with statutory and regulatory filings or engagements for the fiscal years ended December 31, 2005 and 2006 were $110,343 and $72,977 respectively.
(b) Audit-Related Fees
The aggregate fees billed for assurance and related services rendered by the principal accountants that are reasonably related to the performance of the audit of the registrant’s financial statements and are not reported under paragraph (a) of this Item for the fiscal years ended December 31, 2005 and 2006 were $6,000 and $0 respectively. Audit-related services relate to providing an internal control letter for affiliated transfer agent operations which are billed to the registrant’s investment advisor.
(c) Tax Fees
The aggregate fees billed for professional services rendered by the principal accountant for tax compliance, tax advice, and tax planning for the fiscal years ended December 31, 2005 and 2006 were $15,500 and $16,150 respectively.
(d) All Other Fees
There were no fees billed in each of the last two fiscal years for products and services by the principal accountant, other than the services reported in paragraphs(a) through (c) of this Item.
(e)(1) The Audit committee’s pre-approval policies and procedures are as follows:
The audit committee is required to pre-approve all audit services and permitted non-audit services provided by the independent accountants for the Parnassus Fund, affiliated funds, and other services affiliated.
Explicit pre-approval by the Audit Committee Chair shall be required for any individual non-audit engagement to be performed by the independent accountants with estimated fees of $10,000 or less and the Audit Committee Chair shall report such approval to the full audit committee at the next regularly scheduled meeting. Explicit pre-approval by the full Audit Committee shall be required for any individual non-audit engagement to be performed by the independent accountants with estimated fees in excess of $10,000. Officers of the Funds shall furnish the audit committee at least annually with a listing of all fees paid to the independent accountants including non-audit services performed. For certain non-audit services which are no more than five percent of the total fees paid by the Trust, such fees may be exempted from the required pre-approval process specified above subject to limitations and prompt disclosure of such services when such services are identified, and in all cases approval is required prior to completion.
(e)(2) None
(f) Not applicable.
(g) The aggregate non-audit fees billed by the registrant’s accountant for services rendered to the registrant, and rendered to the registrant’s investment adviser act forth in 4(b) and (c) of this Item of $21,500 and $16,150 for the fiscal years ended December 31, 2005 and 2006, respectively.
Item 5: Not applicable.
Item 6: Included as part of the report to shareholders filed under Item 1 of this form.
Item 7: Not applicable.
Item 8: Not applicable.
Item 9: Not applicable.
Item 10: For the purposes of this Item, there have not been any material changes to the procedures by which shareholders may recommend nominees to the registrant’s board of trustees.
Item 11: Controls and Procedures.
(a) The registrant’s certifying officers have reasonably designed such disclosure controls and procedures to ensure material information relating to the registrant is made known to them by others, particularly during the period in which this report is being prepared. The registrant’s certifying officers have determined that the registrant’s disclosure controls and procedures are effective based on their evaluation of these controls and procedures as of a date within 90 days prior to the filing date of this report.
(b) There were no significant changes in the registrant’s internal controls over financial reporting, or in other factors that could significantly affect these controls, that occurred during the registrant’s first fiscal half-year, including any corrective actions with regard to significant deficiencies and material weaknesses.
Item 12: Exhibits attached hereto.
(a)(1) Code of Ethics.
(a)(2) Certification for each principal executive and principal financial officer of the registrant as required by Rule 30a-2 under the Act (17 CFR 270.30a-2(a)) - Filed as an attachment to this filing.
(b) Certifications required by Rule 30a-2(b) under the Act (17 CFR 270.30a-2(b)), Rule 13a-14(b) or Rule 15d-14(b) under the Exchange Act (17 CFR 240.13a-14(b) or 240.15d-14(b)), and Section 1350 of Chapter 63 of Title 18 of the United States Code (18 U.S.C. 1350). A certification furnished pursuant to this paragraph will not be deemed “filed” for purposes of Section 18 of the Exchange Act (15 U.S.C. 78r), or otherwise subject to the liability of that section. Such certification will not be deemed to be incorporated by reference into any filing under the Securities Act of 1933 or the Exchange Act, except to the extent that the registrant specifically incorporates it by reference – Filed as an attachment to this filing.
Pursuant to the requirements of the Securities Exchange Act of 1934 and the Investment Company Act of 1940, the registrant has duly caused this report to be signed on its behalf by the undersigned, thereunto duly authorized.
| | | | |
| | | Parnassus Income Funds |
| Date: February 12, 2007 | | By: | | /s/ Jerome L. Dodson
|
| | | | | Jerome L. Dodson President |
Pursuant to the requirements of the Securities Exchange Act of 1934 and the Investment Company Act of 1940, this report has been signed below by the following persons on behalf of the registrant and in the capacities and on the dates indicated.
| | | | |
| Date: February 12, 2007 | | By: | | /s/ Jerome L. Dodson
|
| | | | | Jerome L. Dodson President |
| | | | |
| Date: February 12, 2007 | | By: | | /s/ Debra A. Early
|
| | | | | Debra A. Early Treasurer |