PARNASSUS INCOME FUNDS
UNITED STATES
SECURITIES AND EXCHANGE COMMISSION
Washington, D.C. 20549
FORM N-CSR
CERTIFIED SHAREHOLDER REPORT OF
REGISTERED MANAGEMENT INVESTMENT COMPANIES
Investment Company Act file number: 811-06673
Parnassus Income Funds
(Exact name of registrant as specified in charter)
1 Market Street, Suite 1600, San Francisco, California 94105
(Address of principal executive offices) (Zip code)
Marc C. Mahon
Parnassus Income Funds
1 Market Street, Suite 1600, San Francisco, California 94105
(Name and address of agent for service)
Registrant’s telephone number, including area code: (415) 778-0200
Date of fiscal year end: December 31
Date of reporting period: December 31, 2009
| Item 1: | Report to Shareholders |
THE PARNASSUS FUNDS®
Annual Report December 31, 2009
Parnassus Fund
Parnassus Equity Income Fund
Parnassus Mid-Cap Fund
Parnassus Small-Cap Fund
Parnassus Workplace Fund
Parnassus Fixed-Income Fund
| | | |
| Parnassus Fund | | (PARNX | ) |
| Parnassus Equity Income Fund–Investor Shares | | (PRBLX | ) |
| Parnassus Equity Income Fund–Institutional Shares | | (PRILX | ) |
| Parnassus Mid-Cap Fund | | (PARMX | ) |
| Parnassus Small-Cap Fund | | (PARSX | ) |
| Parnassus Workplace Fund | | (PARWX | ) |
| Parnassus Fixed-Income Fund | | (PRFIX | ) |
TABLE OF CONTENTS

THE PARNASSUS FUNDS®
February 8, 2010
Dear Shareholder:
Enclosed you will find annual reports for all six Parnassus Funds. I’m happy to report that all five equity funds had great performance for 2009, beating both their respective indicies and the average returns of their respective mutual fund peer groups as reported by Lipper Inc. In fact, our stock funds have performed so well that three of them almost made up in 2009 what they lost in 2008. The other two funds did even better, having more than made up for what they lost in 2008. From December 31 of 2007 until December 31 of 2009, the Parnassus Mid-Cap Fund is down just 3.77%, the Parnassus Fund is down just 2.54% and the Parnassus Equity Income Fund – Investor Shares is down just 0.82%. The Parnassus Small-Cap Fund is actually up 6.76% during that period, while the Parnassus Workplace Fund is up an amazing 13.59% since the end of 2007. By comparison, the S&P 500 Index (“S&P”) is still down 20.31%.
For 2009, the best-performing Parnassus fund was the Parnassus Workplace Fund. It gained an amazing 62.13%, the best performance of any Parnassus fund for any one-year period. It beat the previous record set by the Parnassus Fund in 1991 with a gain of 52.56%. I think the performance of the Parnassus Workplace Fund shows that companies with great workplaces can be great investments.
During the year, the Parnassus Fund gained 47.94%, the Parnassus Small-Cap Fund 42.50% and the Parnassus Mid-Cap Fund 36.26%. The Parnassus Equity Income Fund, which had a total return of 28.73%, did not keep up with the performance of the other Parnassus Funds, but still managed to beat the S&P’s gain of 26.47%.
Although the Parnassus Equity Income Fund’s performance was not as high a that of the Parnassus Funds, beating the S&P in 2009 was a remarkable achievement. This fund is our most conservative stock fund, and it’s designed to minimize risk. I often joke with portfolio manager Todd Ahlsten, telling him that the Parnassus Equity Income Fund is for widows and orphans only. Under normal circumstances, a low-risk fund outperforms in down markets, but underperforms when the stock market moves sharply higher. The Parnassus Equity Income Fund has outperformed the S&P in both good years and bad years. For example, the Parnassus Equity Income Fund lost only 22.95% in 2008, when the S&P 500 lost 37.00%, yet it gained more than the S&P in the bull market of 2009.
Todd Ahlsten’s ability to outperform in both good and bad markets shows in his fund’s long-term track record. For the ten years ended December 31, 2009, the average annual total return for the Parnassus Equity Income Fund was 6.62% compared with a loss of 0.95% for the S&P. This means that for the past ten years, the Fund has delivered an extra 7.57% a year above the S&P.
For the five years ended December 31, 2009, the Parnassus Equity Income Fund had an average annual return of 5.91% compared to 0.42% for the S&P. For the three years ended December 31, 2009, the Fund had an average annual return of 4.22%, compared to a loss of 5.62% for the S&P, so Todd has delivered almost an extra 10% above the S&P for the last three years.
Performance data quoted represent past performance and are no guarantee of future returns. Current performance may be lower or higher than the performance data quoted. Please see the following pages for more detailed information regarding each fund’s performance and the risks associated with investing in the funds.
Shareholders have recognized Todd’s special ability and have put $2.5 billion into the Parnassus Equity Income Fund, which is by far the largest of the Parnassus Funds. Barron’s has named Todd Ahlsten one of the 100 best mutual fund managers in the country three times in the last seven years. In my view, though, Todd is not only one of the 100 best: he is the best. We’re very fortunate to have him with us.
New Team Members
Robert Burmeister has joined us as our chief trader. He received his bachelor’s degree in economics from Harvard University in 2006, and he played on the varsity water polo team in college. He also worked for two years as an analyst at Accenture Consulting.
Ryan Wilsey joins us as a senior analyst and will work closely with me on the three funds that I manage. Ryan is an engineering graduate of Princeton University and holds an MBA from Harvard Business School. He also interned at Parnassus Investments in 1998, when he was a college student. He was one of the youngest interns we have ever had. His previous experience includes work with Opsware (aka Loudcloud), as an analyst with Summit Partners, an investment firm in Palo Alto, California, as an associate at venture capital firm, Greylock Partners, and as an analyst at Scout Capital, a hedge fund in New York. I am delighted he has joined our staff.
Finally, I would like to thank all of you for investing in the Parnassus Funds. It’s been a great year and we’re happy that we have been able to give you such good returns—especially after a very difficult year in 2008.
|
| Yours truly, |
|
 |
|
Jerome L. Dodson, President Parnassus Investments |
THE PARNASSUS FUND
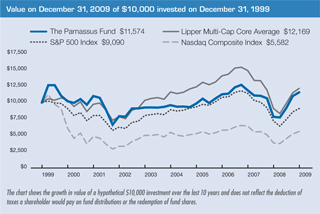
As of December 31, 2009, the net asset value per share (“NAV”) of the Parnassus Fund was $34.82, so after taking dividends into account, the total return for the quarter was 5.24%. This compares to 6.04% for the S&P 500 Index (“S&P 500”), 5.41% for the Lipper Multi-Cap Core Average, which represents the average multi-cap core fund followed by Lipper Inc. (“Lipper average”), and 7.20% for the Nasdaq Composite Index (“Nasdaq”). We lagged slightly behind our benchmarks for the quarter, but the Fund had great performance for the year. For 2009, the Fund’s total return was 47.94%, compared to 26.47% for the S&P 500, 32.01% for the Lipper average and 45.36% for the Nasdaq, so we beat the S&P 500 by over 21 percentage points, we beat the Lipper average by over 16 percentage points and we even beat the Nasdaq in a year when technology stocks soared. The best year for the Parnassus Fund was in 1991, when the Fund gained 52.56%, so we came close to that record year.
Below are a table and a graph comparing the Parnassus Fund with the S&P 500, the Nasdaq and the Lipper average over the past one-, three-, five- and ten-year periods. You’ll notice that we’re ahead of all of our benchmarks for all time periods, a record of which I’m very proud. Of special note is the fact that we’ve actually had a positive return over the last three years while all the indices have shown losses. We’ve also had a positive return for the last ten years while both the S&P 500 and the Nasdaq show losses.
Average Annual Total Returns
for periods ended December 31, 2009
| | | | | | | | | | | | | | | | | | |
| | | One
Year | | | Three
Years | | | Five
Years | | | Ten
Years | | | Gross
Expense
Ratio | | | Net
Expense
Ratio | |
THE PARNASSUS FUND | | 47.94 | % | | 0.91 | % | | 3.80 | % | | 1.47 | % | | 1.02 | % | | 0.99 | % |
S&P 500 Index | | 26.47 | % | | -5.62 | % | | 0.42 | % | | -0.95 | % | | NA | | | NA | |
Lipper Multi-Cap Core Average | | 32.01 | % | | -4.82 | % | | 0.90 | % | | 1.45 | % | | NA | | | NA | |
Nasdaq Composite Index | | 45.36 | % | | -1.16 | % | | 1.71 | % | | -5.08 | % | | NA | | | NA | |
Performance data quoted represent past performance and are no guarantee of future returns. Current performance may be lower or higher than the performance data quoted. Current performance information to the most recent month-end is available on the Parnassus Investments website (www.parnassus.com). Investment return and principal value will fluctuate so that an investor’s shares, when redeemed, may be worth more or less than their original principal cost. Returns shown in the table do not reflect the deduction of taxes a shareholder may pay on fund distributions or redemption of shares. The S&P 500 Composite Stock Index, also known as the S&P 500, and the Nasdaq Composite Index are unmanaged indices of common stocks, and it is not possible to invest directly in an index. Index figures do not take any expenses, fees or taxes into account, but mutual fund returns do. Prior to May 1, 2004, the Parnassus Fund charged a sales load (maximum of 3.5%), which is not reflected in the total return calculations. Before investing, an investor should carefully consider the investment objectives, risks, charges and expenses of the Fund and should carefully read the prospectus, which contains this and other information. The prospectus is available on the Parnassus Investments website, or one can be obtained by calling (800) 999-3505. As described in the Fund’s current prospectus dated May 1, 2009, Parnassus Investments has contractually agreed to limit the total operating expenses to 0.99% of net assets, exclusive of acquired fund fees, until May 1, 2010. This limitation may be continued indefinitely by the Adviser on a year-to-year basis.
With our strong performance this year, we’ve made up most of what we lost in 2008. From December 31, 2007 until December 31, 2009, the Fund is down just 2.54%, compared to a loss of 20.31% for the S&P 500 during the same time period.
Company Analysis
Seven companies contributed the most to our strong performance in 2009, each adding 50¢ or more to each Parnassus share. Four of these were technology companies, two were financials and one makes electronic components.
American Express contributed an astonishing 98¢ to the NAV, as its stock rocketed up 118% from $18.55 to $40.52. The stock had been trading at very depressed levels in early 2009, because of high charge-offs and delinquencies, but once these figures improved in the second half of the year, credit concerns diminished and the stock moved much higher.
Google added 91¢ to each fund share, as its stock soared 102% from $308 to $620. Revenue growth and cost control drove the stock higher, as sales increased by 10% in a year when companies curtailed spending on advertising.

Goldman Sachs added 80¢ to the NAV, climbing from $84.39 to $185.59 where we sold it for a gain of 120%. The company reported record earnings for the year, mostly because its trading operation faced diminished competition, since rival firms were either severely weakened or had become insolvent. Goldman also benefitted from the second-half rebound in equity and debt underwriting in its investment banking operation. We sold the stock, because it was no longer undervalued, and we expect the company will face stronger competitors in the future.
Seagate Technology, a manufacturer of disk-drives, added 75¢ to each of our shares, as its stock shot up an amazing 311% from $4.43 to $18.19. The stock had been trading at very depressed levels at the beginning of the year because of poor economic conditions, but a surprising increase in sales of notebook computers late in the year drove increased demand for hard disk-drives, which led to higher sales and better prices. In December, Seagate unveiled its first solid-state drive, which gave it entry into a potentially lucrative market; the new product is faster, more energy-efficient and more reliable than traditional drives.
Corning, a maker of specialty glass for HDTV and computer monitors, added 68¢ to the NAV, as its stock soared 103% from $9.53 to $19.31. After trading at depressed levels in early 2009 because of the severe recession, the stock moved sharply higher during the year as demand increased, and investors realized the value of Corning’s position as a leading player in a large and fast-growing market.
Texas Instruments contributed 57¢ to each Parnassus share, while its stock rose 68% from $15.52 to $26.06. The company did reasonably well during the economic downturn, because its market-leading position in analog and embedded chips enabled it to take share from weaker competitors. As the economy stabilized and demand picked up, factory utilization increased and margins improved. Texas Instruments recently raised its revenue and earnings guidance for 2010.
Lam Research makes equipment used in manufacturing semiconductors, and its stock climbed 84% from $21.28 to $39.21 for a gain of 51¢ on the NAV. Driving the stock higher was increased demand from semiconductor foundries and memory chip-makers.
There were no companies in the portfolio that had a negative impact of 50¢ or more on the NAV. The company that hurt us the most was Tower Group, which sliced 11¢ off each Parnassus share, as its stock dropped 17% from $28.21 to $23.41. The stock dropped in 2009 because of worries about the quality of the fixed-income securities in its investment portfolio and concern about its aggressive acquisition strategy. We’re continuing to hold the stock, because we like its focus on providing property and casualty insurance to under-served segments of the small and medium-sized business market.
Outlook And Strategy
This section represents my thoughts, and applies to the three funds that I manage: the Parnassus Fund, the Parnassus Small-Cap Fund and the Parnassus Workplace Fund. The other portfolio managers will discuss their thoughts in their respective reports.
The stock market made an amazing recovery this year with the S&P 500 increasing 26%. Many people find this surprising because the economy is still weak and unemployment is still high. For my part, I’m not surprised at all, because the stock market is a discounting mechanism, and therefore, a leading indicator. In this context, discounting means taking a future event into account in making a present calculation, such as determining how much to pay for a stock. The American economy is just now coming out of a period of economic contraction. Most of the time, economic growth is very strong as the economy emerges from a recession. It’s highly likely that this will be the case this time as well. Investors anticipate this and drive up prices. That’s why the stock market is called a leading indicator.
Employment by contrast, is a lagging indicator. Growth in jobs is the last thing to happen as the economy comes out of a recession. Employers are very reluctant to hire until the economy is really chugging along. They’re afraid that if they hire new people too soon, they’ll be stuck paying employees who don’t have enough work to do. For this reason, business owners and managers wait until the last possible moment to hire new people. They don’t hire when orders first pick up, but wait until there is so much work that they can’t possibly handle it with their existing staff. That’s why employment is called a lagging indicator. (This also works in reverse. Employers are slow to lay people off when orders slow down, preferring to keep valuable workers on staff, so they don’t have to hire and train new people when orders pick up again.)
While the high unemployment rate is definitely a problem, it doesn’t mean that the economy won’t keep getting stronger. A lagging indicator does not tell the future – it describes the past. Economic growth should be strong in 2010. There should be a lot of pent-up demand coming out of the recession and this should fuel economic growth.
Now, how does this relate to stock prices? At the beginning of 2009, it was very easy for me to pick stocks. There were so many undervalued stocks around, that it was like catching fish in the proverbial barrel. I knew that almost any stock I bought would be much higher by the end of 2009. The difficulty was keeping my wits about me, as most people predicted that equities would keep going lower in 2009. This negative psychology had an emotional impact on almost everyone – including me. Warren Buffett once said that you don’t have to be brilliant to be a good investor, but you do have to have the right temperament. The 2009 market was a great example of what he must have meant.
The situation at the beginning of 2010 is far different. Most stocks are at or near their intrinsic value. This makes my job much harder. I’m finding some things to buy, but it takes much more work to discover them than it did in early 2009. That’s the bad news.
The good news is that as the economy gets stronger in 2010, corporate earnings will increase and this will raise the value of stocks. This upward movement should help all investors, and I hope that we will participate in that upward movement. The stock market will not have the gains in 2010 that it did in 2009, and the Parnassus Funds certainly won’t have the returns they did in 2009, but I still think we’ll have a good year. All the Funds have sound strategies, so that should benefit all of us as shareholders.
The widespread negativity over lingering effects of the recession, does not really make me nervous. I only get nervous when everyone is positive. It seems that the best stock market gains come when investors are negative, but the market doesn’t do very well when everyone is positive. When everyone is positive, investors are already in the market, and there’s no one left to buy more stock and push prices higher. When people are negative, there’s still a lot of money on the sidelines, and when that money comes into the market, it pushes stocks higher.
Right now, there’s a lot of money on the sidelines. Although bond mutual funds had heavy inflows during 2009, stock funds have had outflows. In 2008, investors took $151 billion out of domestic equity funds and an additional $40 billion came out in 2009. At some point, I suspect that a lot of that money will return to equities, and that will push the stock market higher in 2010.
For this year, I hope to find a lot of stocks that have not run up too much in the surge of 2009. The most important part of our strategy is to find undervalued companies with good businesses that are socially responsible. If we follow this strategy, we should do well.
|
| Yours truly, |
|
 |
|
Jerome L. Dodson Portfolio Manager |
THE PARNASSUS EQUITY INCOME FUND
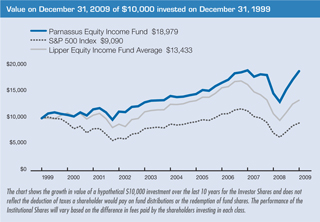
As of December 31, 2009, the NAV of the Parnassus Equity Income Fund – Investor Shares was $24.45, so after taking dividends into account, the total return for the year was 28.73%. This compares to a gain of 26.47% for the S&P 500 Index (“S&P 500”) and a return of 22.87% for the Lipper Equity Income Fund Average, which represents the average equity income fund followed by Lipper Inc. (“Lipper average”). For the fourth quarter, the Fund was up 9.49% versus a gain of 6.04% for the S&P 500 and a return of 5.77% for the Lipper average. Our strategy of owning good businesses at attractive valuations was the foundation for the Fund’s success, while exceptional stock picking in the industrial and energy sectors added greatly to our recent returns.
The Fund’s long-term returns remain outstanding. Our one-, three-, five- and ten-year returns beat both the S&P 500 and Lipper average for all periods. Some professionals have called the past 10 years a “lost decade” for investing because the S&P 500 recorded a negative return. In that light, we are especially proud of our 10-year annual gain of 6.62% relative to the S&P 500’s 0.95% annual loss.
Below are a table and a graph that compares the performance of the Fund with that of the S&P 500 and the Lipper average. Average annual total returns are for the one-, three-, five-, and ten-year periods.
Average Annual Total Returns
for periods ended December 31, 2009
| | | | | | | | | | | | | | | | | | |
| | | One
Year | | | Three
Years | | | Five
Years | | | Ten
Years | | | Gross
Expense
Ratio | | | Net
Expense
Ratio | |
PARNASSUS EQUITY INCOME FUND | | | | | | | | | | | | | | | | | | |
Investor Shares | | 28.73 | % | | 4.22 | % | | 5.91 | % | | 6.62 | % | | 1.02 | % | | 1.01 | % |
Institutional Shares | | 28.97 | % | | 4.45 | % | | 6.19 | % | | 6.70 | % | | 0.81 | % | | 0.80 | % |
S&P 500 Index | | 26.47 | % | | -5.62 | % | | 0.42 | % | | -0.95 | % | | NA | | | NA | |
Lipper Equity Income | | | | | | | | | | | | | | | | | | |
Fund Average | | 22.87 | % | | -5.43 | % | | 1.10 | % | | 2.77 | % | | NA | | | NA | |
The total return for the Parnassus Equity Income Fund-Institutional Shares from commencement (April 28, 2006) was 5.67%. Performance shown prior to the inception of the Institutional Shares reflects the performance of the Parnassus Equity Income Fund-Investor Shares and includes expenses that are not applicable to and are higher than those of the Institutional Shares. The performance of Institutional Shares differs from that shown for the Investor Shares to the extent that the Classes do not have the same expenses. Performance data quoted represent past performance and are no guarantee of future returns. Current performance may be lower or higher than the performance data quoted, and current performance information as of the most recent month-end is on the Parnassus website (www.parnassus.com). Investment return and principal value will fluctuate, so that an investor’s shares, when redeemed, may be worth more or less than their original principal cost. Returns shown in the table do not reflect the deduction of taxes a shareholder may pay on fund distributions or redemption of shares. The S&P 500 is an unmanaged index of common stocks, and it is not possible to invest directly in an index. Index figures do not take any expenses, fees or taxes into account, but mutual fund returns do. On March 31, 1998, the Fund changed its investment objective from a balanced portfolio to an equity income portfolio. Before investing, an investor should carefully consider the investment objectives, risk, charges and expenses of the Fund and should carefully read the prospectus, which contains this and other information. The prospectus is on the Parnassus website, or you can obtain one by calling (800) 999-3505. As described in the Fund’s current prospectus dated, May 1, 2009, Parnassus Investments has contractually agreed to limit the total operating expenses to 0.99% and 0.78% of net assets, exclusive of acquired fund fees, through May 1, 2010 for the Investor Shares and Institutional Shares, respectively. These limitations may be continued indefinitely by the Adviser on a year-to-year basis.
2009 Review
2009 was an outstanding year for the Fund. Our 28.73% gain was our best annual return since 1995 and beat the S&P 500 by over two percentage points. Following the market’s 59% drop in late 2008 and early 2009, the S&P 500 began to rally on March 9th as investors anticipated an economic recovery. Needless to say, the past 15 months have been a remarkable time to be a portfolio manager. Having a talented team and a time-tested investment process has helped me sleep well at night during these volatile times.
As I’ve written many times in the past, our process is to buy businesses which offer products or services that will be increasingly relevant in the future, have a sustainable competitive advantage, are run by ethical and talented managers and are selling at attractive valuations. Our success hinges upon sticking to this process.
Given our relatively conservative investment philosophy, we were extremely pleased that the Fund still managed to beat the S&P 500 by 2.26%. The big driver was our energy and utility investments, which boosted the Fund’s return by 3.6% versus the S&P 500. The portfolio’s energy gains more than offset headwinds from the consumer, financial and materials sectors. We bought a lot of energy stocks in early 2009 when sinking oil and gas prices created amazing investment opportunities.
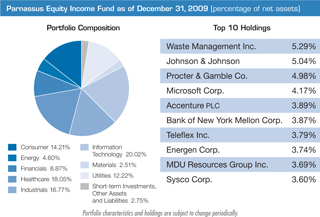
Cleaner-burning natural gas companies became especially undervalued during this time due to weak demand and oversupply. While these stocks have moved significantly higher as oil and gas prices have rebounded, I am still positive on this sector long-term. Quite simply, it’s going to get harder and harder to find new supply to keep pace with future demand. I saw this challenge first hand last year during a 125-mile helicopter ride to an oil platform in the Gulf of Mexico. Our plan is to buy environmentally responsible operators with long-lived, low-cost reserves. We are also looking for renewable energy investments where business models meet our financial requirements. Parnassus analyst Lori Keith was a big contributor to the Fund’s energy portfolio in 2009.
The Fund’s industrial stocks were also a big factor driving performance, adding 2.9% to our lead versus the S&P 500. Analysts Matt Gershuny and Minh Bui helped me identify solid companies serving the water, electrical and environmental infrastructure markets. These stocks did well based on prospects for a global recovery, sorely needed infrastructure investment and purchases of equipment designed to lower operating costs.
While the technology sector cost us 0.4% versus the S&P 500, I’m actually pleased with the result. The average technology stock in the S&P 500 jumped an amazing 61.8% during 2009. Since technology is a large component of the index, we would have lost a lot of ground versus the benchmark if we had been underweight the sector or had picked the wrong companies in this area. Our technology investments rose 58.2% during 2009 and helped us keep pace with the S&P 500. This was a huge accomplishment given our high-quality investing strategy. I owe a big thanks to Director of Research Ben Allen and Lori Keith for finding good technology companies for the Fund.
To round out the major industries, the Fund added about 0.5% versus the S&P 500 in healthcare and consumer staples. Given the market’s strong rally and uncertainty regarding healthcare reform, I was pleased with this result. Overall, our performance showed that it’s important to own quality companies across different industries that meet our investment standards.
Company Analysis
The Fund was fortunate to have only one stock that meaningfully declined during the year. Wells Fargo, the large San Francisco-based bank, fell 30.8% from $29.48 per share to our average selling price of $20.39 and reduced the NAV by 15¢. We like the company’s CEO, John Stumpf, but sold the stock due to the Wachovia merger. At first, we gave Wells Fargo the benefit of the doubt and held our shares. However, after a deeper analysis, we could not get comfortable with the potential risks that Wachovia brought to the table. We sold our final shares during May at a loss.
We had six investments that added 25¢ or more to the NAV. Our biggest winner was Microsoft, which rose 56.8% from $19.44 to $30.49 and boosted the NAV by 64¢. The big driver for Microsoft’s outstanding year was a successful launch of its new operating system, Windows 7. In addition, cost cutting, rebounding PC sales and improving corporate technology spending boosted the company’s outlook. We are optimistic that Microsoft will have a strong year in 2010 as these trends continue. The company’s most recent balance sheet includes $36 billion in cash, so Microsoft remains one of the best capitalized companies in the world.
Energen, a Birmingham, Alabama-based utility that also owns oil and gas assets, was a major contributor to performance in 2009. The stock soared 59.6% from $29.33 per share to $46.80, adding 57¢ to our NAV. Energen had a great year because the company pre-sold a big chunk of its 2009 oil and gas production at high prices during 2008. This helped cushion earnings during the downdraft of 2009. Looking forward, the company used a portion of its 2009 cash flow to make a smart acquisition in Texas to boost growth. Long-term, I am a big fan of Energen’s business. They own low-cost energy reserves and could maintain future production at current levels for 18 years. They have also hedged oil and gas production at high prices for 2010, so the company projects it has over $600 million of after-tax cash flow available for future expansion. I visited CEO James McManus in Birmingham in February and think he is a top-notch manager.
Google was a large winner for the Fund, as its stock jumped 101.5% from $307.65 to $619.98 per share, adding 39¢ to the NAV. With its market dominance, Google was one of the first businesses to see a recovery in online advertising. By the third quarter of 2009, earnings were rising over 20% year-over-year because of paid click growth and cost cutting. While we feel Google is an outstanding business, we have sold a significant portion of our investment due to valuation. I owe a big thanks to Ben Allen, our Research Director, for the Google investment.
Accenture, the global technology consulting and outsourcing firm, added 32¢ to the NAV as its stock rose 26.6% to $41.50 per share from $32.79. I tripled the position size in the company early in the year given Matt Gershuny’s high conviction recommendation. As we expected, Accenture’s outsourcing franchise has remained healthy throughout the economic slump, and its leading consulting practice has positioned the company well for the recovery. We get paid while we wait for this earnings recovery as Accenture increased its dividend 50% during 2009 and announced a substantial stock buyback.
Alcon, the Swiss-owned pharmaceutical company that focuses on eye care, had a good year for the Fund. Its stock jumped 84.3% to $164.35 from $89.19 and added 29¢ to our share price. The company’s eye care business proved to be recession-resistant, as earnings and cash flow remained strong during the economic slowdown. This enabled the company to announce a 44% dividend boost during early 2009. We admire the company, but we sold the majority of our position as the stock rose and approached fair value. We sold our final shares during the first week of 2010, as Swiss drug giant Novartis announced a buyout offer for the entire company. Thanks go to analyst Pearle Lee for this excellent recommendation.
Burlington Northern Santa Fe, the large railroad operator, was our final major winner, adding 27¢ to the NAV. Due to a recovering economy and a buyout offer from Warren Buffett, the stock soared 56.3% from our average cost of $63.10 to $98.62 per share. I had hoped to own the stock for a long time, as the company has great long-term growth opportunities. As it turned out, we were not alone in this assessment. While I admire Mr. Buffett as a value investor, in this case, I’m glad he paid a full price for Burlington Northern! Parnassus analyst Minh Bui did an outstanding job identifying this investment.
Outlook And Strategy
The S&P 500 has soared 66% since the March lows. It has been a truly remarkable stock market rally. While I continue to expect a slow economic recovery, the stock market has powerful reasons to keep rising near-term. The Federal Reserve has vowed to keep interest rates low for an extended period of time. This makes borrowing costs low and encourages investors to pour money into the stock market. In addition, the U.S. government, along with several other major countries, has injected massive stimuli into the economy. These factors, combined with improved corporate earnings power due to modest sales growth and cost cutting, are major positives for stock prices. The Fund is invested in good companies with competitive long-term advantages, so we look forward to participating in any upside.
However, even as the GDP recovers, there are still structural challenges due to our massive consumer and government deficits. Put simply, the United States is consuming far more than it produces. As for monetary policy, the Federal Reserve has short-term rates near zero, and has expanded its balance sheet from $860 billion at the start of 2007 to over $2 trillion at the end of 2009.
Because of this significant support, it’s hard to determine what the sustainable level of economic activity will be when these factors are no longer present. Potentially high inflation resulting from the Fed’s balance sheet expansion is also a major concern. We are working hard to identify businesses with sustainable long-term demand that should hold up even after government support wanes.
As for the portfolio, its sector weights are little changed from the third quarter. I’ve added to our positions in well-run financial institutions like the Royal Bank of Canada and the Bank of New York, but remain underweighted in the finance sector overall relative to the index. I think too many banks have opaque business models and are at risk of more credit losses.
We’re also underweighted in consumer discretionary stocks in comparison to the index, as households continue to work down debt levels and experience high unemployment. Unfortunately, the secular outlook is poor for the U.S. consumer. According to David Rosenberg of the Federal Reserve Board, the percentage of consumer spending on energy, interest, healthcare, food and taxes as a percentage of personal income has increased from 55% in 1984 to 64% by 2008. That doesn’t leave a lot of money left for discretionary items. Our lone consumer discretionary investment is Nike. Despite the headwinds discussed above, our research leads us to believe that the company will do well, given its powerhouse brand and tremendous international growth opportunities.
While the outlook for our technology investments is strong, we are essentially market-weighted in this sector due to valuation. After the group rose over 60% in 2009, we’re finding fewer bargains in the technology arena.
The Fund remains overweighted relative to the index in energy, industrials and healthcare companies. We have identified leading companies in these sectors that benefit from strong long-term demand trends, difficult to replace assets and wide business moats.
I am honored to be working with a great team of professionals, and look forward to using our time-tested investment process on your behalf for many years to come. Thank you for your trust and investment in the Parnassus Equity Income Fund.
|
| Yours truly, |
|
 |
|
Todd C. Ahlsten Portfolio Manager |
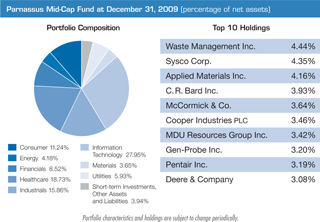
THE PARNASSUS MID - CAP FUND
As of December 31, 2009, the NAV of the Parnassus Mid-Cap Fund was $16.28, so the total return for 2009 was a gain of 36.26%. This compares to a gain of 40.48% for the Russell Midcap Index (the “Russell”) and a gain of 32.01% for the Lipper Multi-Cap Core Average, which represents the average multi-cap core fund followed by Lipper Inc. (the “Lipper average”). Our strong 2009 return reduced our three-year annualized loss to less than 1%. This is considerably better than the almost 5% losses registered by the Russell and Lipper averages for the same period.
For the fourth quarter, the Fund was up 8.79% compared to a gain of 5.92% for the Russell and a gain of 5.41% for the Lipper average. We’re pleased with our performance for the quarter.
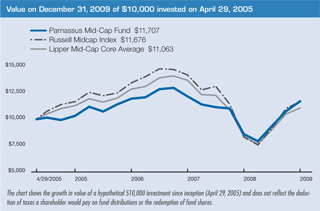
Below are a table and a graph comparing the Parnassus Mid-Cap Fund with the Russell and Lipper averages for the one- and three-year periods, for the period since September 30, 2005 when we first had most of the Fund’s assets invested in stock and for the period since inception on April 29, 2005.
Average Annual Total Returns
for periods ended December 31, 2009
| | | | | | | | | | | | | | | | | | |
| | | One
Year | | | Three
Years | | | Since
September 30,
2005 | | | Since
Inception
April 29, 2005 | | | Gross
Expense
Ratio | | | Net
Expense
Ratio | |
PARNASSUS MID-CAP FUND | | 36.26 | % | | -0.68 | % | | 3.96 | % | | 3.43 | % | | 2.26 | % | | 1.21 | % |
Russell Midcap Index | | 40.48 | % | | -4.59 | % | | 0.57 | % | | 3.37 | % | | NA | | | NA | |
Lipper Multi-Cap Core Average | | 32.01 | % | | -4.82 | % | | 0.00 | % | | 2.08 | % | | NA | | | NA | |
Performance data quoted represent past performance and are no guarantee of future returns. Current performance may be lower or higher than the performance data quoted. Current performance information to the most recent month-end is on the Parnassus Investments website (www.parnassus.com). Investment return and principal value will fluctuate so that an investor’s shares, when redeemed, may be worth more or less than their original principal cost. Returns shown in the table do not reflect the deduction of taxes a shareholder may pay on fund distributions or redemption of shares. The Russell Midcap Index is an unmanaged index of common stocks, and it is not possible to invest directly in an index. Index figures do not take any expenses, fees or taxes into account, but mutual fund returns do. Mid-cap companies can be more sensitive to changing economic conditions and have fewer financial resources than large-cap companies. During the quarter, Lipper changed our classification from “Mid-Cap Core” to “Multi-Cap Core.” Whereas we use a fixed range of $3–$20 billion in market cap to define “mid-cap,” Lipper uses a percentile methodology, which is inherently more variable. Before investing, an investor should carefully consider the investment objectives, risks, charges and expenses of the Fund and should carefully read the prospectus, which contains this and other information. The prospectus is available on the Parnassus Investments website, or one can be obtained by calling (800) 999-3505. As described in the Fund’s current prospectus dated May 1, 2009, Parnassus Investments has contractually agreed to limit the total operating expenses to 1.20% of net assets, exclusive of acquired fund fees, until May 1, 2010. Effective with the year ending December 31, 2008, Parnassus Investments has agreed to further reduce the total operating expenses to 1.20% of net assets, exclusive of acquired fund fees. These limitations may be continued indefinitely by the Adviser on a year-to-year basis.
2009 Review
2009 was the first full calendar year that this team has managed the Fund, and it certainly was an exciting one. The dramatic market swoon that began in late 2008 continued into early 2009. However, when signs of economic stabilization emerged in the spring, the markets surged to their best annual return in years. We’re pleased to report that since taking over the Fund on October 1, 2008, our annualized return of 5.0% compares favorably to the Russell and the Lipper averages, which have returned 1.7% and 1.5%, respectively, over the same period.
For the year, we beat our Lipper peers by over four percentage points, but came up short against the Russell Midcap Index. The Index was very strong in 2009, in part because it generated a much larger loss in 2008 than the Fund, and therefore had more to gain in the recovery. Nevertheless, we’re disappointed that we didn’t perform better against the Russell over the last twelve months, and hope that we can make up for it with meaningful outperformance in 2010.
The key reason that we underperformed our index was that we tend to invest in high quality stocks. This strategy served us well in 2008 by limiting losses for the Fund, but it held us back in 2009 when many lower quality stocks in the index performed exceptionally well.
Company Analysis
No individual stock hurt the Fund significantly in 2009. Conversely, six stocks added at least 20¢ to the Fund’s NAV for the year.
Low-cost technology service-provider Cognizant was our largest contributor, rising 143% from our average cost to add 30¢ to the Fund’s NAV. We bought shares at attractive prices when fear regarding soft spending by the company’s large financial services client base was greatest. The stock rebounded after Cognizant posted better than expected results, proving the resiliency of its business model.
Cooper Industries, a diversified industrial company with a specialty in electrical products, was the Fund’s second largest contributor, adding 25¢ to the Fund’s NAV. We were able to buy Cooper shares at bargain prices, when demand for the company’s products waned with the weak economy. The stock subsequently rose 37% from our average cost, due to improving demand and management’s aggressive restructuring and cost-cutting initiatives.
Nordstrom skyrocketed 182% during the year from $13.31 to $37.58, adding 23¢ to the NAV. Tight expense management combined with lean inventories enabled the company to exceed earnings expectations. The consumer spending climate remained weak but Nordstrom was able to generate stronger than expected sales due to robust demand at its Rack stores and a reasonably priced assortment at its full-price stores. We believe the company is well positioned to expand its market share even further, which should drive the stock higher in 2010.
Leading virtualization software provider Citrix added another 22¢ to the NAV, as its stock rose 76.5% from $23.57 to $41.61 during the year. Customer demand for Citrix’s products remained stable, due to its emphasis on enabling IT managers to reduce costs for applications and servers. A focus on expense management enabled the company to report stronger than expected earnings. We believe the stock is poised to move higher, due to its leading market position and ability to expand margins.
Burlington Northern, the railroad company, added 21¢ to the NAV in 2009, as its stock rose 77.5% from our average cost of $55.25 to our average selling price of $98.06. We bought this company, because we thought they had a good long-term business with a terrific management team. We sold the stock because Warren Buffett agreed with our assessment, and offered to buy Burlington Northern for his company, Berkshire Hathaway.
The stock of AFLAC, the insurance company, rose only 0.9% this year to close at $46.25, but still added 21¢ to the Fund’s NAV. The reason AFLAC helped us so much in spite of a pedestrian 2009 was that we loaded up on shares when the stock was substantially lower, when others were overly concerned about possible credit losses on AFLAC’s investment assets. Our average cost for AFLAC is just under $25 per share.
Outlook And Strategy
The most important macroeconomic driver for 2010 is how the economy will behave after the withdrawal of the considerable government support currently in place. If the economy proves strong enough to continue expanding after stimulus spending wanes and interest rates rise, then corporate earnings and stocks probably have a lot more to gain. On the other hand, if the economy relapses into recession, then stocks would probably come under pressure.
While we’re hoping for the positive scenario, we’re limiting the Fund’s exposure in sectors that would be hardest hit if the economy were to turn down again. Relative to the Index, we are significantly underweighted in the financial and consumer sectors. Conversely, we’re heavily invested in the information technology and healthcare sectors.
Our strategy of investing in good businesses at attractive valuations will not change as we look to 2010 and beyond. Our portfolio companies should grow their businesses over time and increase their competitive positions. We’re also confident that the people managing these companies are highly competent and trustworthy. We think this is a good recipe for strong long-term returns for our shareholders.
Thank you for your investment with us.
| | | | |
| Yours truly, | | | | |
| | |
 | |  | |  |
| | |
| Benjamin E. Allen | | Matthew D. Gershuny | | Lori A. Keith |
| Portfolio Manager | | Portfolio Manager | | Portfolio Manager |
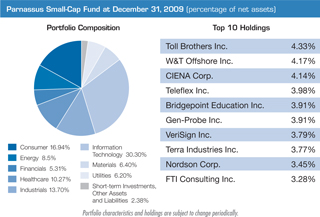
THE PARNASSUS SMALL - CAP FUND
As of December 31, 2009, the NAV of the Parnassus Small-Cap Fund was $17.92, so after taking dividends into account, the total return for the quarter was 0.60%. By comparison, the Russell 2000 Index (“Russell 2000”) of smaller companies gained 3.87% and the Lipper Small-Cap Value Average, which represents the average small-cap value fund followed by Lipper Inc. (“Lipper average”), gained 3.96%. For the quarter, then, we lagged our benchmarks, but we’re substantially ahead of both for the year. For 2009, the Fund gained 42.50%, while the Russell 2000 gained 27.17%, and the Lipper average had a total return of 32.57%. It was a great year for the Parnassus Small-Cap Fund, as it beat the Russell 2000 by over 15 percentage points and the Lipper average by almost ten percentage points.
Average Annual Total Returns
for periods ended December 31, 2009
| | | | | | | | | | | | | | | | | | |
| | | One
Year | | | Three
Years | | | Since
September 30,
2005 | | | Since
Inception
April 29, 2005 | | | Gross
Expense
Ratio | | | Net
Expense
Ratio | |
| PARNASSUS SMALL-CAP FUND | | 42.50 | % | | 0.85 | % | | 6.06 | % | | 5.98 | % | | 1.88 | % | | 1.21 | % |
| Russell 2000 Index | | 27.17 | % | | -6.07 | % | | -0.18 | % | | 3.03 | % | | NA | | | NA | |
| Lipper Small-Cap Value Average | | 32.57 | % | | -6.05 | % | | -0.32 | % | | 2.58 | % | | NA | | | NA | |
Performance data quoted represent past performance and are no guarantee of future returns. Current performance may be lower or higher than the performance data quoted. Current performance information to the most recent month-end is available on the Parnassus Investments website (www.parnassus.com). Investment return and principal value will fluctuate so that an investor’s shares, when redeemed, may be worth more or less than their original principal cost. Returns shown in the table do not reflect the deduction of taxes a shareholder may pay on fund distributions or redemption of shares. The Russell 2000 Index is an unmanaged index of common stocks, and it is not possible to invest directly in an index. Index figures do not take any expenses, fees or taxes into account, but mutual fund returns do. Small-cap companies can be particularly sensitive to changing economic conditions and have fewer financial resources than large-cap companies. Before investing, an investor should carefully consider the investment objectives, risks, charges and expenses of the Fund and should carefully read the prospectus, which contains this and other information. The prospectus is on the Parnassus Investments website, or one can be obtained by calling (800) 999-3505. As described in the Fund’s current prospectus dated May 1, 2009, Parnassus Investments has contractually agreed to limit the total operating expenses to 1.20% of net assets, exclusive of acquired fund fees, until May 1, 2010. For the year ending December 31, 2008, Parnassus Investments has agreed to further reduce the total operating expenses to 1.20% of net assets exclusive of acquired fund fees. These limitations may be continued indefinitely by the Adviser on a year-to-year basis.
Since the last quarterly report, Lipper has reclassified the Parnassus Small-Cap Fund from a small-cap core fund to a small-cap value fund. I’ve always thought of us as value investors, but outside sources quite often put us in different categories. In general, Lipper places a fund in the “growth” category if the stocks in its portfolio are selling at a high price relative to earnings and book value, in the “value” category if its portfolio stocks are selling at a low price relative to earnings and book value and in the “core” category, if its stocks are selling at a price somewhere in between. The Parnassus Small-Cap Fund looks for stocks selling at a low price relative to earnings and book value, but we look for ratios that are low relative to their historical averages. Lipper determines whether a stock’s ratios are high or low by measuring them against all other stocks –not against their historical averages. Parnassus might determine that a stock has low ratios based on its historical averages, while Lipper might conclude that a stock has high or moderate ratios based on comparisons with all others stocks in its statistical universe.
We might also make more subjective judgments about value, such as an assessment of a company’s future earnings potential, the quality of a company’s management, the value of its products, its market position or its financial strength. Clearly, Lipper and other sources cannot take these factors into account, so we often come to different conclusions on the question of value or growth.
There is one more factor at play here. When we buy a stock, we think that it is a good value. As time goes on, however, a stock’s price may move much higher, so that it won’t be as much of a bargain as it was when we first purchased it. We might, though, still hold onto the stock for various reasons until it hits a pre-determined target price. In this situation, an individual stock might be a “growth” stock, even though it might have been a “value” stock in the past. Since Lipper is taking a snapshot of our portfolio at one point in time, many of the companies in the portfolio might be “growth” or “core” stocks, even if they were “value” stocks when we first bought them.
Given this situation, outside sources may put the Fund into different categories at different times, and these categories may be very different from how we think about the Fund. In any case, from our perspective, we are value investors, we have always been value investors, and we intend to remain value investors in the future.
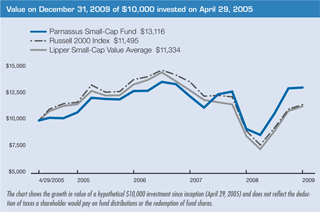
Below are a table and a graph that compare the performance of the Parnassus Small-Cap Fund with that of the Russell 2000 and the Lipper average over various time periods. Besides the one- and three-year numbers, we’ve included the period since inception and the returns since September 30, 2005, which is the approximate date when the Fund first had most of its assets invested in stocks (as opposed to cash). You’ll notice that the Fund has outperformed its benchmarks for all periods, a record of which I’m very proud. Of special note is the performance since September 30 of 2005, where we’ve earned an average of over 6% per year, while both the Russell 2000 and the Lipper average have had negative returns.
I would also like to point out that in 2009, the Fund has more than earned back all the money it lost in 2008. From December 31, 2007 until December 31, 2009, the Fund has gained 6.76% compared to a loss of 15.80% for the Russell 2000 and a loss of 12.73% for the Lipper average.
A number of factors have helped the Parnassus Small-Cap Fund through this difficult period. First, we pick companies with relatively unique characteristics, which give them a competitive edge in the market place. Second, we buy companies at bargain prices. Third, we buy companies that are financially strong, which gives us a margin of safety in difficult times. Fourth, we buy companies that are socially responsible, which we think means more progressive and capable management. We think these principles will help the Fund to do well in the future. Of course, there’s no certainty, and past performance is definitely no guarantee of future returns. There will always be some bumps in the road, but I think our investment philosophy should help us in providing attractive returns to our shareholders.
Company Analysis
Seven companies in the Parnassus Small-Cap Fund portfolio each accounted for a gain of 19¢ or more for each fund share during the year. (No stock in the portfolio accounted for a loss of that much.) Our biggest winner was Nordson with its contribution of 45¢ per fund share, as its stock soared 89% from $32.29 to $61.18. The company makes dispensing equipment for applying adhesives, sealants and coatings as part of the manufacturing process for consumer goods and electronic products. Nordson has seen a rebound in spending for capital equipment in most of its end markets, especially in the electronic markets. For example, growing demand for light-emitting diodes used in flat-panel displays has led to a big increase in demand for Nordson equipment used to make the diodes.
Another big winner was Whole Foods Market, which added 42¢ to the NAV, as its stock shot up an astonishing 230% from $9.44 to $31.19 where we sold it. The company, which operates 275 organic and natural food supermarkets, was trading at depressed levels at the beginning of the year because investors anticipated poor operating results due to the weak economy and consumers’ reluctance to spend money on high-end retail. As it turned out, things were not as bad as expected, even though comparable-store sales did decline in 2009. Whole Foods controlled costs, the economy
started to improve, and much to everyone’s surprise, most of the company’s loyal following continued to pay top dollar for healthy, high-quality food. We sold the stock late in 2009 because the price reached our estimate of intrinsic value.
Natural gas-producer Quicksilver Resources added 31¢ to each fund share, as its stock rose an amazing 169% from $5.57 to $15.01. This stock had been trading at very depressed levels in early 2009 because of low natural gas prices. By year-end, prices had increased somewhat because of lower inventory levels and the start of a very cold winter in the eastern United States. The stock moved up later in the year in anticipation of higher prices in 2010, and because the company forecasted higher production from new wells coming on line.
Mentor Graphics saw its stock climb 71% from $5.17 to $8.83 by year-end, making a contribution of 31¢ to the NAV. The company makes software used in designing semiconductors, and its stock had been trading at very depressed levels at the start of the year. As the semiconductor market started to pick up in the second half of 2009, customers increased capital spending, anticipating a strong market in 2010. If demand for electronic goods picks up in 2010, we expect this stock to move even higher.
Ormat Technologies contributed 20¢ to each fund share as its stock rose 30% from $31.87 at the beginning of the year to $41.37, where we sold most of it. The company develops, owns and operates geothermal power plants and makes and sells equipment to other companies for use in geothermal power production. The stock slumped early in the year because of lower energy prices, but recovered later in the year with better than expected financial results, helped by the fixed-price nature of most of its supply contracts.
Cymer makes lasers for use as a light source for the photolithography process in making semiconductors. Although demand for semiconductors is still fairly weak, it picked up somewhat later in the year, so manufacturers are ordering more capital equipment in anticipation of a stronger 2010. The stock rose 75% from $21.91 to $38.38 while contributing 19¢ to the NAV.
Motor-maker Baldor Electric added 19¢ to each fund share, as it saw its stock climb 57%, going from $17.85 to $28.09. After weak demand in early 2009, Baldor’s sales have picked up and its energy-efficient motors are increasing sales at double-digit rates. Project activity has increased, which should lead to larger motor sales.
|
| Yours truly, |
|
 |
|
Jerome L. Dodson Portfolio Manager |
THE PARNASSUS WORKPLACE FUND
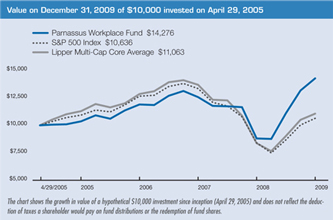
As of December 31, 2009, the NAV of the Parnassus Workplace Fund was $19.45, so after taking dividends into account, the total return for the quarter was 8.38%, compared to 6.04% for the S&P 500 and 5.41% for the Lipper Multi-Cap Core Average, which represents the average multi-cap core fund followed by Lipper Inc. (“Lipper average”). The Parnassus Workplace Fund beat the S&P 500 by two percentage points and the Lipper average by three percentage points during the quarter. For the year, the Parnassus Workplace Fund had a total return of 62.13%, compared to 26.47% for the S&P 500 and 32.01% for the Lipper average. This performance is the best ever one-year return achieved by any of the Parnassus Funds. The previous record was held by the Parnassus Fund, which earned 52.56% in 1991.
Because of our strong performance in 2009, we’ve more than earned back all the money the Fund lost in 2008. From December 31, 2007 until December 31, 2009, the Fund has had a total return of 13.59%, compared to a loss of 20.31% for the S&P 500 and a loss of 18.68% for the Lipper average.
Below are a table and a graph that compare the performance of the Parnassus Workplace Fund with that of the S&P 500 Index and the Lipper average. In addition to the one- and three-year numbers, we’ve also included the period since inception and the returns since September 30, 2005, which is the approximate date when the Fund first had most of its assets invested in stock (as opposed to cash). As you can see from the table, the Fund is ahead of all its benchmarks for all time periods.
Average Annual Total Returns
for periods ended December 31, 2009
| | | | | | | | | | | | | | | | | | |
| | | | | | | | | Since | | | Since | | | Gross | | | Net | |
| | | One | | | Three | | | September 30, | | | Inception | | | Expense | | | Expense | |
| | | Year | | | Years | | | 2005 | | | April 29, 2005 | | | Ratio | | | Ratio | |
| PARNASSUS WORKPLACE FUND | | 62.13 | % | | 6.27 | % | | 8.50 | % | | 7.92 | % | | 2.34 | % | | 1.21 | % |
| S&P 500 Index | | 26.47 | % | | -5.62 | % | | -0.15 | % | | 1.33 | % | | NA | | | NA | |
| Lipper Multi-Cap Core Average | | 32.01 | % | | -4.82 | % | | 0.00 | % | | 2.08 | % | | NA | | | NA | |
Performance data quoted represent past performance and are no guarantee of future returns. Current performance may be lower or higher than the performance data quoted. Current performance information to the most recent month-end is available on the Parnassus Investments website (www.parnassus.com). Investment return and principal value will fluctuate so that an investor’s shares, when redeemed, may be worth more or less than their original principal cost. Returns shown in the table do not reflect the deduction of taxes a shareholder may pay on fund distributions or redemption of shares. The S&P 500 Index is an unmanaged index of common stocks, and it is not possible to invest directly in an index. Index figures do not take any expenses, fees or taxes into account, but mutual fund returns do. Before investing, an investor should carefully consider the investment objectives, risks, charges and expenses of the Fund and should carefully read the prospectus, which contains this and other information. The prospectus is available on the Parnassus Investments website, or one can be obtained by calling (800) 999-3505. As described in the Fund’s current prospectus dated May 1, 2009, Parnassus Investments has contractually agreed to limit the total operating expenses to 1.20% of net assets, exclusive of acquired fund fees, until May 1, 2010. This limitation may be continued indefinitely by the Adviser on a year-to-year basis.
Of special note is that for the period since September 30 of 2005, the Parnassus Workplace Fund has averaged a return of 8.50% per year, compared to a negative return for the S&P 500 and a zero return for the Lipper average. For the last three years, the Fund has averaged a total return of 6.27%, while both the S&P 500 and the Lipper average have been well in the red. For the last three years, the Fund has beaten both benchmarks by more than 11 percentage points per year.
Clearly, we won’t have these kinds of returns forever. Past performance is certainly no guarantee of future returns, but I do think the Parnassus Workplace Fund has some inherent advantages. In my view, companies with great workplaces have a competitive advantage. They can attract very talented people and they motivate their employees to work harder. Great workplaces are also an indication of something else: enlightened managers who likely have great business skills in marketing, finance, production, research and operations. In my opinion, these are the important ingredients in business success. Investing exclusively in companies with great workplaces gives the Parnassus Workplace Fund an edge in providing our shareholders with excellent returns.

Company Analysis
Seven companies helped the Fund the most in achieving our record returns, with each one boosting the NAV by 30¢ or more in 2009. (There were no companies that hurt the Fund by that amount.)
The biggest winner was Corning, a maker of specialty glass for HDTV and computer monitors. It added 47¢ to each fund share, as its stock soared 103% from $9.53 to $19.31. After trading at depressed levels in early 2009 because of the severe recession, the stock moved sharply higher during the year, as demand increased and investors realized the value of Corning’s position as a leading player in a large and fast-growing market.
Deere & Co., the maker of agricultural equipment, contributed 39¢ to the NAV, as its stock climbed 29% from $42.08, where we bought it in the middle of the year to $54.09 by year’s end. Tractor sales declined during the year, but the company did a good job of controlling costs and maintaining pricing. The stock rose in anticipation of higher sales and earnings in 2010.
Disk-drive maker Seagate Technology saw its stock race ahead by an incredible 311%, soaring from $4.43 to $18.19, while boosting the NAV by 34¢. The stock had been trading at very depressed levels at the beginning of the year because of poor economic conditions, but a surprising increase in sales of notebook computers late in the year drove increased demand for hard disk drives, which meant higher sales and better prices. In December, Seagate unveiled its first solid-state drive, which gave it entry into a potentially lucrative market, because the new product is faster, more energy efficient and more reliable than regular drives.
Altera’s stock jumped 35% from $16.71 to $22.63 for an increase of 32¢ per fund share. The company makes chips that can be programmed for use in devices such as cell phone base stations and DVD players; demand for these products has been improving.
Medtronic, manufacturer of pacemakers and other medical devices, added 31¢ to each fund share, as its stock went up 18% from $37.29, where we bought in the middle of the year, to $43.98 by year’s end. This medical device giant is finally gaining investor confidence, as it stops losing market share in its heart-device business. Efforts to cut spending and improve R&D productivity are improving margins.
Nordson contributed 30¢ to the NAV, as its stock rose 89% from $32.29 to $61.18. The company makes dispensing equipment for applying adhesives, sealants and coatings as part of the manufacturing process for consumer goods and electronic products. Nordson has seen a rebound in spending for capital equipment in most of its end markets, especially in electronic products. For example, growing demand for light-emitting diodes used in flat-panel displays has led to a big increase in capital spending for Nordson equipment used to make the diodes.
American Express added 30¢ to each fund share, as its stock raced ahead by 118% from $18.55 to $40.52. The stock had been trading at very depressed levels in early 2009, because of high charge-offs and delinquencies, but once these figures improved in the second half of the year, credit concerns diminished and the stock moved much higher.
|
Yours truly, |
|

|
|
Jerome L. Dodson |
Portfolio Manager |
THE PARNASSUS FIXED - INCOME FUND
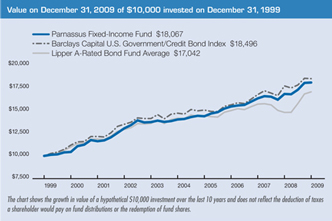
As of December 31, 2009, the NAV of the Parnassus Fixed-Income Fund was $16.74, producing a total return for the year of 7.48% (including dividends). This compares to a gain of 15.18% for the Lipper A-Rated Bond Fund Average, which represents the average return of all A-rated bond funds followed by Lipper Inc. (“Lipper average”) and a gain of 4.52% for the Barclays Capital U.S. Government/Credit Bond Index (“Barclays Capital index”). For the fourth quarter, the Fund was up 0.23% compared to a loss of 0.21% for the Barclays Capital index and a gain of 1.20% for the Lipper average.
Below are a table and a graph comparing the performance of the Fund with that of the Barclays Capital index and the Lipper average. Average annual total returns are for the one-, three-, five- and ten-year periods. The 30-day SEC yield for the Fund for December 2009 was 2.02%. We’re pleased to report that our long-term returns are better than the Lipper average for the three-, five- and ten-year periods as of the end of the year.
Average Annual Total Returns
for periods ended December 31, 2009
| | | | | | | | | | | | | | | | | | |
| | | One
Year | | | Three
Years | | | Five
Years | | | Ten
Years | | | Gross
Expense
Ratio | | | Net
Expense
Ratio | |
| PARNASSUS FIXED-INCOME FUND | | 7.48 | % | | 5.41 | % | | 5.23 | % | | 6.09 | % | | 0.90 | % | | 0.77 | % |
| Barclays Capital U.S. Government/Credit Bond Index | | 4.52 | % | | 5.81 | % | | 4.71 | % | | 6.34 | % | | NA | | | NA | |
Lipper A-Rated Bond Fund Average | | 15.18 | % | | 3.94 | % | | 3.47 | % | | 5.45 | % | | NA | | | NA | |
Performance data quoted represent past performance and are no guarantee of future returns. Current performance may be lower or higher than the performance data quoted. Current performance information to the most recent month-end is available on the Parnassus Investments website (www.parnassus.com). Investment return and principal value will fluctuate so that an investor’s shares, when redeemed, may be worth more or less than their original cost. Returns shown in the table do not reflect the deduction of taxes a shareholder would pay in fund distributions or redemption of shares. The Barclays Capital U.S. Government/Credit Bond Index is an unmanaged index of bonds, and it is not possible to invest directly in an index. Index figures do not take any expenses, fees, or taxes into account, but mutual fund returns do. Before investing, an investor should carefully consider the investment objectives, risks, charges and expenses of the Fund and should carefully read the prospectus, which contains this and other information. The prospectus is on the Parnassus Investments website, or one can be obtained by calling (800) 999-3505. As described in the Fund’s current prospectus dated May 1, 2009, Parnassus Investments has contractually agreed to limit the total operating expenses to 0.87% of net assets, exclusive of acquired fund fees, until May 1, 2010. This limitation may be continued indefinitely by the Adviser on a year-to-year basis.
2009 Review
Returns on bonds and other risk assets enjoyed one of their best years in 2009. It was a broad and aggressive relief rally that occurred almost regardless of the economic news. The effects from the fiscal stimulus, easy monetary policy and an upswing in the inventory cycle helped boost real GDP growth from negative 6.4% in the first quarter to positive 2.2% in the third quarter. For bond investors, the best returns were found in the riskiest investments. According to Barclays Capital, U.S. corporate high-yield bonds returned an astonishing 58%, compared to a loss of 4% for the U.S. Treasury market.
With signs of the economy recovering, investors regained confidence in risk assets. This renewed euphoria helped the performance of our convertible and corporate bonds. For the year, the holdings in convertible bonds contributed 34 cents per share to the NAV, while corporate bonds added 28 cents per share. These gains were partially offset by the losses in our investments in U.S. Treasury and agency bonds. U.S. Treasury bonds reduced the NAV by 14 cents and agency bonds by 17 cents.
The U.S. government bond market suffered as interest rates moved higher. In particular, long-term interest rates increased sharply due to expectations of rising inflation as stronger economic growth resumed. Also, concerns about the financing of the huge fiscal deficit, projected to reach about 10% of GDP in 2010, contributed to the increase in yields. The yield on the 30-year bond increased to 4.64% at the end of 2009 compared to 2.68% at the end of 2008, while the 10-year increased to 3.84% from 2.21% during the same period.
For the year, the Fund performed better than the Barclays Capital index because we had less exposure to the underperforming U.S. government bond market and more exposure to riskier investments, including corporate and convertible bonds. However, my decision not to invest in commercial mortgage-backed securities caused the Fund to underperform relative to the Lipper average. According to Barclays Capital, the commercial mortgage-backed market returned 28.5% during 2009.
I decided to avoid the commercial real estate (“CRE”) market because I think it still faces the same fundamental issues (overcapacity and demand destruction) as the residential market, albeit with a lag. Non-residential construction spending peaked three years after the peak in residential, while commercial property prices peaked 18 months after residential. More importantly, losses on these loans are likely to be worse than during the previous 1990s CRE downturn. During the third quarter, the default rate on U.S. commercial mortgages more than doubled, according to Real Estate Econometrics, a property research firm. Also, default rates in the first three quarters of 2009 have been the highest since 1993. As a result, I am not planning to add exposure to this market at the moment.
Parnassus Fixed-Income Fund
Portfolio Composition
as of December 31, 2009
(percentage of net assets)
Portfolio Composition
| | | |
Corporate Bonds | | 36.38 | % |
U.S. Government Treasury Bonds | | 26.04 | % |
Convertible Bonds | | 14.99 | % |
U.S. Government Agency Bonds | | 13.43 | % |
Municipal Bonds | | 2.22 | % |
Equities | | 0.97 | % |
Short-term Investments, Other Assets and Liabilities | | 5.97 | % |
Portfolio characteristics and holdings are subject to change periodically.
Outlook And Strategy
Government support and further improvement in the inventory cycle should keep the economy growing at a decent pace for at least the first half of the year. While the recovery might be muted by historical standards, the economy should still grow at around 2% to 3% in 2010. The Fed is also likely to maintain a low interest rate policy to further support the recovery.
At some point, though, the benefits of the government support will start to fade, and the burden will fall on consumer spending to sustain economic growth. In the absence of a pickup in consumer demand, policymakers will likely have to extend some of these programs. However, political pressure to address the deficit will likely make it difficult to pass further stimulus measures.
With most equity markets up more than 60% from their trough levels in March, expectations have increased. There is a risk that too many investors have now become convinced of a self-sustaining recovery. My main concern is that growth will turn out to be weaker than expected and investors will lose their optimism. Therefore, the investment strategy for 2010 continues to favor risk assets, but hedged for the possibility of worse-than-expected economic data. As of the end of 2009, high quality corporate and convertible bonds represent 51.4% of the Fund’s total net assets, with 39.4% invested in U.S. government bonds.
One of the objectives of the Fund is to provide shareholders with a relatively low risk investment. This means that occasionally the Fund may underperform its benchmarks, especially when riskier investments rally sharply. However, over the long-term, this focus on risk management should result in superior performance and lower volatility. As illustrated in the table, our longer-term performance is better than the Lipper average.
Thank you for investing in the Parnassus Fixed-Income Fund.
|
| Yours truly, |
|
 |
|
Minh T. Bui Portfolio Manager |
RESPONSIBLE INVESTING NOTES
by Milton Moskowitz and Jerome Dodson
The U.S. Chamber of Commerce, which likes to think of itself as the voice of American business, is facing a revolt by some members who object to the Chamber’s position on global warming. The Chamber has opposed strong curbs on polluting emissions, fearing that they would weaken the economy and trigger job losses. As a result, four companies – Apple, Exelon, Pacific Gas & Electric and PNM Resources – have terminated their memberships. Nike, a Parnassus portfolio company, resigned from the board of the Chamber but continued its membership.
Meanwhile, a survey taken in the UK by pollster Ipsos Mori determined that British consumers are eager to learn about the social credentials of companies. About half of those polled said they wanted more information about such issues as human rights and climate change before investing. Reflecting this demand, the number of social responsibility funds in Europe increased from 537 in 2008 to 683 in 2009, according to a report in the Financial Times. One of these is the Women’s Leadership Fund, which was launched in January from Zurich. It will invest in companies that have women on their boards of directors. Sitting on the board of the Women’s Leadership Fund are Kim Campbell, former prime minister of Canada, Cherie Blair, a lawyer and wife of former British Prime Minister Tony Blair, and Jenny Shipley, former prime minister of New Zealand. They claim that having women on the board correlates with good performance.
Paychex, which handles payroll and other functions for companies, has one woman on its seven-person board, and it has just been recognized by the American Heart Association as a Platinum Level Start! Fit-Friendly Company for its Active Health program, a comprehensive initiative that supports and rewards employees for making health and wellness a priority. To reach the platinum level, a company must promote a wellness culture, increase healthy eating options, offer employees physical activity options, implement nine criteria in the areas of physical activity and nutrition, and demonstrate measurable outcomes.
Medtronic, the world’s largest medical device supplier, has two women on its 11-person board. The Minneapolis-based company is known for its strong corporate governance and transparent financial reporting policies and practices adopted well before recent scandals resulting in mandated reforms. It is routine at each Medtronic board meeting for the board to meet in executive session, without any management members present. The board has direct access to independent experts – lawyers, accountants, compensation consultants – for counsel on Medtronic policies. The board’s audit committee pre-approves all audit services and reviews quarterly and year-end financial statements in advance of their release.
It’s good to have a neighbor like Nordstrom, the upscale fashion specialty store chain. It came to the aid of the Seattle Art Museum after the collapse of Washington Mutual, which was the largest tenant in the museum’s new building in downtown Seattle. The bank had been paying annual rent of $5.8 million. The loss of this income was devastating to the museum. To the rescue came Nordstrom, which is taking over 75% of the vacant space, relieving the museum’s financial crunch. Nordstrom has been based in Seattle for more than 100 years. It has two women on its nine-person board.
Google, the search-engine king, also has two women on its nine-person board, and in 2009 it came to the aid of employees who were holding stock options that were “under water,” meaning they were exercisable at a price above what the shares were selling for on Nasdaq. Early in the year, the price of a Google share dropped to $282.75, down sharply from the $740 it sold for in 2007. This put 85% of employees under water on their options. So, last March, at the nadir of the market slump, Google allowed employees to swap their options for new ones with a strike price of $308.57. Google shares proceeded to double by the end of the year, which meant a windfall of more than $100,000 for each Google employee.
American Express, which has two female directors on a 12-person board, was hit by soaring credit card delinquencies and came through the financial crisis with a pared-down workforce: it laid off 7,000 employees in 2008 and 4,000 in 2009. But things were beginning to look up toward the end of 2009. Amex returned its TARP funds, restored its 401(k) match and rescinded the salary freeze installed in 2008. Also, the stock quadrupled during the year. In a “say on pay” proxy vote, 73% of shareholder votes approved Amex’s executive compensation. CEO Kenneth Chenault declined his 2008 bonus. In a conversation with Fortune’s Geoff Colvin, Chenault said: “If we have a great deal of uncertainty and distrust in the world, then consumers and corporations want to trust companies and brands that they believe will deliver on their promises. So our focus on customer service is critical because if we can provide a higher level of certainty, that gives us a competitive advantage.”
Deere & Company, the world’s largest maker of agricultural equipment, has long had a harmonious relationship with the United Auto Workers, unlike the adversarial climate at nearby neighbor, Caterpillar. Toward the end of 2009, UAW members at 15 Deere plants approved a six-year contract covering 9,500 employees. The new agreement gave workers a $3,500 ratification bonus and a commitment from Deere that it would not close any plants during the life of the agreement, which expires in October 2015.
Ecolab, supplier of industrial cleaning and pest control products, has been named one of the best places to work in the Twin Cities area for the fourth consecutive year. Ecolab scored high on employee surveys conducted by Quantum Market Research and the Minneapolis/St. Paul Business Journal, where the results were published. Of Ecolab’s 12 directors, three are women.
Through its foundation, Texas Instruments has funded grants of $3 million to train teachers in math and science. Half of these grants went to 10 middle and junior high schools in the Dallas, Garland and Richardson areas of Texas. An innovative part of these grants is a multiplier to encourage teachers to stay in the schools for the next five years. These retention bonuses could amount to $4,500 per teacher. The other half of the grants went to bring seven master teachers to three colleges, where they will work with undergraduates to prepare them for teaching math and science in secondary schools. The colleges are: University of North Texas, University of Texas at Dallas and University of Texas at Arlington. Texas Instruments is headquartered in Dallas. Four of its 11 directors are women.
FUND EXPENSES (unaudited)
As a shareholder of the Funds, you incur ongoing costs, which include portfolio management fees, administrative fees, shareholder reports, and other fund expenses. The Funds do not charge transaction fees, so you do not incur transaction costs such as sales charges (loads) on purchase payments, reinvested dividends, or other distributions, redemption fees, and exchange fees. The information on this page is intended to help you understand your ongoing costs of investing in the funds and to compare these costs with the ongoing costs of investing in other mutual funds.
The following example is based on an investment of $1,000 invested at the beginning of the most recent six-month period and held for the period of July 1, 2009 through December 31, 2009.
Actual Expenses
In the example below, the first line for each fund provides information about actual account values and actual expenses. You may use the information in this line, together with the amount you invested, to estimate the expenses that you paid over the period. Simply divide your account value by $1,000 (for example, $8,600 account value divided by $1,000 = 8.6), then multiply the result by the number in the first line under the heading entitled “Expenses Paid During Period” to estimate the expenses you paid on your account during this period.
Hypothetical Example for Comparison Purposes
The second line of each fund provides information about hypothetical account values and hypothetical expenses based on the fund’s expense ratio and an assumed rate of return of 5% per year before expenses, which is not the fund’s actual return. You may compare the ongoing costs of investing in the fund with other mutual funds by comparing this 5% hypothetical example with the 5% hypothetical examples that appear in the shareholder reports of other funds. The hypothetical account values and expenses may not be used to estimate the actual ending account balance or expenses you paid for the period.
Please note that the expenses shown in the table are meant to highlight only your ongoing costs in these funds. Therefore, the second line of each fund is useful in comparing only ongoing costs and will not help you determine the relative total costs of owning other mutual funds, which may include transactional costs such as loads.
FUND EXPENSES (unaudited) continued
| | | | | | | | | |
| | | Beginning
Account Value
July 1, 2009 | | Ending
Account Value
December 31, 2009 | | Expenses
Paid During
Period* |
Parnassus Fund: Actual | | $ | 1,000.00 | | $ | 1,262.17 | | $ | 5.64 |
Hypothetical (5% before expenses) | | $ | 1,000.00 | | $ | 1,020.21 | | $ | 5.04 |
| | | |
Parnassus Equity Income Fund Investor Shares: Actual | | $ | 1,000.00 | | $ | 1,228.44 | | $ | 5.56 |
Hypothetical (5% before expenses) | | $ | 1,000.00 | | $ | 1,020.21 | | $ | 5.04 |
| | | |
Parnassus Equity Income Fund Institutional Shares: Actual | | $ | 1,000.00 | | $ | 1,229.60 | | $ | 4.38 |
Hypothetical (5% before expenses) | | $ | 1,000.00 | | $ | 1,021.27 | | $ | 3.97 |
| | | |
Parnassus Mid-Cap Fund: Actual | | $ | 1,000.00 | | $ | 1,250.13 | | $ | 6.81 |
Hypothetical (5% before expenses) | | $ | 1,000.00 | | $ | 1,019.16 | | $ | 6.11 |
| | | |
Parnassus Small-Cap Fund: Actual | | $ | 1,000.00 | | $ | 1,232.73 | | $ | 6.75 |
Hypothetical (5% before expenses) | | $ | 1,000.00 | | $ | 1,019.16 | | $ | 6.11 |
| | | |
Parnassus Workplace Fund: Actual | | $ | 1,000.00 | | $ | 1,286.49 | | $ | 6.92 |
Hypothetical (5% before expenses) | | $ | 1,000.00 | | $ | 1,019.16 | | $ | 6.11 |
| | | |
Parnassus Fixed-Income Fund: Actual | | $ | 1,000.00 | | $ | 1,046.16 | | $ | 4.49 |
Hypothetical (5% before expenses) | | $ | 1,000.00 | | $ | 1,020.82 | | $ | 4.43 |
| * | Expenses are equal to the fund’s annualized expense ratio of 0.99%, 0.99%, 0.78%, 1.20%, 1.20%, 1.20% and 0.87% for the Parnassus Fund, Parnassus Equity Income Fund – Investor Shares, Parnassus Equity Income Fund – Institutional Shares, Parnassus Mid-Cap Fund, Parnassus Small-Cap Fund, Parnassus Workplace Fund and Parnassus Fixed-Income Fund, respectively, multiplied by the average account value over the period, multiplied by the ratio of days in the period. The ratio of days in the period is 184/365 (to reflect the one-half year period). |
REPORT OF INDEPENDENT REGISTERED PUBLIC ACCOUNTING FIRM
To the Shareholders and Board of Trustees of the Parnassus Funds and the Parnassus Income Funds
San Francisco, California
We have audited the accompanying statements of assets and liabilities, including the portfolios of investments, of the Parnassus Funds (comprised of Parnassus Fund, Parnassus Mid-Cap Fund, Parnassus Small-Cap Fund and Parnassus Workplace Fund) and the Parnassus Income Funds (comprised of Parnassus Equity Income Fund and Parnassus Fixed-Income Fund) (collectively, the “Trusts”) as of December 31, 2009, and the related statements of operations for the year then ended, and of changes in net assets for each of the two years in the period then ended, and the financial highlights for each of the periods presented. These financial statements and financial highlights are the responsibility of the Trusts’ management. Our responsibility is to express an opinion on these financial statements and financial highlights based on our audits.
We conducted our audits in accordance with the standards of the Public Company Accounting Oversight Board (United States). Those standards require that we plan and perform the audit to obtain reasonable assurance about whether the financial statements and financial highlights are free of material misstatement. The Trusts are not required to have, nor were we engaged to perform, an audit of their internal control over financial reporting. Our audits included consideration of internal control over financial reporting as a basis for designing audit procedures that are appropriate in the circumstances, but not for the purpose of expressing an opinion on the effectiveness of the Trusts’ internal control over financial reporting. Accordingly, we express no such opinion. An audit also includes examining, on a test basis, evidence supporting the amounts and disclosures in the financial statements, assessing the accounting principles used and significant estimates made by management, as well as evaluating the overall financial statement presentation. Our procedures included confirmation of securities owned as of December 31, 2009, by correspondence with the custodian. We believe that our audits provide a reasonable basis for our opinion.
In our opinion, the financial statements and financial highlights referred to above present fairly, in all material respects, the financial position of each of the funds constituting the Parnassus Funds and the Parnassus Income Funds as of December 31, 2009, the results of their operations for the year then ended, the changes in their net assets for each of the two years in the period then ended, and the financial highlights for each of the periods presented, in conformity with accounting principles generally accepted in the United States of America.
| | |
 | | |
San Francisco, California | | |
January 28, 2010 | | |
THE PARNASSUS FUND
Portfolio of Investments as of
December 31, 2009
| | | | | | | | |
Shares | | Equities | | Percent of
Net Assets | | | Market Value |
| | Biotechnology | | | | | | |
| 225,000 | | Genzyme Corp.1 | | 3.2 | % | | $ | 11,027,250 |
| | | | | | | | |
| | Communications Equipment | | | | | | |
| 200,000 | | QUALCOMM Inc. | | 2.6 | % | | $ | 9,252,000 |
| | | | | | | | |
| | Computer Peripherals | | | | | | |
| 530,000 | | Seagate Technology1 | | 2.8 | % | | $ | 9,640,700 |
| | | | | | | | |
| | Data Processing | | | | | | |
| 110,000 | | Paychex Inc. | | 1.0 | % | | $ | 3,370,400 |
| | | | | | | | |
| | Education | | | | | | |
| 240,000 | | Bridgepoint Education Inc.1 | | 1.0 | % | | $ | 3,604,800 |
| | | | | | | | |
| | Electronic Components | | | | | | |
| 870,000 | | Corning Inc. | | 4.8 | % | | $ | 16,799,700 |
| | | | | | | | |
| | Financial Services | | | | | | |
| 290,000 | | American Express Co. | | | | | $ | 11,750,800 |
| 150,000 | | First Horizon National Corp.1 | | | | | | 2,010,000 |
| 470,000 | | Wells Fargo & Co. | | | | | | 12,685,300 |
| | | | | | | | |
| | | | 7.5 | % | | $ | 26,446,100 |
| | | | | | | | |
| | Food Products | | | | | | |
| 1,000 | | Sysco Corp. | | 0.0 | % | | $ | 27,940 |
| | | | | | | | |
| | Footwear | | | | | | |
| 50,000 | | Nike Inc. | | 1.0 | % | | $ | 3,303,500 |
| | | | | | | | |
| | Home Builders | | | | | | |
| 1,215,000 | | DR Horton Inc. | | | | | $ | 13,207,050 |
| 530,000 | | KB Home3 | | | | | | 7,250,400 |
| 1,360,000 | | Pulte Homes Inc. | | | | | | 13,600,000 |
| 520,500 | | Toll Brothers Inc.1 | | | | | | 9,790,605 |
| | | | | | | | |
| | | | 12.5 | % | | $ | 43,848,055 |
| | | | | | | | |
| | Industrial Manufacturing | | | | | | |
| 230,000 | | Teleflex Inc. | | 3.5 | % | | $ | 12,394,700 |
| | | | | | | | |
| | Insurance | | | | | | |
| 80,000 | | Tower Group Inc. | | 0.5 | % | | $ | 1,872,800 |
| | | | | | | | |
| | Internet | | | | | | |
| 15,000 | | Google Inc.1 | | 2.7 | % | | $ | 9,299,700 |
| | | | | | | | |
| | Machinery | | | | | | |
| 140,000 | | Deere & Company | | 2.2 | % | | $ | 7,572,600 |
| | | | | | | | |
| | Medical Equipment | | | | | | |
| 70,000 | | Gen-Probe Inc.1 | | | | | $ | 3,003,000 |
| 210,000 | | Medtronic Inc. | | | | | | 9,235,800 |
| | | | | | | | |
| | | | 3.5 | % | | $ | 12,238,800 |
| | | | | | | | |
| | Natural Gas | | | | | | |
| 100,000 | | Quicksilver Resources Inc.1 | | 0.4 | % | | $ | 1,501,000 |
| | | | | | | | |
| | Networking Products | | | | | | |
| 470,000 | | Cisco Systems Inc.1 | | | | | $ | 11,251,800 |
| 170,000 | | Finisar Corp.1, 3 | | | | | | 1,516,400 |
| | | | | | | | |
| | | | 3.6 | % | | $ | 12,768,200 |
| | | | | | | | |
| | Oil & Gas | | | | | | |
| 664,000 | | W&T Offshore Inc. | | 2.2 | % | | $ | 7,768,800 |
| | | | | | | | |
| | Retail | | | | | | |
| 670,000 | | Lowe’s Cos., Inc. | | | | | $ | 15,671,300 |
| 280,000 | | Target Corp. | | | | | | 13,543,600 |
| 135,000 | | Walgreen Co. | | | | | | 4,957,200 |
| | | | | | | | |
| | | | 9.7 | % | | $ | 34,172,100 |
| | | | | | | | |
| | Semiconductor Capital Equipment | | | | | | |
| 1,280,000 | | Applied Materials Inc. | | | | | $ | 17,843,200 |
| 280,000 | | Lam Research Corp.1 | | | | | | 10,978,800 |
| | | | | | | | |
| | | | 8.2 | % | | $ | 28,822,000 |
| | | | | | | | |
| | Semiconductors | | | | | | |
| 510,000 | | Altera Corp. | | | | | $ | 11,541,300 |
| 640,000 | | Intel Corp. | | | | | | 13,056,000 |
| 510,000 | | Texas Instruments Inc. | | | | | | 13,290,600 |
| | | | | | | | |
| | | | 10.8 | % | | $ | 37,887,900 |
| | | | | | | | |
| | Software | | | | | | |
| 430,000 | | Autodesk Inc.1 | | | | | $ | 10,926,300 |
| 590,000 | | Symantec Corp.1 | | | | | | 10,555,100 |
| 540,000 | | VeriSign Inc.1 | | | | | | 13,089,600 |
| | | | | | | | |
| | | | 9.8 | % | | $ | 34,571,000 |
| | | | | | | | |
| | Telecommunications Equipment | | | | | | |
| 996,200 | | CIENA Corp.1, 3 | | 3.1 | % | | $ | 10,798,808 |
| | | | | | | | |
| | Waste Management | | | | | | |
| 160,000 | | Waste Management Inc. | | 1.5 | % | | $ | 5,409,600 |
| | | | | | | | |
| | Total investment in equities | | | | | | |
| | (cost $314,867,997) | | 98.1 | % | | $ | 344,398,453 |
| | | | | | | | |
| | | | |
| 28 | | The accompanying notes are an integral part of these financial statements. | | |
Portfolio of Investments as of
December 31, 2009 continued
| | | | | | | | | |
Principal Amount $ | | Short-Term Securities | | Percent of
Net Assets | | | Market Value | |
| | Certificates of Deposit 2 | | | | | | | |
| 100,000 | | Albina Community Bank | | | | | | | |
| | 2.23%, matures 01/24/2010 | | | | | $ | 99,748 | |
| 100,000 | | Carver Federal Savings Bank | | | | | | | |
| | 2.25%, matures 02/04/2010 | | | | | | 99,628 | |
| 100,000 | | Community Bank of the Bay | | | | | | | |
| | 1.64%, matures 09/06/2010 | | | | | | 97,271 | |
| 100,000 | | Latino Community Credit Union | | | | | | | |
| | 2.75%, matures 02/20/2010 | | | | | | 99,452 | |
| 100,000 | | Louisville Community Development Bank | | | | | | | |
| | 1.25%, matures 05/10/2010 | | | | | | 98,587 | |
| 100,000 | | Opportunities Credit Union | | | | | | | |
| | 1.00%, matures 04/25/2010 | | | | | | 98,751 | |
| 100,000 | | Self-Help Credit Union | | | | | | | |
| | 3.05%, matures 01/14/2010 | | | | | | 99,858 | |
| 100,000 | | Southern Bancorp | | | | | | | |
| | 1.85%, matures 01/12/2010 | | | | | | 99,880 | |
| 100,000 | | Wainwright Bank & Trust Co. | | | | | | | |
| | 2.23%, matures 01/30/2010 | | | | | | 99,682 | |
| | | | | | | | | |
| | | | 0.2 | % | | $ | 892,857 | |
| | | | | | | | | |
| | Community Development Loans2 | | | | | | | |
| 100,000 | | Boston Community Loan Fund | | | | | | | |
| | 1.00%, matures 06/30/2010 | | | | | $ | 97,025 | |
| 100,000 | | Boston Community Loan Fund | | | | | | | |
| | 1.00%, matures 06/30/2010 | | | | | | 97,025 | |
| 200,000 | | Root Capital Loan Fund | | | | | | | |
| | 2.00%, matures 03/16/2010 | | | | | | 197,568 | |
| 100,000 | | Vermont Community Loan Fund | | | | | | | |
| | 1.50%, matures 12/15/2010 | | | | | | 94,263 | |
| | | | | | | | | |
| | | | 0.1 | % | | $ | 485,881 | |
| | | | | | | | | |
| | | |
Principal Amount $/ Shares | | Short-Term Securities | | Percent of
Net Assets | | | Market Value | |
| | Time Deposit | | | | | | | |
| 5,161,392 | | BBH Cash Management Service Citibank, Nassau, | | | | | | | |
| | 0.03%, due 01/04/2010 | | 1.5 | % | | $ | 5,161,392 | |
| | | | | | | | | |
| | Securities Purchased with Cash Collateral from Securities Lending Registered Investment Companies | | | | | | | |
| 16,128,301 | | Invesco Aim Government & Agency Portfolio Short-Term Investments Trust, Institutional Class variable rate, 0.05% | | 4.6 | % | | $ | 16,128,301 | |
| | | | | | | | | |
| | Total short-term securities (cost $22,668,431) | | 6.4 | % | | $ | 22,668,431 | |
| | | | | | | | | |
| | Total securities (cost $337,536,428) | | 104.5 | % | | $ | 367,066,884 | |
| | | | | | | | | |
| | Payable upon return of securities loaned | | -4.6 | % | | $ | (16,128,301 | ) |
| | Other assets and liabilities – net | | 0.1 | % | | $ | 237,313 | |
| | | | | | | | | |
| | Total net assets | | 100.0 | % | | $ | 351,175,896 | |
| | | | | | | | | |
| 1 | These securities are non-income producing. |
| 2 | Market value adjustments have been applied to these securities to reflect early withdrawal. |
| 3 | This security or partial position of this security was on loan at December 31, 2009. |
The total value of the securities on loan at December 31, 2009 was $15,474,122.
Fund holdings will vary over time.
Industry classifications are unaudited.
Fund shares are not FDIC insured.
| | | | |
| | The accompanying notes are an integral part of these financial statements. | | 29 |
THE PARNASSUS EQUITY INCOME FUND
Portfolio of Investments as of
December 31, 2009
| | | | | | | | |
Shares | | Equities | | Percent of
Net Assets | | | Market Value |
| | Chemicals | | | | | | |
| 800,000 | | Praxair Inc. | | 2.5 | % | | $ | 64,248,000 |
| | | | | | | | |
| | Communications Equipment | | | | | | |
| 1,500,000 | | QUALCOMM Inc. | | 2.7 | % | | $ | 69,390,000 |
| | | | | | | | |
| | Consulting Services | | | | | | |
| 2,400,000 | | Accenture PLC | | 3.9 | % | | $ | 99,600,000 |
| | | | | | | | |
| | Cosmetics & Personal Care | | | | | | |
| 2,100,000 | | Procter & Gamble Co. | | 5.0 | % | | $ | 127,323,000 |
| | | | | | | | |
| | Data Processing | | | | | | |
| 1,586,000 | | Paychex Inc. | | 1.9 | % | | $ | 48,595,040 |
| | | | | | | | |
| | Financial Services | | | | | | |
| 3,542,000 | | Bank of New York Mellon Corp. | | | | | $ | 99,069,740 |
| 975,975 | | Glacier Bancorp Inc. | | | | | | 13,390,377 |
| 1,275,000 | | Royal Bank of Canada | | | | | | 68,276,250 |
| | | | | | | | |
| | | | 7.1 | % | | $ | 180,736,367 |
| | | | | | | | |
| | Food Products | | | | | | |
| 1,648,900 | | McCormick & Co. | | | | | $ | 59,574,757 |
| 3,300,000 | | Sysco Corp. | | | | | | 92,202,000 |
| | | | | | | | |
| | | | 5.9 | % | | $ | 151,776,757 |
| | | | | | | | |
| | Footwear | | | | | | |
| 800,000 | | Nike Inc. | | 2.1 | % | | $ | 52,856,000 |
| | | | | | | | |
| | Healthcare Products | | | | | | |
| 50,000 | | Alcon Inc. | | | | | $ | 8,217,500 |
| 2,000,000 | | Johnson & Johnson | | | | | | 128,820,000 |
| | | | | | | | |
| | | | 5.4 | % | | $ | 137,037,500 |
| | | | | | | | |
| | Home Products | | | | | | |
| 974,351 | | WD-40 Co. | | 1.2 | % | | $ | 31,529,998 |
| | | | | | | | |
| | Industrial Manufacturing | | | | | | |
| 350,000 | | 3M Co. | | | | | $ | 28,934,500 |
| 1,504,000 | | Cooper Industries PLC | | | | | | 64,130,560 |
| 500,000 | | Danaher Corp. | | | | | | 37,600,000 |
| 1,010,818 | | Pentair Inc. | | | | | | 32,649,421 |
| 1,800,000 | | Teleflex Inc. | | | | | | 97,002,000 |
| | | | | | | | |
| | | | 10.2 | % | | $ | 260,316,481 |
| | | | | | | | |
| | Insurance | | | | | | |
| 1,000,000 | | AFLAC Inc. | | 1.8 | % | | $ | 46,250,000 |
| | | | | | | | |
| | Internet | | | | | | |
| 75,000 | | Google Inc.1 | | 1.8 | % | | $ | 46,498,500 |
| | | | | | | | |
| | Machinery | | | | | | |
| 850,000 | | Deere & Company | | | | | $ | 45,976,500 |
| 650,000 | | IDEX Corp. | | | | | | 20,247,500 |
| | | | | | | | |
| | | | 2.6 | % | | $ | 66,224,000 |
| | | | | | | | |
| | Medical Equipment | | | | | | |
| 1,500,000 | | Gen-Probe Inc.1 | | | | | $ | 64,350,000 |
| 1,725,000 | | Medtronic Inc. | | | | | | 75,865,500 |
| | | | | | | | |
| | | | 5.5 | % | | $ | 140,215,500 |
| | | | | | | | |
| | Natural Gas | | | | | | |
| 2,043,100 | | Energen Corp. | | | | | $ | 95,617,080 |
| 4,000,000 | | MDU Resources Group Inc. | | | | | | 94,400,000 |
| | | | | | | | |
| | | | 7.4 | % | | $ | 190,017,080 |
| | | | | | | | |
| | Oil & Gas | | | | | | |
| 750,000 | | Apache Corp. | | | | | $ | 77,377,500 |
| 3,434,800 | | W&T Offshore Inc. | | | | | | 40,187,160 |
| | | | | | | | |
| | | | 4.6 | % | | $ | 117,564,660 |
| | | | | | | | |
| | Pharmaceuticals | | | | | | |
| 825,000 | | Novartis AG (ADR) | | | | | $ | 44,904,750 |
| 755,000 | | Teva Pharmaceutical Industries Ltd. (ADR) | | | | | | 42,415,900 |
| | | | | | | | |
| | | | 3.4 | % | | $ | 87,320,650 |
| | | | | | | | |
| | Semiconductor Capital Equipment | | | | | | |
| 5,000,000 | | Applied Materials Inc. | | 2.7 | % | | $ | 69,700,000 |
| | | | | | | | |
| | Software | | | | | | |
| 3,500,000 | | Microsoft Corp. | | | | | $ | 106,715,000 |
| 2,650,000 | | Symantec Corp.1 | | | | | | 47,408,500 |
| 1,000,000 | | VeriSign Inc.1 | | | | | | 24,240,000 |
| | | | | | | | |
| | | | 7.0 | % | | $ | 178,363,500 |
| | | | | | | | |
| | Transportation | | | | | | |
| 650,000 | | Burlington Northern Santa Fe Corp. | | 2.5 | % | | $ | 64,103,000 |
| | | | | | | | |
| | Utility & Power Distribution | | | | | | |
| 1,330,000 | | AGL Resources Inc. | | | | | $ | 48,505,100 |
| 1,600,000 | | Black Hills Corp. | | | | | | 42,608,000 |
| 700,000 | | Northwest Natural Gas Co. | | | | | | 31,528,000 |
| | | | | | | | |
| | | | 4.8 | % | | $ | 122,641,100 |
| | | | | | | | |
| | Waste Management | | | | | | |
| 4,000,000 | | Waste Management Inc. | | 5.3 | % | | $ | 135,240,000 |
| | | | | | | | |
| | Total investment in equities (cost $2,133,667,302) | | 97.3 | % | | $ | 2,487,547,133 |
| | | | | | | | |
| | | | |
| 30 | | The accompanying notes are an integral part of these financial statements. | | |
Portfolio of Investments as of
December 31, 2009 continued
| | | | | | | | |
Principal Amount $ | | Community Loans | | Percent of
Net Assets | | | Market Value |
| | Community Development Loans2 | | | | | | |
| 500,000 | | MicroVest I, LP Note | | | | | | |
| | 5.88%, matures 03/15/2010 | | | | | $ | 493,999 |
| 1,000,000 | | MicroVest I, LP Note | | | | | | |
| | 5.88%, matures 12/15/2010 | | | | | | 942,793 |
| | | | | | | | |
| | | | 0.1 | % | | $ | 1,436,792 |
| | | | | | | | |
| | Total investment in community loans (cost $1,436,792) | | 0.1 | % | | $ | 1,436,792 |
| | | | | | | | |
| | Total investments in long-term securities (cost $2,135,104,094) | | 97.4 | % | | $ | 2,488,983,925 |
| | | | | | | | |
| | | |
Principal Amount $ | | Short-Term Securities | | | | | |
| | Certificates of Deposit 2 | | | | | | |
| 100,000 | | Community Bank of the Bay | | | | | | |
| | 1.64%, matures 08/24/2010 | | | | | $ | 97,414 |
| 250,000 | | Community Trust Credit Union | | | | | | |
| | 2.07%, matures 12/03/2010 | | | | | | 240,742 |
| | | | | | | | |
| | | | 0.0 | % | | $ | 338,156 |
| | | | | | | | |
| | Community Development Loans2 | | | | | | |
| 100,000 | | Boston Community Loan Fund | | | | | | |
| | 1.00%, matures 06/30/2010 | | | | | $ | 97,025 |
| 1,000,000 | | MicroVest I, LP Note | | | | | | |
| | 5.25%, matures 10/15/2010 | | | | | | 952,657 |
| 100,000 | | New Hampshire Community Loan Fund | | | | | | |
| | 1.00%, matures 08/31/2010 | | | | | | 96,006 |
| 200,000 | | Root Capital Loan Fund | | | | | | |
| | 2.00%, matures 01/25/2010 | | | | | | 199,212 |
| 100,000 | | Vermont Community Loan Fund | | | | | | |
| | 2.00%, matures 04/15/2010 | | | | | | 98,291 |
| | | | | | | | |
| | | | 0.1 | % | | $ | 1,443,191 |
| | | | | | | | |
| | Certificate of Deposit Account Registry Service (CDARS)2 | | | | | | |
| 500,000 | | CDARS agreement with Community Bank of the Bay, dated 01/29/2009, matures 01/28/2010, 1.64% Participating depository institutions: First Niagara Bank, par 27,500; First Service Bank, par 94,500; Happy State Bank, par 94,500; F&M Bank & Trust Company, par 94,500; The Huntington National Bank, par 94,500; United Bank, par 94,500; (cost $498,518) | | | | | $ | 498,518 |
| 500,000 | | CDARS agreement with Community Bank of the Bay, dated 02/12/2009, matures 02/11/2010, 1.64% Participating depository institutions: Bank of Blue Valley, par 94,000; Lorain National Bank, par 30,000; MB Financial Bank, par 94,000; Union Bank, par 94,000; Union Bank & Trust Company, par 94,000; WesBanco Bank, par 94,000; (cost $497,749) | | | | | | 497,749 |
| | | | |
| | The accompanying notes are an integral part of these financial statements. | | 31 |
THE PARNASSUS EQUITY INCOME FUND
Portfolio of Investments as of
December 31, 2009 continued
| | | | | | | | |
Principal Amount $ | | Short-Term Securities | | Percent of
Net Assets | | | Market Value |
| 500,000 | | CDARS agreement with Community Bank of the Bay, dated 10/22/2009, matures 10/21/2010, 1.19% Participating depository institutions: Amegy Bank, N.A., par 236,500; Banco Popular de Puerto Rico, par 236,500; The Private Bank & Trust Company, par 27,000; (cost $483,846) | | | | | $ | 483,846 |
| 500,000 | | CDARS agreement with Community Bank of the Bay, dated 12/10/2009, matures 12/09/2010, 1.09% Participating depository institutions: Arvest Bank, par 31,000; First Place Bank, par 234,500; ViewPoint Bank, par 234,500; (cost $481,209) | | | | | | 481,209 |
| | | | | | | | |
| | | | 0.1 | % | | $ | 1,961,322 |
| | | | | | | | |
| | Time Deposit | | | | | | |
| 57,347,648 | | BBH Cash Management Service Wells Fargo, Grand Cayman, 0.03%, due 01/04/2010 | | 2.2 | % | | $ | 57,347,648 |
| | | | | | | | |
| | Total short-term securities (cost $61,090,317) | | 2.4 | % | | $ | 61,090,317 |
| | | | | | | | |
| | Total securities (cost $2,196,194,411) | | 99.8 | % | | $ | 2,550,074,242 |
| | | | | | | | |
| | Other assets and liabilities – net | | 0.2 | % | | $ | 7,604,705 |
| | | | | | | | |
| | Total net assets | | 100.0 | % | | $ | 2,557,678,947 |
| | | | | | | | |
| 1 | These securities are non-income producing. |
| 2 | Market value adjustments have been applied to these securities to reflect early withdrawal. |
Fund holdings will vary over time.
Industry classifications are unaudited.
Fund shares are not FDIC insured.
| | | | |
| 32 | | The accompanying notes are an integral part of these financial statements. | | |
THE PARNASSUS MID - CAP FUND
Portfolio of Investments as of
December 31, 2009
| | | | | | | | |
Shares | | Equities | | Percent of
Net Assets | | | Market Value |
| | Apparel | | | | | | |
| 9,000 | | Coach Inc. | | 1.4 | % | | $ | 328,770 |
| | | | | | | | |
| | Chemicals | | | | | | |
| 3,700 | | Praxair Inc. | | 1.3 | % | | $ | 297,147 |
| | | | | | | | |
| | Consulting Services | | | | | | |
| 12,500 | | Accenture PLC | | | | | $ | 518,750 |
| 9,000 | | Cognizant Technology Solutions Corp.1 | | | | | | 407,700 |
| | | | | | | | |
| | | | 4.1 | % | | $ | 926,450 |
| | | | | | | | |
| | Data Processing | | | | | | |
| 11,300 | | Fiserv Inc.1 | | | | | $ | 547,824 |
| 17,000 | | Paychex Inc. | | | | | | 520,880 |
| | | | | | | | |
| | | | 4.7 | % | | $ | 1,068,704 |
| | | | | | | | |
| | Financial Services | | | | | | |
| 6,500 | | Charles Schwab Corp. | | | | | $ | 122,330 |
| 35,000 | | Glacier Bancorp Inc. | | | | | | 480,200 |
| 38,000 | | Hudson City Bancorp Inc. | | | | | | 521,740 |
| 15,000 | | SEI Investments Co. | | | | | | 262,800 |
| | | | | | | | |
| | | | 6.1 | % | | $ | 1,387,070 |
| | | | | | | | |
| | Food Products | | | | | | |
| 23,000 | | McCormick & Co. | | | | | $ | 830,990 |
| 35,500 | | Sysco Corp. | | | | | | 991,870 |
| | | | | | | | |
| | | | 8.0 | % | | $ | 1,822,860 |
| | | | | | | | |
| | Healthcare Products | | | | | | |
| 5,000 | | CareFusion Corp.1 | | | | | $ | 125,050 |
| 14,000 | | DENTSPLY International Inc. | | | | | | 492,380 |
| | | | | | | | |
| | | | 2.7 | % | | $ | 617,430 |
| | | | | | | | |
| | Healthcare Services | | | | | | |
| 10,000 | | Cardinal Health Inc. | | 1.4 | % | | $ | 322,400 |
| | | | | | | | |
| | Industrial Manufacturing | | | | | | |
| 18,500 | | Cooper Industries PLC | | | | | $ | 788,840 |
| 5,100 | | Danaher Corp. | | | | | | 383,520 |
| 22,500 | | Pentair Inc. | | | | | | 726,750 |
| 10,500 | | Teleflex Inc. | | | | | | 565,845 |
| | | | | | | | |
| | | | 10.8 | % | | $ | 2,464,955 |
| | | | | | | | |
| | Insurance | | | | | | |
| 12,000 | | AFLAC Inc. | | 2.4 | % | | $ | 555,000 |
| | | | | | | | |
| | Machinery | | | | | | |
| 13,000 | | Deere & Company | | 3.1 | % | | $ | 703,170 |
| | | | | | | | |
| | Medical Equipment | | | | | | |
| 11,500 | | C. R. Bard Inc. | | | | | $ | 895,850 |
| 17,000 | | Gen-Probe Inc.1 | | | | | | 729,300 |
| 24,000 | | Patterson Companies Inc.1 | | | | | | 671,520 |
| 10,000 | | Varian Medical Systems Inc.1 | | | | | | 468,500 |
| | | | | | | | |
| | | | 12.1 | % | | $ | 2,765,170 |
| | | | | | | | |
| | Natural Gas | | | | | | |
| 7,000 | | Energen Corp. | | | | | $ | 327,600 |
| 5,600 | | EQT Corp. | | | | | | 245,952 |
| 33,000 | | MDU Resources Group Inc. | | | | | | 778,800 |
| | | | | | | | |
| | | | 5.9 | % | | $ | 1,352,352 |
| | | | | | | | |
| | Oil & Gas | | | | | | |
| 7,500 | | Noble Corp.1 | | | | | $ | 305,250 |
| 3,000 | | Transocean Ltd.1 | | | | | | 248,400 |
| 8,000 | | Ultra Petroleum Corp.1 | | | | | | 398,880 |
| | | | | | | | |
| | | | 4.2 | % | | $ | 952,530 |
| | | | | | | | |
| | Retail | | | | | | |
| 11,000 | | Nordstrom Inc. | | 1.8 | % | | $ | 413,380 |
| | | | | | | | |
| | Semiconductor Capital Equipment | | | | | | |
| 68,000 | | Applied Materials Inc. | | 4.2 | % | | $ | 947,920 |
| | | | | | | | |
| | Semiconductors | | | | | | |
| 14,500 | | Microchip Technology Inc.3 | | 1.9 | % | | $ | 421,370 |
| | | | | | | | |
| | Services | | | | | | |
| 12,000 | | Ecolab Inc. | | 2.4 | % | | $ | 535,080 |
| | | | | | | | |
| | Software | | | | | | |
| 10,600 | | Adobe Systems Inc.1 | | | | | $ | 389,868 |
| 22,500 | | Autodesk Inc.1 | | | | | | 571,725 |
| 6,100 | | Check Point Software Technologies Ltd.1 | | | | | | 206,668 |
| 10,500 | | Citrix Systems Inc.1 | | | | | | 436,905 |
| 17,000 | | Intuit Inc.1 | | | | | | 522,070 |
| 30,000 | | Symantec Corp.1 | | | | | | 536,700 |
| 15,500 | | Synopsys Inc.1 | | | | | | 345,340 |
| | | | | | | | |
| | | | 13.2 | % | | $ | 3,009,276 |
| | | | | | | | |
| | Waste Management | | | | | | |
| 30,000 | | Waste Management Inc. | | 4.4 | % | | $ | 1,014,300 |
| | | | | | | | |
| | Total investment in equities (cost $18,344,919) | | 96.1 | % | | $ | 21,905,334 |
| | | | | | | | |
| | | | |
| | The accompanying notes are an integral part of these financial statements. | | 33 |
THE PARNASSUS MID - CAP FUND
Portfolio of Investments as of
December 31, 2009 continued
| | | | | | | | | |
Principal Amount $/ Shares | | Short-Term Securities | | Percent of
Net Assets | | | Market Value | |
| | Time Deposit | | | | | | | |
| 667,129 | | BBH Cash Management Service Wells Fargo, Grand Cayman, | | | | | | | |
| | 0.03%, due 01/04/2010 | | 2.9 | % | | $ | 667,129 | |
| | | | | | | | | |
| | Securities Purchased with Cash Collateral from Securities Lending Registered Investment Companies | | | | | | | |
| 429,715 | | Invesco Aim Government & Agency Portfolio Short-Term Investments Trust, Institutional Class | | | | | | | |
| | variable rate, 0.05% | | 1.9 | % | | $ | 429,715 | |
| | Total short-term securities (cost $1,096,844) | | 4.8 | % | | $ | 1,096,844 | |
| | | | | | | | | |
| | Total securities (cost $19,441,763) | | 100.9 | % | | $ | 23,002,178 | |
| | | | | | | | | |
| | Payable upon return of securities loaned | | -1.9 | % | | $ | (429,715 | ) |
| | Other assets and liabilities – net | | 1.0 | % | | $ | 231,826 | |
| | | | | | | | | |
| | Total net assets | | 100.0 | % | | $ | 22,804,289 | |
| | | | | | | | | |
| 1 | These securities are non-income producing. |
| 3 | This security or partial position of this security was on loan at December 31, 2009. |
The total value of the securities on loan at December 31, 2009 was $420,992.
Fund holdings will vary over time.
Industry classifications are unaudited.
Fund shares are not FDIC insured.
| | | | |
| 34 | | The accompanying notes are an integral part of these financial statements. | | |
THE PARNASSUS SMALL - CAP FUND
Portfolio of Investments as of
December 31, 2009
| | | | | | | | |
Shares | | Equities | | Percent of
Net Assets | | | Market Value |
| | Building Materials | | | | | | |
| 45,000 | | Simpson Manufacturing Co., Inc. | | 1.1 | % | | $ | 1,210,050 |
| | | | | | | | |
| | Chemicals | | | | | | |
| 45,000 | | Compass Minerals International Inc. | | | | | $ | 3,023,550 |
| 135,000 | | Terra Industries Inc. | | | | | | 4,345,650 |
| | | | | | | | |
| | | | 6.4 | % | | $ | 7,369,200 |
| | | | | | | | |
| | Computer Peripherals | | | | | | |
| 250,000 | | Electronics for Imaging Inc.1 | | 2.8 | % | | $ | 3,252,500 |
| | | | | | | | |
| | Consulting Services | | | | | | |
| 80,000 | | FTI Consulting Inc.1 | | 3.3 | % | | $ | 3,772,800 |
| | | | | | | | |
| | Data Processing | | | | | | |
| 57,000 | | Jack Henry & Associates Inc. | | 1.1 | % | | $ | 1,317,840 |
| | | | | | | | |
| | Education | | | | | | |
| 300,000 | | Bridgepoint Education Inc.1, 3 | | 3.9 | % | | $ | 4,506,000 |
| | | | | | | | |
| | Electric Motors | | | | | | |
| 20,000 | | Baldor Electric Co. | | 0.5 | % | | $ | 561,800 |
| | | | | | | | |
| | Electronics | | | | | | |
| 45,000 | | Analogic Corp. | | 1.5 | % | | $ | 1,732,950 |
| | | | | | | | |
| | Financial Services | | | | | | |
| 150,000 | | First Horizon National Corp. 1 | | | | | $ | 2,010,000 |
| 135,000 | | Glacier Bancorp Inc. | | | | | | 1,852,200 |
| 75,000 | | SEI Investments Co. | | | | | | 1,314,000 |
| | | | | | | | |
| | | | 4.5 | % | | $ | 5,176,200 |
| | | | | | | | |
| | Healthcare Services | | | | | | |
| 30,000 | | LHC Group Inc.1 | | 0.9 | % | | $ | 1,008,300 |
| | | | | | | | |
| | Home Builders | | | | | | |
| 170,000 | | DR Horton Inc. | | | | | $ | 1,847,900 |
| 195,000 | | KB Home | | | | | | 2,667,600 |
| 320,000 | | Pulte Homes Inc.1 | | | | | | 3,200,000 |
| 265,000 | | Toll Brothers Inc.1 | | | | | | 4,984,650 |
| | | | | | | | |
| | | | 11.0 | % | | $ | 12,700,150 |
| | | | | | | | |
| | Industrial Manufacturing | | | | | | |
| 85,000 | | Teleflex Inc. | | 4.0 | % | | $ | 4,580,650 |
| | | | | | | | |
| | Insurance | | | | | | |
| 40,000 | | Tower Group Inc. | | 0.8 | % | | $ | 936,400 |
| | | | | | | | |
| | Machinery | | | | | | |
| 100,000 | | Graco Inc. | | | | | $ | 2,857,000 |
| 65,000 | | Nordson Corp. | | | | | | 3,976,700 |
| | | | | | | | |
| | | | 5.9 | % | | $ | 6,833,700 |
| | | | | | | | |
| | Medical Equipment | | | | | | |
| 105,000 | | Gen-Probe Inc.1 | | 3.9 | % | | $ | 4,504,500 |
| | | | | | | | |
| | Natural Gas | | | | | | |
| 15,000 | | Energen Corp. | | | | | $ | 702,000 |
| 240,000 | | Quicksilver Resources Inc.1, 3 | | | | | | 3,602,400 |
| | | | | | | | |
| | | | 3.7 | % | | $ | 4,304,400 |
| | | | | | | | |
| | Networking Products | | | | | | |
| 320,000 | | Finisar Corp.1, 3 | | 2.5 | % | | $ | 2,854,400 |
| | | | | | | | |
| | Oil & Gas | | | | | | |
| 120,000 | | Mariner Energy Inc.1 | | | | | $ | 1,393,200 |
| 410,000 | | W&T Offshore Inc. | | | | | | 4,797,000 |
| | | | | | | | |
| | | | 5.4 | % | | $ | 6,190,200 |
| | | | | | | | |
| | Professional Services | | | | | | |
| 144,000 | | Administaff Inc. | | 2.9 | % | | $ | 3,396,960 |
| | | | | | | | |
| | Retail | | | | | | |
| 60,000 | | Nash Finch Company | | | | | $ | 2,225,400 |
| 3,000 | | United Natural Foods Inc.1 | | | | | | 80,220 |
| | | | | | | | |
| | | | 2.0 | % | | $ | 2,305,620 |
| | | | | | | | |
| | Semiconductor Capital Equipment | | | | | | |
| 140,000 | | Cognex Corp. | | | | | $ | 2,480,800 |
| 52,000 | | Cymer Inc.1 | | | | | | 1,995,760 |
| 29,000 | | Lam Research Corp.1 | | | | | | 1,137,090 |
| | | | | | | | |
| | | | 4.9 | % | | $ | 5,613,650 |
| | | | | | | | |
| | Software | | | | | | |
| 500,000 | | ClickSoftware Technologies Ltd.1 | | | | | $ | 3,500,000 |
| 375,000 | | Mentor Graphics Corp.1 | | | | | | 3,311,250 |
| 180,000 | | VeriSign Inc.1 | | | | | | 4,363,200 |
| 155,000 | | Websense Inc.1 | | | | | | 2,706,300 |
| | | | | | | | |
| | | | 12.1 | % | | $ | 13,880,750 |
| | | | | | | | |
| | Telecommunications Equipment | | | | | | |
| 440,000 | | CIENA Corp.1, 3 | | | | | $ | 4,769,600 |
| 250,000 | | Harmonic Inc.1 | | | | | | 1,582,500 |
| 285,000 | | Tellabs Inc.1 | | | | | | 1,618,800 |
| | | | | | | | |
| | | | 6.9 | % | | $ | 7,970,900 |
| | | | | | | | |
| | Utility & Power Distribution | | | | | | |
| 65,000 | | AGL Resources Inc. | | | | | $ | 2,370,550 |
| 40,000 | | Northwest Natural Gas Co. | | | | | | 1,801,600 |
| 80,000 | | NorthWestern Corp. | | | | | | 2,081,600 |
| 5,000 | | Ormat Technologies Inc. | | | | | | 189,200 |
| | | | | | | | |
| | | | 5.6 | % | | $ | 6,442,950 |
| | | | | | | | |
| | Total investment in equities (cost $103,345,700) | | 97.6 | % | | $ | 112,422,870 |
| | | | | | | | |
| | | | |
| | The accompanying notes are an integral part of these financial statements. | | 35 |
THE PARNASSUS SMALL - CAP FUND
Portfolio of Investments as of
December 31, 2009 continued
| | | | | | | | | |
Principal
Amount $/
Shares | | Short-Term Securities | | Percent of
Net Assets | | | Market Value | |
| | Time Deposit | | | | | | | |
| 2,346,997 | | BBH Cash Management Service Citibank, London, | | | | | | | |
| | 0.03%, due 01/04/2010 | | 2.0 | % | | $ | 2,346,997 | |
| | | | | | | | | |
| | Securities Purchased with Cash Collateral from Securities Lending Registered Investment Companies | | | | | | | |
| 11,463,598 | | Invesco Aim Government & Agency Portfolio Short-Term Investments Trust, Institutional Class | | | | | | | |
| | variable rate, 0.05% | | 10.0 | % | | $ | 11,463,598 | |
| | Total short-term securities (cost $13,810,595) | | 12.0 | % | | $ | 13,810,595 | |
| | | | | | | | | |
| | Total securities (cost $117,156,295) | | 109.6 | % | | $ | 126,233,465 | |
| | | | | | | | | |
| | Payable upon return of securities loaned | | -10.0 | % | | $ | (11,463,598 | ) |
| | Other assets and liabilities – net | | 0.4 | % | | $ | 397,695 | |
| | | | | | | | | |
| | Total net assets | | 100.0 | % | | $ | 115,167,562 | |
| | | | | | | | | |
| 1 | These securities are non-income producing. |
| 3 | This security or partial position of this security was on loan at December 31, 2009. |
The total value of the securities on loan at December 31, 2009 was $11,162,778.
Fund holdings will vary over time.
Industry classifications are unaudited.
Fund shares are not FDIC insured.
| | | | |
| 36 | | The accompanying notes are an integral part of these financial statements. | | |
THE PARNASSUS WORKPLACE FUND
Portfolio of Investments as of
December 31, 2009
| | | | | | | | |
Shares | | Equities | | Percent of
Net Assets | | | Market Value |
| | Biotechnology | | | | | | |
| 90,000 | | Genzyme Corp.1 | | 4.6 | % | | $ | 4,410,900 |
| | | | | | | | |
| | Building Materials | | | | | | |
| 50,000 | | Simpson Manufacturing Co., Inc. | | 1.4 | % | | $ | 1,344,500 |
| | | | | | | | |
| | Communications Equipment | | | | | | |
| 100,000 | | QUALCOMM Inc. | | 4.9 | % | | $ | 4,626,000 |
| | | | | | | | |
| | Computer Peripherals | | | | | | |
| 80,000 | | Seagate Technology 1 | | 1.5 | % | | $ | 1,455,200 |
| | | | | | | | |
| | Consulting Services | | | | | | |
| 30,000 | | Accenture PLC | | 1.3 | % | | $ | 1,245,000 |
| | | | | | | | |
| | Data Processing | | | | | | |
| 80,000 | | Paychex Inc. | | 2.6 | % | | $ | 2,451,200 |
| | | | | | | | |
| | Electronic Components | | | | | | |
| 240,000 | | Corning Inc. | | 4.9 | % | | $ | 4,634,400 |
| | | | | | | | |
| | Financial Services | | | | | | |
| 30,000 | | American Express Co. | | | | | $ | 1,215,600 |
| 150,000 | | First Horizon National Corp.1 | | | | | | 2,010,000 |
| 100,000 | | SEI Investments Co. | | | | | | 1,752,000 |
| 40,000 | | Wells Fargo & Co. | | | | | | 1,079,600 |
| | | | | | | | |
| | | | 6.4 | % | | $ | 6,057,200 |
| | | | | | | | |
| | Footwear | | | | | | |
| 30,000 | | Nike Inc. | | 2.1 | % | | $ | 1,982,100 |
| | | | | | | | |
| | Industrial Manufacturing | | | | | | |
| 7,000 | | 3M Co. | | 0.6 | % | | $ | 578,690 |
| | | | | | | | |
| | Internet | | | | | | |
| 70,000 | | eBay Inc.1 | | | | | $ | 1,647,800 |
| 2,100 | | Google Inc.1 | | | | | | 1,301,958 |
| 140,000 | | Yahoo! Inc.1 | | | | | | 2,349,200 |
| | | | | | | | |
| | | | 5.6 | % | | $ | 5,298,958 |
| | | | | | | | |
| | Machinery | | | | | | |
| 75,000 | | Deere & Company | | | | | $ | 4,056,750 |
| 55,000 | | Graco Inc. | | | | | | 1,571,350 |
| 26,000 | | Nordson Corp. | | | | | | 1,590,680 |
| | | | | | | | |
| | | | 7.6 | % | | $ | 7,218,780 |
| | | | | | | | |
| | Medical Equipment | | | | | | |
| 110,000 | | Medtronic Inc. | | 5.1 | % | | $ | 4,837,800 |
| | | | | | | | |
| | Natural Gas | | | | | | |
| 137,500 | | MDU Resources Group Inc. | | 3.4 | % | | $ | 3,245,000 |
| | | | | | | | |
| | Networking Products | | | | | | |
| 180,000 | | Cisco Systems Inc.1 | | 4.5 | % | | $ | 4,309,200 |
| | | | | | | | |
| | Office Equipment | | | | | | |
| 7,000 | | Canon Inc. (ADR) | | 0.3 | % | | $ | 296,240 |
| | | | | | | | |
| | Oil & Gas | | | | | | |
| 20,000 | | Devon Energy Corp. | | 1.5 | % | | $ | 1,470,000 |
| | | | | | | | |
| | Pharmaceuticals | | | | | | |
| 20,000 | | Novartis AG (ADR) | | 1.1 | % | | $ | 1,088,600 |
| | | | | | | | |
| | Retail | | | | | | |
| 26,000 | | Costco Wholesale Corp. | | | | | $ | 1,538,420 |
| 185,000 | | Lowe’s Cos., Inc. | | | | | | 4,327,150 |
| 40,000 | | Target Corp. | | | | | | 1,934,800 |
| 40,000 | | Walgreen Co. | | | | | | 1,468,800 |
| | | | | | | | |
| | | | 9.7 | % | | $ | 9,269,170 |
| | | | | | | | |
| | Semiconductor Capital Equipment | | | | | | |
| 310,000 | | Applied Materials Inc. | | 4.5 | % | | $ | 4,321,400 |
| | | | | | | | |
| | Semiconductors | | | | | | |
| 165,000 | | Altera Corp. | | | | | $ | 3,733,950 |
| 200,000 | | Intel Corp. | | | | | | 4,080,000 |
| 80,000 | | Texas Instruments Inc. | | | | | | 2,084,800 |
| | | | | | | | |
| | | | 10.4 | % | | $ | 9,898,750 |
| | | | | | | | |
| | Software | | | | | | |
| 10,000 | | Adobe Systems Inc.1 | | | | | $ | 367,800 |
| 110,000 | | Autodesk Inc.1 | | | | | | 2,795,100 |
| 45,000 | | Microsoft Corp. | | | | | | 1,372,050 |
| 220,000 | | Symantec Corp.1 | | | | | | 3,935,800 |
| | | | | | | | |
| | | | 8.9 | % | | $ | 8,470,750 |
| | | | | | | | |
| | Utility & Power Distribution | | | | | | |
| 20,000 | | Northwest Natural Gas Co. | | 0.9 | % | | $ | 900,800 |
| | | | | | | | |
| | Total investment in equities (cost $75,311,772) | | 93.8 | % | | $ | 89,410,638 |
| | | | | | | | |
| | | | |
| | The accompanying notes are an integral part of these financial statements. | | 37 |
THE PARNASSUS WORKPLACE FUND
Portfolio of Investments as of
December 31, 2009 continued
| | | | | | | | |
Principal
Amount $ | | Short-Term Securities | | Percent of
Net Assets | | | Market Value |
| | Time Deposit | | | | | | |
| 5,593,199 | | BBH Cash Management Service Citibank, London, 0.03%, due 01/04/2010 | | 5.9 | % | | $ | 5,593,199 |
| | | | | | | | |
| | Total short-term securities (cost $5,593,199) | | 5.9 | % | | $ | 5,593,199 |
| | | | | | | | |
| | Total securities (cost $80,904,971) | | 99.7 | % | | $ | 95,003,837 |
| | | | | | | | |
| | Other assets and liabilities – net | | 0.3 | % | | $ | 295,912 |
| | | | | | | | |
| | Total net assets | | 100.0 | % | | $ | 95,299,749 |
| | | | | | | | |
| 1 | These securities are non-income producing. |
Fund holdings will vary over time.
Industry classifications are unaudited.
Fund shares are not FDIC insured.
| | | | |
| 38 | | The accompanying notes are an integral part of these financial statements. | | |
THE PARNASSUS FIXED - INCOME FUND
Portfolio of Investments as of
December 31, 2009
| | | | | | | | |
Principal Amount $ | | Convertible Bonds | | Percent of
Net Assets | | | Market Value |
| | Biotechnology | | | | | | |
| 2,000,000 | | Millipore Corp. | | | | | | |
| | Notes, 3.75%, due 06/01/2026 | | 1.5 | % | | $ | 2,062,500 |
| | | | | | | | |
| | Computer Peripherals | | | | | | |
| 4,000,000 | | Maxtor Corp.3 | | | | | | |
| | Notes, 6.80%, due 04/30/2010 | | 2.9 | % | | $ | 4,040,000 |
| | | | | | | | |
| | Healthcare Products | | | | | | |
| 2,000,000 | | Medtronic Inc. | | | | | | |
| | Notes, 1.50%, due 04/15/2011 | | 1.5 | % | | $ | 2,030,000 |
| | | | | | | | |
| | Healthcare Services | | | | | | |
| 4,000,000 | | Hologic Inc. | | | | | | |
| | Notes, 2.00%, due 12/15/2037 | | 2.5 | % | | $ | 3,415,000 |
| | | | | | | | |
| | Oil & Gas | | | | | | |
| 3,000,000 | | Transocean Inc. | | | | | | |
| | Notes, 1.63%, due 12/15/2037 | | 2.1 | % | | $ | 2,970,000 |
| | | | | | | | |
| | Real Estate Investment Trusts | | | | | | |
| 2,500,000 | | Prologis | | | | | | |
| | Notes, 1.88%, due 11/15/2037 | | | | | $ | 2,212,500 |
| 3,000,000 | | SL Green Realty | | | | | | |
| | Notes, 4.00%, due 06/15/2025 | | | | | | 2,985,000 |
| | | | | | | | |
| | | | 3.8 | % | | $ | 5,197,500 |
| | | | | | | | |
| | Semiconductors | | | | | | |
| 1,000,000 | | Intel Corp. | | | | | | |
| | Notes, 2.95%, due 12/15/2035 | | 0.7 | % | | $ | 965,000 |
| | | | | | | | |
| | Total investment in convertible bonds (cost $19,281,379) | | 15.0 | % | | $ | 20,680,000 |
| | | | | | | | |
| | | |
Principal Amount $ | | Corporate Bonds | | | | | |
| | Air Transportation | | | | | | |
| 2,000,000 | | Southwest Air 07-1 Trust | | | | | | |
| | Notes, 6.15%, due 08/01/2022 | | 1.4 | % | | $ | 1,980,000 |
| | | | | | | | |
| | Biotechnology | | | | | | |
| 3,000,000 | | Genentech Inc. | | | | | | |
| | Notes, 4.75%, due 07/15/2015 | | 2.3 | % | | $ | 3,210,819 |
| | | | | | | | |
| | Chemicals | | | | | | |
| 1,875,000 | | Praxair Inc. | | | | | | |
| | Notes, 4.38%, due 03/31/2014 | | | | | $ | 1,977,092 |
| 2,000,000 | | Praxair Inc. | | | | | | |
| | Notes, 4.50%, due 08/15/2019 | | | | | | 2,006,110 |
| | | | | | | | |
| | | | 2.9 | % | | $ | 3,983,202 |
| | | | | | | | |
| | Computers | | | | | | |
| 2,000,000 | | International Business Machines Corp. | | | | | | |
| | Notes, 6.50%, due 10/15/2013 | | 1.7 | % | | $ | 2,285,520 |
| | | | | | | | |
| | Cosmetics & Personal Care | | | | | | |
| 2,000,000 | | Procter & Gamble Co. | | | | | | |
| | Notes, 4.95%, due 08/15/2014 | | | | | $ | 2,175,978 |
| 500,000 | | Procter & Gamble Co. | | | | | | |
| | Notes, 3.50%, due 02/15/2015 | | | | | | 511,507 |
| | | | | | | | |
| | | | 1.9 | % | | $ | 2,687,485 |
| | | | | | | | |
| | Financial Services | | | | | | |
| 2,000,000 | | Charles Schwab Corp. | | | | | | |
| | Notes, 8.05%, due 03/01/2010 | | | | | $ | 2,023,010 |
| 2,000,000 | | Charles Schwab Corp. | | | | | | |
| | Notes, 4.95%, due 06/01/2014 | | | | | | 2,109,868 |
| 1,500,000 | | Goldman Sachs Inc. | | | | | | |
| | Notes, 5.75%, due 10/01/2016 | | | | | | 1,581,008 |
| 1,000,000 | | Goldman Sachs Inc. | | | | | | |
| | Notes, 5.63%, due 01/15/2017 | | | | | | 1,021,360 |
| 2,000,000 | | JPMorgan Chase & Co. | | | | | | |
| | Notes, 2.63%, due 12/01/2010 | | | | | | 2,039,316 |
| 2,000,000 | | Wells Fargo & Co. | | | | | | |
| | Notes, 3.00%, due 12/09/2011 | | | | | | 2,064,736 |
| | | | | | | | |
| | | | 7.9 | % | | $ | 10,839,298 |
| | | | | | | | |
| | Insurance | | | | | | |
| 2,500,000 | | AFLAC Inc. | | | | | | |
| | Notes, 8.50%, due 05/15/2019 | | 2.1 | % | | $ | 2,879,975 |
| | | | | | | | |
| | Networking Products | | | | | | |
| 2,800,000 | | Cisco Systems Inc. | | | | | | |
| | Notes, 5.50%, due 02/22/2016 | | 2.2 | % | | $ | 3,074,117 |
| | | | | | | | |
| | | | |
| | The accompanying notes are an integral part of these financial statements. | | 39 |
THE PARNASSUS FIXED - INCOME FUND
Portfolio of Investments as of
December 31, 2009 continued
| | | | | | | | |
Principal Amount $ | | Corporate Bonds | | Percent of
Net Assets | | | Market Value |
| | Oil & Gas | | | | | | |
| 2,000,000 | | Valero Energy Corp. | | | | | | |
| | Notes, 9.38%, due 03/15/2019 | | 1.7 | % | | $ | 2,378,796 |
| | | | | | | | |
| | Retail | | | | | | |
| 400,000 | | Target Corp. | | | | | | |
| | Notes, 7.50%, due 08/15/2010 | | | | | $ | 417,084 |
| 1,493,000 | | Target Corp. | | | | | | |
| | Notes, 5.13%, due 01/15/2013 | | | | | | 1,621,105 |
| | | | | | | | |
| | | | 1.5 | % | | $ | 2,038,189 |
| | | | | | | | |
| | Software | | | | | | |
| 2,000,000 | | Intuit Inc. | | | | | | |
| | Notes, 5.75%, due 03/15/2017 | | 1.5 | % | | $ | 2,071,506 |
| | | | | | | | |
| | Telecommunications Services | | | | | | |
| 1,000,000 | | Verizon Communications Inc. | | | | | | |
| | Notes, 5.55%, due 02/15/2016 | | 0.8 | % | | $ | 1,077,997 |
| | | | | | | | |
| | Transportation | | | | | | |
| 2,000,000 | | Burlington Northern Santa Fe Corp. | | | | | | |
| | Notes, 5.65%, due 05/01/2017 | | | | | $ | 2,128,762 |
| 2,000,000 | | Burlington Northern Santa Fe Corp. | | | | | | |
| | Notes, 4.70%, due 10/01/2019 | | | | | | 1,981,364 |
| | | | | | | | |
| | | | 3.0 | % | | $ | 4,110,126 |
| | | | | | | | |
| | Utility & Power Distribution | | | | | | |
| 2,000,000 | | AGL Capital Corp. | | | | | | |
| | Notes, 5.25%, due 08/15/2019 | | 1.5 | % | | $ | 2,014,002 |
| | | | | | | | |
| | Waste Management | | | | | | |
| 3,000,000 | | Waste Management Inc. | | | | | | |
| | Notes, 6.38%, due 03/11/2015 | | | | | $ | 3,324,399 |
| 2,000,000 | | Waste Management Inc. | | | | | | |
| | Notes, 7.13%, due 12/15/2017 | | | | | | 2,217,456 |
| | | | | | | | |
| | | | 4.0 | % | | $ | 5,541,855 |
| | | | | | | | |
| | Total investment in corporate bonds (cost $47,740,934) | | 36.4 | % | | $ | 50,172,887 |
| | | | | | | | |
| | | |
Shares | | Equities | | Percent of
Net Assets | | | Market Value |
| | Natural Gas | | | | | | |
| 30,000 | | ONEOK Inc. | | 1.0 | % | | $ | 1,337,100 |
| | | | | | | | |
| | Total investment in equities (cost $759,304) | | 1.0 | % | | $ | 1,337,100 |
| | | | | | | | |
| | | |
Principal Amount $ | | Municipal Bonds | | | | | |
| | General Obligation | | | | | | |
| 3,000,000 | | State of California | | | | | | |
| | 5.65%, due 04/01/2039 | | 2.2 | % | | $ | 3,060,930 |
| | | | | | | | |
| | Total investment in municipal bonds (cost $2,964,690) | | 2.2 | % | | $ | 3,060,930 |
| | | | | | | | |
| | | |
Principal Amount $ | | U.S. Government Agency Bonds | | | | | |
| 2,000,000 | | Fannie Mae | | | | | | |
| | 5.00%, due 03/02/2015 | | | | | $ | 2,198,408 |
| 3,000,000 | | Federal Farm Credit Bank | | | | | | |
| | 5.41%, due 11/07/2016 | | | | | | 3,131,922 |
| 1,500,000 | | Federal Home Loan Bank System | | | | | | |
| | 5.25%, due 09/12/2014 | | | | | | 1,656,335 |
| 3,000,000 | | Freddie Mac | | | | | | |
| | 4.00%, due 06/12/2013 | | | | | | 3,164,517 |
| 2,000,000 | | Freddie Mac | | | | | | |
| | 5.05%, due 01/26/2015 | | | | | | 2,189,642 |
| 2,000,000 | | Freddie Mac | | | | | | |
| | 5.50%, due 08/23/2017 | | | | | | 2,232,204 |
| 2,000,000 | | Freddie Mac | | | | | | |
| | 3.75%, due 03/27/2019 | | | | | | 1,960,842 |
| 2,000,000 | | Private Export Funding | | | | | | |
| | 4.38%, due 03/15/2019 | | | | | | 1,995,202 |
| | | | | | | | |
| | | | 13.4 | % | | $ | 18,529,072 |
| | | | | | | | |
| | Total investment in U.S. government agency bonds (cost $18,356,162) | | 13.4 | % | | $ | 18,529,072 |
| | | | | | | | |
| | | | |
| 40 | | The accompanying notes are an integral part of these financial statements. | | |
Portfolio of Investments as of
December 31, 2009 continued
| | | | | | | | | |
Principal Amount $ | | U.S. Government Treasury Bonds | | Percent of
Net Assets | | | Market Value | |
| 4,000,000 | | U.S. Treasury | | | | | | | |
| | 4.50%, due 02/28/2011 | | | | | $ | 4,175,156 | |
| 1,000,000 | | U.S. Treasury | | | | | | | |
| | 1.50%, due 07/15/2012 | | | | | | 1,001,562 | |
| 2,000,000 | | U.S. Treasury | | | | | | | |
| | 3.13%, due 09/30/2013 | | | | | | 2,078,594 | |
| 2,000,000 | | U.S. Treasury | | | | | | | |
| | 2.00%, due 11/30/2013 | | | | | | 1,989,376 | |
| 2,000,000 | | U.S. Treasury | | | | | | | |
| | 2.63%, due 06/30/2014 | | | | | | 2,014,532 | |
| 2,000,000 | | U.S. Treasury | | | | | | | |
| | 2.38%, due 09/30/2014 | | | | | | 1,983,120 | |
| 3,000,000 | | U.S. Treasury | | | | | | | |
| | 3.00%, due 09/30/2016 | | | | | | 2,944,452 | |
| 3,000,000 | | U.S. Treasury | | | | | | | |
| | 3.13%, due 10/31/2016 | | | | | | 2,962,266 | |
| 4,000,000 | | U.S. Treasury | | | | | | | |
| | 3.75%, due 11/15/2018 | | | | | | 3,999,688 | |
| 2,500,000 | | U.S. Treasury | | | | | | | |
| | 3.63%, due 08/15/2019 | | | | | | 2,457,813 | |
| 2,000,000 | | U.S. Treasury | | | | | | | |
| | 3.38%, due 11/15/2019 | | | | | | 1,923,760 | |
| 3,000,000 | | U.S. Treasury | | | | | | | |
| | 4.38%, due 11/15/2039 | | | | | | 2,871,564 | |
| 2,353,960 | | U.S. Treasury (TIPS) | | | | | | | |
| | 1.88%, due 07/15/2013 | | | | | | 2,479,198 | |
| 1,031,860 | | U.S. Treasury (TIPS) | | | | | | | |
| | 1.63%, due 01/15/2018 | | | | | | 1,056,286 | |
| 2,063,720 | | U.S. Treasury (TIPS) | | | | | | | |
| | 1.75%, due 01/15/2028 | | | | | | 1,978,913 | |
| | | | | | | | | |
| | | | 26.0 | % | | $ | 35,916,280 | |
| | | | | | | | | |
| | Total investment in U.S. government treasury bonds (cost $36,300,992) | | 26.0 | % | | $ | 35,916,280 | |
| | | | | | | | | |
| | Total investments in long-term securities (cost $125,403,461) | | 94.0 | % | | $ | 129,696,269 | |
| | | | | | | | | |
| | | |
Principal Amount $/ Shares | | Short-Term Securities | | Percent of
Net Assets | | | Market Value | |
| | Community Development Loans2 | | | | | | | |
| 100,000 | | MicroVest I, LP Note | | | | | | | |
| | 4.00%, matures 01/15/2010 | | 0.1 | % | | $ | 99,770 | |
| | | | | | | | | |
| | Time Deposit | | | | | | | |
| 6,527,420 | | BBH Cash Management Service Wells Fargo, Grand Cayman, | | | | | | | |
| | 0.03%, due 01/04/2010 | | 4.7 | % | | $ | 6,527,420 | |
| | | | | | | | | |
| | Securities Purchased with Cash Collateral from Securities Lending Registered Investment Companies | | | | | | | |
| 10,420 | | Invesco Aim Government & Agency Portfolio Short-Term Investments Trust, Institutional Class variable rate, 0.05% | | 0.0 | % | | $ | 10,420 | |
| | | | | | | | | |
| | Total short-term securities (cost $6,637,610) | | 4.8 | % | | $ | 6,637,610 | |
| | | | | | | | | |
| | Total securities (cost $132,041,071) | | 98.8 | % | | $ | 136,333,879 | |
| | | | | | | | | |
| | Payable upon return of securities loaned | | 0.0 | % | | $ | (10,420 | ) |
| | Other assets and liabilities – net | | 1.2 | % | | | 1,600,185 | |
| | | | | | | | | |
| | Total net assets | | 100.0 | % | | $ | 137,923,644 | |
| | | | | | | | | |
| 2 | Market value adjustments have been applied to these securities to reflect early withdrawal. |
| 3 | This security or partial position of this security was on loan at December 31, 2009. |
The total value of the securities on loan at December 31, 2009 was $10,213.
Fund holdings will vary over time.
Industry classifications are unaudited.
Fund shares are not FDIC insured.
| | | | |
| | The accompanying notes are an integral part of these financial statements. | | 41 |
THE PARNASSUS FUNDS
Statement of Assets and Liabilities
December 31, 2009
| | | | | | | | | | | | |
| | | Parnassus
Fund | | | Parnassus
Equity Income
Fund | | | Parnassus
Mid-Cap
Fund | |
Assets | | | | | | | | | | | | |
| | | |
Investments in equities and bonds, at market value (cost $314,867,997, $2,135,104,094, $18,344,919) | | $ | 344,398,453 | | | $ | 2,488,983,925 | | | $ | 21,905,334 | |
Investments in short-term securities
(at cost which approximates market value) | | | 22,668,431 | | | | 61,090,317 | | | | 1,096,844 | |
Cash | | | 221,808 | | | | 549,774 | | | | 11,456 | |
Receivables | | | | | | | | | | | | |
Dividends and interest | | | 62,807 | | | | 3,332,507 | | | | 38,495 | |
Capital shares sold | | | 418,174 | | | | 7,818,397 | | | | 172,340 | |
Other assets | | | 57,872 | | | | 140,206 | | | | 32,919 | |
Total assets | | $ | 367,827,545 | | | $ | 2,561,915,126 | | | $ | 23,257,388 | |
| | | |
Liabilities | | | | | | | | | | | | |
Payable upon return of loaned securities | | | 16,128,301 | | | | — | | | | 429,715 | |
Capital shares redeemed | | | 117,758 | | | | 2,289,867 | | | | — | |
Fees payable to Parnassus Investments | | | 243,273 | | | | 1,549,097 | | | | 11,898 | |
Accounts payable and accrued expenses | | | 162,317 | | | | 397,215 | | | | 11,486 | |
Total liabilities | | $ | 16,651,649 | | | $ | 4,236,179 | | | $ | 453,099 | |
| | | |
Net assets | | $ | 351,175,896 | | | $ | 2,557,678,947 | | | $ | 22,804,289 | |
| | | |
Net assets consists of | | | | | | | | | | | | |
| | | |
Undistributed net investment income | | | — | | | | 360,436 | | | | 6,172 | |
Unrealized appreciation on securities | | | 29,530,456 | | | | 353,879,831 | | | | 3,560,415 | |
Accumulated net realized gain (loss) | | | (11,590,988 | ) | | | (146,790,912 | ) | | | (881,960 | ) |
Capital paid-in | | | 333,236,428 | | | | 2,350,229,592 | | | | 20,119,662 | |
Total net assets | | $ | 351,175,896 | | | $ | 2,557,678,947 | | | $ | 22,804,289 | |
| | | |
Net assets value and offering per share | | | | | | | | | | | | |
Shares outstanding investor shares | | | 10,084,266 | | | | 96,698,019 | | | | 1,400,928 | |
Shares outstanding institutional shares | | | — | | | | 7,874,478 | | | | — | |
| | | |
Net asset values and redemption price per share
(Net asset value divided by shares outstanding) | | | | | | | | | | | | |
Investor shares | | $ | 34.82 | | | $ | 24.45 | | | $ | 16.28 | |
Institutional shares | | | — | | | $ | 24.51 | | | | — | |
| | | | |
| 42 | | The accompanying notes are an integral part of these financial statements. | | |
THE PARNASSUS FUNDS
Statement of Assets and Liabilities
December 31, 2009
| | | | | | | | | | | |
| | | Parnassus
Small-Cap
Fund | | | Parnassus
Workplace
Fund | | | Parnassus
Fixed-Income
Fund |
Assets | | | | | | | | | | | |
| | | |
Investments in equities and bonds, at market value (cost $103,345,700, $75,311,772, $125,403,461) | | $ | 112,422,870 | | | $ | 89,410,638 | | | $ | 129,696,269 |
Investments in short-term securities
(at cost which approximates market value) | | | 13,810,595 | | | | 5,593,199 | | | | 6,637,610 |
Cash | | | 28,775 | | | | 1,784 | | | | 22,758 |
Receivables | | | | | | | | | | | |
Dividends and interest | | | 40,071 | | | | 63,005 | | | | 1,347,624 |
Capital shares sold | | | 409,760 | | | | 294,560 | | | | 341,876 |
Other assets | | | 30,318 | | | | 29,745 | | | | 48,522 |
Total assets | | $ | 126,742,389 | | | $ | 95,392,931 | | | $ | 138,094,659 |
| | | |
Liabilities | | | | | | | | | | | |
| | | |
Payable upon return of loaned securities | | | 11,463,598 | | | | — | | | | 10,420 |
Capital shares redeemed | | | 18,687 | | | | 3,813 | | | | 59,691 |
Fees payable to Parnassus Investments | | | 74,863 | | | | 74,458 | | | | 66,396 |
Accounts payable and accrued expenses | | | 17,679 | | | | 14,911 | | | | 34,508 |
Total liabilities | | $ | 11,574,827 | | | $ | 93,182 | | | $ | 171,015 |
| | | |
Net assets | | $ | 115,167,562 | | | $ | 95,299,749 | | | $ | 137,923,644 |
| | | |
Net assets consists of | | | | | | | | | | | |
| | | |
Undistributed net investment income | | | 19,342 | | | | — | | | | 36,636 |
Unrealized appreciation on securities | | | 9,077,170 | | | | 14,098,866 | | | | 4,292,808 |
Accumulated net realized gain (loss) | | | (707,884 | ) | | | (160,839 | ) | | | 596,818 |
Capital paid-in | | | 106,778,934 | | | | 81,361,722 | | | | 132,997,382 |
Total net assets | | $ | 115,167,562 | | | $ | 95,299,749 | | | $ | 137,923,644 |
| | | |
Net assets value and offering per share | | | | | | | | | | | |
| | | |
Shares outstanding investor shares | | | 6,427,911 | | | | 4,898,726 | | | | 8,237,622 |
Shares outstanding institutional shares | | | — | | | | — | | | | — |
| | | |
Net asset values and redemption price per share
(Net asset value divided by shares outstanding) | | | | | | | | | | | |
Investor shares | | $ | 17.92 | | | $ | 19.45 | | | $ | 16.74 |
Institutional shares | | | — | | | | — | | | | — |
| | | | |
| | The accompanying notes are an integral part of these financial statements. | | 43 |
THE PARNASSUS FUNDS
Statement of Operations
Year Ended December 31, 2009
| | | | | | | | | | | | |
| | | Parnassus
Fund | | | Parnassus
Equity Income
Fund | | | Parnassus
Mid-Cap
Fund | |
Investment income | | | | | | | | | | | | |
| | | |
Dividends
(net of foreign tax withholding of $0, $1,267,072, $0) | | $ | 3,345,257 | | | $ | 47,185,832 | | | $ | 261,049 | |
Interest | | | 27,619 | | | | 230,785 | | | | 220 | |
Securities lending | | | — | | | | — | | | | 194 | |
Other income | | | — | | | | 46,076 | | | | 8 | |
Total investment income | | $ | 3,372,876 | | | $ | 47,462,693 | | | $ | 261,471 | |
| | | |
Expenses | | | | | | | | | | | | |
| | | |
Investment advisory fees | | | 1,753,384 | | | | 11,971,178 | | | | 112,261 | |
Transfer agent fees | | | | | | | | | | | | |
Investor shares | | | 333,340 | | | | 572,772 | | | | 18,748 | |
Institutional shares | | | — | | | | 4,960 | | | | — | |
Fund administration | | | 158,356 | | | | 1,113,339 | | | | 7,972 | |
Service provider fees | | | 119,816 | | | | 3,139,361 | | | | 20,566 | |
Reports to shareholders | | | 94,510 | | | | 466,837 | | | | 9,673 | |
Registration fees and expenses | | | 31,324 | | | | 84,005 | | | | 22,932 | |
Custody fees | | | 19,988 | | | | 87,660 | | | | 2,894 | |
Professional fees | | | 76,051 | | | | 184,747 | | | | 22,123 | |
Trustee fees and expenses | | | 10,746 | | | | 94,550 | | | | 409 | |
Proxy voting fees | | | 5,201 | | | | 5,201 | | | | 5,201 | |
Pricing service fees | | | 3,566 | | | | 5,303 | | | | 3,322 | |
Other expenses | | | 21,247 | | | | 98,000 | | | | 3,583 | |
Total expenses | | $ | 2,627,529 | | | $ | 17,827,913 | | | $ | 229,684 | |
Fees waived by Parnassus Investments | | | (38,004 | ) | | | (39,548 | ) | | | (71,187 | ) |
Net expenses | | $ | 2,589,525 | | | $ | 17,788,365 | | | $ | 158,497 | |
Net investment income | | $ | 783,351 | | | $ | 29,674,328 | | | $ | 102,974 | |
| | | |
Net realized and unrealized gain on investments | | | | | | | | | | | | |
Net realized gain (loss) from securities transactions | | | (6,019,098 | ) | | | (93,175,611 | ) | | | 33,041 | |
Net change in unrealized appreciation of securities | | | 106,136,592 | | | | 572,692,104 | | | | 4,662,447 | |
Net realized and unrealized gain on securities | | $ | 100,117,494 | | | $ | 479,516,493 | | | $ | 4,695,488 | |
Net increase in net assets resulting from operations | | $ | 100,900,845 | | | $ | 509,190,821 | | | $ | 4,798,462 | |
| | | | |
| 44 | | The accompanying notes are an integral part of these financial statements. | | |
THE PARNASSUS FUNDS
Statement of Operations
Year Ended December 31, 2009
| | | | | | | | | | | | |
| | | Parnassus
Small-Cap
Fund | | | Parnassus
Workplace
Fund | | | Parnassus
Fixed-Income
Fund | |
Investment income | | | | | | | | | | | | |
| | | |
Dividends
(net of foreign tax withholding of $0, $1,814, $0) | | $ | 1,287,074 | | | $ | 558,636 | | | $ | 49,200 | |
Interest | | | 1,475 | | | | 955 | | | | 4,479,124 | |
Securities lending | | | 4,405 | | | | 347 | | | | 389 | |
Other income | | | — | | | | 866 | | | | — | |
Total investment income | | $ | 1,292,954 | | | $ | 560,804 | | | $ | 4,528,713 | |
| | | |
Expenses | | | | | | | | | | | | |
| | | |
Investment advisory fees | | | 641,311 | | | | 349,285 | | | | 591,770 | |
Transfer agent fees | | | | | | | | | | | | |
Investor shares | | | 63,018 | | | | 28,533 | | | | 93,930 | |
Institutional shares | | | — | | | | — | | | | — | |
Fund administration | | | 38,645 | | | | 24,496 | | | | 72,182 | |
Service provider fees | | | 111,610 | | | | 75,476 | | | | 148,485 | |
Reports to shareholders | | | 20,917 | | | | 11,829 | | | | 38,266 | |
Registration fees and expenses | | | 23,362 | | | | 23,514 | | | | 29,766 | |
Custody fees | | | 9,078 | | | | 9,385 | | | | 8,650 | |
Professional fees | | | 27,697 | | | | 25,581 | | | | 24,265 | |
Trustee fees and expenses | | | 1,632 | | | | 489 | | | | 6,176 | |
Proxy voting fees | | | 5,201 | | | | 5,201 | | | | — | |
Pricing service fees | | | 3,322 | | | | 3,322 | | | | 2,453 | |
Other expenses | | | 4,198 | | | | 4,017 | | | | 9,287 | |
Total expenses | | $ | 949,991 | | | $ | 561,128 | | | $ | 1,025,230 | |
Fees waived by Parnassus Investments | | | (177,311 | ) | | | (66,802 | ) | | | (133,755 | ) |
Net expenses | | $ | 772,680 | | | $ | 494,326 | | | $ | 891,475 | |
Net investment income | | $ | 520,274 | | | $ | 66,478 | | | $ | 3,637,238 | |
| | | |
Net realized and unrealized gain (loss) on investments | | | | | | | | | | | | |
Net realized gain (loss) from securities transactions | | | 581,429 | | | | 1,619,133 | | | | 1,822,543 | |
Net change in unrealized appreciation of securities | | | 19,436,881 | | | | 16,134,618 | | | | 3,186,893 | |
Net realized and unrealized gain on securities | | $ | 20,018,310 | | | $ | 17,753,751 | | | $ | 5,009,436 | |
Net increase in net assets resulting from operations | | $ | 20,538,584 | | | $ | 17,820,229 | | | $ | 8,646,674 | |
| | | | |
| | The accompanying notes are an integral part of these financial statements. | | 45 |
THE PARNASSUS FUNDS
Statement of Changes in Net Assets
| | | | | | | | | | | | | | | | |
| | | Parnassus Fund | | | Parnassus Equity Income Fund | |
| | | Year Ended
December 31, 2009 | | | Year Ended
December 31, 2008 | | | Year Ended
December 31, 2009 | | | Year Ended
December 31, 2008 | |
Investment income (loss) from operations | | | | | | | | | | | | | | | | |
| | | | |
Net investment income | | $ | 783,351 | | | $ | 1,231,693 | | | $ | 29,674,328 | | | $ | 13,949,834 | |
Net realized gain (loss) from securities transactions | | | (6,019,098 | ) | | | (5,156,106 | ) | | | (93,175,611 | ) | | | (52,646,973 | ) |
Net change in unrealized appreciation (depreciation) | | | 106,136,592 | | | | (87,966,171 | ) | | | 572,692,104 | | | | (317,042,900 | ) |
Increase (decrease) in net assets resulting from operations | | $ | 100,900,845 | | | $ | (91,890,584 | ) | | $ | 509,190,821 | | | $ | (355,740,039 | ) |
| | | | |
Distributions | | | | | | | | | | | | | | | | |
| | | | |
From net investment income | | | | | | | | | | | | | | | | |
Investor shares | | | (801,000 | ) | | | (1,234,658 | ) | | | (27,158,743 | ) | | | (12,894,893 | ) |
Institutional shares | | | — | | | | — | | | | (2,632,132 | ) | | | (1,103,973 | ) |
From net realized capital gains | | | | | | | | | | | | | | | | |
Investor shares | | | — | | | | (2,266,392 | ) | | | — | | | | — | |
Institutional shares | | | — | | | | — | | | | — | | | | — | |
Distributions to shareholders | | $ | (801,000 | ) | | $ | (3,501,050 | ) | | $ | (29,790,875 | ) | | $ | (13,998,866 | ) |
| | | | |
Capital share transactions | | | | | | | | | | | | | | | | |
| | | | |
Investor shares | | | | | | | | | | | | | | | | |
Proceeds from sale of shares | | | 130,749,677 | | | | 15,379,125 | | | | 1,145,591,539 | | | | 1,202,371,687 | |
Reinvestment of dividends | | | 771,805 | | | | 3,371,366 | | | | 26,534,461 | | | | 12,567,117 | |
Shares repurchased | | | (54,356,287 | ) | | | (29,455,595 | ) | | | (649,436,787 | ) | | | (334,510,748 | ) |
Institutional shares | | | | | | | | | | | | | | | | |
Proceeds from sale of shares | | | — | | | | — | | | | 99,277,149 | | | | 124,284,268 | |
Reinvestment of dividends | | | — | | | | — | | | | 2,253,927 | | | | 1,061,513 | |
Shares repurchased | | | — | | | | — | | | | (83,655,936 | ) | | | (11,094,404 | ) |
Increase (decrease) in net assets from capital share transactions | | | 77,165,195 | | | | (10,705,104 | ) | | | 540,564,353 | | | | 994,679,433 | |
Increase (decrease) in net assets | | $ | 177,265,040 | | | $ | (106,096,738 | ) | | $ | 1,019,964,299 | | | $ | 624,940,528 | |
| | | | |
Net assets | | | | | | | | | | | | | | | | |
| | | | |
Beginning of year | | | 173,910,856 | | | | 280,007,594 | | | | 1,537,714,648 | | | | 912,774,120 | |
End of year | | $ | 351,175,896 | | | $ | 173,910,856 | | | $ | 2,557,678,947 | | | $ | 1,537,714,648 | |
Undistributed net investment income | | $ | — | | | $ | — | | | $ | 360,436 | | | $ | 476,988 | |
| | | | |
Shares issued and redeemed | | | | | | | | | | | | | | | | |
| | | | |
Investor shares | | | | | | | | | | | | | | | | |
Shares sold | | | 4,472,562 | | | | 501,518 | | | | 55,859,627 | | | | 53,549,001 | |
Shares issued through dividend reinvestment | | | 22,001 | | | | 165,928 | | | | 1,265,437 | | | | 578,474 | |
Shares repurchased | | | (1,781,078 | ) | | | (934,268 | ) | | | (33,024,100 | ) | | | (15,810,045 | ) |
Institutional shares | | | | | | | | | | | | | | | | |
Shares sold | | | — | | | | — | | | | 4,836,577 | | | | 5,800,852 | |
Shares issued through dividend reinvestment | | | — | | | | — | | | | 108,794 | | | | 49,984 | |
Shares repurchased | | | — | | | | — | | | | (4,180,890 | ) | | | (523,646 | ) |
Net increase (decrease) in shares outstanding | | | | | | | | | | | | | | | | |
Investor shares | | | 2,713,485 | | | | (266,822 | ) | | | 24,100,964 | | | | 38,317,430 | |
Institutional shares | | | — | | | | — | | | | 764,481 | | | | 5,327,190 | |
| | | | |
| 46 | | The accompanying notes are an integral part of these financial statements. | | |
THE PARNASSUS FUNDS
Statement of Changes in Net Assets
| | | | | | | | | | | | | | | | |
| | | Parnassus Mid-Cap Fund | | | Parnassus Small-Cap Fund | |
| | | Year Ended
December 31, 2009 | | | Year Ended
December 31, 2008 | | | Year Ended
December 31, 2009 | | | Year Ended
December 31, 2008 | |
Investment income (loss) from operations | | | | | | | | | | | | | | | | |
| | | | |
Net investment income | | $ | 102,974 | | | $ | 23,029 | | | $ | 520,274 | | | $ | 76,307 | |
Net realized gain (loss) from securities transactions | | | 33,041 | | | | (907,302 | ) | | | 581,429 | | | | (1,274,547 | ) |
Net change in unrealized appreciation (depreciation) | | | 4,662,447 | | | | (1,003,356 | ) | | | 19,436,881 | | | | (10,187,701 | ) |
Increase (decrease) in net assets resulting from operations | | $ | 4,798,462 | | | $ | (1,887,629 | ) | | $ | 20,538,584 | | | $ | (11,385,941 | ) |
| | | | |
Distributions | | | | | | | | | | | | | | | | |
| | | | |
From net investment income | | | | | | | | | | | | | | | | |
Investor shares | | | (100,010 | ) | | | (18,950 | ) | | | (500,932 | ) | | | (78,271 | ) |
Institutional shares | | | — | | | | — | | | | — | | | | — | |
From net realized capital gains | | | | | | | | | | | | | | | | |
Investor shares | | | — | | | | (94,589 | ) | | | — | | | | — | |
Institutional shares | | | — | | | | — | | | | — | | | | — | |
Distributions to shareholders | | $ | (100,010 | ) | | $ | (113,539 | ) | | $ | (500,932 | ) | | $ | (78,271 | ) |
| | | | |
Capital share transactions | | | | | | | | | | | | | | | | |
| | | | |
Investor shares | | | | | | | | | | | | | | | | |
Proceeds from sale of shares | | | 13,904,599 | | | | 4,576,237 | | | | 96,769,553 | | | | 50,771,084 | |
Reinvestment of dividends | | | 93,614 | | | | 106,873 | | | | 476,204 | | | | 75,521 | |
Shares repurchased | | | (2,564,812 | ) | | | (2,533,998 | ) | | | (28,920,613 | ) | | | (20,574,644 | ) |
Institutional shares | | | | | | | | | | | | | | | | |
Proceeds from sale of shares | | | — | | | | — | | | | — | | | | — | |
Reinvestment of dividends | | | — | | | | — | | | | — | | | | — | |
Shares repurchased | | | — | | | | — | | | | — | | | | — | |
Increase in net assets from capital share transactions | | | 11,433,401 | | | | 2,149,112 | | | | 68,325,144 | | | | 30,271,961 | |
Increase in net assets | | $ | 16,131,853 | | | $ | 147,944 | | | $ | 88,362,796 | | | $ | 18,807,749 | |
| | | | |
Net assets | | | | | | | | | | | | | | | | |
| | | | |
Beginning of year | | | 6,672,436 | | | | 6,524,492 | | | | 26,804,766 | | | | 7,997,017 | |
End of year | | $ | 22,804,289 | | | $ | 6,672,436 | | | $ | 115,167,562 | | | $ | 26,804,766 | |
Undistributed net investment income | | $ | 6,172 | | | $ | 3,205 | | | $ | 19,342 | | | $ | — | |
Shares issued and redeemed | | | | | | | | | | | | | | | | |
Investor shares | | | | | | | | | | | | | | | | |
Shares sold | | | 1,034,864 | | | | 338,634 | | | | 6,188,538 | | | | 3,065,626 | |
Shares issued through dividend reinvestment | | | 5,694 | | | | 10,100 | | | | 26,281 | | | | 6,160 | |
Shares repurchased | | | (195,879 | ) | | | (167,660 | ) | | | (1,909,788 | ) | | | (1,421,846 | ) |
Institutional shares | | | | | | | | | | | | | | | | |
Shares sold | | | — | | | | — | | | | — | | | | — | |
Shares issued through dividend reinvestment | | | — | | | | — | | | | — | | | | — | |
Shares repurchased | | | — | | | | — | | | | — | | | | — | |
Net increase in shares outstanding | | | | | | | | | | | | | | | | |
Investor shares | | | 844,679 | | | | 181,074 | | | | 4,305,031 | | | | 1,649,940 | |
Institutional shares | | | — | | | | — | | | | — | | | | — | |
| | | | |
| | The accompanying notes are an integral part of these financial statements. | | 47 |
THE PARNASSUS FUNDS
Statement of Changes in Net Assets
| | | | | | | | | | | | | | | | |
| | | Parnassus Workplace Fund | | | Parnassus Fixed-Income Fund | |
| | | Year Ended
December 31, 2009 | | | Year Ended
December 31, 2008 | | | Year Ended
December 31, 2009 | | | Year Ended
December 31, 2008 | |
Investment income (loss) from operations | | | | | | | | | | | | | | | | |
| | | | |
Net investment income | | $ | 66,478 | | | $ | 16,166 | | | $ | 3,637,238 | | | $ | 2,678,514 | |
Net realized gain (loss) from securities transactions | | | 1,619,133 | | | | (74,509 | ) | | | 1,822,543 | | | | 602,324 | |
Net change in unrealized appreciation (depreciation) | | | 16,134,618 | | | | (2,227,968 | ) | | | 3,186,893 | | | | (667,483 | ) |
| | | | |
Increase (decrease) in net assets resulting from operations | | $ | 17,820,229 | | | $ | (2,286,311 | ) | | $ | 8,646,674 | | | $ | 2,613,355 | |
| | | | |
Distributions | | | | | | | | | | | | | | | | |
| | | | |
From net investment income | | | | | | | | | | | | | | | | |
Investor shares | | | (81,582 | ) | | | — | | | | (3,605,838 | ) | | | (3,286,208 | ) |
Institutional shares | | | — | | | | — | | | | — | | | | — | |
From net realized capital gains | | | | | | | | | | | | | | | | |
Investor shares | | | (1,644,173 | ) | | | (56,594 | ) | | | (1,225,726 | ) | | | (32,159 | ) |
Institutional shares | | | — | | | | — | | | | — | | | | — | |
Distributions to shareholders | | $ | (1,725,755 | ) | | $ | (56,594 | ) | | $ | (4,831,564 | ) | | $ | (3,318,367 | ) |
| | | | |
Capital share transactions | | | | | | | | | | | | | | | | |
| | | | |
Investor shares | | | | | | | | | | | | | | | | |
Proceeds from sale of shares | | | 82,800,029 | | | | 7,725,804 | | | | 59,903,976 | | | | 41,592,869 | |
Reinvestment of dividends | | | 1,674,027 | | | | 56,007 | | | | 4,347,218 | | | | 2,969,659 | |
Shares repurchased | | | (13,220,176 | ) | | | (1,780,611 | ) | | | (30,212,203 | ) | | | (24,650,137 | ) |
Institutional shares | | | | | | | | | | | | | | | | |
Proceeds from sale of shares | | | — | | | | — | | | | — | | | | — | |
Reinvestment of dividends | | | — | | | | — | | | | — | | | | — | |
Shares repurchased | | | — | | | | — | | | | — | | | | — | |
Increase in net assets from capital share transactions | | | 71,253,880 | | | | 6,001,200 | | | | 34,038,991 | | | | 19,912,391 | |
| | | | |
Increase in net assets | | $ | 87,348,354 | | | $ | 3,658,295 | | | $ | 37,854,101 | | | $ | 19,207,379 | |
| | | | |
Net assets | | | | | | | | | | | | | | | | |
| | | | |
Beginning of year | | | 7,951,395 | | | | 4,293,100 | | | | 100,069,543 | | | | 80,862,164 | |
End of year | | $ | 95,299,749 | | | $ | 7,951,395 | | | $ | 137,923,644 | | | $ | 100,069,543 | |
| | | | |
Undistributed net investment income | | $ | — | | | $ | 14,355 | | | $ | 36,636 | | | $ | 5,235 | |
| | | | |
Shares issued and redeemed | | | | | | | | | | | | | | | | |
| | | | |
Investor shares | | | | | | | | | | | | | | | | |
Shares sold | | | 4,952,279 | | | | 538,479 | | | | 3,623,605 | | | | 2,571,690 | |
Shares issued through dividend reinvestment | | | 85,552 | | | | 5,274 | | | | 261,061 | | | | 183,918 | |
Shares repurchased | | | (789,968 | ) | | | (136,871 | ) | | | (1,828,882 | ) | | | (1,536,864 | ) |
Institutional shares | | | | | | | | | | | | | | | | |
Shares sold | | | — | | | | — | | | | — | | | | — | |
Shares issued through dividend reinvestment | | | — | | | | — | | | | — | | | | — | |
Shares repurchased | | | — | | | | — | | | | — | | | | — | |
Net increase in shares outstanding | | | | | | | | | | | | | | | | |
Investor shares | | | 4,247,863 | | | | 406,882 | | | | 2,055,784 | | | | 1,218,744 | |
Institutional shares | | | — | | | | — | | | | — | | | | — | |
| | | | |
| 48 | | The accompanying notes are an integral part of these financial statements. | | |
THE PARNASSUS FUNDS
Notes to Financial Statements
1. Organization and Significant Accounting Policies
The Parnassus Funds are comprised of two Trusts, the Parnassus Funds trust and the Parnassus Income Funds trust (collectively the “Trusts”), organized as Massachusetts Business Trusts registered under the Investment Company Act of 1940 as diversified, open-end investment management companies, and are comprised of six separate funds (collectively the “Funds”). The Parnassus Funds trust includes the Parnassus Fund which commenced operations on December 27, 1984 and the Parnassus Mid-Cap Fund, the Parnassus Small-Cap Fund and the Parnassus Workplace Fund, which commenced operations on April 29, 2005. The Parnassus Income Funds trust includes the Parnassus Equity Income Fund and the Parnassus Fixed-Income Fund, both of which commenced operations on August 31,1992. Each Fund has distinct investment objectives. In general, the Funds seek long-term capital appreciation. Parnassus Equity Income Fund and Parnassus Fixed-Income Fund also seek current income.
Securities Valuations
Equity securities that are listed or traded on a national securities exchange are stated at market value, based on recorded closing sales on the exchange or on the Nasdaq’s National Market official closing price. In the absence of a recorded sale, and for over-the-counter securities, equity securities are stated at the mean between the last recorded bid and asked prices. Long-term, fixed-income securities are valued each business day using prices based on procedures established by independent pricing services and approved by the Board of Trustees (the “Trustees”). Fixed-income securities with an active market are valued at the “bid” price where such quotes are readily available from brokers and dealers and are representative of the actual market for such securities. Other fixed-income securities experiencing a less active market are valued as determined by the pricing services based on methods which include consideration of trading in securities of comparable yield, quality, coupon, maturity and type, as well as indications as to values from dealers and other market data without exclusive reliance upon quoted prices or over-the-counter prices, since such valuations are believed to reflect more accurately the value of such securities. Short-term investments in U.S. government agency discount notes are valued at amortized cost, which approximates market value. Investments in registered investment companies are valued at their net asset value.
Investments where market quotations are not readily available are priced at their fair value, in accordance with procedures established by the Trustees. In determining fair value, the Trustees may consider a variety of information including, but not limited to, the following: price based upon a multiple of earnings or sales, fundamental analytical data and an evaluation of market conditions. A valuation adjustment is applied to certificates of deposit, community development loans and other community development investments as an estimate of potential penalties for early withdrawal.
The Funds follow accounting standards codification (“ASC”) 820, Fair Value Measurements and Disclosure, which defines fair value, establishes a framework for measuring fair value and expands disclosures about fair value measurements. Various inputs are used in determining the value of the Funds’ portfolio investments. These inputs are summarized in three levels, Level 1 – quoted prices in active markets for identical investments, Level 2 – other significant observable inputs (including quoted prices for similar investments) and Level 3 – significant unobservable inputs (including the Fund’s own assumptions in determining the fair value of investments).
Federal Income Taxes
The Trusts intend to comply with the requirements of the Internal Revenue Code applicable to regulated investment companies and to distribute all taxable income to shareholders. Therefore, no federal income tax provision is required. Income distributions and capital-gain distributions are determined in accordance with income tax regulations, which may differ from U.S. Generally Accepted Accounting Principles (“GAAP”).
The Funds follow ASC 740, Income Taxes, relating to uncertainty in income taxes and disclosures. ASC 740 establishes a minimum threshold for income tax benefits to be recognized in the financial statements. These tax benefits must meet a “more likely than not” threshold, which means that based on technical merits, they have a more than 50% likelihood of being sustained upon examination by the tax authority. Tax benefits meeting this threshold are measured as the largest amount of tax benefit that is greater than 50% likely of being realized upon ultimate settlement with the tax authority. As of and during the year ended December 31, 2009, the Funds did not have a liability for any unrecognized tax benefits. The Funds recognize interest and penalties, if any, related to unrecognized tax benefits as income tax expense in the Statement of Operations. During the year the Funds did not incur interest or penalties. The Funds are not subject to examination by U.S. federal taxing authorities or state taxing authorities for the years before 2006 and 2005, respectively.
Securities Transactions
Securities transactions are recorded on the date the securities are purchased or sold (trade date). Realized gains and losses on securities transactions are determined on the basis of first-in, first-out for both financial statement and federal income tax purposes.
49
THE PARNASSUS FUNDS
Notes to Financial Statements continued
Investment Income, Expenses, and Distributions
Dividend income is recognized on the ex-dividend date and interest income is recognized on an accrual basis. Discounts and premiums on securities purchased are amortized over the lives of the respective securities using the constant yield method, which approximates the interest method. Expenses are recorded on an accrual basis. Distributions to shareholders are recorded on the ex-dividend date to shareholders of record on the record date. The Parnassus Equity Income Fund pays income dividends quarterly and capital-gain dividends annually. The Parnassus Fixed-Income Fund pays income dividends monthly and capital–gain dividends annually. The other Funds pay income and capital-gain dividends annually.
Securities Lending
The Parnassus Funds have the ability to lend securities to approved financial institutions to earn additional income and receive cash and/or securities as collateral to secure the loans. Collateral is maintained at not less than 102% of the value of loaned securities. Although the risk of lending is mitigated by the collateral, the Funds could experience a delay in recovering securities and a possible loss of income or value if the borrower fails to return them.
Community Development Investment Programs
The Parnassus Funds may each invest up to 2% of their assets in community investments and community-development loan funds. Each of the Funds may invest in obligations issued by community loan funds at below-market interest rates if the projects financed have a positive social impact. Generally, there is no secondary market on loan funds and thus these are considered illiquid.
As part of our community development investment program, the Parnassus Equity Income Fund has entered into an agreement for fund investments through the Certificate of Deposit Account Registry Service (“CDARS”) network. The CDARS network allows members to place funds in time deposits with depository institutions whose accounts are insured by the Federal Deposit Insurance Corporation (“FDIC”). Provisions stipulate that participating institutions are FDIC insured, however, in the event of default or bankruptcy by any party to the agreement, the proceeds of the investment may be delayed or subject to legal proceedings and are subject to FDIC limits.
The Parnassus Equity Income Fund holds debt instruments issued by Microvest I, LP, a microfinance limited partnership specializing in providing capital to international microfinance institutions (“MFI’s”) that extend credit to developing countries and the entrepreneurial poor. This instrument may be subject to political and foreign currency exchange risk not normally associated with domestic debt instruments. Microvest I, LP’s investment in MFI’s can be affected by, among other factors, commodity prices, inflation, interest rates, taxation, social instability, and other political, economic or diplomatic developments in or affecting the various countries where MFI’s operate.
Capital Stock
Capital stock consists of an unlimited number of authorized shares of capital stock, no par value.
Risk Factors
Investing in the Parnassus Funds may involve certain risks including, but not limited to the following:
The prices of, and the income generated by, the common stocks and other securities held by the Funds may decline in response to certain events taking place around the world, including those directly involving the companies whose securities are owned by the Funds; conditions affecting the general economy; overall market changes; local, regional or global political, social or economic instability; and currency, interest rate and commodity price fluctuations. Additionally, the values of, and the income generated by, most debt securities held by the fund may be affected by changing interest rates and by changes in the effective maturities and credit ratings of these debt securities. The Funds’ investment adviser attempts to reduce these risks through diversification of the portfolio and ongoing credit analysis as well as by monitoring economic and legislative developments, but there can be no assurance that it will be successful at doing so. Investments in securities issued by entities based outside the U.S. may also be affected by currency controls; different accounting, auditing, financial reporting, and legal standards and practices; expropriation; changes in tax policy; greater market volatility; different securities market structures and higher transaction costs.
Use of Estimates
The preparation of financial statements in conformity with GAAP requires management to make estimates and assumptions that affect the reported amounts of assets and liabilities at the date of the financial statements and the reported amounts of revenues and expenses during the reporting period. Actual results could differ from those estimates.
50
Notes to Financial Statements continued
Recent Accounting Pronouncements
In May 2009, the Financial Accounting Standards Board (“FASB”) issued Statement of Financial Accounting Standards No.165, Subsequent Events (codified into ASC Topic 855, Subsequent Events), which provides guidance on management’s general standards of accounting for and disclosure of events that occur after the balance sheet date, but before financial statements are issued or are available to be issued. The standard does not apply to subsequent events or transactions that are within the scope of other applicable GAAP standards that provide different guidance on the accounting treatment for subsequent events or transactions. The Funds initially adopted the standard with these financial statements. The initial application of the standard had no impact on the Funds. The Funds have evaluated subsequent events through January 28, 2010.
In January 2010, the FASB issued Accounting Standards Update No. 2010-06 (“ASU 2010-06”), Improving Disclosures about Fair Value Measurements, which, among other things, amends ASC 820 to require entities to separately present purchases, sales, issuances, and settlements in their reconciliation of Level 3 fair value measurements (i.e., to present such items on a gross basis rather than on a net basis), and which clarifies existing disclosure requirements provided by ASC 820 regarding the level of disaggregation and the inputs and valuation techniques used to measure fair value for measurements that fall within either Level 2 or Level 3 of the fair value hierarchy. ASU 2010-06 is effective for interim and annual periods beginning after December 15, 2009, except for the disclosures about purchases, sales, issuances, and settlements in the roll forward of activity in Level 3 fair value measurements (which are effective for fiscal years beginning after December 15, 2010, and for interim periods within those fiscal years). The Funds are currently assessing the impact that the adoption of ASU 2010-06 will have on the Funds financial statement disclosures.
2. Fair Value Measurements
The following is a summary of the inputs used as of December 31, 2009 in valuing the Funds’ investments in securities:
| | | | | | | | | | | | |
Fund | | Level 1 | | Level 2 | | Level 3 | | Total |
Parnassus Fund | | $ | 360,526,754 | | $ | — | | $ | 1,378,738 | | $ | 361,905,492 |
Parnassus Equity Income Fund | | | 2,487,547,133 | | | — | | | 5,179,461 | | | 2,492,726,594 |
Parnassus Mid-Cap Fund | | | 22,335,049 | | | — | | | — | | | 22,335,049 |
Parnassus Small-Cap Fund | | | 123,886,468 | | | — | | | — | | | 123,886,468 |
Parnassus Workplace Fund | | | 89,410,638 | | | — | | | — | | | 89,410,638 |
Parnassus Fixed-Income Fund | | | 1,347,520 | | | 128,359,169 | | | 99,770 | | | 129,806,460 |
The following is a reconciliation of investments in which significant unobservable inputs are utilized on a recurring basis (Level 3) were used in determining fair value:
| | | | | | | | | | | |
| | | Parnassus
Fund | | | Parnassus
Equity Income
Fund | | Parnassus
Fixed-Income
Fund | |
Balance as of 12/31/2008 | | $ | 1,280,008 | | | $ | 4,759,700 | | $ | — | |
Discounts/premiums amortization | | | (1,270 | ) | | | 69,761 | | | (230 | ) |
Net purchases (sales) | | | 100,000 | | | | 350,000 | | | 100,000 | |
Balance as of 12/31/2009 | | | 1,378,738 | | | | 5,179,461 | | | 99,770 | |
51
THE PARNASSUS FUNDS
Notes to Financial Statements continued
3. Tax Matters and Distributions
The tax character of distributions paid during the years ended December 31, 2009 and 2008, were as follows:
| | | | | | | | | | | | | | | | | | |
| | | Parnassus
Fund | | Parnassus
Equity Income
Fund | | Parnassus
Mid-Cap
Fund |
Distributions paid from: | | 2009 | | 2008 | | 2009 | | 2008 | | 2009 | | 2008 |
Ordinary income | | $ | 783,351 | | $ | 1,231,700 | | $ | 29,790,876 | | $ | 13,998,866 | | $ | 100,010 | | $ | 19,824 |
Long-term capital gains | | | — | | | 2,268,400 | | | — | | | — | | | — | | | 93,715 |
Total distributions | | $ | 783,351 | | $ | 3,500,100 | | $ | 29,790,876 | | $ | 13,998,866 | | $ | 100,010 | | $ | 113,539 |
| | | |
| | | Parnassus
Small-Cap
Fund | | Parnassus
Workplace
Fund | | Parnassus
Fixed-Income
Fund |
Distributions paid from: | | 2009 | | 2008 | | 2009 | | 2008 | | 2009 | | 2008 |
Ordinary income | | $ | 500,932 | | $ | 76,307 | | $ | 1,587,257 | | $ | 1,811 | | $ | 4,765,078 | | $ | 3,298,672 |
Long-term capital gains | | | — | | | — | | | 137,236 | | | 54,783 | | | 66,486 | | | 19,695 |
Total distributions | | $ | 500,932 | | $ | 76,307 | | $ | 1,724,493 | | $ | 56,594 | | $ | 4,831,564 | | $ | 3,318,367 |
At December 31, 2009, the cost of investments in long-term securities, net unrealized appreciation/depreciation, distributable earnings and undistributed earnings for income tax purposes were as follows:
| | | | | | | | | | | | | | | | | | |
| | | Parnassus
Fund | | Parnassus
Equity Income
Fund | | Parnassus
Mid-Cap
Fund | | Parnassus
Small-Cap
Fund | | Parnassus
Workplace
Fund | | Parnassus
Fixed-Income
Fund |
Costs of investment | | $ | 317,073,815 | | $ | 2,145,465,120 | | $ | 18,426,052 | | $ | 103,984,379 | | $ | 75,472,204 | | $ | 125,403,461 |
Unrealized appreciation | | | 37,408,789 | | | 379,438,948 | | �� | 3,583,032 | | | 12,160,541 | | | 14,232,406 | | | 5,261,990 |
Unrealized depreciation | | | 7,878,333 | | | 25,559,117 | | | 22,617 | | | 3,083,371 | | | 133,540 | | | 969,182 |
Net unrealized appreciation (depreciation) | | $ | 29,530,456 | | $ | 353,879,831 | | $ | 3,560,415 | | $ | 9,077,170 | | $ | 14,098,866 | | $ | 4,292,808 |
Distributable earnings – ordinary income | | $ | 783,351 | | $ | 29,674,325 | | $ | 102,976 | | $ | 520,274 | | $ | 1,572,901 | | $ | 4,796,478 |
Distributable earnings – long-term capital gains | | $ | — | | $ | — | | $ | — | | $ | — | | $ | 137,236 | | $ | 663,304 |
Undistributed earnings – ordinary income | | $ | — | | $ | 360,436 | | $ | 6,172 | | $ | 19,342 | | $ | — | | $ | 36,636 |
Undistributed earnings – long-term capital gains | | $ | — | | $ | — | | $ | — | | $ | — | | $ | — | | $ | 596,818 |
52
Notes to Financial Statements continued
At December 31, 2009, estimated net capital loss carryforwards, which are available to offset future net realized capital gains, were:
| | | | | |
Fund | | Expiration
Year | | Capital Loss
Carryforwards |
Parnassus Fund | | 2016 | | $ | 6,604,411 |
| | 2015 | | | 2,708,300 |
| | |
Parnassus Equity Income Fund | | 2016 | | | 115,687,525 |
| | 2015 | | | 17,627,601 |
| | |
Parnassus Mid-Cap Fund | | 2016 | | | 7,777 |
| | 2015 | | | 793,050 |
| | |
Parnassus Small-Cap Fund | | 2015 | | | 69,205 |
Post October capital losses as of December 31, 2009, which are deferred until 2010 for tax purposes:
| | | |
Fund | | Deferred
Post-October
Capital Loss |
Parnassus Equity Income Fund | | $ | 3,114,760 |
Net investment income and net ordinary income is the same for all Funds for financial statement and tax purposes during the year ended December 31, 2009. Net realized gains differ for financial statement and tax purposes primarily due to differing treatment of wash sales.
Reclassifications as shown in the following table have been made in each Fund’s capital accounts to report these balances on a tax basis, excluding certain temporary differences, as of December 31, 2009. Additional adjustments may be required in subsequent reporting periods. These reclassifications, which have no impact on the net asset value of the Funds, are primarily attributable to the reclassification of dividend income and certain differences in the computation of distributable income and capital gains under Federal tax rules versus GAAP.
| | | | | | | | | | |
Fund | | Increase
in Undistributed
Net Investment Income | | Increase
in Undistributed
Net Realized Gain/Loss | | Decrease in
Capital Paid-in | |
Parnassus Fund | | $ | 17,649 | | $ | — | | $ | (17,649 | ) |
Parnassus Workplace Fund | | | 748 | | | 514 | | | (1,262 | ) |
4. Purchases and Sales of Securities
Purchases and proceeds from sales of securities, excluding short-term securities, for the year ended December 31, 2009 were as follows:
| | | | | | |
Fund | | Purchases | | Sales |
Parnassus Fund | | $ | 206,353,604 | | $ | 134,710,272 |
Parnassus Equity Income Fund | | | 1,665,590,939 | | | 1,046,952,020 |
Parnassus Mid-Cap Fund | | | 15,927,875 | | | 5,150,269 |
Parnassus Small-Cap Fund | | | 95,921,066 | | | 28,034,605 |
Parnassus Workplace Fund | | | 76,841,080 | | | 12,780,985 |
Parnassus Fixed-Income Fund | | | 83,138,653 | | | 50,974,560 |
53
THE PARNASSUS FUNDS
Notes to Financial Statements continued
5. Investment Advisory Agreement and Transactions with Affiliates
Under terms of an agreement which provides for furnishing investment management and advice to the Funds, Parnassus Investments is entitled to receive fees payable monthly, based on each Fund’s average daily net assets for the month, at the following annual rates:
Parnassus Fund: 1.00% of the first $10,000,000, 0.75% of the next $20,000,000, 0.70% of the next $70,000,000, 0.65% of the next $100,000,000 and 0.60% of the remaining balance. Parnassus Mid-Cap Fund and Parnassus Workplace Fund: 0.85% of the first $100,000,000, 0.80% of the next $100,000,000, 0.75% of the next $300,000,000 and 0.70% of the amount above $500,000,000. Parnassus Small-Cap Fund: 1.00% of the first $100,000,000, 0.90% of the next $100,000,000, 0.85% of the next $300,000,000 and 0.80% of the amount above $500,000,000. For the year ended December 31, 2009, Parnassus Investments has contractually agreed to reduce its investment advisory fee to the extent necessary to limit total operating expenses to 0.99% of net assets for the Parnassus Fund, 1.20% of net assets for the Parnassus Mid-Cap Fund, Parnassus Small-Cap Fund and the Parnassus Workplace Fund.
Parnassus Equity Income Fund: 0.75% of the first $30,000,000, 0.70% of the next $70,000,000 and 0.65% of the amount above $100,000,000. Parnassus Fixed-Income Fund: 0.50% of the first $200,000,000, 0.45% of the next $200,000,000 and 0.40% of the amount above $400,000,000. For the year ended December 31, 2009, Parnassus Investments has contractually agreed to reduce its investment advisory fee to the extent necessary to limit total operating expenses to 0.99% of net assets for the Parnassus Equity Income Fund – Investor Shares, 0.78% of net assets for the Parnassus Equity Income Fund – Institutional Shares, and 0.87% of net assets for the Parnassus Fixed-Income Fund. Parnassus Investments further waived an additional 0.12% of net assets for Parnassus Fixed-Income Fund for the year ended December 31, 2009.
Parnassus Investments receives fees under terms of a separate agreement which provides for furnishing transfer agent and fund administration services to the funds. The transfer agent fee was $2.50 per month per account plus any out-of-pocket expenses for the Parnassus Fund, Parnassus Mid-Cap Fund, Parnassus Small-Cap Fund and Parnassus Workplace Fund. The transfer agent fee was $2.70 per month per account plus any out-of-pocket expenses for the Parnassus Equity Income Fund and Parnassus Fixed-Income Fund. The Funds pay the monthly fee based on the number of accounts on record at each month-end. The fund administration reflects annual rates based on net assets for all funds managed by Parnassus Investments and was allocated based on respective fund net assets. The fund administration services fee was 0.07% of average net assets under this new agreement for the year ended December 31, 2009.
Parnassus Investments may also arrange for third parties to provide certain services, including account maintenance, recordkeeping and other personal services to their clients who invest in the funds. For these services, the Funds may pay service providers an aggregate service fee on investment accounts at a rate not to exceed 0.25% per annum of average daily net assets. The Parnassus Equity Income Fund – Institutional Shares does not incur service provider fees.
54
THE PARNASSUS FUNDS
Financial Highlights
Selected data for each share of capital stock outstanding, total return and ratios/supplemental data for each of the five years ended December 31 are as follows:
Parnassus Fund
| | | | | | | | | | | | | | | | | | | | |
| | | 2009 | | | 2008 | | | 2007 | | | 2006 | | | 2005 | |
Net asset value at beginning of year | | $ | 23.59 | | | $ | 36.66 | | | $ | 36.23 | | | $ | 31.68 | | | $ | 31.09 | |
Net investment income (loss) | | | 0.09 | | | | 0.17 | | | | — | | | | (0.04 | ) | | | 0.16 | |
Net realized and unrealized gain (loss) on securities | | | 11.22 | | | | (12.76 | ) | | | 2.03 | | | | 4.59 | | | | 0.63 | |
Total from investment operations | | | 11.31 | | | | (12.59 | ) | | | 2.03 | | | | 4.55 | | | | 0.79 | |
Dividends from net investment income | | | (0.08 | ) | | | (0.17 | ) | | | (0.01 | ) | | | — | | | | (0.20 | ) |
Distributions from net realized gains on securities | | | — | | | | (0.31 | ) | | | (1.59 | ) | | | — | | | | — | |
Total distributions | | | (0.08 | ) | | | (0.48 | ) | | | (1.60 | ) | | | — | | | | (0.20 | ) |
Net asset value at end of year | | $ | 34.82 | | | $ | 23.59 | | | $ | 36.66 | | | $ | 36.23 | | | $ | 31.68 | |
Total overall return | | | 47.94 | % | | | (34.12 | %) | | | 5.43 | % | | | 14.36 | % | | | 2.55 | % |
Ratio of gross expenses to average net assets | | | 1.00 | % | | | 1.01 | % | | | 1.00 | % | | | 1.01 | % | | | 1.03 | % |
Ratio of net expenses to average net assets (net of waiver and expense offset arrangements) | | | 0.99 | %(f) | | | 0.99 | %(f) | | | 0.99 | %(f) | | | 0.99 | %(f) | | | 0.99 | %(f) |
Ratio of net investment income (loss) to average net assets | | | 0.30 | % | | | 0.51 | % | | | (0.01 | %) | | | (0.13 | %) | | | 0.53 | % |
Portfolio turnover rate | | | 53.24 | % | | | 98.38 | % | | | 88.67 | % | | | 141.98 | % | | | 136.07 | % |
Net assets, end of year (000s) | | $ | 351,176 | | | $ | 173,911 | | | $ | 280,008 | | | $ | 337,646 | | | $ | 292,384 | |
55
THE PARNASSUS FUNDS
Financial Highlights continued
Parnassus Equity Income Fund – Investor Shares
| | | | | | | | | | | | | | | | | | | | |
| | | 2009 | | | 2008 | | | 2007 | | | 2006 | | | 2005 | |
Net asset value at beginning of year | | $ | 19.29 | | | $ | 25.31 | | | $ | 24.83 | | | $ | 24.02 | | | $ | 25.00 | |
Net investment income | | | 0.33 | | | | 0.27 | | | | 0.20 | | | | 0.30 | | | | 0.41 | |
Net realized and unrealized gain (loss) on securities | | | 5.15 | | | | (6.05 | ) | | | 3.28 | | | | 3.23 | | | | 0.24 | |
Total from investment operations | | | 5.48 | | | | (5.78 | ) | | | 3.48 | | | | 3.53 | | | | 0.65 | |
Dividends from net investment income | | | (0.32 | ) | | | (0.24 | ) | | | (1.18 | ) | | | (1.38 | ) | | | (0.85 | ) |
Distributions from net realized gains on securities | | | — | | | | — | | | | (1.82 | ) | | | (1.34 | ) | | | (0.78 | ) |
Total distributions | | | (0.32 | ) | | | (0.24 | ) | | | (3.00 | ) | | | (2.72 | ) | | | (1.63 | ) |
Net asset value at end of year | | $ | 24.45 | | | $ | 19.29 | | | $ | 25.31 | | | $ | 24.83 | | | $ | 24.02 | |
Total overall return | | | 28.73 | % | | | (22.95 | %) | | | 14.13 | % | | | 14.70 | % | | | 2.62 | % |
Ratio of gross expenses to average net assets | | | 0.99 | % | | | 0.99 | % | | | 1.03 | % | | | 1.06 | % | | | 1.07 | % |
Ratio of net expenses to average net assets (net of waiver and expense offset arrangements) | | | 0.99 | %(f) | | | 0.99 | %(f) | | | 0.99 | %(f) | | | 0.99 | %(f) | | | 0.99 | %(f) |
Ratio of net investment income to average net assets | | | 1.60 | % | | | 1.21 | % | | | 0.73 | % | | | 1.17 | % | | | 1.63 | % |
Portfolio turnover rate | | | 60.16 | % | | | 70.20 | % | | | 91.42 | % | | | 116.75 | % | | | 109.54 | % |
Net assets, end of year (000s) | | $ | 2,364,691 | | | $ | 1,400,214 | | | $ | 867,577 | | | $ | 808,104 | | | $ | 906,844 | |
Parnassus Equity Income Fund – Institutional Shares
| | | | | | | | | | | | | | | | |
| | | 2009 | | | 2008 | | | 2007 | | | 2006 (e) | |
Net asset value at beginning of period | | $ | 19.34 | | | $ | 25.35 | | | $ | 24.86 | | | $ | 25.59 | |
Net investment income | | | 0.37 | | | | 0.32 | | | | 0.25 | | | | 0.19 | |
Net realized and unrealized gain (loss) on securities | | | 5.16 | | | | (6.05 | ) | | | 3.28 | | | | 1.73 | |
Total from investment operations | | | 5.53 | | | | (5.73 | ) | | | 3.53 | | | | 1.92 | |
Dividends from net investment income | | | (0.36 | ) | | | (0.28 | ) | | | (1.22 | ) | | | (1.31 | ) |
Distributions from net realized gains on securities | | | — | | | | — | | | | (1.82 | ) | | | (1.34 | ) |
Total distributions | | | (0.36 | ) | | | (0.28 | ) | | | (3.04 | ) | | | (2.65 | ) |
Net asset value at end of year | | $ | 24.51 | | | $ | 19.34 | | | $ | 25.35 | | | $ | 24.86 | |
Total overall return | | | 28.97 | % | | | (22.73 | %) | | | 14.35 | % | | | 7.46 | %(a) |
Ratio of gross expenses to average net assets | | | 0.77 | % | | | 0.79 | % | | | 0.82 | % | | | 0.85 | %(b) |
Ratio of net expenses to average net assets (net of waiver and expense offset arrangements) | | | 0.77 | %(f) | | | 0.78 | %(f) | | | 0.78 | %(f) | | | 0.78 | %(f) |
Ratio of net investment income to average net assets | | | 1.81 | % | | | 1.44 | % | | | 0.95 | % | | | 1.10 | %(b) |
Portfolio turnover rate | | | 60.16 | % | | | 70.20 | % | | | 91.42 | % | | | 116.75 | % |
Net assets, end of period (000s) | | $ | 192,987 | | | $ | 137,501 | | | $ | 45,197 | | | $ | 46,471 | |
56
Financial Highlights continued
Parnassus Mid-Cap Fund
| | | | | | | | | | | | | | | | | | | | |
| | | 2009 | | | 2008 | | | 2007 | | | 2006 | | | 2005 (d) | |
Net asset value at beginning of period | | $ | 12.00 | | | $ | 17.39 | | | $ | 17.36 | | | $ | 15.30 | | | $ | 15.00 | |
Net investment income (loss) | | | 0.11 | | | | 0.06 | | | | (0.08 | ) | | | (0.06 | ) | | | 0.04 | |
Net realized and unrealized gain (loss) on securities | | | 4.24 | | | | (5.21 | ) | | | 0.40 | | | | 2.47 | | | | 0.44 | |
Total from investment operations | | | 4.35 | | | | (5.15 | ) | | | 0.32 | | | | 2.41 | | | | 0.48 | |
Dividends from net investment income | | | (0.07 | ) | | | (0.03 | ) | | | (0.12 | ) | | | (0.29 | ) | | | (0.04 | ) |
Distributions from net realized gains on securities | | | — | | | | (0.21 | ) | | | (0.17 | ) | | | (0.07 | ) | | | (0.14 | ) |
Total distributions | | | (0.07 | ) | | | (0.24 | ) | | | (0.29 | ) | | | (0.36 | ) | | | (0.18 | ) |
Net asset value at end of year | | $ | 16.28 | | | $ | 12.00 | | | $ | 17.39 | | | $ | 17.36 | | | $ | 15.30 | |
Total overall return | | | 36.26 | % | | | (29.38 | %) | | | 1.81 | % | | | 15.78 | % | | | 3.22 | %(a) |
Ratio of gross expenses to average net assets | | | 1.73 | % | | | 2.25 | % | | | 2.04 | % | | | 5.29 | % | | | 9.03 | %(b) |
Ratio of net expenses to average net assets (net of waiver and expense offset arrangements) | | | 1.20 | %(f)(g) | | | 1.20 | %(f)(g) | | | 1.40 | %(f) | | | 1.40 | %(f) | | | 1.40 | %(b) |
Ratio of net investment income (loss) to average net assets | | | 0.78 | % | | | 0.40 | % | | | (0.42 | %) | | | (0.35 | %) | | | 0.37 | %(b) |
Portfolio turnover rate | | | 40.11 | % | | | 132.74 | % | | | 76.85 | % | | | 122.04 | % | | | 31.41 | %(a) |
Net assets, end of period (000s) | | $ | 22,804 | | | $ | 6,672 | | | $ | 6,524 | | | $ | 2,409 | | | $ | 640 | |
Parnassus Small-Cap Fund
| | | | | | | | | | | | | | | | | | | | |
| | | 2009 | | | 2008 | | | 2007 | | | 2006 | | | 2005 (d) | |
Net asset value at beginning of period | | $ | 12.63 | | | $ | 16.91 | | | $ | 17.94 | | | $ | 15.76 | | | $ | 15.00 | |
Net investment income (loss) | | | 0.13 | | | | 0.08 | | | | (0.13 | ) | | | (0.10 | ) | | | (0.03 | ) |
Net realized and unrealized gain (loss) on securities | | | 5.24 | | | | (4.32 | ) | | | (0.56 | ) | | | 3.07 | | | | 1.18 | |
Total from investment operations | | | 5.37 | | | | (4.24 | ) | | | (0.69 | ) | | | 2.97 | | | | 1.15 | |
Dividends from net investment income | | | (0.08 | ) | | | (0.04 | ) | | | (0.04 | ) | | | (0.74 | ) | | | (0.39 | ) |
Distributions from net realized gains on securities | | | — | | | | — | | | | (0.30 | ) | | | (0.05 | ) | | | — | |
Total distributions | | | (0.08 | ) | | | (0.04 | ) | | | (0.34 | ) | | | (0.79 | ) | | | (0.39 | ) |
Net asset value at end of year | | $ | 17.92 | | | $ | 12.63 | | | $ | 16.91 | | | $ | 17.94 | | | $ | 15.76 | |
Total overall return | | | 42.50 | % | | | (25.08 | %) | | | (3.92 | %) | | | 18.78 | % | | | 7.65 | %(a) |
Ratio of gross expenses to average net assets | | | 1.47 | % | | | 1.86 | % | | | 2.06 | % | | | 3.03 | % | | | 7.27 | %(b) |
Ratio of net expenses to average net assets (net of waiver and expense offset arrangements) | | | 1.20 | %(f)(g) | | | 1.20 | %(f)(g) | | | 1.40 | %(f) | | | 1.40 | %(f) | | | 1.40 | %(b) |
Ratio of net investment income (loss) to average net assets | | | 0.81 | % | | | 0.51 | % | | | (0.72 | %) | | | (0.56 | %) | | | (0.27 | %)(b) |
Portfolio turnover rate | | | 46.00 | % | | | 100.41 | % | | | 100.30 | % | | | 125.00 | % | | | 86.20 | %(a) |
Net assets, end of period (000s) | | $ | 115,168 | | | $ | 26,805 | | | $ | 7,997 | | | $ | 5,269 | | | $ | 1,225 | |
57
THE PARNASSUS FUNDS
Financial Highlights continued
Parnassus Workplace Fund
| | | | | | | | | | | | | | | | | | | | |
| | | 2009 | | | 2008 | | | 2007 | | | 2006 | | | 2005 (d) | |
Net asset value at beginning of period | | $ | 12.22 | | | $ | 17.60 | | | $ | 17.05 | | | $ | 15.49 | | | $ | 15.00 | |
Net investment income | | | 0.03 | | | | 0.05 | | | | 0.03 | | | | 0.02 | | | | 0.04 | |
Net realized and unrealized gain (loss) on securities | | | 7.56 | | | | (5.33 | ) | | | 0.94 | | | | 2.28 | | | | 0.50 | |
Total from investment operations | | | 7.59 | | | | (5.28 | ) | | | 0.97 | | | | 2.30 | | | | 0.54 | |
Dividends from net investment income | | | (0.33 | ) | | | — | | | | (0.17 | ) | | | (0.61 | ) | | | (0.05 | ) |
Distributions from net realized gains on securities | | | (0.03 | ) | | | (0.10 | ) | | | (0.25 | ) | | | (0.13 | ) | | | — | |
Total distributions | | | (0.36 | ) | | | (0.10 | ) | | | (0.42 | ) | | | (0.74 | ) | | | (0.05 | ) |
Net asset value at end of year | | $ | 19.45 | | | $ | 12.22 | | | $ | 17.60 | | | $ | 17.05 | | | $ | 15.49 | |
Total overall return | | | 62.13 | % | | | (29.94 | %) | | | 5.64 | % | | | 14.84 | % | | | 3.60 | %(a) |
Ratio of gross expenses to average net assets | | | 1.36 | % | | | 2.32 | % | | | 2.64 | % | | | 4.04 | % | | | 6.91 | %(b) |
Ratio of net expenses to average net assets (net of waiver and expense offset arrangements) | | | 1.20 | %(f) | | | 1.20 | %(f) | | | 1.20 | %(f) | | | 1.20 | %(f) | | | 1.20 | %(b) |
Ratio of net investment income (loss) to average net assets | | | 0.16 | % | | | 0.30 | % | | | 0.16 | % | | | 0.12 | % | | | 0.39 | %(b) |
Portfolio turnover rate | | | 32.73 | % | | | 72.58 | % | | | 56.18 | % | | | 96.93 | % | | | 27.55 | %(a) |
Net assets, end of period (000s) | | $ | 95,300 | | | $ | 7,951 | | | $ | 4,293 | | | $ | 2,362 | | | $ | 1,013 | |
Parnassus Fixed-Income Fund
| | | | | | | | | | | | | | | | | | | | |
| | | 2009 | | | 2008 | | | 2007 | | | 2006 | | | 2005 | |
Net asset value at beginning of year | | $ | 16.19 | | | $ | 16.29 | | | $ | 16.11 | | | $ | 15.79 | | | $ | 15.87 | |
Net investment income | | | 0.51 | | | | 0.47 | | | | 0.67 | | | | 0.67 | | | | 0.48 | |
Net realized and unrealized gain (loss) on securities | | | 0.69 | | | | 0.01 | | | | 0.25 | | | | 0.49 | | | | (0.08 | ) |
Total from investment operations | | | 1.20 | | | | 0.48 | | | | 0.92 | | | | 1.16 | | | | 0.40 | |
Dividends from net investment income | | | (0.64 | ) | | | (0.57 | ) | | | (0.69 | ) | | | (0.74 | ) | | | (0.48 | ) |
Distributions from net realized gains on securities | | | (0.01 | ) | | | (0.01 | ) | | | (0.05 | ) | | | (0.10 | ) | | | — | |
Return of capital | | | — | | | | — | | | | — | | | | — | | | | — | |
Total distributions | | | (0.65 | ) | | | (0.58 | ) | | | (0.74 | ) | | | (0.84 | ) | | | (0.48 | ) |
Net asset value at end of year | | $ | 16.74 | | | $ | 16.19 | | | $ | 16.29 | | | $ | 16.11 | | | $ | 15.79 | |
Total overall return | | | 7.48 | % | | | 2.98 | % | | | 5.81 | % | | | 7.45 | % | | | 2.55 | % |
Ratio of gross expenses to average net assets | | | 0.87 | % | | | 0.88 | % | | | 0.87 | % | | | 0.92 | % | | | 1.01 | % |
Ratio of net expenses to average net assets (net of waiver and expense offset arrangements) | | | 0.75 | %(f) | | | 0.75 | %(f) | | | 0.75 | %(f) | | | 0.75 | %(f) | | | 0.75 | % |
Ratio of net investment income to average net assets | | | 3.07 | % | | | 2.90 | % | | | 4.13 | % | | | 4.13 | % | | | 3.03 | % |
Portfolio turnover rate | | | 46.24 | % | | | 44.87 | % | | | 32.48 | % | | | 41.27 | % | | | 34.08 | % |
Net assets, end of year (000s) | | $ | 137,924 | | | $ | 100,070 | | | $ | 80,862 | | | $ | 62,520 | | | $ | 45,879 | |
| (a) | Not annualized for periods less than one year. |
| (c) | Income (loss) from operations per share is based on average daily shares outstanding. |
| (d) | The Parnassus Mid-Cap Fund, the Parnassus Small-Cap Fund and the Parnassus Workplace Fund commenced operations on April 29, 2005, and the period shown is from April 29, 2005 through December 31, 2005. |
| (e) | The Parnassus Equity Income Fund – Institutional Shares commenced operations on April 28, 2006, and the period shown is from April 28, 2006 through December 31, 2006. |
| (f) | Parnassus Investments has contractually limited expenses to an annualized rate of 0.99% for the Parnassus Fund, 0.99% for Parnassus Equity Income Fund – Investor Shares, 0.78% for the Parnassus Equity Income Fund – Institutional Shares, 1.20% for the Parnassus Mid-Cap Fund, Parnassus Small-Cap Fund and the Parnassus Workplace Fund and 0.87% for the Parnassus Fixed-Income Fund. Parnassus Investments has also voluntarily limited additional expenses for the Parnassus Fixed-Income Fund. (See note 5 for details). |
58
ADDITIONAL INFORMATION (unaudited)
Board of Trustees and Officers
| | | | | | | | |
| | | Independent Trustees§ | | Interested Trustee† |
| Name | | Herbert A. Houston | | Jeanie S. Joe | | Donald V. Potter | | Jerome L. Dodson†† |
| | | | |
| Age | | 66 | | 62 | | 64 | | 66 |
| | | | |
| Address | | 1 Market Street Suite 1600 San Francisco, California 94105 | | 1 Market Street Suite 1600 San Francisco, California 94105 | | 1 Market Street Suite 1600 San Francisco, California 94105 | | 1 Market Street Suite 1600 San Francisco, California 94105 |
| | | | |
| Position(s) Held with Funds | | Trustee | | Trustee | | Trustee | | President and Trustee |
| | | | |
| Term of Office and Length of Service | | Indefinite. Since 1992 for Parnassus Income Funds. Since 1998 for Parnassus Funds. | | Indefinite. Since 2004. | | Indefinite. Since 2002. | | Indefinite. Since 1992 for Parnassus Income Funds. Since 1984 for the Parnassus Funds. |
| | | | |
| Principal Occupation(s) During Past 5 Years | | Healthcare consultant and owner of several small businesses. | | President of Geo/ Resource Consultants, a geotechnical and environmental consulting firm, since 1995. | | President and owner of Windermere Associates, a consulting firm specializing in business strategy, since 1984. | | President and Trustee of the Parnassus Funds and the Parnassus Income Funds since their inceptions; President and Director of Parnassus Investments, since June 1984. |
| | | | |
| Portfolios in the Fund Complex Overseen by Trustee | | Six | | Six | | Six | | Six |
| | | | |
| Other Directorships Held by Trustee | | None | | None | | None | | None |
| § | “Independent” trustees are trustees who are not deemed to be “interested persons” of the funds, as defined in the Investment Company Act of 1940. |
| † | An “interested” trustee is a trustee who is deemed to be an “interested person” of the funds, as defined in the Investment Company Act of 1940. Jerome L. Dodson is an interested person of the funds because of his ownership in the funds’ investment adviser and because he is an officer of the Trusts. |
Additional information about the fund’s Board of Trustees is available in the Statement of Additional Information. The Statement of Additional information is available without charge on the Securities and Exchange Commission’s website (www.sec.gov) or by calling us at (800) 999-3505.
ADDITIONAL INFORMATION (unaudited) continued
Board of Trustees and Officers continued
| | | | | | | | |
| | | Officers§ |
| Name | | Todd C. Ahlsten | | Marc C. Mahon | | Richard D. Silberman | | John V. Skidmore II |
| | | | |
| Age | | 37 | | 32 | | 71 | | 44 |
| | | | |
| Address | | 1 Market Street Suite 1600 San Francisco, California 94105 | | 1 Market Street Suite 1600 San Francisco, California 94105 | | 1 Market Street Suite 1600 San Francisco, California 94105 | | 1 Market Street Suite 1600 San Francisco, California 94105 |
| | | | |
| Position(s) Held with Funds | | Vice President | | Treasurer | | Secretary | | Chief Compliance Officer and Assistant Secretary |
| | | | |
| Term of Office and Length of Service | | Indefinite. Since 2001. | | Indefinite. Since 2007. | | Indefinite. Since 1986. | | Indefinite. Since 2008. |
| | | | |
| Principal Occupation(s) During Past 5 Years | | Vice President of the Parnassus Funds and Parnassus Income Funds since 2001. Chief Investment Officer of Parnassus Investments since 2007. Director of Research at Parnassus Investments from 1995 to 2007. Portfolio Manager of Parnassus Equity Income Fund since 2001. | | Chief Financial Officer of Parnassus Investments since December 2007. Treasurer of Parnassus Funds and Parnassus Income Funds since March 2007. Accounting Manager of Parnassus Funds and Parnassus Income Funds 2004 to 2007. | | Retired business lawyer. | | Chief Compliance Officer of Parnassus Investments since February 2008. Deputy Chief Compliance Officer of AssetMark Investment Services from 2005 to 2007. Vice President of Wells Fargo Funds Management from 2000 to 2005. |
ADDITIONAL INFORMATION (unaudited) continued
Proxy Disclosures
Parnassus proxy voting policies and procedures are available, without charge, on our website (www.parnassus.com), on the Securities and Exchange Commission’s website (www.sec.gov) and by calling us at (800) 999-3505. The Funds file a proxy voting record with the Securities and Exchange Commission for the 12 months ended June 30. The most recent report is available by calling Parnassus or obtaining from the Securities and Exchange Commission’s website or our Parnassus website.
Quarterly Portfolio Schedule
The Funds file their complete schedule of portfolio holdings with the Securities and Exchange Commission for the first and third quarters of each fiscal year on Form N-Q. The quarterly portfolio holdings are available on the Securities and Exchange Commission’s website (www.sec.gov). The Funds’ Form N-Q may also be reviewed and copied at the Securities and Exchange Commission’s Public Reference Room in Washington, DC, and information on the operation of the Public Reference Room may be obtained by calling (800) SEC-0330.
Federal Income Tax Information
For the year ended December 31, 2009, the following percentages of ordinary income distributed by the Funds that qualify for the individual qualified dividend income deduction (QDI) and the corporate dividends received deduction (DRD) are as follows:
| | | | | | |
| | | QDI | | | DRD | |
Parnassus Fund | | 100.00 | % | | 100.00 | % |
Parnassus Equity Income Fund | | 100.00 | % | | 100.00 | % |
Parnassus Mid-Cap Fund | | 100.00 | % | | 100.00 | % |
Parnassus Small-Cap Fund | | 100.00 | % | | 100.00 | % |
Parnassus Workplace Fund | | 34.85 | % | | 34.35 | % |
Parnassus Fixed-Income Fund | | 1.03 | % | | 1.02 | % |

THE PARNASSUS FUNDS
1 Market Street, Suite 1600 San Francisco, CA 94105
(800) 999-3505 (415) 778-0200
www.parnassus.com
Investment Adviser
Parnassus Investments
1 Market Street, Suite 1600
San Francisco, CA 94105
Independent Registered Public Accounting Firm
Deloitte & Touche LLP
50 Fremont Street
San Francisco, CA 94105
Legal Counsel
Foley & Lardner LLP
777 E. Wisconsin Ave.
Milwaukee, WI 53202
Distributor
Parnassus Funds Distributor
1 Market Street, Suite 1600
San Francisco, CA 94105
This report must be preceded or accompanied by a current prospectus.
Printed on recycled paper with soy-based ink.
Item 2: Code of Ethics
The registrant has adopted a code of ethics dated July 22, 2003 that applies to the registrant’s principal executive officer (President) and principal financial officer (Treasurer) for the fiscal year ending December 31, 2009. During the fiscal year ending December 31, 2009 there were no amendments to any provisions of this code of ethics.
Item 3: Audit Committee Financial Expert
The Board of Trustees of the Parnassus Income Funds determined that Donald Potter, Chairman of the board’s Audit Committee, qualified as an “audit committee financial expert” as defined by Form N-CSR. The Trustee’s decision was based on Mr. Potter’s understanding of generally accepted accounting principles (GAAP), experience applying GAAP, familiarity with internal controls and procedures for financial reporting and understanding of audit committee functions. He gained this knowledge from thirty years of experience as a strategy consultant for major corporations while working at McKinsey & Co. Management Consultants and at his own firm, Windermere Associates. He also spent four years working as a financial executive for a Fortune 500 company. He served as Chairman of the Audit Committee of Media Arts Group and has also served on the Audit Committees of DLJ Direct and Peer Foods. Mr. Potter is a graduate of Harvard Business School where he was named a Baker Scholar for finishing in the top 5% of his class. Mr. Potter is an independent trustee.
Item 4: Principal Accountant Fees and Services
(a) Audit Fees
The aggregate fees billed for professional services rendered by the principal accountant for the audit of the registrant’s annual financial statements or services that are normally provided by the accountant in connection with statutory and regulatory filings or engagements for the fiscal years ended December 31, 2008 and 2009 were $112,565 and $73,004 respectively.
(b) Audit-Related Fees
The aggregate fees billed for assurance and related services rendered by the principal accountants that are reasonably related to the performance of the audit of the registrant’s financial statements and are not reported under paragraph (a) of this Item for the fiscal years ended December 31, 2008 and 2009 were $3,973 and $0 respectively. Audit-related services relate to providing an internal control letter for affiliated transfer agent operations which are billed to the registrant’s investment advisor.
(c) Tax Fees
The aggregate fees billed for professional services rendered by the principal accountant for tax compliance, tax advice, and tax planning for the fiscal years ended December 31, 2008 and 2009 were $13,800 and $8,800 respectively.
(d) All Other Fees
There were no fees billed in each of the last two fiscal years for products and services by the principal accountant, other than the services reported in paragraphs(a) through (c) of this Item.
(e)(1) The Audit committee’s pre-approval policies and procedures are as follows:
The audit committee is required to pre-approve all audit services and permitted non-audit services provided by the independent accountants for the Parnassus Fund, affiliated funds, and other services affiliated.
Explicit pre-approval by the Audit Committee Chair shall be required for any individual non-audit engagement to be performed by the independent accountants with estimated fees of $10,000 or less and the Audit Committee Chair shall report such approval to the full audit committee at the next regularly scheduled meeting. Explicit pre-approval by the full Audit Committee shall be required for any individual non-audit engagement to be performed by the independent accountants with estimated fees in excess of $10,000. Officers of the Funds shall furnish the audit committee at least annually with a listing of all fees paid to the independent accountants including non-audit services performed. For certain non-audit services which are no more than five percent of the total fees paid by the Trust, such fees may be exempted from the required pre-approval process specified above subject to limitations and prompt disclosure of such services when such services are identified, and in all cases approval is required prior to completion.
(e)(2) None
(f) Not applicable.
(g) The aggregate non-audit fees billed by the registrant’s accountant for services rendered to the registrant, and rendered to the registrant’s investment adviser act forth in 4(b) and (c) of this Item of $13,800 and $8,800 for the fiscal years ended December 31, 2008 and 2009, respectively.
Item 5: Not applicable.
Item 6: Included as part of the report to shareholders filed under Item 1 of this form.
Item 7: Not applicable.
Item 8: Not applicable.
Item 9: Not applicable.
Item 10: For the purposes of this Item, there have not been any material changes to the procedures by which shareholders may recommend nominees to the registrant’s board of trustees.
Item 11: Controls and Procedures.
(a) The registrant’s certifying officers have reasonably designed such disclosure controls and procedures to ensure material information relating to the registrant is made known to them by others, particularly during the period in which this report is being prepared. The registrant’s certifying officers have determined that the registrant’s disclosure controls and procedures are effective based on their evaluation of these controls and procedures as of a date within 90 days prior to the filing date of this report.
(b) There were no significant changes in the registrant’s internal controls over financial reporting, or in other factors that could significantly affect these controls, that occurred during the registrant’s first fiscal half-year, including any corrective actions with regard to significant deficiencies and material weaknesses.
Item 12: Exhibits attached hereto.
(a)(1) Code of Ethics.
(a)(2) Certification for each principal executive and principal financial officer of the registrant as required by Rule 30a-2 under the Act (17 CFR 270.30a-2(a)) - Filed as an attachment to this filing.
(b) Certifications required by Rule 30a-2(b) under the Act (17 CFR 270.30a-2(b)), Rule 13a-14(b) or Rule 15d-14(b) under the Exchange Act (17 CFR 240.13a-14(b) or 240.15d-14(b)), and Section 1350 of Chapter 63 of Title 18 of the United States Code (18 U.S.C. 1350). A certification furnished pursuant to this paragraph will not be deemed “filed” for purposes of Section 18 of the Exchange Act (15 U.S.C. 78r), or otherwise subject to the liability of that section. Such certification will not be deemed to be incorporated by reference into any filing under the Securities Act of 1933 or the Exchange Act, except to the extent that the registrant specifically incorporates it by reference – Filed as an attachment to this filing.
Pursuant to the requirements of the Securities Exchange Act of 1934 and the Investment Company Act of 1940, the registrant has duly caused this report to be signed on its behalf by the undersigned, thereunto duly authorized.
| | | | |
| | | Parnassus Income Funds |
| | |
| Date: February 12, 2010 | | By: | | /s/ Jerome L. Dodson
|
| | | | | Jerome L. Dodson President |
Pursuant to the requirements of the Securities Exchange Act of 1934 and the Investment Company Act of 1940, this report has been signed below by the following persons on behalf of the registrant and in the capacities and on the dates indicated.
| | | | |
| Date: February 12, 2010 | | By: | | /s/ Jerome L. Dodson
|
| | | | | Jerome L. Dodson President |
| | | | |
| Date: February 12, 2010 | | By: | | /s/ Marc C. Mahon
|
| | | | | Marc C. Mahon Treasurer |