PARNASSUS INCOME FUNDS
UNITED STATES
SECURITIES AND EXCHANGE COMMISSION
Washington, D.C. 20549
FORM N-CSR
CERTIFIED SHAREHOLDER REPORT OF
REGISTERED MANAGEMENT INVESTMENT COMPANIES
Investment Company Act file number: 811-06673
Parnassus Income Funds
(Exact name of registrant as specified in charter)
1 Market Street, Suite 1600, San Francisco, California 94105
(Address of principal executive offices) (Zip code)
Marc C. Mahon
Parnassus Income Funds
1 Market Street, Suite 1600, San Francisco, California 94105
(Name and address of agent for service)
Registrant’s telephone number, including area code: (415) 778-0200
Date of fiscal year end: December 31
Date of reporting period: December 31, 2008
| Item 1: | Report to Shareholders |
THE PARNASSUS FUNDSSM
Annual Report December 31, 2008
Parnassus Fund Parnassus Small-Cap Fund
Parnassus Equity Income Fund Parnassus Workplace Fund
Parnassus Mid-Cap Fund Parnassus Fixed-Income Fund
| | | |
Parnassus Fund | | (PARNX | ) |
Parnassus Equity Income Fund–Investor Shares | | (PRBLX | ) |
Parnassus Equity Income Fund–Institutional Shares | | (PRILX | ) |
Parnassus Mid-Cap Fund | | (PARMX | ) |
Parnassus Small-Cap Fund | | (PARSX | ) |
Parnassus Workplace Fund | | (PARWX | ) |
Parnassus Fixed-Income Fund | | (PRFIX | ) |
TABLE OF CONTENTS

THE PARNASSUS FUNDSSM
February 9, 2009
DEAR SHAREHOLDER:
The worst financial crisis of my career took place in 2008. In my lifetime, I have never seen anything like it. Major financial institutions have disappeared, and we have seen the end of investment banking as a separate industry. Morgan Stanley and Goldman Sachs, the two most famous investment banks, have become commercial banks and will now have much heavier regulation that will certainly put a damper on their swashbuckling ways. The other large investment banks, Lehman Brothers, Bear Stearns and Merrill Lynch, have completely disappeared either into bankruptcy or into the inner workings of huge financial conglomerates. Large commercial banks have also disappeared, including Washington Mutual and Wachovia. Fannie Mae and Freddie Mac, the two enormous financial institutions that hold half the country’s mortgages, have seen their shareholders wiped out and have been effectively nationalized. In the meantime, home prices have dropped almost 30% on a nationwide basis and last year, the stock market lost more than a third of its value. The economy is now in a deep recession.
Although the country finds itself in dire economic circumstances, both the U.S. Treasury and the Federal Reserve have taken strong action to pull us out of the slump. The thing that makes me most hopeful, though, is the new President and his economic team. So far, his economic appointments have been flawless. President Obama has the right temperament, the right vision and the leadership qualities that will help the nation recover.
Although all five of our equity funds have sustained significant losses, I am happy to report that all of them have outperformed both their Lipper peer groups and their stock market benchmarks. Most impressive has been portfolio manager Todd Ahlsten, whose Parnassus Equity Income Fund beat the S&P 500 Index by 14 percentage points in 2008. As you’ll see in this report, the Parnassus Equity Income Fund is far ahead of all its benchmarks for the three-, five- and ten-year periods as well.
Parnassus Investments Celebrates 25 Years
Parnassus Investments will be celebrating its 25th year anniversary in 2009. It was in 1984 that we launched our first fund, and there remain some very long-term shareholders who have been with us since the beginning. In November we hope to host an event to recognize all our shareholders, and once the date is set I encourage you to plan a trip to San Francisco to celebrate with us in person. We are proud to have earned your trust and confidence and are looking forward to serving you for many years to come.
New Intern
I’m pleased to announce that we have a very highly-qualified individual joining us as an intern. Vikram Gupta is an economics graduate of the University of California at Berkeley. He worked as an investment banking analyst in the Leveraged Finance Group of Credit Suisse First Boston in New York, then served as an associate and later as a principal with the JPMorgan Partners, the private equity/venture capital arm of JPMorgan. In his spare time, Vik enjoys running, hiking, skiing and traveling.
Thank you for investing in the Parnassus Funds.
Yours truly,

Jerome L. Dodson, President
Parnassus Investments
THE PARNASSUS FUND
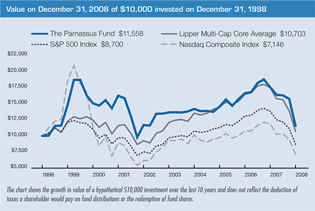
As of December 31, 2008, the net asset value per share (“NAV”) of the Parnassus Fund was $23.59, so after taking dividends into account, the total return for the quarter was a loss of 26.57%. This compares to a loss of 21.94% for the S&P 500 Index (“S&P 500”), a loss of 22.94% for the average multi-cap core fund followed by Lipper Inc. (“Lipper average”) and a loss of 24.37% for the NASDAQ Composite Index (“NASDAQ”). For the quarter, we lagged all three indices, but we did finish well ahead of the benchmarks for the year. For 2008, the Fund’s total return was a loss of 34.12%, compared to a loss of 37.00% for the S&P 500, a loss of 38.79% for the Lipper average and a loss of 39.98% for the NASDAQ.
Below are a table and a graph comparing the Parnassus Fund with the S&P 500, the NASDAQ and the Lipper Multi-Cap Core Average over the past one-, three-, five- and ten-year periods. You will notice that we are ahead of all the benchmarks for the three-year period. For the five-year period, we beat the NASDAQ, but we’re behind the S&P 500 and the Lipper average. For the longer-term period of ten-years, we’re ahead of all the indices.
Average Annual Total Returns
for periods ended December 31, 2008
| | | | | | | | | | | | | | | | | | |
| | | One
Year | | | Three
Years | | | Five
Years | | | Ten
Years | | | Gross
Expense
Ratio | | | Net
Expense
Ratio | |
THE PARNASSUS FUND | | (34.12 | %) | | (7.39 | %) | | (3.28 | %) | | 1.46 | % | | 1.00 | % | | 0.99 | % |
S&P 500 Index | | (37.00 | %) | | (8.36 | %) | | (2.19 | %) | | (1.38 | %) | | NA | | | NA | |
Lipper Multi-Cap Core Average | | (38.79 | %) | | (9.66 | %) | | (2.61 | %) | | 0.82 | % | | NA | | | NA | |
Nasdaq Composite Index | | (39.98 | %) | | (9.81 | %) | | (3.95 | %) | | (2.71 | %) | | NA | | | NA | |
Performance data quoted represent past performance and are no guarantee of future returns. Current performance may be lower or higher than the performance data quoted. Current performance information to the most recent month-end is on the Parnassus website (www.parnassus.com). Investment return and principal value will fluctuate so that an investor’s shares, when redeemed, may be worth more or less than their original principal cost. Returns shown in the table do not reflect the deduction of taxes a shareholder may pay on fund distributions or redemption of shares. The S&P 500 Index and the NASDAQ Composite Index are unmanaged indices of common stocks, and it is not possible to invest directly in an index. Index figures do not take any expenses, fees or taxes into account, but mutual fund returns do. Prior to May 1, 2004, the Parnassus Fund charged a sales load (maximum of 3.5%), which is not reflected in the total return calculations. Before investing, an investor should carefully consider the investment objectives, risks, charges and expenses of the Fund and should carefully read the prospectus, which contains this and other information. The prospectus is available on the Parnassus website, or one can be obtained by calling (800) 999-3505. As described in the Fund’s current prospectus dated May 1, 2008, Parnassus Investments has contractually agreed to limit the total operating expenses to 0.99% of net assets, exclusive of acquired fund fees, until May 1, 2009. This limitation may be continued indefinitely by the Adviser on a year-to-year basis.
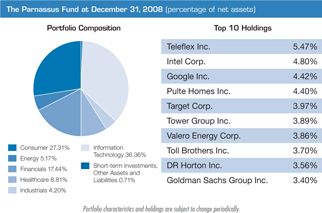
Company Analysis
Our normal practice is to describe which companies had the most impact on the Fund during the year, then briefly explain what caused them to move up or down. It’s difficult to do that this year, since stocks traded on fear, and good companies saw their stock prices crash just as mediocre companies did. In any case, here are six companies that had the most negative impact, each one causing the NAV to drop by 60¢ or more.
Ciena Corporation, a maker of optical network products for telecommunications, hurt our performance the most. It knocked down the price of each Parnassus share by $1.22, as its price sank 80.4% from $34.11 at the beginning of the year to $6.70 by the end. Phone companies, like all businesses, are trying to conserve cash, so they have reduced their capital spending, impacting the sale of Ciena products. I plan to retain Ciena, because demand should increase by the end of 2009, as phone companies have to start adding to their networks.
Refiner Valero Energy cut a very substantial $1.17 off the NAV, as its stock fell from $70.03 at the start of the year to $21.64 by year’s end for a drop of 69.1%. Demand for gasoline dropped as fuel prices increased early in the year, and this caused the company to cut back production. Demand did not pick up much as prices fell later in the year. Valero’s margins also suffered when the “crack spread” (the difference between the cost of crude oil and the price of refined products like gasoline) decreased because gasoline prices dropped faster than the price of crude oil. We’ll continue to hold the stock, since we expect margins to recover in 2009.
Fannie Mae cost the Fund 84¢ on the NAV, as it sank from our cost of $11.31 to $0.95, where we sold it after the announcement that the federal government was taking over the company. Before the government takeover, both Fannie Mae and the federal regulator said that the company had enough capital to weather the storm, so we decided to hold onto the stock. As it turned out, this was not the right decision.
Intel dropped 45.0% during the year, falling from $26.66 to $14.66, thereby slicing 82¢ off each fund share. The recession has reduced demand for electronic products, so semiconductor sales have been disappointing. We’ll continue to hold Intel’s stock, since it’s a solid company that should make a strong comeback once the recovery starts.
American Express cost the Fund 69¢, sinking 52.9% from $39.36 where we bought it during the year until it hit $18.55 by end of the period. At the time we invested, I thought the stock was a bargain, since it had been as high as $65.89 in July of 2007 and traded around $52 at the beginning of the year. American Express was affected because it relies on the credit markets to fund its card business, and investors are concerned that its customers might not be able to pay back what they owe. We’re holding onto the stock, since we think it will move much higher once the recovery gets started.
Powerwave Technologies, a manufacturer and distributor of products for wireless telephone networks, saw its stock fall 87.6% from $4.03 to $0.50, costing the Fund 63¢ per share. Wireless phone companies are hanging onto their cash because of all the economic uncertainty, so they’re not investing much in their networks.
Believe it or not, we had six companies that contributed 20¢ or more to the NAV for the year. In some cases, these companies made a positive contribution to the NAV based on special circumstances.
Valeant Pharmaceuticals added 39¢ to each Parnassus share, as its stock soared 51.6% from $11.97 at the start of 2008 to $18.15 where we sold it late in the year. The company brought out new products, and the CEO restructured what had been an unwieldy organization into a more efficient and rational operation with lower costs. We sold the stock because we thought it had reached its intrinsic value.
Wells Fargo added 36¢ to the NAV, even though its stock dropped 2.4% during the year from $30.19 to $29.48. Your first thought may be that I worked some magic on this stock, or that I might be trying to pull a fast one. In fact, the explanation is pretty straightforward. We didn’t buy any stock at $30 early in the year, but waited until it dropped well below that figure, accumulating most of our shares after it dropped into the mid-20s. In late September and early October when the stock climbed above $37, we sold half of our shares. At that point, Wells Fargo was one of the few banks that looked financially strong, so its stock climbed above $37 a share before it came back to earth. We’re still holding onto half our shares.
A similar thing happened with Qualcomm, the San Diego-based company that makes software and semiconductors that power wireless telecommunications equipment, including cell phones. The stock started the year at $39.35 and ended at $35.83 for a decline of 8.9%. However, we sold most of our Qualcomm stock in August, when the price had risen to about $54 a share.
Even more remarkable is the case of W&T Offshore, a company that explores for and produces petroleum. The shares started the year at $29.96 and ended at $14.32 for a frightening drop of 52.2%. Yet, the stock contributed 29¢ to the NAV. What happened was that we sold most of our shares in the late spring and early summer at prices well over $50, as the price of oil moved up to $140 a barrel. Now that the price of oil is below $50 a barrel, we’ve bought more shares.
Mentor Graphics, the Oregon-based maker of software used to design semiconductors, added 20¢ to each Parnassus share, even though the stock plunged 52.0% from $10.78 to $5.17 at the end of the year. We sold all our shares in June around $15.40 when Cadence Design made a hostile takeover offer at $16 a share.
BEA Systems, a provider of business enterprise software, contributed 20¢ to the NAV as it rose 22.8% from $15.78 to $19.38 on a buyout by Oracle.
Outlook and Strategy
Right now, stocks are trading not on fundamentals but fear. Valuations are as low as I can remember, reflecting the dismal state of the economy. If the economy continues this way, then the valuations are accurate. However, if the economy starts to recover sometime this year, the stock market should move much higher. Since the stock market is a discounting mechanism, it should come back before the economy does. We don’t know when the recovery will occur, and stocks seem to have hit bottom, so we’re staying fully invested in good companies now trading at bargain prices.

Jerome L. Dodson, President
Parnassus Investments
THE PARNASSUS EQUITY INCOME FUND
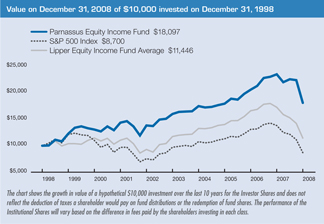
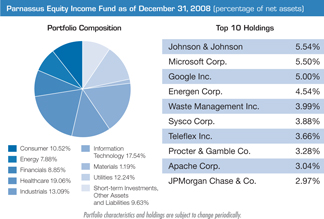
As of December 31, 2008, the net asset value per share (“NAV”) of the Parnassus Equity Income Fund – Investor Shares was $19.29. After taking dividends into account, the total return for the year was a loss of 22.95%. This compares to a decline of 37.00% for the S&P 500 Index (“S&P 500”) and a loss of 33.77% for the average equity income fund followed by Lipper Inc. (“Lipper average”). For the fourth quarter, the Fund was down 19.16% versus a decline of 21.94% for the S&P 500 and drop of 19.53% for the Lipper average. While I hate to lose money, the Fund fell far less than its peer group during 2008’s “once in a generation” stock market decline. We were able to cushion the loss, outperforming the S&P 500 by such a wide margin because the Fund owned few financial stocks. In contrast, the Fund’s performance was boosted by our quality holdings in the healthcare, technology and industrial sectors.
Our strategy of buying good, undervalued businesses has generated superb long-term results. I am especially proud that the Fund has positive investment returns for the trailing three-, five- and ten-year periods versus losses for S&P 500. The Fund’s average annual return over the past 10 years has been 6.11% versus a loss of 1.38% for the S&P 500 in each of those periods. Our objective is to continue building long-term wealth for shareholders. While I am the portfolio manager of the Fund, I am also a substantial shareholder, and the majority of my liquid net worth is invested in the Fund.
Below is a table that compares the performance of the Fund with that of the S&P 500 and the average equity income fund followed by Lipper. Average annual total returns are for the one-, three-, five- and ten-year periods.
Average Annual Total Returns
for periods ended December 31, 2008
| | | | | | | | | | | | | | | | | | |
| | | One
Year | | | Three
Years | | | Five
Years | | | Ten
Years | | | Gross
Expense
Ratio | | | Net
Expense
Ratio | |
PARNASSUS EQUITY INCOME FUND | | | | | | | | | | | | | | | | | | |
Investor Shares | | (22.95 | %) | | 0.29 | % | | 2.50 | % | | 6.11 | % | | 1.04 | % | | 1.00 | % |
Institutional Shares | | (22.73 | %) | | NA | | | NA | | | NA | | | 0.83 | % | | 0.79 | % |
S&P 500 Index | | (37.00 | %) | | (8.36 | %) | | (2.19 | %) | | (1.38 | %) | | NA | | | NA | |
Lipper Equity Income | | | | | | | | | | | | | | | | | | |
Fund Average | | (33.77 | %) | | (6.69 | %) | | (0.73 | %) | | 1.08 | % | | NA | | | NA | |
The total return for the Parnassus Equity Income Fund-Institutional Shares from commencement (April 28, 2006) was (1.92%). The performance of Institutional Shares differs from that shown for the Investor Shares to the extent that the Classes do not have the same expenses. Performance data quoted represent past performance and are no guarantee of future returns. Current performance may be lower or higher than the performance data quoted, and current performance information up to the most recent month-end is on the Parnassus Investments website (www.parnassus.com). Investment return and principal value will fluctuate, so that an investor’s shares, when redeemed, may be worth more or less than their original principal cost. Returns shown in the table do not reflect the deduction of taxes a shareholder may pay on fund distributions or redemption of shares. The Standard and Poor’s 500 Composite Stock Index, also known as the S&P 500, is an unmanaged index of common stocks, and it is not possible to invest directly in an index. An index does not take any expenses, fees or taxes into account, but mutual fund returns do. On March 31, 1998, the Fund changed its investment objective from a balanced portfolio to an equity income portfolio. Before investing, an investor should carefully consider the investment objectives, risk, charges and expenses of the Fund and should carefully read the prospectus, which contains this and other information. The prospectus is on the Parnassus Investments website, or one can be obtained by calling (800) 999-3505. As described in the Fund’s current prospectus dated, May 1, 2008, Parnassus Investments has contractually agreed to limit the total operating expenses to 0.99% and 0.78% of net assets, exclusive of acquired fund fees, through May 1, 2009 for the Investor Shares and Institutional Shares, respectively. This limitation may be continued indefinitely by the Adviser on a year-to-year basis.
2008 Analysis
While the stock market suffered its worst annual result in decades, I am pleased that the Fund reduced potential shareholder losses by beating the S&P 500 by 14 percentage points. Overall, picking the right stocks within sectors added 10% to our return versus the S&P 500, while overweighting and underweighting sectors boosted our results by 4%.
The year’s investment highlight was the decision to underweight the financial services sector. Furthermore, our ability to select the best relative performers within this sector significantly enhanced performance. These decisions shielded investors to a certain extent from the financial market meltdown, adding 4.27% to our return versus the S&P 500. I owe a big thank you to Parnassus Investment analyst Minh Bui as his forewarning regarding this economic crisis proved invaluable. His research, along with input from the rest of the investment team, convinced me to focus investments in this sector only on leading, healthy companies that could emerge stronger from the credit crisis. Wells Fargo, one of the Fund’s largest financial sector investments, actually rose 5.3% from our average cost during the year, as CEO John Stumpf successfully steered the company away from the worst of the financial crisis.
Strong stock-picking in industrials and technology added 2.75% and 2.27% of our S&P 500 lead, respectively. Analysts Ben Allen and Lori Keith were especially helpful to me in these areas. Propelled by the takeover offer of chemical-maker Rohm & Haas, our materials sector exposure added 1.76% to our outperformance versus the S&P 500. A balance of an over weight position with good stock selection within healthcare boosted our outperformance by 1.46%. Within healthcare, analyst Pearle Lee did a fantastic job recommending biotechnology and pharmaceutical companies, while Matthew Gershuny added value with solid healthcare and business service investment ideas. Overall, the portfolio’s results in 2008 proved the importance of owning great companies at undervalued prices within each sector of our investment universe.
Company Analysis
Considering the market’s performance, we were fortunate that only four stocks reduced the NAV by more than 40¢ per share over the course of the year. Microsoft saw its stock decline 45.4%, from $35.60 to $19.44, which lowered our NAV by 71¢ per share. In early 2008, Microsoft took a hit when the company bid $47.5 billion to buy Yahoo!. This offer was much too high, and Microsoft’s stock dropped 10% when the news hit. Fortunately, Yahoo! rejected Microsoft’s offer.
While I was disappointed that Microsoft was willing to pay such a large price for Yahoo!, I held onto our large investment because the company has a phenomenal software business. Unfortunately, the stock market began its rapid slide just as the Yahoo! distraction was fading, so the stock never recovered. Despite strong reported profits from Microsoft during 2008, investors are concerned about a slowdown in 2009. We continue to like Microsoft because of its dominant market position, significant recurring revenue stream, $24 billion cash position and attractive dividend.
Google, another of our large holdings, fell 55.5% for the year from $691 to $308 per share, lowering the price of our fund shares by 61¢. However, this price decline over-states our true loss, as the Fund owned far fewer shares at the beginning of the year and bought more shares as it fell to bargain levels. Our average cost for Google is $384.53 per share, so the loss on our investment for the year is a less daunting 21.7%.
Like Microsoft, Google’s profits held up well during 2008 based on growing demand for its online advertising services. The stock fell because of fears that Google’s customers would cut advertising budgets as consumers pull back on spending in a slowing economy. Our view is that Google is a terrific business with long-term competitive advantages. In addition, while its competitors struggle to catch up, Google has over $14 billion in cash and continues to add great people and products to enhance its competitive moat.
ProLogis, the real estate investment trust, reduced the Fund’s NAV by 51¢ in 2008, losing 78.1% of its value and closing the year at $13.89 per share. Most of this damage was done after Lehman Brothers declared bankruptcy in September. This bankruptcy crippled the credit markets, impairing the value of companies like ProLogis that rely on credit to fund their business activities.
Colleague Ben Allen and I spent a great deal of time during the last quarter determining if this impairment of value is “permanent.” Our belief is that ProLogis should survive this credit crisis, but that it could be a while until the stock returns to our cost basis of $31.46 per share.
Energen, an energy company that operates Alabama Gas and is a top-20 U.S. owner of natural gas and oil reserves, declined 54.3% from $64.23 to $29.33, costing the Fund 45¢ during the year. While we trimmed some energy investments as oil prices entered bubble territory in mid-2008, we held our Energen position. The reason is that the company has hedged a large portion of its 2009 and 2010 production at high prices and has very little debt on its balance sheet. In addition, the company’s oil and gas comes from long-lived wells, which helps Energen predict production levels. Unfortunately, Energen’s stock fell in-line with its peers, disproving my investment thesis in the short-term.
After sitting down with Energen management during the fourth quarter, I am confident that the team is top notch, and that they will use this downturn to buy valuable assets with an eye toward long-term growth. As a result, I added considerably to our position during the most recent quarter.
In a year when the S&P 500 fell 37%, any stock that rose at all could be considered a winner. I am pleased to say the Fund had 16 stocks that contributed a positive gain in 2008, and two of these added over 10¢ to the NAV. Rohm & Haas, a socially responsible chemical company, climbed 32.4% from $53.07 to our average selling price of $70.24, adding 19¢ to our NAV. Dow Chemical, recognizing Rohm & Haas’ strong secular growth prospects, offered to pay $78 per share for the company in July.
On the heels of this offer, we sold our entire position about $8 below the proposed offering price. We did this because of our concern that the deal could fall apart due to the credit crisis and weakening economy. As of this writing, Rohm & Haas’ stock is back down to $61 per share as one of Dow Chemical’s backers, the Kuwaiti government, pulled $7 billion of proposed financing for the deal, proving that our concerns were well founded.
EOG Resources, an oil and gas producer based in Houston, Texas, added 11¢ to the NAV during 2008. EOG has a good environmental record, and the company has a large portfolio of long-lived, low-cost energy reserves. The stock began the year at $89.25 and jumped to over $120 per share in the first quarter of 2008 as oil prices rose, and the company discovered large reserves in North Dakota.
We sold our position at an average cost of $112 per share by March when EOG’s stock hit what I considered its fair value. This transaction generated the majority of our gain in EOG for 2008. After oil and natural gas prices plunged in late 2008, we bought EOG shares back at an average price of $63.44. The stock ended the year up slightly from this level, which contributed to some of the 11¢ NAV gain.
Outlook and Strategy
We are in extraordinary times. As of this writing, the U.S. economy is in a significant recession, and almost all economic data are looking negative and getting worse. The newsstands are filled with varied explanations of how our economy got to this point, and even more predictions about what the coming years will bring. While we have written extensively about housing market risks for almost two years, and our defensive posture helped the Fund’s performance in 2008, the economy is in much worse shape than I originally anticipated. Unfortunately, a near-term recovery is unlikely.
After the S&P 500’s 37% drop in 2008, many investors are fatigued and emotional, jarred by the flood of negative economic, political and social news both here and abroad. While I read the same reports as everyone else, as a portfolio manager, it’s my job to step away from the frenzy, filter out the nonsense, and focus on long-term trends that will reveal sustainable investment themes and ideas.
While it seems highly probable that the economy will get worse before it gets better, massive government stimulus and record-low interest rates should serve as stabilizing factors. This tug of war between despair and optimism is causing immense volatility as winners and losers switch places almost daily. During my two-day trip to New York in early December, the S&P 500 had an amazing 18% swing over two days! That type of volatility used to be measured in years, not days!
We are using this volatility to our advantage, buying great businesses that meet our rigorous research criteria when pricing opportunities arise. While the economy faces serious challenges, and it is extremely hard to know when the recovery will hit, I am confident that “the strong will get stronger” as we move through this economic cycle. In each industry, we are looking to buy the undervalued companies with significant competitive advantages, attractive secular growth opportunities, great management teams and the healthiest balance sheets. These companies, unlike their peers, will be able to invest during the downturn and thrive when the economy rebounds.
We are overweighted relative to our index in the healthcare, technology and energy sectors, as we believe several leaders in these industries are undervalued, can remain profitable in this downturn and will do well in a normalized economic environment. In healthcare, our largest holding is Johnson & Johnson. This company has increased dividends fo 46 years in a row and has a tremendous portfolio of products with sturdy demand. In technology, our two biggest holdings are Microsoft and Google. As discussed earlier, these companies have about $40 billion of combined cash, dominant products, great people and secular growth opportunities. Our two largest energy investments, Energen and Apache Corporation, boast strong track records and low-cost reserves.
The Fund remains underweighted relative to our index in financial and consumer stocks. Companies in these areas have benefited more than most from the excessive leverage of the past few years, so as debt levels return to normal, we believe most stocks in these sectors will continue to under-perform. In the finance arena, our portfolio companies have superb management teams and significant competitive advantages. We are avoiding consumer discretionary businesses and instead are focusing on companies that sell basic goods for everyday life. Foodservice company Sysco is our largest consumer-related holding—despite the downturn, people still need to eat. Procter & Gamble, another important consumer holding, boasts over 20 brands, like Tide detergent, which generates over $1 billion in annual sales. Finally, we are a top ten shareholder in WD-40, which is run by the talented Australian Garry Ridge. I am confident that doors and cabinets will squeak even through recessions!
Even though our financial markets are strained and the national mood is sour, it’s important to remember that the underlying structural advantages of our nation are intact. In previous recessions and bear markets, our country and its leading businesses have emerged stronger from their challenges. I am confident that a similar consequence will emerge after this downturn. This bolsters my conviction that over the long-term, our high-quality portfolio companies should increase in value. It’s also why I still have the bulk of my liquid net worth in the Parnassus Equity Income Fund. To echo what my colleague Ben Allen likes to say, “When it comes to long-term investing, don’t bet against America!”
Yours truly,

Todd C. Ahlsten
Chief Investment Officer
THE PARNASSUS MID - CAP FUND
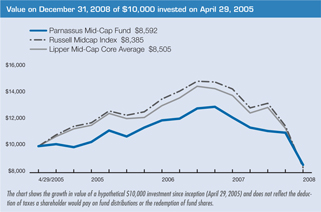
As of December 31, 2008, the net asset value per share (“NAV”) of the Parnassus Mid-Cap Fund was $12.00. After taking dividends into account, the total return for 2008 was a loss of 29.38%. This compares to a loss of 41.46% for the Russell Midcap Index (the “Russell”) and a loss of 38.53% for the average mid-cap core fund followed by Lipper Inc. (“Lipper average”). Although we had a large loss for the year, we substantially outperformed both our benchmarks, beating the Russell Index by 12 percentage points and the Lipper average by nine percentage points.
Below is a table comparing the Parnassus Mid-Cap Fund with the Russell Index and the Lipper average for the one- and three-year periods, for the period since September 30, 2005 when we first had most of the Fund’s assets invested in stock and for the period since inception on April 29, 2005. We’re proud to report that the Fund’s returns are better than all the benchmarks for all time periods.
Average Annual Total Returns
for periods ended December 31, 2008
| | | | | | | | | | | | | | | | | | |
| | | One
Year | | | Three
Years | | | Since
September 30,
2005 | | | Since
Inception
April 29, 2005 | | | Gross
Expense
Ratio | | | Net
Expense
Ratio | |
PARNASSUS MID-CAP FUND | | (29.38 | %) | | (5.93 | %) | | (4.35 | %) | | (4.05 | %) | | 2.05 | % | | 1.41 | % |
Russell Midcap Index | | (41.46 | %) | | (10.68 | %) | | (9.26 | %) | | (4.91 | %) | | NA | | | NA | |
Lipper Mid-Cap Core Average | | (38.53 | %) | | (9.61 | %) | | (8.25 | %) | | (4.15 | %) | | NA | | | NA | |
Performance data quoted represent past performance and are no guarantee of future returns. Current performance may be lower or higher than the performance data quoted. Current performance information up to the most recent month-end is on the Parnassus Investments website (www.parnassus.com). Investment return and principal value will fluctuate so that an investor’s shares, when redeemed, may be worth more or less than their original principal cost. Returns shown in the table do not reflect the deduction of taxes a shareholder may pay on fund distributions or redemption of shares. The Russell Midcap Index is an unmanaged index of common stocks, and it is not possible to invest directly in an index. Index figures do not take any expenses, fees or taxes into account, but mutual fund returns do. During the most recent quarter, Lipper changed our benchmark from Mid-Cap Value to Mid-Cap Core. Mid-cap companies can be more sensitive to changing economic conditions and have fewer financial resources than large-cap companies. Before investing, an investor should carefully consider the investment objectives, risks, charges and expenses of the Fund and should carefully read the prospectus, which contains this and other information. The prospectus is available on the Parnassus Investments website, or one can be obtained by calling (800) 999-3505. As described in the Fund’s current prospectus dated May 1, 2008, Parnassus Investments has contractually agreed to limit the total operating expenses to 1.40% of net assets, exclusive of acquired fund fees, until May 1, 2009. For the year ending December 31, 2008, Parnassus Investments has agreed to further reduce the total operating expenses to 1.20% of net assets exclusive of acquired fund fees. This limitation may be continued indefinitely by the Adviser on a year-to-year basis.
2008 Analysis
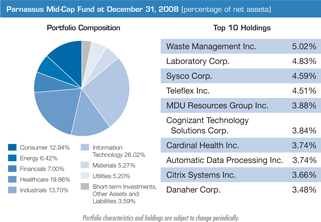
This past year was very difficult for stock investors, culminating in a volatile and demoralizing fourth quarter. The most recent quarter saw all major stock indices plummet, and the Mid-Cap Fund was not immune. It was not an easy time for a new portfolio management team to take over the Fund, but the silver lining is that we outperformed our Russell benchmark by over 5 percentage points, a substantial margin in a short amount of time. For the year as a whole, the Fund’s outperformance was even larger at 12 percentage points. This was almost entirely due to individual stock selection as opposed to sector weights relative to the benchmark. Jerome Dodson did a terrific job running this Fund from inception until September 30, 2008, and we will work hard to build upon his record.
Since taking over the Fund, we have exited a relatively large number of positions and added some new ones. While every portfolio manager at Parnassus Investments shares research resources and follows the same investment process, we do have slight differences in how we construct our respective portfolios. In light of these changes, we will limit our company analysis to six significant winners and losers that the Fund owned after the portfolio management transition.
Company Analysis
Our basic investment philosophy focuses on owning high-quality businesses that stand to benefit from positive, long-term secular trends. We believe the three winners discussed below represent our adherence to this philosophy. These companies also have strong management teams, sound balance sheets and are trading at reasonable valuations relative to their long-term potential.
Amazon.com closed the year at $51.28, 19.5% higher than our cost of $42.92, adding 9¢ to the Fund’s NAV. We think the on-line retailer will benefit from market share growth, helping them offset the negative impacts of the recession. The company generates a large amount of cash flow, which is used for reinvestment in the business and to bolster the balance sheet.
McAfee was up 21.8% to $34.57 from our cost of $28.39, adding another 9¢ to the NAV. We think security software is in the midst of a long, positive upswing, and that McAfee is positioned well relative to its competitors. The company has no debt on its balance sheet and a solid track record of high cash flow generation.
Automatic Data Processing (ADP), a company best known for its payroll processing service, rose 10.6% to $39.34 from our cost of $35.57, adding 7¢ to the NAV. ADP should benefit from a continued move to outsourcing non-core business functions like payroll and benefit administration and potential consolidation in its industry. Regarding its financial position, the company is one of only a handful of AAA-rated companies in the United States.
The most significant loser this year was ProLogis, which cost the Fund 48¢ in NAV, as its shares dropped 78.1% to $13.89 over the course of the year. This real estate investment trust relies on credit to fund its business, and it was negatively affected by the Lehman Brothers’ bankruptcy in September. During the fourth quarter, ProLogis installed a new CEO, Walt Rakowich, who has begun an aggressive restructuring to position the company for a prolonged economic downturn.
Nordstrom, the high-end specialty department store, lopped 30¢ off the NAV, as its stock sank 63.8%, dropping from $36.73 to $13.31. Like most retailers, Nordstrom has been hurt by the recession. We still hold the shares because we think Nordstrom is a best-in-class operator and should emerge from this economic downturn in relatively strong shape.
Software provider Citrix’s shares declined 38.0% from $38.01 to $23.57 during the year, reducing the NAV by 21¢. The stock has suffered from investor concerns about possible information technology budget cuts in 2009, which would hurt sales for Citrix’s web and desktop virtualization software products. The company has also seen their margins contract due to investments in new products. We’re heartened by the fact that the company continues to maintain a leading market share position in its core products, and that its investments should improve sales and margins in 2009.
Outlook and Strategy
Since we joined Parnassus Investments as senior research analysts, all three of us have worked very closely with Jerome Dodson, the previous Parnassus Mid-Cap Fund portfolio manager, and Todd Ahlsten, our Chief Investment Officer. Because of this, we’re very well versed in the Parnassus investment philosophy and rigorous research process.
As Chief Investment Officer, Todd Ahlsten has been invaluable to us in ensuring a smooth transition to our portfolio management responsibilities. He’s been especially good at helping us crystallize an investment strategy that drives our individual stock selections and sector allocations. Practically speaking, this means that our investment strategy for 2009 is essentially the same as what Todd describes in his commentary on the Parnassus Equity Income Fund. The main differences in our portfolios are due to our mid-cap mandate, which means that we don’t own the large cap stocks found in Todd’s fund.
Our overarching investment strategy is to buy undervalued companies with strong balance sheets, competitive advantages, secular growth and great management. Given the strains in the economy and financial markets, we think this strategy should work especially well in 2009. As the recession deepens, we expect companies with poor competitive positions and fragile balance sheets to lag further behind industry leaders. Because of this, we’ve loaded the portfolio with leading companies in industries that should not only hold up in a recession, but also thrive when the economy eventually recovers.
Thank you for your investment with us.
Yours truly,
| | | | |
 | |  | |  |
| | |
| Benjamin E. Allen | | Matthew D. Gershuny | | Lori A. Keith |
| Portfolio Manager | | Portfolio Manager | | Portfolio Manager |
THE PARNASSUS SMALL - CAP FUND
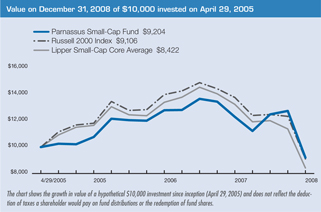
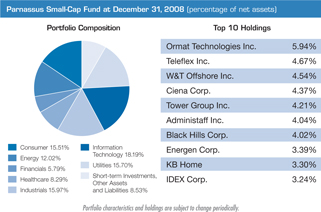
As of December 31, 2008, the net asset value per share (“NAV”) of the Parnassus Small-Cap Fund was $12.63, so after taking dividends into account, the total return for the quarter was a loss of 27.73%. This compares to a loss of 26.12% for the Russell 2000 Index (“the Russell”) and a loss of 25.95% for the average small-cap core fund followed by Lipper Inc. (“Lipper average”). For the quarter, we underperformed the indices, but for the year, we were way ahead of the benchmarks. The Parnassus Small-Cap Fund’s total return for the year was a loss of 25.08%, compared to a loss of 33.79% for the Russell Index and a loss of 36.21% for the Lipper average. Even though it was a terrible year, we finished more than 11 percentage points ahead of the average small-cap core fund followed by Lipper.
Below are a table and a graph that compare the performance of the Parnassus Small-Cap Fund with that of the Russell 2000 Index and the Lipper Small-Cap Core Average. You’ll notice that the Fund is substantially ahead of all benchmarks for all time periods. Besides the one- and three-year numbers, we’ve included the period since inception and the returns since September 30, 2005, since that is the approximate date when the Fund first had most of its assets invested in stock.
Average Annual Total Returns
for periods ended December 31, 2008
| | | | | | | | | | | | | | | | | | |
| | | One
Year | | | Three
Years | | | Since
September 30,
2005 | | | Since
Inception
April 29, 2005 | | | Gross
Expense
Ratio | | | Net
Expense
Ratio | |
PARNASSUS SMALL-CAP FUND | | (25.08 | %) | | (5.09 | %) | | (3.15 | %) | | (2.24 | %) | | 2.08 | % | | 1.42 | % |
Russell 2000 Index | | (33.79 | %) | | (8.28 | %) | | (7.35 | %) | | (2.72 | %) | | NA | | | NA | |
Lipper Small-Cap Core Average | | (36.21 | %) | | (10.06 | %) | | (9.01 | %) | | (4.45 | %) | | NA | | | NA | |
Performance data quoted represent past performance and are no guarantee of future returns. Current performance may be lower or higher than the performance data quoted. Current performance information to the most recent month-end is on the Parnassus website (www.parnassus.com). Investment return and principal value will fluctuate so that an investor’s shares, when redeemed, may be worth more or less than their original principal cost. Returns shown in the table do not reflect the deduction of taxes a shareholder may pay on fund distributions or redemption of shares. The Russell 2000 Index is an unmanaged index of common stocks, and it is not possible to invest directly in an index. Index figures do not take any expenses, fees or taxes into account, but mutual fund returns do. Small-cap companies can be particularly sensitive to changing economic conditions and have fewer financial resources than large-cap companies. Before investing, an investor should carefully consider the investment objectives, risks, charges and expenses of the Fund and should carefully read the prospectus, which contains this and other information. The prospectus is on the Parnassus website, or one can be obtained by calling (800) 999-3505. As described in the Fund’s current prospectus dated May 1, 2008, Parnassus Investments has contractually agreed to limit the total operating expenses to 1.40% of net assets, exclusive of acquired fund fees, until May 1, 2009. For the year ending December 31, 2008, Parnassus Investments has agreed to further reduce the total operating expenses to 1.20% of net assets exclusive of acquired fund fees. This limitation may be continued indefinitely by the Adviser on a year-to-year basis.
Company Analysis
Virtually all stocks went down this year, but five companies in the Parnassus Small-Cap Fund went down more than most and did significant damage to our portfolio. Each accounted for a loss of 70¢ or more on the NAV. The worst one was Ciena, which cost us a staggering $1.40 per fund share, dropping 80.4% from $34.11 to $6.70 by the end of the year. Ciena makes products for optical networks used in telecommunications. Phone companies have cut back on capital spending to build out their networks, and this cutback devastated Ciena’s stock. Had I known how much the shares would drop, I wouldn’t have owned the stock, but now that we own it, I’m hanging on. I expect Ciena to climb much higher when the recovery starts and phone companies increase capital spending to improve their communication networks.
W&T Offshore sliced 99¢ off the NAV, as its stock fell 52.2% from $29.96 at the start of the year to $14.32 by the end. The company has petroleum exploration and production facilities in the Gulf of Mexico, and after a run-up early in the year, the stock crashed as oil prices dropped below $40 a barrel.
Mitcham Industries was a victim of the same crash in oil prices as W&T Offshore: its stock sank 80.7% from $20.56 to $3.97, knocking 95¢ off each fund share. The company makes seismic equipment for use in exploring for oil, and sales of exploration equipment dropped sharply along with the price of oil.
Quicksilver Resources’ primary business is exploring for and producing natural gas; it also owns and operates natural gas pipelines. The stock subtracted 75¢ from the NAV, as it fell 62.5% from $14.85 where we bought it to $5.57. The sharp decline in energy prices affected Quicksilver just as it did W&T Offshore and Mitcham Industries.
Energen explores for, produces and sells natural gas, and demand has weakened during the recession, especially from industrial customers. The stock lost 36.3% of its value, as it dropped from $46.04, where we bought it in August and September, to $29.33 by the end of the year. This drop cost us 73¢ per fund share.
Amidst all the gloom, five companies made positive contributions to the Parnassus Small-Cap Fund’s NAV. Valeant Pharmaceuticals contributed 22¢ to each fund share, as its stock defied gravity by soaring 52.0% from $11.97 at the start of the year to $18.20, where we sold it, late in the year. The company brought out new products, and the new CEO restructured what had been an unwieldy organization into a more efficient and rational operation with lower costs. We sold the stock, because it had appreciated so much, and we thought it had reached its intrinsic value.
Insurer Tower Group added 19¢ to the NAV, even though its stock went from $33.40 to $28.21 during the year for a loss of 15.5%. The reason it made a positive contribution to the NAV is that we bought a lot of stock during the year in the $20 to $25 range and sold a lot of stock in the $29 to $32 range. We’re holding onto the shares we still own because we think Tower has an effective strategy of providing insurance to small businesses.
Computer Programs and Systems provides information technology to community hospitals in the United States, mostly in rural areas. Despite the recession, sales have been strong because of its quality products. The stock rose 17.9% during the year from $22.74 to $26.80 for a gain of 14¢ on the NAV.
Childcare-provider Bright Horizons Family Solutions added 12¢ to the NAV, as its stock went from $34.54 at the start of the year to $48.25 on a buyout. Shares of ViroPharma rose from $7.94 at the start of the year to $10.58 where we sold them in July when the stock hit our target price.

Jerome L. Dodson, President
Parnassus Investments
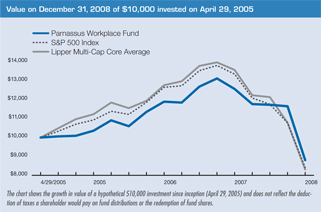
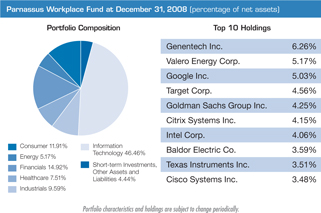
THE PARNASSUS WORKPLACE FUND
As of December 31, 2008, the net asset value per share (“NAV”) of the Parnassus Workplace Fund was $12.22, so after taking dividends into account, the total return for the quarter was a loss of 24.44%. This compares to a loss of 21.94% for the S&P 500 (“S&P 500”) Index and a loss of 22.94% for the average multi-cap core fund followed by Lipper Inc. (“Lipper average”). For the quarter, we underperformed the indices, but for the year, the Fund was substantially ahead of its benchmarks. The Workplace Fund’s total return for 2008 was a loss of 29.94%, compared to a loss of 37.00% for the S&P 500 and a loss of 38.79% for the Lipper average.
Below are a table and a graph that compare the performance of the Parnassus Workplace Fund with that of the S&P 500 Index and the Lipper Multi-Cap Core Average. You will notice that the Workplace Fund is ahead of both its benchmarks for all time periods. We’ve included results for not only the one- and three-year time periods, but also for the period since inception and the period since September 30, 2005, the approximate date when we first had most of the Fund’s assets invested in stock.
Average Annual Total Returns
for periods ended December 31, 2008
| | | | | | | | | | | | | | | | | | |
| | | One
Year | | | Three
Years | | | Since
September 30,
2005 | | | Since
Inception
April 29, 2005 | | | Gross
Expense
Ratio | | | Net
Expense
Ratio | |
PARNASSUS WORKPLACE FUND | | (29.94 | %) | | (5.28 | %) | | (4.11 | %) | | (3.41 | %) | | 2.65 | % | | 1.21 | % |
S&P 500 Index | | (37.00 | %) | | (8.36 | %) | | (7.16 | %) | | (4.61 | %) | | NA | | | NA | |
Lipper Multi-Cap Core Average | | (38.79 | %) | | (9.66 | %) | | (8.31 | %) | | (5.01 | %) | | NA | | | NA | |
Performance data quoted represent past performance and are no guarantee of future returns. Current performance may be lower or higher than the performance data quoted. Current performance information to the most recent month-end is on the Parnassus website (www.parnassus.com). Investment return and principal value will fluctuate so that an investor’s shares, when redeemed, may be worth more or less than their original principal cost. Returns shown in the table do not reflect the deduction of taxes a shareholder may pay on fund distributions or redemption of shares. The S&P 500 Index is an unmanaged index of common stocks, and it is not possible to invest directly in an index. Index figures do not take any expenses, fees or taxes into account, but mutual fund returns do. Before investing, an investor should carefully consider the investment objectives, risks, charges and expenses of the Fund and should carefully read the prospectus, which contains this and other information. The prospectus is available on the Parnassus website, or one can be obtained by calling (800) 999-3505. As described in the Fund’s current prospectus dated May 1, 2008, Parnassus Investments has contractually agreed to limit the total operating expenses to 1.20% of net assets, exclusive of acquired fund fees, until May 1, 2009. This limitation may be continued indefinitely by the Adviser on a year-to-year basis.
Company Analysis
Four companies did the most damage to the Workplace Fund during the year, with each one slicing 47¢ or more off the NAV. American Express cost the Fund 62¢ per fund share, with its stock price dropping 64.3% from $52.02 to $18.55. Investors are concerned because the company uses the credit markets to finance its card business, and there’s also concern that cardholders will not be able to pay back what they owe.
Oil-refiner Valero cut 60¢ off each fund share, as its stock sank 69.1% from $70.03 to $21.64. Earnings declined as margins contracted, and Americans drove less and bought less gasoline.
Corning’s most important product is glass used in liquid crystal displays for high-definition television sets and computer monitors; sales of these items have dropped substantially. The company’s stock fell 60.3% during the year from $23.99 to $9.53 for a decline of 48¢ in the NAV.
Google fell 55.5% during the year, sinking from $691 to $308 for a loss of 47¢ per fund share. Investors became concerned that Internet advertising would drop sharply due to the recession.
Four companies each made a positive contribution of 8¢ or more to the NAV. Bright Horizons Family Solutions contributed 18¢ to each fund share, as its stock rose 39.7% from $34.54 to $48.25 on a buyout by a private equity group.
Wells Fargo Bank added 15¢ to the NAV, even though its stock dropped 2.4% during the year from $30.19 to $29.48. We bought the stock in the range of $27 to $28 early in the year, then sold almost half our position at $36.95 in early October.
Qualcomm, the provider of software and semiconductors that power wireless communications equipment including cell phones, added 13¢ to each fund share, even though its stock dropped 8.9% during the year, going from $39.35 to $35.83. We sold all of our shares at an average price of $49.93, when the stock climbed higher in the August to early October time period.
Simpson Manufacturing contributed 8¢ to the NAV, as its stock went from $26.59 to $27.76 for a gain of 4.4%. The company makes fasteners and other construction materials, and sales held up better than expected during the year.

Jerome L. Dodson, President
Parnassus Investments
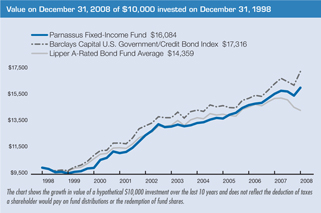
PARNASSUS FIXED - INCOME FUND
As of December 31, 2008, the net asset value per share (“NAV”) of the Parnassus Fixed-Income Fund was $16.19, producing a total return for the year of 2.98% (including dividends). This compares to a loss of 5.88% for the average A-rated bond fund followed by Lipper Inc. and a gain of 5.70% for the Barclays Capital U.S. Government/Credit Bond Index. For the fourth quarter, the Fund was up 3.89% versus a loss of 1.62% for the Lipper average and a gain of 6.42% for the Barclays Capital index. We’re very proud to report that our returns are better than the Lipper average for each of the one-, three-, five- and ten-year periods as of the end of the year.
Below is a table comparing the performance of the Fund with that of the Barclays Capital U.S. Government/Credit Bond Index and the average A-rated bond fund followed by Lipper. Average annual total returns are for the one-, three-, five- and ten-year periods. The 30-day SEC yield for the Fund for December 2008 was 2.64%.
Average Annual Total Returns
for periods ended December 31, 2008
| | | | | | | | | | | | | | | | | | |
| | | One
Year | | | Three
Years | | | Five
Years | | | Ten
Years | | | Gross
Expense
Ratio | | | Net
Expense
Ratio | |
PARNASSUS FIXED-INCOME FUND | | 2.98 | % | | 5.40 | % | | 4.15 | % | | 4.87 | % | | 0.88 | % | | 0.76 | % |
Lipper A-rated Bond Fund Average | | (5.88 | %) | | 0.52 | % | | 1.53 | % | | 3.70 | % | | NA | | | NA | |
Barclays Capital U.S. Government/Credit Bond Index | | 5.70 | % | | 5.56 | % | | 4.64 | % | | 5.64 | % | | NA | | | NA | |
Performance data quoted represent past performance and are no guarantee of future returns. Current performance may be lower or higher than the performance data quoted, and current performance information is on the Parnassus Investments website (www.parnassus.com). Investment return and principal value will fluctuate, so that an investor’s shares, when redeemed, may be worth more or less than their original cost. Returns shown in the table do not reflect the deduction of taxes a shareholder would pay in fund distributions or redemption of shares. Before investing, an investor should carefully consider the investment objectives, risks, charges and expenses of the Fund and should read the prospectus, which contains this and other information. The prospectus is on the Parnassus Investments website, or one can be obtained by calling (800) 999-3505. As described in the Fund’s current prospectus dated May 1, 2008, Parnassus Investments has contractually agreed to limit the total operating expenses to 0.87% of net assets, exclusive of acquired fund fees, until May 1, 2009. The Barclays Capital U.S. Aggregate Bond Index and the Barclays Capital U.S. Government/ Credit Bond Index are unmanaged indexes of bonds, and it is not possible to invest directly in an index. An index does not take expenses into account, but mutual fund returns do. To provide better alignment with the overall investment objective of the Fund, the Barclays Capital U.S. Government/Credit Bond Index replaced the Barclays Capital U.S. Aggregate Bond Index as of December 31, 2008. The returns for the Barclays Capital U.S. Aggregate Bond Index for the one-, three-, five- and ten-year periods were 5.24%, 5.51%, 4.65% and 5.63%, respectively.
2008 Analysis
2008 was the year the impossible happened. From the collapse of Bear Stearns and the bankruptcy of Lehman Brothers to Bernard Madoff’s $50 billion Ponzi scheme, it seemed that everything and anything was possible. We also witnessed a commodities boom and crash with oil surging to $147 then collapsing to $32, the nationalization of Fannie Mae and Freddie Mac, a stock market meltdown, soaring corporate bond yields and record low yields in U.S. Treasury bonds. Nearly all asset classes lost value during the year, except for Treasuries and cash.
The U.S. Treasury market returned close to 14% in 2008 with yields across the entire curve at record low levels as the Federal Reserve reduced the federal funds target rate to a range of 0%–0.25% (bond prices move inversely to interest rates). At the front end, the yield on the 2-year declined from 3.05% at the end of 2007 to 0.76% at the end of 2008. Yields on longer-dated maturities followed the same pattern, with the 10-year yielding 2.21% at the end of 2008, compared to 4.02% in 2007, while the 30-year yield decreased to 2.68% from 4.45% during the same period.
As outlined in the strategy section of the last report, we positioned the portfolio to benefit from this lower interest rates environment. This decision paid off, as our investments in U.S. government bonds added 21¢ per share to the NAV. However, this gain was partially offset by a declining equity market, which hampered the performance of our convertible holdings, as well as wider corporate spreads that negatively impacted corporate bond prices. Overall, given the prevailing extraordinary market conditions, we are pleased that our focus on capital preservation and risk management has delivered value for our shareholders.
Outlook and Strategy
One can argue endlessly about the sustainability of an economic recovery based on reviving a credit cycle with low interest rates without reaching actionable investment conclusions. It seems more useful and practical to pay attention to policymakers’ efforts and resources deployed to achieve that goal. With economic data showing few signs of improvement, the Federal Reserve will have to keep interest rates as low as possible for as long as the economy remains weak. The Federal Reserve has not only lowered its federal funds target rate to an all-time low, but is also trying to influence yields by purchasing longer-term Treasury securities. In addition, it will buy agency debt and mortgage-backed securities in an effort to support the mortgage and housing markets.
The Fund’s investment strategy for 2009 assumes persistent weak economic activity in the U.S. and risk aversion remaining elevated throughout the year. Investors’ focus on capital preservation, rather than capital gain, will likely continue to support the Treasury market. At the same time, given the current record low-yield environment, we would expect a shift toward higher-yielding securities such as agency debts –which now have the explicit backing of the government – and high-quality corporate bonds.
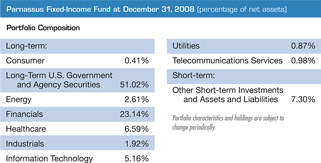
Accordingly, as of the end of 2008, about 60% of the Fund is invested in U.S. government securities, which include agency and Treasury bonds. The majority of this investment is in agency bonds, as they offer higher yields and price appreciation potential relative to Treasury bonds. Because risk management is central to our investment philosophy, the Fund is also positioned to benefit from a faster economic recovery. Therefore, the remainder of the Fund is invested in corporate bonds and convertible debts. As the financial system improves, increased liquidity and lower risk premium would benefit both corporate and convertible bond prices.
As always, we will continue to look for attractive opportunities and adjust our exposure accordingly in those three fixed-income markets to increase the returns of the Fund.
Thank you for investing in the Parnassus Fixed-Income Fund.
Yours truly,
| | |
 | |  |
| |
| Todd C. Ahlsten | | Minh T. Bui |
| Portfolio Manager | | Portfolio Manager |
SOCIAL NOTES
By Milton Moskowitz
2008 was a brutal year on many fronts, and virtually all the companies in Parnassus portfolios were impacted, but perhaps the most crushing blow was the death, on November 18, of social investment pioneer Joan Bavaria after a two-and-one-half year battle with ovarian cancer. Joan was the example non-pareil of someone who lived by her principles, in both her personal and business lives. She founded Boston-based Franklin Research and Development in 1983 as an advisory firm for investors who wanted social responsibility to be reflected in their holdings. The firm’s name was later changed to Trillium Asset Management (she named it after a flower) and it grew to the point where it had more than $1 billion under management. She later founded two of the most important institutions in the social investment field, the Social Investment Forum and CERES, a coalition of investors and environmental and public interest organizations that became a catalyst for change in environmental policies. Joan was a Parnassus shareholder, a mentor to many people who became leaders in this movement and a strong ally of anyone dedicated to bending corporate power to social uses. She was only 65 years old. She will be sorely missed.
Whole Foods Market collected two major awards in 2008. It was selected as “America’s Healthiest Grocery Store” by Health magazine, and it was again named the nation’s number one retailer in seafood sustainability by Greenpeace, which cited its new quality standards for farmed seafood… First Horizon, the Tennessee-based bank holding company, moved to shore up its capital position by selling $866 million of preferred stock to the U.S. Treasury. The leading bank in Tennessee, First Horizon also sold all its mortgage banking operations outside the Volunteer State. And finally, it reduced its head count from 9,555 at the start of the year to 6,000 at the end…Otter Tail, an Upper Midwest electric utility with a number of side interests (plastics, food processing, health services, construction), has a stake in the alternative energy source of wind power through its subsidiary, DMI Industries, which was busy last year in supplying equipment for the expansion of wind farms in North Dakota and Oklahoma…Leading semiconductor maker Texas Instruments boasts a host of family-friendly benefits such as eight weeks maternity leave at full pay, 10 paid days for new fathers and adoptive parents and widely used concierge services and flexible work schedules. It’s no wonder then that TI made Working Mother magazine’s list of the 100 best companies for working mothers for the 13th consecutive year, nor is it surprising that 22% of employees have worked there for more than 20 years…Google, king of the search engine market, did not have to lay off any employees in the turbulence of 2008 — in fact it added people, although at a lower rate — and it maintained its position as the company with the richest benefits in America. For health insurance, employees have a zero premium if they join an HMO, plus they enjoy these privileges: 45 mental health visits a year, 20 acupuncture visits a year, $2,000 coverage for hearing assessments, $10,000 for gender reassignment surgery and 90% coverage up to $20,000 for infertility treatments…Daniel Vasella, CEO of the drug Swiss giant Novartis, joined 156 other CEOs in signing a statement reaffirming their support of the UN’s Universal Declaration of Human Rights, celebrating its 60th anniversary in 2008. The CEOs pledged to reiterate “our own commitment to respect and support human rights within our sphere.” Other signers included the heads of Coca-Cola, Unilever, Volvo, Axa, Diageo, Bacardi, Total, Lufthansa, Nestle and Credit Suisse…
2008 was a tough year for retailers, but the home improvement chain, Lowe’s Companies, did better than most. Same store sales were down but the company created jobs by opening more than 100 new stores. In the last month of the year, the Lowe’s name went up on new stores in Grove Village, Ohio, Belleville, Ontario, South Lebanon, Ohio, Derby, Connecticut and Kansas City. The company now has about 1,650 stores. Lowe’s offers unusual benefits for a retailer. In its 401(k) plan, employee contributions are matched dollar for dollar up to 3% of pay, then 50% from 4 to 5% of pay and finally, 25% on the next 1% up to 6% of pay. Wall Street has high regard for the company. As the year drew to a close, Lowe’s stock was down 25% from its high of $28.50 — and for 2008, that was a winning performance…Goldman Sachs survived the carnage on Wall Street by converting to a bank holding company. It laid off more than 3,000 employees across the globe, but thanks to new hires, it ended the year with about the same number of employees it had at the start of 2008. In 2009 it will celebrate its 140th anniversary by moving into a new 43-story building near the old World Trade Center site. The “green” building will house 11,000 Goldman employees.
FUND EXPENSES (UNAUDITED)
As a shareholder of the funds, you incur ongoing costs, which include portfolio management fees, administrative fees, shareholder reports, and other fund expenses. The funds do not charge transaction fees, so you do not incur transaction costs such as sales charges (loads) on purchase payments, reinvested dividends, or other distributions, redemption fees, and exchange fees. The information on this page is intended to help you understand your ongoing costs of investing in the funds and to compare these costs with the ongoing costs of investing in other mutual funds.
The following example is based on an investment of $1,000 invested at the beginning of the most recent six-month period and held for the period of July 1, 2008 through December 31, 2008.
Actual Expenses
In the example below, the first line for each fund provides information about actual account values and actual expenses. You may use the information in this line, together with the amount you invested, to estimate the expenses that you paid over the period. Simply divide your account value by $1,000 (for example, $8,600 account value divided by $1,000 = 8.6), then multiply the result by the number in the first line under the heading entitled “Expenses Paid During Period” to estimate the expenses you paid on your account during this period.
Hypothetical Example for Comparison Purposes
The second line of each fund provides information about hypothetical account values and hypothetical expenses based on the fund’s expense ratio and an assumed rate of return of 5% per year before expenses, which is not the fund’s actual return. You may compare the ongoing costs of investing in the fund with other mutual funds by comparing this 5% hypothetical example with the 5% hypothetical examples that appear in the shareholder reports of other funds. The hypothetical account values and expenses may not be used to estimate the actual ending account balance or expenses you paid for the period.
Please note that the expenses shown in the table are meant to highlight only your ongoing costs in these funds. Therefore, the second line of each fund is useful in comparing only ongoing costs and will not help you determine the relative total costs of owning other mutual funds, which may include transactional costs such as loads.
FUND EXPENSES (UNAUDITED) continued
| | | | | | | | | |
| | | Beginning
Account Value
July 1, 2008 | | Ending
Account Value
December 31, 2008 | | Expenses
Paid During
Period* |
| | | |
Parnassus Fund: Actual | | $ | 1,000.00 | | $ | 709.00 | | $ | 4.25 |
Hypothetical (5% before expenses) | | $ | 1,000.00 | | $ | 1,020.16 | | $ | 5.03 |
| | | |
Parnassus Equity Income Fund Investor Shares: Actual | | $ | 1,000.00 | | $ | 802.30 | | $ | 4.49 |
Hypothetical (5% before expenses) | | $ | 1,000.00 | | $ | 1,020.16 | | $ | 5.03 |
| | | |
Parnassus Equity Income Fund Institutional Shares: Actual | | $ | 1,000.00 | | $ | 803.50 | | $ | 3.54 |
Hypothetical (5% before expenses) | | $ | 1,000.00 | | $ | 1,021.22 | | $ | 3.96 |
| | | |
Parnassus Mid-Cap Fund: Actual | | $ | 1,000.00 | | $ | 770.90 | | $ | 5.34 |
Hypothetical (5% before expenses) | | $ | 1,000.00 | | $ | 1,019.10 | | $ | 6.09 |
| | | |
Parnassus Small-Cap Fund: Actual | | $ | 1,000.00 | | $ | 737.90 | | $ | 5.24 |
Hypothetical (5% before expenses) | | $ | 1,000.00 | | $ | 1,019.10 | | $ | 6.09 |
| | | |
Parnassus Workplace Fund: Actual | | $ | 1,000.00 | | $ | 750.50 | | $ | 5.28 |
Hypothetical (5% before expenses) | | $ | 1,000.00 | | $ | 1,019.10 | | $ | 6.09 |
| | | |
Parnassus Fixed-Income Fund: Actual | | $ | 1,000.00 | | $ | 1,018.20 | | $ | 4.41 |
Hypothetical (5% before expenses) | | $ | 1,000.00 | | $ | 1,020.76 | | $ | 4.42 |
| * | Expenses are equal to the fund’s annualized expense ratio of 0.99%, 0.99%, 0.78%, 1.20%, 1.20%, 1.20% and 0.87% for the Parnassus Fund, Equity Income Fund – Investor Shares, Equity Income Fund – Institutional Shares, Mid-Cap Fund, Small-Cap Fund, Workplace Fund and Fixed-Income Fund, respectively, multiplied by the average account value over the period, multiplied by the ratio of days in the period. The ratio of days in the period is 184/365 (to reflect the one-half year period). For the year ending December 31, 2008, Parnassus Investments has agreed to further reduce the total operating expenses from 1.40% to 1.20% of net assets, exclusive of acquired fund fees, for the Parnassus Mid-Cap and Parnassus Small-Cap Funds. |
REPORT OF INDEPENDENT REGISTERED PUBLIC ACCOUNTING FIRM
To the Shareholders and Board of Trustees of the Parnassus Funds and the Parnassus Income Funds
San Francisco, California
We have audited the accompanying statements of assets and liabilities, including the portfolios of investments, of the Parnassus Funds (comprised of Parnassus Fund, Parnassus Mid-Cap Fund, Parnassus Small-Cap Fund and Parnassus Workplace Fund) and the Parnassus Income Funds (comprised of Parnassus Equity Income Fund and Parnassus Fixed-Income Fund) (collectively, the “Trusts”) as of December 31, 2008, and the related statements of operations for the year then ended, and of changes in net assets for each of the two years in the period then ended, and the financial highlights for each of the periods presented. These financial statements and financial highlights are the responsibility of the Trusts’ management. Our responsibility is to express an opinion on these financial statements and financial highlights based on our audits.
We conducted our audits in accordance with the standards of the Public Company Accounting Oversight Board (United States). Those standards require that we plan and perform the audit to obtain reasonable assurance about whether the financial statements and financial highlights are free of material misstatement. The Trusts are not required to have, nor were we engaged to perform, an audit of their internal control over financial reporting. Our audits included consideration of internal control over financial reporting as a basis for designing audit procedures that are appropriate in the circumstances, but not for the purpose of expressing an opinion on the effectiveness of the Trusts’ internal control over financial reporting. Accordingly, we express no such opinion. An audit also includes examining, on a test basis, evidence supporting the amounts and disclosures in the financial statements, assessing the accounting principles used and significant estimates made by management, as well as evaluating the overall financial statement presentation. Our procedures included confirmation of securities owned as of December 31, 2008, by correspondence with the custodian. We believe that our audits provide a reasonable basis for our opinion.
In our opinion, such financial statements and financial highlights referred to above present fairly, in all material respects, the financial position of each of the funds constituting the Parnassus Funds and the Parnassus Income Funds as of December 31, 2008, the results of their operations for the year then ended, the changes in their net assets for each of the two years in the period then ended, and the financial highlights for each of the periods presented, in conformity with accounting principles generally accepted in the United States of America.

San Francisco, California
January 30, 2009
THE PARNASSUS FUND
Portfolio of Investments as of
December 31, 2008
| | | | | | | | |
Shares | | Equities | | Percent of
Net Assets | | | Market Value |
| | Biotechnology | | | | | | |
| 70,000 | | Genentech Inc.1 | | 3.3 | % | | $ | 5,803,700 |
| | | | | | | | |
| | Computer Peripherals | | | | | | |
| 310,000 | | Seagate Technology | | 0.8 | % | | $ | 1,373,300 |
| | | | | | | | |
| | Consulting Services | | | | | | |
| 130,000 | | Cognizant Technology Solutions Corp.1 | | 1.3 | % | | $ | 2,347,800 |
| | | | | | | | |
| | Financial Services | | | | | | |
| 250,000 | | American Express Co. | | | | | $ | 4,637,500 |
| 435,000 | | First Horizon National Corp. | | | | | | 4,597,950 |
| 70,000 | | Goldman Sachs Group Inc. | | | | | | 5,907,300 |
| 25,000 | | Paychex Inc. | | | | | | 657,000 |
| 100,000 | | SLM Corp.1 | | | | | | 890,000 |
| 200,000 | | Wells Fargo & Co. | | | | | | 5,896,000 |
| | | | | | | | |
| | | | 13.0 | % | | $ | 22,585,750 |
| | | | | | | | |
| | Home Builders | | | | | | |
| 875,000 | | DR Horton Inc. | | | | | $ | 6,186,250 |
| 310,000 | | KB Home | | | | | | 4,222,200 |
| 700,000 | | Pulte Homes Inc. | | | | | | 7,651,000 |
| 300,000 | | Toll Brothers Inc.1 | | | | | | 6,429,000 |
| | | | | | | | |
| | | | 14.1 | % | | $ | 24,488,450 |
| | | | | | | | |
| | Home Products | | | | | | |
| 60,000 | | WD-40 Co. | | 1.0 | % | | $ | 1,697,400 |
| | | | | | | | |
| | Industrial Manufacturing | | | | | | |
| 80,000 | | Cooper Industries Ltd. | | | | | $ | 2,338,400 |
| 190,000 | | Teleflex Inc. | | | | | | 9,519,000 |
| | | | | | | | |
| | | | 6.8 | % | | $ | 11,857,400 |
| | | | | | | | |
| | Insurance | | | | | | |
| 240,000 | | Tower Group Inc. | | 3.9 | % | | $ | 6,770,400 |
| | | | | | | | |
| | Internet | | | | | | |
| 30,000 | | Amazon.com Inc.1 | | | | | $ | 1,538,400 |
| 40,000 | | eBay Inc.1 | | | | | | 558,400 |
| 25,000 | | Google Inc.1 | | | | | | 7,691,250 |
| | | | | | | | |
| | | | 5.6 | % | | $ | 9,788,050 |
| | | | | | | | |
| | Natural Gas | | | | | | |
| 75,000 | | Quicksilver Resources Inc.1 | | 0.2 | % | | $ | 417,750 |
| | | | | | | | |
| | Networking Products | | | | | | |
| 325,000 | | Cisco Systems Inc.1 | | 3.0 | % | | $ | 5,297,500 |
| | | | | | | | |
| | Oil & Gas | | | | | | |
| 310,000 | | Valero Energy Corp. | | | | | $ | 6,708,400 |
| 130,000 | | W&T Offshore Inc. | | | | | | 1,861,600 |
| | | | | | | | |
| | | | 4.9 | % | | $ | 8,570,000 |
| | | | | | | | |
| | Real Estate Investment Trusts | | | | | | |
| 120,000 | | ProLogis | | 1.0 | % | | $ | 1,666,800 |
| | | | | | | | |
| | Retail | | | | | | |
| 95,000 | | Best Buy Co., Inc. | | | | | $ | 2,670,450 |
| 270,000 | | Lowe’s Cos., Inc. | | | | | | 5,810,400 |
| 200,000 | | Target Corp. | | | | | | 6,906,000 |
| 130,000 | | Walgreen Co. | | | | | | 3,207,100 |
| 125,000 | | Whole Foods Market Inc.1 | | | | | | 1,180,000 |
| | | | | | | | |
| | | | 11.4 | % | | $ | 19,773,950 |
| | | | | | | | |
| | Semiconductor Capital Equipment | | | | | | |
| 460,000 | | Applied Materials Inc. | | | | | $ | 4,659,800 |
| 127,700 | | Cognex Corp. | | | | | | 1,889,960 |
| 100,000 | | Cymer Inc.1 | | | | | | 2,191,000 |
| 200,000 | | Lam Research Corp.1 | | | | | | 4,256,000 |
| | | | | | | | |
| | | | 7.5 | % | | $ | 12,996,760 |
| | | | | | | | |
| | Semiconductors | | | | | | |
| 310,000 | | Altera Corp. | | | | | $ | 5,180,100 |
| 570,000 | | Intel Corp. | | | | | | 8,356,200 |
| 350,000 | | Texas Instruments Inc. | | | | | | 5,432,000 |
| | | | | | | | |
| | | | 10.9 | % | | $ | 18,968,300 |
| | | | | | | | |
| | Software | | | | | | |
| 160,000 | | Autodesk Inc.1 | | | | | $ | 3,144,000 |
| 70,000 | | Citrix Systems Inc.1 | | | | | | 1,649,900 |
| | | | | | | | |
| | | | 2.8 | % | | $ | 4,793,900 |
| | | | | | | | |
| | Telecommunications Equipment | | | | | | |
| 610,000 | | Ciena Corp.1 | | | | | $ | 4,087,000 |
| 400,000 | | Corning Inc. | | | | | | 3,812,000 |
| 1,300,000 | | Powerwave Technologies Inc.1 | | | | | | 650,000 |
| | | | | | | | |
| | | | 4.9 | % | | $ | 8,549,000 |
| | | | | | | | |
| | Waste Management | | | | | | |
| 150,000 | | Waste Management Inc. | | 2.9 | % | | $ | 4,971,000 |
| | | | | | | | |
| | Total investment in equities | | | | | | |
| | (cost $249,323,346) | | 99.3 | % | | $ | 172,717,210 |
| | | | | | | | |
| | | | |
| 24 | | The accompanying notes are an integral part of these financial statements. | | |
Portfolio of Investments as of
December 31, 2008 continued
| | | | | | | | | |
Principal
Amount $ | | Short-Term Securities | | Percent of
Net Assets | | | Market Value | |
| | Certificates of Deposit 2 | | | | | | | |
| 100,000 | | Albina Community Bank | | | | | | | |
| | 3.34%, matures 01/24/2009 | | | | | $ | 99,749 | |
| 100,000 | | Carver Federal Savings Bank | | | | | | | |
| | 3.75%, matures 02/04/2009 | | | | | | 99,628 | |
| 100,000 | | Community Bank of the Bay | | | | | | | |
| | 2.27%, matures 09/06/2009 | | | | | | 97,282 | |
| 100,000 | | Latino Community Credit Union | | | | | | | |
| | 3.30%, matures 02/20/2009 | | | | | | 99,454 | |
| 100,000 | | Louisville Community Development Bank | | | | | | | |
| | 2.25%, matures 05/10/2009 | | | | | | 98,587 | |
| 100,000 | | Opportunities Credit Union | | | | | | | |
| | 2.00%, matures 04/25/2009 | | | | | | 98,751 | |
| 100,000 | | Self-Help Credit Union | | | | | | | |
| | 3.47%, matures 01/14/2009 | | | | | | 99,858 | |
| 100,000 | | Southern Bancorp | | | | | | | |
| | 4.15%, matures 01/12/2009 | | | | | | 99,880 | |
| 100,000 | | Wainwright Bank & Trust Co. | | | | | | | |
| | 3.11%, matures 01/31/2009 | | | | | | 99,672 | |
| | | | | | | | | |
| | | | 0.5 | % | | $ | 892,861 | |
| | | | | | | | | |
| | | Registered Investment Companies—Money Market Funds | | | | | | |
| 6,963 | | Evergreen U.S. Government Fund | | | | | | | |
| | variable rate, 0.85% | | | | | $ | 6,963 | |
| 379,366 | | Janus Government Fund | | | | | | | |
| | variable rate, 0.24% | | | | | | 379,366 | |
| 7,330 | | SSGA U.S. Government Fund | | | | | | | |
| | variable rate, 0.19% | | | | | | 7,330 | |
| | | | | | | | | |
| | | | 0.2 | % | | $ | 393,659 | |
| | | | | | | | | |
| | Community Development Loans2 | | | | | | | |
| 100,000 | | Boston Community Loan Fund | | | | | | | |
| | 3.00%, matures 06/30/2009 | | | | | $ | 97,041 | |
| 100,000 | | Boston Community Loan Fund | | | | | | | |
| | 3.00%, matures 06/30/2009 | | | | | | 97,041 | |
| 100,000 | | Root Capital Loan Fund | | | | | | | |
| | 2.00%, matures 03/16/2009 | | | | | | 98,785 | |
| 100,000 | | Vermont Community Loan Fund | | | | | | | |
| | 3.00%, matures 12/15/2009 | | | | | | 94,280 | |
| | | | | | | | | |
| | | | 0.2 | % | | $ | 387,147 | |
| | | | | | | | | |
| | Total short-term securities
(cost $1,673,667) | | 0.9 | % | | $ | 1,673,667 | |
| | | | | | | | | |
| | Total securities
(cost $250,997,013) | | 100.2 | % | | $ | 174,390,877 | |
| | | | | | | | | |
| | Other assets and liabilities – net | | -0.2 | % | | $ | (480,021 | ) |
| | | | | | | | | |
| | Total net assets | | 100.0 | % | | $ | 173,910,856 | |
| | | | | | | | | |
| 1 | These securities are non-income producing. |
| 2 | Market value adjustments have been applied to these securities to reflect early withdrawal. See note 1 to financial statements. |
Fund holdings will vary over time.
Industry classifications are unaudited.
| | | | |
| | The accompanying notes are an integral part of these financial statements. | | 25 |
THE PARNASSUS EQUITY INCOME FUND
Portfolio of Investments as of
December 31, 2008
| | | | | | | | |
Shares | | Equities | | Percent of
Net Assets | | | Market Value |
| | Biotechnology | | | | | | |
| 300,000 | | Genentech Inc.1 | | 1.6 | % | | $ | 24,873,000 |
| | | | | | | | |
| | Computers | | | | | | |
| 100,000 | | International Business Machines Corp. | | 0.5 | % | | $ | 8,416,000 |
| | | | | | | | |
| | Consulting Services | | | | | | |
| 800,000 | | Accenture Ltd. | | 1.7 | % | | $ | 26,232,000 |
| | | | | | | | |
| | Cosmetics & Personal Care | | | | | | |
| 815,000 | | Procter & Gamble Co. | | 3.3 | % | | $ | 50,383,300 |
| | | | | | | | |
| | Data Processing | | | | | | |
| 815,000 | | Automatic Data Processing Inc. | | 2.1 | % | | $ | 32,062,100 |
| | | | | | | | |
| | Financial Services | | | | | | |
| 1,450,000 | | JPMorgan Chase & Co. | | | | | $ | 45,718,500 |
| 1,500,000 | | Wells Fargo & Co. | | | | | | 44,220,000 |
| | | | | | | | |
| | | | 5.8 | % | | $ | 89,938,500 |
| | | | | | | | |
| | Food Products | | | | | | |
| 1,000,000 | | McCormick & Co. | | | | | $ | 31,860,000 |
| 2,600,000 | | Sysco Corp. | | | | | | 59,644,000 |
| | | | | | | | |
| | | | 6.0 | % | | $ | 91,504,000 |
| | | | | | | | |
| | Healthcare Products | | | | | | |
| 145,000 | | Alcon Inc. | | | | | $ | 12,932,550 |
| 1,425,000 | | Johnson & Johnson | | | | | | 85,257,750 |
| | | | | | | | |
| | | | 6.4 | % | | $ | 98,190,300 |
| | | | | | | | |
| | Healthcare Services | | | | | | |
| 350,000 | | Laboratory Corp.1 | | 1.5 | % | | $ | 22,543,500 |
| | | | | | | | |
| | Home Products | | | | | | |
| 618,665 | | WD-40 Co. | | 1.1 | % | | $ | 17,502,033 |
| | | | | | | | |
| | Industrial Manufacturing | | | | | | |
| 500,000 | | 3M Co. | | | | | $ | 28,770,000 |
| 975,000 | | Cooper Industries Ltd. | | | | | | 28,499,250 |
| 475,000 | | Danaher Corp. | | | | | | 26,889,750 |
| 800,000 | | Pentair Inc. | | | | | | 18,936,000 |
| 1,122,000 | | Teleflex Inc. | | | | | | 56,212,200 |
| | | | | | | | |
| | | | 10.4 | % | | $ | 159,307,200 |
| | | | | | | | |
| | Insurance | | | | | | |
| 615,000 | | AFLAC Inc. | | 1.8 | % | | $ | 28,191,600 |
| | | | | | | | |
| | Internet | | | | | | |
| 45,000 | | Amazon.com Inc.1 | | | | | $ | 2,307,600 |
| 250,000 | | Google Inc.1 | | | | | | 76,912,500 |
| | | | | | | | |
| | | | 5.2 | % | | $ | 79,220,100 |
| | | | | | | | |
| | Machinery | | | | | | |
| 950,000 | | IDEX Corp. | | 1.5 | % | | $ | 22,942,500 |
| | | | | | | | |
| | Natural Gas | | | | | | |
| 2,379,000 | | Energen Corp. | | | | | $ | 69,776,070 |
| 1,500,000 | | MDU Resources Group Inc. | | | | | | 32,370,000 |
| 307,000 | | Praxair Inc. | | | | | | 18,223,520 |
| | | | | | | | |
| | | | 7.8 | % | | $ | 120,369,590 |
| | | | | | | | |
| | Oil & Gas | | | | | | |
| 628,000 | | Apache Corp. | | | | | $ | 46,804,840 |
| 135,000 | | Diamond Offshore Inc. | | | | | | 7,956,900 |
| 170,000 | | EOG Resources Inc. | | | | | | 11,318,600 |
| 1,500,000 | | Valero Energy Corp. | | | | | | 32,460,000 |
| 1,577,000 | | W&T Offshore Inc. | | | | | | 22,582,640 |
| | | | | | | | |
| | | | 7.9 | % | | $ | 121,122,980 |
| | | | | | | | |
| | Pharmaceuticals | | | | | | |
| 900,000 | | Cardinal Health Inc. | | | | | $ | 31,023,000 |
| 675,000 | | Novartis AG (ADR) | | | | | | 33,588,000 |
| 625,000 | | Teva Pharmaceutical Industries Ltd. (ADR) | | | | | | 26,606,250 |
| | | | | | | | |
| | | | 5.9 | % | | $ | 91,217,250 |
| | | | | | | | |
| | Real Estate Investment Trusts | | | | | | |
| 1,286,700 | | ProLogis | | 1.2 | % | | $ | 17,872,263 |
| | | | | | | | |
| | Semiconductors | | | | | | |
| 1,800,000 | | Intel Corp. | | | | | $ | 26,388,000 |
| 775,000 | | Microchip Technology Inc. | | | | | | 15,135,750 |
| | | | | | | | |
| | | | 2.7 | % | | $ | 41,523,750 |
| | | | | | | | |
| | Software | | | | | | |
| 4,350,000 | | Microsoft Corp. | | 5.5 | % | | $ | 84,564,000 |
| | | | | | | | |
| | Utilities | | | | | | |
| 1,050,000 | | AGL Resources Inc. | | | | | $ | 32,917,500 |
| 1,350,000 | | Black Hills Corp. | | | | | | 36,396,000 |
| 200,000 | | Northwest Natural Gas Co. | | | | | | 8,846,000 |
| 250,000 | | Ormat Technologies Inc. | | | | | | 7,967,500 |
| 600,000 | | Otter Tail Corp. | | | | | | 13,998,000 |
| | | | | | | | |
| | | | 6.5 | % | | $ | 100,125,000 |
| | | | | | | | |
| | Waste Management | | | | | | |
| 1,850,000 | | Waste Management Inc. | | 4.0 | % | | $ | 61,309,000 |
| | | | | | | | |
| | Total investment in equities (cost $1,608,222,238) | | 90.4 | % | | $ | 1,389,409,966 |
| | | | | | | | |
| | | | |
| 26 | | The accompanying notes are an integral part of these financial statements. | | |
Portfolio of Investments as of
December 31, 2008 continued
| | | | | | | | |
Principal
Amount $ | | Community Loans | | Percent of
Net Assets | | | Market Value |
| | Community Development Loans2 | | | | | | |
| 500,000 | | MicroVest I, LP Note | | | | | | |
| | 5.88%, matures 03/15/2010 | | | | | $ | 464,000 |
| 1,000,000 | | MicroVest I, LP Note | | | | | | |
| | 5.88%, matures 12/15/2010 | | | | | | 882,793 |
| | | | | | | | |
| | | | 0.1 | % | | $ | 1,346,793 |
| | | | | | | | |
| | Total investment in community loans (cost $1,346,793) | | 0.1 | % | | $ | 1,346,793 |
| | | | | | | | |
| | Total investments in long-term securities (cost $1,609,569,031) | | 90.5 | % | | $ | 1,390,756,759 |
| | | | | | | | |
| | | |
Principal
Amount $ | | Short-Term Securities | | Percent of
Net Assets | | | Market Value |
| | Certificates of Deposit 2 | | | | | | |
| 100,000 | | Community Bank of the Bay | | | | | | |
| | 2.27%, due 08/24/2009 | | 0.0 | % | | $ | 97,425 |
| | | | | | | | |
| | Registered Investment Companies—Money Market Funds | | | | | | |
| 1,138,707 | | Evergreen U.S. Government Fund | | | | | | |
| | variable rate, 0.85% | | | | | $ | 1,138,707 |
| 63,671,368 | | Janus Government Fund | | | | | | |
| | variable rate, 0.24% | | | | | | 63,671,368 |
| 63,192,802 | | SSGA U.S. Government Fund | | | | | | |
| | variable rate, 0.19% | | | | | | 63,192,802 |
| | | | | | | | |
| | | | 8.3 | % | | $ | 128,002,877 |
| | | | | | | | |
| | Community Development Loans2 | | | | | | |
| 100,000 | | Boston Community Loan Fund | | | | | | |
| | 3.00%, matures 06/30/2009 | | | | | $ | 97,041 |
| 1,000,000 | | MicroVest I, LP Note | | | | | | |
| | 5.88%, matures 10/15/2009 | | | | | | 959,795 |
| 200,000 | | Root Capital Loan Fund | | | | | | |
| | 2.00%, matures 01/25/2009 | | | | | | 199,214 |
| 100,000 | | Vermont Community Loan Fund | | | | | | |
| | 3.00%, matures 04/16/2009 | | | | | | 98,274 |
| | | | | | | | |
| | | | 0.1 | % | | $ | 1,354,324 |
| | | | | | | | |
| | Certificate of Deposit Account Registry Service (CDARS)2 | | | | | | |
| 500,000 | | CDARS agreement with Community Bank of the Bay, dated 01/30/2008, matures 01/29/2009, 3.40% Participating depository institutions: Mutual of Omaha Bank, par 94,000; Union Bank & Trust Company, par 62,869; BankFirst Financial Services, par 61,131; Enterprise National Bank of Palm Beach, par 94,000; First Community Bank, par 94,000; The Bank of River Oaks, par 94,000; (cost $498,463) | | | | | $ | 498,463 |
| 500,000 | | CDARS agreement with Community Bank of the Bay, dated 02/13/2008, matures 02/12/2009, 3.11% Participating depository institutions: Liberty Savings Bank, FSB, par 94,500; The PrivateBank and Trust Company, par 94,500; The Buckhead Community Bank, NA, par 94,500; SpiritBank, par 79,687; Community West Bank, NA, par 42,313; Graystone Bank, par 94,500; (cost $497,694) | | | | | | 497,694 |
| | | | |
| | The accompanying notes are an integral part of these financial statements. | | 27 |
THE PARNASSUS EQUITY INCOME FUND
Portfolio of Investments as of
December 31, 2008 continued
| | | | | | | | |
Principal
Amount $ | | Short-Term Securities | | Percent of
Net Assets | | | Market Value |
| 500,000 | | CDARS agreement with Community Bank of the Bay, dated 10/23/2008, due 10/22/2009, 2.27% Participating depository institutions: Chevy Chase Bank, FSB, par 94,500; Flagstar Bank, FSB, par 94,500; Central Bank of Lake of the Ozarks, par 94,500; Banco Popular North America, par 94,500; Citizens National Bank of Elkins, par 27,500; Colonial Bank, NA, par 94,500; (cost $483,846) | | | | | $ | 483,846 |
| 500,000 | | CDARS agreement with Community Bank of the Bay, dated 12/11/2008, due 12/10/2009, 2.03% Participating depository institutions: First Niagara Bank, par 27,500; ShoreBank, par 94,500; Standard Bank & Trust Co., par 94,500; Arvest Bank, par 94,500; TowneBank, par 94,500; BB&T, par 94,500; (cost $481,155) | | | | | | 481,155 |
| | | | | | | | |
| | | | 0.1 | % | | $ | 1,961,158 |
| | | | | | | | |
| | Total short-term securities (cost $131,415,784) | | 8.5 | % | | $ | 131,415,784 |
| | | | | | | | |
| | Total securities (cost $1,740,984,815) | | 99.0 | % | | $ | 1,522,172,543 |
| | | | | | | | |
| | Other assets and liabilities - net | | 1.0 | % | | $ | 15,542,105 |
| | Total net assets | | 100.0 | % | | $ | 1,537,714,648 |
| | | | | | | | |
| 1 | These securities are non-income producing. |
| 2 | Market value adjustments have been applied to these securities to reflect early withdrawal. See note 1 to financial statements. Fund holdings will vary over time. |
Industry classifications are unaudited.
| | | | |
| 28 | | The accompanying notes are an integral part of these financial statements. | | |
THE PARNASSUS MID - CAP FUND
Portfolio of Investments as of
December 31, 2008
| | | | | | | | |
Shares | | Equities | | Percent of
Net Assets | | | Market Value |
| | Apparel | | | | | | |
| 4,500 | | Coach Inc.1 | | 1.4 | % | | $ | 93,465 |
| | | | | | | | |
| | Consulting Services | | | | | | |
| 2,000 | | Accenture Ltd. | | | | | $ | 65,580 |
| 14,200 | | Cognizant Technology Solutions Corp.1 | | | | | | 256,452 |
| | | | | | | | |
| | | | 4.8 | % | | $ | 322,032 |
| | | | | | | | |
| | Data Processing | | | | | | |
| 6,350 | | Automatic Data Processing Inc. | | | | | $ | 249,809 |
| 7,000 | | SEI Investments Co. | | | | | | 109,970 |
| | | | | | | | |
| | | | 5.4 | % | | $ | 359,779 |
| | | | | | | | |
| | Food Products | | | | | | |
| 6,825 | | McCormick & Co. | | | | | $ | 217,444 |
| 13,350 | | Sysco Corp. | | | | | | 306,249 |
| | | | | | | | |
| | | | 7.8 | % | | $ | 523,693 |
| | | | | | | | |
| | Healthcare Products | | | | | | |
| 3,500 | | DENTSPLY | | | | | | |
| | International Inc. | | 1.5 | % | | $ | 98,840 |
| | | | | | | | |
| | Healthcare Services | | | | | | |
| 9,000 | | IMS Health Inc. | | | | | $ | 136,440 |
| 5,000 | | Laboratory Corp.1 | | | | | | 322,050 |
| | | | | | | | |
| | | | 6.9 | % | | $ | 458,490 |
| | | | | | | | |
| | Industrial Manufacturing | | | | | | |
| 5,000 | | Cooper Industries Ltd. | | | | | $ | 146,150 |
| 4,100 | | Danaher Corp. | | | | | | 232,101 |
| 8,500 | | Pentair Inc. | | | | | | 201,195 |
| 6,000 | | Teleflex Inc. | | | | | | 300,600 |
| | | | | | | | |
| | | | 13.2 | % | | $ | 880,046 |
| | | | | | | | |
| | Insurance | | | | | | |
| 5,000 | | AFLAC Inc. | | 3.4 | % | | $ | 229,200 |
| | | | | | | | |
| | Internet | | | | | | |
| 3,250 | | Amazon.com Inc.1 | | 2.5 | % | | $ | 166,660 |
| | | | | | | | |
| | Medical Equipment | | | | | | |
| 2,000 | | Gen-Probe Inc.1 | | | | | $ | 85,680 |
| 3,750 | | Varian Medical Systems Inc.1 | | | | | | 131,400 |
| | | | | | | | |
| | | | 3.3 | % | | $ | 217,080 |
| | | | | | | | |
| | Natural Gas | | | | | | |
| 3,000 | | Energen Corp. | | | | | $ | 87,990 |
| 12,000 | | MDU Resources Group Inc. | | | | | | 258,960 |
| 3,700 | | Praxair Inc. | | | | | | 219,632 |
| 3,000 | | Southern Union Co. | | | | | | 39,120 |
| | | | | | | | |
| | | | 9.1 | % | | $ | 605,702 |
| | | | | | | | |
| | Oil & Gas | | | | | | |
| 2,700 | | Diamond Offshore Inc. | | | | | $ | 159,138 |
| 1,700 | | Smith International Inc. | | | | | | 38,913 |
| 4,400 | | Sunoco Inc. | | | | | | 191,224 |
| | | | | | | | |
| | | | 5.8 | % | | $ | 389,275 |
| | | | | | | | |
| | Pharmaceuticals | | | | | | |
| 7,250 | | Cardinal Health Inc. | | 3.7 | % | | $ | 249,908 |
| | | | | | | | |
| | Real Estate Investment Trusts | | | | | | |
| 9,200 | | ProLogis | | 1.9 | % | | $ | 127,788 |
| | | | | | | | |
| | Retail | | | | | | |
| 6,000 | | Nordstrom Inc. | | 1.2 | % | | $ | 79,860 |
| | | | | | | | |
| | Semiconductors | | | | | | |
| 6,700 | | Microchip Technology Inc. | | 2.0 | % | | $ | 130,851 |
| | | | | | | | |
| | Services | | | | | | |
| 3,750 | | Ecolab Inc. | | 2.0 | % | | $ | 131,812 |
| | | | | | | | |
| | Software | | | | | | |
| 7,450 | | Adobe Systems Inc.1 | | | | | $ | 158,611 |
| 5,000 | | Autodesk Inc.1 | | | | | | 98,250 |
| 8,500 | | Check Point Software Technologies Ltd.1 | | | | | | 161,415 |
| 10,350 | | Citrix Systems Inc.1 | | | | | | 243,950 |
| 5,000 | | Intuit Inc.1 | | | | | | 118,950 |
| 5,150 | | McAfee Inc.1 | | | | | | 178,035 |
| 4,000 | | Synopsys Inc.1 | | | | | | 74,080 |
| | | | | | | | |
| | | | 15.5 | % | | $ | 1,033,291 |
| | | | | | | | |
| | Waste Management | | | | | | |
| 10,100 | | Waste Management Inc. | | 5.0 | % | | $ | 334,714 |
| | | | | | | | |
| | Total investment in equities (cost $7,534,519) | | 96.4 | % | | $ | 6,432,486 |
| | | | | | | | |
| | | | |
| | The accompanying notes are an integral part of these financial statements. | | 29 |
THE PARNASSUS MID - CAP FUND
Portfolio of Investments as of
December 31, 2008 continued
| | | | | | | | |
Principal
Amount $ | | Short-Term Securities | | Percent of
Net Assets | | | Market Value |
| | Registered Investment Companies—Money Market Funds | | | | | | |
| 100,519 | | Janus Government Fund | | | | | | |
| | variable rate, 0.24% | | | | | $ | 100,519 |
| 76,984 | | SSGA U.S. Government Fund | | | | | | |
| | variable rate, 0.19% | | | | | | 76,984 |
| | | | | | | | |
| | | | 2.7 | % | | $ | 177,503 |
| | | | | | | | |
| | Total short-term securities (cost $177,503) | | 2.7 | % | | $ | 177,503 |
| | | | | | | | |
| | Total securities (cost $7,712,022) | | 99.1 | % | | $ | 6,609,989 |
| | | | | | | | |
| | Other assets and liabilities – net | | 0.9 | % | | $ | 62,447 |
| | | | | | | | |
| | Total net assets | | 100.0 | % | | $ | 6,672,436 |
| | | | | | | | |
| 1 | These securities are non-income producing. |
Fund holdings will vary over time.
Industry classifications are unaudited.
| | | | |
| 30 | | The accompanying notes are an integral part of these financial statements. | | |
THE PARNASSUS SMALL - CAP FUND
Portfolio of Investments as of
December 31, 2008
| | | | | | | | |
Shares | | Equities | | Percent of
Net Assets | | | Market Value |
| | Data Processing | | | | | | |
| 20,000 | | Jack Henry & Associates Inc. | | 1.4 | % | | $ | 388,200 |
| | | | | | | | |
| | Electric Motors | | | | | | |
| 31,000 | | Baldor Electric Co. | | 2.1 | % | | $ | 553,350 |
| | | | | | | | |
| | Financial Services | | | | | | |
| 40,000 | | First Horizon National Corp. | | 1.6 | % | | $ | 422,800 |
| | | | | | | | |
| | Footwear | | | | | | |
| 20,000 | | K-Swiss Inc. | | 0.9 | % | | $ | 228,000 |
| | | | | | | | |
| | Healthcare Products | | | | | | |
| 65,000 | | Align Technology Inc.1 | | 2.1 | % | | $ | 568,750 |
| | | | | | | | |
| | Home Builders | | | | | | |
| 50,000 | | DR Horton Inc. | | | | | $ | 353,500 |
| 65,000 | | KB Home | | | | | | 885,300 |
| 75,000 | | Pulte Homes Inc. | | | | | | 819,750 |
| 31,000 | | Toll Brothers Inc.1 | | | | | | 664,330 |
| | | | | | | | |
| | | | 10.2 | % | | $ | 2,722,880 |
| | | | | | | | |
| | Home Products | | | | | | |
| 13,000 | | WD-40 Co. | | 1.4 | % | | $ | 367,770 |
| | | | | | | | |
| | Industrial Manufacturing | | | | | | |
| 25,000 | | Teleflex Inc. | | 4.7 | % | | $ | 1,252,500 |
| | | | | | | | |
| | Insurance | | | | | | |
| 40,000 | | Tower Group Inc. | | 4.2 | % | | $ | 1,128,400 |
| | | | | | | | |
| | Machinery | | | | | | |
| 10,000 | | Graco Inc. | | | | | $ | 237,300 |
| 36,000 | | IDEX Corp. | | | | | | 869,400 |
| 26,000 | | Nordson Corp. | | | | | | 839,540 |
| | | | | | | | |
| | | | 7.3 | % | | $ | 1,946,240 |
| | | | | | | | |
| | Natural Gas | | | | | | |
| 31,000 | | Energen Corp. | | | | | $ | 909,230 |
| 80,000 | | Quicksilver Resources Inc.1 | | | | | | 445,600 |
| 50,000 | | Southern Union Co. | | | | | | 652,000 |
| | | | | | | | |
| | | | 7.5 | % | | $ | 2,006,830 |
| | | | | | | | |
| | Oil & Gas | | | | | | |
| 50,000 | | Mariner Energy Inc.1 | | | | | $ | 510,000 |
| 100,000 | | Mitcham Industries Inc.1 | | | | | | 397,000 |
| 85,000 | | W&T Offshore Inc. | | | | | | 1,217,200 |
| | | | | | | | |
| | | | 7.9 | % | | $ | 2,124,200 |
| | | | | | | | |
| | Professional Services | | | | | | |
| 50,000 | | Administaff Inc. | | 4.0 | % | | $ | 1,082,000 |
| | | | | | | | |
| | Retail | | | | | | |
| 20,000 | | Group 1 Automotive Inc. | | | | | $ | 215,400 |
| 66,000 | | Whole Foods Market Inc.1 | | | | | | 623,040 |
| | | | | | | | |
| | | | 3.1 | % | | $ | 838,440 |
| | | | | | | | |
| | Semiconductor Capital Equipment | | | | | | |
| 38,483 | | Cognex Corp. | | | | | $ | 569,548 |
| 38,000 | | Cymer Inc.1 | | | | | | 832,580 |
| | | | | | | | |
| | | | 5.2 | % | | $ | 1,402,128 |
| | | | | | | | |
| | Semiconductors | | | | | | |
| 100,000 | | O2Micro International Ltd. (ADR) 1 | | 0.7 | % | | $ | 196,000 |
| | | | | | | | |
| | Software | | | | | | |
| 15,000 | | Computer Programs & Systems Inc. | | | | | $ | 402,000 |
| 150,000 | | Mentor Graphics Corp.1 | | | | | | 775,500 |
| 15,000 | | Synopsys Inc.1 | | | | | | 277,800 |
| 18,000 | | Websense Inc.1 | | | | | | 269,460 |
| | | | | | | | |
| | | | 6.5 | % | | $ | 1,724,760 |
| | | | | | | | |
| | Telecommunications Equipment | | | | | | |
| 175,000 | | Ciena Corp.1 | | | | | $ | 1,172,500 |
| 55,000 | | Harmonic Inc.1 | | | | | | 308,550 |
| 170,000 | | Powerwave Technologies Inc.1 | | | | | | 85,000 |
| | | | | | | | |
| | | | 5.8 | % | | $ | 1,566,050 |
| | | | | | | | |
| | Utilities | | | | | | |
| 20,000 | | AGL Resources Inc. | | | | | $ | 627,000 |
| 40,000 | | Black Hills Corp. | | | | | | 1,078,400 |
| 50,000 | | Ormat Technologies Inc. | | | | | | 1,593,500 |
| 30,000 | | Otter Tail Corp. | | | | | | 699,900 |
| | | | | | | | |
| | | | 14.9 | % | | $ | 3,998,800 |
| | | | | | | | |
| | Total investment in equities (cost $34,877,809) | | 91.5 | % | | $ | 24,518,098 |
| | | | | | | | |
| | | | |
| | The accompanying notes are an integral part of these financial statements. | | 31 |
THE PARNASSUS SMALL - CAP FUND
Portfolio of Investments as of
December 31, 2008 continued
| | | | | | | | |
Principal
Amount $ | | Short-Term Securities | | Percent of
Net Assets | | | Market Value |
| | Registered Investment Companies— Money Market Funds | | | | | | |
| 544,305 | | Janus Government Fund | | | | | | |
| | variable rate, 0.24% | | | | | $ | 544,305 |
| 514,467 | | SSGA U.S. Government Fund | | | | | | |
| | variable rate, 0.19% | | | | | | 514,467 |
| | | | | | | | |
| | | | 3.9 | % | | $ | 1,058,772 |
| | | | | | | | |
| | Total short-term securities (cost $1,058,772) | | 3.9 | % | | $ | 1,058,772 |
| | | | | | | | |
| | Total securities (cost $35,936,581) | | 95.4 | % | | $ | 25,576,870 |
| | | | | | | | |
| | Other assets and liabilities – net | | 4.6 | % | | $ | 1,227,896 |
| | | | | | | | |
| | Total net assets | | 100.0 | % | | $ | 26,804,766 |
| | | | | | | | |
| 1 | These securities are non-income producing. |
Fund holdings will vary over time.
Industry classifications are unaudited.
| | | | |
| 32 | | The accompanying notes are an integral part of these financial statements. | | |
THE PARNASSUS WORKPLACE FUND
Portfolio of Investments as of
December 31, 2008
| | | | | | | | |
Shares | | Equities | | Percent of
Net Assets | | | Market Value |
| | Biotechnology | | | | | | |
| 6,000 | | Genentech Inc.1 | | 6.3 | % | | $ | 497,460 |
| | | | | | | | |
| 6,500 | | Simpson Manufacturing Co., Inc. | | 2.3 | % | | $ | 180,440 |
| | | | | | | | |
| | Computer Peripherals | | | | | | |
| 17,500 | | Seagate Technology | | 1.0 | % | | $ | 77,525 |
| | | | | | | | |
| | Computers | | | | | | |
| 1,700 | | International Business Machines Corp. | | 1.8 | % | | $ | 143,072 |
| | | | | | | | |
| | Data Processing | | | | | | |
| 6,000 | | SEI Investments Co. | | 1.2 | % | | $ | 94,260 |
| | | | | | | | |
| | Data Storage | | | | | | |
| 1,000 | | NetApp Inc.1 | | 0.2 | % | | $ | 13,970 |
| | | | | | | | |
| | Electric Motors | | | | | | |
| 16,000 | | Baldor Electric Co. | | 3.6 | % | | $ | 285,600 |
| | | | | | | | |
| | Financial Services | | | | | | |
| 14,500 | | American Express Co. | | | | | $ | 268,975 |
| 19,000 | | First Horizon National Corp. | | | | | | 200,830 |
| 4,000 | | Goldman Sachs Group Inc. | | | | | | 337,560 |
| 8,500 | | Paychex Inc. | | | | | | 223,380 |
| 5,000 | | Wells Fargo & Co. | | | | | | 147,400 |
| | | | | | | | |
| | | | 14.8 | % | | $ | 1,178,145 |
| | | | | | | | |
| | Home Products | | | | | | |
| 2,500 | | WD-40 Co. | | 0.9 | % | | $ | 70,725 |
| | | | | | | | |
| | Industrial Manufacturing | | | | | | |
| 1,500 | | 3M Co. | | 1.1 | % | | $ | 86,310 |
| | | | | | | | |
| | Insurance | | | | | | |
| 3,000 | | AFLAC Inc. | | 1.7 | % | | $ | 137,520 |
| | | | | | | | |
| | Internet | | | | | | |
| 11,000 | | eBay Inc.1 | | | | | $ | 153,560 |
| 1,300 | | Google Inc.1 | | | | | | 399,945 |
| | | | | | | | |
| | | | 6.9 | % | | $ | 553,505 |
| | | | | | | | |
| | Machinery | | | | | | |
| 6,500 | | Nordson Corp. | | 2.6 | % | | $ | 209,885 |
| | | | | | | | |
| | Networking Products | | | | | | |
| 17,000 | | Cisco Systems Inc.1 | | 3.5 | % | | $ | 277,100 |
| | | | | | | | |
| | Office Equipment | | | | | | |
| 7,000 | | Canon Inc. (ADR) | | 2.8 | % | | $ | 219,800 |
| | | | | | | | |
| | Oil & Gas | | | | | | |
| 19,000 | | Valero Energy Corp. | | 5.2 | % | | $ | 411,160 |
| | | | | | | | |
| | Pharmaceuticals | | | | | | |
| 2,000 | | Novartis AG (ADR) | | 1.3 | % | | $ | 99,520 |
| | | | | | | | |
| | Retail | | | | | | |
| 3,000 | | Nordstrom Inc. | | | | | $ | 39,930 |
| 10,500 | | Target Corp. | | | | | | 362,565 |
| 11,000 | | Walgreen Co. | | | | | | 271,370 |
| 21,500 | | Whole Foods Market Inc.1 | | | | | | 202,960 |
| | | | | | | | |
| | | | 11.0 | % | | $ | 876,825 |
| | | | | | | | |
| | Semiconductors | | | | | | |
| 14,000 | | Altera Corp. | | | | | $ | 233,940 |
| 22,000 | | Intel Corp. | | | | | | 322,520 |
| 18,000 | | Texas Instruments Inc. | | | | | | 279,360 |
| | | | | | | | |
| | | | 10.5 | % | | $ | 835,820 |
| | | | | | | | |
| | Software | | | | | | |
| 12,500 | | Adobe Systems Inc.1 | | | | | $ | 266,125 |
| 13,000 | | Autodesk Inc.1 | | | | | | 255,450 |
| 14,000 | | Citrix Systems Inc.1 | | | | | | 329,980 |
| 5,500 | | Intuit Inc.1 | | | | | | 130,845 |
| 9,500 | | Microsoft Corp. | | | | | | 184,680 |
| | | | | | | | |
| | | | 14.6 | % | | $ | 1,167,080 |
| | | | | | | | |
| | Telecommunications Equipment | | | | | | |
| 19,000 | | Corning Inc. | | 2.3 | % | | $ | 181,070 |
| | | | | | | | |
| | Total investment in equities (cost $9,632,545) | | 95.6 | % | | $ | 7,596,792 |
| | | | | | | | |
| | | |
Principal
Amount $ | | Short-Term Securities | | | | | |
| | Registered Investment Companies—Money Market Funds | | | | | | |
| 146,371 | | Janus Government Fund | | | | | | |
| | variable rate, 0.24% | | | | | $ | 146,371 |
| 142,409 | | SSGA U.S. Government Fund | | | | | | |
| | variable rate, 0.19% | | | | | | 142,409 |
| | | | | | | | |
| | | | 3.6 | % | | $ | 288,780 |
| | | | | | | | |
| | Total short-term securities (cost $288,780) | | 3.6 | % | | $ | 288,780 |
| | | | | | | | |
| | Total securities (cost $9,921,325) | | 99.2 | % | | $ | 7,885,572 |
| | | | | | | | |
| | Other assets and liabilities – net | | 0.8 | % | | $ | 65,823 |
| | | | | | | | |
| | Total net assets | | 100.0 | % | | $ | 7,951,395 |
| | | | | | | | |
| 1 | These securities are non-income producing. |
Fund holdings will vary over time.
Industry classifications are unaudited.
| | | | |
| | The accompanying notes are an integral part of these financial statements. | | 33 |
THE PARNASSUS FIXED - INCOME FUND
Portfolio of Investments as of
December 31, 2008
| | | | | | | | |
Principal
Amount $ | | Convertible Bonds | | Percent of
Net Assets | | | Market Value |
| | Biotechnology | | | | | | |
| 3,825,000 | | Invitrogen Inc. | | | | | | |
| | Notes, 2.00%, due 08/01/2023 | | 3.6 | % | | $ | 3,581,156 |
| | | | | | | | |
| | Computer Peripherals | | | | | | |
| 1,500,000 | | Maxtor Corp. | | | | | | |
| | Notes, 6.80%, due 04/30/2010 | | 1.3 | % | | $ | 1,335,000 |
| | | | | | | | |
| | Oil & Gas | | | | | | |
| 3,000,000 | | Transocean Inc. | | | | | | |
| | Notes, 1.63%, due 12/15/2037 | | 2.6 | % | | $ | 2,613,750 |
| | | | | | | | |
| | Real Estate Investment Trusts | | | | | | |
| 2,500,000 | | Prologis | | | | | | |
| | Notes, 1.88%, due 11/15/2037 | | 1.1 | % | | $ | 1,137,500 |
| | | | | | | | |
| | Semiconductors | | | | | | |
| 1,000,000 | | Intel Corp. | | | | | | |
| | Notes, 2.95%, due 12/15/2035 | | 0.9 | % | | $ | 866,250 |
| | | | | | | | |
| | Total investments in convertible bonds (cost $10,934,268) | | 9.5 | % | | $ | 9,533,656 |
| | | | | | | | |
| | | |
Principal
Amount $ | | Corporate Bonds | | Percent of
Net Assets | | | Market Value |
| | Biotechnology | | | | | | |
| 3,000,000 | | Genentech Inc. | | | | | | |
| | Notes, 4.75%, due 07/15/2015 | | 3.0 | % | | $ | 3,018,192 |
| | | | | | | | |
| | Financial Services | | | | | | |
| 2,000,000 | | American Express Co. | | | | | | |
| | Notes, 5.50%, due 09/12/2016 | | | | | $ | 1,835,122 |
| 500,000 | | Bank One Corp. | | | | | | |
| | Notes, 6.00%, due 02/17/2009 | | | | | | 500,025 |
| 500,000 | | Goldman Sachs Inc. | | | | | | |
| | Notes, 6.65%, due 05/15/2009 | | | | | | 501,692 |
| 1,500,000 | | Goldman Sachs Inc. | | | | | | |
| | Notes, 5.75%, due 10/01/2016 | | | | | | 1,405,593 |
| 1,000,000 | | Goldman Sachs Inc. | | | | | | |
| | Notes, 5.63%, due 01/15/2017 | | | | | | 859,077 |
| 2,000,000 | | JPMorgan Chase & Co. | | | | | | |
| | Notes, 2.63%, due 12/01/2010 | | | | | | 2,040,154 |
| 2,000,000 | | Merrill Lynch & Co., Inc. | | | | | | |
| | Notes, 6.50%, due 07/15/2018 | | | | | | 2,019,272 |
| 2,000,000 | | Wells Fargo & Co. | | | | | | |
| | Notes, 3.00%, due 12/09/2011 | | | | | | 2,079,318 |
| 2,000,000 | | Wells Fargo & Co. | | | | | | |
| | Notes, 5.13%, due 09/15/2016 | | | | | | 2,010,222 |
| 500,000 | | Wells Fargo Financial Inc. | | | | | | |
| | Notes, 6.85%, due 07/15/2009 | | | | | | 504,861 |
| | | | | | | | |
| | | | 13.7 | % | | $ | 13,755,336 |
| | | | | | | | |
| | Networking Products | | | | | | |
| 2,800,000 | | Cisco Systems Inc. | | | | | | |
| | Notes, 5.50%, due 02/22/2016 | | 3.0 | % | | $ | 2,965,693 |
| | | | | | | | |
| | Retail | | | | | | |
| 400,000 | | Target Corp. | | | | | | |
| | Notes, 7.50%, due 08/15/2010 | | 0.4 | % | | $ | 414,911 |
| | | | | | | | |
| | Telecommunication Services | | | | | | |
| 1,000,000 | | Verizon Communications Inc. | | | | | | |
| | Notes, 5.55%, due 02/15/2016 | | 1.0 | % | | $ | 977,018 |
| | | | | | | | |
| | Transportation | | | | | | |
| 2,000,000 | | Burlington North Santa Fe Corp. | | | | | | |
| | Notes, 5.65%, due 05/01/2017 | | 1.9 | % | | $ | 1,920,362 |
| | | | | | | | |
| | Total investments in corporate bonds (cost $22,956,372) | | 23.0 | % | | $ | 23,051,512 |
| | | | | | | | |
| | | | |
| 34 | | The accompanying notes are an integral part of these financial statements. | | |
Portfolio of Investments as of
December 31, 2008 continued
| | | | | | | | |
Shares | | Equities | | Percent of
Net Assets | | | Market Value |
| | Natural Gas | | | | | | |
| 30,000 | | ONEOK Inc. | | 0.9 | % | | $ | 873,600 |
| | | | | | | | |
| | Total investment in equities (cost $759,304) | | 0.9 | % | | $ | 873,600 |
| | | | | | | | |
| | | |
Principal
Amount $ | | U.S. Government Agency Bonds | | Percent of
Net Assets | | | Market Value |
| 2,000,000 | | Fannie Mae | | | | | | |
| | 5.25%, due 01/15/2009 | | | | | $ | 2,003,444 |
| 8,000,000 | | Fannie Mae | | | | | | |
| | 4.35%, due 01/25/2010 | | | | | | 8,270,776 |
| 4,000,000 | | Fannie Mae | | | | | | |
| | 5.38%, due 07/17/2013 | | | | | | 4,313,620 |
| 3,000,000 | | Federal Farm Credit Bank | | | | | | |
| | 5.41%, due 11/07/2016 | | | | | | 3,185,919 |
| 1,500,000 | | Federal Home Loan Bank System | | | | | | |
| | 5.25%, due 06/12/2009 | | | | | | 1,532,456 |
| 3,000,000 | | Federal Home Loan Bank System | | | | | | |
| | 2.88%, due 03/11/2011 | | | | | | 3,099,915 |
| 1,500,000 | | Federal Home Loan Bank System | | | | | | |
| | 5.00%, due 09/14/2012 | | | | | | 1,649,751 |
| 2,000,000 | | Federal Home Loan Bank System | | | | | | |
| | 5.25%, due 09/13/2013 | | | | | | 2,243,478 |
| 1,500,000 | | Federal Home Loan Bank System | | | | | | |
| | 5.25%, due 09/12/2014 | | | | | | 1,711,834 |
| 2,000,000 | | Federal Home Loan Bank System | | | | | | |
| | 5.50%, due 11/17/2016 | | | | | | 2,130,022 |
| 1,500,000 | | Federal Home Loan Bank System | | | | | | |
| | 5.13%, due 03/10/2017 | | | | | | 1,691,305 |
| 3,000,000 | | Freddie Mac | | | | | | |
| | 4.00%, due 06/12/2013 | | | | | | 3,192,690 |
| 2,000,000 | | Freddie Mac | | | | | | |
| | 5.50%, due 08/23/2017 | | | | | | 2,358,634 |
| | | | | | | | |
| | | | 37.4 | % | | $ | 37,383,844 |
| | | | | | | | |
| | Total investments in U.S. government agency bonds (cost $35,815,735) | | 37.4 | % | | $ | 37,383,844 |
| | | | | | | | |
| 2,000,000 | | U.S. Treasury | | | | | | |
| | 2.00%, due 09/30/2010 | | | | | $ | 2,050,312 |
| 1,000,000 | | U.S. Treasury | | | | | | |
| | 1.25%, due 11/30/2010 | | | | | | 1,010,740 |
| 4,000,000 | | U.S. Treasury | | | | | | |
| | 4.50%, due 02/28/2011 | | | | | | 4,325,000 |
| 3,000,000 | | U.S. Treasury | | | | | | |
| | 4.25%, due 08/15/2013 | | | | | | 3,410,859 |
| 2,000,000 | | U.S. Treasury | | | | | | |
| | 3.13%, due 09/30/2013 | | | | | | 2,157,968 |
| 2,000,000 | | U.S. Treasury | | | | | | |
| | 4.63%, due 11/15/2016 | | | | | | 2,361,250 |
| 1,000,000 | | U.S. Treasury | | | | | | |
| | 4.00%, due 08/15/2018 | | | | | | 1,154,766 |
| 2,000,000 | | U.S. Treasury | | | | | | |
| | 3.75%, due 11/15/2018 | | | | | | 2,264,060 |
| 2,359,140 | | U.S. Treasury (TIPS) | | | | | | |
| | 1.88%, due 07/15/2013 | | | | | | 2,221,093 |
| 1,034,120 | | U.S. Treasury (TIPS) | | | | | | |
| | 1.63%, due 01/15/2018 | | | | | | 981,525 |
| | | | | | | | |
| | | | 21.9 | % | | $ | 21,937,573 |
| | | | | | | | |
| | Total investments in U.S. government treasury bonds (cost $21,208,592) | | 21.9 | % | | $ | 21,937,573 |
| | | | | | | | |
| | Total investment in long-term securities (cost $91,674,271) | | 92.7 | % | | $ | 92,780,185 |
| | | | | | | | |
| | | | |
| | The accompanying notes are an integral part of these financial statements. | | 35 |
THE PARNASSUS FIXED - INCOME FUND
Portfolio of Investments as of
December 31, 2008 continued
| | | | | | | | |
Principal
Amount $ | | Short-Term Securities | | Percent of
Net Assets | | | Market Value |
| | Registered Investment Companies—Money Market Funds | | | | | | |
| 1,138,707 | | Evergreen U.S. Government Fund | | | | | | |
| | variable rate, 0.85% | | | | | $ | 1,138,707 |
| 2,469,627 | | Janus Government Fund | | | | | | |
| | variable rate, 0.24% | | | | | | 2,469,627 |
| 2,524,983 | | SSGA U.S. Government Fund | | | | | | |
| | variable rate, 0.19% | | | | | | 2,524,983 |
| | | | | | | | |
| | | | 6.1 | % | | $ | 6,133,317 |
| | | | | | | | |
| | Total short-term securities (cost $6,133,317) | | 6.1 | % | | $ | 6,133,317 |
| | | | | | | | |
| | Total securities (cost $97,807,588) | | 98.8 | % | | $ | 98,913,502 |
| | | | | | | | |
| | Other assets and liabilities – net | | 1.2 | % | | | 1,156,041 |
| | Total net assets | | 100.0 | % | | $ | 100,069,543 |
| | | | | | | | |
Fund holdings will vary over time.
Industry classifications are unaudited.
| | | | |
| 36 | | The accompanying notes are an integral part of these financial statements. | | |
THE PARNASSUS FUNDS
Statement of Assets and Liabilities
December 31, 2008
| | | | | | | | | | | | |
| | | Parnassus
Fund | | | Parnassus
Equity Income
Fund | | | Parnassus
Mid-Cap
Fund | |
Assets | | | | | | | | | | | | |
| | | |
Investments in equities and bonds, at market value (cost $249,323,346, $1,609,569,031, $7,534,519) | | $ | 172,717,210 | | | $ | 1,390,756,759 | | | $ | 6,432,486 | |
Investments in short-term securities
(at cost which approximates market value) | | | 1,673,667 | | | | 131,415,784 | | | | 177,503 | |
Cash | | | 164,215 | | | | 7,452,370 | | | | 11,324 | |
Receivables | | | | | | | | | | | | |
Investment securities sold | | | — | | | | — | | | | 66,665 | |
Dividends and interest | | | 60,918 | | | | 2,316,250 | | | | 12,429 | |
Capital shares sold | | | 83,475 | | | | 8,631,595 | | | | 56,578 | |
Due from Parnassus Investments | | | — | | | | — | | | | 1,452 | |
Other assets | | | 82,460 | | | | 160,110 | | | | 37,735 | |
Total assets | | $ | 174,781,945 | | | $ | 1,540,732,868 | | | $ | 6,796,172 | |
| | | |
Liabilities | | | | | | | | | | | | |
Custodian overdraft | | | 315,693 | | | | — | | | | 111,489 | |
Capital shares redeemed | | | 201,615 | | | | 1,761,763 | | | | 3,748 | |
Fees payable to Parnassus Investments | | | 160,469 | | | | 890,557 | | | | — | |
Accounts payable and accrued expenses | | | 193,312 | | | | 365,900 | | | | 8,499 | |
Total liabilities | | $ | 871,089 | | | $ | 3,018,220 | | | $ | 123,736 | |
| | | |
Net assets | | $ | 173,910,856 | | | $ | 1,537,714,648 | | | $ | 6,672,436 | |
| | | |
Net assets consists of | | | | | | | | | | | | |
| | | |
Undistributed net investment income | | | — | | | | 476,988 | | | | 3,205 | |
Unrealized appreciation (depreciation) on securities | | | (76,606,136 | ) | | | (218,812,272 | ) | | | (1,102,033 | ) |
Accumulated net realized loss | | | (5,571,890 | ) | | | (53,615,301 | ) | | | (915,000 | ) |
Capital paid-in | | | 256,088,882 | | | | 1,809,665,233 | | | | 8,686,264 | |
Total net assets | | $ | 173,910,856 | | | $ | 1,537,714,648 | | | $ | 6,672,436 | |
| | | |
Net assets value and offering per share | | | | | | | | | | | | |
Shares outstanding investor shares | | | 7,370,779 | | | | 72,597,055 | | | | 556,248 | |
Shares outstanding institutional shares | | | — | | | | 7,109,997 | | | | — | |
| | | |
Net asset values and redemption price per share
(Net asset value divided by shares outstanding) | | | | | | | | | | | | |
Investor shares | | $ | 23.59 | | | $ | 19.29 | | | $ | 12.00 | |
Institutional shares | | | — | | | $ | 19.34 | | | | — | |
| | | | |
| | The accompanying notes are an integral part of these financial statements. | | 37 |
THE PARNASSUS FUNDS
Statement of Assets and Liabilities
December 31, 2008
| | | | | | | | | | | |
| | | Parnassus
Small-Cap
Fund | | | Parnassus
Workplace
Fund | | | Parnassus
Fixed-Income
Fund |
Assets | | | | | | | | | | | |
| | | |
Investments in equities and bonds, at market value (cost $34,877,809, $9,632,545, $91,674,271) | | $ | 24,518,098 | | | $ | 7,596,792 | | | $ | 92,780,185 |
Investments in short-term securities
(at cost which approximates market value) | | | 1,058,772 | | | | 288,780 | | | | 6,133,317 |
Cash | | | 281,105 | | | | 24,932 | | | | 22,369 |
Receivables | | | | | | | | | | | |
Investment securities sold | | | 518,000 | | | | — | | | | — |
Dividends and interest | | | 21,316 | | | | 4,135 | | | | 1,145,855 |
Capital shares sold | | | 400,740 | | | | 8,820 | | | | 179,072 |
Due from Parnassus Investments | | | — | | | | 1,712 | | | | — |
Other assets | | | 33,134 | | | | 33,351 | | | | 47,684 |
Total assets | | $ | 26,831,165 | | | $ | 7,958,522 | | | $ | 100,308,482 |
| | | |
Liabilities | | | | | | | | | | | |
| | | |
Custodian overdraft | | | — | | | | — | | | | 97,946 |
Capital shares redeemed | | | 12,958 | | | | — | | | | 97,991 |
Fees payable to Parnassus Investments | | | 1,909 | | | | — | | | | 25,241 |
Accounts payable and accrued expenses | | | 11,532 | | | | 7,127 | | | | 17,761 |
Total liabilities | | $ | 26,399 | | | $ | 7,127 | | | $ | 238,939 |
Net assets | | $ | 26,804,766 | | | $ | 7,951,395 | | | $ | 100,069,543 |
| | | |
Net assets consists of | | | | | | | | | | | |
| | | |
Undistributed net investment income | | | — | | | | 14,355 | | | | 5,235 |
Unrealized appreciation (depreciation) on securities | | | (10,359,711 | ) | | | (2,035,753 | ) | | | 1,105,914 |
Accumulated net realized loss | | | (1,289,315 | ) | | | (136,311 | ) | | | — |
Capital paid-in | | | 38,453,792 | | | | 10,109,104 | | | | 98,958,394 |
Total net assets | | $ | 26,804,766 | | | $ | 7,951,395 | | | $ | 100,069,543 |
| | | |
Net assets value and offering per share | | | | | | | | | | | |
| | | |
Shares outstanding investor shares | | | 2,122,887 | | | | 650,861 | | | | 6,181,838 |
Shares outstanding institutional shares | | | — | | | | — | | | | — |
| | | |
Net asset values and redemption price per share
(Net asset value divided by shares outstanding) | | | | | | | | | | | |
Investor shares | | $ | 12.63 | | | $ | 12.22 | | | $ | 16.19 |
Institutional shares | | | — | | | | — | | | | — |
| | | | |
| 38 | | The accompanying notes are an integral part of these financial statements. | | |
THE PARNASSUS FUNDS
Statement of Operations
Year Ended December 31, 2008
| | | | | | | | | | | | |
| | | Parnassus
Fund | | | Parnassus
Equity Income
Fund | | | Parnassus
Mid-Cap
Fund | |
Investment income | | | | | | | | | | | | |
| | | |
Dividends
(net of foreign tax withholding of $0, $95,067, $0) | | $ | 3,192,998 | | | $ | 22,297,132 | | | $ | 88,234 | |
Interest | | | 91,946 | | | | 2,040,978 | | | | 3,933 | |
Securities lending | | | 319,284 | | | | 740,060 | | | | — | |
Other income | | | — | | | | — | | | | — | |
Total investment income | | $ | 3,604,228 | | | $ | 25,078,170 | | | $ | 92,167 | |
| | | |
Expenses | | | | | | | | | | | | |
| | | |
Investment advisory fees | | | 1,629,171 | | | | 7,450,733 | | | | 48,783 | |
Transfer agent fees | | | | | | | | | | | | |
Investor shares | | | 270,004 | | | | 384,167 | | | | 10,514 | |
Institutional shares | | | — | | | | 4,335 | | | | — | |
Fund administration | | | 161,575 | | | | 757,030 | | | | 3,859 | |
Service provider fees | | | 51,194 | | | | 1,862,823 | | | | 7,458 | |
Reports to shareholders | | | 110,089 | | | | 270,393 | | | | 3,880 | |
Registration fees and expenses | | | 28,771 | | | | 41,737 | | | | 18,308 | |
Custody fees | | | 23,725 | | | | 49,329 | | | | 2,682 | |
Professional fees | | | 95,267 | | | | 189,711 | | | | 24,266 | |
Trustee fees and expenses | | | 20,905 | | | | 67,530 | | | | 474 | |
Proxy voting fees | | | 4,520 | | | | 4,520 | | | | 4,520 | |
Pricing service fees | | | 3,576 | | | | 6,055 | | | | 3,375 | |
Other expenses | | | 45,172 | | | | 114,319 | | | | 1,280 | |
Total expenses | | $ | 2,443,969 | | | $ | 11,202,682 | | | $ | 129,399 | |
Fees waived by Parnassus Investments | | | (71,434 | ) | | | (63,875 | ) | | | (60,228 | ) |
Expense offset | | | — | | | | (10,471 | ) | | | (33 | ) |
Net expenses | | $ | 2,372,535 | | | $ | 11,128,336 | | | $ | 69,138 | |
Net investment income | | $ | 1,231,693 | | | $ | 13,949,834 | | | $ | 23,029 | |
| | | |
Net realized and unrealized loss on investments | | | | | | | | | | | | |
Net realized loss from securities transactions | | | (5,156,106 | ) | | | (52,646,973 | ) | | | (907,302 | ) |
Net change in unrealized depreciation of securities | | | (87,966,171 | ) | | | (317,042,900 | ) | | | (1,003,356 | ) |
Net realized and unrealized loss on securities | | $ | (93,122,277 | ) | | $ | (369,689,873 | ) | | $ | (1,910,658 | ) |
Net increase (decrease) in net assets resulting from operations | | $ | (91,890,584 | ) | | $ | (355,740,039 | ) | | $ | (1,887,629 | ) |
| | | | |
| | The accompanying notes are an integral part of these financial statements. | | 39 |
THE PARNASSUS FUNDS
Statement of Operations
Year Ended December 31, 2008
| | | | | | | | | | | | |
| | | Parnassus
Small-Cap
Fund | | | Parnassus
Workplace
Fund | | | Parnassus
Fixed-Income
Fund | |
Investment income | | | | | | | | | | | | |
| | | |
Dividends
(net of foreign tax witholding of $0, $269, $0) | | $ | 241,104 | | | $ | 75,287 | | | $ | 46,800 | |
Interest | | | 13,982 | | | | 4,380 | | | | 3,307,765 | |
Securities lending | | | — | | | | — | | | | 9,350 | |
Other income | | | — | | | | — | | | | 4,653 | |
Total investment income | | $ | 255,086 | | | $ | 79,667 | | | $ | 3,368,568 | |
| | | |
Expenses | | | | | | | | | | | | |
| | | |
Investment advisory fees | | | 148,414 | | | | 44,887 | | | | 459,565 | |
Transfer agent fees | | | | | | | | | | | | |
Investor shares | | | 20,157 | | | | 9,671 | | | | 66,462 | |
Institutional shares | | | — | | | | — | | | | — | |
Fund administration | | | 9,765 | | | | 3,517 | | | | 61,495 | |
Service provider fees | | | 30,431 | | | | 5,552 | | | | 113,940 | |
Reports to shareholders | | | 6,970 | | | | 3,402 | | | | 25,237 | |
Registration fees and expenses | | | 18,269 | | | | 18,876 | | | | 22,082 | |
Custody fees | | | 9,635 | | | | 3,678 | | | | 8,031 | |
Professional fees | | | 24,221 | | | | 24,184 | | | | 34,277 | |
Trustee fees and expenses | | | 587 | | | | 312 | | | | 5,951 | |
Proxy voting fees | | | 4,520 | | | | 4,520 | | | | — | |
Pricing service fees | | | 3,611 | | | | 3,611 | | | | 2,460 | |
Other expenses | | | 1,490 | | | | 1,094 | | | | 9,283 | |
Total expenses | | $ | 278,070 | | | $ | 123,304 | | | $ | 808,783 | |
Fees waived by Parnassus Investments | | | (94,692 | ) | | | (59,757 | ) | | | (117,431 | ) |
Expense offset | | | (4,599 | ) | | | (46 | ) | | | (1,298 | ) |
Net expenses | | $ | 178,779 | | | $ | 63,501 | | | $ | 690,054 | |
Net investment income | | $ | 76,307 | | | $ | 16,166 | | | $ | 2,678,514 | |
| | | |
Net realized and unrealized gain (loss) on investments | | | | | | | | | | | | |
Net realized gain (loss) from securities transactions | | | (1,274,547 | ) | | | (74,509 | ) | | | 602,324 | |
Net change in unrealized depreciation of securities | | | (10,187,701 | ) | | | (2,227,968 | ) | | | (667,483 | ) |
Net realized and unrealized loss on securities | | $ | (11,462,248 | ) | | $ | (2,302,477 | ) | | $ | (65,159 | ) |
Net increase (decrease) in net assets resulting from operations | | $ | (11,385,941 | ) | | $ | (2,286,311 | ) | | $ | 2,613,355 | |
| | | | |
| 40 | | The accompanying notes are an integral part of these financial statements. | | |
THE PARNASSUS FUNDS
Statement of Changes in Net Assets
| | | | | | | | | | | | | | | | |
| | | Parnassus Fund | | | Parnassus Equity Income Fund | |
| | | Year Ended
December 31, 2008 | | | Year Ended
December 31, 2007 | | | Year Ended
December 31, 2008 | | | Year Ended
December 31, 2007 | |
Investment income (loss) from operations | | | | | | | | | | | | | | | | |
| | | | |
Net investment income (loss) | | $ | 1,231,693 | | | $ | (21,567 | ) | | $ | 13,949,834 | | | $ | 6,710,224 | |
Net realized gain (loss) from securities transactions | | | (5,156,106 | ) | | | 28,536,349 | | | | (52,646,973 | ) | | | 83,587,541 | |
Net change in unrealized appreciation (depreciation) | | | (87,966,171 | ) | | | (9,615,794 | ) | | | (317,042,900 | ) | | | 27,496,678 | |
Increase (decrease) in net assets resulting from operations | | $ | (91,890,584 | ) | | $ | 18,898,988 | | | $ | (355,740,039 | ) | | $ | 117,794,443 | |
| | | | |
Distributions to shareholders | | | | | | | | | | | | | | | | |
| | | | |
From net investment income | | | | | | | | | | | | | | | | |
Investor shares | | | (1,234,658 | ) | | | (41,240 | ) | | | (12,894,893 | ) | | | (38,740,084 | ) |
Institutional shares | | | — | | | | — | | | | (1,103,973 | ) | | | (2,101,310 | ) |
From net realized capital gains | | | | | | | | | | | | | | | | |
Investor shares | | | (2,266,392 | ) | | | (11,873,089 | ) | | | — | | | | (57,212,862 | ) |
Institutional shares | | | — | | | | — | | | | — | | | | (2,735,943 | ) |
Distributions to shareholders | | $ | (3,501,050 | ) | | $ | (11,914,329 | ) | | $ | (13,998,866 | ) | | $ | (100,790,199 | ) |
| | | | |
Capital share transactions | | | | | | | | | | | | | | | | |
| | | | |
Investor shares | | | | | | | | | | | | | | | | |
Proceeds from sale of shares | | | 15,379,125 | | | | 17,570,266 | | | | 1,202,371,687 | | | | 126,912,063 | |
Reinvestment of dividends | | | 3,371,366 | | | | 11,457,321 | | | | 12,567,117 | | | | 93,342,311 | |
Shares repurchased | | | (29,455,595 | ) | | | (93,651,117 | ) | | | (334,510,748 | ) | | | (176,632,200 | ) |
Institutional shares | | | | | | | | | | | | | | | | |
Proceeds from sale of shares | | | — | | | | — | | | | 124,284,268 | | | | 21,017,574 | |
Reinvestment of dividends | | | — | | | | — | | | | 1,061,513 | | | | 4,680,007 | |
Shares repurchased | | | — | | | | — | | | | (11,094,404 | ) | | | (28,123,976 | ) |
Increase (decrease) in net assets from capital share transactions | | | (10,705,104 | ) | | | (64,623,530 | ) | | | 994,679,433 | | | | 41,195,779 | |
Increase (decrease) in net assets | | $ | (106,096,738 | ) | | $ | (57,638,871 | ) | | $ | 624,940,528 | | | $ | 58,200,023 | |
| | | | |
Net assets | | | | | | | | | | | | | | | | |
| | | | |
Beginning of year | | | 280,007,594 | | | | 337,646,465 | | | | 912,774,120 | | | | 854,574,097 | |
End of year | | $ | 173,910,856 | | | $ | 280,007,594 | | | $ | 1,537,714,648 | | | $ | 912,774,120 | |
Undistributed net investment income | | $ | — | | | $ | — | | | $ | 476,988 | | | $ | 452,400 | |
| | | | |
Shares issued and redeemed | | | | | | | | | | | | | | | | |
| | | | |
Investor shares | | | | | | | | | | | | | | | | |
Shares sold | | | 501,518 | | | | 457,184 | | | | 53,549,001 | | | | 4,769,277 | |
Shares issued through dividend reinvestment | | | 165,928 | | | | 299,560 | | | | 578,474 | | | | 3,617,824 | |
Shares repurchased | | | (934,268 | ) | | | (2,439,567 | ) | | | (15,810,045 | ) | | | (6,656,133 | ) |
Institutional shares | | | | | | | | | | | | | | | | |
Shares sold | | | — | | | | — | | | | 5,800,852 | | | | 796,103 | |
Shares issued through dividend reinvestment | | | — | | | | — | | | | 49,984 | | | | 181,012 | |
Shares repurchased | | | — | | | | — | | | | (523,646 | ) | | | (1,063,800 | ) |
Net increase (decrease) in shares outstanding | | | | | | | | | | | | | | | | |
Investor shares | | | (266,822 | ) | | | (1,682,823 | ) | | | 38,317,430 | | | | 1,730,968 | |
Institutional shares | | | — | | | | — | | | | 5,327,190 | | | | (86,685 | ) |
| | | | |
| | The accompanying notes are an integral part of these financial statements. | | 41 |
THE PARNASSUS FUNDS
Statement of Changes in Net Assets
| | | | | | | | | | | | | | | | |
| | | Parnassus Mid-Cap Fund | | | Parnassus Small-Cap Fund | |
| | | Year Ended
December 31, 2008 | | | Year Ended
December 31, 2007 | | | Year Ended
December 31, 2008 | | | Year Ended
December 31, 2007 | |
Investment income (loss) from operations | | | | | | | | | | | | | | | | |
| | | | |
Net investment income (loss) | | $ | 23,029 | | | $ | (23,214 | ) | | $ | 76,307 | | | $ | (54,745 | ) |
Net realized gain (loss) from securities transactions | | | (907,302 | ) | | | 212,480 | | | | (1,274,547 | ) | | | 159,434 | |
Net change in unrealized appreciation (depreciation) | | | (1,003,356 | ) | | | (218,623 | ) | | | (10,187,701 | ) | | | (447,743 | ) |
Increase (decrease) in net assets resulting from operations | | $ | (1,887,629 | ) | | $ | (29,357 | ) | | $ | (11,385,941 | ) | | $ | (343,054 | ) |
| | | | |
Distributions to shareholders | | | | | | | | | | | | | | | | |
| | | | |
From net investment income | �� | | | | | | | | | | | | | | | |
Investor shares | | | (18,950 | ) | | | (44,067 | ) | | | (78,271 | ) | | | (18,240 | ) |
Institutional shares | | | — | | | | — | | | | — | | | | — | |
From net realized capital gains | | | | | | | | | | | | | | | | |
Investor shares | | | (94,589 | ) | | | (61,337 | ) | | | — | | | | (135,119 | ) |
Institutional shares | | | — | | | | — | | | | — | | | | — | |
Distributions to shareholders | | $ | (113,539 | ) | | $ | (105,404 | ) | | $ | (78,271 | ) | | $ | (153,359 | ) |
| | | | |
Capital share transactions | | | | | | | | | | | | | | | | |
| | | | |
Investor shares | | | | | | | | | | | | | | | | |
Proceeds from sale of shares | | | 4,576,237 | | | | 5,017,389 | | | | 50,771,084 | | | | 5,045,005 | |
Reinvestment of dividends | | | 106,873 | | | | 99,933 | | | | 75,521 | | | | 148,696 | |
Shares repurchased | | | (2,533,998 | ) | | | (866,885 | ) | | | (20,574,644 | ) | | | (1,968,803 | ) |
Institutional shares | | | | | | | | | | | | | | | | |
Proceeds from sale of shares | | | — | | | | — | | | | — | | | | — | |
Reinvestment of dividends | | | — | | | | — | | | | — | | | | — | |
Shares repurchased | | | — | | | | — | | | | — | | | | — | |
Increase in net assets from capital share transactions | | | 2,149,112 | | | | 4,250,437 | | | | 30,271,961 | | | | 3,224,898 | |
Increase in net assets | | $ | 147,944 | | | $ | 4,115,676 | | | $ | 18,807,749 | | | $ | 2,728,485 | |
| | | | |
Net assets | | | | | | | | | | | | | | | | |
| | | | |
Beginning of year | | | 6,524,492 | | | | 2,408,816 | | | | 7,997,017 | | | | 5,268,532 | |
End of year | | $ | 6,672,436 | | | $ | 6,524,492 | | | $ | 26,804,766 | | | $ | 7,997,017 | |
Undistributed net investment income | | $ | 3,205 | | | $ | — | | | $ | — | | | $ | — | |
Shares issued and redeemed | | | | | | | | | | | | | | | | |
Investor shares | | | | | | | | | | | | | | | | |
Shares sold | | | 338,634 | | | | 277,965 | | | | 3,065,626 | | | | 277,501 | |
Shares issued through dividend reinvestment | | | 10,100 | | | | 5,622 | | | | 6,160 | | | | 8,466 | |
Shares repurchased | | | (167,660 | ) | | | (47,206 | ) | | | (1,421,846 | ) | | | (106,703 | ) |
Institutional shares | | | | | | | | | | | | | | | | |
Shares sold | | | — | | | | — | | | | — | | | | — | |
Shares issued through dividend reinvestment | | | — | | | | — | | | | — | | | | — | |
Shares repurchased | | | — | | | | — | | | | — | | | | — | |
Net increase in shares outstanding | | | | | | | | | | | | | | | | |
Investor shares | | | 181,074 | | | | 236,381 | | | | 1,649,940 | | | | 179,264 | |
Institutional shares | | | — | | | | — | | | | — | | | | — | |
| | | | |
| 42 | | The accompanying notes are an integral part of these financial statements. | | |
THE PARNASSUS FUNDS
Statement of Changes in Net Assets
| | | | | | | | | | | | | | | | |
| | | Parnassus Workplace Fund | | | Parnassus Fixed-Income Fund | |
| | | Year Ended
December 31, 2008 | | | Year Ended
December 31, 2007 | | | Year Ended
December 31, 2008 | | | Year Ended
December 31, 2007 | |
Investment income (loss) from operations | | | | | | | | | | | | | | | | |
| | | | |
Net investment income | | $ | 16,166 | | | $ | 5,327 | | | $ | 2,678,514 | | | $ | 2,951,385 | |
Net realized gain (loss) from securities transactions | | | (74,509 | ) | | | 83,504 | | | | 602,324 | | | | 371,905 | |
Net change in unrealized appreciation (depreciation) | | | (2,227,968 | ) | | | 41,877 | | | | (667,483 | ) | | | 784,019 | |
| | | | |
Increase (decrease) in net assets resulting from operations | | $ | (2,286,311 | ) | | $ | 130,708 | | | $ | 2,613,355 | | | $ | 4,107,309 | |
| | | | |
Distributions to shareholders | | | | | | | | | | | | | | | | |
| | | | |
From net investment income | | | | | | | | | | | | | | | | |
Investor shares | | | — | | | | (39,959 | ) | | | (3,286,208 | ) | | | (3,077,798 | ) |
Institutional shares | | | — | | | | — | | | | — | | | | — | |
From net realized capital gains | | | | | | | | | | | | | | | | |
Investor shares | | | (56,594 | ) | | | (58,400 | ) | | | (32,159 | ) | | | (214,276 | ) |
Institutional shares | | | — | | | | — | | | | — | | | | — | |
Distributions to shareholders | | $ | (56,594 | ) | | $ | (98,359 | ) | | $ | (3,318,367 | ) | | $ | (3,292,074 | ) |
| | | | |
Capital share transactions | | | | | | | | | | | | | | | | |
| | | | |
Investor shares | | | | | | | | | | | | | | | | |
Proceeds from sale of shares | | | 7,725,804 | | | | 2,585,379 | | | | 41,592,869 | | | | 30,169,418 | |
Reinvestment of dividends | | | 56,007 | | | | 96,912 | | | | 2,969,659 | | | | 2,955,648 | |
Shares repurchased | | | (1,780,611 | ) | | | (783,124 | ) | | | (24,650,137 | ) | | | (15,598,252 | ) |
Institutional shares | | | | | | | | | | | | | | | | |
Proceeds from sale of shares | | | — | | | | — | | | | — | | | | — | |
Reinvestment of dividends | | | — | | | | — | | | | — | | | | — | |
Shares repurchased | | | — | | | | — | | | | — | | | | — | |
Increase in net assets from capital share transactions | | | 6,001,200 | | | | 1,899,167 | | | | 19,912,391 | | | | 17,526,814 | |
| | | | |
Increase in net assets | | $ | 3,658,295 | | | $ | 1,931,516 | | | $ | 19,207,379 | | | $ | 18,342,049 | |
| | | | |
Net assets | | | | | | | | | | | | | | | | |
| | | | |
Beginning of year | | | 4,293,100 | | | | 2,361,584 | | | | 80,862,164 | | | | 62,520,115 | |
End of year | | $ | 7,951,395 | | | $ | 4,293,100 | | | $ | 100,069,543 | | | $ | 80,862,164 | |
| | | | |
Undistributed net investment income | | $ | 14,355 | | | $ | — | | | $ | 5,235 | | | $ | 30,614 | |
| | | | |
Shares issued and redeemed | | | | | | | | | | | | | | | | |
| | | | |
Investor shares | | | | | | | | | | | | | | | | |
Shares sold | | | 538,479 | | | | 143,974 | | | | 2,571,690 | | | | 1,867,052 | |
Shares issued through dividend reinvestment | | | 5,274 | | | | 5,432 | | | | 183,918 | | | | 183,013 | |
Shares repurchased | | | (136,871 | ) | | | (43,934 | ) | | | (1,536,864 | ) | | | (966,644 | ) |
Institutional shares | | | | | | | | | | | | | | | | |
Shares sold | | | — | | | | — | | | | — | | | | — | |
Shares issued through dividend reinvestment | | | — | | | | — | | | | — | | | | — | |
Shares repurchased | | | — | | | | — | | | | — | | | | — | |
Net increase (decrease) in shares outstanding | | | | | | | | | | | | | | | | |
Investor shares | | | 406,882 | | | | 105,472 | | | | 1,218,744 | | | | 1,083,421 | |
Institutional shares | | | — | | | | — | | | | — | | | | — | |
| | | | |
| | The accompanying notes are an integral part of these financial statements. | | 43 |
THE PARNASSUS FUNDS
NOTES TO FINANCIAL STATEMENTS
1. Organization and Significant Accounting Policies
The Parnassus Funds are comprised of two Trusts, the Parnassus Funds trust and the Parnassus Income Funds trust (collectively the “Trusts”), organized as Massachusetts Business Trusts registered under the Investment Company Act of 1940 as diversified, open-end investment management companies, and are comprised of six separate funds (collectively the “Funds”). The Parnassus Funds trust includes the Parnassus Fund which commenced operations on December 27, 1984 and the Parnassus Workplace Fund, the Parnassus Small-Cap Fund and the Parnassus Mid-Cap Fund, which commenced operations on April 29, 2005. The Parnassus Income Funds trust includes the Parnassus Equity Income Fund and the Parnassus Fixed-Income Fund, both of which commenced operations on August 31, 1992.
Securities Valuations
Equity securities that are listed or traded on a national securities exchange are stated at market value, based on recorded closing sales on the exchange or on the Nasdaq’s National Market System official closing price. In the absence of a recorded sale, and for over-the-counter securities, equity securities are stated at the mean between the last recorded bid and asked prices. Long-term, fixed-income securities are valued each business day using prices based on procedures established by independent pricing services and approved by the Board of Trustees (the “Trustees”). Fixed-income securities with an active market are valued at the “bid” price where such quotes are readily available from brokers and dealers and are representative of the actual market for such securities. Other fixed-income securities experiencing a less active market are valued as determined by the pricing services based on methods which include consideration of trading in securities of comparable yield, quality, coupon, maturity and type, as well as indications as to values from dealers and other market data without exclusive reliance upon quoted prices or over-the-counter prices, since such valuations are believed to reflect more accurately the value of such securities. Short-term investments in U.S. Government Agency discount notes are valued at amortized cost, which approximates market value. Investments in registered investment companies are valued at their net asset value.
Investments where market quotations are not readily available are priced at their fair value, in accordance with procedures established by the Trustees. In determining fair value, the Trustees may consider a variety of information including, but not limited to, the following: price based upon a multiple of earnings or sales, fundamental analytical data and an evaluation of market conditions. A valuation adjustment is applied to certificates of deposit, community development loans and other community development investments as an estimate of potential penalties for early withdrawal.
In September 2006, Statement of Financial Accounting Standards No. 157 (SFAS 157), Fair Value Measurements, was issued and is effective for fiscal years beginning after November 15, 2007. SFAS 157 defines fair value, establishes a framework for measuring fair value and expands disclosures about fair value measurements. The Funds have adopted SFAS 157 as of January 1, 2008. SFAS 157 does not have a material impact on the financial statements, but additional disclosure is required. Various inputs are used in determining the value of the Funds’ portfolio investments. These inputs are summarized in three levels listed below:
| | | | |
| Level 1 - | | | | Quoted market prices in active markets for identical securities on the measurement date and on an ongoing basis |
| | |
| Level 2 - | | | | Other observable inputs (e.g., quoted prices in active markets for similar securities, securities valuations based on commonly quoted benchmark interest rates and yield curves, and/or securities indices) |
| | |
| Level 3 - | | | | Significant unobservable inputs (e.g., information about assumptions, including risk, market participants would use in pricing a security) |
44
NOTES TO FINANCIAL STATEMENTS CONTINUED
The inputs or methodology used for valuing securities are not necessarily an indication of the risk associated with investing in those securities. Following is a summary of the inputs used in valuing the Funds’ portfolio investments and other financial instruments which are carried at fair value, as of December 31, 2008:
| | | | | | | | |
| | | Parnassus
Fund | | | Parnassus Equity
Income Fund | |
Valuation level | | Investments in
Securities | | | Investments in
Securities | |
Level 1 | | $ | 173,110,869 | | | $ | 1,517,412,843 | |
Level 2 | | | — | | | | — | |
Level 3 | | | 1,280,008 | | | | 4,759,700 | |
Total | | $ | 174,390,877 | | | $ | 1,522,172,543 | |
|
| The following is a reconcilliation of investments in which significant unobservable inputs (Level 3) were used in determining fair value: | |
| | |
Balance as of December 31, 2007 | | $ | 1,280,065 | | | $ | 3,361,162 | |
Discounts/premiums amortization | | | (57 | ) | | | (101,462 | ) |
Net purchases (sales) | | | — | | | | 1,500,000 | |
Balance as of December 31, 2008 | | $ | 1,280,008 | | | $ | 4,759,700 | |
| | |
| | | Parnassus
Mid-Cap Fund | | | Parnassus
Small-Cap Fund | |
Valuation level | | Investments in
Securities | | | Investments in
Securities | |
Level 1 | | $ | 6,609,989 | | | $ | 25,576,870 | |
Level 2 | | | — | | | | — | |
Level 3 | | | — | | | | — | |
Total | | $ | 6,609,989 | | | $ | 25,576,870 | |
| | |
| | | Parnassus
Workplace
Fund | | | Parnassus
Fixed-Income
Fund | |
Valuation level | | Investments in
Securities | | | Investments in
Securities | |
Level 1 | | $ | 7,885,572 | | | $ | 7,006,917 | |
Level 2 | | | — | | | | 91,906,585 | |
Level 3 | | | — | | | | — | |
Total | | $ | 7,885,572 | | | $ | 98,913,502 | |
45
THE PARNASSUS FUNDS
NOTES TO FINANCIAL STATEMENTS CONTINUED
Federal Income Taxes
The Trusts intend to comply with the requirements of the Internal Revenue Code applicable to regulated investment companies and to distribute all taxable income to shareholders. Therefore, no federal income tax provision is required. Income distributions and capital-gain distributions are determined in accordance with income tax regulations, which may differ from accounting principles generally accepted in the United States of America (“U.S. GAAP”).
In June 2006, the Financial Accounting Standards Board (“FASB”) issued FASB Interpretation No. 48 – Accounting for Uncertainty in Income Taxes – an interpretation of FASB No.109, which establishes a minimum threshold for income tax benefits to be recognized in the financial statements. These tax benefits must meet a “more likely than not” threshold, which means that based on technical merits, they have a more than 50% likelihood of being sustained upon examination by the tax authority. Tax benefits meeting this threshold are measured as the largest amount of tax benefit that is greater than 50% likely of being realized upon ultimate settlement with the tax authority. FASB Interpretation No. 48 is effective for periods beginning after December 15, 2006, and was adopted by the funds on January 1, 2007. As of and during the year ended December 31, 2008, the Funds did not have a liability for any unrecognized tax benefits. The Funds recognize interest and penalties, if any, related to unrecognized tax benefits as income tax expense in the statement of operations. During the year the Funds did not incur interest or penalties. The Funds are not subject to examination by U.S. federal taxing authorities or state taxing authorities for years before 2005. The adoption had no effect on the funds’ financial statements.
Securities Transactions
Securities transactions are recorded on the date the securities are purchased or sold (trade date). Realized gains and losses on securities transactions are determined on the basis of first-in, first-out for both financial statement and federal income tax purposes.
Investment Income, Expenses, and Distributions
Dividend income is recognized on the ex-dividend date and interest income is recognized on an accrual basis. Discounts and premiums on securities purchased are amortized over the lives of the respective securities using the constant yield method, which approximates the interest method. Expenses are recorded on an accrual basis. Distributions to shareholders are recorded on the ex-dividend date to shareholders of record on the record date. The Parnassus Equity Income Fund pays income dividends quarterly and capital-gain dividends annually. The Parnassus Fixed-Income Fund pays income dividends monthly and capital-gain dividends annually. The other Funds pay income and capital-gain dividends annually.
Securities Lending
The Parnassus Fund, the Parnassus Equity Income Fund and the Parnassus Fixed-Income Fund have the ability to lend securities to approved financial institutions to earn additional income and receive cash and/or securities as collateral to secure the loans. Collateral is maintained at not less than 102% of the value of loaned securities. Although the risk of lending is mitigated by the collateral, the Funds could experience a delay in recovering securities and a possible loss of income or value if the borrower fails to return them. In September of 2008, the Funds ceased participation in the securities lending program in light of recent credit market activity. The Funds may resume securities lending at a future time if deemed appropriate by the Funds’ Trustees.
Community Development Investment Programs
The Parnassus Fund, the Parnassus Equity Income Fund and the Parnassus Fixed-Income Fund may each invest up to 2% of their assets in community investments and community-development loan funds. Each of the Funds may invest in obligations issued by community loan funds at below-market interest rates if the projects financed have a positive social impact. Generally, there is no secondary market on loan funds and thus these are considered illiquid.
As part of our community development investment program, the Parnassus Equity Income Fund has entered into an agreement for fund investments through the Certificate of Deposit Account Registry Service (“CDARS”) network. The CDARS network allows members to place funds in time deposits with depository institutions whose accounts are insured by the Federal Deposit Insurance Corporation (“FDIC”). Provisions stipulate that participating institutions are FDIC insured, however, in the event of default or bankruptcy by any party to the agreement, the proceeds of the investment may be delayed or subject to legal proceedings and are subject to FDIC limits.
The Parnassus Equity Income Fund holds debt instruments issued by Microvest I, LP, a microfinance limited partnership specializing in providing capital to international microfinance institutions (“MFI’s”) that extend credit to developing countries and the entrepreneurial poor. This instrument may be subject to political and foreign currency exchange risk not normally associated with domestic debt instruments. Microvest I, LP’s investment in MFI’s can be affected by, among other factors, commodity prices, inflation, interest rates, taxation, social instability, and other political, economic or diplomatic developments in or affecting the various countries where MFI’s operate.
46
NOTES TO FINANCIAL STATEMENTS CONTINUED
Capital Stock
Capital stock consists of an unlimited number of authorized shares of capital stock, no par value.
Use of Estimates
The preparation of financial statements in conformity with accounting principles generally accepted in the United States of America requires management to make estimates and assumptions that affect the reported amounts of assets and liabilities at the date of the financial statements and the reported amounts of revenues and expenses during the reporting period. Actual results could differ from those estimates.
2. Tax Matters and Distributions
The tax character of distributions paid during the years ended December 31, 2008 and 2007, were as follows:
| | | | | | | | | | | | | | | | | | |
| | | Parnassus
Fund | | Parnassus
Equity Income
Fund | | Parnassus
Mid-Cap
Fund |
Distributions paid from: | | 2008 | | 2007 | | 2008 | | 2007 | | 2008 | | 2007 |
Ordinary income | | $ | 1,231,700 | | $ | — | | $ | 13,998,866 | | $ | 40,451,184 | | $ | 19,824 | | $ | 39,184 |
Long-term capital gains | | | 2,268,400 | | | 11,914,329 | | | — | | | 60,339,015 | | | 93,715 | | | 66,220 |
Total distributions | | $ | 3,500,100 | | $ | 11,914,329 | | $ | 13,998,866 | | $ | 100,790,199 | | $ | 113,539 | | $ | 105,404 |
| | | |
| | | Parnassus
Small-Cap
Fund | | Parnassus
Workplace
Fund | | Parnassus
Fixed-Income
Fund |
Distributions paid from: | | 2008 | | 2007 | | 2008 | | 2007 | | 2008 | | 2007 |
Ordinary income | | $ | 76,307 | | $ | 18,229 | | $ | 1,811 | | $ | 38,847 | | $ | 3,298,672 | | $ | 3,077,798 |
Long-term capital gains | | | — | | | 135,130 | | | 54,783 | | | 59,512 | | | 19,695 | | | 214,276 |
Total distributions | | $ | 76,307 | | $ | 153,359 | | $ | 56,594 | | $ | 98,359 | | $ | 3,318,367 | | $ | 3,292,074 |
At December 31, 2008, the cost of investments in long-term securities, net unrealized appreciation/depreciation, distributable earnings and undistributed earnings for income tax purposes were as follows:
| | | | | | | | | | | | | | | | | | | | | | | | |
| | | Parnassus
Fund | | | Parnassus
Equity Income
Fund | | | Parnassus
Mid-Cap
Fund | | | Parnassus
Small-Cap
Fund | | | Parnassus
Workplace
Fund | | | Parnassus
Fixed-Income
Fund | |
Costs of investment | | $ | 251,383,826 | | | $ | 1,614,357,880 | | | $ | 7,586,762 | | | $ | 35,967,118 | | | $ | 9,711,504 | | | $ | 91,674,271 | |
Unrealized appreciation | | | 2,310,434 | | | | 12,158,342 | | | | 127,225 | | | | 577,272 | | | | 61,019 | | | | 3,264,903 | |
Unrealized depreciation | | | (78,916,570 | ) | | | (230,970,614 | ) | | | (1,229,258 | ) | | | (10,936,983 | ) | | | (2,096,772 | ) | | | (2,158,989 | ) |
Net unrealized appreciation (depreciation) | | $ | (76,606,136 | ) | | $ | (218,812,272 | ) | | $ | (1,102,033 | ) | | $ | (10,359,711 | ) | | $ | (2,035,753 | ) | | $ | 1,105,914 | |
Distributable earnings – ordinary income | | $ | 1,231,700 | | | $ | 13,968,505 | | | $ | 23,030 | | | $ | 76,307 | | | $ | 16,167 | | | $ | 3,273,294 | |
Distributable earnings – long-term capital gains | | $ | — | | | $ | — | | | $ | — | | | $ | — | | | $ | 53,640 | | | $ | 7,545 | |
Undistributed earnings – ordinary income | | $ | — | | | $ | 476,987 | | | $ | 3,206 | | | $ | — | | | $ | 14,356 | | | $ | 5,236 | |
Undistributed earnings – long-term capital gains | | $ | — | | | $ | — | | | $ | — | | | $ | — | | | $ | — | | | $ | — | |
47
THE PARNASSUS FUNDS
NOTES TO FINANCIAL STATEMENTS CONTINUED
At December 31, 2008, estimated net capital loss carryforwards, which are available to offset future net realized capital gains, were:
| | | | | |
Fund | | Expiration
Year | | Capital Loss
Carryforwards |
Parnassus Fund | | 2016 | | $ | 2,708,300 |
Parnassus Equity Income Fund | | 2016 | | $ | 17,627,601 |
Parnassus Mid-Cap Fund | | 2016 | | $ | 793,050 |
Parnassus Small-Cap Fund | | 2016 | | $ | 178,392 |
Post October capital losses as of December 31, 2008, which are deferred until 2009 for tax purposes:
| | | |
Fund | | Deferred
Post-October
Capital Loss |
Parnassus Fund | | $ | 730,651 |
Parnassus Equity Income Fund | | $ | 30,129,366 |
Parnassus Mid-Cap Fund | | $ | 69,708 |
Parnassus Small-Cap Fund | | $ | 21,612 |
Parnassus Workplace Fund | | $ | 56,947 |
Parnassus Fixed- Income Fund | | $ | — |
Net investment income and net ordinary income is the same for all Funds for financial statement and tax purposes during the year ended December 31, 2008 with the exception of Parnassus Equity Income Fund. For Parnassus Equity Income Fund, the net investment income differs from ordinary income for financial statements and tax purposes primarily due to income recognition differences for partnership investments. Net realized gains differ for financial statement and tax purposes primarily due to differing treatments of wash sales and partnership allocations.
Reclassifications as shown in the following table have been made in each Fund’s capital accounts to report these balances on a tax basis, excluding certain temporary differences, as of December 31, 2008. Additional adjustments may be required in subsequent reporting periods. These reclassifications, which have no impact on the net asset value of the Funds, are primarily attributable to the reclassification of dividend income and certain differences in the computation of distributable income and capital gains under Federal tax rules versus U.S. GAAP.
| | | | | | | | | | | | |
Fund | | Increase (Decrease)
in Undistributed
Net Investment Income | | | Increase (Decrease)
in Undistributed
Net Realized Gain/Loss | | | Decrease in
Capital Paid-in | |
Parnassus Fund | | $ | 2,958 | | | $ | (2,008 | ) | | $ | (950 | ) |
Parnassus Equity Income Fund | | $ | 73,619 | | | $ | 315,476 | | | $ | (389,095 | ) |
Parnassus Mid-Cap Fund | | $ | (874 | ) | | $ | 874 | | | $ | — | |
Parnassus Small-Cap Fund | | $ | 1,964 | | | $ | — | | | $ | (1,964 | ) |
Parnassus Workplace Fund | | $ | (1,811 | ) | | $ | 1,811 | | | $ | — | |
Parnassus Fixed-Income Fund | | $ | 582,315 | | | $ | (582,315 | ) | | $ | — | |
48
NOTES TO FINANCIAL STATEMENTS CONTINUED
3. Purchases and Sales of Securities
Purchases and proceeds from sales of securities, excluding short-term securities, for the year ended December 31, 2008 were as follows:
| | | | | | |
Fund | | Purchases | | Sales |
Parnassus Fund | | $ | 235,141,744 | | $ | 242,479,956 |
Parnassus Equity Income Fund | | $ | 1,665,385,028 | | $ | 751,945,429 |
Parnassus Mid-Cap Fund | | $ | 9,586,350 | | $ | 7,507,562 |
Parnassus Small-Cap Fund | | $ | 44,092,571 | | $ | 14,984,569 |
Parnassus Workplace Fund | | $ | 9,505,193 | | $ | 3,820,069 |
Parnassus Fixed-Income Fund | | $ | 59,447,029 | | $ | 25,281,490 |
4. Investment Advisory Agreement and Transactions with Affiliates
Under terms of an agreement which provides for furnishing investment management and advice to the Funds, Parnassus Investments is entitled to receive fees payable monthly, based on each Fund’s average daily net assets for the month, at the following annual rates:
Parnassus Fund: 1.00% of the first $10,000,000, 0.75% of the next $20,000,000, 0.70% of the next $70,000,000, 0.65% of the next $100,000,000 and 0.60% of the remaining balance. Parnassus Workplace Fund and Parnassus Mid-Cap Fund: 0.85% of the first $100,000,000, 0.80% of the next $100,000,000, 0.75% of the next $300,000,000 and 0.70% of the amount above $500,000,000. Parnassus Small-Cap Fund: 1.00% of the first $100,000,000, 0.90% of the next $100,000,000, 0.85% of the next $300,000,000 and 0.80% of the amount above $500,000,000. For the year ended December 31, 2008 and for the period January 1, 2009 to May 1, 2009, Parnassus Investments has contractually agreed to reduce its investment advisory fee to the extent necessary to limit total operating expenses to 0.99% of net assets for the Parnassus Fund, 1.20% of net assets for the Parnassus Mid-Cap Fund, Parnassus Small-Cap Fund and the Parnassus Workplace Fund.
Parnassus Equity Income Fund: 0.75% of the first $30,000,000, 0.70% of the next $70,000,000 and 0.65% of the amount above $100,000,000. Parnassus Fixed-Income Fund: 0.50% of the first $200,000,000, 0.45% of the next $200,000,000 and 0.40% of the amount above $400,000,000. For the year ended December 31, 2008 and for the period January 1, 2009 to May 1, 2009, Parnassus Investments has contractually agreed to reduce its investment advisory fee to the extent necessary to limit total operating expenses to 0.99% of net assets for the Parnassus Equity Income Fund – Investor Shares, 0.78% of net assets for Parnassus Equity Income Fund – Institutional Shares, and 0.87% of net assets for the Parnassus Fixed-Income Fund. Parnassus Investments further waived an additional 0.12% of net assets for Parnassus Fixed-Income Fund for the year ended December 31, 2008.
Parnassus Investments receives fees under terms of a separate agreement which provides for furnishing transfer agent and fund administration services to the funds. The transfer agent fee was $2.50 per month per account plus any out-of-pocket expenses for the Parnassus Fund, Parnassus Mid-Cap Fund, Parnassus Small-Cap Fund and Parnassus Workplace Fund. The transfer agent fee was $2.70 per month per account plus any out-of-pocket expenses for the Parnassus Equity Income Fund and Parnassus Fixed-Income Fund. The Funds pay the monthly fee based on the number of accounts on record at each month-end. The fund administration reflects annual rates based on net assets for all funds managed by Parnassus Investments and was allocated based on respective fund net assets. The fund administration services fee was 0.07% of average net assets under this new agreement for the year ended December 31, 2008.
Parnassus Investments may also arrange for third parties to provide certain services, including account maintenance, recordkeeping and other personal services to their clients who invest in the funds. For these services, the Funds may pay service providers an aggregate service fee on investment accounts at a rate not to exceed 0.25% per annum of average daily net assets. The Parnassus Equity Income Fund – Institutional Shares does not incur service provider fees.
5. Expense Offset Arrangement
The Funds have entered into an arrangement with the custodian whereby credits realized as a result of uninvested cash balances are used to reduce a portion of the custody fees. During the year ended December 31, 2008, the custody fees were reduced as indicated in the Statements of Operations by the expense offset.
49
THE PARNASSUS FUNDS
Financial Highlights
Selected data for each share of capital stock outstanding, total return and ratios/supplemental data for each of the five years ended December 31 are as follows:
Parnassus Fund(d)
| | | | | | | | | | | | | | | | | | | | |
| | | 2008 | | | 2007 | | | 2006 | | | 2005 | | | 2004 | |
Net asset value at beginning of year | | $ | 36.66 | | | $ | 36.23 | | | $ | 31.68 | | | $ | 31.09 | | | $ | 30.05 | |
Income (loss) from operations(c): | | | | | | | | | | | | | | | | | | | | |
Net investment income (loss) | | | 0.17 | | | | — | | | | (0.04 | ) | | | 0.16 | | | | 0.12 | |
Net realized and unrealized gain (loss) on securities | | | (12.76 | ) | | | 2.03 | | | | 4.59 | | | | 0.63 | | | | 1.05 | |
Total from investment operations | | | (12.59 | ) | | | 2.03 | | | | 4.55 | | | | 0.79 | | | | 1.17 | |
Distributions: | | | | | | | | | | | | | | | | | | | | |
Dividends from net investment income | | | (0.17 | ) | | | (0.01 | ) | | | — | | | | (0.20 | ) | | | (0.13 | ) |
Distributions from net realized gains on securities | | | (0.31 | ) | | | (1.59 | ) | | | — | | | | — | | | | — | |
Total distributions | | | (0.48 | ) | | | (1.60 | ) | | | — | | | | (0.20 | ) | | | (0.13 | ) |
Net asset value at end of year | | $ | 23.59 | | | $ | 36.66 | | | $ | 36.23 | | | $ | 31.68 | | | $ | 31.09 | |
Total overall return | | | (34.12 | %) | | | 5.43 | % | | | 14.36 | % | | | 2.55 | % | | | 3.89 | % |
Ratios/supplemental data: | | | | | | | | | | | | | | | | | | | | |
Ratio of gross expenses to average net assets | | | 1.01 | % | | | 1.00 | % | | | 1.01 | % | | | 1.03 | % | | | 0.99 | % |
Ratio of net expenses to average net assets (net of waiver and expense offset arrangements) | | | 0.99 | %(g) | | | 0.99 | %(g) | | | 0.99 | %(g) | | | 0.99 | %(g) | | | 0.99 | % |
Ratio of net investment income (loss) to average net assets | | | 0.51 | % | | | (0.01 | %) | | | (0.13 | %) | | | 0.53 | % | | | 0.40 | % |
Portfolio turnover rate | | | 98.38 | % | | | 88.67 | % | | | 141.98 | % | | | 136.07 | % | | | 119.80 | % |
Net assets, end of year (000s) | | $ | 173,911 | | | $ | 280,008 | | | $ | 337,646 | | | $ | 292,384 | | | $ | 339,893 | |
50
Financial Highlights continued
Parnassus Equity Income Fund – Investor Shares
| | | | | | | | | | | | | | | | | | | | |
| | | 2008 | | | 2007 | | | 2006 | | | 2005 | | | 2004 | |
Net asset value at beginning of year | | $ | 25.31 | | | $ | 24.83 | | | $ | 24.02 | | | $ | 25.00 | | | $ | 24.00 | |
Income (loss) from operations(c): | | | | | | | | | | | | | | | | | | | | |
Net investment income | | | 0.27 | | | | 0.20 | | | | 0.30 | | | | 0.41 | | | | 0.40 | |
Net realized and unrealized gain (loss) on securities | | | (6.05 | ) | | | 3.28 | | | | 3.23 | | | | 0.24 | | | | 1.79 | |
Total from investment operations | | | (5.78 | ) | | | 3.48 | | | | 3.53 | | | | 0.65 | | | | 2.19 | |
Distributions: | | | | | | | | | | | | | | | | | | | | |
Dividends from net investment income | | | (0.24 | ) | | | (1.18 | ) | | | (1.38 | ) | | | (0.85 | ) | | | (0.56 | ) |
Distributions from net realized gains on securities | | | — | | | | (1.82 | ) | | | (1.34 | ) | | | (0.78 | ) | | | (0.63 | ) |
Total distributions | | | (0.24 | ) | | | (3.00 | ) | | | (2.72 | ) | | | (1.63 | ) | | | (1.19 | ) |
Net asset value at end of year | | $ | 19.29 | | | $ | 25.31 | | | $ | 24.83 | | | $ | 24.02 | | | $ | 25.00 | |
Total overall return | | | (22.95 | %) | | | 14.13 | % | | | 14.70 | % | | | 2.62 | % | | | 9.30 | % |
Ratios/supplemental data: | | | | | | | | | | | | | | | | | | | | |
Ratio of gross expenses to average net assets | | | 0.99 | % | | | 1.03 | % | | | 1.06 | % | | | 1.07 | % | | | 1.04 | % |
Ratio of net expenses to average net assets (net of waiver and expense offset arrangements) | | | 0.99 | %(g) | | | 0.99 | %(g) | | | 0.99 | %(g) | | | 0.99 | %(g) | | | 1.04 | % |
Ratio of net investment income to average net assets | | | 1.21 | % | | | 0.73 | % | | | 1.17 | % | | | 1.63 | % | | | 1.63 | % |
Portfolio turnover rate | | | 70.20 | % | | | 91.42 | % | | | 116.75 | % | | | 109.54 | % | | | 79.88 | % |
Net assets, end of year (000s) | | $ | 1,400,214 | | | $ | 867,577 | | | $ | 808,104 | | | $ | 906,844 | | | $ | 894,415 | |
Parnassus Equity Income Fund – Institutional Shares
| | | | | | | | | | | | |
| | | 2008 | | | 2007 | | | 2006(f) | |
Net asset value at beginning of period | | $ | 25.35 | | | $ | 24.86 | | | $ | 25.59 | |
Income (loss) from operations(c): | | | | | | | | | | | | |
Net investment income | | | 0.32 | | | | 0.25 | | | | 0.19 | |
Net realized and unrealized gain (loss) on securities | | | (6.05 | ) | | | 3.28 | | | | 1.73 | |
Total from investment operations | | | (5.73 | ) | | | 3.53 | | | | 1.92 | |
Distributions: | | | | | | | | | | | | |
Dividends from net investment income | | | (0.28 | ) | | | (1.22 | ) | | | (1.31 | ) |
Distributions from net realized gains on securities | | | — | | | | (1.82 | ) | | | (1.34 | ) |
Total distributions | | | (0.28 | ) | | | (3.04 | ) | | | (2.65 | ) |
Net asset value at end of year | | $ | 19.34 | | | $ | 25.35 | | | $ | 24.86 | |
Total overall return | | | (22.73 | %) | | | 14.35 | % | | | 7.46 | %(a) |
Ratios/supplemental data: | | | | | | | | | | | | |
Ratio of gross expenses to average net assets | | | 0.79 | % | | | 0.82 | % | | | 0.85 | %(b) |
Ratio of net expenses to average net assets (net of waiver and expense offset arrangements) | | | 0.78 | %(g) | | | 0.78 | %(g) | | | 0.78 | %(b)(d) |
Ratio of net investment income to average net assets | | | 1.44 | % | | | 0.95 | % | | | 1.10 | %(b) |
Portfolio turnover rate | | | 70.20 | % | | | 91.42 | % | | | 116.75 | % |
Net assets, end of period (000s) | | $ | 137,501 | | | $ | 45,197 | | | $ | 46,471 | |
51
THE PARNASSUS FUNDS
Financial Highlights continued
Parnassus Mid-Cap Fund
| | | | | | | | | | | | | | | | |
| | | 2008 | | | 2007 | | | 2006 | | | 2005(e) | |
Net asset value at beginning of period | | $ | 17.39 | | | $ | 17.36 | | | $ | 15.30 | | | $ | 15.00 | |
Income (loss) from operations(c): | | | | | | | | | | | | | | | | |
Net investment income (loss) | | | 0.06 | | | | (0.08 | ) | | | (0.06 | ) | | | 0.04 | |
Net realized and unrealized gain (loss) on securities | | | (5.21 | ) | | | 0.40 | | | | 2.47 | | | | 0.44 | |
Total from investment operations | | | (5.15 | ) | | | 0.32 | | | | 2.41 | | | | 0.48 | |
Distributions: | | | | | | | | | | | | | | | | |
Dividends from net investment income | | | (0.03 | ) | | | (0.12 | ) | | | (0.29 | ) | | | (0.04 | ) |
Distributions from net realized gains on securities | | | (0.21 | ) | | | (0.17 | ) | | | (0.07 | ) | | | (0.14 | ) |
Total distributions | | | (0.24 | ) | | | (0.29 | ) | | | (0.36 | ) | | | (0.18 | ) |
Net asset value at end of year | | $ | 12.00 | | | $ | 17.39 | | | $ | 17.36 | | | $ | 15.30 | |
Total overall return | | | (29.38 | %) | | | 1.81 | % | | | 15.78 | % | | | 3.22 | %(a) |
Ratios/supplemental data: | | | | | | | | | | | | | | | | |
Ratio of gross expenses to average net assets | | | 2.25 | % | | | 2.04 | % | | | 5.29 | % | | | 9.03 | %(b) |
Ratio of net expenses to average net assets (net of waiver and expense offset arrangements) | | | 1.20 | % | | | 1.40 | %(g) | | | 1.40 | %(g) | | | 1.40 | %(b) |
Ratio of net investment income (loss) to average net assets | | | 0.40 | % | | | (0.42 | %) | | | (0.35 | %) | | | 0.37 | %(b) |
Portfolio turnover rate | | | 132.74 | % | | | 76.85 | % | | | 122.04 | % | | | 31.41 | %(a) |
Net assets, end of period (000s) | | $ | 6,672 | | | $ | 6,524 | | | $ | 2,409 | | | $ | 640 | |
Parnassus Small-Cap Fund
| | | | | | | | | | | | | | | | |
| | | 2008 | | | 2007 | | | 2006 | | | 2005(e) | |
Net asset value at beginning of period | | $ | 16.91 | | | $ | 17.94 | | | $ | 15.76 | | | $ | 15.00 | |
Income (loss) from operations(c): | | | | | | | | | | | | | | | | |
Net investment income (loss) | | | 0.08 | | | | (0.13 | ) | | | (0.10 | ) | | | (0.03 | ) |
Net realized and unrealized gain (loss) on securities | | | (4.32 | ) | | | (0.56 | ) | | | 3.07 | | | | 1.18 | |
Total from investment operations | | | (4.24 | ) | | | (0.69 | ) | | | 2.97 | | | | 1.15 | |
Distributions: | | | | | | | | | | | | | | | | |
Dividends from net investment income | | | (0.04 | ) | | | (0.04 | ) | | | (0.74 | ) | | | (0.39 | ) |
Distributions from net realized gains on securities | | | — | | | | (0.30 | ) | | | (0.05 | ) | | | — | |
Total distributions | | | (0.04 | ) | | | (0.34 | ) | | | (0.79 | ) | | | (0.39 | ) |
Net asset value at end of year | | $ | 12.63 | | | $ | 16.91 | | | $ | 17.94 | | | $ | 15.76 | |
Total overall return | | | (25.08 | %) | | | (3.92 | %) | | | 18.78 | % | | | 7.65 | %(a) |
Ratios/supplemental data: | | | | | | | | | | | | | | | | |
Ratio of gross expenses to average net assets | | | 1.86 | % | | | 2.06 | % | | | 3.03 | % | | | 7.27 | %(b) |
Ratio of net expenses to average net assets (net of waiver and expense offset arrangements) | | | 1.20 | % | | | 1.40 | %(g) | | | 1.40 | %(g) | | | 1.40 | %(b) |
Ratio of net investment income (loss) to average net assets | | | 0.51 | % | | | (0.72 | %) | | | (0.56 | %) | | | (0.27 | %)(b) |
Portfolio turnover rate | | | 100.41 | % | | | 100.30 | % | | | 125.00 | % | | | 86.20 | %(a) |
Net assets, end of period (000s) | | $ | 26,805 | | | $ | 7,997 | | | $ | 5,269 | | | $ | 1,225 | |
| (a) | Not annualized for periods less than one year. |
| (c) | Income (loss) from operations per share is based on average daily shares outstanding. |
| (d) | Prior to May 1, 2004, the Parnassus Fund charged a sales load of a maximum of 3.5%, which is not reflected in the total overall return figures. |
| (e) | The Parnassus Mid-Cap Fund, the Parnassus Small-Cap Fund and the Parnassus Workplace Fund commenced operations on April 29, 2005, and the period shown is from April 29, 2005 through December 31, 2005. |
52
Financial Highlights continued
Parnassus Workplace Fund
| | | | | | | | | | | | | | | | |
| | | 2008 | | | 2007 | | | 2006 | | | 2005(e) | |
Net asset value at beginning of period | | $ | 17.60 | | | $ | 17.05 | | | $ | 15.49 | | | $ | 15.00 | |
Income (loss) from operations(c): | | | | | | | | | | | | | | | | |
Net investment income | | | 0.05 | | | | 0.03 | | | | 0.02 | | | | 0.04 | |
Net realized and unrealized gain (loss) on securities | | | (5.33 | ) | | | 0.94 | | | | 2.28 | | | | 0.50 | |
Total from investment operations | | | (5.28 | ) | | | 0.97 | | | | 2.30 | | | | 0.54 | |
Distributions: | | | | | | | | | | | | | | | | |
Dividends from net investment income | | | — | | | | (0.17 | ) | | | (0.61 | ) | | | (0.05 | ) |
Distributions from net realized gains on securities | | | (0.10 | ) | | | (0.25 | ) | | | (0.13 | ) | | | — | |
Total distributions | | | (0.10 | ) | | | (0.42 | ) | | | (0.74 | ) | | | (0.05 | ) |
Net asset value at end of year | | $ | 12.22 | | | $ | 17.60 | | | $ | 17.05 | | | $ | 15.49 | |
Total overall return | | | (29.94 | %) | | | 5.64 | % | | | 14.84 | % | | | 3.60 | %(a) |
Ratios/supplemental data: | | | | | | | | | | | | | | | | |
Ratio of gross expenses to average net assets | | | 2.32 | % | | | 2.64 | % | | | 4.04 | % | | | 6.91 | %(b) |
Ratio of net expenses to average net assets (net of waiver and expense offset arrangements) | | | 1.20 | %(g) | | | 1.20 | %(g) | | | 1.20 | %(g) | | | 1.20 | %(b) |
Ratio of net investment income (loss) to average net assets | | | 0.30 | % | | | 0.16 | % | | | 0.12 | % | | | 0.39 | %(b) |
Portfolio turnover rate | | | 72.58 | % | | | 56.18 | % | | | 96.93 | % | | | 27.55 | %(a) |
Net assets, end of period (000s) | | $ | 7,951 | | | $ | 4,293 | | | $ | 2,362 | | | $ | 1,013 | |
Parnassus Fixed-Income Fund
| | | | | | | | | | | | | | | | | | | | |
| | | 2008 | | | 2007 | | | 2006 | | | 2005 | | | 2004 | |
Net asset value at beginning of year | | $ | 16.29 | | | $ | 16.11 | | | $ | 15.79 | | | $ | 15.87 | | | $ | 16.00 | |
Income (loss) from operations(c): | | | | | | | | | | | | | | | | | | | | |
Net investment income | | | 0.47 | | | | 0.67 | | | | 0.67 | | | | 0.48 | | | | 0.33 | |
Net realized and unrealized gain (loss) on securities | | | 0.01 | | | | 0.25 | | | | 0.49 | | | | (0.08 | ) | | | (0.01 | ) |
Total from investment operations | | | 0.48 | | | | 0.92 | | | | 1.16 | | | | 0.40 | | | | 0.32 | |
Distributions: | | | | | | | | | | | | | | | | | | | | |
Dividends from net investment income | | | (0.57 | ) | | | (0.69 | ) | | | (0.74 | ) | | | (0.48 | ) | | | (0.33 | ) |
Distributions from net realized gains on securities | | | (0.01 | ) | | | (0.05 | ) | | | (0.10 | ) | | | — | | | | (0.09 | ) |
Return of capital | | | — | | | | — | | | | — | | | | — | | | | (0.03 | ) |
Total distributions | | | (0.58 | ) | | | (0.74 | ) | | | (0.84 | ) | | | (0.48 | ) | | | (0.45 | ) |
Net asset value at end of year | | $ | 16.19 | | | $ | 16.29 | | | $ | 16.11 | | | $ | 15.79 | | | $ | 15.87 | |
Total overall return | | | 2.98 | % | | | 5.81 | % | | | 7.45 | % | | | 2.55 | % | | | 2.05 | % |
Ratios/supplemental data: | | | | | | | | | | | | | | | | | | | | |
Ratio of gross expenses to average net assets | | | 0.88 | % | | | 0.87 | % | | | 0.92 | % | | | 1.01 | % | | | 0.97 | % |
Ratio of net expenses to average net assets | | | | | | | | | | | | | | | | | | | | |
(net of waiver and expense offset arrangements) | | | 0.75 | %(g) | | | 0.75 | %(g) | | | 0.75 | %(g) | | | 0.75 | % | | | 0.75 | % |
Ratio of net investment income to average net assets | | | 2.90 | % | | | 4.13 | % | | | 4.13 | % | | | 3.03 | % | | | 2.08 | % |
Portfolio turnover rate | | | 44.87 | % | | | 32.48 | % | | | 41.27 | % | | | 34.08 | % | | | 24.38 | % |
Net assets, end of year (000s) | | $ | 100,070 | | | $ | 80,862 | | | $ | 62,520 | | | $ | 45,879 | | | $ | 38,205 | |
| (f) | The Parnassus Equity Income Fund – Institutional Shares commenced operations on April 28, 2006, and the period shown is from April 28, 2006 through December 31, 2006. |
| (g) | Parnassus Investments has contractually limited expenses to an annualized rate of 0.99% for the Parnassus Fund, 0.99% for Parnassus Equity Income Fund – Investor Shares, 0.78% for the Parnassus Equity Income Fund – Institutional Shares, 1.20% for the Parnassus Mid-Cap Fund, Parnassus Small-Cap Fund and the Parnassus Workplace Fund and 0.87% for the Parnassus Fixed-Income Fund. Parnassus Investments has also voluntarily limited additional expenses for the Parnassus Fixed-Income Fund. For the year ending December 31, 2008, Parnassus Investments has agreed to further reduce the total operating expenses from 1.40% to 1.20% of net assets, exclusive of acquired fund fees, for the Parnassus Mid-Cap and Parnassus Small-Cap Funds. (See note 4 for details). |
53
ADDITIONAL INFORMATION (UNAUDITED)
Board of Trustees and Officers
| | | | | | | | |
| | | Independent Trustees§ | | Interested Trustee† |
Name Age Address | | Herbert A. Houston 65 1 Market Street Suite 1600 San Francisco, California 94105 | | Jeanie S. Joe 61 1 Market Street Suite 1600 San Francisco, California 94105 | | Donald V. Potter 63 1 Market Street Suite 1600 San Francisco, California 94105 | | Jerome L. Dodson†† 65 1 Market Street Suite 1600 San Francisco, California 94105 |
| | | | |
Position(s) Held with Funds | | Trustee | | Trustee | | Trustee | | President and Trustee |
| | | | |
Term of Office and Length of Service | | Indefinite. Since 1992 for Parnassus Income Funds. Since 1998 for Parnassus Funds. | | Indefinite. Since 2004. | | Indefinite. Since 2002. | | Indefinite. Since 1992 for Parnassus Income Funds. Since 1984 for the Parnassus Funds. |
| | | | |
Principal Occupation(s) During Past 5 Years | | Healthcare consultant and owner of several small businesses; Chief Executive Officer of the Haight Ashbury Free Clinics, Inc. from 1987 to 1998. | | President of Geo/ Resource Consultants, a geotechnical and environmental consulting firm, since 1995. | | President and owner of Windermere Associates, a consulting firm specializing in business strategy, since 1984. | | President and Trustee of the Parnassus Funds and the Parnassus Income Funds since their inceptions; President and Director of Parnassus Investments since June 1984. |
| | | | |
Portfolios in the Fund Complex Overseen by Trustee | | Six | | Six | | Six | | Six |
| | | | |
Other Directorships Held by Trustee | | None | | None | | None | | None |
| § | “Independent” trustees are trustees who are not deemed to be “interested persons” of the Funds, as defined in the Investment Company Act of 1940. |
| † | An “interested” trustee is a trustee who is deemed to be an “interested person” of the Funds, as defined in the Investment Company Act of 1940. Jerome L. Dodson is an interested person of the Funds because of his ownership in the Funds’ investment adviser and because he is an officer of the Trusts. |
Additional information about the fund’s Board of Trustees is available in the Statement of Additional Information. The Statement of Additional information is available without charge on the Securities and Exchange Commission’s website (www.sec.gov) or by calling us at (800) 999-3505.
ADDITIONAL INFORMATION (UNAUDITED) continued
Board of Trustees and Officers continued
| | | | | | | | |
| | | Officers§ |
Name Age Address | | Todd C. Ahlsten 36 1 Market Street Suite 1600 San Francisco, California 94105 | | Marc C. Mahon 31 1 Market Street Suite 1600 San Francisco, California 94105 | | Richard D. Silberman 70 1 Market Street Suite 1600 San Francisco, California 94105 | | John V. Skidmore II 43 1 Market Street Suite 1600 San Francisco, California 94105 |
| | | | |
Position(s) Held with Funds | | Vice President | | Treasurer | | Secretary | | Chief Compliance Officer and Assistant Secretary |
| | | | |
Term of Office and Length of Service | | Indefinite. Since 2001. | | Indefinite. Since 2007. | | Indefinite. Since 1986. | | Indefinite. Since 2008. |
| | | | |
Principal Occupation(s) During Past 5 Years | | Financial Analyst and Director of Research at Parnassus Investments since 1995. Portfolio manager of the Equity Income Fund and Fixed-Income Fund since May 2001. | | Chief Financial Officer of Parnassus Investments since December 2007. Treasurer of Parnassus Funds and Parnassus Income Funds since March 2007. Accounting Manager of Parnassus Funds and Parnassus Income Funds July 2004 to March 2007. Senior Accountant with Paul Capital Partners 2003-2004. | | Retired business lawyer. | | Chief Compliance Officer of Parnassus Investments since February 2008. Deputy Chief Compliance Officer of AssetMark Investment Services from 2005 to 2007. Vice President of Wells Fargo Funds Management from 2000 to 2005. |
ADDITIONAL INFORMATION (UNAUDITED) continued
Proxy Disclosures
Parnassus proxy voting policies and procedures are available, without charge, on our website (www.parnassus.com), on the Securities and Exchange Commission’s website (www.sec.gov) and by calling us at (800) 999-3505. The Funds file a proxy voting record with the Securities and Exchange Commission for the 12 months ended June 30. The most recent report is available by calling Parnassus or obtaining from the Securities and Exchange Commission’s website or our Parnassus website.
Quarterly Portfolio Schedule
The Funds file their complete schedule of portfolio holdings with the Securities and Exchange Commission for the first and third quarters of each fiscal year on Form N-Q. The quarterly portfolio holdings are available on the Securities and Exchange Commission’s website (www.sec.gov). The Funds’ Form N-Q may also be reviewed and copied at the Securities and Exchange Commission’s Public Reference Room in Washington, DC, and information on the operation of the Public Reference Room may be obtained by calling (800) SEC-0330.
Federal Income Tax Information
For the year ended December 31, 2008, the following percentages of ordinary income distributed by the Funds that qualify for the individual qualified dividend income deduction (QDI) and the corporate dividends received deduction (DRD) are as follows:
| | | | | | |
| | | QDI | | | DRD | |
Parnassus Fund | | 100.00 | % | | 100.00 | % |
Parnassus Equity Income Fund | | 97.03 | % | | 97.04 | % |
Parnassus Mid-Cap Fund | | 100.00 | % | | 100.00 | % |
Parnassus Small-Cap Fund | | 100.00 | % | | 100.00 | % |
Parnassus Workplace Fund | | NA | | | NA | |
Parnassus Fixed-Income Fund | | 0.42 | % | | 0.42 | % |
This page left intentionally blank.

THE PARNASSUS FUNDS
1 Market Street, Suite 1600
San Francisco, CA 94105
(800) 999-3505
(415) 778-0200
www.parnassus.com
Investment Adviser
Parnassus Investments 1 Market Street, Suite 1600 San Francisco, CA 94105
Legal Counsel
Foley & Lardner LLP 777 E. Wisconsin Ave. Milwaukee, WI 53202
Independent Registered Public Accounting Firm
Deloitte & Touche LLP
50 Fremont Street San Francisco, CA 94105
Distributor
Parnassus Funds Distributor 1 Market Street, Suite 1600 San Francisco, CA 94105
This report must be preceded or accompanied by a current prospectus.
Printed on recycled paper with soy-based ink.
Item 2: Code of Ethics
The registrant has adopted a code of ethics dated July 22, 2003 that applies to the registrant’s principal executive officer (President) and principal financial officer (Treasurer) for the fiscal year ending December 31, 2008. During the fiscal year ending December 31, 2008 there were no amendments to any provisions of this code of ethics.
Item 3: Audit Committee Financial Expert
The Board of Trustees of the Parnassus Income Funds determined that Donald Potter, Chairman of the board’s Audit Committee, qualified as an “audit committee financial expert” as defined by Form N-CSR. The Trustee’s decision was based on Mr. Potter’s understanding of generally accepted accounting principles (GAAP), experience applying GAAP, familiarity with internal controls and procedures for financial reporting and understanding of audit committee functions. He gained this knowledge from thirty years of experience as a strategy consultant for major corporations while working at McKinsey & Co. Management Consultants and at his own firm, Windermere Associates. He also spent four years working as a financial executive for a Fortune 500 company. He served as Chairman of the Audit Committee of Media Arts Group and has also served on the Audit Committees of DLJ Direct and Peer Foods. Mr. Potter is a graduate of Harvard Business School where he was named a Baker Scholar for finishing in the top 5% of his class. Mr. Potter is an independent trustee.
Item 4: Principal Accountant Fees and Services
(a) Audit Fees
The aggregate fees billed for professional services rendered by the principal accountant for the audit of the registrant’s annual financial statements or services that are normally provided by the accountant in connection with statutory and regulatory filings or engagements for the fiscal years ended December 31, 2007 and 2008 were $103,847 and $112,565 respectively.
(b) Audit-Related Fees
The aggregate fees billed for assurance and related services rendered by the principal accountants that are reasonably related to the performance of the audit of the registrant’s financial statements and are not reported under paragraph (a) of this Item for the fiscal years ended December 31, 2007 and 2008 were $14,400 and $3,973 respectively. Audit-related services relate to providing an internal control letter for affiliated transfer agent operations which are billed to the registrant’s investment advisor.
(c) Tax Fees
The aggregate fees billed for professional services rendered by the principal accountant for tax compliance, tax advice, and tax planning for the fiscal years ended December 31, 2007 and 2008 were $17,408 and $13,800 respectively.
(d) All Other Fees
There were no fees billed in each of the last two fiscal years for products and services by the principal accountant, other than the services reported in paragraphs(a) through (c) of this Item.
(e)(1) The Audit committee’s pre-approval policies and procedures are as follows:
The audit committee is required to pre-approve all audit services and permitted non-audit services provided by the independent accountants for the Parnassus Fund, affiliated funds, and other services affiliated.
Explicit pre-approval by the Audit Committee Chair shall be required for any individual non-audit engagement to be performed by the independent accountants with estimated fees of $10,000 or less and the Audit Committee Chair shall report such approval to the full audit committee at the next regularly scheduled meeting. Explicit pre-approval by the full Audit Committee shall be required for any individual non-audit engagement to be performed by the independent accountants with estimated fees in excess of $10,000. Officers of the Funds shall furnish the audit committee at least annually with a listing of all fees paid to the independent accountants including non-audit services performed. For certain non-audit services which are no more than five percent of the total fees paid by the Trust, such fees may be exempted from the required pre-approval process specified above subject to limitations and prompt disclosure of such services when such services are identified, and in all cases approval is required prior to completion.
(e)(2) None
(f) Not applicable.
(g) The aggregate non-audit fees billed by the registrant’s accountant for services rendered to the registrant, and rendered to the registrant’s investment adviser act forth in 4(b) and (c) of this Item of $17,408 and $13,800 for the fiscal years ended December 31, 2007 and 2008, respectively.
Item 5: Not applicable.
Item 6: Included as part of the report to shareholders filed under Item 1 of this form.
Item 7: Not applicable.
Item 8: Not applicable.
Item 9: Not applicable.
Item 10: For the purposes of this Item, there have not been any material changes to the procedures by which shareholders may recommend nominees to the registrant’s board of trustees.
Item 11: Controls and Procedures.
(a) The registrant’s certifying officers have reasonably designed such disclosure controls and procedures to ensure material information relating to the registrant is made known to them by others, particularly during the period in which this report is being prepared. The registrant’s certifying officers have determined that the registrant’s disclosure controls and procedures are effective based on their evaluation of these controls and procedures as of a date within 90 days prior to the filing date of this report.
(b) There were no significant changes in the registrant’s internal controls over financial reporting, or in other factors that could significantly affect these controls, that occurred during the registrant’s first fiscal half-year, including any corrective actions with regard to significant deficiencies and material weaknesses.
Item 12: Exhibits attached hereto.
(a)(1) Code of Ethics.
(a)(2) Certification for each principal executive and principal financial officer of the registrant as required by Rule 30a-2 under the Act (17 CFR 270.30a-2(a)) - Filed as an attachment to this filing.
(b) Certifications required by Rule 30a-2(b) under the Act (17 CFR 270.30a-2(b)), Rule 13a-14(b) or Rule 15d-14(b) under the Exchange Act (17 CFR 240.13a-14(b) or 240.15d-14(b)), and Section 1350 of Chapter 63 of Title 18 of the United States Code (18 U.S.C. 1350). A certification furnished pursuant to this paragraph will not be deemed “filed” for purposes of Section 18 of the Exchange Act (15 U.S.C. 78r), or otherwise subject to the liability of that section. Such certification will not be deemed to be incorporated by reference into any filing under the Securities Act of 1933 or the Exchange Act, except to the extent that the registrant specifically incorporates it by reference – Filed as an attachment to this filing.
Pursuant to the requirements of the Securities Exchange Act of 1934 and the Investment Company Act of 1940, the registrant has duly caused this report to be signed on its behalf by the undersigned, thereunto duly authorized.
| | | | |
| | | Parnassus Income Funds |
| | |
| Date: February 13, 2009 | | By: | | /s/ Jerome L. Dodson
|
| | | | | Jerome L. Dodson President |
Pursuant to the requirements of the Securities Exchange Act of 1934 and the Investment Company Act of 1940, this report has been signed below by the following persons on behalf of the registrant and in the capacities and on the dates indicated.
| | | | |
| Date: February 13, 2009 | | By: | | /s/ Jerome L. Dodson
|
| | | | | Jerome L. Dodson President |
| | | | |
| Date: February 13, 2009 | | By: | | /s/ Marc C. Mahon
|
| | | | | Marc C. Mahon Treasurer |