PARNASSUS INCOME FUNDS
UNITED STATES
SECURITIES AND EXCHANGE COMMISSION
Washington, D.C. 20549
FORM N-CSR
CERTIFIED SHAREHOLDER REPORT OF
REGISTERED MANAGEMENT INVESTMENT COMPANIES
Investment Company Act file number: 811-06673
Parnassus Income Funds
(Exact name of registrant as specified in charter)
One Market—Steuart Tower #1600, San Francisco, California 94105
(Address of principal executive offices) (Zip code)
Debra A. Early
Parnassus Income Funds
One Market—Steuart Tower #1600, San Francisco, California 94105
(Name and address of agent for service)
Registrant’s telephone number, including area code: (415) 778-0200
Date of fiscal year end: December 31
Date of reporting period: December 31, 2005
| Item 1: | Report to Shareholders |
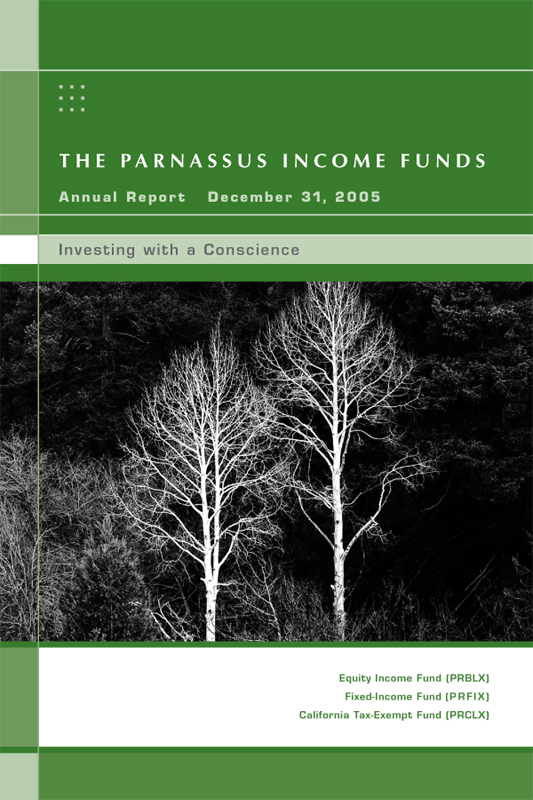

TABLE OF CONTENTS

THE PARNASSUS INCOME FUNDS
February 10, 2006
DEAR SHAREHOLDER:
Enclosed is your quarterly report for the Parnassus Income Funds: the Equity Income Fund, the Fixed-Income Fund and the California Tax-Exempt Fund. Portfolio manager Todd Ahlsten wrote the reports for the Equity Income Fund and the Fixed-Income Fund, and portfolio manager Ben Allen wrote the report for the California Tax-Exempt Fund. They will give you some interesting background on the management of the funds this year.
|
Yours truly, |
|
 |
Jerome L. Dodson, President |
Parnassus Income Funds |
| | | | |
| | | The Parnassus Income Funds Ÿ December 31, 2005 | | 1 |
THE EQUITY INCOME FUND
As of December 31, 2005, the net asset value per share (NAV) of the Equity Income Fund was $24.02, so after taking dividends into account, the total return for the year was 2.62%. This compares to a gain of 4.91% for the S&P 500 and a gain of 5.80% for the average equity income fund followed by Lipper, Inc. While we underperformed the S&P 500 over the past year, our long-term record remains excellent. The Fund’s five- and ten-year returns beat the S&P 500 and Lipper averages for each period. For the fourth quarter, the Fund was up 1.58% compared to 2.09% for the S&P 500 and 1.25% for the Lipper index.
Below are a table and graph that compare the performance of the Fund with the S&P 500 and the average equity income fund followed by Lipper. Average annual total returns are for the one-, three-, five- and ten-year periods.
Average Annual Total Returns
for periods ended December 31, 2005
| | | | | | | | | | | | |
| | | One
Year
| | | Three
Years
| | | Five
Years
| | | Ten
Years
| |
EQUITY INCOME FUND | | 2.62 | % | | 9.07 | % | | 6.57 | % | | 9.87 | % |
S&P 500 Index | | 4.91 | % | | 14.39 | % | | 0.54 | % | | 9.07 | % |
Lipper Equity Income Fund Average | | 5.80 | % | | 14.53 | % | | 3.81 | % | | 8.78 | % |
Performance data quoted represent past performance and are no guarantee of future returns. Current performance may be lower or higher than the performance data quoted, and current performance information is on the Parnassus website (www.parnassus.com). Before investing, an investor should carefully consider the investment objectives, risks, charges and expenses of the Fund and should read the prospectus which contains this information. The prospectus is on the Parnassus website or you can get one by calling (800) 999-3505. Investment return and principal value will fluctuate, so that an investor’s shares, when redeemed, may be worth more or less than their original cost. Returns shown in the table do not reflect the deduction of taxes a shareholder would pay in fund distributions or redemption of shares. The S&P 500 is an unmanaged index of common stocks, and it is not possible to invest directly in an index. An index doesn’t take expenses into account, but mutual fund returns do.
Analysis of 2005
Our research team worked hard this year and I flew over 100,000 miles visiting companies based on my passion to find good investments for the Fund. While a strong work ethic, extensive analysis and positive energy are important, I made two mistakes during 2005 which caused the Fund’s return of 2.62% to lag the 4.91%
| | | | |
| 2 | | The Parnassus Income Funds Ÿ Equity Income Fund | | |

gain for the S&P 500. My first miscalculation was to underweight the soaring energy sector which cost us about 1.7% versus the S&P 500. In essence, the Fund had about 6.6% of our assets, on average, in energy, versus about 12.7% for the S&P 500. I made this decision because energy stocks seemed to have reached speculative heights during 2005 and offered unattractive risk-return ratios. Unfortunately, oil prices continued to soar and that made it difficult for us to keep up with the S&P 500 which had more energy stocks.
My second, and most galling, mistake was to overweight the newspaper and publishing sector which cost the Fund another 1.1% versus the S&P 500. I bought three leading newspaper companies back in 2004, because advertising budgets seemed to be rebounding and the stocks looked like bargains. Unfortunately, I underestimated how much advertising would shift from newspapers to the internet and our newspaper stocks fell between 5% to 20% during 2005. While newspapers aren’t going away anytime soon (everyone still seems to have a paper and a cup of coffee on my morning ferry from Tiburon to San Francisco), they are battling stiff competition from online ads and news websites. In addition, they face increased costs from higher labor and newsprint expenses. As a result, I sold our publishing investments during the fourth quarter of 2005 and reinvested that capital in companies that have stronger business prospects. While I was disappointed to sell those newspaper stocks for losses, I learned a very important lesson: avoid industries that offer weak long-term growth prospects. Unless you’re like my cousin who was an academic All-American swimmer at the University of Kansas, it’s hard to swim upstream!
| | | | |
| | | The Parnassus Income Funds Ÿ Equity Income Fund | | 3 |
| 1 | Composition and sector weightings are based on total investments, rather than net assets, and exclude short-term securities received as collateral from securities lending. Sector distribution and portfolio characteristics are subject to change. |
Strategy
As of this writing, the market looks set to rise during 2006. The S&P 500 has a price-earnings ratio of only 17 times projected earnings, and a strong economy should give stocks a tailwind. Despite high energy prices and the devastating hurricanes of 2005, the economy has been resilient and is growing at a solid 3% to 4% clip. In addition, businesses are hiring workers. While I remain concerned about rising interest rates, high energy prices and the housing bubble, I feel the economy is on track to have a strong year. Based on this view, we have found good opportunities for the Fund in technology, healthcare and the consumer discretionary sector. We remain underweight financials based on our concerns about the housing market bubble. While oil prices and energy stocks finally started to come down a bit during the fourth quarter, we continue to underweight the sector as valuations still seem too high.
I am very excited about the Fund’s prospects for 2006 and doubled my personal investment during the fourth quarter of 2005. The Fund now comprises over 75% of my liquid net worth. While 2005 was disappointing, I am proud that the Fund has had only one down year in the past ten (a modest 3.69% loss in 2002 versus a steep 23% decline for the S&P 500 that year.) In addition, we have produced an average annual return over the past five years of 6.57% versus a paltry 0.54% gain for the S&P 500.
| | | | |
| 4 | | The Parnassus Income Funds Ÿ Equity Income Fund | | |
After my learning experience with the publishing sector, I have a sharpened focus on businesses with solid growth prospects that trade at undervalued prices. As a result, we remain confident that our five-step research process of evaluating each investment’s fundamentals, earnings, management quality, business prospects and risk can generate good returns.
Losers
The Fund had five stocks that reduced the NAV by 5¢ or more during the fourth quarter and, ironically, our three largest losses were energy stocks as oil prices started to retreat.
Pfizer reduced the Fund’s NAV by 10¢ as the stock fell 7.8% from $25.29 to $23.32. The company faced pressure from many fronts during the fourth quarter including expiring patents, low-cost generic competition and a lawsuit that challenged the patent for Pfizer’s $10 billion cholesterol drug Lipitor. However, in late December, we bought back our shares because Pfizer announced it had won the patent lawsuit. This news greatly improves the company’s earnings predictability for the next several years. In addition, the company increased its dividend which should boost the Fund’s yield.
While oil and gas exploration company Apache was the Fund’s biggest winner for the year, it produced our second largest loss during the fourth quarter as the stock fell 8.8% from $75.15 to $68.52. This reduced the NAV by 9¢. We are holding our position since Apache is a premier driller of oil and natural gas and remains under-valued. They also have a strong environmental record and give a lot to charities in their local communities.
Our convertible-preferred stock investment in ONEOK, an Oklahoma-based explorer and distributor of natural gas, fell 23.4% during the quarter from $42.42 to $32.48. This cost the Fund’s NAV 8¢. We are holding our ONEOK position because they are strong operators and the stock offers an attractive dividend yield.
Energen Corporation, an Alabama-based company, that operates an oil and gas exploration business as well as a natural gas utility, reduced the NAV by 6¢. The stock fell 16.3% for the quarter from $43.37 to $36.32, as energy prices began to decline during the fourth quarter from speculative heights. I continue to like our Energen investment because it’s a socially responsible company that has tremendous natural gas exploration opportunities in North America.
Teleflex Corporation, a big winner for the Fund during the first three quarters of the year, cost the Fund’s NAV 5¢ as the stock fell 9.5% during the quarter from $71.80 to $64.98. After a hot start to 2005, the company’s automotive and marine businesses slowed down during the second half and the stock moved lower.
| | | | |
| | | The Parnassus Income Funds Ÿ Equity Income Fund | | 5 |
Winners
The Fund had 9 companies that added 5¢ or more to the NAV during the fourth quarter. Our biggest winner was discounter Ross Stores, which bounced back after falling in the third quarter since investors feared hurricanes and high oil prices would reduce sales. The stock rose 20.4%, from $24.01 to $28.90, as the company reported strong holiday sales. In addition, it seems the company has largely fixed the merchandise problems it had last year when their software program was confused about which items were selling the best.
J.P. Morgan Chase was our second largest gainer as it added 11¢ to the NAV. The bank, which is now run by CEO Jamie Dimon, reported record earnings during the third quarter. We feel the bank will continue to grow earnings during 2006.
Vishay Intertechnology, a maker of capacitors and power management chips for electronic devices, increased the NAV by 8¢, as the stock jumped 14.1% during the quarter from $12.06 to $13.76. The company’s Siliconix division, which is run by the capable Dr. King Owyang, saw especially strong demand from cell phone makers for its power management chips. I have met with Dr. Owyang several times and I can assure you that he is working at least 60 hours a week to ensure that Siliconix continues to gain share in the market.
3M Corporation, the major conglomerate, boosted the NAV by 7¢ as the stock rose 6.9% to $77.50 from $72.53. The stock bounced back after a weak third quarter, as the company reported strong earnings and announced the hiring of George Buckley as Chairman and CEO. Mr. Buckley previously ran the Brunswick Corporation, an outdoor recreational products company. I look forward to seeing him and his team present 3M’s business plan at a conference in February.
Like Ross Stores, TJX Companies, the owner of discount stores T.J. Maxx and Marshalls, bounced back after a disappointing third quarter and boosted the NAV by 6¢. The stock jumped 13.4%, from $20.48 to $23.23, as sales rebounded during December.
Publisher Knight-Ridder, owner of over 30 newspapers including the Miami Herald and the San Jose Mercury-News, increased the NAV by 5¢ during the fourth quarter. The stock bounced back 8.4% during the quarter, from $58.41 to $63.30, as a major shareholder demanded that Knight-Ridder’s management put the company up for sale. After the stock price popped from this announcement, we sold our shares because of the company’s weak long-term fundamentals as discussed earlier.
Two well-run banks both added 5¢ to the NAV. San Francisco-based Wells Fargo climbed 7.5% during the quarter to $62.83 from $58.45. The company, which is managed by the talented Richard Kovacevich, continues to generate strong earnings growth. Charlotte, North Carolina-based Wachovia Bancorp rose 11.4% to $52.86 from $47.46 as the company announced strong results.
| | | | |
| 6 | | The Parnassus Income Funds Ÿ Equity Income Fund | | |
Our final winner was Mentor Graphics, a Portland, Oregon-based company that sells software that helps design computer chips and circuit boards. Our stock soared 20.4% during the fourth quarter to $10.34 from $8.59 as it appears orders are bouncing back after a tough start in 2005.
Social Notes
During a nice fall afternoon in New York, I had a chance to meet with Brian Jennings, the CFO of Devon Energy Corporation, one of our largest energy investments. During the beginning of our conversation, I was encouraged to hear that Devon was doing a better job of finding oil and gas reserves which should drive future earnings growth. In addition, I liked Mr. Jennings’s plan to use some of Devon’s excess cash flow to buy back stock and increase the company’s future dividends. While Devon’s business prospects looked strong, it was great to talk about the company’s commitment to social responsibility. To begin with, Devon has received 10 awards over the past five years from organizations such as the EPA and the Wyoming Fish and Game Department for their environmental efforts, which include minimizing habitat disturbance on drill sites, using groundwater released during production to create reservoirs and wildlife habitat, as well as for restoring acquired oil field property by removing old tanks, revegetating disturbed sites and controlling weeds. In fact, Devon has such a strong track record of converting explored areas back into natural habitats that the U.S. Department of the Interior Bureau of Land Management has used their research for some government remediation projects. While this was great news, I was also very impressed that Devon was placed on the EPA’s 2005 list of Best Workplaces for Commuters. Amazingly, 70% of Devon’s Houston, Texas-based workforce travels by bus or carpool to work. About 700 people work in Devon’s Houston offices. Given how large and sprawling Houston is, this is great news! While Devon must continue to make investments to reduce its environmental impact, I truly feel the company is making a strong effort to be a leading corporate citizen.
Thank you for investing in the Parnassus Equity Income Fund.
|
Yours truly, |
|
 |
| Todd C. Ahlsten |
Portfolio Manager
| | | | |
| | | The Parnassus Income Funds Ÿ Equity Income Fund | | 7 |
THE FIXED - INCOME FUND
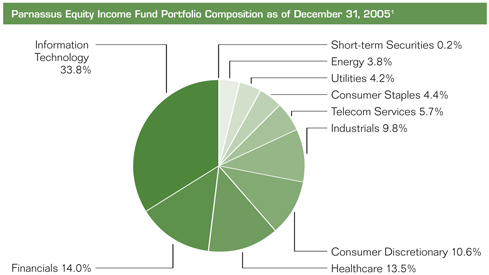
As of December 31, 2005, the net asset value per share (NAV) of the Fixed-Income Fund was $15.79, so after taking dividends into account, the total return for the year was 2.55%. This compares to a gain of 1.87% for the average A-Rated bond fund followed by Lipper, and a return of 2.37% for the Lehman Government/ Corporate Bond Index. The Fund had a good year compared with our peers because we expected interest rates to rise and positioned the portfolio accordingly. The 30-day SEC yield for December was 3.27%.
Below are a table and graph that compare the performance of the Fund with the Lehman and the average A-Rated bond fund followed by Lipper. Average annual total returns are for the one-, three-, five- and ten-year periods.
Average Annual Total Returns
for periods ended December 31, 2005
| | | | | | | | | | | | |
| | | One
Year
| | | Three
Years
| | | Five
Years
| | | Ten
Years
| |
FIXED-INCOME FUND | | 2.55 | % | | 3.29 | % | | 6.60 | % | | 5.40 | % |
Lipper A-Rated Bond Fund Average | | 1.87 | % | | 3.84 | % | | 5.47 | % | | 5.48 | % |
Lehman Government/Corporate Bond Index | | 2.37 | % | | 3.74 | % | | 6.11 | % | | 6.17 | % |
Performance data quoted represent past performance and are no guarantee of future returns. Current performance may be lower or higher than the performance data quoted, and current performance information is on the Parnassus website (www.parnassus.com). Before investing, an investor should carefully consider the investment objectives, risks, charges and expenses of the Fund and should read the prospectus which contains this information. The prospectus is on the Parnassus website or you can get one by calling (800) 999-3505. Investment return and principal value will fluctuate, so that an investor’s shares, when redeemed, may be worth more or less than their original cost. Returns shown in the table do not reflect the deduction of taxes a shareholder would pay in fund distributions or redemption of shares. The Lehman Government/Corporate Bond Index is an unmanaged index of bonds, and it is not possible to invest directly in an index. An index doesn’t take expenses into account, but mutual fund returns do.
| | | | |
| 8 | | The Parnassus Income Funds Ÿ Fixed-Income Fund | | |
Recap of 2005
While we were hoping to outperform by a wider margin in 2005, our return of 2.55% did beat the Lipper average which rose 1.87%. We had expected rates to spike higher during 2005 because of a strong economy and threats of inflation. As a result, we structured the Fund to preserve capital with bond duration of about 1.6 years versus five to six years for many of our peers. As a reminder, duration essentially measures how much, in percentage terms, bond prices change for every 1% change in yield. Since bond prices fall when rates rise, a short duration can cushion potential losses during periods of rising interest rates. The good news was that we were right about short-term rates going up as the Fed lifted the Federal Funds rate from 2.25% to 4.25%. However, longer-term rates barely budged as the 10-year treasury rate began the year at 4.24% and finished 2005 at 4.39%. This happened because many analysts felt inflation fears had seemed to abate and the economy looked set for stable growth. Since we were expecting the ten-year treasury to rise to at least 5% during 2005, our short-duration portfolio, which had a lower current yield, didn’t boost our performance as much as we had anticipated.
| | | | |
| | | The Parnassus Income Funds Ÿ Fixed-Income Fund | | 9 |
Strategy for 2006
The yield curve is now almost as flat as the state of Kansas, with the Federal Funds rate at 4.25% versus 4.39% for the 10-year treasury. The minutes from the Fed’s December 13th meeting said future rate increases “probably would not be large,” as it appears inflation is under control. Many analysts feel the Fed may increase rates only one more time to 4.5% during its January meeting, then hold off to see how the economy and inflation react. Our analysis indicates that a strong economy could spike inflation and push the 10-year treasury to at least 5% during 2006. As a result, we plan to maintain our defensive strategy of short portfolio duration for at least the next several months. While this strategy cost us yield last year, it shouldn’t impact us much in 2006 because short-term interest rates are now almost as high as longer-term bonds. In addition, we have invested over 15% of the Fund’s assets in convertible bonds that offer shareholders increased return potential while we wait for rates to rise.
| | | |
Portfolio Composition at December 31, 2005
| | | |
Long-term Securities: | | | |
Long-term U.S. Government and Agency Securities | | 8.8 | % |
Financial Services | | 3.5 | % |
Electronics | | 10.4 | % |
Retail | | 1.0 | % |
Natural Gas | | 4.0 | % |
Short-term Securities: | | | |
Short-term U.S. Government Agency Securities | | 66.0 | % |
Other Short-term Securities | | 6.3 | % |
Portfolio composition is based upon total securities, rather than net assets, and excludes short-term securities received as collateral from securities lending. Portfolio characteristics are subject to change.
Thank you for investing in the Parnassus Fixed-Income Fund.
|
Yours truly, |
|
 |
Todd C. Ahlsten |
|
Portfolio Manager |
| | | | |
| 10 | | The Parnassus Income Funds Ÿ Fixed-Income Fund | | |
THE CALIFORNIA TAX - EXEMPT FUND
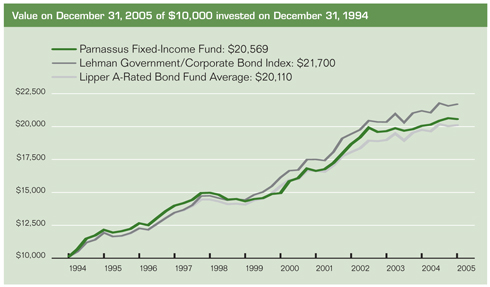
As of December 31, 2005, the net asset value per share (NAV) of the California Tax-Exempt Fund was $16.64. Taking dividends into account, the total return for 2005 was 0.62%. This compares to a gain of 3.82% for the average California municipal bond fund followed by Lipper, Inc.
Below you will find a table and graph that compare our total average annual returns to various indices over the past one-, three-, five- and ten-year periods. The 30-day SEC yield for December 2005 was 3.04%.
Average Annual Total Returns
for periods ended December 31, 2005
| | | | | | | | | | | | |
| | | One
Year
| | | Three
Years
| | | Five
Years
| | | Ten
Years
| |
CALIFORNIA TAX-EXEMPT FUND | | 0.62 | % | | 2.40 | % | | 3.76 | % | | 4.82 | % |
Lipper California Municipal Bond Fund Average | | 3.82 | % | | 4.12 | % | | 4.79 | % | | 5.04 | % |
Lehman Municipal Bond Index | | 3.52 | % | | 4.43 | % | | 5.59 | % | | 5.71 | % |
Performance data quoted represent past performance and are no guarantee of future returns. Current performance may be lower or higher than the performance data quoted, and current performance information is on the Parnassus website (www.parnassus.com). Before investing, an investor should carefully consider the investment objectives, risks, charges and expenses of the Fund and should carefully read the prospectus which contains this information. The prospectus is on the Parnassus website or you can get one by calling (800) 999-3505. Investment return and principal value will fluctuate, so that an investor’s shares, when redeemed, may be worth more or less than their original cost. Returns shown in the table do not reflect the deduction of taxes a shareholder would pay on fund distributions or redemption of shares. The Lehman Municipal Bond Index is an unmanaged index of fixed-income securities and it is not possible to invest directly in an index. An index doesn’t take expenses into account, but mutual fund returns do.
2005 Review
This was a challenging year for the Fund. We underperformed our index because we expected interest rates to rise and kept our duration short, which would have shielded us from losses. The average duration of the Fund was about six years during the fourth quarter, versus approximately seven to nine years for most of our peers. Simply put, duration measures how much in percentage terms a bond price will move for a 1% change in interest rates. Because of this effect, a short-duration portfolio is less risky than a long-duration portfolio.
When planning for 2005, we thought rates would rise evenly across the yield curve, but they did not. Instead, short-term rates increased while long-term rates basically did not change. This means that our relatively short-term portfolio suffered losses
| | | | |
| | | The Parnassus Income Funds Ÿ California Tax-Exempt Fund | | 11 |
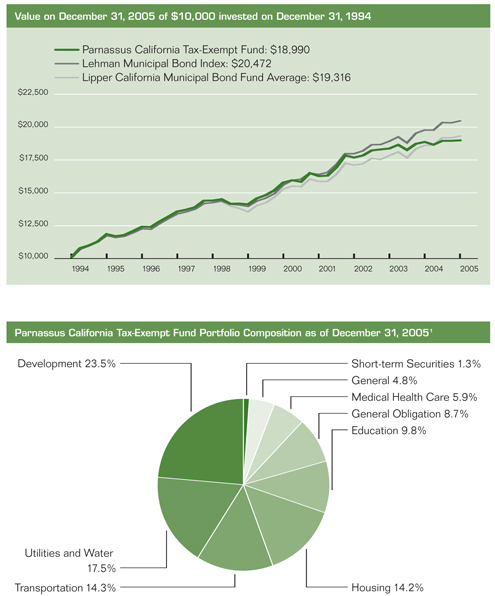
| 1 | Composition and sector weightings are based on total investments, rather than net assets. Sector distribution and portfolio characteristics are subject to change. |
| | | | |
| 12 | | The Parnassus Income Funds Ÿ California Tax-Exempt Fund | | |
greater than our peers. Meanwhile, our peers were collecting higher current yields on their longer-duration funds, as compensation for the higher risk of their portfolios.
Outlook
At its last meeting, the Federal Reserve Board stated that the number of additional rate increases “probably would not be large.” We interpret this to mean that the target Fed Funds rate will increase from its current level of 4.25%, but will likely not exceed 4.75%. This is good news for our portfolio because it signals the end of rising short-term rates, which hurt the Fund’s total return in 2005.
A more uncertain issue is the future level of long-term rates. At the end of 2005, the 10-year Treasury yield stood at 4.39%, which was virtually unchanged from a year before. The fact that long-term rates have stayed constant while short-term rates have risen dramatically is indeed a “conundrum,” to borrow Alan Greenspan’s description. The effect of this conundrum is a relatively flat yield curve, where short- and long-term bonds have similar yields even though the longer bonds carry more risk.
For the next twelve months, our analysis indicates that long-term rates will rise as investors focus on the risk of higher inflation, especially in the face of increasing energy and housing costs. At the same time, short-term rates should remain fairly constant, given the above mentioned statement by the Federal Reserve Board. An increase in the “spread” between short- and long-term interest rates will benefit our portfolio relative to our peers because we are skewed toward the shorter end of the yield curve.
Thank you for investing in the Fund.
Yours truly,
|
|
 |
Ben Allen Portfolio Manager |
| | | | |
| | | The Parnassus Income Funds Ÿ California Tax-Exempt Fund | | 13 |
FUND EXPENSES (UNAUDITED)
As a shareholder of the funds, you incur ongoing costs, which include portfolio-management fees, administrative fees, shareholder reports, and other fund expenses. The funds do not charge transaction fees, so you do not incur transaction costs such as sales charges (loads) on purchase payments, reinvested dividends, or other distributions, redemption fees, and exchange fees. The information on this page is intended to help you understand your ongoing costs of investing in the funds and to compare these costs with the ongoing costs of investing in other mutual funds.
The following example is based on an investment of $1,000 invested at the beginning of the most recent six-month period and held for the period of July 1, 2005 to December 31, 2005.
Actual Expenses
In the example below, the first line for each fund provides information about actual account values and actual expenses. You may use the information in this line, together with the amount you invested, to estimate the expenses that you paid over the period. Simply divide your account value by $1,000 (for example, $8,600 account value divided by $1,000 = 8.6), then multiply the result by the number in the first line under the heading entitled “Expenses Paid During Period” to estimate the expenses you paid on your account during this period.
Hypothetical Example for Comparison Purposes
The second line of each fund provides information about hypothetical account values and hypothetical expenses based on the fund’s expense ratio and an assumed rate of return of 5% per year before expenses, which is not the fund’s actual return. You may compare the ongoing costs of investing in the fund with other mutual funds by comparing this 5% hypothetical example with the 5% hypothetical examples that appear in the shareholder reports of other funds. The hypothetical account values and expenses may not be used to estimate the actual ending account balance or expenses you paid for the period.
| | | | |
| 14 | | The Parnassus Income Funds Ÿ December 31, 2005 | | |
Please note that the expenses shown in the table are meant to highlight only your ongoing costs in these funds. Therefore, the second line of each fund is useful in comparing only ongoing costs and will not help you determine the relative total costs of owning other mutual funds, which may include transactional costs such as loads.
| | | | | | | | | |
| | | Beginning
Account Value
July 1, 2005
| | Ending
Account Value
December 31, 2005
| | Expenses
Paid During
Period*
|
The Equity Income Fund: Actual Hypothetical (5% before expenses) | | $
$ | 1,000.00
1,000.00 | | $
$ | 1,035.39
1,020.10 | | $
$ | 5.05
5.01 |
The Fixed-Income Fund: Actual Hypothetical (5% before expenses) | | $
$ | 1,000.00
1,000.00 | | $
$ | 1,006.21
1,021.31 | | $
$ | 3.77
3.80 |
The California Tax-Exempt Fund: Actual Hypothetical (5% before expenses) | | $
$ | 1,000.00
1,000.00 | | $
$ | 1,001.74
1,021.66 | | $
$ | 3.41
3.45 |
| * | Expenses are equal to the fund’s annualized expense ratio of 0.99%, 0.75%, and 0.68% for Equity Income Fund, Fixed-Income Fund and California Tax-Exempt Fund, respectively, multiplied by the average account value over the period, multiplied by 183/365 (to reflect the one-half year period). |
| | | | |
| | | The Parnassus Income Funds Ÿ December 31, 2005 | | 15 |
REPORT OF INDEPENDENT REGISTERED PUBLIC ACCOUNTING FIRM
To the Shareholders and Board of Trustees of the Parnassus Income Funds:
We have audited the accompanying statements of assets and liabilities of the Parnassus Income Funds (the “Trust”), formerly the Parnassus Income Trust, (comprising the Equity Income Fund, Fixed-Income Fund and California Tax-Exempt Fund), including the portfolios of investments, as of December 31, 2005, and the related statements of operations for the year then ended, the statements of changes in net assets for each of the two years in the period then ended, and the financial highlights for each of the five years in the period then ended. These financial statements and financial highlights are the responsibility of the Trust’s management. Our responsibility is to express an opinion on these financial statements and financial highlights based on our audits.
We conducted our audits in accordance with the standards of the Public Company Accounting Oversight Board (United States). Those standards require that we plan and perform the audit to obtain reasonable assurance about whether the financial statements and financial highlights are free of material misstatement. The Trust is not required to have, nor were we engaged to perform, an audit of its internal control over financial reporting. Our audits included consideration of internal control over financial reporting as a basis for designing audit procedures that are appropriate in the circumstances, but not for the purpose of expressing an opinion on the effectiveness of the Trust’s internal control over financial reporting. Accordingly, we express no such opinion. An audit also includes examining, on a test basis, evidence supporting the amounts and disclosures in the financial statements, assessing the accounting principles used and significant estimates made by management, as well as evaluating the overall financial statement presentation. Our procedures included confirmation of securities owned as of December 31, 2005, by correspondence with the custodian. We believe that our audits provide a reasonable basis for our opinion.
In our opinion, the financial statements and financial highlights referred to above present fairly, in all material respects, the financial position of each of the funds constituting the Parnassus Income Funds as of December 31, 2005, the results of their operations for the year then ended, the changes in their net assets for each of the two years in the period then ended, and the financial highlights for each of the five years in the period then ended, in conformity with accounting principles generally accepted in the United States of America.
|
|
 |
San Francisco, California February 3, 2006 |
| | | | |
| 16 | | The Parnassus Income Funds Ÿ December 31, 2005 | | |
THE EQUITY INCOME FUND
Portfolio of Investments
as of December 31, 2005
| | | | | | | | |
Shares
| | Common Stocks
| | Percent of
Net Assets
| | | Market Value
|
| | | BANKS | | | | | | |
| 750,000 | | J.P. Morgan Chase & Co. | | | | | $ | 29,767,500 |
| 375,000 | | Wachovia Corp. | | | | | | 19,822,500 |
| 400,000 | | Wells Fargo & Co. | | | | | | 25,132,000 |
| | | | | | | |
|
|
| | | | | 8.1 | % | | $ | 74,722,000 |
| | | | | | | |
|
|
| | | BIOTECHNOLOGY | | | | | | |
| 100,000 | | Amgen Inc.1 | | | | | $ | 7,886,000 |
| 525,000 | | Invitrogen Corp.1, 2 | | | | | | 34,986,000 |
| | | | | | | |
|
|
| | | | | 4.7 | % | | $ | 42,872,000 |
| | | | | | | |
|
|
| | | COMPUTERS | | | | | | |
| 200,000 | | International Business Machines Corp. | | | | | $ | 16,440,000 |
| 775,000 | | RadiSys Corp.1, 2 | | | | | | 13,438,500 |
| | | | | | | |
|
|
| | | | | 3.3 | % | | $ | 29,878,500 |
| | | | | | | |
|
|
| | | DATA PROCESSING SERVICES | | | | | | |
| 500,000 | | Automatic Data Processing Inc. | | 2.5 | % | | $ | 22,945,000 |
| | | | | | | |
|
|
| | | ELECTRIC MOTORS | | | | | | |
| 100,000 | | Baldor Electric Co.2 | | 0.3 | % | | $ | 2,565,000 |
| | | | | | | |
|
|
| | | ELECTRONICS | | | | | | |
| 300,000 | | Electro Scientific Industries Inc.1, 2 | | | | | $ | 7,245,000 |
| 1,250,000 | | Vishay Intertechnology Inc.1, 2 | | | | | | 17,200,000 |
| | | | | | | |
|
|
| | | | | 2.7 | % | | $ | 24,445,000 |
| | | | | | | |
|
|
| | | ENTERTAINMENT | | | | | | |
| 650,500 | | Cedar Fair, L.P. .2 | | 2.0 | % | | $ | 18,565,270 |
| | | | | | | |
|
|
| | | FOOD PRODUCTS | | | | | | |
| 50,000 | | McCormick & Co. | | | | | $ | 1,546,000 |
| 500,000 | | Sysco Corp. | | | | | | 15,525,000 |
| | | | | | | |
|
|
| | | | | 1.9 | % | | $ | 17,071,000 |
| | | | | | | |
|
|
| | | HAND & MACHINE TOOLS | | | | | | |
| 275,000 | | The Stanley Works 2 | | 1.5 | % | | $ | 13,211,000 |
| | | | | | | |
|
|
| | | HEALTHCARE PRODUCTS | | | | | | |
| 600,000 | | Johnson & Johnson | | 4.0 | % | | $ | 36,060,000 |
| | | | | | | |
|
|
| | | HEALTHCARE SERVICES | | | | | | |
| 396,304 | | Emdeon Corp.1, 2 | | 0.4 | % | | $ | 3,352,732 |
| | | | | | | |
|
|
| | | | |
| | | The accompanying notes are an integral part of these financial statements. | | 17 |
THE EQUITY INCOME FUND
Portfolio of Investments
as of December 31, 2005 continued
| | | | | | | | |
Shares
| | Common Stocks
| | Percent of
Net Assets
| | | Market Value
|
| | | HOME PRODUCTS | | | | | | |
| 400,000 | | Proctor & Gamble Co. | | | | | $ | 23,152,000 |
| 760,000 | | WD-40 Co.2 | | | | | | 19,957,600 |
| | | | | | | |
|
|
| | | | | 4.8 | % | | $ | 43,109,600 |
| | | | | | | |
|
|
| | | INDUSTRIAL MANUFACTURING | | | | | | |
| 400,000 | | 3M Co. | | | | | $ | 31,000,000 |
| 145,800 | | Teleflex Inc.2 | | | | | | 9,474,084 |
| | | | | | | |
|
|
| | | | | 4.5 | % | | $ | 40,474,084 |
| | | | | | | |
|
|
| | | INSURANCE | | | | | | |
| 250,000 | | AFLAC Inc. | | | | | $ | 11,605,000 |
| 250,000 | | HCC Insurance Holdings Inc. | | | | | | 7,420,000 |
| | | | | | | |
|
|
| | | | | 2.1 | % | | $ | 19,025,000 |
| | | | | | | |
|
|
| | | INSURANCE BROKERAGE | | | | | | |
| 700,000 | | Arthur J. Gallagher & Co.2 | | 2.4 | % | | $ | 21,616,000 |
| | | | | | | |
|
|
| | | INTERNET | | | | | | |
| 450,000 | | eBay Inc.1 | | 2.1 | % | | $ | 19,462,500 |
| | | | | | | |
|
|
| | | MACHINERY | | | | | | |
| 50,000 | | Graco Inc. | | 0.2 | % | | $ | 1,824,000 |
| | | | | | | |
|
|
| | | MEDIA | | | | | | |
| 225,000 | | McGraw-Hill Companies Inc. | | 1.3 | % | | $ | 11,616,750 |
| | | | | | | |
|
|
| | | MEDICAL EQUIPMENT | | | | | | |
| 100,000 | | Dentsply International Inc. | | 0.6 | % | | $ | 5,369,000 |
| | | | | | | |
|
|
| | | NATURAL GAS | | | | | | |
| 326,500 | | Energen Corp.2 | | | | | $ | 11,858,480 |
| 75,000 | | ONEOK, Inc.2 | | | | | | 1,997,250 |
| 150,000 | | Southern Union Co. | | | | | | 3,544,500 |
| | | | | | | |
|
|
| | | | | 1.9 | % | | $ | 17,400,230 |
| | | | | | | |
|
|
| | | NETWORKING PRODUCTS | | | | | | |
| 1,500,000 | | Cisco Systems, Inc.1 | | 2.8 | % | | $ | 25,680,000 |
| | | | | | | |
|
|
| | | OFFICE EQUIPMENT | | | | | | |
| 375,000 | | Avery Dennison Corp.2 | | | | | $ | 20,726,250 |
| 325,000 | | Canon Inc.2 | | | | | | 19,119,750 |
| 400,000 | | Pitney Bowes Inc. | | | | | | 16,900,000 |
| | | | | | | |
|
|
| | | | | 6.3 | % | | $ | 56,746,000 |
| | | | | | | |
|
|
| | | | |
| 18 | | The accompanying notes are an integral part of these financial statements. | | |
| | | | | | | | |
Shares
| | Common Stocks
| | Percent of
Net Assets
| | | Market Value
|
| | | OIL & GAS | | | | | | |
| 350,000 | | Apache Corp. | | | | | $ | 23,982,000 |
| 125,000 | | Devon Energy Corp. | | | | | | 7,817,500 |
| | | | | | | |
|
|
| | | | | 3.5 | % | | $ | 31,799,500 |
| | | | | | | |
|
|
| | | PHARMACEUTICALS | | | | | | |
| 400,000 | | Pfizer Inc. | | 1.0 | % | | $ | 9,328,000 |
| | | | | | | |
|
|
| | | REAL ESTATE INVESTMENT TRUST | | | | | | |
| 15,000 | | Maguire Properties Inc. | | 0.1 | % | | $ | 463,500 |
| | | | | | | |
|
|
| | | RETAIL | | | | | | |
| 1,200,000 | | Ross Stores, Inc. | | | | | $ | 34,680,000 |
| 575,000 | | The Gap, Inc. | | | | | | 10,143,000 |
| 375,000 | | Home Depot, Inc. | | | | | | 15,180,000 |
| 225,000 | | Nautilus Inc.2 | | | | | | 4,198,500 |
| 450,000 | | TJX Companies Inc. | | | | | | 10,453,500 |
| | | | | | | |
|
|
| | | | | 8.1 | % | | $ | 74,655,000 |
| | | | | | | |
|
|
| | | SEMICONDUCTORS | | | | | | |
| 925,000 | | Integrated Device Technology Inc.1, 2 | | | | | $ | 12,191,500 |
| 250,000 | | Intel Corp. | | | | | | 6,240,000 |
| 1,150,000 | | Taiwan Semiconductor | | | | | | |
| | | Manufacturing Co. Ltd.2 | | | | | | 11,396,500 |
| 250,000 | | Xilinx, Inc. | | | | | | 6,302,500 |
| | | | | | | |
|
|
| | | | | 4.0 | % | | $ | 36,130,500 |
| | | | | | | |
|
|
| | | SEMICONDUCTOR CAPITAL EQUIPMENT | | | | | | |
| 350,000 | | Credence Systems Corp.1, 2 | | 0.3 | % | | $ | 2,436,000 |
| | | | | | | |
|
|
| | | SERVICES | | | | | | |
| 1,275,000 | | ServiceMaster Company | | 1.7 | % | | $ | 15,236,250 |
| | | | | | | |
|
|
| | | SOFTWARE | | | | | | |
| 1,200,000 | | Mentor Graphics Corp.1, 2 | | 1.4 | % | | $ | 12,408,000 |
| | | | | | | |
|
|
| | | TELECOMMUNICATIONS | | | | | | |
| 625,000 | | Nokia Corp. (ADR) | | | | | $ | 11,437,500 |
| 750,000 | | Verizon Communications Inc. | | | | | | 22,590,000 |
| | | | | | | |
|
|
| | | | | 3.8 | % | | $ | 34,027,500 |
| | | | | | | |
|
|
| | | Total investment in common stocks (cost $721,260,728) | | 84.3 | % | | $ | 764,494,916 |
| | | | | | | |
|
|
| | | | |
| | | The accompanying notes are an integral part of these financial statements. | | 19 |
THE EQUITY INCOME FUND
Portfolio of Investments
as of December 31, 2005 continued
| | | | | | | | |
Shares
| | Preferred Stocks
| | Percent of
Net Assets
| | | Market Value
|
| | | BANKS | | | | | | |
| 55,439 | | First Republic Preferred Capital Corp. | | | | | | |
| | | Preferred 8.875%, Series B, | | | | | | |
| | | callable 12/30/2006 | | | | | $ | 1,407,042 |
| 55,000 | | Zions Capital Trust B2 | | | | | | |
| | | Preferred 8.000%, | | | | | | |
| | | callable 09/01/2007 | | | | | | 1,433,300 |
| | | | | 0.3 | % | | $ | 2,840,342 |
| | | HEALTH CARE PRODUCTS | | | | | | |
| 350,000 | | Baxter International Inc. | | | | | | |
| | | Preferred 7.000%, | | | | | | |
| | | convertible 02/16/2006 | | 2.1 | % | | $ | 18,812,500 |
| | | NATURAL GAS | | | | | | |
| 325,000 | | ONEOK , Inc. | | | | | | |
| | | Preferred 8.500%, | | | | | | |
| | | convertible 02/16/2006 | | 1.2 | % | | $ | 10,556,000 |
| | | | | | | |
|
|
| | | Total investment in preferred stocks (cost $28,192,946) | | 3.6 | % | | $ | 32,208,842 |
| | | | | | | |
|
|
| | | |
Principal
Amount $
| | Convertible Bonds
| | | | | |
| | | COMPUTERS | | | | | | |
| 1,660,000 | | Radisys Corp. | | | | | | |
| | | 1.375%, due 11/15/20232 | | 0.2 | % | | $ | 1,514,750 |
| | | | | | | |
|
|
| | | ELECTRONICS | | | | | | |
| 30,000,000 | | Vishay Intertechnology Inc. | | | | | | |
| | | 3.625%, due 08/01/20232 | | 3.1 | % | | $ | 29,250,000 |
| | | | | | | |
|
|
| | | FINANCIAL SERVICES | | | | | | |
| 1,000,000 | | E*trade Financial Corp. | | | | | | |
| | | 6.000%, due 02/01/20072 | | 0.1 | % | | $ | 1,010,000 |
| | | | | | | |
|
|
| | | HEALTH CARE SERVICES | | | | | | |
| 22,000,000 | | Emdeon Corp. | | | | | | |
| | | 1.750%, due 06/15/20232 | | 2.0 | % | | $ | 17,902,500 |
| | | | | | | |
|
|
| | | SEMICONDUCTORS | | | | | | |
| 10,000,000 | | Agere Systems, Inc. | | | | | | |
| | | 6.500%, due 12/15/2009 | | 1.1 | % | | $ | 9,837,500 |
| | | | | | | |
|
|
| | | | |
| 20 | | The accompanying notes are an integral part of these financial statements. | | |
| | | | | | | | |
Principal
Amount $
| | Convertible Bonds
| | Percent of
Net Assets
| | | Market Value
|
| | | SEMICONDUCTOR CAPITAL EQUIPMENT | | | | | | |
| 12,500,000 | | Credence Systems Corp. | | | | | | |
| | | 1.500%, due 05/15/2008 | | | | | $ | 11,125,000 |
| 3,500,000 | | Veeco Instruments Inc. | | | | | | |
| | | 4.125%, due 12/21/2008 2 | | | | | | 3,285,624 |
| | | | | | | |
|
|
| | | | | 1.6 | % | | $ | 14,410,624 |
| | | | | | | |
|
|
| | | SOFTWARE | | | | | | |
| 17,637,000 | | Mentor Graphics Corp. | | | | | | |
| | | 6.875%, due 06/15/2007 | | | | | $ | 17,526,769 |
| 9,586,000 | | Mentor Graphics Corp. | | | | | | |
| | | 5.941% (resets quarterly), | | | | | | |
| | | due 08/06/2023 | | | | | | 8,706,964 |
| | | | | | | |
|
|
| | | | | 2.9 | % | | $ | 26,233,733 |
| | | | | | | |
|
|
| | | Total investment in convertible bonds (cost $99,972,150) | | 11.0 | % | | $ | 100,159,107 |
| | | | | | | |
|
|
| | | Total investment in stocks and convertible bonds (cost $849,425,824) | | 98.9 | % | | $ | 896,862,865 |
| | | | | | | |
|
|
| | | Short-Term Investments | | | | | | |
| | | Certificates of Deposit 3 | | | | | | |
| 100,000 | | Community Bank of the Bay | | | | | | |
| | | 3.630%, matures 08/24/2006 | | 0.0 | % | | $ | 97,413 |
| | | | | | | |
|
|
| | | Registered Investment Companies—Money Market Funds | | | | | | |
| 1,010,305 | | Evergreen U.S. Government Fund | | | | | | |
| | | variable rate, 3.950% | | | | | $ | 1,010,305 |
| 97,464 | | Goldman Sachs FS Government Fund | | | | | | |
| | | variable rate, 4.120% | | | | | | 97,464 |
| 27,834 | | Janus Government Fund | | | | | | |
| | | variable rate, 4.160% | | | | | | 27,834 |
| 117,092 | | Scudder Government Fund | | | | | | |
| | | variable rate 4.050% | | | | | | 117,092 |
| 31 | | SSGA U.S Government Fund | | | | | | |
| | | variable rate, 3.880% | | | | | | 31 |
| | | | | | | |
|
|
| | | | | 0.2 | % | | $ | 1,252,726 |
| | | | | | | |
|
|
| | | | |
| | | The accompanying notes are an integral part of these financial statements. | | 21 |
THE EQUITY INCOME FUND
Portfolio of Investments
as of December 31, 2005 continued
| | | | | | | | | |
Principal
Amount $
| | Short-Term Investments
| | Percent of Net Assets
| | | Market Value
| |
| | | Community Development Loans3 | | | | | | | |
| 100,000 | | Boston Community Loan Fund | | | | | | | |
| | | 2.000%, matures 06/30/2006 | | | | | $ | 97,025 | |
| 100,000 | | Ecologic Finance | | | | | | | |
| | | 2.000%, matures 01/25/2006 | | | | | | 99,590 | |
| 100,000 | | Vermont Community Loan Fund | | | | | | | |
| | | 2.000%, matures 04/16/2006 | | | | | | 98,258 | |
| | | | | | | |
|
|
|
| | | | | 0.0 | % | | $ | 294,873 | |
| | | | | | | |
|
|
|
| | | Securities Purchased with Cash Collateral from Securities Lending | | | | | | | |
| | | Registered Investment Companies | | | | | | | |
| 91,324,258 | | State Street Navigator Securities Lending Prime Portfolio | | | | | | | |
| | | variable rate, 4.230% | | 10.1 | % | | $ | 91,324,258 | |
| | | | | | | |
|
|
|
| | | Total investment in short-term securities (cost $92,969,270) | | 10.3 | % | | $ | 92,969,270 | |
| | | | | | | |
|
|
|
| | | Total securities (cost $849,425,824) | | 109.2 | % | | $ | 989,832,135 | |
| | | | | | | |
|
|
|
| | | Payable upon return of securities loaned | | –10.1 | % | | $ | (91,324,258 | ) |
| | | Other assets and liabilities – net | | 0.9 | % | | | 8,335,835 | |
| | | | | | | |
|
|
|
| | | Total net assets | | 100.0 | % | | $ | 906,843,712 | |
| | | | | | | |
|
|
|
| 1 | These securities are non-income producing securities. |
| 2 | This security or partial position of this security was on loan at December 31, 2005 (Note 1). The total value of securities on loan at December 31, 2005 was $88,542,622. |
| 3 | Market value adjustments have been applied to these securities to reflect early withdrawal. |
Fund will vary over time.
Fund shares are not FDIC insured.
| | | | |
| 22 | | The accompanying notes are an integral part of these financial statements. | | |
THE EQUITY INCOME FUND
Statement of Assets and Liabilities
as of December 31, 2005
| | | |
Assets | | | |
| |
Investments in securities, at market value
(identified cost $849,425,824) | | $ | 896,862,865 |
Temporary investments in short-term securities
(at amortized cost which approximates market value) | | | 92,969,270 |
Cash | | | 478,169 |
Receivables: | | | |
Dividends and interest | | | 1,165,316 |
Investment securities sold | | | 8,811,072 |
Capital shares sold | | | 1,021,189 |
Other assets | | | 22,224 |
| | |
|
|
Total assets | | $ | 1,001,330,105 |
| |
Liabilities | | | |
| |
Payable upon return of loaned securities | | | 91,324,258 |
Capital shares redeemed | | | 2,221,811 |
Fees payable to Parnassus Investments | | | 475,773 |
Accounts payable and accrued expenses | | | 464,551 |
| | |
|
|
Total liabilities | | $ | 94,486,393 |
| | |
|
|
Net assets | | $ | 906,843,712 |
| |
Net assets consist of | | | |
| |
Undistributed net investment income | | | 2,628,318 |
Unrealized appreciation on securities | | | 47,437,041 |
Accumulated net realized gain | | | 1,858,428 |
Capital paid-in | | | 854,919,925 |
| | |
|
|
Total net assets | | $ | 906,843,712 |
| |
Computation of net asset value and offering price per share | | | |
| |
Net asset value and redemption price per share
($906,843,712 divided by 37,756,503 shares) | | $ | 24.02 |
| | | | |
| | | The accompanying notes are an integral part of these financial statements. | | 23 |
THE EQUITY INCOME FUND
Statement of Operations
Year ended December 31, 2005
| | | | |
Investment income | | | | |
Dividends (net of foreign tax witholding of $19,235) | | $ | 21,532,335 | |
Interest | | | 3,036,122 | |
Securities lending | | | 144,744 | |
Other income | | | 5,107 | |
| | |
|
|
|
Total investment income | | $ | 24,718,308 | |
| |
Expenses | | | | |
| |
Investment advisory fees (note 5) | | | 6,202,047 | |
Transfer agent fees (note 5) | | | 430,363 | |
Fund administration (note 5) | | | 651,340 | |
Service provider fees (note 5) | | | 1,973,660 | |
Reports to shareholders | | | 320,740 | |
Registration fees and expenses | | | 81,886 | |
Custody fees | | | 58,923 | |
Professional fees | | | 156,156 | |
Trustee fees and expenses | | | 47,881 | |
Other expenses | | | 149,342 | |
| | |
|
|
|
Total expenses | | $ | 10,072,338 | |
Fees waived by Parnassus Investments (note 5) | | | (719,987 | ) |
Expense offset (note 6) | | | (6,571 | ) |
| | |
|
|
|
Net expenses | | $ | 9,345,780 | |
| | |
|
|
|
Net investment income | | $ | 15,372,528 | |
| |
Realized and unrealized gain (loss) on investments | | | | |
| |
Net realized gain (loss) from securities transactions | | $ | 54,405,759 | |
Net change in unrealized appreciation (depreciation) of securities | | | (43,978,912 | ) |
| | |
|
|
|
Net realized and unrealized gain (loss) on securities | | $ | 10,426,847 | |
| | |
|
|
|
Net increase in net assets resulting from operations | | $ | 25,799,375 | |
| | | | |
| 24 | | The accompanying notes are an integral part of these financial statements. | | |
THE EQUITY INCOME FUND
Statement of Changes in Net Assets
| | | | | | | | |
| | | Year Ended
December 31, 2005
| | | Year Ended
December 31, 2004
| |
Income (loss) from operations | | | | | | | | |
Net investment income | | $ | 15,372,528 | | | $ | 11,928,154 | |
Net realized gain (loss) from securities transactions | | | 54,405,759 | | | | 20,107,046 | |
Net change in unrealized appreciation (depreciation) | | | (43,978,912 | ) | | | 38,007,995 | |
| | |
|
|
| |
|
|
|
Increase (decrease) in net assets resulting from operations | | $ | 25,799,375 | | | $ | 70,043,195 | |
Distributions | | | | | | | | |
From net investment income | | | (31,885,584 | ) | | | (17,436,082 | ) |
From realized capital gains | | | (29,345,893 | ) | | | (21,462,046 | ) |
| | |
|
|
| |
|
|
|
Dividends to shareholders | | $ | (61,231,477 | ) | | $ | (38,898,128 | ) |
From capital share transactions | | | | | | | | |
Increase (decrease) in net assets from capital share transactions | | | 47,861,166 | | | | 233,020,302 | |
| | |
|
|
| |
|
|
|
Increase (decrease) in net assets | | $ | 12,429,064 | | | $ | 264,165,369 | |
Net assets | | | | | | | | |
Beginning of period | | | 894,414,648 | | | | 630,249,279 | |
End of period
(including undistributed net investment income of $2,628,318 and $266,831 respectively) | | $ | 906,843,712 | | | $ | 894,414,648 | |
| | | | |
| | | The accompanying notes are an integral part of these financial statements. | | 25 |
THE FIXED - INCOME FUND
Portfolio of Investments
as of December 31, 2005
| | | | | | | | |
Principal Amount $
| | Corporate Bonds
| | Percent of
Net Assets
| | | Market Value
|
| | | BANKS | | | | | | |
| 500,000 | | Bank One Corp. | | | | | | |
| | | Notes, 6.000%, due 02/17/2009 | | 1.1 | % | | $ | 512,127 |
| | | | | | | |
|
|
| | | ELECTRONICS | | | | | | |
| 2,300,000 | | Cymer Inc.1 | | | | | | |
| | | Notes, 3.500%, due 02/15/2009 | | | | | $ | 2,251,125 |
| 2,400,000 | | Vishay Intertechnology Inc. | | | | | | |
| | | Notes, 3.625%, due 08/01/2023 | | | | | | 2,340,000 |
| | | | | | | |
|
|
| | | | | 10.0 | % | | $ | 4,591,125 |
| | | | | | | |
|
|
| | | FINANCIAL SERVICES | | | | | | |
| 500,000 | | Goldman Sachs Group Inc. | | | | | | |
| | | Notes, 6.650%, due 05/15/2009 | | | | | $ | 525,442 |
| 500,000 | | Wells Fargo Financial Inc. | | | | | | |
| | | Notes, 6.850%, due 07/15/2009 | | | | | | 530,198 |
| | | | | | | |
|
|
| | | | | 2.3 | % | | $ | 1,055,640 |
| | | | | | | |
|
|
| | | RETAIL | | | | | | |
| 400,000 | | Target Corp. | | | | | | |
| | | Notes, 7.500%, due 08/15/2010 | | 1.0 | % | | $ | 442,412 |
| | | | | | | |
|
|
| | | Total investment in corporate bonds (cost $6,519,016) | | 14.4 | % | | $ | 6,601,304 |
| | | | | | | |
|
|
| Shares | | Preferred Stocks | | | | | | |
| | | NATURAL GAS | | | | | | |
| 55,000 | | ONEOK , Inc. | | | | | | |
| | | Preferred, 8.500%, convertible 02/16/2006 | | | | | $ | 1,786,400 |
| | | | | | | |
|
|
| | | Total investment in preferred stock (cost $1,680,283) | | 3.9 | % | | $ | 1,786,400 |
| | | | | | | |
|
|
| | | | |
| 26 | | The accompanying notes are an integral part of these financial statements. | | |
| | | | | | | | |
Principal Amount $
| | U.S. Government Agency Securities
| | Percent of
Net Assets
| | | Market Value
|
| 3,000,000 | | Fannie Mae | | | | | | |
| | | 5.125%, due 04/22/2013 | | | | | $ | 2,958,048 |
| 1,000,000 | | Federal Home Loan Bank System | | | | | | |
| | | 5.000%, due 05/28/2015 | | | | | | 974,001 |
| | | | | | | |
|
|
| | | Total investment in U.S. Government Agency securities (cost $4,000,000) | | 8.6 | % | | $ | 3,932,049 |
| | | | | | | |
|
|
| | | Total investment in long-term securities
(cost $12,199,299) | | 26.9 | % | | $ | 12,319,753 |
| | | | | | | |
|
|
| | | Short-Term Investments | | | | | | |
| | | U.S. Government Agency | | | | | | |
| | | Discount Notes | | | | | | |
| 1,000,000 | | Federal Home Loan | | | | | | |
| | | Mortgage Corporation | | | | | | |
| | | Zero Coupon, | | | | | | |
| | | 4.434%, equivalent, | | | | | | |
| | | matures 02/22/2006 | | | | | $ | 993,787 |
| 2,500,000 | | Federal Home Loan | | | | | | |
| | | Mortgage Corporation | | | | | | |
| | | Zero Coupon, | | | | | | |
| | | 4.220%, equivalent, | | | | | | |
| | | matures 01/31/2006 | | | | | | 2,491,088 |
| 10,000,000 | | Federal National Mortgage Association | | | | | | |
| | | Zero Coupon, | | | | | | |
| | | 4.208%, equivalent, | | | | | | |
| | | matures 02/27/2006 | | | | | | 9,931,528 |
| 5,000,000 | | Federal National Mortgage Association | | | | | | |
| | | Zero Coupon, | | | | | | |
| | | 4.440%, equivalent, | | | | | | |
| | | matures 01/25/2006 | | | | | | 4,985,521 |
| 10,000,000 | | Federal National Mortgage Association | | | | | | |
| | | Zero Coupon, | | | | | | |
| | | 4.170%, equivalent, | | | | | | |
| | | matures 01/17/2006 | | | | | | 9,980,308 |
| 1,000,000 | | Federal National Mortgage Association | | | | | | |
| | | Zero Coupon, | | | | | | |
| | | 4.035%, equivalent, | | | | | | |
| | | matures 01/04/2006 | | | | | | 999,551 |
| | | | | | | |
|
|
| | | | | 64.0 | % | | $ | 29,381,783 |
| | | | | | | |
|
|
| | | | |
| | | The accompanying notes are an integral part of these financial statements. | | 27 |
THE FIXED - INCOME FUND
Portfolio of Investments
as of December 31, 2005 continued
| | | | | | | | | |
Principal Amount $
| | Short-Term Investments
| | Percent of
Net Assets
| | | Market Value
| |
| | | Registered Investment Companies— Money Market Funds | | | | | | | |
| 1,010,305 | | Evergreen U.S. Government Fund | | | | | | | |
| | | variable rate, 3.950% | | | | | $ | 1,010,305 | |
| 291,442 | | Goldman Sachs FS Government Fund | | | | | | | |
| | | variable rate, 4.120% | | | | | | 291,442 | |
| 144,268 | | Janus Government Fund | | | | | | | |
| | | variable rate, 4.160% | | | | | | 144,268 | |
| 1,302 | | Scudder Government Fund | | | | | | | |
| | | variable rate, 4.050% | | | | | | 1,302 | |
| 1,379,706 | | SSGA U.S. Government Fund | | | | | | | |
| | | variable rate, 3.880% | | | | | | 1,379,706 | |
| | | | | | | |
|
|
|
| | | | | 6.2 | % | | $ | 2,827,023 | |
| | | | | | | |
|
|
|
| | | Securities Purchased with Cash Collateral from Securities Lending | | | | | | | |
| | | Registered Investment Companies | | | | | | | |
| 101,250 | | State Street Navigator Securities Lending Prime Portfolio | | | | | | | |
| | | variable rate, 4.230% | | 0.2 | % | | $ | 101,250 | |
| | | | | | | |
|
|
|
| | | Total investment in short-term securities (cost $32,310,056) | | 70.4 | % | | $ | 32,310,056 | |
| | | | | | | |
|
|
|
| | �� | Total securities (cost $44,509,355) | | 97.3 | % | | $ | 44,629,809 | |
| | | | | | | |
|
|
|
| | | Payable upon return of securities loaned | | – 0.2 | % | | $ | (101,250 | ) |
| | | Other assets and liabilities – net | | 2.9 | % | | | 1,350,055 | |
| | | | | | | |
|
|
|
| | | Total net assets | | 100.0 | % | | $ | 45,878,614 | |
| | | | | | | |
|
|
|
| 1 | This security or partial position of this security was on loan at December 31, 2005 (Note 1). The total value of securities on loan at December 31, 2005 was $99,188. |
| | Fund will vary over time. |
| | Fund shares are not FDIC insured. |
| | | | |
| 28 | | The accompanying notes are an integral part of these financial statements. | | |
THE FIXED - INCOME FUND
Statement of Assets and Liabilities
as of December 31, 2005
| | | | |
Assets | | | | |
| |
Investments in securities, at market value
(identified cost $12,199,299) | | $ | 12,319,753 | |
Temporary investments in short-term securities
(at amortized cost which approximates market value) | | | 32,310,056 | |
Cash | | | 1,225,752 | |
Receivables: | | | | |
Dividends and interest | | | 148,179 | |
Capital shares sold | | | 41,042 | |
Other assets | | | 1,547 | |
| | |
|
|
|
Total assets | | $ | 46,046,329 | |
| |
Liabilities | | | | |
| |
Payable upon return of loaned securities | | | 101,250 | |
Capital shares redeemed | | | 18,858 | |
Fees payable to Parnassus Investments | | | 25,373 | |
Accounts payable and accrued expenses | | | 22,234 | |
| | |
|
|
|
Total liabilities | | $ | 167,715 | |
| | |
|
|
|
Net assets | | $ | 45,878,614 | |
| |
Net assets consist of | | | | |
| |
Undistributed net investment income | | | — | |
Unrealized appreciation on securities | | | 120,454 | |
Accumulated net realized loss | | | (8,879 | ) |
Capital paid-in | | | 45,767,039 | |
| | |
|
|
|
Total net assets | | $ | 45,878,614 | |
| |
Computation of net asset value and offering price per share | | | | |
| |
Net asset value and redemption price per share
($45,878,614 divided by 2,905,413 shares) | | $ | 15.79 | |
| | | | |
| | | The accompanying notes are an integral part of these financial statements. | | 29 |
THE FIXED - INCOME FUND
Statement of Operations
Year ended December 31, 2005
| | | | |
Investment income | | | | |
| |
Dividends | | $ | 200,932 | |
Interest | | | 1,359,059 | |
Securities lending | | | 611 | |
| | |
|
|
|
Total investment income | | $ | 1,560,602 | |
| |
Expenses | | | | |
| |
Investment advisory fees (note 5) | | | 205,770 | |
Transfer agent fees (note 5) | | | 53,660 | |
Fund administration (note 5) | | | 28,396 | |
Service provider fees (note 5) | | | 38,132 | |
Reports to shareholders | | | 24,379 | |
Registration fees and expenses | | | 33,937 | |
Custody fees | | | 4,641 | |
Professional fees | | | 14,351 | |
Trustee fees and expenses | | | 1,803 | |
Other expenses | | | 10,424 | |
| | |
|
|
|
Total expenses | | $ | 415,493 | |
Fees waived by Parnassus Investments (note 5) | | | (105,813 | ) |
Expense offset (note 6) | | | (857 | ) |
| | |
|
|
|
Net expenses | | $ | 308,823 | |
| | |
|
|
|
Net investment income | | $ | 1,251,779 | |
| |
Realized and unrealized gain (loss) on investments | | | | |
| |
Net realized gain (loss) from securities transactions | | $ | (8,879 | ) |
Net change in unrealized appreciation (depreciation) of securities | | | (239,981 | ) |
| | |
|
|
|
Net realized and unrealized gain (loss) on securities | | $ | (248,860 | ) |
| | |
|
|
|
Net increase in net assets resulting from operations | | $ | 1,002,919 | |
| | | | |
| 30 | | The accompanying notes are an integral part of these financial statements. | | |
THE FIXED - INCOME FUND
Statement of Changes in Net Assets
| | | | | | | | |
| | | Year Ended
December 31, 2005
| | | Year Ended
December 31, 2004
| |
Income (loss) from operations | | | | | | | | |
| | |
Net investment income | | $ | 1,251,779 | | | $ | 755,834 | |
Net realized gain (loss) from securities transactions | | | (8,879 | ) | | | 161,083 | |
Net change in unrealized appreciation (depreciation) | | | (239,981 | ) | | | (168,658 | ) |
| | |
|
|
| |
|
|
|
Increase (decrease) in net assets resulting from operations | | $ | 1,002,919 | | | $ | 748,259 | |
| | |
Distributions | | | | | | | | |
| | |
From net investment income | | | (1,263,108 | ) | | | (755,834 | ) |
From realized capital gains | | | — | | | | (222,827 | ) |
Return of capital | | | — | | | | (71,829 | ) |
| | |
|
|
| |
|
|
|
Dividends to shareholders | | $ | (1,263,108 | ) | | $ | (1,050,490 | ) |
| | |
From capital share transactions | | | | | | | | |
| | |
Increase (decrease) in net assets from capital share transactions | | | 7,934,016 | | | | 4,409,201 | |
| | |
|
|
| |
|
|
|
Increase (decrease) in net assets | | $ | 7,673,827 | | | $ | 4,106,970 | |
| | |
Net assets | | | | | | | | |
| | |
Beginning of period | | | 38,204,787 | | | | 34,097,817 | |
End of period
(including undistributed net investment income of $0 and $0 respectively) | | $ | 45,878,614 | | | $ | 38,204,787 | |
| | | | |
| | | The accompanying notes are an integral part of these financial statements. | | 31 |
THE CALIFORNIA TAX - EXEMPT FUND
Portfolio of Investments
as of December 31, 2005
| | | | | | | | |
Principal
Amount $
| | Municipal Bonds
| | Percent of
Net Assets
| | | Market Value
|
| | | AIRPORT | | | | | | |
| 1,000,000 | | San Francisco City & County | | | | | | |
| | | Airport Commission | | | | | | |
| | | FGIC Insured, | | | | | | |
| | | 5.000%, due 05/01/2010 | | 4.9 | % | | $ | 1,064,180 |
| | | | | | | |
|
|
| | | DEVELOPMENT | | | | | | |
| 800,000 | | State of California | | | | | | |
| | | 5.000%, due 07/01/2016 | | | | | $ | 849,192 |
| 500,000 | | California Infrastructure & Economic Development Bank | | | | | | |
| | | 5.000%, due 10/01/2012 | | | | | | 542,465 |
| 1,000,000 | | Indian Wells Redevelopment Agency AMBAC Insured, | | | | | | |
| | | 4.500%, due 09/01/2011 | | | | | | 1,049,300 |
| 600,000 | | La Quinta Redevelopment Agency Tax Allocation MBIA Insured, | | | | | | |
| | | 7.300%, due 09/01/2011 | | | | | | 711,630 |
| 425,000 | | Rialto Redevelopment Agency | | | | | | |
| | | 4.500%, due 09/01/2013 | | | | | | 436,076 |
| 860,000 | | Rialto Redevelopment Agency | | | | | | |
| | | 4.000%, due 09/01/2007 | | | | | | 861,608 |
| 625,000 | | San Mateo Redevelopment Agency XLCA Insured, | | | | | | |
| | | 4.200%, due 08/01/2023 | | | | | | 620,375 |
| | | | | | | |
|
|
| | | | | 23.3 | % | | $ | 5,070,646 |
| | | | | | | |
|
|
| | | EDUCATION | | | | | | |
| 200,000 | | Sweetwater Union High School District | | | | | | |
| | | 4.250%, due 09/01/2017 | | 0.9 | % | | $ | 198,358 |
| | | | | | | |
|
|
| | | GENERAL | | | | | | |
| 1,000,000 | | Abag Finance Authority for Nonprofit Corps | | | | | | |
| | | 4.250%, due 11/15/2012 | | 4.7 | % | | $ | 1,019,640 |
| | | | | | | |
|
|
| | | GENERAL OBLIGATION | | | | | | |
| 700,000 | | State of California | | | | | | |
| | | 6.100%, due 10/01/2009 | | | | | $ | 762,965 |
| 1,000,000 | | State of California | | | | | | |
| | | 6.600%, due 02/01/2009 | | | | | | 1,089,220 |
| | | | | | | |
|
|
| | | | | 8.6 | % | | $ | 1,852,185 |
| | | | | | | |
|
|
| | | | |
| 32 | | The accompanying notes are an integral part of these financial statements. | | |
| | | | | | | | |
Principal
Amount $
| | Municipal Bonds
| | Percent of
Net Assets
| | | Market Value
|
| | | HOUSING | | | | | | |
| 910,000 | | California Statewide Communities Development Authority ACA Insured, | | | | | | |
| | | 4.500%, due 08/01/2010 | | | | | $ | 920,465 |
| 1,000,000 | | California State Public Works Board FSA Insured, | | | | | | |
| | | 5.375%, due 10/01/2013 | | | | | | 1,102,170 |
| 960,000 | | California State Public Works Board | | | | | | |
| | | 5.500%, due 12/01/2009 | | | | | | 1,025,510 |
| | | | | | | |
|
|
| | | | | 14.1 | % | | $ | 3,048,145 |
| | | | | | | |
|
|
| | | MEDICAL HEALTHCARE | | | | | | |
| 300,000 | | California Health Facilities Financing Authority | | | | | | |
| | | 5.000%, due 07/01/2009 | | | | | $ | 314,055 |
| 500,000 | | Loma Linda Hospital | | | | | | |
| | | 4.500%, due 12/01/2018 | | | | | | 495,155 |
| 415,000 | | Loma Linda Hospital AMBAC Insured, | | | | | | |
| | | 4.850%, due 12/01/2010 | | | | | | 440,232 |
| | | | | | | |
|
|
| | | | | 5.8 | % | | $ | 1,249,442 |
| | | | | | | |
|
|
| | | POWER | | | | | | |
| 1,100,000 | | California State Department of Water Resources | | | | | | |
| | | 5.500%, due 05/01/2009 | | 5.4 | % | | $ | 1,168,024 |
| | | | | | | |
|
|
| | | SCHOOL DISTRICT | | | | | | |
| 450,000 | | Los Altos School District | | | | | | |
| | | 5.250%, due 08/01/2010 | | | | | $ | 485,162 |
| 440,000 | | Los Angeles Unified School District FGIC Insured, | | | | | | |
| | | 5.500%, due 07/01/2013 | | | | | | 479,697 |
| 450,000 | | Morgan Hill Unified School District FGIC Insured, | | | | | | |
| | | 4.900%, due 08/01/2013 | | | | | | 478,076 |
| 410,000 | | Sacramento City Unified School District | | | | | | |
| | | 5.750%, due 07/01/2017 | | | | | | 450,877 |
| | | | | | | |
|
|
| | | | | 8.8 | % | | $ | 1,893,812 |
| | | | | | | |
|
|
| | | | |
| | | The accompanying notes are an integral part of these financial statements. | | 33 |
THE CALIFORNIA TAX - EXEMPT FUND
Portfolio of Investments
as of December 31, 2005 continued
| | | | | | | | |
Principal
Amount $
| | Municipal Bonds
| | Percent of
Net Assets
| | | Market Value
|
| | | TRANSPORTATION | | | | | | |
| 300,000 | | Bay Area Toll Authority AMBAC Insured, | | | | | | |
| | | 2.870%, due 04/01/2025 | | | | | $ | 300,000 |
| 1,000,000 | | Contra Costa Transportation Authority FGIC Insured, | | | | | | |
| | | 4.000%, due 03/01/2009 | | | | | | 1,021,990 |
| 250,000 | | Los Angeles County Metropolitan Transportation Authority AMBAC Insured, | | | | | | |
| | | 5.000%, due 07/01/2013 | | | | | | 262,073 |
| 260,000 | | San Francisco Bay Area Transit Financing Authority Prerefunded | | | | | | |
| | | 5.250%, due 07/01/2013 | | | | | | 275,184 |
| 140,000 | | San Francisco Bay Area Transit Financing Authority Unrefunded | | | | | | |
| | | 5.250%, due 07/01/2013 | | | | | | 147,728 |
| | | | | | | |
|
|
| | | | | 9.3 | % | | $ | 2,006,975 |
| | | | | | | |
|
|
| | | UTILITIES | | | | | | |
| 200,000 | | City of Los Angeles CA FGIC Insured, | | | | | | |
| | | 5.000%, due 06/01/2011 | | | | | $ | 210,214 |
| 1,000,000 | | San Francisco City & County Public Utilities Commission MBIA Insured, | | | | | | |
| | | 5.000%, due 10/01/2009 | | | | | | 1,058,930 |
| | | | | | | |
|
|
| | | | | 5.9 | % | | $ | 1,269,144 |
| | | | | | | |
|
|
| | | WATER | | | | | | |
| 215,000 | | California State Department of Water Resources | | | | | | |
| | | 5.125%, due 12/01/2016 | | | | | $ | 228,349 |
| 185,000 | | California State Department of Water Resources | | | | | | |
| | | 5.125%, due 12/01/2016 | | | | | | 195,958 |
| 500,000 | | Central Coast Water Authority AMBAC Insured, | | | | | | |
| | | 5.000%, due 10/01/2016 | | | | | | 515,890 |
| | | | |
| 34 | | The accompanying notes are an integral part of these financial statements. | | |
| | | | | | | | |
Principal
Amount $
| | Municipal Bonds
| | Percent of
Net Assets
| | | Market Value
|
| 350,000 | | Metropolitan Water District of Southern California | | | | | | |
| | | 5.250%, due 07/01/2015 | | | | | | 363,888 |
| | | | | | | |
|
|
| | | | | 6.0 | % | | $ | 1,304,085 |
| | | | | | | |
|
|
| | | Total investments in municipal bonds (cost $20,889,735) | | 97.7 | % | | $ | 21,144,636 |
| | | | | | | |
|
|
| | | |
| | | Short-Term Investments
| | | | | |
| | | |
| | | Registered Investment Companies—Money Market Funds | | | | | | |
| 265,954 | | California Investment Trust Tax Free Fund | | | | | | |
| | | variable rate, 2.570% | | | | | $ | 265,954 |
| 4,583 | | Goldman Sachs California Tax-Exempt Fund | | | | | | |
| | | variable rate, 2.880% | | | | | | 4,583 |
| | | | | | | |
|
|
| | | Total investment in short-term securities (cost $270,537) | | 1.3 | % | | $ | 270,537 |
| | | | | | | |
|
|
| | | Total securities (cost $21,160,272) | | 99.0 | % | | $ | 21,415,173 |
| | | | | | | |
|
|
| | | Other assets and liabilities – net | | 1.0 | % | | | 219,538 |
| | | | | | | |
|
|
| | | Total net assets | | 100.0 | % | | $ | 21,634,711 |
| | | | | | | |
|
|
Fund Holdings will vary over time.
Fund shares are not FDIC insured.
Glossary of Terms
| | |
| ACA | | ACA Financial Guaranty Corp. |
| |
| AMBAC | | American Municipal Bond Assurance Corp. |
| |
| FGIC | | Financial Guaranty Insurance Co. |
| |
| FSA | | Financial Security Assistance |
| |
| MBIA | | Municipal Bond Investors Assurance Corp. |
| |
| XLCA | | XL Capital Assurance Inc. |
| | | | |
| | | The accompanying notes are an integral part of these financial statements. | | 35 |
THE CALIFORNIA TAX - EXEMPT FUND
Statement of Assets and Liabilities
as of December 31, 2005
| | | |
Assets | | | |
| |
Investments in securities, at market value
(identified cost $20,889,735) | | $ | 21,144,636 |
Temporary investments in short-term securities
(at amortized cost which approximates market value) | | | 270,537 |
Receivables: | | | |
Dividends and interest | | | 287,027 |
Other assets | | | 978 |
| | |
|
|
Total assets | | $ | 21,703,178 |
| |
Liabilities | | | |
Capital shares redeemed | | | 46,063 |
Fees payable to Parnassus Investments | | | 5,809 |
Accounts payable and accrued expenses | | | 16,595 |
| | |
|
|
Total liabilities | | $ | 68,467 |
| | |
|
|
Net assets | | $ | 21,634,711 |
| |
Net assets consist of | | | |
Undistributed net investment income | | | 959 |
Unrealized appreciation on securities | | | 254,901 |
Accumulated net realized gain | | | 10,832 |
Capital paid-in | | | 21,368,019 |
| | |
|
|
Total net assets | | $ | 21,634,711 |
| |
Computation of net asset value and offering price per share | | | |
| |
Net asset value and redemption price per share
($21,634,711 divided by 1,300,323 shares) | | $ | 16.64 |
| | | | |
| 36 | | The accompanying notes are an integral part of these financial statements. | | |
THE CALIFORNIA TAX - EXEMPT FUND
Statement of Operations
Year ended December 31, 2005
| | | | |
Investment income | | | | |
| |
Interest | | $ | 856,168 | |
| | |
|
|
|
Total investment income | | $ | 856,168 | |
| |
Expenses | | | | |
Investment advisory fees (note 5) | | | 115,828 | |
Transfer agent fees (note 5) | | | 12,747 | |
Fund administration (note 5) | | | 15,990 | |
Service provider fees (note 5) | | | 31,896 | |
Reports to shareholders | | | 7,686 | |
Registration fees and expenses | | | 1,287 | |
Custody fees | | | 2,201 | |
Professional fees | | | 12,105 | |
Trustee fees and expenses | | | 1,543 | |
Other expenses | | | 10,635 | |
| | |
|
|
|
Total expenses | | $ | 211,918 | |
Fees waived by Parnassus Investments (note 5) | | | (54,426 | ) |
| | |
|
|
|
Net expenses | | $ | 157,492 | |
| | |
|
|
|
Net investment income | | $ | 698,676 | |
| |
Realized and unrealized gain (loss) on investments | | | | |
| |
Net realized gain (loss) from securities transactions | | $ | 80,253 | |
Net change in unrealized appreciation (depreciation) of securities | | | (642,709 | ) |
| | |
|
|
|
Net realized and unrealized gain (loss) on securities | | $ | (562,456 | ) |
| | |
|
|
|
Net increase in net assets resulting from operations | | $ | 136,220 | |
| | | | |
| | | The accompanying notes are an integral part of these financial statements. | | 37 |
THE CALIFORNIA TAX - EXEMPT FUND
Statement of Changes in Net Assets
| | | | | | | | |
| | | Year Ended December 31, 2005
| | | Year Ended December 31, 2004
| |
| | | |
Income (loss) from operations | | | | | | | | |
| | |
Net investment income | | $ | 698,676 | | | $ | 714,362 | |
Net realized gain (loss) from securities transactions | | | 80,253 | | | | — | |
Net change in unrealized appreciation (depreciation) | | | (642,709 | ) | | | (36,967 | ) |
| | |
|
|
| |
|
|
|
Increase (decrease) in net assets resulting from operations | | $ | 136,220 | | | $ | 677,395 | |
| | |
Distributions | | | | | | | | |
| | |
From net investment income | | | (698,991 | ) | | | (718,553 | ) |
From realized capital gains | | | (69,608 | ) | | | (22,133 | ) |
| | |
|
|
| |
|
|
|
Dividends to shareholders | | $ | (768,599 | ) | | $ | (740,686 | ) |
From capital share transactions | | | | | | | | |
Increase (decrease) in net assets from capital share transactions | | | (3,326,713 | ) | | | 832,566 | |
| | |
|
|
| |
|
|
|
Increase (decrease) in net assets | | $ | (3,959,092 | ) | | $ | 769,275 | |
| | |
Net assets | | | | | | | | |
| | |
Beginning of period | | | 25,593,803 | | | | 24,824,528 | |
End of period
(including undistributed net investment income of $959 and $5,021 respectively) | | $ | 21,634,711 | | | $ | 25,593,803 | |
| | | | |
| 38 | | The accompanying notes are an integral part of these financial statements. | | |
NOTES TO FINANCIAL STATEMENTS
1. Significant Accounting Policies
The Parnassus Income Funds (the “Trust”), formerly The Parnassus Income Trust, organized on August 8,1990 as a Massachusetts Business Trust, is registered under the Investment Company Act of 1940 as a diversified, open-end investment management company comprised of three separate funds (the “funds”), each offering separate shares. The Trust began operations on August 31, 1992.
Securities Valuations
Equity securities that are listed or traded on a national securities exchange are stated at market value, based on recorded closing sales on the exchange or on the Nasdaq’s National Market System official closing price. In the absence of a recorded sale, and for over-the-counter securities, equity securities are stated at the mean between the last recorded bid and asked prices. Long-term, fixed-income securities are valued each business day using prices based on procedures established by independent pricing services and approved by the Board of Trustees (the “Trustees”). Fixed-income securities with an active market are valued at the “bid” price where such quotes are readily available from brokers and dealers, and are representative of the actual market for such securities. Other fixed-income securities experiencing a less active market are valued as determined by the pricing services based on methods which include consideration of trading in securities of comparable yield, quality, coupon, maturity and type, as well as indications as to values from dealers and other market data without exclusive reliance upon quoted prices or over-the-counter prices, since such valuations are believed to reflect more accurately the value of such securities. Short-term investments in U.S. Government Agency discount notes, certificates of deposit and community development loans are valued at amortized cost, which approximates market value. Investments in registered investment companies are valued at their net asset value.
Investments where market quotations are not readily available are priced at their fair value, in accordance with procedures established by the Trustees. In determining fair value, the Trustees may consider a variety of information including, but not limited to, the following: price based upon a multiple of earnings or sales, fundamental analytical data, and an evaluation of market conditions. A valuation adjustment is applied to certificates of deposit and community development loans as an estimate of potential penalties for early withdrawal.
Federal Income Taxes
The Trust intends to comply with the requirements of the Internal Revenue Code applicable to regulated investment companies and to distribute all taxable and tax-exempt income to shareholders. Therefore, no federal income tax provision is required. Income distributions and capital-gain distributions are determined in accordance with income tax regulations, which may differ from accounting principles generally accepted in the United States of America.
NOTES TO FINANCIAL STATEMENTS CONTINUED
Securities Transactions
Securities transactions are recorded on the date the securities are purchased or sold (trade date). Realized gains and losses on securities transactions are determined on the basis of first-in, first-out for both financial statement and federal income tax purposes.
Dividends to Shareholders
Distributions to shareholders are recorded on the record date. The Equity Income Fund pays income dividends quarterly and capital-gain dividends annually. The Fixed-Income and California Tax-Exempt Funds pay income dividends monthly and capital-gain dividends annually.
Investment Income and Expenses
Dividend income is recognized on the ex-dividend date and interest income is recognized on an accrual basis. Discounts and premiums on securities purchased are amortized over the lives of the respective securities using the constant yield method, which approximates the interest method. Expenses are recorded on an accrual basis.
Securities Lending
The Equity Income Fund and the Fixed-Income Fund lend securities to approved financial institutions to earn additional income and receive cash and/or securities as collateral to secure the loans. Collateral is maintained at not less than 102% of the value of loaned securities. Although the risk of lending is mitigated by the collateral, the funds could experience a delay in recovering securities and a possible loss of income or value if the borrower fails to return them.
Repurchase Agreements
Collateral from securities lending may include investments in repurchase agreements secured by U.S. government obligations or other securities. Securities pledged as collateral for repurchase agreements are held by the funds’ custodian bank until maturity of the repurchase agreements. Provisions of the agreements ensure that the market value of the collateral is sufficient in the event of default; however, in the event of default or bankruptcy by the other party to the agreements, realization and/or retention of the collateral may be subject to legal proceedings.
Use of Estimates
The preparation of financial statements in conformity with accounting principles generally accepted in the United States of America requires management to make estimates and assumptions that affect the reported amounts of assets and liabilities at the date of the financial statements and the reported amounts of revenues and expenses during the reporting period. Actual results could differ from those estimates.
2. Tax Matters and Distributions
The tax character of distributions paid during the years ended December 31, 2005 and 2004 were as follows:
| | | | | | | | | | | | | | | | | | |
| | | Equity Income Fund
| | Fixed- Income Fund
| | California Tax- Exempt Fund
|
From
| | 2005
| | 2004
| | 2005
| | 2004
| | 2005
| | 2004
|
Ordinary income | | $ | 31,885,584 | | $ | 21,011,990 | | $ | 1,251,779 | | $ | 755,834 | | $ | — | | $ | — |
Tax-exempt income | | | — | | | — | | | — | | | — | | | 698,991 | | | 719,079 |
Long-term capital gains | | | 29,345,893 | | | 17,886,138 | | | — | | | 222,827 | | | 69,608 | | | 21,607 |
| | | $ | 61,231,477 | | $ | 38,898,128 | | $ | 1,251,779 | | $ | 978,661 | | $ | 768,599 | | $ | 740,686 |
Return of capital | | | — | | | — | | | — | | | 71,829 | | | — | | | — |
Total distributions | | $ | 61,231,477 | | $ | 38,898,128 | | $ | 1,251,779 | | $ | 1,050,490 | | $ | 768,599 | | $ | 740,686 |
At December 31, 2005, the cost of investments in securities excluding temporary investments, net unrealized appreciation (depreciation), distributable earnings, and undistributed earnings, for income tax purposes were as follows:
| | | | | | | | | | | | |
| | | Equity Income Fund
| | | Fixed- Income Fund
| | | California Tax-
Exempt Fund
| |
Cost of investment | | $ | 849,837,046 | | | $ | 12,199,299 | | | $ | 20,889,735 | |
Unrealized appreciation | | $ | 55,552,672 | | | $ | 227,458 | | | $ | 322,667 | |
Unrealized depreciation | | | (8,526,853 | ) | | | (107,004 | ) | | | (67,766 | ) |
Net unrealized appreciation
(depreciation) | | $ | 47,025,819 | | | $ | 120,454 | | | $ | 254,901 | |
Distributable earnings – ordinary income | | $ | 31,818,993 | | | $ | 1,251,779 | | | | — | |
Distributable earnings – tax-exempt income | | | — | | | | — | | | $ | 697,530 | |
Distributable earnings – long-term capital gains | | $ | 29,345,893 | | | | — | | | $ | 69,608 | |
Undistributed – ordinary income | | $ | 1,198,058 | | | | — | | | | — | |
Undistributed earnings – tax-exempt income | | | — | | | | — | | | $ | 959 | |
Undistributed earnings – long-term capital gains | | $ | 2,269,650 | | | | — | | | $ | 10,832 | |
NOTES TO FINANCIAL STATEMENTS CONTINUED
Net investment income differs for financial statements and tax purposes primarily due to income recognition differences for Equity Income Fund’s investment in a partnership and differing treatments of bond discounts. Net realized gains differ for financial statements and tax purposes primarily due to differing treatments of wash sales and bond discounts.
Permanent differences incurred during the year ended December 31, 2005, resulting from differences in book and tax accounting, that have been reclassified at year- end to undistributed net investment income, undistributed net realized gain (loss) and capital paid-in were as follows:
| | | | | | | | | | | | |
Fund
| | Undistributed Net
Investment
Income
| | | Undistributed
Net Realized
Gain (Loss)
| | | Capital
Paid-in
| |
Equity Income Fund | | $ | 18,874,543 | | | $ | (18,874,543 | ) | | $ | — | |
Fixed-Income Fund | | $ | 11,329 | | | $ | — | | | $ | (11,329 | ) |
California Tax-Exempt Fund | | $ | (3,747 | ) | | $ | 187 | | | $ | 3,560 | |
3. Capital Stock
Equity Income Fund: As of December 31, 2005, there were an unlimited number of authorized shares of capital stock, no par value. Paid-in capital aggregated $854,919,925. Transactions in capital stock (shares) were as follows:
| | | | | | | | | | | | | | |
| | | Year Ended December 31, 2005
| | | Year Ended December 31, 2004
| |
| | | Shares
| | | Amount
| | | Shares
| | | Amount
| |
Shares sold | | 10,778,103 | | | $ | 265,932,798 | | | 16,399,818 | | | $ | 399,938,907 | |
Shares issued through dividend reinvestment | | 2,436,068 | | | | 59,492,176 | | | 1,493,344 | | | | 36,552,477 | |
Shares repurchased | | (11,238,235 | ) | | | (277,563,808 | ) | | (8,375,092 | ) | | | (203,471,082 | ) |
Net increase (decrease) | | 1,975,936 | | | $ | 47,861,166 | | | 9,518,070 | | | $ | 233,020,302 | |
Fixed-Income Fund: As of December 31, 2005, there were an unlimited number of authorized shares of capital stock, no par value. Paid-in capital aggregated $45,767,039. Transactions in capital stock (shares) were as follows:
| | | | | | | | | | | | | | |
| | | Year Ended December 31, 2005
| | | Year Ended December 31, 2004
| |
| | | Shares
| | | Amount
| | | Shares
| | | Amount
| |
Shares sold | | 1,090,481 | | | $ | 17,334,116 | | | 772,208 | | | $ | 12,333,370 | |
Shares issued through dividend reinvestment | | 69,617 | | | | 1,105,286 | | | 57,474 | | | | 913,210 | |
Shares repurchased | | (661,531 | ) | | | (10,505,386 | ) | | (554,100 | ) | | | (8,837,379 | ) |
Net increase (decrease) | | 498,567 | | | $ | 7,934,016 | | | 275,582 | | | $ | 4,409,201 | |
California Tax-Exempt Fund: As of December 31, 2005, there were an unlimited number of authorized shares of capital stock, no par value. Paid-in capital aggregated $21,368,019. Transactions in capital stock (shares) were as follows:
| | | | | | | | | | | | | | |
| | | Year Ended December 31, 2005
| | | Year Ended December 31, 2004
| |
| | | Shares
| | | Amount
| | | Shares
| | | Amount
| |
Shares sold | | 137,761 | | | $ | 2,324,658 | | | 245,943 | | | $ | 4,209,312 | |
Shares issued through dividend reinvestment | | 40,694 | | | | 684,185 | | | 38,113 | | | | 649,799 | |
Shares repurchased | | (375,019 | ) | | | (6,335,556 | ) | | (235,836 | ) | | | (4,026,545 | ) |
Net increase (decrease) | | (196,564 | ) | | $ | (3,326,713 | ) | | 48,220 | | | $ | 832,566 | |
4. Purchases and Sales of Securities
Purchases and proceeds from sales of securities, excluding short-term securities, for the year ended December 31, 2005 were as follows:
| | | | | | |
| | | Purchases
| | Sales
|
Equity Income Fund | | $ | 1,010,208,902 | | $ | 1,006,477,394 |
Fixed-Income Fund | | $ | 4,628,000 | | $ | 3,775,182 |
California Tax-Exempt Fund | �� | $ | 2,976,063 | | $ | 5,349,216 |
NOTES TO FINANCIAL STATEMENTS CONTINUED
5. Investment Advisory Agreement and Transactions with Affiliates
Under terms of an agreement which provides for furnishing investment management and advice to the funds, Parnassus Investments is entitled to receive fees payable monthly, based on each fund’s average daily net assets for the month, at the following annual rates:
Equity Income Fund: 0.75% of the first $30,000,000, 0.70% of the next $70,000,000 and 0.65% of the amount above $100,000,000. Fixed-Income Fund and California Tax-Exempt Fund: 0.50% of the first $200,000,000, 0.45% of the next $200,000,000 and 0.40% of the amount above $400,000,000. For the year ended December 31, 2005, Parnassus Investments has contractually agreed to reduce its investment advisory fee through May 1, 2006 to the extent necessary to limit total operating expenses to 0.99% of net assets for the Equity Income Fund, 0.87% of net assets for the Fixed-Income Fund and 0.75% of net assets for the California Tax-Exempt Fund.
As a result of fee waivers, including additional voluntary waivers of 0.12% for Fixed-Income Fund and 0.07% for California Tax-Exempt Fund, the following were actually charged for the year ended December 31, 2005. For the Equity Income Fund, the investment advisory fee was 0.58% and Parnassus Investments received net advisory fees totaling $5,482,060. For the Fixed-Income Fund, the investment advisory fee was 0.24% and Parnassus Investments received net advisory fees totaling $99,957. For the California Tax-Exempt Fund, the investment advisory fee was 0.26% and Parnassus Investments received net advisory fees totaling $61,402.
Parnassus Investments receives fees under terms of a separate agreement which provides for furnishing transfer agent and fund administration services to the funds. The transfer agent fee was $2.70 per month per account plus any out-of-pocket expenses. The funds pay the monthly fee based on the number of accounts on record at each month-end. The fund administration reflects annual rates based on net assets for all funds managed by Parnassus Investments and was allocated based on respective fund net assets. The annualized fund administration services fee was 0.07% of average net assets under this new agreement for the year ended December 31, 2005.
Parnassus Investments may also arrange for third parties to provide certain services, including account maintenance, recordkeeping and other personal services to their clients who invest in the funds. For these services, the funds may pay service providers an aggregate service fee on investment accounts at a rate not to exceed 0.25% per annum of average daily net assets.
Jerome L. Dodson is the president of the Trust and is the president and majority stock-holder of Parnassus Investments.
6. Expense Offset Arrangement
The funds have entered into an arrangement with the custodian whereby credits realized as a result of uninvested cash balances are used to reduce a portion of the custodian fees. During the year ended December 31, 2005, the custodian fees were reduced as indicated in the statement of operations.
7. Geographic and Industry Concentration Risk Factors
The California Tax-Exempt Fund primarily invests in debt obligations issued by the State of California and its political sub-divisions, agencies and public authorities to obtain funds for various public purposes. There are certain risks arising from the concentration of investments in California municipal securities. The California Tax-Exempt Fund is more susceptible to factors adversely affecting issuers of California municipal securities than a fund that is not concentrated in these issuers to the same extent. Uncertain economic conditions or governmental developments may affect the ability of California municipal securities issuers to meet their financial obligations.
NOTES TO FINANCIAL STATEMENTS CONTINUED
8. Financial Highlights
Selected data for each share of capital stock outstanding, total return and ratios/supplemental data for each of the five years ended December 31 are as follows:
Equity Income Fund
| | | | | | | | | | | | | | | | | | | | |
| | | 2005
| | | 2004
| | | 2003
| | | 2002
| | | 2001
| |
Net asset value at beginning of period | | $ | 25.00 | | | $ | 24.00 | | | $ | 21.20 | | | $ | 22.50 | | | $ | 21.48 | |
Income (loss) from operations: | | | | | | | | | | | | | | | | | | | | |
Net investment income(a) | | | 0.41 | | | | 0.40 | | | | 0.44 | | | | 0.49 | | | | 0.67 | |
Net realized and unrealized gain (loss) on securities | | | 0.24 | | | | 1.79 | | | | 2.85 | | | | (1.32 | ) | | | 1.43 | |
Total income (loss) from investment operations | | | 0.65 | | | | 2.19 | | | | 3.29 | | | | (0.83 | ) | | | 2.10 | |
Distributions: | | | | | | | | | | | | | | | | | | | | |
Dividends from net investment income | | | (0.85 | ) | | | (0.56 | ) | | | (0.49 | ) | | | (0.29 | ) | | | (0.45 | ) |
Distributions from net realized gains | | | (0.78 | ) | | | (0.63 | ) | | | — | | | | (0.18 | ) | | | (0.63 | ) |
Total distributions | | | (1.63 | ) | | | (1.19 | ) | | | (0.49 | ) | | | (0.47 | ) | | | (1.08 | ) |
Net asset value at end of period | | $ | 24.02 | | | $ | 25.00 | | | $ | 24.00 | | | $ | 21.20 | | | $ | 22.50 | |
Total return | | | 2.62 | % | | | 9.30 | % | | | 15.69 | % | | | (3.69 | %) | | | 9.97 | % |
Ratios/supplemental data: | | | | | | | | | | | | | | | | | | | | |
Ratio of gross expenses to average net assets | | | 1.07 | % | | | 1.04 | % | | | 0.96 | % | | | 1.03 | % | | | 1.18 | % |
Ratio of net expenses to average net assets (net of reimbursement and credit offset arrangements) | | | 0.99 | %(b) | | | 1.04 | % | | | 0.95 | % | | | 0.96 | % | | | 1.00 | % |
Ratio of net investment income to average net assets | | | 1.63 | % | | | 1.63 | % | | | 1.95 | % | | | 2.29 | % | | | 3.10 | % |
Portfolio turnover rate | | | 109.54 | % | | | 79.88 | % | | | 79.21 | % | | | 42.01 | % | | | 86.78 | % |
Net assets, end of period (000’s) | | $ | 906,844 | | | $ | 894,415 | | | $ | 630,249 | | | $ | 273,429 | | | $ | 85,501 | |
Fixed-Income Fund
| | | | | | | | | | | | | | | | | | | | |
| | | 2005
| | | 2004
| | | 2003
| | | 2002
| | | 2001
| |
Net asset value at beginning of period | | $ | 15.87 | | | $ | 16.00 | | | $ | 15.88 | | | $ | 14.94 | | | $ | 14.19 | |
Income (loss) from operations: | | | | | | | | | | | | | | | | | | | | |
Net investment income (a) | | | 0.48 | | | | 0.33 | | | | 0.58 | | | | 0.82 | | | | 0.87 | |
Net realized and unrealized gain (loss) on securities | | | (0.08 | ) | | | (0.01 | ) | | | 0.26 | | | | 0.95 | | | | 0.72 | |
Total income (loss) from investment operations | | | 0.40 | | | | 0.32 | | | | 0.84 | | | | 1.77 | | | | 1.59 | |
Distributions: | | | | | | | | | | | | | | | | | | | | |
Dividends from net investment income | | | (0.48 | ) | | | (0.33 | ) | | | (0.65 | ) | | | (0.83 | ) | | | (0.84 | ) |
Distributions from net realized gains | | | — | | | | (0.09 | ) | | | (0.07 | ) | | | — | | | | — | |
Return of capital | | | — | | | | (0.03 | ) | | | — | | | | — | | | | — | |
Total distributions | | | (0.48 | ) | | | (0.45 | ) | | | (0.72 | ) | | | (0.83 | ) | | | (0.84 | ) |
Net asset value at end of period | | $ | 15.79 | | | $ | 15.87 | | | $ | 16.00 | | | $ | 15.88 | | | $ | 14.94 | |
Total return | | | 2.55 | % | | | 2.05 | % | | | 5.30 | % | | | 12.20 | % | | | 11.31 | % |
Ratios/supplemental data: | | | | | | | | | | | | | | | | | | | | |
Ratio of gross expenses to average net assets | | | 1.01 | % | | | 0.97 | % | | | 0.92 | % | | | 1.08 | % | | | 1.15 | % |
Ratio of net expenses to average net assets (net of reimbursement and credit offset arrangements) | | | 0.75 | %(b) | | | 0.75 | % | | | 0.62 | % | | | 0.81 | % | | | 0.83 | % |
Ratio of net investment income to average net assets | | | 3.03 | % | | | 2.08 | % | | | 3.59 | % | | | 5.36 | % | | | 5.84 | % |
Portfolio turnover rate | | | 34.08 | % | | | 24.38 | % | | | 125.74 | % | | | 59.00 | % | | | 21.19 | % |
Net assets, end of period (000’s) | | $ | 45,879 | | | $ | 38,205 | | | $ | 34,098 | | | $ | 19,092 | | | $ | 12,947 | |
NOTES TO FINANCIAL STATEMENTS CONTINUED
California Tax-Exempt Fund
| | | | | | | | | | | | | | | | | | | | |
| | | 2005
| | | 2004
| | | 2003
| | | 2002
| | | 2001
| |
Net asset value at beginning of period | | $ | 17.10 | | | $ | 17.14 | | | $ | 17.19 | | | $ | 16.61 | | | $ | 16.90 | |
Income (loss) from operations: | | | | | | | | | | | | | | | | | | | | |
Net investment income(a) | | | 0.50 | | | | 0.48 | | | | 0.53 | | | | 0.59 | | | | 0.70 | |
Net realized and unrealized gain (loss) on securities | | | (0.40 | ) | | | (0.02 | ) | | | 0.12 | | | | 0.83 | | | | (0.18 | ) |
Total income (loss) from investment operations | | | 0.10 | | | | 0.46 | | | | 0.65 | | | | 1.42 | | | | 0.52 | |
Distributions: | | | | | | | | | | | | | | | | | | | | |
Dividends from net investment income | | | (0.51 | ) | | | (0.48 | ) | | | (0.53 | ) | | | (0.59 | ) | | | (0.70 | ) |
Distributions from net realized gains | | | (0.05 | ) | | | (0.02 | ) | | | (0.17 | ) | | | (0.25 | ) | | | (0.11 | ) |
Total distributions | | | (0.56 | ) | | | (0.50 | ) | | | (0.70 | ) | | | (0.84 | ) | | | (0.81 | ) |
Net asset value at end of period | | $ | 16.64 | | | $ | 17.10 | | | $ | 17.14 | | | $ | 17.19 | | | $ | 16.61 | |
Total return | | | 0.62 | % | | | 2.73 | % | | | 3.88 | % | | | 8.66 | % | | | 3.09 | % |
Ratios/supplemental data: | | | | | | | | | | | | | | | | | | | | |
Ratio of gross expenses to average net assets | | | 0.91 | % | | | 0.81 | % | | | 0.83 | % | | | 0.95 | % | | | 0.85 | % |
Ratio of net expenses to average net assets (net of reimbursement and credit offset arrangements) | | | 0.68 | %(b) | | | 0.67 | % | | | 0.62 | % | | | 0.73 | % | | | 0.65 | % |
Ratio of net investment income to average net assets | | | 3.01 | % | | | 2.82 | % | | | 3.08 | % | | | 3.45 | % | | | 4.19 | % |
Portfolio turnover rate | | | 13.18 | % | | | — | | | | 16.16 | % | | | 41.73 | % | | | 23.14 | % |
Net assets, end of period (000’s) | | $ | 21,635 | | | $ | 25,594 | | | $ | 24,825 | | | $ | 26,163 | | | $ | 18,891 | |
| (a) | Net investment income per share is based on average daily shares outstanding. |
| (b) | For the year ended December 31, 2005, Parnassus Investments has contractually limited expenses to an annualized rate of 0.99% for the Equity Income Fund, 0.87% for the Fixed-Income Fund and 0.75% for the California Tax-Exempt Fund. Parnassus Investments has also voluntarily limited additional expenses for the Fixed-Income Fund and the California Tax-Exempt Fund (see note 5 for details). |
ADDITIONAL INFORMATION (UNAUDITED)
Board of Trustees and Officers
Independent Trustees§
| | |
Name | | Herbert A. Houston |
| |
Age | | 62 |
| |
Address | | One Market – Steuart Tower, Suite 1600 |
| | | San Francisco, California 94105 |
| |
Position(s) Held with Funds | | Trustee |
| |
Term of Office and Length of Service | | Indefinite. Since 1992 for Parnassus Income |
| | | Funds. Since 1998 for Parnassus Funds. |
| |
Principal Occupation(s) During Past 5 Years | | Healthcare consultant and owner of serveral small businesses; Chief Executive Officer of the Haight Ashbury Free Clinics, Inc. from 1987 to 1998; Trustee of the Parnassus Funds since 1998 and the Parnassus Income Funds since inception. |
| |
Portfolios in the Fund Complex Overseen by Trustee | | Four |
| |
Other Directorships Held by Trustee | | None |
| |
Name | | Jeanie S. Joe |
| |
Age | | 58 |
| |
Address | | One Market – Steuart Tower, Suite 1600 |
| | | San Francisco, California 94105 |
| |
Position(s) Held with Funds | | Trustee |
| |
Term of Office and Length of Service | | Indefinite. Since October 2004. |
| |
Principal Occupation(s) During Past 5 Years | | President of Geo/Resource Consultants, a geotechnical and environmental consulting firm, since 1995; director and secretary of Telecommunication Consumer Protection Fund Corporation. |
| |
Portfolios in the Fund Complex Overseen by Trustee | | Four |
| |
Other Directorships Held by Trustee | | None |
| § | “Independent” trustees are trustees who are not deemed to be “interested persons” of the funds as defined in the Investment Company Act of 1940. |
ADDITIONAL INFORMATION (UNAUDITED) CONTINUED
| | |
Name | | Donald V. Potter |
| |
Age | | 60 |
| |
Address | | One Market – Steuart Tower, Suite 1600 |
| | | San Francisco, California 94105 |
| |
Position(s) Held with Funds | | Trustee |
| |
Term of Office and Length of Service | | Indefinite. Since 2002. |
| |
Principal Occupation(s) During Past 5 Years | | President and owner of Windermere Associates, a consulting firm specializing in business strategy, since 1984. |
| |
Portfolios in the Fund Complex Overseen by Trustee | | Four |
| |
Other Directorships Held by Trustee | | None |
Interested Trustee†
| | |
Name | | Jerome L. Dodson†† |
| |
Age | | 62 |
| |
Address | | One Market – Steuart Tower, Suite 1600 |
| | | San Francisco, California 94105 |
| |
Position(s) Held with Funds | | President and Trustee |
| |
Term of Office and Length of Service | | Indefinite. Since 1992 for Parnassus Income Funds. Since 1984 for the Parnassus Funds. |
| |
Principal Occupation(s) During Past 5 Years | | President and Trustee of the Parnassus Funds and the Parnassus Income Funds since their inceptions; President and Director of Parnassus Investments since June 1984; portfolio manager of the Parnassus Funds since its inception. |
| |
Portfolios in the Fund Complex Overseen by Trustee | | Four |
| |
Other Directorships Held by Trustee | | None |
| † | An “interested” trustee is a trustee who is deemed to be an “interested person” of the funds, as defined in the Investment Company Act of 1940. Jerome L. Dodson is an interested person of the funds because of his ownership in the funds’ investment adviser and because he is an officer of the Trusts. |
| †† | Jerome L. Dodson is the father of Stephen J. Dodson, the Assistant Secretary of the funds. |
Additional information about the fund’s Board of Trustees is available in the Statement of Additional Information. The Statement of Additional information is available without charge on the Securities and Exchange Commission’s website (www.sec.gov) or by calling us at (800) 999-3505.
Board of Trustees and Officers — continued
Officers (other than Jerome L. Dodson)
| | |
Name | | Debra A. Early |
| |
Age | | 41 |
| |
Address | | One Market – Steuart Tower, Suite 1600 |
| | | San Francisco, California 94105 |
| |
Position(s) Held with Funds | | Chief Compliance Officer and Treasurer |
| |
Term of Office and Length of Service | | Indefinite. Since December 2004. |
| |
Principal Occupation(s) During Past 5 Years | | Treasurer of Parnassus Funds and Parnassus Income Funds since 2004 and Chief Compliance Officer since July 2005. Vice President and Chief Financial Officer of Parnassus Investments since 2004. Senior Manager at PricewaterhouseCoopers LLP October 1992 to November 2004. |
| |
Name | | Todd Ahlsten |
| |
Age | | 33 |
| |
Address | | One Market – Steuart Tower, Suite 1600 |
| | | San Francisco, California 94105 |
| |
Position(s) Held with Funds | | Vice President |
| |
Term of Office and Length of Service | | Indefinite. Since 2001. |
| |
Principal Occupation(s) During Past 5 Years | | Vice President, Financial Analyst and Director of Research at Parnassus Investments since 1995. Portfolio manager of the Equity Income Fund and Fixed-Income Fund since May 2001. |
ADDITIONAL INFORMATION (UNAUDITED) CONTINUED
| | |
Name | | Richard D. Silberman |
| |
Age | | 68 |
| |
Address | | One Market – Steuart Tower, Suite 1600 |
| | | San Francisco, California 94105 |
| |
Position(s) Held with Funds | | Secretary |
| |
Term of Office and Length of Service | | Indefinite. Since 1986. |
| |
Principal Occupation(s) During Past 5 Years | | Attorney specializing in business law in private practice. |
| |
Name | | Stephen J. Dodson* |
| |
Age | | 28 |
| |
Address | | One Market – Steuart Tower, Suite 1600 |
| | | San Francisco, California 94105 |
| |
Position(s) Held with Funds | | Assistant Secretary |
| |
Term of Office and Length of Service | | Indefinite. Since 2002. |
| |
Principal Occupation(s) During Past 5 Years | | Financial Analyst with Morgan Stanley 1999-2001. Associate with Advent International, a venture capital firm 2001-2002. Executive Vice President and Chief Operating Officer of Parnassus Investments 2002-Present. |
| * | Stephen J. Dodson is the son of Jerome L. Dodson, the President and a trustee of the funds. |
Proxy Disclosures
Parnassus proxy voting policies and procedures are available, without charge, on our website (www.parnassus.com), on the Securities and Exchange Commission’s website (www.sec.gov), and by calling us at (800) 999-3505. On the Parnassus website you can also find a record of our votes cast at shareholder meetings.
Quarterly Portfolio Schedule
The funds file their complete schedule of portfolio holdings with the Securities and Exchange Commission for the first and third quarters of each fiscal year on Form N-Q. The quarterly portfolio holdings are available on the Securities and Exchange Commission’s website (www.sec.gov). The funds’ Form N-Q may also be reviewed and copied at the Securities and Exchange Commission’s Public Reference Room in Washington, DC, and information on the operation of the Public Reference Room may be obtained by calling (800) SEC-0330.
Federal Income Tax Information
For the year ended December 31, 2005, the following percentages of ordinary income distributed by the funds that qualify for the individual qualified dividend income deduction (QDI) and the corporate dividends received deduction (DRD) are as follows:
| | | | | | |
| | | QDI
| | | DRD
| |
Parnassus Equity Income Fund | | 40.73 | % | | 41.06 | % |
Parnassus Fixed-Income Fund | | 2.15 | % | | 2.15 | % |
The distribution from net investment income for the California Tax-Exempt Fund will be treated as exempt income for federal income tax purposes at 100%.

Item 2: Code of Ethics
The registrant has adopted a code of ethics dated July 22, 2003 that applies to the registrant’s principal executive officer (President) and principal financial officer (Treasurer) for the fiscal year ending December 31, 2005. During the fiscal year ending December 31, 2005 there were no amendments to any provisions of this code of ethics.
Item 3: Audit Committee Financial Expert
The Board of Trustees of the Parnassus Income Funds determined that Donald Potter, Chairman of the board’s Audit Committee, qualified as an “audit committee financial expert” as defined by Form N-CSR. The Trustee’s decision was based on Mr. Potter’s understanding of generally accepted accounting principles (GAAP), experience applying GAAP, familiarity with internal controls and procedures for financial reporting and understanding of audit committee functions. He gained this knowledge from thirty years of experience as a strategy consultant for major corporations while working at McKinsey & Co. Management Consultants and at his own firm, Windermere Associates. He also spent four years working as a financial executive for a Fortune 500 company. He served as Chairman of the Audit Committee of Media Arts Group and has also served on the Audit Committees of DLJ Direct and Peer Foods. Mr. Potter is a graduate of Harvard Business School where he was named a Baker Scholar for finishing in the top 5% of his class. Mr. Potter is an independent trustee.
Item 4: Principal Accountant Fees and Services
(a) Audit Fees
The aggregate fees billed for professional services rendered by the principal accountant for the audit of the registrant’s annual financial statements or services that are normally provided by the accountant in connection with statutory and regulatory filings or engagements for the fiscal years ended December 31, 2004 and 2005 were $59,595 and $89,043 respectively.
(b) Audit-Related Fees
The aggregate fees billed for assurance and related services rendered by the principal accountants that are reasonably related to the performance of the audit of the registrant’s financial statements and are not reported under paragraph (a) of this Item for the fiscal years ended December 31, 2003 and 2005 were $4,100 and $6,000 respectively. Audit-related services relate to providing an internal control letter for affiliated transfer agent operations which are billed to the registrant’s investment advisor.
(c) Tax Fees
The aggregate fees billed for professional services rendered by the principal accountant for tax compliance, tax advice, and tax planning for the fiscal years ended December 31, 2004 and 2005 were $8,594 and $17,502 respectively.
(d) All Other Fees
There were no fees billed in each of the last two fiscal years for products and services by the principal accountant, other than the services reported in paragraphs(a) through (c) of this Item.
(e)(1) The Audit committee’s pre-approval policies and procedures are as follows:
The audit committee is required to pre-approve all audit services and permitted non-audit services provided by the independent accountants for the Parnassus Fund, affiliated funds, and other services affiliated.
Explicit pre-approval by the Audit Committee Chair shall be required for any individual non-audit engagement to be performed by the independent accountants with estimated fees of $10,000 or less and the Audit Committee Chair shall report such approval to the full audit committee at the next regularly scheduled meeting. Explicit pre-approval by the full Audit Committee shall be required for any individual non-audit engagement to be performed by the independent accountants with estimated fees in excess of $10,000. Officers of the Funds shall furnish the audit committee at least annually with a listing of all fees paid to the independent accountants including non-audit services performed. For certain non-audit services which are no more than five percent of the total fees paid by the Trust, such fees may be exempted from the required pre-approval process specified above subject to limitations and prompt disclosure of such services when such services are identified, and in all cases approval is required prior to completion.
(e)(2) None
(f) Not applicable.
(g) The aggregate non-audit fees billed by the registrant’s accountant for services rendered to the registrant, and rendered to the registrant’s investment adviser act forth in 4(b) and (c) of this Item of $12,694 and $23,502 for the fiscal years ended December 31, 2004 and 2005, respectively.
Item 5: Not applicable.
Item 6: Included as part of the report to shareholders filed under Item 1 of this form.
Item 7: Not applicable.
Item 8: Not applicable.
Item 9: Not applicable.
Item 10: For the purposes of this Item, there have not been any material changes to the procedures by which shareholders may recommend nominees to the registrant’s board of trustees.
Item 11: Controls and Procedures.
(a) The registrant’s certifying officers have reasonably designed such disclosure controls and procedures to ensure material information relating to the registrant is made known to them by others, particularly during the period in which this report is being prepared. The registrant’s certifying officers have determined that the registrant’s disclosure controls and procedures are effective based on their evaluation of these controls and procedures as of a date within 90 days prior to the filing date of this report.
(b) There were no significant changes in the registrant’s internal controls over financial reporting, or in other factors that could significantly affect these controls, that occurred during the registrant’s first fiscal half-year, including any corrective actions with regard to significant deficiencies and material weaknesses.
Item 12: Exhibits attached hereto.
(a)(1) Code of Ethics.
(a)(2) Certification for each principal executive and principal financial officer of the registrant as required by Rule 30a-2 under the Act (17 CFR 270.30a-2(a)) - Filed as an attachment to this filing.
(b) Certifications required by Rule 30a-2(b) under the Act (17 CFR 270.30a-2(b)), Rule 13a-14(b) or Rule 15d-14(b) under the Exchange Act (17 CFR 240.13a-14(b) or 240.15d-14(b)), and Section 1350 of Chapter 63 of Title 18 of the United States Code (18 U.S.C. 1350). A certification furnished pursuant to this paragraph will not be deemed “filed” for purposes of Section 18 of the Exchange Act (15 U.S.C. 78r), or otherwise subject to the liability of that section. Such certification will not be deemed to be incorporated by reference into any filing under the Securities Act of 1933 or the Exchange Act, except to the extent that the registrant specifically incorporates it by reference – Filed as an attachment to this filing.
Pursuant to the requirements of the Securities Exchange Act of 1934 and the Investment Company Act of 1940, the registrant has duly caused this report to be signed on its behalf by the undersigned, thereunto duly authorized.
| | | | |
| | | Parnassus Income Funds |
| Date: February 17, 2006 | | By: | | /s/ Jerome L. Dodson
|
| | | | | Jerome L. Dodson President |
Pursuant to the requirements of the Securities Exchange Act of 1934 and the Investment Company Act of 1940, this report has been signed below by the following persons on behalf of the registrant and in the capacities and on the dates indicated.
| | | | |
| Date: February 17, 2006 | | By: | | /s/ Jerome L. Dodson
|
| | | | | Jerome L. Dodson President |
| | | | |
| Date: February 17, 2006 | | By: | | /s/ Debra A. Early
|
| | | | | Debra A. Early Treasurer |