Table of Contents
PARNASSUS INCOME FUNDS
UNITED STATES
SECURITIES AND EXCHANGE COMMISSION
Washington, D.C. 20549
FORM N-CSRS
CERTIFIED SHAREHOLDER REPORT OF
REGISTERED MANAGEMENT INVESTMENT COMPANIES
Investment Company Act file number: 811-06673
Parnassus Income Funds
(Exact name of registrant as specified in charter)
One Market—Steuart Tower #1600, San Francisco, California 94105
(Address of principal executive offices) (Zip code)
Debra A. Early
Parnassus Income Funds
One Market—Steuart Tower #1600, San Francisco, California 94105
(Name and address of agent for service)
Registrant’s telephone number, including area code: (415) 778-0200
Date of fiscal year end: December 31
Date of reporting period: June 30, 2007
Table of Contents
Item 1: Reports to Shareholders
THE PARNASSUS INCOME FUNDS
Semiannual Report June 30, 2007
Investing with a Conscience
Parnassus Equity Income Fund Parnassus Fixed-Income Fund Parnassus California Tax-Exempt Fund
Table of Contents

| Parnassus Equity Income Fund–Investor Shares | (PRBLX) | |
| Parnassus Equity Income Fund–Institutional Shares | (PRILX) | |
| Parnassus Fixed-Income Fund | (PRFIX) | |
| Parnassus California Tax-Exempt Fund | (PRCLX) |
| 1 | ||
Fund Performance | ||
| 3 | ||
| 10 | ||
| 13 | ||
| 16 | ||
Portfolios and Financial Statements | ||
| 18 | ||
| 28 | ||
| 35 | ||
| 42 | ||
| 49 | ||
| 53 | ||
Table of Contents

THE PARNASSUS INCOME FUNDS
August 6, 2007
Dear Shareholder:
Every summer we bring on interns from college or MBA programs to help us research investment opportunities. This summer, two research interns, Andrew Livingston and Alex Tellez, are helping us find investment opportunities for the funds. Andrew is originally from Palo Alto and will be a senior at Harvard University this fall, studying mathematics and philosophy. He plays on the Harvard golf team and enjoys composing and playing music in his free time. He is also an editor at the Harvard Review of Philosophy.
Alex Tellez recently graduated from Brown University, majoring in economics with an emphasis on statistics. Later this year, he will start his masters in finance studies at the Vanderbilt Owen Graduate School of Management. Alex is originally from Oakland and played on the Brown rugby team, becoming co-captain his freshman year.
In addition, Lia Whisler is a marketing intern working with Nancy Reyes. Lia will be a sophomore at Harvard University this fall. Originally from the Bay Area, Lia started the non-profit Nuestros Niños de las Américas while still in high school and currently serves as the president. She’s been skiing since she was 3 years old and is almost as good as her brother, a ski patroller.
Hoang-Anh Nguyen is also assisting the research team this summer. She is a student at De Anza College in Cupertino, California, and has a degree from Van Lang University in Ho Chi Minh City, Vietnam, her hometown. During the school year at De Anza, she works full-time, taking a comprehensive course load while also tutoring her peers in math five days a week.
Over the years, our interns have gone off to productive careers in business, government and the non-profit world. This network of current and former interns is a valuable asset to our research process and the primary source for our full-time analysts. All of our current analysts interned with us before joining full-time. Finding the right people who exemplify our investment philosophy of investing in great companies at value prices is crucial to our investment process.
The Parnassus Income Funds • June 30, 2007 1
Table of Contents
Enclosed are portfolio manager reports for the Equity Income Fund, the Fixed-Income Fund and the California Tax-Exempt Fund. We’re pleased to report that, for the second quarter, all three funds beat both their market benchmarks and the average return of their Lipper mutual fund peer groups.
Yours truly,
 |  | |||
| Jerome L. Dodson | Stephen J. Dodson | |||
| President | Executive Vice President and Chief Operating Officer | |||
2 The Parnassus Income Funds • June 30, 2007
Table of Contents
THE PARNASSUS EQUITY INCOME FUND
As of June 30, 2007, the net asset value per share (NAV) of the Equity Income Fund – Investor Shares was $27.39, so after taking dividends into account, the total return for the second quarter was 7.03%. This compares to a return of 6.28% for the Standard and Poor’s 500 Index (“S&P 500”) and a gain of 5.64% for the average equity income fund followed by Lipper Inc. I am very pleased the Fund had a strong second quarter and is off to a great start in 2007. Since the beginning of the year, the Fund is up 10.75% versus gains of 6.96% for the S&P 500 and 7.26% for the Lipper Average. I am also pleased that my strategy of buying good businesses at undervalued prices has generated solid long-term results. The Fund’s average annual 10-year return of 11.15% is more than four percentage points ahead of the S&P 500’s gain of 7.13% per year.
Below is a table that compares the performance of the Fund with that of the S&P 500 and the average equity income fund followed by Lipper. Average annual total returns are for the one-, three-, five- and ten-year periods.
Average Annual Total Returns
for periods ended June 30, 2007
| One Year | Three Years | Five Years | Ten Years | Gross Expense Ratio | Net Expense Ratio | |||||||||||||
EQUITY INCOME FUND– | ||||||||||||||||||
Investor Shares | 21.86 | % | 11.48 | % | 10.80 | % | 11.15 | % | 1.07 | % | 1.00 | % | ||||||
Institutional Shares | 22.10 | % | NA | NA | NA | 0.86 | % | 0.79 | % | |||||||||
S&P 500 Index | 20.59 | % | 11.69 | % | 10.70 | % | 7.13 | % | NA | NA | ||||||||
Lipper Equity Income Fund Average | 20.56 | % | 14.02 | % | 11.54 | % | 8.30 | % | NA | NA |
The total return for the Equity Income Fund–Institutional Shares from commencement (April 28, 2006) was 17.45%. The performance of Institutional Shares differ from that shown for the Investor Shares to the extent that the Classes do not have the same expenses. Performance data quoted represent past performance and are no guarantee of future returns. Current performance may be lower or higher than the performance data quoted, and current performance information to the most recent month-end is on the Parnassus website (www.parnassus.com). Investment return and principal value will fluctuate so that an investor’s shares, when redeemed, may be worth more or less than their original cost. Returns shown in the table do not reflect the deduction of taxes a shareholder may pay on fund distributions or redemption of shares. The Standard and Poor’s 500 Composite Stock Index, also known as the S&P 500 is an unmanaged index of common stocks, and it is not possible to invest directly in an index. Index figures do not take expenses, fees and taxes into account, but mutual fund returns may. On March 31,1998, the Fund changed its investment objective from a balanced portfolio to an equity income portfolio. Before investing, an investor should carefully consider the investment objectives, risks, charges and expenses of the Fund and should read the prospectus which contains this and other information. The prospectus is on the Parnassus website or you can get one by calling (800) 999–3505. As described in the Fund’s current prospectus dated May 1, 2007, Parnassus Investments has contractually agreed to limit the total operating expenses to 0.99% and 0.78% of net assets, exclusive of acquired fund fees, through April 30, 2008 for the Investor Shares and Institutional Shares, respectively.
The Parnassus Income Funds • Equity Income Fund 3
Table of Contents
Second Quarter Recap
I’m happy to report the Fund had another solid quarter. In last quarter’s report, I was cautious about the market, given the outlook for decelerating earnings growth, escalating oil prices, rising interest rates and a slowing economy. While most of these concerns played out, the economy grew at rates above consensus estimates, pushing the S&P 500 to an all-time record high in June. Our team watched in amazement as stock prices increased almost every day, fueled by optimism for continued economic growth, low perceived risk and an unprecedented leveraged buyout boom.
One of my first meetings at each quarter’s end is with Parnassus analyst Minh Bui. He is a strong analyst and stock-picker, but also remembers the college calculus I have long since forgotten. These quantitative skills have come in handy when analyzing the portfolio to determine how we truly stacked up versus the S&P 500. Each stock is analyzed for absolute and relative (to its industry) performance. As one can imagine, awaiting these results can be a revealing and anxious time, quite similar to waiting for lab results from the doctor.
This quarter’s analysis revealed a “healthy check-up.” Minh determined that our quarterly outperformance resulted from a balance of industry weighting and good stock-picking. Three industries added to our performance and one hurt our performance. The red caboose was the retail sector, which lowered our return by 0.51% versus the S&P 500. One company in particular, discount-retailer Tuesday Morning, struggled. It is now trading at “bargain basement” levels, and for reasons I will discuss later, we believe it is still a good long-term investment.
The Fund’s best performance came from the technology sector, which added 0.67% to our return versus the S&P 500. We made the correct decision to overweight technology in the portfolio, and large investments in the computer, semiconductor and Internet technology categories paid off. The second winner was healthcare, which added 0.64% to our lead versus the S&P 500. As we mentioned last quarter, the healthcare industry looked attractive because its fortunes are less tied to overall business activity. Senior analysts Ben Allen, Matt Gershuny, Lori Keith and Pearle Lee all contributed winners to our healthcare portfolio.
4 The Parnassus Income Funds • Equity Income Fund
Table of Contents
Equity Income Fund as of June 30, 2007 (percentage of net assets)
Top 10 Holdings | |||
Apache Corp. | 3.99 | % | |
J.P. Morgan Chase & Co. | 3.69 | % | |
Proctor & Gamble Co. | 2.99 | % | |
Google Inc. | 2.84 | % | |
Wells Fargo & Co. | 2.68 | % | |
Sysco Corp. | 2.51 | % | |
Valero Energy Corp. | 2.41 | % | |
AFLAC Inc. | 2.09 | % | |
Rohm & Haas Co. | 2.08 | % | |
Target Corp. | 2.07 | % |
Portfolio characteristics and holdings are subject to change periodically.
The third industry winner was the financial sector, which boosted our return by 0.50% compared to the S&P 500. In this case, we benefited from being underweighted in this poorly performing sector. We entered the quarter owning few bank stocks because our team was concerned that sub-prime mortgage problems, a weak housing sector and rising interest rates would hurt profits. These fears proved true, as news of rising mortgage defaults and accelerating home foreclosures seemed to hit the tape daily. In addition, interest rates moved higher during the quarter. As a result, financial stocks were among the worst performing sectors in the S&P 500 during the second quarter. Our underweight position, in combination with investments in non-banking financial stocks such as the supplemental insurance provider AFLAC, boosted our results.
This quarter’s gains helped solidify our year-to-date outperformance. We are up 10.75% for the first six months of 2007, significantly ahead of the S&P 500’s 6.96% gain. While our team enjoyed well-deserved Fourth of July celebrations with friends and family, rest assured that we returned to the office on the 5th, focused on maintaining the momentum of our first half results.
The Parnassus Income Funds • Equity Income Fund 5
Table of Contents
Company Analysis
The Fund had only one stock, Tuesday Morning, that hurt the NAV significantly, reducing the NAV by 7¢ as the stock dropped 16.7% from $14.84 to $12.36. Tuesday Morning is a closeout retailer of upscale home furnishings, an area that has performed poorly over the last couple of years, partly due to the slowdown in home sales activity.
Senior analyst Ben Allen continually checks in with management at Tuesday Morning. During this past quarter, he flew down to Dallas to visit with top executives; on that trip, Ben concluded that Tuesday Morning is a well-run business weathering a difficult retail environment as best they can.
Two factors give us confidence that Tuesday Morning has staying power: the company is debt-free and has remained profitable in every quarter since their initial public offering in 1999. While this investment has been disappointing, I am confident that the company’s management is making the right moves and that the stock will eventually rebound.
The Fund had many profitable investments during the quarter: 71 of our 94 positions added to the NAV. Four large winners really drove performance. Interestingly, there was one big winner from each of our four major industry groups: energy, healthcare, technology and financial services. Leading the pack was oil and gas exploration company Apache Corporation, which climbed 15.4% to $81.59 from $70.70 adding 19¢ to the NAV. While high oil prices helped profits, the company also made new discoveries in Australia, Egypt, Canada and the United States. In addition, oil is flowing at a faster rate in the North Sea after Apache upgraded some facilities.
While the stock has recently reached an all-time high, Apache remains a solid long-term investment. In early June, I attended Apache’s annual analyst meeting in Houston, Texas. Despite watching my beloved Oakland A’s lose to the Houston Astros during an evening game at MinuteMaid Park, it was a great trip. I remain convinced that the company is well-run and has abundant reserves to maintain production for many years to come.
The meeting also confirmed my view that Apache has strong environmental protection policies. Last October, a History Channel crew flew north to Apache’s Midale Canadian operation to film an episode for its “Modern Marvels” show highlighting “dreamers creating reality.” The episode, which shows how Apache uses carbon dioxide injection technology to recover more oil from the ground and simultaneously reduce greenhouse gases, initially aired in January. Dennis Krainyk, Apache’s production foreman in Midale, was filmed discussing the operation as he braved a brisk, Saskatchewan wind. He was later quoted in the June edition of ARROWS, the Apache employee newsletter, as being excited about the episode. “It certainly was a great opportunity for Apache to show that we are leaders in carbon dioxide injection technology,” he said. “The show will raise awareness as to what our business is really about and may open the door for future opportunities to tell our story.”
6 The Parnassus Income Funds • Equity Income Fund
Table of Contents
There is one final twist to Apache’s “Modern Marvels” episode. While Ben Allen was in Dallas for his Tuesday Morning meeting, by chance he turned on the TV in his hotel room the night before his meeting and happened to see the History Channel episode on Apache!
Chemed Corporation made a big contribution to the Fund for the quarter, adding 16¢ to the NAV as the stock gained 35.4% from $48.96 to $66.29. Chemed operates two businesses: VITAS, a best-in-class hospice provider, and Roto-Rooter, a leader in plumbing and drain-cleaning services. The stock performed well, mostly on the strength of the VITAS business, though strong cash flow generation at Roto-Rooter also helped. Last quarter in this space, I wrote about why VITAS is the leader in an attractive segment of the healthcare market. This time, I offer a retrospective to show how our investment process works.
I have been following the Chemed story for many years. Parnassus has, in fact, invested in the company a few times since our inception in 1984. The most recent investment was spurred by a chance encounter with a former Parnassus intern, Keye Chow, who works at a hedge fund in Los Angeles, California. Keye convinced me at an investor conference in Colorado that I should take another look at Chemed. That evening when I checked in with my team, I spoke to senior analyst Ben Allen and asked him to do an analysis on Chemed.
Ben read the public filings, listened to archived earnings calls, built a detailed financial model, consulted with sell-side analysts and finally flew to Cincinnati for a face-to-face meeting with management. This work convinced me to invest in Chemed, and to add to the position even as the stock dropped in response to the company’s worse-than-expected results in mid-2006. Since bottoming at $30 back in September, the stock has more than doubled, generating very large gains for our shareholders given our average cost per share of around $35. We have trimmed our position somewhat to account for the increase in share price, but we are still optimistic about the long-term Chemed story.
Intel, the world’s largest computer chip company, had a great quarter, as its stock jumped 24.2% from $19.13 to $23.76, boosting the Fund’s NAV by 13¢. Our investment thesis on Intel was simple – after a few years of falling behind main competitor AMD, Intel was ready to regain its technological edge. In addition, the company’s big restructuring plan would cut costs and boost profits. This analysis, supported by our standard investment process, proved true, and the stock moved higher during the second quarter.
SLM Corporation, the student loan company formerly known as Sallie Mae, added 9¢ to the NAV as its stock soared 40% during the quarter from $40.90 to $57.58, just over our average selling price. On April 16th, SLM Corporation announced it had accepted a buyout offer led by two private equity firms and a consortium of banks for $25 billion. Since the buyout offer was above my intrinsic value target, we sold our shares.
The Parnassus Income Funds • Equity Income Fund 7
Table of Contents
Strategy
While our team members spend most of their time analyzing individual companies, they also analyze important economic data. We held a quarterly strategy meeting in June, where all analysts presented their views on different segments of the economy. The theme of the meeting was that after six years of economic expansion, almost all asset classes, including stocks, real estate, commodities, emerging market debt, and even fine art, have appreciated significantly. This value creation reflects the benefits of an integrated global economy. Even after this impressive growth, we think there are many attractive investment opportunities to be found in the U.S. stock market.
Through our research team’s analysis, we predict the economy will grow at a moderate pace during the remainder of the year. While we’re encouraged by recent economic data, factors such as high oil prices, a weak housing market and rising interest rates should somewhat constrain economic growth. Because of this, the Fund’s largest overweight position continues to be in the less economically sensitive healthcare sector. We own several strong businesses in healthcare services, life sciences and biotechnology that should grow earnings, even during an economic slowdown. Our second largest overweight position is energy, as the stocks look relatively undervalued, and we continue to think oil and gas prices will rise. As we discussed in our first quarter report, energy demand is very strong, and it is becoming harder and harder to find supply to offset aging fields.
Based on our economic view and current market valuations, we reduced our technology exposure from overweight to essentially market-weight during the second quarter. We are still underweighted in financial services due to concerns about rising interest rates and falling home prices. In addition, we remain underweighted in the consumer discretionary and industrial sectors based on our view of slowing economic activity.
Overall, our team continues to have high conviction in our portfolio investments. I continue to have over 70% of my liquid net worth in the Fund.
8 The Parnassus Income Funds • Equity Income Fund
Table of Contents
Social Notes
Ever since its initial public offering in 2004, Google Inc. (GOOG) has forged a unique path toward corporate responsibility. At Parnassus, we have observed that companies which integrate corporate responsibility into their businesses distance themselves from peers in areas as diverse as product innovation, employee retention, governance and operational improvements. These companies are pioneers, precisely because they measure themselves by more than just the quarterly profit yardstick. Google is such a company.
Google was refreshingly unconventional from the start of its public company life in 2004. Instead of raising money through investment banks, the company sold its shares via public auction, with the express purpose of attracting a broad range of investors. In its “Owners Manual” for shareholders that accompanied the IPO prospectus, Google’s founders eschewed a harmful fixation with quarterly earnings targets by writing that “a management team distracted by a series of short-term targets is as pointless as a dieter stepping on a scale every half-hour.” We applaud management’s pledge to report results candidly, without using accounting tricks to smooth out the lumps.
Google has also moved to reduce the environmental impact of their operations through initiatives to increase energy efficiency and renewable power usage at their data centers. In addition, the company helps reduce traffic and carbon emissions by running the largest corporate shuttle program in the United States, bringing more than 1,500 “Googlers” from around the Bay Area to its Silicon Valley headquarters (the rooftop of which generates 1.6 megawatts of solar power!). This and other positive workplace initiatives have earned the company the top spot on Fortune Magazine’s “100 Best Companies to Work For” list for 2007.
We’re happy to report that Google is now the fourth largest position in the Equity Income Fund.
| Yours truly, |
 |
| Todd C. Ahlsten |
| Portfolio Manager |
The Parnassus Income Funds • Equity Income Fund 9
Table of Contents
THE PARNASSUS FIXED-INCOME FUND
As of June 30, 2007, the net asset value per share (NAV) of the Fixed-Income Fund was $15.96, yielding a total return for the quarter of 0.41% (including dividends). This compares to a loss of 0.72% for the average A-rated bond fund followed by Lipper Inc. and a loss of 0.52% for the Lehman U.S. Aggregate Bond Index. We generated a positive return during a quarter in which most of our peers lost money. Since the beginning of the year, our gain of 1.16% compares favorably to the returns of 0.63% for the Lipper average and 0.98% for the Lehman Index.
Below is a table comparing the performance of the Fund with that of the Lehman U.S. Aggregate Bond Index and the average A-rated bond fund followed by Lipper. Average annual total returns are for the one-, three-, five- and ten-year periods. The 30-day SEC yield for the Fund for June 2007 was 4.24%.
Average Annual Total Returns
for periods ended June 30, 2007
| One Year | Three Years | Five Years | Ten Years | Gross Expense Ratio | Net Expense Ratio | |||||||||||||
FIXED-INCOME FUND | 5.37 | % | 4.33 | % | 5.33 | % | 5.53 | % | 0.93 | % | 0.88 | % | ||||||
Lipper A-rated Bond Fund Average | 5.65 | % | 3.63 | % | 4.52 | % | 5.40 | % | NA | NA | ||||||||
Lehman U.S. Aggregate Bond Index | 6.12 | % | 3.98 | % | 4.48 | % | 6.02 | % | NA | NA |
Performance data quoted represent past performance and are no guarantee of future returns. Current performance may be lower or higher than the performance data quoted, and current performance information to the most recent month-end is on the Parnassus website (www.parnassus.com). Investment return and principal value will fluctuate so that an investor’s shares, when redeemed, may be worth more or less than their original cost. Returns shown in the table do not reflect the deduction of taxes a shareholder may pay on fund distributions or redemption of shares. The Lehman U.S. Aggregate Bond Index is an unmanaged index of bonds, and it is not possible to invest directly in an index. Index figures do not take expenses, fees or taxes into account, but mutual fund returns may. Before investing, an investor should carefully consider the investment objectives, risks, charges and expenses of the Fund and should read the prospectus which contains this and other information. The prospectus is on the Parnassus website or you can get one by calling (800) 999–3505. As described in the Fund’s current prospectus dated May 1, 2007, Parnassus Investments has contractually agreed to limit the total operating expenses to 0.87% of net assets, exclusive of acquired fund fees, through April 30, 2008.
10 The Parnassus Income Funds • Fixed-Income Fund
Table of Contents
Second Quarter Review
The Fund’s strong performance in the quarter was achieved by being well positioned for rising interest rates. In essence, we held a lot of short-term bonds that, in a rising interest rate environment, maintain better value than the longer-term bonds held by our peers.
During the quarter, the yield on the 10-year Treasury note leapt from 4.65% to a high of 5.26% in mid-June, before settling at 5.03% at quarter-end. Though we predicted last quarter that the 10-year yield would reach 5% by year-end, even we were surprised at how fast interest rates moved higher. We took advantage of this jump in yields to buy high-quality medium- and long-duration bonds. The Fund’s average duration is now at 4.4 years, still slightly below the Lehman index, which currently has a 4.7 year duration.
A key item we consider when buying bonds is the additional return offered over the “risk-free” U.S. Treasury issues of the same duration. This “credit spread” reflects the risk that a borrower will be unable to make the interest and principal payments owed to the lender. After analyzing the bonds available for purchase, we decided to skew our purchases toward four U.S. Treasury issues of different maturities. We felt that U.S. Treasuries offered better risk-adjusted returns than many corporate bonds, given current conditions. In our view, many corporate bonds don’t offer enough yield to compensate for their extra risk versus Treasury issues.
We funded a portion of these purchases with the sale of convertible securities that rose in price due to a strong stock market. Convertible bonds now represent 5% of the portfolio, considerably less than the 13% position at the beginning of the quarter, reflecting our cautious view of the equity market. If we see attractive opportunities in the convertible bond market over the new few quarters, we are now in a position to significantly increase our holdings in this asset class.
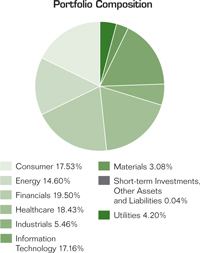
Fixed-Income Fund at June 30, 2007 (percentage of net assets) | |||
Portfolio Composition | |||
Long-term: | |||
Consumer | 0.60 | % | |
Long Term U.S. Government and Agency Securities | 36.15 | % | |
Financials | 18.69 | % | |
Healthcare | 6.48 | % | |
Information Technology | 6.10 | % | |
Utilities | 2.14 | % | |
Telecommunication Services | 1.38 | % | |
Short-term: | |||
Short-term U.S. Government Agency Securities | 22.59 | % | |
Other Short-term Investments, Other Assets and Liabilities | 5.87 | % | |
Portfolio characteristics and holdings are subject to change periodically.
The Parnassus Income Funds • Fixed-Income Fund 11
Table of Contents
Strategy
In addition to the credit spread, we focused on the maturity spread between yields of short- and long-term bonds. Normally, investors demand a higher yield for lending for longer periods of time, meaning that the 10-year yield minus the 3-month yield is usually a positive number. This rule of thumb was violated between August of last year and May of this year, resulting in the “inverted yield curve” that has been discussed widely in the business press. Investors care about this because an inverted yield curve has proven over time to be a leading recession indicator. The fact that the yield curve has returned to “normal” is a positive sign for the economy. However, we are still on the lookout for any early signs of an economic slowdown.
We believe that Chairman Ben Bernanke and his Federal Open Market Committee will keep the Federal Funds rate at 5.25% for the remainder of the year. The economy is still subject to inflationary pressures, most importantly in energy prices and wages, but we feel the housing slowdown should dampen economic activity enough to keep core inflation under 3%. As long as this is the case, we don’t think Chairman Bernanke will press for a rate hike.
Thank you for investing in the Fixed-Income Fund.
Yours truly, |
 |
Todd C. Ahlsten |
Portfolio Manager |
 |
Ben Allen |
Co-Portfolio Manager |
12 The Parnassus Income Funds • Fixed-Income Fund
Table of Contents
THE PARNASSUS CALIFORNIA TAX-EXEMPT FUND
As of June 30, 2007, the net asset value per share (NAV) of the California Tax-Exempt Fund was $16.39. Taking dividends into account, the total return for the quarter was a loss of 0.17%. This compares favorably to a loss of 0.85% for the average California municipal bond fund followed by Lipper and a loss of 0.67% for the Lehman Municipal Bond Index. Year-to-date, the Fund has gained 0.65%, versus a loss of 0.14% for the Lipper average and a gain of 0.14% for the Lehman Index.
Below you will find a table comparing our total average annual returns to various indices over the past one-, three-, five- and ten-year periods. The 30-day SEC yield for the Fund for June 2007 was 3.37%.
Average Annual Total Returns
for periods ended June 30, 2007
| One Year | Three Years | Five Years | Ten Years | Gross Expense Ratio | Net Expense Ratio | |||||||||||||
CALIFORNIA TAX-EXEMPT FUND | 3.61 | % | 2.50 | % | 3.02 | % | 4.37 | % | 0.92 | % | 0.76 | % | ||||||
Lipper California Municipal Bond Fund Average | 4.27 | % | 4.64 | % | 4.30 | % | 4.83 | % | NA | NA | ||||||||
Lehman Municipal Bond Index | 4.70 | % | 4.56 | % | 4.61 | % | 5.44 | % | NA | NA |
Performance data quoted represent past performance and are no guarantee of future returns. Current performance may be lower or higher than the performance data quoted, and current performance information to the most recent month-end is on the Parnassus website (www.parnassus.com). Investment return and principal value will fluctuate so that an investor’s shares, when redeemed, may be worth more or less than their original cost. Returns shown in the table do not reflect the deduction of taxes a shareholder may pay on fund distributions or redemption of shares. The Lehman Municipal Bond Index is an unmanaged index of fixed-income securities and it is not possible to invest directly in an index. Index figures do not take expenses, fees or taxes into account, but mutual fund returns may. Before investing, an investor should carefully consider the investment objectives, risks, charges and expenses of the Fund and should carefully read the prospectus which contains this and other information. The prospectus is on the Parnassus website or you can get one by calling (800) 999–3505. As described in the Fund’s current prospectus dated May 1, 2007, Parnassus Investments has contractually agreed to limit the total operating expenses to 0.75% of net assets, exclusive of acquired fund fees, through April 30, 2008.
The Parnassus Income Funds • California Tax-Exempt Fund 13
Table of Contents
Second Quarter Review
The Fund beat its benchmark for the second quarter of 2007, building on its above average return for the first quarter. I anticipated that interest rates would rise, and therefore invested the bulk of the Fund in short-term bonds. This limited the losses during the quarter to 0.17%, which is consistent with my goal of preserving capital while providing meaningful current income. The average duration of the California Tax-Exempt Fund was 3.7 years during the quarter, versus 6.7 years for the Lehman Municipal Bond Index. Simply put, duration measures how much in percentage terms a bond price will move for a 1% change in interest rates.
California Tax-Exempt Fund as of June 30, 2007 (percentage of net assets)
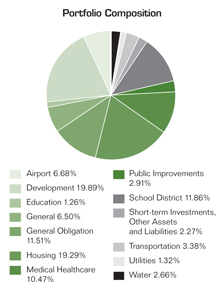
14 The Parnassus Income Funds • California Tax-Exempt Fund
Table of Contents
Outlook
Six years into our current economic expansion, the national economy appears to be relatively stable. Inflation is under control due to the vigilance of the Federal Reserve and the slowdown in the housing sector. I expect the Federal Open Market Committee to maintain the Fed Funds rate at 5.25% for the remainder of the year. I still think that long-term rates will increase over the next six months, so I’m planning on maintaining a relatively short duration for the Fund.
Looking to California, the economy is strong but clearly affected by weakness in residential real estate. The trend in the number of residential units authorized for construction, as measured by building permits is proof of this. The latest data indicate that residential construction is running at roughly half of its peak rate in 2005. This points to a decline in construction jobs. In fact, the latest data indicate that the California unemployment rate is 5.2%, or more than half of a percentage point above the national average. Last year, this gap was smaller. One of the reasons for the increase is that construction jobs have actually shrunk year-over-year, while the number of available workers has risen.
While these factors are troublesome, the rest of the economic picture for California is quite positive. According to the Governor’s latest budget for 2007–2008, personal income in the state is expected to grow between 5% and 6% for the next three years. Also impressive is the amazing surge in exports, which grew at a 9% annual rate to a record $128 billion in 2006. A vibrant technology sector and the richness of our natural resources are two key drivers of this growth. So, while the housing industry is weak, there are still many reasons why I am optimistic about California’s economy, which bodes well for our portfolio.
Thank you for investing in the California Tax-Exempt Fund.
| Yours truly, |
|
| Ben Allen |
| Portfolio Manager |
The Parnassus Income Funds • California Tax-Exempt Fund 15
Table of Contents
As a shareholder of the funds, you incur ongoing costs, which include portfolio-management fees, administrative fees, shareholder reports, and other fund expenses. The funds do not charge transaction fees, so you do not incur transaction costs such as sales charges (loads) on purchase payments, reinvested dividends, or other distributions; redemption fees; and exchange fees. The information on this page is intended to help you understand your ongoing costs of investing in the funds and to compare these costs with the ongoing costs of investing in other mutual funds.
The following example is based on an investment of $1,000 invested at the beginning of the most recent six-month period and held for the period of January 1, 2007 through June 30, 2007.
Actual Expenses
In the example below, the first line for each fund provides information about actual account values and actual expenses. You may use the information in this line, together with the amount you invested, to estimate the expenses that you paid over the period. Simply divide your account value by $1,000 (for example, $8,600 account value divided by $1,000 = 8.6), then multiple the result by the number in the first line under the heading entitled “Expenses Paid During Period” to estimate the expenses you paid on your account during this period.
Hypothetical Example for Comparison Purposes
The second line of each fund provides information about hypothetical account values and hypothetical expenses based on the fund’s expense ratio and an assumed rate of return of 5% per year before expenses, which is not the fund’s actual return. You may compare the ongoing costs of investing in the fund with other mutual funds by comparing this 5% hypothetical example and the 5% hypothetical examples that appear in the shareholder reports of other funds. To do so, compare this 5% hypothetical example with the 5% hypothetical examples that appear in the shareholder reports of the other funds. The hypothetical account values and expenses may not be used to estimate the actual ending account balance or expenses you paid for the period.
16 The Parnassus Income Funds • December 31, 2005
Table of Contents
Please note that the expenses shown in the table are meant to highlight only your ongoing costs in these funds. Therefore, the second line of each fund is useful in comparing only ongoing costs and will not help you determine the relative total costs of owning other mutual funds, which may include transactional costs such as loads.
Beginning January 1, 2007 | Ending Account Value June 30, 2007 | Expenses Paid During Period* | |||||||
Equity Income Fund – Investor Shares: Actual | $ | 1,000.00 | $ | 1,107.50 | $ | 5.17 | |||
Hypothetical (5% before expenses) | $ | 1,000.00 | $ | 1,019.89 | $ | 4.96 | |||
Equity Income Fund – Institutional Shares: Actual | $ | 1,000.00 | $ | 1108.60 | $ | 4.08 | |||
Hypothetical (5% before expenses) | $ | 1,000.00 | $ | 1,020.93 | $ | 3.91 | |||
Fixed-Income Fund: Actual | $ | 1,000.00 | $ | 1,011.60 | $ | 3.74 | |||
Hypothetical (5% before expenses) | $ | 1,000.00 | $ | 1,021.08 | $ | 3.76 | |||
California Tax-Exempt Fund: Actual | $ | 1,000.00 | $ | 1,006.50 | $ | 3.38 | |||
Hypothetical (5% before expenses) | $ | 1,000.00 | $ | 1,021.42 | $ | 3.41 | |||
| * | Expenses are equal to the fund’s annualized expense ratio of 0.99%, 0.78%, 0.75%, and 0.68% for Equity Income Fund – Investor Shares, Equity Income Fund – Institutional Shares, Fixed-Income Fund and California Tax-Exempt Fund, respectively, multiplied by the average account value over the period, multiplied by 181/365 (to reflect the one-half year period from January 1, 2007 through June 30, 2007). |
The Parnassus Income Funds • June 30, 2007 17
Table of Contents
THE PARNASSUS EQUITY INCOME FUND
Portfolio of Investments by Industry Classification
as of June 30, 2007 (unaudited)
| Shares | Common Stocks | Percent of Net Assets | Market Value | |||||
Biotechnology | ||||||||
| 185,000 | Genentech Inc.1 | $ | 13,997,100 | |||||
| 200,000 | Invitrogen Corp.1 | 14,750,000 | ||||||
| 215,000 | Sigma-Aldrich Corp.2 | 9,174,050 | ||||||
| 4.1 | % | $ | 37,921,150 | |||||
Chemicals | ||||||||
| 350,000 | Rohm & Haas Co. | 2.1 | % | $ | 19,138,000 | |||
Communications Equipment | ||||||||
| 115,000 | QUALCOMM Inc. | 0.5 | % | $ | 4,989,850 | |||
Computers | ||||||||
| 165,000 | International Business Machines Corp. | 1.9 | % | $ | 17,366,250 | |||
Cosmetics and Personal Care | ||||||||
| 450,000 | Proctor & Gamble Co. | 3.0 | % | $ | 27,535,500 | |||
Data Processing | ||||||||
| 100,000 | Fiserv Inc.1 | 0.6 | % | $ | 5,680,000 | |||
Entertainment | ||||||||
| 167,000 | Cedar Fair, LP 2 | 0.5 | % | $ | 4,712,740 | |||
Financial Services | ||||||||
| 150,000 | American Express Co. | $ | 9,177,000 | |||||
| 700,000 | J.P. Morgan Chase & Co. | 33,915,000 | ||||||
| 500,000 | U.S. Bancorp | 16,475,000 | ||||||
| 325,000 | Wachovia Corp. | 16,656,250 | ||||||
| 700,000 | Wells Fargo & Co. | 24,619,000 | ||||||
| 11.0 | % | $ | 100,842,250 | |||||
Food Products | ||||||||
| 240,000 | McCormick & Co., Inc. | $ | 9,163,200 | |||||
| 700,000 | Sysco Corp. | 23,093,000 | ||||||
| 3.5 | % | $ | 32,256,200 | |||||
Healthcare Products | ||||||||
| 50,000 | Cytyc Corp.1 | $ | 2,155,500 | |||||
| 275,000 | Johnson & Johnson | 16,945,500 | ||||||
| 2.1 | % | $ | 19,101,000 | |||||
18 | The accompanying notes are an integral part of these financial statements. |
Table of Contents
| Shares | Common Stocks | Percent of Net Assets | Market Value | |||||
Healthcare Services | ||||||||
| 230,000 | Chemed Corp.2 | $ | 15,246,700 | |||||
| 225,000 | Hospira Inc.1 | 8,784,000 | ||||||
| 140,000 | IMS Health Inc. | 4,498,200 | ||||||
| 75,000 | Quest Diagnostics Inc.2 | 3,873,750 | ||||||
| 352,000 | UnitedHealth Group Inc. | 18,001,280 | ||||||
| 5.4 | % | $ | 50,403,930 | |||||
Home Products | ||||||||
| 450,000 | WD-40 Co.2 | 1.6 | % | $ | 14,791,500 | |||
Industrial Manufacturing | ||||||||
| 200,000 | 3M Co. | $ | 17,358,000 | |||||
| 250,000 | Danaher Corp. | 18,875,000 | ||||||
| 60,000 | Teleflex Inc.2 | 4,906,800 | ||||||
| 4.5 | % | $ | 41,139,800 | |||||
Insurance | ||||||||
| 375,000 | AFLAC Inc. | $ | 19,275,000 | |||||
| 568,000 | Tower Group Inc.2 | 18,119,200 | ||||||
| 500,000 | WR Berkley Corp | 16,270,000 | ||||||
| 5.8 | % | $ | 53,664,200 | |||||
Internet | ||||||||
| 50,000 | Google Inc.1 | $ | 26,169,000 | |||||
| 30,000 | McAfee Inc.1 | 1,056,000 | ||||||
| 3.0 | % | $ | 27,225,000 | |||||
Medical Equipment | ||||||||
| 140,000 | Gen-Probe Inc.1 | $ | 8,458,800 | |||||
| 200,000 | Patterson Cos., Inc.1 | 7,454,000 | ||||||
| 1.7 | % | $ | 15,912,800 | |||||
Natural Gas | ||||||||
| 175,000 | Energen Corp. | $ | 9,614,500 | |||||
| 90,000 | ONEOK Inc. | 4,536,900 | ||||||
| 201,100 | Quicksilver Resources Inc.1, 2 | 8,965,038 | ||||||
| 500,000 | Southern Union Co. | 16,295,000 | ||||||
| 250,000 | XTO Energy Inc. | 15,025,000 | ||||||
| 5.9 | % | $ | 54,436,438 | |||||
Networking Products | ||||||||
| 520,000 | Cisco Systems Inc.1 | 1.6 | % | $ | 14,482,000 | |||
| The accompanying notes are an integral part of these financial statements. | 19 |
Table of Contents
THE PARNASSUS EQUITY INCOME FUND
Portfolio of Investments by Industry Classification
as of June 30, 2007 (unaudited) continued
| Shares | Common Stocks | Percent of Net Assets | Market Value | |||||
Oil and Gas | ||||||||
| 450,000 | Apache Corp. | $ | 36,715,500 | |||||
| 60,000 | Devon Energy Corp. | 4,697,400 | ||||||
| 65,000 | EOG Resources Inc. | 4,748,900 | ||||||
| 100,000 | Smith International Inc.2 | 5,864,000 | ||||||
| 185,000 | Sunoco Inc. | 14,740,800 | ||||||
| 85,000 | Ultra Petroleum Corp.1 | 4,695,400 | ||||||
| 300,000 | Valero Energy Corp. | 22,158,000 | ||||||
| 600,000 | W&T Offshore Inc.2 | 16,794,000 | ||||||
| 12.0 | % | $ | 110,414,000 | |||||
Pharmaceuticals | ||||||||
| 275,000 | Endo Pharmaceuticals Holdings Inc.1, 2 | $ | 9,413,250 | |||||
| 33,600 | Gilead Sciences Inc.1 | 1,302,672 | ||||||
| 300,000 | McKesson Corp. | 17,892,000 | ||||||
| 525,000 | Pfizer Inc. | 13,424,250 | ||||||
| 325,000 | Teva Pharmaceutical Industries Ltd. (ADR) | 13,406,250 | ||||||
| 6.0 | % | $ | 55,438,422 | |||||
Power | ||||||||
| 43,000 | Ormat Technologies Inc.2 | 0.2 | % | $ | 1,620,240 | |||
Professional Services | ||||||||
| 100,000 | Gevity HR Inc.2 | 0.2 | % | $ | 1,933,000 | |||
Real Estate Investment Trusts | ||||||||
| 1,200,000 | Annaly Capital Management Inc.2 | $ | 17,304,000 | |||||
| 110,000 | ProLogis | 6,259,000 | ||||||
| 2.6 | % | $ | 23,563,000 | |||||
Retail | ||||||||
| 50,000 | Best Buy Co. | $ | 2,333,500 | |||||
| 865,000 | Foot Locker Inc. | 18,857,000 | ||||||
| 165,000 | Lowe’s Cos., Inc. | 5,063,850 | ||||||
| 300,000 | Target Corp. | 19,080,000 | ||||||
| 1,050,000 | Tuesday Morning Corp.2 | 12,978,000 | ||||||
| 325,000 | Walgreen Co. | 14,150,500 | ||||||
| 250,000 | Whole Foods Market Inc.2 | 9,575,000 | ||||||
| 8.9 | % | $ | 82,037,850 | |||||
20 | The accompanying notes are an integral part of these financial statements. |
Table of Contents
Shares | Common Stocks | Percent of Net Assets | Market Value | |||||
Semiconductors | ||||||||
300,000 | Integrated Device Technology Inc.1 | $ | 4,581,000 | |||||
425,000 | Intel Corp. | 10,098,000 | ||||||
400,000 | Linear Technology Corp. | 14,472,000 | ||||||
76,144 | Microchip Technology Inc.2 | 2,820,374 | ||||||
| 3.5 | % | $ | 31,971,374 | |||||
Services | ||||||||
125,000 | Paychex Inc.2 | 0.5 | % | $ | 4,890,000 | |||
Software | ||||||||
50,000 | Akamai Technologies Inc.1, 2 | $ | 2,432,000 | |||||
75,000 | Autodesk Inc.1, 2 | 3,531,000 | ||||||
575,000 | BEA Systems Inc.1 | 7,871,750 | ||||||
300,000 | Citrix Systems Inc.1, 2 | 10,101,000 | ||||||
250,000 | Informatica Corp.1, 2 | 3,692,500 | ||||||
315,700 | Intuit Inc.1 | 9,496,256 | ||||||
75,000 | SAP AG (ADR) 2 | 3,830,250 | ||||||
250,000 | Transaction Systems Architects Inc.1, 2 | 8,415,000 | ||||||
| 5.4 | % | $ | 49,369,756 | |||||
Transportation | ||||||||
125,000 | United Parcel Service Inc. | 1.0 | % | $ | 9,125,000 | |||
Utilities | ||||||||
90,000 | Northwest Natural Gas Co.2 | $ | 4,157,100 | |||||
75,000 | Otter Tail Corp.2 | 2,405,250 | ||||||
| 0.7 | % | $ | 6,562,350 | |||||
Total investment in common stocks (cost $821,617,884) | 99.8 | % | $ | 918,523,600 | ||||
Shares | Preferred Stocks | Percent of Net Assets | Market Value | |||||
Banks | ||||||||
55,439 | First Republic Preferred Capital Corp. | |||||||
Preferred 8.875%, Series B, callable 08/09/2007 | $ | 1,393,182 | ||||||
Total investment in preferred stock (cost $1,421,496) | 0.2 | % | $ | 1,393,182 | ||||
| The accompanying notes are an integral part of these financial statements. | 21 |
Table of Contents
THE PARNASSUS EQUITY INCOME FUND
Portfolio of Investments by Industry Classification
as of June 30, 2007 (unaudited) continued
Principal | Community Loans | Percent of Net Assets | Market Value | |||||
Community Development Loans3 | ||||||||
500,000 | Microvest Note | |||||||
5.500%, matures 03/15/2009 | $ | 448,783 | ||||||
Total investment in community loans (cost $447,783) | 0.0 | % | $ | 448,783 | ||||
Total investments in long-term securities (cost $823,488,163) | 100.0 | % | $ | 920,365,565 | ||||
Principal | Short-Term Investments | Percent of Net Assets | Market Value | |||||
Certificates of Deposit 3 | ||||||||
100,000 | Community Bank of the Bay | |||||||
4.350%, matures 08/24/2007 | 0.0 | % | $ | 99,398 | ||||
Registered Investment Companies— Money Market Funds | ||||||||
1,084,430 | Evergreen U.S. Government Fund | |||||||
variable rate, 5.000% | $ | 1,084,430 | ||||||
1 | Janus Government Fund | |||||||
variable rate, 5.200% | 1 | |||||||
16,510,751 | SSGA U.S. Government Fund | |||||||
variable rate, 4.930% | 16,510,751 | |||||||
| 2.0 | % | $ | 17,595,182 | |||||
Community Development Loans3 | ||||||||
100,000 | Boston Community Loan Fund | |||||||
2.000%, matures 06/30/2007 | $ | 100,000 | ||||||
200,000 | Ecologic Finance | |||||||
2.000%, matures 01/25/2008 | 193,129 | |||||||
100,000 | Vermont Community Loan Fund | |||||||
3.000%, matures 04/16/2008 | 95,229 | |||||||
| 0.0 | % | $ | 388,358 | |||||
22 | The accompanying notes are an integral part of these financial statements. |
Table of Contents
Principal | Short-Term Investments | Percent of Net Assets | Market Value | ||||
Certificates of Deposit Account Registry Service (CDARS)3 | |||||||
500,000 | CDARS agreement with Community Bank of the Bay, dated 10/26/2006, due 10/25/2007, 4.736% Participating depository institutions: Associated Bank, NA, par 78,392; Community Bank of Missouri, par 93,500; Community National Bank, par 47,608; F&M Bank & Trust Co., par 93,500; First National Bank of Central Alabama, par 93,500; Peoples State Bank, par 93,500; (cost $493,573) | $ | 493,573 | ||||
500,000 | CDARS agreement with Community Bank of the Bay, dated 12/14/2006, due 12/13/2007, 4.640% Participating depository institutions: Bank of Montgomery, par 32,500; Central Bank & Trust Co., par 93,500; Grand Bank, par 93,500; Rocky Mountain Bank, par 93,500; Seaway National Bank of Chicago, par 93,500; Shorebank, par 93,500; (cost $490,848) | 490,848 | |||||
500,000 | CDARS agreement with Community Bank of the Bay, dated 02/01/2007, due 01/31/2008, 4.640% Participating depository institutions: United Bank, par 93,500; MidCarolina Bank, par 5,102; Kansas State Bank of Manhattan, par 35,008; MB Financial Bank, NA, par 76,500; First National Bank of Eagle River, par 9,390; Enterprise National Bank of Palm Beach, par 93,500; First Community Bank, par 93,500; Colonial Bank, NA, par 93,500; (cost $488,188) | 488,188 | |||||
| The accompanying notes are an integral part of these financial statements. | 23 |
Table of Contents
THE PARNASSUS EQUITY INCOME FUND
Portfolio of Investments by Industry Classification
as of June 30, 2007 (unaudited) continued
Principal | Short-Term Investments | Percent of Net Assets | Market Value | ||||||
500,000 | CDARS agreement with Community Bank of the Bay, dated 02/15/2007, due 02/14/2008, 4.550% Participating depository institutions: Arvest Bank, par 93,500; Potomac Bank of Virginia, par 93,500; West Bank, par 93,500; IBERIABANK, par 93,500; Town Center Bank, par 32,500; Northside Bank, par 93,500; (cost $487,418) | $ | 487,418 | ||||||
| 0.2 | % | $ | 1,960,027 | ||||||
| Securities Purchased with Cash Collateral from Securities Lending | |||||||||
| Registered Investment Companies | |||||||||
136,391,658 | State Street Navigator Securities Lending Prime Portfolio | ||||||||
| variable rate, 5.290% | 14.8 | % | $ | 136,391,658 | |||||
Total short-term securities (cost $156,434,623) | 17.0 | % | $ | 156,434,623 | |||||
Total securities (cost $979,921,786) | 117.0 | % | $ | 1,076,800,188 | |||||
| Payable upon return of securities loaned | –14.8 | % | $ | (136,391,658 | ) | ||||
| Other assets and liabilities – net | –2.2 | % | (20,181,647 | ) | |||||
| Total net assets | 100.0 | % | $ | 920,226,883 | |||||
| 1 | These securities are non-income producing. |
| 2 | This security or partial position of this security was on loan at June 30, 2007. The total value of the securities on loan at June 30, 2007 was $132,023,657. |
| 3 | Market value adjustments have been applied to these securities to reflect early withdrawal. |
| Fund holdings will vary over time. |
| Fund shares are not FDIC insured. |
24 | The accompanying notes are an integral part of these financial statements. |
Table of Contents
THE PARNASSUS EQUITY INCOME FUND
Statement of Assets and Liabilities
June 30, 2007 (unaudited)
Assets | |||
Investments in long-term securities, at market value | $ | 920,365,565 | |
Investments in short-term securities | 156,434,623 | ||
Receivables: | |||
Dividends and interest | 760,750 | ||
Investment securities sold | 9,628,179 | ||
Capital shares sold | 364,115 | ||
Other assets | 83,127 | ||
Total assets | $ | 1,087,636,359 | |
Liabilities | |||
Payable to custodian bank | 2,982,824 | ||
Payable upon return of loaned securities | 136,391,658 | ||
Payable for investment securities purchased | 26,010,214 | ||
Capital shares redeemed | 1,269,682 | ||
Fees payable to Parnassus Investments | 71,554 | ||
Distributions payable | 43,825 | ||
Accounts payable and accrued expenses | 639,719 | ||
Total liabilities | $ | 167,409,476 | |
Net assets | $ | 920,226,883 | |
Net assets consist of | |||
Undistributed net investment income | 1,199,734 | ||
Unrealized appreciation on securities | 96,877,402 | ||
Accumulated net realized gain | 69,167,376 | ||
Capital paid-in | 752,982,371 | ||
Total net assets | $ | 920,226,883 | |
Computation of net asset value and offering price per share | |||
Net asset value and redemption price per share | |||
Investor Shares ($867,358,504 divided by 31,664,957 shares) | $ | 27.39 | |
Institutional Shares ($52,868,379 divided by 1,927,935 shares) | $ | 27.42 | |
| The accompanying notes are an integral part of these financial statements. | 25 |
Table of Contents
THE PARNASSUS EQUITY INCOME FUND
Statement of Operations
Six Months Ended June 30, 2007 (unaudited)
Investment income | ||||
Dividends (net of foreign tax witholding of $12,130) | $ | 7,306,317 | ||
Interest | 478,625 | |||
Securities lending | 37,807 | |||
Total investment income | $ | 7,822,749 | ||
Expenses | ||||
Investment advisory fees (note 5) | 2,905,632 | |||
Transfer agent fees (note 5) | ||||
Investor Shares | 216,691 | |||
Institutional Shares | 1,122 | |||
Fund administration (note 5) | 305,152 | |||
Service provider fees – Investor Shares (note 5) | 774,108 | |||
Reports to shareholders | 157,398 | |||
Registration fees and expenses | 9,917 | |||
Custody fees | 41,813 | |||
Professional fees | 84,227 | |||
Trustee fees and expenses | 26,900 | |||
Other expenses | 90,826 | |||
Total expenses | $ | 4,613,786 | ||
Fees waived by Parnassus Investments (note 5) | (294,708 | ) | ||
Expense offset (note 6) | (3,620 | ) | ||
Net expenses | $ | 4,315,458 | ||
Net investment income | $ | 3,507,291 | ||
Realized and unrealized gain (loss) on investments | ||||
Net realized gain from securities transactions | 60,794,746 | |||
Net change in unrealized appreciation of securities | 26,143,453 | |||
Net realized and unrealized gain on securities | $ | 86,938,199 | ||
Net increase in net assets resulting from operations | $ | 90,445,490 | ||
26 | The accompanying notes are an integral part of these financial statements. |
Table of Contents
THE PARNASSUS EQUITY INCOME FUND
Statement of Changes in Net Assets
Six Months Ended June 30, 2007 (unaudited) | Year Ended December 31, 2006* | |||||||
Income (loss) from operations | ||||||||
Net investment income | $ | 3,507,291 | $ | 9,832,459 | ||||
Net realized gain from securities transactions | 60,794,746 | 83,280,336 | ||||||
Net change in unrealized appreciation | 26,143,453 | 23,296,908 | ||||||
Increase in net assets resulting from operations | $ | 90,445,490 | $ | 116,409,703 | ||||
Distributions | ||||||||
From net investment income | ||||||||
Investor Shares | (3,350,757 | ) | (43,443,631 | ) | ||||
Institutional Shares | (245,203 | ) | (2,221,529 | ) | ||||
From realized capital gains | ||||||||
Investor Shares | — | (40,399,809 | ) | |||||
Institutional Shares | — | (1,873,539 | ) | |||||
Dividends to shareholders | $ | (3,595,960 | ) | $ | (87,938,508 | ) | ||
From capital share transactions | ||||||||
Investor Shares | (23,100,699 | ) | (128,706,831 | ) | ||||
Institutional Shares | 1,903,955 | 47,966,021 | ||||||
Decrease in net assets from capital share transactions | (21,196,744 | ) | (80,740,810 | ) | ||||
Increase (decrease) in net assets | $ | 65,652,786 | $ | (52,269,615 | ) | |||
Net assets | ||||||||
Beginning of period | 854,574,097 | 906,843,712 | ||||||
End of period | $ | 920,226,883 | $ | 854,574,097 | ||||
| * | For the period April 28, 2006 (inception of Institutional Shares) through December 31, 2006. |
| The accompanying notes are an integral part of these financial statements. | 27 |
Table of Contents
THE PARNASSUS FIXED-INCOME FUND
Portfolio of Investments by Industry Classification
as of June 30, 2007 (unaudited)
Shares | Common Stocks | Percent of Net Assets | Market Value | |||||
| Natural Gas | ||||||||
30,000 | ONEOK Inc.1 | $ | 1,512,300 | |||||
Total investment in common stock (cost $759,304) | 2.1 | % | $ | 1,512,300 | ||||
Principal | Commercial Mortgage-Backed Securities | |||||||
1,500,000 | J.P. Morgan Chase Commercial Mortgage Securities Corp. 2005-LDP5 A4, Pool # 723263 | |||||||
| variable rate, 5.179%, due 12/15/2044 | $ | 1,449,059 | ||||||
Total investments in commercial mortgage-backed securities (cost $ 1,475,970) | 2.1 | % | $ | 1,449,059 | ||||
Corporate Bonds | ||||||||
| Biotechnology | ||||||||
3,000,000 | Genentech Inc. | |||||||
| Notes, 4.750%, due 07/15/2015 | 4.0 | % | $ | 2,803,698 | ||||
| Financial Services | ||||||||
2,000,000 | American Express Co.1 | |||||||
| Notes, 5.500%, due 09/12/2016 | $ | 1,954,432 | ||||||
500,000 | Bank One Corp.1 | |||||||
| Notes, 6.000%, due 02/17/2009 | 504,242 | |||||||
2,000,000 | Caterpillar Financial Services Corp. | |||||||
| Notes, 4.625%, due 06/01/2015 | 1,856,628 | |||||||
500,000 | Goldman Sachs Group Inc.1 | |||||||
| Notes, 6.650%, due 05/15/2009 | 511,238 | |||||||
1,500,000 | Goldman Sachs Group Inc.1 | |||||||
| Notes, 5.750%, due 10/01/2016 | 1,464,893 | |||||||
28 | The accompanying notes are an integral part of these financial statements. |
Table of Contents
Principal | Corporate Bonds | Percent of Net Assets | Market Value | |||||
1,000,000 | Goldman Sachs Group Inc. | |||||||
| Notes, 5.625%, due 01/15/2017 | $ | 958,413 | ||||||
2,000,000 | Merrill Lynch & Co., Inc.1 | |||||||
| Notes, 6.500%, due 07/15/2018 | 2,087,613 | |||||||
500,000 | Wells Fargo Financial Inc. | |||||||
| Notes, 6.850%, due 07/15/2009 | 513,169 | |||||||
2,000,000 | Wells Fargo & Co.1 | |||||||
| Notes, 5.125%, due 09/15/2016 | 1,905,334 | |||||||
| 16.6 | % | $ | 11,755,962 | |||||
| Networking Products | ||||||||
2,800,000 | Cisco Systems Inc. | |||||||
| Notes, 5.500%, due 02/22/2016 | 3.9 | % | $ | 2,732,262 | ||||
| Retail | ||||||||
400,000 | Target Corp.1 | |||||||
| Notes, 7.500%, due 08/15/2010 | 0.6 | % | $ | 423,576 | ||||
| Telecommunication Services | ||||||||
1,000,000 | Verizon Communications Inc. | |||||||
| Notes, 5.550%, due 02/15/2016 | 1.4 | % | $ | 974,263 | ||||
Total investments in corporate bonds (cost $18,855,208) | 26.5 | % | $ | 18,689,761 | ||||
Convertible Bonds | ||||||||
| Biotechnology | ||||||||
2,000,000 | Amgen Inc.1 | |||||||
| Notes, 0.375%, due 02/01/2013 | 2.5 | % | $ | 1,775,000 | ||||
| Computers | ||||||||
1,500,000 | Maxtor Corp.1 | |||||||
| Notes, 6.800%, due 04/30/2010 | 2.2 | % | $ | 1,575,000 | ||||
Total investments in convertible bonds (cost $3,576,077) | 4.7 | % | $ | 3,350,000 | ||||
| The accompanying notes are an integral part of these financial statements. | 29 |
Table of Contents
THE PARNASSUS FIXED-IN COME FUND
Portfolio of Investments by Industry Classification
as of June 30, 2007 (unaudited) continued
| Principal Amount $ | U.S. Government Agency Securities | Percent of Net Assets | Market Value | |||||
| 2,000,000 | Fannie Mae | |||||||
Notes, 5.250%, due 01/15/2009 | $ | 2,000,156 | ||||||
| 3,000,000 | Fannie Mae | |||||||
Notes, 5.125%, due 04/22/2013 | 2,932,716 | |||||||
| 3,000,000 | Federal Farm Credit Bank | |||||||
Notes, 5.410%, due 11/07/2016 | 2,931,912 | |||||||
| 1,000,000 | Federal Home Loan Bank System | |||||||
Notes, 5.000%, due 05/28/2015 | 960,435 | |||||||
| 2,000,000 | Federal Home Loan Bank System | |||||||
Notes, 5.500%, due 11/07/2016 | 1,964,362 | |||||||
| 1,000,000 | Federal Home Loan Bank System | |||||||
Notes, 5.200%, due 08/13/2013 | 977,700 | |||||||
| 2,000,000 | Freddie Mac | |||||||
Notes, 6.000%, due 09/19/2016 | 1,979,234 | |||||||
| $ | 13,746,515 | |||||||
Total investments in U.S. government agencies (cost $14,042,680) | 19.4 | % | $ | 13,746,515 | ||||
U.S. Government Treasury Securities | ||||||||
| 3,000,000 | United States Treasury Note | |||||||
Notes, 4.500%, 04/30/2009 | $ | 2,979,609 | ||||||
| 3,000,000 | United States Treasury Note | |||||||
Notes, 4.750%, 05/31/2012 | 2,976,564 | |||||||
| 3,000,000 | United States Treasury Note | |||||||
Notes, 4.750%, 05/15/2014 | 2,962,500 | |||||||
| 3,000,000 | United States Treasury Note | |||||||
Notes, 4.500%, 05/15/2017 | 2,876,250 | |||||||
| $ | 11,794,923 | |||||||
Total investments in U.S. government treasuries (cost $11,763,355) | 16.7 | % | $ | 11,794,923 | ||||
Total investment in long-term securities (cost $50,472,594) | 71.5 | % | $ | 50,542,558 | ||||
30 | The accompanying notes are an integral part of these financial statements. |
Table of Contents
Principal Amount $ | Short-Term Investments | Percent of Net Assets | Market Value | ||||||
U.S. Government Agency Discount Notes | |||||||||
| 10,000,000 | Federal Home Loan Bank | ||||||||
Zero Coupon, 5.120% equivalent, matures 07/12/2007 | $ | 9,982,933 | |||||||
| 6,000,000 | Fannie Mae | ||||||||
Zero Coupon, 5.130% equivalent, matures 08/01/2007 | 5,972,640 | ||||||||
| 22.6 | % | $ | 15,955,573 | ||||||
Registered Investment Companies—Money Market Funds | |||||||||
| 1,084,430 | Evergreen U.S. Government Fund | ||||||||
variable rate, 5.000% | $ | 1,084,430 | |||||||
| 2,445,548 | Janus Government Fund | ||||||||
variable rate, 5.200% | 2,445,548 | ||||||||
| 1 | SSGA U.S. Government Fund | ||||||||
variable rate, 4.930% | 1 | ||||||||
| 5.0 | % | $ | 3,529,979 | ||||||
Securities Purchased with Cash Collateral from Securities Lending | |||||||||
| 5,873,002 | State Street Navigator Securities Lending Prime Portfolio | ||||||||
variable rate, 5.290% | 8.3 | % | $ | 5,873,002 | |||||
Total short-term securities (cost $25,358,554) | 35.9 | % | $ | 25,358,554 | |||||
Total securities (cost $75,831,148) | 107.4 | % | $ | 75,901,112 | |||||
Payable upon return of securities loaned | – 8.3 | % | $ | (5,873,002 | ) | ||||
Other assets and liabilities – net | 0.9 | % | $ | 614,042 | |||||
Total net assets | 100.0 | % | $ | 70,642,152 | |||||
| 1 | This security or partial position of this security was on loan at June 30, 2007. The total value of the securities on loan at June 30, 2007 was $5,773,314. |
| Fund holdings will vary over time. |
| Fund shares are not FDIC insured. |
| The accompanying notes are an integral part of these financial statements. | 31 |
Table of Contents
THE PARNASSUS FIXED-INCOME FUND
Statement of Assets and Liabilities
June 30, 2007 (unaudited)
Assets | ||||
Investments in long-term securities, at market value | $ | 50,542,558 | ||
Investments in short-term securities | 25,358,554 | |||
Cash | 21,441 | |||
Receivables: | ||||
Dividends and interest | 636,393 | |||
Capital shares sold | 42,525 | |||
Other assets | 24,086 | |||
Total assets | $ | 76,625,557 | ||
Liabilities | ||||
Payable upon return of loaned securities | 5,873,002 | |||
Capital shares redeemed | 51,156 | |||
Fees payable to Parnassus Investments | 3,855 | |||
Distributions payable | 24,228 | |||
Accounts payable and accrued expenses | 31,164 | |||
Total liabilities | $ | 5,983,405 | ||
Net assets | $ | 70,642,152 | ||
Net assets consist of | ||||
Undistributed net investment loss | (2,232 | ) | ||
Unrealized appreciation on securities | 69,964 | |||
Accumulated net realized gain | 245,412 | |||
Capital paid-in | 70,329,008 | |||
Total net assets | $ | 70,642,152 | ||
Computation of net asset value and offering price per share | ||||
Net asset value and redemption price per share | $ | 15.96 | ||
32 | The accompanying notes are an integral part of these financial statements. |
Table of Contents
THE PARNASSUS FIXED-INCOME FUND
Statement of Operations
Six Months Ended June 30, 2007 (unaudited)
Investment income | ||||
Dividends | $ | 20,400 | ||
Interest | 1,630,559 | |||
Securities lending | 2,553 | |||
Total investment income | $ | 1,653,512 | ||
Expenses | ||||
Investment advisory fees (note 5) | 167,029 | |||
Transfer agent fees (note 5) | 30,150 | |||
Fund administration (note 5) | 23,060 | |||
Service provider fees (note 5) | 33,174 | |||
Reports to shareholders | 14,810 | |||
Registration fees and expenses | 5,329 | |||
Custody fees | 2,979 | |||
Professional fees | 8,347 | |||
Trustee fees and expenses | 1,137 | |||
Other expenses | 5,892 | |||
Total expenses | $ | 291,907 | ||
Fees waived by Parnassus Investments (note 5) | (38,957 | ) | ||
Expense offset (note 6) | (2,172 | ) | ||
Net expenses | $ | 250,778 | ||
Net investment income | $ | 1,402,734 | ||
Realized and unrealized gain (loss) on investments | ||||
Net realized gain from securities transactions | 245,622 | |||
Net change in unrealized depreciation of securities | (919,413 | ) | ||
Net realized and unrealized loss on securities | $ | (673,791 | ) | |
Net increase in net assets resulting from operations | $ | 728,943 | ||
| The accompanying notes are an integral part of these financial statements. | 33 |
Table of Contents
THE PARNASSUS FIXED-INCOME FUND
Statement of Changes in Net Assets
Six Months Ended June 30, 2007 (unaudited) | Year Ended December 31, 2006 | |||||||
Income (loss) from operations | ||||||||
Net investment income | $ | 1,402,734 | $ | 2,158,350 | ||||
Net realized gain from securities transactions | 245,622 | 702,413 | ||||||
Net change in unrealized appreciation (depreciation) | (919,413 | ) | 868,923 | |||||
Increase in net assets resulting from operations | $ | 728,943 | $ | 3,729,686 | ||||
Distributions | ||||||||
From net investment income | (1,416,723 | ) | (2,464,220 | ) | ||||
From realized capital gains | — | (376,117 | ) | |||||
Dividends to shareholders | $ | (1,416,723 | ) | $ | (2,840,337 | ) | ||
From capital share transactions | ||||||||
Increase in net assets from capital share transactions | 8,809,817 | 15,752,152 | ||||||
Increase in net assets | $ | 8,122,037 | $ | 16,641,501 | ||||
Net assets | ||||||||
Beginning of period | 62,520,115 | 45,878,614 | ||||||
End of period (including undistributed net investment income (loss) of ($2,232) and $11,757 respectively) | $ | 70,642,152 | $ | 62,520,115 | ||||
34 | The accompanying notes are an integral part of these financial statements. |
Table of Contents
THE PARNASSUS CALIFORNIA TAX-EXEMPT FUND
Portfolio of Investments by Industry Classification
as of June 30, 2007 (unaudited)
| Principal Amount $ | Municipal Bonds | Percent of Net Assets | Market Value | |||||
Airport | ||||||||
| 1,000,000 | San Francisco City & County Airport Commission | |||||||
FGIC Insured, 5.000%, due 05/01/2010 | 6.7 | % | $ | 1,031,500 | ||||
Development | ||||||||
| 500,000 | California Infrastructure & Economic Development Bank | |||||||
5.000%, due 10/01/2012 | $ | 526,530 | ||||||
| 600,000 | La Quinta Redevelopment Agency Tax Allocation | |||||||
MBIA Insured, 7.300%, due 09/01/2011 | 676,050 | |||||||
| 425,000 | Rialto Redevelopment Agency | |||||||
4.500%, due 09/01/2013 | 430,521 | |||||||
| 625,000 | San Mateo Redevelopment Agency | |||||||
XLCA Insured, 4.200%, due 08/01/2023 | 609,281 | |||||||
| 800,000 | State of California | |||||||
5.000%, due 07/01/2016 | 830,120 | |||||||
| 19.8 | % | $ | 3,072,502 | |||||
Education | ||||||||
| 200,000 | Sweetwater Union High School District | |||||||
4.250%, due 09/01/2017 | 1.3 | % | $ | 194,520 | ||||
General | ||||||||
| 1,000,000 | ABAG Finance Authority for Nonprofit Corps | |||||||
4.250%, due 11/15/2012 | 6.5 | % | $ | 1,003,760 | ||||
General Obligation | ||||||||
| 1,000,000 | State of California | |||||||
6.600%, due 02/01/2009 | $ | 1,043,860 | ||||||
| 700,000 | State of California | |||||||
6.100%, due 10/01/2009 | 733,887 | |||||||
| 11.5 | % | $ | 1,777,747 | |||||
| The accompanying notes are an integral part of these financial statements. | 35 |
Table of Contents
THE PARNASSUS CALIFORNIA TAX-EXEMPT FUND
Portfolio of Investments by Industry Classification
as of June 30, 2007 (unaudited) continued
| Principal Amount $ | Municipal Bonds | Percent of Net Assets | Market Value | |||||
Housing | ||||||||
| 1,000,000 | California State Public Works Board | |||||||
FSA Insured, 5.375%, due 10/01/2013 | $ | 1,068,240 | ||||||
| 960,000 | California State Public Works Board | |||||||
5.500%, due 12/01/2009 | 997,813 | |||||||
| 910,000 | California Statewide Communities Development Authority | |||||||
ACA Insured, 4.500%, due 08/01/2010 | 914,122 | |||||||
| 19.2 | % | $ | 2,980,175 | |||||
Medical Healthcare | ||||||||
| 300,000 | California Health Facilities Financing Authority | |||||||
5.000%, due 07/01/2009 | $ | 305,508 | ||||||
| 395,000 | County of San Diego | |||||||
5.000%, due 09/01/2008 | 399,531 | |||||||
| 500,000 | Loma Linda Hospital | |||||||
4.500%, due 12/01/2018 | 484,785 | |||||||
| 415,000 | Loma Linda Hospital | |||||||
AMBAC Insured, 4.850%, due 12/01/2010 | 427,981 | |||||||
| 10.5 | % | $ | 1,617,805 | |||||
Public Improvements | ||||||||
| 450,000 | Linda Fire Protection District | |||||||
4.400%, due 05/01/2014 | 2.9 | % | $ | 449,996 | ||||
School District | ||||||||
| 450,000 | Los Altos School District | |||||||
5.250%, due 08/01/2010 | $ | 468,873 | ||||||
| 440,000 | Los Angeles Unified School District | |||||||
FGIC Insured, 5.500%, due 07/01/2013 | 461,072 | |||||||
| 450,000 | Morgan Hill Unified School District | |||||||
FGIC Insured, 4.900%, due 08/01/2013 | 468,356 | |||||||
| 410,000 | Sacramento City Unified School District | |||||||
5.750%, due 07/01/2017 | 433,432 | |||||||
| 11.9 | % | $ | 1,831,733 | |||||
36 | The accompanying notes are an integral part of these financial statements. |
Table of Contents
| Principal Amount $ | Municipal Bonds | Percent of Net Assets | Market Value | |||||
Transportation | ||||||||
| 250,000 | Los Angeles County Metropolitan Transportation Authority | |||||||
AMBAC Insured, 5.000%, due 07/01/2013 | $ | 255,563 | ||||||
| 260,000 | San Francisco Bay Area Transit Finance Authority Prerefunded | |||||||
5.250%, due 07/01/2013 | 266,562 | |||||||
| 3.4 | % | $ | 522,125 | |||||
Utilities | ||||||||
| 200,000 | City of Los Angeles | |||||||
FGIC Insured, 5.000%, due 06/01/2011 | 1.3 | % | $ | 204,348 | ||||
Water | ||||||||
| 215,000 | California State Department of Water Resources | |||||||
5.125%, due 12/01/2016 | $ | 221,194 | ||||||
| 185,000 | California State Department of Water Resources | |||||||
5.125%, due 12/01/2016 | 189,636 | |||||||
| 2.7 | % | $ | 410,830 | |||||
Total investments in municipal bonds (cost $15,088,421) | 97.7 | % | $ | 15,097,041 | ||||
| The accompanying notes are an integral part of these financial statements. | 37 |
Table of Contents
THE PARNASSUS CALIFORNIA TAX-EXEMPT FUND
Portfolio of Investments by Industry Classification
as of June 30, 2007 (unaudited) continued
| Principal Amount $ | Short-Term Investments | Percent of Net Assets | Market Value | |||||
Registered Investment Companies—Money Market Funds | ||||||||
| 211,960 | California Investment Trust Tax Free Fund | |||||||
variable rate, 3.120% | $ | 211,960 | ||||||
Total short-term securities (cost $211,960) | 1.4 | % | $ | 211,960 | ||||
Total securities (cost $15,300,381) | 99.1 | % | $ | 15,309,001 | ||||
Other assets and liabilities – net | 0.9 | % | $ | 136,425 | ||||
Total net assets | 100.0 | % | $ | 15,445,426 | ||||
Fund holdings will vary over time.
Fund shares are not FDIC insured.
| Glossary of Terms | ||
| ABAG | The Association of Bay Area Governments | |
| ACA | ACA Financial Guaranty Corp. | |
| AMBAC | American Municipal Bond Assurance Corp. | |
| FGIC | Financial Guaranty Insurance Co. | |
| FSA | Financial Security Assistance | |
| MBIA | Municipal Bond Investors Assurance Corp. | |
| XLCA | XL Capital Assurance Inc. | |
38 | The accompanying notes are an integral part of these financial statements. |
Table of Contents
THE PARNASSUS CALIFORNIA TAX-EXEMPT FUND
Statement of Assets and Liabilities
June 30, 2007 (unaudited)
Assets | ||||
Investments in municipal bonds, at market value | $ | 15,097,041 | ||
Investments in short-term securities | 211,960 | |||
Dividends and interest | 225,636 | |||
Other assets | 1,894 | |||
Total assets | $ | 15,536,531 | ||
Liabilities | ||||
Capital shares redeemed | 70,181 | |||
Fees payable to Parnassus Investments | 2,633 | |||
Distributions payable | 5,598 | |||
Professional fees payable | 2,767 | |||
Service provider fees payable | 1,990 | |||
Accounts payable and accrued expenses | 7,936 | |||
Total liabilities | $ | 91,105 | ||
Net assets | $ | 15,445,426 | ||
Net assets consist of | ||||
Undistributed net investment income | 656 | |||
Unrealized appreciation on securities | 8,620 | |||
Accumulated net realized loss | (1,593 | ) | ||
Capital paid-in | 15,437,743 | |||
Total net assets | $ | 15,445,426 | ||
Computation of net asset value and offering price per share | ||||
Net asset value and redemption price per share | $ | 16.39 | ||
| The accompanying notes are an integral part of these financial statements. | 39 |
Table of Contents
THE PARNASSUS CALIFORNIA TAX-EXEMPT FUND
Statement of Operations
Six Months Ended June 30, 2007 (unaudited)
Investment income | ||||
Interest | $ | 318,533 | ||
Total investment income | $ | 318,533 | ||
Expenses | ||||
Investment advisory fees (note 5) | 39,880 | |||
Transfer agent fees (note 5) | 5,629 | |||
Fund administration (note 5) | 5,507 | |||
Service provider fees (note 5) | 10,498 | |||
Reports to shareholders | 3,342 | |||
Registration fees and expenses | 268 | |||
Custody fees | 1,769 | |||
Professional fees | 6,567 | |||
Trustee fees and expenses | 643 | |||
Other expenses | 5,764 | |||
Total expenses | $ | 79,867 | ||
Fees waived by Parnassus Investments (note 5) | (25,683 | ) | ||
Expense offset (note 6) | (4 | ) | ||
Net expenses | $ | 54,180 | ||
Net investment income | $ | 264,353 | ||
Realized and unrealized gain (loss) on investments | ||||
Net realized loss from securities transactions | (1,593 | ) | ||
Net change in unrealized depreciation of securities | (157,916 | ) | ||
Net realized and unrealized loss on securities | $ | (159,509 | ) | |
Net increase in net assets resulting from operations | $ | 104,844 | ||
40 | The accompanying notes are an integral part of these financial statements. |
Table of Contents
THE PARNASSUS CALIFORNIA TAX-EXEMPT FUND
Statement of Changes in Net Assets
Six Months Ended June 30, 2007 (unaudited) | Year Ended December 31, 2006 | |||||||
Income (loss) from operations | ||||||||
Net investment income | $ | 264,353 | $ | 622,972 | ||||
Net realized gain (loss) from securities transactions | (1,593 | ) | 4,290 | |||||
Net change in unrealized depreciation | (157,916 | ) | (88,365 | ) | ||||
Increase in net assets resulting from operations | $ | 104,844 | $ | 538,897 | ||||
Distributions | ||||||||
From net investment income | (266,824 | ) | (621,030 | ) | ||||
From realized capital gains | — | (14,896 | ) | |||||
Dividends to shareholders | $ | (266,824 | ) | $ | (635,926 | ) | ||
From capital share transactions | ||||||||
Decrease in net assets from capital share transactions | (2,357,842 | ) | (3,572,434 | ) | ||||
Decrease in net assets | $ | (2,519,822 | ) | $ | (3,669,463 | ) | ||
Net assets | ||||||||
Beginning of period | 17,965,248 | 21,634,711 | ||||||
End of period | $ | 15,445,426 | $ | 17,965,248 | ||||
| The accompanying notes are an integral part of these financial statements. | 41 |
Table of Contents
NOTES TO FINANCIAL STATEMENTS (unaudited)
1. Organization and Significant Accounting Policies
The Parnassus Income Funds (the “Trust”), formerly the Parnassus Income Trust, organized on August 8,1990 as a Massachusetts Business Trust, is registered under the Investment Company Act of 1940 as a diversified, open-end investment management company comprised of three separate funds (the “funds”), each offering separate shares. The Trust began operations on August 31,1992.
Securities Valuations
Equity securities that are listed or traded on a national securities exchange are stated at market value, based on recorded closing sales on the exchange or on the Nasdaq’s National Market System official closing price. In the absence of a recorded sale, and for over-the-counter securities, equity securities are stated at the mean between the last recorded bid and asked prices. Long-term, fixed-income securities are valued each business day using prices based on procedures established by independent pricing services and approved by the Board of Trustees (the “Trustees”). Fixed-income securities with an active market are valued at the “bid” price where such quotes are readily available from brokers and dealers, and are representative of the actual market for such securities. Other fixed-income securities experiencing a less active market are valued as determined by the pricing services based on methods which include consideration of trading in securities of comparable yield, quality, coupon, maturity and type, as well as indications as to values from dealers and other market data without exclusive reliance upon quoted prices or over-the-counter prices, since such valuations are believed to reflect more accurately the value of such securities. Short-term investments in U.S. Government Agency discount notes, certificates of deposit, community development loans and other community development investments are valued at amortized cost, which approximates market value. Investments in registered investment companies are valued at their net asset value.
Investments where market quotations are not readily available are priced at their fair value, in accordance with procedures established by the Trustees. In determining fair value, the Trustees may consider a variety of information including, but not limited to, the following: price based upon a multiple of earnings or sales, fundamental analytical data and an evaluation of market conditions. A valuation adjustment is applied to certificates of deposit, community development loans and other community investments as an estimate of potential penalties for early withdrawal.
Federal Income Taxes
The Trust intends to comply with the requirements of the Internal Revenue Code applicable to regulated investment companies and to distribute all taxable and tax-exempt income to shareholders. Therefore, no federal income tax provision is required. Income distributions and capital-gain distributions are determined in accordance with income tax regulations, which may differ from accounting principles generally accepted in the United States of America.
Securities Transactions
Securities transactions are recorded on the date the securities are purchased or sold (trade date). Realized gains and losses on securities transactions are determined on the basis of first-in, first-out for both financial statement and federal income tax purposes.
42
Table of Contents
Dividends to Shareholders
Distributions to shareholders are recorded on the record date. The Equity Income Fund pays income dividends quarterly and capital-gain dividends annually. The Fixed-Income and California Tax-Exempt Funds pay income dividends monthly and capital-gain dividends annually.
Investment Income and Expenses
Dividend income is recognized on the ex-dividend date and interest income is recognized on an accrual basis. Discounts and premiums on securities purchased are amortized over the lives of the respective securities using the constant yield method, which approximates the interest method. Expenses are recorded on an accrual basis.
Income and expenses (other than and investment advisory fees and class-specific expenses) and realized and unrealized gains and losses are allocated daily among the various share classes based on their relative shares outstanding. Investment advisory fees are based on the fund’s average daily net assets and are allocated among the share classes based on relative net assets. Class-specific fees and expenses, such as transfer agency fees and service provider fees, are charged directly to the respective share class.
Securities Lending
The Equity Income Fund and the Fixed-Income Fund lend securities to approved financial institutions to earn additional income and receive cash and/or securities as collateral to secure the loans. Collateral is maintained at not less than 102% of the value of loaned securities. Although the risk of lending is mitigated by the collateral, the funds could experience a delay in recovering securities and a possible loss of income or value if the borrower fails to return them.
Community Development Investment Programs
The Equity Income Fund and the Fixed Income Fund may each invest up to 2% of their assets in community investments and community-development loan funds. Each of the Funds may invest in obligations issued by community loan funds at below-market interest rates if the projects financed have a positive social impact. Generally, there is no secondary market on loan funds and thus these are considered illiquid because they may not be able to be sold within seven days.
As part of our community development investment program, the Equity Income Fund has entered into an agreement for fund investments through the Certificate of Deposit Account Registry Service (“CDARS”) network. The CDARS network allows members to place funds in time deposits with depository institutions whose accounts are insured by the Federal Deposit Insurance Corporation (“FDIC”). Provisions stipulate that participating institutions are FDIC insured, however, in the event of default or bankruptcy by any party to the agreement, the proceeds of the investment may be delayed or subject to legal proceedings and are subject to FDIC limits.
The Equity Income Fund holds a debt instrument issued by Microvest I, LP, a microfinance limited partnership specializing in providing capital to international microfinance institutions (“MFI’s”) that extend credit to developing countries and the entrepreneurial
43
Table of Contents
NOTES TO FINANCIAL STATEMENTS (unaudited) continued
poor. This instrument may be subject to political and foreign currency exchange risk not normally associated with domestic debt instruments. Microvest I, LP investment in MFI’s can be affected by, among other factors, commodity prices, inflation, interest rates, taxation, social instability, and other political, economic or diplomatic developments in or affecting the various countries where MFI’s operate.
When-Issued Securities
The Funds may purchase or sell securities on a delayed delivery or when-issued basis. Payment and delivery may take place after the customary settlement period for that security. The price of the underlying securities and the date when the securities will be delivered and paid for are fixed at the time the transaction is negotiated. During the time a delayed delivery sell is outstanding, the contract is marked-to-market daily and equivalent deliverable securities are held for the transaction. The value of the securities purchased on a delayed delivery or when-issued basis are identified as such in the Fund’s Portfolio of Investments. With respect to purchase commitments, the Fund identifies securities as segregated in its records with a value at least equal to the amount of the commitment. Losses may arise due to changes in the value of the underlying securities or if the counterparty does not perform under the contract’s terms, or if the issuer does not issue the securities due to political, economic, or other factors.
New Accounting Pronouncements
In June 2006, the Financial Accounting Standards Board (FASB) issued FASB Interpretation No. 48 – Accounting for Uncertainty in Income Taxes – an interpretation of FASB No. 109, which establishes a minimum threshold for income tax benefits to be recognized on the financial statements. These tax benefits must meet a “more likely than not” threshold, which means that based on technical merits, they have a more than 50% likelihood of being sustained upon examination by the tax authority. Tax benefits meeting this threshold will be measured as the largest amount of tax benefit that is greater than 50% likely of being realized upon ultimate settlement with the tax authority. FASB Interpretation No. 48 is effective for periods beginning after December 15, 2006, and was adopted by the funds on January 1, 2007. The adoption had no effect on the funds’ financial statements. In addition, in September 2006, Statement of Financial Accounting Standards No. 157, Fair Value Measurements (SFAS 157), was issued and is effective for fiscal years beginning after November 15, 2007. SFAS 157 defines fair value, establishes a framework for measuring fair value and expands disclosures about fair value measurements. Management is currently evaluating the impact the adoption of SFAS 157 will have on the funds’ financial statement disclosures.
Use of Estimates
The preparation of financial statements in conformity with accounting principles generally accepted in the United States of America requires management to make estimates and assumptions that affect the reported amounts of assets and liabilities at the date of the financial statements and the reported amounts of revenues and expenses during the reporting period. Actual results could differ from those estimates.
44
Table of Contents
2. Tax Matters and Distributions
At June 30, 2007, the cost of investments in long-term securities excluding temporary investments, net unrealized appreciation (depreciation) were as follows:
Equity Income Fund | Fixed- Income Fund | California Tax- Exempt Fund | ||||||||||
Cost of investment | $ | 824,182,168 | $ | 50,472,594 | $ | 15,088,421 | ||||||
Unrealized appreciation | 109,776,016 | 872,852 | 99,277 | |||||||||
Unrealized depreciation | (13,592,619 | ) | (802,888 | ) | (90,657 | ) | ||||||
Net unrealized appreciation | $ | 96,183,397 | $ | 69,964 | $ | 8,620 | ||||||
Net investment income differs for financial statements and tax purposes primarily due to income recognition differences for partnership investments. Net realized gains differ for financial statements and tax purposes primarily due to differing treatments of wash sales and partnership allocations.
The Fixed-Income Fund incurred $210 of Post-October capital losses as of December 31, 2006, which are deferred until 2007 for tax purposes.
3. Capital Stock
Equity Income Fund: The Equity Income Fund offers two classes of shares, Investor Shares and Institutional Shares. The shares differ by service provider fees which are only incurred by Investor Shares and transfer agency fees. As of June 30, 2007, there were an unlimited number of authorized shares of capital stock, no par value. Paid-in capital aggregated $752,982,371. Transactions in capital stock (shares) were as follows:
| Six Months Ended June 30, 2007 | Year Ended December 31, 2006 | |||||||||||||
Investor Shares: | Shares | Amount | Shares | Amount | ||||||||||
Shares sold | 2,582,888 | $ | 67,771,747 | 4,315,687 | $ | 109,922,407 | ||||||||
Shares issued through dividend reinvestment | 123,454 | 3,245,878 | 3,180,687 | 81,316,576 | ||||||||||
Shares repurchased | (3,590,042 | ) | (94,118,324 | ) | (12,704,220 | ) | (319,945,814 | ) | ||||||
Net decrease | (883,700 | ) | $ | (23,100,699 | ) | (5,207,846 | ) | $ | (128,706,831 | ) | ||||
45
Table of Contents
NOTES TO FINANCIAL STATEMENTS (unaudited) continued
| Six Months Ended June 30, 2007 | Year Ended December 31, 2006 | |||||||||||||
Institutional Shares: | Shares | Amount | Shares | Amount | ||||||||||
Shares sold | 560,307 | $ | 14,768,104 | 1,836,237 | $ | 47,056,910 | ||||||||
Shares issued through dividend reinvestment | 9,110 | 240,272 | 158,817 | 4,060,327 | ||||||||||
Shares repurchased | (510,975 | ) | (13,104,421 | ) | (125,562 | ) | (3,151,216 | ) | ||||||
Net increase | 58,442 | $ | 1,903,955 | 1,869,492 | $ | 47,966,021 | ||||||||
| (a) | For the period April 28, 2006 (inception of institutional shares) through December 31, 2006. |
Fixed-Income Fund: As of June 30, 2007, there were an unlimited number of authorized shares of capital stock, no par value. Paid-in capital aggregated $70,329,008. Transactions in capital stock (shares) were as follows:
| Six Months Ended June 30, 2007 | Year Ended December 31, 2006 | |||||||||||||
| Shares | Amount | Shares | Amount | |||||||||||
Shares sold | 934,995 | $ | 15,085,605 | 1,534,155 | $ | 24,754,494 | ||||||||
Shares issued through dividend reinvestment | 78,695 | 1,265,473 | 155,252 | 2,503,607 | ||||||||||
Shares repurchased | (467,916 | ) | (7,541,261 | ) | (715,147 | ) | (11,505,949 | ) | ||||||
Net increase | 545,774 | $ | 8,809,817 | 974,260 | $ | 15,752,152 | ||||||||
California Tax-Exempt Fund: As of June 30, 2007, there were an unlimited number of authorized shares of capital stock, no par value. Paid-in capital aggregated $15,437,743. Transactions in capital stock (shares) were as follows:
| Six Months Ended June 30, 2007 | Year Ended December 31, 2006 | |||||||||||||
| Shares | Amount | Shares | Amount | |||||||||||
Shares sold | 68,072 | $ | 1,126,244 | 109,049 | $ | 1,808,073 | ||||||||
Shares issued through dividend reinvestment | 14,137 | 233,354 | 33,780 | 559,043 | ||||||||||
Shares repurchased | (224,594 | ) | (3,717,440 | ) | (358,511 | ) | (5,939,550 | ) | ||||||
Net decrease | (142,384 | ) | $ | (2,357,842 | ) | (215,682 | ) | $ | (3,572,434 | ) | ||||
46
Table of Contents
4. Purchases and Sales of Securities
Purchases and proceeds from sales of securities, excluding short-term securities, for the six-month period ended June 30, 2007 were as follows:
| Purchases | Sales | |||||
Equity Income Fund | $ | 439,191,384 | $ | 645,975,411 | ||
Fixed Income Fund | $ | 20,482,859 | $ | 5,836,801 | ||
California Tax-Exempt Fund | $ | 0 | $ | 3,675,797 | ||
5. Investment Advisory Agreement and Transactions with Affiliates
Under terms of an agreement which provides for furnishing investment management and advice to the funds, Parnassus Investments is entitled to receive fees payable monthly, based on each fund’s average daily net assets for the month, at the following annual rates:
Equity Income Fund: 0.75% of the first $30,000,000, 0.70% of the next $70,000,000 and 0.65% of the amount above $100,000,000. Fixed-Income Fund and California Tax-Exempt Fund: 0.50% of the first $200,000,000, 0.45% of the next $200,000,000 and 0.40% of the amount above $400,000,000. For the six-month period ended June 30, 2007, Parnassus Investments has contractually agreed to reduce its investment advisory fee through May 1, 2007 to the extent necessary to limit total operating expenses to 0.99% of net assets for the Equity Income Fund– Investor Shares, 0.78% of net assets for the Equity Income Fund – Institutional Shares, 0.87% of net assets for the Fixed-Income Fund and 0.75% of net assets for the California Tax-Exempt Fund.
As a result of fee waivers, including additional voluntary waivers of 0.12% for Fixed-Income Fund and 0.07% for California Tax-Exempt Fund, the following were actually charged for the six-month period ended June 30, 2007. For the Equity Income Fund, the net investment advisory fee was 0.63% and Parnassus Investments received net advisory fees totaling $2,610,924. For the Fixed-Income Fund, the net investment advisory fee was 0.38% and Parnassus Investments received net advisory fees totaling $128,072. For the California Tax-Exempt Fund, the net investment advisory fee was 0.18% and Parnassus Investments received net advisory fees totaling $14,197.
Parnassus Investments receives fees under terms of a separate agreement which provides for furnishing transfer agent and fund administration services to the funds. The transfer agent fee was $2.70 per month per account plus any out-of-pocket expenses. The funds pay the monthly fee based on the number of accounts on record at each month-end. The fund administration reflects annual rates based on net assets for all funds managed by Parnassus Investments and was allocated based on respective fund net assets. The annualized fund administration services fee was 0.07% of average net assets under this new agreement for the six-month period ended June 30, 2007.
47
Table of Contents
NOTES TO FINANCIAL STATEMENTS (unaudited) continued
Parnassus Investments may also arrange for third parties to provide certain services, including account maintenance, recordkeeping and other personal services to their clients who invest in the funds. For these services, the funds may pay service providers an aggregate service fee on investment accounts at a rate not to exceed 0.25% per annum of average daily net assets. The Equity Income Fund– Institutional Shares did not incur service provider fees.
Jerome L. Dodson is the president of the Trust and is the president and majority stockholder of Parnassus Investments.
6. Expense Offset Arrangement
The funds have entered into an arrangement with the custodian whereby credits realized as a result of uninvested cash balances are used to reduce a portion of the custodian fees. During the six-month period ended June 30, 2007, the custodian fees were reduced as indicated in the statements of operations.
7. Geographic and Industry Concentration Risk Factors
The California Tax-Exempt Fund primarily invests in debt obligations issued by the State of California and its political sub-divisions, agencies and public authorities to obtain funds for various public purposes. There are certain risks arising from the concentration of investments in California municipal securities. The California Tax-Exempt Fund is more susceptible to factors adversely affecting issuers of California municipal securities than a fund that is not concentrated in these issuers to the same extent. Uncertain economic conditions or governmental developments may affect the ability of California municipal securities issuers to meet their financial obligations.
48
Table of Contents
Selected data for each share of capital stock outstanding, total return and ratios/supplemental data for the six-month period ended June 30, 2007 and each of the five years ended December 31 are as follows:
Equity Income Fund – Investor Shares
June 30, 2007 (unaudited) | 2006 | 2005 | 2004 | 2003 | 2002 | |||||||||||||||||||
Net asset value at beginning of year | $ | 24.83 | $ | 24.02 | $ | 25.00 | $ | 24.00 | $ | 21.20 | $ | 22.50 | ||||||||||||
Income (loss) from operations: | ||||||||||||||||||||||||
Net investment income(c) | 0.10 | 0.30 | 0.41 | 0.40 | 0.44 | 0.49 | ||||||||||||||||||
Net realized and unrealized gain (loss) on securities | 2.56 | 3.23 | 0.24 | 1.79 | 2.85 | (1.32 | ) | |||||||||||||||||
Total from investment operations | 2.66 | 3.53 | 0.65 | 2.19 | 3.29 | (0.83 | ) | |||||||||||||||||
Distributions: | ||||||||||||||||||||||||
Dividends from net investment income | (0.10 | ) | (1.38 | ) | (0.85 | ) | (0.56 | ) | (0.49 | ) | (0.29 | ) | ||||||||||||
Distributions from net realized gains | — | (1.34 | ) | (0.78 | ) | (0.63 | ) | — | (0.18 | ) | ||||||||||||||
Total distributions | (0.10 | ) | (2.72 | ) | (1.63 | ) | (1.19 | ) | (0.49 | ) | (0.47 | ) | ||||||||||||
Net asset value at end of year | $ | 27.39 | $ | 24.83 | $ | 24.02 | $ | 25.00 | $ | 24.00 | $ | 21.20 | ||||||||||||
Total return(a) | 10.75 | % | 14.70 | % | 2.62 | % | 9.30 | % | 15.69 | % | (3.69 | )% | ||||||||||||
Ratios/supplemental data: | ||||||||||||||||||||||||
Ratio of gross expenses to average net assets | 1.06 | %(b) | 1.06 | % | 1.07 | % | 1.04 | % | 0.96 | % | 1.03 | % | ||||||||||||
Ratio of net expenses to average net assets (net of waiver and credit offset arrangements) | 0.99 | %(b)(d) | 0.99 | %(d) | 0.99 | %(d) | 1.04 | % | 0.95 | % | 0.96 | % | ||||||||||||
Ratio of net investment income to average net assets | 0.78 | %(b) | 1.17 | % | 1.63 | % | 1.63 | % | 1.95 | % | 2.29 | % | ||||||||||||
Portfolio turnover rate | 50.15 | % | 116.75 | % | 109.54 | % | 79.88 | % | 79.21 | % | 42.01 | % | ||||||||||||
Net assets, end of year (000s) | $ | 867,359 | $ | 808,104 | $ | 906,844 | $ | 894,415 | $ | 630,249 | $ | 273,429 | ||||||||||||
49
Table of Contents
NOTES TO FINANCIAL STATEMENTS (unaudited) continued
Equity Income Fund – Institutional Shares
| June 30, 2007 (unaudited) | 2006(a) | |||||||
Net asset value at beginning of year | $ | 24.86 | $ | 25.59 | ||||
Income from operations: | ||||||||
Net investment income(c) | 0.14 | 0.19 | ||||||
Net realized and unrealized gain on securities | 2.56 | 1.73 | ||||||
Total from investment operations | 2.70 | 1.92 | ||||||
Distributions: | ||||||||
Dividends from net investment income | (0.14 | ) | (1.31 | ) | ||||
Distributions from net realized gains | — | (1.34 | ) | |||||
Total distributions | (0.14 | ) | (2.65 | ) | ||||
Net asset value at end of year | $ | 27.42 | $ | 24.86 | ||||
Total return(a) | 10.86 | % | 7.46 | % | ||||
Ratios/supplemental data: | ||||||||
Ratio of gross expenses to average net assets(b) | 0.85 | % | 0.85 | % | ||||
Ratio of net expenses to average net assets(b) (net of waiver and credit offset arrangements) (b)(d) | 0.78 | % | 0.78 | % | ||||
Ratio of net investment income to average net assets | 1.03 | % | 1.10 | % | ||||
Portfolio turnover rate | 50.15 | % | 116.75 | % | ||||
Net assets, end of year (000s) | $ | 52,868 | $ | 46,471 | ||||
50
Table of Contents
Fixed-Income Fund
June 30, 2007 (unaudited) | 2006 | 2005 | 2004 | 2003 | 2002 | |||||||||||||||||||
Net asset value at beginning of year | $ | 16.11 | $ | 15.79 | $ | 15.87 | $ | 16.00 | $ | 15.88 | $ | 14.94 | ||||||||||||
Income (loss) from operations: | ||||||||||||||||||||||||
Net investment income(c) | 0.34 | 0.67 | 0.48 | 0.33 | 0.58 | 0.82 | ||||||||||||||||||
Net realized and unrealized gain (loss) on securities | (0.15 | ) | 0.49 | (0.08 | ) | (0.01 | ) | 0.26 | 0.95 | |||||||||||||||
Total from investment operations | 0.19 | 1.16 | 0.40 | 0.32 | 0.84 | 1.77 | ||||||||||||||||||
Distributions: | ||||||||||||||||||||||||
Dividends from net investment income | (0.34 | ) | (0.74 | ) | (0.48 | ) | (0.33 | ) | (0.65 | ) | (0.83 | ) | ||||||||||||
Distributions from net realized gains | — | (0.10 | ) | — | (0.09 | ) | (0.07 | ) | — | |||||||||||||||
Return of capital | — | — | — | (0.03 | ) | — | — | |||||||||||||||||
Total distributions | (0.34 | ) | (0.84 | ) | (0.48 | ) | (0.45 | ) | (0.72 | ) | (0.83 | ) | ||||||||||||
Net asset value at end of year | $ | 15.96 | $ | 16.11 | $ | 15.79 | $ | 15.87 | $ | 16.00 | $ | 15.88 | ||||||||||||
Total return(a) | 1.16 | % | 7.45 | % | 2.55 | % | 2.05 | % | 5.30 | % | 12.20 | % | ||||||||||||
Ratios/supplemental data: | ||||||||||||||||||||||||
Ratio of gross expenses to average net assets | 0.87 | %(b) | 0.92 | % | 1.01 | % | 0.97 | % | 0.92 | % | 1.08 | % | ||||||||||||
Ratio of net expenses to average net assets (net of waiver and credit offset arrangements)(d) | 0.75 | %(b) | 0.75 | % | 0.75 | % | 0.75 | % | 0.62 | % | 0.81 | % | ||||||||||||
Ratio of net investment income to average net assets | 4.20 | %(b) | 4.13 | % | 3.03 | % | 2.08 | % | 3.59 | % | 5.36 | % | ||||||||||||
Portfolio turnover rate | 13.82 | % | 41.27 | % | 34.08 | % | 24.38 | % | 125.74 | % | 59.00 | % | ||||||||||||
Net assets, end of year (000s) | $ | 70,642 | $ | 62,520 | $ | 45,879 | $ | 38,205 | $ | 34,098 | $ | 19,092 | ||||||||||||
51
Table of Contents
NOTES TO FINANCIAL STATEMENTS (unaudited) continued
California Tax-Exempt Fund
June 30, 2007 (unaudited) | 2006 | 2005 | 2004 | 2003 | 2002 | |||||||||||||||||||
Net asset value at beginning of year | $ | 16.56 | $ | 16.64 | $ | 17.10 | $ | 17.14 | $ | 17.19 | $ | 16.61 | ||||||||||||
Income (loss) from operations: | ||||||||||||||||||||||||
Net investment income(c) | 0.28 | 0.53 | 0.50 | 0.48 | 0.53 | 0.59 | ||||||||||||||||||
Net realized and unrealized gain (loss) on securities | (0.17 | ) | (0.06 | ) | (0.40 | ) | (0.02 | ) | 0.12 | 0.83 | ||||||||||||||
Total from investment operations | 0.11 | 0.47 | 0.10 | 0.46 | 0.65 | 1.42 | ||||||||||||||||||
Distributions: | ||||||||||||||||||||||||
Dividends from net investment income | (0.28 | ) | (0.54 | ) | (0.51 | ) | (0.48 | ) | (0.53 | ) | (0.59 | ) | ||||||||||||
Distributions from net realized gains | — | (0.01 | ) | (0.05 | ) | (0.02 | ) | (0.17 | ) | (0.25 | ) | |||||||||||||
Total distributions | (0.28 | ) | (0.55 | ) | (0.56 | ) | (0.50 | ) | (0.70 | ) | (0.84 | ) | ||||||||||||
Net asset value at end of year | $ | 16.39 | $ | 16.56 | $ | 16.64 | $ | 17.10 | $ | 17.14 | $ | 17.19 | ||||||||||||
Total return(a) | 0.65 | % | 2.88 | % | 0.62 | % | 2.73 | % | 3.88 | % | 8.66 | % | ||||||||||||
Ratios/supplemental data: | ||||||||||||||||||||||||
Ratio of gross expenses to average net assets | 1.00 | %(b) | 0.91 | % | 0.91 | % | 0.81 | % | 0.83 | % | 0.95 | % | ||||||||||||
Ratio of net expenses to average net assets (net of waiver and credit offset arrangements)(d) | 0.68 | %(b) | 0.68 | % | 0.68 | % | 0.67 | % | 0.62 | % | 0.73 | % | ||||||||||||
Ratio of net investment income to average net assets | 3.32 | %(b) | 3.22 | % | 3.01 | % | 2.82 | % | 3.08 | % | 3.45 | % | ||||||||||||
Portfolio turnover rate | — | 9.29 | % | 13.18 | % | — | 16.16 | % | 41.73 | % | ||||||||||||||
Net assets, end of year (000s) | $ | 15,445 | $ | 17,965 | $ | 21,635 | $ | 25,594 | $ | 24,825 | $ | 26,163 | ||||||||||||
| (a) | Not annualized for periods less than one year. |
| (b) | Annualized. |
| (c) | Net investment income per share is based on average daily shares outstanding. |
| (d) | Parnassus Investments has contractually limited expenses. For the six month period ended June 30, 2007 expenses were limited to an annualized rate of 0.99% for the Equity Income Fund – Investor Shares, 0.87% for the Fixed-Income Fund and 0.75% for the California Tax-Exempt Fund. Parnassus Investments has also voluntarily limited additional expenses for the Fixed-Income Fund and the California Tax-Exempt Fund (see note 5 for details). For the Equity Income Fund –Institutional Shares, Parnassus has contractually limited expenses to an annualized rate of 0.78% for the periods indicated. |
| (e) | The Equity Income Fund – Institutional Shares commenced operations on April 28, 2006 and the period shown is from April 28, 2006 through December 31, 2006. |
52
Table of Contents
ADDITIONAL INFORMATION (unaudited)
Investment Advisory Agreement Renewal
The Board of Trustees of the Parnassus Income Funds approved the continuation of the Parnassus Income Fund’s investment advisory agreement with Parnassus Investments. Prior to approving the continuation of the investment advisory agreement, the Board considered:
| • | the nature, extent and quality of the services provided by Parnassus Investments; |
| • | the degree to which the Parnassus Equity Income Fund, the Parnassus Fixed-Income Fund and the Parnassus California Tax-Exempt Fund are being managed in accordance with each fund’s stated investment objective; |
| • | the investment performance of the each of the Parnassus Income Funds; |
| • | the cost of the services to be provided and profits to be realized by Parnassus Investments from its relationship with each of the Parnassus Income Funds; |
| • | the extent to which economies of scale would be realized as each of the Parnassus Income Funds grew and whether fee levels reflect these economies of scale; |
| • | the expense ratio of each of the Parnassus Income Funds; and |
| • | the manner in which portfolio transactions for the Parnassus Income Funds are conducted, including the use of soft dollars. |
In considering the nature, extent and quality of the services provided by Parnassus Investments, the Board of Trustees reviewed written and oral reports prepared by Parnassus Investments describing the portfolio management, shareholder communication and servicing, prospective shareholder assistance and regulatory compliance services provided by Parnassus Investments to the Parnassus Income Funds, and a written report prepared by Lipper, Inc. comparing aspects of the portfolio management services provided by Parnassus Investments to similar services provided to comparable mutual funds. The Board concluded that Parnassus Investments was providing essential services to the Parnassus Income Funds. In particular, the Board concluded that Parnassus Investments was preparing reports to shareholders in addition to those required by law.
The Trustees compared the performance of each of the Parnassus Income Funds to benchmark indices over various periods of time and to comparable mutual funds as determined by Lipper, Inc. and concluded that the overall performance of each fund warranted the continuation of the investment advisory agreement.
53
Table of Contents
ADDITIONAL INFORMATION (unaudited) continued
In concluding that the advisory fees payable by each of the Parnassus Income Funds were reasonable, the Trustees reviewed a report of the costs of services provided, and the profits realized, by Parnassus Investments, from its relationship with each fund and concluded that such profits were reasonable and not excessive when compared to profitability guidelines set forth in relevant court cases. The Trustees also reviewed reports comparing each fund’s expense ratio and advisory fees paid by each fund to those of other comparable mutual funds and concluded that the advisory fee paid by each fund and each fund’s expense ratio were within the range of comparable mutual funds. The Trustees noted that the investment advisory fee contained a number of breakpoints in an effort to reflect economies of scale that might be realized as each fund grew.
The Board reviewed reports discussing the manner in which portfolio transactions for the Parnassus Equity Income Fund were conducted, including the use of soft dollars. Based on these reports, the Board concluded that the research obtained by Parnassus Investments was beneficial to the Parnassus Equity Income Fund and that Parnassus Investments was executing the Parnassus Equity Income Fund’s portfolio transactions in a manner designed to obtain best execution for the Parnassus Equity Income Fund.
Proxy Disclosures
Parnassus proxy voting policies and procedures are available, without charge, on our website (www.parnassus.com), on the Securities and Exchange Commission’s website (www.sec.gov), and by calling us at (800) 999-3505. On the Parnassus website you can also find a record of our votes cast at shareholder meetings.
Quarterly Portfolio Schedule
The funds file their complete schedule of portfolio holdings with the Securities and Exchange Commission for the first and third quarters of each fiscal year on Form N-Q. The quarterly portfolio holdings are available on the Securities and Exchange Commission’s website (www.sec.gov). The funds’ Form N-Q may also be reviewed and copied at the Securities and Exchange Commission’s Public Reference Room in Washington, DC, and information on the operation of the Public Reference Room may be obtained by calling (800) SEC-0330.
54
Table of Contents
This page left blank intentionally.
55
Table of Contents
This page left blank intentionally.
56
Table of Contents
This page left blank intentionally.
57
Table of Contents

THE PARNASSUS INCOME FUNDS
Investing with a Conscience
One Market – Steuart Tower, Suite 1600 San Francisco, CA 94105 (800) 999-3505 (415) 778-0200 www.parnassus.com
Investment Adviser
Parnassus Investments One Market – Steuart Tower Suite 1600 San Francisco, CA 94105
Legal Counsel
Foley & Lardner LLP 777 E. Wisconsin Ave. Milwaukee, WI 53202
Independent Registered Public Accounting Firm
Deloitte & Touche LLP 50 Fremont Street San Francisco, CA 94105
Distributor
Parnassus Investments One Market – Steuart Tower Suite 1600 San Francisco, CA 94105
This report must be preceded or accompanied by a current prospectus.
Recycled Paper
Table of Contents
Item 2: Code of Ethics
Not applicable for semi-annual reports. The information required by this Item is only required in an annual report on Form N-CSR.
Item 3: Audit Committee Financial Expert
Not applicable for semi-annual reports. The information required by this Item is only required in an annual report on Form N-CSR.
Item 4: Principal Accountant Fees and Services
Not applicable for semi-annual reports. The information required by this Item is only required in an annual report on Form N-CSR.
Item 5: Not applicable.
Item 6: Included as part of the report to shareholders filed under Item 1 of this form.
Item 7: Not applicable.
Item 8: Not applicable.
Item 9: Not applicable.
Item 10: For the purposes of this Item, there have not been any material changes to the procedures by which shareholders may recommend nominees to the registrant’s Board of Trustees.
Item 11: Controls and Procedures.
(a) The registrant’s certifying officers have reasonably designed such disclosure controls and procedures to ensure material information relating to the registrant is made known to them by others, particularly during the period in which this report is being prepared. The registrant’s certifying officers have determined that the registrant’s disclosure controls and procedures are effective based on their evaluation of these controls and procedures as of a date within 90 days prior to the filing date of this report.
(b) There were no significant changes in the registrant’s internal controls over financial reporting, or in other factors that could significantly affect these controls, that occurred during the registrant’s first fiscal half-year, including any corrective actions with regard to significant deficiencies and material weaknesses.
Item 12: Exhibits attached hereto.
(a)(1) Code of Ethics - Not applicable for semi-annual reports.
(a)(2) Certification for each principal executive and principal financial officer of the registrant as required by Rule 30a-2 under the Act (17 CFR 270.30a-2(a)) - Filed as an attachment to this filing.
(b) Certifications required by Rule 30a-2(b) under the Act (17 CFR 270.30a-2(b)), Rule 13a-14(b) or Rule 15d-14(b) under the Exchange Act (17 CFR 240.13a-14(b) or 240.15d-14(b)), and Section 1350 of Chapter 63 of Title 18 of the United States Code (18 U.S.C. 1350). A certification furnished pursuant to this paragraph will not be deemed “filed” for purposes of Section 18 of the Exchange Act (15 U.S.C. 78r), or otherwise subject to the liability of that section. Such certification will not be deemed to be incorporated by reference into any filing under the Securities Act of 1933 or the Exchange Act, except to the extent that the registrant specifically incorporates it by reference – Filed as an attachment to this filing.
Table of Contents
Pursuant to the requirements of the Securities Exchange Act of 1934 and the Investment Company Act of 1940, the registrant has duly caused this report to be signed on its behalf by the undersigned, thereunto duly authorized.
Parnassus Income Funds
| ||||
| Date: August 15, 2007 | By: | /s/ Jerome L. Dodson | ||
Jerome L. Dodson President | ||||
Pursuant to the requirements of the Securities Exchange Act of 1934 and the Investment Company Act of 1940, this report has been signed below by the following persons on behalf of the registrant and in the capacities and on the dates indicated.
| Date: August 15, 2007 | By: | /s/ Jerome L. Dodson | ||
Jerome L. Dodson President |
| Date: August 15, 2007 | By: | /s/ Debra A. Early | ||
Debra A. Early Principal Accounting Officer |