Table of Contents
PARNASSUS INCOME FUNDS
UNITED STATES
SECURITIES AND EXCHANGE COMMISSION
Washington, D.C. 20549
FORM N-CSRS
CERTIFIED SHAREHOLDER REPORT OF
REGISTERED MANAGEMENT INVESTMENT COMPANIES
Investment Company Act file number: 811-06673
Parnassus Income Funds
(Exact name of registrant as specified in charter)
1 Market Street, Suite 1600, San Francisco, California 94105
(Address of principal executive offices) (Zip code)
Marc C. Mahon
Parnassus Income Funds
1 Market Street, Suite 1600, San Francisco, California 94105
(Name and address of agent for service)
Registrant’s telephone number, including area code: (415) 778-0200
Date of fiscal year end: December 31
Date of reporting period: June 30, 2010
Table of Contents
Item 1: Report to Shareholders
THE PARNASSUS FUNDS®
SEMIANNUAL REPORT JUNE 30, 2010
Parnassus FundSM ¦ PARNX
Parnassus Equity Income Fund SM- Investor Shares PRBLX
Parnassus Equity Income Fund - Institutional Shares PRILX
Parnassus Mid-Cap FundSM PARMX
Parnassus Small-Cap Fund SM PARSX
Parnassus Workplace Fund® PARWX
Parnassus Fixed-Income FundSM PRFIX
Table of Contents
Parnassus Fund | (PARNX | ) | |
Parnassus Equity Income Fund–Investor Shares | (PRBLX | ) | |
Parnassus Equity Income Fund–Institutional Shares | (PRILX | ) | |
Parnassus Mid-Cap Fund | (PARMX | ) | |
Parnassus Small-Cap Fund | (PARSX | ) | |
Parnassus Workplace Fund | (PARWX | ) | |
Parnassus Fixed-Income Fund | (PRFIX | ) |
| 1 | ||
Fund Performance | ||
| 3 | ||
| 6 | ||
| 9 | ||
| 12 | ||
| 15 | ||
| 17 | ||
| 19 | ||
| 21 | ||
Portfolios of Investments | ||
| 22 | ||
| 24 | ||
| 27 | ||
| 29 | ||
| 31 | ||
| 32 | ||
| 36 | ||
| 43 | ||
| 50 | ||
| 54 |
Table of Contents
August 9, 2010
Dear Shareholder:
Enclosed you will find the semiannual reports for all six Parnassus Funds. After the spectacular performance of all our equity Funds in 2009, most of our Funds have come down to earth. The performance is adequate, but not like last year. For the quarter and the year-to-date, most of the Funds were either a bit above or a bit below the benchmarks. Longer-term performance, though, for all the Funds, is still excellent relative to our benchmarks. You can get all the details from the individual Fund reports.
The one Fund that still hasn’t settled down yet is the Parnassus Small-Cap Fund. Although that Fund lost 6.55% for the second quarter, the Russell 2000 Index of smaller companies lost 9.92% and the average small-cap core fund followed by Lipper, a Thomson Reuters company (“Lipper”) lost 9.37% . The Parnassus Small-Cap Fund beat its benchmarks by three percentage points this quarter. For the year-to-date, the Parnassus Small-Cap Fund is still defying the laws of gravity as it has gained 4.30% compared to a loss of 1.95% for the Russell 2000 Index and a loss of 2.05% for the average small-cap core fund followed by Lipper.
New Team Members
Maria Kamin recently joined the Parnassus team as manager of ESG (environmental, social and governance) research. Maria has excellent qualifications, and we’re proud that someone with Maria’s impressive background has joined the firm. Previously, she worked at the responsible investment research firm KLD Research as the research product manager and as a sustainability analyst. (KLD has since been bought out by RiskMetrics Group which, in turn, has been purchased by MSCI, Inc.) In 2008, Boston College recognized Maria as a Sustainability Fellow in the Leadership for Change program. She received her bachelor’s degree in political science from Tufts University, and a master’s degree in Pacific international affairs from the University of California at San Diego. Maria has also worked in Latin America with the U.S. Department of State and WorldTeach. We’re very happy to have her with us.
We also have three highly-qualified interns joining us this summer. Hallie Marshall is an MBA candidate at the Haas School of Business at the University of California at Berkeley, where she helps to manage the $2 million Haas Socially Responsible Investment Fund. Although she is a new mother, she also finds time to be a member of the Investment Club, the Finance Club, Women in Leadership and the Latin American and Hispanic Business Association. Previously, she worked as an equity research associate at Dodge & Cox investment managers in San Francisco. She is a graduate of Princeton University and received a Fulbright Scholarship to study in Honduras.
George Lai is also an MBA student at the Haas School at the University of California at Berkeley, where he is Co-President of the Investment Club and a principal of the Haas Socially Responsible Investment Fund where he works with Hallie. His previous experience includes work as Vice President of China Investment Banking at Merriman Curhan Ford in San Francisco and as an associate at J.P. Morgan Investment Bank in New York and Merrill Lynch in San Francisco. He is a graduate of Yale University where he studied political science and history, and went to the University of Tokyo as an exchange student. At Yale, he received an award for the best senior essay in comparative politics on China-Taiwan high-tech relations.
| THE PARNASSUS FUNDS | 1 |
Table of Contents
Wendy Walker is another MBA candidate at the Haas School at the University of California at Berkeley, where she is Co-President of the Investment Club, participates in Women in Leadership and also joins Hallie and George as a principal with the Haas Socially Responsible Investment Fund. Wendy is also a Haas Merit Scholar, a Forte Fellow and holds scholarships from the American Association of University Women and the Financial Women’s Association of San Francisco. Her previous experience includes work as a securities analyst at Argus Research and as a freelance actor, performing on stage, film, television and radio. She is a graduate of Yale University where she studied comparative literature.
Finally, I would like to thank all of you for investing with Parnassus.
Yours truly,

Jerome L. Dodson
President
Parnassus Investments
| 2 | THE PARNASSUS FUNDS |
Table of Contents
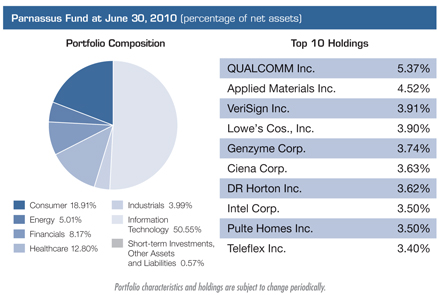
As of June 30, 2010, the net asset value per share (“NAV”) of the Parnassus Fund was $32.33, so the total return for the quarter was a loss of 13.32% . This compares to a loss of 11.41% for the S&P 500 Index (“S&P 500”), a loss of 11.00% for the Lipper Multi-Cap Core Average, which represents the average multi-cap core fund followed by Lipper, a Thomson Reuters company (“Lipper average”), and a loss of 11.83% for the Nasdaq Composite Index (“Nasdaq”). For the quarter, we lagged our benchmarks by a couple of percentage points.
For the year-to-date as of June 30, we were slightly behind the benchmarks. The Fund had a loss of 7.15% compared to a loss of 6.64% for the S&P 500, a loss of 6.15% for the Lipper average and a loss of 6.62% for the Nasdaq. Below is a table comparing the performance of the Parnassus Fund with that of the S&P 500, the Lipper average and the Nasdaq over the past one-, three-, five- and ten-year periods. You’ll notice that for the ten-year period, we’re nearly even with the S&P 500, somewhat behind the Lipper average and ahead of the Nasdaq. For the one-, three- and five-year periods, we’re ahead of all the benchmarks.
Average Annual Total Returns
for periods ended June 30, 2010
| One Year | Three Years | Five Years | Ten Years | Gross Expense Ratio | Net Expense Ratio | |||||||||||||
PARNASSUS FUND | 17.19 | % | -4.48 | % | 2.72 | % | -1.63 | % | 1.00 | % | 0.99 | % | ||||||
S&P 500 Index | 14.43 | % | -9.80 | % | -0.79 | % | -1.59 | % | NA | NA | ||||||||
Lipper Multi-Cap Core Average | 15.17 | % | -9.47 | % | -0.37 | % | 0.67 | % | NA | NA | ||||||||
Nasdaq Composite Index | 16.04 | % | -5.88 | % | 1.39 | % | -5.50 | % | NA | NA |
Performance data quoted represent past performance and are no guarantee of future returns. Current performance may be lower or higher than the performance data quoted. Current performance information to the most recent month-end is available on the Parnassus Investments website (www.parnassus.com). Investment return and principal value will fluctuate so that an investor’s shares, when redeemed, may be worth more or less than their original principal cost. Returns shown in the table do not reflect the deduction of taxes a shareholder may pay on fund distributions or redemption of shares. The S&P 500 Composite Stock Index, (also known as the S&P 500), and the Nasdaq Composite Index are unmanaged indices of common stocks, and it is not possible to invest directly in an index. Index figures do not take any expenses, fees or taxes into account, but mutual fund returns do. Prior to May 1, 2004, the Parnassus Fund charged a sales load (maximum of 3.5%), which is not reflected in the total return calculations. Before investing, an investor should carefully consider the investment objectives, risks, charges and expenses of the Fund and should carefully read the prospectus, which contains this and other information. The prospectus is available on the Parnassus Investments website, or one can be obtained by calling (800) 999–3505. As described in the Fund’s current prospectus dated May 1, 2010, Parnassus Investments has contractually agreed to limit the total operating expenses to 0.99% of net assets, exclusive of acquired fund fees, until May 1, 2011. This limitation may be continued indefinitely by the Adviser on a year-to-year basis.
Company Analysis
Most of the companies in the portfolio moved sharply lower during the quarter, with our stakes in finance, telecommunications, technology and homebuilders suffering big losses. The four companies that hurt us the most each accounted for a loss of 28¢ or more per fund share. The company that had the biggest negative impact on the Fund was Qualcomm, a provider of software and semiconductors for use in cellular telephones. The stock dropped 21.8% during the quarter, sinking from $41.99 to $32.84 and slicing 44¢ off the NAV. Qualcomm earns a royalty on the average selling price of handsets, and increased competition among handset manufacturers led to lower selling prices during the period. We’re hanging onto the stock, because we think the company has valuable technology, and we expect future handset price declines will be less severe than anticipated. We also expect increased handset sales to result in higher revenue and earnings for Qualcomm.
Three homebuilder stocks each accounted for losses of 28¢ or more on the NAV. Pulte Homes lost 38¢ per fund share, as its stock dropped 26.4% from $11.25 to $8.28. DR Horton cut 31¢ off each Parnassus share with its stock swooning 22.0% from $12.60 to $9.83, and KB Home cost the Fund 28¢ per share, with its stock falling 34.3% from $16.75 to $11.00.
The difficult housing market has caused investors to stay away from the homebuilders, so their shares have moved sharply lower. The expiration of the first-time homebuyers tax credit during the quarter removed a stimulus to the housing market. Despite all the negative sentiment, I’ve decided to keep the stocks in the portfolio. Homebuilding shares are trading at very low prices with most of
| THE PARNASSUS FUNDS | 3 |
Table of Contents
them selling around book value, so they’re definitely on the bargain table. Despite difficult conditions in the industry, the homebuilders in our portfolio are in good financial shape with all of them having positive cash flow over the past 12 months.
Although there are a lot of homes on the market right now, including a large number of foreclosures, the expanding U.S. population means the need for housing is increasing at a faster rate than houses are being built, so at some point, home prices will move higher. Housing prices and interest rates are very low now, so housing is much more affordable than at any time in the past decade.
The real problem is jobs. People without jobs cannot make the financial commitment necessary to purchase a home, and even those with a job are reluctant to buy with unemployment rates so high. The economy is expanding, however, and at some point, businesses will start hiring again. Once the economy starts creating large numbers of new jobs, there will be an enormous demand for housing. Typically, housing stocks move much higher 12-18 months before the housing market starts moving upward. I had expected the home-builders to move much higher before now, but I still expect them to move substantially upward before the end of the year.
None of the companies in the portfolio made a substantial positive contribution to the NAV, but there were two companies that each contributed 7¢ per fund share. W&T Offshore, a producer of oil and natural gas, saw its stock price rise 12.6% from $8.40 to $9.46, as it boosted profitability through lower expenses and oil prices that averaged $75 per barrel for the quarter. Unlike BP, W&T has an excellent safety record with its drilling in the Gulf of Mexico, and it focuses primarily on the shallow water in the Gulf, so it has not been affected by the deep-water drilling moratorium. We think the stock will move higher due to its significant reserves and its free cash flow generation.
The shares of Administaff moved from $21.34 to $24.16 during the quarter for a gain of 13.2%. The company provides personnel services and employee benefits such as health insurance to small- and medium-sized businesses, including Parnassus Investments. Earlier this year, the stock had moved lower because of concern about the higher cost of benefits and the lower number of covered employees. However, the company reported lower than expected costs for benefits in the most recent period and the client base has stabilized.
Outlook and Strategy
This section represents my thoughts and applies to the three Funds that I manage: the Parnassus Fund, the Parnassus Small-Cap Fund and the Parnassus Workplace Fund. The other portfolio managers will discuss their thoughts in their respective reports.
The most important function of the stock market is to transfer savings from individuals and institutions to businesses, so we can finance the American economy. Another important function is to provide a mechanism for investors to participate in the economic benefits of American business. A third important function is to provide a method to translate a future stream of earnings into a present value. It’s hard to calculate what a company’s future earnings are worth today, and the stock market gives us a way of doing this. In this manner, the stock market can be considered a discounting mechanism, since it takes into account future events in present calculations.
| 4 | THE PARNASSUS FUNDS |
Table of Contents
In March of 2009, the stock market began a strong move higher, forecasting the end of the recession. For me, the best definition of a recession is two consecutive quarters of contraction in the gross domestic product (GDP), while coming out of the recession means two consecutive quarters of GDP expansion. By this definition, the economy came out of the recession in the second half of 2009, so the market foreshadowed the recovery, but it predicted a much more robust recovery than we’re now having. As if to make up for this exaggerated prediction of recovery, the market has moved sharply lower in May and June. So what is the market forecasting now, a double-dip recession or a pause in the economic expansion?
We don’t know for sure, but my view is that the economic recovery will continue and we won’t have a double-dip recession. For one thing, double-dip recessions are very rare, and the kind of government stimulus we have had has kept us out of recessions in the past and should do so in the present situation. Economic recoveries are rarely straight-upward-line affairs, but they proceed in fits and starts. Periods of weak recovery in a strong economic expansion are normal, so our current experience is not a unique one.
Both investors and the media tend to overreact to economic numbers. For example, the June jobs numbers recently came out, and the Wall Street Journal headline read, “U.S. Jobs Picture Darkens,” and reported that the economy lost 125,000 jobs. While technically correct, the figure was misleading. The reason the economy lost 125,000 jobs was because the U.S. Census Bureau eliminated 225,000 positions because the work associated with those positions was over. Excluding the effect of the Census Bureau’s action, the economy gained 100,000 jobs, of which 83,000 were created by the private sector, the sixth straight month of private sector gains and an increase over the previous month. Of course, we need an increase of about 400,000 jobs a month to bring down the real unemployment rate and get the economy moving again, but a real gain of 100,000 jobs does not mean that we’re going into a double-dip recession.
The same thing can be said for the June figures released by the Institute of Supply Management (ISM) for the service sector, the biggest part of our economy. The ISM reported a June figure of 53.8, down from a figure of 55.4 for May and below the forecast of 55. Any number over 50 means economic expansion, so a figure of 53.8 means that the economy is expanding, but at a slow pace. I view this as a positive rather than a negative.
My interpretation of what happened is that the huge stock market gains from March of 2009 through April of 2010 exaggerated the strength of the economic recovery, so the May-June decline in the stock market is really a correction of a bullish forecast and not a sign of gloom and doom. In the meantime, stocks are at very low valuations and it’s a great time to invest if you can break free from your emotions. I recently bought additional shares in a couple of the Parnassus Funds in my personal account, because of what I consider to be low prices given current valuations.
My view is that the economy will get stronger as the year progresses and the stock market will follow. For this reason, the three Funds that I manage are fully invested in good businesses with strong environmental, social and governance factors that are selling at attractive prices. As always, I appreciate the confidence you’ve shown in us by letting us take care of your money. We’ll do our best to be good stewards of your economic resources.
Yours truly,
Jerome L. Dodson
Portfolio Manager
| THE PARNASSUS FUNDS | 5 |
Table of Contents
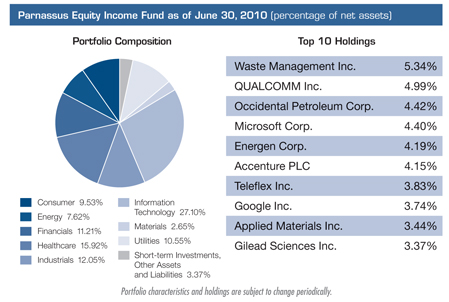
As of June 30, 2010, the NAV of the Parnassus Equity Income Fund-Investor Shares was $22.46 per share. After taking dividends into account, the total return for the second quarter was a loss of 11.04% . This compares to a decline of 11.41% for the S&P 500 Index (“S&P 500”) and a drop of 10.07% for the Lipper Equity Income Fund Average, which represents the average equity income fund followed by Lipper, a Thomson Reuters company (“Lipper average”). The Fund slightly outperformed the S&P 500 during the quarter.
For the first half of 2010, the Fund fell 7.60% versus 6.64% for the S&P 500 and 5.80% for the Lipper average. Despite the underperformance so far this year, our long-term track record remains solid relative to the index. The Fund’s average annual return beat the S&P 500 by over 5% for each of the trailing three-, five-, and ten-year periods. Our ten-year average annual return of 4.65% far exceeds the 1.59% annual loss for the S&P 500.
Below is a table that compares the performance of the Fund with that of the S&P 500 and the Lipper average. Average annual total returns are for the one-, three-, five- and ten-year periods.
Average Annual Total Returns
for periods ended June 30, 2010
| One Year | Three Years | Five Years | Ten Years | Gross Expense Ratio | Net Expense Ratio | |||||||||||||
PARNASSUS EQUITY INCOME FUND– | ||||||||||||||||||
Investor Shares | 13.51 | % | -1.89 | % | 4.43 | % | 4.65 | % | 1.00 | % | 1.00 | % | ||||||
Institutional Shares | 13.73 | % | -1.67 | % | 4.63 | % | 4.75 | % | 0.78 | % | 0.78 | % | ||||||
S&P 500 Index | 14.43 | % | -9.80 | % | -0.79 | % | -1.59 | % | NA | NA | ||||||||
Lipper Equity Income Fund Average | 14.37 | % | -9.36 | % | -0.25 | % | 2.25 | % | NA | NA |
The total return for the Parnassus Equity Income Fund-Institutional Shares from inception (April 28, 2006) was 3.03% . Performance shown prior to the inception of the Institutional Shares reflects the performance of the Parnassus Equity Income Fund-Investor Shares and includes expenses that are not applicable to and are higher than those of the Institutional Shares. The performance of Institutional Shares differs from that shown for the Investor Shares to the extent that the classes do not have the same expenses. Performance data quoted represent past performance and are no guarantee of future returns. Current performance may be lower or higher than the performance data quoted, and current performance information to the most recent month-end is on the Parnassus website (www.parnassus.com). Investment return and principal value will fluctuate, so that an investor’s shares, when redeemed, may be worth more or less than their original principal cost. Returns shown in the table do not reflect the deduction of taxes a shareholder may pay on fund distributions or redemption of shares. The S&P 500 is an unmanaged index of common stocks, and it is not possible to invest directly in an index. Index figures do not take any expenses, fees or taxes into account, but mutual fund returns do. On March 31, 1998, the Fund changed its investment objective from a balanced portfolio to an equity income portfolio. Before investing, an investor should carefully consider the investment objectives, risk, charges and expenses of the Fund and should carefully read the prospectus, which contains this and other information. The prospectus is on the Parnassus website, or one can be obtained by calling (800) 999–3505. As described in the Fund’s current prospectus dated May 1, 2010, Parnassus Investments has contractually agreed to limit the total operating expenses to 0.99% and 0.78% of net assets, exclusive of acquired fund fees, through May 1, 2011 for the Investor Shares and Institutional Shares, respectively. These limitations may be continued indefinitely by the Adviser on a year-to-year basis.
Second Quarter Review
After an 80% rise for the S&P 500 from March of 2009 to mid-April of 2010, the stock market abruptly changed course during the second quarter. While the most talked about problem was the Euro-region debt crisis, other concerns that impacted stock prices included a potential double-dip recession, high unemployment and a weak housing market. The May 4th “flash crash” and the tragic BP oil spill worsened an already negative market sentiment.
Our strategy is to own undervalued companies with sustainable competitive advantages, long-term growth opportunities, solid balance sheets and exceptional managers. This formula has historically provided strong downside protection, because we have avoided companies susceptible to severe boom-bust cycles and financial crises. When the Internet bubble popped during 2000–2002, the Parnassus Equity Income Fund was up 12% while the S&P 500 fell 40%. During the credit crisis of 2008, the S&P plunged 37% for the year while the Fund fell only 23%. Unfortunately, the Fund’s second quarter decline of 11.0% was only slightly better than the index’s 11.4% drop. We attribute this to the fact that this quarter’s market decline was broad-based, and stocks dropped irrespective of their companies’ long-term fundamentals.
| 6 | THE PARNASSUS FUNDS |
Table of Contents
Looking at the portfolio, the most influential sector on the portfolio was technology, which trimmed our lead versus the S&P 500 by 0.65% . We own some great companies in this sector, such as Qualcomm, Microsoft and Google. These businesses have growing profits, sustainable advantages and cash-rich balance sheets. In addition, they trade at historically low multiples of projected 2011 earnings. Nevertheless, these stocks collectively underperformed the S&P 500 technology sector during the quarter. While this short-term performance is frustrating, I’m confident that these high quality technology stocks can boost the Fund’s returns over the long-term.
The Fund’s healthcare investments cost us 0.44% versus the S&P 500, as our average healthcare stock fell 14% versus 12% for the S&P 500 peer group. In this sector, we own stock in companies that can improve quality of life, while also helping to control medical costs. The financial sector trimmed our return by 0.33% versus the S&P 500. The Fund’s investments in financial services are comprised of recurring revenue “fee-based” businesses and high quality banks that either didn’t accept TARP money or were among the first to repay their TARP loans.
Moving to positive sectors, good stock-picking in the industrial and energy-utility industries each added about 0.50% to our lead versus the S&P 500. The consumer staples area added 0.45% to our lead versus the S&P 500. Investments such as Sysco, the food distribution business, McCormick, the spice company, and WD-40, the lubrication company, were essentially flat for the quarter. We like our investments in these sectors because they operate in hard-to-supply industries with predictable demand.
While it was frustrating to generate a large loss this quarter, I’m confident that the Fund’s investments can do well over the next several years, despite the possibility of a slow growth economy.
Company Analysis
While 19 of our 37 stocks fell less than the S&P 500 for the quarter, no company had a meaningful positive return. Four companies trimmed the Fund’s NAV by 16¢ or more.
Qualcomm, a company that provides technology for wireless communication, reduced the Fund’s NAV by 31¢ during the second quarter, as its stock declined 21.8% from $41.99 per share to $32.84. Handset and smartphone prices have declined more than expected recently due to increased competition, which reduces the royalty that Qualcomm collects for its technology. We think investors are over-estimating the long-term price decline for smartphones and its impact on the company’s intrinsic value. We’re bullish on the company, because it has $19 billion in cash, long-term patent protection and trades at only 12 times our expected 2011 earnings, with a 2.3% dividend yield.
Microsoft also trimmed the NAV by 31¢, as the stock declined 21.4% to $23.01 from $29.27 per share. This drop is perplexing, because Microsoft’s Windows 7 launch seems to be going very well. Senior analyst, Lori Keith, thinks that Microsoft has a great set of new product introductions on the way, which should provide six straight quarters of very strong results. The company has over $40 billion in cash, trades at only 9 times our estimated 2011 earnings and pays a 2.2% dividend. Like Qualcomm, our Microsoft investment should prove rewarding over the long-term.
Bank of New York lowered the Fund’s NAV by 19¢ as the stock declined from $30.88 to $24.69 per share. Bank of New York is not a normal bank, because the company generates most of its revenue and earnings from fee-based custodial, asset management and trust services. Bank of New York’s earnings are currently depressed due to low interest rates, which prevent the company from charging its normal fee to money market customers. We think Bank of New York’s stock has substantial upside potential, because the company’s earnings should improve quickly once interest rates rise.
| THE PARNASSUS FUNDS | 7 |
Table of Contents
Medtronic, the medical device company, reduced the NAV by 16¢, as the stock fell 19.5% from $45.03 to $36.27 per share. This stock price decline seems unjustified, as Medtronic reported strong earnings during the quarter and increased its dividend by 8%. More importantly, Medtronic has a host of new heart-, spine- and diabetes-related products that should support revenue growth for years, while improving the lives of recipients.
Outlook and Strategy
As of this writing, the S&P 500 has plunged almost 17% since hitting a recent peak in late April. After this correction, I believe that the stock market is pricing in a slow economic recovery. If this proves correct, the S&P 500 should be near a bottom, especially considering that stocks look relatively inexpensive at an average 13 times estimated 2011 earnings. The Fund should do well, because we own a host of companies that trade for under 12 times projected 2011 profits, many with double digit earnings growth potential for years to come. As for sectors, we are overweighted relative to the index in technology, energy, healthcare and industrial companies. If the market rallies, our investments in these sectors should fuel the Fund’s return.
In spite of my overall optimism, I’m still concerned that unsustainable deficit spending may eventually impact financial markets, including stock prices. At a minimum, the current European sovereign debt crisis has showed that the global recovery is fragile, since it depends in large part on unusually large government spending. If governments begin to cut spending to curb deficits and the private sector doesn’t pick up the slack, a “double-dip” recession is possible. My team accounts for this risk by analyzing a range of possible economic outcomes for each stock in the portfolio. The good news is that, based on our scenario analysis, I think our stocks have significantly more upside than downside potential.
Thank you for your trust and investment in the Parnassus Equity Income Fund.
Highest regards,

Todd C. Ahlsten
Portfolio Manager
| 8 | THE PARNASSUS FUNDS |
Table of Contents
As of June 30, 2010, the NAV of the Parnassus Mid-Cap Fund was $15.82, so the total return for the second quarter of 2010 was a loss of 8.34% . This compares to a loss of 11.00% for the Lipper Multi-Cap Core Average, which represents the average multi-cap core fund followed by Lipper, a Thomson Reuters company (“Lipper average”) and a loss of 9.88% for the Russell Midcap Index (the “Russell”). It’s always disappointing to lose money in a quarter, but we’re proud that the Fund outperformed both its peer group and the benchmark.
For the first half of 2010, the Fund is well ahead of its peers and slightly behind the benchmark. Since the beginning of the year, the Fund is down 2.83% versus a loss of 6.15% for the Lipper average and a loss of 2.06% for the Russell. We are pleased the Fund’s strategy of buying high quality businesses at attractive prices is limiting losses during this tumultuous period. This strategy is also benefiting the Fund’s longer-term results, as evidenced by the three-year and five-year average annual returns, which both beat the Russell and Lipper average.
Below is a table comparing the Parnassus Mid-Cap Fund with the Russell and the Lipper average for the one-, three- and five-year periods and for the period since inception on April 29, 2005.
Average Annual Total Returns
for periods ended June 30, 2010
| One Year | Three Years | Five Years | Since Inception April 29, 2005 | Gross Expense Ratio | Net Expense Ratio | |||||||||||||
PARNASSUS MID-CAP FUND | 21.48 | % | -3.98 | % | 2.30 | % | 2.53 | % | 1.73 | % | 1.20 | % | ||||||
Russell Midcap Index | 25.13 | % | -8.19 | % | 1.22 | % | 2.63 | % | NA | NA | ||||||||
Lipper Multi-Cap Core Average | 15.17 | % | -9.47 | % | -0.37 | % | 0.59 | % | NA | NA |
Performance data quoted represent past performance and are no guarantee of future returns. Current performance may be lower or higher than the performance data quoted. Current performance information to the most recent month-end is on the Parnassus Investments website (www.parnassus.com). Investment return and principal value will fluctuate so that an investor’s shares, when redeemed, may be worth more or less than their original principal cost. Returns shown in the table do not reflect the deduction of taxes a shareholder may pay on fund distributions or redemption of shares. The Russell Midcap Index is an unmanaged index of common stocks, and it is not possible to invest directly in an index. Index figures do not take any expenses, fees or taxes into account, but mutual fund returns do. Mid-cap companies can be more sensitive to changing economic conditions and have fewer financial resources than large-cap companies. Before investing, an investor should carefully consider the investment objectives, risks, charges and expenses of the Fund and should carefully read the prospectus, which contains this and other information. The prospectus is available on the Parnassus Investments website, or one can be obtained by calling (800) 999–3505. As described in the Fund’s current prospectus dated May 1, 2010, Parnassus Investments has contractually agreed to limit the total operating expenses to 1.20% of net assets, exclusive of acquired fund fees, until May 1, 2011. This limitation may be continued indefinitely by the Adviser on a year-to-year basis.
Second Quarter Review
From April 1 through April 23, mid-cap stocks rose over 6%, continuing a rally that lifted the Russell almost 100% from its March 2009 trough. Concerns over European sovereign debt and domestic economic growth soon shifted investor sentiment, and the Russell closed the quarter down almost 10%. Despite this drop, mid-cap stocks outperformed the broader market averages during the second quarter, and the Fund outperformed its peers and benchmark.
The Fund offered downside protection in the challenging second quarter, limiting its loss to 8.34% compared to a loss of 11.00% for the Lipper average and a loss of 9.88% for the Russell. A main factor of the Fund’s quarterly outperformance versus the Russell was its disproportionate investment in companies with better than average returns on equity, a measure of company efficiency and profitability. During the second quarter, high return on equity companies outpaced low return on equity companies in the index.
On a sector basis, we gained ground in the quarter due to our being underweighted in the consumer discretionary sector relative to the index, and being overweighted in the healthcare sector. The most negative sector allocation decision for the quarter was to be underweighted in utilities.
| THE PARNASSUS FUNDS | 9 |
Table of Contents
Company Analysis
As usual, stock selection, not sector allocation, drove our performance for the quarter. Our health-care, industrial, consumer staples and materials stocks limited the Fund’s losses, while our information technology and financial stocks hurt the most. There was only one stock which helped the Fund materially in the quarter. There were four stocks that hurt the Fund’s NAV by 8¢ or more during the period.
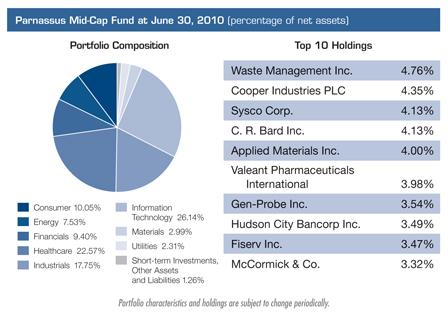
Valeant Pharmaceuticals, a developer of dermatology and neurology drugs, was the Fund’s only significant winner during the quarter. Its stock rose 21.9%, from $42.91 to $52.29, adding 11¢ to the NAV, as management reported better than expected earnings and announced a smart merger with Biovail, a Canadian specialty pharmaceutical company. We will continue holding the stock, given our confidence in management’s ability to create long-term shareholder value.
The Fund’s biggest loser was the oil and gas services company, Noble Corporation. Its shares dropped 26.1% in the quarter from $41.82 to $30.91, taking 15¢ from the Fund’s NAV. Investors sold the stock after the U.S. imposed a ban on offshore drilling in the Gulf of Mexico, where Noble has a sizeable business and outstanding safety record. Fortunately, the company has a deep backlog of international projects, which should enable it to weather the current moratorium in the Gulf.
Our investment in the insurer Aflac took 8¢ from the Fund’s NAV during the quarter, as its shares dropped 21.4% from $54.29 to $42.67. Aflac has investments in European banks and governments, so its stock went down as the continent’s financial crisis flared. We are pleased that management has reduced risk by limiting exposure to certain European banks and selling Greek sovereign debt. We are confident that Aflac’s financial position is adequate to absorb potential credit losses.
Shares of Hudson City Bancorp, the New Jersey-based thrift, lost 13.6% during the quarter, as its stock dropped from $14.16 to $12.24, to drive down the NAV by 8¢. Despite stabilizing credit trends and lower funding costs, Hudson’s earnings have been pressured due to lower mortgage portfolio yields. We continue to like this well-managed, well-capitalized bank as competition in its core market is waning.
Applied Materials, the world’s largest semiconductor equipment provider, dropped 10.8% during the quarter to $12.02 from $13.48, shrinking the Fund’s NAV by 8¢. Investors sold shares over concerns that the sector’s growth cycle is slowing. Also, despite climate change initiatives, the company’s energy and environmental solutions group continues to be a drag on overall profitability.
| 10 | THE PARNASSUS FUNDS |
Table of Contents
Outlook and Strategy
Last quarter, we described our mixed opinion regarding the economy’s direction. Since then, Europe’s sovereign debt crisis blossomed and the United States’ recovery trajectory became less clear. As a result, investors pushed the market down almost 17% from late April highs, during which period the Fund gained ground on its peers and the benchmark.
Going forward, we believe uncertainty is still high as national governments attempt to balance fiscal responsibility with stimulus programs, and central bankers deal with the risk of both deflation and inflation. Overall, our best estimate is for a slow and bumpy recovery path ahead.
We continue to be wary of sectors that would be hardest hit if the economy turns down again. This includes investments in the consumer discretionary and financial areas where, relative to the Russell, we continue to be significantly underweighted. Conversely, we’re heavily invested relative to the index in the information technology, industrial, and healthcare sectors.
We are diligently focused on our process of identifying and investing in attractively valued companies with secular growth opportunities, competitive advantages and quality leadership. This process, which has resulted in solid participation in rising markets and downside protection in declining markets, continues to be the cornerstone of our longer-term strategy for out performance.
Thank you for your investment with us.
Yours truly,
 |
|  | ||
| Benjamin E. Allen | Matthew D. Gershuny | Lori A. Keith | ||
| Portfolio Manager | Portfolio Manager | Portfolio Manager | ||

| THE PARNASSUS FUNDS | 11 |
Table of Contents
As of June 30, 2010, the NAV of the Parnassus Small-Cap Fund was $18.69, so the total return for the quarter was a loss of 6.55% . By comparison, the Russell 2000 Index (“Russell 2000”) of smaller companies lost 9.92%, and the Lipper Small-Cap Core Average, which represents the average small-cap core fund followed by Lipper, a Thomson Reuters company (“Lipper average”) lost 9.37% . For the quarter, we lost money, but we lost significantly less than our benchmarks.
For the year-to-date as of June 30, we’re also substantially ahead of the benchmarks. Apparently defying the law of gravity, the Parnassus Small-Cap Fund actually gained 4.30%, compared to a loss of 1.95% for the Russell 2000 and a loss of 2.05% for the Lipper average.
Below is a table comparing the performance of the Parnassus Small-Cap Fund with that of the Russell 2000 and the Lipper average for the one-, three- and five-year periods and the period since inception. As you can see from the table, the Fund beat all its benchmarks by substantial amounts for all time periods.
Average Annual Total Returns
for periods ended June 30, 2010
| One Year | Three Years | Five Years | Since Inception April 29, 2005 | Gross Expense Ratio | Net Expense Ratio | |||||||||||||
PARNASSUS SMALL-CAP FUND | 28.57 | % | 0.08 | % | 5.94 | % | 6.25 | % | 1.47 | % | 1.20 | % | ||||||
Russell 2000 Index | 21.48 | % | -8.60 | % | 0.37 | % | 2.34 | % | NA | NA | ||||||||
Lipper Small-Cap Core Average | 21.62 | % | -8.74 | % | 0.44 | % | 2.10 | % | NA | NA |
Performance data quoted represent past performance and are no guarantee of future returns. Current performance may be lower or higher than the performance data quoted. Current performance information to the most recent month-end is available on the Parnassus Investments website (www.parnassus.com). Investment return and principal value will fluctuate so that an investor’s shares, when redeemed, may be worth more or less than their original principal cost. Returns shown in the table do not reflect the deduction of taxes a shareholder may pay on fund distributions or redemption of shares. The Russell 2000 Index is an unmanaged index of common stocks, and it is not possible to invest directly in an index. Index figures do not take any expenses, fees or taxes into account, but mutual fund returns do. Small-cap companies can be particularly sensitive to changing economic conditions and have fewer financial resources than large-cap companies. Before investing, an investor should carefully consider the investment objectives, risks, charges and expenses of the Fund and should carefully read the prospectus, which contains this and other information. The prospectus is on the Parnassus Investments website, or one can be obtained by calling (800) 999–3505. As described in the Fund’s current prospectus dated May 1, 2010, Parnassus Investments has contractually agreed to limit the total operating expenses to 1.20% of net assets, exclusive of acquired fund fees, until May 1, 2011. This limitation may be continued indefinitely by the Adviser on a year-to-year basis.
With over five years of history under its belt, the Parnassus Small-Cap Fund seems to have discovered a winning strategy. I think there are a number of things that have helped us achieve this record. First, we try to find companies that have unique characteristics that are not easily duplicated. Warren Buffett calls this a “moat” that defends the company’s castle from invasion by competitors. Of course, every company has competition, but there are some that are better equipped to handle competition than others, and we try to find those companies. It’s not always clear what constitutes a moat, and people may differ on what constitutes unique characteristics, so we’re making subjective judgments on the companies in the portfolio.
Another important factor is valuation. We try to determine the intrinsic value of the companies we follow, and if a stock’s market price falls a third below our estimate of its intrinsic value, it’s a candidate for inclusion in the portfolio. Of course, we won’t always be right in determining a company’s intrinsic value, but by buying stocks trading at a third less than our estimate of its worth, we leave ourselves a margin of safety.
Size and financial strength are also factors. At the time we buy them, almost all of our companies have market valuations below $3 billion, so we’re investing in smaller companies. However, most of the companies we invest in have capitalizations at the higher end of the range compared with the companies in the Russell 2000. These companies are in the small-cap world, but are larger than the small-cap average, so they tend to be more stable.
| 12 | THE PARNASSUS FUNDS |
Table of Contents
Because the companies we invest in are relatively small, we make sure they have a lot of financial strength. These factors give us some downside protection. When small-cap companies go down, the Fund goes down with them, but we usually don’t go down as much as most small-cap names. The corollary to this is that when the really small companies with less financial strength move sharply higher, we probably won’t move up as much. That’s all right with us, since we hope to more than make up for it by not dropping as much during bad times. As you can see by the table, this strategy has worked well over the past five years.
Company Analysis
Six companies in the portfolio each accounted for a loss of 14¢ or more on the NAV. The one that hurt us the most was Ceragon Networks, which cut 24¢ off each fund share, while its stock plummeted 24.1% from $9.75, where we bought it during the quarter, to $7.40 at the end of the period. The company makes equipment used to connect cellular telephone towers to the main telecommunications network (known as “wireless backhaul”). A quarter of the company’s business comes from Europe, and the European debt crisis caused concern among investors that economic activity on that continent would decline and cause a drop-off in business for Ceragon. We’re optimistic that business will increase for Ceragon even in Europe, and it will derive a lot of revenue from all around the world, including the enormous market in India.
LHC Group cost the Fund 23¢ per share, as its stock fell 17.2% from $33.53 to $27.75. The U.S. Senate Finance Committee is investigating home healthcare companies for possibly over-billing for home therapy visits under Medicare. LHC has responded, saying that home therapy visits are only authorized by a doctor, and that it has not abused the system by making unneeded home therapy visits. We’re uncertain of the outcome, but we will continue to hold the stock, since there is no evidence so far of unethical practices. The stock is now very undervalued.
Natural gas-producer Quicksilver Resources sliced 20¢ off the NAV, as its stock dropped 21.8% from $14.07 to $11.00. Weak natural gas prices and the weak stock market accounted for the big drop in the stock price. We still like the company, because it’s a low-cost producer with access to a large number of gas fields. The stock should move sharply higher once natural gas prices improve.
Myriad Genetics, a provider of genetic breast- and ovarian-cancer tests, saw its shares drop sharply from $24.05 to $14.95 for a fall of 37.8% and a loss of 17¢ per fund share. In May, management provided weak earnings guidance because of the slow economy. We believe that there may be some upside opportunity in the stock, because only 12% of eligible women have been tested.
Bridgepoint Education, an online for-profit college, dropped 19.3% from $24.58 at the beginning of the quarter to $19.83, where we sold it during the period. Although Bridgepoint cost the Parnassus Small-Cap Fund 14¢ on the NAV for the quarter, we had a gain of 27.1% on the issue during the nine months we held the stock for an increase of 17¢ per fund share over the holding period. We sold the stock during the quarter, because of concerns about increasing government regulation of loansr to students at for-profit colleges.
The stock of KB Home lost 34.3% during the quarter, falling from $16.75 to $11.00 for a drop of 14¢ on the NAV. See the discussion of homebuilders in the Parnassus Fund section for more information on the company.
Although most stocks in the portfolio were down during the quarter, the Fund did beat both the Lipper average and the Russell 2000, so on a relative basis, it was a successful quarter. Four companies helped cushion the blow from the falling market with each one contributing 8¢ or more to the NAV.
| THE PARNASSUS FUNDS | 13 |
Table of Contents
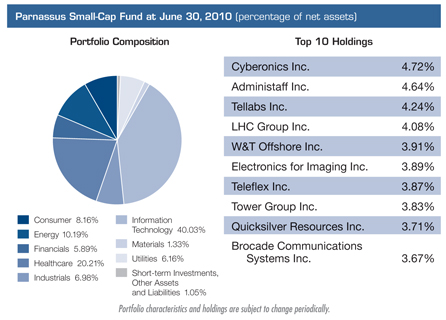
Cyberonics, a maker of devices for the treatment of epilepsy, contributed 16¢ to each fund share, as its stock rose 23.6% from $19.16 to $23.68. Earnings were much better than expected with 11% new patient growth and 17% replacement growth in the U.S. The stock should continue to move higher on increasing sales, because of new sales force incentives, and international expansion including Japan.
Administaff added 12¢ to the NAV, with its stock climbing 13.2% from $21.34 to $24.16. The company provides personnel services and employee benefits such as health insurance to small- and medium-sized businesses including Parnassus Investments. Earlier this year, the stock had moved lower, because of concern about the higher cost of benefits and the lower number of covered employees. However, the company reported lower than expected costs for benefits in the most recent period and the client base has stabilized.
Mariner Energy, an oil- and gas-producer, gained an amazing 40.1%, going from $14.97 to $20.98 where we sold it during the quarter for a gain of 10¢ per fund share. Apache Corporation announced on April 15 an agreement to acquire Mariner, which moved the price much higher. Even though the purchase price Apache offered was higher than the price where we sold the stock, we were concerned that the BP incident and the moratorium on deep-water drilling in the Gulf of Mexico might make Apache reduce its purchase price or walk away from the deal. We decided it was prudent to sell our shares now, rather than wait for the merger to be completed.
Valeant Pharmaceuticals gained 21.9%, rising from $42.91 to $52.29 for a gain of 8¢ per fund share. The company manufactures and markets specialty pharmaceuticals, and its earnings exceeded investor expectations because of higher revenue and better cost control. The company also made two shrewd acquisitions in the quarter that should be accretive to earnings and enable the company to spread more products over its distribution system. Aton, a privately—held ophthalmology and neurology company, and Biovail, a Canadian specialty pharmaceutical company are now part of Valeant. Quite often, the stock of an acquiring company goes down when a merger is announced, but in this case, the stock went up, because it appears that the company did not overpay, and there will be no dilution in earnings, but rather enhanced profitability.
Yours truly,
Jerome L. Dodson
Portfolio Manager
| 14 | THE PARNASSUS FUNDS |
Table of Contents
As of June 30, 2010, the NAV of the Parnassus Workplace Fund was $17.61, so the total return for the quarter was a loss of 12.82% . This compares to a loss of 11.41% for the S&P 500 and a loss of 11.00% for the Lipper Multi-Cap Core Average, which represents the average multi-cap core fund followed by Lipper, a Thomson Reuters company (“Lipper average”), so we lagged somewhat behind our benchmarks during the quarter.
For the year-to-date as of June 30, the Parnassus Workplace Fund lost 9.46%, compared to a loss of 6.64% for the S&P 500 and a loss of 6.15% for the Lipper average. We underperformed for the year-to-date, but our long-term and medium-term results are excellent. Below is a table comparing the Parnassus Workplace Fund with the S&P 500 and the Lipper average for the one-, three- and five-year periods as well as the period since inception. You’ll notice that the Parnassus Workplace Fund is ahead of all its benchmarks for all time periods.
Average Annual Total Returns
for periods ended June 30, 2010
| One Year | Three Years | Five Years | Since Inception April 29, 2005 | Gross Expense Ratio | Net Expense Ratio | |||||||||||||
PARNASSUS WORKPLACE FUND | 16.48 | % | 0.61 | % | 5.14 | % | 5.09 | % | 1.36 | % | 1.20 | % | ||||||
S&P 500 Index | 14.43 | % | -9.80 | % | -0.79 | % | -0.14 | % | NA | NA | ||||||||
Lipper Multi-Cap Core Average | 15.17 | % | -9.47 | % | -0.37 | % | 0.59 | % | NA | NA |
Performance data quoted represent past performance and are no guarantee of future returns. Current performance may be lower or higher than the performance data quoted. Current performance information to the most recent month-end is available on the Parnassus Investments website (www.parnassus.com). Investment return and principal value will fluctuate so that an investor’s shares, when redeemed, may be worth more or less than their original principal cost. Returns shown in the table do not reflect the deduction of taxes a shareholder may pay on fund distributions or redemption of shares. The S&P 500 Index is an unmanaged index of common stocks, and it is not possible to invest directly in an index. Index figures do not take any expenses, fees or taxes into account, but mutual fund returns do. Before investing, an investor should carefully consider the investment objectives, risks, charges and expenses of the Fund and should carefully read the prospectus, which contains this and other information. The prospectus is available on the Parnassus Investments website, or one can be obtained by calling (800) 999-3505. As described in the Fund’s current prospectus dated May 1, 2010, Parnassus Investments has contractually agreed to limit the total operating expenses to 1.20% of net assets, exclusive of acquired fund fees, until May 1, 2011. This limitation may be continued indefinitely by the Adviser on a year-to-year basis.
Company Analysis
Unfortunately, no companies in the portfolio of the Parnassus Workplace Fund made a significant positive contribution to the NAV. There were, however, two companies that each had a negative impact of 27¢ or more.
The one that cost us the most was Qualcomm, a provider of software and semiconductors for use in cellular telephones, which subtracted 32¢ from each fund share. The stock sank 21.8% from $41.99 to $32.84. Qualcomm earns a royalty on the average selling price of handsets, and increased competition among handset manufacturers led to lower selling prices during the period. We’re hanging onto the stock, because we think that company has valuable technology, and we expect future handset price declines will be less severe than anticipated. We also expect increased handset sales to result in higher revenue and earnings for Qualcomm.
| THE PARNASSUS FUNDS | 15 |
Table of Contents
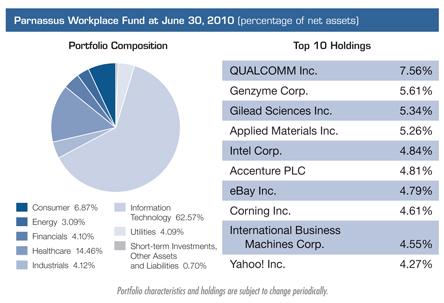
eBay’s stock dropped 27.2% during the quarter, falling from $26.95 to $19.61 for a loss of 27¢ per fund share. While the company’s PayPal unit for online transactions performed well, the Internet auction business did not do well. Investors were also concerned because of the company’s significant exposure to Europe, given the debt crisis on the continent. The stock is trading at bargain levels, so we’ll continue to keep it in the portfolio.
Yours truly,
Jerome L. Dodson
Portfolio Manager
| 16 | THE PARNASSUS FUNDS |
Table of Contents
As of June 30, 2010, the NAV of the Parnassus Fixed-Income Fund was $17.38, producing a total return for the quarter of 3.20% (including dividends). This compares to a gain of 2.89% for the Lipper A-Rated Bond Fund Average, which represents the average return of all A-rated bond funds followed by Lipper, a Thomson Reuters company (“Lipper average”) and a gain of 3.88% for the Barclays Capital U.S. Government/Credit Bond Index (“Barclays Capital Index”). Since the beginning of the year, the total return for the Fund was 5.33% compared to a gain of 5.37% for the Lipper average and a gain of 5.49% for the Barclays Capital Index.
Below is a table comparing the performance of the Fund with that of the Barclays Capital Index and the Lipper average. Average annual total returns are for the one-, three-, five- and ten-year periods. The 30-day SEC yield for the Fund for June 2010 was 2.00% . I’m pleased to report that our long-term returns are better than the Lipper average for the three-, five- and ten-year periods as of the end of June.
Average Annual Total Returns
for periods ended June 30, 2010
| One Year | Three Years | Five Years | Ten Years | Gross Expense Ratio | Net Expense Ratio | |||||||||||||
PARNASSUS FIXED-INCOME FUND | 10.19 | % | 6.84 | % | 5.93 | % | 6.47 | % | 0.88 | % | 0.76 | % | ||||||
Barclays Capital U.S. Government/Credit Bond Index | 9.65 | % | 7.37 | % | 5.26 | % | 6.48 | % | NA | NA | ||||||||
Lipper A-Rated Bond Fund Average | 13.45 | % | 5.75 | % | 4.26 | % | 5.69 | % | NA | NA |
Performance data quoted represent past performance and are no guarantee of future returns. Current performance may be lower or higher than the performance data quoted. Current performance information to the most recent month-end is available on the Parnassus Investments website (www.parnassus.com). Investment return and principal value will fluctuate so that an investor’s shares, when redeemed, may be worth more or less than their original cost. Returns shown in the table do not reflect the deduction of taxes a shareholder would pay in fund distributions or redemption of shares. The Barclays Capital U.S. Government/ Credit Bond Index is an unmanaged index of bonds, and it is not possible to invest directly in an index. Index figures do not take any expenses, fees, or taxes into account, but mutual fund returns do. Before investing, an investor should carefully consider the investment objectives, risks, charges and expenses of the Fund and should carefully read the prospectus, which contains this and other information. The prospectus is on the Parnassus Investments website, or one can be obtained by calling (800) 999-3505. As described in the Fund’s current prospectus dated May 1, 2010, Parnassus Investments has contractually agreed to limit the total operating expenses to 0.87% of net assets, exclusive of acquired fund fees, until May 1, 2011. This limitation may be continued indefinitely by the Adviser on a year-to-year basis.
Second Quarter Review
Equity markets had their worst quarterly performance since the market trough of March 2009. Investors lost their optimism as concerns spread from European sovereign debt to U.S. financial regulations to weak housing market data, and culminated in signs of a slowdown in the Chinese economy. Not surprisingly, corporate and convertible bonds under-performed in that environment, while U.S. Treasuries benefited from their safe haven status.
The S&P 500 closed the second quarter with a total loss of 11.41%, bringing the year-to-date performance to a loss of 6.64% . Meanwhile, U.S. government bonds returned a gain of 4.24% during the quarter and are up 5.40% so far this year. Yields moved lower across the entire curve, with yields on longer-dated bonds down the most. The yield on the 10-year decreased 90 basis points to 2.93% at the end of the second quarter compared to the end of the first quarter. The 30-year decreased 82 basis points to 3.90% during the same period.
With the exception of convertible bonds, all asset classes in the portfolio benefited from lower yields and contributed positively to the NAV during the quarter. Our position in U.S. Treasuries was the biggest winner, adding 36¢ to the NAV. Corporate bonds contributed 23¢, while our convertible bonds reduced the NAV by 2¢. The underperformance of the convertible bonds was due to their sensitivity to a declining equity market.
While the Fund outperformed the Lipper average by 31 basis points during the second quarter, I am disappointed because the performance trailed the Barclays Capital Index by 68 basis points. The underperformance relative to the Barclays Capital Index was due to the benchmark’s larger exposure to government bonds. During the quarter, the Fund had an average of 42% of total net
| THE PARNASSUS FUNDS | 17 |
Table of Contents
assets invested in government bonds, while the index had an average weight of 63%. I talked about the risk of worse-than-anticipated economic data in the March 31, 2010 quarterly shareholder report, but in hindsight, I underestimated the magnitude of the market’s reaction to those events. This is why I didn’t overweight government bonds relative to the Barclays Capital Index during the second quarter.
We outperformed the Lipper average because we don’t own any mortgage-backed securities, while most of the funds in the Lipper average do. These securities underperformed both U.S. government and corporate bonds during the quarter. Commercial mortgage-backed securities returned 2.78%, while mortgage-backed securities were up 2.87% . This compares to the gains of 3.42% for corporate bonds and 4.24% for U.S. government bonds.

Outlook and Strategy
At this time of doubt and confusion, my main worry is not so much about the economic recovery itself. Rather, it is that investors have set expectations too high for economic growth and corporate earnings. As I wrote in previous reports, I think that the economic improvements that we have witnessed so far are mostly due to unprecedented large government interventions. In fact, the economy is still fragile and plagued by a weak housing market and high unemployment. Also, the lingering problem of too much debt has not been solved.
With the impact of the government support starting to fade, I think that the economy will grow at a slower rate than the current market expectation. Even if the economy doesn’t succumb to a double-dip recession during the second half of this year, a slowdown in GDP growth to 1% or 2% would be a sharp disappointment. Indeed, the current market expectation for GDP growth is 3.0% for the third quarter, followed by 2.8% in the fourth quarter.
Given this outlook, I have reduced the portfolio’s exposure to risk assets (corporate and convertible bonds) and increased the holdings in U.S. Treasuries. As of the end of the second quarter, risk assets represent 46.2% of total net assets, down from 56.8% at the end of the first quarter, and U.S. Treasuries make up 48.6% of total net assets. This compares to the Barclays Capital Index, where government bonds represent 63.8% of the index and corporate bonds 36.2% .
I also exited our investments in agency bonds (mostly Freddie Mac and Fannie Mae bonds) and reinvested the proceeds into Treasury bonds. I think that these agency bonds no longer provide enough yields considering their risk profile. It’s especially alarming when Fannie Mae warned earlier in the quarter of “significant uncertainty as to [its] long-term financial sustainability”, because it expects a still fragile housing market to keep default rates and credit-related costs high.
As always, I remain vigilant to changes in the economic outlook and will adapt the investment strategy as necessary.
Thank you for your confidence and investments in the Parnassus Fixed-Income Fund.
Yours truly,

Minh T. Bui
Portfolio Manager
| 18 | THE PARNASSUS FUNDS |
Table of Contents
By Milton Moskowitz and Jerome Dodson
The bar is always being raised in assessing the responsibility of corporations. Issues that would never have surfaced 25 years ago — executive compensation, domestic partner benefits, genocide in Darfur, sustainable practices — are now commonplace in shareholder resolutions and they’re used as criteria by funds in the responsible investing field. The latest cause celebre is labor unrest in contract factories, and who would have thought that it would crop up in, of all places, China. This year, Chinese workers have gone on strike in factories turning out automotive and electronic products for Honda, Toyota, Nissan and Mitsumi Electric. At the sprawling Shenzhen factory operated by a Taiwanese company, Foxconn, high-tech gadgets like the iPhone and iPad are being assembled for Apple by workers earning an average of $300 a month. Indeed, wages are so low at these Chinese plants, that the workers who went on strike were immediately offered wage increases ranging from 30 to 50%. News of these successful walkouts will spread like wildfire in China. You can expect more strikes. The workers are also demanding the right to choose trade unions to represent them. It’s a replay of the 1930s in America.
And it is no longer possible for companies to claim no responsibility, to explain that these plants are operated by contractors. The workers may not be employees of the companies whose brands are on the products, but these companies are being held responsible for conditions in these factories. One of the funds in the Parnassus family is the Parnassus Workplace Fund, where investments are limited to companies with exemplary workplaces — and so this is an issue close to our hearts. Nike, one of the Parnassus Workplace Fund’s investments, closely monitors conditions in the 618 locally-owned factories where 823,000 people are employed. China accounts for 36% of Nike’s footwear production.
Many Parnassus portfolio companies appear on the lists of corporations which contributed to Haiti relief. Microsoft contributed $1.25 million, Google $1 million, Wells Fargo $100,000. Walgreens contributed $100,000 and matched employee contributions up to $50,000.
Sysco, a major supplier of food to restaurants and other institutions, has converted its 585,000 square-foot distribution center in North Houston to a greenfield site. All 98 vehicles there will operate on hydrogen fuel cells instead of rechargeable lead-acid batteries . . . For the second year in a row, the Mexican subsidiary of Cisco Systems has been recognized by the Mexican Center for Philanthropy for its commitment to socially responsible management. At the same time, Cisco’s manufacturing plant in Ciudad Juarez won an award for its employee working conditions — for the third time… Intel, the world’s largest producer of microprocessors, joined the United Nations Global Compact and published its own set of Human Rights Principles to express its “dedication to human rights and responsible labor practices — not only at Intel but throughout its supply chain” . . . Target continued its partnership with Feeding America to combat child hunger and improve nutrition education. It is spending more than $4 million on this front, including a “Meals for Minds” school pantry program
| THE PARNASSUS FUNDS | 19 |
Table of Contents
in Minneapolis/St. Paul, Miami, Baltimore and Los Angeles . . . Google, a holding in three Parnassus Funds, invested $38.8 million in two North Dakota wind farms, its first direct investment in utility-scale renewable energy generation.
Eight Parnassus portfolio companies made the Bloomberg Business Week list of the world’s 50 Most Innovative Companies: Google (2), Microsoft (3) and IBM (4) placed among the Top 10, Intel was ranked 12th, and then came: Procter & Gamble (25), Cisco (31), JPMorgan Chase (39) and Nike (46).
PulteGroup, which became the largest home builder in the United States after its 2009 merger with Centex, is celebrating its 60th birthday this year. William J. “Bill” Pulte, fresh out of high school, built the company’s first home in Detroit in 1950: a five-room bungalow that sold for $10,000. Today the average Pulte home covers more than 2,000 square feet. The company builds homes in 67 markets in 29 states and the District of Columbia. Its three brands are Pulte, Del Webb and Centex. The company is proud of having won more J.D. Power awards for customer satisfaction than any other home builder.
WD-40, a stalwart of the Parnassus Small-Cap Fund, generates sales of $312 million with only 290 employees, a function perhaps of its structure: it has no manufacturing facilities of its own, buying chemicals from contractors and then packaging and marketing the products. Its mainstay product, for which the company is named, squelches squeaks, but the company is always trying to think of new uses. There are a lot of stories about odd uses to which it has been put: a bus driver in Asia who used it to remove a python snake from the undercarriage of his bus; police officers who used it to remove a naked burglar from an air conditioning vent. WD-40 maintains an innovative Fortress of Health Program through Blue Shield of California. By encouraging employees to adopt a healthy lifestyle, the company has been able to reduce its health costs. And as a result, it has been able to reduce its health insurance premiums by 2% each year.
| 20 | THE PARNASSUS FUNDS |
Table of Contents
As a shareholder of the Funds, you incur ongoing costs, which include portfolio management fees, administrative fees, shareholder reports, and other fund expenses. The Funds do not charge transaction fees, so you do not incur transaction costs such as sales charges (loads) on purchase payments, reinvested dividends, or other distributions, redemption fees, and exchange fees. The information on this page is intended to help you understand your ongoing costs of investing in the Funds and to compare these costs with the ongoing costs of investing in other mutual funds.
The following example is based on an investment of $1,000 invested at the beginning of the most recent six-month period and held for the period of January 1, 2010 through June 30, 2010.
Actual Expenses
In the example below, the first line for each Fund provides information about actual account values and actual expenses. You may use the information in this line, together with the amount you invested, to estimate the expenses that you paid over the period. Simply divide your account value by $1,000 (for example, $8,600 account value divided by $1,000 = 8.6), then multiply the result by the number in the first line under the heading entitled “Expenses Paid During Period” to estimate the expenses you paid on your account during this period.
Hypothetical Example for Comparison Purposes
The second line of each Fund provides information about hypothetical account values and hypothetical expenses based on the Fund’s expense ratio and an assumed rate of return of 5% per year before expenses, which is not the Fund’s actual return. You may compare the ongoing costs of investing in the Fund with other mutual funds by comparing this 5% hypothetical example with the 5% hypothetical examples that appear in the shareholder reports of other funds.
The hypothetical account values and expenses may not be used to estimate the actual ending account balance or expenses you paid for the period.
Please note that the expenses shown in the table are meant to highlight only your ongoing costs in these Funds. Therefore, the second line of each Fund is useful in comparing only ongoing costs and will not help you determine the relative total costs of owning other mutual funds, which may include transactional costs such as loads.
| Beginning Account Value January 1, 2010 | Ending Account Value June 30, 2010 | Expenses Paid During Period* | |||||||
Parnassus Fund: Actual | $ | 1,000.00 | $ | 928.49 | $ | 4.73 | |||
Hypothetical (5% before expenses) | $ | 1,000.00 | $ | 1,019.89 | $ | 4.96 | |||
Parnassus Equity Income Fund – Investor Shares: Actual | $ | 1,000.00 | $ | 924.04 | $ | 4.72 | |||
Hypothetical (5% before expenses) | $ | 1,000.00 | $ | 1,019.89 | $ | 4.96 | |||
Parnassus Equity Income Fund – Institutional Shares: Actual | $ | 1,000.00 | $ | 924.94 | $ | 3.72 | |||
Hypothetical (5% before expenses) | $ | 1,000.00 | $ | 1,020.93 | $ | 3.91 | |||
Parnassus Mid-Cap Fund: Actual | $ | 1,000.00 | $ | 971.74 | $ | 5.87 | |||
Hypothetical (5% before expenses) | $ | 1,000.00 | $ | 1,018.84 | $ | 6.01 | |||
Parnassus Small-Cap Fund: Actual | $ | 1,000.00 | $ | 1,042.97 | $ | 6.08 | |||
Hypothetical (5% before expenses) | $ | 1,000.00 | $ | 1,018.84 | $ | 6.01 | |||
Parnassus Workplace Fund: Actual | $ | 1,000.00 | $ | 905.40 | $ | 5.67 | |||
Hypothetical (5% before expenses) | $ | 1,000.00 | $ | 1,018.84 | $ | 6.01 | |||
Parnassus Fixed-Income Fund: Actual | $ | 1,000.00 | $ | 1,053.31 | $ | 3.82 | |||
Hypothetical (5% before expenses) | $ | 1,000.00 | $ | 1,020.48 | $ | 3.76 | |||
| * | Expenses are equal to the Fund’s annualized expense ratio of 0.99%, 0.99%, 0.78%, 1.20%, 1.20%, 1.20% and 0.75% for the Parnassus Fund, Parnassus Equity Income Fund – Investor Shares, Parnassus Equity Income Fund – Institutional Shares, Parnassus Mid-Cap Fund, Parnassus Small-Cap Fund, Parnassus Workplace Fund and Parnassus Fixed-Income Fund respectively, multiplied by the average account value over the period, multiplied by the ratio of days in the period. The ratio of days in the period is 181/365 (to reflect the one-half year period). |
| THE PARNASSUS FUNDS | 21 |
Table of Contents
Portfolio of Investments as of
June 30, 2010 (unaudited)
Shares | Equities | Percent of Net Assets | Market Value | |||||
| Biotechnology | ||||||||
| 270,000 | Genzyme Corp.1 | 3.7 | % | $ | 13,707,900 | |||
| Communications Equipment | ||||||||
| 600,000 | QUALCOMM Inc. | 5.4 | % | $ | 19,704,000 | |||
| Computer Peripherals | ||||||||
| 350,000 | Seagate Technology 1 | 1.2 | % | $ | 4,564,000 | |||
| Computers | ||||||||
| 45,000 | International Business Machines Corp. | 1.5 | % | $ | 5,556,600 | |||
| Consulting Services | ||||||||
| 160,000 | Accenture PLC | 1.7 | % | $ | 6,184,000 | |||
| Data Storage | ||||||||
| 1,055,000 | Brocade Communications Systems Inc.1 | 1.5 | % | $ | 5,443,800 | |||
| Electronic Components | ||||||||
| 540,000 | Corning Inc. | 2.4 | % | $ | 8,721,000 | |||
| Financial Services | ||||||||
| 325,000 | JPMorgan Chase & Co. | $ | 11,898,250 | |||||
| 45,000 | MasterCard Inc. | 8,978,850 | ||||||
| 470,000 | Wells Fargo & Co. | 12,032,000 | ||||||
| 9.0 | % | $ | 32,909,100 | |||||
| Home Builders | ||||||||
| 1,350,000 | DR Horton Inc. | $ | 13,270,500 | |||||
| 650,000 | KB Home | 7,150,000 | ||||||
| 1,550,000 | Pulte Homes Inc.1 | 12,834,000 | ||||||
| 700,000 | Toll Brothers Inc.1 | 11,452,000 | ||||||
| 12.2 | % | $ | 44,706,500 | |||||
| Industrial Manufacturing | ||||||||
| 230,000 | Teleflex Inc. | 3.4 | % | $ | 12,484,400 | |||
| Insurance | ||||||||
| 280,000 | Tower Group Inc. | 1.6 | % | $ | 6,028,400 | |||
| Internet | ||||||||
| 400,000 | eBay Inc.1 | $ | 7,844,000 | |||||
| 23,000 | Google Inc.1 | 10,233,850 | ||||||
| 390,000 | Yahoo! Inc.1 | 5,393,700 | ||||||
| 6.4 | % | $ | 23,471,550 | |||||
| Machinery | ||||||||
| 120,000 | Deere & Co. | 1.8 | % | $ | 6,681,600 | |||
| Medical Equipment | ||||||||
| 70,000 | Gen-Probe Inc.1 | $ | 3,179,400 | |||||
| 220,000 | Medtronic Inc. | 7,979,400 | ||||||
| 3.0 | % | $ | 11,158,800 | |||||
| Natural Gas | ||||||||
| 450,000 | Quicksilver Resources Inc.1 | 1.4 | % | $ | 4,950,000 | |||
| Networking Products | ||||||||
| 470,000 | Cisco Systems Inc.1 | $ | 10,015,700 | |||||
| 170,000 | Finisar Corp.1, 3 | 2,533,000 | ||||||
| 3.4 | % | $ | 12,548,700 | |||||
| Oil & Gas | ||||||||
| 50,000 | Pioneer Natural Resources Co. | $ | 2,972,500 | |||||
| 40,000 | SM Energy Co. | 1,606,400 | ||||||
| 935,000 | W&T Offshore Inc.3 | 8,845,100 | ||||||
| 3.7 | % | $ | 13,424,000 | |||||
| Pharmaceuticals | ||||||||
| 280,000 | Gilead Sciences Inc. | 2.6 | % | $ | 9,598,400 | |||
| Professional Services | ||||||||
| 330,000 | Administaff Inc. | 2.2 | % | $ | 7,972,800 | |||
| Retail | ||||||||
| 700,000 | Lowe’s Cos., Inc. | $ | 14,294,000 | |||||
| 140,000 | Target Corp. | 6,883,800 | ||||||
| 130,000 | Walgreen Co. | 3,471,000 | ||||||
| 6.7 | % | $ | 24,648,800 | |||||
| Semiconductor Capital Equipment | ||||||||
| 1,380,000 | Applied Materials Inc. | $ | 16,587,600 | |||||
| 290,000 | Lam Research Corp.1 | 11,037,400 | ||||||
| 7.5 | % | $ | 27,625,000 | |||||
| Semiconductors | ||||||||
| 660,000 | Intel Corp. | $ | 12,837,000 | |||||
| 350,000 | Texas Instruments Inc. | 8,148,000 | ||||||
| 5.7 | % | $ | 20,985,000 | |||||
| Software | ||||||||
| 430,000 | Autodesk Inc.1 | $ | 10,474,800 | |||||
| 540,000 | VeriSign Inc.1 | 14,337,000 | ||||||
| 6.8 | % | $ | 24,811,800 | |||||
| Telecommunications Equipment | ||||||||
| 1,050,000 | Ciena Corp.1, 3 | $ | 13,314,000 | |||||
| 550,000 | Tellabs Inc. | 3,514,500 | ||||||
| 4.6 | % | $ | 16,828,500 | |||||
| Total investment in equities (cost $379,456,768) | 99.4 | % | $ | 364,714,650 | ||||
| 22 | The accompanying notes are an integral part of these financial statements. |
Table of Contents
Portfolio of Investments as of
June 30, 2010 (unaudited) continued
Principal | Short-Term Securities | Percent of Net Assets | Market Value | ||||||
| Certificates of Deposit 2 | |||||||||
| 100,000 | Albina Community Bank | ||||||||
| 1.29%, matures 01/24/2011 | $ | 97,721 | |||||||
| 100,000 | Carver Federal Savings Bank | ||||||||
| 1.25%, matures 02/04/2011 | 97,600 | ||||||||
| 100,000 | Community Bank of the Bay | ||||||||
| 1.64%, matures 09/06/2010 | 99,255 | ||||||||
| 100,000 | Latino Community Credit Union | ||||||||
| 1.15%, matures 02/20/2011 | 97,436 | ||||||||
| 100,000 | Louisville Community Development Bank | ||||||||
| 0.65%, matures 05/10/2011 | 96,559 | ||||||||
| 100,000 | Opportunities Credit Union | ||||||||
| 1.00%, matures 04/25/2011 | 96,723 | ||||||||
| 100,000 | Self-Help Credit Union | ||||||||
| 2.05%, matures 01/14/2011 | 97,841 | ||||||||
| 100,000 | Southern Bancorp | ||||||||
| 1.50%, matures 01/12/2011 | 97,863 | ||||||||
| 100,000 | Wainwright Bank & Trust Co. | ||||||||
| 1.24%, matures 01/30/2011 | 97,655 | ||||||||
| 0.2 | % | $ | 878,653 | ||||||
| Community Development Loans 2 | |||||||||
| 200,000 | Boston Community Loan Fund | ||||||||
| 1.00%, matures 06/30/2011 | $ | 188,000 | |||||||
| 200,000 | Root Capital Loan Fund | ||||||||
| 2.00%, matures 03/16/2011 | 191,485 | ||||||||
| 100,000 | Vermont Community Loan Fund | ||||||||
| 1.50%, matures 12/15/2010 | 97,239 | ||||||||
| 0.1 | % | $ | 476,724 | ||||||
| Time Deposits | |||||||||
| 2,607,177 | BBH Cash Management Service Wells Fargo, Grand Cayman, | ||||||||
| 0.03%, due 07/01/2010 | 0.7 | % | $ | 2,607,177 | |||||
| Securities Purchased with Cash Collateral from Securities Lending | |||||||||
| Registered Investment Companies | |||||||||
| 11,801,310 | Invesco Aim Government & Agency Portfolio Short-Term Investments Trust, Institutional Class variable rate, 0.08% | 3.2 | % | $ | 11,801,310 | ||||
Total short-term securities (cost $15,763,864) | 4.2 | % | $ | 15,763,864 | |||||
Total securities (cost $395,220,632) | 103.6 | % | $ | 380,478,514 | |||||
| Payable upon return of securities loaned | -3.2 | % | $ | (11,801,310 | ) | ||||
| Other assets and liabilities – net | -0.4 | % | $ | (1,844,481 | ) | ||||
Total net assets | 100.0 | % | $ | 366,832,723 | |||||
| 1 | This security is non-income producing. |
| 2 | Market value adjustments have been applied to these securities to reflect the possibility of loss due to early withdrawal. |
| 3 | This security, or partial position of this security, was on loan at June 30, 2010. |
The total value of the securities on loan at June 30, 2010 was $11,427,602.
Fund holdings will vary over time.
Industry classifications are unaudited.
Fund shares are not FDIC insured.
| The accompanying notes are an integral part of these financial statements. | 23 |
Table of Contents
Portfolio of Investments as of
June 30, 2010 (unaudited)
Shares | Equities | Percent of Net Assets | Market Value | |||||
| Chemicals | ||||||||
| 975,000 | Praxair Inc. | 2.7 | % | $ | 74,090,250 | |||
| Communications Equipment | ||||||||
| 4,250,000 | QUALCOMM Inc. | 5.0 | % | $ | 139,570,000 | |||
| Consulting Services | ||||||||
| 3,000,000 | Accenture PLC | 4.2 | % | $ | 115,950,000 | |||
| Cosmetics & Personal Care | ||||||||
| 1,000,000 | Procter & Gamble Co. | 2.1 | % | $ | 59,980,000 | |||
| Data Processing | ||||||||
| 1,750,000 | Paychex Inc. | 1.6 | % | $ | 45,447,500 | |||
| Financial Services | ||||||||
| 3,500,000 | Bank of New York Mellon Corp. | $ | 86,415,000 | |||||
| 3,500,000 | Hudson City Bancorp Inc. | 42,840,000 | ||||||
| 2,450,000 | JPMorgan Chase & Co. | 89,694,500 | ||||||
| 460,000 | MasterCard Inc. | 91,783,800 | ||||||
| 1,000,000 | Royal Bank of Canada | 47,790,000 | ||||||
| 12.8 | % | $ | 358,523,300 | |||||
| Food Products | ||||||||
| 1,750,000 | McCormick & Co. | $ | 66,430,000 | |||||
| 1,478,000 | Sysco Corp. | 42,226,460 | ||||||
| 3.9 | % | $ | 108,656,460 | |||||
| Footwear | ||||||||
| 950,000 | Nike Inc. | 2.3 | % | $ | 64,172,500 | |||
| Healthcare Products | ||||||||
| 1,500,000 | Johnson & Johnson | 3.2 | % | $ | 88,590,000 | |||
| Home Products | ||||||||
| 1,001,341 | WD-40 Co. | 1.2 | % | $ | 33,444,789 | |||
| Industrial Manufacturing | ||||||||
| 1,650,000 | Cooper Industries PLC | $ | 72,600,000 | |||||
| 1,225,000 | Pentair Inc. | 39,445,000 | ||||||
| 1,971,501 | Teleflex Inc. | 107,013,074 | ||||||
| 7.8 | % | $ | 219,058,074 | |||||
| Insurance | ||||||||
| 1,090,000 | Aflac Inc. | 1.7 | % | $ | 46,510,300 | |||
| Internet | ||||||||
| 235,000 | Google Inc.1 | 3.7 | % | $ | 104,563,250 | |||
| Machinery | ||||||||
| 893,000 | Deere & Co. | $ | 49,722,240 | |||||
| 895,473 | IDEX Corp. | 25,583,664 | ||||||
| 2.7 | % | $ | 75,305,904 | |||||
| Medical Equipment | ||||||||
| 1,500,000 | Gen-Probe Inc.1 | $ | 68,130,000 | |||||
| 2,400,000 | Medtronic Inc. | 87,048,000 | ||||||
| 5.6 | % | $ | 155,178,000 | |||||
| Natural Gas | ||||||||
| 2,642,300 | Energen Corp. | $ | 117,133,159 | |||||
| 5,000,000 | MDU Resources Group Inc. | 90,150,000 | ||||||
| 7.4 | % | $ | 207,283,159 | |||||
| Oil & Gas | ||||||||
| 675,000 | Apache Corp. | $ | 56,828,250 | |||||
| 1,600,000 | Occidental Petroleum Corp. | 123,440,000 | ||||||
| 3,448,000 | W&T Offshore Inc.3 | 32,618,080 | ||||||
| 7.6 | % | $ | 212,886,330 | |||||
| Pharmaceuticals | ||||||||
| 2,745,000 | Gilead Sciences Inc.1 | 3.4 | % | $ | 94,098,600 | |||
| Semiconductor Capital Equipment | ||||||||
| 8,000,000 | Applied Materials Inc. | 3.4 | % | $ | 96,160,000 | |||
| Software | ||||||||
| 5,350,000 | Microsoft Corp. | $ | 123,103,500 | |||||
| 1,540,309 | VeriSign Inc.1 | 40,895,204 | ||||||
| 5.9 | % | $ | 163,998,704 | |||||
| Utility & Power Distribution | ||||||||
| 864,324 | AGL Resources Inc. | $ | 30,960,086 | |||||
| 1,000,000 | Black Hills Corp. | 28,470,000 | ||||||
| 645,000 | Northwest Natural Gas Co. | 28,102,650 | ||||||
| 3.1 | % | $ | 87,532,736 | |||||
| Waste Management | ||||||||
| 4,775,000 | Waste Management Inc. | 5.3 | % | $ | 149,409,750 | |||
Total investment in equities (cost $2,683,726,322) | 96.6 | % | $ | 2,700,409,606 | ||||
| 24 | The accompanying notes are an integral part of these financial statements. |
Table of Contents
Portfolio of Investments as of
June 30, 2010 (unaudited) continued
Principal | Community Loans | Percent of Net Assets | Market Value | |||||
| Community Development Loans 2 | ||||||||
| 1,000,000 | MicroVest I, LP Note | |||||||
| 5.88%, due 12/15/2010 | 0.0 | % | $ | 972,546 | ||||
| Total investment in community loans (cost $972,546) | 0.0 | % | $ | 972,546 | ||||
| Total investment in long-term securities (cost $2,684,698,868) | 96.6 | % | $ | 2,701,382,152 | ||||
Principal Amount $ | Short-Term Securities | |||||||
| Certificates of Deposit 2 | ||||||||
| 100,000 | Community Bank of the Bay | |||||||
| 1.64%, matures 08/24/2010 | $ | 99,398 | ||||||
| 250,000 | Community Trust Credit Union | |||||||
| 2.07%, matures 12/03/2010 | 245,714 | |||||||
| 0.0 | % | $ | 345,112 | |||||
| Certificate of Deposit Account Registry Service (CDARS) 2 | ||||||||
| 500,000 | CDARS agreement with Community Bank of the Bay, dated 10/22/2009, matures 10/21/2010, 1.19% Participating depository institutions: Amegy Bank, N.A., par 236,500; Banco Popular de Puerto Rico, par 236,500; The PrivateBank & Trust Company, par 27,000; (cost $493,792) | $ | 493,792 | |||||
| 500,000 | CDARS agreement with Community Bank of the Bay, dated 12/10/2009, matures 12/09/2010, 1.09% Participating depository institutions: Arvest Bank, par 31,000; First Place Bank, par 234,500; ViewPoint Bank, par 234,500; (cost $491,155) | $ | 491,155 | |||||
| 500,000 | CDARS agreement with Community Bank of the Bay, dated 01/28/2010, matures 01/27/2011, 1.00% Participating depository institutions: EverBank, par 235,500; The Huntington National Bank, par 56,000; The PrivateBank & Trust Company, par 208,500; (cost $488,407) | 488,407 | ||||||
| 500,000 | CDARS agreement with Community Bank of the Bay, dated 02/11/2010, matures 02/10/2011, 1.00% Participating depository institutions: Arvest Bank, par 203,500; The Huntington National Bank, par 179,500; TriState Capital Bank, par 117,000 (cost $487,638) | 487,638 | ||||||
| 0.1 | % | $ | 1,960,992 | |||||
| The accompanying notes are an integral part of these financial statements. | 25 |
Table of Contents
PARNASSUS EQUITY INCOME FUND
Portfolio of Investments as of
June 30, 2010 (unaudited) continued
Principal | Short-Term Securities | Percent of Net Assets | Market Value | ||||||
| Community Development Loans 2 | |||||||||
| 100,000 | Boston Community Loan Fund | ||||||||
| 1.00%, matures 06/30/2011 | $ | 94,000 | |||||||
| 1,000,000 | MicroVest I, LP Note | ||||||||
| 5.25%, matures 10/15/2010 | 982,410 | ||||||||
| 500,000 | MicroVest I, LP Note | ||||||||
| 3.50%, matures 03/15/2011 | 478,794 | ||||||||
| 100,000 | New Hampshire | ||||||||
| Community Loan Fund | |||||||||
| 1.00%, matures 08/31/2010 | 98,981 | ||||||||
| 200,000 | Root Capital Loan Fund | ||||||||
| 2.00%, matures 01/25/2011 | 193,162 | ||||||||
| 100,000 | Vermont Community Loan Fund | ||||||||
| 1.50%, matures 04/15/2011 | 95,249 | ||||||||
| 0.1 | % | $ | 1,942,596 | ||||||
| Time Deposits | |||||||||
| 162,374,218 | BBH Cash Management Service HSBC Bank, Grand Cayman, 0.03%, due 07/01/2010 | 5.8 | % | $ | 162,374,218 | ||||
| Securities Purchased with Cash Collateral from Securities Lending | |||||||||
| Registered Investment Companies | |||||||||
| 3,615,300 | Invesco Aim Government & Agency Portfolio Short-Term Investments Trust, Institutional Class variable rate, 0.08% | 0.1 | % | $ | 3,615,300 | ||||
Total short-term securities (cost $170,238,218) | 6.1 | % | $ | 170,238,218 | |||||
Total securities (cost $2,854,937,086) | 102.7 | % | $ | 2,871,620,370 | |||||
| Payable upon return of securities loaned | -0.1 | % | $ | (3,615,300 | ) | ||||
| Other assets and liabilities – net | -2.6 | % | $ | (72,747,700 | ) | ||||
| Total net assets | 100.0 | % | $ | 2,795,257,370 | |||||
| 1 | This security is non-income producing. |
| 2 | Market value adjustments have been applied to these securities to reflect the possibility of loss due to early withdrawal. |
| 3 | This security, or partial position of this security, was on loan at June 30, 2010. |
The total value of the securities on loan at June 30, 2010 was $3,484,724.
Fund holdings will vary over time.
Industry classifications are unaudited.
Fund shares are not FDIC insured.
| 26 | The accompanying notes are an integral part of these financial statements. |
Table of Contents
Portfolio of Investments as of
June 30, 2010 (unaudited)
Shares | Equities | Percent of Net Assets | Market Value | |||||
| Apparel | ||||||||
| 9,000 | Coach Inc. | 1.2 | % | $ | 328,950 | |||
| Consulting Services | ||||||||
| 9,000 | Cognizant Technology Solutions Corp.1 | 1.7 | % | $ | 450,540 | |||
| Data Processing | ||||||||
| 20,000 | Fiserv Inc.1 | $ | 913,200 | |||||
| 33,000 | Paychex Inc. | 857,010 | ||||||
| 6.7 | % | $ | 1,770,210 | |||||
| Financial Services | ||||||||
| 35,000 | Glacier Bancorp Inc. | $ | 513,450 | |||||
| 75,000 | Hudson City Bancorp Inc. | 918,000 | ||||||
| 26,000 | SEI Investments Co. | 529,360 | ||||||
| 7.5 | % | $ | 1,960,810 | |||||
| Food Products | ||||||||
| 23,000 | McCormick & Co. | $ | 873,080 | |||||
| 38,000 | Sysco Corp. | 1,085,660 | ||||||
| 7.5 | % | $ | 1,958,740 | |||||
| Healthcare Products | ||||||||
| 5,000 | CareFusion Corp.1 | $ | 113,500 | |||||
| 14,000 | DENTSPLY | |||||||
| International Inc. | 418,740 | |||||||
| 2.0 | % | $ | 532,240 | |||||
| Healthcare Services | ||||||||
| 7,000 | Cardinal Health Inc. | 0.9 | % | $ | 235,270 | |||
| Industrial Manufacturing | ||||||||
| 26,000 | Cooper Industries PLC | $ | 1,144,000 | |||||
| 25,000 | Pentair Inc. | 805,000 | ||||||
| 16,000 | Teleflex Inc. | 868,480 | ||||||
| 10.7 | % | $ | 2,817,480 | |||||
| Insurance | ||||||||
| 12,000 | Aflac Inc. | 1.9 | % | $ | 512,040 | |||
| Machinery | ||||||||
| 13,000 | Deere & Co. | $ | 723,840 | |||||
| 26,000 | IDEX Corp. | 742,820 | ||||||
| 5.6 | % | $ | 1,466,660 | |||||
| Medical Equipment | ||||||||
| 14,000 | C. R. Bard Inc. | $ | 1,085,420 | |||||
| 20,500 | Gen-Probe Inc.1 | 931,110 | ||||||
| 30,500 | Patterson Companies Inc. | 870,165 | ||||||
| 7,000 | Varian Medical Systems Inc.1 | 365,960 | ||||||
| 12.4 | % | $ | 3,252,655 | |||||
| Natural Gas | ||||||||
| 7,000 | Energen Corp. | $ | 310,310 | |||||
| 16,500 | MDU Resources Group Inc. | 297,495 | ||||||
| 17,000 | Southwestern Energy Co.1 | 656,880 | ||||||
| 4.8 | % | $ | 1,264,685 | |||||
| Oil & Gas | ||||||||
| 9,000 | Noble Corp. | $ | 278,190 | |||||
| 9,000 | Pioneer Natural Resources Co. | 535,050 | ||||||
| 11,500 | Ultra Petroleum Corp.1 | 508,875 | ||||||
| 5.0 | % | $ | 1,322,115 | |||||
| Pharmaceuticals | ||||||||
| 20,000 | Valeant Pharmaceuticals International 1 | 4.0 | % | $ | 1,045,800 | |||
| Retail | ||||||||
| 11,000 | Nordstrom Inc. | 1.3 | % | $ | 354,090 | |||
| Semiconductor Capital Equipment | ||||||||
| 87,500 | Applied Materials Inc. | 4.0 | % | $ | 1,051,750 | |||
| Semiconductors | ||||||||
| 14,500 | Microchip Technology Inc.3 | 1.5 | % | $ | 402,230 | |||
| Services | ||||||||
| 17,500 | Ecolab Inc. | 3.0 | % | $ | 785,925 | |||
| Software | ||||||||
| 12,100 | Adobe Systems Inc.1 | $ | 319,803 | |||||
| 22,500 | Autodesk Inc.1 | 548,100 | ||||||
| 8,500 | Check Point Software Technologies Ltd.1 | 250,580 | ||||||
| 20,000 | Intuit Inc.1 | 695,400 | ||||||
| 15,000 | McAfee Inc.1 | 460,800 | ||||||
| 33,500 | Symantec Corp.1 | 464,980 | ||||||
| 22,000 | Synopsys Inc.1 | 459,140 | ||||||
| 12.2 | % | $ | 3,198,803 | |||||
| Waste Management | ||||||||
| 40,000 | Waste Management Inc. | 4.8 | % | $ | 1,251,600 | |||
Total investment in equities (cost $23,999,202) | 98.7 | % | $ | 25,962,593 | ||||
| The accompanying notes are an integral part of these financial statements. | 27 |
Table of Contents
PARNASSUS MID - CAP FUND
Portfolio of Investments as of
June 30, 2010 (unaudited) continued
Principal | Short-Term Securities | Percent of Net Assets | Market Value | |||||
| Time Deposits | ||||||||
| 492,475 | BBH Cash Management Service Citibank, London, | |||||||
| 0.03%, due 07/01/2010 | 1.9% | $ | 492,475 | |||||
| Securities Purchased with Cash Collateral from Securities Lending | ||||||||
| Registered Investment Companies | ||||||||
| 407,550 | Invesco Aim Government & Agency Portfolio Short-Term Investments Trust, Institutional Class variable rate, 0.08% | 1.5% | $ | 407,550 | ||||
Total short-term securities (cost $900,025) | 3.4% | $ | 900,025 | |||||
Total securities (cost $24,899,227) | 102.1% | $ | 26,862,618 | |||||
| Payable upon return of securities loaned | -1.5% | $ | (407,550 | ) | ||||
| Other assets and liabilities – net | -0.6% | $ | (156,250 | ) | ||||
| Total net assets | 100.0% | $ | 26,298,818 | |||||
| 1 | This security is non-income producing. |
| 3 | This security, or partial position of this security, was on loan at June 30, 2010. |
The total value of the securities on loan at June 30, 2010 was $399,113.
Fund holdings will vary over time.
Industry classifications are unaudited.
Fund shares are not FDIC insured.
| 28 | The accompanying notes are an integral part of these financial statements. |
Table of Contents
Portfolio of Investments as of
June 30, 2010 (unaudited)
Shares | Equities | Percent of Net Assets | Market Value | |||||
| Biotechnology | ||||||||
| 170,000 | Myriad Genetics Inc.1 | 1.2 | % | $ | 2,541,500 | |||
| Building Materials | ||||||||
| 45,000 | Simpson Manufacturing Co., Inc. | 0.5 | % | $ | 1,104,750 | |||
| Chemicals | ||||||||
| 40,000 | Compass Minerals International Inc. | 1.3 | % | $ | 2,811,200 | |||
| Computer Peripherals | ||||||||
| 840,000 | Electronics for Imaging Inc.1 | 3.9 | % | $ | 8,190,000 | |||
| Data Processing | ||||||||
| 230,000 | Jack Henry & Associates Inc. | 2.6 | % | $ | 5,492,400 | |||
| Data Storage | ||||||||
| 1,500,000 | Brocade Communications Systems Inc.1 | 3.7 | % | $ | 7,740,000 | |||
| Electric Motors | ||||||||
| 20,000 | Baldor Electric Co. | 0.3 | % | $ | 721,600 | |||
| Electronics | ||||||||
| 55,000 | Analogic Corp. | 1.2 | % | $ | 2,503,050 | |||
| Financial Services | ||||||||
| 80,000 | Glacier Bancorp Inc. | $ | 1,173,600 | |||||
| 155,000 | SEI Investments Co. | 3,155,800 | ||||||
| 2.1 | % | $ | 4,329,400 | |||||
| Healthcare Services | ||||||||
| 310,000 | LHC Group Inc.1 | 4.1 | % | $ | 8,602,500 | |||
| Home Builders | ||||||||
| 140,000 | DR Horton Inc. | $ | 1,376,200 | |||||
| 410,000 | KB Home | 4,510,000 | ||||||
| 225,000 | Pulte Homes Inc.1 | 1,863,000 | ||||||
| 390,000 | Toll Brothers Inc.1 | 6,380,400 | ||||||
| 6.7 | % | $ | 14,129,600 | |||||
| Home Products | ||||||||
| 30,000 | WD-40 Co. | 0.5 | % | $ | 1,002,000 | |||
| Industrial Manufacturing | ||||||||
| 150,000 | Teleflex Inc. | 3.9 | % | $ | 8,142,000 | |||
| Insurance | ||||||||
| 375,000 | Tower Group Inc. | 3.8 | % | $ | 8,073,750 | |||
| Machinery | ||||||||
| 110,000 | Graco Inc. | 1.5 | % | $ | 3,100,900 | |||
| Medical Equipment | ||||||||
| 420,000 | Cyberonics Inc.1 | $ | 9,945,600 | |||||
| 135,000 | Gen-Probe Inc.1 | 6,131,700 | ||||||
| 7.6 | % | $ | 16,077,300 | |||||
| Natural Gas | ||||||||
| 60,000 | Energen Corp. | $ | 2,659,800 | |||||
| 710,000 | Quicksilver Resources Inc.1 | 7,810,000 | ||||||
| 5.0 | % | $ | 10,469,800 | |||||
| Networking Products | ||||||||
| 340,000 | Finisar Corp.1, 3 | 2.4 | % | $ | 5,066,000 | |||
| Oil & Gas | ||||||||
| 135,000 | SM Energy Co. | $ | 5,421,600 | |||||
| 870,000 | W&T Offshore Inc. | 8,230,200 | ||||||
| 6.5 | % | $ | 13,651,800 | |||||
| Pharmaceuticals | ||||||||
| 90,000 | Valeant Pharmaceuticals International 1, 3 | 2.2 | % | $ | 4,706,100 | |||
| Professional Services | ||||||||
| 405,000 | Administaff Inc. | 4.6 | % | $ | 9,784,800 | |||
| Retail | ||||||||
| 60,000 | Nash Finch Co. | 1.0 | % | $ | 2,049,600 | |||
| Semiconductor Capital Equipment | ||||||||
| 140,000 | Cognex Corp. | $ | 2,461,200 | |||||
| 185,000 | Cymer Inc.1 | 5,557,400 | ||||||
| 20,000 | Electro Scientific Industries Inc.1 | 267,200 | ||||||
| 15,000 | Lam Research Corp.1 | 570,900 | ||||||
| 4.2 | % | $ | 8,856,700 | |||||
| Software | ||||||||
| 1,130,000 | ClickSoftware Technologies Ltd.1 | $ | 6,011,600 | |||||
| 750,000 | Mentor Graphics Corp.1 | 6,637,500 | ||||||
| 210,000 | VeriSign Inc.1 | 5,575,500 | ||||||
| 295,000 | Websense Inc.1 | 5,575,500 | ||||||
| 11.3 | % | $ | 23,800,100 | |||||
| Telecommunications Equipment | ||||||||
| 1,041,500 | Ceragon Networks Ltd.1 | $ | 7,707,100 | |||||
| 500,000 | Ciena Corp.1 | 6,340,000 | ||||||
| 400,000 | Harmonic Inc.1 | 2,176,000 | ||||||
| 1,400,000 | Tellabs Inc. | 8,946,000 | ||||||
| 11.9 | % | $ | 25,169,100 | |||||
| Utility & Power Distribution | ||||||||
| 65,000 | AGL Resources Inc. | $ | 2,328,300 | |||||
| 75,000 | Northwest Natural Gas Co. | 3,267,750 | ||||||
| 180,000 | NorthWestern Corp. | 4,716,000 | ||||||
| 4.9 | % | $ | 10,312,050 | |||||
| Total investment in equities (cost $211,155,629) | 98.9 | % | $ | 208,428,000 | ||||
| The accompanying notes are an integral part of these financial statements. | 29 |
Table of Contents
PARNASSUS SMALL - CAP FUND
Portfolio of Investments as of
June 30, 2010 (unaudited) continued
Principal | Short-Term Securities | Percent of Net Assets | Market Value | ||||||
| Time Deposits | |||||||||
| 7,548,326 | BBH Cash Management Service HSBC Bank, Grand Cayman, | ||||||||
| 0.03%, due 07/01/2010 | 3.6 | % | $ | 7,548,326 | |||||
| Securities Purchased with Cash Collateral from Securities Lending | |||||||||
| Registered Investment Companies | |||||||||
| 5,568,039 | Invesco Aim Government & Agency Portfolio Short-Term Investments Trust, Institutional Class variable rate, 0.08% | 2.6 | % | $ | 5,568,039 | ||||
| Total short-term securities (cost $13,116,365) | 6.2 | % | $ | 13,116,365 | |||||
| Total securities (cost $224,271,994) | 105.1 | % | $ | 221,544,365 | |||||
| Payable upon return of securities loaned | -2.6 | % | $ | (5,568,039 | ) | ||||
| Other assets and liabilities – net | -2.5 | % | $ | (5,325,783 | ) | ||||
| Total net assets | 100.0 | % | $ | 210,650,543 | |||||
| 1 | This security is non-income producing. |
| 3 | This security, or partial position of this security, was on loan at June 30, 2010. |
The total value of the securities on loan at June 30, 2010 was $5,389,299.
Fund holdings will vary over time.
Industry classifications are unaudited.
Fund shares are not FDIC insured.
| 30 | The accompanying notes are an integral part of these financial statements. |
Table of Contents
Portfolio of Investments as of
June 30, 2010 (unaudited)
Shares | Equities | Percent of Net Assets | Market Value | ||||||
| Biotechnology | |||||||||
| 120,000 | Genzyme Corp.1 | 5.6 | % | $ | 6,092,400 | ||||
| Communications Equipment | |||||||||
| 250,000 | QUALCOMM Inc. | 7.6 | % | $ | 8,210,000 | ||||
| Computer Peripherals | |||||||||
| 20,000 | Seagate Technology1 | 0.2 | % | $ | 260,800 | ||||
| Computers | |||||||||
| 40,000 | International Business Machines Corp. | 4.6 | % | $ | 4,939,200 | ||||
| Consulting Services | |||||||||
| 135,000 | Accenture PLC | 4.8 | % | $ | 5,217,750 | ||||
| Data Processing | |||||||||
| 90,000 | Paychex Inc. | 2.2 | % | $ | 2,337,300 | ||||
| Data Storage | |||||||||
| 750,000 | Brocade Communications Systems Inc.1 | 3.6 | % | $ | 3,870,000 | ||||
| Electronic Components | |||||||||
| 310,000 | Corning Inc. | 4.6 | % | $ | 5,006,500 | ||||
| Financial Services | |||||||||
| 20,000 | MasterCard Inc. | $ | 3,990,600 | ||||||
| 200,000 | SEI Investments Co. | 4,072,000 | |||||||
| 15,000 | Wells Fargo & Co. | 384,000 | |||||||
| 7.8 | % | $ | 8,446,600 | ||||||
| Footwear | |||||||||
| 15,000 | Nike Inc. | 0.9 | % | $ | 1,013,250 | ||||
| Internet | |||||||||
| 265,000 | eBay Inc.1 | $ | 5,196,650 | ||||||
| 8,000 | Google Inc.1 | 3,559,600 | |||||||
| 335,000 | Yahoo! Inc.1 | 4,633,050 | |||||||
| 12.3 | % | $ | 13,389,300 | ||||||
| Machinery | |||||||||
| 60,000 | Deere & Co. | $ | 3,340,800 | ||||||
| 40,000 | Graco Inc. | 1,127,600 | |||||||
| 4.1 | % | $ | 4,468,400 | ||||||
| Medical Equipment | |||||||||
| 105,000 | Medtronic Inc. | 3.5 | % | $ | 3,808,350 | ||||
| Natural Gas | |||||||||
| 210,000 | MDU Resources Group Inc. | 3.5 | % | $ | 3,786,300 | ||||
| Networking Products | |||||||||
| 180,000 | Cisco Systems Inc.1 | 3.5 | % | $ | 3,835,800 | ||||
| Oil & Gas | |||||||||
| 55,000 | Devon Energy Corp. | 3.1 | % | $ | 3,350,600 | ||||
| Pharmaceuticals | |||||||||
| 169,000 | Gilead Sciences Inc.1 | 5.3 | % | $ | 5,793,320 | ||||
| Retail | |||||||||
| 185,000 | Lowe’s Cos., Inc. | $ | 3,777,700 | ||||||
| 100,000 | Walgreen Co. | 2,670,000 | |||||||
| 5.9 | % | $ | 6,447,700 | ||||||
| Semiconductor Capital Equipment | |||||||||
| 475,000 | Applied Materials Inc. | 5.3 | % | $ | 5,709,500 | ||||
| Semiconductors | |||||||||
| 270,000 | Intel Corp. | $ | 5,251,500 | ||||||
| 100,000 | Texas Instruments Inc. | 2,328,000 | |||||||
| 7.0 | % | $ | 7,579,500 | ||||||
| Software | |||||||||
| 90,000 | Autodesk Inc.1 | $ | 2,192,400 | ||||||
| 100,000 | Symantec Corp.1 | 1,388,000 | |||||||
| 3.3 | % | $ | 3,580,400 | ||||||
| Utility & Power Distribution | |||||||||
| 15,000 | Northwest Natural Gas Co. | 0.6 | % | $ | 653,550 | ||||
| Total investment in equities (cost $113,189,395) | 99.3 | % | $ | 107,796,520 | |||||
Principal | Short-Term Securities | ||||||||
| Time Deposits | |||||||||
| 2,571,680 | BBH Cash Management Service Citibank, London, | ||||||||
| 0.03%, due 07/01/2010 | 2.4 | % | $ | 2,571,680 | |||||
| Total short-term securities (cost $2,571,680) | 2.4 | % | $ | 2,571,680 | |||||
| Total securities (cost $115,761,075) | 101.7 | % | $ | 110,368,200 | |||||
| Other assets and liabilities – net | -1.7 | % | $ | (1,804,761 | ) | ||||
| Total net assets | 100.0 | % | $ | 108,563,439 | |||||
| 1 | This security is non-income producing. |
Fund holdings will vary over time.
Industry classifications are unaudited.
Fund shares are not FDIC insured.
| The accompanying notes are an integral part of these financial statements. | 31 |
Table of Contents
Portfolio of Investments as of
June 30, 2010 (unaudited)
Principal | Convertible Bonds | Percent of Net Assets | Market Value | |||||
| Computer Peripherals | ||||||||
| 3,000,000 | SanDisk Corp. | |||||||
| Notes, 1.00%, due 05/15/2013 | 1.6 | % | $ | 2,666,250 | ||||
| Financial Services | ||||||||
| 2,000,000 | NASDAQ OMX Group Inc.3 | |||||||
| Notes, 2.50%, due 08/15/2013 | 1.1 | % | $ | 1,897,500 | ||||
| Healthcare Services | ||||||||
| 2,500,000 | Hologic Inc. | |||||||
| Notes, 2.00%, due 12/15/2037 | 1.3 | % | $ | 2,128,125 | ||||
| Medical Equipment | ||||||||
| 3,500,000 | Medtronic Inc. | |||||||
| Notes, 1.50%, due 04/15/2011 | 2.1 | % | $ | 3,478,125 | ||||
| Real Estate Investment Trusts | ||||||||
| 2,500,000 | Prologis | |||||||
| Notes, 1.88%, due 11/15/2037 | 1.4 | % | $ | 2,243,750 | ||||
| Semiconductors | ||||||||
| 1,000,000 | Intel Corp. | |||||||
| Notes, 2.95%, due 12/15/2035 | 0.6 | % | $ | 950,000 | ||||
| Software | ||||||||
| 2,000,000 | Microsoft Corp. | |||||||
| Notes, 0.00%, due 05/15/2013 | 1.2 | % | $ | 1,972,500 | ||||
| Telecommunications Services | ||||||||
| 2,000,000 | NII Holdings Inc. | |||||||
| Notes, 3.13%, due 06/15/2012 | 1.1 | % | $ | 1,887,500 | ||||
| Total investment in convertible bonds (cost $16,690,156) | 10.4 | % | $ | 17,223,750 | ||||
| Air Transportation | ||||||||
| 1,809,446 | Southwest Air 07-1 Trust | |||||||
| Notes, 6.15%, due 08/01/2022 | 1.1 | % | $ | 1,863,729 | ||||
| Biotechnology | ||||||||
| 3,000,000 | Genentech Inc. | |||||||
| Notes, 4.75%, due 07/15/2015 | $ | 3,319,302 | ||||||
| 2,500,000 | Genzyme Corp. | |||||||
| Notes, 3.63%, due 06/15/2015 | 2,528,765 | |||||||
| 3.5 | % | $ | 5,848,067 | |||||
| Chemicals | ||||||||
| 2,500,000 | Praxair Inc. | |||||||
| Notes, 4.38%, due 03/31/2014 | $ | 2,706,807 | ||||||
| 3,000,000 | Praxair Inc. | |||||||
| Notes, 4.50%, due 08/15/2019 | 3,184,044 | |||||||
| 3.5 | % | $ | 5,890,851 | |||||
| Computers | ||||||||
| 2,000,000 | International Business Machines Corp. | |||||||
| Notes, 6.50%, due 10/15/2013 | 1.4 | % | $ | 2,312,612 | ||||
| Cosmetics & Personal Care | ||||||||
| 2,000,000 | Procter & Gamble Co. | |||||||
| Notes, 4.95%, due 08/15/2014 | $ | 2,241,514 | ||||||
| 500,000 | Procter & Gamble Co. | |||||||
| Notes, 3.50%, due 02/15/2015 | 532,702 | |||||||
| 1.7 | % | $ | 2,774,216 | |||||
| 32 | The accompanying notes are an integral part of these financial statements. |
Table of Contents
Portfolio of Investments as of
June 30, 2010 (unaudited) continued
Principal | Corporate Bonds | Percent of Net Assets | Market Value | |||||
| Financial Services | ||||||||
| 2,000,000 | Charles Schwab Corp. | |||||||
| Notes, 4.95%, due 06/01/2014 | $ | 2,168,462 | ||||||
| 2,000,000 | JPMorgan Chase & Co. | |||||||
| Notes, 2.63%, due 12/01/2010 | 2,018,418 | |||||||
| 2,000,000 | JPMorgan Chase & Co. | |||||||
| Notes, 5.15%, due 10/01/2015 | 2,139,856 | |||||||
| 2,000,000 | Wells Fargo & Co. | |||||||
| Notes, 3.00%, due 12/09/2011 | 2,067,164 | |||||||
| 5.0 | % | $ | 8,393,900 | |||||
| Insurance | ||||||||
| 3,000,000 | Aflac Inc. | |||||||
| Notes, 8.50%, due 05/15/2019 | 2.2 | % | $ | 3,609,528 | ||||
| Networking Products | ||||||||
| 2,800,000 | Cisco Systems Inc. | |||||||
| Notes, 5.50%, due 02/22/2016 | 1.9 | % | $ | 3,225,580 | ||||
| Oil & Gas | ||||||||
| 2,000,000 | Valero Energy Corp. | |||||||
| Notes, 9.38%, due 03/15/2019 | 1.5 | % | $ | 2,422,574 | ||||
| Retail | ||||||||
| 1,493,000 | Target Corp. | |||||||
| Notes, 5.13%, due 01/15/2013 | $ | 1,628,947 | ||||||
| 3,500,000 | TJX Cos., Inc. | |||||||
| Notes, 4.20%, due 08/15/2015 | 3,801,095 | |||||||
| 3.3 | % | $ | 5,430,042 | |||||
| Software | ||||||||
| 2,000,000 | Adobe Systems Inc. | |||||||
| Notes, 3.25%, due 02/01/2015 | $ | 2,053,904 | ||||||
| 2,000,000 | Intuit Inc. | |||||||
| Notes, 5.75%, due 03/15/2017 | 2,197,136 | |||||||
| 2.6 | % | $ | 4,251,040 | |||||
| Telecommunications Services | ||||||||
| 1,000,000 | Verizon Communications Inc. | |||||||
| Notes, 5.55%, due 02/15/2016 | 0.7 | % | $ | 1,120,009 | ||||
| Transportation | ||||||||
| 2,000,000 | Burlington Northern Santa Fe Corp. | |||||||
| Notes, 5.65%, due 05/01/2017 | $ | 2,235,484 | ||||||
| 2,000,000 | Burlington Northern Santa Fe Corp. | |||||||
| Notes, 4.70%, due 10/01/2019 | 2,118,206 | |||||||
| 2.6 | % | $ | 4,353,690 | |||||
| Utility & Power Distribution | ||||||||
| 2,000,000 | AGL Capital Corp. | |||||||
| Notes, 5.25%, due 08/15/2019 | 1.3 | % | $ | 2,115,384 | ||||
| Waste Management | ||||||||
| 3,000,000 | Waste Management Inc. | |||||||
| Notes, 6.38%, due 03/11/2015 | $ | 3,440,325 | ||||||
| 2,000,000 | Waste Management Inc. | |||||||
| Notes, 7.13%, due 12/15/2017 | 2,369,580 | |||||||
| 3.5 | % | $ | 5,809,905 | |||||
| Total investment in corporate bonds (cost $55,309,005) | 35.8 | % | $ | 59,421,127 | ||||
| The accompanying notes are an integral part of these financial statements. | 33 |
Table of Contents
PARNASSUS FIXED - INCOME FUND
Portfolio of Investments as of
June 30, 2010 (unaudited) continued
Principal | U.S. Government Treasury Bonds | Percent of Net Assets | Market Value | ||||||
| 4,000,000 | U.S. Treasury | ||||||||
| 4.50%, due 02/28/2011 | $ | 4,111,564 | |||||||
| 1,000,000 | U.S. Treasury | ||||||||
| 1.50%, due 07/15/2012 | 1,018,203 | ||||||||
| 2,000,000 | U.S. Treasury | ||||||||
| 1.75%, due 04/15/2013 | 2,045,460 | ||||||||
| 2,000,000 | U.S. Treasury | ||||||||
| 3.13%, due 09/30/2013 | 2,129,376 | ||||||||
| 3,500,000 | U.S. Treasury | ||||||||
| 2.00%, due 11/30/2013 | 3,592,967 | ||||||||
| 3,500,000 | U.S. Treasury | ||||||||
| 2.63%, due 06/30/2014 | 3,658,869 | ||||||||
| 3,500,000 | U.S. Treasury | ||||||||
| 2.38%, due 09/30/2014 | 3,615,119 | ||||||||
| 6,000,000 | U.S. Treasury | ||||||||
| 2.50%, due 04/30/2015 | 6,213,282 | ||||||||
| 5,000,000 | U.S. Treasury | ||||||||
| 3.00%, due 09/30/2016 | 5,213,670 | ||||||||
| 5,000,000 | U.S. Treasury | ||||||||
| 3.13%, due 10/31/2016 | 5,244,920 | ||||||||
| 5,000,000 | U.S. Treasury | ||||||||
| 3.13%, due 04/30/2017 | 5,226,560 | ||||||||
| 4,000,000 | U.S. Treasury | ||||||||
| 2.75%, due 05/31/2017 | 4,084,376 | ||||||||
| 4,000,000 | U.S. Treasury | ||||||||
| 3.75%, due 11/15/2018 | 4,310,000 | ||||||||
| 5,000,000 | U.S. Treasury | ||||||||
| 3.63%, due 08/15/2019 | 5,287,110 | ||||||||
| 5,000,000 | U.S. Treasury | ||||||||
| 3.38%, due 11/15/2019 | 5,178,515 | ||||||||
| 5,000,000 | U.S. Treasury | ||||||||
| 3.63%, due 02/15/2020 | 5,282,810 | ||||||||
| 4,000,000 | U.S. Treasury | ||||||||
| 4.38%, due 11/15/2039 | 4,318,124 | ||||||||
| 4,000,000 | U.S. Treasury | ||||||||
| 4.63%, due 02/15/2040 | 4,496,248 | ||||||||
| 2,373,860 | U.S. Treasury (TIPS) | ||||||||
| 1.88%, due 07/15/2013 | 2,510,912 | ||||||||
| 1,040,570 | U.S. Treasury (TIPS) | ||||||||
| 1.63%, due 01/15/2018 | 1,096,825 | ||||||||
| 2,081,140 | U.S. Treasury (TIPS) | ||||||||
| 1.75%, due 01/15/2028 | 2,111,056 | ||||||||
| Total investment in U.S. government treasury bonds (cost $78,150,800) | 48.6 | % | $ | 80,745,966 | |||||
| Total investment in long-term securities (cost $150,149,961) | 94.8 | % | $ | 157,390,843 | |||||
Principal | Short-Term Securities | ||||||||
| Community Development Loans2 | |||||||||
| 1,000,000 | MicroVest I, LP Note | ||||||||
| 3.50%, matures 01/15/2011 | 0.6 | % | $ | 967,451 | |||||
| Time Deposits | |||||||||
| 3,821,764 | BBH Cash Management Service Wells Fargo, Grand Cayman, | ||||||||
| 0.03%, due 07/01/2010 | 2.3 | % | $ | 3,821,764 | |||||
| Securities Purchased with Cash Collateral from Securities Lending | |||||||||
| Registered Investment Companies | |||||||||
| 453,792 | Invesco Aim Government & Agency Portfolio | ||||||||
| Short-Term Investments Trust, Institutional Class variable rate, 0.08% | 0.3 | % | $ | 453,792 | |||||
| Total short-term securities (cost $5,243,007) | 3.2 | % | $ | 5,243,007 | |||||
| Total securities (cost $155,392,968) | 98.0 | % | $ | 162,633,850 | |||||
| Payable upon return of securities loaned | -0.3 | % | $ | (453,792 | ) | ||||
| Other assets and liabilities – net | 2.3 | % | $ | 3,937,705 | |||||
| Total net assets | 100.0 | % | $ | 166,117,763 | |||||
| 2 | Market value adjustments have been applied to these securities to reflect the possibility of loss due to early withdrawal. |
| 3 | This security, or partial position of this security, was on loan at June 30, 2010. |
The total value of the securities on loan at June 30, 2010 was $444,538.
Fund holdings will vary over time.
Industry classifications are unaudited.
Fund shares are not FDIC insured.
| 34 | The accompanying notes are an integral part of these financial statements. |
Table of Contents
This page left intentionally blank.
| THE PARNASSUS FUNDS | 35 |
Table of Contents
Statement of Assets and Liabilities
June 30, 2010 (unaudited)
| Parnassus Fund | Parnassus Equity Income Fund | Parnassus Mid-Cap Fund | ||||||||||
Assets | ||||||||||||
Investments in equities and bonds, at market value (cost $379,456,768, $2,684,698,868, $23,999,202) | $ | 364,714,650 | $ | 2,701,382,152 | $ | 25,962,593 | ||||||
Investments in short-term securities | 15,763,864 | 170,238,218 | 900,025 | |||||||||
Cash | 166,656 | 253,497 | 14 | |||||||||
Receivables | ||||||||||||
Investment securities sold | — | 960,905 | — | |||||||||
Dividends and interest | 41,876 | 2,837,956 | 29,147 | |||||||||
Capital shares sold | 184,498 | 2,566,785 | 6,403 | |||||||||
Other assets | 41,346 | 135,465 | 16,409 | |||||||||
Total assets | $ | 380,912,890 | $ | 2,878,374,978 | $ | 26,914,591 | ||||||
Liabilities | ||||||||||||
Payable upon return of loaned securities | 11,801,310 | 3,615,300 | 407,550 | |||||||||
Payable for investment securities purchased | 1,963,805 | 74,585,243 | 194,549 | |||||||||
Capital shares redeemed | 115,284 | 4,013,489 | — | |||||||||
Distributions payable | — | 345,009 | — | |||||||||
Accounts payable and accrued expenses | 199,768 | 558,567 | 13,674 | |||||||||
Total liabilities | $ | 14,080,167 | $ | 83,117,608 | $ | 615,773 | ||||||
Net assets | $ | 366,832,723 | $ | 2,795,257,370 | $ | 26,298,818 | ||||||
Net assets consists of | ||||||||||||
Undistributed net investment income (loss) | 100,976 | 258,504 | 40,333 | |||||||||
Unrealized appreciation (depreciation) on securities | (14,742,118 | ) | 16,683,284 | 1,963,391 | ||||||||
Accumulated net realized gain (loss) | 1,355,709 | (62,407,826 | ) | (279,622 | ) | |||||||
Capital paid-in | 380,118,156 | 2,840,723,408 | 24,574,716 | |||||||||
Total net assets | $ | 366,832,723 | $ | 2,795,257,370 | $ | 26,298,818 | ||||||
Net asset value and offering per share | ||||||||||||
Net assets investor class | $ | 366,832,723 | $ | 2,600,770,635 | $ | 26,298,818 | ||||||
Net assets institutional class | $ | — | $ | 194,486,735 | $ | — | ||||||
Shares outstanding investor class | 11,344,851 | 115,817,963 | 1,662,567 | |||||||||
Shares outstanding institutional class | — | 8,639,616 | — | |||||||||
Net asset value and redemption price per share | ||||||||||||
Investor class | $ | 32.33 | $ | 22.46 | $ | 15.82 | ||||||
Institutional class | — | $ | 22.51 | — | ||||||||
| 36 | The accompanying notes are an integral part of these financial statements. |
Table of Contents
THE PARNASSUS FUNDS
Statement of Assets and Liabilities
June 30, 2010 (unaudited)
| Parnassus Small-Cap Fund | Parnassus Workplace Fund | Parnassus Fixed-Income Fund | ||||||||||
Assets | ||||||||||||
Investments in equities and bonds, at market value (cost $211,155,629, $113,189,395, $150,149,961) | $ | 208,428,000 | $ | 107,796,520 | $ | 157,390,843 | ||||||
Investments in short-term securities | 13,116,365 | 2,571,680 | 5,243,007 | |||||||||
Cash | 207 | 30 | 113 | |||||||||
Receivables | ||||||||||||
Investment securities sold | — | 615,212 | 2,503,958 | |||||||||
Dividends and interest | 8,948 | 54,288 | 1,388,039 | |||||||||
Capital shares sold | 753,458 | 250,554 | 236,410 | |||||||||
Other assets | 13,450 | 21,624 | 34,005 | |||||||||
Total assets | $ | 222,320,428 | $ | 111,309,908 | $ | 166,796,375 | ||||||
Liabilities | ||||||||||||
Payable upon return of loaned securities | 5,568,039 | — | 453,792 | |||||||||
Payable for investment securities purchased | 5,556,829 | 2,460,866 | — | |||||||||
Capital shares redeemed | 526,937 | 270,421 | 192,058 | |||||||||
Distributions payable | — | — | — | |||||||||
Accounts payable and accrued expenses | 18,080 | 15,182 | 32,762 | |||||||||
Total liabilities | $ | 11,669,885 | $ | 2,746,469 | $ | 678,612 | ||||||
Net assets | $ | 210,650,543 | $ | 108,563,439 | $ | 166,117,763 | ||||||
Net assets consists of | ||||||||||||
Undistributed net investment income (loss) | (235,724 | ) | 127,538 | (5,531 | ) | |||||||
Unrealized appreciation (depreciation) on securities | (2,727,629 | ) | (5,392,875 | ) | 7,240,882 | |||||||
Accumulated net realized gain (loss) | 9,461,870 | 6,919,239 | 3,377,751 | |||||||||
Capital paid-in | 204,152,026 | 106,909,537 | 155,504,661 | |||||||||
Total net assets | $ | 210,650,543 | $ | 108,563,439 | $ | 166,117,763 | ||||||
Net asset value and offering per share | ||||||||||||
Net assets investor class | $ | 210,650,543 | $ | 108,563,439 | $ | 166,117,763 | ||||||
Net assets institutional class | $ | — | $ | — | $ | — | ||||||
Shares outstanding investor class | 11,268,470 | 6,163,915 | 9,555,891 | |||||||||
Shares outstanding institutional class | — | — | — | |||||||||
Net asset value and redemption price per share | ||||||||||||
Investor class | $ | 18.69 | $ | 17.61 | $ | 17.38 | ||||||
Institutional class | — | — | — | |||||||||
| The accompanying notes are an integral part of these financial statements. | 37 |
Table of Contents
THE PARNASSUS FUNDS
Statement of Operations
Six Months Ended June 30, 2010 (unaudited)
| Parnassus Fund | Parnassus Equity Income Fund | Parnassus Mid-Cap Fund | ||||||||||
Investment income | ||||||||||||
Dividends | $ | 2,012,621 | $ | 30,399,851 | $ | 188,366 | ||||||
Interest | 11,314 | 153,963 | 103 | |||||||||
Securities lending | 11,036 | — | 96 | |||||||||
Other income | — | — | — | |||||||||
Total investment income | $ | 2,034,971 | $ | 30,553,814 | $ | 188,565 | ||||||
Expenses | ||||||||||||
Investment advisory fees | 1,253,545 | 9,131,184 | 109,448 | |||||||||
Transfer agent fees | ||||||||||||
Investor shares | 181,213 | 376,254 | 13,565 | |||||||||
Institutional shares | — | 4,251 | — | |||||||||
Fund administration | 109,741 | 795,099 | 7,313 | |||||||||
Service provider fees | 179,313 | 2,887,213 | 17,486 | |||||||||
Reports to shareholders | 77,610 | 251,164 | 5,755 | |||||||||
Registration fees and expenses | 27,340 | 78,351 | 18,511 | |||||||||
Custody fees | 11,151 | 51,519 | 2,174 | |||||||||
Professional fees | 51,508 | 109,681 | 13,754 | |||||||||
Trustee fees and expenses | 8,220 | 60,557 | 522 | |||||||||
Proxy voting fees | 2,579 | 2,579 | 2,579 | |||||||||
Pricing service fees | 1,768 | 2,630 | 1,647 | |||||||||
Other expenses | 30,007 | 40,631 | 1,674 | |||||||||
Total expenses | $ | 1,933,995 | $ | 13,791,113 | $ | 194,428 | ||||||
Fees waived by Parnassus Investments | — | (219,984 | ) | (40,024 | ) | |||||||
Net expenses | $ | 1,933,995 | $ | 13,571,129 | $ | 154,404 | ||||||
Net investment gain (loss) | $ | 100,976 | $ | 16,982,685 | $ | 34,161 | ||||||
Realized and unrealized gain on investments | ||||||||||||
Net realized gain from securities transactions | 12,946,695 | 84,383,086 | 602,337 | |||||||||
Net change in unrealized appreciation (depreciation) of securities | (44,272,574 | ) | (337,196,547 | ) | (1,597,024 | ) | ||||||
Net realized and unrealized gain (loss) on securities | $ | (31,325,879 | ) | $ | (252,813,461 | ) | $ | (994,687 | ) | |||
Net increase (decrease) in net assets resulting from operations | $ | (31,224,903 | ) | $ | (235,830,776 | ) | $ | (960,526 | ) | |||
| 38 | The accompanying notes are an integral part of these financial statements. |
Table of Contents
THE PARNASSUS FUNDS
Statement of Operations
Six Months Ended June 30, 2010 (unaudited)
| Parnassus Small-Cap Fund | Parnassus Workplace Fund | Parnassus Fixed- Income Fund | ||||||||||
Investment income | ||||||||||||
Dividends | $ | 764,518 | $ | 824,527 | $ | 26,480 | ||||||
Interest | 1,645 | 575 | 2,696,249 | |||||||||
Securities lending | 8,415 | 461 | 49 | |||||||||
Other income | 245 | — | — | |||||||||
Total investment income | $ | 774,823 | $ | 825,563 | $ | 2,722,778 | ||||||
Expenses | ||||||||||||
Investment advisory fees | 819,171 | 489,925 | 373,158 | |||||||||
Transfer agent fees | ||||||||||||
Investor shares | 66,098 | 35,985 | 53,492 | |||||||||
Institutional shares | — | — | — | |||||||||
Fund administration | 48,600 | 33,018 | 42,398 | |||||||||
Service provider fees | 153,889 | 117,165 | 100,055 | |||||||||
Reports to shareholders | 21,860 | 14,022 | 19,916 | |||||||||
Registration fees and expenses | 24,451 | 14,855 | 27,161 | |||||||||
Custody fees | 7,154 | 3,692 | 4,159 | |||||||||
Professional fees | 25,619 | 19,883 | 18,336 | |||||||||
Trustee fees and expenses | 2,620 | 2,132 | 3,139 | |||||||||
Proxy voting fees | 2,579 | 2,579 | — | |||||||||
Pricing service fees | 1,647 | 1,647 | 1,216 | |||||||||
Other expenses | 2,565 | 2,069 | 3,868 | |||||||||
Total expenses | $ | 1,176,253 | $ | 736,972 | $ | 646,898 | ||||||
Fees waived by Parnassus Investments | (146,364 | ) | (38,947 | ) | (87,578 | ) | ||||||
Net expenses | $ | 1,029,889 | $ | 698,025 | $ | 559,320 | ||||||
Net investment gain (loss) | $ | (255,066 | ) | $ | 127,538 | $ | 2,163,458 | |||||
Realized and unrealized gain on investments | ||||||||||||
Net realized gain from securities transactions | 10,169,755 | 7,080,078 | 2,780,934 | |||||||||
Net change in unrealized appreciation (depreciation) of securities | (11,804,799 | ) | (19,491,741 | ) | 2,948,074 | |||||||
Net realized and unrealized gain (loss) on securities | $ | (1,635,044 | ) | $ | (12,411,663 | ) | $ | 5,729,008 | ||||
Net increase (decrease) in net assets resulting from operations | $ | (1,890,110 | ) | $ | (12,284,125 | ) | $ | 7,892,466 | ||||
| The accompanying notes are an integral part of these financial statements. | 39 |
Table of Contents
THE PARNASSUS FUNDS
Statement of Changes in Net Assets
| Parnassus Fund | Parnassus Equity Income Fund | |||||||||||||||
| Six Months Ended June 30, 2010 (unaudited) | Year Ended December 31, 2009 | Six Months Ended June 30, 2010 (unaudited) | Year Ended December 31, 2009 | |||||||||||||
Investment income (loss) from operations | ||||||||||||||||
Net investment income | $ | 100,976 | $ | 783,351 | $ | 16,982,685 | $ | 29,674,328 | ||||||||
Net realized gain (loss) from securities transactions | 12,946,695 | (6,019,098 | ) | 84,383,086 | (93,175,611 | ) | ||||||||||
Net change in unrealized appreciation (depreciation) | (44,272,574 | ) | 106,136,592 | (337,196,547 | ) | 572,692,104 | ||||||||||
Increase (decrease) in net assets resulting from operations | $ | (31,224,903 | ) | $ | 100,900,845 | $ | (235,830,776 | ) | $ | 509,190,821 | ||||||
Distributions | ||||||||||||||||
From net investment income | ||||||||||||||||
Investor shares | — | (801,000 | ) | (15,622,446 | ) | (27,158,743 | ) | |||||||||
Institutional shares | — | — | (1,462,171 | ) | (2,632,132 | ) | ||||||||||
From realized capital gains | ||||||||||||||||
Investor shares | — | — | — | — | ||||||||||||
Institutional shares | — | — | — | — | ||||||||||||
Distributions to shareholders | $ | — | $ | (801,000 | ) | $ | (17,084,617 | ) | $ | (29,790,875 | ) | |||||
Capital share transactions | ||||||||||||||||
Investor shares | ||||||||||||||||
Proceeds from sale of shares | 76,635,230 | 130,749,677 | 722,032,499 | 1,145,591,539 | ||||||||||||
Reinvestment of dividends | — | 771,805 | 15,308,157 | 26,534,461 | ||||||||||||
Shares repurchased | (29,753,500 | ) | (54,356,287 | ) | (266,484,291 | ) | (649,436,787 | ) | ||||||||
Institutional shares | ||||||||||||||||
Proceeds from sale of shares | — | — | 74,816,506 | 99,277,149 | ||||||||||||
Reinvestment of dividends | — | — | 1,167,176 | 2,253,927 | ||||||||||||
Shares repurchased | — | — | (56,346,231 | ) | (83,655,936 | ) | ||||||||||
Increase in net assets from capital share transactions | 46,881,730 | 77,165,195 | 490,493,816 | 540,564,353 | ||||||||||||
Increase in net assets | $ | 15,656,827 | $ | 177,265,040 | $ | 237,578,423 | $ | 1,019,964,299 | ||||||||
Net assets | ||||||||||||||||
Beginning of year | 351,175,896 | 173,910,856 | 2,557,678,947 | 1,537,714,648 | ||||||||||||
End of period | $ | 366,832,723 | $ | 351,175,896 | $ | 2,795,257,370 | $ | 2,557,678,947 | ||||||||
Undistributed net investment income | $ | 100,976 | $ | — | $ | 258,504 | $ | 360,436 | ||||||||
Shares issued and redeemed | ||||||||||||||||
Investor shares | ||||||||||||||||
Shares sold | 2,088,063 | 4,472,562 | 29,410,509 | 55,859,627 | ||||||||||||
Shares issued through dividend reinvestment | — | 22,001 | 646,085 | 1,265,437 | ||||||||||||
Shares repurchased | (827,478 | ) | (1,781,078 | ) | (10,936,649 | ) | (33,024,100 | ) | ||||||||
Institutional shares | ||||||||||||||||
Shares sold | — | — | 3,040,883 | 4,836,577 | ||||||||||||
Shares issued through dividend reinvestment | — | — | 48,938 | 108,794 | ||||||||||||
Shares repurchased | — | — | (2,324,682 | ) | (4,180,890 | ) | ||||||||||
Net increase in shares outstanding | ||||||||||||||||
Investor shares | 1,260,585 | 2,713,485 | 19,119,945 | 24,100,964 | ||||||||||||
Institutional shares | — | — | 765,139 | 764,481 | ||||||||||||
| 40 | The accompanying notes are an integral part of these financial statements. |
Table of Contents
THE PARNASSUS FUNDS
Statement of Changes in Net Assets
| Parnassus Mid-Cap Fund | Parnassus Small-Cap Fund | |||||||||||||||
| Six Months Ended June 30, 2010 (unaudited) | Year Ended December 31, 2009 | Six Months Ended June 30, 2010 (unaudited) | Year Ended December 31, 2009 | |||||||||||||
Investment income (loss) from operations | ||||||||||||||||
Net investment income | $ | 34,161 | $ | 102,974 | $ | (255,066 | ) | $ | 520,274 | |||||||
Net realized gain (loss) from securities transactions | 602,337 | 33,041 | 10,169,755 | 581,429 | ||||||||||||
Net change in unrealized appreciation (depreciation) | (1,597,024 | ) | 4,662,447 | (11,804,799 | ) | 19,436,881 | ||||||||||
Increase (decrease) in net assets resulting from operations | $ | (960,526 | ) | $ | 4,798,462 | $ | (1,890,110 | ) | $ | 20,538,584 | ||||||
Distributions | ||||||||||||||||
From net investment income | ||||||||||||||||
Investor shares | — | (100,010 | ) | — | (500,932 | ) | ||||||||||
Institutional shares | — | — | — | — | ||||||||||||
From net realized capital gains | ||||||||||||||||
Investor shares | — | — | — | — | ||||||||||||
Institutional shares | — | — | — | — | ||||||||||||
Distributions to shareholders | $ | — | $ | (100,010 | ) | $ | — | $ | (500,932 | ) | ||||||
Capital share transactions | ||||||||||||||||
Investor shares | ||||||||||||||||
Proceeds from sale of shares | 7,176,857 | 13,904,599 | 123,430,453 | 96,769,553 | ||||||||||||
Reinvestment of dividends | — | 93,614 | — | 476,204 | ||||||||||||
Shares repurchased | (2,721,802 | ) | (2,564,812 | ) | (26,057,362 | ) | (28,920,613 | ) | ||||||||
Institutional shares | ||||||||||||||||
Proceeds from sale of shares | — | — | — | — | ||||||||||||
Reinvestment of dividends | — | — | — | — | ||||||||||||
Shares repurchased | — | — | — | — | ||||||||||||
Increase in net assets from capital share transactions | 4,455,055 | 11,433,401 | 97,373,091 | 68,325,144 | ||||||||||||
Increase in net assets | $ | 3,494,529 | $ | 16,131,853 | $ | 95,482,981 | $ | 88,362,796 | ||||||||
Net assets | ||||||||||||||||
Beginning of year | 22,804,289 | 6,672,436 | 115,167,562 | 26,804,766 | ||||||||||||
End of period | $ | 26,298,818 | $ | 22,804,289 | $ | 210,650,543 | $ | 115,167,562 | ||||||||
Undistributed net investment income (loss) | $ | 40,333 | $ | 6,172 | $ | (235,724 | ) | $ | 19,342 | |||||||
Shares issued and redeemed | ||||||||||||||||
Investor shares | ||||||||||||||||
Shares sold | 427,045 | 1,034,864 | 6,177,380 | 6,188,538 | ||||||||||||
Shares issued through dividend reinvestment | — | 5,694 | — | 26,281 | ||||||||||||
Shares repurchased | (165,406 | ) | (195,879 | ) | (1,336,820 | ) | (1,909,788 | ) | ||||||||
Institutional shares | ||||||||||||||||
Shares sold | — | — | — | — | ||||||||||||
Shares issued through dividend reinvestment | — | — | — | — | ||||||||||||
Shares repurchased | — | — | — | — | ||||||||||||
Net increase in shares outstanding | ||||||||||||||||
Investor shares | 261,639 | 844,679 | 4,840,560 | 4,305,031 | ||||||||||||
Institutional shares | — | — | — | — | ||||||||||||
| The accompanying notes are an integral part of these financial statements. | 41 |
Table of Contents
THE PARNASSUS FUNDS
Statement of Changes in Net Assets
| Parnassus Workplace Fund | Parnassus Fixed-Income Fund | |||||||||||||||
| Six Months Ended June 30, 2010 (unaudited) | Year Ended December 31, 2009 | Six Months Ended June 30, 2010 (unaudited) | Year Ended December 31, 2009 | |||||||||||||
Investment income (loss) from operations | ||||||||||||||||
Net investment income | $ | 127,538 | $ | 66,478 | $ | 2,163,458 | $ | 3,637,238 | ||||||||
Net realized gain from securities transactions | 7,080,078 | 1,619,133 | 2,780,934 | 1,822,543 | ||||||||||||
Net change in unrealized appreciation (depreciation) | (19,491,741 | ) | 16,134,618 | 2,948,074 | 3,186,893 | |||||||||||
Increase (decrease) in net assets resulting from operations | $ | (12,284,125 | ) | $ | 17,820,229 | $ | 7,892,466 | $ | 8,646,674 | |||||||
Distributions | ||||||||||||||||
From net investment income | ||||||||||||||||
Investor shares | — | (81,582 | ) | (2,205,625 | ) | (3,605,838 | ) | |||||||||
Institutional shares | — | — | — | — | ||||||||||||
From net realized capital gains | ||||||||||||||||
Investor shares | — | (1,644,173 | ) | — | (1,225,726 | ) | ||||||||||
Institutional shares | — | — | — | — | ||||||||||||
Distributions to shareholders | $ | — | $ | (1,725,755 | ) | $ | (2,205,625 | ) | $ | (4,831,564 | ) | |||||
Capital share transactions | ||||||||||||||||
Investor shares | ||||||||||||||||
Proceeds from sale of shares | 64,283,448 | 82,800,029 | 35,294,732 | 59,903,976 | ||||||||||||
Reinvestment of dividends | — | 1,674,027 | 2,006,555 | 4,347,218 | ||||||||||||
Shares repurchased | (38,735,633 | ) | (13,220,176 | ) | (14,794,009 | ) | (30,212,203 | ) | ||||||||
Institutional shares | ||||||||||||||||
Proceeds from sale of shares | — | — | — | — | ||||||||||||
Reinvestment of dividends | — | — | — | — | ||||||||||||
Shares repurchased | — | — | — | — | ||||||||||||
Increase in net assets from capital share transactions | 25,547,815 | 71,253,880 | 22,507,278 | 34,038,991 | ||||||||||||
Increase in net assets | $ | 13,263,690 | $ | 87,348,354 | $ | 28,194,119 | $ | 37,854,101 | ||||||||
Net assets | ||||||||||||||||
Beginning of year | 95,299,749 | 7,951,395 | 137,923,644 | 100,069,543 | ||||||||||||
End of period | $ | 108,563,439 | $ | 95,299,749 | $ | 166,117,763 | $ | 137,923,644 | ||||||||
Undistributed net investment income (loss) | $ | 127,538 | $ | — | $ | (5,531 | ) | $ | 36,636 | |||||||
Shares issued and redeemed | ||||||||||||||||
Investor shares | ||||||||||||||||
Shares sold | 3,261,987 | 4,952,279 | 2,068,747 | 3,623,605 | ||||||||||||
Shares issued through dividend reinvestment | — | 85,552 | 117,452 | 261,061 | ||||||||||||
Shares repurchased | (1,996,797 | ) | (789,968 | ) | (867,930 | ) | (1,828,882 | ) | ||||||||
Institutional shares | ||||||||||||||||
Shares sold | — | — | — | — | ||||||||||||
Shares issued through dividend reinvestment | — | — | — | — | ||||||||||||
Shares repurchased | — | — | — | — | ||||||||||||
Net increase in shares outstanding | ||||||||||||||||
Investor shares | 1,265,190 | 4,247,863 | 1,318,269 | 2,055,784 | ||||||||||||
Institutional shares | — | — | — | — | ||||||||||||
| 42 | The accompanying notes are an integral part of these financial statements. |
Table of Contents
Notes to Financial Statements (unaudited)
1. Organization and Significant Accounting Policies
The Parnassus Funds are comprised of two Trusts, the Parnassus Funds trust and the Parnassus Income Funds trust (collectively the “Trusts”), organized as Massachusetts Business Trusts registered under the Investment Company Act of 1940 as diversified, open-end investment management companies, and are comprised of six separate funds (collectively the “Funds”). The Parnassus Funds trust includes the Parnassus Fund which commenced operations on December 27, 1984 and the Parnassus Mid-Cap Fund, the Parnassus Small-Cap Fund and the Parnassus Workplace Fund, which commenced operations on April 29, 2005. The Parnassus Income Funds trust includes the Parnassus Equity Income Fund and the Parnassus Fixed-Income Fund, both of which commenced operations on August 31, 1992. Each Fund has distinct investment objectives. In general, the Funds seek long-term capital appreciation. The Parnassus Equity Income Fund and the Parnassus Fixed-Income Fund also seek current income.
Securities Valuations
Equity securities that are listed or traded on a national securities exchange are stated at market value, based on recorded closing sales on the exchange or on the Nasdaq’s National Market official closing price. In the absence of a recorded sale, and for over-the-counter securities, equity securities are stated at the mean between the last recorded bid and asked prices. Long-term, fixed-income securities are valued each business day using prices based on procedures established by independent pricing services and approved by the Board of Trustees (the “Trustees”). Fixed-income securities with an active market are valued at the “bid” price where such quotes are readily available from brokers and dealers and are representative of the actual market for such securities. Other fixed-income securities experiencing a less active market are valued as determined by the pricing services based on methods which include consideration of trading in securities of comparable yield, quality, coupon, maturity and type, as well as indications as to values from dealers and other market data without exclusive reliance upon quoted prices or over-the-counter prices, since such valuations are believed to reflect more accurately the value of such securities. Short-term investments in U.S. government agency discount notes are valued at amortized cost, which approximates market value. Investments in registered investment companies are valued at their net asset value.
Investments where market quotations are not readily available are priced at their fair value, in accordance with procedures established by the Trustees. In determining fair value, the Trustees may consider a variety of information including, but not limited to, the following: price based upon a multiple of earnings or sales, fundamental analytical data and an evaluation of market conditions. A valuation adjustment is applied to certificates of deposit, community development loans and other community development investments as an estimate of potential penalties for early withdrawal.
The Funds follow Accounting Standards Codification (“ASC”) 820, Fair Value Measurements and Disclosure, which defines fair value, establishes a framework for measuring fair value and expands disclosures about fair value measurements. Various inputs are used in determining the value of the Funds’ portfolio investments. These inputs are summarized in three levels, Level 1– quoted prices in active markets for identical investments, Level 2 – other significant observable inputs (including quoted prices for similar investments) and Level 3 – significant unobservable inputs (including the Fund’s own assumptions in determining the fair value of investments).
Federal Income Taxes
The Trusts intend to comply with the requirements of the Internal Revenue Code applicable to regulated investment companies and to distribute all taxable income to shareholders. Therefore, no federal income tax provision is required. Income distributions and capital-gain distributions are determined in accordance with income tax regulations, which may differ from U.S. Generally Accepted Accounting Principles (“GAAP”).
The Funds follow ASC 740, Income Taxes, relating to uncertainty in income taxes and disclosures. ASC 740 establishes a minimum threshold for income tax benefits to be recognized in the financial statements. These tax benefits must meet a “more likely than not” threshold, which means that based on technical merits, they have a more than 50% likelihood of being sustained upon examination by the tax authority. Tax benefits meeting this threshold are measured as the largest amount of tax benefit that is greater than 50% likely of being realized upon ultimate settlement with the tax authority. As of and during the year ended December 31, 2009, the Funds did not have a liability for any unrecognized tax benefits. The Funds recognize interest and penalties, if any, related to unrecognized tax benefits as income tax expense in the Statement of Operations. During the year the Funds did not incur interest or penalties. The Funds are not subject to examination by U.S. federal taxing authorities or state taxing authorities for the years before 2006 and 2005, respectively.
Securities Transactions
Securities transactions are recorded on the date the securities are purchased or sold (trade date). Realized gains and losses on securities transactions are determined on the basis of first-in, first-out for both financial statement and federal income tax purposes.
| 43 |
Table of Contents
THE PARNASSUS FUNDS
Notes to Financial Statements (unaudited) continued
Investment Income, Expenses, and Distributions
Dividend income is recognized on the ex-dividend date and interest income is recognized on an accrual basis. Discounts and premiums on securities purchased are amortized over the lives of the respective securities using the constant yield method, which approximates the interest method. Expenses are recorded on an accrual basis. Distributions to shareholders are recorded on the ex-dividend date to shareholders of record on the record date. The Parnassus Equity Income Fund pays income dividends quarterly and capital-gain dividends annually. The Parnassus Fixed-Income Fund pays income dividends monthly and capital-gain dividends annually. The other Funds pay income and capital-gain dividends annually.
Securities Lending
The Parnassus Funds have the ability to lend securities to approved financial institutions to earn additional income and receive cash and/or securities as collateral to secure the loans. Collateral is maintained at not less than 102% of the value of loaned securities. Although the risk of lending is mitigated by the collateral, the Funds could experience a delay in recovering securities and a possible loss of income or value if the borrower fails to return them.
Community Development Investment Programs
The Parnassus Funds may each invest up to 2% of their assets in community investments and community-development loan funds. Each of the Funds may invest in obligations issued by community loan funds at below-market interest rates if the projects financed have a positive ESG impact. Generally, there is no secondary market on loan funds and thus these are considered illiquid.
As part of our community development investment program, the Parnassus Equity Income Fund has entered into an agreement for Fund investments through the Certificate of Deposit Account Registry Service (“CDARS”) network. The CDARS network allows members to place funds in time deposits with depository institutions whose accounts are insured by the Federal Deposit Insurance Corporation (“FDIC”). Provisions stipulate that participating institutions are FDIC insured, however, in the event of default or bankruptcy by any party to the agreement, the proceeds of the investment may be delayed or subject to legal proceedings and are subject to FDIC limits.
The Parnassus Equity Income Fund and the Parnassus Fixed-Income Fund hold debt instruments issued by Microvest I, LP, a microfinance limited partnership specializing in providing capital to international microfinance institutions (“MFI’s”) that extend credit to developing countries and the entrepreneurial poor. These instruments may be subject to political and foreign currency exchange risk not normally associated with domestic debt instruments. Microvest I, LP’s investment in MFI’s can be affected by, among other factors, commodity prices, inflation, interest rates, taxation, social instability, and other political, economic or diplomatic developments in or affecting the various countries where MFI’s operate.
Capital Stock
Capital stock consists of an unlimited number of authorized shares of capital stock, no par value.
Risk Factors
Investing in the Parnassus Funds may involve certain risks including, but not limited to the following:
The prices of, and the income generated by, the common stocks and other securities held by the Funds may decline in response to certain events taking place around the world, including those directly involving the companies whose securities are owned by the Funds; conditions affecting the general economy; overall market changes; local, regional or global political, social or economic instability; and currency, interest rate and commodity price fluctuations. The Parnassus Fund, the Parnassus Equity Income Fund and the Parnassus Workplace Fund may invest in large capitalization (“large cap”), mid-capitalization (“mid-cap”) and small-capitalization (‘small-cap”) companies. The Parnassus Mid-Cap Fund invests primarily in mid-cap companies, which can be particularly sensitive to changing economic conditions and have fewer financial resources than large-cap companies. The Parnassus Small-Cap Fund invests primarily in small-cap companies, which can be particularly sensitive to changing economic conditions and have fewer financial resources than large-cap companies. Additionally, the values of, and the income generated by, most debt securities held by the Parnassus Fixed-Income Fund may be affected by changing interest rates and by changes in the effective maturities and credit ratings of these debt securities. The Funds’ investment adviser attempts to reduce these risks through diversification of the portfolio and ongoing credit analysis as well as by monitoring economic and legislative developments, but there can be no assurance that it will be successful at doing so. Investments in securities issued by entities based outside the U.S. may also be affected by currency controls; different accounting, auditing, financial reporting, and legal standards and practices; expropriation; changes in tax policy; greater market volatility; different securities market structures and higher transaction costs.
Use of Estimates
The preparation of financial statements in conformity with GAAP requires management to make estimates and assumptions that affect the reported amounts of assets and liabilities at the date of the financial statements and the reported amounts of revenues and expenses during the reporting period. Actual results could differ from those estimates.
| 44 |
Table of Contents
Notes to Financial Statements (unaudited) continued
2. Fair Value Measurements
The following table summarizes the portfolio’s financial assets as of June 30, 2010, that are valued at fair value on a recurring basis:
Parnassus Fund
Investment Securities | Level 1 | Level 2 | Level 3 | Total | ||||||||
Equities: | ||||||||||||
Consumer Discretionary | $ | 65,884,300 | $ | — | $ | — | $ | 65,884,300 | ||||
Consumer Staples | 3,471,000 | — | — | 3,471,000 | ||||||||
Energy | 18,374,000 | — | — | 18,374,000 | ||||||||
Financials | 29,958,650 | — | — | 29,958,650 | ||||||||
Healthcare | 46,949,500 | — | — | 46,949,500 | ||||||||
Industrials | 14,654,400 | — | — | 14,654,400 | ||||||||
Information Technology | 185,422,800 | — | — | 185,422,800 | ||||||||
Short-Term Investments | 14,408,487 | — | 1,355,377 | 15,763,864 | ||||||||
Total | $ | 379,123,137 | $ | — | $ | 1,355,377 | $ | 380,478,514 | ||||
Parnassus Equity Income Fund
| ||||||||||||
Investment Securities | Level 1 | Level 2 | Level 3 | Total | ||||||||
Equities: | ||||||||||||
Consumer Discretionary | $ | 64,172,500 | $ | — | $ | — | $ | 64,172,500 | ||||
Consumer Staples | 202,081,249 | — | — | 202,081,249 | ||||||||
Energy | 212,886,330 | — | — | 212,886,330 | ||||||||
Financials | 313,249,800 | — | — | 313,249,800 | ||||||||
Healthcare | 444,879,674 | — | — | 444,879,674 | ||||||||
Industrials | 336,760,654 | — | — | 336,760,654 | ||||||||
Information Technology | 757,473,254 | — | — | 757,473,254 | ||||||||
Materials | 74,090,250 | — | — | 74,090,250 | ||||||||
Utilities | 294,815,895 | — | — | 294,815,895 | ||||||||
Notes | — | — | 972,546 | 972,546 | ||||||||
Short-Term Investments | 165,989,518 | — | 4,248,700 | 170,238,218 | ||||||||
Total | $ | 2,866,399,124 | $ | — | $ | 5,221,246 | $ | 2,871,620,370 | ||||
| 45 |
Table of Contents
THE PARNASSUS FUNDS
Notes to Financial Statements (unaudited) continued
Parnassus Mid-Cap Fund
Investment Securities | Level 1 | Level 2 | Level 3 | Total | ||||||||
Equities: | ||||||||||||
Consumer Discretionary | $ | 683,040 | $ | — | $ | — | $ | 683,040 | ||||
Consumer Staples | 1,958,740 | — | — | 1,958,740 | ||||||||
Energy | 1,978,995 | — | — | 1,978,995 | ||||||||
Financials | 2,472,850 | — | — | 2,472,850 | ||||||||
Healthcare | 5,934,445 | — | — | 5,934,445 | ||||||||
Industrials | 4,667,260 | — | — | 4,667,260 | ||||||||
Information Technology | 6,873,533 | — | — | 6,873,533 | ||||||||
Materials | 785,925 | — | — | 785,925 | ||||||||
Utilities | 607,805 | — | — | 607,805 | ||||||||
Short-Term Investments | 900,025 | — | — | 900,025 | ||||||||
Total | $ | 26,862,618 | $ | — | $ | — | $ | 26,862,618 | ||||
Parnassus Small-Cap Fund
| ||||||||||||
Investment Securities | Level 1 | Level 2 | Level 3 | Total | ||||||||
Equities: | ||||||||||||
Consumer Discretionary | $ | 14,129,600 | $ | — | $ | — | $ | 14,129,600 | ||||
Consumer Staples | 3,051,600 | — | — | 3,051,600 | ||||||||
Energy | 21,461,800 | — | — | 21,461,800 | ||||||||
Financials | 12,403,150 | — | — | 12,403,150 | ||||||||
Healthcare | 42,572,450 | — | — | 42,572,450 | ||||||||
Industrials | 14,712,050 | — | — | 14,712,050 | ||||||||
Information Technology | 84,314,300 | — | — | 84,314,300 | ||||||||
Materials | 2,811,200 | — | — | 2,811,200 | ||||||||
Utilities | 12,971,850 | — | — | 12,971,850 | ||||||||
Short-Term Investments | 13,116,365 | — | — | 13,116,365 | ||||||||
Total | $ | 221,544,365 | $ | — | $ | — | $ | 221,544,365 | ||||
| 46 |
Table of Contents
Notes to Financial Statements (unaudited) continued
Parnassus Workplace Fund
Investment Securities | Level 1 | Level 2 | Level 3 | Total | ||||||||
Equities: | ||||||||||||
Consumer Discretionary | $ | 4,790,950 | $ | — | $ | — | $ | 4,790,950 | ||||
Consumer Staples | 2,670,000 | — | — | 2,670,000 | ||||||||
Energy | 3,350,600 | — | — | 3,350,600 | ||||||||
Financials | 4,456,000 | — | — | 4,456,000 | ||||||||
Healthcare | 15,694,070 | — | — | 15,694,070 | ||||||||
Industrials | 4,468,400 | — | — | 4,468,400 | ||||||||
Information Technology | 67,926,650 | — | — | 67,926,650 | ||||||||
Utilities | 4,439,850 | — | — | 4,439,850 | ||||||||
Short-Term Investments | 2,571,680 | — | — | 2,571,680 | ||||||||
Total | $ | 110,368,200 | $ | — | $ | — | $ | 110,368,200 | ||||
Parnassus Fixed-Income Fund
| ||||||||||||
Investment Securities | Level 1 | Level 2 | Level 3 | Total | ||||||||
Convertible Bonds | $ | — | $ | 17,223,750 | $ | — | $ | 17,223,750 | ||||
Corporate Bonds | — | 59,421,127 | — | 59,421,127 | ||||||||
U.S. Government Treasury Bonds | — | 80,745,966 | — | 80,745,966 | ||||||||
Short-Term Investments | 4,275,556 | — | 967,451 | 5,243,007 | ||||||||
Total | $ | 4,275,556 | $ | 157,390,843 | $ | 967,451 | $ | 162,633,850 | ||||
The following table reconciles the valuation of the Fund’s Level 3 investment securities and related transactions as of June 30, 2010:
| Parnassus Fund | Parnassus Equity Income Fund | Parnassus Fixed–Income Fund | |||||||||
Balance as of December 31, 2009 | $ | 1,378,738 | $ | 5,179,461 | $ | 99,770 | |||||
Discounts/premiums amortization | (23,361 | ) | 41,785 | (32,319 | ) | ||||||
Net purchases (sales) | — | — | 900,000 | ||||||||
Balance as of June 30, 2010 | $ | 1,355,377 | $ | 5,221,246 | $ | 967,451 | |||||
| 47 |
Table of Contents
THE PARNASSUS FUNDS
Notes to Financial Statements (unaudited) continued
3. Tax Matters and Distributions
At June 30, 2010, the cost of investments in long-term securities and net unrealized appreciation (depreciation) for income tax purposes were as follows:
| Parnassus Fund | Parnassus Equity Income Fund | Parnassus Mid-Cap Fund | Parnassus Small-Cap Fund | Parnassus Workplace Fund | Parnassus Fixed-Income Fund | |||||||||||||||||||
Costs of investment | $ | 381,662,586 | $ | 2,695,059,894 | $ | 24,080,335 | $ | 211,794,308 | $ | 113,349,827 | $ | 150,149,961 | ||||||||||||
Unrealized appreciation | 16,859,715 | 161,672,572 | 2,530,604 | 13,442,132 | 2,184,880 | 7,371,072 | ||||||||||||||||||
Unrealized depreciation | (31,601,833 | ) | (144,989,288 | ) | (567,213 | ) | (16,169,761 | ) | (7,577,755 | ) | (130,190 | ) | ||||||||||||
Net unrealized appreciation (depreciation) | $ | (14,742,118 | ) | $ | 16,683,284 | $ | 1,963,391 | $ | (2,727,629 | ) | $ | (5,392,875 | ) | $ | 7,240,882 | |||||||||
At December 31, 2009, estimated net capital loss carryforwards, which are available to offset future net realized capital gains, were:
Fund | Expiration Year | Capital Loss Carryforwards | |||
Parnassus Fund | 2016 | $ | 6,604,411 | ||
| 2015 | 2,708,300 | ||||
Parnassus Equity Income Fund | 2016 | 115,687,525 | |||
| 2015 | 17,627,601 | ||||
Parnassus Mid-Cap Fund | 2016 | 7,777 | |||
| 2015 | 793,050 | ||||
Parnassus Small-Cap Fund | 2015 | 69,205 | |||
Post-October capital losses as of December 30, 2009 which is deferred until 2010 for tax purposes:
Fund | Deferred Post-October Capital Loss | ||
Parnassus Equity Income Fund | $ | 3,114,760 | |
Net investment income and net ordinary income is the same for all Funds for financial statement and tax purposes during the six-month period ended June 30, 2010 with the exception of Parnassus Equity Income Fund. For the Parnassus Equity Income Fund, the net investment income differs from ordinary income for financial statement and tax purposes primarily due to income recognition differences for partnership investments. Net realized gains differ for financial statement and tax purposes primarily due to differing treatments of wash sales and partnership allocations.
| 48 |
Table of Contents
Notes to Financial Statements (unaudited) continued
4. Purchases and Sales of Securities
Purchases and proceeds from sales of securities, excluding short-term securities, for the six-month period ended June 30, 2010 were as follows:
Fund | Purchases | Sales | ||||
Parnassus Fund | $ | 145,623,831 | $ | 93,879,840 | ||
Parnassus Equity Income Fund | 1,150,159,371 | 684,275,424 | ||||
Parnassus Mid-Cap Fund | 8,338,816 | 3,285,405 | ||||
Parnassus Small-Cap Fund | 147,645,844 | 50,005,671 | ||||
Parnassus Workplace Fund | 67,808,876 | 37,011,332 | ||||
Parnassus Fixed-Income Fund | 67,056,228 | 45,052,679 | ||||
5. Investment Advisory Agreement and Transactions with Affiliates
Under terms of an agreement which provides for furnishing investment management and advice to the Funds, Parnassus Investments is entitled to receive fees payable monthly, based on each Fund’s average daily net assets for the month, at the following annual rates:
Parnassus Fund: 1.00% of the first $10,000,000, 0.75% of the next $20,000,000, 0.70% of the next $70,000,000, 0.65% of the next $100,000,000 and 0.60% of the remaining balance. Parnassus Mid-Cap Fund and Parnassus Workplace Fund: 0.85% of the first $100,000,000, 0.80% of the next $100,000,000, 0.75% of the next $300,000,000 and 0.70% of the amount above $500,000,000. Parnassus Small-Cap Fund: 1.00% of the first $100,000,000, 0.90% of the next $100,000,000, 0.85% of the next $300,000,000 and 0.80% of the amount above $500,000,000. For a period including the six-month period ended June 30, 2010, Parnassus Investments has contractually agreed to reduce its investment advisory fee to the extent necessary to limit total operating expenses to 0.99% of net assets for the Parnassus Fund and 1.20% of net assets for the Parnassus Mid-Cap Fund, Parnassus Small-Cap Fund and the Parnassus Workplace Fund.
Parnassus Equity Income Fund: 0.75% of the first $30,000,000, 0.70% of the next $70,000,000 and 0.65% of the amount above $100,000,000. Parnassus Fixed-Income Fund: 0.50% of the first $200,000,000, 0.45% of the next $200,000,000 and 0.40% of the amount above $400,000,000. For a period including the six-month period ended June 30, 2010, Parnassus Investments has contractually agreed to reduce its investment advisory fee to the extent necessary to limit total operating expenses to 0.99% of net assets for the Parnassus Equity Income Fund – Investor Shares, 0.78% of net assets for the Parnassus Equity Income Fund – Institutional Shares, and 0.75% of net assets for the Parnassus Fixed-Income Fund.
Parnassus Investments receives fees under terms of a separate agreement which provides for furnishing transfer agent and fund administration services to the Funds. The transfer agent fee was $2.50 per month per account plus any out-of-pocket expenses for the Parnassus Fund, Parnassus Mid-Cap Fund, Parnassus Small-Cap Fund and Parnassus Workplace Fund. The transfer agent fee was $2.70 per month per account plus any out-of-pocket expenses for the Parnassus Equity Income Fund and Parnassus Fixed-Income Fund. The Funds pay the monthly fee based on the number of accounts on record at each month-end. The fund administration service fees reflects annual rates based on net assets for all Funds managed by Parnassus Investments and was allocated based on respective Fund net assets. The fund administration services fee was 0.07% of average net assets under this new agreement for the six-month period ended June 30, 2010.
Parnassus Investments may also arrange for third parties to provide certain services, including account maintenance, recordkeeping and other personal services to their clients who invest in the Funds. For these services, the Funds may pay service providers an aggregate service fee on investment accounts at a rate not to exceed 0.25% per annum of average daily net assets. The Parnassus Equity Income Fund – Institutional Shares does not incur service provider fees.
| 49 |
Table of Contents
Financial Highlights (unaudited)
Selected data for each share of capital stock outstanding, total return and ratios/supplemental data for the six-month period ended June 30, 2010 and each of the five years ended December 31 are as follows:
Parnassus Fund
| June 30, 2010 | ||||||||||||||||||||||||
| (unaudited) | 2009 | 2008 | 2007 | 2006 | 2005 | |||||||||||||||||||
Net asset value at beginning of year | $ | 34.82 | $ | 23.59 | $ | 36.66 | $ | 36.23 | $ | 31.68 | $ | 31.09 | ||||||||||||
Income (loss) from operations(c): | ||||||||||||||||||||||||
Net investment income (loss) | 0.01 | 0.09 | 0.17 | — | (0.04 | ) | 0.16 | |||||||||||||||||
Net realized and unrealized gain (loss) on securities | (2.50 | ) | 11.22 | (12.76 | ) | 2.03 | 4.59 | 0.63 | ||||||||||||||||
Total from investment operations | (2.49 | ) | 11.31 | (12.59 | ) | 2.03 | 4.55 | 0.79 | ||||||||||||||||
Distributions: | ||||||||||||||||||||||||
Dividends from net investment income | — | (0.08 | ) | (0.17 | ) | (0.01 | ) | — | (0.20 | ) | ||||||||||||||
Distributions from net realized gains on securities | — | — | (0.31 | ) | (1.59 | ) | — | — | ||||||||||||||||
Total distributions | — | (0.08 | ) | (0.48 | ) | (1.60 | ) | — | (0.20 | ) | ||||||||||||||
Net asset value at end of period | $ | 32.33 | $ | 34.82 | $ | 23.59 | $ | 36.66 | $ | 36.23 | $ | 31.68 | ||||||||||||
Total overall return | (7.15 | %) | 47.94 | % | (34.12 | %) | 5.43 | % | 14.36 | % | 2.55 | % | ||||||||||||
Ratios/supplemental data: | ||||||||||||||||||||||||
Ratio of gross expenses to average net assets | 0.99 | % | 1.00 | % | 1.01 | % | 1.00 | % | 1.01 | % | 1.03 | % | ||||||||||||
Ratio of net expenses to average net assets | 0.99 | %(f) | 0.99 | %(f) | 0.99 | %(f) | 0.99 | %(f) | 0.99 | %(f) | 0.99 | %(f) | ||||||||||||
Ratio of net investment income to average net assets | 0.05 | % | 0.30 | % | 0.51 | % | (0.01 | %) | (0.13 | %) | 0.53 | % | ||||||||||||
Portfolio turnover rate | 24.94 | % | 53.24 | % | 98.38 | % | 88.67 | % | 141.98 | % | 136.07 | % | ||||||||||||
Net assets, end of period (000s) | $ | 366,833 | $ | 351,176 | $ | 173,911 | $ | 280,008 | $ | 337,646 | $ | 292,384 | ||||||||||||
| 50 |
Table of Contents
Financial Highlights (unaudited) continued
Parnassus Equity Income Fund – Investor Shares
| June 30, 2010 (unaudited) | 2009 | 2008 | 2007 | 2006 | 2005 | |||||||||||||||||||
Net asset value at beginning of year | $ | 24.45 | $ | 19.29 | $ | 25.31 | $ | 24.83 | $ | 24.02 | $ | 25.00 | ||||||||||||
Income (loss) from | ||||||||||||||||||||||||
Net investment income | 0.14 | 0.33 | 0.27 | 0.20 | 0.30 | 0.41 | ||||||||||||||||||
Net realized and unrealized gain (loss) on securities | (1.99 | ) | 5.15 | (6.05 | ) | 3.28 | 3.23 | 0.24 | ||||||||||||||||
Total from investment operations | (1.85 | ) | 5.48 | (5.78 | ) | 3.48 | 3.53 | 0.65 | ||||||||||||||||
Distributions: | ||||||||||||||||||||||||
Dividends from net investment income | (0.14 | ) | (0.32 | ) | (0.24 | ) | (1.18 | ) | (1.38 | ) | (0.85 | ) | ||||||||||||
Distributions from net realized gains on securities | — | — | — | (1.82 | ) | (1.34 | ) | (0.78 | ) | |||||||||||||||
Total distributions | (0.14 | ) | (0.32 | ) | (0.24 | ) | (3.00 | ) | (2.72 | ) | (1.63 | ) | ||||||||||||
Net asset value at end of period | $ | 22.46 | $ | 24.45 | $ | 19.29 | $ | 25.31 | $ | 24.83 | $ | 24.02 | ||||||||||||
Total overall return | (7.60 | %) | 28.73 | % | (22.95 | %) | 14.13 | % | 14.70 | % | 2.62 | % | ||||||||||||
Ratios/supplemental data: | ||||||||||||||||||||||||
Ratio of gross expenses to average net assets | 1.00 | % | 0.99 | % | 0.99 | % | 1.03 | % | 1.06 | % | 1.07 | % | ||||||||||||
Ratio of net expenses to average net assets (net of waiver and expense offset arrangements) | 0.99 | %(f) | 0.99 | %(f) | 0.99 | %(f) | 0.99 | %(f) | 0.99 | %(f) | 0.99 | %(f) | ||||||||||||
Ratio of net investment income to average net assets | 1.19 | % | 1.60 | % | 1.21 | % | 0.73 | % | 1.17 | % | 1.63 | % | ||||||||||||
Portfolio turnover rate | 25.56 | % | 60.16 | % | 70.20 | % | 91.42 | % | 116.75 | % | 109.54 | % | ||||||||||||
Net assets, end of period (000s) | $ | 2,600,771 | $ | 2,364,691 | $ | 1,400,214 | $ | 867,577 | $ | 808,104 | $ | 906,844 | ||||||||||||
Parnassus Equity Income Fund – Institutional Shares
| June 30, 2010 (unaudited) | 2009 | 2008 | 2007 | 2006(e) | ||||||||||||||||
Net asset value at beginning of period | $ | 24.51 | $ | 19.34 | $ | 25.35 | $ | 24.86 | $ | 25.59 | ||||||||||
Income (loss) from operations(c): | ||||||||||||||||||||
Net investment income | 0.18 | 0.37 | 0.32 | 0.25 | 0.19 | |||||||||||||||
Net realized and unrealized gain (loss) on securities | (2.01 | ) | 5.16 | (6.05 | ) | 3.28 | 1.73 | |||||||||||||
Total from investment operations | (1.83 | ) | 5.53 | (5.73 | ) | 3.53 | 1.92 | |||||||||||||
Distributions: | ||||||||||||||||||||
Dividends from net investment income | (0.17 | ) | (0.36 | ) | (0.28 | ) | (1.22 | ) | (1.31 | ) | ||||||||||
Distributions from net realized gains on securities | — | — | — | (1.82 | ) | (1.34 | ) | |||||||||||||
Total distributions | (0.17 | ) | (0.36 | ) | (0.28 | ) | (3.04 | ) | (2.65 | ) | ||||||||||
Net asset value at end of period | $ | 22.51 | $ | 24.51 | $ | 19.34 | $ | 25.35 | $ | 24.86 | ||||||||||
Total overall return | (7.51 | %) | 28.97 | % | (22.73 | %) | 14.35 | % | 7.46 | %(a) | ||||||||||
Ratios/supplemental data: | ||||||||||||||||||||
Ratio of gross expenses to average net assets | 0.75 | % | 0.77 | % | 0.79 | % | 0.82 | % | 0.85 | %(b) | ||||||||||
Ratio of net expenses to average net assets (net of waiver and expense offset arrangements) | 0.74 | %(f) | 0.77 | %(f) | 0.78 | %(f) | 0.78 | %(f) | 0.78 | %(f) | ||||||||||
Ratio of net investment income to average net assets | 1.44 | % | 1.81 | % | 1.44 | % | 0.95 | % | 1.10 | %(b) | ||||||||||
Portfolio turnover rate | 25.56 | % | 60.16 | % | 70.20 | % | 91.42 | % | 116.75 | % | ||||||||||
Net assets, end of period (000s) | $ | 194,487 | $ | 192,987 | $ | 137,501 | $ | 45,197 | $ | 46,471 | ||||||||||
| 51 |
Table of Contents
THE PARNASSUS FUNDS
Financial Highlights (unaudited) continued
Parnassus Mid-Cap Fund
| June 30, 2010 (unaudited) | 2009 | 2008 | 2007 | 2006 | 2005(d) | |||||||||||||||||||
Net asset value at beginning of period | $ | 16.28 | $ | 12.00 | $ | 17.39 | $ | 17.36 | $ | 15.30 | $ | 15.00 | ||||||||||||
Income (loss) from operations(c): | ||||||||||||||||||||||||
Net investment income (loss) | 0.02 | 0.11 | 0.06 | (0.08 | ) | (0.06 | ) | 0.04 | ||||||||||||||||
Net realized and unrealized gain (loss) on securities | (0.48 | ) | 4.24 | (5.21 | ) | 0.40 | 2.47 | 0.44 | ||||||||||||||||
Total from investment operations | (0.46 | ) | 4.35 | (5.15 | ) | 0.32 | 2.41 | 0.48 | ||||||||||||||||
Distributions: | ||||||||||||||||||||||||
Dividends from net investment income | — | (0.07 | ) | (0.03 | ) | (0.12 | ) | (0.29 | ) | (0.04 | ) | |||||||||||||
Distributions from net realized gains on securities | — | — | (0.21 | ) | (0.17 | ) | (0.07 | ) | (0.14 | ) | ||||||||||||||
Total distributions | — | (0.07 | ) | (0.24 | ) | (0.29 | ) | (0.36 | ) | (0.18 | ) | |||||||||||||
Net asset value at end of period | $ | 15.82 | $ | 16.28 | $ | 12.00 | $ | 17.39 | $ | 17.36 | $ | 15.30 | ||||||||||||
Total overall return | (2.83 | %) | 36.26 | % | (29.38 | %) | 1.81 | % | 15.78 | % | 3.22 | %(a) | ||||||||||||
Ratios/supplemental data: | ||||||||||||||||||||||||
Ratio of gross expenses to average net assets | 1.51 | % | 1.73 | % | 2.25 | % | 2.04 | % | 5.29 | % | 9.03 | %(b) | ||||||||||||
Ratio of net expenses to average net assets (net of waiver and expense offset arrangements) | 1.20 | %(f) | 1.20 | %(f) | 1.20 | %(f) | 1.40 | %(f) | 1.40 | %(f) | 1.40 | %(b) | ||||||||||||
Ratio of net investment income (loss) to average net assets | 0.27 | % | 0.78 | % | 0.40 | % | (0.42 | %) | (0.35 | %) | 0.37 | %(b) | ||||||||||||
Portfolio turnover rate | 13.19 | % | 40.11 | % | 132.74 | % | 76.85 | % | 122.04 | % | 31.41 | %(a) | ||||||||||||
Net assets, end of period (000s) | $ | 26,299 | $ | 22,804 | $ | 6,672 | $ | 6,524 | $ | 2,409 | $ | 640 | ||||||||||||
Parnassus Small-Cap Fund
| June 30, 2010 (unaudited) | 2009 | 2008 | 2007 | 2006 | 2005(d) | |||||||||||||||||||
Net asset value at beginning of period | $ | 17.92 | $ | 12.63 | $ | 16.91 | $ | 17.94 | $ | 15.76 | $ | 15.00 | ||||||||||||
Income (loss) from operations(c): | ||||||||||||||||||||||||
Net investment income (loss) | (0.03 | ) | 0.13 | 0.08 | (0.13 | ) | (0.10 | ) | (0.03 | ) | ||||||||||||||
Net realized and unrealized gain (loss) on securities | 0.80 | 5.24 | (4.32 | ) | (0.56 | ) | 3.07 | 1.18 | ||||||||||||||||
Total from investment operations | 0.77 | 5.37 | (4.24 | ) | (0.69 | ) | 2.97 | 1.15 | ||||||||||||||||
Distributions: | ||||||||||||||||||||||||
Dividends from net investment income | — | (0.08 | ) | (0.04 | ) | (0.04 | ) | (0.74 | ) | (0.39 | ) | |||||||||||||
Distributions from net realized gains on securities | — | — | — | (0.30 | ) | (0.05 | ) | — | ||||||||||||||||
Total distributions | — | (0.08 | ) | (0.04 | ) | (0.34 | ) | (0.79 | ) | (0.39 | ) | |||||||||||||
Net asset value at end of period | $ | 18.69 | $ | 17.92 | $ | 12.63 | $ | 16.91 | $ | 17.94 | $ | 15.76 | ||||||||||||
Total overall return | 4.30 | % | 42.50 | % | (25.08 | %) | (3.92 | %) | 18.78 | % | 7.65 | %(a) | ||||||||||||
Ratios/supplemental data: | ||||||||||||||||||||||||
Ratio of gross expenses to average net assets | 1.37 | % | 1.47 | % | 1.86 | % | 2.06 | % | 3.03 | % | 7.27 | %(b) | ||||||||||||
Ratio of net expenses to average net assets (net of waiver and expense offset arrangements) | 1.20 | %(f) | 1.20 | %(f) | 1.20 | %(f) | 1.40 | %(f) | 1.40 | %(f) | 1.40 | %(b) | ||||||||||||
Ratio of net investment income (loss) to average net assets | (0.30 | %) | 0.81 | % | 0.51 | % | (0.72 | %) | (0.56 | %) | (0.27 | %)(b) | ||||||||||||
Portfolio turnover rate | 30.58 | % | 46.00 | % | 100.41 | % | 100.30 | % | 125.00 | % | 86.20 | %(a) | ||||||||||||
Net assets, end of period (000s) | $ | 210,651 | $ | 115,168 | $ | 26,805 | $ | 7,997 | $ | 5,269 | $ | 1,225 | ||||||||||||
| 52 |
Table of Contents
Financial Highlights (unaudited) continued
Parnassus Workplace Fund
| June 30, 2010 (unaudited) | 2009 | 2008 | 2007 | 2006 | 2005(d) | |||||||||||||||||||
Net asset value at beginning of period | $ | 19.45 | $ | 12.22 | $ | 17.60 | $ | 17.05 | $ | 15.49 | $ | 15.00 | ||||||||||||
Income (loss) from operations(c): | ||||||||||||||||||||||||
Net investment income | 0.02 | 0.03 | 0.05 | 0.03 | 0.02 | 0.04 | ||||||||||||||||||
Net realized and unrealized gain (loss) on securities | (1.86 | ) | 7.56 | (5.33 | ) | 0.94 | 2.28 | 0.50 | ||||||||||||||||
Total from investment operations | (1.84 | ) | 7.59 | (5.28 | ) | 0.97 | 2.30 | 0.54 | ||||||||||||||||
Distributions: | ||||||||||||||||||||||||
Dividends from net investment income | — | (0.33 | ) | — | (0.17 | ) | (0.61 | ) | (0.05 | ) | ||||||||||||||
Distributions from net realized gains on securities | — | (0.03 | ) | (0.10 | ) | (0.25 | ) | (0.13 | ) | — | ||||||||||||||
Total distributions | — | (0.36 | ) | (0.10 | ) | (0.42 | ) | (0.74 | ) | (0.05 | ) | |||||||||||||
Net asset value at end of period | $ | 17.61 | $ | 19.45 | $ | 12.22 | $ | 17.60 | $ | 17.05 | $ | 15.49 | ||||||||||||
Total overall return | (9.46 | %) | 62.13 | % | (29.94 | %) | 5.64 | % | 14.84 | % | 3.60 | %(a) | ||||||||||||
Ratios/supplemental data: | ||||||||||||||||||||||||
Ratio of gross expenses to average net assets | 1.27 | % | 1.36 | % | 2.32 | % | 2.64 | % | 4.04 | % | 6.91 | %(b) | ||||||||||||
Ratio of net expenses to average net assets (net of waiver and expense offset arrangements) | 1.20 | %(f) | 1.20 | %(f) | 1.20 | %(f) | 1.20 | %(f) | 1.20 | %(f) | 1.20 | %(b) | ||||||||||||
Ratio of net investment income (loss) to average net assets | 0.22 | % | 0.16 | % | 0.30 | % | 0.16 | % | 0.12 | % | 0.39 | %(b) | ||||||||||||
Portfolio turnover rate | 33.38 | % | 32.73 | % | 72.58 | % | 56.18 | % | 96.93 | % | 27.55 | %(a) | ||||||||||||
Net assets, end of period (000s) | $ | 108,563 | $ | 95,300 | $ | 7,951 | $ | 4,293 | $ | 2,362 | $ | 1,013 | ||||||||||||
Parnassus Fixed-Income Fund
| June 30, 2010 (unaudited) | 2009 | 2008 | 2007 | 2006 | 2005 | |||||||||||||||||||
Net asset value at beginning of year | $ | 16.74 | $ | 16.19 | $ | 16.29 | $ | 16.11 | $ | 15.79 | $ | 15.87 | ||||||||||||
Income (loss) from operations(c): | ||||||||||||||||||||||||
Net investment income | 0.25 | 0.51 | 0.47 | 0.67 | 0.67 | 0.48 | ||||||||||||||||||
Net realized and unrealized gain (loss) on securities | 0.64 | 0.69 | 0.01 | 0.25 | 0.49 | (0.08 | ) | |||||||||||||||||
Total from investment operations | 0.89 | 1.20 | 0.48 | 0.92 | 1.16 | 0.40 | ||||||||||||||||||
Distributions: | ||||||||||||||||||||||||
Dividends from net investment income | (0.25 | ) | (0.64 | ) | (0.57 | ) | (0.69 | ) | (0.74 | ) | (0.48 | ) | ||||||||||||
Distributions from net realized gains on securities | — | (0.01 | ) | (0.01 | ) | (0.05 | ) | (0.10 | ) | — | ||||||||||||||
Total distributions | (0.25 | ) | (0.65 | ) | (0.58 | ) | (0.74 | ) | (0.84 | ) | (0.48 | ) | ||||||||||||
Net asset value at end of period | $ | 17.38 | $ | 16.74 | $ | 16.19 | $ | 16.29 | $ | 16.11 | $ | 15.79 | ||||||||||||
Total overall return | 5.33 | % | 7.48 | % | 2.98 | % | 5.81 | % | 7.45 | % | 2.55 | % | ||||||||||||
Ratios/supplemental data: | ||||||||||||||||||||||||
Ratio of gross expenses to average net assets | 0.87 | % | 0.87 | % | 0.88 | % | 0.87 | % | 0.92 | % | 1.01 | % | ||||||||||||
Ratio of net expenses to average net assets (net of waiver and expense offset arrangements) | 0.75 | %(f) | 0.75 | %(f) | 0.75 | %(f) | 0.75 | %(f) | 0.75 | %(f) | 0.75 | % | ||||||||||||
Ratio of net investment income to average net assets | 2.90 | % | 3.07 | % | 2.90 | % | 4.13 | % | 4.13 | % | 3.03 | % | ||||||||||||
Portfolio turnover rate | 32.47 | % | 46.24 | % | 44.87 | % | 32.48 | % | 41.27 | % | 34.08 | % | ||||||||||||
Net assets, end of period (000s) | $ | 166,118 | $ | 137,924 | $ | 100,070 | $ | 80,862 | $ | 62,520 | $ | 45,879 | ||||||||||||
| (a) | Not annualized for periods less than one year. |
| (b) | Annualized. |
| (c) | Income (loss) from operations per share is based on average daily shares outstanding. |
| (d) | The Parnassus Mid-Cap Fund, the Parnassus Small-Cap Fund and the Parnassus Workplace Fund commenced operations on April 29, 2005, and the period shown is from April 29, 2005 through December 31, 2005. |
| (e) | The Parnassus Equity Income Fund – Institutional Shares commenced operations on April 28, 2006, and the period shown is from April 28, 2006 through December 31, 2006. |
| (f) | Parnassus Investments has contractually limited expenses to an annualized rate of 0.99% for the Parnassus Fund, 0.99% for the Parnassus Equity Income Fund – Investor Shares, 0.78% for the Parnassus Equity Income Fund – Institutional Shares, 1.20% for the Parnassus Mid-Cap Fund, Parnassus Small-Cap Fund and the Parnassus Workplace Fund and 0.75% for the Parnassus Fixed-Income Fund. |
| 53 |
Table of Contents
ADDITIONAL INFORMATION (unaudited)
Board of Trustees Consideration of Investment Advisory Agreements
Section 15(c) of the Investment Company Act of 1940 (the “1940 Act”) requires that the Board of Trustees (the “Trustees”) of the Parnassus Funds trust and the Parnassus Income Funds trust (the “Trusts”) which collectively are known as the Parnassus Funds (the “Funds”), meet in person to review and consider the continuation of any investment advisory agreement. In this regard, the Trustees who are not “interested persons” of the Trusts, as defined in the 1940 Act, (the “Independent Trustees”) met in person on March 18, 2010 and reviewed and re-approved the Trusts’ investment advisory agreements with Parnassus Investments. The Independent Trustees were provided with relevant information by Parnassus Investments, as described below, and were assisted in their evaluation of the investment advisory agreements by independent legal counsel, from whom they received assistance and advice, including a written memorandum, regarding the legal standards applicable to the consideration of advisory arrangements and with whom they met separately from Parnassus Investments’ management. In addition, the Trustees consider matters bearing on the management of the Funds and other arrangements at regular meetings throughout the year, including reviews of investment results and performance data at each regular meeting and periodic presentations from Parnassus Investments. Prior to approving the continuation of the investment advisory agreements, the Independent Trustees considered:
| • | the nature, extent and quality of the services provided by Parnassus Investments; |
| • | the degree to which the Parnassus Fund, the Parnassus Equity Income Fund, the Parnassus Mid-Cap Fund, the Parnassus Small-Cap Fund, the Parnassus Workplace Fund and the Parnassus Fixed-Income Fund are being managed in accordance with each Fund’s stated investment objective; |
| • | the investment performance of the each of the Funds; |
| • | the cost of the services to be provided and profits to be realized by Parnassus Investments from its relationship with each of the Funds; |
| • | the extent to which economies of scale would be realized as each of the Funds grew and whether fee levels reflect these economies of scale; |
| • | the expense ratio of each of the Funds; and |
| • | the manner in which portfolio transactions for the Funds are conducted, including the use of soft dollars. |
In considering the nature, extent and quality of the services provided by Parnassus Investments, the Independent Trustees reviewed written and oral reports prepared by Parnassus Investments describing the portfolio management, shareholder communication and servicing, prospective shareholder assistance and regulatory compliance services provided by Parnassus Investments to the Funds. The Independent Trustees also considered a written report prepared by Lipper, an independent provider of investment company data, comparing aspects of the portfolio management services provided by Parnassus Investments to similar services provided to a universe of comparable mutual funds (“Universe”). The Independent Trustees considered the experience of senior management and the qualifications, tenure, background and responsibilities of the portfolio managers primarily responsible for the day-to-day portfolio management of the Funds. The Independent Trustees evaluated the ability of Parnassus Investments based on its financial condition, resources, reputation and other attributes to attract and retain qualified investment professionals, including research,
| 54 |
Table of Contents
ADDITIONAL INFORMATION (unaudited) continued
advisory and supervisory personnel. The Independent Trustees further considered the compliance programs and compliance records of Parnassus Investments. In addition, the Independent Trustees took into account the administrative services provided to the Funds by Parnassus Investments. The Independent Trustees concluded that Parnassus Investments was providing essential services to the Funds.
The Independent Trustees compared the performance of each of the Funds to benchmark indices over various periods of time ending December 31, 2009 and to the Universe of comparable mutual funds as determined by Lipper. The Independent Trustees noted that the Funds’ performance was higher than the median performance of the Universe for all of the periods under review, with the exception of the Parnassus Fund and Parnassus Fixed-Income Fund, which each fell below the median performance of the Universe for one of the review periods evaluated by the Trustees. The Independent Trustees noted that the performance of the Parnassus Fund was lower than the median for the 10-year period and higher than the median performance for all other time periods under review. The Independent Trustees further noted that the performance of the Parnassus Fixed-Income Fund was below the median for the one-year period and higher than the median for all other periods under review. The Independent Trustees concluded that the overall performance of the Funds warranted the continuation of the investment advisory agreements.
In concluding that the advisory fees payable by each of the Funds were reasonable, the Independent Trustees reviewed a report of the costs of services provided, and the profits realized, by Parnassus Investments from its relationship with each Fund and concluded that such profits were reasonable and not excessive when compared to profitability guidelines set forth in relevant court cases. The Independent Trustees also reviewed reports comparing each Fund’s expense ratio and the advisory fees paid by each Fund to that of the applicable Universe and concluded that the advisory fee paid by each Fund and each Fund’s expense ratio were within the range of their respective Universe. The Independent Trustees noted that the Funds’ advisory fees were below the median for each Fund’s respective Universe. The Independent Trustees noted that the investment advisory fee for each Fund contained a number of breakpoints in an effort to reflect economies of scale that might be realized as each Fund grew. The Independent Trustees also noted that actual or potential economies of scale will be reasonably shared with the Fund shareholders through these breakpoints, fee waivers and expense reimbursement arrangements applicable to the Funds.
The Independent Trustees reviewed reports discussing the manner in which portfolio transactions for the Funds were conducted, including the use of soft dollars. Based on these reports, the Independent Trustees concluded that the research obtained by Parnassus Investments was beneficial to the Funds and that Parnassus Investments was executing each Fund’s portfolio transactions in a manner designed to obtain best execution for the Funds.
Based on their careful consideration of the information and factors described above, the Independent Trustees concluded that the approval of the continuation of the investment advisory agreements for the Trusts was in the best interest of the Funds and their shareholders. The Independent Trustees unanimously approved the continuation of the investment advisory agreements for an additional one-year period.
| 55 |
Table of Contents
ADDITIONAL INFORMATION (unaudited) continued
Proxy Disclosures
Parnassus proxy voting policies and procedures are available, without charge, on our website (www.parnassus.com), on the Securities and Exchange Commission’s website (www.sec.gov), and by calling us at (800) 999-3505. The Funds file a proxy voting record with the Securities and Exchange Commission for the 12 months ended June 30. The most recent report is available by calling Parnassus or obtaining it from the Securities and Exchange Commission’s website or the Parnassus website.
Quarterly Portfolio Schedule
The Funds file their complete schedule of portfolio holdings with the Securities and Exchange Commission for the first and third quarters of each fiscal year on Form N-Q. The quarterly portfolio holdings are available on the Securities and Exchange Commission’s website (www.sec.gov). The Funds’ Form N-Q may also be reviewed and copied at the Securities and Exchange Commission’s Public Reference Room in Washington, DC, and information on the operation of the Public Reference Room may be obtained by calling (800) SEC – 0330.
| 56 |
Table of Contents
This page left intentionally blank.
| 57 |
Table of Contents
THE PARNASSUS FUNDS
1 Market Street, Suite 1600
San Francisco, CA 94105
(800) 999-3505
www.parnassus.com
This report must be preceded or accompanied by a current prospectus
Investment Adviser
Parnassus Investments
1 Market Street, Suite 1600
San Francisco, CA 94105
Legal Counsel
Foley and Lardner LLP
777 E. Wisconsin Ave.
Milwaukee, WI 53202
Independent Registered Public Accounting Firm
Deloitte and Touche, LLP
50 Fremont Street
San Francisco, CA 94105
Distributor
Parnasssus Funds Distributor
1 Market Street, Suite 1600
San Francisco, CA 94105
Printed on recycled paper with soy-based ink.
Table of Contents
Item 2: Code of Ethics
Not applicable for semi-annual reports. The information required by this Item is only required in an annual report on Form N-CSR.
Item 3: Audit Committee Financial Expert
Not applicable for semi-annual reports. The information required by this Item is only required in an annual report on Form N-CSR.
Item 4: Principal Accountant Fees and Services
Not applicable for semi-annual reports. The information required by this Item is only required in an annual report on Form N-CSR.
Item 5: Not applicable.
Item 6: Included as part of the report to shareholders filed under Item 1 of this form.
Item 7: Not applicable.
Item 8: Not applicable.
Item 9: Not applicable.
Item 10: For the purposes of this Item, there have not been any material changes to the procedures by which shareholders may recommend nominees to the registrant’s Board of Trustees.
Item 11: Controls and Procedures.
(a) The registrant’s certifying officers have reasonably designed such disclosure controls and procedures to ensure material information relating to the registrant is made known to them by others, particularly during the period in which this report is being prepared. The registrant’s certifying officers have determined that the registrant’s disclosure controls and procedures are effective based on their evaluation of these controls and procedures as of a date within 90 days prior to the filing date of this report.
(b) There were no significant changes in the registrant’s internal controls over financial reporting, or in other factors that could significantly affect these controls, that occurred during the registrant’s first fiscal half-year, including any corrective actions with regard to significant deficiencies and material weaknesses.
Item 12: Exhibits attached hereto.
(a)(1) Code of Ethics - Not applicable for semi-annual reports.
(a)(2) Certification for each principal executive and principal financial officer of the registrant as required by Rule 30a-2 under the Act (17 CFR 270.30a-2(a)) - Filed as an attachment to this filing.
(b) Certifications required by Rule 30a-2(b) under the Act (17 CFR 270.30a-2(b)), Rule 13a-14(b) or Rule 15d-14(b) under the Exchange Act (17 CFR 240.13a-14(b) or 240.15d-14(b)), and Section 1350 of Chapter 63 of Title 18 of the United States Code (18 U.S.C. 1350). A certification furnished pursuant to this paragraph will not be deemed “filed” for purposes of Section 18 of the Exchange Act (15 U.S.C. 78r), or otherwise subject to the liability of that section. Such certification will not be deemed to be incorporated by reference into any filing under the Securities Act of 1933 or the Exchange Act, except to the extent that the registrant specifically incorporates it by reference – Filed as an attachment to this filing.
Table of Contents
Pursuant to the requirements of the Securities Exchange Act of 1934 and the Investment Company Act of 1940, the registrant has duly caused this report to be signed on its behalf by the undersigned, thereunto duly authorized.
Parnassus Income Funds
| ||||
| Date: August 11, 2010 | By: | /s/ Jerome L. Dodson | ||
Jerome L. Dodson President | ||||
Pursuant to the requirements of the Securities Exchange Act of 1934 and the Investment Company Act of 1940, this report has been signed below by the following persons on behalf of the registrant and in the capacities and on the dates indicated.
| Date: August 11, 2010 | By: | /s/ Jerome L. Dodson | ||
Jerome L. Dodson President |
| Date: August 11, 2010 | By: | /s/ Marc C. Mahon | ||
Marc C. Mahon Principal Accounting Officer |