Table of Contents
PARNASSUS INCOME FUNDS
UNITED STATES
SECURITIES AND EXCHANGE COMMISSION
Washington, D.C. 20549
FORM N-CSRS
CERTIFIED SHAREHOLDER REPORT OF
REGISTERED MANAGEMENT INVESTMENT COMPANIES
Investment Company Act file number: 811-06673
Parnassus Income Funds
(Exact name of registrant as specified in charter)
1 Market Street, Suite 1600, San Francisco, California 94105
(Address of principal executive offices) (Zip code)
Marc C. Mahon
Parnassus Income Funds
1 Market Street, Suite 1600, San Francisco, California 94105
(Name and address of agent for service)
Registrant’s telephone number, including area code: (415) 778-0200
Date of fiscal year end: December 31
Date of reporting period: June 30, 2009
Table of Contents
Item 1: Report to Shareholders
THE PARNASSUS FUNDSSM
Semiannual Report June 30, 2009
Parnassus Fund
Parnassus Equity Income Fund
Parnassus Mid-Cap Fund
Parnassus Small-Cap Fund
Parnassus Workplace Fund
Parnassus Fixed-Income Fund
Table of Contents
Parnassus Fund | (PARNX | ) | |
Parnassus Equity Income Fund–Investor Shares | (PRBLX | ) | |
Parnassus Equity Income Fund–Institutional Shares | (PRILX | ) | |
Parnassus Mid-Cap Fund | (PARMX | ) | |
Parnassus Small-Cap Fund | (PARSX | ) | |
Parnassus Workplace Fund | (PARWX | ) | |
Parnassus Fixed-Income Fund | (PRFIX | ) |
| 1 | ||
Fund Performance | ||
| 3 | ||
| 7 | ||
| 11 | ||
| 14 | ||
| 16 | ||
| 18 | ||
| 20 | ||
| 22 | ||
Portfolios of Investments | ||
| 23 | ||
| 25 | ||
| 28 | ||
| 30 | ||
| 32 | ||
| 33 | ||
| 36 | ||
| 43 | ||
| 48 | ||
| 52 |
Table of Contents

August 7, 2009
DEAR SHAREHOLDER:
Enclosed you will find the semiannual reports for all six Parnassus Funds. We had another good quarter, and I’m happy to report that four of our five equity funds beat both their primary stock market indices and their respective Lipper categories for both the quarter and the year-to-date. For the one-year and three-year periods, all five equity funds outperformed all their benchmarks.
The best-performing fund for the quarter was the Parnassus Workplace Fund, which gained 26.65% compared to 15.93% for the S&P 500 Index and 17.77% for the average multi-cap core fund followed by Lipper Inc. For the year-to-date, the Workplace Fund is up 26.02% compared to 3.16% for the S&P 500 and 7.32% for the Lipper Multi-Cap Core Average. The Workplace Fund is also ahead of all its benchmarks for the one- and three-year periods and for the period since inception. It seems to show that companies with good workplaces can have excellent investment returns.
On November 19 of this year, we will be celebrating the 25th anniversary of Parnassus Investments. The celebration will be held at the Palace Hotel in San Francisco from 5:00 pm to 9:00 pm and all of you are invited to attend. Shareholders holding accounts directly with the Parnassus Funds will receive a formal invitation at a later date, but be sure to mark your calendars now.
As I was thinking about our 25 years of history, I received a letter from one of our original shareholders, Ruth Gottstein, founder of Volcano Press, a small, high-quality publisher. Now located in Volcano, California in the foothills of our state, Ruth used to work out of her house in the Haight-Ashbury district of San Francisco. When Parnassus Investments was founded, I also used to work out of my house in the Haight-Ashbury district right near Parnassus Avenue. At the time we were founded, we started with only $330,000 in assets distributed among 30 original shareholders. I was so happy to get Ruth as an original shareholder, that I personally walked down the street to pick up her check. Since that time, we’ve become friends and she has remained a loyal shareholder through ups and downs.
Ruth and I share a passion for San Francisco history, so she recently sent me a beautifully illustrated book published by Volcano Press about the famous San Francisco landmark, Coit Tower. Masha Zakheim, Ruth’s sister, is the author of the book, and it features the murals of Coit Tower painted by Bernard Zakheim, the father of Ruth and Masha. (If you’re interested in purchasing the book, go to Volcanopress.com.)
Ruth’s letter got me thinking about how much we’ve grown over the years. We now have almost $2.2 billion in assets under management and we have more than 100,000 shareholders. I’m really fortunate to have had this great history with Parnassus.
Four New Interns
We have four excellent interns working with us this summer. Katherine Loarie is a recent graduate of the Tuck School of Business at Dartmouth where she earned her MBA. She is also a graduate of the University of California at Berkeley, where she majored in economics and mass communication and played on the varsity women’s water polo team. Her previous experience includes three years with Morgan Stanley working in private wealth management.
Ian Sexsmith is an MBA candidate at the Haas School of Business at the University of California at Berkeley, where he is a Haas Merit Scholar. He also graduated from the University of Manitoba in Winnipeg, Canada and played for the Elmwood Giants in the Manitoba Junior Baseball League. For four years, Ian worked at Scotia Capital in Toronto, where he was an analyst in the investment banking division and also worked in institutional equity trading.
| The Parnassus Funds | 1 |
Table of Contents
Samantha Seto graduated cum laude from Choate Rosemary Hall School in Connecticut and is now a junior at Columbia College where she is majoring in economics and East Asia Studies. She also studied one summer at Fudan University in Shanghai and has worked at ChinaVest, a venture capital firm in Shanghai. Samantha is also the founder of Caring Soles, a non-profit that collects shoes from local clubs, gyms and schools and donates them to San Francisco homeless centers.
Also joining us this summer for his second time as an intern is Ryan Wilsey, who first interned with us in the summer of 1998 when he was an undergraduate at Princeton. He graduated from Harvard Business School in 2006 and most recently worked as an analyst for Scout Capital, a hedge fund in New York. Ryan has decided to return home to the San Francisco Bay Area and will intern with us while he looks for a permanent investment management role.
Below you will find a picture of attendees at the Parnassus Intern Reunion Dinner on June 13, 2009.

Seated in the front row (left to right): Samantha Seto, Andrea Reichert, Christine Song, Jeanine Cotter, Jerome Dodson, Vivian Wang, Lori Keith, Pearle Lee and Elina Sheykh-Zade. Standing in the back row (left to right): Daniel Conrad, Russell Caprio, Peter Tsai, Ian Sexsmith, Brendan Simon, Todd Ahlsten, Ben Allen, Minh Bui, Matt Gershuny, Ryan Wilsey, Michael Fernandez, Yanik Jayaram, Andrew Livingston and Marie Lee.
Yours truly,

Jerome L. Dodson
President
Parnassus Investments
| 2 | The Parnassus Funds |
Table of Contents
As of June 30, 2009, the net asset value per share (“NAV”) of the Parnassus Fund was $27.65, so the total return for the quarter was 18.67%. This compares to 15.93% for the S&P 500 Index (“S&P 500”), 17.77% for the average multi-cap core fund followed by Lipper Inc. (“Lipper average”) and 20.34% for the Nasdaq Composite Index (“Nasdaq”). For the quarter, then, we beat the S&P 500 and the Lipper average, but we lagged slightly behind the Nasdaq.
For the year-to-date as of June 30, we are ahead of all our benchmarks with a gain of 17.21%, compared to 3.16% for the S&P 500, 7.32% for the Lipper average and 16.98% for the Nasdaq. Below is a table comparing the Parnassus Fund with the S&P 500, the Lipper Multi-Cap Core Average and the Nasdaq over the past one-, three-, five- and ten-year periods. You’ll notice that we’re ahead of all the benchmarks for all time periods. We’re very proud of this record. Of special note is the ten-year period, where we actually show a positive return of 1.61% per year compared to negative returns for the S&P 500 and the Nasdaq. You’ll notice that if you have been a shareholder of the Parnassus Fund for the past ten years, you have earned almost 4% more per year than the S&P 500 returned during that time period.
Average Annual Total Returns
for periods ended June 30, 2009
| One Year | Three Years | Five Years | Ten Years | Gross Expense Ratio | Net Expense Ratio | |||||||||||||
THE PARNASSUS FUND | -16.89 | % | -2.62 | % | -0.14 | % | 1.61 | % | 1.02 | % | 0.99 | % | ||||||
S&P 500 Index | -26.21 | % | -8.22 | % | -2.24 | % | -2.22 | % | NA | NA | ||||||||
Lipper Multi-Cap Core Average | -26.35 | % | -8.33 | % | -1.74 | % | 0.17 | % | NA | NA | ||||||||
Nasdaq Composite Index | -19.13 | % | -4.64 | % | -1.37 | % | -3.17 | % | NA | NA |
Performance data quoted represent past performance and are no guarantee of future returns. Current performance may be lower or higher than the performance data quoted. Current performance information to the most recent month-end is available on the Parnassus website (www.parnassus.com). Investment return and principal value will fluctuate so that an investor’s shares, when redeemed, may be worth more or less than their original principal cost. Returns shown in the table do not reflect the deduction of taxes a shareholder may pay on fund distributions or redemption of shares. The S&P 500 Index and the Nasdaq Composite Index are unmanaged indices of common stocks, and it is not possible to invest directly in an index. Index figures do not take any expenses, fees or taxes into account, but mutual fund returns do. Prior to May 1, 2004, the Parnassus Fund charged a sales load (maximum of 3.5%), which is not reflected in the total return calculations. Before investing, an investor should carefully consider the investment objectives, risks, charges and expenses of the Fund and should carefully read the prospectus, which contains this and other information. The prospectus is available on the Parnassus website, or one can be obtained by calling (800) 999-3505. As described in the Fund’s current prospectus dated May 1, 2009, Parnassus Investments has contractually agreed to limit the total operating expenses to 0.99% of net assets, exclusive of acquired fund fees, until May 1, 2010. This limitation may be continued indefinitely by the Adviser on a year-to-year basis.
Company Analysis
Only two companies in the portfolio had a substantial negative impact on the Fund during the quarter. The one that hurt us the most was homebuilder Pulte Homes; it cut 19¢ off the NAV, as its shares sank 19.2%, going from $10.93 to $8.83 by the end of June. In the March quarter, the homebuilders helped us quite a bit, but difficult conditions in the housing industry pulled their shares back down in the June quarter. Declining orders and write-offs on land depressed earnings for all the homebuilders, pushing their stock prices lower. For the most part, these declines in share prices did not affect the Fund too much, but Pulte was a special case. Pulte is buying rival Centex, and investors usually don’t like mergers, because they normally have a negative financial impact on the companies in question. Most of the time, I’m in the camp that dislikes mergers, so I would normally sell the stock of a company making a big acquisition. In the case of Pulte, though, the stock price is down so low that I regard it as a very good value.
Refiner Valero Energy cost the Fund 10¢ for each fund share, as its stock declined from $17.90 to $16.89 for a loss of 5.6%. The company temporarily shut down several of its refineries during the quarter due to depressed demand for gasoline. Earnings were hurt because of lower margins or reduced “crack spread” (the difference between the price of oil and the price of gasoline). We expect refining margins to recover as the economy picks up, so we’re hanging on to the stock, since we think it’s very undervalued.
| The Parnassus Funds | 3 |
Table of Contents
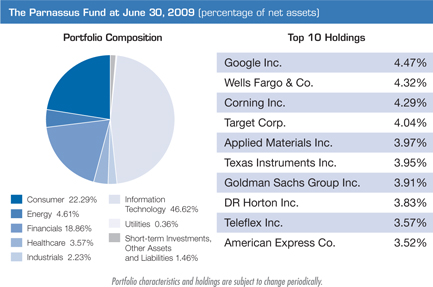
Seven companies each contributed 21¢ or more to the NAV during the quarter. The star was Wells Fargo, which added 46¢ to each Parnassus share, as its stock soared an amazing 70.4% from $14.24 to $24.26. The stock moved higher because the company reported better than expected earnings, with higher mortgage banking and trading revenues offsetting credit losses.
American Express contributed almost as much to the NAV as Wells Fargo, adding 42¢ to each fund share, as its stock rocketed up 70.5% from $13.63 to $23.24. The stock had been trading at very depressed levels because of investor concerns about the possibility of big losses in the company’s credit card portfolio. As it turned out, earnings came in better than expected because of good expense control and lower funding costs due to low interest rates. The balance sheet of American Express also looks in reasonably good shape, as the company obtained permission in June to repay the U.S. Treasury the $3.4 billion in TARP money it had received; the company paid it all back before the end of the quarter.
Goldman Sachs added 34¢ to each Parnassus share, climbing from $106 to $147 for a gain of 39.1%. The company reported earnings well in excess of expectations, with the big money-makers being commodities, currency and fixed-income trading. Goldman enjoyed higher trading margins because of less competition as weaker players were forced out of the market. It also demonstrated its financial strength during the quarter by paying back the $10 billion in TARP funds it received from the U.S. Treasury.
Semiconductor-maker Texas Instruments moved the NAV higher by 26¢, as its stock rose 29.0% from $16.51 to $21.30. The company reported higher orders, increased revenue and better earnings, driven by demand from China’s 3G build-out and improving conditions in the handset, notebook and LCD TV end-markets.
Seagate Technology makes hard disk-drives used for electronic storage and its stock rose 74.0% during the quarter from $6.01 to $10.46 for a gain of 25¢ on the NAV. Late in the quarter, the company said demand was increasing and it was able to get better pricing for its products. It also raised guidance for revenue in the next quarter from an average of $2.05 billion to an average of $2.25 billion. Analysts from ten brokerage firms raised their forecasts for Seagate.
Google also added 22¢ to the NAV, as its stock climbed 21.1% from $348 to $422. The company’s earnings were better than expected because of strong financial controls and lower discretionary spending. Revenue declined from the previous quarter due to general softness in the economy, but was still up 10% year-over-year, as Google continues to dominate the online search market.
After seeing its stock lose 57.8% in the first quarter because of investment losses and slowing sales, insurer AFLAC rebounded in the second quarter, contributing 21¢ to each fund share, as its stock soared 84.5% from $19.36 to $35.72 where we sold it during the quarter. Financial results gave investors a positive surprise, as sales in Japan and the US held up better than expected and investment losses were not as bad as feared. Standard & Poor’s removed AFLAC from its credit watch list, indicating that no downgrade was imminent. The Parnassus Fund sold this stock, because we thought it became fully-valued after the run-up, and we had better uses for the money.
| 4 | The Parnassus Funds |
Table of Contents
Outlook And Strategy
This section represents my thoughts and applies to the three funds that I manage: the Parnassus Fund, the Small-Cap Fund and the Workplace Fund. The other portfolio managers will discuss their thoughts in their respective sections.
The market made a strong comeback in the second quarter with technology and small-cap companies leading the way. The Dow Jones Industrial Average was up 11.96% for the quarter and the S&P 500 was up 15.93%, so these big-company indices had substantial gains, but they were overshadowed by the technology-heavy Nasdaq which was up 20.34% and the Russell 2000 Index of smaller companies that was up 20.69%. Coming out of a recession, small-cap stocks tend to do better than large-cap stocks, and this past quarter has followed that pattern. There’s no mystery as to why this happens. When the stock market falls before and during a recession, small-cap and technology names fall more than large-cap names, because the former are riskier than the latter. Just before the economy comes out of a recession, small-cap and technology stocks make substantial moves upward, outshining their large-cap brethren. Since the small-cap and technology names fell further, they moved higher and sooner than the big companies in their effort to return to non-recession levels.
I think the market action of the second quarter signaled an end to the recession fairly soon— probably by the end of the year. Given this situation, stocks should continue to move higher. There will, however, continue to be periods of volatility with strong moves higher followed by major moves downward. Despite these stomach-churning dips, the market should be substantially higher by the end of the year. I plan to keep all three funds fully-invested to take advantage of this move upward.
When markets go down, they can go down very quickly, but the corollary is that when they go up, they can go up very quickly. For example, from the market bottom on March 9 until June 30, the Parnassus Fund gained 45.5%. During the same time period of less than four months, the Small-Cap Fund gained an astounding 55.2%, while the Workplace Fund gained an even more astounding 57.0%. Because of the possibility of these sharp upward moves, it’s prudent to keep all three funds fully invested.
Although the Parnassus Fund, the Small-Cap Fund and the Workplace Fund are all up substantially since the market hit bottom on March 9, all three are still substantially below the levels they reached when the market peaked on October 9 of 2007. Since that time, the Parnassus Fund is down 30.72%, the Small-Cap Fund is down 24.72% and the Workplace Fund is down 17.64%, so we still have a lot of work to do. However, all three funds have dropped far less than the S&P 500 which is down 38.6% from its high point.
The Small-Cap Fund did well for the quarter, gaining 23.21% compared to 20.69% for the Russell 2000, so the Fund beat the index by 2.52%. For the year-to-date, however, the Fund is almost 13 percentage points ahead of the Russell 2000—a much more substantial margin. The reason for this is that the Small-Cap Fund dropped only 6.18% for the first quarter compared to 14.95% for the Russell 2000. In choosing companies for the Small-Cap portfolio, I try to choose firms that have relatively unique characteristics, and this normally helps to keep their stocks from falling as much as the Russell 2000.
For the Parnassus Fund, I plan to put more emphasis on technology and some smaller-cap names, although that fund will continue to hold a lot of large-cap and mid-cap stocks as well. The Parnassus Fund earned 18.67% for the quarter compared to 15.93% for the S&P 500 so it finished 2.74% ahead. However, for the year-to-date, the Parnassus Fund is up 17.21% compared to only 3.16% for the S&P. Here again, the reason for the big lead for the year-to-date is because the Parnassus Fund did not go down much in the first quarter—only 1.23% compared to 11.01% for the S&P 500.
| The Parnassus Funds | 5 |
Table of Contents
Not all large-cap companies lose out to small-cap names when the economy is coming out of a recession. The Workplace Fund has mostly large-cap names in its portfolio, but it was up 26.65% for the quarter, substantially outperforming the S&P 500’s gain of 15.93%. For the year-to-date, the Workplace Fund is up 26.02% compared to a gain of 3.16% for the S&P 500. This performance is truly amazing, so I’m sure there’s some amount of luck involved, but I think it also shows that companies that treat their employees well can have excellent stock-market performance.
Yours truly,

Jerome L. Dodson
President
Parnassus Investments
| 6 | The Parnassus Funds |
Table of Contents
THE PARNASSUS EQUITY INCOME FUND
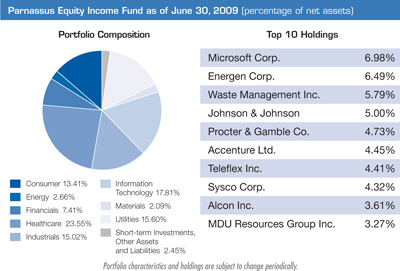
As of June 30, 2009, the net asset value per share (“NAV”) of the Equity Income Fund – Investor Shares was $20.04, so after taking dividends into account, the total return for the second quarter was 17.67%. This compares to a gain of 15.93% for the S&P 500 and a return of 15.50% for the average equity income fund followed by Lipper Inc. The Fund had a good quarter as it outperformed the S&P 500 during a strong market rally. We were able to beat the market due to strong gains in energy, healthcare and technology stocks.
For the first half of 2009, the Fund is also doing well versus the market and its peers. Since the beginning of the year, the Fund is up 4.79% versus a gain of 3.16% for the S&P 500 and a return of 1.23% for the Lipper Equity Income Fund Average. Most importantly, we are proud that the Fund’s strategy of buying good businesses at undervalued prices has generated solid long-term results. The Fund’s one-, three-, five- and ten-year returns beat both the S&P 500 and the Lipper Average for all periods. In fact, our 10-year average annual return of 5.48% far exceeds the 2% average annual loss for the S&P 500.
Below is a table that compares the performance of the Fund with that of the S&P 500 and the average equity income fund followed by Lipper. Average annual total returns are for the one-, three-, five- and ten-year periods.
Average Annual Total Returns
for periods ended June 30, 2009
| One Year | Three Years | Five Years | Ten Years | Gross Expense Ratio | Net Expense Ratio | |||||||||||||
PARNASSUS EQUITY INCOME FUND– | ||||||||||||||||||
Investor Shares | -15.92 | % | 0.46 | % | 2.88 | % | 5.48 | % | 1.02 | % | 1.01 | % | ||||||
Institutional Shares | -15.73 | % | 0.68 | % | 3.04 | % | 5.55 | % | 0.81 | % | 0.80 | % | ||||||
S&P 500 Index | -26.21 | % | -8.22 | % | -2.24 | % | -2.22 | % | NA | NA | ||||||||
Lipper Equity Income | ||||||||||||||||||
Fund Average | -24.52 | % | -7.84 | % | -0.92 | % | 0.38 | % | NA | NA |
The performance of Institutional Shares differs from that shown for the Investor Shares to the extent that the Classes do not have the same expenses. Performance data quoted represent past performance and are no guarantee of future returns. Current performance may be lower or higher than the performance data quoted, and current performance information to the most recent month-end is on the Parnassus website (www.parnassus.com). Investment return and principal value will fluctuate so that an investor’s shares, when redeemed, may be worth more or less than their original principal cost. Returns shown in the table do not reflect the deduction of taxes a shareholder may pay on fund distributions or redemption of shares. The S&P 500, is an unmanaged index of common stocks, and it is not possible to invest directly in an index. Index figures do not take any expenses, fees or taxes into account, but mutual fund returns do. On March 31, 1998, the Fund changed its investment objective from a balanced portfolio to an equity income portfolio. Before investing, an investor should carefully consider the investment objectives, risk, charges and expenses of the Fund and should carefully read the prospectus, which contains this and other information. The prospectus is on the Parnassus website, or you can obtain one by calling (800) 999-3505. As described in the Fund’s current prospectus dated, May 1, 2009, Parnassus Investments has contractually agreed to limit the total operating expenses to 0.99% and 0.78% of net assets, exclusive of acquired fund fees, through May 31, 2010 for the Investor Shares and Institutional Shares, respectively. These limitations may be continued indefinitely by the Adviser on a year-to-year basis. Parnassus Equity Income Fund – Institutional Shares incepted on April 28, 2006. Performance shown prior to the inception of the Institutional Shares reflects the performance of the Parnassus Equity Income Fund – Investor Shares and includes expenses that are not applicable to and are higher than those of the Institutional Shares.
Second Quarter Review
The stock market had a huge rally during the second quarter, as the prospect of an economic recovery fueled a wave of investor optimism. I was especially pleased that the Fund beat the S&P 500 in spite of being underweighted relative to the index in finance stocks, which surged 37% during the quarter.
The big driver of our outperformance was the energy-utilities sector, which added 3.6% to our gain compared to the S&P 500. We spent much of early 2009 buying stock in energy companies with low-cost operations and long-lived reserves. Our energy investments did well in the quarter for short-and long-term factors. Near-term, the earnings picture looks better as oil prices jumped more than 40% during the quarter in anticipation of economic recovery. This will help many of our energy companies post strong earnings for the second half of 2009. The long-term factor affecting energy stocks is the expectation of increased inflation. Quite simply, it’s much easier to print U.S. dollars than it is to find oil. As our government keeps interest rates artificially low and runs record deficits, it increases the chances that we will experience higher inflation.
| The Parnassus Funds | 7 |
Table of Contents
Strong stock-picking in the healthcare sector added almost 1% to our lead versus the S&P 500. Despite the uncertainty caused by looming healthcare reform in Washington, all six of our healthcare investments added to the Fund’s NAV during the quarter. Finally, our technology stocks, led by a resurgent Microsoft, added nearly half a percent to our return versus the S&P 500.
While it was nice to generate strong gains during the second quarter, we still have quite a ways to go before our NAV returns to past levels. The Fund is down “only” 19.4% from its all-time high, versus an incredible decline of 38.6% for the S&P 500 from its peak. Our team continues to work hard to identify good businesses that meet our strict investment criteria. Companies in the portfolio must have wide competitive moats in growth industries and be run by good people.
Company Analysis
Given the strong stock market, the Fund didn’t have any investments that significantly hurt our NAV during the second quarter. In contrast, we were fortunate to have many winners, with six companies adding 13¢ or more to the NAV. Our biggest gainer was Energen Corporation, a Birmingham, Alabama-based energy company that runs a utility and produces natural gas and oil. The stock jumped an amazing 37.0% during the quarter from $29.13 to $39.90, adding 38¢ to the Fund’s NAV.
We like Energen because it owns long-lived, low-cost energy reserves. The management team, led by CEO James McManus, is also top notch. During late February, I met with him at Energen’s headquarters in Alabama and was impressed by his ability to grow the company in a relatively low-risk way. For instance, during the oil bubble of 2008, McManus pre-sold a major portion of the company’s 2009 and 2010 production at high prices to lock in revenues. This move protected short-term earnings and provided cash flow to pay down the company’s debt.
Longer-term, Energen has over 18 years worth of proven reserves at current production rates, and vast unproven opportunities. This means that the company has major long-term earnings potential. While other investors focused on temporary factors such as depressed oil and gas prices, we significantly increased our position in the first half of 2009. We have owned this stock since 1996 and are now the company’s second largest shareholder.
The Fund’s second largest winner was Microsoft, which jumped 29.4% during the quarter from $18.37 per share to $23.77 and boosted our NAV by 35¢. Despite the recession, the company’s prospects brightened during the second quarter. Anticipation of Microsoft’s Windows 7 launch, scheduled for this fall, was a major catalyst that boosted investor optimism. In addition, the outlook for computer sales seemed to improve, which pushed the stock higher. I owe thanks to Parnassus Mid-Cap Fund Portfolio Manager and Senior Research Analyst, Lori Keith, who has done an outstanding job researching Microsoft. Her conviction and investment insight contributed to making Microsoft the largest holding of the Fund.
AFLAC, the insurance company represented by the famous duck, was a big winner during the second quarter. The stock jumped 60.6% from $19.36 to $31.09 and added 18¢ to the NAV. While it was a nice pop, the move was from a very depressed level. The stock had plunged during the first quarter of 2009 due to concerns about the company’s investment portfolio. While we acknowledge the risks to some of their assets, we feel that the expected losses could be absorbed by the company’s otherwise healthy balance sheet. In addition, we continue to like the AFLAC insurance business long-term. As a result, we added significantly to our position during early 2009.
| 8 | The Parnassus Funds |
Table of Contents
By May, the stock began bouncing back, as fears about the company’s investment portfolio started to subside. Around this time, Parnassus Fixed-Income Fund Portfolio Manager Minh Bui and I attended AFLAC’s analyst day in New York. During a dinner meeting, CEO Daniel Amos spoke about AFLAC’s great track record, strong capital position and commitment to social responsibility. In a humorous moment of candor, he admitted that during the volatile early months of 2009, he slept “just like a baby—I would get up and cry every hour.” We remain bullish on the long-term prospects of AFLAC, and trust that Mr. Amos is getting better sleep these days.
Alcon, the Swiss-based pharmaceutical company focused on eye care, had a strong quarter. The stock jumped 27.7% from $90.91 to $116.12 and boosted the NAV by 18¢. Alcon’s eye care products have been relatively recession-resistant, allowing the company to report strong first quarter results. In a rare act these days, the company even boosted its dividend by an impressive 50% during the quarter. Our healthcare analyst, Pearle Lee, has done a superb job researching this investment.
Accenture, the global consulting, technology services and outsourcing firm, added 15¢ to the Fund’s NAV as the stock climbed 21.7% to $33.46 from $27.49. Despite softening demand for consulting services due to the global recession, Accenture has defended its bottom line by aggressively cutting costs. The company also booked a healthy $6.4 billion worth of business during the quarter, as clients looked to save money by outsourcing non-core business functions. In addition, the company generated almost a billion dollars of free cash flow during the quarter. This boosted Accenture’s already large cash position and underscored its ability to increase stock buybacks and dividends over time. Matt Gershuny, one of our Parnassus Mid-Cap Fund portfolio managers, made a significant contribution by convincing me to make Accenture a top five holding during April.
Our final winner was W&T Offshore, a Houston, Texas-based producer of oil and natural gas. Like Energen, the stock fell during early 2009 only to bounce back strong as oil prices recovered. In the past quarter, the stock soared 58.4% from $6.15 per share to $9.74 and added 12¢ to the NAV. During a February meeting in Houston with CEO Tracy Krohn, Parnassus Director of Research Ben Allen and I were impressed with the company’s long-term opportunities. In essence, the recession is hurting weaker drillers in the Gulf of Mexico, and Mr. Krohn has the capital to scoop up assets at attractive prices. He is a true entrepreneur, and we are excited to watch him take advantage of uncertainty and grow the company.
Outlook And Strategy
We draw great comfort that our investment process has yielded consistency and strong, long-term results. The cornerstone of this process is to own businesses that have long-term competitive advantages in secular growth markets. Furthermore, we want to invest with managers who are ethical and treat shareholders as true partners. That is why I write so much in these reports about meeting executives directly. This is a critical factor in an era when too many executives put their interests before those of their shareholders.
Despite the S&P 500’s 37% rally since March 9th, there remains a lot of uncertainty for the economy and stock market, and we think the key factor to monitor is jobs. Unemployment is a significant concern because jobs produce wages, wages fuel consumption, and consumer spending represents almost 70% of our entire economy. The U.S. lost 467,000 jobs in June, according to the Department of Labor, which brings the total job losses since the start of 2008 to 6.5 million—a truly staggering sum. While many argue that the economy typically improves before the job market grows, we think it could be different this time. In fact, we try to stay a few steps ahead of other investors precisely by analyzing how things could be different this time.
One key difference is that both the government and the consumers have massive debts that need to be paid down. At all levels of our society, starting with households, extending to cities, counties, states and the Federal government, we are consuming more than we produce. In most previous recessions, we had the option of increasing total debt to solve economic slumps, even before the job market improved. It may not be that easy this time. As a result, while we think the economy could stabilize this year, we don’t anticipate a “V-shaped” recovery.
| The Parnassus Funds | 9 |
Table of Contents
Another source of uncertainty is the potential for major government reform in the healthcare and energy sectors. Almost every day, I read about the predicted costs and promised benefits of these reforms. While I trust our lawmakers’ good intentions, I worry that their plans could be more expensive than they think, and that the range of possible outcomes is less certain than they admit.
One of my favorite authors, Nassim Taleb, argues in his book The Black Swan that “the policies we need to make decisions on should depend far more on the range of possible outcomes than on the expected number.” As an investor, I take this approach to heart, and I hope that our representatives in Washington do too. In short, while I hope that any new government reforms yield positive results for our economy, so far the biggest effect has been a widening of the range of outcomes and an increase in uncertainty. We expect that uncertainly will benefit us because of our disciplined investment approach. When uncertainty causes stock price volatility, we’ll use temporary drops in stock prices to buy larger stakes in companies we like for the long-term.
From a sector perspective, our two largest overweight positions relative to the index are energy-utilities and healthcare. We expect the energy sector to perform well due to shrinking supply, growing global demand and potential inflation. Despite looming healthcare reform, companies that offer low-cost solutions that improve healthcare should also do well.
The Fund remains underweighted relative to the index in financial services. Despite the second quarter rally, we still see significant risks of loan write-offs and other balance sheet concerns. The four financial stocks we own have either paid the TARP money back or didn’t accept it in the first place. We think this demonstrates their relative strength and will allow our portfolio companies to operate with fewer restrictions going forward. Given our concerns about jobs, we’re still significantly underweighted relative to the index in the consumer discretionary sector.
Thank you for your trust and investment in the Fund.
| Yours truly, |
 |
| Todd C. Ahlsten |
| Chief Investment Officer |
| 10 | The Parnassus Funds |
Table of Contents
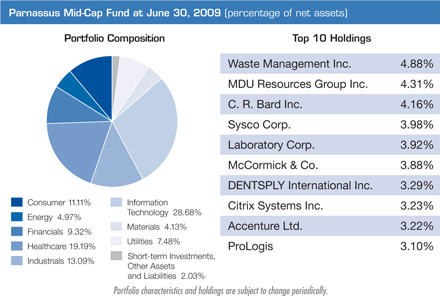
As of June 30, 2009, the net asset value per share (“NAV”) of the Parnassus Mid-Cap Fund was $13.08, so the total return for the quarter was a gain of 18.26%. This compares to a gain of 20.80% for the Russell Midcap Index and a gain of 19.07% for the average mid-cap core fund followed by Lipper Inc. Although the Fund fell short of its benchmarks for the quarter, we are pleased to have made such a large gain.
For the first half of 2009, the Fund is slightly behind the benchmark and its peers. Since the beginning of the year, the Fund is up 9.00% versus a gain of 9.96% for the Russell Index and a return of 9.21% for the Lipper Average. The Fund’s one- and three-year returns and its record since inception beat both the Russell Midcap Index and Lipper Mid-Cap Core Average for all periods. We are proud that the Fund’s strategy of buying good businesses at undervalued prices has generated solid longer-term results.
Below is a table comparing the Parnassus Mid-Cap Fund with the Russell Index and the Lipper average for the one- and three-year periods, for the period since September 30, 2005 when we first had most of the Fund’s assets invested in stock and for the period since inception on April 29, 2005.
Average Annual Total Returns
for periods ended June 30, 2009
| One Year | Three Years | Since September 30, 2005 | Since Inception April 29, 2005 | Gross Expense Ratio | Net Expense Ratio | |||||||||||||
PARNASSUS MID-CAP FUND | -15.97 | % | -4.44 | % | -1.54 | % | -1.56 | % | 2.26 | % | 1.21 | % | ||||||
Russell Midcap Index | -30.36 | % | -9.25 | % | -5.72 | % | -2.14 | % | NA | NA | ||||||||
Lipper Mid-Cap Core Average | -29.09 | % | -8.86 | % | -5.48 | % | -2.14 | % | NA | NA |
Performance data quoted represent past performance and are no guarantee of future returns. Current performance may be lower or higher than the performance data quoted. Current performance information up to the most recent month-end is on the Parnassus Investments website (www.parnassus.com). Investment return and principal value will fluctuate so that an investor’s shares, when redeemed, may be worth more or less than their original principal cost. Returns shown in the table do not reflect the deduction of taxes a shareholder may pay on fund distributions or redemption of shares. The Russell Midcap Index is an unmanaged index of common stocks, and it is not possible to invest directly in an index. Index figures do not take any expenses, fees or taxes into account, but mutual fund returns do. Mid-cap companies can be more sensitive to changing economic conditions and have fewer financial resources than large-cap companies. Before investing, an investor should carefully consider the investment objectives, risks, charges and expenses of the Fund and should carefully read the prospectus, which contains this and other information. The prospectus is available on the Parnassus Investments website, or one can be obtained by calling (800) 999-3505. As described in the Fund’s current prospectus dated May 1, 2009, Parnassus Investments has contractually agreed to limit the total operating expenses to 1.40% of net assets, exclusive of acquired fund fees, until May 1, 2010. Effective with the year ending December 31, 2008, Parnassus Investments has agreed to further reduce the total operating expenses to 1.20% of net assets, exclusive of acquired fund fees. These limitations may be continued indefinitely by the Adviser on a year-to-year basis.
Second Quarter Review
This quarter, the Russell Midcap Index surged an amazing 20.8%, far outpacing most major market indices. The climb was fueled by the prospects of an economic recovery and by the magnitude of the recent market correction. Despite the Fund’s impressive 18.3% gain in the quarter, we trailed our index.
Two key factors caused the under-performance. First, the Fund was invested primarily in higher-quality companies. This quality bias helped us weather the storm when the stock market dropped, but it held us back somewhat in the rebound. Second, we owned fewer consumer and financial stocks than our benchmark, and these sectors led the market recovery from the early March nadir. Though we are still underweighted relative to the index in the consumer and financial sectors, during the quarter we doubled positions at very favorable prices in quality retailer Coach and insurance company AFLAC. These investments added significantly to Fund NAV.
| The Parnassus Funds | 11 |
Table of Contents
Company Analysis
The biggest positive contributor by far was AFLAC, which gained a whopping 60.6%, adding 24¢ to the NAV. While we are happy to report this gain, it’s important to note that AFLAC was coming off a major swoon in the first quarter on concerns about the company’s investment portfolio. The stock rebounded as investors became more optimistic that the company wouldn’t need to raise additional capital. First quarter financial results also surprised investors to the upside, as sales in the U.S. and Japan held up better than expected, and investment losses were mostly lower than expectations. Fortunately, we had strong enough conviction in the stock and the businesses’ long-term health to double the position at low levels.
Another winner was Citrix Systems, which gained 40.9%, increasing the NAV by 15¢. Demand for Citrix’s unique virtualization software remains steady, and customers continue to renew their licenses for Citrix’s products. This enabled the company to report better than expected financial results during the quarter. Aside from strong demand for Citrix’s products, we also like the company’s healthy balance sheet, which should help fund growth and innovation.
Our third largest positive contributor was retailer Coach, which rose 61.0% during the quarter adding 11¢ to the Fund’s NAV. The company boosted its sales by releasing a moderately priced handbag line appealing to more price sensitive consumers. Despite the big move, we still like the stock and expect further outperformance as the company continues executing its international expansion plan.
Our only significant loser was oil refiner Sunoco, which dropped 12.4%, knocking 4¢ from the NAV. Utilization at Sunoco’s refineries was down to 74% during the quarter in response to weak demand for refined products. The company’s chemicals division also reported poor quarterly results, reflecting lower margins for its polypropylene and phenol products. We expect margins to recover as the economy moves out of recession and demand for refined products picks up. In the meantime, we think the stock is undervalued, and we plan to hold on to our shares.
| 12 | The Parnassus Funds |
Table of Contents
Outlook And Strategy
While there are signs of economic stabilization, we believe the recent market rally has been a bit hasty. We are still concerned about unemployment, corporate bankruptcies, consumer spending and housing. As a result, we have invested the Fund’s assets in high-quality companies that we think will better weather the recession than their weaker competitors.
The Fund continues to be heavily weighted toward technology and healthcare companies. Despite lower corporate spending, we like the positive long-term, secular growth trends in our technology investments. We’re trying to look past the uncertainty surrounding potential healthcare reform by focusing on top-notch franchises. Our companies offer necessary and cost-effective solutions. Since last quarter, we have increased our utilities and energy sector holdings, believing that limited supply, growing global demand, and long-term inflationary pressures will drive earnings for these companies.
In response to the market’s tremendous move, we further reduced our exposure to consumer stocks during the quarter, believing that stocks in this sector have moved too far too fast. Our most meaningful underweight position relative to the index continues to be the financial sector. We continue to believe that a sustained recovery path is not yet visible for most companies in this sector.
For further detail on our investment strategy, please refer to the strategy section prepared by our Chief Investment Officer, Todd Ahlsten. This can be found at the end of the report he has prepared for the Parnassus Equity Income Fund.
Thank you for your investment with us.
Yours truly,
 |  |  | ||
| Benjamin E. Allen | Matthew D. Gershuny | Lori A. Keith | ||
| Portfolio Manager | Portfolio Manager | Portfolio Manager |
| The Parnassus Funds | 13 |
Table of Contents
THE PARNASSUS SMALL - CAP FUND
As of June 30, 2009, the net asset value per share (“NAV”) of the Parnassus Small-Cap Fund was $14.60, so the total return for the quarter was 23.21%. By comparison, the Russell 2000 Index (“Russell”) of smaller companies gained 20.69%, and the average small-cap core fund followed by Lipper Inc. gained 21.57%. For the quarter, then, we beat the Russell and the Lipper average.
For the year-to-date as of June 30, we’re substantially ahead of all the benchmarks, with the Fund up 15.60%, the Russell up 2.64% and the Lipper average up 6.29%.
Below is a table comparing the performance of the Small-Cap Fund with that of the Russell 2000 and the Lipper Small-Cap Core Average. Besides the one- and three-year numbers, we’ve also included the period since inception and the return since September 30, 2005, since that is the approximate date when the Fund first had most of its assets invested in stocks. As you can see from the table, the Fund beat all the benchmarks for all time periods.
Average Annual Total Returns
for periods ended June 30, 2009
| One Year | Three Years | Since September 30, 2005 | Since Inception April 29, 2005 | Gross Expense Ratio | Net Expense Ratio | |||||||||||||
PARNASSUS SMALL-CAP FUND | -14.71 | % | -4.02 | % | 1.10 | % | 1.50 | % | 1.88 | % | 1.21 | % | ||||||
Russell 2000 Index | -25.01 | % | -9.89 | % | -5.75 | % | -1.78 | % | .NA | NA | ||||||||
Lipper Small-Cap Core Average | -25.42 | % | -10.09 | % | -6.24 | % | -2.39 | % | .NA | NA |
Performance data quoted represent past performance and are no guarantee of future returns. Current performance may be lower or higher than the performance data quoted. Current performance information to the most recent month-end is available on the Parnassus website (www.parnassus.com). Investment return and principal value will fluctuate so that an investor’s shares, when redeemed, may be worth more or less than their original principal cost. Returns shown in the table do not reflect the deduction of taxes a shareholder may pay on fund distributions or redemption of shares. The Russell 2000 Index is an unmanaged index of common stocks, and it is not possible to invest directly in an index. Index figures do not take any expenses, fees or taxes into account, but mutual fund returns do. Small-cap companies can be particularly sensitive to changing economic conditions and have fewer financial resources than large-cap companies. Before investing, an investor should carefully consider the investment objectives, risks, charges and expenses of the Fund and should carefully read the prospectus, which contains this and other information. The prospectus is on the Parnassus website, or one can be obtained by calling (800) 999-3505. As described in the Fund’s current prospectus dated May 1, 2009, Parnassus Investments has contractually agreed to limit the total operating expenses to 1.40% of net assets, exclusive of acquired fund fees, until May 1, 2010. Effective with the year ending December 31, 2008, Parnassus Investments has agreed to further reduce the total operating expenses to 1.20% of net assets, exclusive of acquired fund fees. These limitations may be continued indefinitely by the Adviser on a year-to-year basis.
Company Analysis
Only one company made a substantial dent in the NAV of the Small-Cap Fund. Pulte Homes dropped 19.2% from $10.93 to $8.83, slicing 13¢ off the value of each fund share. In the March quarter, the homebuilders helped us quite a bit, but difficult conditions in the housing industry pulled their shares back down to earth in the June quarter. Declining orders and write-offs on land depressed earnings for all the homebuilders, pushing their stock prices lower. For the most part, though, these declines in share prices did not affect the Fund too much, but Pulte was a special case. Pulte is buying rival Centex, and investors usually don’t like mergers, because they normally have a negative financial impact on the companies in question. Most of the time, I’m in the camp that dislikes mergers, so I would normally sell the stock of a company making a big acquisition. In the case of Pulte, though, the stock price is down so low that I regard it as a good value.
Six companies made substantial contributions to the Fund’s share price in the quarter, each one adding 14¢ or more. The big winner was Baldor Electric, the maker of energy-efficient motors based in Ft. Smith, Arkansas. The company’s stock motored up 64.2% from $14.49 to $23.79 for a gain of 22¢ for each fund share. Financial results for the last quarter were stronger than expected and analysts raised estimates for the company. Baldor was also able to renegotiate terms of its major credit agreement, thereby ensuring access to the financing it needs to operate effectively.
| 14 | The Parnassus Funds |
Table of Contents
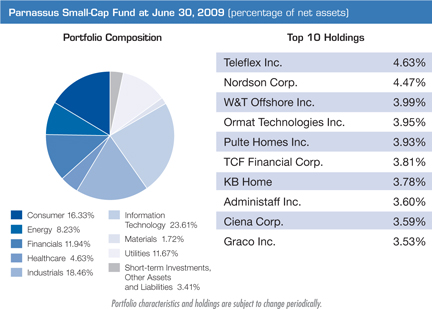
W&T Offshore saw its stock price rebound 58.4% from $6.15 to $9.74 during the quarter, adding 19¢ to the NAV. Rising energy prices helped this oil-producer’s earnings, while service and drilling costs have come down, which greatly improves the economics of the company’s drilling program.
Ormat Technologies contributed 17¢ to the NAV during the quarter, as its stock climbed 46.8% from $27.46 to $40.31. Ormat is a renewable energy company that develops, owns and operates geothermal power plants. Increased revenue and better margins contributed to strong financial results.
Nordson is a leading manufacturer of precision dispensing equipment that applies adhesives, sealants and coatings for consumer goods and industrial products. During the quarter, Nordson contributed 15¢ to each fund share, with its stock price increasing by 36.0% from $28.43 to $38.66. Revenue has held up better than expected in the packaging and non-woven markets, while orders and sales have improved in all business segments, especially in electronic assembly and life sciences.
Ciena Corporation makes products for optical networks used in telecommunications. The stock had been trading at depressed levels because phone companies have cut back on capital spending. During the second quarter, the stock added 14¢ to the NAV, as it climbed 33.0% from $7.78 to $10.35. Investors anticipate that orders from telecommunications providers will pick up soon, and Ciena has already received a number of orders for its excellent products.
The price of Energen shares surged 37.0% in the second quarter from $29.13 to $39.90 for a gain of 14¢ on the NAV. The firm is a diversified energy holding company that has a natural gas utility and also develops and produces oil and natural gas. Crude oil prices moved from the low forties to about $70 per barrel during the quarter, benefitting Energen’s exploration and production businesses.
| Yours truly, |
 |
Jerome L. Dodson President Parnassus Investments |
| The Parnassus Funds | 15 |
Table of Contents
As of June 30, 2009, the net asset value per share (“NAV”) of the Parnassus Workplace Fund was $15.40, so the total return for the quarter was 26.65%. This compares to a return of 15.93% for the S&P 500 and 17.77% for the average multi-cap core fund followed by Lipper Inc. It was an outstanding quarter for the Workplace Fund, as we beat both benchmarks by a substantial amount.
For the year-to-date, the Workplace Fund is even further ahead of its benchmarks, gaining 26.02% as of June 30, compared to 3.16% for the S&P 500 and 7.32% for the Lipper average. The Workplace Fund was the best-performing of all the Parnassus Funds for the quarter and the year-to-date.
Below is a table comparing the Workplace Fund with the S&P 500 and the Lipper Multi-Cap Core Average. Besides the one- and three-year numbers, we’ve also included the period since inception and the return since September 30, 2005, since that is the approximate date when the Fund first had most of its assets invested in stocks. You’ll notice that the Fund has a very substantial lead over all the indices for all time periods. It seems as if the Fund’s strategy of investing in companies that provide their workers with great workplaces is succeeding in providing solid returns to its shareholders.
Average Annual Total Returns
for periods ended June 30, 2009
| One Year | Three Years | Since September 30, 2005 | Since Inception April 29, 2005 | Gross Expense Ratio | Net Expense Ratio | |||||||||||||
PARNASSUS WORKPLACE FUND | -5.42 | % | 1.54 | % | 2.56 | % | 2.53 | % | 2.34 | % | 1.21 | % | ||||||
S&P 500 Index | -26.21 | % | -8.22 | % | -5.44 | % | -3.34 | % | NA | NA | ||||||||
Lipper Multi-Cap Core Average | -26.35 | % | -8.33 | % | -5.32 | % | -2.59 | % | NA | NA |
Performance data quoted represent past performance and are no guarantee of future returns. Current performance may be lower or higher than the performance data quoted. Current performance information to the most recent month-end is available on the Parnassus website (www.parnassus.com). Investment return and principal value will fluctuate so that an investor’s shares, when redeemed, may be worth more or less than their original principal cost. Returns shown in the table do not reflect the deduction of taxes a shareholder may pay on fund distributions or redemption of shares. The S&P 500 Index is an unmanaged index of common stocks, and it is not possible to invest directly in an index. Index figures do not take any expenses, fees or taxes into account, but mutual fund returns do. Before investing, an investor should carefully consider the investment objectives, risks, charges and expenses of the Fund and should carefully read the prospectus, which contains this and other information. The prospectus is available on the Parnassus website, or one can be obtained by calling (800) 999-3505. As described in the Fund’s current prospectus dated May 1, 2009, Parnassus Investments has contractually agreed to limit the total operating expenses to 1.20% of net assets, exclusive of acquired fund fees, until May 1, 2010. This limitation may be continued indefinitely by the Adviser on a year-to-year basis.
Company Analysis
Only one stock in the Workplace Fund portfolio had a substantial negative impact on the Fund’s NAV. Refiner Valero Energy sliced 10¢ off the NAV, with its shares declining 5.6% from $17.90 to $16.89 at the end of the quarter. The company temporarily shut down several of its refineries during the quarter due to depressed demand for gasoline. Earnings were hurt because of lower margins or reduced “crack spreads” (the difference between the price of oil and the price of gasoline.) We expect refining margins to recover as the economy picks up, so we’re hanging on to the stock, since we think it’s very undervalued.
Seven companies made substantial contributions, each one boosting the NAV by 14¢ or more. The big winner for the quarter was Wells Fargo, with its stock soaring 70.4% from $14.24 to $24.26 for a gain of 22¢ for each fund share. The stock moved higher, because the company reported earnings that were much better than expected, with higher mortgage banking and trading revenues offsetting credit losses.
American Express also made a major contribution to the Fund’s strong second quarter performance, as its stock climbed 70.5% from $13.63 to $23.24 for a gain of 19¢. The stock had been trading at very depressed levels because of investor concerns about the possibility of big losses in the company’s credit card portfolio. As it turned out, earnings came in better than expected because of good expense control and lower funding costs courtesy of low interest rates. The balance sheet of American Express also looks reasonably healthy, as the company obtained permission in June to repay the U.S. Treasury the $3.4 billion in TARP money it had received; the company paid it all back before the end of the quarter.
| 16 | The Parnassus Funds |
Table of Contents
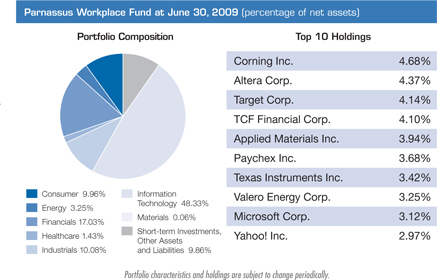
Baldor Electric, the maker of energy-efficient motors, added 17¢ to the NAV, as its stock soared 64.2% from $14.49 to $23.79. Financial results for the last quarter were stronger than expected and analysts raised estimates for the company. Baldor was also able to renegotiate terms of its major credit agreement, thereby ensuring access to the financing it needs to operate effectively.
Semiconductor-maker Texas Instruments contributed 16¢ to the shares of the Workplace Fund, as its stock climbed 29.0% from $16.51 to $21.30. The company reported higher orders, increased revenue and better earnings, driven by demand from China’s 3G build-out and improving conditions in the handset, notebook and LCD TV end-markets.
Seagate Technology makes hard disk-drives used for electronic storage and its stock rose 74.0% during the quarter from $6.01 to $10.46 for a gain of 15¢ on the NAV. Late in the quarter, the company said demand was increasing and it was able to get better pricing for its products. It also raised guidance for revenue in the next quarter from an average of $2.05 billion to an average of $2.25 billion. Analysts from ten brokerage firms raised their forecasts for Seagate.
After seeing its stock lose 57.8% in the first quarter, because of investments losses and slowing sales, insurer AFLAC rebounded in the second quarter, contributing 14¢ to each fund share, as its stock soared 60.6% from $19.36 to $31.09. Financial results gave investors a positive surprise, as sales in Japan and the US held up better than expected and investment losses were not as bad as feared. Standard & Poor’s removed AFLAC from its credit watch list, indicating that no downgrade was imminent.
Microsoft boosted the Workplace Fund by 14¢ per share, with its stock rising 29.4% from $18.37 to $23.77. Expectations for the company increased on the release of Bing, its new search engine and the announcement that a new operating system, Windows 7, is on track to launch this fall.
Yours truly, |
 |
| Jerome L. Dodson |
| President |
| Parnassus Investments |
| The Parnassus Funds | 17 |
Table of Contents
THE PARNASSUS FIXED - INCOME FUND
As of June 30, 2009, the net asset value per share (“NAV”) of the Parnassus Fixed-Income Fund was $16.41, producing a total return for the quarter of 2.93% (including dividends). This compares to a gain of 6.36% for the average A-rated bond fund followed by Lipper Inc. and a gain of 1.85% for the Barclays Capital U.S. Government/Credit Bond Index. Since the beginning of the year, the total return for the Fund was 2.73% compared to a gain of 0.55% for the Barclays Capital U.S. Government/ Credit Bond Index and a gain of 6.56% for the average A-rated bond fund followed by Lipper Inc.
Below is a table comparing the performance of the Fund with that of the Barclays Capital U.S Government/Credit Bond Index and the average A-rated bond fund followed by Lipper. Average annual total returns are for the one-, three-, five- and ten-year periods. The 30-day SEC yield for the Fund for June 2009 was 2.96%. We’re pleased to report that our returns are better than the Lipper average for each of the one-, three-, five- and ten-year periods as of the end of the year.
Average Annual Total Returns
for periods ended June 30, 2009
| One Year | Three Years | Five Years | Ten Years | Gross Expense Ratio | Net Expense Ratio | |||||||||||||
PARNASSUS FIXED-INCOME FUND | 4.60 | % | 5.25 | % | 4.68 | % | 5.52 | % | 0.90 | % | 0.77 | % | ||||||
Lipper A-rated Bond Fund Average | 0.42 | % | 2.98 | % | 2.78 | % | 4.58 | % | NA | NA | ||||||||
Barclays Capital U.S. Government/Credit Bond Index | 5.26 | % | 6.16 | % | 4.80 | % | 5.95 | % | NA | NA |
Performance data quoted represent past performance and are no guarantee of future returns. Current performance may be lower or higher than the performance data quoted. Current performance information to the most recent-month end is available on the Parnassus website (www.parnassus.com). Investment return and principal value will fluctuate, so that an investor’s shares, when redeemed, may be worth more or less than their original cost. Returns shown in the table do not reflect the deduction of taxes a shareholder would pay in fund distributions or redemption of shares. The Barclays Capital U.S. Government/Credit Bond Index is an unmanaged index of bonds, and it is not possible to invest directly in an index. An index does not take expenses into account, but mutual fund returns do. Before investing, an investor should carefully consider the investment objectives, risks, charges and expenses of the Fund and should read the prospectus, which contains this and other information. The prospectus is on the Parnassus Investments website, or one can be obtained by calling (800) 999-3505. As described in the Fund’s current prospectus dated May 1, 2009, Parnassus Investments has contractually agreed to limit the total operating expenses to 0.87% of net assets, exclusive of acquired fund fees, until May 1, 2010. This limitation may be continued indefinitely by the Adviser on a year-to-year basis.
Second Quarter Review
The appetite for risk came roaring back during the second quarter, as financial markets erased most of the losses incurred earlier in the year. Equity markets were up on average more than 40% from their lows in March, while U.S. corporate bonds returned 10% during the quarter, according to the Barclays Capital U.S. Credit Index. Animal spirits got a jolt of life after several indicators of economic activity showed some signs of stabilization. Fueled by a slower rate of decline in these economic data, investors started to see green shoots at every corner and quickly concluded than an economic recovery was on the way.
The U.S. Treasury market suffered from all this excitement. The reason is that a robust economic turnaround would imply higher inflation, and in turn make the equity market a better investment alternative. Consequently, yields backed up across the curve, most notably in the long end, where the yield on the 30-year increased by 80 basis points to 4.33% during the quarter, and the 10-year increased from 2.66% to 3.53%. Interest rates at the front end of the curve went up less, with the 3-year ending at 1.62%, up 50 basis points and the 2-year up 31 basis points to 1.11%.
The Fund’s performance in the quarter trailed the average A-rated bond fund followed by Lipper, because we don’t invest in commercial mortgage-backed securities (CMBS) and asset-backed securities (ABS). CMBS are bonds that represent a claim on the cash flows from commercial property loans, while ABS are bonds backed by a pool of assets such as credit card and auto loans. During the quarter, these securities returned more than 10%, as the perceived default risk on the underlying assets declined with the improving economic data. While these bonds offer much higher yields than
| 18 | The Parnassus Funds |
Table of Contents
investment-grade corporate bonds, they come with much higher risk profiles and complexity. We are willing to give up some of these riskier returns, as our investment strategy emphasizes safety and risk management. Even though we underperformed for the quarter, our longer-term performance is substantially better than the Lipper average as illustrated in the table.
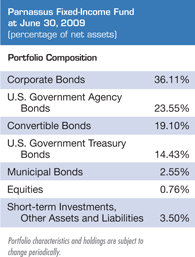
On the other hand, the Fund performed much better for the quarter compared to the Barclays Capital U.S. Government/Credit Bond Index. The reason is that we had less exposure to the declining Treasury market. The decision during the last quarter to increase the Fund’s holdings in corporate and convertible bonds also contributed to our quarterly performance. The investments in corporate bonds contributed the most, adding 30¢ per share to the NAV. Convertible bonds added about 19¢ per share due to their sensitivity to the soaring equity market. Finally, agency bonds were unchanged during the quarter, while the Treasury holdings negatively impacted the Fund by 2¢ per share.
Outlook And Strategy
During the second quarter, the market has been looking for signs of economic stabilization. Going forward, however, investors will likely pay more attention to the prospects for growth in consumer demand, so employment and consumer data will have increasing importance. If investors are to take on more risk, there needs to be rapid improvements in labor market indicators, as well as sustainable evidence of recovery in consumer confidence and spending. Indeed, without a recovery in these drivers of demand, profit margins will stay compressed and corporate credit quality will deteriorate.
The current labor market is unlike previous cycles because of the permanency of job losses. With roughly 75% of the workers that were fired over the last 12 months on a permanent, not temporary, basis, there are now a relatively low number of temporary layoffs and a high number of involuntary part-time workers. This means that employment growth will be tepid, when the economy starts to expand again and a jobless recovery would be more likely. In turn, this implies that the next economic expansion is going to be more fragile and more volatile than in the past cycles.
In light of the above, the portfolio is positioned for a slow and volatile economic recovery. I added a few investment-grade corporate bonds during the quarter as they still offer an attractive risk/return profile. Even though the yield differential between corporate and Treasury bonds has decreased from its peak in January, it remains wider than during past crises. In addition, the Fund remains flexible and also provides safety in cases of a sharp increase in risk aversion or a sudden surge in inflation expectations. The investments in agency and Treasury bonds would outperform with lower interest rates, while convertible bonds and the relative short duration of the portfolio lowers its sensitivity to rising interest rates.
Thank you for investing in the Parnassus Fixed-Income Fund.
Yours truly, |
 |
| Minh T. Bui |
| Portfolio Manager |
| The Parnassus Funds | 19 |
Table of Contents
by Jerome L. Dodson and Milton Moskowitz
The Obama Administration has created an Office of Social Innovation to promote the idea of social entrepreneurship. The First Lady, Michelle Obama, announced that plans call for the office to be funded with a $50 million appropriation in the 2010 budget. Heading up the office is Sonal Shah, who designed a development strategy for Google.org and an environmental strategy for Goldman Sachs.
Applied Materials takes a pro-active stance on environmental issues. In late June, after the U.S. House of Representatives passed a climate security act that includes a cap-and-trade component, Applied’s CEO, Mike Splinter, fired off a message urging the Senate to follow suit to show “the world that we want to be leaders when it comes to saving our climate.” Long the leading supplier of equipment used to make semiconductors, Applied also has a hand in solar energy, supplying products used to make silicon solar panels. Its SunFab Thin Line makes possible the world’s largest solar panels...Adobe Foundation, philanthropic arm of Adobe Systems, convened a three-day digital immersion event for 100 students and educators from around the world. The goal: “to empower youth to create media for social change.” More than 60 students, ages 14 to 19, came from more than 16 countries to participate in workshops led by Adobe employees. “Now more than ever, youths need to be able to relate to other cultures and ideas and to express themselves in digital media,” said Michelle Mann, executive director of the Adobe Foundation. The summit took place at Stanford University...In the July issue of The Costco Connection, the monthly magazine sent to 53 million cardholders, Costco Wholesale featured 13 members who are doing something to change the world, ranging from Russell Jackson, an ex-firefighter who started a foundation, Kid One, which transports impoverished children from poor rural communities in Alabama to metropolitan hospitals, to Lucy Summer, a retired school teacher who set up a nonprofit, The Magic Penny, to help rural communities in West Africa. The magazine ended its report with the message, “Now it’s your turn,” listing places where they could find help to launch their own humanitarian projects...Paychex, which handles payroll services for more than half a million businesses across the country, was recognized by the National Business Group on Health as one of the nation’s best employers for its healthy lifestyles. Paychex’s Active Health programs include on-site health screenings, online health risk assessments, healthy cooking classes and unlimited access to preventive medical care at no cost to employees. Eighty-seven percent of Paychex employees participated in these programs in 2008...Pulte Homes, one of the nation’s largest home builders, was recognized by the Department of Energy for building more energy-efficient homes than any
| 20 | The Parnassus Funds |
Table of Contents
other builder. During 2008, Pulte completed 649 homes which had scores of 70 or better on the DOE’s EnergySmart Home Scale... Mentor Graphics came to the aid of unemployed engineers and designers with a Displaced Worker Program that offers free training courses. Classroom instruction takes place at the company’s training centers — in Austin, Boston, Chicago, Minneapolis, Dallas, Denver, Portland and San Jose — but the courses are also offered online...Intel, the world’s largest maker of microprocessors, has invested over $23 million in energy efficiency and conservation since 2001, resulting in savings of more than $50 million. The company is now the nation’s largest purchaser of green power. Intel ties a portion of employee compensation to environmental metrics...Whole Foods Market was the first national retailer to offer 100 percent recycled paper bags at its checkouts, and last year it banned plastic bags from its checkouts. Now it has gone one step further by using recycled paper bags certified by the Forest Stewardship Council, which means the paper has been traced through the supply chain to ensure zero impact on virgin forests. Shoppers who bring their own bags get refunds of five or 10 cents at the checkouts...Women hold top jobs at the Tennessee-based bank holding company, First Horizon, accounting for 67% of managers and supervisors and 18% of senior managers and top executives. As a result, the bank has been named to the list of the Top 50 Companies for Executive Women by the National Association for Female Executives. Two of the top female officers are Christine Munson, executive vice president-corporate banking, and Kim Cherry, executive vice president-corporate communications...Institutional Investor has named AFLAC chairman Dan Amos the best CEO in the life insurance field, the fourth time he has earned this designation...Johnson & Johnson, a healthcare company, reports on the health of its employee force: 4% are smokers, down from 5% in 2005, 6% have high blood pressure, down from 10% in 2005, 7% have high cholesterol, down from 8% in 2005, and 36% do little or no exercise, down from 38% in 2005...The University of Michigan’s American Customer Satisfaction Industry ranked FedEx Corp. number one in customer satisfaction in the Express Delivery industry...Coach, provider of luxury leatherware, has been impacted by the recession but it signaled how strong its financial condition is by paying a cash dividend to shareholders on June 29. It’s the first dividend in its history. The company promotes a Global Business Integrity Program, imposing ethical standards on its vendors. China is becoming one of its major markets — and the leader of this push is Andre Cohen, who joined Coach in 2008 after six years at Timberland, a shoe maker widely known for its social responsibility programs.
| The Parnassus Funds | 21 |
Table of Contents
As a shareholder of the funds, you incur ongoing costs, which include portfolio management fees, administrative fees, shareholder reports, and other fund expenses. The funds do not charge transaction fees, so you do not incur transaction costs such as sales charges (loads) on purchase payments, reinvested dividends, or other distributions, redemption fees, and exchange fees. The information on this page is intended to help you understand your ongoing costs of investing in the funds and to compare these costs with the ongoing costs of investing in other mutual funds.
The following example is based on an investment of $1,000 invested at the beginning of the most recent six-month period and held for the period of January 1, 2009 through June 30, 2009.
Actual Expenses
In the example below, the first line for each fund provides information about actual account values and actual expenses. You may use the information in this line, together with the amount you invested, to estimate the expenses that you paid over the period. Simply divide your account value by $1,000 (for example, $8,600 account value divided by $1,000 = 8.6), then multiply the result by the number in the first line under the heading entitled “Expenses Paid During Period” to estimate the expenses you paid on your account during this period.
Hypothetical Example for Comparison Purposes
The second line of each fund provides information about hypothetical account values and hypothetical expenses based on the fund’s expense ratio and an assumed rate of return of 5% per year before expenses, which is not the fund’s actual return. You may compare the ongoing costs of investing in the fund with other mutual funds by comparing this 5% hypothetical example with the 5% hypothetical examples that appear in the shareholder reports of other funds.
The hypothetical account values and expenses may not be used to estimate the actual ending account balance or expenses you paid for the period.
Please note that the expenses shown in the table are meant to highlight only your ongoing costs in these funds. Therefore, the second line of each fund is useful in comparing only ongoing costs and will not help you determine the relative total costs of owning other mutual funds, which may include transactional costs such as loads.
| Beginning Account Value January 1, 2009 | Ending Account Value June 30, 2009 | Expenses Paid During Period* | |||||||
Parnassus Fund: Actual | $ | 1,000.00 | $ | 1,172.11 | $ | 5.33 | |||
Hypothetical (5% before expenses) | $ | 1,000.00 | $ | 1,019.89 | $ | 4.96 | |||
Parnassus Equity Income Fund – Investor Shares: Actual | $ | 1,000.00 | $ | 1,047.91 | $ | 5.03 | |||
Hypothetical (5% before expenses) | $ | 1,000.00 | $ | 1,019.89 | $ | 4.96 | |||
Parnassus Equity Income Fund – Institutional Shares: Actual | $ | 1,000.00 | $ | 1,048.86 | $ | 3.96 | |||
Hypothetical (5% before expenses) | $ | 1,000.00 | $ | 1,020.93 | $ | 3.91 | |||
Parnassus Mid-Cap Fund: Actual | $ | 1,000.00 | $ | 1,090.00 | $ | 6.22 | |||
Hypothetical (5% before expenses) | $ | 1,000.00 | $ | 1,018.84 | $ | 6.01 | |||
Parnassus Small-Cap Fund: Actual | $ | 1,000.00 | $ | 1,155.98 | $ | 6.41 | |||
Hypothetical (5% before expenses) | $ | 1,000.00 | $ | 1,018.84 | $ | 6.01 | |||
Parnassus Workplace Fund: Actual | $ | 1,000.00 | $ | 1,260.23 | $ | 6.72 | |||
Hypothetical (5% before expenses) | $ | 1,000.00 | $ | 1,018.84 | $ | 6.01 | |||
Parnassus Fixed-Income Fund: Actual | $ | 1,000.00 | $ | 1,027.33 | $ | 4.37 | |||
Hypothetical (5% before expenses) | $ | 1,000.00 | $ | 1,020.48 | $ | 4.36 | |||
| * | Expenses are equal to the fund’s annualized expense ratio of 0.99%, 0.99%, 0.78%, 1.20%, 1.20%, 1.20% and 0.87% for the Parnassus Fund, Equity Income Fund – Investor Shares, Equity Income Fund – Institutional Shares, Mid-Cap Fund, Small-Cap Fund, Workplace Fund and Fixed-Income Fund respectively, multiplied by the average account value over the period, multiplied by the ratio of days in the period. The ratio of days in the period is 181/365 (to reflect the one-half year). |
| 22 | The Parnassus Funds |
Table of Contents
Portfolio of Investments as of
June 30, 2009 (unaudited)
Shares | Equities | Percent of Net Assets | Market Value | |||||
| Building Materials | ||||||||
| 25,000 | Simpson Manufacturing Co., Inc. | 0.2 | % | $ | 540,500 | |||
| Computer Peripherals | ||||||||
| 530,000 | Seagate Technology | 2.1 | % | $ | 5,543,800 | |||
| Consulting Services | ||||||||
| 200,000 | Accenture Ltd. | 2.5 | % | $ | 6,692,000 | |||
| Data Processing | ||||||||
| 10,000 | Fiserv Inc.1 | 0.2 | % | $ | 457,000 | |||
| Financial Services | ||||||||
| 400,000 | American Express Co. | $ | 9,296,000 | |||||
| 25,000 | Charles Schwab Corp. | 438,500 | ||||||
| 450,000 | First Horizon National Corp.1 | 5,400,000 | ||||||
| 70,000 | Goldman Sachs Group Inc. | 10,320,800 | ||||||
| 15,000 | JPMorgan Chase & Co. | 511,650 | ||||||
| 67,604 | Paychex Inc. | 1,703,620 | ||||||
| 320,000 | TCF Financial Corp. | 4,278,400 | ||||||
| 470,000 | Wells Fargo & Co. | 11,402,200 | ||||||
| 16.4 | % | $ | 43,351,170 | |||||
Food Products | ||||||||
| 40,000 | Sysco Corp. | 0.3 | % | $ | 899,200 | |||
Home Builders | ||||||||
| 1,080,000 | DR Horton Inc. | $ | 10,108,800 | |||||
| 510,000 | KB Home | 6,976,800 | ||||||
| 940,000 | Pulte Homes Inc.1 | 8,300,200 | ||||||
| 360,000 | Toll Brothers Inc.1 | 6,109,200 | ||||||
| 11.9 | % | $ | 31,495,000 | |||||
Home Products | ||||||||
| 60,000 | WD-40 Co. | 0.7 | % | $ | 1,740,000 | |||
Industrial Manufacturing | ||||||||
| 210,000 | Teleflex Inc. | 3.6 | % | $ | 9,414,300 | |||
Insurance | ||||||||
| 205,000 | Tower Group Inc. | 1.9 | % | $ | 5,079,900 | |||
Internet | ||||||||
| 30,000 | eBay Inc.1 | $ | 513,900 | |||||
| 28,000 | Google Inc.1 | 11,804,520 | ||||||
| 360,000 | Yahoo! Inc.1 | 5,637,600 | ||||||
| 6.8 | % | $ | 17,956,020 | |||||
Networking Products | ||||||||
| 355,000 | Cisco Systems Inc.1 | 2.5 | % | $ | 6,617,200 | |||
Oil & Gas | ||||||||
| 450,000 | Valero Energy Corp. | $ | 7,600,500 | |||||
| 470,000 | W&T Offshore Inc. | 4,577,800 | ||||||
| 4.6 | % | $ | 12,178,300 | |||||
Real Estate Investment Trusts | ||||||||
| 380,000 | ProLogis | 1.2 | % | $ | 3,062,800 | |||
Retail | ||||||||
| 440,000 | Lowe’s Cos., Inc. | $ | 8,540,400 | |||||
| 270,000 | Target Corp. | 10,656,900 | ||||||
| 100,000 | Walgreen Co. | 2,940,000 | ||||||
| 135,000 | Whole Foods Market Inc.1 | 2,562,300 | ||||||
| 9.4 | % | $ | 24,699,600 | |||||
Semiconductor Capital Equipment | ||||||||
| 955,000 | Applied Materials Inc. | $ | 10,476,350 | |||||
| 230,000 | Cognex Corp. | 3,249,900 | ||||||
| 110,000 | Cymer Inc.1 | 3,270,300 | ||||||
| 260,000 | Lam Research Corp.1 | 6,760,000 | ||||||
| 9.0 | % | $ | 23,756,550 | |||||
Semiconductors | ||||||||
| 470,000 | Altera Corp. | $ | 7,651,600 | |||||
| 530,000 | Intel Corp. | 8,771,500 | ||||||
| 490,000 | Texas Instruments Inc. | 10,437,000 | ||||||
| 10.2 | % | $ | 26,860,100 | |||||
Software | ||||||||
| 25,000 | Adobe Systems Inc.1 | $ | 707,500 | |||||
| 320,000 | Autodesk Inc.1 | 6,073,600 | ||||||
| 120,000 | Citrix Systems Inc.1 | 3,826,800 | ||||||
| 90,000 | Microsoft Corp. | 2,139,300 | ||||||
| 30,000 | Symantec Corp.1 | 466,800 | ||||||
| 5.0 | % | $ | 13,214,000 | |||||
Telecommunications Equipment | ||||||||
| 660,000 | Ciena Corp.1 | $ | 6,831,000 | |||||
| 705,000 | Corning Inc. | 11,322,300 | ||||||
| 1,300,000 | Powerwave Technologies Inc.1 | 2,093,000 | ||||||
| 7.7 | % | $ | 20,246,300 | |||||
Utilities | ||||||||
| 30,000 | AGL Resources Inc. | 0.4 | % | $ | 954,000 | |||
Waste Management | ||||||||
| 190,000 | Waste Management Inc. | 2.0 | % | $ | 5,350,400 | |||
Total investment in equities | ||||||||
| (cost $303,997,878) | 98.6 | % | $ | 260,108,140 | ||||
| The accompanying notes are an integral part of these financial statements. | 23 |
Table of Contents
Portfolio of Investments as of
June 30, 2009 (unaudited) continued
Principal Amount $ | Short-Term Securities | Percent of Net Assets | Market Value | ||||||
| Certificates of Deposit 2 | |||||||||
| 100,000 | Albina Community Bank | ||||||||
| 2.23%, matures 01/24/2010 | $ | 97,732 | |||||||
| 100,000 | Carver Federal Savings Bank | ||||||||
| 2.25%, matures 02/04/2010 | 97,611 | ||||||||
| 100,000 | Community Bank of the Bay | ||||||||
| 2.27%, matures 09/06/2009 | 99,267 | ||||||||
| 100,000 | Latino Community Credit Union | ||||||||
| 2.75%, matures 02/20/2010 | 97,436 | ||||||||
| 100,000 | Louisville Community Development Bank | ||||||||
| 1.25%, matures 05/10/2010 | 96,570 | ||||||||
| 100,000 | Opportunities Credit Union | ||||||||
| 1.00%, matures 04/25/2010 | 96,734 | ||||||||
| 100,000 | Self-Help Credit Union | ||||||||
| 3.05%, matures 01/14/2010 | 97,841 | ||||||||
| 100,000 | Southern Bancorp | ||||||||
| 1.85%, matures 01/12/2010 | 97,863 | ||||||||
| 100,000 | Wainwright Bank & Trust Co. | ||||||||
| 2.23%, matures 01/30/2010 | 97,666 | ||||||||
| 0.3 | % | $ | 878,720 | ||||||
Community Development Loans2 | |||||||||
| 100,000 | Boston Community Loan Fund | ||||||||
| 1.00%, matures 06/30/2010 | $ | 94,000 | |||||||
| 100,000 | Boston Community Loan Fund | ||||||||
| 1.00%, matures 06/30/2010 | 94,000 | ||||||||
| 200,000 | Root Capital Loan Fund | ||||||||
| 2.00%, matures 03/16/2010 | 191,518 | ||||||||
| 100,000 | Vermont Community Loan Fund | ||||||||
| 3.00%, matures 12/15/2009 | 97,255 | ||||||||
| 0.2 | % | $ | 476,773 | ||||||
Time Deposits | |||||||||
| 2,929,696 | BBH Cash Management Service, Wells Fargo, Grand Cayman, | ||||||||
| 0.09%, due 07/01/2009 | 1.1 | % | $ | 2,929,696 | |||||
Total short-term securities | |||||||||
| (cost $4,285,189) | 1.6 | % | $ | 4,285,189 | |||||
Total securities | |||||||||
| (cost $308,283,067) | 100.2 | % | $ | 264,393,329 | |||||
| Other assets and liabilities – net | -0.2 | % | $ | (388,922 | ) | ||||
Total net assets | 100.0 | % | $ | 264,004,407 | |||||
| 1 | These securities are non-income producing. |
| 2 | Market value adjustments have been applied to these securities to reflect early withdrawal. See Notes to Financial Statements, Section 1. |
Fund holdings will vary over time.
Fund shares are not FDIC insured.
| 24 | The accompanying notes are an integral part of these financial statements. |
Table of Contents
THE PARNASSUS EQUITY INCOME FUND
Portfolio of Investments as of
June 30, 2009 (unaudited)
Shares | Equities | Percent of Net Assets | Market Value | |||||
Chemicals | ||||||||
| 500,000 | Praxair Inc. | 2.1 | % | $ | 35,535,000 | |||
Consulting Services | ||||||||
| 2,265,000 | Accenture Ltd. | 4.5 | % | $ | 75,786,900 | |||
Cosmetics & Personal Care | ||||||||
| 1,575,000 | Procter & Gamble Co. | 4.7 | % | $ | 80,482,500 | |||
Financial Services | ||||||||
| 1,775,000 | Glacier Bancorp Inc. | $ | 26,216,750 | |||||
| 1,900,000 | Paychex Inc. | 47,880,000 | ||||||
| 2,675,000 | TCF Financial Corp. | 35,764,750 | ||||||
| 6.4 | % | $ | 109,861,500 | |||||
Food Products | ||||||||
| 1,450,050 | McCormick & Co. | $ | 47,170,126 | |||||
| 3,275,000 | Sysco Corp. | 73,622,000 | ||||||
| 7.1 | % | $ | 120,792,126 | |||||
Healthcare Products | ||||||||
| 528,888 | Alcon Inc. | $ | 61,414,475 | |||||
| 1,500,000 | Johnson & Johnson | 85,200,000 | ||||||
| 1,250,000 | Medtronic Inc. | 43,612,500 | ||||||
| 11.2 | % | $ | 190,226,975 | |||||
Healthcare Services | ||||||||
| 600,000 | Cardinal Health Inc. | $ | 18,330,000 | |||||
| 700,100 | Laboratory Corp.1 | 47,459,779 | ||||||
| 3.9 | % | $ | 65,789,779 | |||||
Home Products | ||||||||
| 934,104 | WD-40 Co. | 1.6 | % | $ | 27,089,016 | |||
Industrial Manufacturing | ||||||||
| 615,010 | 3M Co. | $ | 36,962,101 | |||||
| 950,000 | Cooper Industries Ltd. | 29,497,500 | ||||||
| 300,000 | Danaher Corp. | 18,522,000 | ||||||
| 600,000 | Pentair Inc. | 15,372,000 | ||||||
| 1,675,800 | Teleflex Inc. | 75,126,114 | ||||||
| 10.3 | % | $ | 175,479,715 | |||||
Insurance | ||||||||
| 1,055,000 | AFLAC Inc. | 1.9 | % | $ | 32,799,950 | |||
Internet | ||||||||
| 75,000 | Google Inc.1 | 1.9 | % | $ | 31,619,250 | |||
Machinery | ||||||||
| 623,900 | IDEX Corp. | 0.9 | % | $ | 15,329,223 | |||
Medical Equipment | ||||||||
| 520,000 | C. R. Bard Inc. | 2.3 | % | $ | 38,714,000 | |||
Natural Gas | ||||||||
| 2,768,000 | Energen Corp. | $ | 110,443,200 | |||||
| 2,936,300 | MDU Resources Group Inc. | 55,701,611 | ||||||
| 9.7 | % | $ | 166,144,811 | |||||
Oil & Gas | ||||||||
| 875,000 | Valero Energy Corp. | $ | 14,778,750 | |||||
| 3,125,100 | W&T Offshore Inc. | 30,438,474 | ||||||
| 2.6 | % | $ | 45,217,224 | |||||
Pharmaceuticals | ||||||||
| 400,000 | Novartis AG (ADR) | $ | 16,316,000 | |||||
| 300,000 | Teva Pharmaceutical Industries Ltd. (ADR) | 14,802,000 | ||||||
| 1.8 | % | $ | 31,118,000 | |||||
Real Estate Investment Trusts | ||||||||
| 3,900,000 | ProLogis | 1.8 | % | $ | 31,434,000 | |||
Semiconductor Capital Equipment | ||||||||
| 2,250,000 | Applied Materials Inc. | 1.4 | % | $ | 24,682,500 | |||
Semiconductors | ||||||||
| 195,500 | Microchip Technology Inc. | 0.3 | % | $ | 4,408,525 | |||
Software | ||||||||
| 5,000,000 | Microsoft Corp. | 7.0 | % | $ | 118,850,000 | |||
Transportation | ||||||||
| 500,000 | Burlington Northern Santa Fe Corp. | 2.2 | % | $ | 36,770,000 | |||
Utilities | ||||||||
| 1,275,000 | AGL Resources Inc. | $ | 40,545,000 | |||||
| 1,600,000 | Black Hills Corp. | 36,784,000 | ||||||
| 500,000 | Northwest Natural Gas Co. | 22,160,000 | ||||||
| 214,742 | Otter Tail Corp. | 4,689,965 | ||||||
| 6.1 | % | $ | 104,178,965 | |||||
Waste Management | ||||||||
| 3,500,000 | Waste Management Inc. | 5.8 | % | $ | 98,560,000 | |||
Total investment in equities | ||||||||
| (cost $1,718,458,236) | 97.5 | % | $ | 1,660,869,959 | ||||
| The accompanying notes are an integral part of these financial statements. | 25 |
Table of Contents
THE PARNASSUS EQUITY INCOME FUND
Portfolio of Investments as of
June 30, 2009 (unaudited) continued
Principal | Community Loans | Percent of Net Assets | Market Value | |||||
| Community Development Loans2 | ||||||||
| 1,000,000 | MicroVest I, LP Note | |||||||
5.88%, matures 10/15/2009 | $ | 985,152 | ||||||
| 500,000 | MicroVest I, LP Note | |||||||
5.88%, matures 03/15/2010 | 478,876 | |||||||
| 1,000,000 | MicroVest I, LP Note | |||||||
5.88%, matures 12/15/2010 | 912,547 | |||||||
| 0.2 | % | $ | 2,376,575 | |||||
Total investment in community loans (cost $2,376,575) | 0.2 | % | $ | 2,376,575 | ||||
Total investments in long-term securities (cost $1,720,834,811) | 97.7 | % | $ | 1,663,246,534 | ||||
Principal | Short-Term Securities | Percent of Net Assets | Market Value | |||||
| Certificates of Deposit 2 | ||||||||
| 100,000 | Community Bank of the Bay | |||||||
| 2.27%, matures 08/24/2009 | 0.0 | % | $ | 99,409 | ||||
| Community Development Loans2 | ||||||||
| 100,000 | Boston Community Loan Fund | |||||||
| 1.00%, matures 06/30/2010 | $ | 94,000 | ||||||
| 200,000 | Root Capital Loan Fund | |||||||
| 2.00%, matures 01/25/2010 | 193,162 | |||||||
| 100,000 | Vermont Community Loan Fund | |||||||
| 2.00%, matures 04/15/2010 | 95,266 | |||||||
| 0.0 | % | $ | 382,428 | |||||
| Certificate of Deposit Account Registry Service (CDARS) 2 | ||||||||
| 500,000 | CDARS agreement with Community Bank of the Bay, dated 10/23/2008, matures 10/22/2009, 2.27% Participating depository institutions: Chevy Chase Bank, FSB, par 94,500; Flagstar Bank, FSB, par 94,500; Central Bank of Lake of the Ozarks, par 94,500; Banco Popular North America, par 94,500; Citizens National Bank of Elkins, par 27,500; (cost $493,792) | $ | 493,792 | |||||
| 500,000 | CDARS agreement with Community Bank of the Bay, dated 12/11/2008, matures 12/10/2009, 2.03% Participating depository institutions: First Niagara Bank, par 27,500; ShoreBank, par 94,500; Standard Bank & Trust Co., par 94,500; Arvest Bank, par 94,500; TowneBank, par 94,500; BB&T, par 94,500; (cost $491,100) | 491,100 | ||||||
| 26 | The accompanying notes are an integral part of these financial statements. |
Table of Contents
Portfolio of Investments as of
June 30, 2009 (unaudited) continued
Principal Amount $ | Short-Term Securities | Percent of Net Assets | Market Value | ||||||
| 500,000 | CDARS agreement with Community Bank of the Bay, dated 01/29/2009, matures 01/28/2010, 1.64% Participating depository institutions: First Niagara Bank. par 27,500; First Service Bank, par 94,500; Happy State Bank, par 94,500; F&M Bank & Trust Company, par 94,500; The Huntington National Bank, par 94,500; United Bank, par 94,500; (cost $488,407) | $ | 488,407 | ||||||
| 500,000 | CDARS agreement with Community Bank of the Bay, dated 02/12/2009, matures 02/11/2010, 1.64% Participating depository institutions: Bank of Blue Valley, par 94,000; Lorain National Bank, par 30,000; MB Financial Bank, par 94,000; Union Bank, par 94,000; Union Bank & Trust Company, par 94,000; WesBanco Bank, par 94,000; (cost $487,638) | 487,638 | |||||||
| 0.1 | % | $ | 1,960,937 | ||||||
| Time Deposits | |||||||||
| 41,456,615 | BBH Cash Management Service, Wells Fargo, Grand Cayman, 0.09%, due 07/01/2009 | 2.4 | % | $ | 41,456,615 | ||||
Total short-term securities (cost $43,899,389) | 2.5 | % | $ | 43,899,389 | |||||
Total securities (cost $1,764,734,200) | 100.2 | % | $ | 1,707,145,923 | |||||
| Other assets and liabilities – net | -0.2 | % | $ | (4,282,121 | ) | ||||
| Total net assets | 100.0 | % | $ | 1,702,863,802 | |||||
| 1 | These securities are non-income producing. |
| 2 | Market value adjustments have been applied to these securities to reflect early withdrawal. See Notes to Financial Statements, Section 1. |
Fund holdings will vary over time.
Fund shares are not FDIC insured.
| The accompanying notes are an integral part of these financial statements. | 27 |
Table of Contents
Portfolio of Investments as of
June 30, 2009 (unaudited)
Shares | Equities | Percent of Net Assets | Market Value | |||||
| Apparel | ||||||||
| 9,000 | Coach Inc. | 1.9 | % | $ | 241,920 | |||
| Chemicals | ||||||||
| 3,700 | Praxair Inc. | 2.0 | % | $ | 262,959 | |||
| Consulting Services | ||||||||
| 12,500 | Accenture Ltd. | $ | 418,250 | |||||
| 10,000 | Cognizant Technology Solutions Corp.1 | 267,000 | ||||||
| 5.3 | % | $ | 685,250 | |||||
| Data Processing | ||||||||
| 7,000 | Fiserv Inc.1 | $ | 319,900 | |||||
| 13,000 | SEI Investments Co. | 234,520 | ||||||
| 4.3 | % | $ | 554,420 | |||||
| Financial Services | ||||||||
| 6,500 | Charles Schwab Corp. | $ | 114,010 | |||||
| 10,000 | Glacier Bancorp Inc. | 147,700 | ||||||
| 15,000 | Paychex Inc. | 378,000 | ||||||
| 4.9 | % | $ | 639,710 | |||||
| Food Products | ||||||||
| 15,500 | McCormick & Co. | $ | 504,215 | |||||
| 23,000 | Sysco Corp. | 517,040 | ||||||
| 7.9 | % | $ | 1,021,255 | |||||
| Healthcare Products | ||||||||
| 14,000 | DENTSPLY | |||||||
| International Inc. | 3.3 | % | $ | 427,280 | ||||
| Healthcare Services | ||||||||
| 10,000 | Cardinal Health Inc. | $ | 305,500 | |||||
| 7,500 | Laboratory Corp.1 | 508,425 | ||||||
| 6.2 | % | $ | 813,925 | |||||
| Industrial Manufacturing | ||||||||
| 6,000 | Cooper Industries Ltd. | $ | 186,300 | |||||
| 5,100 | Danaher Corp. | 314,874 | ||||||
| 12,000 | Pentair Inc. | 307,440 | ||||||
| 8,000 | Teleflex Inc. | 358,640 | ||||||
| 9.0 | % | $ | 1,167,254 | |||||
| Insurance | ||||||||
| 10,000 | AFLAC Inc. | 2.4 | % | $ | 310,900 | |||
| Medical Equipment | ||||||||
| 7,250 | C. R. Bard Inc. | $ | 539,763 | |||||
| 10,000 | Varian Medical Systems Inc.1 | 351,400 | ||||||
| 6.8 | % | $ | 891,163 | |||||
| Natural Gas | ||||||||
| 7,000 | Energen Corp. | $ | 279,300 | |||||
| 3,800 | EQT Corp. | 132,658 | ||||||
| 29,500 | MDU Resources Group Inc. | 559,615 | ||||||
| 5,000 | XTO Energy Inc. | 190,700 | ||||||
| 9.0 | % | $ | 1,162,273 | |||||
| Oil & Gas | ||||||||
| 10,000 | Sunoco Inc. | $ | 232,000 | |||||
| 3,000 | Transocean Ltd.1 | 222,870 | ||||||
| 3.5 | % | $ | 454,870 | |||||
| Real Estate Investment Trusts | ||||||||
| 50,000 | ProLogis | 3.1 | % | $ | 403,000 | |||
| Retail | ||||||||
| 9,000 | Nordstrom Inc. | 1.4 | % | $ | 179,010 | |||
| Semiconductor Capital Equipment | ||||||||
| 34,000 | Applied Materials Inc. | 2.9 | % | $ | 372,980 | |||
| Semiconductors | ||||||||
| 11,000 | Microchip Technology Inc. | 1.9 | % | $ | 248,050 | |||
| Services | ||||||||
| 7,000 | Ecolab Inc. | 2.1 | % | $ | 272,930 | |||
| Software | ||||||||
| 10,600 | Adobe Systems Inc.1 | $ | 299,980 | |||||
| 8,500 | Autodesk Inc.1 | 161,330 | ||||||
| 9,600 | Check Point Software Technologies Ltd.1 | 225,313 | ||||||
| 13,150 | Citrix Systems Inc.1 | 419,353 | ||||||
| 7,500 | Intuit Inc.1 | 211,200 | ||||||
| 2,700 | McAfee Inc.1 | 113,913 | ||||||
| 18,500 | Symantec Corp.1 | 287,860 | ||||||
| 13.2 | % | $ | 1,718,949 | |||||
| Transportation | ||||||||
| 3,500 | Burlington Northern Santa Fe Corp. | 2.0 | % | $ | 257,390 | |||
| Waste Management | ||||||||
| 22,500 | Waste Management Inc. | 4.9 | % | $ | 633,600 | |||
Total investment in equities (cost $12,600,891) | 98.0 | % | $ | 12,719,088 | ||||
| 28 | The accompanying notes are an integral part of these financial statements. |
Table of Contents
Portfolio of Investments as of
June 30, 2009 (unaudited) continued
Principal | Short-Term Securities | Percent of Net Assets | Market Value | ||||||
| Time Deposits | |||||||||
| 347,961 | BBH Cash Management Service, Citibank, Nassau, | ||||||||
| 0.09%, due 07/01/2009 | 2.7 | % | $ | 347,961 | |||||
Total short-term securities (cost $347,961) | 2.7 | % | $ | 347,961 | �� | ||||
Total securities (cost $12,948,852) | 100.7 | % | $ | 13,067,049 | |||||
| Other assets and liabilities – net | -0.7 | % | $ | (85,204 | ) | ||||
| Total net assets | 100.0 | % | $ | 12,981,845 | |||||
| 1 | These securities are non-income producing. |
Fund holdings will vary over time.
Fund shares are not FDIC insured.
| The accompanying notes are an integral part of these financial statements. | 29 |
Table of Contents
THE PARNASSUS SMALL - CAP FUND
Portfolio of Investments as of
June 30, 2009 (unaudited)
Shares | Equities | Percent of Net Assets | Market Value | |||||
| Building Materials | ||||||||
| 40,000 | Simpson Manufacturing Co., Inc. | 1.5 | % | $ | 864,800 | |||
| Chemicals | ||||||||
| 40,000 | Terra Industries Inc. | 1.7 | % | $ | 968,800 | |||
| Data Processing | ||||||||
| 57,000 | Jack Henry & Associates Inc. | $ | 1,182,750 | |||||
| 75,000 | SEI Investments Co. | 1,353,000 | ||||||
| 4.5 | % | $ | 2,535,750 | |||||
| Electric Motors | ||||||||
| 40,200 | Baldor Electric Co. | 1.7 | % | $ | 956,358 | |||
| Financial Services | ||||||||
| 105,000 | First Horizon National Corp.1 | $ | 1,260,000 | |||||
| 45,000 | Glacier Bancorp Inc. | 664,650 | ||||||
| 160,000 | TCF Financial Corp. | 2,139,200 | ||||||
| 7.3 | % | $ | 4,063,850 | |||||
| Home Builders | ||||||||
| 155,000 | DR Horton Inc. | $ | 1,450,800 | |||||
| 155,000 | KB Home | 2,120,400 | ||||||
| 250,000 | Pulte Homes Inc.1 | 2,207,500 | ||||||
| 83,000 | Toll Brothers Inc.1 | 1,408,510 | ||||||
| 12.8 | % | $ | 7,187,210 | |||||
| Home Products | ||||||||
| 16,000 | WD-40 Co. | 0.8 | % | $ | 464,000 | |||
| Industrial Manufacturing | ||||||||
| 58,000 | Teleflex Inc. | 4.6 | % | $ | 2,600,140 | |||
| Machinery | ||||||||
| 90,000 | Graco Inc. | $ | 1,981,800 | |||||
| 47,000 | IDEX Corp. | 1,154,790 | ||||||
| 65,000 | Nordson Corp. | 2,512,900 | ||||||
| 10.1 | % | $ | 5,649,490 | |||||
| Natural Gas | ||||||||
| 40,000 | Energen Corp. | $ | 1,596,000 | |||||
| 100,000 | Quicksilver Resources Inc.1 | 929,000 | ||||||
| 4.5 | % | $ | 2,525,000 | |||||
| �� | ||||||||
| Networking Products | ||||||||
| 20,000 | Starent Networks Corp.1 | 0.9 | % | $ | 488,200 | |||
| Oil & Gas | ||||||||
| 75,000 | Mariner Energy Inc.1 | $ | 881,250 | |||||
| 110,000 | Mitcham Industries Inc.1 | 570,900 | ||||||
| 230,000 | W&T Offshore Inc. | 2,240,200 | ||||||
| 6.6 | % | $ | 3,692,350 | |||||
| Professional Services | ||||||||
| 86,900 | Administaff Inc. | 3.6 | % | $ | 2,022,163 | |||
| Real Estate Investment Trusts | ||||||||
| 160,000 | ProLogis | 2.3 | % | $ | 1,289,600 | |||
| Retail | ||||||||
| 80,000 | Whole Foods Market Inc.1 | 2.7 | % | $ | 1,518,400 | |||
| Semiconductor Capital Equipment | ||||||||
| 125,000 | Cognex Corp. | $ | 1,766,250 | |||||
| 52,000 | Cymer Inc.1 | 1,545,960 | ||||||
| 75,000 | Electro Scientific Industries Inc.1 | 838,500 | ||||||
| 29,000 | Lam Research Corp.1 | 754,000 | ||||||
| 8.7 | % | $ | 4,904,710 | |||||
| Semiconductors | ||||||||
| 60,000 | O2Micro International Ltd. (ADR) 1 | 0.5 | % | $ | 300,000 | |||
| Software | ||||||||
| 8,000 | Informatica Corp.1 | $ | 137,520 | |||||
| 360,000 | Mentor Graphics Corp.1 | 1,969,200 | ||||||
| 62,000 | Websense Inc.1 | 1,106,080 | ||||||
| 5.7 | % | $ | 3,212,800 | |||||
| Telecommunications Equipment | ||||||||
| 195,000 | Ciena Corp.1 | $ | 2,018,250 | |||||
| 125,000 | Harmonic Inc.1 | 736,250 | ||||||
| 190,000 | Powerwave Technologies Inc.1 | 305,900 | ||||||
| 20,000 | Tellabs Inc.1 | 114,600 | ||||||
| 5.7 | % | $ | 3,175,000 | |||||
| Utilities | ||||||||
| 32,000 | AGL Resources Inc. | $ | 1,017,600 | |||||
| 75,000 | Black Hills Corp. | 1,724,250 | ||||||
| 55,000 | Ormat Technologies Inc. | 2,217,050 | ||||||
| 40,000 | Otter Tail Corp. | 873,600 | ||||||
| 10.4 | % | $ | 5,832,500 | |||||
Total investment in equities (cost $58,886,232) | 96.6 | % | $ | 54,251,121 | ||||
| 30 | The accompanying notes are an integral part of these financial statements. |
Table of Contents
Portfolio of Investments as of
June 30, 2009 (unaudited) continued
Principal | Short-Term Securities | Percent of Net Assets | Market Value | ||||||
| Time Deposits | |||||||||
| 2,038,769 | BBH Cash Management Service, Wells Fargo, Grand Cayman, | ||||||||
| 0.09%, due 07/01/2009 | 3.6 | % | $ | 2,038,769 | |||||
Total short-term securities (cost $2,038,769) | 3.6 | % | $ | 2,038,769 | |||||
Total securities (cost $60,925,001) | 100.2 | % | $ | 56,289,890 | |||||
| Other assets and liabilities – net | -0.2 | % | $ | (123,736 | ) | ||||
| Total net assets | 100.0 | % | $ | 56,166,154 | |||||
| 1 | These securities are non-income producing. |
Fund holdings will vary over time.
Fund shares are not FDIC insured.
| The accompanying notes are an integral part of these financial statements. | 31 |
Table of Contents
Portfolio of Investments as of
June 30, 2009 (unaudited)
Shares | Equities | Percent of Net Assets | Market Value | |||||
| Building Materials | ||||||||
| 35,000 | Simpson Manufacturing Co., Inc. | 2.2 | % | $ | 756,700 | |||
| Computer Peripherals | ||||||||
| 60,000 | Seagate Technology | 1.8 | % | $ | 627,600 | |||
| Consulting Services | ||||||||
| 30,000 | Accenture Ltd. | 2.9 | % | $ | 1,003,800 | |||
| Data Processing | ||||||||
| 55,000 | SEI Investments Co. | 2.9 | % | $ | 992,200 | |||
| Electric Motors | ||||||||
| 10,000 | Baldor Electric Co. | 0.7 | % | $ | 237,900 | |||
| Financial Services | ||||||||
| 30,000 | American Express Co. | $ | 697,200 | |||||
| 8,000 | Charles Schwab Corp. | 140,320 | ||||||
| 58,000 | First Horizon National Corp.1 | 696,000 | ||||||
| 4,000 | Goldman Sachs Group Inc. | 589,760 | ||||||
| 50,000 | Paychex Inc. | 1,260,000 | ||||||
| 105,000 | TCF Financial Corp. | 1,403,850 | ||||||
| 39,000 | Wells Fargo & Co. | 946,140 | ||||||
| 16.7 | % | $ | 5,733,270 | |||||
| Home Products | ||||||||
| 4,000 | WD-40 Co. | 0.3 | % | $ | 116,000 | |||
| Industrial Manufacturing | ||||||||
| 7,000 | 3M Co. | 1.2 | % | $ | 420,700 | |||
| Insurance | ||||||||
| 12,000 | AFLAC Inc. | 1.1 | % | $ | 373,080 | |||
| Internet | ||||||||
| 16,000 | eBay Inc.1 | $ | 274,080 | |||||
| 2,100 | Google Inc.1 | 885,339 | ||||||
| 65,000 | Yahoo! Inc.1 | 1,017,900 | ||||||
| 6.4 | % | $ | 2,177,319 | |||||
| Machinery | ||||||||
| 42,000 | Graco Inc. | $ | 924,840 | |||||
| 26,000 | Nordson Corp. | 1,005,160 | ||||||
| 5.6 | % | $ | 1,930,000 | |||||
| Networking Products | ||||||||
| 50,000 | Cisco Systems Inc.1 | 2.7 | % | $ | 932,000 | |||
| Office Equipment | ||||||||
| 7,000 | Canon Inc. (ADR) | 0.7 | % | $ | 227,710 | |||
| Oil & Gas | ||||||||
| 66,000 | Valero Energy Corp. | 3.3 | % | $ | 1,114,740 | |||
| Pharmaceuticals | ||||||||
| 12,000 | Novartis AG (ADR) | 1.4 | % | $ | 489,480 | |||
| Retail | ||||||||
| 21,000 | Costco Wholesale Corp. | $ | 959,700 | |||||
| 11,000 | Nordstrom Inc. | 218,790 | ||||||
| 36,000 | Target Corp. | 1,420,920 | ||||||
| 9,000 | Walgreen Co. | 264,600 | ||||||
| 23,000 | Whole Foods Market Inc.1 | 436,540 | ||||||
| 9.6 | % | $ | 3,300,550 | |||||
| Semiconductor Capital Equipment | ||||||||
| 123,000 | Applied Materials Inc. | 3.9 | % | $ | 1,349,310 | |||
| Semiconductors | ||||||||
| 92,000 | Altera Corp. | $ | 1,497,760 | |||||
| 22,000 | Intel Corp. | 364,100 | ||||||
| 55,000 | Texas Instruments Inc. | 1,171,500 | ||||||
| 8.9 | % | $ | 3,033,360 | |||||
| Services | ||||||||
| 500 | Ecolab Inc. | 0.1 | % | $ | 19,495 | |||
| Software | ||||||||
| 23,000 | Adobe Systems Inc.1 | $ | 650,900 | |||||
| 52,000 | Autodesk Inc.1 | 986,960 | ||||||
| 17,000 | Citrix Systems Inc.1 | 542,130 | ||||||
| 8,000 | Intuit Inc.1 | 225,280 | ||||||
| 45,000 | Microsoft Corp. | 1,069,650 | ||||||
| 500 | Salesforce.com Inc.1 | 19,085 | ||||||
| 55,000 | Symantec Corp.1 | 855,800 | ||||||
| 12.7 | % | $ | 4,349,805 | |||||
| Telecommunications Equipment | ||||||||
| 100,000 | Corning Inc. | 4.7 | % | $ | 1,606,000 | |||
| Transportation | ||||||||
| 2,000 | FedEx Corp. | 0.3 | % | $ | 111,240 | |||
Total investment in equities (cost $29,822,297) | 90.1 | % | $ | 30,902,259 | ||||
Principal | Short-Term Securities | |||||||
| Time Deposits | ||||||||
| 3,231,862 | BBH Cash Management Service, Wells Fargo, Grand Cayman, | |||||||
| 0.09%, due 07/01/2009 | 9.4 | % | $ | 3,231,862 | ||||
Total short-term securities (cost $3,231,862) | 9.4 | % | $ | 3,231,862 | ||||
Total securities (cost $33,054,159) | 99.5 | % | $ | 34,134,121 | ||||
| Other assets and liabilities – net | 0.5 | % | $ | 147,357 | ||||
| Total net assets | 100.0 | % | $ | 34,281,478 | ||||
| 1 | These securities are non-income producing. |
Fund holdings will vary over time.
Fund shares are not FDIC insured.
| 32 | The accompanying notes are an integral part of these financial statements. |
Table of Contents
THE PARNASSUS FIXED - INCOME FUND
Portfolio of Investments as of
June 30, 2009 (unaudited)
Principal | Convertible Bonds | Percent of Net Assets | Market Value | |||||
| Biotechnology | ||||||||
| 2,000,000 | Millipore Corp. | |||||||
| Notes, 3.75%, due 06/01/2026 | 1.7 | % | $ | 1,975,000 | ||||
| Computer Peripherals | ||||||||
| 4,000,000 | Maxtor Corp. | |||||||
| Notes, 6.80%, due 04/30/2010 | 3.4 | % | $ | 3,980,000 | ||||
| Healthcare Products | ||||||||
| 2,000,000 | Metronic Inc. | |||||||
| Notes, 1.50%, due 04/15/2011 | 1.7 | % | $ | 1,935,000 | ||||
| Healthcare Services | ||||||||
| 4,000,000 | Hologic Inc. | |||||||
| Notes, 2.00%, due 12/15/2037 | 2.5 | % | $ | 2,840,000 | ||||
| Oil & Gas | ||||||||
| 3,000,000 | Transocean Inc. | |||||||
| Notes, 1.63%, due 12/15/2037 | 2.5 | % | $ | 2,835,000 | ||||
| Real Estate Investment Trusts | ||||||||
| 2,500,000 | Prologis | |||||||
| Notes, 1.88%, due 11/15/2037 | $ | 1,853,125 | ||||||
| 3,000,000 | SL Green Realty | |||||||
| Notes, 4.00%, due 06/15/2025 | 2,868,750 | |||||||
| 4.0 | % | $ | 4,721,875 | |||||
| Semiconductors | ||||||||
| 1,000,000 | Intel Corp. | |||||||
| Notes, 2.95%, due 12/15/2035 | 0.7 | % | $ | 840,000 | ||||
| Telecommunications Services | ||||||||
| 3,000,000 | Nextel Communications Inc. | |||||||
| Notes, 5.25%, due 01/15/2010 | 2.6 | % | $ | 2,970,000 | ||||
Total investments in convertible bonds (cost $22,133,437) | 19.1 | % | $ | 22,096,875 | ||||
Principal | Convertible Bonds | Percent of Net Assets | Market Value | |||||
| Biotechnology | ||||||||
| 3,000,000 | Genentech Inc. | |||||||
| Notes, 4.75%, due 07/15/2015 | 2.7 | % | $ | 3,099,591 | ||||
| Chemicals | ||||||||
| 1,875,000 | Praxair Inc. | |||||||
| Notes, 4.38%, due 03/31/2014 | 1.7 | % | $ | 1,941,343 | ||||
| Computers | ||||||||
| 2,000,000 | International Business Machines Corp. | |||||||
| Notes, 6.50%, due 10/15/2013 | 1.9 | % | $ | 2,235,340 | ||||
| Cosmetics & Personal Care | ||||||||
| 2,000,000 | Procter & Gamble Co. | |||||||
| Notes, 4.95%, due 08/15/2014 | $ | 2,141,140 | ||||||
| 500,000 | Procter & Gamble Co. | |||||||
| Notes, 3.50%, due 02/15/2015 | 504,611 | |||||||
| 2.2 | % | $ | 2,645,751 | |||||
| Financial Services | ||||||||
| 2,000,000 | American Express Co. | |||||||
| Notes, 5.50%, due 09/12/2016 | $ | 1,817,644 | ||||||
| 2,000,000 | Charles Schwab Corp. | |||||||
| Notes, 8.05%, due 03/01/2010 | 2,063,736 | |||||||
| 2,000,000 | Charles Schwab Corp. | |||||||
| Notes, 4.95%, due 06/01/2014 | 2,034,350 | |||||||
| 1,500,000 | Goldman Sachs Inc. | |||||||
| Notes, 5.75%, due 10/01/2016 | 1,468,727 | |||||||
| 1,000,000 | Goldman Sachs Inc. | |||||||
| Notes, 5.63%, due 01/15/2017 | 950,413 | |||||||
| 2,000,000 | JPMorgan Chase & Co. | |||||||
| Notes, 2.63%, due 12/01/2010 | 2,048,520 | |||||||
| 2,000,000 | Merrill Lynch & Co., Inc. | |||||||
| Notes, 6.50%, due 07/15/2018 | 1,801,614 | |||||||
| 2,000,000 | Wells Fargo & Co. | |||||||
| Notes, 3.00%, due 12/09/2011 | 2,066,680 | |||||||
| 2,000,000 | Wells Fargo & Co. | |||||||
| Notes, 5.13%, due 09/15/2016 | 1,897,732 | |||||||
| 500,000 | Wells Fargo Financial Inc. | |||||||
| Notes, 6.85%, due 07/15/2009 | 500,236 | |||||||
| 14.4 | % | $ | 16,649,652 | |||||
| The accompanying notes are an integral part of these financial statements. | 33 |
Table of Contents
THE PARNASSUS FIXED - INCOME FUND
Portfolio of Investments as of
June 30, 2009 (unaudited) continued
Principal | Corporate Bonds | Percent of Net Assets | Market Value | |||||
| Insurance | ||||||||
| 1,645,000 | AFLAC Inc. | |||||||
| Notes, 8.50%, due 5/15/2019 | 1.5 | % | $ | 1,757,739 | ||||
| Networking Products | ||||||||
| 2,800,000 | Cisco Systems Inc. | |||||||
| Notes, 5.50%, due 02/22/2016 | 2.6 | % | $ | 2,966,295 | ||||
| Oil & Gas | ||||||||
| 2,000,000 | Valero Energy Corp. | |||||||
| Notes, 9.38%, due 03/15/2019 | 2.0 | % | $ | 2,278,028 | ||||
| Retail | ||||||||
| 400,000 | Target Corp. | |||||||
| Notes, 7.50%, due 08/15/2010 | $ | 423,815 | ||||||
| 1,493,000 | Target Corp. | |||||||
| Notes, 5.13%, due 01/15/2013 | 1,581,469 | |||||||
| 1.7 | % | $ | 2,005,284 | |||||
| Telecommunications Services | ||||||||
| 1,000,000 | Verizon Communications Inc. | |||||||
| Notes, 5.55%, due 02/15/2016 | 0.9 | % | $ | 1,035,063 | ||||
| Transportation | ||||||||
| 2,000,000 | Burlington Northern Santa Fe Corp. | |||||||
| Notes, 5.65%, due 05/01/2017 | 1.8 | % | $ | 2,041,300 | ||||
| Waste Management | ||||||||
| 3,000,000 | Waste Management Inc. | |||||||
| Notes, 6.38%, due 03/11/2015 | 2.7 | % | $ | 3,108,129 | ||||
Total investments in corporate bonds (cost $41,256,302) | 36.1 | % | $ | 41,763,515 | ||||
| Natural Gas | ||||||||
| 30,000 | ONEOK Inc. | 0.8 | % | $ | 884,700 | |||
Total investment in equities (cost $759,304) | 0.8 | % | $ | 884,700 | ||||
Principal | Municipal Bonds | |||||||
| General Obligation | ||||||||
| 3,000,000 | State of California | |||||||
| 5.65%, due 04/01/2039 | 2.6 | % | $ | 2,953,230 | ||||
Total investment in municipal bonds (cost $2,964,690) | 2.6 | % | $ | 2,953,230 | ||||
Principal | U.S. Government Agency Bonds | |||||||
| 2,000,000 | Fannie Mae | |||||||
| 5.00%, due 03/02/2015 | $ | 2,164,264 | ||||||
| 3,000,000 | Federal Farm Credit Bank | |||||||
| 5.41%, due 11/07/2016 | 3,171,465 | |||||||
| 3,000,000 | Federal Home Loan Bank System | |||||||
| 2.88%, due 03/11/2011 | 3,088,626 | |||||||
| 1,500,000 | Federal Home Loan Bank System | |||||||
| 5.00%, due 09/14/2012 | 1,630,434 | |||||||
| 2,000,000 | Federal Home Loan Bank System | |||||||
| 5.25%, due 09/13/2013 | 2,200,959 | |||||||
| 1,500,000 | Federal Home Loan Bank System | |||||||
| 5.25%, due 09/12/2014 | 1,661,655 | |||||||
| 2,000,000 | Federal Home Loan Bank System | |||||||
| 5.50%, due 11/17/2016 | 2,131,738 | |||||||
| 1,500,000 | Federal Home Loan Bank System | |||||||
| 5.13%, due 03/10/2017 | 1,619,242 | |||||||
| 3,000,000 | Freddie Mac | |||||||
| 4.00%, due 06/12/2013 | 3,135,843 | |||||||
| 2,000,000 | Freddie Mac | |||||||
| 5.05%, due 01/26/2015 | 2,191,548 | |||||||
| 2,000,000 | Freddie Mac | |||||||
| 5.50%, due 08/23/2017 | 2,249,624 | |||||||
| 2,000,000 | Private Export Funding | |||||||
| 4.38%, due 03/15/2019 | 1,998,694 | |||||||
| 23.6 | % | $ | 27,244,092 | |||||
Total investments in U.S. government agency bonds (cost $26,475,452) | 23.6 | % | $ | 27,244,092 | ||||
| 34 | The accompanying notes are an integral part of these financial statements. |
Table of Contents
Portfolio of Investments as of
June 30, 2009 (unaudited) continued
Principal | U.S. Government Treasury Bonds | Percent of Net Assets | Market Value | ||||||
| 2,000,000 | U.S. Treasury | ||||||||
| 2.00%, due 09/30/2010 | $ | 2,034,454 | |||||||
| 1,000,000 | U.S. Treasury | ||||||||
| 1.25%, due 11/30/2010 | 1,007,380 | ||||||||
| 4,000,000 | U.S. Treasury | ||||||||
| 4.50%, due 02/28/2011 | 4,240,468 | ||||||||
| 2,000,000 | U.S. Treasury | ||||||||
| 3.13%, due 09/30/2013 | 2,069,062 | ||||||||
| 2,000,000 | U.S. Treasury | ||||||||
| 3.75%, due 11/15/2018 | 2,034,540 | ||||||||
| 2,321,860 | U.S. Treasury (TIPS) | ||||||||
| 1.88%, due 07/15/2013 | 2,381,358 | ||||||||
| 1,017,780 | U.S. Treasury (TIPS) | ||||||||
| 1.63%, due 01/15/2018 | 1,007,919 | ||||||||
| 2,035,560 | U.S. Treasury (TIPS) | ||||||||
| 1.75%, due 01/15/2028 | 1,921,060 | ||||||||
| 14.4 | % | $ | 16,696,241 | ||||||
Total investments in U.S. government treasury bonds (cost $16,627,738) | 14.4 | % | $ | 16,696,241 | |||||
Total investment in long-term securities (cost $110,216,923) | 96.6 | % | $ | 111,638,653 | |||||
Principal | Short-Term Securities | Percent of Net Assets | Market Value | ||||||
| Community Development Loans2 | |||||||||
| 100,000 | MicroVest I, LP Note | ||||||||
| 4.00%, due 01/15/2010 | 0.1 | % | $ | 96,745 | |||||
| Time Deposits | |||||||||
| 4,596,236 | BBH Cash Management Service, Wells Fargo, Grand Cayman, | ||||||||
| 0.09%, due 07/01/2009 | 3.9 | % | $ | 4,596,236 | |||||
Total short-term securities (cost $4,692,981) | 4.0 | % | $ | 4,692,981 | |||||
Total securities (cost $114,909,904) | 100.6 | % | $ | 116,331,634 | |||||
| Other assets and liabilities – net | -0.6 | % | (662,001 | ) | |||||
| Total net assets | 100.0 | % | $ | 115,669,633 | |||||
| 2 | Market value adjustments have been applied to these securities to reflect early withdrawal. See Notes to Financial Statements, Section 1. |
Fund holdings will vary over time.
Fund shares are not FDIC insured.
| The accompanying notes are an integral part of these financial statements. | 35 |
Table of Contents
Statement of Assets and Liabilities
June 30, 2009 (unaudited)
| Parnassus Fund | Parnassus Equity Income Fund | Parnassus Mid-Cap Fund | ||||||||||
Assets | ||||||||||||
Investments in equities and bonds, at market value (cost $303,997,878, $1,720,834,811, $12,600,891) | $ | 260,108,140 | $ | 1,663,246,534 | $ | 12,719,088 | ||||||
Investments in short-term securities | 4,285,189 | 43,899,389 | 347,961 | |||||||||
Cash | 165,502 | 530,577 | 11,416 | |||||||||
Receivables | ||||||||||||
Investment securities sold | — | — | — | |||||||||
Dividends and interest | 122,134 | 1,800,213 | 16,350 | |||||||||
Capital shares sold | 433,940 | 3,416,330 | 71,381 | |||||||||
Due from Parnassus Investments | 57,570 | 7,784 | 53 | |||||||||
Other assets | 56,716 | 150,283 | 27,146 | |||||||||
Total assets | $ | 265,229,191 | $ | 1,713,051,110 | $ | 13,193,395 | ||||||
Liabilities | ||||||||||||
Payable for investment securities purchased | 1,045,949 | 7,469,333 | 192,050 | |||||||||
Capital shares redeemed | 63,354 | 2,100,639 | 12,281 | |||||||||
Fees payable to Parnassus Investments | — | — | — | |||||||||
Distributions payable | — | 281,553 | — | |||||||||
Accounts payable and accrued expenses | 115,481 | 335,783 | 7,219 | |||||||||
Total liabilities | $ | 1,224,784 | $ | 10,187,308 | $ | 211,550 | ||||||
Net assets | $ | 264,004,407 | $ | 1,702,863,802 | $ | 12,981,845 | ||||||
Net assets consists of | ||||||||||||
Undistributed net investment income (loss) | 663,368 | 671,135 | 45,611 | |||||||||
Unrealized appreciation (depreciation) on securities | (43,889,738 | ) | (57,588,277 | ) | 118,197 | |||||||
Accumulated net realized gain (loss) | (8,890,724 | ) | (145,290,307 | ) | (1,133,837 | ) | ||||||
Capital paid-in | 316,121,501 | 1,905,071,251 | 13,951,874 | |||||||||
Total net assets | $ | 264,004,407 | $ | 1,702,863,802 | $ | 12,981,845 | ||||||
Net asset value and offering per share | ||||||||||||
Shares outstanding investor class | 9,547,603 | 77,437,538 | 992,336 | |||||||||
Shares outstanding institutional class | — | 7,531,812 | — | |||||||||
Net asset value and redemption price per share | ||||||||||||
Investor class | $ | 27.65 | $ | 20.04 | $ | 13.08 | ||||||
Institutional class | — | $ | 20.09 | — | ||||||||
| 36 | The accompanying notes are an integral part of these financial statements. |
Table of Contents
THE PARNASSUS FUNDS
Statement of Assets and Liabilities
June 30, 2009 (unaudited)
| Parnassus Small-Cap Fund | Parnassus Workplace Fund | Parnassus Fixed-Income Fund | ||||||||||
Assets | ||||||||||||
Investments in equities and bonds, at market value (cost $58,886,232, $29,822,297, $110,216,923) | $ | 54,251,121 | $ | 30,902,259 | $ | 111,638,653 | ||||||
Investments in short-term securities | 2,038,769 | 3,231,862 | 4,692,981 | |||||||||
Cash | 28,600 | 1,727 | 22,709 | |||||||||
Receivables | ||||||||||||
Investment securities sold | 21,635 | — | — | |||||||||
Dividends and interest | 4,036 | 12,506 | 1,326,030 | |||||||||
Capital shares sold | 224,142 | 503,228 | 181,938 | |||||||||
Due from Parnassus Investments | 667 | 315 | — | |||||||||
Other assets | 23,913 | 24,491 | 48,987 | |||||||||
Total assets | $ | 56,592,883 | $ | 34,676,388 | $ | 117,911,298 | ||||||
Liabilities | ||||||||||||
Payable for investment securities purchased | 388,365 | 350,321 | 1,976,389 | |||||||||
Capital shares redeemed | 16,298 | 22,912 | 241,993 | |||||||||
Fees payable to Parnassus Investments | — | — | 17 | |||||||||
Distributions payable | — | — | — | |||||||||
Accounts payable and accrued expenses | 22,066 | 21,677 | 23,266 | |||||||||
Total liabilities | $ | 426,729 | $ | 394,910 | $ | 2,241,665 | ||||||
Net assets | $ | 56,166,154 | $ | 34,281,478 | $ | 115,669,633 | ||||||
Net assets consists of | ||||||||||||
Undistributed net investment income (loss) | 99,133 | 44,287 | (1,301 | ) | ||||||||
Unrealized appreciation (depreciation) on securities | (4,635,111 | ) | 1,079,962 | 1,421,730 | ||||||||
Accumulated net realized gain (loss) | (1,922,257 | ) | (220,328 | ) | 1,268,479 | |||||||
Capital paid-in | 62,624,389 | 33,377,557 | 112,980,725 | |||||||||
Total net assets | $ | 56,166,154 | $ | 34,281,478 | $ | 115,669,633 | ||||||
Net asset value and offering per share | ||||||||||||
Shares outstanding investor class | 3,847,822 | 2,226,557 | 7,050,403 | |||||||||
Shares outstanding institutional class | — | — | — | |||||||||
Net asset value and redemption price per share | ||||||||||||
Investor class | $ | 14.60 | $ | 15.40 | $ | 16.41 | ||||||
Institutional class | — | — | — | |||||||||
| The accompanying notes are an integral part of these financial statements. | 37 |
Table of Contents
THE PARNASSUS FUNDS
Statement of Operations
Six Months Ended June 30, 2009 (unaudited)
| Parnassus Fund | Parnassus Equity Income Fund | Parnassus Mid-Cap Fund | ||||||||||
Investment income | ||||||||||||
Dividends | $ | 1,578,154 | $ | 21,275,879 | $ | 95,324 | ||||||
Interest | — | 112,597 | 88 | |||||||||
Other income | 60,376 | — | — | |||||||||
Total investment income | $ | 1,638,530 | $ | 21,388,476 | $ | 95,412 | ||||||
Expenses | ||||||||||||
Investment advisory fees | 679,611 | 5,033,479 | 37,413 | |||||||||
Transfer agent fees | ||||||||||||
Investor shares | 163,538 | 269,570 | 8,150 | |||||||||
Institutional shares | — | 2,074 | — | |||||||||
Fund administration | 61,867 | 485,072 | 2,768 | |||||||||
Service provider fees | 31,166 | 1,233,135 | 8,176 | |||||||||
Reports to shareholders | 41,110 | 309,401 | 5,848 | |||||||||
Registration fees and expenses | 15,533 | 24,102 | 9,954 | |||||||||
Custody fees | 8,651 | 53,048 | 1,435 | |||||||||
Professional fees | 41,453 | 99,427 | 13,539 | |||||||||
Trustee fees and expenses | 5,329 | 46,886 | 203 | |||||||||
Proxy voting fees | 2,579 | 2,579 | 2,579 | |||||||||
Pricing service fees | 1,768 | 2,630 | 1,647 | |||||||||
Other expenses | 19,036 | 221 | 2,757 | |||||||||
Total expenses | $ | 1,071,641 | $ | 7,561,624 | $ | 94,469 | ||||||
Fees waived by Parnassus Investments | (96,479 | ) | (43,589 | ) | (41,454 | ) | ||||||
Net expenses | $ | 975,162 | $ | 7,518,035 | $ | 53,015 | ||||||
Net investment income | $ | 663,368 | $ | 13,870,441 | $ | 42,397 | ||||||
Realized and unrealized gain (loss) on investments | ||||||||||||
Net realized gain (loss) from securities transactions | (3,318,835 | ) | (91,673,276 | ) | (218,837 | ) | ||||||
Net change in unrealized appreciation of securities | 32,716,398 | 161,223,996 | 1,220,229 | |||||||||
Net realized and unrealized gain on securities | $ | 29,397,563 | $ | 69,550,720 | $ | 1,001,392 | ||||||
Net increase in net assets resulting from operations | $ | 30,060,931 | $ | 83,421,161 | $ | 1,043,789 | ||||||
| 38 | The accompanying notes are an integral part of these financial statements. |
Table of Contents
THE PARNASSUS FUNDS
Statement of Operations
Six Months Ended June 30, 2009 (unaudited)
| Parnassus Small-Cap Fund | Parnassus Workplace Fund | Parnassus Fixed-Income Fund | ||||||||||
Investment income | ||||||||||||
Dividends | $ | 324,019 | $ | 118,218 | $ | 24,000 | ||||||
Interest | 456 | 208 | 1,862,321 | |||||||||
Other income | — | — | — | |||||||||
Total investment income | $ | 324,475 | $ | 118,426 | $ | 1,886,321 | ||||||
Expenses | ||||||||||||
Investment advisory fees | 187,627 | 62,076 | 268,669 | |||||||||
Transfer agent fees | ||||||||||||
Investor shares | 21,328 | 7,840 | 45,525 | |||||||||
Institutional shares | — | — | — | |||||||||
Fund administration | 11,776 | 4,565 | 33,913 | |||||||||
Service provider fees | 40,618 | 25,690 | 71,649 | |||||||||
Reports to shareholders | 10,826 | 6,147 | 20,305 | |||||||||
Registration fees and expenses | 9,507 | 9,845 | 12,199 | |||||||||
Custody fees | 3,417 | 3,673 | 4,298 | |||||||||
Professional fees | 14,213 | 13,488 | 13,447 | |||||||||
Trustee fees and expenses | 809 | 243 | 3,063 | |||||||||
Proxy voting fees | 2,579 | 2,579 | — | |||||||||
Pricing service fees | 1,647 | 1,647 | 1,216 | |||||||||
Other expenses | 4,027 | 3,536 | 4,226 | |||||||||
Total expenses | $ | 308,374 | $ | 141,329 | $ | 478,510 | ||||||
Fees waived by Parnassus Investments | (83,032 | ) | (52,834 | ) | (74,306 | ) | ||||||
Net expenses | $ | 225,342 | $ | 88,495 | $ | 404,204 | ||||||
Net investment income | $ | 99,133 | $ | 29,931 | $ | 1,482,117 | ||||||
Realized and unrealized gain (loss) on investments | ||||||||||||
Net realized gain (loss) from securities transactions | (632,943 | ) | (84,016 | ) | 1,268,479 | |||||||
Net change in unrealized appreciation of securities | 5,724,600 | 3,115,714 | 315,815 | |||||||||
Net realized and unrealized gain on securities | $ | 5,091,657 | $ | 3,031,698 | $ | 1,584,294 | ||||||
Net increase in net assets resulting from operations | $ | 5,190,790 | $ | 3,061,629 | $ | 3,066,411 | ||||||
| The accompanying notes are an integral part of these financial statements. | 39 |
Table of Contents
THE PARNASSUS FUNDS
Statement of Changes in Net Assets
| Parnassus Fund | Parnassus Equity Income Fund | |||||||||||||||
| Six Months Ended June 30, 2009 (unaudited) | Year Ended December 31, 2008 | Six Months Ended June 30, 2009 (unaudited) | Year Ended December 31, 2008 | |||||||||||||
Investment income (loss) from operations | ||||||||||||||||
Net investment income | $ | 663,368 | $ | 1,231,693 | $ | 13,870,441 | $ | 13,949,834 | ||||||||
Net realized loss from securities transactions | (3,318,835 | ) | (5,156,106 | ) | (91,673,276 | ) | (52,646,973 | ) | ||||||||
Net change in unrealized appreciation (depreciation) | 32,716,398 | (87,966,171 | ) | 161,223,996 | (317,042,900 | ) | ||||||||||
Increase (decrease) in net assets resulting from operations | $ | 30,060,931 | $ | (91,890,584 | ) | $ | 83,421,161 | $ | (355,740,039 | ) | ||||||
Distributions | ||||||||||||||||
From net investment income | ||||||||||||||||
Investor shares | — | (1,234,658 | ) | (12,376,804 | ) | (12,894,893 | ) | |||||||||
Institutional shares | — | — | (1,299,489 | ) | (1,103,973 | ) | ||||||||||
From realized capital gains | ||||||||||||||||
Investor shares | — | (2,266,392 | ) | — | — | |||||||||||
Institutional shares | — | — | — | — | ||||||||||||
Distributions to shareholders | $ | — | $ | (3,501,050 | ) | $ | (13,676,293 | ) | $ | (13,998,866 | ) | |||||
From capital share transactions | ||||||||||||||||
Investor shares | ||||||||||||||||
Proceeds from sale of shares | 70,719,982 | 15,379,125 | 500,205,871 | 1,202,371,687 | ||||||||||||
Reinvestment of dividends | — | 3,371,366 | 12,041,267 | 12,567,117 | ||||||||||||
Shares repurchased | (10,687,362 | ) | (29,455,595 | ) | (425,529,083 | ) | (334,510,748 | ) | ||||||||
Institutional shares | ||||||||||||||||
Proceeds from sale of shares | — | — | 39,925,764 | 124,284,268 | ||||||||||||
Reinvestment of dividends | — | — | 1,172,152 | 1,061,513 | ||||||||||||
Shares repurchased | — | — | (32,411,685 | ) | (11,094,404 | ) | ||||||||||
Increase (decrease) in net assets from capital share transactions | 60,032,620 | (10,705,104 | ) | 95,404,286 | 994,679,433 | |||||||||||
Increase (decrease) in net assets | $ | 90,093,551 | $ | (106,096,738 | ) | $ | 165,149,154 | $ | 624,940,528 | |||||||
Net assets | ||||||||||||||||
Beginning of period | 173,910,856 | 280,007,594 | 1,537,714,648 | 912,774,120 | ||||||||||||
End of period | $ | 264,004,407 | $ | 173,910,856 | $ | 1,702,863,802 | $ | 1,537,714,648 | ||||||||
Undistributed net investment income | $ | 663,368 | $ | — | $ | 671,135 | $ | 476,988 | ||||||||
Shares issued and redeemed | ||||||||||||||||
Investor shares | ||||||||||||||||
Shares sold | 2,607,318 | 501,518 | 27,232,902 | 53,549,001 | ||||||||||||
Shares issued through dividend reinvestment | — | 165,928 | 652,107 | 578,474 | ||||||||||||
Shares repurchased | (430,494 | ) | (934,268 | ) | (23,044,525 | ) | (15,810,045 | ) | ||||||||
Institutional shares | ||||||||||||||||
Shares sold | — | — | 2,234,316 | 5,800,852 | ||||||||||||
Shares issued through dividend reinvestment | — | — | 63,215 | 49,984 | ||||||||||||
Shares repurchased | — | — | (1,875,716 | ) | (523,646 | ) | ||||||||||
Net increase (decrease) in shares outstanding | ||||||||||||||||
Investor shares | 2,176,824 | (266,822 | ) | 4,840,484 | 38,317,430 | |||||||||||
Institutional shares | — | — | 421,815 | 5,327,190 | ||||||||||||
| 40 | The accompanying notes are an integral part of these financial statements. |
Table of Contents
THE PARNASSUS FUNDS
Statement of Changes in Net Assets
| Parnassus Mid-Cap Fund | Parnassus Small-Cap Fund | |||||||||||||||
| Six Months Ended June 30, 2009 (unaudited) | Year Ended December 31, 2008 | Six Months Ended June 30, 2009 (unaudited) | Year Ended December 31, 2008 | |||||||||||||
Investment income (loss) from operations | ||||||||||||||||
Net investment income | $ | 42,397 | $ | 23,029 | $ | 99,133 | $ | 76,307 | ||||||||
Net realized gain (loss) from securities transactions | (218,837 | ) | (907,302 | ) | (632,943 | ) | (1,274,547 | ) | ||||||||
Net change in unrealized appreciation (depreciation) | 1,220,229 | (1,003,356 | ) | 5,724,600 | (10,187,701 | ) | ||||||||||
Increase (decrease) in net assets resulting from operations | $ | 1,043,789 | $ | (1,887,629 | ) | $ | 5,190,790 | $ | (11,385,941 | ) | ||||||
Distributions | ||||||||||||||||
From net investment income | ||||||||||||||||
Investor shares | — | (18,950 | ) | — | (78,271 | ) | ||||||||||
Institutional shares | — | — | — | — | ||||||||||||
From net realized capital gains | ||||||||||||||||
Investor shares | — | (94,589 | ) | — | — | |||||||||||
Institutional shares | — | — | — | — | ||||||||||||
Distributions to shareholders | $ | — | $ | (113,539 | ) | $ | — | $ | (78,271 | ) | ||||||
From capital share transactions | ||||||||||||||||
Investor shares | ||||||||||||||||
Proceeds from sale of shares | 6,459,462 | 4,576,237 | 36,879,576 | 50,771,084 | ||||||||||||
Reinvestment of dividends | — | 106,873 | — | 75,521 | ||||||||||||
Shares repurchased | (1,193,842 | ) | (2,533,998 | ) | (12,708,978 | ) | (20,574,644 | ) | ||||||||
Institutional shares | ||||||||||||||||
Proceeds from sale of shares | — | — | — | — | ||||||||||||
Reinvestment of dividends | — | — | — | — | ||||||||||||
Shares repurchased | — | — | — | — | ||||||||||||
Increase (decrease) in net assets from capital share transactions | 5,265,620 | 2,149,112 | 24,170,598 | 30,271,961 | ||||||||||||
Increase (decrease) in net assets | $ | 6,309,409 | $ | 147,944 | $ | 29,361,388 | $ | 18,807,749 | ||||||||
Net assets | ||||||||||||||||
Beginning of period | 6,672,436 | 6,524,492 | 26,804,766 | 7,997,017 | ||||||||||||
End of period | $ | 12,981,845 | $ | 6,672,436 | $ | 56,166,154 | $ | 26,804,766 | ||||||||
Undistributed net investment income | $ | 45,611 | $ | 3,205 | $ | 99,133 | $ | — | ||||||||
Shares issued and redeemed | ||||||||||||||||
Investor shares | ||||||||||||||||
Shares sold | 539,077 | 338,634 | 2,676,142 | 3,065,626 | ||||||||||||
Shares issued through dividend reinvestment | — | 10,100 | — | 6,160 | ||||||||||||
Shares repurchased | (102,989 | ) | (167,660 | ) | (951,207 | ) | (1,421,846 | ) | ||||||||
Institutional shares | ||||||||||||||||
Shares sold | — | — | — | — | ||||||||||||
Shares issued through dividend reinvestment | — | — | — | — | ||||||||||||
Shares repurchased | — | — | — | — | ||||||||||||
Net increase in shares outstanding | ||||||||||||||||
Investor shares | 436,088 | 181,074 | 1,724,935 | 1,649,940 | ||||||||||||
Institutional shares | — | — | — | — | ||||||||||||
| The accompanying notes are an integral part of these financial statements. | 41 |
Table of Contents
THE PARNASSUS FUNDS
Statement of Changes in Net Assets
| Parnassus Workplace Fund | Parnassus Fixed-Income Fund | |||||||||||||||
| Six Months Ended June 30, 2009 (unaudited) | Year Ended December 31, 2008 | Six Months Ended June 30, 2009 (unaudited) | Year Ended December 31, 2008 | |||||||||||||
Investment income (loss) from operations | ||||||||||||||||
Net investment income | $ | 29,931 | $ | 16,166 | $ | 1,482,117 | $ | 2,678,514 | ||||||||
Net realized gain (loss) from securities transactions | (84,016 | ) | (74,509 | ) | 1,268,479 | 602,324 | ||||||||||
Net change in unrealized appreciation (depreciation) | 3,115,714 | (2,227,968 | ) | 315,815 | (667,483 | ) | ||||||||||
Increase (decrease) in net assets resulting from operations | $ | 3,061,629 | $ | (2,286,311 | ) | $ | 3,066,411 | $ | 2,613,355 | |||||||
Distributions | ||||||||||||||||
From net investment income | ||||||||||||||||
Investor shares | — | — | (1,488,654 | ) | (3,286,208 | ) | ||||||||||
Institutional shares | — | — | — | — | ||||||||||||
From net realized capital gains | ||||||||||||||||
Investor shares | — | (56,594 | ) | — | (32,159 | ) | ||||||||||
Institutional shares | — | — | — | — | ||||||||||||
Distributions to shareholders | $ | — | $ | (56,594 | ) | $ | (1,488,654 | ) | $ | (3,318,367 | ) | |||||
From capital share transactions | ||||||||||||||||
Investor shares | ||||||||||||||||
Proceeds from sale of shares | 26,054,722 | 7,725,804 | 27,305,757 | 41,592,869 | ||||||||||||
Reinvestment of dividends | — | 56,007 | 1,326,671 | 2,969,659 | ||||||||||||
Shares repurchased | (2,786,268 | ) | (1,780,611 | ) | (14,610,095 | ) | (24,650,137 | ) | ||||||||
Institutional shares | ||||||||||||||||
Proceeds from sale of shares | — | — | — | — | ||||||||||||
Reinvestment of dividends | — | — | — | — | ||||||||||||
Shares repurchased | — | — | — | — | ||||||||||||
Increase (decrease) in net assets from capital share transactions | 23,268,454 | 6,001,200 | 14,022,333 | 19,912,391 | ||||||||||||
Increase (decrease) in net assets | $ | 26,330,083 | $ | 3,658,295 | $ | 15,600,090 | $ | 19,207,379 | ||||||||
Net assets | ||||||||||||||||
Beginning of period | 7,951,395 | 4,293,100 | 100,069,543 | 80,862,164 | ||||||||||||
End of period | $ | 34,281,478 | $ | 7,951,395 | $ | 115,669,633 | $ | 100,069,543 | ||||||||
Undistributed net investment income (loss) | $ | 44,287 | $ | 14,355 | $ | (1,301 | ) | $ | 5,235 | |||||||
Shares issued and redeemed | ||||||||||||||||
Investor shares | ||||||||||||||||
Shares sold | 1,794,394 | 538,479 | 1,690,942 | 2,571,690 | ||||||||||||
Shares issued through dividend reinvestment | — | 5,274 | 81,981 | 183,918 | ||||||||||||
Shares repurchased | (218,698 | ) | (136,871 | ) | (904,358 | ) | (1,536,864 | ) | ||||||||
Institutional shares | ||||||||||||||||
Shares sold | — | — | — | — | ||||||||||||
Shares issued through dividend reinvestment | — | — | — | — | ||||||||||||
Shares repurchased | — | — | — | — | ||||||||||||
Net increase in shares outstanding | ||||||||||||||||
Investor shares | 1,575,696 | 406,882 | 868,565 | 1,218,744 | ||||||||||||
Institutional shares | — | — | — | — | ||||||||||||
| 42 | The accompanying notes are an integral part of these financial statements. |
Table of Contents
NOTES TO FINANCIAL STATEMENTS (UNAUDITED)
1. Organization and Significant Accounting Policies
The Parnassus Funds are comprised of two Trusts, the Parnassus Funds trust and the Parnassus Income Funds trust (collectively the “Trusts”), organized as Massachusetts Business Trusts registered under the Investment Company Act of 1940 as diversified, open-end investment management companies, and are comprised of six separate funds (collectively the “Funds”). The Parnassus Funds trust includes the Parnassus Fund, which commenced operations on December 27, 1984 and the Parnassus Workplace Fund, the Parnassus Small-Cap Fund and the Parnassus Mid-Cap Fund, which commenced operations on April 29, 2005. The Parnassus Income Funds trust includes the Parnassus Equity Income Fund and the Parnassus Fixed-Income Fund, both of which commenced operations on August 31, 1992.
Securities Valuations
Equity securities that are listed or traded on a national securities exchange are stated at market value, based on recorded closing sales on the exchange or on the Nasdaq’s National Market System official closing price. In the absence of a recorded sale and for over-the-counter securities, equity securities are stated at the mean between the last recorded bid and asked prices. Long-term, fixed-income securities are valued each business day using prices based on procedures established by independent pricing services and approved by the Board of Trustees (the “Trustees”). Fixed-income securities with an active market are valued at the “bid” price where such quotes are readily available from brokers and dealers and are representative of the actual market for such securities. Other fixed-income securities experiencing a less active market are valued as determined by the pricing services based on methods which include consideration of trading in securities of comparable yield, quality, coupon, maturity and type, as well as indications as to values from dealers and other market data without exclusive reliance upon quoted prices or over-the-counter prices, since such valuations are believed to reflect more accurately the value of such securities. Short-term investments in U.S. Government Agency discount notes are valued at amortized cost, which approximates market value. Investments in registered investment companies are valued at their net asset value.
Investments where market quotations are not readily available are priced at their fair value, in accordance with procedures established by the Trustees. In determining fair value, the Trustees may consider a variety of information including, but not limited to, the following: price based upon a multiple of earnings or sales, fundamental analytical data and an evaluation of market conditions. A valuation adjustment is applied to certificates of deposit, community development loans and other community development investments as an estimate of potential penalties for early withdrawal.
In September 2006, Statement of Financial Accounting Standards No. 157 (SFAS 157), Fair Value Measurements, was issued and is effective for fiscal years beginning after November 15, 2007. SFAS 157 defines fair value, establishes a framework for measuring fair value and expands disclosures about fair value measurements. The Funds have adopted SFAS 157 as of January 1, 2008. SFAS 157 does not have a material impact on the financial statements, but additional disclosure is required. Various inputs are used in determining the value of the Funds’ portfolio investments. These inputs are summarized in three levels listed below:
| Level 1 | - | Quoted market prices in active markets for identical securities on the measurement date and on an ongoing basis | ||
| Level 2 | - | Other observable inputs (e.g., quoted prices in active markets for similar securities, securities valuations based on commonly quoted benchmark interest rates and yield curves, and/or securities indices) | ||
| Level 3 | - | Significant unobservable inputs (e.g., information about assumptions, including risk, market participants would use in pricing a security) | ||
| 43 |
Table of Contents
THE PARNASSUS FUNDS
NOTES TO FINANCIAL STATEMENTS (UNAUDITED) CONTINUED
The inputs or methodology used for valuing securities are not necessarily an indication of the risk associated with investing in those securities. Following is a summary of the inputs used in valuing the Funds’ portfolio investments and other financial instruments which are carried at fair value, as of June 30, 2009:
| Parnassus Fund | Parnassus Equity Income Fund | |||||||
Valuation level | Investments in Securities | Investments in Securities | ||||||
Level 1 | $ | 260,108,140 | $ | 1,660,869,959 | ||||
Level 2 | — | — | ||||||
Level 3 | 1,355,493 | 4,819,349 | ||||||
Total | $ | 261,463,633 | $ | 1,665,689,308 | ||||
| The following is a reconciliation of investments in which significant unobservable inputs (Level 3) were used in determining fair value: | ||||||||
Balance as of December 31, 2008 | $ | 1,280,008 | $ | 4,759,700 | ||||
Discounts/premiums amortization | (24,515 | ) | 59,649 | |||||
Net purchases (sales) | 100,000 | — | ||||||
Balance as of June 30, 2009 | $ | 1,355,493 | $ | 4,819,349 | ||||
| Parnassus Mid-Cap Fund | Parnassus Small-Cap Fund | |||||||
Valuation level | Investments in Securities | Investments in Securities | ||||||
Level 1 | $ | 12,719,088 | $ | 54,251,121 | ||||
Level 2 | — | — | ||||||
Level 3 | — | — | ||||||
Total | $ | 12,719,088 | $ | 54,251,121 | ||||
| Parnassus Workplace Fund | Parnassus Fixed-Income Fund | |||||||
Valuation level | Investments in Securities | Investments in Securities | ||||||
Level 1 | $ | 30,902,259 | $ | 884,700 | ||||
Level 2 | — | 110,753,953 | ||||||
Level 3 | — | 96,745 | ||||||
Total | $ | 30,902,259 | $ | 111,735,398 | ||||
| The following is a reconciliation of investments in which significant unobservable inputs (Level 3) were used in determining fair value: | ||||||||
Balance as of December 31, 2008 | $ | — | ||||||
Discounts/premiums amortization | (3,255 | ) | ||||||
Net purchases (sales) | 100,000 | |||||||
Balance as of June 30, 2009 | $ | 96,745 | ||||||
44
Table of Contents
NOTES TO FINANCIAL STATEMENTS (UNAUDITED) CONTINUED
Federal Income Taxes
The Trusts intend to comply with the requirements of the Internal Revenue Code applicable to regulated investment companies and to distribute all taxable income to shareholders. Therefore, no federal income tax provision is required. Income distributions and capital-gain distributions are determined in accordance with income tax regulations, which may differ from accounting principles generally accepted in the United States of America (“U.S.GAAP”).
In June 2006, the Financial Accounting Standards Board (“FASB”) issued FASB Interpretation No. 48 – Accounting for Uncertainty in Income Taxes – an interpretation of FASB No. 109, which establishes a minimum threshold for income tax benefits to be recognized in the financial statements. These tax benefits must meet a “more likely than not” threshold, which means that based on technical merits, they have a more than 50% likelihood of being sustained upon examination by the tax authority. Tax benefits meeting this threshold are measured as the largest amount of tax benefit that is greater than 50% likely of being realized upon ultimate settlement with the tax authority. FASB Interpretation No. 48 is effective for periods beginning after December 15, 2006, and was adopted by the funds on January 1, 2007. As of and during the six-month period ended June 30, 2009, the Funds did not have a liability for any unrecognized tax benefits. The Funds recognize interest and penalties, if any, related to unrecognized tax benefits as income tax expense in the Statement of Operations. During the year the Funds did not incur interest or penalties. The Funds are not subject to examination by U.S. federal taxing authorities or state taxing authorities for the years before 2005. The adoption had no effect on the Funds’ financial statements.
Securities Transactions
Securities transactions are recorded on the date the securities are purchased or sold (trade date). Realized gains and losses on securities transactions are determined on the basis of first-in, first-out for both financial statement and federal income tax purposes.
Investment Income, Expenses, and Distributions
Dividend income is recognized on the ex-dividend date and interest income is recognized on an accrual basis. Discounts and premiums on securities purchased are amortized over the lives of the respective securities using the constant yield method, which approximates the interest method. Expenses are recorded on an accrual basis. Distributions to shareholders are recorded on the ex-dividend date to shareholders of record on the record date. The Parnassus Equity Income Fund pays income dividends quarterly and capital-gain dividends annually. The Parnassus Fixed-Income Fund pays income dividends monthly and capital-gain dividends annually. The other Funds pay income and capital-gain dividends annually.
Securities Lending
The Parnassus Funds have the ability to lend securities to approved financial institutions to earn additional income and receive cash and/or securities as collateral to secure the loans. Collateral is maintained at not less than 102% of the value of loaned securities. Although the risk of lending is mitigated by the collateral, the Funds could experience a delay in recovering securities and a possible loss of income or value if the borrower fails to return them. In September of 2008, the Funds ceased participation in the securities lending program in light of recent credit market activity. After careful consideration of the current market environment and the lending program by Parnassus Investments and the Funds’ Trustees, the Funds will resume securities lending activities in August 2009.
Community Development Investment Programs
The Parnassus Funds may each invest up to 2% of their assets in community investments and community-development loan funds. Each of the Funds may invest in obligations issued by community loan funds at below-market interest rates if the projects financed have a positive social impact. Generally, there is no secondary market on loan funds and thus these are considered illiquid.
As part of our community development investment program, the Parnassus Equity Income Fund has entered into an agreement for fund investments through the Certificate of Deposit Account Registry Service (“CDARS”) network. The CDARS network allows members to place funds in time deposits with depository institutions whose accounts are insured by the Federal Deposit Insurance Corporation (“FDIC”). Provisions stipulate that participating institutions are FDIC insured, however, in the event of default or bankruptcy by any party to the agreement, the proceeds of the investment may be delayed or subject to legal proceedings and are subject to FDIC limits.
The Parnassus Equity Income Fund and Parnassus Fixed-Income Fund hold debt instruments issued by Microvest I, LP, a microfinance limited partnership specializing in providing capital to international microfinance institutions (“MFI’s”) that extend credit to developing countries and the entrepreneurial poor. This instrument may be subject to political and foreign currency exchange risk not normally associated with domestic debt instruments. Microvest I, LP’s investment in MFI’s can be affected by, among other factors, commodity prices, inflation, interest rates, taxation, social instability, and other political, economic or diplomatic developments in or affecting the various countries where MFI’s operate.
| 45 |
Table of Contents
THE PARNASSUS FUNDS
NOTES TO FINANCIAL STATEMENTS (UNAUDITED) CONTINUED
Capital Stock
Capital stock consists of an unlimited number of authorized shares of capital stock, no par value.
Use of Estimates
The preparation of financial statements in conformity with accounting principles generally accepted in the United States of America requires management to make estimates and assumptions that affect the reported amounts of assets and liabilities at the date of the financial statements and the reported amounts of revenues and expenses during the reporting period. Actual results could differ from those estimates.
2. Tax Matters and Distributions
At June 30, 2009, the cost of investments in long-term securities and net unrealized appreciation (depreciation) for income tax purposes were as follows:
| Parnassus Fund | Parnassus Equity Income Fund | Parnassus Mid-Cap Fund | Parnassus Small-Cap Fund | Parnassus Workplace Fund | Parnassus Fixed-Income Fund | |||||||||||||||||||
Costs of investment | $ | 306,058,358 | $ | 1,725,623,660 | $ | 12,653,134 | $ | 59,975,541 | $ | 29,901,256 | $ | 110,216,923 | ||||||||||||
Unrealized appreciation | 7,895,367 | 77,832,327 | 986,676 | 2,454,159 | 1,906,117 | 3,027,922 | ||||||||||||||||||
Unrealized depreciation | (51,785,105 | ) | (135,420,604 | ) | (868,479 | ) | (7,089,270 | ) | (826,155 | ) | (1,606,192 | ) | ||||||||||||
Net unrealized appreciation (depreciation) | $ | (43,889,738 | ) | $ | (57,588,277 | ) | $ | 118,197 | $ | (4,635,111 | ) | $ | 1,079,962 | $ | 1,421,730 | |||||||||
At December 31, 2008, estimated net capital loss carryforwards, which are available to offset future net realized capital gains, were:
Fund | Expiration Year | Capital Loss Carryforwards | |||
Parnassus Fund | 2016 | $ | 2,708,300 | ||
Parnassus Equity Income Fund | 2016 | $ | 17,627,601 | ||
Parnassus Mid-Cap Fund | 2016 | $ | 793,050 | ||
Parnassus Small-Cap Fund | 2016 | $ | 178,392 | ||
Post October capital losses as of December 31, 2008, which are deferred until 2009 for tax purposes:
Fund | Deferred Post-October Capital Loss | ||
Parnassus Fund | $ | 730,651 | |
Parnassus Equity Income Fund | $ | 30,129,366 | |
Parnassus Mid-Cap Fund | $ | 69,708 | |
Parnassus Small-Cap Fund | $ | 21,612 | |
Parnassus Workplace Fund | $ | 56,870 | |
Parnassus Fixed-Income Fund | $ | — | |
Net investment income and net ordinary income is the same for all Funds for financial statement and tax purposes during the six-month period ended June 30, 2009 with the exception of Parnassus Equity Income Fund. For Parnassus Equity Income Fund, the net investment income differs from ordinary income for financial statements and tax purposes primarily due to income recognition differences for partnership investments. Net realized gains differ for financial statement and tax purposes primarily due to differing treatments of wash sales and partnership allocations.
| 46 |
Table of Contents
NOTES TO FINANCIAL STATEMENTS (UNAUDITED) CONTINUED
3. Purchases and Sales of Securities
Purchases and proceeds from sales of securities, excluding short-term securities, for the six-month period ended June 30, 2009 were as follows:
Fund | Purchases | Sales | ||||
Parnassus Fund | $ | 94,748,874 | $ | 36,755,506 | ||
Parnassus Equity Income Fund | $ | 814,847,962 | $ | 612,937,344 | ||
Parnassus Mid-Cap Fund | $ | 7,669,155 | $ | 2,383,947 | ||
Parnassus Small-Cap Fund | $ | 30,807,421 | $ | 6,166,055 | ||
Parnassus Workplace Fund | $ | 22,771,593 | $ | 2,497,825 | ||
Parnassus Fixed-Income Fund | $ | 45,322,851 | $ | 27,860,435 | ||
4. Investment Advisory Agreement and Transactions with Affiliates
Under terms of an agreement which provides for furnishing investment management and advice to the Funds, Parnassus Investments is entitled to receive fees payable monthly, based on each Fund’s average daily net assets for the month, at the following annual rates:
Parnassus Fund: 1.00% of the first $10,000,000, 0.75% of the next $20,000,000, 0.70% of the next $70,000,000, 0.65% of the next $100,000,000 and 0.60% of the remaining balance. Parnassus Mid-Cap Fund and Parnassus Workplace Fund: 0.85% of the first $100,000,000, 0.80% of the next $100,000,000, 0.75% of the next $300,000,000 and 0.70% of the amount above $500,000,000. Parnassus Small-Cap Fund: 1.00% of the first $100,000,000, 0.90% of the next $100,000,000, 0.85% of the next $300,000,000 and 0.80% of the amount above $500,000,000. For the six-month period June 30, 2009, Parnassus Investments has contractually agreed to reduce its investment advisory fee through May 1, 2010 to the extent necessary to limit total operating expenses to 0.99% of net assets for the Parnassus Fund, 1.20% of net assets for the Parnassus Mid-Cap Fund, the Parnassus Small-Cap Fund and the Parnassus Workplace Fund.
Parnassus Equity Income Fund: 0.75% of the first $30,000,000, 0.70% of the next $70,000,000 and 0.65% of the amount above $100,000,000. Parnassus Fixed-Income Fund: 0.50% of the first $200,000,000, 0.45% of the next $200,000,000 and 0.40% of the amount above $400,000,000. For the six-month period ended June 30, 2009, Parnassus Investments has contractually agreed to reduce its investment advisory fee through May 1, 2010 to the extent necessary to limit total operating expenses to 0.99% of net assets for the Parnassus Equity Income Fund – Investor Shares, 0.78% of net assets for the Parnassus Equity Income Fund – Institutional Shares, and 0.87% of net assets for the Parnassus Fixed-Income Fund. Parnassus Investments further waived an additional 0.12% of net assets for the Parnassus Fixed-Income Fund for the six-month period ended June 30, 2009.
Parnassus Investments receives fees under terms of a separate agreement which provides for furnishing transfer agent and fund administration services to the funds. The transfer agent fee was $2.50 per month per account plus any out-of-pocket expenses for the Parnassus Fund, Parnassus Mid-Cap Fund, Parnassus Small-Cap Fund and Parnassus Workplace Fund. The transfer agent fee was $2.70 per month per account plus any out-of-pocket expenses for the Parnassus Equity Income Fund and Parnassus Fixed-Income Fund. The Funds pay the monthly fee based on the number of accounts on record at each month-end. The fund administration reflects annual rates based on net assets for all funds managed by Parnassus Investments and was allocated based on respective fund net assets. The fund administration services fee was 0.07% of average net assets under this new agreement for the six-month period ended June 30, 2009.
Parnassus Investments may also arrange for third parties to provide certain services, including account maintenance, recordkeeping and other personal services to their clients who invest in the funds. For these services, the Funds may pay service providers an aggregate service fee on investment accounts at a rate not to exceed 0.25% per annum of average daily net assets. The Parnassus Equity Income Fund – Institutional Shares does not incur service provider fees.
| 47 |
Table of Contents
Financial Highlights (unaudited)
Selected data for each share of capital stock outstanding, total return and ratios/supplemental data for the six-month period ended June 30, 2009 and each of the five years ended December 31 are as follows:
Parnassus Fund(d)
| June 30, 2009 | ||||||||||||||||||||||||
| (unaudited) | 2008 | 2007 | 2006 | 2005 | 2004 | |||||||||||||||||||
Net asset value at beginning of period | $ | 23.59 | $ | 36.66 | $ | 36.23 | $ | 31.68 | $ | 31.09 | $ | 30.05 | ||||||||||||
Income (loss) from operations(c): | ||||||||||||||||||||||||
Net investment income (loss) | 0.08 | 0.17 | — | (0.04 | ) | 0.16 | 0.12 | |||||||||||||||||
Net realized and unrealized gain (loss) on securities | 3.98 | (12.76 | ) | 2.03 | 4.59 | 0.63 | 1.05 | |||||||||||||||||
Total from investment operations | 4.06 | (12.59 | ) | 2.03 | 4.55 | 0.79 | 1.17 | |||||||||||||||||
Distributions: | ||||||||||||||||||||||||
Dividends from net investment income | — | (0.17 | ) | (0.01 | ) | — | (0.20 | ) | (0.13 | ) | ||||||||||||||
Distributions from net realized gains on securities | — | (0.31 | ) | (1.59 | ) | — | — | — | ||||||||||||||||
Total distributions | — | (0.48 | ) | (1.60 | ) | — | (0.20 | ) | (0.13 | ) | ||||||||||||||
Net asset value at end of period | $ | 27.65 | $ | 23.59 | $ | 36.66 | $ | 36.23 | $ | 31.68 | $ | 31.09 | ||||||||||||
Total overall return | 17.21 | % | (34.12 | %) | 5.43 | % | 14.36 | % | 2.55 | % | 3.89 | % | ||||||||||||
Ratios/supplemental data: | ||||||||||||||||||||||||
Ratio of gross expenses to average net assets | 1.09 | % | 1.01 | % | 1.00 | % | 1.01 | % | 1.03 | % | 0.99 | % | ||||||||||||
Ratio of net expenses to average net assets (net of waiver and expense offset arrangements) | 0.99 | %(g) | 0.99 | %(g) | 0.99 | %(g) | 0.99 | %(g) | 0.99 | %(g) | 0.99 | % | ||||||||||||
Ratio of net investment income (loss) to average net assets | 0.67 | % | 0.51 | % | (0.01 | %) | (0.13 | %) | 0.53 | % | 0.40 | % | ||||||||||||
Portfolio turnover rate | 18.74 | % | 98.38 | % | 88.67 | % | 141.98 | % | 136.07 | % | 119.80 | % | ||||||||||||
Net assets, end of period (000s) | $ | 264,004 | $ | 173,911 | $ | 280,008 | $ | 337,646 | $ | 292,384 | $ | 339,893 | ||||||||||||
| 48 |
Table of Contents
Financial Highlights (unaudited) continued
Parnassus Equity Income Fund – Investor Shares
| June 30, 2009 | ||||||||||||||||||||||||
| (unaudited) | 2008 | 2007 | 2006 | 2005 | 2004 | |||||||||||||||||||
Net asset value at beginning of period | $ | 19.29 | $ | 25.31 | $ | 24.83 | $ | 24.02 | $ | 25.00 | $ | 24.00 | ||||||||||||
Income (loss) from operations(c): | ||||||||||||||||||||||||
Net investment income | 0.16 | 0.27 | 0.20 | 0.30 | 0.41 | 0.40 | ||||||||||||||||||
Net realized and unrealized gain (loss) on securities | 0.75 | (6.05 | ) | 3.28 | 3.23 | 0.24 | 1.79 | |||||||||||||||||
Total from investment operations | 0.91 | (5.78 | ) | 3.48 | 3.53 | 0.65 | 2.19 | |||||||||||||||||
Distributions: | ||||||||||||||||||||||||
Dividends from net investment income | (0.16 | ) | (0.24 | ) | (1.18 | ) | (1.38 | ) | (0.85 | ) | (0.56 | ) | ||||||||||||
Distributions from net realized gains on securities | — | — | (1.82 | ) | (1.34 | ) | (0.78 | ) | (0.63 | ) | ||||||||||||||
Total distributions | (0.16 | ) | (0.24 | ) | (3.00 | ) | (2.72 | ) | (1.63 | ) | (1.19 | ) | ||||||||||||
Net asset value at end of period | $ | 20.04 | $ | 19.29 | $ | 25.31 | $ | 24.83 | $ | 24.02 | $ | 25.00 | ||||||||||||
Total overall return | 4.79 | % | (22.95 | %) | 14.13 | % | 14.70 | % | 2.62 | % | 9.30 | % | ||||||||||||
Ratios/supplemental data: | ||||||||||||||||||||||||
Ratio of gross expenses to average net assets | 1.00 | % | 0.99 | % | 1.03 | % | 1.06 | % | 1.07 | % | 1.04 | % | ||||||||||||
Ratio of net expenses to average net assets (net of waiver and expense offset arrangements) | 0.99 | %(g) | 0.99 | %(g) | 0.99 | %(g) | 0.99 | %(g) | 0.99 | %(g) | 1.04 | % | ||||||||||||
Ratio of net investment income to average net assets | 1.79 | % | 1.21 | % | 0.73 | % | 1.17 | % | 1.63 | % | 1.63 | % | ||||||||||||
Portfolio turnover rate | 42.82 | % | 70.20 | % | 91.42 | % | 116.75 | % | 109.54 | % | 79.88 | % | ||||||||||||
Net assets, end of period (000s) | $ | 1,551,561 | $ | 1,400,214 | $ | 867,577 | $ | 808,104 | $ | 906,844 | $ | 894,415 | ||||||||||||
Parnassus Equity Income Fund – Institutional Shares
| June 30, 2009 | ||||||||||||||||
| (unaudited) | 2008 | 2007 | 2006(f) | |||||||||||||
Net asset value at beginning of period | $ | 19.34 | $ | 25.35 | $ | 24.86 | $ | 25.59 | ||||||||
Income (loss) from operations(c): | ||||||||||||||||
Net investment income | 0.17 | 0.32 | 0.25 | 0.19 | ||||||||||||
Net realized and unrealized gain (loss) on securities | 0.76 | (6.05 | ) | 3.28 | 1.73 | |||||||||||
Total from investment operations | 0.93 | (5.73 | ) | 3.53 | 1.92 | |||||||||||
Distributions: | ||||||||||||||||
Dividends from net investment income | (0.18 | ) | (0.28 | ) | (1.22 | ) | (1.31 | ) | ||||||||
Distributions from net realized gains on securities | — | — | (1.82 | ) | (1.34 | ) | ||||||||||
Total distributions | (0.18 | ) | (0.28 | ) | (3.04 | ) | (2.65 | ) | ||||||||
Net asset value at end of period | $ | 20.09 | $ | 19.34 | $ | 25.35 | $ | 24.86 | ||||||||
Total overall return | 4.89 | % | (22.73 | %) | 14.35 | % | 7.46 | %(a) | ||||||||
Ratios/supplemental data: | ||||||||||||||||
Ratio of gross expenses to average net assets | 0.79 | % | 0.79 | % | 0.82 | % | 0.85 | %(b) | ||||||||
Ratio of net expenses to average net assets (net of waiver and expense offset arrangements) | 0.78 | %(g) | 0.78 | %(g) | 0.78 | %(g) | 0.78 | %(b)(d) | ||||||||
Ratio of net investment income to average net assets | 1.88 | % | 1.44 | % | 0.95 | % | 1.10 | %(b) | ||||||||
Portfolio turnover rate | 42.82 | % | 70.20 | % | 91.42 | % | 116.75 | % | ||||||||
Net assets, end of period (000s) | $ | 151,303 | $ | 137,501 | $ | 45,197 | $ | 46,471 | ||||||||
| 49 |
Table of Contents
THE PARNASSUS FUNDS
Financial Highlights (unaudited) continued
Parnassus Mid-Cap Fund
| June 30, 2009 | ||||||||||||||||||||
| (unaudited) | 2008 | 2007 | 2006 | 2005(e) | ||||||||||||||||
Net asset value at beginning of period | $ | 12.00 | $ | 17.39 | $ | 17.36 | $ | 15.30 | $ | 15.00 | ||||||||||
Income (loss) from operations(c): | ||||||||||||||||||||
Net investment income (loss) | 0.06 | 0.06 | (0.08 | ) | (0.06 | ) | 0.04 | |||||||||||||
Net realized and unrealized gain (loss) on securities | 1.02 | (5.21 | ) | 0.40 | 2.47 | 0.44 | ||||||||||||||
Total from investment operations | 1.08 | (5.15 | ) | 0.32 | 2.41 | 0.48 | ||||||||||||||
Distributions: | ||||||||||||||||||||
Dividends from net investment income | — | (0.03 | ) | (0.12 | ) | (0.29 | ) | (0.04 | ) | |||||||||||
Distributions from net realized gains on securities | — | (0.21 | ) | (0.17 | ) | (0.07 | ) | (0.14 | ) | |||||||||||
Total distributions | — | (0.24 | ) | (0.29 | ) | (0.36 | ) | (0.18 | ) | |||||||||||
Net asset value at end of period | $ | 13.08 | $ | 12.00 | $ | 17.39 | $ | 17.36 | $ | 15.30 | ||||||||||
Total overall return | 9.00 | % | (29.38 | %) | 1.81 | % | 15.78 | % | 3.22 | %(a) | ||||||||||
Ratios/supplemental data: | ||||||||||||||||||||
Ratio of gross expenses to average net assets | 2.14 | % | 2.25 | % | 2.04 | % | 5.29 | % | 9.03 | %(b) | ||||||||||
Ratio of net expenses to average net assets (net of waiver and expense offset arrangements) | 1.20 | %(g) | 1.20 | %(g) | 1.40 | %(g) | 1.40 | %(g) | 1.40 | %(b) | ||||||||||
Ratio of net investment income (loss) to average net assets | 0.96 | % | 0.40 | % | (0.42 | %) | (0.35 | %) | 0.37 | %(b) | ||||||||||
Portfolio turnover rate | 27.56 | % | 132.74 | % | 76.85 | % | 122.04 | % | 31.41 | %(a) | ||||||||||
Net assets, end of period (000s) | $ | 12,982 | $ | 6,672 | $ | 6,524 | $ | 2,409 | $ | 640 | ||||||||||
Parnassus Small-Cap Fund
| June 30, 2009 | ||||||||||||||||||||
| (unaudited) | 2008 | 2007 | 2006 | 2005(e) | ||||||||||||||||
Net asset value at beginning of period | $ | 12.63 | $ | 16.91 | $ | 17.94 | $ | 15.76 | $ | 15.00 | ||||||||||
Income (loss) from operations(c): | ||||||||||||||||||||
Net investment income (loss) | 0.03 | 0.08 | (0.13 | ) | (0.10 | ) | (0.03 | ) | ||||||||||||
Net realized and unrealized gain (loss) on securities | 1.94 | (4.32 | ) | (0.56 | ) | 3.07 | 1.18 | |||||||||||||
Total from investment operations | 1.97 | (4.24 | ) | (0.69 | ) | 2.97 | 1.15 | |||||||||||||
Distributions: | ||||||||||||||||||||
Dividends from net investment income | — | (0.04 | ) | (0.04 | ) | (0.74 | ) | (0.39 | ) | |||||||||||
Distributions from net realized gains on securities | — | — | (0.30 | ) | (0.05 | ) | — | |||||||||||||
Total distributions | — | (0.04 | ) | (0.34 | ) | (0.79 | ) | (0.39 | ) | |||||||||||
Net asset value at end of period | $ | 14.60 | $ | 12.63 | $ | 16.91 | $ | 17.94 | $ | 15.76 | ||||||||||
Total overall return | 15.60 | % | (25.08 | %) | (3.92 | %) | 18.78 | % | 7.65 | %(a) | ||||||||||
Ratios/supplemental data: | ||||||||||||||||||||
Ratio of gross expenses to average net assets | 1.64 | % | 1.86 | % | 2.06 | % | 3.03 | % | 7.27 | %(b) | ||||||||||
Ratio of net expenses to average net assets (net of waiver and expense offset arrangements) | 1.20 | %(g) | 1.20 | %(g) | 1.40 | %(g) | 1.40 | %(g) | 1.40 | %(b) | ||||||||||
Ratio of net investment income (loss) to average net assets | 0.53 | % | 0.51 | % | (0.72 | %) | (0.56 | %) | (0.27 | %)(b) | ||||||||||
Portfolio turnover rate | 16.78 | % | 100.41 | % | 100.30 | % | 125.00 | % | 86.20 | %(a) | ||||||||||
Net assets, end of period (000s) | $ | 56,166 | $ | 26,805 | $ | 7,997 | $ | 5,269 | $ | 1,225 | ||||||||||
| (a) | Not annualized for periods less than one year. |
| (b) | Annualized. |
| (c) | Income (loss) from operations per share is based on average daily shares outstanding. |
| (d) | Prior to May 1, 2004, the Parnassus Fund charged a sales load of a maximum of 3.5%, which is not reflected in the total overall return figures. |
| (e) | The Parnassus Mid-Cap Fund, the Parnassus Small-Cap Fund and the Parnassus Workplace Fund commenced operations on April 29, 2005, and the period shown is from April 29, 2005 through December 31, 2005. |
| 50 |
Table of Contents
Financial Highlights (unaudited) continued
Parnassus Workplace Fund
| June 30, 2009 | ||||||||||||||||||||
| (unaudited) | 2008 | 2007 | 2006 | 2005(e) | ||||||||||||||||
Net asset value at beginning of period | $ | 12.22 | $ | 17.60 | $ | 17.05 | $ | 15.49 | $ | 15.00 | ||||||||||
Income (loss) from operations(c): | ||||||||||||||||||||
Net investment income | 0.03 | 0.05 | 0.03 | 0.02 | 0.04 | |||||||||||||||
Net realized and unrealized gain (loss) on securities | 3.15 | (5.33 | ) | 0.94 | 2.28 | 0.50 | ||||||||||||||
Total from investment operations | 3.18 | (5.28 | ) | 0.97 | 2.30 | 0.54 | ||||||||||||||
Distributions: | ||||||||||||||||||||
Dividends from net investment income | — | — | (0.17 | ) | (0.61 | ) | (0.05 | ) | ||||||||||||
Distributions from net realized gains on securities | — | (0.10 | ) | (0.25 | ) | (0.13 | ) | — | ||||||||||||
Total distributions | — | (0.10 | ) | (0.42 | ) | (0.74 | ) | (0.05 | ) | |||||||||||
Net asset value at end of period | $ | 15.40 | $ | 12.22 | $ | 17.60 | $ | 17.05 | $ | 15.49 | ||||||||||
Total overall return | 26.02 | % | (29.94 | %) | 5.64 | % | 14.84 | % | 3.60 | %(a) | ||||||||||
Ratios/supplemental data: | ||||||||||||||||||||
Ratio of gross expenses to average net assets | 1.92 | % | 2.32 | % | 2.64 | % | 4.04 | % | 6.91 | %(b) | ||||||||||
Ratio of net expenses to average net assets (net of waiver and expense offset arrangements) | 1.20 | %(g) | 1.20 | %(g) | 1.20 | %(g) | 1.20 | %(g) | 1.20 | %(b) | ||||||||||
Ratio of net investment income (loss) to average net assets | 0.41 | % | 0.30 | % | 0.16 | % | 0.12 | % | 0.39 | %(b) | ||||||||||
Portfolio turnover rate | 16.95 | % | 72.58 | % | 56.18 | % | 96.93 | % | 27.55 | %(a) | ||||||||||
Net assets, end of period (000s) | $ | 34,281 | $ | 7,951 | $ | 4,293 | $ | 2,362 | $ | 1,013 | ||||||||||
Parnassus Fixed-Income Fund
| June 30, 2009 | ||||||||||||||||||||||||
| (unaudited) | 2008 | 2007 | 2006 | 2005 | 2004 | |||||||||||||||||||
Net asset value at beginning of period | $ | 16.19 | $ | 16.29 | $ | 16.11 | $ | 15.79 | $ | 15.87 | $ | 16.00 | ||||||||||||
Income (loss) from operations(c): | ||||||||||||||||||||||||
Net investment income | 0.22 | 0.47 | 0.67 | 0.67 | 0.48 | 0.33 | ||||||||||||||||||
Net realized and unrealized gain (loss) on securities | 0.22 | 0.01 | 0.25 | 0.49 | (0.08 | ) | (0.01 | ) | ||||||||||||||||
Total from investment operations | 0.44 | 0.48 | 0.92 | 1.16 | 0.40 | 0.32 | ||||||||||||||||||
Distributions: | ||||||||||||||||||||||||
Dividends from net investment income | (0.22 | ) | (0.57 | ) | (0.69 | ) | (0.74 | ) | (0.48 | ) | (0.33 | ) | ||||||||||||
Distributions from net realized gains on securities | — | (0.01 | ) | (0.05 | ) | (0.10 | ) | — | (0.09 | ) | ||||||||||||||
Return of capital | — | — | — | — | — | (0.03 | ) | |||||||||||||||||
Total distributions | (0.22 | ) | (0.58 | ) | (0.74 | ) | (0.84 | ) | (0.48 | ) | (0.45 | ) | ||||||||||||
Net asset value at end of period | $ | 16.41 | $ | 16.19 | $ | 16.29 | $ | 16.11 | $ | 15.79 | $ | 15.87 | ||||||||||||
Total overall return | 2.73 | % | 2.98 | % | 5.81 | % | 7.45 | % | 2.55 | % | 2.05 | % | ||||||||||||
Ratios/supplemental data: | ||||||||||||||||||||||||
Ratio of gross expenses to average net assets | 0.89 | % | 0.88 | % | 0.87 | % | 0.92 | % | 1.01 | % | 0.97 | % | ||||||||||||
Ratio of net expenses to average net assets (net of waiver and expense offset arrangements) | 0.75 | %(g) | 0.75 | %(g) | 0.75 | %(g) | 0.75 | %(g) | 0.75 | % | 0.75 | % | ||||||||||||
Ratio of net investment income to average net assets | 2.76 | % | 2.90 | % | 4.13 | % | 4.13 | % | 3.03 | % | 2.08 | % | ||||||||||||
Portfolio turnover rate | 28.50 | % | 44.87 | % | 32.48 | % | 41.27 | % | 34.08 | % | 24.38 | % | ||||||||||||
Net assets, end of period (000s) | $ | 115,670 | $ | 100,070 | $ | 80,862 | $ | 62,520 | $ | 45,879 | $ | 38,205 | ||||||||||||
| (f) | The Parnassus Equity Income Fund – Institutional Shares commenced operations on April 28, 2006 and the period shown is from April 28, 2006 through December 31, 2006. |
| (g) | Parnassus Investments has contractually limited expenses to an annualized rate of 0.99% for the Parnassus Fund, 0.99% for the Parnassus Equity Income Fund – Investor Shares, 0.78% for the Parnassus Equity Income Fund – Institutional Shares, 1.20% for the Parnassus Mid-Cap Fund, the Parnassus Small-Cap Fund and the Parnassus Workplace Fund and 0.87% for the Parnassus Fixed-Income Fund. Parnassus Investments has also voluntarily limited additional expenses for the Parnassus Fixed-Income Fund. (See note 4 for details). |
| 51 |
Table of Contents
ADDITIONAL INFORMATION (UNAUDITED)
Investment Advisory Agreement Renewal
The Board of Trustees of the Parnassus Funds approved the continuation of the Parnassus Funds investment advisory agreement with Parnassus Investments. Prior to approving the continuation of the investment advisory agreement, the Board considered:
| • | the nature, extent and quality of the services provided by Parnassus Investments; |
| • | the degree to which the Parnassus Fund, the Parnassus Equity Income Fund, the Parnassus Mid-Cap Fund, the Parnassus Small-Cap Fund, the Parnassus Workplace Fund and the Parnassus Fixed-Income Fund are being managed in accordance with each Fund’s stated investment objective; |
| • | the investment performance of each of the Parnassus Funds; |
| • | the cost of the services to be provided and profits to be realized by Parnassus Investments from its relationship with each of the Parnassus Funds; |
| • | the extent to which economies of scale would be realized as each of the Parnassus Funds grew and whether fee levels reflect these economies of scale; |
| • | the expense ratio of each of the Parnassus Funds; and |
| • | the manner in which portfolio transactions for the Parnassus Funds are conducted, including the use of soft dollars. |
In considering the nature, extent and quality of the services provided by Parnassus Investments, the Board of Trustees reviewed written and oral reports prepared by Parnassus Investments describing the portfolio management, shareholder communication and servicing, prospective shareholder assistance and regulatory compliance services provided by Parnassus Investments to the Parnassus Funds, and a written report prepared by Lipper Inc. comparing aspects of the portfolio management services provided by Parnassus Investments to similar services provided to comparable mutual funds. The Board concluded that Parnassus Investments was providing essential services to the Parnassus Funds. In particular, the Board concluded that Parnassus Investments was preparing reports to shareholders in addition to those required by law.
The Trustees compared the performance of each of the Parnassus Funds to benchmark indices over various periods of time and to comparable mutual funds as determined by Lipper Inc. and concluded that the overall performance of each Fund warranted the continuation of the investment advisory agreement.
In concluding that the advisory fees payable by each of the Parnassus Funds were reasonable, the Trustees reviewed a report of the costs of services provided, and the profits realized, by Parnassus Investments, from its relationship with each Fund and concluded that such profits were reasonable and not excessive when compared to profitability guidelines set forth in relevant court cases. The Trustees also reviewed reports comparing each Fund’s expense ratio and advisory fees paid by each Fund to those of other comparable mutual funds and concluded that the advisory fee paid by each Fund and each Fund’s expense ratio were within the range of comparable mutual funds. The Trustees noted that the investment advisory fee contained a number of breakpoints in an effort to reflect economies of scale that might be realized as each Fund grew.
The Board reviewed reports discussing the manner in which portfolio transactions for the Parnassus Funds were conducted, including the use of soft dollars. Based on these reports, the Board concluded that the research obtained by Parnassus Investments was beneficial to the Parnassus Funds and that Parnassus Investments was executing each Fund’s portfolio transactions in a manner designed to obtain best execution for the Parnassus Funds.
| 52 |
Table of Contents
ADDITIONAL INFORMATION (UNAUDITED) continued
Proxy Disclosures
Parnassus proxy voting policies and procedures are available, without charge, on our website (www.parnassus.com), on the Securities and Exchange Commission’s website (www.sec.gov), and by calling us at (800) 999-3505. The Funds file a proxy voting record with the Securities and Exchange Commission for the 12 months ended June 30. The most recent report is available by calling Parnassus or obtaining it from the Securities and Exchange Commission’s website or the Parnassus website.
Quarterly Portfolio Schedule
The Funds file their complete schedule of portfolio holdings with the Securities and Exchange Commission for the first and third quarters of each fiscal year on Form N-Q. The quarterly portfolio holdings are available on the Securities and Exchange Commission’s website (www.sec.gov). The Funds’ Form N-Q may also be reviewed and copied at the Securities and Exchange Commission’s Public Reference Room in Washington, DC, and information on the operation of the Public Reference Room may be obtained by calling (800) SEC-0330.
| 53 |
Table of Contents

THE PARNASSUS FUNDS
1 Market Street, Suite 1600 San Francisco, CA 94105
(800) 999-3505 (415) 778-0200
www.parnassus.com
Investment Adviser
Parnassus Investments
1 Market Street, Suite 1600
San Francisco, CA 94105
Legal Counsel
Foley & Lardner LLP
777 E. Wisconsin Ave.
Milwaukee, WI 53202
Independent Registered Public Accounting Firm
Deloitte & Touche LLP
50 Fremont Street
San Francisco, CA 94105
Distributor
Parnassus Funds Distributor
1 Market Street, Suite 1600
San Francisco, CA 94105
This report must be preceded or accompanied by a current prospectus.
Printed on recycled paper with soy-based ink.
Table of Contents
Item 2: Code of Ethics
Not applicable for semi-annual reports. The information required by this Item is only required in an annual report on Form N-CSR.
Item 3: Audit Committee Financial Expert
Not applicable for semi-annual reports. The information required by this Item is only required in an annual report on Form N-CSR.
Item 4: Principal Accountant Fees and Services
Not applicable for semi-annual reports. The information required by this Item is only required in an annual report on Form N-CSR.
Item 5: Not applicable.
Item 6: Included as part of the report to shareholders filed under Item 1 of this form.
Item 7: Not applicable.
Item 8: Not applicable.
Item 9: Not applicable.
Item 10: For the purposes of this Item, there have not been any material changes to the procedures by which shareholders may recommend nominees to the registrant’s Board of Trustees.
Item 11: Controls and Procedures.
(a) The registrant’s certifying officers have reasonably designed such disclosure controls and procedures to ensure material information relating to the registrant is made known to them by others, particularly during the period in which this report is being prepared. The registrant’s certifying officers have determined that the registrant’s disclosure controls and procedures are effective based on their evaluation of these controls and procedures as of a date within 90 days prior to the filing date of this report.
(b) There were no significant changes in the registrant’s internal controls over financial reporting, or in other factors that could significantly affect these controls, that occurred during the registrant’s first fiscal half-year, including any corrective actions with regard to significant deficiencies and material weaknesses.
Item 12: Exhibits attached hereto.
(a)(1) Code of Ethics - Not applicable for semi-annual reports.
(a)(2) Certification for each principal executive and principal financial officer of the registrant as required by Rule 30a-2 under the Act (17 CFR 270.30a-2(a)) - Filed as an attachment to this filing.
(b) Certifications required by Rule 30a-2(b) under the Act (17 CFR 270.30a-2(b)), Rule 13a-14(b) or Rule 15d-14(b) under the Exchange Act (17 CFR 240.13a-14(b) or 240.15d-14(b)), and Section 1350 of Chapter 63 of Title 18 of the United States Code (18 U.S.C. 1350). A certification furnished pursuant to this paragraph will not be deemed “filed” for purposes of Section 18 of the Exchange Act (15 U.S.C. 78r), or otherwise subject to the liability of that section. Such certification will not be deemed to be incorporated by reference into any filing under the Securities Act of 1933 or the Exchange Act, except to the extent that the registrant specifically incorporates it by reference – Filed as an attachment to this filing.
Table of Contents
Pursuant to the requirements of the Securities Exchange Act of 1934 and the Investment Company Act of 1940, the registrant has duly caused this report to be signed on its behalf by the undersigned, thereunto duly authorized.
Parnassus Income Funds
| ||||
| Date: August 14, 2009 | By: | /s/ Jerome L. Dodson | ||
Jerome L. Dodson President | ||||
Pursuant to the requirements of the Securities Exchange Act of 1934 and the Investment Company Act of 1940, this report has been signed below by the following persons on behalf of the registrant and in the capacities and on the dates indicated.
| Date: August 14, 2009 | By: | /s/ Jerome L. Dodson | ||
Jerome L. Dodson President |
| Date: August 14, 2009 | By: | /s/ Marc C. Mahon | ||
Marc C. Mahon Principal Accounting Officer |