Table of Contents
PARNASSUS INCOME FUNDS
UNITED STATES
SECURITIES AND EXCHANGE COMMISSION
Washington, D.C. 20549
FORM N-CSRS
CERTIFIED SHAREHOLDER REPORT OF
REGISTERED MANAGEMENT INVESTMENT COMPANIES
Investment Company Act file number: 811-06673
Parnassus Income Funds
(Exact name of registrant as specified in charter)
1 Market Street, Suite 1600, San Francisco, California 94105
(Address of principal executive offices) (Zip code)
Marc C. Mahon
Parnassus Income Funds
1 Market Street, Suite 1600, San Francisco, California 94105
(Name and address of agent for service)
Registrant’s telephone number, including area code: (415) 778-0200
Date of fiscal year end: December 31
Date of reporting period: June 30, 2008
Table of Contents
| Item 1: | Report to Shareholders |

THE PARNASSUS FUNDSSM
Semiannual Report June 30, 2008
Parnassus Fund Parnassus Small-Cap Fund
Parnassus Equity Income Fund Parnassus Workplace Fund
Parnassus Mid-Cap Fund Parnassus Fixed-Income Fund
Table of Contents
Parnassus Fund | (PARNX | ) | |||||
Parnassus Equity Income Fund–Investor Shares | (PRBLX | ) | |||||
Parnassus Equity Income Fund–Institutional Shares | (PRILX | ) | |||||
Parnassus Mid-Cap Fund | (PARMX | ) | |||||
Parnassus Small-Cap Fund | (PARSX | ) | |||||
Parnassus Workplace Fund | (PARWX | ) | |||||
Parnassus Fixed-Income Fund | (PRFIX | ) |
| 1 | ||
Fund Performance | ||
| 2 | ||
| 6 | ||
| 11 | ||
| 13 | ||
| 16 | ||
| 18 | ||
| 20 | ||
| 21 | ||
Portfolios of Investments | ||
| 22 | ||
| 24 | ||
| 28 | ||
| 30 | ||
| 32 | ||
| 33 | ||
| 36 | ||
| 43 | ||
| 48 | ||
| 52 | ||
Table of Contents

August 4, 2008
Dear Shareholder:
There was a lot of volatility in the capital markets during the second quarter of 2008, and most of the major market indices were down. We’re happy to report, though, that our funds have weathered the storms pretty well. Five of our six funds outperformed their Lipper peer groups for both the second quarter and the year-to-date, and although the Mid-Cap Fund underperformed its Lipper peer group for the second quarter, it outperformed that benchmark for the year-to-date. The Equity Income Fund and the Small-Cap Fund have done especially well this year, with both funds having a positive return for this difficult second quarter.
Although there are a lot of economic clouds on the horizon, the good news is that we’re finding many bargains. The intrinsic value of an individual company is, roughly speaking, the present value of its future earnings, and an investment in its stock is an ownership claim on those earnings. Therefore, over the very long term, the returns of the stock market will reflect the total earnings of public companies. The tricky part is that in the short term, the psychology of investors gets in the way of this fundamental relationship. Investors are people, and can be influenced by emotion and other things unrelated to fundamental value. Year-to-year, the market may have large swings, but over the long term, stocks stay around their intrinsic value.
As a steward of your money, it’s our job to find companies with the ability to earn a lot compared to the amount of capital invested regardless of where the market is. We’re happy to report that, overall, the companies in our portfolio have continued to perform well despite a weak economy, and our returns relative to the market reflect that. We’d also like to note that a major benefit of a down market is that companies that we have always admired, but couldn’t own because they were too expensive, are now a lot more attractive. We’ll be keeping our eyes open for great opportunities.
Personnel Matters
We’re fortunate to have three very good interns with us this summer. All of them are undergraduates at the University of California, Berkeley. Yanik Jayaram is a senior at Berkeley studying economics and also pursuing a minor in music. He’s a drummer in the UC Jazz Big Band. We won’t be able to offer Yanik much opportunity to hone his music skills, but hopefully, he leaves here with a better sense of economics than he did coming in.
Abdullah Nezami is a senior majoring in business administration at UC Berkeley’s Haas School of Business. Abdullah was born in Afghanistan and grew up in Fremont, California. He’s a member of the National Society of Collegiate Scholars honor society at Berkeley and initiated its student scholarship program.
Elina Sheykh-Zade is a senior at UC Berkeley studying economics. At Berkeley, she has volunteered for the school’s Habitat for Humanity chapter and also works as a tour guide on the Berkeley campus. Elina was born in Russia and lived there until the age of 9.
Enclosed you’ll find the reports for the six Parnassus Funds. As always, thank you for being an investor with Parnassus.
 |  | |||
| Jerome L. Dodson | Stephen J. Dodson | |||
| Chairman and Chief Executive | President | |||
| Parnassus Investments | Parnassus Investments | |||
The Parnassus Funds 1
Table of Contents
Dear Shareholder:
As of June 30, 2008, the net asset value (“NAV”) per share of the Parnassus Fund was $34.06, so the total return for the second quarter was a loss of 0.50%. This compares to a loss of 2.73% for the S&P 500 Index (“S&P 500”), a loss of 0.81% for the average multi-cap core fund followed by Lipper Inc. (“Lipper average”), and a gain of 0.82% for the NASDAQ Composite Index (“NASDAQ”). For the quarter, then, we beat the S&P by over two percentage points, beat the Lipper average by a small margin and underperformed the NASDAQ.
For the year-to-date, the Fund is down 7.09% compared to a loss of 11.91% for the S&P, a loss of 10.62% for the Lipper average and a loss of 13.18% for the NASDAQ. Although we’re down for the year-to-date, we’re substantially ahead of all our benchmarks.
Below is a table comparing the Parnassus Fund with the S&P 500, the Lipper Multi-Cap Core Average and the NASDAQ over the past one-, three-, five- and ten-year periods. The Fund is ahead of all the indices for all periods, except for the five-year term.
Analysis
Although the Fund’s loss for the quarter was a modest half of one percent, six companies each accounted for a loss of 23¢ or more for each fund share. Two were homebuilders. As most of you know, homebuilders are one of the two industries suffering the most from the subprime mortgage problem and the resulting impact on credit markets. As the economy slows, fewer people are qualified to buy homes, resulting in too many houses on the market. With weak demand, the credit problems and the oversupply of houses, homebuilders are in trouble. Given this situation, you might wonder why I’m putting some of the Fund’s assets into homebuilders. As I explained in the March quarterly report, previous cycles have shown that homebuilder stocks hit bottom about 12-18 months before the fundamentals of the business start to improve. In my view, conditions for the homebuilders will start to improve sometime in the middle of 2009, or about a year from now. In previous cycles, homebuilder stocks have increased more than 100% from the bottom. Psychologically, it’s very hard to buy a stock at the bottom, but if you can control your emotions, it’s a great time to invest.
Average Annual Total Returns
for periods ended June 30, 2008
| One Year | Three Years | Five Years | Ten Years | Gross Expense Ratio | Net Expense Ratio | |||||||||||||
PARNASSUS FUND | (10.52 | %) | 5.49 | % | 3.94 | % | 5.96 | % | 1.00 | % | 0.99 | % | ||||||
S&P 500 Index | (13.12 | %) | 4.41 | % | 7.58 | % | 2.88 | % | NA | NA | ||||||||
Lipper Multi-Cap Core Average | (11.88 | %) | 4.82 | % | 8.27 | % | 4.52 | % | NA | NA | ||||||||
NASDAQ Composite Index | (11.19 | %) | 4.51 | % | 7.90 | % | 2.45 | % | NA | NA |
Performance data quoted represent past performance and are no guarantee of future returns. Current performance may be lower or higher than the performance data quoted. Current performance information to the most recent month-end is on the Parnassus website (www.parnassus.com). Investment return and principal value will fluctuate so that an investor’s shares, when redeemed, may be worth more or less than their original principal cost. Returns shown in the table do not reflect the deduction of taxes a shareholder may pay on fund distributions or redemption of shares. The S&P 500 Index and the NASDAQ Composite Index are unmanaged indices of common stocks, and it is not possible to invest directly in an index. Index figures do not take any expenses, fees or taxes into account, but mutual fund returns may. Prior to May 1, 2004, the Parnassus Fund charged a sales load (maximum of 3.5%), which is not reflected in the total return calculations. Before investing, an investor should carefully consider the investment objectives, risks, charges and expenses of the Fund and should carefully read the prospectus, which contains this and other information. The prospectus is available on the Parnassus website, or you can obtain one by calling (800) 999–3505. As described in the Fund’s current prospectus dated May 1, 2008, Parnassus Investments has contractually agreed to limit the total operating expenses to 0.99% of net assets, exclusive of acquired fund fees, until May 1, 2009. This limitation may be continued indefinitely by the Adviser on a year-to-year basis.
2 The Parnassus Funds
Table of Contents
What was really surprising during the first quarter of this year was that homebuilder stocks increased on average between 20% and 40%. Pulte Homes climbed 38%, DH Horton rose 20% and Toll Brothers ran up 25%. I had mixed emotions about this surge. On the one hand, I was happy because it helped the Fund’s first quarter return; on the other, I was a little disappointed that I didn’t have a chance to build a bigger position in these issues.
I also had mixed emotions when the homebuilding companies lost all that gain in the second quarter. I was disappointed because it hurt our second quarter return, but I was happy that it gave me another chance to build a bigger position. I believe our homebuilder stocks will do well over the next two years. We’ve invested in companies with strong balance sheets that will be able to weather the current economic storm. They should also be able to increase market share over the next 18 months, as smaller homebuilders go out of business.
For the quarter, Pulte Homes sliced 32¢ off the NAV, as its stock fell 33.8% from $14.55 to $9.63, and DH Horton dropped 31.1% from $15.75 to $10.85, for a loss of 26¢ on the NAV.
Refiner Valero Energy cost the Fund 30¢ per share, as its stock declined 16.2% from $49.11 to $41.18. One would think that with record-high oil prices, an energy company would be hitting all-time highs. The difficulty is that Valero produces no oil – it only refines it into gasoline. Oil is a cost for Valero, so the higher price means more expensive raw materials. What really determines profits for Valero is the difference between the price of oil and the price of gasoline or the so-called “crack spread.” In June of 2007, the “crack spread” was around $27.88 per barrel, while in June of 2008, the margin was only about $9.24 per barrel. We’re hanging onto Valero, because we think the stock price will come back when margins return. Since no new refineries are being constructed in the United States, margins will definitely return at some point. We also like the company because it’s a great place to work, appearing regularly on the Fortune list of best places to work.
First Horizon, the holding company for First Tennessee Bank, sank an incredible 47.0% during the quarter, going from $14.01 to $7.43 per share for a loss of 26¢ on the NAV. The company had real estate loans that soured, and it also financed small and medium-sized homebuilders who are having difficulties. The stock is now trading at a fraction of its book value, even after taking huge reserves for bad loans. I think there’s still a lot of value in the banking franchise, so I’ll continue to hold the stock.
Ciena Corporation cost the NAV 26¢, as its stock dropped 24.9% from $30.83 to $23.17. The company makes optical network products for telecommunications, and investors perceive that the demand for these products is declining. I think demand will pick up late this year or early in 2009.
Freddie Mac, the big federally-sponsored, but privately-owned purchaser of home mortgages, dropped 35.2% from $25.32 to $16.40, because of concerns about mortgage foreclosures. There is also concern about dilution, since the company plans to increase its capital base by selling more stock.
Fortunately, we had four companies in the portfolio that each added 23¢ or more to the NAV, virtually balancing out the losses. The big winner for the quarter was W&T Offshore, which contributed an amazing 61¢ to each fund share, as its stock soared 71.5% from $34.11 to $58.51. Part of the reason for the dramatic increase, of course, was the big jump in oil prices, which helped all companies that own and operate oil wells. However, W&T has been especially successful in exploration, having found oil in 12 of 14 wells drilled since the first of the year. The company also has been environmentally responsible in its oil operations. None of its wells in the Gulf of Mexico leaked while Hurricane Katrina raged offshore. W&T also has a very good safety record.
The Parnassus Funds 3
Table of Contents
Some socially responsible investors have asked us what we think about investing in oil companies. We reply that it depends on the company. We probably wouldn’t invest in most of them, but we’re proud of our position in W&T. Of course, I’m in favor of moving away from petroleum products and finding renewable resources such as solar, wind, geothermal and biomass. In the meantime, however, virtually all of us use petroleum products in some form, and we’ll probably continue to do so for the rest of our lifetimes.
Powerwave Technologies, a manufacturer and distributor of products for wireless telephone networks, saw its stock climb 66.7% during the quarter from $2.55 to $4.25 for a gain of 33¢ per fund share. Demand for improved wireless coverage and more data capacity is driving carriers to buy more products from Powerwave. The company also showed progress in reducing costs.

Valeant Pharmaceuticals rose 33.4% during the quarter from $12.83 to $17.11 for a gain of 27¢ on the NAV. The company’s epilepsy drug successfully completed Phase 3 clinical studies and its second-generation hepatitis drug released a favorable side-effect profile. Valeant also announced a $100 million stock buyback program.
Mentor Graphics contributed 24¢ to each Parnassus share, as its stock rose 74.2% from $8.83 at the beginning of the quarter to $15.38 where we sold it. The company makes software for use in designing semi-conductors, and it received a hostile takeover bid of $16 per share from competitor Cadence Design. We decided to sell our stock, even though the merger might go through at $16.00, because Mentor’s management opposed the deal. If the merger were called off, the stock might have dropped down below $10. We decided not to be greedy and accepted $15.38 in the open market.
4 The Parnassus Funds
Table of Contents
Outlook and Strategy
This section represents my thoughts and applies to the four funds that I manage: the Parnassus Fund, the Mid-Cap Fund, the Small-Cap Fund and the Workplace Fund. Portfolio manager Todd Ahlsten will cover the outlook and strategy for the Equity Income Fund and the Fixed-Income Fund in those sections. Although we share the same investment philosophy, we manage different funds and our views may differ.
The most important factor in the current economic weakness has been the collapse of the housing market, which induced the subprime mortgage crisis, which in turn induced the financial crisis in the credit markets. Homebuilders and financial institutions have suffered the most from the crisis. The trouble in the housing and credit markets has affected the entire economy, and the huge jump in oil prices has cast a pall over consumer confidence and dampened economic activity. To me, though, the striking thing is that these factors have not created an economic crisis – at least not yet. The economy is down, but not out. Unemployment jumped from around 4.0% to the current 5.5%, but even that is relatively low. (By comparison, France and Germany have unemployment rates closer to 10%) Manufacturing has held up reasonably well, primarily because exchange rates have pushed down the value of the dollar, making our manufactured goods cheaper in international markets, while making foreign products more expensive in U.S. markets. This has reduced our trade deficit and given a boost to the economy. All in all, the American economy has been pretty resilient, given all the negative factors it has had to deal with.
No one knows if things will get worse or how long the current economic weakness will last. In general, though, recessions and other bouts of economic weakness rarely last longer than 12-16 months. If what’s past is prologue and the economic weakness started early this year, then the current recession or quasi-recession should be over in the first half of 2009. That, however, doesn’t mean that the stock market will continue dropping until then. The stock market is a leading indicator and foretells economic developments that lie ahead. It can lead events by 6-18 months. That means that the stock market will likely hit bottom very soon, if it hasn’t done so already. My view is that the market should be headed upward by late this fall.
My goal is to keep the funds that I manage fully-invested. I’ve been finding a lot of stocks trading at low valuations, so I’m doing a lot of bargain-hunting. I expect these stocks to be trading at much higher prices a year from now.
| Yours truly, |
|
| Jerome L. Dodson |
| Chairman and Chief Executive |
| Parnassus Investments |
The Parnassus Funds 5
Table of Contents
THE PARNASSUS EQUITY INCOME FUND
As of June 30, 2008, the NAV of the Parnassus Equity Income Fund – Investor Shares was $24.19, so after taking dividends into account, the total return for the second quarter was 2.55%. This compares to a loss of 2.73% for the S&P 500 and a decline of 3.86% for the average equity income fund followed by Lipper Inc. We had a great quarter as the Fund had a positive return in an extremely difficult environment. We were able to do this because the Fund owned few bank and large industrial stocks that suffered major price declines. In contrast, the Fund was over-weight in technology, healthcare and energy stocks, which moved higher during the quarter.
For the first half of 2008, the Fund kept losses modest and is doing very well versus the market and its peers. Since the beginning of the year, the Fund has declined only 3.97% compared with a loss of 11.91% for the S&P and a drop of 11.41% for the Lipper average. We are also pleased that our strategy of buying good businesses at undervalued prices has generated solid long-term results. The Fund’s one-, three-, five- and ten-year returns beat both the S&P 500 and Lipper averages for all periods. In fact, our ten-year return of 9.42% is over triple the 2.88% annual gain for the S&P 500.
Below is a table that compares the performance of the Fund with that of the S&P 500 and the average equity income fund followed by Lipper. Average annual total returns are for the one-, three-, five- and ten-year periods.
Second Quarter Recap
I am happy to report that the Fund was up 2.55% during a volatile and negative quarter for the S&P 500. The quarter started with a big rally as the S&P 500 soared 8.15% from March 31 to May 19. Fueled by persistent rate-cutting by the Federal Reserve, many investors bet that the financial, housing and inflationary crises were being well managed, and that an economic recovery was on the horizon. The Fund participated in the rally, outperforming the S&P 500. Our research team, however, was cautious. The Fund’s positioning reflected our concern that the aforementioned crises were being underestimated and would likely overpower the Fed’s monetary policy actions.
Average Annual Total Returns
for periods ended June 30, 2008
| One Year | Three Years | Five Years | Ten Years | Gross Expense Ratio | Net Expense Ratio | |||||||||||||
EQUITY INCOME FUND– | ||||||||||||||||||
Investor Shares | (1.05 | %) | 9.18 | % | 8.60 | % | 9.42 | % | 1.04 | % | 1.00 | % | ||||||
Institutional Shares | (0.81 | %) | NA | NA | NA | 0.83 | % | 0.79 | % | |||||||||
S&P 500 Index | (13.12 | %) | 4.41 | % | 7.58 | % | 2.88 | % | NA | NA | ||||||||
Lipper Equity Income Fund Average | (14.15 | %) | 4.31 | % | 8.10 | % | 4.32 | % | NA | NA |
The total return for the Equity Income Fund-Institutional Shares from commencement (April 28, 2006) was 7.99%. The performance of Institutional Shares differs from that shown for the Investor Shares to the extent that the Classes do not have the same expenses. Performance data quoted represent past performance and are no guarantee of future returns. Current performance may be lower or higher than the performance data quoted. Current performance information to the most recent month-end can be found on the Parnassus website (www.parnassus.com). Investment return and principal value will fluctuate, so that an investor’s shares, when redeemed, may be worth more or less than their original principal cost. Returns shown in the table do not reflect the deduction of taxes a shareholder may pay on fund distributions or redemption of shares. The S&P 500 is an unmanaged index of common stock, and it is not possible to invest directly in an index. Index figures do not take any expenses, fees or taxes into account, but mutual fund returns may. On March 31, 1998, the Fund changed its investment objective from a balanced portfolio to an equity income portfolio. Before investing, an investor should carefully consider the investment objectives, risk, charges and expenses of the Fund and should carefully read the prospectus, which contains this and other information. The prospectus is available on the Parnassus website, and can also be obtained by calling (800) 999–3505. As described in the Fund’s current prospectus dated May 1, 2008, Parnassus Investments has contractually agreed to limit the total operating expenses to 0.99% and 0.78% of net assets, exclusive of acquired fund fees, until May 1, 2009 for the Investor Shares and Institutional Shares, respectively. This limitation may be continued indefinitely by the Adviser on a year-to-year basis.
As we expected, the rally was fleeting and stock prices began a major decline on May 20th. Headlines citing record oil prices, accelerating inflation, falling home prices and weakening employment took turns atop the Wall Street Journal’s front page. Rising inflation was, perhaps, the most damaging to the market’s upward momentum, since it signaled an end to the Federal Reserve’s rate-cutting trend. Furthermore, the dramatic rise in oil prices delivered a blow to consumer spending. By June 30, the S&P 500 had
6 The Parnassus Funds
Table of Contents
plunged 10.1% from its mid-May highs and ended the quarter down 2.73%. In light of this volatility and severe late quarter market decline, I am proud that we were able to generate a gain of 2.55% for the quarter.
It was not easy to make money during the second quarter, but here is how we did it: Our stock-picking in the industrials area was the biggest contributor to our gain for the second quarter, adding 2.18% versus the S&P 500. Amazingly, not owning General Electric (“GE”) stock, which fell over 27% during the quarter, helped the Fund by almost 1% versus the S&P 500. While GE doesn’t meet our social responsibility requirements due to defense contracting, nuclear power and a troubled long-term environmental record, from a business standpoint, we have long been concerned about its financial services exposure. That business, in combination with weak orders, crushed GE’s stock during the first quarter. In contrast, we owned large stakes in smaller industrial companies with good secular growth trends, such as Danaher and Teleflex, which actually rose during the quarter.
The second-largest contributor to performance was our long-standing decision to underweight financial stocks. This position added 1.62% to our lead versus the S&P 500 during the second quarter. Finally, our overweight positions in technology and healthcare boosted our results versus the S&P 500 by 0.84% and 0.47%, respectively. We have identified many companies in both sectors that are positioned to grow their earnings and intrinsic values during 2008 despite the significant economic slowdown.
Looking back on the current cycle, I am pleased to report that the Fund is down only 3.68% versus a 16.42% drop for the S&P 500 since the stock market peaked on October 11, 2007. Our strategy of owning good companies, with time-tested management teams and sustainable business models, at reasonable prices has provided downside protection during this market cycle. I am very proud of our team for their dedication to rigorous research.
Company Analysis
The Fund had only one stock that hurt the NAV by more than 10¢ per share. Wells Fargo, the large financial services firm, fell 18.4% from $29.10 to $23.75 and reduced the NAV by 17¢ per share. For the most part, Wells Fargo maintained responsible lending standards during the housing boom. Unfortunately, its large home equity portfolio and mortgage businesses are not immune to falling home prices and a weakening economy. After the stock had fallen over 25% from its 2008 highs, I started adding to our position in May, thinking the company could weather this downturn and gain major share long-term. It appears I was a bit early, and, as credit losses are expected to increase significantly over the next year, we might have a long turnaround time on this investment. However, I am willing to accept the risk, as I feel there is limited chance of permanent capital loss. Longer-term, I feel the position will boost the Fund’s return. I am encouraged by the fact that the company’s largest shareholder is Warren Buffet. Wells Fargo is the only U.S. bank awarded the highest (AAA) rating by S&P.
I spent an hour with CEO John Stumpf at the Wells Fargo headquarters here in San Francisco during late May and I left the meeting confident the company will survive this credit crisis and thrive following it. He is an excellent CEO — confident but humble, and focused on the long-term franchise. Mr. Stumpf enjoys an admirable combination of financial acumen and the common sense and virtues of being raised in a small, central Minnesota town.
The housing market may not begin recovery until spring of 2010, but a significant portion of the bad news is finally starting to get priced into financial stocks. Stock prices of massive companies such as Citigroup and Wachovia have declined over 70% from their all-time highs, so it is no longer a secret that the U.S. banking system has challenges. At the same time, subprime poster child Countrywide Financial saw its stock fall over 90% before it was bought by Bank of America. Washington Mutual, another significant subprime lender, has witnessed its shares plunge almost 85% from their peak. At some point, the strong banks will bounce back in anticipation of stabilizing home prices and economic recovery while the weak ones will vanish. I feel the “easy” part of being underweight
The Parnassus Funds 7
Table of Contents
financials, due to our expectation of large bank losses, is coming to a conclusion, and that the tricky part, timing the up-cycle, is just beginning. In the meantime, outside of Wells Fargo and J.P. Morgan, we have not bought any other bank stocks and are being prudent and rigorous with our research in the sector.
The Fund had five stocks that added 10¢ to the NAV, and four of them were energy stocks. Our largest contributor to performance was MDU Resources, a Bismarck, North Dakota-based energy company which soared 42.0% during the quarter to $34.86 from $24.55 and added 25¢ to the NAV. The company not only reported big profits from oil and gas production, but also announced that it found significant new reserves in the Bakken Shale of North Dakota. In addition, MDU’s pipeline and natural gas utilities generated strong profits, which more than offset weakness at the company’s construction materials business. MDU has excellent management as the company has increased dividends 13 straight years. This was confirmed after I had a great, two-hour meeting with Terry Hildestat, the CEO of MDU, at their Bismarck offices last October. He is a talented CEO, who demonstrated a combination of calm demeanor with a laser focus on the company’s long-term strategy. They also have a good environmental track record and are investing to build a 20-megawatt wind farm this year. While I was a long way from home, it was truly worth the trip, as after the meeting I was able to enjoy a big meal and a couple of days with my 86-year-old grandmother Ella Ahlsten, a lifetime resident of northern Minnesota.
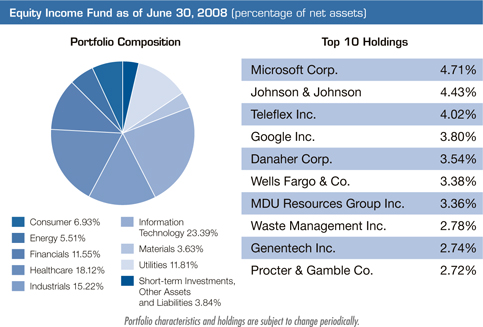
Our second biggest winner this quarter was Internet search firm Google, which increased 19.5% from $440 to $526, increasing the Fund’s NAV by 16¢. This positive move stands in contrast to the stock’s weakness in the first quarter, when the market overreacted to a report hinting at slower growth for Google. After analyzing this report with my colleague, Ben Allen, I decided to triple the amount of Google shares owned by the Fund by the start of the second quarter. This move paid off when the company reported its results in mid-April, and the stock jumped about 20% in one day. Even after this increase, I still think Google is a good investment, which is why the stock was a top holding for the Fund at quarter-end.
W&T Offshore, a Houston-based oil and gas producer in the Gulf of Mexico, jumped 71.5% from $34.11 to $58.51 and boosted the NAV by 15¢. While the company benefited from high oil and gas prices, W&T is doing a good job finding more reserves in the Gulf. As I wrote last quarter, CEO Tracy Krohn is an outstanding executive who cares about environmentally-responsible drilling and the safety of his employees. I have met Tracy Krohn three times and can say without exception that few executives match his passion for running a business. He is a petroleum engineer running an oil company, not an accountant.
Smith International, another Houston-based company that sells drill bits and completion fluid systems for oil and gas wells, rose 29.4% during the quarter to $83.14 from $64.23 and added 11¢ to the NAV. While high energy prices help Smith’s earnings as firms have more incentive to find more oil and gas, the company sells an extensive line of products that help make drilling wells more environmentally friendly. As a result, Smith is experiencing tremendous demand for its fluid completion systems, which keep areas around wells clean. In February, I visited Smith’s headquarters in Houston
8 The Parnassus Funds
Table of Contents
and, in true Parnassus form, pulled up to the security gate driving a Toyota Prius. After about 90 minutes speaking with CFO Margaret Dorman, I could really see why many investors consider her a top executive in the oil and gas business. She is a great business partner to CEO Douglas Rock, and I am excited about the long-term secular trends for Smith International.
Another winner for the Fund was Apache Corporation, a company that seems to make our leader board on a regular basis. Apache’s stock jumped 15.1% during the period from $120.82 per share to $139.00 and boosted the NAV by 10¢. Clearly, high energy prices are helping Apache’s profits. However, the company continues to do a great job finding oil and gas responsibly in the U.S., Canada, Argentina, Australia, Egypt and the North Sea. I enjoyed the annual Apache dinner with CEO Stephen Farris at the Howard Weil Energy Conference in New Orleans during early April. While energy prices could pull back over the near-term, I remain impressed with Mr. Farris’ plan to grow production for many years to come. In addition, he remains committed to Apache’s Project SpringBoard to help build schools for underprivileged Egyptian girls.
Strategy
We have been increasingly concerned about the fallout of the financial crisis on the broader economy, and have positioned the portfolio with defensive stocks that could provide not only upside participation but also downside protection in a volatile market. While we understand that the equity market is a discounting mechanism, we expect few positive economic developments over the next few quarters that would justify a sustainable recovery. Therefore, at this point, we plan on maintaining our defensive stance for the rest of the year. Since the Federal Reserve first cut interest rates on September 18 of last year, the economy hasn’t shown much improvement. The Case-Shiller home price index has slumped 14%, employment payrolls have declined for six consecutive months, earnings for the S&P 500 have fallen for three straight quarters and are estimated to have dropped about 10% in the second quarter. In addition, soaring oil prices and other commodities have brought American consumer confidence to the lowest level since February 1992 and raised serious concerns about inflation.
The investment themes that we have discussed in previous reports still prevail in this challenging economic environment. We continue to expect the financial and consumer discretionary sectors to underperform relative to the market.
Since last summer, financial institutions have recognized between $200 and $250 billion of losses on subprime mortgage securities. According to reports from the Bank of International Settlements and Goldman Sachs, these announced and discounted losses may be a reasonable estimate of the losses that will eventually occur. Therefore, at an aggregate level, the subprime crisis is probably mostly over as far as investors are concerned. However, banks have only recognized about $50 billion of losses on residential mortgages other than securitized subprime debt (Alt-A, HELOCs, home equity loans, prime mortgages). These losses could spike fivefold to reach $250 billion or more according to Goldman Sachs. In essence, now is time for the “prime” mortgage shoe to drop. There is mounting evidence that loan delinquencies are rising as the economy slows. In its latest report, the American Bankers Association (“ABA”) reported that delinquent home-equity accounts are at the highest level in 11 years and have increased at the fastest pace since the ABA began collecting data in 1987. Increased recognition of these losses is likely to weigh on balance sheets, especially among smaller regional banks with large portfolios of home equity loans. Consequently, we see few compelling investment opportunities in banks at this time.
After more than a decade of relentless consumer spending fueled by easy access to credit and high asset valuations, we see a structural shift in households’ consumption-savings behavior that will dampen discretionary spending over the next few years. While we have explained how banks are in the midst of de-leveraging by raising capital and shrinking their balance sheets, the same process is at play with household balance sheets. The substantial rise in household debt-to-income and the fall in saving rates over the last 10-15 years have left consumer balance sheets extremely stretched.
The Parnassus Funds 9
Table of Contents
Given a significant fall in house prices and reduced access to credit, the only way the gap between income and consumption growth can be filled is through increased savings which means people need to spend less. The need to rebuild savings will also be reinforced as the baby boomers intensify their retirement-planning efforts. Finally, in the short-term, the U.S. consumer is facing rising unemployment, falling home prices, soaring food and energy costs and stagnant wage growth. As a result, these trends will negatively affect the business outlook for firms in consumer-driven sectors.
Given our current expectations, the Fund remains underweight the financial sector and doesn’t own any consumer discretionary stocks. While we have a significant position in energy-utilities, we have reduced exposure as oil soared 38% during the quarter to close at $140 a barrel. Healthcare and technology remain our largest overweight positions, because we expect companies in those sectors to be able to weather a slowing economy better than the ones in the other sectors. Finally, with the market down more than 10% year-to-date, we are starting to see investment opportunities emerge and have slightly increased our industrial exposure. However, we remain disciplined and focused on our research process and are only selectively adding companies that meet our requirements. We prefer companies that can benefit from secular industry trends and become more relevant businesses over the next two to three years. Despite these challenging times, I feel we own a portfolio of good businesses with time-tested executives. We expect to find some great investment opportunities, as this economic slowdown eventually nears an inevitable recovery.
| Yours truly, |
 |
| Todd C. Ahlsten |
| Chief Investment Officer |
| Parnassus Investments |
10 The Parnassus Funds
Table of Contents
As of June 30, 2008, the NAV of the Parnassus Mid-Cap Fund was $15.93, so the total return for the quarter was a loss of 2.27%. This compares to a gain of 2.67% for the Russell Midcap Index (the “Russell”) and a return of 0.0% for the average mid-cap value fund followed by Lipper Inc. (“Lipper average”), so we trailed both indices for the quarter. For the year-to-date, the Fund was down 8.40% compared to a loss of 7.57% for the Russell and a loss of 9.36% for the Lipper average, so we underperformed the Russell, but beat the Lipper average.
Below is a table comparing the Parnassus Mid-Cap Fund with the Russell index and the Lipper average for the one- and three-year periods, for the period since September 30, 2005 when we first had most of the Fund’s assets invested in stock and for the period since inception on April 29, 2005.
Average Annual Total Returns
for periods ended June 30, 2008
| One Year | Three Years | Since September 30, 2005 | Since Inception April 29, 2005 | Gross Expense Ratio | Net Expense Ratio | |||||||||||||
MID-CAP FUND | (13.28 | %) | 3.16 | % | 4.30 | % | 3.48 | % | 2.05 | % | 1.41 | % | ||||||
Russell Midcap Index | (11.19 | %) | 6.84 | % | 5.26 | % | 8.96 | % | NA | NA | ||||||||
Lipper Mid-Cap Value Average | (16.89 | %) | 4.46 | % | 3.05 | % | 6.54 | % | NA | NA |
Performance data quoted represent past performance and are no guarantee of future returns. Current performance may be lower or higher than the performance data quoted. Current performance information to the most recent month-end is on the Parnassus website (www.parnassus.com). Investment return and principal value will fluctuate so that an investor’s shares, when redeemed, may be worth more or less than their original principal cost. Returns shown in the table do not reflect the deduction of taxes a shareholder may pay on fund distributions or redemption of shares. The Russell Midcap Index is an unmanaged index of common stocks, and it is not possible to invest directly in an index. Index figures do not take any expenses, fees or taxes into account, but mutual fund returns may. Mid-cap companies can be more sensitive to changing economic conditions and have fewer financial resources than large-cap companies. Before investing, an investor should carefully consider the investment objectives, risks, charges and expenses of the Fund and should carefully read the prospectus, which contains this and other information. The prospectus is available on the Parnassus website, or you can obtain one by calling (800) 999–3505. As described in the Fund’s current prospectus dated May 1, 2008, Parnassus Investments has contractually agreed to limit the total operating expenses to 1.40% of net assets, exclusive of acquired fund fees, until May 1, 2009. This limitation may be continued indefinitely by the Adviser on a year-to-year basis.
Analysis
Four companies in the Mid-Cap Fund’s portfolio hurt us the most, each accounting for a loss of 11¢ or more on the NAV. The one with the largest impact was First Horizon, holding company for First Tennessee Bank, which sank 47.0% during the quarter, dropping from $14.01 to $7.43 for a loss of 30¢ per fund share. The bank financed many of the small- and medium-sized homebuilders that are having trouble now and a lot of its real estate loans have soured. The stock is now trading at a fraction of its book value, even after taking huge write-downs for bad loans. I think there’s still a lot of value in this banking franchise, however, so I’m holding onto the stock.
Two homebuilders also hurt the performance of the Fund in the second quarter. Pulte homes sliced 27¢ off the NAV, as its stock plunged 33.8% from $14.55 to $9.63. DH Horton dropped 31.1% from $15.75 to $10.85, depressing the NAV by 19¢. Home-building stocks ran up quite a bit in the first quarter, then came back down in the second quarter. I’ve used the drop in stock prices to add more of these issues to our portfolio. Please read the discussion on homebuilders in the Parnassus Fund section for more information on my thoughts and our strategy with these stocks.
Oil-refiner Sunoco threw the NAV for a loss of 11¢, with its shares sinking 22.5% from $52.47 to $40.69. As oil prices climbed higher, the company had to pay more for its raw material, but was unable to pass along all the increases in the prices it charges for gasoline. A year ago, refining margins were around $27.88 per barrel, while current refining margins are around $9.24 per barrel.
The Parnassus Funds 11
Table of Contents
Three companies made positive contributions of 11¢ each or more to each fund share. Ultra Petroleum added 12¢, as its stock went from $77.50 to $98.20 for a gain of 26.7%. Earnings were up because of higher energy prices, and the company increased its natural gas production by 31%.

Cognizant Technology also contributed 12¢ to the NAV, with its stock price rising 12.8% from $28.83 to $32.51. This company provides high-quality information technology services at very low prices. Cognizant reported strong earnings and a positive full-year outlook because companies are increasingly focusing on lowering costs.
MDU Resources owns a utility serving Montana and North Dakota, explores for oil and runs a natural gas pipeline. Its stock added 11¢ to each fund share, rising an amazing 42.0% from $24.55 to $34.86. First quarter earnings rose 70% to a record high, as all its businesses posted strong results.
| Yours truly, |
|
| Jerome L. Dodson |
| Chairman and Chief Executive |
| Parnassus Investments |
12 The Parnassus Funds
Table of Contents
As of June 30, 2008, the NAV of the Parnassus Small-Cap Fund was $17.17, so the total return for the quarter was 11.21%, compared to 0.58% for the Russell 2000 Index (“Russell 2000”) and 0.72% for the average small-cap core fund followed by Lipper Inc. (“Lipper average”). The Small-Cap Fund performed exceptionally well this quarter, beating each of its benchmarks by more than 10 percentage points.
For the year-to-date, the Fund is up 1.54%, compared to a loss of 9.37% for the Russell 2000 and a loss of 9.19% for the Lipper average. We believe this is a remarkable performance in a year when all the major indices had big losses.
Below is a table comparing the performance of the Small-Cap Fund with that of the Russell 2000 and the Lipper average for the one- and three-year periods, for the period since September 30, 2005, when we first had most of the Fund’s assets in stock, and for the period since inception on April 29, 2005. Looking at the table, you’ll see that the Fund is ahead of all its benchmarks for all time periods, in most cases by substantial margins. The one exception is the period since inception on April 29, 2005, where the Fund’s lead over the indices is more modest. The reason for the discrepancy is that the Fund’s assets over the period from inception until September 30, 2005 were mostly in cash, and small stocks moved sharply higher while we were on the sidelines. From inception on April 29 of 2005 until September 30 of 2005, the Fund gained only 2.13% compared to 16.73% for the Russell 2000, which meant that we were over 14 percentage points behind because of our high cash position. Our intentions were good, since we wanted to invest our assets slowly and carefully, but our timing was unfortunate. Since that time, however, we’ve more than closed the gap, and the performance since the third quarter of 2005 has been remarkable.
Average Annual Total Returns
for periods ended June 30, 2008
| One Year | Three Years | Since September 30, 2005 | Since Inception April 29, 2005 | Gross Expense Ratio | Net Expense Ratio | |||||||||||||
SMALL-CAP FUND | (8.61 | %) | 6.75 | % | 7.54 | % | 7.22 | % | 2.08 | % | 1.42 | % | ||||||
Russell 2000 Index | (16.19 | %) | 3.79 | % | 2.42 | % | 6.94 | % | NA | NA | ||||||||
Lipper Small-Cap Core Average | (16.99 | %) | 3.40 | % | 1.71 | % | 6.05 | % | NA | NA |
Performance data quoted represent past performance and are no guarantee of future returns. Current performance may be lower or higher than the performance data quoted. Current performance information to the most recent month-end is on the Parnassus website (www.parnassus.com). Investment return and principal value will fluctuate so that an investor’s shares, when redeemed, may be worth more or less than their original principal cost. Returns shown in the table do not reflect the deduction of taxes a shareholder may pay on fund distributions or redemption of shares. The Russell 2000 Index is an unmanaged index of common stocks, and it is not possible to invest directly in an index. Index figures do not take any expenses, fees or taxes into account, but mutual fund returns may. Small-cap companies can be particularly sensitive to changing economic conditions and have fewer financial resources than large-cap companies. Before investing, an investor should carefully consider the investment objectives, risks, charges and expenses of the Fund and should carefully read the prospectus, which contains this and other information. The prospectus is on the Parnassus website, or you can obtain one by calling (800) 999–3505. As described in the Fund’s current prospectus dated May 1, 2008, Parnassus Investments has contractually agreed to limit the total operating expenses to 1.40% of net assets, exclusive of acquired fund fees, until May 1, 2009. This limitation may be continued indefinitely by the Adviser on a year-to-year basis.
I hasten to add that the Small-Cap Fund is not for everyone. It’s much more volatile than, say, the Parnassus Equity Income Fund. The Small-Cap Fund has had its ups and downs, and it went through some difficult times last year. The best use of the Fund is for money that you don’t need any time soon, and for which you can take a longer-term perspective. However, for money you may need in, say, less than two or three years, it may not be the right choice. In any case, I don’t think most shareholders will mind a few bumps in the road, as long as we get to the right destination.
The Parnassus Funds 13
Table of Contents
Analysis
Seven stocks contributed at least 13¢ each to the value of each fund share during the quarter, but even more remarkable was the fact that no stock accounted for a loss of 13¢ or more on the NAV. The big winner for the quarter was Mentor Graphics, which added 44¢ to each fund share, as the stock rose 70.4% from $8.83 at the beginning of the quarter to $15.05 where we sold it during the period. The company makes software for use in designing semiconductors, and it received a hostile takeover bid of $16 per share from competitor Cadence Design. We decided to sell our stock, even though the merger might go through at $16.00, since Mentor’s management opposed the deal. If the merger were to be called off, the stock might drop below $10. We decided not to be greedy and accepted the $15.05 in the open market.
W&T Offshore boosted the NAV by 42¢, as its stock soared 71.5% from $34.11 to $58.51. The company drills for oil and operates wells, so part of the reason for the dramatic increase in the value of its stock was the big jump in oil prices. The other part is that W&T has been especially successful in exploration, having found oil in 12 of 14 wells drilled since the first of the year. The company has been environmentally responsible in its oil operations. None of its wells in the Gulf of Mexico leaked while Hurricane Katrina raged offshore. W&T also has a good safety record.
Powerwave Technologies, a manufacturer and distributor of products for wireless telephone networks, saw its stock climb 66.7% from $2.55 to $4.25 for a gain of 41¢ for each fund share. Demand for improved wireless coverage and more data capacity is driving carriers to buy more products from Powerwave. The company also showed progress in reducing costs.
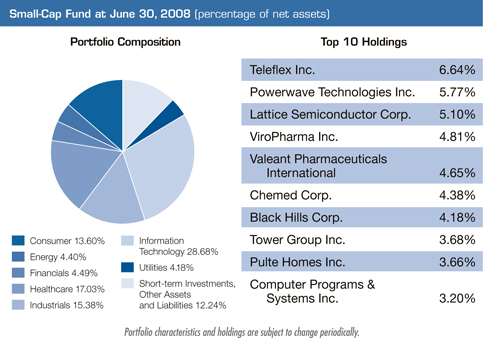
Valeant Pharmaceuticals climbed 33.4% during the quarter from $12.83 to $17.11 for a gain of 22¢ for each fund share. The company’s epilepsy drug successfully completed Phase III clinical studies, and its second-generation hepatitis drug released a favorable side-effects profile. Valeant also announced a $100 million stock buyback program.
Nordson designs, manufactures and markets equipment that applies adhesives, sealants and coatings to consumer and industrial products as part of the manufacturing process. The stock added 20¢ to the NAV, as it climbed 35.4% from $53.85 to $72.89. Despite economic weakness in the United States, orders were strong for Nordson’s pumps and dispensers, as it gained market share in the industrial sector. Orders from Asia were up 31% in the first quarter.
14 The Parnassus Funds
Table of Contents
ViroPharma shares rose 23.7% from $8.94 to $11.06, while pushing each fund share 17¢ higher. A recent decision by an FDA panel will probably mean that it will be harder for generic companies to copy Vancocin, the company’s main drug. Phase II trials for the company’s new Camvia drug indicated that it was working well for patients that had bone marrow transplants.
LifeCell added 13¢ to the NAV, as its stock went up 12.7% from $42.03 to $47.38, which was the average price where we sold it during the quarter. The stock moved higher on a takeout offer from Kinetic Concepts.
One factor that helped performance is a focus on companies that have unique characteristics. This doesn’t mean they don’t have competition; it does mean they have expertise in a specific area that helps them weather economic storms in bad times and do very well in good times. To give you a better idea of what I mean, let me give examples from the seven companies we’ve discussed in this report.
Mentor Graphics has a software tool called Calibre, used for designing semiconductors of very small sizes. It is the best in its field for ensuring that a computer drawing can be transformed into a chip that can actually be manufactured. W&T Offshore specializes in drilling and exploration only in the Gulf of Mexico, and unlike many big oil companies, W&T has a CEO who is a petroleum engineer with a remarkable record in finding oil.
Powerwave provides almost all the equipment a carrier would need to build out a wireless network. Valeant Pharmaceuticals is on the verge of receiving approval for a new epilepsy drug that can help many patients who receive no benefit from medicines currently available. Nordson has a product line so broad that its equipment can be used to apply virtually all kinds of adhesives, sealants and coatings.
ViroPharma makes Vancocin, the only antibiotic approved to treat significant bacterial infection of the lower digestive tract, and if its new Camvia drug receives approval, it would be the only one that fights the cytomegalovirus in bone marrow transplant patients without having toxic effects on the kidney. LifeCell makes a unique artificial skin used for third-degree burns and in reconstructive surgery.
| Yours truly, |
|
| Jerome L. Dodson |
| Chairman and Chief Executive |
| Parnassus Investments |
The Parnassus Funds 15
Table of Contents
As of June 30, 2008, the NAV of the Parnassus Workplace Fund was $16.43, so the total return for the quarter was a loss of 0.30%. This compares to a loss of 2.73% for the S&P 500 and a loss of 0.81% for the average multi-cap core fund followed by Lipper Inc. (“Lipper average”). Although we lost a small amount of money in the second quarter, we beat both of our benchmarks. For the year-to-date, the Fund lost 6.65%, compared to a loss of 11.91% for the S&P 500 and a loss of 10.62% for the Lipper average, so we were ahead of both indices.
Below is a table comparing the Parnassus Workplace Fund with the S&P 500 and the Lipper Multi-Cap Core average for the one- and three-year periods, for the period since September 30, 2005 when we first had most of the Fund’s assets in stock, and the period since inception on April 29, 2005. You will notice that the Fund is ahead of both its benchmarks for all periods, except the period since inception when its return lagged the Lipper average and was slightly below the S&P 500. The reason for the discrepancy is that from April 29 of 2005 until September 30 of that year, the Fund had most of its assets in cash, and stocks moved higher while we were on the sidelines. The S&P 500 gained over six percentage points on the Fund. Our idea was to invest slowly and carefully, but the timing was unfortunate. Since September 30 of 2005, the Fund has performed substantially better than the benchmarks, essentially closing the gap with the S&P 500.
The premise on which the Workplace Fund was founded was that companies that are good places to work should be better investments than the average company in the S&P 500. At least since September 30 of 2005, that has been the case. It certainly has been with the companies in our portfolio.
Average Annual Total Returns
for periods ended June 30, 2008
| One Year | Three Years | Since September 30, 2005 | Since Inception April 29, 2005 | Gross Expense Ratio | Net Expense Ratio | |||||||||||||
WORKPLACE FUND | (7.56 | %) | 5.26 | % | 5.62 | % | 5.17 | % | 2.65 | % | 1.21 | % | ||||||
S&P 500 Index | (13.12 | %) | 4.41 | % | 3.47 | % | 5.24 | % | NA | NA | ||||||||
Lipper Multi-Cap Core Average | (11.88 | %) | 4.82 | % | 3.60 | % | 6.20 | % | NA | NA |
Performance data quoted represent past performance and are no guarantee of future returns. Current performance may be lower or higher than the performance data quoted. Current performance information to the most recent month-end is on the Parnassus website (www.parnassus.com). Investment return and principal value will fluctuate so that an investor’s shares, when redeemed, may be worth more or less than their original principal cost. Returns shown in the table do not reflect the deduction of taxes a shareholder may pay on fund distributions or redemption of shares. The S&P 500 Index is an unmanaged index of common stocks, and it is not possible to invest directly in an index. Index figures do not take any expenses, fees or taxes into account, but mutual fund returns may. Before investing, an investor should carefully consider the investment objectives, risks, charges and expenses of the Fund and should carefully read the prospectus, which contains this and other information. The prospectus is available on the Parnassus website, or you can obtain one by calling (800) 999–3505. As described in the Fund’s current prospectus dated May 1, 2008, Parnassus Investments has contractually agreed to limit total operating expenses to 1.20% of net assets, exclusive of acquired fund fees, until May 1, 2009. This limitation may be continued indefinitely by the Adviser on a year-to-year basis.
Analysis
Four stocks accounted for losses of 11¢ or more on the NAV. There were also four that accounted for gains of 11¢ or more per fund share. First Horizon hurt the Fund the most. This holding company for First Tennessee Bank dropped an astounding 47.0%, sinking from $14.01 to $7.43 for a loss of 27¢ on the NAV. The bank made real estate and construction loans all over the country, moving beyond its base in Tennessee. Many of these loans have gone bad. First Horizon has recently written off these bad loans and shrunk the size of its footprint, retreating to its base in Tennessee. I’m hanging onto the stock, since there’s a lot of value in the banking franchise and it’s trading at a fraction of its book value.
16 The Parnassus Funds
Table of Contents
Refiner Valero Energy sliced 24¢ off the NAV, as its stock fell 16.2% from $49.11 to $41.18. The company doesn’t produce oil, but refines it into gasoline, so as oil prices climb, Valero’s costs increase. A year ago, the margin between the price of crude oil and the price of gasoline was $27.88 a barrel, but last month the spread was only $9.24 per barrel and the result was much lower earnings.
Wells Fargo saw its stock price decline 18.4% from $29.10 to $23.75 for a loss of 14¢ per fund share. Although Wells Fargo has weathered the financial crisis better than most banks, investors are concerned and have depressed the price of virtually all banking shares. When the crisis is over, Wells Fargo should make a strong comeback.
American Express saw its stock drop 13.8% during the quarter from $43.72 to $37.67 for a decline of 12¢ per fund share. Financial concerns and fear that cardholders will not pay their bills caused the decline. We think American Express will weather the storm and its share price will bounce back.
Turning to the winners, Nordson was the company that helped us the most, climbing 35.4% from $53.85 to $72.89 while boosting the NAV by 17¢. The company makes industrial equipment for applying adhesives, sealants and coatings, and orders were strong in the first quarter despite the economic weakness; orders in Asia grew 31%. Nordson has an excellent CEO in Ed Campbell, who is able to focus R&D spending to come up with excellent products, while at the same time controlling costs and motivating an effective sales force.
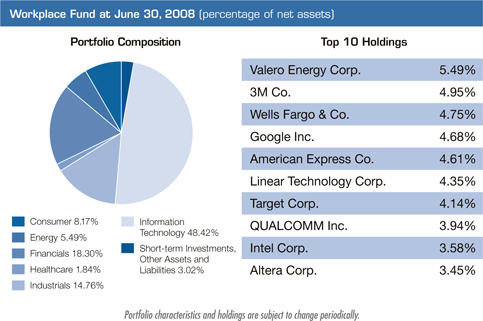
Google contributed 13¢ to each fund share, as its stock rose 19.5% from $440 to $526. Shareholders may remember that the company’s stock dropped over 36% in the first quarter, because data-analysis firm comScore reported that Google had fewer “paid clicks” than expected in January and February. As it turned out, “paid clicks” were fine, search revenue continues to be strong and the stock bounced back.
Daycare-provider Bright Horizons added 11¢ to the NAV, as it climbed from $43.04 to $48.20 for a gain of 12%. The company received and accepted a buyout offer from a private equity firm.
Baldor Electric rose 24.9% from $28.00 to $34.98 for an increase of 11¢ on the NAV. Despite the weak economy, sales increased 19% and earnings 11% in the first quarter. Its energy-efficient Super-E motors continue to sell well.
| Yours truly, |
|
| Jerome L. Dodson |
| Chairman and Chief Executive Parnassus Investments |
The Parnassus Funds 17
Table of Contents
THE PARNASSUS FIXED-INCOME FUND
As of June 30, 2008, the NAV of the Fixed-Income Fund was $16.22, so the total return for the quarter was a loss of 0.34% (including dividends). This compares to a loss of 0.89% for the average A-rated bond fund followed by Lipper Inc. and a loss of 1.02% for the Lehman U.S. Aggregate Bond Index. Since the beginning of the year, our gain of 1.14% is in line with the 1.13% return for the Lehman Index, and is considerably better than the loss of 0.72% registered by our Lipper peer group. We’re very proud to report that our returns are better than the Lipper average for each of the one-, three-, five- and ten-year periods as of the end of the quarter.
Below is a table comparing the performance of the Fund with that of the Lehman U.S. Aggregate Bond Index and the average A-rated bond fund followed by Lipper. Average annual total returns are for the one-, three-, five- and ten-year periods. The 30-day SEC yield for the Fund for June 2008 was 2.49%.
Average Annual Total Returns
for periods ended June 30, 2008
| One Year | Three Years | Five Years | Ten Years | Gross Expense Ratio | Net Expense Ratio | |||||||||||||
FIXED-INCOME FUND | 5.80 | % | 4.98 | % | 3.49 | % | 5.06 | % | 0.88 | % | 0.76 | % | ||||||
Lipper A-rated Bond Fund Average* | 3.06 | % | 2.37 | % | 2.89 | % | 4.65 | % | NA | NA | ||||||||
Lehman U.S. Aggregate Bond Index | 7.12 | % | 4.09 | % | 3.85 | % | 5.68 | % | NA | NA |
Performance data quoted represent past performance and are no guarantee of future returns. Current performance may be lower or higher than the performance data quoted. Current performance information to the most recent month-end is on the Parnassus website (www.parnassus.com). Investment return and principal value will fluctuate, so that an investor’s shares, when redeemed, may be worth more or less than their original cost. Returns shown in the table do not reflect the deduction of taxes a shareholder would pay in fund distributions or redemption of shares. The Lehman U.S. Aggregate Bond Index is an unmanaged index of bonds, and it is not possible to invest directly in an index. An index doesn’t take expenses, fees or taxes into account, but mutual fund returns do. Before investing, an investor should carefully consider the investment objectives, risks, charges and expenses of the Fund and should read the prospectus which contains this and other information. The prospectus is available on the Parnassus website, or you can obtain one by calling (800) 999–3505. As described in Fund’s current prospectus dated May 1, 2008, Parnassus Investments has contractually agreed to limit total operating expenses to 0.87% of net assets, exclusive of acquired fund fees, until May 1, 2009. This limitation may be continued indefinitely by the Adviser on a year-to-year basis.
Second Quarter Review
The Fund’s strong relative performance in the quarter was due to our decision to position the portfolio for rising interest rates. During the quarter, we held a lot of short-term bonds that were able to maintain their value better than the longer-term bonds held by many of our peers. The yield on the 10-year Treasury note was just 3.41% at the end of the first quarter, and it jumped to 3.97% by the end of June. Considering that the latest annual inflation reading for May was 4.2%, we still think long-term rates are too low. In essence, “real” interest rates are negative right now. As a result, long-term bonds are not great investments given current conditions.
Here is why negative real interest rates make bond values unattractive. Imagine a basket of goods that costs $100 today. If we assume that inflation will run at the current 4.2% rate for the next 10 years, this same basket of goods will cost $151 in 2018. Now, let’s say we decide to buy $100 of 10-year Treasuries at a rate of 4.0%. If we reinvest the coupons at the same 4.0% rate, then our original $100 investment would be worth $148.
18 The Parnassus Funds
Table of Contents
The difference between the $151 future cost of our basket of goods and the $148 that we would end up with by buying Treasuries represents a reduction in our purchasing power of about 2% over this 10-year period. And this is even before taxes are factored in! Our objective is to preserve value and generate stable income. We feel that short-term bonds give us the best combination of short duration and current yield to meet this goal.
In order to avoid a reduction in purchasing power, either one of two things would have to happen. First, inflation could go down, which would make that future basket of goods less expensive. The second option would be for long-term interest rates to go up. We think the second option is more likely, and we’ve based our strategy on this assumption.
Fixed-Income Fund at June 30, 2008 (percentage of net assets) | |||
Portfolio Composition | |||
Long-term: | |||
Consumer | 0.45 | % | |
Long-term U.S. Government and Agency Securities | 24.81 | ||
Financials | 12.37 | % | |
Healthcare | 3.14 | % | |
Information Technology | 5.67 | % | |
Utilities | 1.54 | % | |
Telecommunication Services | 1.03 | % | |
Short-term: | |||
Short-term U.S. Government Agency Securities | 44.25 | % | |
Other Short-term Investments and Assets and Liabilities | 6.74 | % | |
Portfolio characteristics and holdings are subject to change periodically.
Strategy
We think that higher than normal inflation is likely to persist in the short term, especially given the global supply-demand dynamics for food and energy, which are pushing up prices of both of those critical household items. An additional and significant cause of elevated inflation is the weakening of the dollar. A weaker dollar means that imported goods will go up in price. Since we think inflation will remain high, it follows that we expect interest rates to keep climbing.
Because of this expectation, we’ve positioned the portfolio with a lower-than-average duration. At quarter-end, the Fund’s average duration was 2.8 years, significantly below the Lehman index, which currently has a 4.7-year duration. Duration is important because it measures how sensitive a bond’s price is to changes in interest rates.
At the end of the quarter, about 5% of the portfolio was invested in convertible bonds. We think these securities will increase in value over time, as the stocks of the issuing companies rise. Our convertible bond strategy will depend in large part on the stock market, which has recently seen a rather dramatic move downward, as you can read about in other parts of this report. A lower stock market generally makes convertible bonds more attractively priced, so we are actively searching for appropriate convertible bonds to boost the returns to the portfolio.
Thank you for investing in the Parnassus Fixed-Income Fund.
Yours truly, | ||||
|  |  | ||
| Todd C. Ahlsten | Ben Allen | Minh Bui | ||
Portfolio Manager and Chief Investment Officer | Co-Portfolio Manager | Co-Portfolio Manager | ||
The Parnassus Funds 19
Table of Contents
(This section was written by Milton Moskowitz, a consultant to Parnassus Investments who helps with the Parnassus Workplace Fund. Mr. Moskowitz has been a “corporation-watcher” for over 40 years and also co-authors the annual Fortune survey, “The 100 Best Companies To Work For.”)
All the Parnassus funds take social and environmental factors into consideration before investing in companies. We are proud of the steps taken by our portfolio companies in these areas.
Aflac became the first publicly-traded company to give shareholders a say on executive compensation. At the annual meeting on May 5, 2008, 93% of shareholders voted to approve the pay given to top officers. Only 2.5% said “no.” CEO Daniel Amos said that if the majority vote had been negative, the compensation plan would have been revised. His pay in 2007: $11.9 million…Microsoft has been a fixture on Fortune’s 100 Best Workplaces since inception of the survey in 1998 and now it is beginning to repeat that performance in Europe. In employee surveys conducted by the Great Place to Work Institute, the software company made the best workplace lists in 14 countries: Austria, Belgium, Denmark, Finland, France, Germany, Greece, Ireland, Italy, Netherlands, Norway, Portugal, Spain and Sweden. No other company came close to that multi-country ranking… Swiss pharmaceutical giant Novartis has pledged to pay at least a living wage to every employee throughout the world.…3M matches employee contributions to higher education and public broadcasting on a dollar-for-dollar basis. Effective this year, it raised the maximum match from $5,000 to $10,000…Target has its roots in the old Dayton department store of Minneapolis, which was an early promoter of the 5% Club in which member companies agreed to donate 5% of pretax profits to charitable causes. Target continues to adhere to that policy. It gives away $3 million a week to education, the arts and social services…Valero, the nation’s largest oil refiner, invested $600 million in environmental protection in 2007 and plans another $1.9 billion over the next three years. State-of-the-art scrubbers have reduced emissions of sulfur dioxide by more than 95%...Corning, worldwide leader in specialty glass and ceramics, has a support group for everyone. Among the affinity groups sponsored by the company are the following: Black Growth Council, Black Women’s Forum, Corning Chinese Association, Council of Indigenous People, Corning Latino Association, Corning Professionals Network, Corning Professional Women’s Forum, Ethnic Diversity Group of Employees, MTE Asian & Latin American Group, Society of Black Professionals, Southern Tier Indian Cultural Association, SPECTRA (Lesbian, Gay, Bisexual, Transgender Employee Resource Group), Society of Women Engineers, Women’s Leadership Forum, Women’s Quality Improvement Team…Intel invests heavily in education. Its Teach Program has trained five million teachers in more than 40 countries on how to effectively integrate technology into their classrooms. In 2007, it awarded more than $4 million in prizes and scholarships to 1,500 high school students who were finalists in the Intel International Science and Engineering Fair…IBM is piloting a new initiative, enabling employees to contribute up to $1,000 a year to an interest-bearing account. The company matches half of this contribution and the funds are then available to each staff member for educational courses of the employee’s choosing. IBM invests close to $700 million a year in employee education and training. More than 30,000 online courses are available to employees…In 2007, Best Buy increased the number of female general managers in its stores by 40%, female sales managers by 100% and female district managers by 200%.
20 The Parnassus Funds
Table of Contents
As a shareholder of the Funds, you incur ongoing costs, which include portfolio management fees, administrative fees, the production of shareholder reports, and other fund expenses. The Funds do not charge transaction fees, so you do not incur transaction costs such as sales charges (loads) on purchases, reinvested dividends, or other distributions, redemptions, and exchanges. The information on this page is intended to help you understand your ongoing costs of investing in the Funds and to compare these costs with the ongoing costs of investing in other mutual funds.
The following example is based on an investment of $1,000 invested at the beginning of the most recent six-month period and held for the period of January 1, 2008 through June 30, 2008.
Actual Expenses
In the example below, the first line for each fund provides information about actual account values and actual expenses. You may use the information in this line, together with the amount you invested, to estimate the expenses that you paid over the period. Simply divide your account value by $1,000 (for example, $8,600 account value divided by $1,000 = 8.6), then multiply the result by the number in the first line under the heading entitled “Expenses Paid During Period” to estimate the expenses you paid on your account during this period.
Hypothetical Example for Comparison Purposes
The second line of each fund provides information about hypothetical account values and hypothetical expenses based on the fund’s expense ratio and an assumed rate of return of 5% per year before expenses, which is not the fund’s actual return. You may compare the ongoing costs of investing in the Fund with other mutual funds by comparing this 5% hypothetical example with the 5% hypothetical examples that appear in the shareholder reports of other funds. The hypothetical account values and expenses may not be used to estimate the actual ending account balance or expenses you paid for the period.
Please note that the expenses shown in the table are meant to highlight only your ongoing costs in these funds. Therefore, the second line of each fund is useful in comparing only ongoing costs and will not help you determine the relative total costs of owning other mutual funds, which may include transactional costs such as loads.
| Beginning Account Value January 1, 2008 | Ending Account Value June 30, 2008 | Expenses Paid During Period* | |||||||
Parnassus Fund: Actual | $ | 1,000.00 | $ | 929.08 | $ | 4.75 | |||
Hypothetical (5% before expenses) | $ | 1,000.00 | $ | 1,019.94 | $ | 4.97 | |||
Equity Income Fund – Investor Shares: Actual | $ | 1,000.00 | $ | 960.27 | $ | 4.83 | |||
Hypothetical (5% before expenses) | $ | 1,000.00 | $ | 1,019.94 | $ | 4.97 | |||
Equity Income Fund – Institutional Shares: Actual | $ | 1,000.00 | $ | 961.64 | $ | 3.80 | |||
Hypothetical (5% before expenses) | $ | 1,000.00 | $ | 1,020.98 | $ | 3.92 | |||
Mid-Cap Fund: Actual | $ | 1,000.00 | $ | 916.04 | $ | 6.67 | |||
Hypothetical (5% before expenses) | $ | 1,000.00 | $ | 1,017.90 | $ | 7.02 | |||
Small-Cap Fund: Actual | $ | 1,000.00 | $ | 1,015.38 | $ | 7.02 | |||
Hypothetical (5% before expenses) | $ | 1,000.00 | $ | 1,017.90 | $ | 7.02 | |||
Workplace Fund: Actual | $ | 1,000.00 | $ | 933.52 | $ | 5.77 | |||
Hypothetical (5% before expenses) | $ | 1,000.00 | $ | 1,018.90 | $ | 6.02 | |||
Fixed-Income Fund: Actual | $ | 1,000.00 | $ | 1,011.43 | $ | 4.35 | |||
Hypothetical (5% before expenses) | $ | 1,000.00 | $ | 1,020.54 | $ | 4.37 | |||
| * | Expenses are equal to the fund’s annualized expense ratio of 0.99%, 0.99%, 0.78%, 1.40%, 1.40%, 1.20% and 0.87% for the Parnassus Fund, Equity Income Fund – Investor Shares, Equity Income Fund – Institutional Shares, Mid-Cap Fund, Small-Cap Fund, Workplace Fund and Fixed-Income Fund respectively, multiplied by the average account value over the period, multiplied by the ratio of days in the period. The ratio of days in the period is 182/366 (to reflect the one-half year period). |
The Parnassus Funds 21
Table of Contents
Portfolio of Investments
as of June 30, 2008 (unaudited)
Shares | Equities | Percent of Net Assets | Market Value | |||||
| Communications Equipment | ||||||||
| 150,000 | QUALCOMM Inc. | 2.6 | % | $ | 6,655,500 | |||
| Computer Peripherals | ||||||||
| 100,000 | Seagate Technology | 0.8 | % | $ | 1,913,000 | |||
| Data Storage | ||||||||
| 240,000 | NetApp Inc.1 | 2.1 | % | $ | 5,198,400 | |||
| Electronics | ||||||||
| 100,000 | Vishay Intertechnology1 | 10.4 | % | $ | $887,000 | |||
| Financial Services | ||||||||
| 110,000 | American Express Co. | $ | 4,143,700 | |||||
| 60,000 | Fannie Mae | 1,170,600 | ||||||
| 330,000 | First Horizon National Corp. | 2,451,900 | ||||||
| 230,000 | Freddie Mac | 3,772,000 | ||||||
| 7,000 | Goldman Sachs Group Inc. | 1,224,300 | ||||||
| 120,000 | JPMorgan Chase & Co. | 4,117,200 | ||||||
| 15,000 | Paychex Inc. | 469,200 | ||||||
| 335,000 | SLM Corp.1 | 6,482,250 | ||||||
| 355,000 | Wells Fargo & Co. | 8,431,250 | ||||||
| 12.7 | % | $ | 32,262,400 | |||||
| Food Products | ||||||||
| 70,000 | Sysco Corp. | 0.8 | % | $ | 1,925,700 | |||
| Healthcare Services | ||||||||
| 169,400 | Chemed Corp. 2 | 2.5 | % | $ | 6,201,734 | |||
| Home Builders | ||||||||
| 560,000 | DR Horton Inc. 2 | $ | 6,076,000 | |||||
| 70,000 | KB Home 2 | 1,185,100 | ||||||
| 600,000 | Pulte Homes Inc. 2 | 5,778,000 | ||||||
| 175,000 | Toll Brothers Inc.1, 2 | 3,277,750 | ||||||
| 6.5 | % | $ | 16,316,850 | |||||
| Home Products | ||||||||
| 66,000 | WD-40 Co. 2 | 0.8 | % | $ | 1,930,500 | |||
| Industrial Manufacturing | ||||||||
| 15,000 | 3M Co. | $ | 1,043,850 | |||||
| 10,000 | Cooper Industries Ltd. | 395,000 | ||||||
| 10,000 | Illinois Tool Works Inc. | 475,100 | ||||||
| 210,000 | Teleflex Inc. | 11,673,900 | ||||||
| 5.4 | % | $ | 13,587,850 | |||||
| Insurance | ||||||||
| 295,000 | Tower Group Inc. 2 | 2.5 | % | $ | 6,251,050 | |||
| Internet | ||||||||
| 16,000 | Google Inc.1 | 3.3 | % | $ | 8,422,720 | |||
| Machinery | ||||||||
| 80,000 | Graco Inc. 2 | 1.2 | % | $ | 3,045,600 | |||
| Networking Products | ||||||||
| 325,000 | Cisco Systems Inc.1 | 3.0 | % | $ | 7,559,500 | |||
| Oil & Gas | ||||||||
| 30,000 | Ultra Petroleum Corp.1 | $ | 2,946,000 | |||||
| 230,000 | Valero Energy Corp. | 9,471,400 | ||||||
| 90,000 | W&T Offshore Inc. | 5,265,900 | ||||||
| 7.0 | % | $ | 17,683,300 | |||||
| Pharmaceuticals | ||||||||
| 110,000 | Barr Pharmaceuticals Inc.1 | $ | 4,958,800 | |||||
| 90,000 | Cardinal Health Inc. | 4,642,200 | ||||||
| 150,000 | Forest Laboratories Inc.1 | 5,211,000 | ||||||
| 475,000 | Valeant Pharmaceuticals International 1, 2 | 8,127,250 | ||||||
| 360,000 | ViroPharma Inc.1, 2 | 3,981,600 | ||||||
| 10.6 | % | $ | 26,920,850 | |||||
| Real Estate Investment Trusts | ||||||||
| 80,000 | ProLogis | 1.7 | % | $ | 4,348,000 | |||
| Retail | ||||||||
| 80,000 | Best Buy Co., Inc. 2 | $ | 3,168,000 | |||||
| 240,000 | Lowe’s Cos., Inc. | 4,980,000 | ||||||
| 130,000 | Target Corp. | 6,043,700 | ||||||
| 130,000 | Walgreen Co. | 4,226,300 | ||||||
| 7.3 | % | $ | 18,418,000 | |||||
| Semiconductor Capital Equipment | ||||||||
| 90,000 | Applied Materials Inc. | $ | 1,718,100 | |||||
| 120,000 | Cognex Corp. 2 | 2,766,000 | ||||||
| 100,000 | Cymer Inc.1, 2 | 2,688,000 | ||||||
| 140,000 | Lam Research Corp.1 | 5,061,000 | ||||||
| 4.8 | % | $ | 12,233,100 | |||||
| Semiconductors | ||||||||
| 310,000 | Altera Corp. | $ | 6,417,000 | |||||
| 600,000 | Intel Corp. | 12,888,000 | ||||||
| 1,200,000 | Lattice Semiconductor Corp.1 | 3,756,000 | ||||||
| 180,000 | Linear Technology Corp. | 5,862,600 | ||||||
| 80,000 | Texas Instruments Inc. | 2,252,800 | ||||||
| 12.3 | % | $ | 31,176,400 | |||||
| Software | ||||||||
| 100,000 | Autodesk Inc.1 | $ | 3,381,000 | |||||
| 60,000 | Intuit Inc.1 | 1,654,200 | ||||||
| 2.0 | % | $ | 5,035,200 | |||||
| Telecommunication Equipment | ||||||||
| 250,000 | Ciena Corp.1, 2 | $ | 5,792,500 | |||||
| 190,000 | Corning Inc. | 4,379,500 | ||||||
| 1,500,000 | Powerwave Technologies Inc.1, 2 | 6,375,000 | ||||||
| 6.6 | % | $ | 16,547,000 | |||||
| Waste Management | ||||||||
| 120,000 | Waste Management Inc. | 1.8 | % | $ | 4,525,200 | |||
Total investment in equities (cost $266,377,699) | 98.7 | % | $ | 249,044,854 | ||||
22 | The accompanying notes are an integral part of these financial statements. |
Table of Contents
Portfolio of Investments
as of June 30, 2008 (unaudited) continued
Principal | Short-Term Securities | Percent of Net Assets | Market Value | ||||||
| Certificates of Deposit 3 | |||||||||
| 100,000 | Albina Community Bank | ||||||||
| 3.34%, matures 01/24/2009 | $ | 97,738 | |||||||
| 100,000 | Carver Federal Savings Bank | ||||||||
| 3.75%, matures 02/04/2009 | 97,611 | ||||||||
| 100,000 | Community Bank of the Bay | ||||||||
| 4.40%, matures 09/06/2008 | 99,268 | ||||||||
| 100,000 | Latino Community Credit Union | ||||||||
| 3.30%, matures 02/20/2009 | 97,443 | ||||||||
| 100,000 | Louisville Community Development Bank | ||||||||
| 2.25%, matures 05/10/2009 | 96,570 | ||||||||
| 100,000 | Opportunities Credit Union | ||||||||
| 2.00%, matures 04/25/2009 | 96,734 | ||||||||
| 100,000 | Self-Help Credit Union | ||||||||
| 3.47%, matures 01/14/2009 | 97,847 | ||||||||
| 100,000 | Southern Bancorp | ||||||||
| 4.15%, matures 01/12/2009 | 97,869 | ||||||||
| 100,000 | Wainwright Bank & Trust Co. | ||||||||
| 3.11%, matures 01/31/2009 | 97,661 | ||||||||
| 0.3 | % | $ | 878,741 | ||||||
| Registered Investment Companies— Money Market Funds | |||||||||
| 6,897 | Evergreen U.S. Government Fund | ||||||||
| variable rate, 2.09% | $ | 6,897 | |||||||
| 3,054,504 | Janus Government Fund | ||||||||
| variable rate, 2.30% | 3,054,504 | ||||||||
| 7,278 | SSGA U.S. Government Fund | ||||||||
| variable rate, 1.85% | 7,278 | ||||||||
| 1.2 | % | $ | 3,068,679 | ||||||
| Community Development Loans3 | |||||||||
| 100,000 | Boston Community Loan Fund | ||||||||
| 3.00%, matures 06/30/2009 | $ | 94,000 | |||||||
| 100,000 | Boston Community Loan Fund | ||||||||
| 3.00%, matures 06/30/2009 | 94,000 | ||||||||
| 100,000 | Root Capital Loan Fund | ||||||||
| 2.00%, matures 03/16/2009 | 95,759 | ||||||||
| 100,000 | Vermont Community Loan Fund | ||||||||
| 3.00%, matures 12/15/2008 | 97,320 | ||||||||
| 0.2 | % | $ | 381,079 | ||||||
| Securities Purchased with Cash Collateral from Securities Lending | |||||||||
| Registered Investment Companies | |||||||||
| 48,839,086 | State Street Navigator Securities Lending Prime Portfolio | ||||||||
| variable rate, 2.66% | 19.4 | % | $ | 48,839,086 | |||||
Total short-term securities (cost $53,167,585) | 21.1 | % | $ | 53,167,585 | |||||
Total securities (cost $319,545,284) | 119.8 | % | $ | 302,212,439 | |||||
| Payable upon return of securities loaned | -19.4 | % | $ | (48,839,086 | ) | ||||
| Other assets and liabilities – net | -0.4 | % | $ | (979,510 | ) | ||||
| Total net assets | 100.0 | % | $ | 252,393,843 | |||||
| 1 | These securities are non-income producing. |
| 2 | This security or partial position of this security was on loan at June 30, 2008. The total value of the securities on loan at June 30, 2008 was $46,838,878. |
| 3 | Market value adjustments have been applied to these securities to reflect early withdrawal. |
Fund holdings will vary over time.
| The accompanying notes are an integral part of these financial statements. | 23 |
Table of Contents
THE PARNASSUS EQUITY INCOME FUND
Portfolio of Investments
as of June 30, 2008 (unaudited)
Shares | Equities | Percent of Net Assets | Market Value | |||||
| Biotechnology | ||||||||
| 375,000 | Genentech Inc.1 | 2.7 | % | $ | 28,462,500 | |||
| Chemicals | ||||||||
| 515,000 | Rohm & Haas Co. 2 | 2.3 | % | $ | 23,916,600 | |||
| Computers | ||||||||
| 165,000 | International Business Machines Corp. | 1.9 | % | $ | 19,557,450 | |||
| Consulting Services | ||||||||
| 300,000 | Accenture Ltd. | $ | 12,216,000 | |||||
| 340,000 | Cognizant Technology Solutions Corp.1 | 11,053,400 | ||||||
| 2.2 | % | $ | 23,269,400 | |||||
| Cosmetics & Personal Care | ||||||||
| 465,000 | Procter & Gamble Co. | 2.7 | % | $ | 28,276,650 | |||
| Data Processing | ||||||||
| 300,000 | Automatic Data Processing Inc. | $ | 12,570,000 | |||||
| 800,000 | Jack Henry & Associates Inc. 2 | 17,312,000 | ||||||
| 2.9 | % | $ | 29,882,000 | |||||
| Financial Services | ||||||||
| 710,000 | JPMorgan Chase & Co. | $ | 24,360,100 | |||||
| 145,000 | Paychex Inc. | 4,535,600 | ||||||
| 1,475,000 | Wells Fargo & Co. | 35,031,250 | ||||||
| 6.2 | % | $ | 63,926,950 | |||||
| Food Products | ||||||||
| 435,000 | McCormick & Co. | $ | 15,512,100 | |||||
| 650,000 | Sysco Corp. | 17,881,500 | ||||||
| 3.2 | % | $ | 33,393,600 | |||||
| Healthcare Products | ||||||||
| 715,000 | Johnson & Johnson | 4.4 | % | $ | 46,003,100 | |||
| Healthcare Services | ||||||||
| 500,000 | Chemed Corp. 2 | $ | 18,305,000 | |||||
| 200,000 | IMS Health Inc. | 4,660,000 | ||||||
| 305,000 | Laboratory Corp.1 | 21,237,150 | ||||||
| 4.3 | % | $ | 44,202,150 | |||||
| Home Products | ||||||||
| 345,000 | WD-40 Co. 2 | 1.0 | % | $ | 10,091,250 | |||
| Industrial Manufacturing | ||||||||
| 400,000 | 3M Co. | $ | 27,836,000 | |||||
| 195,000 | Cooper Industries Ltd. | 7,702,500 | ||||||
| 475,000 | Danaher Corp. 2 | 36,717,500 | ||||||
| 100,000 | Pentair Inc. | 3,502,000 | ||||||
| 750,000 | Teleflex Inc. | 41,692,500 | ||||||
| 11.3 | % | $ | 117,450,500 | |||||
| Insurance | ||||||||
| 340,000 | AFLAC Inc. | 2.1 | % | $ | 21,352,000 | |||
| Internet | ||||||||
| 75,000 | Google Inc.1 | 3.8 | % | $ | 39,481,500 | |||
| Medical Equipment | ||||||||
| 140,000 | Gen-Probe Inc.1 | 0.6 | % | $ | 6,647,200 | |||
| Natural Gas | ||||||||
| 250,000 | Energen Corp. | $ | 19,507,500 | |||||
| 1,000,000 | MDU Resources Group Inc. | 34,860,000 | ||||||
| 650,000 | Southern Union Co. 2 | 17,563,000 | ||||||
| 200,000 | XTO Energy Inc. | 13,702,000 | ||||||
| 8.3 | % | $ | 85,632,500 | |||||
| Networking Products | ||||||||
| 790,000 | Cisco Systems Inc.1 | 1.8 | % | $ | 18,375,400 | |||
| Oil & Gas | ||||||||
| 100,000 | Apache Corp. | $ | 13,900,000 | |||||
| 285,000 | Smith International Inc. 2 | 23,694,900 | ||||||
| 100,000 | W&T Offshore Inc. 2 | 5,851,000 | ||||||
| 4.2 | % | $ | 43,445,900 | |||||
| Pharmaceuticals | ||||||||
| 400,000 | Cardinal Health Inc. | $ | 20,632,000 | |||||
| 270,000 | Novartis AG (ADR) | 14,860,800 | ||||||
| 325,000 | Teva Pharmaceutical Industries Ltd. (ADR) | 14,885,000 | ||||||
| 725,000 | Valeant Pharmaceuticals International 1, 2 | 12,404,750 | ||||||
| 6.0 | % | $ | 62,782,550 | |||||
| Real Estate Investment Trusts | ||||||||
| 335,000 | AMB Property Corp. | $ | 16,877,300 | |||||
| 410,000 | ProLogis | 22,283,500 | ||||||
| 3.8 | % | $ | 39,160,800 | |||||
| Semiconductors | ||||||||
| 350,000 | Intel Corp. | $ | 7,518,000 | |||||
| 550,000 | Linear Technology Corp.2 | 17,913,500 | ||||||
| 365,000 | Microchip Technology Inc. 2 | 11,147,100 | ||||||
| 3.5 | % | $ | 36,578,600 | |||||
| Services | ||||||||
| 320,000 | Ecolab Inc. | 1.3 | % | $ | 13,756,800 | |||
| Software | ||||||||
| 800,000 | Intuit Inc.1 | $ | 22,056,000 | |||||
| 1,775,000 | Microsoft Corp. | 48,830,250 | ||||||
| 6.8 | % | $ | 70,886,250 | |||||
24 | The accompanying notes are an integral part of these financial statements. |
Table of Contents
Portfolio of Investments
as of June 30, 2008 (unaudited) continued
Shares | Equities | Percent of Net Assets | Market Value | |||||
| Utilities | ||||||||
| 705,387 | Black Hills Corp. 2 | $ | 22,614,707 | |||||
| 130,000 | Northwest Natural Gas Co. 2 | 6,013,800 | ||||||
| 135,000 | Ormat Technologies Inc.2 | 6,639,300 | ||||||
| 300,000 | Otter Tail Corp. 2 | 11,649,000 | ||||||
| 600,000 | Pepco Holdings Inc. | 15,390,000 | ||||||
| 6.0 | % | $ | 62,306,807 | |||||
| Waste Management | ||||||||
| 765,000 | Waste Management Inc. | 2.8 | % | $ | 28,848,150 | |||
Total investment in equities (cost $ 957,995,716) | 96.1 | % | $ | 997,686,607 | ||||
Principal | Community Loans | |||||||
| Community Development Loans3 | ||||||||
| 1,000,000 | MicroVest I, LP Note | |||||||
| 5.88%, due 10/15/2009 | $ | 934,015 | ||||||
| 500,000 | MicroVest I, LP Note | |||||||
| 5.88%, due 03/15/2010 | 448,877 | |||||||
| 0.1 | % | $ | 1,382,892 | |||||
Total investment in community loans (cost $ 1,382,892) | 0.1 | % | $ | 1,382,892 | ||||
Total investments in equities and bonds (cost $ 959,378,608) | 96.2 | % | $ | 999,069,499 | ||||
Principal | Short-Term Investments | Percent of Net Assets | Market Value | |||||
| Certificates of Deposit 3 | ||||||||
| 100,000 | Community Bank of the Bay | |||||||
| 4.40%, matures 08/24/2008 | 0.0 | % | $ | 99,410 | ||||
| Registered Investment Companies— Money Market Funds | ||||||||
| 1,127,944 | Evergreen U.S. Government Fund | |||||||
| variable rate, 2.09% | $ | 1,127,944 | ||||||
| 27,103,314 | Janus Government Fund | |||||||
| variable rate, 2.30% | 27,103,314 | |||||||
| 23,557,742 | SSGA U.S. Government Fund | |||||||
| variable rate, 1.85% | 23,557,742 | |||||||
| 5.0 | % | $ | 51,789,000 | |||||
| Community Development Loans3 | ||||||||
| 100,000 | Boston Community Loan Fund | |||||||
| 3.00%, matures 06/30/2009 | $ | 94,000 | ||||||
| 200,000 | Root Capital Loan Fund | |||||||
| 2.00%, matures 01/25/2009 | 193,181 | |||||||
| 100,000 | Vermont Community Loan Fund | |||||||
| 3.00%, matures 04/16/2009 | 95,249 | |||||||
| 0.0 | % | $ | 382,430 | |||||
| The accompanying notes are an integral part of these financial statements. | 25 |
Table of Contents
THE PARNASSUS EQUITY INCOME FUND
Portfolio of Investments
as of June 30, 2008 (unaudited) continued
Principal | Short-Term Investments | Percent of Net Assets | Market Value | |||||
Certificate of Deposit Account Registry Service (CDARS) 3 | ||||||||
| 500,000 | CDARS agreement with Community Bank of the Bay, dated 10/24/2007, matures 10/23/2008, 4.40% Participating depository institutions: AMCORE Bank, NA, par 94,000; City National Bank of New Jersey, par 25,645; First Federal Bank of the Midwest, par 94,000; First National Bank of Arizona, par 94,000; Harris, NA, par 94,000; Johnson Bank, par 94,000; Orion Bank, par 4,355; (cost $ 493,737) | $493,737 | ||||||
| 500,000 | CDARS agreement with Community Bank of the Bay, dated 12/12/2007, matures 12/11/2008, 4.40% Participating depository institutions: Burke & Herbert Bank & Trust Co., par 94,000; Cross Keys Bank, par 94,000; Greater Buffalo Savings Bank, par 94,000; INSOUTH Bank, par 94,000; Landmark National Bank, par 6,856; ShoreBank, par 94,000; Union National Community Bank, par 23,144; (cost $ 491,045) | $491,045 | ||||||
Principal | Short-Term Investments | Percent of Net Assets | Market Value | |||||
| 500,000 | CDARS agreement with Community Bank of the Bay, dated 01/30/2008, matures 01/29/2009, 3.40% Participating depository institutions: First National Bank of Nevada, par 94,000; Union Bank & Trust Company, par 62,869; BankFirst Financial Services, par 61,131; Enterprise National Bank of Palm Beach, par 94,000; First Community Bank, par 94,000; The Bank of River Oaks, par 94,000; (cost $ 488,352) | $ | 488,352 | |||||
| 500,000 | CDARS agreement with Community Bank of the Bay, dated 02/13/2008, matures 02/12/2009, 3.11% Participating depository institutions: Liberty Savings Bank, FSB, par 94,500; The PrivateBank and Trust Company, par 94,500; The Buckhead Community Bank, NA, par 94,500; SpiritBank, par 79,687; Community West Bank, NA, par 42,313; Graystone Bank, par 94,500; (cost $487,584) | 487,584 | ||||||
| 0.3 | % | $ | 1,960,718 | |||||
26 | The accompanying notes are an integral part of these financial statements. |
Table of Contents
Portfolio of Investments
as of June 30, 2008 (unaudited) continued
Principal | Short-Term Investments | Percent of Net Assets | Market Value | ||||||
| Securities Purchased with Cash Collateral from Securities Lending | |||||||||
| Registered Investment Companies | |||||||||
| 106,367,854 | State Street Navigator Securities Lending Prime Portfolio | ||||||||
| variable rate, 2.66% | 10.2 | % | $ | 106,367,854 | |||||
Total short-term securities (cost $ 160,599,412) | 15.5 | % | $ | 160,599,412 | |||||
Total securities (cost $ 1,119,978,020) | 111.7 | % | $ | 1,159,668,911 | |||||
| Payable upon return of securities loaned | -10.2 | % | $ | (106,367,854 | ) | ||||
| Other assets and liabilities – net | -1.5 | % | $ | (15,486,925 | ) | ||||
| Total net assets | 100.0 | % | $ | 1,037,814,132 | |||||
| 1 | These securities are non-income producing. |
| 2 | This security or partial position of this security was on loan at June 30, 2008. The total value of the securities on loan at June 30, 2008 was $104,352,160. |
| 3 | Market value adjustments have been applied to these securities to reflect early withdrawal. |
Fund holdings will vary over time.
| The accompanying notes are an integral part of these financial statements. | 27 |
Table of Contents
Portfolio of Investments
as of June 30, 2008 (unaudited)
Shares | Equities | Percent of Net Assets | Market Value | |||||
| Apparel | ||||||||
| 4,000 | Liz Claiborne Inc. | 1.0 | % | $ | 56,600 | |||
| Computer Peripherals | ||||||||
| 9,000 | Seagate Technology | 3.1 | % | $ | 172,170 | |||
| Consulting Services | ||||||||
| 3,000 | Cognizant Technology Solutions Corp.1 | 1.8 | % | $ | 97,530 | |||
| Data Processing | ||||||||
| 2,000 | SEI Investments Co. | 0.9 | % | $ | 47,040 | |||
| Data Storage | ||||||||
| 9,000 | NetApp Inc.1 | 3.5 | % | $ | 194,940 | |||
| Financial Services | ||||||||
| 18,000 | First Horizon National Corp. | $ | 133,740 | |||||
| 3,500 | Paychex Inc. | 109,480 | ||||||
| 11,000 | SLM Corp.1 | 212,850 | ||||||
| 8.3 | % | $ | 456,070 | |||||
| Food Products | ||||||||
| 2,500 | Sysco Corp. | 1.2 | % | $ | 68,775 | |||
| Healthcare Services | ||||||||
| 9,000 | IMS Health Inc. | 3.8 | % | $ | 209,700 | |||
| Home Builders | ||||||||
| 23,000 | DR Horton Inc. | $ | 249,550 | |||||
| 21,000 | Pulte Homes Inc. | 202,230 | ||||||
| 6,500 | Toll Brothers Inc.1 | 121,745 | ||||||
| 10.4 | % | $ | 573,525 | |||||
| Industrial Manufacturing | ||||||||
| 500 | Cooper Industries Ltd. | $ | 19,750 | |||||
| 6,000 | Teleflex Inc. | 333,540 | ||||||
| 6.4 | % | $ | 353,290 | |||||
| Medical Equipment | ||||||||
| 2,000 | Varian Medical Systems Inc.1 | 1.9 | % | $ | 103,700 | |||
| Natural Gas | ||||||||
| 4,000 | MDU Resources Group Inc. | 2.5 | % | $ | 139,440 | |||
Shares | Equities | Percent of Net Assets | Market Value | |||||
| Oil & Gas | ||||||||
| 4,000 | Sunoco Inc. | $ | 162,760 | |||||
| 1,400 | Ultra Petroleum Corp.1 | 137,480 | ||||||
| 5.4 | % | $ | 300,240 | |||||
| Pharmaceuticals | ||||||||
| 6,000 | Barr Pharmaceuticals Inc.1 | $ | 270,480 | |||||
| 4,000 | Forest Laboratories Inc.1 | 138,960 | ||||||
| 7.4 | % | $ | 409,440 | |||||
| Real Estate Investment Trusts | ||||||||
| 2,000 | ProLogis | 2.0 | % | $ | 108,700 | |||
| Retail | ||||||||
| 3,000 | Best Buy Co., Inc. | $ | 118,800 | |||||
| 2,000 | Nordstrom Inc. | 60,600 | ||||||
| 3.3 | % | $ | 179,400 | |||||
| Semiconductor Capital Equipment | ||||||||
| 8,000 | Lam Research Corp.1 | 5.2 | % | $ | 289,200 | |||
| Semiconductors | ||||||||
| 9,000 | Altera Corp. | $ | 186,300 | |||||
| 8,000 | Linear Technology Corp. | 260,560 | ||||||
| 5,000 | Microchip | |||||||
| Technology Inc. | 152,700 | |||||||
| 21,000 | Micron Technology Inc.1 | 126,000 | ||||||
| 6,000 | NVIDIA Corp.1 | 112,320 | ||||||
| 15.3 | % | $ | 837,880 | |||||
| Software | ||||||||
| 4,000 | Autodesk Inc.1 | $ | 135,240 | |||||
| 2,500 | Citrix Systems Inc.1 | 73,525 | ||||||
| 8,000 | Intuit Inc.1 | 220,560 | ||||||
| 7.8 | % | $ | 429,325 | |||||
| Waste Management | ||||||||
| 5,500 | Waste Management Inc. | 3.8 | % | $ | 207,405 | |||
Total investment in equities (cost $5,920,112) | 95.0 | % | $ | 5,234,370 | ||||
28 | The accompanying notes are an integral part of these financial statements. |
Table of Contents
Portfolio of Investments
as of June 30, 2008 (unaudited) continued
Principal Amount $ | Short-Term Securities | Percent of Net Assets | Market Value | |||||
| Registered Investment Companies— Money Market Funds | ||||||||
| 122,149 | Janus Government Fund | |||||||
| variable rate, 2.30% | $ | 122,149 | ||||||
| 121,942 | SSGA U.S. Government Fund | |||||||
| variable rate, 1.85% | 121,942 | |||||||
| 4.4 | % | $ | 244,091 | |||||
Total short-term securities (cost $ 244,091) | 4.4 | % | $ | 244,091 | ||||
Total securities (cost $ 6,164,203) | 99.4 | % | $ | 5,478,461 | ||||
| Other assets and liabilities – net | 0.6 | % | $ | 31,496 | ||||
| Total net assets | 100.0 | % | $ | 5,509,957 | ||||
| 1 | These securities are non-income producing. |
Fund holdings will vary over time.
| The accompanying notes are an integral part of these financial statements. | 29 |
Table of Contents
Portfolio of Investments
as of June 30, 2008 (unaudited)
Shares | Equities | Percent of Net Assets | Market Value | |||||
| Building Materials | ||||||||
| 3,000 | Simpson Manufacturing Co., Inc. | 0.8 | % | $ | 71,220 | |||
| Data Processing | ||||||||
| 9,000 | Jack Henry & Associates Inc. | 2.1 | % | $ | 194,760 | |||
| Data Storage | ||||||||
| 9,000 | NetApp Inc.1 | 2.1 | % | $ | 194,940 | |||
| Electric Motors | ||||||||
| 5,000 | Baldor Electric Co. | 1.9 | % | $ | 174,900 | |||
| Electronics | ||||||||
| 6,000 | Plantronics Inc. | $ | 133,920 | |||||
| 16,000 | Vishay Intertechnology Inc.1 | 141,920 | ||||||
| 3.0 | % | $ | 275,840 | |||||
| Financial Services | ||||||||
| 10,000 | First Horizon National Corp. | 0.8 | % | $ | 74,300 | |||
| Footwear | ||||||||
| 19,000 | K-Swiss Inc. | 3.0 | % | $ | 279,300 | |||
| Healthcare Services | ||||||||
| 11,000 | Chemed Corp. | 4.4 | % | $ | 402,710 | |||
| Home Builders | ||||||||
| 10,000 | KB Home | $ | 169,300 | |||||
| 35,000 | Pulte Homes Inc. | 337,050 | ||||||
| 7,000 | Toll Brothers Inc.1 | 131,110 | ||||||
| 6.9 | % | $ | 637,460 | |||||
| Home Products | ||||||||
| 7,000 | WD-40 Co. | 2.2 | % | $ | 204,750 | |||
| Industrial Automation | ||||||||
| 4,000 | Nordson Corp. | 3.2 | % | $ | 291,560 | |||
| Industrial Manufacturing | ||||||||
| 11,000 | Teleflex Inc. | 6.6 | % | $ | 611,490 | |||
| Insurance | ||||||||
| 16,000 | Tower Group Inc. | 3.7 | % | $ | 339,040 | |||
Shares | Equities | Percent of Net Assets | Market Value | |||||
| Machinery | ||||||||
| 7,000 | Graco Inc. | 2.9 | % | $ | 266,490 | |||
| Networking Products | ||||||||
| 20,000 | Zhone Technologies Inc.1 | 0.2 | % | $ | 15,600 | |||
| Oil & Gas | ||||||||
| 10,000 | Mitcham Industries Inc.1 | $ | 170,800 | |||||
| 4,000 | W&T Offshore Inc. | 234,040 | ||||||
| 4.4 | % | $ | 404,840 | |||||
| Pharmaceuticals | ||||||||
| 25,000 | Valeant Pharmaceuticals International1 | $ | 427,750 | |||||
| 40,000 | ViroPharma Inc.1 | 442,400 | ||||||
| 9.5 | % | $ | 870,150 | |||||
| Retail | ||||||||
| 18,000 | Build-A-Bear | |||||||
| Workshop Inc.1 | 1.4 | % | $ | 130,860 | ||||
| Semiconductor Capital Equipment | ||||||||
| 12,000 | Cognex Corp. | $ | 276,600 | |||||
| 10,000 | Cymer Inc.1 | 268,800 | ||||||
| 5.9 | % | $ | 545,400 | |||||
| Semiconductors | ||||||||
| 150,000 | Lattice Semiconductor Corp.1 | 5.1 | % | $ | 469,500 | |||
| Software | ||||||||
| 17,000 | Computer Programs & Systems Inc. | $ | 294,610 | |||||
| 5,000 | Websense Inc.1 | 84,200 | ||||||
| 4.1 | % | $ | 378,810 | |||||
| Telecommunications Equipment | ||||||||
| 8,000 | Ciena Corp.1 | $ | 185,360 | |||||
| 15,000 | Harmonic Inc.1 | 142,650 | ||||||
| 125,000 | Powerwave Technologies Inc.1 | 531,250 | ||||||
| 9.4 | % | $ | 859,260 | |||||
| Utilities | ||||||||
| 12,000 | Black Hills Corp. | 4.2 | % | $ | 384,720 | |||
Total investment in equities (cost $8,512,767) | 87.8 | % | $ | 8,077,900 | ||||
30 | The accompanying notes are an integral part of these financial statements. |
Table of Contents
Portfolio of Investments
as of June 30, 2008 (unaudited) continued
Principal | Short-Term Securities | Percent of Net Assets | Market Value | |||||
| Registered Investment Companies— Money Market Funds | ||||||||
| 414,174 | Janus Government Fund | |||||||
| variable rate, 2.30% | $ | 414,174 | ||||||
| 558,415 | SSGA U.S. Government Fund | |||||||
| variable rate, 1.85% | 558,415 | |||||||
| 10.5 | % | $ | 972,589 | |||||
Total short-term securities (cost $972,589) | 10.5 | % | $ | 972,589 | ||||
Total securities (cost $9,485,356) | 98.3 | % | $ | 9,050,489 | ||||
| Other assets and liabilities – net | 1.7 | % | $ | 153,774 | ||||
| Total net assets | 100.0 | % | $ | 9,204,263 | ||||
| 1 | These securities are non-income producing. |
Fund holdings will vary over time.
| The accompanying notes are an integral part of these financial statements. | 31 |
Table of Contents
Portfolio of Investments
as of June 30, 2008 (unaudited)
Shares | Equities | Percent of Net Assets | Market Value | ||||||
| Building Materials | |||||||||
| 4,000 | Simpson Manufacturing Co., Inc. | 2.1 | % | $ | 94,960 | ||||
| Communications Equipment | |||||||||
| 4,000 | QUALCOMM Inc. | 3.9 | % | $ | 177,480 | ||||
| Computers | |||||||||
| 500 | International Business Machines Corp. | 1.3 | % | $ | 59,265 | ||||
| Data Processing | |||||||||
| 6,000 | SEI Investments Co. | 3.1 | % | $ | 141,120 | ||||
| Data Storage | |||||||||
| 6,500 | NetApp Inc.1 | 3.1 | % | $ | 140,790 | ||||
| Electric Motors | |||||||||
| 4,000 | Baldor Electric Co. | 3.1 | % | $ | 139,920 | ||||
| Financial Services | |||||||||
| 5,500 | American Express Co. | $ | 207,185 | ||||||
| 13,000 | First Horizon | ||||||||
| National Corp. | 96,590 | ||||||||
| 400 | Goldman Sachs | ||||||||
| Group Inc. | 69,960 | ||||||||
| 4,000 | Paychex Inc. | 125,120 | |||||||
| 9,000 | Wells Fargo & Co. | 213,750 | |||||||
| 15.8 | % | $ | 712,605 | ||||||
| Industrial Automation | |||||||||
| 1,000 | Nordson Corp. | 1.6 | % | $ | 72,890 | ||||
| Industrial Manufacturing | |||||||||
| 3,200 | 3M Co. | 5.0 | % | $ | 222,688 | ||||
| Insurance | |||||||||
| 1,500 | AFLAC Inc. | 2.1 | % | $ | 94,200 | ||||
| Internet | |||||||||
| 3,000 | eBay Inc.1 | $ | 81,990 | ||||||
| 400 | Google Inc.1 | 210,568 | |||||||
| 6.5 | % | $ | 292,558 | ||||||
| Machinery | |||||||||
| 3,500 | Graco Inc. | 3.0 | % | $ | 133,245 | ||||
| Networking Products | |||||||||
| 2,000 | Cisco Systems Inc.1 | 1.0 | % | $ | 46,520 | ||||
| Oil & Gas | |||||||||
| 6,000 | Valero Energy Corp. | 5.5 | % | $ | 247,080 | ||||
| Pharmaceuticals | |||||||||
| 1,500 | Novartis AG (ADR) | 1.8 | % | $ | 82,560 | ||||
| Retail | |||||||||
| 500 | Costco Wholesale Co. | $ | 35,070 | ||||||
| 4,000 | Target Corp. | 185,960 | |||||||
| 4,500 | Walgreen Co. | 146,295 | |||||||
| 8.2 | % | $ | 367,325 | ||||||
Shares | Equities | Percent of Net Assets | Market Value | ||||||
| Semiconductors | |||||||||
| 7,500 | Altera Corp. | $ | 155,250 | ||||||
| 7,500 | Intel Corp. | 161,100 | |||||||
| 6,000 | Linear Technology Corp. | 195,420 | |||||||
| 2,000 | Texas Instruments Inc. | 56,320 | |||||||
| 4,000 | Xilinx Inc. | 101,000 | |||||||
| 15.0 | % | $ | 669,090 | ||||||
| Software | |||||||||
| 1,500 | Adobe Systems Inc.1 | $ | 59,085 | ||||||
| 4,500 | Autodesk Inc.1 | 152,145 | |||||||
| 2,500 | Citrix Systems Inc.1 | 73,525 | |||||||
| 5,500 | Intuit Inc.1 | 151,635 | |||||||
| 1,500 | Microsoft Corp. | 41,265 | |||||||
| 10.7 | % | $ | 477,655 | ||||||
| Telecommunications Equipment | |||||||||
| 5,000 | Corning Inc. | $ | 115,250 | ||||||
| 3,000 | Nokia Corp. (ADR) | 73,500 | |||||||
| 4.2 | % | $ | 188,750 | ||||||
Total investment in equities (cost $4,552,545) | 97.0 | % | $ | 4,360,701 | |||||
Principal | Short-Term Securities | ||||||||
| Registered Investment Companies— Money Market Funds | |||||||||
| 46,691 | Janus Government Fund | ||||||||
| variable rate, 2.30% | $ | 46,691 | |||||||
| 115,321 | SSGA U.S. Government Fund | ||||||||
| variable rate, 1.85% | 115,321 | ||||||||
| 3.6 | % | $ | 162,012 | ||||||
Total short-term securities (cost $162,012) | 3.6 | % | $ | 162,012 | |||||
Total securities (cost $4,714,557) | 100.6 | % | $ | 4,522,713 | |||||
| Other assets and liabilities – net | - 0.6 | % | $ | (26,063 | ) | ||||
| Total net assets | 100.0 | % | $ | 4,496,650 | |||||
| 1 | These securities are non-income producing. |
Fund holdings will vary over time.
32 | The accompanying notes are an integral part of these financial statements. |
Table of Contents
THE PARNASSUS FIXED-INCOME FUND
Portfolio of Investments
as of June 30, 2008 (unaudited)
Shares | Equities | Percent of Net Assets | Market Value | |||||
| Natural Gas | ||||||||
| 30,000 | ONEOK Inc. 2 | $ | 1,464,900 | |||||
Total investment in equities (cost $759,304) | 1.5 | % | $ | 1,464,900 | ||||
Principal | Convertible Bonds | |||||||
| Computer Peripherals | ||||||||
| 1,500,000 | Maxtor Corp. 2 | |||||||
| Notes, 6.80%, due 04/30/2010 | 1.7 | % | $ | 1,573,125 | ||||
| Real Estate Investment Trusts | ||||||||
| 2,500,000 | Prologis | |||||||
| Notes, 1.88%, due 11/15/2037 | 2.3 | % | $ | 2,162,500 | ||||
| Semiconductors | ||||||||
| 1,000,000 | Intel Corp. 2 | |||||||
| Notes, 2.95%, due 12/15/2035 | 1.0 | % | $ | 973,750 | ||||
Total investments in convertible bonds (cost $4,852,447) | 5.0 | % | $ | 4,709,375 | ||||
Principal | Corporate Bonds | Percent of Net Assets | Market Value | |||||
| Biotechnology | ||||||||
| 3,000,000 | Genentech Inc. | |||||||
| Notes, 4.75%, due 07/15/2015 | 3.1 | % | $ | 2,974,149 | ||||
| Financial Services | ||||||||
| 2,000,000 | American Express Co. | |||||||
| Notes, 5.50%, due 09/12/2016 | $ | 1,899,834 | ||||||
| 500,000 | Bank One Corp. | |||||||
| Notes, 6.00%, due 02/17/2009 | 502,947 | |||||||
| 500,000 | Goldman Sachs Inc. | |||||||
| Notes, 6.65%, due 05/15/2009 | 509,840 | |||||||
| 1,500,000 | Goldman Sachs Inc. | |||||||
| Notes, 5.75%, due 10/01/2016 | 1,454,879 | |||||||
| 1,000,000 | Goldman Sachs Inc. | |||||||
| Notes, 5.63%, due 01/15/2017 | 926,557 | |||||||
| 2,000,000 | Merrill Lynch & Co., Inc. | |||||||
| Notes, 6.50%, due 07/15/2018 | 1,859,320 | |||||||
| 2,000,000 | Wells Fargo & Co. | |||||||
| Notes, 5.13%, due 09/15/2016 | 1,901,372 | |||||||
| 500,000 | Wells Fargo Financial Inc. | |||||||
| Notes, 6.85%, due 07/15/2009 | 507,450 | |||||||
| 10.1 | % | $ | 9,562,199 | |||||
| Networking Products | ||||||||
| 2,800,000 | Cisco Systems Inc. | |||||||
| Notes, 5.50%, due 02/22/2016 | 3.0 | % | $ | 2,824,940 | ||||
| Retail | ||||||||
| 400,000 | Target Corp. | |||||||
| Notes, 7.50%, due 08/15/2010 | 0.5 | % | $ | 428,287 | ||||
| Telecom Services | ||||||||
| 1,000,000 | Verizon Communications Inc. | |||||||
| Notes, 5.55%, due 02/15/2016 | 1.0 | % | $ | 974,044 | ||||
Total investments in corporate bonds (cost $17,034,178) | 17.7 | % | $ | 16,763,619 | ||||
| The accompanying notes are an integral part of these financial statements. | 33 |
Table of Contents
THE PARNASSUS FIXED-INCOME FUND
Portfolio of Investments
as of June 30, 2008 (unaudited) continued
Principal | U.S. Government Agency Securities | Percent of Net Assets | Market Value | ||||||
| 8,000,000 | Fannie Mae | ||||||||
| 4.35%, due 01/25/2010 | $ | 8,152,143 | |||||||
| 2,000,000 | Fannie Mae | ||||||||
| 5.25%, due 01/15/2009 | 2,026,042 | ||||||||
| 3,000,000 | Federal Farm Credit Bank | ||||||||
| 5.41%, due 11/07/2016 | 3,074,730 | ||||||||
| 2,000,000 | Federal Home Loan | ||||||||
| Bank System | |||||||||
| 5.50%, due 11/17/2016 | 2,058,066 | ||||||||
| 1,500,000 | Federal Home Loan | ||||||||
| Bank System | |||||||||
| 5.25%, due 09/12/2014 | 1,573,362 | ||||||||
| 1,500,000 | Federal Home Loan | ||||||||
| Bank System | |||||||||
| 5.00%, due 09/14/2012 | 1,558,248 | ||||||||
| 1,500,000 | Federal Home Loan | ||||||||
| Bank System | |||||||||
| 5.13%, due 03/10/2017 | 1,521,260 | ||||||||
| 1,500,000 | Federal Home Loan | ||||||||
| Bank System | |||||||||
| 5.25%, due 06/12/2009 | 1,532,562 | ||||||||
| 2,000,000 | Freddie Mac | ||||||||
| 6.00%, due 09/19/2016 | 2,011,708 | ||||||||
| 24.8 | % | $ | 23,508,121 | ||||||
Total investments in U.S. government agencies (cost $22,979,330) | 24.8 | % | $ | 23,508,121 | |||||
Total investment in equities and bonds (cost $45,625,259) | 49.0 | % | $ | 46,446,015 | |||||
Principal | Short-Term Investments | Percent of Net Assets | Market Value | ||||||
| U.S. Government Agency Discount Notes | |||||||||
| 11,000,000 | FHLB Discount Note | ||||||||
| 2.13% equivalent, matures 07/17/2008 | $ | 10,989,587 | |||||||
| 9,000,000 | FHLB Discount Note | ||||||||
| 2.15% equivalent, matures 07/23/2008 | 8,988,175 | ||||||||
| 13,000,000 | FHLB Discount Note | ||||||||
| 2.20% equivalent, matures 07/25/2008 | 12,980,933 | ||||||||
| 9,000,000 | FNMA Discount Note | ||||||||
| 2.17% equivalent, matures 08/08/2008 | 8,979,385 | ||||||||
| 44.3 | % | $ | 41,938,080 | ||||||
| Registered Investment Companies— Money Market Funds | |||||||||
| 1,127,944 | Evergreen U.S. Government Fund | ||||||||
| variable rate, 2.09% | $ | 1,127,944 | |||||||
| 3,391,115 | Janus Government Fund | ||||||||
| variable rate, 2.30% | 3,391,115 | ||||||||
| 1,023,118 | SSGA U.S. Government Fund | ||||||||
| variable rate, 1.85% | 1,023,118 | ||||||||
| 5.8 | % | $ | 5,542,177 | ||||||
| Securities Purchased with Cash Collateral from Securities Lending | |||||||||
| 1,559,468 | State Street Navigator Securities Lending Prime Portfolio | ||||||||
| variable rate, 2.66% | 1.6 | % | $ | 1,559,468 | |||||
Total short-term securities (cost $49,039,725) | 51.7 | % | $ | 49,039,725 | |||||
Total securities (cost $94,664,984) | 100.7 | % | $ | 95,485,740 | |||||
| Payable upon return of securities loaned | -1.6 | % | $ | (1,559,468 | ) | ||||
| Other assets and liabilities – net | 0.9 | % | 839,009 | ||||||
| Total net assets | 100.0 | % | $ | 94,765,281 | |||||
| 2 | This security or partial position of this security was on loan at June 30, 2008. The total value of the securities on loan on June 30, 2008 was $1,535,433. |
Fund holdings will vary over time.
34 | The accompanying notes are an integral part of these financial statements. |
Table of Contents
This page left blank intentionally.
The Parnassus Funds 35
Table of Contents
Statement of Assets and Liabilities
June 30, 2008 (unaudited)
| Parnassus Fund | Equity Income Fund | Mid-Cap Fund | |||||||||
Assets | |||||||||||
Investments in equities and bonds, at market value (cost $266,377,699, $959,378,608, $ 5,920,112) | $ | 249,044,854 | $ | 999,069,499 | $ | 5,234,370 | |||||
Investments in short-term securities | 53,167,585 | 160,599,412 | 244,091 | ||||||||
Cash | 162,884 | 521,164 | 11,218 | ||||||||
Receivables | |||||||||||
Dividends and interest | 151,702 | 4,952,608 | 5,229 | ||||||||
Capital shares sold | 16,217 | 2,238,925 | — | ||||||||
Due from Parnassus Investments | 11,436 | 2,228 | — | ||||||||
Other assets | 79,212 | 141,146 | 23,181 | ||||||||
Total assets | $ | 302,633,890 | $ | 1,167,524,982 | $ | 5,518,089 | |||||
Liabilities | |||||||||||
Payable upon return of loaned securities | 48,839,086 | 106,367,854 | — | ||||||||
Payable for investment securities purchased | 1,056,909 | 21,869,789 | — | ||||||||
Capital shares redeemed | 137,179 | 822,753 | — | ||||||||
Fees payable to Parnassus Investments | — | — | 32 | ||||||||
Distributions payable | — | 62,714 | — | ||||||||
Accounts payable and accrued expenses | 206,873 | 587,740 | 8,100 | ||||||||
Total liabilities | $ | 50,240,047 | $ | 129,710,850 | $ | 8,132 | |||||
Net assets | $ | 252,393,843 | $ | 1,037,814,132 | $ | 5,509,957 | |||||
Net assets consists of | |||||||||||
Undistributed net investment income (loss) | 408,204 | 372,768 | (4,573 | ) | |||||||
Unrealized appreciation (depreciation) on securities | (17,332,845 | ) | 39,690,891 | (685,742 | ) | ||||||
Accumulated net realized gain | 10,450,230 | 15,327,347 | 152,052 | ||||||||
Capital paid-in | 258,868,254 | 982,423,126 | 6,048,220 | ||||||||
Total net assets | $ | 252,393,843 | $ | 1,037,814,132 | $ | 5,509,957 | |||||
Net assets value and offering per share | |||||||||||
Shares outstanding investor class | 7,410,872 | 40,770,682 | 345,792 | ||||||||
Shares outstanding institutional class | — | 2,123,810 | — | ||||||||
Net asset values and redemption price per share | |||||||||||
Investor class | $ | 34.06 | $ | 24.19 | $ | 15.93 | |||||
Institutional class | — | $ | 24.24 | — | |||||||
36 | The accompanying notes are an integral part of these financial statements. |
Table of Contents
THE PARNASSUS FUNDS
Statement of Assets and Liabilities
June 30, 2008 (unaudited)
| Small-Cap Fund | Workplace Fund | Fixed- Income Fund | |||||||||
Assets | |||||||||||
Investments in equities and bonds, at market value (cost $8,512,767, $4,552,545, $ 45,625,259) | $ | 8,077,900 | $ | 4,360,701 | $ | 46,446,015 | |||||
Investments in short-term securities | 972,589 | 162,012 | 49,039,725 | ||||||||
Cash | 167,001 | 1,494 | 22,161 | ||||||||
Receivables | |||||||||||
Dividends and interest | 3,367 | 2,982 | 745,745 | ||||||||
Capital shares sold | 43,430 | 378 | 96,442 | ||||||||
Due from Parnassus Investments | 81 | — | 2,314 | ||||||||
Other assets | 17,778 | 17,950 | 43,602 | ||||||||
Total assets | $ | 9,282,146 | $ | 4,545,517 | $ | 96,396,004 | |||||
Liabilities | |||||||||||
Payable upon return of loaned securities | — | — | 1,559,468 | ||||||||
Payable for investment securities purchased | — | 42,300 | — | ||||||||
Capital shares redeemed | 71,300 | — | 61,008 | ||||||||
Fees payable to Parnassus Investments | — | 165 | — | ||||||||
Distributions payable | — | — | — | ||||||||
Accounts payable and accrued expenses | 6,583 | 6,402 | 10,247 | ||||||||
Total liabilities | $ | 77,883 | $ | 48,867 | $ | 1,630,723 | |||||
Net assets | $ | 9,204,263 | $ | 4,496,650 | $ | 94,765,281 | |||||
Net assets consists of | |||||||||||
Undistributed net investment income (loss) | (21,841 | ) | 4,706 | 27,116 | |||||||
Unrealized appreciation (depreciation) on securities | (434,867 | ) | (191,844 | ) | 820,756 | ||||||
Accumulated net realized gain | 342,708 | 65,648 | 472,175 | ||||||||
Capital paid-in | 9,318,263 | 4,618,140 | 93,445,234 | ||||||||
Total net assets | $ | 9,204,263 | $ | 4,496,650 | $ | 94,765,281 | |||||
Net assets value and offering per share | |||||||||||
Shares outstanding investor class | 536,055 | 273,690 | 5,842,139 | ||||||||
Shares outstanding institutional class | — | — | — | ||||||||
Net asset values and redemption price per share | |||||||||||
Investor class | $ | 17.17 | $ | 16.43 | $ | 16.22 | |||||
Institutional class | — | — | — | ||||||||
| The accompanying notes are an integral part of these financial statements. | 37 |
Table of Contents
THE PARNASSUS FUNDS
Statement of Operations
Six Months Ended June 30, 2008 (unaudited)
| Parnassus Fund | Equity Income Fund | Mid-Cap Fund | ||||||||||
Investment income | ||||||||||||
Dividends | $ | 1,459,452 | $ | 7,666,919 | $ | 35,286 | ||||||
Interest | 45,617 | 1,164,693 | 1,582 | |||||||||
Securities lending | 217,134 | 443,411 | — | |||||||||
Total investment income | $ | 1,722,203 | $ | 9,275,023 | $ | 36,868 | ||||||
Expenses | ||||||||||||
Investment advisory fees | 889,343 | 3,141,009 | 25,116 | |||||||||
Transfer agent fees | ||||||||||||
Investor shares | 108,138 | 141,954 | 4,439 | |||||||||
Institutional shares | — | 1,994 | — | |||||||||
Fund administration | 91,122 | 328,697 | 2,033 | |||||||||
Service provider fees | 45,364 | 795,885 | 3,573 | |||||||||
Reports to shareholders | 65,722 | 91,969 | 976 | |||||||||
Registration fees and expenses | 12,980 | 18,659 | 8,304 | |||||||||
Custody fees | 18,985 | 42,201 | 1,836 | |||||||||
Professional fees | 55,668 | 104,392 | 14,532 | |||||||||
Trustee fees and expenses | 10,421 | 33,352 | 229 | |||||||||
Proxy voting fees | 2,248 | 2,248 | 2,248 | |||||||||
Pricing service fees | 1,778 | 3,382 | 1,700 | |||||||||
Other expenses | 25,460 | 57,726 | 700 | |||||||||
Total expenses | $ | 1,327,229 | $ | 4,763,468 | $ | 65,686 | ||||||
Fees waived by Parnassus Investments | (13,000 | ) | (64,450 | ) | (24,224 | ) | ||||||
Expense offset | (230 | ) | (7,955 | ) | (21 | ) | ||||||
Net expenses | $ | 1,313,999 | $ | 4,691,063 | $ | 41,441 | ||||||
Net investment income (loss) | $ | 408,204 | $ | 4,583,960 | $ | (4,573 | ) | |||||
Realized and unrealized gain (loss) on investments | ||||||||||||
Net realized gain from securities transactions | 8,597,614 | 16,611,150 | 66,035 | |||||||||
Net change in unrealized depreciation of securities | (28,692,881 | ) | (58,539,737 | ) | (587,065 | ) | ||||||
Net realized and unrealized loss on securities | $ | (20,095,267 | ) | $ | (41,928,587 | ) | $ | (521,030 | ) | |||
Net decrease in net assets resulting from operations | $ | (19,687,063 | ) | $ | (37,344,627 | ) | $ | (525,603 | ) | |||
38 | The accompanying notes are an integral part of these financial statements. |
Table of Contents
THE PARNASSUS FUNDS
Statement of Operations
Six Months Ended June 30, 2008 (unaudited)
| Small-Cap Fund | Workplace Fund | Fixed-Income Fund | ||||||||||
Investment income | ||||||||||||
Dividends | $ | 26,348 | $ | 29,116 | $ | 22,800 | ||||||
Interest | 6,185 | 1,798 | 1,676,326 | |||||||||
Securities lending | — | — | 7,841 | |||||||||
Total investment income | $ | 32,533 | $ | 30,914 | $ | 1,706,967 | ||||||
Expenses | ||||||||||||
Investment advisory fees | 38,877 | 18,600 | 217,773 | |||||||||
Transfer agent fees | ||||||||||||
Investor shares | 6,688 | 4,321 | 27,611 | |||||||||
Institutional shares | — | — | — | |||||||||
Fund administration | 2,672 | 1,504 | 29,950 | |||||||||
Service provider fees | 4,066 | 1,376 | 44,274 | |||||||||
Reports to shareholders | 2,576 | 1,019 | 9,490 | |||||||||
Registration fees and expenses | 8,772 | 9,016 | 9,888 | |||||||||
Custody fees | 2,854 | 1,727 | 2,097 | |||||||||
Professional fees | 14,473 | 14,441 | 17,508 | |||||||||
Trustee fees and expenses | 287 | 152 | 2,922 | |||||||||
Proxy voting fees | 2,248 | 2,248 | — | |||||||||
Pricing service fees | 1,936 | 1,906 | 1,223 | |||||||||
Other expenses | 776 | 603 | 4,870 | |||||||||
Total expenses | $ | 86,225 | $ | 56,913 | $ | 367,606 | ||||||
Fees waived by Parnassus Investments | (31,501 | ) | (30,682 | ) | (38,928 | ) | ||||||
Expense offset | (350 | ) | (23 | ) | (1,286 | ) | ||||||
Net expenses | $ | 54,374 | $ | 26,208 | $ | 327,392 | ||||||
Net investment income (loss) | $ | (21,841 | ) | $ | 4,706 | $ | 1,379,575 | |||||
Realized and unrealized gain (loss) on investments | ||||||||||||
Net realized gain from securities transactions | 357,476 | 72,667 | 460,025 | |||||||||
Net change in unrealized depreciation of securities | (262,857 | ) | (384,059 | ) | (952,642 | ) | ||||||
Net realized and unrealized gain (loss) on securities | $ | 94,619 | $ | (311,392 | ) | $ | (492,617 | ) | ||||
Net increase (decrease) in net assets resulting from operations | $ | 72,778 | $ | (306,686 | ) | $ | 886,958 | |||||
| The accompanying notes are an integral part of these financial statements. | 39 |
Table of Contents
THE PARNASSUS FUNDS
Statement of Changes in Net Assets
| Parnassus Fund | Equity Income Fund | |||||||||||||||
| Six Months Ended June 30, 2008 (unaudited) | Year Ended December 31, 2007 | Six Months Ended June 30, 2008 (unaudited) | Year Ended December 31, 2007 | |||||||||||||
Investment income (loss) from operations | ||||||||||||||||
Net investment income (loss) | $ | 408,204 | $ | (21,567 | ) | $ | 4,583,960 | $ | 6,710,224 | |||||||
Net realized gain from securities transactions | 8,597,614 | 28,536,349 | 16,611,150 | 83,587,541 | ||||||||||||
Net change in unrealized appreciation (depreciation) | (28,692,881 | ) | (9,615,794 | ) | (58,539,737 | ) | 27,496,678 | |||||||||
Increase (decrease) in net assets resulting from operations | $ | (19,687,063 | ) | $ | 18,898,988 | $ | (37,344,627 | ) | $ | 117,794,443 | ||||||
Distributions | ||||||||||||||||
From net investment income | ||||||||||||||||
Investor shares | — | (41,240 | ) | (4,383,880 | ) | (38,740,084 | ) | |||||||||
Institutional shares | — | — | (279,713 | ) | (2,101,310 | ) | ||||||||||
From realized capital gains | ||||||||||||||||
Investor shares | — | (11,873,089 | ) | — | (57,212,862 | ) | ||||||||||
Institutional shares | — | — | — | (2,735,943 | ) | |||||||||||
Distributions to shareholders | $ | — | $ | (11,914,329 | ) | $ | (4,663,593 | ) | $ | (100,790,199 | ) | |||||
From capital share transactions | ||||||||||||||||
Investor shares | ||||||||||||||||
Proceeds from sale of shares | 6,839,058 | 17,570,266 | 231,585,099 | 126,912,063 | ||||||||||||
Reinvestment of dividends | — | 11,457,321 | 4,254,921 | 93,342,311 | ||||||||||||
Shares repurchased | (14,765,746 | ) | (93,651,117 | ) | (77,099,006 | ) | (176,632,200 | ) | ||||||||
Institutional shares | ||||||||||||||||
Proceeds from sale of shares | — | — | 9,040,968 | 21,017,574 | ||||||||||||
Reinvestment of dividends | — | — | 269,826 | 4,680,007 | ||||||||||||
Shares repurchased | — | — | (1,003,576 | ) | (28,123,976 | ) | ||||||||||
Increase (decrease) in net assets from capital share transactions | (7,926,688 | ) | (64,623,530 | ) | 167,048,232 | 41,195,779 | ||||||||||
Increase (decrease) in net assets | $ | (27,613,751 | ) | $ | (57,638,871 | ) | $ | 125,040,012 | $ | 58,200,023 | ||||||
Net assets | ||||||||||||||||
Beginning of period | 280,007,594 | 337,646,465 | 912,774,120 | 854,574,097 | ||||||||||||
End of period | $ | 252,393,843 | $ | 280,007,594 | $ | 1,037,814,132 | $ | 912,774,120 | ||||||||
Undistributed net investment income | $ | 408,204 | $ | — | $ | 372,768 | $ | 452,400 | ||||||||
Shares issued and redeemed | ||||||||||||||||
Investor shares | ||||||||||||||||
Shares sold | 191,825 | 457,184 | 9,488,495 | 4,769,277 | ||||||||||||
Shares issued through dividend reinvestment | — | 299,560 | 177,981 | 3,617,824 | ||||||||||||
Shares repurchased | (418,554 | ) | (2,439,567 | ) | (3,175,419 | ) | (6,656,133 | ) | ||||||||
Institutional shares | ||||||||||||||||
Shares sold | — | — | 371,259 | 796,103 | ||||||||||||
Shares issued through dividend reinvestment | — | — | 11,265 | 181,012 | ||||||||||||
Shares repurchased | — | — | (41,521 | ) | (1,063,800 | ) | ||||||||||
Net increase (decrease) in shares outstanding | ||||||||||||||||
Investor shares | (226,729 | ) | (1,682,823 | ) | 6,491,057 | 1,730,968 | ||||||||||
Institutional shares | — | — | 341,003 | (86,685 | ) | |||||||||||
40 | The accompanying notes are an integral part of these financial statements. |
Table of Contents
THE PARNASSUS FUNDS
Statement of Changes in Net Assets
| Mid-Cap Fund | Small-Cap Fund | |||||||||||||||
| Six Months Ended June 30, 2008 (unaudited) | Year Ended December 31, 2007 | Six Months Ended June 30, 2008 (unaudited) | Year Ended December 31, 2007 | |||||||||||||
Investment income (loss) from operations | ||||||||||||||||
Net investment loss | $ | (4,573 | ) | $ | (23,214 | ) | $ | (21,841 | ) | $ | (54,745 | ) | ||||
Net realized gain from securities transactions | 66,035 | 212,480 | 357,476 | 159,434 | ||||||||||||
Net change in unrealized depreciation | (587,065 | ) | (218,623 | ) | (262,857 | ) | (447,743 | ) | ||||||||
Increase (decrease) in net assets resulting from operations | $ | (525,603 | ) | $ | (29,357 | ) | $ | 72,778 | $ | (343,054 | ) | |||||
Distributions | ||||||||||||||||
From net investment income | ||||||||||||||||
Investor shares | — | (44,067 | ) | — | (18,240 | ) | ||||||||||
Institutional shares | — | — | — | — | ||||||||||||
From net realized capital gains | ||||||||||||||||
Investor shares | — | (61,337 | ) | — | (135,119 | ) | ||||||||||
Institutional shares | — | — | — | — | ||||||||||||
Distributions to shareholders | $ | — | $ | (105,404 | ) | $ | — | $ | (153,359 | ) | ||||||
From capital share transactions | ||||||||||||||||
Investor shares | ||||||||||||||||
Proceeds from sale of shares | 678,975 | 5,017,389 | 2,377,408 | 5,045,005 | ||||||||||||
Reinvestment of dividends | — | 99,933 | — | 148,696 | ||||||||||||
Shares repurchased | (1,167,907 | ) | (866,885 | ) | (1,242,940 | ) | (1,968,803 | ) | ||||||||
Institutional shares | ||||||||||||||||
Proceeds from sale of shares | — | — | — | — | ||||||||||||
Reinvestment of dividends | — | — | — | — | ||||||||||||
Shares repurchased | — | — | — | — | ||||||||||||
Increase (decrease) in net assets from capital share transactions | (488,932 | ) | 4,250,437 | 1,134,468 | 3,224,898 | |||||||||||
Increase (decrease) in net assets | $ | (1,014,535 | ) | $ | 4,115,676 | $ | 1,207,246 | $ | 2,728,485 | |||||||
Net assets | ||||||||||||||||
Beginning of period | 6,524,492 | 2,408,816 | 7,997,017 | 5,268,532 | ||||||||||||
End of period | $ | 5,509,957 | $ | 6,524,492 | $ | 9,204,263 | $ | 7,997,017 | ||||||||
Undistributed net investment income | $ | (4,573 | ) | $ | — | $ | (21,841 | ) | $ | — | ||||||
Shares issued and redeemed | ||||||||||||||||
Investor shares | ||||||||||||||||
Shares sold | 39,904 | 277,965 | 139,493 | 277,501 | ||||||||||||
Shares issued through dividend reinvestment | — | 5,622 | — | 8,466 | ||||||||||||
Shares repurchased | (69,286 | ) | (47,206 | ) | (76,384 | ) | (106,703 | ) | ||||||||
Institutional shares | ||||||||||||||||
Shares sold | — | — | — | — | ||||||||||||
Shares issued through dividend reinvestment | — | — | — | — | ||||||||||||
Shares repurchased | — | — | — | — | ||||||||||||
Net increase (decrease) in shares outstanding | ||||||||||||||||
Investor shares | (29,382 | ) | 236,381 | 63,109 | 179,264 | |||||||||||
Institutional shares | — | — | — | — | ||||||||||||
| The accompanying notes are an integral part of these financial statements. | 41 |
Table of Contents
THE PARNASSUS FUNDS
Statement of Changes in Net Assets
| Workplace Fund | Fixed-Income Fund | |||||||||||||||
| Six Months Ended June 30, 2008 (unaudited) | Year Ended December 31, 2007 | Six Months Ended June 30, 2008 (unaudited) | Year Ended December 31, 2007 | |||||||||||||
Investment income (loss) from operations | ||||||||||||||||
Net investment income | $ | 4,706 | $ | 5,327 | $ | 1,379,575 | $ | 2,951,385 | ||||||||
Net realized gain from securities transactions | 72,667 | 83,504 | 460,025 | 371,905 | ||||||||||||
Net change in unrealized appreciation (depreciation) | (384,059 | ) | 41,877 | (952,642 | ) | 784,019 | ||||||||||
Increase (decrease) in net assets resulting from operations | $ | (306,686 | ) | $ | 130,708 | $ | 886,958 | $ | 4,107,309 | |||||||
Distributions | ||||||||||||||||
From net investment income | ||||||||||||||||
Investor shares | — | (39,959 | ) | (1,383,073 | ) | (3,077,798 | ) | |||||||||
Institutional shares | — | — | — | — | ||||||||||||
From net realized capital gains | ||||||||||||||||
Investor shares | — | (58,400 | ) | — | (214,276 | ) | ||||||||||
Institutional shares | — | — | — | — | ||||||||||||
Distributions to shareholders | $ | — | $ | (98,359 | ) | $ | (1,383,073 | ) | $ | (3,292,074 | ) | |||||
From capital share transactions | ||||||||||||||||
Investor shares | ||||||||||||||||
Proceeds from sale of shares | 736,243 | 2,585,379 | 21,378,810 | 30,169,418 | ||||||||||||
Reinvestment of dividends | — | 96,912 | 1,239,246 | 2,955,648 | ||||||||||||
Shares repurchased | (226,007 | ) | (783,124 | ) | (8,218,824 | ) | (15,598,252 | ) | ||||||||
Institutional shares | ||||||||||||||||
Proceeds from sale of shares | — | — | — | — | ||||||||||||
Reinvestment of dividends | — | — | — | — | ||||||||||||
Shares repurchased | — | — | — | — | ||||||||||||
Increase in net assets from capital share transactions | 510,236 | 1,899,167 | 14,399,232 | 17,526,814 | ||||||||||||
Increase in net assets | $ | 203,550 | $ | 1,931,516 | $ | 13,903,117 | $ | 18,342,049 | ||||||||
Net assets | ||||||||||||||||
Beginning of period | 4,293,100 | 2,361,584 | 80,862,164 | 62,520,115 | ||||||||||||
End of period | $ | 4,496,650 | $ | 4,293,100 | $ | 94,765,281 | $ | 80,862,164 | ||||||||
Undistributed net investment income | $ | 4,706 | $ | — | $ | 27,116 | $ | 30,614 | ||||||||
Shares issued and redeemed | ||||||||||||||||
Investor shares | ||||||||||||||||
Shares sold | 42,957 | 143,974 | 1,304,769 | 1,867,052 | ||||||||||||
Shares issued through dividend reinvestment | — | 5,432 | 75,683 | 183,013 | ||||||||||||
Shares repurchased | (13,246 | ) | (43,934 | ) | (501,407 | ) | (966,644 | ) | ||||||||
Institutional shares | ||||||||||||||||
Shares sold | — | — | — | — | ||||||||||||
Shares issued through dividend reinvestment | — | — | — | — | ||||||||||||
Shares repurchased | — | — | — | — | ||||||||||||
Net increase in shares outstanding | ||||||||||||||||
Investor shares | 29,711 | 105,472 | 879,045 | 1,083,421 | ||||||||||||
Institutional shares | — | — | — | — | ||||||||||||
42 | The accompanying notes are an integral part of these financial statements. |
Table of Contents
Notes to Financial Statements (unaudited)
1. Organization and Significant Accounting Policies
The Parnassus Funds are comprised of two trusts, the Parnassus Funds trust and the Parnassus Income Funds trust (collectively the “Trusts”), organized as Massachusetts Business Trusts registered under the Investment Company Act of 1940 as diversified, open-end investment management companies and are comprised of six separate funds (collectively the “Funds”). The Parnassus Funds trust includes the Parnassus Fund which commenced operations on December 27, 1984 and the Parnassus Workplace Fund, the Parnassus Small-Cap Fund and the Parnassus Mid-Cap Fund which commenced operations on April 29, 2005. The Parnassus Income Funds trust includes the Parnassus Equity Income Fund and the Parnassus Fixed-Income Fund, both of which commenced operations on August 31,1992. The Parnassus California Tax-Exempt Fund, formerly a Fund in the Parnassus Income Funds trust, was liquidated and ceased operations on December 14, 2007. The Trusts’ financial statements and reports are presented in a single consolidated report for all periods presented.
Securities Valuations
Equity securities that are listed or traded on a national securities exchange are stated at market value, based on recorded closing sales on the exchange or on the NASDAQ’s National Market System official closing price. In the absence of a recorded sale, and for over-the-counter securities, equity securities are stated at the mean between the last recorded bid and asked prices. Long-term, fixed-income securities are valued each business day using prices based on procedures established by independent pricing services and approved by the Board of Trustees (the “Trustees”). Fixed-income securities with an active market are valued at the “bid” price where such quotes are readily available from brokers and dealers, and are representative of the actual market for such securities. Other fixed-income securities experiencing a less active market are valued as determined by the pricing services based on methods which include consideration of trading in securities of comparable yield, quality, coupon, maturity and type, as well as indications as to values from dealers and other market data without exclusive reliance upon quoted prices or over-the-counter prices, since such valuations are believed to reflect more accurately the value of such securities. Short-term investments in U.S. government agency discount notes are valued at amortized cost, which approximates market value. Investments in registered investment companies are valued at their net asset value.
Investments where market quotations are not readily available are priced at their fair value, in accordance with procedures established by the Trustees. In determining fair value, the Trustees may consider a variety of information including, but not limited to, the following: price based upon a multiple of earnings or sales, fundamental analytical data and an evaluation of market conditions. A valuation adjustment is applied to certificates of deposit, community development loans and other community development investments as an estimate of potential penalties for early withdrawal.
In September 2006, Statement of Financial Accounting Standards No.157, Fair Value Measurements (SFAS 157), was issued and is effective for fiscal years beginning after November 15, 2007. SFAS 157 defines fair value, establishes a framework for measuring fair value and expands disclosures about fair value measurements. The Funds have adopted SFAS 157 as of January 1, 2008. SFAS 157 does not have a material impact on the financial statements, but additional disclosure is required. Various inputs are used in determining the value of the Portfolio’s investments. These inputs are summarized in three levels listed below:
Level 1 - | Quoted market prices in active markets for identical securities on the measurement date and on an ongoing basis | |
| Level 2 - | Other observable inputs (e.g., quoted prices in active markets for similar securities, securities valuations based on commonly quoted benchmark interest rates and yield curves, and/or securities indices) | |
| Level 3 - | Significant unobservable inputs (e.g., information about assumptions, including risk, market participants would use in pricing a security) | |
43
Table of Contents
THE PARNASSUS FUNDS
Notes to Financial Statements (unaudited) continued
The inputs or methodology used for valuing securities are not necessarily an indication of the risk associated with investing in those securities. Following is a summary of the inputs used in valuing the funds’ portfolio investments and other financial instruments which are carried at fair value, as of June 30, 2008:
| Parnassus Fund | Equity Income Fund | |||||||||||||
Valuation level | Investments in Securities | Other Financial Instruments* | Investments in Securities | Other Financial Instruments* | ||||||||||
Level 1 | $ | 300,952,619 | $ | — | $ | 1,155,843,461 | $ | — | ||||||
Level 2 | — | — | — | — | ||||||||||
Level 3 | 1,259,820 | — | 3,825,450 | — | ||||||||||
Total | $ | 302,212,439 | $ | — | $ | 1,159,668,911 | $ | — | ||||||
| The following is a reconciliation of investments in which significant unobservable inputs (Level 3) were used in determining fair value: | ||||||||||||||
Balance as of December 31, 2007 | $ | 1,280,065 | $ | — | $ | 3,361,162 | $ | — | ||||||
Accrued discounts/premiums amortization | (20,245 | ) | — | (35,712 | ) | — | ||||||||
Realized gain (loss) | — | — | — | — | ||||||||||
Change in unrealized appreciation/depreciation | — | — | — | — | ||||||||||
Net purchases (sales) | — | — | 500,000 | — | ||||||||||
Transfers in and/or out of Level 3 | — | — | — | — | ||||||||||
Balance as of June 30, 2008 | $ | 1,259,820 | $ | — | $ | 3,825,450 | $ | — | ||||||
| Mid-Cap Fund | Small-Cap Fund | |||||||||||
Valuation level | Investments in Securities | Other Financial Instruments* | Investments in Securities | Other Financial Instruments* | ||||||||
Level 1 | $ | 5,478,461 | $ | — | $ | 9,050,489 | $ | — | ||||
Level 2 | — | — | — | — | ||||||||
Level 3 | — | — | — | — | ||||||||
Total | $ | 5,478,461 | $ | — | $ | 9,050,489 | $ | — | ||||
| Workplace Fund | Fixed-Income Fund | |||||||||||
Valuation level | Investments in Securities | Other Financial Instruments* | Investments in Securities | Other Financial Instruments* | ||||||||
Level 1 | $ | 4,522,713 | $ | — | $ | 50,504,625 | $ | — | ||||
Level 2 | — | — | 44,981,115 | — | ||||||||
Level 3 | — | — | — | — | ||||||||
Total | $ | 4,522,713 | $ | — | $ | 95,485,740 | $ | — | ||||
| * | Other financial instruments include futures and forwards, if applicable. |
44
Table of Contents
Notes to Financial Statements (unaudited) continued
Federal Income Taxes
The Trusts intend to comply with the requirements of the Internal Revenue Code applicable to regulated investment companies and to distribute all taxable income to shareholders. Therefore, no federal income tax provision is required. Income distributions and capital-gain distributions are determined in accordance with income tax regulations, which may differ from accounting principles generally accepted in the United States of America.
In June 2006, the Financial Accounting Standards Board (“FASB”) issued FASB Interpretation No. 48 – Accounting for Uncertainty in Income Taxes – an interpretation of FASB No.109, which establishes a minimum threshold for income tax benefits to be recognized on the financial statements. These tax benefits must meet a “more likely than not” threshold, which means that based on technical merits, they have a more than 50% likelihood of being sustained upon examination by the tax authority. Tax benefits meeting this threshold are measured as the largest amount of tax benefit that is greater than 50% likely of being realized upon ultimate settlement with the tax authority. FASB Interpretation No. 48 is effective for periods beginning after December 15, 2006, and was adopted by the funds on January 1, 2007. The adoption had no effect on the funds’ financial statements for the period ending June 30, 2008.
Securities Transactions
Securities transactions are recorded on the date the securities are purchased or sold (trade date). Realized gains and losses on securities transactions are determined on the basis of first-in, first-out for both financial statement and federal income tax purposes.
Dividends to Shareholders
Distributions to shareholders are recorded on the record date. The Equity Income Fund pays income dividends quarterly and capital-gain dividends annually. The Fixed-Income Fund pays income dividends monthly and capital-gain dividends annually. The other Funds pay income and capital-gain dividends annually.
Investment Income, Expenses, and Distributions
Dividend income is recognized on the ex-dividend date and interest income is recognized on an accrual basis. Discounts and premiums on securities purchased are amortized over the lives of the respective securities using the constant yield method, which approximates the interest method. Expenses are recorded on an accrual basis. Distributions to shareholders are recorded on the record date.
Securities Lending
The Parnassus Fund, Equity Income Fund and Fixed-Income Fund lend securities to approved financial institutions to earn additional income and receive cash and/or securities as collateral to secure the loans. Collateral is maintained at not less than 102% of the value of loaned securities. Although the risk of lending is mitigated by the collateral, the Funds could experience a delay in recovering securities and a possible loss of income or value if the borrower fails to return them.
Community Development Investment Programs
The Parnassus Fund, Equity Income Fund and the Fixed-Income Fund may each invest up to 2% of their assets in community investments and community-development loan funds. Each of the Funds may invest in obligations issued by community loan funds at below-market interest rates if the projects financed have a positive social impact. Generally, there is no secondary market on loan funds and thus these are considered illiquid because they may not be able to be sold within seven days.
As part of our community development investment program, the Equity Income Fund has entered into an agreement for fund investments through the Certificate of Deposit Account Registry Service (“CDARS”) network. The CDARS network allows members to place funds in time deposits with depository institutions whose accounts are insured by the Federal Deposit Insurance Corporation (“FDIC”). Provisions stipulate that participating institutions are FDIC insured, however, in the event of default or bankruptcy by any party to the agreement, the proceeds of the investment may be delayed or subject to legal proceedings and are subject to FDIC limits.
The Equity Income Fund holds a debt instrument issued by Microvest I, LP, a microfinance limited partnership specializing in providing capital to international microfinance institutions (“MFI’s”) that extend credit to developing countries and the entrepreneurial poor. This instrument may be subject to political and foreign currency exchange risk not normally associated with domestic debt instruments. Microvest I, LP investments in MFI’s can be affected by, among other factors, commodity prices, inflation, interest rates, taxation, social instability, and other political, economic or diplomatic developments in or affecting the various countries where MFI’s operate.
45
Table of Contents
THE PARNASSUS FUNDS
Notes to Financial Statements (unaudited) continued
Capital Stock
Capital stock consists of an unlimited number of authorized shares of capital stock, no par value.
Use of Estimates
The preparation of financial statements in conformity with accounting principles generally accepted in the United States of America requires management to make estimates and assumptions that affect the reported amounts of assets and liabilities at the date of the financial statements and the reported amounts of revenues and expenses during the reporting period. Actual results could differ from those estimates.
2. Tax Matters and Distributions
At June 30, 2008, the cost of investments in long-term securities, and net unrealized appreciation (depreciation), for income tax purposes were as follows:
| Parnassus Fund | Equity Income Fund | Mid-Cap Fund | Small-Cap Fund | Workplace Fund | Fixed-Income Fund | |||||||||||||||||||
Costs of investment | $ | 266,792,631 | $ | 959,637,001 | $ | 5,927,628 | $ | 8,519,518 | $ | 4,558,006 | $ | 45,625,259 | ||||||||||||
Unrealized appreciation | 15,743,399 | 77,767,074 | 166,741 | 553,459 | 263,874 | 1,490,366 | ||||||||||||||||||
Unrealized depreciation | (33,076,244 | ) | (38,076,183 | ) | (852,483 | ) | (988,326 | ) | (455,718 | ) | (669,610 | ) | ||||||||||||
Net unrealized appreciation (depreciation) | $ | (17,332,845 | ) | $ | 39,690,891 | $ | (685,742 | ) | $ | (434,867 | ) | $ | (191,844 | ) | $ | 820,756 | ||||||||
The Small-Cap Fund incurred $3,377 of post-October capital losses as of December 31, 2007, which is deferred until 2008 for tax purposes.
Net investment income and net ordinary income is the same for all funds for financial statement and tax purposes during the six-month period ended June 30, 2008 with the exception of Parnassus Equity Income Fund. For Parnassus Equity Income Fund, the net investment income differs from ordinary income for financial statement and tax purposes primarily due to income recognition differences for partnership investments. Net realized gains differ for financial statement and tax purposes primarily due to differing treatments of wash sales and partnership allocations.
3. Purchases and Sales of Securities
Purchases and proceeds from sales of securities, excluding short-term securities, for the six-month period ended June 30, 2008 were as follows:
Fund | Purchases | Sales | ||||
Parnassus Fund | $ | 127,830,515 | $ | 131,868,092 | ||
Equity Income Fund | $ | 516,307,201 | $ | 322,379,408 | ||
Mid-Cap Fund | $ | 2,833,373 | $ | 3,342,328 | ||
Small-Cap Fund | $ | 5,028,166 | $ | 3,917,305 | ||
Workplace Fund | $ | 2,423,994 | $ | 1,966,046 | ||
Fixed-Income Fund | $ | 2,257,500 | $ | 14,122,897 | ||
46
Table of Contents
Notes to Financial Statements (unaudited) continued
4. Investment Advisory Agreement and Transactions with Affiliates
Under terms of an agreement which provides for furnishing investment management and advice to the funds, Parnassus Investments is entitled to receive fees payable monthly, based on each fund’s average daily net assets for the month, at the following annual rates:
Parnassus Fund: 1.00% of the first $10,000,000, 0.75% of the next $20,000,000, 0.70% of the next $70,000,000, 0.65% of the next $100,000,000 and 0.60% of the remaining balance. Workplace Fund and Mid-Cap Fund: 0.85% of the first $100,000,000, 0.80% of the next $100,000,000, 0.75% of the next $300,000,000 and 0.70% of the amount above $500,000,000. Small-Cap Fund: 1.00% of the first $100,000,000, 0.90% of the next $100,000,000, 0.85% of the next $300,000,000 and 0.80% of the amount above $500,000,000. For the six-month period ended June 30, 2008, Parnassus Investments has contractually agreed to reduce its investment advisory fee through May 1, 2009 to the extent necessary to limit total operating expenses to 0.99% of net assets for the Parnassus Fund, 1.20% of net assets for the Workplace Fund and 1.40% of net assets for the Small-Cap Fund and the Mid-Cap Fund.
Equity Income Fund: 0.75% of the first $30,000,000, 0.70% of the next $70,000,000 and 0.65% of the amount above $100,000,000. Fixed-Income Fund: 0.50% of the first $200,000,000, 0.45% of the next $200,000,000 and 0.40% of the amount above $400,000,000. For the six-month period ended June 30, 2008, Parnassus Investments has contractually agreed to reduce its investment advisory fee through May 1, 2009 to the extent necessary to limit total operating expenses to 0.99% of net assets for the Equity Income Fund – Investor Shares, 0.78% of net assets for the Equity Income Fund –Institutional Shares, and 0.87% of net assets for the Fixed-Income Fund. Parnassus Investments further waived an additional 0.12% of net assets for Fixed-Income Fund for the six-month period ended June 30, 2008.
Parnassus Investments receives fees under terms of a separate agreement which provides for furnishing transfer agent and fund administration services to the funds. The transfer agent fee was $2.50 per month per account plus any out-of-pocket expenses for the Parnassus Fund, Mid-Cap Fund, Small-Cap Fund and Workplace Fund. The transfer agent fee was $2.70 per month per account plus any out-of-pocket expenses for the Equity Income Fund and Fixed-Income Fund. The Funds pay the monthly fee based on the number of accounts on record at each month-end. The fund administration reflects annual rates based on net assets for all funds managed by Parnassus Investments and was allocated based on respective fund net assets. The fund administration services fee was 0.07% of average net assets under this new agreement for the six-month period ended June 30, 2008.
Parnassus Investments may also arrange for third parties to provide certain services, including account maintenance, recordkeeping and other personal services to their clients who invest in the funds. For these services, the funds may pay service providers an aggregate service fee on investment accounts at a rate not to exceed 0.25% per annum of average daily net assets. The Equity Income Fund – Institutional Shares does not incur service provider fees.
5. Expense Offset Arrangement
The Funds have entered into an arrangement with the custodian whereby credits realized as a result of uninvested cash balances are used to reduce a portion of the custody fees. During the six-month period ended June 30, 2008, the custody fees were reduced as indicated in the Statements of Operations by the expense offset.
47
Table of Contents
Financial Highlights (unaudited)
Selected data for each share of capital stock outstanding, total return and ratios/supplemental data for the six-month period ended June 30, 2008 and each of the five years ended December 31 are as follows:
Parnassus Fund(d)
| June 30, 2008 (unaudited) | 2007 | 2006 | 2005 | 2004 | 2003 | |||||||||||||||||||
Net asset value at beginning of period | $ | 36.66 | $ | 36.23 | $ | 31.68 | $ | 31.09 | $ | 30.05 | $ | 25.79 | ||||||||||||
Income (loss) from operations(c): | ||||||||||||||||||||||||
Net investment income (loss) | 0.05 | — | (0.04 | ) | 0.16 | 0.12 | 0.02 | |||||||||||||||||
Net realized and unrealized gain (loss) on securities | (2.65 | ) | 2.03 | 4.59 | 0.63 | 1.05 | 4.32 | |||||||||||||||||
Total from investment operations | (2.60 | ) | 2.03 | 4.55 | 0.79 | 1.17 | 4.34 | |||||||||||||||||
Distributions: | ||||||||||||||||||||||||
Dividends from net investment income | — | (0.01 | ) | — | (0.20 | ) | (0.13 | ) | (0.08 | ) | ||||||||||||||
Distributions from net realized gains on securities | — | (1.59 | ) | — | — | — | — | |||||||||||||||||
Total distributions | — | (1.60 | ) | — | (0.20 | ) | (0.13 | ) | (0.08 | ) | ||||||||||||||
Net asset value at end of period | $ | 34.06 | $ | 36.66 | $ | 36.23 | $ | 31.68 | $ | 31.09 | $ | 30.05 | ||||||||||||
Total return | (7.09 | %) | 5.43 | % | 14.36 | % | 2.55 | % | 3.89 | % | 16.83 | % | ||||||||||||
Ratios/supplemental data: | ||||||||||||||||||||||||
Ratio of gross expenses to average net assets | 1.00 | % | 1.00 | % | 1.01 | % | 1.03 | % | 0.99 | % | 1.03 | % | ||||||||||||
Ratio of net expenses to average net assets (net of waiver and expense offset arrangements) | 0.99 | %(g) | 0.99 | %(g) | 0.99 | %(g) | 0.99 | %(g) | 0.99 | % | 0.99 | % | ||||||||||||
Ratio of net investment income (loss) to average net assets | 0.31 | % | (0.01 | %) | (0.13 | %) | 0.53 | % | 0.40 | % | 0.07 | % | ||||||||||||
Portfolio turnover rate | 48.73 | % | 88.67 | % | 141.98 | % | 136.07 | % | 119.80 | % | 61.33 | % | ||||||||||||
Net assets, end of period (000s) | $ | 252,394 | $ | 280,008 | $ | 337,646 | $ | 292,384 | $ | 339,893 | $ | 369,555 | ||||||||||||
48
Table of Contents
Financial Highlights (unaudited) continued
Equity Income Fund – Investor Shares
| June 30, 2008 (unaudited) | 2007 | 2006 | 2005 | 2004 | 2003 | |||||||||||||||||||
Net asset value at beginning of period | $ | 25.31 | $ | 24.83 | $ | 24.02 | $ | 25.00 | $ | 24.00 | $ | 21.20 | ||||||||||||
Income (loss) from operations(c): | ||||||||||||||||||||||||
Net investment income | 0.12 | 0.20 | 0.30 | 0.41 | 0.40 | 0.44 | ||||||||||||||||||
Net realized and unrealized gain (loss) on securities | (1.13 | ) | 3.28 | 3.23 | 0.24 | 1.79 | 2.85 | |||||||||||||||||
Total from investment operations | (1.01 | ) | 3.48 | 3.53 | 0.65 | 2.19 | 3.29 | |||||||||||||||||
Distributions: | ||||||||||||||||||||||||
Dividends from net investment income | (0.11 | ) | (1.18 | ) | (1.38 | ) | (0.85 | ) | (0.56 | ) | (0.49 | ) | ||||||||||||
Distributions from net realized gains on securities | — | (1.82 | ) | (1.34 | ) | (0.78 | ) | (0.63 | ) | — | ||||||||||||||
Total distributions | (0.11 | ) | (3.00 | ) | (2.72 | ) | (1.63 | ) | (1.19 | ) | (0.49 | ) | ||||||||||||
Net asset value at end of period | $ | 24.19 | $ | 25.31 | $ | 24.83 | $ | 24.02 | $ | 25.00 | $ | 24.00 | ||||||||||||
Total return | (3.97 | %) | 14.13 | % | 14.70 | % | 2.62 | % | 9.30 | % | 15.69 | % | ||||||||||||
Ratios/supplemental data: | ||||||||||||||||||||||||
Ratio of gross expenses to average net assets | 1.01 | % | 1.03 | % | 1.06 | % | 1.07 | % | 1.04 | % | 0.96 | % | ||||||||||||
Ratio of net expenses to average net assets (net of waiver and expense offset arrangements) | 0.99 | %(g) | 0.99 | %(g) | 0.99 | %(g) | 0.99 | %(g) | 1.04 | % | 0.95 | % | ||||||||||||
Ratio of net investment income to average net assets | 0.95 | % | 0.73 | % | 1.17 | % | 1.63 | % | 1.63 | % | 1.95 | % | ||||||||||||
Portfolio turnover rate | 36.16 | % | 91.42 | % | 116.75 | % | 109.54 | % | 79.88 | % | 79.21 | % | ||||||||||||
Net assets, end of period (000s) | $ | 986,340 | $ | 867,577 | $ | 808,104 | $ | 906,844 | $ | 894,415 | $ | 630,249 | ||||||||||||
Equity Income Fund – Institutional Shares
| June 30, 2008 (unaudited) | 2007 | 2006(f) | ||||||||||
Net asset value at beginning of period | $ | 25.35 | $ | 24.86 | $ | 25.59 | ||||||
Income (loss) from operations(c): | ||||||||||||
Net investment income | 0.14 | 0.25 | 0.19 | |||||||||
Net realized and unrealized gain (loss) on securities | (1.11 | ) | 3.28 | 1.73 | ||||||||
Total from investment operations | (0.97 | ) | 3.53 | 1.92 | ||||||||
Distributions: | ||||||||||||
Dividends from net investment income | (0.14 | ) | (1.22 | ) | (1.31 | ) | ||||||
Distributions from net realized gains on securities | — | (1.82 | ) | (1.34 | ) | |||||||
Total distributions | (0.14 | ) | (3.04 | ) | (2.65 | ) | ||||||
Net asset value at end of period | $ | 24.24 | $ | 25.35 | $ | 24.86 | ||||||
Total return | (3.84 | %) | 14.35 | % | 7.46 | %(a) | ||||||
Ratios/supplemental data: | ||||||||||||
Ratio of gross expenses to average net assets | 0.81 | % | 0.82 | % | 0.85 | %(b) | ||||||
Ratio of net expenses to average net assets (net of waiver and expense offset arrangements) | 0.78 | %(g) | 0.78 | %(g) | 0.78 | %(b)(d) | ||||||
Ratio of net investment income to average net assets | 1.14 | % | 0.95 | % | 1.10 | %(b) | ||||||
Portfolio turnover rate | 36.16 | % | 91.42 | % | 116.75 | % | ||||||
Net assets, end of period (000s) | $ | 51,474 | $ | 45,197 | $ | 46,471 | ||||||
49
Table of Contents
THE PARNASSUS FUNDS
Financial Statements (unaudited) continued
Mid-Cap Fund
| June 30, 2008 (unaudited) | 2007 | 2006 | 2005(e) | |||||||||||||
Net asset value at beginning of period | $ | 17.39 | $ | 17.36 | $ | 15.30 | $ | 15.00 | ||||||||
Income (loss) from operations(c): | ||||||||||||||||
Net investment income (loss) | (0.01 | ) | (0.08 | ) | (0.06 | ) | 0.04 | |||||||||
Net realized and unrealized gain (loss) on securities | (1.45 | ) | 0.40 | 2.47 | 0.44 | |||||||||||
Total from investment operations | (1.46 | ) | 0.32 | 2.41 | 0.48 | |||||||||||
Distributions: | ||||||||||||||||
Dividends from net investment income | — | (0.12 | ) | (0.29 | ) | (0.04 | ) | |||||||||
Distributions from net realized gains on securities | — | (0.17 | ) | (0.07 | ) | (0.14 | ) | |||||||||
Total distributions | — | (0.29 | ) | (0.36 | ) | (0.18 | ) | |||||||||
Net asset value at end of period | $ | 15.93 | $ | 17.39 | $ | 17.36 | $ | 15.30 | ||||||||
Total return | (8.40 | )% | 1.81 | % | 15.78 | % | 3.22 | %(a) | ||||||||
Ratios/supplemental data: | ||||||||||||||||
Ratio of gross expenses to average net assets | 2.23 | % | 2.04 | % | 5.29 | % | 9.03 | %(b) | ||||||||
Ratio of net expenses to average net assets (net of waiver and expense offset arrangements) | 1.40 | %(g) | 1.40 | %(g) | 1.40 | %(g) | 1.40 | %(b) | ||||||||
Ratio of net investment income (loss) to average net assets | (0.15 | )% | (0.42 | )% | (0.35 | )% | 0.37 | %(b) | ||||||||
Portfolio turnover rate | 49.11 | % | 76.85 | % | 122.04 | % | 31.41 | %(a) | ||||||||
Net assets, end of period (000s) | $ | 5,510 | $ | 6,524 | $ | 2,409 | $ | 640 | ||||||||
Small-Cap Fund
| June 30, 2008 (unaudited) | 2007 | 2006 | 2005(e) | |||||||||||||
Net asset value at beginning of period | $ | 16.91 | $ | 17.94 | $ | 15.76 | $ | 15.00 | ||||||||
Income (loss) from operations(c): | ||||||||||||||||
Net investment income (loss) | (0.05 | ) | (0.13 | ) | (0.10 | ) | (0.03 | ) | ||||||||
Net realized and unrealized gain (loss) on securities | 0.31 | (0.56 | ) | 3.07 | 1.18 | |||||||||||
Total from investment operations | 0.26 | (0.69 | ) | 2.97 | 1.15 | |||||||||||
Distributions: | ||||||||||||||||
Dividends from net investment income | — | (0.04 | ) | (0.74 | ) | (0.39 | ) | |||||||||
Distributions from net realized gains on securities | — | (0.30 | ) | (0.05 | ) | — | ||||||||||
Total distributions | — | (0.34 | ) | (0.79 | ) | (0.39 | ) | |||||||||
Net asset value at end of period | $ | 17.17 | $ | 16.91 | $ | 17.94 | $ | 15.76 | ||||||||
Total return | 1.54 | % | (3.92 | )% | 18.78 | % | 7.65 | %(a) | ||||||||
Ratios/supplemental data: | ||||||||||||||||
Ratio of gross expenses to average net assets | 2.22 | % | 2.06 | % | 3.03 | % | 7.27 | %(b) | ||||||||
Ratio of net expenses to average net assets (net of waiver and expense offset arrangements) | 1.40 | %(g) | 1.40 | %(g) | 1.40 | %(g) | 1.40 | %(b) | ||||||||
Ratio of net investment income (loss) to average net assets | (0.56 | )% | (0.72 | )% | (0.56 | )% | (0.27 | )%(b) | ||||||||
Portfolio turnover rate | 53.08 | % | 100.30 | % | 125.00 | % | 86.20 | %(a) | ||||||||
Net assets, end of period (000s) | $ | 9,204 | $ | 7,997 | $ | 5,269 | $ | 1,225 | ||||||||
50
Table of Contents
Financial Highlights (unaudited) continued
Workplace Fund
| June 30, 2008 (unaudited) | 2007 | 2006 | 2005(e) | |||||||||||||
Net asset value at beginning of period | $ | 17.60 | $ | 17.05 | $ | 15.49 | $ | 15.00 | ||||||||
Income (loss) from operations(c): | ||||||||||||||||
Net investment income | 0.02 | 0.03 | 0.02 | 0.04 | ||||||||||||
Net realized and unrealized gain (loss) on securities | (1.19 | ) | 0.94 | 2.28 | 0.50 | |||||||||||
Total from investment operations | (1.17 | ) | 0.97 | 2.30 | 0.54 | |||||||||||
Distributions: | ||||||||||||||||
Dividends from net investment income | — | (0.17 | ) | (0.61 | ) | (0.05 | ) | |||||||||
Distributions from net realized gains on securities | — | (0.25 | ) | (0.13 | ) | — | ||||||||||
Total distributions | — | (0.42 | ) | (0.74 | ) | (0.05 | ) | |||||||||
Net asset value at end of period | $ | 16.43 | $ | 17.60 | $ | 17.05 | $ | 15.49 | ||||||||
Total return | (6.65 | )% | 5.64 | % | 14.84 | % | 3.60 | %(a) | ||||||||
Ratios/supplemental data: | ||||||||||||||||
Ratio of gross expenses to average net assets | 2.60 | % | 2.64 | % | 4.04 | % | 6.91 | %(b) | ||||||||
Ratio of net expenses to average net assets (net of waiver and expense offset arrangements) | 1.20 | %(g) | 1.20 | %(g) | 1.20 | %(g) | 1.20 | %(b) | ||||||||
Ratio of net investment income (loss) to average net assets | 0.22 | % | 0.16 | % | 0.12 | % | 0.39 | %(b) | ||||||||
Portfolio turnover rate | 46.29 | % | 56.18 | % | 96.93 | % | 27.55 | %(a) | ||||||||
Net assets, end of period (000s) | $ | 4,497 | $ | 4,293 | $ | 2,362 | $ | 1,013 | ||||||||
Fixed-Income Fund
| June 30, 2008 (unaudited) | 2007 | 2006 | 2005 | 2004 | 2003 | |||||||||||||||||||
Net asset value at beginning of period | $ | 16.29 | $ | 16.11 | $ | 15.79 | $ | 15.87 | $ | 16.00 | $ | 15.88 | ||||||||||||
Income (loss) from operations(c): | ||||||||||||||||||||||||
Net investment income | 0.26 | 0.67 | 0.67 | 0.48 | 0.33 | 0.58 | ||||||||||||||||||
Net realized and unrealized gain (loss) on securities | (0.07 | ) | 0.25 | 0.49 | (0.08 | ) | (0.01 | ) | 0.26 | |||||||||||||||
Total from investment operations | 0.19 | 0.92 | 1.16 | 0.40 | 0.32 | 0.84 | ||||||||||||||||||
Distributions: | ||||||||||||||||||||||||
Dividends from net investment income | (0.26 | ) | (0.69 | ) | (0.74 | ) | (0.48 | ) | (0.33 | ) | (0.65 | ) | ||||||||||||
Distributions from net realized gains on securities | — | (0.05 | ) | (0.10 | ) | — | (0.09 | ) | (0.07 | ) | ||||||||||||||
Return of capital | — | — | — | — | (0.03 | ) | — | |||||||||||||||||
Total distributions | (0.26 | ) | (0.74 | ) | (0.84 | ) | (0.48 | ) | (0.45 | ) | (0.72 | ) | ||||||||||||
Net asset value at end of period | $ | 16.22 | $ | 16.29 | $ | 16.11 | $ | 15.79 | $ | 15.87 | $ | 16.00 | ||||||||||||
Total return | 1.14 | % | 5.81 | % | 7.45 | % | 2.55 | % | 2.05 | % | 5.30 | % | ||||||||||||
Ratios/supplemental data: | ||||||||||||||||||||||||
Ratio of gross expenses to average net assets | 0.84 | % | 0.87 | % | 0.92 | % | 1.01 | % | 0.97 | % | 0.92 | % | ||||||||||||
Ratio of net expenses to average net assets (net of waiver and expense offset arrangements) | 0.75 | %(g) | 0.75 | %(g) | 0.75 | %(g) | 0.75 | % | 0.75 | % | 0.62 | % | ||||||||||||
Ratio of net investment income to average net assets | 3.16 | % | 4.13 | % | 4.13 | % | 3.03 | % | 2.08 | % | 3.59 | % | ||||||||||||
Portfolio turnover rate | 4.55 | % | 32.48 | % | 41.27 | % | 34.08 | % | 24.38 | % | 125.74 | % | ||||||||||||
Net assets, end of period (000s) | $ | 94,765 | $ | 80,862 | $ | 62,520 | $ | 45,879 | $ | 38,205 | $ | 34,098 | ||||||||||||
| (a) | Not annualized for periods less than one year. |
| (b) | Annualized. |
| (c) | Income (loss) from operations per share is based on average daily shares outstanding. |
| (d) | Prior to May 1, 2004, the Parnassus Fund charged a sales load of a maximum of 3.5%, which is not reflected in the total overall return figures. |
| (e) | The Mid-Cap Fund, the Small-Cap Fund and the Workplace Fund commenced operations on April 29, 2005 and the period shown is from April 29, 2005 through December 31, 2005. |
| (f) | The Equity Income Fund – Institutional Shares commenced operations on April 28, 2006 and the period shown is from April 28, 2006 through December 31, 2006. |
| (g) | Parnassus Investments has contractually limited expenses to an annualized rate of 0.99% for the Parnassus Fund, 0.99% for the Equity Income Fund – Investor Shares, 0.78% for the Equity Income Fund – Institutional Shares, 1.40% for the Mid-Cap Fund and the Small-Cap Fund, 1.20% for the Workplace Fund and 0.87% for the Fixed-Income Fund. |
Parnassus Investments has also voluntarily limited additional expenses for the Fixed-Income Fund. (see note 4 for details).
51
Table of Contents
ADDITIONAL INFORMATION (unaudited)
Investment Advisory Agreement Renewal
On March 19, 2008, the Board of Trustees of the Parnassus Funds approved the continuation of the Parnassus Funds investment advisory agreement with Parnassus Investments. Prior to approving the continuation of the investment advisory agreement, the Board considered:
| • | the nature, extent and quality of the services provided by Parnassus Investments; |
| • | the degree to which the Parnassus Fund, the Parnassus Equity Income Fund, the Parnassus Mid-Cap Fund, the Parnassus Small-Cap Fund, the Parnassus Workplace Fund and the Parnassus Fixed-Income Fund are being managed in accordance with each fund’s stated investment objective; |
| • | the investment performance of each of the Parnassus Funds; |
| • | the cost of the services to be provided and profits to be realized by Parnassus Investments from its relationship with each of the Parnassus Funds; |
| • | the extent to which economies of scale would be realized as each of the Parnassus Funds grew and whether fee levels reflect these economies of scale; |
| • | the expense ratio of each of the Parnassus Funds; and |
| • | the manner in which portfolio transactions for the Parnassus Funds are conducted, including the use of soft dollars. |
In considering the nature, extent and quality of the services provided by Parnassus Investments, the Board of Trustees reviewed written and oral reports prepared by Parnassus Investments describing the portfolio management, shareholder communication and servicing, prospective shareholder assistance and regulatory compliance services provided by Parnassus Investments to the Parnassus Funds, and a written report prepared by Lipper Inc. comparing aspects of the portfolio management services provided by Parnassus Investments to similar services provided to comparable mutual funds. The Board concluded that Parnassus Investments was providing essential services to the Parnassus Funds. In particular, the Board concluded that Parnassus Investments was preparing reports to shareholders in addition to those required by law.
The Trustees compared the performance of each of the Parnassus Funds to benchmark indices over various periods of time and to comparable mutual funds as determined by Lipper Inc. and concluded that the overall performance of each fund warranted the continuation of the investment advisory agreement.
In concluding that the advisory fees payable by each of the Parnassus Funds were reasonable, the Trustees reviewed a report of the costs of services provided, and the profits realized, by Parnassus Investments, from its relationship with each fund and concluded that such profits were reasonable and not excessive when compared to profitability guidelines set forth in relevant court cases. The Trustees also reviewed reports comparing each fund’s expense ratio and advisory fees paid by each fund to those of other comparable mutual funds and concluded that the advisory fee paid by each fund and each fund’s expense ratio were within the range of comparable mutual funds. The Trustees noted that the investment advisory fee contained a number of breakpoints in an effort to reflect economies of scale that might be realized as each fund grew.
The Board reviewed reports discussing the manner in which portfolio transactions for the Parnassus Funds were conducted, including the use of soft dollars. Based on these reports, the Board concluded that the research obtained by Parnassus Investments was beneficial to the Parnassus Funds and that Parnassus Investments was executing each fund’s portfolio transactions in a manner designed to obtain best execution for the Parnassus Funds.
52
Table of Contents
ADDITIONAL INFORMATION (unaudited) continued
Proxy Disclosures
Parnassus proxy voting policies and procedures are available, without charge, on our website (www.parnassus.com), on the Securities and Exchange Commission’s website (www.sec.gov), and by calling us at (800) 999–3505. The funds file a proxy voting record with the Securities and Exchange Commission for the 12 months ended June 30. The most recent report is available by calling Parnassus or obtaining from the Securities and Exchange Commission’s website or our Parnassus website.
Quarterly Portfolio Schedule
The funds file their complete schedule of portfolio holdings with the Securities and Exchange Commission for the first and third quarters of each fiscal year on Form N-Q. The quarterly portfolio holdings are available on the Securities and Exchange Commission’s website (www.sec.gov). The funds’ Form N-Q may also be reviewed and copied at the Securities and Exchange Commission’s Public Reference Room in Washington, DC, and information on the operation of the Public Reference Room may be obtained by calling (800) SEC–0330.
53
Table of Contents

THE PARNASSUS FUNDSSM
1 Market Street, Suite 1600 San Francisco, CA 94105
(800) 999-3505 (415) 778-0200
www.parnassus.com
Investment Adviser
Parnassus Investments
1 Market Street, Suite 1600
San Francisco, CA 94105
Legal Counsel
Foley & Lardner LLP
777 E. Wisconsin Ave.
Milwaukee, WI 53202
Independent Registered
Public Accounting Firm
Deloitte & Touche LLP
50 Fremont Street
San Francisco, CA 94105
Distributor
Parnassus Funds
Distributor
1 Market Street, Suite 1600
San Francisco, CA 94105
This report must be preceded or accompanied by a current prospectus.
Printed on recycled paper with soy-based ink.
Table of Contents
Item 2: Code of Ethics
Not applicable for semi-annual reports. The information required by this Item is only required in an annual report on Form N-CSR.
Item 3: Audit Committee Financial Expert
Not applicable for semi-annual reports. The information required by this Item is only required in an annual report on Form N-CSR.
Item 4: Principal Accountant Fees and Services
Not applicable for semi-annual reports. The information required by this Item is only required in an annual report on Form N-CSR.
Item 5: Not applicable.
Item 6: Included as part of the report to shareholders filed under Item 1 of this form.
Item 7: Not applicable.
Item 8: Not applicable.
Item 9: Not applicable.
Item 10: For the purposes of this Item, there have not been any material changes to the procedures by which shareholders may recommend nominees to the registrant’s Board of Trustees.
Item 11: Controls and Procedures.
(a) The registrant’s certifying officers have reasonably designed such disclosure controls and procedures to ensure material information relating to the registrant is made known to them by others, particularly during the period in which this report is being prepared. The registrant’s certifying officers have determined that the registrant’s disclosure controls and procedures are effective based on their evaluation of these controls and procedures as of a date within 90 days prior to the filing date of this report.
(b) There were no significant changes in the registrant’s internal controls over financial reporting, or in other factors that could significantly affect these controls, that occurred during the registrant’s first fiscal half-year, including any corrective actions with regard to significant deficiencies and material weaknesses.
Item 12: Exhibits attached hereto.
(a)(1) Code of Ethics - Not applicable for semi-annual reports.
(a)(2) Certification for each principal executive and principal financial officer of the registrant as required by Rule 30a-2 under the Act (17 CFR 270.30a-2(a)) - Filed as an attachment to this filing.
(b) Certifications required by Rule 30a-2(b) under the Act (17 CFR 270.30a-2(b)), Rule 13a-14(b) or Rule 15d-14(b) under the Exchange Act (17 CFR 240.13a-14(b) or 240.15d-14(b)), and Section 1350 of Chapter 63 of Title 18 of the United States Code (18 U.S.C. 1350). A certification furnished pursuant to this paragraph will not be deemed “filed” for purposes of Section 18 of the Exchange Act (15 U.S.C. 78r), or otherwise subject to the liability of that section. Such certification will not be deemed to be incorporated by reference into any filing under the Securities Act of 1933 or the Exchange Act, except to the extent that the registrant specifically incorporates it by reference – Filed as an attachment to this filing.
Table of Contents
Pursuant to the requirements of the Securities Exchange Act of 1934 and the Investment Company Act of 1940, the registrant has duly caused this report to be signed on its behalf by the undersigned, thereunto duly authorized.
Parnassus Income Funds
| ||||
| Date: August 14, 2008 | By: | /s/ Jerome L. Dodson | ||
Jerome L. Dodson President | ||||
Pursuant to the requirements of the Securities Exchange Act of 1934 and the Investment Company Act of 1940, this report has been signed below by the following persons on behalf of the registrant and in the capacities and on the dates indicated.
| Date: August 14, 2008 | By: | /s/ Jerome L. Dodson | ||
Jerome L. Dodson President |
| Date: August 14, 2008 | By: | /s/ Marc C. Mahon | ||
Marc C. Mahon Principal Accounting Officer |