Semi-Annual Report
December 31, 2016
| | Quaker Event Arbitrage Fund |
| | Quaker Global Tactical Allocation Fund |
| | Quaker Mid-Cap Value Fund |
| | Quaker Small-Cap Value Fund |
| | Quaker Strategic Growth Fund |
| | | |
| | Mutual fund investing involves risk. Principal loss is possible. | |
| | Investing in the Quaker Funds may involve special risk including, but not limited to, investments in smaller companies, short sales, foreign securities, special situations, debt securities and value growth investing. Please refer to the prospectus for more complete information. | |
| | This report must be preceded or accompanied by a current prospectus. | |
| | The opinions expressed are those of the adviser or sub-advisers through the end of the period for this report, are subject to change, are not a guarantee, and should not be considered investment advice. | |
| | Fund holdings are subject to change and should not be considered a recommendation to buy or sell any security. Current and future holdings are subject to risk. | |
| | | |
Chairman’s Letter to the Shareholders (unaudited)
December 31, 2016
Dear Fellow Shareholder:
The premise upon which Quaker Funds, Inc. was founded was the desire to afford everyday investors access to the same tactical and allocation strategies used by professional money managers to augment traditional investing strategies within a holistic asset allocation mix. Our commitment to this principle is still as strong today as it was the day we opened our doors.
Our management team continually strives to provide our shareholders with innovative investment alternatives and advisers that constantly seek superior returns. Thank you for your trust and investment in the Quaker Funds.
Sincerely,
Jeffry H. King, Sr.
Chairman & CEO
Quaker Investment Trust
| | | | | |
| | | Table of Contents | | |
| | | | Page | |
| | | Chairman’s Letter to the Shareholders | 1 | |
| | | Performance Update: | | |
| | | Quaker Event Arbitrage Fund | 2 | |
| | | Quaker Global Tactical Allocation Fund | 4 | |
| | | Quaker Mid-Cap Value Fund | 6 | |
| | | Quaker Small-Cap Value Fund | 8 | |
| | | Quaker Strategic Growth Fund | 10 | |
| | | Expense Information | 12 | |
| | | Schedule of Investments | 14 | |
| | | Statements of Assets and Liabilities | 36 | |
| | | Statements of Operations | 38 | |
| | | Statements of Changes in Net Assets | 40 | |
| | | Financial Highlights | 42 | |
| | | Notes to the Financial Statements | 57 | |
| | | Board Consideration of the | | |
| | | Sub-Advisory Agreement | 75 | |
| | | General Information | 77 | |
| | | | | |
Performance Update (unaudited)
Quaker Event Arbitrage Fund (QEAAX, QEACX, QEAIX)
OBJECTIVES AND PRINCIPAL STRATEGIES
The Quaker Event Arbitrage Fund (“Fund”) seeks to provide long-term growth of capital. The Fund generally invest in the securities of publicly traded companies involved in mergers, takeovers, tender offers, leveraged buyouts, spin-offs, liquidations or similar events (corporate reorganizations).
| Average Annualized Total Return |
| | | | | | | | | | Commencement |
| | | | | | | | | | of operations |
| | Expense | Inception | | | | | | | through |
| | Ratio* | Date | One Year | Five Year | Ten Year | 12/31/2016 |
| | | | with | without | with | without | with | without | with | without |
| | | | sales | sales | sales | sales | sales | sales | sales | sales |
| | | | charge | charge | charge | charge | charge | charge | charge | charge |
| Class A | 1.99% | 11/21/03 | 7.55% | 13.80% | 3.61% | 4.78% | 1.39% | 1.96% | 4.98% | 5.43% |
| Class C | 2.74% | 6/7/10 | 12.96% | 12.96% | 3.99% | 3.99% | N/A | N/A | 2.36% | 2.36% |
| Institutional Class | 1.74% | 6/7/10 | 14.04% | 14.04% | 5.02% | 5.02% | N/A | N/A | 3.36% | 3.36% |
| S&P 500® Total Return Index** | | 11.96% | 11.96% | 14.66% | 14.66% | 6.95% | 6.95% | 8.28% | 8.28% |
| * | As stated in the Prospectus dated November 1, 2016. Net Expense Ratio shown. Gross Expense Ratio: A:2.41%, C:3.16%, I:2.16%. The net expense ratio reflects a contractual commitment by the Fund’s investment adviser to waive fees and reimburse expenses through November 1, 2017. Absent the waiver and reimbursement, performance would have been less favorable. |
| ** | The benchmark since inception returns are calculated since commencement of November 21, 2003 through December 31, 2016. |
Performance data quoted represents past performance and is no guarantee of future results. Investment return and principal value will fluctuate so that shares, when redeemed, may be worth more or less than their original cost. Current performance may be lower or higher than performance data quoted. Performance data current to the most recent month end is available at www.quakerfunds.com or by calling us toll free at 800-220-8888. Total return includes reinvestment of dividends and capital gains.
Class A shares of the Fund have a maximum sales charge of 5.50%.
The performance table does not reflect the deduction of taxes that a shareholder might pay on fund distributions or the redemption of fund shares. Total return calculations reflect expense reimbursements and fee waivers in the applicable periods. See financial highlights for periods where fees were waived or reimbursed.
The Fund’s portfolio holdings may differ significantly from the securities held in the index and, unlike a mutual fund, an unmanaged index assumes no transaction costs, taxes, management fees or other expenses. You cannot invest directly in an index.
The S&P 500® Total Return Index (“S&P 500® Index”) is a widely recognized, unmanaged index consisting of the approximately 500 largest companies in the United States as measured by market capitalization. The S&P 500® Index assumes reinvestment of all dividends and distributions.
2016 SEMI-ANNUAL REPORT
Performance Update (unaudited) (continued)
Quaker Event Arbitrage Fund (QEAAX, QEACX, QEAIX)
ADVISER:
Quaker Funds, Inc.
TOTAL NET ASSETS:
AS OF DECEMBER 31, 2016
$29,393,874
| Top 10 Holdings* (% of net assets) | | |
| Mondelez International Inc. | 5.2% | |
| Pfizer Inc. | 4.8% | |
| Hess Corp. | 3.7% | |
| Diagnostic Services Holdings Inc. | 3.6% | |
| IEC Electronics Corp. | 3.4% | |
| Ithaca Energy Inc., 8.125%, 07/01/2019 | 3.4% | |
| Kosmos Energy Ltd., 7.875%, 08/01/2021 | 3.4% | |
| Gastar Exploration Inc., 8.625%, 05/15/2018 | 3.3% | |
| Tullow Oil PLC, 6.00%, 11/01/2020 | 3.2% | |
| Imperva Inc. | 3.0% | |
| % Fund Total | 37.0% | |
* Includes Long-Term Investments only.
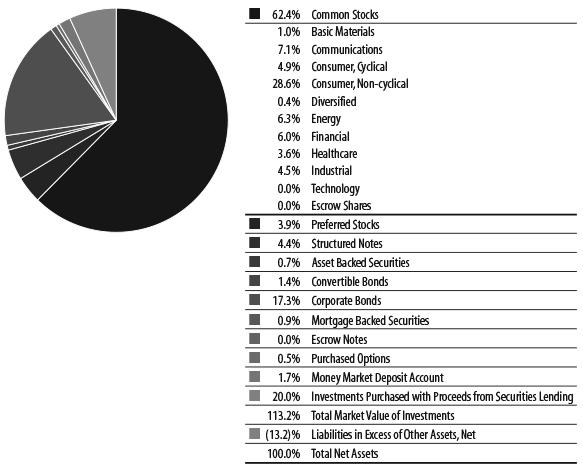
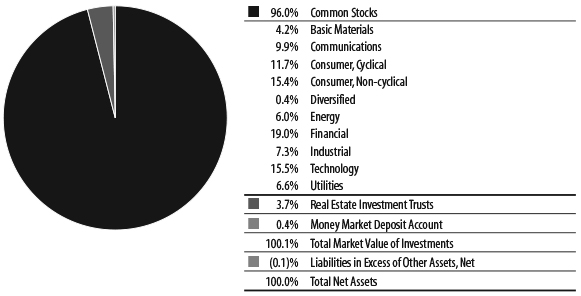
| Sectors (% of net assets) |
2016 SEMI-ANNUAL REPORT
Performance Update (unaudited)
Quaker Global Tactical Allocation Fund (QTRAX, QTRCX, QTRIX)
OBJECTIVES AND PRINCIPAL STRATEGIES
The Fund seeks to provide long-term growth of capital. The Fund invests in ETFs and common stocks of US companies, ETF’s and ADRs of foreign companies, and individual bonds and ETFs of fixed income securities, without regard to market capitalization.
| Average Annualized Total Return |
| | | | | | | | | | Commencement |
| | | | | | | | | | of operations |
| | Expense | Inception | | | | | | | through |
| | Ratio* | Date | One Year | Five Year | Ten Year | 12/31/2016 |
| | | | with | without | with | without | with | without | with | without |
| | | | sales | sales | sales | sales | sales | sales | sales | sales |
| | | | charge | charge | charge | charge | charge | charge | charge | charge |
| Class A | 1.80% | 5/1/08 | -10.67% | -5.50% | 7.72% | 8.95% | N/A | N/A | -0.31% | 0.34% |
| Class C | 2.55% | 5/1/08 | -6.13% | -6.13% | 8.12% | 8.12% | N/A | N/A | -0.41% | -0.41% |
| Institutional Class | 1.55% | 7/23/08 | -5.18% | -5.18% | 9.22% | 9.22% | N/A | N/A | 2.07% | 2.07% |
| MSCI World® Index** | | | 7.51% | 7.51% | 10.41% | 10.41% | N/A | N/A | 3.86% | 3.86% |
| * | As stated in the Prospectus dated November 1, 2016. Net Expense Ratio shown. Gross Expense Ratio: A:2.10%, C:2.85%, I:1.85%. The net expense ratio reflects a contractual commitment by the Fund’s investment adviser to waive fees and reimburse expenses through November 1, 2017. Absent the waiver and reimbursement, performance would have been less favorable. |
| ** | The benchmark since inception returns are calculated since commencement of May 1, 2008 through December 31, 2016. |
Performance data quoted represents past performance and is no guarantee of future results. Investment return and principal value will fluctuate so that shares, when redeemed, may be worth more or less than their original cost. Current performance may be lower or higher than performance data quoted. Performance data current to the most recent month end is available at www.quakerfunds.com or by calling us toll free at 800-220-8888. Total return includes reinvestment of dividends and capital gains.
Class A shares of the Fund have a maximum sales charge of 5.50%.
The performance table does not reflect the deduction of taxes that a shareholder might pay on fund distributions or the redemption of fund shares. Total return calculations reflect expense reimbursements and fee waivers in the applicable periods. See financial highlights for periods where fees were waived or reimbursed.
The Fund’s portfolio holdings may differ significantly from the securities held in the index and, unlike a mutual fund, an unmanaged index assumes no transaction costs, taxes, management fees or other expenses. You cannot invest directly in an index.
The Morgan Stanley Capital International World Index (“MSCI World® Index”) measures developed-market equity performance throughout the world. The MSCI World® Index assumes reinvestment of all dividends and distributions.
2016 SEMI-ANNUAL REPORT
Performance Update (unaudited) (continued)
Quaker Global Tactical Allocation Fund (QTRAX, QTRCX, QTRIX)
ADVISER:
Quaker Funds, Inc.
TOTAL NET ASSETS:
AS OF DECEMBER 31, 2016
$6,751,100
| Top 10 Holdings* (% of net assets) | | |
| Direxion Daily Emerging Markets Bull 3X Shares | 5.0% | |
| Direxion Daily S&P 500 Bull 3X | 4.5% | |
| Direxion Daily Small Cap Bull 3X Shares | 4.4% | |
| PowerShares DB Commodity Index Tracking Fund | 2.5% | |
| New Jersey State Economic Development Authority | | |
| Revenue, Series NN, 5.00%, 03/01/2021 | 1.7% | |
| General Motors Financial Co. Inc., 2.94%, 01/15/2019 | 1.5% | |
| Steel Dynamics Inc., 6.125%, 08/15/2019 | 1.2% | |
| Bank of America Corp., 2.625%, 10/19/2020 | 1.2% | |
| Altria Group Inc., 4.75%, 05/05/2021 | 1.1% | |
| Gilead Sciences Inc., 4.40%, 12/01/2021 | 1.1% | |
| % Fund Total | 24.2% | |
* Includes Long-Term Investments only.
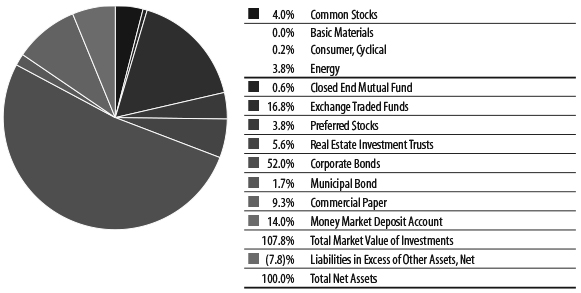
| Sectors (% of net assets) |
2016 SEMI-ANNUAL REPORT
Performance Update (unaudited)
Quaker Mid-Cap Value Fund (QMCVX, QMCCX, QMVIX)
OBJECTIVES AND PRINCIPAL STRATEGIES
The Quaker Mid-Cap Value Fund (the “Fund”) seeks to provide long-term growth of capital. Current income is not a significant investment consideration and any such income realized will be considered incidental to the Fund’s investment objective. The Fund invests primarily in common stocks comparable to the companies included in the Russell Midcap® Value Index.
| Average Annualized Total Return |
| | | | | | | | | | Commencement |
| | | | | | | | | | of operations |
| | Expense | Inception | | | | | | | through |
| | Ratio* | Date | One Year | Five Year | Ten Year | 12/31/2016 |
| | | | with | without | with | without | with | without | with | without |
| | | | sales | sales | sales | sales | sales | sales | sales | sales |
| | | | charge | charge | charge | charge | charge | charge | charge | charge |
| Class A | 2.17% | 12/31/97 | 14.95% | 21.65% | 11.56% | 12.84% | 4.98% | 5.58% | 7.23% | 7.55% |
| Class C | 2.92% | 7/31/00 | 20.76% | 20.76% | 12.00% | 12.00% | 4.79% | 4.79% | 7.76% | 7.76% |
| Institutional Class | 1.92% | 11/21/00 | 21.94% | 21.94% | 13.13% | 13.13% | 5.85% | 5.85% | 9.03% | 9.03% |
| Russell Mid-Cap® Value Index** | | 20.00% | 20.00% | 15.70% | 15.70% | 7.59% | 7.59% | 9.45% | 9.45% |
| * | As stated in the Prospectus dated November 1, 2016. |
| ** | The benchmark since inception returns are calculated since commencement of December 31,1997 through December 31, 2016. |
Performance data quoted represents past performance and is no guarantee of future results. Investment return and principal value will fluctuate so that shares, when redeemed, may be worth more or less than their original cost. Current performance may be lower or higher than performance data quoted. Performance data current to the most recent month end is available at www.quakerfunds.com or by calling us toll free at 800-220-8888. Total return includes reinvestment of dividends and capital gains.
Class A shares of the Fund have a maximum sales charge of 5.50%.
The performance table does not reflect the deduction of taxes that a shareholder might pay on fund distributions or the redemption of fund shares. Total return calculations reflect expense reimbursements and fee waivers in the applicable periods. See financial highlights for periods where fees were waived or reimbursed.
The Fund’s portfolio holdings may differ significantly from the securities held in the index and, unlike a mutual fund, an unmanaged index assumes no transaction costs, taxes, management fees or other expenses. You cannot invest directly in an index.
The Russell Midcap® Value Index is a widely recognized, unmanaged index of companies included in the Russell 1000 Index with current market capitalizations approximately between $1.2 billion to $28.2 billion. The Russell Midcap® Value index assumes reinvestment of all dividends.
2016 SEMI-ANNUAL REPORT
Performance Update (unaudited) (continued)
Quaker Mid-Cap Value Fund (QMCVX, QMCCX, QMVIX)
SUB-ADVISER:
Kennedy Capital Management, Inc.
TOTAL NET ASSETS:
AS OF DECEMBER 31, 2016
$7,418,462
| Top 10 Holdings* (% of net assets) | | |
| Reinsurance Group of America Inc. Cl A | 3.1% | |
| ON Semiconductor Corp. | 2.6% | |
| East West Bancorp Inc. | 2.5% | |
| Huntington Bancshares Inc. | 2.4% | |
| PacWest Bancorp | 2.4% | |
| Helmerich & Payne Inc. | 2.4% | |
| Harman International Industries Inc. | 2.4% | |
| Old Dominion Freight Line Inc. | 2.4% | |
| Reliance Steel & Aluminum Co. | 2.3% | |
| Torchmark Corp. | 2.3% | |
| % Fund Total | 24.8% | |
* Includes Long-Term Investments only.
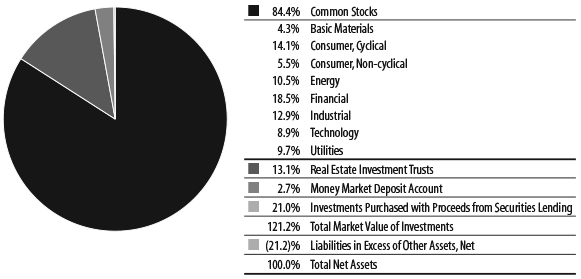
| Sectors (% of net assets) |
2016 SEMI-ANNUAL REPORT
Performance Update (unaudited)
Quaker Small-Cap Value Fund (QUSVX, QSVCX, QSVIX)
OBJECTIVES AND PRINCIPAL STRATEGIES
The Fund seeks to provide long-term growth of capital. Current income is not a significant investment consideration, and any such income realized will be considered incidental to the Fund’s investment objective. The Fund invests primarily in common stocks of U.S. companies with market capitalizations similar to the market capitalizations of companies included in the Russell 2000® Index and Russell 2500® Index. The Fund invests in companies considered by the Fund’s sub-adviser to have consistent earnings and above-average core assets, selling at relatively low market valuations, with attractive growth and momentum characteristics.
| Average Annualized Total Return |
| | | | | | | | | | Commencement |
| | | | | | | | | | of operations |
| | Expense | Inception | | | | | | | through |
| | Ratio* | Date | One Year | Five Year | Ten Year | 12/31/2016 |
| | | | with | without | with | without | with | without | with | without |
| | | | sales | sales | sales | sales | sales | sales | sales | sales |
| | | | charge | charge | charge | charge | charge | charge | charge | charge |
| Class A | 1.98% | 11/25/96 | 9.94% | 16.36% | 11.62% | 12.89% | 5.30% | 5.89% | 9.66% | 9.97% |
| Class C | 2.73% | 7/28/00 | 15.47% | 15.47% | 12.04% | 12.04% | 5.10% | 5.10% | 8.71% | 8.71% |
| Institutional Class | 1.73% | 9/12/00 | 16.65% | 16.65% | 13.17% | 13.17% | 6.16% | 6.16% | 9.12% | 9.12% |
| Russell 2000® Index** | | | 21.31% | 21.31% | 14.46% | 14.46% | 7.07% | 7.07% | 8.37% | 8.37% |
| * | As stated in the Prospectus dated November 1, 2016. |
| ** | The benchmark since inception returns are calculated since commencement of November 25, 1996 through December 31, 2016. |
Performance data quoted represents past performance and is no guarantee of future results. Investment return and principal value will fluctuate so that shares, when redeemed, may be worth more or less than their original cost. Current performance may be lower or higher than performance data quoted. Performance data current to the most recent month end is available at www.quakerfunds.com or by calling us toll free at 800-220-8888. Total return includes reinvestment of dividends and capital gains.
Class A shares of the Fund have a maximum sales charge of 5.50%.
The performance table does not reflect the deduction of taxes that a shareholder might pay on fund distributions or the redemption of fund shares. Total return calculations reflect expense reimbursements and fee waivers in the applicable periods. See financial highlights for periods where fees were waived or reimbursed.
The Fund’s portfolio holdings may differ significantly from the securities held in the index and, unlike a mutual fund, an unmanaged index assumes no transaction costs, taxes, management fees or other expenses. You cannot invest directly in an index.
The Russell 2000® Index is a widely recognized, unmanaged index comprised of the smallest 2000 companies represented in the Russell 3000® Index. The Russell 2000® Index currently represents approximately 8% of the market capitalization of the Russell 3000® Index.
2016 SEMI-ANNUAL REPORT
Performance Update (unaudited) (continued)
Quaker Small-Cap Value Fund (QUSVX, QSVCX, QSVIX)
SUB-ADVISER:
Aronson Johnson Ortiz, LP
TOTAL NET ASSETS:
AS OF DECEMBER 31, 2016
$33,366,229
| Top 10 Holdings* (% of net assets) | | |
| Aspen Technology Inc. | 1.3% | |
| Vishay Intertechnology Inc. | 1.2% | |
| Reinsurance Group of America Inc. Cl A | 1.2% | |
| Assured Guaranty Ltd. | 1.2% | |
| National Bank Holdings Corp. | 1.2% | |
| Popular Inc. | 1.2% | |
| Quanta Services Inc. | 1.2% | |
| Central Pacific Financial Corp. | 1.2% | |
| United Therapeutics Corp. | 1.2% | |
| Trinseo SA | 1.2% | |
| % Fund Total | 12.1% | |
* Includes Long-Term Investments only.
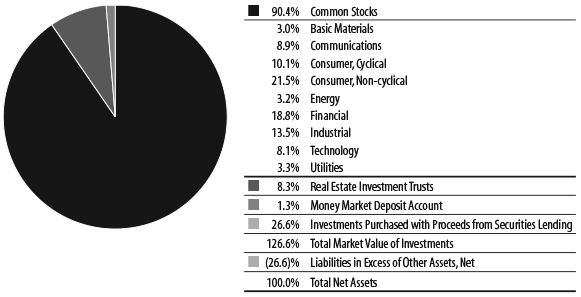
| Sectors (% of net assets) |
2016 SEMI-ANNUAL REPORT
Performance Update (unaudited)
Quaker Strategic Growth Fund (QUAGX, QAGCX, QAGIX)
OBJECTIVES AND PRINCIPAL STRATEGIES
The Fund seeks to provide long-term growth of capital. Current income is not a significant investment consideration. The Fund invests primarily in equity securities of domestic U.S. companies which the Fund’s sub-adviser believes show a high probability for superior growth.
| Average Annualized Total Return |
| | | | | | | | | | Commencement |
| | | | | | | | | | of operations |
| | Expense | Inception | | | | | | | through |
| | Ratio* | Date | One Year | Five Year | Ten Year | 12/31/2016 |
| | | | with | without | with | without | with | without | with | without |
| | | | sales | sales | sales | sales | sales | sales | sales | sales |
| | | | charge | charge | charge | charge | charge | charge | charge | charge |
| Class A | 1.87% | 11/25/96 | -3.02% | 2.61% | 10.48% | 11.74% | 3.70% | 4.29% | 10.49% | 10.80% |
| Class C | 2.62% | 7/11/00 | 1.87% | 1.87% | 10.92% | 10.92% | 3.52% | 3.52% | 3.84% | 3.84% |
| Institutional Class | 1.62% | 7/20/00 | 2.88% | 2.88% | 12.01% | 12.01% | 4.54% | 4.54% | 4.79% | 4.79% |
| S&P 500® Total Return Index** | | | 11.96% | 11.96% | 14.66% | 14.66% | 6.95% | 6.95% | 7.54% | 7.54% |
| * | As stated in the Prospectus dated November 1, 2016. |
| ** | The benchmark since inception returns are calculated since commencement of November 25, 1996 through December 31, 2016. |
Performance data quoted represents past performance and is no guarantee of future results. Investment return and principal value will fluctuate so that shares, when redeemed, may be worth more or less than their original cost. Current performance may be lower or higher than performance data quoted. Performance data current to the most recent month end is available at www.quakerfunds.com or by calling us toll free at 800-220-8888. Total return includes reinvestment of dividends and capital gains.
Class A shares of the Fund have a maximum sales charge of 5.50%.
The performance table does not reflect the deduction of taxes that a shareholder might pay on fund distributions or the redemption of fund shares. Total return calculations reflect expense reimbursements and fee waivers in the applicable periods. See financial highlights for periods where fees were waived or reimbursed.
The Fund’s portfolio holdings may differ significantly from the securities held in the index and, unlike a mutual fund, an unmanaged index assumes no transaction costs, taxes, management fees or other expenses. You cannot invest directly in an index.
The S&P 500® Total Return Index (“S&P 500® Index”) is a widely recognized, unmanaged index consisting of the approximately 500 largest companies in the United States as measured by market capitalization. The S&P 500® Index assumes reinvestment of all dividends and distributions.
2016 SEMI-ANNUAL REPORT
Performance Update (unaudited) (continued)
Quaker Strategic Growth Fund (QUAGX, QAGCX, QAGIX)
SUB-ADVISER:
Los Angeles Capital Management and Equity Research, Inc.
TOTAL NET ASSETS:
AS OF DECEMBER 31, 2016
$76,437,851
| Top 10 Holdings* (% of net assets) | | |
| Apple Inc. | 4.2% | |
| AT&T Inc. | 2.2% | |
| International Business Machines Corp. | 2.2% | |
| JPMorgan Chase & Co. | 2.1% | |
| Verizon Communications Inc. | 1.9% | |
| Exxon Mobil Corp. | 1.9% | |
| Wells Fargo & Co. | 1.8% | |
| Bank of America Corp. | 1.6% | |
| Johnson & Johnson | 1.6% | |
| Gilead Sciences Inc. | 1.6% | |
| % Fund Total | 21.1% | |
* Includes Long-Term Investments only.
| Sectors (% of net assets) |
2016 SEMI-ANNUAL REPORT
Expense Information (unaudited)
As a shareholder of the Funds, you incur two types of costs: (1) transaction costs, including applicable sales charges and redemption fees; and (2) ongoing costs, including management fees, distribution (12b-1) fees and other Fund expenses. This example is intended to help you understand your ongoing costs (in dollars) of investing in the Funds and to compare these costs with the ongoing costs of investing in other funds. The example is based on an investment of $1,000 invested at the beginning of the (six-month) period and held for the entire period July 1, 2016 through December 31, 2016.
ACTUAL EXPENSES
The first section of each table below provides information about actual account values and actual expenses for each of the Funds. You may use this information, together with the amount you invested, to estimate the expenses that you paid over the period. Simply divide your account value by $1,000 (for example, an $8,600 account value divided by $1,000 = 8.6), then multiply the result by the number in the applicable line under the heading entitled “Expenses Paid During the Period” to estimate the expenses you paid on your account during this period.
HYPOTHETICAL EXAMPLE FOR COMPARISON PURPOSES
The second section of each table below provides information about hypothetical account values and hypothetical expenses based on the Fund’s actual expense ratio and an assumed rate of return of 5% per year before expenses, which is not the Fund’s actual return. The hypothetical account values and expenses may not be used to estimate the actual ending account balance or expenses you paid for the period. You may use this information to compare the ongoing costs of investing in the Funds to other funds. To do so, compare this 5% hypothetical example with the 5% hypothetical examples that appear in the shareholder reports of the other funds. Please note that the expenses shown in the table are meant to highlight your ongoing costs only and do not reflect any transactional costs, such as sales charges (loads), redemption fees or exchange fees. Therefore, the second section of the table is useful in comparing ongoing costs only, and will not help you determine the relative total costs of owning different funds. In addition, if these transactional costs were included, your costs would have been higher.
| | | | Beginning | Annualized | Ending | |
| | | | Account Value | Expense Ratio | Account Value | Expenses Paid |
| | | | (7/1/2016) | for the Period | (12/31/2016) | During Period* |
| | Event Arbitrage | | | | | |
| | Example based on actual return of: | | | | | |
| | Class A | 5.35% | $1,000.00 | 1.99% | $1,053.50 | $10.30 |
| | Class C | 5.04% | 1,000.00 | 2.74% | 1,050.40 | 14.16 |
| | Institutional Class | 5.53% | 1,000.00 | 1.74% | 1,055.30 | 9.01 |
| | Hypothetical example based on assumed 5% return: | | | | | |
| | Class A | | 1,000.00 | 1.99% | 1,015.17 | 10.11 |
| | Class C | | 1,000.00 | 2.74% | 1,011.39 | 13.89 |
| | Institutional Class | | 1,000.00 | 1.74% | 1,016.43 | 8.84 |
2016 SEMI-ANNUAL REPORT
Expense Information (unaudited) (continued)
| | | | Beginning | Annualized | Ending | |
| | | | Account Value | Expense Ratio | Account Value | Expenses Paid |
| | | | (7/1/2016) | for the Period | (12/31/2016) | During Period* |
| | Global Tactical Allocation | | | | | |
| | Example based on actual return of: | | | | | |
| | Class A | 3.52% | $1,000.00 | 2.41% | $1,035.20 | $12.36 |
| | Class C | 3.10% | 1,000.00 | 3.16% | 1,031.00 | 16.18 |
| | Institutional Class | 3.66% | 1,000.00 | 2.16% | 1,036.60 | 11.09 |
| | Hypothetical example based on assumed 5% return: | | | | | |
| | Class A | | 1,000.00 | 2.41% | 1,013.06 | 12.23 |
| | Class C | | 1,000.00 | 3.16% | 1,009.28 | 16.00 |
| | Institutional Class | | 1,000.00 | 2.16% | 1,014.32 | 10.97 |
| | Mid-Cap Value | | | | | |
| | Example based on actual return of: | | | | | |
| | Class A | 14.12% | 1,000.00 | 2.39% | 1,141.20 | 12.90 |
| | Class C | 13.69% | 1,000.00 | 3.14% | 1,136.90 | 16.91 |
| | Institutional Class | 14.27% | 1,000.00 | 2.14% | 1,142.70 | 11.56 |
| | Hypothetical example based on assumed 5% return: | | | | | |
| | Class A | | 1,000.00 | 2.39% | 1,013.16 | 12.13 |
| | Class C | | 1,000.00 | 3.14% | 1,009.38 | 15.90 |
| | Institutional Class | | 1,000.00 | 2.14% | 1,014.42 | 10.87 |
| | Small-Cap Value | | | | | |
| | Example based on actual return of: | | | | | |
| | Class A | 18.96% | 1,000.00 | 2.16% | 1,189.60 | 11.92 |
| | Class C | 18.47% | 1,000.00 | 2.91% | 1,184.70 | 16.02 |
| | Institutional Class | 19.13% | 1,000.00 | 1.91% | 1,191.30 | 10.55 |
| | Hypothetical example based on assumed 5% return: | | | | | |
| | Class A | | 1,000.00 | 2.16% | 1,014.32 | 10.97 |
| | Class C | | 1,000.00 | 2.91% | 1,010.54 | 14.75 |
| | Institutional Class | | 1,000.00 | 1.91% | 1,015.58 | 9.70 |
| | Strategic Growth | | | | | |
| | Example based on actual return of: | | | | | |
| | Class A | 10.63% | 1,000.00 | 2.24% | 1,106.30 | 11.89 |
| | Class C | 10.28% | 1,000.00 | 2.99% | 1,102.80 | 15.85 |
| | Institutional Class | 10.84% | 1,000.00 | 1.99% | 1,108.40 | 10.58 |
| | Hypothetical example based on assumed 5% return: | | | | | |
| | Class A | | 1,000.00 | 2.24% | 1,013.91 | 11.37 |
| | Class C | | 1,000.00 | 2.99% | 1,010.13 | 15.15 |
| | Institutional Class | | 1,000.00 | 1.99% | 1,015.17 | 10.11 |
| * | Expenses are equal to the Funds’ annualized six-month expense ratios multiplied by the average account value over the period multiplied by the number of days in the most recent fiscal half year (184) divided by 365 to reflect the one-half year period. |
2016 SEMI-ANNUAL REPORT
Schedule of Investments
Quaker Event Arbitrage Fund
December 31, 2016 (unaudited)
| | | Number | | | Fair | |
| | | of Shares | | | Value | |
| Long-Term Investments — 91.0% | | | | | | |
| Common Stocks — 62.4% | | | | | | |
| Basic Materials — 1.0% | | | | | | |
| Chemicals — 1.0% | | | | | | |
| MPM Holdings Inc. (a)(b) | | | 34,576 | | | $ | 276,608 | |
| Mining — 0.0% | | | | | | | | |
Sacre-Coeur Minerals Ltd. (a) f *^ | | | 109,444 | | | | 0 | |
| Total Basic Materials | | | | | | | | |
| (Cost $1,252,601) | | | | | | | 276,608 | |
| Communications — 7.1% | | | | | | | | |
| Internet — 4.3% | | | | | | | | |
30DC Inc. (a)• | | | 50,000 | | | | 1,000 | |
| Imperva Inc. (a)(b)** | | | 23,000 | | | | 883,200 | |
| Liberty Ventures (a)(b) | | | 9,000 | | | | 331,830 | |
| WebMD Health Corp. (a) | | | 1,071 | | | | 53,090 | |
| | | | | | | | 1,269,120 | |
| Media — 2.1% | | | | | | | | |
| Tribune Media Co. Cl A ** | | | 17,340 | | | | 606,553 | |
| Telecommunications — 0.7% | | | | | | | | |
| NII Holdings Inc. (a)(b) | | | 89,529 | | | | 192,487 | |
| Total Communications | | | | | | | | |
| (Cost $3,461,603) | | | | | | | 2,068,160 | |
| Consumer, Cyclical — 4.9% | | | | | | | | |
| Auto Parts & Equipment — 0.0% | | | | | | | | |
| Exide Technologies (a)*^ | | | 5,926 | | | | 15,000 | |
| Distribution & Wholesale — 0.5% | | | | | | | | |
Medion AG f • | | | 8,011 | | | | 148,459 | |
| Lodging — 0.0% | | | | | | | | |
| Trump Entertainment | | | | | | | | |
| Resorts Inc. (a)*^ | | | 8,949 | | | | 0 | |
| Trump Entertainment | | | | | | | | |
| Resorts Inc. (a)*^ | | | 135 | | | | 0 | |
| | | | | | | | 0 | |
| Retail — 4.4% | | | | | | | | |
| Advance Auto Parts Inc. (b) | | | 2,000 | | | | 338,240 | |
| Chipotle Mexican Grill Inc. (a)(b) | | | 1,000 | | | | 377,320 | |
Punch Taverns PLC (a) f | | | 60,336 | | | | 140,538 | |
Signet Jewelers Ltd. f | | | 4,500 | | | | 424,170 | |
| | | | | | | | 1,280,268 | |
| Total Consumer, Cyclical | | | | | | | | |
| (Cost $1,968,033) | | | | | | | 1,443,727 | |
| Consumer, Non-cyclical — 28.6% | | | | | | | | |
| Beverages — 2.5% | | | | | | | | |
Anheuser-Busch InBev NV - ADR (b) f | | | 7,000 | | | | 738,080 | |
| Biotechnology — 1.5% | | | | | | | | |
| Amgen Inc. | | | 3,000 | | | | 438,630 | |
| Commercial Services — 3.6% | | | | | | | | |
GFK SE f | | | 6,000 | | | | 274,017 | |
| Herc Holdings Inc. (a) | | | 3,224 | | | | 129,476 | |
| Sotheby’s (a)(b) | | | 16,320 | | | | 650,515 | |
| | | | | | | | 1,054,008 | |
| Cosmetics & Personal Care — 0.8% | | | | | | | | |
| Coty Inc. (b) | | | 12,800 | | | | 234,368 | |
| Food — 5.2% | | | | | | | | |
| Mondelez International Inc. ** | | | 34,840 | | | | 1,544,457 | |
| Healthcare-Products — 1.2% | | | | | | | | |
| NuVasive Inc. (a)(b) | | | 5,000 | | | | 336,800 | |
| Synovis Life Technologies Inc. (a)^ | | | 43,000 | | | | 14,035 | |
| | | | | | | | 350,835 | |
| Healthcare-Services — 2.9% | | | | | | | | |
| Air Methods Corp. (a)(b) | | | 15,000 | | | | 477,750 | |
| Brookdale Senior Living Inc. (a) | | | 29,650 | | | | 368,253 | |
| | | | | | | | 846,003 | |
| Pharmaceuticals — 10.9% | | | | | | | | |
| AbbVie Inc. (b)** | | | 12,030 | | | | 753,319 | |
Celesio AG f | | | 11,796 | | | | 319,057 | |
| Depomed Inc. (a)(b) | | | 28,000 | | | | 504,560 | |
GlaxoSmithKline PLC - ADR f | | | 5,850 | | | | 225,283 | |
| INYX Inc. (a) | | | 167,850 | | | | 101 | |
| Pfizer Inc. (b)** | | | 43,060 | | | | 1,398,589 | |
| | | | | | | | 3,200,909 | |
| Total Consumer, Non-cyclical | | | | | | | | |
| (Cost $8,527,608) | | | | | | | 8,407,290 | |
| Diversified — 0.4% | | | | | | | | |
| Holding Companies-Diversified — 0.4% | | | | | | | | |
CF Corp. (a) f | | | 11,400 | | | | 119,358 | |
| Stoneleigh Partners | | | | | | | | |
| Acquisition Corp. (a)*^ | | | 400 | | | | 0 | |
| | | | | | | | 119,358 | |
| Total Diversified | | | | | | | | |
| (Cost $114,000) | | | | | | | 119,358 | |
The accompanying notes are an integral part of the financial statements.
2016 SEMI-ANNUAL REPORT
Schedule of Investments (continued)
Quaker Event Arbitrage Fund
December 31, 2016 (unaudited)
| | | Number | | | Fair | |
| | | of Shares | | | Value | |
| Common Stocks — 62.4% (Continued) | | | | | | |
| Energy — 6.3% | | | | | | |
| Energy-Alternate Sources — 0.7% | | | | | | |
| TerraForm Global Inc. (b) | | | 20,000 | | | $ | 79,000 | |
| TerraForm Power Inc. (a)(b) | | | 9,000 | | | | 115,290 | |
| | | | | | | | 194,290 | |
| Oil & Gas — 4.8% | | | | | | | | |
| Hess Corp. (b) ** | | | 17,300 | | | | 1,077,617 | |
| OGX Austria Petroleo e | | | | | | | | |
Gas SA-SP-ADR f • | | | 55,075 | | | | 37,567 | |
| SandRidge Energy Inc. (a) | | | 12,500 | | | | 294,375 | |
| | | | | | | | 1,409,559 | |
| Pipelines — 0.8% | | | | | | | | |
| The Williams Cos. Inc. | | | 8,000 | | | | 249,120 | |
| Total Energy | | | | | | | | |
| (Cost $2,169,315) | | | | | | | 1,852,969 | |
| Financial — 6.0% | | | | | | | | |
| Diversified Financial Services — 0.9% | | | | | | | | |
| Alliance Data Systems Corp. (b) | | | 700 | | | | 159,950 | |
Guoco Group Ltd. f | | | 10,000 | | | | 110,259 | |
| | | | | | | | 270,209 | |
| Real Estate — 5.1% | | | | | | | | |
CA Immobilien Anlagen AG f | | | 38,800 | | | | 713,322 | |
Conwert Immobilien Invest SE f | | | 45,000 | | | | 768,332 | |
| Safeway Casa Ley CVR (a)*^ | | | 47,000 | | | | 10,575 | |
| Safeway Property Development | | | | | | | | |
| Center LLC CVR (a)*^ | | | 47,000 | | | | 10,575 | |
| | | | | | | | 1,502,804 | |
| Total Financial | | | | | | | | |
| (Cost $1,468,138) | | | | | | | 1,773,013 | |
| Healthcare — 3.6% | | | | | | | | |
| Healthcare-Services — 3.6% | | | | | | | | |
| Diagnostic Services | | | | | | | | |
| Holdings Inc. (a)^ | | | 10,221 | | | | 1,063,505 | |
| Total Healthcare | | | | | | | | |
| (Cost $735,000) | | | | | | | 1,063,505 | |
| Industrial — 4.5% | | | | | | | | |
| Electronics — 4.5% | | | | | | | | |
| IEC Electronics Corp. (a) | | | 283,656 | | | | 1,012,652 | |
| PerkinElmer Inc. (b) | | | 6,000 | | | | 312,900 | |
| | | | | | | | 1,325,552 | |
| Total Industrial | | | | | | | | |
| (Cost $1,525,727) | | | | | | | 1,325,552 | |
| Technology — 0.0% | | | | | | | | |
| Computers — 0.0% | | | | | | | | |
| Computer Horizons Corp. (a)*^ | | | 65,000 | | | | 0 | |
| Total Technology | | | | | | | | |
| (Cost $0) | | | | | | | 0 | |
| Escrow Shares — 0.0% | | | | | | | | |
| Exide Technologies (a)*^ | | | 1,777 | | | | 0 | |
| Petrocorp Inc. (a)*^ | | | 200 | | | | 0 | |
| Total Escrow Shares | | | | | | | | |
| (Cost $1,687) | | | | | | | 0 | |
| Total Common Stocks | | | | | | | | |
| (Cost $21,223,712) | | | | | | | 18,330,182 | |
| Preferred Stocks — 3.9% | | | | | | | | |
| Energy — 0.0% | | | | | | | | |
| Oil & Gas — 0.0% | | | | | | | | |
| GeoMet Inc., 12.50%, | | | | | | | | |
Convertible Series A (a)• | | | 3 | | | | 5 | |
| Total Energy | | | | | | | | |
| (Cost $22) | | | | | | | 5 | |
| Financial — 1.8% | | | | | | | | |
| Insurance — 0.1% | | | | | | | | |
| MBIA Insurance Corp., | | | | | | | | |
| 4.71% (a)*#^ | | | 10 | | | | 40,000 | |
| Mortgage Agencies — 1.7% | | | | | | | | |
| Federal Home Loan Mortgage Corp., | | | | | | | | |
0.00%, Series G (a) | | | 3,000 | | | | 33,765 | |
| Federal Home Loan Mortgage Corp., | | | | | | | | |
| 0.00%, Series M (a) | | | 9,500 | | | | 109,250 | |
| Federal Home Loan Mortgage Corp., | | | | | | | | |
0.00%, Series Q (a)• | | | 1,000 | | | | 11,445 | |
| Federal Home Loan Mortgage Corp., | | | | | | | | |
0.00%, Series S (a) | | | 25,000 | | | | 287,750 | |
| Federal Home Loan Mortgage Corp., | | | | | | | | |
| 5.00%, Series F (a) | | | 4,500 | | | | 53,775 | |
| | | | | | | | 495,985 | |
| Total Financial | | | | | | | | |
| (Cost $1,051,290) | | | | | | | 535,985 | |
| Healthcare — 2.1% | | | | | | | | |
| Healthcare-Services — 2.1% | | | | | | | | |
| Diagnostic Services Holdings Inc., | | | | | | | | |
| 0.00% (a)*^ | | | 613 | | | | 613,000 | |
| Total Healthcare | | | | | | | | |
| (Cost $613,000) | | | | | | | 613,000 | |
The accompanying notes are an integral part of the financial statements.
2016 SEMI-ANNUAL REPORT
Schedule of Investments (continued)
Quaker Event Arbitrage Fund
December 31, 2016 (unaudited)
| | | Number | | | Fair | |
| | | of Shares | | | Value | |
| Preferred Stocks — 3.9% (Continued) | | | | | | |
| Industrial — 0.0% | | | | | | |
| Aerospace & Defense — 0.0% | | | | | | |
| Rolls-Royce Holdings PLC, | | | | | | |
0.00% (a) f^ | | | 2,122,900 | | | $ | 2,611 | |
| Total Industrial | | | | | | | | |
| (Cost $3,102) | | | | | | | 2,611 | |
| Total Preferred Stocks | | | | | | | | |
| (Cost $1,667,414) | | | | | | | 1,151,601 | |
| Structured Notes — 4.4% | | | | | | | | |
| Bank of America Corp. Structured | | | | | | | | |
Note, Expiration: 02/14/2017 (a)• | | | 4,000 | | | | 426,280 | |
| Heineken Holding NV Structured | | | | | | | | |
Note, Expiration: 11/20/2017 (a)• | | | 212 | | | | 878,388 | |
| | | | | | | | 1,304,668 | |
| Total Structured Notes | | | | | | | | |
| (Cost $1,247,321) | | | | | | | 1,304,668 | |
| | | Par | | | | | |
| | | Value | | | | | |
| Asset Backed Securities — 0.7% | | | | | | | | |
| AFC Home Equity Loan Trust | | | | | | | | |
| Class 1A, Series 2000-2, | | | | | | | | |
1.37%, 06/25/2030• | | $ | 8,078 | | | | 7,159 | |
| Citigroup Mortgage Loan Trust Inc. | | | | | | | | |
| Class M3, Series 2005-OPT1, | | | | | | | | |
1.29%, 02/25/2035• | | | 199,478 | | | | 168,932 | |
| Countrywide Asset-Backed Certificates | | | | | | | | |
| Class 2M2, Series 2007-11, | | | | | | | | |
1.08%, 06/25/2047+• | | | 1,052,005 | | | | 16,633 | |
| Countrywide Home Equity Loan Trust | | | | | | | | |
| Class 2A, Series 2005-A, | | | | | | | | |
0.78%, 04/15/2035• | | | 17,402 | | | | 15,274 | |
| | | | | | | | 207,998 | |
| Total Asset Backed Securities | | | | | | | | |
| (Cost $213,264) | | | | | | | 207,998 | |
| Convertible Bonds — 1.4% | | | | | | | | |
| Basic Materials — 0.0% | | | | | | | | |
| Mining — 0.0% | | | | | | | | |
| Talvivaara Mining Co. PLC, | | | | | | | | |
4.00%, 12/16/2015 f *+^ | | € | 12,900,000 | | | | 0 | |
| Total Basic Materials | | | | | | | | |
| (Cost $1,141,280) | | | | | | | 0 | |
| Consumer, Cyclical — 0.3% | | | | | | | | |
| Auto Parts & Equipment — 0.3% | | | | | | | | |
| Exide Technologies, 7.00%, | | | | | | | | |
04/30/2025• | | $ | 165,209 | | | | 85,909 | |
| Total Consumer, Cyclical | | | | | | | | |
| (Cost $158,629) | | | | | | | 85,909 | |
| Financial — 1.1% | | | | | | | | |
| Banks — 1.1% | | | | | | | | |
| BNP Paribas Fortis SA, | | | | | | | | |
1.68%, 12/29/2049 f• | | € | 500,000 | | | | 337,217 | |
| Total Financial | | | | | | | | |
| (Cost $556,507) | | | | | | | 337,217 | |
| Total Convertible Bonds | | | | | | | | |
| (Cost $1,856,416) | | | | | | | 423,126 | |
| Corporate Bonds — 17.3% | | | | | | | | |
| Consumer, Cyclical — 1.2% | | | | | | | | |
| Auto Parts & Equipment — 1.2% | | | | | | | | |
| Exide Technologies, | | | | | | | | |
| 8.625%, 02/12/2018 *+^ | | $ | 1,000,000 | | | | 0 | |
| Exide Technologies, | | | | | | | | |
11.00%, 04/30/2020• | | | 436,390 | | | | 340,384 | |
| | | | | | | | 340,384 | |
| Total Consumer, Cyclical | | | | | | | | |
| (Cost $422,157) | | | | | | | 340,384 | |
| Energy — 14.8% | | | | | | | | |
| Oil & Gas — 14.8% | | | | | | | | |
| Gastar Exploration Inc., | | | | | | | | |
8.625%, 05/15/2018• | | | 1,000,000 | | | | 980,000 | |
| Halcon Resources Corp., | | | | | | | | |
12.00%, 02/15/2022*#• | | | 390,000 | | | | 425,100 | |
| Ithaca Energy Inc., | | | | | | | | |
8.125%, 07/01/2019 f *#• | | | 1,000,000 | | | | 997,500 | |
| Kosmos Energy Ltd., | | | | | | | | |
7.875%, 08/01/2021 (b) f #• | | | 1,000,000 | | | | 995,000 | |
| OGX Austria GMBH, | | | | | | | | |
8.50%, 06/01/2018 f *+• | | | 3,500,000 | | | | 35 | |
| Tullow Oil PLC, | | | | | | | | |
6.00%, 11/01/2020 f #• | | | 1,000,000 | | | | 952,500 | |
| | | | | | | | 4,350,135 | |
| Total Energy | | | | | | | | |
| (Cost $4,259,707) | | | | | | | 4,350,135 | |
The accompanying notes are an integral part of the financial statements.
2016 SEMI-ANNUAL REPORT
Schedule of Investments (continued)
Quaker Event Arbitrage Fund
December 31, 2016 (unaudited)
| | | Par | | | Fair | |
| | | Value | | | Value | |
| Corporate Bonds — 17.3% (Continued) | | | | | | |
| Financial — 1.3% | | | | | | |
| Diversified Financial Services — 1.3% | | | | | | |
| Hellas Telecommunications | | | | | | |
| Luxembourg II SCA, | | | | | | |
0.00%, 01/15/2015 f *+#^ | | $ | 5,000,000 | | | $ | 25,000 | |
| Lehman Brothers Holdings Inc., | | | | | | | | |
4.55%, 12/29/2099 +• | | | 110,000 | | | | 6,325 | |
| Lehman Brothers Holdings Inc., | | | | | | | | |
5.32%, 12/29/2099 +• | | | 130,000 | | | | 7,313 | |
| Lehman Brothers Holdings Inc., | | | | | | | | |
5.50%, 02/27/2020 +• | | | 100,000 | | | | 5,625 | |
| Lehman Brothers Holdings Inc., | | | | | | | | |
7.00%, 01/28/2020 +• | | | 100,000 | | | | 5,625 | |
| Lehman Brothers Holdings Inc., | | | | | | | | |
8.25%, 09/23/2020 +• | | | 100,000 | | | | 5,625 | |
| Lehman Brothers Holdings Inc., | | | | | | | | |
8.75%, 02/14/2023 +• | | | 200,000 | | | | 11,250 | |
| Twin Reefs Pass-Through Trust, | | | | | | | | |
| 0.00%, 12/29/2049 *+#^ | | | 1,000,000 | | | | 320,000 | |
| | | | | | | | 386,763 | |
| Venture Capital — 0.0% | | | | | | | | |
| Infinity Capital Group, | | | | | | | | |
| 7.00%, 12/31/2049 *+^ | | | 25,000 | | | | 0 | |
| Total Financial | | | | | | | | |
| (Cost $610,000) | | | | | | | 386,763 | |
| Total Corporate Bonds | | | | | | | | |
| (Cost $5,291,864) | | | | | | | 5,077,282 | |
| Mortgage Backed Securities — 0.9% | | | | | | | | |
| Federal Home Loan Mortgage | | | | | | | | |
| Corp. Class IG, Series 3756, | | | | | | | | |
4.00%, 11/15/2037• | | | 1,070,206 | | | | 36,488 | |
| GSR Mortgage Loan Trust | | | | | | | | |
| Class B2, Series 2005-5F, | | | | | | | | |
5.73%, 06/25/2035• | | | 628,584 | | | | 222,476 | |
| | | | | | | | 258,964 | |
| Total Mortgage Backed Securities | | | | | | | | |
| (Cost $583,870) | | | | | | | 258,964 | |
| Escrow Notes — 0.0% | | | | | | | | |
| Mirant Corp.*+^ | | | 20,000 | | | | 0 | |
| NewPage Corp.*+^ | | | 300,000 | | | | 0 | |
| | | | | | | | 0 | |
| Total Escrow Notes | | | | | | | | |
| (Cost $198,770) | | | | | | | 0 | |
| Total Long-Term Investments | | | | | | | | |
| (Cost $32,282,631) | | | | | | | 26,753,821 | |
| | | | | | | | | |
| | | Number | | | | | |
| | | of Contracts | | | | | |
| | | (100 Shares | | | | | |
| | | Per Contract) | | | | | |
| Purchased Options — 0.5% | | | | | | | | |
| Call Options — 0.1% | | | | | | | | |
| Mondelez International Inc., | | | | | | | | |
| Expiration: January, 2017 | | | | | | | | |
| Exercise Price: $50.00 | | | 100 | | | | 2,700 | |
| Valeant Pharmaceuticals | | | | | | | | |
| International Inc., | | | | | | | | |
| Expiration: January, 2018 | | | | | | | | |
| Exercise Price: $30.00 | | | 100 | | | | 14,500 | |
| Total Call Options | | | | | | | | |
| (Cost $84,578) | | | | | | | 17,200 | |
| Put Options — 0.4% | | | | | | | | |
| CurrencyShares Euro Trust, | | | | | | | | |
| Expiration: March, 2017 | | | | | | | | |
| Exercise Price: $105.00 | | | 370 | | | | 131,350 | |
| Total Put Options | | | | | | | | |
| (Cost $165,142) | | | | | | | 131,350 | |
| Total Purchased Options | | | | | | | | |
| (Cost $249,720) | | | | | | | 148,550 | |
| | | Par | | | | | |
| | | Value | | | | | |
| Money Market Deposit Account — 1.7% | | | | | | | | |
| U.S. Bank N.A., 0.10% | | $ | 496,406 | | | | 496,406 | |
| Total Money Market Deposit Account | | | | | | | | |
| (Cost $496,406) | | | | | | | 496,406 | |
The accompanying notes are an integral part of the financial statements.
2016 SEMI-ANNUAL REPORT
Schedule of Investments (continued)
Quaker Event Arbitrage Fund
December 31, 2016 (unaudited)
| | | | | | Fair | |
| | | Units | | | Value | |
| Investments Purchased with Proceeds | | | | | | |
| from Securities Lending — 20.0% | | | | | | |
| Mount Vernon Liquid Assets | | | | | | |
| Portfolio, 0.98% (c)(d) | | | | | | |
| (Cost $5,883,218) | | | 5,883,218 | | | $ | 5,883,218 | |
| Total Investments | | | | | | | | |
| (Cost $38,911,975) — 113.2% | | | | | | | 33,281,995 | |
| Liabilities in Excess | | | | | | | | |
| of Other Assets, Net (13.2)% | | | | | | | (3,888,121 | ) |
| Total Net Assets — 100.0% | | | | | | $ | 29,393,874 | |
| | | Number | | | | | |
| | | of Shares | | | | | |
| Schedule of Securities Sold Short (a) | | | | | | | | |
| Common Stocks — 2.1% | | | | | | | | |
| Communications — 1.1% | | | | | | | | |
| Media —1.1 % | | | | | | | | |
| Liberty Broadband Corp. Series C | | | 4,452 | | | | 329,760 | |
| Consumer, Non-cyclical - 1.0% | | | | | | | | |
| Cosmetics & Personal Care - 1.0% | | | | | | | | |
| The Procter & Gamble Co. | | | 3,400 | | | | 285,872 | |
| Total Common Stocks | | | | | | | 615,632 | |
| Total Securities Sold Short | | | | | | | | |
| (Proceeds $586,864) | | | | | | $ | 615,632 | |
| | | Number | | | | | |
| | | of Contracts | | | | | |
| | | (100 Shares Per | | | | | |
| | | Contract) | | | | | |
| Written Options | | | | | | | | |
| Call Options | | | | | | | | |
| Advance Auto Parts Inc., | | | | | | | | |
| Expiration: January, 2017 | | | | | | | | |
| Exercise Price: $170.00 | | | 20 | | | | 6,600 | |
| Alliance Data Systems Corp., | | | | | | | | |
| Expiration: January, 2017 | | | | | | | | |
Exercise Price: $240.00• | | | 7 | | | | 1,207 | |
| CurrencyShares Euro Trust, | | | | | | | | |
| Expiration: March, 2017 | | | | | | | | |
| Exercise Price: $105.00 | | | 370 | | | | 38,850 | |
| Herc Holdings Inc., | | | | | | | | |
| Expiration: January, 2017 | | | | | | | | |
Exercise Price: $40.00• | | | 32 | | | | 5,360 | |
| Hess Corp., | | | | | | | | |
| Expiration: January, 2017 | | | | | | | | |
| Exercise Price: $64.50 | | | 173 | | | | 19,895 | |
| Signet Jewelers Ltd., | | | | | | | | |
| Expiration: January, 2017 | | | | | | | | |
| Exercise Price: $95.00 | | | 45 | | | | 14,850 | |
| Sotheby’s, | | | | | | | | |
| Expiration: January, 2017 | | | | | | | | |
Exercise Price: $37.00• | | | 163 | | | | 54,198 | |
| Valeant Pharmaceuticals | | | | | | | | |
| International Inc., | | | | | | | | |
| Expiration: January, 2018 | | | | | | | | |
| Exercise Price: $40.00 | | | 100 | | | | 7,500 | |
| Total Call Options | | | | | | | | |
| (Premiums Received $241,510) | | | | | | | 148,460 | |
| Put Options | | | | | | | | |
| Mondelez International Inc., | | | | | | | | |
| Expiration: January, 2017 | | | | | | | | |
| Exercise Price: $40.00 | | | 100 | | | | 2,300 | |
| Total Put Options | | | | | | | | |
| (Premiums Received $12,900) | | | | | | | 2,300 | |
| Total Written Options | | | | | | | | |
| (Premiums Received $254,410) | | | | | | $ | 150,760 | |
ADR - American Depositary Receipt
CVR - Contingent Value Rights
€ - Euro
| (a) | Non-income producing security. |
| (b) | All or a portion of the security is out on loan. The total market value of securities on loan was $5,754,974. The remaining contractual maturity of all of the securities lending transactions is overnight and continuous. |
| (c) | The rate shown is the annualized seven-day yield at period end. |
| (d) | Represents investments of collateral received from securities lending transactions. |
| f | Foreign issued security. |
| * | Indicates an illiquid security. Total market value for illiquid securities is $2,456,785, representing 8.4% of net assets. |
| ** | All or a portion of the shares have been committed as collateral for open securities sold short or written options. |
| + | Defaulted bonds. |
| # | Restricted security that may be sold to “qualified institutional buyers” pursuant to the conditions of Rule 144A under the Securities Act of 1933, as amended. |
| | The coupon rate shown on floating or adjustable rate securities represents the rate at period end. |
| • | Level 2 securities. |
| ^ | Indicates a fair valued security. Total market value for fair valued securities is $2,114,301 representing 7.2% of net assets and Level 3 securities. |
The accompanying notes are an integral part of the financial statements.
2016 SEMI-ANNUAL REPORT
Schedule of Investments
Quaker Global Tactical Allocation Fund
December 31, 2016 (unaudited)
| | | Number | | | Fair | |
| | | of Shares | | | Value | |
| Long-Term Investments — 84.5% | | | | | | |
| Common Stocks — 4.0% | | | | | | |
| Basic Materials — 0.0% | | | | | | |
| Chemicals — 0.0% | | | | | | |
| AdvanSix Inc. (a) | | | 20 | | | $ | 443 | |
| Total Basic Materials (Cost $302) | | | | | | | 443 | |
| Consumer, Cyclical — 0.2% | | | | | | | | |
| Airlines — 0.2% | | | | | | | | |
| AMR Corp. Escrow (a)*^ | | | 7,600 | | | | 14,668 | |
| Auto Manufacturers — 0.0% | | | | | | | | |
Tata Motors Ltd. - ADR f | | | 0 | | | | 16 | |
| Total Consumer, Cyclical | | | | | | | | |
| (Cost $3,199) | | | | | | | 14,684 | |
| Energy — 3.8% | | | | | | | | |
| Pipelines — 3.8% | | | | | | | | |
| Cheniere Energy Partners LP | | | 1,229 | | | | 35,420 | |
| Enterprise Products Partners LP | | | 1,392 | | | | 37,640 | |
| Magellan Midstream Partners LP | | | 522 | | | | 39,479 | |
| ONEOK Partners LP | | | 845 | | | | 36,343 | |
| Plains All American Pipeline LP | | | 1,105 | | | | 35,680 | |
| Spectra Energy Corp. | | | 845 | | | | 34,721 | |
| Western Gas Partners LP | | | 615 | | | | 36,137 | |
| | | | | | | | 255,420 | |
| Total Energy (Cost $248,955) | | | | | | | 255,420 | |
| Total Common Stocks | | | | | | | | |
| (Cost $252,456) | | | | | | | 270,547 | |
| Closed End Mutual Fund — 0.6% | | | | | | | | |
| Ares Capital Corp. | | | 2,242 | | | | 36,971 | |
| Total Closed End Mutual Fund | | | | | | | | |
| (Cost $35,547) | | | | | | | 36,971 | |
| Exchange Traded Funds — 16.8% | | | | | | | | |
| Direxion Daily Emerging Markets | | | | | | | | |
| Bull 3X Shares (a) | | | 6,361 | | | | 336,115 | |
| Direxion Daily Small Cap | | | | | | | | |
| Bull 3X Shares (a) | | | 2,955 | | | | 298,898 | |
| Direxion Daily S&P 500 Bull 3X (a) | | | 2,849 | | | | 306,979 | |
| PowerShares DB Commodity | | | | | | | | |
| Index Tracking Fund (a) | | | 10,760 | | | | 170,439 | |
| VanEck Vectors Emerging | | | | | | | | |
| Markets High Yield Bond | | | 1,000 | | | | 24,040 | |
| | | | | | | | 1,136,471 | |
| Total Exchange Traded Funds | | | | | | | | |
| (Cost $1,130,460) | | | | | | | 1,136,471 | |
| Preferred Stocks — 3.8% | | | | | | | | |
| Energy — 0.6% | | | | | | | | |
| Pipelines — 0.6% | | | | | | | | |
| Kinder Morgan Inc., 9.75%, | | | | | | | | |
| Series A, Convertible | | | 729 | | | | 35,466 | |
| Total Energy (Cost $35,518) | | | | | | | 35,466 | |
| Financial — 3.2% | | | | | | | | |
| Banks — 0.5% | | | | | | | | |
| Barclays Bank PLC, | | | | | | | | |
8.125%, Series 5 f | | | 1,365 | | | | 34,862 | |
| Private Equity — 0.5% | | | | | | | | |
| Hercules Capital Inc., 7.00% | | | 1,400 | | | | 35,854 | |
| Real Estate Investment Trusts — 2.2% | | | | | | | | |
| Alexandria Real Estate Equities Inc., | | | | | | | | |
| 6.45%, Series E | | | 2,404 | | | | 60,220 | |
| Digital Realty Trust Inc., | | | | | | | | |
| 6.625%, Series F | | | 2,380 | | | | 59,786 | |
| NorthStar Realty Finance Corp., | | | | | | | | |
| 8.75%, Series A | | | 1,000 | | | | 25,330 | |
| | | | | | | | 145,336 | |
| Total Financial (Cost 217,333) | | | | | | | 216,052 | |
| Total Preferred Stocks | | | | | | | | |
| (Cost $252,851) | | | | | | | 251,518 | |
| Real Estate Investment Trusts — 5.6% | | | | | | | | |
| Apartment Investment & | | | | | | | | |
| Management Co. | | | 1,514 | | | | 68,811 | |
| Colony Capital Inc. | | | 2,963 | | | | 60,001 | |
| Lamar Advertising Co. | | | 921 | | | | 61,928 | |
| MGM Growth Properties LLC | | | 2,500 | | | | 63,275 | |
| Prologis Inc. | | | 1,244 | | | | 65,671 | |
| Weyerhaeuser Co. | | | 1,960 | | | | 58,976 | |
| | | | | | | | 378,662 | |
| Total Real Estate Investment Trusts | | | | | | | | |
| (Cost $362,450) | | | | | | | 378,662 | |
| | | Par | | | | | |
| | | Value | | | | | |
| Corporate Bonds — 52.0% | | | | | | | | |
| Basic Materials — 6.2% | | | | | | | | |
| Chemicals — 2.0% | | | | | | | | |
| CF Industries Inc., | | | | | | | | |
3.45%, 06/01/2023• | | $ | 70,000 | | | | 62,930 | |
| Monsanto Co., | | | | | | | | |
2.75%, 07/15/2021• | | | 70,000 | | | | 69,985 | |
| | | | | | | | 132,915 | |
The accompanying notes are an integral part of the financial statements.
2016 SEMI-ANNUAL REPORT
Schedule of Investments (continued)
Quaker Global Tactical Allocation Fund
December 31, 2016 (unaudited)
| | | Par | | | Fair | |
| | | Value | | | Value | |
| Corporate Bonds — 52.0% (Continued) | | | | | | |
| Iron & Steel — 4.2% | | | | | | |
| ArcelorMittal, | | | | | | |
5.50%, 03/01/2021 f • | | $ | 65,000 | | | $ | 71,175 | |
| Cliffs Natural Resources Inc., | | | | | | | | |
4.875%, 04/01/2021• | | | 65,000 | | | | 60,450 | |
| Steel Dynamics Inc., | | | | | | | | |
6.125%, 08/15/2019• | | | 80,000 | | | | 82,440 | |
| United States Steel Corp., | | | | | | | | |
7.50%, 03/15/2022• | | | 70,000 | | | | 72,275 | |
| | | | | | | | 286,340 | |
| Total Basic Materials (Cost $418,272) | | | | | | | 419,255 | |
| Communications — 5.3% | | | | | | | | |
| Internet — 1.0% | | | �� | | | | | |
eBay Inc., 2.20%, 08/01/2019• | | | 70,000 | | | | 69,968 | |
| Media — 1.1% | | | | | | | | |
| Discovery Communications LLC, | | | | | | | | |
4.375%, 06/15/2021• | | | 70,000 | | | | 73,808 | |
| Telecommunications — 3.2% | | | | | | | | |
AT&T Inc., 2.80%, 02/17/2021• | | | 70,000 | | | | 69,444 | |
| CenturyLink Inc., | | | | | | | | |
7.50%, 04/01/2024• | | | 70,000 | | | | 73,500 | |
| Frontier Communications Corp., | | | | | | | | |
11.00%, 09/15/2025• | | | 70,000 | | | | 72,275 | |
| | | | | | | | 215,219 | |
| Total Communications (Cost $359,973) | | | | | | | 358,995 | |
| Consumer, Cyclical — 5.6% | | | | | | | | |
| Auto Manufacturers — 1.5% | | | | | | | | |
| General Motors Financial Co. Inc., | | | | | | | | |
2.94%, 01/15/2019 • | | | 100,000 | | | | 100,441 | |
| Home Builders — 1.1% | | | | | | | | |
KB Home, 7.50%, 09/15/2022• | | | 70,000 | | | | 73,850 | |
| Retail — 3.0% | | | | | | | | |
| JC Penney Corp. Inc., | | | | | | | | |
5.65%, 06/01/2020• | | | 70,000 | | | | 69,038 | |
| Toys R Us. Inc., | | | | | | | | |
7.375%, 10/15/2018• | | | 66,000 | | | | 65,010 | |
| Walgreens Boots Alliance Inc., | | | | | | | | |
2.60%, 06/01/2021• | | | 70,000 | | | | 69,560 | |
| | | | | | | | 203,608 | |
| Total Consumer, Cyclical (Cost $380,425) | | | | | | | 377,899 | |
| Consumer, Non-cyclical — 10.3% | | | | | | | | |
| Agriculture — 1.1% | | | | | | | | |
| Altria Group Inc., | | | | | | | | |
4.75%, 05/05/2021• | | | 70,000 | | | | 76,286 | |
| Beverages — 1.0% | | | | | | | | |
| Molson Coors Brewing Co., | | | | | | | | |
2.10%, 07/15/2021• | | | 70,000 | | | | 68,174 | |
| Biotechnology — 1.1% | | | | | | | | |
| Gilead Sciences Inc., | | | | | | | | |
4.40%, 12/01/2021• | | | 70,000 | | | | 75,309 | |
| Commercial Services — 2.1% | | | | | | | | |
| Quad Graphics Inc., | | | | | | | | |
7.00%, 05/01/2022• | | | 70,000 | | | | 68,250 | |
| RR Donnelley & Sons Co., | | | | | | | | |
7.00%, 02/15/2022• | | | 70,000 | | | | 70,350 | |
| | | | | | | | 138,600 | |
| Food — 2.2% | | | | | | | | |
| Campbell Soup Co., | | | | | | | | |
4.25%, 04/15/2021• | | | 70,000 | | | | 74,616 | |
| SUPERVALU Inc., | | | | | | | | |
6.75%, 06/01/2021• | | | 70,000 | | | | 70,700 | |
| | | | | | | | 145,316 | |
| Healthcare-Services — 1.8% | | | | | | | | |
| CHS/Community | | | | | | | | |
| Health Systems Inc., | | | | | | | | |
5.125%, 08/15/2018• | | | 50,000 | | | | 49,000 | |
Cigna Corp., 4.50%, 03/15/2021• | | | 70,000 | | | | 74,402 | |
| | | | | | | | 123,402 | |
| Pharmaceuticals — 1.0% | | | | | | | | |
| Teva Pharmaceutical Finance | | | | | | | | |
| Netherlands III BV, | | | | | | | | |
2.20%, 07/21/2021 f • | | | 70,000 | | | | 66,968 | |
| Total Consumer, Non-cyclical (Cost $696,700) | | | | | | | 694,055 | |
| Energy — 5.0% | | | | | | | | |
| Oil & Gas — 4.0% | | | | | | | | |
Apache Corp., 3.625%, 02/01/2021• | | | 70,000 | | | | 72,590 | |
Chevron Corp., 2.10%, 05/16/2021• | | | 70,000 | | | | 69,400 | |
Ensco PLC, 4.50%, 10/01/2024 f • | | | 70,000 | | | | 60,025 | |
| Shell International Finance BV, | | | | | | | | |
1.875%, 05/10/2021 f • | | | 70,000 | | | | 68,440 | |
| | | | | | | | 270,455 | |
The accompanying notes are an integral part of the financial statements.
2016 SEMI-ANNUAL REPORT
Schedule of Investments (continued)
Quaker Global Tactical Allocation Fund
December 31, 2016 (unaudited)
| | | Par | | | Fair | |
| | | Value | | | Value | |
| Corporate Bonds — 52.0% Continued) | | | | | | |
| Oil & Gas Services — 1.0% | | | | | | |
SESI LLC, 6.375%, 05/01/2019• | | $ | 70,000 | | | $ | 70,000 | |
| Total Energy (Cost $340,438) | | | | | | | 340,455 | |
| Financial — 10.6% | | | | | | | | |
| Banks — 6.4% | | | | | | | | |
| Bank of America Corp., | | | | | | | | |
2.625%, 10/19/2020• | | | 80,000 | | | | 80,046 | |
| Bank of Montreal, | | | | | | | | |
1.497%, 07/31/2018 f • | | | 70,000 | | | | 70,278 | |
| Citigroup Inc., | | | | | | | | |
2.35%, 08/02/2021• | | | 70,000 | | | | 68,474 | |
| Goldman Sachs Group Inc., | | | | | | | | |
2.042%, 04/23/2020 • | | | 70,000 | | | | 70,669 | |
| JPMorgan Chase & Co., | | | | | | | | |
4.35%, 08/15/2021• | | | 70,000 | | | | 74,886 | |
| Wells Fargo & Co., | | | | | | | | |
1.958%, 12/07/2020 • | | | 70,000 | | | | 70,486 | |
| | | | | | | | 434,839 | |
| Diversified Financial Services — 1.1% | | | | | | | | |
| Navient Corp., | | | | | | | | |
7.25%, 09/25/2023• | | | 70,000 | | | | 71,925 | |
| Real Estate Investment Trusts — 1.0% | | | | | | | | |
| Simon Property Group LP, | | | | | | | | |
2.50%, 07/15/2021• | | | 70,000 | | | | 70,067 | |
| Insurance — 1.0% | | | | | | | | |
| Genworth Holdings Inc., | | | | | | | | |
6.515%, 05/22/2018• | | | 70,000 | | | | 68,950 | |
| Private Equity — 1.1% | | | | | | | | |
| Icahn Enterprises LP, | | | | | | | | |
6.00%, 08/01/2020• | | | 70,000 | | | | 71,487 | |
| Total Financial (Cost $719,081) | | | | | | | 717,268 | |
| Industrial — 2.0% | | | | | | | | |
| Aerospace & Defense — 1.0% | | | | | | | | |
| Kratos Defense & Security | | | | | | | | |
| Solutions Inc., | | | | | | | | |
7.00%, 05/15/2019• | | | 70,000 | | | | 67,725 | |
| Engineering & Construction — 1.0% | | | | | | | | |
| MasTec Inc., | | | | | | | | |
4.875%, 03/15/2023• | | | 70,000 | | | | 68,425 | |
| Total Industrial (Cost $137,578) | | | | | | | 136,150 | |
| Technology — 5.9% | | | | | | | | |
| Computers — 0.9% | | | | | | | | |
| Seagate HDD Cayman, | | | | | | | | |
4.875%, 06/01/2027 f • | | | 65,000 | | | | 58,580 | |
| Office & Business Equipment — 1.1% | | | | | | | | |
Xerox Corp., 4.50%, 05/15/2021• | | | 70,000 | | | | 72,780 | |
| Semiconductors — 2.1% | | | | | | | | |
| Analog Devices Inc., | | | | | | | | |
2.50%, 12/05/2021• | | | 70,000 | | | | 69,358 | |
| Micron Technology Inc., | | | | | | | | |
5.875%, 02/15/2022• | | | 70,000 | | | | 72,975 | |
| | | | | | | | 142,333 | |
| Software — 1.8% | | | | | | | | |
| BMC Software Inc., | | | | | | | | |
7.25%, 06/01/2018• | | | 55,000 | | | | 55,275 | |
| Oracle Corp., | | | | | | | | |
1.90%, 09/15/2021• | | | 70,000 | | | | 68,404 | |
| | | | | | | | 123,679 | |
| Total Technology (Cost $398,045) | | | | | | | 397,372 | |
| Utilities — 1.1% | | | | | | | | |
| Electric — 1.1% | | | | | | | | |
DPL Inc., 7.25%, 10/15/2021• | | | 70,000 | | | | 71,400 | |
| Total Utilities (Cost $72,410) | | | | | | | 71,400 | |
| Total Corporate Bonds | | | | | | | | |
| (Cost $3,522,922) | | | | | | | 3,512,849 | |
| Municipal Bond — 1.7% | | | | | | | | |
| New Jersey State Economic | | | | | | | | |
| Development Authority | | | | | | | | |
| Revenue, Series NN, | | | | | | | | |
5.00%, 03/01/2021• | | | 110,000 | | | | 116,631 | |
| Total Municipal Bond | | | | | | | | |
| (Cost $116,994) | | | | | | | 116,631 | |
| Total Long-Term Investments | | | | | | | | |
| (Cost $5,673,680) | | | | | | | 5,703,649 | |
The accompanying notes are an integral part of the financial statements.
2016 SEMI-ANNUAL REPORT
Schedule of Investments (continued)
Quaker Global Tactical Allocation Fund
December 31, 2016 (unaudited)
| | | Par | | | Fair | |
| | | Value | | | Value | |
| Short Term Investments — 23.3% | | | | | | |
| Commercial Paper — 9.3% | | | | | | |
| Canadian Imperial Holdings Inc., | | | | | | |
1.198%, 06/06/2017 †• | | $ | 100,000 | | | $ | 99,481 | |
| Ford Motor Credit Co. LLC, | | | | | | | | |
0.945%, 01/17/2017 †• | | | 100,000 | | | | 99,958 | |
| ING US Funding LLC, | | | | | | | | |
1.144%, 05/15/2017 †• | | | 100,000 | | | | 99,571 | |
| JPMorgan Securities LLC, | | | | | | | | |
1.167%, 05/08/2017 †• | | | 100,000 | | | | 99,585 | |
| Kaiser Foundation Health Plan Inc., | | | | | | | | |
1.149%, 03/22/2017 †• | | | 132,000 | | | | 131,663 | |
| Toyota Credit De Puerto Rico Corp., | | | | | | | | |
0.806%, 03/09/2017 †• | | | 100,000 | | | | 99,850 | |
| | | | | | | | 630,108 | |
| Total Commercial Paper (Cost $630,200) | | | | | | | 630,108 | |
| Money Market Deposit Account — 14.0% | | | | | | | | |
| U.S. Bank N.A., 0.10% | | | 943,013 | | | | 943,013 | |
| Total Money Market Deposit Account | | | | | | | | |
| (Cost $943,013) | | | | | | | 943,013 | |
| Total Short Term Investments | | | | | | | | |
| (Cost $1,573,213) | | | | | | | 1,573,121 | |
| Total Investments | | | | | | | | |
| (Cost $7,246,893) — 107.8% | | | | | | | 7,276,770 | |
| Liabilities in Excess of | | | | | | | | |
| Other Assets, Net (7.8)% | | | | | | | (525,670 | ) |
| Total Net Assets — 100.0% | | | | | | $ | 6,751,100 | |
ADR - American Depositary Receipt
| (a) | Non-income producing security. |
| f | Foreign issued security. |
| * | Indicates an illiquid security. Total market value for illiquid securities is $14,668, representing 0.2% of net assets. |
| † | The rate shown is the yield as of 12/31/2016. |
| | The coupon rate shown on floating or adjustable rate securities represents the rate at period end. |
| • | Level 2 securities. |
| ^ | Indicates a fair valued security. Total market value for fair valued securities is $14,668, representing 0.2% of net assets and Level 3 securities. |
The accompanying notes are an integral part of the financial statements.
2016 SEMI-ANNUAL REPORT
Schedule of Investments
Quaker Mid-Cap Value Fund
December 31, 2016 (unaudited)
| | | Number | | | Fair | |
| | | of Shares | | | Value | |
| Long-Term Investments — 97.5% | | | | | | |
| Common Stocks — 84.4% | | | | | | |
| Basic Materials — 4.3% | | | | | | |
| Chemicals — 2.0% | | | | | | |
| Westlake Chemical Corp. | | | 2,592 | | | $ | 145,126 | |
| Iron & Steel — 2.3% | | | | | | | | |
| Reliance Steel & Aluminum Co. | | | 2,153 | | | | 171,250 | |
| Total Basic Materials (Cost $267,352) | | | | | | | 316,376 | |
| Consumer, Cyclical — 14.1% | | | | | | | | |
| Auto Manufacturers — 2.0% | | | | | | | | |
| PACCAR Inc. | | | 2,318 | | | | 148,120 | |
| Auto Parts & Equipment — 1.8% | | | | | | | | |
| The Goodyear Tire & Rubber Co. (b) | | | 4,288 | | | | 132,371 | |
| Home Furnishings — 3.5% | | | | | | | | |
| Harman International Industries Inc. | | | 1,583 | | | | 175,966 | |
| Whirlpool Corp. (b) | | | 472 | | | | 85,795 | |
| | | | | | | | 261,761 | |
| Leisure Time — 3.4% | | | | | | | | |
| Brunswick Corp. | | | 2,803 | | | | 152,876 | |
| Norwegian Cruise Line | | | | | | | | |
Holdings Ltd. (a)(b) f | | | 2,285 | | | | 97,181 | |
| | | | | | | | 250,057 | |
| Retail — 0.9% | | | | | | | | |
| Casey’s General Stores Inc. | | | 594 | | | | 70,615 | |
| Textiles — 0.9% | | | | | | | | |
| Mohawk Industries Inc. (a) | | | 338 | | | | 67,492 | |
| Toys/Games & Hobbies — 1.6% | | | | | | | | |
| Hasbro Inc. | | | 1,486 | | | | 115,596 | |
| Total Consumer, Cyclical | | | | | | | | |
| (Cost $908,702) | | | | | | | 1,046,012 | |
| Consumer, Non-cyclical — 5.5% | | | | | | | | |
| Food — 1.8% | | | | | | | | |
| Ingredion Inc. | | | 1,057 | | | | 132,083 | |
| Healthcare-Services — 1.9% | | | | | | | | |
| Centene Corp. (a) | | | 2,500 | | | | 141,275 | |
| Pharmaceuticals — 1.8% | | | | | | | | |
Mylan NV (a) f | | | 3,529 | | | | 134,631 | |
| Total Consumer, Non-cyclical | | | | | | | | |
| (Cost $395,643) | | | | | | | 407,989 | |
| Energy — 10.5% | | | | | | | | |
| Oil & Gas — 9.4% | | | | | | | | |
| Concho Resources Inc. (a) | | | 1,089 | | | | 144,401 | |
| Diamond Offshore Drilling Inc. (a)(b) | | | 2,329 | | | | 41,223 | |
| Helmerich & Payne Inc. (b) | | | 2,300 | | | | 178,020 | |
| Marathon Oil Corp. (b) | | | 6,813 | | | | 117,933 | |
| Newfield Exploration Co. (a) | | | 2,514 | | | | 101,817 | |
| Tesoro Corp. (b) | | | 1,335 | | | | 116,746 | |
| | | | | | | | 700,140 | |
| Oil & Gas Services — 1.1% | | | | | | | | |
| RPC Inc. (b) | | | 4,207 | | | | 83,341 | |
| Total Energy (Cost $695,080) | | | | | | | 783,481 | |
| Financial — 18.5% | | | | | | | | |
| Banks — 9.3% | | | | | | | | |
| East West Bancorp Inc. | | | 3,628 | | | | 184,411 | |
| Huntington Bancshares Inc. | | | 13,627 | | | | 180,149 | |
| PacWest Bancorp | | | 3,272 | | | | 178,128 | |
| Zions Bancorporation | | | 3,500 | | | | 150,640 | |
| | | | | | | | 693,328 | |
| Diversified Financial Services — 1.5% | | | | | | | | |
| T. Rowe Price Group Inc. | | | 1,468 | | | | 110,482 | |
| Insurance — 7.7% | | | | | | | | |
| Lincoln National Corp. | | | 2,571 | | | | 170,380 | |
| Reinsurance Group of America Inc. Cl A | | | 1,829 | | | | 230,143 | |
| Torchmark Corp. | | | 2,312 | | | | 170,533 | |
| | | | | | | | 571,056 | |
| Total Financial (Cost $889,443) | | | | | | | 1,374,866 | |
| Industrial — 12.9% | | | | | | | | |
| Aerospace & Defense — 1.7% | | | | | | | | |
| Teledyne Technologies Inc. (a) | | | 1,036 | | | | 127,428 | |
| Electronics — 4.2% | | | | | | | | |
| Avnet Inc. | | | 1,601 | | | | 76,223 | |
| Trimble Navigation Ltd. (a) | | | 3,798 | | | | 114,510 | |
| Woodward Inc. | | | 1,764 | | | | 121,804 | |
| | | | | | | | 312,537 | |
| Machinery-Diversified — 1.7% | | | | | | | | |
| Roper Technologies Inc. | | | 659 | | | | 120,650 | |
| Miscellaneous Manufacturing — 1.4% | | | | | | | | |
| Carlisle Cos. Inc. | | | 956 | | | | 105,437 | |
| Transportation — 3.9% | | | | | | | | |
| Kirby Corp. (a)(b) | | | 1,719 | | | | 114,314 | |
| Old Dominion Freight Line Inc. (a) | | | 2,051 | | | | 175,955 | |
| | | | | | | | 290,269 | |
| Total Industrial (Cost $753,098) | | | | | | | 956,321 | |
The accompanying notes are an integral part of the financial statements.
2016 SEMI-ANNUAL REPORT
Schedule of Investments (continued)
Quaker Mid-Cap Value Fund
December 31, 2016 (unaudited)
| | | Number | | | Fair | |
| | | of Shares | | | Value | |
| Common Stocks — 84.4% (Continued) | | | | | | |
| Technology — 8.9% | | | | | | |
| Computers — 3.6% | | | | | | |
| CSRA Inc. (b) | | | 3,622 | | | $ | 115,324 | |
| Western Digital Corp. (b) | | | 2,285 | | | | 155,266 | |
| | | | | | | | 270,590 | |
| Semiconductors — 3.7% | | | | | | | | |
| ON Semiconductor Corp. (a)(b) | | | 15,164 | | | | 193,492 | |
| Skyworks Solutions Inc. | | | 1,047 | | | | 78,169 | |
| | | | | | | | 271,661 | |
| Software — 1.6% | | | | | | | | |
| Synopsys Inc. (a) | | | 1,959 | | | | 115,307 | |
| Total Technology (Cost $516,430) | | | | | | | 657,558 | |
| Utilities — 9.7% | | | | | | | | |
| Electric — 6.0% | | | | | | | | |
| DTE Energy Co. | | | 1,623 | | | | 159,882 | |
| OGE Energy Corp. | | | 4,203 | | | | 140,590 | |
| Xcel Energy Inc. | | | 3,659 | | | | 148,921 | |
| | | | | | | | 449,393 | |
| Gas — 3.7% | | | | | | | | |
| CenterPoint Energy Inc. | | | 4,947 | | | | 121,894 | |
| UGI Corp. | | | 3,269 | | | | 150,636 | |
| | | | | | | | 272,530 | |
| Total Utilities (Cost $549,051) | | | | | | | 721,923 | |
| Total Common Stocks | | | | | | | | |
| (Cost $4,974,799) | | | | | | | 6,264,526 | |
| Real Estate Investment Trusts — 13.1% | | | | | | | | |
| Alexandria Real Estate Equities Inc. | | | 1,387 | | | | 154,137 | |
| AvalonBay Communities Inc. (b) | | | 338 | | | | 59,877 | |
| Brixmor Property Group Inc. | | | 5,029 | | | | 122,808 | |
| CyrusOne Inc. (b) | | | 2,665 | | | | 119,206 | |
| DDR Corp. | | | 3,688 | | | | 56,316 | |
| Duke Realty Corp. | | | 3,205 | | | | 85,125 | |
| Gaming and Leisure Properties Inc. | | | 3,920 | | | | 120,030 | |
| Sun Communities Inc. | | | 1,707 | | | | 130,773 | |
| Taubman Centers Inc. | | | 1,634 | | | | 120,802 | |
| | | | | | | | 969,074 | |
| Total Real Estate Investment Trusts | | | | | | | | |
| (Cost $894,900) | | | | | | | 969,074 | |
| Total Long-Term Investments | | | | | | | | |
| (Cost $5,869,699) | | | | | | | 7,233,600 | |
| | | Par | | | Fair | |
| | | Value | | | Value | |
| Money Market Deposit Account — 2.7% | | | | | | | | |
| U.S. Bank N.A., 0.10% | | $ | 202,786 | | | | 202,786 | |
| Total Money Market Deposit Account | | | | | | | | |
| (Cost $202,786) | | | | | | | 202,786 | |
| | | Units | | | | | |
| Investments Purchased with Proceeds | | | | | | | | |
| from Securities Lending — 21.0% | | | | | | | | |
| Mount Vernon Liquid Assets | | | | | | | | |
| Portfolio LLC., 0.98% (c)(d) | | | 1,555,473 | | | | 1,555,473 | |
| Total Investments Purchased with | | | | | | | | |
| Proceeds from Securities Lending | | | | | | | | |
| (Cost $1,555,473) | | | | | | | 1,555,473 | |
| Total Investments | | | | | | | | |
| (Cost $7,627,958) — 121.2% | | | | | | | 8,991,859 | |
| Liabilities in Excess of | | | | | | | | |
| Other Assets, Net (21.2)% | | | | | | | (1,573,397 | ) |
| Total Net Assets — 100.0% | | | | | | $ | 7,418,462 | |
| (a) | Non-income producing security. |
| (b) | All or a portion of the security is out on loan. The total market value of securities on loan was $1,505,176. The remaining contractual maturity of all of the securities lending transactions is overnight and continuous. |
| (c) | The rate shown is the annualized seven-day yield at period end. |
| (d) | Represents investments of collateral received from securities lending transactions. |
| f | Foreign issued security. |
The accompanying notes are an integral part of the financial statements.
2016 SEMI-ANNUAL REPORT
Schedule of Investments
Quaker Small-Cap Value Fund
December 31, 2016 (unaudited)
| | | Number | | | Fair | |
| | | of Shares | | | Value | |
| Long-Term Investments — 98.7% | | | | | | |
| Common Stocks — 90.4% | | | | | | |
| Basic Materials — 3.0% | | | | | | |
| Chemicals — 1.7% | | | | | | |
| Cabot Corp. | | | 773 | | | $ | 39,067 | |
| Innophos Holdings Inc. | | | 4,455 | | | | 232,818 | |
| Koppers Holdings Inc. (a) | | | 3,670 | | | | 147,901 | |
Orion Engineered Carbons SA f | | | 7,332 | | | | 138,208 | |
| | | | | | | | 557,994 | |
| Forest Products & Paper — 0.1% | | | | | | | | |
| Resolute Forest Products Inc. (a) | | | 8,508 | | | | 45,518 | |
| Iron & Steel — 0.1% | | | | | | | | |
| Ryerson Holding Corp. (a) | | | 2,496 | | | | 33,322 | |
| Mining — 1.1% | | | | | | | | |
Constellium NV (a) f | | | 10,433 | | | | 61,555 | |
Dominion Diamond Corp. f | | | 31,735 | | | | 307,195 | |
| | | | | | | | 368,750 | |
| Total Basic Materials | | | | | | | | |
| (Cost $876,069) | | | | | | | 1,005,584 | |
| Communications — 8.9% | | | | | | | | |
| Internet — 4.7% | | | | | | | | |
| ChannelAdvisor Corp. (a) | | | 3,978 | | | | 57,084 | |
| DHI Group Inc. (a) | | | 39,905 | | | | 249,406 | |
| IAC/InterActive Corp. (a)(b) | | | 1,716 | | | | 111,180 | |
| Internap Corp. (a) | | | 8,475 | | | | 13,052 | |
magicJack VocalTec Ltd. (a)(b) f | | | 8,420 | | | | 57,677 | |
| New Media Investment Group Inc. | | | 7,059 | | | | 112,873 | |
| RetailMeNot Inc. (a)(b) | | | 31,560 | | | | 293,508 | |
| Rocket Fuel Inc. (a) | | | 32,294 | | | | 55,223 | |
| The Rubicon Project Inc. (a) | | | 6,874 | | | | 51,005 | |
| Travelzoo Inc. (a) | | | 8,832 | | | | 83,021 | |
| Web.com Group Inc. (a) | | | 16,294 | | | | 344,618 | |
| Zix Corp. (a) | | | 28,316 | | | | 139,881 | |
| | | | | | | | 1,568,528 | |
| Media — 2.3% | | | | | | | | |
| Gannett Co. Inc. | | | 11,132 | | | | 108,092 | |
| MSG Networks Inc. (a) | | | 15,164 | | | | 326,026 | |
| Scholastic Corp. (b) | | | 1,071 | | | | 50,862 | |
| Time Inc. (b) | | | 16,064 | | | | 286,742 | |
| | | | | | | | 771,722 | |
| Telecommunications — 1.9% | | | | | | | | |
| Black Box Corp. | | | 9,858 | | | | 150,335 | |
| DigitalGlobe Inc. (a) | | | 10,963 | | | | 314,090 | |
| Extreme Networks Inc. (a) | | | 27,948 | | | | 140,578 | |
| General Communication Inc. (a) | | | 1,720 | | | | 33,454 | |
| | | | | | | | 638,457 | |
| Total Communications | | | | | | | | |
| (Cost $2,904,039) | | | | | | | 2,978,707 | |
| Consumer, Cyclical — 10.1% | | | | | | | | |
| Airlines — 2.1% | | | | | | | | |
Copa Holdings SA (b) f | | | 612 | | | | 55,588 | |
| Hawaiian Holdings Inc. (a) | | | 5,368 | | | | 305,976 | |
| JetBlue Airways Corp. (a) | | | 1,279 | | | | 28,675 | |
| Spirit Airlines Inc. (a)(b) | | | 5,306 | | | | 307,005 | |
| | | | | | | | 697,244 | |
| Auto Manufacturers — 0.6% | | | | | | | | |
| Wabash National Corp. (a)(b) | | | 13,449 | | | | 212,763 | |
| Auto Parts & Equipment — 2.9% | | | | | | | | |
| American Axle & Manufacturing | | | | | | | | |
| Holdings Inc. (a) | | | 7,000 | | | | 135,100 | |
| Cooper Tire & Rubber Co. (b) | | | 5,961 | | | | 231,585 | |
| Meritor Inc. (a)(b) | | | 2,378 | | | | 29,535 | |
| Tenneco Inc. (a)(b) | | | 1,558 | | | | 97,328 | |
| Tower International Inc. | | | 4,339 | | | | 123,011 | |
| Visteon Corp. | | | 4,534 | | | | 364,262 | |
| | | | | | | | 980,821 | |
| Entertainment — 0.5% | | | | | | | | |
| Pinnacle Entertainment Inc. (a) | | | 10,713 | | | | 155,339 | |
| Home Builders — 0.1% | | | | | | | | |
| NVR Inc. (a)(b) | | | 15 | | | | 25,035 | |
| Home Furnishings — 1.0% | | | | | | | | |
| Ethan Allen Interiors Inc. | | | 8,845 | | | | 325,938 | |
| Leisure Time — 0.2% | | | | | | | | |
| MCBC Holdings Inc. | | | 4,578 | | | | 66,747 | |
| Retail — 2.6% | | | | | | | | |
| Big Lots Inc. (b) | | | 2,471 | | | | 124,069 | |
| Build-A-Bear Workshop Inc. (a) | | | 2,162 | | | | 29,727 | |
| Chico’s FAS Inc. | | | 3,722 | | | | 53,560 | |
| The Children’s Place Inc. | | | 1,565 | | | | 157,987 | |
| Del Frisco’s Restaurant Group Inc. (a) | | | 6,589 | | | | 112,013 | |
| Francesca’s Holdings Corp. (a)(b) | | | 12,305 | | | | 221,859 | |
| Potbelly Corp. (a)(b) | | | 6,808 | | | | 87,823 | |
| Ruth’s Hospitality Group Inc. | | | 2,565 | | | | 46,940 | |
| Tailored Brands Inc. | | | 1,293 | | | | 33,036 | |
| | | | | | | | 867,014 | |
The accompanying notes are an integral part of the financial statements.
2016 SEMI-ANNUAL REPORT
Schedule of Investments (continued)
Quaker Small-Cap Value Fund
December 31, 2016 (unaudited)
| | | Number | | | Fair | |
| | | of Shares | | | Value | |
| Common Stocks — 90.4% (Continued) | | | | | | |
| Toys/Games & Hobbies — 0.1% | | | | | | |
| JAKKS Pacific Inc. (a)(b) | | | 9,501 | | | $ | 48,930 | |
| Total Consumer, Cyclical | | | | | | | | |
| (Cost $2,848,548) | | | | | | | 3,379,831 | |
| Consumer, Non-cyclical — 21.5% | | | | | | | | |
| Agriculture — 0.5% | | | | | | | | |
| Universal Corp. (b) | | | 2,310 | | | | 147,263 | |
| Biotechnology — 4.3% | | | | | | | | |
| Acorda Therapeutics Inc. (a)(b) | | | 7,722 | | | | 145,174 | |
| AMAG Pharmaceuticals Inc. (a)(b) | | | 8,714 | | | | 303,247 | |
| Applied Genetic Technologies Corp. (a) | | | 27,159 | | | | 253,937 | |
| Emergent BioSolutions Inc. (a)(b) | | | 5,708 | | | | 187,451 | |
| Lexicon Pharmaceuticals Inc. (a) | | | 1,448 | | | | 20,026 | |
| Retrophin Inc. (a)(b) | | | 6,781 | | | | 128,364 | |
| United Therapeutics Corp. (a)(b) | | | 2,763 | | | | 396,297 | |
| | | | | | | | 1,434,496 | |
| Commercial Services — 6.2% | | | | | | | | |
| Aaron’s Inc. (b) | | | 9,447 | | | | 302,210 | |
| Avis Budget Group Inc. (a) | | | 1,759 | | | | 64,520 | |
| The Brink’s Co. | | | 676 | | | | 27,885 | |
| Capella Education Co. (b) | | | 4,343 | | | | 381,315 | |
| CRA International Inc. | | | 2,020 | | | | 73,932 | |
| The Hackett Group Inc. | | | 1,618 | | | | 28,574 | |
| ManpowerGroup Inc. | | | 224 | | | | 19,907 | |
| Medifast Inc. | | | 4,591 | | | | 191,123 | |
| Neff Corp. (a) | | | 4,548 | | | | 64,127 | |
| Quanta Services Inc. (a) | | | 11,420 | | | | 397,987 | |
| Rent-A-Center Inc. | | | 18,231 | | | | 205,099 | |
| RPX Corp. (a) | | | 22,135 | | | | 239,058 | |
| Strayer Education Inc. (a)(b) | | | 1,005 | | | | 81,033 | |
| | | | | | | | 2,076,770 | |
| Food — 1.9% | | | | | | | | |
Cosan Ltd. f | | | 12,277 | | | | 92,200 | |
| Darling Ingredients Inc. (a) | | | 4,255 | | | | 54,932 | |
| Dean Foods Co. | | | 17,943 | | | | 390,799 | |
| Sanderson Farms Inc. | | | 1,097 | | | | 103,381 | |
| | | | | | | | 641,312 | |
| Healthcare-Products — 2.4% | | | | | | | | |
| Halyard Health Inc. (a)(b) | | | 7,737 | | | | 286,114 | |
| Lantheus Holdings Inc. (a) | | | 3,147 | | | | 27,064 | |
| Meridian Bioscience Inc. | | | 2,272 | | | | 40,214 | |
Orthofix International NV (a) f | | | 8,597 | | | | 311,039 | |
Syneron Medical Ltd. (a) f | | | 16,709 | | | | 140,356 | |
| | | | | | | | 804,787 | |
| Healthcare-Services — 0.9% | | | | | | | | |
| Chemed Corp. (b) | | | 865 | | | | 138,755 | |
| Magellan Health Inc. (a) | | | 1,390 | | | | 104,597 | |
| RadNet Inc. (a) | | | 9,926 | | | | 64,023 | |
| | | | | | | | 307,375 | |
| Household Products & Wares — 0.6% | | | | | | | | |
| ACCO Brands Corp. (a) | | | 11,088 | | | | 144,698 | |
| Avery Dennison Corp. | | | 517 | | | | 36,304 | |
| | | | | | | | 181,002 | |
| Pharmaceuticals — 4.7% | | | | | | | | |
| Anika Therapeutics Inc. (a) | | | 6,441 | | | | 315,351 | |
| BioSpecifics Technologies Corp. (a) | | | 1,342 | | | | 74,749 | |
| Enanta Pharmaceuticals Inc. (a)(b) | | | 8,563 | | | | 286,861 | |
Horizon Pharma PLC (a) f | | | 2,259 | | | | 36,551 | |
Mallinckrodt PLC (a)(b) f | | | 1,033 | | | | 51,464 | |
| Omega Protein Corp. (a) | | | 10,628 | | | | 266,231 | |
| Sucampo Pharmaceuticals Inc. (a)(b) | | | 8,219 | | | | 111,367 | |
| Threshold Pharmaceuticals Inc. (a) | | | 21,915 | | | | 9,665 | |
| Vanda Pharmaceuticals Inc. (a)(b) | | | 22,102 | | | | 352,527 | |
| Zafgen Inc. (a)(b) | | | 23,979 | | | | 76,253 | |
| | | | | | | | 1,581,019 | |
| Total Consumer, Non-cyclical | | | | | | | | |
| (Cost $6,299,004) | | | | | | | 7,174,024 | |
| Energy — 3.2% | | | | | | | | |
| Coal — 0.5% | | | | | | | | |
| CONSOL Energy Inc. (b) | | | 4,304 | | | | 78,462 | |
| Westmoreland Coal Co. (a) | | | 5,369 | | | | 94,870 | |
| | | | | | | | 173,332 | |
| Energy-Alternate Sources — 1.8% | | | | | | | | |
| Renewable Energy Group Inc. (a) | | | 24,229 | | | | 235,021 | |
| REX American Resources Corp. (a)(b) | | | 3,877 | | | | 382,854 | |
| | | | | | | | 617,875 | |
| Oil & Gas — 0.8% | | | | | | | | |
| Bill Barrett Corp. (a) | | | 14,324 | | | | 100,125 | |
Rowan Cos. PLC (a) f | | | 8,674 | | | | 163,852 | |
| | | | | | | | 263,977 | |
| Oil & Gas Services — 0.1% | | | | | | | | |
| Matrix Service Co. (a) | | | 1,042 | | | | 23,653 | |
| Total Energy (Cost $902,389) | | | | | | | 1,078,837 | |
The accompanying notes are an integral part of the financial statements.
2016 SEMI-ANNUAL REPORT
Schedule of Investments (continued)
Quaker Small-Cap Value Fund
December 31, 2016 (unaudited)
| | | Number | | | Fair | |
| | | of Shares | | | Value | |
| Common Stocks — 90.4% (Continued) | | | | | | |
| Financial — 18.8% | | | | | | |
| Banks — 6.7% | | | | | | |
| Central Pacific Financial Corp. (b) | | | 12,614 | | | $ | 396,332 | |
| Customers Bancorp Inc. (a) | | | 2,192 | | | | 78,518 | |
| Enterprise Financial Services Corp. | | | 1,124 | | | | 48,332 | |
| Financial Institutions Inc. | | | 4,197 | | | | 143,537 | |
| Independent Bank Corp. | | | 8,519 | | | | 184,862 | |
| National Bank Holdings Corp. (b) | | | 12,545 | | | | 400,060 | |
OFG Bancorp f | | | 17,655 | | | | 231,281 | |
| Peapack Gladstone Financial Corp. | | | 5,231 | | | | 161,533 | |
Popular Inc. f | | | 9,083 | | | | 398,017 | |
| Walker & Dunlop Inc. (a) | | | 6,242 | | | | 194,750 | |
| | | | | | | | 2,237,222 | |
| Diversified Financial Services — 3.5% | | | | | | | | |
| Altisource Portfolio | | | | | | | | |
Solutions SA (a)(b) f | | | 2,485 | | | | 66,076 | |
| Enova International Inc. (a) | | | 3,722 | | | | 46,711 | |
| Federal Agricultural Mortgage Corp. | | | 3,916 | | | | 224,269 | |
| GAMCO Investors Inc. | | | 2,357 | | | | 72,808 | |
| Investment Technology Group Inc. | | | 4,150 | | | | 81,921 | |
| Oppenheimer Holdings Inc. | | | 6,146 | | | | 114,316 | |
| Piper Jaffray Cos. (a)(b) | | | 3,452 | | | | 250,270 | |
| Regional Management Corp. (a) | | | 6,593 | | | | 173,264 | |
| World Acceptance Corp. (a)(b) | | | 1,911 | | | | 122,839 | |
| | | | | | | | 1,152,474 | |
| Insurance — 6.5% | | | | | | | | |
| American Financial Group Inc. | | | 2,598 | | | | 228,936 | |
Assured Guaranty Ltd. f | | | 10,649 | | | | 402,213 | |
| Baldwin & Lyons Inc. | | | 2,742 | | | | 69,098 | |
| Genworth Financial Inc. (a) | | | 7,585 | | | | 28,899 | |
| HCI Group Inc. (b) | | | 3,376 | | | | 133,284 | |
| Heritage Insurance Holdings Inc. | | | 3,315 | | | | 51,946 | |
| Reinsurance Group of America Inc. Cl A | | | 3,258 | | | | 409,954 | |
| Universal Insurance Holdings Inc. (b) | | | 6,160 | | | | 174,944 | |
Validus Holdings Ltd. f | | | 7,029 | | | | 386,665 | |
| Voya Financial Inc. | | | 7,328 | | | | 287,404 | |
| | | | | | | | 2,173,343 | |
| Investment Companies — 0.1% | | | | | | | | |
| Acacia Research Corp. (a) | | | 5,795 | | | | 37,667 | |
| Real Estate — 0.1% | | | | | | | | |
| The RMR Group Inc. | | | 645 | | | | 25,478 | |
| Savings & Loans — 1.9% | | | | | | | | |
| Banc of California Inc. (b) | | | 5,521 | | | | 95,789 | |
| Flagstar Bancorp Inc. (a)(b) | | | 12,949 | | | | 348,846 | |
| HomeTrust Bancshares Inc. (a) | | | 897 | | | | 23,232 | |
| Meta Financial Group Inc. | | | 1,316 | | | | 135,416 | |
| United Community Financial Corp. | | | 4,250 | | | | 37,995 | |
| | | | | | | | 641,278 | |
| Total Financial | | | | | | | | |
| (Cost $4,801,270) | | | | | | | 6,267,462 | |
| Industrial — 13.5% | | | | | | | | |
| Aerospace & Defense — 1.3% | | | | | | | | |
| Spirit AeroSystems Holdings Inc. | | | 5,638 | | | | 328,977 | |
| Triumph Group Inc. | | | 3,233 | | | | 85,675 | |
| | | | | | | | 414,652 | |
| Building Materials — 1.5% | | | | | | | | |
| Apogee Enterprises Inc. | | | 1,976 | | | | 105,835 | |
| Continental Building Products Inc. (a) | | | 2,259 | | | | 52,183 | |
Masonite International Corp. (a) f | | | 701 | | | | 46,126 | |
| Owens Corning | | | 5,956 | | | | 307,091 | |
| | | | | | | | 511,235 | |
| Electrical Components & Equipment — 0.6% | | | | | | | | |
| Advanced Energy Industries Inc. (a)(b) | | | 3,568 | | | | 195,348 | |
| Electronics — 1.9% | | | | | | | | |
| Bel Fuse Inc. | | | 3,503 | | | | 108,243 | |
Celestica Inc. (a) f | | | 10,120 | | | | 119,922 | |
| Vishay Intertechnology Inc. (b) | | | 25,462 | | | | 412,484 | |
| | | | | | | | 640,649 | |
| Engineering & Construction — 2.8% | | | | | | | | |
| Aegion Corp. (a)(b) | | | 15,185 | | | | 359,885 | |
| Argan Inc. | | | 864 | | | | 60,955 | |
| EMCOR Group Inc. | | | 1,105 | | | | 78,190 | |
| MYR Group Inc. (a) | | | 9,838 | | | | 370,696 | |
| Orion Group Holdings Inc. (a) | | | 5,951 | | | | 59,212 | |
| | | | | | | | 928,938 | |
| Machinery-Diversified — 0.7% | | | | | | | | |
| BWX Technologies Inc. (b) | | | 6,191 | | | | 245,783 | |
| Metal Fabricate & Hardware — 0.6% | | | | | | | | |
| Global Brass & Copper Holdings Inc. | | | 3,962 | | | | 135,897 | |
| Olympic Steel Inc. (b) | | | 2,655 | | | | 64,331 | |
| | | | | | | | 200,228 | |
| Miscellaneous Manufacturing — 1.5% | | | | | | | | |
| Myers Industries Inc. | | | 8,433 | | | | 120,592 | |
The accompanying notes are an integral part of the financial statements.
2016 SEMI-ANNUAL REPORT
Schedule of Investments (continued)
Quaker Small-Cap Value Fund
December 31, 2016 (unaudited)
| | | Number | | | Fair | |
| | | of Shares | | | Value | |
| Common Stocks — 90.4% (Continued) | | | | | | |
| Miscellaneous Manufacturing (Continued) | | | | | | |
Trinseo SA f | | | 6,639 | | | $ | 393,693 | |
| | | | | | | | 514,285 | |
| Packaging & Containers — 0.6% | | | | | | | | |
| Packaging Corp. of America | | | 2,285 | | | | 193,814 | |
| Shipbuilding — 0.7% | | | | | | | | |
| Huntington Ingalls Industries Inc. | | | 1,230 | | | | 226,554 | |
| Transportation — 1.3% | | | | | | | | |
| Aegean Marine Petroleum | | | | | | | | |
Network Inc. (b) f | | | 5,856 | | | | 59,438 | |
| Air Transport Services Group Inc. (a) | | | 4,528 | | | | 72,267 | |
DHT Holdings Inc. f | | | 24,123 | | | | 99,869 | |
Euronav NV f | | | 7,431 | | | | 59,076 | |
| Swift Transportation Co. (a)(b) | | | 6,039 | | | | 147,110 | |
| | | | | | | | 437,760 | |
| Total Industrial | | | | | | | | |
| (Cost $3,744,080) | | | | | | | 4,509,246 | |
| Technology — 8.1% | | | | | | | | |
| Computers — 0.9% | | | | | | | | |
| Carbonite Inc. (a) | | | 5,533 | | | | 90,741 | |
| NCR Corp. (a) | | | 3,682 | | | | 149,342 | |
| Teradata Corp. (a)(b) | | | 1,383 | | | | 37,576 | |
| | | | | | | | 277,659 | |
| Semiconductors — 2.9% | | | | | | | | |
| Amkor Technology Inc. (a)(b) | | | 18,831 | | | | 198,667 | |
| IXYS Corp. | | | 2,107 | | | | 25,073 | |
| Kulicke & Soffa Industries Inc. (a) | | | 23,428 | | | | 373,677 | |
| Teradyne Inc. (b) | | | 10,142 | | | | 257,607 | |
| Ultra Clean Holdings Inc. (a) | | | 3,330 | | | | 32,301 | |
| Xcerra Corp. (a) | | | 9,719 | | | | 74,253 | |
| | | | | | | | 961,578 | |
| Software — 4.3% | | | | | | | | |
| Aspen Technology Inc. (a) | | | 8,027 | | | | 438,916 | |
| Cadence Design Systems Inc. (a)(b) | | | 3,031 | | | | 76,442 | |
| Jive Software Inc. (a) | | | 17,470 | | | | 75,995 | |
| MicroStrategy Inc. (a)(b) | | | 124 | | | | 24,478 | |
| Progress Software Corp. | | | 6,753 | | | | 215,623 | |
| Rosetta Stone Inc. (a) | | | 10,397 | | | | 92,637 | |
| Synopsys Inc. (a) | | | 3,054 | | | | 179,758 | |
| Take-Two Interactive Software Inc. (a)(b) | | | 6,902 | | | | 340,200 | |
| | | | | | | | 1,444,049 | |
| Total Technology | | | | | | | | |
| (Cost $2,117,041) | | | | | | | 2,683,286 | |
| Utilities — 3.3% | | | | | | | | |
| Electric — 1.6% | | | | | | | | |
| Dynegy Inc. (a) | | | 5,192 | | | | 43,924 | |
| El Paso Electric Co. | | | 2,118 | | | | 98,487 | |
| NRG Energy Inc. | | | 14,053 | | | | 172,290 | |
| Portland General Electric Co. | | | 4,821 | | | | 208,894 | |
| | | | | | | | 523,595 | |
| Gas — 1.6% | | | | | | | | |
Just Energy Group Inc. f | | | 13,532 | | | | 73,885 | |
| Southwest Gas Corp. | | | 598 | | | | 45,819 | |
| UGI Corp. | | | 8,344 | | | | 384,491 | |
| Vectren Corp. | | | 412 | | | | 21,486 | |
| | | | | | | | 525,681 | |
| Water — 0.1% | | | | | | | | |
Consolidated Water Co. Ltd. f | | | 4,298 | | | | 46,633 | |
| Total Utilities | | | | | | | | |
| (Cost $948,241) | | | | | | | 1,095,909 | |
| Total Common Stocks | | | | | | | | |
| (Cost $25,440,681) | | | | | | | 30,172,886 | |
| Real Estate Investment Trusts — 8.3% | | | | | | | | |
| Armada Hoffler Properties Inc. | | | 3,255 | | | | 47,425 | |
| Ashford Hospitality Trust Inc. (b) | | | 50,658 | | | | 393,106 | |
| CBL & Associates Properties Inc. (b) | | | 26,461 | | | | 304,301 | |
| First Potomac Realty Trust | | | 4,909 | | | | 53,852 | |
| Hospitality Properties Trust | | | 8,417 | | | | 267,156 | |
| Mack-Cali Realty Corp. | | | 12,599 | | | | 365,623 | |
| New Senior Investment Group Inc. | | | 26,126 | | | | 255,774 | |
| NexPoint Residential Trust Inc. | | | 1,114 | | | | 24,887 | |
| Preferred Apartment | | | | | | | | |
| Communities Inc. | | | 13,062 | | | | 194,754 | |
| Taubman Centers Inc. | | | 4,115 | | | | 304,222 | |
| Washington Prime Group Inc. | | | 26,744 | | | | 278,405 | |
| Xenia Hotels & Resorts Inc. | | | 14,284 | | | | 277,395 | |
| | | | | | | | 2,766,900 | |
| Total Real Estate Investment Trusts | | | | | | | | |
| (Cost $2,708,556) | | | | | | | 2,766,900 | |
| Total Long-Term Investments | | | | | | | | |
| (Cost $28,149,237) | | | | | | | 32,939,786 | |
The accompanying notes are an integral part of the financial statements.
2016 SEMI-ANNUAL REPORT
Schedule of Investments (continued)
Quaker Small-Cap Value Fund
December 31, 2016 (unaudited)
| | | Par | | | Fair | |
| | | Value | | | Value | |
| Money Market Deposit Account — 1.3% | | | | | | |
| U.S. Bank N.A., 0.10% | | $ | 417,994 | | | $ | 417,994 | |
| Total Money Market Deposit Account | | | | | | | | |
| (Cost $417,994) | | | | | | | 417,994 | |
| | | Units | | | | | |
| Investments Purchased with Proceeds | | | | | | | | |
| from Securities Lending — 26.6% | | | | | | | | |
| Mount Vernon Liquid Assets | | | | | | | | |
| Portfolio LLC, 0.98% (c)(d) | | | 8,883,757 | | | | 8,883,757 | |
| Total Investments Purchased with | | | | | | | | |
| Proceeds from Securities Lending | | | | | | | | |
| (Cost $8,883,757) | | | | | | | 8,883,757 | |
| Total Investments | | | | | | | | |
| (Cost $37,450,988) — 126.6% | | | | | | | 42,241,537 | |
| Liabilities in Excess | | | | | | | | |
| of Other Assets, Net (26.6)% | | | | | | | (8,875,308 | ) |
| Total Net Assets — 100.0% | | | | | | $ | 33,366,229 | |
| (a) | Non-income producing security. |
| (b) | All or a portion of the security is out on loan. The total market value of securities on loan was $8,629,212. The remaining contractual maturity of all of the securities lending transactions is overnight and continuous. |
| (c) | The rate shown is the annualized seven-day yield at period end. |
| (d) | Represents investments of collateral received from securities lending transactions. |
| f | Foreign issued security. |
The accompanying notes are an integral part of the financial statements.
2016 SEMI-ANNUAL REPORT
Schedule of Investments
Quaker Strategic Growth Fund
December 31, 2016 (unaudited)
| | | Number | | | Fair | |
| | | of Shares | | | Value | |
| Long-Term Investments — 99.7% | | | | | | |
| Common Stocks — 96.0% | | | | | | |
| Basic Materials — 4.2% | | | | | | |
| Chemicals — 3.2% | | | | | | |
| AdvanSix Inc. (a) | | | 128 | | | $ | 2,834 | |
| CF Industries Holdings Inc. | | | 6,570 | | | | 206,824 | |
| The Dow Chemical Co. | | | 5,850 | | | | 334,737 | |
| Eastman Chemical Co. | | | 2,600 | | | | 195,546 | |
| FMC Corp. | | | 1,100 | | | | 62,216 | |
| International Flavors & Fragrances Inc. | | | 300 | | | | 35,349 | |
LyondellBasell Industries NV f | | | 4,240 | | | | 363,707 | |
| The Mosaic Co. | | | 24,000 | | | | 703,920 | |
| PPG Industries Inc. | | | 2,000 | | | | 189,520 | |
| Praxair Inc. | | | 3,300 | | | | 386,727 | |
| | | | | | | | 2,481,380 | |
| Forest Products & Paper — 0.3% | | | | | | | | |
| International Paper Co. | | | 4,000 | | | | 212,240 | |
| Mining — 0.7% | | | | | | | | |
| Newmont Mining Corp. | | | 16,800 | | | | 572,376 | |
| Total Basic Materials | | | | | | | | |
| (Cost $3,003,819) | | | | | | | 3,265,996 | |
| Communications — 9.9% | | | | | | | | |
| Internet — 2.5% | | | | | | | | |
| Alphabet Inc. Cl A (a) | | | 185 | | | | 146,603 | |
| Alphabet Inc. Cl C (a) | | | 253 | | | | 195,271 | |
| eBay Inc. (a) | | | 16,400 | | | | 486,916 | |
| F5 Networks Inc. (a) | | | 300 | | | | 43,416 | |
| Symantec Corp. | | | 42,490 | | | | 1,015,086 | |
| VeriSign Inc. (a) | | | 120 | | | | 9,128 | |
| Yahoo! Inc. (a) | | | 600 | | | | 23,202 | |
| | | | | | | | 1,919,622 | |
| Media — 1.5% | | | | | | | | |
| News Corp. Cl A | | | 49,880 | | | | 571,625 | |
| TEGNA Inc. | | | 3,600 | | | | 77,004 | |
| Viacom Inc. | | | 11,100 | | | | 389,610 | |
| The Walt Disney Co. | | | 1,200 | | | | 125,064 | |
| | | | | | | | 1,163,303 | |
| Telecommunications — 5.9% | | | | | | | | |
| AT&T Inc. | | | 39,500 | | | | 1,679,935 | |
| CenturyLink Inc. | | | 460 | | | | 10,939 | |
| Cisco Systems Inc. | | | 22,500 | | | | 679,950 | |
| Juniper Networks Inc. | | | 11,100 | | | | 313,686 | |
| Motorola Solutions Inc. | | | 3,760 | | | | 311,666 | |
| Verizon Communications Inc. | | | 27,900 | | | | 1,489,302 | |
| | | | | | | | 4,485,478 | |
| Total Communications | | | | | | | | |
| (Cost $7,120,366) | | | | | | | 7,568,403 | |
| Consumer, Cyclical — 11.7% | | | | | | | | |
| Airlines — 1.6% | | | | | | | | |
| Alaska Air Group Inc. | | | 551 | | | | 48,890 | |
| AMR Corp. Escrow (a)*^ | | | 211,235 | | | | 407,684 | |
| Delta Air Lines Inc. | | | 7,117 | | | | 350,085 | |
| Southwest Airlines Co. | | | 5,223 | | | | 260,314 | |
| United Continental Holdings Inc. (a) | | | 2,140 | | | | 155,963 | |
| | | | | | | | 1,222,936 | |
| Apparel — 0.6% | | | | | | | | |
Michael Kors Holdings Ltd. (a) f | | | 3,930 | | | | 168,911 | |
| Ralph Lauren Corp. | | | 2,700 | | | | 243,864 | |
| | | | | | | | 412,775 | |
| Auto Manufacturers — 1.8% | | | | | | | | |
| Ford Motor Co. | | | 19,910 | | | | 241,508 | |
| General Motors Co. | | | 33,000 | | | | 1,149,720 | |
| | | | | | | | 1,391,228 | |
| Auto Parts & Equipment — 0.2% | | | | | | | | |
| BorgWarner Inc. | | | 900 | | | | 35,496 | |
| The Goodyear Tire & Rubber Co. | | | 3,620 | | | | 111,750 | |
| | | | | | | | 147,246 | |
| Home Builders — 0.7% | | | | | | | | |
| DR Horton Inc. | | | 9,610 | | | | 262,641 | |
| PulteGroup Inc. | | | 15,200 | | | | 279,376 | |
| | | | | | | | 542,017 | |
| Leisure Time — 0.3% | | | | | | | | |
| Harley-Davidson Inc. | | | 3,700 | | | | 215,858 | |
| Lodging — 0.1% | | | | | | | | |
| Wyndham Worldwide Corp. | | | 1,400 | | | | 106,918 | |
| Retail — 6.0% | | | | | | | | |
| Bed Bath & Beyond Inc. | | | 20,700 | | | | 841,248 | |
| Best Buy Co. Inc. | | | 890 | | | | 37,976 | |
| Coach Inc. | | | 5,000 | | | | 175,100 | |
| Costco Wholesale Corp. | | | 555 | | | | 88,861 | |
| CVS Health Corp. | | | 360 | | | | 28,408 | |
| The Gap Inc. | | | 8,180 | | | | 183,559 | |
| The Home Depot Inc. | | | 60 | | | | 8,045 | |
The accompanying notes are an integral part of the financial statements.
2016 SEMI-ANNUAL REPORT
Schedule of Investments (continued)
Quaker Strategic Growth Fund
December 31, 2016 (unaudited)
| | | Number | | | Fair | |
| | | of Shares | | | Value | |
| Common Stocks — 96.0% (Continued) | | | | | | |
| Retail (Continued) | | | | | | |
| Kohl’s Corp. | | | 7,400 | | | $ | 365,412 | |
| L Brands Inc. | | | 3,500 | | | | 230,440 | |
| Lowe’s Cos. Inc. | | | 1,380 | | | | 98,146 | |
| Macy’s Inc. | | | 11,600 | | | | 415,396 | |
| McDonald’s Corp. | | | 5,400 | | | | 657,288 | |
Signet Jewelers Ltd. f | | | 1,100 | | | | 103,686 | |
| Staples Inc. | | | 70,580 | | | | 638,749 | |
| Target Corp. | | | 3,600 | | | | 260,028 | |
| Tiffany & Co. | | | 1,300 | | | | 100,659 | |
| Wal-Mart Stores Inc. | | | 4,900 | | | | 338,688 | |
| | | | | | | | 4,571,689 | |
| Toys/Games & Hobbies — 0.4% | | | | | | | | |
| Hasbro Inc. | | | 700 | | | | 54,453 | |
| Mattel Inc. | | | 9,400 | | | | 258,970 | |
| | | | | | | | 313,423 | |
| Total Consumer, Cyclical | | | | | | | | |
| (Cost $8,349,667) | | | | | | | 8,924,090 | |
| Consumer, Non-cyclical — 15.4% | | | | | | | | |
| Agriculture — 1.4% | | | | | | | | |
| Archer-Daniels-Midland Co. | | | 2,750 | | | | 125,537 | |
| Philip Morris International Inc. | | | 9,950 | | | | 910,326 | |
| | | | | | | | 1,035,863 | |
| Biotechnology — 2.8% | | | | | | | | |
| Alexion Pharmaceuticals Inc. (a) | | | 900 | | | | 110,115 | |
| Amgen Inc. | | | 4,185 | | | | 611,889 | |
| Biogen Inc. (a) | | | 610 | | | | 172,984 | |
| Gilead Sciences Inc. | | | 16,930 | | | | 1,212,357 | |
| | | | | | | | 2,107,345 | |
| Commercial Services — 1.0% | | | | | | | | |
| Cintas Corp. | | | 2,270 | | | | 262,321 | |
| H&R Block Inc. | | | 1,300 | | | | 29,887 | |
Nielsen Holdings PLC f | | | 2,200 | | | | 92,290 | |
| PayPal Holdings Inc. (a) | | | 385 | | | | 15,196 | |
| The Western Union Co. | | | 18,500 | | | | 401,820 | |
| | | | | | | | 801,514 | |
| Cosmetics & Personal Care — 0.9% | | | | | | | | |
| The Procter & Gamble Co. | | | 8,430 | | | | 708,794 | |
| Food — 1.4% | | | | | | | | |
| Campbell Soup Co. | | | 2,700 | | | | 163,269 | |
| Conagra Brands Inc. | | | 830 | | | | 32,826 | |
| General Mills Inc. | | | 7,300 | | | | 450,921 | |
| The Hershey Co. | | | 1,800 | | | | 186,174 | |
| Lamb Weston Holdings Inc. (a) | | | 261 | | | | 9,879 | |
| Mondelez International Inc. | | | 2,200 | | | | 97,526 | |
| Whole Foods Market Inc. | | | 3,400 | | | | 104,584 | |
| | | | | | | | 1,045,179 | |
| Healthcare-Products — 0.9% | | | | | | | | |
| Abbott Laboratories | | | 7,600 | | | | 291,916 | |
| Baxter International Inc. | | | 5,000 | | | | 221,700 | |
| Edwards Lifesciences Corp. (a) | | | 70 | | | | 6,559 | |
| Patterson Cos. Inc. | | | 3,690 | | | | 151,401 | |
| | | | | | | | 671,576 | |
| Healthcare-Services — 0.0% | | | | | | | | |
| Anthem Inc. | | | 250 | | | | 35,942 | |
| Household Products & Wares — 0.6% | | | | | | | | |
| Avery Dennison Corp. | | | 3,700 | | | | 259,814 | |
| Kimberly-Clark Corp. | | | 2,100 | | | | 239,652 | |
| | | | | | | | 499,466 | |
| Pharmaceuticals — 6.4% | | | | | | | | |
| AbbVie Inc. | | | 5,263 | | | | 329,569 | |
| AmerisourceBergen Corp. | | | 2,450 | | | | 191,565 | |
| Bristol-Myers Squibb Co. | | | 16,220 | | | | 947,897 | |
| Cardinal Health Inc. | | | 670 | | | | 48,220 | |
| Eli Lilly & Co. | | | 5,601 | | | | 411,954 | |
| Johnson & Johnson | | | 10,830 | | | | 1,247,724 | |
| Merck & Co Inc. | | | 12,330 | | | | 725,867 | |
Perrigo Co. PLC f | | | 1,020 | | | | 84,895 | |
| Pfizer Inc. | | | 26,800 | | | | 870,464 | |
| | | | | | | | 4,858,155 | |
| Total Consumer, Non-cyclical | | | | | | | | |
| (Cost $11,769,210) | | | | | | | 11,763,834 | |
| Diversified — 0.4% | | | | | | | | |
| Holding Companies — 0.4% | | | | | | | | |
| Leucadia National Corp. | | | 12,900 | | | | 299,925 | |
| Total Diversified | | | | | | | | |
| (Cost $239,172) | | | | | | | 299,925 | |
| Energy — 6.0% | | | | | | | | |
| Oil & Gas — 5.6% | | | | | | | | |
| Apache Corp. | | | 5,459 | | | | 346,483 | |
| Chevron Corp. | | | 5,200 | | | | 612,040 | |
The accompanying notes are an integral part of the financial statements.
2016 SEMI-ANNUAL REPORT
Schedule of Investments (continued)
Quaker Strategic Growth Fund
December 31, 2016 (unaudited)
| | | Number | | | Fair | |
| | | of Shares | | | Value | |
| Common Stocks — 96.0% (Continued) | | | | | | |
| Oil & Gas (Continued) | | | | | | |
| ConocoPhillips | | | 4,780 | | | $ | 239,669 | |
| Exxon Mobil Corp. | | | 16,500 | | | | 1,489,290 | |
| Hess Corp. | | | 3,850 | | | | 239,816 | |
| Marathon Oil Corp. | | | 13,755 | | | | 238,099 | |
| Marathon Petroleum Corp. | | | 2,600 | | | | 130,910 | |
| Murphy Oil Corp. | | | 6,700 | | | | 208,571 | |
| Noble Energy Inc. | | | 700 | | | | 26,642 | |
| Phillips 66 | | | 1,810 | | | | 156,402 | |
| Southwestern Energy Co. (a) | | | 5,100 | | | | 55,182 | |
| Tesoro Corp. | | | 150 | | | | 13,118 | |
| Valero Energy Corp. | | | 7,890 | | | | 539,045 | |
| | | | | | | | 4,295,267 | |
| Oil & Gas Services — 0.1% | | | | | | | | |
| FMC Technologies Inc. (a) | | | 2,760 | | | | 98,063 | |
| Pipelines — 0.3% | | | | | | | | |
| Kinder Morgan Inc. | | | 9,000 | | | | 186,390 | |
| Total Energy | | | | | | | | |
| (Cost $4,164,750) | | | | | | | 4,579,720 | |
| Financial — 19.0% | | | | | | | | |
| Banks — 10.2% | | | | | | | | |
| Bank of America Corp. | | | 56,945 | | | | 1,258,485 | |
| Capital One Financial Corp. | | | 1,300 | | | | 113,412 | |
| Citigroup Inc. | | | 17,880 | | | | 1,062,608 | |
| Citizens Financial Group Inc. | | | 300 | | | | 10,689 | |
| Fifth Third Bancorp | | | 2,300 | | | | 62,031 | |
| Goldman Sachs Group Inc. | | | 2,280 | | | | 545,946 | |
| Huntington Bancshares Inc. | | | 21,100 | | | | 278,942 | |
| JPMorgan Chase & Co. | | | 18,491 | | | | 1,595,588 | |
| Morgan Stanley | | | 20,900 | | | | 883,025 | |
| Northern Trust Corp. | | | 600 | | | | 53,430 | |
| PNC Financial Services Group Inc. | | | 1,100 | | | | 128,656 | |
| State Street Corp. | | | 700 | | | | 54,404 | |
| SunTrust Banks Inc. | | | 4,200 | | | | 230,370 | |
| Wells Fargo & Co. | | | 24,660 | | | | 1,359,013 | |
| Zions Bancorporation | | | 3,400 | | | | 146,336 | |
| | | | | | | | 7,782,935 | |
| Diversified Financial Services — 2.4% | | | | | | | | |
| Alliance Data Systems Corp. | | | 300 | | | | 68,550 | |
| American Express Co. | | | 7,700 | | | | 570,416 | |
| Ameriprise Financial Inc. | | | 1,500 | | | | 166,410 | |
| Franklin Resources Inc. | | | 3,100 | | | | 122,698 | |
Invesco Ltd. f | | | 1,400 | | | | 42,476 | |
| Mastercard Inc. Cl A | | | 3,455 | | | | 356,729 | |
| Synchrony Financial | | | 13,260 | | | | 480,940 | |
| | | | | | | | 1,808,219 | |
| Insurance — 5.8% | | | | | | | | |
| Aflac Inc. | | | 5,860 | | | | 407,856 | |
| American International Group Inc. | | | 2,700 | | | | 176,337 | |
| Assurant Inc. | | | 2,322 | | | | 215,621 | |
| Berkshire Hathaway Inc. Cl B(a) | | | 2,050 | | | | 334,109 | |
Chubb Ltd. f | | | 2,365 | | | | 312,464 | |
| Cincinnati Financial Corp. | | | 2,100 | | | | 159,075 | |
| The Hartford Financial | | | | | | | | |
| Services Group Inc. | | | 9,800 | | | | 466,970 | |
| Lincoln National Corp. | | | 610 | | | | 40,425 | |
| Loews Corp. | | | 2,000 | | | | 93,660 | |
| MetLife Inc. | | | 13,840 | | | | 745,838 | |
| Principal Financial Group Inc. | | | 2,200 | | | | 127,292 | |
| The Progressive Corp. | | | 6,380 | | | | 226,490 | |
| Prudential Financial Inc. | | | 6,540 | | | | 680,552 | |
| The Travelers Cos. Inc. | | | 3,400 | | | | 416,228 | |
XL Group Ltd. f | | | 400 | | | | 14,904 | |
| | | | | | | | 4,417,821 | |
| Savings & Loans — 0.6% | | | | | | | | |
| People’s United Financial Inc. | | | 25,700 | | | | 497,552 | |
| Total Financial | | | | | | | | |
| (Cost $11,921,331) | | | | | | | 14,506,527 | |
| Industrial — 7.3% | | | | | | | | |
| Aerospace & Defense — 0.6% | | | | | | | | |
| The Boeing Co. | | | 1,600 | | | | 249,088 | |
| L-3 Communications Holdings Inc. | | | 730 | | | | 111,040 | |
| United Technologies Corp. | | | 900 | | | | 98,658 | |
| | | | | | | | 458,786 | |
| Electronics — 1.0% | | | | | | | | |
Allegion PLC f | | | 1,500 | | | | 96,000 | |
| Corning Inc. | | | 11,900 | | | | 288,813 | |
Garmin Ltd. f | | | 3,020 | | | | 146,440 | |
| Honeywell International Inc. | | | 2,300 | | | | 266,455 | |
| | | | | | | | 797,708 | |
| Engineering & Construction — 0.2% | | | | | | | | |
| Fluor Corp. | | | 2,270 | | | | 119,220 | |
| Jacobs Engineering Group Inc. (a) | | | 500 | | | | 28,500 | |
| | | | | | | | 147,720 | |
The accompanying notes are an integral part of the financial statements.
2016 SEMI-ANNUAL REPORT
Schedule of Investments (continued)
Quaker Strategic Growth Fund
December 31, 2016 (unaudited)
| | | Number | | | Fair | |
| | | of Shares | | | Value | |
| Common Stocks — 96.0% (Continued) | | | | | | |
| Environmental Control — 0.1% | | | | | | |
| Stericycle Inc. (a) | | | 800 | | | $ | 61,632 | |
| Hand & Machine Tools — 0.0% | | | | | | | | |
| Snap-on Inc. | | | 100 | | | | 17,127 | |
| Machinery-Construction & Mining — 0.5% | | | | | | | | |
| Caterpillar Inc. | | | 3,700 | | | | 343,138 | |
| Machinery-Diversified — 1.6% | | | | | | | | |
| Cummins Inc. | | | 300 | | | | 41,001 | |
| Deere & Co. | | | 11,600 | | | | 1,195,264 | |
| | | | | | | | 1,236,265 | |
| Miscellaneous Manufacturing — 1.9% | | | | | | | | |
| 3M Co. | | | 1,740 | | | | 310,712 | |
Eaton Corp. PLC f | | | 2,000 | | | | 134,180 | |
| General Electric Co. | | | 24,250 | | | | 766,300 | |
| Illinois Tool Works Inc. | | | 300 | | | | 36,738 | |
Ingersoll-Rand PLC f | | | 1,600 | | | | 120,064 | |
| Parker-Hannifin Corp. | | | 500 | | | | 70,000 | |
| | | | | | | | 1,437,994 | |
| Packaging & Containers — 0.0% | | | | | | | | |
| WestRock Co. | | | 500 | | | | 25,385 | |
| Transportation — 1.4% | | | | | | | | |
| CSX Corp. | | | 1,400 | | | | 50,302 | |
| Kansas City Southern | | | 2,780 | | | | 235,883 | |
| Norfolk Southern Corp. | | | 780 | | | | 84,295 | |
| Union Pacific Corp. | | | 2,610 | | | | 270,605 | |
| United Parcel Service Inc. | | | 3,800 | | | | 435,632 | |
| | | | | | | | 1,076,717 | |
| Total Industrial | | | | | | | | |
| (Cost $5,078,989) | | | | | | | 5,602,472 | |
| Technology — 15.5% | | | | | | | | |
| Computers — 9.0% | | | | | | | | |
Accenture PLC Cl A f | | | 1,100 | | | | 128,843 | |
| Apple Inc. | | | 27,700 | | | | 3,208,214 | |
| Hewlett Packard Enterprise Co. | | | 17,500 | | | | 404,950 | |
| HP Inc. | | | 21,480 | | | | 318,763 | |
| International Business | | | | | | | | |
| Machines Corp. | | | 10,000 | | | | 1,659,900 | |
| NetApp Inc. | | | 11,300 | | | | 398,551 | |
Seagate Technology PLC f | | | 10,100 | | | | 385,517 | |
| Western Digital Corp. | | | 4,920 | | | | 334,314 | |
| | | | | | | | 6,839,052 | |
| Office & Business Equipment — 0.2% | | | | | | | | |
| Xerox Corp. | | | 21,600 | | | | 188,568 | |
| Semiconductors — 3.7% | | | | | | | | |
| Analog Devices Inc. | | | 400 | | | | 29,048 | |
| Applied Materials Inc. | | | 1,240 | | | | 40,015 | |
| Intel Corp. | | | 30,400 | | | | 1,102,608 | |
| Micron Technology Inc. (a) | | | 8,300 | | | | 181,936 | |
| QUALCOMM Inc. | | | 16,500 | | | | 1,075,800 | |
| Texas Instruments Inc. | | | 2,600 | | | | 189,722 | |
| Xilinx Inc. | | | 3,600 | | | | 217,332 | |
| | | | | | | | 2,836,461 | |
| Software — 2.6% | | | | | | | | |
| CA Inc. | | | 5,700 | | | | 181,089 | |
| Citrix Systems Inc. (a) | | | 2,460 | | | | 219,703 | |
| The Dun & Bradstreet Corp. | | | 1,100 | | | | 133,452 | |
| Microsoft Corp. | | | 14,520 | | | | 902,273 | |
| Oracle Corp. | | | 4,700 | | | | 180,715 | |
| Paychex Inc. | | | 5,700 | | | | 347,016 | |
| | | | | | | | 1,964,248 | |
| Total Technology | | | | | | | | |
| (Cost $11,219,637) | | | | | | | 11,828,329 | |
| Utilities — 6.6% | | | | | | | | |
| Electric — 6.2% | | | | | | | | |
| Ameren Corp. | | | 4,000 | | | | 209,840 | |
| American Electric Power Co. Inc. | | | 2,500 | | | | 157,400 | |
| Consolidated Edison Inc. | | | 1,250 | | | | 92,100 | |
| Dominion Resources Inc. | | | 2,500 | | | | 191,475 | |
| DTE Energy Co. | | | 700 | | | | 68,957 | |
| Duke Energy Corp. | | | 4,700 | | | | 364,814 | |
| Entergy Corp. | | | 7,300 | | | | 536,331 | |
| Eversource Energy | | | 500 | | | | 27,615 | |
| Exelon Corp. | | | 23,100 | | | | 819,819 | |
| FirstEnergy Corp. | | | 31,300 | | | | 969,361 | |
| NextEra Energy Inc. | | | 1,000 | | | | 119,460 | |
| PG&E Corp. | | | 700 | | | | 42,539 | |
| Pinnacle West Capital Corp. | | | 1,400 | | | | 109,242 | |
| PPL Corp. | | | 6,700 | | | | 228,135 | |
| Public Service Enterprise Group Inc. | | | 7,790 | | | | 341,825 | |
| SCANA Corp. | | | 600 | | | | 43,968 | |
| The Southern Co. | | | 8,400 | | | | 413,196 | |
| | | | | | | | 4,736,077 | |
The accompanying notes are an integral part of the financial statements.
2016 SEMI-ANNUAL REPORT
Schedule of Investments (continued)
Quaker Strategic Growth Fund
December 31, 2016 (unaudited)
| | | Number | | | Fair | |
| | | of Shares | | | Value | |
| Common Stocks — 96.0% (Continued) | | | | | | |
| Gas — 0.4% | | | | | | |
| CenterPoint Energy Inc. | | | 12,900 | | | $ | 317,856 | |
| Sempra Energy | | | 200 | | | | 20,128 | |
| | | | | | | | 337,984 | |
| Total Utilities | | | | | | | | |
| (Cost $5,049,955) | | | | | | | 5,074,061 | |
| Total Common Stocks | | | | | | | | |
| (Cost $67,916,896) | | | | | | | 73,413,357 | |
| Real Estate Investment Trusts — 3.7% | | | | | | | | |
| Equity Residential | | | 6,100 | | | | 392,596 | |
| General Growth Properties Inc. | | | 4,500 | | | | 112,410 | |
| HCP Inc. | | | 3,200 | | | | 95,104 | |
| Host Hotels & Resorts Inc. | | | 12,000 | | | | 226,080 | |
| Kimco Realty Corp. | | | 17,100 | | | | 430,236 | |
| The Macerich Co. | | | 5,200 | | | | 368,368 | |
| Prologis Inc. | | | 9,800 | | | | 517,342 | |
| Public Storage | | | 1,000 | | | | 223,500 | |
| Simon Property Group Inc. | | | 990 | | | | 175,893 | |
| Welltower Inc. | | | 1,700 | | | | 113,781 | |
| Weyerhaeuser Co. | | | 5,900 | | | | 177,531 | |
| | | | | | | | 2,832,841 | |
| Total Real Estate Investment Trusts | | | | | | | | |
| (Cost $2,737,201) | | | | | | | 2,832,841 | |
| Total Long-Term Investments | | | | | | | | |
| (Cost $70,654,097) | | | | | | | 76,246,198 | |
| | | Par | | | Fair | |
| | | Value | | | Value | |
| Money Market Deposit Account — 0.4% | | | | | | | | |
| U.S. Bank, N.A., 0.10% | | $ | 282,123 | | | $ | 282,123 | |
| Total Money Market Deposit Account | | | | | | | | |
| (Cost $282,123) | | | | | | | 282,123 | |
| Total Investments | | | | | | | | |
| (Cost $70,936,220) — 100.1% | | | | | | | 76,528,321 | |
| Liabilities in Excess of | | | | | | | | |
| Other Assets, Net (0.1)% | | | | | | | (90,470 | ) |
| Total Net Assets — 100.0% | | | | | | $ | 76,437,851 | |
| (a) | Non-income producing security. |
| f | Foreign issued security. |
| * | Indicates an illiquid security. Total market value for illiquid securities is $407,684, representing 0.5% of net assets. |
| ^ | Indicates a fair valued security. Total market value for fair valued securities is $407,684, representing 0.5% of net assets and Level 3 securities. |
The accompanying notes are an integral part of the financial statements.
2016 SEMI-ANNUAL REPORT
(This Page Intentionally Left Blank.)
2016 SEMI-ANNUAL REPORT
Statements of Assets and Liabilities
December 31, 2016 (unaudited)
| | | | | | Quaker Global | | | Quaker | | | Quaker | | | Quaker | |
| | | Quaker Event | | | Tactical | | | Mid-Cap | | | Small-Cap | | | Strategic | |
| | | Arbitrage Fund | | | Allocation Fund | | | Value Fund | | | Value Fund | | | Growth Fund | |
| ASSETS: | | | | | | | | | | | | | | | |
| Investments, at value (Note 11) | | $ | 33,281,995 | | | $ | 7,276,770 | | | $ | 8,991,859 | | | $ | 42,241,537 | | | $ | 76,528,321 | |
| Cash | | | — | | | | 2,593 | | | | — | | | | — | | | | 19,183 | |
| Cash held at brokers for short sales | | | 1,552,967 | | | | — | | | | — | | | | — | | | | — | |
| Receivables: | | | | | | | | | | | | | | | | | | | | |
| Dividends and interest | | | 150,596 | | | | 46,257 | | | | 12,324 | | | | 39,620 | | | | 118,789 | |
| Capital shares sold | | | 1,582 | | | | — | | | | 19,947 | | | | 75 | | | | 12,204 | |
| Investment securities sold | | | 1,539,089 | | | | — | | | | — | | | | 45,666 | | | | — | |
| Securities lending income, net | | | 1,331 | | | | — | | | | 374 | | | | 2,995 | | | | 2 | |
| Prepaid expenses and other assets | | | 39,850 | | | | 7,985 | | | | 6,914 | | | | 32,639 | | | | 91,246 | |
| Total assets | | | 36,567,410 | | | | 7,333,605 | | | | 9,031,418 | | | | 42,362,532 | | | | 76,769,745 | |
| | | | | | | | | | | | | | | | | | | | | |
| LIABILITIES: | | | | | | | | | | | | | | | | | | | | |
| Written options, at value | | $ | 150,760 | | | $ | — | | | $ | — | | | $ | — | | | $ | — | |
| Securities sold short, at value | | | 615,632 | | | | — | | | | — | | | | — | | | | — | |
| Payables: | | | | | | | | | | | | | | | | | | | | |
| Due to advisor (Note 3) | | | 19,786 | | | | 2,634 | | | | 6,630 | | | | 27,063 | | | | 58,091 | |
| Due to custodian | | | 222,924 | | | | — | | | | — | | | | — | | | | — | |
| Capital shares redeemed | | | 195,224 | | | | 182 | | | | 33,854 | | | | 12,793 | | | | 95,085 | |
| Upon return of securities loaned | | | 5,883,218 | | | | — | | | | 1,555,473 | | | | 8,883,757 | | | | — | |
| Investment securities purchased | | | — | | | | 559,223 | | | | — | | | | 19,144 | | | | — | |
| Shareholder distributions | | | 7 | | | | — | | | | — | | | | — | | | | — | |
| Distribution fees | | | 11,145 | | | | 3,122 | | | | 3,523 | | | | 3,007 | | | | 28,961 | |
| Trustee expenses | | | 5,178 | | | | 1,092 | | | | 1,057 | | | | 5,001 | | | | 13,083 | |
| Chief compliance officer fees | | | 3,433 | | | | 563 | | | | 603 | | | | 2,837 | | | | 8,403 | |
| Accrued expenses | | | 66,229 | | | | 15,689 | | | | 11,816 | | | | 42,701 | | | | 128,271 | |
| Total liabilities | | | 7,173,536 | | | | 582,505 | | | | 1,612,956 | | | | 8,996,303 | | | | 331,894 | |
| Net assets | | $ | 29,393,874 | | | $ | 6,751,100 | | | $ | 7,418,462 | | | $ | 33,366,229 | | | $ | 76,437,851 | |
The accompanying notes are an integral part of the financial statements.
2016 SEMI-ANNUAL REPORT
Statements of Assets and Liabilities (continued)
December 31, 2016 (unaudited)
| | | | | | Quaker Global | | | Quaker | | | Quaker | | | Quaker | |
| | | Quaker Event | | | Tactical | | | Mid-Cap | | | Small-Cap | | | Strategic | |
| | | Arbitrage Fund | | | Allocation Fund | | | Value Fund | | | Value Fund | | | Growth Fund | |
| NET ASSETS CONSIST OF: | | | | | | | | | | | | | | | |
| Paid-in capital | | $ | 42,224,452 | | | $ | 17,249,405 | | | $ | 10,869,554 | | | $ | 27,811,616 | | | $ | 427,988,732 | |
| Accumulated net investment income (loss) | | | (44,542 | ) | | | (113,206 | ) | | | (42,810 | ) | | | (141,010 | ) | | | (832,002 | ) |
| Accumulated net realized | | | | | | | | | | | | | | | | | | | | |
| gain (loss) on investments | | | (7,227,790 | ) | | | (10,414,976 | ) | | | (4,772,183 | ) | | | 905,074 | | | | (356,310,980 | ) |
| Net unrealized appreciation (depreciation) | | | | | | | | | | | | | | | | | | | | |
| on investments: | | | | | | | | | | | | | | | | | | | | |
| Securities | | | (5,629,980 | ) | | | 29,877 | | | | 1,363,901 | | | | 4,790,549 | | | | 5,592,101 | |
| Securities sold short | | | (28,768 | ) | | | — | | | | — | | | | — | | | | — | |
| Written option contracts | | | 103,650 | | | | — | | | | — | | | | — | | | | — | |
| Foreign currency transactions | | | (3,148 | ) | | | — | | | | — | | | | — | | | | — | |
| Total net assets | | $ | 29,393,874 | | | $ | 6,751,100 | | | $ | 7,418,462 | | | $ | 33,366,229 | | | $ | 76,437,851 | |
| Total investments, at cost | | $ | 38,911,975 | | | $ | 7,246,893 | | | $ | 7,627,958 | | | $ | 37,450,988 | | | $ | 70,936,220 | |
| Includes loaned securities | | | | | | | | | | | | | | | | | | | | |
| with a market value of | | $ | 5,754,974 | | | $ | — | | | $ | 1,505,176 | | | $ | 8,629,212 | | | $ | — | |
| Proceeds from securities sold short | | | 586,864 | | | | — | | | | — | | | | — | | | | — | |
| Premiums on written options | | | 254,410 | | | | — | | | | — | | | | — | | | | — | |
| Class A shares: | | | | | | | | | | | | | | | | | | | | |
| Net assets | | $ | 13,108,159 | | | $ | 2,135,514 | | | $ | 4,362,103 | | | $ | 7,162,767 | | | $ | 53,620,549 | |
Shares of beneficial interest outstanding(1) | | | 1,068,025 | | | | 207,276 | | | | 162,091 | | | | 299,703 | | | | 2,035,323 | |
| Net asset value per share and | | | | | | | | | | | | | | | | | | | | |
| redemption price per share | | $ | 12.27 | | | $ | 10.30 | | | $ | 26.91 | | | $ | 23.90 | | | $ | 26.34 | |
| Offering price per share | | | | | | | | | | | | | | | | | | | | |
| (100/94.50 x net asset value per share) | | $ | 12.98 | | | $ | 10.90 | | | $ | 28.48 | | | $ | 25.29 | | | $ | 27.87 | |
| Class C shares: | | | | | | | | | | | | | | | | | | | | |
| Net assets | | $ | 3,731,539 | | | $ | 1,154,469 | | | $ | 1,599,614 | | | $ | 1,493,974 | | | $ | 13,647,949 | |
Shares of beneficial interest outstanding(1) | | | 316,005 | | | | 119,624 | | | | 68,556 | | | | 77,887 | | | | 597,411 | |
| Net asset value per share and | | | | | | | | | | | | | | | | | | | | |
| redemption price per share | | $ | 11.81 | | | $ | 9.65 | | | $ | 23.33 | | | $ | 19.18 | | | $ | 22.85 | |
| Institutional Class Shares: | | | | | | | | | | | | | | | | | | | | |
| Net assets | | $ | 12,554,176 | | | $ | 3,461,117 | | | $ | 1,456,745 | | | $ | 24,709,488 | | | $ | 9,169,353 | |
Shares of beneficial interest outstanding(1) | | | 1,014,544 | | | | 291,045 | | | | 51,382 | | | | 979,898 | | | | 333,353 | |
| Net asset value per share and | | | | | | | | | | | | | | | | | | | | |
| redemption price per share | | $ | 12.37 | | | $ | 11.89 | | | $ | 28.35 | | | $ | 25.22 | | | $ | 27.51 | |
(1) | Unlimited number of shares of beneficial interest with a 0.01 par value authorized. |
The accompanying notes are an integral part of the financial statements.
2016 SEMI-ANNUAL REPORT
Statements of Operations
For the Six-Month Period Ended December 31, 2016 (unaudited)
| | | | | | Quaker Global | | | Quaker | | | Quaker | | | Quaker | |
| | | Quaker Event | | | Tactical | | | Mid-Cap | | | Small-Cap | | | Strategic | |
| | | Arbitrage Fund | | | Allocation Fund | | | Value Fund | | | Value Fund | | | Growth Fund | |
| INVESTMENT INCOME (LOSS) | | | | | | | | | | | | | | | |
| Income: | | | | | | | | | | | | | | | |
| Dividends (net of foreign withholding taxes) | | $ | 129,194 | | | $ | 29,287 | | | $ | 59,991 | | | $ | 234,386 | | | $ | 629,724 | |
| Interest | | | 292,073 | | | | 10,001 | | | | 97 | | | | 111 | | | | 1,254 | |
| Securities lending income, net | | | 7,681 | | | | — | | | | 2,638 | | | | 14,133 | | | | 28,838 | |
| Other Income | | | 8,287 | | | | — | | | | — | | | | 2 | | | | 5 | |
| Total Income | | | 437,235 | | | | 39,288 | | | | 62,726 | | | | 248,632 | | | | 659,821 | |
| Expenses: | | | | | | | | | | | | | | | | | | | | |
| Investment advisory fees (Note 3) | | | 209,068 | | | | 43,206 | | | | 37,567 | | | | 164,975 | | | | 489,676 | |
| Funds administration and accounting fees | | | 35,103 | | | | 8,625 | | | | 8,125 | | | | 35,741 | | | | 79,737 | |
| Transfer agent fees | | | 67,950 | | | | 11,175 | | | | 11,330 | | | | 34,069 | | | | 133,952 | |
| Custody fees | | | 11,183 | | | | 5,528 | | | | 1,308 | | | | 6,164 | | | | 7,766 | |
| Trustee fees | | | 10,043 | | | | 2,292 | | | | 2,108 | | | | 10,066 | | | | 25,902 | |
| Legal fees | | | 7,727 | | | | 1,402 | | | | 1,298 | | | | 6,193 | | | | 15,968 | |
| Audit fees | | | 7,501 | | | | 1,721 | | | | 1,585 | | | | 7,569 | | | | 19,433 | |
| Distribution fee — Class A | | | 17,992 | | | | 3,508 | | | | 5,286 | | | | 8,466 | | | | 70,441 | |
| Distribution fee — Class C | | | 21,523 | | | | 6,927 | | | | 7,912 | | | | 7,700 | | | | 74,987 | |
| Insurance | | | 15,621 | | | | 3,097 | | | | 2,965 | | | | 13,968 | | | | 38,033 | |
| Officers’ compensation fees | | | 18,144 | | | | 4,200 | | | | 3,839 | | | | 18,273 | | | | 46,851 | |
| Registration and filing expenses | | | 23,496 | | | | 4,384 | | | | 3,911 | | | | 18,340 | | | | 52,004 | |
| Printing expenses | | | 5,880 | | | | 1,598 | | | | 1,488 | | | | 5,929 | | | | 14,794 | |
| Dividends and interest on securities sold short | | | 2,277 | | | | — | | | | — | | | | — | | | | — | |
| Other operating expenses | | | 1,064 | | | | 991 | | | | 935 | | | | 1,045 | | | | 1,266 | |
| Total expenses | | | 454,572 | | | | 98,654 | | | | 89,657 | | | | 338,498 | | | | 1,070,810 | |
| Investment advisory fees | | | | | | | | | | | | | | | | | | | | |
| reimbursed (Note 3) | | | (135,228 | ) | | | (3,505 | ) | | | — | | | | — | | | | (92,694 | ) |
| Net expenses | | | 319,344 | | | | 95,149 | | | | 89,657 | | | | 338,498 | | | | 978,116 | |
| Net investment income (loss) | | | 117,891 | | | | (55,861 | ) | | | (26,931 | ) | | | (89,866 | ) | | | (318,295 | ) |
The accompanying notes are an integral part of the financial statements.
2016 SEMI-ANNUAL REPORT
Statements of Operations (continued)
For the Six-Month Period Ended December 31, 2016 (unaudited)
| | | | | | Quaker Global | | | Quaker | | | Quaker | | | Quaker | |
| | | Quaker Event | | | Tactical | | | Mid-Cap | | | Small-Cap | | | Strategic | |
| | | Arbitrage Fund | | | Allocation Fund | | | Value Fund | | | Value Fund | | | Growth Fund | |
| REALIZED AND UNREALIZED GAIN (LOSS) ON INVESTMENTS | | | | | | | | | | | | | |
| Net realized gain (loss) on investments: | | | | | | | | | | | | | | | |
| Securities | | $ | 294,393 | | | $ | 449,445 | | | $ | 138,262 | | | $ | 1,831,484 | | | $ | 6,373,125 | |
| Securities sold short | | | (20,161 | ) | | | — | | | | — | | | | — | | | | — | |
| Written options | | | 340,201 | | | | — | | | | — | | | | — | | | | — | |
| Foreign currency transactions | | | (11,314 | ) | | | — | | | | — | | | | (33 | ) | | | — | |
| Net realized gain (loss) on investments | | | 603,119 | | | | 449,445 | | | | 138,262 | | | | 1,831,451 | | | | 6,373,125 | |
| Net change in unrealized appreciation | | | | | | | | | | | | | | | | | | | | |
| (depreciation) of investments: | | | | | | | | | | | | | | | | | | | | |
| Securities | | | 1,005,951 | | | | (151,433 | ) | | | 821,603 | | | | 3,922,098 | | | | 2,053,176 | |
| Securities sold short | | | (28,768 | ) | | | — | | | | — | | | | — | | | | — | |
| Written options | | | (27,144 | ) | | | — | | | | — | | | | — | | | | — | |
| Foreign currency transactions | | | (2,759 | ) | | | — | | | | — | | | | (2 | ) | | | — | |
| Net change in unrealized appreciation | | | | | | | | | | | | | | | | | | | | |
| (depreciation) of investments | | | 947,280 | | | | (151,433 | ) | | | 821,603 | | | | 3,922,096 | | | | 2,053,176 | |
| Net realized and unrealized | | | | | | | | | | | | | | | | | | | | |
| gain (loss) on investments | | | 1,550,399 | | | | 298,012 | | | | 959,865 | | | | 5,753,547 | | | | 8,426,301 | |
| Net increase (decrease) in net assets | | | | | | | | | | | | | | | | | | | | |
| resulting from operations | | $ | 1,668,290 | | | $ | 242,151 | | | $ | 932,934 | | | $ | 5,663,681 | | | $ | 8,108,006 | |
| (Foreign withholding taxes on | | | | | | | | | | | | | | | | | | | | |
| dividends/tax reclaims/interest) | | $ | (1,903 | ) | | $ | (117 | ) | | $ | — | | | $ | (3,337 | ) | | $ | (2,497 | ) |
The accompanying notes are an integral part of the financial statements.
2016 SEMI-ANNUAL REPORT
Statements of Changes in Net Assets
For the Six-Month Period Ended December 31, 2016 (unaudited)
| | | | | | Quaker Global | | | Quaker | | | Quaker | | | Quaker | |
| | | Quaker Event | | | Tactical | | | Mid-Cap | | | Small-Cap | | | Strategic | |
| | | Arbitrage Fund | | | Allocation Fund | | | Value Fund | | | Value Fund | | | Growth Fund | |
| INCREASE (DECREASE) IN NET ASSETS | | | | | | | | | | | | | | | |
| Operations: | | | | | | | | | | | | | | | |
| Net investment income (loss) | | $ | 117,891 | | | $ | (55,861 | ) | | $ | (26,931 | ) | | $ | (89,866 | ) | | $ | (318,295 | ) |
| Net realized gain (loss) | | | | | | | | | | | | | | | | | | | | |
| on investment transactions: | | | | | | | | | | | | | | | | | | | | |
| Securities | | | 294,393 | | | | 449,445 | | | | 138,262 | | | | 1,831,484 | | | | 6,373,125 | |
| Securities sold short | | | (20,161 | ) | | | — | | | | — | | | | — | | | | — | |
| Written options | | | 340,201 | | | | — | | | | — | | | | — | | | | — | |
| Foreign currency transactions | | | (11,314 | ) | | | — | | | | — | | | | (33 | ) | | | — | |
| Net change in unrealized appreciation | | | | | | | | | | | | | | | | | | | | |
| (depreciation) of investment transactions: | | | | | | | | | | | | | | | | | | | | |
| Securities | | | 1,005,951 | | | | (151,433 | ) | | | 821,603 | | | | 3,922,098 | | | | 2,053,176 | |
| Securities sold short | | | (28,768 | ) | | | — | | | | — | | | | — | | | | — | |
| Written options | | | (27,144 | ) | | | — | | | | — | | | | — | | | | — | |
| Foreign currency transactions | | | (2,759 | ) | | | — | | | | — | | | | (2 | ) | | | — | |
| Net increase (decrease) in | | | | | | | | | | | | | | | | | | | | |
| net assets resulting from operations | | | 1,668,290 | | | | 242,151 | | | | 932,934 | | | | 5,663,681 | | | | 8,108,006 | |
| Distributions to shareholders from: | | | | | | | | | | | | | | | | | | | | |
| Net investment income — Class A | | | (70,505 | ) | | | — | | | | — | | | | — | | | | — | |
| Net investment income — Class C | | | (5,529 | ) | | | — | | | | — | | | | — | | | | — | |
| Net investment income — Institutional Class | | | (83,962 | ) | | | — | | | | — | | | | — | | | | — | |
| Total distributions | | | (159,996 | ) | | | — | | | | — | | | | — | | | | — | |
| Capital share transactions: | | | | | | | | | | | | | | | | | | | | |
| Increase (decrease) in net assets | | | | | | | | | | | | | | | | | | | | |
| from fund share transactions (Note 8) | | | (6,006,008 | ) | | | (229,971 | ) | | | (419,407 | ) | | | (4,847,666 | ) | | | (17,660,808 | ) |
| Total increase (decrease) in net assets | | | (4,497,714 | ) | | | 12,180 | | | | 513,527 | | | | 816,015 | | | | (9,552,802 | ) |
| | | | | | | | | | | | | | | | | | | | | |
| NET ASSETS | | | | | | | | | | | | | | | | | | | | |
| Beginning of period | | | 33,891,588 | | | | 6,738,920 | | | | 6,904,935 | | | | 32,550,214 | | | | 85,990,653 | |
| End of period | | $ | 29,393,874 | | | $ | 6,751,100 | | | $ | 7,418,462 | | | $ | 33,366,229 | | | $ | 76,437,851 | |
| Undistributed (Accumulated) net investment | | | | | | | | | | | | | | | | | | | | |
| income (loss), at end of period | | $ | (44,542 | ) | | $ | (113,206 | ) | | $ | (42,810 | ) | | $ | (141,010 | ) | | $ | (832,002 | ) |
The accompanying notes are an integral part of the financial statements.
2016 SEMI-ANNUAL REPORT
Statements of Changes in Net Assets (continued)
For the Fiscal Year Ended June 30, 2016
| | | | | | Quaker Global | | | Quaker | | | Quaker | | | Quaker | |
| | | Quaker Event | | | Tactical | | | Mid-Cap | | | Small-Cap | | | Strategic | |
| | | Arbitrage Fund | | | Allocation Fund | | | Value Fund | | | Value Fund | | | Growth Fund | |
| INCREASE (DECREASE) IN NET ASSETS | | | | | | | | | | | | | | | |
| Operations: | | | | | | | | | | | | | | | |
| Net investment income (loss) | | $ | 15,072 | | | $ | (120,903 | ) | | $ | (28,091 | ) | | $ | (72,892 | ) | | $ | (1,558,243 | ) |
| Net realized gain (loss) on | | | | | | | | | | | | | | | | | | | | |
| investment transactions: | | | | | | | | | | | | | | | | | | | | |
| Securities | | | (7,728,438 | ) | | | (551,302 | ) | | | (39,028 | ) | | | (902,423 | ) | | | (562,424 | ) |
| Securities sold short | | | (117,016 | ) | | | (14,810 | ) | | | — | | | | — | | | | (173,758 | ) |
| Written options | | | 316,179 | | | | — | | | | — | | | | — | | | | — | |
| Foreign currency transactions | | | (20,296 | ) | | | 15 | | | | — | | | | (6 | ) | | | — | |
| Capital gain distributions from | | | | | | | | | | | | | | | | | | | | |
| regulated investment companies | | | — | | | | 9,574 | | | | — | | | | — | | | | — | |
| Net change in unrealized appreciation | | | | | | | | | | | | | | | | | | | | |
| (depreciation) of investment transactions: | | | | | | | | | | | | | | | | | | | | |
| Securities | | | (4,096,077 | ) | | | (749,693 | ) | | | (441,921 | ) | | | (2,691,298 | ) | | | (10,304,539 | ) |
| Securities sold short | | | 11,942 | | | | — | | | | — | | | | — | | | | — | |
| Written options | | | 92,613 | | | | — | | | | — | | | | — | | | | — | |
| Foreign currency transactions | | | (3,994 | ) | | | — | | | | — | | | | 2 | | | | — | |
| Net increase (decrease) in net | | | | | | | | | | | | | | | | | | | | |
| assets resulting from operations | | | (11,530,015 | ) | | | (1,427,119 | ) | | | (509,040 | ) | | | (3,666,617 | ) | | | (12,598,964 | ) |
| Distributions to shareholders from: | | | | | | | | | | | | | | | | | | | | |
| Net realized capital gain — Class A | | | (1,695,347 | ) | | | — | | | | — | | | | (539,696 | ) | | | — | |
| Net realized capital gain — Class C | | | (467,044 | ) | | | — | | | | — | | | | (156,220 | ) | | | — | |
| Net realized capital gain — Institutional Class | | | (3,193,513 | ) | | | — | | | | — | | | | (1,869,051 | ) | | | — | |
| Total distributions | | | (5,355,904 | ) | | | — | | | | — | | | | (2,564,967 | ) | | | — | |
| Capital share transactions: | | | | | | | | | | | | | | | | | | | | |
| Increase (decrease) in net assets | | | | | | | | | | | | | | | | | | | | |
| from fund share transactions (Note 8) | | | (63,054,301 | ) | | | (864,896 | ) | | | (1,553,878 | ) | | | 781,008 | | | | (65,259,779 | ) |
| Total increase (decrease) in net assets | | | (79,940,220 | ) | | | (2,292,015 | ) | | | (2,062,918 | ) | | | (5,450,576 | ) | | | (77,858,743 | ) |
| | | | | | | | | | | | | | | | | | | | | |
| NET ASSETS | | | | | | | | | | | | | | | | | | | | |
| Beginning of year | | | 113,831,808 | | | | 9,030,935 | | | | 8,967,853 | | | | 38,000,790 | | | | 163,849,396 | |
| End of year | | $ | 33,891,588 | | | $ | 6,738,920 | | | $ | 6,904,935 | | | $ | 32,550,214 | | | $ | 85,990,653 | |
| Undistributed (Accumulated) net investment | | | | | | | | | | | | | | | | | | | | |
| income (loss), at end of year | | $ | (2,437 | ) | | $ | (57,345 | ) | | $ | (15,879 | ) | | $ | (51,144 | ) | | $ | (513,707 | ) |
The accompanying notes are an integral part of the financial statements.
2016 SEMI-ANNUAL REPORT
Financial Highlights
Quaker Event Arbitrage Fund
(For a Share Outstanding Throughout the Period)
| | | Class A | |
| | | (unaudited) | | | | | | | | | | | | | | | | |
| | | For the | | | | | | | | | | | | | | | | |
| | | Six-Month | | | | | | | | | | | | | | | | |
| | | Period from | | | | | | | | | | | | | | | | |
| | | July 1, 2016 | | | | | | | | | | | | | | | | |
| | | to December 31, | | | Years Ended June 30, | |
| | | 2016 | | | 2016 | | | 2015 | | | 2014 | | | 2013 | | | 2012 | |
| Net asset value, beginning of period | | $ | 11.71 | | | $ | 13.39 | | | $ | 14.07 | | | $ | 12.81 | | | $ | 11.93 | | | $ | 12.50 | |
| Income from investment operations: | | | | | | | | | | | | | | | | | | | | | | | | |
Net investment income (loss)(1) | | | 0.04 | | | | (0.01 | ) | | | (0.04 | ) | | | 0.41 | | | | 0.37 | | | | 0.11 | |
| Net realized and unrealized | | | | | | | | | | | | | | | | | | | | | | | | |
| gain (loss) on investments | | | 0.59 | | | | (0.65 | ) | | | 0.21 | | | | 0.93 | | | | 0.65 | | | | (0.41 | ) |
| Total from investment operations | | | 0.63 | | | | (0.66 | ) | | | 0.17 | | | | 1.34 | | | | 1.02 | | | | (0.30 | ) |
| Distributions to shareholders from: | | | | | | | | | | | | | | | | | | | | | | | | |
| Net investment income | | | (0.07 | ) | | | — | | | | (0.11 | ) | | | (0.01 | ) | | | (0.01 | ) | | | — | |
| Net realized capital gain | | | — | | | | (1.02 | ) | | | (0.74 | ) | | | (0.07 | ) | | | (0.13 | ) | | | (0.27 | ) |
| Total distributions | | | (0.07 | ) | | | (1.02 | ) | | | (0.85 | ) | | | (0.08 | ) | | | (0.14 | ) | | | (0.27 | ) |
| Net asset value, end of period | | $ | 12.27 | | | $ | 11.71 | | | $ | 13.39 | | | $ | 14.07 | | | $ | 12.81 | | | $ | 11.93 | |
Total Return(2) | | | 5.35 | %* | | | (4.33 | )% | | | 1.38 | % | | | 10.47 | % | | | 8.70 | % | | | (2.31 | )% |
| Ratios/supplemental data: | | | | | | | | | | | | | | | | | | | | | | | | |
| Net assets, end of period (000’ omitted) | | $ | 13,108 | | | $ | 14,363 | | | $ | 31,817 | | | $ | 53,035 | | | $ | 35,232 | | | $ | 34,725 | |
| Ratio of expenses to average net assets: | | | | | | | | | | | | | | | | | | | | | | | | |
Expense before reductions(3)(4) | | | 2.83 | %** | | | 2.41 | % | | | 2.17 | % | | | 2.15 | % | | | 2.37 | % | | | 2.37 | % |
Expense net of fee waivers, if any(3)(5) | | | 1.99 | %** | | | 1.99 | % | | | 1.99 | % | | | 1.99 | % | | | 1.99 | % | | | 1.99 | % |
| Ratio of net investment income (loss) | | | | | | �� | | | | | | | | | | | | | | | | | | |
| to average net assets***: | | | | | | | | | | | | | | | | | | | | | | | | |
Before waiver and expense reimbursement(3) | (0.11 | )%** | | | (0.50 | )% | | | (0.47 | )% | | | 2.85 | % | | | 2.64 | % | | | 0.55 | % |
After waiver and expense reimbursement(3) | 0.73 | %** | | | (0.08 | )% | | | (0.29 | )% | | | 3.01 | % | | | 3.02 | % | | | 0.92 | % |
| Portfolio turnover rate | | | 114 | %* | | | 160 | % | | | 237 | % | | | 280 | % | | | 186 | % | | | 157 | % |
| (1) | The average shares outstanding method has been applied for per share information. |
| (2) | Total investment return is based on the change in net asset value of a share during the period, assumes reinvestment of dividends and distributions at net asset value and does not reflect the impact of a sales charge. |
| (3) | Expense waived or reimbursed reflect reductions to total expenses, as discussed in the notes to the financial statements. These amounts would increase the net investment loss ratio or decrease the net investment income ratio, as applicable, had such reductions not occurred. |
| (4) | Expenses before reductions (excluding dividend and interest expense for securities sold short) were 2.82%**, 2.40%, 2.16%, 2.14%, 2.34% and 2.35% for the six-month period from July 1, 2016 to December 31, 2016, and for the years ended June 30, 2016, 2015, 2014, 2013 and 2012, respectively. |
| (5) | Expenses net of all reductions (excluding dividend and interest expense for securities sold short) were 1.98%**,1.98%, 1.98%, 1.98%, 1.96% and 1.98% for the six-month period from July 1, 2016 to December 31, 2016, and for the years ended June 30, 2016, 2015, 2014, 2013 and 2012, respectively. |
| * | Not annualized. |
| ** | Annualized. |
| *** | The net investment income (loss) ratios include dividends on short positions. |
The accompanying notes are an integral part of the financial statements.
2016 SEMI-ANNUAL REPORT
Financial Highlights
Quaker Event Arbitrage Fund
(For a Share Outstanding Throughout the Period)
| | | Class C | |
| | | (unaudited) | | | | | | | | | | | | | | | | |
| | | For the | | | | | | | | | | | | | | | | |
| | | Six-Month | | | | | | | | | | | | | | | | |
| | | Period from | | | | | | | | | | | | | | | | |
| | | July 1, 2016 | | | | | | | | | | | | | | | | |
| | | to December 31, | | | Years Ended June 30, | |
| | | 2016 | | | 2016 | | | 2015 | | | 2014 | | | 2013 | | | 2012 | |
| Net asset value, beginning of period | | $ | 11.26 | | | $ | 13.01 | | | $ | 13.72 | | | $ | 12.57 | | | $ | 11.78 | | | $ | 12.45 | |
| Income from investment operations: | | | | | | | | | | | | | | | | | | | | | | | | |
Net investment income (loss)(1) | | (0.00 | )^ | | | (0.09 | ) | | | (0.14 | ) | | | 0.30 | | | | 0.28 | | | | 0.02 | |
| Net realized and unrealized | | | | | | | | | | | | | | | | | | | | | | | | |
| gain (loss) on investments | | | 0.57 | | | | (0.64 | ) | | | 0.20 | | | | 0.92 | | | | 0.64 | | | | (0.42 | ) |
| Total from investment operations | | | 0.57 | | | | (0.73 | ) | | | 0.06 | | | | 1.22 | | | | 0.92 | | | | (0.40 | ) |
| Distributions to shareholders from: | | | | | | | | | | | | | | | | | | | | | | | | |
| Net investment income | | | (0.02 | ) | | | — | | | | (0.03 | ) | | | — | | | | — | | | | — | |
| Net realized capital gain | | | — | | | | (1.02 | ) | | | (0.74 | ) | | | (0.07 | ) | | | (0.13 | ) | | | (0.27 | ) |
| Total distributions | | | (0.02 | ) | | | (1.02 | ) | | | (0.77 | ) | | | (0.07 | ) | | | (0.13 | ) | | | (0.27 | ) |
| Net asset value, end of period | | $ | 11.81 | | | $ | 11.26 | | | $ | 13.01 | | | $ | 13.72 | | | $ | 12.57 | | | $ | 11.78 | |
Total Return(2) | | | 5.04 | %* | | | (5.03 | )% | | | 0.52 | % | | | 9.72 | % | | | 7.91 | % | | | (3.13 | )% |
| Ratios/supplemental data: | | | | | | | | | | | | | | | | | | | | | | | | |
| Net assets, end of period (000’ omitted) | | $ | 3,732 | | | $ | 4,576 | | | $ | 6,595 | | | $ | 6,555 | | | $ | 5,954 | | | $ | 7,195 | |
| Ratio of expenses to average net assets: | | | | | | | | | | | | | | | | | | | | | | | | |
Expense before reductions(3)(4) | | | 3.58 | %** | | | 3.16 | % | | | 2.92 | % | | | 2.90 | % | | | 3.12 | % | | | 3.12 | % |
Expense net of fee waivers, if any(3)(5) | | | 2.74 | %** | | | 2.74 | % | | | 2.74 | % | | | 2.74 | % | | | 2.74 | % | | | 2.74 | % |
| Ratio of net investment income (loss) | | | | | | | | | | | | | | | | | | | | | | | | |
| to average net assets***: | | | | | | | | | | | | | | | | | | | | | | | | |
Before waiver and expense reimbursement(3) | (0.86 | )%** | | | (1.25 | )% | | | (1.22 | )% | | | 2.10 | % | | | 1.89 | % | | | (0.17 | )% |
After waiver and expense reimbursement(3) | (0.02 | )%** | | | (0.83 | )% | | | (1.04 | )% | | | 2.26 | % | | | 2.27 | % | | | 0.21 | % |
| Portfolio turnover rate | | | 114 | %* | | | 160 | % | | | 237 | % | | | 280 | % | | | 186 | % | | | 157 | % |
| (1) | The average shares outstanding method has been applied for per share information. |
| (2) | Total investment return is based on the change in net asset value of a share during the period, assumes reinvestment of dividends and distributions at net asset value and does not reflect the impact of a sales charge. |
| (3) | Expense waived or reimbursed reflect reductions to total expenses, as discussed in the notes to the financial statements. These amounts would increase the net investment loss ratio or decrease the net investment income ratio, as applicable, had such reductions not occurred. |
| (4) | Expenses before reductions (excluding dividend and interest expense for securities sold short) were 3.57%**, 3.15%, 2.91%, 2.89%, 3.09% and 3.10% for the six-month period from July 1, 2016 to December 31, 2016, and for the years ended June 30, 2016, 2015, 2014, 2013 and 2012, respectively. |
| (5) | Expenses net of all reductions (excluding dividend and interest expense for securities sold short) were 2.73%**, 2.73%, 2.73%, 2.73%, 2.71% and 2.73% for the six-month period from July 1, 2016 to December 31, 2016, and for the years ended June 30, 2016, 2015, 2014, 2013 and 2012, respectively. |
| ^ | Amount is less than 0.005 per share. |
| * | Not annualized. |
| ** | Annualized. |
| *** | The net investment income (loss) ratios include dividends on short positions. |
The accompanying notes are an integral part of the financial statements.
2016 SEMI-ANNUAL REPORT
Financial Highlights
Quaker Event Arbitrage Fund
(For a Share Outstanding Throughout the Period)
| | | Institutional Class | |
| | | (unaudited) | | | | | | | | | | | | | | | | |
| | | For the | | | | | | | | | | | | | | | | |
| | | Six-Month | | | | | | | | | | | | | | | | |
| | | Period from | | | | | | | | | | | | | | | | |
| | | July 1, 2016 | | | | | | | | | | | | | | | | |
| | | to December 31, | | | Years Ended June 30, | |
| | | 2016 | | | 2016 | | | 2015 | | | 2014 | | | 2013 | | | 2012 | |
| Net asset value, beginning of period | | $ | 11.80 | | | $ | 13.46 | | | $ | 14.15 | | | $ | 12.86 | | | $ | 11.97 | | | $ | 12.52 | |
| Income from investment operations: | | | | | | | | | | | | | | | | | | | | | | | | |
Net investment income (loss)(1) | | | 0.06 | | | | 0.02 | | | | (0.01 | ) | | | 0.44 | | | | 0.40 | | | | 0.13 | |
| Net realized and unrealized | | | | | | | | | | | | | | | | | | | | | | | | |
| gain (loss) on investments | | | 0.59 | | | | (0.66 | ) | | | 0.21 | | | | 0.94 | | | | 0.67 | | | | (0.41 | ) |
| Total from investment operations | | | 0.65 | | | | (0.64 | ) | | | 0.20 | | | | 1.38 | | | | 1.07 | | | | (0.28 | ) |
| Distributions to shareholders from: | | | | | | | | | | | | | | | | | | | | | | | | |
| Net investment income | | | (0.08 | ) | | | — | | | | (0.15 | ) | | | (0.02 | ) | | | (0.05 | ) | | | — | |
| Net realized capital gain | | | — | | | | (1.02 | ) | | | (0.74 | ) | | | (0.07 | ) | | | (0.13 | ) | | | (0.27 | ) |
| Total distributions | | | (0.08 | ) | | | (1.02 | ) | | | (0.89 | ) | | | (0.09 | ) | | | (0.18 | ) | | | (0.27 | ) |
| Net asset value, end of period | | $ | 12.37 | | | $ | 11.80 | | | $ | 13.46 | | | $ | 14.15 | | | $ | 12.86 | | | $ | 11.97 | |
Total Return(2) | | | 5.53 | %* | | | (4.15 | )% | | | 1.61 | % | | | 10.77 | % | | | 9.04 | % | | | (2.14 | )% |
| Ratios/supplemental data: | | | | | | | | | | | | | | | | | | | | | | | | |
| Net assets, end of period (000’ omitted) | | $ | 12,554 | | | $ | 14,953 | | | $ | 75,420 | | | $ | 59,474 | | | $ | 24,929 | | | $ | 13,292 | |
| Ratio of expenses to average net assets: | | | | | | | | | | | | | | | | | | | | | | | | |
Expense before reductions(3)(4) | | | 2.58 | %** | | | 2.16 | % | | | 1.92 | % | | | 1.90 | % | | | 2.12 | % | | | 2.09 | % |
Expense net of fee waivers, if any(3)(5) | | | 1.74 | %** | | | 1.74 | % | | | 1.74 | % | | | 1.74 | % | | | 1.74 | % | | | 1.74 | % |
| Ratio of net investment income (loss) | | | | | | | | | | | | | | | | | | | | | | | | |
| to average net assets***: | | | | | | | | | | | | | | | | | | | | | | | | |
Before waiver and expense reimbursement(3) | 0.14 | %** | | | (0.25 | )% | | | (0.22 | )% | | | 3.10 | % | | | 2.89 | % | | | 0.75 | % |
After waiver and expense reimbursement(3) | 0.98 | %** | | | 0.17 | % | | | (0.04 | )% | | | 3.26 | % | | | 3.27 | % | | | 1.11 | % |
| Portfolio turnover rate | | | 114 | %* | | | 160 | % | | | 237 | % | | | 280 | % | | | 186 | % | | | 157 | % |
| (1) | The average shares outstanding method has been applied for per share information. |
| (2) | Total investment return is based on the change in net asset value of a share during the period, assumes reinvestment of dividends and distributions at net asset value and does not reflect the impact of a sales charge. |
| (3) | Expense waived or reimbursed reflect reductions to total expenses, as discussed in the notes to the financial statements. These amounts would increase the net investment loss ratio or decrease the net investment income ratio, as applicable, had such reductions not occurred. |
| (4) | Expenses before reductions (excluding dividend and interest expense for securities sold short) were 2.57%**, 2.15%, 1.91%, 1.89%, 2.09% and 2.08% for the six-month period from July 1, 2016 to December 31, 2016, and for the years ended June 30, 2016, 2015, 2014, 2013 and 2012, respectively. |
| (5) | Expenses net of all reductions (excluding dividend and interest expense for securities sold short) were 1.73%**, 1.73%, 1.73%, 1.73%, 1.71% and 1.73% for the six-month period from July 1, 2016 to December 31, 2016, and for the years ended June 30, 2016, 2015, 2014, 2013 and 2012, respectively. |
| * | Not annualized. |
| ** | Annualized. |
| *** | The net investment income (loss) ratios include dividends on short positions. |
The accompanying notes are an integral part of the financial statements.
2016 SEMI-ANNUAL REPORT
Financial Highlights
Quaker Global Tactical Allocation Fund
(For a Share Outstanding Throughout the Period)
| | | Class A | |
| | | (unaudited) | | | | | | | | | | | | | | | | |
| | | For the | | | | | | | | | | | | | | | | |
| | | Six-Month | | | | | | | | | | | | | | | | |
| | | Period from | | | | | | | | | | | | | | | | |
| | | July 1, 2016 | | | | | | | | | | | | | | | | |
| | | to December 31, | | | Years Ended June 30, | |
| | | 2016 | | | 2016 | | | 2015 | | | 2014 | | | 2013 | | | 2012 | |
| Net asset value, beginning of period | | $ | 9.95 | | | $ | 11.51 | | | $ | 10.46 | | | $ | 8.30 | | | $ | 7.12 | | | $ | 7.51 | |
| Income from investment operations: | | | | | | | | | | | | | | | | | | | | | | | | |
Net investment income (loss)(1) | | | (0.07 | ) | | | (0.14 | ) | | | (0.11 | ) | | | (0.08 | ) | | | (0.09 | ) | | | (0.10 | ) |
| Net realized and unrealized | | | | | | | | | | | | | | | | | | | | | | | | |
| gain (loss) on investments | | | 0.42 | | | | (1.42 | ) | | | 1.16 | | | | 2.24 | | | | 1.27 | | | | (0.29 | ) |
| Total from investment operations | | | 0.35 | | | | (1.56 | ) | | | 1.05 | | | | 2.16 | | | | 1.18 | | | | (0.39 | ) |
| Distributions to shareholders from: | | | | | | | | | | | | | | | | | | | | | | | | |
| Net investment income | | | — | | | | — | | | | — | | | | — | | | | — | | | | — | |
| Net realized capital gain | | | — | | | | — | | | | — | | | | — | | | | — | | | | — | |
| Total distributions | | | — | | | | — | | | | — | | | | — | | | | — | | | | — | |
| Net asset value, end of period | | $ | 10.30 | | | $ | 9.95 | | | $ | 11.51 | | | $ | 10.46 | | | $ | 8.30 | | | $ | 7.12 | |
Total Return(2) | | | 3.52 | %* | | | (13.55 | )% | | | 10.04 | % | | | 26.02 | % | | | 16.57 | % | | | (5.19 | )% |
| Ratios/supplemental data: | | | | | | | | | | | | | | | | | | | | | | | | |
| Net assets, end of period (000’ omitted) | | $ | 2,136 | | | $ | 3,184 | | | $ | 5,707 | | | $ | 3,992 | | | $ | 3,856 | | | $ | 5,707 | |
| Ratio of expenses to average net assets: | | | | | | | | | | | | | | | | | | | | | | | | |
Expense before reductions(3)(4) | | | 2.50 | %** | | | 2.42 | % | | | 2.27 | % | | | 2.19 | % | | | 2.83 | % | | | 2.68 | % |
Expense net of fee waivers, if any(3) | | | 2.41 | %** | | | 2.42 | % | | | 2.27 | % | | | 2.19 | % | | | 2.83 | % | | | 2.68 | % |
| Ratio of net investment income (loss) | | | | | | | | | | | | | | | | | | | | | | | | |
| to average net assets***: | | | | | | | | | | | | | | | | | | | | | | | | |
Before waiver and expense reimbursement(3) | (1.50 | )%** | | | (1.30 | )% | | | (1.03 | )% | | | (0.80 | )% | | | (1.22 | )% | | | (1.41 | )% |
After waiver and expense reimbursement(3) | (1.41 | )%** | | | (1.30 | )% | | | (1.03 | )% | | | (0.80 | )% | | | (1.22 | )% | | | (1.41 | )% |
| Portfolio turnover rate | | | 133 | %* | | | 211 | % | | | 125 | % | | | 130 | % | | | 484 | % | | | 880 | % |
| (1) | The average shares outstanding method has been applied for per share information. |
| (2) | Total investment return is based on the change in net asset value of a share during the period, assumes reinvestment of dividends and distributions at net asset value and does not reflect the impact of a sales charge. |
| (3) | Expense waived or reimbursed reflect reductions to total expenses, as discussed in the notes to the financial statements. These amounts would increase the net investment loss ratio or decrease the net investment income ratio, as applicable, had such reductions not occurred. |
| (4) | Ratio of expenses (excluding dividend and interest expense for securities sold short) were 2.41%, 2.25%, 2.15% and 2.83% for the years ended June 30, 2016, 2015, 2014, and 2013, respectively. |
| * | Not annualized. |
| ** | Annualized. |
| *** | The net investment income (loss) ratios include dividends on short positions. |
The accompanying notes are an integral part of the financial statements.
2016 SEMI-ANNUAL REPORT
Financial Highlights
Quaker Global Tactical Allocation Fund
(For a Share Outstanding Throughout the Period)
| | | Class C | |
| | | (unaudited) | | | | | | | | | | | | | | | | |
| | | For the | | | | | | | | | | | | | | | | |
| | | Six-Month | | | | | | | | | | | | | | | | |
| | | Period from | | | | | | | | | | | | | | | | |
| | | July 1, 2016 | | | | | | | | | | | | | | | | |
| | | to December 31, | | | Years Ended June 30, | |
| | | 2016 | | | 2016 | | | 2015 | | | 2014 | | | 2013 | | | 2012 | |
| Net asset value, beginning of period | | $ | 9.36 | | | $ | 10.91 | | | $ | 9.99 | | | $ | 7.98 | | | $ | 6.90 | | | $ | 7.34 | |
| Income from investment operations: | | | | | | | | | | | | | | | | | | | | | | | | |
Net investment income (loss)(1) | | | (0.11 | ) | | | (0.20 | ) | | | (0.19 | ) | | | (0.14 | ) | | | (0.14 | ) | | | (0.15 | ) |
| Net realized and unrealized | | | | | | | | | | | | | | | | | | | | | | | | |
| gain (loss) on investments | | | 0.40 | | | | (1.35 | ) | | | 1.11 | | | | 2.15 | | | | 1.22 | | | | (0.29 | ) |
| Total from investment operations | | | 0.29 | | | | (1.55 | ) | | | 0.92 | | | | 2.01 | | | | 1.08 | | | | (0.44 | ) |
| Distributions to shareholders from: | | | | | | | | | | | | | | | | | | | | | | | | |
| Net investment income | | | — | | | | — | | | | — | | | | — | | | | — | | | | — | |
| Net realized capital gain | | | — | | | | — | | | | — | | | | — | | | | — | | | | — | |
| Total distributions | | | — | | | | — | | | | — | | | | — | | | | — | | | | — | |
| Net asset value, end of period | | $ | 9.65 | | | $ | 9.36 | | | $ | 10.91 | | | $ | 9.99 | | | $ | 7.98 | | | $ | 6.90 | |
Total Return(2) | | | 3.10 | %* | | | (14.21 | )% | | | 9.21 | % | | | 25.19 | % | | | 15.65 | % | | | (5.99 | )% |
| Ratios/supplemental data: | | | | | | | | | | | | | | | | | | | | | | | | |
| Net assets, end of period (000’ omitted) | | $ | 1,154 | | | $ | 1,497 | | | $ | 1,851 | | | $ | 2,093 | | | $ | 2,124 | | | $ | 3,158 | |
| Ratio of expenses to average net assets: | | | | | | | | | | | | | | | | | | | | | | | | |
Expense before reductions(3)(4) | | | 3.25 | %** | | | 3.17 | % | | | 3.02 | % | | | 2.94 | % | | | 3.58 | % | | | 3.43 | % |
Expense net of fee waivers, if any(3) | | | 3.16 | %** | | | 3.17 | % | | | 3.02 | % | | | 2.94 | % | | | 3.58 | % | | | 3.43 | % |
| Ratio of net investment income (loss) | | | | | | | | | | | | | | | | | | | | | | | | |
| to average net assets***: | | | | | | | | | | | | | | | | | | | | | | | | |
Before waiver and expense reimbursement(3) | (2.25 | )%** | | | (2.05 | )% | | | (1.78 | )% | | | (1.55 | )% | | | (1.97 | )% | | | (2.15 | )% |
After waiver and expense reimbursement(3) | (2.16 | )%** | | | (2.05 | )% | | | (1.78 | )% | | | (1.55 | )% | | | (1.97 | )% | | | (2.15 | )% |
| Portfolio turnover rate | | | 133 | %* | | | 211 | % | | | 125 | % | | | 130 | % | | | 484 | % | | | 880 | % |
| (1) | The average shares outstanding method has been applied for per share information. |
| (2) | Total investment return is based on the change in net asset value of a share during the period, assumes reinvestment of dividends and distributions at net asset value and does not reflect the impact of a sales charge. |
| (3) | Expense waived or reimbursed reflect reductions to total expenses, as discussed in the notes to the financial statements. These amounts would increase the net investment loss ratio or decrease the net investment income ratio, as applicable, had such reductions not occurred. |
| (4) | Ratio of expenses (excluding dividend and interest expense for securities sold short) were 3.16%, 3.00%, 2.90% and 3.58% for the years ended June 30, 2016, 2015, 2014, and 2013, respectively. |
| * | Not annualized. |
| ** | Annualized. |
| *** | The net investment income (loss) ratios include dividends on short positions. |
The accompanying notes are an integral part of the financial statements.
2016 SEMI-ANNUAL REPORT
Financial Highlights
Quaker Global Tactical Allocation Fund
(For a Share Outstanding Throughout the Period)
| | | Institutional Class | |
| | | (unaudited) | | | | | | | | | | | | | | | | |
| | | For the | | | | | | | | | | | | | | | | |
| | | Six-Month | | | | | | | | | | | | | | | | |
| | | Period from | | | | | | | | | | | | | | | | |
| | | July 1, 2016 | | | | | | | | | | | | | | | | |
| | | to December 31, | | | Years Ended June 30, | |
| | | 2016 | | | 2016 | | | 2015 | | | 2014 | | | 2013 | | | 2012 | |
| Net asset value, beginning of period | | $ | 11.47 | | | $ | 13.23 | | | $ | 12.00 | | | $ | 9.49 | | | $ | 8.12 | | | $ | 8.55 | |
| Income from investment operations: | | | | | | | | | | | | | | | | | | | | | | | | |
Net investment income (loss)(1) | | | (0.07 | ) | | | (0.13 | ) | | | (0.10 | ) | | | (0.06 | ) | | | (0.08 | ) | | | (0.09 | ) |
| Net realized and unrealized | | | | | | | | | | | | | | | | | | | | | | | | |
| gain (loss) on investments | | | 0.49 | | | | (1.63 | ) | | | 1.33 | | | | 2.57 | | | | 1.45 | | | | (0.34 | ) |
| Total from investment operations | | | 0.42 | | | | (1.76 | ) | | | 1.23 | | | | 2.51 | | | | 1.37 | | | | (0.43 | ) |
| Distributions to shareholders from: | | | | | | | | | | | | | | | | | | | | | | | | |
| Net investment income | | | — | | | | — | | | | — | | | | — | | | | — | | | | — | |
| Net realized capital gain | | | — | | | | — | | | | — | | | | — | | | | — | | | | — | |
| Total distributions | | | — | | | | — | | | | — | | | | — | | | | — | | | | — | |
| Net asset value, end of period | | $ | 11.89 | | | $ | 11.47 | | | $ | 13.23 | | | $ | 12.00 | | | $ | 9.49 | | | $ | 8.12 | |
Total Return(2) | | | 3.66 | %* | | | (13.30 | )% | | | 10.25 | % | | | 26.45 | % | | | 16.87 | % | | | (5.03 | )% |
| Ratios/supplemental data: | | | | | | | | | | | | | | | | | | | | | | | | |
| Net assets, end of period (000’ omitted) | | $ | 3,461 | | | $ | 2,058 | | | $ | 1,474 | | | $ | 1,240 | | | $ | 625 | | | $ | 899 | |
| Ratio of expenses to average net assets: | | | | | | | | | | | | | | | | | | | | | | | | |
Expense before reductions(3)(4) | | | 2.25 | %** | | | 2.17 | % | | | 2.02 | % | | | 1.94 | % | | | 2.58 | % | | | 2.47 | % |
Expense net of fee waivers, if any(3) | | | 2.16 | %** | | | 2.17 | % | | | 2.02 | % | | | 1.94 | % | | | 2.58 | % | | | 2.47 | % |
| Ratio of net investment income (loss) | | | | | | | | | | | | | | | | | | | | | | | | |
| to average net assets***: | | | | | | | | | | | | | | | | | | | | | | | | |
Before waiver and expense reimbursement(3) | (1.25 | )%** | | | (1.05 | )% | | | (0.78 | )% | | | (0.55 | )% | | | (0.97 | )% | | | (1.12 | )% |
After waiver and expense reimbursement(3) | (1.16 | )%** | | | (1.05 | )% | | | (0.78 | )% | | | (0.55 | )% | | | (0.97 | )% | | | (1.12 | )% |
| Portfolio turnover rate | | | 133 | %* | | | 211 | % | | | 125 | % | | | 130 | % | | | 484 | % | | | 880 | % |
| (1) | The average shares outstanding method has been applied for per share information. |
| (2) | Total investment return is based on the change in net asset value of a share during the period, assumes reinvestment of dividends and distributions at net asset value and does not reflect the impact of a sales charge. |
| (3) | Expense waived or reimbursed reflect reductions to total expenses, as discussed in the notes to the financial statements. These amounts would increase the net investment loss ratio or decrease the net investment income ratio, as applicable, had such reductions not occurred. |
| (4) | Ratio of expenses (excluding dividend and interest expense for securities sold short) were 2.16%, 2.00%, 1.90% and 2.58% for the years ended June 30, 2016, 2015, 2014, and 2013, respectively. |
| * | Not annualized. |
| ** | Annualized. |
| *** | The net investment income (loss) ratios include dividends on short positions. |
The accompanying notes are an integral part of the financial statements.
2016 SEMI-ANNUAL REPORT
Financial Highlights
Quaker Mid-Cap Value Fund
(For a Share Outstanding Throughout the Period)
| | | Class A | |
| | | (unaudited) | | | | | | | | | | | | | | | | |
| | | For the | | | | | | | | | | | | | | | | |
| | | Six-Month | | | | | | | | | | | | | | | | |
| | | Period from | | | | | | | | | | | | | | | | |
| | | July 1, 2016 | | | | | | | | | | | | | | | | |
| | | to December 31, | | | Years Ended June 30, | |
| | | 2016 | | | 2016 | | | 2015 | | | 2014 | | | 2013 | | | 2012 | |
| Net asset value, beginning of period | | $ | 23.58 | | | $ | 24.78 | | | $ | 24.62 | | | $ | 18.99 | | | $ | 15.73 | | | $ | 16.03 | |
| Income from investment operations: | | | | | | | | | | | | | | | | | | | | | | | | |
Net investment income (loss)(1) | | | (0.08 | ) | | | (0.06 | ) | | | (0.10 | ) | | | (0.09 | ) | | | (0.14 | ) | | | (0.11 | ) |
| Net realized and unrealized | | | | | | | | | | | | | | | | | | | | | | | | |
| gain (loss) on investments | | | 3.41 | | | | (1.14 | ) | | | 0.26 | | | | 5.72 | | | | 3.40 | | | | (0.19 | ) |
| Total from investment operations | | | 3.33 | | | | (1.20 | ) | | | 0.16 | | | | 5.63 | | | | 3.26 | | | | (0.30 | ) |
| Distributions to shareholders from: | | | | | | | | | | | | | | | | | | | | | | | | |
| Net investment income | | | — | | | | — | | | | — | | | | — | | | | — | | | | — | |
| Net realized capital gain | | | — | | | | — | | | | — | | | | — | | | | — | | | | — | |
| Total distributions | | | — | | | | — | | | | — | | | | — | | | | — | | | | — | |
| Net asset value, end of period | | $ | 26.91 | | | $ | 23.58 | | | $ | 24.78 | | | $ | 24.62 | | | $ | 18.99 | | | $ | 15.73 | |
Total Return(2) | | | 14.12 | %* | | | (4.84 | )% | | | 0.65 | % | | | 29.65 | % | | | 20.72 | % | | | (1.87 | )% |
| Ratios/supplemental data: | | | | | | | | | | | | | | | | | | | | | | | | |
| Net assets, end of period (000’ omitted) | | $ | 4,362 | | | $ | 4,057 | | | $ | 5,520 | | | $ | 5,724 | | | $ | 6,029 | | | $ | 6,114 | |
| Ratio of expenses to average net assets | | | 2.39 | %** | | | 2.17 | % | | | 1.98 | % | | | 2.03 | % | | | 2.19 | % | | | 2.21 | % |
| Ratio of net investment income (loss) | | | | | | | | | | | | | | | | | | | | | | | | |
| to average net assets | | | (0.63 | )%** | | | (0.26 | )% | | | (0.39 | )% | | | (0.42 | )% | | | (0.80 | )% | | | (0.70 | )% |
| Portfolio turnover rate | | | 17 | %* | | | 71 | % | | | 49 | % | | | 62 | % | | | 47 | % | | | 42 | % |
| (1) | The average shares outstanding method has been applied for per share information. |
| (2) | Total investment return is based on the change in net asset value of a share during the period, assumes reinvestment of dividends and distributions at net asset value and does not reflect the impact of a sales charge. |
| * | Not annualized. |
| ** | Annualized. |
The accompanying notes are an integral part of the financial statements.
2016 SEMI-ANNUAL REPORT
Financial Highlights
Quaker Mid-Cap Value Fund
(For a Share Outstanding Throughout the Period)
| | | Class C | |
| | | (unaudited) | | | | | | | | | | | | | | | | |
| | | For the | | | | | | | | | | | | | | | | |
| | | Six-Month | | | | | | | | | | | | | | | | |
| | | Period from | | | | | | | | | | | | | | | | |
| | | July 1, 2016 | | | | | | | | | | | | | | | | |
| | | to December 31, | | | Years Ended June 30, | |
| | | 2016 | | | 2016 | | | 2015 | | | 2014 | | | 2013 | | | 2012 | |
| Net asset value, beginning of period | | $ | 20.52 | | | $ | 21.73 | | | $ | 21.75 | | | $ | 16.91 | | | $ | 14.11 | | | $ | 14.48 | |
| Income from investment operations: | | | | | | | | | | | | | | | | | | | | | | | | |
Net investment income (loss)(1) | | | (0.15 | ) | | | (0.20 | ) | | | (0.25 | ) | | | (0.22 | ) | | | (0.24 | ) | | | (0.20 | ) |
| Net realized and unrealized | | | | | | | | | | | | | | | | | | | | | | | | |
| gain (loss) on investments | | | 2.96 | | | | (1.01 | ) | | | 0.23 | | | | 5.06 | | | | 3.04 | | | | (0.17 | ) |
| Total from investment operations | | | 2.81 | | | | (1.21 | ) | | | (0.02 | ) | | | 4.84 | | | | 2.80 | | | | (0.37 | ) |
| Distributions to shareholders from: | | | | | | | | | | | | | | | | | | | | | | | | |
| Net investment income | | | — | | | | — | | | | — | | | | — | | | | — | | | | — | |
| Net realized capital gain | | | — | | | | — | | | | — | | | | — | | | | — | | | | — | |
| Total distributions | | | — | | | | — | | | | — | | | | — | | | | — | | | | — | |
| Net asset value, end of period | | $ | 23.33 | | | $ | 20.52 | | | $ | 21.73 | | | $ | 21.75 | | | $ | 16.91 | | | $ | 14.11 | |
Total Return(2) | | | 13.69 | %* | | | (5.57 | )% | | | (0.09 | )% | | | 28.62 | % | | | 19.84 | % | | | (2.56 | )% |
| Ratios/supplemental data: | | | | | | | | | | | | | | | | | | | | | | | | |
| Net assets, end of period (000’ omitted) | | $ | 1,599 | | | $ | 1,565 | | | $ | 1,944 | | | $ | 2,086 | | | $ | 1,815 | | | $ | 1,950 | |
| Ratio of expenses to average net assets | | | 3.14 | %** | | | 2.92 | % | | | 2.73 | % | | | 2.78 | % | | | 2.94 | % | | | 2.96 | % |
| Ratio of net investment income (loss) | | | | | | | | | | | | | | | | | | | | | | | | |
| to average net assets | | | (1.38 | )%** | | | (1.01 | )% | | | (1.14 | )% | | | (1.17 | )% | | | (1.55 | )% | | | (1.45 | )% |
| Portfolio turnover rate | | | 17 | %* | | | 71 | % | | | 49 | % | | | 62 | % | | | 47 | % | | | 42 | % |
| (1) | The average shares outstanding method has been applied for per share information. |
| (2) | Total investment return is based on the change in net asset value of a share during the period, assumes reinvestment of dividends and distributions at net asset value and does not reflect the impact of a sales charge. |
| * | Not annualized. |
| ** | Annualized. |
The accompanying notes are an integral part of the financial statements.
2016 SEMI-ANNUAL REPORT
Financial Highlights
Quaker Mid-Cap Value Fund
(For a Share Outstanding Throughout the Period)
| | | Institutional Class | |
| | | (unaudited) | | | | | | | | | | | | | | | | |
| | | For the | | | | | | | | | | | | | | | | |
| | | Six-Month | | | | | | | | | | | | | | | | |
| | | Period from | | | | | | | | | | | | | | | | |
| | | July 1, 2016 | | | | | | | | | | | | | | | | |
| | | to December 31, | | | Years Ended June 30, | |
| | | 2016 | | | 2016 | | | 2015 | | | 2014 | | | 2013 | | | 2012 | |
| Net asset value, beginning of period | | $ | 24.81 | | | $ | 26.01 | | | $ | 25.77 | | | $ | 19.83 | | | $ | 16.39 | | | $ | 16.66 | |
| Income from investment operations: | | | | | | | | | | | | | | | | | | | | | | | | |
Net investment income (loss)(1) | | | (0.05 | ) | | (0.00 | )^ | | | (0.04 | ) | | | (0.04 | ) | | | (0.10 | ) | | | (0.07 | ) |
| Net realized and unrealized | | | | | | | | | | | | | | | | | | | | | | | | |
| gain (loss) on investments | | | 3.59 | | | | (1.20 | ) | | | 0.28 | | | | 5.98 | | | | 3.54 | | | | (0.20 | ) |
| Total from investment operations | | | 3.54 | | | | (1.20 | ) | | | 0.24 | | | | 5.94 | | | | 3.44 | | | | (0.27 | ) |
| Distributions to shareholders from: | | | | | | | | | | | | | | | | | | | | | | | | |
| Net investment income | | | — | | | | — | | | | — | | | | — | | | | — | | | | — | |
| Net realized capital gain | | | — | | | | — | | | | — | | | | — | | | | — | | | | — | |
| Total distributions | | | — | | | | — | | | | — | | | | — | | | | — | | | | — | |
| Net asset value, end of period | | $ | 28.35 | | | $ | 24.81 | | | $ | 26.01 | | | $ | 25.77 | | | $ | 19.83 | | | $ | 16.39 | |
Total Return(2) | | | 14.27 | %* | | | (4.61 | )% | | | 0.93 | % | | | 29.95 | % | | | 20.99 | % | | | (1.62 | )% |
| Ratios/supplemental data: | | | | | | | | | | | | | | | | | | | | | | | | |
| Net assets, end of period (000’ omitted) | | $ | 1,457 | | | $ | 1,283 | | | $ | 1,504 | | | $ | 2,216 | | | $ | 1,060 | | | $ | 351 | |
| Ratio of expenses to average net assets | | | 2.14 | %** | | | 1.92 | % | | | 1.73 | % | | | 1.78 | % | | | 1.94 | % | | | 1.96 | % |
| Ratio of net investment income (loss) | | | | | | | | | | | | | | | | | | | | | | | | |
| to average net assets | | | (0.38 | )%** | | | (0.01 | )% | | | (0.14 | )% | | | (0.17 | )% | | | (0.55 | )% | | | (0.45 | )% |
| Portfolio turnover rate | | | 17 | %* | | | 71 | % | | | 49 | % | | | 62 | % | | | 47 | % | | | 42 | % |
| (1) | The average shares outstanding method has been applied for per share information. |
| (2) | Total investment return is based on the change in net asset value of a share during the period, assumes reinvestment of dividends and distributions at net asset value and does not reflect the impact of a sales charge. |
| ^ | Amount is less than 0.005 per share. |
| * | Not annualized. |
| ** | Annualized. |
The accompanying notes are an integral part of the financial statements.
2016 SEMI-ANNUAL REPORT
Financial Highlights
Quaker Small-Cap Value Fund
(For a Share Outstanding Throughout the Period)
| | | Class A | |
| | | (unaudited) | | | | | | | | | | | | | | | | |
| | | For the | | | | | | | | | | | | | | | | |
| | | Six-Month | | | | | | | | | | | | | | | | |
| | | Period from | | | | | | | | | | | | | | | | |
| | | July 1, 2016 | | | | | | | | | | | | | | | | |
| | | to December 31, | | | Years Ended June 30, | |
| | | 2016 | | | 2016 | | | 2015 | | | 2014 | | | 2013 | | | 2012 | |
| Net asset value, beginning of period | | $ | 20.09 | | | $ | 24.15 | | | $ | 24.28 | | | $ | 19.50 | | | $ | 15.85 | | | $ | 16.53 | |
| Income from investment operations: | | | | | | | | | | | | | | | | | | | | | | | | |
Net investment income (loss)(1) | | | (0.08 | ) | | | (0.08 | ) | | | (0.06 | ) | | | (0.11 | ) | | | 0.09 | | | | (0.08 | ) |
| Net realized and unrealized | | | | | | | | | | | | | | | | | | | | | | | | |
| gain (loss) on investments | | | 3.89 | | | | (2.26 | ) | | | 1.22 | | | | 4.95 | | | | 3.58 | | | | (0.60 | ) |
| Total from investment operations | | | 3.81 | | | | (2.34 | ) | | | 1.16 | | | | 4.84 | | | | 3.67 | | | | (0.68 | ) |
| Distributions to shareholders from: | | | | | | | | | | | | | | | | | | | | | | | | |
| Net investment income | | | — | | | | — | | | | — | | | | (0.06 | ) | | | (0.02 | ) | | | — | |
| Net realized capital gain | | | — | | | | (1.72 | ) | | | (1.29 | ) | | | — | | | | — | | | | — | |
| Total distributions | | | — | | | | (1.72 | ) | | | (1.29 | ) | | | (0.06 | ) | | | (0.02 | ) | | | — | |
| Net asset value, end of period | | $ | 23.90 | | | $ | 20.09 | | | $ | 24.15 | | | $ | 24.28 | | | $ | 19.50 | | | $ | 15.85 | |
Total Return(2) | | | 18.96 | %* | | | (9.93 | )% | | | 4.96 | % | | | 24.83 | % | | | 23.17 | % | | | (4.11 | )% |
| Ratios/supplemental data: | | | | | | | | | | | | | | | | | | | | | | | | |
| Net assets, end of period (000’ omitted) | | $ | 7,163 | | | $ | 6,431 | | | $ | 7,790 | | | $ | 8,512 | | | $ | 7,727 | | | $ | 8,347 | |
| Ratio of expenses to average net assets | | | 2.16 | %** | | | 1.93 | % | | | 1.78 | % | | | 1.83 | % | | | 1.93 | % | | | 1.96 | % |
| Ratio of net investment income (loss) | | | | | | | | | | | | | | | | | | | | | | | | |
| to average net assets | | | (0.69 | )%** | | | (0.37 | )% | | | (0.26 | )% | | | (0.47 | )% | | | 0.49 | % | | | (0.52 | )% |
| Portfolio turnover rate | | | 62 | %* | | | 119 | % | | | 128 | % | | | 176 | % | | | 142 | % | | | 158 | % |
| (1) | The average shares outstanding method has been applied for per share information. |
| (2) | Total investment return is based on the change in net asset value of a share during the period, assumes reinvestment of dividends and distributions at net asset value and does not reflect the impact of a sales charge. |
| * | Not annualized. |
| ** | Annualized. |
The accompanying notes are an integral part of the financial statements.
2016 SEMI-ANNUAL REPORT
Financial Highlights
Quaker Small-Cap Value Fund
(For a Share Outstanding Throughout the Period)
| | | Class C | |
| | | (unaudited) | | | | | | | | | | | | | | | | |
| | | For the | | | | | | | | | | | | | | | | |
| | | Six-Month | | | | | | | | | | | | | | | | |
| | | Period from | | | | | | | | | | | | | | | | |
| | | July 1, 2016 | | | | | | | | | | | | | | | | |
| | | to December 31, | | | Years Ended June 30, | |
| | | 2016 | | | 2016 | | | 2015 | | | 2014 | | | 2013 | | | 2012 | |
| Net asset value, beginning of period | | $ | 16.19 | | | $ | 19.96 | | | $ | 20.43 | | | $ | 16.49 | | | $ | 13.49 | | | $ | 14.17 | |
| Income from investment operations: | | | | | | | | | | | | | | | | | | | | | | | | |
Net investment income (loss)(1) | | | (0.13 | ) | | | (0.19 | ) | | | (0.20 | ) | | | (0.23 | ) | | | (0.04 | ) | | | (0.16 | ) |
| Net realized and unrealized | | | | | | | | | | | | | | | | | | | | | | | | |
| gain (loss) on investments | | | 3.12 | | | | (1.86 | ) | | | 1.02 | | | | 4.17 | | | | 3.04 | | | | (0.52 | ) |
| Total from investment operations | | | 2.99 | | | | (2.05 | ) | | | 0.82 | | | | 3.94 | | | | 3.00 | | | | (0.68 | ) |
| Distributions to shareholders from: | | | | | | | | | | | | | | | | | | | | | | | | |
| Net investment income | | | — | | | | — | | | | — | | | | — | | | | — | | | | — | |
| Net realized capital gain | | | — | | | | (1.72 | ) | | | (1.29 | ) | | | — | | | | — | | | | — | |
| Total distributions | | | — | | | | (1.72 | ) | | | (1.29 | ) | | | — | | | | — | | | | — | |
| Net asset value, end of period | | $ | 19.18 | | | $ | 16.19 | | | $ | 19.96 | | | $ | 20.43 | | | $ | 16.49 | | | $ | 13.49 | |
Total Return(2) | | | 18.47 | %* | | | (10.59 | )% | | | 4.20 | % | | | 23.89 | % | | | 22.24 | % | | | (4.80 | )% |
| Ratios/supplemental data: | | | | | | | | | | | | | | | | | | | | | | | | |
| Net assets, end of period (000’ omitted) | | $ | 1,494 | | | $ | 1,477 | | | $ | 1,684 | | | $ | 1,806 | | | $ | 1,625 | | | $ | 1,863 | |
| Ratio of expenses to average net assets | | | 2.91 | %** | | | 2.68 | % | | | 2.53 | % | | | 2.58 | % | | | 2.68 | % | | | 2.70 | % |
| Ratio of net investment income (loss) | | | | | | | | | | | | | | | | | | | | | | | | |
| to average net assets | | | (1.44 | )%** | | | (1.12 | )% | | | (1.01 | )% | | | (1.22 | )% | | | (0.26 | )% | | | (1.25 | )% |
| Portfolio turnover rate | | | 62 | %* | | | 119 | % | | | 128 | % | | | 176 | % | | | 142 | % | | | 158 | % |
| (1) | The average shares outstanding method has been applied for per share information. |
| (2) | Total investment return is based on the change in net asset value of a share during the period, assumes reinvestment of dividends and distributions at net asset value and does not reflect the impact of a sales charge. |
| * | Not annualized. |
| ** | Annualized. |
The accompanying notes are an integral part of the financial statements.
2016 SEMI-ANNUAL REPORT
Financial Highlights
Quaker Small-Cap Value Fund
(For a Share Outstanding Throughout the Period)
| | | Institutional Class | |
| | | (unaudited) | | | | | | | | | | | | | | | | |
| | | For the | | | | | | | | | | | | | | | | |
| | | Six-Month | | | | | | | | | | | | | | | | |
| | | Period from | | | | | | | | | | | | | | | | |
| | | July 1, 2016 | | | | | | | | | | | | | | | | |
| | | to December 31, | | | Years Ended June 30, | |
| | | 2016 | | | 2016 | | | 2015 | | | 2014 | | | 2013 | | | 2012 | |
| Net asset value, beginning of period | | $ | 21.17 | | | $ | 25.29 | | | $ | 25.30 | | | $ | 20.29 | | | $ | 16.50 | | | $ | 17.15 | |
| Income from investment operations: | | | | | | | | | | | | | | | | | | | | | | | | |
Net investment income (loss)(1) | | | (0.05 | ) | | | (0.03 | ) | | (0.00 | )^ | | | (0.05 | ) | | | 0.13 | | | | (0.04 | ) |
| Net realized and unrealized | | | | | | | | | | | | | | | | | | | | | | | | |
| gain (loss) on investments | | | 4.10 | | | | (2.37 | ) | | | 1.28 | | | | 5.14 | | | | 3.73 | | | | (0.61 | ) |
| Total from investment operations | | | 4.05 | | | | (2.40 | ) | | | 1.28 | | | | 5.09 | | | | 3.86 | | | | (0.65 | ) |
| Distributions to shareholders from: | | | | | | | | | | | | | | | | | | | | | | | | |
| Net investment income | | | — | | | | — | | | | — | | | | (0.08 | ) | | | (0.07 | ) | | | — | |
| Net realized capital gain | | | — | | | | (1.72 | ) | | | (1.29 | ) | | | — | | | | — | | | | — | |
| Total distributions | | | — | | | | (1.72 | ) | | | (1.29 | ) | | | (0.08 | ) | | | (0.07 | ) | | | — | |
| Net asset value, end of period | | $ | 25.22 | | | $ | 21.17 | | | $ | 25.29 | | | $ | 25.30 | | | $ | 20.29 | | | $ | 16.50 | |
Total Return(2) | | | 19.13 | %* | | | (9.71 | )% | | | 5.24 | % | | | 25.13 | % | | | 23.44 | % | | | (3.79 | )% |
| Ratios/supplemental data: | | | | | | | | | | | | | | | | | | | | | | | | |
| Net assets, end of period (000’ omitted) | | $ | 24,709 | | | $ | 24,642 | | | $ | 28,528 | | | $ | 27,868 | | | $ | 23,393 | | | $ | 20,028 | |
| Ratio of expenses to average net assets | | | 1.91 | %** | | | 1.68 | % | | | 1.53 | % | | | 1.58 | % | | | 1.68 | % | | | 1.71 | % |
| Ratio of net investment income (loss) | | | | | | | | | | | | | | | | | | | | | | | | |
| to average net assets | | | (0.44 | )%** | | | (0.12 | )% | | | (0.01 | )% | | | (0.22 | )% | | | 0.74 | % | | | (0.25 | )% |
| Portfolio turnover rate | | | 62 | %* | | | 119 | % | | | 128 | % | | | 176 | % | | | 142 | % | | | 158 | % |
| (1) | The average shares outstanding method has been applied for per share information. |
| (2) | Total investment return is based on the change in net asset value of a share during the period, assumes reinvestment of dividends and distributions at net asset value and does not reflect the impact of a sales charge. |
| ^ | Amount is less than 0.005 per share. |
| * | Not annualized. |
| ** | Annualized. |
The accompanying notes are an integral part of the financial statements.
2016 SEMI-ANNUAL REPORT
Financial Highlights
Quaker Strategic Growth Fund
(For a Share Outstanding Throughout the Period)
| | | Class A | |
| | | (unaudited) | | | | | | | | | | | | | | | | |
| | | For the | | | | | | | | | | | | | | | | |
| | | Six-Month | | | | | | | | | | | | | | | | |
| | | Period from | | | | | | | | | | | | | | | | |
| | | July 1, 2016 | | | | | | | | | | | | | | | | |
| | | to December 31, | | | Years Ended June 30, | |
| | | 2016 | | | 2016 | | | 2015 | | | 2014 | | | 2013 | | | 2012 | |
| Net asset value, beginning of period | | $ | 23.80 | | | $ | 26.55 | | | $ | 24.19 | | | $ | 19.31 | | | $ | 16.13 | | | $ | 16.53 | |
| Income from investment operations: | | | | | | | | | | | | | | | | | | | | | | | | |
Net investment income (loss)(1) | | | (0.08 | ) | | | (0.32 | ) | | | (0.30 | ) | | | (0.26 | ) | | | (0.15 | ) | | | (0.15 | ) |
| Net realized and unrealized | | | | | | | | | | | | | | | | | | | | | | | | |
| gain (loss) on investments | | | 2.62 | | | | (2.43 | ) | | | 2.66 | | | | 5.14 | | | | 3.33 | | | | (0.25 | ) |
| Total from investment operations | | | 2.54 | | | | (2.75 | ) | | | 2.36 | | | | 4.88 | | | | 3.18 | | | | (0.40 | ) |
| Distributions to shareholders from: | | | | | | | | | | | | | | | | | | | | | | | | |
| Net investment income | | | — | | | | — | | | | — | | | | — | | | | — | | | | — | |
| Net realized capital gain | | | — | | | | — | | | | — | | | | — | | | | — | | | | — | |
| Total distributions | | | — | | | | — | | | | — | | | | — | | | | — | | | | — | |
| Net asset value, end of period | | $ | 26.34 | | | $ | 23.80 | | | $ | 26.55 | | | $ | 24.19 | | | $ | 19.31 | | | $ | 16.13 | |
Total Return(2) | | | 10.63 | %* | | | (10.36 | )% | | | 9.76 | % | | | 25.27 | % | | | 19.71 | % | | | (2.42 | )% |
| Ratios/supplemental data: | | | | | | | | | | | | | | | | | | | | | | | | |
| Net assets, end of period (000’ omitted) | | $ | 53,621 | | | $ | 57,159 | | | $ | 77,188 | | | $ | 87,053 | | | $ | 88,970 | | | $ | 111,778 | |
| Ratio of expenses to average net assets: | | | | | | | | | | | | | | | | | | | | | | | | |
| Before expense reimbursements | | | | | | | | | | | | | | | | | | | | | | | | |
or recoveries(3)(4) | | | 2.46 | %** | | | 2.30 | % | | | 2.12 | % | | | 2.15 | % | | | 2.36 | % | | | 2.30 | % |
| After expense reimbursements | | | | | | | | | | | | | | | | | | | | | | | | |
or recoveries(3)(5) | | | 2.24 | %** | | | 2.24 | % | | | 2.24 | % | | | 2.24 | % | | | 2.24 | % | | | 2.24 | % |
| Ratio of net investment income (loss) | | | | | | | | | | | | | | | | | | | | | | | | |
| to average net assets***: | | | | | | | | | | | | | | | | | | | | | | | | |
Before expense reimbursements or recoveries(3) | (0.88 | )%** | | | (1.34 | )% | | | (1.06 | )% | | | (1.06 | )% | | | (0.98 | )% | | | (1.03 | )% |
After expense reimbursements or recoveries(3) | (0.66 | )%** | | | (1.28 | )% | | | (1.18 | )% | | | (1.15 | )% | | | (0.86 | )% | | | (0.98 | )% |
| Portfolio turnover rate | | | 143 | %* | | | 211 | % | | | 149 | % | | | 170 | % | | | 294 | % | | | 178 | % |
| (1) | The average shares outstanding method has been applied for per share information. |
| (2) | Total investment return is based on the change in net asset value of a share during the period, assumes reinvestment of dividends and distributions at net asset value and does not reflect the impact of a sales charge. |
| (3) | Expense waived or reimbursed reflect reductions to total expenses, as discussed in the notes to the financial statements. These reimbursed amounts would increase the net investment loss ratio or decrease the net investment income ratio and recovered amounts would decrease the net investment loss ratio or increase the net investment income ratio, as applicable, had such reductions or increases not occurred. |
| (4) | Expenses before reductions (excluding dividend and interest expense for securities sold short) were 2.29% for the year ended June 30, 2016. |
| (5) | Expenses net of all reductions (excluding dividend and interest expense for securities sold short) were 2.23% for the year ended June 30, 2016. |
| * | Not annualized. |
| ** | Annualized. |
| *** | The net investment income (loss) ratios include dividends on short positions. |
The accompanying notes are an integral part of the financial statements.
2016 SEMI-ANNUAL REPORT
Financial Highlights
Quaker Strategic Growth Fund
(For a Share Outstanding Throughout the Period)
| | | Class C | |
| | | (unaudited) | | | | | | | | | | | | | | | | |
| | | For the | | | | | | | | | | | | | | | | |
| | | Six-Month | | | | | | | | | | | | | | | | |
| | | Period from | | | | | | | | | | | | | | | | |
| | | July 1, 2016 | | | | | | | | | | | | | | | | |
| | | to December 31, | | | Years Ended June 30, | |
| | | 2016 | | | 2016 | | | 2015 | | | 2014 | | | 2013 | | | 2012 | |
| Net asset value, beginning of period | | $ | 20.72 | | | $ | 23.28 | | | $ | 21.37 | | | $ | 17.19 | | | $ | 14.47 | | | $ | 14.94 | |
| Income from investment operations: | | | | | | | | | | | | | | | | | | | | | | | | |
Net investment income (loss)(1) | | | (0.16 | ) | | | (0.44 | ) | | | (0.43 | ) | | | (0.37 | ) | | | (0.25 | ) | | | (0.24 | ) |
| Net realized and unrealized | | | | | | | | | | | | | | | | | | | | | | | | |
| gain (loss) on investments | | | 2.29 | | | | (2.12 | ) | | | 2.34 | | | | 4.55 | | | | 2.97 | | | | (0.23 | ) |
| Total from investment operations | | | 2.13 | | | | (2.56 | ) | | | 1.91 | | | | 4.18 | | | | 2.72 | | | | (0.47 | ) |
| Distributions to shareholders from: | | | | | | | | | | | | | | | | | | | | | | | | |
| Net investment income | | | — | | | | — | | | | — | | | | — | | | | — | | | | — | |
| Net realized capital gain | | | — | | | | — | | | | — | | | | — | | | | — | | | | — | |
| Total distributions | | | — | | | | — | | | | — | | | | — | | | | — | | | | — | |
| Net asset value, end of period | | $ | 22.85 | | | $ | 20.72 | | | $ | 23.28 | | | $ | 21.37 | | | $ | 17.19 | | | $ | 14.47 | |
Total Return(2) | | | 10.28 | %* | | | (11.00 | )% | | | 8.94 | % | | | 24.32 | % | | | 18.80 | % | | | (3.15 | )% |
| Ratios/supplemental data: | | | | | | | | | | | | | | | | | | | | | | | | |
| Net assets, end of period (000’ omitted) | | $ | 13,648 | | | $ | 15,375 | | | $ | 20,140 | | | $ | 22,931 | | | $ | 22,968 | | | $ | 27,102 | |
| Ratio of expenses to average net assets: | | | | | | | | | | | | | | | | | | | | | | | | |
| Before expense reimbursements | | | | | | | | | | | | | | | | | | | | | | | | |
or recoveries(3)(4) | | | 3.21 | %** | | | 3.05 | % | | | 2.87 | % | | | 2.90 | % | | | 3.11 | % | | | 3.04 | % |
| After expense reimbursements | | | | | | | | | | | | | | | | | | | | | | | | |
or recoveries(3)(5) | | | 2.99 | %** | | | 2.99 | % | | | 2.99 | % | | | 2.99 | % | | | 2.99 | % | | | 2.99 | % |
| Ratio of net investment income (loss) | | | | | | | | | | | | | | | | | | | | | | | | |
| to average net assets***: | | | | | | | | | | | | | | | | | | | | | | | | |
Before expense reimbursements or recoveries(3) | | | (1.63 | )%** | | | (2.09 | )% | | | (1.81 | )% | | | (1.81 | )% | | | (1.74 | )% | | | (1.77 | )% |
After expense reimbursements or recoveries(3) | | | (1.41 | )%** | | | (2.03 | )% | | | (1.93 | )% | | | (1.90 | )% | | | (1.62 | )% | | | (1.72 | )% |
| Portfolio turnover rate | | | 143 | %* | | | 211 | % | | | 149 | % | | | 170 | % | | | 294 | % | | | 178 | % |
| (1) | The average shares outstanding method has been applied for per share information. |
| (2) | Total investment return is based on the change in net asset value of a share during the period, assumes reinvestment of dividends and distributions at net asset value and does not reflect the impact of a sales charge. |
| (3) | Expense waived or reimbursed reflect reductions to total expenses, as discussed in the notes to the financial statements. These reimbursed amounts would increase the net investment loss ratio or decrease the net investment income ratio and recovered amounts would decrease the net investment loss ratio or increase the net investment income ratio, as applicable, had such reductions or increases not occurred. |
| (4) | Expenses before reductions (excluding dividend and interest expense for securities sold short) were 3.04% for the year ended June 30, 2016. |
| (5) | Expenses net of all reductions (excluding dividend and interest expense for securities sold short) were 2.98% for the year ended June 30, 2016. |
| * | Not annualized. |
| ** | Annualized. |
| *** | The net investment income (loss) ratios include dividends on short positions. |
The accompanying notes are an integral part of the financial statements.
2016 SEMI-ANNUAL REPORT
Financial Highlights
Quaker Strategic Growth Fund
(For a Share Outstanding Throughout the Period)
| | | Institutional Class | |
| | | (unaudited) | | | | | | | | | | | | | | | | |
| | | For the | | | | | | | | | | | | | | | | |
| | | Six-Month | | | | | | | | | | | | | | | | |
| | | Period from | | | | | | | | | | | | | | | | |
| | | July 1, 2016 | | | | | | | | | | | | | | | | |
| | | to December 31, | | | Years Ended June 30, | |
| | | 2016 | | | 2016 | | | 2015 | | | 2014 | | | 2013 | | | 2012 | |
| Net asset value, beginning of period | | $ | 24.82 | | | $ | 27.62 | | | $ | 25.10 | | | $ | 19.99 | | | $ | 16.66 | | | $ | 17.03 | |
| Income from investment operations: | | | | | | | | | | | | | | | | | | | | | | | | |
Net investment income (loss)(1) | | | (0.05 | ) | | | (0.27 | ) | | | (0.25 | ) | | | (0.21 | ) | | | (0.11 | ) | | | (0.11 | ) |
| Net realized and unrealized | | | | | | | | | | | | | | | | | | | | | | | | |
| gain (loss) on investments | | | 2.74 | | | | (2.53 | ) | | | 2.77 | | | | 5.32 | | | | 3.44 | | | | (0.26 | ) |
| Total from investment operations | | | 2.69 | | | | (2.80 | ) | | | 2.52 | | | | 5.11 | | | | 3.33 | | | | (0.37 | ) |
| Distributions to shareholders from: | | | | | | | | | | | | | | | | | | | | | | | | |
| Net investment income | | | — | | | | — | | | | — | | | | — | | | | — | | | | — | |
| Net realized capital gain | | | — | | | | — | | | | — | | | | — | | | | — | | | | — | |
| Total distributions | | | — | | | | — | | | | — | | | | — | | | | — | | | | — | |
| Net asset value, end of period | | $ | 27.51 | | | $ | 24.82 | | | $ | 27.62 | | | $ | 25.10 | | | $ | 19.99 | | | $ | 16.66 | |
Total Return(2) | | | 10.84 | %* | | | (10.14 | )% | | | 10.04 | % | | | 25.56 | % | | | 19.99 | % | | | (2.17 | )% |
| Ratios/supplemental data: | | | | | | | | | | | | | | | | | | | | | | | | |
| Net assets, end of period (000’ omitted) | | $ | 9,169 | | | $ | 13,457 | | | $ | 66,521 | | | $ | 58,999 | | | $ | 45,851 | | | $ | 40,288 | |
| Ratio of expenses to average net assets: | | | | | | | | | | | | | | | | | | | | | | | | |
| Before expense reimbursements | | | | | | | | | | | | | | | | | | | | | | | | |
or recoveries(3)(4) | | | 2.21 | %** | | | 2.05 | % | | | 1.87 | % | | | 1.90 | % | | | 2.11 | % | | | 2.03 | % |
| After expense reimbursements | | | | | | | | | | | | | | | | | | | | | | | | |
or recoveries(3)(5) | | | 1.99 | %** | | | 1.99 | % | | | 1.99 | % | | | 1.99 | % | | | 1.99 | % | | | 1.99 | % |
| Ratio of net investment income (loss) | | | | | | | | | | | | | | | | | | | | | | | | |
| to average net assets***: | | | | | | | | | | | | | | | | | | | | | | | | |
Before expense reimbursements or recoveries(3) | | | (0.63 | )%** | | | (1.09 | )% | | | (0.81 | )% | | | (0.81 | )% | | | (0.74 | )% | | | (0.72 | )% |
After expense reimbursements or recoveries(3) | | | (0.41 | )%** | | | (1.03 | )% | | | (0.93 | )% | | | (0.90 | )% | | | (0.62 | )% | | | (0.68 | )% |
| Portfolio turnover rate | | | 143 | %* | | | 211 | % | | | 149 | % | | | 170 | % | | | 294 | % | | | 178 | % |
| (1) | The average shares outstanding method has been applied for per share information. |
| (2) | Total investment return is based on the change in net asset value of a share during the period, assumes reinvestment of dividends and distributions at net asset value and does not reflect the impact of a sales charge. |
| (3) | Expense waived or reimbursed reflect reductions to total expenses, as discussed in the notes to the financial statements. These reimbursed amounts would increase the net investment loss ratio or decrease the net investment income ratio and recovered amounts would decrease the net investment loss ratio or increase the net investment income ratio, as applicable, had such reductions or increases not occurred. |
| (4) | Expenses before reductions (excluding dividend and interest expense for securities sold short) were 2.04% for the year ended June 30, 2016. |
| (5) | Expenses net of all reductions (excluding dividend and interest expense for securities sold short) were 1.98% for the year ended June 30, 2016. |
| * | Not annualized. |
| ** | Annualized. |
| *** | The net investment income (loss) ratios include dividends on short positions. |
The accompanying notes are an integral part of the financial statements.
2016 SEMI-ANNUAL REPORT
Notes to the Financial Statements (unaudited)
Note 1 — Organization
The Quaker Investment Trust (“Trust”), a diversified, open-end management investment company, was organized as a Massachusetts business trust on October 24, 1990, and is registered under the Investment Company Act of 1940, as amended (“1940 Act”). The Trust’s Amended and Restated Declaration of Trust permits the Trustees to issue an unlimited number of shares of beneficial interest. The Trust currently has five series: Quaker Event Arbitrage Fund (“Event Arbitrage”), Quaker Global Tactical Allocation Fund (“Global Tactical Allocation”), Quaker Mid-Cap Value Fund (“Mid-Cap Value”), Quaker Small-Cap Value Fund (“Small-Cap Value”) and Quaker Strategic Growth Fund (“Strategic Growth”) (each a “Fund” and collectively, “Funds”). All Funds are diversified. The investment objectives of each Fund are set forth below.
Strategic Growth and Small-Cap Value commenced operations on November 25, 1996. Mid-Cap Value commenced operations on December 31, 1997. Global Tactical Allocation commenced operations on May 1, 2008. Event Arbitrage commenced operations on June 7, 2010 in conjunction with the reorganization of the Pennsylvania Avenue Event Driven Fund (“Event Driven Fund”). The predecessor to the Event Driven Fund, the Pennsylvania Avenue Fund, commenced operations on September 19, 2002. The investment objective of these Funds is to seek long-term growth of capital. The investment objective of these funds is non-fundamental in that this objective may be changed by the Board of Trustees (“Board” or “Trustees”) without shareholder approval. Each Fund is an investment company and accordingly follows the investment company accounting and reporting guidance of the Financial Accounting Standards Board (“FASB”) Accounting Standards Codification Topic 946 “Financial Services – Investment Companies.”
The Funds currently offer three classes of shares (Class A, Class C and Institutional Class shares). Class A shares are charged a front-end sales charge and a distribution and servicing fee; Class C shares are charged a distribution fee, but bear no front-end sales charge or contingent deferred sales charge (“CDSC”); and Institutional Class shares bear no front-end sales charge or CDSC, but have higher minimum investment thresholds. Quaker Funds, Inc. (“QFI”), the investment adviser to each of the Funds, has the ability to waive the minimum investment for Institutional Class shares at its discretion.
Note 2 — Summary of Significant Accounting Policies and Other Information
The following is a summary of significant accounting policies consistently followed by the Funds in the preparation of their financial statements. The policies are in conformity with accounting principles generally accepted in the United States of America (“GAAP”).
A. Security Valuation. The Funds’ investments in securities are carried at market value. Securities listed on an exchange or quoted on a national market system are generally valued at the last quoted sales price at the time of valuation. Other securities traded in the over-the-counter market and listed securities for which no sale was reported on that date are valued at the most recent bid price. Each security reported on the NASDAQ National Market System is valued at the NASDAQ Official Closing Price.
Debt and other fixed-income securities are valued at the last quoted bid price and/or by using a combination of daily quotes and matrix evaluations provided by an independent pricing service (which reflect such factors as security prices, yields, maturities, ratings, and dealer and exchange quotations), the use of which has been approved by the Board.
The Funds may enter into forward foreign currency contracts to lock in the U.S. dollar cost of purchase and sale transactions or to defend the portfolio against currency fluctuations. A forward foreign currency contract is a commitment to purchase or sell a foreign currency at a future date at a negotiated rate. These contracts are valued daily, and the Fund’s net equity therein, representing unrealized gain or loss on the contracts as measured
2016 SEMI-ANNUAL REPORT
Notes to the Financial Statements (unaudited) (continued)
Note 2 — Summary of Significant Accounting Policies and Other Information (Continued)
by the difference between the forward foreign exchange rates at the dates of entry into the contracts and the forward rates at the end of the reporting period, is included in the Statements of Assets and Liabilities. Realized and unrealized gains and losses are included in the Statements of Operations. Risks may arise upon entering into these contracts from the potential inability of counterparties to meet the terms of the contract and from unanticipated movements in the value of foreign currencies relative to the U.S. dollar.
For financial reporting purposes, investment transactions are recorded on the trade date; however, for purposes of executing shareholder transactions, the Funds record changes in holdings of portfolio securities no later than the first business day after the trade date in accordance with Rule 2a-4 of the 1940 Act. Accordingly, certain differences between net asset value for financial reporting and for executing shareholder transactions may arise.
The Funds have adopted fair valuation procedures to value securities at fair market value in certain circumstances, and the Trust has established a Valuation Committee responsible for determining when fair valuing a security is necessary and appropriate. The Funds will value securities at fair market value when market quotations are not readily available or when securities cannot be accurately valued within established pricing procedures. The Valuation Committee may also fair value foreign securities whose prices may have been affected by events occurring after the close of trading in their respective markets but prior to the time the Fund holding the foreign securities calculates its net asset value. The Funds’ fair valuation procedures are designed to help ensure that prices at which Fund shares are purchased and redeemed are fair and do not result in dilution of shareholder interest or other harm to shareholders.
The Fund is required to disclose information regarding the fair value measurements of the Fund’s assets and liabilities. Fair value is defined as the price that the Fund may receive upon selling an investment in an orderly transaction to an independent buyer in the principal or most advantageous market for the investment. The disclosure requirements utilize a three-tier hierarchy to maximize the use of observable market data, minimize the use of unobservable inputs and establish classification of fair value measurements for disclosure purposes. A financial instrument’s level within the fair value hierarchy is based on the lowest level that is significant to the fair value measurement. Inputs refer broadly to the assumptions that market participants would use in pricing the asset or liability, including assumptions about risk, for example, the risk inherent in a particular valuation technique used to measure fair value including the pricing model used and/or the risk inherent in the inputs to the valuation technique. Inputs may be observable or unobservable.
Observable inputs are inputs that reflect the assumptions market participants would use in pricing the asset or liability, which are based on market data obtained from sources independent of the reporting entity. Unobservable inputs are inputs that reflect the reporting entity’s own assumptions about the assumptions market participants would use in pricing the asset or liability developed based on the best information available in the circumstances.
The significant unobservable inputs used in the fair value measurement of the reporting entity’s private equity holdings are, the last traded price, the cost of prior transactions, single broker quotes, uncertainty of future payout, pricing service price adjusted for recent payout distribution, last trade price on pre-conversion bond and discounts applied for lack of marketability. Significant increases (decreases) in any of those inputs in isolation could result in a significantly lower (higher) fair value measurement.
Various inputs may be used to determine the value of each Fund’s investments. These inputs are summarized in three broad levels for financial statement purposes. The inputs or methodologies used to value securities are not necessarily an indication of the risk associated with investing in those securities.
2016 SEMI-ANNUAL REPORT
Notes to the Financial Statements (unaudited) (continued)
Note 2 — Summary of Significant Accounting Policies and Other Information (Continued)
Level 1 — Quoted prices in active markets for identical securities.
Level 2 — Prices determined using significant other observable inputs (including quoted prices for similar securities, interest rates, prepayment speeds, credit risk, etc.) municipal securities, long-term U.S. Government obligations and corporate debt securities are valued in accordance with the evaluated price supplied by the pricing service and generally categorized as Level 2 in the hierarchy. Other securities that are categorized as Level 2 in the hierarchy include, but are not limited to, warrants and structured notes that do not trade on an exchange, OTC options and international equity securities valued by an independent third party in order to adjust for stale pricing and foreign market holidays.
Level 3 — Prices determined using significant unobservable inputs (including the Fund’s own assumptions). For restricted equity securities where observable inputs are limited, assumptions about market activity and risk are used in determining fair value. These are categorized as Level 3 in the hierarchy.
For international equity securities traded on a foreign exchange or market which closes prior to a Fund’s Valuation Time, in order to adjust for events which occur between the close of the foreign exchange they are traded on and the close of the New York Stock Exchange, a fair valuation model is used, and these securities are categorized as Level 2.
A Fund may hold securities, some of which are classified as Level 3 investments (as defined below). Level 3 investments have significant unobservable inputs, as they trade infrequently. In determining the fair value of these investments, management uses the market approach which includes as the primary input the capital balance reported; however, adjustments to the reported capital balance may be made based on various factors, including, but not limited to, the attributes of the interest held, including the rights and obligations, and any restrictions or illiquidity of such interests, and the fair value of these securities.
The value of a foreign security is generally determined as of the close of trading on the foreign stock exchange on which the security is primarily traded, or as of the close of trading on the New York Stock Exchange (“NYSE”), if earlier. The value is then converted into its U.S. dollar equivalent at the foreign exchange rate in effect at the close of the NYSE (generally 4:00 p.m. Eastern time) on the day that the value of the foreign security is determined. If no sale is reported at that time, the foreign security will be valued within the range of the most recent quoted bid and ask prices. If market quotations are not readily available for a foreign security or an event has occurred that caused a quotation to be unavailable or unreliable, the Valuation Committee will fair value foreign securities using the procedures described below.
The Trust has adopted fair valuation procedures to value securities at fair market value when independent prices are unavailable or unreliable, and the Trust has established a Valuation Committee that is responsible for determining when fair valuing a security is necessary and appropriate. Securities and assets for which market quotations are not readily available may be valued based upon valuation methods that include: (i) multiple of earnings; (ii) yield to maturity with respect to debt issues; (iii) discounts from market prices of similar freely traded securities; or (iv) a combination of these or other methods. Securities may also be priced using fair value pricing methods when their closing prices do not reflect their market values at the time the Fund calculates its net asset value (“NAV”) because an event had occurred since the closing prices were established on the domestic or foreign exchange or market but before the Fund’s NAV calculation.
2016 SEMI-ANNUAL REPORT
Notes to the Financial Statements (unaudited) (continued)
Note 2 — Summary of Significant Accounting Policies and Other Information (Continued)
The following is a summary of the fair valuations according to the inputs used as of December 31, 2016 in valuing the Fund’s assets and liabilities:
| Description | EVENT ARBITRAGE FUND | | Level 1 | | | Level 2 | | | Level 3 | | | Total | |
| Common Stocks | | | $ | 17,029,466 | | | $ | 187,026 | | | $ | 1,113,690 | | | $ | 18,330,182 | |
| Preferred Stocks | | | | 484,540 | | | | 11,450 | | | | 655,611 | | | | 1,151,601 | |
| Structured Notes | | | | — | | | | 1,304,668 | | | | — | | | | 1,304,668 | |
| Asset Backed Securities | | | | — | | | | 207,998 | | | | — | | | | 207,998 | |
| Convertible Bonds | | | | — | | | | 423,126 | | | | 0 | | | | 423,126 | |
| Corporate Bonds | | | | — | | | | 4,732,282 | | | | 345,000 | | | | 5,077,282 | |
| Mortgage Backed Securities | | | | — | | | | 258,964 | | | | — | | | | 258,964 | |
| Escrow Notes | | | | — | | | | — | | | | 0 | | | | 0 | |
| Purchased Options | | | | 148,550 | | | | — | | | | — | | | | 148,550 | |
| Money Market Deposit Account | | | 496,406 | | | | — | | | | — | | | | 496,406 | |
| Investments Purchased with | | | | | | | | | | | | | | | | | |
| Proceeds from Securities Lending | | | 5,883,218 | | | | — | | | | — | | | | 5,883,218 | |
| Total Investments in Securities | | $ | 24,042,180 | | | $ | 7,125,514 | | | $ | 2,114,301 | | | $ | 33,281,995 | |
| Common Stocks sold short | | | $ | (615,632 | ) | | $ | — | | | $ | — | | | $ | (615,632 | ) |
| Written Options | | | | (89,995 | ) | | | (60,765 | ) | | | — | | | | (150,760 | ) |
| Total Investments in Securities sold short | | $ | (705,627 | ) | | $ | (60,765 | ) | | $ | — | | | $ | (766,392 | ) |
| | | | | | | | | | | | | | |
| Description | GLOBAL TACTICAL ALLOCATION FUND | | Level 1 | | | Level 2 | | | Level 3 | | | Total | |
| Common Stocks | | | $ | 255,879 | | | $ | — | | | $ | 14,668 | | | $ | 270,547 | |
| Closed End Mutual Fund | | | | 36,971 | | | | — | | | | — | | | | 36,971 | |
| Exchange Traded Funds | | | | 1,136,471 | | | | — | | | | — | | | | 1,136,471 | |
| Preferred Stocks | | | | 251,518 | | | | — | | | | — | | | | 251,518 | |
| Real Estate Investment Trusts | | | 378,662 | | | | — | | | | — | | | | 378,662 | |
| Corporate Bonds | | | | — | | | | 3,512,849 | | | | — | | | | 3,512,849 | |
| Municipal Bond | | | | — | | | | 116,631 | | | | — | | | | 116,631 | |
| Commercial Paper | | | | — | | | | 630,108 | | | | — | | | | 630,108 | |
| Money Market Deposit Account | | | 943,013 | | | | — | | | | — | | | | 943,013 | |
| Total Investments in Securities | | $ | 3,002,514 | | | $ | 4,259,588 | | | $ | 14,668 | | | $ | 7,276,770 | |
| | | | | | | | | | | | | | |
| Description | MID-CAP VALUE FUND | | Level 1 | | | Level 2 | | | Level 3 | | | Total | |
| Common Stocks | | | $ | 6,264,526 | | | $ | — | | | $ | — | | | $ | 6,264,526 | |
| Real Estate Investment Trusts | | | 969,074 | | | | — | | | | — | | | | 969,074 | |
| Money Market Deposit Account | | | 202,786 | | | | — | | | | — | | | | 202,786 | |
| Investments Purchased with | | | | | | | | | | | | | | | | | |
| Proceeds from Securities Lending | | | 1,555,473 | | | | — | | | | — | | | | 1,555,473 | |
| Total Investments in Securities | | $ | 8,991,859 | | | $ | — | | | $ | — | | | $ | 8,991,859 | |
| | | | | | | | | | | | | | |
| Description | SMALL-CAP VALUE FUND | | Level 1 | | | Level 2 | | | Level 3 | | | Total | |
| Common Stocks | | | $ | 30,172,886 | | | $ | — | | | $ | — | | | $ | 30,172,886 | |
| Real Estate Investment Trusts | | | 2,766,900 | | | | — | | | | — | | | | 2,766,900 | |
| Money Market Deposit Account | | | 417,994 | | | | — | | | | — | | | | 417,994 | |
| Investments Purchased with | | | | | | | | | | | | | | | | | |
| Proceeds from Securities Lending | | | 8,883,757 | | | | — | | | | — | | | | 8,883,757 | |
| Total Investments in Securities | | $ | 42,241,537 | | | $ | — | | | $ | — | | | $ | 42,241,537 | |
2016 SEMI-ANNUAL REPORT
Notes to the Financial Statements (unaudited) (continued)
Note 2 — Summary of Significant Accounting Policies and Other Information (Continued)
| Description | STRATEGIC GROWTH FUND | | Level 1 | | | Level 2 | | | Level 3 | | | Total | |
| Common Stocks | | | $ | 73,005,673 | | | $ | — | | | $ | 407,684 | | | $ | 73,413,357 | |
| Real Estate Investment Trusts | | | 2,832,841 | | | | — | | | | — | | | | 2,832,841 | |
| Money Market Deposit Account | | | 282,123 | | | | — | | | | — | | | | 282,123 | |
| Total Investments in Securities | | $ | 76,120,637 | | | $ | — | | | $ | 407,684 | | | $ | 76,528,321 | |
Refer to the Fund’s Schedules of Investments for industry classifications.
Level 3 Reconciliation
The following is a reconciliation of Event Arbitrage’s, Global Tactical Allocation’s and Strategic Growth’s Level 3 investments for which significant unobservable inputs were used in determining value. See Schedules of Investments for industry breakouts:
| EVENT ARBITRAGE FUND | |
| | | | | | | | | | | | | | | | | | | | | | | | | | | | |
| | | Balance | | | | | | | | | | | | Net | | | | | | | | | | | | Balance | |
| | | as of | | | | | | | | | | | | Unrealized | | | Amortized | | | Transfers | | | Transfers | | | as of | |
| | | June 30, | | | | | | | | | Realized | | | appreciation | | | discounts/ | | | in to | | | out of | | | December | |
| | | 2016 | | | Purchases | | | Sales | | | gain (loss) | | | (depreciation) | | | premiums | | | Level 3 | | | Level 3 | | | 31, 2016 | |
| Common Stocks | | $ | 1,175,330 | | | $ | — | | | $ | — | | | $ | — | | | $ | (61,640 | ) | | $ | — | | | $ | — | | | $ | — | | | $ | 1,113,690 | |
| Preferred Stocks | | | 695,826 | | | | — | | | | — | | | | — | | | | (40,215 | ) | | | — | | | | — | | | | — | | | | 655,611 | |
| Convertible Bonds | | | 0 | | | | — | | | | — | | | | — | | | | — | | | | — | | | | — | | | | — | | | | 0 | |
| Corporate Bonds | | | 581,627 | | | | — | | | | (250,102 | ) | | | 37,772 | | | | (24,477 | ) | | | 180 | | | | — | | | | — | | | | 345,000 | |
| Escrow Notes | | | 0 | | | | — | | | | — | | | | — | | | | — | | | | — | | | | — | | | | — | | | | 0 | |
| | | $ | 2,452,783 | | | $ | — | | | $ | (250,102 | ) | | $ | 37,772 | | | $ | (126,332 | ) | | $ | 180 | | | $ | — | | | $ | — | | | $ | 2,114,301 | |
| Net change in unrealized appreciation (depreciation) for Level 3 investments still held as of December 31, 2016 | | | $ | (146,855 | ) |
| | |
| GLOBAL TACTICAL ALLOCATION FUND | |
| | | | | | | | | | | | | | | | | | | | | | | | | | | | | | | | | | |
| | | Balance | | | | | | | | | | | | | | | Net | | | | | | | | | | | | | | | Balance | |
| | | as of | | | | | | | | | | | | | | | Unrealized | | | Amortized | | | Transfers | | | Transfers | | | as of | |
| | | June 30, | | | | | | | | | | | Realized | | | appreciation | | | discounts/ | | | in to | | | out of | | | December | |
| | | 2016 | | | Purchases | | | Sales | | | gain (loss) | | | (depreciation) | | | premiums | | | Level 3 | | | Level 3 | | | 31, 2016 | |
| Common Stocks | | $ | 11,020 | | | $ | — | | | $ | — | | | $ | — | | | $ | 3,648 | | | $ | — | | | $ | — | | | $ | — | | | $ | 14,668 | |
| | | $ | 11,020 | | | $ | — | | | $ | — | | | $ | — | | | $ | 3,648 | | | $ | — | | | $ | — | | | $ | — | | | $ | 14,668 | |
| Net change in unrealized appreciation (depreciation) for Level 3 investments still held as of December 31, 2016 | | | $ | 3,648 | |
| | |
| STRATEGIC GROWTH FUND | |
| | | | | | | | | | | | | | | | | | | | | | | | | | | | | | | | | | |
| | | Balance | | | | | | | | | | | | | | | Net | | | | | | | | | | | | | | | Balance | |
| | | as of | | | | | | | | | | | | | | | Unrealized | | | Amortized | | | Transfers | | | Transfers | | | as of | |
| | | June 30, | | | | | | | | | | | Realized | | | appreciation | | | discounts/ | | | in to | | | out of | | | December | |
| | | 2016 | | | Purchases | | | Sales | | | gain (loss) | | | (depreciation) | | | premiums | | | Level 3 | | | Level 3 | | | 31, 2016 | |
| Common Stocks | | $ | 306,291 | | | $ | — | | | $ | — | | | $ | — | | | $ | 101,393 | | | $ | — | | | $ | — | | | $ | — | | | $ | 407,684 | |
| | | $ | 306,291 | | | $ | — | | | $ | — | | | $ | — | | | $ | 101,393 | | | $ | — | | | $ | — | | | $ | — | | | $ | 407,684 | |
| Net change in unrealized appreciation (depreciation) for Level 3 investments still held as of December 31, 2016 | | | $ | 101,393 | |
Transfers are recognized at the end of the reporting period.
There have been no transfers in and out of Level 1 and Level 2 fair value measurements as of December 31, 2016, except for the Quaker Event Arbitrage Fund listed below:
| Transfers out of Level 1 into Level 2 | $148,459 | Due to a decrease of market activity. |
| Transfers out of Level 2 into Level 1 | $276,709 | Due to an increase of market activity. |
2016 SEMI-ANNUAL REPORT
Notes to the Financial Statements (unaudited) (continued)
Note 2 — Summary of Significant Accounting Policies and Other Information (Continued)
The following presents information about significant unobservable inputs related to Level 3 investments at December 31, 2016:
| EVENT ARBITRAGE FUND | | | | | |
| | | | | | | | | | |
| Asset | | Fair Value at | | Valuation | Unobservable | | Input | | Increase in Inputs |
| Categories | December 31, 2016 | Technique | Input | | Values | | Impact on Valuation* |
| Common Stocks | | | | | | | | | |
| Auto Parts & | | $ | 15,000 | | Market approach | Last traded price of | | $ | 2.53 | | Increase |
| Equipment | | | | | | pre-conversion bonds | | | | | |
| Computers | | | 0 | | Profitibility expected | Uncertainty of any | | $ | 0.00 | | Increase |
| | | | | | return method | additional future payout | | | | | |
| Escrow Shares | | | 0 | | Profitibility expected | Uncertainty of any | | $ | 0.00 | | Increase |
| | | | | | return method | additional future payout | | | | | |
| Healthcare-Products | | | 14,035 | | Market approach | Last traded price of non- | | | -21.00 | % | Decrease |
| | | | | | | restricted shares less a discount | | | | | |
| Healthcare-Services | | | 1,063,505 | | Market approach | Last traded price adjusted | | | 0.74 | % | Increase |
| | | | | | | by movement in index | | | | | |
| Holding Companies- | | | 0 | | Profitibility expected | Uncertainty of any | | $ | 0.00 | | Increase |
| Diversified | | | | | return method | additional future payout | | | | | |
| Lodging | | | 0 | | Profitibility expected | Uncertainty of any | | $ | 0.00 | | Increase |
| | | | | | return method | additional future payout | | | | | |
| Mining | | | 0 | | Profitibility expected | Uncertainty of any | | $ | 0.00 | | Increase |
| | | | | | return method | additional future payout | | | | | |
| Real Estate | | | 21,150 | | Vendor pricing | Single broker quote since | | $ | 0.23 | | Increase |
| | | | | | | shares are not listed yet | | | | | |
| Convertible Bonds | | | | | | | | | | | |
| Mining | | | 0 | | Profitibility expected | Uncertainty of any | | $ | 0.00 | | Increase |
| | | | | | return method | additional future payout | | | | | |
| Corporate Bonds | | | | | | | | | | | |
| Auto Parts & | | | 0 | | Profitibility expected | Uncertainty of any | | $ | 0.00 | | Increase |
| Equipment | | | | | return method | additional future payout | | | | | |
| Diversified Financial | | | 25,000 | | Vendor pricing | Single broker quote | | $ | 0.50 | | Increase |
| Services | | | | | | | | | | | |
| Diversified Financial | | | 320,000 | | Vendor pricing | Single broker quote | | $ | 32.00 | | Increase |
| Services | | | | | | | | | | | |
| Venture Capital | | | 0 | | Profitibility expected | Uncertainty of any | | $ | 0.00 | | Increase |
| | | | | | return method | additional future payout | | | | | |
| Escrow Notes | | | 0 | | Profitibility expected | Uncertainty of any | | $ | 0.00 | | Increase |
| | | | | | return method | additional future payout | | | | | |
| Preferred stock | | | | | | | | | | | |
| Aerospace & Defense | | | 2,611 | | Market approach | Prior transaction cost | | $ | 0.001 | | Increase |
| Healthcare-Services | | | 613,000 | | Market approach | Prior transaction cost | | $ | 1,000.00 | | Increase |
| Insurance | | | 40,000 | | Vendor pricing | Single broker quote | | $ | 4,000.00 | | Increase |
| GLOBAL TACTICAL ALLOCATION FUND | | | | | |
| Common Stocks | | | | | | | | | | | |
| Airlines | | $ | 14,668 | | Market approach | Projected final distribution, | | | -10.00 | % | Decrease |
| | | | | | | discounted for lack of marketability | | | | | |
| STRATEGIC GROWTH FUND | | | | | |
| Common Stocks | | | | | | | | | | | |
| Airlines | | $ | 407,684 | | Market approach | Projected final distribution, | | | -10.00 | % | Decrease |
| | | | | | | discounted for lack of marketability | | | | | |
* An impact to Valuation from a decrease in input would produce the opposite effect of an increase.
2016 SEMI-ANNUAL REPORT
Notes to the Financial Statements (unaudited) (continued)
Note 2 — Summary of Significant Accounting Policies and Other Information (Continued)
B. Federal Income Taxes. It is the Funds’ policy to comply with the requirements of Subchapter M of the Internal Revenue Code and to distribute substantially all of their taxable income to shareholders. Therefore, no federal income tax provision is required.
In accordance with Financial Accounting Standards Board (“FASB”) Interpretation ASC 740, (“ASC 740”), each Fund recognizes a tax benefit from an uncertain position only if it is more likely than not that the position is sustainable, based solely on its technical merits and consideration of the relevant taxing authority’s widely understood administrative practices and precedents. If this threshold is met, a Fund measures the tax benefit as the largest amount of benefit that is greater than fifty percent likely of being realized upon ultimate settlement. Management has reviewed the tax positions for each of the three open tax years as of June 30, 2016 and has determined that the implementation of ASC 740 does not have a material impact on the Funds’ financial statements. Each Fund’s federal tax returns for the prior three fiscal years remains subject to examination by the Internal Revenue Service.
Net investment income or loss and net realized gains or losses may differ for financial statement and income tax purposes primarily due to investments that have a different basis for financial statement and income tax purposes. The character of distributions made during the year from net investment income or net realized gains may differ from their ultimate characterization for federal income tax purposes. Also, due to the timing of dividend distributions, the fiscal year in which amounts are distributed may differ from the year that the income or realized gains were recorded by each Fund. Permanent differences in the recognition of earnings are reclassified to additional paid-in capital. Distributions in excess of tax-basis earnings are recorded as a return of capital.
C. Security Transactions and Investment Income. Security transactions are recorded on the trade date. Realized gains and losses are determined using the specific identification cost method. Interest income on debt securities is recorded daily on the accrual basis. Discounts and premiums on debt securities are amortized over their respective lives. Dividend income is recorded on the ex-dividend date, or as soon as information is available to the Fund.
D. Short Sales of Investments. Certain Funds may make short sales of investments, which are transactions in which a Fund sells a security it does not own in anticipation of a decline in the fair value of that security. To complete such a transaction, the Fund must borrow the security to make delivery to the buyer. The Fund is then obligated to replace the security borrowed by purchasing it at the market price at the time of replacement. The broker retains the proceeds of short sales to the extent necessary to meet margin requirements until the short position is closed out.
If a security pays a dividend while the Fund holds it short, the Fund will need to pay the dividend to the original owner of the security. Since the Fund borrowed the shares and sold them to a third party, the third party will receive the dividend from the security and the Fund will pay the original owner the dividend directly. The Fund is not entitled to the dividend because it does not own the shares. A gain, limited to the price at which the Fund sold the security short, or a loss, unlimited in size, will be recognized upon the termination of a short sale.
E. Written Options Contracts. Certain Funds may write options to manage exposure to certain changes in the market. When a Fund writes an option, an amount equal to the premium received by the Fund is recorded as a liability, which is marked-to-market daily to reflect the current market value of the option written. If the option expires, the Fund realizes a gain from investments equal to the amount of the premium received. When a written call option is exercised, the difference between the premium and the amount for effecting a closing purchase
2016 SEMI-ANNUAL REPORT
Notes to the Financial Statements (unaudited) (continued)
Note 2 — Summary of Significant Accounting Policies and Other Information (Continued)
transaction, including brokerage commission, is also treated as a realized gain or loss. When a written put option is exercised, the amount of the premium received reduces the cost of the security purchased by the Fund.
A risk in writing a covered call option is that the Fund may forego the opportunity of profit if the market price of the underlying security increases and the option is exercised. The risk in writing a put option is that the Fund may incur a loss if the market price of the underlying security decreases and the option is exercised.
In addition, there is the risk that the Fund may not be able to enter into a closing transaction because of an illiquid secondary market.
F. Purchased Options. Certain Funds may purchase call options in anticipation of an increase in the market value of securities of the type in which they may invest. The purchase of a call option will entitle a Fund, in return for the premium paid, to purchase specified securities at a specified price during the option period. A Fund will ordinarily realize a gain if, during the option period, the value of such securities exceeded the sum of the exercise price, the premium paid and transaction costs; otherwise, the Fund will realize either no gain or a loss on the purchase of the call option. A Fund will normally purchase put options in anticipation of a decline in the market value of securities in its portfolio (“protective puts”) or in securities in which it may invest. The purchase of a put option will entitle the Fund, in exchange for the premium paid, to sell specified securities at a specified price during the option period. The purchase of protective puts is designed to offset or hedge against a decline in the market value of the Fund’s securities. Put options may also be purchased by a Fund for the purpose of affirmatively benefiting from a decline in the price of securities which it does not own. The Fund will ordinarily realize a gain if, during the option period, the value of the underlying securities decreased below the exercise price sufficiently to more than cover the premium and transaction costs; otherwise the Fund will realize either no gain or a loss on the purchase of the put option. Gains and losses on the purchase of protective put options would tend to be offset by countervailing changes in the value of the underlying portfolio securities.
G. Futures Contracts. Certain Funds may enter into financial futures contracts, to the extent permitted by their investment policies and objectives, for bona fide hedging and other permissible risk management purposes including protecting against anticipated changes in the value of securities a Fund intends to purchase. Upon entering into a financial futures contract, a Fund is required to deposit cash or securities as initial margin.
Additional securities are also segregated as collateral up to the current market value of the financial futures contracts. Subsequent payments, known as variation margin, are made or received by the Fund, depending on the fluctuation in the value of the underlying financial instruments. The Fund recognizes an unrealized gain or loss equal to the variation margin. When the financial futures contracts are closed, a realized gain or loss is recognized equal to the difference between the proceeds from (or cost of) the closing transactions and the Fund’s basis in the contracts. The risks associated with entering into financial futures contracts include the possibility that a change in the value of the contract may not correlate with the changes in the value of the underlying instruments. In addition, investing in financial futures contracts involves the risk that the Fund could lose more than the original margin deposit and subsequent payments required for a futures transaction. Risks may also arise upon entering into these contracts from the potential inability of the counterparties to meet the terms of their contracts.
H. Foreign Currency Transactions. Securities and other assets and liabilities denominated in foreign currencies are converted each business day into U.S. dollars based on the prevailing rates of exchange. Purchases and sales of portfolio securities and income and expenses are converted into U.S. dollars on the respective dates of such transactions.
2016 SEMI-ANNUAL REPORT
Notes to the Financial Statements (unaudited) (continued)
Note 2 — Summary of Significant Accounting Policies and Other Information (Continued)
Gains and losses resulting from changes in exchange rates applicable to foreign securities are not reported separately from gains and losses arising from movements in securities prices.
Net realized foreign exchange gains and losses include gains and losses from sales and maturities of foreign currency exchange contracts, gains and losses realized between the trade and settlement dates of foreign securities transactions, and the difference between the amount of dividends, interest and foreign withholding taxes on the Funds’ books and the U.S. dollar equivalent of the amounts actually received. Net unrealized foreign exchange gains and losses include gains and losses from changes in the fair value of assets and liabilities denominated in foreign currencies other than portfolio securities, resulting from changes in exchange rates.
I. Forward Foreign Currency Contracts. Certain Funds may enter into forward foreign currency contracts to hedge against foreign currency exchange rate risk on their non-U.S. dollar denominated securities or to facilitate settlement of foreign currency denominated portfolio transactions. A forward foreign currency contract is an agreement between two parties to buy and sell a currency at a set price on a future date. The contract is marked-to-market daily and the change in value is recorded by a Fund as an unrealized gain or loss. When a forward foreign currency contract is extinguished, through either delivery or offset by entering into another forward foreign currency contract, the Fund records a realized gain or loss equal to the difference between the value of the contract at the time it was opened and the value of the contract at the time it was extinguished.
Forward foreign currency contracts involve elements of market risk in excess of the amounts reflected in the Statements of Assets and Liabilities. The Fund bears the risk of an unfavorable change in the foreign exchange rate underlying the forward foreign currency contract. Risks may also arise upon entering into these contracts from the potential inability of the counterparties to meet the terms of their contracts.
J. Portfolio Investment Risks. Investments in securities of foreign issuers carry certain risks not ordinarily associated with investments in securities of U.S. issuers. These risks include future disruptive political and economic developments and the possible imposition of exchange controls or other unfavorable foreign government laws and restrictions. In addition, investments in certain countries may carry risks of expropriation of assets, confiscatory taxation, political or social instability, or diplomatic developments that adversely affect investments in those countries. Certain countries may also impose substantial restrictions on investments in their capital markets by foreign entities, including restrictions on investments in issuers in industries deemed sensitive to relevant national interests. These factors may limit the investment opportunities available and result in a lack of liquidity and high price volatility with respect to securities of issuers from developing countries.
K. Multiple Class Allocations. Each class of shares has equal rights as to earnings and assets except that each class bears different distribution and shareholder servicing expenses. Each class of shares has exclusive voting rights with respect to matters that affect just that class. Income, expenses (other than expenses attributable to a specific class) and realized and unrealized gains or losses on investments are allocated to each class of shares based on its relative net assets.
L. Expense Allocations. Expenses are allocated to each series based upon its relative proportion of net assets to the Trust’s total net assets.
M. Distributions to Shareholders. Each Fund generally declares dividends at least annually, payable in December, on a date selected by the Board. In addition, distributions may be made annually in December out of net realized gains through October 31 of that calendar year. Distributions to shareholders are recorded on the ex-dividend date. Each Fund may make a supplemental distribution subsequent to the end of its fiscal year ending June 30.
2016 SEMI-ANNUAL REPORT
Notes to the Financial Statements (unaudited) (continued)
Note 2 — Summary of Significant Accounting Policies and Other Information (Continued)
N. Use of Estimates. The preparation of financial statements in conformity with GAAP requires management to make estimates and assumptions that affect the reported amounts of assets and liabilities and the disclosure of contingent assets and liabilities at the date of the financial statements, and the reported amounts of revenue and expenses during the reporting period. Actual results could differ from those estimates, and those differences could be significant.
O. Security Loans. The Funds receive compensation in the form of fees, or retain a portion of interest on the investment of any cash received as collateral. The Funds also continue to receive interest or dividends on the securities loaned. The loans are secured by collateral at least equal to 102% of the prior days market value of the loaned securities. Gain or loss in the fair value of the securities loaned that may occur during the term of the loan will be for the account of the Funds. The Funds have the right under the lending agreement to recover the securities from the borrower on demand.
P. Derivative Instruments. The Funds have adopted amendments to authoritative guidance on disclosures about derivative instruments and hedging activities which require that the Funds disclose: a) how and why an entity uses derivative instruments; and b) how derivative instruments and related hedged items affect an entity’s financial position, financial performance and cash flows.
The Funds may trade financial instruments where they are considered to be a seller of credit derivatives in accordance with authoritative guidance under GAAP on derivatives and hedging.
The fair value of derivative instruments whose primary underlying risk exposure is equity price risk at December 31, 2016 were as follows:
| EVENT ARBITRAGE | |
| | | Fair Value | |
| Derivative | Asset Derivatives(1) | Liability Derivatives(2) |
| Written Options | | $ | — | | | $ | 150,760 | |
| Purchased Options | | | 148,550 | | | | — | |
| (1) | Statement of Assets and Liabilities location: Investments, at value. |
| (2) | Statement of Assets and Liabilities location: Written options, at value. |
The effect of derivative instruments on the Statement of Operations whose underlying risk exposure is equity price risk for the period ended December 31, 2016 were as follows:
| EVENT ARBITRAGE | | | | Change in Unrealized Appreciation |
| | Realized Gain (Loss) on Derivatives | (Depreciation) on Derivatives |
| Derivative | Recognized in Income(1) | Recognized in Income(2) |
| Written Options | | $ | 340,201 | | | $ | (27,144 | ) |
| Purchased Options | | | (14,824 | ) | | | 8,443 | |
| (1) | Statement of Operations location: Net realized gain (loss) from written options and net realized gain (loss) from securities. |
| (2) | Statement of Operations location: Net unrealized appreciation (depreciation) on written options and net unrealized appreciation (depreciation) on securities. |
For the six-month period ended December 31, 2016, the Event Arbitrage Fund had: long option contracts (2,594 contracts) were purchased and $937,478 in premiums were paid, written option contracts (10,192 contracts) were opened and $1,356,272 in premiums were received.
2016 SEMI-ANNUAL REPORT
Notes to the Financial Statements (unaudited) (continued)
Note 3 — Investment Advisory Fee and Other Related Party Transactions
QFI serves as investment adviser to each Fund. Pursuant to separate investment sub-advisory agreements, QFI has selected the following investment advisory firms to serve as sub-advisers:
| Fund | Sub-adviser |
| Event Arbitrage | N/A |
| Global Tactical Allocation | N/A |
| Mid-Cap Value | Kennedy Capital Management, Inc. |
| Small-Cap Value | Aronson Johnson Ortiz, LP |
| Strategic Growth | Los Angeles Capital Management and Equity Research, Inc. |
As of the close of business on October 31, 2016, DG Capital Management, Inc. resigned as the sub-adviser to the Global Tactical Allocation Fund and the Strategic Growth Fund. The Global Tactical Allocation Fund has not entered into a new sub-advisory agreement. On November 1, 2016 the Strategic Growth Fund entered into a new sub-advisory agreement with Los Angeles Capital Management and Equity Research, Inc.
QFI or the sub-advisers provide each Fund with a continuous program of supervision of the Fund’s assets, including the composition of its portfolio, and furnish advice and recommendations with respect to investments, investment policies and the purchase and sale of securities.
Each Fund paid QFI aggregate fees shown in the table below for the six-month period ended December 31, 2016. Amounts are expressed as an annualized percentage of average net assets.
| | Aggregate | Subadvisory | Advisory & |
| | advisory fee | fee paid by QFI | subadvisory |
| | paid to QFI | to the sub-adviser* | (reimbursed) fee |
| Event Arbitrage | 1.30% | N/A | (0.84)% |
| Global Tactical Allocation | 1.25% | 0.53% | (0.09)% |
| Mid-Cap Value | 1.05% | 0.75% | N/A |
| Small-Cap Value | 1.00% | 0.63% | N/A |
| Strategic Growth | 1.30% | 0.62% | (0.22)% |
| * | The Global Tactical Allocation Fund paid a Subadvisory fee of 0.75% for the period July 1, 2016 to October 31, 2016 and 0.00% for the period November 1, 2016 to December 31, 2016 . The Small-Cap Value Fund paid a Subadvisory fee of 0.65% for the period July 1, 2016 to September 30, 2016 and 0.60% for the period October 1, 2016 to December 31, 2016. The Strategic Growth Fund paid a Subadvisory fee of 0.75% for the period July 1, 2016 to October 31, 2016 and a fee of 0.40% on the first $25 million; 0.30% on the next $175 million; and 0.20% thereafter for the period November 1, 2016 to December 31, 2016. |
For the six-month period ended December 31, 2016, QFI and the sub-advisers earned and reimbursed fees as follows:
| | Aggregate | Subadvisory | Advisory & |
| | advisory fee | fee paid by QFI | subadvisory |
| | paid to QFI | to the sub-adviser | (reimbursed) fee |
| Event Arbitrage | $209,068 | N/A | $(135,228) |
| Global Tactical Allocation | 22,540 | 20,666 | (3,505) |
| Mid-Cap Value | 10,733 | 26,834 | N/A |
| Small-Cap Value | 59,198 | 105,777 | N/A |
| Strategic Growth | 229,853 | 259,823 | (92,694) |
QFI contractually agreed to waive its management fee to the extent that the total operating expenses of Event Arbitrage (exclusive of interest, taxes, brokerage commissions and other costs incurred in connection with the purchase or sale of portfolio securities, and extraordinary items) exceed the annual rate of 1.99% for Class A shares, 2.74% for Class C shares, and 1.74% for Institutional Class shares of the average net assets of each class, respectively. QFI currently has no intention to terminate this arrangement; however, it may do so at any time in its sole discretion.
2016 SEMI-ANNUAL REPORT
Notes to the Financial Statements (unaudited) (continued)
Note 3 — Investment Advisory Fee and Other Related Party Transactions (Continued)
If, at any time, the annualized expenses of Event Arbitrage were less than the annualized expense ratio, the Trust, on behalf of Event Arbitrage, would reimburse QFI for any fees previously waived and/or expenses previously assumed; provided, however, that repayment would be payable only to the extent that it (a) can be made during the three (3) years following the time at which the adviser waived fees or assumed expenses for Event Arbitrage, and (b) can be repaid without causing the expenses of Event Arbitrage to exceed the annualized expense ratio. This fee waiver agreement shall continue in effect from October 28, 2016 until November 1, 2017. This agreement shall automatically terminate upon termination of the advisory agreement between QFI and the Trust or, with respect to Event Arbitrage, in the event of its merger or liquidation.
On November 1, 2016, QFI contractually agreed to waive the lesser of 0.30% of its management fee or assume expenses to the extent necessary to reduce the total operating expenses of Global Tactical Allocation (excluding 12b-1 fees, interest, taxes, brokerage commissions and other costs incurred in connection with the purchase or sale of portfolio securities, and extraordinary items) when they exceed 1.50% of the average daily net assets of the Global Tactical Allocation Fund. QFI currently has no intention to terminate this arrangement; however, it may do so at any time in its sole discretion.
If, at any time, the annualized expenses of Global Tactical Allocation were less than the annualized expense ratio or fee waiver, the Trust, on behalf of Global Tactical Allocation, would reimburse QFI for any fees previously waived and/or expenses previously assumed, provided, however, that the repayment shall be payable only to the extent that it: (a) can be made during the three (3) years following the time at which the adviser waived fees or assumed expenses for Global Tactical Allocation, and (b) can be repaid without causing the expenses of Global Tactical Allocation to exceed the annualized expense ratio. This fee waiver agreement shall continue in effect from November 1, 2016 until November 1, 2017. This agreement shall automatically terminate upon termination of the advisory agreement between QFI and the Trust or, with respect to Global Tactical Allocation, in the event of its merger or liquidation.
Additionally, QFI contractually agreed to waive its management fee to the extent that the total operating expenses of Strategic Growth (exclusive of interest, taxes, brokerage commissions and other costs incurred in connection with the purchase or sale of portfolio securities, and extraordinary items) exceed the annual rate of 2.24% for Class A shares, 2.99% for Class C shares, and 1.99% for Institutional Class shares of the average net assets of each class, respectively. QFI has agreed to pass these waivers onto the shareholders. QFI terminated this arrangement as of the close of business on October 31, 2016.
If, prior to November 1, 2016 the annualized expenses of Strategic Growth were less than the annualized expense ratio, the Trust, on behalf of Strategic Growth, would reimburse the sub-adviser for any fees previously waived and/or expenses previously assumed, provided, however, that the repayment shall be payable only to the extent that it: (a) can be made during the three (3) years following the time at which the sub-adviser waived fees or assumed expenses for Strategic Growth, and (b) can be repaid without causing the expenses of Strategic Growth to exceed the annualized expense ratio. This agreement automatically terminated upon the termination of the sub-advisory agreement with DG Capital Management, Inc., with respect to Strategic Growth.
At December 31, 2016, the cumulative unreimbursed amount paid and/or waived by the Adviser on behalf of Event Arbitrage and Global Tactical Allocation that may be recovered are $784,225 and $3,505, respectively. For Strategic Growth Fund the unreimbursed amount waived by the Adviser which may not be recovered is $92,694. The Adviser may recapture portions of the above amounts no later than the dates stated below.
2016 SEMI-ANNUAL REPORT
Notes to the Financial Statements (unaudited) (continued)
Note 3 — Investment Advisory Fee and Other Related Party Transactions (Continued)
| | | June 30, | | | June 30, | | | June 30, | | | June 30, | |
| | | 2017 | | | 2018 | | | 2019 | | | 2020 | |
| Event Arbitrage | | $ | 143,771 | | | $ | 206,244 | | | $ | 298,982 | | | $ | 135,228 | |
| Global Tactical Allocation | | | — | | | | — | | | | — | | | | 3,505 | |
Foreside Fund Services, LLC (“Distributor”) serves as principal underwriter for the Trust. The Trust has adopted distribution and shareholder servicing plans pursuant to Rule 12b-1 of the 1940 Act for Class A and Class C shares described below. There is no Rule 12b-1 distribution plan for Institutional Class shares of the Funds. The Class A Plan provides that each Fund may pay a servicing or Rule 12b-1 fee at an annual rate of 0.25% of the Class A average net assets on a monthly basis to persons or institutions for performing certain servicing functions for the Class A shareholders. The Class A Plan also allows the Fund to pay or reimburse expenditures in connection with sales and promotional services related to distribution of the Fund’s shares, including personal services provided to prospective and existing shareholders. The Class C Plan provides that each Fund may compensate QFI and others for services provided and expenses incurred in the distribution of shares at an annual rate of 1.00% of the average net assets of each class on a monthly basis.
For the six-month period ended December 31, 2016, the Distributor received underwriter concessions from the sale of Funds shares as follows:
| Fund | | Amount | |
| Event Arbitrage | | $ | 1,722 | |
| Global Tactical Allocation | | | 6 | |
| Mid-Cap Value | | | 5 | |
| Small-Cap Value | | | 3 | |
| Strategic Growth | | | 391 | |
Except for the Trust’s Chief Compliance Officer (“CCO”), employees and Officers of QFI do not receive any compensation from the Trust. The CCO of the Trust also serves as general counsel to QFI. For the six-month period ended December 31, 2016, the Funds compensated the CCO as follows:
| Fund | | Amount | |
| Event Arbitrage | | $ | 18,144 | |
| Global Tactical Allocation | | | 4,200 | |
| Mid-Cap Value | | | 3,839 | |
| Small-Cap Value | | | 18,273 | |
| Strategic Growth | | | 46,851 | |
Note 4 — Purchases and Sales of Investments
For the six-month ended December 31, 2016 aggregate purchases and sales of investment securities (excluding short-term investments) for each Fund were as follows:
| | | Purchases | | | Sales | |
| Event Arbitrage | | $ | 30,466,544 | | | $ | 35,382,643 | |
| Global Tactical Allocation | | | 9,381,836 | | | | 10,503,603 | |
| Mid-Cap Value | | | 1,192,939 | | | | 1,628,484 | |
| Small-Cap Value | | | 20,457,829 | | | | 25,262,399 | |
| Strategic Growth | | | 112,123,793 | | | | 122,963,060 | |
2016 SEMI-ANNUAL REPORT
Notes to the Financial Statements (unaudited) (continued)
Note 5 — Options Written
A summary of option contracts written by the Trust during the six-month period ended December 31, 2016 are as follows:
| | | Event Arbitrage | |
| | | Number of | | | Option | |
| | | Contracts | | | Premiums | |
| Options outstanding at beginning of year | | | 1,510 | | | $ | 342,341 | |
| Options written | | | 10,192 | | | | 1,356,272 | |
| Options closed | | | (3,722 | ) | | | (672,840 | ) |
| Options exercised | | | (1,610 | ) | | | (250,448 | ) |
| Options expired | | | (5,360 | ) | | | (520,915 | ) |
| Options outstanding at end of year | | | 1,010 | | | $ | 254,410 | |
Note 6 — Tax Matters
For U.S. federal income tax purposes, the cost of securities owned, gross appreciation, gross depreciation, and net unrealized appreciation (depreciation) of investments at June 30, 2016 for each Fund were as follows:
| | | | | | Gross | | | Gross | | | Net Appreciation | |
| Fund | | Cost | | | Appreciation | | | Depreciation | | | (Depreciation) | |
| Event Arbitrage | | $ | 42,556,338 | | | $ | 2,078,115 | | | $ | (8,788,722 | ) | | $ | (6,710,607 | ) |
| Global Tactical Allocation | | | 6,534,244 | | | | 373,787 | | | | (378,201 | ) | | | (4,414 | ) |
| Mid-Cap Value | | | 8,115,488 | | | | 903,570 | | | | (373,246 | ) | | | 530,324 | |
| Small-Cap Value | | | 40,008,937 | | | | 3,143,266 | | | | (2,301,441 | ) | | | 841,825 | |
| Strategic Growth | | | 100,600,386 | | | | 5,086,370 | | | | (3,302,479 | ) | | | 1,783,891 | |
As of June 30, 2016, the components of distributable earnings on a tax basis were as follows:
| | | | | | | | | | | | | | | | | | | | | | | | Total | |
| | | | | | Undis- | | | Undis- | | | Other | | | Capital | | | | | | Post- | | | Distribu- | |
| | | Unrealized | | | tributed | | | tributed | | | Accum- | | | Loss | | | Late | | | October | | | table | |
| | | Appreciation | | | Ordinary | | | Capital | | | ulated | | | Carry- | | | Year | | | Capital | | | Earnings/ | |
| Fund | | (Depreciation) | | | Income | | | Gain | | | Gain | | | forward | | | Loss | | | Loss | | | (Loss) | |
| Event Arbitrage | | $ | (6,710,607 | ) | | $ | — | | | $ | — | | | $ | 130,405 | | | $ | (240,752 | ) | | $ | (2,437 | ) | | $ | (7,515,481 | ) | | $ | (14,338,872 | ) |
| Global Tactical Allocation | | | (4,414 | ) | | | — | | | | — | | | | — | | | | (10,128,327 | ) | | | (57,345 | ) | | | (550,370 | ) | | | (10,740,456 | ) |
| Mid-Cap Value | | | 530,324 | | | | — | | | | — | | | | — | | | | (4,759,171 | ) | | | (15,879 | ) | | | (139,300 | ) | | | (4,384,026 | ) |
| Small-Cap Value | | | 841,825 | | | | — | | | | — | | | | 2 | | | | — | | | | (51,144 | ) | | | (899,751 | ) | | | (109,068 | ) |
| Strategic Growth | | | 1,783,891 | | | | — | | | | — | | | | — | | | | (357,918,875 | ) | | | (513,707 | ) | | | (3,010,196 | ) | | | (359,658,887 | ) |
The difference between book basis and tax basis unrealized appreciation (depreciation) is attributable primarily to the tax deferral of losses on wash sales and straddles from options, and the differing book/tax treatment of unrealized appreciation/depreciation on partnership adjustments.
The undistributed ordinary income, capital gains and carryforward losses shown above differ from the corresponding accumulated net investment income and accumulated net realized gain (loss) figures reported in the statements of assets and liabilities due to differing book/tax treatment of short-term capital gains, and certain temporary book/tax differences such as the deferral of realized losses on wash sales, PFIC mark to market, partnership adjustments, straddles from options and net losses realized after October 31 and from ordinary losses incurred after December 31.
Under current tax law, foreign currency and net capital losses realized after October 31 may be deferred and treated as occurring on the first day of the following fiscal year. The Funds elected to defer net capital and currency losses as indicated in the chart below.
2016 SEMI-ANNUAL REPORT
Notes to the Financial Statements (unaudited) (continued)
Note 6 — Tax Matters (Continued)
At June 30, 2016, the capital loss carryovers, late year losses, post-October capital loss and the capital loss utilized for the Funds were as follows:
| | | Capital Loss Carryovers Expiring | | | Late Year | | | Post-October | | | Capital Loss | |
| Fund | | Indefinite | | | 2018 | | | 2017 | | | Loss | | | Capital Loss | | | Utilized | |
| Event Arbitrage | | $ | 240,752 | | | $ | — | | | $ | — | | | $ | 2,437 | | | $ | 7,515,481 | | | $ | — | |
| Global Tactical Allocation | | | — | | | | 2,718,683 | | | | 7,409,644 | | | | 57,345 | | | | 550,370 | | | | 149,387 | |
| Mid-Cap Value | | | — | | | | 1,170,572 | | | | 3,588,599 | | | | 15,879 | | | | 139,300 | | | | 70,991 | |
| Small-Cap Value | | | — | | | | — | | | | — | | | | 51,144 | | | | 899,751 | | | | — | |
| Strategic Growth | | | — | | | | 164,714,297 | | | | 193,204,578 | | | | 513,707 | | | | 3,010,196 | | | | 3,019,714 | |
Note 7 — Distributions to Shareholders
Income and long-term capital gain distributions are determined in accordance with federal income tax regulations, which may differ from GAAP. The information set forth below is for each Fund as required by federal securities laws.
The tax character of dividends and distributions paid during the six-month period ended December 31, 2016* and for the fiscal year ending June 30, 2016 were as follows:
| | | Ordinary Income | | | | Long-Term Capital Gain | |
| | Six-Month Period Ended | Fiscal Year Ending | | Six-Month Period Ended | Fiscal Year Ending |
| Fund | December 31,2016 | June 30,2016 | | December 31,2016 | June 30,2016 |
| Event Arbitrage | | $ | 159,996 | | | $ | 5,355,904 | | | | $ | — | | | $ | — | |
| Small-Cap Value | | | — | | | | — | | | | | — | | | | 2,564,967 | |
| * | Tax information for the six-month period ended December 31, 2016 is an estimate and the tax character of dividends and distributions may be redesigned at the fiscal year ending June 30, 2017. |
Note 8 — Fund Share Transactions
At December 31, 2016, there were an unlimited number of shares of beneficial interest with a $0.01 par value authorized. The following table summarizes the activity in shares of each Fund:
| | | Event Arbitrage | |
| | | Six Months Ended 12/31/16 | | | Year Ended 6/30/16 | |
| | | Shares | | | Value | | | Shares | | | Value | |
| Shares sold: | | | | | | | | | | | | |
| Class A | | | 86,844 | | | $ | 1,042,357 | | | | 164,719 | | | $ | 2,016,773 | |
| Class C | | | 6,129 | | | | 70,600 | | | | 65,857 | | | | 752,078 | |
| Institutional Class | | | 110,068 | | | | 1,347,498 | | | | 1,417,648 | | | | 17,829,495 | |
| Shares issued to shareholders due | | | | | | | | | | | | | | | | |
| to reinvestment of distributions: | | | | | | | | | | | | | | | | |
| Class A | | | 4,798 | | | | 58,779 | | | | 131,922 | | | | 1,436,632 | |
| Class C | | | 435 | | | | 5,123 | | | | 40,419 | | | | 424,799 | |
| Institutional Class | | | 5,782 | | | | 71,407 | | | | 188,327 | | | | 2,064,058 | |
| | | | 214,056 | | | $ | 2,595,764 | | | | 2,008,892 | | | $ | 24,523,835 | |
| Shares Redeemed: | | | | | | | | | | | | | | | | |
| Class A | | | (250,643 | ) | | | (3,046,752 | ) | | | (1,446,579 | ) | | | (16,822,707 | ) |
| Class C | | | (96,871 | ) | | | (1,122,416 | ) | | | (206,687 | ) | | | (2,299,048 | ) |
| Institutional Class | | | (368,263 | ) | | | (4,432,604 | ) | | | (5,943,485 | ) | | | (68,456,381 | ) |
| | | | (715,777 | ) | | $ | (8,601,772 | ) | | | (7,596,751 | ) | | $ | (87,578,136 | ) |
| Net increase (decrease) | | | (501,721 | ) | | $ | (6,006,008 | ) | | | (5,587,859 | ) | | $ | (63,054,301 | ) |
2016 SEMI-ANNUAL REPORT
Notes to the Financial Statements (unaudited) (continued)
Note 8 — Fund Share Transactions (Continued)
| | | Global Tactical Allocation | |
| | | Six Months Ended 12/31/16 | | | Year Ended 6/30/16 | |
| | | Shares | | | Value | | | Shares | | | Value | |
| Shares sold: | | | | | | | | | | | | |
| Class A | | | 7,052 | | | $ | 73,693 | | | | 89,237 | | | $ | 959,273 | |
| Class C | | | 980 | | | | 9,692 | | | | 72,024 | | | | 754,719 | |
| Institutional Class | | | 210,399 | | | | 2,503,403 | | | | 243,325 | | | | 3,016,440 | |
| Shares issued to shareholders due | | | | | | | | | | | | | | | | |
| to reinvestment of distributions: | | | | | | | | | | | | | | | | |
| Class A | | | — | | | | — | | | | — | | | | — | |
| Class C | | | — | | | | — | | | | — | | | | — | |
| Institutional Class | | | — | | | | — | | | | — | | | | — | |
| | | | 218,431 | | | $ | 2,586,788 | | | | 404,586 | | | $ | 4,730,432 | |
| Shares Redeemed: | | | | | | | | | | | | | | | | |
| Class A | | | (119,571 | ) | | | (1,244,911 | ) | | | (265,117 | ) | | | (2,753,883 | ) |
| Class C | | | (41,314 | ) | | | (401,130 | ) | | | (81,694 | ) | | | (787,122 | ) |
| Institutional Class | | | (98,739 | ) | | | (1,170,718 | ) | | | (175,288 | ) | | | (2,054,323 | ) |
| | | | (259,624 | ) | | $ | (2,816,759 | ) | | | (522,099 | ) | | $ | (5,595,328 | ) |
| Net increase (decrease) | | | (41,193 | ) | | $ | (229,971 | ) | | | (117,513 | ) | | $ | (864,896 | ) |
| | | | |
| | | Mid-Cap Value | |
| | | Six Months Ended 12/31/16 | | | Year Ended 6/30/16 | |
| | | Shares | | | Value | | | Shares | | | Value | |
| Shares sold: | | | | | | | | | | | | | | | | |
| Class A | | | 3,390 | | | $ | 87,906 | | | | 1,881 | | | $ | 43,012 | |
| Class C | | | 75 | | | | 1,620 | | | | 694 | | | | 13,877 | |
| Institutional Class | | | 2,250 | | | | 64,425 | | | | 5,020 | | | | 114,887 | |
| Shares issued to shareholders due | | | | | | | | | | | | | | | | |
| to reinvestment of distributions: | | | | | | | | | | | | | | | | |
| Class A | | | — | | | | — | | | | — | | | | — | |
| Class C | | | — | | | | — | | | | — | | | | — | |
| Institutional Class | | | — | | | | — | | | | — | | | | — | |
| | | | 5,715 | | | $ | 153,951 | | | | 7,595 | | | $ | 171,776 | |
| Shares Redeemed: | | | | | | | | | | | | | | | | |
| Class A | | | (13,329 | ) | | | (335,405 | ) | | | (52,638 | ) | | | (1,183,778 | ) |
| Class C | | | (7,775 | ) | | | (170,164 | ) | | | (13,894 | ) | | | (273,981 | ) |
| Institutional Class | | | (2,587 | ) | | | (67,789 | ) | | | (11,130 | ) | | | (267,895 | ) |
| | | | (23,691 | ) | | $ | (573,358 | ) | | | (77,662 | ) | | $ | (1,725,654 | ) |
| Net increase (decrease) | | | (17,976 | ) | | $ | (419,407 | ) | | | (70,067 | ) | | $ | (1,553,878 | ) |
2016 SEMI-ANNUAL REPORT
Notes to the Financial Statements (unaudited) (continued)
Note 8 — Fund Share Transactions (Continued)
| | | Small-Cap Value | |
| | | Six Months Ended 12/31/16 | | | Year Ended 6/30/16 | |
| | | Shares | | | Value | | | Shares | | | Value | |
| Shares sold: | | | | | | | | | | | | |
| Class A | | | 5,422 | | | $ | 119,884 | | | | 11,691 | | | $ | 250,197 | |
| Class C | | | 205 | | | | 3,743 | | | | 10,602 | | | | 193,798 | |
| Institutional Class | | | 7,616 | | | | 171,140 | | | | 52,805 | | | | 1,135,000 | |
| Shares issued to shareholders due | | | | | | | | | | | | | | | | |
| to reinvestment of distributions: | | | | | | | | | | | | | | | | |
| Class A | | | — | | | | — | | | | 24,361 | | | | 506,715 | |
| Class C | | | — | | | | — | | | | 7,880 | | | | 132,549 | |
| Institutional Class | | | — | | | | — | | | | 67,292 | | | | 1,473,012 | |
| | | | 13,243 | | | $ | 294,767 | | | | 174,631 | | | $ | 3,691,271 | |
| Shares Redeemed: | | | | | | | | | | | | | | | | |
| Class A | | | (25,758 | ) | | | (565,016 | ) | | | (38,582 | ) | | | (804,852 | ) |
| Class C | | | (13,591 | ) | | | (248,022 | ) | | | (11,575 | ) | | | (186,481 | ) |
| Institutional Class | | | (191,492 | ) | | | (4,329,395 | ) | | | (84,509 | ) | | | (1,918,930 | ) |
| | | | (230,841 | ) | | $ | (5,142,433 | ) | | | (134,666 | ) | | $ | (2,910,263 | ) |
| Net increase (decrease) | | | (217,598 | ) | | $ | (4,847,666 | ) | | | 39,965 | | | $ | 781,008 | |
| | | | |
| | | Strategic Growth | |
| | | Six Months Ended 12/31/16 | | | Year Ended 6/30/16 | |
| | | Shares | | | Value | | | Shares | | | Value | |
| Shares sold: | | | | | | | | | | | | | | | | |
| Class A | | | 14,673 | | | $ | 370,830 | | | | 57,050 | | | $ | 1,408,584 | |
| Class C | | | 2,490 | | | | 53,901 | | | | 17,680 | | | | 375,441 | |
| Institutional Class | | | 32,342 | | | | 847,527 | | | | 179,430 | | | | 4,801,987 | |
| Shares issued to shareholders due | | | | | | | | | | | | | | | | |
| to reinvestment of distributions: | | | | | | | | | | | | | | | | |
| Class A | | | — | | | | — | | | | — | | | | — | |
| Class C | | | — | | | | — | | | | — | | | | — | |
| Institutional Class | | | — | | | | — | | | | — | | | | — | |
| | | | 49,505 | | | $ | 1,272,258 | | | | 254,160 | | | $ | 6,586,012 | |
| Shares Redeemed: | | | | | | | | | | | | | | | | |
| Class A | | | (380,573 | ) | | | (9,512,788 | ) | | | (563,222 | ) | | | (13,957,325 | ) |
| Class C | | | (147,112 | ) | | | (3,211,879 | ) | | | (140,669 | ) | | | (3,022,567 | ) |
| Institutional Class | | | (241,089 | ) | | | (6,208,399 | ) | | | (2,046,038 | ) | | | (54,865,899 | ) |
| | | | (768,774 | ) | | $ | (18,933,066 | ) | | | (2,749,929 | ) | | $ | (71,845,791 | ) |
| Net increase (decrease) | | | (719,269 | ) | | $ | (17,660,808 | ) | | | (2,495,769 | ) | | $ | (65,259,779 | ) |
Note 9 — Offsetting Assets and Liabilities
The Funds are subject to various Master Netting Arrangements (“MNA”), which govern the terms of certain transactions with select counterparties. The MNA allow the Funds to close out and net their total exposure to a counterparty in the event of a default with respect to all the transactions governed under a single agreement with a counterparty. The MNA also specify collateral posting arrangements at pre-arranged exposure levels. Under the MNA, collateral is routinely transferred if the total net exposure to certain transactions (net of existing collateral already in place) governed under the relevant MNA with a counterparty in a given account exceeds a specified threshold depending on the counterparty and the type of MNA.
2016 SEMI-ANNUAL REPORT
Notes to the Financial Statements (unaudited) (continued)
Note 9 — Offsetting Assets and Liabilities (Continued)
The following is a summary of the Assets and Liabilities for each Fund subject to offsets as of December 31, 2016:
| Liabilities: | | | | | | | | | | | | | | | | | | |
| | | | | | Gross | | | Net | | | | | | | | | | |
| | | | | | Amounts | | | Amounts | | | Gross Amounts Not | | | | |
| | | | | | Offset | | | Presented | | | Offset in the Statements | | | | |
| | | | | | in the | | | in the | | | of Assets and Liabilities | | | | |
| | | Gross Amounts | | | Statements | | | Statements | | | | | | Collateral | | | | |
| | | of Recognized | | | of Assets | | | of Assets | | | Financial | | | Pledged | | | Net | |
| Description | | Liabilities | | | and Liabilities | | | and Liabilities | | | Instruments | | | (Received) | | | Amount | |
Event Arbitrage | | | | | | | | | | | | | | | | | | |
| Written Options | | $ | 150,760 | | | $ | — | | | $ | 150,760 | | | $ | — | | | $ | 150,760 | | | $ | — | |
| Securities Lending | | | 5,883,218 | | | | — | | | | 5,883,218 | | | | 5,883,218 | | | | — | | | | — | |
| | | | 6,033,978 | | | | — | | | | 6,033,978 | | | | 5,883,218 | | | | 150,760 | | | | — | |
| | | | | | | | | | | | | | | | | | | | | | | | | |
Mid-Cap Value | | | | | | | | | | | | | | | | | | | | | | | | |
| Securities Lending | | | 1,555,473 | | | | — | | | | 1,555,473 | | | | 1,555,473 | | | | — | | | | — | |
| | | | | | | | | | | | | | | | | | | | | | | | | |
Small-Cap Value | | | | | | | | | | | | | | | | | | | | | | | | |
| Securities Lending | | | 8,883,757 | | | | — | | | | 8,883,757 | | | | 8,883,757 | | | | — | | | | — | |
Note 10 — Indemnifications
Under the Trust’s organizational documents, its officers and Trustees are indemnified against certain liabilities arising out of the performance of their duties to the Funds. In addition, in the normal course of business, the Trust enters into contracts with its vendors and others that provide for general indemnifications.
The Trust’s maximum exposure under these arrangements is dependent on future claims that may be made against the Trust, and, therefore, cannot be estimated; however, based on experience, risk of loss from such claims is considered remote.
Note 11 — Securities Lending
The Funds hold units of the Mount Vernon Liquid Assets Portfolio, LLC as cash collateral whose main objective is to maximize current income to the extent consistent with the preservation of capital and liquidity. It primarily invests in Certificates of Deposits, Asset Backed and Financial Company Commercial Paper, and Repurchase Agreements.
At December 31, 2016, the aggregate market value of loaned securities and the value of the cash collateral the Funds received is as follows:
| | | Loaned Securities | | | Value of | | | % of | |
| | | Market Value | | | Cash Collateral | | | Net Assets | |
| Event Arbitrage | | $ | 5,754,974 | | | $ | 5,883,218 | | | | 20.0 | % |
| Mid-Cap Value | | | 1,505,176 | | | | 1,555,473 | | | | 21.0 | % |
| Small-Cap Value | | | 8,629,212 | | | | 8,883,757 | | | | 26.6 | % |
Investments purchased with proceeds from securities lending collateral is included in the Schedules of Investments and the Statements of Assets and Liabilities.
2016 SEMI-ANNUAL REPORT
Board Consideration of the Sub-Advisory Agreement (unaudited)
At a meeting held on September 15, 2016, the Trustees of the Board of the Trust (“Trustees” or “Board”) considered the materials relating to the proposal to enter into a new Sub-Advisory Agreement between Quaker Funds, Inc. (the “Adviser” or “QFI”) and Los Angeles Capital Management and Equity Research, Inc. (“LA Capital” or “sub-adviser”), proposed sub-adviser to the Quaker Strategic Growth Fund (“Strategic Growth” or “Fund”). At the meeting, the Independent Trustees reported to the full Board their considerations with respect to the Agreements, and the Board, including a majority of Independent Trustees, considered and approved the terms of the proposed Sub-Advisory Agreement between the Adviser, sub-adviser and the Fund.
The Board considered and reviewed information about LA Capital, including its personnel, operations and financial condition, which had been provided by LA Capital. The Board also reviewed material furnished by the Adviser, including: a memorandum from the Adviser supporting the approval; a description of LA Capital’s proposed sub-advisory fees under the Sub-advisory Agreement; information concerning LA Capital’s organizational structure and the experience of its investment management personnel; a “due diligence” questionnaire describing various material items in relation to LA Capital personnel, organization and policies; copies of LA Capital’s Code of Ethics; and a copy of the Sub-advisory Agreement.
In considering such information and materials, the Independent Trustees received assistance and advice from and met separately with independent counsel. The materials prepared by the Adviser specifically in connection with the approval of the Sub-advisory Agreement were sent to the Independent Trustees in advance of the Board meeting. While attention was given to all information furnished, the following discusses some primary factors relevant to the Board’s decision. This discussion of the information and factors considered by the Board (as well as the discussion above) is not intended to be exhaustive, but rather summarizes certain factors considered by the Board. In view of the wide variety of factors considered, the Board did not, unless otherwise noted, find it practicable to quantify or otherwise assign relative weights to the following factors. In addition, individual Trustees may have assigned different weights to various factors.
In considering the nature, extent and quality of the services to be provided by LA Capital, the Board reviewed the services to be provided by LA Capital pursuant to the Sub-advisory Agreement, noting specifically that the Sub-advisory Agreement contains substantially similar provisions to those in the prior sub-advisory agreement, except for the provisions relating to the fees. The Board reviewed materials provided by LA Capital regarding the experience and qualifications of personnel who will be responsible for managing the Fund. The Board also placed weight on the performance of a LA Capital composite (the “Composite”) that utilized the investment process and parameters that would be employed by LA Capital. Based upon these considerations, the Board was satisfied with the nature and quality of the overall services to be provided by LA Capital to the Fund and its shareholders and was confident in the abilities of LA Capital to provide quality services to the Fund and its shareholders.
The Board reviewed information on the performance of the Composite over various time periods against the Russell 1000 Growth Index. The Board believed such information and analysis evidenced the potential benefits to the Fund of having LA Capital serve as its sub-adviser and the high quality of portfolio management services expected to be provided by LA Capital under the Sub-advisory Agreement.
In considering the appropriateness of the sub-advisory fees to be charged by LA Capital, the Board reviewed and considered the sub-advisory fees in light of the nature, extent and quality of the sub-advisory services to be provided by LA Capital, as more fully described above. The Board noted that LA Capital’s sub-advisory fees are paid by the Adviser and are not additional fees borne by the Fund. The Board also noted that the sub-advisory
2016 SEMI-ANNUAL REPORT
Board Consideration of the Sub-Advisory Agreement (unaudited) (continued)
fees to be paid by the Adviser to LA Capital were the product of arms-length negotiations between the Adviser and LA Capital, and the Board considered the allocation of the investment management fees charged to the Fund between the Adviser and LA Capital in light of the nature, extent and quality of the investment management services to be provided by the Adviser and LA Capital. In particular, the Board was provided with a description of fees to be charged by LA Capital under the Sub-advisory Agreement, which showed them to be significantly lower than the sub-advisory fees charged by the Fund’s former sub-adviser at the Fund’s current amount of assets under management. The Board noted that these lower costs would be passed through to Fund shareholders. The Board discussed the impact that the differences in fees would have on the Adviser’s profitability. Based upon such facts, the Board believed that the fees to be charged by LA Capital under the Sub-advisory Agreement were acceptable in relation to the services being provided.
The Board considered whether LA Capital would receive any fall-out benefits in connection with its relationship with the Fund, such as benefits relating to soft-dollar arrangements. Information about LA Capital’s profitability from its relationship with the Fund was not available because it had not begun to provide services to the Fund. The Trustees also noted that economies of scale are shared with the Fund and its shareholders through sub-advisory fee breakpoints so that as the Fund grows in size, its effective sub-advisory fee rate declines.
The Board discussed in detail the content of the information provided and raised specific questions they had from their individual reviews. In voting unanimously to approve the proposed new Sub-Advisory agreement, based on the various considerations discussed above, the Trustees, including a majority of the Independent Trustees, determined that the approval of the Sub-Advisory Agreement was in the best interest of the Fund.
2016 SEMI-ANNUAL REPORT
General Information (unaudited)
The Statement of Additional Information for the Trust includes additional information about the Trustees and Officers and is available, without charge, upon request by calling (800) 220-8888.
Each Fund files its complete schedule of portfolio holdings with the Securities and Exchange Commission (“SEC”) for the first and third quarters of each fiscal year on Form N-Q. Each Fund’s Forms N-Q, as well as a description of the policies and procedures that each Fund uses to determine how to vote proxies (if any) relating to portfolio securities is available without charge: (i) upon request, by calling (800) 220-8888; and (ii) on the SEC’s web-site at http://www.sec.gov. Each Fund’s Forms N-Q may be reviewed and copied at the SEC’s Public Reference Room in Washington, DC; information on the operation of the Public Reference Room may be obtained by calling 1-800-SEC-0330.
Information (if any) regarding how the Funds voted proxies relating to portfolio securities during the most recently disclosed 12-month period ended June 30 is available: (i) without charge, upon request, by calling (800) 220-8888; and (ii) on the SEC’s web-site at http://www.sec.gov.
2016 SEMI-ANNUAL REPORT
The Quaker Funds are distributed by
Foreside Fund Services, LLC.
Contact us:
Quaker Funds, Inc.
c/o U.S. Bancorp Fund Services, LLC.
PO Box 701
Milwaukee, WI 53201-0701
800.220.8888
www.quakerfunds.com
©2016 Quaker® Investment Trust
QKSAR 122016
Item 2. Code of Ethics.
Not applicable for semi-annual reports.
Item 3. Audit Committee Financial Expert.
Not applicable for semi-annual reports.
Item 4. Principal Accountant Fees and Services.
Not applicable for semi-annual reports.
Item 5. Audit Committee of Listed Registrants.
Not applicable to registrants who are not listed issuers (as defined in Rule 10A-3 under the Securities Exchange Act of 1934).
Item 6. Schedule of Investments.
| (a) | A Schedule of Investments in securities of unaffiliated issuers as of the close of the reporting period is included as part of the report to shareholders filed under Item 1, Report to Shareholders, of this Form N-CSR. |
Item 7. Disclosure of Proxy Voting Policies and Procedures for Closed-End Management Investment Companies.
Not applicable to open-end investment companies.
Item 8. Portfolio Managers of Closed-End Management Investment Companies.
Not applicable to open-end investment companies.
Item 9. Purchases of Equity Securities by Closed‑End Management Investment Company and Affiliated Purchasers.
Not applicable to open-end investment companies.
Item 10. Submission of Matters to a Vote of Security Holders.
There have been no material changes to the procedures by which shareholders may recommend nominees to the registrant’s Board of Trustees, where those changes were implemented after the Registrant last provided disclosure in response to the requirements of Item 407(c)(2)(iv) of Regulation S-K (as required by Item 22(b)(15) of Schedule 14A (17 CFR 240.14a-101)), or this Item.
Item 11. Controls and Procedures.
| (a) | The Registrant’s Principal Executive Officer and Principal Financial Officer, or persons performing similar functions, have reviewed the Registrant's disclosure controls and procedures (as defined in Rule 30a-3(c) under the Investment Company Act of 1940, as amended (the “Act”)) as of a date within 90 days of the filing of this report, as required by Rule 30a-3(b) under the Act and Rules 13a-15(b) or 15d‑15(b) under the Securities Exchange Act of 1934. Based on their review, such officers have concluded that the disclosure controls and procedures are effective in ensuring that information required to be disclosed in this report is appropriately recorded, processed, summarized and reported and made known to them by others within the Registrant and by the Registrant’s service provider. |
| (b) | There were no changes in the Registrant's internal control over financial reporting (as defined in Rule 30a-3(d) under the Act) that occurred during the second fiscal quarter of the period covered by this report that has materially affected, or is reasonably likely to materially affect, the Registrant's internal control over financial reporting. |
Item 12. Exhibits.
(a)(1) Any code of ethics or amendment thereto, that is subject of the disclosure required by Item 2, to the extent that the registrant intends to satisfy Item 2 requirements through filing an exhibit. Not applicable for semi-annual reports.
(a)(2) Certifications pursuant to Section 302 of the Sarbanes-Oxley Act of 2002. Filed herewith.
(a)(3) Any written solicitation to purchase securities under Rule 23c‑1 under the Act sent or given during the period covered by the report by or on behalf of the registrant to 10 or more persons. Not applicable to open-end investment companies.
(b)Certification pursuant to Section 906 of the Sarbanes‑Oxley Act of 2002. Filed herewith.
SIGNATURES
Pursuant to the requirements of the Securities Exchange Act of 1934 and the Investment Company Act of 1940, the registrant has duly caused this report to be signed on its behalf by the undersigned, thereunto duly authorized.
(Registrant) Quaker Investment Trust
By (Signature and Title) /s/Jeffry H. King, Sr.
Jeffry H. King, Sr.,
Chief Executive Officer
Date March 2, 2017
Pursuant to the requirements of the Securities Exchange Act of 1934 and the Investment Company Act of 1940, this report has been signed below by the following persons on behalf of the registrant and in the capacities and on the dates indicated.
By (Signature and Title) /s/Jeffry H. King, Sr.
Jeffry H. King, Sr.,
Chief Executive Officer
Date March 2, 2017
By (Signature and Title) /s/Laurie Keyes
Laurie Keyes,
Treasurer
Date March 2, 2017