UNITED STATES
SECURITIES AND EXCHANGE COMMISSION
Washington, D.C. 20549
FORM N-CSR
CERTIFIED SHAREHOLDER REPORT OF REGISTERED
MANAGEMENT INVESTMENT COMPANIES
Investment Company Act file number (811-06260)
Quaker Investment Trust
(Exact name of registrant as specified in charter)
2500 Weston Road, Suite 101
Weston, FL 33331
(Address of principal executive offices) (Zip code)
Alyssa Greenspan
Quaker Investment Trust
2500 Weston Road, Suite 101
Weston, FL 33331
(Name and address of agent for service)
(800) 220-8888
Registrant's telephone number, including area code
Date of fiscal year end: June 30, 2018
Date of reporting period: December 31, 2017
Item 1. Report to Stockholders.
Semi-Annual Report
December 31, 2017
Quaker Event Arbitrage Fund
Quaker Global Tactical Allocation Fund
Quaker Mid-Cap Value Fund
Quaker Small-Cap Value Fund
Quaker Strategic Growth Fund
| | Mutual fund investing involves risk. Principal loss is possible. Investing in the Quaker Funds may involve special risk including, but not limited to, investments in smaller companies, short sales, foreign securities, special situations, debt securities and value growth investing. Please refer to the prospectus for more complete information. This report must be preceded or accompanied by a current prospectus. The opinions expressed are those of the adviser or sub-advisers through the end of the period for this report, are subject to change, are not a guarantee, and should not be considered investment advice. Fund holdings are subject to change and should not be considered a recommendation to buy or sell any security. Current and future holdings are subject to risk.
| |
Chairman’s Letter to the Shareholders (unaudited)
December 31, 2017
Dear Shareholders:
Thank you for your continued investment in the Quaker Funds and for your support over the past 27 years. As of January 1, 2018, Community Capital Management, Inc. (“CCM”) has assumed the management of the Funds and will continue to manage the Quaker Funds in accordance with their existing investment policies.
CCM has $2.5 billion in assets under management and we have full confidence in their management team and investment and client service professionals. This expertise made them the ideal choice to continue serving you, our Quaker Funds’ shareholders.
Sincerely,
Jeffry H. King, Sr.
Chairman & CEO
Quaker Investment Trust
| | Table of Contents | | |
| | | Page | |
| | Chairman’s Letter to the Shareholders | 1 | |
| | Performance Update: | | |
| | Quaker Event Arbitrage Fund | 2 | |
| | Quaker Global Tactical Allocation Fund | 4 | |
| | Quaker Mid-Cap Value Fund | 6 | |
| | Quaker Small-Cap Value Fund | 8 | |
| | Quaker Strategic Growth Fund | 10 | |
| | Expense Information | 12 | |
| | Schedule of Investments | 14 | |
| | Statements of Assets and Liabilities | 36 | |
| | Statements of Operations | 38 | |
| | Statements of Changes in Net Assets | 40 | |
| | Financial Highlights | 42 | |
| | Notes to the Financial Statements | 57 | |
| | Approval of Interim Advisory Agreements | 76 | |
| | General Information | 80 | |
Performance Update (unaudited)
Quaker Event Arbitrage Fund (QEAAX, QEACX, QEAIX)
OBJECTIVES AND PRINCIPAL STRATEGIES
The Quaker Event Arbitrage Fund (“Fund”) seeks to provide long-term growth of capital. The Fund generally invest in the securities of publicly traded companies involved in mergers, takeovers, tender offers, leveraged buyouts, spin-offs, liquidations or similar events.
| Average Annualized Total Return |
| | | | | | | | | | | Commencement |
| | Gross | Net | | | | | | | | of operations |
| | Expense | Expense | Inception | | | | | | | through |
| | Ratio* | Ratio* | Date | One Year | Five Year | Ten Year | 12/31/2017 |
| | | | | with | without | with | without | with | without | with | without |
| | | | | sales | sales | sales | sales | sales | sales | sales | sales |
| | | | | charge | charge | charge | charge | charge | charge | charge | charge |
| Class A | 2.80% | 1.99% | 11/21/03 | 2.24% | 8.16% | 4.04% | 5.23% | 2.19% | 2.77% | 5.20% | 5.62% |
| Class C | 3.55% | 2.74% | 6/7/10 | 7.29% | 7.29% | 4.44% | 4.44% | N/A | N/A | 3.00% | 3.00% |
| Institutional Class | 2.55% | 1.74% | 6/7/10 | 8.45% | 8.45% | 5.50% | 5.50% | N/A | N/A | 4.02% | 4.02% |
| S&P 500® Total Return Index** | 21.83% | 21.83% | 15.79% | 15.79% | 8.50% | 8.50% | 9.19% | 9.19% |
| * | As stated in the Prospectus dated October 30, 2017. Has contractually agreed to waive its fees and/or assume expenses to the extent necessary to reduce the Total Annual Fund Operating Expenses (excluding 12b-1 fees) when they exceed 1.74% of the average daily net assets. This agreement will continue in effect from October 30, 2017 to October 28, 2018 and may recoup previously waived expenses that it assumed during the prior three-year period. |
| ** | The benchmark since inception returns are calculated since commencement of November 21, 2003 through December 31, 2017. |
Performance data quoted represents past performance and is no guarantee of future results. Investment return and principal value will fluctuate so that shares, when redeemed, may be worth more or less than their original cost. Current performance may be lower or higher than performance data quoted. Performance data current to the most recent month end is available at www.quakerfunds.com or by calling us toll free at 800-220-8888. Total return includes reinvestment of dividends and capital gains.
Class A shares of the Fund have a maximum sales charge of 5.50%.
The performance table does not reflect the deduction of taxes that a shareholder might pay on fund distributions or the redemption of fund shares. Total return calculations reflect expense reimbursements and fee waivers in the applicable periods. See financial highlights for periods where fees were waived or reimbursed.
The Fund’s portfolio holdings may differ significantly from the securities held in the index and, unlike a mutual fund, an unmanaged index assumes no transaction costs, taxes, management fees or other expenses. You cannot invest directly in an index.
The S&P 500® Total Return Index (“S&P 500® Index”) is a widely recognized, unmanaged index consisting of the approximately 500 largest companies in the United States as measured by market capitalization. The S&P 500® Index assumes reinvestment of all dividends and distributions.
Performance Update (unaudited) (continued)
Quaker Event Arbitrage Fund (QEAAX, QEACX, QEAIX)
ADVISER:
Quaker Funds, Inc.
TOTAL NET ASSETS:
AS OF DECEMBER 31, 2017
$22,497,813
| Top 10 Holdings* (% of net assets) | |
| Altaba Inc. | 9.3% | |
| IEC Electronics Corp. | 5.4% | |
| CA Immobilien Anlagen AG | 5.3% | |
| Heineken Holding NV, Structured Note, | | |
| Expiration 2/27/2018 | 4.0% | |
| MPM Holdings Inc. | 3.1% | |
| Advance Auto Parts Inc. | 2.8% | |
| The Procter & Gamble Co. | 2.5% | |
| BNP Paribas Fortis SA, 1.671% | | |
| (3 Month EURIBOR + 2.000%), Perpetual | 2.3% | |
| Liberty Ventures - Series A | 2.2% | |
| Twin Reefs Pass-Through Trust, 0.000%, Perpetual | 2.1% | |
| % Fund Total | 39.0% | |
* Includes Long-Term Investments only.
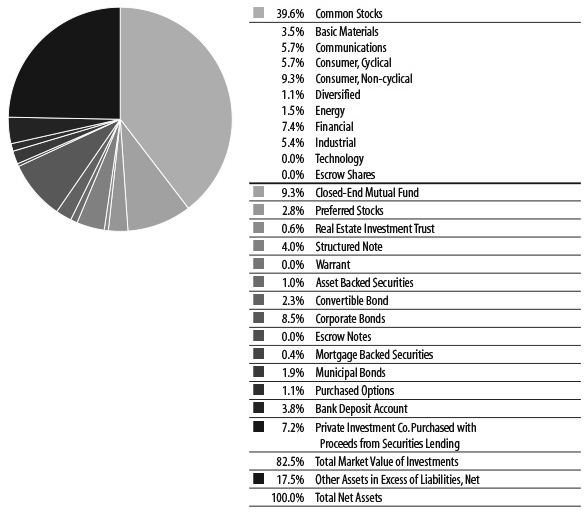
| Sectors (% of net assets) |
Performance Update (unaudited)
Quaker Global Tactical Allocation Fund (QTRAX, QTRCX, QTRIX)
OBJECTIVES AND PRINCIPAL STRATEGIES
The Fund seeks to provide long-term growth of capital. The Fund invests in ETFs and common stocks of U.S. companies, ETF’s and ADRs of foreign companies, and individual bonds and ETFs of fixed income securities, without regard to market capitalization.
| Average Annualized Total Return |
| | | | | | | | | | | Commencement |
| | Gross | Net | | | | | | | | of operations |
| | Expense | Expense | Inception | | | | | | | through |
| | Ratio* | Ratio* | Date | One Year | Five Year | Ten Year | 12/31/2017 |
| | | | | with | without | with | without | with | without | with | without |
| | | | | sales | sales | sales | sales | sales | sales | sales | sales |
| | | | | charge | charge | charge | charge | charge | charge | charge | charge |
| Class A | 2.43% | 2.24% | 5/1/08 | -0.73% | 5.05% | 6.60% | 7.81% | N/A | N/A | 0.23% | 0.82% |
| Class C | 3.18% | 2.99% | 5/1/08 | 4.25% | 4.25% | 7.01% | 7.01% | N/A | N/A | 0.06% | 0.06% |
| Institutional Class | 2.18% | 1.99% | 7/23/08 | 5.30% | 5.30% | 8.10% | 8.10% | N/A | N/A | 2.41% | 2.41% |
| MSCI World® Index** | | 22.40% | 22.40% | 11.64% | 11.64% | N/A | N/A | 5.64% | 5.64% |
| * | As stated in the Prospectus dated October 30, 2017. Has contractually agreed to waive the lesser of 0.30% of its fees or assume expenses to the extent necessary to reduce the Total Annual Fund Operating Expenses (excluding 12b-1 fees, interest, taxes, brokerage commissions and other costs incurred in connection with the purchase or sale of portfolio securities and extraordinary items) when they exceed 1.50% of the average daily net assets. This agreement will continue in effect from October 30, 2017 to October 28, 2018 and may recoup previously waived expenses that it assumed within the three-year period. |
| ** | The benchmark since inception returns are calculated since commencement of May 1, 2008 through December 31, 2017. |
Performance data quoted represents past performance and is no guarantee of future results. Investment return and principal value will fluctuate so that shares, when redeemed, may be worth more or less than their original cost. Current performance may be lower or higher than performance data quoted. Performance data current to the most recent month end is available at www.quakerfunds.com or by calling us toll free at 800-220-8888. Total return includes reinvestment of dividends and capital gains.
Class A shares of the Fund have a maximum sales charge of 5.50%.
The performance table does not reflect the deduction of taxes that a shareholder might pay on fund distributions or the redemption of fund shares. Total return calculations reflect expense reimbursements and fee waivers in the applicable periods. See financial highlights for periods where fees were waived or reimbursed.
The Fund’s portfolio holdings may differ significantly from the securities held in the index and, unlike a mutual fund, an unmanaged index assumes no transaction costs, taxes, management fees or other expenses. You cannot invest directly in an index.
The Morgan Stanley Capital International World Index (“MSCI World® Index”) measures developed-market equity performance throughout the world. The MSCI World® Index assumes reinvestment of all dividends and distributions.
Performance Update (unaudited) (continued)
Quaker Global Tactical Allocation Fund (QTRAX, QTRCX, QTRIX)
ADVISER:
Quaker Funds, Inc.
TOTAL NET ASSETS:
AS OF DECEMBER 31, 2017
$6,356,849
| Top 10 Holdings* (% of net assets) | |
| iShares MSCI United Kingdom ETF | 3.5% | |
| Verizon Communications Inc. | 3.3% | |
| QUALCOMM Inc. | 3.2% | |
| Microsoft Corp. | 3.0% | |
| PowerShares DB Commodity Index Tracking Fund | 2.8% | |
| AT&T Inc. | 2.6% | |
| Molson Coors Brewing Co. | 2.2% | |
| Twenty-First Century Fox Inc. Cl B | 2.0% | |
| General Motors Co. | 1.9% | |
| Microsemi Corp. | 1.8% | |
| % Fund Total | 26.3% | |
* Includes Long-Term Investments only.
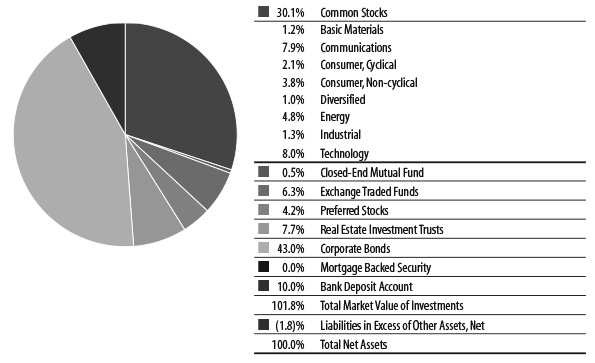
| Sectors (% of net assets) |
Performance Update (unaudited)
Quaker Mid-Cap Value Fund (QMCVX, QMCCX, QMVIX)
OBJECTIVES AND PRINCIPAL STRATEGIES
The Quaker Mid-Cap Value Fund (the “Fund”) seeks to provide long-term growth of capital. Current income is not a significant investment consideration and any such income realized will be considered incidental to the Fund’s investment objective. The Fund invests primarily in common stocks comparable to the companies included in the Russell Midcap® Value Index.
| Average Annualized Total Return |
| | | | | | | | | | Commencement |
| | | | | | | | | | of operations |
| | Expense | Inception | | | | | | | through |
| | Ratio* | Date | One Year | Five Year | Ten Year | 12/31/2017 |
| | | | with | without | with | without | with | without | with | without |
| | | | sales | sales | sales | sales | sales | sales | sales | sales |
| | | | charge | charge | charge | charge | charge | charge | charge | charge |
| Class A | 2.39% | 12/31/97 | 10.01% | 16.43% | 12.38% | 13.66% | 6.59% | 7.19% | 7.67% | 7.98% |
| Class C | 3.14% | 7/31/00 | 15.56% | 15.56% | 12.80% | 12.80% | 6.40% | 6.40% | 8.19% | 8.19% |
| Institutional Class | 2.14% | 11/21/00 | 16.72% | 16.72% | 13.94% | 13.94% | 7.46% | 7.46% | 9.46% | 9.46% |
| Russell Midcap® Value Index** | 13.34% | 13.34% | 14.68% | 14.68% | 9.10% | 9.10% | 9.64% | 9.64% |
| * | As stated in the Prospectus dated October 30, 2017. |
| ** | The benchmark since inception returns are calculated since commencement of December 31,1997 through December 31, 2017. |
Performance data quoted represents past performance and is no guarantee of future results. Investment return and principal value will fluctuate so that shares, when redeemed, may be worth more or less than their original cost. Current performance may be lower or higher than performance data quoted. Performance data current to the most recent month end is available at www.quakerfunds.com or by calling us toll free at 800-220-8888. Total return includes reinvestment of dividends and capital gains.
Class A shares of the Fund have a maximum sales charge of 5.50%.
The performance table does not reflect the deduction of taxes that a shareholder might pay on fund distributions or the redemption of fund shares. Total return calculations reflect expense reimbursements and fee waivers in the applicable periods. See financial highlights for periods where fees were waived or reimbursed.
The Fund’s portfolio holdings may differ significantly from the securities held in the index and, unlike a mutual fund, an unmanaged index assumes no transaction costs, taxes, management fees or other expenses. You cannot invest directly in an index.
The Russell Midcap® Value Index is a widely recognized, unmanaged index of companies included in the Russell 1000 Index with current market capitalizations approximately between $1.6 billion to $33.7 billion. The Russell Midcap® Value index assumes reinvestment of all dividends.
Performance Update (unaudited) (continued)
Quaker Mid-Cap Value Fund (QMCVX, QMCCX, QMVIX)
SUB-ADVISER:
Kennedy Capital Management, Inc.
TOTAL NET ASSETS:
AS OF DECEMBER 31, 2017
$7,136,012
| Top 10 Holdings* (% of net assets) | |
| Teledyne Technologies Inc. | 2.5% | |
| Reinsurance Group of America Inc. Cl A | 2.5% | |
| East West Bancorp Inc. | 2.4% | |
| ON Semiconductor Corp. | 2.4% | |
| Westlake Chemical Corp. | 2.3% | |
| Torchmark Corp. | 2.3% | |
| Huntington Bancshares Inc. | 2.2% | |
| Aqua America Inc. | 2.1% | |
| Reliance Steel & Aluminum Co. | 2.1% | |
| Snap-on Inc. | 2.0% | |
| % Fund Total | 22.8% | |
* Includes Long-Term Investments only.
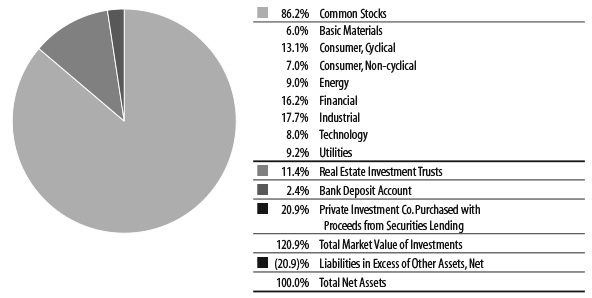
| Sectors (% of net assets) |
Performance Update (unaudited)
Quaker Small-Cap Value Fund (QUSVX, QSVCX, QSVIX)
OBJECTIVES AND PRINCIPAL STRATEGIES
The Fund seeks to provide long-term growth of capital. Current income is not a significant investment consideration, and any such income realized will be considered incidental to the Fund’s investment objective. The Fund invests primarily in common stocks of U.S. companies with market capitalizations similar to the market capitalizations of companies included in the Russell 2000® Index and Russell 2500® Index. The Fund invests in companies considered by the Fund’s sub-adviser to have consistent earnings and above-average core assets, selling at relatively low market valuations, with attractive growth and momentum characteristics.
| Average Annualized Total Return |
| | | | | | | | | | Commencement |
| | | | | | | | | | of operations |
| | Expense | Inception | | | | | | | through |
| | Ratio* | Date | One Year | Five Year | Ten Year | 12/31/2017 |
| | | | with | without | with | without | with | without | with | without |
| | | | sales | sales | sales | sales | sales | sales | sales | sales |
| | | | charge | charge | charge | charge | charge | charge | charge | charge |
| Class A | 2.22% | 11/25/96 | 3.30% | 9.30% | 10.93% | 12.20% | 6.92% | 7.53% | 9.64% | 9.94% |
| Class C | 2.97% | 7/28/00 | 8.51% | 8.51% | 11.35% | 11.35% | 6.73% | 6.73% | 8.70% | 8.70% |
| Institutional Class | 1.97% | 9/12/00 | 9.57% | 9.57% | 12.48% | 12.48% | 7.80% | 7.80% | 9.14% | 9.14% |
| Russell 2000® Index** | | | 14.65% | 14.65% | 14.12% | 14.12% | 8.71% | 8.71% | 8.66% | 8.66% |
| * | As stated in the Prospectus dated October 30, 2017. |
| ** | The benchmark since inception returns are calculated since commencement of November 25, 1996 through December 31, 2017. |
Performance data quoted represents past performance and is no guarantee of future results. Investment return and principal value will fluctuate so that shares, when redeemed, may be worth more or less than their original cost. Current performance may be lower or higher than performance data quoted. Performance data current to the most recent month end is available at www.quakerfunds.com or by calling us toll free at 800-220-8888. Total return includes reinvestment of dividends and capital gains.
Class A shares of the Fund have a maximum sales charge of 5.50%.
The performance table does not reflect the deduction of taxes that a shareholder might pay on fund distributions or the redemption of fund shares. Total return calculations reflect expense reimbursements and fee waivers in the applicable periods. See financial highlights for periods where fees were waived or reimbursed.
The Fund’s portfolio holdings may differ significantly from the securities held in the index and, unlike a mutual fund, an unmanaged index assumes no transaction costs, taxes, management fees or other expenses. You cannot invest directly in an index.
The Russell 2000® Index is a widely recognized, unmanaged index comprised of the smallest 2000 companies represented in the Russell 3000® Index. The Russell 2000® Index currently represents approximately 8% of the market capitalization of the Russell 3000® Index.
Performance Update (unaudited) (continued)
Quaker Small-Cap Value Fund (QUSVX, QSVCX, QSVIX)
SUB-ADVISER:
AJO, LP
TOTAL NET ASSETS:
AS OF DECEMBER 31, 2017
$29,233,585
| Top 10 Holdings* (% of net assets) | |
| Aspen Technology Inc. | 1.2% | |
| Dana Inc. | 1.2% | |
| Lear Corp. | 1.2% | |
| Owens Corning | 1.2% | |
| CNO Financial Group Inc. | 1.2% | |
| Reinsurance Group of America Inc. Cl A | 1.2% | |
| Progress Software Corp. | 1.2% | |
| Portland General Electric Co. | 1.1% | |
| Cadence Design Systems Inc. | 1.1% | |
| Ryman Hospitality Properties Inc. | 1.1% | |
| % Fund Total | 11.7% | |
* Includes Long-Term Investments only.
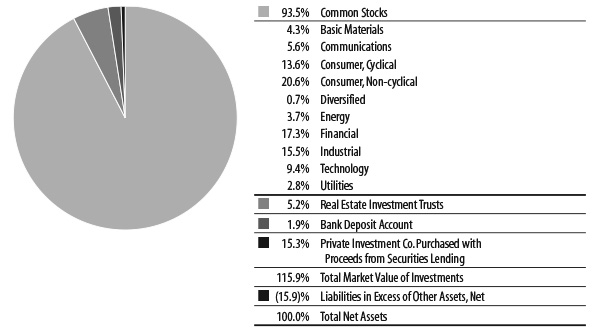
| Sectors (% of net assets) |
Performance Update (unaudited)
Quaker Strategic Growth Fund (QUAGX, QAGCX, QAGIX)
OBJECTIVES AND PRINCIPAL STRATEGIES
The Fund seeks to provide long-term growth of capital. The Fund invests primarily in the common stock of companies, which the Fund’s sub-adviser believes will provide a higher total return than that of the index.
| Average Annualized Total Return |
| | | | | | | | | | | Commencement |
| | Gross | Net | | | | | | | | of operations |
| | Expense | Expense | Inception | | | | | | | through |
| | Ratio* | Ratio* | Date | One Year | Five Year | Ten Year | 12/31/2017 |
| | | | | with | without | with | without | with | without | with | without |
| | | | | sales | sales | sales | sales | sales | sales | sales | sales |
| | | | | charge | charge | charge | charge | charge | charge | charge | charge |
| Class A | 2.34% | 2.22% | 11/25/96 | 9.94% | 16.33% | 11.68% | 12.95% | 2.31% | 2.89% | 10.76% | 11.06% |
| Class C | 3.09% | 2.97% | 7/11/00 | 15.40% | 15.40% | 12.09% | 12.09% | 2.13% | 2.13% | 4.47% | 4.47% |
| Institutional Class | 2.09% | 1.97% | 7/20/00 | 16.58% | 16.58% | 13.22% | 13.22% | 3.13% | 3.13% | 5.43% | 5.43% |
| S&P 500® Total Return Index** | 21.83% | 21.83% | 15.79% | 15.79% | 8.50% | 8.50% | 8.18% | 8.18% |
| * | As stated in the Prospectus dated October 30, 2017. |
| ** | The benchmark since inception returns are calculated since commencement of November 25, 1996 through December 31, 2017. |
Performance data quoted represents past performance and is no guarantee of future results. Investment return and principal value will fluctuate so that shares, when redeemed, may be worth more or less than their original cost. Current performance may be lower or higher than performance data quoted. Performance data current to the most recent month end is available at www.quakerfunds.com or by calling us toll free at 800-220-8888. Total return includes reinvestment of dividends and capital gains.
Class A shares of the Fund have a maximum sales charge of 5.50%.
The performance table does not reflect the deduction of taxes that a shareholder might pay on fund distributions or the redemption of fund shares. Total return calculations reflect expense reimbursements and fee waivers in the applicable periods. See financial highlights for periods where fees were waived or reimbursed.
The Fund’s portfolio holdings may differ significantly from the securities held in the index and, unlike a mutual fund, an unmanaged index assumes no transaction costs, taxes, management fees or other expenses. You cannot invest directly in an index.
The S&P 500® Total Return Index (“S&P 500® Index”) is a widely recognized, unmanaged index consisting of the approximately 500 largest companies in the United States as measured by market capitalization. The S&P 500® Index assumes reinvestment of all dividends and distributions.
Performance Update (unaudited) (continued)
Quaker Strategic Growth Fund (QUAGX, QAGCX, QAGIX)
SUB-ADVISER:
Los Angeles Capital Management and Equity Research, Inc.
TOTAL NET ASSETS:
AS OF DECEMBER 31, 2017
$68,530,833
| Top 10 Holdings* (% of net assets) | |
| Apple Inc. | 5.7% | |
| Alphabet Inc. Cl A & C | 3.9% | |
| Microsoft Corp. | 3.2% | |
| Facebook Inc. Cl A | 2.4% | |
| Intel Corp. | 2.0% | |
| FMC Corp. | 1.8% | |
| Deere & Co. | 1.7% | |
| McDonald’s Corp. | 1.7% | |
| Amazon.com Inc. | 1.7% | |
| Franklin Resources Inc. | 1.6% | |
| % Fund Total | 25.7% | |
* Includes Long-Term Investments only.
| Sectors (% of net assets) |
Expense Information (unaudited)
As a shareholder of the Funds, you incur two types of costs: (1) transaction costs, including applicable sales charges and redemption fees; and (2) ongoing costs, including management fees, distribution (12b-1) fees and other Fund expenses. This example is intended to help you understand your ongoing costs (in dollars) of investing in the Funds and to compare these costs with the ongoing costs of investing in other funds. The example is based on an investment of $1,000 invested at the beginning of the (six-month) period and held for the entire period July 1, 2017 through December 31, 2017.
ACTUAL EXPENSES
The first section of each table below provides information about actual account values and actual expenses for each of the Funds. You may use this information, together with the amount you invested, to estimate the expenses that you paid over the period. Simply divide your account value by $1,000 (for example, an $8,600 account value divided by $1,000 = 8.6), then multiply the result by the number in the applicable line under the heading entitled “Expenses Paid During the Period” to estimate the expenses you paid on your account during this period.
HYPOTHETICAL EXAMPLE FOR COMPARISON PURPOSES
The second section of each table below provides information about hypothetical account values and hypothetical expenses based on the Fund’s actual expense ratio and an assumed rate of return of 5% per year before expenses, which is not the Fund’s actual return. The hypothetical account values and expenses may not be used to estimate the actual ending account balance or expenses you paid for the period. You may use this information to compare the ongoing costs of investing in the Fund to other funds. To do so, compare this 5% hypothetical example with the 5% hypothetical examples that appear in the shareholder reports of the other funds. Please note that the expenses shown in the table are meant to highlight your ongoing costs only and do not reflect any transactional costs, such as sales charges (loads), redemption fees or exchange fees. Therefore, the second section of the table is useful in comparing ongoing costs only, and will not help you determine the relative total costs of owning different funds. In addition, if these transactional costs were included, your costs would have been higher.
| | | Beginning | Annualized | Ending | |
| | | Account Value | Expense Ratio | Account Value | Expenses Paid |
| | | (7/1/2017) | for the Period | (12/31/2017) | During Period* |
| Event Arbitrage |
| Example based on actual return of: |
| Class A | 1.93% | $1,000.00 | 1.99% | $1,019.30 | $10.13 |
| Class C | 1.53% | 1,000.00 | 2.74% | 1,015.30 | 13.92 |
| Institutional Class | 2.09% | 1,000.00 | 1.74% | 1,020.90 | 8.86 |
| Hypothetical example based on assumed 5% return: |
| Class A | | 1,000.00 | 1.99% | 1,015.17 | 10.11 |
| Class C | | 1,000.00 | 2.74% | 1,011.39 | 13.89 |
| Institutional Class | | 1,000.00 | 1.74% | 1,016.43 | 8.84 |
Expense Information (unaudited) (continued)
| | | Beginning | Annualized | Ending | |
| | | Account Value | Expense Ratio | Account Value | Expenses Paid |
| | | (7/1/2017) | for the Period | (12/31/2017) | During Period* |
| Global Tactical Allocation |
| Example based on actual return of: |
| Class A | 1.88% | $1,000.00 | 1.97% | $1,018.80 | $10.02 |
| Class C | 1.51% | 1,000.00 | 2.72% | 1,015.10 | 13.82 |
| Institutional Class | 2.04% | 1,000.00 | 1.72% | 1,020.40 | 8.76 |
| Hypothetical example based on assumed 5% return: |
| Class A | | 1,000.00 | 1.97% | 1,015.27 | 10.01 |
| Class C | | 1,000.00 | 2.72% | 1,011.49 | 13.79 |
| Institutional Class | | 1,000.00 | 1.72% | 1,016.53 | 8.74 |
| Mid-Cap Value |
| Example based on actual return of: |
| Class A | 11.65% | 1,000.00 | 2.49% | 1,116.50 | 13.28 |
| Class C | 11.22% | 1,000.00 | 3.24% | 1,112.20 | 17.25 |
| Institutional Class | 11.79% | 1,000.00 | 2.24% | 1,117.90 | 11.96 |
| Hypothetical example based on assumed 5% return: |
| Class A | | 1,000.00 | 2.49% | 1,012.65 | 12.63 |
| Class C | | 1,000.00 | 3.24% | 1,008.87 | 16.41 |
| Institutional Class | | 1,000.00 | 2.24% | 1,013.91 | 11.37 |
| Small-Cap Value |
| Example based on actual return of: |
| Class A | 8.26% | 1,000.00 | 2.27% | 1,082.60 | 11.92 |
| Class C | 7.84% | 1,000.00 | 3.02% | 1,078.40 | 15.82 |
| Institutional Class | 8.41% | 1,000.00 | 2.02% | 1,084.10 | 10.61 |
| Hypothetical example based on assumed 5% return: |
| Class A | | 1,000.00 | 2.27% | 1,013.76 | 11.52 |
| Class C | | 1,000.00 | 3.02% | 1,009.98 | 15.30 |
| Institutional Class | | 1,000.00 | 2.02% | 1,015.02 | 10.26 |
| Strategic Growth |
| Example based on actual return of: |
| Class A | 9.98% | 1,000.00 | 2.28% | 1,099.80 | 12.07 |
| Class C | 9.56% | 1,000.00 | 3.03% | 1,095.60 | 16.00 |
| Institutional Class | 10.13% | 1,000.00 | 2.03% | 1,101.30 | 10.75 |
| Hypothetical example based on assumed 5% return: |
| Class A | | 1,000.00 | 2.28% | 1,013.71 | 11.57 |
| Class C | | 1,000.00 | 3.03% | 1,009.93 | 15.35 |
| Institutional Class | | 1,000.00 | 2.03% | 1,014.97 | 10.31 |
| * | Expenses are equal to the Funds’ annualized six-month expense ratios multiplied by the average account value over the period multiplied by the number of days in the most recent fiscal half year (184) divided by 365 to reflect the one-half year period. |
Schedule of Investments
Quaker Event Arbitrage Fund
December 31, 2017 (Unaudited)
| | | Number | | | Fair | |
| | | of Shares | | | Value | |
| Long-Term Investments — 70.4% | | | | | | |
| Common Stocks — 39.6% | |
| Basic Materials — 3.5% | | | | | | |
| Chemicals — 3.5% | | | | | | |
Linde AG f | | | 500 | | | $ | 108,826 | |
| MPM Holdings Inc. (a)(b) | | | 34,576 | | | | 691,520 | |
| | | | | | | | 800,346 | |
| Mining — 0.0% | | | | | | | | |
Ahtium PLC (a) f *^ | | | 123,845,509 | | | | 0 | |
Sacre-Coeur Minerals Ltd. (a) f *^ | | | 109,444 | | | | 0 | |
| | | | | | | | 0 | |
| Total Basic Materials | | | | | | | | |
| (Cost $2,505,011) | | | | | | | 800,346 | |
| Communications — 5.7% | | | | | | | | |
| Internet — 3.3% | | | | | | | | |
30DC Inc. (a)• | | | 50,000 | | | | 325 | |
| comScore Inc. (a)(b) | | | 8,500 | | | | 242,250 | |
| Liberty Ventures - Series A (a)** | | | 9,000 | | | | 488,160 | |
| | | | | | | | 730,735 | |
| Media — 1.6% | | | | | | | | |
| Discovery Communications | | | | | | | | |
| Inc. Cl A (a)(b) | | | 8,000 | | | | 179,040 | |
| DISH Network Corp. (a) | | | 4,000 | | | | 191,000 | |
| | | | | | | | 370,040 | |
| Telecommunications — 0.8% | | | | | | | | |
| CenturyLink Inc. (b) | | | 9,000 | | | | 150,120 | |
| NII Holdings Inc. (a) | | | 64,529 | | | | 27,380 | |
| | | | | | | | 177,500 | |
| Total Communications | | | | | | | | |
| (Cost $2,038,474) | | | | | | | 1,278,275 | |
| Consumer, Cyclical — 5.7% | | | | | | | | |
| Auto Parts & Equipment — 0.1% | | | | | | | | |
| Exide Technologies (a) *^ | | | 5,926 | | | | 15,000 | |
| Distribution/Wholesale — 0.7% | | | | | | | | |
Medion AG f | | | 8,011 | | | | 153,551 | |
| Housewares — 0.6% | | | | | | | | |
| Newell Brands Inc. (b) | | | 4,500 | | | | 139,050 | |
| Retail — 4.3% | | | | | | | | |
| Advance Auto Parts Inc. | | | 6,300 | | | | 628,047 | |
| Chipotle Mexican Grill Inc. (a)** | | | 1,200 | | | | 346,836 | |
| | | | | | | | 974,883 | |
| Total Consumer, Cyclical | | | | | | | | |
| (Cost $2,067,070) | | | | | | | 1,282,484 | |
| Consumer, Non-cyclical — 9.3% | | | | | | | | |
| Agriculture — 0.0% | | | | | | | | |
Black Earth Farming Ltd. (a) f *^ | | | 240,000 | | | | 907 | |
| Cosmetics & Personal Care — 2.4% | | | | | | | | |
| The Procter & Gamble Co. (b) | | | 6,000 | | | | 551,280 | |
| Food — 1.7% | | | | | | | | |
| The Kraft Heinz Co. | | | 5,000 | | | | 388,800 | |
| Healthcare-Products — 1.2% | | | | | | | | |
| Strategic Environment Inc. (a)*^ | | | 43,000 | | | | 21,930 | |
| Zimmer Biomet Holdings Inc. ** | | | 2,000 | | | | 241,340 | |
| | | | | | | | 263,270 | |
| Healthcare-Services — 1.3% | | | | | | | | |
| Brookdale Senior Living Inc. (a) | | | 29,650 | | | | 287,605 | |
| Pharmaceuticals — 2.7% | | | | | | | | |
McKesson Europe AG f | | | 11,796 | | | | 373,508 | |
| Depomed Inc. (a)(b) | | | 28,000 | | | | 225,400 | |
INYX Inc. (a)• | | | 167,850 | | | | 293 | |
| | | | | | | | 599,201 | |
| Total Consumer, Non-cyclical | | | | | | | | |
| (Cost $2,446,639) | | | | | | | 2,091,063 | |
| Diversified — 1.1% | | | | | | | | |
| Holding Companies — 1.1% | | | | | | | | |
| Silver Run Acquisition Corp. II (a) | | | 22,800 | | | | 238,146 | |
| Stoneleigh Partners | | | | | | | | |
| Acquisition Corp. (a)*^ | | | 400 | | | | 0 | |
| | | | | | | | 238,146 | |
| Total Diversified | | | | | | | | |
| (Cost $228,000) | | | | | | | 238,146 | |
| Energy — 1.5% | | | | | | | | |
| Oil & Gas — 1.5% | | | | | | | | |
Dommo Energia SA f • | | | 55,075 | | | | 13,493 | |
Ocean Rig UDW, Inc. (a) f | | | 12,178 | | | | 326,371 | |
| | | | | | | | 339,864 | |
| Total Energy | | | | | | | | |
| (Cost $933,767) | | | | | | | 339,864 | |
| Financial — 7.4% | | | | | | | | |
| Diversified Financial Services — 0.6% | | | | | | | | |
Guoco Group Ltd. f | | | 10,000 | | | | 128,506 | |
| Insurance — 1.4% | | | | | | | | |
FGL Holdings (a) f | | | 11,400 | | | | 114,798 | |
| Stewart Information Services Corp. (b) | | | 5,000 | | | | 211,500 | |
| | | | | | | | 326,298 | |
The accompanying notes are an integral part of the financial statements.
Schedule of Investments (continued)
Quaker Event Arbitrage Fund
December 31, 2017 (Unaudited)
| | | Number | | | Fair | |
| | | of Shares | | | Value | |
| Common Stocks — 39.6% (Continued) | |
| Real Estate — 5.4% | | | | | | |
CA Immobilien Anlagen AG f | | | 38,800 | | | $ | 1,201,327 | |
| Safeway Casa Ley CVR (a)*^ | | | 47,000 | | | | 10,575 | |
| Safeway Property Development | | | | | | | | |
| Center LLC CVR (a)*^ | | | 47,000 | | | | 10,575 | |
| | | | | | | | 1,222,477 | |
| Total Financial | | | | | | | | |
| (Cost $1,101,686) | | | | | | | 1,677,281 | |
| Industrial — 5.4% | | | | | | | | |
| Electronics — 5.4% | | | | | | | | |
| IEC Electronics Corp. (a) | | | 293,656 | | | | 1,209,863 | |
| Total Industrial | | | | | | | | |
| (Cost $1,263,275) | | | | | | | 1,209,863 | |
| Technology — 0.0% | | | | | | | | |
| Computers — 0.0% | | | | | | | | |
| Computer Horizons Corp. (a)*^ | | | 65,000 | | | | 0 | |
| Total Technology | | | | | | | | |
| (Cost $0) | | | | | | | 0 | |
| Escrow Shares — 0.0% | | | | | | | | |
| Exide Technologies (a)*^ | | | 1,777 | | | | 0 | |
| Petrocorp Inc. (a)*^ | | | 200 | | | | 0 | |
| Total Escrow Shares | | | | | | | | |
| (Cost $1,687) | | | | | | | 0 | |
| Total Common Stocks | | | | | | | | |
| (Cost $12,585,609) | | | | | | | 8,917,322 | |
| Closed-End Mutual Fund — 9.3% | |
| Altaba Inc. (a)** | | | 30,000 | | | | 2,095,500 | |
| Total Closed-End Mutual Fund | | | | | | | | |
| (Cost $1,601,700) | | | | | | | 2,095,500 | |
| Preferred Stocks — 2.8% | |
| Energy — 0.0% | | | | | | | | |
| Oil & Gas — 0.0% | | | | | | | | |
| GeoMet Inc., Convertible Series A, | | | | | | | | |
12.500%, Perpetual • | | | 3 | | | | 1 | |
| Total Energy | | | | | | | | |
| (Cost $17) | | | | | | | 1 | |
| Financial — 2.8% | | | | | | | | |
| Insurance — 0.1% | | | | | | | | |
| MBIA Insurance Corp., | | | | | | | | |
| 4.707%, Perpetual (a)*#^ | | | 10 | | | | 20,000 | |
| Mortgage Agencies — 2.7% | | | | | | | | |
| Federal Home Loan Mortgage Corp., | | | | | | | | |
| Series F, 5.000%, Perpetual (a) | | | 4,500 | | | | 57,105 | |
| Federal Home Loan Mortgage Corp., | | | | | | | | |
| Series M, 0.000%, Perpetual (a) | | | 9,500 | | | | 118,750 | |
| Federal Home Loan Mortgage Corp., | | | | | | | | |
Series Q, 0.000%, Perpetual (a) | | | 1,000 | | | | 12,550 | |
| Federal Home Loan Mortgage Corp., | | | | | | | | |
Series S, 0.000%, Perpetual (a) | | | 25,000 | | | | 281,500 | |
| Federal Home Loan Mortgage Corp., | | | | | | | | |
| Series V, 5.570%, Perpetual (a) | | | 8,300 | | | | 52,871 | |
| Federal Home Loan Mortgage Corp., | | | | | | | | |
| Series W, 5.660%, Perpetual (a) | | | 2,674 | | | | 17,248 | |
| Federal Home Loan Mortgage Corp., | | | | | | | | |
| Series X, 6.020%, Perpetual (a) | | | 10,000 | | | | 64,200 | |
| | | | | | | | 604,224 | |
| Total Financial | | | | | | | | |
| (Cost $1,099,271) | | | | | | | 624,224 | |
| Total Preferred Stocks | | | | | | | | |
| (Cost $1,099,288) | | | | | | | 624,225 | |
| Real Estate Investment Trust — 0.6% | |
| New York REIT Inc. | | | 33,000 | | | | 129,690 | |
| Total Real Estate Investment Trust | | | | | | | | |
| (Cost $208,025) | | | | | | | 129,690 | |
| Structured Note — 4.0% | |
| Heineken Holding NV, Structured Note, | | | | | | | | |
Expiration 2/27/2018 (a) • | | | 212 | | | | 890,260 | |
| Total Structured Note | | | | | | | | |
| (Cost $940,223) | | | | | | | 890,260 | |
| Warrant — 0.0% | |
| Financial — 0.0% | | | | | | | | |
| Insurance — 0.0% | | | | | | | | |
| FGL Holdings, | | | | | | | | |
Expiration: 11/30/2022 (a) f | | | 5,700 | | | | 8,835 | |
| Total Warrant | | | | | | | | |
| (Cost $9,132) | | | | | | | 8,835 | |
The accompanying notes are an integral part of the financial statements.
Schedule of Investments (continued)
Quaker Event Arbitrage Fund
December 31, 2017 (Unaudited)
| | | Par | | | Fair | |
| | | Value | | | Value | |
| Asset Backed Securities — 1.0% | |
| AFC Home Equity Loan Trust | | | | | | |
| Class 1A, Series 2000-2, 2.342% | | | | | | |
| (1 Month LIBOR USD + 0.790%), | | | | | | |
06/25/2030 • | | $ | 6,853 | | | $ | 6,011 | |
| Citigroup Mortgage Loan Trust Inc. | | | | | | | | |
| Class M3, Series 2005-OPT1, 2.257% | | | | | | | | |
| (1 Month LIBOR USD + 0.705%), | | | | | | | | |
02/25/2035 • | | | 184,418 | | | | 175,533 | |
| Countrywide Asset-Backed Certificates | | | | | | | | |
| Class 2M2, Series 2007-11, 1.872% | | | | | | | | |
| (1 Month LIBOR USD + 0.320%), | | | | | | | | |
06/25/2047 +• | | | 764,326 | | | | 26,090 | |
| Countrywide Home Equity Loan Trust | | | | | | | | |
| Class 2A, Series 2005-A, 1.799% | | | | | | | | |
| (1 Month LIBOR USD + 0.240%), | | | | | | | | |
04/15/2035 • | | | 13,396 | | | | 12,305 | |
| | | | | | | | 219,939 | |
| Total Asset Backed Securities | | | | | | | | |
| (Cost $201,456) | | | | | | | 219,939 | |
| Convertible Bond — 2.3% | |
| Financial — 2.3% | | | | | | | | |
| Banks — 2.3% | | | | | | | | |
| BNP Paribas Fortis SA, 1.671% | | | | | | | | |
| (3 Month EURIBOR + 2.000%), | | | | | | | | |
Perpetual f • | | € | 500,000 | | | | 512,934 | |
| Total Financial | | | | | | | | |
| (Cost $558,274) | | | | | | | 512,934 | |
| Total Convertible Bond | | | | | | | | |
| (Cost $558,274) | | | | | | | 512,934 | |
| Corporate Bonds — 8.5% | |
| Consumer, Cyclical — 3.8% | | | | | | | | |
| Auto Parts & Equipment — 2.4% | | | | | | | | |
| Exide Technologies, | | | | | | | | |
| 8.625%, 02/12/2018 *+^ | | $ | 1,000,000 | | | | 0 | |
| Exide Technologies, 11.000% | | | | | | | | |
Cash or PIK, 04/30/2022# • | | | 476,515 | | | | 428,863 | |
| Exide Technologies, 7.000% | | | | | | | | |
Cash or PIK, 04/30/2025 * • | | | 176,975 | | | | 108,840 | |
| | | | | | | | 537,703 | |
| Retail — 1.4% | | | | | | | | |
| The Neiman Marcus Group LLC, | | | | | | | | |
7.125%, 06/01/2028 • | | | 500,000 | | | | 311,250 | |
| Total Consumer, Cyclical | | | | | | | | |
| (Cost $1,023,144) | | | | | | | 848,953 | |
| Consumer, Non-cyclical — 2.0% | | | | | | | | |
| Pharmaceuticals — 2.0% | | | | | | | | |
| Valeant Pharmaceuticals | | | | | | | | |
| International Inc., | | | | | | | | |
5.500%, 03/01/2023 f # • | | | 500,000 | | | | 457,500 | |
| Total Consumer, Non-cyclical | | | | | | | | |
| (Cost $401,370) | | | | | | | 457,500 | |
| Energy — 0.4% | | | | | | | | |
| Oil & Gas — 0.4% | | | | | | | | |
| OGX Austria GMBH, | | | | | | | | |
8.500%, 06/01/2018 f *+ • | | | 3,500,000 | | | | 35 | |
| Seadrill Ltd., | | | | | | | | |
5.625%, 09/15/2017 f *+ # • | | | 550,000 | | | | 93,500 | |
| | | | | | | | 93,535 | |
| Total Energy | | | | | | | | |
| (Cost $206,966) | | | | | | | 93,535 | |
| Financial — 2.3% | | | | | | | | |
| Diversified Financial Services — 2.3% | | | | | | | | |
| Hellas Telecommunications | | | | | | | | |
| Luxembourg II SCA, | | | | | | | | |
0.000%, 01/15/2015 f *+#^ | | | 5,000,000 | | | | 6,250 | |
| Lehman Brothers Holdings Inc., | | | | | | | | |
7.000%, 01/28/2020 +• | | | 100,000 | | | | 4,475 | |
| Lehman Brothers Holdings Inc., | | | | | | | | |
5.500%, 02/27/2020 +• | | | 100,000 | | | | 4,475 | |
| Lehman Brothers Holdings Inc., | | | | | | | | |
8.250%, 09/23/2020 +• | | | 100,000 | | | | 4,475 | |
| Lehman Brothers Holdings Inc., | | | | | | | | |
8.750%, 02/14/2023 +• | | | 200,000 | | | | 8,950 | |
| Lehman Brothers Holdings Inc., | | | | | | | | |
4.550%, 12/29/2099 +• | | | 110,000 | | | | 5,060 | |
| Lehman Brothers Holdings Inc., | | | | | | | | |
5.320%, 12/29/2099 +• | | | 130,000 | | | | 5,818 | |
| Twin Reefs Pass-Through Trust, | | | | | | | | |
| 0.000%, Perpetual *+#^ | | | 1,000,000 | | | | 480,000 | |
| | | | | | | | 519,503 | |
| Venture Capital — 0.0% | | | | | | | | |
| Infinity Capital Group, | | | | | | | | |
| 7.000%, 12/31/2049 *+^ | | | 25,000 | | | | 0 | |
| Total Financial | | | | | | | | |
| (Cost $610,000) | | | | | | | 519,503 | |
| Total Corporate Bonds | | | | | | | | |
| (Cost $2,241,480) | | | | | | | 1,919,491 | |
The accompanying notes are an integral part of the financial statements.
Schedule of Investments (continued)
Quaker Event Arbitrage Fund
December 31, 2017 (Unaudited)
| | | Par | | | Fair | |
| | | Value | | | Value | |
| Escrow Notes — 0.0% | |
| Mirant Corp. *+^ | | $ | 20,000 | | | $ | 0 | |
| NewPage Corp. *+^ | | | 300,000 | | | | 0 | |
| | | | | | | | 0 | |
| Total Escrow Notes | | | | | | | | |
| (Cost $196,568) | | | | | | | 0 | |
| Mortgage Backed Securities — 0.4% | |
| Federal Home Loan | | | | | | | | |
| Mortgage Corp. Class IG, | | | | | | | | |
Series 3756, 4.000%, 11/15/2037• | | | 206,480 | | | | 1,559 | |
| GSR Mortgage Loan Trust | | | | | | | | |
| Class B2, Series 2005-5F, | | | | | | | | |
5.741%, 06/25/2035 ~• | | | 564,497 | | | | 82,128 | |
| | | | | | | | 83,687 | |
| Total Mortgage Backed Securities | | | | | | | | |
| (Cost $533,479) | | | | | | | 83,687 | |
| Municipal Bonds — 1.9% | |
| Puerto Rico Public | | | | | | | | |
| Buildings Authority, Series C, | | | | | | | | |
| 5.750%, 07/01/2019 +^ | | | 40,000 | | | | 8,313 | |
| Puerto Rico Public | | | | | | | | |
| Buildings Authority, Series D, | | | | | | | | |
| 5.250%, 07/01/2027 +^ | | | 60,000 | | | | 12,470 | |
| Puerto Rico Public | | | | | | | | |
| Buildings Authority, Series D, | | | | | | | | |
| 5.250%, 07/01/2036 +^ | | | 50,000 | | | | 10,391 | |
| Puerto Rico Public | | | | | | | | |
| Buildings Authority, Series M, | | | | | | | | |
| 6.000%, 07/01/2020 +^ | | | 30,000 | | | | 6,235 | |
| Puerto Rico Public | | | | | | | | |
| Buildings Authority, Series N, | | | | | | | | |
| 5.500%, 07/01/2024 +^ | | | 30,000 | | | | 6,235 | |
| Puerto Rico Public | | | | | | | | |
| Buildings Authority, Series N, | | | | | | | | |
| 5.500%, 07/01/2027 +^ | | | 55,000 | | | | 11,431 | |
| Puerto Rico Public | | | | | | | | |
| Buildings Authority, Series N, | | | | | | | | |
| 5.000%, 07/01/2037 +^ | | | 410,000 | | | | 85,210 | |
| Puerto Rico Public | | | | | | | | |
| Buildings Authority, Series Q, | | | | | | | | |
| 5.500%, 07/01/2037 +^ | | | 135,000 | | | | 28,057 | |
| Puerto Rico Public | | | | | | | | |
| Buildings Authority, Series S, | | | | | | | | |
| 5.000%, 07/01/2024 +^ | | | 85,000 | | | | 17,666 | |
| Puerto Rico Public | | | | | | | | |
| Buildings Authority, Series S, | | | | | | | | |
| 6.00%, 07/01/2041 +^ | | | 30,000 | | | | 6,235 | |
| Puerto Rico Public | | | | | | | | |
| Buildings Authority, Series U, | | | | | | | | |
| 5.000%, 07/01/2018 +^ | | | 50,000 | | | | 10,391 | |
| University of Puerto Rico, Series P, | | | | | | | | |
5.000%, 06/01/2018 • | | | 100,000 | | | | 72,750 | |
| University of Puerto Rico, Series P, | | | | | | | | |
5.000%, 06/01/2019 • | | | 85,000 | | | | 54,187 | |
| University of Puerto Rico, Series P, | | | | | | | | |
5.000%, 06/01/2020 • | | | 30,000 | | | | 18,825 | |
| University of Puerto Rico, Series P, | | | | | | | | |
5.000%, 06/01/2024 * • | | | 25,000 | | | | 15,687 | |
| University of Puerto Rico, Series P, | | | | | | | | |
5.000%, 06/01/2026 * • | | | 10,000 | | | | 6,275 | |
| University of Puerto Rico, Series P, | | | | | | | | |
5.000%, 06/01/2030 * • | | | 25,000 | | | | 15,688 | |
| University of Puerto Rico, Series Q, | | | | | | | | |
5.000%, 06/01/2021 • | | | 15,000 | | | | 9,413 | |
| University of Puerto Rico, Series Q, | | | | | | | | |
5.000%, 06/01/2030 * • | | | 25,000 | | | | 15,688 | |
| University of Puerto Rico, Series Q, | | | | | | | | |
5.000%, 06/01/2036 * • | | | 30,000 | | | | 18,825 | |
| | | | | | | | 429,972 | |
| Total Municipal Bonds | | | | | | | | |
| (Cost $507,736) | | | | | | | 429,972 | |
| Total Long-Term Investments | | | | | | | | |
| (Cost $20,682,970) | | | | | | | 15,831,855 | |
The accompanying notes are an integral part of the financial statements.
Schedule of Investments (continued)
Quaker Event Arbitrage Fund
December 31, 2017 (Unaudited)
| | | Number | | | | | | | |
| | | of Contracts | | | | | | | |
| | | (100 Shares | | | Notional | | | Fair | |
| | | Per Contract) | | | Amount | | | Value | |
| Purchased Options — 1.1% | |
| Call Options — 0.9% | | | | | | | | | |
| The Hain Celestial Group Inc., Expiration: January, 2018 | | | | | | | | | |
Exercise Price: $38.00• | | | 400 | | | $ | 1,695,600 | | | $ | 194,000 | |
| Valeant Pharmaceuticals International Inc., Expiration: January, 2018 | | | | | | | | | | | | |
| Exercise Price: $30.00 | | | 100 | | | | 207,800 | | | | 300 | |
| Total Call Options | | | | | | | | | | | | |
| (Cost $216,878) | | | | | | | | | | | 194,300 | |
| Put Options — 0.2% | | | | | | | | | | | | |
| CurrencyShares Euro Trust, Expiration: March, 2018 | | | | | | | | | | | | |
| Exercise Price: $116.00 | | | 320 | | | | 3,699,520 | | | | 49,600 | |
| Total Put Options | | | | | | | | | | | | |
| (Cost $99,946) | | | | | | | | | | | 49,600 | |
| Total Purchased Options | | | | | | | | | | | | |
| (Cost $316,824) | | | | | | | | | | | 243,900 | |
| | | Par | | | | | | | | | |
| | | Value | | | | | | | | | |
| Bank Deposit Account — 3.8% | |
| U.S. Bank N.A., 0.30% | | $ | 847,553 | | | | | | | | 847,553 | |
| Total Bank Deposit Account | | | | | | | | | | | | |
| (Cost $847,553) | | | | | | | | | | | 847,553 | |
| | | Units | | | | | | | | | |
| Private Investment Co. Purchased with Proceeds from Securities Lending — 7.2% | |
| Mount Vernon Liquid Assets Portfolio LLC, 1.60% (c)(d) | | | 1,629,245 | | | | | | | | 1,629,245 | |
| Total Private Investment Co. Purchased with Proceeds from Securities Lending | | | | | | | | | | | | |
| (Cost 1,629,245) | | | | | | | | | | | 1,629,245 | |
| Total Investments | | | | | | | | | | | | |
| (Cost $23,476,592) — 82.5% | | | | | | | | | | | 18,552,553 | |
| Other Assets in Excess of Liabilities, Net 17.5% | | | | | | | | | | | 3,945,260 | |
| Total Net Assets — 100.0% | | | | | | | | | | $ | 22,497,813 | |
| | | Number | | | | | | | | | |
| | | of Shares | | | | | | | | | |
| Schedule of Securities Sold Short (a) | | | | | | | | | | | | |
| Common Stocks | |
| Communications — 8.1% | | | | | | | | | | | | |
| Internet —6.4% | | | | | | | | | | | | |
Alibaba Group Holding Ltd. - ADR f | | | 8,310 | | | | | | | | 1,432,893 | |
| Media —1.7% | | | | | | | | | | | | |
| Liberty Broadband Corp. Cl C | | | 4,452 | | | | | | | | 379,133 | |
| Total Common Stocks | | | | | | | | | | | 1,812,026 | |
| Total Securities Sold Short | | | | | | | | | | | | |
| (Proceeds $1,372,726) | | | | | | | | | | $ | 1,812,026 | |
The accompanying notes are an integral part of the financial statements.
Schedule of Investments (continued)
Quaker Event Arbitrage Fund
December 31, 2017 (Unaudited)
| | | Number | | | | | | | |
| | | of Contracts | | | | | | | |
| | | (100 Shares | | | Notional | | | Fair | |
| | | Per Contract) | | | Amount | | | Value | |
| Written Options | |
| Call Options | | | | | | | | | |
| CurrencyShares Euro Trust, Expiration: March, 2018 | | | | | | | | | |
| Exercise Price: $116.00 | | | 320 | | | $ | (3,699,520 | ) | | $ | 48,320 | |
| The Hain Celestial Group Inc., Expiration: January, 2018 | | | | | | | | | | | | |
| Exercise Price: $41.00 | | | 400 | | | | (1,695,600 | ) | | | 82,000 | |
| Total Call Options | | | | | | | | | | | | |
| (Premiums Received $101,182) | | | | | | | | | | | 130,320 | |
| Total Written Options | | | | | | | | | | | | |
| (Premiums Received $101,182) | | | | | | | | | | $ | 130,320 | |
ADR - American Depositary Receipt
CVR - Contingent Value Rights
€ - Euro
| (a) | Non-income producing security. |
| (b) | All or a portion of the security is out on loan. The total market value of securities on loan was $1,573,631. The remaining contractual maturity of all of the securities lending transactions is overnight and continuous. |
| (c) | Rate shown is the annualized seven-day yield at period end. |
| (d) | Represents investments of collateral received from securities lending transactions. Refer to Note 10 of Notes to Financial Statements for additional information. |
| f | Foreign issued security. |
| * | Indicates an illiquid security. Total market value for illiquid securities is $839,775, representing 3.7% of net assets. |
| ** | All or a portion of the shares have been committed as collateral for open securities sold short or written options. |
| + | Defaulted bonds. |
| # | Indicates securities that may be sold to “qualified institutional buyers” pursuant to the conditions of Rule 144A under the Securities Act of 1933, as amended, is $1,486,113 representing 6.6% of net assets. |
| | The coupon rate shown on floating or adjustable rate securities represents the rate at period end. |
| ~ | Variable rate security. The coupon is based on an underlying pool of loans. |
| • | Level 2 securities. |
| ^ | Indicates a fair valued security. Total market value for fair valued securities is $767,871 representing 3.4% of net assets and Level 3 securities. Refer to Note 2 of Notes to Financial Statements for additional information. |
The accompanying notes are an integral part of the financial statements.
Schedule of Investments
Quaker Global Tactical Allocation Fund
December 31, 2017 (Unaudited)
| | | Number | | | Fair | |
| | | of Shares | | | Value | |
| Long-Term Investments — 91.8% | | | | | | |
| Common Stocks — 30.1% | |
| Basic Materials — 1.2% | | | | | | |
| Chemicals — 1.2% | | | | | | |
| The Mosaic Co. | | | 3,000 | | | $ | 76,980 | |
| Total Basic Materials (Cost $81,430) | | | | | | | 76,980 | |
| Communications — 7.9% | | | | | | | | |
| Media — 2.0% | | | | | | | | |
| Twenty-First Century Fox Inc. Cl B | | | 3,700 | | | | 126,244 | |
| Telecommunications — 5.9% | | | | | | | | |
| AT&T Inc. | | | 4,200 | | | | 163,296 | |
| Verizon Communications Inc. | | | 4,000 | | | | 211,720 | |
| | | | | | | | 375,016 | |
| Total Communications | | | | | | | | |
| (Cost $474,579) | | | | | | | 501,260 | |
| Consumer, Cyclical — 2.1% | | | | | | | | |
| Airlines — 0.2% | | | | | | | | |
| AMR Corp. Escrow (a)*^ | | | 7,600 | | | | 14,744 | |
| Auto Manufacturers — 1.9% | | | | | | | | |
| General Motors Co. | | | 3,000 | | | | 122,970 | |
| Total Consumer, Cyclical | | | | | | | | |
| (Cost $106,023) | | | | | | | 137,714 | |
| Consumer, Non-cyclical — 3.8% | | | | | | | | |
| Beverages — 2.2% | | | | | | | | |
| Molson Coors Brewing Co. | | | 1,700 | | | | 139,519 | |
| Food — 1.4% | | | | | | | | |
Nestle SA f | | | 1,000 | | | | 85,970 | |
| Pharmaceuticals — 0.2% | | | | | | | | |
Mallinckrodt PLC (a) f | | | 600 | | | | 13,536 | |
| Total Consumer, Non-cyclical | | | | | | | | |
| (Cost $274,028) | | | | | | | 239,025 | |
| Diversified — 1.0% | | | | | | | | |
| Holding Companies — 1.0% | | | | | | | | |
CK Hutchison Holdings Ltd. f | | | 5,000 | | | | 62,775 | |
| Total Diversified (Cost $60,044) | | | | | | | 62,775 | |
| Energy — 4.8% | | | | | | | | |
| Pipelines — 4.8% | | | | | | | | |
| Andeavor Logistics LP | | | 635 | | | | 29,331 | |
| Cheniere Energy Partners LP | | | 1,229 | | | | 36,427 | |
Enbridge Inc. f | | | 831 | | | | 32,501 | |
| Enterprise Products Partners LP | | | 1,392 | | | | 36,902 | |
| Magellan Midstream Partners LP | | | 522 | | | | 37,031 | |
| MPLX LP | | | 980 | | | | 34,761 | |
| ONEOK Inc. | | | 832 | | | | 44,470 | |
| Plains All American Pipeline LP | | | 1,105 | | | | 22,807 | |
| Western Gas Partners LP | | | 615 | | | | 29,575 | |
| | | | | | | | 303,805 | |
| Total Energy (Cost $314,480) | | | | | | | 303,805 | |
| Industrial — 1.3% | | | | | | | | |
| Miscellaneous Manufacturing — 1.3% | | | | | | | | |
| General Electric Co. | | | 4,800 | | | | 83,760 | |
| Total Industrial (Cost $144,658) | | | | | | | 83,760 | |
| Technology — 8.0% | | | | | | | | |
| Semiconductors — 5.0% | | | | | | | | |
| Microsemi Corp. (a) | | | 2,200 | | | | 113,630 | |
| QUALCOMM Inc. | | | 3,200 | | | | 204,864 | |
| | | | | | | | 318,494 | |
| Software — 3.0% | | | | | | | | |
| Microsoft Corp. | | | 2,200 | | | | 188,188 | |
| Total Technology (Cost $436,386) | | | | | | | 506,682 | |
| Total Common Stocks | | | | | | | | |
| Cost ($1,891,628) | | | | | | | 1,912,001 | |
| Closed-End Mutual Fund — 0.5% | |
| Ares Capital Corp. | | | 2,242 | | | | 35,244 | |
| Total Closed-End Mutual Fund | | | | | | | | |
| Cost ($35,547) | | | | | | | 35,244 | |
| Exchange Traded Funds — 6.3% | |
| iShares MSCI United Kingdom ETF | | | 6,250 | | | | 223,875 | |
| PowerShares DB Commodity | | | | | | | | |
| Index Tracking Fund (a) | | | 10,760 | | | | 178,724 | |
| Total Exchange Traded Funds | | | | | | | | |
| Cost ($369,732) | | | | | | | 402,599 | |
| Preferred Stocks — 4.2% | |
| Consumer, Cyclical — 1.3% | | | | | | | | |
| Auto Manufacturers — 1.3% | | | | | | | | |
| Porsche Automobil | | | | | | | | |
Holding SE - ADR f | | | 10,000 | | | | 83,350 | |
| Total Consumer, Cyclical | | | | | | | | |
| (Cost $52,502) | | | | | | | 83,350 | |
| Energy — 0.4% | | | | | | | | |
| Pipelines — 0.4% | | | | | | | | |
| Kinder Morgan Inc., | | | | | | | | |
| Convertible, Series A, 9.750% | | | 729 | | | | 27,673 | |
| Total Energy (Cost $35,518) | | | | | | | 27,673 | |
The accompanying notes are an integral part of the financial statements.
Schedule of Investments (continued)
Quaker Global Tactical Allocation Fund
December 31, 2017 (Unaudited)
| | | Number | | | Fair | |
| | | of Shares | | | Value | |
| Preferred Stocks — 4.2% (Continued) | |
| Financial — 1.2% | | | | | | |
| Banks — 0.6% | | | | | | |
| Barclays Bank PLC, | | | | | | |
Series 5, 8.125%, Perpetual f | | | 1,365 | | | $ | 36,404 | |
| Insurance — 0.6% | | | | | | | | |
| PartnerRe Ltd., | | | | | | | | |
Series I, 5.875%, Perpetual f | | | 1,485 | | | | 39,011 | |
| Real Estate Investment Trusts — 1.3% | | | | | | | | |
| Public Storage, | | | | | | | | |
| Series V, 5.375%, Perpetual | | | 1,620 | | | | 40,840 | |
| Taubman Centers Inc., | | | | | | | | |
| Series K, 6.250%, Perpetual | | | 1,490 | | | | 37,593 | |
| | | | | | | | 78,433 | |
| Total Financial (Cost $147,138) | | | | | | | 153,848 | |
| Total Preferred Stocks | | | | | | | | |
| Cost ($235,158) | | | | | | | 264,871 | |
| Real Estate Investment Trusts — 7.7% | |
| Apartment Investment & | | | | | | | | |
| Management Co. | | | 1,514 | | | | 66,177 | |
| Colony NorthStar Inc., Cl A | | | 4,344 | | | | 49,565 | |
| Digital Realty Trust Inc. | | | 743 | | | | 84,628 | |
| Lamar Advertising Co. | | | 921 | | | | 68,375 | |
| MGM Growth Properties LLC | | | 2,500 | | | | 72,875 | |
| Prologis Inc. | | | 1,244 | | | | 80,250 | |
| Weyerhaeuser Co. | | | 1,960 | | | | 69,110 | |
| | | | | | | | 490,980 | |
| Total Real Estate Investment Trusts | | | | | | | | |
| Cost ($425,955) | | | | | | | 490,980 | |
| | | Par | | | | | |
| | | Value | | | | | |
| Corporate Bonds — 43.0% | |
| Basic Materials — 2.2% | | | | | | | | |
| Chemicals — 2.2% | | | | | | | | |
| CF Industries Inc., | | | | | | | | |
3.450%, 06/01/2023 • | | $ | 70,000 | | | | 69,037 | |
| Monsanto Co., | | | | | | | | |
2.750%, 07/15/2021 • | | | 70,000 | | | | 70,313 | |
| | | | | | | | 139,350 | |
| Total Basic Materials | | | | | | | | |
| (Cost $134,027) | | | | | | | 139,350 | |
| Communications — 5.3% | | | | | | | | |
| Internet — 1.1% | | | | | | | | |
eBay Inc., 2.200%, 08/01/2019 • | | | 70,000 | | | | 69,825 | |
| Media — 1.2% | | | | | | | | |
| Discovery Communications LLC, | | | | | | | | |
4.375%, 06/15/2021 • | | | 70,000 | | | | 73,233 | |
| Telecommunications — 3.0% | | | | | | | | |
AT&T Inc., 2.800%, 02/17/2021 • | | | 70,000 | | | | 70,310 | |
| CenturyLink Inc., Series Y, | | | | | | | | |
7.500%, 04/01/2024 • | | | 70,000 | | | | 69,825 | |
| Frontier Communications Corp., | | | | | | | | |
11.000%, 09/15/2025 • | | | 70,000 | | | | 51,450 | |
| | | | | | | | 191,585 | |
| Total Communications | | | | | | | | |
| (Cost $358,409) | | | | | | | 334,643 | |
| Consumer, Cyclical — 2.6% | | | | | | | | |
| Home Builders — 1.3% | | | | | | | | |
KB Home, 7.500%, 09/15/2022 • | | | 70,000 | | | | 79,625 | |
| Retail — 1.3% | | | | | | | | |
| JC Penney Corp. Inc., | | | | | | | | |
5.650%, 06/01/2020 • | | | 70,000 | | | | 63,875 | |
| Toys R Us Inc., | | | | | | | | |
7.375%, 10/15/2018 • | | | 66,000 | | | | 21,120 | |
| | | | | | | | 84,995 | |
| Total Consumer, Cyclical | | | | | | | | |
| (Cost $209,666) | | | | | | | 164,620 | |
| Consumer, Non-cyclical — 10.2% | | | | | | | | |
| Agriculture — 1.2% | | | | | | | | |
| Altria Group Inc., | | | | | | | | |
4.750%, 05/05/2021 • | | | 70,000 | | | | 75,067 | |
| Beverages — 1.1% | | | | | | | | |
| Molson Coors Brewing Co., | | | | | | | | |
2.100%, 07/15/2021 • | | | 70,000 | | | | 68,609 | |
| Biotechnology — 1.2% | | | | | | | | |
| Gilead Sciences Inc., | | | | | | | | |
4.400%, 12/01/2021 • | | | 70,000 | | | | 74,658 | |
| Commercial Services — 2.3% | | | | | | | | |
| Quad Graphics Inc., | | | | | | | | |
7.000%, 05/01/2022 • | | | 70,000 | | | | 72,450 | |
| RR Donnelley & Sons Co., | | | | | | | | |
7.000%, 02/15/2022 • | | | 70,000 | | | | 72,275 | |
| | | | | | | | 144,725 | |
The accompanying notes are an integral part of the financial statements.
Schedule of Investments (continued)
Quaker Global Tactical Allocation Fund
December 31, 2017 (Unaudited)
| | | Par | | | Fair | |
| | | Value | | | Value | |
| Corporate Bonds — 43.0% (Continued) | |
| Food — 2.2% | | | | | | |
| Campbell Soup Co., | | | | | | |
4.250%, 04/15/2021 • | | $ | 70,000 | | | $ | 73,373 | |
| SUPERVALU Inc., | | | | | | | | |
6.750%, 06/01/2021 • | | | 70,000 | | | | 69,738 | |
| | | | | | | | 143,111 | |
| Healthcare-Services — 1.2% | | | | | | | | |
Cigna Corp., 4.500%, 03/15/2021 • | | | 70,000 | | | | 73,574 | |
| Pharmaceuticals — 1.0% | | | | | | | | |
| Teva Pharmaceutical Finance | | | | | | | | |
| Netherlands III BV, | | | | | | | | |
2.200%, 07/21/2021 f • | | | 70,000 | | | | 63,943 | |
| Total Consumer, Non-cyclical | | | | | | | | |
| (Cost $643,257) | | | | | | | 643,687 | |
| Energy — 4.2% | | | | | | | | |
| Oil & Gas — 4.2% | | | | | | | | |
Apache Corp., 3.625%, 02/01/2021 • | | | 70,000 | | | | 71,663 | |
Chevron Corp., 2.100%, 05/16/2021 • | | | 70,000 | | | | 69,427 | |
Ensco PLC, 4.500%, 10/01/2024 f • | | | 70,000 | | | | 58,800 | |
| Shell International Finance BV, | | | | | | | | |
1.875%, 05/10/2021 f • | | | 70,000 | | | | 68,971 | |
| | | | | | | | 268,861 | |
| Total Energy (Cost $271,594) | | | | | | | 268,861 | |
| Financial — 10.2% | | | | | | | | |
| Banks — 6.9% | | | | | | | | |
| Bank of America Corp., | | | | | | | | |
2.625%, 10/19/2020 • | | | 80,000 | | | | 80,672 | |
| Bank of Montreal, 1.990% | | | | | | | | |
| (3 Month LIBOR USD + 0.610%), | | | | | | | | |
07/31/2018 f• | | | 70,000 | | | | 70,190 | |
Citigroup Inc., 2.350%, 08/02/2021 • | | | 70,000 | | | | 69,237 | |
| The Goldman Sachs Group Inc., 2.523% | | | | | | | | |
| (3 Month LIBOR USD + 1.160%), | | | | | | | | |
04/23/2020 • | | | 70,000 | | | | 71,079 | |
| JPMorgan Chase & Co., | | | | | | | | |
4.350%, 08/15/2021 • | | | 70,000 | | | | 74,243 | |
| Wells Fargo & Co., 2.525% | | | | | | | | |
| (3 Month LIBOR USD + 1.010%), | | | | | | | | |
12/07/2020• | | | 70,000 | | | | 71,248 | |
| | | | | | | | 436,669 | |
| Insurance — 1.1% | | | | | | | | |
| Genworth Holdings Inc., | | | | | | | | |
6.515%, 05/22/2018 • | | | 70,000 | | | | 70,000 | |
| Private Equity — 1.1% | | | | | | | | |
| Icahn Enterprises LP, | | | | | | | | |
6.000%, 08/01/2020 • | | | 70,000 | | | | 71,990 | |
| Real Estate Investment Trusts — 1.1% | | | | | | | | |
| Simon Property Group LP, | | | | | | | | |
2.500%, 07/15/2021 • | | | 70,000 | | | | 70,178 | |
| Total Financial (Cost $645,200) | | | | | | | 648,837 | |
| Industrial — 2.2% | | | | | | | | |
| Engineering & Construction — 1.1% | | | | | | | | |
| MasTec Inc., | | | | | | | | |
4.875%, 03/15/2023 • | | | 70,000 | | | | 71,400 | |
| Machinery-Diversified — 1.1% | | | | | | | | |
| Xerium Technologies Inc., | | | | | | | | |
9.500%, 08/15/2021 • | | | 70,000 | | | | 70,875 | |
| Total Industrial (Cost $139,732) | | | | | | | 142,275 | |
| Technology — 4.9% | | | | | | | | |
| Computers — 1.0% | | | | | | | | |
| Seagate HDD Cayman, | | | | | | | | |
4.875%, 06/01/2027 f • | | | 65,000 | | | | 62,151 | |
| Office & Business Equipment — 1.1% | | | | | | | | |
Xerox Corp., 4.500%, 05/15/2021 • | | | 70,000 | | | | 73,140 | |
| Semiconductors — 1.1% | | | | | | | | |
| Analog Devices Inc., | | | | | | | | |
2.500%, 12/05/2021 • | | | 70,000 | | | | 69,311 | |
| Software — 1.7% | | | | | | | | |
| BMC Software Inc., | | | | | | | | |
7.250%, 06/01/2018 • | | | 37,000 | | | | 37,462 | |
| Oracle Corp., | | | | | | | | |
1.900%, 09/15/2021 • | | | 70,000 | | | | 68,895 | |
| | | | | | | | 106,357 | |
| Total Technology (Cost $307,708) | | | | | | | 310,959 | |
| Utilities — 1.2% | | | | | | | | |
| Electric — 1.2% | | | | | | | | |
DPL Inc., 7.250%, 10/15/2021 • | | | 70,000 | | | | 77,700 | |
| Total Utilities (Cost $71,941) | | | | | | | 77,700 | |
| Total Corporate Bonds | | | | | | | | |
| Cost ($2,781,534) | | | | | | | 2,730,932 | |
The accompanying notes are an integral part of the financial statements.
Schedule of Investments (continued)
Quaker Global Tactical Allocation Fund
December 31, 2017 (Unaudited)
| | | Par | | | Fair | |
| | | Value | | | Value | |
| Mortgage Backed Security — 0.0% | |
| Federal Home Loan | | | | | | |
| Mortgage Corp., Class IG, | | | | | | |
Series 3756, 4.000%, 11/15/2037 • | | $ | 181,123 | | | $ | 1,367 | |
| Total Mortgage Backed Security | | | | | | | | |
| Cost ($14,070) | | | | | | | 1,367 | |
| Total Long-Term Investments | | | | | | | | |
| Cost ($5,753,624) | | | | | | | 5,837,994 | |
| Bank Deposit Account — 10.0% | |
| U.S. Bank N.A., 0.30% | | | 633,506 | | | | 633,506 | |
| Total Bank Deposit Account | | | | | | | | |
| Cost ($633,506) | | | | | | | 633,506 | |
| Total Investments | | | | | | | | |
| (Cost $6,387,130) — 101.8% | | | | | | | 6,471,500 | |
| Liabilities in Excess | | | | | | | | |
| of Other Assets, Net (1.8)% | | | | | | | (114,651 | ) |
| Total Net Assets — 100.0% | | | | | | $ | 6,356,849 | |
ADR - American Depositary Receipt
| (a) | Non-income producing security. |
| f | Foreign issued security. |
| * | Indicates an illiquid security. Total market value for illiquid securities is $14,744, representing 0.2% of net assets. |
| | The coupon rate shown on floating or adjustable rate securities represents the rate at period end. |
| • | Level 2 securities. |
| ^ | Indicates a fair valued security. Total market value for fair valued securities is $14,744, representing 0.2% of net assets and Level 3 securities. Refer to Note 2 of Notes to Financial Statements for additional information. |
The accompanying notes are an integral part of the financial statements.
Schedule of Investments
Quaker Mid-Cap Value Fund
December 31, 2017 (Unaudited)
| | | Number | | | Fair | |
| | | of Shares | | | Value | |
| Long-Term Investments — 97.6% | | | | | | |
| Common Stocks — 86.2% | |
| Basic Materials — 6.0% | | | | | | |
| Chemicals — 2.4% | | | | | | |
| Westlake Chemical Corp. | | | 1,563 | | | $ | 166,507 | |
| Iron & Steel — 3.6% | | | | | | | | |
| Reliance Steel & Aluminum Co. | | | 1,712 | | | | 146,872 | |
| Steel Dynamics Inc. | | | 2,599 | | | | 112,095 | |
| | | | | | | | 258,967 | |
| Total Basic Materials (Cost $281,696) | | | | | | | 425,474 | |
| Consumer, Cyclical — 13.1% | | | | | | | | |
| Auto Manufacturers — 1.9% | | | | | | | | |
| PACCAR Inc. (b) | | | 1,866 | | | | 132,635 | |
| Auto Parts & Equipment — 3.5% | | | | | | | | |
| The Goodyear Tire & Rubber Co. | | | 3,427 | | | | 110,726 | |
| Lear Corp. (b) | | | 809 | | | | 142,918 | |
| | | | | | | | 253,644 | |
| Home Furnishings — 0.9% | | | | | | | | |
| Whirlpool Corp. | | | 372 | | | | 62,734 | |
| Leisure Time — 3.1% | | | | | | | | |
| Brunswick Corp. | | | 2,205 | | | | 121,760 | |
| Norwegian Cruise Line | | | | | | | | |
Holdings Ltd. (a)(b) f | | | 1,828 | | | | 97,341 | |
| | | | | | | | 219,101 | |
| Retail — 1.2% | | | | | | | | |
| Casey’s General Stores Inc. (b) | | | 775 | | | | 86,753 | |
| Textiles — 1.0% | | | | | | | | |
| Mohawk Industries Inc. (a)(b) | | | 271 | | | | 74,769 | |
| Toys/Games & Hobbies — 1.5% | | | | | | | | |
| Hasbro Inc. | | | 1,165 | | | | 105,887 | |
| Total Consumer, Cyclical | | | | | | | | |
| (Cost $791,644) | | | | | | | 935,523 | |
| Consumer, Non-cyclical — 7.0% | | | | | | | | |
| Biotechnology — 1.3% | | | | | | | | |
| United Therapeutics Corp. (a)(b) | | | 619 | | | | 91,581 | |
| Food — 2.7% | | | | | | | | |
| Ingredion Inc. | | | 822 | | | | 114,916 | |
| US Foods Holding Corp. (a)(b) | | | 2,310 | | | | 73,758 | |
| | | | | | | | 188,674 | |
| Healthcare-Products — 1.4% | | | | | | | | |
STERIS PLC f | | | 1,158 | | | | 101,290 | |
| Healthcare-Services — 1.6% | | | | | | | | |
| Centene Corp. (a)(b) | | | 1,142 | | | | 115,205 | |
| Total Consumer, Non-cyclical | | | | | | | | |
| (Cost $383,388) | | | | | | | 496,750 | |
| Energy — 9.0% | | | | | | | | |
| Oil & Gas — 7.8% | | | | | | | | |
| Andeavor | | | 1,051 | | | | 120,171 | |
| Concho Resources Inc. (a)(b) | | | 879 | | | | 132,043 | |
| Diamond Offshore Drilling Inc. (a)(b) | | | 1,855 | | | | 34,485 | |
| Helmerich & Payne Inc. (b) | | | 1,832 | | | | 118,421 | |
| Marathon Oil Corp. | | | 5,386 | | | | 91,185 | |
| Newfield Exploration Co. (a)(b) | | | 1,976 | | | | 62,303 | |
| | | | | | | | 558,608 | |
| Oil & Gas Services — 1.2% | | | | | | | | |
| RPC Inc. (b) | | | 3,356 | | | | 85,679 | |
| Total Energy (Cost $546,615) | | | | | | | 644,287 | |
| Financial — 16.2% | | | | | | | | |
| Banks — 8.0% | | | | | | | | |
| Bank of the Ozarks Inc. | | | 2,349 | | | | 113,809 | |
| East West Bancorp Inc. | | | 2,829 | | | | 172,088 | |
| Huntington Bancshares Inc. | | | 10,650 | | | | 155,064 | |
| PacWest Bancorp | | | 2,579 | | | | 129,982 | |
| | | | | | | | 570,943 | |
| Diversified Financial Services — 1.7% | | | | | | | | |
| T. Rowe Price Group Inc. (b) | | | 1,184 | | | | 124,237 | |
| Insurance — 6.5% | | | | | | | | |
| Lincoln National Corp. | | | 1,585 | | | | 121,839 | |
| Reinsurance Group of America Inc. Cl A | | | 1,139 | | | | 177,604 | |
| Torchmark Corp. | | | 1,803 | | | | 163,550 | |
| | | | | | | | 462,993 | |
| Total Financial (Cost $737,634) | | | | | | | 1,158,173 | |
| Industrial — 17.7% | | | | | | | | |
| Aerospace & Defense — 2.6% | | | | | | | | |
| Teledyne Technologies Inc. (a)(b) | | | 999 | | | | 180,969 | |
| Building Materials — 2.0% | | | | | | | | |
| Eagle Materials Inc. | | | 1,279 | | | | 144,910 | |
| Electronics — 4.4% | | | | | | | | |
| Avnet Inc. | | | 2,214 | | | | 87,719 | |
Garmin Ltd. (b) f | | | 1,766 | | | | 105,201 | |
| Trimble Inc. (a)(b) | | | 3,007 | | | | 122,204 | |
| | | | | | | | 315,124 | |
The accompanying notes are an integral part of the financial statements.
Schedule of Investments (continued)
Quaker Mid-Cap Value Fund
December 31, 2017 (Unaudited)
| | | Number | | | Fair | |
| | | of Shares | | | Value | |
| Common Stocks — 86.2% (Continued) | |
| Hand & Machine Tools — 2.0% | | | | | | |
| Snap-on Inc. (b) | | | 833 | | | $ | 145,192 | |
| Machinery-Diversified — 1.9% | | | | | | | | |
| Roper Technologies Inc. | | | 522 | | | | 135,198 | |
| Miscellaneous Manufacturing — 1.2% | | | | | | | | |
| Carlisle Cos. Inc. | | | 769 | | | | 87,397 | |
| Transportation — 3.6% | | | | | | | | |
| Kirby Corp. (a)(b) | | | 2,017 | | | | 134,736 | |
| Old Dominion Freight Line Inc. | | | 919 | | | | 120,894 | |
| | | | | | | | 255,630 | |
| Total Industrial (Cost $957,994) | | | | | | | 1,264,420 | |
| Technology — 8.0% | | | | | | | | |
| Computers — 1.2% | | | | | | | | |
| CSRA Inc. (b) | | | 2,847 | | | | 85,182 | |
| Semiconductors — 5.8% | | | | | | | | |
Marvell Technology Group Ltd. f | | | 5,583 | | | | 119,867 | |
| ON Semiconductor Corp. (a)(b) | | | 8,081 | | | | 169,216 | |
| Skyworks Solutions Inc. (b) | | | 1,314 | | | | 124,765 | |
| | | | | | | | 413,848 | |
| Software — 1.0% | | | | | | | | |
| Akamai Technologies Inc. (a)(b) | | | 1,059 | | | | 68,877 | |
| Total Technology (Cost $450,050) | | | | | | | 567,907 | |
| Utilities — 9.2% | | | | | | | | |
| Electric — 5.4% | | | | | | | | |
| CenterPoint Energy Inc. | | | 3,836 | | | | 108,789 | |
| DTE Energy Co. | | | 1,267 | | | | 138,686 | |
| Xcel Energy Inc. | | | 2,883 | | | | 138,701 | |
| | | | | | | | 386,176 | |
| Gas — 1.7% | | | | | | | | |
| UGI Corp. | | | 2,590 | | | | 121,601 | |
| Water — 2.1% | | | | | | | | |
| Aqua America Inc. | | | 3,848 | | | | 150,957 | |
| Total Utilities (Cost $466,691) | | | | | | | 658,734 | |
| Total Common Stocks | | | | | | | | |
| (Cost $4,615,712) | | | | | | | 6,151,268 | |
| Real Estate Investment Trusts — 11.4% | |
| Alexandria Real Estate Equities Inc. | | | 1,086 | | | | 141,821 | |
| AvalonBay Communities Inc. | | | 520 | | | | 92,773 | |
| Brixmor Property Group Inc. | | | 4,969 | | | | 92,721 | |
| CyrusOne Inc. | | | 2,147 | | | | 127,811 | |
| Duke Realty Corp. | | | 4,415 | | | | 120,132 | |
| Gaming and Leisure Properties Inc. | | | 3,094 | | | | 114,478 | |
| Sun Communities Inc. | | | 1,361 | | | | 126,274 | |
| | | | | | | | 816,010 | |
| Total Real Estate Investment Trusts | | | | | | | | |
| (Cost $685,208) | | | | | | | 816,010 | |
| Total Long-Term Investments | | | | | | | | |
| (Cost $5,300,920) | | | | | | | 6,967,278 | |
| | | Par | | | | | |
| | | Value | | | | | |
| Bank Deposit Account — 2.4% | |
| U.S. Bank N.A., 0.30% | | $ | 167,300 | | | | 167,300 | |
| Total Bank Deposit Account | | | | | | | | |
| (Cost $167,300) | | | | | | | 167,300 | |
| | | Units | | | | | |
| Private Investment Co. Purchased with | |
| Proceeds from Securities Lending — 20.9% | |
| Mount Vernon Liquid Assets | | | | | | | | |
| Portfolio LLC., 1.60% (c)(d) | | | 1,492,470 | | | | 1,492,470 | |
| Total Private Investment Co. Purchased | | | | | | | | |
| with Proceeds from Securities Lending | | | | | | | | |
| (Cost 1,492,470) | | | | | | | 1,492,470 | |
| Total Investments | | | | | | | | |
| (Cost $6,960,690) — 120.9% | | | | | | | 8,627,048 | |
| Liabilities in Excess | | | | | | | | |
| of Other Assets, Net (20.9)% | | | | | | | (1,491,036 | ) |
| Total Net Assets — 100.0% | | | | | | $ | 7,136,012 | |
| (a) | Non-income producing security. |
| (b) | All or a portion of the security is out on loan. The total market value of securities on loan was $1,451,889. The remaining contractual maturity of all of the securities lending transactions is overnight and continuous. |
| (c) | The rate shown is the annualized seven-day yield at period end. |
| (d) | Represents investments of collateral received from securities lending transactions. Refer to Note 10 of Notes to the Financial Statements for additional information. |
| f | Foreign issued security. |
The accompanying notes are an integral part of the financial statements.
Schedule of Investments
Quaker Small-Cap Value Fund
December 31, 2017 (Unaudited)
| | | Number | | | Fair | |
| | | of Shares | | | Value | |
| Long-Term Investments — 98.7% | | | | | | |
| Common Stocks — 93.5% | |
| Basic Materials — 4.3% | | | | | | |
| Chemicals — 2.6% | | | | | | |
| AdvanSix Inc. (a) | | | 3,462 | | | $ | 145,646 | |
| Cabot Corp. | | | 3,348 | | | | 206,203 | |
| CSW Industrials Inc. (a) | | | 3,477 | | | | 159,768 | |
| Koppers Holdings Inc. (a) | | | 1,366 | | | | 69,530 | |
Orion Engineered Carbons SA f | | | 6,680 | | | | 171,008 | |
| | | | | | | | 752,155 | |
| Forest Products & Paper — 1.0% | | | | | | | | |
| Mercer International Inc. | | | 12,965 | | | | 185,400 | |
| Verso Corp. (a) | | | 6,267 | | | | 110,111 | |
| | | | | | | | 295,511 | |
| Iron & Steel — 0.3% | | | | | | | | |
| Shiloh Industries Inc. (a) | | | 8,780 | | | | 71,996 | |
| Mining — 0.4% | | | | | | | | |
Taseko Mines Ltd. (a) f | | | 55,790 | | | | 129,991 | |
| Total Basic Materials | | | | | | | | |
| (Cost $1,072,926) | | | | | | | 1,249,653 | |
| Communications — 5.6% | | | | | | | | |
| Advertising — 0.3% | | | | | | | | |
| Telaria Inc. (a) | | | 20,661 | | | | 83,264 | |
| Internet — 2.4% | | | | | | | | |
| AutoWeb Inc. (a) | | | 6,502 | | | | 58,583 | |
| DHI Group Inc. (a) | | | 41,639 | | | | 79,114 | |
| New Media Investment Group Inc. | | | 2,536 | | | | 42,554 | |
Quarterhill Inc. f | | | 54,652 | | | | 100,560 | |
| QuinStreet Inc. (a) | | | 10,557 | | | | 88,467 | |
| Travelzoo Inc. (a) | | | 8,046 | | | | 51,897 | |
| Web.com Group Inc. (a)(b) | | | 6,931 | | | | 151,096 | |
| XO Group Inc. (a) | | | 983 | | | | 18,146 | |
| Zix Corp. (a)(b) | | | 25,797 | | | | 112,991 | |
| | | | | | | | 703,408 | |
| Media — 2.2% | | | | | | | | |
| Gannett Co. Inc. | | | 9,332 | | | | 108,158 | |
| John Wiley & Sons Inc. | | | 2,764 | | | | 181,733 | |
| News Corp. Cl A | | | 14,405 | | | | 233,505 | |
| tronc Inc. (a) | | | 7,770 | | | | 136,674 | |
| | | | | | | | 660,070 | |
| Telecommunications — 0.7% | | | | | | | | |
| Spok Holdings Inc. | | | 1,359 | | | | 21,269 | |
| Telephone & Data Systems Inc. | | | 6,320 | | | | 175,696 | |
| | | | | | | | 196,965 | |
| Total Communications | | | | | | | | |
| (Cost $1,862,402) | | | | | | | 1,643,707 | |
| Consumer, Cyclical — 13.6% | | | | | | | | |
| Apparel — 0.5% | | | | | | | | |
Michael Kors Holdings Ltd. (a)f | | | 2,413 | | | | 151,898 | |
| Auto Manufacturers — 0.6% | | | | | | | | |
| Wabash National Corp. (b) | | | 8,011 | | | | 173,839 | |
| Auto Parts & Equipment — 4.9% | | | | | | | | |
| Commercial Vehicle Group Inc. (a) | | | 12,679 | | | | 135,539 | |
| Dana Inc. | | | 11,330 | | | | 362,673 | |
| Lear Corp. (b) | | | 2,023 | | | | 357,383 | |
| Miller Industries Inc. | | | 4,278 | | | | 110,372 | |
| Tenneco Inc. | | | 4,886 | | | | 286,026 | |
| Tower International Inc. | | | 5,781 | | | | 176,610 | |
| | | | | | | | 1,428,603 | |
| Distribution/Wholesale — 0.4% | | | | | | | | |
| H&E Equipment Services Inc. | | | 2,524 | | | | 102,601 | |
| Entertainment — 0.8% | | | | | | | | |
| International Speedway Corp. | | | 6,039 | | | | 240,654 | |
| Home Builders — 1.0% | | | | | | | | |
| M/I Homes Inc. (a) | | | 8,300 | | | | 285,520 | |
| Leisure Time — 1.2% | | | | | | | | |
| Johnson Outdoors Inc. | | | 1,500 | | | | 93,135 | |
| MCBC Holdings Inc. (a) | | | 9,627 | | | | 213,912 | |
| Town Sports International | | | | | | | | |
| Holdings Inc. (a) | | | 8,591 | | | | 47,680 | |
| | | | | | | | 354,727 | |
| Lodging — 1.0% | | | | | | | | |
| Century Casinos Inc. (a) | | | 12,906 | | | | 117,832 | |
| La Quinta Holdings Inc. (a) | | | 9,722 | | | | 179,468 | |
| | | | | | | | 297,300 | |
| Office Furnishings — 0.6% | | | | | | | | |
| Interface Inc. | | | 7,010 | | | | 176,302 | |
| Retail — 2.6% | | | | | | | | |
| Abercrombie & Fitch Co. (b) | | | 6,049 | | | | 105,434 | |
| Chico’s FAS Inc. (b) | | | 11,504 | | | | 101,465 | |
| Citi Trends Inc. | | | 3,759 | | | | 99,463 | |
| Haverty Furniture Cos. Inc. | | | 3,480 | | | | 78,822 | |
The accompanying notes are an integral part of the financial statements.
Schedule of Investments (continued)
Quaker Small-Cap Value Fund
December 31, 2017 (Unaudited)
| | | Number | | | Fair | |
| | | of Shares | | | Value | |
| Common Stocks — 93.5% (Continued) | |
| Retail (Continued) | | | | | | |
| Office Depot Inc. | | | 17,191 | | | $ | 60,856 | |
| Rush Enterprises Inc. (a) | | | 4,027 | | | | 204,612 | |
| Shoe Carnival Inc. | | | 3,521 | | | | 94,187 | |
| | | | | | | | 744,839 | |
| Total Consumer, Cyclical | | | | | | | | |
| (Cost $3,384,871) | | | | | | | 3,956,283 | |
| Consumer, Non-cyclical — 20.6% | | | | | | | | |
| Agriculture — 0.3% | | | | | | | | |
| Turning Point Brands Inc. | | | 3,714 | | | | 78,477 | |
| Biotechnology — 3.6% | | | | | | | | |
| CytomX Therapeutics Inc. (a) | | | 4,585 | | | | 96,789 | |
| Exelixis Inc. (a) | | | 4,252 | | | | 129,261 | |
| Innoviva Inc. (a)(b) | | | 16,082 | | | | 228,204 | |
| MEI Pharma Inc. (a) | | | 41,036 | | | | 86,176 | |
| OvaScience Inc. (a) | | | 61,357 | | | | 85,900 | |
| Pieris Pharmaceuticals Inc. (a) | | | 14,514 | | | | 109,581 | |
| Retrophin Inc. (a) | | | 5,189 | | | | 109,332 | |
| RTI Surgical Inc. (a) | | | 19,969 | | | | 81,873 | |
| Vericel Corp. (a)(b) | | | 20,530 | | | | 111,888 | |
| | | | | | | | 1,039,004 | |
| Commercial Services — 5.5% | | | | | | | | |
| Aaron’s Inc. (b) | | | 4,304 | | | | 171,514 | |
| CAI International Inc. (a) | | | 3,964 | | | | 112,261 | |
Colliers International Group Inc. f | | | 2,300 | | | | 138,805 | |
| CorVel Corp. (a) | | | 3,155 | | | | 166,900 | |
| Ennis Inc. (b) | | | 8,120 | | | | 168,490 | |
| Heidrick & Struggles International Inc. | | | 3,709 | | | | 91,056 | |
| Herc Holdings Inc. (a) | | | 1,710 | | | | 107,063 | |
| Korn/Ferry International | | | 6,476 | | | | 267,977 | |
| Medifast Inc. | | | 1,154 | | | | 80,561 | |
| RPX Corp. | | | 15,723 | | | | 211,317 | |
| Vectrus Inc. (a) | | | 2,991 | | | | 92,272 | |
| | | | | | | | 1,608,216 | |
| Food — 1.6% | | | | | | | | |
| Dean Foods Co. | | | 13,289 | | | | 153,621 | |
| Ingredion Inc. (b) | | | 947 | | | | 132,390 | |
| Sanderson Farms Inc. (b) | | | 1,441 | | | | 199,982 | |
| | | | | | | | 485,993 | |
| Healthcare-Products — 2.1% | | | | | | | | |
| Haemonetics Corp. (a) | | | 3,771 | | | | 219,019 | |
| Meridian Bioscience Inc. (b) | | | 10,478 | | | | 146,692 | |
Orthofix International NV (a)f | | | 4,361 | | | | 238,547 | |
| | | | | | | | 604,258 | |
| Healthcare-Services — 1.2% | | | | | | | | |
Nobilis Health Corp. (a)(b)f | | | 47,393 | | | | 63,980 | |
| The Providence Services Corp. (a) | | | 3,641 | | | | 216,057 | |
| Psychemedics Corp. | | | 4,075 | | | | 83,782 | |
| | | | | | | | 363,819 | |
| Pharmaceuticals — 6.3% | | | | | | | | |
| Aquinox Pharmaceuticals Inc. (a) | | | 8,209 | | | | 96,538 | |
| BioSpecifics Technologies Corp. (a) | | | 2,589 | | | | 112,181 | |
| Catalent Inc. (a) | | | 6,144 | | | | 252,396 | |
| Catalyst Pharmaceuticals Inc. (a) | | | 36,774 | | | | 143,786 | |
| Eagle Pharmaceuticals Inc. (a)(b) | | | 1,823 | | | | 97,385 | |
| Enanta Pharmaceuticals Inc. (a) | | | 2,536 | | | | 148,812 | |
Endo International PLC (a)f | | | 15,457 | | | | 119,792 | |
Jazz Pharmaceuticals PLC (a)(b)f | | | 497 | | | | 66,921 | |
Mallinckrodt PLC (a)(b)f | | | 4,153 | | | | 93,692 | |
| Ophthotech Corp. (a) | | | 30,800 | | | | 96,096 | |
| Phibro Animal Health Corp. | | | 5,151 | | | | 172,558 | |
| Taro Pharmaceutical | | | | | | | | |
Industries Ltd. (a)f | | | 1,374 | | | | 143,872 | |
| Valeant Pharmaceuticals | | | | | | | | |
International Inc. (a)f | | | 4,053 | | | | 84,221 | |
| Vanda Pharmaceuticals Inc. (a) | | | 11,696 | | | | 177,779 | |
| VIVUS Inc. (a) | | | 86,205 | | | | 43,327 | |
| | | | | | | | 1,849,356 | |
| Total Consumer, Non-cyclical | | | | | | | | |
| (Cost $5,550,927) | | | | | | | 6,029,123 | |
| Diversified — 0.7% | | | | | | | | |
| Holding Companies — 0.7% | | | | | | | | |
| Leucadia National Corp. | | | 7,855 | | | | 208,079 | |
| Total Diversified (Cost $203,863) | | | | | | | 208,079 | |
| Energy — 3.7% | | | | | | | | |
| Coal — 0.3% | | | | | | | | |
| Cloud Peak Energy Inc. (a)(b) | | | 20,479 | | | | 91,132 | |
| Energy-Alternate Sources — 0.7% | | | | | | | | |
| Renewable Energy Group Inc. (a) | | | 13,010 | | | | 153,518 | |
| REX American Resources Corp. (a)(b) | | | 666 | | | | 55,138 | |
| | | | | | | | 208,656 | |
| Oil & Gas — 1.6% | | | | | | | | |
| Par Pacific Holdings Inc. (a) | | | 9,325 | | | | 179,786 | |
| PBF Energy Inc. | | | 1,929 | | | | 68,383 | |
| QEP Resources Inc. (a) | | | 9,994 | | | | 95,642 | |
| SRC Energy Inc. (a)(b) | | | 3,460 | | | | 29,514 | |
The accompanying notes are an integral part of the financial statements.
Schedule of Investments (continued)
Quaker Small-Cap Value Fund
December 31, 2017 (Unaudited)
| | | Number | | | Fair | |
| | | of Shares | | | Value | |
| Common Stocks — 93.5% (Continued) | |
| Oil & Gas (Continued) | | | | | | |
| W&T Offshore Inc. (a) | | | 30,855 | | | $ | 102,130 | |
| | | | | | | | 475,455 | |
| Oil & Gas Services — 1.1% | | | | | | | | |
| Archrock Inc. | | | 7,212 | | | | 75,726 | |
| Exterran Corp. (a) | | | 4,775 | | | | 150,126 | |
McDermott International Inc. (a)(b)f | | | 10,544 | | | | 69,379 | |
North American Energy Partners Inc. f | | | 2,705 | | | | 13,390 | |
| | | | | | | | 308,621 | |
| Total Energy (Cost $977,256) | | | | | | | 1,083,864 | |
| Financial — 17.3% | | | | | | | | |
| Banks — 5.9% | | | | | | | | |
| The Bancorp Inc. (a) | | | 18,754 | | | | 185,290 | |
| Central Pacific Financial Corp. | | | 9,242 | | | | 275,689 | |
| Century Bancorp Inc. | | | 1,241 | | | | 97,108 | |
| Financial Institutions Inc. | | | 5,055 | | | | 157,211 | |
| First Internet Bancorp | | | 493 | | | | 18,808 | |
| Independent Bank Corp. | | | 7,761 | | | | 173,458 | |
| Old Second Bancorp Inc. | | | 10,413 | | | | 142,137 | |
| QCR Holdings Inc. (b) | | | 1,053 | | | | 45,121 | |
| Republic Bancorp Inc. | | | 2,377 | | | | 90,374 | |
| Sierra Bancorp | | | 2,470 | | | | 65,603 | |
| State Bank Financial Corp. | | | 6,419 | | | | 191,543 | |
| Synovus Financial Corp. | | | 702 | | | | 33,654 | |
| TriCo Bancshares | | | 4,461 | | | | 168,893 | |
| TrustCo Bank Corp. | | | 10,086 | | | | 92,791 | |
| | | | | | | | 1,737,680 | |
| Diversified Financial Services — 2.4% | | | | | | | | |
| Enova International Inc. (a) | | | 2,791 | | | | 42,423 | |
Lazard Ltd. f | | | 5,792 | | | | 304,080 | |
OM Asset Management PLC f | | | 15,490 | | | | 259,458 | |
| Oppenheimer Holdings Inc. | | | 3,604 | | | | 96,587 | |
| | | | | | | | 702,548 | |
| Insurance — 6.3% | | | | | | | | |
| American Equity | | | | | | | | |
| Investment Life Holding Co. (b) | | | 9,151 | | | | 281,210 | |
Assured Guaranty Ltd. f | | | 7,204 | | | | 244,000 | |
| CNO Financial Group Inc. (b) | | | 13,965 | | | | 344,796 | |
| Reinsurance Group of America Inc. Cl A | | | 2,202 | | | | 343,358 | |
Third Point Reinsurance Ltd. (a)f | | | 2,160 | | | | 31,644 | |
| Torchmark Corp. | | | 3,123 | | | | 283,287 | |
| Voya Financial Inc. | | | 6,118 | | | | 302,657 | |
| | | | | | | | 1,830,952 | |
| Real Estate — 2.1% | | | | | | | | |
FirstService Corp. f | | | 3,500 | | | | 244,720 | |
| Jones Lang LaSalle Inc. | | | 1,375 | | | | 204,779 | |
| RMR Group Inc. | | | 2,993 | | | | 177,485 | |
| | | | | | | | 626,984 | |
| Savings & Loans — 0.6% | | | | | | | | |
| Riverview Bancorp Inc. | | | 11,573 | | | | 100,338 | |
| United Community Financial Corp. | | | 6,718 | | | | 61,335 | |
| | | | | | | | 161,673 | |
| Total Financial (Cost $4,294,643) | | | | | | | 5,059,837 | |
| Industrial — 15.5% | | | | | | | | |
| Aerospace & Defense — 1.1% | | | | | | | | |
| Moog Inc. (a) | | | 3,655 | | | | 317,437 | |
| Building Materials — 3.1% | | | | | | | | |
| Armstrong Flooring Inc. (a) | | | 5,768 | | | | 97,594 | |
| Boise Cascade Co. | | | 6,004 | | | | 239,560 | |
| Louisiana-Pacific Corp. (a)(b) | | | 7,946 | | | | 208,662 | |
| Owens Corning | | | 3,836 | | | | 352,682 | |
| | | | | | | | 898,498 | |
| Electronics — 4.2% | | | | | | | | |
| Allied Motion Technologies Inc. | | | 2,394 | | | | 79,217 | |
| CTS Corp. | | | 5,548 | | | | 142,861 | |
| Electro Scientific Industries Inc. (a) | | | 7,013 | | | | 150,289 | |
| Jabil Inc. (b) | | | 8,165 | | | | 214,331 | |
| Kimball Electronics Inc. (a) | | | 6,902 | | | | 125,961 | |
Orbotech Ltd. (a)f | | | 3,670 | | | | 184,381 | |
| Vishay Intertechnology Inc. | | | 15,530 | | | | 322,248 | |
| | | | | | | | 1,219,288 | |
| Engineering & Construction — 0.5% | | | | | | | | |
| Argan Inc. | | | 3,238 | | | | 145,710 | |
| Machinery-Diversified — 1.1% | | | | | | | | |
| Alamo Group Inc. | | | 2,013 | | | | 227,207 | |
Ichor Holdings Ltd. (a)f | | | 3,419 | | | | 84,108 | |
| | | | | | | | 311,315 | |
| Metal Fabricate & Hardware — 0.5% | | | | | | | | |
| Global Brass & Copper Holdings Inc. (b) | | | 4,942 | | | | 163,580 | |
| Miscellaneous Manufacturing — 1.5% | | | | | | | | |
| Core Molding Technologies Inc. | | | 4,047 | | | | 87,820 | |
| EnPro Industries Inc. | | | 863 | | | | 80,699 | |
| FreightCar America Inc. | | | 3,137 | | | | 53,580 | |
Trinseo SA f | | | 3,151 | | | | 228,762 | |
| | | | | | | | 450,861 | |
The accompanying notes are an integral part of the financial statements.
Schedule of Investments (continued)
Quaker Small-Cap Value Fund
December 31, 2017 (Unaudited)
| | | Number | | | Fair | |
| | | of Shares | | | Value | |
| Common Stocks — 93.5% (Continued) | |
| Transportation — 3.5% | | | | | | |
| ArcBest Corp. | | | 3,049 | | | $ | 109,002 | |
| Covenant Transportation | | | | | | | | |
| Group Inc. (a)(b) | | | 3,162 | | | | 90,844 | |
| Forward Air Corp. | | | 3,561 | | | | 204,544 | |
| Marten Transport Ltd. | | | 10,436 | | | | 211,851 | |
| Ryder System Inc. | | | 3,769 | | | | 317,236 | |
| USA Truck Inc. (a) | | | 4,929 | | | | 89,363 | |
| | | | | | | | 1,022,840 | |
| Total Industrial (Cost $3,923,289) | | | | | | | 4,529,529 | |
| Technology — 9.4% | | | | | | | | |
| Computers — 0.4% | | | | | | | | |
| ExlService Holdings Inc. (a) | | | 497 | | | | 29,994 | |
| Finjan Holdings Inc. (a) | | | 40,479 | | | | 87,434 | |
| | | | | | | | 117,428 | |
| Semiconductors — 3.6% | | | | | | | | |
| Alpha & Omega | | | | | | | | |
Semiconductor Ltd. (a)f | | | 8,195 | | | | 134,070 | |
| Amkor Technology Inc. (a)(b) | | | 16,056 | | | | 161,363 | |
| Cohu Inc. | | | 1,223 | | | | 26,845 | |
| Diodes Inc. (a) | | | 7,382 | | | | 211,642 | |
| inTEST Corp. (a) | | | 10,895 | | | | 94,242 | |
| Kulicke & Soffa Industries Inc. (a) | | | 6,660 | | | | 162,071 | |
Nova Measuring Instruments Ltd. (a)f | | | 2,935 | | | | 76,046 | |
| Photronics Inc. (a) | | | 20,132 | | | | 171,625 | |
| | | | | | | | 1,037,904 | |
| Software — 5.4% | | | | | | | | |
| American Software Inc. | | | 8,610 | | | | 100,134 | |
| Aspen Technology Inc. (a) | | | 5,492 | | | | 363,571 | |
| Cadence Design Systems Inc. (a) | | | 7,948 | | | | 332,385 | |
| MicroStrategy Inc. (a) | | | 1,457 | | | | 191,304 | |
Pointer Telocation Ltd. (a)f | | | 5,204 | | | | 96,794 | |
| Progress Software Corp. (b) | | | 8,007 | | | | 340,858 | |
| QAD Inc. | | | 3,843 | | | | 149,301 | |
| | | | | | | | 1,574,347 | |
| Total Technology | | | | | | | | |
| (Cost $2,298,139) | | | | | | | 2,729,679 | |
| Utilities — 2.8% | | | | | | | | |
| Electric — 2.1% | | | | | | | | |
| AES Corp. | | | 23,673 | | | | 256,379 | |
| Pinnacle West Capital Corp. | | | 293 | | | | 24,958 | |
| Portland General Electric Co. | | | 7,332 | | | | 334,192 | |
| | | | | | | | 615,529 | |
| Gas — 0.7% | | | | | | | | |
| Southwest Gas Corp. | | | 80 | | | | 6,438 | |
| UGI Corp. | | | 4,382 | | | | 205,735 | |
| | | | | | | | 212,173 | |
| Total Utilities (Cost $759,362) | | | | | | | 827,702 | |
| Total Common Stocks | | | | | | | | |
| (Cost $24,327,678) | | | | | | | 27,317,456 | |
| Real Estate Investment Trusts — 5.2% | |
| Ashford Hospitality Trust Inc. | | | 29,546 | | | | 198,844 | |
| DiamondRock Hospitality Co. (b) | | | 23,568 | | | | 266,083 | |
| Gaming and Leisure Properties Inc. | | | 5,474 | | | | 202,538 | |
| Rexford Industrial Realty Inc. | | | 7,793 | | | | 227,244 | |
| Ryman Hospitality Properties Inc. | | | 4,684 | | | | 323,290 | |
| Xenia Hotels & Resorts Inc. | | | 14,171 | | | | 305,952 | |
| | | | | | | | 1,523,951 | |
| Total Real Estate Investment Trusts | | | | | | | | |
| (Cost $1,457,026) | | | | | | | 1,523,951 | |
| Total Long-Term Investments | | | | | | | | |
| (Cost $25,784,704) | | | | | | | 28,841,407 | |
| | | | | | | | | |
| | | Par | | | | | |
| | | Value | | | | | |
| Bank Deposit Account — 1.9% | |
| U.S. Bank N.A., 0.30% | | $ | 567,393 | | | | 567,393 | |
| Total Bank Deposit Account | | | | | | | | |
| (Cost $567,393) | | | | | | | 567,393 | |
The accompanying notes are an integral part of the financial statements.
Schedule of Investments (continued)
Quaker Small-Cap Value Fund
December 31, 2017 (Unaudited)
| | | | | | Fair | |
| | | Units | | | Value | |
| Private Investment Co. Purchased with | |
| Proceeds from Securities Lending — 15.3% | |
| Mount Vernon Liquid Assets | | | | | | |
| Portfolio LLC, 1.60% (c)(d) | | | 4,487,434 | | | $ | 4,487,434 | |
| Total Private Investment Co. Purchased | | | | | | | | |
| with Proceeds from Securities Lending | | | | | | | | |
| (Cost 4,487,434) | | | | | | | 4,487,434 | |
| Total Investments | | | | | | | | |
| (Cost $30,839,531) — 115.9% | | | | | | | 33,896,234 | |
| Liabilities in Excess | | | | | | | | |
| of Other Assets, Net (15.9)% | | | | | | | (4,662,649 | ) |
| Total Net Assets — 100.0% | | | | | | $ | 29,233,585 | |
| (a) | Non-income producing security. |
| (b) | All or a portion of the security is out on loan. The total market value of securities on loan was $4,325,132. The remaining contractual maturity of all of the securities lending transactions is overnight and continuous. |
| (c) | The rate shown is the annualized seven-day yield at period end. |
| (d) | Represents investments of collateral received from securities lending transactions. Refer to Note 10 of Notes to the Financial Statements for additional information. |
| f | Foreign issued security. |
The accompanying notes are an integral part of the financial statements.
Schedule of Investments
Quaker Strategic Growth Fund
December 31, 2017 (Unaudited)
| | | Number | | | Fair | |
| | | of Shares | | | Value | |
| Long-Term Investments — 99.8% | | | | | | |
| Common Stocks — 97.5% | |
| Basic Materials — 5.8% | | | | | | |
| Chemicals — 4.5% | | | | | | |
| AdvanSix Inc. (a) | | | 128 | | | $ | 5,385 | |
| Air Products & Chemicals Inc. | | | 1,750 | | | | 287,140 | |
| Albemarle Corp. (b) | | | 1,450 | | | | 185,440 | |
| DowDuPont Inc. | | | 5,410 | | | | 385,300 | |
| Eastman Chemical Co. | | | 130 | | | | 12,043 | |
| FMC Corp. (b) | | | 12,804 | | | | 1,212,027 | |
LyondellBasell Industries NV f | | | 2,965 | | | | 327,099 | |
| PPG Industries Inc. (b) | | | 2,000 | | | | 233,640 | |
| Praxair Inc. | | | 2,760 | | | | 426,917 | |
| | | | | | | | 3,074,991 | |
| Mining — 1.3% | | | | | | | | |
| Freeport-McMoRan Inc. (a) | | | 26,780 | | | | 507,749 | |
| Newmont Mining Corp. | | | 10,790 | | | | 404,841 | |
| | | | | | | | 912,590 | |
| Total Basic Materials | | | | | | | | |
| (Cost $3,459,379) | | | | | | | 3,987,581 | |
| Communications — 12.0% | | | | | | | | |
| Internet — 9.4% | | | | | | | | |
| Alphabet Inc. Cl A (a) | | | 1,235 | | | | 1,300,949 | |
| Alphabet Inc. Cl C (a) | | | 1,303 | | | | 1,363,459 | |
| Amazon.com Inc. (a) | | | 968 | | | | 1,132,047 | |
| eBay Inc. (a) | | | 15,670 | | | | 591,386 | |
| Facebook Inc. Cl A (a) | | | 9,134 | | | | 1,611,785 | |
| Netflix Inc. (a) | | | 1,022 | | | | 196,183 | |
| The Priceline Group Inc. (a) | | | 150 | | | | 260,661 | |
| VeriSign Inc. (a)(b) | | | 120 | | | | 13,733 | |
| | | | | | | | 6,470,203 | |
| Media — 0.3% | | | | | | | | |
| News Corp. - Cl B | | | 10,596 | | | | 175,894 | |
| Telecommunications — 2.3% | | | | | | | | |
| Cisco Systems Inc. | | | 16,390 | | | | 627,737 | |
| Juniper Networks Inc. | | | 11,100 | | | | 316,350 | |
| LogMeIn Inc. | | | 232 | | | | 26,564 | |
| Motorola Solutions Inc. | | | 2,860 | | | | 258,372 | |
| Verizon Communications Inc. | | | 6,443 | | | | 341,028 | |
| | | | | | | | 1,570,051 | |
| Total Communications | | | | | | | | |
| (Cost $6,938,671) | | | | | | | 8,216,148 | |
| Consumer, Cyclical — 8.7% | | | | | | | | |
| Airlines — 0.6% | | | | | | | | |
| AMR Corp. Escrow (a)*^ | | | 211,235 | | | | 409,796 | |
| Apparel — 0.2% | | | | | | | | |
Michael Kors Holdings Ltd. (a)f | | | 2,370 | | | | 149,191 | |
| Auto Parts & Equipment — 0.1% | | | | | | | | |
| BorgWarner Inc. | | | 1,370 | | | | 69,993 | |
| Home Builders — 0.1% | | | | | | | | |
| DR Horton Inc. | | | 610 | | | | 31,153 | |
| PulteGroup Inc. | | | 640 | | | | 21,280 | |
| | | | | | | | 52,433 | |
| Leisure Time — 0.1% | | | | | | | | |
Royal Caribbean Cruises Ltd. f | | | 770 | | | | 91,845 | |
| Lodging — 0.1% | | | | | | | | |
| Hilton Worldwide Holdings Inc. | | | 600 | | | | 47,916 | |
| Wyndham Worldwide Corp. | | | 170 | | | | 19,698 | |
| | | | | | | | 67,614 | |
| Retail — 6.9% | | | | | | | | |
| Advance Auto Parts Inc. | | | 680 | | | | 67,789 | |
| CVS Health Corp. | | | 14,520 | | | | 1,052,700 | |
| Foot Locker Inc. (b) | | | 9,900 | | | | 464,112 | |
| The Gap Inc. (b) | | | 10 | | | | 341 | |
| The Home Depot Inc. | | | 1,070 | | | | 202,797 | |
| Kohl’s Corp. (b) | | | 4,090 | | | | 221,801 | |
| L Brands Inc. (b) | | | 100 | | | | 6,022 | |
| Lowe’s Cos. Inc. | | | 1,350 | | | | 125,469 | |
| Macy’s Inc. (b) | | | 3,890 | | | | 97,989 | |
| McDonald’s Corp. | | | 6,672 | | | | 1,148,385 | |
| O’Reilly Automotive, Inc. (a)(b) | | | 410 | | | | 98,621 | |
| Tiffany & Co. | | | 1,770 | | | | 183,992 | |
| The TJX Cos. Inc. (b) | | | 1,250 | | | | 95,575 | |
| Ulta Beauty Inc. (a) | | | 100 | | | | 22,366 | |
| Walgreens Boots Alliance Inc. | | | 970 | | | | 70,441 | |
| Wal-Mart Stores Inc. (b) | | | 3,320 | | | | 327,850 | |
| Yum! Brands Inc. | | | 6,546 | | | | 534,219 | |
| | | | | | | | 4,720,469 | |
| Textiles — 0.5% | | | | | | | | |
| Mohawk Industries Inc. (a) | | | 1,100 | | | | 303,490 | |
| Toys/Games & Hobbies — 0.1% | | | | | | | | |
| Hasbro Inc. (b) | | | 700 | | | | 63,623 | |
| Total Consumer, Cyclical | | | | | | | | |
| (Cost $4,879,632) | | | | | | | 5,928,454 | |
The accompanying notes are an integral part of the financial statements.
Schedule of Investments (continued)
Quaker Strategic Growth Fund
December 31, 2017 (Unaudited)
| | | Number | | | Fair | |
| | | of Shares | | | Value | |
| Common Stocks — 97.5% (Continued) | |
| Consumer, Non-cyclical — 16.5% | | | | | | |
| Agriculture — 1.9% | | | | | | |
| Altria Group Inc. | | | 5,693 | | | $ | 406,537 | |
| Philip Morris International Inc. | | | 8,550 | | | | 903,308 | |
| | | | | | | | 1,309,845 | |
| Beverages — 0.8% | | | | | | | | |
| The Coca-Cola Co. (b) | | | 4,990 | | | | 228,941 | |
| PepsiCo Inc. | | | 2,470 | | | | 296,202 | |
| | | | | | | | 525,143 | |
| Biotechnology — 1.3% | | | | | | | | |
| Amgen Inc. | | | 1,345 | | | | 233,896 | |
| Biogen Inc. (a) | | | 860 | | | | 273,970 | |
| Gilead Sciences Inc. | | | 990 | | | | 70,924 | |
| Illumina Inc. (a) | | | 380 | | | | 83,026 | |
| Regeneron Pharmaceuticals Inc. (a) | | | 440 | | | | 165,422 | |
| Vertex Pharmaceuticals Inc. (a) | | | 640 | | | | 95,910 | |
| | | | | | | | 923,148 | |
| Commercial Services — 1.5% | | | | | | | | |
| Cintas Corp. | | | 2,270 | | | | 353,734 | |
| Ecolab Inc. | | | 760 | | | | 101,977 | |
IHS Markit Ltd. (a)f | | | 700 | | | | 31,605 | |
| PayPal Holdings Inc. (a) | | | 385 | | | | 28,344 | |
| Quanta Services Inc. (a) | | | 10,510 | | | | 411,046 | |
| S&P Global Inc. | | | 520 | | | | 88,088 | |
| Verisk Analytics Inc. Cl A (a)(b) | | | 100 | | | | 9,600 | |
| | | | | | | | 1,024,394 | |
| Cosmetics & Personal Care — 0.4% | | | | | | | | |
| The Estee Lauder Cos. Inc. | | | 100 | | | | 12,724 | |
| The Procter & Gamble Co. | | | 3,200 | | | | 294,016 | |
| | | | | | | | 306,740 | |
| Food — 0.2% | | | | | | | | |
| The Hershey Co. | | | 1,030 | | | | 116,915 | |
| Lamb Weston Holdings Inc. | | | 261 | | | | 14,734 | |
| | | | | | | | 131,649 | |
| Healthcare-Products — 4.5% | | | | | | | | |
| Abbott Laboratories | | | 20 | | | | 1,142 | |
| Align Technology Inc. (a) | | | 520 | | | | 115,539 | |
| Baxter International Inc. | | | 5,000 | | | | 323,200 | |
| Becton Dickinson and Co. (b) | | | 1,618 | | | | 346,349 | |
| Boston Scientific Corp. (a) | | | 8,370 | | | | 207,492 | |
| The Cooper Cos. Inc. (b) | | | 2,297 | | | | 500,470 | |
| Danaher Corp. | | | 4,920 | | | | 456,674 | |
| Edwards Lifesciences Corp. (a) | | | 3,380 | | | | 380,960 | |
| IDEXX Laboratories Inc. (a) | | | 2,130 | | | | 333,089 | |
| Intuitive Surgical Inc. (a) | | | 320 | | | | 116,781 | |
| Patterson Cos. Inc. (b) | | | 3,690 | | | | 133,320 | |
| Thermo Fisher Scientific Inc. | | | 970 | | | | 184,184 | |
| | | | | | | | 3,099,200 | |
| Healthcare-Services — 1.0% | | | | | | | | |
| Aetna Inc. | | | 230 | | | | 41,490 | |
| Anthem Inc. | | | 250 | | | | 56,253 | |
| Centene Corp. (a) | | | 263 | | | | 26,531 | |
| Cigna Corp. | | | 1,390 | | | | 282,295 | |
| UnitedHealth Group Inc. | | | 1,120 | | | | 246,915 | |
| | | | | | | | 653,484 | |
| Household Products & Wares — 0.3% | | | | | | | | |
| Avery Dennison Corp. | | | 80 | | | | 9,189 | |
| Kimberly-Clark Corp. | | | 1,660 | | | | 200,295 | |
| | | | | | | | 209,484 | |
| Pharmaceuticals — 4.6% | | | | | | | | |
| Bristol-Myers Squibb Co. | | | 11,520 | | | | 705,946 | |
| Eli Lilly & Co. | | | 5,601 | | | | 473,061 | |
| Express Scripts Holding Co. (a) | | | 2,425 | | | | 181,002 | |
| Johnson & Johnson | | | 7,370 | | | | 1,029,736 | |
| Merck & Co. Inc. | | | 4,990 | | | | 280,787 | |
| Pfizer Inc. | | | 8,090 | | | | 293,020 | |
| Zoetis Inc. (b) | | | 2,380 | | | | 171,455 | |
| | | | | | | | 3,135,007 | |
| Total Consumer, Non-cyclical | | | | | | | | |
| (Cost $10,346,043) | | | | | | | 11,318,094 | |
| Diversified — 0.4% | | | | | | | | |
| Holding Companies — 0.4% | | | | | | | | |
| Leucadia National Corp. | | | 9,670 | | | | 256,158 | |
| Total Diversified (Cost $179,287) | | | | | | | 256,158 | |
| Energy — 4.6% | | | | | | | | |
| Oil & Gas — 3.8% | | | | | | | | |
| Cabot Oil & Gas Corp. | | | 6,480 | | | | 185,328 | |
| Chevron Corp. | | | 5,712 | | | | 715,085 | |
| Cimarex Energy Co. | | | 1,000 | | | | 122,010 | |
| Devon Energy Corp. | | | 1,300 | | | | 53,820 | |
| Exxon Mobil Corp. | | | 12,890 | | | | 1,078,120 | |
| Marathon Petroleum Corp. | | | 200 | | | | 13,196 | |
| Newfield Exploration Co. (a) | | | 2,280 | | | | 71,888 | |
Transocean Ltd. (a)(b)f | | | 24,200 | | | | 258,456 | |
| Valero Energy Corp. | | | 860 | | | | 79,043 | |
| | | | | | | | 2,576,946 | |
The accompanying notes are an integral part of the financial statements.
Schedule of Investments (continued)
Quaker Strategic Growth Fund
December 31, 2017 (Unaudited)
| | | Number | | | Fair | |
| | | of Shares | | | Value | |
| Common Stocks — 97.5% (Continued) | |
| Oil & Gas Services — 0.8% | | | | | | |
| Baker Hughes a GE Co. (b) | | | 2,000 | | | $ | 63,280 | |
| Halliburton Co. | | | 9,924 | | | | 484,986 | |
| | | | | | | | 548,266 | |
| Total Energy (Cost $2,899,724) | | | | | | | 3,125,212 | |
| Financial — 18.1% | | | | | | | | |
| Banks — 7.3% | | | | | | | | |
| Bank of America Corp. | | | 37,475 | | | | 1,106,262 | |
| Capital One Financial Corp. | | | 8,931 | | | | 889,349 | |
| Citigroup Inc. | | | 4,450 | | | | 331,125 | |
| Comerica, Inc. | | | 2,620 | | | | 227,442 | |
| Fifth Third Bancorp (b) | | | 2,300 | | | | 69,782 | |
| The Goldman Sachs Group Inc. | | | 400 | | | | 101,904 | |
| JPMorgan Chase & Co. | | | 7,391 | | | | 790,394 | |
| Morgan Stanley | | | 12,340 | | | | 647,480 | |
| Northern Trust Corp. | | | 600 | | | | 59,934 | |
| The PNC Financial Services Group Inc. | | | 1,100 | | | | 158,719 | |
| State Street Corp. | | | 700 | | | | 68,327 | |
| SunTrust Banks Inc. (b) | | | 1,760 | | | | 113,678 | |
| Wells Fargo & Co. | | | 7,690 | | | | 466,552 | |
| | | | | | | | 5,030,948 | |
| Diversified Financial Services — 5.0% | | | | | | | | |
| Affiliated Managers Group Inc. | | | 420 | | | | 86,205 | |
| American Express Co. | | | 3,350 | | | | 332,688 | |
| Discover Financial Services | | | 1,930 | | | | 148,455 | |
| E*TRADE Financial Corp. (a) | | | 1,280 | | | | 63,450 | |
| Franklin Resources Inc. | | | 25,870 | | | | 1,120,947 | |
| Intercontinental Exchange Inc. | | | 1,680 | | | | 118,541 | |
| Mastercard Inc. Cl A (b) | | | 3,455 | | | | 522,949 | |
| Raymond James Financial Inc. | | | 350 | | | | 31,255 | |
| Synchrony Financial | | | 11,920 | | | | 460,231 | |
| Visa Inc. Cl A | | | 4,640 | | | | 529,053 | |
| | | | | | | | 3,413,774 | |
| Insurance — 5.4% | | | | | | | | |
| Aflac Inc. (b) | | | 6,160 | | | | 540,725 | |
Aon PLC f | | | 280 | | | | 37,520 | |
| Assurant Inc. | | | 100 | | | | 10,084 | |
| Berkshire Hathaway Inc. Cl B (a) | | | 3,920 | | | | 777,022 | |
Chubb Ltd. f | | | 3,175 | | | | 463,963 | |
| Cincinnati Financial Corp. | | | 860 | | | | 64,474 | |
Everest Re Group Ltd. f | | | 1,890 | | | | 418,181 | |
| The Progressive Corp. | | | 9,630 | | | | 542,361 | |
| Torchmark Corp. | | | 2,800 | | | | 253,988 | |
| The Travelers Cos. Inc. | | | 1,740 | | | | 236,014 | |
| Unum Group | | | 3,400 | | | | 186,626 | |
XL Group Ltd. f | | | 4,510 | | | | 158,572 | |
| | | | | | | | 3,689,530 | |
| Real Estate — 0.2% | | | | | | | | |
| CBRE Group Inc. (a) | | | 2,250 | | | | 97,448 | |
| Savings & Loans — 0.2% | | | | | | | | |
| People’s United Financial Inc. | | | 8,170 | | | | 152,779 | |
| Total Financial (Cost $9,960,089) | | | | | | | 12,384,479 | |
| Industrial — 11.6% | | | | | | | | |
| Aerospace & Defense — 2.9% | | | | | | | | |
| Arconic Inc. (b) | | | 110 | | | | 2,997 | |
| The Boeing Co. | | | 950 | | | | 280,164 | |
| General Dynamics Corp. | | | 840 | | | | 170,898 | |
| L3 Technologies Inc. | | | 730 | | | | 144,431 | |
| Lockheed Martin Corp. | | | 280 | | | | 89,894 | |
| Northrop Grumman Corp. | | | 2,200 | | | | 675,202 | |
| Raytheon Co. | | | 2,850 | | | | 535,373 | |
| United Technologies Corp. | | | 620 | | | | 79,093 | |
| | | | | | | | 1,978,052 | |
| Electrical Components & Equipment — 0.3% | | | | | | | | |
| AMETEK Inc. | | | 2,950 | | | | 213,786 | |
| Electronics — 2.7% | | | | | | | | |
| Agilent Technologies Inc. | | | 2,507 | | | | 167,894 | |
Allegion PLC f | | | 1,500 | | | | 119,340 | |
| Amphenol Corp. | | | 1,710 | | | | 150,138 | |
| Fortive Corp. (b) | | | 2,029 | | | | 146,798 | |
Garmin Ltd. f | | | 3,020 | | | | 179,901 | |
| Honeywell International Inc. | | | 5,060 | | | | 776,002 | |
| Mettler-Toledo International Inc. (a) | | | 357 | | | | 221,169 | |
| Waters Corp. (a) | | | 460 | | | | 88,867 | |
| | | | | | | | 1,850,109 | |
| Engineering & Construction — 0.0% | | | | | | | | |
| Jacobs Engineering Group Inc. | | | 500 | | | | 32,980 | |
| Environmental Control — 0.3% | | | | | | | | |
| Waste Management Inc. | | | 2,642 | | | | 228,005 | |
| Hand & Machine Tools — 0.2% | | | | | | | | |
| Stanley Black & Decker Inc. | | | 710 | | | | 120,480 | |
| Machinery-Construction & Mining — 0.1% | | | | | | | | |
| Caterpillar Inc. | | | 530 | | | | 83,517 | |
The accompanying notes are an integral part of the financial statements.
Schedule of Investments (continued)
Quaker Strategic Growth Fund
December 31, 2017 (Unaudited)
| | | Number | | | Fair | |
| | | of Shares | | | Value | |
| Common Stocks — 97.5% (Continued) | |
| Machinery-Diversified — 2.9% | | | | | | |
| Cummins Inc. | | | 3,367 | | | $ | 594,747 | |
| Deere & Co. | | | 7,470 | | | | 1,169,130 | |
| Rockwell Automation Inc. | | | 1,000 | | | | 196,350 | |
| | | | | | | | 1,960,227 | |
| Miscellaneous Manufacturing — 1.4% | | | | | | | | |
| 3M Co. | | | 1,450 | | | | 341,286 | |
| AO Smith Corp. | | | 1,120 | | | | 68,634 | |
Eaton Corp. PLC f | | | 2,000 | | | | 158,020 | |
| Illinois Tool Works Inc. | | | 200 | | | | 33,370 | |
Ingersoll-Rand PLC f | | | 2,450 | | | | 218,516 | |
| Parker-Hannifin Corp. | | | 500 | | | | 99,790 | |
Pentair PLC f | | | 597 | | | | 42,160 | |
| | | | | | | | 961,776 | |
| Packaging & Containers — 0.1% | | | | | | | | |
| Packaging Corp. of America | | | 490 | | | | 59,070 | |
| Transportation — 0.7% | | | | | | | | |
| Expeditors International | | | | | | | | |
| of Washington Inc. | | | 2,260 | | | | 146,199 | |
| Kansas City Southern (b) | | | 100 | | | | 10,522 | |
| Union Pacific Corp. | | | 2,380 | | | | 319,158 | |
| | | | | | | | 475,879 | |
| Total Industrial (Cost $6,494,746) | | | | | | | 7,963,881 | |
| Technology — 17.9% | | | | | | | | |
| Computers — 6.1% | | | | | | | | |
Accenture PLC Cl A f | | | 1,100 | | | | 168,399 | |
| Apple Inc. | | | 23,140 | | | | 3,915,982 | |
| Cognizant Technology | | | | | | | | |
| Solutions Corp. (b) | | | 580 | | | | 41,192 | |
| HP Inc. | | | 140 | | | | 2,942 | |
| Western Digital Corp. | | | 680 | | | | 54,080 | |
| | | | | | | | 4,182,595 | |
| Semiconductors — 4.4% | | | | | | | | |
| Analog Devices Inc. (b) | | | 400 | | | | 35,612 | |
| Applied Materials Inc. (b) | | | 2,170 | | | | 110,930 | |
Broadcom Ltd. f | | | 1,441 | | | | 370,193 | |
| Intel Corp. (b) | | | 29,110 | | | | 1,343,718 | |
| Lam Research Corp. | | | 220 | | | | 40,495 | |
| Micron Technology Inc. (a) | | | 9,879 | | | | 406,225 | |
| Skyworks Solutions Inc. (b) | | | 2,340 | | | | 222,183 | |
| Texas Instruments Inc. (b) | | | 2,600 | | | | 271,544 | |
| Xilinx Inc. (b) | | | 3,600 | | | | 242,712 | |
| | | | | | | | 3,043,612 | |
| Software — 7.4% | | | | | | | | |
| Activision Blizzard Inc. | | | 200 | | | | 12,664 | |
| Adobe Systems Inc. (a) | | | 701 | | | | 122,843 | |
| ANSYS Inc. (a) | | | 110 | | | | 16,235 | |
| Autodesk Inc. (a) | | | 940 | | | | 98,540 | |
| CA Inc. | | | 2,980 | | | | 99,174 | |
| Citrix Systems Inc. (a) | | | 1,870 | | | | 164,560 | |
| The Dun & Bradstreet Corp. | | | 7,950 | | | | 941,360 | |
| Electronic Arts Inc. (a) | | | 3,190 | | | | 335,141 | |
| Fiserv Inc. (a) | | | 270 | | | | 35,405 | |
| Microsoft Corp. | | | 25,660 | | | | 2,194,956 | |
| Oracle Corp. | | | 4,700 | | | | 222,216 | |
| Paychex Inc. | | | 5,500 | | | | 374,440 | |
| salesforce.com Inc. (a) | | | 2,390 | | | | 244,330 | |
| Synopsys Inc. (a) | | | 2,340 | | | | 199,462 | |
| | | | | | | | 5,061,326 | |
| Total Technology | | | | | | | | |
| (Cost $9,533,247) | | | | | | | 12,287,533 | |
| Utilities — 1.9% | | | | | | | | |
| Electric — 1.9% | | | | | | | | |
| Ameren Corp. | | | 4,000 | | | | 235,960 | |
| American Electric Power Co. Inc. | | | 850 | | | | 62,535 | |
| CenterPoint Energy Inc. | | | 9,220 | | | | 261,479 | |
| DTE Energy Co. | | | 700 | | | | 76,622 | |
| Eversource Energy (b) | | | 500 | | | | 31,590 | |
| NextEra Energy Inc. | | | 1,000 | | | | 156,190 | |
| NRG Energy Inc. (b) | | | 5,280 | | | | 150,374 | |
| Pinnacle West Capital Corp. | | | 1,400 | | | | 119,252 | |
| PPL Corp. | | | 6,700 | | | | 207,365 | |
| | | | | | | | 1,301,367 | |
| Gas — 0.0% | | | | | | | | |
| Sempra Energy (b) | | | 200 | | | | 21,384 | |
| Total Utilities | | | | | | | | |
| (Cost $1,181,677) | | | | | | | 1,322,751 | |
| Total Common Stocks | | | | | | | | |
| (Cost $55,872,495) | | | | | | | 66,790,291 | |
The accompanying notes are an integral part of the financial statements.
Schedule of Investments (continued)
Quaker Strategic Growth Fund
December 31, 2017 (Unaudited)
| | | Number | | | Fair | |
| | | of Shares | | | Value | |
| Real Estate Investment Trusts — 2.3% | |
| American Tower Corp. | | | 3,630 | | | $ | 517,892 | |
| AvalonBay Communities Inc. | | | 1,580 | | | | 281,888 | |
| Equinix Inc. (b) | | | 748 | | | | 339,008 | |
| Equity Residential | | | 3,270 | | | | 208,528 | |
| Public Storage (b) | | | 270 | | | | 56,430 | |
| SBA Communications Corp. (a) | | | 920 | | | | 150,291 | |
| UDR Inc. | | | 1,330 | | | | 51,232 | |
| | | | | | | | 1,605,269 | |
| Total Real Estate Investment Trusts | | | | | | | | |
| (Cost $1,622,619) | | | | | | | 1,605,269 | |
| Total Long-Term Investments | | | | | | | | |
| (Cost $57,495,114) | | | | | | | 68,395,560 | |
| | | Par | | | | | |
| | | Value | | | | | |
| Bank Deposit Account — 0.4% | | | | | | | | |
| U.S. Bank N.A., 0.30% | | $ | 258,383 | | | | 258,383 | |
| Total Bank Deposit Account | | | | | | | | |
| (Cost $258,383) | | | | | | | 258,383 | |
| | | Units | | | | | |
| Private Investment Co. Purchased with | |
| Proceeds from Securities Lending — 10.7% | |
| Mount Vernon Liquid Assets | | | | | | | | |
| Portfolio LLC, 1.60% (c)(d) | | | 7,351,293 | | | | 7,351,293 | |
| Total Private Investment Co. Purchased | | | | | | | | |
| with Proceeds from Securities Lending | | | | | | | | |
| (Cost 7,351,293) | | | | | | | 7,351,293 | |
| Total Investments | | | | | | | | |
| (Cost $65,104,790) — 110.9% | | | | | | | 76,005,236 | |
| Liabilities in Excess | | | | | | | | |
| of Other Assets, Net (10.9)% | | | | | | | (7,474,403 | ) |
| Total Net Assets — 100.0% | | | | | | $ | 68,530,833 | |
| (a) | Non-income producing security. |
| (b) | All or a portion of the security is out on loan. The total market value of securities on loan was $7,166,681. The remaining contractual maturity of all of the securities lending transactions is overnight and continuous. |
| (c) | The rate shown is the annualized seven-day yield at period end. |
| (d) | Represents investments of collateral received from securities lending transactions. Refer to Note 10 of Notes to the Financial Statements for additional information. |
| f | Foreign issued security. |
| * | Indicates an illiquid security. Total market value for illiquid securities is $409,796, representing 0.6% of net assets. |
| ^ | Indicates a fair valued security. Total market value for fair valued securities is $409,796, representing 0.6% of net assets and Level 3 securities. Refer to Note 2 of Notes to Financial Statements for additional information. |
The accompanying notes are an integral part of the financial statements.
Statements of Assets and Liabilities
December 31, 2017 (unaudited)
| | | | | | Quaker Global | | | Quaker | | | Quaker | | | Quaker | |
| | | Quaker Event | | | Tactical | | | Mid-Cap | | | Small-Cap | | | Strategic | |
| | | Arbitrage Fund | | | Allocation Fund | | | Value Fund | | | Value Fund | | | Growth Fund | |
| ASSETS: | |
| Investments, at value (Note 10) | | $ | 18,552,553 | | | $ | 6,471,500 | | | $ | 8,627,048 | | | $ | 33,896,234 | | | $ | 76,005,236 | |
| Cash | | | 149,002 | | | | — | | | | — | | | | — | | | | — | |
| Foreign currency, at value | | | 1,343,472 | | | | — | | | | — | | | | — | | | | — | |
| Cash held at brokers for short sales | | | 1,714,558 | | | | — | | | | — | | | | — | | | | — | |
| Receivables: | | | | | | | | | | | | | | | | | | | | |
| Dividends and interest | | | 48,998 | | | | 34,374 | | | | 11,914 | | | | 30,824 | | | | 75,394 | |
| Capital shares sold | | | 8,057 | | | | 9,316 | | | | 82 | | | | 306 | | | | 1,246 | |
| Investment securities sold | | | 4,338,326 | | | | — | | | | — | | | | 60,273 | | | | — | |
| Securities lending income, net | | | 140 | | | | — | | | | 470 | | | | 1,679 | | | | 849 | |
| Prepaid expenses and other assets | | | 39,734 | | | | 9,400 | | | | 9,847 | | | | 39,742 | | | | 99,581 | |
| Total assets | | | 26,194,840 | | | | 6,524,590 | | | | 8,649,361 | | | | 34,029,058 | | | | 76,182,306 | |
| | | | | | | | | | | | | | | | | | | | | |
| LIABILITIES: | |
| Written options, at value | | $ | 130,320 | | | $ | — | | | $ | — | | | $ | — | | | $ | — | |
| Securities sold short, at value | | | 1,812,026 | | | | — | | | | — | | | | — | | | | — | |
| Payables: | | | | | | | | | | | | | | | | | | | | |
| Due to advisor (Note 3) | | | 1,767 | | | | 2,482 | | | | 6,339 | | | | 23,743 | | | | 52,152 | |
| Capital shares redeemed | | | 60,593 | | | | 151,368 | | | | 143 | | | | 106 | | | | 104,864 | |
| Upon return of securities loaned | | | 1,629,245 | | | | — | | | | 1,492,470 | | | | 4,487,434 | | | | 7,351,293 | |
| Investment securities purchased | | | — | | | | — | | | | — | | | | 237,475 | | | | — | |
| Distribution fees | | | 6,975 | | | | 2,364 | | | | 3,091 | | | | 2,178 | | | | 26,953 | |
| Trustee expenses | | | 5,183 | | | | 1,195 | | | | 1,196 | | | | 5,079 | | | | 12,759 | |
| Chief compliance officer fees | | | 3,807 | | | | 713 | | | | 724 | | | | 2,681 | | | | 7,912 | |
| Accrued expenses | | | 47,111 | | | | 9,619 | | | | 9,386 | | | | 36,777 | | | | 95,540 | |
| Total liabilities | | | 3,697,027 | | | | 167,741 | | | | 1,513,349 | | | | 4,795,473 | | | | 7,651,473 | |
| Net assets | | $ | 22,497,813 | | | $ | 6,356,849 | | | $ | 7,136,012 | | | $ | 29,233,585 | | | $ | 68,530,833 | |
The accompanying notes are an integral part of the financial statements.
Statements of Assets and Liabilities (continued)
December 31, 2017 (unaudited)
| | | | | | Quaker Global | | | Quaker | | | Quaker | | | Quaker | |
| | | Quaker Event | | | Tactical | | | Mid-Cap | | | Small-Cap | | | Strategic | |
| | | Arbitrage Fund | | | Allocation Fund | | | Value Fund | | | Value Fund | | | Growth Fund | |
| NET ASSETS CONSIST OF: | |
| Paid-in capital | | $ | 34,052,369 | | | $ | 9,050,489 | | | $ | 6,219,453 | | | $ | 25,174,755 | | | $ | 218,994,050 | |
| Accumulated net investment income (loss) | | | (680,170 | ) | | | 39,109 | | | | (63,203 | ) | | | (133,621 | ) | | | (222,163 | ) |
| Accumulated net realized | | | | | | | | | | | | | | | | | | | | |
| gain (loss) on investments | | | (5,478,518 | ) | | | (2,817,120 | ) | | | (686,596 | ) | | | 1,135,738 | | | | (161,141,500 | ) |
| Net unrealized appreciation (depreciation) | | | | | | | | | | | | | | | | | | | | |
| on investments: | | | | | | | | | | | | | | | | | | | | |
| Investments | | | (4,924,039 | ) | | | 84,370 | | | | 1,666,358 | | | | 3,056,703 | | | | 10,900,446 | |
| Securities sold short | | | (439,300 | ) | | | — | | | | — | | | | — | | | | — | |
| Written option contracts | | | (29,138 | ) | | | — | | | | — | | | | — | | | | — | |
| Foreign currency transactions | | | (3,391 | ) | | | 1 | | | | — | | | | 10 | | | | — | |
| Total net assets | | $ | 22,497,813 | | | $ | 6,356,849 | | | $ | 7,136,012 | | | $ | 29,233,585 | | | $ | 68,530,833 | |
| Total investments, at cost | | $ | 23,476,592 | | | $ | 6,387,130 | | | $ | 6,960,690 | | | $ | 30,839,531 | | | $ | 65,104,790 | |
| Includes loaned securities | | | | | | | | | | | | | | | | | | | | |
| with a market value of | | $ | 1,629,245 | | | $ | — | | | $ | 1,451,889 | | | $ | 4,325,132 | | | $ | 7,166,681 | |
| Total foreign currency, at cost | | $ | 1,345,052 | | | $ | — | | | $ | — | | | $ | — | | | $ | — | |
| Proceeds from securities sold short | | | 1,372,726 | | | | — | | | | — | | | | — | | | | — | |
| Premiums on written options | | | 101,182 | | | | — | | | | — | | | | — | | | | — | |
| Class A shares: | | | | | | | | | | | | | | | | | | | | |
| Net assets | | $ | 9,062,376 | | | $ | 1,462,002 | | | $ | 4,043,644 | | | $ | 5,584,683 | | | $ | 47,460,638 | |
Shares of beneficial interest outstanding(1) | | | 709,633 | | | | 135,115 | | | | 129,054 | | | | 248,881 | | | | 1,548,915 | |
| Net asset value per share and | | | | | | | | | | | | | | | | | | | | |
| redemption price per share | | $ | 12.77 | | | $ | 10.82 | | | $ | 31.33 | | | $ | 22.44 | | | $ | 30.64 | |
| Offering price per share | | | | | | | | | | | | | | | | | | | | |
| (100/94.50 x net asset value per share) | | $ | 13.51 | | | $ | 11.45 | | | $ | 33.15 | | | $ | 23.75 | | | $ | 32.42 | |
| Class C shares: | | | | | | | | | | | | | | | | | | | | |
| Net assets | | $ | 2,492,072 | | | $ | 908,251 | | | $ | 1,564,119 | | | $ | 1,243,097 | | | $ | 11,965,528 | |
Shares of beneficial interest outstanding(1) | | | 202,737 | | | | 90,278 | | | | 58,012 | | | | 72,580 | | | | 453,721 | |
| Net asset value per share and | | | | | | | | | | | | | | | | | | | | |
| redemption price per share | | $ | 12.29 | | | $ | 10.06 | | | $ | 26.96 | | | $ | 17.13 | | | $ | 26.37 | |
| Institutional Class Shares: | | | | | | | | | | | | | | | | | | | | |
| Net assets | | $ | 10,943,365 | | | $ | 3,986,596 | | | $ | 1,528,249 | | | $ | 22,405,805 | | | $ | 9,104,667 | |
Shares of beneficial interest outstanding(1) | | | 850,352 | | | | 318,335 | | | | 46,186 | | | | 935,612 | | | | 283,881 | |
| Net asset value per share and | | | | | | | | | | | | | | | | | | | | |
| redemption price per share | | $ | 12.87 | | | $ | 12.52 | | | $ | 33.09 | | | $ | 23.95 | | | $ | 32.07 | |
(1) | Unlimited number of shares of beneficial interest with a 0.01 par value authorized. |
The accompanying notes are an integral part of the financial statements.
Statements of Operations
For the Six-Month Period Ended December 31, 2017 (unaudited)
| | | | | | Quaker Global | | | Quaker | | | Quaker | | | Quaker | |
| | | Quaker Event | | | Tactical | | | Mid-Cap | | | Small-Cap | | | Strategic | |
| | | Arbitrage Fund | | | Allocation Fund | | | Value Fund | | | Value Fund | | | Growth Fund | |
| INVESTMENT INCOME (LOSS) | |
| Income: | | | | | | | | | | | | | | | |
| Dividends (net of foreign withholding taxes) | | $ | 64,831 | | | $ | 42,745 | | | $ | 55,785 | | | $ | 164,765 | | | $ | 619,984 | |
| Interest | | | (73,829 | )(1) | | | 66,019 | | | | 291 | | | | 289 | | | | 262 | |
| Securities lending income, net | | | 1,277 | | | | — | | | | 2,864 | | | | 9,484 | | | | 6,738 | |
| Total Income | | | (7,721 | ) | | | 108,764 | | | | 58,940 | | | | 174,538 | | | | 626,984 | |
Expenses: | | | | | | | | | | | | | | | | | | | | |
| Investment advisory fees (Note 3) | | | 170,379 | | | | 25,396 | | | | 37,414 | | | | 138,348 | | | | 313,478 | |
| Funds administration and accounting fees | | | 36,007 | | | | 12,123 | | | | 9,229 | | | | 36,467 | | | | 82,281 | |
| Transfer agent fees | | | 57,633 | | | | 9,795 | | | | 11,150 | | | | 30,033 | | | | 113,287 | |
| Custody fees | | | 8,284 | | | | 478 | | | | 912 | | | | 8,113 | | | | 7,030 | |
| Trustee fees | | | 10,091 | | | | 2,415 | | | | 2,533 | | | | 10,048 | | | | 25,325 | |
| Legal fees | | | 8,962 | | | | 1,647 | | | | 1,712 | | | | 6,886 | | | | 17,295 | |
| Audit fees | | | 7,370 | | | | 1,821 | | | | 1,891 | | | | 7,607 | | | | 19,119 | |
| Distribution fee — Class A | | | 13,621 | | | | 2,035 | | | | 5,084 | | | | 7,560 | | | | 61,421 | |
| Distribution fee — Class C | | | 14,690 | | | | 4,775 | | | | 7,682 | | | | 6,314 | | | | 62,251 | |
| Insurance | | | 15,035 | | | | 3,496 | | | | 3,643 | | | | 14,817 | | | | 37,100 | |
| Officers’ compensation fees | | | 18,225 | | | | 4,366 | | | | 4,536 | | | | 18,219 | | | | 45,961 | |
| Registration and filing expenses | | | 18,985 | | | | 4,276 | | | | 4,503 | | | | 18,521 | | | | 46,925 | |
| Printing expenses | | | 4,352 | | | | 1,467 | | | | 1,509 | | | | 4,188 | | | | 10,941 | |
| Dividends and interest on securities sold short | | | 2,403 | | | | — | | | | — | | | | — | | | | — | |
| Other operating expenses | | | 1,146 | | | | 965 | | | | 922 | | | | 1,038 | | | | 1,102 | |
| Total expenses | | | 387,183 | | | | 75,055 | | | | 92,720 | | | | 308,159 | | | | 843,516 | |
| Investment advisory fees | | | | | | | | | | | | | | | | | | | | |
| reimbursed (Note 3) | | | (130,825 | ) | | | (10,159 | ) | | | — | | | | — | | | | — | |
| Net expenses | | | 256,358 | | | | 64,896 | | | | 92,720 | | | | 308,159 | | | | 843,516 | |
| Net investment income (loss) | | | (264,079 | ) | | | 43,868 | | | | (33,780 | ) | | | (133,621 | ) | | | (216,532 | ) |
(1) | Negative interest is due to the bankruptcy of a security and final disposition is unknown. |
The accompanying notes are an integral part of the financial statements.
Statements of Operations (continued)
For the Six-Month Period Ended December 31, 2017 (unaudited)
| | | | | | Quaker Global | | | Quaker | | | Quaker | | | Quaker | |
| | | Quaker Event | | | Tactical | | | Mid-Cap | | | Small-Cap | | | Strategic | |
| | | Arbitrage Fund | | | Allocation Fund | | | Value Fund | | | Value Fund | | | Growth Fund | |
| REALIZED AND UNREALIZED GAIN (LOSS) ON INVESTMENTS | |
| Net realized gain (loss) on investments: | | | | | | | | | | | | | | | |
| Securities | | $ | 1,086,109 | | | $ | 14,875 | | | $ | 492,285 | | | $ | 1,930,182 | | | $ | 3,680,488 | |
| Securities sold short | | | (176,213 | ) | | | — | | | | — | | | | — | | | | — | |
| Written options | | | 168,649 | | | | — | | | | — | | | | — | | | | — | |
| Foreign currency transactions | | | 34,242 | | | | 13 | | | | — | | | | (15 | ) | | | — | |
| Net realized gain (loss) on investments | | | 1,112,787 | | | | 14,888 | | | | 492,285 | | | | 1,930,167 | | | | 3,680,488 | |
| Net change in unrealized appreciation | | | | | | | | | | | | | | | | | | | | |
| (depreciation) of investments: | | | | | | | | | | | | | | | | | | | | |
| Securities | | | (321,141 | ) | | | 64,573 | | | | 317,114 | | | | 508,233 | | | | 3,195,868 | |
| Securities sold short | | | (198,201 | ) | | | — | | | | — | | | | — | | | | — | |
| Written options | | | 76,512 | | | | — | | | | — | | | | — | | | | — | |
| Foreign currency transactions | | | (7,262 | ) | | | (1 | ) | | | — | | | | (2 | ) | | | — | |
| Net change in unrealized appreciation | | | | | | | | | | | | | | | | | | | | |
| (depreciation) of investments | | | (450,092 | ) | | | 64,572 | | | | 317,114 | | | | 508,231 | | | | 3,195,868 | |
| Net realized and unrealized | | | | | | | | | | | | | | | | | | | | |
| gain (loss) on investments | | | 662,695 | | | | 79,460 | | | | 809,399 | | | | 2,438,398 | | | | 6,876,356 | |
| Net increase (decrease) in net | | | | | | | | | | | | | | | | | | | | |
| assets resulting from operations | | $ | 398,616 | | | $ | 123,328 | | | $ | 775,619 | | | $ | 2,304,777 | | | $ | 6,659,824 | |
| (Foreign withholding taxes on | | | | | | | | | | | | | | | | | | | | |
| dividends/tax reclaims/interest) | | $ | (2,702 | ) | | $ | (230 | ) | | $ | — | | | $ | (690 | ) | | $ | — | |
The accompanying notes are an integral part of the financial statements.
Statements of Changes in Net Assets
For the Six-Month Period Ended December 31, 2017 (unaudited)
| | | | | | Quaker Global | | | Quaker | | | Quaker | | | Quaker | |
| | | Quaker Event | | | Tactical | | | Mid-Cap | | | Small-Cap | | | Strategic | |
| | | Arbitrage Fund | | | Allocation Fund | | | Value Fund | | | Value Fund | | | Growth Fund | |
| INCREASE (DECREASE) IN NET ASSETS | |
| Operations: | | | | | | | | | | | | | | | |
| Net investment income (loss) | | $ | (264,079 | ) | | $ | 43,868 | | | $ | (33,780 | ) | | $ | (133,621 | ) | | $ | (216,532 | ) |
| Net realized gain (loss) on | | | | | | | | | | | | | | | | | | | | |
| investment transactions: | | | | | | | | | | | | | | | | | | | | |
| Securities | | | 1,086,109 | | | | 14,875 | | | | 492,285 | | | | 1,930,182 | | | | 3,680,488 | |
| Securities sold short | | | (176,213 | ) | | | — | | | | — | | | | — | | | | — | |
| Written options | | | 168,649 | | | | — | | | | — | | | | — | | | | — | |
| Foreign currency transactions | | | 34,242 | | | | 13 | | | | — | | | | (15 | ) | | | — | |
| Net change in unrealized appreciation | | | | | | | | | | | | | | | | | | | | |
| (depreciation) of investment transactions: | | | | | | | | | | | | | | | | | | | | |
| Securities | | | (321,141 | ) | | | 64,573 | | | | 317,114 | | | | 508,233 | | | | 3,195,868 | |
| Securities sold short | | | (198,201 | ) | | | — | | | | — | | | | — | | | | — | |
| Written options | | | 76,512 | | | | — | | | | — | | | | — | | | | — | |
| Foreign currency transactions | | | (7,262 | ) | | | (1 | ) | | | — | | | | (2 | ) | | | — | |
| Net increase (decrease) in net | | | | | | | | | | | | | | | | | | | | |
| assets resulting from operations | | | 398,616 | | | | 123,328 | | | | 775,619 | | | | 2,304,777 | | | | 6,659,824 | |
| Distributions to shareholders from: | | | | | | | | | | | | | | | | | | | | |
| Net investment income — Class A | | | (344,719 | ) | | | — | | | | — | | | | — | | | | — | |
| Net investment income — Class C | | | (75,017 | ) | | | — | | | | — | | | | — | | | | — | |
| Net investment income — Institutional Class | | | (448,777 | ) | | | — | | | | — | | | | — | | | | — | |
| Net realized capital gain — Class A | | | — | | | | — | | | | — | | | | (816,102 | ) | | | — | |
| Net realized capital gain — Class C | | | — | | | | — | | | | — | | | | (221,639 | ) | | | — | |
| Net realized capital gain — Institutional Class | | | — | | | | — | | | | — | | | | (3,013,329 | ) | | | — | |
| Total distributions | | | (868,513 | ) | | | — | | | | — | | | | (4,051,070 | ) | | | — | |
| Capital share transactions: | | | | | | | | | | | | | | | | | | | | |
| Increase (decrease) in net assets | | | | | | | | | | | | | | | | | | | | |
| from fund share transactions (Note 7) | | | (6,733,382 | ) | | | (560,099 | ) | | | (728,414 | ) | | | 2,291,533 | | | | (9,679,541 | ) |
| Total increase (decrease) in net assets | | | (7,203,279 | ) | | | (436,771 | ) | | | 47,205 | | | | 545,240 | | | | (3,019,717 | ) |
| | | | | | | | | | | | | | | | | | | | | |
| NET ASSETS | |
| Beginning of period | | | 29,701,092 | | | | 6,793,620 | | | | 7,088,807 | | | | 28,688,345 | | | | 71,550,550 | |
| End of period | | $ | 22,497,813 | | | $ | 6,356,849 | | | $ | 7,136,012 | | | $ | 29,233,585 | | | $ | 68,530,833 | |
| Undistributed (Accumulated) net investment | | | | | | | | | | | | | | | | | | | | |
| income (loss), at end of year | | $ | (680,170 | ) | | $ | 39,109 | | | $ | (63,203 | ) | | $ | (133,621 | ) | | $ | (222,163 | ) |
The accompanying notes are an integral part of the financial statements.
Statements of Changes in Net Assets (continued)
For the Fiscal Year Ended June 30, 2017
| | | | | | Quaker Global | | | Quaker | | | Quaker | | | Quaker | |
| | | Quaker Event | | | Tactical | | | Mid-Cap | | | Small-Cap | | | Strategic | |
| | | Arbitrage Fund | | | Allocation Fund | | | Value Fund | | | Value Fund | | | Growth Fund | |
| INCREASE (DECREASE) IN NET ASSETS | |
| Operations: | | | | | | | | | | | | | | | |
| Net investment income (loss) | | $ | 402,534 | | | $ | 2,518 | | | $ | (55,798 | ) | | $ | (234,855 | ) | | $ | (302,466 | ) |
| Net realized gain (loss) on | | | | | | | | | | | | | | | | | | | | |
| investment transactions: | | | | | | | | | | | | | | | | | | | | |
| Securities | | | 626,325 | | | | 619,944 | | | | 489,697 | | | | 4,469,004 | | | | 8,397,117 | |
| Securities sold short | | | (48,427 | ) | | | (1,932 | ) | | | — | | | | — | | | | — | |
| Written options | | | 884,772 | | | | — | | | | — | | | | — | | | | — | |
| Foreign currency transactions | | | (10,745 | ) | | | — | | | | — | | | | 13 | | | | — | |
| Net change in unrealized appreciation | | | | | | | | | | | | | | | | | | | | |
| (depreciation) of investment transactions: | | | | | | | | | | | | | | | | | | | | |
| Securities | | | 2,033,033 | | | | (161,513 | ) | | | 806,946 | | | | 1,680,019 | | | | 4,165,653 | |
| Securities sold short | | | (241,099 | ) | | | — | | | | — | | | | — | | | | — | |
| Written options | | | (236,444 | ) | | | — | | | | — | | | | — | | | | — | |
| Foreign currency transactions | | | 4,260 | | | | 2 | | | | — | | | | 10 | | | | — | |
| Net increase (decrease) in net | | | | | | | | | | | | | | | | | | | | |
| assets resulting from operations | | | 3,414,209 | | | | 459,019 | | | | 1,240,845 | | | | 5,914,191 | | | | 12,260,304 | |
| Distributions to shareholders from: | | | | | | | | | | | | | | | | | | | | |
| Net investment income — Class A | | | (70,505 | ) | | | — | | | | — | | | | — | | | | — | |
| Net realized capital gain — Class C | | | (5,529 | ) | | | — | | | | — | | | | — | | | | — | |
| Net realized capital gain — Institutional Class | | | (83,962 | ) | | | — | | | | — | | | | — | | | | — | |
| Total distributions | | | (159,996 | ) | | | — | | | | — | | | | — | | | | — | |
| Capital share transactions: | | | | | | | | | | | | | | | | | | | | |
| Increase (decrease) in net assets | | | | | | | | | | | | | | | | | | | | |
| from fund share transactions (Note 7) | | | (7,444,709 | ) | | | (404,319 | ) | | | (1,056,973 | ) | | | (9,776,060 | ) | | | (26,700,407 | ) |
| Total increase (decrease) in net assets | | | (4,190,496 | ) | | | 54,700 | | | | 183,872 | | | | (3,861,869 | ) | | | (14,440,103 | ) |
| | | | | | | | | | | | | | | | | | | | | |
| NET ASSETS | |
| Beginning of year | | | 33,891,588 | | | | 6,738,920 | | | | 6,904,935 | | | | 32,550,214 | | | | 85,990,653 | |
| End of year | | $ | 29,701,092 | | | $ | 6,793,620 | | | $ | 7,088,807 | | | $ | 28,688,345 | | | $ | 71,550,550 | |
| Undistributed (Accumulated) net investment | | | | | | | | | | | | | | | | | | | | |
| income (loss), at end of year | | $ | 452,422 | | | $ | (4,759 | ) | | $ | (29,423 | ) | | $ | — | | | $ | (5,631 | ) |
The accompanying notes are an integral part of the financial statements.
Financial Highlights
Quaker Event Arbitrage Fund
(For a Share Outstanding Throughout the Period)
| | | Class A | |
| | | (unaudited) | | | | | | | | | | | | | | | | |
| | | For the | | | | | | | | | | | | | | | | |
| | | Six-Month | | | | | | | | | | | | | | | | |
| | | Period from | | | | | | | | | | | | | | | | |
| | | July 1, 2017 | | | Years Ended June 30, | |
| | | to December 31, | | | |
| | | 2017 | | | 2017 | | | 2016 | | | 2015 | | | 2014 | | | 2013 | |
| Net asset value, beginning of period | | $ | 13.01 | | | $ | 11.71 | | | $ | 13.39 | | | $ | 14.07 | | | $ | 12.81 | | | $ | 11.93 | |
| Income from investment operations: | | | | | | | | | | | | | | | | | | | | | | | | |
Net investment income (loss)(1) | | | (0.13 | ) | | | 0.16 | | | | (0.01 | ) | | | (0.04 | ) | | | 0.41 | | | | 0.37 | |
| Net realized and unrealized | | | | | | | | | | | | | | | | | | | | | | | | |
| gain (loss) on investments | | | 0.39 | | | | 1.21 | | | | (0.65 | ) | | | 0.21 | | | | 0.93 | | | | 0.65 | |
| Total from investment operations | | | 0.26 | | | | 1.37 | | | | (0.66 | ) | | | 0.17 | | | | 1.34 | | | | 1.02 | |
| Distributions to shareholders from: | | | | | | | | | | | | | | | | | | | | | | | | |
| Net investment income | | | (0.50 | ) | | | (0.07 | ) | | | — | | | | (0.11 | ) | | | (0.01 | ) | | | (0.01 | ) |
| Net realized capital gain | | | — | | | | — | | | | (1.02 | ) | | | (0.74 | ) | | | (0.07 | ) | | | (0.13 | ) |
| Total distributions | | | (0.50 | ) | | | (0.07 | ) | | | (1.02 | ) | | | (0.85 | ) | | | (0.08 | ) | | | (0.14 | ) |
| Net asset value, end of period | | $ | 12.77 | | | $ | 13.01 | | | $ | 11.71 | | | $ | 13.39 | | | $ | 14.07 | | | $ | 12.81 | |
Total Return(2) | | | 1.93 | %* | | | 11.70 | % | | | (4.33 | )% | | | 1.38 | % | | | 10.47 | % | | | 8.70 | % |
| Ratios/supplemental data: | | | | | | | | | | | | | | | | | | | | | | | | |
| Net assets, end of period (000’ omitted) | | $ | 9,063 | | | $ | 12,548 | | | $ | 14,363 | | | $ | 31,817 | | | $ | 53,035 | | | $ | 35,232 | |
| Ratio of expenses to average net assets: | | | | | | | | | | | | | | | | | | | | | | | | |
Expense before reductions(3)(4) | | | 2.99 | %** | | | 2.80 | % | | | 2.41 | % | | | 2.17 | % | | | 2.15 | % | | | 2.37 | % |
Expense net of fee waivers, if any(3)(5) | | | 1.99 | %** | | | 1.99 | % | | | 1.99 | % | | | 1.99 | % | | | 1.99 | % | | | 1.99 | % |
| Ratio of net investment income (loss) | | | | | | | | | | | | | | | | | | | | | | | | |
| to average net assets***: | | | | | | | | | | | | | | | | | | | | | | | | |
Before waiver and expense reimbursement(3) | (3.05 | )%** | | | 0.49 | % | | | (0.50 | )% | | | (0.47 | )% | | | 2.85 | % | | | 2.64 | % |
After waiver and expense reimbursement(3) | (2.05 | )%** | | | 1.30 | % | | | (0.08 | )% | | | (0.29 | )% | | | 3.01 | % | | | 3.02 | % |
| Portfolio turnover rate | | | 195 | %* | | | 326 | % | | | 160 | % | | | 237 | % | | | 280 | % | | | 186 | % |
| (1) | The average shares outstanding method has been applied for per share information. |
| (2) | Total investment return is based on the change in net asset value of a share during the period, assumes reinvestment of dividends and distributions at net asset value and does not reflect the impact of a sales charge. |
| (3) | Expense waived or reimbursed reflect reductions to total expenses, as discussed in the notes to the financial statements. These amounts would increase the net investment loss ratio or decrease the net investment income ratio, as applicable, had such reductions not occurred. |
| (4) | Expenses before reductions (excluding dividend and interest expense for securities sold short) were 2.97%**, 2.78%, 2.40%, 2.16%, 2.14% and 2.34% for the six-month period from July 1, 2017 to December 31, 2017, and for the years ended June 30, 2017, 2016, 2015, 2014 and 2013, respectively. |
| (5) | Expenses net of all reductions (excluding dividend and interest expense for securities sold short) were 1.97%**, 1.98%,1.98%, 1.98%, 1.98% and 1.96% for the six-month period from July 1, 2017 to December 31, 2017, and for the years ended June 30, 2017, 2016, 2015, 2014 and 2013, respectively. |
| * | Not annualized. |
| ** | Annualized. |
| *** | The net investment income (loss) ratios include dividends on short positions. |
The accompanying notes are an integral part of the financial statements.
Financial Highlights
Quaker Event Arbitrage Fund
(For a Share Outstanding Throughout the Period)
| | | Class C | |
| | | (unaudited) | | | | | | | | | | | | | | | | |
| | | For the | | | | | | | | | | | | | | | | |
| | | Six-Month | | | | | | | | | | | | | | | | |
| | | Period from | | | | | | | | | | | | | | | | |
| | | July 1, 2017 | | | Years Ended June 30, | |
| | | to December 31, | | | |
| | | 2017 | | | 2017 | | | 2016 | | | 2015 | | | 2014 | | | 2013 | |
| Net asset value, beginning of period | | $ | 12.47 | | | $ | 11.26 | | | $ | 13.01 | | | $ | 13.72 | | | $ | 12.57 | | | $ | 11.78 | |
| Income from investment operations: | | | | | | | | | | | | | | | | | | | | | | | | |
Net investment income (loss)(1) | | | (0.17 | ) | | | 0.06 | | | | (0.09 | ) | | | (0.14 | ) | | | 0.30 | | | | 0.28 | |
| Net realized and unrealized | | | | | | | | | | | | | | | | | | | | | | | | |
| gain (loss) on investments | | | 0.37 | | | | 1.17 | | | | (0.64 | ) | | | 0.20 | | | | 0.92 | | | | 0.64 | |
| Total from investment operations | | | 0.20 | | | | 1.23 | | | | (0.73 | ) | | | 0.06 | | | | 1.22 | | | | 0.92 | |
| Distributions to shareholders from: | | | | | | | | | | | | | | | | | | | | | | | | |
| Net investment income | | | (0.38 | ) | | | (0.02 | ) | | | — | | | | (0.03 | ) | | | — | | | | — | |
| Net realized capital gain | | | — | | | | — | | | | (1.02 | ) | | | (0.74 | ) | | | (0.07 | ) | | | (0.13 | ) |
| Total distributions | | | (0.38 | ) | | | (0.02 | ) | | | (1.02 | ) | | | (0.77 | ) | | | (0.07 | ) | | | (0.13 | ) |
| Net asset value, end of period | | $ | 12.29 | | | $ | 12.47 | | | $ | 11.26 | | | $ | 13.01 | | | $ | 13.72 | | | $ | 12.57 | |
Total Return(2) | | | 1.53 | %* | | | 10.91 | % | | | (5.03 | )% | | | 0.52 | % | | | 9.72 | % | | | 7.91 | % |
| Ratios/supplemental data: | | | | | | | | | | | | | | | | | | | | | | | | |
| Net assets, end of period (000’ omitted) | | $ | 2,492 | | | $ | 3,263 | | | $ | 4,576 | | | $ | 6,595 | | | $ | 6,555 | | | $ | 5,954 | |
| Ratio of expenses to average net assets: | | | | | | | | | | | | | | | | | | | | | | | | |
Expense before reductions(3)(4) | | | 3.74 | %** | | | 3.55 | % | | | 3.16 | % | | | 2.92 | % | | | 2.90 | % | | | 3.12 | % |
Expense net of fee waivers, if any(3)(5) | | | 2.74 | %** | | | 2.74 | % | | | 2.74 | % | | | 2.74 | % | | | 2.74 | % | | | 2.74 | % |
| Ratio of net investment income (loss) | | | | | | | | | | | | | | | | | | | | | | | | |
| to average net assets***: | | | | | | | | | | | | | | | | | | | | | | | | |
Before waiver and expense reimbursement(3) | (3.80 | )%** | | | (0.26 | )% | | | (1.25 | )% | | | (1.22 | )% | | | 2.10 | % | | | 1.89 | % |
After waiver and expense reimbursement(3) | (2.80 | )%** | | | 0.55 | % | | | (0.83 | )% | | | (1.04 | )% | | | 2.26 | % | | | 2.27 | % |
| Portfolio turnover rate | | | 195 | %* | | | 326 | % | | | 160 | % | | | 237 | % | | | 280 | % | | | 186 | % |
| (1) | The average shares outstanding method has been applied for per share information. |
| (2) | Total investment return is based on the change in net asset value of a share during the period, assumes reinvestment of dividends and distributions at net asset value and does not reflect the impact of a sales charge. |
| (3) | Expense waived or reimbursed reflect reductions to total expenses, as discussed in the notes to the financial statements. These amounts would increase the net investment loss ratio or decrease the net investment income ratio, as applicable, had such reductions not occurred. |
| (4) | Expenses before reductions (excluding dividend and interest expense for securities sold short) were 3.72%**, 3.53%, 3.15%, 2.91%, 2.89% and 3.09% for the six-month period from July 1, 2017 to December 31, 2017, and for the years ended June 30, 2017, 2016, 2015, 2014 and 2013, respectively. |
| (5) | Expenses net of all reductions (excluding dividend and interest expense for securities sold short) were 2.72%**, 2.73%, 2.73%, 2.73%, 2.73% and 2.71% for the six-month period from July 1, 2017 to December 31, 2017, and for the years ended June 30, 2017, 2016, 2015, 2014 and 2013, respectively. |
| * | Not annualized. |
| ** | Annualized. |
| *** | The net investment income (loss) ratios include dividends on short positions. |
The accompanying notes are an integral part of the financial statements.
Financial Highlights
Quaker Event Arbitrage Fund
(For a Share Outstanding Throughout the Period)
| | | Institutional Class | |
| | | (unaudited) | | | | | | | | | | | | | | | | |
| | | For the | | | | | | | | | | | | | | | | |
| | | Six-Month | | | | | | | | | | | | | | | | |
| | | Period from | | | | | | | | | | | | | | | | |
| | | July 1, 2017 | | | Years Ended June 30, | |
| | | to December 31, | | | |
| | | 2017 | | | 2017 | | | 2016 | | | 2015 | | | 2014 | | | 2013 | |
| Net asset value, beginning of period | | $ | 13.14 | | | $ | 11.80 | | | $ | 13.46 | | | $ | 14.15 | | | $ | 12.86 | | | $ | 11.97 | |
| Income from investment operations: | | | | | | | | | | | | | | | | | | | | | | | | |
Net investment income (loss)(1) | | | (0.12 | ) | | | 0.19 | | | | 0.02 | | | | (0.01 | ) | | | 0.44 | | | | 0.40 | |
| Net realized and unrealized | | | | | | | | | | | | | | | | | | | | | | | | |
| gain (loss) on investments | | | 0.39 | | | | 1.23 | | | | (0.66 | ) | | | 0.21 | | | | 0.94 | | | | 0.67 | |
| Total from investment operations | | | 0.27 | | | | 1.42 | | | | (0.64 | ) | | | 0.20 | | | | 1.38 | | | | 1.07 | |
| Distributions to shareholders from: | | | | | | | | | | | | | | | | | | | | | | | | |
| Net investment income | | | (0.54 | ) | | | (0.08 | ) | | | — | | | | (0.15 | ) | | | (0.02 | ) | | | (0.05 | ) |
| Net realized capital gain | | | — | | | | — | | | | (1.02 | ) | | | (0.74 | ) | | | (0.07 | ) | | | (0.13 | ) |
| Total distributions | | | (0.54 | ) | | | (0.08 | ) | | | (1.02 | ) | | | (0.89 | ) | | | (0.09 | ) | | | (0.18 | ) |
| Net asset value, end of period | | $ | 12.87 | | | $ | 13.14 | | | $ | 11.80 | | | $ | 13.46 | | | $ | 14.15 | | | $ | 12.86 | |
Total Return(2) | | | 2.09 | %* | | | 12.10 | % | | | (4.15 | )% | | | 1.61 | % | | | 10.77 | % | | | 9.04 | % |
| Ratios/supplemental data: | | | | | | | | | | | | | | | | | | | | | | | | |
| Net assets, end of period (000’ omitted) | | $ | 10,943 | | | $ | 13,890 | | | $ | 14,953 | | | $ | 75,420 | | | $ | 59,474 | | | $ | 24,929 | |
| Ratio of expenses to average net assets: | | | | | | | | | | | | | | | | | | | | | | | | |
Expense before reductions(3)(4) | | | 2.74 | %** | | | 2.55 | % | | | 2.16 | % | | | 1.92 | % | | | 1.90 | % | | | 2.12 | % |
Expense net of fee waivers, if any(3)(5) | | | 1.74 | %** | | | 1.74 | % | | | 1.74 | % | | | 1.74 | % | | | 1.74 | % | | | 1.74 | % |
| Ratio of net investment income (loss) | | | | | | | | | | | | | | | | | | | | | | | | |
| to average net assets***: | | | | | | | | | | | | | | | | | | | | | | | | |
Before waiver and expense reimbursement(3) | (2.80 | )%** | | | 0.74 | % | | | (0.25 | )% | | | (0.22 | )% | | | 3.10 | % | | | 2.89 | % |
After waiver and expense reimbursement(3) | (1.80 | %)** | | | 1.55 | % | | | 0.17 | % | | | (0.04 | )% | | | 3.26 | % | | | 3.27 | % |
| Portfolio turnover rate | | | 195 | %* | | | 326 | % | | | 160 | % | | | 237 | % | | | 280 | % | | | 186 | % |
| (1) | The average shares outstanding method has been applied for per share information. |
| (2) | Total investment return is based on the change in net asset value of a share during the period, assumes reinvestment of dividends and distributions at net asset value and does not reflect the impact of a sales charge. |
| (3) | Expense waived or reimbursed reflect reductions to total expenses, as discussed in the notes to the financial statements. These amounts would increase the net investment loss ratio or decrease the net investment income ratio, as applicable, had such reductions not occurred. |
| (4) | Expenses before reductions (excluding dividend and interest expense for securities sold short) were 2.72%**, 2.53%, 2.15%, 1.91%, 1.89% and 2.09% for the six-month period from July 1, 2017 to December 31, 2017, and for the years ended June 30, 2017, 2016, 2015, 2014 and 2013, respectively. |
| (5) | Expenses net of all reductions (excluding dividend and interest expense for securities sold short) were 1.72%**, 1.73%, 1.73%, 1.73%, 1.73% and 1.71% for the six-month period from July 1, 2017 to December 31, 2017, and for the years ended June 30, 2017, 2016, 2015, 2014 and 2013, respectively. |
| * | Not annualized. |
| ** | Annualized. |
| *** | The net investment income (loss) ratios include dividends on short positions. |
The accompanying notes are an integral part of the financial statements.
Financial Highlights
Quaker Global Tactical Allocation Fund
(For a Share Outstanding Throughout the Period)
| | | Class A | |
| | | (unaudited) | | | | | | | | | | | | | | | | |
| | | For the | | | | | | | | | | | | | | | | |
| | | Six-Month | | | | | | | | | | | | | | | | |
| | | Period from | | | | | | | | | | | | | | | | |
| | | July 1, 2017 | | | Years Ended June 30, | |
| | | to December 31, | | | |
| | | 2017 | | | 2017 | | | 2016 | | | 2015 | | | 2014 | | | 2013 | |
| Net asset value, beginning of period | | $ | 10.62 | | | $ | 9.95 | | | $ | 11.51 | | | $ | 10.46 | | | $ | 8.30 | | | $ | 7.12 | |
| Income from investment operations: | | | | | | | | | | | | | | | | | | | | | | | | |
Net investment income (loss)(1) | | | 0.07 | | | | — | | | | (0.14 | ) | | | (0.11 | ) | | | (0.08 | ) | | | (0.09 | ) |
| Net realized and unrealized | | | | | | | | | | | | | | | | | | | | | | | | |
| gain (loss) on investments | | | 0.13 | | | | 0.67 | | | | (1.42 | ) | | | 1.16 | | | | 2.24 | | | | 1.27 | |
| Total from investment operations | | | 0.20 | | | | 0.67 | | | | (1.56 | ) | | | 1.05 | | | | 2.16 | | | | 1.18 | |
| Distributions to shareholders from: | | | | | | | | | | | | | | | | | | | | | | | | |
| Net investment income | | | — | | | | — | | | | — | | | | — | | | | — | | | | — | |
| Net realized capital gain | | | — | | | | — | | | | — | | | | — | | | | — | | | | — | |
| Total distributions | | | — | | | | — | | | | — | | | | — | | | | — | | | | — | |
| Net asset value, end of period | | $ | 10.82 | | | $ | 10.62 | | | $ | 9.95 | | | $ | 11.51 | | | $ | 10.46 | | | $ | 8.30 | |
Total Return(2) | | | 1.88 | %* | | | 6.73 | % | | | (13.55 | )% | | | 10.04 | % | | | 26.02 | % | | | 16.57 | % |
| Ratios/supplemental data: | | | | | | | | | | | | | | | | | | | | | | | | |
| Net assets, end of period (000’ omitted) | | $ | 1,462 | | | $ | 1,706 | | | $ | 3,184 | | | $ | 5,707 | | | $ | 3,992 | | | $ | 3,856 | |
| Ratio of expenses to average net assets: | | | | | | | | | | | | | | | | | | | | | | | | |
Expense before reductions(3)(4) | | | 2.27 | %** | | | 2.35 | % | | | 2.42 | % | | | 2.27 | % | | | 2.19 | % | | | 2.83 | % |
Expense net of fee waivers, if any(3) | | | 1.97 | %** | | | 2.16 | % | | | 2.42 | % | | | 2.27 | % | | | 2.19 | % | | | 2.83 | % |
| Ratio of net investment income (loss) | | | | | | | | | | | | | | | | | | | | | | | | |
| to average net assets: | | | | | | | | | | | | | | | | | | | | | | | | |
Before waiver and expense reimbursement(3) | 0.95 | %** | | | (0.15 | )% | | | (1.30 | )%*** | | | (1.03 | )%*** | | | (0.80 | )%*** | | | (1.22 | )%*** |
After waiver and expense reimbursement(3) | 1.25 | %** | | | 0.04 | % | | | (1.30 | )%*** | | | (1.03 | )%*** | | | (0.80 | )%*** | | | (1.22 | )%*** |
| Portfolio turnover rate | | | 0 | %* | | | 184 | % | | | 211 | % | | | 125 | % | | | 130 | % | | | 484 | % |
| (1) | The average shares outstanding method has been applied for per share information. |
| (2) | Total investment return is based on the change in net asset value of a share during the period, assumes reinvestment of dividends and distributions at net asset value and does not reflect the impact of a sales charge. |
| (3) | Expense waived or reimbursed reflect reductions to total expenses, as discussed in the notes to the financial statements. These amounts would increase the net investment loss ratio or decrease the net investment income ratio, as applicable, had such reductions not occurred. |
| (4) | Ratio of expenses (excluding dividend and interest expense for securities sold short) were 2.41%, 2.25%, 2.15% and 2.83% for the years ended June 30, 2016, 2015, 2014 and 2013, respectively. |
| * | Not annualized. |
| ** | Annualized. |
| *** | The net investment income (loss) ratios include dividends on short positions. |
The accompanying notes are an integral part of the financial statements.
Financial Highlights
Quaker Global Tactical Allocation Fund
(For a Share Outstanding Throughout the Period)
| | | Class C | |
| | | (unaudited) | | | | | | | | | | | | | | | | |
| | | For the | | | | | | | | | | | | | | | | |
| | | Six-Month | | | | | | | | | | | | | | | | |
| | | Period from | | | | | | | | | | | | | | | | |
| | | July 1, 2017 | | | Years Ended June 30, | |
| | | to December 31, | | | |
| | | 2017 | | | 2017 | | | 2016 | | | 2015 | | | 2014 | | | 2013 | |
| Net asset value, beginning of period | | $ | 9.91 | | | $ | 9.36 | | | $ | 10.91 | | | $ | 9.99 | | | $ | 7.98 | | | $ | 6.90 | |
| Income from investment operations: | | | | | | | | | | | | | | | | | | | | | | | | |
Net investment income (loss)(1) | | | 0.02 | | | | (0.07 | ) | | | (0.20 | ) | | | (0.19 | ) | | | (0.14 | ) | | | (0.14 | ) |
| Net realized and unrealized | | | | | | | | | | | | | | | | | | | | | | | | |
| gain (loss) on investments | | | 0.13 | | | | 0.62 | | | | (1.35 | ) | | | 1.11 | | | | 2.15 | | | | 1.22 | |
| Total from investment operations | | | 0.15 | | | | 0.55 | | | | (1.55 | ) | | | 0.92 | | | | 2.01 | | | | 1.08 | |
| Distributions to shareholders from: | | | | | | | | | | | | | | | | | | | | | | | | |
| Net investment income | | | — | | | | — | | | | — | | | | — | | | | — | | | | — | |
| Net realized capital gain | | | — | | | | — | | | | — | | | | — | | | | — | | | | — | |
| Total distributions | | | — | | | | — | | | | — | | | | — | | | | — | | | | — | |
| Net asset value, end of period | | $ | 10.06 | | | $ | 9.91 | | | $ | 9.36 | | | $ | 10.91 | | | $ | 9.99 | | | $ | 7.98 | |
Total Return(2) | | | 1.51 | %* | | | 5.88 | % | | | (14.21 | )% | | | 9.21 | % | | | 25.19 | % | | | 15.65 | % |
| Ratios/supplemental data: | | | | | | | | | | | | | | | | | | | | | | | | |
| Net assets, end of period (000’ omitted) | | $ | 908 | | | $ | 1,041 | | | $ | 1,497 | | | $ | 1,851 | | | $ | 2,093 | | | $ | 2,124 | |
| Ratio of expenses to average net assets: | | | | | | | | | | | | | | | | | | | | | | | | |
Expense before reductions(3)(4) | | | 3.02 | %** | | | 3.10 | % | | | 3.17 | % | | | 3.02 | % | | | 2.94 | % | | | 3.58 | % |
Expense net of fee waivers, if any(3) | | | 2.72 | %** | | | 2.91 | % | | | 3.17 | % | | | 3.02 | % | | | 2.94 | % | | | 3.58 | % |
| Ratio of net investment income (loss) | | | | | | | | | | | | | | | | | | | | | | | | |
| to average net assets: | | | | | | | | | | | | | | | | | | | | | | | | |
Before waiver and expense reimbursement(3) | 0.20 | %** | | | (0.90 | )% | | | (2.05 | )%*** | | | (1.78 | )%*** | | | (1.55 | )%*** | | | (1.97 | )%*** |
After waiver and expense reimbursement(3) | 0.50 | %** | | | (0.71 | )% | | | (2.05 | )%*** | | | (1.78 | )%*** | | | (1.55 | )%*** | | | (1.97 | )%*** |
| Portfolio turnover rate | | | 0 | %* | | | 184 | % | | | 211 | % | | | 125 | % | | | 130 | % | | | 484 | % |
| (1) | The average shares outstanding method has been applied for per share information. |
| (2) | Total investment return is based on the change in net asset value of a share during the period, assumes reinvestment of dividends and distributions at net asset value and does not reflect the impact of a sales charge. |
| (3) | Expense waived or reimbursed reflect reductions to total expenses, as discussed in the notes to the financial statements. These amounts would increase the net investment loss ratio or decrease the net investment income ratio, as applicable, had such reductions not occurred. |
| (4) | Ratio of expenses (excluding dividend and interest expense for securities sold short) were 3.16%, 3.00%, 2.90% and 3.58% for the years ended June 30, 2016, 2015, 2014 and 2013, respectively. |
| * | Not annualized. |
| ** | Annualized. |
| *** | The net investment income (loss) ratios include dividends on short positions. |
The accompanying notes are an integral part of the financial statements.
Financial Highlights
Quaker Global Tactical Allocation Fund
(For a Share Outstanding Throughout the Period)
| | | Institutional Class | |
| | | (unaudited) | | | | | | | | | | | | | | | | |
| | | For the | | | | | | | | | | | | | | | | |
| | | Six-Month | | | | | | | | | | | | | | | | |
| | | Period from | | | | | | | | | | | | | | | | |
| | | July 1, 2017 | | | Years Ended June 30, | |
| | | to December 31, | | | |
| | | 2017 | | | 2017 | | | 2016 | | | 2015 | | | 2014 | | | 2013 | |
| Net asset value, beginning of period | | $ | 12.27 | | | $ | 11.47 | | | $ | 13.23 | | | $ | 12.00 | | | $ | 9.49 | | | $ | 8.12 | |
| Income from investment operations: | | | | | | | | | | | | | | | | | | | | | | | | |
Net investment income (loss)(1) | | | 0.09 | | | | 0.03 | | | | (0.13 | ) | | | (0.10 | ) | | | (0.06 | ) | | | (0.08 | ) |
| Net realized and unrealized | | | | | | | | | | | | | | | | | | | | | | | | |
| gain (loss) on investments | | | 0.16 | | | | 0.77 | | | | (1.63 | ) | | | 1.33 | | | | 2.57 | | | | 1.45 | |
| Total from investment operations | | | 0.25 | | | | 0.80 | | | | (1.76 | ) | | | 1.23 | | | | 2.51 | | | | 1.37 | |
| Distributions to shareholders from: | | | | | | | | | | | | | | | | | | | | | | | | |
| Net investment income | | | — | | | | — | | | | — | | | | — | | | | — | | | | — | |
| Net realized capital gain | | | — | | | | — | | | | — | | | | — | | | | — | | | | — | |
| Total distributions | | | — | | | | — | | | | — | | | | — | | | | — | | | | — | |
| Net asset value, end of period | | $ | 12.52 | | | $ | 12.27 | | | $ | 11.47 | | | $ | 13.23 | | | $ | 12.00 | | | $ | 9.49 | |
Total Return(2) | | | 2.04 | %* | | | 6.97 | % | | | (13.30 | )% | | | 10.25 | % | | | 26.45 | % | | | 16.87 | % |
| Ratios/supplemental data: | | | | | | | | | | | | | | | | | | | | | | | | |
| Net assets, end of period (000’ omitted) | | $ | 3,987 | | | $ | 4,047 | | | $ | 2,058 | | | $ | 1,474 | | | $ | 1,240 | | | $ | 625 | |
| Ratio of expenses to average net assets: | | | | | | | | | | | | | | | | | | | | | | | | |
Expense before reductions(3)(4) | | | 2.02 | %** | | | 2.10 | % | | | 2.17 | % | | | 2.02 | % | | | 1.94 | % | | | 2.58 | % |
Expense net of fee waivers, if any(3) | | | 1.72 | %** | | | 1.91 | % | | | 2.17 | % | | | 2.02 | % | | | 1.94 | % | | | 2.58 | % |
| Ratio of net investment income (loss) | | | | | | | | | | | | | | | | | | | | | | | | |
| to average net assets: | | | | | | | | | | | | | | | | | | | | | | | | |
Before waiver and expense reimbursement(3) | 1.20 | %** | | | 0.10 | % | | | (1.05 | )%*** | | | (0.78 | )%*** | | | (0.55 | )%*** | | | (0.97 | )%*** |
After waiver and expense reimbursement(3) | 1.50 | %** | | | 0.29 | % | | | (1.05 | )%*** | | | (0.78 | )%*** | | | (0.55 | )%*** | | | (0.97 | )%*** |
| Portfolio turnover rate | | | 0 | %* | | | 184 | % | | | 211 | % | | | 125 | % | | | 130 | % | | | 484 | % |
| (1) | The average shares outstanding method has been applied for per share information. |
| (2) | Total investment return is based on the change in net asset value of a share during the period, assumes reinvestment of dividends and distributions at net asset value and does not reflect the impact of a sales charge. |
| (3) | Expense waived or reimbursed reflect reductions to total expenses, as discussed in the notes to the financial statements. These amounts would increase the net investment loss ratio or decrease the net investment income ratio, as applicable, had such reductions not occurred. |
| (4) | Ratio of expenses (excluding dividend and interest expense for securities sold short) were 2.16%, 2.00%, 1.90% and 2.58% for the years ended June 30, 2016, 2015, 2014 and 2013, respectively. |
| * | Not annualized. |
| ** | Annualized. |
| *** | The net investment income (loss) ratios include dividends on short positions. |
The accompanying notes are an integral part of the financial statements.
Financial Highlights
Quaker Mid-Cap Value Fund
(For a Share Outstanding Throughout the Period)
| | | Class A | |
| | | (unaudited) | | | | | | | | | | | | | | | | |
| | | For the | | | | | | | | | | | | | | | | |
| | | Six-Month | | | | | | | | | | | | | | | | |
| | | Period from | | | | | | | | | | | | | | | | |
| | | July 1, 2017 | | | Years Ended June 30, | |
| | | to December 31, | | | |
| | | 2017 | | | 2017 | | | 2016 | | | 2015 | | | 2014 | | | 2013 | |
| Net asset value, beginning of period | | $ | 28.06 | | | $ | 23.58 | | | $ | 24.78 | | | $ | 24.62 | | | $ | 18.99 | | | $ | 15.73 | |
| Income from investment operations: | | | | | | | | | | | | | | | | | | | | | | | | |
Net investment income (loss)(1) | | | (0.12 | ) | | | (0.17 | ) | | | (0.06 | ) | | | (0.10 | ) | | | (0.09 | ) | | | (0.14 | ) |
| Net realized and unrealized | | | | | | | | | | | | | | | | | | | | | | | | |
| gain (loss) on investments | | | 3.39 | | | | 4.65 | | | | (1.14 | ) | | | 0.26 | | | | 5.72 | | | | 3.40 | |
| Total from investment operations | | | 3.27 | | | | 4.48 | | | | (1.20 | ) | | | 0.16 | | | | 5.63 | | | | 3.26 | |
| Distributions to shareholders from: | | | | | | | | | | | | | | | | | | | | | | | | |
| Net investment income | | | — | | | | — | | | | — | | | | — | | | | — | | | | — | |
| Net realized capital gain | | | — | | | | — | | | | — | | | | — | | | | — | | | | — | |
| Total distributions | | | — | | | | — | | | | — | | | | — | | | | — | | | | — | |
| Net asset value, end of period | | $ | 31.33 | | | $ | 28.06 | | | $ | 23.58 | | | $ | 24.78 | | | $ | 24.62 | | | $ | 18.99 | |
Total Return(2) | | | 11.65 | %* | | | 19.00 | % | | | (4.84 | )% | | | 0.65 | % | | | 29.65 | % | | | 20.72 | % |
| Ratios/supplemental data: | | | | | | | | | | | | | | | | | | | | | | | | |
| Net assets, end of period (000’ omitted) | | $ | 4,044 | | | $ | 4,081 | | | $ | 4,057 | | | $ | 5,520 | | | $ | 5,724 | | | $ | 6,029 | |
| Ratio of expenses to average net assets | | | 2.49 | %** | | | 2.39 | % | | | 2.17 | % | | | 1.98 | % | | | 2.03 | % | | | 2.19 | % |
| Ratio of net investment income (loss) | | | | | | | | | | | | | | | | | | | | | | | | |
| to average net assets | | | (0.84 | )%** | | | (0.66 | )% | | | (0.26 | )% | | | (0.39 | )% | | | (0.42 | )% | | | (0.80 | )% |
| Portfolio turnover rate | | | 13 | %* | | | 28 | % | | | 71 | % | | | 49 | % | | | 62 | % | | | 47 | % |
| (1) | The average shares outstanding method has been applied for per share information. |
| (2) | Total investment return is based on the change in net asset value of a share during the period, assumes reinvestment of dividends and distributions at net asset value and does not reflect the impact of a sales charge. |
| * | Not annualized. |
| ** | Annualized. |
The accompanying notes are an integral part of the financial statements.
Financial Highlights
Quaker Mid-Cap Value Fund
(For a Share Outstanding Throughout the Period)
| | | Class C | |
| | | (unaudited) | | | | | | | | | | | | | | | | |
| | | For the | | | | | | | | | | | | | | | | |
| | | Six-Month | | | | | | | | | | | | | | | | |
| | | Period from | | | | | | | | | | | | | | | | |
| | | July 1, 2017 | | | Years Ended June 30, | |
| | | to December 31, | | | |
| | | 2017 | | | 2017 | | | 2016 | | | 2015 | | | 2014 | | | 2013 | |
| Net asset value, beginning of period | | $ | 24.24 | | | $ | 20.52 | | | $ | 21.73 | | | $ | 21.75 | | | $ | 16.91 | | | $ | 14.11 | |
| Income from investment operations: | | | | | | | | | | | | | | | | | | | | | | | | |
Net investment income (loss)(1) | | | (0.20 | ) | | | (0.32 | ) | | | (0.20 | ) | | | (0.25 | ) | | | (0.22 | ) | | | (0.24 | ) |
| Net realized and unrealized | | | | | | | | | | | | | | | | | | | | | | | | |
| gain (loss) on investments | | | 2.92 | | | | 4.04 | | | | (1.01 | ) | | | 0.23 | | | | 5.06 | | | | 3.04 | |
| Total from investment operations | | | 2.72 | | | | 3.72 | | | | (1.21 | ) | | | (0.02 | ) | | | 4.84 | | | | 2.80 | |
| Distributions to shareholders from: | | | | | | | | | | | | | | | | | | | | | | | | |
| Net investment income | | | — | | | | — | | | | — | | | | — | | | | — | | | | — | |
| Net realized capital gain | | | — | | | | — | | | | — | | | | — | | | | — | | | | — | |
| Total distributions | | | — | | | | — | | | | — | | | | — | | | | — | | | | — | |
| Net asset value, end of period | | $ | 26.96 | | | $ | 24.24 | | | $ | 20.52 | | | $ | 21.73 | | | $ | 21.75 | | | $ | 16.91 | |
Total Return(2) | | | 11.22 | %* | | | 18.13 | % | | | (5.57 | )% | | | (0.09 | )% | | | 28.62 | % | | | 19.84 | % |
| Ratios/supplemental data: | | | | | | | | | | | | | | | | | | | | | | | | |
| Net assets, end of period (000’ omitted) | | $ | 1,564 | | | $ | 1,526 | | | $ | 1,565 | | | $ | 1,944 | | | $ | 2,086 | | | $ | 1,815 | |
| Ratio of expenses to average net assets | | | 3.24 | %** | | | 3.14 | % | | | 2.92 | % | | | 2.73 | % | | | 2.78 | % | | | 2.94 | % |
| Ratio of net investment income (loss) | | | | | | | | | | | | | | | | | | | | | | | | |
| to average net assets | | | (1.59 | )%** | | | (1.41 | )% | | | (1.01 | )% | | | (1.14 | )% | | | (1.17 | )% | | | (1.55 | )% |
| Portfolio turnover rate | | | 13 | %* | | | 28 | % | | | 71 | % | | | 49 | % | | | 62 | % | | | 47 | % |
| (1) | The average shares outstanding method has been applied for per share information. |
| (2) | Total investment return is based on the change in net asset value of a share during the period, assumes reinvestment of dividends and distributions at net asset value and does not reflect the impact of a sales charge. |
| * | Not annualized. |
| ** | Annualized. |
The accompanying notes are an integral part of the financial statements.
Financial Highlights
Quaker Mid-Cap Value Fund
(For a Share Outstanding Throughout the Period)
| | | Institutional Class | |
| | | (unaudited) | | | | | | | | | | | | | | | | |
| | | For the | | | | | | | | | | | | | | | | |
| | | Six-Month | | | | | | | | | | | | | | | | |
| | | Period from | | | | | | | | | | | | | | | | |
| | | July 1, 2017 | | | Years Ended June 30, | |
| | | to December 31, | | | |
| | | 2017 | | | 2017 | | | 2016 | | | 2015 | | | 2014 | | | 2013 | |
| Net asset value, beginning of period | | $ | 29.60 | | | $ | 24.81 | | | $ | 26.01 | | | $ | 25.77 | | | $ | 19.83 | | | $ | 16.39 | |
| Income from investment operations: | | | | | | | | | | | | | | | | | | | | | | | | |
Net investment income (loss)(1) | | | (0.09 | ) | | | (0.11 | ) | | (0.00 | )^ | | | (0.04 | ) | | | (0.04 | ) | | | (0.10 | ) |
| Net realized and unrealized | | | | | | | | | | | | | | | | | | | | | | | | |
| gain (loss) on investments | | | 3.58 | | | | 4.90 | | | | (1.20 | ) | | | 0.28 | | | | 5.98 | | | | 3.54 | |
| Total from investment operations | | | 3.49 | | | | 4.79 | | | | (1.20 | ) | | | 0.24 | | | | 5.94 | | | | 3.44 | |
| Distributions to shareholders from: | | | | | | | | | | | | | | | | | | | | | | | | |
| Net investment income | | | — | | | | — | | | | — | | | | — | | | | — | | | | — | |
| Net realized capital gain | | | — | | | | — | | | | — | | | | — | | | | — | | | | — | |
| Total distributions | | | — | | | | — | | | | — | | | | — | | | | — | | | | — | |
| Net asset value, end of period | | $ | 33.09 | | | $ | 29.60 | | | $ | 24.81 | | | $ | 26.01 | | | $ | 25.77 | | | $ | 19.83 | |
Total Return(2) | | | 11.79 | %* | | | 19.31 | % | | | (4.61 | )% | | | 0.93 | % | | | 29.95 | % | | | 20.99 | % |
| Ratios/supplemental data: | | | | | | | | | | | | | | | | | | | | | | | | |
| Net assets, end of period (000’ omitted) | | $ | 1,528 | | | $ | 1,482 | | | $ | 1,283 | | | $ | 1,504 | | | $ | 2,216 | | | $ | 1,060 | |
| Ratio of expenses to average net assets | | | 2.24 | %** | | | 2.14 | % | | | 1.92 | % | | | 1.73 | % | | | 1.78 | % | | | 1.94 | % |
| Ratio of net investment income (loss) | | | | | | | | | | | | | | | | | | | | | | | | |
| to average net assets | | | (0.59 | )%** | | | (0.41 | )% | | | (0.01 | )% | | | (0.14 | )% | | | (0.17 | )% | | | (0.55 | )% |
| Portfolio turnover rate | | | 13 | %* | | | 28 | % | | | 71 | % | | | 49 | % | | | 62 | % | | | 47 | % |
| (1) | The average shares outstanding method has been applied for per share information. |
| (2) | Total investment return is based on the change in net asset value of a share during the period, assumes reinvestment of dividends and distributions at net asset value and does not reflect the impact of a sales charge. |
| ^ | Amount is less than 0.005 per share. |
| * | Not annualized. |
| ** | Annualized. |
The accompanying notes are an integral part of the financial statements.
Financial Highlights
Quaker Small-Cap Value Fund
(For a Share Outstanding Throughout the Period)
| | | Class A | |
| | | (unaudited) | | | | | | | | | | | | | | | | |
| | | For the | | | | | | | | | | | | | | | | |
| | | Six-Month | | | | | | | | | | | | | | | | |
| | | Period from | | | | | | | | | | | | | | | | |
| | | July 1, 2017 | | | Years Ended June 30, | |
| | | to December 31, | | | |
| | | 2017 | | | 2017 | | | 2016 | | | 2015 | | | 2014 | | | 2013 | |
| Net asset value, beginning of period | | $ | 24.13 | | | $ | 20.09 | | | $ | 24.15 | | | $ | 24.28 | | | $ | 19.50 | | | $ | 15.85 | |
| Income from investment operations: | | | | | | | | | | | | | | | | | | | | | | | | |
Net investment income (loss)(1) | | | (0.13 | ) | | | (0.20 | ) | | | (0.08 | ) | | | (0.06 | ) | | | (0.11 | ) | | | 0.09 | |
| Net realized and unrealized | | | | | | | | | | | | | | | | | | | | | | | | |
| gain (loss) on investments | | | 2.13 | | | | 4.24 | | | | (2.26 | ) | | | 1.22 | | | | 4.95 | | | | 3.58 | |
| Total from investment operations | | | 2.00 | | | | 4.04 | | | | (2.34 | ) | | | 1.16 | | | | 4.84 | | | | 3.67 | |
| Distributions to shareholders from: | | | | | | | | | | | | | | | | | | | | | | | | |
| Net investment income | | | — | | | | — | | | | — | | | | — | | | | (0.06 | ) | | | (0.02 | ) |
| Net realized capital gain | | | (3.69 | ) | | | — | | | | (1.72 | ) | | | (1.29 | ) | | | — | | | | — | |
| Total distributions | | | (3.69 | ) | | | — | | | | (1.72 | ) | | | (1.29 | ) | | | (0.06 | ) | | | (0.02 | ) |
| Net asset value, end of period | | $ | 22.44 | | | $ | 24.13 | | | $ | 20.09 | | | $ | 24.15 | | | $ | 24.28 | | | $ | 19.50 | |
Total Return(2) | | | 8.26 | %* | | | 20.11 | % | | | (9.93 | )% | | | 4.96 | % | | | 24.83 | % | | | 23.17 | % |
| Ratios/supplemental data: | | | | | | | | | | | | | | | | | | | | | | | | |
| Net assets, end of period (000’ omitted) | | $ | 5,585 | | | $ | 6,434 | | | $ | 6,431 | | | $ | 7,790 | | | $ | 8,512 | | | $ | 7,727 | |
| Ratio of expenses to average net assets | | | 2.27 | %** | | | 2.21 | % | | | 1.93 | % | | | 1.78 | % | | | 1.83 | % | | | 1.93 | % |
| Ratio of net investment income (loss) | | | | | | | | | | | | | | | | | | | | | | | | |
| to average net assets | | | (1.07 | )%** | | | (0.89 | )% | | | (0.37 | )% | | | (0.26 | )% | | | (0.47 | )% | | | 0.49 | % |
| Portfolio turnover rate | | | 65 | %* | | | 146 | % | | | 119 | % | | | 128 | % | | | 176 | % | | | 142 | % |
| (1) | The average shares outstanding method has been applied for per share information. |
| (2) | Total investment return is based on the change in net asset value of a share during the period, assumes reinvestment of dividends and distributions at net asset value and does not reflect the impact of a sales charge. |
| * | Not annualized. |
| ** | Annualized. |
The accompanying notes are an integral part of the financial statements.
Financial Highlights
Quaker Small-Cap Value Fund
(For a Share Outstanding Throughout the Period)
| | | Class C | |
| | | (unaudited) | | | | | | | | | | | | | | | | |
| | | For the | | | | | | | | | | | | | | | | |
| | | Six-Month | | | | | | | | | | | | | | | | |
| | | Period from | | | | | | | | | | | | | | | | |
| | | July 1, 2017 | | | Years Ended June 30, | |
| | | to December 31, | | | |
| | | 2017 | | | 2017 | | | 2016 | | | 2015 | | | 2014 | | | 2013 | |
| Net asset value, beginning of period | | $ | 19.30 | | | $ | 16.19 | | | $ | 19.96 | | | $ | 20.43 | | | $ | 16.49 | | | $ | 13.49 | |
| Income from investment operations: | | | | | | | | | | | | | | | | | | | | | | | | |
Net investment income (loss)(1) | | | (0.18 | ) | | | (0.30 | ) | | | (0.19 | ) | | | (0.20 | ) | | | (0.23 | ) | | | (0.04 | ) |
| Net realized and unrealized | | | | | | | | | | | | | | | | | | | | | | | | |
| gain (loss) on investments | | | 1.70 | | | | 3.41 | | | | (1.86 | ) | | | 1.02 | | | | 4.17 | | | | 3.04 | |
| Total from investment operations | | | 1.52 | | | | 3.11 | | | | (2.05 | ) | | | 0.82 | | | | 3.94 | | | | 3.00 | |
| Distributions to shareholders from: | | | | | | | | | | | | | | | | | | | | | | | | |
| Net investment income | | | — | | | | — | | | | — | | | | — | | | | — | | | | — | |
| Net realized capital gain | | | (3.69 | ) | | | — | | | | (1.72 | ) | | | (1.29 | ) | | | — | | | | — | |
| Total distributions | | | (3.69 | ) | | | — | | | | (1.72 | ) | | | (1.29 | ) | | | — | | | | — | |
| Net asset value, end of period | | $ | 17.13 | | | $ | 19.30 | | | $ | 16.19 | | | $ | 19.96 | | | $ | 20.43 | | | $ | 16.49 | |
Total Return(2) | | | 7.84 | %* | | | 19.21 | % | | | (10.59 | )% | | | 4.20 | % | | | 23.89 | % | | | 22.24 | % |
| Ratios/supplemental data: | | | | | | | | | | | | | | | | | | | | | | | | |
| Net assets, end of period (000’ omitted) | | $ | 1,243 | | | $ | 1,302 | | | $ | 1,477 | | | $ | 1,684 | | | $ | 1,806 | | | $ | 1,625 | |
| Ratio of expenses to average net assets | | | 3.02 | %** | | | 2.96 | % | | | 2.68 | % | | | 2.53 | % | | | 2.58 | % | | | 2.68 | % |
| Ratio of net investment income (loss) | | | | | | | | | | | | | | | | | | | | | | | | |
| to average net assets | | | (1.82 | )%** | | | (1.64 | )% | | | (1.12 | )% | | | (1.01 | )% | | | (1.22 | )% | | | (0.26 | )% |
| Portfolio turnover rate | | | 65 | %* | | | 146 | % | | | 119 | % | | | 128 | % | | | 176 | % | | | 142 | % |
| (1) | The average shares outstanding method has been applied for per share information. |
| (2) | Total investment return is based on the change in net asset value of a share during the period, assumes reinvestment of dividends and distributions at net asset value and does not reflect the impact of a sales charge. |
| * | Not annualized. |
| ** | Annualized. |
The accompanying notes are an integral part of the financial statements.
Financial Highlights
Quaker Small-Cap Value Fund
(For a Share Outstanding Throughout the Period)
| | | Institutional Class | |
| | | (unaudited) | | | | | | | | | | | | | | | | |
| | | For the | | | | | | | | | | | | | | | | |
| | | Six-Month | | | | | | | | | | | | | | | | |
| | | Period from | | | | | | | | | | | | | | | | |
| | | July 1, 2017 | | | Years Ended June 30, | |
| | | to December 31, | | | |
| | | 2017 | | | 2017 | | | 2016 | | | 2015 | | | 2014 | | | 2013 | |
| Net asset value, beginning of period | | $ | 25.49 | | | $ | 21.17 | | | $ | 25.29 | | | $ | 25.30 | | | $ | 20.29 | | | $ | 16.50 | |
| Income from investment operations: | | | | | | | | | | | | | | | | | | | | | | | | |
Net investment income (loss)(1) | | | (0.11 | ) | | | (0.15 | ) | | | (0.03 | ) | | (0.00 | )^ | | | (0.05 | ) | | | 0.13 | |
| Net realized and unrealized | | | | | | | | | | | | | | | | | | | | | | | | |
| gain (loss) on investments | | | 2.26 | | | | 4.47 | | | | (2.37 | ) | | | 1.28 | | | | 5.14 | | | | 3.73 | |
| Total from investment operations | | | 2.15 | | | | 4.32 | | | | (2.40 | ) | | | 1.28 | | | | 5.09 | | | | 3.86 | |
| Distributions to shareholders from: | | | | | | | | | | | | | | | | | | | | | | | | |
| Net investment income | | | — | | | | — | | | | — | | | | — | | | | (0.08 | ) | | | (0.07 | ) |
| Net realized capital gain | | | (3.69 | ) | | | — | | | | (1.72 | ) | | | (1.29 | ) | | | — | | | | — | |
| Total distributions | | | (3.69 | ) | | | — | | | | (1.72 | ) | | | (1.29 | ) | | | (0.08 | ) | | | (0.07 | ) |
| Net asset value, end of period | | $ | 23.95 | | | $ | 25.49 | | | $ | 21.17 | | | $ | 25.29 | | | $ | 25.30 | | | $ | 20.29 | |
Total Return(2) | | | 8.41 | %* | | | 20.41 | % | | | (9.71 | )% | | | 5.24 | % | | | 25.13 | % | | | 23.44 | % |
| Ratios/supplemental data: | | | | | | | | | | | | | | | | | | | | | | | | |
| Net assets, end of period (000’ omitted) | | $ | 22,406 | | | $ | 20,952 | | | $ | 24,642 | | | $ | 28,528 | | | $ | 27,868 | | | $ | 23,393 | |
| Ratio of expenses to average net assets | | | 2.02 | %** | | | 1.96 | % | | | 1.68 | % | | | 1.53 | % | | | 1.58 | % | | | 1.68 | % |
| Ratio of net investment income (loss) | | | | | | | | | | | | | | | | | | | | | | | | |
| to average net assets | | | (0.82 | )%** | | | (0.64 | )% | | | (0.12 | )% | | | (0.01 | )% | | | (0.22 | )% | | | 0.74 | % |
| Portfolio turnover rate | | | 65 | %* | | | 146 | % | | | 119 | % | | | 128 | % | | | 176 | % | | | 142 | % |
| (1) | The average shares outstanding method has been applied for per share information. |
| (2) | Total investment return is based on the change in net asset value of a share during the period, assumes reinvestment of dividends and distributions at net asset value and does not reflect the impact of a sales charge. |
| ^ | Amount is less than 0.005 per share. |
| * | Not annualized. |
| ** | Annualized. |
The accompanying notes are an integral part of the financial statements.
Financial Highlights
Quaker Strategic Growth Fund
(For a Share Outstanding Throughout the Period)
| | | Class A | |
| | | (unaudited) | | | | | | | | | | | | | | | | |
| | | For the | | | | | | | | | | | | | | | | |
| | | Six-Month | | | | | | | | | | | | | | | | |
| | | Period from | | | | | | | | | | | | | | | | |
| | | July 1, 2017 | | | Years Ended June 30, | |
| | | to December 31, | | | |
| | | 2017 | | | 2017 | | | 2016 | | | 2015 | | | 2014 | | | 2013 | |
| Net asset value, beginning of period | | $ | 27.86 | | | $ | 23.80 | | | $ | 26.55 | | | $ | 24.19 | | | $ | 19.31 | | | $ | 16.13 | |
| Income from investment operations: | | | | | | | | | | | | | | | | | | | | | | | | |
Net investment income (loss)(1) | | | (0.08 | ) | | | (0.07 | ) | | | (0.32 | ) | | | (0.30 | ) | | | (0.26 | ) | | | (0.15 | ) |
| Net realized and unrealized | | | | | | | | | | | | | | | | | | | | | | | | |
| gain (loss) on investments | | | 2.86 | | | | 4.13 | | | | (2.43 | ) | | | 2.66 | | | | 5.14 | | | | 3.33 | |
| Total from investment operations | | | 2.78 | | | | 4.06 | | | | (2.75 | ) | | | 2.36 | | | | 4.88 | | | | 3.18 | |
| Distributions to shareholders from: | | | | | | | | | | | | | | | | | | | | | | | | |
| Net investment income | | | — | | | | — | | | | — | | | | — | | | | — | | | | — | |
| Net realized capital gain | | | — | | | | — | | | | — | | | | — | | | | — | | | | — | |
| Total distributions | | | — | | | | — | | | | — | | | | — | | | | — | | | | — | |
| Net asset value, end of period | | $ | 30.64 | | | $ | 27.86 | | | $ | 23.80 | | | $ | 26.55 | | | $ | 24.19 | | | $ | 19.31 | |
Total Return(2) | | | 9.98 | %* | | | 17.01 | % | | | (10.36 | )% | | | 9.76 | % | | | 25.27 | % | | | 19.71 | % |
| Ratios/supplemental data: | | | | | | | | | | | | | | | | | | | | | | | | |
| Net assets, end of period (000’ omitted) | | $ | 47,461 | | | $ | 49,859 | | | $ | 57,159 | | | $ | 77,188 | | | $ | 87,053 | | | $ | 88,970 | |
| Ratio of expenses to average net assets: | | | | | | | | | | | | | | | | | | | | | | | | |
Before expense reimbursements or recoveries(3)(4) | | | 2.28 | %** | | | 2.34 | % | | | 2.30 | % | | | 2.12 | % | | | 2.15 | % | | | 2.36 | % |
After expense reimbursements or recoveries(3)(5) | | | 2.28 | %** | | | 2.22 | % | | | 2.24 | % | | | 2.24 | % | | | 2.24 | % | | | 2.24 | % |
| Ratio of net investment income (loss) | | | | | | | | | | | | | | | | | | | | | | | | |
| to average net assets: | | | | | | | | | | | | | | | | | | | | | | | | |
Before expense reimbursements or recoveries(3) | | | (0.51 | )%** | | | (0.40 | )% | | | (1.34 | )%*** | | | (1.06 | )% | | | (1.06 | )% | | | (0.98 | )% |
After expense reimbursements or recoveries(3) | | | (0.51 | )%** | | | (0.28 | )% | | | (1.28 | )%*** | | | (1.18 | )% | | | (1.15 | )% | | | (0.86 | )% |
| Portfolio turnover rate | | | 42 | %* | | | 185 | % | | | 211 | % | | | 149 | % | | | 170 | % | | | 294 | % |
| (1) | The average shares outstanding method has been applied for per share information. |
| (2) | Total investment return is based on the change in net asset value of a share during the period, assumes reinvestment of dividends and distributions at net asset value and does not reflect the impact of a sales charge. |
| (3) | Expense waived or reimbursed reflect reductions to total expenses, as discussed in the notes to the financial statements. These reimbursed amounts would increase the net investment loss ratio or decrease the net investment income ratio and recovered amounts would decrease the net investment loss ratio or increase the net investment income ratio, as applicable, had such reductions or increases not occurred. |
| (4) | Expenses before reductions (excluding dividend and interest expense for securities sold short) were 2.29% for the year ended June 30, 2016. |
| (5) | Expenses net of all reductions (excluding dividend and interest expense for securities sold short) were 2.23% for the year ended June 30, 2016. |
| * | Not annualized. |
| ** | Annualized. |
| *** | The net investment income (loss) ratios include dividends on short positions. |
The accompanying notes are an integral part of the financial statements.
Financial Highlights
Quaker Strategic Growth Fund
(For a Share Outstanding Throughout the Period)
| | | Class C | |
| | | (unaudited) | | | | | | | | | | | | | | | | |
| | | For the | | | | | | | | | | | | | | | | |
| | | Six-Month | | | | | | | | | | | | | | | | |
| | | Period from | | | | | | | | | | | | | | | | |
| | | July 1, 2017 | | | Years Ended June 30, | |
| | | to December 31, | | | |
| | | 2017 | | | 2017 | | | 2016 | | | 2015 | | | 2014 | | | 2013 | |
| Net asset value, beginning of period | | $ | 24.07 | | | $ | 20.72 | | | $ | 23.28 | | | $ | 21.37 | | | $ | 17.19 | | | $ | 14.47 | |
| Income from investment operations: | | | | | | | | | | | | | | | | | | | | | | | | |
Net investment income (loss)(1) | | | (0.16 | ) | | | (0.23 | ) | | | (0.44 | ) | | | (0.43 | ) | | | (0.37 | ) | | | (0.25 | ) |
| Net realized and unrealized | | | | | | | | | | | | | | | | | | | | | | | | |
| gain (loss) on investments | | | 2.46 | | | | 3.58 | | | | (2.12 | ) | | | 2.34 | | | | 4.55 | | | | 2.97 | |
| Total from investment operations | | | 2.30 | | | | 3.35 | | | | (2.56 | ) | | | 1.91 | | | | 4.18 | | | | 2.72 | |
| Distributions to shareholders from: | | | | | | | | | | | | | | | | | | | | | | | | |
| Net investment income | | | — | | | | — | | | | — | | | | — | | | | — | | | | — | |
| Net realized capital gain | | | — | | | | — | | | | — | | | | — | | | | — | | | | — | |
| Total distributions | | | — | | | | — | | | | — | | | | — | | | | — | | | | — | |
| Net asset value, end of period | | $ | 26.37 | | | $ | 24.07 | | | $ | 20.72 | | | $ | 23.28 | | | $ | 21.37 | | | $ | 17.19 | |
Total Return(2) | | | 9.56 | %* | | | 16.17 | % | | | (11.00 | )% | | | 8.94 | % | | | 24.32 | % | | | 18.80 | % |
| Ratios/supplemental data: | | | | | | | | | | | | | | | | | | | | | | | | |
| Net assets, end of period (000’ omitted) | | $ | 11,965 | | | $ | 12,687 | | | $ | 15,375 | | | $ | 20,140 | | | $ | 22,931 | | | $ | 22,968 | |
| Ratio of expenses to average net assets: | | | | | | | | | | | | | | | | | | | | | | | | |
Before expense reimbursements or recoveries(3)(4) | | | 3.03 | %** | | | 3.09 | % | | | 3.05 | % | | | 2.87 | % | | | 2.90 | % | | | 3.11 | % |
After expense reimbursements or recoveries(3)(5) | | | 3.03 | %** | | | 2.97 | % | | | 2.99 | % | | | 2.99 | % | | | 2.99 | % | | | 2.99 | % |
| Ratio of net investment income (loss) | | | | | | | | | | | | | | | | | | | | | | | | |
| to average net assets: | | | | | | | | | | | | | | | | | | | | | | | | |
Before expense reimbursements or recoveries(3) | | | (1.26 | )%** | | | (1.15 | )% | | | (2.09 | )%*** | | | (1.81 | )% | | | (1.81 | )% | | | (1.74 | )% |
After expense reimbursements or recoveries(3) | | | (1.26 | )%** | | | (1.03 | )% | | | (2.03 | )%*** | | | (1.93 | )% | | | (1.90 | )% | | | (1.62 | )% |
| Portfolio turnover rate | | | 42 | %* | | | 185 | % | | | 211 | % | | | 149 | % | | | 170 | % | | | 294 | % |
| (1) | The average shares outstanding method has been applied for per share information. |
| (2) | Total investment return is based on the change in net asset value of a share during the period, assumes reinvestment of dividends and distributions at net asset value and does not reflect the impact of a sales charge. |
| (3) | Expense waived or reimbursed reflect reductions to total expenses, as discussed in the notes to the financial statements. These reimbursed amounts would increase the net investment loss ratio or decrease the net investment income ratio and recovered amounts would decrease the net investment loss ratio or increase the net investment income ratio, as applicable, had such reductions or increases not occurred. |
| (4) | Expenses before reductions (excluding dividend and interest expense for securities sold short) were 3.04% for the year ended June 30, 2016. |
| (5) | Expenses net of all reductions (excluding dividend and interest expense for securities sold short) were 2.98% for the year ended June 30, 2016. |
| * | Not Annualized. |
| ** | Annualized. |
| *** | The net investment income (loss) ratios include dividends on short positions. |
The accompanying notes are an integral part of the financial statements.
Financial Highlights
Quaker Strategic Growth Fund
(For a Share Outstanding Throughout the Period)
| | | Institutional Class | |
| | | (unaudited) | | | | | | | | | | | | | | | | |
| | | For the | | | | | | | | | | | | | | | | |
| | | Six-Month | | | | | | | | | | | | | | | | |
| | | Period from | | | | | | | | | | | | | | | | |
| | | July 1, 2017 | | | Years Ended June 30, | |
| | | to December 31, | | | |
| | | 2017 | | | 2017 | | | 2016 | | | 2015 | | | 2014 | | | 2013 | |
| Net asset value, beginning of period | | $ | 29.12 | | | $ | 24.82 | | | $ | 27.62 | | | $ | 25.10 | | | $ | 19.99 | | | $ | 16.66 | |
| Income from investment operations: | | | | | | | | | | | | | | | | | | | | | | | | |
Net investment income (loss)(1) | | | (0.04 | ) | | | (0.01 | ) | | | (0.27 | ) | | | (0.25 | ) | | | (0.21 | ) | | | (0.11 | ) |
| Net realized and unrealized | | | | | | | | | | | | | | | | | | | | | | | | |
| gain (loss) on investments | | | 2.99 | | | | 4.31 | | | | (2.53 | ) | | | 2.77 | | | | 5.32 | | | | 3.44 | |
| Total from investment operations | | | 2.95 | | | | 4.30 | | | | (2.80 | ) | | | 2.52 | | | | 5.11 | | | | 3.33 | |
| Distributions to shareholders from: | | | | | | | | | | | | | | | | | | | | | | | | |
| Net investment income | | | — | | | | — | | | | — | | | | — | | | | — | | | | — | |
| Net realized capital gain | | | — | | | | — | | | | — | | | | — | | | | — | | | | — | |
| Total distributions | | | — | | | | — | | | | — | | | | — | | | | — | | | | — | |
| Net asset value, end of period | | $ | 32.07 | | | $ | 29.12 | | | $ | 24.82 | | | $ | 27.62 | | | $ | 25.10 | | | $ | 19.99 | |
Total Return(2) | | | 10.13 | %* | | | 17.32 | % | | | (10.14 | )% | | | 10.04 | % | | | 25.56 | % | | | 19.99 | % |
| Ratios/supplemental data: | | | | | | | | | | | | | | | | | | | | | | | | |
| Net assets, end of period (000’ omitted) | | $ | 9,105 | | | $ | 9,005 | | | $ | 13,457 | | | $ | 66,521 | | | $ | 58,999 | | | $ | 45,851 | |
| Ratio of expenses to average net assets: | | | | | | | | | | | | | | | | | | | | | | | | |
Before expense reimbursements or recoveries(3)(4) | | | 2.03 | %** | | | 2.09 | % | | | 2.05 | % | | | 1.87 | % | | | 1.90 | % | | | 2.11 | % |
After expense reimbursements or recoveries(3)(5) | | | 2.03 | %** | | | 1.97 | % | | | 1.99 | % | | | 1.99 | % | | | 1.99 | % | | | 1.99 | % |
| Ratio of net investment income (loss) | | | | | | | | | | | | | | | | | | | | | | | | |
| to average net assets: | | | | | | | | | | | | | | | | | | | | | | | | |
Before expense reimbursements or recoveries(3) | | | (0.26 | )%** | | | (0.15 | )% | | | (1.09 | )%*** | | | (0.81 | )% | | | (0.81 | )% | | | (0.74 | )% |
After expense reimbursements or recoveries(3) | | | (0.26 | )%** | | | (0.03 | )% | | | (1.03 | )%*** | | | (0.93 | )% | | | (0.90 | )% | | | (0.62 | )% |
| Portfolio turnover rate | | | 42 | %* | | | 185 | % | | | 211 | % | | | 149 | % | | | 170 | % | | | 294 | % |
| (1) | The average shares outstanding method has been applied for per share information. |
| (2) | Total investment return is based on the change in net asset value of a share during the period, assumes reinvestment of dividends and distributions at net asset value and does not reflect the impact of a sales charge. |
| (3) | Expense waived or reimbursed reflect reductions to total expenses, as discussed in the notes to the financial statements. These reimbursed amounts would increase the net investment loss ratio or decrease the net investment income ratio and recovered amounts would decrease the net investment loss ratio or increase the net investment income ratio, as applicable, had such reductions or increases not occurred. |
| (4) | Expenses before reductions (excluding dividend and interest expense for securities sold short) were 2.04% for the year ended June 30, 2016. |
| (5) | Expenses net of all reductions (excluding dividend and interest expense for securities sold short) were 1.98% for the year ended June 30, 2016. |
| * | Not Annualized. |
| ** | Annualized. |
| *** | The net investment income (loss) ratios include dividends on short positions. |
The accompanying notes are an integral part of the financial statements.
Notes to the Financial Statements (unaudited)
Note 1 — Organization
The Quaker Investment Trust (“Trust”), a diversified, open-end management investment company, was organized as a Massachusetts business trust on October 24, 1990, and is registered under the Investment Company Act of 1940, as amended (“1940 Act”). The Trust’s Amended and Restated Declaration of Trust permits the Trustees to issue an unlimited number of shares of beneficial interest. The Trust currently has five series: Quaker Event Arbitrage Fund (“Event Arbitrage”), Quaker Global Tactical Allocation Fund (“Global Tactical Allocation”), Quaker Mid-Cap Value Fund (“Mid-Cap Value”), Quaker Small-Cap Value Fund (“Small-Cap Value”) and Quaker Strategic Growth Fund (“Strategic Growth”) (each a “Fund” and collectively, “Funds”). All Funds are diversified. The investment objectives of each Fund are set forth below.
Strategic Growth and Small-Cap Value commenced operations on November 25, 1996. Mid-Cap Value commenced operations on December 31, 1997. Global Tactical Allocation commenced operations on May 1, 2008. Event Arbitrage commenced operations on June 7, 2010 in conjunction with the reorganization of the Pennsylvania Avenue Event Driven Fund (“Event Driven Fund”). The predecessor to the Event Driven Fund, the Pennsylvania Avenue Fund, commenced operations on September 19, 2002. The investment objective of these Funds is to seek long-term growth of capital. The investment objective of these funds is non-fundamental in that this objective may be changed by the Board of Trustees (“Board” or “Trustees”) without shareholder approval. Each Fund is an investment company and accordingly follows the investment company accounting and reporting guidance of the Financial Accounting Standards Board (“FASB”) Accounting Standards Codification Topic 946 “Financial Services – Investment Companies.”
The Funds currently offer three classes of shares (Class A, Class C and Institutional Class shares). Class A shares are charged a front-end sales charge and a distribution and servicing fee; Class C shares are charged a distribution fee, but bear no front-end sales charge or contingent deferred sales charge (“CDSC”); and Institutional Class shares bear no front-end sales charge or CDSC, but have higher minimum investment thresholds. Quaker Funds, Inc. (“QFI”), the investment adviser to each of the Funds, has the ability to waive the minimum investment for Institutional Class shares at its discretion.
Note 2 — Summary of Significant Accounting Policies and Other Information
The following is a summary of significant accounting policies consistently followed by the Funds in the preparation of their financial statements. The policies are in conformity with accounting principles generally accepted in the United States of America (“GAAP”).
A. Security Valuation. The Funds’ investments in securities are carried at market value. Securities listed on an exchange or quoted on a national market system are generally valued at the last quoted sales price at the time of valuation. Other securities traded in the over-the-counter market and listed securities for which no sale was reported on that date are valued at the most recent bid price. Each security reported on the NASDAQ National Market System is valued at the NASDAQ Official Closing Price.
Debt and other fixed-income securities are valued at the last quoted bid price and/or by using a combination of daily quotes and matrix evaluations provided by an independent pricing service (which reflect such factors as security prices, yields, maturities, ratings, and dealer and exchange quotations), the use of which has been approved by the Board.
The Funds may enter into forward foreign currency contracts to lock in the U.S. dollar cost of purchase and sale transactions or to defend the portfolio against currency fluctuations. A forward foreign currency contract is a commitment to purchase or sell a foreign currency at a future date at a negotiated rate. These contracts are
Notes to the Financial Statements (unaudited) (continued)
Note 2 — Summary of Significant Accounting Policies and Other Information (Continued)
valued daily, and the Fund’s net equity therein, representing unrealized gain or loss on the contracts as measured by the difference between the forward foreign exchange rates at the dates of entry into the contracts and the forward rates at the end of the reporting period, if any, is included in the Statements of Assets and Liabilities. Realized and unrealized gains and losses, if any, are included in the Statements of Operations. Risks may arise upon entering into these contracts from the potential inability of counterparties to meet the terms of the contract and from unanticipated movements in the value of foreign currencies relative to the U.S. dollar.
For financial reporting purposes, investment transactions are recorded on the trade date; however, for purposes of executing shareholder transactions, the Funds record changes in holdings of portfolio securities no later than the first business day after the trade date in accordance with Rule 2a-4 of the 1940 Act. Accordingly, certain differences between net asset value for financial reporting and for executing shareholder transactions may arise.
The Funds have adopted fair valuation procedures to value securities at fair market value in certain circumstances, and the Trust has established a Valuation Committee responsible for determining when fair valuing a security is necessary and appropriate. The Funds will value securities at fair market value when market quotations are not readily available or when securities cannot be accurately valued within established pricing procedures. The Valuation Committee may also fair value foreign securities whose prices may have been affected by events occurring after the close of trading in their respective markets but prior to the time the Fund holding the foreign securities calculates its net asset value. The Funds’ fair valuation procedures are designed to help ensure that prices at which Fund shares are purchased and redeemed are fair and do not result in dilution of shareholder interest or other harm to shareholders.
The Fund is required to disclose information regarding the fair value measurements of the Fund’s assets and liabilities. Fair value is defined as the price that the Fund may receive upon selling an investment in an orderly transaction to an independent buyer in the principal or most advantageous market for the investment. The disclosure requirements utilize a three-tier hierarchy to maximize the use of observable market data, minimize the use of unobservable inputs and establish classification of fair value measurements for disclosure purposes. A financial instrument’s level within the fair value hierarchy is based on the lowest level that is significant to the fair value measurement. Inputs refer broadly to the assumptions that market participants would use in pricing the asset or liability, including assumptions about risk, for example, the risk inherent in a particular valuation technique used to measure fair value including the pricing model used and/or the risk inherent in the inputs to the valuation technique. Inputs may be observable or unobservable.
Observable inputs are inputs that reflect the assumptions market participants would use in pricing the asset or liability, which are based on market data obtained from sources independent of the reporting entity. Unobservable inputs are inputs that reflect the reporting entity’s own assumptions about the assumptions market participants would use in pricing the asset or liability developed based on the best information available in the circumstances.
The significant unobservable inputs used in the fair value measurement of the reporting entity’s private equity holdings are, the last traded price, the cost of prior transactions, single broker quotes, uncertainty of future payout, pricing service price adjusted for recent payout distribution, last trade price on pre-conversion bond, discounts applied for lack of marketability and last traded price of comparable securities of the same issuer. Significant increases (decreases) in any of those inputs in isolation could result in a significantly lower (higher) fair value measurement.
Various inputs may be used to determine the value of each Fund’s investments. These inputs are summarized in three broad levels for financial statement purposes. The inputs or methodologies used to value securities are not necessarily an indication of the risk associated with investing in those securities.
Notes to the Financial Statements (unaudited) (continued)
Note 2 — Summary of Significant Accounting Policies and Other Information (Continued)
Level 1 — Quoted prices in active markets for identical securities.
Level 2 — Prices determined using significant other observable inputs (including quoted prices for similar securities, interest rates, prepayment speed, credit risk, etc.) Municipal securities, long-term U.S. Government obligations and corporate debt securities, if any, are valued in accordance with the evaluated price supplied by the pricing service and generally categorized as Level 2 in the hierarchy. Other securities that are categorized as Level 2 in the hierarchy include, but are not limited to, structured notes and warrants that do not trade on an exchange, OTC options and international equity securities, if any, are valued by an independent third party in order to adjust for stale pricing and foreign market holidays.
Level 3 — Prices determined using significant unobservable inputs (including the Fund’s own assumptions). For restricted equity securities where observable inputs are limited, assumptions about market activity and risk are used in determining fair value. These are categorized as Level 3 in the hierarchy.
For international equity securities traded on a foreign exchange or market which closes prior to a Fund’s Valuation Time, in order to adjust for events which occur between the close of the foreign exchange they are traded on and the close of the New York Stock Exchange, a fair valuation model is used, and these securities are categorized as Level 2.
A Fund may hold securities, some of which are classified as Level 3 investments (as defined below). Level 3 investments have significant unobservable inputs, as they trade infrequently. In determining the fair value of these investments, management uses the market approach which includes as the primary input the capital balance reported; however, adjustments to the reported capital balance may be made based on various factors, including, but not limited to, the attributes of the interest held, including the rights and obligations, and any restrictions or illiquidity of such interests, and the fair value of these securities.
The value of a foreign security is generally determined as of the close of trading on the foreign stock exchange on which the security is primarily traded, or as of the close of trading on the New York Stock Exchange (“NYSE”), if earlier. The value is then converted into its U.S. dollar equivalent at the foreign exchange rate in effect at the close of the NYSE (generally 4:00 p.m. Eastern time) on the day that the value of the foreign security is determined. If no sale is reported at that time, the foreign security will be valued within the range of the most recent quoted bid and ask prices. If market quotations are not readily available for a foreign security or an event has occurred that caused a quotation to be unavailable or unreliable, the Valuation Committee will fair value foreign securities using the procedures described below.
The Trust has adopted fair valuation procedures to value securities at fair market value when independent prices are unavailable or unreliable, and the Trust has established a Valuation Committee that is responsible for determining when fair valuing a security is necessary and appropriate. Securities and assets for which market quotations are not readily available may be valued based upon valuation methods that include: (i) multiple of earnings; (ii) yield to maturity with respect to debt issues; (iii) discounts from market prices of similar freely traded securities; or (iv) a combination of these or other methods. Securities may also be priced using fair value pricing methods when their closing prices do not reflect their market values at the time the Fund calculates its net asset value (“NAV”) because an event had occurred since the closing prices were established on the domestic or foreign exchange or market but before the Fund’s NAV calculation.
Notes to the Financial Statements (unaudited) (continued)
Note 2 — Summary of Significant Accounting Policies and Other Information (Continued)
The following is a summary of the fair valuations according to the inputs used as of December 31, 2017 in valuing the Fund’s assets and liabilities:
| | | | | | | | | | | | Investments | | | | |
| | | | | | | | | | | | Measured at | | | | |
| Description EVENT ARBITRAGE FUND | | Level 1 | | | Level 2 | | | Level 3 | | | Net Asset Value | | | Total | |
| Common Stocks | | $ | 8,844,224 | | | $ | 14,111 | | | $ | 58,987 | | | $ | — | | | $ | 8,917,322 | |
| Closed End Mutual Fund | | | 2,095,500 | | | | — | | | | — | | | | — | | | | 2,095,500 | |
| Preferred Stocks | | | 604,224 | | | | 1 | | | | 20,000 | | | | — | | | | 624,225 | |
| Real Estate Investment Trust | | | 129,690 | | | | — | | | | — | | | | — | | | | 129,690 | |
| Structured Note | | | — | | | | 890,260 | | | | — | | | | — | | | | 890,260 | |
| Warrant | | | 8,835 | | | | — | | | | — | | | | — | | | | 8,835 | |
| Asset Backed Securities | | | — | | | | 219,939 | | | | — | | | | — | | | | 219,939 | |
| Convertible Bond | | | — | | | | 512,934 | | | | — | | | | — | | | | 512,934 | |
| Corporate Bonds | | | — | | | | 1,433,241 | | | | 486,250 | | | | — | | | | 1,919,491 | |
| Escrow Notes | | | — | | | | — | | | | 0 | | | | — | | | | 0 | |
| Mortgage Backed Securities | | | — | | | | 83,687 | | | | — | | | | — | | | | 83,687 | |
| Municipal Bonds | | | — | | | | 227,338 | | | | 202,634 | | | | — | | | | 429,972 | |
| Purchased Options | | | 49,900 | | | | 194,000 | | | | — | | | | — | | | | 243,900 | |
| Bank Deposit Account | | | 847,553 | | | | — | | | | — | | | | — | | | | 847,553 | |
| Private Investment Co. Purchased | | | | | | | | | | | | | | | | | | | | |
| with Proceeds from Securities Lending | | | — | | | | — | | | | — | | | | 1,629,245 | | | | 1,629,245 | |
| Total Investments in Securities | | $ | 12,579,926 | | | $ | 3,575,511 | | | $ | 767,871 | | | $ | 1,629,245 | | | $ | 18,552,553 | |
| Common Stocks sold short | | $ | (1,812,026 | ) | | $ | — | | | $ | — | | | $ | — | | | $ | (1,812,026 | ) |
| Written Options | | | (130,320 | ) | | | — | | | | — | | | | — | | | | (130,320 | ) |
| Total Investments in Securities sold short | | $ | (1,942,346 | ) | | $ | — | | | $ | — | | | $ | — | | | $ | (1,942,346 | ) |
| | | | | | | | | | | | | | | | | | | | |
| | | | | | | | | | | | | | | Investments | | | | | |
| | | | | | | | | | | | | | | Measured at | | | | | |
| Description GLOBAL TACTICAL ALLOCATION FUND | Level 1 | | | Level 2 | | | Level 3 | | | Net Asset Value | | | Total | |
| Common Stocks | | $ | 1,897,257 | | | $ | — | | | $ | 14,744 | | | $ | — | | | $ | 1,912,001 | |
| Closed End Mutual Fund | | | 35,244 | | | | — | | | | — | | | | — | | | | 35,244 | |
| Exchange Traded Funds | | | 402,599 | | | | — | | | | — | | | | — | | | | 402,599 | |
| Preferred Stocks | | | 264,871 | | | | — | | | | — | | | | — | | | | 264,871 | |
| Real Estate Investment Trusts | | | 490,980 | | | | — | | | | — | | | | — | | | | 490,980 | |
| Corporate Bonds | | | — | | | | 2,730,932 | | | | — | | | | — | | | | 2,730,932 | |
| Mortgage Backed Security | | | — | | | | 1,367 | | | | — | | | | — | | | | 1,367 | |
| Bank Deposit Account | | | 633,506 | | | | — | | | | — | | | | — | | | | 633,506 | |
| Total Investments in Securities | | $ | 3,724,457 | | | $ | 2,732,299 | | | $ | 14,744 | | | $ | — | | | $ | 6,471,500 | |
| | | | | | | | | | | | | | | | | | | | |
| | | | | | | | | | | | | | | Investments | | | | | |
| | | | | | | | | | | | | | | Measured at | | | | | |
| Description MID-CAP VALUE FUND | | Level 1 | | | Level 2 | | | Level 3 | | | Net Asset Value | | | Total | |
| Common Stocks | | $ | 6,151,268 | | | $ | — | | | $ | — | | | $ | — | | | $ | 6,151,268 | |
| Real Estate Investment Trusts | | | 816,010 | | | | — | | | | — | | | | — | | | | 816,010 | |
| Bank Deposit Account | | | 167,300 | | | | — | | | | — | | | | — | | | | 167,300 | |
| Private Investment Co. Purchased | | | | | | | | | | | | | | | | | | | | |
| with Proceeds from Securities Lending | | | — | | | | — | | | | — | | | | 1,492,470 | | | | 1,492,470 | |
| Total Investments in Securities | | $ | 7,134,578 | | | $ | — | | | $ | — | | | $ | 1,492,470 | | | $ | 8,627,048 | |
Notes to the Financial Statements (unaudited) (continued)
Note 2 — Summary of Significant Accounting Policies and Other Information (Continued)
| | | | | | | | | | | | Investments | | | | |
| | | | | | | | | | | | Measured at | | | | |
| Description SMALL-CAP VALUE FUND | | Level 1 | | | Level 2 | | | Level 3 | | | Net Asset Value | | | Total | |
| Common Stocks | | $ | 27,317,456 | | | $ | — | | | $ | — | | | $ | — | | | $ | 27,317,456 | |
| Real Estate Investment Trusts | | | 1,523,951 | | | | — | | | | — | | | | — | | | | 1,523,951 | |
| Bank Deposit Account | | | 567,393 | | | | — | | | | — | | | | — | | | | 567,393 | |
| Private Investment Co. Purchased | | | | | | | | | | | | | | | | | | | | |
| with Proceeds from Securities Lending | | | — | | | | — | | | | — | | | | 4,487,434 | | | | 4,487,434 | |
| Total Investments in Securities | | $ | 29,408,800 | | | $ | — | | | $ | — | | | $ | 4,487,434 | | | $ | 33,896,234 | |
| | | | | | | | | | | | | | | | | | | | |
| | | | | | | | | | | | | | | Investments | | | | | |
| | | | | | | | | | | | | | | Measured at | | | | | |
| Description STRATEGIC GROWTH FUND | | Level 1 | | | Level 2 | | | Level 3 | | | Net Asset Value | | | Total | |
| Common Stocks | | $ | 66,380,495 | | | $ | — | | | $ | 409,796 | | | $ | — | | | $ | 66,790,291 | |
| Real Estate Investment Trusts | | | 1,605,269 | | | | — | | | | — | | | | — | | | | 1,605,269 | |
| Bank Deposit Account | | | 258,383 | | | | — | | | | — | | | | — | | | | 258,383 | |
| Private Investment Co. Purchased | | | | | | | | | | | | | | | | | | | | |
| with Proceeds from Securities Lending | | | — | | | | — | | | | — | | | | 7,351,293 | | | | 7,351,293 | |
| Total Investments in Securities | | $ | 68,244,147 | | | $ | — | | | $ | 409,796 | | | $ | 7,351,293 | | | $ | 76,005,236 | |
Refer to the Fund’s Schedules of Investments for industry classifications.
Level 3 Reconciliation
The following is a reconciliation of Event Arbitrage’s, Global Tactical Allocation’s and Strategic Growth’s Level 3 investments for which significant unobservable inputs were used in determining value. See Schedules of Investments for industry breakouts:
| EVENT ARBITRAGE FUND | |
| | | Balance | | | | | | | | | | | | Net | | | | | | | | | Balance | |
| | | as of | | | | | | | | | | | | Unrealized | | | Amortized | | | Transfers | | | as of | |
| | | June 30, | | | | | | | | | Realized | | | appreciation | | | discounts/ | | | in to | | | December 31, | |
| | | 2017 | | | Purchases | | | Sales | | | gain (loss) | | | (depreciation) | | | premiums | | | Level 3 | | | 2017 | |
| Common Stocks | | $ | 1,295,681 | | | $ | — | | | $ | (1,137,000 | ) | | $ | 402,000 | | | $ | (502,601 | ) | | $ | — | | | $ | 907 | | | $ | 58,987 | |
| Preferred Stocks | | | 653,000 | | | | — | | | | (613,000 | ) | | | — | | | | (20,000 | ) | | | — | | | | — | | | | 20,000 | |
| Corporate Bonds | | | 445,000 | | | | — | | | | — | | | | — | | | | 41,250 | | | | — | | | | — | | | | 486,250 | |
| Escrow Notes | | | 0 | | | | — | | | | (2,202 | ) | | | — | | | | 2,202 | | | | — | | | | — | | | | 0 | |
| Municipal Bonds | | | 0 | | | | 267,527 | | | | — | | | | — | | | | (64,893 | ) | | | — | | | | — | | | | 202,634 | |
| | | $ | 2,393,681 | | | $ | 267,527 | | | $ | (1,752,202 | ) | | $ | 402,000 | | | $ | (544,042 | ) | | $ | — | | | $ | 907 | | | $ | 767,871 | |
| Net change in unrealized appreciation (depreciation) for Level 3 investments still held as of December 31, 2017 | | | $ | (38,513 | ) |
| | |
| GLOBAL TACTICAL ALLOCATION FUND | |
| | | Balance | | | | | | | | | | | | | | | Net | | | | | | | | | | | Balance | |
| | | as of | | | | | | | | | | | | | | | Unrealized | | | Amortized | | | Transfers | | | as of | |
| | | June 30, | | | | | | | | | | | Realized | | | appreciation | | | discounts/ | | | in to | | | December 31, | |
| | | 2017 | | | Purchases | | | Sales | | | gain (loss) | | | (depreciation) | | | premiums | | | Level 3 | | | 2017 | |
| Common Stocks | | $ | 14,364 | | | $ | — | | | $ | — | | | $ | — | | | $ | 380 | | | $ | — | | | $ | — | | | $ | 14,744 | |
| | | $ | 14,364 | | | $ | — | | | $ | — | | | $ | — | | | $ | 380 | | | $ | — | | | $ | — | | | $ | 14,744 | |
| Net change in unrealized appreciation (depreciation) for Level 3 investments still held as of December 31, 2017 | | | $ | 380 | |
Notes to the Financial Statements (unaudited) (continued)
Note 2 — Summary of Significant Accounting Policies and Other Information (Continued)
| STRATEGIC GROWTH FUND | |
| | | Balance | | | | | | | | | | | | Net | | | | | | | | | Balance | |
| | | as of | | | | | | | | | | | | Unrealized | | | Amortized | | | Transfers | | | as of | |
| | | June 30, | | | | | | | | | Realized | | | appreciation | | | discounts/ | | | in to | | | December 31, | |
| | | 2017 | | | Purchases | | | Sales | | | gain (loss) | | | (depreciation) | | | premiums | | | Level 3 | | | 2017 | |
| Common Stocks | | $ | 399,234 | | | $ | — | | | $ | — | | | $ | — | | | $ | 10,562 | | | $ | — | | | $ | — | | | $ | 409,796 | |
| | | $ | 399,234 | | | $ | — | | | $ | — | | | $ | — | | | $ | 10,562 | | | $ | — | | | $ | — | | | $ | 409,796 | |
| Net change in unrealized appreciation (depreciation) for Level 3 investments still held as of December 31, 2017 | | | $ | 10,562 | |
Transfers are recognized at the end of the reporting period.
There have been no transfers in and out of Level 1 and Level 2 fair value measurements as of December 31, 2017, except for the Quaker Event Arbitrage Fund listed below:
| Transfers out of Level 1 into Level 3 | $907 | | Due to a decrease of market activity. |
| Transfers out of Level 2 into Level 1 | $650,946 | | Due to an increase of market activity. |
The following presents information about significant unobservable inputs related to Level 3 investments at December 31, 2017:
EVENT ARBITRAGE FUND
| Asset | | Fair Value at | | Valuation | Unobservable | | Input | | Increase in Inputs |
| Categories | December 31, 2017 | Technique | Input | | Values | | Impact on Valuation* |
| Common Stocks | | | | | | | | | |
| Agriculture | | $ | 907 | | Market approach | Last traded price | | € | 0.03 | | Increase |
| Auto Parts & | | | 15,000 | | Market approach | Last traded price of | | $ | 2.53 | | Increase |
| Equipment | | | | | | pre-conversion bonds | | | | | |
| Computers | | | 0 | | Profitability expected | Uncertainty of any | | $ | — | | Increase |
| | | | | | return method | additional future payout | | | | | |
| Escrow Shares | | | 0 | | Profitability expected | Uncertainty of any | | $ | — | | Increase |
| | | | | | return method | additional future payout | | | | | |
| Healthcare-Products | | | 21,930 | | Market approach | Last traded price of non- | | | -32.00 | % | Increase |
| | | | | | | restricted shares less a discount | | | | | |
| Holding Companies- | | | 0 | | Profitability expected | Uncertainty of any | | $ | — | | Increase |
| Diversified | | | | | return method | additional future payout | | | | | |
| Mining | | | 0 | | Profitability expected | Uncertainty of any | | $ | — | | Increase |
| | | | | | return method | additional future payout | | | | | |
| Real Estate | | | 21,150 | | Vendor pricing | Single broker quote since | | $ | 0.23 | | Increase |
| | | | | | | shares are not listed yet | | | | | |
| Preferred stock | | | | | | | | | | | |
| Insurance | | | 20,000 | | Vendor pricing | Single broker quote | | $ | 2,000.00 | | Increase |
| Corporate Bonds | | | | | | | | | | | |
| Auto Parts & | | | 0 | | Profitability expected | Uncertainty of any | | $ | — | | Increase |
| Equipment | | | | | return method | additional future payout | | | | | |
| Diversified Financial | | | 6,250 | | Vendor pricing | Single broker quote | | $ | 0.13 | | Increase |
| Services | | | | | | | | | | | |
| Diversified Financial | | | 480,000 | | Vendor pricing | Single broker quote | | $ | 48.00 | | Increase |
| Services | | | | | | | | | | | |
| Venture Capital | | | 0 | | Profitability expected | Uncertainty of any | | $ | — | | Increase |
| | | | | | return method | additional future payout | | | | | |
| Escrow Notes | | | 0 | | Profitability expected | Uncertainty of any | | $ | — | | Increase |
| | | | | | return method | additional future payout | | | | | |
| Municipal Bonds | | | 202,634 | | Market approach | Trading price of comparable | | $ | 20.78 | | Increase |
| | | | | | | securities of the same issuer | | | | | |
€ Euro
Notes to the Financial Statements (unaudited) (continued)
Note 2 — Summary of Significant Accounting Policies and Other Information (Continued)
| GLOBAL TACTICAL ALLOCATION FUND |
| |
| Asset | | Fair Value at | | Valuation | Unobservable | | Input | | Increase in Inputs |
| Categories | December 31, 2017 | Technique | Input | | Values | | Impact on Valuation* |
| Common Stocks | | | | | | | | | |
| Airlines | | $ | 14,744 | | Market approach | Projected final distribution, | | $ | 1.94 | | Decrease |
| | | | | | | discounted for lack of marketability | | | | | |
| |
| STRATEGIC GROWTH FUND |
| |
| Asset | | Fair Value at | | Valuation | Unobservable | | Input | | |
| Categories | December 31, 2017 | Technique | Input | | Values | | |
| Common Stocks | | | | | | | | | | | |
| Airlines | | $ | 409,796 | | Market approach | Projected final distribution, | | $ | 1.94 | | Decrease |
| | | | | | | discounted for lack of marketability | | | | | |
* An impact to Valuation from a decrease in input would produce the opposite effect of an increase.
B. Federal Income Taxes. It is the Funds’ policy to comply with the requirements of Subchapter M of the Internal Revenue Code and to distribute substantially all of their taxable income to shareholders. Therefore, no federal income tax provision is required.
In accordance with Financial Accounting Standards Board (“FASB”) Interpretation ASC 740, (“ASC 740”), each Fund recognizes a tax benefit from an uncertain position only if it is more likely than not that the position is sustainable, based solely on its technical merits and consideration of the relevant taxing authority’s widely understood administrative practices and precedents. If this threshold is met, a Fund measures the tax benefit as the largest amount of benefit that is greater than fifty percent likely of being realized upon ultimate settlement. The Funds identify their major tax jurisdictions as U.S. Federal and the Commonwealth of Massachusetts. Management has reviewed the tax positions for each of the three open tax years as of June 30, 2017 and has determined that the implementation of ASC 740 does not have a material impact on the Funds’ financial statements. Each Fund’s federal tax returns for the prior three fiscal years remains subject to examination by the Internal Revenue Service.
Net investment income or loss and net realized gains or losses may differ for financial statement and income tax purposes primarily due to investments that have a different basis for financial statement and income tax purposes. The character of distributions made during the year from net investment income or net realized gains may differ from their ultimate characterization for federal income tax purposes. Also, due to the timing of dividend distributions, the fiscal year in which amounts are distributed may differ from the year that the income or realized gains were recorded by each Fund. Permanent differences in the recognition of earnings are reclassified to additional paid-in capital. Distributions in excess of tax-basis earnings are recorded as a return of capital.
C. Security Transactions and Investment Income. Security transactions are recorded on the trade date. Realized gains and losses are determined using the specific identification cost method. Interest income on debt securities is recorded daily on the accrual basis. Discounts and premiums on debt securities are amortized over their respective lives. Dividend income is recorded on the ex-dividend date, or as soon as information is available to the Fund.
D. Short Sales of Investments. Certain Funds may make short sales of investments, which are transactions in which a Fund sells a security it does not own in anticipation of a decline in the fair value of that security. To complete such a transaction, the Fund must borrow the security to make delivery to the buyer. The Fund is then obligated to replace the security borrowed by purchasing it at the market price at the time of replacement. The broker retains the proceeds of short sales to the extent necessary to meet margin requirements until the short position is closed out.
Notes to the Financial Statements (unaudited) (continued)
Note 2 — Summary of Significant Accounting Policies and Other Information (Continued)
If a security pays a dividend while the Fund holds it short, the Fund will need to pay the dividend to the original owner of the security. Since the Fund borrowed the shares and sold them to a third party, the third party will receive the dividend from the security and the Fund will pay the original owner the dividend directly. The Fund is not entitled to the dividend because it does not own the shares. A gain, limited to the price at which the Fund sold the security short, or a loss, unlimited in size, will be recognized upon the termination of a short sale.
E. Written Options Contracts. Certain Funds may write options to manage exposure to certain changes in the market. When a Fund writes an option, an amount equal to the premium received by the Fund is recorded as a liability, which is marked-to-market daily to reflect the current market value of the option written. If the option expires, the Fund realizes a gain from investments equal to the amount of the premium received. When a written call option is exercised, the difference between the premium and the amount for effecting a closing purchase transaction, including brokerage commission, is also treated as a realized gain or loss. When a written put option is exercised, the amount of the premium received reduces the cost of the security purchased by the Fund.
A risk in writing a covered call option is that the Fund may forego the opportunity of profit if the market price of the underlying security increases and the option is exercised. The risk in writing a put option is that the Fund may incur a loss if the market price of the underlying security decreases and the option is exercised.
In addition, there is the risk that the Fund may not be able to enter into a closing transaction because of an illiquid secondary market.
F. Purchased Options. Certain Funds may purchase call options in anticipation of an increase in the market value of securities of the type in which they may invest. The purchase of a call option will entitle a Fund, in return for the premium paid, to purchase specified securities at a specified price during the option period. A Fund will ordinarily realize a gain if, during the option period, the value of such securities exceeded the sum of the exercise price, the premium paid and transaction costs; otherwise, the Fund will realize either no gain or a loss on the purchase of the call option. A Fund will normally purchase put options in anticipation of a decline in the market value of securities in its portfolio (“protective puts”) or in securities in which it may invest. The purchase of a put option will entitle the Fund, in exchange for the premium paid, to sell specified securities at a specified price during the option period. The purchase of protective puts is designed to offset or hedge against a decline in the market value of the Fund’s securities. Put options may also be purchased by a Fund for the purpose of affirmatively benefiting from a decline in the price of securities which it does not own. The Fund will ordinarily realize a gain if, during the option period, the value of the underlying securities decreased below the exercise price sufficiently to more than cover the premium and transaction costs; otherwise the Fund will realize either no gain or a loss on the purchase of the put option. Gains and losses on the purchase of protective put options would tend to be offset by countervailing changes in the value of the underlying portfolio securities.
G. Futures Contracts. Certain Funds may enter into financial futures contracts, to the extent permitted by their investment policies and objectives, for bona fide hedging and other permissible risk management purposes including protecting against anticipated changes in the value of securities a Fund intends to purchase. Upon entering into a financial futures contract, a Fund is required to deposit cash or securities as initial margin.
Additional securities are also segregated as collateral up to the current market value of the financial futures contracts. Subsequent payments, known as variation margin, are made or received by the Fund, depending on the fluctuation in the value of the underlying financial instruments. The Fund recognizes an unrealized gain or loss equal to the variation margin. When the financial futures contracts are closed, a realized gain or loss is
Notes to the Financial Statements (unaudited) (continued)
Note 2 — Summary of Significant Accounting Policies and Other Information (Continued)
recognized equal to the difference between the proceeds from (or cost of) the closing transactions and the Fund’s basis in the contracts. The risks associated with entering into financial futures contracts include the possibility that a change in the value of the contract may not correlate with the changes in the value of the underlying instruments. In addition, investing in financial futures contracts involves the risk that the Fund could lose more than the original margin deposit and subsequent payments required for a futures transaction. Risks may also arise upon entering into these contracts from the potential inability of the counterparties to meet the terms of their contracts.
H. Foreign Currency Transactions. Securities and other assets and liabilities denominated in foreign currencies are converted each business day into U.S. dollars based on the prevailing rates of exchange. Purchases and sales of portfolio securities and income and expenses are converted into U.S. dollars on the respective dates of such transactions.
Gains and losses resulting from changes in exchange rates applicable to foreign securities are not reported separately from gains and losses arising from movements in securities prices.
Net realized foreign exchange gains and losses include gains and losses from sales and maturities of foreign currency exchange contracts, gains and losses realized between the trade and settlement dates of foreign securities transactions, and the difference between the amount of dividends, interest and foreign withholding taxes on the Funds’ books and the U.S. dollar equivalent of the amounts actually received. Net unrealized foreign exchange gains and losses include gains and losses from changes in the fair value of assets and liabilities denominated in foreign currencies other than portfolio securities, resulting from changes in exchange rates.
I. Forward Foreign Currency Contracts. Certain Funds may enter into forward foreign currency contracts to hedge against foreign currency exchange rate risk on their non-U.S. dollar denominated securities or to facilitate settlement of foreign currency denominated portfolio transactions. A forward foreign currency contract is an agreement between two parties to buy and sell a currency at a set price on a future date. The contract is marked-to-market daily and the change in value is recorded by a Fund as an unrealized gain or loss. When a forward foreign currency contract is extinguished, through either delivery or offset by entering into another forward foreign currency contract, the Fund records a realized gain or loss equal to the difference between the value of the contract at the time it was opened and the value of the contract at the time it was extinguished.
Forward foreign currency contracts involve elements of market risk in excess of the amounts reflected in the Statements of Assets and Liabilities. The Fund bears the risk of an unfavorable change in the foreign exchange rate underlying the forward foreign currency contract. Risks may also arise upon entering into these contracts from the potential inability of the counterparties to meet the terms of their contracts.
J. Portfolio Investment Risks. Investments in securities of foreign issuers carry certain risks not ordinarily associated with investments in securities of U.S. issuers. These risks include future disruptive political and economic developments and the possible imposition of exchange controls or other unfavorable foreign government laws and restrictions. In addition, investments in certain countries may carry risks of expropriation of assets, confiscatory taxation, political or social instability, or diplomatic developments that adversely affect investments in those countries. Certain countries may also impose substantial restrictions on investments in their capital markets by foreign entities, including restrictions on investments in issuers in industries deemed sensitive to relevant national interests. These factors may limit the investment opportunities available and result in a lack of liquidity and high price volatility with respect to securities of issuers from developing countries.
Notes to the Financial Statements (unaudited) (continued)
Note 2 — Summary of Significant Accounting Policies and Other Information (Continued)
K. Multiple Class Allocations. Each class of shares has equal rights as to earnings and assets except that each class bears different distribution and shareholder servicing expenses. Each class of shares has exclusive voting rights with respect to matters that affect just that class. Income, expenses (other than expenses attributable to a specific class) and realized and unrealized gains or losses on investments are allocated to each class of shares based on its relative net assets.
L. Expense Allocations. Expenses are allocated to each series based upon its relative proportion of net assets to the Trust’s total net assets.
M. Distributions to Shareholders. Each Fund generally declares dividends at least annually, payable in December, on a date selected by the Board. In addition, distributions may be made annually in December out of net realized gains through October 31 of that calendar year. Distributions to shareholders are recorded on the ex-dividend date. Each Fund may make a supplemental distribution subsequent to the end of its fiscal year ending June 30.
N. Use of Estimates. The preparation of financial statements in conformity with GAAP requires management to make estimates and assumptions that affect the reported amounts of assets and liabilities and the disclosure of contingent assets and liabilities at the date of the financial statements, and the reported amounts of revenue and expenses during the reporting period. Actual results could differ from those estimates, and those differences could be significant.
O. Security Loans. The Funds receive compensation in the form of fees, or retain a portion of interest on the investment of any cash received as collateral. The Funds also continue to receive interest or dividends on the securities loaned. The loans are secured by collateral at least equal to 102% of the prior days market value of the loaned securities. Gain or loss in the fair value of the securities loaned that may occur during the term of the loan will be for the account of the Funds. The Funds have the right under the lending agreement to recover the securities from the borrower on demand.
P. Derivative Instruments. The Funds have adopted amendments to authoritative guidance on disclosures about derivative instruments and hedging activities which require that the Funds disclose: a) how and why an entity uses derivative instruments; and b) how derivative instruments and related hedged items affect an entity’s financial position, financial performance and cash flows.
The Funds may trade financial instruments where they are considered to be a seller of credit derivatives in accordance with authoritative guidance under GAAP on derivatives and hedging.
The fair value of derivative instruments whose primary underlying risk exposure is equity price risk at December 31, 2017 were as follows:
EVENT ARBITRAGE
| | | Fair Value | |
| Derivative | | Asset Derivatives(1) | | | Liability Derivatives(2) | |
| Written Options | | $ | — | | | $ | 130,320 | |
| Purchased Options | | | 243,900 | | | | — | |
| (1) | Statement of Assets and Liabilities location: Investments, at value. |
| (2) | Statement of Assets and Liabilities location: Written options, at value. |
Notes to the Financial Statements (unaudited) (continued)
Note 2 — Summary of Significant Accounting Policies and Other Information (Continued)
The effect of derivative instruments on the Statement of Operations whose underlying risk exposure is equity price risk for the period ended December 31, 2017 were as follows:
EVENT ARBITRAGE
| | | | | Change in Unrealized Appreciation |
| | Realized Gain(Loss)on Derivatives | | (Depreciation) on Derivatives |
| Derivative | Recognized in Income(1) | | Recognized in Income(2) |
| Written Options | | $ | 168,649 | | | | $ | 76,512 | |
| Purchased Options | | | (112,278 | ) | | | | (32,449 | ) |
| (1) | Statement of Operations location: Net realized gain (loss) from written options and net realized gain (loss) from investments. |
| (2) | Statement of Operations location: Net unrealized appreciation (depreciation) on written options and net unrealized appreciation (depreciation) on investments. |
For the six-month period ended December 31, 2017, the Event Arbitrage Fund had: long option contracts (3,668 contracts) were purchased and $764,534 in premiums were paid, written option contracts (5,304 contracts) were opened and $415,114 in premiums were received.
Note 3 — Investment Advisory Fee and Other Related Party Transactions
QFI serves as investment adviser to each Fund. Pursuant to separate investment sub-advisory agreements, QFI has selected the following investment advisory firms to serve as sub-advisers:
| Fund | Sub-adviser |
| Event Arbitrage | N/A |
| Global Tactical Allocation | N/A |
| Mid-Cap Value | Kennedy Capital Management, Inc. |
| Small-Cap Value | AJO, LP |
| Strategic Growth | Los Angeles Capital Management and Equity Research, Inc. |
QFI or the sub-advisers provide each Fund with a continuous program of supervision of the Fund’s assets, including the composition of its portfolio, and furnish advice and recommendations with respect to investments, investment policies and the purchase and sale of securities.
Each Fund paid QFI aggregate fees shown in the table below for the six-month period ended December 31, 2017. Amounts are expressed as an annualized percentage of average net assets.
| | Aggregate | Subadvisory | Advisory & |
| | advisory fee | fee paid by QFI | subadvisory |
| | paid to QFI | to the sub-adviser | (reimbursed)/recovered |
| Event Arbitrage | 1.30% | N/A | (1.00)% |
| Global Tactical Allocation | 0.75% | N/A | (0.30)% |
| Mid-Cap Value | 1.05% | 0.75% | N/A |
| Small-Cap Value | 0.95% | 0.60% | N/A |
| Strategic Growth | 0.89%* | 0.34% | N/A |
| * | The Strategic Growth Fund paid an aggregate advisory fee of 0.95% on the first $25 million; 0.85% on the next $175 million; and 0.75% thereafter. |
Notes to the Financial Statements (unaudited) (continued)
Note 3 — Investment Advisory Fee and Other Related Party Transactions (Continued)
For the six-month period ended December 31, 2017, QFI and the sub-advisers earned and reimbursed fees as follows:
| | | Aggregate | | Subadvisory | | Advisory & | |
| | | advisory fee | | fee paid by QFI | | subadvisory | |
| | | paid to QFI | | to the sub-adviser | (reimbursed)/recovered |
| Event Arbitrage | | $ | 170,379 | | | N/A | | | $ | (130,825 | ) |
| Global Tactical Allocation | | | 25,396 | | | N/A | | | | (10,159 | ) |
| Mid-Cap Value | | | 37,414 | | | 26,724 | | | | N/A | |
| Small-Cap Value | | | 138,348 | | | 87,378 | | | | N/A | |
| Strategic Growth | | | 313,478 | | | 118,794 | | | | N/A | |
QFI contractually agreed to waive its management fee to the extent that the total operating expenses of Event Arbitrage (exclusive of interest, taxes, brokerage commissions and other costs incurred in connection with the purchase or sale of portfolio securities, and extraordinary items) exceed the annual rate of 1.99% for Class A shares, 2.74% for Class C shares, and 1.74% for Institutional Class shares of the average net assets of each class, respectively. QFI currently has no intention to terminate this arrangement; however, it may do so at any time in its sole discretion.
If, at any time, the annualized expenses of Event Arbitrage were less than the annualized expense ratio, the Trust, on behalf of Event Arbitrage, would reimburse QFI for any fees previously waived and/or expenses previously assumed; provided, however, that repayment would be payable only to the extent that it (a) can be made during the three (3) years following the time at which the adviser waived fees or assumed expenses for Event Arbitrage, and (b) can be repaid without causing the expenses of Event Arbitrage to exceed the annualized expense ratio. This fee waiver agreement shall continue in effect from October 30, 2017 until October 28, 2018. This agreement shall automatically terminate upon termination of the advisory agreement between QFI and the Trust or, with respect to Event Arbitrage, in the event of its merger or liquidation.
On November 1, 2016, QFI contractually agreed to waive the lesser of 0.30% of its management fee or assume expenses to the extent necessary to reduce the total operating expenses of Global Tactical Allocation (excluding 12b-1 fees, interest, taxes, brokerage commissions and other costs incurred in connection with the purchase or sale of portfolio securities, and extraordinary items) when they exceed 1.50% of the average daily net assets of the Global Tactical Allocation Fund. QFI currently has no intention to terminate this arrangement; however, it may do so at any time in its sole discretion.
If, at any time, the annualized expenses of Global Tactical Allocation were less than the annualized expense ratio or fee waiver, the Trust, on behalf of Global Tactical Allocation, would reimburse QFI for any fees previously waived and/or expenses previously assumed, provided, however, that the repayment shall be payable only to the extent that it: (a) can be made during the three (3) years following the time at which the adviser waived fees or assumed expenses for Global Tactical Allocation, and (b) can be repaid without causing the expenses of Global Tactical Allocation to exceed the annualized expense ratio. This fee waiver agreement shall continue in effect from October 30, 2017 until October 28, 2018. This agreement shall automatically terminate upon termination of the advisory agreement between QFI and the Trust or, with respect to Global Tactical Allocation, in the event of its merger or liquidation.
Notes to the Financial Statements (unaudited) (continued)
Note 3 — Investment Advisory Fee and Other Related Party Transactions (Continued)
At December 31, 2017, the cumulative unreimbursed amount paid and/or waived by the Adviser on behalf of Event Arbitrage and Global Tactical Allocation that may be recovered are $800,439 and $23,951, respectively. The Adviser may recapture portions of the above amounts no later than the dates stated below.
| | | June 30, | | | June 30, | | | June 30, | | | June 30, | |
| | | 2018 | | | 2019 | | | 2020 | | | 2021 | |
| Event Arbitrage | | $ | 122,084 | | | $ | 298,982 | | | $ | 248,548 | | | $ | 130,825 | |
| Global Tactical Allocation | | | — | | | | — | | | | 13,792 | | | | 10,159 | |
Foreside Fund Services, LLC (“Distributor”) serves as principal underwriter for the Trust. The Trust has adopted distribution and shareholder servicing plans pursuant to Rule 12b-1 of the 1940 Act for Class A and Class C shares described below. There is no Rule 12b-1 distribution plan for Institutional Class shares of the Funds. The Class A Plan provides that each Fund may pay a servicing or Rule 12b-1 fee at an annual rate of 0.25% of the Class A average net assets on a monthly basis to persons or institutions for performing certain servicing functions for the Class A shareholders. The Class A Plan also allows the Fund to pay or reimburse expenditures in connection with sales and promotional services related to distribution of the Fund’s shares, including personal services provided to prospective and existing shareholders. The Class C Plan provides that each Fund may compensate QFI and others for services provided and expenses incurred in the distribution of shares at an annual rate of 1.00% of the average net assets of each class on a monthly basis.
For the six-month period ended December 31, 2017, the Distributor received underwriter concessions from the sale of Funds shares as follows:
| Fund | | Amount | |
| Event Arbitrage | | $ | 698 | |
| Global Tactical Allocation | | | 1 | |
| Mid-Cap Value | | | 3 | |
| Small-Cap Value | | | 2 | |
| Strategic Growth | | | 197 | |
Except for the Trust’s Chief Compliance Officer (“CCO”), employees and Officers of QFI do not receive any compensation from the Trust. The CCO of the Trust also serves as general counsel to QFI. For the six-month period ended December 31, 2017, the Funds compensated the CCO as follows:
| Fund | | Amount | |
| Event Arbitrage | | $ | 18,225 | |
| Global Tactical Allocation | | | 4,366 | |
| Mid-Cap Value | | | 4,536 | |
| Small-Cap Value | | | 18,219 | |
| Strategic Growth | | | 45,961 | |
Note 4 — Purchases and Sales of Investments
For the six-month period ended December 31, 2017, aggregate purchases and sales of investment securities (excluding short-term investments) for each Fund were as follows:
| | | Purchases | | | Sales | |
| Event Arbitrage | | $ | 37,120,931 | | | $ | 43,484,778 | |
| Global Tactical Allocation | | | — | | | | 215,045 | |
| Mid-Cap Value | | | 918,222 | | | | 1,554,734 | |
| Small-Cap Value | | | 18,635,827 | | | | 20,500,367 | |
| Strategic Growth | | | 29,172,584 | | | | 39,249,119 | |
Notes to the Financial Statements (unaudited) (continued)
Note 5 — Tax Matters
For U.S. federal income tax purposes, the cost of securities owned, gross appreciation, gross depreciation, and net unrealized appreciation (depreciation) of investments at June 30, 2017 for each Fund were as follows:
| | | | | | Gross | | | Gross | | | Net Appreciation | |
| Fund | | Cost | | | Appreciation | | | Depreciation | | | (Depreciation) | |
| Event Arbitrage | | $ | 31,805,889 | | | $ | 2,085,635 | | | $ | (7,018,639 | ) | | $ | (4,933,004 | ) |
| Global Tactical Allocation | | | 6,729,063 | | | | 180,781 | | | | (160,984 | ) | | | 19,797 | |
| Mid-Cap Value | | | 7,831,227 | | | | 1,533,380 | | | | (192,445 | ) | | | 1,340,935 | |
| Small-Cap Value | | | 31,765,750 | | | | 3,401,035 | | | | (882,141 | ) | | | 2,518,894 | |
| Strategic Growth | | | 75,995,782 | | | | 8,503,411 | | | | (906,157 | ) | | | 7,597,254 | |
As of June 30, 2017, the components of distributable earnings on a tax basis were as follows:
| | | | | | | | | | | | Other | | | | | | | | | | | | Total | |
| | | | | | Undis- | | | Undis- | | | Accum- | | | Capital | | | | | | Post- | | | Distribu- | |
| | | Unrealized | | | tributed | | | tributed | | | ulated | | | Loss | | | Late | | | October | | | table | |
| | | Appreciation | | | Ordinary | | | Capital | | | Gain/ | | | Carry- | | | Year | | | Capital | | | Earnings/ | |
| Fund | | (Depreciation) | | | Income | | | Gain | | | (Loss) | | | forward | | | Loss | | | Loss | | | (Loss) | |
| Event Arbitrage | | $ | (4,933,004 | ) | | $ | 745,188 | | | $ | — | | | $ | (342,878 | ) | | $ | (5,514,315 | ) | | $ | — | | | $ | (1,039,650 | ) | | $ | (11,084,659 | ) |
| Global Tactical Allocation | | | 19,797 | | | | — | | | | — | | | | 2 | | | | (2,836,767 | ) | | | — | | | | — | | | | (2,816,968 | ) |
| Mid-Cap Value | | | 1,340,935 | | | | — | | | | — | | | | — | | | | (1,170,572 | ) | | | (29,423 | ) | | | — | | | | 140,940 | |
| Small-Cap Value | | | 2,518,894 | | | | 1,025,614 | | | | 2,260,603 | | | | 12 | | | | — | | | | — | | | | — | | | | 5,805,123 | |
| Strategic Growth | | | 7,597,254 | | | | — | | | | — | | | | (367 | ) | | | (164,714,297 | ) | | | (5,631 | ) | | | — | | | | (157,123,041 | ) |
The difference between book basis and tax basis unrealized appreciation (depreciation) is attributable primarily to the tax deferral of losses on wash sales and straddles from options, and the differing book/tax treatment of unrealized appreciation/depreciation on partnership adjustments.
The undistributed ordinary income, capital gains and carryforward losses shown above differ from the corresponding accumulated net investment income and accumulated net realized gain (loss) figures reported in the statements of assets and liabilities due to differing book/tax treatment of short-term capital gains, and certain temporary book/tax differences such as the deferral of realized losses on wash sales, PFIC mark to market, partnership adjustments, straddles from options and net losses realized after October 31 and from ordinary losses incurred after December 31.
Under current tax law, foreign currency and net capital losses realized after October 31 may be deferred and treated as occurring on the first day of the following fiscal year. The Funds elected to defer net capital and currency losses as indicated in the chart below.
At June 30, 2017, the capital loss carryovers, late year losses, post-October capital loss and the capital loss utilized for the Funds were as follows:
| | | Capital Loss Carryovers Expiring | | | Late Year | | | Post-October | | | Capital Loss | |
| Fund | | Indefinite | | | 2018 | | | Loss | | | Capital Loss | | | Utilized | |
| Event Arbitrage | | $ | 5,514,315 | | | $ | — | | | $ | — | | | $ | 1,039,650 | | | $ | — | |
| Global Tactical Allocation | | | 118,084 | | | | 2,718,683 | | | | — | | | | — | | | | — | |
| Mid-Cap Value | | | — | | | | 1,170,572 | | | | 29,423 | | | | — | | | | 347,332 | |
| Small-Cap Value | | | — | | | | — | | | | — | | | | — | | | | — | |
| Strategic Growth | | | — | | | | 164,714,297 | | | | 5,631 | | | | — | | | | 3,739,578 | |
Notes to the Financial Statements (unaudited) (continued)
Note 6 — Distributions to Shareholders
Income and long-term capital gain distributions are determined in accordance with federal income tax regulations, which may differ from GAAP.
The information set forth below is for each Fund as required by federal securities laws.
The tax character of dividends and distributions paid during the six-month period ended December 31, 2017* and for the fiscal year ending June 30, 2017 were as follows:
| | | Ordinary Income | | | Long-Term Capital Gain | |
| | | Six-Month Period Ended | | | Fiscal Year Ending | | | Six-Month Period Ended | | | Fiscal Year Ending | |
| Fund | | December 31, 2017 | | | June 30, 2017 | | | December 31, 2017 | | | June 30, 2017 | |
| Event Arbitrage | | $ | 868,513 | | | $ | 159,996 | | | $ | — | | | $ | — | |
| Small-Cap Value | | | 1,382,278 | | | | — | | | | 2,668,792 | | | | — | |
| * | Tax information for the six-month period ended December 31, 2017 is an estimate and the tax character of dividends and distributions may be redesignated at the fiscal year ending June 30,2018. |
Note 7 — Fund Share Transactions
At December 31, 2017, there were an unlimited number of shares of beneficial interest with a $0.01 par value authorized. The following table summarizes the activity in shares of each Fund:
| | | Event Arbitrage | |
| | | Six Months Ended 12/31/17 | | | Year Ended 6/30/17 | |
| | | Shares | | | Value | | | Shares | | | Value | |
| Shares sold: | | | | | | | | | | | | |
| Class A | | | 35,182 | | | $ | 454,479 | | | | 207,521 | | | $ | 2,565,664 | |
| Class C | | | 9,696 | | | | 119,979 | | | | 14,517 | | | | 173,664 | |
| Institutional Class | | | 101,583 | | | | 1,326,355 | | | | 352,078 | | | | 4,453,078 | |
| Shares issued to shareholders due | | | | | | | | | | | | | | | | |
| to reinvestment of distributions: | | | | | | | | | | | | | | | | |
| Class A | | | 25,665 | | | | 325,939 | | | | 4,798 | | | | 58,779 | |
| Class C | | | 5,712 | | | | 69,861 | | | | 435 | | | | 5,123 | |
| Institutional Class | | | 27,002 | | | | 345,624 | | | | 5,782 | | | | 71,407 | |
| | | | 204,840 | | | $ | 2,642,237 | | | | 585,131 | | | $ | 7,327,715 | |
| Shares Redeemed: | | | | | | | | | | | | | | | | |
| Class A | | | (315,425 | ) | | | (4,083,556 | ) | | | (475,134 | ) | | | (5,908,748 | ) |
| Class C | | | (74,224 | ) | | | (919,647 | ) | | | (159,711 | ) | | | (1,888,778 | ) |
| Institutional Class | | | (335,540 | ) | | | (4,372,416 | ) | | | (567,510 | ) | | | (6,974,898 | ) |
| | | | (725,189 | ) | | $ | (9,375,619 | ) | | | (1,202,355 | ) | | $ | (14,772,424 | ) |
| Net increase (decrease) | | | (520,349 | ) | | $ | (6,733,382 | ) | | | (617,224 | ) | | $ | (7,444,709 | ) |
Notes to the Financial Statements (unaudited) (continued)
Note 7 — Fund Share Transactions (Continued)
| | | Global Tactical Allocation | |
| | | Six Months Ended 12/31/17 | | | Year Ended 6/30/17 | |
| | | Shares | | | Value | | | Shares | | | Value | |
| Shares sold: | | | | | | | | | | | | |
| Class A | | | 77 | | | $ | 823 | | | | 7,980 | | | $ | 83,591 | |
| Class C | | | — | | | | — | | | | 2,103 | | | | 20,892 | |
| Institutional Class | | | 90,124 | | | | 1,112,335 | | | | 307,084 | | | | 3,677,885 | |
| Shares issued to shareholders due | | | | | | | | | | | | | | | | |
| to reinvestment of distributions: | | | | | | | | | | | | | | | | |
| Class A | | | — | | | | — | | | | — | | | | — | |
| Class C | | | — | | | | — | | | | — | | | | — | |
| Institutional Class | | | — | | | | — | | | | — | | | | — | |
| | | | 90,201 | | | $ | 1,113,158 | | | | 317,167 | | | $ | 3,782,368 | |
| Shares Redeemed: | | | | | | | | | | | | | | | | |
| Class A | | | (25,620 | ) | | | (274,026 | ) | | | (167,117 | ) | | | (1,748,988 | ) |
| Class C | | | (14,787 | ) | | | (147,526 | ) | | | (56,996 | ) | | | (557,112 | ) |
| Institutional Class | | | (101,613 | ) | | | (1,251,705 | ) | | | (156,645 | ) | | | (1,880,587 | ) |
| | | | (142,020 | ) | | $ | (1,673,257 | ) | | | (380,758 | ) | | $ | (4,186,687 | ) |
| Net increase (decrease) | | | (51,819 | ) | | $ | (560,099 | ) | | | (63,591 | ) | | $ | (404,319 | ) |
| | | | | | | | | | | | | | | | | |
| | | Mid-Cap Value | |
| | | Six Months Ended 12/31/17 | | | Year Ended 6/30/17 | |
| | | Shares | | | Value | | | Shares | | | Value | |
| Shares sold: | | | | | | | | | | | | | | | | |
| Class A | | | 282 | | | $ | 8,286 | | | | 4,309 | | | $ | 113,588 | |
| Class C | | | 64 | | | | 1,620 | | | | 247 | | | | 5,732 | |
| Institutional Class | | | 1,481 | | | | 44,740 | | | | 6,465 | | | | 187,330 | |
| Shares issued to shareholders due | | | | | | | | | | | | | | | | |
| to reinvestment of distributions: | | | | | | | | | | | | | | | | |
| Class A | | | — | | | | — | | | | — | | | | — | |
| Class C | | | — | | | | — | | | | — | | | | — | |
| Institutional Class | | | — | | | | — | | | | — | | | | — | |
| | | | 1,827 | | | $ | 54,646 | | | | 11,021 | | | $ | 306,650 | |
| Shares Redeemed: | | | | | | | | | | | | | | | | |
| Class A | | | (16,635 | ) | | | (489,647 | ) | | | (30,932 | ) | | | (823,921 | ) |
| Class C | | | (5,025 | ) | | | (125,700 | ) | | | (13,530 | ) | | | (309,983 | ) |
| Institutional Class | | | (5,359 | ) | | | (167,713 | ) | | | (8,120 | ) | | | (229,719 | ) |
| | | | (27,019 | ) | | $ | (783,060 | ) | | | (52,582 | ) | | $ | (1,363,623 | ) |
| Net increase (decrease) | | | (25,192 | ) | | $ | (728,414 | ) | | | (41,561 | ) | | $ | (1,056,973 | ) |
Notes to the Financial Statements (unaudited) (continued)
Note 7 — Fund Share Transactions (Continued)
| | | Small-Cap Value | |
| | | Six Months Ended 12/31/17 | | | Year Ended 6/30/17 | |
| | | Shares | | | Value | | | Shares | | | Value | |
| Shares sold: | | | | | | | | | | | | |
| Class A | | | 845 | | | $ | 21,250 | | | | 8,736 | | | $ | 199,054 | |
| Class C | | | 629 | | | | 11,016 | | | | 411 | | | | 7,675 | |
| Institutional Class | | | 7,663 | | | | 190,321 | | | | 15,401 | | | | 366,482 | |
| Shares issued to shareholders due | | | | | | | | | | | | | | | | |
| to reinvestment of distributions: | | | | | | | | | | | | | | | | |
| Class A | | | 35,546 | | | | 800,131 | | | | — | | | | — | |
| Class C | | | 12,052 | | | | 207,168 | | | | — | | | | — | |
| Institutional Class | | | 117,150 | | | | 2,815,103 | | | | — | | | | — | |
| | | | 173,885 | | | $ | 4,044,989 | | | | 24,548 | | | $ | 573,211 | |
| Shares Redeemed: | | | | | | | | | | | | | | | | |
| Class A | | | (54,110 | ) | | | (1,318,524 | ) | | | (62,175 | ) | | | (1,437,981 | ) |
| Class C | | | (7,575 | ) | | | (145,601 | ) | | | (24,210 | ) | | | (451,121 | ) |
| Institutional Class | | | (11,047 | ) | | | (289,331 | ) | | | (357,329 | ) | | | (8,460,169 | ) |
| | | | (72,732 | ) | | $ | (1,753,456 | ) | | | (443,714 | ) | | $ | (10,349,271 | ) |
| Net increase (decrease) | | | 101,153 | | | $ | 2,291,533 | | | | (419,166 | ) | | $ | (9,776,060 | ) |
| | | | | | | | | | | | | | | | | |
| | | Strategic Growth | |
| | | Six Months Ended 12/31/17 | | | Year Ended 6/30/17 | |
| | | Shares | | | Value | | | Shares | | | Value | |
| Shares sold: | | | | | | | | | | | | | | | | |
| Class A | | | 8,686 | | | $ | 254,770 | | | | 26,993 | | | $ | 704,491 | |
| Class C | | | 2,793 | | | | 72,806 | | | | 15,462 | | | | 363,910 | |
| Institutional Class | | | 5,022 | | | | 150,545 | | | | 44,663 | | | | 1,197,952 | |
| Shares issued to shareholders due | | | | | | | | | | | | | | | | |
| to reinvestment of distributions: | | | | | | | | | | | | | | | | |
| Class A | | | — | | | | — | | | | — | | | | — | |
| Class C | | | — | | | | — | | | | — | | | | — | |
| Institutional Class | | | — | | | | — | | | | — | | | | — | |
| | | | 16,501 | | | $ | 478,121 | | | | 87,118 | | | $ | 2,266,353 | |
| Shares Redeemed: | | | | | | | | | | | | | | | | |
| Class A | | | (249,547 | ) | | | (7,298,076 | ) | | | (638,440 | ) | | | (16,536,992 | ) |
| Class C | | | (76,235 | ) | | | (1,925,207 | ) | | | (230,332 | ) | | | (5,180,033 | ) |
| Institutional Class | | | (30,360 | ) | | | (934,379 | ) | | | (277,544 | ) | | | (7,249,735 | ) |
| | | | (356,142 | ) | | $ | (10,157,662 | ) | | | (1,146,316 | ) | | $ | (28,966,760 | ) |
| Net increase (decrease) | | | (339,641 | ) | | $ | (9,679,541 | ) | | | (1,059,198 | ) | | $ | (26,700,407 | ) |
Note 8 — Offsetting Assets and Liabilities
The Funds are subject to various Master Netting Arrangements (“MNA”), which govern the terms of certain transactions with select counterparties. The MNA allow the Funds to close out and net their total exposure to a counterparty in the event of a default with respect to all the transactions governed under a single agreement with a counterparty. The MNA also specify collateral posting arrangements at pre-arranged exposure levels. Under the MNA, collateral is routinely transferred if the total net exposure to certain transactions (net of existing collateral already in place) governed under the revelant MNA with a counterparty in a given account exceeds a specified threshold depending on the counterparty and the type of MNA.
Notes to the Financial Statements (unaudited) (continued)
Note 8 — Offsetting Assets and Liabilities (Continued)
The following is a summary of the Assets and Liabilities for each Fund subject to offsets as of December 31, 2017:
Liabilities:
| | | | | | Gross | | | Net | | | Gross Amounts Not Offset in the Statements of Assets and Liabilities | | | | |
| | | | | | Amounts | | | Amounts | | | | | | |
| | | | | | Offset | | | Presented | | | | | | |
| | | | | | in the | | | in the | | | | | | |
| | | Gross Amounts | | | Statements | | | Statements | | | | | | Collateral | | | | |
| | | of Recognized | | | of Assets | | | of Assets | | | Financial | | | Pledged | | | Net | |
| Description | | Liabilities | | | and Liabilities | | | and Liabilities | | | Instruments | | | (Received) | | | Amount | |
| Event Arbitrage | | | | | | | | | | | | | | | | | | |
| Written Options | | $ | 130,320 | | | $ | — | | | $ | 130,320 | | | $ | — | | | $ | 130,320 | | | $ | — | |
| Securities Lending | | | 1,629,245 | | | | — | | | | 1,629,245 | | | | 1,629,245 | | | | — | | | | — | |
| | | | 1,759,565 | | | | — | | | | 1,759,565 | | | | 1,629,245 | | | | 130,320 | | | | — | |
| Mid-Cap Value | | | | | | | | | | | | | | | | | | | | | | | | |
| Securities Lending | | | 1,492,470 | | | | — | | | | 1,492,470 | | | | 1,492,470 | | | | — | | | | — | |
| Small-Cap Value | | | | | | | | | | | | | | | | | | | | | | | | |
| Securities Lending | | | 4,487,434 | | | | — | | | | 4,487,434 | | | | 4,487,434 | | | | — | | | | — | |
| Strategic Growth | | | | | | | | | | | | | | | | | | | | | | | | |
| Securities Lending | | | 7,351,293 | | | | — | | | | 7,351,293 | | | | 7,351,293 | | | | — | | | | — | |
Note 9 — Indemnifications
Under the Trust’s organizational documents, its officers and Trustees are indemnified against certain liabilities arising out of the performance of their duties to the Funds. In addition, in the normal course of business, the Trust enters into contracts with its vendors and others that provide for general indemnifications.
The Trust’s maximum exposure under these arrangements is dependent on future claims that may be made against the Trust, and, therefore, cannot be estimated; however, based on experience, risk of loss from such claims is considered remote.
Note 10 — Securities Lending
The Funds hold units of the Mount Vernon Liquid Assets Portfolio, LLC as cash collateral whose main objective is to maximize current income to the extent consistent with the preservation of capital and liquidity. It primarily invests in Certificates of Deposits, Asset Backed and Financial Company Commercial Paper, and Repurchase Agreements. The Mid-Cap Value, Small-Cap Value and Strategic Growth Funds’ all hold a significant concentration in the Mount Vernon Liquid Assets Portfolio, LLC.
At December 31, 2017, the aggregate market value of loaned securities and the value of the cash collateral the Funds received is as follows:
| | | Loaned Securities | | | Value of | | | % of | |
| | | Market Value | | | Cash Collateral | | | Net Assets | |
| Event Arbitrage | | $ | 1,573,631 | | | $ | 1,629,245 | | | | 7.2 | % |
| Mid-Cap Value | | | 1,451,889 | | | | 1,492,470 | | | | 20.9 | % |
| Small-Cap Value | | | 4,325,132 | | | | 4,487,434 | | | | 15.3 | % |
| Strategic Growth | | $ | 7,166,681 | | | $ | 7,351,293 | | | | 10.7 | % |
Notes to the Financial Statements (unaudited) (continued)
Note 10 — Securities Lending (Continued)
Private Investment Co. purchased with proceeds from securities lending collateral is included in the Schedules of Investments and the Statements of Assets and Liabilities. The interest income, net of fees, earned by the Funds on the cash collateral received from borrowers for the securities loaned to them is reflected in the Statements of Operations.
Note 11 — Events Subsequent to the Semi-Annual Period Ended December 31, 2017
The Trust’s investment advisory agreement with Quaker Funds, Inc. (“QFI”) was terminated by the Board of Trustees effective December 31, 2017 due to the QFI’s plans to exit the investment advisory business in 2018. As a result of the termination, the Board hired Community Capital Management, Inc. (“CCM”) to manage the Quaker Strategic Growth Fund, Quaker Global Tactical Allocation Fund, Quaker Small-Cap Value Fund, and Quaker Mid-Cap Value Fund. In addition, the Board hired Camelot Funds, LLC (“Camelot”) to manage the Quaker Event Arbitrage Fund. Both CCM and Camelot began managing their respective Funds effective January 1, 2018 under separate interim investment advisory agreements pursuant to Rule 15a-4(b)(1) under the Investment Company Act of 1940.
Approval of Interim Advisory Agreements (unaudited)
Community Capital Management, Inc.
At a regular Board meeting held on November 16, 2017, the Board, including the Independent Trustees, discussed and approved an interim advisory agreement pursuant to Rule 15a-4 under the Investment Company Act of 1940 (the “Interim Advisory Agreement”) and a new definitive advisory agreement (the “New Investment Advisory Agreement” and together with the Interim Advisory Agreement, the “Advisory Agreements”) between Community Capital Management, Inc. (the “Adviser”) and the Trust, on behalf of the Quaker Strategic Growth Fund, Quaker Global Tactical Allocation Fund, Quaker Small-Cap Value Fund, and Quaker Mid-Cap Value Fund (collectively, the “Funds”) and determined to recommend that the Funds’ shareholders approve the New Investment Advisory Agreement. In considering information relating to the approval of the Advisory Agreements, the Board, and the Independent Trustees, received assistance and advice from counsel and Independent Trustees’ counsel, and was provided with a written description of their responsibilities in approving the Advisory Agreements. The Independent Trustees had requested and been provided with detailed materials prepared by the Adviser in advance of the meeting. At the meeting, the Trustees discussed QFI’s intention to exit the investment advisory business in 2018; the Funds’ need for continuity in investment advisory services; and the capabilities, resources, and personnel available through the Adviser. The Board also considered the Adviser’s general plans and intentions regarding the operations and management of the Funds and the Trust. At the meeting, representatives of the Adviser responded to questions from the Board.
In connection with the Board’s review of the Advisory Agreements, the Adviser advised the Trustees on a variety of matters, including that no material changes were contemplated in the nature, quality, or extent of services currently provided to the Funds and their shareholders, including investment management, distribution, or other shareholder services, other than no longer relying on sub-advisers to manage certain of the Funds’ portfolios.
In addition to the information provided by the Adviser as described above, the Board also considered, among other factors, the following:
| | • | The significant financial resources of the Adviser that the Adviser indicated would benefit the Funds by providing a more robust operational infrastructure and a dedicated team designed to grow Fund assets. |
| | • | The terms and conditions of the New Investment Advisory Agreement, including that each Fund’s contractual fee rate under the New Investment Advisory Agreement will be lower than or the same as under the prior investment advisory agreement with the Funds’ prior investment adviser (the “Prior Investment Advisory Agreement”). |
| | • | The Funds’ existing investment policies and strategies will remain the same and additionally, the Adviser will implement an impact investing categorization and risk assessment process for the Funds. |
| | • | At its in-person meeting on November 16, 2017, the Board reviewed the Advisory Agreements as required by the 1940 Act and determined that the Adviser had the capabilities, resources, experience and personnel necessary to provide at least the level of investment management services provided to the Funds pursuant to the Prior Investment Advisory Agreement. The Board carefully considered that the advisory fees to be paid by the Funds would be lower than or the same as under the Prior Investment Advisory Agreement, and acknowledged the Adviser’s willingness to continue to waive fees and/or reimburse expenses in order to cap the costs paid by shareholders of the Quaker Global Tactical Allocation Fund. |
| | • | The Adviser has agreed to pay all costs associated with obtaining shareholder approval of the New Investment Advisory Agreement. |
Approval of Interim Advisory Agreements (unaudited) (continued)
Certain of these considerations are discussed in more detail below.
In making the decision to approve the Advisory Agreements, the Trustees gave attention to all information furnished. The following discussion identifies the primary factors taken into account by the Board in approving the Advisory Agreements.
The nature, extent, and quality of services to be provided to the Funds by the Adviser. The Board considered materials provided describing the services to be provided by the Adviser to each Fund and its shareholders as well as information provided at the November Board meeting. In reviewing the nature, extent, and quality of services to be provided to each Fund, the Board considered that the Advisory Agreements will be substantially identical to the Prior Investment Advisory Agreement. The Board carefully considered the Adviser’s proposed reduction in or continuation of the current advisory fees. The Board noted the continuity between the prior and new agreements with respect to the Adviser’s anticipated responsibilities as the Funds’ investment adviser, including: overall supervisory responsibility for the general management and investment of each Fund’s securities portfolio; the Adviser’s strategic plans to market the Funds; and the Adviser’s expected adoption of the existing compliance structure for the Funds to monitor compliance with the Funds’ respective investment objectives, strategies and restrictions on a day-to-day basis and undertaking to report to the Board on a quarterly basis and as otherwise deemed necessary or appropriate.
Based on its consideration and review of the foregoing information, the Board determined that the Funds were likely to benefit from the nature, extent, and quality of services to be provided by the Adviser, as well as the Adviser’s ability to render such services based on its experience, operations, and resources.
Comparison of services to be provided and fees to be charged by the Adviser, and the cost of the services provided and profits realized by the Adviser from the relationship with the Funds. At this meeting, the Board carefully considered the Adviser’s proposed contractual advisory fee rates, noting that they are less than or the same as the contractual fees under the Prior Investment Advisory Agreement. The Board also acknowledged the Adviser’s willingness to continue to waive fees and/or reimburse expenses in order to cap the costs paid by fund shareholders of the Quaker Global Tactical Allocation Fund.
Profitability and Economies of Scale. The Board considered possible costs, profitability and any “fall out” or ancillary benefits that may accrue to the Adviser as a result of its proposed relationship with the Funds. Based on the discussions with representatives of the Adviser and the relative size of the Funds, the Trustees concluded that there did not appear to be any significant benefits in this regard.
Conclusion. Based on the totality of the information considered, the Trustees concluded that the Funds were likely to benefit from the nature, extent and quality of Adviser’s services and that the Adviser has the ability to provide these services based on its significant experience, operations and resources. After evaluation of the fee and expense information, ancillary benefits and other considerations as described above, and in light of the nature, extent and quality of services to be provided by the Adviser, the Trustees, including a majority of the Independent Trustees, approved the Advisory Agreements, concluding that the advisory fee rates are reasonable in relation to the services provided to each Fund and that the Advisory Agreements are in the best interests of the shareholders and the Funds.
Approval of Interim Advisory Agreements (unaudited) (continued)
Camelot Funds, LLC
At a special board meeting held on December 15, 2017 (the “Special Meeting”), the Board, including the Independent Trustees, discussed and approved an interim advisory agreement pursuant to Rule 15a-4 under the Investment Company Act of 1940 (the “Interim Advisory Agreement”) between Camelot Funds, LLC (“Camelot”) and the Trust, on behalf of the Quaker Event Arbitrage Fund (the “Fund”). In considering information relating to the approval of the Interim Advisory Agreement, the Board, and the Independent Trustees, received assistance and advice from counsel and Independent Trustees’ counsel. The Independent Trustees had requested and been provided with detailed materials prepared by Camelot in advance of the Special Meeting and a prior meeting. At the Special Meeting, the Trustees discussed QFI’s intention to exit the investment advisory business in 2018; the Fund’s need for continuity in investment advisory services; and the capabilities, resources, and personnel available through Camelot. The Board also considered Camelot’s general plans and intentions regarding the Fund’s operations and management.
In addition to the information provided by Camelot as described above, the Board also considered, among other factors, the following:
| | • | Camelot’s plans to market and distribute the Fund. |
| | • | The terms and conditions of the Interim Advisory Agreement, including that the Fund’s contractual fee rate under the New Investment Advisory Agreement will be the same as under the prior investment advisory agreement with the Fund’s prior investment adviser (the “Prior Investment Advisory Agreement”). |
| | • | The Fund’s existing investment policies and strategies will remain the same. |
| | • | The Board acknowledged Camelot’s willingness to continue to waive fees and/or reimburse expenses in order to cap the costs paid by shareholders of the Fund. |
Certain of these considerations are discussed in more detail below.
In making the decision to approve the Interim Advisory Agreement, the Trustees gave attention to all information furnished. The following discussion identifies the primary factors taken into account by the Board in approving the Interim Advisory Agreement.
The nature, extent, and quality of services to be provided to the Fund by Camelot. In considering the approval of the Interim Advisory Agreement, the Trustees first considered the nature, extent and quality of the services to be provided by Camelot, in particular, its capabilities, its experience, and the ability of Camelot to provide continuity of management to the Fund. The Board’s deliberations included consideration of information provided to the Board at the Special Meeting and prior meetings. The Trustees also considered Camelot’s commitment to grow the Fund’s distribution channels and, thereby, increase the likelihood of growing its assets. The Board reviewed factors such as the background and experience of the Camelot personnel to be involved in the Fund’s operations, the anticipated quality of the monitoring of the Fund’s operations and investment performance. The Board also took into account Camelot’s intention to retain the Fund’s current portfolio management team in continuing to manage the Fund’s assets and Camelot’s desire to increase distribution efforts and propel asset growth in the Fund, which should result in economies-of-scale and, in turn, could result in the Fund benefitting from economies of scale. The Board was satisfied that Camelot would provide at least equivalent services as the Fund’s prior investment adviser.
Approval of Interim Advisory Agreements (unaudited) (continued)
Performance. In light of Camelot’s intention to retain the Fund’s existing portfolio management team, the Board took into consideration the past performance of the Fund as presented at the Fund’s regular quarterly meetings.
Comparison of services to be provided and fees to be charged by Camelot, and the cost of the services provided and profits realized by Camelot from the relationship with the Fund. At this meeting, the Board carefully considered Camelot’s proposed contractual advisory fee rate, noting that it is the same as the contractual fees under the Prior Investment Advisory Agreement. The Board also acknowledged Camelot’s willingness to continue to waive fees and/or reimburse expenses in order to cap the costs paid by Fund shareholders. The Trustees considered the fact that if Camelot were to become adviser to the Fund, Camelot was unlikely to realize a profit at least in the short-term.
Profitability and Economies of Scale. The Board considered possible costs, profitability and any “fall out” or ancillary benefits that may accrue to Camelot as a result of its proposed relationship with the Fund. Based on the current size of the Fund, the Trustees concluded that there did not appear to be any significant benefits in this regard.
Conclusion. Based on the totality of the information considered, the Trustees, including a majority of the Fund’s independent Trustees, concluded that the Interim Advisory Agreement should be approved.
General Information (unaudited)
The Statement of Additional Information for the Trust includes additional information about the Trustees and Officers and is available, without charge, upon request by calling (800) 220-8888.
Each Fund files its complete schedule of portfolio holdings with the Securities and Exchange Commission (“SEC”) for the first and third quarters of each fiscal year on Form N-Q. Each Fund’s Forms N-Q, as well as a description of the policies and procedures that each Fund uses to determine how to vote proxies (if any) relating to portfolio securities is available without charge: (i) upon request, by calling (800) 220-8888; and (ii) on the SEC’s web-site at http://www.sec.gov. Each Fund’s Forms N-Q may be reviewed and copied at the SEC’s Public Reference Room in Washington, DC; information on the operation of the Public Reference Room may be obtained by calling 1-800-SEC-0330.
Information (if any) regarding how the Funds voted proxies relating to portfolio securities during the most recently disclosed 12-month period ended June 30 is available: (i) without charge, upon request, by calling (800) 220-8888; and (ii) on the SEC’s web-site at http://www.sec.gov.
(This Page Intentionally Left Blank.)
The Quaker Funds are distributed by
Foreside Fund Services, LLC.
Contact us:
Quaker Funds, Inc.
c/o U.S. Bancorp Fund Services, LLC.
PO Box 701
Milwaukee, WI 53201-0701
800.220.8888
www.quakerfunds.com
©2017 Quaker® Investment Trust
QKAR 122017
Item 2. Code of Ethics.
Not applicable for semi-annual reports.
Item 3. Audit Committee Financial Expert.
Not applicable for semi-annual reports.
Item 4. Principal Accountant Fees and Services.
Not applicable for semi-annual reports.
Item 5. Audit Committee of Listed Registrants.
Not applicable to registrants who are not listed issuers (as defined in Rule 10A-3 under the Securities Exchange Act of 1934).
Item 6. Schedule of Investments.
| (a) | A Schedule of Investments in securities of unaffiliated issuers as of the close of the reporting period is included as part of the report to shareholders filed under Item 1, Report to Shareholders, of this Form N-CSR. |
Item 7. Disclosure of Proxy Voting Policies and Procedures for Closed-End Management Investment Companies.
Not applicable to open-end investment companies.
Item 8. Portfolio Managers of Closed-End Management Investment Companies.
Not applicable to open-end investment companies.
Item 9. Purchases of Equity Securities by Closed‑End Management Investment Company and Affiliated Purchasers.
Not applicable to open-end investment companies.
Item 10. Submission of Matters to a Vote of Security Holders.
There have been no material changes to the procedures by which shareholders may recommend nominees to the registrant’s Board of Trustees, where those changes were implemented after the Registrant last provided disclosure in response to the requirements of Item 407(c)(2)(iv) of Regulation S-K (as required by Item 22(b)(15) of Schedule 14A (17 CFR 240.14a-101)), or this Item.
Item 11. Controls and Procedures.
| (a) | The Registrant’s Principal Executive Officer and Principal Financial Officer, or persons performing similar functions, have reviewed the Registrant's disclosure controls and procedures (as defined in Rule 30a-3(c) under the Investment Company Act of 1940, as amended (the “Act”)) as of a date within 90 days of the filing of this report, as required by Rule 30a-3(b) under the Act and Rules 13a-15(b) or 15d‑15(b) under the Securities Exchange Act of 1934. Based on their review, such officers have concluded that the disclosure controls and procedures are effective in ensuring that information required to be disclosed in this report is appropriately recorded, processed, summarized and reported and made known to them by others within the Registrant and by the Registrant’s service provider. |
| (b) | There were no changes in the Registrant's internal control over financial reporting (as defined in Rule 30a-3(d) under the Act) that occurred during the second fiscal quarter of the period covered by this report that has materially affected, or is reasonably likely to materially affect, the Registrant's internal control over financial reporting. |
Item 12. Disclosure of Securities Lending Activities for Closed-End Management Investment Companies
Not applicable to open-end investment companies.
Item 13. Exhibits.
(a)(1) Any code of ethics or amendment thereto, that is subject of the disclosure required by Item 2, to the extent that the registrant intends to satisfy Item 2 requirements through filing an exhibit. Not Applicable
(a)(2) Certifications pursuant to Section 302 of the Sarbanes-Oxley Act of 2002. Filed herewith.
(a)(3) Any written solicitation to purchase securities under Rule 23c‑1 under the Act sent or given during the period covered by the report by or on behalf of the registrant to 10 or more persons. Not applicable to open-end investment companies.
(a)(4) Change in the registrant’s independent public accountant. There was no change in the registrant’s independent public accountant for the period covered by this report.
(b)Certification pursuant to Section 906 of the Sarbanes‑Oxley Act of 2002. Filed herewith.
SIGNATURES
Pursuant to the requirements of the Securities Exchange Act of 1934 and the Investment Company Act of 1940, the registrant has duly caused this report to be signed on its behalf by the undersigned, thereunto duly authorized.
(Registrant) Quaker Investment Trust
By (Signature and Title) /s/Alyssa Greenspan
Alyssa Greenspan,
President/Principal Executive Officer
Date March 8, 2018
Pursuant to the requirements of the Securities Exchange Act of 1934 and the Investment Company Act of 1940, this report has been signed below by the following persons on behalf of the registrant and in the capacities and on the dates indicated.
By (Signature and Title) /s/Alyssa Greenspan
Alyssa Greenspan,
President/Principal Executive Officer
Date March 8, 2018
By (Signature and Title) /s/David Downes
David Downes,
Treasurer/Principal Financial Officer
Date March 7, 2018