Semi-Annual Report
December 31, 2019
Quaker Impact Growth Fund
Quaker Small/Mid-Cap Impact Value Fund
Beginning on January 1, 2021, as permitted by regulations adopted by the U.S. Securities and Exchange Commission, paper copies of the Funds’ annual and semi-annual shareholder reports will no longer be sent by mail, unless you specifically request paper copies of the reports. Instead, the reports will be made available on the Funds’ website (www.ccminvests.com), and you will be notified by mail each time a report is posted and provided with a website link to access the report.
If you already elected to receive shareholder reports electronically, you will not be affected by this change and you need not take any action. You may elect to receive shareholder reports and other communications from the Funds electronically anytime by contacting your financial intermediary (such as a broker-dealer or bank) or, if you are a direct investor, by calling toll-free 800-220-8888 or by sending an email request to the Funds at info@ccminvests.com.
You may elect to receive all future reports in paper free of charge. If you invest through a financial intermediary, you can contact your financial intermediary to request that you continue to receive paper copies of your shareholder reports. If you invest directly with the Funds, you can call toll-free 800-220-8888 or send an email request to info@ccminvests.com to let the Funds know you wish to continue receiving paper copies of your shareholder reports. Your election to receive reports in paper will apply to all Funds held in your account if you invest through your financial intermediary or all Funds held with the fund complex if you invest directly with the Funds.
Mutual fund investing involves risk. Principal loss is possible.
This report must be preceded or accompanied by a current prospectus.
The opinions expressed are those of the adviser through the end of the period for this report, are subject to change, are not a guarantee, and should not be considered investment advice.
Fund holdings are subject to change and should not be considered a recommendation to buy or sell any security. Current and future holdings are subject to risk.
Table of Contents
| | |
| | Page |
| Performance Update: | |
| Quaker Impact Growth Fund | 2 |
| Quaker Small/Mid-Cap Impact Value Fund | 4 |
| Expense Information | 6 |
| Schedules of Investments | 7 |
| Statements of Assets and Liabilities | 12 |
| Statements of Operations | 13 |
| Statements of Changes in Net Assets | 14 |
| Financial Highlights | 16 |
| Notes to the Financial Statements | 20 |
| General Information | 33 |
Performance Update (unaudited)
Quaker Impact Growth Fund (QUAGX, QAGIX)
OBJECTIVES AND PRINCIPAL STRATEGIES
The Fund, seeks to provide long-term growth of capital. The Fund’s principal holdings are large companies that demonstrate long term ability to compound earnings at higher rates than the broader market, regardless of industry. The Fund is managed independent of any index sector weightings. The Fund investments will be centered on US-domestic based companies although the Fund has the ability to invest internationally as well. The Fund will under normal market conditions, employ a tactical allocation philosophy.
| Average Annualized Total Return |
| | | | | Inception |
| | Expense | Inception | | through |
| | Ratio* | Date | One Year | 12/31/19+ |
| Advisor Class | 2.12% | 1/1/18 | 32.85% | 11.16% |
| Institutional Class | 1.87% | 1/1/18 | 33.18% | 11.43% |
S&P 500® Total Return Index** | | | 31.49% | 12.13% |
| * | As stated in the Prospectus dated October 28, 2019. |
| ** | The benchmark since inception returns are calculated since commencement of January 1, 2018 through December 31, 2019. |
+ | The Fund amended and restated its Registration Statement to change the performance reporting history. The inception date for the Fund’s performance history is now January 1, 2018, the date Community Capital Management, Inc. became the new investment adviser to the Fund. |
Performance data quoted represents past performance and is no guarantee of future results. Investment return and principal value will fluctuate so that shares, when redeemed, may be worth more or less than their original cost. Current performance may be lower or higher than performance data quoted. Performance data current to the most recent month end is available at www.ccminvests.com or by calling us toll free at 800-220-8888. Total return includes reinvestment of dividends and capital gains.
The performance table does not reflect the deduction of taxes that a shareholder might pay on fund distributions or the redemption of fund shares. Total return calculations reflect expense reimbursements and fee waivers in the applicable periods. See financial highlights for periods where fees were waived or reimbursed.
The Fund’s portfolio holdings may differ significantly from the securities held in the index and, unlike a mutual fund, an unmanaged index assumes no transaction costs, taxes, management fees or other expenses. You cannot invest directly in an index.
The S&P 500® Total Return Index (“S&P 500® Index”) is a widely recognized, unmanaged index consisting of the approximately 500 largest companies in the United States as measured by market capitalization. The S&P 500® Index assumes reinvestment of all dividends and distributions.
2019 SEMI-ANNUAL REPORT
Performance Update (unaudited) (continued)
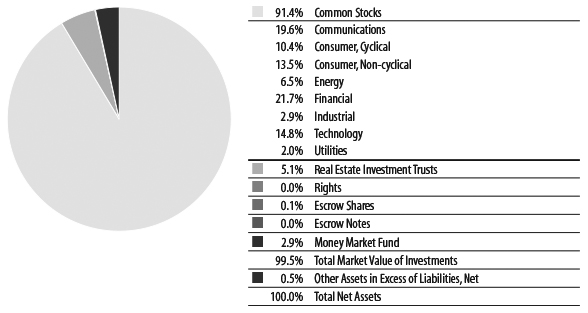
Quaker Impact Growth Fund
TOTAL NET ASSETS:
AS OF DECEMBER 31, 2019
$63,615,422
| Top 10 Holdings* (% of net assets) | | |
| Microsoft Corp. | 6.4% | |
| Amazon.com Inc. | 5.0% | |
| Berkshire Hathaway Inc. Cl B | 4.9% | |
| Apple Inc. | 4.6% | |
| Facebook Inc. Cl A | 4.1% | |
| JPMorgan Chase & Co. | 3.9% | |
| Alphabet Inc. Cl C | 2.8% | |
| Alphabet Inc. Cl A | 2.7% | |
| Visa Inc. Cl A | 2.2% | |
| Six Flags Entertainment Corp. | 2.0% | |
| % Fund Total | 38.6% | |
* Includes Long-Term Investments only.
Sectors (% of net assets) |
Performance Update (unaudited)
Quaker Small/Mid-Cap Impact Value Fund (QUSVX, QSVIX)
OBJECTIVES AND PRINCIPAL STRATEGIES
The Fund, seeks to provide long-term growth of capital. Under normal circumstances, the Fund will invest at least 80% of its assets, plus the amount of any borrowings for investment purposes, in the securities of small- and mid-cap U.S. companies.
The Fund generally considers small- and mid-cap companies to be those companies represented by the Russell 2500® Index.
| Average Annualized Total Return |
| | Gross | Net | | | Inception |
| | Expense | Expense | Inception | | through |
| | Ratio* | Ratio* | Date | One Year | 12/31/19+ |
| Advisor Class | 2.51% | 1.71% | 1/1/18 | 25.23% | 7.89% |
| Institutional Class | 2.26% | 1.46% | 1/1/18 | 25.53% | 8.16% |
Russell 2500® Value Index** | | | | 23.56% | 4.07% |
Russell 2500® Index** | | | | 27.77% | 7.23% |
| * | As stated in the Prospectus dated October 28, 2019. The Adviser has contractually agreed to waive all or a portion of its investment advisory fees and/or pay/reimburse expenses (excluding any Rule 12b-1 fees, taxes, interest, acquired fund fees and expenses, short sale dividend and interest expenses, brokerage fees, certain insurance costs, and nonroutine expenses or costs, including, but not limited to, those relating to reorganizations, litigation, conducting shareholder meetings, liquidations and other extraordinary expenses) in order to prevent total annual fund operating expenses from exceeding 1.30% of the Fund’s average daily net assets through October 30, 2020. Pursuant to its expense limitation agreement with the Fund, the Adviser is entitled to recoup any fees that it waived and/or Fund expenses that it paid for a period of three years. |
| ** | The benchmarks since inception returns are calculated since commencement of January 1, 2018 through December 31, 2019. |
+ | The Fund amended and restated its Registration Statement to change the performance reporting history. The inception date for the Fund’s performance history is now January 1, 2018, the date Community Capital Management, Inc. became the new investment adviser to the Fund. |
Performance data quoted represents past performance and is no guarantee of future results. Investment return and principal value will fluctuate so that shares, when redeemed, may be worth more or less than their original cost. Current performance may be lower or higher than performance data quoted. Performance data current to the most recent month end is available at www.ccminvests.com or by calling us toll free at 800-220-8888. Total return includes reinvestment of dividends and capital gains.
The performance table does not reflect the deduction of taxes that a shareholder might pay on fund distributions or the redemption of fund shares. Total return calculations reflect expense reimbursements and fee waivers in the applicable periods.
The Fund’s portfolio holdings may differ significantly from the securities held in the index and, unlike a mutual fund, an unmanaged index assumes no transaction costs, taxes, management fees or other expenses. You cannot invest directly in an index.
The Russell 2500® Index is a widely recognized, unmanaged index comprised of the smallest 2500 companies represented in the Russell 3000® Index.
Performance Update (unaudited) (continued)
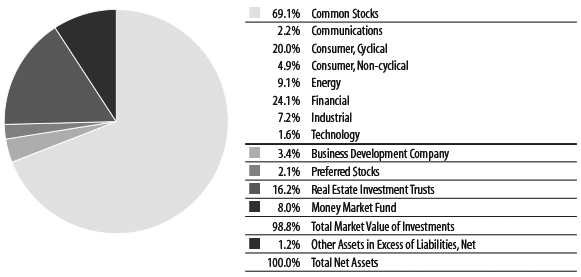
Quaker Small/Mid-Cap Impact Value Fund
TOTAL NET ASSETS:
AS OF DECEMBER 31, 2019
$28,917,615
| Top 10 Holdings* (% of net assets) | | |
| Six Flags Entertainment Corp. | 4.2% | |
| Starwood Property Trust Inc. | 3.6% | |
| FS KKR Capital Corp. | 3.4% | |
| Synovus Financial Corp. | 3.4% | |
| CorePoint Lodging Inc. | 3.3% | |
| Enviva Partners LP | 3.3% | |
| Wabtec Corp. | 3.2% | |
| Skyline Champion Corp. | 3.0% | |
| Raymond James Financial Inc. | 3.0% | |
| Invesco Mortgage Capital Inc. | 3.0% | |
| % Fund Total | 33.4% | |
* Includes Long-Term Investments only.
Sectors (% of net assets) |
Expense Information (unaudited)
As a shareholder of the Funds, you incur two types of costs: (1) transaction costs, including applicable sales charges and redemption fees; and (2) ongoing costs, including management fees, distribution (12b-1) fees and other Fund expenses. This example is intended to help you understand your ongoing costs (in dollars) of investing in the Funds and to compare these costs with the ongoing costs of investing in other funds. The example is based on an investment of $1,000 invested at the beginning of the (six-month) period and held for the entire period July 1, 2019 through December 31, 2019.
ACTUAL EXPENSES
The first section of each table below provides information about actual account values and actual expenses for each of the Funds. You may use this information, together with the amount you invested, to estimate the expenses that you paid over the period. Simply divide your account value by $1,000 (for example, an $8,600 account value divided by $1,000 = 8.6), then multiply the result by the number in the applicable line under the heading entitled “Expenses Paid During the Period” to estimate the expenses you paid on your account during this period.
HYPOTHETICAL EXAMPLE FOR COMPARISON PURPOSES
The second section of each table below provides information about hypothetical account values and hypothetical expenses based on the Fund’s actual expense ratio and an assumed rate of return of 5% per year before expenses, which is not the Fund’s actual return. The hypothetical account values and expenses may not be used to estimate the actual ending account balance or expenses you paid for the period. You may use this information to compare the ongoing costs of investing in the Fund to other funds. To do so, compare this 5% hypothetical example with the 5% hypothetical examples that appear in the shareholder reports of the other funds. Please note that the expenses shown in the table are meant to highlight your ongoing costs only and do not reflect any transactional costs, such as sales charges (loads), redemption fees or exchange fees. Therefore, the second section of the table is useful in comparing ongoing costs only, and will not help you determine the relative total costs of owning different funds. In addition, if these transactional costs were included, your costs would have been higher.
| | | Beginning | Annualized | Ending | |
| | | Account Value | Expense Ratio | Account Value | Expenses Paid |
| | | (7/1/2019) | for the Period | (12/31/2019) | During Period* |
| Impact Growth | | | | | |
| Example based on actual return of: | | | | | |
| Advisor Class | 10.64% | $1,000.00
| 2.06% | $1,106.40
| $10.91
|
| Institutional Class | 10.74% | 1,000.00 | 1.81% | 1,107.40 | 9.59 |
| Hypothetical example based on assumed 5% return: | | | | | |
| Advisor Class | | 1,000.00 | 2.06% | 1,014.78 | 10.43
|
| Institutional Class | | 1,000.00 | 1.81% | 1,016.04 | 9.17 |
| Small/Mid-Cap Impact Value | | | | | |
| Example based on actual return of: | | | | | |
| Advisor Class | 8.98% | 1,000.00 | 1.55% | 1,089.80 | 8.14 |
| Institutional Class | 9.06% | 1,000.00 | 1.30% | 1,090.60 | 6.83 |
| Hypothetical example based on assumed 5% return: | | | | | |
| Advisor Class | | 1,000.00 | 1.55% | 1,017.34 | 7.86 |
| Institutional Class | | 1,000.00 | 1.30% | 1,018.60 | 6.60 |
| * | Expenses are equal to the Funds’ annualized six-month expense ratios multiplied by the average account value over the period multiplied by the number of days in the most recent fiscal half year (184) divided by 366 to reflect the one-half year period. |
Schedule of Investments
Quaker Impact Growth Fund
December 31, 2019 (unaudited)
| | | Number | | | Fair | |
| | | of Shares | | | Value | |
| Long-Term Investments — 96.6% | | | | | | |
| Common Stocks — 91.4% | | | | | | |
| Communications — 19.6% | | | | | | |
| Internet — 15.8% | | | | | | |
| Alphabet Inc. Cl A (a) | | | 1,262 | | | $ | 1,690,310 | |
| Alphabet Inc. Cl C (a) | | | 1,328 | | | | 1,775,563 | |
| Amazon.com Inc. (a) | | | 1,727 | | | | 3,191,220 | |
| Booking Holdings Inc. (a) | | | 380 | | | | 780,417 | |
| Facebook Inc. Cl A (a) | | | 12,611 | | | | 2,588,408 | |
| | | | | | | | 10,025,918 | |
| Media — 2.3% | | | | | | | | |
| Comcast Corp. | | | 28,000 | | | | 1,259,160 | |
| Liberty Media Corp. Liberty | | | | | | | | |
| SiriusXM, Tracking Stock (a) | | | 4,300 | | | | 207,862 | |
| | | | | | | | 1,467,022 | |
| Telecommunications — 1.5% | | | | | | | | |
| AT&T Inc. | | | 25,000 | | | | 977,000 | |
| Total Communications | | | | | | | | |
| (Cost $9,982,037) | | | | | | | 12,469,940 | |
| Consumer, Cyclical — 10.4% | | | | | | | | |
| Apparel — 0.8% | | | | | | | | |
adidas AG -SP-ADR f | | | 3,332 | | | | 542,450 | |
| Distribution & Wholesale — 1.8% | | | | | | | | |
| IAA Inc. (a) | | | 6,500 | | | | 305,890 | |
| LKQ Corp. (a) | | | 23,500 | | | | 838,950 | |
| | | | | | | | 1,144,840 | |
| Entertainment — 5.3% | | | | | | | | |
| AMC Entertainment Holdings Inc. | | | 75,618 | | | | 547,474 | |
IMAX Corp. (a) f | | | 43,167 | | | | 881,902 | |
| Six Flags Entertainment Corp. | | | 28,000 | | | | 1,263,080 | |
| Vail Resorts Inc. | | | 2,800 | | | | 671,524 | |
| | | | | | | | 3,363,980 | |
| Lodging — 0.8% | | | | | | | | |
| Marriott International Inc. | | | 3,300 | | | | 499,719 | |
| Retail — 1.7% | | | | | | | | |
| The Home Depot Inc. | | | 1,435 | | | | 313,375 | |
| Starbucks Corp. | | | 8,844 | | | | 777,564 | |
| | | | | | | | 1,090,939 | |
| Total Consumer, Cyclical | | | | | | | | |
| (Cost $7,189,494) | | | | | | | 6,641,928 | |
| Consumer, Non-cyclical — 13.5% | | | | | | | | |
| Biotechnology — 2.4% | | | | | | | | |
| Amgen Inc. | | | 3,285 | | | | 791,915 | |
| MYOS RENS Technology Inc. (a) | | | 142,452 | | | | 172,367 | |
| Regeneron Pharmaceuticals Inc. (a) | | | 1,445 | | | | 542,569 | |
| | | | | | | | 1,506,851 | |
| Commercial Services — 0.9% | | | | | | | | |
| PayPal Holdings Inc. (a) | | | 4,998 | | | | 540,634 | |
| Healthcare-Products — 5.2% | | | | | | | | |
| The Cooper Cos. Inc. | | | 1,479 | | | | 475,188 | |
| Edwards Lifesciences Corp. (a) | | | 1,270 | | | | 296,278 | |
| Intuitive Surgical Inc. (a) | | | 854 | | | | 504,842 | |
LivaNova PLC (a) f | | | 3,000 | | | | 226,290 | |
Medtronic PLC f | | | 6,222 | | | | 705,886 | |
| Stryker Corp. | | | 1,956 | | | | 410,643 | |
| Thermo Fisher Scientific Inc. | | | 2,181 | | | | 708,541 | |
| | | | | | | | 3,327,668 | |
| Healthcare-Services — 2.2% | | | | | | | | |
| Becton Dickinson and Co. | | | 1,437 | | | | 390,821 | |
| HCA Healthcare Inc. | | | 4,927 | | | | 728,260 | |
| Laboratory Corp. of America Holdings (a) | | | 1,814 | | | | 306,874 | |
| | | | | | | | 1,425,955 | |
| Pharmaceuticals — 2.8% | | | | | | | | |
| Bristol-Myers Squibb Co. | | | 16,560 | | | | 1,062,986 | |
| Merck & Co Inc. | | | 8,030 | | | | 730,329 | |
| | | | | | | | 1,793,315 | |
| Total Consumer, Non-cyclical | | | | | | | | |
| (Cost $7,031,837) | | | | | | | 8,594,423 | |
| Energy — 6.5% | | | | | | | | |
| Energy-Alternate Sources — 2.8% | | | | | | | | |
| Enviva Partners LP | | | 19,993 | | | | 745,939 | |
| NextEra Energy Partners LP | | | 12,447 | | | | 655,335 | |
Westport Fuel Systems Inc. (a) f | | | 144,571 | | | | 342,633 | |
| | | | | | | | 1,743,907 | |
| Pipelines — 3.7% | | | | | | | | |
| Crestwood Equity Partners LP | | | 36,100 | | | | 1,112,602 | |
| Enterprise Products Partners LP | | | 44,300 | | | | 1,247,488 | |
| | | | | | | | 2,360,090 | |
| Total Energy | | | | | | | | |
| (Cost $3,419,930) | | | | | | | 4,103,997 | |
The accompanying notes are an integral part of the financial statements.
Schedule of Investments (continued)
Quaker Impact Growth Fund
December 31, 2019 (unaudited)
| | | Number | | | Fair | |
| | | of Shares | | | Value | |
| Common Stocks — 91.4% (Continued) | | | | | | |
| Financial — 21.7% | | | | | | |
| Banks — 6.6% | | | | | | |
| Bank of America Corp. | | | 28,000 | | | $ | 986,160 | |
| JPMorgan Chase & Co. | | | 17,622 | | | | 2,456,507 | |
| M&T Bank Corp. | | | 4,330 | | | | 735,017 | |
| | | | | | | | 4,177,684 | |
| Diversified Financial Services — 7.8% | | | | | | | | |
| Ameriprise Financial Inc. | | | 3,819 | | | | 636,169 | |
| BlackRock Inc. | | | 1,445 | | | | 726,402 | |
| Credit Acceptance Corp. (a) | | | 700 | | | | 309,631 | |
| Mastercard Inc. Cl A | | | 3,910 | | | | 1,167,487 | |
| Raymond James Financial Inc. | | | 7,885 | | | | 705,392 | |
| Visa Inc. Cl A | | | 7,600 | | | | 1,428,040 | |
| | | | | | | | 4,973,121 | |
| Insurance — 7.3% | | | | | | | | |
| Berkshire Hathaway Inc. Cl B (a) | | | 13,853 | | | | 3,137,704 | |
| Cigna Corp. | | | 3,877 | | | | 792,808 | |
| The Progressive Corp. | | | 8,500 | | | | 615,315 | |
| Tiptree Inc. | | | 11,000 | | | | 89,540 | |
| | | | | | | | 4,635,367 | |
| Total Financial | | | | | | | | |
| (Cost $10,331,136) | | | | | | | 13,786,172 | |
| Industrial — 2.9% | | | | | | | | |
| Electronics — 0.8% | | | | | | | | |
| PerkinElmer Inc. | | | 5,115 | | | | 496,667 | |
| Hand & Machine Tools — 0.5% | | | | | | | | |
| Snap-on Inc. | | | 2,040 | | | | 345,576 | |
| Machinery-Diversified — 1.6% | | | | | | | | |
| Wabtec Corp. | | | 13,200 | | | | 1,026,960 | |
| Total Industrial | | | | | | | | |
| (Cost $1,618,296) | | | | | | | 1,869,203 | |
| Technology — 14.8% | | | | | | | | |
| Computers — 6.3% | | | | | | | | |
| Apple Inc. | | | 10,000 | | | | 2,936,500 | |
| Dell Technologies Inc. (a) | | | 15,000 | | | | 770,850 | |
| MAXIMUS Inc. | | | 4,250 | | | | 316,157 | |
| | | | | | | | 4,023,507 | |
| Semiconductors — 0.9% | | | | | | | | |
| NVIDIA Corp. | | | 2,485 | | | | 584,721 | |
| Software — 7.6% | | | | | | | | |
| Adobe Systems Inc. (a) | | | 2,087 | | | | 688,313 | |
| ImageWare Systems Inc. (a) | | | 125,000 | | | | 41,875 | |
| Microsoft Corp. | | | 26,000 | | | | 4,100,200 | |
| | | | | | | | 4,830,388 | |
| Total Technology | | | | | | | | |
| (Cost $6,483,435) | | | | | | | 9,438,616 | |
| Utilities — 2.0% | | | | | | | | |
| Electric — 2.0% | | | | | | | | |
Brookfield Renewable Partners LP f | | | 10,276 | | | | 479,170 | |
| Clearway Energy Inc. Cl C | | | 20,000 | | | | 399,000 | |
| NextEra Energy Inc. | | | 1,500 | | | | 363,240 | |
| | | | | | | | 1,241,410 | |
| Total Utilities | | | | | | | | |
| (Cost $949,433) | | | | | | | 1,241,410 | |
| Total Common Stocks | | | | | | | | |
| (Cost $47,005,598) | | | | | | | 58,145,689 | |
| Real Estate Investment Trusts — 5.1% | | | | | | | | |
| American Tower Corp. | | | 1,608 | | | | 369,550 | |
| Equinix Inc. | | | 990 | | | | 577,863 | |
| Independence Realty Trust Inc. | | | 70,000 | | | | 985,600 | |
| MFA Financial Inc. | | | 126,066 | | | | 964,405 | |
| Starwood Property Trust Inc. | | | 14,129 | | | | 351,247 | |
| | | | | | | | 3,248,665 | |
| Total Real Estate Investment Trusts | | | | | | | | |
| (Cost $2,597,994) | | | | | | | 3,248,665 | |
| Rights — 0.0% | | | | | | | | |
| Consumer, Non-cyclical — 0.0% | | | | | | | | |
| Pharmaceuticals — 0.0% | | | | | | | | |
| Bristol-Myers Squibb Co. (a) | | | 3,500 | | | | 10,535 | |
| Total Rights | | | | | | | | |
| (Cost $7,455) | | | | | | | 10,535 | |
| Escrow Shares — 0.1% | | | | | | | | |
| Consumer, Cyclical — 0.1% | | | | | | | | |
| Airlines — 0.1% | | | | | | | | |
| AMR Corp. (a)*^ | | | 218,835 | | | | 52,520 | |
| Total Escrow Shares | | | | | | | | |
| (Cost $24,535) | | | | | | | 52,520 | |
The accompanying notes are an integral part of the financial statements.
Schedule of Investments (continued)
Quaker Impact Growth Fund
December 31, 2019 (unaudited)
| | | Par | | | Fair | |
| | | Value | | | Value | |
| Escrow Notes — 0.0% | | | | | | |
| Consumer, Cyclical — 0.0% | | | | | | |
| Retail — 0.0% | | | | | | |
| CB Trailer Bridge Inc. | | | | | | |
| (Toys R Us) (a)+*^ | | $ | 66,000 | | | $ | 0 | |
| Total Escrow Notes | | | | | | | | |
| (Cost $65,792) | | | | | | | 0 | |
| Total Long-Term Investments | | | | | | | | |
| (Cost $49,701,374) | | | | | | | 61,457,409 | |
| | | Number | | | | | |
| | | of Shares | | | | | |
| Short-Term Investments — 2.9% | | | | | | | | |
| Money Market Fund — 2.9% | | | | | | | | |
| First American Government | | | | | | | | |
| Obligations Fund, Cl X 1.511% (b) | | | 1,852,692 | | | | 1,852,692 | |
| Total Short-Term Investments | | | | | | | | |
| (Cost $1,852,692) | | | | | | | 1,852,692 | |
| Total Investments | | | | | | | | |
| (Cost $51,554,066) — 99.5% | | | | | | | 63,310,101 | |
| Other Assets in Excess | | | | | | | | |
| of Liabilities, Net 0.5% | | | | | | | 305,321 | |
| Total Net Assets — 100.0% | | | | | | $ | 63,615,422 | |
ADR - American Depositary Receipt
SP-ADR - Sponsored American Depositary Receipt
| (a) | Non-income producing security. |
| (b) | The rate quoted is the annualized 7 day yield as of December 31, 2019. |
| f | Foreign issued security. |
| + | Defaulted Security. |
| * | Indicates an illiquid security. Total market value for illiquid securities is $52,520, representing 0.1% of net assets. |
| ^ | Indicates a fair valued security. Total market value for fair valued securities is $52,520, representing 0.1% of net assets and level 3 securities. |
The accompanying notes are an integral part of the financial statements.
Schedule of Investments
Quaker Small/Mid-Cap Impact Value Fund
December 31, 2019 (Unaudited)
| | | Number | | | Fair | |
| | | of Shares | | | Value | |
| Long-Term Investments — 90.8% | | | | | | |
| Common Stocks — 69.1% | | | | | | |
| Communications — 2.2% | | | | | | |
| Internet — 1.1% | | | | | | |
| NortonLifeLock Inc. | | | 13,000 | | | $ | 331,760 | |
| Media — 1.1% | | | | | | | | |
| Liberty Media Corp. Liberty | | | | | | | | |
| SiriusXM ,Tracking Stock (a) | | | 6,500 | | | | 314,210 | |
| Total Communications | | | | | | | | |
| (Cost $637,357) | | | | | | | 645,970 | |
| Consumer, Cyclical — 20.0% | | | | | | | | |
| Auto Parts & Equipment — 2.1% | | | | | | | | |
| Spartan Motors Inc. | | | 13,000 | | | | 235,040 | |
Westport Fuel Systems Inc. (a) f | | | 160,000 | | | | 379,200 | |
| | | | | | | | 614,240 | |
| Entertainment — 10.7% | | | | | | | | |
| AMC Entertainment Holdings Inc. | | | 110,000 | | | | 796,400 | |
| Cinemark Holdings Inc. | | | 15,000 | | | | 507,750 | |
IMAX Corp. (a) f | | | 28,000 | | | | 572,040 | |
| Six Flags Entertainment Corp. | | | 27,000 | | | | 1,217,970 | |
| | | | | | | | 3,094,160 | |
| Home Builders — 5.1% | | | | | | | | |
| DR Horton Inc. | | | 6,000 | | | | 316,500 | |
| Lennar Corp. | | | 5,000 | | | | 278,950 | |
| Skyline Champion Corp. (a) | | | 27,500 | | | | 871,750 | |
| | | | | | | | 1,467,200 | |
| Retail — 2.1% | | | | | | | | |
| Bed Bath & Beyond Inc. | | | 18,000 | | | | 311,400 | |
| Papa John’s International Inc. | | | 4,500 | | | | 284,175 | |
| | | | | | | | 595,575 | |
| Total Consumer, Cyclical | | | | | | | | |
| (Cost $6,119,781) | | | | | | | 5,771,175 | |
| Consumer, Non-cyclical — 4.9% | | | | | | | | |
| Commercial Services — 2.9% | | | | | | | | |
| ASGN Inc. (a) | | | 7,500 | | | | 532,275 | |
| Macquarie Infrastructure Corp. | | | 7,500 | | | | 321,300 | |
| | | | | | | | 853,575 | |
| Healthcare-Products — 2.0% | | | | | | | | |
LivaNova PLC (a) f | | | 7,500 | | | | 565,725 | |
| Healthcare-Services — 0.0% | | | | | | | | |
Nobilis Health Corp. (a) f *^ | | | 38,393 | | | | 0 | |
| Total Consumer, Non-cyclical | | | | | | | | |
| (Cost $1,446,960) | | | | | | | 1,419,300 | |
| Energy — 9.1% | | | | | | | | |
| Energy-Alternate Sources — 3.3% | | | | | | | | |
| Enviva Partners LP | | | 25,501 | | | | 951,442 | |
| Pipelines — 5.8% | | | | | | | | |
| Crestwood Equity Partners LP | | | 26,700 | | | | 822,894 | |
| Enterprise Products Partners LP | | | 30,250 | | | | 851,840 | |
| | | | | | | | 1,674,734 | |
| Total Energy | | | | | | | | |
| (Cost $2,349,894) | | | | | | | 2,626,176 | |
| Financial — 24.1% | | | | | | | | |
| Banks — 5.5% | | | | | | | | |
| Financial Institutions Inc. | | | 10,000 | | | | 321,000 | |
| Synovus Financial Corp. | | | 25,000 | | | | 980,000 | |
| TriCo Bancshares | | | 7,500 | | | | 306,075 | |
| | | | | | | | 1,607,075 | |
| Diversified Financial Services — 5.4% | | | | | | | | |
| Ameriprise Financial Inc. | | | 2,500 | | | | 416,450 | |
| Credit Acceptance Corp. (a) | | | 600 | | | | 265,398 | |
| Raymond James Financial Inc. | | | 9,700 | | | | 867,762 | |
| | | | | | | | 1,549,610 | |
| Insurance — 7.0% | | | | | | | | |
| Ambac Financial Group Inc. (a) | | | 15,000 | | | | 323,550 | |
| Globe Life Inc. | | | 4,926 | | | | 518,462 | |
| Reinsurance Group of America Inc. Cl A | | | 3,500 | | | | 570,710 | |
| Tiptree Inc. | | | 75,000 | | | | 610,500 | |
| | | | | | | | 2,023,222 | |
| Real Estate — 2.1% | | | | | | | | |
Invesque Inc. f | | | 90,000 | | | | 606,042 | |
| Savings & Loans — 4.1% | | | | | | | | |
| Pacific Premier Bancorp Inc. | | | 22,000 | | | | 717,310 | |
| TFS Financial Corp. | | | 24,000 | | | | 472,320 | |
| | | | | | | | 1,189,630 | |
| Total Financial | | | | | | | | |
| (Cost $6,185,914) | | | | | | | 6,975,579 | |
The accompanying notes are an integral part of the financial statements.
Schedule of Investments (continued)
Quaker Small/Mid-Cap Impact Value Fund
December 31, 2019 (Unaudited)
| | | Number | | | Fair | |
| | | of Shares | | | Value | |
| Common Stocks — 69.1% (Continued) | | | | | | |
| Industrial — 7.2% | | | | | | |
| Electronics — 1.9% | | | | | | |
| Tech Data Corp. (a) | | | 3,750 | | | $ | 538,500 | |
| Machinery-Diversified — 4.1% | | | | | | | | |
CNH Industrial NV f | | | 22,000 | | | | 242,000 | |
| Wabtec Corp. | | | 12,000 | | | | 933,600 | |
| | | | | | | | 1,175,600 | |
| Transportation — 1.2% | | | | | | | | |
Scorpio Tankers Inc. f | | | 9,000 | | | | 354,060 | |
| Total Industrial | | | | | | | | |
| (Cost $1,697,343) | | | | | | | 2,068,160 | |
| Technology — 1.6% | | | | | | | | |
| Computers — 1.6% | | | | | | | | |
| Dell Technologies Inc. (a) | | | 9,000 | | | | 462,510 | |
| Software — 0.0% | | | | | | | | |
| ImageWare Systems Inc. (a) | | | 30,000 | | | | 10,050 | |
| Total Technology | | | | | | | | |
| (Cost $514,423) | | | | | | | 472,560 | |
| Total Common Stocks | | | | | | | | |
| (Cost $18,951,672) | | | | | | | 19,978,920 | |
| Business Development Company — 3.4% | | | | | | | | |
| FS KKR Capital Corp. | | | 160,000 | | | | 980,800 | |
| Total Business Development Company | | | | | | | | |
| (Cost $964,880) | | | | | | | 980,800 | |
| Preferred Stocks — 2.1% | | | | | | | | |
| Energy — 1.3% | | | | | | | | |
| Pipelines — 1.3% | | | | | | | | |
| Crestwood Equity Partners LP, | | | | | | | | |
| 9.25%, Perpetual | | | 40,000 | | | | 369,200 | |
| Total Energy | | | | | | | | |
| (Cost $360,813) | | | | | | | 369,200 | |
| Financial — 0.5% | | | | | | | | |
| Banks — 0.5% | | | | | | | | |
| CIT Group Inc., 5.625%, Perpetual | | | 6,000 | | | | 153,000 | |
| Total Financial | | | | | | | | |
| (Cost $150,420) | | | | | | | 153,000 | |
| Industrial — 0.3% | | | | | | | | |
| Trucking & Leasing— 0.3% | | | | | | | | |
| Fortress Transportation & Infrastructure | | | | | | | | |
| Investors LLC, 8.00%, Perpetual ▲ | | | 4,000 | | | | 104,000 | |
| Total Industrial | | | | | | | | |
| (Cost $99,360) | | | | | | | 104,000 | |
| Total Preferred Stocks | | | | | | | | |
| (Cost $610,593) | | | | | | | 626,200 | |
| Real Estate Investment Trusts — 16.2% | | | | | | | | |
| AG Mortgage Investment Trust Inc. | | | 17,000 | | | | 262,140 | |
| Blackstone Mortgage Trust Inc. | | | 10,000 | | | | 372,200 | |
| CorePoint Lodging Inc. | | | 90,000 | | | | 961,200 | |
| Independence Realty Trust Inc. | | | 55,000 | | | | 774,400 | |
| Invesco Mortgage Capital Inc. | | | 52,000 | | | | 865,800 | |
| MFA Financial Inc. | | | 54,000 | | | | 413,100 | |
| Starwood Property Trust Inc. | | | 41,588 | | | | 1,033,878 | |
| | | | | | | | 4,682,718 | |
| Total Real Estate Investment Trusts | | | | | | | | |
| (Cost $4,110,348) | | | | | | | 4,682,718 | |
| Total Long-Term Investments | | | | | | | | |
| (Cost $24,637,493) | | | | | | | 26,268,638 | |
| Short-Term Investments — 8.0% | | | | | | | | |
| Money Market Fund — 8.0% | | | | | | | | |
| First American Government | | | | | | | | |
| Obligations Fund, Cl X 1.511% (b) | | | 2,301,441 | | | | 2,301,441 | |
| Total Short-Term Investments | | | | | | | | |
| (Cost $2,301,441) | | | | | | | 2,301,441 | |
| Total Investments | | | | | | | | |
| (Cost $26,938,934) — 98.8% | | | | | | | 28,570,079 | |
| Other Assets in Excess | | | | | | | | |
| of Liabilities, Net 1.2% | | | | | | | 347,536 | |
| Total Net Assets — 100.0% | | | | | | $ | 28,917,615 | |
| (a) | Non-income producing security. |
| (b) | The rate quoted is the annualized 7 day yield as of December 31, 2019. |
| f | Foreign issued security. |
| ▲ | The coupon rate shown on floating or adjustable rate securities represents the rate at period end. |
| * | Indicates an illiquid security. Total market value for illiquid securities is $0, representing 0.0% of net assets. |
| ^ | Indicates a fair valued security. Total market value for fair valued securities is $0, representing 0.0% of net assets and level 3 securities. |
The accompanying notes are an integral part of the financial statements.
Statements of Assets and Liabilities
December 31, 2019 (unaudited)
| | | Quaker Impact | | | Quaker Small/Mid-Cap | |
| | | Growth Fund | | | Impact Value Fund | |
| ASSETS: | | | | | | |
| Investments, at value | | $ | 63,310,101 | | | $ | 28,570,079 | |
| Cash | | | 5,292 | | | | — | |
| Receivables: | | | | | | | | |
| Investment securities sold | | | 311,721 | | | | 123,853 | |
| Dividends and interest | | | 72,585 | | | | 150,750 | |
| Capital shares sold | | | 1,168 | | | | 163,185 | |
| Prepaid expenses and other assets | | | 71,109 | | | | 34,764 | |
| Total assets | | | 63,771,976 | | | | 29,042,631 | |
| | | | | | | | | |
| LIABILITIES: | | | | | | | | |
| Payables: | | | | | | | | |
| Due to advisor (Note 3) | | | 40,157 | | | | 8,575 | |
| Capital shares redeemed | | | 12,779 | | | | 9,202 | |
| Investment securities purchased | | | — | | | | 78,211 | |
| Distribution fees | | | 11,397 | | | | 2,052 | |
| Transfer agent fees | | | 26,014 | | | | 6,180 | |
| Fund administration and accounting fees | | | 19,908 | | | | 4,647 | |
| Trustee fees | | | 19,408 | | | | 6,038 | |
| Audit fees | | | 11,287 | | | | 3,589 | |
| Shareholder servicing fees | | | 8,729 | | | | 855 | |
| Accrued expenses | | | 6,875 | | | | 5,667 | |
| Total liabilities | | | 156,554 | | | | 125,016 | |
| Net assets | | $ | 63,615,422 | | | $ | 28,917,615 | |
| | | | | | | | | |
| NET ASSETS CONSIST OF: | | | | | | | | |
| Paid-in capital | | $ | 47,826,386 | | | $ | 26,891,673 | |
| Total distributable earnings (losses) | | | 15,789,036 | | | | 2,025,942 | |
| Total net assets | | $ | 63,615,422 | | | $ | 28,917,615 | |
| Total investments, at cost | | $ | 51,554,066 | | | $ | 26,938,934 | |
| Advisor Class shares: | | | | | | | | |
| Net assets | | $ | 54,136,593 | | | $ | 9,780,312 | |
Shares of beneficial interest outstanding(1) | | | 1,455,925 | | | | 546,448 | |
| Net asset value per share and redemption price per share | | $ | 37.19 | | | $ | 17.90 | |
| Institutional Class Shares: | | | | | | | | |
| Net assets | | $ | 9,478,829 | | | $ | 19,137,303 | |
Shares of beneficial interest outstanding(1) | | | 242,115 | | | | 970,954 | |
| Net asset value per share and redemption price per share | | $ | 39.15 | | | $ | 19.71 | |
(1) | Unlimited number of shares of beneficial interest with no par value authorized. |
The accompanying notes are an integral part of the financial statements.
Statements of Operations
For the Six-Month Period Ended December 31, 2019 (unaudited)
| | | Quaker Impact | | | Quaker Small/Mid-Cap | |
| | | Growth Fund | | | Impact Value Fund | |
| INVESTMENT INCOME (LOSS) | | | | | | |
| Income: | | | | | | |
| Dividends (net of foreign withholding taxes) | | $ | 442,447 | | | $ | 371,099 | |
| Interest | | | 12,850 | | | | 17,569 | |
| Other Income | | | 730 | | | | 233 | |
| Total Income | | | 456,027 | | | | 388,901 | |
| Expenses: | | | | | | | | |
| Investment advisory fees (Note 3) | | | 233,758 | | | | 106,943 | |
| Transfer agent fees | | | 72,869 | | | | 21,823 | |
| Distribution fee – Advisor Class | | | 66,623 | | | | 11,891 | |
| Funds administration and accounting fees | | | 51,429 | | | | 16,190 | |
| Insurance | | | 46,420 | | | | 15,202 | |
| Trustee fees | | | 38,105 | | | | 12,341 | |
| Shareholder servicing fees | | | 32,299 | | | | 6,172 | |
| Registration and filing expenses | | | 25,107 | | | | 24,020 | |
| Officers’ compensation fees | | | 24,133 | | | | 12,083 | |
| Legal fees | | | 16,135 | | | | 7,698 | |
| Audit fees | | | 11,175 | | | | 3,701 | |
| Printing expenses | | | 10,287 | | | | 6,426 | |
| Custody fees | | | 2,324 | | | | 2,345 | |
| Other operating expenses | | | 1,127 | | | | 1,113 | |
| Total expenses | | | 631,791 | | | | 247,948 | |
| Investment advisory fees reimbursed (Note 3) | | | — | | | | (81,584 | ) |
| Net expenses | | | 631,791 | | | | 166,364 | |
| Net investment income (loss) | | | (175,764 | ) | | | 222,537 | |
| | | | | | | | | |
| REALIZED AND UNREALIZED GAIN (LOSS) ON INVESTMENTS | | | | | | | | |
| Net realized gain (loss) on investments: | | | | | | | | |
| Securities | | | 4,436,813 | | | | 934,661 | |
| Foreign currency transactions | | | 139 | | | | — | |
| Net realized gain (loss) on investments | | | 4,436,952 | | | | 934,661 | |
| Net change in unrealized appreciation (depreciation) of investments: | | | | | | | | |
| Securities | | | 2,036,440 | | | | 875,568 | |
| Net realized and unrealized gain (loss) on investments | | | 6,473,392 | | | | 1,810,229 | |
| Net increase (decrease) in net assets resulting from operations | | $ | 6,297,628 | | | $ | 2,032,766 | |
| (Foreign withholding taxes on dividends/tax reclaims/interest) | | $ | (1,090 | ) | | $ | (1,197 | ) |
The accompanying notes are an integral part of the financial statements.
Statements of Changes in Net Assets
Quaker Impact Growth Fund
| | | (unaudited) | | | | |
| | | For the | | | For the | |
| | | Six-Month Period Ended | | | Year Ended | |
| | | December 31, 2019 | | | June 30, 2019 | |
| INCREASE (DECREASE) IN NET ASSETS | | | | | | |
| Operations: | | | | | | |
| Net investment income (loss) | | $ | (175,764 | ) | | $ | (621,884 | ) |
| Net realized gain (loss) on investment transactions: | | | | | | | | |
| Securities | | | 4,436,813 | | | | 2,006,003 | |
| Foreign currency transactions | | | 139 | | | | (525 | ) |
| Net change in unrealized appreciation | | | | | | | | |
| (depreciation) of investment transactions: | | | | | | | | |
| Securities | | | 2,036,440 | | | | 3,114,591 | |
| Net increase (decrease) in net assets resulting from operations | | | 6,297,628 | | | | 4,498,185 | |
| Distributions to shareholders from: | | | | | | | | |
| Advisor Class | | | (959,644 | ) | | | — | |
| Institutional Class | | | (159,052 | ) | | | — | |
| Total distributions | | | (1,118,696 | ) | | | — | |
| Capital share transactions: | | | | | | | | |
| Increase (decrease) in net assets from fund share transactions (Note 8) | | | (3,601,498 | ) | | | (7,583,509 | ) |
| Total increase (decrease) in net assets | | | 1,577,434 | | | | (3,085,324 | ) |
| | | | | | | | | |
| NET ASSETS | | | | | | | | |
| Beginning of period | | | 62,037,988 | | | | 65,123,312 | |
| End of period | | $ | 63,615,422 | | | $ | 62,037,988 | |
The accompanying notes are an integral part of the financial statements.
Statements of Changes in Net Assets (continued)
Quaker Small/Mid-Cap Impact Value Fund
| | | (unaudited) | | | | |
| | | For the | | | For the | |
| | | Six-Month Period Ended | | | Year Ended | |
| | | December 31, 2019 | | | June 30, 2019 | |
| INCREASE (DECREASE) IN NET ASSETS | | | | | | |
| Operations: | | | | | | |
| Net investment income (loss) | | $ | 222,537 | | | $ | 107,369 | |
| Net realized gain (loss) on investment transactions: | | | | | | | | |
| Securities | | | 934,661 | | | | 1,903,780 | |
| Foreign currency transactions | | | — | | | | (2,335 | ) |
| Net change in unrealized appreciation | | | | | | | | |
| (depreciation) of investment transactions: | | | | | | | | |
| Securities | | | 875,568 | | | | (1,170,301 | ) |
| Net increase (decrease) in net assets resulting from operations | | | 2,032,766 | | | | 838,513 | |
| Distributions to shareholders from: | | | | | | | | |
| Advisor Class | | | (675,516 | ) | | | (1,482,530 | ) |
| Institutional Class | | | (1,222,174 | ) | | | (2,207,375 | ) |
| Total distributions | | | (1,897,690 | ) | | | (3,689,905 | ) |
| Capital share transactions: | | | | | | | | |
| Increase (decrease) in net assets from fund share transactions (Note 8) | | | 8,796,163 | | | | 7,084,717 | |
| Total increase (decrease) in net assets | | | 8,931,239 | | | | 4,233,325 | |
| | | | | | | | | |
| NET ASSETS | | | | | | | | |
| Beginning of period | | | 19,986,376 | | | | 15,753,051 | |
| End of period | | $ | 28,917,615 | | | $ | 19,986,376 | |
The accompanying notes are an integral part of the financial statements.
Financial Highlights
Quaker Impact Growth Fund
(For a Share Outstanding Throughout each Period)
| | | Advisor Class |
| | | (unaudited) | | | | | | | | | | | | | | | | |
| | | For the | | | | | | | | | | | | | | | | |
| | | Six-Month | | | | | | | | | | | | | | | | |
| | | Period from | | | | | | | | | | | | | | | | |
| | | July 1, 2019 to | | | Years Ended June 30, | |
| | | December 31, | |
| | | 2019 | | | | 2019 | | | | 2018 | | | | 2017 | | | | 2016 | | | | 2015 | |
| Net asset value, beginning of period | | $ | 34.22 | | | $ | 31.87 | | | $ | 27.86 | | | $ | 23.80 | | | $ | 26.55 | | | $ | 24.19 | |
| Income from investment operations: | | | | | | | | | | | | | | | | | | | | | |
Net investment income (loss)(1) | | | (0.11 | ) | | | (0.30 | ) | | | (0.24 | ) | | | (0.07 | ) | | | (0.32 | ) | | | (0.30 | ) |
| Net realized and unrealized | | | | | | | | | | | | | | | | | | | | | | | | |
| gain (loss) on investments | | | 3.75 | | | | 2.65 | | | | 4.25 | | | | 4.13 | | | | (2.43 | ) | | | 2.66 | |
| Total from investment operations | | | 3.64 | | | | 2.35 | | | | 4.01 | | | | 4.06 | | | | (2.75 | ) | | | 2.36 | |
| Distributions to shareholders from: | | | | | | | | | | | | | | | | | | | | | | | | |
| Net investment income | | | — | | | | — | | | | — | | | | — | | | | — | | | | — | |
| Net realized capital gain | | | (0.67 | ) | | | — | | | | — | | | | — | | | | — | | | | — | |
| Total distributions | | | (0.67 | ) | | | — | | | | — | | | | — | | | | — | | | | — | |
| Net asset value, end of period | | $ | 37.19 | | | $ | 34.22 | | | $ | 31.87 | | | $ | 27.86 | | | $ | 23.80 | | | $ | 26.55 | |
Total Return(2) | | | 10.64 | %* | | | 7.37 | % | | | 14.39 | % | | | 17.01 | % | | | (10.36 | )% | | | 9.76 | % |
| Ratios/supplemental data: | | | | | | | | | | | | | | | | | | | | | | | | |
| Net assets, end of period (000’ omitted) | | $ | 54,137 | | | $ | 53,292 | | | $ | 44,964 | | | $ | 49,859 | | | $ | 57,159 | | | $ | 77,188 | |
| Ratio of expenses to average net assets: | | | | | | | | | | | | | | | | | | | | | | | | |
Before expense reimbursements or recoveries | | | 2.06 | %** | | | 2.48 | % | | | 2.30 | % | | | 2.34 | %(3)(4) | | | 2.30 | %(3)(4) | | | 2.12 | %(3)(4) |
After expense reimbursements or recoveries | | | 2.06 | %** | | | 2.48 | % | | | 2.30 | % | | | 2.22 | %(3)(5) | | | 2.24 | %(3)(5) | | | 2.24 | %(3)(5) |
| Ratio of net investment income (loss) | | | | | | | | | | | | | | | | | | | | | | | | |
| to average net assets: | | | | | | | | | | | | | | | | | | | | | | | | |
Before expense reimbursements or recoveries | | | (0.60 | )%** | | | (0.99 | )% | | | (0.78 | )% | | | (0.40 | )%(3) | | (1.34 | )%(3)^ | | | (1.06 | )%(3) |
After expense reimbursements or recoveries | | | (0.60 | )%** | | | (0.99 | )% | | | (0.78 | )% | | | (0.28 | )%(3) | | (1.28 | )%(3)^ | | | (1.18 | )%(3) |
| Portfolio turnover rate | | | 45 | %* | | | 24 | % | | | 119 | % | | | 185 | % | | | 211 | % | | | 149 | % |
| (1) | The average shares outstanding method has been applied for per share information. |
| (2) | Total investment return is based on the change in net asset value of a share during the period, assumes reinvestment of dividends and distributions at net asset value and does not reflect the impact of a sales charge. As of September 30, 2018 the Fund no longer charges a sales charge. |
| (3) | Expense waived or reimbursed reflect reductions to total expenses, as discussed in the notes to the financial statements. These reimbursed amounts would increase the net investment loss ratio or decrease the net investment income ratio and recovered amounts would decrease the net investment loss ratio or increase the net investment income ratio, as applicable, had such reductions or increases not occurred. |
| (4) | Expenses before reductions (excluding dividend and interest expense for securities sold short) were 2.29% for the year ended June 30, 2016. |
| (5) | Expenses net of all reductions (excluding dividend and interest expense for securities sold short) were 2.23% for the year ended June 30, 2016. |
| * | Not annualized. |
| ** | Annualized. |
| ^ | The net investment income (loss) ratios include dividends on short positions. |
The accompanying notes are an integral part of the financial statements.
Financial Highlights
Quaker Impact Growth Fund
(For a Share Outstanding Throughout each Period)
| | | Institutional Class |
| | | (unaudited) | | | | | | | | | | | | | | | | |
| | | For the | | | | | | | | | | | | | | | | |
| | | Six-Month | | | | | | | | | | | | | | | | |
| | | Period from | | | | | | | | | | | | | | | | |
| | | July 1, 2019 to | | | Years Ended June 30, | |
| | | December 31, | |
| | | 2019 | | | | 2019 | | | | 2018 | | | | 2017 | | | | 2016 | | | | 2015 | |
| Net asset value, beginning of period | | $ | 35.96 | | | $ | 33.40 | | | $ | 29.12 | | | $ | 24.82 | | | $ | 27.62 | | | $ | 25.10 | |
| Income from investment operations: | | | | | | | | | | | | | | | | | | | | | |
Net investment income (loss)(1) | | | (0.07 | ) | | | (0.25 | ) | | | (0.17 | ) | | | (0.01 | ) | | | (0.27 | ) | | | (0.25 | ) |
| Net realized and unrealized | | | | | | | | | | | | | | | | | | | | | | | | |
| gain (loss) on investments | | | 3.93 | | | | 2.81 | | | | 4.45 | | | | 4.31 | | | | (2.53 | ) | | | 2.77 | |
| Total from investment operations | | | 3.86 | | | | 2.56 | | | | 4.28 | | | | 4.30 | | | | (2.80 | ) | | | 2.52 | |
| Distributions to shareholders from: | | | | | | | | | | | | | | | | | | | | | | | | |
| Net investment income | | | — | | | | — | | | | — | | | | — | | | | — | | | | — | |
| Net realized capital gain | | | (0.67 | ) | | | ��� | | | | — | | | | — | | | | — | | | | — | |
| Total distributions | | | (0.67 | ) | | | — | | | | — | | | | — | | | | — | | | | — | |
| Net asset value, end of period | | $ | 39.15 | | | $ | 35.96 | | | $ | 33.40 | | | $ | 29.12 | | | $ | 24.82 | | | $ | 27.62 | |
Total Return(2) | | | 10.74 | %* | | | 7.66 | % | | | 14.70 | % | | | 17.32 | % | | | (10.14 | )% | | | 10.04 | % |
| Ratios/supplemental data: | | | | | | | | | | | | | | | | | | | | | | | | |
| Net assets, end of period (000’ omitted) | | $ | 9,479 | | | $ | 8,746 | | | $ | 9,039 | | | $ | 9,005 | | | $ | 13,457 | | | $ | 66,521 | |
| Ratio of expenses to average net assets: | | | | | | | | | | | | | | | | | | | | | | | | |
Before expense reimbursements or recoveries | | | 1.81 | %** | | | 2.23 | % | | | 2.05 | % | | | 2.09 | %(3)(4) | | | 2.05 | %(3)(4) | | | 1.87 | %(3)(4) |
After expense reimbursements or recoveries | | | 1.81 | %** | | | 2.23 | % | | | 2.05 | % | | | 1.97 | %(3)(5) | | | 1.99 | %(3)(5) | | | 1.99 | %(3)(5) |
| Ratio of net investment income (loss) | | | | | | | | | | | | | | | | | | | | | | |
| to average net assets: | | | | | | | | | | | | | | | | | | | | | | | | |
Before expense reimbursements or recoveries | | | (0.35 | )%** | | | (0.74 | )% | | | (0.53 | )% | | | (0.15 | )%(3) | | (1.09 | )%(3)^ | | | (0.81 | )%(3) |
After expense reimbursements or recoveries | | | (0.35 | )%** | | | (0.74 | )% | | | (0.53 | )% | | | (0.03 | )%(3) | | (1.03 | )%(3)^ | | | (0.93 | )%(3) |
| Portfolio turnover rate | | | 45 | %* | | | 24 | % | | | 119 | % | | | 185 | % | | | 211 | % | | | 149 | % |
| (1) | The average shares outstanding method has been applied for per share information. |
| (2) | Total investment return is based on the change in net asset value of a share during the period, assumes reinvestment of dividends and distributions at net asset value. |
| (3) | Expense waived or reimbursed reflect reductions to total expenses, as discussed in the notes to the financial statements. These reimbursed amounts would increase the net investment loss ratio or decrease the net investment income ratio and recovered amounts would decrease the net investment loss ratio or increase the net investment income ratio, as applicable, had such reductions or increases not occurred. |
| (4) | Expenses before reductions (excluding dividend and interest expense for securities sold short) were 2.04% for the year ended June 30, 2016. |
| (5) | Expenses net of all reductions (excluding dividend and interest expense for securities sold short) were 1.98% for the year ended June 30, 2016. |
| * | Not annualized. |
| ** | Annualized. |
| ^ | The net investment income (loss) ratios include dividends on short positions. |
The accompanying notes are an integral part of the financial statements.
Financial Highlights
Quaker Small/Mid-Cap Impact Value Fund
(For a Share Outstanding Throughout the Period)
| | | Advisor Class |
| | | (unaudited) | | | | | | | | | | | | | | | | |
| | | For the | | | | | | | | | | | | | | | | |
| | | Six-Month | | | | | | | | | | | | | | | | |
| | | Period from | | | | | | | | | | | | | | | | |
| | | July 1, 2019 to | | | Years Ended June 30, | |
| | | December 31, | |
| | | 2019 | | | | 2019 | | | | 2018 | | | | 2017 | | | | 2016 | | | | 2015 | |
| Net asset value, beginning of period | | $ | 17.65 | | | $ | 23.23 | | | $ | 24.13 | | | $ | 20.09 | | | $ | 24.15 | | | $ | 24.28 | |
| Income from investment operations: | | | | | | | | | | | | | | | | | | | | | | | | |
Net investment income (loss)(1) | | | 0.16 | | | | 0.08 | | | | (0.23 | ) | | | (0.20 | ) | | | (0.08 | ) | | | (0.06 | ) |
| Net realized and unrealized | | | | | | | | | | | | | | | | | | | | | | | | |
| gain (loss) on investments | | | 1.43 | | | | 0.12 | | | | 3.03 | | | | 4.24 | | | | (2.26 | ) | | | 1.22 | |
| Total from investment operations | | | 1.59 | | | | 0.20 | | | | 2.80 | | | | 4.04 | | | | (2.34 | ) | | | 1.16 | |
| Distributions to shareholders from: | | | | | | | | | | | | | | | | | | | | | | | | |
| Net investment income | | | (0.34 | ) | | | — | | | | — | | | | — | | | | — | | | | — | |
| Net realized capital gain | | | (1.00 | ) | | | (5.78 | ) | | | (3.70 | ) | | | — | | | | (1.72 | ) | | | (1.29 | ) |
| Total distributions | | | (1.34 | ) | | | (5.78 | ) | | | (3.70 | ) | | | — | | | | (1.72 | ) | | | (1.29 | ) |
| Net asset value, end of period | | $ | 17.90 | | | $ | 17.65 | | | $ | 23.23 | | | $ | 24.13 | | | $ | 20.09 | | | $ | 24.15 | |
Total Return(2) | | | 8.98 | %* | | | 3.17 | % | | | 12.07 | % | | | 20.11 | % | | | (9.93 | )% | | | 4.96 | % |
| Ratios/supplemental data: | | | | | | | | | | | | | | | | | | | | | | | | |
| Net assets, end of period (000’ omitted) | | $ | 9,780 | | | $ | 9,176 | | | $ | 4,737 | | | $ | 6,434 | | | $ | 6,431 | | | $ | 7,790 | |
| Ratio of expenses to average net assets: | | | | | | | | | | | | | | | | | | | | | | |
| Before expense reimbursements | | | 2.24 | %(3)** | | | 2.84 | %(3) | | | 2.44 | % | | | 2.21 | % | | | 1.93 | % | | | 1.78 | % |
| After expense reimbursements | | | 1.55 | %(3)** | | | 2.65 | %(3) | | | 2.44 | % | | | 2.21 | % | | | 1.93 | % | | | 1.78 | % |
| Ratio of net investment income (loss) | | | | | | | | | | | | | | | | | | | | | | | | |
| to average net assets: | | | | | | | | | | | | | | | | | | | | | | | | |
| Before expense reimbursements | | | 1.03 | %(3)** | | | 0.28 | %(3) | | | (0.99 | )% | | | (0.89 | )% | | | (0.37 | )% | | | (0.26 | )% |
| After expense reimbursements | | | 1.72 | %(3)** | | | 0.47 | %(3) | | | (0.99 | )% | | | (0.89 | )% | | | (0.37 | )% | | | (0.26 | )% |
| Portfolio turnover rate | | | 37 | %* | | | 111 | % | | | 122 | % | | | 146 | % | | | 119 | % | | | 128 | % |
| (1) | The average shares outstanding method has been applied for per share information. |
| (2) | Total investment return is based on the change in net asset value of a share during the period, assumes reinvestment of dividends and distributions at net asset value and does not reflect the impact of a sales charge. As of September 30, 2018 the Fund no longer charges a sales charge. |
| (3) | Expense waived or reimbursed reflect reductions to total expenses, as discussed in the notes to the financial statements. These reimbursed amounts would increase the net investment loss ratio or decrease the net investment income ratio, as applicable, had such reductions not occurred. |
| * | Not annualized. |
| ** | Annualized. |
The accompanying notes are an integral part of the financial statements.
Financial Highlights
Quaker Small/Mid-Cap Impact Value Fund
(For a Share Outstanding Throughout the Period)
| | | Institutional Class |
| | | (unaudited) | | | | | | | | | | | | | | | | |
| | | For the | | | | | | | | | | | | | | | | |
| | | Six-Month | | | | | | | | | | | | | | | | |
| | | Period from | | | | | | | | | | | | | | | | |
| | | July 1, 2019 to | | | Years Ended June 30, | |
| | | December 31, | |
| | | 2019 | | | | 2019 | | | | 2018 | | | | 2017 | | | | 2016 | | | | 2015 | |
| Net asset value, beginning of period | | $ | 19.36 | | | $ | 24.83 | | | $ | 25.49 | | | $ | 21.17 | | | $ | 25.29 | | | $ | 25.30 | |
| Income from investment operations: | | | | | | | | | | | | | | | | | | | | | | | | |
Net investment income (loss)(1) | | | 0.20 | | | | 0.15 | | | | (0.19 | ) | | | (0.15 | ) | | | (0.03 | ) | | | (0.00 | )+ |
| Net realized and unrealized | | | | | | | | | | | | | | | | | | | | | | | | |
| gain (loss) on investments | | | 1.56 | | | | 0.16 | | | | 3.23 | | | | 4.47 | | | | (2.37 | ) | | | 1.28 | |
| Total from investment operations | | | 1.76 | | | | 0.31 | | | | 3.04 | | | | 4.32 | | | | (2.40 | ) | | | 1.28 | |
| Distributions to shareholders from: | | | | | | | | | | | | | | | | | | | | | | | | |
| Net investment income | | | (0.41 | ) | | | — | | | | — | | | | — | | | | — | | | | — | |
| Net realized capital gain | | | (1.00 | ) | | | (5.78 | ) | | | (3.70 | ) | | | — | | | | (1.72 | ) | | | (1.29 | ) |
| Total distributions | | | (1.41 | ) | | | (5.78 | ) | | | (3.70 | ) | | | — | | | | (1.72 | ) | | | (1.29 | ) |
| Net asset value, end of period | | $ | 19.71 | | | $ | 19.36 | | | $ | 24.83 | | | $ | 25.49 | | | $ | 21.17 | | | $ | 25.29 | |
Total Return(2) | | | 9.06 | %* | | | 3.47 | % | | | 12.39 | % | | | 20.41 | % | | | (9.71 | )% | | | 5.24 | % |
| Ratios/supplemental data: | | | | | | | | | | | | | | | | | | | | | | | | |
| Net assets, end of period (000’ omitted) | | $ | 19,137 | | | $ | 10,811 | | | $ | 9,747 | | | $ | 20,952 | | | $ | 24,642 | | | $ | 28,528 | |
| Ratio of expenses to average net assets: | | | | | | | | | | | | | | | | | | | | | | | | |
| Before expense reimbursements | | | 1.99 | %(3)** | | | 2.58 | %(3) | | | 2.19 | % | | | 1.96 | % | | | 1.68 | % | | | 1.53 | % |
| After expense reimbursements | | | 1.30 | %(3)** | | | 2.39 | %(3) | | | 2.19 | % | | | 1.96 | % | | | 1.68 | % | | | 1.53 | % |
| Ratio of net investment income (loss) | | | | | | | | | | | | | | | | | | | | | | | | |
| to average net assets: | | | | | | | | | | | | | | | | | | | | | | | | |
| Before expense reimbursements | | | 1.28 | %(3)** | | | 0.53 | %(3) | | | (0.74 | )% | | | (0.64 | )% | | | (0.12 | )% | | | (0.01 | )% |
| After expense reimbursements | | | 1.97 | %(3)** | | | 0.72 | %(3) | | | (0.74 | )% | | | (0.64 | )% | | | (0.12 | )% | | | (0.01 | )% |
| Portfolio turnover rate | | | 37 | %* | | | 111 | % | | | 122 | % | | | 146 | % | | | 119 | % | | | 128 | % |
| (1) | The average shares outstanding method has been applied for per share information. |
| (2) | Total investment return is based on the change in net asset value of a share during the period, assumes reinvestment of dividends and distributions at net asset value. |
| (3) | Expense waived or reimbursed reflect reductions to total expenses, as discussed in the notes to the financial statements. These reimbursed amounts would increase the net investment loss ratio or decrease the net investment income ratio, as applicable, had such reductions not occurred. |
| + | Amount is less than $0.005 per share. |
| * | Not annualized. |
| ** | Annualized. |
The accompanying notes are an integral part of the financial statements.
Notes to the Financial Statements (unaudited)
Note 1 — Organization
The Quaker Investment Trust (“Trust”), a diversified, open-end management investment company, was originally organized as a Massachusetts business trust on October 24, 1990, and was reorganized as a Delaware statutory trust on September 30, 2018. The Trust is registered under the Investment Company Act of 1940, as amended (“1940 Act”). The Trust’s Declaration of Trust permits the Trustees to issue an unlimited number of shares of beneficial interest for each of its series. Currently, the Trust offers two series: Quaker Impact Growth Fund (“Impact Growth”) and Quaker Small/Mid-Cap Impact Value Fund (“Small/Mid-Cap Impact Value”) (each a “Fund” and collectively, “Funds”). Both Funds are diversified. The investment objectives of each Fund are set forth below. On January 1, 2018, Community Capital Management, Inc. (“CCM”) became the new investment adviser to the Trust.
Impact Growth and Small/Mid-Cap Impact Value commenced operations on November 25, 1996. The investment objective of these Funds is to seek long-term growth of capital. The investment objective of these Funds is non-fundamental in that this objective may be changed by the Board of Trustees (“Board” or “Trustees”) without shareholder approval. Each Fund is an investment company and accordingly follows the investment company accounting and reporting guidance of the Financial Accounting Standards Board (“FASB”) Accounting Standards Codification Topic 946 “Financial Services – Investment Companies.”
The Funds offer two classes of shares: Advisor Class and Institutional Class. The Advisor Class shares are charged a distribution and service fee (the front-end sales charge was removed); and Institutional Class shares bear no distribution fee, but have higher minimum investment thresholds. CCM, the investment adviser to each of the Funds, has the ability to waive the minimum investment for Institutional Class shares at its discretion.
On February 1, 2019 the Trust amended and restated its Registration Statement to change each of the Funds’ performance reporting history. The inception date for each of the Fund’s performance reporting history is now January 1, 2018, the date CCM became the Adviser to the Funds.
Note 2 — Summary of Significant Accounting Policies and Other Information
The following is a summary of significant accounting policies consistently followed by the Funds in the preparation of their financial statements. The policies are in conformity with accounting principles generally accepted in the United States of America (“GAAP”).
A. Security Valuation. The Funds’ investments in securities are carried at market value. Securities listed on an exchange or quoted on a national market system are generally valued at the last quoted sales price at the time of valuation. Other securities traded in the over-the-counter market and listed securities for which no sale was reported on that date are valued at the most recent bid price. Each security reported on the NASDAQ National Market System is valued at the NASDAQ Official Closing Price.
Debt and other fixed-income securities are valued at the last quoted bid price and/or by using a combination of daily quotes and matrix evaluations provided by an independent pricing service (which reflect such factors as security prices, yields, maturities, ratings, and dealer and exchange quotations), the use of which has been approved by the Board.
The Funds may enter into forward foreign currency contracts to lock in the U.S. dollar cost of purchase and sale transactions or to defend the portfolio against currency fluctuations. A forward foreign currency contract is a commitment to purchase or sell a foreign currency at a future date at a negotiated rate. These contracts are valued daily, and the Fund’s net equity therein, representing unrealized gain or loss on the contracts as measured by the difference between the forward foreign exchange rates at the dates of entry into the contracts and the forward rates at the end of the reporting period, if any, is included in the Statements of Assets and Liabilities.
Notes to the Financial Statements (unaudited) (continued)
Note 2 — Summary of Significant Accounting Policies and Other Information (Continued)
Realized and unrealized gains and losses, if any, are included in the Statements of Operations. Risks may arise upon entering into these contracts from the potential inability of counterparties to meet the terms of the contract and from unanticipated movements in the value of foreign currencies relative to the U.S. dollar.
For financial reporting purposes, investment transactions are recorded on the trade date; however, for purposes of executing shareholder transactions, the Funds record changes in holdings of portfolio securities no later than the first business day after the trade date in accordance with Rule 2a-4 of the 1940 Act. Accordingly, certain differences between net asset value for financial reporting and for executing shareholder transactions may arise.
The Funds have adopted fair valuation procedures to value securities at fair market value in certain circumstances, and the Trust has established a Valuation Committee responsible for determining when fair valuing a security is necessary and appropriate. The Funds will value securities at fair market value when market quotations are not readily available or when securities cannot be accurately valued within established pricing procedures. The Valuation Committee may also fair value foreign securities whose prices may have been affected by events occurring after the close of trading in their respective markets but prior to the time the Fund holding the foreign securities calculates its net asset value. The Funds’ fair valuation procedures are designed to help ensure that prices at which Fund shares are purchased and redeemed are fair and do not result in dilution of shareholder interest or other harm to shareholders.
The Fund is required to disclose information regarding the fair value measurements of the Fund’s assets and liabilities. Fair value is defined as the price that the Fund may receive upon selling an investment in an orderly transaction to an independent buyer in the principal or most advantageous market for the investment. The disclosure requirements utilize a three-tier hierarchy to maximize the use of observable market data, minimize the use of unobservable inputs and establish classification of fair value measurements for disclosure purposes. A financial instrument’s level within the fair value hierarchy is based on the lowest level that is significant to the fair value measurement. Inputs refer broadly to the assumptions that market participants would use in pricing the asset or liability, including assumptions about risk, for example, the risk inherent in a particular valuation technique used to measure fair value including the pricing model used and/or the risk inherent in the inputs to the valuation technique. Inputs may be observable or unobservable.
Observable inputs are inputs that reflect the assumptions market participants would use in pricing the asset or liability, which are based on market data obtained from sources independent of the reporting entity. Unobservable inputs are inputs that reflect the reporting entity’s own assumptions about the assumptions market participants would use in pricing the asset or liability developed based on the best information available in the circumstances.
The significant unobservable inputs used in the fair value measurement of the reporting entity’s equity holdings are, the projected final distribution applied for lack of marketability. Significant increases (decreases) in any of those inputs in isolation could result in a significantly lower (higher) fair value measurement.
Various inputs may be used to determine the value of each Fund’s investments. These inputs are summarized in three broad levels for financial statement purposes. The inputs or methodologies used to value securities are not necessarily an indication of the risk associated with investing in those securities.
Level 1 — Quoted prices in active markets for identical securities.
Notes to the Financial Statements (unaudited) (continued)
Note 2 — Summary of Significant Accounting Policies and Other Information (Continued)
Level 2 — Prices determined using significant other observable inputs (including quoted prices for similar securities, interest rates, prepayment speeds, credit risk, etc.) municipal securities, long-term U.S. Government obligations and corporate debt securities are valued in accordance with the evaluated price supplied by the pricing service and generally categorized as Level 2 in the hierarchy. Other securities that are categorized as Level 2 in the hierarchy may include, but are not limited to, OTC options and international equity securities valued by an independent third party in order to adjust for stale pricing and foreign market holidays.
Level 3 — Prices determined using significant unobservable inputs (including the Fund’s own assumptions). For restricted equity securities where observable inputs are limited, assumptions about market activity and risk are used in determining fair value. These are categorized as Level 3 in the hierarchy.
For international equity securities traded on a foreign exchange or market which closes prior to a Fund’s Valuation Time, in order to adjust for events which occur between the close of the foreign exchange they are traded on and the close of the New York Stock Exchange, a fair valuation model is used, and these securities are categorized as Level 2.
A Fund may hold securities, some of which are classified as Level 3 investments (as defined below). Level 3 investments have significant unobservable inputs, as they trade infrequently. In determining the fair value of these investments, management uses the market approach which includes as the primary input the capital balance reported; however, adjustments to the reported capital balance may be made based on various factors, including, but not limited to, the attributes of the interest held, including the rights and obligations, and any restrictions or illiquidity of such interests, and the fair value of these securities.
The value of a foreign security is generally determined as of the close of trading on the foreign stock exchange on which the security is primarily traded, or as of the close of trading on the New York Stock Exchange (“NYSE”), if earlier. The value is then converted into its U.S. dollar equivalent at the foreign exchange rate in effect at the close of the NYSE (generally 4:00 p.m. Eastern time) on the day that the value of the foreign security is determined. If no sale is reported at that time, the foreign security will be valued within the range of the most recent quoted bid and ask prices. If market quotations are not readily available for a foreign security or an event has occurred that caused a quotation to be unavailable or unreliable, the Valuation Committee will fair value foreign securities using the procedures described below.
The Trust has adopted fair valuation procedures to value securities at fair market value when independent prices are unavailable or unreliable, and the Trust has established a Valuation Committee that is responsible for determining when fair valuing a security is necessary and appropriate. Securities and assets for which market quotations are not readily available may be valued based upon valuation methods that include: (i) multiple of earnings; (ii) yield to maturity with respect to debt issues; (iii) discounts from market prices of similar freely traded securities; or (iv) a combination of these or other methods. Securities may also be priced using fair value pricing methods when their closing prices do not reflect their market values at the time the Fund calculates its net asset value (“NAV”) because an event had occurred since the closing prices were established on the domestic or foreign exchange or market but before the Fund’s NAV calculation.
Notes to the Financial Statements (unaudited) (continued)
Note 2 — Summary of Significant Accounting Policies and Other Information (Continued)
The following is a summary of the fair valuations according to the inputs used as of December 31, 2019 in valuing the Fund’s assets and liabilities:
IMPACT GROWTH FUND
| Description | | Level 1 | | | Level 2 | | | Level 3 | | | Total | |
| Common Stocks | | $ | 58,145,689 | | | $ | — | | | $ | — | | | $ | 58,145,689 | |
| Real Estate Investment Trusts | | | 3,248,665 | | | | — | | | | — | | | | 3,248,665 | |
| Rights | | | 10,535 | | | | — | | | | — | | | | 10,535 | |
Escrow Shares(1) | | | — | | | | — | | | | 52,520 | | | | 52,520 | |
Escrow Notes(1) | | | — | | | | — | | | | 0 | | | | 0 | |
| Money Market Fund | | | 1,852,692 | | | | — | | | | — | | | | 1,852,692 | |
| Total Investments in Securities | | $ | 63,257,581 | | | $ | — | | | $ | 52,520 | | | $ | 63,310,101 | |
SMALL/MID-CAP IMPACT VALUE FUND
| Description | | Level 1 | | | Level 2 | | | Level 3 | | | Total | |
Common Stocks(2) | | $ | 19,978,920 | | | $ | — | | | $ | 0 | | | $ | 19,978,920 | |
| Business Development Company | | | 980,800 | | | | — | | | | — | | | | 980,800 | |
| Preferred Stocks | | | 626,200 | | | | — | | | | — | | | | 626,200 | |
| Real Estate Investment Trusts | | | 4,682,718 | | | | — | | | | — | | | | 4,682,718 | |
| Money Market Fund | | | 2,301,441 | | | | — | | | | — | | | | 2,301,441 | |
| Total Investments in Securities | | $ | 28,570,079 | | | $ | — | | | $ | 0 | | | $ | 28,570,079 | |
| (1) | See the Impact Growth Fund’s Schedule of Investments for industry classifications of the two securities noted as Level 3. |
| (2) | See the Small/Mid-Cap Impact Value Fund’s Schedule of Investments Consumer, Non-Cyclical for the industry classification of the one security noted as Level 3. |
Level 3 Reconciliation
The following is a reconciliation of each Fund’s Level 3 investments for which significant unobservable inputs were used in determining value:
IMPACT GROWTH FUND
| | | Balance | | | | | | | | | | | | Net | | | | | | | | | Balance | |
| | | as of | | | | | | | | | | | | Unrealized | | | Amortized | | | Transfers | | | as of | |
| | | June 30, | | | | | | | | | Realized | | | appreciation | | | discounts / | | | in to | | | December 31, | |
| | | 2019 | | | Purchases | | | Sales | | | gain (loss) | | | (depreciation) | | | premiums | | | Level 3 | | | 2019 | |
| Escrow Shares | | $ | 67,839 | | | $ | — | | | $ | — | | | $ | — | | | $ | (15,319 | ) | | $ | — | | | $ | — | | | $ | 52,520 | |
| Escrow Notes | | $ | 0 | | | $ | — | | | $ | — | | | $ | — | | | $ | — | | | $ | — | | | $ | — | | | $ | 0 | |
| Total | | $ | 67,839 | | | $ | — | | | $ | — | | | $ | — | | | $ | (15,319 | ) | | $ | — | | | $ | 0 | | | $ | 52,520 | |
| Net change in unrealized appreciation (depreciation) for Level 3 investments still held as of December 31, 2019 | | | $ | (15,319 | ) |
SMALL/MID-CAP IMPACT VALUE FUND
| | | Balance | | | | | | | | | | | | Net | | | | | | | | | Balance | |
| | | as of | | | | | | | | | | | | Unrealized | | | Amortized | | | Transfers | | | as of | |
| | | June 30, | | | | | | | | | Realized | | | appreciation | | | discounts / | | | in to | | | December 31, | |
| | | 2019 | | | Purchases | | | Sales | | | gain (loss) | | | (depreciation) | | | premiums | | | Level 3 | | | 2019 | |
| Common Stocks | | $ | — | | | $ | — | | | $ | — | | | $ | — | | | $ | — | | | $ | — | | | $ | 0 | | | $ | 0 | |
| Total | | $ | — | | | $ | — | | | $ | — | | | $ | — | | | $ | — | | | $ | — | | | $ | 0 | | | $ | 0 | |
| Net change in unrealized appreciation (depreciation) for Level 3 investments still held as of December 31, 2019 | | | $ | — | |
Notes to the Financial Statements (unaudited) (continued)
Note 2 — Summary of Significant Accounting Policies and Other Information (Continued)
The following presents information about significant unobservable inputs related to Level 3 investments at December 31, 2019:
IMPACT GROWTH FUND
| | Fair Value at | Valuation | Unobservable | Input |
| | December 31, 2019 | Technique | Input | Values |
| Escrow Shares | | | | |
| Airlines | $52,520 | Market approach | Estimated obligations to other parties | 60mm* |
| | | | | |
| Escrow Notes | | | | |
| | | Profitability expected | Uncertainty of any | |
| Retail | $ 0 | return method | additional future payout | $0.00** |
SMALL/MID-CAP IMPACT VALUE FUND
| | Fair Value at | Valuation | Unobservable | Input |
| | December 31, 2019 | Technique | Input | Values |
| Common Stocks | | | | |
| | | Profitability expected | Uncertainty of any | |
| Healthcare-Services | $ 0 | return method | additional future payout | $0.00** |
| * | | An increase in the unobservable input would decrease the valuation and a decrease in the unobservable input would increase the valuation. |
| ** | | An increase in the unobservable input would increase the valuation and a decrease in the unobservable input would decrease the valuation. |
B. Federal Income Taxes. It is the Funds’ policy to comply with the requirements of Subchapter M of the Internal Revenue Code and to distribute substantially all of their taxable income to shareholders. Therefore, no federal income tax provision is required.
In accordance with Financial Accounting Standards Board (“FASB”) Interpretation ASC 740, (“ASC 740”), each Fund recognizes a tax benefit from an uncertain position only if it is more likely than not that the position is sustainable, based solely on its technical merits and consideration of the relevant taxing authority’s widely understood administrative practices and precedents. If this threshold is met, a Fund measures the tax benefit as the largest amount of benefit that is greater than fifty percent likely of being realized upon ultimate settlement. The Funds identify their major tax jurisdictions as U.S. Federal, the Commonwealth of Massachusetts and the State of Delaware. Management has reviewed the tax positions for each of the three open tax years as of June 30, 2019 and has determined that the implementation of ASC 740 does not have a material impact on the Funds’ financial statements. Each Fund’s federal tax returns for the prior three fiscal years remains subject to examination by the Internal Revenue Service.
Net investment income or loss and net realized gains or losses may differ for financial statement and income tax purposes primarily due to investments that have a different basis for financial statement and income tax purposes. The character of distributions made during the year from net investment income or net realized gains may differ from their ultimate characterization for federal income tax purposes. Also, due to the timing of dividend distributions, the fiscal year in which amounts are distributed may differ from the year that the income or realized gains were recorded by each Fund. Permanent differences in the recognition of earnings are reclassified to additional paid-in capital. Distributions in excess of tax-basis earnings are recorded as a return of capital.
C. Security Transactions and Investment Income. Security transactions are recorded on the trade date. Realized gains and losses are determined using the specific identification cost method. Interest income on debt
Notes to the Financial Statements (unaudited) (continued)
Note 2 — Summary of Significant Accounting Policies and Other Information (Continued)
securities is recorded daily on the accrual basis. Discounts and premiums on debt securities are amortized over their respective lives. Dividend income is recorded on the ex-dividend date, or as soon as information is available to the Fund.
D. Short Sales of Investments. Certain Funds may make short sales of investments, which are transactions in which a Fund sells a security it does not own in anticipation of a decline in the fair value of that security. To complete such a transaction, the Fund must borrow the security to make delivery to the buyer. The Fund is then obligated to replace the security borrowed by purchasing it at the market price at the time of replacement. The broker retains the proceeds of short sales to the extent necessary to meet margin requirements until the short position is closed out.
If a security pays a dividend while the Fund holds it short, the Fund will need to pay the dividend to the original owner of the security. Since the Fund borrowed the shares and sold them to a third party, the third party will receive the dividend from the security and the Fund will pay the original owner the dividend directly. The Fund is not entitled to the dividend because it does not own the shares. A gain, limited to the price at which the Fund sold the security short, or a loss, unlimited in size, will be recognized upon the termination of a short sale. The Funds did not have any short sales during the six-month period ended December 31, 2019.
E. Written Options Contracts. Certain Funds may write options to manage exposure to certain changes in the market. When a Fund writes an option, an amount equal to the premium received by the Fund is recorded as a liability, which is marked-to-market daily to reflect the current market value of the option written. If the option expires, the Fund realizes a gain from investments equal to the amount of the premium received. When a written call option is exercised, the difference between the premium and the amount for effecting a purchase transaction, including brokerage commission, is also treated as a realized gain or loss. When a written put option is exercised, the amount of the premium received reduces the cost of the security purchased by the Fund.
A risk in writing a covered call option is that the Fund may forego the opportunity of profit if the market price of the underlying security increases and the option is exercised. The risk in writing a put option is that the Fund may incur a loss if the market price of the underlying security decreases and the option is exercised.
In addition, there is the risk that the Fund may not be able to enter into a closing transaction because of an illiquid secondary market. The Funds did not have any written option contracts for the six-month period ended December 31, 2019.
F. Purchased Options. Certain Funds may purchase call options in anticipation of an increase in the market value of securities of the type in which they may invest. The purchase of a call option will entitle a Fund, in return for the premium paid, to purchase specified securities at a specified price during the option period. A Fund will ordinarily realize a gain if, during the option period, the value of such securities exceeded the sum of the exercise price, the premium paid and transaction costs; otherwise, the Fund will realize either no gain or a loss on the purchase of the call option. A Fund will normally purchase put options in anticipation of a decline in the market value of securities in its portfolio (“protective puts”) or in securities in which it may invest. The purchase of a put option will entitle the Fund, in exchange for the premium paid, to sell specified securities at a specified price during the option period. The purchase of protective puts is designed to offset or hedge against a decline in the market value of the Fund’s securities. Put options may also be purchased by a Fund for the purpose of affirmatively benefiting from a decline in the price of securities which it does not own. The Fund will ordinarily realize a gain if, during the option period, the value of the underlying securities decreased below the exercise price sufficiently
Notes to the Financial Statements (unaudited) (continued)
Note 2 — Summary of Significant Accounting Policies and Other Information (Continued)
to more than cover the premium and transaction costs; otherwise the Fund will realize either no gain or a loss on the purchase of the put option. Gains and losses on the purchase of protective put options would tend to be offset by countervailing changes in the value of the underlying portfolio securities. The Funds did not have any purchased options for the six-month period ended December 31, 2019.
G. Futures Contracts. Certain Funds may enter into financial futures contracts, to the extent permitted by their investment policies and objectives, for bona fide hedging and other permissible risk management purposes including protecting against anticipated changes in the value of securities a Fund intends to purchase. Upon entering into a financial futures contract, a Fund is required to deposit cash or securities as initial margin.
Additional securities are also segregated as collateral up to the current market value of the financial futures contracts. Subsequent payments, known as variation margin, are made or received by the Fund, depending on the fluctuation in the value of the underlying financial instruments. The Fund recognizes an unrealized gain or loss equal to the variation margin. When the financial futures contracts are closed, a realized gain or loss is recognized equal to the difference between the proceeds from (or cost of) the closing transactions and the Fund’s basis in the contracts. The risks associated with entering into financial futures contracts include the possibility that a change in the value of the contract may not correlate with the changes in the value of the underlying instruments. In addition, investing in financial futures contracts involves the risk that the Fund could lose more than the original margin deposit and subsequent payments required for a futures transaction. Risks may also arise upon entering into these contracts from the potential inability of the counterparties to meet the terms of their contracts. The Funds did not enter into any futures contracts during the six-month period ended December 31, 2019.
H. Foreign Currency Transactions. Securities and other assets and liabilities denominated in foreign currencies are converted each business day into U.S. dollars based on the prevailing rates of exchange. Purchases and sales of portfolio securities and income and expenses are converted into U.S. dollars on the respective dates of such transactions.
Gains and losses resulting from changes in exchange rates applicable to foreign securities are not reported separately from gains and losses arising from movements in securities prices.
Net realized foreign exchange gains and losses include gains and losses from sales and maturities of foreign currency exchange contracts, gains and losses realized between the trade and settlement dates of foreign securities transactions, and the difference between the amount of dividends, interest and foreign withholding taxes on the Funds’ books and the U.S. dollar equivalent of the amounts actually received. Net unrealized foreign exchange gains and losses include gains and losses from changes in the fair value of assets and liabilities denominated in foreign currencies other than portfolio securities, resulting from changes in exchange rates.
I. Forward Foreign Currency Contracts. Certain Funds may enter into forward foreign currency contracts to hedge against foreign currency exchange rate risk on their non-U.S. dollar denominated securities or to facilitate settlement of foreign currency denominated portfolio transactions. A forward foreign currency contract is an agreement between two parties to buy and sell a currency at a set price on a future date. The contract is marked-to-market daily and the change in value is recorded by a Fund as an unrealized gain or loss. When a forward foreign currency contract is extinguished, through either delivery or offset by entering into another forward foreign currency contract, the Fund records a realized gain or loss equal to the difference between the value of the contract at the time it was opened and the value of the contract at the time it was extinguished.
Notes to the Financial Statements (unaudited) (continued)
Note 2 — Summary of Significant Accounting Policies and Other Information (Continued)
Forward foreign currency contracts involve elements of market risk in excess of the amounts reflected in the Statements of Assets and Liabilities. The Fund bears the risk of an unfavorable change in the foreign exchange rate underlying the forward foreign currency contract. Risks may also arise upon entering into these contracts from the potential inability of the counterparties to meet the terms of their contracts. The Funds did not enter into any forward foreign currency contracts during the six-month period ended December 31, 2019.
J. Portfolio Investment Risks. Investments in securities of foreign issuers carry certain risks not ordinarily associated with investments in securities of U.S. issuers. These risks include future disruptive political and economic developments and the possible imposition of exchange controls or other unfavorable foreign government laws and restrictions. In addition, investments in certain countries may carry risks of expropriation of assets, confiscatory taxation, political or social instability, or diplomatic developments that adversely affect investments in those countries. Certain countries may also impose substantial restrictions on investments in their capital markets by foreign entities, including restrictions on investments in issuers in industries deemed sensitive to relevant national interests. These factors may limit the investment opportunities available and result in a lack of liquidity and high price volatility with respect to securities of issuers from developing countries.
K. Multiple Class Allocations. Each class of shares has equal rights as to earnings and assets except that each class bears different distribution and shareholder servicing expenses. Each class of shares has exclusive voting rights with respect to matters that affect just that class. Income, expenses (other than expenses attributable to a specific class) and realized and unrealized gains or losses on investments are allocated to each class of shares based on its relative net assets.
L. Expense Allocations. Expenses are allocated to each series based upon its relative proportion of net assets to the Trust’s total net assets or by other equitable means.
M. Distributions to Shareholders. Each Fund generally declares dividends at least annually, payable in December, on a date selected by the Board. In addition, distributions may be made annually in December out of net realized gains through October 31 of that calendar year. Distributions to shareholders are recorded on the ex-dividend date. Each Fund may make a supplemental distribution subsequent to the end of its fiscal year ending June 30.
N. Use of Estimates. The preparation of financial statements in conformity with GAAP requires management to make estimates and assumptions that affect the reported amounts of assets and liabilities and the disclosure of contingent assets and liabilities at the date of the financial statements, and the reported amounts of revenue and expenses during the reporting period. Actual results could differ from those estimates, and those differences could be significant.
O. Derivative Instruments. The Funds have adopted amendments to authoritative guidance on disclosures about derivative instruments and hedging activities which require that the Funds disclose: a) how and why an entity uses derivative instruments; and b) how derivative instruments and related hedged items affect an entity’s financial position, financial performance and cash flows.
The Funds may trade financial instruments where they are considered to be a seller of credit derivatives in accordance with authoritative guidance under GAAP on derivatives and hedging.
The Funds did not have any derivative instruments at December 31, 2019.
Notes to the Financial Statements (unaudited) (continued)
Note 3 — Investment Advisory Fee and Other Related Party Transactions
Community Capital Management, Inc. (“CCM” or “Adviser”) serves as investment adviser to each Fund.
Each Fund paid advisory fees shown in the table below for the six-month period ended December 31, 2019. Amounts paid and reimbursed are expressed as dollar amounts and annualized percentages of average net assets.
| | | | | Percentage of |
| | | Percentage of | Advisory Fees | Advisory Fees |
| | Advisory Fees Paid | Advisory Fees Paid | Reimbursed | Reimbursed |
| Impact Growth | $233,758 | 0.75% | N/A | N/A |
| Small/Mid-Cap Impact Value | 106,943 | 0.90% | $81,584 | 0.69% |
On May 1, 2019, CCM contractually agreed to waive a portion of its management fee and/or assume expenses to the extent necessary to reduce the total operating expenses of Small/Mid-Cap Impact Value (excluding 12b-1 fees, taxes, interest, brokerage commissions and other costs incurred in connection with the purchase or sale of portfolio securities, and extraordinary items) when they exceed 1.30% of the average daily net assets of the Small/Mid-Cap Impact Value Fund. CCM currently has no intention to terminate this arrangement; however, it may do so at any time in its sole discretion.
If, at any time, the annualized expenses of Small/Mid-Cap Impact Value were less than the annualized expense ratio or fee waiver, the Trust, on behalf of Small/Mid-Cap Impact Value, would reimburse CCM for any fees previously waived and/or expenses previously assumed, provided, however, that the repayment shall be payable only to the extent that it: (a) can be made during the three (3) years following the time at which the adviser waived fees or assumed expenses for Small/Mid-Cap Impact Value, and (b) can be repaid without causing the expenses of Small/Mid-Cap Impact Value to exceed the annualized expense ratio. This fee waiver agreement shall continue in effect until October 30, 2020. This agreement shall automatically terminate upon termination of the advisory agreement between CCM and the Trust or, with respect to Small/Mid-Cap Impact Value, in the event of its merger or liquidation.
At December 31, 2019, the unreimbursed amount paid and/or waived by the Adviser on behalf of Small/Mid-Cap Impact Value that may be recovered is $116,603. The Adviser may recapture portions of the above amounts no later than the dates stated below:
| | June 30, 2022 | June 30, 2023 |
| Small/Mid-Cap Impact Value | $35,019 | $81,584 |
At December 31, 2019, a shareholder owned 38.77% of the outstanding shares of the Institutional Class of the Small/Mid-Cap Impact Value, which is deemed to be “control” as defined in the 1940 Act.
Foreside Fund Services, LLC (“Distributor”) serves as principal underwriter for the Trust. The Trust has adopted distribution and shareholder servicing plans pursuant to Rule 12b-1 of the 1940 Act for Class A shares described below. There is no Rule 12b-1 distribution plan for Institutional Class shares of the Funds. The Class A Plan provides that each Fund may pay a servicing or Rule 12b-1 fee at an annual rate of 0.25% of the Class A average net assets on a monthly basis to persons or institutions for performing certain servicing functions for the Class A shareholders. The Class A Plan also allows the Fund to pay or reimburse expenditures in connection with sales and promotional services related to distribution of the Fund’s shares, including personal services provided to prospective and existing shareholders. Effective September 30, 2018, the Class A shares were renamed Advisor Class shares and the Class C shares were merged into the Advisor Class shares. For the six-month period ended December 31, 2019, Rule 12b-1 fees incurred are disclosed on the statement of operations for each Fund.
Notes to the Financial Statements (unaudited) (continued)
Note 3 — Investment Advisory Fee and Other Related Party Transactions (Continued)
For the six-month period ended December 31, 2019, the Trust paid Little Consulting Group, LLC the following fees for Chief Compliance Officer (“CCO”) services:
| Fund | Amount |
| Impact Growth | $24,133 |
| Small/Mid-Cap Impact Value | 12,083 |
Note 4 — Shareholder Servicing Plan
The Funds have adopted a Shareholder Servicing Plan on behalf of each of the Funds pursuant to which each Fund’s Advisor Class shares may pay financial institutions; securities dealers and other industry professionals (“Shareholder Servicing Agents”) at an annual rate not to exceed 0.20% of the average daily net assets value.
For the six-month period ended December 31, 2019, shareholder servicing fees incurred are:
| Fund | Amount |
| Impact Growth | $32,299 |
| Small/Mid-Cap Impact Value | 6,172 |
Note 5 — Purchases and Sales of Investments
For the six-month period ended December 31, 2019 aggregate purchases and sales of investment securities (excluding short-term investments) for each Fund were as follows:
| Fund | Purchases | Sales |
| Impact Growth | $27,129,280 | $33,242,353 |
| Small/Mid-Cap Impact Value | 14,491,378 | 8,061,398 |
Note 6 — Tax Matters
For U.S. federal income tax purposes, the cost of securities owned, gross appreciation, gross depreciation, and net unrealized appreciation (depreciation) of investments at June 30, 2019 for each Fund were as follows:
| | | Gross | Gross | Net Appreciation |
| Fund | Cost | Appreciation | Depreciation | (Depreciation) |
| Impact Growth | $52,288,230 | $12,294,964 | $(2,672,032) | $9,622,932 |
| Small/Mid-Cap Impact Value | 18,821,957 | 1,768,757 | (1,112,289) | 656,468 |
As of June 30, 2019, the components of distributable earnings on a tax basis were as follows:
| | | | | Other | | | | Total |
| | | Undis- | Undis- | Accum- | Capital | | Post- | Distribu- |
| | Unrealized | tributed | tributed | ulated | Loss | Late | October | table |
| | Appreciation | Ordinary | Capital | Gain/ | Carry- | Year | Capital | Earnings/ |
| Fund | (Depreciation) | Income | Gain | (Loss) | forward | Loss | Loss | (Loss) |
| Impact Growth | $9,622,932 | $140,754 | $846,418 | $— | $— | $— | $— | $10,610,104 |
| Small/Mid-Cap | | | | | | | | |
| Impact Value | 656,468 | 620,135 | 614,263 | — | — | — | — | 1,890,866 |
The difference between book basis and tax basis unrealized appreciation (depreciation) is attributable primarily to the tax deferral of losses on wash sales, the differing book/tax treatment of unrealized appreciation/depreciation on partnership adjustments, and PFIC adjustments.
Under current tax law, foreign currency and net capital losses realized after October 31 may be deferred and treated as occurring on the first day of the following fiscal year. The Funds elected to defer net capital and currency losses as indicated in the chart below.
Notes to the Financial Statements (unaudited) (continued)
Note 6 — Tax Matters (Continued)
At June 30, 2019, the capital loss carryovers, late year losses, post-October capital loss and the capital loss utilized for the Funds were as follows:
| | Capital Loss | | | |
| | Carryovers | Late Year | Post-October | Capital Loss |
| Fund | Indefinite | Loss | Capital Loss | Utilized |
| Impact Growth | $— | $— | $— | $— |
| Small/Mid-Cap Impact Value | — | — | — | — |
Note 7 — Distributions to Shareholders
Income and long-term capital gain distributions are determined in accordance with federal income tax regulations, which may differ from GAAP. The information set forth below is for each Fund as required by federal securities laws.
The tax character of dividends and distributions paid during the six-month period ended December 31, 2019* and for the fiscal year ended June 30, 2019 were as follows:
| | | Ordinary Income | | | Long-Term Capital Gain | |
| | | Six-Month Period Ended | | | Fiscal Year Ended | | | Six-Month Period Ended | | | Fiscal Year Ended | |
| Fund | | December 31, 2019 | | | June 30, 2019 | | | December 31, 2019 | | | June 30, 2019 | |
| Impact Value | | $ | — | | | $ | — | | | $ | 1,118,696 | | | $ | — | |
| Small/Mid-Cap Impact Value | | $ | 1,027,832 | | | $ | 1,445,437 | | | $ | 869,858 | | | $ | 2,244,468 | |
| * | Tax information for the six-month period ended December 31, 2019 is an estimate and the tax character of dividends and distributions may be redesignated at fiscal year ending June 30, 2020. |
Note 8 — Fund Share Transactions
At December 31, 2019, there were an unlimited number of shares of beneficial interest with no par value authorized. The following table summarizes the activity in shares of each Fund:
| | | Impact Growth | |
| | | Six-Month Ended 12/31/19 | | | Year Ended 6/30/19 | |
| | | Shares | | | Value | | | Shares | | | Value | |
| Shares sold: | | | | | | | | | | | | |
| Advisor Class | | | 9,478 | | | $ | 330,038 | | | | 23,270 | | | $ | 749,915 | |
| Shares issued in connection with the | | | | | | | | | | | | | | | | |
| reorganization of Class C (Note 9) | | | — | | | | — | | | | 336,941 | | | | 11,354,302 | |
| Shares issued in connection with the | | | | | | | | | | | | | | | | |
| reorganization of Global Tactical Allocation (Note 9) | | | — | | | | — | | | | 61,305 | | | | 1,856,975 | |
| Class C | | | — | | | | — | | | | 1,121 | | | | 31,594 | |
| Institutional Class | | | 11,574 | | | | 425,817 | | | | 12,913 | | | | 419,316 | |
| Shares issued in connection with the | | | | | | | | | | | | | | | | |
| reorganization of Global Tactical Allocation (Note 9) | | | — | | | | — | | | | 11,734 | | | | 372,805 | |
| Shares issued to shareholders due to reinvestment of distributions: | | | | | | | | | | | | | | | | |
| Advisor Class | | | 24,107 | | | | 888,323 | | | | — | | | | — | |
| Class C | | | — | | | | — | | | | — | | | | — | |
| Institutional Class | | | 3,976 | | | | 154,272 | | | | — | | | | — | |
| | | | 49,135 | | | $ | 1,798,450 | | | | 447,284 | | | $ | 14,784,907 | |
| Shares Redeemed: | | | | | | | | | | | | | | | | |
| Advisor Class | | | (134,787 | ) | | | (4,776,090 | ) | | | (275,332 | ) | | | (8,844,372 | ) |
| Class C | | | — | | | | — | | | | (408,051 | ) | | | (11,763,660 | ) |
| Institutional Class | | | (16,668 | ) | | | (623,858 | ) | | | (52,071 | ) | | | (1,760,384 | ) |
| | | | (151,455 | ) | | $ | (5,399,948 | ) | | | (735,454 | ) | | $ | (22,368,416 | ) |
| Net increase (decrease) | | | (102,320 | ) | | $ | (3,601,498 | ) | | | (288,170 | ) | | $ | (7,583,509 | ) |
Notes to the Financial Statements (unaudited) (continued)
Note 8 — Fund Share Transactions (Continued)
| | | Small/Mid-Cap Impact Value | |
| | | Six-Month Ended 12/31/19 | | | Year Ended 6/30/19 | |
| | | Shares | | | Value | | | Shares | | | Value | |
| Shares sold: | | | | | | | | | | | | |
| Advisor Class | | | 44,714 | | | $ | 816,575 | | | | 24,003 | | | $ | 431,592 | |
| Shares issued in connection with the | | | | | | | | | | | | | | | | |
| reorganization of Class C (Note 9) | | | — | | | | — | | | | 54,043 | | | | 1,281,850 | |
| Shares issued in connection with the | | | | | | | | | | | | | | | | |
| reorganization of Mid-Cap Value (Note 9) | | | — | | | | — | | | | 235,980 | | | | 3,896,620 | |
| Class C | | | — | | | | — | | | | 20 | | | | 360 | |
| Institutional Class | | | 391,403 | | | | 7,929,836 | | | | 47,276 | | | | 918,611 | |
| Shares issued in connection with the | | | | | | | | | | | | | | | | |
| reorganization of Mid-Cap Value (Note 9) | | | — | | | | — | | | | 44,049 | | | | 794,871 | |
| Shares issued to shareholders due to reinvestment of distributions: | | | | | | | | | | | | | | | | |
| Advisor Class | | | 34,789 | | | | 623,772 | | | | 87,993 | | | | 1,442,274 | |
| Class C | | | — | | | | — | | | | — | | | | — | |
| Institutional Class | | | 59,122 | | | | 1,167,079 | | | | 114,100 | | | | 2,047,338 | |
| | | | 530,028 | | | $ | 10,537,262 | | | | 607,464 | | | $ | 10,813,516 | |
| Shares Redeemed: | | | | | | | | | | | | | | | | |
| Advisor Class | | | (52,807 | ) | | | (971,361 | ) | | | (86,198 | ) | | | (1,584,724 | ) |
| Class C | | | — | | | | — | | | | (71,842 | ) | | | (1,293,337 | ) |
| Institutional Class | | | (38,125 | ) | | | (769,738 | ) | | | (39,479 | ) | | | (850,738 | ) |
| | | | (90,932 | ) | | $ | (1,741,099 | ) | | | (197,519 | ) | | $ | (3,728,799 | ) |
| Net increase (decrease) | | | 439,096 | | | $ | 8,796,163 | | | | 409,945 | | | $ | 7,084,717 | |
Note 9 — Plan of Reorganization
On August 2, 2018 and September 20, 2018, the Board of Trustees of the Trust approved a two part plan of reorganization (the “Reorganization”), under part one of the reorganization Class C shares of the Impact Growth and Small/Mid-Cap Impact Value merged into the Advisor Class shares and removed the Advisor Class shares front end load.
The first part of the Reorganization was as of the close of business on September 28, 2018. The reorganization was accomplished by a tax free exchange of Class C shares for Advisor Class shares of each Fund in the following amounts and at the following conversion ratios:
| | Class C shares Prior | | |
| Fund | to Reorganization | Conversion Ratio | Advisor Class shares |
| Impact Growth | 393,689 | 0.85585576 | 336,941 |
| Small/Mid-Cap Impact Value | 71,202 | 0.75900958 | 54,043 |
The second part of the Reorganization was as of the close of business on October 26, 2018, whereby the Impact Growth Fund (“Acquiring Fund A”) acquired all of the net assets of the Global Tactical Allocation Fund (“Acquired Fund A”), and the Small/Mid-Cap Impact Value Fund (“Acquiring Fund B”) acquired all of the net assets of the Mid-Cap Value Fund (“Acquired Fund B”). The acquisitions were accomplished by tax free exchanges of each Class of Acquired Fund A for each corresponding Class of Acquiring Fund A and each Class of Acquired Fund B for each corresponding Class of Acquiring Fund B in the following share amounts and at the following conversion ratios:
| | Global Tactical | | |
| | Allocation Fund | | Impact Growth Fund |
| | (“Acquired Fund A”) | Conversion Ratio | (“Acquiring Fund A”) |
| Advisor Class Shares | 182,901 | 0.33518079 | 61,305 |
| Institutional Class Shares | 31,645 | 0.37080792 | 11,734 |
Notes to the Financial Statements (unaudited) (continued)
Note 9 — Plan of Reorganization (Continued)
| | | | Small/Mid-Cap |
| | Mid-Cap Value Fund | | Impact Value Fund |
| | (“Acquired Fund B”) | Conversion Ratio | (“Acquiring Fund B”) |
| Advisor Class Shares | 138,954 | 1.69825986 | 235,980 |
| Institutional Class Shares | 26,757 | 1.64625419 | 44,049 |
The Acquired Fund A and Acquired Fund B net assets and composition of net assets on October 26, 2018, the valuation date of the Reorganization, were as follows:
| | | | Accumulated |
| | Net Assets | Paid-in Capital | Gain/(Loss) |
| Acquired Fund A | $2,229,780 | $2,340,235 | $(110,455)* |
| Acquired Fund B | 4,691,491 | 4,095,454 | 596,037* |
| * | Includes unrealized appreciation/depreciation of $(30,658) and $654,508 for Acquired Fund A and Acquired Fund B, respectively. |
The net assets of the Acquiring Fund A and Acquiring Fund B before the acquisition were $59,198,210 and $13,977,138, respectively. The aggregate net assets of Acquiring Fund A and Acquiring Fund B immediately after the acquisition amounted to $61,427,990 and $18,668,629, respectively.
The purpose of this transaction was to combine Acquired Fund A and Acquiring Fund A (collectively “Combined Fund A”) and Acquired Fund B and Acquiring Fund B (collectively “Combined Fund B”), all managed by CCM. The Board and CCM believe that each of these reorganizations is in the best interests of the shareholders and each Combined Fund may benefit from the larger combined assets and efficiencies.
Assuming the acquisitions had been completed on July 1, 2018, the beginning of the fiscal reporting period of each of the Combined Funds, the pro forma results of operations for the fiscal year ended June 30, 2019 are as follows:
| | | Net Realized | Change in unrealized | Net (decrease) in |
| | Net Investment | gain/(loss) on | gain/(loss) on | net assets resulting |
| Fund | (losses) | investments | investments | from operations |
| Combined Fund A | $(635,930) | $2,014,673 | $ 3,054,783 | $4,433,526 |
| Combined Fund B | 81,193 | 2,075,345 | (1,639,412) | 517,126 |
Because the combined Fund portfolios have each been managed as single integrated portfolios since the acquisitions were completed, it is not practicable to separate the amounts of revenue and earnings of each of the Acquired Funds.
Note 10 — Indemnifications
Under the Trust’s organizational documents, its officers and Trustees are indemnified against certain liabilities arising out of the performance of their duties to the Funds. In addition, in the normal course of business, the Trust enters into contracts with its vendors and others that provide for general indemnifications.
The Trust’s maximum exposure under these arrangements is dependent on future claims that may be made against the Trust, and, therefore, cannot be estimated; however, based on experience, risk of loss from such claims is considered remote.
Note 11 — Events Subsequent to the Semi-Annual Period Ended December 31, 2019
Management has evaluated portfolio related events and transactions that occurred subsequent to December 31, 2019 through the date of issuance of the financial statements. There were no events or transactions that occurred during the period that materially impacted the amounts or disclosures in the financial statements.
General Information (unaudited)
The Statement of Additional Information for the Trust includes additional information about the Trustees and Officers and is available, without charge, upon request by calling (800) 220-8888.
Each Fund files its complete schedule of portfolio holdings with the Securities and Exchange Commission (“SEC”) for the first and third quarters of each fiscal year on Form N-Q or as an exhibit to its reports on Form N-PORT (beginning with filings after March 31, 2020). Each Fund’s Forms N-Q, as well as a description of the policies and procedures that each Fund uses to determine how to vote proxies (if any) relating to portfolio securities is available without charge: (i) upon request, by calling (800) 220-8888; and (ii) on the SEC’s web-site at http://www.sec.gov. Each Fund’s Forms N-Q may be reviewed and copied at the SEC’s Public Reference Room in Washington, DC; information on the operation of the Public Reference Room may be obtained by calling 1-800-SEC-0330.
Information (if any) regarding how the Funds voted proxies relating to portfolio securities during the most recently disclosed 12-month period ended June 30 is available: (i) without charge, upon request, by calling (800) 220-8888; and (ii) on the SEC’s web-site at http://www.sec.gov.
The Quaker Funds are distributed by
Foreside Fund Services, LLC.
Contact us:
Quaker Funds, Inc.
c/o U.S. Bancorp Fund Services, LLC.
PO Box 701
Milwaukee, WI 53201-0701
800.220.8888
www.ccminvests.com
©2019 Quaker® Investment Trust
QKSAR 122019
Item 2. Code of Ethics.
Not applicable for semi-annual reports.
Item 3. Audit Committee Financial Expert.
Not applicable for semi-annual reports.
Item 4. Principal Accountant Fees and Services.
Not applicable for semi-annual reports.
Item 5. Audit Committee of Listed Registrants.
Not applicable to registrants who are not listed issuers (as defined in Rule 10A-3 under the Securities Exchange Act of 1934).
Item 6. Schedule of Investments.
| (a) | A Schedule of Investments in securities of unaffiliated issuers as of the close of the reporting period is included as part of the report to shareholders filed under Item 1, Report to Shareholders, of this Form N-CSR. |
Item 7. Disclosure of Proxy Voting Policies and Procedures for Closed-End Management Investment Companies.
Not applicable to open-end investment companies.
Item 8. Portfolio Managers of Closed-End Management Investment Companies.
Not applicable to open-end investment companies.
Item 9. Purchases of Equity Securities by Closed‑End Management Investment Company and Affiliated Purchasers.
Not applicable to open-end investment companies.
Item 10. Submission of Matters to a Vote of Security Holders.
There have been no material changes to the procedures by which shareholders may recommend nominees to the registrant’s Board of Trustees, where those changes were implemented after the Registrant last provided disclosure in response to the requirements of Item 407(c)(2)(iv) of Regulation S-K (as required by Item 22(b)(15) of Schedule 14A (17 CFR 240.14a-101)), or this Item.
Item 11. Controls and Procedures.
(a) | The Registrant’s Principal Executive Officer and Principal Financial Officer, or persons performing similar functions, have reviewed the Registrant's disclosure controls and procedures (as defined in Rule 30a-3(c) under the Investment Company Act of 1940, as amended (the “Act”)) as of a date within 90 days of the filing of this report, as required by Rule 30a-3(b) under the Act and Rules 13a-15(b) or 15d‑15(b) under the Securities Exchange Act of 1934. Based on their review, such officers have concluded that the disclosure controls and procedures are effective in ensuring that information required to be disclosed in this report is appropriately recorded, processed, summarized and reported and made known to them by others within the Registrant and by the Registrant’s service provider. |
(b) | There were no changes in the Registrant's internal control over financial reporting (as defined in Rule 30a-3(d) under the Act) that occurred during the second fiscal quarter of the period covered by this report that has materially affected, or is reasonably likely to materially affect, the Registrant's internal control over financial reporting. |
Item 12. Disclosure of Securities Lending Activities for Closed-End Management Investment Companies
Not applicable to open-end investment companies.
Item 13. Exhibits.
(a)(1) Any code of ethics or amendment thereto, that is subject of the disclosure required by Item 2, to the extent that the registrant intends to satisfy Item 2 requirements through filing an exhibit. Not Applicable.
(a)(2) Certifications pursuant to Section 302 of the Sarbanes-Oxley Act of 2002. Filed herewith.
(a)(3) Any written solicitation to purchase securities under Rule 23c‑1 under the Act sent or given during the period covered by the report by or on behalf of the registrant to 10 or more persons. Not applicable to open-end investment companies.
(a)(4) Change in the registrant’s independent public accountant. There was no change in the registrant’s independent public accountant for the period covered by this report.
(b)Certification pursuant to Section 906 of the Sarbanes‑Oxley Act of 2002. Filed herewith.
SIGNATURES
Pursuant to the requirements of the Securities Exchange Act of 1934 and the Investment Company Act of 1940, the registrant has duly caused this report to be signed on its behalf by the undersigned, thereunto duly authorized.
(Registrant) Quaker Investment Trust
By (Signature and Title) /s/Alyssa Greenspan
Alyssa Greenspan,
President/Principal Executive Officer
Date February 28, 2020
Pursuant to the requirements of the Securities Exchange Act of 1934 and the Investment Company Act of 1940, this report has been signed below by the following persons on behalf of the registrant and in the capacities and on the dates indicated.
By (Signature and Title) /s/Alyssa Greenspan
Alyssa Greenspan,
President/Principal Executive Officer
Date February 28, 2020
By (Signature and Title) /s/David Downes
David Downes,
Treasurer/Principal Financial Officer
Date February 29, 2020