Item 1: Report to Shareholders| Balanced Fund | December 31, 2005 |
The views and opinions in this report were current as of December 31, 2005. They are not guarantees of performance or investment results and should not be taken as investment advice. Investment decisions reflect a variety of factors, and the managers reserve the right to change their views about individual stocks, sectors, and the markets at any time. As a result, the views expressed should not be relied upon as a forecast of the fund’s future investment intent. The report is certified under the Sarbanes-Oxley Act of 2002, which requires mutual funds and other public companies to affirm that, to the best of their knowledge, the information in their financial reports is fairly and accurately stated in all material respects.
REPORTS ON THE WEB
Sign up for our E-mail Program, and you can begin to receive updated fund reports and prospectuses online rather than through the mail. Log in to your account at troweprice.com for more information.
Fellow Shareholders
U.S. stocks completed their third consecutive year of gains in 2005, as good performance in the second half of the year lifted equities out of their first-half doldrums. Bond returns were narrowly mixed in the last six months, as interest rates rose across all maturities and the Federal Reserve lifted the federal funds target rate to 4.25%. Non-U.S. stocks outperformed U.S. equities in the last six months and for the entire year, led by emerging market shares.
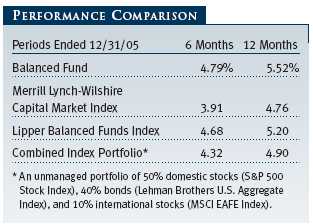
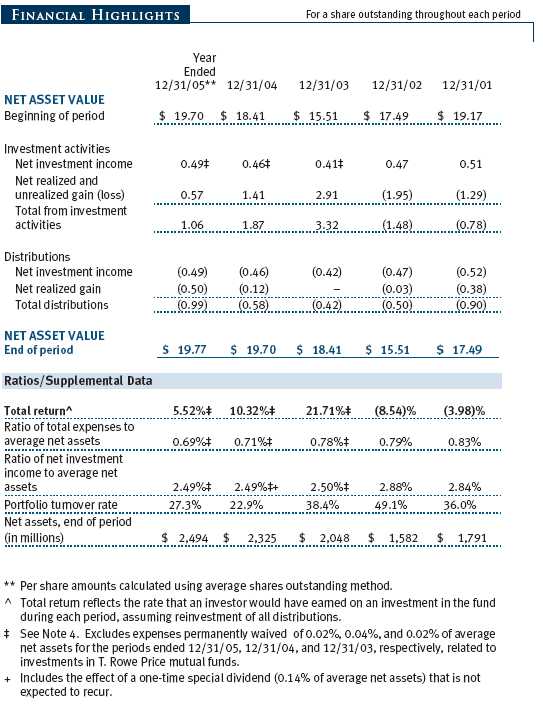
Your fund returned 4.79% in the second half of 2005 and 5.52% for the entire year. As shown in the table, the fund outpaced all of its benchmarks in both periods. In the last six months, overweighting equities and underweighting fixed-income securities contributed to our outperformance. Our greater exposure to international stocks relative to the typical balanced fund was also advantageous.
MARKET ENVIRONMENT
Conditions in the U.S. economy were favorable over the last six months. Economic growth as measured by gross domestic product (GDP) was probably about 3%, job growth was steady, and unemployment hovered around 5%. Fears of higher inflation and slower economic growth, however, picked up in the third quarter. Oil prices spiked in late August to $70 per barrel as Hurricane Katrina severely disrupted energy production along the Gulf Coast, but prices settled around $60 by the end of December. In addition, consumer sentiment soured as gasoline temporarily surged above $3 per gallon, and higher oil and natural gas prices presaged a significant jump in heating costs this winter. A sharp fourth-quarter decline in energy costs helped lift consumer sentiment and tempered fears of a significant acceleration of inflation.
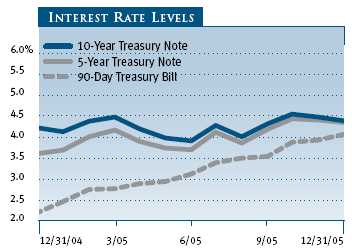
Federal Reserve officials acknowledged the economic uncertainty stemming from hurricane damage and elevated energy costs, but they concluded that the effects on the economy would be temporary and persisted in raising short-term interest rates at a gradual pace. In the last six months, the central bank lifted the federal funds target rate from 3.25% to 4.25%, a level not seen in more than four years. However, there have been signs in recent months that the Fed may be nearing the end of its rate-tightening program, which began 18 months ago when the fed funds rate was 1.00%.
Despite soaring energy prices, rising borrowing costs, and widespread damage along the Gulf Coast stemming from several hurricanes, U.S. stocks finished near their highest levels of the year, supported by firm economic and corporate earnings growth and merger activity. The S&P 500 Index returned 5.77% in the last six months and 4.91% for the entire year. As measured by various Russell indexes, value stocks outperformed growth for the full year, but the relative performance of growth stocks improved notably in the second half.
In the large-cap universe, as measured by the S&P 500, materials and energy stocks did best in the last six months, helped by elevated commodity prices, but financials, information technology, and industrial shares also performed well. Consumer staples and health care stocks lagged, while consumer discretionary and utility stocks were flat, and telecommunication services shares declined. For the full year, energy stocks far surpassed other segments, but utilities also performed well, as investors sought securities with attractive dividend yields in an environment of relatively low interest rates.
The U.S. bond market was essentially flat in the second half of the year, as falling bond prices in response to rising interest rates offset income. Investment-grade corporate and Treasury bonds generally fell, especially long-term issues. Mortgage-backed securities were flat, but high-yield issues rebounded from a period of weakness in the spring and posted modest gains. The Lehman Brothers U.S. Aggregate Index, which measures the performance of domestic investment-grade taxable bonds, returned -0.08% in the last six months and 2.43% for the entire year.
Non-U.S. stocks posted impressive gains in the last six months. Strong corporate earnings, improving economic forecasts, and an absence of global inflation contributed to investor optimism. Moderating energy prices later in the period helped sustain the rally. Emerging markets outperformed developed markets, though Japan advanced briskly. Among non-U.S. equities, the strongest sector was information technology followed by industrials and financials. Fierce competition in telecommunication services caused stocks in the sector to lose ground, and energy lagged later in the period as oil prices retreated. The MSCI EAFE Index, which measures the performance of large-cap shares in Europe, Australasia, and the Far East, returned 14.99% in the last six months and 14.02% in 2005.

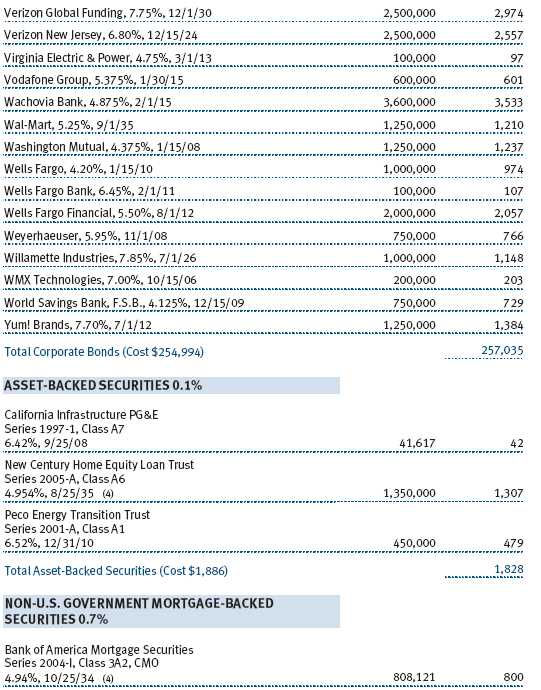
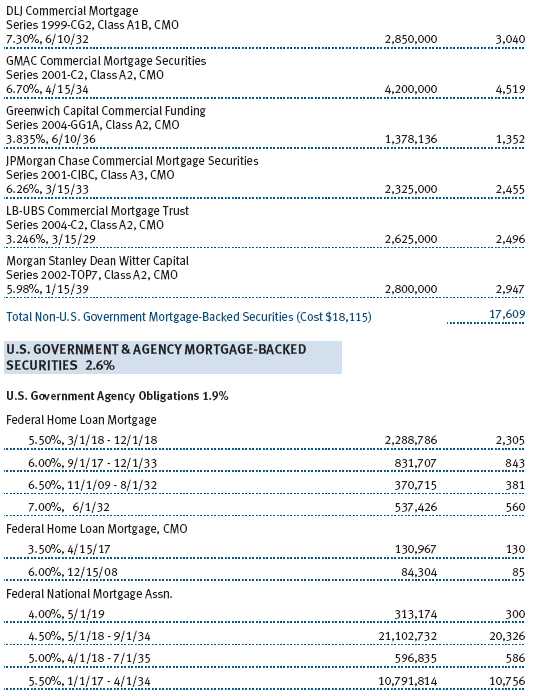
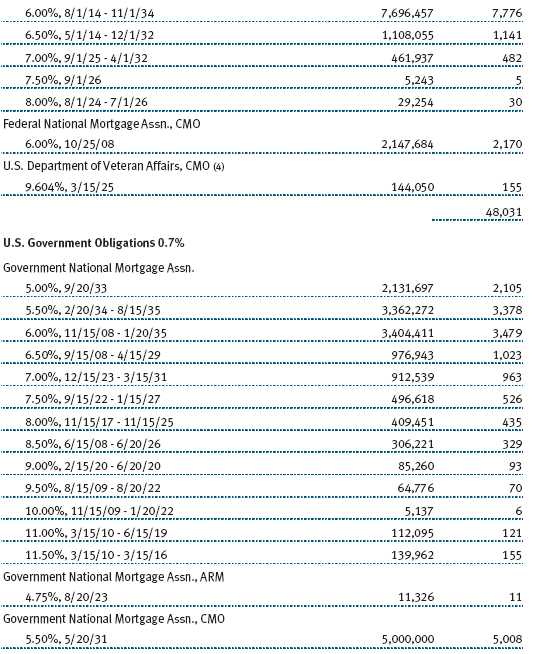
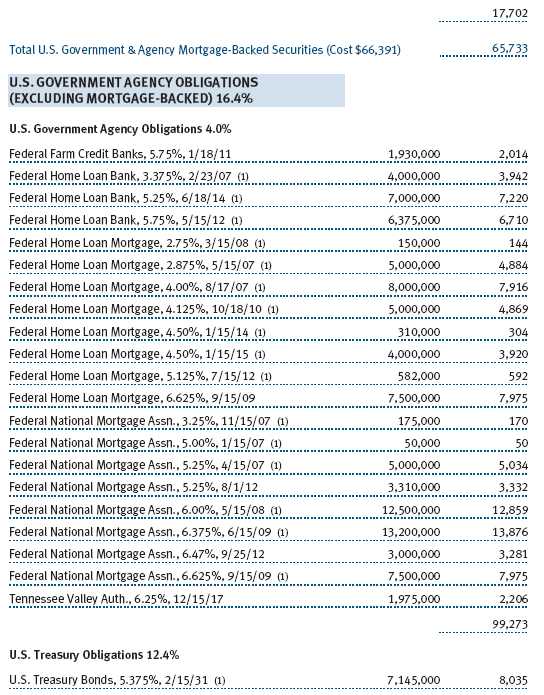
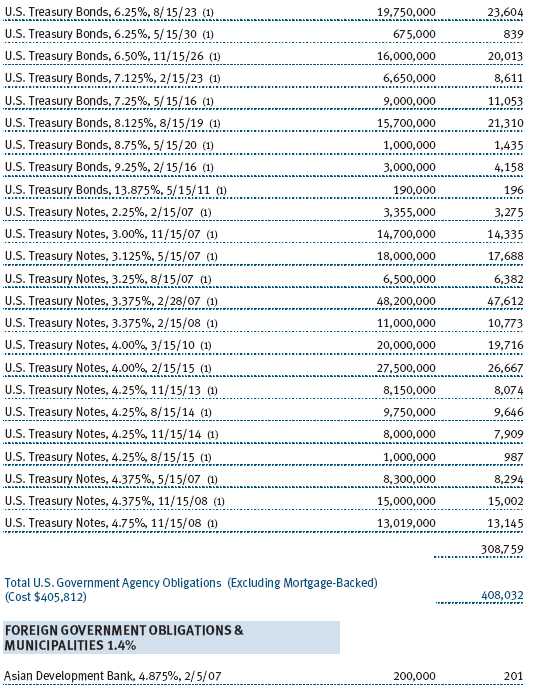
Our asset allocations changed slightly in the second half of the year. Using our cash reserves, we increased our stock exposure from 63% to 65% of assets, thus expanding our equity overweighting relative to the neutral 60% stock weighting in the combined index portfolio. As of December 31, U.S. and international stocks represented 51% and 14%, respectively, versus 50% and 13% six months ago. Fixed-income securities accounted for the remaining 35% of assets, with Treasury and agency bonds and corporate bonds each representing 16%. Mortgage-backed securities remained at 3%.
PORTFOLIO REVIEW
Domestic Stocks
Within the domestic equity portfolio, financials, energy, and materials were some of the sectors that contributed the most to our performance, while consumer discretionary, telecommunication services, and utilities stocks were the primary laggards. We have a slight bias toward value stocks, which helped our performance for the entire year.
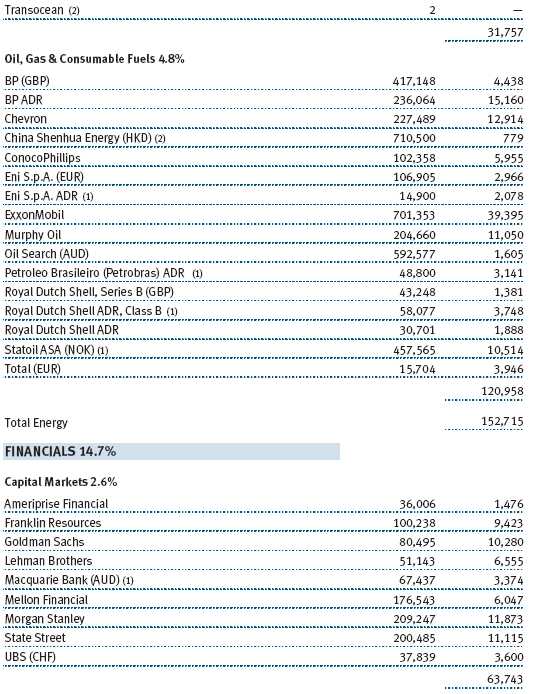
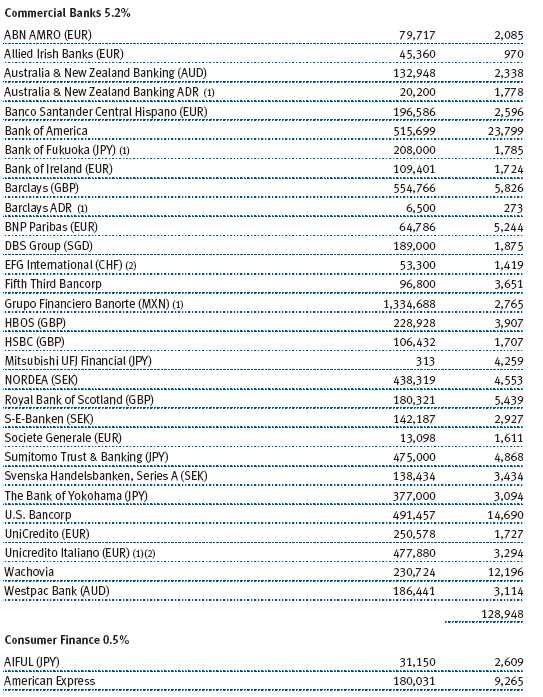
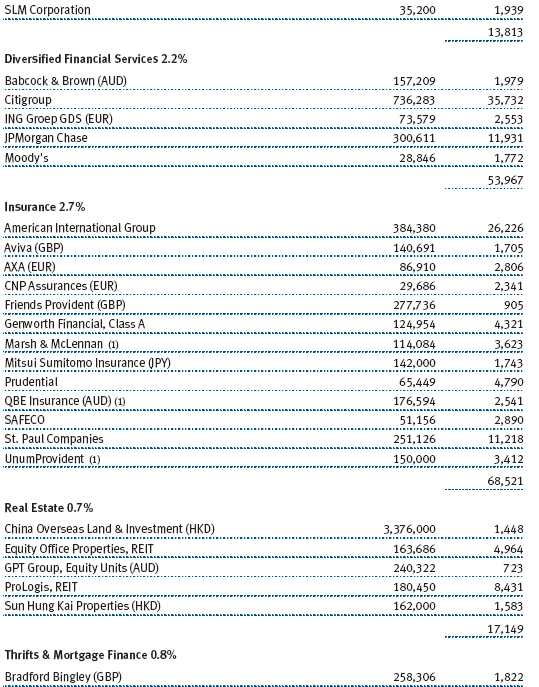
Financial stocks, which tend to be sensitive to interest rate fluctuations, contributed the most to our results in the second half, helped by growing indications that the Federal Reserve will soon stop raising short-term interest rates. In the sector, businesses tied to the capital markets—namely asset managers and brokerages—did best for us, but two large providers of diversified financial services, J.P. Morgan Chase and Citigroup, also greatly added value. In addition, insurance companies rose strongly, especially AIG, amid beliefs that the industry’s pricing power would be stronger in the wake of last year’s tragic hurricane season. (Please refer to the fund’s portfolio of investments for a complete listing of holdings and the amount each represents in the portfolio.)
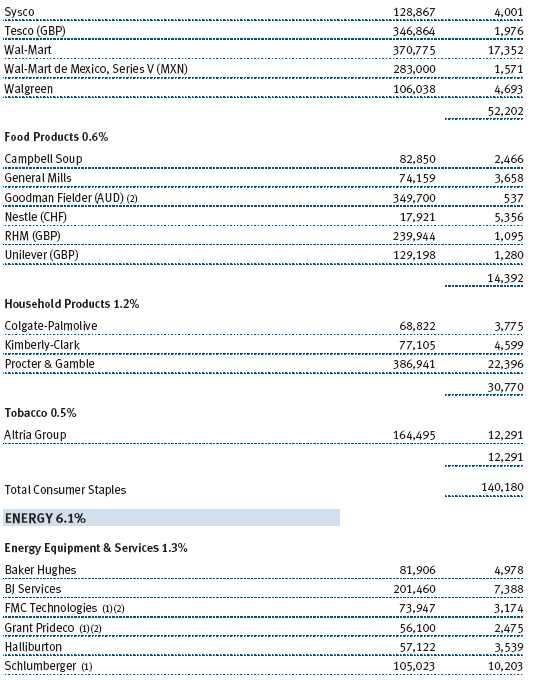
Energy stocks produced extraordinary returns in the first nine months of the year but dipped in the fourth quarter as energy costs fell from peak levels. In the last six months, large integrated oil majors declined, led by industry bellwether ExxonMobil, but equipment and service companies continued to benefit from tight oil supplies and strong global demand. Schlumberger, which gained over 28%, posted the best results in its peer group through its international operations, which we believe will be the key driver of the industry’s future growth. Rising commodity prices also lifted metals and mining stocks in the materials sector, such as Phelps Dodge and Newmont Mining, whose earnings are closely tied to copper and gold prices, respectively.
On the downside, consumer discretionary shares performed worst in the second half of 2005. Weakness among media and specialty retailers weighed most, but General Motors was one of our largest performance detractors. The company’s debt was downgraded to “junk” status earlier in 2005, but shares continued to stumble for a variety of reasons, including weak sales and earnings, mounting health care and pension costs, and auto-parts supplier Delphi’s bankruptcy filing in October. We continued to own GM shares because of its attractive 9% dividend yield and because we believe the shares may have been punished too much.
Telecommunication services stocks as a whole hampered our results, as poor performance of Verizon Communications offset gains from our relatively few holdings in the sector. Our information technology shares detracted from relative performance in the last six months, despite producing gains in absolute terms. Internet software and services company VeriSign and computer maker Dell were two of our weakest holdings. The companies disappointed investors with worse-than-expected revenues.
We added a few companies to the domestic equity portfolio since our last report to you. In the energy sector, we purchased shares of Grant Prideco. This provider of oil drilling products and services reported better-than-expected third-quarter earnings, suffered minimal disruptions from the Gulf Coast hurricanes, and has a large backlog of orders that should bode well for revenue and earnings growth. In the industrials and business services category, we bought Illinois Tool Works, which makes fasteners and components for automotive and construction companies. Due to macroeconomic concerns about the company’s end markets, particularly the automobile industry, the stock’s valuation dipped to a very attractive level. We also added Southwest Airlines, a company that has an extremely healthy balance sheet and is the envy of the entire airline industry.
International Stocks
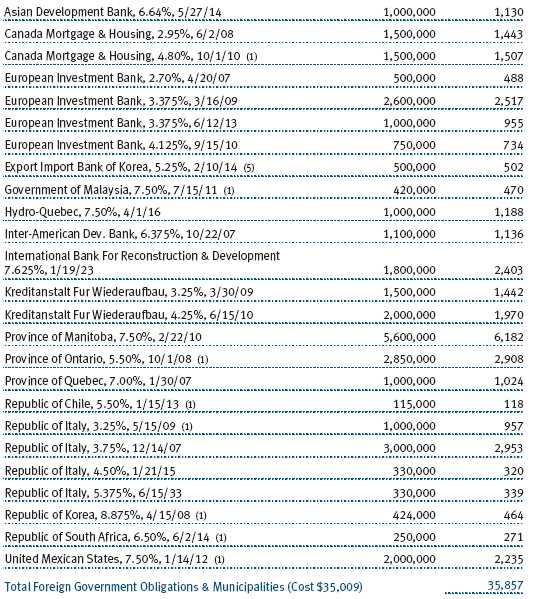
The fund’s international equity portfolio performed better than the MSCI EAFE Index. Our positions in Latin America did especially well on the back of solid economic growth and improved fiscal and monetary policies in Mexico and Brazil. Top regional performers in the portfolio included Brazil’s integrated energy major Petrobras; independent Mexican bank Grupo Financiero Banorte, which benefited from increased lending; and wireless telecom services provider America Movil, which is adding subscribers throughout Latin America.
The economic and market recovery in Japan was a major feature of the investment landscape in 2005. Many of our holdings participated in the rally, including Sumitomo Trust and Banking. We added appreciably to our position over the period, as the company’s valuation looked reasonable in light of its business outlook. Other winners included Bank of Yokohama, Toshiba, and Nippon Steel. Elsewhere in Asia, the fund benefited from a dramatic rise in the shares of China Overseas Land & Investment, a Hong Kong-based property developer with expanding business in China.
Although European telecom stocks were generally weak during the last six months, several of our holdings bucked the trend. Tele Danmark rose sharply—and we eliminated it—after the company received a buyout offer from a private equity group. Norway’s Telenor also performed well. Swedish specialty steel company SSAB and U.K. housing company Persimmon were other important contributors. Over the period, we sold shares of France’s Thomson, a provider of digital media technology, on disappointment with the pace of its business restructuring and profit expansion.
Domestic Bonds
The performance of the fund’s bond portfolio was consistent with that of the broad investment-grade bond market in the last six months and for the entire year. Bonds lagged stocks in both periods, so underweighting fixed-income securities helped the fund’s relative performance. The improved performance of high-yield bonds in the last six months also helped our results.
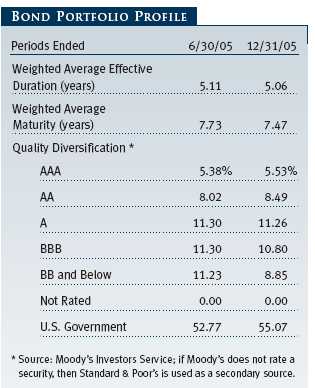
As shown in the table, the bond portfolio’s weighted average maturity edged lower in the last six months. Its duration did the same, though this measure of the bond portfolio’s interest rate sensitivity was neutral to that of the broad market throughout our reporting period. In terms of quality diversification, very little changed in the last six months. The main difference was a slight increase in U.S. government bonds and a corresponding decrease in below investment-grade bonds (which we own primarily through the T. Rowe Price Institutional High Yield Fund).
OUTLOOK
The environment for global equities going into 2006 looks favorable. The U.S. economy is growing at a steady clip, and global economic growth has not been substantially affected by higher energy costs, although earnings growth is likely to slow. In addition, corporate balance sheets are flush with cash, consumers have generally remained resilient in the face of rising interest rates and higher energy costs, and the Federal Reserve is nearly finished raising short-term rates. Of course, stocks could stumble if this pleasant picture becomes clouded. For example, rates could keep rising, particularly if inflation picks up, and corporate earnings might slow more than is generally expected. Slower Chinese growth or U.S. consumption, possibly in response to a new surge in energy prices, are also risks.
Despite the approaching end of the Federal Reserve’s tightening cycle, the bond market does not appear poised to rally off a year of moderate returns in 2005. In fact, given the strong U.S. economy and the current level of interest rates, bond yields are likely to climb modestly. In general, we believe 2006 will be a transition year as interest rates settle into some higher ranges and as yield spreads widen for those taking more risk. The good news for bond investors will be higher income, especially from shorter-term bonds. Inflation will be a key driver of interest rates as we wait to see whether the rise in energy prices feeds through into core inflation, which has remained notably constrained to date.
Abundant geopolitical uncertainties and the ongoing tug-of-war between bullish and bearish forces in the major asset classes support the case for a diversified, risk-aware approach to long-term capital appreciation. We continue to believe that the Balanced Fund’s broad exposure to domestic and international equities and U.S. fixed-income securities can provide long-term returns that are comparable with an all-stock portfolio but with reduced volatility. We appreciate your confidence in our investment management abilities, and we thank you for investing with T. Rowe Price.
Respectfully submitted,

Richard T. Whitney
Cochairman of the fund’s Investment Advisory Committee

Edmund M. Notzon III
Cochairman of the fund’s Investment Advisory Committee
January 20, 2006
The committee chairmen have day-to-day responsibility for managing the portfolio and work with committee members in developing and executing the fund’s investment program.
RISKS OF INVESTING IN STOCKS
As with all stock mutual funds, the fund’s share price can fall because of weakness in the stock market, a particular industry, or specific holdings. Stock markets can decline for many reasons, including adverse political or economic developments, changes in investor psychology, or heavy institutional selling. The prospects for an industry or company may deteriorate because of a variety of factors, including disappointing earnings or changes in the competitive environment. In addition, the investment manager’s assessment of companies held in a fund may prove incorrect, resulting in losses or poor performance even in rising markets.
RISKS OF INTERNATIONAL INVESTING
Funds that invest overseas generally carry more risk than funds that invest strictly in U.S. assets. Risks can result from varying stages of economic and political development, differing regulatory environments, trading days, and accounting standards, currency fluctuations, and higher transaction costs of non-U.S. markets. Investments outside the United States could be subject to governmental actions such as capital or currency controls, nationalization of a company or industry, expropriation of assets, or imposition of high taxes.
RISKS OF INVESTING IN BONDS
Funds that invest in bonds are subject to interest rate risk, the decline in bond prices that usually accompanies a rise in interest rates. Longer-maturity bonds typically decline more than those with shorter maturities. Funds that invest in bonds are also subject to credit risk, the chance that any fund holding could have its credit rating downgraded, or that a bond issuer will default (fail to make timely payments of interest or principal), potentially reducing the fund’s income level and share price.
GLOSSARY
Duration: The average time (expressed in years) needed for an investor to receive the present value of the future cash flows on a fixed-income investment. It is used to measure a bond or bond fund’s sensitivity to interest rate changes. For example, a fund with a five-year duration would fall about 5% in price in response to a one-percentage-point increase in interest rates, and vice versa.
Fed funds target rate: An overnight lending rate set by the Federal Reserve and used by banks to meet reserve requirements. Banks also use the fed funds rate as a benchmark for their prime lending rates.
Lehman Brothers U.S. Aggregate Index: A widely used benchmark for the domestic investment-grade bond market. The index typically includes more than 5,000 fixed-income securities with an overall intermediate- to long-term average maturity.
Lipper indexes: Consist of a small number (10 to 30) of the largest mutual funds in a particular category as tracked by Lipper Inc.
Merrill Lynch-Wilshire Capital Market Index: A market capitalization-weighted index including the Wilshire 5000 and Merrill Lynch, High Yield II, and Domestic Master Indexes.
MSCI EAFE Index: Widely accepted as the benchmark for international stock performance (EAFE refers to Europe, Australasia, and Far East). The index represents the major markets of the world excluding the U.S. and Canada, is listed in local currency, and includes reinvestment of dividends.
S&P 500 Stock Index: Tracks the stocks of 500 mostly large U.S. companies.
This chart shows the value of a hypothetical $10,000 investment in the fund over the past 10 fiscal year periods or since inception (for funds lacking 10-year records). The result is compared with benchmarks, which may include a broad-based market index and a peer group average or index. Market indexes do not include expenses, which are deducted from fund returns as well as mutual fund averages and indexes.

| AVERAGE ANNUAL COMPOUND TOTAL RETURN |
This table shows how the fund would have performed each year if its actual (or cumulative) returns for the periods shown had been earned at a constant rate.
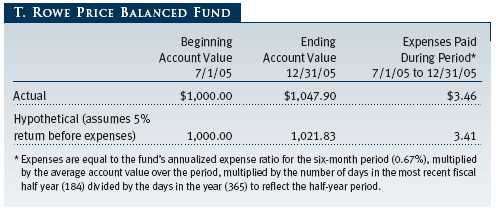
As a mutual fund shareholder, you may incur two types of costs: (1) transaction costs, such as redemption fees or sales loads, and (2) ongoing costs, including management fees, distribution and service (12b-1) fees, and other fund expenses. The following example is intended to help you understand your ongoing costs (in dollars) of investing in the fund and to compare these costs with the ongoing costs of investing in other mutual funds. The example is based on an investment of $1,000 invested at the beginning of the most recent six-month period and held for the entire period.
Actual Expenses
The first line of the following table (“Actual”) provides information about actual account values and actual expenses. You may use the information in this line, together with your account balance, to estimate the expenses that you paid over the period. Simply divide your account value by $1,000 (for example, an $8,600 account value divided by $1,000 = 8.6), then multiply the result by the number in the first line under the heading “Expenses Paid During Period” to estimate the expenses you paid on your account during this period.
Hypothetical Example for Comparison Purposes
The information on the second line of the table (“Hypothetical”) is based on hypothetical account values and expenses derived from the fund’s actual expense ratio and an assumed 5% per year rate of return before expenses (not the fund’s actual return). You may compare the ongoing costs of investing in the fund with other funds by contrasting this 5% hypothetical example and the 5% hypothetical examples that appear in the shareholder reports of the other funds. The hypothetical account values and expenses may not be used to estimate the actual ending account balance or expenses you paid for the period.
Note: T. Rowe Price charges an annual small-account maintenance fee of $10, generally for accounts with less than $2,000 ($500 for UGMA/UTMA). The fee is waived for any investor whose T. Rowe Price mutual fund accounts total $25,000 or more, accounts employing automatic investing, and IRAs and other retirement plan accounts that utilize a prototype plan sponsored by T. Rowe Price (although a separate custodial or administrative fee may apply to such accounts). This fee is not included in the accompanying table. If you are subject to the fee, keep it in mind when you are estimating the ongoing expenses of investing in the fund and when comparing the expenses of this fund with other funds.
You should also be aware that the expenses shown in the table highlight only your ongoing costs and do not reflect any transaction costs, such as redemption fees or sales loads. Therefore, the second line of the table is useful in comparing ongoing costs only and will not help you determine the relative total costs of owning different funds. To the extent a fund charges transaction costs, however, the total cost of owning that fund is higher.
The accompanying notes are an integral part of these financial statements.


The accompanying notes are an integral part of these financial statements.
The accompanying notes are an integral part of these financial statements.
The accompanying notes are an integral part of these financial statements.

The accompanying notes are an integral part of these financial statements.
| NOTES TO FINANCIAL STATEMENTS |
NOTE 1 - SIGNIFICANT ACCOUNTING POLICIES
T. Rowe Price Balanced Fund, Inc. (the fund) is registered under the Investment Company Act of 1940 (the 1940 Act) as a diversified, open-end management investment company. The fund commenced operations on December 31, 1939. The fund seeks to provide capital growth, current income, and preservation of capital through a portfolio of stocks and fixed-income securities.
The accompanying financial statements were prepared in accordance with accounting principles generally accepted in the United States of America, which require the use of estimates made by fund management. Fund management believes that estimates and security valuations are appropriate; however actual results may differ from those estimates, and the security valuations reflected in the financial statements may differ from the value the fund ultimately realizes upon sale of the securities.
Valuation The fund values its investments and computes its net asset value per share at the close of the New York Stock Exchange (NYSE), normally 4 p.m. ET, each day that the NYSE is open for business. Equity securities listed or regularly traded on a securities exchange or in the over-the-counter market are valued at the last quoted sale price or, for certain markets, the official closing price at the time the valuations are made, except for OTC Bulletin Board securities, which are valued at the mean of the latest bid and asked prices. A security that is listed or traded on more than one exchange is valued at the quotation on the exchange determined to be the primary market for such security. Listed securities not traded on a particular day are valued at the mean of the latest bid and asked prices for domestic securities and the last quoted sale price for international securities.
Debt securities are generally traded in the over-the-counter market. Securities with original maturities of one year or more are valued at prices furnished by dealers who make markets in such securities or by an independent pricing service, which considers yield or price of bonds of comparable quality, coupon, maturity, and type, as well as prices quoted by dealers who make markets in such securities. Securities with original maturities of less than one year are valued at amortized cost in local currency, which approximates fair value when combined with accrued interest.
Investments in mutual funds are valued at the mutual fund’s closing net asset value per share on the day of valuation.
Other investments, including restricted securities, and those for which the above valuation procedures are inappropriate or are deemed not to reflect fair value are stated at fair value as determined in good faith by the T. Rowe Price Valuation Committee, established by the fund’s Board of Directors.
Most foreign markets close before the close of trading on the NYSE. If the fund determines that developments between the close of a foreign market and the close of the NYSE will, in its judgment, materially affect the value of some or all of its portfolio securities, which in turn will affect the fund’s share price, the fund will adjust the previous closing prices to reflect the fair value of the securities as of the close of the NYSE, as determined in good faith by the T. Rowe Price Valuation Committee, established by the fund’s Board of Directors. A fund may also fair value securities in other situations, such as when a particular foreign market is closed but the fund is open. In deciding whether to make fair value adjustments, the fund reviews a variety of factors, including developments in foreign markets, the performance of U.S. securities markets, and the performance of instruments trading in U.S. markets that represent foreign securities and baskets of foreign securities. The fund uses outside pricing services to provide it with closing market prices and information used for adjusting those prices. The fund cannot predict when and how often it will use closing prices and when it will adjust those prices to reflect fair value. As a means of evaluating its fair value process, the fund routinely compares closing market prices, the next day’s opening prices in the same markets, and adjusted prices.
Currency Translation Assets, including investments, and liabilities denominated in foreign currencies are translated into U.S. dollar values each day at the prevailing exchange rate, using the mean of the bid and asked prices of such currencies against U.S. dollars as quoted by a major bank. Purchases and sales of securities, income, and expenses are translated into U.S. dollars at the prevailing exchange rate on the date of the transaction. The effect of changes in foreign currency exchange rates on realized and unrealized security gains and losses is reflected as a component of security gains and losses.
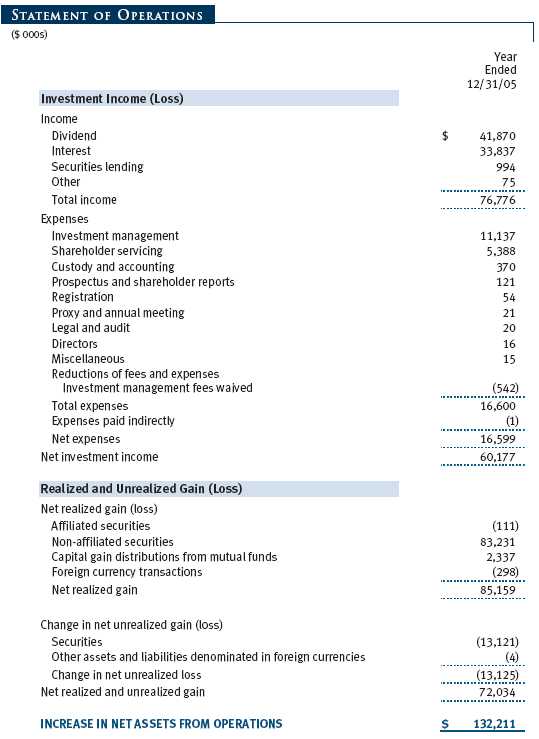
Rebates and Credits Subject to best execution, the fund may direct certain security trades to brokers who have agreed to rebate a portion of the related brokerage commission to the fund in cash. Commission rebates are reflected as realized gain on securities in the accompanying financial statements and totaled $31,000 for the year ended December 31, 2005. Additionally, the fund earns credits on temporarily uninvested cash balances at the custodian that reduce the fund’s custody charges. Custody expense in the accompanying financial statements is presented before reduction for credits, which are reflected as expenses paid indirectly.
In-Kind Subscriptions Under certain circumstances and when considered in the best interest of the fund, the fund may accept portfolio securities rather than cash as payment for the purchase of fund shares (in-kind subscription). For financial reporting and tax purposes, the cost basis of contributed securities is equal to the market value of the securities on the date of contribution. In-kind subscriptions result in no gain or loss and no tax consequences for the fund. During the year ended December 31, 2005, the fund accepted $40,269,000 of in-kind subscriptions, including $0 from other T. Rowe Price funds.
Investment Transactions, Investment Income, and Distributions Income and expenses are recorded on the accrual basis. Premiums and discounts on debt securities are amortized for financial reporting purposes. Dividends received from mutual fund investments are reflected as dividend income; capital gain distributions are reflected as realized gain/loss. Dividend income and capital gain distributions are recorded on the ex-dividend date. Investment transactions are accounted for on the trade date. Realized gains and losses are reported on the identified cost basis. Paydown gains and losses are recorded as an adjustment to interest income. Distributions to shareholders are recorded on the ex-dividend date. Income distributions are declared and paid on a quarterly basis. Capital gain distributions, if any, are declared and paid by the fund, typically on an annual basis.
NOTE 2 - INVESTMENT TRANSACTIONS
Consistent with its investment objective, the fund engages in the following practices to manage exposure to certain risks or enhance performance. The investment objective, policies, program, and risk factors of the fund are described more fully in the fund’s prospectus and Statement of Additional Information.
Restricted Securities The fund may invest in securities that are subject to legal or contractual restrictions on resale. Although certain of these securities may be readily sold, for example, under Rule 144A, others may be illiquid, their sale may involve substantial delays and additional costs, and prompt sale at an acceptable price may be difficult.
TBA Purchase Commitments During the year ended December 31, 2005, the fund entered into TBA (to be announced) purchase commitments, pursuant to which it agrees to purchase mortgage-backed securities for a fixed unit price, with payment and delivery at a scheduled future date beyond the customary settlement period for that security. With TBA transactions, the particular securities to be delivered are not identified at trade date; however, delivered securities must meet specified terms, including issuer, rate, and mortgage term, and be within industry-accepted “good delivery” standards. The fund generally enters into TBAs with the intention of taking possession of the underlying mortgage securities. Until settlement, the fund maintains cash reserves and liquid assets sufficient to settle its TBAs.
Dollar Rolls During the year ended December 31, 2005, the fund entered into dollar roll transactions, pursuant to which it sells a mortgage-backed TBA or security and simultaneously purchases a similar, but not identical, TBA with the same issuer, rate, and terms. The fund may execute a “roll” to obtain better underlying mortgage securities or to enhance returns. The fund generally enters into dollar roll transactions with the intention of taking possession of the underlying mortgage securities, but may close a contract prior to settlement or “roll” settlement to a later date if deemed in the best interest of shareholders. Actual mortgages received by the fund may be less favorable than those anticipated. The fund accounts for dollar roll transactions as purchases and sales, which has the effect of increasing its portfolio turnover rate.
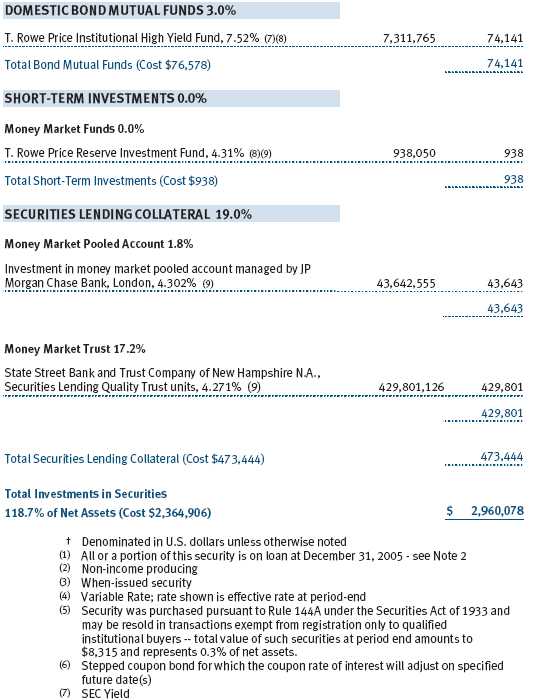
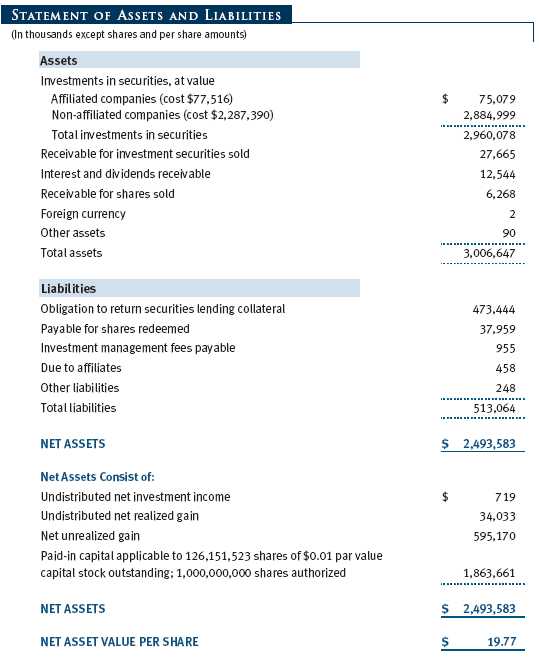
Securities Lending The fund lends its securities to approved brokers to earn additional income. It receives as collateral cash and U.S. government securities valued at 102% to 105% of the value of the securities on loan. Cash collateral is invested in money market pooled accounts managed by the fund’s lending agents in accordance with investment guidelines approved by fund management. Collateral is maintained over the life of the loan in an amount not less than the value of loaned securities, as determined at the close of fund business each day; any additional collateral required due to changes in security values is delivered to the fund the next business day. Although risk is mitigated by the collateral, the fund could experience a delay in recovering its securities and a possible loss of income or value if the borrower fails to return the securities. Securities lending revenue recognized by the fund consists of earnings on invested collateral and borrowing fees, net of any rebates to the borrower and compensation to the lending agent. At December 31, 2005, the value of loaned securities was $466,030,000; aggregate collateral consisted of $473,444,000 in money market pooled accounts and U.S. government securities valued at $8,355,000.
Other Purchases and sales of portfolio securities, other than short-term and U.S. government securities, aggregated $388,647,000 and $410,343,000, respectively, for the year ended December 31, 2005. Purchases and sales of U.S. government securities aggregated $352,475,000 and $239,116,000, respectively, for the year ended December 31, 2005.
NOTE 3 - FEDERAL INCOME TAXES
No provision for federal income taxes is required since the fund intends to continue to qualify as a regulated investment company under Subchapter M of the Internal Revenue Code and distribute to shareholders all of its taxable income and gains. Federal income tax regulations differ from generally accepted accounting principles; therefore, distributions determined in accordance with tax regulations may differ significantly in amount or character from net investment income and realized gains for financial reporting purposes. Financial reporting records are adjusted for permanent book/tax differences to reflect tax character. Financial records are not adjusted for temporary differences.
Distributions during the year ended December 31, 2005 were characterized as follows for tax purposes:

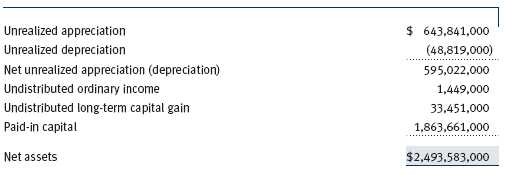
At December 31, 2005, the tax-basis components of net assets were as follows:
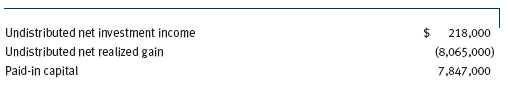
For the year ended December 31, 2005, the fund recorded the following permanent reclassifications to reflect tax character. Reclassifications to paid-in capital relate primarily to a tax practice that treats a portion of the proceeds from each redemption of capital shares as a distribution of taxable net investment income and/or realized capital gain. Results of operations and net assets were not affected by these reclassifications.
At December 31, 2005, the cost of investments for federal income tax purposes was $2,365,054,000.
NOTE 4 - RELATED PARTY TRANSACTIONS
The fund is managed by T. Rowe Price Associates, Inc. (the manager or Price Associates), a wholly owned subsidiary of T. Rowe Price Group, Inc. The investment management agreement between the fund and the manager provides for an annual investment management fee, which is computed daily and paid monthly. The fee consists of an individual fund fee, equal to 0.15% of the fund’s average daily net assets, and a group fee. The group fee rate is calculated based on the combined net assets of certain mutual funds sponsored by Price Associates (the group) applied to a graduated fee schedule, with rates ranging from 0.48% for the first $1 billion of assets to 0.29% for assets in excess of $160 billion. Prior to May 1, 2005, the maximum group fee rate in the graduated fee schedule had been 0.295% for assets in excess of $120 billion. The fund’s group fee is determined by applying the group fee rate to the fund’s average daily net assets. At December 31, 2005, the effective annual group fe e rate was 0.31%.
In addition, the fund has entered into service agreements with Price Associates and two wholly owned subsidiaries of Price Associates (collectively, Price). Price Associates computes the daily share price and maintains the financial records of the fund. T. Rowe Price Services, Inc., provides shareholder and administrative services in its capacity as the fund’s transfer and dividend disbursing agent. T. Rowe Price Retirement Plan Services, Inc., provides subaccounting and recordkeeping services for certain retirement accounts invested in the fund. For the year ended December 31, 2005, expenses incurred pursuant to these service agreements were $107,000 for Price Associates, $763,000 for T. Rowe Price Services, Inc., and $3,634,000 for T. Rowe Price Retirement Plan Services, Inc. The total amount payable at period end pursuant to these service agreements is reflected as Due to Affiliates in the accompanying financial statements.
The fund may invest in the T. Rowe Price Reserve Investment Fund and the T. Rowe Price Government Reserve Investment Fund (collectively, the T. Rowe Price Reserve Funds), open-end management investment companies managed by Price Associates and affiliates of the fund. The T. Rowe Price Reserve Funds are offered as cash management options to mutual funds, trusts, and other accounts managed by Price Associates and/or its affiliates, and are not available for direct purchase by members of the public. The T. Rowe Price Reserve Funds pay no investment management fees. During the year ended December 31, 2005, dividend income from the T. Rowe Price Reserve Funds totaled $1,079,000, and the value of shares of the T. Rowe Price Reserve Funds held at December 31, 2005, and December 31, 2004, was $938,000 and $15,788,000, respectively.
The fund may invest in the T. Rowe Price Institutional High Yield Fund, Inc. (High Yield Fund) as a means of gaining efficient and cost-effective exposure to the high-yield bond markets. The High Yield Fund is an open-end management investment company managed by Price Associates, and an affiliate of the fund. The High Yield Fund pays an annual all-inclusive management and administrative fee to Price Associates equal to 0.50% of average daily net assets. To ensure that Balanced Fund does not incur duplicate fees for its assets invested in High Yield Fund, Price Associates has agreed to reduce its management fee to the fund. Accordingly, the management fee waiver reflected on the accompanying Statement of Operations includes $542,000 of management fees permanently waived pursuant to this agreement. During the year ended December 31, 2005, purchases and sales of High Yield Fund were $11,192,000 and $90,111,000, respectively. Realized losses during the period were $111,000, and investment income during the period was $8,313,000. At December 31, 2005, and December 31, 2004, the value of shares of High Yield Fund held were $74,141,000 and $161,216,000, respectively.
| REPORT OF INDEPENDENT REGISTERED PUBLIC ACCOUNTING FIRM |
To the Board of Directors and Shareholders of T. Rowe Price Balanced Fund, Inc.
In our opinion, the accompanying statement of assets and liabilities, including the portfolio of investments, and the related statements of operations and of changes in net assets and the financial highlights present fairly, in all material respects, the financial position of T. Rowe Price Balanced Fund, Inc. (the “Fund”) at December 31, 2005, the results of its operations for the year then ended, the changes in its net assets for each of the two years in the period then ended and the financial highlights for each of the five years in the period then ended, in conformity with accounting principles generally accepted in the United States of America. These financial statements and financial highlights (hereafter referred to as “financial statements”) are the responsibility of the Fund’s management; our responsibility is to express an opinion on these financial statements based on our audits. We conducted our audits of these financial statements in accordance with the standards of the Public Company Accounting Oversight Board (United States). Those standards require that we plan and perform the audit to obtain reasonable assurance about whether the financial statements are free of material misstatement. An audit includes examining, on a test basis, evidence supporting the amounts and disclosures in the financial statements, assessing the accounting principles used and significant estimates made by management, and evaluating the overall financial statement presentation. We believe that our audits, which included confirmation of securities at December 31, 2005 by correspondence with the custodian and by agreement to the underlying ownership records for T. Rowe Price Reserve Investment Fund and T. Rowe Price Institutional High Yield Fund, provide a reasonable basis for our opinion.
PricewaterhouseCoopers LLP
Baltimore, Maryland
February 13, 2006
| TAX INFORMATION (UNAUDITED) FOR THE TAX YEAR ENDED 12/31/05 |
We are providing this information as required by the Internal Revenue Code. The amounts shown may differ from those elsewhere in this report because of differences between tax and financial reporting requirements.
The fund’s distributions to shareholders included:
• $2,108,000 from short-term capital gains,
• $67,329,000 from long-term capital gains, subject to the 15% rate gains category.
For taxable non-corporate shareholders, $25,412,000 of the fund’s income represents qualified dividend income subject to the 15% rate category.
For corporate shareholders, $19,184,000 of the fund’s income qualifies for the dividends-received deduction.
| INFORMATION ON PROXY VOTING POLICIES, PROCEDURES, AND RECORDS |
A description of the policies and procedures used by T. Rowe Price funds and portfolios to determine how to vote proxies relating to portfolio securities is available in each fund’s Statement of Additional Information, which you may request by calling 1-800-225-5132 or by accessing the SEC’s Web site, www.sec.gov. The description of our proxy voting policies and procedures is also available on our Web site, www.troweprice.com. To access it, click on the words “Company Info” at the top of our homepage for individual investors. Then, in the window that appears, click on the “Proxy Voting Policy” navigation button in the top left corner.
Each fund’s most recent annual proxy voting record is available on our Web site and through the SEC’s Web site. To access it through our Web site, follow the directions above, then click on the words “Proxy Voting Record” at the bottom of the Proxy Voting Policy page.
| HOW TO OBTAIN QUARTERLY PORTFOLIO HOLDINGS |
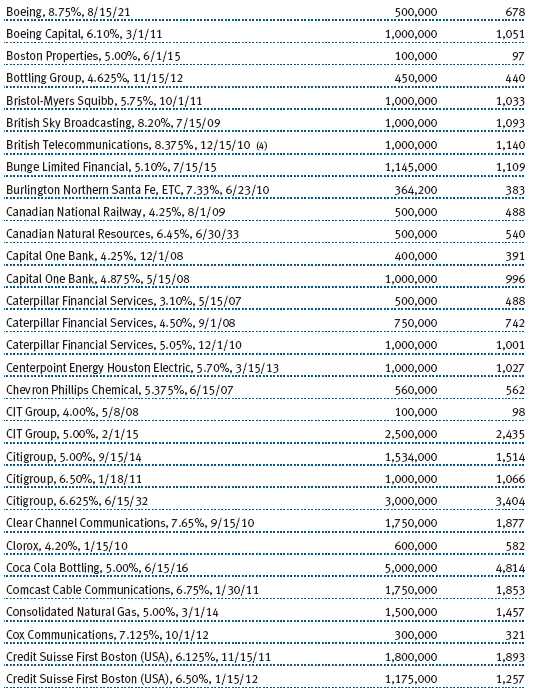
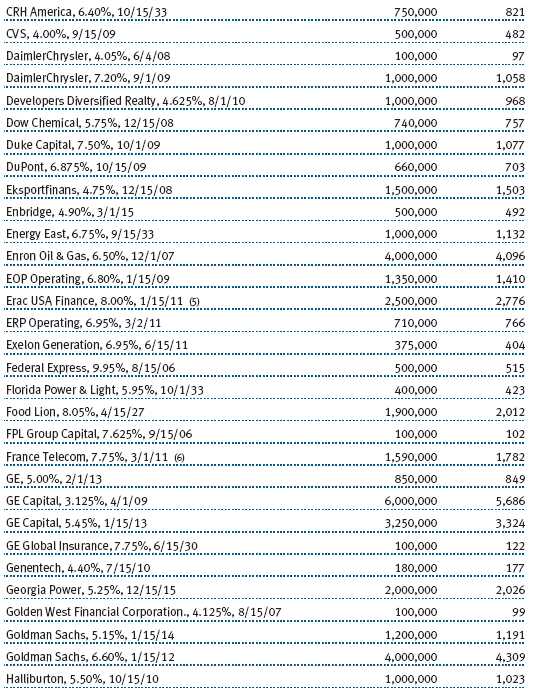
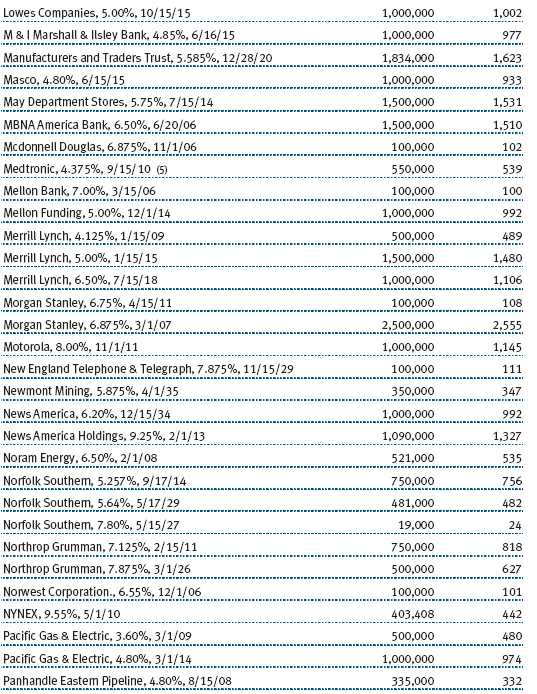
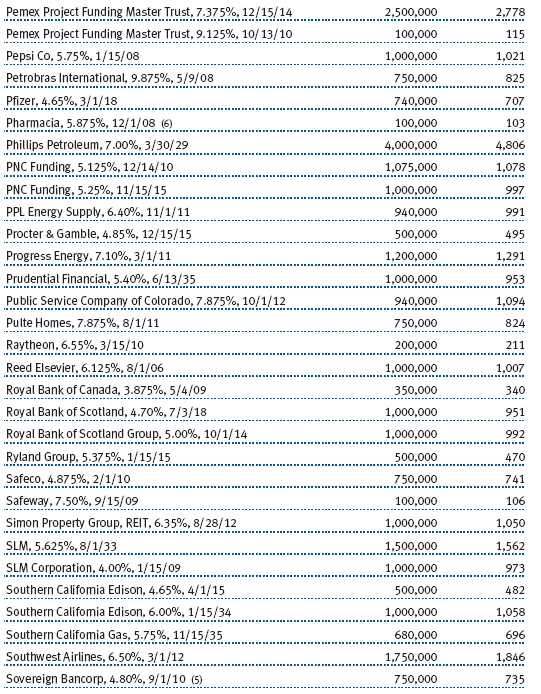
The fund files a complete schedule of portfolio holdings with the Securities and Exchange Commission for the first and third quarters of each fiscal year on Form N-Q. The fund’s Form N-Q is available electronically on the SEC’s Web site (www.sec.gov); hard copies may be reviewed and copied at the SEC’s Public Reference Room, 450 Fifth St. N.W., Washington, DC 20549. For more information on the Public Reference Room, call 1-800-SEC-0330.
| ABOUT THE FUND’S DIRECTORS AND OFFICERS |
Your fund is governed by a Board of Directors that meets regularly to review investments, performance, compliance matters, advisory fees, expenses, and other business affairs, and is responsible for protecting the interests of shareholders. The majority of the fund’s directors are independent of T. Rowe Price Associates, Inc. (T. Rowe Price); “inside” directors are officers of T. Rowe Price. The Board of Directors elects the fund’s officers, who are listed in the final table. The business address of each director and officer is 100 East Pratt Street, Baltimore, MD 21202. The Statement of Additional Information includes additional information about the fund directors and is available without charge by calling a T. Rowe Price representative at 1-800-225-5132.
| Independent Directors | |
| |
| Name | |
| (Year of Birth) | |
| Year Elected * | |
| [Number of T. Rowe Price | Principal Occupation(s) During Past 5 Years and Directorships of |
| Portfolios Overseen] | Other Public Companies |
| |
| Jeremiah E. Casey ** | Director, National Life Insurance (2001 to 8/05); Director, The Rouse |
| (1940) | Company, real estate developers (1990 to 2004) |
| 2005 | |
| [59] | |
| |
| Anthony W. Deering | Chairman, Exeter Capital, LLC, a private investment firm (2004 to pres- |
| (1945) | ent); Director, Chairman of the Board, and Chief Executive Officer, The |
| 2001 | Rouse Company, real estate developers (1997 to 2004); Director, |
| [113] | Mercantile Bank (4/03 to present) |
| |
| Donald W. Dick, Jr. | Principal, EuroCapital Advisors, LLC, an acquisition and management |
| (1943) | advisory firm; Chairman, President, and Chief Executive Officer, The |
| 1991 | Haven Group, a custom manufacturer of modular homes (1/04 |
| [113] | to present) |
| |
| David K. Fagin | Chairman and President, Nye Corporation (6/88 to present); Director, |
| (1938) | Canyon Resources Corp. and Golden Star Resources Ltd. (5/00 to |
| 1991 | present) and Pacific Rim Mining Corp. (2/02 to present) |
| [113] | |
| |
| Karen N. Horn | Managing Director and President, Global Private Client Services, Marsh |
| (1943) | Inc. (1999 to 2003); Managing Director and Head of International Private |
| 2003 | Banking, Bankers Trust (1996 to 1999); Director, Eli Lilly and Company |
| [113] | and Georgia Pacific |
| F. Pierce Linaweaver | President, F. Pierce Linaweaver & Associates, Inc., consulting environ- |
| (1934) | mental and civil engineers |
| 2001 | |
| [113] | |
| |
| Theo C. Rodgers *** | President, A&R Development Corporation |
| (1941) | |
| 2005 | |
| [97] | |
| |
| John G. Schreiber | Owner/President, Centaur Capital Partners, Inc., a real estate investment |
| (1946) | company; Partner, Blackstone Real Estate Advisors, L.P.; Director, AMLI |
| 2001 | Residential Properties Trust |
| [113] | |
| * | Each independent director serves until retirement, resignation, or election of a successor. |
| ** | Elected effective October 19, 2005. |
| *** | Elected effective April 1, 2005. |
| Inside Directors | |
| |
| Name | |
| (Year of Birth) | |
| Year Elected * | |
| [Number of T. Rowe Price | Principal Occupation(s) During Past 5 Years and Directorships of |
| Portfolios Overseen] | Other Public Companies |
| |
| James A.C. Kennedy, CFA | Director and Vice President, T. Rowe Price and T. Rowe Price Group, Inc.; |
| (1953) | Director, T. Rowe Price Global Asset Management Limited, T. Rowe Price |
| 1997 | Global Investment Services Limited, and T. Rowe Price International, Inc. |
| [45] | |
| |
| James S. Riepe | Director and Vice President, T. Rowe Price; Vice Chairman of the Board, |
| (1943) | Director, and Vice President, T. Rowe Price Group, Inc.; Chairman of the |
| 1991 | Board and Director, T. Rowe Price Global Asset Management Limited, |
| [113] | T. Rowe Price Global Investment Services Limited, T. Rowe Price |
| | Investment Services, Inc., T. Rowe Price Retirement Plan Services, |
| | Inc., and T. Rowe Price Services, Inc.; Chairman of the Board, Director, |
| | President, and Trust Officer, T. Rowe Price Trust Company; Director, |
| | T. Rowe Price International, Inc.; Chairman of the Board, all funds |
| |
| * Each inside director serves until retirement, resignation, or election of a successor. |
| Officers | |
| |
| Name (Year of Birth) | |
| Title and Fund(s) Served | Principal Occupation(s) |
| |
| E. Frederick Bair, CFA, CPA (1969) | Vice President, T. Rowe Price and T. Rowe Price |
| Vice President, Balanced Fund | Trust Company |
| |
| Stephen W. Boesel (1944) | Vice President, T. Rowe Price, T. Rowe Price |
| Vice President, Balanced Fund | Group, Inc., and T. Rowe Price Trust Company |
| |
| Joseph A. Carrier (1960) | Vice President, T. Rowe Price, T. Rowe Price |
| Treasurer, Balanced Fund | Group, Inc., T. Rowe Price Investment Services, |
| | Inc., and T. Rowe Price Trust Company |
| |
| Wendy R. Diffenbaugh (1953) | Vice President, T. Rowe Price |
| Vice President, Balanced Fund | |
| |
| Roger L. Fiery III, CPA (1959) | Vice President, T. Rowe Price, T. Rowe Price |
| Vice President, Balanced Fund | Group, Inc., T. Rowe Price International, Inc., |
| | and T. Rowe Price Trust Company |
| |
| John R. Gilner (1961) | Chief Compliance Officer and Vice President, |
| Chief Compliance Officer, Balanced Fund | T. Rowe Price; Vice President, T. Rowe Price |
| | Group, Inc., and T. Rowe Price Investment |
| | Services, Inc. |
| |
| Gregory S. Golczewski (1966) | Vice President, T. Rowe Price and T. Rowe Price |
| Vice President, Balanced Fund | Trust Company |
| |
| Henry H. Hopkins (1942) | Director and Vice President, T. Rowe Price |
| Vice President, Balanced Fund | Investment Services, Inc., T. Rowe Price Services, |
| | Inc., and T. Rowe Price Trust Company; Vice |
| | President, T. Rowe Price, T. Rowe Price Group, |
| | Inc., T. Rowe Price International, Inc., and T. Rowe |
| | Price Retirement Plan Services, Inc. |
| |
| Patricia B. Lippert (1953) | Assistant Vice President, T. Rowe Price and |
| Secretary, Balanced Fund | T. Rowe Price Investment Services, Inc. |
| |
| Raymond A. Mills, Ph.D., CFA (1960) | Vice President, T. Rowe Price, T. Rowe Price |
| Vice President, Balanced Fund | Group, Inc., and T. Rowe Price International, Inc. |
| |
| Edmund M. Notzon III, Ph.D., CFA (1945) | Vice President, T. Rowe Price, T. Rowe Price |
| Vice President, Balanced Fund | Group, Inc., T. Rowe Price Investment Services, |
| | Inc., and T. Rowe Price Trust Company |
| Mark J. Vaselkiv (1958) | Vice President, T. Rowe Price and T. Rowe Price |
| Vice President, Balanced Fund | Group, Inc. |
| |
| Julie L. Waples (1970) | Vice President, T. Rowe Price |
| Vice President, Balanced Fund | |
| |
| Richard T. Whitney, CFA (1958) | Vice President, T. Rowe Price, T. Rowe Price |
| President, Balanced Fund | Group, Inc., T. Rowe Price International, Inc., |
| | and T. Rowe Price Trust Company |
| |
| Unless otherwise noted, officers have been employees of T. Rowe Price or T. Rowe Price International for at |
| least five years. | |
Item 2. Code of Ethics.
The registrant has adopted a code of ethics, as defined in Item 2 of Form N-CSR, applicable to its principal executive officer, principal financial officer, principal accounting officer or controller, or persons performing similar functions. A copy of this code of ethics is filed as an exhibit to this Form N-CSR. No substantive amendments were approved or waivers were granted to this code of ethics during the period covered by this report.
Item 3. Audit Committee Financial Expert.
The registrant’s Board of Directors/Trustees has determined that Mr. Donald W. Dick Jr. qualifies as an audit committee financial expert, as defined in Item 3 of Form N-CSR. Mr. Dick is considered independent for purposes of Item 3 of Form N-CSR.
Item 4. Principal Accountant Fees and Services.
(a) – (d) Aggregate fees billed to the registrant for the last two fiscal years for professional services rendered by the registrant’s principal accountant were as follows:
| | 2005 | 2004 |
| Audit Fees | $10,364 | $9,523 |
| Audit-Related Fees | 666 | 1,316 |
| Tax Fees | 2,944 | 2,583 |
| All Other Fees | 393 | - |
Audit fees include amounts related to the audit of the registrant’s annual financial statements and services normally provided by the accountant in connection with statutory and regulatory filings. Audit-related fees include amounts reasonably related to the performance of the audit of the registrant’s financial statements and specifically include the issuance of a report on internal controls. Tax fees include amounts related to services for tax compliance, tax planning, and tax advice. The nature of these services specifically includes the review of distribution calculations and the preparation of Federal, state, and excise tax returns. All other fees include the registrant’s pro-rata share of amounts for agreed-upon procedures in conjunction with service contract approvals by the registrant’s Board of Directors/Trustees.
(e)(1) The registrant’s audit committee has adopted a policy whereby audit and non-audit services performed by the registrant’s principal accountant for the registrant, its investment adviser, and any entity controlling, controlled by, or under common control with the investment adviser that provides ongoing services to the registrant require pre-approval in advance at regularly scheduled audit committee meetings. If such a service is required between regularly scheduled audit committee meetings, pre-approval may be authorized by one audit committee member with ratification at the next scheduled audit committee meeting. Waiver of pre-approval for audit or non-audit services requiring fees of a de minimis amount is not permitted.
(2) No services included in (b) – (d) above were approved pursuant to paragraph (c)(7)(i)(C) of Rule 2-01 of Regulation S-X.
(f) Less than 50 percent of the hours expended on the principal accountant’s engagement to audit the registrant’s financial statements for the most recent fiscal year were attributed to work performed by persons other than the principal accountant’s full-time, permanent employees.
(g) The aggregate fees billed for the most recent fiscal year and the preceding fiscal year by the registrant’s principal accountant for non-audit services rendered to the registrant, its investment adviser, and any entity controlling, controlled by, or under common control with the investment adviser that provides ongoing services to the registrant were $1,008,000 and $903,000, respectively, and were less than the aggregate fees billed for those same periods by the registrant’s principal accountant for audit services rendered to the T. Rowe Price Funds.
(h) All non-audit services rendered in (g) above were pre-approved by the registrant’s audit committee. Accordingly, these services were considered by the registrant’s audit committee in maintaining the principal accountant’s independence.Item 5. Audit Committee of Listed Registrants.
Not applicable.
Item 6. Schedule of Investments.
Not applicable. The complete schedule of investments is included in Item 1 of this Form N-CSR.
Item 7. Disclosure of Proxy Voting Policies and Procedures for Closed-End Management Investment Companies.
Not applicable.
Item 8. Portfolio Managers of Closed-End Management Investment Companies.
Not applicable.
Item 9. Purchases of Equity Securities by Closed-End Management Investment Company and Affiliated Purchasers.
Not applicable.
Item 10. Submission of Matters to a Vote of Security Holders.
Not applicable.
Item 11. Controls and Procedures.
(a) The registrant’s principal executive officer and principal financial officer have evaluated the registrant’s disclosure controls and procedures within 90 days of this filing and have concluded that the registrant’s disclosure controls and procedures were effective, as of that date, in ensuring that information required to be disclosed by the registrant in this Form N-CSR was recorded, processed, summarized, and reported timely.
(b) The registrant’s principal executive officer and principal financial officer are aware of no change in the registrant’s internal control over financial reporting that occurred during the registrant’s second fiscal quarter covered by this report that has materially affected, or is reasonably likely to materially affect, the registrant’s internal control over financial reporting.
Item 12. Exhibits.
(a)(1) The registrant’s code of ethics pursuant to Item 2 of Form N-CSR is attached.
(2) Separate certifications by the registrant's principal executive officer and principal financial officer, pursuant to Section 302 of the Sarbanes-Oxley Act of 2002 and required by Rule 30a-2(a) under the Investment Company Act of 1940, are attached.
(3) Written solicitation to repurchase securities issued by closed-end companies: not applicable.
(b) A certification by the registrant's principal executive officer and principal financial officer, pursuant to Section 906 of the Sarbanes-Oxley Act of 2002 and required by Rule 30a-2(b) under the Investment Company Act of 1940, is attached.
| | |
SIGNATURES |
| |
| | Pursuant to the requirements of the Securities Exchange Act of 1934 and the Investment |
| Company Act of 1940, the registrant has duly caused this report to be signed on its behalf by the |
| undersigned, thereunto duly authorized. |
| |
| T. Rowe Price Balanced Fund, Inc. |
| |
| |
| By | /s/ James S. Riepe |
| | James S. Riepe |
| | Principal Executive Officer |
| |
| Date | February 21, 2006 |
| |
| |
| | Pursuant to the requirements of the Securities Exchange Act of 1934 and the Investment |
| Company Act of 1940, this report has been signed below by the following persons on behalf of |
| the registrant and in the capacities and on the dates indicated. |
| |
| |
| By | /s/ James S. Riepe |
| | James S. Riepe |
| | Principal Executive Officer |
| |
| Date | February 21, 2006 |
| |
| |
| |
| By | /s/ Joseph A. Carrier |
| | Joseph A. Carrier |
| | Principal Financial Officer |
| |
| Date | February 21, 2006 |