Item 1: Report to Shareholders| Balanced Fund | December 31, 2007 |
The views and opinions in this report were current as of December 31, 2007. They are not guarantees of performance or investment results and should not be taken as investment advice. Investment decisions reflect a variety of factors, and the managers reserve the right to change their views about individual stocks, sectors, and the markets at any time. As a result, the views expressed should not be relied upon as a forecast of the fund’s future investment intent. The report is certified under the Sarbanes-Oxley Act, which requires mutual funds and other public companies to affirm that, to the best of their knowledge, the information in their financial reports is fairly and accurately stated in all material respects.
REPORTS ON THE WEB
Sign up for our E-mail Program, and you can begin to receive updated fund reports and prospectuses online rather than through the mail. Log in to your account at troweprice.com for more information.
Manager’s Letter
Fellow Shareholders
Last year was marked by two distinct periods in which U.S. stocks performed well in the first half of the year but saw sharp declines in the second half. Bonds produced solid returns as prices rose and yields declined in the last six months due to turmoil in certain segments of the fixed-income market and fears of significant economic weakness. The Federal Reserve lowered short-term interest rates three times in the second half of the year. Non-U.S. stocks performed better than domestic shares in 2007, as stronger foreign currencies relative to the U.S. dollar enhanced returns in dollar terms. Emerging markets produced stellar returns. The Balanced Fund’s broad diversification across these asset classes served investors well in 2007.
HIGHLIGHTS
• U.S. stocks produced meager gains in the final half of 2007, while international equity markets and bonds had solid returns.
• The Balanced Fund produced gains, aided by its broad diversification, and surpassed its benchmarks for the full year.
• Overweighting international stocks helped the fund’s relative performance. We believe that slower economic growth favors undervalued large-cap growth companies.
• We have introduced U.S. large-cap growth and U.S. large-cap value style subportfolios to complement the fund’s current large-cap core holdings within U.S. equities.
• We believe that shareholders will continue to benefit from the fund’s commitment to a diversified portfolio.
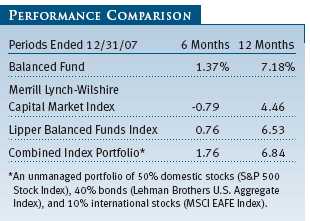
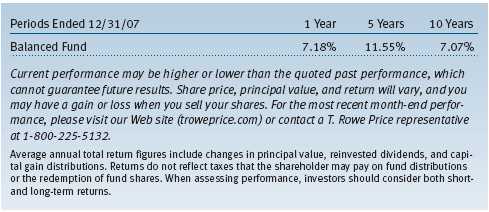
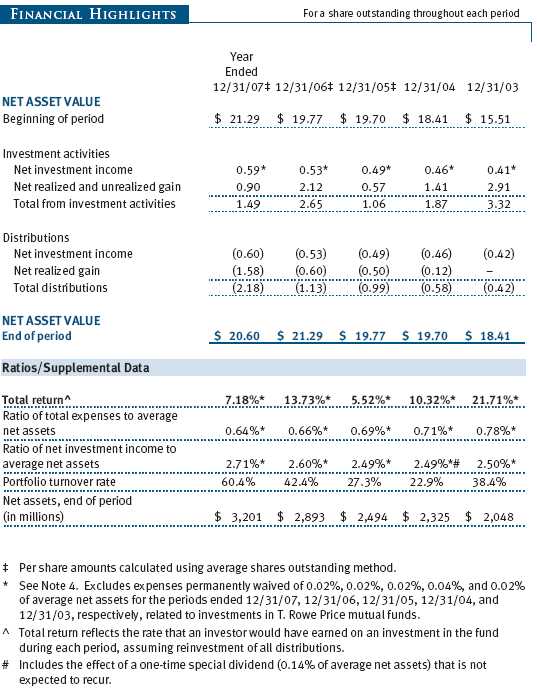
Your fund returned 1.37% in the second half of 2007 and 7.18% for the entire year. As shown in the Performance Comparison table, the fund did better than the benchmarks for the entire year and lagged only the combined index portfolio in the last six months. For the year, the portfolio was slightly overweight in non-U.S. equities, which helped returns, as international stocks produced solid gains. The fund also benefited from its emphasis on large-cap shares in the domestic equity portfolio. An underweight to bonds versus stocks hurt performance in the second half of the year.
MARKET ENVIRONMENT
U.S. economic growth accelerated through most of 2007, in spite of the growing credit and housing contraction that weighed on financial markets. The economy expanded at an annualized rate of 4.9% in the third quarter, 3.8% in the second quarter, and 0.6% in the first quarter. But fourth-quarter growth was widely expected to suffer due to increased credit problems among lenders, the housing contraction, and high energy costs.
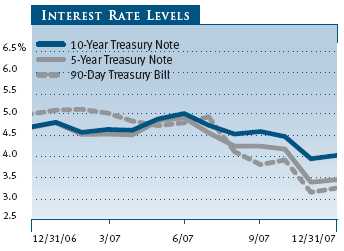
The overall rate of inflation increased as oil and gas prices climbed throughout the year, and oil closed out the year with the price of a barrel at around $100. “Core” inflation (excluding food and energy prices) remained mostly in check, leading the Federal Reserve to lower short-term interest rates in an attempt to avoid recession. The Fed appeared set on a course of continuing to reduce interest rates, as it signaled that the risks of economic weakness were greater than inflation, especially with consumer spending expected to moderate.
U.S. stocks declined in the last six months of 2007, hobbled by the implosion of the subprime mortgage market and the credit squeeze among banks and other financial lenders. Early in the year, many companies that had loaned to homebuyers with questionable credit acknowledged an increase in defaults and delinquencies. By the summer, major Wall Street firms and commercial banks with exposure to the subprime market reported substantial losses. Liquidity in asset-backed commercial paper soon evaporated as fears of additional losses discouraged banks from lending to each other. The Federal Reserve reduced short-term rates and attempted to boost liquidity. But economic concerns weighed on market performance and slowed mergers and acquisitions, which had been robust early in the year.
Small-cap shares lagged large-caps in the last six months and for the full year. The small-cap Russell 2000 Index returned -7.53% and -1.57% in the 6- and 12-month periods ended December 31, 2007, respectively, versus -1.37% and 5.49% for the S&P 500 Index. As measured by various Russell indexes, growth stocks did better than value stocks across all market capitalizations for both periods.
In the large-cap universe, mounting mortgage losses at major banks and brokerages pushed financials sharply lower. Consumer discretionary shares also stumbled as rising oil prices, declining home values, and weakening economic activity threatened to discourage consumer spending on nonessentials. Energy stocks performed well, with oil prices remaining close to the record of $100 a barrel reached in November. Consumer staples stocks, whose business prospects tend not to be closely tied to the economy’s health, also produced good returns. For the entire year, technology shares rose strongly, while industrials and business services and telecommunications stocks produced milder gains. Consumer discretionary and financial shares fell for the year.
U.S. bonds produced solid returns for 2007, as prices rose and yields declined in the second half of the year due to turmoil in certain segments of the fixed-income market and fears of a significant slowdown. U.S. Treasuries, which are sensitive to interest rate changes, did best, as the Fed reduced the fed funds rate from 5.25% to 4.25%. Ginnie Mae mortgage-backed securities and investment-grade corporate bonds also performed well. High-yield bonds produced modest gains for the full year, as investors shunned assets with higher credit risks in the last six months. The Lehman Brothers U.S. Aggregate Index, which measures the taxable domestic investment-grade bond universe, returned about 6.97%.
Non-U.S. stock markets turned in superior returns relative to their domestic counterparts in the 6- and 12-month periods ended December 31, as stronger foreign currencies relative to the U.S. dollar enhanced returns for U.S. investors. Emerging markets produced stellar returns, led by equities in Latin America and Asia. Developed European markets produced solid gains, but Japanese shares declined. The MSCI EAFE Index, which measures the performance of mostly large-cap stocks in Europe, Australasia, and the Far East, returned 11.63%.
ASSET ALLOCATION STRATEGY
In keeping with the broad diversification of the Balanced Fund, we have introduced U.S. large-cap growth and U.S. large-cap value style subportfolios to complement the fund’s current large-cap holdings within U.S. equities. These dedicated growth and value style portfolios will provide an opportunity to overweight and underweight growth and value styles within U.S. equities. The neutral weights are equal across all three strategies, although we are currently overweight large-cap growth and underweight large-cap value.
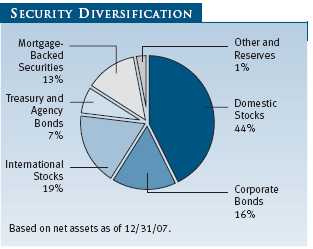
Overall, our allocations to the major asset classes changed little in the second half of the year. As of December 31, the fund’s overall exposure to equities was 63% of assets—44% for U.S. (down from 48% at midyear) and 19% for international stocks (up from 14%)—which represented a slight overweighting of stocks relative to the combined index portfolio. Established non-U.S. equities appear to have reasonable valuations, although export-oriented earnings could face headwinds from stronger currencies. We are underweight in emerging market equities because while we believe that growth remains solid, valuations are full. The remainder was invested in fixed-income securities, with cash reserves representing about 1% of assets.
PORTFOLIO REVIEW
Domestic Stocks
Most sectors in the fund’s domestic equity portfolio produced gains in the last six months. The glaring exceptions were financials, which have been hard-hit by the subprime debacle, and consumer discretionary, harmed by the prospects of lower spending. On the positive side, energy turned in solid returns as global demand for oil forced prices skyward.
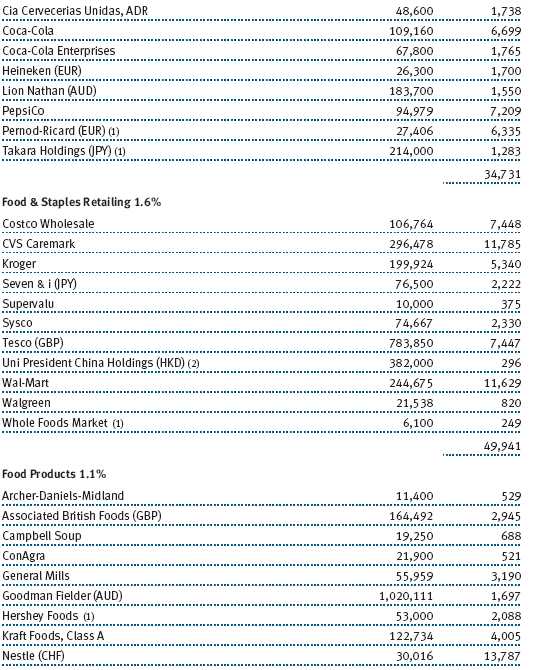
Consumer staples also showed gains, as they often do in a softer economy. Materials did well, propelled by demand for metals and mining. Utilities and industrials and business services also turned in respectable results for the six-month period.
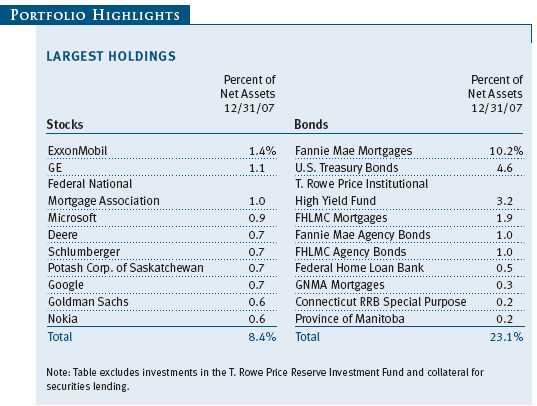
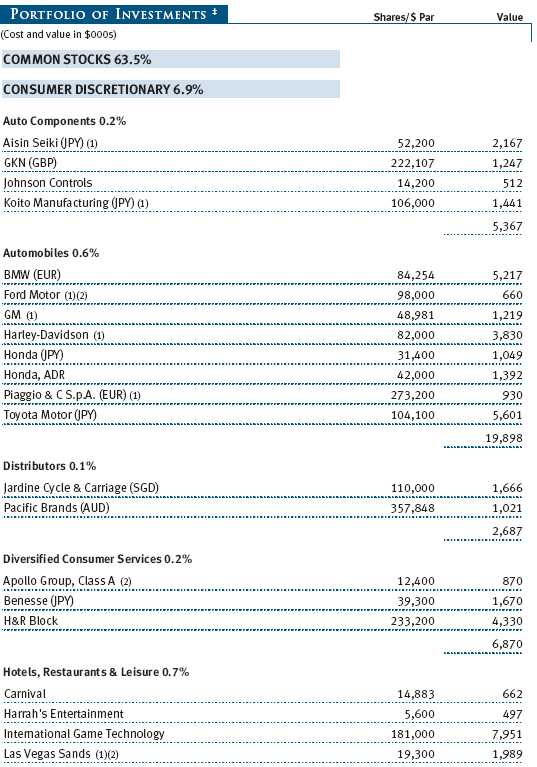
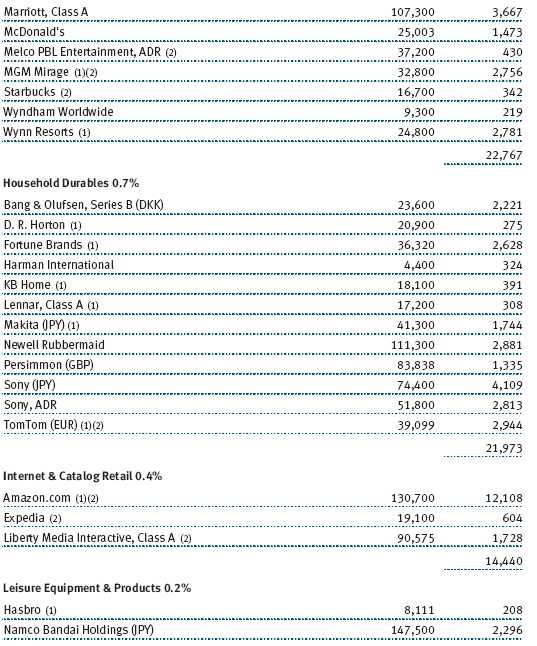
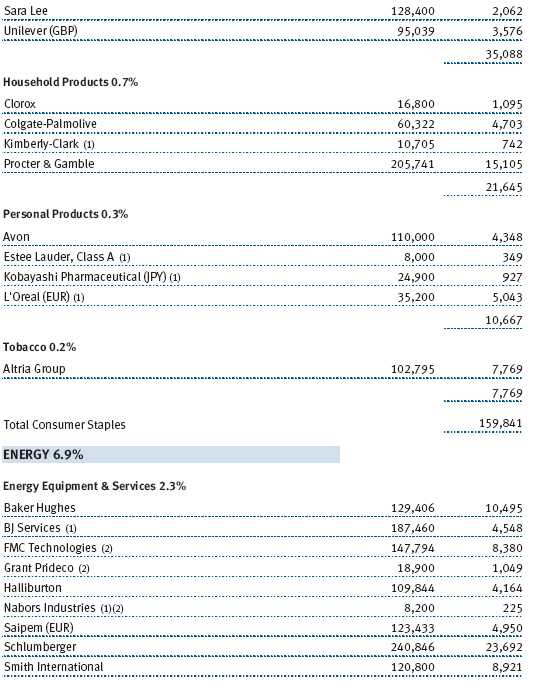
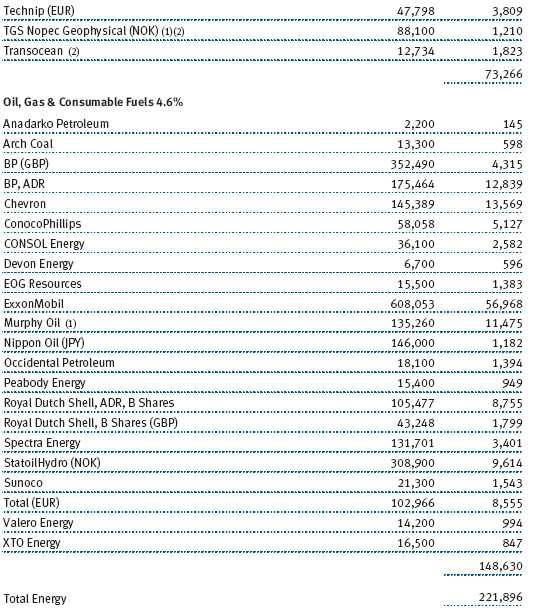
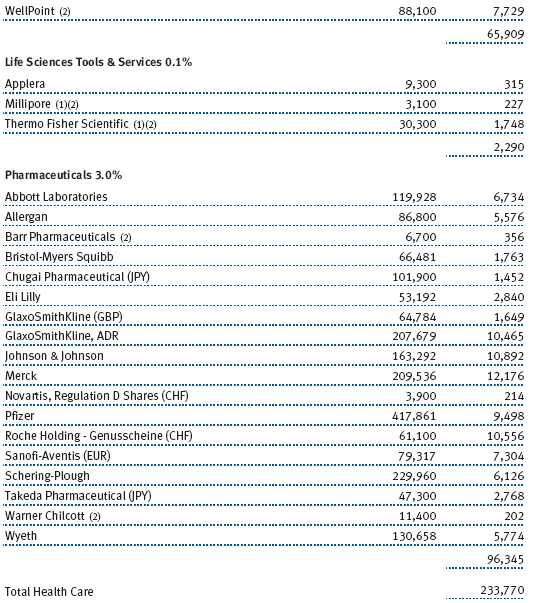
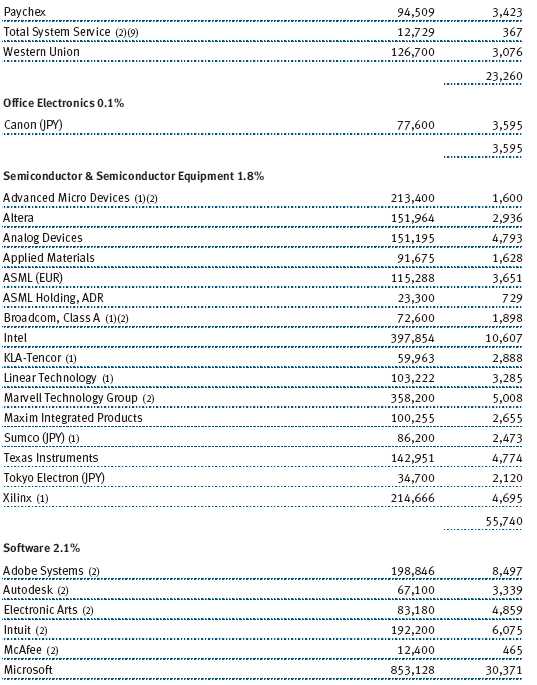
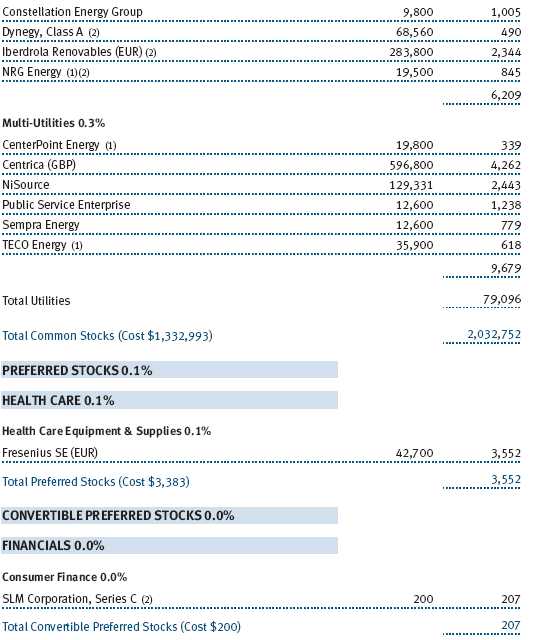
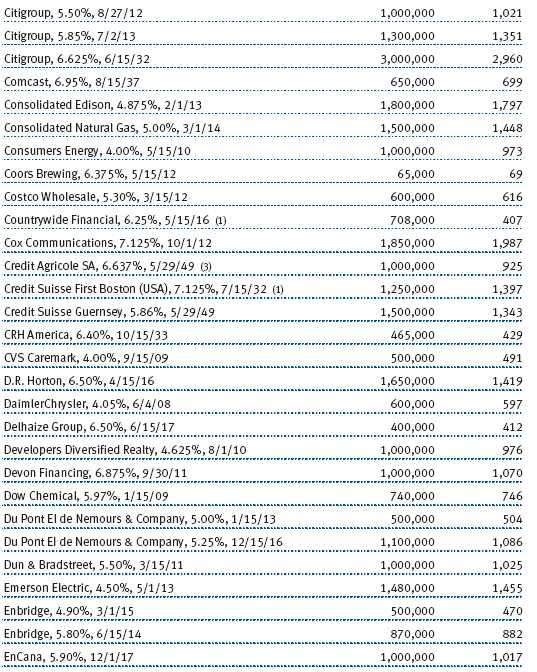
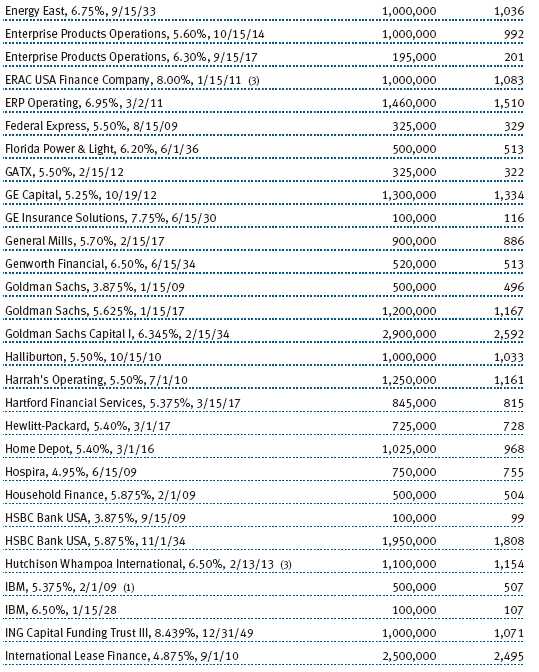
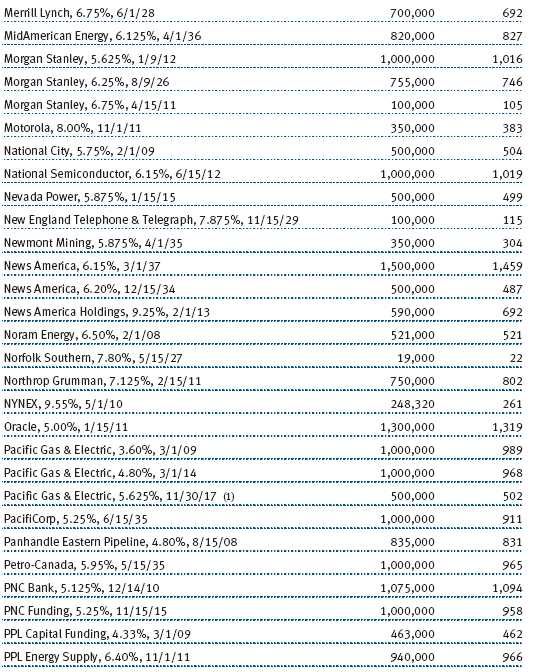
Energy was the standout. Most of our energy holdings produced positive returns, led by integrated majors ExxonMobil and Chevron and oilfield services giant Schlumberger. Consumer staples companies also rose strongly. We saw solid returns from Procter & Gamble and Coca-Cola. (Please refer to the portfolio of investments for a complete listing of holdings and the amount each represents in the portfolio.)
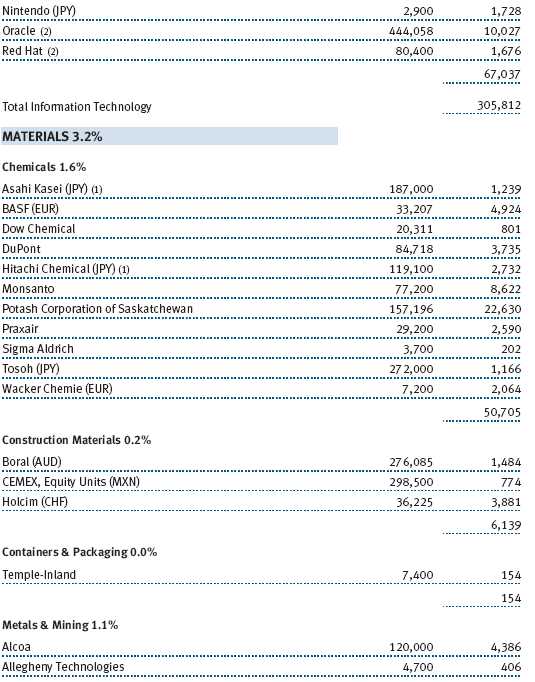
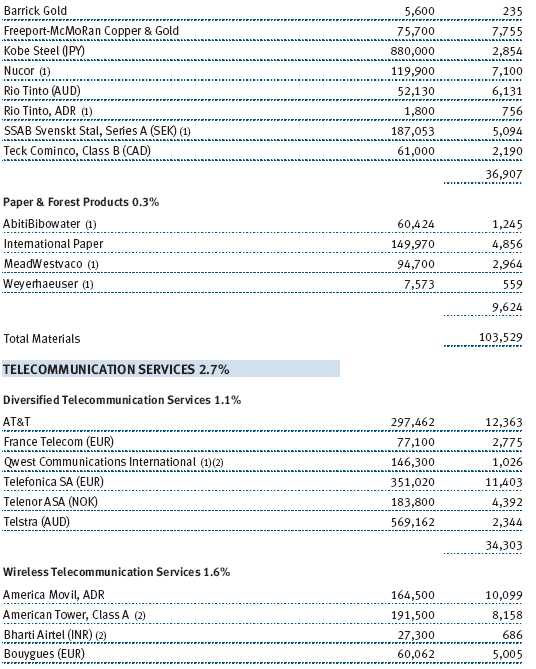
Our holdings in the materials sector did well, led by chemical company Potash Corp. of Saskatchewan. The stock benefited from high nitrogen and phosphate prices and more than doubled during the year. It was our top equity performer in the last six months. Shares of mining company Rio Tinto, which experienced strong demand for its ore and energy production from emerging markets and was targeted for takeover by its larger competitor BHP Billiton, also had solid gains.
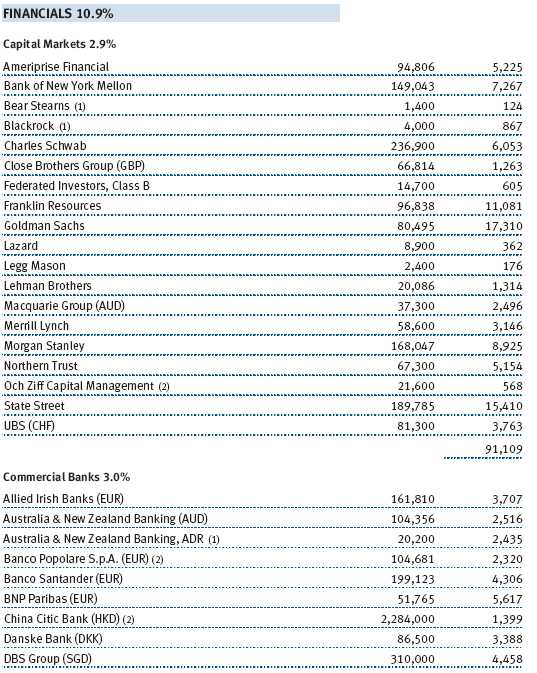
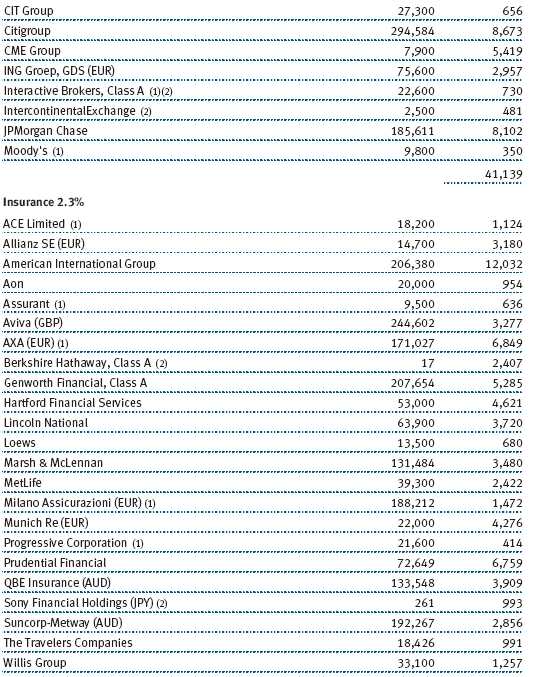
Financials were a major drag on performance, particularly diversified financial services companies and commercial banks, which struggled with the fallout from the subprime mortgage meltdown. Our exposure to Citigroup hurt performance. The giant banking concern was hit with escalating losses stemming from soaring mortgages. Bank of America, too, felt the impact of rising delinquencies. Among other commercial banks suffering from the subprime fallout was Wachovia. We added to some of our positions on this weakness, as we believe many profitable institutions were underpriced and that, over time, these additions will boost our overall performance.
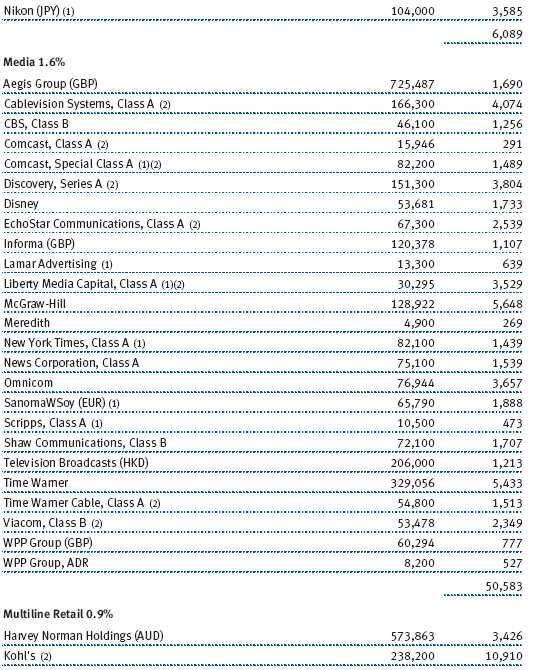
Consumer spending declined, particularly late in the year, as a result of high energy prices and the drumbeat of negative news in the housing markets. Consumer discretionary was down as well. The multiline retail industry was in the middle of the storm, with losses at Target and Kohl’s. Media companies continued to disappoint, and we reduced or eliminated positions in Clear Channel Communications and Viacom.
International Stocks
The fund’s international portfolio underperformed the broad market largely due to weak stock selection, especially among the energy, financials, and materials sectors. Although we had increased our exposure to energy stocks, our holdings did not perform as well as those in the benchmark. We reduced our exposure in the beleaguered financials sector, but the stocks in our portfolio fell farther than the benchmark’s. We realized solid returns from our holdings in the telecommunication services and consumer discretionary sectors.
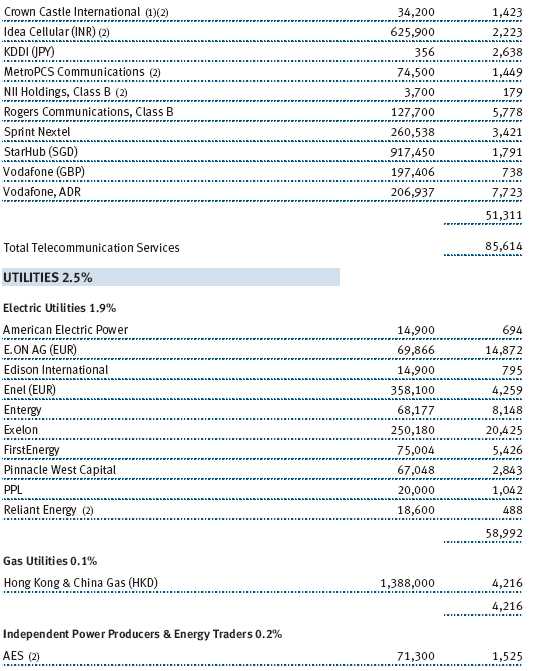
Our holdings in the telecommunication services and energy sectors were among the largest absolute contributors to performance during the last six months. Spanish telephone company Telefonica was our best absolute performer, and Finnish handset maker Nokia was also a top-10 contributor. Benefiting from deregulation and increased sales, E.ON, the German electric utility, and Hong Kong & China Gas, a Chinese natural gas distributor, generated solid returns during the past six months. Construction and energy giant Acciona (Spain) gained on the strong organic growth in its infrastructure construction and energy businesses. As mentioned earlier, Rio Tinto, which had strong ore sales to China, rose after competitor BHP Billiton offered to acquire it. Two of our health care holdings—CSL Limited and Sanofi-Aventis also posted solid gains. As a group, our banking holdings were the weakest performers. Royal Bank of Scotland, Sumitomo Trust & Banking Company, and Societe Generale struggled. Former standout performer SSAB Svenskt Stal, the Swedish stainless steel maker, fell on fears that a global slowdown would reduce demand for its products. Even though Toyota Motor surpassed Ford in U.S. market share in 2007, the company’s stock fell during the last six months.
Although global economic growth continues, the credit squeeze and U.S. housing downturn is beginning to take its toll. The European economy continues to grow, but business and consumer confidence have declined from exuberant levels in early 2007. Japan remains stagnant, and the weaker dollar may hurt export-oriented Asian economies. Gains in emerging market stocks have been extraordinary in the past few years but, while we expect positive returns to continue, it is unlikely that they will maintain the same brisk pace.
Domestic Bonds
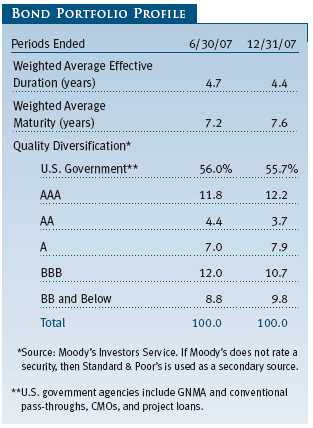
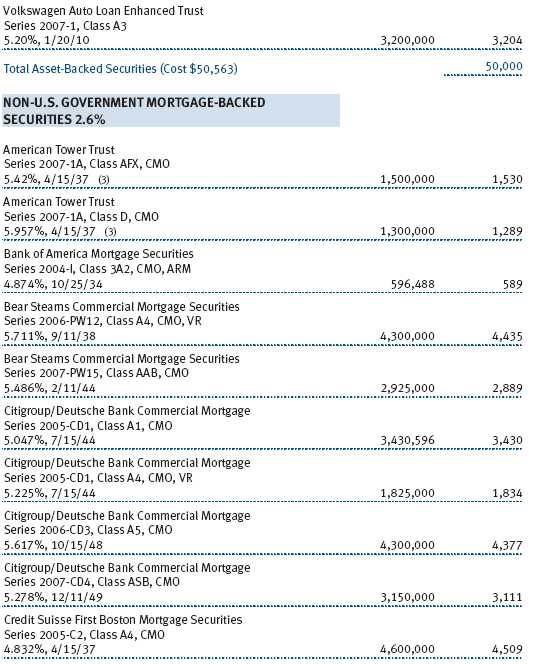
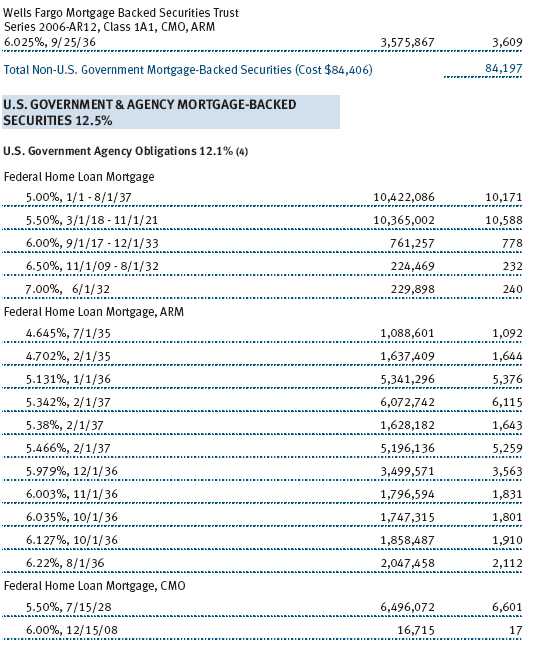
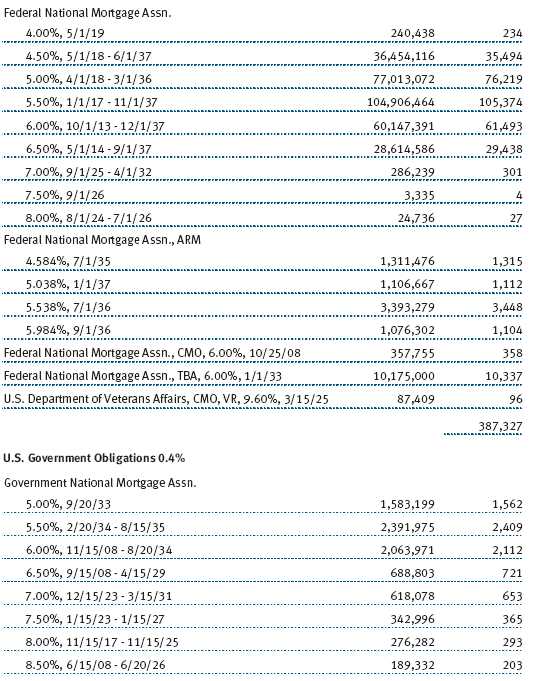
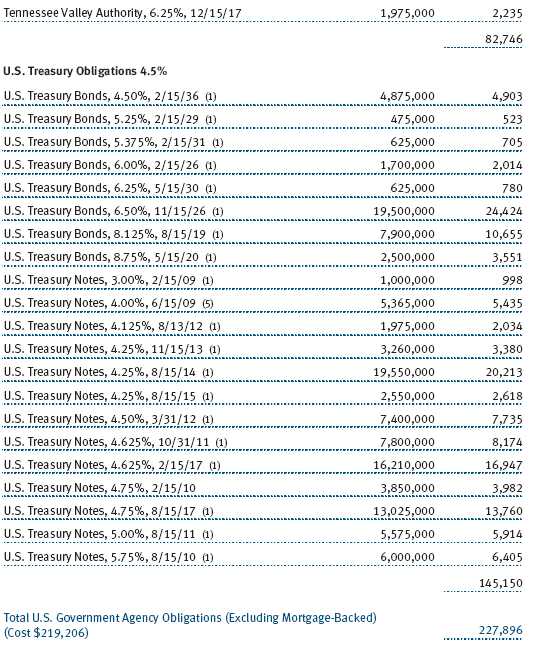
The investment-grade portfolio lagged the Lehman Brothers U.S. Aggregate Index over the last 12 months primarily due to being underweight in Treasuries in favor of modest overweights in asset-backed securities, collateralized mortgage-backed securities, and corporate credit. These sectors all underperformed Treasuries.
The Treasury yield curve steepened considerably during the year as short-term yields plummeted while long-term yields fell more moderately. Easier monetary policy and investors’ desire for low-risk assets sent short-term yields dramatically lower. While yield spreads have widened to more attractive levels from their lows in June, fundamentals for the high-yield sector are likely to prove more challenging in 2008. In general, high-yield fundamentals are positive with corporate profits remaining supportive and historically low corporate default rates.
OUTLOOK
As we write this letter, markets around the world are experiencing turbulence. The Federal Reserve’s rate cut of 75 basis points on January 22, 2008, underscores the fragility of the markets and deepening concerns of recession. Although we do not necessarily believe that equity markets will outperform fixed income for the next three to six months, we believe the environment remains supportive for equities—particularly at current valuation levels. Profit growth will likely decelerate as slower U.S. economic growth and higher commodity prices and labor costs take their toll on corporate earnings growth. We believe that years of large-cap underperformance have created attractive valuations and, in an environment of slower earnings growth, those quality large-cap growth companies that offer consistent earnings increases should command a premium. Our investment approach continues to incorporate a disciplined strategy, broad diversification, and a long-term focus. Whatever the near term holds, we believe that shareholders will be well-served by the fund’s fundamental commitment to diversification across asset classes.
Respectfully submitted,

Richard T. Whitney
Co-chairman of the fund’s Investment Advisory Committee

Edmund M. Notzon III
Co-chairman of the fund’s Investment Advisory Committee
January 23, 2008
The committee chairmen have day-to-day responsibility for managing the portfolio and work with committee members in developing and executing the fund’s investment program.
RISKS OF INVESTING IN STOCKS
As with all stock mutual funds, the fund’s share price can fall because of weakness in the stock market, a particular industry, or specific holdings. Stock markets can decline for many reasons, including adverse political or economic developments, changes in investor psychology, or heavy institutional selling. The prospects for an industry or company may deteriorate because of a variety of factors, including disappointing earnings or changes in the competitive environment. In addition, the investment manager’s assessment of companies held in a fund may prove incorrect, resulting in losses or poor performance even in rising markets.
RISKS OF INTERNATIONAL INVESTING
Funds that invest overseas generally carry more risk than funds that invest strictly in U.S. assets. Risks can result from varying stages of economic and political development; differing regulatory environments, trading days, and accounting standards; currency fluctuations; and higher transaction costs of non-U.S. markets. Investments outside the United States could be subject to governmental actions such as capital or currency controls, nationalization of a company or industry, expropriation of assets, or imposition of high taxes.
RISKS OF INVESTING IN BONDS
Funds that invest in bonds are subject to interest rate risk, the decline in bond prices that usually accompanies a rise in interest rates. Longer-maturity bonds typically decline more than those with shorter maturities. Funds that invest in bonds are also subject to credit risk, the chance that any fund holding could have its credit rating downgraded, or that a bond issuer will default (fail to make timely payments of interest or principal), potentially reducing the fund’s income level and share price.
GLOSSARY
Duration: The average time (expressed in years) needed for an investor to receive the present value of the future cash flows on a fixed-income investment. It is used to measure a bond or bond fund’s sensitivity to interest rate changes. For example, a fund with a five-year duration would fall about 5% in price in response to a one-percentage-point increase in interest rates, and vice versa.
Fed funds target rate: An overnight lending rate set by the Federal Reserve and used by banks to meet reserve requirements. Banks also use the fed funds rate as a benchmark for their prime lending rates.
Lehman Brothers U.S. Aggregate Index: A widely used benchmark for the domestic investment-grade bond market. The index typically includes more than 5,000 fixed-income securities with an overall intermediate- to long-term average maturity.
Lipper indexes: Consist of a small number (10 to 30) of the largest mutual funds in a particular category as tracked by Lipper Inc.
Merrill Lynch-Wilshire Capital Market Index: A market capitalization weighted index including the Wilshire 5000 and Merrill Lynch, High Yield II, and Domestic Master Indexes.
MSCI EAFE Index: Widely accepted as the benchmark for international stock performance (EAFE refers to Europe, Australasia, and Far East). The index represents the major markets of the world excluding the U.S. and Canada, is listed in local currency, and includes reinvestment of dividends.
S&P 500 Stock Index: Tracks the stocks of 500 mostly large U.S. companies.
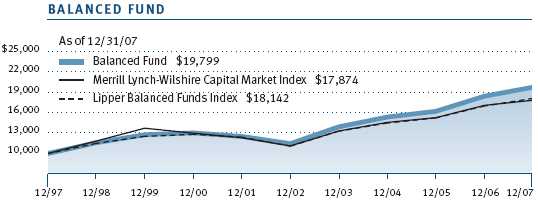
Performance and Expenses
This chart shows the value of a hypothetical $10,000 investment in the fund over the past 10 fiscal year periods or since inception (for funds lacking 10-year records). The result is compared with benchmarks, which may include a broad-based market index and a peer group average or index. Market indexes do not include expenses, which are deducted from fund returns as well as mutual fund averages and indexes.
| AVERAGE ANNUAL COMPOUND TOTAL RETURN |
This table shows how the fund would have performed each year if its actual (or cumulative) returns for the periods shown had been earned at a constant rate.
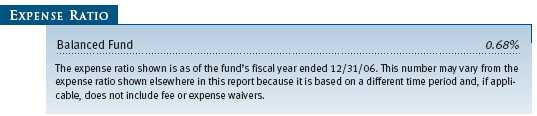
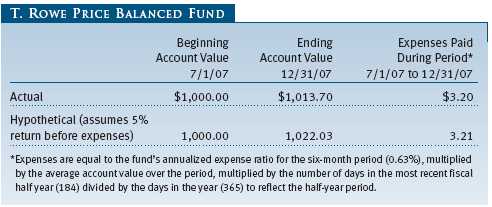
As a mutual fund shareholder, you may incur two types of costs: (1) transaction costs, such as redemption fees or sales loads, and (2) ongoing costs, including management fees, distribution and service (12b-1) fees, and other fund expenses. The following example is intended to help you understand your ongoing costs (in dollars) of investing in the fund and to compare these costs with the ongoing costs of investing in other mutual funds. The example is based on an investment of $1,000 invested at the beginning of the most recent six-month period and held for the entire period.
Actual Expenses
The first line of the following table (“Actual”) provides information about actual account values and expenses based on the fund’s actual returns. You may use the information in this line, together with your account balance, to estimate the expenses that you paid over the period. Simply divide your account value by $1,000 (for example, an $8,600 account value divided by $1,000 = 8.6), then multiply the result by the number in the first line under the heading “Expenses Paid During Period” to estimate the expenses you paid on your account during this period.
Hypothetical Example for Comparison Purposes
The information on the second line of the table (“Hypothetical”) is based on hypothetical account values and expenses derived from the fund’s actual expense ratio and an assumed 5% per year rate of return before expenses (not the fund’s actual return). You may compare the ongoing costs of investing in the fund with other funds by contrasting this 5% hypothetical example and the 5% hypothetical examples that appear in the shareholder reports of the other funds. The hypothetical account values and expenses may not be used to estimate the actual ending account balance or expenses you paid for the period.
Note: T. Rowe Price charges an annual small-account maintenance fee of $10, generally for accounts with less than $2,000 ($500 for UGMA/UTMA). The fee is waived for any investor whose T. Rowe Price mutual fund accounts total $25,000 or more, accounts employing automatic investing, and IRAs and other retirement plan accounts that utilize a prototype plan sponsored by T. Rowe Price (although a separate custodial or administrative fee may apply to such accounts). This fee is not included in the accompanying table. If you are subject to the fee, keep it in mind when you are estimating the ongoing expenses of investing in the fund and when comparing the expenses of this fund with other funds.
You should also be aware that the expenses shown in the table highlight only your ongoing costs and do not reflect any transaction costs, such as redemption fees or sales loads. Therefore, the second line of the table is useful in comparing ongoing costs only and will not help you determine the relative total costs of owning different funds. To the extent a fund charges transaction costs, however, the total cost of owning that fund is higher.
The accompanying notes are an integral part of these financial statements.


The accompanying notes are an integral part of these financial statements.
The accompanying notes are an integral part of these financial statements.

The accompanying notes are an integral part of these financial statements.
The accompanying notes are an integral part of these financial statements.
| NOTES TO FINANCIAL STATEMENTS |
NOTE 1 - SIGNIFICANT ACCOUNTING POLICIES
T. Rowe Price Balanced Fund, Inc. (the fund), is registered under the Investment Company Act of 1940 (the 1940 Act) as a diversified, open-end management investment company. The fund commenced operations on December 31, 1939. The fund seeks to provide capital growth, current income, and preservation of capital through a portfolio of stocks and fixed-income securities.
The accompanying financial statements were prepared in accordance with accounting principles generally accepted in the United States of America, which require the use of estimates made by fund management. Fund management believes that estimates and security valuations are appropriate; however, actual results may differ from those estimates, and the security valuations reflected in the financial statements may differ from the value the fund ultimately realizes upon sale of the securities.
Valuation The fund values its investments and computes its net asset value per share at the close of the New York Stock Exchange (NYSE), normally 4 p.m. ET, each day that the NYSE is open for business. Equity securities listed or regularly traded on a securities exchange or in the over-the-counter (OTC) market are valued at the last quoted sale price or, for certain markets, the official closing price at the time the valuations are made, except for OTC Bulletin Board securities, which are valued at the mean of the latest bid and asked prices. A security that is listed or traded on more than one exchange is valued at the quotation on the exchange determined to be the primary market for such security. Listed securities not traded on a particular day are valued at the mean of the latest bid and asked prices for domestic securities and the last quoted sale price for international securities.
Debt securities are generally traded in the over-the-counter market. Securities with original maturities of one year or more are valued at prices furnished by dealers who make markets in such securities or by an independent pricing service, which considers yield or price of bonds of comparable quality, coupon, maturity, and type, as well as prices quoted by dealers who make markets in such securities. Securities with original maturities of less than one year are valued at amortized cost in local currency, which approximates fair value when combined with accrued interest.
Investments in mutual funds are valued at the mutual fund’s closing net asset value per share on the day of valuation. Financial futures contracts are valued at closing settlement prices. Swap agreements are valued at prices furnished by dealers who make markets in such securities or by an independent pricing service.
Other investments, including restricted securities, and those for which the above valuation procedures are inappropriate or are deemed not to reflect fair value are stated at fair value as determined in good faith by the T. Rowe Price Valuation Committee, established by the fund’s Board of Directors.
Most foreign markets close before the close of trading on the NYSE. If the fund determines that developments between the close of a foreign market and the close of the NYSE will, in its judgment, materially affect the value of some or all of its portfolio securities, which in turn will affect the fund’s share price, the fund will adjust the previous closing prices to reflect the fair value of the securities as of the close of the NYSE, as determined in good faith by the T. Rowe Price Valuation Committee, established by the fund’s Board of Directors. A fund may also fair value securities in other situations, such as when a particular foreign market is closed but the fund is open. In deciding whether to make fair value adjustments, the fund reviews a variety of factors, including developments in foreign markets, the performance of U.S. securities markets, and the performance of instruments trading in U.S. markets that represent foreign securities and baskets of foreign securities. The fund uses outside pricing services to provide it with closing market prices and information used for adjusting those prices. The fund cannot predict when and how often it will use closing prices and when it will adjust those prices to reflect fair value. As a means of evaluating its fair value process, the fund routinely compares closing market prices, the next day’s opening prices in the same markets, and adjusted prices.
Currency Translation Assets, including investments, and liabilities denominated in foreign currencies are translated into U.S. dollar values each day at the prevailing exchange rate, using the mean of the bid and asked prices of such currencies against U.S. dollars as quoted by a major bank. Purchases and sales of securities, income, and expenses are translated into U.S. dollars at the prevailing exchange rate on the date of the transaction. The effect of changes in foreign currency exchange rates on realized and unrealized security gains and losses is reflected as a component of security gains and losses.
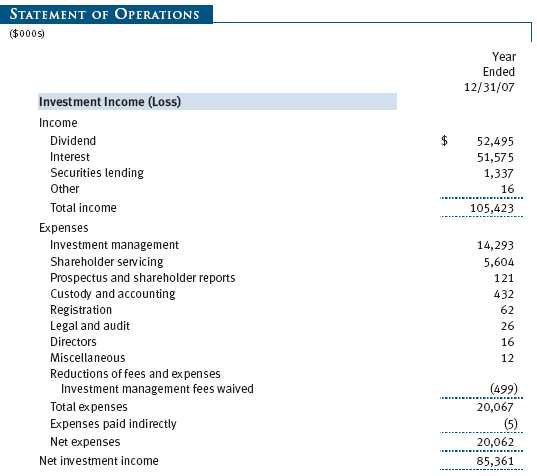
Rebates and Credits Subject to best execution, the fund may direct certain security trades to brokers who have agreed to rebate a portion of the related brokerage commission to the fund in cash. Commission rebates are reflected as realized gain on securities in the accompanying financial statements and totaled $14,000 for the year ended December 31, 2007. Additionally, the fund earns credits on temporarily uninvested cash balances at the custodian that reduce the fund’s custody charges. Custody expense in the accompanying financial statements is presented before reduction for credits, which are reflected as expenses paid indirectly.
Investment Transactions, Investment Income, and Distributions Income and expenses are recorded on the accrual basis. Premiums and discounts on debt securities are amortized for financial reporting purposes. Dividends received from mutual fund investments are reflected as dividend income; capital gain distributions are reflected as realized gain/loss. Dividend income and capital gain distributions are recorded on the ex-dividend date. Income tax-related interest and penalties, if incurred, would be recorded as income tax expense. Investment transactions are accounted for on the trade date. Realized gains and losses are reported on the identified cost basis. Payments (“variation margin”) made or received to settle the daily fluctuations in the value of futures contracts are recorded as unrealized gains or losses until the contracts are closed. Unsettled variation margin on futures contracts is reflected as other assets or liabilities, and unrealized gains and losses on futures contracts are reflected as the change in net unrealized gain or loss in the accompanying financial statements. Net periodic receipts or payments required by swaps are accrued daily and recorded as realized gain or loss in the accompanying financial statements. Fluctuations in the fair value of swaps are reflected in the change in net unrealized gain or loss and are reclassified to realized gain or loss upon termination prior to maturity. Paydown gains and losses are recorded as an adjustment to interest income. Distributions to shareholders are recorded on the ex-dividend date. Income distributions are declared and paid on a quarterly basis. Capital gain distributions, if any, are declared and paid by the fund, typically on an annual basis.
New Accounting Pronouncements Effective June 29, 2007, the fund adopted Financial Accounting Standards Board (FASB) Interpretation No. 48 (FIN 48), Accounting for Uncertainty in Income Taxes, a clarification of FASB Statement No. 109, Accounting for Income Taxes. FIN 48 establishes financial accounting and disclosure requirements for recognition and measurement of tax positions taken or expected to be taken on an income tax return. The adoption of FIN 48 had no impact on the fund’s net assets or results of operations.
In September 2006, the FASB released the Statement of Financial Accounting Standard No. 157 (FAS 157), Fair Value Measurements. FAS 157 clarifies the definition of fair value and establishes the framework for measuring fair value, as well as proper disclosure of this methodology in the financial statements. It will be effective for the fund’s fiscal year beginning January 1, 2008. Management is evaluating the effects of FAS 157; however, it is not expected to have a material impact on the fund’s net assets or results of operations.
NOTE 2 - INVESTMENT TRANSACTIONS
Consistent with its investment objective, the fund engages in the following practices to manage exposure to certain risks or to enhance performance. The investment objective, policies, program, and risk factors of the fund are described more fully in the fund’s prospectus and Statement of Additional Information.
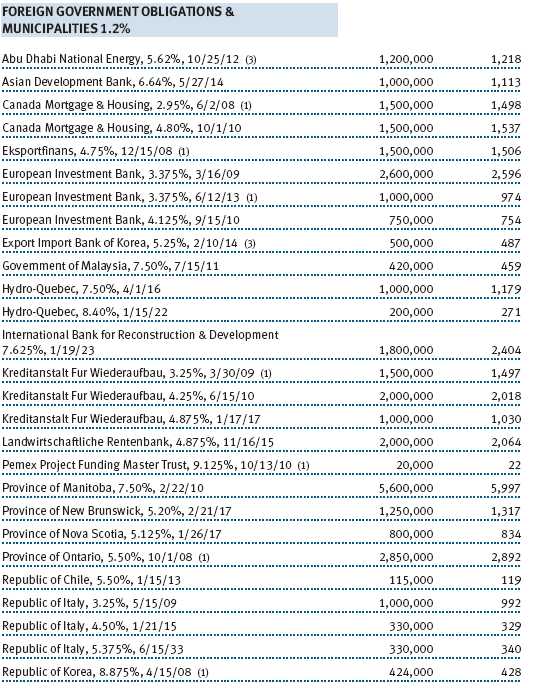
Restricted Securities The fund may invest in securities that are subject to legal or contractual restrictions on resale. Prompt sale of such securities at an acceptable price may be difficult due to substantial delays and additional costs related to their restrictions.
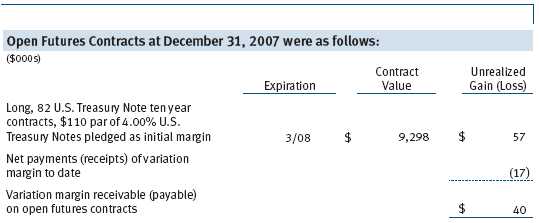
Futures Contracts During the year ended December 31, 2007, the fund was a party to futures contracts, which provide for the future sale by one party and purchase by another of a specified amount of a specific financial instrument at an agreed upon price, date, time, and place. Risks arise from possible illiquidity of the futures market and from movements in security values and/or interest rates.
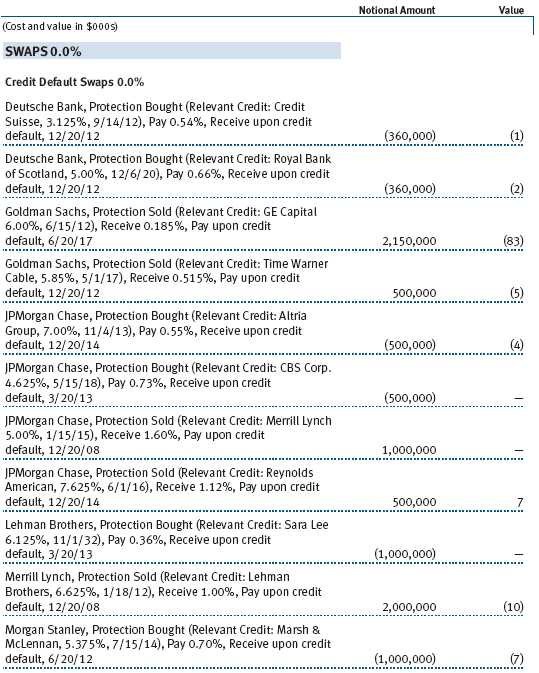
Swaps During the year ended December 31, 2007, the fund was a party to credit default swaps under which it buys or sells credit protection against a defined-issuer credit event. Upon a defined-issuer credit event, the fund is required to either deliver the notional amount of the contract in cash and take delivery of the relevant credit or deliver cash approximately equal to the notional amount of the contract less market value of the relevant credit at the time of the credit event. Risks arise from the possible inability of counterparties to meet the terms of their agreements and from changes in creditworthiness of the relevant underlying issuer.
TBA Purchase Commitments During the year ended December 31, 2007, the fund entered into to be announced (TBA) purchase commitments, pursuant to which it agrees to purchase mortgage-backed securities for a fixed unit price, with payment and delivery at a scheduled future date beyond the customary settlement period for that security. With TBA transactions, the particular securities to be delivered are not identified at the trade date; however, delivered securities must meet specified terms, including issuer, rate, and mortgage term, and be within industry-accepted “good delivery” standards. The fund generally enters into TBAs with the intention of taking possession of the underlying mortgage securities. Until settlement, the fund maintains cash reserves and liquid assets sufficient to settle its TBAs.
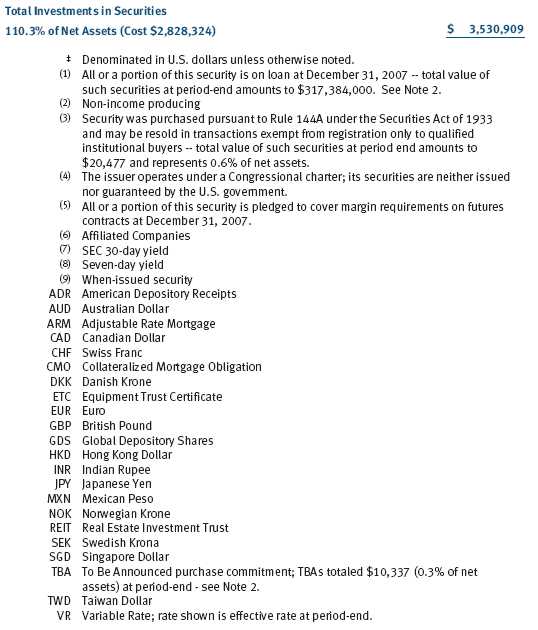
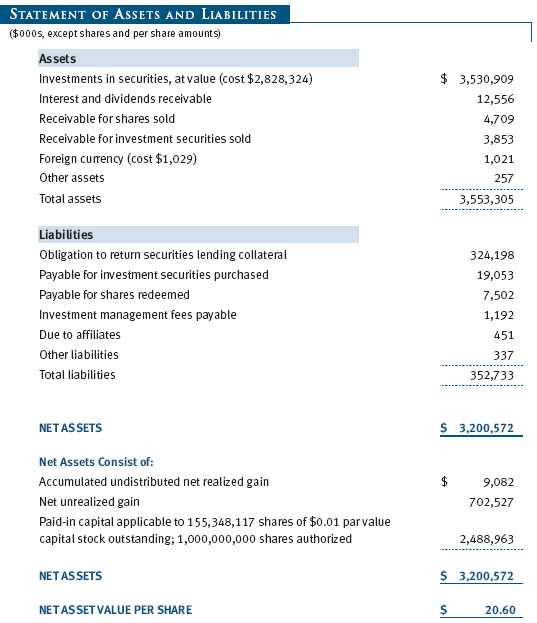
Securities Lending The fund lends its securities to approved brokers to earn additional income. It receives as collateral cash and U.S. government securities valued at 102% to 105% of the value of the securities on loan. Cash collateral is invested in money market pooled accounts managed by the fund’s lending agents in accordance with investment guidelines approved by fund management. Collateral is maintained over the life of the loan in an amount not less than the value of loaned securities, as determined at the close of fund business each day; any additional collateral required due to changes in security values is delivered to the fund the next business day. Although risk is mitigated by the collateral, the fund could experience a delay in recovering its securities and a possible loss of income or value if the borrower fails to return the securities. Securities lending revenue recognized by the fund consists of earnings on invested collateral and borrowing fees, net of any rebates to the borrower and compensation to the lending agent. At December 31, 2007, the value of loaned securities was $317,384,000; aggregate collateral consisted of $324,198,000 in money market pooled accounts and U.S. government securities valued at $3,695,000.
Other Purchases and sales of portfolio securities, other than short-term and U.S. government securities, aggregated $1,068,482,000 and $939,760,000, respectively, for the year ended December 31, 2007. Purchases and sales of U.S. government securities aggregated $965,918,000 and $931,495,000, respectively, for the year ended December 31, 2007.
NOTE 3 - FEDERAL INCOME TAXES
No provision for federal income taxes is required since the fund intends to continue to qualify as a regulated investment company under Subchapter M of the Internal Revenue Code and distribute to shareholders all of its taxable income and gains. Federal income tax regulations differ from generally accepted accounting principles; therefore, distributions determined in accordance with tax regulations may differ significantly in amount or character from net investment income and realized gains for financial reporting purposes. Financial reporting records are adjusted for permanent book/tax differences to reflect tax character. Financial records are not adjusted for temporary differences.
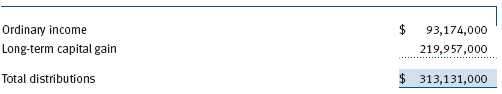
Distributions during the year ended December 31, 2007, were characterized as follows for tax purposes:
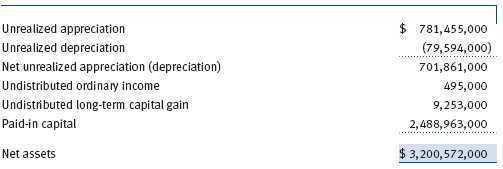
At December 31, 2007, the tax-basis components of net assets were as follows:
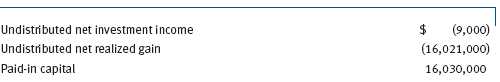
For the year ended December 31, 2007, the fund recorded the following permanent reclassifications to reflect tax character. Reclassifications to paid-in capital relate primarily to a tax practice that treats a portion of the proceeds from each redemption of capital shares as a distribution of taxable net investment income and/or realized capital gain. Results of operations and net assets were not affected by these reclassifications.
At December 31, 2007, the cost of investments for federal income tax purposes was $2,829,042,000.
NOTE 4 - RELATED PARTY TRANSACTIONS
The fund is managed by T. Rowe Price Associates, Inc. (the manager or Price Associates), a wholly owned subsidiary of T. Rowe Price Group, Inc. The investment management agreement between the fund and the manager provides for an annual investment management fee, which is computed daily and paid monthly. The fee consists of an individual fund fee, equal to 0.15% of the fund’s average daily net assets, and a group fee. The group fee rate is calculated based on the combined net assets of certain mutual funds sponsored by Price Associates (the group) applied to a graduated fee schedule, with rates ranging from 0.48% for the first $1 billion of assets to 0.285% for assets in excess of $220 billion. The fund’s group fee is determined by applying the group fee rate to the fund’s average daily net assets. At December 31, 2007, the effective annual group fee rate was 0.30%.
In addition, the fund has entered into service agreements with Price Associates and two wholly owned subsidiaries of Price Associates (collectively, Price). Price Associates computes the daily share price and provides certain other administrative services to the fund. T. Rowe Price Services, Inc., provides shareholder and administrative services in its capacity as the fund’s transfer and dividend disbursing agent. T. Rowe Price Retirement Plan Services, Inc., provides subaccounting and recordkeeping services for certain retirement accounts invested in the fund. For the year ended December 31, 2007, expenses incurred pursuant to these service agreements were $154,000 for Price Associates, $896,000 for T. Rowe Price Services, Inc., and $3,551,000 for T. Rowe Price Retirement Plan Services, Inc. The total amount payable at period-end pursuant to these service agreements is reflected as Due to Affiliates in the accompanying financial statements.
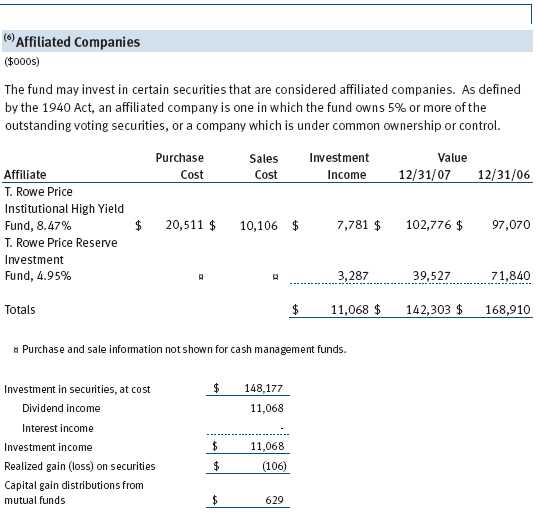
The fund may invest in the T. Rowe Price Reserve Investment Fund and the T. Rowe Price Government Reserve Investment Fund (collectively, the T. Rowe Price Reserve Investment Funds), open-end management investment companies managed by Price Associates and affiliates of the fund. The T. Rowe Price Reserve Investment Funds are offered as cash management options to mutual funds, trusts, and other accounts managed by Price Associates and/or its affiliates, and are not available for direct purchase by members of the public. The T. Rowe Price Reserve Investment Funds pay no investment management fees.
The fund may invest in the T. Rowe Price Institutional High Yield Fund, Inc. (High Yield Fund), as a means of gaining efficient and cost-effective exposure to the high-yield bond markets. The High Yield Fund is an open-end management investment company managed by Price Associates, and an affiliate of the fund. The High Yield Fund pays an annual all-inclusive management and administrative fee to Price Associates equal to 0.50% of average daily net assets. To ensure that Balanced Fund does not incur duplicate fees for its assets invested in the High Yield Fund, Price Associates has agreed to reduce its management fee to the fund. Accordingly, the management fee waiver reflected on the accompanying Statement of Operations includes $499,000 of management fees permanently waived pursuant to this agreement.
| REPORT OF INDEPENDENT REGISTERED PUBLIC ACCOUNTING FIRM |
To the Board of Directors and Shareholders of T. Rowe Price Balanced Fund, Inc.
In our opinion, the accompanying statement of assets and liabilities, including the portfolio of investments, and the related statements of operations and of changes in net assets and the financial highlights present fairly, in all material respects, the financial position of T. Rowe Price Balanced Fund, Inc. (the “Fund”) at December 31, 2007, the results of its operations for the year then ended, the changes in its net assets for each of the two years in the period then ended and the financial highlights for each of the five years in the period then ended, in conformity with accounting principles generally accepted in the United States of America. These financial statements and financial highlights (hereafter referred to as “financial statements”) are the responsibility of the Fund’s management; our responsibility is to express an opinion on these financial statements based on our audits. We conducted our audits of these financial statements in accordance with the auditing standards of the Public Company Accounting Oversight Board (United States). Those standards require that we plan and perform the audit to obtain reasonable assurance about whether the financial statements are free of material misstatement. An audit includes examining, on a test basis, evidence supporting the amounts and disclosures in the financial statements, assessing the accounting principles used and significant estimates made by management, and evaluating the overall financial statement presentation. We believe that our audits, which included confirmation of securities at December 31, 2007, by correspondence with the custodian, brokers and by agreement to the underlying ownership records for T. Rowe Price Reserve Investment Fund and T. Rowe Price Institutional High Yield Fund, provide a reasonable basis for our opinion.
PricewaterhouseCoopers LLP
Baltimore, Maryland
February 12, 2008
| TAX INFORMATION (UNAUDITED) FOR THE TAX YEAR ENDED 12/31/07 |
We are providing this information as required by the Internal Revenue Code. The amounts shown may differ from those elsewhere in this report because of differences between tax and financial reporting requirements.
The fund’s distributions to shareholders included:
• $11,901,000 from short-term capital gains,
• $231,270,000 from long-term capital gains, subject to the 15% rate gains category
For taxable non-corporate shareholders, $32,282,000 of the fund’s income represents quali fied dividend income subject to the 15% rate category.
For corporate shareholders, $22,293,000 of the fund’s income qualifies for the dividends-received deduction.
| INFORMATION ON PROXY VOTING POLICIES, PROCEDURES, AND RECORDS |
A description of the policies and procedures used by T. Rowe Price funds and portfolios to determine how to vote proxies relating to portfolio securities is available in each fund’s Statement of Additional Information, which you may request by calling 1-800-225-5132 or by accessing the SEC’s Web site, www.sec.gov. The description of our proxy voting policies and procedures is also available on our Web site, www.troweprice.com. To access it, click on the words “Company Info” at the top of our homepage for individual investors. Then, in the window that appears, click on the “Proxy Voting Policy” navigation button in the top left corner.
Each fund’s most recent annual proxy voting record is available on our Web site and through the SEC’s Web site. To access it through our Web site, follow the directions above, then click on the words “Proxy Voting Record” at the bottom of the Proxy Voting Policy page.
| HOW TO OBTAIN QUARTERLY PORTFOLIO HOLDINGS |
The fund files a complete schedule of portfolio holdings with the Securities and Exchange Commission for the first and third quarters of each fiscal year on Form N-Q. The fund’s Form N-Q is available electronically on the SEC’s Web site (www.sec.gov); hard copies may be reviewed and copied at the SEC’s Public Reference Room, 450 Fifth St. N.W., Washington, DC 20549. For more information on the Public Reference Room, call 1-800-SEC-0330.
| ABOUT THE FUND’S DIRECTORS AND OFFICERS |
Your fund is governed by a Board of Directors (Board) that meets regularly to review a wide variety of matters affecting the fund, including performance, investment programs, compliance matters, advisory fees and expenses, service providers, and other business affairs. The Board elects the fund’s officers, who are listed in the final table. At least 75% of Board members are independent of T. Rowe Price Associates, Inc. (T. Rowe Price), and T. Rowe Price International, Inc. (T. Rowe Price International); “inside” or “interested” directors are employees or officers of T. Rowe Price. The business address of each director and officer is 100 East Pratt Street, Baltimore, Maryland 21202. The Statement of Additional Information includes additional information about the directors and is available without charge by calling a T. Rowe Price representative at 1-800-225-5132.
| Independent Directors | |
| |
| Name | |
| (Year of Birth) | Principal Occupation(s) During Past 5 Years and Directorships of |
| Year Elected* | Other Public Companies |
| |
| Jeremiah E. Casey | Director, National Life Insurance (2001 to 2005); Director, The Rouse |
| (1940) | Company, real estate developers (1990 to 2004); Director, Allfirst |
| 2005 | Financial Inc. (previously First Maryland Bancorp) (1983 to 2002) |
| |
| Anthony W. Deering | Chairman, Exeter Capital, LLC, a private investment firm (2004 to pres- |
| (1945) | ent); Director, Vornado Real Estate Investment Trust (3/04 to present); |
| 2001 | Member, Advisory Board, Deutsche Bank North America (2004 to pres- |
| | ent); Director, Chairman of the Board, and Chief Executive Officer, The |
| | Rouse Company, real estate developers (1997 to 2004) |
| |
| Donald W. Dick, Jr. | Principal, EuroCapital Advisors, LLC, an acquisition and management |
| (1943) | advisory firm; Chairman, The Haven Group, a custom manufacturer of |
| 1991 | modular homes (1/04 to present) |
| |
| David K. Fagin | Chairman and President, Nye Corporation (6/88 to present); Chairman, |
| (1938) | Canyon Resources Corp. (8/07 to present); Director, Golden Star |
| 1991 | Resources Ltd. (5/92 to present); Director, Pacific Rim Mining Corp. |
| | (2/02 to present) |
| |
| Karen N. Horn | Director, Federal National Mortgage Association (9/06 to present); |
| (1943) | Managing Director and President, Global Private Client Services, |
| 2003 | Marsh Inc. (1999 to 2003); Director, Georgia Pacific (5/04 to 12/05), |
| | Eli Lilly and Company, and Simon Property Group |
| |
| Theo C. Rodgers | President, A&R Development Corporation (1977 to present) |
| (1941) | |
| 2005 | |
| John G. Schreiber | Owner/President, Centaur Capital Partners, Inc., a real estate invest- |
| (1946) | ment company; Partner, Blackstone Real Estate Advisors, L.P. |
| 2001 | |
| |
| *Each independent director oversees 121 T. Rowe Price portfolios and serves until retirement, resignation, or |
| election of a successor. | |
| Inside Directors | |
| |
| Name | |
| (Year of Birth) | |
| Year Elected* | |
| [Number of T. Rowe Price | Principal Occupation(s) During Past 5 Years and Directorships of |
| Portfolios Overseen] | Other Public Companies |
| |
| Edward C. Bernard | Director and Vice President, T. Rowe Price; Vice Chairman of the Board, |
| (1956) | Director, and Vice President, T. Rowe Price Group, Inc.; Chairman of the |
| 2006 | Board, Director, and President, T. Rowe Price Investment Services, Inc.; |
| [121] | Chairman of the Board and Director, T. Rowe Price Global Asset |
| | Management Limited, T. Rowe Price Global Investment Services |
| | Limited, T. Rowe Price Retirement Plan Services, Inc., T. Rowe Price |
| | Savings Bank, and T. Rowe Price Services, Inc.; Director, T. Rowe Price |
| | International, Inc.; Chief Executive Officer, Chairman of the Board, |
| | Director, and President, T. Rowe Price Trust Company; Chairman of |
| | the Board, all funds |
| |
| Brian C. Rogers, CFA, CIC | Chief Investment Officer, Director, and Vice President, T. Rowe Price; |
| (1955) | Chairman of the Board, Chief Investment Officer, Director, and Vice |
| 2006 | President, T. Rowe Price Group, Inc.; Vice President, T. Rowe Price |
| [68] | Trust Company |
| |
| *Each inside director serves until retirement, resignation, or election of a successor. |
| Officers | |
| |
| Name (Year of Birth) | |
| Title and Fund(s) Served | Principal Occupation(s) |
| |
| E. Frederick Bair, CFA, CPA (1969) | Vice President, T. Rowe Price, T. Rowe Price |
| Vice President, Balanced Fund | Group, Inc., and T. Rowe Price Trust Company |
| |
| Joseph A. Carrier, CPA (1960) | Vice President, T. Rowe Price, T. Rowe Price |
| Treasurer, Balanced Fund | Group, Inc., T. Rowe Price Investment Services, |
| | Inc., and T. Rowe Price Trust Company |
| |
| Wendy R. Diffenbaugh (1953) | Vice President, T. Rowe Price |
| Vice President, Balanced Fund | |
| |
| Roger L. Fiery III, CPA (1959) | Vice President, T. Rowe Price, T. Rowe Price |
| Vice President, Balanced Fund | Group, Inc., T. Rowe Price International, Inc., |
| | and T. Rowe Price Trust Company |
| |
| John R. Gilner (1961) | Chief Compliance Officer and Vice President, |
| Chief Compliance Officer, Balanced Fund | T. Rowe Price; Vice President, T. Rowe Price |
| | Group, Inc., and T. Rowe Price Investment |
| | Services, Inc. |
| |
| Gregory S. Golczewski (1966) | Vice President, T. Rowe Price and T. Rowe Price |
| Vice President, Balanced Fund | Trust Company |
| |
| Henry H. Hopkins (1942) | Director and Vice President, T. Rowe Price |
| Vice President, Balanced Fund | Investment Services, Inc., T. Rowe Price Services, |
| | Inc., and T. Rowe Price Trust Company; Vice |
| | President, T. Rowe Price, T. Rowe Price Group, |
| | Inc., T. Rowe Price International, Inc., and |
| | T. Rowe Price Retirement Plan Services, Inc. |
| |
| Robert M. Larkins (1973) | Vice President, T. Rowe Price and T. Rowe Price |
| Vice President, Balanced Fund | Trust Company; formerly student, The Wharton |
| | Business School, University of Pennsylvania |
| | (to 2003) |
| |
| Patricia B. Lippert (1953) | Assistant Vice President, T. Rowe Price and |
| Secretary, Balanced Fund | T. Rowe Price Investment Services, Inc. |
| |
| Raymond A. Mills, Ph.D., CFA (1960) | Vice President, T. Rowe Price, T. Rowe Price |
| Vice President, Balanced Fund | Group, Inc., and T. Rowe Price International, Inc. |
| |
| Edmund M. Notzon III, Ph.D., CFA (1945) | Vice President, T. Rowe Price, T. Rowe Price |
| President, Balanced Fund | Group, Inc., T. Rowe Price Investment Services, |
| | Inc., and T. Rowe Price Trust Company |
| Mark J. Vaselkiv (1958) | Vice President, T. Rowe Price and T. Rowe Price |
| Vice President, Balanced Fund | Group, Inc. |
| |
| Julie L. Waples (1970) | Vice President, T. Rowe Price |
| Vice President, Balanced Fund | |
| |
| Richard T. Whitney, CFA (1958) | Vice President, T. Rowe Price, T. Rowe Price |
| Executive Vice President, Balanced Fund | Group, Inc., T. Rowe Price International, Inc., |
| | and T. Rowe Price Trust Company |
| |
| Unless otherwise noted, officers have been employees of T. Rowe Price or T. Rowe Price International for at least |
| five years. | |
Item 2. Code of Ethics.
The registrant has adopted a code of ethics, as defined in Item 2 of Form N-CSR, applicable to its principal executive officer, principal financial officer, principal accounting officer or controller, or persons performing similar functions. A copy of this code of ethics is filed as an exhibit to this Form N-CSR. No substantive amendments were approved or waivers were granted to this code of ethics during the period covered by this report.
Item 3. Audit Committee Financial Expert.
The registrant’s Board of Directors/Trustees has determined that Ms. Karen N. Horn qualifies as an audit committee financial expert, as defined in Item 3 of Form N-CSR. Ms. Horn is considered independent for purposes of Item 3 of Form N-CSR.
Item 4. Principal Accountant Fees and Services.
(a) – (d) Aggregate fees billed to the registrant for the last two fiscal years for professional services rendered by the registrant’s principal accountant were as follows:
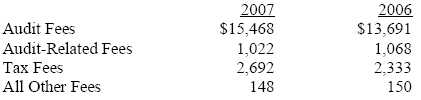
Audit fees include amounts related to the audit of the registrant’s annual financial statements and services normally provided by the accountant in connection with statutory and regulatory filings. Audit-related fees include amounts reasonably related to the performance of the audit of the registrant’s financial statements and specifically include the issuance of a report on internal controls and, if applicable, agreed-upon procedures related to fund acquisitions. Tax fees include amounts related to services for tax compliance, tax planning, and tax advice. The nature of these services specifically includes the review of distribution calculations and the preparation of Federal, state, and excise tax returns. All other fees include the registrant’s pro-rata share of amounts for agreed-upon procedures in conjunction with service contract approvals by the registrant’s Board of Directors/Trustees.
(e)(1) The registrant’s audit committee has adopted a policy whereby audit and non-audit services performed by the registrant’s principal accountant for the registrant, its investment adviser, and any entity controlling, controlled by, or under common control with the investment adviser that provides ongoing services to the registrant require pre-approval in advance at regularly scheduled audit committee meetings. If such a service is required between regularly scheduled audit committee meetings, pre-approval may be authorized by one audit committee member with ratification at the next scheduled audit committee meeting. Waiver of pre-approval for audit or non-audit services requiring fees of a de minimis amount is not permitted.
(2) No services included in (b) – (d) above were approved pursuant to paragraph (c)(7)(i)(C) of Rule 2-01 of Regulation S-X.
(f) Less than 50 percent of the hours expended on the principal accountant’s engagement to audit the registrant’s financial statements for the most recent fiscal year were attributed to work performed by persons other than the principal accountant’s full-time, permanent employees.
(g) The aggregate fees billed for the most recent fiscal year and the preceding fiscal year by the registrant’s principal accountant for non-audit services rendered to the registrant, its investment adviser, and any entity controlling, controlled by, or under common control with the investment adviser that provides ongoing services to the registrant were $1,486,000 and $1,401,000, respectively, and were less than the aggregate fees billed for those same periods by the registrant’s principal accountant for audit services rendered to the T. Rowe Price Funds.
(h) All non-audit services rendered in (g) above were pre-approved by the registrant’s audit committee. Accordingly, these services were considered by the registrant’s audit committee in maintaining the principal accountant’s independence.
Item 5. Audit Committee of Listed Registrants.
Not applicable.
Item 6. Schedule of Investments.
Not applicable. The complete schedule of investments is included in Item 1 of this Form N-CSR.
Item 7. Disclosure of Proxy Voting Policies and Procedures for Closed-End Management Investment Companies.
Not applicable.
Item 8. Portfolio Managers of Closed-End Management Investment Companies.
Not applicable.
Item 9. Purchases of Equity Securities by Closed-End Management Investment Company and Affiliated Purchasers.
Not applicable.
Item 10. Submission of Matters to a Vote of Security Holders.
Not applicable.
Item 11. Controls and Procedures.
(a) The registrant’s principal executive officer and principal financial officer have evaluated the registrant’s disclosure controls and procedures within 90 days of this filing and have concluded that the registrant’s disclosure controls and procedures were effective, as of that date, in ensuring that information required to be disclosed by the registrant in this Form N-CSR was recorded, processed, summarized, and reported timely.
(b) The registrant’s principal executive officer and principal financial officer are aware of no change in the registrant’s internal control over financial reporting that occurred during the registrant’s second fiscal quarter covered by this report that has materially affected, or is reasonably likely to materially affect, the registrant’s internal control over financial reporting.
Item 12. Exhibits.
(a)(1) The registrant’s code of ethics pursuant to Item 2 of Form N-CSR is attached.
(2) Separate certifications by the registrant's principal executive officer and principal financial officer, pursuant to Section 302 of the Sarbanes-Oxley Act of 2002 and required by Rule 30a-2(a) under the Investment Company Act of 1940, are attached.
(3) Written solicitation to repurchase securities issued by closed-end companies: not applicable.
(b) A certification by the registrant's principal executive officer and principal financial officer, pursuant to Section 906 of the Sarbanes-Oxley Act of 2002 and required by Rule 30a-2(b) under the Investment Company Act of 1940, is attached.
| | |
SIGNATURES |
| |
| | Pursuant to the requirements of the Securities Exchange Act of 1934 and the Investment |
| Company Act of 1940, the registrant has duly caused this report to be signed on its behalf by the |
| undersigned, thereunto duly authorized. |
| |
| T. Rowe Price Balanced Fund, Inc. |
| |
| |
| By | /s/ Edward C. Bernard |
| | Edward C. Bernard |
| | Principal Executive Officer |
| |
| Date | February 19, 2008 |
| |
| |
| |
| | Pursuant to the requirements of the Securities Exchange Act of 1934 and the Investment |
| Company Act of 1940, this report has been signed below by the following persons on behalf of |
| the registrant and in the capacities and on the dates indicated. |
| |
| |
| By | /s/ Edward C. Bernard |
| | Edward C. Bernard |
| | Principal Executive Officer |
| |
| Date | February 19, 2008 |
| |
| |
| |
| By | /s/ Joseph A. Carrier |
| | Joseph A. Carrier |
| | Principal Financial Officer |
| |
| Date | February 19, 2008 |