Item 1: Report to Shareholders| Balanced Fund | December 31, 2006 |
The views and opinions in this report were current as of December 31, 2006. They are not guarantees of performance or investment results and should not be taken as investment advice. Investment decisions reflect a variety of factors, and the managers reserve the right to change their views about individual stocks, sectors, and the markets at any time. As a result, the views expressed should not be relied upon as a forecast of the fund’s future investment intent. The report is certified under the Sarbanes-Oxley Act, which requires mutual funds and other public companies to affirm that, to the best of their knowledge, the information in their financial reports is fairly and accurately stated in all material respects.
REPORTS ON THE WEB
Sign up for our E-mail Program, and you can begin to receive updated fund reports and prospectuses online rather than through the mail. Log in to your account at troweprice.com for more information.
Fellow Shareholders
U.S. stocks rose strongly in the second half of 2006, capping the market’s fourth consecutive year of gains since the end of the 2000–2002 bear market. Bonds also produced excellent returns as intermediate-and long-term rates declined while the Federal Reserve kept the fed funds target rate at 5.25%. Non-U.S. stocks outperformed their domestic counterparts, aided by the U.S. dollar’s weakness versus European and some Asian currencies. The Balanced Fund’s broad diversification across these asset classes served investors well in 2006.
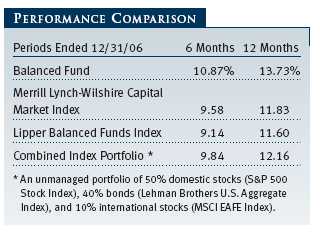
Your fund returned 10.87% in the second half of 2006 and 13.73% for the entire year. As shown in the Performance Comparison table, the fund did better than all of its benchmarks in both periods. In both halves of the year, the fund outperformed in large part from overweighting stocks and underweighting bonds. Strong absolute returns from international stocks coupled with an overweight in this segment also contributed to our relative performance. In addition, our bias in the domestic equity portfolio toward large-cap value stocks, which continued to outpace large-cap growth, contributed to our performance advantage.
HIGHLIGHTS
• Domestic and international stocks and U.S. bonds performed well in 2006, particularly in the last six months. The fund’s broad diversification across these asset classes served investors well.
• Your fund outperformed its benchmarks because it overweighted stocks and underweighted bonds. Strong returns from international stocks and our bias toward domestic large-cap value stocks also contributed.
• At year-end, equities represented 65% of the fund’s assets versus a 60% neutral weighting. We believe corporate profit growth will remain supportive of equities, though it is likely to trend lower as the economic expansion matures.
• The fund’s broad diversification is designed not only to help investors participate in market upswings but also to continue pursuing long-term financial goals during periods of more difficult market conditions, when weakness in some areas may be offset by gains in others.
MARKET ENVIRONMENT
U.S. economic growth moderated significantly over the course of 2006. According to the latest data, the economy expanded at an annualized rate of 2.0% in the third quarter versus 2.6% in the second and 5.6% in the first. The slowdown reflected a cooler housing market, softer manufacturing activity, and some deceleration of consumer spending amid high energy prices, rising mortgage costs, and slower housing equity growth.
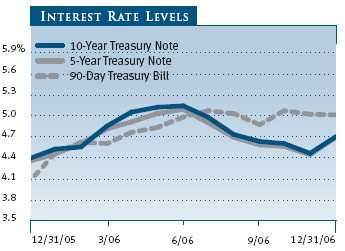
The overall rate of inflation eased somewhat as oil and gas prices declined from their summer peaks, but “core” inflation (excluding food and energy prices) remained above the stated comfort zone of Federal Reserve officials. Nevertheless, the central bank refrained from raising the fed funds rate in the last six months based on the moderation of U.S. economic growth and expectations that inflation will diminish over time. However, Fed officials believe that “some inflation risks remain” and have left open the possibility of additional rate increases.
U.S. stocks climbed in the last six months, recovering from a sharp decline from mid-May through mid-June. Equities were lifted by substantial merger and leveraged buyout activity, continued strong corporate earnings growth despite an economic deceleration, and declining oil prices and long-term interest rates. Investors were also pleased that the Federal Reserve kept the federal funds target rate steady in the second half while waiting for slower economic growth to help moderate inflation.
Small-cap shares lagged large-caps in the second half of the year but outperformed for the entire year. The small-cap Russell 2000 Index returned 9.38% and 18.37% in the 6- and 12-month periods ended December 31, 2006, respectively, versus 12.74% and 15.79% for the S&P 500 Index. As measured by various Russell indexes, value stocks did better than growth across all market capitalizations in both periods.
In the large-cap universe, all major sectors advanced in 2006. In the last six months, telecommunication services produced the strongest returns in percentage terms. Consumer discretionary, financials, information technology, and utilities stocks also did well, performing better than the broad market. Other sectors trailed, especially industrials and business services, energy, and consumer staples. For the entire year, telecommunication services and energy stocks produced the strongest gains, while health care and information technology—two traditional growth sectors—lagged substantially.
U.S. bonds produced good returns in 2006, thanks primarily to favorable performance stemming from falling intermediate- and long-term interest rates in the last six months. For the year, high-yield corporate bonds substantially outperformed investment-grade issues, as investors seeking higher returns continued to embrace risk. In the high-quality taxable bond market, mortgage-backed securities fared best, but corporate securities also did well. Treasuries lagged, as yields across all maturities at the end of 2006 were higher than at the end of 2005. The Lehman Brothers U.S. Aggregate Index, which measures the performance of domestic investment-grade taxable bonds, returned 5.09% in the second half of the year and 4.33% for the entire year.
Non-U.S. stock markets outperformed their domestic counterparts in the 6- and 12-month periods ended December 31, as returns were enhanced by the U.S. dollar’s weakness versus European and some Asian currencies. Despite a sharp pullback in the spring, emerging markets did best for the year. In the developed regions of the world, European equities produced excellent returns, whereas Japanese stock returns in U.S. dollar terms were less robust. The MSCI EAFE Index, which measures the performance of equities in Europe, Australasia, and the Far East, returned 14.80% in the second half of 2006 and 26.86% for the entire year.
ASSET ALLOCATION STRATEGY
Our allocations to the major asset classes changed very little in the second half of the year. As of December 31, the fund’s overall exposure to equities was 65% of assets—50% U.S. (unchanged from midyear) and 15% international (up from 14%)—which represented an overweighting relative to the combined index portfolio. We believe economic growth and corporate profits will remain supportive of equities, though they are likely to trend lower as the expansion matures. The remainder was invested in fixed-income securities, with cash reserves representing about 1% of assets.
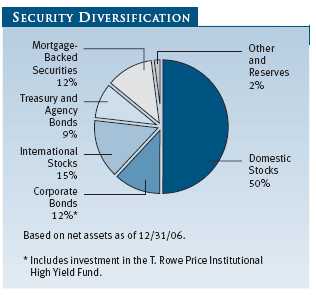
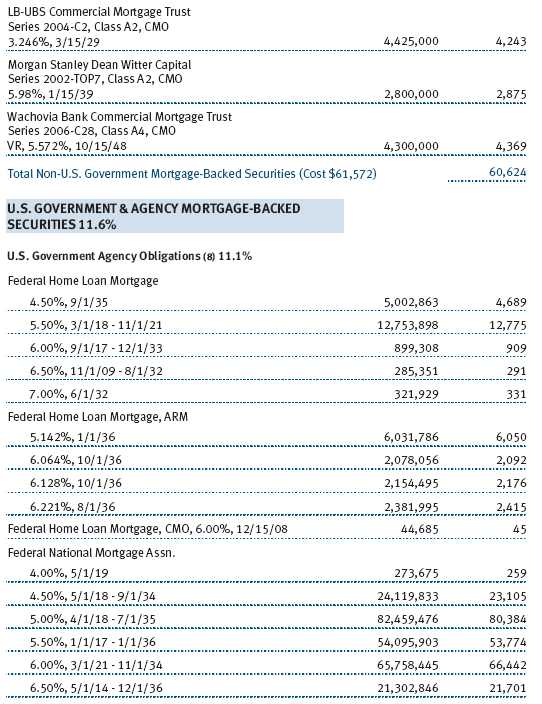
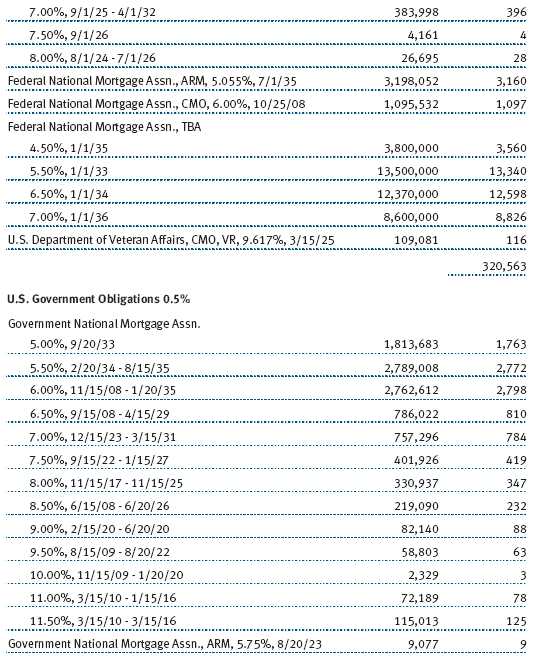
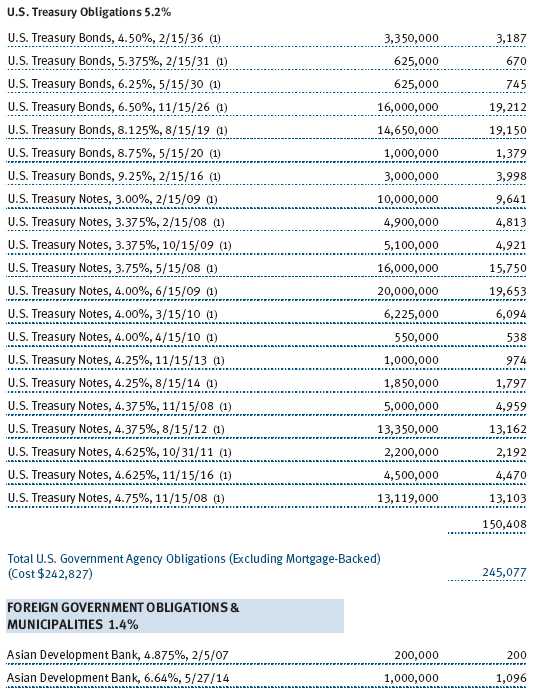
The fund’s underlying fixed-income allocations have changed somewhat in the last six months. Treasury and government agency bonds declined from 15% to 9% of assets, while corporate bonds were reduced from 16% to 12%. In contrast, mortgage-backed securities increased from 3% to 12%. We’ll discuss these changes in detail in the Domestic Bonds portion of the report.
PORTFOLIO REVIEW
Domestic Stocks
All major U.S. stock market sectors produced gains in the last six months. Financials, consumer discretionary, and information technology shares contributed the most to the domestic equity portfolio’s performance, whereas utilities and energy stocks were among the sectors that contributed the least. Our bias toward value stocks worked to our advantage throughout the year, as value maintained its performance advantage over growth.
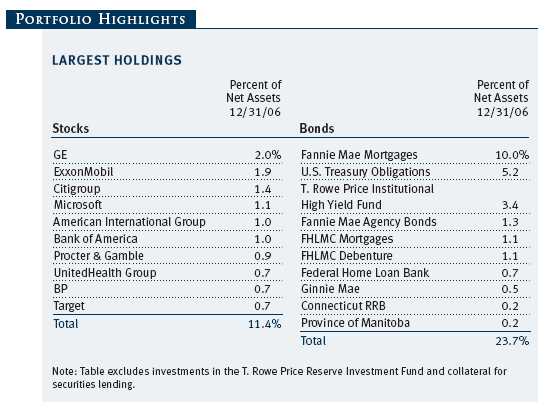
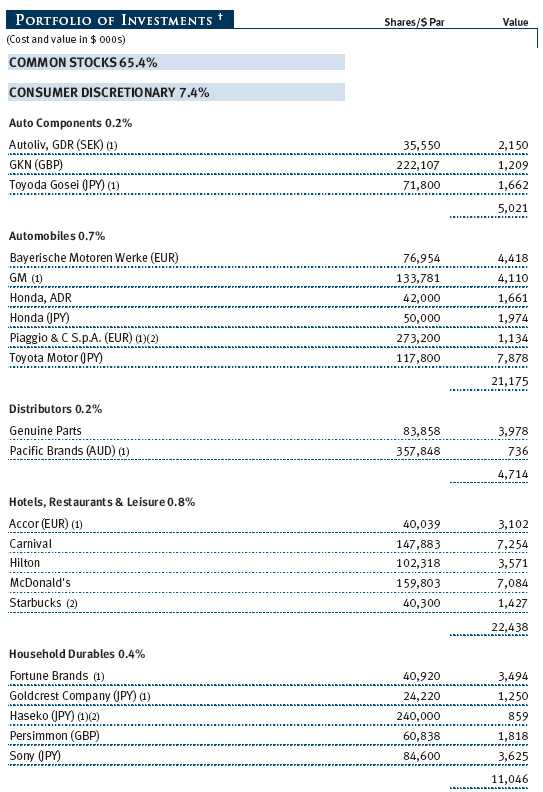
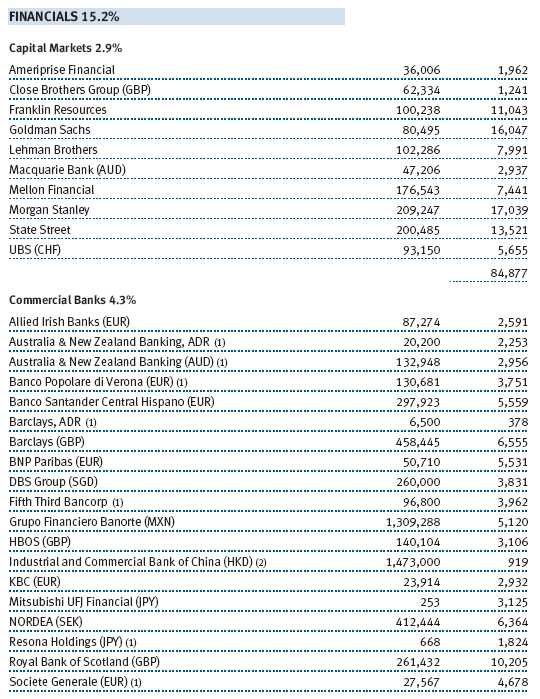
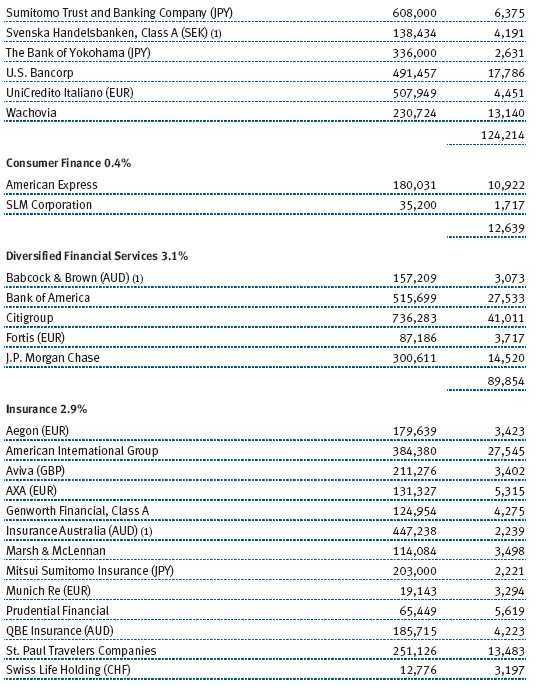
In the financials sector, Wall Street firms Goldman Sachs and Morgan Stanley and diversified financial services companies such as Citigroup advanced strongly, benefiting from favorable capital market conditions, falling interest rates, and increased investment banking revenues. Insurance companies American International Group and St. Paul Travelers Companies also performed well, helped by the dearth of disaster-related claims following a quiet 2006 Atlantic hurricane season. In addition, our position in Equity Office Properties, a real estate investment trust (REIT), produced good gains, thanks to a strong commercial (in contrast to residential) real estate market and a buyout offer from the Blackstone Group. (Please refer to the fund’s portfolio of investments for a complete listing of the fund’s holdings and the amount each represents in the portfolio.)
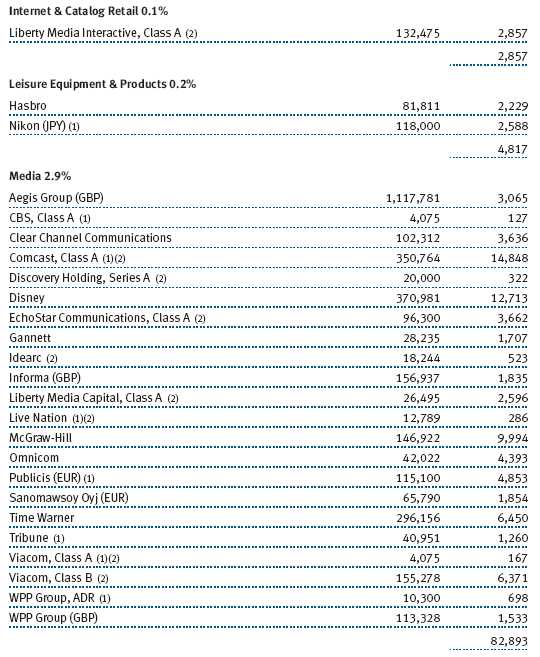
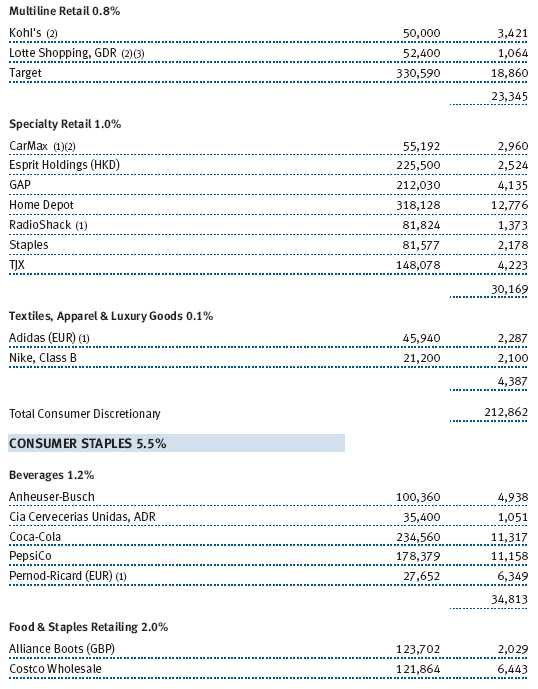
Stocks in the consumer discretionary sector outperformed the broad market in the second half of the year, as consumer spending was helped by falling oil and gas prices, increases in wages and personal income, and declining longer-term interest rates. Media stocks did well in response to leveraged buyout activity and some encouraging industry trends; Comcast was helped by acquisitions that increased the company’s cable revenues. Among specialty retailers, CarMax performed very well, as the company celebrated its first year of profitability and reported earnings that greatly surpassed expectations. Another noteworthy contributor to our results was fast-food restaurant chain McDonald’s, which reported strong sales and growth in North America and Europe.
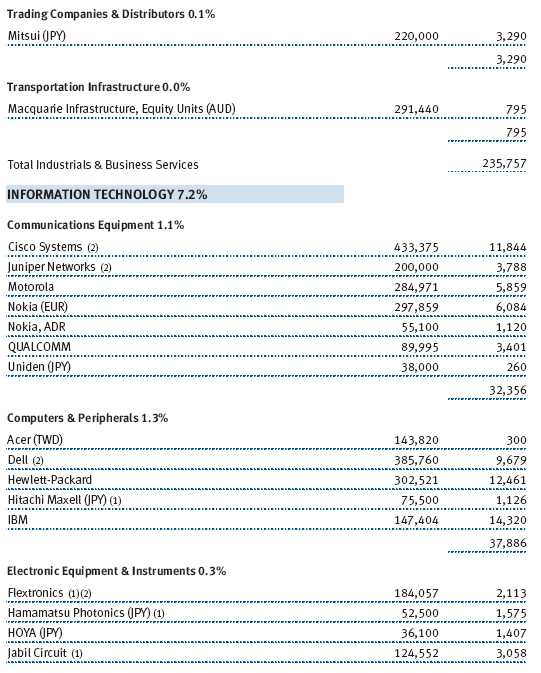
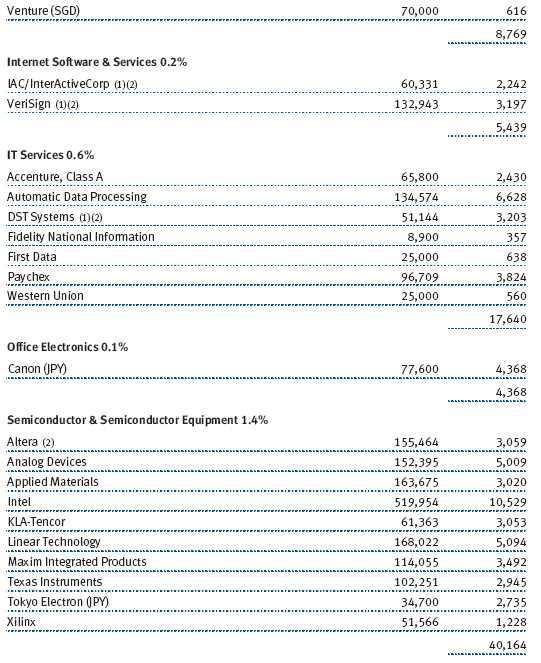
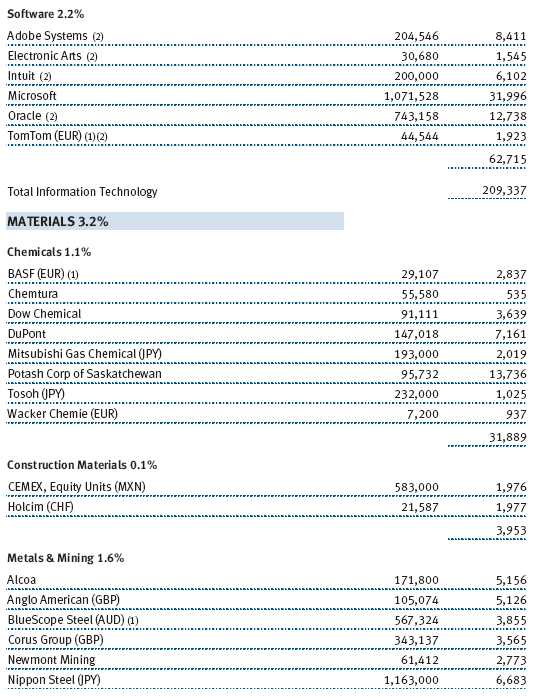
Information technology shares produced solid returns in the last six months. Software stocks did best, led by Microsoft, which benefited from bringing its Xbox 360 video game system to market ahead of competing products from Sony and Nintendo. IBM and Hewlett-Packard, which make PCs and peripheral devices, and communications equipment giant Cisco Systems were also large contributors to fund performance. Semiconductor stocks lagged.
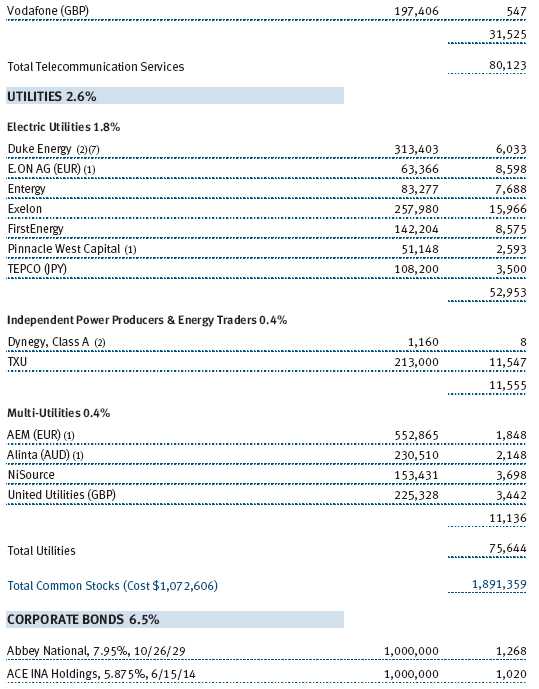
Utilities stocks contributed the least to the domestic equity portfolio’s results in the last six months—not because of poor performance in absolute terms, but rather because of their low representation in the portfolio. Utilities sometimes act like bonds because of their high dividend payouts, so falling interest rates in the last six months increased their appeal. Electric utilities Entergy, Duke Energy, and Exelon did very well, but TXU struggled as energy costs fell sharply in the second half of the year and the company reduced its earnings expectations for 2007.
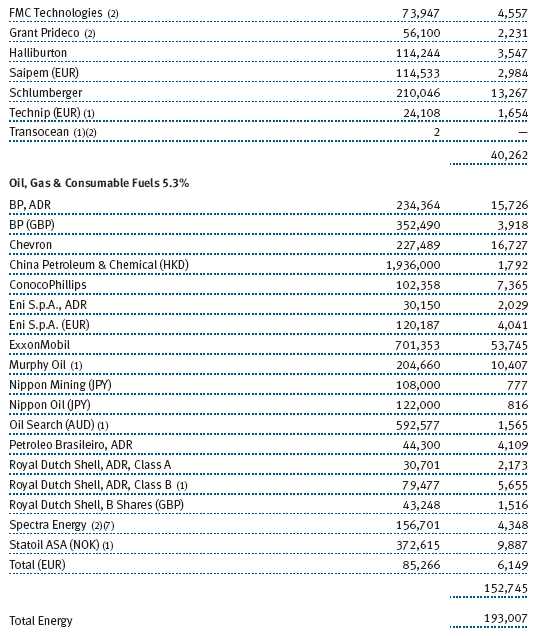
Falling oil and gas prices also weighed on the performance of energy stocks in the last six months. Almost all of our oil exploration, drilling, and services companies declined, with BJ Services and Halliburton detracting the most from our results. However, large integrated oil companies ExxonMobil and, to a lesser extent, Chevron produced substantial gains that offset the weakness of our other energy names.
International Stocks
Once again, the fund’s international holdings benefited the portfolio as non-U.S. markets outperformed the U.S. Additionally, the performance of our international holdings nicely exceeded that of the MSCI EAFE Index due to favorable stock selection, especially in the materials, financials, telecommunication services, and industrials and business services sectors. On a geographic basis, our lighter exposure to the weaker Japanese market aided results, as did our good stock selection there.
Financials were the top absolute contributors to the international portfolio’s performance, led by commercial banks Grupo Financiero Banorte (Mexico), Royal Bank of Scotland (U.K.), and Banco Santander Central Hispano (Spain). Banorte’s management is executing well amid growing penetration of banking services in Mexico, while Royal Bank of Scotland and Santander enjoyed solid fundamental prospects. Chinese residential housing developer China Overseas Land & Investment was our best absolute contributor, underpinned by rapid growth in demand for upper-end housing in China. Australian property and casualty insurer QBE Insurance also provided strong returns.
Despite generally lackluster market performance in Japan, two of our Japanese holdings stood out during the final half of 2006. Nippon Steel and Toyota Motor were among the international equity portfolio’s top absolute contributors. Toyota shares continued to reflect its gains in market share around the globe and commensurate positive profit outlook. We also saw strong performance from construction firm Acciona (Spain) and utility company E.ON (Germany).
The health care sector provided the international portfolio’s weakest absolute returns. Shares of French pharmaceutical company Sanofi-Aventis and U.K. drug giant GlaxoSmithKline declined on concerns of competition from generic drug makers and potential regulatory pressures on industry revenues. Reflecting the decline in crude oil prices, a number of our energy holdings declined, including Oil Search (Papua New Guinea), BP (U.K.), and Statoil ASA (Norway). We eliminated China Senhua Energy from the portfolio on the prospect of moderating coal prices and a more expensive stock valuation.
Domestic Bonds
Bonds produced solid returns as prices rose and longer-term interest rates fell in the second half of 2006. Nevertheless, stocks performed much better, so underweighting fixed-income securities helped the fund’s relative performance in the last six months.
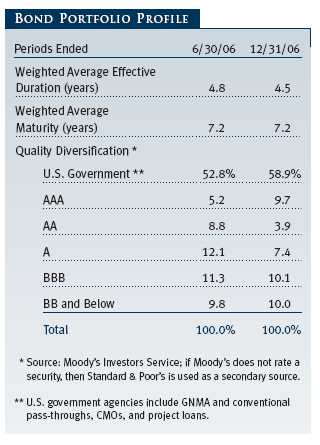
High-yield corporate bonds substantially outperformed investment-grade issues throughout the year, and our position in the T. Rowe Price Institutional High Yield Fund continued to add value in the last six months. In the high-quality universe, corporate and mortgage-backed securities outpaced Treasuries. Longer maturity bonds outperformed relative to shorter-maturity bonds over the last six months. Among the investment-grade sectors, BBB rated bonds outperformed higher-rated issues.
As mentioned earlier in the report, our fixed-income allocations changed somewhat during our reporting period. In the fourth quarter, we initiated a restructuring of the investment-grade fixed-income segment of the fund so that it more closely resembled the composition of the Lehman Brothers U.S. Aggregate Index, which is the fixed-income component of the fund’s combined index portfolio benchmark. The changes should not be construed as a reconsideration of our fixed-income strategy, but the net result is a substantial increase in exposure to mortgages and lower allocations to Treasury and investment-grade corporate bonds.
OUTLOOK
Although the current U.S. equity bull market has lasted more than four years, there is no indication that the bull is on its last legs. The economy seems to be expanding at a healthy pace, corporate profits remain strong, energy costs have fallen substantially from their peaks, and interest rates, though not as low as they were a few years ago, remain supportive. Still, after four years of strong returns, it is reasonable to expect any future gains to be more moderate, particularly if any of the current favorable trends come to an end.
The economies of Europe and, to a lesser degree, Japan have improved markedly in the past year, while fundamentals in emerging markets remain strong. We believe developed international markets are approaching fair value in absolute terms while they generally remain less expensive than the U.S. market. Emerging markets valuations are now in line with—and in some cases exceed—developed markets. In this environment, the universe of compelling stocks shrinks.
The world’s central banks remain on guard about inflation, but they have been judicious in raising rates so far. As long as price increases in the U.S. continue to be modest, we expect the Fed to keep its current neutral policy in place. We expect sturdier bond returns in 2007, due mainly to the higher income that investors are receiving from short- and intermediate-term securities. We have become more cautious about corporate bonds because of rising debt levels and stretched valuations in the high-yield market. However, we see good opportunities in high-quality bonds that offer higher yields than Treasuries, such as mortgage-backed securities.
Although we are pleased with the fund’s performance in 2006 and over the last four years, we are mindful that the major asset classes probably cannot continue their synchronized ascent indefinitely—certainly not at the same pace—because economic and market conditions are seldom static. The fund’s broad diversification is designed not only to help investors participate in market upswings but also to continue pursuing long-term financial goals during periods of more difficult market conditions, when weakness in some areas may be offset by gains in others. We believe that a diverse portfolio of U.S. stocks, international stocks, and domestic bonds can produce competitive long-term returns without the volatility of an all-stock portfolio, and we thank you for your continuing confidence in our investment management abilities.
Respectfully submitted,

Richard T. Whitney
Co-chairman of the fund’s Investment Advisory Committee

Edmund M. Notzon III
Co-chairman of the fund’s Investment Advisory Committee
January 25, 2007
The committee co-chairmen have day-to-day responsibility for managing the portfolio and work with committee members in developing and executing the fund’s investment program.
RISKS OF INVESTING IN STOCKS
As with all stock mutual funds, the fund’s share price can fall because of weakness in the stock market, a particular industry, or specific holdings. Stock markets can decline for many reasons, including adverse political or economic developments, changes in investor psychology, or heavy institutional selling. The prospects for an industry or company may deteriorate because of a variety of factors, including disappointing earnings or changes in the competitive environment. In addition, the investment manager’s assessment of companies held in a fund may prove incorrect, resulting in losses or poor performance even in rising markets.
RISKS OF INTERNATIONAL INVESTING
Funds that invest overseas generally carry more risk than funds that invest strictly in U.S. assets. Risks can result from varying stages of economic and political development, differing regulatory environments, trading days, and accounting standards, currency fluctuations, and higher transaction costs of non-U.S. markets. Investments outside the United States could be subject to governmental actions such as capital or currency controls, nationalization of a company or industry, expropriation of assets, or imposition of high taxes.
RISKS OF INVESTING IN BONDS
Funds that invest in bonds are subject to interest rate risk, the decline in bond prices that usually accompanies a rise in interest rates. Longer-maturity bonds typically decline more than those with shorter maturities. Funds that invest in bonds are also subject to credit risk, the chance that any fund holding could have its credit rating downgraded, or that a bond issuer will default (fail to make timely payments of interest or principal), potentially reducing the fund’s income level and share price.
GLOSSARY
Duration: The average time (expressed in years) needed for an investor to receive the present value of the future cash flows on a fixed-income investment. It is used to measure a bond or bond fund’s sensitivity to interest rate changes. For example, a fund with a five-year duration would fall about 5% in price in response to a one-percentage-point increase in interest rates, and vice versa.
Fed funds target rate: An overnight lending rate set by the Federal Reserve and used by banks to meet reserve requirements. Banks also use the fed funds rate as a benchmark for their prime lending rates.
Lehman Brothers U.S. Aggregate Index: A widely used benchmark for the domestic investment-grade bond market. The index typically includes more than 5,000 fixed-income securities with an overall intermediate- to long-term average maturity.
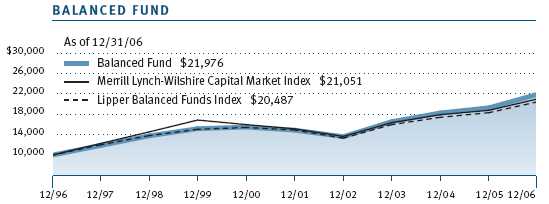
Lipper indexes: Consist of a small number (10 to 30) of the largest mutual funds in a particular category as tracked by Lipper Inc.
Merrill Lynch-Wilshire Capital Market Index: A market capitalization weighted index including the Wilshire 5000 and Merrill Lynch, High Yield II, and Domestic Master Indexes.
MSCI EAFE Index: Widely accepted as the benchmark for international stock performance (EAFE refers to Europe, Australasia, and Far East). The index represents the major markets of the world excluding the U.S. and Canada, is listed in local currency, and includes reinvestment of dividends.
S&P 500 Stock Index: Tracks the stocks of 500 mostly large U.S. companies.
This chart shows the value of a hypothetical $10,000 investment in the fund over the past 10 fiscal year periods or since inception (for funds lacking 10-year records). The result is compared with benchmarks, which may include a broad-based market index and a peer group average or index. Market indexes do not include expenses, which are deducted from fund returns as well as mutual fund averages and indexes.
| AVERAGE ANNUAL COMPOUND TOTAL RETURN |
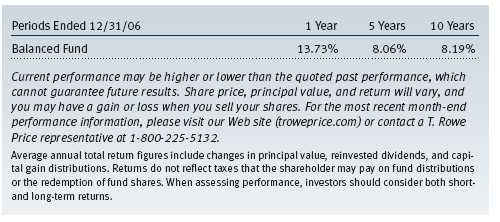
This table shows how the fund would have performed each year if its actual (or cumulative) returns for the periods shown had been earned at a constant rate.
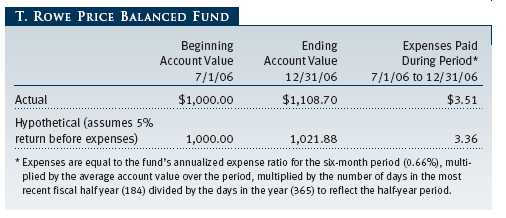
As a mutual fund shareholder, you may incur two types of costs: (1) transaction costs, such as redemption fees or sales loads, and (2) ongoing costs, including management fees, distribution and service (12b-1) fees, and other fund expenses. The following example is intended to help you understand your ongoing costs (in dollars) of investing in the fund and to compare these costs with the ongoing costs of investing in other mutual funds. The example is based on an investment of $1,000 invested at the beginning of the most recent six-month period and held for the entire period.
Actual Expenses
The first line of the following table (“Actual”) provides information about actual account values and expenses based on the fund’s actual returns. You may use the information in this line, together with your account balance, to estimate the expenses that you paid over the period. Simply divide your account value by $1,000 (for example, an $8,600 account value divided by $1,000 = 8.6), then multiply the result by the number in the first line under the heading “Expenses Paid During Period” to estimate the expenses you paid on your account during this period.
Hypothetical Example for Comparison Purposes
The information on the second line of the table (“Hypothetical”) is based on hypothetical account values and expenses derived from the fund’s actual expense ratio and an assumed 5% per year rate of return before expenses (not the fund’s actual return). You may compare the ongoing costs of investing in the fund with other funds by contrasting this 5% hypothetical example and the 5% hypothetical examples that appear in the shareholder reports of the other funds. The hypothetical account values and expenses may not be used to estimate the actual ending account balance or expenses you paid for the period.
Note: T. Rowe Price charges an annual small-account maintenance fee of $10, generally for accounts with less than $2,000 ($500 for UGMA/UTMA). The fee is waived for any investor whose T. Rowe Price mutual fund accounts total $25,000 or more, accounts employing automatic investing, and IRAs and other retirement plan accounts that utilize a prototype plan sponsored by T. Rowe Price (although a separate custodial or administrative fee may apply to such accounts). This fee is not included in the accompanying table. If you are subject to the fee, keep it in mind when you are estimating the ongoing expenses of investing in the fund and when comparing the expenses of this fund with other funds.
You should also be aware that the expenses shown in the table highlight only your ongoing costs and do not reflect any transaction costs, such as redemption fees or sales loads. Therefore, the second line of the table is useful in comparing ongoing costs only and will not help you determine the relative total costs of owning different funds. To the extent a fund charges transaction costs, however, the total cost of owning that fund is higher.
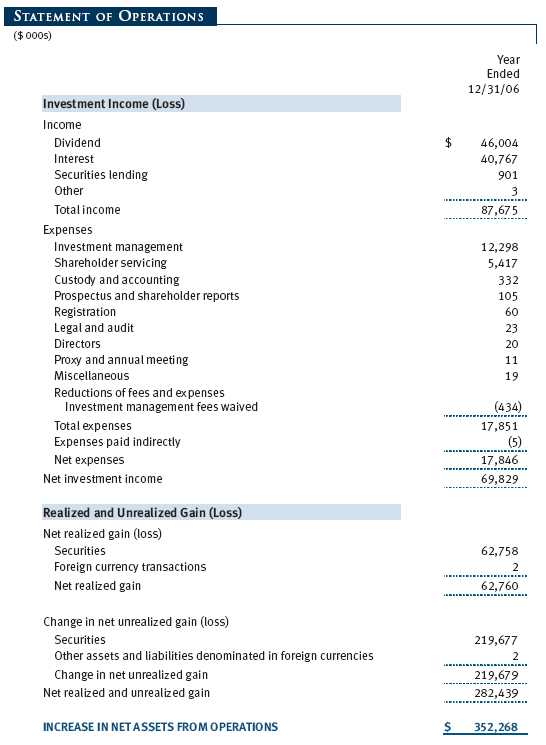
The accompanying notes are an integral part of these financial statements.


The accompanying notes are an integral part of these financial statements.

The accompanying notes are an integral part of these financial statements.
The accompanying notes are an integral part of these financial statements.

The accompanying notes are an integral part of these financial statements.
| NOTES TO FINANCIAL STATEMENTS |
NOTE 1 - SIGNIFICANT ACCOUNTING POLICIES
T. Rowe Price Balanced Fund, Inc. (the fund), is registered under the Investment Company Act of 1940 (the 1940 Act) as a diversified, open-end management investment company. The fund commenced operations on December 31, 1939. The fund seeks to provide capital growth, current income, and preservation of capital through a portfolio of stocks and fixed-income securities.
The accompanying financial statements were prepared in accordance with accounting principles generally accepted in the United States of America, which require the use of estimates made by fund management. Fund management believes that estimates and security valuations are appropriate; however, actual results may differ from those estimates, and the security valuations reflected in the financial statements may differ from the value the fund ultimately realizes upon sale of the securities.
Valuation The fund values its investments and computes its net asset value per share at the close of the New York Stock Exchange (NYSE), normally 4 p.m. ET, each day that the NYSE is open for business. Equity securities listed or regularly traded on a securities exchange or in the over-the-counter (OTC) market are valued at the last quoted sale price or, for certain markets, the official closing price at the time the valuations are made, except for OTC Bulletin Board securities, which are valued at the mean of the latest bid and asked prices. A security that is listed or traded on more than one exchange is valued at the quotation on the exchange determined to be the primary market for such security. Listed securities not traded on a particular day are valued at the mean of the latest bid and asked prices for domestic securities and the last quoted sale price for international securities.
Debt securities are generally traded in the over-the-counter market. Securities with original maturities of one year or more are valued at prices furnished by dealers who make markets in such securities or by an independent pricing service, which considers yield or price of bonds of comparable quality, coupon, maturity, and type, as well as prices quoted by dealers who make markets in such securities. Securities with original maturities of less than one year are valued at amortized cost in local currency, which approximates fair value when combined with accrued interest.
Investments in mutual funds are valued at the mutual fund’s closing net asset value per share on the day of valuation.
Other investments, including restricted securities, and those for which the above valuation procedures are inappropriate or are deemed not to reflect fair value are stated at fair value as determined in good faith by the T. Rowe Price Valuation Committee, established by the fund’s Board of Directors.
Most foreign markets close before the close of trading on the NYSE. If the fund determines that developments between the close of a foreign market and the close of the NYSE will, in its judgment, materially affect the value of some or all of its portfolio securities, which in turn will affect the fund’s share price, the fund will adjust the previous closing prices to reflect the fair value of the securities as of the close of the NYSE, as determined in good faith by the T. Rowe Price Valuation Committee, established by the fund’s Board of Directors. A fund may also fair value securities in other situations, such as when a particular foreign market is closed but the fund is open. In deciding whether to make fair value adjustments, the fund reviews a variety of factors, including developments in foreign markets, the performance of U.S. securities markets, and the performance of instruments trading in U.S. markets that represent foreign securities and baskets of foreign securities. The fund uses outside pricing services to provide it with closing market prices and information used for adjusting those prices. The fund cannot predict when and how often it will use closing prices and when it will adjust those prices to reflect fair value. As a means of evaluating its fair value process, the fund routinely compares closing market prices, the next day’s opening prices in the same markets, and adjusted prices.
Currency Translation Assets, including investments, and liabilities denominated in foreign currencies are translated into U.S. dollar values each day at the prevailing exchange rate, using the mean of the bid and asked prices of such currencies against U.S. dollars as quoted by a major bank. Purchases and sales of securities, income, and expenses are translated into U.S. dollars at the prevailing exchange rate on the date of the transaction. The effect of changes in foreign currency exchange rates on realized and unrealized security gains and losses is reflected as a component of security gains and losses.
Rebates and Credits Subject to best execution, the fund may direct certain security trades to brokers who have agreed to rebate a portion of the related brokerage commission to the fund in cash. Commission rebates are reflected as realized gain on securities in the accompanying financial statements and totaled $44,000 for the year ended December 31, 2006. Additionally, the fund earns credits on temporarily uninvested cash balances at the custodian that reduce the fund’s custody charges. Custody expense in the accompanying financial statements is presented before reduction for credits, which are reflected as expenses paid indirectly.
Investment Transactions, Investment Income, and Distributions Income and expenses are recorded on the accrual basis. Premiums and discounts on debt securities are amortized for financial reporting purposes. Dividends received from mutual fund investments are reflected as dividend income; capital gain distributions are reflected as realized gain/loss. Dividend income and capital gain distributions are recorded on the ex-dividend date. Investment transactions are accounted for on the trade date. Realized gains and losses are reported on the identified cost basis. Paydown gains and losses are recorded as an adjustment to interest income. Distributions to shareholders are recorded on the ex-dividend date. Income distributions are declared and paid on a quarterly basis. Capital gain distributions, if any, are declared and paid by the fund, typically on an annual basis.
New Accounting Pronouncements In June 2006, the Financial Accounting Standards Board (“FASB”) issued FASB Interpretation No. 48 (“FIN 48”), Accounting for Uncertainty in Income Taxes, a clarification of FASB Statement No. 109, Accounting for Income Taxes. FIN 48 establishes financial reporting rules regarding recognition and measurement of tax positions taken or expected to be taken on a tax return. Management is evaluating the anticipated impact, if any, that FIN 48 will have on the fund upon adoption, which, pursuant to a delay granted by the U.S. Securities and Exchange Commission, is expected to be on the last business day of the fund’s semi-annual period, June 29, 2007.
In September 2006, the FASB released the Statement of Financial Accounting Standard No. 157 (“FAS 157”), Fair Value Measurements. FAS 157 clarifies the definition of fair value and establishes the framework for measuring fair value, as well as proper disclosure of this methodology in the financial statements. It will be effective for the fund’s fiscal year beginning January 1, 2008. Management is evaluating the effects of FAS 157; however, it is not expected to have a material impact on the fund’s net assets or results of operations.
NOTE 2 - INVESTMENT TRANSACTIONS
Consistent with its investment objective, the fund engages in the following practices to manage exposure to certain risks or to enhance performance. The investment objective, policies, program, and risk factors of the fund are described more fully in the fund’s prospectus and Statement of Additional Information.
Restricted Securities The fund may invest in securities that are subject to legal or contractual restrictions on resale. Although certain of these securities may be readily sold, for example, under Rule 144A, others may be illiquid, their sale may involve substantial delays and additional costs, and prompt sale at an acceptable price may be difficult.
TBA Purchase Commitments During the year ended December 31, 2006, the fund entered into to be announced (TBA) purchase commitments, pursuant to which it agrees to purchase mortgage-backed securities for a fixed unit price, with payment and delivery at a scheduled future date beyond the customary settlement period for that security. With TBA transactions, the particular securities to be delivered are not identified at the trade date; however, delivered securities must meet specified terms, including issuer, rate, and mortgage term, and be within industry-accepted “good delivery” standards. The fund generally enters into TBAs with the intention of taking possession of the underlying mortgage securities. Until settlement, the fund maintains cash reserves and liquid assets sufficient to settle its TBAs.
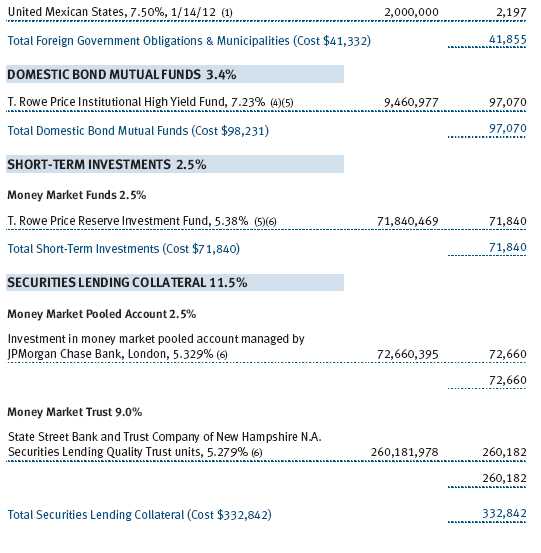
Securities Lending The fund lends its securities to approved brokers to earn additional income. It receives as collateral cash and U.S. government securities valued at 102% to 105% of the value of the securities on loan. Cash collateral is invested in money market pooled accounts managed by the fund’s lending agents in accordance with investment guidelines approved by fund management. Collateral is maintained over the life of the loan in an amount not less than the value of loaned securities, as determined at the close of fund business each day; any additional collateral required due to changes in security values is delivered to the fund the next business day. Although risk is mitigated by the collateral, the fund could experience a delay in recovering its securities and a possible loss of income or value if the borrower fails to return the securities. Securities lending revenue recognized by the fund consists of earnings on invested collateral and borrowing fees, net of any rebates to the borrower and compensation to the lending agent. At December 31, 2006, the value of loaned securities was $326,950,000; aggregate collateral consisted of $332,842,000 in money market pooled accounts and U.S. government securities valued at $5,593,000.
Other Purchases and sales of portfolio securities, other than short-term and U.S. government securities, aggregated $373,408,000 and $376,462,000, respectively, for the year ended December 31, 2006. Purchases and sales of U.S. government securities aggregated $863,409,000 and $751,255,000, respectively, for the year ended December 31, 2006.
NOTE 3 - FEDERAL INCOME TAXES
No provision for federal income taxes is required since the fund intends to continue to qualify as a regulated investment company under Subchapter M of the Internal Revenue Code and distribute to shareholders all of its taxable income and gains. Federal income tax regulations differ from generally accepted accounting principles; therefore, distributions determined in accordance with tax regulations may differ significantly in amount or character from net investment income and realized gains for financial reporting purposes. Financial reporting records are adjusted for permanent book/tax differences to reflect tax character. Financial records are not adjusted for temporary differences.
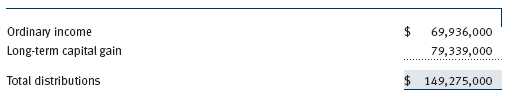
Distributions during the year ended December 31, 2006, were characterized as follows for tax purposes:
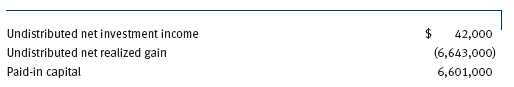
At December 31, 2006, the tax-basis components of net assets were as follows:
For the year ended December 31, 2006, the fund recorded the following permanent reclassifications to reflect tax character. Reclassifications to paid-in capital relate primarily to a tax practice that treats a portion of the proceeds from each redemption of capital shares as a distribution of taxable net investment income and/or realized capital gain. Results of operations and net assets were not affected by these reclassifications.
At December 31, 2006, the cost of investments for federal income tax purposes was $2,465,922,000.
NOTE 4 - RELATED PARTY TRANSACTIONS
The fund is managed by T. Rowe Price Associates, Inc. (the manager or Price Associates), a wholly owned subsidiary of T. Rowe Price Group, Inc. The investment management agreement between the fund and the manager provides for an annual investment management fee, which is computed daily and paid monthly. The fee consists of an individual fund fee, equal to 0.15% of the fund’s average daily net assets, and a group fee. The group fee rate is calculated based on the combined net assets of certain mutual funds sponsored by Price Associates (the group) applied to a graduated fee schedule, with rates ranging from 0.48% for the first $1 billion of assets to 0.29% for assets in excess of $160 billion. The fund’s group fee is determined by applying the group fee rate to the fund’s average daily net assets. At December 31, 2006, the effective annual group fee rate was 0.31%.
In addition, the fund has entered into service agreements with Price Associates and two wholly owned subsidiaries of Price Associates (collectively, Price). Price Associates computes the daily share price and provides certain other administrative services to the fund. T. Rowe Price Services, Inc., provides shareholder and administrative services in its capacity as the fund’s transfer and dividend disbursing agent. T. Rowe Price Retirement Plan Services, Inc., provides subaccounting and recordkeeping services for certain retirement accounts invested in the fund. For the year ended December 31, 2006, expenses incurred pursuant to these service agreements were $107,000 for Price Associates, $795,000 for T. Rowe Price Services, Inc., and $3,576,000 for T. Rowe Price Retirement Plan Services, Inc. The total amount payable at period-end pursuant to these service agreements is reflected as Due to Affiliates in the accompanying financial statements.
The fund may invest in the T. Rowe Price Reserve Investment Fund and the T. Rowe Price Government Reserve Investment Fund (collectively, the T. Rowe Price Reserve Funds), open-end management investment companies managed by Price Associates and affiliates of the fund. The T. Rowe Price Reserve Funds are offered as cash management options to mutual funds, trusts, and other accounts managed by Price Associates and/or its affiliates, and are not available for direct purchase by members of the public. The T. Rowe Price Reserve Funds pay no investment management fees. During the year ended December 31, 2006, dividend income from the T. Rowe Price Reserve Funds totaled $2,009,000, and the value of shares of the T. Rowe Price Reserve Funds held at December 31, 2006, and December 31, 2005, was $71,840,000 and $938,000, respectively.
The fund may invest in the T. Rowe Price Institutional High Yield Fund, Inc. (High Yield Fund) as a means of gaining efficient and cost-effective exposure to the high-yield bond markets. The High Yield Fund is an open-end management investment company managed by Price Associates, and an affiliate of the fund. The High Yield Fund pays an annual all-inclusive management and administrative fee to Price Associates equal to 0.50% of average daily net assets. To ensure that Balanced Fund does not incur duplicate fees for its assets invested in the High Yield Fund, Price Associates has agreed to reduce its management fee to the fund. Accordingly, the management fee waiver reflected on the accompanying Statement of Operations includes $434,000 of management fees permanently waived pursuant to this agreement. During the year ended December 31, 2006, purchases and sales of the High Yield Fund were $21,654,000 and $0, respectively. For the year then ended, net investment income was $7,028,000. At December 31, 2006, and December 31, 2005, the value of shares of the High Yield Fund held were $97,070,000 and $74,141,000, respectively.
| REPORT OF INDEPENDENT REGISTERED PUBLIC ACCOUNTING FIRM |
To the Board of Directors and Shareholders of
T. Rowe Price Balanced Fund, Inc.
In our opinion, the accompanying statement of assets and liabilities, including the portfolio of investments, and the related statements of operations and of changes in net assets and the financial highlights present fairly, in all material respects, the financial position of T. Rowe Price Balanced Fund, Inc. (the “Fund”) at December 31, 2006, the results of its operations for the year then ended, the changes in its net assets for each of the two years in the period then ended and the financial highlights for each of the five years in the period then ended, in conformity with accounting principles generally accepted in the United States of America. These financial statements and financial highlights (hereafter referred to as “financial statements”) are the responsibility of the Fund’s management; our responsibility is to express an opinion on these financial statements based on our audits. We conducted our audits of these financial statements in accordance with the auditing standards of the Public Company Accounting Oversight Board (United States). Those standards require that we plan and perform the audit to obtain reasonable assurance about whether the financial statements are free of material misstatement. An audit includes examining, on a test basis, evidence supporting the amounts and disclosures in the financial statements, assessing the accounting principles used and significant estimates made by management, and evaluating the overall financial statement presentation. We believe that our audits, which included confirmation of securities at December 31, 2006 by correspondence with the custodian and by agreement to the underlying ownership records for T. Rowe Price Investment Fund and T. Rowe Price Institutional High Yield Fund, provide a reasonable basis for our opinion.
PricewaterhouseCoopers LLP
Baltimore, Maryland
February 12, 2007
| TAX INFORMATION (UNAUDITED) FOR THE TAX YEAR ENDED 12/31/06 |
We are providing this information as required by the Internal Revenue Code. The amounts shown may differ from those elsewhere in this report because of differences between tax and financial reporting requirements.
The fund’s distributions to shareholders included:
• $3,697,000 from short-term capital gains,
• $82,243,000 from long-term capital gains, of which $82,168,000 was subject to the 15% rate gains category, and $75,000 to the 25% rate gains category.
For taxable non-corporate shareholders, $29,481,000 of the fund’s income represents qualified dividend income subject to the 15% rate category.
For corporate shareholders, $22,179,000 of the fund’s income qualifies for the dividends-received deduction.
| INFORMATION ON PROXY VOTING POLICIES, PROCEDURES, AND RECORDS |
A description of the policies and procedures used by T. Rowe Price funds and portfolios to determine how to vote proxies relating to portfolio securities is available in each fund’s Statement of Additional Information, which you may request by calling 1-800-225-5132 or by accessing the SEC’s Web site, www.sec.gov. The description of our proxy voting policies and procedures is also available on our Web site, www.troweprice.com. To access it, click on the words “Company Info” at the top of our homepage for individual investors. Then, in the window that appears, click on the “Proxy Voting Policy” navigation button in the top left corner.
Each fund’s most recent annual proxy voting record is available on our Web site and through the SEC’s Web site. To access it through our Web site, follow the directions above, then click on the words “Proxy Voting Record” at the bottom of the Proxy Voting Policy page.
| HOW TO OBTAIN QUARTERLY PORTFOLIO HOLDINGS |
The fund files a complete schedule of portfolio holdings with the Securities and Exchange Commission for the first and third quarters of each fiscal year on Form N-Q. The fund’s Form N-Q is available electronically on the SEC’s Web site (www.sec.gov); hard copies may be reviewed and copied at the SEC’s Public Reference Room, 450 Fifth St. N.W., Washington, DC 20549. For more information on the Public Reference Room, call 1-800-SEC-0330.
| ABOUT THE FUND’S DIRECTORS AND OFFICERS |
Your fund is governed by a Board of Directors that meets regularly to review a wide variety of matters affecting the fund, including performance, investment programs, compliance matters, advisory fees and expenses, service providers, and other business affairs. The Board of Directors elects the fund’s officers, who are listed in the final table. At least 75% of Board members are independent of T. Rowe Price Associates, Inc. (T. Rowe Price), and T. Rowe Price International, Inc. (T. Rowe Price International); “inside” or “interested” directors are officers of T. Rowe Price. The business address of each director and officer is 100 East Pratt Street, Baltimore, Maryland 21202. The Statement of Additional Information includes additional information about the fund directors and is available without charge by calling a T. Rowe Price representative at 1-800-225-5132.
| Independent Directors | |
| |
| Name | |
| (Year of Birth) | Principal Occupation(s) During Past 5 Years and Directorships of |
| Year Elected * | Other Public Companies |
| |
| Jeremiah E. Casey | Director, Allfirst Financial Inc. (previously First Maryland Bankcorp) |
| (1940) | (1983 to 2002); Director, National Life Insurance (2001 to 2005); |
| 2005 | Director, The Rouse Company, real estate developers (1990 to 2004) |
| |
| Anthony W. Deering | Chairman, Exeter Capital, LLC, a private investment firm (2004 to |
| (1945) | present); Director, Vornado Real Estate Investment Trust (3/04 to |
| 2001 | present); Director, Mercantile Bankshares (4/03 to present); Member, |
| | Advisory Board, Deutsche Bank North America (2004 to present); |
| | Director, Chairman of the Board, and Chief Executive Officer, The |
| | Rouse Company, real estate developers (1997 to 2004) |
| |
| Donald W. Dick, Jr. | Principal, EuroCapital Advisors, LLC, an acquisition and management |
| (1943) | advisory firm; Chairman, President, and Chief Executive Officer, |
| 1991 | The Haven Group, a custom manufacturer of modular homes |
| | (1/04 to present) |
| |
| David K. Fagin | Chairman and President, Nye Corporation (6/88 to present); Director, |
| (1938) | Canyon Resources Corp., Golden Star Resources Ltd. (5/92 to pres- |
| 1991 | ent), and Pacific Rim Mining Corp. (2/02 to present) |
| |
| Karen N. Horn | Director, Federal National Mortgage Association (9/06 to present); |
| (1943) | Managing Director and President, Global Private Client Services, |
| 2003 | Marsh Inc. (1999 to 2003); Director, Georgia Pacific (5/04 to |
| | 12/05), Eli Lilly and Company, and Simon Property Group |
| |
| Theo C. Rodgers | President, A&R Development Corporation |
| (1941) | |
| 2005 | |
| | |
| John G. Schreiber | Owner/President, Centaur Capital Partners, Inc., a real estate invest- |
| (1946) | ment company; Partner, Blackstone Real Estate Advisors, L.P. |
| 2001 | |
* Each independent director oversees 115 T. Rowe Price portfolios and serves until retirement, resignation, or election of a successor.
| Inside Directors | |
| |
| Name | |
| (Year of Birth) | |
| Year Elected * | |
| [Number of T. Rowe Price | Principal Occupation(s) During Past 5 Years and Directorships of |
| Portfolios Overseen] | Other Public Companies |
| |
| Edward C. Bernard | Director and Vice President, T. Rowe Price and T. Rowe Price Group, |
| (1956) | Inc.; Chairman of the Board, Director, and President, T. Rowe Price |
| 2006 | Investment Services, Inc.; Chairman of the Board and Director, |
| [115] | T. Rowe Price International, Inc., T. Rowe Price Retirement Plan |
| | Services, Inc., T. Rowe Price Services, Inc., and T. Rowe Price Savings |
| | Bank; Director, T. Rowe Price Global Asset Management Limited and |
| | T. Rowe Price Global Investment Services Limited; Chief Executive |
| | Officer, Chairman of the Board, Director, and President, T. Rowe |
| | Price Trust Company; Chairman of the Board, all funds |
| |
| Brian C. Rogers, CFA, CIC | Chief Investment Officer, Director, and Vice President, T. Rowe |
| (1955) | Price and T. Rowe Price Group, Inc.; Vice President, T. Rowe Price |
| 2006 | Trust Company |
| [62] | |
* Each inside director serves until retirement, resignation, or election of a successor.
| Officers | |
| |
| Name (Year of Birth) | |
| Title and Fund(s) Served | Principal Occupation(s) |
| |
| E. Frederick Bair, CFA, CPA (1969) | Vice President, T. Rowe Price, T. Rowe Price |
| Vice President, Balanced Fund | Group, Inc., and T. Rowe Price Trust Company |
| |
| Stephen W. Boesel (1944) | Vice President, T. Rowe Price, T. Rowe Price |
| Vice President, Balanced Fund | Group, Inc., and T. Rowe Price Trust Company |
| |
| Joseph A. Carrier, CPA (1960) | Vice President, T. Rowe Price, T. Rowe Price |
| Treasurer, Balanced Fund | Group, Inc., T. Rowe Price Investment Services, |
| | Inc., and T. Rowe Price Trust Company |
| |
| Wendy R. Diffenbaugh (1953) | Vice President, T. Rowe Price |
| Vice President, Balanced Fund | |
| |
| Roger L. Fiery III, CPA (1959) | Vice President, T. Rowe Price, T. Rowe Price |
| Vice President, Balanced Fund | Group, Inc., T. Rowe Price International, Inc., |
| | and T. Rowe Price Trust Company |
| |
| John R. Gilner (1961) | Chief Compliance Officer and Vice President, |
| Chief Compliance Officer, Balanced Fund | T. Rowe Price; Vice President, T. Rowe Price |
| | Group, Inc., and T. Rowe Price Investment |
| | Services, Inc. |
| |
| Gregory S. Golczewski (1966) | Vice President, T. Rowe Price and T. Rowe Price |
| Vice President, Balanced Fund | Trust Company |
| |
| Henry H. Hopkins (1942) | Director and Vice President, T. Rowe Price |
| Vice President, Balanced Fund | Investment Services, Inc., T. Rowe Price |
| | Services, Inc., and T. Rowe Price Trust |
| | Company; Vice President, T. Rowe Price, |
| | T. Rowe Price Group, Inc., T. Rowe Price |
| | International, Inc., and T. Rowe Price |
| | Retirement Plan Services, Inc. |
| |
| Patricia B. Lippert (1953) | Assistant Vice President, T. Rowe Price and |
| Secretary, Balanced Fund | T. Rowe Price Investment Services, Inc. |
| |
| Raymond A. Mills, Ph.D., CFA (1960) | Vice President, T. Rowe Price, T. Rowe Price |
| Vice President, Balanced Fund | Group, Inc., and T. Rowe Price International, Inc. |
| |
| Edmund M. Notzon III, Ph.D., CFA (1945) | Vice President, T. Rowe Price, T. Rowe Price |
| President, Balanced Fund | Group, Inc., T. Rowe Price Investment Services, |
| | Inc., and T. Rowe Price Trust Company |
| | |
| Mark J. Vaselkiv (1958) | Vice President, T. Rowe Price and T. Rowe Price |
| Vice President, Balanced Fund | Group, Inc. |
| |
| Julie L. Waples (1970) | Vice President, T. Rowe Price |
| Vice President, Balanced Fund | |
| |
| Richard T. Whitney, CFA (1958) | Vice President, T. Rowe Price, T. Rowe Price |
| Executive Vice President, Balanced Fund | Group, Inc., T. Rowe Price International, Inc., |
| | and T. Rowe Price Trust Company |
Unless otherwise noted, officers have been employees of T. Rowe Price or T. Rowe Price International for at least five years.
Item 2. Code of Ethics.
The registrant has adopted a code of ethics, as defined in Item 2 of Form N-CSR, applicable to its principal executive officer, principal financial officer, principal accounting officer or controller, or persons performing similar functions. A copy of this code of ethics is filed as an exhibit to this Form N-CSR. No substantive amendments were approved or waivers were granted to this code of ethics during the period covered by this report.
Item 3. Audit Committee Financial Expert.
The registrant’s Board of Directors/Trustees has determined that Mr. Donald W. Dick Jr. qualifies as an audit committee financial expert, as defined in Item 3 of Form N-CSR. Mr. Dick is considered independent for purposes of Item 3 of Form N-CSR.
Item 4. Principal Accountant Fees and Services.
(a) – (d) Aggregate fees billed to the registrant for the last two fiscal years for professional services rendered by the registrant’s principal accountant were as follows:
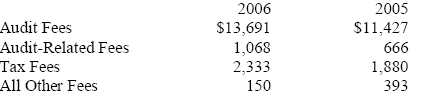
Audit fees include amounts related to the audit of the registrant’s annual financial statements and services normally provided by the accountant in connection with statutory and regulatory filings. Audit-related fees include amounts reasonably related to the performance of the audit of the registrant’s financial statements and specifically include the issuance of a report on internal controls and, if applicable for 2006, agreed-upon procedures related to fund acquisitions. Tax fees include amounts related to services for tax compliance, tax planning, and tax advice. The nature of these services specifically includes the review of distribution calculations and the preparation of Federal, state, and excise tax returns. Reclassification from tax fees to audit fees of fiscal 2005 amounts related to the auditing of tax disclosures within the registrant’s annual financial statements has been made in order to conform to fiscal 2006 presentation. All other fees include the registrant’s pro-rata share of amounts for agreed-upon procedures in conjunction with service contract approvals by the registrant’s Board of Directors/Trustees.
(e)(1) The registrant’s audit committee has adopted a policy whereby audit and non-audit services performed by the registrant’s principal accountant for the registrant, its investment adviser, and any entity controlling, controlled by, or under common control with the investment adviser that provides ongoing services to the registrant require pre-approval in advance at regularly scheduled audit committee meetings. If such a service is required between regularly scheduled audit committee meetings, pre-approval may be authorized by one audit committee member with ratification at the next scheduled audit committee meeting. Waiver of pre-approval for audit or non-audit services requiring fees of a de minimis amount is not permitted.
(2) No services included in (b) – (d) above were approved pursuant to paragraph (c)(7)(i)(C) of Rule 2-01 of Regulation S-X.
(f) Less than 50 percent of the hours expended on the principal accountant’s engagement to audit the registrant’s financial statements for the most recent fiscal year were attributed to work performed by persons other than the principal accountant’s full-time, permanent employees.
(g) The aggregate fees billed for the most recent fiscal year and the preceding fiscal year by the registrant’s principal accountant for non-audit services rendered to the registrant, its investment adviser, and any entity controlling, controlled by, or under common control with the investment adviser that provides ongoing services to the registrant were $1,401,000 and $883,000, respectively, and were less than the aggregate fees billed for those same periods by the registrant’s principal accountant for audit services rendered to the T. Rowe Price Funds. Preceding fiscal year amount reflects the reclassification of tax fees described in (a) – (d) above.
(h) All non-audit services rendered in (g) above were pre-approved by the registrant’s audit committee. Accordingly, these services were considered by the registrant’s audit committee in maintaining the principal accountant’s independence.
Item 5. Audit Committee of Listed Registrants.
Not applicable.
Item 6. Schedule of Investments.
Not applicable. The complete schedule of investments is included in Item 1 of this Form N-CSR.
Item 7. Disclosure of Proxy Voting Policies and Procedures for Closed-End Management Investment Companies.
Not applicable.
Item 8. Portfolio Managers of Closed-End Management Investment Companies.
Not applicable.
Item 9. Purchases of Equity Securities by Closed-End Management Investment Company and Affiliated Purchasers.
Not applicable.
Item 10. Submission of Matters to a Vote of Security Holders.
Not applicable.
Item 11. Controls and Procedures.
(a) The registrant’s principal executive officer and principal financial officer have evaluated the registrant’s disclosure controls and procedures within 90 days of this filing and have concluded that the registrant’s disclosure controls and procedures were effective, as of that date, in ensuring that information required to be disclosed by the registrant in this Form N-CSR was recorded, processed, summarized, and reported timely.
(b) The registrant’s principal executive officer and principal financial officer are aware of no change in the registrant’s internal control over financial reporting that occurred during the registrant’s second fiscal quarter covered by this report that has materially affected, or is reasonably likely to materially affect, the registrant’s internal control over financial reporting.
Item 12. Exhibits.
(a)(1) The registrant’s code of ethics pursuant to Item 2 of Form N-CSR is attached.
(2) Separate certifications by the registrant's principal executive officer and principal financial officer, pursuant to Section 302 of the Sarbanes-Oxley Act of 2002 and required by Rule 30a-2(a) under the Investment Company Act of 1940, are attached.
(3) Written solicitation to repurchase securities issued by closed-end companies: not applicable.
(b) A certification by the registrant's principal executive officer and principal financial officer, pursuant to Section 906 of the Sarbanes-Oxley Act of 2002 and required by Rule 30a-2(b) under the Investment Company Act of 1940, is attached.
| | |
SIGNATURES |
| |
| | Pursuant to the requirements of the Securities Exchange Act of 1934 and the Investment |
| Company Act of 1940, the registrant has duly caused this report to be signed on its behalf by the |
| undersigned, thereunto duly authorized. |
| |
| T. Rowe Price Balanced Fund, Inc. |
| |
| |
| |
| By | /s/ Edward C. Bernard |
| | Edward C. Bernard |
| | Principal Executive Officer |
| |
| Date | February 16, 2007 |
| |
| |
| | Pursuant to the requirements of the Securities Exchange Act of 1934 and the Investment |
| Company Act of 1940, this report has been signed below by the following persons on behalf of |
| the registrant and in the capacities and on the dates indicated. |
| |
| |
| By | /s/ Edward C. Bernard |
| | Edward C. Bernard |
| | Principal Executive Officer |
| |
| Date | February 16, 2007 |
| |
| |
| |
| By | /s/ Joseph A. Carrier |
| | Joseph A. Carrier |
| | Principal Financial Officer |
| |
| Date | February 16, 2007 |