| UNITED STATES |
| SECURITIES AND EXCHANGE COMMISSION |
| Washington, D.C. 20549 |
| |
FORM N-CSR |
| |
CERTIFIED SHAREHOLDER REPORT OF REGISTERED |
MANAGEMENT INVESTMENT COMPANIES |
| |
| |
| |
| Investment Company Act File Number: 811-6275 |
|
| |
| T. Rowe Price Balanced Fund, Inc. |
|
| (Exact name of registrant as specified in charter) |
| |
| 100 East Pratt Street, Baltimore, MD 21202 |
|
| (Address of principal executive offices) |
| |
| David Oestreicher |
| 100 East Pratt Street, Baltimore, MD 21202 |
|
| (Name and address of agent for service) |
| |
| |
| Registrant’s telephone number, including area code: (410) 345-2000 |
| |
| |
| Date of fiscal year end: December 31 |
| |
| |
| Date of reporting period: December 31, 2008 |
Item 1: Report to Shareholders| Balanced Fund | December 31, 2008 |
The views and opinions in this report were current as of December 31, 2008. They are not guarantees of performance or investment results and should not be taken as investment advice. Investment decisions reflect a variety of factors, and the managers reserve the right to change their views about individual stocks, sectors, and the markets at any time. As a result, the views expressed should not be relied upon as a forecast of the fund’s future investment intent. The report is certified under the Sarbanes-Oxley Act, which requires mutual funds and other public companies to affirm that, to the best of their knowledge, the information in their financial reports is fairly and accurately stated in all material respects.
REPORTS ON THE WEB
Sign up for our E-mail Program, and you can begin to receive updated fund reports and prospectuses online rather than through the mail. Log in to your account at troweprice.com for more information.
Managers’ Letter
Fellow Shareholders
The past six months have been among the most turbulent in memory. U.S. stock and bond markets suffered punishing blows as a result of a deeply weakened financial system stemming from the credit crisis. The collapse spread quickly, impairing global economies that struggled with a jolt to demand and consumer confidence. With the exception of Treasury securities, there were no safe havens—all asset classes suffered substantial declines. As a result, the broadly diversified Balanced Fund generated losses for the past six and 12 months.
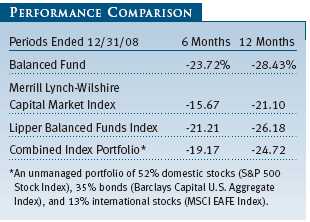
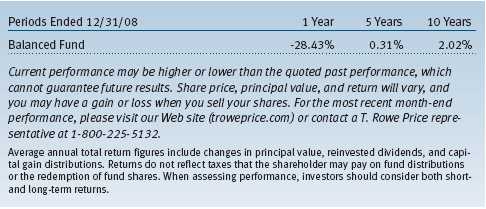
Your fund declined 23.72% in the second half of 2008 and 28.43% for the entire year. As shown in the Performance Comparison table, the fund lagged the benchmarks for both periods. For the year, the driving force for the portfolio’s underperformance was stock and bond selection in the equity and fixed-income markets. Large-cap growth stocks were the largest detractor on relative performance. Our international stock holdings also hurt results. The high-yield portion of our fixed-income allocation performed better than its benchmark, but the inclusion of the bonds in the portfolio hurt performance relative to the Barclays Capital U.S. Aggregate benchmark, an investment-grade bond index.
HIGHLIGHTS
• U.S. and international stocks plummeted amid worsening economic conditions in the second half of 2008, while bonds generated mixed results.
• The Balanced Fund posted steep losses in the last six months, despite its broadly diversified portfolio of holdings.
• Stock selection hurt overall performance. However, we believe that slower economic growth will benefit our overweight allocation to equities relative to bonds.
• We believe that shareholders will be well-served over the long term by the fund’s fundamental commitment to diversification.
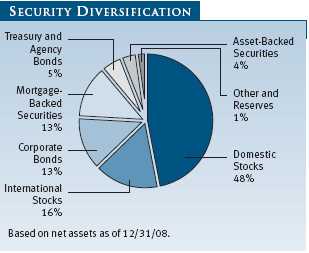
The period was extremely humbling. Despite the once-in-a-generation perfect storm that hit the bond and stock markets, we remain committed to our investment approach, which incorporates a disciplined strategy, broad diversification, and a long-term focus. Although diversification could not withstand the simultaneous collapses in the equity and bond markets and prevent short-term losses, we believe that over the long term, diversification has a time-tested track record as a prudent investment approach to moderate a portfolio’s volatility.
MARKET ENVIRONMENT
For about a year, the U.S. economy was weakening and, in early December 2008, the National Bureau of Economic Research announced that the U.S. has been in recession since December 2007. The average recession is just eight months, but this downturn is projected to be longer and steeper. Growth is expected to remain anemic for at least half of 2009, and any recovery is now forecast to begin some time in the second half of the year. The number of job losses grows each week, and the unemployment rate reached 7.2% in December 2008, the highest level in 15 years. Crude oil prices, a dominant concern several months ago when the cost of a barrel was more than $140, have now dropped to below $40 per barrel.
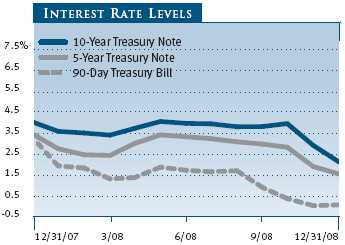
As inflation fears subsided, investors became anxious about possible deflation, the widespread erosion in prices that could ultimately curb demand and corporate investment. Despite the Federal Reserve’s policy of lowering interest rates and infusing financial markets with cash, credit market liquidity remained problematic throughout the summer and fall. By the end of the period, trading in high-yield bonds and commercial mortgage-backed securities had been curtailed, and only the most creditworthy investment-grade corporate issues were changing hands. Meanwhile, investors seeking a safe haven drove Treasury yields to historic lows, with the two-year note dropping to 0.76% in December.
U.S. stocks were volatile: There were weeks when the Dow Jones Industrial Average fell several hundred points in a day and then recovered 300 or 400 points the next day, only to drop by a larger amount in the following days. The cumulative effect was to drive stocks much lower. Growth and value stocks lost considerable ground, but value stocks held up slightly better.
Small-cap shares outpaced large-caps in the last six months and for the full year. The small-cap Russell 2000 Index returned -26.94% and -33.79% in the 6- and 12-month periods ended December 31, 2008, respectively, versus -28.48% and - -37.00% for the S&P 500 Index. As measured by various Russell indexes, growth stocks underperformed value stocks across all market capitalizations for both periods.
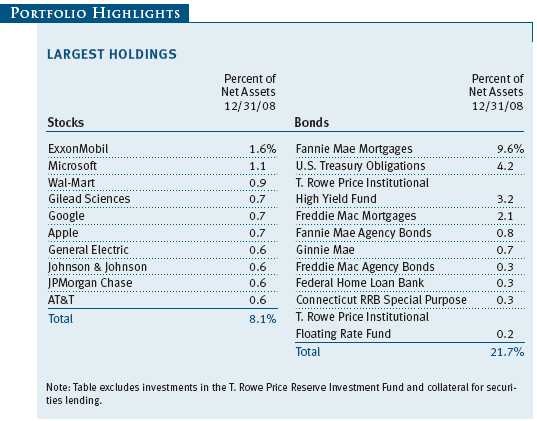
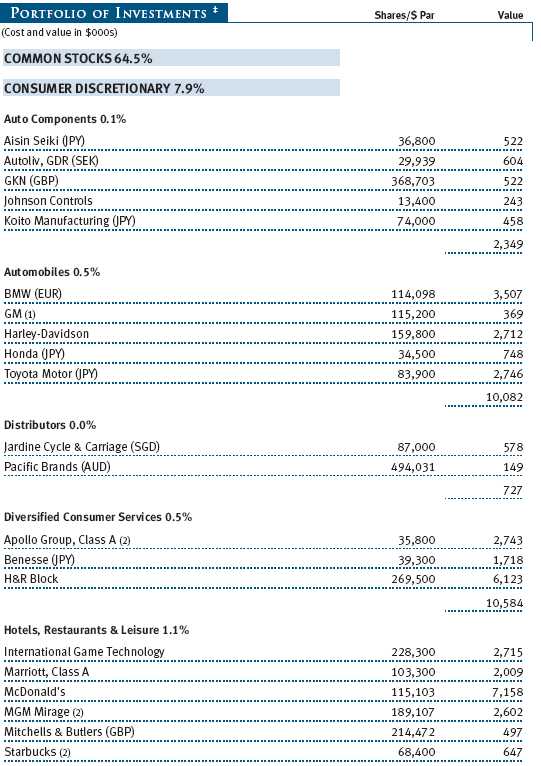
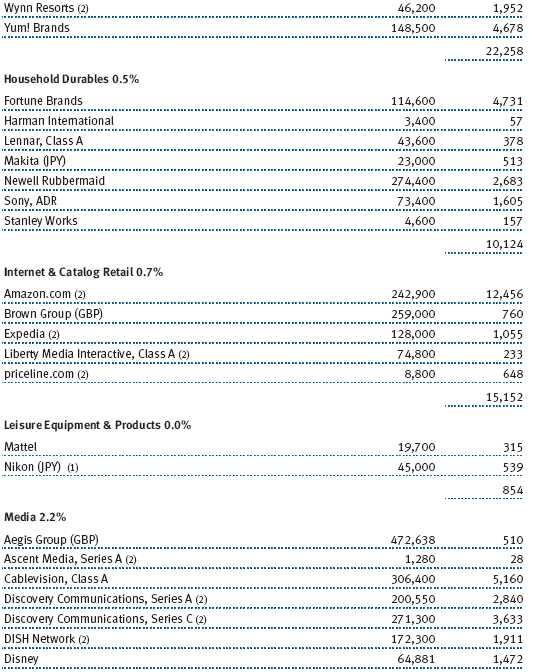
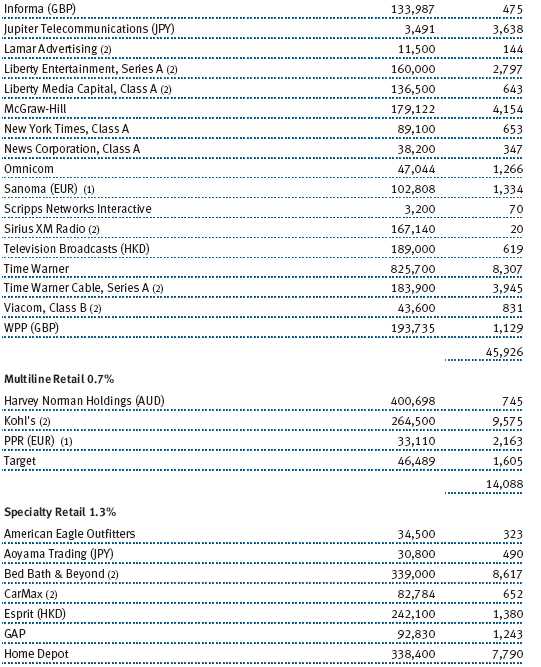
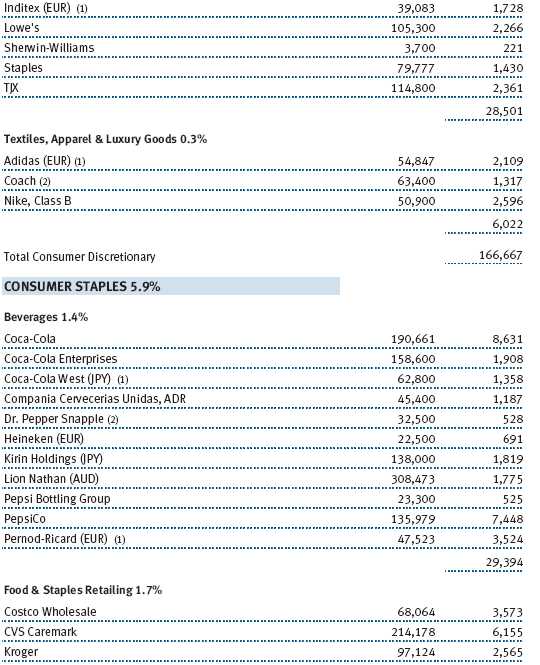
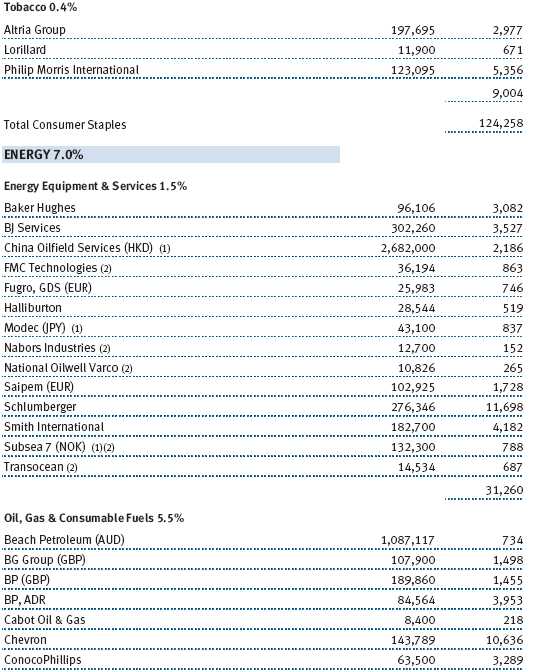
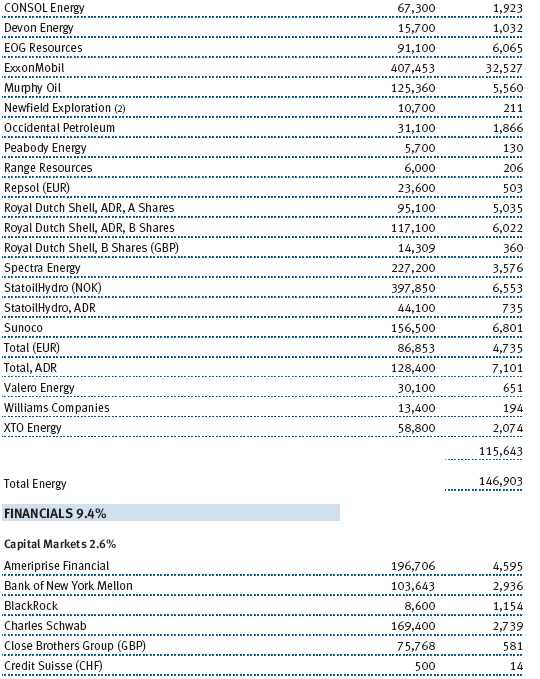
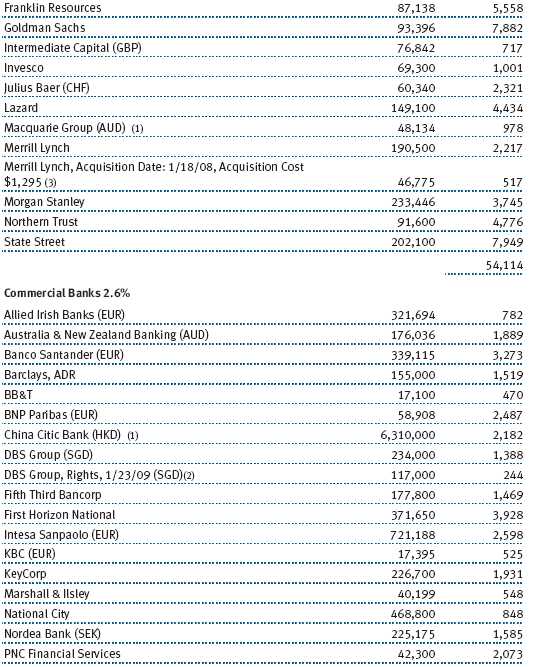
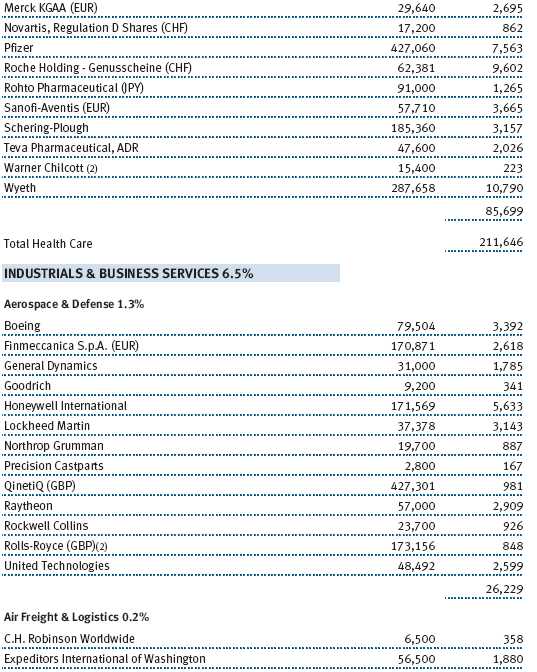
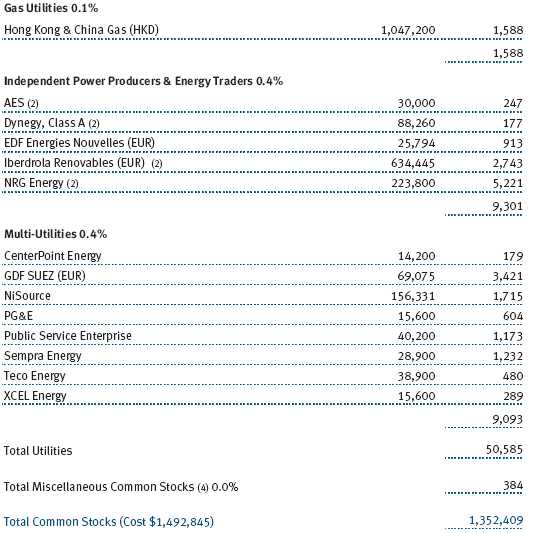
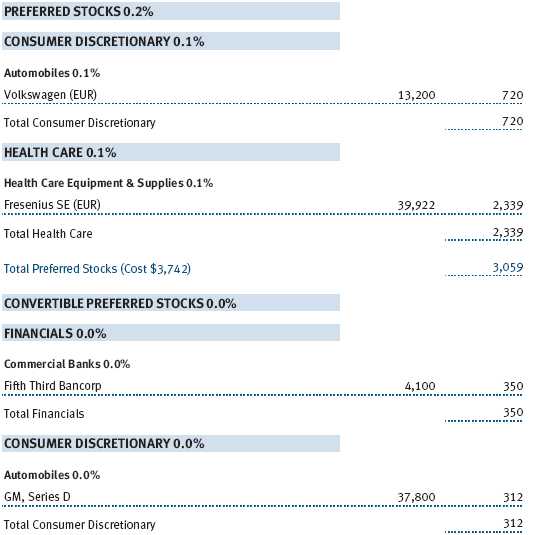
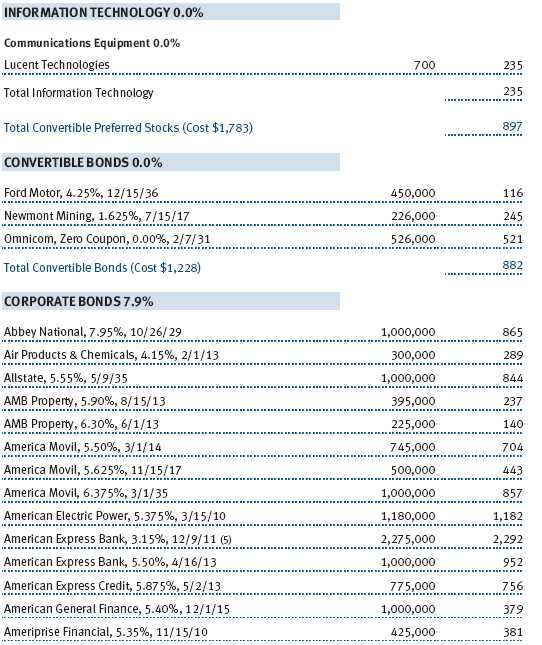
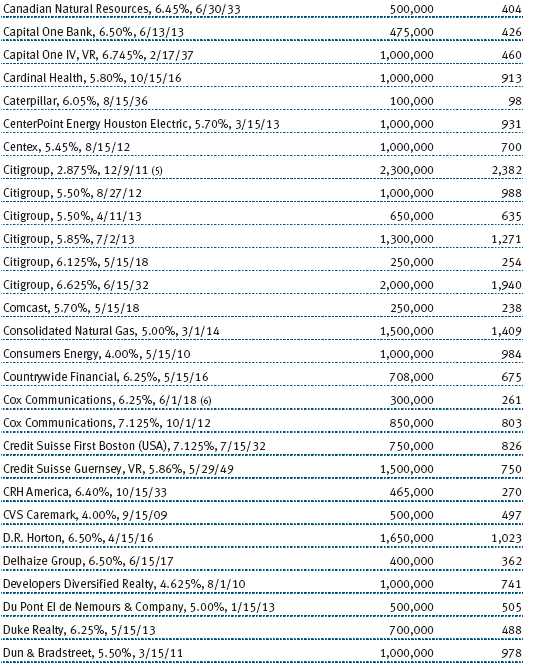
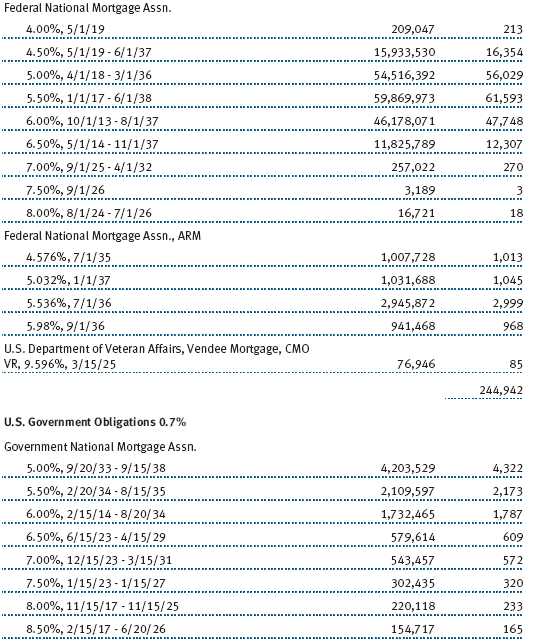
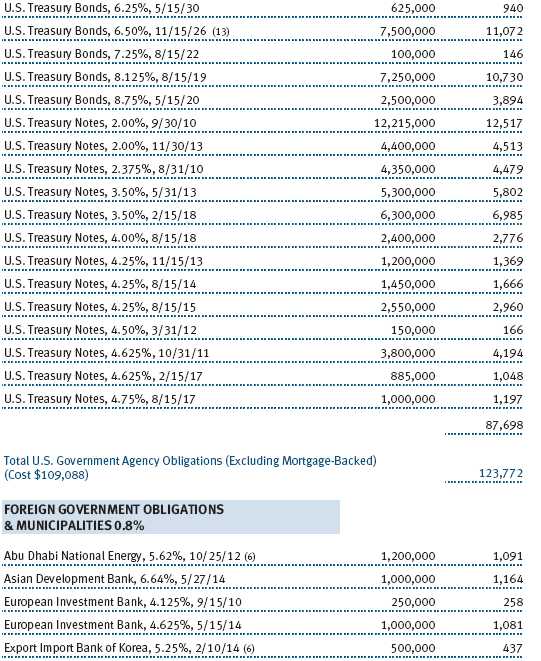
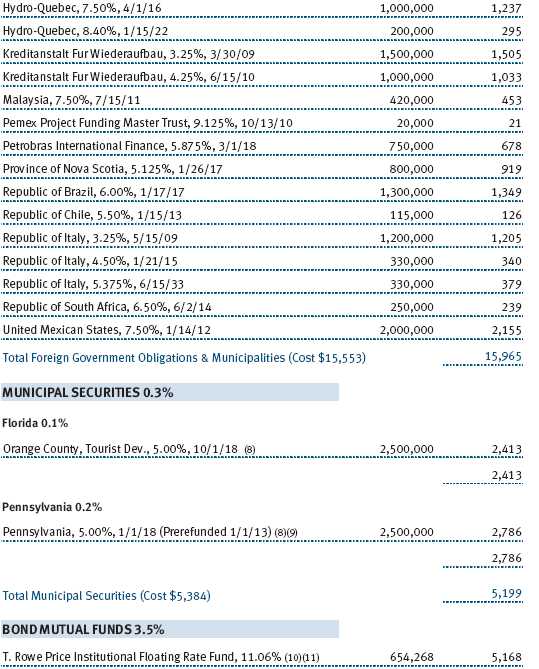
Among large-cap companies, the story of the year began and ended with financial companies. The sector lost more than half its value in 2008 because the credit crisis that claimed Bear Stearns as its first victim in March ravaged investment banks and wreaked havoc for commercial banks as investors lost confidence. By the end of the year, the once-mighty Citigroup was looking to sell off substantial assets to survive. No sector came even close to recording a gain for the year, though consumer staples was less beaten up than the others. Still, it lost more than 17%. The industrials and materials sectors were punished amid the growing negative sentiment. (Please refer to the portfolio of investments for a complete listing of holdings and the amount each represents in the portfolio.)
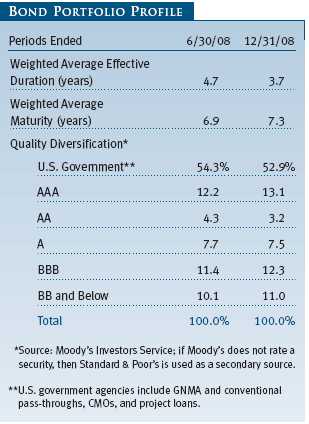
U.S. bond returns were widely mixed in 2008. U.S. Treasuries soared, as the weak economy and investors’ fears of losses triggered a massive flight to safety and the Federal Reserve reduced the fed funds target rate to a range of 0.00% to 0.25%. Other securities backed by the full faith and credit of the U.S. government, such as Ginnie Mae mortgage-backed securities, produced moderate gains. In contrast, other fixed-income sectors declined as investors shunned assets that had any degree of credit risk. Municipal and investment-grade corporate bonds produced moderate losses. Asset-backed securities, which are backed by credit card, auto loan, or other debt payments, fell sharply. High-yield bonds plunged as credit spreads widened to record levels in anticipation of a significant increase in defaults. The Barclays Capital U.S. Aggregate Index (formerly the Lehman Brothers U.S. Aggregate Index), a broad measure of the taxable domestic investment-grade bond market, returned 5.24%.
Non-U.S. stocks fell more than U.S. shares in 2008, in part because tumbling foreign currencies in the second half of the year exacerbated overseas losses in U.S. dollar terms. Stocks in emerging markets did the worst, especially those in emerging Europe. Among developed markets, European equities fell sharply, but Japanese stocks held up somewhat better in dollar terms as the yen strengthened versus the dollar. The MSCI EAFE Index, which measures the performance of mostly large-cap shares in Europe, Australasia, and the Far East, returned -43.06% versus -53.18% for the MSCI Emerging Markets Index.
ASSET ALLOCATION STRATEGY
With the economic recovery not expected to gain momentum until at least the second half of the year, we are overweighting U.S. growth stocks versus value in the belief that the climate favors high-quality growth companies that have a more durable earnings profile. However, we have tempered our view as the valuation differential has come down. We are underweighting small-cap stocks versus large-caps as valuations remain rich relative to large-cap stocks. Large-caps should also benefit from more diversified sources of earnings across business lines and geography.
We are neutral in non-U.S. equity markets, both in the developed and emerging world. Valuations appear to be reasonable in developed markets as a weaker growth outlook appears to be priced into equities. At current valuations, emerging markets appear to fairly represent expected growth rates in emerging economies. However, sentiment remains fragile in the current market environment.
We are underweighting high yield relative to investment-grade bonds as fundamental and technical factors for the sector are expected to remain challenging. Within fixed income, we recently moved to moderate our underweight to high yield in light of significant spread widening over the last several months. We continue to rely on the fundamental credit research of our high-yield team in the security selection process, particularly as these higher spread levels imply a significant increase in default rates.
PORTFOLIO REVIEW
Domestic Stocks
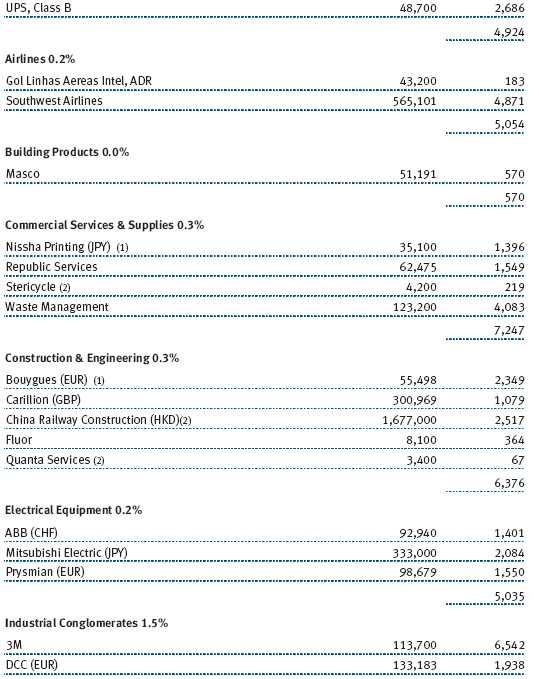
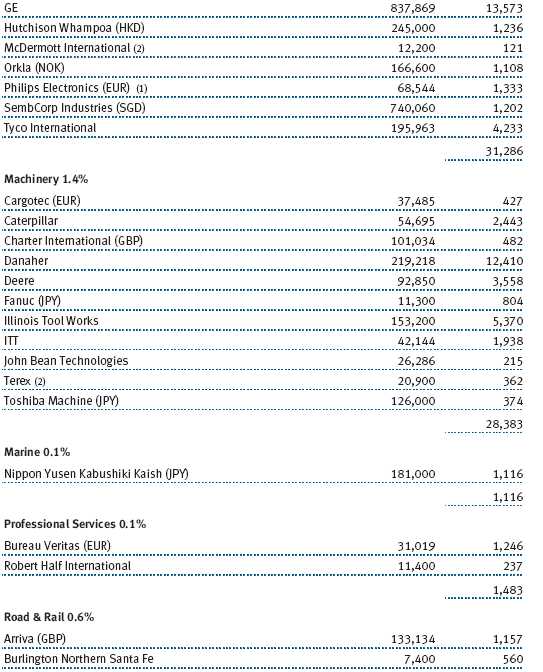
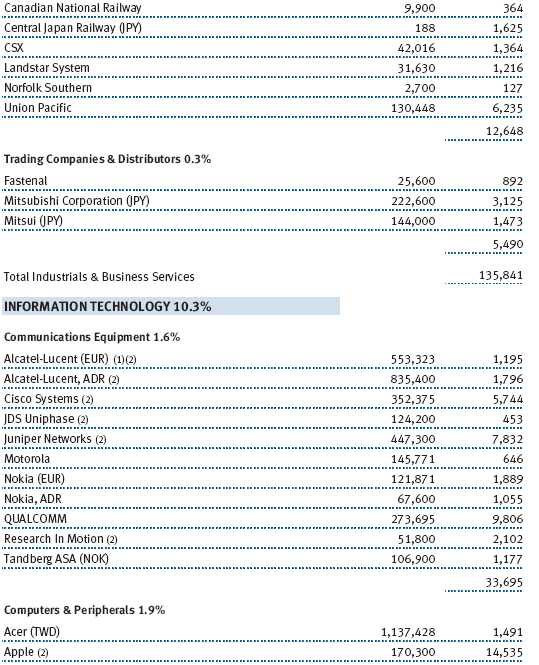
Every sector in the fund’s domestic equity portfolio endured steep declines in the last six months. The sharpest sell-off was in the financials sector, which has been buffeted by the credit crisis and the economic slowdown. Energy was down sharply after oil prices reversed course from their heights last summer. Information technology also was among the worst-performing sectors as businesses reined in spending. The industrials and business services and materials sectors were also hard hit by the economic collapse. Consumer discretionary suffered a severe decline as the economic slowdown and soaring food and energy prices put pressure on the sector.
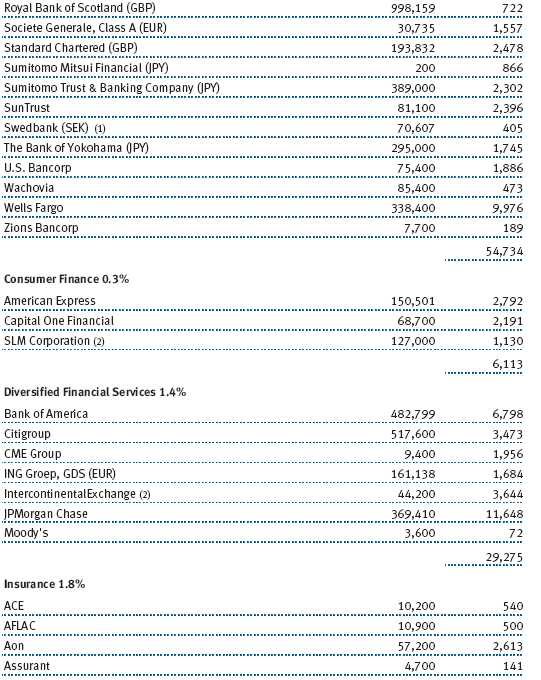
Financials were a major drag on performance, and diversified financial services companies and commercial banks were particularly hit as they struggled with the fallout from the subprime mortgage meltdown. Our exposure to Citigroup hurt performance. The giant banking concern was hit with escalating losses stemming from soaring mortgage losses. Bank of America also felt the impact of rising delinquencies. Among other commercial banks, Wachovia also suffered from the subprime fallout. Investment bank Goldman Sachs received major capital investments from Warren Buffett’s Berkshire Hathaway and the U.S. Treasury. Goldman also ultimately became regulated as a commercial bank to improve its funding and ability to deal with significant illiquid or troubled investments. Morgan Stanley perhaps came closer to meeting the grim fate of Lehman Brothers and Bear Stearns but used its broad franchise to attract an investment from a major Japanese bank as well as capital from the U.S. government’s Troubled Asset Relief Program (TARP). Both Goldman and Morgan Stanley appear to be on much sounder footing and could generate strong growth if the environment continues to improve.
Information technology declined precipitously in the last six months. Google and Apple were among the worst detractors for the second half. Both had been strong performers in the prior year. Google declined as investors worried that an advertising slowdown in the paid-search area would have a profound effect on the company. While we realize the company has never been through a major recession, management is cutting expenses meaningfully, and the company’s business model and financial strength are positives in this type of environment. Google stock appreciated late in 2008 as investors became somewhat more comfortable that the company’s fundamentals were holding up reasonably well. Apple was a victim of its own success as Mac sales and the iPhone launch were so strong that investors questioned if they could continue to excel. Investors also fretted over Steve Jobs’ health and whether Apple’s long-term record of product innovation would continue after his leave of absence, which he announced in January 2009. We have concerns that sales of some products are bound to slow in this type of economic environment. However, we also think that the company continues to execute quite well and has tremendous management talent.
Microsoft and Amazon.com were also major technology holdings that declined significantly during the past six months. Amazon (like Google and Apple) was a standout performer in 2007 and continues to take market share and generate strong results. However, with the sharp decline in retail sales, investors have become concerned about whether the company will continue to grow as rapidly. Microsoft’s stock has been somewhat disappointing for several years. Product innovation has been slow and the company’s failed effort to buy Yahoo! proved to be a costly distraction and a burden on the stock. However, we believe the company has the strength to deal with the challenging environment.
The energy sector was a major disappointment. Longtime energy services holdings Schlumberger and Smith International were among the largest detractors. Both are well-run companies that have produced solid operating results and strong stock performance for your fund in earlier periods. They have adapted to fluctuating energy prices over the years, but the current sharp contraction will impair growth even for these leaders.
Our holdings in the materials sector performed poorly as the global economy weakened considerably in just months. Chemical company Potash Corp. of Saskatchewan and metals and mining company Freeport-McMoRan Copper & Gold declined sharply from the collapse in commodity prices.
International Stocks
Non-U.S. markets fell more than U.S. shares in the last six months, in part because tumbling foreign currencies exacerbated overseas losses in U.S. dollar terms.
Each of the portfolio’s sectors lost ground during the quarter. In terms of absolute sector performance, health care, consumer staples, and telecommunication services held up better than other sectors. Financials, industrials, and materials were the weakest absolute performers.
The collapse of energy prices provided us with an opportunity to add some new names to our list of energy and energy service company holdings, including BG Group and China Oilfield Services. We believe that global supply is fundamentally constrained. This should support higher energy prices once demand stabilizes and will make companies with large reserves attractive to investors. We also added to our telecommunication holdings. We like the sector’s recurring revenues and believe they currently are attractively valued. In general, we are using the market crisis to invest in quality companies whose stocks were too expensive in the past but are now selling at attractive valuations with solid prospects for long-term appreciation.
Among the portfolio’s strongest contributors over the six months was Japanese cable company Jupiter Telecommunications. Other top performers were China Railway Construction, gaming company Nintendo, and utility GDF Suez. Stocks that had the largest negative impact on the portfolio included those in the hard-hit sectors of financials, energy, and materials. Among these were energy companies Statoil Hydro and Royal Dutch Shell; utility company E.ON; and mining and metals companies Xstrata, which we eliminated from the portfolio, and SSAB Svenskt Stal.
The weakening global economy is likely to continue presenting formidable hurdles for overseas markets. In the face of roiled markets, we will maintain our disciplined, research-oriented investment approach. We continue to evaluate portfolio holdings to reassess how changing financial and economic conditions are bearing on business and investment fundamentals. At the same time, we believe the current market turmoil has created opportunities that offer long-term potential for investors. Many well-managed companies with solid business models, healthy cash flows, and strong balance sheets now carry extremely attractive valuations.
Domestic Bonds
The portfolio’s holdings in fixed-income securities helped to moderate the impact of the significant decline among equities. We were, however, underweight in fixed income relative to the portfolio’s blended benchmark during the period, which detracted from relative performance. In an environment where only the safest securities, such as U.S. Treasuries, saw significant gains, our allocation to corporate bonds, both investment grade as well as high yield, detracted from performance.
The Treasury yield curve, which is a graphic depiction of the relationship between the yields and maturities of government bonds, fell across all maturities. Easier monetary policy and investors’ desire for low-risk assets sent short-term yields dramatically lower. With yields so low, we expect them to rise over the next year, which will hinder the performance of Treasury securities. Fundamentals for the high-yield sector may prove more challenging in 2009, and we are underweight in high yield relative to investment-grade bonds. High-yield spreads have widened year-to-date, reflecting expectations for a significant increase in defaults from historically low levels.
OUTLOOK
Markets around the world continue to experience extraordinary turbulence. Credit markets have yet to return to normal, and what began as a problem in the subprime housing market has infected nearly every major economy. Governments and central banks are taking extraordinary actions in an attempt to restore balance to markets and economies. These policies will take time to result in positive changes, and the near-term future remains uncertain. Tighter credit, rising unemployment, and weak consumer spending are likely to take their toll on short-term corporate profitability.
At the same time, fiscal and monetary stimulus should have a favorable impact on stocks and lift consumer confidence. While stock markets could always fall further, we believe they have priced in considerable weakness, making today’s valuations in the U.S. and overseas markets attractive. What’s more, we believe that shareholders will be well-served over the long term by the fund’s fundamental commitment to diversification across asset classes, as well as our emphasis on strong fundamental research in seeking investment opportunities in the current market environment.
Respectfully submitted,

Richard T. Whitney
Cochairman of the fund’s Investment Advisory Committee

Edmund M. Notzon III
Cochairman of the fund’s Investment Advisory Committee
January 20, 2009
The committee chairmen have day-to-day responsibility for managing the portfolio and work with committee members in developing and executing the fund’s investment program.
RISKS OF INVESTING IN STOCKS
As with all stock mutual funds, the fund’s share price can fall because of weakness in the stock market, a particular industry, or specific holdings. Stock markets can decline for many reasons, including adverse political or economic developments, changes in investor psychology, or heavy institutional selling. The prospects for an industry or company may deteriorate because of a variety of factors, including disappointing earnings or changes in the competitive environment. In addition, the investment manager’s assessment of companies held in a fund may prove incorrect, resulting in losses or poor performance even in rising markets.
RISKS OF INTERNATIONAL INVESTING
Funds that invest overseas generally carry more risk than funds that invest strictly in U.S. assets. Risks can result from varying stages of economic and political development; differing regulatory environments, trading days, and accounting standards; currency fluctuations; and higher transaction costs of non-U.S. markets. Investments outside the United States could be subject to governmental actions such as capital or currency controls, nationalization of a company or industry, expropriation of assets, or imposition of high taxes.
RISKS OF INVESTING IN BONDS
Funds that invest in bonds are subject to interest rate risk, the decline in bond prices that usually accompanies a rise in interest rates. Longer-maturity bonds typically decline more than those with shorter maturities. Funds that invest in bonds are also subject to credit risk, the chance that any fund holding could have its credit rating downgraded, or that a bond issuer will default (fail to make timely payments of interest or principal), potentially reducing the fund’s income level and share price.
GLOSSARY
Barclays Capital U.S. Aggregate Index: A widely used benchmark for the domestic investment-grade bond market. The index typically includes more than 5,000 fixed-income securities with an overall intermediate- to long-term average maturity.
Duration: The average time (expressed in years) needed for an investor to receive the present value of the future cash flows on a fixed-income investment. It is used to measure a bond or bond fund’s sensitivity to interest rate changes. For example, a fund with a five-year duration would fall about 5% in price in response to a one-percentage-point increase in interest rates, and vice versa.
Fed funds target rate: An overnight lending rate set by the Federal Reserve and used by banks to meet reserve requirements. Banks also use the fed funds rate as a benchmark for their prime lending rates.
Lipper indexes: Consist of a small number (10 to 30) of the largest mutual funds in a particular category as tracked by Lipper Inc.
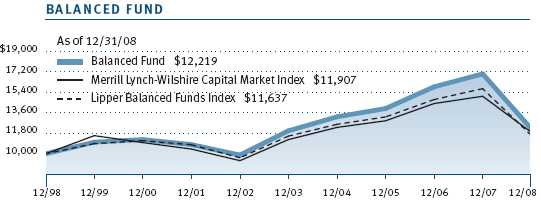
Merrill Lynch-Wilshire Capital Market Index: A market capitalization-weighted index, including the Wilshire 5000 and Merrill Lynch, High Yield II, and Domestic Master indexes.
MSCI EAFE Index: Widely accepted as the benchmark for international stock performance (EAFE refers to Europe, Australasia, and Far East). The index represents the major markets of the world excluding the U.S. and Canada, is listed in local currency, and includes reinvestment of dividends.
S&P 500 Stock Index: Tracks the stocks of 500 mostly large U.S. companies.
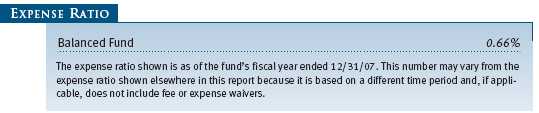
Performance and Expenses
This chart shows the value of a hypothetical $10,000 investment in the fund over the past 10 fiscal year periods or since inception (for funds lacking 10-year records). The result is compared with benchmarks, which may include a broad-based market index and a peer group average or index. Market indexes do not include expenses, which are deducted from fund returns as well as mutual fund averages and indexes.
| AVERAGE ANNUAL COMPOUND TOTAL RETURN |
This table shows how the fund would have performed each year if its actual (or cumulative) returns for the periods shown had been earned at a constant rate.
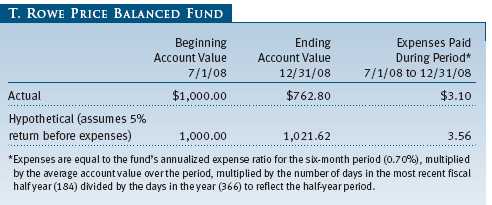
As a mutual fund shareholder, you may incur two types of costs: (1) transaction costs, such as redemption fees or sales loads, and (2) ongoing costs, including management fees, distribution and service (12b-1) fees, and other fund expenses. The following example is intended to help you understand your ongoing costs (in dollars) of investing in the fund and to compare these costs with the ongoing costs of investing in other mutual funds. The example is based on an investment of $1,000 invested at the beginning of the most recent six-month period and held for the entire period.
Actual Expenses
The first line of the following table (“Actual”) provides information about actual account values and expenses based on the fund’s actual returns. You may use the information in this line, together with your account balance, to estimate the expenses that you paid over the period. Simply divide your account value by $1,000 (for example, an $8,600 account value divided by $1,000 = 8.6), then multiply the result by the number in the first line under the heading “Expenses Paid During Period” to estimate the expenses you paid on your account during this period.
Hypothetical Example for Comparison Purposes
The information on the second line of the table (“Hypothetical”) is based on hypothetical account values and expenses derived from the fund’s actual expense ratio and an assumed 5% per year rate of return before expenses (not the fund’s actual return). You may compare the ongoing costs of investing in the fund with other funds by contrasting this 5% hypothetical example and the 5% hypothetical examples that appear in the shareholder reports of the other funds. The hypothetical account values and expenses may not be used to estimate the actual ending account balance or expenses you paid for the period.
Note: T. Rowe Price charges an annual small-account maintenance fee of $10, generally for accounts with less than $2,000 ($500 for UGMA/UTMA). The fee is waived for any investor whose T. Rowe Price mutual fund accounts total $25,000 or more, accounts employing automatic investing, and IRAs and other retirement plan accounts that utilize a prototype plan sponsored by T. Rowe Price (although a separate custodial or administrative fee may apply to such accounts). This fee is not included in the accompanying table. If you are subject to the fee, keep it in mind when you are estimating the ongoing expenses of investing in the fund and when comparing the expenses of this fund with other funds.
You should also be aware that the expenses shown in the table highlight only your ongoing costs and do not reflect any transaction costs, such as redemption fees or sales loads. Therefore, the second line of the table is useful in comparing ongoing costs only and will not help you determine the relative total costs of owning different funds. To the extent a fund charges transaction costs, however, the total cost of owning that fund is higher.
The accompanying notes are an integral part of these financial statements.


The accompanying notes are an integral part of these financial statements.
The accompanying notes are an integral part of these financial statements.


The accompanying notes are an integral part of these financial statements.
The accompanying notes are an integral part of these financial statements.
| NOTES TO FINANCIAL STATEMENTS |
T. Rowe Price Balanced Fund, Inc. (the fund), is registered under the Investment Company Act of 1940 (the 1940 Act) as a diversified, open-end management investment company. The fund commenced operations on December 31, 1939. The fund seeks to provide capital growth, current income, and preservation of capital through a portfolio of stocks and fixed-income securities.
NOTE 1 - SIGNIFICANT ACCOUNTING POLICIES
Basis of Preparation The accompanying financial statements were prepared in accordance with accounting principles generally accepted in the United States of America, which require the use of estimates made by fund management. Fund management believes that estimates and security valuations are appropriate; however, actual results may differ from those estimates, and the security valuations reflected in the financial statements may differ from the value the fund ultimately realizes upon sale of the securities.
Investment Transactions, Investment Income, and Distributions Income and expenses are recorded on the accrual basis. Premiums and discounts on debt securities are amortized for financial reporting purposes. Dividends received from mutual fund investments are reflected as dividend income; capital gain distributions are reflected as realized gain/loss. Dividend income and capital gain distributions are recorded on the ex-dividend date. Income tax-related interest and penalties, if incurred, would be recorded as income tax expense. Investment transactions are accounted for on the trade date. Realized gains and losses are reported on the identified cost basis. Payments (“variation margin”) made or received to settle the daily fluctuations in the value of futures contracts are recorded as unrealized gains or losses until the contracts are closed. Unsettled variation margin on futures contracts is reflected as other assets or liabilities, and unrealized gains and losses on futures contracts are reflected as the change in net unrealized gain or loss in the accompanying financial statements. Net periodic receipts or payments required by swaps are accrued daily and recorded as realized gain or loss in the accompanying financial statements. Fluctuations in the fair value of swaps are reflected in the change in net unrealized gain or loss and are reclassified to realized gain or loss upon termination prior to maturity or cash settlement. Paydown gains and losses are recorded as an adjustment to interest income. Distributions to shareholders are recorded on the ex-dividend date. Income distributions are declared and paid on a quarterly basis. Capital gain distributions, if any, are declared and paid by the fund, typically on an annual basis.
Currency Translation Assets, including investments, and liabilities denominated in foreign currencies are translated into U.S. dollar values each day at the prevailing exchange rate, using the mean of the bid and asked prices of such currencies against U.S. dollars as quoted by a major bank. Purchases and sales of securities, income, and expenses are translated into U.S. dollars at the prevailing exchange rate on the date of the transaction. The effect of changes in foreign currency exchange rates on realized and unrealized security gains and losses is reflected as a component of security gains and losses.
Rebates and Credits Subject to best execution, the fund may direct certain security trades to brokers who have agreed to rebate a portion of the related brokerage commission to the fund in cash. Commission rebates are reflected as realized gain on securities in the accompanying financial statements and totaled $10,000 for the year ended December 31, 2008. Additionally, the fund earns credits on temporarily uninvested cash balances at the custodian that reduce the fund’s custody charges. Custody expense in the accompanying financial statements is presented before reduction for credits, which are reflected as expenses paid indirectly.
New Accounting Pronouncements On January 1, 2008, the fund adopted Statement of Financial Accounting Standards No. 157 (FAS 157), Fair Value Measurements. FAS 157 defines fair value, establishes the framework for measuring fair value, and expands the disclosures of fair value measurements in the financial statements. Adoption of FAS 157 did not have a material impact on the fund’s net assets or results of operations.
In March 2008, the Financial Accounting Standards Board issued Statement of Financial Accounting Standards No. 161 (FAS 161), Disclosures about Derivative Instruments and Hedging Activities, which is effective for fiscal years and interim periods beginning after November 15, 2008. FAS 161 requires enhanced disclosures about derivative and hedging activities, including how such activities are accounted for and their effect on financial position, performance and cash flows. Management is currently evaluating the impact the adoption of FAS 161 will have on the fund’s financial statements and related disclosures.
NOTE 2 - VALUATION
The fund’s investments are reported at fair value as defined under FAS 157. The fund values its investments and computes its net asset value per share at the close of the New York Stock Exchange (NYSE), normally 4 p.m. ET, each day that the NYSE is open for business.
Valuation Methods Equity securities listed or regularly traded on a securities exchange or in the over-the-counter (OTC) market are valued at the last quoted sale price or, for certain markets, the official closing price at the time the valuations are made, except for OTC Bulletin Board securities, which are valued at the mean of the latest bid and asked prices. A security that is listed or traded on more than one exchange is valued at the quotation on the exchange determined to be the primary market for such security. Listed securities not traded on a particular day are valued at the mean of the latest bid and asked prices for domestic securities and the last quoted sale price for international securities.
Debt securities are generally traded in the OTC market. Securities with remaining maturities of one year or more at the time of acquisition are valued at prices furnished by dealers who make markets in such securities or by an independent pricing service, which considers the yield or price of bonds of comparable quality, coupon, maturity, and type, as well as prices quoted by dealers who make markets in such securities. Securities with remaining maturities of less than one year at the time of acquisition generally use amortized cost in local currency to approximate fair value. However, if amortized cost is deemed not to reflect fair value or the fund holds a significant amount of such securities with remaining maturities of more than 60 days, the securities are valued at prices furnished by dealers who make markets in such securities or by an independent pricing service.
Investments in mutual funds are valued at the mutual fund’s closing net asset value per share on the day of valuation. Financial futures contracts are valued at closing settlement prices. Swaps are valued at prices furnished by independent swap dealers or by an independent pricing service.
Other investments, including restricted securities, and those for which the above valuation procedures are inappropriate or are deemed not to reflect fair value are stated at fair value as determined in good faith by the T. Rowe Price Valuation Committee, established by the fund’s Board of Directors.
For valuation purposes, the last quoted prices of non-U.S. equity securities may be adjusted under the circumstances described below. If the fund determines that developments between the close of a foreign market and the close of the NYSE will, in its judgment, materially affect the value of some or all of its portfolio securities, the fund will adjust the previous closing prices to reflect what it believes to be the fair value of the securities as of the close of the NYSE. In deciding whether it is necessary to adjust closing prices to reflect fair value, the fund reviews a variety of factors, including developments in foreign markets, the performance of U.S. securities markets, and the performance of instruments trading in U.S. markets that represent foreign securities and baskets of foreign securities. A fund may also fair value securities in other situations, such as when a particular foreign market is closed but the fund is open. The fund uses outside pricing services to provide it with closing prices and information to evaluate and/or adjust those prices. The fund cannot predict how often it will use closing prices and how often it will determine it necessary to adjust those prices to reflect fair value. As a means of evaluating its security valuation process, the fund routinely compares closing prices, the next day’s opening prices in the same markets, and adjusted prices.
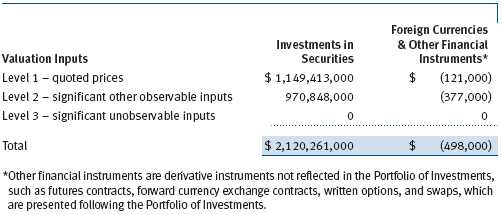
Valuation Inputs Various inputs are used to determine the value of the fund’s investments. These inputs are summarized in the three broad levels listed below:
Level 1 – quoted prices in active markets for identical securities
Level 2 – observable inputs other than Level 1 quoted prices (including, but not limited to, quoted prices for similar securities, interest rates, prepayment speeds, credit risk)
Level 3 – unobservable inputs
Observable inputs are those based on market data obtained from sources independent of the fund, and unobservable inputs reflect the fund’s own assumptions based on the best information available. The input levels are not necessarily an indication of the risk or liquidity associated with investments at that level. For example, non-U.S. equity securities actively traded in foreign markets generally are reflected in Level 2 despite the availability of closing prices, because the fund evaluates and determines whether those closing prices reflect fair value at the close of the NYSE or require adjustment, as described above. The following table summarizes the fund’s investments, based on the inputs used to determine their values on December 31, 2008:
NOTE 3 - INVESTMENT TRANSACTIONS
Consistent with its investment objective, the fund engages in the following practices to manage exposure to certain risks or to enhance performance. The investment objective, policies, program, and risk factors of the fund are described more fully in the fund’s prospectus and Statement of Additional Information.
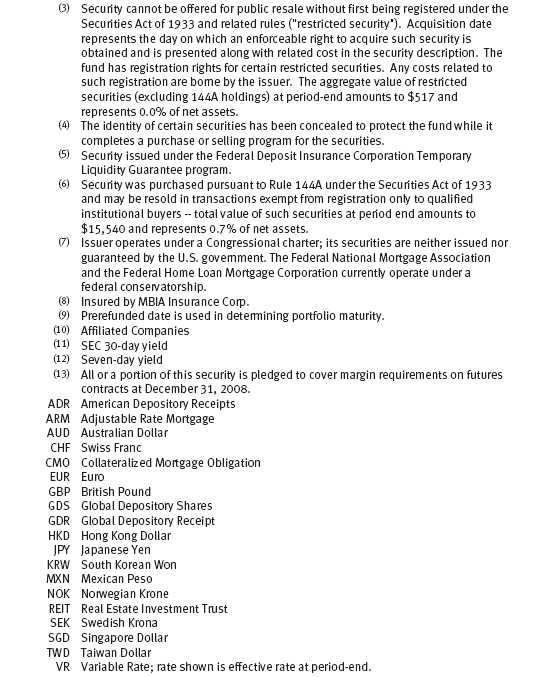
Restricted Securities The fund may invest in securities that are subject to legal or contractual restrictions on resale. Prompt sale of such securities at an acceptable price may be difficult and may involve substantial delays and additional costs.
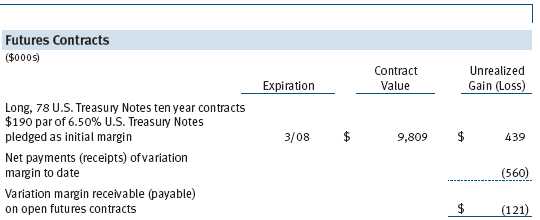
Futures Contracts During the year ended December 31, 2008, the fund was a party to futures contracts, which provide for the future sale by one party and purchase by another of a specified amount of a specific financial instrument at an agreed upon price, date, time, and place. Risks arise from possible illiquidity of the futures market and from movements in security values and/or interest rates.
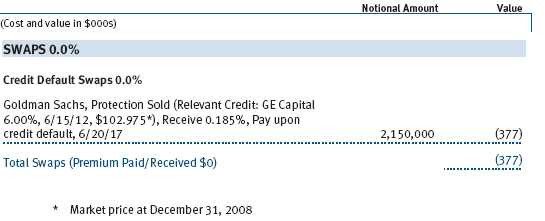
Credit Default Swaps During the year ended December 31, 2008, the fund was a party to credit default swaps. The fund may use swaps in an effort to manage exposure to changes in credit quality, to adjust overall exposure to certain markets, to enhance total return or protect the value of portfolio securities, to serve as a cash management tool, and/or to adjust portfolio duration or credit exposure. Credit default swaps are agreements where one party (the protection buyer) will make periodic payments to another party (the protection seller) in exchange for protection against specified credit events, such as certain defaults and bankruptcies related to an underlying credit instrument or issuer thereof. Upon occurrence of a specified credit event, the protection seller is required to pay the buyer the difference between the notional amount of the swap and the value of the underlying credit, either in the form of a net cash settlement or by paying the gross notional amount and accepting delivery of the relevant underlying credit. Generally, the payment risk for the seller of protection is inversely related to the current market price of the underlying credit; therefore, the payment risk increases as the price of the relevant underlying credit declines due to market valuations of credit quality. At December 31, 2008, the notional amount of protection sold by the fund totaled $2,150,000 (0.1% of net assets), which reflects the maximum potential amount the fund could be required to pay under such contracts. Risks related to the use of credit default swaps include the possible inability of the fund to accurately assess the current and future creditworthiness of underlying issuers and the possible failure of a counterparty to perform in accordance with the terms of the swap agreements.
Collateral Agreements The fund has entered collateral agreements with certain counterparties to mitigate counterparty risk on over-the-counter derivatives, including swaps and forward currency exchange contracts. Subject to established minimum levels, collateral is generally determined based on the net aggregate unrealized gain or loss on contracts with a particular counterparty. Collateral pledged to the fund is held in a segregated account by a third-party agent and can be in the form of cash or debt securities issued by the U.S. government or related agencies; collateral posted by the fund is noted in the accompanying Portfolio of Investments. As of December 31, 2008, no collateral was pledged by counterparties for the benefit of the fund and securities valued at $477,000 had been posted by the fund for the benefit of counterparties.
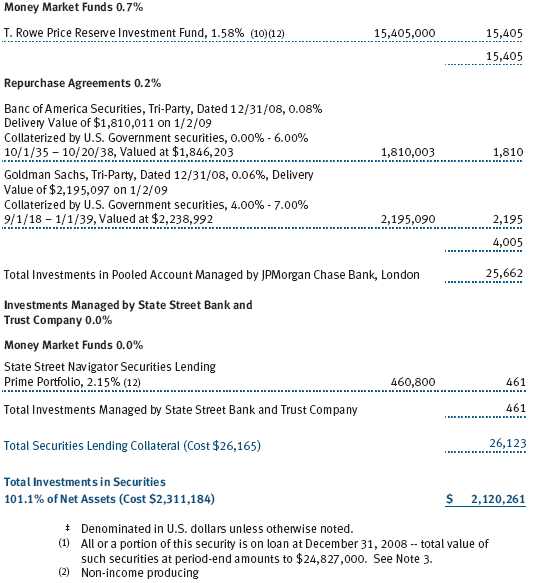
Repurchase Agreements All repurchase agreements are fully collateralized by U.S. government securities. Collateral is in the possession of the fund’s custodian or, for tri-party agreements, the custodian designated by the agreement. Market value of collateral is evaluated daily to ensure it exceeds the delivery value of the repurchase agreements at maturity. Although risk is mitigated by the collateral, the fund could experience a delay in recovering its value and a possible loss of income or value if the counterparty fails to perform in accordance with the terms of the agreement.
TBA Purchase Commitments During the year ended December 31, 2008, the fund entered into to be announced (TBA) purchase commitments, pursuant to which it agrees to purchase mortgage-backed securities for a fixed unit price, with payment and delivery at a scheduled future date beyond the customary settlement period for that security. With TBA transactions, the particular securities to be delivered are not identified at the trade date; however, delivered securities must meet specified terms, including issuer, rate, and mortgage term, and be within industry-accepted “good delivery” standards. The fund generally enters into TBAs with the intention of taking possession of the underlying mortgage securities. Until settlement, the fund maintains cash reserves and liquid assets sufficient to settle its TBAs.
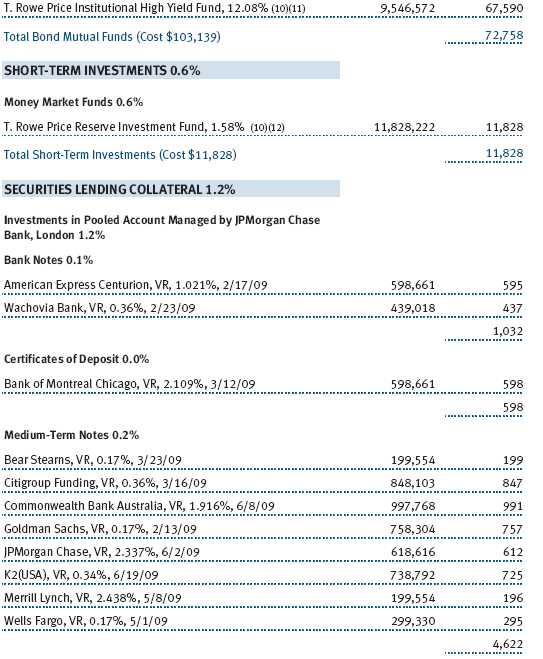
Securities Lending The fund lends its securities to approved brokers to earn additional income. It receives as collateral cash and U.S. government securities valued at 102% to 105% of the value of the securities on loan. Cash collateral is invested by the fund’s lending agent(s) in accordance with investment guidelines approved by fund management. Although risk is mitigated by the collateral, the fund could experience a delay in recovering its securities and a possible loss of income or value if the borrower fails to return the securities or if collateral investments decline in value. Securities lending revenue recognized by the fund consists of earnings on invested collateral and borrowing fees, net of any rebates to the borrower and compensation to the lending agent. On December 31, 2008, the value of loaned securities was $24,827,000.
Other Purchases and sales of portfolio securities, other than short-term and U.S. government securities, aggregated $1,186,647,000 and $1,052,781,000, respectively, for the year ended December 31, 2008. Purchases and sales of U.S. government securities aggregated $397,735,000 and $666,355,000, respectively, for the year ended December 31, 2008.
NOTE 4 - FEDERAL INCOME TAXES
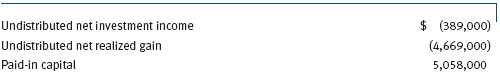
No provision for federal income taxes is required since the fund intends to continue to qualify as a regulated investment company under Subchapter M of the Internal Revenue Code and distribute to shareholders all of its taxable income and gains. Distributions are determined in accordance with Federal income tax regulations, which differ from generally accepted accounting principles, and, therefore, may differ significantly in amount or character from net investment income and realized gains for financial reporting purposes. Financial reporting records are adjusted for permanent book/tax differences to reflect tax character but are not adjusted for temporary differences.
Reclassifications to paid-in capital relate primarily to a tax practice that treats a portion of the proceeds from each redemption of capital shares as a distribution of taxable net investment income and/or realized capital gain. Reclassifications between income and gain relate primarily to the character of passive foreign investment companies. For the year ended December 31, 2008, the following reclassifications, which had no impact on results of operations or net assets, were recorded to reflect tax character:
Distributions during the years ended December 31, 2008 and December 31, 2007 were characterized for tax purposes as follows:

At December 31, 2008, the tax-basis cost of investments and components of net assets were as follows:
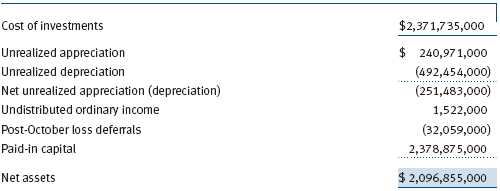
The difference between book-basis and tax-basis net unrealized appreciation (depreciation) is attributable to the deferral of losses from wash sales for tax purposes. Pursuant to federal income tax regulations applicable to investment companies, recognition of capital losses on certain transactions is deferred until the subsequent tax year. Consequently, realized losses reflected in the accompanying financial statements include net capital losses realized between November 1 and the fund’s fiscal year-end that have not been recognized for tax purposes (Post-October loss deferrals).
NOTE 5 - RELATED PARTY TRANSACTIONS
The fund is managed by T. Rowe Price Associates, Inc. (the manager or Price Associates), a wholly owned subsidiary of T. Rowe Price Group, Inc. The investment management agreement between the fund and the manager provides for an annual investment management fee, which is computed daily and paid monthly. The fee consists of an individual fund fee, equal to 0.15% of the fund’s average daily net assets, and a group fee. The group fee rate is calculated based on the combined net assets of certain mutual funds sponsored by Price Associates (the group) applied to a graduated fee schedule, with rates ranging from 0.48% for the first $1 billion of assets to 0.285% for assets in excess of $220 billion. The fund’s group fee is determined by applying the group fee rate to the fund’s average daily net assets. At December 31, 2008, the effective annual group fee rate was 0.31%.
In addition, the fund has entered into service agreements with Price Associates and two wholly owned subsidiaries of Price Associates (collectively, Price). Price Associates computes the daily share price and provides certain other administrative services to the fund. T. Rowe Price Services, Inc., provides shareholder and administrative services in its capacity as the fund’s transfer and dividend disbursing agent. T. Rowe Price Retirement Plan Services, Inc., provides subaccounting and recordkeeping services for certain retirement accounts invested in the fund. For the year ended December 31, 2008, expenses incurred pursuant to these service agreements were $208,000 for Price Associates, $958,000 for T. Rowe Price Services, Inc., and $3,520,000 for T. Rowe Price Retirement Plan Services, Inc. The total amount payable at period-end pursuant to these service agreements is reflected as Due to Affiliates in the accompanying financial statements.
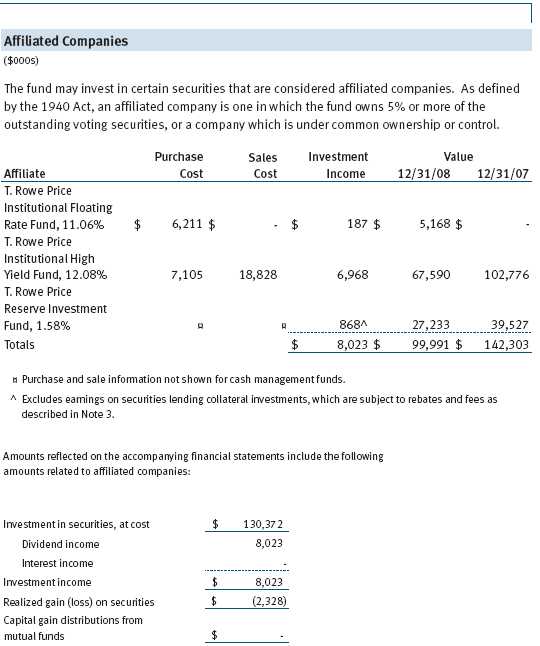
The fund may invest in the T. Rowe Price Reserve Investment Fund and the T. Rowe Price Government Reserve Investment Fund (collectively, the T. Rowe Price Reserve Investment Funds), open-end management investment companies managed by Price Associates and considered affiliates of the fund. The T. Rowe Price Reserve Investment Funds are offered as cash management options to mutual funds, trusts, and other accounts managed by Price Associates and/or its affiliates and are not available for direct purchase by members of the public. The T. Rowe Price Reserve Investment Funds pay no investment management fees.
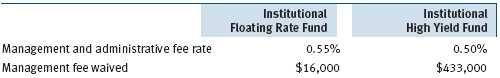
The fund may also invest in certain T. Rowe Price institutional funds (underlying institutional funds) as a means of gaining efficient and cost-effective exposure to certain markets. The underlying institutional funds are open-end management investment companies managed by Price Associates and/or T. Rowe Price International, Inc. (collectively, the Price managers) and are considered affiliates of the fund. Each underlying institutional fund pays an all-inclusive management and administrative fee to its Price manager. To ensure that the fund does not incur duplicate fees, each Price manager has agreed to permanently waive a portion of its management fee charged to the fund in an amount sufficient to fully offset the fees paid by the underlying institutional funds related to fund assets invested therein. Accordingly, the accompanying Statement of Operations includes management fees permanently waived pursuant to this agreement. Annual fee rates and amounts waived within the accompanying Statement of Operations related to shares of the underlying institutional funds for the year ended December 31, 2008 are as follows:
| REPORT OF INDEPENDENT REGISTERED PUBLIC ACCOUNTING FIRM |
To the Board of Directors and Shareholders of T. Rowe Price Balanced Fund, Inc.
In our opinion, the accompanying statement of assets and liabilities, including the schedule of investments, and the related statements of operations and of changes in net assets and the financial highlights present fairly, in all material respects, the financial position of T. Rowe Price Balanced Fund, Inc. (the “Fund”) at December 31, 2008, the results of its operations for the year then ended, the changes in its net assets for each of the two years in the period then ended and the financial highlights for each of the five years in the period then ended, in conformity with accounting principles generally accepted in the United States of America. These financial statements and financial highlights (hereafter referred to as “financial statements”) are the responsibility of the Fund’s management; our responsibility is to express an opinion on these financial statements based on our audits. We conducted our audits of these financial statements in accordance with the standards of the Public Company Accounting Oversight Board (United States). Those standards require that we plan and perform the audit to obtain reasonable assurance about whether the financial statements are free of material misstatement. An audit includes examining, on a test basis, evidence supporting the amounts and disclosures in the financial statements, assessing the accounting principles used and significant estimates made by management, and evaluating the overall financial statement presentation. We believe that our audits, which included confirmation of securities at December 31, 2008 by correspondence with the custodian and brokers and confirmation of the underlying funds by correspondence with the transfer agent, provide a reasonable basis for our opinion.
PricewaterhouseCoopers LLP
Baltimore, Maryland
February 12, 2009
| TAX INFORMATION (UNAUDITED) FOR THE TAX YEAR ENDED 12/31/08 |
We are providing this information as required by the Internal Revenue Code. The amounts shown may differ from those elsewhere in this report because of differences between tax and financial reporting requirements.
The fund’s distributions to shareholders included $48,151,000 from long-term capital gains, subject to the 15% rate gains category.
For taxable non-corporate shareholders, $28,893,000 of the fund’s income represents qualified dividend income subject to the 15% rate category.
For corporate shareholders, $19,780,000 of the fund’s income qualifies for the dividends-received deduction.
| INFORMATION ON PROXY VOTING POLICIES, PROCEDURES, AND RECORDS |
A description of the policies and procedures used by T. Rowe Price funds and portfolios to determine how to vote proxies relating to portfolio securities is available in each fund’s Statement of Additional Information, which you may request by calling 1-800-225-5132 or by accessing the SEC’s Web site, www.sec.gov. The description of our proxy voting policies and procedures is also available on our Web site, www.troweprice.com. To access it, click on the words “Our Company” at the top of our corporate homepage. Then, when the next page appears, click on the words “Proxy Voting Policies” on the left side of the page.
Each fund’s most recent annual proxy voting record is available on our Web site and through the SEC’s Web site. To access it through our Web site, follow the directions above, then click on the words “Proxy Voting Records” on the right side of the Proxy Voting Policies page.
| HOW TO OBTAIN QUARTERLY PORTFOLIO HOLDINGS |
The fund files a complete schedule of portfolio holdings with the Securities and Exchange Commission for the first and third quarters of each fiscal year on Form N-Q. The fund’s Form N-Q is available electronically on the SEC’s Web site (www.sec.gov); hard copies may be reviewed and copied at the SEC’s Public Reference Room, 450 Fifth St. N.W., Washington, DC 20549. For more information on the Public Reference Room, call 1-800-SEC-0330.
| ABOUT THE FUND’S DIRECTORS AND OFFICERS |
Your fund is governed by a Board of Directors (Board) that meets regularly to review a wide variety of matters affecting the fund, including performance, investment programs, compliance matters, advisory fees and expenses, service providers, and other business affairs. The Board elects the fund’s officers, who are listed in the final table. At least 75% of Board members are independent of T. Rowe Price Associates, Inc. (T. Rowe Price), and T. Rowe Price International, Inc. (T. Rowe Price International); “inside” or “interested” directors are employees or officers of T. Rowe Price. The business address of each director and officer is 100 East Pratt Street, Baltimore, Maryland 21202. The Statement of Additional Information includes additional information about the directors and is available without charge by calling a T. Rowe Price representative at 1-800-225-5132.
| Independent Directors | |
| |
| Name | |
| (Year of Birth) | Principal Occupation(s) During Past Five Years and Directorships of |
| Year Elected* | Other Public Companies |
| |
| Jeremiah E. Casey | Director, National Life Insurance (2001 to 2005); Director, The Rouse |
| (1940) | Company, real estate developers (1990 to 2004) |
| 2005 | |
| |
| Anthony W. Deering | Chairman, Exeter Capital, LLC, a private investment firm (2004 to |
| (1945) | present); Director, Under Armour (8/08 to present); Director, Vornado |
| 2001 | Real Estate Investment Trust (3/04 to present); Director, Mercantile |
| | Bankshares (2002 to 2007); Member, Advisory Board, Deutsche Bank |
| | North America (2004 to present); Director, Chairman of the Board, |
| | and Chief Executive Officer, The Rouse Company, real estate develop- |
| | ers (1997 to 2004) |
| |
| Donald W. Dick, Jr. | Principal, EuroCapital Advisors, LLC, an acquisition and management |
| (1943) | advisory firm (10/95 to present); Chairman, The Haven Group, a cus- |
| 1991 | tom manufacturer of modular homes (1/04 to present) |
| |
| David K. Fagin | Chairman and President, Nye Corporation (6/88 to present); Director, |
| (1938) | Golden Star Resources Ltd. (5/92 to present); Director, Pacific Rim |
| 1991 | Mining Corp. (2/02 to present); Director, B.C. Corporation (3/08 to |
| | present); Chairman, Canyon Resources Corp. (8/07 to 3/08); Director, |
| | Atna Resources Ltd. (3/08 to present) |
| |
| Karen N. Horn | Director, Eli Lilly and Company (1987 to present); Director, Simon |
| (1943) | Property Group (2004 to present); Director, Federal National Mortgage |
| 2003 | Association (9/06 to present); Director, Norfolk Southern (2/08 to pres- |
| | ent); Director, Georgia Pacific (5/04 to 12/05); Managing Director and |
| | President, Global Private Client Services, Marsh Inc. (1999 to 2003) |
| Theo C. Rodgers | President, A&R Development Corporation (1977 to present) |
| (1941) | |
| 2005 | |
| |
| John G. Schreiber | Owner/President, Centaur Capital Partners, Inc., a real estate invest- |
| (1946) | ment company (1991 to present); Partner, Blackstone Real Estate |
| 2001 | Advisors, L.P. (10/92 to present) |
| |
| *Each independent director oversees 126 T. Rowe Price portfolios (except for Mr. Fagin, who oversees 125 |
| T. Rowe Price portfolios) and serves until retirement, resignation, or election of a successor |
| Inside Directors | |
| |
| Name | |
| (Year of Birth) | |
| Year Elected* | |
| [Number of T. Rowe Price | Principal Occupation(s) During Past Five Years and Directorships of |
| Portfolios Overseen] | Other Public Companies |
| |
| Edward C. Bernard | Director and Vice President, T. Rowe Price; Vice Chairman of the Board, |
| (1956) | Director, and Vice President, T. Rowe Price Group, Inc.; Chairman of the |
| 2006 | Board, Director, and President, T. Rowe Price Investment Services, |
| [126] | Inc.; Chairman of the Board and Director, T. Rowe Price Global Asset |
| | Management Limited, T. Rowe Price Global Investment Services |
| | Limited, T. Rowe Price Retirement Plan Services, Inc., T. Rowe Price |
| | Savings Bank, and T. Rowe Price Services, Inc.; Director, T. Rowe Price |
| | International, Inc.; Chief Executive Officer, Chairman of the Board, |
| | Director, and President, T. Rowe Price Trust Company; Chairman of the |
| | Board, all funds |
| |
| Brian C. Rogers, CFA, CIC | Chief Investment Officer, Director, and Vice President, T. Rowe Price; |
| (1955) | Chairman of the Board, Chief Investment Officer, Director, and Vice |
| 2006 | President, T. Rowe Price Group, Inc.; Vice President, T. Rowe Price |
| [71] | Trust Company |
| |
| *Each inside director serves until retirement, resignation, or election of a successor. |
| Officers | |
| |
| Name (Year of Birth) | |
| Title and Fund(s) Served | Principal Occupation(s) |
| |
| E. Frederick Bair, CFA, CPA (1969) | Vice President, T. Rowe Price, T. Rowe Price |
| Vice President, Balanced Fund | Group, Inc., and T. Rowe Price Trust Company |
| |
| Wendy R. Diffenbaugh (1954) | Vice President, T. Rowe Price |
| Vice President, Balanced Fund | |
| |
| Roger L. Fiery III, CPA (1959) | Vice President, T. Rowe Price, T. Rowe Price |
| Vice President, Balanced Fund | Group, Inc., T. Rowe Price International, Inc., |
| | and T. Rowe Price Trust Company |
| |
| John R. Gilner (1961) | Chief Compliance Officer and Vice President, |
| Chief Compliance Officer, Balanced Fund | T. Rowe Price; Vice President, T. Rowe Price |
| | Group, Inc., and T. Rowe Price Investment |
| | Services, Inc. |
| |
| Gregory S. Golczewski (1966) | Vice President, T. Rowe Price and T. Rowe Price |
| Vice President, Balanced Fund | Trust Company |
| |
| Gregory K. Hinkle, CPA (1958) | Vice President, T. Rowe Price, T. Rowe Price |
| Treasurer, Balanced Fund | Group, Inc., T. Rowe Price Investment Services, |
| | Inc., and T. Rowe Price Trust Company; formerly |
| | Partner, PricewaterhouseCoopers LLP (to 2007) |
| |
| Robert M. Larkins, CFA (1973) | Vice President, T. Rowe Price, T. Rowe Price |
| Vice President, Balanced Fund | Group, Inc., and T. Rowe Price Trust Company; |
| | formerly student, The Wharton Business |
| | School, University of Pennsylvania (to 2003) |
| |
| Patricia B. Lippert (1953) | Assistant Vice President, T. Rowe Price and |
| Secretary, Balanced Fund | T. Rowe Price Investment Services, Inc. |
| |
| Raymond A. Mills, Ph.D., CFA (1960) | Vice President, T. Rowe Price, T. Rowe Price |
| Vice President, Balanced Fund | Group, Inc., T. Rowe Price International, Inc., |
| | and T. Rowe Price Trust Company |
| |
| Edmund M. Notzon III, Ph.D., CFA (1945) | Vice President, T. Rowe Price, T. Rowe Price |
| President, Balanced Fund | Group, Inc., T. Rowe Price Investment Services, |
| | Inc., and T. Rowe Price Trust Company |
| David Oestreicher (1967) | Director and Vice President, T. Rowe Price |
| Vice President, Balanced Fund | Investment Services, Inc., T. Rowe Price Trust |
| | Company, and T. Rowe Price Services, Inc.; Vice |
| | President, T. Rowe Price, T. Rowe Price Global |
| | Asset Management Limited, T. Rowe Price Global |
| | Investment Services Limited, T. Rowe Price |
| | Group, Inc., T. Rowe Price International, Inc., |
| | and T. Rowe Price Retirement Plan Services, Inc. |
| |
| Mark J. Vaselkiv (1958) | Vice President, T. Rowe Price, T. Rowe Price |
| Vice President, Balanced Fund | Group, Inc., and T. Rowe Price Trust Company |
| |
| Julie L. Waples (1970) | Vice President, T. Rowe Price |
| Vice President, Balanced Fund | |
| |
| Richard T. Whitney, CFA (1958) | Vice President, T. Rowe Price, T. Rowe Price |
| Executive Vice President, Balanced Fund | Group, Inc., T. Rowe Price International, Inc., |
| | and T. Rowe Price Trust Company |
| |
| Unless otherwise noted, officers have been employees of T. Rowe Price or T. Rowe Price International for at |
| least five years. | |
Item 2. Code of Ethics.
The registrant has adopted a code of ethics, as defined in Item 2 of Form N-CSR, applicable to its principal executive officer, principal financial officer, principal accounting officer or controller, or persons performing similar functions. A copy of this code of ethics is filed as an exhibit to this Form N-CSR. No substantive amendments were approved or waivers were granted to this code of ethics during the period covered by this report.
Item 3. Audit Committee Financial Expert.
The registrant’s Board of Directors/Trustees has determined that Ms. Karen N. Horn qualifies as an audit committee financial expert, as defined in Item 3 of Form N-CSR. Ms. Horn is considered independent for purposes of Item 3 of Form N-CSR.
Item 4. Principal Accountant Fees and Services.
(a) – (d) Aggregate fees billed to the registrant for the last two fiscal years for professional services rendered by the registrant’s principal accountant were as follows:
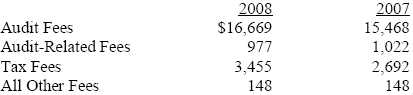
Audit fees include amounts related to the audit of the registrant’s annual financial statements and services normally provided by the accountant in connection with statutory and regulatory filings. Audit-related fees include amounts reasonably related to the performance of the audit of the registrant’s financial statements and specifically include the issuance of a report on internal controls and, if applicable, agreed-upon procedures related to fund acquisitions. Tax fees include amounts related to services for tax compliance, tax planning, and tax advice. The nature of these services specifically includes the review of distribution calculations and the preparation of Federal, state, and excise tax returns. All other fees include the registrant’s pro-rata share of amounts for agreed-upon procedures in conjunction with service contract approvals by the registrant’s Board of Directors/Trustees.
(e)(1) The registrant’s audit committee has adopted a policy whereby audit and non-audit services performed by the registrant’s principal accountant for the registrant, its investment adviser, and any entity controlling, controlled by, or under common control with the investment adviser that provides ongoing services to the registrant require pre-approval in advance at regularly scheduled audit committee meetings. If such a service is required between regularly scheduled audit committee meetings, pre-approval may be authorized by one audit committee member with ratification at the next scheduled audit committee meeting. Waiver of pre-approval for audit or non-audit services requiring fees of a de minimis amount is not permitted.
(2) No services included in (b) – (d) above were approved pursuant to paragraph (c)(7)(i)(C) of Rule 2-01 of Regulation S-X.
(f) Less than 50 percent of the hours expended on the principal accountant’s engagement to audit the registrant’s financial statements for the most recent fiscal year were attributed to work performed by persons other than the principal accountant’s full-time, permanent employees.
(g) The aggregate fees billed for the most recent fiscal year and the preceding fiscal year by the registrant’s principal accountant for non-audit services rendered to the registrant, its investment adviser, and any entity controlling, controlled by, or under common control with the investment adviser that provides ongoing services to the registrant were $1,922,000 and $1,486,000, respectively.
(h) All non-audit services rendered in (g) above were pre-approved by the registrant’s audit committee. Accordingly, these services were considered by the registrant’s audit committee in maintaining the principal accountant’s independence.
Item 5. Audit Committee of Listed Registrants.
Not applicable.
Item 6. Investments.
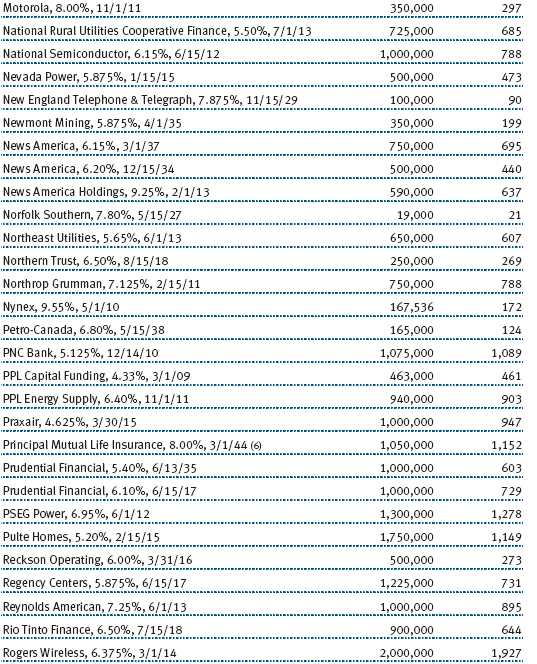
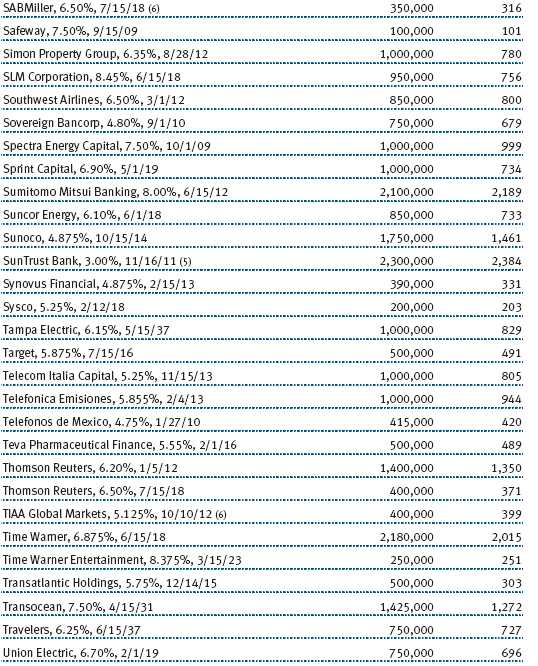
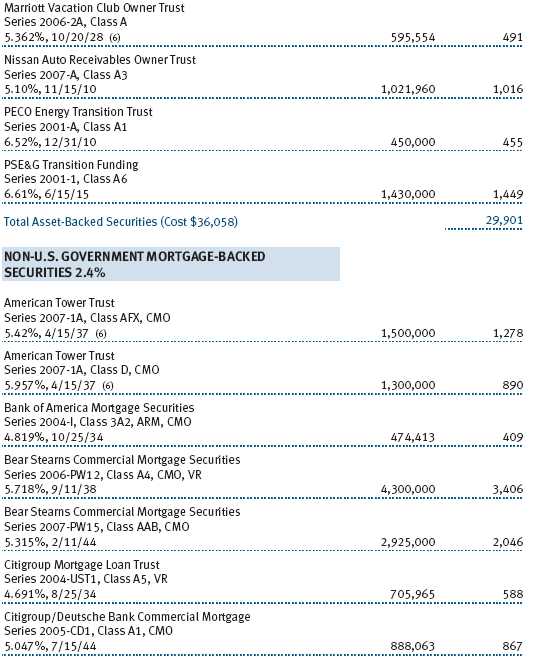
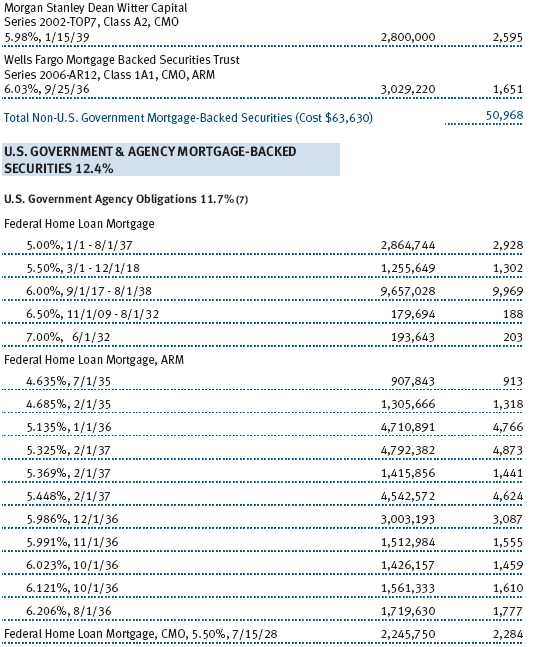
(a) Not applicable. The complete schedule of investments is included in Item 1 of this Form N-CSR.
(b) Not applicable.
Item 7. Disclosure of Proxy Voting Policies and Procedures for Closed-End Management Investment Companies.
Not applicable.
Item 8. Portfolio Managers of Closed-End Management Investment Companies.
Not applicable.
Item 9. Purchases of Equity Securities by Closed-End Management Investment Company and Affiliated Purchasers.
Not applicable.
Item 10. Submission of Matters to a Vote of Security Holders.
Not applicable.
Item 11. Controls and Procedures.
(a) The registrant’s principal executive officer and principal financial officer have evaluated the registrant’s disclosure controls and procedures within 90 days of this filing and have concluded that the registrant’s disclosure controls and procedures were effective, as of that date, in ensuring that information required to be disclosed by the registrant in this Form N-CSR was recorded, processed, summarized, and reported timely.
(b) The registrant’s principal executive officer and principal financial officer are aware of no change in the registrant’s internal control over financial reporting that occurred during the registrant’s second fiscal quarter covered by this report that has materially affected, or is reasonably likely to materially affect, the registrant’s internal control over financial reporting.
Item 12. Exhibits.
(a)(1) The registrant’s code of ethics pursuant to Item 2 of Form N-CSR is attached.
(2) Separate certifications by the registrant's principal executive officer and principal financial officer, pursuant to Section 302 of the Sarbanes-Oxley Act of 2002 and required by Rule 30a-2(a) under the Investment Company Act of 1940, are attached.
(3) Written solicitation to repurchase securities issued by closed-end companies: not applicable.
(b) A certification by the registrant's principal executive officer and principal financial officer, pursuant to Section 906 of the Sarbanes-Oxley Act of 2002 and required by Rule 30a-2(b) under the Investment Company Act of 1940, is attached.
| | |
SIGNATURES |
| |
| | Pursuant to the requirements of the Securities Exchange Act of 1934 and the Investment |
| Company Act of 1940, the registrant has duly caused this report to be signed on its behalf by the |
| undersigned, thereunto duly authorized. |
| |
| T. Rowe Price Balanced Fund, Inc. |
| |
| |
| |
| By | /s/ Edward C. Bernard |
| | Edward C. Bernard |
| | Principal Executive Officer |
| |
| Date | February 19, 2009 |
| |
| |
| |
| | Pursuant to the requirements of the Securities Exchange Act of 1934 and the Investment |
| Company Act of 1940, this report has been signed below by the following persons on behalf of |
| the registrant and in the capacities and on the dates indicated. |
| |
| |
| By | /s/ Edward C. Bernard |
| | Edward C. Bernard |
| | Principal Executive Officer |
| |
| Date | February 19, 2009 |
| |
| |
| |
| By | /s/ Gregory K. Hinkle |
| | Gregory K. Hinkle |
| | Principal Financial Officer |
| |
| Date | February 19, 2009 |