| UNITED STATES |
| SECURITIES AND EXCHANGE COMMISSION |
| Washington, D.C. 20549 |
| |
FORM N-CSR |
| |
CERTIFIED SHAREHOLDER REPORT OF REGISTERED |
MANAGEMENT INVESTMENT COMPANIES |
| |
| |
| |
| Investment Company Act File Number: 811-6275 |
|
| |
| T. Rowe Price Balanced Fund, Inc. |
|
| (Exact name of registrant as specified in charter) |
| |
| 100 East Pratt Street, Baltimore, MD 21202 |
|
| (Address of principal executive offices) |
| |
| David Oestreicher |
| 100 East Pratt Street, Baltimore, MD 21202 |
|
| (Name and address of agent for service) |
| |
| |
| Registrant’s telephone number, including area code: (410) 345-2000 |
| |
| |
| Date of fiscal year end: December 31 |
| |
| |
| Date of reporting period: December 31, 2009 |
Item 1: Report to Shareholders| Balanced Fund | December 31, 2009 |
The views and opinions in this report were current as of December 31, 2009. They are not guarantees of performance or investment results and should not be taken as investment advice. Investment decisions reflect a variety of factors, and the managers reserve the right to change their views about individual stocks, sectors, and the markets at any time. As a result, the views expressed should not be relied upon as a forecast of the fund’s future investment intent. The report is certified under the Sarbanes-Oxley Act, which requires mutual funds and other public companies to affirm that, to the best of their knowledge, the information in their financial reports is fairly and accurately stated in all material respects.
REPORTS ON THE WEB
Sign up for our E-mail Program, and you can begin to receive updated fund reports and prospectuses online rather than through the mail. Log in to your account at troweprice.com for more information.
Manager’s Letter
Fellow Shareholders
U.S. stocks gained in the second half of 2009, extending the remarkable rally that began in early March. It was the best year for U.S. equities since 2003. Share prices soared as credit market conditions improved, corporate earnings were generally better than expected, and the economy showed signs that it was emerging from the longest and deepest recession since the Great Depression.
PERFORMANCE REVIEW
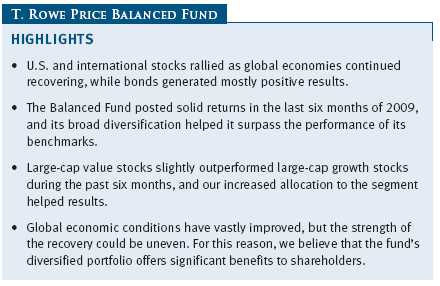
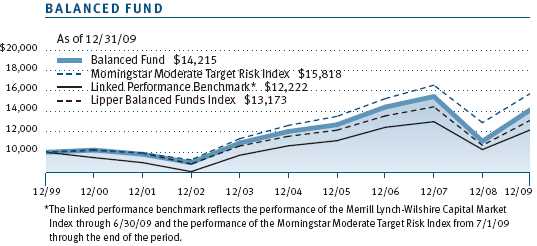
Your fund returned 17.07% in the last six months and 28.28% for the one-year period ended December 31, 2009. As shown in the Performance Comparison table, the fund surpassed the Lipper Balanced Funds Index and the Morningstar Moderate Target Risk Index for both periods. Strong stock selection was the primary contributor to portfolio outperformance.

Please note some important changes to the portfolio’s performance benchmarks. Due to the discontinuation of the Merrill Lynch-Wilshire Capital Market Index on June 30, 2009, we have replaced it with the Morningstar Moderate Target Risk Index. As a result, we have created a linked performance benchmark that combines data from the Merrill Lynch index before its discontinuation and the Morningstar index for the remainder of the period.
MARKET ENVIRONMENT
Global equity markets continued to recover from the sharp sell-off that began in 2008, as aggressive monetary and stimulus measures enabled banks and companies to repair their balance sheets. Markets looked considerably healthier than one year ago, with the broad S&P 500 Index climbing 26.46% in the last year.
While many investors remained wary of equities, investment psychology appeared to shift from the general fear of experiencing losses to the fear of missing out on gains. With the investment environment assuming a more positive tone, riskier asset classes performed best in recent months. Credit spreads have continued narrowing in the bond markets, and overall liquidity has improved. As their losses on bad loans moderated and as their balance sheets began to improve, several of the largest financial institutions began to repay funds loaned to them at the height of the financial crisis through the Treasury’s Troubled Asset Relief Program. But problems persisted at several large institutions, suggesting that while a major financial collapse had been averted, many vexing problems remained.
Unemployment climbed throughout the last six months, and with 100,000 new jobs needed every month just to absorb new workers into the job force, it seemed likely that the jobless rate would remain extraordinarily high for some time. However, consumer confidence has gradually improved, and while housing prices weakened further, there were signs of stabilization and even price increases in several leading markets.
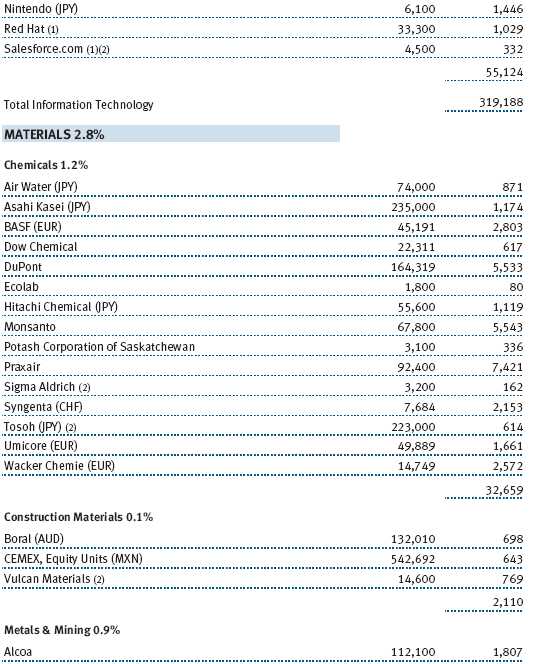
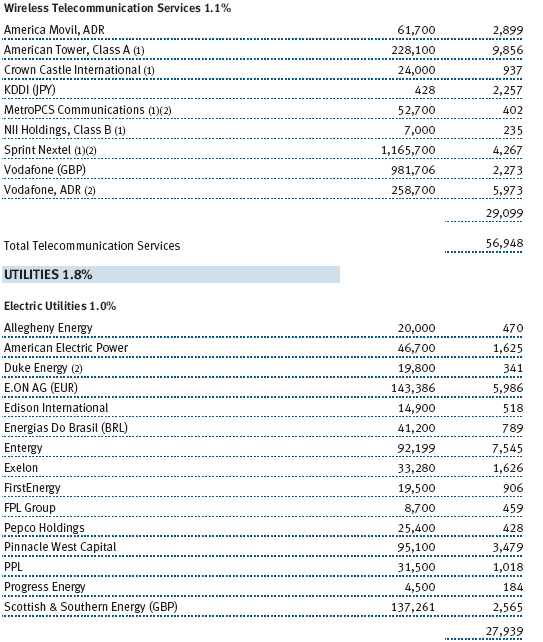
U.S. stocks gained in the second half of 2009 amid improved investor sentiment. Large-cap shares slightly trailed their small-cap peers, but mid-cap stocks trumped both segments. As measured by various Russell indexes, value stocks narrowly outpaced growth stocks among large-cap shares, but growth stocks trumped value stocks in the small-cap and mid-cap universe. In the large-cap universe, shares of information technology companies produced superior returns, thanks to attractive valuations, aggressive cost-cutting, cash-rich balance sheets, and revenues that were not as bad as feared. Consumer discretionary and industrials and business services stocks also did very well, as investors anticipated that these sectors would benefit substantially from an economic recovery, while materials stocks climbed with commodity prices. Utilities and telecommunication services—two sectors often perceived as relatively safe havens in an economic downturn—lagged with modest gains.
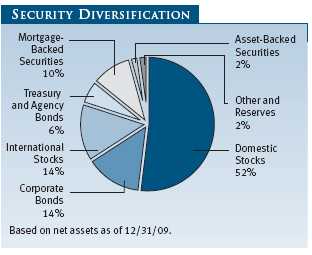
Domestic bonds were positive in the last six months as credit market conditions continued to improve and money market yields near 0% prompted yield-hungry investors to seek riskier securities with an income advantage. High yield bonds fared best and produced excellent returns as credit spreads narrowed significantly, but investment-grade corporate bonds also did well. Asset-backed securities—which are backed by credit card, auto loan, or other debt payments—benefited from increased demand through the Federal Reserve’s Term Asset-Backed Securities Loan Facility. Municipal bonds and agency mortgage-backed securities lagged with milder gains. U.S. Treasury securities were mostly flat as longer-term interest rates rose amid signs of an economic recovery and heavy new issuance. The Barclays Capital U.S. Aggregate Index, which measures the performance of domestic taxable investment-grade bonds, returned 3.95%.
Non-U.S. stocks in developed markets slightly trailed U.S. shares in the second half of 2009 as a late-year rally in the U.S. dollar versus other currencies dampened returns in dollar terms. Shares in Europe fared well, but Japanese shares trailed significantly. Emerging markets outperformed developed markets, led by equities in Latin America and emerging Europe. The MSCI EAFE Index, which measures the performance of mostly large-cap equities in Europe, Australasia, and the Far East, returned about 22% versus about 31% for the MSCI Emerging Markets Index.
ASSET ALLOCATION STRATEGY
In the last six months, we have reduced our position in growth stocks, which are now neutral with value shares. Our view is that while growth stocks with consistent and strong earnings remain inexpensive relative to their historical values, the value segment could benefit as corporate earnings prospects begin to turn up from their low levels. We have seen some evidence of that trend lately. Non-U.S. equity markets also remain attractive.
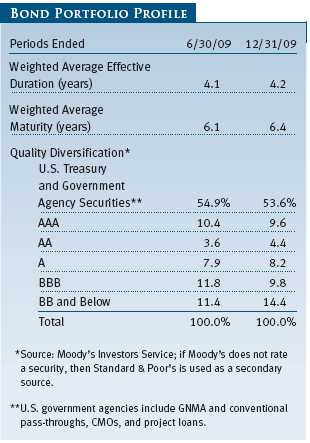
We have increased our weighting in high yield relative to investment-grade bonds given a gradually improving economy and expectations for a lower default rate. Technical factors have also improved. We continue to rely on the fundamental credit research of our high yield team in the security selection process, particularly in the context of uncertainty in the current environment.
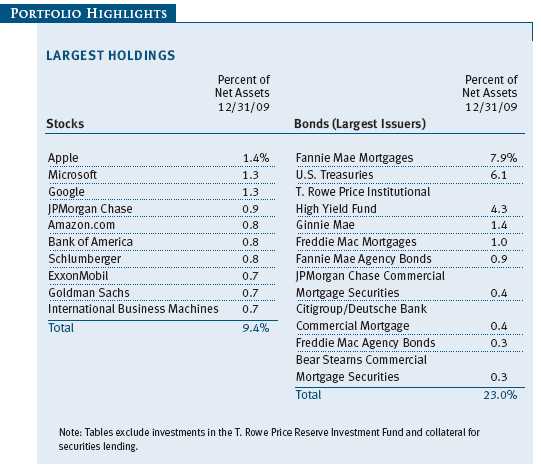
PORTFOLIO REVIEW
Domestic Stocks
Performance in the past six months was driven by a sharp recovery in the stocks in several sectors, including information technology, consumer discretionary, financials, and health care. As investors became more comfortable that the global economy was recovering, and that some of the regulatory changes might not be as onerous as feared, our holdings in various industries performed well.
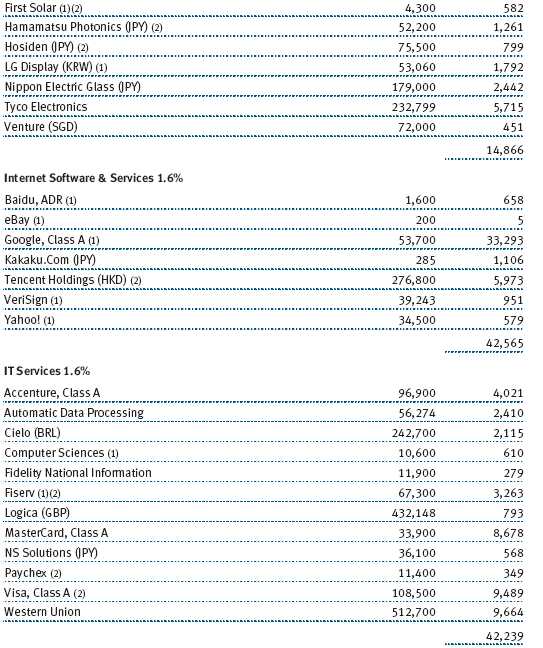
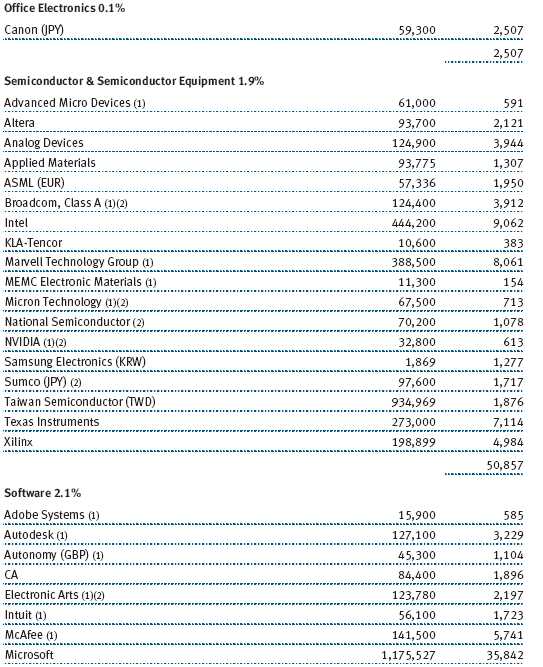
The information technology (IT) sector was the portfolio’s largest contributor in the second half of 2009. Our holdings in computers and peripherals were especially beneficial as Apple continued to generate impressive revenues and better-than-expected earnings margins thanks to record sales for Mac computers and iPhones. Despite recent gains in market share and high investor expectations, we believe there are further growth opportunities in the PC and smartphone markets. In addition, our positions in Internet software and services, as well as an overweight versus the Russell index, helped sector performance. Google was boosted by growth in the global advertising market. The company reported solid growth in revenue and profits, and we believe that the leading search engine will be further aided by an economic recovery. Google stands to benefit from growth initiatives in display and mobile. Marvell Technology Group, the maker of chips for computers and mobile phones, delivered excellent results due to tighter cost controls.
The company reported strong revenue growth for two quarters in succession and raised its earnings guidance, citing increasing growth in its mobile and wireless end markets. (Please refer to the fund’s portfolio of investments for a complete listing of holdings and the amount each represents in the portfolio.)
We believe IT offers superior long-term growth prospects compared with other sectors because of the rising availability of wireless Internet and the growing popularity of smartphones and other devices that broaden the appeal of mobile computing. Our holdings are concentrated in Internet software and services, computers and peripherals, and IT services.
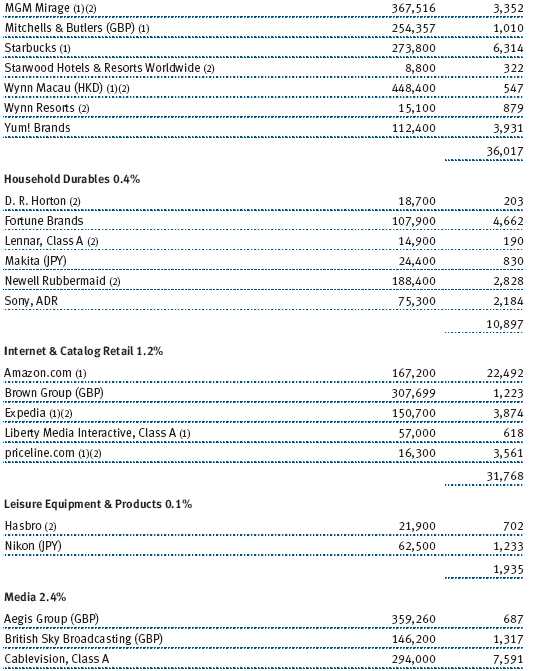
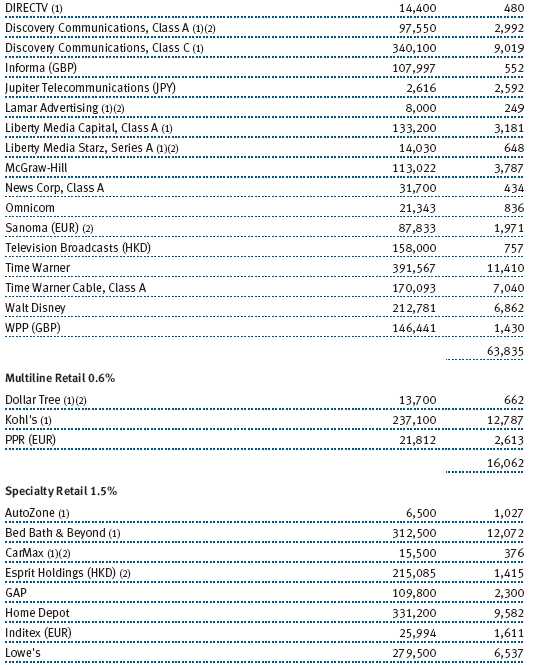
Consumer discretionary stocks benefited broadly from the improving economic outlook. Amazon.com was the second-best contributor in the second half and for the year. The most recent quarterly results exceeded estimates by a considerable margin. Amazon is taking substantial market share within the rapidly growing Internet retailing category in part due to its free shipping program for frequent customers, large third-party sales effort, and excellent customer service. Its Kindle electronic book reader and online book offerings are selling briskly. Priceline.com and Expedia, the leading online travel companies, continue to prosper despite a decline in overall consumer travel. Both have low-cost models (particularly Priceline thanks to its low-bid model) that resonate with consumers seeking to stretch their travel dollars. Several of our traditional retailers, such as Kohl’s and Bed Bath & Beyond, performed relatively well in the downturn, are taking market share, and generated strong results as consumer spending recovered. Media companies, including Discovery Communications, Time Warner, and Walt Disney also generated strong performance as consumer confidence and advertising improved. An increase in discretionary purchasing activity and travel also benefited Starbucks and Marriott.
After a remarkable rebound earlier in the year, financials stocks were inconsistent fourth-quarter performers, but several stocks generated solid second-half results. Franklin Resources, the mutual fund giant, utilized its strong position in emerging markets and fixed income investing to drive solid profitability and was among our top contributors in the second half and for the year.
Goldman Sachs, another strong 6- and 12-month contributor, staged a steady but powerful recovery, more than tripling off its lows. The company, along with several other investment banks, has come under scrutiny for its compensation practices—forcing many of its top executives to take bonuses in restricted stock rather than in cash this year. We continue to believe the company’s management, culture, capital position, and earnings power compare favorably with peers. American Express also showed remarkable resilience, and its stock rose sharply in the past six months as consumers began to spend more freely. Expense discipline and credit underwriting have been impressive relative to most peers and reflect the company’s strong management. JPMorgan Chase was our best performer in the diversified financial services segment. Its financial strength was instrumental in helping stabilize financial markets. Although its compensation practices also have been scrutinized, we believe its management and operations will continue to be viewed favorably.
International Stocks
Non-U.S. markets continued their recovery from the stock market collapse, as investors appeared to believe that the worst of the world’s financial crisis was over and the global economy was in recovery. Concerns about the global economy and the worldwide financial system eased during the summer and early fall, and investors increased their appetite for risk. Emerging markets advancing sharply. China, Brazil, and other emerging markets benefited from aggressive stimulus measures enacted by their governments and the prevailing view among investors that stock markets in these countries suffered inequitably from the sell-off of 2008–09. Major European stock markets experienced steep rallies. Many markets—including those with deeply troubled economies such as Spain and Ireland—posted double-digit returns. The only exceptions were Finland and Greece, which suffered a financial crisis after the new government announced that its fiscal deficits were much larger than previously reported and the European Central Bank said it would no longer provide emergency credit to cover the deficits. Developed Asian markets had their best performance since 2003, even after taking into account Japan’s anemic gain. Resource-rich Australia led the Pacific markets.
During the period, the fund benefited from a cyclical recovery, with information technology and consumer discretionary sectors showing renewed health. Financials had a strong showing, with commercial banks registering decent gains. Among financials, Banco Santander (Spain) generated strong returns. Standard Chartered (U.K.) was also a solid performer and is a good example of a company based in a mature market that generates a significant portion of its revenue in developing markets. The multinational corporation provides commercial banking services to companies and institutions in Asia, Africa, Europe, the Middle East, and the Americas. China Citic Bank and BNP Paribas turned in strong performances, while Barclays posted negative returns for the period.
IT was the fund’s top performer as our global portfolio produced solid returns amid renewed business and consumer spending. Tencent Holdings, the operator of China’s largest online messaging community, rose steadily during the period as the company posted impressive revenue growth driven by a successful gaming business. Baidu, which had been a strong contributor in the first half of the year, generated more modest second-half results. ASML, a semiconductor manufacturer, produced decent returns.
Within the consumer discretionary sector, the standout performers were Liberty Global (United States), Jupiter Telecommunications (Japan), and WPP (United Kingdom). Liberty Global is an international media company, one of the largest broadband providers outside the U.S., and one of the largest cable operators in several countries across Europe and the Pacific Rim. We like the company because it consistently generates strong free cash flow and its management team has a solid record of deploying the cash wisely or returning it to shareholders. One of Liberty Global’s biggest international holdings is Jupiter Telecom, Japan’s leading cable provider. It also sells subscription television services, VOIP and wireless telephone services, and broadband Internet access. We think Jupiter’s growth prospects will improve in 2010, unlocking value that is not yet reflected in its share price. WPP is a media and advertising Goliath. The company operates as four divisions, but about half of the firm’s revenues are generated by its advertising and media investment management business. We think WPP’s businesses were showing significant improvement toward the end of 2009, and the companies can generate improving profit margins and double-digit earnings growth. We added one new holding in the media segment during the past six months: British Sky Broadcasting. Although we had a modest loss on the position for the period, we are excited about the company’s growth potential. We think that Sky will report significant earnings gains and profit margin expansion in coming quarters.
Domestic Bonds
Despite ending on a weak note, bonds recorded a decent overall gain in the second half of the year. All major categories advanced, but gains were much stronger among credit-sensitive issues, which benefited from optimism that a recovering economy would lead to healthier balance sheets. Longer-term government bonds recorded more modest gains as investors worried that the recovery would result in higher inflation and interest rates. Although it reversed course at the end of the period, the U.S. dollar declined against other major currencies, which boosted gains for investors in bonds from developed markets overseas. Investors in dollar-denominated emerging markets fared very well as rising commodity prices and other factors led to strong recoveries in many developing economies.
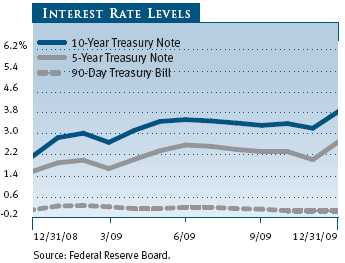
The Treasury yield curve, which is a graphic depiction of the relationship between the yields and maturities of government bonds, steepened during the last six months as short-term yields remained stuck at historically low levels, while long-term yields rose. Expectations of lower default rates have prompted us to retain a higher allocation to high yield bonds relative to investment-grade corporate bonds.
OUTLOOK
Global stock and bond markets have recovered sharply over the last year, an indication that economic fundamentals have improved. The fears of 2008 and 2009 have given way to a more stable environment in the new decade. Signs of growth, though uneven, are unmistakable, from increased spending among companies and consumers to improved consumer growth. However, it remains to be seen whether economies are strong enough to gain traction in the absence of artificially low interest rates, vast amounts of liquidity created by central banks, and massive stimulus measures. While companies have benefited from extensive cost-cutting, they cannot cut their way to prosperity. A resumption of durable, sustainable growth will be necessary to further boost markets in developed countries.
This period of economic disparity and uncertainty emphasizes the benefits of strong fundamental research in security selection to help identify companies with seasoned management teams and the best positioning to weather continued strains. We believe our investment approach, which incorporates a disciplined strategy, broad diversification, and a long-term focus, should serve shareholders’ long-term interests well regardless of short-term economic conditions and market volatility.
Respectfully submitted,

Edmund M. Notzon III
Chairman of the fund’s Investment Advisory Committee
January 19, 2010
The committee chairman has day-to-day responsibility for managing the portfolio and works with committee members in developing and executing the fund’s investment program.
RISKS OF INVESTING IN STOCKS
As with all stock mutual funds, the fund’s share price can fall because of weakness in the stock market, a particular industry, or specific holdings. Stock markets can decline for many reasons, including adverse political or economic developments, changes in investor psychology, or heavy institutional selling. The prospects for an industry or company may deteriorate because of a variety of factors, including disappointing earnings or changes in the competitive environment. In addition, the investment manager’s assessment of companies held in a fund may prove incorrect, resulting in losses or poor performance even in rising markets.
RISKS OF INTERNATIONAL INVESTING
Funds that invest overseas generally carry more risk than funds that invest strictly in U.S. assets. Risks can result from varying stages of economic and political development, differing regulatory environments, trading days, and accounting standards, currency fluctuations, and higher transaction costs of non-U.S. markets. Investments outside the United States could be subject to governmental actions such as capital or currency controls, nationalization of a company or industry, expropriation of assets, or imposition of high taxes.
RISKS OF INVESTING IN BONDS
Funds that invest in bonds are subject to interest rate risk, the decline in bond prices that usually accompanies a rise in interest rates. Longer-maturity bonds typically decline more than those with shorter maturities. Funds that invest in bonds are also subject to credit risk, the chance that any fund holding could have its credit rating downgraded or that a bond issuer will default (fail to make timely payments of interest or principal), potentially reducing the fund’s income level and share price.GLOSSARY
Barclays Capital U.S. Aggregate Index: An unmanaged index that tracks investment-grade corporate and government bonds.
Combined index portfolio: An unmanaged portfolio of 52% domestic stocks (S&P 500 Index), 35% bonds (Barclays Capital U.S. Aggregate Index), and 13% international stocks (MSCI EAFE Index).
Linked performance benchmark: A custom benchmark that reflects the performance of the Merrill Lynch-Wilshire Capital Market Index through June 30, 2009, and the performance of the Morningstar Moderate Target Risk Index from July 1, 2009, through the end of the reporting period.
Lipper indexes: Consist of a small number (10 to 30) of the largest mutual funds in a particular category as tracked by Lipper Inc.
Merrill Lynch-Wilshire Capital Market Index: A market capitalization-weighted index including the Wilshire 5000, Merrill Lynch High Yield II, and Domestic Master indexes. This index was discontinued on June 30, 2009.
Morningstar Moderate Target Risk Index: An index that represents a portfolio of global equities (fixed at 60%), bonds, and other asset classes.
MSCI EAFE Index: An index that’s widely accepted as the benchmark for international stock performance (EAFE refers to Europe, Australasia, and Far East). The index represents the major markets of the world excluding the U.S. and Canada, is listed in local currency, and includes the reinvestment of dividends.
S&P 500 Index: An index that tracks the stocks of 500 mostly large U.S. companies.
Performance and Expenses
This chart shows the value of a hypothetical $10,000 investment in the fund over the past 10 fiscal year periods or since inception (for funds lacking 10-year records). The result is compared with benchmarks, which may include a broad-based market index and a peer group average or index. Market indexes do not include expenses, which are deducted from fund returns as well as mutual fund averages and indexes.
| AVERAGE ANNUAL COMPOUND TOTAL RETURN |
This table shows how the fund would have performed each year if its actual (or cumulative) returns for the periods shown had been earned at a constant rate.

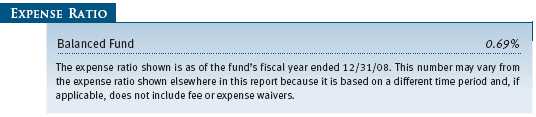
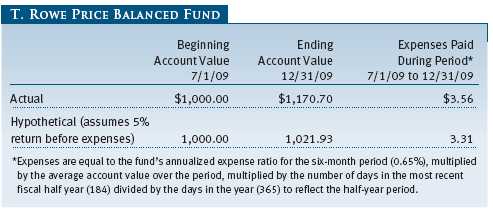
As a mutual fund shareholder, you may incur two types of costs: (1) transaction costs, such as redemption fees or sales loads, and (2) ongoing costs, including management fees, distribution and service (12b-1) fees, and other fund expenses. The following example is intended to help you understand your ongoing costs (in dollars) of investing in the fund and to compare these costs with the ongoing costs of investing in other mutual funds. The example is based on an investment of $1,000 invested at the beginning of the most recent six-month period and held for the entire period.
Actual Expenses
The first line of the following table (“Actual”) provides information about actual account values and expenses based on the fund’s actual returns. You may use the information in this line, together with your account balance, to estimate the expenses that you paid over the period. Simply divide your account value by $1,000 (for example, an $8,600 account value divided by $1,000 = 8.6), then multiply the result by the number in the first line under the heading “Expenses Paid During Period” to estimate the expenses you paid on your account during this period.
Hypothetical Example for Comparison Purposes
The information on the second line of the table (“Hypothetical”) is based on hypothetical account values and expenses derived from the fund’s actual expense ratio and an assumed 5% per year rate of return before expenses (not the fund’s actual return). You may compare the ongoing costs of investing in the fund with other funds by contrasting this 5% hypothetical example and the 5% hypothetical examples that appear in the shareholder reports of the other funds. The hypothetical account values and expenses may not be used to estimate the actual ending account balance or expenses you paid for the period.
Note: T. Rowe Price charges an annual small-account maintenance fee of $10, generally for accounts with less than $2,000 ($500 for UGMA/UTMA). The fee is waived for any investor whose T. Rowe Price mutual fund accounts total $25,000 or more, accounts employing automatic investing, and IRAs and other retirement plan accounts that utilize a prototype plan sponsored by T. Rowe Price (although a separate custodial or administrative fee may apply to such accounts). This fee is not included in the accompanying table. If you are subject to the fee, keep it in mind when you are estimating the ongoing expenses of investing in the fund and when comparing the expenses of this fund with other funds.
You should also be aware that the expenses shown in the table highlight only your ongoing costs and do not reflect any transaction costs, such as redemption fees or sales loads. Therefore, the second line of the table is useful in comparing ongoing costs only and will not help you determine the relative total costs of owning different funds. To the extent a fund charges transaction costs, however, the total cost of owning that fund is higher.

The accompanying notes are an integral part of these financial statements.


The accompanying notes are an integral part of these financial statements.

The accompanying notes are an integral part of these financial statements.

The accompanying notes are an integral part of these financial statements.

The accompanying notes are an integral part of these financial statements.
| NOTES TO FINANCIAL STATEMENTS |
T. Rowe Price Balanced Fund, Inc. (the fund), is registered under the Investment Company Act of 1940 (the 1940 Act) as a diversified, open-end management investment company. The fund commenced operations on December 31, 1939. The fund seeks to provide capital growth, current income, and preservation of capital through a portfolio of stocks and fixed-income securities.
NOTE 1 - SIGNIFICANT ACCOUNTING POLICIES
Basis of Preparation The accompanying financial statements were prepared in accordance with accounting principles generally accepted in the United States of America (GAAP), which require the use of estimates made by fund management. Fund management believes that estimates and security valuations are appropriate; however, actual results may differ from those estimates, and the security valuations reflected in the accompanying financial statements may differ from the value ultimately realized upon sale of the securities. Further, fund management believes that no events have occurred between December 31, 2009, the date of this report, and February 25, 2010, the date of issuance of the financial statements, that require adjustment of, or disclosure in, the accompanying financial statements.
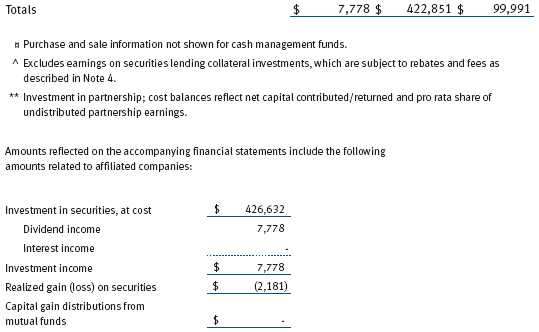
Investment Transactions, Investment Income, and Distributions Income and expenses are recorded on the accrual basis. Premiums and discounts on debt securities are amortized for financial reporting purposes. Paydown gains and losses are recorded as an adjustment to interest income. Dividends received from mutual fund investments are reflected as dividend income; capital gain distributions are reflected as realized gain/loss. Earnings on investments recognized as partnerships for federal income tax purposes reflect the tax character of such earnings. Dividend income and capital gain distributions are recorded on the ex-dividend date. Income tax-related interest and penalties, if incurred, would be recorded as income tax expense. Investment transactions are accounted for on the trade date. Realized gains and losses are reported on the identified cost basis. Distributions to shareholders are recorded on the ex-dividend date. Income distributions are declared and paid quarterly. Capital gain distributions, if any, are generally declared and paid by the fund, annually.
Currency Translation Assets, including investments, and liabilities denominated in foreign currencies are translated into U.S. dollar values each day at the prevailing exchange rate, using the mean of the bid and asked prices of such currencies against U.S. dollars as quoted by a major bank. Purchases and sales of securities, income, and expenses are translated into U.S. dollars at the prevailing exchange rate on the date of the transaction. The effect of changes in foreign currency exchange rates on realized and unrealized security gains and losses is reflected as a component of security gains and losses.
Rebates and Credits Subject to best execution, the fund may direct certain security trades to brokers who have agreed to rebate a portion of the related brokerage commission to the fund in cash. Commission rebates are reflected as realized gain on securities in the accompanying financial statements and totaled $40,000 for the year ended December 31, 2009. Additionally, the fund earns credits on temporarily uninvested cash balances held at the custodian, which reduce the fund’s custody charges. Custody expense in the accompanying financial statements is presented before reduction for credits, which are reflected as expenses paid indirectly.
New Accounting Pronouncement On January 1, 2009, the fund adopted new accounting guidance that requires enhanced disclosures about derivative and hedging activities, including how such activities are accounted for and their effect on financial position, performance, and cash flows. Adoption of this guidance had no impact on the fund’s net assets or results of operations.
NOTE 2 - VALUATION
The fund’s investments are reported at fair value as defined under GAAP. The fund determines the values of its assets and liabilities and computes its net asset value per share at the close of the New York Stock Exchange (NYSE), normally 4 p.m. ET, each day that the NYSE is open for business.
Valuation Methods Equity securities listed or regularly traded on a securities exchange or in the over-the-counter (OTC) market are valued at the last quoted sale price or, for certain markets, the official closing price at the time the valuations are made, except for OTC Bulletin Board securities, which are valued at the mean of the latest bid and asked prices. A security that is listed or traded on more than one exchange is valued at the quotation on the exchange determined to be the primary market for such security. Listed securities not traded on a particular day are valued at the mean of the latest bid and asked prices for domestic securities and the last quoted sale price for international securities.
Debt securities are generally traded in the OTC market. Securities with remaining maturities of one year or more at the time of acquisition are valued at prices furnished by dealers who make markets in such securities or by an independent pricing service, which considers the yield or price of bonds of comparable quality, coupon, maturity, and type, as well as prices quoted by dealers who make markets in such securities. Securities with remaining maturities of less than one year at the time of acquisition generally use amortized cost in local currency to approximate fair value. However, if amortized cost is deemed not to reflect fair value or the fund holds a significant amount of such securities with remaining maturities of more than 60 days, the securities are valued at prices furnished by dealers who make markets in such securities or by an independent pricing service.
Investments in mutual funds are valued at the mutual fund’s closing net asset value per share on the day of valuation. Investments in private investment companies are valued at the entity’s net asset value (or equivalent) as of the valuation date. Financial futures contracts are valued at closing settlement prices. Swaps are valued at prices furnished by independent swap dealers or by an independent pricing service.
Other investments, including restricted securities, and those financial instruments for which the above valuation procedures are inappropriate or are deemed not to reflect fair value are stated at fair value as determined in good faith by the T. Rowe Price Valuation Committee, established by the fund’s Board of Directors.
For valuation purposes, the last quoted prices of non-U.S. equity securities may be adjusted under the circumstances described below. If the fund determines that developments between the close of a foreign market and the close of the NYSE will, in its judgment, materially affect the value of some or all of its portfolio securities, the fund will adjust the previous closing prices to reflect what it believes to be the fair value of the securities as of the close of the NYSE. In deciding whether it is necessary to adjust closing prices to reflect fair value, the fund reviews a variety of factors, including developments in foreign markets, the performance of U.S. securities markets, and the performance of instruments trading in U.S. markets that represent foreign securities and baskets of foreign securities. A fund may also fair value securities in other situations, such as when a particular foreign market is closed but the fund is open. The fund uses outside pricing services to provide it with closing prices and information to evaluate and/or adjust those prices. The fund cannot predict how often it will use closing prices and how often it will determine it necessary to adjust those prices to reflect fair value. As a means of evaluating its security valuation process, the fund routinely compares closing prices, the next day’s opening prices in the same markets, and adjusted prices.
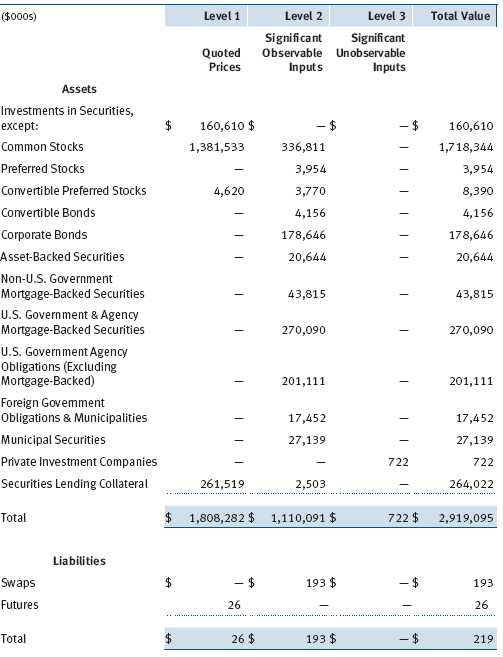
Valuation Inputs Various inputs are used to determine the value of the fund’s financial instruments. These inputs are summarized in the three broad levels listed below:
Level 1 – quoted prices in active markets for identical securities
Level 2 – observable inputs other than Level 1 quoted prices (including, but not limited to, quoted prices for similar securities, interest rates, prepayment speeds, and credit risk)
Level 3 – unobservable inputs
Observable inputs are those based on market data obtained from sources independent of the fund, and unobservable inputs reflect the fund’s own assumptions based on the best information available. The input levels are not necessarily an indication of the risk or liquidity associated with financial instruments at that level. For example, non-U.S. equity securities actively traded in foreign markets generally are reflected in Level 2 despite the availability of closing prices because the fund evaluates and determines whether those closing prices reflect fair value at the close of the NYSE or require adjustment, as described above. The following table summarizes the fund’s financial instruments, based on the inputs used to determine their values on December 31, 2009:
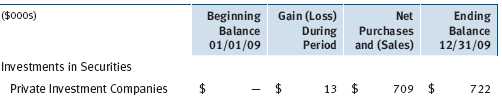
Following is a reconciliation of the fund’s Level 3 holdings for the year ended December 31, 2009. Gain (loss) reflects both realized and change in unrealized gain (loss) on Level 3 holdings during the period, if any, and is included on the accompanying Statement of Operations. The change in unrealized gain/loss on Level 3 instruments held at December 31, 2009, totaled $13,000 for the year ended December 31, 2009.
NOTE 3 - DERIVATIVE INSTRUMENTS
During the year ended December 31, 2009, the fund invested in derivative instruments. As defined by GAAP, a derivative is a financial instrument whose value is derived from an underlying security price, foreign exchange rate, interest rate, index of prices or rates, or other variable; it requires little or no initial investment and permits or requires net settlement. The fund invests in derivatives only if the expected risks and rewards are consistent with its investment objectives, policies, and overall risk profile, as described in its prospectus and Statement of Additional Information. The fund may use derivatives for a variety of purposes, such as seeking to hedge against declines in principal value, increase yield, invest in an asset with greater efficiency and at a lower cost than is possible through direct investment, or to adjust credit exposure. The risks associated with the use of derivatives are different from, and potentially much greater than, the risks associated with investing directly in the instruments on which the derivatives are based. Investments in derivatives can magnify returns positively or negatively; however, the fund at all times maintains sufficient cash reserves, liquid assets, or other SEC-permitted asset types to cover the settlement obligations under its open derivative contracts. During the year ended December 31, 2009, the fund’s exposure to derivatives, based on underlying notional amounts, was generally between 0% and 1% of net assets.
The fund values its derivatives at fair value, as described below and in Note 2, and recognizes changes in fair value currently in its results of operations. Accordingly, the fund does not follow hedge accounting, even for derivatives employed as economic hedges. The following table summarizes the fair value of the fund’s derivative instruments held as of December 31, 2009, and the related location on the accompanying Statement of Assets and Liabilities, presented by primary underlying risk exposure:

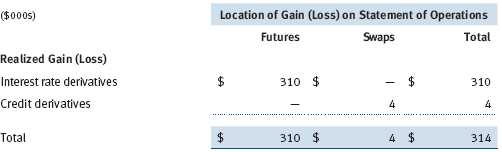
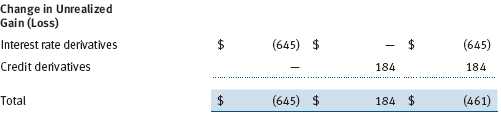
Additionally, the amount of gains and losses on derivative instruments recognized in fund earnings during the year ended December 31, 2009, and the related location on the accompanying Statement of Operations is summarized in the following table by primary underlying risk exposure:
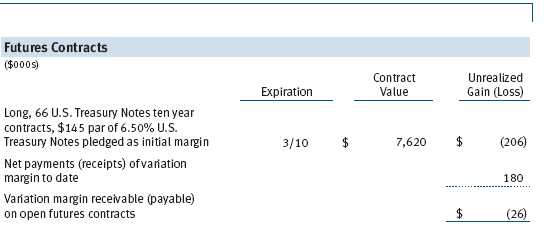
Futures Contracts The fund is subject to interest rate risk in the normal course of pursuing its investment objectives and uses futures contracts to help manage such risk. The fund may enter into futures contracts to manage exposure to interest rates, security prices, foreign currencies, and credit quality; as an efficient means of adjusting exposure to all or part of a target market; to enhance income; as a cash management tool; and/or to adjust credit exposure. A futures contract provides for the future sale by one party and purchase by another of a specified amount of a particular underlying financial instrument at an agreed-upon price, date, time, and place. The fund currently invests only in exchange-traded futures, which generally are standardized as to maturity date, underlying financial instrument, and other contract terms. Upon entering into a futures contract, the fund is required to deposit with the broker cash or securities in an amount equal to a certain percentage of the contract value (initial margin deposit); the margin deposit must then be maintained at the established level over the life of the contract. Subsequent payments are made or received by the fund each day to settle daily fluctuations in the value of the contract (variation margin), which reflect changes in the value of the underlying financial instrument. Variation margin is recorded as unrealized gain or loss until the contract is closed. The value of a futures contract included in net assets is the amount of unsettled variation margin; net variation margin receivable is reflected as an asset, and net variation margin payable is reflected as a liability on the accompanying Statement of Assets and Liabilities. Risks related to the use of futures contracts include possible illiquidity of the futures markets, contract prices that can be highly volatile and imperfectly correlated to movements in hedged security values and/or interest rates, and potential losses in excess of the fund’s initial investment.
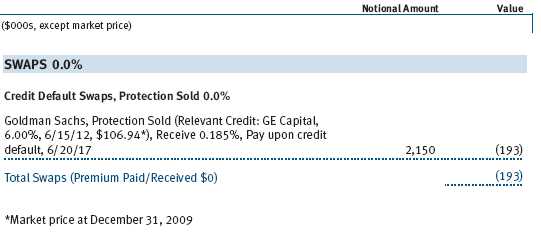
Credit Default Swaps The fund is subject to credit risk in the normal course of pursuing its investment objectives and uses swap contracts to help manage such risk. The fund may use swaps in an effort to manage exposure to changes in interest rates and credit quality, to adjust overall exposure to certain markets, to enhance total return or protect the value of portfolio securities, to serve as a cash management tool, and/or to adjust portfolio duration or credit exposure. Credit default swaps are agreements where one party (the protection buyer) agrees to make periodic payments to another party (the protection seller) in exchange for protection against specified credit events, such as certain defaults and bankruptcies related to an underlying credit instrument, index, or issuer thereof. Upon occurrence of a specified credit event, the protection seller is required to pay the buyer the difference between the notional amount of the swap and the value of the underlying credit, either in the form of a net cash settlement or by paying the gross notional amount and accepting delivery of the relevant underlying credit. Generally, the payment risk for the seller of protection is inversely related to the current market price of the underlying credit; therefore, the payment risk increases as the price of the relevant underlying credit declines due to market valuations of credit quality. As of December 31, 2009, the notional amount of protection sold by the fund totaled $2,150,000 (0.1% of net assets), which reflects the maximum potential amount the fund could be required to pay under such contracts. The value of a swap included in net assets is the unrealized gain or loss on the contract. Appreciated swaps are reflected as assets, and depreciated swaps are reflected as liabilities on the accompanying Statement of Assets and Liabilities. Net periodic receipts or payments required by swaps are accrued daily and are recorded as realized gain or loss for financial reporting purposes; fluctuations in the fair value of swaps are reflected in the change in net unrealized gain or loss and are reclassified to realized gain or loss upon termination prior to maturity or cash settlement. Risks related to the use of credit default swaps include the possible inability of the fund to accurately assess the current and future creditworthiness of underlying issuers, the possible failure of a counterparty to perform in accordance with the terms of the swap agreements, potential government regulation that could adversely affect the fund’s swap investments, and potential losses in excess of the fund’s initial investment.
Counterparty Risk and Collateral The fund has entered into collateral agreements with certain counterparties to mitigate counterparty risk associated with over-the-counter (OTC) derivatives, including swaps and forward currency exchange contracts. Subject to certain minimum exposure requirements (which range from $100,000 to $500,000), collateral generally is determined based on the net aggregate unrealized gain or loss on all OTC derivative contracts with a particular counterparty. Collateral, both pledged by and for the benefit of the fund, is held in a segregated account by a third-party agent and can be in the form of cash or debt securities issued by the U.S. government or related agencies. Securities posted as collateral by the fund are so noted in the accompanying Portfolio of Investments and remain in the fund’s net assets. As of December 31, 2009, securities valued at $427,000 had been posted by the fund for the benefit of counterparties and no collateral was pledged by counterparties for the benefit of the fund.
The fund’s maximum risk of loss from counterparty credit risk on OTC derivatives is the aggregate unrealized gain on appreciated contracts in excess of any collateral pledged by the counterparty for the benefit of the fund. Counterparty risk related to exchange-traded futures and options contracts is minimal because the exchange’s clearinghouse provides protection against defaults. In accordance with standard derivatives agreements, counterparties to OTC derivatives may be able to terminate derivative contracts prior to maturity in the event the fund fails to maintain sufficient asset coverage; its net assets decline by stated percentages; or it otherwise fails to meet the terms of its agreements, which would cause the fund to accelerate payment of any net liability owed to the counterparty under the contract. For exchange-traded derivatives such as futures and options, each broker in its sole discretion may change margin requirements applicable to the fund.
NOTE 4 - OTHER INVESTMENT TRANSACTIONS
Consistent with its investment objective, the fund engages in the following practices to manage exposure to certain risks and/or to enhance performance. The investment objective, policies, program, and risk factors of the fund are described more fully in the fund’s prospectus and Statement of Additional Information.
Restricted Securities The fund may invest in securities that are subject to legal or contractual restrictions on resale. Prompt sale of such securities at an acceptable price may be difficult and may involve substantial delays and additional costs.
Repurchase Agreements All repurchase agreements are fully collateralized by U.S. government securities. Collateral is in the possession of the fund’s custodian or, for tri-party agreements, the custodian designated by the agreement. Collateral is evaluated daily to ensure that its market value exceeds the delivery value of the repurchase agreements at maturity. Although risk is mitigated by the collateral, the fund could experience a delay in recovering its value and a possible loss of income or value if the counterparty fails to perform in accordance with the terms of the agreement.
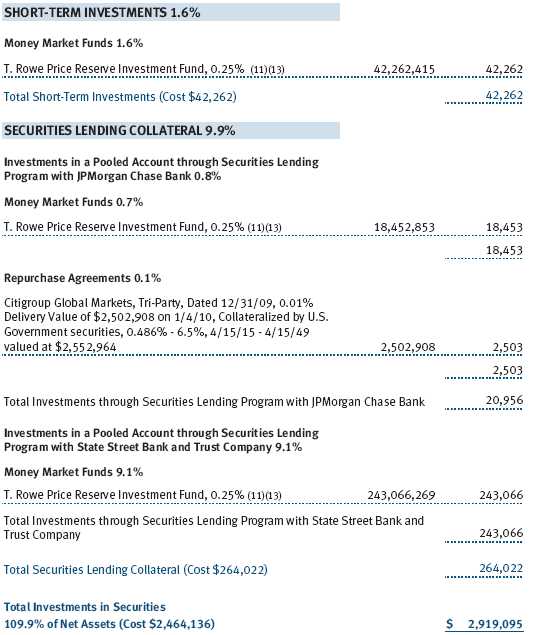
Securities Lending The fund lends its securities to approved brokers to earn additional income. It receives as collateral cash and U.S. government securities valued at 102% to 105% of the value of the securities on loan. Cash collateral is invested by the fund’s lending agent(s) in accordance with investment guidelines approved by fund management. Although risk is mitigated by the collateral, the fund could experience a delay in recovering its securities and a possible loss of income or value if the borrower fails to return the securities or if collateral investments decline in value. Securities lending revenue recognized by the fund consists of earnings on invested collateral and borrowing fees, net of any rebates to the borrower and compensation to the lending agent. On December 31, 2009, the value of loaned securities was $257,178,000; aggregate collateral received included U.S. government securities valued at $1,759,000.
T. Rowe Price Term Asset-Backed Opportunity Fund, L.L.C. During the year ended December 31, 2009, the fund invested in the T. Rowe Price Term Asset-Backed Opportunity Fund, L.L.C. (private fund), a private investment company managed by Price Associates that participates in the Term Asset-Backed Securities Loan Facility (TALF) program created and administered by the Federal Reserve Bank of New York (FRBNY). The TALF program provides eligible borrowers with term loans secured by eligible asset-backed securities and/or commercial mortgage-backed securities, which are either owned by the borrower or purchased by the borrower and subsequently pledged as collateral for a TALF loan. TALF loans generally are nonrecourse in nature. The private fund is treated as a partnership for federal income tax purposes. It has a limited life extending five years from final termination of the TALF program, currently scheduled for June 30, 2010, with two possible one-year extensions. Invested capital generally will be returned to investors as underlying securities are liquidated and the TALF loans mature, with the balance paid at maturity of the private fund. Ownership interests in the private fund may not be redeemed, sold, or assigned. As of December 31, 2009, the fund had outstanding capital commitments in the amount of $1,172,000 which may be called at the discretion of the private fund’s manager.
Other Purchases and sales of portfolio securities other than short-term and U.S. government securities aggregated $697,169,000 and $795,541,000, respectively, for the year ended December 31, 2009. Purchases and sales of U.S. government securities aggregated $262,039,000 and $166,772,000, respectively, for the year ended December 31, 2009.
NOTE 5 - FEDERAL INCOME TAXES
No provision for federal income taxes is required since the fund intends to continue to qualify as a regulated investment company under Subchapter M of the Internal Revenue Code and distribute to shareholders all of its taxable income and gains. Distributions determined in accordance with federal income tax regulations may differ in amount or character from net investment income and realized gains for financial reporting purposes. Financial reporting records are adjusted for permanent book/tax differences to reflect tax character but are not adjusted for temporary differences.
The fund files U.S. federal, state, and local tax returns as required. The fund’s tax returns are subject to examination by the relevant tax authorities until expiration of the applicable statute of limitations, which is generally three years after filing of the tax return but could be longer in certain circumstances.
Reclassifications between income and gain relate primarily to the character of paydown gains and losses on asset-backed securities. For the year ended December 31, 2009, the following reclassifications were recorded to reflect tax character; there was no impact on results of operations or net assets:

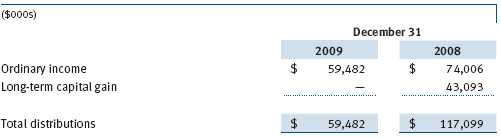
Distributions during the years ended December 31, 2009 and December 31, 2008 were characterized for tax purposes as follows:
At December 31, 2009, the tax-basis cost of investments and components of net assets were as follows:

The difference between book-basis and tax-basis net unrealized appreciation (depreciation) is attributable to the deferral of losses from wash sales for tax purposes. The fund intends to retain realized gains to the extent of available capital loss carryforwards. The fund’s unused capital loss carryforwards as of December 31, 2009, expire: $154,000 in fiscal 2010, $317,000 in fiscal 2015, $68,000 in fiscal 2016, and $132,584,000 in fiscal 2017. In accordance with federal income tax regulations applicable to investment companies, recognition of capital losses on certain transactions realized between November 1 and the fund’s fiscal year end is deferred for tax purposes until the subsequent year (post-October loss deferrals); however, such losses are recognized for financial reporting purposes in the year realized.
NOTE 6 - ACQUISITION
On August 31, 2009, the fund acquired substantially all of the assets of the T. Rowe Price Tax-Efficient Balanced Fund (the acquired fund), pursuant to the Agreement and Plan of Reorganization dated June 23, 2009, and approved by shareholders of the acquired fund on August 21, 2009. The acquired fund’s assets had grown slowly since its inception, which caused its expenses to remain relatively high. The reorganization provided acquired fund shareholders the opportunity to become shareholders of a larger, more diversified fund with a significantly lower expense ratio, while maintaining a balanced approach to investing. The acquisition was accomplished by a tax-free exchange of 1,866,789 shares of the fund (with a value of $30,989,000) for all 2,445,504 shares of the acquired fund outstanding on August 28, 2009, with the same value. The net assets of the acquired fund at that date included $3,228,000 of unrealized appreciation and $539,000 of net realized losses carried forward for tax purposes to offset distributable gains realized by the fund in the future. Assets of the acquired fund, including securities of $23,704,000, cash of $96,000, and receivables and other assets of $7,250,000, were combined with those of the fund, resulting in aggregate net assets of $2,473,005,000 immediately after the acquisition.
Proforma results of operations of the combined entity for the entire year ended December 31, 2009, as though the acquisition had occurred as of the beginning of the year (rather than on the actual acquisition date), are as follows:
Because the combined investment portfolios have been managed as a single portfolio since the acquisition was completed, it is not practicable to separate the amounts of revenue and earnings of the acquired fund that have been included in the fund’s accompanying Statement of Operations since August 31, 2009.
NOTE 7 - RELATED PARTY TRANSACTIONS
The fund is managed by T. Rowe Price Associates, Inc. (the manager or Price Associates), a wholly owned subsidiary of T. Rowe Price Group, Inc. The investment management agreement between the fund and the manager provides for an annual investment management fee, which is computed daily and paid monthly. The fee consists of an individual fund fee, equal to 0.15% of the fund’s average daily net assets, and a group fee. The group fee rate is calculated based on the combined net assets of certain mutual funds sponsored by Price Associates (the group) applied to a graduated fee schedule, with rates ranging from 0.48% for the first $1 billion of assets to 0.285% for assets in excess of $220 billion. The fund’s group fee is determined by applying the group fee rate to the fund’s average daily net assets. At December 31, 2009, the effective annual group fee rate was 0.30%.
In addition, the fund has entered into service agreements with Price Associates and two wholly owned subsidiaries of Price Associates (collectively, Price). Price Associates computes the daily share price and provides certain other administrative services to the fund. T. Rowe Price Services, Inc., provides shareholder and administrative services in its capacity as the fund’s transfer and dividend disbursing agent. T. Rowe Price Retirement Plan Services, Inc., provides subaccounting and recordkeeping services for certain retirement accounts invested in the fund. For the year ended December 31, 2009, expenses incurred pursuant to these service agreements were $161,000 for Price Associates; $724,000 for T. Rowe Price Services, Inc.; and $3,097,000 for T. Rowe Price Retirement Plan Services, Inc. The total amount payable at period-end pursuant to these service agreements is reflected as Due to Affiliates in the accompanying financial statements.
The fund may invest in the T. Rowe Price Reserve Investment Fund and the T. Rowe Price Government Reserve Investment Fund (collectively, the T. Rowe Price Reserve Investment Funds), open-end management investment companies managed by Price Associates and considered affiliates of the fund. The T. Rowe Price Reserve Investment Funds are offered as cash management options to mutual funds, trusts, and other accounts managed by Price Associates and/or its affiliates and are not available for direct purchase by members of the public. The T. Rowe Price Reserve Investment Funds pay no investment management fees.
The fund may also invest in certain T. Rowe Price institutional funds (underlying institutional funds) as a means of gaining efficient and cost-effective exposure to certain markets. The underlying institutional funds are open-end management investment companies managed by Price Associates and/or T. Rowe Price International, Inc. (collectively, the Price managers) and are considered affiliates of the fund. Each underlying institutional fund pays an all-inclusive management and administrative fee to its Price manager. To ensure that the fund does not incur duplicate fees, each Price manager has agreed to permanently waive a portion of its management fee charged to the fund in an amount sufficient to fully offset the fees paid by the underlying institutional funds related to fund assets invested therein. Accordingly, the accompanying Statement of Operations includes management fees permanently waived pursuant to this agreement. Annual fee rates and amounts waived within the accompanying Statement of Operations related to shares of the underlying institutional funds for the year ended December 31, 2009, are as follows:

| REPORT OF INDEPENDENT REGISTERED PUBLIC ACCOUNTING FIRM |
To the Board of Directors and Shareholders of
T. Rowe Price Balanced Fund, Inc.
In our opinion, the accompanying statement of assets and liabilities, including the schedule of investments, and the related statements of operations and of changes in net assets and the financial highlights present fairly, in all material respects, the financial position of T. Rowe Price Balanced Fund, Inc. (the “Fund”) at December 31, 2009, the results of its operations for the year then ended, the changes in its net assets for each of the two years in the period then ended and the financial highlights for each of the five years in the period then ended, in conformity with accounting principles generally accepted in the United States of America. These financial statements and financial highlights (hereafter referred to as “financial statements”) are the responsibility of the Fund’s management; our responsibility is to express an opinion on these financial statements based on our audits. We conducted our audits of these financial statements in accordance with the standards of the Public Company Accounting Oversight Board (United States). Those standards require that we plan and perform the audit to obtain reasonable assurance about whether the financial statements are free of material misstatement. An audit includes examining, on a test basis, evidence supporting the amounts and disclosures in the financial statements, assessing the accounting principles used and significant estimates made by management, and evaluating the overall financial statement presentation. We believe that our audits, which included confirmation of securities at December 31, 2009 by correspondence with the custodian and brokers, and confirmation of the underlying funds by correspondence with the transfer agent and recordkeeper, provide a reasonable basis for our opinion.
PricewaterhouseCoopers LLP
Baltimore, Maryland
February 25, 2010
| TAX INFORMATION (UNAUDITED) FOR THE TAX YEAR ENDED 12/31/09 |
We are providing this information as required by the Internal Revenue Code. The amounts shown may differ from those elsewhere in this report because of differences between tax and financial reporting requirements.
For taxable non-corporate shareholders, $29,639,000 of the fund’s income represents qualified dividend income subject to the 15% rate category.
For corporate shareholders, $18,740,000 of the fund’s income qualifies for the dividends-received deduction.
| INFORMATION ON PROXY VOTING POLICIES, PROCEDURES, AND RECORDS |
A description of the policies and procedures used by T. Rowe Price funds and portfolios to determine how to vote proxies relating to portfolio securities is available in each fund’s Statement of Additional Information, which you may request by calling 1-800-225-5132 or by accessing the SEC’s Web site, www.sec.gov. The description of our proxy voting policies and procedures is also available on our Web site, www.troweprice.com. To access it, click on the words “Our Company” at the top of our corporate homepage. Then, when the next page appears, click on the words “Proxy Voting Policies” on the left side of the page.
Each fund’s most recent annual proxy voting record is available on our Web site and through the SEC’s Web site. To access it through our Web site, follow the directions above, then click on the words “Proxy Voting Records” on the right side of the Proxy Voting Policies page.
| HOW TO OBTAIN QUARTERLY PORTFOLIO HOLDINGS |
The fund files a complete schedule of portfolio holdings with the Securities and Exchange Commission for the first and third quarters of each fiscal year on Form N-Q. The fund’s Form N-Q is available electronically on the SEC’s Web site (www.sec.gov); hard copies may be reviewed and copied at the SEC’s Public Reference Room, 450 Fifth St. N.W., Washington, DC 20549. For more information on the Public Reference Room, call 1-800-SEC-0330.
| ABOUT THE FUND’S DIRECTORS AND OFFICERS |
Your fund is governed by a Board of Directors (Board) that meets regularly to review a wide variety of matters affecting the fund, including performance, investment programs, compliance matters, advisory fees and expenses, service providers, and other business affairs. The Board elects the fund’s officers, who are listed in the final table. At least 75% of Board members are independent of T. Rowe Price Associates, Inc. (T. Rowe Price), and T. Rowe Price International, Inc. (T. Rowe Price International); “inside” or “interested” directors are employees or officers of T. Rowe Price. The business address of each director and officer is 100 East Pratt Street, Baltimore, Maryland 21202. The Statement of Additional Information includes additional information about the directors and is available without charge by calling a T. Rowe Price representative at 1-800-225-5132.
| Independent Directors | |
| |
| Name | |
| (Year of Birth) | Principal Occupation(s) During Past Five Years and Directorships of |
| Year Elected* | Other Public Companies |
| | |
| William R. Brody, M.D., | President and Trustee, Salk Institute for Biological Studies (2009 |
| Ph.D. | to present); Director, Novartis, Inc. (2009 to present); Director, IBM |
| (1944) | (2007 to present); President and Trustee, Johns Hopkins University |
| 2009 | (1996 to 2009); Chairman of Executive Committee and Trustee, |
| | Johns Hopkins Health System (1996 to 2009) |
| | |
| Jeremiah E. Casey | Director, National Life Insurance (2001 to 2005); Director, The Rouse |
| (1940) | Company, real estate developers (1990 to 2004) |
| 2005 | |
| | |
| Anthony W. Deering | Chairman, Exeter Capital, LLC, a private investment firm (2004 to |
| (1945) | present); Director, Under Armour (2008 to present); Director, Vornado |
| 2001 | Real Estate Investment Trust (2004 to present); Director, Mercantile |
| | Bankshares (2002 to 2007); Member, Advisory Board, Deutsche Bank |
| | North America (2004 to present); Director, Chairman of the Board, |
| | and Chief Executive Officer, The Rouse Company, real estate develop- |
| | ers (1997 to 2004) |
| | |
| Donald W. Dick, Jr. | Principal, EuroCapital Advisors, LLC, an acquisition and management |
| (1943) | advisory firm (1995 to present) |
| 1991 | |
| | |
| Karen N. Horn | Director, Eli Lilly and Company (1987 to present); Director, Simon |
| (1943) | Property Group (2004 to present); Director, Norfolk Southern (2008 |
| 2003 | to present); Director, Georgia Pacific (2004 to 2005) |
| | |
| Theo C. Rodgers | President, A&R Development Corporation (1977 to present) |
| (1941) | |
| 2005 | |
| | |
| John G. Schreiber | Owner/President, Centaur Capital Partners, Inc., a real estate invest- |
| (1946) | ment company (1991 to present); Partner, Blackstone Real Estate |
| 2001 | Advisors, L.P. (1992 to present) |
| | |
| Mark R. Tercek | President and Chief Executive Officer, The Nature Conservancy (2008 |
| (1957) | to present); Managing Director, The Goldman Sachs Group, Inc. |
| 2009 | (1984 to 2008) |
| |
| *Each independent director oversees 124 T. Rowe Price portfolios and serves until retirement, resignation, or |
| election of a successor. | |
| Inside Directors | |
| |
| Name | |
| (Year of Birth) | |
| Year Elected* | |
| [Number of T. Rowe Price | Principal Occupation(s) During Past Five Years and Directorships of |
| Portfolios Overseen] | Other Public Companies |
| | |
| Edward C. Bernard | Director and Vice President, T. Rowe Price; Vice Chairman of the |
| (1956) | Board, Director, and Vice President, T. Rowe Price Group, Inc.; |
| 2006 | Chairman of the Board, Director, and President, T. Rowe Price |
| [124] | Investment Services, Inc.; Chairman of the Board and Director, |
| | T. Rowe Price Global Asset Management Limited, T. Rowe Price |
| | Global Investment Services Limited, T. Rowe Price Retirement |
| | Plan Services, Inc., T. Rowe Price Savings Bank, and T. Rowe Price |
| | Services, Inc.; Director, T. Rowe Price International, Inc.; Chief |
| | Executive Officer, Chairman of the Board, Director, and President, |
| | T. Rowe Price Trust Company; Chairman of the Board, all funds |
| | |
| Brian C. Rogers, CFA, CIC | Chief Investment Officer, Director, and Vice President, T. Rowe Price; |
| (1955) | Chairman of the Board, Chief Investment Officer, Director, and Vice |
| 2006 | President, T. Rowe Price Group, Inc.; Vice President, T. Rowe Price |
| [69] | Trust Company |
| |
| *Each inside director serves until retirement, resignation, or election of a successor. |
| Officers | |
| |
| Name (Year of Birth) | |
| Position Held With Balanced Fund | Principal Occupation(s) |
| | |
| E. Frederick Bair, CFA, CPA (1969) | Vice President, T. Rowe Price, T. Rowe Price |
| Vice President | Group, Inc., and T. Rowe Price Trust Company |
| | |
| Wendy R. Diffenbaugh (1954) | Vice President, T. Rowe Price |
| Vice President | |
| | |
| Anna M. Dopkin, CFA (1967) | Vice President, T. Rowe Price, T. Rowe Price |
| Vice President | Group, Inc., and T. Rowe Price Trust Company |
| | |
| Roger L. Fiery III, CPA (1959) | Vice President, T. Rowe Price, T. Rowe Price |
| Vice President | Group, Inc., T. Rowe Price International, Inc., |
| | and T. Rowe Price Trust Company |
| | |
| John R. Gilner (1961) | Chief Compliance Officer and Vice President, |
| Chief Compliance Officer | T. Rowe Price; Vice President, T. Rowe Price |
| | Group, Inc., and T. Rowe Price Investment |
| | Services, Inc. |
| | |
| Gregory S. Golczewski (1966) | Vice President, T. Rowe Price and T. Rowe Price |
| Vice President | Trust Company |
| | |
| Gregory K. Hinkle, CPA (1958) | Vice President, T. Rowe Price, T. Rowe Price |
| Treasurer | Group, Inc., and T. Rowe Price Trust Company; |
| | formerly Partner, PricewaterhouseCoopers LLP |
| | (to 2007) |
| | |
| Paul A. Karpers, CFA (1967) | Vice President, T. Rowe Price and T. Rowe Price |
| Vice President | Group, Inc. |
| | |
| Robert M. Larkins, CFA (1973) | Vice President, T. Rowe Price, T. Rowe Price |
| Vice President | Group, Inc., and T. Rowe Price Trust Company |
| | |
| John D. Linehan, CFA (1965) | Vice President, T. Rowe Price, T. Rowe Price |
| Vice President | Group, Inc., and T. Rowe Price Trust Company |
| | |
| Patricia B. Lippert (1953) | Assistant Vice President, T. Rowe Price and |
| Secretary | T. Rowe Price Investment Services, Inc. |
| | |
| Raymond A. Mills, Ph.D., CFA (1960) | Vice President, T. Rowe Price, T. Rowe Price |
| Vice President | Group, Inc., T. Rowe Price International, Inc., |
| | and T. Rowe Price Trust Company |
| | |
| Edmund M. Notzon III, Ph.D., CFA (1945) | Vice President, T. Rowe Price, T. Rowe Price |
| President | Global Investment Services Limited, T. Rowe |
| | Price Group, Inc., T. Rowe Price Investment |
| | Services, Inc., and T. Rowe Price Trust Company |
| | |
| David Oestreicher (1967) | Director and Vice President, T. Rowe Price |
| Vice President | Investment Services, Inc., T. Rowe Price Trust |
| | Company, and T. Rowe Price Services, Inc.; Vice |
| | President, T. Rowe Price, T. Rowe Price Global |
| | Asset Management Limited, T. Rowe Price |
| | Global Investment Services Limited, T. Rowe |
| | Price Group, Inc., T. Rowe Price International, |
| | Inc., and T. Rowe Price Retirement Plan |
| | Services, Inc. |
| | |
| Larry J. Puglia, CFA, CPA (1960) | Vice President, T. Rowe Price, T. Rowe Price |
| Vice President | Group, Inc., and T. Rowe Price Trust Company |
| | |
| Deborah D. Seidel (1962) | Vice President, T. Rowe Price, T. Rowe Price |
| Vice President | Investment Services, Inc., and T. Rowe Price |
| | Services, Inc. |
| | |
| Julie L. Waples (1970) | Vice President, T. Rowe Price |
| Vice President | |
| | |
| Richard T. Whitney, CFA (1958) | Vice President, T. Rowe Price, T. Rowe Price |
| Executive Vice President | Group, Inc., T. Rowe Price International, Inc., |
| | and T. Rowe Price Trust Company |
| |
| Unless otherwise noted, officers have been employees of T. Rowe Price or T. Rowe Price International for at least |
| five years. | |
Item 2. Code of Ethics.
The registrant has adopted a code of ethics, as defined in Item 2 of Form N-CSR, applicable to its principal executive officer, principal financial officer, principal accounting officer or controller, or persons performing similar functions. A copy of this code of ethics is filed as an exhibit to this Form N-CSR. No substantive amendments were approved or waivers were granted to this code of ethics during the period covered by this report.
Item 3. Audit Committee Financial Expert.
The registrant’s Board of Directors/Trustees has determined that Mr. Anthony W. Deering qualifies as an audit committee financial expert, as defined in Item 3 of Form N-CSR. Mr. Deering is considered independent for purposes of Item 3 of Form N-CSR.
Item 4. Principal Accountant Fees and Services.
(a) – (d) Aggregate fees billed to the registrant for the last two fiscal years for professional services rendered by the registrant’s principal accountant were as follows:

Audit fees include amounts related to the audit of the registrant’s annual financial statements and services normally provided by the accountant in connection with statutory and regulatory filings. Audit-related fees include amounts reasonably related to the performance of the audit of the registrant’s financial statements and specifically include the issuance of a report on internal controls and, if applicable, agreed-upon procedures related to fund acquisitions. Tax fees include amounts related to services for tax compliance, tax planning, and tax advice. The nature of these services specifically includes the review of distribution calculations and the preparation of Federal, state, and excise tax returns. All other fees include the registrant’s pro-rata share of amounts for agreed-upon procedures in conjunction with service contract approvals by the registrant’s Board of Directors/Trustees.
(e)(1) The registrant’s audit committee has adopted a policy whereby audit and non-audit services performed by the registrant’s principal accountant for the registrant, its investment adviser, and any entity controlling, controlled by, or under common control with the investment adviser that provides ongoing services to the registrant require pre-approval in advance at regularly scheduled audit committee meetings. If such a service is required between regularly scheduled audit committee meetings, pre-approval may be authorized by one audit committee member with ratification at the next scheduled audit committee meeting. Waiver of pre-approval for audit or non-audit services requiring fees of a de minimis amount is not permitted.
(2) No services included in (b) – (d) above were approved pursuant to paragraph (c)(7)(i)(C) of Rule 2-01 of Regulation S-X.
(f) Less than 50 percent of the hours expended on the principal accountant’s engagement to audit the registrant’s financial statements for the most recent fiscal year were attributed to work performed by persons other than the principal accountant’s full-time, permanent employees.
(g) The aggregate fees billed for the most recent fiscal year and the preceding fiscal year by the registrant’s principal accountant for non-audit services rendered to the registrant, its investment adviser, and any entity controlling, controlled by, or under common control with the investment adviser that provides ongoing services to the registrant were $1,879,000 and $1,922,000, respectively.
(h) All non-audit services rendered in (g) above were pre-approved by the registrant’s audit committee. Accordingly, these services were considered by the registrant’s audit committee in maintaining the principal accountant’s independence.
Item 5. Audit Committee of Listed Registrants.
Not applicable.
Item 6. Investments.
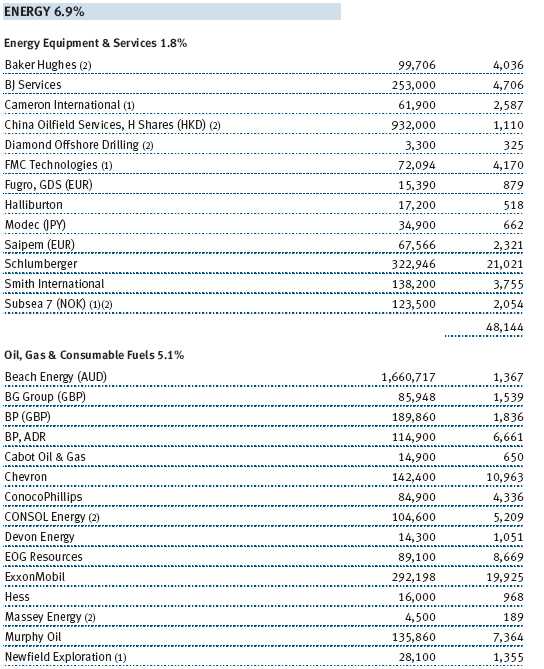
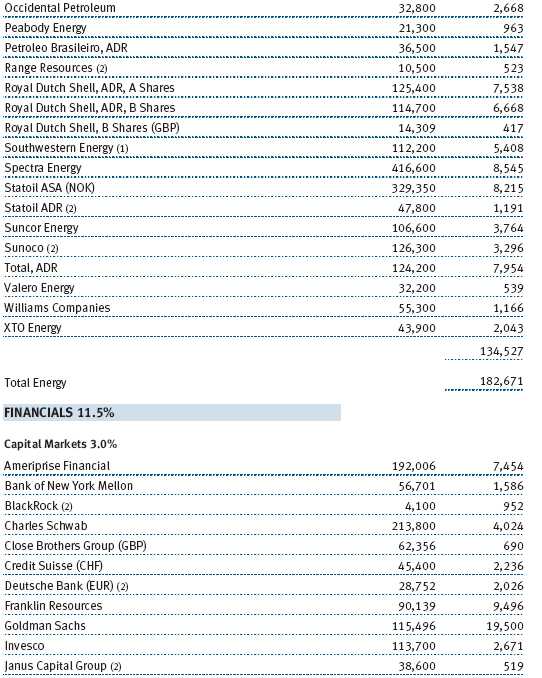
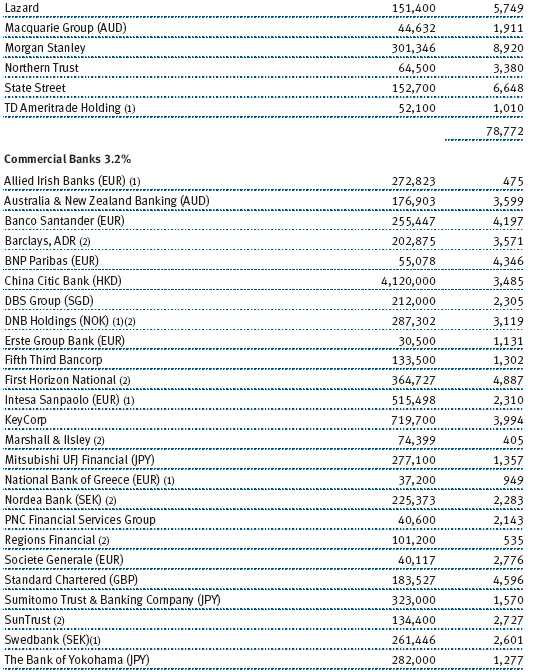
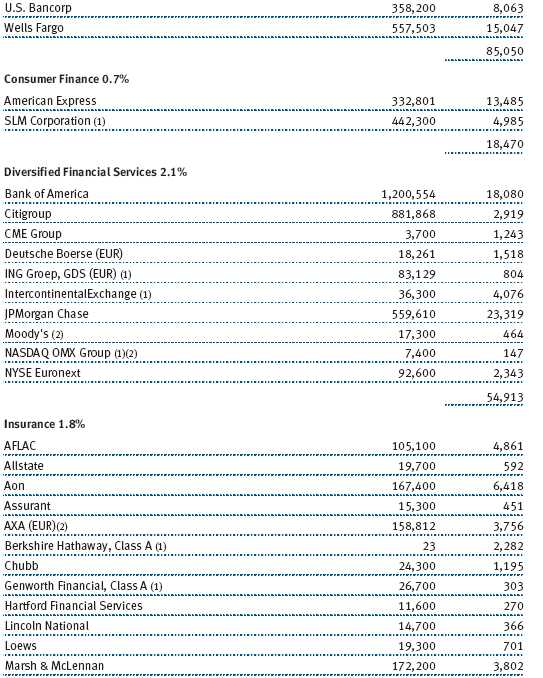
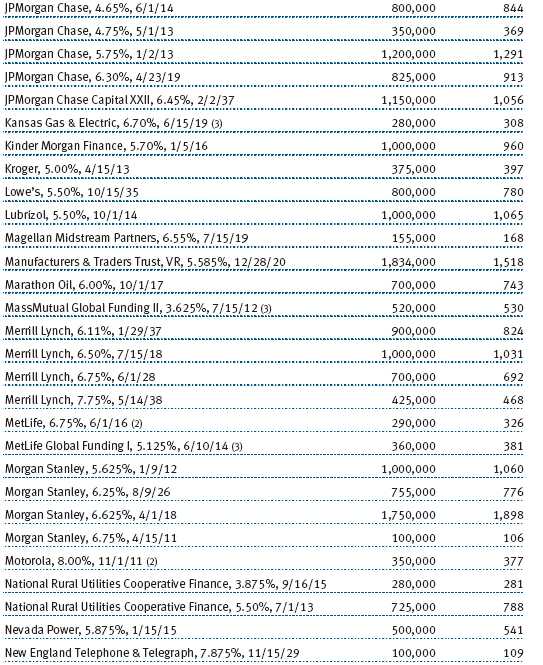
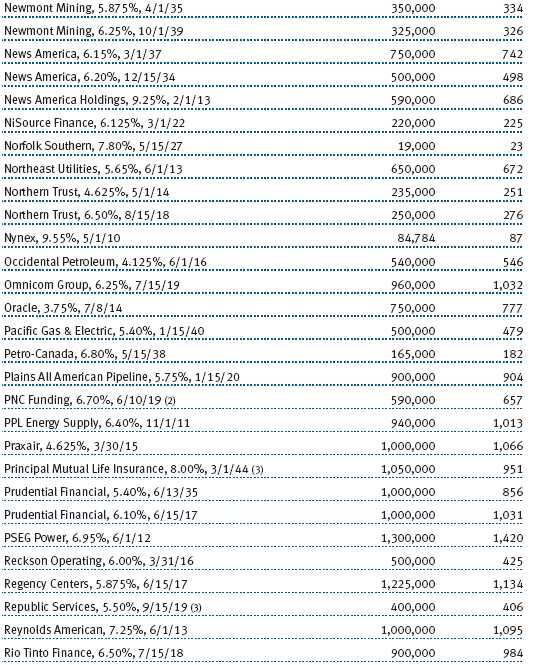
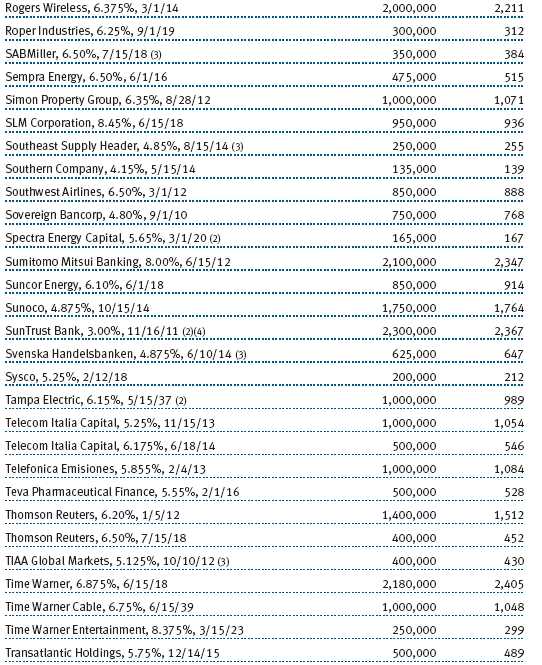
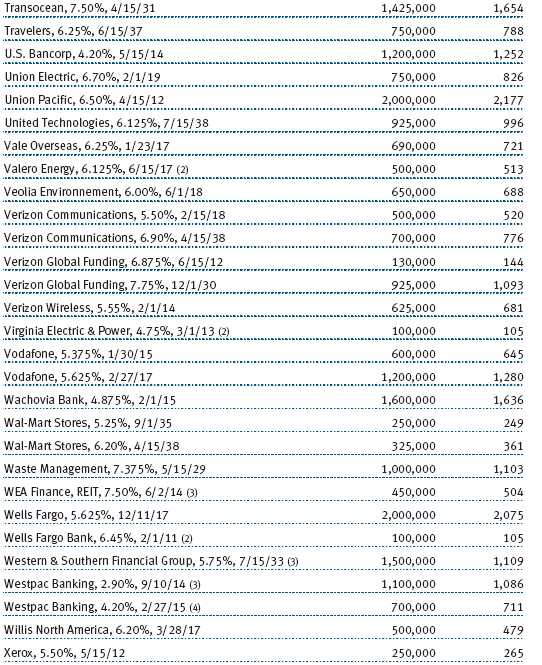
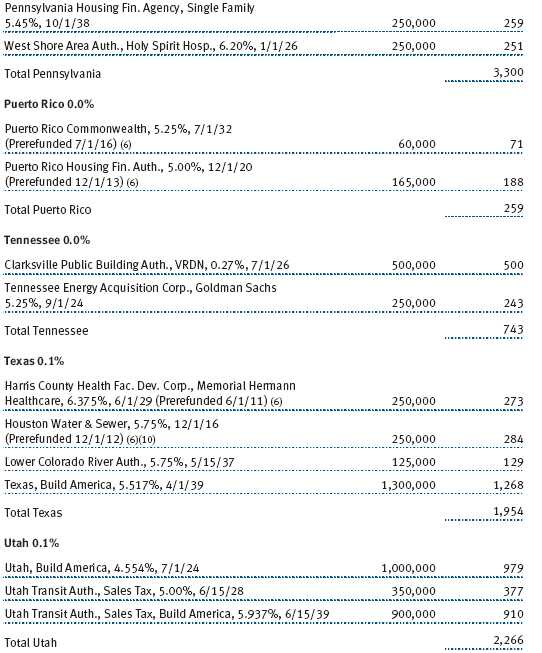
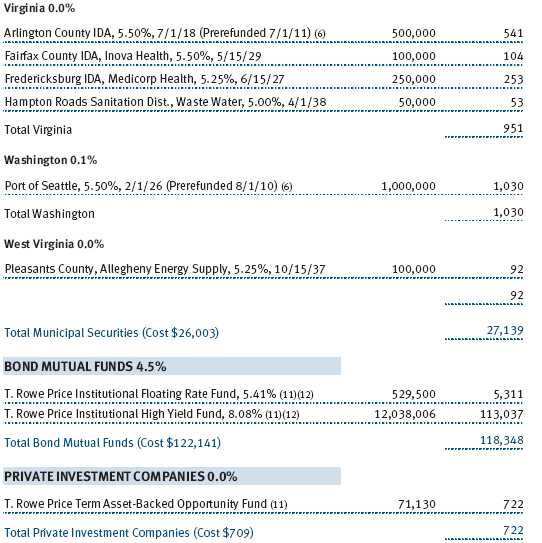
(a) Not applicable. The complete schedule of investments is included in Item 1 of this Form N-CSR.
(b) Not applicable.
Item 7. Disclosure of Proxy Voting Policies and Procedures for Closed-End Management Investment Companies.
Not applicable.
Item 8. Portfolio Managers of Closed-End Management Investment Companies.
Not applicable.
Item 9. Purchases of Equity Securities by Closed-End Management Investment Company and Affiliated Purchasers.
Not applicable.
Item 10. Submission of Matters to a Vote of Security Holders.
Not applicable.
Item 11. Controls and Procedures.
(a) The registrant’s principal executive officer and principal financial officer have evaluated the registrant’s disclosure controls and procedures within 90 days of this filing and have concluded that the registrant’s disclosure controls and procedures were effective, as of that date, in ensuring that information required to be disclosed by the registrant in this Form N-CSR was recorded, processed, summarized, and reported timely.
(b) The registrant’s principal executive officer and principal financial officer are aware of no change in the registrant’s internal control over financial reporting that occurred during the registrant’s second fiscal quarter covered by this report that has materially affected, or is reasonably likely to materially affect, the registrant’s internal control over financial reporting.
Item 12. Exhibits.
(a)(1) The registrant’s code of ethics pursuant to Item 2 of Form N-CSR is attached.
(2) Separate certifications by the registrant's principal executive officer and principal financial officer, pursuant to Section 302 of the Sarbanes-Oxley Act of 2002 and required by Rule 30a-2(a) under the Investment Company Act of 1940, are attached.
(3) Written solicitation to repurchase securities issued by closed-end companies: not applicable.
(b) A certification by the registrant's principal executive officer and principal financial officer, pursuant to Section 906 of the Sarbanes-Oxley Act of 2002 and required by Rule 30a-2(b) under the Investment Company Act of 1940, is attached.
| | |
SIGNATURES |
| |
| | Pursuant to the requirements of the Securities Exchange Act of 1934 and the Investment |
| Company Act of 1940, the registrant has duly caused this report to be signed on its behalf by the |
| undersigned, thereunto duly authorized. |
| |
| T. Rowe Price Balanced Fund, Inc. |
| |
| |
| |
| By | /s/ Edward C. Bernard |
| | Edward C. Bernard |
| | Principal Executive Officer |
| |
| Date | February 25, 2010 |
| |
| |
| |
| | Pursuant to the requirements of the Securities Exchange Act of 1934 and the Investment |
| Company Act of 1940, this report has been signed below by the following persons on behalf of |
| the registrant and in the capacities and on the dates indicated. |
| |
| |
| By | /s/ Edward C. Bernard |
| | Edward C. Bernard |
| | Principal Executive Officer |
| |
| Date | February 25, 2010 |
| |
| |
| |
| By | /s/ Gregory K. Hinkle |
| | Gregory K. Hinkle |
| | Principal Financial Officer |
| |
| Date | February 25, 2010 |