UNITED STATES
SECURITIES AND EXCHANGE COMMISSION
Washington, D.C. 20549
FORM N-CSR
CERTIFIED SHAREHOLDER REPORT OF REGISTERED
MANAGEMENT INVESTMENT COMPANIES
Investment Company Act file number | 811-06279 |
|
Harris Associates Investment Trust |
(Exact name of registrant as specified in charter) |
|
Two North La Salle Street, Suite 500 Chicago, Illinois | | 60602-3790 |
(Address of principal executive offices) | | (Zip code) |
|
John R. Raitt
Harris Associates L.P.
Two North La Salle Street, #500
Chicago, Illinois 60602 | Cameron S. Avery
Bell, Boyd & Lloyd LLC
Three First National Plaza, #3100
Chicago, Illinois 60602 |
(Name and address of agent for service) |
|
Registrant’s telephone number, including area code: | (312) 621-0600 | |
|
Date of fiscal year end: | 09/30/06 | |
|
Date of reporting period: | 09/30/06 | |
| | | | | | | | | |
Item 1. Reports to Shareholders.

ANNUAL REPORT
SEPTEMBER 30, 2006

Advised by Harris Associates L.P.
THE OAKMARK FUNDS
2006 Annual Report
| President's Letter | | | 1 | | |
|
| Summary Information | | | 2 | | |
|
| Fund Expenses | | | 4 | | |
|
| Commentary on The Oakmark and Oakmark Select Funds | | | 6 | | |
|
| The Oakmark Fund | |
|
| Letter from the Portfolio Managers | | | 8 | | |
|
| Schedule of Investments | | | 9 | | |
|
| The Oakmark Select Fund | |
|
| Letter from the Portfolio Managers | | | 13 | | |
|
| Schedule of Investments | | | 14 | | |
|
| The Oakmark Equity and Income Fund | |
|
| Letter from the Portfolio Managers | | | 16 | | |
|
| Schedule of Investments | | | 18 | | |
|
| The Oakmark Global Fund | |
|
| Letter from the Portfolio Managers | | | 22 | | |
|
| Global Diversification Chart | | | 24 | | |
|
| Schedule of Investments | | | 25 | | |
|
| Commentary on The International and International Small Cap Funds | | | 30 | | |
|
| The Oakmark International Fund | |
|
| Letter from the Portfolio Manager | | | 31 | | |
|
| International Diversification Chart | | | 33 | | |
|
| Schedule of Investments | | | 34 | | |
|
| The Oakmark International Small Cap Fund | |
|
| Letter from the Portfolio Managers | | | 40 | | |
|
| International Diversification Chart | | | 42 | | |
|
| Schedule of Investments | | | 43 | | |
|
| Financial Statements | |
|
| Statements of Assets and Liabilities | | | 50 | | |
|
| Statements of Operations | | | 52 | | |
|
| Statements of Changes in Net Assets | | | 54 | | |
|
| Notes to Financial Statements | | | 60 | | |
|
| Trustees and Officers | | | 80 | | |
|
| Oakmark Philosophy and Process | | | 83 | | |
|
| The Oakmark Glossary | | | 84 | | |
|
FORWARD-LOOKING STATEMENT DISCLOSURE
One of our most important responsibilities as mutual fund managers is to communicate with shareholders in an open and direct manner. Some of our comments in our letters to shareholders are based on current management expectations and are considered "forward-looking statements". Actual future results, however, may prove to be different from our expectations. You can identify forward-looking statements by words such as "estimate", "may", "will", "expect", "believe", "plan" and other similar terms. We cannot promise future returns. Our opinions are a reflection of our best judgment at the time this report is compiled, and we disclaim any obligation to update or alter forward-looking statements as a result of new information, future events, or otherwise.
President's Letter

Dear Fellow Shareholders,
World markets rose strongly in the quarter ended September 30. All of our Funds also posted significant positive returns in the quarter. Compounding capital at positive rates of return over long periods is key to long-term wealth creation. Importantly, all of our Funds have produced solidly positive returns year-to-date.
Benchmarks, Over-diversification and Long Term Returns
Understanding a fund manager's investment process and strategy is essential to successful mutual fund investing, so we write about our investment process often. At Oakmark, we continuously search for businesses selling at large discounts to intrinsic value and try to fill our portfolios with the most undervalued of these ideas. We also believe that good investment ideas are scarce—so we concentrate our portfolios. That concentration occurs in two ways. First, the number of stocks in our portfolios is lower than our peers. Second, since we focus on owning the most undervalued ideas available, we often develop holdings that are concentrated in out of favor sectors or industries. We will also have few or even zero holdings in industries where we believe that stocks are fairly valued or overvalued. As a result, our portfolios tend to look quite different from most other funds and the broader market indexes.
Given our approach, we were interested to read of a recent study published by Professors Cremers and Petajisto from Yale University1. The professors' work focused on mutual fund performance, market indexes and how fund managers build their portfolios. As Bill Nygren discusses in his letter this quarter, many fund managers tend to over-diversify their holdings in an attempt to limit the impact of their mistakes. Along the way, however, they often become "closet indexers," owning so many stocks that it is mathematically difficult for their performance to differ much from the market averages. With returns destined to be average, it also becomes tricky for these managers to justify full management fees.
In focusing on this issue, Professors Cremers and Petajisto analyzed data across the mutual fund universe and created a statistic called "Active Share." Simply put, Active Share measures the portion of a mutual fund's portfolio that is different from the fund's benchmark index. Interestingly, the professors found that, while their returns might be more volatile, the funds with the highest Active Share significantly outperformed the market. At the same time, the funds with the lowest Active Share tended to underperform. Although the funds with a high Active Share generally do charge higher fees, the study found that these funds outperformed the market both before and after expenses. In other words, it has been worth paying for the extra cost of truly active portfolio management.
As one would expect from the description of the Oakmark stock selection process above, all of The Oakmark Funds have a high Active Share. The average U.S. equity mutual fund benchmarked against the S&P 5002, has an Active Share of 66%. As of September 30, four of six Oakmark Funds had an Active Share of over 90%, with the other two Funds above 80%. As we have discussed in past letters, our concentrated approach does increase the chance that our portfolios may lag behind the broader market indexes for several quarters or even years. However, we believe that concentrating on our best ideas greatly increases the chances for long-term Fund outperformance. These professors' research seems to indicate that we are on the right track.
Oakmark Offers a New Fund
On October 2, we launched a new Fund in the Oakmark family, The Oakmark Global Select Fund. Oakmark Global Select is a non-diversified, large company, global equity fund. The Fund is managed by David Herro and Bill Nygren, two of our most talented portfolio managers, and it will own the stocks of approximately 20 large companies from around the world. We believe that large, well run, high quality companies are attractively priced in both domestic and international markets. The Fund will be managed using the same value-oriented investment approach that is the hallmark of The Oakmark Funds. As with our other Funds, the portfolio managers and employees of Harris Associates L.P., Oakmark's adviser, have made significant personal investments in Oakmark Global Select.
Thank you for your continued investment and confidence in The Oakmark Funds. We welcome your comments and questions. You can reach us via e-mail at ContactOakmark@oakmark.com.
John R. Raitt
President of The Oakmark Funds
President and CEO of Harris Associates L.P.
1
THE OAKMARK FUNDS
Summary Information
Performance for Period
Ended September 30, 20063
(Unaudited) | | The Oakmark
Fund—Class I
(OAKMX) | | The Oakmark
Select Fund—Class I
(OAKLX) | | The Oakmark
Equity and Income
Fund—Class I
(OAKBX) | |
| 3 Months* | | | 5.56 | % | | | 3.02 | % | | | 2.36 | % | |
| 1 Year | | | 10.46 | % | | | 9.58 | % | | | 6.51 | % | |
Average Annual Total
Return for: | |
| 3 Year | | | 10.27 | % | | | 10.38 | % | | | 11.54 | % | |
| 5 Year | | | 7.43 | % | | | 8.07 | % | | | 10.59 | % | |
| 10 Year | | | 8.51 | % | | | N/A | | | | 13.46 | % | |
| Since inception | | | 15.25%
(8/5/91) | | | | 17.83%
(11/1/96) | | | | 13.36%
(11/1/95) | | |
Top Five Equity
Holdings as of
September 30, 20064
(Unaudited)
Company and % of Total
Net Assets | | | Washington
Mutual, Inc. 3.2%
McDonald's
Corporation 3.0%
Yum! Brands, Inc. 2.6%
Time Warner Inc. 2.5%
Baxter
International Inc. 2.4% | | | | Washington
Mutual, Inc. 15.0%
Yum! Brands, Inc. 7.6%
H&R Block, Inc. 5.7%
McDonald's
Corporation 5.5%
First Data
Corporation 5.0% | | | | XTO Energy, Inc. 4.0%
Nestle SA 3.1%
General Dynamics
Corporation 3.0%
EnCana Corp 2.7%
Diageo plc 2.6% | | |
Sector
Allocation as of
September 30, 2006
(Unaudited)
Sector and % of
Market Value | | | Consumer
Discretionary 42.6%
Financials 14.5%
Information
Technology 13.1%
Consumer Staples 12.6%
Health Care 9.0%
Industrials 6.9%
Energy 1.3% | | | | Consumer
Discretionary 49.2%
Financials 20.4%
Information
Technology 18.2%
Health Care 7.8%
Industrials 4.4% | | | | U.S. Government
Securities 32.6%
Consumer Staples 12.1%
Consumer
Discretionary 12.0%
Foreign Government
Securities 10.8%
Energy 10.5%
Industrials 7.6%
Financials 6.1%
Health Care 5.6%
Information
Technology 2.5%
Materials 0.2% | | |
The performance data quoted represents past performance. The above performance information for the Funds does not reflect the imposition of a 2% redemption fee on shares held for 90 days or less to deter market timers. If reflected, the fee would reduce the performance quoted. Past performance does not guarantee future results. The investment return and principal value will fluctuate so that an investor's shares, when redeemed, may be worth more or less than their original cost. Current performance may be lower or higher than the performance data quoted. Average annual total return measures annualized change, while total return measures aggregate change. To obtain most recent month-end performance data, visit oakmark.com.
* Not annualized
THE OAKMARK FUNDS
2
Performance for Period
Ended September 30, 20063
(Unaudited) | | The Oakmark
Global Fund—Class I
(OAKGX) | | The Oakmark
International
Fund—Class I
(OAKIX) | | The Oakmark
International
Small Cap Fund—Class I
(OAKEX) | |
| 3 Months* | | | 5.58 | % | | | 5.09 | % | | | 8.42 | % | |
| 1 Year | | | 17.46 | % | | | 22.14 | % | | | 28.50 | % | |
Average Annual Total
Return for: | |
| 3 Year | | | 19.25 | % | | | 23.29 | % | | | 30.47 | % | |
| 5 Year | | | 22.18 | % | | | 19.12 | % | | | 26.58 | % | |
| 10 Year | | | N/A | | | | 11.99 | % | | | 14.64 | % | |
| Since inception | | | 16.67%
(8/4/99) | | | | 13.23%
(9/30/92) | | | | 14.88%
(11/1/95) | | |
Top Five Equity
Holdings as of
September 30, 20064
(Unaudited)
Company and % of Total
Net Assets | | | GlaxoSmithKline plc 3.5%
Snap-on
Incorporated 3.3%
Bayerische Motoren
Werke (BMW) AG 3.2%
Oracle Corporation 3.1%
Julius Baer Holding
Ltd., Class B 3.1% | | | | DaimlerChrysler AG 3.5%
GlaxoSmithKline plc 3.4%
British Sky
Broadcasting
Group plc 3.3%
Bayerische Motoren
Werke (BMW) AG 3.2%
Signet Group plc 3.0% | | | | Square Enix
Co., Ltd. 4.0%
MLP AG 4.0%
Sogecable SA 3.8%
JJB Sports plc 3.8%
Matalan PLC 3.8% | | |
Sector
Allocation as of
September 30, 2006
(Unaudited)
Sector and % of
Market Value | | | Consumer
Discretionary 27.7%
Information
Technology 17.6%
Health Care 11.0%
Financials 11.0%
Consumer Staples 10.8%
Telecommunication
Services 8.6%
Industrials 8.5%
Energy 2.8%
Materials 2.0% | | | | Consumer
Discretionary 34.5%
Financials 21.6%
Consumer Staples 13.9%
Telecommunication
Services 8.1%
Health Care 8.0%
Materials 5.8%
Industrials 5.2%
Information
Technology 2.6%
Energy 0.3% | | | | Consumer
Discretionary 34.0%
Information
Technology 17.9%
Industrials 17.7%
Financials 14.1%
Consumer Staples 6.3%
Health Care 5.4%
Materials 3.1%
Telecommunication
Services 1.5% | | |
THE OAKMARK FUNDS
3
FUND EXPENSES
A shareholder of each Fund incurs two types of costs: (1) transaction costs, such as redemption fees, and (2) ongoing costs, including investment advisory fees, transfer agent fees, and other fund expenses. The examples below are intended to help shareholders understand the ongoing cost (in dollars) of investing in each Fund and to compare these costs with the ongoing costs of investing in other funds.
Actual Expenses
The following table provides information about actual account values and actual fund expenses for Class I of each Fund. The table shows the expenses a Class I shareholder would have paid on a $1,000 investment in each Fund from April 1, 2006, to September 30, 2006, as well as how much a $1,000 investment would be worth at the close of the period, assuming actual fund returns and expenses. A Class I shareholder can estimate expenses incurred for the period by dividing the account value at September 30, 2006, by $1,000 and multiplying the result by the number in the Expenses Paid During Period row as shown below.
Certain accounts invested for 90 days or less may be charged a 2% redemption fee. Please consult the Funds' prospectus at oakmark.com for more information.
| | | The Oakmark Fund | | The Oakmark Select Fund | | The Oakmark Equity and Income Fund | | The Oakmark Global Fund | | The Oakmark International Fund | | The Oakmark International Small Cap Fund | |
Beginning
Account Value | | $ | 1,000.00 | | | $ | 1,000.00 | | | $ | 1,000.00 | | | $ | 1,000.00 | | | $ | 1,000.00 | | | $ | 1,000.00 | | |
Ending
Account Value | | $ | 1,051.80 | | | $ | 1,022.20 | | | $ | 1,039.60 | | | $ | 1,064.20 | | | $ | 1,081.40 | | | $ | 1,077.90 | | |
Expenses Paid
During Period* | | $ | 5.30 | | | $ | 4.97 | | | $ | 4.35 | | | $ | 6.05 | | | $ | 5.84 | | | $ | 7.03 | | |
Annualized
Expense Ratio | | | 1.03 | % | | | 0.98 | % | | | 0.85 | % | | | 1.17 | % | | | 1.12 | % | | | 1.35 | % | |
* Expenses are equal to each Fund's annualized expense ratio for Class I, multiplied by the average account value over the period, multiplied by the number of days in the most recent fiscal half-year divided by 365 (to reflect the one-half year period).
THE OAKMARK FUNDS
4
FUND EXPENSES
Hypothetical Example for Comparison Purposes
The following table provides information about hypothetical account values and hypothetical expenses for Class I of each Fund based on actual expense ratios and an assumed rate of return of 5% per year before expenses, which are not the Funds' actual returns. The hypothetical account values and expenses may not be used to estimate the actual ending account balances or expenses shareholders paid for the period. Shareholders may use this information to compare the ongoing costs of investing in a Fund and other funds. To do so, compare this 5% hypothetical example with the 5% hypothetical examples that appear in the shareholder reports of the other funds.
Please note that the expenses shown in the table are meant to highlight your ongoing costs only and do not reflect any transaction costs, such as redemption fees. Therefore, the third line of the table is useful in comparing ongoing costs only, and will not help you determine the relative total costs of owning different funds. In addition, if these transaction costs were included, the total costs would have been higher.
| | | The Oakmark Fund | | The Oakmark Select Fund | | The Oakmark Equity and Income Fund | | The Oakmark Global Fund | | The Oakmark International Fund | | The Oakmark International Small Cap Fund | |
Beginning
Account Value | | $ | 1,000.00 | | | $ | 1,000.00 | | | $ | 1,000.00 | | | $ | 1,000.00 | | | $ | 1,000.00 | | | $ | 1,000.00 | | |
Ending
Account Value | | $ | 1,019.90 | | | $ | 1,020.16 | | | $ | 1,020.81 | | | $ | 1,019.20 | | | $ | 1,019.45 | | | $ | 1,018.30 | | |
Expenses Paid
During Period* | | $ | 5.22 | | | $ | 4.96 | | | $ | 4.31 | | | $ | 5.92 | | | $ | 5.67 | | | $ | 6.83 | | |
Annualized
Expense Ratio | | | 1.03 | % | | | 0.98 | % | | | 0.85 | % | | | 1.17 | % | | | 1.12 | % | | | 1.35 | % | |
* Expenses are equal to each Fund's annualized expense ratio for Class I, multiplied by the average account value over the period, multiplied by the number of days in the most recent fiscal half-year divided by 365 (to reflect the one-half year period).
THE OAKMARK FUNDS
5
THE OAKMARK AND OAKMARK SELECT FUNDS
At Oakmark, we are long-term investors. We attempt to identify growing businesses that are managed to benefit their shareholders. We will purchase stock in those businesses only when priced substantially below our estimate of intrinsic value. After purchase, we patiently wait for the gap between stock price and intrinsic value to close.

"If you think most stocks are attractively priced, how come you don't find as many to buy as most mutual funds do?"—Representative shareholder e-mail
Oakmark is one of few mutual fund families that makes their portfolio managers accessible via e-mail. I've often been asked why we "waste" our time answering these shareholder questions. I have three reasons: 1) We consider communicating with shareholders to be an opportunity to help them understand how we think and why we invest as we do. The better our shareholders understand us, the more likely they are to be long-term shareholders—and that is good for all of us. 2) Shareholders have been very respectful of our time. With the exception of a few 2:00 AM rants that senders often regret the next day, their questions are usually honest requests for better understanding. 3) Occasionally, a consistent theme develops from these e-mails that highlights an area where our communication needs to improve.
Such a theme has emerged recently regarding portfolio construction. I think we've done a pretty good job explaining how we select the stocks we own. Our three criteria—discount to value, growth in value, and owner-oriented management—appear at the top of each of these quarterly commentaries and are frequently topics for the reports. But we have not devoted nearly as much attention to an equally important topic: after identifying stocks that meet our criteria, how do we build the portfolio? And as the question at the top of the report shows, there is some confusion on this issue!
To make sense of how we structure a portfolio, we first need to identify our goals. First, the reason our Funds exist is to make money for our shareholders. So, we take great satisfaction when we report to you that a Fund has reached a new all-time high price. Some have commented that these new-high references are "cute" or even "corny." And given how sophisticated performance measurement has become, I can see why they think that. Simple as it may be, we think it is the most important thing we can say about our Funds' performance. We view new highs as a reminder that our primary objective is to increase your capital. We're pleased that even during the past three years, when other funds have increased more than we have, Oakmark has reached a new high in nine of those twelve quarters, and Oakmark Select did so in eight. (And both have already hit new highs again this quart er.)
Another important goal is to outperform passive management. An index fund can match the stock market's return at almost no cost to its shareholders. This is important because a broad-based index, such as the S&P 5002, has historically provided a return that was superior to most investment alternatives. Matching that return creates a pretty high hurdle, and if we—or any other active managers—are going to justify our fees, then over long periods of time we either have to earn a higher return than the market or deliver a similar return but with less risk. We believe our three investment criteria simultaneously address both goals—higher than average returns and lower than average risk. As active managers, we must balance the potential risk that an individual stock could perform meaningfully worse than the market with the potential benefit of concentrating our assets in the stocks we deem most attractive.
A typical mutual fund manager today spreads portfolio assets across more than 100 stocks. As a competing fund manager I was seated next to for a panel discussion once said, "We keep our position sizes small enough so that our mistakes don't hurt us." That pretty much sums up the positive case for diversification—minimize the cost of your mistakes. Though the logic of that approach is sound, it is tough, if not impossible, to diversify your way to superior performance. The law of large numbers says that the more stocks you own, the more likely it becomes that your portfolio performs like the average of all stocks. And if you are content with an average outcome, a passive portfolio, or index fund, is a lower cost solution.
Since we believe our approach can identify above-average stocks, we take a very different tack. The problem with owning so many stocks that mistakes don't matter, is that successes won't matter then either. At Oakmark, we want to own enough of each of our stocks so that our successes do matter.
The Oakmark Fund is the more diversified of the two Funds I work on. But even Oakmark is much more concentrated than the average mutual fund. At most times our portfolio is invested in about 50-60 stocks, roughly half the average fund's number of holdings. A typical position for us is just under 2% of assets, and it is unusual to have a position as high as 4% of assets. We keep Oakmark this diversified so that we are comfortable when a long-term investor tells us
THE OAKMARK AND OAKMARK SELECT FUNDS
6
they have put most of their stock market investments in The Oakmark Fund.
The Oakmark Select Fund owns less than half as many stocks as The Oakmark Fund does—usually about 20 stocks. It is a non-diversified fund, and because of that, we routinely caution that it is a high-risk strategy to use it as your only mutual fund. With only 20 stocks, a normal position for Oakmark Select is about 4% of assets (bigger than Oakmark's largest position), and our top holdings are usually a double-digit percentage of the portfolio. For example, both Funds' largest position today is Washington Mutual. It represents 3% of Oakmark's assets and 15% of Select's. If Washington Mutual continues to be a profitable stock, then it will be an important positive for Oakmark, but it will be far more important to Select. And if it doesn't, Select will suffer more than Oakmark does. We believe that the risk is worth taking, but we need Select's shareholders to understand the volatility they could experience.
So when we find lots of attractive stocks, why don't we just add them all to our portfolios? Most investors define "attractive" relative to cash. When we think about adding a new stock to our portfolios, the hurdle isn't just cash, but rather all the other stocks we already own. Since our portfolios are normally close to fully invested, adding a new stock needs to be funded by selling some existing holdings. Even if we thought hundreds of stocks were priced to produce attractive returns, we wouldn't increase our number of holdings. We believe that the twenty stocks in The Oakmark Select Fund will average a higher return than the fifty stocks in The Oakmark Fund, but the offset is that the portfolio will have higher risk. Our next favorite fifty stocks, the most attractive stocks we don't own, are, in our judgment, likely to average decent returns, just not quite as high as the stocks we already own. We don't believe that further diversificat ion of The Oakmark Fund—say to 100 stocks—would reduce risk by enough to justify accepting a lower expected return.
Outperforming the market with a value approach requires discipline and patience to get through the inevitable periods when other investors enjoy more rapid price appreciation than we do. That patience is needed not just by the investment adviser, but also by the shareholders. We trust that our commitment to answering your questions will help you be patient as we work to continue increasing the value of your investments.
Best wishes,
William C. Nygren, CFA
Portfolio Manager
bnygren@oakmark.com
THE OAKMARK AND OAKMARK SELECT FUNDS
7
THE OAKMARK FUND
Report from Bill Nygren and Kevin Grant, Portfolio Managers


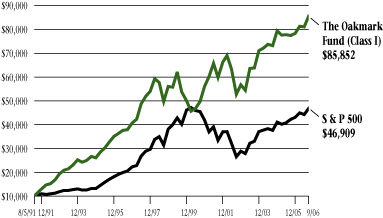
THE VALUE OF A $10,000 INVESTMENT IN THE OAKMARK FUND FROM ITS INCEPTION (8/5/91) TO PRESENT (9/30/06) AS COMPARED TO THE STANDARD & POOR'S 500 INDEX2 (UNAUDITED)
| | | | | Average Annual Total Returns
(as of 9/30/06) | |
| (Unaudited) | | Total Return
Last 3 Months* | | 1-year | | 5-year | | 10-year | | Since
Inception
(8/5/91) | |
| Oakmark Fund (Class I) | | | 5.56 | % | | | 10.46 | % | | | 7.43 | % | | | 8.51 | % | | | 15.25 | % | |
| S&P 500 | | | 5.67 | % | | | 10.79 | % | | | 6.97 | % | | | 8.59 | % | | | 10.74 | % | |
| Dow Jones Average5 | | | 5.35 | % | | | 13.14 | % | | | 8.06 | % | | | 9.21 | % | | | 11.89 | % | |
Lipper Large Cap
Value Index6 | | | 5.81 | % | | | 12.59 | % | | | 8.01 | % | | | 8.60 | % | | | 10.66 | % | |
The graph and table do not reflect the deduction of taxes that a shareholder would pay on fund distributions or the redemption of fund shares.
The performance data quoted represents past performance. The above performance information for the Fund does not reflect the imposition of a 2% redemption fee on shares held for 90 days or less to deter market timers. If reflected, the fee would reduce the performance quoted. Past performance does not guarantee future results. The investment return and principal value will fluctuate so that an investor's shares, when redeemed, may be worth more or less than their original cost. Current performance may be lower or higher than the performance data quoted. Average annual total return measures annualized change, while total return measures aggregate change. To obtain most recent month-end performance data, visit oakmark.com.
* Not annualized
For the quarter ended September 30, both The Oakmark Fund and the S&P 500 increased by 6%. Though we are never fully satisfied with market-matching returns, an absolute return of 6% in a quarter is always pleasing. And unlike the S&P 500, The Oakmark Fund did again achieve a new all-time-high during the quarter, extending our new-high streak to three consecutive quarters. For the fiscal year, the story was similar. We trailed the S&P 500 by a fraction of a percentage point, but still achieved a double-digit return of just over 10%.
During the quarter nearly one-third of our stocks (17 of 52) achieved gains above 10%, and none suffered declines of that magnitude. Our best performer was Baxter International, up 24%. We added Baxter to our portfolio in the first quarter of 2003. At the time, the stock had lost more than half its value due to short-term concerns about their products and longer-term concerns about their management. Baxter's Earnings Per Share bottomed in 2003 while new management was working toward increasing sales and improving operating margins. Our earnings forecast for next year is 65% higher than that 2003 trough. Now selling at 18x projected earnings, Baxter is no longer the bargain it was in 2003, but it is still priced at a more modest premium than we believe is deserved.
During the quarter we did not add or eliminate any positions. That's the first time that's happened since we assumed management of the Fund over six years ago. The lack of activity is neither good nor bad. Turnover creates transaction costs, and those costs reduce investment returns. In that sense, it is good that we tend to have low turnover. On the other hand, no turnover also means that none of our holdings increased enough in price so that other stocks appeared to offer better return potential. We continue to believe that our current portfolio, with more large cap and higher quality businesses than we typically own, is appropriate for a market that is showing little price differentiation between low and high quality businesses.
Best wishes,
William C. Nygren, CFA
Portfolio Manager
bnygren@oakmark.com | | Kevin G. Grant, CFA
Portfolio Manager
kgrant@oakmark.com | |
|
THE OAKMARK FUND
8
THE OAKMARK FUND
Schedule of Investments—September 30, 2006
Name | |
Shares Held | |
Market Value | |
| Common Stocks—94.9% | |
| Apparel Retail—3.9% | |
| Limited Brands | | | 4,628,047 | | | $ | 122,596,965 | | |
| The Gap, Inc. | | | 5,066,700 | | | | 96,013,965 | | |
| | | | 218,610,930 | | |
| Broadcasting & Cable TV—7.3% | |
| Comcast Corporation, Special Class A (a) | | | 3,225,000 | | | $ | 118,712,250 | | |
| The DIRECTV Group, Inc. (a) | | | 5,850,000 | | | | 115,128,000 | | |
| EchoStar Communications Corporation, Class A (a) | | | 2,525,000 | | | | 82,668,500 | | |
| Liberty Media Holding Corporation - Capital, Class A (a) | | | 739,970 | | | | 61,839,293 | | |
| Discovery Holding Company, Class A (a) | | | 1,740,140 | | | | 25,162,425 | | |
| | | | 403,510,468 | | |
| Catalog Retail—1.4% | |
| Liberty Media Holding Corporation - Interactive, Class A (a) | | | 3,699,850 | | | $ | 75,402,943 | | |
| Department Stores—2.2% | |
| Kohl's Corporation (a) | | | 1,850,000 | | | $ | 120,102,000 | | |
| Home Improvement Retail—1.9% | |
| The Home Depot, Inc. | | | 2,881,500 | | | $ | 104,512,005 | | |
| Homebuilding—2.0% | |
| Pulte Homes, Inc. | | | 3,500,000 | | | $ | 111,510,000 | | |
| Household Appliances—2.0% | |
| The Black & Decker Corporation | | | 1,400,000 | | | $ | 111,090,000 | | |
| Housewares & Specialties—1.9% | |
| Fortune Brands, Inc. | | | 1,400,000 | | | $ | 105,154,000 | | |
| Leisure Products—0.7% | |
| Mattel, Inc. | | | 2,074,300 | | | $ | 40,863,710 | | |
| Motorcycle Manufacturers—2.4% | |
| Harley-Davidson, Inc. | | | 2,100,000 | | | $ | 131,775,000 | | |
| Movies & Entertainment—6.3% | |
| Time Warner, Inc. | | | 7,447,700 | | | $ | 135,771,571 | | |
| Viacom, Inc., Class B (a) | | | 2,939,745 | | | | 109,299,719 | | |
| The Walt Disney Company | | | 3,300,000 | | | | 102,003,000 | | |
| | | | 347,074,290 | | |
| Publishing—0.7% | |
| Gannett Co., Inc. | | | 684,500 | | | $ | 38,900,135 | | |
THE OAKMARK FUND
9
THE OAKMARK FUND
Schedule of Investments—September 30, 2006 cont.
Name | |
Shares Held | |
Market Value | |
| Common Stocks—94.9% (cont.) | |
| Restaurants—5.6% | |
| McDonald's Corporation | | | 4,250,000 | | | $ | 166,260,000 | | |
| Yum! Brands, Inc. | | | 2,724,000 | | | | 141,784,200 | | |
| | | | 308,044,200 | | |
| Specialized Consumer Services—2.1% | |
| H&R Block, Inc. | | | 5,358,600 | | | $ | 116,495,964 | | |
| Brewers—3.8% | |
| Anheuser-Busch Companies, Inc. | | | 2,250,000 | | | $ | 106,897,500 | | |
| InBev NV (b) | | | 1,850,000 | | | | 101,858,652 | | |
| | | | 208,756,152 | | |
| Distillers & Vintners—1.6% | |
| Diageo plc (c) | | | 1,271,000 | | | $ | 90,291,840 | | |
| Hypermarkets & Super Centers—1.9% | |
| Wal-Mart Stores, Inc. | | | 2,100,000 | | | $ | 103,572,000 | | |
| Packaged Foods & Meats—3.5% | |
| General Mills, Inc. | | | 1,756,000 | | | $ | 99,389,600 | | |
| H.J. Heinz Company | | | 2,250,000 | | | | 94,342,500 | | |
| | | | 193,732,100 | | |
| Soft Drinks—1.1% | |
| The Coca-Cola Company | | | 1,398,700 | | | $ | 62,493,916 | | |
| Integrated Oil & Gas—1.3% | |
| ConocoPhillips | | | 1,200,373 | | | $ | 71,458,205 | | |
| Asset Management & Custody Banks—1.4% | |
| The Bank of New York Company, Inc. | | | 2,150,000 | | | $ | 75,809,000 | | |
| Diversified Banks—2.1% | |
| U.S. Bancorp | | | 3,450,000 | | | $ | 114,609,000 | | |
| Life & Health Insurance—1.5% | |
| AFLAC Incorporated | | | 1,767,000 | | | $ | 80,857,919 | | |
| Other Diversified Financial Services—4.4% | |
| JPMorgan Chase & Co. | | | 2,700,000 | | | $ | 126,792,000 | | |
| Citigroup, Inc. | | | 2,400,000 | | | | 119,208,000 | | |
| | | | 246,000,000 | | |
| Thrifts & Mortgage Finance—4.4% | |
| Washington Mutual, Inc. | | | 4,037,300 | | | $ | 175,501,431 | | |
| MGIC Investment Corporation | | | 1,090,600 | | | | 65,403,282 | | |
| | | | 240,904,713 | | |
THE OAKMARK FUND
10
THE OAKMARK FUND
Schedule of Investments—September 30, 2006 cont.
Name | | Shares Held/
Par Value | |
Market Value | |
| Common Stocks—94.9% (cont.) | |
| Health Care Equipment—2.4% | |
| Baxter International, Inc. | | | 2,900,000 | | | $ | 131,834,000 | | |
| Pharmaceuticals—6.2% | |
| Abbott Laboratories | | | 2,487,300 | | | $ | 120,783,288 | | |
| Bristol-Myers Squibb Company | | | 4,500,000 | | | | 112,140,000 | | |
| Schering-Plough Corporation | | | 4,960,200 | | | | 109,570,818 | | |
| | | | 342,494,106 | | |
| Aerospace & Defense—3.5% | |
| Raytheon Company | | | 2,450,000 | | | $ | 117,624,500 | | |
| Honeywell International, Inc. | | | 1,900,000 | | | | 77,710,000 | | |
| | | | 195,334,500 | | |
| Building Products—1.7% | |
| Masco Corporation | | | 3,433,600 | | | $ | 94,149,312 | | |
| Industrial Conglomerates—1.3% | |
| Tyco International Ltd. (b) | | | 2,558,000 | | | $ | 71,598,420 | | |
| Computer Hardware—5.3% | |
| Hewlett-Packard Company | | | 2,925,000 | | | $ | 107,318,250 | | |
| Sun Microsystems, Inc. (a) | | | 19,270,000 | | | | 95,771,900 | | |
| Dell Inc. (a) | | | 4,000,000 | | | | 91,360,000 | | |
| | | | 294,450,150 | | |
| Data Processing & Outsourced Services—2.0% | |
| First Data Corporation | | | 2,575,000 | | | $ | 108,150,000 | | |
| Office Electronics—1.5% | |
| Xerox Corporation (a) | | | 5,272,400 | | | $ | 82,038,544 | | |
| Semiconductors—3.6% | |
| Intel Corp. | | | 4,900,000 | | | $ | 100,793,000 | | |
| Texas Instruments Incorporated | | | 3,000,000 | | | | 99,750,000 | | |
| | | | 200,543,000 | | |
| Total Common Stocks (Cost: $3,733,386,310) | | | | | | | 5,242,122,522 | | |
| Short Term Investments—4.9% | |
| U.S. Government Agencies—1.8% | |
| Federal Home Loan Bank, 5.14% due 10/18/2006 | | $ | 100,000,000 | | | $ | 99,757,278 | | |
| Total U.S. Government Agencies (Cost: $99,757,278) | | | | | 99,757,278 | | |
THE OAKMARK FUND
11
THE OAKMARK FUND
Schedule of Investments—September 30, 2006 cont.
Name | | Par Value | |
Market Value | |
| Short Term Investments—4.9% (cont.) | |
| Repurchase Agreement—3.1% | |
IBT Repurchase Agreement, 5.16% dated 9/29/2006
due 10/2/2006, repurchase price $172,284,634,
collateralized by Government National Mortgage
Association Bonds with rates of 6.400%, with maturity
dates from 4/20/2034 - 2/20/2035, and with an aggregate
market value plus accrued interest of $96,329,384, and by
Small Business Administration Bonds, with rates of
6.000% - 9.000%, with maturities from
4/25/2027 - 9/25/2030, and with an aggregate market
value plus accrued interest of $84,491,728 | | $ | 172,210,583 | | | $ | 172,210,583 | | |
| Total Repurchase Agreement (Cost: $172,210,583) | | | | | 172,210,583 | | |
| Total Short Term Investments (Cost: $271,967,861) | | | | | 271,967,861 | | |
| Total Investments (Cost $4,005,354,171)—99.8% | | | | $ | 5,514,090,383 | | |
| Other Assets In Excess Of Other Liabilities—0.2% | | | | | 9,568,540 | | |
| Total Net Assets—100% | | | | $ | 5,523,658,923 | | |
(a) Non-income producing security.
(b) Represents a foreign domiciled corporation.
(c) Represents an American Depository Receipt.
THE OAKMARK FUND
See accompanying Notes to Financial Statements.
12
THE OAKMARK SELECT FUND
Report from Bill Nygren and Henry Berghoef, Portfolio Managers


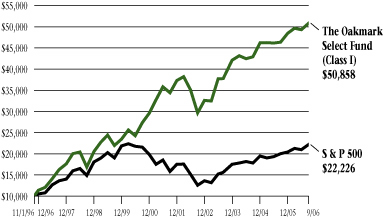
THE VALUE OF A $10,000 INVESTMENT IN THE OAKMARK SELECT FUND FROM ITS INCEPTION (11/1/96) TO PRESENT (9/30/06) AS COMPARED TO THE STANDARD & POOR'S 500 INDEX2 (UNAUDITED)
| | | | | Average Annual Total Returns
(as of 9/30/06) | |
| (Unaudited) | | Total Return
Last 3 Months* | | 1-year | | 5-year | | Since
Inception
(11/1/96) | |
| Oakmark Select Fund (Class I) | | | 3.02 | % | | | 9.58 | % | | | 8.07 | % | | | 17.83 | % | |
| S&P 500 | | | 5.67 | % | | | 10.79 | % | | | 6.97 | % | | | 8.39 | % | |
| S&P MidCap 4007 | | | -1.08 | % | | | 6.56 | % | | | 13.08 | % | | | 13.46 | % | |
| Lipper Mid Cap Value Index8 | | | 2.61 | % | | | 9.20 | % | | | 13.64 | % | | | 10.91 | % | |
The graph and table do not reflect the deduction of taxes that a shareholder would pay on fund distributions or the redemption of fund shares.
The performance data quoted represents past performance. The above performance information for the Fund does not reflect the imposition of a 2% redemption fee on shares held for 90 days or less to deter market timers. If reflected, the fee would reduce the performance quoted. Past performance does not guarantee future results. The investment return and principal value will fluctuate so that an investor's shares, when redeemed, may be worth more or less than their original cost. Current performance may be lower or higher than the performance data quoted. Average annual total return measures annualized change, while total return measures aggregate change. To obtain most recent month-end performance data, visit oakmark.com.
* Not annualized
The Oakmark Select Fund gained 3% for the quarter, bringing the fiscal year gain to 10%. Though good on an absolute basis, the Fund's returns fell short of the S&P 500's 6% for the quarter and 11% for the fiscal year. Despite underperforming for the quarter, we believe the month of September, when oil prices fell by more than 10%, finally demonstrated the positive relative performance we expect to see if commodity prices fall. In September, Oakmark Select gained 5% while the S&P gained only 3%. We continue to believe that most of the attractive stocks today are in businesses that are less economically sensitive and would benefit from declining prices for energy and other basic materials.
During the quarter, the strongest contributor to our positive performance was McDonald's. In addition to achieving good results at its restaurants, McDonald's announced a creative approach for spinning-off their ownership in Chipotle. Chipotle is a restaurant chain that is a small, marginally profitable, but rapidly growing business—characteristics that often appeal to different investors than those who own McDonald's. By requiring shareholders to exchange their McDonald's shares to obtain Chipotle shares, McDonald's is effectively using its Chipotle ownership to fund a share repurchase. Good things happen to per-share-value when earnings are increasing while shares outstanding are decreasing! We much prefer investing with managements who evaluate their success using per-share metrics, thinking like shareholders, than with those who use corporate metrics, thinking like professional managers.
For the fiscal year, the Fund's largest holding, Washington Mutual, was also the largest contributor to our return. Increasing 15%, Washington Mutual was not our best performer (another bank, JP Morgan was), but because of our large weighting, its performance helped the Fund the most. We continue to believe that retail banking has good growth prospects, and with both Washington Mutual and JP Morgan selling at below average P/E9 multiples, we believe they will continue to be good long-term performers.
Best wishes,
William C. Nygren, CFA
Portfolio Manager
bnygren@oakmark.com | | Henry R. Berghoef, CFA
Portfolio Manager
berghoef@oakmark.com | |
|
THE OAKMARK SELECT FUND
13
THE OAKMARK SELECT FUND
Schedule of Investments—September 30, 2006
Name | |
Shares Held | |
Market Value | |
| Common Stocks—95.6% | |
| Apparel Retail—7.0% | |
| Limited Brands | | | 9,280,981 | | | $ | 245,853,187 | | |
| The Gap, Inc. | | | 8,560,000 | | | | 162,212,000 | | |
| | | | 408,065,187 | | |
| Broadcasting & Cable TV—2.7% | |
| Discovery Holding Company, Class A (a) | | | 10,809,500 | | | $ | 156,305,370 | | |
| Catalog Retail—4.6% | |
| Liberty Media Holding Corporation - Interactive, Class A (a) | | | 13,050,000 | | | $ | 265,959,000 | | |
| Homebuilding—2.8% | |
| Pulte Homes, Inc. | | | 5,224,200 | | | $ | 166,443,012 | | |
| Leisure Products—2.4% | |
| Mattel, Inc. | | | 7,070,900 | | | $ | 139,296,730 | | |
| Movies & Entertainment—8.6% | |
| Time Warner, Inc. | | | 15,340,000 | | | $ | 279,648,200 | | |
| Viacom, Inc., Class B (a) | | | 5,975,000 | | | | 222,150,500 | | |
| | | | 501,798,700 | | |
| Restaurants—13.1% | |
| Yum! Brands, Inc. | | | 8,557,000 | | | $ | 445,391,850 | | |
| McDonald's Corporation | | | 8,200,000 | | | | 320,784,000 | | |
| | | | 766,175,850 | | |
| Specialized Consumer Services—5.7% | |
| H&R Block, Inc. (b) | | | 15,419,600 | | | $ | 335,222,104 | | |
| Other Diversified Financial Services—4.4% | |
| JPMorgan Chase & Co. | | | 5,500,000 | | | $ | 258,280,000 | | |
| Thrifts & Mortgage Finance—15.0% | |
| Washington Mutual, Inc. | | | 20,167,400 | | | $ | 876,676,878 | | |
| Health Care Technology—3.8% | |
| IMS Health Incorporated | | | 8,303,441 | | | $ | 221,203,668 | | |
| Pharmaceuticals—3.6% | |
| Bristol-Myers Squibb Company | | | 8,490,200 | | | $ | 211,575,784 | | |
| Diversified Commercial and Professional Services—4.2% | |
| The Dun & Bradstreet Corporation (a)(b) | | | 3,284,900 | | | $ | 246,334,651 | | |
| Computer Hardware—3.5% | |
| Dell Inc. (a) | | | 9,000,000 | | | $ | 205,560,000 | | |
| Data Processing & Outsourced Services—5.4% | |
| First Data Corporation (c) | | | 7,015,400 | | | $ | 294,646,800 | | |
| Western Union Company, When Issued (a)(d) | | | 1,100,000 | | | | 21,043,000 | | |
| | | | 315,689,800 | | |
| Office Electronics—4.4% | |
| Xerox Corporation (a) | | | 16,446,400 | | | $ | 255,905,984 | | |
THE OAKMARK SELECT FUND
14
THE OAKMARK SELECT FUND
Schedule of Investments—September 30, 2006 cont.
Name | | Shares Held/
Par Value | |
Market Value | |
| Common Stocks—95.6% (cont.) | |
| Semiconductors—4.4% | |
| Intel Corp. | | | 12,500,000 | | | $ | 257,125,000 | | |
| Total Common Stocks (Cost: $3,912,760,962) | | | | | | | 5,587,617,718 | | |
| Short Term Investments—4.9% | |
| U.S. Government Agencies—2.1% | |
| Fannie Mae, 5.08% due 10/26/2006 | | $ | 25,000,000 | | | $ | 24,911,806 | | |
| Federal Home Loan Bank, 5.14% due 10/18/2006 | | | 100,000,000 | | | | 99,757,278 | | |
| Total U.S. Government Agencies (Cost: $124,669,084) | | | | | | | 124,669,084 | | |
| Repurchase Agreement—2.8% | |
IBT Repurchase Agreement, 5.16% dated 9/29/2006
due 10/2/2006, repurchase price $162,245,766,
collateralized by Government National Mortgage
Association Bonds with a rate of 6.400%, with
maturities from 5/20/2034 - 10/20/2034, and with an
aggregate market value plus accrued interest of
$52,934,905, and by Small Business Administration
Bonds, with rates of 7.650% - 8.500%, with maturities
from 3/25/2023 - 9/25/2030, and with an aggregate
market value plus accrued interest of $117,349,926 | | $ | 162,176,030 | | | $ | 162,176,030 | | |
| Total Repurchase Agreement (Cost: $162,176,030) | | | | | | | 162,176,030 | | |
| Total Short Term Investments (Cost: $286,845,114) | | | | | | | 286,845,114 | | |
| Total Investments (Cost $4,199,606,076)—100.5% | | | | | | $ | 5,874,462,832 | | |
| Common Stocks Sold Short—(0.4%) | |
| Data Processing & Outsourced Services—(0.4%) | |
| First Data Corporation, When Issued (e) | | | (950,000 | ) | | $ | (21,840,500 | ) | |
Total Common Stocks Sold Short
(Proceeds Received: $(21,737,301)) | | | | | | | (21,840,500 | ) | |
| Other Liabilities In Excess Of Other Assets—(0.1%) | | | | | | | (7,928,046 | ) | |
| Total Net Assets—100% | | | | | | $ | 5,844,694,286 | | |
(a) Non-income producing security.
(b) See footnote number five in the Notes to Financial Statements regarding investments in affiliated issuers.
(c) A portion of this security is designated as collateral in connection with common stocks sold short.
(d) Security purchased on a when issued or delayed delivery basis.
(e) Security sold on a when issued or delayed delivery basis.
See accompanying Notes to Financial Statements.
THE OAKMARK SELECT FUND
15
THE OAKMARK EQUITY AND INCOME FUND
Report from Clyde S. McGregor and Edward A. Studzinski, Portfolio Managers


THE VALUE OF A $10,000 INVESTMENT IN THE OAKMARK EQUITY AND INCOME FUND FROM ITS INCEPTION (11/1/95) TO PRESENT (9/30/06) AS COMPARED TO THE LIPPER BALANCED FUND INDEX10 (UNAUDITED)

| | | | | Average Annual Total Returns
(as of 9/30/06) | |
| (Unaudited) | | Total Return
Last 3 Months* | | 1-year | | 5-year | | 10-year | | Since
Inception
(11/1/95) | |
Oakmark Equity &
Income Fund (Class I) | | | 2.36 | % | | | 6.51 | % | | | 10.59 | % | | | 13.46 | % | | | 13.36 | % | |
Lipper Balanced
Fund Index | | | 3.87 | % | | | 8.02 | % | | | 6.79 | % | | | 7.49 | % | | | 7.92 | % | |
| S&P 5002 | | | 5.67 | % | | | 10.79 | % | | | 6.97 | % | | | 8.59 | % | | | 9.67 | % | |
Lehman Govt./
Corp. Bond11 | | | 3.91 | % | | | 3.33 | % | | | 4.96 | % | | | 6.47 | % | | | 6.17 | % | |
The graph and table do not reflect the deduction of taxes that a shareholder would pay on fund distributions or the redemption of fund shares.
The performance data quoted represents past performance. The above performance information for the Fund does not reflect the imposition of a 2% redemption fee on shares held for 90 days or less to deter market timers. If reflected, the fee would reduce the performance quoted. Past performance does not guarantee future results. The investment return and principal value will fluctuate so that an investor's shares, when redeemed, may be worth more or less than their original cost. Current performance may be lower or higher than the performance data quoted. Average annual total return measures annualized change, while total return measures aggregate change. To obtain most recent month-end performance data, visit oakmark.com.
* Not annualized
Quarter and Fiscal Year Review
The Equity and Income Fund earned 2% in the quarter ended September 30. This is a solid return, but it nevertheless lags behind the 4% result of the Lipper Balanced Fund Index. The comparison for the fiscal year ended September 30 is 7% for the Fund and 8% for the Lipper Balanced Fund Index. As always, we are pleased to report a positive rate of return for the Fund, even when the comparison with Lipper is uninspiring. It especially pleases us that in the recent quarter the fixed income segment of the portfolio contributed meaningfully. When the quarter began, the Fund's duration (a measure of sensitivity to changes in interest rates) was a very low 1.8 years, meaning that we had positioned that portfolio segment defensively. During the quarter the Federal Reserve broke its string of 17 consecutive hikes in short-term interest rates. Believing that the risk in longer term fixed income securities had diminished, we increased the portfolio's du ration to 3.2 years by quarter's end. The extension of maturity produced a significantly favorable effect on the Fund's return in the quarter.
Many of our investors wrote to us earlier in the year expressing concern about the fixed income outlook and the Fund's bond holdings. These correspondents argued that continued upward pressure on short-term rates would inevitably result in deterioration in bond prices. As we noted two letters ago, during the time that the Fed increased short-term rates 17 times, long-term bond prices stayed remarkably stable. Now that the Federal Reserve has either paused or perhaps completed its cycle of increasing rates, longer term bonds have rallied vigorously. Markets often move in a fashion designed to frustrate the maximum amount of investors, and this appears to have happened in the bond market.
Earnings Season
In late July, the writer of this letter was awaiting the arrival of his commuter train when an investing professional from a competitor asked, "How is your earnings season going?" Your letter writer stumbled to construct a response, attempting to hide the fact that he did not know that our industry now designates the period in a quarter when the majority of companies report earnings as "earnings season." As most of our regular readers know (and those who don't can infer from our pictures), your Fund managers have labored long enough in the investment management industry to observe our industry pursue many fads. In the early 1980s, for example, the weekly money supply figures were the data du jour, and many professionals made good livings simply forecasting these numbers. The current obsession with quarterly earnings announcements and mid-quarter "earnings guidance" strikes us as a similar fad,
THE OAKMARK EQUITY AND INCOME FUND
16
because quarterly earnings reports rarely contain information that changes a business's intrinsic value.
This fad may be losing momentum, however. In July the Business Roundtable Institute for Corporate Ethics and the CFA Institute issued a joint report calling for business leaders to stop issuing quarterly earnings guidance. [The National Investor Relations Institute estimates that just over half of U.S. public companies provide earnings guidance each quarter.] The report argues that regular three-month forecasts distract management from concentrating on their businesses' long-term health. We agree and often share this opinion with the management teams that we meet. We should note, though, that the stock market's focus on short-term earnings benefits our investing style by generating stock price volatility unconnected to long-term fundamental value.
Shortly after the Business Roundtable issued its report, New York Times columnist Joe Nocera wrote a piece titled "A Defense of Short-Termism."12 He argued that before the investment community forced corporate management teams to focus on quarterly results, managers often avoided making tough decisions and could appear lethargic. He points out that "Having sailed through the post-war era without much in the way of global competition, there were plenty of American industries that desperately needed to be shaken up in a tougher, more competitive era." It may be that Mr. Nocera is correct, that the obsession with short-term earnings has been necessary for reinvigorating the U.S. economy. But we believe that this phase has persisted too long. In any event, you may rest assured that your managers will continue to ignore the noise of the moment and focus on understanding long-term business value.
Passage of Time
Notwithstanding the previous section of this report, we do charge our security analysts with the task of developing annual earnings forecasts for the companies that they cover. Every August we require them to extend their estimates another year into the future. While the analysts may grumble about the difficulty of forecasting so far out, the point is simply to keep their focus very long term.
As the analysts review their earnings projections, they often increase their estimates for intrinsic value because of the "passage of time." This brings to mind an experience we had with a client many years ago who sold his business for cash and hired us to manage some of the proceeds. All too soon he terminated his account. When asked why, he explained his reasons. Before the sale of his business, he had never owned a stock nor paid any attention to the stock market. Once he began to pay attention, however, the daily volatility of stock prices shocked him. He remarked that when he owned his business, he knew that every evening when he left the office the business was worth more than when the day began. The daily price movements in the stock market were not just disconnected from economic reality (as he saw it), they were completely irrational!
As value investors, we simply try to answer two questions about an investment: "What is it worth?" and "What is its current price?" If our former client's understanding of the world—where every security properly reflected its intrinsic value—prevailed, we would have to change careers! As it is, however, the securities markets provide us with enough irrational pricing to continue to employ our value investing approach. Here's to irrationality in the stock market!
As always, we thank you for entrusting us with your assets.
Clyde S. McGregor, CFA
Portfolio Manager
mcgregor@oakmark.com | | Edward A. Studzinski, CFA
Portfolio Manager
estudzinski@oakmark.com | |
|
THE OAKMARK EQUITY AND INCOME FUND
17
THE OAKMARK EQUITY AND INCOME FUND
Schedule of Investments—September 30, 2006
Name | |
Shares Held | |
Market Value | |
| Equity and Equivalents—54.3% | |
| Common Stocks—54.3% | |
| Apparel Retail—1.8% | |
| The TJX Companies, Inc. | | | 7,240,000 | | | $ | 202,937,200 | | |
| Broadcasting & Cable TV—4.7% | |
| EchoStar Communications Corporation, Class A (a) | | | 8,250,000 | | | $ | 270,105,000 | | |
| The E.W. Scripps Company, Class A | | | 4,750,000 | | | | 227,667,500 | | |
| CBS Corporation, Class A | | | 910,000 | | | | 25,680,200 | | |
| | | | 523,452,700 | | |
| Movies & Entertainment—1.8% | |
| News Corporation, Class B | | | 9,735,100 | | | $ | 200,932,464 | | |
| Publishing—1.9% | |
| The Washington Post Company, Class B | | | 280,000 | | | $ | 206,360,000 | | |
| PRIMEDIA Inc. (a) | | | 3,500,000 | | | | 5,320,000 | | |
| | | | 211,680,000 | | |
| Restaurants—1.1% | |
| McDonald's Corporation | | | 3,000,000 | | | $ | 117,360,000 | | |
| Specialty Stores—0.2% | |
| Zale Corporation (a) | | | 940,000 | | | $ | 26,075,600 | | |
| Brewers—1.0% | |
| InBev NV (b) | | | 2,100,000 | | | $ | 115,623,335 | | |
| Distillers & Vintners—2.6% | |
| Diageo plc (c) | | | 4,100,000 | | | $ | 291,264,000 | | |
| Hypermarkets & Super Centers—0.9% | |
| Costco Wholesale Corporation | | | 2,100,000 | | | $ | 104,328,000 | | |
| Packaged Foods & Meats—3.8% | |
| Nestle SA (c)(d) | | | 3,900,000 | | | $ | 339,959,100 | | |
| Smithfield Foods, Inc. (a) | | | 2,985,000 | | | | 80,654,700 | | |
| | | | 420,613,800 | | |
| Personal Products—1.6% | |
| Avon Products, Inc. | | | 5,719,000 | | | $ | 175,344,540 | | |
| Tobacco—1.7% | |
| UST, Inc. | | | 3,500,000 | | | $ | 191,905,000 | | |
| Integrated Oil & Gas—2.4% | |
| ConocoPhillips | | | 4,500,000 | | | $ | 267,885,000 | | |
THE OAKMARK EQUITY AND INCOME FUND
18
THE OAKMARK EQUITY AND INCOME FUND
Schedule of Investments—September 30, 2006 cont.
Name | |
Shares Held | |
Market Value | |
| Equity and Equivalents—54.3% (cont.) | |
| Oil & Gas Exploration & Production—7.7% | |
| XTO Energy, Inc. | | | 10,561,338 | | | $ | 444,949,170 | | |
| EnCana Corp (b) | | | 6,500,000 | | | | 303,485,000 | | |
| St. Mary Land & Exploration Company (e) | | | 2,900,000 | | | | 106,459,000 | | |
| | | | 854,893,170 | | |
| Property & Casualty Insurance—5.4% | |
| SAFECO Corporation | | | 4,610,000 | | | $ | 271,667,300 | | |
| MBIA Inc. | | | 2,918,300 | | | | 179,300,352 | | |
| The Progressive Corporation | | | 6,239,500 | | | | 153,117,330 | | |
| | | | 604,084,982 | | |
| Reinsurance—0.5% | |
| PartnerRe, Ltd. (b) | | | 800,000 | | | $ | 54,056,000 | | |
| Biotechnology—1.7% | |
| MedImmune, Inc. (a) | | | 6,500,800 | | | $ | 189,888,368 | | |
| Health Care Equipment—0.7% | |
| Hospira, Inc. (a) | | | 1,350,000 | | | $ | 51,664,500 | | |
| Medtronic, Inc. | | | 500,000 | | | | 23,220,000 | | |
| | | | 74,884,500 | | |
| Health Care Services—2.3% | |
| Caremark Rx, Inc. | | | 4,500,000 | | | $ | 255,015,000 | | |
| Life Science Tools & Services—0.7% | |
| Varian, Inc. (a)(e) | | | 1,649,400 | | | $ | 75,657,978 | | |
| Aerospace & Defense—6.3% | |
| General Dynamics Corporation | | | 4,700,000 | | | $ | 336,849,000 | | |
| Raytheon Company | | | 3,599,700 | | | | 172,821,597 | | |
| Alliant Techsystems, Inc. (a) | | | 1,325,000 | | | | 107,404,500 | | |
| Honeywell International, Inc. | | | 1,889,500 | | | | 77,280,550 | | |
| Rockwell Collins, Inc. | | | 150,000 | | | | 8,226,000 | | |
| | | | 702,581,647 | | |
| Industrial Conglomerates—0.8% | |
| Walter Industries, Inc. | | | 2,075,000 | | | $ | 88,561,000 | | |
| Industrial Machinery—0.2% | |
| Mueller Water Products, Inc (a) | | | 1,700,000 | | | $ | 24,837,000 | | |
| Application Software—0.4% | |
| Mentor Graphics Corporation (a) | | | 3,288,318 | | | $ | 46,299,518 | | |
| Data Processing & Outsourced Services—1.0% | |
| Ceridian Corporation (a) | | | 4,800,000 | | | $ | 107,328,000 | | |
THE OAKMARK EQUITY AND INCOME FUND
19
THE OAKMARK EQUITY AND INCOME FUND
Schedule of Investments—September 30, 2006 cont.
Name | | Shares Held/
Par Value | |
Market Value | |
| Equity and Equivalents—54.3% (cont.) | |
| Semiconductors—0.3% | |
| International Rectifier Corporation (a) | | | 1,089,700 | | | $ | 37,965,148 | | |
| Technology Distributors—0.7% | |
| CDW Corporation | | | 1,200,000 | | | $ | 74,016,000 | | |
| Paper Products—0.1% | |
| Schweitzer-Mauduit International, Inc. | | | 350,000 | | | $ | 6,643,000 | | |
| Total Common Stocks (Cost: $4,470,336,150) | | | | | | | 6,046,112,950 | | |
| Total Equity and Equivalents (Cost: $4,470,336,150) | | | | | | | 6,046,112,950 | | |
| Fixed Income—41.9% | |
| Corporate Bonds—0.2% | |
| Paper Packaging—0.2% | |
| Sealed Air Corporation, 144A, 5.625% due 7/15/2013 (f) | | $ | 20,000,000 | | | $ | 19,679,180 | | |
| Total Corporate Bonds (Cost: $20,173,684) | | | | | | | 19,679,180 | | |
| Government and Agency Securities—41.7% | |
| Canadian Government Bonds—10.0% | |
| Canada Government, 4.25% due 12/1/2008 | | CAD | 250,000,000 | | | $ | 225,229,255 | | |
| Canada Government, 4.00% due 9/1/2010 | | CAD | 250,000,000 | | | | 224,553,791 | | |
| Canada Government, 3.25% due 12/1/2006 | | CAD | 250,000,000 | | | | 223,316,931 | | |
| Canada Government, 3.00% due 6/1/2007 | | CAD | 250,000,000 | | | | 222,075,598 | | |
| Canada Government, 2.75% due 12/1/2007 | | CAD | 250,000,000 | | | | 220,509,953 | | |
| | | | 1,115,685,528 | | |
| France Government Bonds—0.4% | |
France Government, 3.00%
due 7/25/2012, Inflation Indexed | | EUR | 33,028,200 | | | $ | 45,213,913 | | |
| U.S. Government Notes—31.3% | |
| United States Treasury Notes, 4.875% due 2/15/2012 (g) | | | 500,000,000 | | | $ | 506,972,500 | | |
| United States Treasury Notes, 5.125% due 6/30/2008 | | | 500,000,000 | | | | 503,203,000 | | |
| United States Treasury Notes, 4.875% due 5/15/2009 | | | 500,000,000 | | | | 502,890,500 | | |
| United States Treasury Notes, 4.875% due 8/15/2016 | | | 375,000,000 | | | | 382,089,750 | | |
United States Treasury Notes, 3.375% due 1/15/2007,
Inflation Indexed | | | 273,530,340 | | | | 271,158,285 | | |
| United States Treasury Notes, 5.125% due 6/30/2011 | | | 250,000,000 | | | | 255,517,500 | | |
| United States Treasury Notes, 4.875% due 5/31/2011 | | | 250,000,000 | | | | 252,871,000 | | |
| United States Treasury Notes, 4.75% due 3/31/2011 | | | 250,000,000 | | | | 251,533,250 | | |
| United States Treasury Notes, 4.875% due 5/31/2008 | | | 250,000,000 | | | | 250,468,750 | | |
THE OAKMARK EQUITY AND INCOME FUND
20
THE OAKMARK EQUITY AND INCOME FUND
Schedule of Investments—September 30, 2006 cont.
Name | | Par Value | |
Market Value | |
| Fixed Income—41.9% (cont.) | |
| U.S. Government Notes—31.3% (cont.) | |
| United States Treasury Notes, 4.50% due 2/15/2016 | | $ | 250,000,000 | | | $ | 247,490,250 | | |
United States Treasury Notes, 3.625% due 1/15/2008,
Inflation Indexed | | | 62,969,500 | | | | 63,473,760 | | |
| | | | 3,487,668,545 | | |
| Total Government and Agency Securities (Cost: $4,560,095,037) | | | | | | | 4,648,567,986 | | |
| Total Fixed Income (Cost: $4,580,268,721) | | | | | | | 4,668,247,166 | | |
| Short Term Investments—3.0% | |
| Repurchase Agreement—3.0% | |
IBT Repurchase Agreement, 5.16% dated 9/29/2006
due 10/2/2006, repurchase price $334,312,156,
collateralized by Government National Mortgage
Association Bonds with rates of 5.250% - 6.400%,
with maturities from 8/20/2032 - 4/20/2035, and
with an aggregate market value plus accrued
interest of $69,050,520, and by Small Business
Administration Bonds, with rates of 7.000% - 10.500%,
with maturities from 10/25/2016 - 8/25/2030, and
with an aggregate market value plus accrued
interest of $281,826,368 | | $ | 334,168,464 | | | $ | 334,168,464 | | |
| Total Repurchase Agreement (Cost: $334,168,464) | | | | | | | 334,168,464 | | |
| Total Short Term Investments (Cost: $334,168,464) | | | | | | | 334,168,464 | | |
| Total Investments (Cost $9,384,773,335)—99.2% | | | | | | $ | 11,048,528,580 | | |
| Other Assets In Excess Of Other Liabilities—0.8% | | | | | | | 84,088,324 | | |
| Total Net Assets—100% | | | | | | $ | 11,132,616,904 | | |
(a) Non-income producing security.
(b) Represents a foreign domiciled corporation.
(c) Represents an American Depository Receipt.
(d) Market value is determined in accordance with procedures established in good faith by the Board of Trustees.
(e) See footnote number five in the Notes to Financial Statements regarding investments in affiliated issuers.
(f) Security exempt from registration under Rule 144A of the Securities Act of 1933. These securities may be resold in transactions exempt from registration, normally to qualified institutional buyers.
(g) A portion of security out on loan.
Key to abbreviations:
CAD: Canadian Dollar
EUR: Euro Dollar
See accompanying Notes to Financial Statements.
THE OAKMARK EQUITY AND INCOME FUND
21
THE OAKMARK GLOBAL FUND
Report from Clyde S. McGregor and Robert A. Taylor, Portfolio Managers


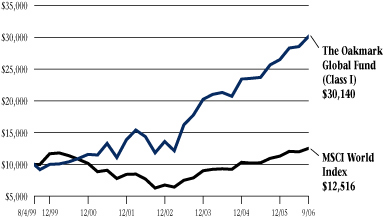
THE VALUE OF A $10,000 INVESTMENT IN THE OAKMARK GLOBAL FUND FROM ITS INCEPTION (8/4/99) TO PRESENT (9/30/06) AS COMPARED TO THE MSCI WORLD INDEX13 (UNAUDITED)
| | | | | Average Annual Total Returns
(as of 9/30/06) | |
| (Unaudited) | | Total Return
Last 3 Months* | | 1-year | | 5-year | | Since
Inception
(8/4/99) | |
| Oakmark Global Fund (Class I) | | | 5.58 | % | | | 17.46 | % | | | 22.18 | % | | | 16.67 | % | |
| MSCI World | | | 4.47 | % | | | 14.18 | % | | | 10.01 | % | | | 3.19 | % | |
| Lipper Global Fund Index14 | | | 4.06 | % | | | 14.36 | % | | | 10.63 | % | | | 5.17 | % | |
The graph and table do not reflect the deduction of taxes that a shareholder would pay on fund distributions or the redemption of fund shares.
The performance data quoted represents past performance. The above performance information for the Fund does not reflect the imposition of a 2% redemption fee on shares held for 90 days or less to deter market timers. If reflected, the fee would reduce the performance quoted. Past performance does not guarantee future results. The investment return and principal value will fluctuate so that an investor's shares, when redeemed, may be worth more or less than their original cost. Current performance may be lower or higher than the performance data quoted. Average annual total return measures annualized change, while total return measures aggregate change. To obtain most recent month-end performance data, visit oakmark.com.
* Not annualized
Quarter and Fiscal Year Review
A strong recovery in world stock markets helped to propel The Oakmark Global Fund to a pleasing 6% gain in the quarter ended September 30. Both the Lipper Global Fund Index and the MSCI World Index reported 4% for the period. September 30 also is the end of the Fund's fiscal year. For that 12-month period the Fund earned 17%, which contrasts to 14% for the Lipper Global Fund Index as well as the MSCI World Index. Most importantly, the Fund since inception has compounded at approximately 17% per year, measured against 3% per year for the MSCI World Index and 5% for the Lipper Global Fund Index.
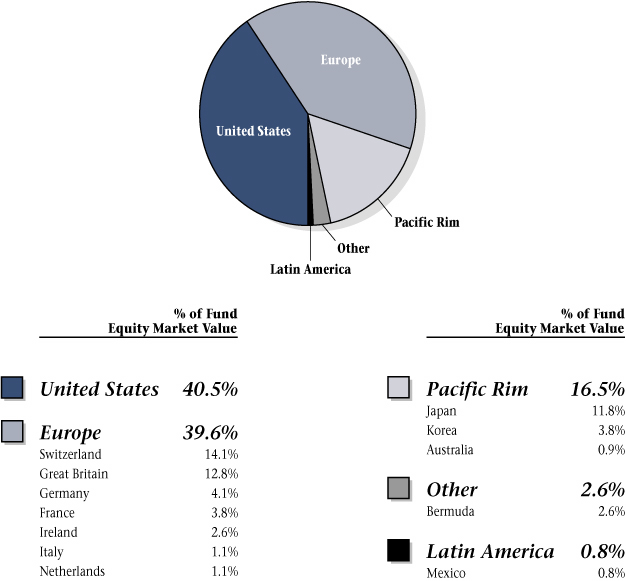
While several stocks in the Fund lost ground during the quarter, every country in which we invested Fund assets contributed positively. The Netherlands, Italy, and Mexico provided the highest percentage total return. We ended the quarter with the portfolio divided roughly 40/60 between U.S. stocks and foreign-domiciled issues. As we have often stated, we build the portfolio from the bottom up. Each individual name fights for space within the portfolio. The resulting split between the U.S. and international simply captures a snapshot view of where we have identified dominant investment ideas. Consultants may tell us that we are "underweight" a country or an industry, but this has little meaning for our investment process. We go wherever we believe value to be taking us, and currently that means a lot of Europe and the U.S., some Asia, and a small position in the emerging markets.
Japan—The New Frontier
The changes that have taken place in Japan over the past decade have been dramatic. Deflation has ended, interest rates are on the rise, capital spending is booming, the banks are back from the brink, and the real estate market is experiencing a renaissance. Also, very importantly, management teams are starting to care about shareholders. Meeting a CEO or CFO is becoming common compared to dealing only with the investor relations department in the past. Companies are truly restructuring, and share repurchases are more than just an announcement. Average returns, measured by return on equity, have jumped from low single-digit levels to almost 10% today. The recent apex was the bid by OJI Paper for Hokuetsu Paper, which marked the first time a blue-chip Japanese company attempted a hostile takeover of a competitor. While the attempt was unsuccessful, it illustrates how things have changed from the keiretsu-dominated business relationships in Ja pan.
It is interesting to note that despite these positives, Japan has been one of the worst performing
THE OAKMARK GLOBAL FUND
22
equity markets for the year. We see this as an opportunity. Close to 12% of the Fund is invested in Japan because of changes mentioned above, the owner-oriented management teams of our holdings, and our holdings' respective discounts to fair value. The management teams at Rohm, Takeda, Meitec and Uni-Charm share our belief in this discount to intrinsic value and are executing meaningful share repurchases. We are pleased that our Japanese holdings have been some of the biggest contributors for the Fund quarter and year-to-date. Even after these price moves we remain excited about our Japanese holdings.
Portfolio Changes
We kept the number of stocks in the portfolio constant during the quarter, adding two new names and eliminating another two. As noted above, every holding in the portfolio fights for space, and ConocoPhillips (received in exchange for the Fund's Burlington Resources shares) and Santen Pharmaceutical lost that fight. Both, however, are solid companies that could easily return to the portfolio in the future.
Our two new purchases are Intel and Kinetic Concepts, both U.S.-domiciled concerns. Intel, the world's largest microprocessor company, typifies the opportunity to buy a great company at a good price, which we always desire but rarely see. In the summer, market share losses to a major competitor combined with poor personal computer industry conditions to push Intel's stock price down to 1997 levels. Intel's market share position has experienced many cycles, and we believe that the current share loss will prove to be temporary. The company introduced several important new products in the third quarter, and more are on the way. Not only does Intel spend more than four times as much on research and development than its nearest competitor, but also the company sets the standard, in our opinion, for state of the art manufacturing in its industry.
In contrast to the very well known Intel, Kinetic Concepts is a somewhat obscure mid-size company that develops and manufactures health care products. The company has long been known for its specialty hospital beds, but wound care products now dominate corporate revenues. Kinetic Concepts controls a patented technology named Vacuum Assisted Closure that speeds healing for difficult wounds. Demographics are favorable for this product because two rapidly growing populations (diabetics and nursing home residents) are primary customers. Usually, specialty medical device companies trade at prices that we find too expensive, and this is usually the case for Kinetic Concepts. However, when a patent infringement trial produced an unexpected outcome, Kinetic Concepts' share price decreased, and we saw an investment opportunity. As with Intel, we believe that the stock market has overreacted to ambiguous news.
In closing, we note that the Fund passed its seventh anniversary during the quarter. While the Fund has grown in size over the years, it has not changed in its character. We thank you for your support and patience, and we welcome your e-mailed questions and comments.
Clyde S. McGregor, CFA
Portfolio Manager
mcgregor@oakmark.com | | Robert A. Taylor, CFA
Portfolio Manager
rtaylor@oakmark.com | |
|
THE OAKMARK GLOBAL FUND
23
THE OAKMARK GLOBAL FUND
Global Diversification—September 30, 2006 (Unaudited)
THE OAKMARK GLOBAL FUND
24
THE OAKMARK GLOBAL FUND
Schedule of Investments—September 30, 2006
| Name | | Description | | Shares Held | | Market Value | |
| Common Stocks—97.9% | |
| Apparel Retail—2.0% | |
The TJX Companies, Inc.
(United States) | | Discount Apparel & Home
Fashion Retailer | | | 1,689,000 | | | $ | 47,342,670 | | |
| Apparel, Accessories & Luxury Goods—1.1% | |
| Bulgari S.p.A. (Italy) | | Jewelry Manufacturer & Retailer | | | 1,946,000 | | | $ | 24,774,958 | | |
| Automobile Manufacturers—3.2% | |
Bayerische Motoren
Werke (BMW) AG
(Germany) | | Luxury Automobile Manufacturer | | | 1,424,000 | | | $ | 76,272,903 | | |
| Broadcasting & Cable TV—3.7% | |
CBS Corporation, Class B
(United States) | | Radio & Television Broadcasting | | | 1,585,000 | | | $ | 44,649,450 | | |
Discovery Holding
Company, Class A
(United States) (a) | | Media Management &
Network Services | | | 2,913,700 | | | | 42,132,102 | | |
| | | | 86,781,552 | | |
| Household Appliances—3.3% | |
Snap-on Incorporated
(United States) | | Tool & Equipment Manufacturer | | | 1,760,000 | | | $ | 78,408,000 | | |
| Leisure Products—1.2% | |
Brunswick Corp.
(United States) | | Leisure & Recreation
Products Manufacturer | | | 877,000 | | | $ | 27,353,630 | | |
| Motorcycle Manufacturers—3.0% | |
Harley-Davidson, Inc.
(United States) | | Motorcycle Manufacturer | | | 1,126,000 | | | $ | 70,656,500 | | |
| Movies & Entertainment—6.2% | |
Time Warner, Inc.
(United States) | | | | | 2,117,000 | | | $ | 38,592,910 | | |
Vivendi Universal SA
(France) | | Music, Games, Television, Film, &
Telecommunications | | | 1,051,500 | | | | 37,907,271 | | |
News Corporation,
Class B (United States) | | International Multimedia &
Entertainment Company | | | 1,726,500 | | | | 35,634,960 | | |
Viacom, Inc., Class B
(United States) (a) | | | | | 944,000 | | | | 35,097,920 | | |
| | | | 147,233,061 | | |
THE OAKMARK GLOBAL FUND
25
THE OAKMARK GLOBAL FUND
Schedule of Investments—September 30, 2006 cont.
| Name | | Description | | Shares Held | | Market Value | |
| Common Stocks—97.9% (cont.) | |
| Publishing—3.4% | |
The Washington Post
Company, Class B
(United States) | | Newspaper & Magazine Publishing | | | 61,418 | | | $ | 45,265,066 | | |
Trinity Mirror plc
(Great Britain) | | Newspaper Publishing | | | 4,078,900 | | | | 36,352,731 | | |
| | | | 81,617,797 | | |
| Distillers & Vintners—2.9% | |
| Diageo plc (Great Britain) | | Beverages, Wines, &
Spirits Manufacturer | | | 3,902,500 | | | $ | 68,940,091 | | |
| Household Products—2.5% | |
Uni-Charm Corporation
(Japan) | | Toiletry Products Manufacturer | | | 397,400 | | | $ | 22,069,367 | | |
| Henkel KGaA (Germany) | | Consumer Chemical
Products Manufacturer | | | 154,000 | | | | 19,057,346 | | |
Kimberly-Clark de
Mexico S.A. de C.V
(Mexico) | | Hygiene Products Manufacturer,
Marketer & Distributor | | | 4,391,000 | | | | 17,669,442 | | |
| | | | 58,796,155 | | |
| Packaged Foods & Meats—4.2% | |
| Nestle SA (Switzerland) | | Food & Beverage Manufacturer | | | 175,500 | | | $ | 61,192,371 | | |
Cadbury Schweppes plc
(Great Britain) | | Beverage & Confectionary
Manufacturer | | | 3,493,000 | | | | 37,180,574 | | |
| | | | 98,372,945 | | |
| Soft Drinks—1.0% | |
Lotte Chilsung
Beverage Co., Ltd.
(Korea) | | Soft Drinks, Juices & Sports
Drinks Manufacturer | | | 16,680 | | | $ | 22,616,053 | | |
| Oil & Gas Exploration & Production—2.7% | |
XTO Energy, Inc.
(United States) | | Oil & Natural Gas Exploration &
Production | | | 1,509,000 | | | $ | 63,574,170 | | |
| Asset Management & Custody Banks—3.1% | |
Julius Baer Holding AG-B
(Switzerland) | | Asset Management | | | 729,300 | | | $ | 72,845,432 | | |
| Diversified Banks—3.4% | |
| Bank of Ireland (Ireland) | | Commercial Bank | | | 3,032,000 | | | $ | 59,285,700 | | |
Australia and New Zealand
Banking Group Limited
(Australia) | | Commercial Bank | | | 1,095,000 | | | | 21,920,540 | | |
| | | | 81,206,240 | | |
THE OAKMARK GLOBAL FUND
26
THE OAKMARK GLOBAL FUND
Schedule of Investments—September 30, 2006 cont.
| Name | | Description | | Shares Held | | Market Value | |
| Common Stocks—97.9% (cont.) | |
| Diversified Capital Markets—3.0% | |
Credit Suisse Group
(Switzerland) | | Investment Services & Insurance | | | 1,228,400 | | | $ | 71,074,205 | | |
| Investment Banking & Brokerage—1.3% | |
Daiwa Securities Group,
Inc. (Japan) | | Stock Broker | | | 2,558,000 | | | $ | 29,840,626 | | |
| Health Care Equipment—1.5% | |
Kinetic Concepts, Inc.
(United States) (a) | | Health Care Equipment & Supplies | | | 1,115,100 | | | $ | 35,081,046 | | |
| Health Care Services—2.6% | |
Laboratory Corporation of
America Holdings
(United States) (a) | | Medical Laboratory & Testing
Services | | | 920,000 | | | $ | 60,324,400 | | |
| Pharmaceuticals—6.7% | |
GlaxoSmithKline plc
(Great Britain) | | Pharmaceuticals | | | 3,055,000 | | | $ | 81,338,816 | | |
| Novartis AG (Switzerland) | | Pharmaceuticals | | | 899,600 | | | | 52,517,734 | | |
Takeda Pharmaceutical
Company Limited
(Japan) | | Pharmaceuticals & Food
Supplements | | | 416,000 | | | | 25,954,878 | | |
| | | | 159,811,428 | | |
| Aerospace & Defense—0.9% | |
Alliant Techsystems, Inc.
(United States) (a) | | Propulsion Systems & Munitions | | | 269,087 | | | $ | 21,812,192 | | |
| Diversified Commercial and Professional Services—1.0% | |
Meitec Corporation
(Japan) | | Software Engineering Services | | | 760,000 | | | $ | 23,354,921 | | |
| Environmental & Facilities Services—1.9% | |
Waste Management, Inc.
(United States) | | Waste Management Services | | | 1,234,000 | | | $ | 45,263,120 | | |
| Human Resource & Employment Services—2.0% | |
| Adecco SA (Switzerland) | | Temporary Employment Services | | | 783,000 | | | $ | 47,244,872 | | |
| Industrial Conglomerates—2.5% | |
Tyco International Ltd.
(Bermuda) | | Diversified Manufacturing &
Services | | | 2,131,000 | | | $ | 59,646,690 | | |
| Computer Hardware—1.6% | |
Dell Inc.
(United States) (a) | | Technology Products & Services | | | 1,635,000 | | | $ | 37,343,400 | | |
THE OAKMARK GLOBAL FUND
27
THE OAKMARK GLOBAL FUND
Schedule of Investments—September 30, 2006 cont.
| Name | | Description | | Shares Held | | Market Value | |
| Common Stocks—97.9% (cont.) | |
| Data Processing & Outsourced Services—3.5% | |
eFunds Corporation
(United States) (a) | | Electronic Debit Payment Services | | | 1,980,100 | | | $ | 47,878,818 | | |
Ceridian Corporation
(United States) (a) | | Data Management Services | | | 1,538,000 | | | | 34,389,680 | | |
| | | | 82,268,498 | | |
| Home Entertainment Software—2.6% | |
Square Enix Co., Ltd.
(Japan) | | Entertainment Software | | | 2,551,800 | | | $ | 61,891,276 | | |
| Office Electronics—2.2% | |
| Neopost SA (France) | | Mailroom Equipment Supplier | | | 424,750 | | | $ | 50,682,659 | | |
| Semiconductors—4.2% | |
| Intel Corp. (United States) | | | | | 2,530,000 | | | $ | 52,042,100 | | |
Rohm Company Limited
(Japan) | | Integrated Circuits & Semiconductor
Devices Manufacturer | | | 518,000 | | | | 48,105,481 | | |
| | | | 100,147,581 | | |
| Systems Software—3.1% | |
Oracle Corporation
(United States) (a) | | Software Services | | | 4,182,000 | | | $ | 74,188,680 | | |
| Diversified Chemicals—1.0% | |
Akzo Nobel N.V.
(Netherlands) | | Chemical Producer | | | 394,000 | | | $ | 24,271,136 | | |
| Specialty Chemicals—0.9% | |
| Givaudan (Switzerland) | | Fragrance & Flavor Compound
Manufacturer | | | 26,900 | | | $ | 21,533,768 | | |
| Wireless Telecommunication Services—8.5% | |
Vodafone Group Plc
(Great Britain) | | Mobile Telecommunications | | | 31,650,625 | | | $ | 72,446,631 | | |
SK Telecom Co., Ltd.
(Korea) | | Mobile Telecommunications | | | 302,130 | | | | 64,337,326 | | |
NTT DoCoMo, Inc.
(Japan) | | Mobile Telecommunications | | | 39,200 | | | | 60,397,037 | | |
SK Telecom Co., Ltd.
(Korea) (b) | | Mobile Telecommunications | | | 55,000 | | | | 1,299,650 | | |
| | | | 198,480,644 | | |
| Total Common Stocks (Cost: $1,840,894,743) | | | | | | | | | 2,311,053,299 | | |
THE OAKMARK GLOBAL FUND
28
THE OAKMARK GLOBAL FUND
Schedule of Investments—September 30, 2006 cont.
| Name | | Par Value | | Market Value | |
| Short Term Investments—2.1% | |
| Repurchase Agreement—2.1% | |
IBT Repurchase Agreement, 5.16% dated 9/29/2006
due 10/2/2006, repurchase price $48,995,872 collateralized
by Small Business Administration Bonds, with rates of
7.000% - 9.280%, with maturities from 9/25/2018 - 4/25/2030,
and with an aggregate market value plus accrued interest
of $51,423,554 | | $ | 48,974,813 | | | $ | 48,974,813 | | |
| Total Repurchase Agreement (Cost: $48,974,813) | | | | | 48,974,813 | | |
| Total Short Term Investments (Cost: $48,974,813) | | | | | 48,974,813 | | |
| Total Investments (Cost $1,889,869,556)—100.0% | | | | $ | 2,360,028,112 | | |
| Other Liabilities In Excess Of Other Assets—0.0% | | | | | (719,220 | ) | |
| Total Net Assets—100% | | | | $ | 2,359,308,892 | | |
(a) Non-income producing security.
(b) Represents an American Depository Receipt.
See accompanying Notes to Financial Statements.
THE OAKMARK GLOBAL FUND
29
THE OAKMARK INTERNATIONAL AND
OAKMARK INTERNATIONAL SMALL CAP FUNDS

Fellow Shareholders,
During the past quarter, The Oakmark International Fund and The Oakmark International Small Cap Fund continued to perform well. Year to date, both Funds are outpacing comparable international market indices. Please see individual Fund letters for more specific performance information.
In Like a Bear...
You may recall that at the quarter's start, lots of negative sentiments surrounded the global equity markets. Numerous fears, including high energy prices, a housing meltdown in the U.S., and terrorist attacks fostered these negative views. However, we remained fairly bullish despite these "exogenous" forces because, as bottom-up value investors, we found plenty of opportunities in overseas markets. This highlights a very important lesson for all investors: investment success is generally driven by long term thinking, such as buying high quality businesses that are selling at discounted values and not trying to time markets or sectors. We will continue to focus on our fundamental task of searching for those foreign companies that fit our strict value criteria. Fortunately, we maintain our belief that the environment is very fertile for our type of investing.
Money, Money Everywhere!
The rebound in equity prices is in part due to increased corporate activity, which has been fueled by significant cash flows into the alternative investment space. Both private equity funds and hedge funds have raised significant fresh capital, and—with their borrowing power—this has meant that cheap stocks often don't stay cheap for too long. Within our two international portfolios, past and present names such as Associated British Ports, Giordano, Signet, Matalan, Enodis, Euronext, MLP and Julius Baer have been involved in some sort of corporate activity over the last 12 months. Despite the rising interest rate environment, in which financing often is difficult to obtain, the "alternative" players still have plenty of options. Ultimately, we believe this situation benefits fundamental long-term investors like us. These alternative funds' substantial cash reserves and their considerable leverage power enable them to pounce on low priced stocks, which in turn provides a catalyst for equity revaluation.
Farewell to a Strong Leader
Before this letter ends, I want to address Junichiro Koizumi's departure from Japan's office of Prime Minister and head of the ruling Liberal Democratic Party (LDP). Koizumi's policies were instrumental in halting Japan's decade-long deflationary spiral. He also took a strong political stand on the privatization of the Postal Savings Banks in Japan, a signal that he was serious about reform. It remains to be seen whether new Prime Minister Shinzo Abe will have such zeal, but it will be necessary to maintain the Japanese economy's positive momentum, especially since true micro- and macro-economic change is just now taking root. We are hopeful that the positive trends we have witnessed will continue to move forward.
David G. Herro, CFA
Portfolio Manager
dherro@oakmark.com
THE OAKMARK INTERNATIONAL AND OAKMARK INTERNATIONAL SMALL CAP FUNDS
30
THE OAKMARK INTERNATIONAL FUND
Report from David G. Herro

THE VALUE OF A $10,000 INVESTMENT IN THE OAKMARK INTERNATIONAL FUND FROM ITS INCEPTION (9/30/92) TO PRESENT (9/30/06) AS COMPARED TO THE MSCI WORLD EX U.S. INDEX15(UNAUDITED)

| | | | | Average Annual Total Returns
(as of 9/30/06) | |
| (Unaudited) | | Total Return
Last 3 Months* | | 1-year | | 5-year | | 10-year | | Since
Inception
(9/30/92) | |
Oakmark International
Fund (Class I) | | | 5.09 | % | | | 22.14 | % | | | 19.12 | % | | | 11.99 | % | | | 13.23 | % | |
| MSCI World ex U.S. | | | 3.72 | % | | | 18.65 | % | | | 14.63 | % | | | 7.14 | % | | | 8.61 | % | |
| MSCI EAFE16 | | | 3.93 | % | | | 19.16 | % | | | 14.26 | % | | | 6.82 | % | | | 8.38 | % | |
Lipper International
Fund Index17 | | | 4.18 | % | | | 19.29 | % | | | 14.70 | % | | | 8.24 | % | | | 9.59 | % | |
The graph and table do not reflect the deduction of taxes that a shareholder would pay on fund distributions or the redemption of fund shares.
The performance data quoted represents past performance. The above performance information for the Fund does not reflect the imposition of a 2% redemption fee on shares held for 90 days or less to deter market timers. If reflected, the fee would reduce the performance quoted. Past performance does not guarantee future results. The investment return and principal value will fluctuate so that an investor's shares, when redeemed, may be worth more or less than their original cost. Current performance may be lower or higher than the performance data quoted. Average annual total return measures annualized change, while total return measures aggregate change. To obtain most recent month-end performance data, visit oakmark.com.
* Not annualized
The Oakmark International Fund returned 5% for the quarter ending September 30, which compares favorably to the MSCI World ex U.S. Index's return of 4%. More importantly, year-to-date, the Fund is up 19%, and since inception, the Fund is up 13% per annum. These positive long-term results especially please us and once again fare well in comparison with the MSCI World ex U.S. Index's return of 14% year-to-date and 9% since the Fund's inception.
Impact Players
During 2006, the two greatest contributors to the Fund's performance have been BMW and Diageo. Both stocks are long time holdings of the Fund. BMW is still performing well in a weak sector because of its rising profits, which stem from the company's new models and its cost-cutting efforts. Further, BMW's incredibly strong balance sheet has enabled the company to buy back stock and return cash to its owners. Diageo, the global leader in branded spirits, continues to increase its free cash generation as it integrates newly acquired brands and increases its market share in the U.S.
Two names that have weakened the Fund's year-to-date performance are Rohm and DaimlerChrysler. Rohm, the Japanese maker of specialty semiconductors, seems to be suffering simply because it is a Japanese tech stock. This sector has been very weak despite the fact that the businesses of individual constituents, like Rohm, are performing well. We believe that Rohm will rebound over time as the market looks beyond industry and country concerns to appreciate Rohm's solid fundamentals.
DaimlerChrysler, a relatively new addition to the portfolio, has been hurt mostly by its exposure to the U.S. automotive sector. We feel that the market is fixated on Chrysler's situation in North America and is overlooking the company's progress at Mercedes-Benz and in its commercial vehicle divisions.
The quarter's top contributor, Signet, has benefited from private equity interest, which has subsequently drawn attention to this Anglo/U.S. jewelry retailer, perhaps best known for its Jarrod's and Kay's retail shops. Despite these indications of interest (at too low of a price, in our opinion), the company has avoided being taken over.
THE OAKMARK INTERNATIONAL FUND
31
UK-based maker of kitchen equipment, Enodis, has been a top ten contributor to the Fund in 2006, partially because two of its competitors showed interest in taking over the company. Yet recent news that no deals would happen hurt the share price, making it the Fund's worst performer from July through September.
Lastly, we remain very underweight in the Japanese market, ending the quarter just under 12%, compared to the EAFE weight of just under 24%. Last year, when Japan performed well, this underweight slowed performance. This year, our underweighting has helped because Japan has lagged behind other foreign markets. We remain diligent in our search for Japanese companies that meet our criteria, but have found this a difficult task. As stated in past letters, we are not only concerned about "price" in Japan; rather, we continue to have trouble finding companies that consistently earn good returns and wisely allocate capital.
David G. Herro, CFA
Portfolio Manager
dherro@oakmark.com | |
|
THE OAKMARK INTERNATIONAL FUND
32
THE OAKMARK INTERNATIONAL FUND
International Diversification—September 30, 2006 (Unaudited)
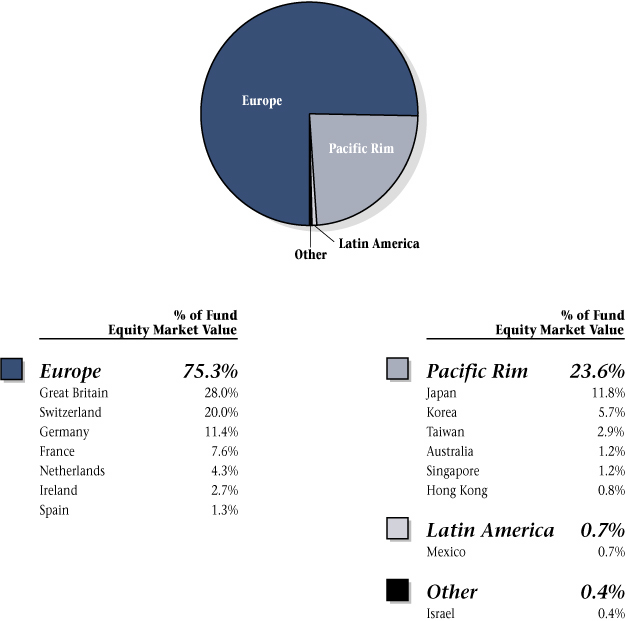
THE OAKMARK INTERNATIONAL FUND
33
THE OAKMARK INTERNATIONAL FUND
Schedule of Investments—September 30, 2006
| Name | | Description | | Shares Held | | Market Value | |
| Common Stocks—95.2% | |
| Advertising—1.9% | |
| Publicis Groupe (France) | | Advertising & Media Services | | | 3,706,400 | | | $ | 145,978,910 | | |
| Apparel Retail—0.8% | |
Giordano
International Limited
(Hong Kong) (b) | | Pacific Rim Clothing Retailer &
Manufacturer | | | 121,265,300 | | | $ | 59,148,870 | | |
| Apparel, Accessories & Luxury Goods—2.0% | |
Swatch Group AG,
Bearer Shares
(Switzerland) | | Watch Manufacturer | | | 801,100 | | | $ | 154,780,887 | | |
Swatch Group AG,
Registered Shares
(Switzerland) | | Watch Manufacturer | | | 24,700 | | | | 958,015 | | |
| | | | 155,738,902 | | |
| Automobile Manufacturers—8.5% | |
Bayerische Motoren
Werke (BMW) AG
(Germany) | | Luxury Automobile Manufacturer | | | 4,599,500 | | | $ | 246,360,406 | | |
DaimlerChrysler AG
(Germany) | | Automobile Manufacturer | | | 5,377,400 | | | | 268,729,384 | | |
Honda Motor Co., Ltd.
(Japan) | | Automobile & Motorcycle
Manufacturer | | | 4,050,000 | | | | 136,114,286 | | |
| | | | 651,204,076 | | |
| Broadcasting & Cable TV—5.7% | |
British Sky Broadcasting
Group plc
(Great Britain) | | Television Production &
Broadcasting | | | 25,124,300 | | | $ | 256,846,498 | | |
Gestevision Telecinco SA
(Spain) | | Television Production &
Broadcasting | | | 3,866,900 | | | | 98,558,793 | | |
Grupo Televisa S.A.
(Mexico) (c) | | Television Production &
Broadcasting | | | 2,343,300 | | | | 49,818,558 | | |
Societe Television
Francaise 1 (France) | | Television Production &
Broadcasting | | | 1,261,000 | | | | 40,279,088 | | |
| | | | 445,502,937 | | |
THE OAKMARK INTERNATIONAL FUND
34
THE OAKMARK INTERNATIONAL FUND
Schedule of Investments—September 30, 2006 cont.
| Name | | Description | | Shares Held | | Market Value | |
| Common Stocks—95.2% (cont.) | |
| Consumer Electronics—2.3% | |
Koninklijke (Royal)
Philips Electronics N.V.
(Netherlands) | | Electronics Manufacturer | | | 4,952,300 | | | $ | 173,761,070 | | |
| Movies & Entertainment—1.7% | |
Vivendi Universal SA
(France) | | Music, Games, Television, Film, &
Telecommunications | | | 3,572,300 | | | $ | 128,783,778 | | |
| Publishing—3.2% | |
Johnston Press plc
(Great Britain) | | Newspaper Publishing | | | 13,392,300 | | | $ | 102,118,234 | | |
Trinity Mirror plc
(Great Britain) (b) | | Newspaper Publishing | | | 16,238,538 | | | | 144,724,119 | | |
| | | | 246,842,353 | | |
| Restaurants—2.2% | |
Compass Group PLC
(Great Britain) | | International Foodservice
Group Operator | | | 33,783,000 | | | $ | 169,677,782 | | |
| Specialty Stores—3.0% | |
Signet Group plc
(Great Britain) (b) | | Jewelry Retailer | | | 111,717,000 | | | $ | 231,136,524 | | |
| Tires & Rubber—1.5% | |
Compagnie Generale
des Etablissements
Michelin (France) | | Tire Manufacturer | | | 1,603,800 | | | $ | 117,547,779 | | |
| Distillers & Vintners—2.9% | |
| Diageo plc (Great Britain) | | Beverages, Wines, & Spirits
Manufacturer | | | 12,570,000 | | | $ | 222,056,872 | | |
| Household Products—2.7% | |
| Henkel KGaA (Germany) | | Consumer Chemical Products
Manufacturer | | | 811,200 | | | $ | 100,385,188 | | |
| Kao Corporation (Japan) | | Household & Chemical Products
Manufacturer | | | 575,000 | | | | 15,333,333 | | |
Uni-Charm Corporation
(Japan) | | Toiletry Products Manufacturer | | | 1,616,400 | | | | 89,765,790 | | |
| | | | 205,484,311 | | |
| Hypermarkets & Super Centers—1.2% | |
| Metro AG (Germany) | | Internet Food Retailer | | | 1,592,000 | | | $ | 93,043,524 | | |
THE OAKMARK INTERNATIONAL FUND
35
THE OAKMARK INTERNATIONAL FUND
Schedule of Investments—September 30, 2006 cont.
| Name | | Description | | Shares Held | | Market Value | |
| Common Stocks—95.2% (cont.) | |
| Packaged Foods & Meats—5.0% | |
Cadbury Schweppes plc
(Great Britain) | | Beverage & Confectionary
Manufacturer | | | 17,248,900 | | | $ | 183,602,634 | | |
| Nestle SA (Switzerland) | | Food & Beverage Manufacturer | | | 566,300 | | | | 197,454,356 | | |
| | | | 381,056,990 | | |
| Soft Drinks—1.6% | |
Lotte Chilsung Beverage
Co., Ltd. (Korea) (b) | | Soft Drinks, Juices & Sports Drinks
Manufacturer | | | 88,800 | | | $ | 120,402,008 | | |
| Integrated Oil & Gas—0.3% | |
| Total SA (France) | | Oil & Natural Gas Exploration and
Production | | | 344,000 | | | $ | 22,573,826 | | |
| Asset Management & Custody Banks—0.1% | |
Schroders PLC
(Great Britain) | | International Asset Management | | | 269,200 | | | $ | 4,687,541 | | |
| Diversified Banks—10.9% | |
Australia and
New Zealand
Banking Group
Limited (Australia) | | Commercial Bank | | | 4,567,800 | | | $ | 91,441,683 | | |
| Bank of Ireland (Ireland) | | Commercial Bank | | | 10,284,500 | | | | 201,096,233 | | |
| BNP Paribas SA (France) | | Commercial Bank | | | 454,500 | | | | 48,901,492 | | |
Chinatrust Financial
Holding Co. (Taiwan) | | Commercial Bank | | | 285,734,318 | | | | 213,237,787 | | |
| Kookmin Bank (Korea) | | Commercial Bank | | | 864,000 | | | | 68,115,614 | | |
Lloyds TSB Group plc
(Great Britain) | | Commercial Bank | | | 12,750,300 | | | | 128,794,966 | | |
United Overseas Bank
Limited, Foreign
Shares (Singapore) | | Commercial Bank | | | 8,395,368 | | | | 86,160,553 | | |
| | | | 837,748,328 | | |
| Diversified Capital Markets—5.3% | |
Credit Suisse Group
(Switzerland) | | Investment Services & Insurance | | | 3,390,700 | | | $ | 196,183,090 | | |
| UBS AG (Switzerland) | | Investment Banking | | | 3,560,700 | | | | 212,995,610 | | |
| | | | 409,178,700 | | |
| Insurance Brokers—0.5% | |
Willis Group
Holdings Limited
(Great Britain) | | Consulting Services Provider | | | 1,086,000 | | | $ | 41,268,000 | | |
THE OAKMARK INTERNATIONAL FUND
36
THE OAKMARK INTERNATIONAL FUND
Schedule of Investments—September 30, 2006 cont.
| Name | | Description | | Shares Held | | Market Value | |
| Common Stocks—95.2% (cont.) | |
| Investment Banking & Brokerage—2.1% | |
Daiwa Securities
Group, Inc. (Japan) | | Stock Broker | | | 13,747,000 | | | $ | 160,367,120 | | |
| Real Estate Management & Development—0.0% | |
United Overseas Land
Limited (Singapore) | | Real Estate Investor | | | 839,536 | | | $ | 1,850,071 | | |
| Reinsurance—1.6% | |
Hannover
Rueckversicherung AG
(Germany) (a) | | Reinsurance | | | 3,028,000 | | | $ | 127,361,370 | | |
| Pharmaceuticals—7.6% | |
GlaxoSmithKline plc
(Great Britain) | | Pharmaceuticals | | | 9,936,000 | | | $ | 264,544,182 | | |
| Novartis AG (Switzerland) | | Pharmaceuticals | | | 3,320,000 | | | | 193,818,225 | | |
| Sanofi-Aventis (France) | | Pharmaceuticals | | | 588,508 | | | | 52,387,281 | | |
Takeda Pharmaceutical
Company Limited
(Japan) | | Pharmaceuticals & Food
Supplements | | | 1,274,600 | | | | 79,524,250 | | |
| | | | 590,273,938 | | |
| Diversified Commercial and Professional Services—1.0% | |
Meitec Corporation
(Japan) (b) | | Software Engineering Services | | | 2,483,800 | | | $ | 76,327,568 | | |
| Human Resource & Employment Services—3.1% | |
| Adecco SA (Switzerland) | | Temporary Employment Services | | | 3,703,000 | | | $ | 223,432,644 | | |
Michael Page
International plc
(Great Britain) (b) | | Recruitment Consultancy Services | | | 2,360,303 | | | | 17,003,308 | | |
| | | | 240,435,952 | | |
| Industrial Machinery—0.8% | |
Enodis plc
(Great Britain) (b) | | Food Processing Equipment | | | 19,852,920 | | | $ | 64,678,610 | | |
| Electronic Equipment Manufacturers—0.4% | |
| Orbotech, Ltd. (Israel) (a) | | Optical Inspection Systems | | | 1,237,700 | | | $ | 29,333,490 | | |
| Semiconductors—2.1% | |
| Rohm Company Limited | | | | | | | | |
| | |
| (Japan) | | Integrated Circuits & | | | | | | |
| | |
| | Semiconductor Devices | | | | | | |
| | |
| | Manufacturer | | | 1,708,500 | | | $ | 158,664,508 | | |
THE OAKMARK INTERNATIONAL FUND
37
THE OAKMARK INTERNATIONAL FUND
Schedule of Investments—September 30, 2006 cont.
| Name | | Description | | Shares Held | | Market Value | |
| Common Stocks—95.2% (cont.) | |
| Diversified Chemicals—1.8% | |
Akzo Nobel N.V.
(Netherlands) | | Chemical Producer | | | 2,258,200 | | | $ | 139,109,341 | | |
| Fertilizers & Agricultural Chemicals—1.2% | |
Syngenta AG
(Switzerland) (a) | | Agricultural Chemicals | | | 614,500 | | | $ | 92,682,394 | | |
| Specialty Chemicals—2.5% | |
| Givaudan (Switzerland) | | Fragrance & Flavor Compound
Manufacturer | | | 134,700 | | | $ | 107,828,942 | | |
Lonza Group AG,
Registered Shares
(Switzerland) | | Industrial Organic Chemicals | | | 1,206,800 | | | | 83,577,016 | | |
| | | | 191,405,958 | | |
| Wireless Telecommunication Services—7.7% | |
NTT DoCoMo, Inc.
(Japan) | | Mobile Telecommunications | | | 96,700 | | | $ | 148,989,630 | | |
SK Telecom Co., Ltd.
(Korea) (c) | | Mobile Telecommunications | | | 405,100 | | | | 9,572,513 | | |
SK Telecom Co., Ltd.
(Korea) | | Mobile Telecommunications | | | 1,021,312 | | | | 217,484,141 | | |
Vodafone Group Plc
(Great Britain) (c) | | Mobile Telecommunications | | | 530,250 | | | | 12,121,515 | | |
Vodafone Group Plc
(Great Britain) | | Mobile Telecommunications | | | 89,997,062 | | | | 205,998,584 | | |
| | | | 594,166,383 | | |
| Total Common Stocks (Cost: $5,596,071,520) | | | | | | | | | 7,329,479,784 | | |
THE OAKMARK INTERNATIONAL FUND
38
THE OAKMARK INTERNATIONAL FUND
Schedule of Investments—September 30, 2006 cont.
| Name | | Par Value | | Market Value | |
| Short Term Investments—4.7% | |
| U.S. Government Agencies—1.6% | |
| Fannie Mae, 5.08% due 10/26/2006 | | $ | 75,000,000 | | | $ | 74,735,416 | | |
| Federal Home Loan Bank, 5.14% due 10/18/2006 | | | 50,000,000 | | | | 49,878,639 | | |
| Total U.S. Government Agencies (Cost: $124,614,055) | | | | | | | 124,614,055 | | |
| Repurchase Agreement—3.1% | |
IBT Repurchase Agreement, 5.16% dated 9/29/2006 due
10/2/2006, repurchase price $237,212,754, collateralized
by Government National Mortgage Association Bonds,
with rates of 6.400%, with maturities from
2/20/2033 - 7/20/2034, and an aggregate market value
plus accrued interest of $38,964,285, and by Small
Business Administration Bonds, with rates of
7.000% - 9.400%, with maturities from
11/25/2016 - 11/25/2030, and with an aggregate market
value plus accrued interest of $210,002,051 | | $ | 237,110,797 | | | $ | 237,110,797 | | |
| Total Repurchase Agreement (Cost: $237,110,797) | | | | | | | 237,110,797 | | |
| Total Short Term Investments (Cost: $361,724,852) | | | | | | | 361,724,852 | | |
| Total Investments (Cost $5,957,796,372)—99.9% | | | | | | $ | 7,691,204,636 | | |
| Foreign Currencies (Cost $23)—0.0% | | | | | | $ | 39 | | |
| Other Assets In Excess Of Other Liabilities—0.1% | | | | | | | 5,336,206 | | |
| Total Net Assets—100% | | | | | | $ | 7,696,540,881 | | |
(a) Non-income producing security.
(b) See footnote number five in the Notes to Financial Statements regarding investments in affiliated issuers.
(c) Represents an American Depository Receipt.
See accompanying Notes to Financial Statements.
THE OAKMARK INTERNATIONAL FUND
39
THE OAKMARK INTERNATIONAL
SMALL CAP FUND
Report from David G. Herro and Chad M. Clark, Portfolio Managers


THE VALUE OF A $10,000 INVESTMENT IN THE OAKMARK INTERNATIONAL SMALL CAP FUND FROM ITS INCEPTION (11/1/95) TO PRESENT (9/30/06) AS COMPARED TO THE MSCI WORLD EX U.S. INDEX15 (UNAUDITED)
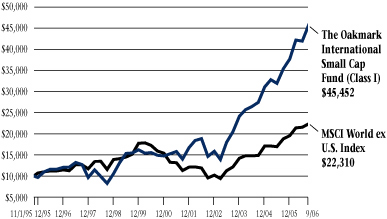
| | | | | Average Annual Total Returns
(as of 9/30/06) | |
| (Unaudited) | | Total Return
Last 3 Months* | | 1-year | | 5-year | | 10-year | | Since
Inception
(11/1/95) | |
Oakmark International
Small Cap Fund
(Class I) | | | 8.42 | % | | | 28.50 | % | | | 26.58 | % | | | 14.64 | % | | | 14.88 | % | |
| MSCI World ex U.S. | | | 3.72 | % | | | 18.65 | % | | | 14.63 | % | | | 7.14 | % | | | 7.63 | % | |
MSCI World ex U.S.
Small Cap18 | | | 0.14 | % | | | 14.81 | % | | | 22.68 | % | | | N/A | | | | N/A | | |
Lipper International
Small Cap Index19 | | | 2.16 | % | | | 19.69 | % | | | 22.52 | % | | | 12.15 | % | | | N/A | | |
The graph and table do not reflect the deduction of taxes that a shareholder would pay on fund distributions or the redemption of fund shares.
The performance data quoted represents past performance. The above performance information for the Fund does not reflect the imposition of a 2% redemption fee on shares held for 90 days or less to deter market timers. If reflected, the fee would reduce the performance quoted. Past performance does not guarantee future results. The investment return and principal value will fluctuate so that an investor's shares, when redeemed, may be worth more or less than their original cost. Current performance may be lower or higher than the performance data quoted. Average annual total return measures annualized change, while total return measures aggregate change. To obtain most recent month-end performance data, visit oakmark.com.
* Not annualized
The Oakmark International Small Cap gained 8% in the quarter ended September 30, 2006, solidly outperforming our benchmark indices. More importantly, however, for the past twelve months and since inception your Fund is up 29% and 15% per annum respectively, outpacing the MSCI World ex U.S. Index with returns of 19% and 8%.
Following last quarter's volatility, risk aversion in the global equity markets appears to have subsided, despite lingering geo-political anxiety. Outside of Japan, which fell 3.4% locally, most international small cap markets performed well in the quarter.
This quarter, the Fund benefited greatly from both geographic allocation and stock selection. For the second consecutive quarter Japan was one of the worst performing small cap markets. The Fund remains well underweight in the Japanese market, having just 9% of assets invested in the country versus almost 30% for the MSCI World ex U.S. Small Cap Index. Not only was the Fund underweight in Japan, but its Japanese positions, led by Square Enix, advanced in the quarter. As a result, Japan was the largest contributor to relative performance.
Combined stock selection in Norway and the United Kingdom also boosted relative performance in the quarter. The Fund's Norwegian and UK names advanced almost 16% and 8% respectively in the quarter, versus the local markets which posted -5% and 5% returns respectively.
Large Contributors
Sogecable, the leading Spanish pay-TV provider, was the largest contributor to performance, advancing 25% in the quarter. As you may recall from last quarter's discussion, concerns about soccer rights and soccer content costs led to a 1 billion Euro decline in Sogecable's market capitalization. We assumed some content cost inflation in our forecasts, but nothing warranting a 30% decline in the stock price of the country's premium pay-TV provider. As a result, we aggressively added to our position. While the dust hasn't completely settled yet, we do know Sogecable will retain access to soccer matches for the foreseeable future, albeit at a higher price. With this modicum of clarity, the shares rebounded strongly during the quarter.
Tandberg ASA, a Norwegian manufacturer of video-conferencing equipment, rose 35% in the quarter. We highlighted this stock in the March 2006 report. After a series of earnings misses, new management came in and stabilized what had always been a product-strong company. First and second quarter earnings reports exceeded the Street's expectations, although they
THE OAKMARK INTERNATIONAL SMALL CAP FUND
40
generally fell in-line with our forecasts. With no significant news during the quarter, the stock's strong showing appears to have coincided with the Street's upward earnings revisions.
Morse, a UK IT services and consulting group, rose 29% in the quarter. Management has successfully transformed this company from an infrastructure reseller to a services business, with two-thirds of profits derived from the latter. After recently disposing of poorly performing reselling activities in France, Germany and Austria, the company initiated central cost-cutting measures. These steps, combined with a potential new revenue stream from mobile ATM software, should enable the company's earnings to advance strongly. As the rebound in share price indicates, the market appears to be waking up to the new Morse.
Detractors
This quarter, no meaningful positions (those weighted 1.5% or more of the portfolio) fell more than 10%. Exposure to the automotive sector was the only consistent factor among the Fund's negative performers. Both Kongsberg Automotive, a Norwegian niche auto parts manufacturer, and Wagon PLC, a UK general auto parts manufacturer, fell in the quarter. These are very unique assets with limited U.S. auto exposure. And, in Wagon's case, it's a roll-up and restructuring of former bankrupt European auto parts players spear-headed by Wilbur Ross.
Portfolio Composition
Portfolio activity was somewhat muted in the quarter. We trimmed positions in some holdings as they approached what we believe to be their fair value. We added to new names, including Kimberly Clark de Mexico and Binggrae. New ideas generated in the quarter include Robert Walters, a UK recruitment consultant; CTS Eventim, a German ticket broker; and Ementor, a Norwegian IT distributor targeting small and medium-sized enterprises.
Geographically, our portfolio weightings remain very similar to last quarter. Europe and the UK represent almost 70% of investments, and the majority of the balance excluding cash is invested in the Pacific Rim.
After a slight retrenchment last quarter, small capitalization international stocks (ex Japan) rebounded nicely in the quarter. Given the markets' advance, the number of attractive investment candidates has diminished. However, we continue to own names that have demonstrated a consistent ability to grow value per share over time. We thank you for your continued support.
David G. Herro, CFA
Portfolio Manager
dherro@oakmark.com | | Chad M. Clark, CFA
Portfolio Manager
cclark@oakmark.com | |
|
THE OAKMARK INTERNATIONAL SMALL CAP FUND
41
THE OAKMARK INTERNATIONAL SMALL CAP FUND
International Diversification—September 30, 2006 (Unaudited)
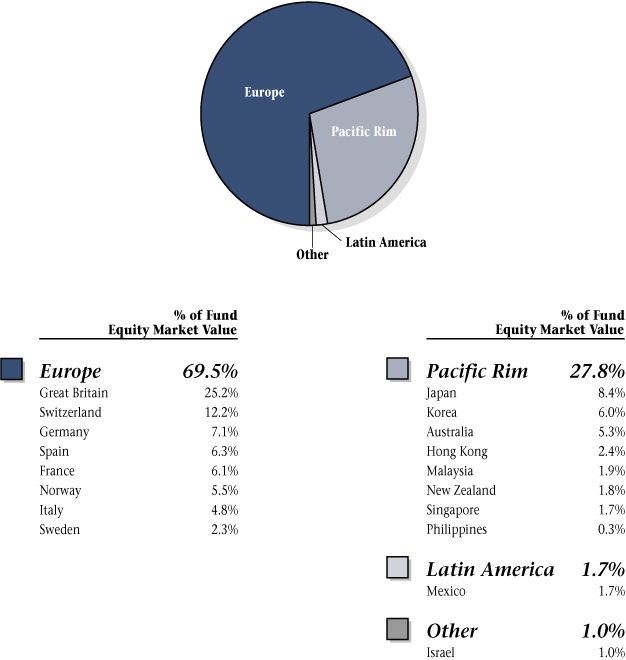
THE OAKMARK INTERNATIONAL SMALL CAP FUND
42
THE OAKMARK INTERNATIONAL SMALL CAP FUND
Schedule of Investments—September 30, 2006
| Name | | Description | | Shares Held | | Market Value | |
| Common Stocks—95.3% | |
| Advertising—0.8% | |
| Asatsu-DK, Inc. (Japan) | | Advertising Services Provider | | | 341,500 | | | $ | 10,378,709 | | |
| Apparel Retail—7.6% | |
JJB Sports plc
(Great Britain) (b) | | Sportswear & Sports Equipment
Retailer | | | 13,924,000 | | | $ | 48,752,025 | | |
Matalan PLC
(Great Britain) | | Clothing Retailer | | | 13,827,935 | | | | 48,286,219 | | |
| | | | 97,038,244 | | |
| Apparel, Accessories & Luxury Goods—2.3% | |
| Bulgari S.p.A. (Italy) | | Jewelry Manufacturer & Retailer | | | 2,312,000 | | | $ | 29,434,585 | | |
| Auto Parts & Equipment—2.9% | |
Kongsberg
Automotive ASA
(Norway) (b) | | Auto Parts & Equipment
Manufacturer | | | 3,350,200 | | | $ | 26,949,024 | | |
Wagon PLC
(Great Britain) | | Auto Parts & Equipment
Manufacturer | | | 2,645,034 | | | | 10,065,813 | | |
| | | | 37,014,837 | | |
| Broadcasting & Cable TV—6.4% | |
| Sogecable SA (Spain) (a) | | Cable Television Services | | | 1,372,500 | | | $ | 48,992,221 | | |
Media Prima Berhad
(Malaysia) (b) | | Film Producer & Sports Promoter | | | 45,694,100 | | | | 23,664,786 | | |
M6 Metropole Television
(France) | | Television Entertainment
Channel Owner & Operator | | | 297,700 | | | | 9,135,463 | | |
| | | | 81,792,470 | | |
| Home Improvement Retail—2.8% | |
Carpetright plc
(Great Britain) | | Carpet Retailer | | | 1,648,552 | | | $ | 35,650,996 | | |
| Movies & Entertainment—0.7% | |
CTS Eventim AG
(Germany) | | Entertainment Tickets Producer
& Distributor | | | 277,200 | | | $ | 9,033,639 | | |
| Photographic Products—2.2% | |
Vitec Group plc
(Great Britain) (b) | | Photo Equipment & Supplies | | | 2,780,379 | | | $ | 28,267,725 | | |
THE OAKMARK INTERNATIONAL SMALL CAP FUND
43
THE OAKMARK INTERNATIONAL SMALL CAP FUND
Schedule of Investments—September 30, 2006 cont.
| Name | | Description | | Shares Held | | Market Value | |
| Common Stocks—95.3% (cont.) | |
| Publishing—4.9% | |
| Daekyo Co., Ltd. (Korea) | | Educational Information Service
Provider | | | 394,918 | | | $ | 31,509,970 | | |
| Tamedia AG (Switzerland) | | TV Broadcasting & Publishing | | | 178,941 | | | | 19,375,914 | | |
SCMP Group, Ltd.
(Hong Kong) | | Newspaper Publisher &
Distributor | | | 31,402,000 | | | | 11,124,812 | | |
| | | | 62,010,696 | | |
| Restaurants—0.1% | |
| Alsea SA (Mexico) | | Pizza Restaurants | | | 311,800 | | | $ | 1,283,332 | | |
| Textiles—1.7% | |
Chargeurs SA
(France) (a)(b) | | Wool, Textile Production &
Trading | | | 790,182 | | | $ | 21,703,110 | | |
| Brewers—0.3% | |
Kook Soon Dang
Brewery Co., Ltd.
(Korea) | | Wine & Spirits Manufacturer | | | 408,828 | | | $ | 3,339,752 | | |
| Distillers & Vintners—0.6% | |
Baron de Ley, S.A.
(Spain) (a) | | Beverages, Wines, & Spirits
Manufacturer | | | 146,700 | | | $ | 7,654,844 | | |
| Household Products—1.5% | |
Kimberly-Clark de
Mexico S.A.B. de C.V
(Mexico) | | Hygiene Products Manufacturer,
Marketer & Distributor | | | 4,743,800 | | | $ | 19,089,113 | | |
| Packaged Foods & Meats—3.2% | |
Lotte Confectionery
Co., Ltd. (Korea) | | Candy & Snacks Manufacturer | | | 17,104 | | | $ | 20,859,198 | | |
| Binggrae Co., Ltd. (Korea) | | Dairy Products Manufacturer | | | 376,290 | | | | 16,920,623 | | |
Alaska Milk Corporation
(Philippines) (b) | | Milk Producer | | | 56,360,000 | | | | 3,593,385 | | |
| | | | 41,373,206 | | |
| Soft Drinks—0.4% | |
| Britvic Plc (Great Britain) | | Soft Drink Manufacturer &
Supplier | | | 1,231,000 | | | $ | 5,341,520 | | |
| Asset Management & Custody Banks—7.7% | |
| MLP AG (Germany) | | Asset Management | | | 2,281,200 | | | $ | 51,084,652 | | |
Julius Baer Holding AG-B
(Switzerland) | | Asset Management | | | 469,300 | | | | 46,875,581 | | |
| | | | 97,960,233 | | |
THE OAKMARK INTERNATIONAL SMALL CAP FUND
44
THE OAKMARK INTERNATIONAL SMALL CAP FUND
Schedule of Investments—September 30, 2006 cont.
| Name | | Description | | Shares Held | | Market Value | |
| Common Stocks—95.3% (cont.) | |
| Insurance Brokers—2.9% | |
Benfield Group Ltd.
(Great Britain) | | Reinsurance Service Provider | | | 5,352,000 | | | $ | 36,626,087 | | |
| Multi-Sector Holdings—1.6% | |
Pargesa Holding AG,
Class B (Switzerland) | | Diversified Operations | | | 215,400 | | | $ | 20,825,991 | | |
| Other Diversified Financial Services—0.2% | |
Ichiyoshi Securities
Co., Ltd. (Japan) | | Stock Broker | | | 143,000 | | | $ | 1,913,930 | | |
| Real Estate Management & Development—1.1% | |
Countrywide PLC
(Great Britain) | | Real Estate Service Provider | | | 1,359,000 | | | $ | 13,326,943 | | |
| Health Care Distributors—1.2% | |
Australian Pharmaceutical
Industries Limited
(Australia) | | Pharmaceutical Products
Distributor | | | 8,856,914 | | | $ | 14,720,359 | | |
| Health Care Supplies—3.0% | |
| Ansell Limited (Australia) | | Protective Rubber & Plastics
Products | | | 3,623,900 | | | $ | 28,602,453 | | |
Medisize Holding AG
(Switzerland) (a) | | Medical & Dental Applications
Holding Company | | | 140,000 | | | | 10,020,393 | | |
| | | | 38,622,846 | | |
| Pharmaceuticals—0.9% | |
Santen Pharmaceutical
Co., Ltd. (Japan) | | Pharmaceuticals | | | 474,100 | | | $ | 12,040,635 | | |
| Air Freight & Logistics—1.7% | |
Mainfreight Limited
(New Zealand) (b) | | Logistics Services | | | 5,172,577 | | | $ | 22,117,112 | | |
| Commercial Printing—0.2% | |
De La Rue plc
(Great Britain) | | Commercial Printing | | | 247,000 | | | $ | 2,645,331 | | |
| Diversified Commercial and Professional Services—3.7% | |
Intrum Justitia AB
(Sweden) | | Diversified Financial Services | | | 2,782,643 | | | $ | 27,339,819 | | |
Prosegur, Compania
de Seguridad SA
(Spain) | | Security & Transportation Services | | | 677,700 | | | | 20,349,585 | | |
| | | | 47,689,404 | | |
THE OAKMARK INTERNATIONAL SMALL CAP FUND
45
THE OAKMARK INTERNATIONAL SMALL CAP FUND
Schedule of Investments—September 30, 2006 cont.
| Name | | Description | | Shares Held | | Market Value | |
| Common Stocks—95.3% (cont.) | |
| Human Resource & Employment Services—0.1% | |
Robert Walters plc
(Great Britain) | | Recruitment Services | | | 237,478 | | | $ | 1,121,609 | | |
| Industrial Conglomerates—2.1% | |
Haw Par Corporation
Limited (Singapore) | | Diversified Operations | | | 5,018,687 | | | $ | 20,065,268 | | |
Rheinmetall AG
(Germany) | | Automotive Pump Manufacturer | | | 82,700 | | | | 6,019,408 | | |
| | | | 26,084,676 | | |
| Industrial Machinery—6.9% | |
Interpump Group
S.p.A. (Italy) (b) | | Pump & Piston Manufacturer | | | 3,259,900 | | | $ | 28,977,350 | | |
Schindler Holding AG
(Switzerland) | | Escalator & Elevator Manufacturer | | | 467,173 | | | | 24,676,538 | | |
Saurer AG
(Switzerland) (a) | | Textile Equipment Manufacturer | | | 171,000 | | | | 15,575,913 | | |
Pfeiffer Vacuum
Technology AG
(Germany) | | Vacuum Pump Manufacturer | | | 162,241 | | | | 10,584,793 | | |
| Halma plc (Great Britain) | | Electronic Instrument Producer | | | 1,233,000 | | | | 4,409,440 | | |
| LISI (France) | | Industrial Fastener Manufacturer | | | 49,600 | | | | 3,368,042 | | |
| | | | 87,592,076 | | |
| Office Services & Supplies—2.1% | |
Domino Printing
Sciences plc
(Great Britain) | | Printing Equipment | | | 4,832,700 | | | $ | 27,145,518 | | |
| Communication Equipment—3.1% | |
| Tandberg ASA (Norway) | | Develops & Markets
Communication Equipments | | | 3,663,000 | | | $ | 39,118,546 | | |
| Computer Storage & Peripherals—1.0% | |
| Lectra (France) (b) | | Manufacturing Process Systems | | | 2,186,404 | | | $ | 13,086,056 | | |
| Data Processing & Outsourced Services—1.7% | |
Baycorp Advantage
Limited (Australia) | | Credit Reference Services | | | 9,507,300 | | | $ | 21,540,804 | | |
| Electronic Equipment Manufacturers—2.1% | |
Mabuchi Motor
Co., Ltd. (Japan) | | Digital Camera Motors Manufacturer | | | 235,900 | | | $ | 14,418,607 | | |
Orbotech, Ltd.
(Israel) (a) | | Optical Inspection Systems | | | 536,500 | | | | 12,715,050 | | |
| | | | 27,133,657 | | |
THE OAKMARK INTERNATIONAL SMALL CAP FUND
46
THE OAKMARK INTERNATIONAL SMALL CAP FUND
Schedule of Investments—September 30, 2006 cont.
| Name | | Description | | Shares Held | | Market Value | |
| Common Stocks—95.3% (cont.) | |
| Home Entertainment Software—4.0% | |
Square Enix Co., Ltd.
(Japan) | | Entertainment Software | | | 2,124,000 | | | $ | 51,515,429 | | |
| IT Consulting & Other Services—2.3% | |
Morse plc
(Great Britain) (b) | | Business & Technology Solutions | | | 15,231,000 | | | $ | 28,802,941 | | |
Ementor ASA
(Norway) (a) | | Management & IT Consulting
Services | | | 79,100 | | | | 367,225 | | |
| | | | 29,170,166 | | |
| Office Electronics—2.9% | |
| Neopost SA (France) | | Mailroom Equipment Supplier | | | 220,700 | | | $ | 26,334,698 | | |
Boewe Systec AG
(Germany) | | Automated Paper Management
Systems Producer | | | 177,114 | | | | 9,994,229 | | |
| | | | 36,328,927 | | |
| Industrial Gases—1.0% | |
Taiyo Ink Mfg.
Co., Ltd. (Japan) | | Manufacturer of Resist Inks | | | 218,000 | | | $ | 12,106,497 | | |
| Specialty Chemicals—2.0% | |
Croda International plc
(Great Britain) | | Chemical Producer | | | 1,625,900 | | | $ | 15,540,916 | | |
Gurit Holding AG
(Switzerland) (b) | | Chemical Producer | | | 14,407 | | | | 10,254,093 | | |
| | | | 25,795,009 | | |
| Alternative Carriers—1.4% | |
Asia Satellite
Telecommunications
Holdings Limited
(Hong Kong) | | Satellite Operator | | | 10,903,800 | | | $ | 18,194,810 | | |
| Total Common Stocks (Cost: $901,352,751) | | | | | | | | | 1,214,829,429 | | |
THE OAKMARK INTERNATIONAL SMALL CAP FUND
47
THE OAKMARK INTERNATIONAL SMALL CAP FUND
Schedule of Investments—September 30, 2006 cont.
| Name | | Par Value | | Market Value | |
| Short Term Investments—4.7% | |
| U.S. Government Agencies—1.5% | |
| Federal Home Loan Bank, 5.14% due 10/18/2006 | | $ | 20,000,000 | | | $ | 19,951,456 | | |
| Total U.S. Government Agencies (Cost: $19,951,456) | | | | | 19,951,456 | | |
| Repurchase Agreement—3.2% | |
IBT Repurchase Agreement, 5.16% dated 9/29/2006 due
10/2/2006, repurchase price $40,465,615, collateralized
by Small Business Administration Bonds, with rates of
7.880% - 9.500%, with maturities from
05/25/2016 - 10/25/2029, and with an aggregate market
value plus accrued interest of $42,470,633 | | $ | 40,448,222 | | | $ | 40,448,222 | | |
| Total Repurchase Agreement (Cost: $40,448,222) | | | | | 40,448,222 | | |
| Total Short Term Investments (Cost: $60,399,678) | | | | | 60,399,678 | | |
| Total Investments (Cost $961,752,429)—100.0% | | | | $ | 1,275,229,107 | | |
| Foreign Currencies (Cost $241,906)—0.0% | | | | $ | 241,844 | | |
| Other Liabilities In Excess Of Other Assets—0.0% | | | | | (158,572 | ) | |
| Total Net Assets—100% | | | | $ | 1,275,312,379 | | |
(a) Non-income producing security.
(b) See footnote number five in the Notes to Financial Statements regarding investments in affiliated issuers.
THE OAKMARK INTERNATIONAL SMALL CAP FUND
See accompanying Notes to Financial Statements.
48

(This page has been intentionally left blank.)
THE OAKMARK FUNDS
49
THE OAKMARK FUNDS
Statements of Assets and Liabilities—September 30, 2006
| | | | | The Oakmark
Fund | | The Oakmark
Select
Fund | | The Oakmark
Equity and
Income Fund | |
| Assets | |
| Investments in unaffiliated securities, at value | | (a) | | $ | 5,514,090,383 | | | $ | 5,874,462,832 | | | $ | 10,866,411,602 | | |
| Investments in affiliated securities, at value | | (b) | | | 0 | | | | 0 | | | | 182,116,978 | | |
| Cash | | | | | 0 | | | | 70 | | | | 62 | | |
| Foreign currency, at value | | (c) | | | 0 | | | | 0 | | | | 0 | | |
| Receivable for: | |
| Securities sold | | | | | 7,929,876 | | | | 0 | | | | 940,471 | | |
| Fund shares sold | | | | | 3,811,419 | | | | 4,248,492 | | | | 65,154,223 | | |
| Dividends and interest | | | | | 6,011,811 | | | | 2,337,106 | | | | 62,048,734 | | |
| Securities sold short | | | | | 0 | | | | 21,737,301 | | | | 0 | | |
| Tax reclaim | | | | | 112,603 | | | | 0 | | | | 76,083 | | |
| Total receivables | | | | | 17,865,709 | | | | 28,322,899 | | | | 128,219,511 | | |
| Other assets | | | | | 438 | | | | 440 | | | | 431,120 | | |
| Total assets | | | | $ | 5,531,956,530 | | | $ | 5,902,786,241 | | | $ | 11,177,179,273 | | |
| Liabilities and Net Assets | |
| Payable for: | |
| Securities purchased | | | | $ | 0 | | | $ | 0 | | | $ | 23,374,465 | | |
| Fund shares redeemed | | | | | 5,406,529 | | | | 33,545,886 | | | | 16,656,879 | | |
| Securities sold short, at value | | (d) | | | 0 | | | | 21,840,500 | | | | 0 | | |
| Investment advisory fees | | | | | 273,033 | | | | 266,831 | | | | 438,446 | | |
| Transfer and dividend disbursing agent fees | | | | | 220,814 | | | | 140,984 | | | | 154,981 | | |
| Trustee fees | | | | | 32,716 | | | | 34,356 | | | | 48,466 | | |
| Deferred trustee compensation | | | | | 1,013,952 | | | | 886,520 | | | | 784,051 | | |
| Other | | | | | 1,350,563 | | | | 1,376,878 | | | | 3,105,081 | | |
| Total liabilities | | | | | 8,297,607 | | | | 58,091,955 | | | | 44,562,369 | | |
| Net assets applicable to Fund shares outstanding | | | | $ | 5,523,658,923 | | | $ | 5,844,694,286 | | | $ | 11,132,616,904 | | |
| Analysis of Net Assets | |
| Paid in capital | | | | $ | 3,736,773,177 | | | $ | 3,561,682,562 | | | $ | 8,766,146,099 | | |
Accumulated undistributed net realized gain of investments, forward
contracts, options, short sales and foreign currency transactions | | | | | 225,445,185 | | | | 570,164,515 | | | | 538,854,084 | | |
| Net unrealized appreciation of investments and foreign currencies | | | | | 1,508,736,212 | | | | 1,674,753,557 | | | | 1,663,755,245 | | |
| Net unrealized appreciation (depreciation)—other | | | | | 1,909 | | | | 0 | | | | 483,716 | | |
| Accumulated undistributed net investment income | | | | | 52,702,440 | | | | 38,093,652 | | | | 163,377,760 | | |
| Net assets applicable to Fund shares outstanding | | | | $ | 5,523,658,923 | | | $ | 5,844,694,286 | | | $ | 11,132,616,904 | | |
| Price of Shares | |
| Net asset value per share: Class I | | | | $ | 44.64 | | | $ | 34.48 | | | $ | 26.49 | | |
| Class I—Net assets | | | | $ | 5,486,180,831 | | | $ | 5,776,588,527 | | | $ | 10,414,522,263 | | |
| Class I—Shares outstanding (Unlimited shares authorized) | | | | | 122,890,761 | | | | 167,554,680 | | | | 393,158,290 | | |
| Net asset value per share: Class II | | | | $ | 44.35 | | | $ | 34.23 | | | $ | 26.35 | | |
| Class II—Net assets | | | | $ | 37,478,092 | | | $ | 68,105,759 | | | $ | 718,094,641 | | |
| Class II—Shares outstanding (Unlimited shares authorized) | | | | | 845,119 | | | | 1,989,425 | | | | 27,256,462 | | |
| (a) Identified cost of investments in unaffiliated securities | | | | $ | 4,005,354,171 | | | $ | 4,199,606,076 | | | $ | 9,298,867,346 | | |
| (b) Identified cost of investments in affiliated securities | | | | | 0 | | | | 0 | | | | 85,905,989 | | |
| (c) Identified cost of foreign currency | | | | | 0 | | | | 0 | | | | 0 | | |
| (d) Proceeds on securities sold short | | | | | 0 | | | | 21,737,301 | | | | 0 | | |
THE OAKMARK FUNDS
50
| | | The Oakmark
Global
Fund | | The Oakmark
International
Fund | | The Oakmark
International
Small Cap Fund | |
| Assets | |
| Investments in unaffiliated securities, at value | | $ | 2,360,028,112 | | | $ | 7,059,465,547 | | | $ | 1,058,292,943 | | |
| Investments in affiliated securities, at value | | | 0 | | | | 631,739,089 | | | | 216,936,164 | | |
| Cash | | | 25 | | | | 1,318 | | | | 0 | | |
| Foreign currency, at value | | | 0 | | | | 39 | | | | 241,844 | | |
| Receivable for: | |
| Securities sold | | | 1,401,802 | | | | 7,572,665 | | | | 0 | | |
| Fund shares sold | | | 3,258,372 | | | | 8,725,525 | | | | 1,512,489 | | |
| Dividends and interest | | | 4,546,522 | | | | 16,448,896 | | | | 1,289,989 | | |
| Securities sold short | | | 0 | | | | 0 | | | | 0 | | |
| Tax reclaim | | | 212,663 | | | | 1,039,260 | | | | 569,215 | | |
| Total receivables | | | 9,419,359 | | | | 33,786,346 | | | | 3,371,693 | | |
| Other assets | | | 277 | | | | 437 | | | | 241 | | |
| Total assets | | $ | 2,369,447,773 | | | $ | 7,724,992,776 | | | $ | 1,278,842,885 | | |
| Liabilities and Net Assets | |
| Payable for: | |
| Securities purchased | | $ | 7,644,126 | | | $ | 9,730,616 | | | $ | 1,900,702 | | |
| Fund shares redeemed | | | 1,258,617 | | | | 15,339,251 | | | | 808,307 | | |
| Securities sold short, at value | | | 0 | | | | 0 | | | | 0 | | |
| Investment advisory fees | | | 126,274 | | | | 370,702 | | | | 77,115 | | |
| Transfer and dividend disbursing agent fees | | | 59,202 | | | | 103,983 | | | | 17,728 | | |
| Trustee fees | | | 23,041 | | | | 38,242 | | | | 19,929 | | |
| Deferred trustee compensation | | | 410,853 | | | | 681,683 | | | | 396,099 | | |
| Other | | | 616,768 | | | | 2,187,418 | | | | 310,626 | | |
| Total liabilities | | | 10,138,881 | | | | 28,451,895 | | | | 3,530,506 | | |
| Net assets applicable to Fund shares outstanding | | $ | 2,359,308,892 | | | $ | 7,696,540,881 | | | $ | 1,275,312,379 | | |
| Analysis of Net Assets | |
| Paid in capital | | $ | 1,585,362,561 | | | $ | 4,876,782,899 | | | $ | 791,275,831 | | |
Accumulated undistributed net realized gain of investments, forward
contracts, options, short sales and foreign currency transactions | | | 281,053,755 | | | | 972,651,598 | | | | 159,754,643 | | |
| Net unrealized appreciation of investments and foreign currencies | | | 470,105,234 | | | | 1,733,351,273 | | | | 313,471,159 | | |
| Net unrealized appreciation (depreciation)—other | | | 40,176 | | | | (81,091 | ) | | | (5,494 | ) | |
| Accumulated undistributed net investment income | | | 22,747,166 | | | | 113,836,202 | | | | 10,816,240 | | |
| Net assets applicable to Fund shares outstanding | | $ | 2,359,308,892 | | | $ | 7,696,540,881 | | | $ | 1,275,312,379 | | |
| Price of Shares | |
| Net asset value per share: Class I | | $ | 26.69 | | | $ | 26.83 | | | $ | 24.09 | | |
| Class I—Net assets | | $ | 2,282,188,653 | | | $ | 7,200,507,048 | | | $ | 1,274,547,457 | | |
| Class I—Shares outstanding (Unlimited shares authorized) | | | 85,502,945 | | | | 268,357,156 | | | | 52,915,833 | | |
| Net asset value per share: Class II | | $ | 26.31 | | | $ | 26.61 | | | $ | 24.05 | | |
| Class II—Net assets | | $ | 77,120,239 | | | $ | 496,033,833 | | | $ | 764,922 | | |
| Class II—Shares outstanding (Unlimited shares authorized) | | | 2,931,310 | | | | 18,643,501 | | | | 31,810 | | |
| (a) Identified cost of investments in unaffiliated securities | | $ | 1,889,869,556 | | | $ | 5,450,446,599 | | | $ | 781,174,690 | | |
| (b) Identified cost of investments in affiliated securities | | | 0 | | | | 507,349,773 | | | | 180,577,739 | | |
| (c) Identified cost of foreign currency | | | 0 | | | | 23 | | | | 241,906 | | |
| (d) Proceeds on securities sold short | | | 0 | | | | 0 | | | | 0 | | |
See accompanying Notes to Financial Statements.
THE OAKMARK FUNDS
51
THE OAKMARK FUNDS
Statements of Operations—Year Ended September 30, 2006
| | | The Oakmark
Fund | | The Oakmark
Select
Fund | | The Oakmark
Equity and
Income Fund | |
| Investment Income: | |
| Dividends from unaffiliated securities | | $ | 95,392,160 | | | $ | 100,005,348 | | | $ | 94,460,636 | | |
| Dividends from affiliated securities | | | 0 | | | | 8,201,496 | | | | 290,000 | | |
| Interest income | | | 13,236,603 | | | | 16,570,844 | | | | 188,621,440 | | |
| Securities lending income | | | 0 | | | | 0 | | | | 2,211,600 | | |
| Other income | | | 5,674,409 | | | | 323,164 | | | | 444,150 | | |
| Foreign taxes withheld | | | (166,040 | ) | | | 0 | | | | (1,503,968 | ) | |
| Total investment income | | | 114,137,132 | | | | 125,100,852 | | | | 284,523,858 | | |
| Expenses: | |
| Investment advisory fee | | | 50,810,228 | | | | 51,360,669 | | | | 73,931,558 | | |
| Transfer and dividend disbursing agent fees | | | 1,986,574 | | | | 1,255,510 | | | | 1,346,817 | | |
| Other shareholder servicing fees | | | 4,664,917 | | | | 4,619,032 | | | | 10,241,440 | | |
| Service Fee—Class II | | | 98,980 | | | | 175,774 | | | | 1,568,799 | | |
| Reports to shareholders | | | 1,255,952 | | | | 1,046,487 | | | | 1,465,471 | | |
| Custody and accounting fees | | | 663,301 | | | | 642,730 | | | | 1,386,883 | | |
| Registration and blue sky expenses | | | 56,449 | | | | 125,419 | | | | 191,947 | | |
| Trustee fees | | | 287,356 | | | | 298,907 | | | | 414,195 | | |
| Legal fees | | | 175,892 | | | | 180,252 | | | | 247,868 | | |
| Audit fees | | | 39,631 | | | | 42,957 | | | | 61,339 | | |
| Other | | | 313,549 | | | | 324,378 | | | | 470,048 | | |
| Total expenses | | | 60,352,829 | | | | 60,072,115 | | | | 91,326,365 | | |
| Net Investment Income | | | 53,784,303 | | | | 65,028,737 | | | | 193,197,493 | | |
Net realized and unrealized gain (loss) on
investments and foreign currency transactions: | |
| Net realized gain on unaffiliated securities | | | 270,945,539 | | | | 538,098,694 | | | | 545,472,604 | | |
| Net realized gain on affiliated securities | | | 0 | | | | 41,239,799 | | | | 0 | | |
| Net realized gain on short sales | | | 40,635 | | | | 60,953 | | | | 0 | | |
| Net realized gain (loss) on foreign currency transactions | | | (6,771 | ) | | | 0 | | | | 953,110 | | |
Net change in unrealized appreciation (depreciation) of
investments and foreign currencies | | | 238,673,740 | | | | (92,651,376 | ) | | | (77,004,918 | ) | |
| Net change in unrealized depreciation of securities sold short | | | 0 | | | | (103,199 | ) | | | 0 | | |
| Net change in unrealized appreciation—other | | | 1,909 | | | | 0 | | | | 254,072 | | |
Net realized and unrealized gain on
investments and foreign currency transactions | | | 509,655,052 | | | | 486,644,871 | | | | 469,674,868 | | |
| Net increase in net assets resulting from operations | | $ | 563,439,355 | | | $ | 551,673,608 | | | $ | 662,872,361 | | |
THE OAKMARK FUNDS
52
| | | The Oakmark
Global
Fund | | The Oakmark
International
Fund | | The Oakmark
International
Small Cap Fund | |
| Investment Income: | |
| Dividends from unaffiliated securities | | $ | 49,988,453 | | | $ | 176,802,743 | | | $ | 23,270,992 | | |
| Dividends from affiliated securities | | | 0 | | | | 19,172,620 | | | | 11,258,699 | | |
| Interest income | | | 2,102,123 | | | | 12,069,686 | | | | 2,517,790 | | |
| Securities lending income | | | 591,366 | | | | 2,350,894 | | | | 456,572 | | |
| Other income | | | 23,496 | | | | 29,215 | | | | 1,048 | | |
| Foreign taxes withheld | | | (2,433,443 | ) | | | (13,754,124 | ) | | | (2,401,033 | ) | |
| Total investment income | | | 50,271,995 | | | | 196,671,034 | | | | 35,104,068 | | |
| Expenses: | |
| Investment advisory fee | | | 21,200,163 | | | | 61,243,264 | | | | 13,155,012 | | |
| Transfer and dividend disbursing agent fees | | | 508,342 | | | | 910,131 | | | | 156,606 | | |
| Other shareholder servicing fees | | | 1,423,236 | | | | 5,162,896 | | | | 597,585 | | |
| Service Fee—Class II | | | 172,522 | | | | 1,068,769 | | | | 704 | | |
| Reports to shareholders | | | 345,809 | | | | 816,583 | | | | 144,229 | | |
| Custody and accounting fees | | | 1,132,817 | | | | 4,994,069 | | | | 919,585 | | |
| Registration and blue sky expenses | | | 89,568 | | | | 245,364 | | | | 60,784 | | |
| Trustee fees | | | 197,787 | | | | 322,696 | | | | 171,161 | | |
| Legal fees | | | 117,460 | | | | 190,447 | | | | 114,361 | | |
| Audit fees | | | 29,659 | | | | 48,637 | | | | 25,380 | | |
| Other | | | 185,613 | | | | 340,485 | | | | 150,992 | | |
| Total expenses | | | 25,402,976 | | | | 75,343,341 | | | | 15,496,399 | | |
| Net Investment Income | | | 24,869,019 | | | | 121,327,693 | | | | 19,607,669 | | |
Net realized and unrealized gain (loss) on
investments and foreign currency transactions: | |
| Net realized gain on unaffiliated securities | | | 310,301,304 | | | | 907,150,059 | | | | 156,507,381 | | |
| Net realized gain on affiliated securities | | | 0 | | | | 115,080,865 | | | | 20,601,784 | | |
| Net realized gain on short sales | | | 0 | | | | 0 | | | | 0 | | |
| Net realized gain (loss) on foreign currency transactions | | | 6,838,930 | | | | 85,933,770 | | | | 14,662,887 | | |
Net change in unrealized appreciation (depreciation) of
investments and foreign currencies | | | 2,947,332 | | | | 131,694,166 | | | | 71,230,284 | | |
| Net change in unrealized depreciation of securities sold short | | | 0 | | | | 0 | | | | 0 | | |
| Net change in unrealized appreciation—other | | | 163,945 | | | | 294,298 | | | | 43,207 | | |
Net realized and unrealized gain on
investments and foreign currency transactions | | | 320,251,511 | | | | 1,240,153,158 | | | | 263,045,543 | | |
| Net increase in net assets resulting from operations | | $ | 345,120,530 | | | $ | 1,361,480,851 | | | $ | 282,653,212 | | |
See accompanying Notes to Financial Statements.
THE OAKMARK FUNDS
53
THE OAKMARK FUNDS
Statements of Changes in Net Assets—September 30, 2006
| | | The Oakmark Fund | |
| | | Year Ended
September 30, 2006 | | Year Ended
September 30, 2005 | |
| From Operations: | |
| Net investment income | | $ | 53,784,303 | | | $ | 54,415,372 | | |
| Net realized gain (loss) on investments | | | 270,986,174 | | | | 222,641,166 | | |
| Net realized gain (loss) on foreign currency transactions | | | (6,771 | ) | | | (8,888 | ) | |
Net change in unrealized appreciation (depreciation) of
investments and foreign currencies | | | 238,673,740 | | | | 106,334,519 | | |
Net change in unrealized appreciation
(depreciation)—other | | | 1,909 | | | | 0 | | |
| Net increase in net assets from operations | | | 563,439,355 | | | | 383,382,169 | | |
| Distributions to shareholders from: | |
| Net investment income—Class I | | | (51,650,726 | ) | | | (29,018,121 | ) | |
| Net investment income—Class II | | | (231,758 | ) | | | (112,443 | ) | |
| Total distributions to shareholders | | | (51,882,484 | ) | | | (29,130,564 | ) | |
| From Fund share transactions: | |
| Proceeds from shares sold—Class I | | | 779,885,052 | | | | 1,362,078,314 | | |
| Proceeds from shares sold—Class II | | | 6,336,611 | | | | 24,293,697 | | |
| Reinvestment of distributions—Class I | | | 48,533,582 | | | | 26,428,576 | | |
| Reinvestment of distributions—Class II | | | 201,619 | | | | 63,924 | | |
| Payments for shares redeemed—Class I | | | (2,190,991,773 | ) | | | (1,874,276,130 | ) | |
| Payments for shares redeemed—Class II | | | (16,267,132 | ) | | | (34,990,942 | ) | |
| Redemption fees—Class I | | | 324,889 | | | | 334,756 | | |
| Redemption fees—Class II | | | 680 | | | | 0 | | |
Net increase (decrease) in net assets from Fund
share transactions | | | (1,371,976,472 | ) | | | (496,067,805 | ) | |
| Total decrease in net assets | | | (860,419,601 | ) | | | (141,816,200 | ) | |
| Net assets: | |
| Beginning of period | | | 6,384,078,524 | | | | 6,525,894,724 | | |
| End of period | | $ | 5,523,658,923 | | | $ | 6,384,078,524 | | |
| Undistributed net investment income | | $ | 52,702,440 | | | $ | 50,807,392 | | |
| Fund Share Transactions—Class I: | |
| Shares sold | | | 18,756,564 | | | | 33,399,717 | | |
| Shares issued in reinvestment of dividends | | | 1,171,177 | | | | 648,872 | | |
| Less shares redeemed | | | (52,610,324 | ) | | | (45,831,912 | ) | |
| Net increase (decrease) in shares outstanding | | | (32,682,583 | ) | | | (11,783,323 | ) | |
| Fund Share Transactions—Class II: | |
| Shares sold | | | 152,248 | | | | 602,472 | | |
| Shares issued in reinvestment of dividends | | | 4,883 | | | | 1,576 | | |
| Less shares redeemed | | | (390,394 | ) | | | (874,201 | ) | |
| Net increase (decrease) in shares outstanding | | | (233,263 | ) | | | (270,153 | ) | |
THE OAKMARK FUNDS
54
| | | The Oakmark Select Fund | |
| | | Year Ended
September 30, 2006 | | Year Ended
September 30, 2005 | |
| From Operations: | |
| Net investment income | | $ | 65,028,737 | | | $ | 50,968,447 | | |
| Net realized gain (loss) on investments | | | 579,399,446 | | | | 365,072,967 | | |
Net change in unrealized appreciation (depreciation)
of investments | | | (92,754,575 | ) | | | 19,063,862 | | |
| Net increase in net assets from operations | | | 551,673,608 | | | | 435,105,276 | | |
| Distributions to shareholders from: | |
| Net investment income—Class I | | | (51,471,735 | ) | | | (41,681,659 | ) | |
| Net investment income—Class II | | | (488,531 | ) | | | (456,984 | ) | |
| Net realized gain—Class I | | | (313,884,121 | ) | | | 0 | | |
| Net realized gain—Class II | | | (4,367,840 | ) | | | 0 | | |
| Total distributions to shareholders | | | (370,212,227 | ) | | | (42,138,643 | ) | |
| From Fund share transactions: | |
| Proceeds from shares sold—Class I | | | 971,797,581 | | | | 1,213,430,549 | | |
| Proceeds from shares sold—Class II | | | 17,443,658 | | | | 25,716,965 | | |
| Reinvestment of distributions—Class I | | | 352,444,215 | | | | 39,145,855 | | |
| Reinvestment of distributions—Class II | | | 2,386,123 | | | | 205,309 | | |
| Payments for shares redeemed—Class I | | | (1,635,155,035 | ) | | | (1,193,862,714 | ) | |
| Payments for shares redeemed—Class II | | | (39,109,368 | ) | | | (45,645,335 | ) | |
| Redemption fees—Class I | | | 251,026 | | | | 183,103 | | |
| Redemption fees—Class II | | | 1,251 | | | | 0 | | |
Net increase (decrease) in net assets from Fund
share transactions | | | (329,940,549 | ) | | | 39,173,732 | | |
| Total increase (decrease) in net assets | | | (148,479,168 | ) | | | 432,140,365 | | |
| Net assets: | |
| Beginning of period | | | 5,993,173,454 | | | | 5,561,033,089 | | |
| End of period | | $ | 5,844,694,286 | | | $ | 5,993,173,454 | | |
| Undistributed net investment income | | $ | 38,093,652 | | | $ | 27,766,940 | | |
| Fund Share Transactions—Class I: | |
| Shares sold | | | 29,030,193 | | | | 36,498,372 | | |
| Shares issued in reinvestment of dividends | | | 10,628,595 | | | | 1,205,230 | | |
| Less shares redeemed | | | (48,799,020 | ) | | | (36,106,003 | ) | |
| Net increase (decrease) in shares outstanding | | | (9,140,232 | ) | | | 1,597,599 | | |
| Fund Share Transactions—Class II: | |
| Shares sold | | | 523,360 | | | | 781,192 | | |
| Shares issued in reinvestment of dividends | | | 72,263 | | | | 6,346 | | |
| Less shares redeemed | | | (1,169,938 | ) | | | (1,385,275 | ) | |
| Net increase (decrease) in shares outstanding | | | (574,315 | ) | | | (597,737 | ) | |
See accompanying Notes to Financial Statements.
THE OAKMARK FUNDS
55
THE OAKMARK FUNDS
Statements of Changes in Net Assets—September 30, 2006
| | | The Oakmark
Equity and Income Fund | |
| | | Year Ended
September 30, 2006 | | Year Ended
September 30, 2005 | |
| From Operations: | |
| Net investment income | | $ | 193,197,493 | | | $ | 119,409,290 | | |
| Net realized gain (loss) on investments | | | 545,472,604 | | | | 113,595,101 | | |
| Net realized gain (loss) on foreign currency transactions | | | 953,110 | | | | 349,069 | | |
Net change in unrealized appreciation (depreciation)
of investments | | | (77,004,918 | ) | | | 912,480,570 | | |
Net change in unrealized appreciation
(depreciation)—other | | | 254,072 | | | | 102,972 | | |
| Net increase in net assets from operations | | | 662,872,361 | | | | 1,145,937,002 | | |
| Distributions to shareholders from: | |
| Net investment income—Class I | | | (127,230,307 | ) | | | (67,147,479 | ) | |
| Net investment income—Class II | | | (6,660,455 | ) | | | (3,563,528 | ) | |
| Net realized gain—Class I | | | (76,265,144 | ) | | | (196,511,764 | ) | |
| Net realized gain—Class II | | | (4,944,566 | ) | | | (13,715,030 | ) | |
| Total distributions to shareholders | | | (215,100,472 | ) | | | (280,937,801 | ) | |
| From Fund share transactions: | |
| Proceeds from shares sold—Class I | | | 2,056,526,635 | | | | 1,820,363,521 | | |
| Proceeds from shares sold—Class II | | | 311,212,011 | | | | 312,413,005 | | |
| Reinvestment of distributions—Class I | | | 193,933,598 | | | | 254,487,605 | | |
| Reinvestment of distributions—Class II | | | 7,917,854 | | | | 7,740,318 | | |
| Payments for shares redeemed—Class I | | | (1,479,474,288 | ) | | | (1,238,425,257 | ) | |
| Payments for shares redeemed—Class II | | | (210,686,071 | ) | | | (273,110,583 | ) | |
| Redemption fees—Class I | | | 190,842 | | | | 194,331 | | |
| Redemption fees—Class II | | | 4,611 | | | | 0 | | |
Net increase (decrease) in net assets from Fund
share transactions | | | 879,625,192 | | | | 883,662,940 | | |
| Total increase in net assets | | | 1,327,397,081 | | | | 1,748,662,141 | | |
| Net assets: | |
| Beginning of period | | | 9,805,219,823 | | | | 8,056,557,682 | | |
| End of period | | $ | 11,132,616,904 | | | $ | 9,805,219,823 | | |
| Undistributed net investment income | | $ | 163,377,760 | | | $ | 104,982,979 | | |
| Fund Share Transactions—Class I: | |
| Shares sold | | | 80,485,715 | | | | 76,592,615 | | |
| Shares issued in reinvestment of dividends | | | 7,695,778 | | | | 10,997,735 | | |
| Less shares redeemed | | | (57,994,019 | ) | | | (52,314,769 | ) | |
| Net increase (decrease) in shares outstanding | | | 30,187,474 | | | | 35,275,581 | | |
| Fund Share Transactions—Class II: | |
| Shares sold | | | 12,229,061 | | | | 13,294,303 | | |
| Shares issued in reinvestment of dividends | | | 315,076 | | | | 335,369 | | |
| Less shares redeemed | | | (8,300,682 | ) | | | (11,403,546 | ) | |
| Net increase (decrease) in shares outstanding | | | 4,243,455 | | | | 2,226,126 | | |
THE OAKMARK FUNDS
56
| | | The Oakmark
Global Fund | |
| | | Year Ended
September 30, 2006 | | Year Ended
September 30, 2005 | |
| From Operations: | |
| Net investment income | | $ | 24,869,019 | | | $ | 13,170,380 | | |
| Net realized gain (loss) on investments | | | 310,301,304 | | | | 55,983,090 | | |
| Net realized gain (loss) on foreign currency transactions | | | 6,838,930 | | | | 2,655,497 | | |
Net change in unrealized appreciation (depreciation) of
investments and foreign currencies | | | 2,947,332 | | | | 268,798,583 | | |
Net change in unrealized appreciation
(depreciation)—other | | | 163,945 | | | | (200,695 | ) | |
| Net increase in net assets from operations | | | 345,120,530 | | | | 340,406,855 | | |
| Distributions to shareholders from: | |
| Net investment income—Class I | | | (20,913,767 | ) | | | (7,092,334 | ) | |
| Net investment income—Class II | | | (581,696 | ) | | | (103,658 | ) | |
| Net realized gain—Class I | | | (76,617,645 | ) | | | (25,218,974 | ) | |
| Net realized gain—Class II | | | (2,579,429 | ) | | | (520,696 | ) | |
| Total distributions to shareholders | | | (100,692,537 | ) | | | (32,935,662 | ) | |
| From Fund share transactions: | |
| Proceeds from shares sold—Class I | | | 439,182,726 | | | | 414,769,896 | | |
| Proceeds from shares sold—Class II | | | 17,019,479 | | | | 29,165,244 | | |
| Reinvestment of distributions—Class I | | | 92,918,085 | | | | 30,609,171 | | |
| Reinvestment of distributions—Class II | | | 2,954,863 | | | | 557,171 | | |
| Payments for shares redeemed—Class I | | | (329,606,864 | ) | | | (238,881,611 | ) | |
| Payments for shares redeemed—Class II | | | (9,199,239 | ) | | | (3,289,295 | ) | |
| Redemption fees—Class I | | | 104,623 | | | | 81,661 | | |
| Redemption fees—Class II | | | 2,156 | | | | 0 | | |
Net increase (decrease) in net assets from Fund
share transactions | | | 213,375,829 | | | | 233,012,237 | | |
| Total increase in net assets | | | 457,803,822 | | | | 540,483,430 | | |
| Net assets: | |
| Beginning of period | | | 1,901,505,070 | | | | 1,361,021,640 | | |
| End of period | | $ | 2,359,308,892 | | | $ | 1,901,505,070 | | |
| Undistributed net investment income | | $ | 22,747,166 | | | $ | 13,892,204 | | |
| Fund Share Transactions—Class I: | |
| Shares sold | | | 17,806,211 | | | | 18,829,404 | | |
| Shares issued in reinvestment of dividends | | | 3,942,219 | | | | 1,443,149 | | |
| Less shares redeemed | | | (13,308,581 | ) | | | (10,924,262 | ) | |
| Net increase (decrease) in shares outstanding | | | 8,439,849 | | | | 9,348,291 | | |
| Fund Share Transactions—Class II: | |
| Shares sold | | | 699,957 | | | | 1,339,114 | | |
| Shares issued in reinvestment of dividends | | | 126,818 | | | | 26,519 | | |
| Less shares redeemed | | | (375,302 | ) | | | (151,324 | ) | |
| Net increase (decrease) in shares outstanding | | | 451,473 | | | | 1,214,309 | | |
See accompanying Notes to Financial Statements.
THE OAKMARK FUNDS
57
THE OAKMARK FUNDS
Statements of Changes in Net Assets—September 30, 2006
| | | The Oakmark
International Fund | |
| | | Year Ended
September 30, 2006 | | Year Ended
September 30, 2005 | |
| From Operations: | |
| Net investment income | | $ | 121,327,693 | | | $ | 67,741,309 | | |
| Net realized gain (loss) on investments | | | 1,022,230,924 | | | | 231,949,113 | | |
| Net realized gain (loss) on foreign currency transactions | | | 85,933,770 | | | | 12,385,971 | | |
Net change in unrealized appreciation (depreciation) of
investments and foreign currencies | | | 131,694,166 | | | | 848,532,506 | | |
Net change in unrealized appreciation
(depreciation)—other | | | 294,298 | | | | (671,292 | ) | |
| Net increase in net assets from operations | | | 1,361,480,851 | | | | 1,159,937,607 | | |
| Distributions to shareholders from: | |
| Net investment income—Class I | | | (144,087,090 | ) | | | (57,688,379 | ) | |
| Net investment income—Class II | | | (8,528,390 | ) | | | (3,146,570 | ) | |
| Net realized gain—Class I | | | (241,359,448 | ) | | | (11,785,113 | ) | |
| Net realized gain—Class II | | | (15,880,415 | ) | | | (790,281 | ) | |
| Total distributions to shareholders | | | (409,855,343 | ) | | | (73,410,343 | ) | |
| From Fund share transactions: | |
| Proceeds from shares sold—Class I | | | 1,307,428,773 | | | | 1,220,262,175 | | |
| Proceeds from shares sold—Class II | | | 271,362,458 | | | | 191,988,151 | | |
| Reinvestment of distributions—Class I | | | 348,431,594 | | | | 63,036,515 | | |
| Reinvestment of distributions—Class II | | | 16,204,525 | | | | 2,198,011 | | |
| Payments for shares redeemed—Class I | | | (975,665,459 | ) | | | (713,216,070 | ) | |
| Payments for shares redeemed—Class II | | | (213,303,958 | ) | | | (156,918,221 | ) | |
| Redemption fees—Class I | | | 198,369 | | | | 261,391 | | |
| Redemption fees—Class II | | | 9,557 | | | | 0 | | |
Net increase (decrease) in net assets from Fund
share transactions | | | 754,665,859 | | | | 607,611,952 | | |
| Total increase in net assets | | | 1,706,291,367 | | | | 1,694,139,216 | | |
| Net assets: | |
| Beginning of period | | | 5,990,249,514 | | | | 4,296,110,298 | | |
| End of period | | $ | 7,696,540,881 | | | $ | 5,990,249,514 | | |
| Undistributed net investment income | | $ | 113,836,202 | | | $ | 71,132,509 | | |
| Fund Share Transactions—Class I: | |
| Shares sold | | | 53,137,278 | | | | 56,890,583 | | |
| Shares issued in reinvestment of dividends | | | 15,492,735 | | | | 3,074,952 | | |
| Less shares redeemed | | | (39,575,515 | ) | | | (33,360,212 | ) | |
| Net increase (decrease) in shares outstanding | | | 29,054,498 | | | | 26,605,323 | | |
| Fund Share Transactions—Class II: | |
| Shares sold | | | 11,066,476 | | | | 8,978,667 | | |
| Shares issued in reinvestment of dividends | | | 724,062 | | | | 107,693 | | |
| Less shares redeemed | | | (8,682,291 | ) | | | (7,296,822 | ) | |
| Net increase (decrease) in shares outstanding | | | 3,108,247 | | | | 1,789,538 | | |
THE OAKMARK FUNDS
58
| | | The Oakmark International
Small Cap Fund | |
| | | Year Ended
September 30, 2006 | | Year Ended
September 30, 2005 | |
| From Operations: | |
| Net investment income | | $ | 19,607,669 | | | $ | 8,562,439 | | |
| Net realized gain (loss) on investments | | | 177,109,165 | | | | 163,621,128 | | |
| Net realized gain (loss) on foreign currency transactions | | | 14,662,887 | | | | 362,424 | | |
Net change in unrealized appreciation (depreciation) of
investments and foreign currencies | | | 71,230,284 | | | | 47,885,993 | | |
Net change in unrealized appreciation
(depreciation)—other | | | 43,207 | | | | (85,458 | ) | |
| Net increase in net assets from operations | | | 282,653,212 | | | | 220,346,526 | | |
| Distributions to shareholders from: | |
| Net investment income—Class I | | | (31,166,621 | ) | | | (11,222,305 | ) | |
| Net investment income—Class II | | | (18,114 | ) | | | (6,999 | ) | |
| Net realized gain—Class I | | | (156,716,232 | ) | | | (15,538,999 | ) | |
| Net realized gain—Class II | | | (93,410 | ) | | | (10,001 | ) | |
| Total distributions to shareholders | | | (187,994,377 | ) | | | (26,778,304 | ) | |
| From Fund share transactions: | |
| Proceeds from shares sold—Class I | | | 201,993,652 | | | | 180,090,052 | | |
| Proceeds from shares sold—Class II | | | 144,934 | | | | 112,795 | | |
| Reinvestment of distributions—Class I | | | 176,611,867 | | | | 24,846,478 | | |
| Reinvestment of distributions—Class II | | | 64,080 | | | | 10,284 | | |
| Payments for shares redeemed—Class I | | | (205,919,657 | ) | | | (125,328,062 | ) | |
| Payments for shares redeemed—Class II | | | (101,375 | ) | | | (110,335 | ) | |
| Redemption fees—Class I | | | 48,587 | | | | 38,178 | | |
| Redemption fees—Class II | | | 19 | | | | 0 | | |
Net increase (decrease) in net assets from Fund
share transactions | | | 172,842,107 | | | | 79,659,390 | | |
| Total increase in net assets | | | 267,500,942 | | | | 273,227,612 | | |
| Net assets: | |
| Beginning of period | | | 1,007,811,437 | | | | 734,583,825 | | |
| End of period | | $ | 1,275,312,379 | | | $ | 1,007,811,437 | | |
| Undistributed net investment income | | $ | 10,816,240 | | | $ | 5,933,633 | | |
| Fund Share Transactions—Class I: | |
| Shares sold | | | 9,211,608 | | | | 8,779,360 | | |
| Shares issued in reinvestment of dividends | | | 8,974,181 | | | | 1,298,823 | | |
| Less shares redeemed | | | (9,457,429 | ) | | | (6,084,980 | ) | |
| Net increase (decrease) in shares outstanding | | | 8,728,360 | | | | 3,993,203 | | |
| Fund Share Transactions—Class II: | |
| Shares sold | | | 6,780 | | | | 5,611 | | |
| Shares issued in reinvestment of dividends | | | 3,259 | | | | 537 | | |
| Less shares redeemed | | | (4,539 | ) | | | (5,127 | ) | |
| Net increase (decrease) in shares outstanding | | | 5,500 | | | | 1,021 | | |
See accompanying Notes to Financial Statements.
THE OAKMARK FUNDS
59
THE OAKMARK FUNDS
Notes to Financial Statements
1. SIGNIFICANT ACCOUNTING POLICIES
The following are the significant accounting policies of The Oakmark Fund ("Oakmark"), The Oakmark Select Fund ("Select"), The Oakmark Equity and Income Fund ("Equity and Income"), The Oakmark Global Fund ("Global"), The Oakmark International Fund ("International"), and The Oakmark International Small Cap Fund ("Int'l Small Cap"), collectively referred to as "the Funds", each a series of Harris Associates Investment Trust (the "Trust"), a Massachusetts business trust, organized on February 1, 1991, which is registered as an investment company under the Investment Company Act of 1940. These policies are in conformity with accounting principles generally accepted in the United States of America ("GAAP"). The presentation of financial statements in conformity with GAAP requires management to make estimates and assumptions that affect the reported amounts of assets and liabilities at the date of the financial statements and the repo rted amounts of revenues and expenses during the reporting period. Actual results could differ from those estimates and assumptions.
Class disclosure—
Each Fund offers two classes of shares: Class I Shares and Class II Shares. Class I Shares are offered to the general public. Class II Shares are offered to certain retirement plans such as 401(k) and profit sharing plans. Class II Shares pay a service fee at the annual rate of up to 0.25% of average net assets of Class II Shares of the Funds. This service fee is paid to an administrator for performing the services associated with the administration of such retirement plans. Class I Shares do not have an associated service fee.
Income, realized and unrealized capital gains and losses and expenses of the Funds that are not directly attributable to a specific class of shares are prorated among the classes based on the relative net assets of each class.
Redemption fees—
Each Fund imposes a short-term trading fee on redemptions of Class I Shares held for 90 days or less to offset two types of costs to the Fund caused by short-term trading: portfolio transaction and market impact costs associated with erratic redemption activity and administrative costs associated with processing redemptions. The fee is 2% of the redemption value and is deducted from the redemption proceeds. The "first-in, first-out" ("FIFO") method is used to determine the holding period. Effective April 1, 2006, the fee was allocated to both Class I and Class II pro rata based on their respective net assets.
Security valuation—
The Funds' share prices or net asset values ("NAVs") are calculated as of the close of regular session trading (usually 4:00 pm Eastern time) on the New York Stock Exchange ("NYSE") on any day on which the NYSE is open for trading. Domestic equity securities traded on securities exchanges and over-the-counter securities are valued at the last sales price on the day of valuation, or lacking any reported sales that day, at the most recent bid quotation. Securities traded on the NASDAQ National Market are valued at the NASDAQ Official Closing Price ("NOCP"), or lacking an NOCP, at the most recent bid quotation on the NASDAQ National Market. Foreign equity securities traded on securities exchanges shall be valued at, depending on local convention or regulation, the last sales price, last bid or asked price, the mean between the last bid and asked prices, an official closing price, or shall be based on a pricing composite as of the c lose of the regular trading hours on the appropriate exchange or other designated time. Debt obligations and money market instruments maturing in more than 60 days from the date of purchase are valued at the latest bid quotation. Debt obligations and money market instruments maturing in less than 61 days from the date of purchase are valued on an amortized cost basis, which approximates value. Options are valued at the last reported sales price on the day of valuation, or lacking any reported sales that day, at the mean of the most recent bid and asked quotations, or if the mean is not available, at the most recent bid quotation.
Securities for which quotations are not readily available or securities that may have been affected by a significant event occurring between the close of a foreign market and the close of the NYSE are valued at fair values, determined by or under the direction of the pricing committee established by the Board of Trustees. A significant event may include the performance of U.S. markets since the close of foreign markets. The pricing committee will evaluate movements in the U.S markets after the close of foreign markets and may adjust security prices to reflect changes in reaction to U.S. markets as determined by a third party model. At September 30, 2006, the Funds held no securities for which quotations were not readily available, and no securities that were believed to be affected by a significant event prior to the computation of the NAV.
Foreign currency translations—
Certain Funds invest in foreign securities, which may involve a number of risk factors and special considerations not present with investments in securities of U.S. corporations. Values of investments and other assets and liabilities denominated in foreign currencies are translated into U.S. dollars at current exchange rates obtained by a recognized bank, dealer, or independent pricing service on the day of valuation. Purchases and sales of investments and dividend and interest income are converted at the prevailing rate of exchange on the respective dates of such transactions. Forward foreign currency contracts are valued at the current day's interpolated foreign exchange rates.
The Funds do not isolate that portion of the results of operations resulting from changes in foreign exchange rates on investments from the fluctuations arising from changes in market prices of securities held. Such fluctuations are included with the net realized and unrealized gains and losses from securities.
Net realized gains and losses on foreign currency transactions arise from sales of foreign currencies, currency gains or losses realized between the trade and settlement dates on securities transactions, the difference between the amounts of dividends, interest, and foreign withholding
THE OAKMARK FUNDS
60
THE OAKMARK FUNDS
Notes to Financial Statements (cont.)
taxes recorded and the U.S. dollar equivalent of the amounts actually received or paid, and the realized gains or losses resulting from portfolio and transaction hedges. Net unrealized foreign exchange gains and losses arise from changes in the fair value of assets and liabilities, other than investments in securities, at fiscal year end resulting from changes in exchange rates.
At September 30, 2006, net unrealized appreciation (depreciation)—other included the following components:
| | | Oakmark | | Equity and
Income | | Global | | International | | Int'l
Small Cap | |
Unrealized appreciation
(depreciation) on interest,
dividends and dividend
reclaims receivable | | $ | 1,909 | | | $ | 483,716 | | | $ | (14,099 | ) | | $ | (110,144 | ) | | $ | (9,558 | ) | |
Unrealized appreciation
(depreciation) on open
securities purchases and
sales | | | 0 | | | | 0 | | | | 54,275 | | | | 29,053 | | | | 4,064 | | |
Net unrealized appreciation
(depreciation) - other | | $ | 1,909 | | | $ | 483,716 | | | $ | 40,176 | | | $ | (81,091 | ) | | $ | (5,494 | ) | |
Forward foreign currency contracts—
The Funds' currency transactions are limited to transaction hedging and portfolio hedging. The contractual amounts of forward foreign exchange contracts do not necessarily represent the amounts potentially subject to risk. The measurement of the risks associated with these instruments is meaningful only when all related and offsetting transactions are considered. Risks arise from the possible inability of counterparties to meet the terms of their contracts and from movements in currency values. At September 30, 2006, none of the Funds held forward foreign currency contracts.
Security transactions and investment income—
Security transactions are accounted for on the trade date (date the order to buy or sell is executed) and dividend income is recorded on the ex-dividend date. Interest income and expenses are recorded on an accrual basis. Bond discount is accreted and premium is amortized over the expected life of each applicable security using the effective yield method. Withholding taxes on foreign dividends have been provided for in accordance with the Funds' understanding of the applicable country's tax rules and rates. Net realized gains and losses on investments are determined by the specific identification method.
Short sales—
Each Fund may sell a security it does not own in anticipation of a decline in the value of that security. When the Fund sells a security short, it must borrow the security sold short and deliver it to the broker-dealer through which it made the short sale. A gain, limited to the price at which the Fund sold the security short, or loss, unlimited in size, will be recognized upon the termination of a short sale. At September 30, 2006, Select had a short sale of common stock of First Data Corporation, When Issued.
Accounting for options—
When a Fund writes an option, the premium received by the Fund is recorded as a liability and is subsequently adjusted to the current market value of the option written. Premiums received from writing options that expire are recorded by the Fund on the expiration date as realized gains from option transactions. The difference between the premium and the amount paid on effecting a closing purchase transaction, including brokerage commissions, is also treated as a realized gain, or if the premium is less than the amount paid for the closing purchase transaction, as a realized loss. If a call option is exercised, the premium is added to the proceeds from the sale of the underlying security or currency in determining whether the Fund has realized a gain or a loss. If a put option is exercised, the premium reduces the cost basis of the security or currency purchased by the Fund. In writing an option, the Fund bears the market risk of an unfavorable change in the price of the security or currency underlying the written option. Exercise of an option written by the Fund could result in the Fund selling or buying a security or currency at a price different from the current market value. Options written by the Fund do not give rise to counterparty credit risk, as they obligate the Fund, not its counterparties, to perform.
When a Fund purchases an option, the premium paid by the Fund is recorded as an asset and is subsequently adjusted to the current value of the option purchased. Purchasing call options tends to increase the Fund's exposure to the underlying instrument. Purchasing put options tends
THE OAKMARK FUNDS
61
THE OAKMARK FUNDS
Notes to Financial Statements (cont.)
to decrease the Fund's exposure to the underlying instrument. Premiums paid for purchasing options that expire are treated as realized losses. Premiums paid for purchasing options that are exercised or closed are added to the amounts paid or offset against the proceeds on the underlying security to determine the realized gain or loss. The risks associated with purchasing put and call options are potential loss of the premium paid and the failure of the counterparty to honor its obligation under the contract.
At September 30, 2006, the Funds had no outstanding options.
Committed line of credit—
The Trust has an unsecured committed line of credit with Investors Bank & Trust Company ("IBT") in the amount of $450 million. Borrowings under that arrangement bear interest at 0.45% above the Federal Funds Effective Rate, as defined in the credit agreement. There were no borrowings during the year ended September 30, 2006.
Expense offset arrangement—
IBT serves as custodian of the Funds. IBT's fee may be reduced by credits that are an earnings allowance calculated on the average daily cash balances each Fund maintains with IBT. Credit balances used to reduce the Funds' custodian fees are reported as a reduction of total expenses in the Statements of Operations. For the year ended September 30, 2006, there were no credit balances.
Repurchase agreements—
Each Fund may invest in repurchase agreements, which are short-term investments whereby the Fund acquires ownership of a debt security and the seller agrees to repurchase the security at a future date at a specified price.
The Fund, through IBT, receives delivery of the underlying securities collateralizing repurchase agreements. It is the Funds' policy that the value of the collateral be at least equal to 105% of the repurchase price, including interest. Harris Associates L.P. ("the Adviser") is responsible for determining that the value of the collateral is at all times at least equal to 105% of the repurchase price, including interest. Repurchase agreements could involve certain risks in the event of default or insolvency of the counterparty including possible delays or restrictions upon a Fund's ability to dispose of the underlying securities.
Security lending—
Each Fund, except Oakmark, may lend its portfolio securities to broker-dealers and banks. Any such loan must be continuously secured by collateral in cash or cash equivalents maintained on a current basis in an amount at least equal to the fair value of the securities loaned by the Fund. Collateral is marked to market and monitored daily. The Fund would continue to receive the equivalent of the interest or dividends paid by the issuer on the securities loaned, and would also receive an additional return that may be in the form of a fixed fee or a percentage of the earnings on the collateral. The Fund would have the right to call the loan and obtain the securities loaned at any time, and the counterparty is required to return the securities within five business days or less. In the event of bankruptcy or other default of the borrower, the Fund could experience delays in liquidating the loan collateral or recovering the loaned sec urities and incur expenses related to enforcing its rights. In addition, there could be a decline in the value of the collateral or in the fair value of the securities loaned while the Fund seeks to enforce its rights thereto and the Fund could experience subnormal levels of income or lack of access to income during that period.
At September 30, 2006, Equity and Income had securities on loan with a value of approximately $153,121,000 and held $158,553,000 of U.S. Treasury securities as collateral for the loans.
THE OAKMARK FUNDS
62
THE OAKMARK FUNDS
Notes to Financial Statements (cont.)
Restricted securities—
The following investments, the sales of which are restricted to qualified institutional buyers, have been valued according to the securities valuation procedures for debt obligations and money market instruments (as stated in the Security valuation section) since their acquisition dates. These securities are priced using market quotations and there are no unrestricted securities with the same maturity dates and yields for the issuer.
At September 30, 2006, Equity and Income held the following restricted securities:
| Quantity | | Security
Name | | Acquisition
Date | | Carrying
Value | | Cost | | Value | | Percentage
of Value
Net Assets | |
| $ | 3,000,000 |
| | Sealed Air Corporation,
144A, 5.625% due
7/15/2013 | |
6/27/2003 | | | 98.3959 | | | | 100.68 | | | $ | 2,951,877 | | | | 0.03 | % | |
| | 5,000,000 |
| | Sealed Air Corporation,
144A, 5.625% due
7/15/2013 | |
8/20/2003 | | | 98.3959 | | | | 96.41 | | | | 4,919,795 | | | | 0.04 | % | |
| | 300,000 |
| | Sealed Air Corporation,
144A, 5.625% due
7/15/2013 | |
8/21/2003 | | | 98.3959 | | | | 96.79 | | | | 295,188 | | | | 0.00 | % | |
| | 11,700,000 |
| | Sealed Air Corporation,
144A, 5.625% due
7/15/2013 | |
4/6/2004 | | | 98.3959 | | | | 103.31 | | | | 11,512,320 | | | | 0.10 | % | |
| | | | | | | | | | | | | | | | | | | $ | 19,679,180 | | | | 0.17 | % | |
Federal income taxes—
It is each Fund's policy to comply with the requirements of the Internal Revenue Code applicable to regulated investment companies and to distribute substantially all of its net taxable income, including any net realized gains on investments, to its shareholders. Therefore, no federal income tax provision is required.
Recently issued accounting pronouncement—
In June 2006, the Financial Accounting Standards Board ("FASB") issued FASB Interpretation No. 48, ("FIN 48") "Accounting for Uncertainty in Income Taxes—an interpretation of FASB Statement No. 109". This interpretation prescribes a recognition threshold and measurement attribute for the financial statement recognition and measurement of a tax position taken or expected to be taken in a tax return. It also provides guidance on de-recognition, classification, interest and penalties, accounting in interim periods, disclosure and transition. FIN 48 is effective for fiscal years beginning after December 15, 2006. The Trust is currently evaluating the impact of applying the various provisions of FIN 48.
2. TRANSACTIONS WITH AFFILIATES
Each Fund has an investment advisory agreement with the Adviser. For management services and facilities furnished, the Funds pay the Adviser monthly fees. Each fee is calculated on the total net assets as determined at the end of each preceding calendar month. Annual fee rates are as follows:
| Fund | | Advisory Fees | | Fund | | Advisory Fees | |
Oakmark
| | 1.00% up to $2 billion;
0.90% on the next $1 billion;
0.80% on the next $2 billion;
0.75% on the next $2.5 billion;
0.70% on the next $2.5 billion; and
0.65% over $10 billion | | Equity and Income
| | 0.75% up to $5 billion;
0.70% on the next $2.5 billion;
0.675% on the next $2.5 billion;
0.65% on the next $2.5 billion; and
0.60% over $12.5 billion
| |
|
THE OAKMARK FUNDS
63
THE OAKMARK FUNDS
Notes to Financial Statements (cont.)
| Fund | | Advisory Fees | | Fund | | Advisory Fees | |
Select
| | 1.00% up to $1 billion;
0.95% on the next $500 million;
0.90% on the next $500 million;
0.85% on the next $500 million;
0.80% on the next $2.5 billion;
0.75% on the next $5 billion; and
0.725% over $10 billion
| | Global
International
Int'l Small Cap
| | 1.00% up to $2 billion;
0.95% on the next $2 billion; and
0.90% over $4 billion
1.00% up to $2 billion;
0.95% on the next $1 billion;
0.85% on the next $2 billion;
0.825% on the next $2.5 billion; and
0.815% over $7.5 billion
1.25% up to $500 million;
1.10% on the next $1 billion; and
1.05% over $1.5 billion | |
|
The Adviser is contractually obligated through January 31, 2007 to reimburse each Fund Class to the extent, but only to the extent, that its annualized expenses (excluding taxes, interest, all commissions and other normal charges incident to the purchase and sale of portfolio securities, and extraordinary charges such as litigation costs, but including fees paid to the Adviser) exceed the percent set forth below of average daily net assets of the Fund Class.
| Fund | | Class I | | Class II | |
| Oakmark | | | 1.50 | % | | | 1.75 | % | |
| Select | | | 1.50 | | | | 1.75 | | |
| Equity and Income | | | 1.00 | | | | 1.25 | | |
| Global | | | 1.75 | | | | 2.00 | | |
| International | | | 2.00 | | | | 2.25 | | |
| Int'l Small Cap | | | 2.00 | | | | 2.25 | | |
The Adviser and the Funds have entered into agreements with financial intermediaries to provide recordkeeping, processing, shareholder communications and other services to customers of the intermediaries and have agreed to compensate the intermediaries for providing those services. Certain of those services would be provided by the Funds if the shares of those customers were registered directly with the Funds' transfer agent. Accordingly, the Funds pay a portion of the intermediary fees pursuant to an agreement with the Adviser, which calls for each Fund to pay a portion of the intermediary fees attributable to shares of the Fund held by the intermediary (which generally are a percentage of value of the shares) not exceeding the lesser of 75% of the fees charged by the intermediary or what the Fund would have paid its transfer agent had each customer's shares been registered directly with the transfer agent instead of held throu gh the intermediary. The Adviser pays the remainder of the fees. The fees incurred by the Funds are reflected as other shareholder servicing fees in the Statements of Operations.
The non-interested Trustees of the Trust may participate in the Trust's Deferred Compensation Plan for Independent Trustees. Participants in the plan may elect to defer all or a portion of their compensation. Amounts deferred are retained by the Trust and represent an unfunded obligation of the Trust. The value of amounts deferred for a participant is determined by reference to the change in value of Class I shares of one or more of the Funds or a money market fund as specified by the participant. Benefits would be payable after a stated number of years or retirement from the board. The accrued obligations of the Funds under the plan are reflected as deferred trustee compensation in the Statements of Assets and Liabilities. The interested trustees are not compensated by the Funds.
THE OAKMARK FUNDS
64
THE OAKMARK FUNDS
Notes to Financial Statements (cont.)
3. FEDERAL INCOME TAXES
For the year ended September 30, 2006, cost of investments for federal income tax purposes and related composition of unrealized gains and losses were as follows:
| Fund | | Cost of Investments
for Federal Income
Tax Purposes | | Gross Unrealized
Appreciation | | Gross Unrealized
(Depreciation) | | Net Unrealized
Appreciation
(Depreciation) | |
| Oakmark | | $ | 4,009,410,737 | | | $ | 1,549,330,338 | | | $ | (44,650,692 | ) | | $ | 1,504,679,646 | | |
| Select | | | 4,188,994,286 | | | | 1,740,512,627 | | | | (76,884,581 | ) | | | 1,663,628,046 | | |
| Equity and Income | | | 9,384,773,335 | | | | 1,719,055,391 | | | | (55,300,146 | ) | | | 1,663,755,245 | | |
| Global | | | 1,890,369,830 | | | | 501,283,413 | | | | (31,625,131 | ) | | | 469,658,282 | | |
| International | | | 5,964,743,209 | | | | 1,803,066,518 | | | | (76,605,091 | ) | | | 1,726,461,427 | | |
| Int'l Small Cap | | | 973,843,962 | | | | 307,858,064 | | | | (6,472,919 | ) | | | 301,385,145 | | |
As of September 30, 2006, none of the Funds had a net capital loss carryforward available to offset future realized gains and thereby potentially reduce future taxable gains distributions.
For the year ended September 30, 2006, the components of distributable earnings on a tax basis (excluding unrealized appreciation (depreciation)) were as follows:
| Fund | | Undistributed
Ordinary Income | | Undistributed Long-
Term Gain | | Total Distributable
Earnings | |
| Oakmark | | $ | 53,652,695 | | | $ | 229,501,751 | | | $ | 283,233,683 | | |
| Select | | | 38,922,087 | | | | 581,290,026 | | | | 620,274,828 | | |
| Equity and Income | | | 164,088,837 | | | | 538,854,084 | | | | 702,988,680 | | |
| Global | | | 23,124,221 | | | | 281,554,029 | | | | 304,704,307 | | |
| International | | | 129,847,906 | | | | 964,217,394 | | | | 1,094,108,978 | | |
| Int'l Small Cap | | | 46,648,540 | | | | 136,379,884 | | | | 183,054,527 | | |
During the years ended September 30, 2006 and September 30, 2005, the tax character of distributions paid was as follows:
| | | Year Ended
September 30, 2006 | | Year Ended
September 30, 2005 | |
| Fund | | Distributions Paid
from Ordinary
Income | | Distributions Paid
from Long-Term
Capital Gain | | Distributions Paid
from Ordinary
Income | | Distributions Paid
from Long-Term
Capital Gain | |
| Oakmark | | $ | 51,882,484 | | | $ | 0 | | | $ | 29,130,564 | | | $ | 0 | | |
| Select | | | 51,960,266 | | | | 318,251,961 | | | | 42,138,643 | | | | 0 | | |
| Equity and Income | | | 133,890,762 | | | | 81,209,710 | | | | 70,711,007 | | | | 210,226,794 | | |
| Global | | | 27,510,133 | | | | 73,182,404 | | | | 7,195,992 | | | | 25,739,670 | | |
| International | | | 158,218,276 | | | | 251,637,067 | | | | 60,834,949 | | | | 12,575,394 | | |
| Int'l Small Cap | | | 40,979,591 | | | | 147,014,786 | | | | 11,229,304 | | | | 15,549,000 | | |
On September 30, 2006, the Funds had temporary book/tax differences in undistributed earnings that were primarily attributable to trustee deferred compensation expenses, passive foreign investment companies, and deferrals of capital losses on wash sales. Temporary differences will reverse over time. The Funds have permanent differences in book/tax undistributed earnings primarily attributable to currency gains and losses and equalization debits. Permanent differences have been reflected in their respective component of the Analysis of Net Assets.
THE OAKMARK FUNDS
65
THE OAKMARK FUNDS
Notes to Financial Statements (cont.)
4. INVESTMENT TRANSACTIONS
For the year ended September 30, 2006, transactions in investment securities (excluding short term and U.S. Government securities) were as follows (in thousands):
| | | Oakmark | | Select | | Equity and
Income | | Global | | International | | Int'l
Small Cap | |
| Purchases | | $ | 466,962 | | | $ | 1,246,146 | | | $ | 2,660,026 | | | $ | 1,057,935 | | | $ | 2,835,395 | | | $ | 483,122 | | |
| Proceeds from sales | | | 1,652,578 | | | | 1,678,571 | | | | 2,523,877 | | | | 864,819 | | | | 2,403,318 | | | | 477,622 | | |
Purchases at cost and proceeds from sales of long-term U.S. Government securities for the year ended September 30, 2006 were $5,991,243 and $5,483,416 respectively for Equity and Income.
5. INVESTMENTS IN AFFILIATED ISSUERS
An issuer in which a Fund's holdings represents 5% or more of the outstanding voting securities is an affiliated issuer as defined under the Investment Company Act of 1940. A schedule of each Fund's investments in securities of affiliated issuers held during the year ended September 30, 2006, is set forth below:
Schedule of Transactions with Affiliated Issuers
The Oakmark Select Fund
| Affiliates | | Shares Held | | Purchases
(Cost) | | Sales
Proceeds | | Dividend
Income | | Value
September 30,
2006 | |
The Dun & Bradstreet
Corporation *+ | | | 3,284,900 | | | $ | 0 | | | $ | 46,161,930 | | | $ | 0 | | | $ | 246,334,651 | | |
| H&R Block, Inc. * | | | 15,419,600 | | | | 0 | | | | 25,261,243 | | | | 8,201,496 | | | | 335,222,104 | | |
| TOTALS | | | | $ | 0 | | | $ | 71,423,173 | | | $ | 8,201,496 | | | $ | 581,556,755 | | |
Schedule of Transactions with Affiliated Issuers
The Oakmark Equity and Income Fund
| Affiliates | | Shares Held | | Purchases
(Cost) | | Sales
Proceeds | | Dividend
Income | | Value
September 30,
2006 | |
St Mary Land &
Exploration Company | | | 2,900,000 | | | $ | 0 | | | $ | 0 | | | $ | 290,000 | | | $ | 106,459,000 | | |
| Varian, Inc.+ | | | 1,649,400 | | | | 0 | | | | 0 | | | | 0 | | | | 75,657,978 | | |
| TOTALS | | | | $ | 0 | | | $ | 0 | | | $ | 290,000 | | | $ | 182,116,978 | | |
Schedule of Transactions with Affiliated Issuers
The Oakmark International Fund
| Affiliates | | Shares Held | | Purchases
(Cost) | | Sales
Proceeds | | Dividend
Income | | Value
September 30,
2006 | |
| Chargeurs SA ** | | | 0 | | | $ | 0 | | | $ | 17,467,399 | | | $ | 0 | | | $ | 0 | | |
| Enodis plc * | | | 19,852,920 | | | | 0 | | | | 52,054,205 | | | | 1,289,628 | | | | 64,678,610 | | |
| Giordano International Limited | | | 121,265,300 | | | | 34,054,359 | | | | 0 | | | | 4,141,459 | | | | 59,148,870 | | |
| Lotte Chilsung Beverage Co., Ltd. | | | 88,800 | | | | 4,508,699 | | | | 0 | | | | 192,699 | | | | 120,402,008 | | |
| Meitec Corporation | | | 2,483,800 | | | | 0 | | | | 0 | | | | 1,951,799 | | | | 76,327,568 | | |
| Michael Page International plc * | | | 2,360,303 | | | | 0 | | | | 136,195,131 | | | | 1,043,952 | | | | 17,003,308 | | |
| Signet Group plc | | | 111,717,000 | | | | 86,556,328 | | | | 0 | | | | 6,080,018 | | | | 231,136,524 | | |
| Trinity Mirror plc | | | 16,238,538 | | | | 167,122,824 | | | | 0 | | | | 4,473,065 | | | | 144,724,119 | | |
| TOTALS | | | | | | $ | 292,242,210 | | | $ | 205,716,735 | | | $ | 19,172,620 | | | $ | 713,421,007 | | |
THE OAKMARK FUNDS
66
THE OAKMARK FUNDS
Notes to Financial Statements (cont.)
Schedule of Transactions with Affiliated Issuers
The Oakmark Int'l Small Cap Fund
| Affiliates | | Shares Held | | Purchases
(Cost) | | Sales
Proceeds | | Dividend
Income | | Value
September 30,
2006 | |
| Alaska Milk Corporation | | | 56,360,000 | | | $ | 0 | | | $ | 0 | | | $ | 269,915 | | | $ | 3,593,385 | | |
| Chargeurs SA + | | | 790,182 | | | | 17,467,399 | | | | 0 | | | | 0 | | | | 21,703,110 | | |
| Gurit Holding AG * | | | 14,407 | | | | 230,479 | | | | 21,488,244 | | | | 477,033 | | | | 10,254,093 | | |
| Interpump Group S.p.A. * | | | 3,259,900 | | | | 0 | | | | 12,119,439 | | | | 4,743,536 | | | | 28,977,350 | | |
| JJB Sports plc | | | 13,924,000 | | | | 14,675,074 | | | | 0 | | | | 2,333,638 | | | | 48,752,025 | | |
| Kongsberg Automotive ASA | | | 3,350,200 | | | | 26,061,415 | | | | 0 | | | | 759,797 | | | | 26,949,024 | | |
| Lectra | | | 2,186,404 | | | | 0 | | | | 0 | | | | 363,690 | | | | 13,086,056 | | |
| Mainfreight Limited | | | 5,172,577 | | | | 2,558,745 | | | | 11,350,115 | | | | 589,789 | | | | 22,117,112 | | |
| Media Prima Berhad | | | 45,694,100 | | | | 10,878,602 | | | | 0 | | | | 150,153 | | | | 23,664,786 | | |
| Morse plc | | | 15,231,000 | | | | 4,826,523 | | | | 0 | | | | 833,830 | | | | 28,802,941 | | |
| Vitec Group plc | | | 2,780,379 | | | | 3,636,663 | | | | 0 | | | | 737,318 | | | | 28,267,725 | | |
| TOTALS | | | | | | $ | 80,334,900 | | | $ | 44,957,798 | | | $ | 11,258,699 | | | $ | 256,167,607 | | |
* Due to transactions during the year ended September 30, 2006, the company is no longer an affiliated security.
** Position in issuer liquidated during the year ended September 30, 2006.
+ Non-income producing security.
6. SUBSEQUENT EVENT
On October 2, 2006, Harris Associates L.P. launched The Oakmark Global Select Fund as an additional series of the Trust. The launch of this non-diversified Fund was previously approved by the Board of Trustees on July 7, 2006. The Fund will be managed using the same value-oriented investment approach as the other Oakmark Funds.
THE OAKMARK FUNDS
67
THE OAKMARK FUNDS
FINANCIAL HIGHLIGHTS
The following tables are intended to help you understand each Fund's financial performance during the last five years (or since it began operations, if less than five years). Certain information reflects financial results for a single Fund share. Total returns represent the rate you would have earned (or less) on an investment, assuming reinvestment of all dividends and distributions. The information for the fiscal year ended September 30, 2006 has been audited by Deloitte & Touche LLP, an independent registered public accounting firm, whose report, along with each Fund's financial statements, is included in this report. Deloitte & Touche LLP has also audited the information for the fiscal years ended September 30, 2005, 2004, 2003 and 2002. For each year shown, all information is for the fiscal year ended September 30, unless otherwise noted.
THE OAKMARK FUNDS
68
THE OAKMARK FUND
Financial Highlights–Class I
For a share outstanding throughout each period
| | | Year Ended
September 30,
2006 | | Year Ended
September 30,
2005 | | Year Ended
September 30,
2004 | | Year Ended
September 30,
2003 | | Year Ended
September 30,
2002 | |
| Net Asset Value, Beginning of Period | | $ | 40.75 | | | $ | 38.68 | | | $ | 33.85 | | | $ | 28.08 | | | $ | 32.01 | | |
| Income From Investment Operations: | |
| Net Investment Income | | | 0.39 | (a) | | | 0.34 | | | | 0.16 | | | | 0.13 | | | | 0.12 | | |
| Net Gain (Loss) on Investments (both realized and unrealized) | | | 3.85 | | | | 1.90 | | | | 4.81 | | | | 5.75 | | | | (3.85 | ) | |
| Total From Investment Operations: | | | 4.24 | | | | 2.24 | | | | 4.97 | | | | 5.88 | | | | (3.73 | ) | |
| Less Distributions: | |
| Dividends (from net investment income) | | | (0.35 | ) | | | (0.17 | ) | | | (0.14 | ) | | | (0.11 | ) | | | (0.20 | ) | |
| Distributions (from capital gains) | | | 0.00 | | | | 0.00 | | | | 0.00 | | | | 0.00 | | | | 0.00 | | |
| Total Distributions | | | (0.35 | ) | | | (0.17 | ) | | | (0.14 | ) | | | (0.11 | ) | | | (0.20 | ) | |
| Redemption Fees | | | 0.00 | (b) | | | 0.00 | (b) | | | 0.00 | (b) | | | 0.00 | | | | 0.00 | | |
| Net Asset Value, End of Period | | $ | 44.64 | | | $ | 40.75 | | | $ | 38.68 | | | $ | 33.85 | | | $ | 28.08 | | |
| Total Return | | | 10.46 | % | | | 5.79 | % | | | 14.73 | % | | | 20.99 | % | | | (11.77 | )% | |
| Ratios/Supplemental Data: | |
| Net Assets, End of Period ($million) | | $ | 5,486.2 | | | $ | 6,340.4 | | | $ | 6,474.0 | | | $ | 4,769.4 | | | $ | 3,300.9 | | |
| Ratio of Expenses to Average Net Assets | | | 1.05 | %* | | | 1.03 | %* | | | 1.05 | % | | | 1.14 | % | | | 1.17 | % | |
| Ratio of Net Investment Income to Average Net Assets | | | 0.94 | % | | | 0.79 | % | | | 0.47 | % | | | 0.48 | % | | | 0.38 | % | |
| Portfolio Turnover Rate | | | 9 | % | | | 16 | % | | | 19 | % | | | 21 | % | | | 44 | % | |
Financial Highlights–Class II
For a share outstanding throughout each period
| | | Year Ended
September 30,
2006 | | Year Ended
September 30,
2005 | | Year Ended
September 30,
2004 | | Year Ended
September 30,
2003 | | Year Ended
September 30,
2002 | |
| Net Asset Value, Beginning of Period | | $ | 40.51 | | | $ | 38.45 | | | $ | 33.68 | | | $ | 28.04 | | | $ | 31.97 | | |
| Income From Investment Operations: | |
| Net Investment Income | | | 0.25 | (a) | | | 0.26 | (a) | | | 0.04 | (a) | | | 0.05 | (a) | | | 0.16 | | |
| Net Gain (Loss) on Investments (both realized and unrealized) | | | 3.82 | | | | 1.87 | | | | 4.78 | | | | 5.69 | | | | (3.92 | ) | |
| Total From Investment Operations: | | | 4.07 | | | | 2.13 | | | | 4.82 | | | | 5.74 | | | | (3.76 | ) | |
| Less Distributions: | |
| Dividends (from net investment income) | | | (0.23 | ) | | | (0.07 | ) | | | (0.05 | ) | | | (0.10 | ) | | | (0.17 | ) | |
| Distributions (from capital gains) | | | 0.00 | | | | 0.00 | | | | 0.00 | | | | 0.00 | | | | 0.00 | | |
| Total Distributions | | | (0.23 | ) | | | (0.07 | ) | | | (0.05 | ) | | | (0.10 | ) | | | (0.17 | ) | |
| Redemption Fees | | | 0.00 | (b) | | | 0.00 | | | | 0.00 | | | | 0.00 | | | | 0.00 | | |
| Net Asset Value, End of Period | | $ | 44.35 | | | $ | 40.51 | | | $ | 38.45 | | | $ | 33.68 | | | $ | 28.04 | | |
| Total Return | | | 10.08 | % | | | 5.55 | % | | | 14.32 | % | | | 20.52 | % | | | (11.85 | )% | |
| Ratios/Supplemental Data: | |
| Net Assets, End of Period ($million) | | $ | 37.5 | | | $ | 43.7 | | | $ | 51.9 | | | $ | 21.1 | | | $ | 7.7 | | |
| Ratio of Expenses to Average Net Assets | | | 1.40 | %* | | | 1.26 | %* | | | 1.40 | % | | | 1.53 | % | | | 1.44 | % | |
| Ratio of Net Investment Income to Average Net Assets | | | 0.59 | % | | | 0.58 | % | | | 0.11 | % | | | 0.06 | % | | | 0.35 | % | |
| Portfolio Turnover Rate | | | 9 | % | | | 16 | % | | | 19 | % | | | 21 | % | | | 44 | % | |
* The ratio excludes expense offset arrangement.
(a) Computed using average shares outstanding throughout the period.
(b) Amount rounds to less than $0.01 per share.
See accompanying Notes to Financial Statements.
THE OAKMARK FUNDS
69
THE OAKMARK SELECT FUND
Financial Highlights–Class I
For a share outstanding throughout each period
| | | Year Ended
September 30,
2006 | | Year Ended
September 30,
2005 | | Year Ended
September 30,
2004 | | Year Ended
September 30,
2003 | | Year Ended
September 30,
2002 | |
| Net Asset Value, Beginning of Period | | $ | 33.44 | | | $ | 31.20 | | | $ | 27.55 | | | $ | 21.67 | | | $ | 25.20 | | |
| Income From Investment Operations: | |
| Net Investment Income | | | 0.36 | (a) | | | 0.29 | | | | 0.15 | (a) | | | 0.05 | | | | 0.02 | | |
| Net Gain (Loss) on Investments (both realized and unrealized) | | | 2.76 | | | | 2.19 | | | | 3.60 | | | | 5.85 | | | | (3.50 | ) | |
| Total From Investment Operations: | | | 3.12 | | | | 2.48 | | | | 3.75 | | | | 5.90 | | | | (3.48 | ) | |
| Less Distributions: | |
| Dividends (from net investment income) | | | (0.29 | ) | | | (0.24 | ) | | | (0.10 | ) | | | (0.02 | ) | | | (0.05 | ) | |
| Distributions (from capital gains) | | | (1.79 | ) | | | 0.00 | | | | 0.00 | | | | 0.00 | | | | 0.00 | | |
| Total Distributions | | | (2.08 | ) | | | (0.24 | ) | | | (0.10 | ) | | | (0.02 | ) | | | (0.05 | ) | |
| Redemption Fees | | | 0.00 | (b) | | | 0.00 | (b) | | | 0.00 | (b) | | | 0.00 | | | | 0.00 | | |
| Net Asset Value, End of Period | | $ | 34.48 | | | $ | 33.44 | | | $ | 31.20 | | | $ | 27.55 | | | $ | 21.67 | | |
| Total Return | | | 9.58 | % | | | 7.98 | % | | | 13.64 | % | | | 27.25 | % | | | (13.85 | )% | |
| Ratios/Supplemental Data: | |
| Net Assets, End of Period ($million) | | $ | 5,776.6 | | | $ | 5,908.0 | | | $ | 5,463.0 | | | $ | 4,993.0 | | | $ | 3,717.6 | | |
| Ratio of Expenses to Average Net Assets | | | 0.99 | %* | | | 1.00 | %* | | | 1.00 | % | | | 1.02 | % | | | 1.07 | % | |
| Ratio of Net Investment Income to Average Net Assets | | | 1.08 | % | | | 0.87 | % | | | 0.50 | % | | | 0.23 | % | | | 0.09 | % | |
| Portfolio Turnover Rate | | | 22 | % | | | 21 | % | | | 14 | % | | | 20 | % | | | 32 | % | |
Financial Highlights–Class II
For a share outstanding throughout each period
| | | Year Ended
September 30,
2006 | | Year Ended
September 30,
2005 | | Year Ended
September 30,
2004 | | Year Ended
September 30,
2003 | | Year Ended
September 30,
2002 | |
| Net Asset Value, Beginning of Period | | $ | 33.24 | | | $ | 31.00 | | | $ | 27.37 | | | $ | 21.56 | | | $ | 25.10 | | |
| Income From Investment Operations: | |
| Net Investment Income (Loss) | | | 0.26 | (a) | | | 0.21 | | | | 0.09 | (a) | | | 0.00 | (b) | | | (0.04 | ) | |
| Net Gain (Loss) on Investments (both realized and unrealized) | | | 2.72 | | | | 2.18 | | | | 3.58 | | | | 5.81 | | | | (3.50 | ) | |
| Total From Investment Operations: | | | 2.98 | | | | 2.39 | | | | 3.67 | | | | 5.81 | | | | (3.54 | ) | |
| Less Distributions: | |
| Dividends (from net investment income) | | | (0.20 | ) | | | (0.15 | ) | | | (0.04 | ) | | | 0.00 | | | | 0.00 | | |
| Distributions (from capital gains) | | | (1.79 | ) | | | 0.00 | | | | 0.00 | | | | 0.00 | | | | 0.00 | | |
| Total Distributions | | | (1.99 | ) | | | (0.15 | ) | | | (0.04 | ) | | | 0.00 | | | | 0.00 | | |
| Redemption Fees | | | 0.00 | (b) | | | 0.00 | | | | 0.00 | | | | 0.00 | | | | 0.00 | | |
| Net Asset Value, End of Period | | $ | 34.23 | | | $ | 33.24 | | | $ | 31.00 | | | $ | 27.37 | | | $ | 21.56 | | |
| Total Return | | | 9.18 | % | | | 7.72 | % | | | 13.40 | % | | | 26.95 | % | | | (14.10 | )% | |
| Ratios/Supplemental Data: | |
| Net Assets, End of Period ($million) | | $ | 68.1 | | | $ | 85.2 | | | $ | 98.0 | | | $ | 93.1 | | | $ | 64.4 | | |
| Ratio of Expenses to Average Net Assets | | | 1.34 | %* | | | 1.25 | %* | | | 1.21 | % | | | 1.29 | % | | | 1.36 | % | |
| Ratio of Net Investment Income (Loss) to Average Net Assets | | | 0.78 | % | | | 0.65 | % | | | 0.29 | % | | | (0.04 | )% | | | (0.19 | )% | |
| Portfolio Turnover Rate | | | 22 | % | | | 21 | % | | | 14 | % | | | 20 | % | | | 32 | % | |
* The ratio excludes expense offset arrangement.
(a) Computed using average shares outstanding throughout the period.
(b) Amount rounds to less than $0.01 per share.
THE OAKMARK FUNDS
70
THE OAKMARK EQUITY AND INCOME FUND
Financial Highlights–Class I
For a share outstanding throughout each period
| | | Year Ended
September 30,
2006 | | Year Ended
September 30,
2005 | | Year Ended
September 30,
2004 | | Year Ended
September 30,
2003 | | Year Ended
September 30,
2002 | |
| Net Asset Value, Beginning of Period | | $ | 25.41 | | | $ | 23.12 | | | $ | 20.30 | | | $ | 17.18 | | | $ | 17.45 | | |
| Income From Investment Operations: | |
| Net Investment Income | | | 0.44 | | | | 0.31 | | | | 0.15 | | | | 0.17 | | | | 0.33 | (a) | |
| Net Gain (Loss) on Investments (both realized and unrealized) | | | 1.18 | | | | 2.77 | | | | 2.81 | | | | 3.19 | | | | (0.40 | ) | |
| Total From Investment Operations: | | | 1.62 | | | | 3.08 | | | | 2.96 | | | | 3.36 | | | | (0.07 | ) | |
| Less Distributions: | |
| Dividends (from net investment income) | | | (0.34 | ) | | | (0.20 | ) | | | (0.14 | ) | | | (0.24 | ) | | | (0.16 | ) | |
| Distributions (from capital gains) | | | (0.20 | ) | | | (0.59 | ) | | | 0.00 | | | | 0.00 | | | | (0.04 | ) | |
| Total Distributions | | | (0.54 | ) | | | (0.79 | ) | | | (0.14 | ) | | | (0.24 | ) | | | (0.20 | ) | |
| Redemption Fees | | | 0.00 | (b) | | | 0.00 | (b) | | | 0.00 | (b) | | | 0.00 | | | | 0.00 | | |
| Net Asset Value, End of Period | | $ | 26.49 | | | $ | 25.41 | | | $ | 23.12 | | | $ | 20.30 | | | $ | 17.18 | | |
| Total Return | | | 6.51 | % | | | 13.65 | % | | | 14.64 | % | | | 19.75 | % | | | (0.47 | )% | |
| Ratios/Supplemental Data: | |
| Net Assets, End of Period ($million) | | $ | 10,414.5 | | | $ | 9,223.2 | | | $ | 7,577.9 | | | $ | 4,138.0 | | | $ | 2,241.9 | | |
| Ratio of Expenses to Average Net Assets | | | 0.86 | %* | | | 0.89 | %* | | | 0.92 | % | | | 0.93 | % | | | 0.96 | % | |
| Ratio of Net Investment Income to Average Net Assets | | | 1.88 | % | | | 1.36 | % | | | 0.78 | % | | | 1.07 | % | | | 1.71 | % | |
| Portfolio Turnover Rate | | | 81 | % | | | 112 | % | | | 72 | % | | | 48 | % | | | 73 | % | |
Financial Highlights–Class II
For a share outstanding throughout each period
| | | Year Ended
September 30,
2006 | | Year Ended
September 30,
2005 | | Year Ended
September 30,
2004 | | Year Ended
September 30,
2003 | | Year Ended
September 30,
2002 | |
| Net Asset Value, Beginning of Period | | $ | 25.29 | | | $ | 23.03 | | | $ | 20.24 | | | $ | 17.15 | | | $ | 17.40 | | |
| Income From Investment Operations: | |
| Net Investment Income | | | 0.35 | | | | 0.28 | | | | 0.11 | | | | 0.16 | | | | 0.30 | (a) | |
| Net Gain (Loss) on Investments (both realized and unrealized) | | | 1.19 | | | | 2.72 | | | | 2.79 | | | | 3.15 | | | | (0.40 | ) | |
| Total From Investment Operations: | | | 1.54 | | | | 3.00 | | | | 2.90 | | | | 3.31 | | | | (0.10 | ) | |
| Less Distributions: | |
| Dividends (from net investment income) | | | (0.28 | ) | | | (0.15 | ) | | | (0.11 | ) | | | (0.22 | ) | | | (0.11 | ) | |
| Distributions (from capital gains) | | | (0.20 | ) | | | (0.59 | ) | | | 0.00 | | | | 0.00 | | | | (0.04 | ) | |
| Total Distributions | | | (0.48 | ) | | | (0.74 | ) | | | (0.11 | ) | | | (0.22 | ) | | | (0.15 | ) | |
| Redemption Fees | | | 0.00 | (b) | | | 0.00 | | | | 0.00 | | | | 0.00 | | | | 0.00 | | |
| Net Asset Value, End of Period | | $ | 26.35 | | | $ | 25.29 | | | $ | 23.03 | | | $ | 20.24 | | | $ | 17.15 | | |
| Total Return | | | 6.18 | % | | | 13.34 | % | | | 14.36 | % | | | 19.46 | % | | | (0.60 | )% | |
| Ratios/Supplemental Data: | |
| Net Assets, End of Period ($million) | | $ | 718.1 | | | $ | 582.0 | | | $ | 478.7 | | | $ | 246.6 | | | $ | 118.7 | | |
| Ratio of Expenses to Average Net Assets | | | 1.18 | %* | | | 1.14 | %* | | | 1.17 | % | | | 1.17 | % | | | 1.20 | % | |
| Ratio of Net Investment Income to Average Net Assets | | | 1.57 | % | | | 1.11 | % | | | 0.53 | % | | | 0.84 | % | | | 1.50 | % | |
| Portfolio Turnover Rate | | | 81 | % | | | 112 | % | | | 72 | % | | | 48 | % | | | 73 | % | |
* The ratio excludes expense offset arrangements.
(a) Computed using average shares outstanding throughout the period.
(b) Amount rounds to less than $0.01 per share.
See accompanying Notes to Financial Statements.
THE OAKMARK FUNDS
71
THE OAKMARK GLOBAL FUND
Financial Highlights–Class I
For a share outstanding throughout each period
| | | Year Ended
September 30,
2006 | | Year Ended
September 30,
2005 | | Year Ended
September 30,
2004 | | Year Ended
September 30,
2003 | | Year Ended
September 30,
2002 | |
| Net Asset Value, Beginning of Period | | $ | 23.91 | | | $ | 19.73 | | | $ | 16.98 | | | $ | 11.30 | | | $ | 10.83 | | |
| Income From Investment Operations: | |
| Net Investment Income | | | 0.27 | | | | 0.17 | | | | 0.09 | | | | 0.01 | | | | 0.00 | (a)(b) | |
| Net Gain (Loss) on Investments (both realized and unrealized) | | | 3.74 | | | | 4.48 | | | | 2.71 | | | | 5.67 | | | | 0.76 | (c) | |
| Total From Investment Operations: | | | 4.01 | | | | 4.65 | | | | 2.80 | | | | 5.68 | | | | 0.76 | | |
| Less Distributions: | |
| Dividends (from net investment income) | | | (0.26 | ) | | | (0.10 | ) | | | 0.00 | (a) | | | 0.00 | | | | 0.00 | | |
| Distributions (from capital gains) | | | (0.97 | ) | | | (0.37 | ) | | | (0.05 | ) | | | 0.00 | | | | (0.29 | ) | |
| Total Distributions | | | (1.23 | ) | | | (0.47 | ) | | | (0.05 | ) | | | 0.00 | | | | (0.29 | ) | |
| Redemption Fees | | | 0.00 | (a) | | | 0.00 | (a) | | | 0.00 | (a) | | | 0.00 | | | | 0.00 | | |
| Net Asset Value, End of Period | | $ | 26.69 | | | $ | 23.91 | | | $ | 19.73 | | | $ | 16.98 | | | $ | 11.30 | | |
| Total Return | | | 17.46 | % | | | 23.88 | % | | | 16.54 | % | | | 50.27 | % | | | 6.84 | % | |
| Ratios/Supplemental Data: | |
| Net Assets, End of Period ($million) | | $ | 2,282.2 | | | $ | 1,842.9 | | | $ | 1,336.3 | | | $ | 704.8 | | | $ | 175.6 | | |
| Ratio of Expenses to Average Net Assets | | | 1.18 | %* | | | 1.20 | %* | | | 1.26 | % | | | 1.28 | % | | | 1.55 | % | |
| Ratio of Net Investment Income (Loss) to Average Net Assets | | | 1.18 | % | | | 0.81 | % | | | 0.47 | % | | | 0.00 | %(d) | | | (0.01 | )% | |
| Portfolio Turnover Rate | | | 41 | % | | | 17 | % | | | 16 | % | | | 42 | % | | | 86 | % | |
* The ratio excludes expense offset arrangement.
(a) Amount rounds to less than $0.01 per share.
(b) Computed using average shares outstanding throughout the period.
(c) The amount shown for a share outstanding does not correspond with the aggregate net realized and unrealized gain/loss for the period due to the timing of purchases and redemptions of Fund shares in relation to the fluctuating net asset value per share of the class.
(d) Amount rounds to less than 0.01%.
THE OAKMARK FUNDS
72
THE OAKMARK GLOBAL FUND
Financial Highlights–Class II
For a share outstanding throughout each period
| | | Year Ended
September 30,
2006 | | Year Ended
September 30,
2005 | | Year Ended
September 30,
2004 | | Year Ended
September 30,
2003 | | October 10, 2001
through
September 30,
2002 (a) | |
| Net Asset Value, Beginning of Period | | $ | 23.63 | | | $ | 19.53 | | | $ | 16.84 | | | $ | 11.24 | | | $ | 11.25 | | |
| Income From Investment Operations: | |
| Net Investment Income (Loss) | | | 0.18 | | | | 0.11 | | | | 0.05 | | | | 0.02 | | | | (0.03 | ) | |
| Net Gain (Loss) on Investments (both realized and unrealized) | | | 3.69 | | | | 4.43 | | | | 2.69 | | | | 5.58 | | | | 0.31 | (b) | |
| Total From Investment Operations: | | | 3.87 | | | | 4.54 | | | | 2.74 | | | | 5.60 | | | | 0.28 | | |
| Less Distributions: | |
| Dividends (from net investment income) | | | (0.22 | ) | | | (0.07 | ) | | | 0.00 | | | | 0.00 | | | | 0.00 | | |
| Distributions (from capital gains) | | | (0.97 | ) | | | (0.37 | ) | | | (0.05 | ) | | | 0.00 | | | | (0.29 | ) | |
| Total Distributions | | | (1.19 | ) | | | (0.44 | ) | | | (0.05 | ) | | | 0.00 | | | | (0.29 | ) | |
| Redemption Fees | | | 0.00 | (c) | | | 0.00 | | | | 0.00 | | | | 0.00 | | | | 0.00 | | |
| Net Asset Value, End of Period | | $ | 26.31 | | | $ | 23.63 | | | $ | 19.53 | | | $ | 16.84 | | | $ | 11.24 | | |
| Total Return | | | 17.01 | % | | | 23.53 | % | | | 16.32 | % | | | 49.82 | % | | | 2.31 | % | |
| Ratios/Supplemental Data: | |
| Net Assets, End of Period ($million) | | $ | 77.1 | | | $ | 58.6 | | | $ | 24.7 | | | $ | 5.8 | | | $ | 0.6 | | |
| Ratio of Expenses to Average Net Assets | | | 1.56 | %* | | | 1.45 | %* | | | 1.50 | % | | | 1.46 | % | | | 1.86 | % | |
| Ratio of Net Investment Income (Loss) to Average Net Assets | | | 0.80 | % | | | 0.63 | % | | | 0.37 | % | | | (0.01 | )% | | | (0.26 | )% | |
| Portfolio Turnover Rate | | | 41 | % | | | 17 | % | | | 16 | % | | | 42 | % | | | 86 | % | |
* The ratio excludes expense offset arrangement.
(a) The date on which Class II shares were first offered for sale to the public was October 10, 2001.
(b) The amount shown for a share outstanding does not correspond with the aggregate net realized and unrealized gain/loss for the period due to the timing of purchases and redemptions of Fund shares in relation to the fluctuating net asset value per share of the class.
(c) Amount rounds to less than $0.01 per share.
See accompanying Notes to Financial Statements.
THE OAKMARK FUNDS
73
THE OAKMARK INTERNATIONAL FUND
Financial Highlights–Class I
For a share outstanding throughout each period
| | | Year Ended
September 30,
2006 | | Year Ended
September 30,
2005 | | Year Ended
September 30,
2004 | | Year Ended
September 30,
2003 | | Year Ended
September 30,
2002 | |
| Net Asset Value, Beginning of Period | | $ | 23.52 | | | $ | 18.98 | | | $ | 15.67 | | | $ | 12.17 | | | $ | 12.51 | | |
| Income From Investment Operations: | |
| Net Investment Income | | | 0.41 | | | | 0.27 | | | | 0.24 | | | | 0.11 | | | | 0.14 | | |
| Net Gain (Loss) on Investments (both realized and unrealized) | | | 4.49 | | | | 4.59 | | | | 3.18 | | | | 3.52 | | | | (0.31 | ) | |
| Total From Investment Operations | | | 4.90 | | | | 4.86 | | | | 3.42 | | | | 3.63 | | | | (0.17 | ) | |
| Less Distributions: | |
| Dividends (from net investment income) | | | (0.59 | ) | | | (0.27 | ) | | | (0.11 | ) | | | (0.13 | ) | | | (0.17 | ) | |
| Distributions (from capital gains) | | | (1.00 | ) | | | (0.05 | ) | | | 0.00 | | | | 0.00 | | | | 0.00 | | |
| Total Distributions | | | (1.59 | ) | | | (0.32 | ) | | | (0.11 | ) | | | (0.13 | ) | | | (0.17 | ) | |
| Redemption Fees | | | 0.00 | (a) | | | 0.00 | (a) | | | 0.00 | (a) | | | 0.00 | | | | 0.00 | | |
| Net Asset Value, End of Period | | $ | 26.83 | | | $ | 23.52 | | | $ | 18.98 | | | $ | 15.67 | | | $ | 12.17 | | |
| Total Return | | | 22.14 | % | | | 25.85 | % | | | 21.92 | % | | | 29.97 | % | | | (1.53 | )% | |
| Ratios/Supplemental Data: | |
| Net Assets, End of Period ($million) | | $ | 7,200.5 | | | $ | 5,627.4 | | | $ | 4,036.9 | | | $ | 2,676.6 | | | $ | 1,393.8 | | |
| Ratio of Expenses to Average Net Assets | | | 1.10 | %* | | | 1.11 | %* | | | 1.20 | % | | | 1.25 | % | | | 1.31 | % | |
| Ratio of Net Investment Incometo Average Net Assets | | | 1.80 | % | | | 1.32 | % | | | 1.40 | % | | | 1.03 | % | | | 1.34 | % | |
| Portfolio Turnover Rate | | | 37 | % | | | 14 | % | | | 21 | % | | | 34 | % | | | 24 | % | |
Financial Highlights–Class II
For a share outstanding throughout each period
| | | Year Ended
September 30,
2006 | | Year Ended
September 30,
2005 | | Year Ended
September 30,
2004 | | Year Ended
September 30,
2003 | | Year Ended
September 30,
2002 | |
| Net Asset Value, Beginning of Period | | $ | 23.36 | | | $ | 18.86 | | | $ | 15.58 | | | $ | 12.13 | | | $ | 12.47 | | |
| Income From Investment Operations: | |
| Net Investment Income | | | 0.34 | | | | 0.22 | | | | 0.18 | | | | 0.08 | | | | 0.15 | | |
| Net Gain (Loss) on Investments (both realized and unrealized) | | | 4.45 | | | | 4.55 | | | | 3.16 | | | | 3.48 | | | | (0.37 | ) | |
| Total From Investment Operations | | | 4.79 | | | | 4.77 | | | | 3.34 | | | | 3.56 | | | | (0.22 | ) | |
| Less Distributions: | |
| Dividends (from net investment income) | | | (0.54 | ) | | | (0.22 | ) | | | (0.06 | ) | | | (0.11 | ) | | | (0.12 | ) | |
| Distributions (from capital gains) | | | (1.00 | ) | | | (0.05 | ) | | | 0.00 | | | | 0.00 | | | | 0.00 | | |
| Total Distributions | | | (1.54 | ) | | | (0.27 | ) | | | (0.06 | ) | | | (0.11 | ) | | | (0.12 | ) | |
| Redemption Fees | | | 0.00 | (a) | | | 0.00 | | | | 0.00 | | | | 0.00 | | | | 0.00 | | |
| Net Asset Value, End of Period | | $ | 26.61 | | | $ | 23.36 | | | $ | 18.86 | | | $ | 15.58 | | | $ | 12.13 | | |
| Total Return | | | 21.71 | % | | | 25.50 | % | | | 21.52 | % | | | 29.52 | % | | | (1.76 | )% | |
| Ratios/Supplemental Data: | |
| Net Assets, End of Period ($million) | | $ | 496.0 | | | $ | 362.9 | | | $ | 259.2 | | | $ | 123.2 | | | $ | 48.5 | | |
| Ratio of Expenses to Average Net Assets | | | 1.49 | %* | | | 1.38 | %* | | | 1.53 | % | | | 1.67 | % | | | 1.58 | % | |
| Ratio of Net Investment Income to Average Net Assets | | | 1.43 | % | | | 1.08 | % | | | 1.18 | % | | | 0.69 | % | | | 1.33 | % | |
| Portfolio Turnover Rate | | | 37 | % | | | 14 | % | | | 21 | % | | | 34 | % | | | 24 | % | |
* The ratio excludes expense offset arrangement.
(a) Amount rounds to less than $0.01 per share.
THE OAKMARK FUNDS
74
THE OAKMARK INTERNATIONAL SMALL CAP FUND
Financial Highlights–Class I
For a share outstanding throughout each period
| | | Year Ended
September 30,
2006 | | Year Ended
September 30,
2005 | | Year Ended
September 30,
2004 | | Year Ended
September 30,
2003 | | Year Ended
September 30,
2002 | |
| Net Asset Value, Beginning of Period | | $ | 22.79 | | | $ | 18.26 | | | $ | 13.74 | | | $ | 10.17 | | | $ | 10.00 | | |
| Income From Investment Operations: | |
| Net Investment Income | | | 0.42 | | | | 0.20 | | | | 0.11 | | | | 0.11 | | | | 0.11 | | |
| Net Gain (Loss) on Investments (both realized and unrealized) | | | 5.12 | | | | 4.98 | | | | 4.52 | | | | 3.82 | | | | 0.36 | (a) | |
| Total From Investment Operations | | | 5.54 | | | | 5.18 | | | | 4.63 | | | | 3.93 | | | | 0.47 | | |
| Less Distributions: | |
| Dividends (from net investment income) | | | (0.70 | ) | | | (0.27 | ) | | | (0.12 | ) | | | (0.09 | ) | | | (0.16 | ) | |
| Distributions (from capital gains) | | | (3.54 | ) | | | (0.38 | ) | | | 0.00 | | | | (0.27 | ) | | | (0.14 | ) | |
| Total Distributions | | | (4.24 | ) | | | (0.65 | ) | | | (0.12 | ) | | | (0.36 | ) | | | (0.30 | ) | |
| Redemption Fees | | | 0.00 | (b) | | | 0.00 | (b) | | | 0.01 | | | | 0.00 | | | | 0.00 | | |
| Net Asset Value, End of Period | | $ | 24.09 | | | $ | 22.79 | | | $ | 18.26 | | | $ | 13.74 | | | $ | 10.17 | | |
| Total Return | | | 28.50 | % | | | 29.04 | % | | | 33.94 | % | | | 39.78 | % | | | 4.68 | % | |
| Ratios/Supplemental Data: | |
| Net Assets, End of Period ($million) | | $ | 1,274.5 | | | $ | 1,007.2 | | | $ | 734.1 | | | $ | 477.8 | | | $ | 357.7 | | |
| Ratio of Expenses to Average Net Assets | | | 1.37 | %* | | | 1.41 | %* | | | 1.49 | % | | | 1.57 | % | | | 1.64 | % | |
| Ratio of Net Investment Income to Average Net Assets | | | 1.73 | % | | | 0.96 | % | | | 0.72 | % | | | 0.99 | % | | | 1.28 | % | |
| Portfolio Turnover Rate | | | 44 | % | | | 47 | % | | | 29 | % | | | 30 | % | | | 42 | % | |
Financial Highlights–Class II
For a share outstanding throughout each period
| | | Year Ended
September 30,
2006 | | Year Ended
September 30,
2005 | | Year Ended
September 30,
2004 | | Year Ended
September 30,
2003 | | Year Ended
September 30,
2002 | |
| Net Asset Value, Beginning of Period | | $ | 22.77 | | | $ | 18.25 | | | $ | 13.69 | | | $ | 10.14 | | | $ | 9.97 | | |
| Income From Investment Operations: | |
| Net Investment Income | | | 0.41 | | | | 0.18 | | | | 0.13 | | | | 0.08 | | | | 0.13 | (c) | |
| Net Gain (Loss) on Investments (both realized and unrealized) | | | 5.10 | | | | 4.98 | | | | 4.52 | | | | 3.81 | | | | 0.30 | (a) | |
| Total From Investment Operations | | | 5.51 | | | | 5.16 | | | | 4.65 | | | | 3.89 | | | | 0.43 | | |
| Less Distributions: | |
| Dividends (from net investment income) | | | (0.69 | ) | | | (0.26 | ) | | | (0.09 | ) | | | (0.07 | ) | | | (0.12 | ) | |
| Distributions (from capital gains) | | | (3.54 | ) | | | (0.38 | ) | | | 0.00 | | | | (0.27 | ) | | | (0.14 | ) | |
| Total Distributions | | | (4.23 | ) | | | (0.64 | ) | | | (0.09 | ) | | | (0.34 | ) | | | (0.26 | ) | |
| Redemption Fees | | | 0.00 | (b) | | | 0.00 | | | | 0.00 | | | | 0.00 | | | | 0.00 | | |
| Net Asset Value, End of Period | | $ | 24.05 | | | $ | 22.77 | | | $ | 18.25 | | | $ | 13.69 | | | $ | 10.14 | | |
| Total Return | | | 28.33 | % | | | 28.94 | % | | | 34.11 | % | | | 39.39 | % | | | 4.25 | % | |
| Ratios/Supplemental Data: | |
| Net Assets, End of Period ($million) | | $ | 0.8 | | | $ | 0.6 | | | $ | 0.5 | | | $ | 0.4 | | | $ | 0.3 | | |
| Ratio of Expenses to Average Net Assets | | | 1.47 | %* | | | 1.49 | %* | | | 1.39 | % | | | 1.81 | % | | | 1.87 | % | |
| Ratio of Net Investment Income to Average Net Assets | | | 1.62 | % | | | 0.87 | % | | | 0.75 | % | | | 0.72 | % | | | 1.06 | % | |
| Portfolio Turnover Rate | | | 44 | % | | | 47 | % | | | 29 | % | | | 30 | % | | | 42 | % | |
* The ratio excludes expense offset arrangement.
(a) The amount shown for a share outstanding does not correspond with the aggregate net realized and unrealized gain/loss for the period due to the timing of purchases and redemption of Fund shares in relation to the fluctuating net asset value per share of the class.
(b) Amount rounds to less than $0.01 per share.
(c) Computed using average shares outstanding throughout the period.
See accompanying Notes to Financial Statements.
THE OAKMARK FUNDS
75
THE OAKMARK FUNDS
Report of Independent Registered Public Accounting Firm
To the Board of Trustees and Shareholders of
Harris Associates Investment Trust:
We have audited the accompanying statements of assets and liabilities, including the schedules of investments, of Harris Associates Investment Trust comprising The Oakmark Fund, The Oakmark Select Fund, The Oakmark Equity and Income Fund, The Oakmark Global Fund, The Oakmark International Fund, and The Oakmark International Small Cap Fund (collectively, the "Funds"), as of September 30, 2006, the related statements of operations for the year then ended, the statements of changes in net assets for each of the two years in the period then ended, and the financial highlights for each of the five years in the period then ended. These financial statements and financial highlights are the responsibility of the Funds' management. Our responsibility is to express an opinion on these financial statements and financial highlights based on our audits.
We conducted our audits in accordance with standards of the Public Company Accounting Oversight Board (United States). Those standards require that we plan and perform the audit to obtain reasonable assurance about whether the financial statements and financial highlights are free of material misstatement. The Funds are not required to have, nor were we engaged to perform, an audit of their internal control over financial reporting. Our audits included consideration of internal control over financial reporting as a basis for designing audit procedures that are appropriate in the circumstances, but not for the purpose of expressing an opinion on the effectiveness of the Funds' internal control over financial reporting. Accordingly, we express no such opinion. An audit also includes examining, on a test basis, evidence supporting the amounts and disclosures in the financial statements, assessing the accounting principles used a nd significant estimates made by management, as well as evaluating the overall financial statement presentation. Our procedures included confirmation of securities owned as of September 30, 2006, by correspondence with the Funds' custodian and brokers; where replies were not received from brokers, we performed other auditing procedures. We believe that our audits provide a reasonable basis for our opinion.
In our opinion, the financial statements and financial highlights referred to above present fairly, in all material respects, the financial position of each of the Funds as of September 30, 2006, the results of their operations for the year then ended, the changes in their net assets for each of the two years in the period then ended, and their financial highlights for each of the five years in the period then ended, in conformity with accounting principles generally accepted in the United States of America.

Chicago, Illinois
October 27, 2006
THE OAKMARK FUNDS
76
Federal Tax Information (Unaudited)
Global, International and Int'l Small Cap paid qualifying foreign taxes of $2,431,333, $11,773,587 and $2,158,380 and earned $40,627,408, $195,975,363 and $34,529,691 foreign source income during the year ended September 30, 2006, respectively. Pursuant to Section 853 of the Internal Revenue Code, Global, International and Int'l Small Cap designated $0.03, $0.04 and $0.04 per share as foreign taxes paid and $0.46, $0.68 and $0.65 per share as income earned from foreign sources for the year ended September 30, 2006, respectively.
Qualified dividend income ("QDI") received by the Funds through September 30, 2006 that qualified for a reduced tax rate pursuant to the Jobs and Growth Tax Relief Reconciliation Act of 2003 are as follows:
| Fund | | | | | |
| Oakmark | | $ | 94,541,294 | | |
| Select | | | 108,235,698 | | |
| Equity and Income | | | 92,241,827 | | |
| Global | | | 31,660,396 | | |
| International | | | 115,600,608 | | |
| Int'l Small Cap | | | 25,453,909 | | |
For corporate shareholders, a portion of the ordinary dividends paid during the Funds' year ended September 30, 2006 qualified for the dividends received deduction, as follows:
| Fund | | | | | |
| Oakmark | | | 100.00 | % | |
| Select | | | 100.00 | % | |
| Equity and Income | | | 42.74 | % | |
| Global | | | 31.12 | % | |
THE OAKMARK FUNDS
77
This material must be preceded or accompanied by a prospectus. To order a prospectus, which explains management fees and expenses and the special risks of investing in the Funds, visit oakmark.com or call 1-800-OAKMARK. Please read the prospectus carefully before investing.
The discussion of the Funds' investments and investment strategies (including current investment themes, the portfolio managers' research and investment process, and portfolio characteristics) represents the Funds' investments and the views of the portfolio managers and Harris Associates L.P., the Funds' investment adviser, at the time of this report, and are subject to change without notice.
The performance data quoted represents past performance. The above performance for the Funds does not reflect the imposition of a 2% redemption fee on shares held for 90 days or less to deter market timers. If reflected, the fee would reduce the performance quoted. Past performance does not guarantee future results. The investment return and principal value will fluctuate so that an investor's shares, when redeemed, may be worth more or less than their original cost. Current performance may be lower or higher than the performance data quoted. Average annual total return measures annualized change, while total return measures aggregate change. To obtain most recent month-end performance data visit oakmark.com.
The performance information for Class I shares of The Oakmark Fund, The Oakmark Select Fund, The Oakmark Equity & Income Fund, The Oakmark Global Fund, The Oakmark International Fund and The Oakmark International Small Cap Fund does not reflect the imposition of a 2% redemption fee on shares held by an investor for 90 days or less. The purpose of this redemption fee is to deter market timers.
Investing in value stocks presents the risk that value stocks may fall out of favor with investors and underperform growth stocks during given periods.
Because The Oakmark Global Select Fund and The Oakmark Select Fund are non-diversified, the performance of each holding will have a greater impact on the Fund's total return, and may make the Fund's returns more volatile than a more diversified fund.
The Oakmark Equity and Income Fund closed to certain new investors as of 5/7/04.
The Oakmark Equity and Income Fund invests in medium- and lower-quality debt securities that have higher yield potential but present greater investment and credit risk than higher-quality securities, which may result in greater share price volatility. An economic downturn could severely disrupt the market in medium or lower grade debt securities and adversely affect the value of outstanding bonds and the ability of the issuers to repay principal and interest.
The Oakmark Global Fund and The Oakmark International Fund closed to certain new investors as of 12/15/03.
The Oakmark International Small Cap Fund closed to most new investors as of 5/10/02.
Investing in foreign securities represents risks that in some way may be greater than in U.S. investments. Those risks include: currency fluctuation; different regulation, accounting standards, trading practices and levels of available information; generally higher transaction costs; and political risks.
The stocks of smaller companies often involve more risk than the stocks of larger companies. Stocks of small companies tend to be more volatile and have a smaller public market than stocks of larger companies. Small companies may have a shorter history of operations than larger companies, may not have as great an ability to raise additional capital and may have a less diversified product line, making them more susceptible to market pressure.
1. The study referred to, "How Active is Your Fund Manager? A New Measure that Predicts Performance," is by Martijn Cremers and Antti Petajisto, June 28, 2006, AFA 2007.
2. The S&P 500 Index is a broad market-weighted average of U.S. blue-chip companies. This index is unmanaged and investors cannot actually make investments in this index.
3. Total return includes change in share prices and in each case includes reinvestment of any dividends and capital gain distributions.
4. Portfolio holdings are subject to change without notice and are not intended as recommendations of individual stocks.
THE OAKMARK FUNDS
78
5. The Dow Jones Industrial Average is an unmanaged index that includes only 30 big companies. This index is unmanaged and investors cannot actually make investments in this index.
6. The Lipper Large Cap Value Fund Index is an equally weighted index of the largest 30 funds within the large cap value funds investment objective as defined by Lipper Inc. The index is adjusted for the reinvestment of capital gains and income dividends. This index is unmanaged and investors cannot actually make investments in this index.
7. The S&P MidCap 400 is an unmanaged broad market-weighted index of 400 stocks that are in the next tier down from the S&P 500 and that are chosen for market size, liquidity, and industry group representation. This index is unmanaged and investors cannot actually make investments in this index.
8. The Lipper Mid Cap Value Fund Index measures the performance of the 30 largest U.S. mid-cap value funds tracked by Lipper. This index is unmanaged and investors cannot actually make investments in this index.
9. The Price-Earnings Ratio ("P/E") is the most common measure of the expensiveness of a stock.
10. The Lipper Balanced Fund Index measures the performance of the 30 largest U.S. balanced funds tracked by Lipper. This index is unmanaged and investors cannot actually make investments in this index.
11. Lehman Brothers Government/Corporate Bond Index is a benchmark index made up of the Lehman Brothers Government and Corporate Bond indexes, including U.S. government Treasury and agency securities as well as corporate and Yankee bonds. This index is unmanaged and investors cannot actually make investments in this index.
12. The quoted passage is taken from "A Defense of Short-Termism" by Joe Nocera, New York Times, July 29, 2006.
13. The MSCI World Index is a free float-adjusted market capitalization index that is designed to measure global developed market equity performance. As of December 2003, the MSCI World Index consisted of the following 23 developed market country indices: Australia, Austria, Belgium, Canada, Denmark, Finland, France, Germany, Greece, Hong Kong, Ireland, Italy, Japan, Netherlands, New Zealand, Norway, Portugal, Singapore, Spain, Sweden, Switzerland, the United Kingdom and the United States. This index is unmanaged and investors cannot actually make investments in this index.
14. The Lipper Global Fund Index measures the performance of the 30 largest mutual funds that invest in securities throughout the world. This index is unmanaged and investors cannot actually make investments in this index.
15. The MSCI World Index ex U.S. is a free float-adjusted market capitalization index that is designed to measure global developed market equity performance. As of April 2002, the MSCI World Index consisted of the following 22 developed market country indices: Australia, Austria, Belgium, Canada, Denmark, Finland, France, Germany, Greece, Hong Kong, Ireland, Italy, Japan, Netherlands, New Zealand, Norway, Portugal, Singapore, Spain, Sweden, Switzerland, and the United Kingdom. This index is unmanaged and investors cannot actually make investments in this index.
16. The MSCI EAFE Index (Europe, Australasia, Far East) is a free float-adjusted market capitalization index that is designed to measure developed market equity performance, excluding the US & Canada. As of December 2003, the MSCI EAFE Index consisted of the following 21 developed market country indices: Australia, Austria, Belgium, Denmark, Finland, France, Germany, Greece, Hong Kong, Ireland, Italy, Japan, the Netherlands, New Zealand, Norway, Portugal, Singapore, Spain, Sweden, Switzerland and the United Kingdom. This index is unmanaged and investors cannot actually make investments in this index.
17. The Lipper International Fund Index reflects the net asset value weighted total return of the 30 largest international equity funds. This index is unmanaged and investors cannot actually make investments in this index.
18. The MSCI World ex U.S. Small Cap Index is the small cap component of the MSCI World ex U.S. Standard Index. Securities selected represent 40% of the small cap asset class in each developed market on a capitalization-weighted basis. This index is unmanaged and investors cannot actually make an investment in this index.
19. The Lipper International Small Cap Funds Index measures the performance of the 10 largest international small-cap funds tracked by Lipper. This index is unmanaged and investors cannot actually make investments in this index.
THE OAKMARK FUNDS
79
THE OAKMARK FUNDS
Trustees and Officers
The board of trustees has overall responsibility for the conduct of the affairs of Harris Associates Investment Trust ("Trust"), and its series, The Oakmark Funds. Each trustee serves until the next annual meeting of shareholders and until the election and qualification of his or her successor, or until he or she dies, resigns or is removed. Each trustee must retire at the end of the calendar year in which the trustee attains the age of 72. The board of trustees may fill any vacancy on the board provided that after such appointment, at least two-thirds of the trustees have been elected by the shareholders. No person shall be appointed or elected to serve as a trustee for the first time after attaining the age of 65. A majority of trustees then in office may remove a trustee with or without cause. The shareholders may remove a trustee by a vote of two-thirds of the outstanding shares of the Trust at any meeting of shareholders called for the purpose of removing such trustee.
The board of trustees elects or appoints the Trust's officers. The president, any vice president, treasurer and secretary serves until the election and qualification of his or her successor, or until he or she dies, resigns, or is removed or disqualified. Each other officer shall serve at the pleasure of the board of trustees. The board of trustees may remove any officer at any time, with or without cause, by the vote of a majority of the trustees then in office.
The names and ages of the trustees and officers, the position each holds with the Trust, the date each was first elected to office, their principal business occupations during the last five years and other directorships held are shown below.
Name and Age at September 30, 2006, Positions Held with the Trust, Date First Elected or Appointed to Office, Principal Occupations During the Past 5 Years. Other Directorships Held by Trustee, if any.
Trustees who are "interested persons"*
Peter S. Voss, 59, Trustee, 1995
Chairman and Chief Executive Officer, IXIS Asset Management Group; Chairman, President and Chief Executive Officer, IXIS Asset Management US Corporation, formerly named IXIS Asset Management North America, L.P. (investment management); Chairman of IXIS Asset Management US, LLC; Member of the Supervisory Board, IXIS Asset Management; Director, Harris Associates, Inc. ("HAI"). Chairman, AEW Real Estate Income Fund (closed-end investment company); Chairman and Chief Executive Officer, IXIS Advisor Funds (open-end investment company with 14 portfolios).
John R. Raitt, 51, Trustee and President, 2003
President and Chief Executive Officer, HAI, Harris Associates L.P. ("HALP") and Harris Associates Securities L.P. ("HASLP") since 2003; Chief Operating Officer, HALP 2001-2002; Director of Research, HALP, prior thereto.
Trustees who are not "interested persons"
Gary N. Wilner, M.D., 66, Trustee and Chairman of the Board of Trustees, 1993
Retired since 2004; Senior Attending Physician, Evanston Hospital; Medical Director of Cardiopulmonary Wellness Program, Evanston Hospital Corporation, prior thereto. Chairman of the Board of Directors, North American Scientific, Inc. (developer of radioisotopic products for the treatment and diagnosis of disease).
Michael J. Friduss, 63, Trustee, 1995
Principal, MJ Friduss & Associates, Inc. (telecommunications consultants).
THE OAKMARK FUNDS
80
Trustees and Officers cont.
Thomas H. Hayden, 55, Trustee, 1995
Principal, TerraNova Market Strategies, LLC (market research and strategic consulting practice), since July 2006; President, Greenhouse Communications (advertising agency), 2004 to 2006; Executive Vice President, Campbell Mithun (advertising and marketing communication agency), prior thereto.
Christine M. Maki, 45, Trustee, 1995
Vice President–Tax, Hyatt Corporation (hotel management).
Allan J. Reich, 58, Trustee, 1993
Partner, Seyfarth Shaw LLP (law firm), since 2003; Vice Chairman, D'Ancona & Pflaum LLC (law firm), prior thereto.
Steven S. Rogers, 49, Trustee, 2006
Clinical Professor of Finance & Management, Kellogg Graduate School of Management, Northwestern University, since 1995; Entrepreneur-in-Residence, Ewing Marion Kauffman Foundation, since 1994. Director, SC Johnson Wax (manufacturer of household cleaning, personal care and insecticide products), SuperValu, Inc. (supermarket retailer and food distributor), AMCORE Financial, Inc. (bank holding company), and W.S. Darley & Co.
Marv R. Rotter, 60, Trustee, 1995
Retired since 2004; Senior Advisor to Chief Executive Officer, AXA Advisors, LLC (formerly named Rotter & Associates), prior thereto.
Burton W. Ruder, 62, Trustee, 1995
President, The Academy Financial Group (venture capital investment and transaction financing firm); Manager, Cedar Green Associates (real estate management firm).
Officers of the Trust
Henry R. Berghoef, 57, Vice President and Portfolio Manager (The Oakmark Select Fund), 2000
Director of Domestic Research, HALP, since 2003; Associate Director of Research, 2001 to 2002; Portfolio Manager and Analyst, HALP.
Chad M. Clark, 34, Vice President and Portfolio Manager (The Oakmark International Small Cap Fund), 2005
Portfolio Manager, HALP, since 2001; International Analyst, HALP.
Richard J. Gorman, 40, Vice President, Chief Compliance Officer and Assistant Secretary, HALP, 2006
Senior Special Counsel, Investment Management Regulation, United States Securities and Exchange Commission, prior thereto.
Kevin G. Grant, 42, Vice President and Portfolio Manager (The Oakmark Fund), 2000
Portfolio Manager and Analyst, HALP.
David G. Herro, 45, Vice President and Portfolio Manager (The Oakmark International Fund and The Oakmark International Small Cap Fund), 1992
Chief Investment Officer of International Equity, HALP, since 2003; Portfolio Manager and Analyst, HALP.
John J. Kane, 35, Treasurer, 2005
Assistant Treasurer, 1999 to 2005; Manager, Mutual Fund and Institutional Services, HALP.
THE OAKMARK FUNDS
81
Trustees and Officers cont.
Robert M. Levy, 56, Executive Vice President, 2004
Chairman, HAI and Chief Investment Officer of Domestic Equity, HALP, since 2001; President and Chief Executive Officer, HAI, HALP and HASLP, 1997 to 2002; Portfolio Manager, HALP.
Clyde S. McGregor, 53, Vice President and Portfolio Manager (The Oakmark Equity and Income Fund and The Oakmark Global Fund), 1995
Portfolio Manager, HALP.
William C. Nygren, 48, Vice President and Portfolio Manager (The Oakmark Fund and The Oakmark Select Fund), 1996
Portfolio Manager and Analyst, HALP.
Vineeta D. Raketich, 35, Vice President, 2003
Manager, International Operations and Client Relations, HALP, since 2003; Supervisor, Mutual Fund and Institutional Services, HALP, prior thereto.
Janet L. Reali, 55, Vice President and Secretary, 2001
Vice President, General Counsel and Secretary, HAI, HALP and HASLP.
Kristi L. Rowsell, 40, Vice President and Principal Financial Officer, 2005
Director, Chief Financial Officer and Treasurer, HAI; Chief Financial Officer, HALP and HASLP, prior thereto.
Edward A. Studzinski, 57, Vice President and Portfolio Manager (The Oakmark Equity and Income Fund), 2000
Portfolio Manager and Analyst, HALP.
Robert A. Taylor, 34, Vice President and Portfolio Manager (The Oakmark Global Fund), 2005
Director of International Research, since 2004; Portfolio Manager and Analyst, HALP.
Christopher P. Wright, 32, Vice President, 2005
Director of Mutual Fund Operations, HALP, since 2004; Assistant Director of Mutual Fund Operations, HALP, 2002 to 2004; Manager of Mutual Fund Operations, HALP, prior thereto.
* Mr. Voss is a trustee who is an "interested person" of the Funds as defined in the Investment Company Act of 1940, because he is a director of HAI, the general partner and manager of HALP, the investment adviser to the Funds. Mr. Voss is also the Chairman, President and Chief Executive Officer of IXIS Asset Management US Corporation, formerly named IXIS Asset Management North America, L.P., the parent company of HALP. Mr. Raitt is a trustee who is an "interested person" of the Funds because he is the President and Chief Executive Officer of HAI, HASLP and HALP.
The business address of the officers and trustees is Two North LaSalle Street, #500, Chicago, Illinois 60602.
The Statement of Additional Information (SAI) contains further information about the trustees and is available without charge upon your request by calling 1-800-625-6275.
THE OAKMARK FUNDS
82
THE OAKMARK FUNDS
Investment Philosophy
All Oakmark managers follow a consistent investment philosophy—to invest in companies they believe are trading at a substantial discount to underlying business value. Critical to this philosophy is to invest with management teams who are committed to maximizing the company's business value.
Three key tenets of our
investment philosophy:
1 Buy businesses trading at a significant discount
to our estimate of true business value.
2 Invest in companies expected to grow shareholder value over time.
3 Invest with management teams who think
and act as owners.
Investment Process
We seek to identify undervalued companies through an intensive, in-house research process. This process is not based on macro-economic factors, such as the performance of the economy or the direction of interest rates. Nor is it based on technical factors, such as the performance of the stock market itself. And, while some value managers might use only one summary statistic—such as price-earnings ratio—our investment professionals take a more in-depth approach using a range of valuation measures appropriate for a specific company or industry.
From the universe of thousands of equity securities, our team generates investment ideas through a variety of methods. If a security appears attractive, detailed quantitative and qualitative research follows. This careful process of identifying undervalued stocks results in an "approved list."
The Result: a unified effort aimed at identifying the best values in the marketplace. From the list of
approved stocks, each fund manager constructs a relatively focused portfolio, built on a stock-by-stock basis from the bottom up.
Who Should Invest
Any investor who is seeking a disciplined value manager for the purposes of growing and diversifying a portfolio should consider one of The Oakmark Funds, keeping in mind that all equity investments should be considered long-term investments. As value investors, we recognize that patience is a virtue and believe that, over the long term, investors are rewarded for their patience. We generally hold the companies in which we invest for three to five years, a time horizon that we encourage our shareholders to consider as well.
How to Use Value Funds
in an Overall Portfolio
Investment styles tend to move in cycles. One style may be in favor for a few years while the other is out of favor, and vice versa. Diversifying the stock portion of your portfolio may help reduce overall volatility—and potentially provide more consistent returns over time.
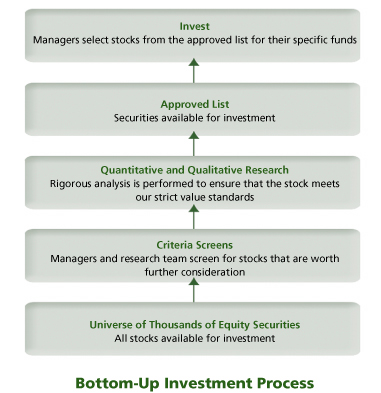
THE OAKMARK FUNDS
83
The Oakmark Glossary
Book value – A company's common stock equity as it appears on a balance sheet, equal to total assets minus liabilities, preferred stock, and intangible assets such as goodwill. A company's book value often differs substantially from economic value, especially in industries such as media.
Business value/Intrinsic value – The perceived or estimated actual value of a security, as opposed to its current market price or book value. Business value can be evaluated based on what a knowledgeable buyer would pay for a business if the company were sold in its entirety.
Growth investing – Investors who look for companies based on whether the stock of a company is growing earnings and/or revenue faster than the industry as a whole or the overall market. Growth investors generally expect high rates of growth to persist, and the stock, in turn, to deliver returns exceeding the market's. A growth mutual fund is generally one that emphasizes stocks believed to offer above-average growth prospects, with little to no emphasis on the stock's current price.
M & A (Mergers & Acquisitions) – Merger: the combining of two or more entities into one, through a purchase acquisition or a pooling of interests. Acquisition: can also be called a takeover, and is defined as acquiring control of a corporation, called a target, by stock purchase or exchange, either hostile or friendly.
Market capitalization (market cap or cap) – The market price of an entire company on any given day, calculated by multiplying the number of shares outstanding by the price per share.
Momentum investing – Approach to investing based on the belief that stock price trends are likely to continue. Momentum investors tend to buy stocks that have been outperforming the market and to sell those stocks when their relative performance deteriorates. Momentum investors do not consider a company's underlying value or fundamentals in their investment decisions.
Multiple – A ratio used to measure a stock's valuation, usually greater than 1. Sometimes used to mean price/earnings ratio.
P/B or Price-to-Book Ratio – A stock's capitalization divided by its book value. The value is the same whether the calculation is done for the whole company or on a per-share basis.
P/E or Price-to-Earnings Ratio – The most common measure of a stock's valuation. It is equal to a stock's capitalization divided by its after-tax earnings over a 12-month period. The value is the same whether the calculation is done for the whole company or on a per-share basis. Equivalently, the cost an investor in a given stock must pay per dollar of current annual earnings. Also called earnings multiple.
Share repurchase – Program through which a corporation buys back its own shares in the open market, typically an indication that the corporation's management believes the stock price is undervalued.
Value investing – Investors who utilize valuation measures such as business value (including growth rate), price/earnings ratio, price/book ratio, and yield to gauge the attractiveness of a company. Managers who employ a value investment style believe that the true, underlying value of a company is not reflected in its current share price, and, over time, the price has potential to increase as the market recognizes the overall value of the business. Value stocks sell at relatively low prices in relation to their underlying business value, earnings, or book value.
Stocks become undervalued for a variety of reasons, including an overall market decline, or when a specific industry falls into disfavor and investors view all companies in that industry in the same light. Consequently, an individual company's stock price may fall, even though it may be only temporarily affected by the industry's problems and its underlying value has remained unchanged.
"x times earnings" ("12 times earnings") – Another way to express a stock's price-to-earnings (P/E) ratio. A stock with a P/E ratio of 12 sells at 12 times earnings.
THE OAKMARK FUNDS
84
THE OAKMARK FUNDS
Other Information
Investment Adviser
Harris Associates L.P.
Two North LaSalle Street
Chicago, Illinois 60602-3790
Transfer Agent
Boston Financial Data Services, Inc.
Quincy, Massachusetts
Legal Counsel
Bell, Boyd & Lloyd LLC
Chicago, Illinois
Independent Auditors
Deloitte & Touche LLP
Chicago, Illinois
Contact Us
Please call 1-800-OAKMARK
(1-800-625-6275)
or 617-483-3250
Website
oakmark.com
To obtain a prospectus, an application or periodic reports, access our web site at oakmark.com, or call 1-800-OAKMARK (1-800-625-6275) or (617) 483-3250.
The Funds will file its complete schedule of portfolio holdings with the Securities and Exchange Commission (the "SEC") for the first and third quarters of each fiscal year on Form N-Q. The Funds' Forms N-Q are available on the SEC's website at www.sec.gov. The Funds' Forms N-Q may be reviewed and copied at the SEC's Public Reference Room in Washington, DC, and information on the operation of the Public Reference Room may be obtained by calling 1-800-SEC-0330.
A description of the policies and procedures the Funds use to determine how to vote proxies relating to portfolio securities is available without charge, upon request, by calling toll-free 1-800-625-6275; on the Funds' website at oakmark.com; and on the SEC's website at www.sec.gov.
No later than August 31 of each year, information regarding how the Adviser, on behalf of the Funds, voted proxies relating to the Funds' portfolio securities for the twelve months ended the preceding June 30 will be available through a link on the Funds' website at oakmark.com and on the SEC's website at www.sec.gov.
This report is submitted for the general information of the Funds' shareholders. The report is not authorized for distribution to prospective investors in the Funds unless it is accompanied or preceded by the Funds' currently effective prospectus.
No sales charge to the shareholder or to the new investor is made in offering the shares of the Funds, however, a shareholder may incur a 2% redemption fee on an exchange or redemption of Class I shares held for 90 days or less from any Fund.

1-800-OAKMARK
oakmark.com
The Oakmark Funds are distributed by Harris Associates Securities L.P., member NASD. Date of first use: November 2006.
THE OAKMARK FUND CLASS II
THE VALUE OF A $10,000 INVESTMENT IN THE OAKMARK FUND FROM ITS
INCEPTION (4/5/01) TO PRESENT (9/30/06) AS COMPARED TO THE
STANDARD & POOR'S 500 INDEX (UNAUDITED)
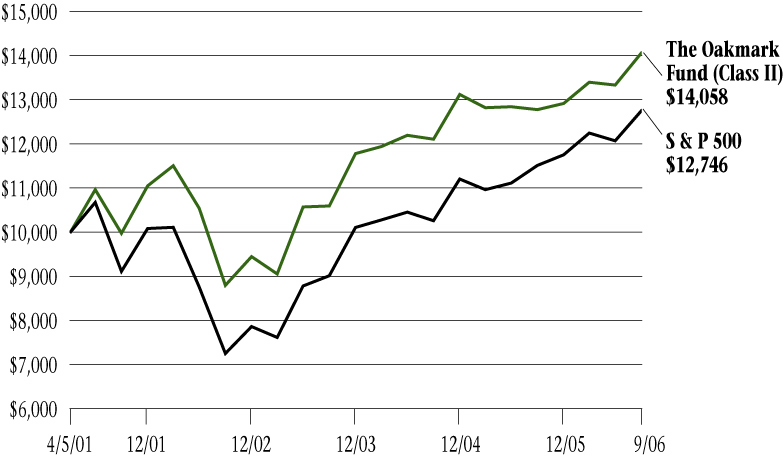
Average Annual Total Returns
(as of 9/30/06)
| (Unaudited) | | 1-year | | 5-year | | Since
Inception
(4/5/01) | |
| Oakmark Fund (Class II) | | | 10.08 | % | | | 7.13 | % | | | 7.20 | % | |
| S&P 500 | | | 10.79 | % | | | 6.97 | % | | | 4.52 | % | |
The graph and table do not reflect the deduction of taxes that a shareholder would pay on fund distributions or the redemption of fund shares.
The performance data quoted represents past performance. Past performance does not guarantee future results. The investment return and principal value will fluctuate so that an investor's shares, when redeemed, may be worth more or less than their original cost. Current performance may be lower or higher than the performance data quoted. Average annual total return measures annualized change, while total return measures aggregate change. To obtain most recent month-end performance data, visit oakmark.com.
Harris Associates Securities L.P., member NASD, November 2006
THE OAKMARK SELECT FUND CLASS II
THE VALUE OF A $10,000 INVESTMENT IN THE OAKMARK SELECT FUND FROM ITS
INCEPTION (12/31/99) TO PRESENT (9/30/06) AS COMPARED TO THE
STANDARD & POOR'S 500 INDEX (UNAUDITED)

Average Annual Total Returns
(as of 9/30/06)
| (Unaudited) | | 1-year | | 5-year | | Since
Inception
(12/31/99) | |
| Oakmark Select Fund (Class II) | | | 9.18 | % | | | 7.78 | % | | | 12.94 | % | |
| S&P 500 | | | 10.79 | % | | | 6.97 | % | | | 0.20 | % | |
The graph and table do not reflect the deduction of taxes that a shareholder would pay on fund distributions or the redemption of fund shares.
The performance data quoted represents past performance. Past performance does not guarantee future results. The investment return and principal value will fluctuate so that an investor's shares, when redeemed, may be worth more or less than their original cost. Current performance may be lower or higher than the performance data quoted. Average annual total return measures annualized change, while total return measures aggregate change. To obtain most recent month-end performance data, visit oakmark.com.
Harris Associates Securities L.P., member NASD, November 2006
THE OAKMARK EQUITY AND INCOME FUND CLASS II
THE VALUE OF A $10,000 INVESTMENT IN THE OAKMARK EQUITY AND INCOME
FUND FROM ITS INCEPTION (7/13/00) TO PRESENT (9/30/06) AS COMPARED TO
THE LIPPER BALANCED FUND INDEX (UNAUDITED)
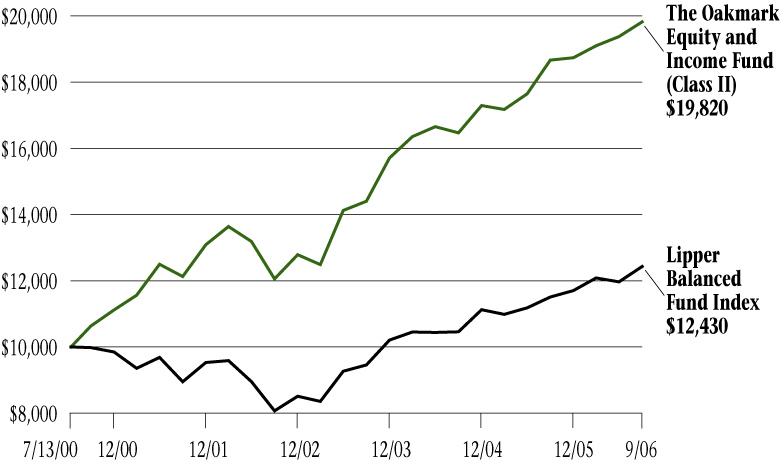
Average Annual Total Returns
(as of 9/30/06)
| (Unaudited) | | 1-year | | 5-year | | Since
Inception
(7/13/00) | |
| Oakmark Equity & Income Fund (Class II) | | | 6.18 | % | | | 10.32 | % | | | 12.93 | % | |
| Lipper Balanced Fund Index | | | 8.02 | % | | | 6.79 | % | | | 3.56 | % | |
The graph and table do not reflect the deduction of taxes that a shareholder would pay on fund distributions or the redemption of fund shares.
The performance data quoted represents past performance. Past performance does not guarantee future results. The investment return and principal value will fluctuate so that an investor's shares, when redeemed, may be worth more or less than their original cost. Current performance may be lower or higher than the performance data quoted. Average annual total return measures annualized change, while total return measures aggregate change. To obtain most recent month-end performance data, visit oakmark.com.
Harris Associates Securities L.P., member NASD, November 2006
THE OAKMARK GLOBAL FUND CLASS II
THE VALUE OF A $10,000 INVESTMENT IN THE OAKMARK GLOBAL FUND
FROM ITS INCEPTION (10/10/01) TO PRESENT (9/30/06) AS COMPARED TO THE
MSCI WORLD INDEX (UNAUDITED)

Average Annual Total Returns
(as of 9/30/06)
| (Unaudited) | | 1-year | | 5-year | | Since
Inception
(10/10/01) | |
| Oakmark Global Fund (Class II) | | | 17.01 | % | | | 20.84 | % | | | 24.11 | % | |
| MSCI World | | | 14.18 | % | | | 10.01 | % | | | 9.33 | % | |
The graph and table do not reflect the deduction of taxes that a shareholder would pay on fund distributions or the redemption of fund shares.
The performance data quoted represents past performance. Past performance does not guarantee future results. The investment return and principal value will fluctuate so that an investor's shares, when redeemed, may be worth more or less than their original cost. Current performance may be lower or higher than the performance data quoted. Average annual total return measures annualized change, while total return measures aggregate change. To obtain most recent month-end performance data, visit oakmark.com.
Harris Associates Securities L.P., member NASD, November 2006
THE OAKMARK INTERNATIONAL FUND CLASS II
THE VALUE OF A $10,000 INVESTMENT IN THE OAKMARK INTERNATIONAL FUND
FROM ITS INCEPTION (11/4/99) TO PRESENT (9/30/06) AS COMPARED TO THE
MSCI WORLD EX U.S. INDEX (UNAUDITED)
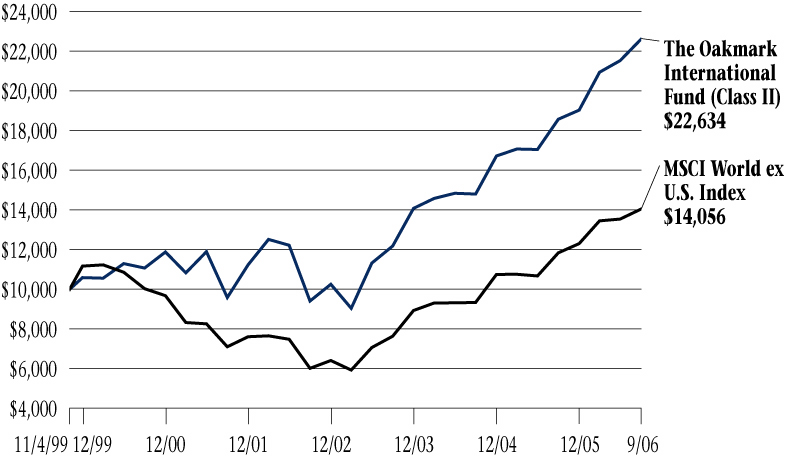
Average Annual Total Returns
(as of 9/30/06)
| (Unaudited) | | 1-year | | 5-year | | Since
Inception
(11/4/99) | |
| Oakmark International Fund (Class II) | | | 21.71 | % | | | 18.74 | % | | | 13.81 | % | |
| MSCI World ex U.S. Index | | | 18.65 | % | | | 14.63 | % | | | 5.05 | % | |
The graph and table do not reflect the deduction of taxes that a shareholder would pay on fund distributions or the redemption of fund shares.
The performance data quoted represents past performance. Past performance does not guarantee future results. The investment return and principal value will fluctuate so that an investor's shares, when redeemed, may be worth more or less than their original cost. Current performance may be lower or higher than the performance data quoted. Average annual total return measures annualized change, while total return measures aggregate change. To obtain most recent month-end performance data, visit oakmark.com.
Harris Associates Securities L.P., member NASD, November 2006
THE OAKMARK INTERNATIONAL
SMALL CAP FUND CLASS II
THE VALUE OF A $10,000 INVESTMENT IN THE OAKMARK INTERNATIONAL SMALL
CAP FUND FROM ITS INCEPTION (1/8/01) TO PRESENT (9/30/06) AS COMPARED
TO THE MSCI WORLD EX U.S. INDEX (UNAUDITED)

Average Annual Total Returns
(as of 9/30/06)
| (Unaudited) | | 1-year | | 5-year | | Since
Inception
(1/8/01) | |
| Oakmark International Small Cap Fund (Class II) | | | 28.33 | % | | | 26.39 | % | | | 23.81 | % | |
| MSCI World ex U.S. | | | 18.65 | % | | | 14.63 | % | | | 6.80 | % | |
The graph and table do not reflect the deduction of taxes that a shareholder would pay on fund distributions or the redemption of fund shares.
The performance data quoted represents past performance. Past performance does not guarantee future results. The investment return and principal value will fluctuate so that an investor's shares, when redeemed, may be worth more or less than their original cost. Current performance may be lower or higher than the performance data quoted. Average annual total return measures annualized change, while total return measures aggregate change. To obtain most recent month-end performance data, visit oakmark.com.
Harris Associates Securities L.P., member NASD, November 2006
FUND EXPENSES
A shareholder of each Fund incurs two types of costs: (1) transaction costs, such as redemption fees, and (2) ongoing costs, including investment advisory fees, transfer agent fees, and other fund expenses. The examples below are intended to help shareholders understand the ongoing cost (in dollars) of investing in each Fund and to compare these costs with the ongoing costs of investing in other funds.
Actual Expenses
The following table provides information about actual account values and actual fund expenses for Class II of each Fund. The table shows the expenses a Class II shareholder would have paid on a $1,000 investment in each Fund from April 1, 2006, to September 30, 2006, as well as how much a $1,000 investment would be worth at the close of the period, assuming actual fund returns and expenses. A Class II shareholder can estimate expenses incurred for the period by dividing the account value at September 30, 2006, by $1,000 and multiplying the result by the number in the Expenses Paid During the Period row as shown below.
| | | The Oakmark
Fund | | The Oakmark
Select Fund | | The Oakmark
Equity and
Income Fund | | The Oakmark
Global Fund | | The Oakmark
International
Fund | | The Oakmark
International
Small Cap
Fund | |
| Beginning Account Value | | $ | 1,000.00 | | | $ | 1,000.00 | | | $ | 1,000.00 | | | $ | 1,000.00 | | | $ | 1,000.00 | | | $ | 1,000.00 | | |
| Ending Account Value | | $ | 1,049.70 | | | $ | 1,020.30 | | | $ | 1,037.80 | | | $ | 1,062.20 | | | $ | 1,079.50 | | | $ | 1,077.00 | | |
| Expenses Paid During Period* | | $ | 7.30 | | | $ | 6.79 | | | $ | 6.13 | | | $ | 8.17 | | | $ | 7.98 | | | $ | 7.71 | | |
| Annualized Expense Ratio | | | 1.42 | % | | | 1.34 | % | | | 1.20 | % | | | 1.58 | % | | | 1.53 | % | | | 1.48 | % | |
* Expenses are equal to each Fund's annualized expense ratio for Class II, multiplied by the average account value over the period, multiplied by the number of days in the most recent fiscal half-year divided by 365 (to reflect the one-half year period).
Hypothetical Example for Comparison Purposes
The following table provides information about hypothetical account values and hypothetical expenses for Class II of each Fund based on actual expense ratios and an assumed rate of return of 5% per year before expenses, which are not the Funds' actual returns. The hypothetical account values and expenses may not be used to estimate the actual ending account balances or expenses shareholders paid for the period. Shareholders may use this information to compare the ongoing costs of investing in a Fund and other funds. To do so, compare this 5% hypothetical example with the 5% hypothetical examples that appear in the shareholder reports of the other funds.
Please note that the expenses shown in the table are meant to highlight your ongoing costs only and do not reflect any transaction costs, such as redemption fees. Therefore, the third line of the table is useful in comparing ongoing costs only, and will not help you determine the relative total costs of owning different funds. In addition, if these transaction costs were included, the total costs would have been higher.
| | | The Oakmark
Fund | | The Oakmark
Select Fund | | The Oakmark
Equity and
Income Fund | | The Oakmark
Global Fund | | The Oakmark
International
Fund | | The Oakmark
International
Small Cap
Fund | |
| Beginning Account Value | | $ | 1,000.00 | | | $ | 1,000.00 | | | $ | 1,000.00 | | | $ | 1,000.00 | | | $ | 1,000.00 | | | $ | 1,000.00 | | |
| Ending Account Value | | $ | 1,017.95 | | | $ | 1,018.35 | | | $ | 1,019.05 | | | $ | 1,017.15 | | | $ | 1,017.40 | | | $ | 1,017.65 | | |
| Expenses Paid During Period* | | $ | 7.18 | | | $ | 6.78 | | | $ | 6.07 | | | $ | 7.99 | | | $ | 7.74 | | | $ | 7.49 | | |
| Annualized Expense Ratio | | | 1.42 | % | | | 1.34 | % | | | 1.20 | % | | | 1.58 | % | | | 1.53 | % | | | 1.48 | % | |
* Expenses are equal to each Fund's annualized expense ratio for Class II, multiplied by the average account value over the period, multiplied by the number of days in the most recent fiscal half-year divided by 365 (to reflect the one-half year period).
Item 2. Code of Ethics.
(a) Registrant has adopted a code of ethics (the “Code”) that applies to its Principal Executive Officer, Principal Financial Officer and Principal Accounting Officer.
(b) No disclosures are required by this Item 2(b).
(c) During the period covered by the report, no amendments were made to the provisions of the Code.
(d) During the period covered by the report, Registrant did not grant any waivers, including implicit waivers, from the provisions of the Code.
(e) Not applicable.
(f) A copy of the Code is filed as Exhibit (a)(1) to this Form N-CSR. Copies of the Code will also be made available free of charge upon request, by writing or calling The Oakmark Funds, P.O. Box 8510, Boston, MA 02266-8510, 1-800-OAKMARK, (1-800-625-6275).
Item 3. Audit Committee Financial Expert.
Registrant’s board of trustees has determined that each of the following five members of the Registrant’s audit committee qualifies as an “audit committee financial expert,” as such term is defined in Instruction 2(b) to Item 3 of Form N-CSR: Michael J. Friduss, Thomas H. Hayden, Christine M. Maki, Allan J. Reich and Gary N. Wilner, M.D. Each of those members of Registrant’s audit committee is “independent” as such term is defined in paragraph (a)(2) of Item 3 of Form N-CSR.
Under applicable securities laws, a person who is determined to be an audit committee financial expert will not be deemed an “expert” for any purpose, including without limitation for the purposes of Section 11 of the Securities Act of 1933, as a result of being designated or identified as an audit committee financial expert. The designation or identification of a person as an audit committee financial expert does not impose on such person any duties, obligations, or liability that are greater than the duties, obligations, and liability imposed on such person as a member of the audit committee and board of trustees in the absence of such designation or identification. The designation or identification of a person as an audit committee financial expert does not affect the duties, obligations, or liability of any other member of the audit committee or board of trustees.
Item 4. Principal Accountant Fees and Services.
Aggregate fees billed to the Registrant for professional services rendered by the Registrant’s principal accountant were as follows:
| | Fiscal Year
Ended
September 30,
2006 | | Fiscal Year
Ended
September 30,
2005 | |
Audit Fees(1) | | $ | 171,000 | | $ | 170,900 | |
Audit-Related Fees(2) | | $ | 51,000 | | $ | 48,600 | |
Tax Fees(3) | | $ | 23,270 | | $ | 20,700 | |
All Other Fees(4) | | $ | 0 | | $ | 0 | |
During its regularly scheduled periodic meetings, the Registrant’s audit committee will pre-approve all audit, audit-related, tax and other services to be provided by the principal accountants of the Registrant. The audit committee has authorized its chairman to exercise that authority in the intervals between meetings; and the chairman presents any such pre-approvals to the audit committee at its next regularly scheduled meeting. Under paragraph (c)(7)(i)(C) of Rule 2-01 of Regulation S-X, pre-approval of non-audit services may waived provided that: 1) the aggregate amount for all such services provided constitutes no more than five percent of the total amount of revenues paid by the Registrant to its principal accountant during the fiscal year in which such services are provided; 2) such services were not recognized by management at the time of engagement as non-audit services; and 3) such services are promptly brought to the attention of the Registrant’s audit committee by management and approved prior to the completion of the audit by the audit committee or by one or more members of the audit committee who are members of the board of trustees to whom authority to grant such approvals has been delegated by the audit committee.
No audit-related, tax or non-audit services were approved by waiver pursuant to paragraph (c)(7)(i)(C) of Rule 2-01 of Regulation S-X.
(1) “Audit Fees” include amounts for professional services rendered by the principal accountant for the audit of the Registrant’s annual financial statements and services that are normally provided by the accountant in connection with statutory and regulatory filings or engagements.
(2) “Audit-Related Fees” include amounts for assurance and related services by the principal accountant that are reasonably related to the performance of the audit of the Registrant’s financial statements, specifically the semi-annual reviews of the Funds in fiscal year 2006.
(3) “Tax Fees” include amounts for professional services rendered by the principal accountant for tax compliance, tax advice and tax planning, specifically distribution consultation.
(4) “All Other Fees” include amounts for products and services provided by the principal accountant. No such products and services were provided.
Less than 50 percent of the hours expended on the principal accountant’s engagement to audit the Registrant’s financial statements for the most recent fiscal year were attributed to work performed by persons other than the principal accountant’s full-time, permanent employees.
The aggregate non-audit fees billed for the fiscal years ended September 30, 2006 and September 30, 2005 by the Registrant’s principal accountant for services rendered to the Registrant, its investment adviser and any entity controlling, controlled by or under common control with the investment adviser that provides ongoing services to the Registrant were $133,000 and $28,000, respectively.
The audit committee of Registrant’s board of trustees has considered whether the provision of non-audit services that were rendered by Registrant’s principal accountant to Registrant’s investment adviser, and any entity controlling, controlled by or under common control with the investment adviser that provides ongoing services to the Registrant that were not pre-approved pursuant to paragraph (c)(7)(ii) of Rule 2-01 of Regulation S-X is compatible with maintaining the principal accountant’s independence. No such services were rendered.
Item 5. Audit Committee of Listed Registrants.
Not applicable.
Item 6. Schedule of Investments.
The Schedule of Investments in securities of unaffiliated issuers as of the close of the reporting period is included as part of the annual report to shareholders filed under Item 1 of this Form.
Item 7. Disclosure of Proxy Voting Policies and Procedures for Closed-End Management Investment Companies.
Not applicable.
Item 8. Portfolio Managers of Closed-End Management Investment Companies.
Not applicable.
Item 9. Purchases of Equity Securities by Closed-End Management Investment Company and Affiliated Purchasers.
Not applicable.
Item 10. Submission of Matters to a Vote of Security Holders.
During the period covered by this report, no material changes were made to the procedures by which shareholders may recommend nominees to the Registrant’s board of trustees that were adopted in fiscal year 2005.
Item 11. Controls and Procedures.
Based on an evaluation of the Registrant’s disclosure controls and procedures (as defined in Rule 30a-3(c) under the Investment Company Act of 1940, the “Disclosure Controls”), the Disclosure Controls are effectively designed to ensure that information required to be disclosed by the Registrant in this report is recorded, processed, summarized, and reported within 90 days prior to the filing of this report, including ensuring that information required to be disclosed in this report is accumulated and communicated to the Registrant’s management, including the Registrant’s principal executive officer and principal financial officer, as appropriate to allow timely decisions regarding required disclosure.
There were no changes in the Registrant’s internal control over financial reporting (as defined in Rule 30a-3(d) under the Investment Company Act of 1940) that occurred during the Registrant’s second fiscal quarter of the period covered by this report that has materially affected, or is reasonably likely to materially affect, the Registrant’s internal control over financial reporting.
Item 12. Exhibits.
(a)(1) Code of Ethics for Principal Executive Officer and Senior Financial Officers (as referenced in Item 2 above), attached hereto as Exhibit (a)(1).
(2) Certifications of John R. Raitt, Principal Executive Officer, and Kristi L. Rowsell, Principal Financial Officer, pursuant to Rule 30a-2 under the Investment Company Act of 1940 (17 CFR 270.30a-2), attached hereto as Exhibits (a)(2)(i) and (a)(2)(ii).
(3) Not applicable.
(b) Certification of John R. Raitt, Principal Executive Officer and Kristi L. Rowsell, Principal Financial Officer, pursuant to Section 906 of the Sarbanes-Oxley Act of 2002, attached hereto as Exhibit (b).
SIGNATURES
Pursuant to the requirements of the Securities Exchange Act of 1934 and the Investment Company Act of 1940, the Registrant has duly caused this report to be signed on its behalf by the undersigned, thereunto duly authorized.
Harris Associates Investment Trust
By: | /s/ John R. Raitt | |
| John R. Raitt | |
| Principal Executive Officer | |
Date: | November 16, 2006 | |
Pursuant to the requirements of the Securities Exchange Act of 1934 and the Investment Company Act of 1940, this report has been signed below by the following persons on behalf of the Registrant and in the capacities and on the dates indicated.
By: | /s/ John R. Raitt | |
| John R. Raitt | |
| Principal Executive Officer | |
Date: | November 16, 2006 | |
By: | /s/ Kristi L. Rowsell | |
| Kristi L. Rowsell | |
| Principal Financial Officer | |
Date: | November 16, 2006 | |