UNITED STATES
SECURITIES AND EXCHANGE COMMISSION
Washington, D.C. 20549
FORM N-CSR
CERTIFIED SHAREHOLDER REPORT OF REGISTERED
MANAGEMENT INVESTMENT COMPANIES
Investment Company Act file number | 811-06279 |
|
Harris Associates Investment Trust |
(Exact name of registrant as specified in charter) |
|
Two North La Salle Street, Suite 500 Chicago, Illinois | | 60602-3790 |
(Address of principal executive offices) | | (Zip code) |
|
John R. Raitt Harris Associates L.P. Two North La Salle Street, #500 Chicago, Illinois 60602 | | Cameron S. Avery Bell, Boyd & Lloyd LLP Three First National Plaza, #3100 Chicago, Illinois 60602 |
(Name and address of agent for service) |
|
Registrant’s telephone number, including area code: | (312) 621-0600 | |
|
Date of fiscal year end: | 09/30/07 | |
|
Date of reporting period: | 09/30/07 | |
| | | | | | | | | | |
Item 1. Reports to Shareholders.
ANNUAL REPORT
SEPTEMBER 30, 2007


Advised by Harris Associates L.P.
THE OAKMARK FUNDS
2007 Annual Report
| President's Letter | | | 1 | | |
|
| Summary Information | | | 2 | | |
|
| Fund Expenses | | | 4 | | |
|
| Commentary on The Oakmark and Oakmark Select Funds | | | 6 | | |
|
| The Oakmark Fund | |
|
| Letter from the Portfolio Managers | | | 8 | | |
|
| Schedule of Investments | | | 9 | | |
|
| The Oakmark Select Fund | |
|
| Letter from the Portfolio Managers | | | 13 | | |
|
| Schedule of Investments | | | 14 | | |
|
| The Oakmark Equity and Income Fund | |
|
| Letter from the Portfolio Managers | | | 16 | | |
|
| Schedule of Investments | | | 18 | | |
|
| The Oakmark Global Fund | |
|
| Letter from the Portfolio Managers | | | 23 | | |
|
| Global Diversification Chart | | | 25 | | |
|
| Schedule of Investments | | | 26 | | |
|
| The Oakmark Global Select Fund | |
|
| Letter from Portfolio Managers | | | 31 | | |
|
| Global Diversification Chart | | | 33 | | |
|
| Schedule of Investments | | | 34 | | |
|
| Commentary on The International and International Small Cap Funds | | | 37 | | |
|
| The Oakmark International Fund | |
|
| Letter from the Portfolio Manager | | | 38 | | |
|
| International Diversification Chart | | | 40 | | |
|
| Schedule of Investments | | | 41 | | |
|
| The Oakmark International Small Cap Fund | |
|
| Letter from the Portfolio Managers | | | 46 | | |
|
| International Diversification Chart | | | 48 | | |
|
| Schedule of Investments | | | 49 | | |
|
| Financial Statements | |
|
| Statements of Assets and Liabilities | | | 56 | | |
|
| Statements of Operations | | | 58 | | |
|
| Statements of Changes in Net Assets | | | 60 | | |
|
| Notes to Financial Statements | | | 67 | | |
|
| Trustees and Officers | | | 88 | | |
|
| Oakmark Philosophy and Process | | | 91 | | |
|
| The Oakmark Glossary | | | 92 | | |
|
FORWARD-LOOKING STATEMENT DISCLOSURE
One of our most important responsibilities as mutual fund managers is to communicate with shareholders in an open and direct manner. Some of our comments in our letters to shareholders are based on current management expectations and are considered "forward-looking statements". Actual future results, however, may prove to be different from our expectations. You can identify forward-looking statements by words such as "estimate", "may", "will", "expect", "believe", "plan" and other similar terms. We cannot promise future returns. Our opinions are a reflection of our best judgment at the time this report is compiled, and we disclaim any obligation to update or alter forward-looking statements as a result of new information, future events, or otherwise.
President's Letter

Dear Fellow Shareholders,
Domestic and international stock markets rose in the third quarter, with most of the broader indexes extending their gains of the past several quarters. While world stock markets finished the quarter up slightly, the endpoint belies the volatility of the period. Rapid deterioration of the U.S. mortgage market in the early summer and a related liquidity squeeze converged to threaten financial market stability. U.S. stocks fell over 6% in the quarter before the Fed stepped in to cut the discount rate and reassure investors.
With this quarter's gains, most of the broader U.S. indexes have produced mid-teens increases over year-ago levels, and international equity indexes have risen over 20%. Low interest rates and worldwide economic growth (albeit somewhat slower growth) continue to contribute to this performance. Looking through the rear-view mirror at 15-25%+ returns in the domestic and international markets for the last several years, the market looks great. However, interest rates, history and economics suggest that returns are likely to revert to long-term norms—with prospective returns averaging in the high single digits.
Though almost all of our Funds produced solid double-digit returns for the fiscal year just ended and our clients' wealth has grown, only two of our Funds kept pace with the rapidly rising market indexes. As we have counseled our investors in the past, this is often the case with our disciplined value investment approach.
Credit Cycles and Investment Risk (Chapter II)
In our June quarterly report, we discussed the widespread underpricing of risk in the world's capital markets. Several of our portfolio managers also made similar observations related to international and domestic debt and equity markets. In particular, I suggested that the abundance of capital available for risky investments had led to excesses that made a credit market correction likely.
The ink was hardly dry on last quarter's letters when the correction hit with a vengeance. Difficulties in the subprime mortgage market accelerated. Rising default rates prompted nervous lenders to pull credit lines to mortgage brokers. At several banks with large mortgage lending operations, depositors lined up to withdraw their money. Market bids for riskier mortgage securities all but disappeared. The mortgage market suddenly faced a full-fledged liquidity panic.
Several hedge funds that had invested in mortgage securities were quickly liquidated. These difficulties spread to the high-yield bond market as debt investors demanded higher yields and several pending leveraged buyouts ("LBOs") were cancelled. For other LBOs for which banks had committed to underwrite loans at fixed rates, the increase in market rates led to hundreds of millions of dollars of write-offs. Further deterioration was headed off only when the Federal Reserve stepped up in mid-August to lower short-term interest rates and provide assurances of liquidity to the market. A strong stock market rally ensued, and broader market indexes have surprisingly reached new highs.
While the white knuckle days of mid-August are behind us, two important observations are worth making about the unwinding of this credit cycle. First, fundamentals suggest that the credit correction has not completely run its course. As we pointed out last quarter, the excesses of the underpricing of risk occurred in a broad range of markets—not just for mortgages and LBOs. The unwinding of these excesses is likely to include other market adjustments, including rising corporate debt default rates, higher yield premiums for risky loans, and a broader differentiation of business quality in equity market valuations. Oakmark's investment approach, with our focus on valuation and risk-and-reward tradeoffs, has limited our exposure to investments in areas vulnerable to these forces.
Second, although we see potential for further distress in the debt and equity markets, we will not be tempted to time the market. Instead, we view weakness in market prices as an opportunity to add to existing holdings or buy new stocks at steeply discounted valuations—as we did in the recent quarter. While the market delivered a few bumps and bruises to our holdings this summer, we continue to believe that our disciplined investment process—involving thorough analysis, a valuation driven focus, and patience will continue to reward our shareholders.
Thank you for entrusting your long term assets to The Oakmark Funds. We welcome your comments and questions. You can reach us via e-mail at ContactOakmark@oakmark.com.
John R. Raitt
President of The Oakmark Funds
President and CEO of Harris Associates L.P.
September 30, 2007
1
THE OAKMARK FUNDS
Summary Information
Performance for Periods
Ended September 30, 20071
(Unaudited) | | The Oakmark
Fund—Class I
(OAKMX) | | The Oakmark
Select Fund—Class I
(OAKLX) | | The Oakmark
Equity and Income
Fund—Class I
(OAKBX) | | The Oakmark
Global Fund—Class I
(OAKGX) | |
| 3 Months* | | | -2.94 | % | | | -6.48 | % | | | 3.17 | % | | | 0.25 | % | |
| 1 Year | | | 11.51 | % | | | 7.00 | % | | | 15.77 | % | | | 21.29 | % | |
Average Annual Total
Return for: | |
| 3 Year | | | 9.23 | % | | | 8.18 | % | | | 11.91 | % | | | 20.85 | % | |
| 5 Year | | | 12.58 | % | | | 12.86 | % | | | 13.98 | % | | | 25.32 | % | |
| 10 Year | | | 6.29 | % | | | 12.78 | % | | | 11.87 | % | | | N/A | | |
| Since inception | | | 15.01%
(8/5/91) | | | | 16.79%
(11/1/96) | | | | 13.56%
(11/1/95) | | | | 17.23%
(8/4/99) | | |
Top Five Equity
Holdings as of
September 30, 20072
Company and % of Total
Net Assets | | | McDonald's
Corporation 3.4%
Yum! Brands, Inc. 2.9%
Washington
Mutual, Inc. 2.8%
Schering-Plough
Corporation 2.5%
Raytheon
Company 2.4% | | | | Washington
Mutual, Inc. 13.1%
Yum! Brands, Inc. 8.1%
McDonald's
Corporation 6.8%
H&R Block, Inc. 6.2%
Discovery Holding
Company,
Class A 5.6% | | | | XTO Energy, Inc. 4.9%
Nestle SA 3.3%
General Dynamics
Corporation 3.0%
CVS Caremark
Corporation 3.0%
EnCana Corp 2.9%
GlaxoSmithKline plc 3.5% | | | |
Oracle Corporation 3.4%
XTO Energy, Inc. 3.3%
DaimlerChrysler AG 3.2%
Rohm Company
Limited 3.2% | | |
Sector
Allocation as of
September 30, 2007
Sector and %
of Market Value | | | Consumer
Discretionary 35.4%
Financials 14.9%
Information
Technology 13.5%
Consumer Staples 13.3%
Health Care 11.5%
Industrials 7.7%
Telecommunication
Services 2.1%
Energy 1.6% | | | | Consumer
Discretionary 51.5%
Financials 17.6%
Information
Technology 15.6%
Health Care 8.9%
Telecommunication
Services 3.7%
Industrials 2.7% | | | | U.S. Government
Securities 36.2%
Consumer
Discretionary 14.5%
Consumer Staples 14.5%
Energy 12.9%
Industrials 9.1%
Health Care 6.1%
Financials 3.4%
Foreign Government
Securities 2.4%
Information
Technology 0.8%
Materials 0.1% | | | | Consumer
Discretionary 25.9%
Health Care 18.2%
Information
Technology 18.1%
Financials 14.8%
Consumer Staples 8.5%
Industrials 5.7%
Energy 5.5%
Telecommunication
Services 2.8%
Materials 0.5% | | |
The performance data quoted represents past performance. The above performance information for the Funds does not reflect the imposition of a 2% redemption fee on shares held for 90 days or less to deter market timers. If reflected, the fee would reduce the performance quoted. Past performance does not guarantee future results. The investment return and principal value will fluctuate so that an investor's shares, when redeemed, may be worth more or less than their original cost. Current performance may be lower or higher than the performance data quoted. Average annual total return measures annualized change, while total return measures aggregate change. To obtain current month end performance data, visit oakmark.com.
* Not annualized
THE OAKMARK FUNDS
2
Performance for Periods
Ended September 30, 20071
(Unaudited) | | The Oakmark
Global Select
Fund—Class I
(OAKWX) | | The Oakmark
International
Fund—Class I
(OAKIX) | | The Oakmark
International
Small Cap Fund—Class I
(OAKEX) | |
| 3 Months* | | | -3.65 | % | | | -3.48 | % | | | -6.60 | % | |
| 1 Year | | | N/A | | | | 14.53 | % | | | 13.35 | % | |
Average Annual Total
Return for: | |
| 3 Year | | | N/A | | | | 20.75 | % | | | 23.41 | % | |
| 5 Year | | | N/A | | | | 22.78 | % | | | 28.61 | % | |
| 10 Year | | | N/A | | | | 10.84 | % | | | 15.06 | % | |
| Since inception | | 16.23%
(10/2/06) | | 13.31%
(9/30/92) | | | 14.75%
(11/1/95) | | |
Top Five Equity
Holdings as of
September 30, 20072
Company and % of Total
Net Assets | | | Intel Corporation 5.3%
GlaxoSmithKline plc 5.3%
Daiwa Securities
Group Inc. 5.3%
McDonald's
Corporation 5.2%
Rohm Company
Limited 5.2% | | | | GlaxoSmithKline plc 4.1%
Daiwa Securities
Group Inc. 4.0%
UBS AG 4.0%
Credit Suisse
Group 3.5%
Novartis AG 3.5% | | | | Benfield Group Plc 3.7%
Carpetright plc 3.6%
MDS Inc. 3.6%
Julius Baer
Holding Ltd. 3.6%
Enodis plc 3.3% | | |
Sector
Allocation as of
September 30, 2007
Sector and %
of Market Value | | | Consumer
Discretionary 27.5%
Financials 24.6%
Information
Technology 16.2%
Health Care 15.9%
Consumer Staples 5.5%
Industrials 5.2%
Telecommunication
Services 5.1% | | | | Financials 35.4%
Consumer
Discretionary 27.4%
Information
Technology 10.7%
Consumer Staples 9.0%
Health Care 8.6%
Industrials 4.9%
Telecommunication
Services 3.3%
Materials 0.7% | | | | Consumer
Discretionary 34.8%
Industrials 19.6%
Financials 16.7%
Information
Technology 13.7%
Health Care 7.6%
Consumer Staples 6.7%
Materials 0.9% | | |
As of 9/30/07, the expense ratio was 1.01% for The Oakmark Fund, 0.97% for The Oakmark Select Fund, 0.83% for The Oakmark Equity and Income Fund, 1.13% for The Oakmark Global Fund, 1.31% for The Oakmark Global Select Fund, 1.05% for The Oakmark International Fund and 1.34% for The Oakmark International Small Cap Fund.
THE OAKMARK FUNDS
3
FUND EXPENSES
A shareholder of each Fund incurs two types of costs: (1) transaction costs, such as redemption fees, and (2) ongoing costs, including investment advisory fees, transfer agent fees, and other fund expenses. The examples below are intended to help shareholders understand the ongoing cost (in dollars) of investing in each Fund and to compare these costs with the ongoing costs of investing in other funds.
Actual Expenses
The following table provides information about actual account values and actual fund expenses for Class I of each Fund. The table shows the expenses a Class I shareholder would have paid on a $1,000 investment in each Fund from April 1, 2007, to September 30, 2007, as well as how much a $1,000 investment would be worth at the close of the period, assuming actual fund returns and expenses. A Class I shareholder can estimate expenses incurred for the period by dividing the account value at September 30, 2007, by $1,000 and multiplying the result by the number in the Expenses Paid During Period row as shown below.
Certain accounts invested for 90 days or less may be charged a 2% redemption fee. Please consult the Funds' prospectus at oakmark.com for more information.
| | | The Oakmark Fund | | The Oakmark Select Fund | | The Oakmark Equity and Income Fund | | The Oakmark Global Fund | | The Oakmark Global Select Fund | | The Oakmark International Fund | | The Oakmark International Small Cap Fund | |
Beginning
Account
Value | | $ | 1,000.00 | | | $ | 1,000.00 | | | $ | 1,000.00 | | | $ | 1,000.00 | | | $ | 1,000.00 | | | $ | 1,000.00 | | | $ | 1,000.00 | | |
Ending
Account
Value | | $ | 1,032.30 | | | $ | 1,008.50 | | | $ | 1,073.40 | | | $ | 1,058.00 | | | $ | 1,038.50 | | | $ | 995.90 | | | $ | 957.50 | | |
Expenses
Paid
During
Paid* | | $ | 5.15 | | | $ | 4.88 | | | $ | 4.31 | | | $ | 5.83 | | | $ | 6.44 | | | $ | 5.30 | | | $ | 6.58 | | |
Annualized
Expense
Ratio | | | 1.01 | % | | | 0.97 | % | | | 0.83 | % | | | 1.13 | % | | | 1.26 | % | | | 1.06 | % | | | 1.34 | % | |
* Expenses are equal to each Fund's annualized expense ratio for Class I, multiplied by the average account value over the period, multiplied by the number of days in the most recent fiscal half-year divided by 365 (to reflect the one-half year period).
THE OAKMARK FUNDS
4
Hypothetical Example for Comparison Purposes
The following table provides information about hypothetical account values and hypothetical expenses for Class I of each Fund based on actual expense ratios and an assumed rate of return of 5% per year before expenses, which are not the Funds' actual returns. The hypothetical account values and expenses may not be used to estimate the actual ending account balances or expenses shareholders paid for the period. Shareholders may use this information to compare the ongoing costs of investing in a Fund and other funds. To do so, compare this 5% hypothetical example with the 5% hypothetical examples that appear in the shareholder reports of the other funds.
Please note that the expenses shown in the table are meant to highlight your ongoing costs only and do not reflect any transaction costs, such as redemption fees. Therefore, the third line of the table is useful in comparing ongoing costs only, and will not help you determine the relative total costs of owning different funds. In addition, if these transaction costs were included, the total costs would have been higher.
| | | The Oakmark Fund | | The Oakmark Select Fund | | The Oakmark Equity and Income Fund | | The Oakmark Global Fund | | The Oakmark Global Select Fund | | The Oakmark International Fund | | The Oakmark International Small Cap Fund | |
Beginning
Account
Value | | $ | 1,000.00 | | | $ | 1,000.00 | | | $ | 1,000.00 | | | $ | 1,000.00 | | | $ | 1,000.00 | | | $ | 1,000.00 | | | $ | 1,000.00 | | |
Ending
Account
Value | | $ | 1,020.00 | | | $ | 1,020.21 | | | $ | 1,020.91 | | | $ | 1,019.40 | | | $ | 1,018.75 | | | $ | 1,019.75 | | | $ | 1,018.35 | | |
Expenses
Paid
During
Paid* | | $ | 5.11 | | | $ | 4.91 | | | $ | 4.20 | | | $ | 5.72 | | | $ | 6.38 | | | $ | 5.37 | | | $ | 6.78 | | |
Annualized
Expense
Ratio | | | 1.01 | % | | | 0.97 | % | | | 0.83 | % | | | 1.13 | % | | | 1.26 | % | | | 1.06 | % | | | 1.34 | % | |
* Expenses are equal to each Fund's annualized expense ratio for Class I, multiplied by the average account value over the period, multiplied by the number of days in the most recent fiscal half-year divided by 365 (to reflect the one-half year period).
THE OAKMARK FUNDS
5
THE OAKMARK AND OAKMARK SELECT FUNDS
At Oakmark, we are long-term investors. We attempt to identify growing businesses that are managed to benefit their shareholders. We will purchase stock in those businesses only when priced substantially below our estimate of intrinsic value. After purchase, we patiently wait for the gap between stock price and intrinsic value to close.
 "In a crisis, don't hide behind anything or anybody. They're going to find you anyway." Bear Bryant
In August we posted a special letter on our website to Oakmark Select shareholders highlighting the negative performance that the Fund had experienced following the end of the second quarter. Though many shareholders expressed their appreciation for the additional update, several expressed surprise that a fund family as long-term oriented as Oakmark would be responsive to a short-term performance shortfall. To explain our thinking, here is our approach to shareholder communication: We believe that well-informed shareholders are more likely to have positive experiences owning our Funds, and satisfying customers makes good business sense. Of course we know that none of you are investing in our Funds just to get these quarterly letters! Like us, you expect the Funds to achieve good returns. But i f there is a way to consistently produce good returns each and every quarter, we unfortunately haven't found it. And that means that even good long-term results will inevitably include some disappointing short-terms. As a group, mutual fund investors have, regrettably, shown an uncanny ability to take self-destructive actions following poor performance periods—buying near tops and selling near bottoms. We believe that investors who understand how their managers think about investing will be more likely to avoid that mistake.
A mutual fund company isn't required to say much to its shareholders: only two reports per year, mailed up to 60 days after quarter-end, including a summary of top holdings, fund financial statements, and a brief discussion and analysis of results (which some funds limit to a list of their best and worst performing holdings). In addition, complete portfolio holdings need to be filed quarterly with the SEC. When funds only deliver the minimum communication, it is no wonder that investors make decisions primarily based on recent performance.
When we invest in a business, we want timely, candid communication from management. We believe our Fund shareholders deserve the same. We don't think reporting semi-annually is frequent enough. Our companies report to their shareholders quarterly, and even though we are very long-term owners, we appreciate getting performance updates at that frequency. To us, quarterly reporting for mutual funds seems appropriate, too. Some of our Fund shareholders ask why we don't give updates more often than once a quarter, with some even requesting daily updates of our activity. We believe there is little to be said in more frequent updates, and importantly, such updates could disclose our intentions, which would invite front-running and increase our transactions costs. Sixty days after quarter-end doesn't seem timely to us. We expect to hear from our companies closer to the end of the quarter they are reporting on, so we strive to do the same. Our goal i s to have our quarterly commentary and portfolio weightings available on our website within two weeks of quarter-end.
We also want a company to explain what went wrong. Most businesses love to trumpet their successes. It's not unusual to see a company issue a press release to draw attention to each tidbit of good news. Few companies give equal treatment to bad news. It raises a red flag for us when a company promotes the good news, but makes us dig through their 10-Qs to find the bad news. When we have good news to share with you, we'll wait for our normal reporting cycle, and chances are you'll find out about it before that. But when we have bad news, we want to make sure you hear it from us. Throughout Oakmark's history, we've only contacted shareholders between quarterly reports to explain bad news. We believe that communicating bad news in a candid, timely fashion builds trust.
We want our quarterly reports to be informative and tell our story. When we start researching a potential new holding, we will often read old annual reports. If a corporate annual report is well written it will not only highlight the ups and downs of the prior year, but it will also give a strategic plan. Managers will state their views of their company's competitive strengths and will explain how they intend to capitalize on them. After reading a series of these reports we can develop an informed opinion about a management's business philosophy and its rationale. We want our reports to leave a similar trail. An investor who reads a series of Oakmark reports should without a doubt understand that we are stock-pickers, that we are value investors, that we use a very long time horizon, and that we aren't concerned about short-term deviation from benchmarks. They should know that our goal is to maximize long-term, after-tax returns. They can se e why we positioned the portfolios as we did, and what we got right and what we got wrong. They will get a much more complete view of how we approach investing than an investor who just looks at the performance figures.
THE OAKMARK AND OAKMARK SELECT FUNDS
6
We believe communication should be two-way. Most good companies want to answer questions from their investors. In some smaller companies, top management will communicate one-on-one with investors or potential investors, but to protect their managers' time, most larger companies have an investor relations officer whose job is handling investor inquiries. We use e-mail to facilitate one-on-one communication with investors. We not only want to answer your questions, but seeing the questions from our investors helps us to better target future commentary. From the day we first published e-mail addresses in our quarterlies we've been asked "Aren't you afraid too many shareholders will contact you?" We've always said we hope that time comes, and if it does, we'll get help to answer all the questions. For me, that time has finally arrived, and I've asked Mike Neary, our head of client servicing, and his team to begin helping me handle e-mail respons es.
In summary, what we really want to see from a company's communication is that a management team's goal is to maximize the long-term value of the company's stock, that it has a reasonable strategy to achieve that goal, and that like us, it has an important personal investment in the stock. In our President's letter, once a year we update you on the total ownership our employees and Fund trustees have in The Oakmark Funds. Those numbers show that our investment is significant, and also, by comparing prior years, they show that we are adding new capital to our investment each year. By going far beyond the required level of communication we aim to have the most informed mutual fund shareholders. You can know with certainty our goals, our methods for achieving those goals, and our economic alignment with you. There are many unknowns in investing, but how your Fund is managed doesn't need to be one of them.
William C. Nygren, CFA
Portfolio Manager
oakmx@oakmark.com
oaklx@oakmark.com
September 30, 2007
THE OAKMARK AND OAKMARK SELECT FUNDS
7
THE OAKMARK FUND
Report from Bill Nygren and Kevin Grant, Portfolio Managers


THE VALUE OF A $10,000 INVESTMENT IN THE OAKMARK FUND FROM ITS INCEPTION (8/5/91) TO PRESENT (9/30/07) AS COMPARED TO THE STANDARD & POOR'S 500 INDEX3 (UNAUDITED)

| | | | | Average Annual Total Returns | |
| | | | | (as of 9/30/07) | |
| (Unaudited) | | Total Return
Last 3 Months* | | 1-year | | 5-year | | 10-year | | Since
Inception
(8/5/91) | |
| Oakmark Fund (Class I) | | | -2.94 | % | | | 11.51 | % | | | 12.58 | % | | | 6.29 | % | | | 15.01 | % | |
| S&P 5004 | | | 2.03 | % | | | 16.44 | % | | | 15.45 | % | | | 6.57 | % | | | 11.08 | % | |
| Dow Jones Average4 | | | 1.83 | % | | | 18.92 | % | | | 14.90 | % | | | 7.62 | % | | | 12.31 | % | |
Lipper Large Cap
Value Index5 | | | 0.21 | % | | | 15.05 | % | | | 16.04 | % | | | 6.76 | % | | | 10.93 | % | |
The graph and table do not reflect the deduction of taxes that a shareholder would pay on fund distributions or the redemption of fund shares.
Expense Ratio as of 9/30/07 was 1.01%.
The performance data quoted represents past performance. The above performance information for the Fund does not reflect the imposition of a 2% redemption fee on shares held for 90 days or less to deter market timers. If reflected, the fee would reduce the performance quoted. Past performance does not guarantee future results. The investment return and principal value will fluctuate so that an investor's shares, when redeemed, may be worth more or less than their original cost. Current performance may be lower or higher than the performance data quoted. Average annual total return measures annualized change, while total return measures aggregate change. To obtain most recent month-end performance data, visit oakmark.com.
* Not annualized
Our fiscal year ended with a down quarter, but our return for the year was still a respectable 12%. Over the twelve-month period, we had positions in sixty-one different stocks. Forty-three of those stocks went up in price while we held them, and only eighteen declined. Looking at the large magnitude changes, only three stocks declined by over 20% (Pulte Homes, Harley Davidson and MGIC) while twenty-one increased by more than 20%. The two most important positive contributors were McDonalds, our largest holding up 43%, and InBev, a lesser position but up 66%. Both achieved significantly stronger than expected earnings growth. Our portfolio followed its typical pattern for good years: more winners than losers, and more big winners than big losers. Despite the good absolute return, our satisfaction is tempered by the fact that other investors had even higher returns. The S&P 500 gained 16% for the year, assisted by very large increases in e nergy and materials stocks, businesses in which we have negligible investment.
Last quarter was our weakest quarter of the year, losing 3% while the S&P 500 gained 2%. During the quarter we sold the remainder of our Gap position and used that money to add to our other retailers that we believe are better positioned yet no more expensive. The two new names in the portfolio, Covidien and Tyco Electronics, were not new purchases, but rather were spin-offs from our position in Tyco Industries. The shortfall in quarterly performance was the result of both declines in stocks we held, as well as gains in those we didn't. Energy was the best performing market sector again last quarter, and we have little exposure. We continue to believe that financial speculators have driven current oil and gas prices well beyond the level justified by long-term supply and demand. Retailers were one of the worst performing industries, and we suffered double-digit declines in Kohl's, Limited Brands (Victoria's Secret), Home Depot and Libert y Interactive (QVC). In addition, continued weakness in housing led to losses in Pulte Homes, Washington Mutual, and MGIC (mortgage insurance). We believe that retailers and consumer finance companies are priced as if we are likely to be entering a recession, while the rest of the market is priced as if growth will continue. To us, the risk-reward tradeoff in our portfolio holdings looks quite attractive.
William C. Nygren, CFA
Portfolio Manager
oakmx@oakmark.com | | Kevin G. Grant, CFA
Portfolio Manager
oakmx@oakmark.com | |
|
September 30, 2007
THE OAKMARK FUND
8
THE OAKMARK FUND
Schedule of Investments—September 30, 2007
| Name | | Shares Held | | Market Value | |
| Common Stocks—95.3% | |
| Apparel Retail—1.9% | |
| Limited Brands | | | 4,628,047 | | | $ | 105,935,996 | | |
| Broadcasting & Cable TV—3.7% | |
| Liberty Media Holding Corporation - Capital, Class A (a) | | | 999,670 | | | $ | 124,788,806 | | |
| Discovery Holding Company, Class A (a) | | | 1,540,140 | | | | 44,433,039 | | |
| The DIRECTV Group, Inc. (a) | | | 1,650,000 | | | | 40,062,000 | | |
| | | | 209,283,845 | | |
| Catalog Retail—1.3% | |
| Liberty Media Holding Corporation - Interactive, Class A (a) | | | 3,699,850 | | | $ | 71,074,118 | | |
| Computer & Electronics Retail—2.0% | |
| Best Buy Co., Inc. | | | 2,419,400 | | | $ | 111,340,788 | | |
| Department Stores—1.8% | |
| Kohl's Corporation (a) | | | 1,750,000 | | | $ | 100,327,500 | | |
| Home Improvement Retail—1.8% | |
| The Home Depot, Inc. | | | 3,181,500 | | | $ | 103,207,860 | | |
| Homebuilding—0.8% | |
| Pulte Homes, Inc. | | | 3,492,200 | | | $ | 47,528,842 | | |
| Household Appliances—2.0% | |
| The Black & Decker Corporation | | | 1,350,000 | | | $ | 112,455,000 | | |
| Housewares & Specialties—1.9% | |
| Fortune Brands, Inc. | | | 1,350,000 | | | $ | 110,011,500 | | |
| Motorcycle Manufacturers—1.6% | |
| Harley-Davidson, Inc. | | | 2,000,000 | | | $ | 92,420,000 | | |
| Movies & Entertainment—6.6% | |
| Time Warner, Inc. | | | 7,447,700 | | | $ | 136,739,772 | | |
| Viacom, Inc., Class B (a) | | | 3,239,745 | | | | 126,252,863 | | |
| The Walt Disney Company | | | 3,300,000 | | | | 113,487,000 | | |
| | | | 376,479,635 | | |
| Restaurants—6.3% | |
| McDonald's Corporation | | | 3,550,000 | | | $ | 193,368,500 | | |
| Yum! Brands, Inc. | | | 4,948,000 | | | | 167,390,840 | | |
| | | | 360,759,340 | | |
| Specialized Consumer Services—2.0% | |
| H&R Block, Inc. | | | 5,358,600 | | | $ | 113,495,148 | | |
THE OAKMARK FUND
9
THE OAKMARK FUND
Schedule of Investments—September 30, 2007 cont.
| Name | | Shares Held | | Market Value | |
| Common Stocks—95.3% (cont.) | |
| Brewers—4.3% | |
| InBev NV (b) | | | 1,450,000 | | | $ | 131,418,404 | | |
| Anheuser-Busch Companies, Inc. | | | 2,250,000 | | | | 112,477,500 | | |
| | | | 243,895,904 | | |
| Distillers & Vintners—2.0% | |
| Diageo plc (c) | | | 1,271,000 | | | $ | 111,504,830 | | |
| Hypermarkets & Super Centers—1.5% | |
| Wal-Mart Stores, Inc. | | | 2,000,000 | | | $ | 87,300,000 | | |
| Packaged Foods & Meats—3.5% | |
| General Mills, Inc. | | | 1,756,000 | | | $ | 101,865,560 | | |
| H.J. Heinz Company | | | 2,150,000 | | | | 99,330,000 | | |
| | | | 201,195,560 | | |
| Soft Drinks—1.3% | |
| The Coca-Cola Company | | | 1,298,700 | | | $ | 74,636,289 | | |
| Integrated Oil & Gas—1.5% | |
| ConocoPhillips | | | 1,000,373 | | | $ | 87,802,738 | | |
| Asset Management & Custody Banks—1.4% | |
| Bank of New York Mellon Corporation | | | 1,839,630 | | | $ | 81,201,268 | | |
| Consumer Finance—1.2% | |
| Capital One Financial Corporation | | | 1,028,000 | | | $ | 68,290,040 | | |
| Diversified Banks—2.0% | |
| U.S. Bancorp | | | 3,450,000 | | | $ | 112,228,500 | | |
| Life & Health Insurance—1.6% | |
| AFLAC Incorporated | | | 1,567,000 | | | $ | 89,381,680 | | |
| Other Diversified Financial Services—4.1% | |
| JPMorgan Chase & Co. | | | 2,700,000 | | | $ | 123,714,000 | | |
| Citigroup, Inc. | | | 2,400,000 | | | | 112,008,000 | | |
| | | | 235,722,000 | | |
| Thrifts & Mortgage Finance—3.9% | |
| Washington Mutual, Inc. | | | 4,537,300 | | | $ | 160,212,063 | | |
| MGIC Investment Corporation | | | 1,828,800 | | | | 59,088,528 | | |
| | | | 219,300,591 | | |
| Health Care Equipment—4.3% | |
| Baxter International, Inc. | | | 2,000,000 | | | $ | 112,560,000 | | |
| Medtronic, Inc. | | | 1,850,000 | | | | 104,358,500 | | |
| Covidien Limited | | | 639,500 | | | | 26,539,250 | | |
| | | | 243,457,750 | | |
THE OAKMARK FUND
10
THE OAKMARK FUND
Schedule of Investments—September 30, 2007 cont.
| Name | | Shares Held | | Market Value | |
| Common Stocks—95.3% (cont.) | |
| Pharmaceuticals—6.7% | |
| Schering-Plough Corporation | | | 4,460,200 | | | $ | 141,076,126 | | |
| Bristol-Myers Squibb Company | | | 4,400,000 | | | | 126,808,000 | | |
| Abbott Laboratories | | | 2,137,300 | | | | 114,602,026 | | |
| | | | 382,486,152 | | |
| Aerospace & Defense—4.1% | |
| Raytheon Company | | | 2,150,000 | | | $ | 137,213,000 | | |
| Honeywell International, Inc. | | | 1,600,000 | | | | 95,152,000 | | |
| | | | 232,365,000 | | |
| Air Freight & Logistics—1.4% | |
| FedEx Corp. | | | 750,000 | | | $ | 78,562,500 | | |
| Building Products—1.4% | |
| Masco Corporation | | | 3,433,600 | | | $ | 79,556,512 | | |
| Industrial Conglomerates—0.5% | |
| Tyco International, Ltd. | | | 639,500 | | | $ | 28,355,430 | | |
| Computer Hardware—5.2% | |
| Hewlett-Packard Company | | | 2,225,000 | | | $ | 110,782,750 | | |
| Dell Inc. (a) | | | 3,900,000 | | | | 107,640,000 | | |
| Sun Microsystems, Inc. (a) | | | 13,770,000 | | | | 77,249,700 | | |
| | | | 295,672,450 | | |
| Data Processing & Outsourced Services—1.0% | |
| Western Union Company | | | 2,575,000 | | | $ | 53,997,750 | | |
| Electronic Manufacturing Services—0.4% | |
| Tyco Electronics, Ltd. | | | 639,500 | | | $ | 22,657,485 | | |
| Office Electronics—1.6% | |
| Xerox Corporation (a) | | | 5,272,400 | | | $ | 91,423,416 | | |
| Semiconductors—4.7% | |
| Texas Instruments Incorporated | | | 3,700,000 | | | $ | 135,383,000 | | |
| Intel Corporation | | | 5,200,000 | | | | 134,472,000 | | |
| | | | 269,855,000 | | |
| Wireless Telecommunication Services—2.0% | |
| Sprint Nextel Corporation | | | 5,903,000 | | | $ | 112,157,000 | | |
| Total Common Stocks (Cost: $3,751,680,900) | | | | | | | 5,417,325,417 | | |
THE OAKMARK FUND
11
THE OAKMARK FUND
Schedule of Investments—September 30, 2007 cont.
| Name | | Par Value | | Market Value | |
| Short Term Investments—5.2% | |
| U.S. Government Agencies—1.6% | |
Federal Home Loan Bank, 4.68% - 4.70%
due 10/5/2007 - 10/15/2007 | | $ | 90,000,000 | | | $ | 89,901,089 | | |
| Total U.S. Government Agencies (Cost: $89,901,089) | | | | | 89,901,089 | | |
| Repurchase Agreement—3.6% | |
State Street Bank and Trust Co. Repurchase
Agreement, 5.00% dated 9/28/2007 due 10/1/2007,
repurchase price $204,447,188, collateralized by
Federal Home Loan Mortgage Corp. Bonds, with
rates of 6.103%, with maturities from
1/15/2036 - 5/15/2036, and with an aggregate
market value plus accrued interest of $114,100,205,
and by Federal National Mortgage Association Bonds,
with rates of 5.431% - 5.511%, with maturities from
1/25/2036 - 5/25/2036, and with an aggregate
market value plus accrued interest of $100,483,413 | | $ | 204,362,037 | | | $ | 204,362,037 | | |
| Total Repurchase Agreement (Cost: $204,362,037) | | | | | 204,362,037 | | |
| Total Short Term Investments (Cost: $294,263,126) | | | | | 294,263,126 | | |
| Total Investments (Cost $4,045,944,026)—100.5% | | | | $ | 5,711,588,543 | | |
| Other Liabilities In Excess Of Other Assets—(0.5)% | | | | | (25,597,014 | ) | |
| Total Net Assets—100% | | | | $ | 5,685,991,529 | | |
(a) Non-income producing security.
(b) Represents a foreign domiciled corporation.
(c) Represents an American Depository Receipt.
See accompanying Notes to Financial Statements.
THE OAKMARK FUND
12
THE OAKMARK SELECT FUND
Report from Bill Nygren and Henry Berghoef, Portfolio Managers


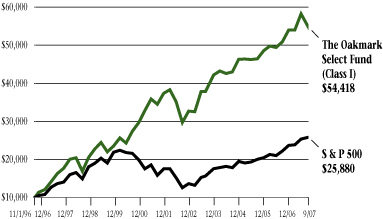
THE VALUE OF A $10,000 INVESTMENT IN THE OAKMARK SELECT FUND FROM ITS INCEPTION (11/1/96) TO PRESENT (9/30/07) AS COMPARED TO THE STANDARD & POOR'S 500 INDEX3 (UNAUDITED)
| | | | | Average Annual Total Returns | |
| | | | | (as of 9/30/07) | |
| (Unaudited) | | Total Return
Last 3 Months* | | 1-year | | 5-year | | 10-year | | Since
Inception
(11/1/96) | |
Oakmark Select Fund
(Class I) | | | -6.48 | % | | | 7.00 | % | | | 12.86 | % | | | 12.78 | % | | | 16.79 | % | |
| S&P 500 | | | 2.03 | % | | | 16.44 | % | | | 15.45 | % | | | 6.57 | % | | | 9.10 | % | |
Lipper Multi-Cap
Value Index6 | | | -1.93 | % | | | 12.72 | % | | | 16.62 | % | | | 7.49 | % | | | 9.81 | % | |
The graph and table do not reflect the deduction of taxes that a shareholder would pay on fund distributions or the redemption of fund shares.
Expense Ratio as of 9/30/07 was 0.97%.
The performance data quoted represents past performance. The above performance information for the Fund does not reflect the imposition of a 2% redemption fee on shares held for 90 days or less to deter market timers. If reflected, the fee would reduce the performance quoted. Past performance does not guarantee future results. The investment return and principal value will fluctuate so that an investor's shares, when redeemed, may be worth more or less than their original cost. Current performance may be lower or higher than the performance data quoted. Average annual total return measures annualized change, while total return measures aggregate change. To obtain most recent month-end performance data, visit oakmark.com.
* Not annualized
The Oakmark Select Fund had a difficult end to its fiscal year, with fourth quarter losses reducing our one-year return to only 7%. The Fund's best performer for the year, Discovery Holdings, doubled. Good programming, large increases in viewers, and closure of a money-losing division combined to dramatically boost reported earnings. Our fast-food companies, YUM Brands and McDonalds, also posted good earnings gains and very good stock price performance. On the flip side, our stocks with housing or retail exposure—Pulte Homes (new home construction), Home Depot (building supply retailing), Washington Mutual (home mortgages), and Limited Brands (Victoria's Secret)—each experienced losses of over 10% which detracted from performance.
As we said in our mid-quarter letter, last quarter had very disappointing performance. The Fund lost 6% of its value, and that happened despite the S&P 500's slight increase. We believe three general themes explain that weakness. First, industrial and commodity-based businesses performed well, and we don't own any of them. Second, the weak dollar substantially increased the value of non-U.S. earnings. By most estimates, about 40% of the business of S&P 500 companies is generated outside the U.S. However, most of our holdings—with the exception of strong international operators like McDonald's, YUM and IMS— derive the overwhelming majority of their profit domestically. Finally, performance was weak in consumer companies, including retail financials, and we are heavily invested in those areas. One of the reasons investing is so challenging is that there is a strong temptation to sell what has hurt you and to buy what you shou ld have owned. More often than not, that is a mistake. As we look forward, we believe that U.S. consumer financials and retail stocks are among the few sectors that appear to be priced as if a recession is probable. We don't have an opinion as to whether or not a recession is imminent, but if it is, we can't believe it will be confined to consumer businesses. We also believe that abundant financial speculation is present across commodity markets including energy, and we believe that has pushed prices well beyond long-term market clearing levels. Finally, we think the decline in the dollar has created a purchasing power gap that makes further declines less likely—just ask anyone who has recently traveled to Europe what prices there are like!
Last quarter was an extremely frustrating one for us because we believe the stocks we own performed much worse than did the businesses they represent. We believe our portfolio has become more attractive and is properly positioned to capitalize on today's undervalued opportunities. We appreciate your patience as we wait for our stocks to reflect that value.
William C. Nygren, CFA
Portfolio Manager
oaklx@oakmark.com | | Henry R. Berghoef, CFA
Portfolio Manager
oaklx@oakmark.com | |
|
September 30, 2007
THE OAKMARK SELECT FUND
13
THE OAKMARK SELECT FUND
Schedule of Investments—September 30, 2007
| Name | | Shares Held | |
Market Value | |
| Common Stocks—95.6% | |
| Apparel Retail—3.9% | |
| Limited Brands | | | 9,280,981 | | | $ | 212,441,655 | | |
| Broadcasting & Cable TV—5.6% | |
| Discovery Holding Company, Class A (a) | | | 10,609,500 | | | $ | 306,084,075 | | |
| Catalog Retail—4.2% | |
| Liberty Media Holding Corporation - Interactive, Class A (a) | | | 11,750,000 | | | $ | 225,717,500 | | |
| Home Improvement Retail—2.7% | |
| The Home Depot, Inc. | | | 4,600,000 | | | $ | 149,224,000 | | |
| Homebuilding—2.9% | |
| Pulte Homes, Inc. | | | 11,562,600 | | | $ | 157,366,986 | | |
| Movies & Entertainment—8.8% | |
| Time Warner, Inc. | | | 13,767,000 | | | $ | 252,762,120 | | |
| Viacom, Inc., Class B (a) | | | 5,775,000 | | | | 225,051,750 | | |
| | | | 477,813,870 | | |
| Restaurants—14.9% | |
| Yum! Brands, Inc. | | | 13,031,000 | | | $ | 440,838,730 | | |
| McDonald's Corporation | | | 6,800,000 | | | | 370,396,000 | | |
| | | | 811,234,730 | | |
| Specialized Consumer Services—6.2% | |
| H&R Block, Inc. | | | 15,919,600 | | | $ | 337,177,128 | | |
| Other Diversified Financial Services—3.8% | |
| JPMorgan Chase & Co. | | | 4,444,000 | | | $ | 203,624,080 | | |
| Thrifts & Mortgage Finance—13.1% | |
| Washington Mutual, Inc. | | | 20,167,400 | | | $ | 712,110,894 | | |
| Health Care Technology—4.5% | |
| IMS Health Incorporated | | | 7,903,441 | | | $ | 242,161,433 | | |
| Pharmaceuticals—4.0% | |
| Bristol-Myers Squibb Company | | | 7,610,200 | | | $ | 219,325,964 | | |
| Diversified Commercial & Professional Services—2.6% | |
| The Dun & Bradstreet Corporation (b) | | | 1,434,900 | | | $ | 141,495,489 | | |
| Computer Hardware—3.5% | |
| Dell Inc. (a) | | | 6,913,000 | | | $ | 190,798,800 | | |
| Data Processing & Outsourced Services—3.3% | |
| Western Union Company | | | 8,515,400 | | | $ | 178,567,938 | | |
THE OAKMARK SELECT FUND
14
THE OAKMARK SELECT FUND
Schedule of Investments—September 30, 2007 cont.
| Name | | Shares Held/
Par Value | |
Market Value | |
| Common Stocks—95.6% (cont.) | |
| Office Electronics—3.9% | |
| Xerox Corporation (a) | | | 12,346,400 | | | $ | 214,086,576 | | |
| Semiconductors—4.2% | |
| Intel Corporation | | | 8,797,000 | | | $ | 227,490,419 | | |
| Wireless Telecommunication Services—3.5% | |
| Sprint Nextel Corporation | | | 10,000,000 | | | $ | 190,000,000 | | |
| Total Common Stocks (Cost: $3,682,109,502) | | | | | | | 5,196,721,537 | | |
| Short Term Investments—4.4% | |
| U.S. Government Agencies—1.1% | |
| Federal Home Loan Bank, 4.70% due 10/5/2007 | | $ | 50,000,000 | | | $ | 49,973,889 | | |
| Federal Farm Credit Bank, 4.72% due 10/16/2007 | | | 11,000,000 | | | | 10,978,366 | | |
| Total U.S. Government Agencies (Cost: $60,952,255) | | | | | | | 60,952,255 | | |
| Repurchase Agreement—3.3% | |
State Street Bank and Trust Co. Repurchase Agreement,
5.00% dated 9/28/2007 due 10/1/2007, repurchase
price $177,682,178, collateralized by Federal Home
Loan Mortgage Corp. Bonds, with rates of
5.528% - 6.103%, with maturities from
6/1/2036 - 7/15/2036, and with an aggregate
market value plus accrued interest of $38,301,307,
and by Federal National Mortgage Association.
Bonds, with a rates of 5.431% - 5.441%, with a
maturity of 5/25/2036, and with an aggregate
market value plus accrued interest of $148,187,995 | | $ | 177,608,175 | | | $ | 177,608,175 | | |
| Total Repurchase Agreement (Cost: $177,608,175) | | | | | | | 177,608,175 | | |
| Total Short Term Investments (Cost: $238,560,430) | | | | | | | 238,560,430 | | |
| Total Investments (Cost $3,920,669,932)—100.0% | | | | | | $ | 5,435,281,967 | | |
| Other Liabilities In Excess Of Other Assets—(0.0)% | | | | | | | (1,666,534 | ) | |
| Total Net Assets—100% | | | | | | $ | 5,433,615,433 | | |
(a) Non-income producing security.
(b) See footnote number five in the Notes to the Financial Statements regarding investments in affiliated issuers.
See accompanying Notes to Financial Statements.
THE OAKMARK SELECT FUND
15
THE OAKMARK EQUITY AND INCOME FUND
Report from Clyde S. McGregor and Edward A. Studzinski, Portfolio Managers


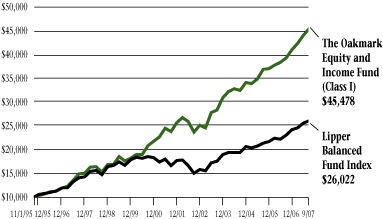
THE VALUE OF A $10,000 INVESTMENT IN THE OAKMARK EQUITY AND INCOME FUND FROM ITS INCEPTION (11/1/95) TO PRESENT (9/30/07) AS COMPARED TO THE LIPPER BALANCED FUND INDEX7 (UNAUDITED)
| | | | | Average Annual Total Returns | |
| | | | | (as of 9/30/07) | |
| (Unaudited) | | Total Return
Last 3 Months* | | 1-year | | 5-year | | 10-year | | Since
Inception
(11/1/95) | |
Oakmark Equity &
Income Fund (Class I) | | | 3.17 | % | | | 15.77 | % | | | 13.98 | % | | | 11.87 | % | | | 13.56 | % | |
Lipper Balanced
Fund Index | | | 1.90 | % | | | 13.22 | % | | | 11.76 | % | | | 6.42 | % | | | 8.36 | % | |
| S&P 5003 | | | 2.03 | % | | | 16.44 | % | | | 15.45 | % | | | 6.57 | % | | | 10.23 | % | |
Lehman Govt./
Corp. Bond8 | | | 3.01 | % | | | 5.08 | % | | | 4.16 | % | | | 6.03 | % | | | 6.08 | % | |
The graph and table do not reflect the deduction of taxes that a shareholder would pay on fund distributions or the redemption of fund shares.
Expense Ratio as of 9/30/07 was 0.83%.
The performance data quoted represents past performance. The above performance information for the Fund does not reflect the imposition of a 2% redemption fee on shares held for 90 days or less to deter market timers. If reflected, the fee would reduce the performance quoted. Past performance does not guarantee future results. The investment return and principal value will fluctuate so that an investor's shares, when redeemed, may be worth more or less than their original cost. Current performance may be lower or higher than the performance data quoted. Average annual total return measures annualized change, while total return measures aggregate change. To obtain most recent month-end performance data, visit oakmark.com.
* Not annualized
"Our current system of levered finance and its related structures may be critically flawed. Nothing within it allows for the hedging of liquidity risk, and that is the problem of the moment."
William Gross, CIO of PIMCO
Quarter and Fiscal-Year Review
Anyone who slept through the summer quarter may glance at the Equity and Income Fund's return of 3% and the Lipper Balanced Fund Index 2% result and think that the quarter was pleasant and probably dull. All others will know that pleasant and dull were not the operative descriptors. For what seemed like forever, market forecasters had argued that securities markets were mis-pricing risk and that low volatility could not continue. But as the late MIT Professor Rudi Dornbusch once observed, in financial markets, things always take longer to happen than you expect, but once they happen, events unfold much more quickly than you expect. During the summer the cumulative effect of overly aggressive private equity transactions combined with many quarters of poor mortgage underwriting to precipitate a financial markets crisis. Several hedge funds required liquidation, and in both the U.S. and the UK, depositors made panicked withdrawals from wounded institutions. The monetary authorities in the U.S. and Europe stepped in to provide liquidity. The Federal Reserve cut-short term interest rates and the Bank of England pretty much had to rescue that country's fifth largest mortgage lender. At the nadir of the crisis, the CFO of a major investment bank stated that "We are seeing things that are 25 standard deviation events...." Your Fund's managers note that such events happen less than once in 100,000 years, somewhat beyond the scope of even our long-term investment horizon.
The Equity and Income Fund was conservatively oriented going into the summer swoon, and this positioning enabled us to be opportunistic as market dislocations occurred. We were active in equities, reducing the number of holdings while taking advantage of volatility to build up undervalued positions. We re-worked our financial industry exposures. We eliminated two successful holdings (Ceridian and CDW) that were the subjects of buyout offers, both with private equity components. Perhaps most importantly, we worked carefully with our firm's fixed income team to ensure that the Fund's cash reserves were defensively positioned during this challenging time. Our biggest disappointment during the quarter derived from the failure of issues in the high yield corporate debt market to fall to prices that would offer compellingly attractive total returns to Fund investors. Newer Equity and Income Fund shareholders have yet to see a meaningful high yield debt allocation, yet historically this has been an important source of the Fund's returns and income.
THE OAKMARK EQUITY AND INCOME FUND
16
September 30 also ends the Fund's fiscal year. We are pleased to report a return of nearly 16% for that time period, which compares to 13% for the Lipper Balanced Fund Index. As always, we report the Lipper figure only because our industry demands a benchmark. In truth, our goal for returns is to produce positive outcomes in every measuring period. While this goal is not realistic on a quarterly basis, we are pleased that only one fiscal year has produced a negative outcome which was a mere -0.47%. The compound rate of return since inception exceeds 13% per year.
Investing Environment Outlook
One of our all-time favorite comic strips came many years ago from the writer of the Wizard of Id. In the strip the king sits before his fortune teller and asks, "What are your predictions for the coming year?" She replies, "Plague, famine, and pestilence." The king, unperturbed, states, "You say that every year." To which the fortune teller replies, "Maybe this year I'll get lucky."
Given the recent financial crisis, which may not be over yet, it would be easy to write a fearsome forecast at this point. Real estate, currency values, and domestic inflation all look to remain difficult issues. Nevertheless, history teaches that financial crises that do not lead to meaningful recessions tend to create favorable investing conditions. Whether the U.S. can avoid a recession in spite of the various retarding effects remains a pivotal question.
We do not make economic forecasts but we do have to make investing decisions based on an understanding of the prevailing investing environment. While we can easily see an outcome where U.S. growth is sluggish because of the problems mentioned above, a recession forecast seems extreme. Economic growth remains robust in much of the world, particularly in developing economies, and the low value of the U.S. dollar will help export-oriented companies. Corporate balance sheets are healthy, and profit margins are wide. While many economists have predicted a downturn in consumer spending, we believe evidence to date does not support this idea.
Given the data currently available, a recession forecast appears aggressive. While the Wizard of Id fortune teller may some day get lucky, we believe that the resiliency and diversification of the U.S. economy, combined with worldwide economic momentum, will limit the impact of the past summer's events.
Is Growth the New Value?
We recently received a copy of an abstract from the consulting firm Frank Russell. The abstract's writers recommend that investors now shift toward growth equities. Quoting from their conclusion, "The last seven years have represented a perfect scenario for the Value investor. They began with historically dispersed valuations inside the market due to rampant speculation and euphoric expectations. In the period following, we witnessed unprecedented corporate scandals, a terrorist attack on U.S. soil, a major corporate profits recession, a dramatic decline in credit spreads, soaring commodity prices, major tax law changes that disproportionately helped income-oriented stocks, an extended war, an abnormal period of double-digit corporate profit growth, and a global flight to income. With these gale-force tailwinds, the market has responded with the strongest leadership shift in the history of Russell indexes in favor of more conservative, lower valuation investments."9
Your managers are card-carrying value investors, but the Russell analysis does not discourage us. Our goal has always been to understand and to interpret value as the market presents it to us at any moment of time. The Russell piece implies that value investors always favor equities with low price/earnings or price/book value ratios. While this describes part of our stock selection process, our approach is far more wide-ranging. As we have often written, we first look for companies selling at a significant discount to what an informed investor would pay to purchase the entire company. We next attempt to determine whether the company has been persistently increasing its intrinsic value per share. A company's ability to grow is itself an important component of its value. We also study management actions and investment position in the company to assess whether they have been shareholder friendly (watch what they do, not what they say). Sometime s our analysis leads us to noticeable industry concentrations. At other times we may find value leading us to favor either larger or smaller companies. And, if we are having difficulty populating the equity side of the portfolio with dominant investing ideas, we will enlarge the fixed income portion.
What does the current equity portfolio state about the Fund's managers perception of the investing environment? In general, the Fund remains quite diversified and eclectic in its composition. With 40 individual holdings, the portfolio is somewhat more concentrated than usual, and this reflects a greater degree of confidence in individual holdings. The Fund continues to have a significant exposure to oil and natural gas exploration companies. Foreign-domiciled concerns comprise almost one-fifth of the equity portfolio. The average market capitalization of the Fund's holdings has risen, but the range remains wide from low to high ($600 million up to $172 billion). Over the last few years we have added several traditional growth names to the portfolio such as Medtronic, McDonalds, and Express Scripts, but it would be hard to say that such names constitute an important theme.
In conclusion, your managers continue their search for value wherever it may be found, both in terms of equities and fixed income investments. Our job is fascinating to us in part because the investing environment is always evolving and recasting value. We thank you for being our shareholders and welcome your suggestions and comments.
Clyde S. McGregor, CFA
Portfolio Manager
oakbx@oakmark.com | | Edward A. Studzinski, CFA
Portfolio Manager
oakbx@oakmark.com | |
|
September 30, 2007
THE OAKMARK EQUITY AND INCOME FUND
17
THE OAKMARK EQUITY AND INCOME FUND
Schedule of Investments—September 30, 2007
Name | |
Shares Held | | Market Value | |
| Equity and Equivalents—59.0% | |
| Common Stocks—59.0% | |
| Apparel Retail—1.4% | |
| Foot Locker, Inc. | | | 7,000,000 | | | $ | 107,310,000 | | |
| The TJX Companies, Inc. | | | 2,900,000 | | | | 84,303,000 | | |
| | | | 191,613,000 | | |
| Apparel, Accessories & Luxury Goods—0.4% | |
| Carter's, Inc. (a) | | | 2,750,000 | | | $ | 54,862,500 | | |
| Broadcasting & Cable TV—5.1% | |
| EchoStar Communications Corporation, Class A (a) | | | 8,250,000 | | | $ | 386,182,500 | | |
| The E.W. Scripps Company, Class A | | | 6,400,000 | | | | 268,800,000 | | |
| CBS Corporation, Class A | | | 910,000 | | | | 28,674,100 | | |
| | | | 683,656,600 | | |
| Home Furnishings—0.5% | |
| Mohawk Industries, Inc. (a) | | | 850,200 | | | $ | 69,121,260 | | |
| Movies & Entertainment—1.9% | |
| News Corporation, Class B | | | 11,000,000 | | | $ | 257,290,000 | | |
| Publishing—3.2% | |
| The Washington Post Company, Class B | | | 325,000 | | | $ | 260,910,000 | | |
| Idearc, Inc. | | | 5,250,000 | | | | 165,217,500 | | |
| Primedia, Inc. | | | 583,333 | | | | 8,189,995 | | |
| | | | 434,317,495 | | |
| Restaurants—1.2% | |
| McDonald's Corporation | | | 3,000,000 | | | $ | 163,410,000 | | |
| Specialty Stores—0.2% | |
| Zale Corporation (a) | | | 940,000 | | | $ | 21,751,600 | | |
| Brewers—1.6% | |
| InBev NV (b) | | | 2,350,000 | | | $ | 212,988,448 | | |
| Distillers & Vintners—2.7% | |
| Diageo plc (c) | | | 4,100,000 | | | $ | 359,693,000 | | |
| Drug Retail—2.9% | |
| CVS Caremark Corporation | | | 10,000,000 | | | $ | 396,300,000 | | |
| Hypermarkets & Super Centers—1.0% | |
| Costco Wholesale Corporation | | | 2,100,000 | | | $ | 128,877,000 | | |
| Packaged Foods & Meats—3.3% | |
| Nestle SA (c)(d) | | | 3,900,000 | | | $ | 437,985,600 | | |
THE OAKMARK EQUITY AND INCOME FUND
18
THE OAKMARK EQUITY AND INCOME FUND
Schedule of Investments—September 30, 2007 cont.
Name | |
Shares Held | | Market Value | |
| Equity and Equivalents—59.0% (cont.) | |
| Personal Products—1.6% | |
| Avon Products, Inc. | | | 5,720,100 | | | $ | 214,675,353 | | |
| Tobacco—0.9% | |
| UST, Inc. | | | 2,332,300 | | | $ | 115,682,080 | | |
| Oil & Gas Exploration & Production—12.4% | |
| XTO Energy, Inc. | | | 10,561,338 | | | $ | 653,113,142 | | |
| EnCana Corp. (b) | | | 6,303,902 | | | | 389,896,339 | | |
| Apache Corporation | | | 3,850,000 | | | | 346,731,000 | | |
| Newfield Exploration Co. (a) | | | 5,600,000 | | | | 269,696,000 | | |
| | | | 1,659,436,481 | | |
| Property & Casualty Insurance—2.0% | |
| SAFECO Corporation | | | 4,000,000 | | | $ | 244,880,000 | | |
| First American Corporation | | | 600,000 | | | | 21,972,000 | | |
| | | | 266,852,000 | | |
| Reinsurance—0.7% | |
| PartnerRe, Ltd. (b) | | | 1,150,000 | | | $ | 90,838,500 | | |
| Thrifts & Mortgage Finance—0.6% | |
| MGIC Investment Corporation | | | 2,528,995 | | | $ | 81,711,828 | | |
| Health Care Equipment—4.0% | |
| Medtronic, Inc. | | | 5,900,000 | | | $ | 332,819,000 | | |
| Hospira, Inc. (a) | | | 5,000,000 | | | | 207,250,000 | | |
| | | | 540,069,000 | | |
| Health Care Services—1.1% | |
| Express Scripts, Inc. (a) | | | 2,600,000 | | | $ | 145,132,000 | | |
| Life Sciences Tools & Services—0.8% | |
| Varian, Inc. (a)(e) | | | 1,649,400 | | | $ | 104,918,334 | | |
| Aerospace & Defense—5.7% | |
| General Dynamics Corporation | | | 4,700,000 | | | $ | 397,009,000 | | |
| Raytheon Company | | | 3,599,700 | | | | 229,732,854 | | |
| Alliant Techsystems, Inc. (a) | | | 1,325,000 | | | | 144,822,500 | | |
| | | | 771,564,354 | | |
| Industrial Conglomerates—0.5% | |
| Walter Industries, Inc. | | | 2,500,700 | | | $ | 67,268,830 | | |
| Industrial Machinery—2.5% | |
| Ingersoll-Rand Co., Class A | | | 4,805,000 | | | $ | 261,728,350 | | |
| Mueller Water Products, Inc., Class B (e) | | | 6,719,153 | | | | 73,910,683 | | |
| | | | 335,639,033 | | |
THE OAKMARK EQUITY AND INCOME FUND
19
THE OAKMARK EQUITY AND INCOME FUND
Schedule of Investments—September 30, 2007 cont.
Name | | Shares Held/
Par Value | | Market Value | |
| Equity and Equivalents—59.0% (cont.) | |
| Application Software—0.4% | |
| Mentor Graphics Corporation (a) | | | 3,288,318 | | | $ | 49,653,602 | | |
| Semiconductors—0.4% | |
| International Rectifier Corporation (a) | | | 1,599,700 | | | $ | 52,774,103 | | |
| Total Common Stocks (Cost: $5,571,500,047) | | | | | | | 7,908,082,001 | | |
| Total Equity And Equivalents (Cost: $5,571,500,047) | | | | | | | 7,908,082,001 | | |
| Fixed Income—37.2% | |
| Corporate Bonds—0.1% | |
| Paper Packaging—0.1% | |
| Sealed Air Corporation, 144A, 5.625% due 7/15/2013 (f) | | $ | 20,000,000 | | | $ | 19,249,180 | | |
| Total Corporate Bonds (Cost: $20,151,030) | | | | | | | 19,249,180 | | |
| Government and Agency Securities—37.1% | |
| Canadian Government Bonds—1.9% | |
| Canada Government, 3.75% due 6/1/2008 | | CAD | 250,000,000 | | | $ | 250,512,743 | | |
| France Government Bonds—0.4% | |
France Government, 3.00% due 7/25/2012,
Inflation Indexed | | EUR | 39,209,450 | | | $ | 58,502,177 | | |
| U.S. Government Notes—32.5% | |
| United States Treasury Notes, 4.875% due 5/15/2009 | | $ | 750,000,000 | | | $ | 760,722,750 | | |
| United States Treasury Notes, 5.125% due 5/15/2016 | | | 500,000,000 | | | | 520,976,500 | | |
| United States Treasury Notes, 5.125% due 6/30/2011 | | | 500,000,000 | | | | 517,383,000 | | |
| United States Treasury Notes, 4.875% due 2/15/2012 | | | 500,000,000 | | | | 514,922,000 | | |
United States Treasury Notes, 3.625% due 1/15/2008,
Inflation Indexed | | | 386,811,000 | | | | 386,327,486 | | |
| United States Treasury Notes, 5.00% due 8/15/2011 | | | 250,000,000 | | | | 258,300,750 | | |
| United States Treasury Notes, 4.75% due 3/31/2011 | | | 250,000,000 | | | | 255,468,750 | | |
United States Treasury Notes, 2.00% due 4/15/2012,
Inflation Indexed | | | 256,632,500 | | | | 254,767,808 | | |
| United States Treasury Notes, 4.875% due 8/15/2009 | | | 250,000,000 | | | | 254,023,500 | | |
| United States Treasury Notes, 4.875% due 1/31/2009 | | | 250,000,000 | | | | 252,871,000 | | |
| United States Treasury Notes, 4.00% due 4/15/2010 | | | 250,000,000 | | | | 250,019,500 | | |
United States Treasury Notes, 0.875% due 4/15/2010,
Inflation Indexed | | | 137,443,750 | | | | 132,880,205 | | |
| | | | 4,358,663,249 | | |
THE OAKMARK EQUITY AND INCOME FUND
20
THE OAKMARK EQUITY AND INCOME FUND
Schedule of Investments—September 30, 2007 cont.
Name | | Par Value | | Market Value | |
| Fixed Income—37.2% (cont.) | |
| U.S. Government Agencies—2.3% | |
| Federal Home Loan Bank, 5.25% due 1/16/2009 | | $ | 50,000,000 | | | $ | 50,423,700 | | |
| Federal Home Loan Bank, 5.00% due 2/4/2009 | | | 34,840,000 | | | | 35,067,854 | | |
| Federal Farm Credit Bank, 3.75% due 1/15/2009 | | | 25,887,000 | | | | 25,644,594 | | |
| Federal Home Loan Bank, 4.50% due 6/9/2010 | | | 25,000,000 | | | | 25,037,500 | | |
| Federal Farm Credit Bank, 4.92% due 1/11/2010 | | | 20,000,000 | | | | 20,216,100 | | |
| Federal Farm Credit Bank, 5.00% due 3/2/2009 | | | 15,500,000 | | | | 15,611,383 | | |
| Federal Home Loan Bank, 4.50% due 5/12/2010 | | | 15,000,000 | | | | 15,023,235 | | |
| Federal Farm Credit Bank, 5.15% due 7/20/2009 | | | 10,531,000 | | | | 10,663,417 | | |
| Federal Farm Credit Bank, 5.25% due 7/16/2010 | | | 10,000,000 | | | | 10,209,280 | | |
| Federal Home Loan Bank, 4.54% due 7/6/2010 | | | 10,000,000 | | | | 10,024,910 | | |
| Tennessee Valley Authority, 6.79% due 5/23/2012 | | | 9,000,000 | | | | 9,776,331 | | |
| Tennessee Valley Authority, 5.625% due 1/18/2011 | | | 8,991,000 | | | | 9,274,945 | | |
| Federal Home Loan Bank, 6.795% due 6/30/2009 | | | 7,005,000 | | | | 7,281,228 | | |
| Federal Farm Credit Bank, 4.85% due 12/16/2009 | | | 6,500,000 | | | | 6,548,607 | | |
| Federal Farm Credit Bank, 5.125% due 6/6/2011 | | | 5,605,000 | | | | 5,720,082 | | |
| Federal Farm Credit Bank, 4.125% due 4/15/2009 | | | 5,147,000 | | | | 5,122,721 | | |
| Federal Farm Credit Bank, 5.10% due 8/9/2011 | | | 5,000,000 | | | | 5,095,975 | | |
| Federal Farm Credit Bank, 4.90% due 9/2/2009 | | | 5,000,000 | | | | 5,045,505 | | |
| Federal Farm Credit Bank, 4.75% due 5/7/2010 | | | 5,000,000 | | | | 5,038,160 | | |
| Federal Home Loan Bank, 4.75% due 12/11/2009 | | | 5,000,000 | | | | 5,034,225 | | |
| Federal Farm Credit Bank, 5.01% due 1/22/2009 | | | 5,000,000 | | | | 5,031,920 | | |
| Federal Farm Credit Bank, 4.125% due 7/17/2009 | | | 5,000,000 | | | | 4,975,075 | | |
| Federal Farm Credit Bank, 4.85% due 3/9/2011 | | | 4,457,000 | | | | 4,510,627 | | |
| Federal Home Loan Bank, 4.75% due 3/13/2009 | | | 4,100,000 | | | | 4,116,347 | | |
| Federal Farm Credit Bank, 5.05% due 5/25/2011 | | | 4,000,000 | | | | 4,072,508 | | |
| Federal Farm Credit Bank, 4.50% due 8/8/2011 | | | 3,000,000 | | | | 2,968,446 | | |
| | | | 307,534,675 | | |
| Total Government and Agency Securities (Cost: $4,869,342,387) | | | | | | | 4,975,212,844 | | |
| Total Fixed Income (Cost: $4,889,493,417) | | | | | | | 4,994,462,024 | | |
| Short Term Investments—3.8% | |
| U.S. Government Agencies—2.3% | |
Federal Home Loan Bank, 4.70% - 4.89%
due 10/5/2007 - 1/4/2008 | | $ | 300,000,000 | | | $ | 298,713,876 | | |
| Federal Agricultural Mortgage Corp., 4.90% due 11/21/2007 | | | 6,300,000 | | | | 6,256,267 | | |
| Total U.S. Government Agencies (Cost: $304,970,143) | | | | | | | 304,970,143 | | |
THE OAKMARK EQUITY AND INCOME FUND
21
THE OAKMARK EQUITY AND INCOME FUND
Schedule of Investments—September 30, 2007 cont.
Name | | Par Value | | Market Value | |
| Short Term Investments—3.8% (cont.) | |
| Repurchase Agreement—1.5% | |
State Street Bank and Trust Co. Repurchase
Agreement, 5.00% dated 9/28/2007 due 10/1/2007,
repurchase price $199,517,116, collateralized by
Federal Home Loan Mortgage Corp. Bonds, with
rates of 5.765% - 6.103%, with maturities from
8/15/2036 - 10/1/2036, and with an aggregate
market value plus accrued interest of $160,490,290,
and by Federal National Mortgage Association
Bonds, with rates of 5.431% - 5.531%, with a
maturities from 8/25/2036 - 10/25/2036, and
with an aggregate market value plus accrued
interest of $48,917,665 | | $ | 199,434,018 | | | $ | 199,434,018 | | |
| Total Repurchase Agreement (Cost: $199,434,018) | | | | | 199,434,018 | | |
| Total Short Term Investments (Cost: $504,404,161) | | | | | 504,404,161 | | |
| Total Investments (Cost $10,965,397,625)—100.0% | | | | $ | 13,406,948,186 | | |
| Other Liabilities In Excess Of Other Assets—(0.0)% | | | | | (2,276,615 | ) | |
| Total Net Assets—100% | | | | $ | 13,404,671,571 | | |
(a) Non-income producing security.
(b) Represents a foreign domiciled corporation.
(c) Represents an American Depository Receipt.
(d) Market value is determined in accordance with procedures established in good faith by the Board of Trustees.
(e) See footnote number five in the Notes to the Financial Statements regarding investments in affiliated issuers.
(f) Security exempt from registration under Rule 144A of the Securities Act of 1933. These securities may be resold in transactions exempt from registration, normally to qualified institutional buyers.
Key to abbreviations:
CAD: Canadian Dollar
EUR: Euro
See accompanying Notes to Financial Statements.
THE OAKMARK EQUITY AND INCOME FUND
22
THE OAKMARK GLOBAL FUND
Report from Clyde S. McGregor and Robert A. Taylor, Portfolio Managers


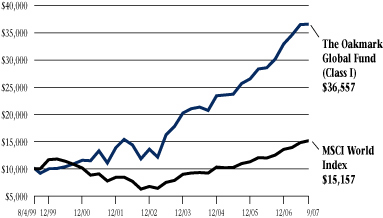
THE VALUE OF A $10,000 INVESTMENT IN THE OAKMARK GLOBAL FUND FROM ITS INCEPTION (8/4/99) TO PRESENT (9/30/07) AS COMPARED TO THE MSCI WORLD INDEX10 (UNAUDITED)
| | | | | Average Annual Total Returns
(as of 9/30/07) | |
| (Unaudited) | | Total Return
Last 3 Months* | | 1-year | | 5-year | | Since
Inception
(8/4/99) | |
| Oakmark Global Fund (Class I) | | | 0.25 | % | | | 21.29 | % | | | 25.32 | % | | | 17.23 | % | |
| MSCI World | | | 2.36 | % | | | 21.10 | % | | | 19.28 | % | | | 5.23 | % | |
| Lipper Global Fund Index11 | | | 1.80 | % | | | 21.00 | % | | | 18.98 | % | | | 7.00 | % | |
The graph and table do not reflect the deduction of taxes that a shareholder would pay on fund distributions or the redemption of fund shares.
Expense Ratio as of 9/30/07 was 1.13%.
The performance data quoted represents past performance. The above performance information for the Fund does not reflect the imposition of a 2% redemption fee on shares held for 90 days or less to deter market timers. If reflected, the fee would reduce the performance quoted. Past performance does not guarantee future results. The investment return and principal value will fluctuate so that an investor's shares, when redeemed, may be worth more or less than their original cost. Current performance may be lower or higher than the performance data quoted. Average annual total return measures annualized change, while total return measures aggregate change. To obtain most recent month-end performance data, visit oakmark.com.
* Not annualized
Quarter and Fiscal Year Review
While the Oakmark Global Fund extended its streak of profitable quarters to twelve in the quarter ended September 30, the Fund's recent relative returns were uninspiring. For the quarter the Fund returned a fraction of a percent, which lagged the 2% returns of both the Lipper Global Fund Index and the MSCI World Index. It was a particularly poor quarter for Europe as the pan-European Dow Jones Stoxx 600 Index12 fell 4%. Oakmark Global's large Europe weighting, as well as its lack of exposure to resource-based economies and to the BRIC's (Brazil, Russia, India, and China), all dampened Fund results. See David Herro's International and International Small Cap Letter for more commentary on commodities and emerging markets. Countries where the Fund enjoyed strong relative performance included Japan, France, and Germany, while Switzerland, the United Kingdom, and Canada brought up the rear. Currency translations played a meaningful part in the quarter's returns as the U.S. dollar's value eroded. We maintained partial hedges against the British pound and initiated a hedge versus the Euro.
We are pleased to report that the Fund's return for the fiscal year exceeded 21% which matches the 21% for the Lipper Global Fund Index and the MSCI World Index. As always, we most enjoy reporting that the compound annualized rate of return since the Fund's inception is 17%.
For more than a year, the balance between U.S. and foreign-domiciled companies has been close to 40/60. Since investors often express interest in how we determine this balance, we will take the liberty of repeating ourselves. We build the portfolio from the bottom up. Each individual name fights for space within the portfolio. The resulting split between U.S. and international is simply an artifact of this endless battle for portfolio position. The same could be said for our Japanese holdings versus our European, emerging market versus developed, etc. We take the portfolio wherever we find dominant value opportunities. Currently that means a lot of U.S., United Kingdom, continental Europe, and Japanese equities.
Oceans of Difference on Competition
Last quarter we wrote about the effect of private equity transactions on equity markets and suggested that the environment was trending less favorably for private equity deals. For once we made a timely and correct forecast! The summer quarter saw several important transactions fall apart, and others experienced duress as bankers struggled to offload some of the debt that makes these deals possible. While we probably should
THE OAKMARK GLOBAL FUND
23
retire from making forecasts at this point, we will push our luck and argue that the ruling in the Luxembourg-based Court of First Instance against Microsoft in its nine-year antitrust battle will prove in the long-term to be the most important financial markets event of the quarter.
Quoting from the Financial Times, "the judgment was delivered in Luxembourg, drafted by an Irishman and read out by a judge from Denmark. The original (European) Commission ruling was prepared by a Spaniard and handed down by Mario Monti, the Italian EU competition commissioner. He has since been replaced by a Dutch official, Neelie Kroes."13 While we are not antitrust law experts, we understand the core of the difference between U.S. and European authorities revolves around market domination and its collateral impacts. Oakmark Global owns shares of Intel, the U.S.-based microprocessor company, and the European Commission issued antitrust ch arges against that company early in the summer, again alleging abuse of a dominant market position. We will not make a specific forecast as to how the divergent application of antitrust law will affect investing opportunities, but we do expect this issue to remain an important factor when analyzing large international companies.
Portfolio Activity
Once again we ended the quarter with 51 equity holdings in the portfolio. We actually eliminated two positions and added only one. With Tyco International splitting into three separate companies and the buyout of eFunds effected in September, however, the portfolio number remained flat at 51.
Strong performers in the quarter included Discovery Holding Class A (U.S.), Medtronic (U.S.), Oracle (U.S.), Apache (U.S.), Square Enix (Japan), and Nestle (Switzerland). Names on the negative side of the ledger included Harley-Davidson (U.S.), Trinity Mirror (UK), a trio of U.S. media concerns, CBS, Time Warner, and Viacom Class B, as well as three Swiss companies, Adecco, Credit Suisse, and UBS. Media continues to be under pressure world-wide as market fragmentation challenges traditional providers. Discovery proved a strong exception to this trend. Investors flocked to Discovery's shares as the probability of a corporate reorganization improved. Harley-Davidson reduced its guidance for sales and earnings, causing its stock to drop. The outlook for Adecco's U.S. temporary help business is mirroring the market's uneasiness about the U.S. economy. Concerns related to liquidity, the fixed income market, and trading books at global investment banks depressed shares of UBS and Credit Suisse.
On the last day of the quarter UBS pre-announced a $2.5-3.5 billion write down related to fixed income securities, causing a pre-tax loss of around $700 million. While the amount has shock value and is higher than what the previous management team had intimated, we can highlight a few positives. First, Marcel Rohner, UBS's new CEO, is proactively changing management and cutting costs at the investment bank. Furthermore, it is sensible for him to take the big write down early in his term as CEO, making future comparisons easier. Second, the balance sheet at UBS remains exceptionally strong in absolute terms and relative to most other investment banks. Third, Rohner realizes that investors who employ short-term trading tactics have become panicked sellers, thereby distorting current prices for fixed income securities. He states that gains are possible in the future as pricing becomes more rational. Finally, the value of the private bank remain s intact, and UBS as a whole appears to remain extremely undervalued. We have commented for some time that we are not as concerned with the volatility in the investment bank segment of the business because we were investing in UBS for the value of the private bank business alone. The losses at the investment bank do not make us happy, but fall in our expected range and are not very material to the company's overall intrinsic value. In related news, Credit Suisse announced that third quarter results would be profitable (around $1 billion) and that the company profited from the negative subprime environment.
We exited positions in Vivendi (France) and Vodafone (UK) during the quarter because both approached our sell targets.
Samsung ("SEC," Korea) was our only new purchase. SEC is the industry leader in two types of memory chips, DRAM and NAND (flash), and the company has established significant competitive advantages. Because of its leading market position and financial strength, SEC has been able to maintain and increase research and development as well as capital spending during down cycles which has allowed it to become a low cost producer by a wide margin. In general, we believe SEC is six to nine months ahead of its competitors. Barriers to entry are significant in part because SEC devotes approximately $8 billion per annum to capital spending and research and development on its semi businesses, an amount roughly equal to the entire market capitalization of its primary competitors. Finally, corporate governance at SEC is an improving story: management uses performance-based compensation and has increased dividends and share repurchases.
We thank you for being our shareholders and welcome your suggestions and comments.
Clyde S. McGregor, CFA
Portfolio Manager
oakgx@oakmark.com | | Robert A. Taylor, CFA
Portfolio Manager
oakgx@oakmark.com | |
|
September 30, 2007
THE OAKMARK GLOBAL FUND
24
THE OAKMARK GLOBAL FUND
Global Diversification—September 30, 2007 (Unaudited)
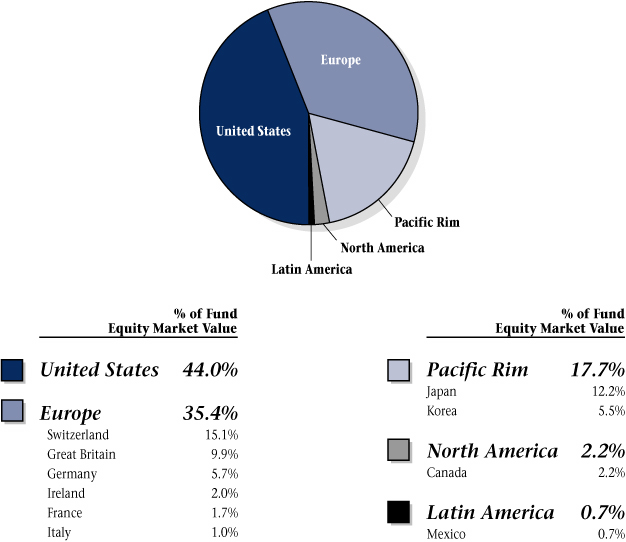
THE OAKMARK GLOBAL FUND
25
THE OAKMARK GLOBAL FUND
Schedule of Investments—September 30, 2007
| Name | | Description | | Shares Held | | Market Value | |
| Common Stocks—96.0% | |
| Apparel, Accessories & Luxury Goods—1.0% | |
Bulgari S.p.A.
(Italy) | | Jewelry Manufacturer & Retailer | | | 1,946,000 | | | $ | 30,634,882 | | |
| Automobile Manufacturers—5.4% | |
DaimlerChrysler AG
(Germany) | | Automobile Manufacturer | | | 995,100 | | | $ | 100,235,535 | | |
Bayerische Motoren
Werke (BMW) AG
(Germany) | | Luxury Automobile Manufacturer | | | 1,064,000 | | | | 68,623,444 | | |
| | | | 168,858,979 | | |
| Broadcasting & Cable TV—4.3% | |
Discovery Holding
Company, Class A
(United States) (a) | | Media Management &
Network Services | | | 2,913,700 | | | $ | 84,060,245 | | |
CBS Corporation, Class B
(United States) | | Radio & Television Broadcasting | | | 1,585,000 | | | | 49,927,500 | | |
| | | | 133,987,745 | | |
| Household Appliances—3.1% | |
Snap-on Incorporated
(United States) | | Tool & Equipment Manufacturer | | | 1,913,300 | | | $ | 94,784,882 | | |
| Motorcycle Manufacturers—1.2% | |
Harley-Davidson, Inc.
(United States) | | Motorcycle Manufacturer | | | 824,000 | | | $ | 38,077,040 | | |
| Movies & Entertainment—6.8% | |
Live Nation
(United States) (a) | | Live Events Producer, Operator, &
Promoter | | | 3,119,500 | | | $ | 66,289,375 | | |
Viacom, Inc., Class B
(United States) (a) | | Publishing Company | | | 1,325,300 | | | | 51,646,941 | | |
Time Warner, Inc.
(United States) | | Filmed Entertainment &
Television Networks | | | 2,602,300 | | | | 47,778,228 | | |
News Corporation, Class B
(United States) | | International Multimedia &
Entertainment Company | | | 1,986,100 | | | | 46,454,879 | | |
| | | | 212,169,423 | | |
THE OAKMARK GLOBAL FUND
26
THE OAKMARK GLOBAL FUND
Schedule of Investments—September 30, 2007 cont.
| Name | | Description | | Shares Held | | Market Value | |
| Common Stocks—96.0% (cont.) | |
| Publishing—2.9% | |
The Washington Post
Company, Class B
(United States) | | Newspaper & Magazine Publishing;
Educational & Career
Development Service Provider | | | 70,360 | | | $ | 56,485,008 | | |
Trinity Mirror plc
(Great Britain) | | Newspaper Publishing | | | 4,078,900 | | | | 34,383,169 | | |
| | | | 90,868,177 | | |
| Distillers & Vintners—2.5% | |
| Diageo plc (Great Britain) | | Beverages, Wines, &
Spirits Manufacturer | | | 3,509,600 | | | $ | 77,120,091 | | |
| Household Products—1.3% | |
Kimberly-Clark de Mexico
S.A.B. de C.V. (Mexico) | | Hygiene Products Manufacturer,
Marketer & Distributor | | | 4,391,000 | | | $ | 19,993,033 | | |
Uni-Charm Corporation
(Japan) | | Toiletry Products Manufacturer | | | 310,100 | | | | 19,032,821 | | |
| | | | 39,025,854 | | |
| Packaged Foods & Meats—3.6% | |
Cadbury Schweppes plc
(Great Britain) | | Beverage & Confectionary
Manufacturer | | | 6,396,300 | | | $ | 74,202,325 | | |
| Nestle SA (Switzerland) | | Food & Beverage Manufacturer | | | 84,900 | | | | 38,138,458 | | |
| | | | 112,340,783 | | |
| Soft Drinks—0.8% | |
Lotte Chilsung Beverage
Co., Ltd. (Korea) | | Soft Drinks, Juices & Sports
Drinks Manufacturer | | | 16,595 | | | $ | 25,313,177 | | |
| Oil & Gas Exploration & Production—5.3% | |
XTO Energy, Inc.
(United States) | | Oil & Natural Gas Exploration &
Production | | | 1,643,600 | | | $ | 101,640,224 | | |
Apache Corporation
(United States) | | Oil & Natural Gas Exploration &
Production | | | 681,500 | | | | 61,375,890 | | |
| | | | 163,016,114 | | |
| Asset Management & Custody Banks—2.6% | |
Julius Baer Holding AG
(Switzerland) | | Asset Management | | | 1,090,400 | | | $ | 81,528,297 | | |
THE OAKMARK GLOBAL FUND
27
THE OAKMARK GLOBAL FUND
Schedule of Investments—September 30, 2007 cont.
| Name | | Description | | Shares Held | | Market Value | |
| Common Stocks—96.0% (cont.) | |
| Diversified Banks—2.0% | |
| Bank of Ireland (Ireland) | | Commercial Bank | | | 3,249,500 | | | $ | 60,237,119 | | |
| Diversified Capital Markets—5.9% | |
| UBS AG (Switzerland) | | Investment Banking | | | 1,711,600 | | | $ | 92,030,200 | | |
Credit Suisse Group
(Switzerland) | | Investment Services & Insurance | | | 1,350,100 | | | | 89,639,450 | | |
| | | | 181,669,650 | | |
| Investment Banking & Brokerage—3.7% | |
Daiwa Securities Group,
Inc. (Japan) | | Stock Broker | | | 7,595,000 | | | $ | 72,336,482 | | |
Nikko Cordial Corporation
(Japan) | | Comprehensive Financial Services
Provider | | | 3,530,100 | | | | 44,347,141 | | |
| | | | 116,683,623 | | |
| Health Care Equipment—5.5% | |
Medtronic, Inc.
(United States) | | Health Care Equipment | | | 1,460,000 | | | $ | 82,358,600 | | |
Kinetic Concepts, Inc.
(United States) (a) | | Health Care Equipment & Supplies | | | 1,015,100 | | | | 57,129,828 | | |
Covidien Limited
(United States) | | Health Care Equipment & Supplies | | | 709,875 | | | | 29,459,813 | | |
| | | | 168,948,241 | | |
| Health Care Services—2.7% | |
Laboratory Corporation of
America Holdings
(United States) (a) | | Medical Laboratory & Testing
Services | | | 1,085,000 | | | $ | 84,879,550 | | |
| Life Sciences Tools & Services—2.1% | |
| MDS, Inc. (Canada) (a) | | Products & Services for Medical
Product Manufacturers | | | 3,040,500 | | | $ | 65,522,775 | | |
| Pharmaceuticals—7.2% | |
GlaxoSmithKline plc
(Great Britain) | | Pharmaceuticals | | | 4,069,800 | | | $ | 107,998,736 | | |
| Novartis AG (Switzerland) | | Pharmaceuticals | | | 1,552,400 | | | | 85,670,346 | | |
Takeda Pharmaceutical
Company Limited
(Japan) | | Pharmaceuticals & Food
Supplements | | | 416,000 | | | | 29,262,874 | | |
| | | | 222,931,956 | | |
THE OAKMARK GLOBAL FUND
28
THE OAKMARK GLOBAL FUND
Schedule of Investments—September 30, 2007 cont.
| Name | | Description | | Shares Held | | Market Value | |
| Common Stocks—96.0% (cont.) | |
| Aerospace & Defense—1.0% | |
Alliant Techsystems, Inc.
(United States) (a) | | Propulsion Systems & Munitions | | | 269,087 | | | $ | 29,411,209 | | |
| Diversified Commercial & Professional Services—0.7% | |
| Meitec Corporation (Japan) | | Software Engineering Services | | | 760,000 | | | $ | 22,297,480 | | |
| Human Resource & Employment Services—1.5% | |
| Adecco SA (Switzerland) | | Temporary Employment Services | | | 787,800 | | | $ | 46,587,958 | | |
| Industrial Conglomerates—0.1% | |
Tyco International, Ltd.
(United States) | | Diversified Manufacturing &
Service Company | | | 100,525 | | | $ | 4,457,279 | | |
| Railroads—2.1% | |
Union Pacific Corporation
(United States) | | Rail Transportation Provider | | | 573,700 | | | $ | 64,862,522 | | |
| Computer Hardware—1.3% | |
Dell Inc.
(United States) (a) | | Technology Products & Services | | | 1,410,000 | | | $ | 38,916,000 | | |
| Electronic Equipment Manufacturers—1.3% | |
OMRON Corporation
(Japan) | | Component, Equipment, &
System Manufacturer | | | 1,570,300 | | | $ | 41,559,326 | | |
| Electronic Manufacturing Services—1.0% | |
Tyco Electronics, Ltd.
(United States) | | Manufactures Electronic
Components | | | 865,875 | | | $ | 30,677,951 | | |
| Home Entertainment Software—1.2% | |
Square Enix Co., Ltd.
(Japan) | | Entertainment Software | | | 1,074,900 | | | $ | 35,560,179 | | |
| Office Electronics—1.6% | |
| Neopost SA (France) | | Mailroom Equipment Supplier | | | 359,150 | | | $ | 50,659,894 | | |
| Semiconductors—7.7% | |
Rohm Company Limited
(Japan) | | Integrated Circuits & Semiconductor
Devices Manufacturer | | | 1,116,988 | | | $ | 98,702,200 | | |
Intel Corporation
(United States) | | Computer Component
Manufacturer & Designer | | | 3,187,900 | | | | 82,439,094 | | |
Samsung Electronics
Co., Ltd. (Korea) | | Consumer & Industrial Electronic
Equipment Manufacturer | | | 89,800 | | | | 56,419,362 | | |
| | | | 237,560,656 | | |
THE OAKMARK GLOBAL FUND
29
THE OAKMARK GLOBAL FUND
Schedule of Investments—September 30, 2007 cont.
| Name | | Description | | Shares Held/
Par Value | | Market Value | |
| Common Stocks—96.0% (cont.) | |
| Systems Software—3.4% | |
Oracle Corporation
(United States) (a) | | Software Services | | | 4,816,800 | | | $ | 104,283,720 | | |
| Specialty Chemicals—0.5% | |
| Givaudan (Switzerland) | | Fragrance & Flavor Compound
Manufacturer | | | 16,100 | | | $ | 14,879,622 | | |
| Wireless Telecommunication Services—2.7% | |
SK Telecom Co., Ltd.
(Korea) | | Mobile Telecommunications | | | 353,930 | | | $ | 81,212,085 | | |
SK Telecom Co., Ltd.
(Korea) (b) | | Mobile Telecommunications | | | 55,000 | | | | 1,633,500 | | |
| | | | 82,845,585 | | |
| Total Common Stocks (Cost: $2,317,766,295) | | | | | | | | | 2,973,157,739 | | |
| Short Term Investments—3.5% | |
| Repurchase Agreement—3.5% | |
State Street Bank and Trust Co. Repurchase Agreement,
5.00% dated 9/28/2007, due 10/1/2007, repurchase
price $107,878,184, collateralized by a Federal
Home Loan Mortgage Corp. Bond, with a rate
of 4.500%, with a maturity of 12/1/2020, and with
an aggregate market value plus accrued interest
of $92,445,953, and by Federal National Mortgage
Corp. Bonds, with rates of 5.431% - 5.533%, with
maturities of 10/25/2036 - 8/1/2037, and with an
aggregate market value plus accrued interest
of $20,779,206 | | $ | 107,833,253 | | | $ | 107,833,253 | | |
| Total Repurchase Agreement (Cost: $107,833,253) | | | | | 107,833,253 | | |
| Total Short Term Investments (Cost: $107,833,253) | | | | | 107,833,253 | | |
| Total Investments (Cost $2,425,599,548)—99.5% | | | | $ | 3,080,990,992 | | |
| Other Assets In Excess Of Other Liabilities—0.5% | | | | | 15,543,741 | | |
| Total Net Assets—100% | | | | $ | 3,096,534,733 | | |
(a) Non-income producing security.
(b) Represents an American Depository Receipt.
See accompanying Notes to Financial Statements.
THE OAKMARK GLOBAL FUND
30
THE OAKMARK GLOBAL SELECT FUND
Report from Bill Nygren and David Herro, Portfolio Managers


THE VALUE OF A $10,000 INVESTMENT IN THE OAKMARK GLOBAL SELECT FUND FROM ITS INCEPTION (10/2/06) TO PRESENT (9/30/07) AS COMPARED TO THE MSCI WORLD INDEX10 (UNAUDITED)
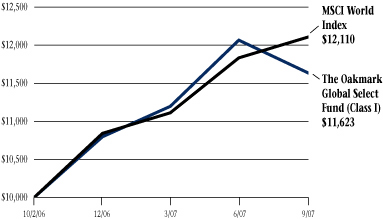
| | | Total Return
(as of 9/30/07) | |
| (Unaudited) | | Last 3 Months* | | Since
Inception
(10/2/06) | |
| Oakmark Global Select Fund (Class I) | | | -3.65 | % | | | 16.23 | % | |
| MSCI World | | | 2.36 | % | | | 21.10 | % | |
| Lipper Global Fund Index11 | | | 1.80 | % | | | 21.00 | % | |
The graph and table do not reflect the deduction of taxes that a shareholder would pay on fund distributions or the redemption of fund shares.
Expense Ratio as of 9/30/07 was 1.31%.
The performance data quoted represents past performance. The above performance information for the Fund does not reflect the imposition of a 2% redemption fee on shares held for 90 days or less to deter market timers. If reflected, the fee would reduce the performance quoted. Past performance does not guarantee future results. The investment return and principal value will fluctuate so that an investor's shares, when redeemed, may be worth more or less than their original cost. Current performance may be lower or higher than the performance data quoted. Average annual total return measures annualized change, while total return measures aggregate change. To obtain most recent month-end performance data, visit oakmark.com.
* Not annualized
The Oakmark Global Select Fund returned -4% for the quarter ended September 30, 2007, which compares unfavorably to the MSCI World Index return of 2%.
Impact Players
Schroders plc, a UK-based asset management group, was the quarter's largest contributor, returning 11%. Even though the group's UK and Japanese institutional products experienced significant outflows, the company's revenue still increased because new assets flowed into higher fee based products. Strong retail business growth in Asia and the UK produced solid results. U.S.-based Intel Corp, a global computer products manufacturer, was another top contributor, returning 9% for the quarter. Intel management remains focused on regaining market dominance. Management has shortened the new product cycle time from four years to two years as well as initiated a cost-cutting program that eliminated $2B in spending this year and is anticipated to eliminate another $1B next year. Stronger than expected demand for Intel's core chip products, combined with the company's expansion into other computing areas, should increase future revenues. Finally, McDona lds Corp. returned 7% during the quarter due to continued strong global earnings growth as well as a 50% increase in their dividend.
The largest detractor from performance for the quarter was Swiss-based Adecco S.A., a personnel and temporary employment company. Please refer to the Oakmark International letter for information pertaining to Adecco's price weakness. Washington Mutual and Home Depot also significantly detracted from the Fund's performance. During the quarter consumer companies, including retailers and consumer finance companies, performed poorly, mostly due to weakness in the U.S. housing market.
Portfolio Composition
Despite short-term price fluctuations and volatility there were no names added to or removed from the Fund. We maintain our positive outlook on the Fund's composition, and we believe that these companies will solidly contribute in the future.
We would like to reiterate that we are long-term value investors and that we believe we are very well positioned for the medium and long-term. While performance may lag in the short-term, we maintain our conviction that investing in under-valued businesses with management
THE OAKMARK GLOBAL SELECT FUND
31
teams focused on building shareholder value is the best strategy for providing positive, long-term results for our shareholders. Thank you for your continued confidence and support.
William C. Nygren, CFA
Portfolio Manager
oakwx@oakmark.com | | David G. Herro, CFA
Portfolio Manager
oakwx@oakmark.com | |
|
September 30, 2007
THE OAKMARK GLOBAL SELECT FUND
32
THE OAKMARK GLOBAL SELECT FUND
Global Diversification—September 30, 2007 (Unaudited)
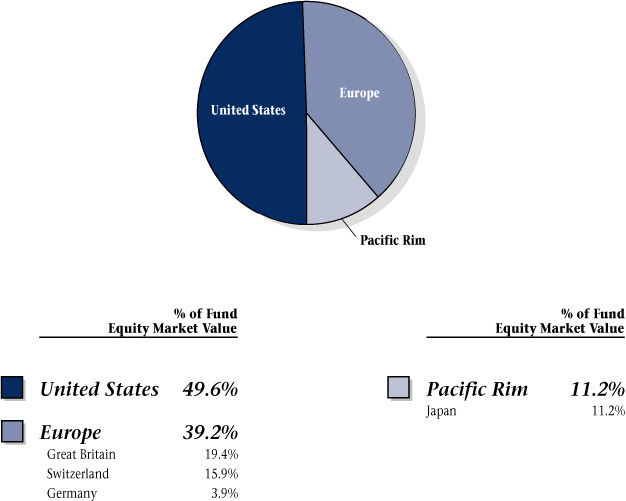
THE OAKMARK GLOBAL SELECT FUND
33
THE OAKMARK GLOBAL SELECT FUND
Schedule of Investments—September 30, 2007
| Name | | Description | | Shares Held | | Market Value | |
| Common Stocks—93.6% | |
| Automobile Manufacturers—3.6% | |
DaimlerChrysler AG
(Germany) | | Automobile Manufacturer | | | 136,100 | | | $ | 13,709,232 | | |
| Broadcasting & Cable TV—3.6% | |
British Sky Broadcasting
Group plc
(Great Britain) | | Television Production &
Broadcasting | | | 953,200 | | | $ | 13,554,218 | | |
| Home Improvement Retail—4.2% | |
The Home Depot, Inc.
(United States) | | Home Improvement Retailer | | | 485,000 | | | $ | 15,733,400 | | |
| Movies & Entertainment—9.1% | |
Viacom, Inc., Class B
(United States) (a) | | Publishing Company | | | 454,000 | | | $ | 17,692,380 | | |
Time Warner, Inc.
(United States) | | Filmed Entertainment &
Television Networks | | | 915,000 | | | | 16,799,400 | | |
| | | | 34,491,780 | | |
| Restaurants—5.2% | |
McDonald's Corporation
(United States) | | Fast-food Restaurant Operator | | | 362,000 | | | $ | 19,718,140 | | |
| Distillers & Vintners—5.2% | |
Diageo plc
(Great Britain) | | Beverages, Wines, &
Spirits Manufacturer | | | 890,700 | | | $ | 19,572,277 | | |
| Asset Management & Custody Banks—4.1% | |
Schroders PLC
(Great Britain) | | International Asset Management | | | 552,200 | | | $ | 15,670,343 | | |
| Diversified Capital Markets—5.0% | |
| UBS AG (Switzerland) | | Investment Banking | | | 348,600 | | | $ | 18,743,706 | | |
| Investment Banking & Brokerage—5.3% | |
Daiwa Securities Group,
Inc. (Japan) | | Stock Broker | | | 2,086,000 | | | $ | 19,867,531 | | |
| Other Diversified Financial Services—3.8% | |
Citigroup, Inc.
(United States) | | Diversified Financial Services | | | 304,000 | | | $ | 14,187,680 | | |
| Thrifts & Mortgage Finance—4.9% | |
Washington Mutual, Inc.
(United States) | | Diversified Financial Services | | | 525,000 | | | $ | 18,537,750 | | |
THE OAKMARK GLOBAL SELECT FUND
34
THE OAKMARK GLOBAL SELECT FUND
Schedule of Investments—September 30, 2007 cont.
| Name | | Description | | Shares Held/
Par Value | | Market Value | |
| Common Stocks—93.6% (cont.) | |
| Pharmaceuticals—14.9% | |
GlaxoSmithKline plc
(Great Britain) | | Pharmaceuticals | | | 749,800 | | | $ | 19,897,158 | | |
Novartis AG
(Switzerland) | | Pharmaceuticals | | | 352,100 | | | | 19,430,900 | | |
Bristol-Myers Squibb
Company
(United States) | | Health & Personal Care | | | 584,000 | | | | 16,830,880 | | |
| | | | 56,158,938 | | |
| Human Resource & Employment Services—4.8% | |
Adecco SA
(Switzerland) | | Temporary Employment Services | | | 307,400 | | | $ | 18,178,647 | | |
| Computer Hardware—4.6% | |
Dell Inc.
(United States) (a) | | Technology Products & Services | | | 633,000 | | | $ | 17,470,800 | | |
| Semiconductors—10.5% | |
Intel Corporation
(United States) | | Computer Component
Manufacturer & Designer | | | 777,000 | | | $ | 20,093,220 | | |
Rohm Company
Limited (Japan) Integrated Circuits &
Semiconductor Devices | |
Manufacturer | | | 222,800 | | | | 19,687,633 | | |
| | | | 39,780,853 | | |
| Wireless Telecommunication Services—4.8% | |
Sprint Nextel Corporation
(United States) | | Telecommunications | | | 952,000 | | | $ | 18,088,000 | | |
| Total Common Stocks (Cost: $344,234,350) | | | | | | | | | 353,463,295 | | |
| Short Term Investments—5.6% | |
| U.S. Government Agencies—1.6% | |
| Federal Home Loan Bank, 4.70% due 10/5/2007 | | | | $ | 6,000,000 | | | $ | 5,996,867 | | |
| Total U.S. Government Agencies (Cost: $5,996,867) | | | | | | | | | 5,996,867 | | |
THE OAKMARK GLOBAL SELECT FUND
35
THE OAKMARK GLOBAL SELECT FUND
Schedule of Investments—September 30, 2007 cont.
| Name | | Par Value | | Market Value | |
| Short Term Investments—5.6% (cont.) | |
| Repurchase Agreement—4.0% | |
State Street Bank and Trust Co. Repurchase
Agreement, 5.00% dated 9/28/2007
due 10/1/2007, repurchase price $15,026,342,
collateralized by a Federal Home Loan
Mortgage Corp. Bond, with a rate of 6.103%,
with a maturity of 7/15/2036, and with a
market value plus accrued interest
of $15,773,842 | | $ | 15,020,084 | | | $ | 15,020,084 | | |
| Total Repurchase Agreement (Cost: $15,020,084) | | | 15,020,084 | | |
| Total Short Term Investments (Cost: $21,016,951) | | | 21,016,951 | | |
| Total Investments (Cost $365,251,301)—99.2% | | $ | 374,480,246 | | |
| Other Assets In Excess Of Other Liabilities—0.8% | | | | | 3,207,915 | | |
| Total Net Assets—100% | | $ | 377,688,161 | | |
(a) Non-income producing security.
See accompanying Notes to Financial Statements.
THE OAKMARK GLOBAL SELECT FUND
36
THE OAKMARK INTERNATIONAL AND
OAKMARK INTERNATIONAL SMALL CAP FUNDS

Fellow Shareholders,
Despite the recent volatility in global markets and specific weakness in the companies and sectors in which we are invested, we are extremely enthused about the prospect for our international portfolios.
The U.S. dollar continues to depreciate against the global currencies. During the quarter we initiated hedges on the Euro exposure in the Funds while we maintained our Sterling hedge exposure as previously discussed in the Semi-Annual Report. We believe both currencies have appreciated above the range of their intrinsic values as measured by the purchasing power parity and other economic fundamentals.
Why Are We Lagging in 2007?
More than a few shareholders have asked why our results are sluggish in 2007—especially since 2006 returns were so strong. Before I answer this question in detail, I would like to note that we are long-term value investors. We believe that long-term investment success requires determining a company's value and then buying it at a significant discount to its worth. This approach distinguishes us from momentum "investors" who buy stocks that have increasing prices and then hope to sell them before their prices drop. Usually, these investors do attach themes to their decisions as a way of explaining stocks' upward movements, but these themes are often not linked to corporate fundamentals. Therefore, this strategy frequently leads to significant losses of capital. For example, during the tech nology bubble of the late 90s, investors bought expensive stocks and then used the theme of the growth of information technology, the internet and new media to justify their purchases. Initially, prices actually appeared to be disconnected from fundamental business value. Yet, in the end, fundamentals reasserted themselves, and the high share prices dropped precipitously. Resisting these trends hurt our returns at first, but in the longer term, our investors were protected from this mania.
Today, we face a similar situation. In the global equity markets, so-called investment experts proclaim that the business cycle is dead and that growth in emerging markets will provide a "super-cycle," which will push material and resource prices upwards indefinitely. Indeed, the prices of materials and resources have been quite strong to date, as indicated by the share prices of companies in these industries. As of September 30, the MSCI World Index's10 energy sector was up 24.7%, materials were up 35.4% and metals and mining were up 47.9% year to date! We have no exposure to these hot areas. Additionally, we are over exposed to the cold ones: the consumer discretionary sector is up just 3.9%, pharmaceuticals are 0.4%, and financials are 1.2%.
We believe that these price movements are widely exaggerated. In the past five years, global economic growth has averaged 4.5% per year according to the IMF. In that time, the prices of copper and nickel have more than quadrupled, while oil has more than tripled. Consequently, share prices of resource companies have performed quite strongly—some have increased at the same exponential rates as the individual commodities.
We are not invested in these businesses for a reason: we believe that these sectors are significantly over-priced.
We reject the notion that the forces of supply and demand have been suspended. Instead, we anticipate that today's high prices will generate huge increases in supply. For example, it is hard to find a mining company that is not dramatically expanding output. Despite continued economic growth for the globe, we believe that both supply and demand will negatively affect prices. As supply increases and demand declines or grows at a slower rate, prices will respond significantly.
On the other hand, we believe it is the out-of-favor sectors that offer the best long-term value. We are aware of the current challenges to the global financial system; however, looking beyond the short-term, we are able to find great franchises in growth areas like asset management, media, consumer products and pharmaceuticals at what we think are bargain prices. These businesses are characterized by strong cash generation and secure balance sheets as well as low valuations. In our opinion, they are far less attached to the business cycle than the cyclical industries mentioned above and they offer both defensive and offensive qualities.
Though current trends have dampened our short-term performance, we think we are extremely well positioned for the medium and longer term. Although we are missing the short-term spike caused by the belief in the "super-cycle," we believe we are keeping our investors out of harm's way.
David G. Herro, CFA
Portfolio Manager
oakix@oakmark.com
oakex@oakmark.com
September 30, 2007
THE OAKMARK INTERNATIONAL AND OAKMARK INTERNATIONAL SMALL CAP FUNDS
37
THE OAKMARK INTERNATIONAL FUND
Report from David G. Herro

THE VALUE OF A $10,000 INVESTMENT IN THE OAKMARK INTERNATIONAL FUND FROM ITS INCEPTION (9/30/92) TO PRESENT (9/30/07) AS COMPARED TO THE MSCI WORLD EX U.S. INDEX14 (UNAUDITED)
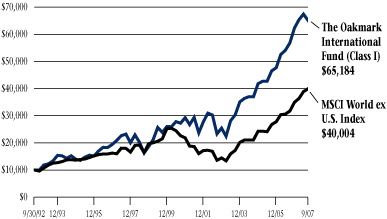
| | | | | Average Annual Total Returns
(as of 9/30/07) | |
| (Unaudited) | | Total Return
Last 3 Months* | | 1-year | | 5-year | | 10-year | | Since
Inception
(9/30/92) | |
Oakmark International
Fund (Class I) | | | -3.48 | % | | | 14.53 | % | | | 22.78 | % | | | 10.84 | % | | | 13.31 | % | |
| MSCI World ex U.S. | | | 2.71 | % | | | 25.85 | % | | | 24.08 | % | | | 8.30 | % | | | 9.68 | % | |
| MSCI EAFE15 | | | 2.18 | % | | | 24.87 | % | | | 23.56 | % | | | 7.97 | % | | | 9.41 | % | |
Lipper International
Fund Index16 | | | 3.51 | % | | | 27.57 | % | | | 23.65 | % | | | 8.70 | % | | | 10.70 | % | |
The graph and table do not reflect the deduction of taxes that a shareholder would pay on fund distributions or the redemption of fund shares.
Expense Ratio as of 9/30/07 was 1.05%.
The performance data quoted represents past performance. The above performance information for the Fund does not reflect the imposition of a 2% redemption fee on shares held for 90 days or less to deter market timers. If reflected, the fee would reduce the performance quoted. Past performance does not guarantee future results. The investment return and principal value will fluctuate so that an investor's shares, when redeemed, may be worth more or less than their original cost. Current performance may be lower or higher than the performance data quoted. Average annual total return measures annualized change, while total return measures aggregate change. To obtain most recent month-end performance data, visit oakmark.com.
* Not annualized
The Oakmark International Fund returned -3% for the quarter ended September 30, 2007, lagging behind the return of 3% for the MSCI World ex U.S. Index. More importantly, however, since the Fund's inception in September 1992, it is up 13% per annum, which compares favorably with the MSCI World ex U.S. Index's return of 10% over the same period.
Impact Players
Schroders plc, a UK-based asset management group, was the quarter's largest contributor, returning 11%. Strong retail business growth in the UK and Asia produced positive results. Even though the group's UK and Japanese institutional products experienced significant outflows, the company's revenue still increased because new assets flowed into higher fee-based products. A top contributor in the second quarter of 2007, UK-based British Sky Broadcasting Group ("BskyB") was again a top contributor last quarter, returning 10%. BskyB continues to grow its pay-television market and has maintained its successful strategy, cross-selling products in its broadband and telephony service. Low operating costs have allowed BskyB to price aggressively and gain market share from competitors British Telecom and Virgin Media. Rounding out the top three contributors is Swiss-based Nestle S.A., which has benefited from stronger than expected growth and margin i mprovement across most product lines. Nestle S.A. has aggressively increased its prices—a trend that is expected to continue.
Adecco S.A., a Swiss-based personnel and temporary employment company and second quarter's largest contributor, was last quarter's largest detractor to performance with the price falling 24%. Declining sales in the U.S. and declining profits in the UK (20+% of profits) have weakened shares despite profit growth and margin gains in France (35% of profits). Short-term turnarounds are unlikely in both countries as economic outlooks remain challenging. Management remains focused on improving core margins and diversifying into specialty staffing. Another detractor for the quarter was Signet Group, the world's largest specialty jewelry retailer. The group continues to focus on gaining market share in the U.S. and has managed to outperform its peers in a difficult market environment. Television Francaise 1, France's largest television broadcaster, was also a detractor for the quarter with the price falling 23%. Earnings and sales results for 1H fai led to meet the Street's forecasts and caused significant weakness in share price. On a positive note, the French media regulatory environment, one of the most stringent in Europe, is likely to be reformed given recent changes in government control. We maintain our positive outlook on these companies and believe they will become solid contributors to the portfolio.
Portfolio Composition
In order to take advantage of extreme market volatility during the last quarter, our activity was greater than normal. We sold our positions in Willis Group, Vodafone Group, ANZ Banking, United Overseas Bank, Akzo Nobel, Sanofi-Aventis, NTT Docomo, and Syngenta AG as they reached fair value. Four new
THE OAKMARK INTERNATIONAL FUND
38
names were added to the portfolio: Barclays plc, a UK-based financial services group; Experian Group, credit service and marketing solutions provider; SAP AG, a global software company; Richemont SA, manufacturer and luxury goods retailer of famous brands such as Cartier and Montblanc.
In closing, as discussed in the International lead letter, we are long-term value investors and focus on finding attractive, under-valued foreign companies trading at at least a 30% discount to its measured worth. We welcome market weakness and instability because they create opportunities that allow us to invest in quality companies trading at low prices.
David G. Herro, CFA
Portfolio Manager
oakix@oakmark.com | |
|
September 30, 2007
THE OAKMARK INTERNATIONAL FUND
39
THE OAKMARK INTERNATIONAL FUND
International Diversification—September 30, 2007 (Unaudited)

THE OAKMARK INTERNATIONAL FUND
40
THE OAKMARK INTERNATIONAL FUND
Schedule of Investments—September 30, 2007
| Name | | Description | | Shares Held | | Market Value | |
| Common Stocks—97.0% | |
| Advertising—1.9% | |
Publicis Groupe
(France) | | Advertising & Media Services | | | 4,124,200 | | | $ | 169,605,242 | | |
| Apparel Retail—0.7% | |
Giordano International
Limited (Hong Kong) (c) | | Pacific Rim Clothing Retailer &
Manufacturer | | | 120,007,300 | | | $ | 58,970,508 | | |
| Apparel, Accessories & Luxury Goods—3.2% | |
Compagnie Financiere
Richemont SA
(Switzerland) | | Manufacturer and Retailer of
Luxury Goods | | | 2,510,700 | | | $ | 166,373,635 | | |
LVMH Moet Hennessy
Louis Vuitton SA
(France) | | Diversified Luxury
Goods Conglomerate | | | 1,071,700 | | | | 128,474,985 | | |
| | | | 294,848,620 | | |
| Automobile Manufacturers—6.4% | |
Bayerische Motoren
Werke (BMW) AG
(Germany) | | Luxury Automobile
Manufacturer | | | 4,299,000 | | | $ | 277,267,094 | | |
DaimlerChrysler AG
(Germany) | | Automobile Manufacturer | | | 1,841,300 | | | | 185,472,507 | | |
Honda Motor Co., Ltd.
(Japan) | | Automobile & Motorcycle
Manufacturer | | | 3,231,500 | | | | 108,593,479 | | |
| | | | 571,333,080 | | |
| Broadcasting & Cable TV—7.4% | |
Societe Television
Francaise 1 (France) | | Television Production &
Broadcasting | | | 7,267,000 | | | $ | 195,330,838 | | |
Gestevision Telecinco SA
(Spain) | | Television Production &
Broadcasting | | | 6,860,900 | | | | 180,110,560 | | |
British Sky Broadcasting
Group plc
(Great Britain) | | Television Production &
Broadcasting | | | 11,548,400 | | | | 164,214,783 | | |
Grupo Televisa S.A.
(Mexico) (b) | | Television Production &
Broadcasting | | | 5,245,300 | | | | 126,778,901 | | |
| | | | 666,435,082 | | |
THE OAKMARK INTERNATIONAL FUND
41
THE OAKMARK INTERNATIONAL FUND
Schedule of Investments—September 30, 2007 cont.
| Name | | Description | | Shares Held | | Market Value | |
| Common Stocks—97.0% (cont.) | |
| Consumer Electronics—0.8% | |
Koninklijke (Royal) Philips
Electronics N.V.
(Netherlands) | | Electronics Manufacturer | | | 1,538,500 | | | $ | 69,434,532 | | |
| Movies & Entertainment—1.0% | |
Vivendi Universal SA
(France) | | Music, Games, Television,
Film, & Telecommunications | | | 2,218,900 | | | $ | 93,655,597 | | |
| Publishing—2.7% | |
Trinity Mirror plc
(Great Britain) (c) | | Newspaper Publishing | | | 17,792,038 | | | $ | 149,978,340 | | |
Johnston Press plc
(Great Britain) | | Newspaper Publishing | | | 13,392,300 | | | | 88,983,597 | | |
| | | | 238,961,937 | | |
| Restaurants—0.2% | |
Compass Group PLC
(Great Britain) | | International Foodservice
Group Operator | | | 2,271,021 | | | $ | 14,032,457 | | |
| Specialty Stores—2.5% | |
Signet Group plc
(Great Britain) (c) | | Jewelry Retailer | | | 131,486,300 | | | $ | 225,305,062 | | |
| Distillers & Vintners—2.4% | |
| Diageo plc (Great Britain) | | Beverages, Wines, & Spirits
Manufacturer | | | 9,663,000 | | | $ | 212,335,149 | | |
| Household Products—1.2% | |
Uni-Charm Corporation
(Japan) | | Toiletry Products Manufacturer | | | 1,525,400 | | | $ | 93,623,558 | | |
| Henkel KGaA (Germany) | | Consumer Chemical Products
Manufacturer | | | 466,000 | | | | 22,067,803 | | |
| | | | 115,691,361 | | |
| Packaged Foods & Meats—3.5% | |
Cadbury Schweppes plc
(Great Britain) | | Beverage & Confectionary
Manufacturer | | | 19,791,600 | | | $ | 229,598,789 | | |
| Nestle SA (Switzerland) | | Food & Beverage Manufacturer | | | 209,600 | | | | 94,155,723 | | |
| | | | 323,754,512 | | |
| Soft Drinks—1.5% | |
Lotte Chilsung Beverage
Co., Ltd. (Korea) (c) | | Soft Drinks, Juices & Sports
Drinks Manufacturer | | | 88,635 | | | $ | 135,199,366 | | |
THE OAKMARK INTERNATIONAL FUND
42
THE OAKMARK INTERNATIONAL FUND
Schedule of Investments—September 30, 2007 cont.
| Name | | Description | | Shares Held | | Market Value | |
| Common Stocks—97.0% (cont.) | |
| Asset Management & Custody Banks—3.2% | |
Schroders PLC
(Great Britain) | | International Asset Management | | | 10,126,720 | | | $ | 287,376,263 | | |
| Diversified Banks—15.5% | |
HSBC Holdings plc
(Great Britain) | | International Banking &
Financial Services | | | 15,576,400 | | | $ | 288,257,949 | | |
Lloyds TSB Group plc
(Great Britain) | | Commercial Bank | | | 22,356,100 | | | | 248,142,650 | | |
| BNP Paribas SA (France) | | Commercial Bank | | | 1,934,800 | | | | 211,720,139 | | |
Barclays PLC
(Great Britain) Commercial & Investment
Banking, Insurance, Financial,
Asset Management and | |
Related Services | | | 17,045,000 | | | | 207,675,087 | | |
| Bank of Ireland (Ireland) | | Commercial Bank | | | 10,509,800 | | | | 194,823,841 | | |
Chinatrust Financial
Holding Co. (Taiwan) (a) | | Commercial Bank | | | 233,188,318 | | | | 171,131,000 | | |
| Kookmin Bank (Korea) | | Commercial Bank | | | 961,750 | | | | 80,075,776 | | |
| | | | 1,401,826,442 | | |
| Diversified Capital Markets—7.5% | |
| UBS AG (Switzerland) | | Investment Banking | | | 6,647,000 | | | $ | 357,399,356 | | |
Credit Suisse Group
(Switzerland) | | Investment Services & Insurance | | | 4,789,200 | | | | 317,977,376 | | |
| | | | 675,376,732 | | |
| Investment Banking & Brokerage—5.4% | |
Daiwa Securities Group,
Inc. (Japan) | | Stock Broker | | | 38,049,000 | | | $ | 362,387,202 | | |
Nikko Cordial Corporation
(Japan) | | Comprehensive Financial
Services Provider | | | 10,330,500 | | | | 129,777,665 | | |
| | | | 492,164,867 | | |
| Multi-Line Insurance—1.3% | |
| Allianz SE (Germany) | | Insurance, Banking &
Financial Services | | | 509,400 | | | $ | 119,017,188 | | |
| Reinsurance—1.4% | |
Hannover
Rueckversicherung AG
(Germany) | | Reinsurance | | | 2,530,400 | | | $ | 128,380,606 | | |
THE OAKMARK INTERNATIONAL FUND
43
THE OAKMARK INTERNATIONAL FUND
Schedule of Investments—September 30, 2007 cont.
| Name | | Description | | Shares Held | | Market Value | |
| Common Stocks—97.0% (cont.) | |
| Pharmaceuticals—8.3% | |
GlaxoSmithKline plc
(Great Britain) | | Pharmaceuticals | | | 14,026,000 | | | $ | 372,202,632 | | |
| Novartis AG (Switzerland) | | Pharmaceuticals | | | 5,698,200 | | | | 314,459,394 | | |
Takeda Pharmaceutical
Company Limited
(Japan) | | Pharmaceuticals & Food
Supplements | | | 956,500 | | | | 67,283,507 | | |
| | | | 753,945,533 | | |
| Diversified Commercial & Professional Services—2.7% | |
| G4S PLC (Great Britain) | | Security Services | | | 30,091,638 | | | $ | 124,366,333 | | |
Meitec Corporation
(Japan) (c) | | Software Engineering Services | | | 2,483,800 | | | | 72,871,684 | | |
Experian Group, Ltd.
(Ireland) | | Credit and Marketing Services | | | 4,336,900 | | | | 45,874,948 | | |
| | | | 243,112,965 | | |
| Human Resource & Employment Services—2.1% | |
| Adecco SA (Switzerland) | | Temporary Employment Services | | | 3,139,200 | | | $ | 185,642,190 | | |
| Application Software—1.3% | |
| SAP AG (Germany) | | Develops Business Software | | | 1,981,300 | | | $ | 115,975,886 | | |
| Electronic Equipment Manufacturers—1.9% | |
OMRON Corporation
(Japan) | | Component, Equipment, &
System Manufacturer | | | 5,520,400 | | | $ | 146,102,085 | | |
| Orbotech, Ltd. (Israel) (a) | | Optical Inspection Systems | | | 1,237,700 | | | | 26,028,831 | | |
| | | | 172,130,916 | | |
| Semiconductors—6.5% | |
Rohm Company Limited
(Japan) Integrated Circuits &
Semiconductor Devices | |
Manufacturer | | | 3,494,979 | | | $ | 308,832,428 | | |
Samsung Electronics
Co., Ltd. (Korea) | | Consumer & Industrial Electronic
Equipment Manufacturer | | | 443,600 | | | | 278,704,108 | | |
| | | | 587,536,536 | | |
| Semiconductor Equipment—0.7% | |
ASML Holding NV
(Netherlands) (a) | | Develop, Produce, and Market
Semiconductor Manufacturing
Equipment | | | 2,030,300 | | | $ | 67,311,221 | | |
THE OAKMARK INTERNATIONAL FUND
44
THE OAKMARK INTERNATIONAL FUND
Schedule of Investments—September 30, 2007 cont.
| Name | | Description | | Shares Held/
Par Value | | Market Value | |
| Common Stocks—97.0% (cont.) | |
| Specialty Chemicals—0.6% | |
| Givaudan (Switzerland) | | Fragrance & Flavor Compound
Manufacturer | | | 63,100 | | | $ | 58,317,028 | | |
| Wireless Telecommunication Services—3.2% | |
SK Telecom Co., Ltd.
(Korea) | | Mobile Telecommunications | | | 1,258,612 | | | $ | 288,798,645 | | |
| Total Common Stocks (Cost: $7,394,757,336) | | | | | | | 8,766,475,523 | | |
| Short Term Investments—2.7% | |
| Repurchase Agreement—2.7% | |
State Street Bank and Trust Co. Repurchase Agreement,
5.00% dated 9/28/2007 due 10/1/2007, repurchase
price $239,965,491, collateralized by Federal Home
Loan Mortgage Corp. Bonds, with rates of
6.053% - 6.103%, with maturities from
7/15/2036 - 8/15/2036, and with an aggregate
market value plus accrued interest of $211,202,548,
and by a Federal National Mortgage Association Bond,
with a rate of 5.491%, with a maturity of 7/25/2036,
and with a market value plus accrued
interest of $40,657,659 | | $ | 239,865,547 | | | $ | 239,865,547 | | |
| Total Repurchase Agreement (Cost: $239,865,547) | | | | | 239,865,547 | | |
| Total Short Term Investments (Cost: $239,865,547) | | | | | 239,865,547 | | |
| Total Investments (Cost $7,634,622,883)—99.7% | | | | $ | 9,006,341,070 | | |
| Other Assets In Excess Of Other Liabilities—0.3% | | | | | 27,135,483 | | |
| Total Net Assets—100% | | | | $ | 9,033,476,553 | | |
(a) Non-income producing security.
(b) Represents an American Depository Receipt.
(c) See footnote number five in the Notes to the Financial Statements regarding investments in affiliated issuers.
See accompanying Notes to Financial Statements.
THE OAKMARK INTERNATIONAL FUND
45
THE OAKMARK INTERNATIONAL
SMALL CAP FUND
Report from David G. Herro and Chad M. Clark, Portfolio Managers


THE VALUE OF A $10,000 INVESTMENT IN THE OAKMARK INTERNATIONAL SMALL CAP FUND FROM ITS INCEPTION (11/1/95) TO PRESENT (9/30/07) AS COMPARED TO THE MSCI WORLD EX U.S. INDEX14 (UNAUDITED)
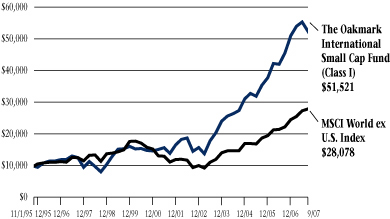
| | | | | Average Annual Total Returns
(as of 9/30/07) | |
| (Unaudited) | | Total Return
Last 3 Months* | | 1-year | | 5-year | | 10-year | | Since
Inception
(11/1/95) | |
Oakmark International
Small Cap Fund
(Class I) | | | -6.60 | % | | | 13.35 | % | | | 28.61 | % | | | 15.06 | % | | | 14.75 | % | |
| MSCI World ex U.S. | | | 2.71 | % | | | 25.85 | % | | | 24.08 | % | | | 8.30 | % | | | 9.05 | % | |
MSCI World ex U.S.
Small Cap17 | | | -3.73 | % | | | 21.26 | % | | | 27.78 | % | | | N/A | | | N/A | |
Lipper International
Small Cap Index18 | | | 0.59 | % | | | 31.35 | % | | | 30.54 | % | | | 14.38 | % | | N/A | |
The graph and table do not reflect the deduction of taxes that a shareholder would pay on fund distributions or the redemption of fund shares.
Expense Ratio as of 9/30/07 was 1.34%.
The performance data quoted represents past performance. The above performance information for the Fund does not reflect the imposition of a 2% redemption fee on shares held for 90 days or less to deter market timers. If reflected, the fee would reduce the performance quoted. Past performance does not guarantee future results. The investment return and principal value will fluctuate so that an investor's shares, when redeemed, may be worth more or less than their original cost. Current performance may be lower or higher than the performance data quoted. Average annual total return measures annualized change, while total return measures aggregate change. To obtain most recent month-end performance data, visit oakmark.com.
* Not annualized
The Oakmark International Small Cap Fund returned -7% for the quarter ended September 30, 2007, compared to the MSCI World ex U.S. Index that returned 3% and the MSCI World ex U.S. Small Cap Index that returned -4%. For the past twelve months and since inception your Fund returned 13% and 15% versus the MSCI World ex U.S. Index, which returned 26% and 9% for the same periods, and the MSCI World ex U.S. Small Cap Index, which returned 21% for the past twelve months.
South Korea and Japan each added approximately 100 basis points to relative performance in the quarter. Our holdings in South Korea were particularly strong, advancing 14% versus the overall index's decline of 4%. In Japan, our relative underweight position and stock selection contributed equally to the Fund's performance. Our Japanese positions only declined 3% versus the index's decline of almost 7%. The Fund's German, UK, and Australian names were the largest detractors, and they accounted for approximately 3% of the underperformance relative to the benchmark.
Detractors
MLP AG, one of Germany's largest independent financial advisors (IFAs), was the Fund's largest detractor from performance. The stock was down 31% last quarter and about 32% year-to-date. MLP has experienced some management turnover in the past several months, including its CFO and Head of Sales. While we weren't happy with the CFO's departure—as we discussed in the Third Quarter Report—we are satisfied with the firing of the Head of Sales, because he never adapted to the sales-driven culture of the MLP organization. We continue to believe that MLP's price declines are primarily a result of investors' aversion to financial intermediaries of all types.
JJB Sports, the second-largest sporting goods retailer in the UK, was another poor performer last quarter. The company reported relatively weak first half results due to a sales decline in 2006 World Cup apparel, primarily because English shoppers—who had flocked to buy the merchandise last year—were deterred by recent flooding. Additionally, in August CEO Tom Knight stepped down and was replaced by Deputy CEO Chris Ronnie. While the new CEO is focused on improving JJB's private label offering and brand mix, we are concerned about the rationale behind the management change and are monitoring the situation.
Rounding out the detractors was a new holding to the Fund, LSL properties, a UK appraisal company. Though LSL reported strong first half results, its shares have declined along with the
THE OAKMARK INTERNATIONAL SMALL CAP FUND
46
UK housing market. LSL is predominantly exposed to mortgage appraisals, rather than real estate brokerage, which should yield a far more stable earnings stream than its competitors can offer. Thus, we continue buying shares here as well.
Contributors
South Korean Lotte Confectionery rose 31% in the quarter. The company reported strong first half results due to strong sales and operating profit growth spurred by market share gains. In addition, Lotte benefited from speculation that the company may adopt a holding company structure, which should increase transparency to minority shareholders, insure that the company won't invest outside its core operations, and provide greater dividend payouts to shareholders.
Square Enix, a Japanese software developer and publisher, was up 32% last quarter. The company has reported good results from increasing sales and successful software launches. The group has also realized the margin improvement on its recently acquired arcade business, which appears to have been a positive move.
MDS Inc. is a leading Canadian provider of products and services to the global life sciences market and returned 6% this quarter. A new management team continues to make progress resolving FDA issues within its pharma services business. The division is restructuring in order to improve profitability by aligning its cost structure with business levels. MDS is also benefiting from strong demand from the pharmaceutical sector for its mass spectrometry equipment.
Portfolio Composition
It was another active quarter for trading, and the Fund sold our entire positions in Ansell, Lectra Systems, Mabuchi Motor Co., Taiyo Ink, Baron de Ley, Intrum Justitia, Schindler Holding and Croda International as each reached its respective sell price. New additions to the portfolio included Sperian, a French manufacturer of equipment designed to provide protection to people in hazardous work environments; Beter Bed, the leading mid-market bedroom furniture store in the Netherlands; Trigano, the leading French manufacturer in the European Recreation Vehicle (RV) market; Aegis Group, the largest independent media buyer worldwide, headquartered in the UK; Britvic, a UK soft drinks and juices bottler; and LSL Property Services, the second largest appraisal company in the UK.
Geographically, our portfolio weightings remain quite similar to prior quarters. Europe and the UK represent 65% of investments, North America is approximately 4%, Latin America is around 2%, and the majority of the balance excluding cash is invested in the Pacific Rim.
As long-term value investors, we will continue to focus on finding attractive, under-valued foreign companies with management teams focused on building shareholder value. We continue to believe we're well positioned to benefit from any rebound in the underlying equity markets. We thank you for your continued support.
David G. Herro, CFA
Portfolio Manager
oakex@oakmark.com | | Chad M. Clark, CFA
Portfolio Manager
oakex@oakmark.com | |
|
September 30, 2007
THE OAKMARK INTERNATIONAL SMALL CAP FUND
47
THE OAKMARK INTERNATIONAL SMALL CAP FUND
International Diversification—September 30, 2007 (Unaudited)
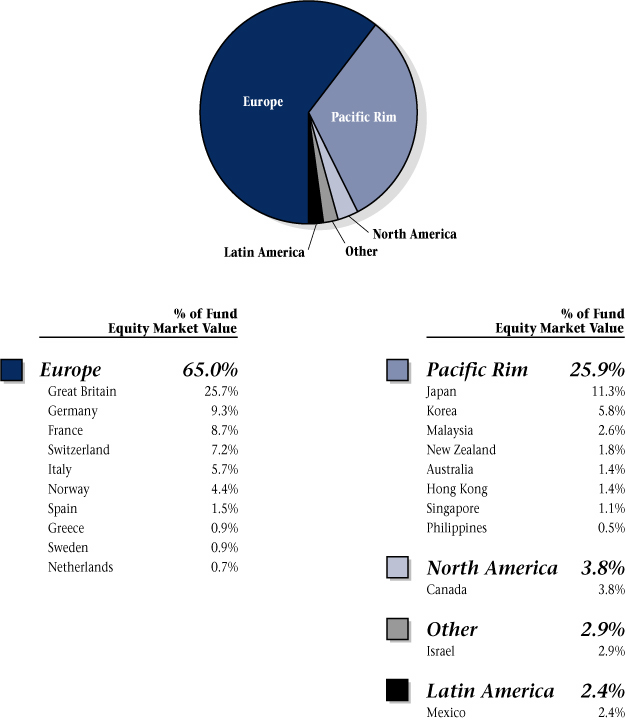
THE OAKMARK INTERNATIONAL SMALL CAP FUND
48
THE OAKMARK INTERNATIONAL SMALL CAP FUND
Schedule of Investments—September 30, 2007
| Name | | Description | | Shares Held | | Market Value | |
| Common Stocks—95.8% | |
| Advertising—1.9% | |
| Asatsu-DK, Inc. (Japan) | | Advertising Services Provider | | | 554,700 | | | $ | 17,867,845 | | |
Aegis Group plc
(Great Britain) | | Media Services Provider | | | 2,868,000 | | | | 7,334,910 | | |
| | | | 25,202,755 | | |
| Apparel, Accessories & Luxury Goods—2.7% | |
| Bulgari S.p.A. (Italy) | | Jewelry Manufacturer & Retailer | | | 2,287,000 | | | $ | 36,003,070 | | |
| Automotive Retail—2.6% | |
| USS Co., Ltd. (Japan) | | Used Car Auction Facility Manager | | | 518,700 | | | $ | 34,093,806 | | |
| Auto Parts & Equipment—1.8% | |
Kongsberg Automotive
ASA (Norway) (b) | | Auto Parts & Equipment
Manufacturer | | | 3,350,200 | | | $ | 22,495,199 | | |
Wagon p.l.c.
(Great Britain) | | Auto Parts & Equipment
Manufacturer | | | 1,228,739 | | | | 747,915 | | |
| | | | 23,243,114 | | |
| Broadcasting & Cable TV—6.4% | |
Media Prima Berhad
(Malaysia) (b) | | Film Producer &
Sports Promoter | | | 39,734,000 | | | $ | 33,233,133 | | |
M6 Metropole Television
(France) | | Television Entertainment
Channel Owner & Operator | | | 1,132,700 | | | | 32,868,782 | | |
| Sogecable SA (Spain) (a) | | Cable Television Services | | | 518,800 | | | | 18,820,076 | | |
| | | | 84,921,991 | | |
| Homefurnishing Retail—0.7% | |
Beter Bed Holding NV
(Netherlands) | | Bedroom Furniture Retailer | | | 324,220 | | | $ | 9,126,227 | | |
| Home Improvement Retail—3.6% | |
Carpetright plc
(Great Britain) | | Carpet Retailer | | | 2,235,200 | | | $ | 48,110,266 | | |
| Leisure Products—0.7% | |
| Trigano SA (France) | | Manufacturer & Retailer of
Recreational Vehicles and
Garden Equipment | | | 215,559 | | | $ | 9,743,831 | | |
THE OAKMARK INTERNATIONAL SMALL CAP FUND
49
THE OAKMARK INTERNATIONAL SMALL CAP FUND
Schedule of Investments—September 30, 2007 cont.
| Name | | Description | | Shares Held | | Market Value | |
| Common Stocks—95.8% (cont.) | |
| Movies & Entertainment—1.6% | |
CTS Eventim AG
(Germany) | | Entertainment Tickets
Producer & Distributor | | | 532,200 | | | $ | 21,051,625 | | |
| Photographic Products—2.8% | |
Vitec Group plc
(Great Britain) (b) | | Photo Equipment & Supplies | | | 2,917,079 | | | $ | 36,585,947 | | |
| Publishing—5.1% | |
Daekyo Co., Ltd.
(Korea) | | Educational Information
Service Provider | | | 286,000 | | | $ | 29,843,750 | | |
Tamedia AG
(Switzerland) | | TV Broadcasting & Publishing | | | 156,000 | | | | 19,817,393 | | |
SCMP Group, Ltd.
(Hong Kong) | | Newspaper Publisher &
Distributor | | | 53,468,000 | | | | 17,882,619 | | |
| | | | 67,543,762 | | |
| Specialty Stores—1.8% | |
JJB Sports plc
(Great Britain) | | Sportswear & Sports Equipment
Retailer | | | 7,585,800 | | | $ | 23,901,642 | | |
| Textiles—1.7% | |
Chargeurs SA
(France) (b) | | Wool, Textile Production & Trading | | | 790,182 | | | $ | 23,132,383 | | |
| Household Products—2.3% | |
Kimberly-Clark de Mexico
S.A.B. de C.V. (Mexico) | | Hygiene Products Manufacturer,
Marketer & Distributor | | | 6,668,400 | | | $ | 30,362,456 | | |
| Packaged Foods & Meats—3.8% | |
Binggrae Co., Ltd.
(Korea) (b) | | Dairy Products Manufacturer | | | 606,500 | | | $ | 27,435,643 | | |
Lotte Confectionery Co.,
Ltd. (Korea) | | Candy & Snacks Manufacturer | | | 9,360 | | | | 16,281,818 | | |
Alaska Milk Corporation
(Philippines) (b) | | Milk Producer | | | 56,360,000 | | | | 6,505,483 | | |
| | | | 50,222,944 | | |
| Soft Drinks—0.3% | |
| Britvic Plc (Great Britain) | | Soft Drink Manufacturer &
Marketer | | | 686,200 | | | $ | 4,534,808 | | |
THE OAKMARK INTERNATIONAL SMALL CAP FUND
50
THE OAKMARK INTERNATIONAL SMALL CAP FUND
Schedule of Investments—September 30, 2007 cont.
| Name | | Description | | Shares Held | | Market Value | |
| Common Stocks—95.8% (cont.) | |
| Asset Management & Custody Banks—6.4% | |
Julius Baer Holding AG
(Switzerland) | | Asset Management | | | 636,400 | | | $ | 47,583,096 | | |
| MLP AG (Germany) | | Asset Management | | | 2,820,100 | | | | 37,639,570 | | |
| | | | 85,222,666 | | |
| Investment Banking & Brokerage—1.9% | |
Ichiyoshi Securities Co.,
Ltd. (Japan) | | Stock Broker | | | 2,399,500 | | | $ | 25,464,593 | | |
| Multi-Sector Holdings—1.1% | |
Pargesa Holding AG
(Switzerland) | | Diversified Operations | | | 132,500 | | | $ | 14,601,460 | | |
| Real Estate Management & Development—2.8% | |
LSL Property Services
PLC (Great Britain) (b) | | Residential Property Service
Provider | | | 6,760,200 | | | $ | 25,726,347 | | |
| Estavis AG (Germany) (a) | | Real Estate Investment Company | | | 385,300 | | | | 12,356,423 | | |
| | | | 38,082,770 | | |
| Reinsurance—3.7% | |
Benfield Group Ltd.
(Great Britain) | | Reinsurance Service Provider | | | 8,233,500 | | | $ | 48,852,649 | | |
| Health Care Distributors—2.5% | |
Australian Pharmaceutical
Industries Limited
(Australia) (a) | | Pharmaceutical Products
Distributor | | | 10,696,929 | | | $ | 18,034,648 | | |
| Amplifon S.p.A. (Italy) | | Hearing Aids and Supplies
Distributor | | | 1,848,712 | | | | 14,643,929 | | |
| | | | 32,678,577 | | |
| Health Care Supplies—0.7% | |
Medisize Holding AG
(Switzerland) | | Medical & Dental Applications
Holding Company | | | 119,137 | | | $ | 9,516,634 | | |
| Life Sciences Tools & Services—3.6% | |
MDS, Inc. (a)
(Canada) | | Products & Services for Medical
Product Manufacturers | | | 2,226,700 | | | $ | 48,109,167 | | |
| Pharmaceuticals—0.5% | |
Santen Pharmaceutical Co.,
Ltd. (Japan) | | Pharmaceuticals | | | 245,100 | | | $ | 6,134,702 | | |
THE OAKMARK INTERNATIONAL SMALL CAP FUND
51
THE OAKMARK INTERNATIONAL SMALL CAP FUND
Schedule of Investments—September 30, 2007 cont.
| Name | | Description | | Shares Held | | Market Value | |
| Common Stocks—95.8% (cont.) | |
| Air Freight & Logistics—1.8% | |
Freightways Limited
(New Zealand) (b) | | Express Package Services | | | 7,624,568 | | | $ | 21,956,011 | | |
Mainfreight Limited
(New Zealand) | | Logistics Services | | | 310,293 | | | | 1,575,438 | | |
| | | | 23,531,449 | | |
| Diversified Commercial & Professional Services—0.8% | |
Cision AB
(Sweden) (a) | | Business & Communication
Intelligence | | | 2,963,700 | | | $ | 11,129,799 | | |
| Human Resource & Employment Services—2.7% | |
| Pasona, Inc. (Japan) (b) | | Placement Service Provider | | | 27,100 | | | $ | 36,333,087 | | |
| Industrial Conglomerates—3.4% | |
Tomkins plc
(Great Britain) | | International Manufacturing | | | 5,079,000 | | | $ | 23,614,988 | | |
Haw Par Corporation
Limited (Singapore) | | Diversified Operations | | | 2,583,000 | | | | 14,084,349 | | |
Rheinmetall AG
(Germany) | | Automotive Pump Manufacturer | | | 82,700 | | | | 6,569,661 | | |
| | | | 44,268,998 | | |
| Industrial Machinery—8.4% | |
Enodis plc
(Great Britain) | | Food Processing Equipment | | | 12,239,950 | | | $ | 43,699,926 | | |
Duerr AG
(Germany) (a) | | Automotive Industry Machinery
Manufacturer | | | 624,700 | | | | 26,599,018 | | |
Interpump
Group S.p.A. (Italy) | | Pump & Piston Manufacturer | | | 2,195,811 | | | | 21,682,983 | | |
Domino Printing
Sciences plc
(Great Britain) | | Printing Equipment | | | 3,115,277 | | | | 20,141,387 | | |
| | | | 112,123,314 | | |
| Office Services & Supplies—1.7% | |
Sperian Protection
(France) | | Manufactures Protection
Equipment For People In
Hazardous Work Environments | | | 177,583 | | | $ | 22,152,077 | | |
| Electronic Equipment Manufacturers—3.8% | |
Orbotech, Ltd.
(Israel) (a) (b) | | Optical Inspection Systems | | | 1,741,500 | | | $ | 36,623,745 | | |
THE OAKMARK INTERNATIONAL SMALL CAP FUND
52
THE OAKMARK INTERNATIONAL SMALL CAP FUND
Schedule of Investments—September 30, 2007 cont.
| Name | | Description | | Shares Held | | Market Value | |
| Common Stocks—95.8% (cont.) | |
| Electronic Equipment Manufacturers—3.8% (cont.) | |
Citizen Watch Co.,
Ltd. (Japan) | | Watch & Machine Tool Producer &
Seller | | | 718,900 | | | $ | 7,235,001 | | |
Spectris plc
(Great Britain) | | Electronic Component
Manufacturer, Designer & Marketer | | | 397,400 | | | | 7,138,846 | | |
| | | | 50,997,592 | | |
| Home Entertainment Software—1.2% | |
Square Enix Co.,
Ltd. (Japan) | | Entertainment Software | | | 486,200 | | | $ | 16,084,621 | | |
| IT Consulting & Other Services—4.7% | |
Ementor ASA
(Norway) (a) | | Management & IT Consulting
Services | | | 3,761,000 | | | $ | 34,043,459 | | |
Morse plc
(Great Britain) (b) | | Business & Technology
Solutions | | | 15,086,998 | | | | 27,472,518 | | |
| | | | 61,515,977 | | |
| Office Electronics—2.7% | |
| Neopost SA (France) | | Mailroom Equipment Supplier | | | 162,596 | | | $ | 22,934,975 | | |
Boewe Systec AG
(Germany) | | Automated Paper Management
Systems Producer | | | 285,039 | | | | 13,693,346 | | |
| | | | 36,628,321 | | |
| Systems Software—0.7% | |
Monitise PLC
(Great Britain) (a) (b) | | Mobile Banking Service Solutions | | | 24,657,285 | | | $ | 8,828,541 | | |
| Construction Materials—0.9% | |
Titan Cement Co. SA
(Greece) | | Cement & Building Materials
Producer & Distributor | | | 235,100 | | | $ | 12,149,127 | | |
| Total Common Stocks (Cost: $1,128,654,223) | | | | | | | | | 1,272,186,748 | | |
THE OAKMARK INTERNATIONAL SMALL CAP FUND
53
THE OAKMARK INTERNATIONAL SMALL CAP FUND
Schedule of Investments—September 30, 2007 cont.
| Name | | Par Value | |
Market Value | |
| Short Term Investments—4.0% | |
| Repurchase Agreement—4.0% | |
State Street Bank and Trust Co. Repurchase Agreement,
5.00% dated 9/28/2007 due 10/1/2007,
repurchase price $52,404,040, collateralized by a
Federal Home Loan Mortgage Corp. Bond, with
a rate of 4.500%, with a maturity of 12/1/2020,
and with an aggregate market value plus accrued
interest of $55,001,554 | | $ | 52,382,214 | | | $ | 52,382,214 | | |
| Total Repurchase Agreement (Cost: $52,382,214) | | | | | 52,382,214 | | |
| Total Short Term Investments (Cost: $52,382,214) | | | | | 52,382,214 | | |
| Total Investments (Cost $1,181,036,437)—99.8% | | | | $ | 1,324,568,962 | | |
| Foreign Currencies (Cost $1,797,017)—0.1% | | | | $ | 1,813,656 | | |
| Other Assets In Excess Of Other Liabilities—0.1% | | | | | 1,085,530 | | |
| Total Net Assets—100% | | | | $ | 1,327,468,148 | | |
(a) Non-income producing security.
(b) See footnote number five in the Notes to the Financial Statements regarding investments in affiliated issuers.
See accompanying Notes to Financial Statements.
THE OAKMARK INTERNATIONAL SMALL CAP FUND
54

(This page has been intentionally left blank.)
THE OAKMARK FUNDS
55
THE OAKMARK FUNDS
Statements of Assets and Liabilities—September 30, 2007
| | | | | The Oakmark
Fund | | The Oakmark
Select
Fund | | The Oakmark
Equity and
Income Fund | |
| Assets | |
| Investments in unaffiliated securities, at value | | (a) | | $ | 5,711,588,543 | | | $ | 5,435,281,967 | | | $ | 13,228,119,169 | | |
| Investments in affiliated securities, at value | | (b) | | | 0 | | | | 0 | | | | 178,829,017 | | |
| Cash | | | | | 0 | | | | 0 | | | | 0 | | |
| Foreign currency, at value | | (c) | | | 0 | | | | 0 | | | | 0 | | |
| Receivable for: | |
| Securities sold | | | | | 0 | | | | 0 | | | | 21,900,720 | | |
| Fund shares sold | | | | | 5,972,193 | | | | 5,329,341 | | | | 17,566,630 | | |
| Dividends and interest | | | | | 7,646,726 | | | | 2,805,050 | | | | 71,693,413 | | |
| Tax reclaim | | | | | 316,561 | | | | 0 | | | | 0 | | |
| Total receivables | | | | | 13,935,480 | | | | 8,134,391 | | | | 111,160,763 | | |
| Other assets | | | | | 369 | | | | 378 | | | | 556 | | |
| Total assets | | | | $ | 5,725,524,392 | | | $ | 5,443,416,736 | | | $ | 13,518,109,505 | | |
| Liabilities and Net Assets | |
| Payable for: | |
| Securities purchased | | | | $ | 1,485,445 | | | $ | 0 | | | $ | 28,582,395 | | |
| Fund shares redeemed | | | | | 35,139,950 | | | | 7,190,486 | | | | 79,595,118 | | |
| Forward currency exchange contracts | | | | | 0 | | | | 0 | | | | 0 | | |
| Investment advisory fee | | | | | 419,609 | | | | 394,505 | | | | 759,031 | | |
| Other shareholder servicing fees | | | | | 464,587 | | | | 494,971 | | | | 1,998,629 | | |
| Transfer and dividend disbursing agent fees | | | | | 206,237 | | | | 132,540 | | | | 150,484 | | |
| Trustee fee | | | | | 33,231 | | | | 33,182 | | | | 52,765 | | |
| Deferred trustee compensation | | | | | 1,165,765 | | | | 1,026,459 | | | | 936,136 | | |
| Other | | | | | 618,039 | | | | 529,160 | | | | 1,363,376 | | |
| Total liabilities | | | | | 39,532,863 | | | | 9,801,303 | | | | 113,437,934 | | |
| Net assets applicable to Fund shares outstanding | | | | $ | 5,685,991,529 | | | $ | 5,433,615,433 | | | $ | 13,404,671,571 | | |
| Analysis of Net Assets | |
| Paid in capital | | | | $ | 3,564,474,426 | | | $ | 3,384,010,852 | | | $ | 10,003,021,243 | | |
Accumulated undistributed net realized gain (loss) of investments, forward
contracts, options, short sales and foreign currency transactions | | | | | 399,664,889 | | | | 495,330,215 | | | | 712,758,508 | | |
| Net unrealized appreciation (depreciation) of investments and foreign currencies | | | | | 1,665,644,517 | | | | 1,514,612,035 | | | | 2,441,550,561 | | |
| Net unrealized appreciation—other | | | | | 23,909 | | | | 0 | | | | 319,687 | | |
| Accumulated undistributed net investment income | | | | | 56,183,788 | | | | 39,662,331 | | | | 247,021,572 | | |
| Net assets applicable to Fund shares outstanding | | | | $ | 5,685,991,529 | | | $ | 5,433,615,433 | | | $ | 13,404,671,571 | | |
| Price of Shares | |
| Net asset value per share: Class I | | | | $ | 47.28 | | | $ | 33.05 | | | $ | 28.67 | | |
| Class I—Net assets | | | | $ | 5,656,939,583 | | | $ | 5,397,403,899 | | | $ | 12,489,528,365 | | |
| Class I—Shares outstanding (Unlimited shares authorized) | | | | | 119,637,620 | | | | 163,317,687 | | | | 435,622,490 | | |
| Net asset value per share: Class II | | | | $ | 46.97 | | | $ | 32.82 | | | $ | 28.50 | | |
| Class II—Net assets | | | | $ | 29,051,946 | | | $ | 36,211,534 | | | $ | 915,143,206 | | |
| Class II—Shares outstanding (Unlimited shares authorized) | | | | | 618,487 | | | | 1,103,461 | | | | 32,113,347 | | |
| (a) Identified cost of investments in unaffiliated securities | | | | $ | 4,045,944,026 | | | $ | 3,920,669,932 | | | $ | 10,813,794,930 | | |
| (b) Identified cost of investments in affiliated securities | | | | | 0 | | | | 0 | | | | 151,602,695 | | |
| (c) Identified cost of foreign currency | | | | | 0 | | | | 0 | | | | 0 | | |
THE OAKMARK FUNDS
56
| | | The Oakmark
Global
Fund | | The Oakmark
Global Select
Fund | | The Oakmark
International
Fund | | The Oakmark
International
Small Cap Fund | |
| Assets | |
| Investments in unaffiliated securities, at value | | $ | 3,080,990,992 | | | $ | 374,480,246 | | | $ | 8,364,016,110 | | | $ | 1,051,474,060 | | |
| Investments in affiliated securities, at value | | | 0 | | | | 0 | | | | 642,324,960 | | | | 273,094,902 | | |
| Cash | | | 0 | | | | 0 | | | | 875 | | | | 0 | | |
| Foreign currency, at value | | | 0 | | | | 0 | | | | 0 | | | | 1,813,656 | | |
| Receivable for: | |
| Securities sold | | | 15,439,745 | | | | 3,848,305 | | | | 98,085,639 | | | | 4,647,974 | | |
| Fund shares sold | | | 3,589,939 | | | | 403,594 | | | | 6,653,433 | | | | 8,589,683 | | |
| Dividends and interest | | | 7,217,948 | | | | 877,480 | | | | 28,086,469 | | | | 2,233,277 | | |
| Tax reclaim | | | 2,197,033 | | | | 136,363 | | | | 7,759,599 | | | | 1,086,008 | | |
| Total receivables | | | 28,444,665 | | | | 5,265,742 | | | | 140,585,140 | | | | 16,556,942 | | |
| Other assets | | | 258 | | | | 175 | | | | 453 | | | | 218 | | |
| Total assets | | $ | 3,109,435,915 | | | $ | 379,746,163 | | | $ | 9,146,927,538 | | | $ | 1,342,939,778 | | |
| Liabilities and Net Assets | |
| Payable for: | |
| Securities purchased | | $ | 3,891,604 | | | $ | 0 | | | $ | 53,599,273 | | | $ | 6,905,780 | | |
| Fund shares redeemed | | | 2,654,746 | | | | 524,380 | | | | 11,028,571 | | | | 1,710,041 | | |
| Forward currency exchange contracts | | | 4,846,500 | | | | 1,322,839 | | | | 44,205,915 | | | | 5,879,060 | | |
| Investment advisory fee | | | 246,672 | | | | 31,838 | | | | 663,835 | | | | 130,643 | | |
| Other shareholder servicing fees | | | 227,310 | | | | 20,884 | | | | 1,334,301 | | | | 96,899 | | |
| Transfer and dividend disbursing agent fees | | | 65,598 | | | | 17,098 | | | | 109,838 | | | | 17,230 | | |
| Trustee fee | | | 24,632 | | | | 17,051 | | | | 42,956 | | | | 20,184 | | |
| Deferred trustee compensation | | | 486,472 | | | | 15,316 | | | | 808,601 | | | | 465,493 | | |
| Other | | | 457,648 | | | | 108,596 | | | | 1,657,695 | | | | 246,300 | | |
| Total liabilities | | | 12,901,182 | | | | 2,058,002 | | | | 113,450,985 | | | | 15,471,630 | | |
| Net assets applicable to Fund shares outstanding | | $ | 3,096,534,733 | | | $ | 377,688,161 | | | $ | 9,033,476,553 | | | $ | 1,327,468,148 | | |
| Analysis of Net Assets | |
| Paid in capital | | $ | 2,154,089,154 | | | $ | 360,803,591 | | | $ | 6,234,604,494 | | | $ | 882,057,592 | | |
Accumulated undistributed net realized gain (loss) of investments, forward
contracts, options, short sales and foreign currency transactions | | | 282,910,511 | | | | 7,145,837 | | | | 1,366,648,117 | | | | 305,214,848 | | |
| Net unrealized appreciation (depreciation) of investments and foreign currencies | | | 650,531,769 | | | | 7,871,633 | | | | 1,326,937,201 | | | | 137,679,053 | | |
| Net unrealized appreciation—other | | | 146,499 | | | | 45,644 | | | | 944,571 | | | | 92,011 | | |
| Accumulated undistributed net investment income | | | 8,856,800 | | | | 1,821,456 | | | | 104,342,170 | | | | 2,424,644 | | |
| Net assets applicable to Fund shares outstanding | | $ | 3,096,534,733 | | | $ | 377,688,161 | | | $ | 9,033,476,553 | | | $ | 1,327,468,148 | | |
| Price of Shares | |
| Net asset value per share: Class I | | $ | 28.08 | | | $ | 11.61 | | | $ | 26.59 | | | $ | 23.19 | | |
| Class I—Net assets | | $ | 3,006,240,853 | | | $ | 377,688,161 | | | $ | 8,446,622,166 | | | $ | 1,326,520,920 | | |
| Class I—Shares outstanding (Unlimited shares authorized) | | | 107,040,985 | | | | 32,543,954 | | | | 317,677,686 | | | | 57,195,099 | | |
| Net asset value per share: Class II | | $ | 27.62 | | | $ | 0.00 | | | $ | 26.32 | | | $ | 23.15 | | |
| Class II—Net assets | | $ | 90,293,880 | | | $ | 0 | | | $ | 586,854,387 | | | $ | 947,228 | | |
| Class II—Shares outstanding (Unlimited shares authorized) | | | 3,269,460 | | | | 0 | | | | 22,294,640 | | | | 40,924 | | |
| (a) Identified cost of investments in unaffiliated securities | | $ | 2,425,599,548 | | | $ | 365,251,301 | | | $ | 7,065,849,306 | | | $ | 906,682,362 | | |
| (b) Identified cost of investments in affiliated securities | | | 0 | | | | 0 | | | | 568,773,577 | | | | 274,354,075 | | |
| (c) Identified cost of foreign currency | | | 0 | | | | 0 | | | | 0 | | | | 1,797,017 | | |
See accompanying Notes to Financial Statements.
THE OAKMARK FUNDS
57
THE OAKMARK FUNDS
Statements of Operations—September 30, 2007
| | | The Oakmark
Fund | | The Oakmark
Select
Fund | | The Oakmark
Equity and
Income Fund | | The Oakmark
Global
Fund | |
| Investment Income: | |
| Dividends from unaffiliated securities | | $ | 101,642,121 | | | $ | 108,752,255 | | | $ | 131,546,987 | | | $ | 51,047,481 | | |
| Dividends from affiliated securities | | | 0 | | | | 1,676,175 | | | | 695,256 | | | | 0 | | |
| Interest income | | | 16,254,615 | | | | 13,991,636 | | | | 237,415,410 | | | | 2,429,724 | | |
| Securities lending income | | | 0 | | | | 0 | | | | 715,568 | | | | 573,085 | | |
| Other income | | | 2,448,632 | | | | 628,756 | | | | 209,314 | | | | 16,158 | | |
| Foreign taxes withheld | | | (272,937 | ) | | | 0 | | | | (2,263,750 | ) | | | (3,414,433 | ) | |
| Total investment income | | | 120,072,431 | | | | 125,048,822 | | | | 368,318,785 | | | | 50,652,015 | | |
| Expenses: | |
| Investment advisory fee | | | 51,887,047 | | | | 50,982,717 | | | | 86,511,792 | | | | 27,575,178 | | |
| Transfer and dividend disbursing agent fees | | | 1,799,023 | | | | 1,168,523 | | | | 1,326,287 | | | | 575,639 | | |
| Other shareholder servicing fees | | | 4,217,214 | | | | 3,948,162 | | | | 11,794,723 | | | | 1,627,267 | | |
| Service Fee—Class II | | | 89,124 | | | | 137,797 | | | | 2,060,292 | | | | 223,111 | | |
| Reports to shareholders | | | 1,026,949 | | | | 870,017 | | | | 1,403,404 | | | | 393,509 | | |
| Custody and accounting fees | | | 702,798 | | | | 625,378 | | | | 1,562,193 | | | | 1,424,096 | | |
| Registration and blue sky expenses | | | 0 | | | | 39,102 | | | | 231,084 | | | | 112,953 | | |
| Trustee fees | | | 313,830 | | | | 297,797 | | | | 385,036 | | | | 184,330 | | |
| Legal fees | | | 86,689 | | | | 87,241 | | | | 137,401 | | | | 64,931 | | |
| Audit fees | | | 29,951 | | | | 33,111 | | | | 64,223 | | | | 28,936 | | |
| Amortization of organization expenses | | | 0 | | | | 0 | | | | 0 | | | | 0 | | |
| Other | | | 260,125 | | | | 325,833 | | | | 474,237 | | | | 233,651 | | |
| Total expenses | | | 60,412,750 | | | | 58,515,678 | | | | 105,950,672 | | | | 32,443,601 | | |
| Expense offset arrangements | | | 0 | | | | 0 | | | | 0 | | | | 0 | | |
| Net expenses | | | 60,412,750 | | | | 58,515,678 | | | | 105,950,672 | | | | 32,443,601 | | |
| Net Investment Income | | | 59,659,681 | | | | 66,533,144 | | | | 262,368,113 | | | | 18,208,414 | | |
Net realized and unrealized gain (loss) on
investments and foreign currency transactions: | | | | | | | | | | | | | | | | | |
| Net realized gain on unaffiliated securities | | | 420,276,708 | | | | 360,877,909 | | | | 696,644,180 | | | | 324,857,952 | | |
| Net realized gain on affiliated securities | | | 0 | | | | 146,530,068 | | | | 59,312,087 | | | | 0 | | |
| Net realized gain on options | | | 274,481 | | | | 0 | | | | 0 | | | | 0 | | |
| Net realized loss on foreign currency transactions | | | (15,670 | ) | | | 0 | | | | (1,022,336 | ) | | | (3,749,056 | ) | |
Net change in unrealized appreciation (depreciation) of
investments and foreign currencies | | | 156,908,305 | | | | (160,141,522 | ) | | | 777,795,316 | | | | 180,426,535 | | |
| Net change in unrealized appreciation (depreciation)—other | | | 22,000 | | | | 0 | | | | (164,029 | ) | | | 106,323 | | |
Net realized and unrealized gain on
investments and foreign currency transactions | | | 577,465,824 | | | | 347,266,455 | | | | 1,532,565,218 | | | | 501,641,754 | | |
| Net increase in net assets resulting from operations | | $ | 637,125,505 | | | $ | 413,799,599 | | | $ | 1,794,933,331 | | | $ | 519,850,168 | | |
(a) From October 2, 2006, the date on which Fund shares were first offered for sale to the public.
THE OAKMARK FUNDS
58
| | | The Oakmark
Global Select
Fund (a) | | The Oakmark
International
Fund | | The Oakmark
International
Small Cap Fund | |
| Investment Income: | |
| Dividends from unaffiliated securities | | $ | 4,692,010 | | | $ | 221,932,682 | | | $ | 25,793,694 | | |
| Dividends from affiliated securities | | | 0 | | | | 19,862,228 | | | | 9,126,430 | | |
| Interest income | | | 927,364 | | | | 16,381,902 | | | | 2,891,684 | | |
| Securities lending income | | | 0 | | | | 2,841,312 | | | | 216,104 | | |
| Other income | | | 0 | | | | 24,693 | | | | 0 | | |
| Foreign taxes withheld | | | (152,450 | ) | | | (18,155,505 | ) | | | (2,078,107 | ) | |
| Total investment income | | | 5,466,924 | | | | 242,887,312 | | | | 35,949,805 | | |
| Expenses: | |
| Investment advisory fee | | | 2,195,107 | | | | 78,627,916 | | | | 16,364,055 | | |
| Transfer and dividend disbursing agent fees | | | 93,916 | | | | 978,851 | | | | 152,082 | | |
| Other shareholder servicing fees | | | 155,808 | | | | 6,994,944 | | | | 676,512 | | |
| Service Fee—Class II | | | 0 | | | | 1,554,608 | | | | 1,074 | | |
| Reports to shareholders | | | 44,786 | | | | 1,056,007 | | | | 136,654 | | |
| Custody and accounting fees | | | 151,673 | | | | 6,526,601 | | | | 1,187,510 | | |
| Registration and blue sky expenses | | | 88,728 | | | | 177,208 | | | | 59,099 | | |
| Trustee fees | | | 83,589 | | | | 318,859 | | | | 160,490 | | |
| Legal fees | | | 38,416 | | | | 112,320 | | | | 53,220 | | |
| Audit fees | | | 46,096 | | | | 54,842 | | | | 22,569 | | |
| Amortization of organization expenses | | | 33,966 | | | | 0 | | | | 0 | | |
| Other | | | 151,156 | | | | 388,410 | | | | 198,415 | | |
| Total expenses | | | 3,083,241 | | | | 96,790,566 | | | | 19,011,680 | | |
| Expense offset arrangements | | | (193 | ) | | | 0 | | | | 0 | | |
| Net expenses | | | 3,083,048 | | | | 96,790,566 | | | | 19,011,680 | | |
| Net Investment Income | | | 2,383,876 | | | | 146,096,746 | | | | 16,938,125 | | |
Net realized and unrealized gain (loss) on
investments and foreign currency transactions: | | | | | | | | | | | | | |
| Net realized gain on unaffiliated securities | | | 7,145,836 | | | | 1,412,511,279 | | | | 297,807,160 | | |
| Net realized gain on affiliated securities | | | 0 | | | | 13,675,635 | | | | 37,227,561 | | |
| Net realized gain on options | | | 0 | | | | 0 | | | | 0 | | |
| Net realized loss on foreign currency transactions | | | (448,111 | ) | | | (27,388,159 | ) | | | (3,567,638 | ) | |
Net change in unrealized appreciation (depreciation) of
investments and foreign currencies | | | 7,871,633 | | | | (406,414,072 | ) | | | (175,792,106 | ) | |
| Net change in unrealized appreciation (depreciation)—other | | | 45,644 | | | | 1,025,662 | | | | 97,505 | | |
Net realized and unrealized gain on
investments and foreign currency transactions | | | 14,615,002 | | | | 993,410,345 | | | | 155,772,482 | | |
| Net increase in net assets resulting from operations | | $ | 16,998,878 | | | $ | 1,139,507,091 | | | $ | 172,710,607 | | |
See accompanying Notes to Financial Statements.
THE OAKMARK FUNDS
59
THE OAKMARK FAMILY OF FUNDS
Statements of Changes in Net Assets
| | | The Oakmark Fund | |
| | | Year Ended
September 30, 2007 | | Year Ended
September 30, 2006 | |
| From Operations: | |
| Net investment income | | $ | 59,659,681 | | | $ | 53,784,303 | | |
| Net realized gain (loss) on investments | | | 420,551,189 | | | | 270,986,174 | | |
| Net realized gain (loss) on foreign currency transactions | | | (15,670 | ) | | | (6,771 | ) | |
Net change in unrealized appreciation (depreciation)
of investments | | | 156,908,305 | | | | 238,673,740 | | |
Net change in unrealized appreciation
(depreciation)—other | | | 22,000 | | | | 1,909 | | |
| Net increase in net assets from operations | | | 637,125,505 | | | | 563,439,355 | | |
| Distributions to shareholders from: | |
| Net investment income—Class I | | | (53,539,601 | ) | | | (51,650,726 | ) | |
| Net investment income—Class II | | | (208,772 | ) | | | (231,758 | ) | |
| Net realized gain—Class I | | | (247,108,056 | ) | | | 0 | | |
| Net realized gain—Class II | | | (1,637,719 | ) | | | 0 | | |
| Total distributions to shareholders | | | (302,494,148 | ) | | | (51,882,484 | ) | |
| From Fund share transactions: | |
| Proceeds from shares sold—Class I | | | 861,518,944 | | | | 779,885,052 | | |
| Proceeds from shares sold—Class II | | | 9,068,112 | | | | 6,336,611 | | |
| Reinvestment of distributions—Class I | | | 284,353,008 | | | | 48,533,582 | | |
| Reinvestment of distributions—Class II | | | 1,632,253 | | | | 201,619 | | |
| Payments for shares redeemed—Class I | | | (1,307,641,112 | ) | | | (2,190,991,773 | ) | |
| Payments for shares redeemed—Class II | | | (21,478,972 | ) | | | (16,267,132 | ) | |
| Redemption fees—Class I | | | 247,506 | | | | 324,889 | | |
| Redemption fees—Class II | | | 1,510 | | | | 680 | | |
Net increase (decrease) in net assets from Fund
share transactions | | | (172,298,751 | ) | | | (1,371,976,472 | ) | |
| Total increase (decrease) in net assets | | | 162,332,606 | | | | (860,419,601 | ) | |
| Net assets: | |
| Beginning of period | | | 5,523,658,923 | | | | 6,384,078,524 | | |
| End of period | | $ | 5,685,991,529 | | | $ | 5,523,658,923 | | |
| Undistributed net investment income | | $ | 56,183,788 | | | $ | 52,702,440 | | |
| Fund Share Transactions—Class I: | |
| Shares sold | | | 18,391,432 | | | | 18,756,564 | | |
| Shares issued in reinvestment of dividends | | | 6,185,622 | | | | 1,171,177 | | |
| Less shares redeemed | | | (27,830,195 | ) | | | (52,610,324 | ) | |
| Net increase (decrease) in shares outstanding | | | (3,253,141 | ) | | | (32,682,583 | ) | |
| Fund Share Transactions—Class II: | |
| Shares sold | | | 194,191 | | | | 152,248 | | |
| Shares issued in reinvestment of dividends | | | 35,647 | | | | 4,883 | | |
| Less shares redeemed | | | (456,470 | ) | | | (390,394 | ) | |
| Net increase (decrease) in shares outstanding | | | (226,632 | ) | | | (233,263 | ) | |
THE OAKMARK FUNDS
60
| | | The Oakmark Select Fund | |
| | | Year Ended
September 30, 2007 | | Year Ended
September 30, 2006 | |
| From Operations: | |
| Net investment income | | $ | 66,533,144 | | | $ | 65,028,737 | | |
| Net realized gain (loss) on investments | | | 507,407,977 | | | | 579,399,446 | | |
Net change in unrealized appreciation (depreciation)
of investments | | | (160,141,522 | ) | | | (92,754,575 | ) | |
| Net increase in net assets from operations | | | 413,799,599 | | | | 551,673,608 | | |
| Distributions to shareholders from: | |
| Net investment income—Class I | | | (64,072,754 | ) | | | (51,471,735 | ) | |
| Net investment income—Class II | | | (433,784 | ) | | | (488,531 | ) | |
| Net realized gain—Class I | | | (576,351,927 | ) | | | (313,884,121 | ) | |
| Net realized gain—Class II | | | (6,348,277 | ) | | | (4,367,840 | ) | |
| Total distributions to shareholders | | | (647,206,742 | ) | | | (370,212,227 | ) | |
| From Fund share transactions: | |
| Proceeds from shares sold—Class I | | | 774,598,160 | | | | 971,797,581 | | |
| Proceeds from shares sold—Class II | | | 15,646,313 | | | | 17,443,658 | | |
| Reinvestment of distributions—Class I | | | 618,361,472 | | | | 352,444,215 | | |
| Reinvestment of distributions—Class II | | | 3,215,331 | | | | 2,386,123 | | |
| Payments for shares redeemed—Class I | | | (1,541,125,659 | ) | | | (1,635,155,035 | ) | |
| Payments for shares redeemed—Class II | | | (48,592,972 | ) | | | (39,109,368 | ) | |
| Redemption fees—Class I | | | 223,491 | | | | 251,026 | | |
| Redemption fees—Class II | | | 2,154 | | | | 1,251 | | |
Net increase (decrease) in net assets from Fund
share transactions | | | (177,671,710 | ) | | | (329,940,549 | ) | |
| Total decrease in net assets | | | (411,078,853 | ) | | | (148,479,168 | ) | |
| Net assets: | |
| Beginning of period | | | 5,844,694,286 | | | | 5,993,173,454 | | |
| End of period | | $ | 5,433,615,433 | | | $ | 5,844,694,286 | | |
| Undistributed net investment income | | $ | 39,662,331 | | | $ | 38,093,652 | | |
| Fund Share Transactions—Class I: | |
| Shares sold | | | 22,573,030 | | | | 29,030,193 | | |
| Shares issued in reinvestment of dividends | | | 18,359,901 | | | | 10,628,595 | | |
| Less shares redeemed | | | (45,169,924 | ) | | | (48,799,020 | ) | |
| Net increase (decrease) in shares outstanding | | | (4,236,993 | ) | | | (9,140,232 | ) | |
| Fund Share Transactions—Class II: | |
| Shares sold | | | 459,298 | | | | 523,360 | | |
| Shares issued in reinvestment of dividends | | | 95,865 | | | | 72,263 | | |
| Less shares redeemed | | | (1,441,127 | ) | | | (1,169,938 | ) | |
| Net increase (decrease) in shares outstanding | | | (885,964 | ) | | | (574,315 | ) | |
See accompanying Notes to Financial Statements.
THE OAKMARK FUNDS
61
THE OAKMARK FAMILY OF FUNDS
Statements of Changes in Net Assets
| | | The Oakmark
Equity and Income Fund | |
| | | Year Ended
September 30, 2007 | | Year Ended
September 30, 2006 | |
| From Operations: | |
| Net investment income | | $ | 262,368,113 | | | $ | 193,197,493 | | |
| Net realized gain (loss) on investments | | | 755,956,267 | | | | 545,472,604 | | |
| Net realized gain (loss) on foreign currency transactions | | | (1,022,336 | ) | | | 953,110 | | |
Net change in unrealized appreciation (depreciation)
of investments | | | 777,795,316 | | | | (77,004,918 | ) | |
Net change in unrealized appreciation
(depreciation)—other | | | (164,029 | ) | | | 254,072 | | |
| Net increase in net assets from operations | | | 1,794,933,331 | | | | 662,872,361 | | |
| Distributions to shareholders from: | |
| Net investment income—Class I | | | (197,295,609 | ) | | | (127,230,307 | ) | |
| Net investment income—Class II | | | (11,590,883 | ) | | | (6,660,455 | ) | |
| Net realized gain—Class I | | | (514,829,367 | ) | | | (76,265,144 | ) | |
| Net realized gain—Class II | | | (36,037,949 | ) | | | (4,944,566 | ) | |
| Total distributions to shareholders | | | (759,753,808 | ) | | | (215,100,472 | ) | |
| From Fund share transactions: | |
| Proceeds from shares sold—Class I | | | 2,268,150,133 | | | | 2,056,526,635 | | |
| Proceeds from shares sold—Class II | | | 303,169,618 | | | | 311,212,011 | | |
| Reinvestment of distributions—Class I | | | 676,419,126 | | | | 193,933,598 | | |
| Reinvestment of distributions—Class II | | | 38,550,451 | | | | 7,917,854 | | |
| Payments for shares redeemed—Class I | | | (1,835,852,952 | ) | | | (1,479,474,288 | ) | |
| Payments for shares redeemed—Class II | | | (213,986,804 | ) | | | (210,686,071 | ) | |
| Redemption fees—Class I | | | 396,816 | | | | 190,842 | | |
| Redemption fees—Class II | | | 28,756 | | | | 4,611 | | |
Net increase (decrease) in net assets from Fund
share transactions | | | 1,236,875,144 | | | | 879,625,192 | | |
| Total increase in net assets | | | 2,272,054,667 | | | | 1,327,397,081 | | |
| Net assets: | |
| Beginning of period | | | 11,132,616,904 | | | | 9,805,219,823 | | |
| End of period | | $ | 13,404,671,571 | | | $ | 11,132,616,904 | | |
| Undistributed net investment income | | $ | 247,021,572 | | | $ | 163,377,760 | | |
| Fund Share Transactions—Class I: | |
| Shares sold | | | 84,094,622 | | | | 80,485,715 | | |
| Shares issued in reinvestment of dividends | | | 26,036,152 | | | | 7,695,778 | | |
| Less shares redeemed | | | (67,666,574 | ) | | | (57,994,019 | ) | |
| Net increase (decrease) in shares outstanding | | | 42,464,200 | | | | 30,187,474 | | |
| Fund Share Transactions—Class II: | |
| Shares sold | | | 11,303,525 | | | | 12,229,061 | | |
| Shares issued in reinvestment of dividends | | | 1,489,010 | | | | 315,076 | | |
| Less shares redeemed | | | (7,935,650 | ) | | | (8,300,682 | ) | |
| Net increase (decrease) in shares outstanding | | | 4,856,885 | | | | 4,243,455 | | |
THE OAKMARK FUNDS
62
| | | The Oakmark
Global Fund | |
| | | Year Ended
September 30, 2007 | | Year Ended
September 30, 2006 | |
| From Operations: | |
| Net investment income | | $ | 18,208,414 | | | $ | 24,869,019 | | |
| Net realized gain (loss) on investments | | | 324,857,952 | | | | 310,301,304 | | |
| Net realized gain (loss) on foreign currency transactions | | | (3,749,056 | ) | | | 6,838,930 | | |
Net change in unrealized appreciation (depreciation)
of investments and foreign currencies | | | 180,426,535 | | | | 2,947,332 | | |
Net change in unrealized appreciation
(depreciation)—other | | | 106,323 | | | | 163,945 | | |
| Net increase in net assets from operations | | | 519,850,168 | | | | 345,120,530 | | |
| Distributions to shareholders from: | |
| Net investment income—Class I | | | (27,704,385 | ) | | | (20,913,767 | ) | |
| Net investment income—Class II | | | (645,340 | ) | | | (581,696 | ) | |
| Net realized gain—Class I | | | (312,319,850 | ) | | | (76,617,645 | ) | |
| Net realized gain—Class II | | | (10,681,345 | ) | | | (2,579,429 | ) | |
| Total distributions to shareholders | | | (351,350,920 | ) | | | (100,692,537 | ) | |
| From Fund share transactions: | |
| Proceeds from shares sold—Class I | | | 609,489,866 | | | | 439,182,726 | | |
| Proceeds from shares sold—Class II | | | 17,269,919 | | | | 17,019,479 | | |
| Reinvestment of distributions—Class I | | | 326,216,720 | | | | 92,918,085 | | |
| Reinvestment of distributions—Class II | | | 10,756,868 | | | | 2,954,863 | | |
| Payments for shares redeemed—Class I | | | (375,481,639 | ) | | | (329,606,864 | ) | |
| Payments for shares redeemed—Class II | | | (19,691,332 | ) | | | (9,199,239 | ) | |
| Redemption fees—Class I | | | 161,035 | | | | 104,623 | | |
| Redemption fees—Class II | | | 5,156 | | | | 2,156 | | |
Net increase (decrease) in net assets from Fund
share transactions | | | 568,726,593 | | | | 213,375,829 | | |
| Total increase in net assets | | | 737,225,841 | | | | 457,803,822 | | |
| Net assets: | |
| Beginning of period | | | 2,359,308,892 | | | | 1,901,505,070 | | |
| End of period | | $ | 3,096,534,733 | | | $ | 2,359,308,892 | | |
| Undistributed net investment income | | $ | 8,856,800 | | | $ | 22,747,166 | | |
| Fund Share Transactions—Class I: | |
| Shares sold | | | 22,540,232 | | | | 17,806,211 | | |
| Shares issued in reinvestment of dividends | | | 12,934,841 | | | | 3,942,219 | | |
| Less shares redeemed | | | (13,937,033 | ) | | | (13,308,581 | ) | |
| Net increase (decrease) in shares outstanding | | | 21,538,040 | | | | 8,439,849 | | |
| Fund Share Transactions—Class II: | |
| Shares sold | | | 643,786 | | | | 699,957 | | |
| Shares issued in reinvestment of dividends | | | 432,350 | | | | 126,818 | | |
| Less shares redeemed | | | (737,986 | ) | | | (375,302 | ) | |
| Net increase (decrease) in shares outstanding | | | 338,150 | | | | 451,473 | | |
See accompanying Notes to Financial Statements.
THE OAKMARK FUNDS
63
THE OAKMARK FAMILY OF FUNDS
Statements of Changes in Net Assets
| | | The Oakmark
Global Select Fund | |
| | | For the Period from
October 2, 2006 (a) to
September 30, 2007 | |
| From Operations: | |
| Net investment income | | $ | 2,383,876 | | |
| Net realized gain (loss) on investments | | | 7,145,836 | | |
| Net realized gain (loss) on foreign currency transactions | | | (448,111 | ) | |
| Net change in unrealized appreciation (depreciation) of investments and foreign currencies | | | 7,871,633 | | |
| Net change in unrealized appreciation (depreciation)—other | | | 45,644 | | |
| Net increase in net assets from operations | | | 16,998,878 | | |
| Distributions to shareholders from: | |
| Net investment income—Class I | | | (114,308 | ) | |
| Total distributions to shareholders | | | (114,308 | ) | |
| From Fund share transactions: | |
| Proceeds from shares sold—Class I | | | 417,863,246 | | |
| Reinvestment of distributions—Class I | | | 113,161 | | |
| Payments for shares redeemed—Class I | | | (57,339,417 | ) | |
| Redemption fees—Class I | | | 166,601 | | |
| Net increase (decrease) in net assets from Fund share transactions | | | 360,803,591 | | |
| Total increase in net assets | | | 377,688,161 | | |
| Net assets: | |
| End of period | | $ | 377,688,161 | | |
| Undistributed net investment income | | $ | 1,821,456 | | |
| Fund Share Transactions—Class I: | |
| Shares sold | | | 37,547,411 | | |
| Shares issued in reinvestment of dividends | | | 10,576 | | |
| Less shares redeemed | | | (5,014,033 | ) | |
| Net increase (decrease) in shares outstanding | | | 32,543,954 | | |
(a) From October 2, 2006, the date on which Fund shares were first offered for sale to the public.
THE OAKMARK FUNDS
64
| | | The Oakmark
International Fund | |
| | | Year Ended
September 30, 2007 | | Year Ended
September 30, 2006 | |
| From Operations: | |
| Net investment income | | $ | 146,096,746 | | | $ | 121,327,693 | | |
| Net realized gain (loss) on investments | | | 1,426,186,914 | | | | 1,022,230,924 | | |
| Net realized gain (loss) on foreign currency transactions | | | (27,388,159 | ) | | | 85,933,770 | | |
Net change in unrealized appreciation (depreciation)
of investments and foreign currencies | | | (406,414,072 | ) | | | 131,694,166 | | |
Net change in unrealized appreciation
(depreciation)—other | | | 1,025,662 | | | | 294,298 | | |
| Net increase in net assets from operations | | | 1,139,507,091 | | | | 1,361,480,851 | | |
| Distributions to shareholders from: | |
| Net investment income—Class I | | | (122,435,261 | ) | | | (144,087,090 | ) | |
| Net investment income—Class II | | | (6,951,720 | ) | | | (8,528,390 | ) | |
| Net realized gain—Class I | | | (961,546,440 | ) | | | (241,359,448 | ) | |
| Net realized gain—Class II | | | (69,459,593 | ) | | | (15,880,415 | ) | |
| Total distributions to shareholders | | | (1,160,393,014 | ) | | | (409,855,343 | ) | |
| From Fund share transactions: | |
| Proceeds from shares sold—Class I | | | 1,677,032,856 | | | | 1,307,428,773 | | |
| Proceeds from shares sold—Class II | | | 382,659,739 | | | | 271,362,458 | | |
| Reinvestment of distributions—Class I | | | 957,801,465 | | | | 348,431,594 | | |
| Reinvestment of distributions—Class II | | | 53,952,152 | | | | 16,204,525 | | |
| Payments for shares redeemed—Class I | | | (1,369,590,984 | ) | | | (975,665,459 | ) | |
| Payments for shares redeemed—Class II | | | (344,460,679 | ) | | | (213,303,958 | ) | |
| Redemption fees—Class I | | | 397,544 | | | | 198,369 | | |
| Redemption fees—Class II | | | 29,502 | | | | 9,557 | | |
Net increase (decrease) in net assets from Fund
share transactions | | | 1,357,821,595 | | | | 754,665,859 | | |
| Total increase in net assets | | | 1,336,935,672 | | | | 1,706,291,367 | | |
| Net assets: | |
| Beginning of period | | | 7,696,540,881 | | | | 5,990,249,514 | | |
| End of period | | $ | 9,033,476,553 | | | $ | 7,696,540,881 | | |
| Undistributed net investment income | | $ | 104,342,170 | | | $ | 113,836,202 | | |
| Fund Share Transactions—Class I: | |
| Shares sold | | | 62,804,278 | | | | 53,137,278 | | |
| Shares issued in reinvestment of dividends | | | 38,038,184 | | | | 15,492,735 | | |
| Less shares redeemed | | | (51,521,932 | ) | | | (39,575,515 | ) | |
| Net increase (decrease) in shares outstanding | | | 49,320,530 | | | | 29,054,498 | | |
| Fund Share Transactions—Class II: | |
| Shares sold | | | 14,470,106 | | | | 11,066,476 | | |
| Shares issued in reinvestment of dividends | | | 2,157,223 | | | | 724,062 | | |
| Less shares redeemed | | | (12,976,190 | ) | | | (8,682,291 | ) | |
| Net increase (decrease) in shares outstanding | | | 3,651,139 | | | | 3,108,247 | | |
See accompanying Notes to Financial Statements.
THE OAKMARK FUNDS
65
THE OAKMARK FAMILY OF FUNDS
Statements of Changes in Net Assets
| | | The Oakmark International
Small Cap Fund | |
| | | Year Ended
September 30, 2007 | | Year Ended
September 30, 2006 | |
| From Operations: | |
| Net investment income | | $ | 16,938,125 | | | $ | 19,607,669 | | |
| Net realized gain (loss) on investments | | | 335,034,721 | | | | 177,109,165 | | |
| Net realized gain (loss) on foreign currency transactions | | | (3,567,638 | ) | | | 14,662,887 | | |
Net change in unrealized appreciation (depreciation)
of investments and foreign currencies | | | (175,792,106 | ) | | | 71,230,284 | | |
Net change in unrealized appreciation
(depreciation)—other | | | 97,505 | | | | 43,207 | | |
| Net increase in net assets from operations | | | 172,710,607 | | | | 282,653,212 | | |
| Distributions to shareholders from: | |
| Net investment income—Class I | | | (29,840,093 | ) | | | (31,166,621 | ) | |
| Net investment income—Class II | | | (20,129 | ) | | | (18,114 | ) | |
| Net realized gain—Class I | | | (181,349,841 | ) | | | (156,716,232 | ) | |
| Net realized gain—Class II | | | (126,536 | ) | | | (93,410 | ) | |
| Total distributions to shareholders | | | (211,336,599 | ) | | | (187,994,377 | ) | |
| From Fund share transactions: | |
| Proceeds from shares sold—Class I | | | 239,079,369 | | | | 201,993,652 | | |
| Proceeds from shares sold—Class II | | | 334,644 | | | | 144,934 | | |
| Reinvestment of distributions—Class I | | | 201,840,075 | | | | 176,611,867 | | |
| Reinvestment of distributions—Class II | | | 74,623 | | | | 64,080 | | |
| Payments for shares redeemed—Class I | | | (350,389,665 | ) | | | (205,919,657 | ) | |
| Payments for shares redeemed—Class II | | | (200,687 | ) | | | (101,375 | ) | |
| Redemption fees—Class I | | | 43,370 | | | | 48,587 | | |
| Redemption fees—Class II | | | 32 | | | | 19 | | |
Net increase (decrease) in net assets from Fund
share transactions | | | 90,781,761 | | | | 172,842,107 | | |
| Total increase in net assets | | | 52,155,769 | | | | 267,500,942 | | |
| Net assets: | |
| Beginning of period | | | 1,275,312,379 | | | | 1,007,811,437 | | |
| End of period | | $ | 1,327,468,148 | | | $ | 1,275,312,379 | | |
| Undistributed net investment income | | $ | 2,424,644 | | | $ | 10,816,240 | | |
| Fund Share Transactions—Class I: | |
| Shares sold | | | 10,010,170 | | | | 9,211,608 | | |
| Shares issued in reinvestment of dividends | | | 8,962,703 | | | | 8,974,181 | | |
| Less shares redeemed | | | (14,693,607 | ) | | | (9,457,429 | ) | |
| Net increase (decrease) in shares outstanding | | | 4,279,266 | | | | 8,728,360 | | |
| Fund Share Transactions—Class II: | |
| Shares sold | | | 14,067 | | | | 6,780 | | |
| Shares issued in reinvestment of dividends | | | 3,318 | | | | 3,259 | | |
| Less shares redeemed | | | (8,271 | ) | | | (4,539 | ) | |
| Net increase (decrease) in shares outstanding | | | 9,114 | | | | 5,500 | | |
THE OAKMARK FUNDS
66
THE OAKMARK FUNDS
Notes to Financial Statements
1. SIGNIFICANT ACCOUNTING POLICIES
The following are the significant accounting policies of The Oakmark Fund ("Oakmark"), The Oakmark Select Fund ("Select"), The Oakmark Equity and Income Fund ("Equity and Income"), The Oakmark Global Fund ("Global"), The Oakmark Global Select Fund ("Global Select"), The Oakmark International Fund ("International"), and The Oakmark International Small Cap Fund ("Int'l Small Cap"), collectively referred to as "the Funds", each a series of Harris Associates Investment Trust (the "Trust"), a Massachusetts business trust, organized on February 1, 1991, which is registered as an investment company under the Investment Company Act of 1940. These policies are in conformity with accounting principles generally accepted in the United States of America ("GAAP"). The presentation of financial statements in conformity with GAAP requires management to make estimates and assumptions that affect the reported amounts of assets and liabilities at the date of the financial statements and the reported amounts of revenues and expenses during the reporting period. Actual results could differ from those estimates and assumptions.
Class Disclosure—
Each Fund offers two classes of shares: Class I Shares and Class II Shares. Class I Shares are offered to the general public. Class II Shares are offered to certain retirement plans such as 401(k) and profit sharing plans. Class II Shares pay a service fee at the annual rate of up to 0.25% of average net assets of Class II Shares of the Funds. This service fee is paid to an administrator for performing the services associated with the administration of such retirement plans. Class I Shares do not have an associated service fee.
Income, realized and unrealized capital gains and losses and expenses of the Funds that are not directly attributable to a specific class of shares are prorated among the classes based on the relative net assets of each class.
Redemption fees—
Each Fund (except Equity and Income as of October 29, 2007) imposes a short-term trading fee on redemptions of shares held for 90 days or less to offset two types of costs to the Fund caused by short-term trading: portfolio transaction and market impact costs associated with erratic redemption activity and administrative costs associated with processing redemptions. The fee is 2% of the redemption value and is deducted from the redemption proceeds. The "first-in, first-out" ("FIFO") method is used to determine the holding period.
Security valuation—
The Funds' share prices or net asset values ("NAVs") are calculated as of the close of regular session trading (usually 4:00 pm Eastern time) on the New York Stock Exchange ("NYSE") on any day on which the NYSE is open for trading. Equity securities principally traded on securities exchanges in the United States and over-the-counter securities are valued at the last sales price on the day of valuation, or lacking any reported sales that day, at the most recent bid quotation. Securities traded on the NASDAQ National Market are valued at the NASDAQ Official Closing Price ("NOCP"), or lacking an NOCP, at the most recent bid quotation on the NASDAQ National Market. Equity securities principally traded on securities exchanges outside the United States shall be valued at, depending on local convention or regulation, at the last sales price, the last bid or asked price, the mean between the last bid and asked prices, or the official cl osing price, or shall be based on a pricing composite as of the close of the regular trading hours on the appropriate exchange or other designated time. Debt obligations and money market instruments maturing in more than 60 days from the date of purchase are valued at the latest bid quotation. Debt obligations and money market instruments maturing in less than 61 days from the date of purchase are valued on an amortized cost basis, which approximates value. Options are valued at the last reported sales price on the day of valuation, or lacking any reported sale price on the valuation date, at the mean of the most recent bid and asked quotations, or if the mean is not available, at the most recent bid quotation.
Securities for which quotations are not readily available or securities that may have been affected by a significant event occurring between the close of a foreign market and the close of the NYSE are valued at fair values, determined by or under the direction of the pricing committee established by the Board of Trustees. A significant event may include the performance of U.S. markets since the close of foreign markets. The pricing committee appointed by the Board of Trustees evaluates movements in the U.S markets after the close of foreign markets and may adjust security prices to reflect changes in reaction to U.S. markets as determined by a third party model. At September 30, 2007, no Funds except Equity and Income held securities for which market quotations were not readily available. Equity and Income held a security whose market value was determined by procedures established in good faith by the Board of Trustees.
Foreign currency translations—
Certain Funds invest in foreign securities, which may involve a number of risk factors and special considerations not present with investments in securities of U.S. corporations. Values of investments and other assets and liabilities denominated in foreign currencies are translated into U.S. dollars at current exchange rates obtained by a recognized bank, dealer, or independent pricing service on the day of valuation. Purchases and
THE OAKMARK FUNDS
67
THE OAKMARK FUNDS
Notes to Financial Statements (cont.)
sales of investments and dividend and interest income are converted at the prevailing rate of exchange on the respective dates of such transactions. Forward foreign currency contracts are valued at the current day's interpolated foreign exchange rates.
The Funds do not isolate that portion of the results of operations resulting from changes in foreign exchange rates on investments from the fluctuations arising from changes in market prices of securities held. Such fluctuations are included with the net realized and unrealized gains and losses from securities.
Net realized gains and losses on foreign currency transactions arise from sales of foreign currencies, currency gains or losses realized between the trade and settlement dates on securities transactions, the difference between the amounts of dividends, interest, and foreign withholding taxes recorded and the U.S. dollar equivalent of the amounts actually received or paid, and the realized gains or losses resulting from portfolio and transaction hedges. Net unrealized foreign exchange gains and losses arise from changes in the fair value of assets and liabilities, other than investments in securities, at fiscal year end resulting from changes in exchange rates.
At September 30, 2007, net unrealized appreciation (depreciation) - other included the following components:
| | | Oakmark | | Equity and
Income | | Global | | Global Select | | International | | Int'l
Small Cap | |
Unrealized appreciation
(depreciation) on
interest, dividends and
dividend reclaims receivable | | $ | 23,909 | | | $ | 319,687 | | | $ | 133,372 | | | $ | 8,641 | | | $ | 439,190 | | | $ | 104,762 | | |
Unrealized appreciation
(depreciation) on open
securities purchases and
sales | | | 0 | | | | 0 | | | | 13,127 | | | | 37,003 | | | | 505,381 | | | | (12,751 | ) | |
Net unrealized
appreciation
(depreciation) - other | | $ | 23,909 | | | $ | 319,687 | | | $ | 146,499 | | | $ | 45,644 | | | $ | 944,571 | | | $ | 92,011 | | |
Forward foreign currency contracts—
The Funds' currency transactions are limited to transaction hedging and portfolio hedging. The contractual amounts of forward foreign exchange contracts do not necessarily represent the amounts potentially subject to risk. The measurement of the risks associated with these instruments is meaningful only when all related and offsetting transactions are considered. Risks arise from the possible inability of counterparties to meet the terms of their contracts and from movements in currency values. At September 30, 2007, Global, Global Select, International, and Int'l Small Cap held forward foreign currency contracts as follows:
The Oakmark Global Fund
| | | Contract
Amount | | Settlement
Date | | Valuation at
09/30/07 | | Unrealized
Appreciation/
(Depreciation) | |
Foreign Currency Sold:
British Pound Sterling | | | 27,500,000 | | | 10/5/07 | | $ | 56,261,407 | | | $ | (2,027,282 | ) | |
| British Pound Sterling | | | 26,000,000 | | | 10/19/07 | | | 53,176,751 | | | | (1,148,151 | ) | |
| British Pound Sterling | | | 15,800,000 | | | 1/7/08 | | | 32,255,955 | | | | (597,337 | ) | |
| British Pound Sterling | | | 24,800,000 | | | 1/18/08 | | | 50,613,023 | | | | (278,943 | ) | |
| British Pound Sterling | | | 12,810,000 | | | 1/23/08 | | | 26,139,367 | | | | 26,340 | | |
| British Pound Sterling | | | 7,470,000 | | | 3/7/08 | | | 15,222,889 | | | | (240,982 | ) | |
| Euro | | | 42,800,000 | | | 3/31/08 | | | 61,168,039 | | | | (580,145 | ) | |
| | | | | | | | | $ | 294,837,431 | | | $ | (4,846,500 | ) | |
THE OAKMARK FUNDS
68
THE OAKMARK FUNDS
Notes to Financial Statements (cont.)
The Oakmark Global Select Fund
| | | Contract
Amount | | Settlement
Date | | Valuation at
09/30/07 | | Unrealized
Appreciation/
(Depreciation) | |
Foreign Currency Sold:
British Pound Sterling | | | 5,460,000 | | | 10/5/07 | | $ | 11,170,447 | | | $ | (402,508 | ) | |
| British Pound Sterling | | | 4,950,000 | | | 10/19/07 | | | 10,124,035 | | | | (218,590 | ) | |
| British Pound Sterling | | | 1,430,000 | | | 11/2/07 | | | 2,923,850 | | | | (69,498 | ) | |
| British Pound Sterling | | | 2,423,000 | | | 11/23/07 | | | 4,951,758 | | | | (187,171 | ) | |
| British Pound Sterling | | | 2,070,000 | | | 12/27/07 | | | 4,227,126 | | | | (102,631 | ) | |
| British Pound Sterling | | | 3,165,000 | | | 1/7/08 | | | 6,461,399 | | | | (119,656 | ) | |
| British Pound Sterling | | | 4,830,000 | | | 1/18/08 | | | 9,857,294 | | | | (54,326 | ) | |
| British Pound Sterling | | | 1,125,000 | | | 1/23/08 | | | 2,295,612 | | | | 2,313 | | |
| British Pound Sterling | | | 3,720,000 | | | 3/25/08 | | | 7,576,807 | | | | (145,289 | ) | |
| Euro | | | 1,880,000 | | | 3/31/08 | | | 2,686,820 | | | | (25,483 | ) | |
| | | | | | | | | $ | 62,275,148 | | | $ | (1,322,839 | ) | |
The Oakmark International Fund
| | | Contract
Amount | | Settlement
Date | | Valuation at
09/30/07 | | Unrealized
Appreciation/
(Depreciation) | |
Foreign Currency Sold:
British Pound Sterling | | | 298,150,000 | | | 10/5/07 | | $ | 609,975,947 | | | $ | (21,979,424 | ) | |
| British Pound Sterling | | | 229,800,000 | | | 10/19/07 | | | 470,000,668 | | | | (10,147,888 | ) | |
| British Pound Sterling | | | 155,650,000 | | | 1/7/08 | | | 317,761,989 | | | | (5,884,527 | ) | |
| British Pound Sterling | | | 216,500,000 | | | 1/18/08 | | | 441,843,523 | | | | (2,435,123 | ) | |
| British Pound Sterling | | | 100,100,000 | | | 1/23/08 | | | 204,258,437 | | | | 205,823 | | |
| Euro | | | 292,500,000 | | | 3/31/08 | | | 418,029,239 | | | | (3,964,776 | ) | |
| | | | | | | | | $ | 2,461,869,803 | | | $ | (44,205,915 | ) | |
The Oakmark Int'l Small Cap Fund
| | | Contract
Amount | | Settlement
Date | | Valuation at
09/30/07 | | Unrealized
Appreciation/
(Depreciation) | |
Foreign Currency Sold:
British Pound Sterling | | | 37,210,000 | | | 10/5/07 | | $ | 76,126,799 | | | $ | (2,743,097 | ) | |
| British Pound Sterling | | | 27,670,000 | | | 10/19/07 | | | 56,592,335 | | | | (1,221,898 | ) | |
| British Pound Sterling | | | 22,390,000 | | | 1/7/08 | | | 45,709,547 | | | | (846,480 | ) | |
| British Pound Sterling | | | 38,540,000 | | | 1/18/08 | | | 78,654,270 | | | | (433,486 | ) | |
| British Pound Sterling | | | 7,380,000 | | | 1/23/08 | | | 15,059,214 | | | | 15,175 | | |
| Euro | | | 47,900,000 | | | 3/31/08 | | | 68,456,754 | | | | (649,274 | ) | |
| | | | | | | | | $ | 340,598,919 | | | $ | (5,879,060 | ) | |
Security transactions and investment income—
Security transactions are accounted for on the trade date (date the order to buy or sell is executed) and dividend income is recorded on the ex-dividend date. Interest income and expenses are recorded on an accrual basis. Bond discount is accreted and premium is amortized over the expected life of each applicable security using the effective yield method. Withholding taxes on foreign dividends have been provided for in
THE OAKMARK FUNDS
69
THE OAKMARK FUNDS
Notes to Financial Statements (cont.)
accordance with the Funds' understanding of the applicable country's tax rules and rates. Net realized gains and losses on investments are determined by the specific identification method.
Short sales—
Each Fund may sell a security it does not own in anticipation of a decline in the value of that security. When the Fund sells a security short, it must borrow the security sold short and deliver it to the broker-dealer through which it made the short sale. A gain, limited to the price at which the Fund sold the security short, or loss, unlimited in size, will be recognized upon the termination of a short sale. At September 30, 2007, none of the funds had short sales.
Accounting for options—
When a Fund writes an option, the premium received by the Fund is recorded as a liability and is subsequently adjusted to the current market value of the option written. Premiums received from writing options that expire are recorded by the Fund on the expiration date as realized gains from option transactions. The difference between the premium and the amount paid on effecting a closing purchase transaction, including brokerage commissions, is also treated as a realized gain, or if the premium is less than the amount paid for the closing purchase transaction, as a realized loss. If a call option is exercised, the premium is added to the proceeds from the sale of the underlying security or currency in determining whether the Fund has realized a gain or a loss. If a put option is exercised, the premium reduces the cost basis of the security or currency purchased by the Fund. In writing an option, the Fund bears the market risk of an unfavorable change in the price of the security or currency underlying the written option. Exercise of an option written by the Fund could result in the Fund selling or buying a security or currency at a price different from the current market value. Options written by the Fund do not give rise to counterparty credit risk, as they obligate the Funds, not its counterparties, to perform.
When a Fund purchases an option, the premium paid by the Fund is recorded as an asset and is subsequently adjusted to the current value of the option purchased. Purchasing call options tends to increase the Fund's exposure to the underlying instrument. Purchasing put options tends to decrease the Fund's exposure to the underlying instrument. Premiums paid for purchasing options that expire are treated as realized losses. Premiums paid for purchasing options that are exercised or closed are added to the amounts paid or offset against the proceeds on the underlying security to determine the realized gain or loss. The risks associated with purchasing put and call options are potential loss of the premium paid and the failure of the counterparty to honor its obligation under the contract.
At September 30, 2007, the Funds had no outstanding options.
Committed line of credit—
The Trust has an unsecured committed line of credit with State Street Bank and Trust Company ("State Street") in the amount of $450 million. Borrowings under that arrangement bear interest at 0.45% above the Federal Funds Effective Rate, as defined in the credit agreement. There were no borrowings under the arrangement during the year ended September 30, 2007.
Expense offset arrangement—
State Street serves as custodian of the Funds. State Street's fee may be reduced by credits that are an earnings allowance calculated on the average daily cash balances each Fund maintains with State Street. Credit balances used to reduce the Funds' custodian fees, if any, are reported as a reduction of total expenses in the Statements of Operations. During the year ended September 30, 2007, Global Select had an expense offset arrangement of $193.
Repurchase agreements—
Each Fund may invest in repurchase agreements, which are short-term investments whereby the Fund acquires ownership of a debt security and the seller agrees to repurchase the security at a future date at a specified price.
The Fund, through State Street, receives delivery of the underlying securities collateralizing repurchase agreements. It is the Funds' policy that the value of the collateral be at least equal to 105% of the repurchase price, including interest. Harris Associates L.P. ("the Adviser") is responsible for determining that the value of the collateral is at all times at least equal to 105% of the repurchase price, including interest. Repurchase agreements could involve certain risks in the event of default or insolvency of the counterparty including possible delays or restrictions upon a Fund's ability to dispose of the underlying securities.
THE OAKMARK FUNDS
70
THE OAKMARK FUNDS
Notes to Financial Statements (cont.)
Security lending—
Each Fund, except Oakmark, may lend its portfolio securities to broker-dealers and banks. Any such loan must be continuously secured by collateral in cash or cash equivalents maintained on a current basis in an amount at least equal to the fair value of the securities loaned by the Fund. Collateral is marked to market and monitored daily. The Fund would continue to receive the equivalent of the interest or dividends paid by the issuer on the securities loaned, and would also receive an additional return that may be in the form of a fixed fee or a percentage of the earnings on the collateral. The Fund would have the right to call the loan and obtain the securities loaned at any time, and the counterparty is required to return the securities within five business days or less. In the event of bankruptcy or other default of the borrower, the Fund could experience delays in liquidating the loan collateral or recovering the loaned sec urities and incur expenses related to enforcing its rights. In addition, there could be a decline in the value of the collateral or in the fair value of the securities loaned while the Fund seeks to enforce its rights thereto and the Fund could experience subnormal levels of income or lack of access to income during that period.
At September 30, 2007, none of the Funds had securities on loan.
Restricted securities—
The following investments, the sales of which are restricted to qualified institutional buyers, have been valued according to the securities valuation procedures for debt obligations and money market instruments (as stated in the Security valuation section) since their acquisition dates. These securities are priced using market quotations and there are no unrestricted securities with the same maturity dates and yields for the issuer.
At September 30, 2007, Equity and Income held the following restricted securities:
| Quantity | | Security
Name | | Acquisition
Date | | Carrying
Value | | Cost | | Value | | Percentage of
Net Assets | |
| $ | 3,000,000 | | | Sealed Air Corporation,
144A, 5.625% due
7/15/2013 | | 6/27/2003 | | | 96.2459 | | | | 100.68 | | | | 2,887,377 | | | | 0.02 | % | |
| | 5,000,000 | | | Sealed Air Corporation,
144A, 5.625% due
7/15/2013 | | 8/20/2003 | | | 96.2459 | | | | 96.41 | | | | 4,812,295 | | | | 0.04 | % | |
| | 300,000 | | | Sealed Air Corporation,
144A, 5.625% due
7/15/2013 | | 8/21/2003 | | | 96.2459 | | | | 96.79 | | | | 288,738 | | | | 0.00 | % | |
| | 11,700,000 | | | Sealed Air Corporation,
144A, 5.625% due
7/15/2013 | | 4/6/2004 | | | 96.2459 | | | | 103.31 | | | | 11,260,770 | | | | 0.08 | % | |
| | | | | | | | | | | | | | | | | | 19,249,180 | | | | 0.14 | % | |
Federal income taxes—
It is each Fund's policy to comply with the requirements of the Internal Revenue Code applicable to regulated investment companies and to distribute substantially all of its net taxable income, including any net realized gains on investments, to its shareholders. Therefore, no federal income tax provision is required.
Recently issued accounting pronouncement—
In June 2006, the Financial Accounting Standards Board ("FASB") issued Interpretation No. 48 ("FIN 48") "Accounting for Uncertainty in Income Taxes—an interpretation of FASB Statement No. 109". This interpretation prescribes a recognition threshold and measurement attribute for the financial statement recognition and measurement of a tax position taken or expected to be taken in a tax return. It also provides guidance on de-recognition, classification, interest and penalties, accounting in interim periods, disclosure and transition. FIN 48 is effective for fiscal years beginning after December 15, 2006.
In September 2006, FASB issued Statement of Financial Accounting Standards No. 157 ("FAS 157"), "Fair Value Measurements." FAS 157 defines fair value, establishes a framework for measuring fair value in accordance with generally accepted accounting principles and expands disclosure about fair value measurements. FAS 157 is effective for fiscal years beginning after November 15, 2007.
THE OAKMARK FUNDS
71
THE OAKMARK FUNDS
Notes to Financial Statements (cont.)
In February 2007, FASB issued Statement of Financial Accounting Standards No. 159 ("FAS 159") "The Fair Value Option for Financial Assets and Financial Liabilities—including an amendment of FASB Statement No. 115." FAS 159 permits entities to elect to measure certain financial assets and liabilities at fair value. Unrealized gains and losses on items for which the fair value option has been elected will be reported in earnings at each subsequent reporting date. FAS 159 is effective as of the beginning of the first fiscal year that begins after November 15, 2007.
Management is currently evaluating the impact the adoption of these accounting pronouncements on the Funds' financial statements and related disclosures.
2. TRANSACTIONS WITH AFFILIATES
Each Fund has an investment advisory agreement with the Adviser. For management services and facilities furnished, the Funds pay the Adviser monthly fees. Each fee is calculated on the total net assets as determined at the end of each preceding calendar month. Annual fee rates are as follows:
| Fund | | Advisory Fees | | Fund | | Advisory Fees | |
Oakmark
| | 1.00% up to $2 billion;
0.90% on the next $1 billion;
0.80% on the next $2 billion;
0.75% on the next $2.5 billion;
0.70% on the next $2.5 billion; and
0.65% over 10 billion
| | Global
Global Select
| | 1.00% up to $2 billion;
0.95% on the next $2 billion; and
0.90% over $4 billion
1.00% up to $2 billion;
0.95% on the next $1 billion;
0.875% on the next $4 billion; and
0.85% over $7 billion | |
|
Select
| | 1.00% up to $1 billion;
0.95% on the next $500 million;
0.90% on the next $500 million;
0.85% on the next $500 million;
0.80% on the next $2.5 billion;
0.75% on the next $5 billion; and
0.725% over 10 billion
| |
International
| |
1.00% up to $2 billion;
0.95% on the next $1 billion;
0.85% on the next $2 billion;
0.825% on the next $2.5 billion;
0.815% on the next $3.5 billion; and
0.805% over $11 billion | |
|
Equity and Income
| | 0.75% up to $5 billion;
0.70% on the next $2.5 billion;
0.675% on the next $2.5 billion;
0.65% on the next $2.5 billion; and
0.60% over $12.5 billion | |
Int'l Small Cap
| |
1.25% up to $500 million;
1.10% on the next $1 billion;
1.05% on the next $2 billion; and
1.025% over $3.5 billion | |
|
The Adviser is contractually obligated through January 31, 2008 to reimburse each Fund Class to the extent, but only to the extent, that its annualized expenses (excluding taxes, interest, all commissions and other normal charges incident to the purchase and sale of portfolio securities, and extraordinary charges such as litigation costs, but including fees paid to the Adviser) exceed the percent set forth below of average daily net assets of the Fund Class.
| Fund | | Class I | | Class II | |
| Oakmark | | | 1.50 | % | | | 1.75 | % | |
| Select | | | 1.50 | | | | 1.75 | | |
| Equity and Income | | | 1.00 | | | | 1.25 | | |
| Global | | | 1.75 | | | | 2.00 | | |
| Global Select | | | 1.75 | | | | 2.00 | | |
| International | | | 2.00 | | | | 2.25 | | |
| Int'l Small Cap | | | 2.00 | | | | 2.25 | | |
The Adviser and the Funds have entered into agreements with financial intermediaries to provide recordkeeping, processing, shareholder communications and other services to customers of the intermediaries and have agreed to compensate the intermediaries for providing those services. Certain of those services would be provided by the Funds if the shares of those customers were registered directly with the Funds' transfer
THE OAKMARK FUNDS
72
THE OAKMARK FUNDS
Notes to Financial Statements (cont.)
agent. Accordingly, the Funds pay a portion of the intermediary fees pursuant to an agreement with the Adviser, which calls for each Fund to pay a portion of the intermediary fees attributable to shares of the Fund held by the intermediary (which generally are a percentage of value of the shares held) not exceeding the lesser of 75% of the fees charged by the intermediary or what the Fund would have paid its transfer agent had each customer's shares been registered directly with the transfer agent instead of held through the intermediary. The Adviser pays the remainder of the fees. The fees incurred by the Funds are reflected as other shareholder servicing fees in the Statements of Operations.
The non-interested Trustees of the Trust may participate in the Trust's Deferred Compensation Plan for Independent Trustees. Participants in the plan may elect to defer all or a portion of their compensation. Amounts deferred are retained by the Trust and represent an unfunded obligation of the Trust. The value of amounts deferred for a participant is determined by reference to the change in value of Class I shares of one or more of the Funds or a money market fund as specified by the participant. Benefits would be payable after a stated number of years or retirement from the board. The accrued obligations of the Funds under the plan are reflected as deferred trustee compensation in the Statement of Assets and Liabilities. The interested trustees are not compensated by the Funds.
3. FEDERAL INCOME TAXES
For the year ended September 30, 2007, cost of investments for federal income tax purposes and related composition of unrealized gains and losses were as follows:
| Fund | | Cost of Investments
for Federal Income
Tax Purposes | | Gross Unrealized
Appreciation | | Gross Unrealized
(Depreciation) | | Net Unrealized
Appreciation
(Depreciation) | |
| Oakmark | | $ | 4,049,726,803 | | | $ | 1,743,683,298 | | | $ | (81,821,558 | ) | | $ | 1,661,861,740 | | |
| Select | | | 3,931,757,757 | | | | 1,708,110,032 | | | | (204,585,822 | ) | | | 1,503,524,210 | | |
| Equity and Income | | | 10,965,397,626 | | | | 2,594,524,961 | | | | (152,974,401 | ) | | | 2,441,550,560 | | |
| Global | | | 2,425,599,584 | | | | 687,751,383 | | | | (32,359,975 | ) | | | 655,391,408 | | |
| Global Select | | | 365,348,178 | | | | 26,267,023 | | | | (17,134,955 | ) | | | 9,132,068 | | |
| International | | | 7,639,333,185 | | | | 1,523,521,812 | | | | (156,513,927 | ) | | | 1,367,007,885 | | |
| Int'l Small Cap | | | 1,195,143,768 | | | | 212,411,078 | | | | (82,985,884 | ) | | | 129,425,194 | | |
As of September 30, 2007, none of the Funds had a net capital loss carryforward available to offset future realized gains and thereby potentially reduce future taxable gains distributions.
For the year ended September 30, 2007, the components of distributable earnings on a tax basis (excluding unrealized appreciation (depreciation)) were as follows:
| Fund | | Undistributed
Ordinary Income | | Undistributed Long-
Term Gain | | Total Distributable
Earnings | |
| Oakmark | | $ | 57,286,314 | | | $ | 403,447,666 | | | $ | 460,733,980 | | |
| Select | | | 40,631,261 | | | | 506,418,040 | | | | 547,049,301 | | |
| Equity and Income | | | 247,885,793 | | | | 712,758,509 | | | | 960,644,302 | | |
| Global | | | 39,057,793 | | | | 248,309,444 | | | | 287,367,237 | | |
| Global Select | | | 7,781,171 | | | | 0 | | | | 7,781,171 | | |
| International | | | 170,071,524 | | | | 1,262,155,884 | | | | 1,432,227,408 | | |
| Int'l Small Cap | | | 28,370,504 | | | | 287,950,083 | | | | 316,320,587 | | |
THE OAKMARK FUNDS
73
THE OAKMARK FUNDS
Notes to Financial Statements (cont.)
During the years ended September 30, 2007 and September 30, 2006, the tax character of distributions paid was as follows:
| | | Year Ended
September 30, 2007 | | Year Ended
September 30, 2006 | |
| Fund | | Distributions Paid
from Ordinary
Income | | Distributions Paid
from Long-Term
Capital Gain | | Distributions Paid
from Ordinary
Income | | Distributions Paid
from Long-Term
Capital Gain | |
| Oakmark | | $ | 53,748,373 | | | $ | 248,745,775 | | | $ | 51,882,484 | | | $ | 0 | | |
| Select | | | 64,506,538 | | | | 582,700,204 | | | | 51,960,266 | | | | 318,251,961 | | |
| Equity and Income | | | 208,886,492 | | | | 550,867,316 | | | | 133,890,762 | | | | 81,209,710 | | |
| Global | | | 28,349,725 | | | | 323,001,195 | | | | 27,510,133 | | | | 73,182,404 | | |
| Global Select | | | 114,308 | | | | 0 | | | | N/A | | | | N/A | | |
| International | | | 144,238,130 | | | | 1,016,154,884 | | | | 158,218,276 | | | | 251,637,067 | | |
| Int'l Small Cap | | | 55,312,279 | | | | 156,024,320 | | | | 40,979,591 | | | | 147,014,786 | | |
N/A – Not applicable as Fund commenced operations on October 2, 2006.
On September 30, 2007, the Funds had temporary book/tax differences in undistributed earnings that were primarily attributable to trustee deferred compensation expenses, passive foreign investment companies, foreign currency contracts and deferrals of capital losses on wash sales. Temporary differences will reverse over time. The Funds have permanent differences in book/tax undistributed earnings primarily attributable to currency gains and losses and equalization debits. Permanent differences have been in their respective component of the Analysis of Net Assets.
4. INVESTMENT TRANSACTIONS
For the year ended September 30, 2007, transactions in investment securities (excluding short term and U.S. Government securities) were as follows (in thousands):
| | | Oakmark | | Select | | Equity &
Income | | Global | | Global
Select | | International | | Int'l
Small Cap | |
| Purchases | | $ | 668,478 | | | $ | 554,263 | | | $ | 8,324,311 | | | $ | 1,113,644 | | | $ | 413,439 | | | $ | 4,635,504 | | | $ | 769,576 | | |
| Proceeds from sales | | | 1,070,460 | | | | 1,270,585 | | | | 7,995,027 | | | | 961,163 | | | | 76,350 | | | | 4,261,055 | | | | 877,308 | | |
Purchases at cost and proceeds (in thousands) from sales of long-term U.S. Government securities for the year ended September 30, 2007, were $5,500,340 and $4,485,228 respectively for Equity and Income.
5. INVESTMENTS IN AFFILIATED ISSUERS
An issuer in which a Fund's holdings represents 5% or more of the outstanding voting securities of the issuer is an affiliated issuer as defined under the Investment Company Act of 1940. A schedule of each Fund's investments in securities of affiliated issuers held during the year ended September 30, 2007, is set forth below:
Schedule of Transactions with Affiliated Issuers
The Oakmark Select Fund
| Affiliates | | Shares Held | | Purchases
(Cost) | | Sales
Proceeds | | Dividend
Income | | Value
September 30,
2007 | |
| The Dun & Bradstreet Corporation* | | | 1,434,900 | | | $ | 0 | | | $ | 174,917,733 | | | $ | 1,676,175 | | | $ | 141,495,489 | | |
| TOTALS | | | | | | $ | 0 | | | $ | 174,917,733 | | | $ | 1,676,175 | | | $ | 141,495,489 | | |
THE OAKMARK FUNDS
74
THE OAKMARK FUNDS
Notes to Financial Statements (cont.)
Schedule of Transactions with Affiliated Issuers
The Oakmark Equity and Income Fund
| Affiliates | | Shares Held | | Purchases
(Cost) | | Sales
Proceeds | | Dividend
Income | | Value
September 30,
2007 | |
Meuller Water Products, Inc.,
Class A** | | | 0 | | | $ | 18,773,063 | | | $ | 44,367,930 | | | $ | 52,500 | | | $ | 0 | | |
Meuller Water Products, Inc.,
Class B | | | 6,719,153 | | | | 44,113,565 | | | | 13 | | | | 352,756 | | | | 73,910,683 | | |
St Mary Land & Exploration
Company** | | | 0 | | | | 0 | | | | 96,260,649 | | | | 290,000 | | | | 0 | | |
| Varian, Inc.+ | | | 1,649,400 | | | | 0 | | | | 0 | | | | 0 | | | | 104,918,334 | | |
| TOTALS | | | | | | $ | 62,886,628 | | | $ | 140,628,592 | | | $ | 695,256 | | | $ | 178,829,017 | | |
Schedule of Transactions with Affiliated Issuers
The Oakmark International Fund
| Affiliates | | Shares Held | | Purchases
(Cost) | | Sales
Proceeds | | Dividend
Income | | Value
September 30,
2007 | |
| Giordano International Limited | | | 120,007,300 | | | $ | 0 | | | $ | 642,911 | | | $ | 4,105,454 | | | $ | 58,970,508 | | |
| Lotte Chilsung Beverage Co., Ltd. | | | 88,635 | | | | 0 | | | | 261,462 | | | | 179,294 | | | | 135,199,366 | | |
| Meitec Corporation | | | 2,483,800 | | | | 0 | | | | 0 | | | | 1,598,493 | | | | 72,871,684 | | |
| Signet Group plc | | | 131,486,300 | | | | 101,592,047 | | | | 67,553,726 | | | | 6,532,314 | | | | 225,305,062 | | |
| Trinity Mirror plc | | | 17,792,038 | | | | 14,614,222 | | | | 0 | | | | 7,446,673 | | | | 149,978,340 | | |
| TOTALS | | | | | | $ | 116,206,269 | | | $ | 68,458,099 | | | $ | 19,862,228 | | | $ | 642,324,960 | | |
Schedule of Transactions with Affiliated Issuers
The Oakmark Int'l Small Cap Fund
| Affiliates | | Shares Held | | Purchases
(Cost) | | Sales
Proceeds | | Dividend
Income | | Value
September 30,
2007 | |
| Alaska Milk Corporation | | | 56,360,000 | | | $ | 0 | | | $ | 0 | | | $ | 222,104 | | | $ | 6,505,483 | | |
| Binggrae Co., Ltd. | | | 606,500 | | | | 10,072,105 | | | | 0 | | | | 359,306 | | | | 27,435,643 | | |
| Chargeurs SA | | | 790,182 | | | | 0 | | | | 0 | | | | 587,565 | | | | 23,132,383 | | |
| Freightways Limited | | | 7,624,568 | | | | 23,832,653 | | | | 0 | | | | 712,532 | | | | 21,956,011 | | |
| Kongsberg Automotive ASA | | | 3,350,200 | | | | 1,687,076 | | | | 1,359,104 | | | | 624,069 | | | | 22,495,199 | | |
| Lectra** | | | 0 | | | | 0 | | | | 18,149,868 | | | | 294,579 | | | | 0 | | |
| LSL Property Services PLC | | | 6,760,200 | | | | 34,420,898 | | | | 0 | | | | 307,656 | | | | 25,726,347 | | |
| Media Prima Berhad* | | | 39,734,000 | | | | 2,709,439 | | | | 8,883,416 | | | | 301,859 | | | | 33,233,133 | | |
| Monitise PLC+ | | | 24,657,285 | | | | 4,142,588 | | | | 0 | | | | 0 | | | | 8,828,541 | | |
| Morse plc | | | 15,086,998 | | | | 0 | | | | 281,702 | | | | 1,142,315 | | | | 27,472,518 | | |
| Orbotech, Ltd.+ | | | 1,741,500 | | | | 26,897,079 | | | | 0 | | | | 0 | | | | 36,623,745 | | |
| Pasona, Inc. | | | 27,100 | | | | 50,638,254 | | | | 0 | | | | 108,527 | | | | 36,333,087 | | |
| Veda Advantage Limited** | | | 0 | | | | 15,900,070 | | | | 49,964,345 | | | | 3,501,373 | | | | 0 | | |
| Vitec Group plc | | | 2,917,079 | | | | 1,665,510 | | | | 0 | | | | 964,545 | | | | 36,585,947 | | |
| TOTALS | | | | | | $ | 171,965,672 | | | $ | 78,638,435 | | | $ | 9,126,430 | | | $ | 306,328,037 | | |
* Due to transactions during the year ended September 30, 2007, the company is no longer an affiliated security.
** Position in issuer liquidated during the year ended September 30, 2007.
+ Non-income producing security.
THE OAKMARK FUNDS
75
THE OAKMARK FUNDS
FINANCIAL HIGHLIGHTS
The following tables are intended to help you understand each Fund's financial performance during the last 5 years (or since it began operations, if less than five years). Certain information reflects financial results for a single Fund share. Total returns represent the rate you would have earned (or lost) on an investment, assuming reinvestment of all dividends and distributions. The information for the year ended September 30, 2007, is audited, and each Fund's financial statements, is included in this report. Deloitte & Touche LLP, an independent registered accounting firm has audited the information for the fiscal years ended September 30, 2007, 2006, 2005, 2004 and 2003. For each year shown, all information is for the fiscal year ended September 30, unless otherwise noted.
THE OAKMARK FUNDS
76
THE OAKMARK FUND
Financial Highlights–Class I
For a share outstanding throughout each period
| | | Year Ended
September 30,
2007 | | Year Ended
September 30,
2006 | | Year Ended
September 30,
2005 | | Year Ended
September 30,
2004 | | Year Ended
September 30,
2003 | |
| Net Asset Value, Beginning of Period | | $ | 44.64 | | | $ | 40.75 | | | $ | 38.68 | | | $ | 33.85 | | | $ | 28.08 | | |
| Income From Investment Operations: | |
| Net Investment Income | | | 0.47 | (a) | | | 0.39 | (a) | | | 0.34 | | | | 0.16 | | | | 0.13 | | |
| Net Gain (Loss) on Investments (both realized and unrealized) | | | 4.60 | | | | 3.85 | | | | 1.90 | | | | 4.81 | | | | 5.75 | | |
| Total From Investment Operations | | | 5.07 | | | | 4.24 | | | | 2.24 | | | | 4.97 | | | | 5.88 | | |
| Less Distributions: | |
| Dividends (from net investment income) | | | (0.43 | ) | | | (0.35 | ) | | | (0.17 | ) | | | (0.14 | ) | | | (0.11 | ) | |
| Distributions (from capital gains) | | | (2.00 | ) | | | 0.00 | | | | 0.00 | | | | 0.00 | | | | 0.00 | | |
| Total Distributions | | | (2.43 | ) | | | (0.35 | ) | | | (0.17 | ) | | | (0.14 | ) | | | (0.11 | ) | |
| Redemption Fees | | | 0.00 | (b) | | | 0.00 | (b) | | | 0.00 | (b) | | | 0.00 | (b) | | | 0.00 | | |
| Net Asset Value, End of Period | | $ | 47.28 | | | $ | 44.64 | | | $ | 40.75 | | | $ | 38.68 | | | $ | 33.85 | | |
| Total Return | | | 11.51 | % | | | 10.46 | % | | | 5.79 | % | | | 14.73 | % | | | 20.99 | % | |
| Ratios/Supplemental Data: | |
| Net Assets, End of Period ($million) | | $ | 5,656.9 | | | $ | 5,486.2 | | | $ | 6,340.4 | | | $ | 6,474.0 | | | $ | 4,769.4 | | |
| Ratio of Expenses to Average Net Assets | | | 1.01 | %* | | | 1.05 | %* | | | 1.03 | %* | | | 1.05 | % | | | 1.14 | % | |
| Ratio of Net Investment Income to Average Net Assets | | | 1.01 | % | | | 0.94 | % | | | 0.79 | % | | | 0.47 | % | | | 0.48 | % | |
| Portfolio Turnover Rate | | | 12 | % | | | 9 | % | | | 16 | % | | | 19 | % | | | 21 | % | |
Financial Highlights–Class II
For a share outstanding throughout each period
| | | Year Ended
September 30,
2007 | | Year Ended
September 30,
2006 | | Year Ended
September 30,
2005 | | Year Ended
September 30,
2004 | | Year Ended
September 30,
2003 | |
| Net Asset Value, Beginning of Period | | $ | 44.35 | | | $ | 40.51 | | | $ | 38.45 | | | $ | 33.68 | | | $ | 28.04 | | |
| Income From Investment Operations: | |
| Net Investment Income | | | 0.32 | (a) | | | 0.25 | (a) | | | 0.26 | (a) | | | 0.04 | (a) | | | 0.05 | (a) | |
| Net Gain (Loss) on Investments (both realized and unrealized) | | | 4.55 | | | | 3.82 | | | | 1.87 | | | | 4.78 | | | | 5.69 | | |
| Total From Investment Operations | | | 4.87 | | | | 4.07 | | | | 2.13 | | | | 4.82 | | | | 5.74 | | |
| Less Distributions: | |
| Dividends (from net investment income) | | | (0.25 | ) | | | (0.23 | ) | | | (0.07 | ) | | | (0.05 | ) | | | (0.10 | ) | |
| Distributions (from capital gains) | | | (2.00 | ) | | | 0.00 | | | | 0.00 | | | | 0.00 | | | | 0.00 | | |
| Total Distributions | | | (2.25 | ) | | | (0.23 | ) | | | (0.07 | ) | | | (0.05 | ) | | | (0.10 | ) | |
| Redemption Fees | | | 0.00 | (b) | | | 0.00 | (b) | | | 0.00 | | | | 0.00 | | | | 0.00 | | |
| Net Asset Value, End of Period | | $ | 46.97 | | | $ | 44.35 | | | $ | 40.51 | | | $ | 38.45 | | | $ | 33.68 | | |
| Total Return | | | 11.11 | % | | | 10.08 | % | | | 5.55 | % | | | 14.32 | % | | | 20.52 | % | |
| Ratios/Supplemental Data: | |
| Net Assets, End of Period ($million) | | $ | 29.1 | | | $ | 37.5 | | | $ | 43.7 | | | $ | 51.9 | | | $ | 21.1 | | |
| Ratio of Expenses to Average Net Assets | | | 1.36 | %* | | | 1.40 | %* | | | 1.26 | %* | | | 1.40 | % | | | 1.53 | % | |
| Ratio of Net Investment Income to Average Net Assets | | | 0.67 | % | | | 0.59 | % | | | 0.58 | % | | | 0.11 | % | | | 0.06 | % | |
| Portfolio Turnover Rate | | | 12 | % | | | 9 | % | | | 16 | % | | | 19 | % | | | 21 | % | |
* The ratio excludes expense offset arrangement.
(a) Computed using average shares outstanding throughout the period.
(b) Amount rounds to less than $0.01 per share.
THE OAKMARK FUNDS
77
THE OAKMARK SELECT FUND
Financial Highlights–Class I
For a share outstanding throughout each period
| | | Year Ended
September 30,
2007 | | Year Ended
September 30,
2006 | | Year Ended
September 30,
2005 | | Year Ended
September 30,
2004 | | Year Ended
September 30,
2003 | |
| Net Asset Value, Beginning of Period | | $ | 34.48 | | | $ | 33.44 | | | $ | 31.20 | | | $ | 27.55 | | | $ | 21.67 | | |
| Income From Investment Operations: | |
| Net Investment Income | | | 0.38 | (a) | | | 0.36 | (a) | | | 0.29 | | | | 0.15 | (a) | | | 0.05 | | |
| Net Gain (Loss) on Investments (both realized and unrealized) | | | 2.11 | | | | 2.76 | | | | 2.19 | | | | 3.60 | | | | 5.85 | | |
| Total From Investment Operations | | | 2.49 | | | | 3.12 | | | | 2.48 | | | | 3.75 | | | | 5.90 | | |
| Less Distributions: | |
| Dividends (from net investment income) | | | (0.39 | ) | | | (0.29 | ) | | | (0.24 | ) | | | (0.10 | ) | | | (0.02 | ) | |
| Distributions (from capital gains) | | | (3.53 | ) | | | (1.79 | ) | | | 0.00 | | | | 0.00 | | | | 0.00 | | |
| Total Distributions | | | (3.92 | ) | | | (2.08 | ) | | | (0.24 | ) | | | (0.10 | ) | | | (0.02 | ) | |
| Redemption Fees | | | 0.00 | (b) | | | 0.00 | (b) | | | 0.00 | (b) | | | 0.00 | (b) | | | 0.00 | | |
| Net Asset Value, End of Period | | $ | 33.05 | | | $ | 34.48 | | | $ | 33.44 | | | $ | 31.20 | | | $ | 27.55 | | |
| Total Return | | | 7.00 | % | | | 9.58 | % | | | 7.98 | % | | | 13.64 | % | | | 27.25 | % | |
| Ratios/Supplemental Data: | |
| Net Assets, End of Period ($million) | | $ | 5,397.4 | | | $ | 5,776.6 | | | $ | 5,908.0 | | | $ | 5,463.0 | | | $ | 4,993.0 | | |
| Ratio of Expenses to Average Net Assets | | | 0.97 | %* | | | 0.99 | %* | | | 1.00 | %* | | | 1.00 | % | | | 1.02 | % | |
| Ratio of Net Investment Income to Average Net Assets | | | 1.11 | % | | | 1.08 | % | | | 0.87 | % | | | 0.50 | % | | | 0.23 | % | |
| Portfolio Turnover Rate | | | 10 | % | | | 22 | % | | | 21 | % | | | 14 | % | | | 20 | % | |
Financial Highlights–Class II
For a share outstanding throughout each period
| | | Year Ended
September 30,
2007 | | Year Ended
September 30,
2006 | | Year Ended
September 30,
2005 | | Year Ended
September 30,
2004 | | Year Ended
September 30,
2003 | |
| Net Asset Value, Beginning of Period | | $ | 34.23 | | | $ | 33.24 | | | $ | 31.00 | | | $ | 27.37 | | | $ | 21.56 | | |
| Income From Investment Operations: | |
| Net Investment Income | | | 0.27 | (a) | | | 0.26 | (a) | | | 0.21 | | | | 0.09 | (a) | | | 0.00 | (b) | |
| Net Gain (Loss) on Investments (both realized and unrealized) | | | 2.09 | | | | 2.72 | | | | 2.18 | | | | 3.58 | | | | 5.81 | | |
| Total From Investment Operations | | | 2.36 | | | | 2.98 | | | | 2.39 | | | | 3.67 | | | | 5.81 | | |
| Less Distributions: | |
| Dividends (from net investment income) | | | (0.24 | ) | | | (0.20 | ) | | | (0.15 | ) | | | (0.04 | ) | | | 0.00 | | |
| Distributions (from capital gains) | | | (3.53 | ) | | | (1.79 | ) | | | 0.00 | | | | 0.00 | | | | 0.00 | | |
| Total Distributions | | | (3.77 | ) | | | (1.99 | ) | | | (0.15 | ) | | | (0.04 | ) | | | 0.00 | | |
| Redemption Fees | | | 0.00 | (b) | | | 0.00 | (b) | | | 0.00 | | | | 0.00 | | | | 0.00 | | |
| Net Asset Value, End of Period | | $ | 32.82 | | | $ | 34.23 | | | $ | 33.24 | | | $ | 31.00 | | | $ | 27.37 | | |
| Total Return | | | 6.65 | % | | | 9.18 | % | | | 7.72 | % | | | 13.40 | % | | | 26.95 | % | |
| Ratios/Supplemental Data: | |
| Net Assets, End of Period ($million) | | $ | 36.2 | | | $ | 68.1 | | | $ | 85.2 | | | $ | 98.0 | | | $ | 93.1 | | |
| Ratio of Expenses to Average Net Assets | | | 1.35 | %* | | | 1.34 | %* | | | 1.25 | %* | | | 1.21 | % | | | 1.29 | % | |
| Ratio of Net Investment Income (Loss) to Average Net Assets | | | 0.79 | % | | | 0.78 | % | | | 0.65 | % | | | 0.29 | % | | | (0.04 | )% | |
| Portfolio Turnover Rate | | | 10 | % | | | 22 | % | | | 21 | % | | | 14 | % | | | 20 | % | |
* The ratio excludes expense offset arrangement.
(a) Computed using average shares outstanding throughout the period.
(b) Amount rounds to less than $0.01 per share.
THE OAKMARK FUNDS
78
THE OAKMARK EQUITY AND INCOME FUND
Financial Highlights–Class I
For a share outstanding throughout each period
| | | Year Ended
September 30,
2007 | | Year Ended
September 30,
2006 | | Year Ended
September 30,
2005 | | Year Ended
September 30,
2004 | | Year Ended
September 30,
2003 | |
| Net Asset Value, Beginning of Period | | $ | 26.49 | | | $ | 25.41 | | | $ | 23.12 | | | $ | 20.30 | | | $ | 17.18 | | |
| Income From Investment Operations: | |
| Net Investment Income | | | 0.58 | (a) | | | 0.44 | | | | 0.31 | | | | 0.15 | | | | 0.17 | | |
| Net Gain (Loss) on Investments (both realized and unrealized) | | | 3.41 | | | | 1.18 | | | | 2.77 | | | | 2.81 | | | | 3.19 | | |
| Total From Investment Operations | | | 3.99 | | | | 1.62 | | | | 3.08 | | | | 2.96 | | | | 3.36 | | |
| Less Distributions: | |
| Dividends (from net investment income) | | | (0.50 | ) | | | (0.34 | ) | | | (0.20 | ) | | | (0.14 | ) | | | (0.24 | ) | |
| Distributions (from capital gains) | | | (1.31 | ) | | | (0.20 | ) | | | (0.59 | ) | | | 0.00 | | | | 0.00 | | |
| Total Distributions | | | (1.81 | ) | | | (0.54 | ) | | | (0.79 | ) | | | (0.14 | ) | | | (0.24 | ) | |
| Redemption Fees | | | 0.00 | (b) | | | 0.00 | (b) | | | 0.00 | (b) | | | 0.00 | (b) | | | 0.00 | | |
| Net Asset Value, End of Period | | $ | 28.67 | | | $ | 26.49 | | | $ | 25.41 | | | $ | 23.12 | | | $ | 20.30 | | |
| Total Return | | | 15.77 | % | | | 6.51 | % | | | 13.65 | % | | | 14.64 | % | | | 19.75 | % | |
| Ratios/Supplemental Data: | |
| Net Assets, End of Period ($million) | | $ | 12,489.5 | | | $ | 10,414.5 | | | $ | 9,223.2 | | | $ | 7,577.9 | | | $ | 4,138.0 | | |
| Ratio of Expenses to Average Net Assets | | | 0.83 | %* | | | 0.86 | %* | | | 0.89 | %* | | | 0.92 | % | | | 0.93 | % | |
| Ratio of Net Investment Income to Average Net Assets | | | 2.14 | % | | | 1.88 | % | | | 1.36 | % | | | 0.78 | % | | | 1.07 | % | |
| Portfolio Turnover Rate | | | 67 | % | | | 81 | % | | | 112 | % | | | 72 | % | | | 48 | % | |
Financial Highlights–Class II
For a share outstanding throughout each period
| | | Year Ended
September 30,
2007 | | Year Ended
September 30,
2006 | | Year Ended
September 30,
2005 | | Year Ended
September 30,
2004 | | Year Ended
September 30,
2003 | |
| Net Asset Value, Beginning of Period | | $ | 26.35 | | | $ | 25.29 | | | $ | 23.03 | | | $ | 20.24 | | | $ | 17.15 | | |
| Income From Investment Operations: | |
| Net Investment Income | | | 0.48 | (a) | | | 0.35 | | | | 0.28 | | | | 0.11 | | | | 0.16 | | |
| Net Gain (Loss) on Investments (both realized and unrealized) | | | 3.40 | | | | 1.19 | | | | 2.72 | | | | 2.79 | | | | 3.15 | | |
| Total From Investment Operations | | | 3.88 | | | | 1.54 | | | | 3.00 | | | | 2.90 | | | | 3.31 | | |
| Less Distributions: | |
| Dividends (from net investment income) | | | (0.42 | ) | | | (0.28 | ) | | | (0.15 | ) | | | (0.11 | ) | | | (0.22 | ) | |
| Distributions (from capital gains) | | | (1.31 | ) | | | (0.20 | ) | | | (0.59 | ) | | | 0.00 | | | | 0.00 | | |
| Total Distributions | | | (1.73 | ) | | | (0.48 | ) | | | (0.74 | ) | | | (0.11 | ) | | | (0.22 | ) | |
| Redemption Fees | | | 0.00 | (b) | | | 0.00 | (b) | | | 0.00 | | | | 0.00 | | | | 0.00 | | |
| Net Asset Value, End of Period | | $ | 28.50 | | | $ | 26.35 | | | $ | 25.29 | | | $ | 23.03 | | | $ | 20.24 | | |
| Total Return | | | 15.38 | % | | | 6.18 | % | | | 13.34 | % | | | 14.36 | % | | | 19.46 | % | |
| Ratios/Supplemental Data: | |
| Net Assets, End of Period ($million) | | $ | 915.1 | | | $ | 718.1 | | | $ | 582.0 | | | $ | 478.7 | | | $ | 246.6 | | |
| Ratio of Expenses to Average Net Assets | | | 1.17 | %* | | | 1.18 | %* | | | 1.14 | %* | | | 1.17 | % | | | 1.17 | % | |
| Ratio of Net Investment Income to Average Net Assets | | | 1.82 | % | | | 1.57 | % | | | 1.11 | % | | | 0.53 | % | | | 0.84 | % | |
| Portfolio Turnover Rate | | | 67 | % | | | 81 | % | | | 112 | % | | | 72 | % | | | 48 | % | |
* The ratio excludes expense offset arrangements.
(a) Computed using average shares outstanding throughout the period.
(b) Amount rounds to less than $0.01 per share.
THE OAKMARK FUNDS
79
THE OAKMARK GLOBAL FUND
Financial Highlights–Class I
For a share outstanding throughout each period
| | | Year Ended
September 30,
2007 | | Year Ended
September 30,
2006 | | Year Ended
September 30,
2005 | | Year Ended
September 30,
2004 | | Year Ended
September 30,
2003 | |
| Net Asset Value, Beginning of Period | | $ | 26.69 | | | $ | 23.91 | | | $ | 19.73 | | | $ | 16.98 | | | $ | 11.30 | | |
| Income From Investment Operations: | |
| Net Investment Income | | | 0.18 | (a) | | | 0.27 | | | | 0.17 | | | | 0.09 | | | | 0.01 | | |
| Net Gain (Loss) on Investments (both realized and unrealized) | | | 5.06 | | | | 3.74 | | | | 4.48 | | | | 2.71 | | | | 5.67 | | |
| Total From Investment Operations | | | 5.24 | | | | 4.01 | | | | 4.65 | | | | 2.80 | | | | 5.68 | | |
| Less Distributions: | |
| Dividends (from net investment income) | | | (0.31 | ) | | | (0.26 | ) | | | (0.10 | ) | | | 0.00 | (b) | | | 0.00 | | |
| Distributions (from capital gains) | | | (3.54 | ) | | | (0.97 | ) | | | (0.37 | ) | | | (0.05 | ) | | | 0.00 | | |
| Total Distributions | | | (3.85 | ) | | | (1.23 | ) | | | (0.47 | ) | | | (0.05 | ) | | | 0.00 | | |
| Redemption Fees | | | 0.00 | (b) | | | 0.00 | (b) | | | 0.00 | (b) | | | 0.00 | (b) | | | 0.00 | | |
| Net Asset Value, End of Period | | $ | 28.08 | | | $ | 26.69 | | | $ | 23.91 | | | $ | 19.73 | | | $ | 16.98 | | |
| Total Return | | | 21.29 | % | | | 17.46 | % | | | 23.88 | % | | | 16.54 | % | | | 50.27 | % | |
| Ratios/Supplemental Data: | |
| Net Assets, End of Period ($million) | | $ | 3,006.2 | | | $ | 2,282.2 | | | $ | 1,842.9 | | | $ | 1,336.3 | | | $ | 704.8 | | |
| Ratio of Expenses to Average Net Assets | | | 1.13 | %* | | | 1.18 | %* | | | 1.20 | %* | | | 1.26 | % | | | 1.28 | % | |
| Ratio of Net Investment Income to Average Net Assets | | | 0.66 | % | | | 1.18 | % | | | 0.81 | % | | | 0.47 | % | | | 0.00 | %(c) | |
| Portfolio Turnover Rate | | | 35 | % | | | 41 | % | | | 17 | % | | | 16 | % | | | 42 | % | |
Financial Highlights–Class II
For a share outstanding throughout each period
| | | Year Ended
September 30,
2007 | | Year Ended
September 30,
2006 | | Year Ended
September 30,
2005 | | Year Ended
September 30,
2004 | | Year Ended
September 30,
2003 | |
| Net Asset Value, Beginning of Period | | $ | 26.31 | | | $ | 23.63 | | | $ | 19.53 | | | $ | 16.84 | | | $ | 11.24 | | |
| Income From Investment Operations: | |
| Net Investment Income | | | 0.07 | (a) | | | 0.18 | | | | 0.11 | | | | 0.05 | | | | 0.02 | | |
| Net Gain (Loss) on Investments (both realized and unrealized) | | | 4.99 | | | | 3.69 | | | | 4.43 | | | | 2.69 | | | | 5.58 | | |
| Total From Investment Operations | | | 5.06 | | | | 3.87 | | | | 4.54 | | | | 2.74 | | | | 5.60 | | |
| Less Distributions: | |
| Dividends (from net investment income) | | | (0.21 | ) | | | (0.22 | ) | | | (0.07 | ) | | | 0.00 | | | | 0.00 | | |
| Distributions (from capital gains) | | | (3.54 | ) | | | (0.97 | ) | | | (0.37 | ) | | | (0.05 | ) | | | 0.00 | | |
| Total Distributions | | | (3.75 | ) | | | (1.19 | ) | | | (0.44 | ) | | | (0.05 | ) | | | 0.00 | | |
| Redemption Fees | | | 0.00 | (b) | | | 0.00 | (b) | | | 0.00 | | | | 0.00 | | | | 0.00 | | |
| Net Asset Value, End of Period | | $ | 27.62 | | | $ | 26.31 | | | $ | 23.63 | | | $ | 19.53 | | | $ | 16.84 | | |
| Total Return | | | 20.82 | % | | | 17.01 | % | | | 23.53 | % | | | 16.32 | % | | | 49.82 | % | |
| Ratios/Supplemental Data: | |
| Net Assets, End of Period ($million) | | $ | 90.3 | | | $ | 77.1 | | | $ | 58.6 | | | $ | 24.7 | | | $ | 5.8 | | |
| Ratio of Expenses to Average Net Assets | | | 1.53 | %* | | | 1.56 | %* | | | 1.45 | %* | | | 1.50 | % | | | 1.46 | % | |
| Ratio of Net Investment Income (Loss) to Average Net Assets | | | 0.25 | % | | | 0.80 | % | | | 0.63 | % | | | 0.37 | % | | | (0.01 | )% | |
| Portfolio Turnover Rate | | | 35 | % | | | 41 | % | | | 17 | % | | | 16 | % | | | 42 | % | |
* The ratio excludes expense offset arrangement.
(a) Computed using average shares outstanding throughout the period.
(b) Amount rounds to less than $0.01 per share.
(c) Amount rounds to less than 0.01%.
THE OAKMARK FUNDS
80
THE OAKMARK GLOBAL SELECT FUND
Financial Highlights–Class I
For a share outstanding throughout each period
| | | October 2, 2006
through
September 30,
2007 (a) | |
| Net Asset Value, Beginning of Period | | $ | 10.00 | | |
| Income From Investment Operations: | |
| Net Investment Income | | | 0.12 | (b) | |
| Net Gain (Loss) on Investments (both realized and unrealized) | | | 1.49 | | |
| Total From Investment Operations | | | 1.61 | | |
| Less Distributions: | |
| Dividends (from net investment income) | | | (0.01 | ) | |
| Total Distributions | | | (0.01 | ) | |
| Redemption Fees | | | 0.01 | | |
| Net Asset Value, End of Period | | $ | 11.61 | | |
| Total Return | | | 16.23 | %* | |
| Ratios/Supplemental Data: | |
| Net Assets, End of Period ($million) | | $ | 377.7 | | |
| Ratio of Expenses to Average Net Assets | | | 1.31 | %**† | |
| Ratio of Net Investment Income to Average Net Assets | | | 1.01 | % | |
| Portfolio Turnover Rate | | | 33 | % | |
* Data has not been annualized.
**Data has been annualized.
† The ratio excludes expense offset arrangement.
(a) The date on which fund shares were first offered for sale to the public was October 2, 2006.
(b) Computed using average shares outstanding throughout the period.
THE OAKMARK FUNDS
81
THE OAKMARK INTERNATIONAL FUND
Financial Highlights–Class I
For a share outstanding throughout each period
| | | Year Ended
September 30,
2007 | | Year Ended
September 30,
2006 | | Year Ended
September 30,
2005 | | Year Ended
September 30,
2004 | | Year Ended
September 30,
2003 | |
| Net Asset Value, Beginning of Period | | $ | 26.83 | | | $ | 23.52 | | | $ | 18.98 | | | $ | 15.67 | | | $ | 12.17 | | |
| Income From Investment Operations: | |
| Net Investment Income | | | 0.43 | | | | 0.41 | | | | 0.27 | | | | 0.24 | | | | 0.11 | | |
| Net Gain (Loss) on Investments (both realized and unrealized) | | | 3.25 | | | | 4.49 | | | | 4.59 | | | | 3.18 | | | | 3.52 | | |
| Total From Investment Operations | | | 3.68 | | | | 4.90 | | | | 4.86 | | | | 3.42 | | | | 3.63 | | |
| Less Distributions: | |
| Dividends (from net investment income) | | | (0.44 | ) | | | (0.59 | ) | | | (0.27 | ) | | | (0.11 | ) | | | (0.13 | ) | |
| Distributions (from capital gains) | | | (3.48 | ) | | | (1.00 | ) | | | (0.05 | ) | | | 0.00 | | | | 0.00 | | |
| Total Distributions | | | (3.92 | ) | | | (1.59 | ) | | | (0.32 | ) | | | (0.11 | ) | | | (0.13 | ) | |
| Redemption Fees | | | 0.00 | (a) | | | 0.00 | (a) | | | 0.00 | (a) | | | 0.00 | (a) | | | 0.00 | | |
| Net Asset Value, End of Period | | $ | 26.59 | | | $ | 26.83 | | | $ | 23.52 | | | $ | 18.98 | | | $ | 15.67 | | |
| Total Return | | | 14.53 | % | | | 22.14 | % | | | 25.85 | % | | | 21.92 | % | | | 29.97 | % | |
| Ratios/Supplemental Data: | |
| Net Assets, End of Period ($million) | | $ | 8,446.6 | | | $ | 7,200.5 | | | $ | 5,627.4 | | | $ | 4,036.9 | | | $ | 2,676.6 | | |
| Ratio of Expenses to Average Net Assets | | | 1.05 | %* | | | 1.08 | %* | | | 1.11 | %* | | | 1.20 | % | | | 1.25 | % | |
| Ratio of Net Investment Income to Average Net Assets | | | 1.65 | % | | | 1.80 | % | | | 1.32 | % | | | 1.40 | % | | | 1.03 | % | |
| Portfolio Turnover Rate | | | 50 | % | | | 37 | % | | | 14 | % | | | 21 | % | | | 34 | % | |
Financial Highlights–Class II
For a share outstanding throughout each period
| | | Year Ended
September 30,
2007 | | Year Ended
September 30,
2006 | | Year Ended
September 30,
2005 | | Year Ended
September 30,
2004 | | Year Ended
September 30,
2003 | |
| Net Asset Value, Beginning of Period | | $ | 26.61 | | | $ | 23.36 | | | $ | 18.86 | | | $ | 15.58 | | | $ | 12.13 | | |
| Income From Investment Operations: | |
| Net Investment Income | | | 0.35 | | | | 0.34 | | | | 0.22 | | | | 0.18 | | | | 0.08 | | |
| Net Gain (Loss) on Investments (both realized and unrealized) | | | 3.19 | | | | 4.45 | | | | 4.55 | | | | 3.16 | | | | 3.48 | | |
| Total From Investment Operations | | | 3.54 | | | | 4.79 | | | | 4.77 | | | | 3.34 | | | | 3.56 | | |
| Less Distributions: | |
| Dividends (from net investment income) | | | (0.35 | ) | | | (0.54 | ) | | | (0.22 | ) | | | (0.06 | ) | | | (0.11 | ) | |
| Distributions (from capital gains) | | | (3.48 | ) | | | (1.00 | ) | | | (0.05 | ) | | | 0.00 | | | | 0.00 | | |
| Total Distributions | | | (3.83 | ) | | | (1.54 | ) | | | (0.27 | ) | | | (0.06 | ) | | | (0.11 | ) | |
| Redemption Fees | | | 0.00 | (a) | | | 0.00 | (a) | | | 0.00 | | | | 0.00 | | | | 0.00 | | |
| Net Asset Value, End of Period | | $ | 26.32 | | | $ | 26.61 | | | $ | 23.36 | | | $ | 18.86 | | | $ | 15.58 | | |
| Total Return | | | 14.04 | % | | | 21.71 | % | | | 25.50 | % | | | 21.52 | % | | | 29.52 | % | |
| Ratios/Supplemental Data: | |
| Net Assets, End of Period ($million) | | $ | 586.9 | | | $ | 496.0 | | | $ | 362.9 | | | $ | 259.2 | | | $ | 123.2 | | |
| Ratio of Expenses to Average Net Assets | | | 1.44 | %* | | | 1.47 | %* | | | 1.38 | %* | | | 1.53 | % | | | 1.67 | % | |
| Ratio of Net Investment Income to Average Net Assets | | | 1.31 | % | | | 1.43 | % | | | 1.08 | % | | | 1.18 | % | | | 0.69 | % | |
| Portfolio Turnover Rate | | | 50 | % | | | 37 | % | | | 14 | % | | | 21 | % | | | 34 | % | |
* The ratio excludes expense offset arrangement.
(a) Amount rounds to less than $0.01 per share.
THE OAKMARK FUNDS
82
THE OAKMARK INTERNATIONAL SMALL CAP FUND
Financial Highlights–Class I
For a share outstanding throughout each period
| | | Year Ended
September 30,
2007 | | Year Ended
September 30,
2006 | | Year Ended
September 30,
2005 | | Year Ended
September 30,
2004 | | Year Ended
September 30,
2003 | |
| Net Asset Value, Beginning of Period | | $ | 24.09 | | | $ | 22.79 | | | $ | 18.26 | | | $ | 13.74 | | | $ | 10.17 | | |
| Income From Investment Operations: | |
| Net Investment Income | | | 0.32 | | | | 0.42 | | | | 0.20 | | | | 0.11 | | | | 0.11 | | |
| Net Gain (Loss) on Investments (both realized and unrealized) | | | 2.77 | | | | 5.12 | | | | 4.98 | | | | 4.52 | | | | 3.82 | | |
| Total From Investment Operations | | | 3.09 | | | | 5.54 | | | | 5.18 | | | | 4.63 | | | | 3.93 | | |
| Less Distributions: | |
| Dividends (from net investment income) | | | (0.56 | ) | | | (0.70 | ) | | | (0.27 | ) | | | (0.12 | ) | | | (0.09 | ) | |
| Distributions (from capital gains) | | | (3.43 | ) | | | (3.54 | ) | | | (0.38 | ) | | | 0.00 | | | | (0.27 | ) | |
| Total Distributions | | | (3.99 | ) | | | (4.24 | ) | | | (0.65 | ) | | | (0.12 | ) | | | (0.36 | ) | |
| Redemption Fees | | | 0.00 | (a) | | | 0.00 | (a) | | | 0.00 | (a) | | | 0.01 | | | | 0.00 | | |
| Net Asset Value, End of Period | | $ | 23.19 | | | $ | 24.09 | | | $ | 22.79 | | | $ | 18.26 | | | $ | 13.74 | | |
| Total Return | | | 13.35 | % | | | 28.50 | % | | | 29.04 | % | | | 33.94 | % | | | 39.78 | % | |
| Ratios/Supplemental Data: | |
| Net Assets, End of Period ($million) | | $ | 1,326.5 | | | $ | 1,274.5 | | | $ | 1,007.2 | | | $ | 734.1 | | | $ | 477.8 | | |
| Ratio of Expenses to Average Net Assets | | | 1.34 | %* | | | 1.37 | %* | | | 1.41 | %* | | | 1.49 | % | | | 1.57 | % | |
| Ratio of Net Investment Income to Average Net Assets | | | 1.19 | % | | | 1.73 | % | | | 0.96 | % | | | 0.72 | % | | | 0.99 | % | |
| Portfolio Turnover Rate | | | 57 | % | | | 44 | % | | | 47 | % | | | 29 | % | | | 30 | % | |
Financial Highlights–Class II
For a share outstanding throughout each period
| | | Year Ended
September 30,
2007 | | Year Ended
September 30,
2006 | | Year Ended
September 30,
2005 | | Year Ended
September 30,
2004 | | Year Ended
September 30,
2003 | |
| Net Asset Value, Beginning of Period | | $ | 24.05 | | | $ | 22.77 | | | $ | 18.25 | | | $ | 13.69 | | | $ | 10.14 | | |
| Income From Investment Operations: | |
| Net Investment Income | | | 0.29 | | | | 0.41 | | | | 0.18 | | | | 0.13 | | | | 0.08 | | |
| Net Gain (Loss) on Investments (both realized and unrealized) | | | 2.79 | | | | 5.10 | | | | 4.98 | | | | 4.52 | | | | 3.81 | | |
| Total From Investment Operations | | | 3.08 | | | | 5.51 | | | | 5.16 | | | | 4.65 | | | | 3.89 | | |
| Less Distributions: | |
| Dividends (from net investment income) | | | (0.55 | ) | | | (0.69 | ) | | | (0.26 | ) | | | (0.09 | ) | | | (0.07 | ) | |
| Distributions (from capital gains) | | | (3.43 | ) | | | (3.54 | ) | | | (0.38 | ) | | | 0.00 | | | | (0.27 | ) | |
| Total Distributions | | | (3.98 | ) | | | (4.23 | ) | | | (0.64 | ) | | | (0.09 | ) | | | (0.34 | ) | |
| Redemption Fees | | | 0.00 | (a) | | | 0.00 | (a) | | | 0.00 | | | | 0.00 | | | | 0.00 | | |
| Net Asset Value, End of Period | | $ | 23.15 | | | $ | 24.05 | | | $ | 22.77 | | | $ | 18.25 | | | $ | 13.69 | | |
| Total Return | | | 13.29 | % | | | 28.33 | % | | | 28.94 | % | | | 34.11 | % | | | 39.39 | % | |
| Ratios/Supplemental Data: | |
| Net Assets, End of Period ($million) | | $ | 0.9 | | | $ | 0.8 | | | $ | 0.6 | | | $ | 0.5 | | | $ | 0.4 | | |
| Ratio of Expenses to Average Net Assets | | | 1.43 | %* | | | 1.47 | %* | | | 1.49 | %* | | | 1.39 | % | | | 1.81 | % | |
| Ratio of Net Investment Income to Average Net Assets | | | 1.12 | % | | | 1.62 | % | | | 0.87 | % | | | 0.75 | % | | | 0.72 | % | |
| Portfolio Turnover Rate | | | 57 | % | | | 44 | % | | | 47 | % | | | 29 | % | | | 30 | % | |
* The ratio excludes expense offset arrangement.
(a) Amount rounds to less than $0.01 per share.
THE OAKMARK FUNDS
83
THE OAKMARK FUNDS
Report of Independent Registered Public Accounting Firm
To the Board of Trustees and Shareholders of Harris
Associates Investment Trust:
We have audited the accompanying statements of assets and liabilities, including the schedules of investments, of Harris Associates Investment Trust comprising The Oakmark Fund, The Oakmark Select Fund, The Oakmark Equity and Income Fund, The Oakmark Global Fund, The Oakmark Global Select Fund, The Oakmark International Fund, and The Oakmark International Small Cap Fund (collectively, the "Funds"), as of September 30, 2007, the related statements of operations for the period then ended, the statements of changes in net assets for each of the two years in the period then ended, and the financial highlights for each of the five years in the period then ended. These financial statements and financial highlights are the responsibility of the Funds' management. Our responsibility is to express an opinion on these financial statements and financial highlights based on our audits.
We conducted our audits in accordance with standards of the Public Company Accounting Oversight Board (United States). Those standards require that we plan and perform the audit to obtain reasonable assurance about whether the financial statements and financial highlights are free of material misstatement. The Funds are not required to have, nor were we engaged to perform, an audit of their internal control over financial reporting. Our audits included consideration of internal control over financial reporting as a basis for designing audit procedures that are appropriate in the circumstances, but not for the purpose of expressing an opinion on the effectiveness of the Funds' internal control over financial reporting. Accordingly, we express no such opinion. An audit also includes examining, on a test basis, evidence supporting the amounts and disclosures in the financial statements, assessing the accounting principles used a nd significant estimates made by management, as well as evaluating the overall financial statement presentation. Our procedures included confirmation of securities owned as of September 30, 2007, by correspondence with the Funds' custodian and brokers; where replies were not received from brokers, we performed other auditing procedures. We believe that our audits provide a reasonable basis for our opinion.
In our opinion, the financial statements and financial highlights referred to above present fairly, in all material respects, the financial position of each of the Funds as of September 30, 2007, the results of their operations for the period then ended, the changes in their net assets for each of the two years in the period then ended, and their financial highlights for each of the five years in the period then ended, in conformity with accounting principles generally accepted in the United States of America.

Chicago, Illinois
October 29, 2007
THE OAKMARK FUNDS
84
Federal Tax Information (Unaudited)
Global, International and Int'l Small Cap paid qualifying foreign taxes of $3,166,307, $18,155,505 and $1,938,570 and earned $31,053,653, $153,390,795 and $25,334,707 foreign source income during the year ended September 30, 2007, respectively. Pursuant to Section 853 of the Internal Revenue Code, Global, International, and Int'l Small Cap designated $0.03, $0.05 and $0.03 per share as foreign taxes paid and $0.28, $0.45 and $0.44 per share as income earned from foreign sources for the year ended September 30, 2007, respectively.
Qualified dividend income ("QDI") received by the Funds through September 30, 2007 that qualified for a reduced tax rate pursuant to the Jobs and Growth Tax Relief Reconciliation Act of 2003 are as follows:
| Fund | | | |
| Oakmark | | $ | 53,748,005 | | |
| Select | | | 64,506,538 | | |
| Equity and Income | | | 128,916,974 | | |
| Global | | | 28,349,725 | | |
| Global Select | | | 114,308 | | |
| International | | | 144,238,130 | | |
| Int'l Small Cap | | | 26,763,146 | | |
For corporate shareholders, a portion of the ordinary dividends paid during the Funds' year ended September 30, 2007 qualified for the dividends received deduction, as follows:
| Fund | | | |
| Oakmark | | | 100.00 | % | |
| Select | | | 100.00 | % | |
| Equity and Income | | | 35.22 | % | |
| Global | | | 19.68 | % | |
| Global Select | | | 26.23 | % | |
| International | | | 0.00 | % | |
| Int'l Small Cap | | | 0.00 | % | |
THE OAKMARK FUNDS
85
This material must be preceded or accompanied by a prospectus. To order a prospectus, which explains management fees and expenses and the special risks of investing in the Funds, visit oakmark.com or call 1-800-OAKMARK. Please read the prospectus carefully before investing.
The discussion of the Funds' investments and investment strategies (including current investment themes, the portfolio managers' research and investment process, and portfolio characteristics) represents the Funds' investments and the views of the portfolio managers and Harris Associates L.P., the Funds' investment adviser, at the time of writing this report, and are subject to change without notice.
The performance data quoted represents past performance. The above performance for the Funds does not reflect the imposition of a 2% redemption fee on shares held for 90 days or less to deter market timers. If reflected, the fee would reduce the performance quoted. Past performance does not guarantee future results. The investment return and principal value will fluctuate so that an investor's shares, when redeemed, may be worth more or less than their original cost. Current performance may be lower or higher than the performance data quoted. Average annual total return measures annualized change, while total return measures aggregate change. To obtain most recent month-end performance data visit oakmark.com.
Investing in value stocks presents the risk that value stocks may fall out of favor with investors and underperform growth stocks during given periods.
The Oakmark International Small Cap Fund closed to new investors as of 5/10/02, The Oakmark Global Fund and The Oakmark International Fund closed to certain new investors as of 12/15/03, and The Oakmark Equity and Income Fund closed to certain new investors as of 5/7/04.
Because The Oakmark Select Fund and The Oakmark Global Select Fund are non-diversified, the performance of each holding will have a greater impact on each Fund's total return, and may make the Funds' returns more volatile than a more diversified fund.
The Oakmark Equity and Income Fund invests in medium- and lower-quality debt securities that have higher yield potential but present greater investment and credit risk than higher-quality securities, which may result in greater share price volatility. An economic downturn could severely disrupt the market in medium or lower grade debt securities and adversely affect the value of outstanding bonds and the ability of the issuers to repay principal and interest.
Investing in foreign securities represents risks which in some way may be greater than in U.S. investments. Those risks include: currency fluctuation; different regulation, accounting standards, trading practices and levels of available information; generally higher transaction costs; and political risks.
The stocks of smaller companies often involve more risk than the stocks of larger companies. Stocks of small companies tend to be more volatile and have a smaller public market than stocks of larger companies. Small companies may have a shorter history of operations than larger companies, may not have as great an ability to raise additional capital and may have a less diversified product line, making them more susceptible to market pressure.
1. Total return includes change in share prices and in each case includes reinvestment of any dividends and capital gain distributions.
2. Portfolio holdings are subject to change without notice and are not intended as recommendations of individual stocks.
3. The S&P 500 Index is a broad market-weighted average of U.S. blue-chip companies. This index is unmanaged and investors cannot actually make investments in this index.
4. The Dow Jones Industrial Average is an unmanaged index that includes only 30 big companies. This index is unmanaged and investors cannot invest directly in this index.
5. The Lipper Large Cap Value Fund Index is an equally weighted index of the largest 30 funds within the large cap value funds investment objective as defined by Lipper Inc. The index is adjusted for the reinvestment of capital gains and income dividends. This index is unmanaged and investors cannot invest directly in this index.
THE OAKMARK FUNDS
86
6. The Lipper Multi-Cap Value Funds Index tracks the results of the 30 largest mutual funds in the Lipper Multi-Cap Value Funds category. This index is unmanaged and investors cannot invest directly in this index.
7. The Lipper Balanced Fund Index measures the performance of the 30 largest U.S. balanced funds tracked by Lipper. This index is unmanaged and investors cannot invest directly in this index.
8. Lehman Brothers Government/Corporate Bond Index is a benchmark index made up of the Lehman Brothers Government and Corporate Bond indexes, including U.S. government Treasury and agency securities as well as corporate and Yankee bonds. This index is unmanaged and investors cannot invest directly in this index.
9. The quoted passage is taken from "Has Growth Become Value—Reprise" written by Dennis J. Trittin and published by Russell Research Group Commentary, March 2007.
10. The MSCI World Index is a free float-adjusted market capitalization index that is designed to measure global developed market equity performance. As of June 2006 the MSCI World Index consisted of the following 23 developed market country indices: Australia, Austria, Belgium, Canada, Denmark, Finland, France, Germany, Greece, Hong Kong, Ireland, Italy, Japan, Netherlands, New Zealand, Norway, Portugal, Singapore, Spain, Sweden, Switzerland, the United Kingdom and the United States. This index is unmanaged and investors cannot invest directly in this index.
11. The Lipper Global Fund Index measures the performance of the 30 largest mutual funds that invest in securities throughout the world. This index is unmanaged and investors cannot invest directly in this index.
12. The Dow Jones STOXX (Price) Index is a broad based capitalization-weighted index of European stocks designed to provide a broad yet liquid representation of companies in the European region. The equities use free float shares in the index calculation. The index was developed with a base value of 100 as of December 31, 1991. This index uses float shares, is unmanaged and investors cannot actually make investments.
13. The quoted passage is taken from "Microsoft case reveals a regulatory gulf" written by Tobias Buck in Brussels and Stephanie Kirchgaessner in Washington and published by The Financial Times, September 18, 2007.
14. The MSCI World Index ex U.S. is a free float-adjusted market capitalization index that is designed to measure global developed market equity performance. As of June 2006 the MSCI World Index consisted of the following 22 developed market country indices: Australia, Austria, Belgium, Canada, Denmark, Finland, France, Germany, Greece, Hong Kong, Ireland, Italy, Japan, Netherlands, New Zealand, Norway, Portugal, Singapore, Spain, Sweden, Switzerland, and the United Kingdom. This index is unmanaged and investors cannot invest directly in this index.
15. The MSCI EAFE Index (Europe, Australasia, Far East) is a free float-adjusted market capitalization index that is designed to measure developed market equity performance, excluding the US & Canada. As of June 2006 the MSCI EAFE Index consisted of the following 21 developed market country indices: Australia, Austria, Belgium, Denmark, Finland, France, Germany, Greece, Hong Kong, Ireland, Italy, Japan, the Netherlands, New Zealand, Norway, Portugal, Singapore, Spain, Sweden, Switzerland and the United Kingdom. This index is unmanaged and investors cannot invest directly in this index.
16. The Lipper International Fund Index reflects the net asset value weighted total return of the 30 largest international equity funds. This index is unmanaged and investors cannot invest directly in this index.
17. The MSCI World ex U.S. Small Cap Index is the small cap component of the MSCI World ex U.S. Standard Index. Securities selected represent 40% of the small cap asset class in each developed market on a capitalization-weighted basis. This index is unmanaged and investors cannot invest directly in this index.
18. The Lipper International Small Cap Funds Index measures the performance of the 10 largest international small-cap funds tracked by Lipper. This index is unmanaged and investors cannot invest directly in this index.
THE OAKMARK FUNDS
87
THE OAKMARK FUNDS
Trustees and Officers
The board of trustees has overall responsibility for the conduct of the affairs of Harris Associates Investment Trust ("Trust"), and its series, The Oakmark Funds. Each trustee serves until the next annual meeting of shareholders and until the election and qualification of his or her successor, or until he or she dies, resigns or is removed. Each trustee must retire at the end of the calendar year in which the trustee attains the age of 72. The board of trustees may fill any vacancy on the board provided that after such appointment, at least two-thirds of the trustees have been elected by the shareholders. No person shall be appointed or elected to serve as a trustee for the first time after attaining the age of 65. A majority of trustees then in office may remove a trustee with or without cause. The shareholders may remove a trustee by a vote of two-thirds of the outstanding shares of the Trust at any meeting of shareholders called for the purpose of removing such trustee.
The board of trustees elects or appoints the Trust's officers. The president, any vice president, treasurer and secretary serves until the election and qualification of his or her successor, or until he or she dies, resigns, or is removed or disqualified. Each other officer shall serve at the pleasure of the board of trustees. The board of trustees may remove any officer at any time, with or without cause, by the vote of a majority of the trustees then in office.
The names and ages of the trustees and officers, the position each holds with the Trust, the date each was first elected to office, their principal business occupations during the last five years and other directorships held are shown below.
Name and Age at September 30, 2007, Position(s) Held with the Trust, Date First Elected or Appointed to Office
Principal Occupations During the Past 5 Years. Other Directorships Held by Trustee, if any.
Trustees who are "interested persons"*
Peter S. Voss, 60, Trustee, 1995
Retired since 2007; Chairman and Chief Executive Officer, IXIS Asset Management Group; Chairman, President and Chief Executive Officer, IXIS Asset Management US Corporation, formerly named IXIS Asset Management North America, L.P. (investment management); Chairman of IXIS Asset Management US, LLC; Member of the Supervisory Board, IXIS Asset Management; Director, Harris Associates, Inc. ("HAI"), prior thereto.
John R. Raitt, 52, Trustee and President, 2003
President and Chief Executive Officer, HAI, Harris Associates L.P. ("HALP") and Harris Associates Securities L.P. ("HASLP") since 2003; Chief Operating Officer, HALP, prior thereto.
Trustees who are not "interested persons"
Gary N. Wilner, M.D., 67, Trustee and Chairman of the Board of Trustees, 1993
Retired, since 2004; Senior Attending Physician, Evanston Hospital; Medical Director of Cardiopulmonary Wellness Program, Evanston Hospital Corporation, prior thereto. Chairman of the Board of Directors, North American Scientific, Inc. (developer of radioisotopic products for the treatment and diagnosis of disease).
Michael J. Friduss, 64, Trustee, 1995
Principal, MJ Friduss & Associates, Inc. (telecommunications consultants).
THE OAKMARK FUNDS
88
Trustees and Officers cont.
Thomas H. Hayden, 56, Trustee, 1995
Principal, TerraNova Market Strategies, LLC (market research and strategic consulting practice), since July 2006; President, Greenhouse Communications (advertising agency), 2004 to 2006; Executive Vice President, Campbell Mithun (advertising and marketing communication agency), prior thereto.
Christine M. Maki, 46, Trustee, 1995
Vice President–Tax, Hyatt Corporation (hotel management).
Allan J. Reich, 59, Trustee, 1993
Partner, Seyfarth Shaw LLP (law firm), since 2003; Vice Chairman, D'Ancona & Pflaum LLC (law firm), prior thereto.
Steven S. Rogers, 50, Trustee, 2006
Clinical Professor of Finance & Management, Kellogg Graduate School of Management, Northwestern University, since 1995; Entrepreneur-in-Residence, Ewing Marion Kauffman Foundation, since 1994. Director, SC Johnson Wax (manufacturer of household cleaning, personal care and insecticide products), SuperValu, Inc. (supermarket retailer and food distributor), AMCORE Financial, Inc. (bank holding company), and W.S. Darley & Co. (fire fighting and emergency equipment manufacturers).
Burton W. Ruder, 63, Trustee, 1995
President, The Academy Financial Group (venture capital investment and transaction financing firm); Manager, Cedar Green Associates (real estate management firm).
Officers of the Trust
Henry R. Berghoef, 58, Vice President and Portfolio Manager (The Oakmark Select Fund), 2000
Director of Domestic Research, HALP, since 2003; Associate Director of Research, 2001 to 2002; Portfolio Manager and Analyst, HALP.
Chad M. Clark, 35, Vice President and Portfolio Manager (The Oakmark International Small Cap Fund), 2005
Portfolio Manager, HALP, since 2001; International Analyst, HALP.
Richard J. Gorman, 41, Vice President, Chief Compliance Officer and Assistant Secretary, 2006
Senior Special Counsel, Investment Management Regulation, United States Securities and Exchange Commission, prior thereto.
Kevin G. Grant, 43, Vice President and Portfolio Manager (The Oakmark Fund), 2000
Portfolio Manager and Analyst, HALP.
David G. Herro, 46, Vice President and Portfolio Manager (The Oakmark Global Select Fund, The Oakmark International Fund and The Oakmark International Small Cap Fund), 1992
Chief Investment Officer, HALP, since 2003; Portfolio Manager and Analyst, HALP.
John J. Kane, 36, Treasurer, 2005
Assistant Treasurer, 1999 to 2005; Manager, Mutual Fund and Institutional Services, HALP.
Robert M. Levy, 57, Executive Vice President, 2004
Chairman, HAI; Chief Investment Officer of Domestic Equity, HALP, since 2001; President and Chief Executive Officer, HAI, HALP and HASLP, 1997 to 2002; Portfolio Manager, HALP.
THE OAKMARK FUNDS
89
Trustees and Officers cont.
Clyde S. McGregor, 54, Vice President and Portfolio Manager (The Oakmark Equity and Income Fund and The Oakmark Global Fund), 1995
Portfolio Manager, HALP.
William C. Nygren, 49, Vice President and Portfolio Manager (The Oakmark Fund, The Oakmark Select Fund and The Oakmark Global Select Fund), 1996
Portfolio Manager and Analyst, HALP.
Vineeta D. Raketich, 36, Vice President, 2003
Manager, International Operations and Client Relations, HALP, since 2003; Supervisor, Mutual Fund and Institutional Services, HALP, prior thereto.
Janet L. Reali, 56, Vice President and Secretary, 2001
Vice President, General Counsel and Secretary, HAI, HALP and HASLP, since 2001.
Kristi L. Rowsell, 41, Vice President and Principal Financial Officer, 2005
Director, Chief Financial Officer and Treasurer, HAI; Chief Financial Officer, HALP and HASLP, prior thereto.
Edward A. Studzinski, 58, Vice President and Portfolio Manager (The Oakmark Equity and Income Fund), 2000
Portfolio Manager and Analyst, HALP.
Robert A. Taylor, 35, Vice President and Portfolio Manager (The Oakmark Global Fund), 2005
Director of International Research, since 2004; Portfolio Manager and Analyst, HALP.
Christopher P. Wright, 33, Vice President, 2005
Director of Mutual Fund Operations, HALP, since 2004; Assistant Director of Mutual Fund Operations, HALP, prior thereto.
* Mr. Voss is a trustee who is deemed to be an "interested person" of the Trust as defined in the Investment Company Act of 1940, because he was a director of HAI, the general partner and manager of HALP, the investment adviser to the Funds. Mr. Raitt is a trustee who is deemed to be an "interested person" of the Trust because he is the President and Chief Executive Officer of HAI, HASLP and HALP.
The business address of the officers and trustees is Two North LaSalle Street, #500, Chicago, Illinois 60602.
The Statement of Additional Information (SAI) contains further information about the trustees and is available without charge upon your request by calling 1-800-625-6275.
THE OAKMARK FUNDS
90
THE OAKMARK FUNDS
Investment Philosophy
All Oakmark managers follow a consistent investment philosophy—to invest in companies they believe are trading at a substantial discount to underlying business value. Critical to this philosophy is to invest with management teams who are committed to maximizing the company's business value.
Three key tenets of our
investment philosophy:
1 Buy businesses trading at a significant discount
to our estimate of true business value.
2 Invest in companies expected to grow shareholder value over time.
3 Invest with management teams who think
and act as owners.
Investment Process
We seek to identify undervalued companies through an intensive, in-house research process. This process is not based on macro-economic factors, such as the performance of the economy or the direction of interest rates. Nor is it based on technical factors, such as the performance of the stock market itself. And, while some value managers might use only one summary statistic—such as price-earnings ratio—our investment professionals take a more in-depth approach using a range of valuation measures appropriate for a specific company or industry.
From the universe of thousands of equity securities, our team generates investment ideas through a variety of methods. If a security appears attractive, detailed quantitative and qualitative research follows. This careful process of identifying undervalued stocks results in an "approved list."
The Result: a unified effort aimed at identifying the best values in the marketplace. From the list of
approved stocks, each fund manager constructs a relatively focused portfolio, built on a stock-by-stock basis from the bottom up.
Who Should Invest
Any investor who is seeking a disciplined value manager for the purposes of growing and diversifying a portfolio should consider one of The Oakmark Funds, keeping in mind that all equity investments should be considered long-term investments. As value investors, we recognize that patience is a virtue and believe that, over the long term, investors are rewarded for their patience. We generally hold the companies in which we invest for three to five years, a time horizon that we encourage our shareholders to consider as well.
How to Use Value Funds
in an Overall Portfolio
Investment styles tend to move in cycles. One style may be in favor for a few years while the other is out of favor, and vice versa. Diversifying the stock portion of your portfolio may help reduce overall volatility—and potentially provide more consistent returns over time.
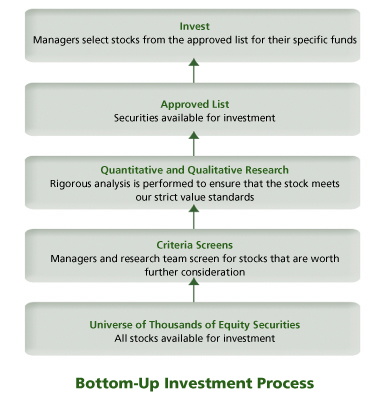
THE OAKMARK FUNDS
91
The Oakmark Glossary
Book value – A company's common stock equity as it appears on a balance sheet, equal to total assets minus liabilities, preferred stock, and intangible assets such as goodwill. A company's book value often differs substantially from economic value, especially in industries such as media.
Business value/Intrinsic value – The perceived or estimated actual value of a security, as opposed to its current market price or book value. Business value can be evaluated based on what a knowledgeable buyer would pay for a business if the company were sold in its entirety.
Growth investing – Investors who look for companies based on whether the stock of a company is growing earnings and/or revenue faster than the industry as a whole or the overall market. Growth investors generally expect high rates of growth to persist, and the stock, in turn, to deliver returns exceeding the market's. A growth mutual fund is generally one that emphasizes stocks believed to offer above-average growth prospects, with little to no emphasis on the stock's current price.
M & A (Mergers & Acquisitions) – Merger: the combining of two or more entities into one, through a purchase acquisition or a pooling of interests. Acquisition: can also be called a takeover, and is defined as acquiring control of a corporation, called a target, by stock purchase or exchange, either hostile or friendly.
Market capitalization (market cap or cap) – The market price of an entire company on any given day, calculated by multiplying the number of shares outstanding by the price per share.
Momentum investing – Approach to investing based on the belief that stock price trends are likely to continue. Momentum investors tend to buy stocks that have been outperforming the market and to sell those stocks when their relative performance deteriorates. Momentum investors do not consider a company's underlying value or fundamentals in their investment decisions.
Multiple – A ratio used to measure a stock's valuation, usually greater than 1. Sometimes used to mean price/earnings ratio.
P/B or Price-to-Book Ratio – A stock's capitalization divided by its book value. The value is the same whether the calculation is done for the whole company or on a per-share basis.
P/E or Price-to-Earnings Ratio – The most common measure of a stock's valuation. It is equal to a stock's capitalization divided by its after-tax earnings over a 12-month period. The value is the same whether the calculation is done for the whole company or on a per-share basis. Equivalently, the cost an investor in a given stock must pay per dollar of current annual earnings. Also called earnings multiple.
Share repurchase – Program through which a corporation buys back its own shares in the open market, typically an indication that the corporation's management believes the stock price is undervalued.
Value investing – Investors who utilize valuation measures such as business value (including growth rate), price/earnings ratio, price/book ratio, and yield to gauge the attractiveness of a company. Managers who employ a value investment style believe that the true, underlying value of a company is not reflected in its current share price, and, over time, the price has potential to increase as the market recognizes the overall value of the business. Value stocks sell at relatively low prices in relation to their underlying business value, earnings, or book value.
Stocks become undervalued for a variety of reasons, including an overall market decline, or when a specific industry falls into disfavor and investors view all companies in that industry in the same light. Consequently, an individual company's stock price may fall, even though it may be only temporarily affected by the industry's problems and its underlying value has remained unchanged.
"x times earnings" ("12 times earnings") – Another way to express a stock's price-to-earnings (P/E) ratio. A stock with a P/E ratio of 12 sells at 12 times earnings.
THE OAKMARK FUNDS
92
THE OAKMARK FUNDS
Other Information
Investment Adviser
Harris Associates L.P.
Two North LaSalle Street
Chicago, Illinois 60602-3790
Transfer Agent
Boston Financial Data Services, Inc.
Quincy, Massachusetts
Legal Counsel
Bell, Boyd & Lloyd LLP
Chicago, Illinois
Independent Registered Public
Accounting Firm
Deloitte & Touche LLP
Chicago, Illinois
Contact Us
Please call 1-800-OAKMARK
(1-800-625-6275)
or 617-483-3250
Website
oakmark.com
To obtain a prospectus, an application or periodic reports, access our web site at oakmark.com, or call 1-800-OAKMARK (1-800-625-6275) or (617) 483-3250.
The Funds will file its complete schedule of portfolio holdings with the Securities and Exchange Commission (the "SEC") for the first and third quarters of each fiscal year on Form N-Q. The Funds' Forms N-Q are available on the SEC's website at www.sec.gov. The Funds' Forms N-Q may be reviewed and copied at the SEC's Public Reference Room in Washington, DC, and information on the operation of the Public Reference Room may be obtained by calling 1-800-SEC-0330.
A description of the policies and procedures the Funds use to determine how to vote proxies relating to portfolio securities is available without charge, upon request, by calling toll-free 1-800-625-6275; on the Funds' website at oakmark.com; and on the SEC's website at www.sec.gov.
No later than August 31 of each year, information regarding how the Adviser, on behalf of the Funds, voted proxies relating to the Funds' portfolio securities for the twelve months ended the preceding June 30 will be available through a link on the Funds' website at oakmark.com and on the SEC's website at www.sec.gov.
This report is submitted for the general information of the Funds' shareholders. The report is not authorized for distribution to prospective investors in the Funds unless it is accompanied or preceded by the Funds' currently effective prospectus.
No sales charge to the shareholder or to the new investor is made in offering the shares of the Funds, however, a shareholder may incur a 2% redemption fee on an exchange or redemption of Class I shares held for 90 days or less from any Fund.

1-800-OAKMARK
oakmark.com
The Oakmark Funds are distributed by Harris Associates Securities L.P., member FINRA. Date of first use: November 2007.
THE OAKMARK FUND CLASS II
THE VALUE OF A $10,000 INVESTMENT IN THE OAKMARK FUND FROM ITS
INCEPTION (4/5/01) TO PRESENT (9/30/07) AS COMPARED TO THE
STANDARD & POOR'S 500 INDEX (UNAUDITED)

Average Annual Total Returns
(as of 9/30/07)
| (Unaudited) | | 1-year | | 5-year | | Since
Inception
(4/5/01) | |
| Oakmark Fund (Class II) | | | 11.11 | % | | | 12.21 | % | | | 7.12 | % | |
| S&P 500 | | | 16.44 | % | | | 15.45 | % | | | 6.28 | % | |
The graph and table do not reflect the deduction of taxes that a shareholder would pay on fund distributions or the redemption of fund shares.
Expense Ratio as of 9/30/07 was 1.36%.
The performance data quoted represents past performance. Past performance does not guarantee future results. The investment return and principal value will fluctuate so that an investor's shares, when redeemed, may be worth more or less than their original cost. Current performance may be lower or higher than the performance data quoted. Average annual total return measures annualized change, while total return measures aggregate change. To obtain most recent month-end performance data, visit oakmark.com.
Harris Associates Securities L.P., member FINRA, November 2007
THE OAKMARK SELECT FUND CLASS II
THE VALUE OF A $10,000 INVESTMENT IN THE OAKMARK SELECT FUND FROM ITS
INCEPTION (12/31/99) TO PRESENT (9/30/07) AS COMPARED TO THE
STANDARD & POOR'S 500 INDEX (UNAUDITED)
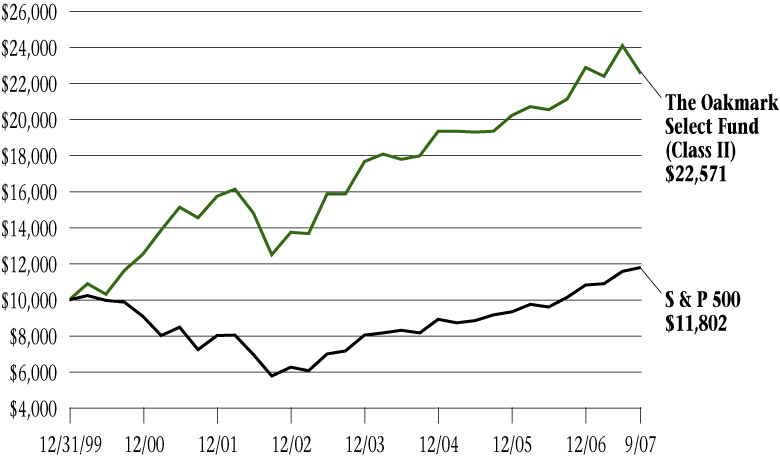
Average Annual Total Returns
(as of 9/30/07)
| (Unaudited) | | 1-year | | 5-year | | Since
Inception
(12/31/99) | |
| Oakmark Select Fund (Class II) | | | 6.65 | % | | | 12.54 | % | | | 11.08 | % | |
| S&P 500 | | | 16.44 | % | | | 15.45 | % | | | 2.16 | % | |
The graph and table do not reflect the deduction of taxes that a shareholder would pay on fund distributions or the redemption of fund shares.
Expense Ratio as of 9/30/07 was 1.35%.
The performance data quoted represents past performance. Past performance does not guarantee future results. The investment return and principal value will fluctuate so that an investor's shares, when redeemed, may be worth more or less than their original cost. Current performance may be lower or higher than the performance data quoted. Average annual total return measures annualized change, while total return measures aggregate change. To obtain most recent month-end performance data, visit oakmark.com.
Harris Associates Securities L.P., member FINRA, November 2007
THE OAKMARK EQUITY AND INCOME FUND CLASS II
THE VALUE OF A $10,000 INVESTMENT IN THE OAKMARK EQUITY AND INCOME
FUND FROM ITS INCEPTION (7/12/00) TO PRESENT (9/30/07) AS COMPARED TO
THE LIPPER BALANCED FUND INDEX (UNAUDITED)
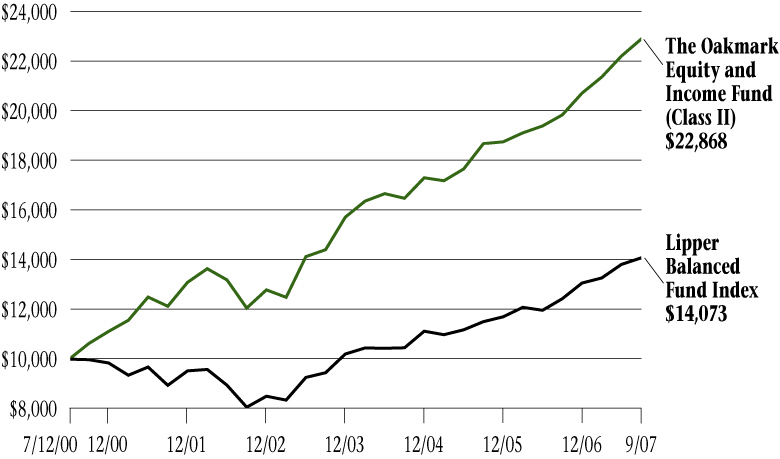
Average Annual Total Returns
(as of 9/30/07)
| (Unaudited) | | 1-year | | 5-year | | Since
Inception
(7/12/00) | |
| Oakmark Equity & Income Fund (Class II) | | | 15.38 | % | | | 13.66 | % | | | 12.14 | % | |
| Lipper Balanced Fund Index | | | 13.22 | % | | | 11.76 | % | | | 4.85 | % | |
The graph and table do not reflect the deduction of taxes that a shareholder would pay on fund distributions or the redemption of fund shares.
Expense Ratio as of 9/30/07 was 1.17%.
The performance data quoted represents past performance. Past performance does not guarantee future results. The investment return and principal value will fluctuate so that an investor's shares, when redeemed, may be worth more or less than their original cost. Current performance may be lower or higher than the performance data quoted. Average annual total return measures annualized change, while total return measures aggregate change. To obtain most recent month-end performance data, visit oakmark.com.
Harris Associates Securities L.P., member FINRA, November 2007
THE OAKMARK GLOBAL FUND CLASS II
THE VALUE OF A $10,000 INVESTMENT IN THE OAKMARK GLOBAL FUND
FROM ITS INCEPTION (10/10/01) TO PRESENT (9/30/07) AS COMPARED TO THE
MSCI WORLD INDEX (UNAUDITED)
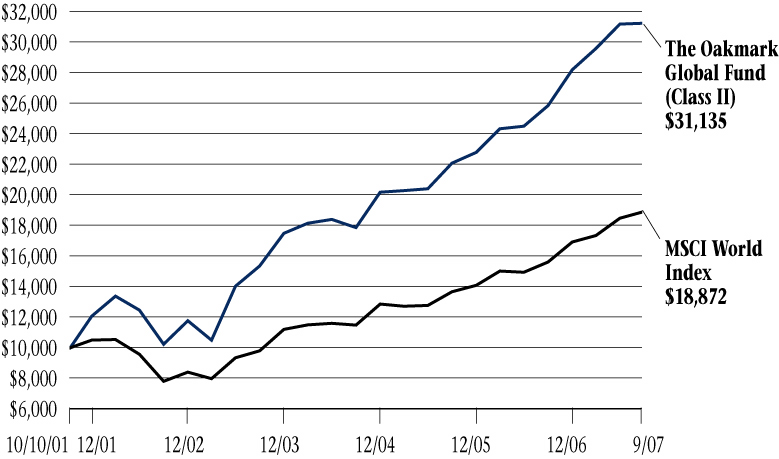
Average Annual Total Returns
(as of 9/30/07)
| (Unaudited) | | 1-year | | 5-year | | Since
Inception
(10/10/01) | |
| Oakmark Global Fund (Class II) | | | 20.82 | % | | | 24.93 | % | | | 20.94 | % | |
| MSCI World | | | 21.10 | % | | | 19.28 | % | | | 11.22 | % | |
The graph and table do not reflect the deduction of taxes that a shareholder would pay on fund distributions or the redemption of fund shares.
Expense Ratio as of 9/30/07 was 1.53%.
The performance data quoted represents past performance. Past performance does not guarantee future results. The investment return and principal value will fluctuate so that an investor's shares, when redeemed, may be worth more or less than their original cost. Current performance may be lower or higher than the performance data quoted. Average annual total return measures annualized change, while total return measures aggregate change. To obtain most recent month-end performance data, visit oakmark.com.
Harris Associates Securities L.P., member FINRA, November 2007
THE OAKMARK INTERNATIONAL FUND CLASS II
THE VALUE OF A $10,000 INVESTMENT IN THE OAKMARK INTERNATIONAL FUND
FROM ITS INCEPTION (11/4/99) TO PRESENT (9/30/07) AS COMPARED TO THE
MSCI WORLD EX U.S. INDEX (UNAUDITED)
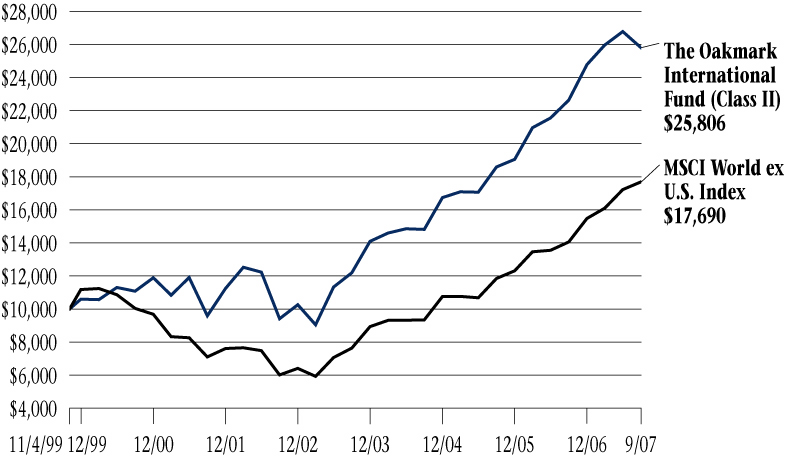
Average Annual Total Returns
(as of 9/30/07)
| (Unaudited) | | 1-year | | 5-year | | Since
Inception
(11/4/99) | |
| Oakmark International Fund (Class II) | | | 14.04 | % | | | 22.33 | % | | | 12.74 | % | |
| MSCI World ex U.S. | | | 25.85 | % | | | 24.08 | % | | | 7.48 | % | |
The graph and table do not reflect the deduction of taxes that a shareholder would pay on fund distributions or the redemption of fund shares.
Expense Ratio as of 9/30/07 1.44%.
The performance data quoted represents past performance. Past performance does not guarantee future results. The investment return and principal value will fluctuate so that an investor's shares, when redeemed, may be worth more or less than their original cost. Current performance may be lower or higher than the performance data quoted. Average annual total return measures annualized change, while total return measures aggregate change. To obtain most recent month-end performance data, visit oakmark.com.
Harris Associates Securities L.P., member FINRA, November 2007
THE OAKMARK INTERNATIONAL
SMALL CAP FUND CLASS II
THE VALUE OF A $10,000 INVESTMENT IN THE OAKMARK INTERNATIONAL SMALL
CAP FUND FROM ITS INCEPTION (1/8/01) TO PRESENT (9/30/07) AS COMPARED
TO THE MSCI WORLD EX U.S. INDEX (UNAUDITED)
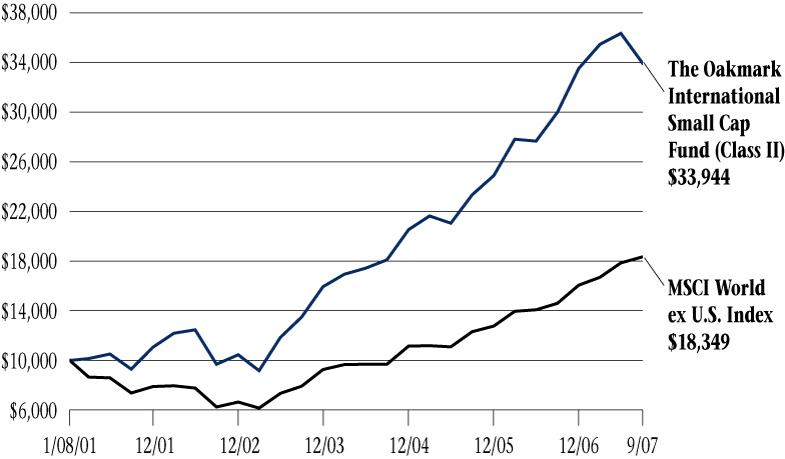
Average Annual Total Returns
(as of 9/30/07)
| (Unaudited) | | 1-year | | 5-year | | Since
Inception
(1/8/01) | |
| Oakmark International Small Cap Fund (Class II) | | | 13.29 | % | | | 28.51 | % | | | 19.93 | % | |
| MSCI World ex U.S. | | | 25.85 | % | | | 24.08 | % | | | 9.44 | % | |
The graph and table do not reflect the deduction of taxes that a shareholder would pay on fund distributions or the redemption of fund shares.
Expense Ratio as of 9/30/07 1.44%.
The performance data quoted represents past performance. Past performance does not guarantee future results. The investment return and principal value will fluctuate so that an investor's shares, when redeemed, may be worth more or less than their original cost. Current performance may be lower or higher than the performance data quoted. Average annual total return measures annualized change, while total return measures aggregate change. To obtain most recent month-end performance data, visit oakmark.com.
Harris Associates Securities L.P., member FINRA, November 2007
FUND EXPENSES
A shareholder of each Fund incurs two types of costs: (1) transaction costs, such as redemption fees, and (2) ongoing costs, including investment advisory fees, transfer agent fees, and other fund expenses. The examples below are intended to help shareholders understand the ongoing cost (in dollars) of investing in each Fund and to compare these costs with the ongoing costs of investing in other funds.
Actual Expenses
The following table provides information about actual account values and actual fund expenses for Class II of each Fund. The table shows the expenses a Class II shareholder would have paid on a $1,000 investment in each Fund from April 1, 2007, to September 30, 2007, as well as how much a $1,000 investment would be worth at the close of the period, assuming actual fund returns and expenses. A Class II shareholder can estimate expenses incurred for the period by dividing the account value at September 30, 2007, by $1,000 and multiplying the result by the number in the Expenses Paid During the Period row as shown below.
| | | The Oakmark
Fund | | The Oakmark
Select Fund | | The Oakmark
Equity and
Income Fund | | The Oakmark
Global Fund | | The Oakmark
International
Fund | | The Oakmark
International
Small Cap
Fund | |
| Beginning Account Value | | $ | 1,000.00 | | | $ | 1,000.00 | | | $ | 1,000.00 | | | $ | 1,000.00 | | | $ | 1,000.00 | | | $ | 1,000.00 | | |
| Ending Account Value | | $ | 1,030.50 | | | $ | 1,006.70 | | | $ | 1,071.40 | | | $ | 1,055.80 | | | $ | 994.00 | | | $ | 957.40 | | |
| Expenses Paid During Period* | | $ | 6.92 | | | $ | 6.69 | | | $ | 6.02 | | | $ | 7.88 | | | $ | 7.30 | | | $ | 7.07 | | |
| Annualized Expense Ratio | | | 1.36 | % | | | 1.33 | % | | | 1.16 | % | | | 1.53 | % | | | 1.46 | % | | | 1.44 | % | |
* Expenses are equal to each Fund's annualized expense ratio for Class II, multiplied by the average account value over the period, multiplied by the number of days in the most recent fiscal half-year divided by 365 (to reflect the one-half year period).
Hypothetical Example for Comparison Purposes
The following table provides information about hypothetical account values and hypothetical expenses for Class II of each Fund based on actual expense ratios and an assumed rate of return of 5% per year before expenses, which are not the Funds' actual returns. The hypothetical account values and expenses may not be used to estimate the actual ending account balances or expenses shareholders paid for the period. Shareholders may use this information to compare the ongoing costs of investing in a Fund and other funds. To do so, compare this 5% hypothetical example with the 5% hypothetical examples that appear in the shareholder reports of the other funds.
Please note that the expenses shown in the table are meant to highlight your ongoing costs only and do not reflect any transaction costs, such as redemption fees. Therefore, the third line of the table is useful in comparing ongoing costs only, and will not help you determine the relative total costs of owning different funds. In addition, if these transaction costs were included, the total costs would have been higher.
| | | The Oakmark
Fund | | The Oakmark
Select Fund | | The Oakmark
Equity and
Income Fund | | The Oakmark
Global Fund | | The Oakmark
International
Fund | | The Oakmark
International
Small Cap
Fund | |
| Beginning Account Value | | $ | 1,000.00 | | | $ | 1,000.00 | | | $ | 1,000.00 | | | $ | 1,000.00 | | | $ | 1,000.00 | | | $ | 1,000.00 | | |
| Ending Account Value | | $ | 1,018.25 | | | $ | 1,018.40 | | | $ | 1,019.25 | | | $ | 1,017.40 | | | $ | 1,017.75 | | | $ | 1,017.85 | | |
| Expenses Paid During Period* | | $ | 6.88 | | | $ | 6.73 | | | $ | 5.87 | | | $ | 7.74 | | | $ | 7.38 | | | $ | 7.28 | | |
| Annualized Expense Ratio | | | 1.36 | % | | | 1.33 | % | | | 1.16 | % | | | 1.53 | % | | | 1.46 | % | | | 1.44 | % | |
* Expenses are equal to each Fund's annualized expense ratio for Class II, multiplied by the average account value over the period, multiplied by the number of days in the most recent fiscal half-year divided by 365 (to reflect the one-half year period).
Item 2. Code of Ethics.
(a) Registrant has adopted a code of ethics (the “Code”) that applies to its Principal Executive Officer, Principal Financial Officer and Principal Accounting Officer.
(b) No disclosures are required by this Item 2(b).
(c) During the period covered by the report, no amendments were made to the provisions of the Code.
(d) During the period covered by the report, Registrant did not grant any waivers, including implicit waivers, from the provisions of the Code.
(e) Not applicable.
(f) A copy of the Code is filed as Exhibit (a)(1) to this Form N-CSR. Copies of the Code will also be made available free of charge upon request, by writing or calling The Oakmark Funds, P.O. Box 8510, Boston, MA 02266-8510, 1-800-OAKMARK,
(1-800-625-6275).
Item 3. Audit Committee Financial Expert.
Registrant’s board of trustees has determined that each of the following five members of the Registrant’s audit committee qualifies as an “audit committee financial expert,” as such term is defined in Instruction 2(b) to Item 3 of Form N-CSR: Michael J. Friduss, Christine M. Maki, Allan J. Reich, Stephen S. Rogers and Gary N. Wilner, M.D. Each of those members of Registrant’s audit committee is “independent” as such term is defined in paragraph (a)(2) of Item 3 of Form N-CSR.
Under applicable securities laws, a person who is determined to be an audit committee financial expert will not be deemed an “expert” for any purpose, including without limitation for the purposes of Section 11 of the Securities Act of 1933, as a result of being designated or identified as an audit committee financial expert. The designation or identification of a person as an audit committee financial expert does not impose on such person any duties, obligations, or liability that are greater than the duties, obligations, and liability imposed on such person as a member of the audit committee and board of trustees in the absence of such designation or identification. The designation or identification of a person as an audit committee financial expert does not affect the duties, obligations, or liability of any other member of the audit committee or board of trustees.
Item 4. Principal Accountant Fees and Services.
Aggregate fees billed to the Registrant for professional services rendered by the Registrant’s principal accountant were as follows:
| | Fiscal Year
Ended
September 30,
2007 | | Fiscal Year
Ended
September 30,
2006 | |
Audit Fees(1) | | $ | 214,900 | | $ | 181,900 | |
Audit-Related Fees(2) | | $ | 62,000 | | $ | 51,000 | |
Tax Fees(3) | | $ | 27,600 | | $ | 21,700 | |
All Other Fees(4) | | $ | 0 | | $ | 0 | |
During its regularly scheduled periodic meetings, the Registrant’s audit committee will pre-approve all audit, audit-related, tax and other services to be provided by the principal accountants of the Registrant. The audit committee has authorized its chairman to exercise that authority in the intervals between meetings; and the chairman presents any such pre-approvals to the audit committee at its next regularly scheduled meeting. Under paragraph (c)(7)(i)(C) of Rule 2-01 of Regulation S-X, pre-approval of non-audit services may waived provided that: 1) the aggregate amount for all such services provided constitutes no more than five percent of the total amount of revenues paid by the Registrant to its principal accountant during the fiscal year in which such services are provided; 2) such services were not recognized by management at the time of engagement as non-audit services; and 3) such services are promptly brought to the attention of the Registrant’s audit committee by management and approved prior to the completion of the audit by the audit committee or by one or more members of the audit committee who are members of the board of trustees to whom authority to grant such approvals has been delegated by the audit committee.
No audit-related, tax or non-audit services were approved by waiver pursuant to paragraph (c)(7)(i)(C) of Rule 2-01 of Regulation
S-X.
1 “Audit Fees” include amounts for professional services rendered by the principal accountant for the audit of the Registrant’s annual financial statements and services that are normally provided by the accountant in connection with statutory and regulatory filings or engagements.
2 “Audit-Related Fees” include amounts for assurance and related services by the principal accountant that are reasonably related to the performance of the audit of the Registrant’s financial statements, specifically the semi-annual reviews of the Funds in fiscal years 2006 and 2007.
3 “Tax Fees” include amounts for professional services rendered by the principal accountant for tax compliance, tax advice and tax planning, specifically distribution consultation.
4 “All Other Fees” include amounts for products and services provided by the principal accountant. No such products and services were provided.
Less than 50 percent of the hours expended on the principal accountant’s engagement to audit the Registrant’s financial statements for the most recent fiscal year were attributed to work performed by persons other than the principal accountant’s full-time, permanent employees.
The aggregate non-audit fees billed for the fiscal years ended September 30, 2007 and September 30, 2006 by the Registrant’s principal accountant for services rendered to the Registrant, its investment adviser and any entity controlling, controlled by or under common control with the investment adviser that provides ongoing services to the Registrant were $0 and $175,000, respectively.
The audit committee of Registrant’s board of trustees has considered whether the provision of non-audit services that were rendered by Registrant’s principal accountant to Registrant’s investment adviser, and any entity controlling, controlled by or under common control with the investment adviser that provides ongoing services to the Registrant that were not pre-approved pursuant to paragraph (c)(7)(ii) of Rule 2-01 of Regulation S-X is compatible with maintaining the principal accountant’s independence. No such services were rendered.
Item 5. Audit Committee of Listed Registrants.
Not applicable.
Item 6. Schedule of Investments.
The Schedule of Investments in securities of unaffiliated issuers as of the close of the reporting period is included as part of the annual report to shareholders filed under Item 1 of this Form.
Item 7. Disclosure of Proxy Voting Policies and Procedures for Closed-End Management Investment Companies.
Not applicable.
Item 8. Portfolio Managers of Closed-End Management Investment Companies.
Not applicable.
Item 9. Purchases of Equity Securities by Closed-End Management Investment Company and Affiliated Purchasers.
Not applicable.
Item 10. Submission of Matters to a Vote of Security Holders.
During the period covered by this report, no material changes were made to the procedures by which shareholders may recommend nominees to the Registrant’s board of trustees that were adopted in fiscal year 2005.
Item 11. Controls and Procedures.
Based on an evaluation of the Registrant’s disclosure controls and procedures (as defined in Rule 30a-3(c) under the Investment Company Act of 1940, the “Disclosure Controls”), the Disclosure Controls are effectively designed to ensure that information required to be disclosed by the Registrant in this report is recorded, processed, summarized, and reported within 90 days prior to the filing of this report, including ensuring that information required to be disclosed in this report is accumulated and communicated to the Registrant’s management, including the Registrant’s principal executive officer and principal financial officer, as appropriate to allow timely decisions regarding required disclosure.
There were no changes in the Registrant’s internal controls over financial reporting (as defined in Rule 30a-3(d) under the Investment Company Act of 1940) that occurred during the Registrant’s second fiscal quarter of the time period covered by this report that has materially affected, or is reasonably likely to materially affect, the Registrant’s internal control over financial reporting.
Item 12. Exhibits.
(a)(1) Code of Ethics for Principal Executive Officer and Senior Financial Officers (as referenced in Item 2 above), attached hereto as Exhibit (a)(1).
(2) Certifications of John R. Raitt, Principal Executive Officer, and Kristi L. Rowsell, Principal Financial Officer, pursuant to Rule 30a-2 under the Investment Company Act of 1940 (17 CFR 270.30a-2), attached hereto as Exhibits (a)(2)(i) and (a)(2)(ii).
(3) Not applicable.
(b) Certification of John R. Raitt, Principal Executive Officer and Kristi L. Rowsell, Principal Financial Officer, pursuant to Section 906 of the Sarbanes-Oxley Act of 2002, attached hereto as Exhibit (b).
SIGNATURES
Pursuant to the requirements of the Securities Exchange Act of 1934 and the Investment Company Act of 1940, the Registrant has duly caused this report to be signed on its behalf by the undersigned, thereunto duly authorized.
Harris Associates Investment Trust
By: | /s/ John R. Raitt | |
| John R. Raitt | |
| Principal Executive Officer | |
Date: | November 16, 2007 | |
Pursuant to the requirements of the Securities Exchange Act of 1934 and the Investment Company Act of 1940, this report has been signed below by the following persons on behalf of the Registrant and in the capacities and on the dates indicated.
By: | /s/ John R. Raitt | |
| John R. Raitt | |
| Principal Executive Officer | |
Date: | November 16, 2007 | |
| | |
| | |
By: | /s/ Kristi L. Rowsell | |
| Kristi L. Rowsell | |
| Principal Financial Officer | |
Date: | November 16, 2007 | |