UNITED STATES
SECURITIES AND EXCHANGE COMMISSION
Washington, D.C. 20549
FORM N-CSR
CERTIFIED SHAREHOLDER REPORT OF REGISTERED
MANAGEMENT INVESTMENT COMPANIES
Investment Company Act file number | 811-06279 |
|
Harris Associates Investment Trust |
(Exact name of registrant as specified in charter) |
|
Two North La Salle Street, Suite 500 Chicago, Illinois | | 60602-3790 |
(Address of principal executive offices) | | (Zip code) |
|
John R. Raitt | Paulita A. Pike |
Harris Associates L.P. | K&L Gates LLP |
Two North La Salle Street, #500 | Three First National Plaza, #3100 |
Chicago, Illinois 60602 | Chicago, Illinois 60602 |
(Name and address of agent for service) |
|
Registrant’s telephone number, including area code: | (312) 621-0600 | |
|
Date of fiscal year end: | 09/30/09 | |
|
Date of reporting period: | 09/30/09 | |
| | | | | | | | | |
Item 1. Reports to Shareholders.

ANNUAL REPORT
SEPTEMBER 30, 2009
oakmark.com

Advised by Harris Associates L.P.
THE OAKMARK FUNDS
2009 Annual Report
| President's Letter | | | 1 | | |
|
| Summary Information | | | 2 | | |
|
| Fund Expenses | | | 4 | | |
|
| Commentary on Oakmark and Oakmark Select Funds | | | 6 | | |
|
| Oakmark Fund | |
|
| Letter from the Portfolio Managers | | | 8 | | |
|
| Schedule of Investments | | | 9 | | |
|
| Oakmark Select Fund | |
|
| Letter from the Portfolio Managers | | | 13 | | |
|
| Schedule of Investments | | | 14 | | |
|
| Oakmark Equity and Income Fund | |
|
| Letter from the Portfolio Managers | | | 16 | | |
|
| Schedule of Investments | | | 19 | | |
|
| Oakmark Global Fund | |
|
| Letter from the Portfolio Managers | | | 26 | | |
|
| Global Diversification Chart | | | 29 | | |
|
| Schedule of Investments | | | 30 | | |
|
| Oakmark Global Select Fund | |
|
| Letter from the Portfolio Managers | | | 34 | | |
|
| Global Diversification Chart | | | 36 | | |
|
| Schedule of Investments | | | 37 | | |
|
| Commentary on International and International Small Cap Funds | | | 40 | | |
|
| Oakmark International Fund | |
|
| Letter from the Portfolio Managers | | | 41 | | |
|
| Global Diversification Chart | | | 43 | | |
|
| Schedule of Investments | | | 44 | | |
|
| Oakmark International Small Cap Fund | |
|
| Letter from the Portfolio Manager | | | 50 | | |
|
| Global Diversification Chart | | | 52 | | |
|
| Schedule of Investments | | | 53 | | |
|
| Financial Statements | |
|
| Statements of Assets and Liabilities | | | 60 | | |
|
| Statements of Operations | | | 62 | | |
|
| Statements of Changes in Net Assets | | | 64 | | |
|
| Notes to Financial Statements | | | 71 | | |
|
| Financial Highlights | | | 82 | | |
|
| Report of Independent Registered Public Accounting Firm | | | 90 | | |
|
| Trustees and Officers | | | 94 | | |
|
| Oakmark Glossary | | | 97 | | |
|
FORWARD-LOOKING STATEMENT DISCLOSURE
One of our most important responsibilities as mutual fund managers is to communicate with shareholders in an open and direct manner. Some of our comments in our letters to shareholders are based on current management expectations and are considered "forward-looking statements". Actual future results, however, may prove to be different from our expectations. You can identify forward-looking statements by words such as "estimate", "may", "will", "expect", "believe", "plan" and other similar terms. We cannot promise future returns. Our opinions are a reflection of our best judgment at the time this report is compiled, and we disclaim any obligation to update or alter forward-looking statements as a result of new information, future events, or otherwise.

IMPORTANT MESSAGE ABOUT
OAKMARK QUARTERLY REPORT MAILINGS
Beginning with the First Quarter Report, dated 12/31/09, we will no longer print and mail our first and third quarter reports. These reports will only be available online at oakmark.com.
If you wish to receive an e-mail each quarter letting you know when the quarterly reports are posted, please visit our website and sign up for e-mail updates.
To sign up, simply enter your e-mail address in the appropriate box on the right-hand side of the home page and click Join.

(This page has been intentionally left blank.)
President's Letter
Dear Fellow Shareholders,
World markets continued their remarkable rebound in the third quarter. From its lows in early March, the S&P 500 Index1 has now risen by almost 60%, and international markets have rebounded even more strongly. For the quarter, all of our equity Funds once again produced returns that exceeded the market averages. Importantly, for The Oakmark Funds' fiscal year ended 9/30/09, all of our Funds had positive returns—in sharp contrast to losses in most of the broader market indexes.
Perspective
The wild up and down ride in the stock markets over the past two years is only one of many extreme swings to hit the world during this period. The economy, credit markets, home prices and government deficits have all seen historic shifts. After so many dramatic changes, many investors and Fund shareholders no doubt wonder if they shouldn't be reassessing their exposure to equities. At such times, we suggest that it is best to focus on fundamentals—the economy and equity valuations—in the context of a long-term strategy.
Economic signposts in our view have become increasingly positive over the past quarter. Global financial markets still face substantial risks, and some sectors continue to slide. However, fundamental economic data suggest to us that the massive worldwide stimulus efforts are fostering recovery, and we believe that the current programs intended to stabilize financial institutions should also help markets heal.
Although some might conclude that the recent market rebound has left equities fairly valued, we still find overall stock market valuation to be attractive when one considers long-term earnings power. This is confirmed at the micro level, as the average stock in our portfolios still sells at a larger than typical discount to value. Of course, it is impossible to predict the market's short-term direction, but we believe that buying equities (or equity mutual funds) when they sell at discounted values will lead to superior long-term returns.
2009 Capital Gains Distributions
We try to minimize the taxes that Oakmark shareholders pay in order to maximize their after-tax returns. As Bill Nygren describes in his quarterly commentary, our portfolio managers pay close attention to taxable capital gains and losses, and they try to minimize any required tax distributions. Although last year's volatile market made Fund management more challenging, it also provided us with expanded opportunities to manage taxes. We are pleased to report that we do not expect to make capital gains distributions for any of our Funds this year. In fact, all of our Funds should end the year with a capital loss carry-forward that helps shelter future gains. We will, of course, pay income distributions (on interest and dividend income) for each of the Funds in mid-December and will post estimates on oakmark.com in advance of these Fund payouts.
Quarterly Report Mailings
At Oakmark, we believe that thoughtful, timely and frequent communication with our shareholders is important. Our quarterly reports are probably our most important vehicle for this communication. We emphasize these communications because of our conviction that an informed shareholder is able to achieve better long-term investment results. We also believe in watching Fund expenses closely. With this in mind, beginning with our FY 2010 First Quarter Report (quarter ended 12/31), we will no longer print our first and third quarter reports and will only post them on-line. Doing so will provide meaningful savings in shareholder operating expenses and also save more than a few trees! If you wish to receive an e-mail each quarter letting you know when the quarterly reports are available, please go to our website at oakmark.com and sign up for e-mail updates located in the top right corner of our site. This service will give you faster access to our managers' perspective on the most recent quarter's events. We hope that you find this change to be a convenient way to stay informed about Fund performance and the investment marketplace. We will continue to provide printed copies of our second quarter (Semi-Annual) reports and fourth quarter (Annual) reports to all shareholders, as regulations require.
We are extremely grateful for our shareholders' continued loyalty and confidence through these remarkably difficult times. We thank you for your patience and support, and we will continue to work hard to keep your trust. As always, we welcome your comments and questions. You can reach us via e-mail at: ContactOakmark@oakmark.com.
John R. Raitt
President and CEO of The Oakmark Funds
President and CEO of Harris Associates L.P.
September 30, 2009

1
THE OAKMARK FUNDS
Summary Information
Performance for Period
Ended September 30, 20092 | | Oakmark
Fund—Class I
(OAKMX) | | Oakmark
Select Fund—Class I
(OAKLX) | | Oakmark
Equity and Income
Fund—Class I
(OAKBX) | | Oakmark
Global Fund—Class I
(OAKGX) | |
| 3 Months* | | 20.43% | | 20.45% | | 10.55% | | 20.95% | |
| 1 Year | | 3.38% | | 13.30% | | 1.02% | | 2.65% | |
Average Annual Total
Return for: | |
| 3 Year | | -1.91% | | -5.52% | | 3.99% | | -1.01% | |
| 5 Year | | 1.98% | | -0.04% | | 6.36% | | 7.13% | |
| 10 Year | | 4.16% | | 6.89% | | 9.69% | | 12.28% | |
| Since inception | | 12.21%
(8/5/91) | | 11.94%
(11/1/96) | | 11.27%
(11/1/95) | | 11.14%
(8/4/99) | |
Top Five Equity
Holdings as of
September 30, 20093
Company and % of Total
Net Assets | | Liberty Media Corp.
-Entertainment 3.1%
Intel Corp. 2.5%
Walgreen Co. 2.4%
Hewlett-Packard Co. 2.2%
Schering-Plough
Corp. 2.2% | | Discovery
Communications, Inc.
Class C 10.3%
Liberty Media Corp.
-Entertainment 7.4%
H&R Block, Inc. 5.1%
Schering-Plough
Corp. 4.7%
Viacom, Inc.-Class B 4.6% | | XTO Energy, Inc. 3.7%
Avon Products, Inc. 3.4%
General Dynamics
Corp. 3.3%
EnCana Corp. 3.1%
Wal-Mart Stores,
Inc. 2.9% | | Societe Television
Francaise 1 4.9%
Julius Baer Holding
Ltd. 4.4%
Snap-on Inc. 4.1%
Laboratory Corp. of
America Holdings 4.0%
Oracle Corp. 3.7% | |
Sector
Allocation as of
September 30, 2009
Sector and % of
Market Value | | Consumer
Discretionary 34.2%
Information
Technology 23.1%
Financials 11.3%
Health Care 10.8%
Industrials 10.3%
Consumer Staples 8.1%
Energy 2.2%
| | Consumer
Discretionary 45.2%
Information
Technology 24.9%
Health Care 13.6%
Financials 12.1%
Energy 4.2% | | U.S. Government
Securities 28.9%
Consumer Staples 19.9%
Energy 11.9%
Industrials 11.8%
Health Care 10.6%
Consumer
Discretionary 7.4%
Foreign Government
Securities 4.4%
Information
Technology 2.4%
Financials 1.9%
Materials 0.8% | | Information
Technology 25.5%
Consumer
Discretionary 22.5%
Industrials 17.8%
Financials 15.8%
Health Care 9.4%
Energy 5.2%
Consumer Staples 2.4%
Materials 1.4% | |
The performance data quoted represents past performance. The above performance information for the Funds does not reflect the imposition of a 2% redemption fee on shares of all Funds, other than Oakmark Equity & Income Fund, redeemed within 90 days. If reflected, the fee would reduce the performance quoted. Past performance does not guarantee future results. The investment return and principal value will fluctuate so that an investor's shares, when redeemed, may be worth more or less than their original cost. Current performance may be lower or higher than the performance data quoted. Average annual total return measures annualized change, while total return measures aggregate change. To obtain current month end performance data, visit oakmark.com.
* Not annualized
THE OAKMARK FUNDS
2
Performance for Period
Ended September 30, 20092 | | Oakmark
Global Select
Fund—Class I
(OAKWX) | | Oakmark
International
Fund—Class I
(OAKIX) | | Oakmark
International
Small Cap Fund—Class I
(OAKEX) | |
| 3 Months* | | 20.61% | | 23.95% | | 26.90% | |
| 1 Year | | 22.24% | | 17.71% | | 16.28% | |
Average Annual Total
Return for: | |
| 3 Year | | N/A | | -1.26% | | -3.80% | |
| 5 Year | | N/A | | 8.15% | | 8.10% | |
| 10 Year | | N/A | | 8.65% | | 10.11% | |
| Since inception | | 1.71%
(10/2/06) | | 10.52%
(9/30/92) | | 10.57%
(11/1/95) | |
Top Five Equity
Holdings as of
September 30, 20093
Company and % of Total
Net Assets | | Societe Television
Francaise 1 9.7%
Compagnie Financiere
Richemont SA 7.9%
Liberty Media Corp.
-Entertainment 6.3%
UBS AG 6.2%
Viacom, Inc.-Class B 5.1% | | Allianz SE 3.6%
Compagnie Financiere
Richemont SA 3.5%
Daiwa Securities
Group Inc. 3.0%
Societe Television
Francaise 1 3.0%
Signet Jewelers Ltd. 3.0% | | Julius Baer Holding
Ltd. 3.5%
Interpump Group
SpA 3.5%
Atea ASA 3.4%
Sperian Protection 3.2%
LSL Property
Services PLC 3.2% | |
Sector
Allocation as of
September 30, 2009
Sector and % of
Market Value | | Consumer
Discretionary 42.8%
Information
Technology 23.2%
Financials 21.1%
Health Care 7.7%
Industrials 5.2% | | Consumer
Discretionary 39.1%
Financials 17.9%
Industrials 15.1%
Information
Technology 10.3%
Consumer Staples 7.7%
Health Care 4.7%
Materials 3.8%
Energy 1.4% | | Industrials 32.5%
Consumer
Discretionary 24.6%
Information
Technology 16.3%
Financials 11.8%
Materials 6.0%
Consumer Staples 4.5%
Health Care 4.3% | |
As of 9/30/08, the expense ratio for Class I shares was 1.10% for Oakmark Fund, 1.08% for Oakmark Select Fund, 0.81% for Oakmark Equity and Income Fund, 1.16% for Oakmark Global Fund, 1.35% for Oakmark Global Select Fund, 1.10% for Oakmark International Fund and 1.41% for Oakmark International Small Cap Fund.
The expense ratios as of 9/30/09 are included in the Financial Highlights tables beginning on page 83 of this report.
THE OAKMARK FUNDS
3
FUND EXPENSES
A shareholder of each Fund incurs two types of costs: (1) transaction costs, such as redemption fees, and (2) ongoing costs, including investment advisory fees, transfer agent fees, and other fund expenses. The examples below are intended to help shareholders understand the ongoing cost (in dollars) of investing in each Fund and to compare these costs with the ongoing costs of investing in other funds.
Actual Expenses
The following table provides information about actual account values and actual fund expenses for Class I of each Fund. The table shows the expenses a Class I shareholder would have paid on a $1,000 investment in each Fund from April 1, 2009 to September 30, 2009, as well as how much a $1,000 investment would be worth at the close of the period, assuming actual fund returns and expenses. A Class I shareholder can estimate expenses incurred for the period by dividing the account value at September 30, 2009, by $1,000 and multiplying the result by the number in the Expenses Paid During Period row as shown below.
Shares of all Funds, other than Oakmark Equity and Income Fund, invested for 90 days or less may be charged a 2% redemption fee. Please consult the Funds' prospectus at oakmark.com for more information.
| | | Oakmark Fund | | Oakmark Select Fund | | Oakmark Equity and Income Fund | | Oakmark Global Fund | | Oakmark Global Select Fund | | Oakmark International Fund | | Oakmark International Small Cap Fund | |
Beginning
Account
Value | | $ | 1,000.00 | | | $ | 1,000.00 | | | $ | 1,000.00 | | | $ | 1,000.00 | | | $ | 1,000.00 | | | $ | 1,000.00 | | | $ | 1,000.00 | | |
Ending
Account
Value | | $ | 1,484.10 | | | $ | 1,514.00 | | | $ | 1,220.10 | | | $ | 1,566.60 | | | $ | 1,526.40 | | | $ | 1,651.40 | | | $ | 1,824.10 | | |
Expenses
Paid
During
Period* | | $ | 7.22 | | | $ | 7.00 | | | $ | 4.62 | | | $ | 7.46 | | | $ | 8.17 | | | $ | 7.31 | | | $ | 10.19 | | |
Annualized
Expense
Ratio | | | 1.16 | % | | | 1.11 | % | | | 0.83 | % | | | 1.16 | % | | | 1.29 | % | | | 1.10 | % | | | 1.44 | % | |
* Expenses are equal to each Fund's annualized expense ratio for Class I, multiplied by the average account value over the period, multiplied by the number of days in the most recent fiscal half-year divided by 365 (to reflect the one-half year period).
THE OAKMARK FUNDS
4
Hypothetical Example for Comparison Purposes
The following table provides information about hypothetical account values and hypothetical expenses for Class I of each Fund based on actual expense ratios and an assumed rate of return of 5% per year before expenses, which are not the Funds' actual returns. The hypothetical account values and expenses may not be used to estimate the actual ending account balances or expenses shareholders paid for the period. Shareholders may use this information to compare the ongoing costs of investing in a Fund and other funds. To do so, compare this 5% hypothetical example with the 5% hypothetical examples that appear in the shareholder reports of the other funds.
Please note that the expenses shown in the table are meant to highlight your ongoing costs only and do not reflect any transaction costs, such as redemption fees. Therefore, the third line of the table is useful in comparing ongoing costs only, and will not help you determine the relative total costs of owning different funds. In addition, if these transaction costs were included, the total costs would have been higher.
| | | Oakmark Fund | | Oakmark Select Fund | | Oakmark Equity and Income Fund | | Oakmark Global Fund | | Oakmark Global Select Fund | | Oakmark International Fund | | Oakmark International Small Cap Fund | |
Beginning
Account
Value | | $ | 1,000.00 | | | $ | 1,000.00 | | | $ | 1,000.00 | | | $ | 1,000.00 | | | $ | 1,000.00 | | | $ | 1,000.00 | | | $ | 1,000.00 | | |
Ending
Account
Value | | $ | 1,019.25 | | | $ | 1,019.50 | | | $ | 1,020.91 | | | $ | 1,019.25 | | | $ | 1,018.60 | | | $ | 1,019.55 | | | $ | 1,017.85 | | |
Expenses
Paid
During
Period* | | $ | 5.87 | | | $ | 5.62 | | | $ | 4.20 | | | $ | 5.87 | | | $ | 6.53 | | | $ | 5.57 | | | $ | 7.28 | | |
Annualized
Expense
Ratio | | | 1.16 | % | | | 1.11 | % | | | 0.83 | % | | | 1.16 | % | | | 1.29 | % | | | 1.10 | % | | | 1.44 | % | |
* Expenses are equal to each Fund's annualized expense ratio for Class I, multiplied by the average account value over the period, multiplied by the number of days in the most recent fiscal half-year divided by 365 (to reflect the one-half year period).
THE OAKMARK FUNDS
5
OAKMARK AND OAKMARK SELECT FUNDS
At Oakmark, we are long-term investors. We attempt to identify growing businesses that are managed to benefit their shareholders. We will purchase stock in those businesses only when priced substantially below our estimate of intrinsic value. After purchase, we patiently wait for the gap between stock price and intrinsic value to close.
 If you were just awakening from a year-long snooze and you looked at the one-year performance numbers presented in this report for our seven Oakmark Funds, you'd probably conclude that fiscal 2009 was a decent, though pretty mundane, year. But since you weren't napping, you know that there was rarely a dull day. Our fiscal year started with the S&P 5001 dropping 22% in the first quarter. To put that drop in perspective, there have only been six calendar quarters during the past 50 years in which the S&P has moved more than 20%. Then, in our second fiscal quarter, the S&P lost another 11%. The S&P has experienced double-digit changes in only thirty-eight of the past two hundred quarters—or just 19% of the time. The combination of these two consecutive declines and a furthe r drop at the beginning of the third quarter resulted in the S&P being down 41% from our fiscal year end through March 9. That loss was then followed by a series of positive moves: a recovery during the rest of March, a 16% gain in our third quarter, and a 16% gain in the fourth quarter to trim the full fiscal year loss to 7%. Again, to put these numbers in perspective, in the past fifty years, the S&P has never experienced four consecutive quarters of double digit price changes (though it came very close to happening in 1983).
Unprecedented volatility created great opportunity for observers to play games with statistics. My favorite storyline, which started after the market had rallied about 10% from March 9, was that stock prices were moving up faster than the economy and therefore investors should be cautious. Though it is true that the S&P 500 is now 58% higher than it was at the bottom (and the economy isn't), the problem with that comparison is that it implies that the price at the bottom was rational. One could just as easily say that the S&P, without including dividends, is down 31% from two years ago, down 5% from five years ago, and down 18% from ten years ago. Given that many indicators suggest we are already recovering from the recession, those declines over longer time periods seem excessive. More important than where stock prices have been is where earnings will be in the future. It is true that the S&P 500 price-to-earnings ratio no longe r appears low relative to expected 2009 earnings. However, we believe that 2009 was heavily affected by unusual loan losses and unsustainable inventory reductions. If you eliminate those, then the price-to-earnings ratio looks pretty reasonable. If you add in some rebound in end demand, then that ratio is meaningfully below historical averages. As the market has risen, the magnitude of undervaluation has lessened, but we continue to believe that stocks remain fundamentally undervalued.
Taxation
Although the volatility we experienced in 2009 was extremely unpleasant, one silver lining was the opportunity it gave us to improve our Funds' tax positions. As you probably know, mutual funds are required to annually distribute net capital gains to shareholders. Shareholders are then taxed on those gains, even if they continue to hold their fund shares. It's a tax rule that we believe should be changed—having fund shareholders simply pay their capital gains when they sell their shares would sharply reduce their record-keeping costs, would encourage them to invest for the long term, would level the playing field between mutual funds and ETFs and would have a negligible cost, if any, to the U.S. Treasury. But, unfortunately, we aren't in charge of tax policy, so we have to maximize value under the current rules.
At Oakmark, we actively manage our portfolios with the goal of maximizing after-tax returns without reducing pre-tax returns. Extreme volatility in the past year gave us two ways to capture tax losses that will defer future capital gains distributions. First, when the market was in freefall, none of our holdings hit our sell targets. However, we actively sold stocks we believed were somewhat undervalued in order to provide the funds to purchase stocks we believed were significantly more undervalued. During a strong market, the tax gain that results from those sales would give us pause—the valuation gap needs to be wide enough to make it worth realizing a taxable gain. In the weak 2009 market, however, most stocks were selling below our cost, so capturing the tax loss became an incremental positive to an already attractive transaction.
The second way we captured losses was trading around core positions. Usually, we don't want to eliminate holdings that are selling below cost, because, in the absence of bad fundamental news, we view those stocks as even more attractive than when we purchased them. So instead of eliminating them from the portfolio, we'll add to some that we believe are the most attractive and reduce some that we believe aren't quite as attractive. After 31 days, we can reverse the trade, restore our original position, capture the tax losses, and hopefully add modestly to pre-tax returns. This tax trading is an important reason that our Funds had higher turnover last year than in prior years. As an example, the Oakmark Fund had turnover of 32% in Fiscal 2008. That increased to 62% in 2009, despite selling only 7 of the 49 securities that we started the year with.
OAKMARK AND OAKMARK SELECT FUNDS
6
The result of this tax trading is that every one of the seven Oakmark Funds today has a loss carry-forward that will reduce future taxable gains distributions. Financial advisers often warn mutual fund investors that they may have to prepay capital gains because of mutual fund tax rules, but today, because of the actions we took during a tough market, our Fund investors will enjoy deferral of future gains.
Rebalancing
In these reports we have often discussed why shareholders would benefit from rebalancing their asset allocations after extreme price shifts. The concept is simple: as the old timers in the business say, "Trees don't grow to the sky." In other words, extreme performance can't continue indefinitely. Rebalancing helps to mechanize a task that is very difficult psychologically: reducing exposure to asset classes that have increased in value and increasing exposure to asset classes that have decreased. We believe that it is beneficial to periodically rebalance various aspects of one's portfolio: stocks versus bonds, domestic versus international and small cap versus large cap. If extreme performance is indeed unsustainable—and we believe that to be true—then it follows that periodic rebalancing reduces risk and increases return.
As an over simplified illustration, let's assume that two investors each met with a financial adviser two years ago, and the adviser wisely set them up with a 60/40 asset allocation, $60,000 invested in the S&P 500 and $40,000 in the Barclays U.S. Treasury 7-10 Year Bond Index. Each investor sleeps well that night, knowing that their portfolio is prudently diversified. On March 9 of this year, both check their accounts. The S&P had declined by 56% subsequent to the financial adviser visit, while the Treasury Index increased by 19%. Both were glad that their 26% loss was much smaller than what their friends who had only owned equities experienced.
Then their paths diverge. Investor one, let's call him Goofus (if you don't remember Highlights just Google "Goofus and Gallant"), closes his investment file, pats himself on the back and goes on his merry way. Gallant, on the other hand, checks his asset allocation and sees that stocks now represent only 36% of his portfolio, while bonds have climbed from 40% to 64%. Realizing that his portfolio is now invested very differently than he'd intended, he sells some of his bonds, uses the money to buy stocks and restores his target 60% stock, 40% bond allocation. At September 30 the two investors are now in very different positions. First, Gallant is now over-invested in stocks, which have grown to 70% of his portfolio, while Goofus remains way below his target, having only 47% of his portfolio in vested in equities. Just as important, Gallant has fully regained his losses while Goofus is still down 10%.
Sadly, there should have been a third investor in this example who mimics the self-destructive behavior investors frequently exhibit. This investor checks his account on March 9, is angry and scared that he's lost so much in equities while bonds increased in value, so to prevent making that mistake again, sells half his equities to buy more bonds. At September 30, this investor now has only 25% of his assets invested in stocks, and he has lost nearly 20% of his initial assets.
We continue to believe that equities are attractive and are likely to achieve higher, though more volatile, long-term returns than bonds. After any large price change, we encourage investors to restore their portfolios to their target asset allocations, and this time is no different. Because of the large stock market rebound, those who were wise enough, or lucky enough, to rebalance earlier this year are now above their target equity allocation. Restoring appropriate balance to their portfolios requires selling some stocks. Most investors, however, didn't increase their equity exposure when stock prices were down. Their portfolios are far below their equity targets. Those investors need to purchase equities if they want to return to their target asset allocation. And even though the stock market has improved considerably, it's not too late; it never is. That's because rebalancing is not about correctly guessing the market's short-term trends . Instead, rebalancing positions a portfolio for the future, the direction of which we can never be certain.
William C. Nygren, CFA
Portfolio Manager
oakmx@oakmark.com
oaklx@oakmark.com
September 30, 2009
OAKMARK AND OAKMARK SELECT FUNDS
7
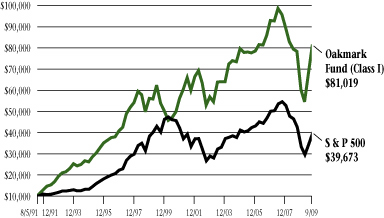
OAKMARK FUND
Report from Bill Nygren and Kevin Grant, Portfolio Managers


THE VALUE OF A $10,000 INVESTMENT IN OAKMARK FUND FROM ITS INCEPTION (8/5/91) TO PRESENT (9/30/09) AS COMPARED TO THE STANDARD & POOR'S 500 INDEX1 (UNAUDITED)
| | | | | Average Annual Total Returns
(as of 9/30/09) | |
| (Unaudited) | | Total Return
Last 3 Months* | | 1-year | | 5-year | | 10-year | | Since
Inception
(8/5/91) | |
| Oakmark Fund (Class I) | | | 20.43 | % | | | 3.38 | % | | | 1.98 | % | | | 4.16 | % | | | 12.21 | % | |
| S&P 500 | | | 15.61 | % | | | -6.91 | % | | | 1.02 | % | | | -0.15 | % | | | 7.89 | % | |
| Dow Jones Average4 | | | 15.82 | % | | | -7.38 | % | | | 1.85 | % | | | 1.62 | % | | | 9.19 | % | |
Lipper Large Cap
Value Index5 | | | 15.90 | % | | | -6.10 | % | | | 0.99 | % | | | 1.17 | % | | | 7.66 | % | |
The graph and table do not reflect the deduction of taxes that a shareholder would pay on fund distributions or the redemption of fund shares.
The expense ratio for Class I shares as of 9/30/08 was 1.10%.
The performance data quoted represents past performance. The above performance information for the Fund does not reflect the imposition of a 2% redemption fee on shares redeemed within 90 days. If reflected, the fee would reduce the performance quoted. Past performance does not guarantee future results. The investment return and principal value will fluctuate so that an investor's shares, when redeemed, may be worth more or less than their original cost. Current performance may be lower or higher than the performance data quoted. Average annual total return measures annualized change, while total return measures aggregate change. To obtain most recent month-end performance data, visit oakmark.com.
* Not annualized
The Oakmark Fund gained 20% in the quarter, comparing favorably to the S&P 500's 16% gain. For our fiscal year, the Fund gained 3% while the S&P 500 lost 7%. Though we are pleased to make a profit when others lose money, we aren't high-fiving each other over a 3% gain. Over extended periods we expect stocks to produce a much better return than they achieved last year, and when that happens, we also expect to achieve higher positive returns.
In a year that was marked by extreme stock market volatility, our portfolio holdings achieved extremely diverse returns. Two holdings—State Street and Apple—more than doubled after our purchases. State Street's mark-to-market losses, which had spooked investors, turned into gains as most of their maturing investments paid in full. Apple also proved skeptical investors wrong, as fears that cash-strapped consumers would trade down from Apple's premium products never materialized. Two other holdings, Schering-Plough and Liberty Entertainment, agreed to be acquired. Their gains weren't quite as large, but heavier weightings made their portfolio impact just as big.
Leading the year's biggest loser list were two banks that suffered from large mortgage losses—Citigroup and Bank of America. We sold our position in Citi near the financial stock bottom because we believed investors were underestimating the dilution from their newly raised capital. We used that money to add to other financials we believed were safer, yet more undervalued. We still own Bank of America because we believe its high market share in consumer banking will lead to good profitability when loan losses subside.
During this past quarter, the general rule seemed to be that whichever stocks fell the most, recovered the most. Liberty Interactive and Capital One were two of our worst performers early in the year, but were our two best in the quarter. Neither reported stellar results, but neither got close to the Armageddon scenarios that were implied by their lowest prices. Our worst performers were generally high-quality companies that didn't fall as much in the decline, but didn't move higher during the quarter. That list included Oracle, McDonald's and Wal-Mart, where we made significant additions to our holdings. Our new purchases, ADP and Johnson & Johnson, fit that same profile. Our thoughts on those two stocks are on our website. The only elimination last quarter was Morgan Stanley, but we also reduced Capital One. Their strong rebounds allowed us to fund new purchases, which we viewed as more undervalued and less risky.
William C. Nygren, CFA
Portfolio Manager
oakmx@oakmark.com | | Kevin G. Grant, CFA
Portfolio Manager
oakmx@oakmark.com | |
|
September 30, 2009
OAKMARK FUND
8
OAKMARK FUND
Schedule of Investments—September 30, 2009
Name | |
Shares Held | |
Value | |
| Common Stocks—95.1% | |
| Advertising—1.5% | |
| Omnicom Group, Inc. | | | 1,241,254 | | | $ | 45,851,923 | | |
| Apparel Retail—1.5% | |
| Limited Brands | | | 2,700,000 | | | | 45,873,000 | | |
| Broadcasting—1.3% | |
| Discovery Communications, Inc. Class C (a) | | | 1,540,140 | | | | 40,089,844 | | |
| Cable & Satellite—4.8% | |
| Liberty Media Corp. - Entertainment (a) | | | 3,098,680 | | | | 96,399,935 | | |
| Comcast Corp., Class A | | | 3,400,000 | | | | 54,672,000 | | |
| | | | 151,071,935 | | |
| Catalog Retail—1.4% | |
| Liberty Media Holding Corp. - Interactive, Class A (a) | | | 4,005,000 | | | | 43,934,850 | | |
| Computer & Electronics Retail—2.2% | |
| Best Buy Co., Inc. | | | 1,800,000 | | | | 67,536,000 | | |
| Department Stores—1.3% | |
| Kohl's Corp. (a) | | | 726,900 | | | | 41,469,645 | | |
| Home Improvement Retail—1.9% | |
| The Home Depot, Inc. | | | 2,281,500 | | | | 60,779,160 | | |
| Household Appliances—1.6% | |
| The Black & Decker Corp. | | | 1,100,000 | | | | 50,919,000 | | |
| Housewares & Specialties—1.8% | |
| Fortune Brands, Inc. | | | 1,350,000 | | | | 58,023,000 | | |
| Motorcycle Manufacturers—1.8% | |
| Harley-Davidson, Inc. | | | 2,462,000 | | | | 56,626,000 | | |
| Movies & Entertainment—6.5% | |
| The Walt Disney Co. | | | 2,250,000 | | | | 61,785,000 | | |
| Viacom, Inc., Class B (a) | | | 2,089,745 | | | | 58,596,450 | | |
| Time Warner, Inc. | | | 1,982,566 | | | | 57,058,249 | | |
| Liberty Media Holding Corp. - Capital, Class A (a) | | | 1,345,836 | | | | 28,154,889 | | |
| | | | 205,594,588 | | |
| Restaurants—3.2% | |
| Yum! Brands, Inc. | | | 1,514,000 | | | | 51,112,640 | | |
| McDonald's Corp. | | | 894,000 | | | | 51,020,580 | | |
| | | | 102,133,220 | | |
OAKMARK FUND
9
OAKMARK FUND
Schedule of Investments—September 30, 2009 cont.
Name | |
Shares Held | |
Value | |
| Common Stocks—95.1% (cont.) | |
| Specialized Consumer Services—1.8% | |
| H&R Block, Inc. | | | 3,058,600 | | | $ | 56,217,068 | | |
| Distillers & Vintners—1.8% | |
| Diageo PLC (b) | | | 921,000 | | | | 56,632,290 | | |
| Drug Retail—2.4% | |
| Walgreen Co. | | | 2,000,000 | | | | 74,940,000 | | |
| Hypermarkets & Super Centers—1.9% | |
| Wal-Mart Stores, Inc. | | | 1,200,000 | | | | 58,908,000 | | |
| Packaged Foods & Meats—1.6% | |
| H.J. Heinz Co. | | | 1,300,000 | | | | 51,675,000 | | |
| Oil & Gas Exploration & Production—2.1% | |
| EnCana Corp. (c) | | | 1,150,000 | | | | 66,251,500 | | |
| Asset Management & Custody Banks—3.7% | |
| Bank of New York Mellon Corp. | | | 2,139,630 | | | | 62,027,873 | | |
| State Street Corp. | | | 1,050,000 | | | | 55,230,000 | | |
| | | | 117,257,873 | | |
| Consumer Finance—3.9% | |
| American Express Co. | | | 1,850,000 | | | | 62,715,000 | | |
| Capital One Financial Corp. | | | 1,679,800 | | | | 60,019,254 | | |
| | | | 122,734,254 | | |
| Other Diversified Financial Services—3.2% | |
| JPMorgan Chase & Co. | | | 1,347,400 | | | | 59,043,068 | | |
| Bank of America Corp. | | | 2,400,000 | | | | 40,608,000 | | |
| | | | 99,651,068 | | |
| Health Care Equipment—3.2% | |
| Medtronic, Inc. | | | 1,850,000 | | | | 68,080,000 | | |
| Covidien PLC (c) | | | 750,000 | | | | 32,445,000 | | |
| | | | 100,525,000 | | |
| Pharmaceuticals—7.0% | |
| Schering-Plough Corp. | | | 2,431,135 | | | | 68,679,564 | | |
| GlaxoSmithKline PLC (b) | | | 1,600,000 | | | | 63,216,000 | | |
| Bristol-Myers Squibb Co. | | | 2,500,000 | | | | 56,300,000 | | |
| Johnson & Johnson | | | 550,000 | | | | 33,489,500 | | |
| | | | 221,685,064 | | |
| Aerospace & Defense—3.0% | |
| The Boeing Co. | | | 1,000,000 | | | | 54,150,000 | | |
| Precision Castparts Corp. | | | 400,000 | | | | 40,748,000 | | |
| | | | 94,898,000 | | |
OAKMARK FUND
10
OAKMARK FUND
Schedule of Investments—September 30, 2009 cont.
Name | |
Shares Held | |
Value | |
| Common Stocks—95.1% (cont.) | |
| Air Freight & Logistics—1.9% | |
| FedEx Corp. | | | 800,000 | | | $ | 60,176,000 | | |
| Industrial Conglomerates—3.4% | |
| Tyco International, Ltd. (c) | | | 1,900,000 | | | | 65,512,000 | | |
| 3M Co. | | | 550,000 | | | | 40,590,000 | | |
| | | | 106,102,000 | | |
| Industrial Machinery—1.5% | |
| Illinois Tool Works, Inc. | | | 1,100,000 | | | | 46,981,000 | | |
| Communications Equipment—1.9% | |
| Cisco Systems, Inc. (a) | | | 2,500,000 | | | | 58,850,000 | | |
| Computer Hardware—5.7% | |
| Hewlett-Packard Co. | | | 1,475,000 | | | | 69,634,750 | | |
| Dell, Inc. (a) | | | 3,900,000 | | | | 59,514,000 | | |
| Apple, Inc. (a) | | | 270,000 | | | | 50,049,900 | | |
| | | | 179,198,650 | | |
| Data Processing & Outsourced Services—2.7% | |
| Western Union Co. | | | 2,530,000 | | | | 47,867,600 | | |
| Automatic Data Processing, Inc. | | | 1,000,000 | | | | 39,300,000 | | |
| | | | 87,167,600 | | |
| Electronic Manufacturing Services—2.0% | |
| Tyco Electronics, Ltd. (c) | | | 2,789,500 | | | | 62,150,060 | | |
| Internet Software & Services—1.8% | |
| eBay, Inc. (a) | | | 2,400,000 | | | | 56,664,000 | | |
| Semiconductors—4.4% | |
| Intel Corp. | | | 3,950,000 | | | | 77,301,500 | | |
| Texas Instruments, Inc. | | | 2,600,000 | | | | 61,594,000 | | |
| | | | 138,895,500 | | |
| Systems Software—3.4% | |
| Microsoft Corp. | | | 2,600,000 | | | | 67,314,000 | | |
| Oracle Corp. | | | 2,000,000 | | | | 41,680,000 | | |
| | | | 108,994,000 | | |
| Total Common Stocks (Cost: $2,070,216,885) | | | | | | $ | 2,996,456,092 | | |
OAKMARK FUND
11
OAKMARK FUND
Schedule of Investments—September 30, 2009 cont.
Name | |
Par Value | |
Value | |
| Short Term Investments—4.5% | |
| Commercial Paper—1.0% | |
Toyota Motor Credit Corp., 0.12%, due 10/1/2009
(Cost: $30,000,000) | | $ | 30,000,000 | | | $ | 30,000,000 | | |
| Repurchase Agreement—3.5% | |
Fixed Income Clearing Corp. Repurchase
Agreement, 0.02% dated 9/30/2009 due 10/1/2009,
repurchase price $111,821,037, collateralized by
a Federal Home Loan Mortgage Corp. Bond, with
a rate of 1.625%, with a maturity of 7/22/2011, and
with a market value plus accrued interest of $29,103,731,
and by a Federal National Mortgage Association Bond,
with a rate of 5.125%, with a maturity of 4/15/2011,
and with a market value plus accrued interest
of $84,958,140 (Cost: $111,820,975) | | | 111,820,975 | | | | 111,820,975 | | |
| Total Short Term Investments (Cost: $141,820,975) | | | | $ | 141,820,975 | | |
| Total Investments (Cost: $2,212,037,860)—99.6% | | | | | 3,138,277,067 | | |
| Other Assets In Excess Of Liabilities—0.4% | | | | | 14,105,747 | | |
| Total Net Assets—100% | | | | $ | 3,152,382,814 | | |
(a) Non income-producing security.
(b) Represents a Sponsored American Depositary Receipt.
(c) Represents a foreign domiciled corporation.
See accompanying Notes to Financial Statements.
OAKMARK FUND
12
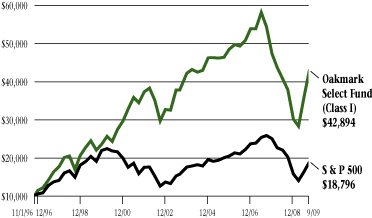
OAKMARK SELECT FUND
Report from Bill Nygren and Henry Berghoef, Portfolio Managers


THE VALUE OF A $10,000 INVESTMENT IN OAKMARK SELECT FUND FROM ITS INCEPTION (11/1/96) TO PRESENT (9/30/09) AS COMPARED TO THE STANDARD & POOR'S 500 INDEX1 (UNAUDITED)
| | | | | Average Annual Total Returns
(as of 9/30/09) | |
| (Unaudited) | | Total Return
Last 3 Months* | | 1-year | | 5-year | | 10-year | | Since
Inception
(11/1/96) | |
Oakmark Select Fund
(Class I) | | | 20.45 | % | | | 13.30 | % | | | -0.04 | % | | | 6.89 | % | | | 11.94 | % | |
| S&P 500 | | | 15.61 | % | | | -6.91 | % | | | 1.02 | % | | | -0.15 | % | | | 5.01 | % | |
Lipper Multi-Cap
Value Index6 | | | 17.41 | % | | | -4.70 | % | | | 0.56 | % | | | 3.20 | % | | | 5.43 | % | |
The graph and table do not reflect the deduction of taxes that a shareholder would pay on fund distributions or the redemption of fund shares.
The expense ratio for Class I shares as of 9/30/08 was 1.08%.
The performance data quoted represents past performance. The above performance information for the Fund does not reflect the imposition of a 2% redemption fee on shares redeemed within 90 days. If reflected, the fee would reduce the performance quoted. Past performance does not guarantee future results. The investment return and principal value will fluctuate so that an investor's shares, when redeemed, may be worth more or less than their original cost. Current performance may be lower or higher than the performance data quoted. Average annual total return measures annualized change, while total return measures aggregate change. To obtain most recent month-end performance data, visit oakmark.com.
* Not annualized
The Oakmark Select Fund increased in value by 20% in the quarter, putting our fiscal year into the black by 13%. Both numbers compare favorably to the S&P 500, which gained 16% for the quarter but was still down 7% for the year. Our fiscal year performance benefited greatly from purchases made during the panics this past fall and winter. Portfolio newcomers Liberty Entertainment and Newfield Exploration more than doubled after they were purchased. We bought Newfield after energy prices fell below our estimate of long-term market clearing prices, and after investors became concerned about Newfield's debt levels. Our careful examination of Newfield's extensive hedges made us confident that their leverage was not a significant risk. We purchased Liberty Entertainment when it traded at a large discount to the market value of its equity investment in DirecTV. Later in the year, after DirecTV announced its intention to merge with Liberty Enter tainment, that discount disappeared. Other top performers for the year were: e-Bay, which was another portfolio newcomer; Schering-Plough, which agreed to be acquired by Merck; and Discovery Communications, which outperformed peers in a difficult advertising environment.
At the other end of the spectrum, we suffered losses in Comcast and Limited Brands, which were sold in the midst of the decline to make room for more attractively priced stocks. This increased the valuation discount of our portfolio, and also allowed us to capture significant tax losses. The stock that most hurt our fiscal year return was Capital One—it didn't go down the most, but the combination of its loss and our portfolio weighting created the biggest impact. However, we kept Capital One in the portfolio because we believed that historically unprecedented defaults were a cyclical issue, and we projected that Capital One would be relatively inexpensive once losses normalized.
The decision to keep Capital One helped our results in the most recent quarter, as the stock rebounded 64%, making it one of our best performers. Perhaps the biggest contributor to the quarter was not the increase in any single stock, but rather the absence of any losers. Our worst performing stock, which was one of the previous year's bright spots, was YUM Brands, which gained 2%. We had no additions or deletions to the portfolio during the quarter because we have continued confidence that our existing holdings represent good value.
William C. Nygren, CFA
Portfolio Manager
oaklx@oakmark.com | | Henry R. Berghoef, CFA
Portfolio Manager
oaklx@oakmark.com | |
|
September 30, 2009
OAKMARK SELECT FUND
13
OAKMARK SELECT FUND
Schedule of Investments—September 30, 2009
Name | |
Shares Held | |
Value | |
| Common Stocks—94.4% | |
| Broadcasting—10.3% | |
| Discovery Communications, Inc. Class C (a) | | | 9,009,500 | | | $ | 234,517,285 | | |
| Cable & Satellite—7.4% | |
| Liberty Media Corp. - Entertainment (a) | | | 5,417,029 | | | | 168,523,772 | | |
| Catalog Retail—4.2% | |
| Liberty Media Holding Corp. - Interactive, Class A (a) | | | 8,600,000 | | | | 94,342,000 | | |
| Computer & Electronics Retail—3.7% | |
| Best Buy Co., Inc. | | | 2,250,000 | | | | 84,420,000 | | |
| Movies & Entertainment—8.7% | |
| Viacom, Inc., Class B (a) | | | 3,725,000 | | | | 104,449,000 | | |
| Time Warner, Inc. | | | 3,210,666 | | | | 92,402,968 | | |
| | | | 196,851,968 | | |
| Restaurants—3.3% | |
| Yum! Brands, Inc. | | | 2,215,000 | | | | 74,778,400 | | |
| Specialized Consumer Services—5.1% | |
| H&R Block, Inc. | | | 6,369,600 | | | | 117,073,248 | | |
| Oil & Gas Exploration & Production—3.9% | |
| Newfield Exploration Co. (a) | | | 2,100,000 | | | | 89,376,000 | | |
| Consumer Finance—3.8% | |
| Capital One Financial Corp. | | | 2,410,600 | | | | 86,130,738 | | |
| Other Diversified Financial Services—7.7% | |
| JPMorgan Chase & Co. | | | 2,094,000 | | | | 91,759,080 | | |
| Bank of America Corp. | | | 4,900,000 | | | | 82,908,000 | | |
| | | | 174,667,080 | | |
| Health Care Equipment—4.0% | |
| Medtronic, Inc. | | | 2,500,000 | | | | 92,000,000 | | |
| Pharmaceuticals—8.8% | |
| Schering-Plough Corp. | | | 3,782,954 | | | | 106,868,450 | | |
| Bristol-Myers Squibb Co. | | | 4,110,200 | | | | 92,561,704 | | |
| | | | 199,430,154 | | |
| Computer Hardware—3.8% | |
| Dell, Inc. (a) | | | 5,613,000 | | | | 85,654,380 | | |
OAKMARK SELECT FUND
14
OAKMARK SELECT FUND
Schedule of Investments—September 30, 2009 cont.
Name | | Shares Held/
Par Value | |
Value | |
| Common Stocks—94.4% (cont.) | |
| Data Processing & Outsourced Services—3.7% | |
| Western Union Co. | | | 4,465,400 | | | $ | 84,485,368 | | |
| Electronic Manufacturing Services—4.0% | |
| Tyco Electronics, Ltd. (b) | | | 4,067,838 | | | | 90,631,431 | | |
| Internet Software & Services—3.9% | |
| eBay, Inc. (a) | | | 3,800,000 | | | | 89,718,000 | | |
| Semiconductors—8.1% | |
| Intel Corp. | | | 5,047,000 | | | | 98,769,790 | | |
| Texas Instruments, Inc. | | | 3,575,000 | | | | 84,691,750 | | |
| | | | 183,461,540 | | |
| Total Common Stocks (Cost: $1,668,296,150) | | | | | | $ | 2,146,061,364 | | |
| Short Term Investments—5.6% | |
| Commercial Paper—1.1% | |
Toyota Motor Credit Corp., 0.12%, due 10/1/2009
(Cost: $25,000,000) | | $ | 25,000,000 | | | $ | 25,000,000 | | |
| Repurchase Agreement—4.5% | |
Fixed Income Clearing Corp. Repurchase
Agreement, 0.02% dated 9/30/2009 due 10/1/2009,
repurchase price $102,176,366, collateralized by
a Federal Home Loan Mortgage Corp. Bond, with
a rate of 1.625%, with a maturity of 7/22/2011,
and with a market value plus accrued interest
of $104,224,381 (Cost: $102,176,309) | | | 102,176,309 | | | | 102,176,309 | | |
| Total Short Term Investments (Cost: $127,176,309) | | | | | | $ | 127,176,309 | | |
| Total Investments (Cost: $1,795,472,459)—100.0% | | | | | | | 2,273,237,673 | | |
| Other Assets In Excess Of Liabilities—0.0% | | | | | | | 167,933 | | |
| Total Net Assets—100% | | | | | | $ | 2,273,405,606 | | |
(a) Non income-producing security.
(b) Represents a foreign domiciled corporation.
See accompanying Notes to Financial Statements.
OAKMARK SELECT FUND
15
OAKMARK EQUITY AND INCOME FUND
Report from Clyde S. McGregor and Edward A. Studzinski, Portfolio Managers


THE VALUE OF A $10,000 INVESTMENT IN OAKMARK EQUITY AND INCOME FUND FROM ITS INCEPTION (11/1/95) TO PRESENT (9/30/09) AS COMPARED TO THE LIPPER BALANCED FUND INDEX7 (UNAUDITED)

| | | | | Average Annual Total Returns
(as of 9/30/09) | |
| (Unaudited) | | Total Return
Last 3 Months* | | 1-year | | 5-year | | 10-year | | Since
Inception
(11/1/95) | |
Oakmark Equity &
Income Fund (Class I) | | | 10.55 | % | | | 1.02 | % | | | 6.36 | % | | | 9.69 | % | | | 11.27 | % | |
Lipper Balanced
Fund Index | | | 12.33 | % | | | 2.34 | % | | | 3.17 | % | | | 3.13 | % | | | 6.07 | % | |
| S&P 5001 | | | 15.61 | % | | | -6.91 | % | | | 1.02 | % | | | -0.15 | % | | | 6.22 | % | |
Barclays Capital
U.S. Govt./Credit8 | | | 4.16 | % | | | 11.46 | % | | | 4.92 | % | | | 6.32 | % | | | 6.19 | % | |
The graph and table do not reflect the deduction of taxes that a shareholder would pay on fund distributions or the redemption of fund shares.
The expense ratio for Class I shares as of 9/30/08 was 0.81%.
The performance data quoted represents past performance. Past performance does not guarantee future results. The investment return and principal value will fluctuate so that an investor's shares, when redeemed, may be worth more or less than their original cost. Current performance may be lower or higher than the performance data quoted. Average annual total return measures annualized change, while total return measures aggregate change. To obtain most recent month-end performance data, visit oakmark.com.
* Not annualized
Quarter and Fiscal Year Review
Twelve months ago we wrote that although the Fund's returns bested the comparative indices in a difficult market environment, we would be much happier reporting positive rates of return. Well, we are in fact much happier this year, even though we have lagged behind the Lipper Balanced Fund Index for the quarter and the fiscal year. The Fund earned a return of nearly 11% for the recent quarter in contrast to the Lipper peer group's 12%. We believe that this gap comes from the Equity and Income Fund's relative underweight in equities and corporate bonds.
During the past quarter, the strongest contributors to the Fund's return included Avon Products, Apache, Walter Energy, Costco and EnCana. Weak performers, all of which came close to breaking even over the period, included Alliant Techsystems, Laboratory Corporation of America and Broadridge Financial, a new purchase. During the quarter the portfolio's equity commitment grew 7% to comprise 62% of the portfolio, partly because of the equity purchases described below and partly due to robust portfolio appreciation. We reduced the holdings of Treasury Inflation-Indexed Securities from 15% of the portfolio to 5% because we believe that their prices forecast a more rapid return to general price inflation than we believe probable.
In terms of the fiscal year that ended on September 30, the Fund earned 1% and the Lipper Balanced Fund Index earned 2%. Retailer TJX had the largest positive effect on the Fund's fiscal-year return followed by Goodrich, Avon Products, Costco and Hospira. The most significant detractors were Medtronic and ITT (both sold in the March quarter), along with Mohawk Industries. The annualized compound rate of return since the Fund's inception nearly 14 years ago is 11%, over which time the Lipper Balanced Fund Index return is 6%.
Environmental Change
"The accuracy of an economic vision is not always commensurate with the analytical ability of those who hold it. Pessimistic visions about almost anything always strike the public as more erudite than optimistic ones."—Joseph Schumpeter
One year ago, the pessimistic vision held sway around the world as weaknesses in the financial system were exposed. Some authorities have asserted that the economic world came close to seizing up last fall. Writing one year later, we know that the stock market hit its nadir in early March and has since rocketed upward. It appears to us that the value compression that developed in the bear market was both excessive and
OAKMARK EQUITY AND INCOME FUND
16
unsustainable, helping to make the rebound of the past six months more explicable.
We believe the re-emergence of mergers and acquisitions activity during the recent quarter is one indication that the economy may be returning to something approaching normal. The Equity and Income Fund contained one beneficiary of such activity: Varian Inc. In July, former Fund holding Agilent agreed to purchase Varian for $52 in cash. Although the offer price was well below the stock's all-time high price, it was more than twice Varian's March share price. We are sorry to lose such an interesting company from the Fund, but are pleased to see that an intelligent management team endorses one of our value judgments. As value investors, we expect our portfolios to benefit occasionally from merger and acquisition activity. In fact, the absence of acquisitions in the Fund could indicate poor price discipline or style drift on our part. We are gratified to have two cash buyouts in the Fund this year: UST and Varian.
On a related note, during last November's tumultuous times, we observed that Chesapeake Energy had completed two sales of natural gas production properties. These sales were to respected purchasers and at prices that validated our methodology for valuing companies in that industry. We have consistently argued that the prices of oil and gas properties are far more stable than the prices of the commodities they produce, and we believe that Chesapeake's distress sales support our case.
Transaction Activity
The portfolio grew by five equity holdings in the quarter, as we initiated positions in seven companies while eliminating two. As usual, the only thing that the new holdings have in common is what we believe to be their attractive valuation. The companies range from relatively small (Diebold) to very large (Cisco Systems, at one time the highest market capitalization company in the world). A few of the new issues allowed us to purchase the position sizes that we desired, while others' share prices quickly rose out of our buy range. Shareholders periodically ask why we put up with the "clutter" in the portfolio that emerges from the application of our price discipline. Our response is that we can put up with almost anything if it adds to shareholder value and complies with the Fund's prospectus limits. One example is the spinoff from Walter Energy, named Walter Investment Management Corp. Soon after the spinoff the new concern's price dropped to a point where the Fund's position was equal to merely 0.05% of the Fund. Had we chosen simply to eliminate this "clutter" at that moment, the Fund would have missed out on the subsequent price rebound, at current prices worth roughly $11 million in incremental value. "Profitable clutter" we say.
Touching on the new names alphabetically, Broadridge Financial provides the financial industry with outsourcing services. Formerly part of Automatic Data Processing, Broadridge supplies investor communications solutions (proxy distribution and processing), as well as securities processing and clearing services. Another—and perhaps better known—new holding is Cisco Systems, which develops and markets data networking equipment, such as routers and switches. Cisco's high profitability gives the company a powerful balance sheet with plentiful net cash. The aforementioned Diebold is primarily a manufacturer and servicer of automated teller machines (ATMs). The fourth new purchase, L-3 Communications Holdings, is the first position in the Fund's history that has a number in its name. The company provides military communications equipment—a product line that should benefit from the continued need for intelligence and reconnaissance a ctivity. Next, Precision Castparts manufactures complex metal components for aerospace and industrial gas turbines. Former Fund holding Rockwell Automation returned to the portfolio. We have always appreciated the company's market position and shareholder orientation, and we are pleased to resume an ownership position. U.K.-based Unilever adds to the Fund's international exposures, especially given the company's strong presence throughout developing and emerging markets. We are also attracted to the evolution of the company's management structure. Finally, we eliminated two holdings in the quarter: Dish Network and Washington Post.
The Trouble with Bonds
"Bonds: Why Bother?" writes well-known investor Robert Arnott in a now famous article in the April edition of the Journal of Indexes. The article's title is deceptive because Arnott actually argues that investors' faith in equities is misplaced. Arnott seeks to deflate the arguments that 1) stocks earn superior returns to long-term bonds and 2) stocks always rebound strongly from periods of under-performance so that true long-term investors will enjoy higher returns in equities with little additional risk. Demonstrating his case with a powerful, albeit extreme, example, Arnott calculates that for the 40-year period ending February 2009, investor s in 20-year U.S. Treasury bonds earned marginally higher returns than stock index fund investors. (Of course, index funds did not actually exist in 1969.) Arnott also notes that "it's hard to construct a scenario that delivers a 5 percent risk premium for stocks, relative to Treasury bonds, except from the troughs of a deep depression..."9
History will finally decide whether we are emerging from a depression trough, but whatever happened, it was certainly deep and depressing. Economic indicators are currently quite conflicted, and the unparalleled extent of governmental intervention makes forecasting hazardous. But with Treasury bond yields at their current levels it is hard to envision a long-term outlook in which equity returns do not outdistance bonds. In recent years we have written voluminously about the Fund's fixed income component and our struggles to balance risk, reward and liquidity. As noted early in this report, we have reduced the Fund's holdings of inflation-indexed bonds because we found them to be expensive relative to standard-issue Treasurys given the low inflation environment that we expect to prevail for some time.
OAKMARK EQUITY AND INCOME FUND
17
Inflation may simply be a monetary phenomenon, and worldwide monetary authorities are working diligently to expand the money supply. Nevertheless, it is hard to ignite inflation in an environment of declining unit labor costs. In the future when employment figures improve and unit labor costs rise, we expect the Fund's fixed income segment to look quite different than it does today.
Once again, we thank you for being our shareholders and invite your questions and comments.
Clyde S. McGregor, CFA
Portfolio Manager
oakbx@oakmark.com | | Edward A. Studzinski, CFA
Portfolio Manager
oakbx@oakmark.com | |
|
September 30, 2009
OAKMARK EQUITY AND INCOME FUND
18
OAKMARK EQUITY AND INCOME FUND
Schedule of Investments—September 30, 2009
Name | |
Shares Held | |
Value | |
| Common Stocks—62.2% | |
| Apparel Retail—2.5% | |
| The TJX Cos., Inc. | | | 8,901,900 | | | $ | 330,705,585 | | |
| Foot Locker, Inc. | | | 4,830,000 | | | | 57,718,500 | | |
| | | | 388,424,085 | | |
| Cable & Satellite—3.1% | |
| Comcast Corp., Class A | | | 15,000,000 | | | | 253,350,000 | | |
| Scripps Networks Interactive, Inc., Class A | | | 5,996,900 | | | | 221,585,455 | | |
| | | | 474,935,455 | | |
| Home Furnishings—0.8% | |
| Mohawk Industries, Inc. (a) | | | 2,182,170 | | | | 104,067,687 | | |
| Leggett & Platt, Inc. | | | 1,327,656 | | | | 25,756,527 | | |
| | | | 129,824,214 | | |
| Specialty Stores—0.4% | |
| Tractor Supply Co. (a) | | | 1,367,300 | | | | 66,204,666 | | |
| Distillers & Vintners—2.3% | |
| Diageo PLC (b) | | | 5,683,300 | | | | 349,466,117 | | |
| Drug Retail—2.2% | |
| CVS Caremark Corp. | | | 9,660,100 | | | | 345,251,974 | | |
| Hypermarkets & Super Centers—5.3% | |
| Wal-Mart Stores, Inc. | | | 9,250,000 | | | | 454,082,500 | | |
| Costco Wholesale Corp. | | | 6,426,400 | | | | 362,834,544 | | |
| | | | 816,917,044 | | |
| Packaged Foods & Meats—5.7% | |
| Nestle SA (b) (c) | | | 9,136,000 | | | | 389,312,368 | | |
| ConAgra Foods, Inc. | | | 17,500,000 | | | | 379,400,000 | | |
| Unilever PLC (b) | | | 2,319,300 | | | | 66,517,524 | | |
| Unilever NV (b) | | | 1,620,500 | | | | 46,767,630 | | |
| | | | 881,997,522 | | |
| Personal Products—3.4% | |
| Avon Products, Inc. | | | 15,500,000 | | | | 526,380,000 | | |
| Coal & Consumable Fuels—1.2% | |
| Walter Energy, Inc. (e) | | | 3,000,000 | | | | 180,180,000 | | |
| Oil & Gas Exploration & Production—9.1% | |
| XTO Energy, Inc. | | | 13,819,372 | | | | 571,016,451 | | |
| EnCana Corp. (d) | | | 8,250,000 | | | | 475,282,500 | | |
| Apache Corp. | | | 4,000,000 | | | | 367,320,000 | | |
| | | | 1,413,618,951 | | |
OAKMARK EQUITY AND INCOME FUND
19
OAKMARK EQUITY AND INCOME FUND
Schedule of Investments—September 30, 2009 cont.
Name | |
Shares Held | |
Value | |
| Common Stocks—62.2% (cont.) | |
| Oil & Gas Storage & Transportation—1.0% | |
| The Williams Cos., Inc. | | | 8,694,100 | | | $ | 155,363,567 | | |
| Real Estate Investment Trusts—0.1% | |
| Walter Investment Management Corp. (e) | | | 1,093,695 | | | | 17,520,994 | | |
| Reinsurance—1.2% | |
| PartnerRe, Ltd. (d) | | | 2,511,600 | | | | 193,242,504 | | |
| Health Care Equipment—7.4% | |
| Covidien PLC (d) | | | 9,392,500 | | | | 406,319,550 | | |
| Hospira, Inc. (a) (e) | | | 7,728,000 | | | | 344,668,800 | | |
| Varian Medical Systems, Inc. (a) | | | 5,700,000 | | | | 240,141,000 | | |
| Steris Corp. | | | 2,768,300 | | | | 84,294,735 | | |
| Kinetic Concepts, Inc. (a) | | | 1,921,800 | | | | 71,068,164 | | |
| | | | 1,146,492,249 | | |
| Health Care Services—2.0% | |
| Laboratory Corp. of America Holdings (a) | | | 4,666,100 | | | | 306,562,770 | | |
| Life Sciences Tools & Services—0.6% | |
| PerkinElmer, Inc. | | | 3,500,000 | | | | 67,340,000 | | |
| Varian, Inc. (a) | | | 500,000 | | | | 25,530,000 | | |
| | | | 92,870,000 | | |
| Aerospace & Defense—9.3% | |
| General Dynamics Corp. | | | 8,000,000 | | | | 516,800,000 | | |
| Rockwell Collins, Inc. | | | 6,279,000 | | | | 318,973,200 | | |
| L-3 Communications Holdings, Inc. | | | 2,926,400 | | | | 235,048,448 | | |
| Goodrich Corp. | | | 4,293,700 | | | | 233,319,658 | | |
| Alliant Techsystems, Inc. (a) | | | 1,241,500 | | | | 96,650,775 | | |
| Precision Castparts Corp. | | | 494,300 | | | | 50,354,341 | | |
| | | | 1,451,146,422 | | |
| Electrical Components & Equipment—0.3% | |
| Rockwell Automation Inc. | | | 1,125,000 | | | | 47,925,000 | | |
| Industrial Machinery—0.9% | |
| Pentair, Inc. | | | 4,200,000 | | | | 123,984,000 | | |
| Mueller Water Products, Inc., Class A (e) | | | 2,000,000 | | | | 10,960,000 | | |
| | | | 134,944,000 | | |
| Marine—0.6% | |
| Kirby Corp. (a) | | | 2,559,900 | | | | 94,255,518 | | |
| Application Software—0.2% | |
| Mentor Graphics Corp. (a) | | | 3,081,318 | | | | 28,687,070 | | |
OAKMARK EQUITY AND INCOME FUND
20
OAKMARK EQUITY AND INCOME FUND
Schedule of Investments—September 30, 2009 cont.
Name | | Shares Held/
Par Value | |
Value | |
| Common Stocks—62.2% (cont.) | |
| Communications Equipment—0.6% | |
| Cisco Systems, Inc. (a) | | | 4,000,000 | | | $ | 94,160,000 | | |
| Computer Hardware—0.2% | |
| Diebold, Inc. | | | 983,956 | | | | 32,401,671 | | |
| Data Processing & Outsourced Services—0.3% | |
| Broadridge Financial Solutions, Inc. | | | 2,494,900 | | | | 50,147,490 | | |
| Electronic Manufacturing Services—0.9% | |
| Tyco Electronics, Ltd. (d) | | | 6,037,600 | | | | 134,517,728 | | |
| Construction Materials—0.6% | |
| Martin Marietta Materials, Inc. | | | 1,063,400 | | | | 97,907,238 | | |
| Total Common Stocks (Cost: $7,950,356,283) | | | | | | $ | 9,651,344,249 | | |
| Fixed Income—32.3% | |
| Corporate Bonds—0.9% | |
| Diversified Real Estate Activities—0.2% | |
| Brookfield Asset Management, Inc., 7.125%, due 6/15/2012 | | $ | 18,840,000 | | | $ | 19,024,896 | | |
| Brookfield Asset Management, Inc., 5.75%, due 3/1/2010 | | | 4,710,000 | | | | 4,796,405 | | |
| | | | 23,821,301 | | |
| Property & Casualty Insurance—0.1% | |
| Fund American Cos., Inc., 5.875%, due 5/15/2013 | | | 20,498,000 | | | | 19,583,379 | | |
| Insurance Brokers—0.1% | |
| Marsh & McLennan Cos., Inc., 6.25%, due 3/15/2012 | | | 10,385,000 | | | | 10,731,703 | | |
| Marsh & McLennan Cos., Inc., 5.15%, due 9/15/2010 | | | 8,270,000 | | | | 8,439,651 | | |
| | | | 19,171,354 | | |
| Leisure Facilities—0.1% | |
| Vail Resorts, Inc., 6.75%, due 2/15/2014 | | | 14,897,000 | | | | 14,710,787 | | |
| Home Improvement Retail—0.1% | |
| Home Depot, Inc., 0.42%, due 12/16/2009 (f) | | | 8,105,000 | | | | 8,100,672 | | |
| Movies & Entertainment—0.0% | |
| The Walt Disney Co., 4.70%, due 12/1/2012 | | | 5,000,000 | | | | 5,394,000 | | |
| Casinos & Gaming—0.0% | |
International Game Technology, Senior Note,
7.50%, due 6/15/2019 | | | 1,755,000 | | | | 1,944,803 | | |
OAKMARK EQUITY AND INCOME FUND
21
OAKMARK EQUITY AND INCOME FUND
Schedule of Investments—September 30, 2009 cont.
Name | | Par Value | |
Value | |
| Fixed Income—32.3% (cont.) | |
| Paper Packaging—0.1% | |
| Sealed Air Corp., 144A, 5.625%, due 7/15/2013 (g) | | $ | 18,740,000 | | | $ | 18,978,598 | | |
| Semiconductors—0.1% | |
| ASML Holding NV, 5.75%, due 6/13/2017 | | EUR | 9,660,000 | | | | 13,499,833 | | |
| Health Care Services—0.1% | |
| Tenet Healthcare Corp., Senior Note, 7.375%, due 2/1/2013 | | $ | 10,000,000 | | | | 9,900,000 | | |
| Quest Diagnostic, Inc., Senior Note, 5.125%, due 11/1/2010 | | | 1,620,000 | | | | 1,661,639 | | |
| | | | 11,561,639 | | |
| Oil & Gas Exploration & Production—0.0% | |
| Newfield Exploration Co., 7.625%, due 3/1/2011 | | | 2,220,000 | | | | 2,297,700 | | |
| Total Corporate Bonds (Cost: $124,474,697) | | | | | | $ | 139,064,066 | | |
| Government and Agency Securities—31.4% | |
| Canadian Government Bonds—3.4% | |
| Canadian Government Bond, 4.00%, due 6/1/2017 | | CAD | 98,870,000 | | | $ | 98,623,437 | | |
| Canadian Government Bond, 4.00%, due 6/1/2016 | | CAD | 97,735,000 | | | | 97,724,958 | | |
| Canadian Government Bond, 3.00%, due 6/1/2014 | | CAD | 98,870,000 | | | | 94,466,030 | | |
| Canadian Government Bond, 3.50%, due 6/1/2013 | | CAD | 96,600,000 | | | | 94,389,474 | | |
| Canadian Government Bond, 1.25%, due 6/1/2011 | | CAD | 98,870,000 | | | | 92,613,574 | | |
| Canadian Government Bond, 4.25%, due 6/1/2018 | | CAD | 50,000,000 | | | | 50,541,727 | | |
| | | | 528,359,200 | | |
| Swedish Government Bonds—0.2% | |
| Swedish Government Bond, 3.00%, due 7/12/2016 | | SEK | 200,000,000 | | | | 28,505,239 | | |
| U.S. Government Agencies—5.0% | |
| Federal Farm Credit Bank, 3.50%, due 10/3/2011 | | $ | 96,600,000 | | | | 101,040,316 | | |
| Federal Farm Credit Bank, 0.136%, due 2/22/2012 (f) | | | 93,700,000 | | | | 93,216,039 | | |
| Federal Home Loan Bank, 3.25%, due 3/11/2011 | | | 77,280,000 | | | | 80,084,955 | | |
| Tennessee Valley Authority, 6.79%, due 5/23/2012 | | | 56,735,000 | | | | 63,912,318 | | |
| Tennessee Valley Authority, 5.50%, due 7/18/2017 | | | 56,515,000 | | | | 63,310,533 | | |
| Federal Farm Credit Bank, 3.875%, due 11/13/2012 | | | 38,645,000 | | | | 40,927,837 | | |
| Federal Farm Credit Bank, 3.15%, due 5/19/2011 | | | 33,810,000 | | | | 35,005,589 | | |
| Tennessee Valley Authority, 4.875%, due 12/15/2016 | | | 30,515,000 | | | | 32,786,018 | | |
| Private Export Funding Corp. Series Y, 3.55%, due 4/15/2013 | | | 24,150,000 | | | | 25,404,327 | | |
| Federal Home Loan Mortgage Corp., 1.00%, due 12/2/2011 (h) | | | 19,775,000 | | | | 19,797,464 | | |
| Federal Home Loan Bank, 0.50%, due 6/24/2011 (h) | | | 18,785,000 | | | | 18,800,873 | | |
| Federal Home Loan Mortgage Corp., 1.50%, due 4/30/2012 (h) | | | 17,300,000 | | | | 17,313,477 | | |
| Federal Farm Credit Bank, 4.50%, due 10/17/2012 | | | 15,215,000 | | | | 16,438,560 | | |
| Federal Farm Credit Bank, 5.125%, due 8/25/2016 | | | 14,130,000 | | | | 15,493,828 | | |
Private Export Funding Corp. Secured Note,
Series 1, 7.20%, due 1/15/2010 | | | 14,490,000 | | | | 14,776,235 | | |
| Federal Farm Credit Bank, 3.875%, due 8/25/2011 | | | 14,005,000 | | | | 14,720,081 | | |
OAKMARK EQUITY AND INCOME FUND
22
OAKMARK EQUITY AND INCOME FUND
Schedule of Investments—September 30, 2009 cont.
Name | |
Par Value | |
Value | |
| Fixed Income—32.3% (cont.) | |
| U.S. Government Agencies—5.0% (cont.) | |
Federal National Mortgage Association, 3.50%,
due 6/23/2014 | | $ | 12,500,000 | | | $ | 12,548,287 | | |
| Tennessee Valley Authority, 4.375%, due 6/15/2015 | | | 9,660,000 | | | | 10,287,649 | | |
Federal National Mortgage Association, 1.50%,
due 5/12/2014 (h) | | | 9,885,000 | | | | 9,898,473 | | |
| Federal Farm Credit Bank, 0.304%, due 6/8/2011 (f) | | | 9,885,000 | | | | 9,882,964 | | |
| Federal Farm Credit Bank, 3.85%, due 2/11/2015 | | | 9,415,000 | | | | 9,828,865 | | |
| Federal Home Loan Bank, 1.00%, due 6/8/2012 (h) | | | 9,390,000 | | | | 9,417,297 | | |
| Tennessee Valley Authority, 5.625%, due 1/18/2011 | | | 8,426,000 | | | | 8,961,245 | | |
Federal Home Loan Mortgage Corp., 3.00%,
due 6/30/2014 (h) | | | 8,780,000 | | | | 8,896,958 | | |
| Federal Farm Credit Bank, 5.28%, due 8/16/2013 | | | 7,245,000 | | | | 8,039,161 | | |
| Federal Farm Credit Bank, 5.20%, due 11/28/2016 | | | 5,650,000 | | | | 6,192,400 | | |
| Federal Farm Credit Bank, 5.125%, due 6/6/2011 | | | 5,250,000 | | | | 5,610,234 | | |
| Federal Farm Credit Bank, 4.92%, due 8/26/2013 | | | 4,710,000 | | | | 5,164,284 | | |
| Federal Farm Credit Bank, 4.875%, due 12/16/2015 | | | 4,710,000 | | | | 5,108,471 | | |
| Federal Farm Credit Bank, 5.10%, due 8/9/2011 | | | 4,685,000 | | | | 5,026,462 | | |
| Federal Farm Credit Bank, 4.85%, due 3/9/2011 | | | 4,172,000 | | | | 4,411,298 | | |
| Federal Farm Credit Bank, 5.05%, due 5/25/2011 | | | 3,746,000 | | | | 3,995,289 | | |
| Federal Farm Credit Bank, 4.50%, due 8/8/2011 | | | 2,815,000 | | | | 2,989,088 | | |
| Federal Farm Credit Bank, 4.82%, due 10/12/2012 | | | 2,345,000 | | | | 2,548,065 | | |
| | | | 781,834,940 | | |
| U.S. Government Bonds—1.1% | |
| United States Treasury Bonds, 8.125%, due 8/15/2019 | | | 120,755,000 | | | | 168,264,606 | | |
| U.S. Government Notes—21.2% | |
United States Treasury Notes, 1.625%, due 1/15/2018,
Inflation Indexed | | | 508,181,520 | | | | 513,263,335 | | |
| United States Treasury Notes, 3.25%, due 5/31/2016 | | | 494,340,000 | | | | 506,428,096 | | |
| United States Treasury Notes, 2.875%, due 1/31/2013 | | | 483,005,000 | | | | 503,645,736 | | |
| United States Treasury Notes, 3.125%, due 5/15/2019 | | | 500,000,000 | | | | 491,992,000 | | |
| United States Treasury Notes, 4.875%, due 2/15/2012 | | | 250,000,000 | | | | 271,933,500 | | |
| United States Treasury Notes, 3.25%, due 7/31/2016 | | | 250,000,000 | | | | 255,859,500 | | |
| United States Treasury Notes, 3.00%, due 8/31/2016 | | | 250,000,000 | | | | 251,484,500 | | |
| United States Treasury Notes, 1.375%, due 9/15/2012 | | | 250,000,000 | | | | 249,570,250 | | |
United States Treasury Notes, 1.375%, due 7/15/2018,
Inflation Indexed | | | 249,677,500 | | | | 247,180,725 | | |
| | | | 3,291,357,642 | | |
| United Kingdom Government Bonds—0.5% | |
| United Kingdom Gilt, 4.25%, due 3/7/2011 | | GBP | 50,000,000 | | | | 83,731,939 | | |
Total Government and Agency Securities
(Cost: $4,714,278,084) | | | | | | $ | 4,882,053,566 | | |
| Total Fixed Income (Cost: $4,838,752,781) | | | | | | $ | 5,021,117,632 | | |
OAKMARK EQUITY AND INCOME FUND
23
OAKMARK EQUITY AND INCOME FUND
Schedule of Investments—September 30, 2009 cont.
Name | |
Par Value | |
Value | |
| Short Term Investments—5.8% | |
| Australian Government Bills—0.2% | |
Australia Treasury Bills, 2.88% - 2.96%,
due 11/27/2009 - 1/22/2010 (i) (Cost: $32,849,475) | | AUD | 38,000,000 | | | $ | 33,295,331 | | |
| Canadian Treasury Bills—1.3% | |
Canadian Treasury Bills, 0.46% - 0.65%,
due 2/18/2010 - 9/2/2010 (i) (Cost: $195,407,645) | | CAD | 222,445,000 | | | | 207,155,831 | | |
| Commercial Paper—0.6% | |
Toyota Motor Credit Corp., 0.12%, due 10/1/2009
(Cost: $100,000,000) | | $ | 100,000,000 | | | | 100,000,000 | | |
| Japan Government Bonds—0.4% | |
Japan Government, 0.50%, due 12/20/2009
(Cost: $54,300,106) | | JPY | 5,000,000,000 | | | | 55,740,322 | | |
| United Kingdom Government Bonds—0.5% | |
United Kingdom Gilt, 4.75%, due 6/7/2010
(Cost: $83,864,860) | | GBP | 49,435,000 | | | | 81,306,802 | | |
| Repurchase Agreement—2.8% | |
Fixed Income Clearing Corp. Repurchase Agreement,
0.02% dated 9/30/2009 due 10/1/2009, repurchase
price $428,592,304, collateralized by a Federal
Home Loan Bank Bond, with a rate of 0.420%,
with a maturity of 9/21/2010, and with a market
value plus accrued interest of $200,000,000, and
by a Federal National Mortgage Association Bond,
with a rate of 5.125%, with a maturity of 4/15/2011,
and with a market value plus accrued interest
of $30,515,932, and by an United States Treasury
Note, with a rate of 4.125%, with a maturity
of 8/15/2010, and with a market value plus accrued
interest of $206,649,250 (Cost: $428,592,066) | | $ | 428,592,066 | | | | 428,592,066 | | |
| Total Short Term Investments (Cost: $895,014,152) | | | | | | $ | 906,090,352 | | |
| Total Investments (Cost: $13,684,123,216)—100.3% | | | | | | | 15,578,552,233 | | |
| Liabilities In Excess Of Other Assets—(0.3)% | | | | | | | (49,733,686 | ) | |
| Total Net Assets—100% | | | | | | $ | 15,528,818,547 | | |
OAKMARK EQUITY AND INCOME FUND
24
OAKMARK EQUITY AND INCOME FUND
Schedule of Investments—September 30, 2009 cont.
(a) Non income-producing security.
(b) Represents a Sponsored American Depositary Receipt.
(c) Fair value is determined in good faith in accordance with procedures established by the Board of Trustees.
(d) Represents a foreign domiciled corporation.
(e) See Note 5 in the Notes to the Financial Statements regarding investments in affiliated issuers.
(f) Floating Rate Note. Rate shown is as of September 30, 2009.
(g) Security exempt from registration pursuant to Rule 144A under the Securities Act of 1933. These securities may be resold in transactions exempt from registration, normally to qualified institutional buyers.
(h) Step-Coupon.
(i) The rate shown represents the annualized yield at the time of purchase; not a coupon rate.
Key to abbreviations:
AUD: Australian Dollar
GBP: British Pound
CAD: Canadian Dollar
EUR: Euro
JPY: Japanese Yen
SEK: Swedish Krona
See accompanying Notes to Financial Statements.
OAKMARK EQUITY AND INCOME FUND
25
OAKMARK GLOBAL FUND
Report from Clyde S. McGregor and Robert A. Taylor, Portfolio Managers


THE VALUE OF A $10,000 INVESTMENT IN OAKMARK GLOBAL FUND FROM ITS INCEPTION (8/4/99) TO PRESENT (9/30/09) AS COMPARED TO THE MSCI WORLD INDEX10 (UNAUDITED)

| | | | | Average Annual Total Returns
(as of 9/30/09) | |
| (Unaudited) | | Total Return
Last 3 Months* | | 1-year | | 5-year | | 10-year | | Since
Inception
(8/4/99) | |
Oakmark Global
Fund (Class I) | | | 20.95 | % | | | 2.65 | % | | | 7.13 | % | | | 12.28 | % | | | 11.14 | % | |
| MSCI World | | | 17.45 | % | | | -2.29 | % | | | 3.51 | % | | | 0.92 | % | | | 0.89 | % | |
| Lipper Global Fund Index11 | | | 16.77 | % | | | 0.09 | % | | | 4.66 | % | | | 2.71 | % | | | 2.66 | % | |
The graph and table do not reflect the deduction of taxes that a shareholder would pay on fund distributions or the redemption of fund shares.
The expense ratio for Class I shares as of 9/30/08 was 1.16%.
The performance data quoted represents past performance. The above performance information for the Fund does not reflect the imposition of a 2% redemption fee on shares redeemed within 90 days. If reflected, the fee would reduce the performance quoted. Past performance does not guarantee future results. The investment return and principal value will fluctuate so that an investor's shares, when redeemed, may be worth more or less than their original cost. Current performance may be lower or higher than the performance data quoted. Average annual total return measures annualized change, while total return measures aggregate change. To obtain most recent month-end performance data, visit oakmark.com.
* Not annualized
Quarter and Fiscal Year Review
We are pleased to report the second consecutive positive quarter for the Oakmark Global Fund. The Fund earned 21% over the period, which compares to 17% for the MSCI World and the Lipper Global Fund Indexes. The countries with the greatest positive contribution to this outcome were Switzerland, the U.S. and Germany, although low-weighted Canada, Ireland, Italy, France and Sweden all had higher percentage returns than the U.S. The United Kingdom and Japan brought up the rear but generated positive returns in the period.
This quarter's best performer was a previous laggard, Societe Television Francaise 1. Other leading stocks included Swiss financial concerns UBS and Julius Baer, Italy's Bulgari, and Bank of Ireland. The only losers in the period were Daiwa Securities (Japan), Alliant Techsystems (U.S.), Laboratory Corporation of America (U.S.), Rohm (Japan), and Oracle (U.S.).
The strong rebound from the March lows boosted the Fund's return for the fiscal year ended September 30 to 3%, bringing it into positive territory. The Lipper Global Fund Index was flat for the fiscal year and the MSCI World Index returned -2%. The most significant contributors to the Fund's twelve-month return were Discovery Communications (U.S.), Assa Abloy (Sweden), Canon (Japan), Julius Baer and Credit Suisse. The largest detractors were Live Nation (U.S.), MDS (Canada), Daiwa Securities, Snap-on (U.S.) and Medtronic (U.S.—sold during the quarter). Switzerland, Germany and Japan were among the Fund's best performing countries for the year, while Canada, the U.S. and Ireland were at the bottom. Since the Fund's inception in August 1999, it has earned an annualized rate of return of 11%, while the Lipper Global Fund Index has earned 3%, and the MSCI World Index has earned 1%.
10-Year Anniversary
You may have noted that this inception date means that the Oakmark Global Fund enjoyed its 10-year anniversary during the quarter. We have many people to thank for making this journey possible, including Greg Jackson and Michael Welsh, the portfolio managers of the Fund at its
OAKMARK GLOBAL FUND
26
inception. Although the path has been bumpier than we would have preferred or than we might have predicted, the Fund has met our expectation for double-digit compound rates of return. The Fund's portfolio managers have played their role, but this outcome would have been impossible without our investment research analysts and our administrative support group. Oakmark Global is an all-cap go-anywhere fund, meaning that there are few limits on which equities we can purchase. In addition, the Fund is fairly concentrated. Thankfully, we are blessed with a 20-person investment research department whose job is to find the best values, wherever they may be. The efforts of these dedicated men and women end up populating the Global Fund portfolio. We thank them for their work, and we thank you, our shareholders, for your support and encouragement over these many years.
Quarter Activity
Our trading activity in the quarter was balanced, with three new names replacing three eliminations. Because we sold two U.S. companies and purchased only one new one, the portfolio continued its recent trend towards a higher weighting in international securities. For the past two quarters the international "overweight" has boosted returns because foreign markets have bested the U.S., particularly when currency effects are included. Over the past year we have persistently identified superior value opportunities in international markets, which has led to the current 69% international allocation. We can allocate in this manner because we are not slaves to a benchmark. We understand that the U.S. comprises approximately 47% of the MSCI World Index, but this fact has little to no bearing on our portfolio construction. In the same vein, the Fund's 21% weighting in Swiss securities far exceeds the Index's.
On that note, we find it slightly amusing that the Fund's newest U.S.-domiciled holding is International Flavors & Fragrances (IFF), the second largest factor in the flavors and fragrances industry. In the June quarter we initiated a position in Givaudan, the largest flavors and fragrances producer. Though we believe that this industry has many strong attributes, we based the Givaudan purchase on its exceptionally attractive valuation at the time. On the other hand, the catalyst for our IFF purchase was the recent significant management change there. The Chief Executive Officer of Ansell—a long-time holding in the Oakmark International Small Cap Fund and previous holding in the Oakmark Global Fund—will become the new CEO at IFF. His track record at Ansell suggests that the profit margin differential between IFF and its competitors should narrow.
We also added two non-U.S. names during the quarter, Richemont and Square Enix. Richemont is the largest hard luxury goods company in the world, led by its flagship Cartier brand and its impressive portfolio of high-end watch makers, including Montblanc, Piaget and Jaeger-LeCoultre. Richemont is a truly global company with nearly 40% of revenue coming from fast-growing developing countries in Asia, the Middle East and South America. The Rupert Family, which founded Richemont, has voting control of the company's stock as well as leadership positions in management. From both an operational and capital allocation standpoint, we believe the Ruperts have been impressive, spearheading 900 basis points of margin improvement during the past decade. Management recently spun-off its ownership stake in British American Tobacco to shareholders, providing more direct exposure to luxury goods assets. Although the recession has hurt the business, managemen t has responded by reducing costs in the hardest hit regions (U.S. and Western Europe), while also investing in new store openings and advertising in Asia and the Middle East. We believe these investments will pay off in the long term because the luxury goods presence in those regions is well below that of developed market countries, leaving significant room for growth.
This is the second time the Oakmark Global Fund has owned Square Enix, a game software company that sells the popular titles Final Fantasy and Dragon Quest. Our colleagues managing the Oakmark International Small Cap Fund have also invested in the company's shares on five separate occasions. The game software business, while lumpy because of title launches, produces great returns and cash flows, and it is one of the fastest growing segments of the toy industry. Square Enix's recent acquisition of Eidos, which makes Tomb Raider, has expanded the company's library of hits, as well as its talent pool of skillful programmers. With net cash equal to over 30% of the market cap, Square Enix should be able to weather short-term slack in consumer spending and the swings of the game hardware cycle.
OAKMARK GLOBAL FUND
27
To help fund these new holdings we sold our positions in Medtronic, Washington Post and Luxottica, which were all relatively less attractive alternatives.
One to Have Missed
Toronto-based MDS is probably one of the most unfamiliar names in the Global Fund portfolio, and in hindsight, it would have been best had it stayed unfamiliar to us. The company comprises three business units: a contract research organization (CRO) that performs testing and trials for pharmaceutical companies; a mass spectrometer manufacturer (Sciex); and a medical isotope business (Nordion). During our 30-month ownership of the stock, much went wrong. The CRO market deteriorated significantly, and MDS management was unable to improve that unit's substandard profit margins. Sciex has performed better, although its margins still lag behind its competitors', and the economic downturn has limited the division's growth. The other component, Nordion, has suffered because the Canadian government nuclear reactors that produce much of the unit's products have been shut down because of a heavy water leak. Thus, because of MDS's own difficulties and because of broader market troubles, the stock has performed poorly during our holding period. In September, management announced the sale of the Sciex unit. Sale proceeds will be used to eliminate most outstanding debt and to repurchase shares. The company announced that the CRO unit is also for sale and that the company's CEO would step down. Finally, the company has sued Atomic Energy of Canada Ltd. for breach of contract.
In hindsight, MDS has been a "value trap," a stock that is always cheaply valued but also suffers from fundamental deterioration that continuously undermines the value case. How do we normally avoid value traps? We focus on companies that are persistently growing their per share value, and we seek to invest with owner-oriented management teams that treat their shareholders as their partners. With MDS, the company required more turnaround than we understood, management was not up to the task, and the company was also unlucky.
As always, we welcome your questions and comments as we look forward to the Oakmark Global Fund's next ten years.
Clyde S. McGregor, CFA
Portfolio Manager
oakgx@oakmark.com | | Robert A. Taylor, CFA
Portfolio Manager
oakgx@oakmark.com | |
|
September 30, 2009
OAKMARK GLOBAL FUND
28
OAKMARK GLOBAL FUND
Global Diversification—September 30, 2009 (Unaudited)
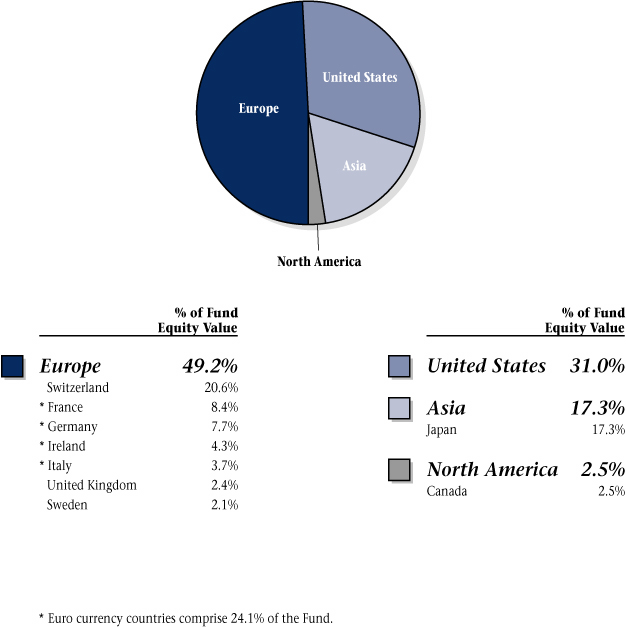
OAKMARK GLOBAL FUND
29
OAKMARK GLOBAL FUND
Schedule of Investments—September 30, 2009
| Name | | Description | | Shares Held | | Value | |
| Common Stocks—97.1% | |
| Apparel, Accessories & Luxury Goods—6.9% | |
| Bulgari SpA (Italy) | | Jewelry Manufacturer & Retailer | | | 7,995,700 | | | $ | 61,778,636 | | |
Compagnie Financiere
Richemont SA
(Switzerland) | | Manufacturer & Retailer of
Luxury Goods | | | 2,017,400 | | | | 57,000,359 | | |
| | | | 118,778,995 | | |
| Automobile Manufacturers—5.4% | |
Daimler AG Registered
(Germany) | | Automobile Manufacturer | | | 937,100 | | | | 47,179,725 | | |
| Toyota Motor Corp. (Japan) | | Automobile Manufacturer | | | 1,161,800 | | | | 46,205,381 | | |
| | | | 93,385,106 | | |
| Broadcasting—8.0% | |
Societe Television
Francaise 1 (France) | | Broadcasting & Cable TV | | | 4,806,600 | | | | 84,475,135 | | |
Discovery
Communications, Inc.
Class C (United States) (a) | | Media Management &
Network Services | | | 1,550,150 | | | | 40,350,404 | | |
Discovery
Communications, Inc.
Class A (United States) (a) | | Media Management &
Network Services | | | 472,750 | | | | 13,657,748 | | |
| | | | 138,483,287 | | |
| Movies & Entertainment—1.5% | |
Live Nation, Inc.
(United States) (a) | | Live Events Producer, Operator, &
Promoter | | | 3,296,600 | | | | 26,999,154 | | |
| Distillers & Vintners—2.3% | |
Diageo PLC
(United Kingdom) | | Beverages, Wines, & Spirits
Manufacturer | | | 2,607,800 | | | | 40,009,525 | | |
| Oil & Gas Exploration & Production—5.1% | |
XTO Energy, Inc.
(United States) | | Oil & Natural Gas Exploration &
Production | | | 1,239,800 | | | | 51,228,536 | | |
Apache Corp.
(United States) | | Oil & Natural Gas Exploration &
Production | | | 404,500 | | | | 37,145,235 | | |
| | | | 88,373,771 | | |
OAKMARK GLOBAL FUND
30
OAKMARK GLOBAL FUND
Schedule of Investments—September 30, 2009 cont.
| Name | | Description | | Shares Held | | Value | |
| Common Stocks—97.1% (cont.) | |
| Asset Management & Custody Banks—4.3% | |
Julius Baer Holding AG
(Switzerland) | | Asset Management | | | 1,510,700 | | | $ | 75,440,244 | | |
| Diversified Banks—1.4% | |
Bank of Ireland
(Ireland) (a) | | Commercial Bank | | | 4,932,100 | | | | 24,683,451 | | |
| Diversified Capital Markets—6.4% | |
| UBS AG (Switzerland) (a) | | Wealth Management &
Investment Banking | | | 3,180,020 | | | | 58,211,888 | | |
Credit Suisse Group
(Switzerland) | | Wealth Management &
Investment Banking | | | 938,200 | | | | 52,056,837 | | |
| | | | 110,268,725 | | |
| Investment Banking & Brokerage—3.2% | |
Daiwa Securities
Group, Inc. (Japan) | | Stock Broker | | | 10,652,000 | | | | 54,942,082 | | |
| Health Care Equipment—2.8% | |
| Covidien PLC (Ireland) | | Health Care Equipment & Supplies | | | 1,098,000 | | | | 47,499,480 | | |
| Health Care Services—4.0% | |
Laboratory Corp. of
America Holdings
(United States) (a) | | Medical Laboratory & Testing Services | | | 1,043,200 | | | | 68,538,240 | | |
| Life Sciences Tools & Services—2.4% | |
| MDS, Inc. (Canada) (a) | | Products & Services for Medical
Product Manufacturers | | | 5,140,400 | | | | 42,099,876 | | |
| Aerospace & Defense—2.6% | |
ITT Corp. (United States) Designs & Manufactures a Variety
of Engineered Products & Military | |
Defense Systems | | | 480,000 | | | | 25,032,000 | | |
Alliant Techsystems, Inc.
(United States) (a) | | Propulsion Systems & Munitions | | | 260,487 | | | | 20,278,913 | | |
| | | | 45,310,913 | | |
| Building Products—2.1% | |
Assa Abloy AB, Series B
(Sweden) | | Develops, Designs, & Manufactures
Security Locks | | | 2,237,000 | | | | 36,356,244 | | |
| Human Resource & Employment Services—2.9% | |
| Adecco SA (Switzerland) | | Temporary Employment Services | | | 943,500 | | | | 50,165,830 | | |
| Industrial Conglomerates—2.3% | |
| Rheinmetall AG (Germany) | | Automotive Pump Manufacturer | | | 672,400 | | | | 39,810,854 | | |
OAKMARK GLOBAL FUND
31
OAKMARK GLOBAL FUND
Schedule of Investments—September 30, 2009 cont.
| Name | | Description | | Shares Held | | Value | |
| Common Stocks—97.1% (cont.) | |
| Industrial Machinery—4.1% | |
Snap-On, Inc.
(United States) | | Tool & Equipment Manufacturer | | | 2,017,000 | | | $ | 70,110,920 | | |
| Railroads—2.7% | |
Union Pacific Corp.
(United States) | | Rail Transportation Provider | | | 813,600 | | | | 47,473,560 | | |
| Research & Consulting Services—0.6% | |
| Meitec Corp. (Japan) | | Software Engineering Services | | | 565,000 | | | | 9,592,380 | | |
| Application Software—2.4% | |
| SAP AG (Germany) | | Develops Business Software | | | 865,300 | | | | 42,140,329 | | |
| Electronic Components—2.5% | |
| OMRON Corp. (Japan) | | Component, Equipment, &
System Manufacturer | | | 2,300,600 | | | | 43,415,768 | | |
| Electronic Manufacturing Services—2.0% | |
Tyco Electronics, Ltd.
(Switzerland) | | Manufactures Electronic
Components | | | 1,581,200 | | | | 35,229,136 | | |
| Home Entertainment Software—2.5% | |
Square Enix Holdings
Co., Ltd. (Japan) | | Develops & Sells Entertainment
Software for Video Game Consoles | | | 1,567,800 | | | | 42,441,419 | | |
| Office Electronics—5.9% | |
| Neopost SA (France) | | Mailroom Equipment Supplier | | | 628,700 | | | | 56,424,060 | | |
| Canon, Inc. (Japan) | | Computers & Information | | | 1,116,700 | | | | 45,158,146 | | |
| | | | 101,582,206 | | |
| Semiconductors—5.7% | |
Intel Corp.
(United States) | | Computer Component
Manufacturer & Designer | | | 2,539,000 | | | | 49,688,230 | | |
| ROHM Co., Ltd. (Japan) | | Integrated Circuits & Semiconductor
Devices Manufacturer | | | 702,600 | | | | 49,154,214 | | |
| | | | 98,842,444 | | |
| Systems Software—3.7% | |
Oracle Corp.
(United States) | | Software Services | | | 3,086,200 | | | | 64,316,408 | | |
OAKMARK GLOBAL FUND
32
OAKMARK GLOBAL FUND
Schedule of Investments—September 30, 2009 cont.
| Name | | Description | | Shares Held/
Par Value | | Value | |
| Common Stocks—97.1% (cont.) | |
| Specialty Chemicals—1.4% | |
Givaudan SA
(Switzerland) | | Manufactures & Markets Fragrances | | | 24,100 | | | $ | 18,069,767 | | |
International Flavors &
Fragrances, Inc.
(United States) | | Manufactures Flavors &
Fragrance Products | | | 156,100 | | | | 5,920,873 | | |
| | | | 23,990,640 | | |
| Total Common Stocks (Cost: $1,578,202,180) | | | | | | $ | 1,680,280,987 | | |
| Short Term Investment—2.7% | |
| Repurchase Agreement—2.7% | |
Fixed Income Clearing Corp. Repurchase Agreement,
0.02% dated 9/30/2009 due 10/1/2009, repurchase
price $46,830,444, collateralized by a Federal
National Mortgage Association Bond, with a
rate of 5.125%, with a maturity of 4/15/2011, and
with a market value plus accrued interest of $47,770,929
(Cost: $46,830,418) | | $ | 46,830,418 | | | | 46,830,418 | | |
| Total Short Term Investment (Cost: $46,830,418) | | | | $ | 46,830,418 | | |
| Total Investments (Cost: $1,625,032,598)—99.8% | | | | | 1,727,111,405 | | |
| Other Assets In Excess of Liabilities—0.2% | | | | | 3,153,841 | | |
| Total Net Assets—100% | | | | $ | 1,730,265,246 | | |
(a) Non income-producing security.
See accompanying Notes to Financial Statements.
OAKMARK GLOBAL FUND
33
OAKMARK GLOBAL SELECT FUND
Report from Bill Nygren and David Herro, Portfolio Managers


THE VALUE OF A $10,000 INVESTMENT IN OAKMARK GLOBAL SELECT FUND FROM ITS INCEPTION (10/2/06) TO PRESENT (9/30/09) AS COMPARED TO THE MSCI WORLD INDEX10 (UNAUDITED)
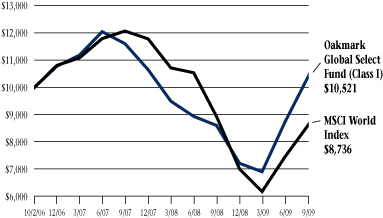
| | | Total Returns
(as of 9/30/09) | |
| (Unaudited) | | Last 3 Months* | | 1-year | | Average Annual
Total Return
Since Inception
(10/2/06) | |
Oakmark Global
Select Fund (Class I) | | | 20.61 | % | | | 22.24 | % | | | 1.71 | % | |
| MSCI World | | | 17.45 | % | | | -2.29 | % | | | -4.41 | % | |
| Lipper Global Fund Index11 | | | 16.77 | % | | | 0.09 | % | | | -3.08 | % | |
The graph and table do not reflect the deduction of taxes that a shareholder would pay on fund distributions or the redemption of fund shares.
The expense ratio for Class I shares as of 9/30/08 was 1.35%.
The performance data quoted represents past performance. The above performance information for the Fund does not reflect the imposition of a 2% redemption fee on shares redeemed within 90 days. If reflected, the fee would reduce the performance quoted. Past performance does not guarantee future results. The investment return and principal value will fluctuate so that an investor's shares, when redeemed, may be worth more or less than their original cost. Current performance may be lower or higher than the performance data quoted. Average annual total return measures annualized change, while total return measures aggregate change. To obtain most recent month-end performance data, visit oakmark.com.
* Not annualized
The global equity markets have been extremely volatile during the past year. The Oakmark Global Select Fund returned 22% for the year ended September 30, 2009, compared to the MSCI World Index, which was down 2% for the same period. Year to date and quarter to date, the Fund has returned 46% and 21%, respectively, comparing favorably to the MSCI World Index which returned 25% and 17%, respectively. Since inception, the Fund has returned an average of 2% per year, outperforming the MSCI World Index, which has averaged -4% per year over the same period. We achieved these results by remaining disciplined about our value investment approach.
As we have mentioned before, stock prices have been much more volatile than business values over the past year. An example of this phenomenon is one of our holdings, U.S.-based Liberty Entertainment, which has returned 183% since our initial purchase in November 2008. This superior performance is due partly to the fact that we purchased the stock near its all-time low price. When we initiated our position, the stock was trading at about half the value of its equity investment in DirecTV Group. Even though the underlying business remained unchanged, the discount disappeared when DirecTV announced their intention to merge with Liberty Entertainment.
Another top contributor to the Fund for the year was Swiss-based Compagnie Financiere Richemont (Richemont), a luxury goods manufacturer and retailer of brands such as Cartier and Montblanc, which returned 86.8%. Similar to Liberty Entertainment, Richemont's outstanding performance in the Fund is partly because we purchased the stock in February '09, near the bottom of the market. In addition, Richemont has a strong collection of brands, and it has significantly outperformed its peers. Their sizeable presence in emerging markets and their limited exposure to the U.S. market helped contribute to their outperformance relative to peers. Because the company's balance sheet contains nearly one billion euros in net cash, we believe that our investment carries little risk—no matter how long the downturn lasts. We maintain our belief that Richemont is very well positioned, owns one of the premier portfolios of luxury brands, and has a world-cla ss management team.
OAKMARK GLOBAL SELECT FUND
34
The biggest detractor from the Fund's performance for the year was Daiwa Securities Group, a financial services company based in Japan, which was down 25%. Daiwa has been hurt by numerous factors including decreased equity and capital market activity given the global financial crisis. Additionally, shares reacted to news that Daiwa had ended its investment banking joint venture with Sumitomo Mitsui Financial Group (SMFG). Daiwa raised a significant amount of new equity to finance its purchase of SMFG's stake in the joint venture. Although we decreased our assessment of Daiwa's intrinsic value after the transaction, the share price dropped well below our new estimate of the company's value. Finally, Daiwa's balance sheet remains well capitalized during this uncertain time and should more than adequately cover any new regulatory demands for improved balance sheet strength. We maintain our belief that Daiwa is a powerful brand, and that the sto ck continues to trade at a significant discount to the company's fair value. For these reasons, Daiwa has remained in our portfolio.
Capital One Financial Corp.'s stock price rebounded in the third quarter, increasing 63%. However, its one-year performance of -28% significantly detracted from the Fund's performance. The stock suffered due to high unemployment, global economic uncertainty, and regulatory reform. We expect that an economic recovery, most notably an improvement in unemployment figures, would reduce credit provisioning and would cause earnings to improve rapidly.
We made minor changes to the portfolio this quarter. We sold our investment in Credit Suisse Group and used the proceeds to purchase another international financial services company, UBS. While our investment thesis for Credit Suisse had not changed, UBS was trading at a larger discount to our estimate of fair value, and given its similar business profile, we decided to swap holdings.
We continue to hedge some of the Fund's currency exposure. Due to a further weakening in the dollar during the past quarter, we initiated a 15% hedge of our underlying euro exposure, and at quarter end, approximately 21% of the Fund's Japanese yen and 28% of the Fund's Swiss franc exposures were hedged.
Short-term market fluctuations have enabled us to build a portfolio with high-quality companies trading at significant discounts to their fair value. We will continue to focus on our long-term value approach. We thank you, our shareholders, for your continued confidence and support during what has been an unprecedented year in the global markets.
William C. Nygren, CFA
Portfolio Manager
oakwx@oakmark.com | | David G. Herro, CFA
Portfolio Manager
oakwx@oakmark.com | |
|
September 30, 2009
OAKMARK GLOBAL SELECT FUND
35
OAKMARK GLOBAL SELECT FUND
Global Diversification—September 30, 2009 (Unaudited)
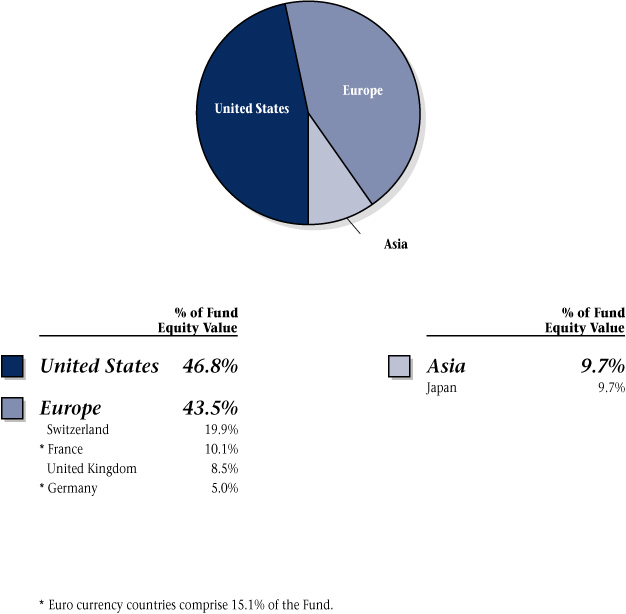
OAKMARK GLOBAL SELECT FUND
36
OAKMARK GLOBAL SELECT FUND
Schedule of Investments—September 30, 2009
| Name | | Description | | Shares Held | | Value | |
| Common Stocks—96.0% | |
| Apparel, Accessories & Luxury Goods—7.9% | |
Compagnie Financiere
Richemont SA
(Switzerland) | | Manufacturer & Retailer
of Luxury Goods | | | 742,000 | | | $ | 20,964,740 | | |
| Broadcasting—9.7% | |
Societe Television
Francaise 1 (France) | | Broadcasting & Cable TV | | | 1,462,000 | | | | 25,694,388 | | |
| Cable & Satellite—10.6% | |
Liberty Media Corp. -
Entertainment
(United States) (a) | | Television & On-line
Media Holdings | | | 535,000 | | | | 16,643,850 | | |
British Sky Broadcasting
Group PLC
(United Kingdom) | | Television Production &
Broadcasting | | | 1,277,000 | | | | 11,663,396 | | |
| | | | 28,307,246 | | |
| Computer & Electronics Retail—4.5% | |
Best Buy Co., Inc.
(United States) | | Computer & Electronics Retailer | | | 320,000 | | | | 12,006,400 | | |
| Movies & Entertainment—8.4% | |
Viacom, Inc., Class B
(United States) (a) | | Publishing Company | | | 484,000 | | | | 13,571,360 | | |
Time Warner, Inc.
(United States) | | Filmed Entertainment &
Television Networks | | | 303,333 | | | | 8,729,924 | | |
| | | | 22,301,284 | | |
| Asset Management & Custody Banks—3.8% | |
Schroders PLC
(United Kingdom) | | International Asset Management | | | 582,000 | | | | 10,166,255 | | |
| Consumer Finance—3.3% | |
Capital One Financial Corp.
(United States) | | Credit Card Products & Services
Provider | | | 245,000 | | | | 8,753,850 | | |
| Diversified Capital Markets—6.2% | |
| UBS AG (Switzerland) (a) | | Wealth Management & Investment
Banking | | | 903,400 | | | | 16,537,198 | | |
| Investment Banking & Brokerage—4.7% | |
Daiwa Securities Group, Inc.
(Japan) | | Stock Broker | | | 2,428,000 | | | | 12,523,411 | | |
OAKMARK GLOBAL SELECT FUND
37
OAKMARK GLOBAL SELECT FUND
Schedule of Investments—September 30, 2009 cont.
| Name | | Description | | Shares Held | | Value | |
| Common Stocks—96.0% (cont.) | |
| Other Diversified Financial Services—2.2% | |
Bank of America Corp.
(United States) | | Banking & Financial Services | | | 350,000 | | | $ | 5,922,000 | | |
| Pharmaceuticals—7.4% | |
Schering-Plough Corp.
(United States) | | Pharmaceuticals | | | 370,000 | | | | 10,452,500 | | |
Bristol-Myers Squibb Co.
(United States) | | Health & Personal Care | | | 405,000 | | | | 9,120,600 | | |
| | | | 19,573,100 | | |
| Human Resource & Employment Services—5.0% | |
| Adecco SA (Switzerland) | | Temporary Employment
Services | | | 252,400 | | | | 13,420,091 | | |
| Application Software—4.8% | |
| SAP AG (Germany) | | Develops Business Software | | | 261,500 | | | | 12,735,116 | | |
| Computer Hardware—4.2% | |
Dell, Inc.
(United States) (a) | | Technology Products & Services | | | 738,000 | | | | 11,261,880 | | |
| Semiconductors—13.3% | |
ROHM Co., Ltd. (Japan) Integrated Circuits &
Semiconductor Devices | |
Manufacturer | | | 176,500 | | | | 12,348,020 | | |
| Intel Corp. (United States) | | Computer Component
Manufacturer & Designer | | | 592,000 | | | | 11,585,440 | | |
Texas Instruments, Inc.
(United States) Designs & Supplies Digital
Signal Processing & Analog | |
Technologies | | | 485,000 | | | | 11,489,650 | | |
| | | | 35,423,110 | | |
| Total Common Stocks (Cost: $237,815,345) | | | | | | | | $ | 255,590,069 | | |
OAKMARK GLOBAL SELECT FUND
38
OAKMARK GLOBAL SELECT FUND
Schedule of Investments—September 30, 2009 cont.
| Name | | Par Value | | Value | |
| Short Term Investment—4.0% | |
| Repurchase Agreement—4.0% | |
Fixed Income Clearing Corp. Repurchase Agreement,
0.02% dated 9/30/2009 due 10/1/2009, repurchase
price $10,780,190, collateralized by an United States
Treasury Note, with a rate of 4.125%,with a
maturity of 8/15/10, and with a market value
plus accrued interest of $11,412,500 (Cost: $10,780,184) | | $ | 10,780,184 | | | $ | 10,780,184 | | |
| Total Short Term Investment (Cost: $10,780,184) | | | | $ | 10,780,184 | | |
| Total Investments (Cost: $248,595,529)—100.0% | | | | | 266,370,253 | | |
| Foreign Currencies (Cost: $114,832)—0.0% | | | | | 115,562 | | |
| Liabilities In Excess of Other Assets—0.0% | | | | | (238,966 | ) | |
| Total Net Assets—100% | | | | $ | 266,246,849 | | |
(a) Non income-producing security.
See accompanying Notes to Financial Statements.
OAKMARK GLOBAL SELECT FUND
39
OAKMARK INTERNATIONAL AND
OAKMARK INTERNATIONAL SMALL CAP FUNDS

Fellow Shareholders,
After an extremely unstable and frightening first six months of our fiscal year, equity markets around the globe have stabilized, and in our view, recovered. Your International Funds have performed well over this period—both in absolute terms and in comparison with their peers. Please see specific Fund write-ups for the details.
The Year in Review
I believe this wild ride had its roots in a U.S. Federal Reserve policy that kept interest rates too low for too long. As such, economic agents (consumers, banks and even government entities) around the world adapted to artificially low rates by altering their economic behavior. Most noticeably, they increased their debt levels, and found new ways to package and spread debt obligations globally. Unfortunately, the build-up of debt raised consumption and caused home prices to rise to unsustainable levels. It took the extraordinary economic crisis of last fall to finally stop spending growth. Consumer spending is now declining. This "new" change in behavior has led to widespread weakness in consumer goods purchases and the housing sector in many countries. Keep in mind that U.S. consumer spending has traditionally comprised 66-68% of GDP. Just before the crisis, it had risen to over 73% of GDP. Today, consumption makes up slightly less than 70 % of GDP. Where has the money gone? Well, the U.S. savings rate, which was flat before the economic downturn, has now reached 6%.
The impact of these exuberant behavioral changes were felt everywhere because financial institutions around the world owned this weak credit. Additionally, some places, like the U.K. and Ireland, experienced real estate bubbles similar to the United States. This mountain of leverage caused numerous well-known financial firms to collapse. Fears of a global financial meltdown severely damaged consumer sentiment in highly leveraged countries, like the U.S. and the U.K., and also in developing nations including those with high savings rates. Consumer spending dried up, throwing the entire global economy into recession, and the fear of financial calamity prompted businesses and consumers to adopt a new mantra: "cash is king."
Aggressive policy by the U.S. Federal Reserve, the U.S. Treasury and other global financial institutions brought relief by March. Led by improvements in the credit markets, equity markets began to recover. Since the equity markets hit lows in March, many pundits and traders have tried to anticipate the "precise bottom" of the market and have parked their assets in T-bills and money market deposits. Despite their reticence (or hubris), global equity markets rallied as fears of a financial collapse passed. Recent predictions for stronger economic growth, such as the IMF's projection of 3.1% global growth in 2010, indicate a cautious optimism. I believe that the global economic recovery will be uneven. The nations that overspent and were overleveraged will need to repair their balance sheets before spending can recover there. Nations with high savings rates, however, will not.
Given this unstable environment, you may wonder how we achieved our returns. First, we stuck to our philosophy by analyzing the underlying intrinsic value of our holdings and of our prospective investments. For instance, in late 2008, the conventional wisdom urged people to exit financial and consumer stocks, so the herd moved out of these sectors. We, however, remained focused on specific company valuation, and we ended up increasing our positions in these sectors. We bought companies that we thought had the financial strength to survive the crisis and even flourish once it ended, including Signet (retail), Credit Suisse and Julius Baer (financial). As usual, "the market" appeared to be distracted by short-term turmoil and ignored long-term value. Again, we believe that if we focus on companies' valuations and strengths, instead of broader price volatility, then we are more likely to succeed. Tumultuous times especially require discipline. Rather than running to what appears to be safe ground, we must value businesses as accurately as possible and have the determination to act on opportunities.
The Future....
No one can predict what will happen in the markets. That is why we use the macro environment, whether it is stable or unstable, to find the best investment opportunities, according to our value philosophy. We are extremely grateful to our shareholders who have weathered a remarkable storm and stuck with us through this memorable period of financial market history. We will continue to work hard to achieve satisfactory results through the investment cycle.
David G. Herro, CFA
Portfolio Manager
oakix@oakmark.com
oakex@oakmark.com
September 30, 2009
OAKMARK INTERNATIONAL AND OAKMARK INTERNATIONAL SMALL CAP FUNDS
40
OAKMARK INTERNATIONAL FUND
Report from David G. Herro and Robert A. Taylor, Portfolio Managers


THE VALUE OF A $10,000 INVESTMENT IN OAKMARK INTERNATIONAL FUND FROM ITS INCEPTION (9/30/92) TO PRESENT (9/30/09) AS COMPARED TO THE MSCI WORLD EX U.S. INDEX12 (UNAUDITED)
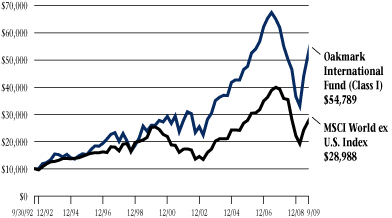
| | | | | Average Annual Total Returns
(as of 9/30/09) | |
| (Unaudited) | | Total Return
Last 3 Months* | | 1-year | | 5-year | | 10-year | | Since
Inception
(9/30/92) | |
Oakmark International
Fund (Class I) | | | 23.95 | % | | | 17.71 | % | | | 8.15 | % | | | 8.65 | % | | | 10.52 | % | |
| MSCI World ex U.S. | | | 19.36 | % | | | 2.89 | % | | | 6.53 | % | | | 3.02 | % | | | 6.46 | % | |
| MSCI EAFE13 | | | 19.47 | % | | | 3.23 | % | | | 6.07 | % | | | 2.54 | % | | | 6.16 | % | |
Lipper International
Fund Index14 | | | 19.80 | % | | | 4.05 | % | | | 7.19 | % | | | 3.97 | % | | | 7.43 | % | |
The graph and table do not reflect the deduction of taxes that a shareholder would pay on fund distributions or the redemption of fund shares.
The expense ratio for Class I shares as of 9/30/08 was 1.10%.
The performance data quoted represents past performance. The above performance information for the Fund does not reflect the imposition of a 2% redemption fee on shares redeemed within 90 days. If reflected, the fee would reduce the performance quoted. Past performance does not guarantee future results. The investment return and principal value will fluctuate so that an investor's shares, when redeemed, may be worth more or less than their original cost. Current performance may be lower or higher than the performance data quoted. Average annual total return measures annualized change, while total return measures aggregate change. To obtain most recent month-end performance data, visit oakmark.com.
* Not annualized
What a volatile, interesting year it has been! A year ago, we wrote about weakening global credit markets, contracting liquidity, declining consumer confidence and failing financial giants like Lehman Brothers. Although our current environment remains unclear, the market seems to have returned from what some called the brink of disaster.
We are happy to report that the Oakmark International Fund returned 18% for the year ended September 30, 2009, compared to the MSCI World ex U.S. Index, which returned 3% over the same period. The Fund has returned 50% year to date and 24% for the quarter, compared to the MSCI World ex U.S. Index's returns of 30% and 19%, respectively. Most importantly, the Fund has returned an average of 11% per year since its inception in September 1992, outperforming the MSCI World ex U.S. Index, which has averaged 6% per year over the same period.
We have written about Signet Jewelers in the past four consecutive Fund commentaries; so let's make it a fifth. Signet Jewelers was the largest contributor to the Fund's return over the last year. Although its 12.6% return over this period does not seem outstanding, the holding contributed so much to performance because we took advantage of its significant price weakness and bought additional shares throughout the year. Signet's management continues to deliver on its targeted $100 million expense-reduction plan in the U.S., which it initiated to help offset declining sales. Signet's differentiated merchandise and exclusive offerings, like the Russell Simmons line or Jane Seymour's Open Heart Necklace, have helped Signet consistently outperform its peers. Although these exclusive lines are only slightly more profitable than regular offerings, they enable Signet to stand out relative to peers and increase foot traffic and sales. Signet's conti nued strength will likely enable the company to get a first look at future exclusive product lines which may further support their outperformance. Signet returned 26.5% during the most recent quarter, and even though the company's performance has been volatile over the past year, we maintain our positive, long-term outlook on the stock and believe it will emerge from this downturn in an exceptionally strong competitive position.
The largest detractor from the Fund's performance over the past year was Lloyds Banking
OAKMARK INTERNATIONAL FUND
41
Group. Although Lloyds seemed to be successfully navigating the economic crisis, the company's balance sheet and financial strength suffered as a result of its purchase of HBOS. We believed that the bad debt and risky assets that came with HBOS would damage Lloyds' reputation and financial security, and we viewed the purchase as significantly changing our original investment thesis. As such, we sold our investment in Lloyds in May 2009. Another security that detracted from the Fund's performance for the year was Daiwa Securities Group, which was down 25%. Daiwa has been hurt by numerous factors including decreased equity and capital market activity given the global financial crisis. Additionally, shares reacted to news that Daiwa had ended its investment banking joint venture with Sumitomo Mitsui Financial Group (SMFG). Daiwa raised a significant amount of new equity to finance its purchase of SMFG's stake in the joint venture. Although we r educed our estimate of Daiwa's intrinsic value after the transaction, the share price dropped well below our new estimate of the company's value. Finally, Daiwa's balance sheet remains well capitalized during this uncertain time and should more than adequately cover any new regulatory demands for improved balance sheet strength. We maintain our belief that Daiwa is a powerful brand, and the stock continues to trade at a significant discount to the company's fair value. For these reasons, Daiwa has remained in our portfolio.
We had numerous changes to the portfolio during the past quarter. In addition to selling our positions in ASML Holding and Kone OYJ, we purchased six new names into the Fund, four of which the Fund has owned before: Heineken Holding, a Dutch-based producer and distributor of beer, wine, spirits and soft drinks; L'Oreal, a French manufacturer, marketer and distributor of personal care products; Reed Elsevier, a U.K.-based professional service provider; and Rolls-Royce, a U.K.-based global power systems provider with significant operations in civil aerospace, military aerospace, marine, and energy sectors. Other additions include Foster's Group, an Australian-based beer and wine manufacturer of brands such as Penfolds, Beringer, Victoria Bitter, and Carlton; and Unilever plc, a global consumer products manufacturer.
Our geographical composition changed only slightly over the past year. We decrease our European holdings to approximately 77% and our Asia exposure to approximately 16%. We increased our Latin and North America exposure to 7%, and the remainder, excluding cash, is invested in the Middle East.
Due to the weakening dollar during the past quarter, we initiated a 15% hedge of our underlying euro exposure, and at quarter end, approximately 19% of the Fund's Japanese yen and 28% of the Fund's Swiss franc exposures were hedged.
The global equity markets have been extremely volatile over the past year. While this volatility has negatively impacted returns of some Fund holdings, it has also presented opportunities for us to purchase high-quality names at extremely distressed prices. We remain confident in our long-term value approach and are thankful to you, our shareholders, for your continued support.
David G. Herro, CFA
Portfolio Manager
oakix@oakmark.com | | Robert A. Taylor, CFA
Portfolio Manager
oakix@oakmark.com | |
|
September 30, 2009
OAKMARK INTERNATIONAL FUND
42
OAKMARK INTERNATIONAL FUND
Global Diversification—September 30, 2009 (Unaudited)
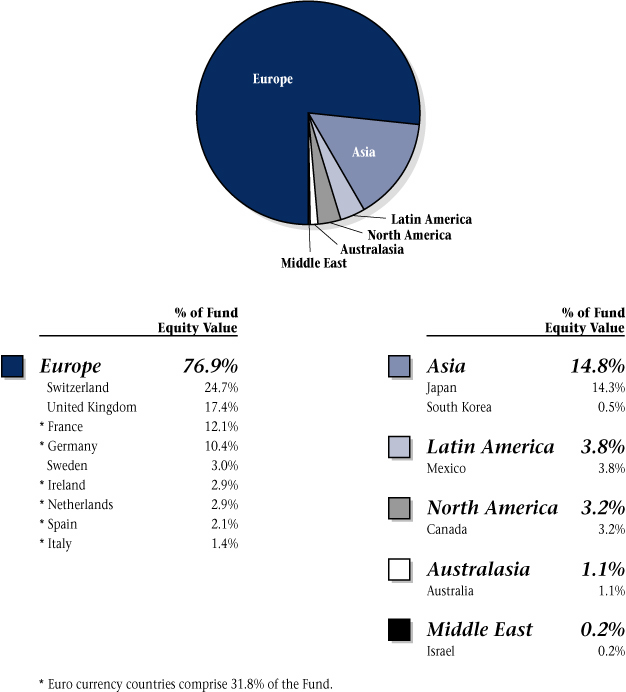
OAKMARK INTERNATIONAL FUND
43
OAKMARK INTERNATIONAL FUND
Schedule of Investments—September 30, 2009
| Name | | Description | | Shares Held | | Value | |
| Common Stocks—95.7% | |
| Advertising—2.6% | |
Publicis Groupe
(France) | | Advertising & Media Services | | | 2,730,843 | | | $ | 109,535,192 | | |
| Apparel, Accessories & Luxury Goods—8.7% | |
Compagnie Financiere
Richemont SA
(Switzerland) | | Manufacturer & Retailer of
Luxury Goods | | | 5,096,000 | | | | 143,984,252 | | |
Swatch Group AG, Bearer
Shares (Switzerland) | | Watch Manufacturer | | | 398,700 | | | | 93,913,606 | | |
LVMH Moet Hennessy
Louis Vuitton SA
(France) | | Diversified Luxury Goods
Conglomerate | | | 659,900 | | | | 66,370,085 | | |
Luxottica Group SpA
(Italy) | | Manufacturer & Retailer of
Eyeglass Frames & Sunglasses | | | 2,195,915 | | | | 56,877,002 | | |
| | | | 361,144,945 | | |
| Automobile Manufacturers—6.9% | |
Toyota Motor Corp.
(Japan) | | Automobile Manufacturer | | | 2,493,400 | | | | 99,163,794 | | |
Daimler AG Registered
(Germany) | | Automobile Manufacturer | | | 1,920,000 | | | | 96,665,320 | | |
Bayerische Motoren
Werke (BMW) AG
(Germany) | | Luxury Automobile Manufacturer | | | 1,659,600 | | | | 80,021,511 | | |
Honda Motor Co., Ltd.
(Japan) | | Automobile & Motorcycle
Manufacturer | | | 394,300 | | | | 12,145,486 | | |
| | | | 287,996,111 | | |
| Broadcasting—7.2% | |
Societe Television
Francaise 1 (France) | | Broadcasting & Cable TV | | | 7,127,000 | | | | 125,255,749 | | |
Grupo Televisa SA
(Mexico) (b) | | Television Production &
Broadcasting | | | 4,763,000 | | | | 88,544,170 | | |
Gestevision Telecinco SA
(Spain) | | Television Production &
Broadcasting | | | 6,730,395 | | | | 84,897,661 | | |
| | | | 298,697,580 | | |
OAKMARK INTERNATIONAL FUND
44
OAKMARK INTERNATIONAL FUND
Schedule of Investments—September 30, 2009 cont.
| Name | | Description | | Shares Held | | Value | |
| Common Stocks—95.7% (cont.) | |
| Cable & Satellite—2.0% | |
British Sky Broadcasting
Group PLC
(United Kingdom) | | Television Production &
Broadcasting | | | 8,934,800 | | | $ | 81,605,410 | | |
| Publishing—3.2% | |
Thomson Reuters Corp.
(Canada) | | Electronic Information &
Solutions Company | | | 1,845,400 | | | | 61,878,168 | | |
Reed Elsevier PLC
(United Kingdom) | | Publisher & Information Provider | | | 7,936,100 | | | | 59,394,902 | | |
Johnston Press PLC
(United Kingdom) (a) | | Newspaper Publishing | | | 20,044,256 | | | | 12,012,657 | | |
| | | | 133,285,727 | | |
| Restaurants—3.8% | |
Compass Group PLC
(United Kingdom) | | International Foodservice Group
Operator | | | 13,678,200 | | | | 83,570,140 | | |
| Sodexo (France) | | Food and Facilities Management
Services | | | 1,254,400 | | | | 75,150,485 | | |
| | | | 158,720,625 | | |
| Specialty Stores—3.0% | |
Signet Jewelers, Ltd.
(United Kingdom) (c) | | Jewelry Retailer | | | 4,659,636 | | | | 122,688,216 | | |
| Brewers—1.3% | |
Foster's Group, Ltd.
(Australia) Manufactures & Markets
Alcoholic & Non-Alcoholic | |
Beverages | | | 8,599,300 | | | | 42,103,972 | | |
Heineken Holdings NV
(Netherlands) | | Produces Beers, Spirits, Wines, &
Soft Drinks | | | 265,100 | | | | 10,813,655 | | |
| | | | 52,917,627 | | |
| Distillers & Vintners—1.7% | |
Diageo PLC
(United Kingdom) | | Beverages, Wines, & Spirits
Manufacturer | | | 4,623,500 | | | | 70,934,902 | | |
OAKMARK INTERNATIONAL FUND
45
OAKMARK INTERNATIONAL FUND
Schedule of Investments—September 30, 2009 cont.
| Name | | Description | | Shares Held | | Value | |
| Common Stocks—95.7% (cont.) | |
| Packaged Foods & Meats—2.0% | |
| Nestle SA (Switzerland) | | Food & Beverage Manufacturer | | | 1,491,400 | | | $ | 63,553,241 | | |
Unilever PLC
(United Kingdom) | | Food & Consumer Goods
Manufacturer | | | 751,600 | | | | 21,356,811 | | |
| | | | 84,910,052 | | |
| Personal Products—0.8% | |
| L'Oreal SA (France) | | Manufactures & Markets
Health & Beauty Products | | | 335,300 | | | | 33,340,409 | | |
| Soft Drinks—1.5% | |
Fomento Economico
Mexicano S.A.B. de C.V.
(Mexico) (b) | | Beverage Company | | | 1,676,300 | | | | 63,783,215 | | |
| Oil & Gas Exploration & Production—1.3% | |
| EnCana Corp. (Canada) | | Develops, Produces, &
Markets Natural Gas | | | 955,800 | | | | 55,063,638 | | |
| Asset Management & Custody Banks—2.1% | |
Schroders PLC
(United Kingdom) | | International Asset Management | | | 4,899,600 | | | | 85,585,200 | | |
| Diversified Banks—3.0% | |
| BNP Paribas (France) | | Commercial Bank | | | 843,762 | | | | 67,415,616 | | |
Bank of Ireland
(Ireland) (a) | | Commercial Bank | | | 11,274,378 | | | | 56,424,355 | | |
BNP Paribas Rights
(France) (a) | | Commercial Bank | | | 843,762 | | | | 1,827,383 | | |
| | | | 125,667,354 | | |
| Diversified Capital Markets—5.5% | |
| UBS AG (Switzerland) (a) | | Wealth Management &
Investment Banking | | | 6,290,000 | | | | 115,141,658 | | |
Credit Suisse Group
(Switzerland) | | Wealth Management &
Investment Banking | | | 2,022,400 | | | | 112,214,609 | | |
| | | | 227,356,267 | | |
| Investment Banking & Brokerage—3.0% | |
Daiwa Securities Group,
Inc. (Japan) | | Stock Broker | | | 24,320,000 | | | | 125,440,428 | | |
| Multi-line Insurance—3.6% | |
Allianz SE Registered
(Germany) | | Insurance, Banking &
Financial Services | | | 1,184,700 | | | | 147,999,952 | | |
OAKMARK INTERNATIONAL FUND
46
OAKMARK INTERNATIONAL FUND
Schedule of Investments—September 30, 2009 cont.
| Name | | Description | | Shares Held | | Value | |
| Common Stocks—95.7% (cont.) | |
| Pharmaceuticals—4.5% | |
| Novartis AG (Switzerland) | | Pharmaceuticals | | | 2,217,600 | | | $ | 110,954,897 | | |
GlaxoSmithKline PLC
(United Kingdom) | | Pharmaceuticals | | | 3,902,900 | | | | 76,689,135 | | |
| | | | 187,644,032 | | |
| Aerospace & Defense—0.3% | |
Rolls-Royce Group PLC
(United Kingdom) (a) | | Manufactures Aero, Marine &
Industrial Gas Turbines | | | 1,851,300 | | | | 13,929,359 | | |
| Building Products—3.2% | |
Assa Abloy AB, Series B
(Sweden) | | Develops, Designs, &
Manufactures Security Locks | | | 5,477,300 | | | | 89,018,352 | | |
Geberit AG,
Registered Shares
(Switzerland) | | Building Products | | | 280,915 | | | | 43,155,137 | | |
| | | | 132,173,489 | | |
| Human Resource & Employment Services—2.5% | |
| Adecco SA (Switzerland) | | Temporary Employment Services | | | 1,916,500 | | | | 101,900,174 | | |
| Industrial Conglomerates—2.2% | |
Tyco International, Ltd.
(Switzerland) | | Security Products &
Services Provider | | | 1,458,800 | | | | 50,299,424 | | |
Koninklijke (Royal)
Philips Electronics NV
(Netherlands) | | Electronics Manufacturer | | | 1,644,100 | | | | 40,034,043 | | |
| | | | 90,333,467 | | |
| Industrial Machinery—0.8% | |
Atlas Copco AB,
Series B (Sweden) | | Industrial Equipment Manufacturer | | | 2,804,300 | | | | 31,979,724 | | |
| Marine—1.4% | |
Kuehne + Nagel
International AG
(Switzerland) | | Sea, Land, & Rail Freight
Transportation Businesses | | | 659,100 | | | | 57,272,947 | | |
| Railroads—0.2% | |
Canadian National
Railway Co. (Canada) | | Railroad Transportation | | | 183,200 | | | | 8,974,968 | | |
| Research & Consulting Services—2.5% | |
Experian Group, Ltd.
(Ireland) | | Credit & Marketing Services | | | 7,104,200 | | | | 59,776,631 | | |
OAKMARK INTERNATIONAL FUND
47
OAKMARK INTERNATIONAL FUND
Schedule of Investments—September 30, 2009 cont.
| Name | | Description | | Shares Held | | Value | |
| Common Stocks—95.7% (cont.) | |
| Research & Consulting Services—2.5% (cont.) | |
| Meitec Corp. (Japan) (c) | | Software Engineering Services | | | 2,475,100 | | | $ | 42,021,416 | | |
| | | | 101,798,047 | | |
| Security & Alarm Services—1.5% | |
| G4S PLC (United Kingdom) | | Security Services | | | 17,992,500 | | | | 63,432,949 | | |
| Application Software—2.1% | |
| SAP AG (Germany) | | Develops Business Software | | | 1,787,700 | | | | 87,061,443 | | |
| Electronic Components—2.5% | |
| OMRON Corp. (Japan) | | Component, Equipment, &
System Manufacturer | | | 5,453,200 | | | | 102,910,052 | | |
| Electronic Equipment & Instruments—0.2% | |
| Orbotech, Ltd. (Israel) (a) | | Optical Inspection Systems | | | 1,056,300 | | | | 9,987,316 | | |
| Office Electronics—2.2% | |
| Canon, Inc. (Japan) | | Computers & Information | | | 2,270,200 | | | | 91,804,445 | | |
| Semiconductors—2.8% | |
| ROHM Co., Ltd. (Japan) | | Integrated Circuits & Semiconductor
Devices Manufacturer | | | 1,348,700 | | | | 94,355,662 | | |
Samsung Electronics
Co., Ltd. (South Korea) | | Consumer & Industrial Electronic
Equipment Manufacturer | | | 31,200 | | | | 21,581,159 | | |
| | | | 115,936,821 | | |
| Diversified Chemicals—1.5% | |
Akzo Nobel NV
(Netherlands) | | Produces & Markets Chemicals,
Coatings, & Paints | | | 1,008,100 | | | | 62,452,681 | | |
| Specialty Chemicals—2.1% | |
| Givaudan SA (Switzerland) | | Manufactures & Markets Fragrances | | | 116,599 | | | | 87,423,934 | | |
| Total Common Stocks (Cost: $3,613,977,420) | | | | | | | | $ | 3,973,688,698 | | |
OAKMARK INTERNATIONAL FUND
48
OAKMARK INTERNATIONAL FUND
Schedule of Investments—September 30, 2009 cont.
| Name | | Par Value | | Value | |
| Short Term Investment—3.8% | |
| Repurchase Agreement—3.8% | |
Fixed Income Clearing Corp. Repurchase Agreement,
0.02% dated 9/30/2009 due 10/1/2009, repurchase
price $156,154,939, collateralized by a Federal Home
Loan Mortgage Corp. Bond, with a rate of 1.625%,
with a maturity of 7/22/2011, and with a market value
plus accrued interest of $159,280,069 (Cost: $156,154,852) | | $ | 156,154,852 | | | $ | 156,154,852 | | |
| Total Short Term Investment (Cost: $156,154,852) | | | | $ | 156,154,852 | | |
| Total Investments (Cost: $3,770,132,272)—99.5% | | | | | 4,129,843,550 | | |
| Foreign Currencies (Cost: $817,322)—0.0% | | | | | 819,702 | | |
| Other Assets In Excess of Liabilities—0.5% | | | | | 22,561,257 | | |
| Total Net Assets—100% | | | | $ | 4,153,224,509 | | |
(a) Non income-producing security.
(b) Represents a Sponsored American Depositary Receipt.
(c) See Note 5 in the Notes to the Financial Statements regarding investments in affiliated issuers.
See accompanying Notes to Financial Statements.
OAKMARK INTERNATIONAL FUND
49
OAKMARK INTERNATIONAL
SMALL CAP FUND
Report from David G. Herro, Portfolio Manager

THE VALUE OF A $10,000 INVESTMENT IN OAKMARK INT'L SMALL CAP FUND FROM 9/30/99 TO PRESENT (9/30/09) AS COMPARED TO MSCI WORLD EX U.S. SMALL CAP15 AND MSCI WORLD EX U.S.12 INDEXES (UNAUDITED)†
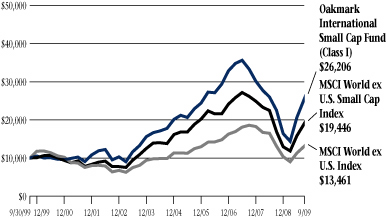
| | | | | Average Annual Total Returns
(as of 9/30/09) | |
| (Unaudited) | | Total Return
Last 3 Months* | | 1-year | | 5-year | | 10-year | | Since
Inception
(11/1/95) | |
Oakmark International
Small Cap Fund
(Class I) | | | 26.90 | % | | | 16.28 | % | | | 8.10 | % | | | 10.11 | % | | | 10.57 | % | |
MSCI World ex U.S.
Small Cap | | | 22.91 | % | | | 14.75 | % | | | 7.12 | % | | | 6.88 | % | | N/A | |
| MSCI World ex U.S. | | | 19.36 | % | | | 2.89 | % | | | 6.53 | % | | | 3.02 | % | | | 5.29 | % | |
Lipper International
Small Cap Index16 | | | 21.29 | % | | | 9.48 | % | | | 8.39 | % | | | 7.91 | % | | N/A | |
The graph and table do not reflect the deduction of taxes that a shareholder would pay on fund distributions or the redemption of fund shares.
The expense ratio for Class I shares as of 9/30/08 was 1.41%.
The performance data quoted represents past performance. The above performance information for the Fund does not reflect the imposition of a 2% redemption fee on shares redeemed within 90 days. If reflected, the fee would reduce the performance quoted. Past performance does not guarantee future results. The investment return and principal value will fluctuate so that an investor's shares, when redeemed, may be worth more or less than their original cost. Current performance may be lower or higher than the performance data quoted. Average annual total return measures annualized change, while total return measures aggregate change. To obtain most recent month-end performance data, visit oakmark.com.
* Not annualized
The Oakmark International Small Cap Fund returned 27% for the quarter ended September 30, 2009, compared to the MSCI World ex U.S. Small Cap Index, which rose 23%, and the MSCI World ex U.S. Index, which increased 19%. For the fiscal year ended September 30, the Fund returned 16% while the MSCI World ex U.S. Small Cap and the MSCI World ex U.S. Index returned 15% and 3%, respectively. Since inception, your Fund has earned an annualized return of 11%, compared to the MSCI World ex U.S. Index, which has returned 5% for the same period.
Global markets continued to recover, and consequently the Fund's U.K. holdings performed well in both the quarter and one-year time periods. In particular, LSL Property Services, a leading provider of residential appraisal and brokerage services, was the largest contributor to Fund performance for both periods, returning 61% for the quarter and 185% over the past twelve months. You may recall that in our March 31 report we discussed our reasons for owning LSL. We believed LSL's strong balance sheet and business model were superior to its peers' and that it was well positioned to win market share when the U.K. housing market recovered. Indeed, LSL reported very strong second quarter results due to its gains in market share, cost cutting actions and new business initiatives. We believe that LSL will continue to benefit from a further rebound in the U.K. real estate market.
Rheinmetall, a German defense company and automotive parts supplier, was another strong performer during the past year and most recent quarter. During Harris Associates' 33-year history, we often have discovered value in diversified companies in which one division's poor results obscure both the success and the value of another, and Rheinmetall is such a case. The automotive industry's problems had caused Rheinmetall's share price to fall considerably from its mid-2006 peak. While the automotive parts division remains substantial, we estimate that the automotive component comprises only 20% of the company's total enterprise value. In contrast, the defense division has tripled its profitability over the past five years because of operational enhancements, an improved business mix and lucrative new contracts. All of these factors have boosted the company's performance over the
OAKMARK INTERNATIONAL SMALL CAP FUND
50
past year. Given the current negative investment environment for anything related to automobiles, Rheinmetall's shares sell for less than their accounting book value. We estimate that the share price reflects only the defense division's business value, which means we are able to own the automotive parts business for less than zero.
BBA Aviation operates Signature, the dominant network of Fixed Based Operations (FBOs) for the re-fueling of noncommercial aircrafts both in the U.S. and in international markets. This industry has very limited competition and has benefited from continually increasing usage. The company generates sustainable profit growth and has little capital requirements. The current management team is led by CEO Simon Price, who joined the company in '07. Since his arrival, management cleaned up BBA's outdated portfolio of businesses and has focused on creating value for shareholders. Short-term concerns over the cyclical nature of general aviation traffic gave us a unique opportunity to build up our position in this well-run, high-quality business at attractive prices. As macro-economic fears started to dissipate, markets have recognized the value of these unique assets, as evidenced by the stock bouncing back from its December 2008 low and returning 37 % in the third quarter and 39% over the fiscal year 2009.
The largest detractor from the Fund's performance over the past year was Carnegie AB, the Swiss investment banking and asset management group. As we discussed in a previous report, Carnegie stopped trading on November 10 after Sweden's Financial Services Authority revoked Carnegie's banking licenses and, in coordination with the National Debt Office, seized control of its operating assets. Another large detractor was Japanese brokerage firm Ichiyoshi Securities. Ichiyoshi's share price has been weakened because of the company's direct ties to the volatile Japanese market. Further, the Japanese market performed poorly over the past quarter, and this hurt the share price.
We added numerous securities from across the globe to the Fund this quarter, including Mainfreight, a New Zealand freight forwarding services firm and a former Fund holding. From France, we added Bureau Veritas, a leading inspection and verification firm. Other additions include Nifco, a Japanese manufacturer of synthetic resinous fasteners and plastic components for home electronics appliances and automobiles; ElringKlinger, a German manufacturer of original equipment and parts for automobiles; and Coca-Cola Femsa, the largest Coke bottler in Mexico. We sold our holdings in Chargeurs and Raymarine during this past quarter.
These changes to the portfolio during the quarter shifted the Fund's geographic weighting. European holdings decreased to approximately 71%. The Pacific Rim holdings ended the quarter at 25%, while North American and Latin American holdings comprised 2% each.
We continue to hedge some of the Fund's currency exposure. At the recent quarter end, approximately 30% of the Fund's Swiss franc, 14% of the euro and 18% of the Japanese yen exposures were hedged.
During this year of volatility we thank shareholders for your continued confidence and support. We remain committed to finding attractive, undervalued foreign companies with management teams that are dedicated to building shareholder value.
David G. Herro, CFA
Portfolio Manager
oakex@oakmark.com | |
|
September 30, 2009
† Prior to January 1, 2009, the Fund's primary benchmark was the MSCI World ex U.S. Index, an unmanaged index that includes countries throughout the world, excluding the U.S., in proportion to world stock market capitalization. The Fund changed its primary benchmark because the MSCI World ex U.S. Small Cap Index reached its tenth anniversary on December 31, 2008 and now provides an historical perspective to make a more meaningful comparison given the small cap focus of the Fund.
OAKMARK INTERNATIONAL SMALL CAP FUND
51
OAKMARK INTERNATIONAL SMALL CAP FUND
Global Diversification—September 30, 2009 (Unaudited)

OAKMARK INTERNATIONAL SMALL CAP FUND
52
OAKMARK INTERNATIONAL SMALL CAP FUND
Schedule of Investments—September 30, 2009
| Name | | Description | | Shares Held | | Value | |
| Common Stocks—95.0% | |
| Advertising—1.7% | |
| Asatsu-DK, Inc. (Japan) | | Advertising Services Provider | | | 619,000 | | | $ | 13,067,509 | | |
| Apparel, Accessories & Luxury Goods—2.7% | |
| Bulgari SpA (Italy) | | Jewelry Manufacturer & Retailer | | | 2,698,800 | | | | 20,852,231 | | |
| Auto Parts & Equipment—0.1% | |
ElringKlinger AG (Germany) Manufactures & Distributes
Original Equipment &
Replacement Parts For | |
Automobiles | | | 54,600 | | | | 1,120,981 | | |
| Automotive Retail—1.6% | |
| USS Co., Ltd. (Japan) | | Used Car Auction Facility Manager | | | 202,400 | | | | 12,063,053 | | |
| Broadcasting—6.8% | |
Media Prima Berhad
(Malaysia) (b) | | Film Producer & Sports Promoter | | | 42,704,400 | | | | 19,865,381 | | |
Ten Network Holdings, Ltd.
(Australia) | | Operates Commercial Television
Stations | | | 12,874,500 | | | | 16,468,929 | | |
M6 Metropole Television
(France) | | Television Entertainment Channel
Owner & Operator | | | 595,800 | | | | 15,667,384 | | |
| | | | 52,001,694 | | |
| Home Furnishing Retail—2.8% | |
Beter Bed Holding NV
(Netherlands) | | Bedroom Furniture Retailer | | | 936,070 | | | | 18,081,321 | | |
Fourlis Holdings SA
(Greece) | | Wholesales Electric & Electronic
Appliances | | | 232,700 | | | | 3,657,199 | | |
| | | | 21,738,520 | | |
| Home Improvement Retail—2.3% | |
Carpetright PLC
(United Kingdom) | | Carpet Retailer | | | 1,354,000 | | | | 17,321,994 | | |
| Household Appliances—0.6% | |
| Rational AG (Germany) | | Manufactures & Markets Food
Preparation Appliances | | | 30,100 | | | | 4,214,839 | | |
| Movies & Entertainment—0.6% | |
CTS Eventim AG
(Germany) | | Entertainment Tickets Producer &
Distributor | | | 109,078 | | | | 4,941,810 | | |
| Photographic Products—2.3% | |
Vitec Group PLC
(United Kingdom) (b) | | Photo Equipment & Supplies | | | 3,035,979 | | | | 17,709,631 | | |
OAKMARK INTERNATIONAL SMALL CAP FUND
53
OAKMARK INTERNATIONAL SMALL CAP FUND
Schedule of Investments—September 30, 2009 cont.
| Name | | Description | | Shares Held | | Value | |
| Common Stocks—95.0% (cont.) | |
| Publishing—0.7% | |
| Tamedia AG (Switzerland) | | TV Broadcasting & Publishing | | | 73,481 | | | $ | 5,601,659 | | |
| Specialty Stores—1.2% | |
JJB Sports PLC
(United Kingdom) (a) (b) | | Sportswear & Sports Equipment
Retailer | | | 17,927,180 | | | | 9,239,736 | | |
| Household Products—0.1% | |
Kimberly-Clark de Mexico
S.A.B. de C.V. (Mexico) | | Hygiene Products Manufacturer,
Marketer & Distributor | | | 250,000 | | | | 1,048,566 | | |
| Packaged Foods & Meats—3.1% | |
Goodman Fielder, Ltd.
(Australia) | | Produces Food Products | | | 8,471,200 | | | | 12,480,397 | | |
Alaska Milk Corp.
(Philippines) (b) | | Milk Producer | | | 56,360,000 | | | | 6,304,517 | | |
Binggrae Co., Ltd.
(South Korea) | | Dairy Products Manufacturer | | | 127,400 | | | | 4,644,031 | | |
| | | | 23,428,945 | | |
| Soft Drinks—1.1% | |
Britvic PLC
(United Kingdom) | | Soft Drink Manufacturer & Marketer | | | 1,051,900 | | | | 5,925,861 | | |
Coca-Cola Femsa S.A.B
de C.V. (Mexico) (c) | | Bottles & Distributes Branded
Beverages | | | 59,100 | | | | 2,842,710 | | |
| | | | 8,768,571 | | |
| Asset Management & Custody Banks—6.0% | |
Julius Baer Holding AG
(Switzerland) | | Asset Management | | | 546,100 | | | | 27,270,747 | | |
| MLP AG (Germany) | | Asset Management | | | 1,615,300 | | | | 18,744,518 | | |
| | | | 46,015,265 | | |
| Investment Banking & Brokerage—1.7% | |
Ichiyoshi Securities Co.,
Ltd. (Japan) | | Stock Broker | | | 1,902,200 | | | | 13,053,587 | | |
D. Carnegie & Co. AB
(Sweden) (a) (d) | | Diversified Financials Services | | | 2,314,000 | | | | 0 | | |
| | | | 13,053,587 | | |
| Life & Health Insurance—0.4% | |
Amil Participacoes SA
(Brazil) | | Provides Health Insurance &
Related Services | | | 569,600 | | | | 3,121,933 | | |
OAKMARK INTERNATIONAL SMALL CAP FUND
54
OAKMARK INTERNATIONAL SMALL CAP FUND
Schedule of Investments—September 30, 2009 cont.
| Name | | Description | | Shares Held | | Value | |
| Common Stocks—95.0% (cont.) | |
| Real Estate Services—3.2% | |
LSL Property Services PLC
(United Kingdom) (a) (b) | | Residential Property Service
Provider | | | 6,569,064 | | | $ | 24,329,944 | | |
| Health Care Supplies—2.2% | |
| Ansell, Ltd. (Australia) | | Manufactures Latex | | | 1,952,255 | | | | 17,222,791 | | |
| Life Sciences Tools & Services—1.8% | |
| MDS, Inc. (Canada) (a) | | Products & Services for Medical
Product Manufacturing | | | 1,702,000 | | | | 13,941,568 | | |
| Air Freight & Logistics—3.4% | |
Freightways, Ltd.
(New Zealand) (b) | | Express Package Services | | | 5,657,300 | | | | 12,543,105 | | |
Panalpina Welttransport
Holding AG
(Switzerland) | | Freight Shipping & Supply Chain
Management Services | | | 115,500 | | | | 9,540,481 | | |
Mainfreight, Ltd.
(New Zealand) | | Provides & Supplies Freight,
Warehousing & Logistics Services | | | 1,027,300 | | | | 3,946,993 | | |
| | | | 26,030,579 | | |
| Airport Services—2.8% | |
BBA Aviation PLC
(United Kingdom) | | Flight Support & Aftermarket
Services & Systems Provider | | | 8,658,600 | | | | 21,905,162 | | |
| Building Products—2.1% | |
Kaba Holding AG
(Switzerland) | | Provides Mechanical & Electronic
Security Systems | | | 64,786 | | | | 15,879,228 | | |
| Human Resource & Employment Services—5.6% | |
Pasona Group, Inc.
(Japan) (b) | | Placement Service Provider | | | 23,842 | | | | 17,583,027 | | |
Michael Page
International PLC
(United Kingdom) | | Recruitment Consultancy Services | | | 2,438,600 | | | | 13,040,204 | | |
Robert Walters PLC
(United Kingdom) | | International Recruitment
Company | | | 3,787,900 | | | | 12,515,895 | | |
| | | | 43,139,126 | | |
| Industrial Conglomerates—3.4% | |
| Rheinmetall AG (Germany) | | Automotive Pump Manufacturer | | | 390,900 | | | | 23,144,055 | | |
Tomkins PLC
(United Kingdom) | | International Manufacturing | | | 1,047,500 | | | | 3,157,284 | | |
| | | | 26,301,339 | | |
OAKMARK INTERNATIONAL SMALL CAP FUND
55
OAKMARK INTERNATIONAL SMALL CAP FUND
Schedule of Investments—September 30, 2009 cont.
| Name | | Description | | Shares Held | | Value | |
| Common Stocks—95.0% (cont.) | |
| Industrial Machinery—9.2% | |
Interpump Group SpA
(Italy) (a) (b) | | Pump & Piston Manufacturer | | | 4,169,700 | | | $ | 26,710,306 | | |
| Duerr AG (Germany) | | Automotive Industry Machinery
Manufacturer | | | 691,800 | | | | 13,059,248 | | |
| GEA Group AG (Germany) | | Engineering Services Provider | | | 420,000 | | | | 8,764,290 | | |
IMI PLC (United Kingdom)
| | Manufactures Merchandise Displays,
Ventilation & Air Conditioning
Equipment | | | 1,194,800 | | | | 8,546,793 | | |
Bobst Group AG
(Switzerland) (a) | | Manufactures Printing Presses &
Packaging Producing Machinery | | | 217,400 | | | | 8,370,414 | | |
Schindler Holding AG
(Switzerland)
| | Manufactures & Installs Elevators,
Escalators, & Moving Walkways
Internationally | | | 72,100 | | | | 4,943,264 | | |
| | | | 70,394,315 | | |
| Office Services & Supplies—3.2% | |
Sperian Protection (France)
| | Manufactures Protection Equipment
For People In Hazardous Work
Environments | | | 318,100 | | | | 24,419,674 | | |
| Research & Consulting Services—1.2% | |
| Bureau Veritas SA (France) | | Provides Consulting Services | | | 106,600 | | | | 6,015,090 | | |
| Cision AB (Sweden) (a) | | Business & Communication
Intelligence | | | 3,139,100 | | | | 3,264,572 | | |
| | | | 9,279,662 | | |
| Application Software—1.5% | |
Exact Holding N.V.
(Netherlands) | | Develops & Markets Business
Software | | | 437,846 | | | | 11,488,136 | | |
| Computer Hardware—2.7% | |
Wincor Nixdorf AG
(Germany) | | Banking Machines & Cash Registers
Manufacturer | | | 319,700 | | | | 20,589,316 | | |
| Electronic Components—0.1% | |
Hirose Electric Co., Ltd.
(Japan) | | Develops & Sells Electronic
Equipment | | | 7,800 | | | | 879,363 | | |
| Electronic Equipment & Instruments—2.2% | |
| Orbotech, Ltd. (Israel) (a) | | Optical Inspection Systems | | | 1,066,200 | | | | 10,080,921 | | |
Domino Printing
Sciences PLC
(United Kingdom) | | Printing Equipment | | | 1,519,690 | | | | 7,069,930 | | |
| | | | 17,150,851 | | |
OAKMARK INTERNATIONAL SMALL CAP FUND
56
OAKMARK INTERNATIONAL SMALL CAP FUND
Schedule of Investments—September 30, 2009 cont.
| Name | | Description | | Shares Held | | Value | |
| Common Stocks—95.0% (cont.) | |
| Home Entertainment Software—2.2% | |
Square Enix Holdings
Co., Ltd. (Japan) | | Develops & Sells Entertainment
Software for Video Game Consoles | | | 621,400 | | | $ | 16,821,723 | | |
| IT Consulting & Other Services—3.4% | |
| Atea ASA (Norway) | | Management & IT Consulting
Services | | | 4,153,300 | | | | 26,245,295 | | |
| Office Electronics—2.8% | |
| Neopost SA (France) | | Mailroom Equipment Supplier | | | 207,300 | | | | 18,604,593 | | |
Boewe Systec AG
(Germany) (a) | | Automated Paper Management
Systems Producer | | | 285,039 | | | | 2,794,647 | | |
| | | | 21,399,240 | | |
| Systems Software—0.6% | |
| Totvs SA (Brazil) | | Develops & Markets Software
Solutions | | | 77,500 | | | | 3,805,882 | | |
Monitise PLC
(United Kingdom) (a) (b) | | Mobile Banking Service Solutions | | | 3,061,088 | | | | 721,582 | | |
| | | | 4,527,464 | | |
| Commodity Chemicals—0.3% | |
Nifco, Inc (Japan)
| | Manufactures Synthetic Resinous
Fasteners & Plastic Components
Appliances | | | 130,200 | | | | 2,597,763 | | |
| Construction Materials—1.4% | |
Titan Cement Co. SA
(Greece) | | Cement & Building Materials
Producer & Distributor | | | 321,399 | | | | 11,099,526 | | |
| Specialty Chemicals—3.9% | |
| Symrise AG (Germany) | | Diversified Chemical Manufacturer | | | 781,000 | | | | 14,891,668 | | |
Taiyo Ink Manufacturing
Co., Ltd. (Japan) | | Manufactures & Sells Resist Inks | | | 374,900 | | | | 9,564,095 | | |
| Sika AG (Switzerland) | | Manufactures Construction Materials | | | 3,950 | | | | 5,332,481 | | |
| | | | 29,788,244 | | |
| Total Common Stocks (Cost: $773,172,776) | | | | | | | | $ | 730,740,833 | | |
OAKMARK INTERNATIONAL SMALL CAP FUND
57
OAKMARK INTERNATIONAL SMALL CAP FUND
Schedule of Investments—September 30, 2009 cont.
| Name | | Par Value | | Market Value | |
| Short Term Investment—4.6% | |
| Repurchase Agreement—4.6% | |
Fixed Income Clearing Corp. Repurchase Agreement,
0.02% dated 9/30/2009 due 10/1/2009, repurchase
price $35,169,175, collateralized by an United States
Treasury Note, with a rate of 4.125%, with a
maturity of 8/15/2010, and with a market value
plus accrued interest of $37,350,000 (Cost: $35,169,154) | | $ | 35,169,154 | | | $ | 35,169,154 | | |
| Total Short Term Investment (Cost: $35,169,154) | | | | $ | 35,169,154 | | |
| Total Investments (Cost: $808,341,930)—99.6% | | | | | 765,909,987 | | |
| Foreign Currencies (Cost: $560,338)—0.1% | | | | | 564,794 | | |
| Other Assets In Excess Of Liabilities—0.3% | | | | | 2,350,333 | | |
| Total Net Assets—100% | | | | $ | 768,825,114 | | |
(a) Non income-producing security.
(b) See Note 5 in the Notes to the Financial Statements regarding investments in affiliated issuers.
(c) Represents a Sponsored American Depositary Receipt.
(d) Fair value is determined in good faith in accordance with procedures established by the Board of Trustees.
See accompanying Notes to Financial Statements.
OAKMARK INTERNATIONAL SMALL CAP FUND
58

(This page has been intentionally left blank.)
THE OAKMARK FUNDS
59
THE OAKMARK FUNDS
Statements of Assets and Liabilities—September 30, 2009
| | | | | Oakmark
Fund | | Oakmark
Select
Fund | | Oakmark
Equity and
Income Fund | |
| Assets | |
| Investments in unaffiliated securities, at value | | (a) | | $ | 3,138,277,067 | | | $ | 2,273,237,673 | | | $ | 15,380,851,239 | | |
| Investments in affiliated securities, at value | | (b) | | | 0 | | | | 0 | | | | 197,700,994 | | |
| Foreign currency, at value | | (c) | | | 0 | | | | 0 | | | | 0 | | |
| Receivable for: | |
| Securities sold | | | | | 8,960,760 | | | | 0 | | | | 2,137,160 | | |
| Fund shares sold | | | | | 3,733,839 | | | | 1,786,016 | | | | 30,605,526 | | |
| Dividends and interest (Net of foreign tax withheld) | | | | | 5,455,366 | | | | 2,229,659 | | | | 48,983,568 | | |
| Tax reclaim | | | | | 487,002 | | | | 0 | | | | 813,733 | | |
| Total receivables | | | | | 18,636,967 | | | | 4,015,675 | | | | 82,539,987 | | |
| Other assets | | | | | 979 | | | | 848 | | | | 2,712 | | |
| Total assets | | | | $ | 3,156,915,013 | | | $ | 2,277,254,196 | | | $ | 15,661,094,932 | | |
| Liabilities and Net Assets | |
| Payable for: | |
| Securities purchased | | | | $ | 0 | | | $ | 0 | | | $ | 109,570,424 | | |
| Fund shares redeemed | | | | | 2,585,938 | | | | 2,384,417 | | | | 17,208,735 | | |
| Foreign currency exchange contracts | | | | | 0 | | | | 0 | | | | 0 | | |
| Investment advisory fee | | | | | 81,992 | | | | 58,226 | | | | 284,744 | | |
| Other shareholder servicing fees | | | | | 328,085 | | | | 182,964 | | | | 2,527,691 | | |
| Transfer and dividend disbursing agent fees | | | | | 235,528 | | | | 153,466 | | | | 247,244 | | |
| Trustee fees | | | | | 2,276 | | | | 2,126 | | | | 7,123 | | |
| Deferred trustee compensation | | | | | 895,728 | | | | 788,693 | | | | 771,326 | | |
| Other | | | | | 402,652 | | | | 278,698 | | | | 1,659,098 | | |
| Total liabilities | | | | | 4,532,199 | | | | 3,848,590 | | | | 132,276,385 | | |
| Net assets applicable to Fund shares outstanding | | | | $ | 3,152,382,814 | | | $ | 2,273,405,606 | | | $ | 15,528,818,547 | | |
| Analysis of Net Assets | |
| Paid in capital | | | | $ | 2,642,189,220 | | | $ | 2,041,718,465 | | | $ | 14,302,777,252 | | |
Accumulated undistributed net realized gain (loss) on investments, forward
contracts, short sales and foreign currency transactions | | | | | (432,294,398 | ) | | | (250,956,785 | ) | | | (807,515,407 | ) | |
Net unrealized appreciation (depreciation) on investments, forward
contracts and foreign currency translation | | | | | 926,235,632 | | | | 477,765,214 | | | | 1,894,426,215 | | |
| Accumulated undistributed net investment income | | | | | 16,252,360 | | | | 4,878,712 | | | | 139,130,487 | | |
| Net assets applicable to Fund shares outstanding | | | | $ | 3,152,382,814 | | | $ | 2,273,405,606 | | | $ | 15,528,818,547 | | |
| Price of Shares | |
| Net asset value per share: Class I | | | | $ | 34.55 | | | $ | 22.68 | | | $ | 24.72 | | |
| Class I—Net assets | | | | $ | 3,144,220,353 | | | $ | 2,265,320,548 | | | $ | 14,418,397,552 | | |
| Class I—Shares outstanding (Unlimited shares authorized) | | | | | 90,991,918 | | | | 99,869,942 | | | | 583,330,898 | | |
| Net asset value per share: Class II | | | | $ | 34.56 | | | $ | 22.70 | | | $ | 24.57 | | |
| Class II—Net assets | | | | $ | 8,162,461 | | | $ | 8,085,058 | | | $ | 1,110,420,995 | | |
| Class II—Shares outstanding (Unlimited shares authorized) | | | | | 236,162 | | | | 356,199 | | | | 45,196,322 | | |
| (a) Identified cost of investments in unaffiliated securities | | | | $ | 2,212,037,860 | | | $ | 1,795,472,459 | | | $ | 13,600,529,198 | | |
| (b) Identified cost of investments in affiliated securities | | | | | 0 | | | | 0 | | | | 83,594,018 | | |
| (c) Identified cost of foreign currency | | | | | 0 | | | | 0 | | | | 0 | | |
THE OAKMARK FUNDS
60
| | | Oakmark
Global
Fund | | Oakmark
Global Select
Fund | | Oakmark
International
Fund | | Oakmark
International
Small Cap Fund | |
| Assets | |
| Investments in unaffiliated securities, at value | | $ | 1,727,111,405 | | | $ | 266,370,253 | | | $ | 3,965,133,918 | | | $ | 644,167,445 | | |
| Investments in affiliated securities, at value | | | 0 | | | | 0 | | | | 164,709,632 | | | | 121,742,542 | | |
| Foreign currency, at value | | | 0 | | | | 115,562 | | | | 819,702 | | | | 564,794 | | |
| Receivable for: | |
| Securities sold | | | 13,897,892 | | | | 0 | | | | 12,038,334 | | | | 3,627,442 | | |
| Fund shares sold | | | 2,994,876 | | | | 261,196 | | | | 27,739,085 | | | | 2,543,844 | | |
| Dividends and interest (Net of foreign tax withheld) | | | 3,235,337 | | | | 369,355 | | | | 8,493,573 | | | | 2,138,606 | | |
| Tax reclaim | | | 5,097,201 | | | | 264,232 | | | | 15,832,069 | | | | 976,980 | | |
| Total receivables | | | 25,225,306 | | | | 894,783 | | | | 64,103,061 | | | | 9,286,872 | | |
| Other assets | | | 776 | | | | 566 | | | | 970 | | | | 605 | | |
| Total assets | | $ | 1,752,337,487 | | | $ | 267,381,164 | | | $ | 4,194,767,283 | | | $ | 775,762,258 | | |
| Liabilities and Net Assets | |
| Payable for: | |
| Securities purchased | | $ | 14,341,308 | | | $ | 0 | | | $ | 20,794,319 | | | $ | 4,589,965 | | |
| Fund shares redeemed | | | 964,068 | | | | 193,237 | | | | 4,055,840 | | | | 526,169 | | |
| Foreign currency exchange contracts | | | 5,796,006 | | | | 785,008 | | | | 14,758,174 | | | | 1,221,765 | | |
| Investment advisory fee | | | 46,351 | | | | 7,268 | | | | 103,867 | | | | 23,176 | | |
| Other shareholder servicing fees | | | 164,155 | | | | 13,963 | | | | 537,306 | | | | 51,079 | | |
| Transfer and dividend disbursing agent fees | | | 93,413 | | | | 26,022 | | | | 123,949 | | | | 24,646 | | |
| Trustee fees | | | 1,812 | | | | 1,410 | | | | 2,701 | | | | 1,380 | | |
| Deferred trustee compensation | | | 373,787 | | | | 11,768 | | | | 622,139 | | | | 357,668 | | |
| Other | | | 291,341 | | | | 95,639 | | | | 544,479 | | | | 141,296 | | |
| Total liabilities | | | 22,072,241 | | | | 1,134,315 | | | | 41,542,774 | | | | 6,937,144 | | |
| Net assets applicable to Fund shares outstanding | | $ | 1,730,265,246 | | | $ | 266,246,849 | | | $ | 4,153,224,509 | | | $ | 768,825,114 | | |
| Analysis of Net Assets | |
| Paid in capital | | $ | 1,898,097,217 | | | $ | 315,164,883 | | | $ | 4,912,066,798 | | | $ | 979,509,473 | | |
Accumulated undistributed net realized gain (loss) on investments, forward
contracts, short sales and foreign currency transactions | | | (278,582,256 | ) | | | (67,772,388 | ) | | | (1,149,823,665 | ) | | | (176,375,546 | ) | |
Net unrealized appreciation (depreciation) on investments, forward
contracts and foreign currency translation | | | 96,576,194 | | | | 17,014,043 | | | | 346,031,498 | | | | (43,587,416 | ) | |
| Accumulated undistributed net investment income | | | 14,174,091 | | | | 1,840,311 | | | | 44,949,878 | | | | 9,278,603 | | |
| Net assets applicable to Fund shares outstanding | | $ | 1,730,265,246 | | | $ | 266,246,849 | | | $ | 4,153,224,509 | | | $ | 768,825,114 | | |
| Price of Shares | |
| Net asset value per share: Class I | | $ | 18.94 | | | $ | 9.54 | | | $ | 16.25 | | | $ | 11.51 | | |
| Class I—Net assets | | $ | 1,675,869,857 | | | $ | 266,246,849 | | | $ | 4,045,384,240 | | | $ | 767,998,433 | | |
| Class I—Shares outstanding (Unlimited shares authorized) | | | 88,496,051 | | | | 27,907,052 | | | | 248,993,127 | | | | 66,702,584 | | |
| Net asset value per share: Class II | | $ | 18.58 | | | $ | 0 | | | $ | 16.38 | | | $ | 11.50 | | |
| Class II—Net assets | | $ | 54,395,389 | | | $ | 0 | | | $ | 107,840,269 | | | $ | 826,681 | | |
| Class II—Shares outstanding (Unlimited shares authorized) | | | 2,927,650 | | | | 0 | | | | 6,583,951 | | | | 71,904 | | |
| (a) Identified cost of investments in unaffiliated securities | | $ | 1,625,032,598 | | | $ | 248,595,529 | | | $ | 3,602,539,831 | | | $ | 660,214,284 | | |
| (b) Identified cost of investments in affiliated securities | | | 0 | | | | 0 | | | | 167,592,441 | | | | 148,127,646 | | |
| (c) Identified cost of foreign currency | | | 0 | | | | 114,832 | | | | 817,332 | | | | 560,338 | | |
See accompanying Notes to Financial Statements.
THE OAKMARK FUNDS
61
THE OAKMARK FUNDS
Statements of Operations—For the Year Ended September 30, 2009
| | | Oakmark
Fund | | Oakmark
Select
Fund | | Oakmark
Equity and
Income Fund | | Oakmark
Global
Fund | |
| Investment Income: | |
| Dividends from unaffiliated securities | | $ | 58,604,321 | | | $ | 34,639,033 | | | $ | 140,725,883 | | | $ | 28,714,512 | | |
| Dividends from affiliated securities | | | 0 | | | | 0 | | | | 6,048,578 | | | | 0 | | |
| Interest income | | | 212,168 | | | | 158,620 | | | | 169,962,817 | | | | 50,364 | | |
| Security lending income | | | 0 | | | | 0 | | | | 0 | | | | 832,551 | | |
| Other income | | | 1,031,417 | | | | 74,422 | | | | 5,677,641 | | | | 783,475 | | |
| Foreign taxes withheld | | | (108,000 | ) | | | 0 | | | | (3,639,585 | ) | | | (2,254,746 | ) | |
| Total investment income | | | 59,739,906 | | | | 34,872,075 | | | | 318,775,334 | | | | 28,126,156 | | |
| Expenses: | |
| Investment advisory fee | | | 25,876,673 | | | | 18,433,398 | | | | 91,561,713 | | | | 14,483,493 | | |
| Transfer and dividend disbursing agent fees | | | 1,293,607 | | | | 797,196 | | | | 1,376,437 | | | | 486,316 | | |
| Other shareholder servicing fees | | | 3,057,534 | | | | 1,872,346 | | | | 13,470,236 | | | | 1,160,604 | | |
| Service Fee—Class II | | | 17,257 | | | | 14,242 | | | | 2,337,972 | | | | 104,796 | | |
| Reports to shareholders | | | 858,024 | | | | 505,634 | | | | 1,580,534 | | | | 335,854 | | |
| Custody and accounting fees | | | 275,494 | | | | 193,342 | | | | 1,381,665 | | | | 429,295 | | |
| Registration and blue sky expenses | | | 40,749 | | | | 20,740 | | | | 461,719 | | | | 54,481 | | |
| Trustees fees | | | 208,660 | | | | 182,692 | | | | 567,785 | | | | 154,039 | | |
| Legal fees | | | 76,753 | | | | 64,181 | | | | 236,082 | | | | 58,452 | | |
| Audit fees | | | 36,663 | | | | 28,590 | | | | 137,589 | | | | 28,307 | | |
| Other | | | 309,325 | | | | 276,164 | | | | 610,926 | | | | 239,613 | | |
| Total expenses | | | 32,050,739 | | | | 22,388,525 | | | | 113,722,658 | | | | 17,535,250 | | |
| Net Investment Income: | | | 27,689,167 | | | | 12,483,550 | | | | 205,052,676 | | | | 10,590,906 | | |
| Net realized and unrealized gain (loss) on: | |
| Net realized gain (loss) on: | |
| Unaffiliated securities | | | (433,127,602 | ) | | | 16,602,590 | | | | (757,030,050 | ) | | | (257,331,593 | ) | |
| Affiliated securities | | | 0 | | | | 0 | | | | (108,545,089 | ) | | | 0 | | |
| Unaffiliated in-kind transactions | | | 0 | | | | 0 | | | | 56,556,321 | | | | 0 | | |
| Affiliated in-kind transactions | | | 0 | | | | 0 | | | | 1,492,553 | | | | 0 | | |
| Forward foreign currency contracts | | | 0 | | | | 0 | | | | 0 | | | | 60,861,336 | | |
| Foreign currency transactions | | | (266,181 | ) | | | 0 | | | | (2,705,467 | ) | | | (231,406 | ) | |
| Net realized gain (loss) | | | (433,393,783 | ) | | | 16,602,590 | | | | (810,231,732 | ) | | | (196,701,663 | ) | |
| Net change in unrealized appreciation (depreciation) on: | |
| Investments | | | 376,260,699 | | | | 127,889,641 | | | | 829,657,750 | | | | 182,508,215 | | |
| Forward foreign currency contracts | | | 0 | | | | 0 | | | | 0 | | | | (39,620,590 | ) | |
| Foreign currency translation | | | 12,925 | | | | 0 | | | | 92,927 | | | | 323,488 | | |
| Net change in unrealized appreciation (depreciation) | | | 376,273,624 | | | | 127,889,641 | | | | 829,750,677 | | | | 143,211,113 | | |
| Net realized and unrealized gain (loss) | | | (57,120,159 | ) | | | 144,492,231 | | | | 19,518,945 | | | | (53,490,550 | ) | |
| Net increase (decrease) in net assets resulting from operations | | $ | (29,430,992 | ) | | $ | 156,975,781 | | | $ | 224,571,621 | | | $ | (42,899,644 | ) | |
THE OAKMARK FUNDS
62
| | | Oakmark
Global Select
Fund | | Oakmark
International
Fund | | Oakmark
International
Small Cap Fund | |
| Investment Income: | |
| Dividends from unaffiliated securities | | $ | 4,995,464 | | | $ | 78,216,908 | | | $ | 15,161,469 | | |
| Dividends from affiliated securities | | | 0 | | | | 1,376,660 | | | | 2,955,826 | | |
| Interest income | | | 14,503 | | | | 144,182 | | | | 35,364 | | |
| Security lending income | | | 85,777 | | | | 2,395,882 | | | | 90,891 | | |
| Other income | | | 0 | | | | 74,561 | | | | 13,313 | | |
| Foreign taxes withheld | | | (287,434 | ) | | | (7,975,991 | ) | | | (1,701,373 | ) | |
| Total investment income | | | 4,808,310 | | | | 74,232,202 | | | | 16,555,490 | | |
| Expenses: | |
| Investment advisory fee | | | 2,097,148 | | | | 29,265,480 | | | | 6,181,276 | | |
| Transfer and dividend disbursing agent fees | | | 138,172 | | | | 702,358 | | | | 142,373 | | |
| Other shareholder servicing fees | | | 167,482 | | | | 2,732,153 | | | | 522,635 | | |
| Service Fee—Class II | | | 0 | | | | 119,556 | | | | 521 | | |
| Reports to shareholders | | | 81,415 | | | | 446,975 | | | | 116,934 | | |
| Custody and accounting fees | | | 121,634 | | | | 1,072,101 | | | | 323,043 | | |
| Registration and blue sky expenses | | | 43,668 | | | | 47,439 | | | | 52,363 | | |
| Trustees fees | | | 104,584 | | | | 208,061 | | | | 124,538 | | |
| Legal fees | | | 45,156 | | | | 74,781 | | | | 48,466 | | |
| Audit fees | | | 21,491 | | | | 33,763 | | | | 21,070 | | |
| Other | | | 154,656 | | | | 314,159 | | | | 150,189 | | |
| Total expenses | | | 2,975,406 | | | | 35,016,826 | | | | 7,683,408 | | |
| Net Investment Income: | | | 1,832,904 | | | | 39,215,376 | | | | 8,872,082 | | |
| Net realized and unrealized gain (loss) on: | |
| Net realized gain (loss) on: | |
| Unaffiliated securities | | | (24,476,884 | ) | | | (942,459,913 | ) | | | (89,319,514 | ) | |
| Affiliated securities | | | 0 | | | | (33,083,401 | ) | | | (64,234,120 | ) | |
| Unaffiliated in-kind transactions | | | 0 | | | | 0 | | | | 0 | | |
| Affiliated in-kind transactions | | | 0 | | | | 0 | | | | 0 | | |
| Forward foreign currency contracts | | | 6,153,437 | | | | 201,068,041 | | | | 30,480,433 | | |
| Foreign currency transactions | | | (114,015 | ) | | | (702,389 | ) | | | (239,730 | ) | |
| Net realized gain (loss) | | | (18,437,462 | ) | | | (775,177,662 | ) | | | (123,312,931 | ) | |
| Net change in unrealized appreciation (depreciation) on: | |
| Investments | | | 69,728,514 | | | | 1,331,145,550 | | | | 217,867,016 | | |
| Forward foreign currency contracts | | | (4,304,901 | ) | | | (131,286,571 | ) | | | (18,804,676 | ) | |
| Foreign currency translation | | | 57,443 | | | | 1,758,496 | | | | 95,256 | | |
| Net change in unrealized appreciation (depreciation) | | | 65,481,056 | | | | 1,201,617,475 | | | | 199,157,596 | | |
| Net realized and unrealized gain (loss) | | | 47,043,594 | | | | 426,439,813 | | | | 75,844,665 | | |
| Net increase (decrease) in net assets resulting from operations | | $ | 48,876,498 | | | $ | 465,655,189 | | | $ | 84,716,747 | | |
See accompanying Notes to Financial Statements.
THE OAKMARK FUNDS
63
THE OAKMARK FUNDS
Statements of Changes in Net Assets
| | | Oakmark Fund | |
| | | Year Ended
September 30, 2009 | | Year Ended
September 30, 2008 | |
| From Operations: | |
| Net investment income | | $ | 27,689,167 | | | $ | 51,813,927 | | |
| Net realized gain (loss) | | | (433,393,783 | ) | | | 137,303,033 | | |
| Net change in unrealized appreciation (depreciation) | | | 376,273,624 | | | | (1,115,706,418 | ) | |
| Net decrease in net assets from operations | | | (29,430,992 | ) | | | (926,589,458 | ) | |
| Distributions to shareholders from: | |
| Net investment income—Class I | | | (42,725,032 | ) | | | (63,360,741 | ) | |
| Net investment income—Class II | | | (75,879 | ) | | | (183,226 | ) | |
| Net realized gain—Class I | | | (93,416,024 | ) | | | (390,074,654 | ) | |
| Net realized gain—Class II | | | (288,563 | ) | | | (1,912,176 | ) | |
| Total distributions to shareholders | | | (136,505,498 | ) | | | (455,530,797 | ) | |
| From Fund share transactions: | |
| Proceeds from shares sold—Class I | | | 601,934,705 | | | | 506,525,729 | | |
| Proceeds from shares sold—Class II | | | 1,887,729 | | | | 3,714,709 | | |
| Reinvestment of distributions—Class I | | | 130,739,804 | | | | 430,870,683 | | |
| Reinvestment of distributions—Class II | | | 313,903 | | | | 1,896,434 | | |
| Payment for shares redeemed—Class I | | | (1,034,053,034 | ) | | | (1,608,697,232 | ) | |
| Payment for shares redeemed—Class II | | | (5,433,570 | ) | | | (15,906,999 | ) | |
| Redemption fees—Class I | | | 430,656 | | | | 222,124 | | |
| Redemption fees—Class II | | | 1,355 | | | | 1,034 | | |
Net decrease in net assets from Fund
share transactions | | | (304,178,452 | ) | | | (681,373,518 | ) | |
| Total decrease in net assets | | | (470,114,942 | ) | | | (2,063,493,773 | ) | |
| Net assets: | |
| Beginning of year | | | 3,622,497,756 | | | | 5,685,991,529 | | |
| End of year | | $ | 3,152,382,814 | | | $ | 3,622,497,756 | | |
| Undistributed net investment income | | $ | 16,252,360 | | | $ | 36,894,100 | | |
| Fund Share Transactions—Class I: | |
| Shares sold | | | 22,827,276 | | | | 12,842,108 | | |
| Shares issued in reinvestment of dividends | | | 5,145,211 | | | | 10,404,991 | | |
| Less shares redeemed | | | (39,216,734 | ) | | | (40,648,554 | ) | |
| Net decrease in shares outstanding | | | (11,244,247 | ) | | | (17,401,455 | ) | |
| Fund Share Transactions—Class II: | |
| Shares sold | | | 70,339 | | | | 94,005 | | |
| Shares issued in reinvestment of dividends | | | 12,339 | | | | 45,918 | | |
| Less shares redeemed | | | (200,080 | ) | | | (404,846 | ) | |
| Net decrease in shares outstanding | | | (117,402 | ) | | | (264,923 | ) | |
THE OAKMARK FUNDS
64
| | | Oakmark Select Fund | |
| | | Year Ended
September 30, 2009 | | Year Ended
September 30, 2008 | |
| From Operations: | |
| Net investment income | | $ | 12,483,550 | | | $ | 42,414,250 | | |
| Net realized gain (loss) | | | 16,602,590 | | | | (244,888,582 | ) | |
| Net change in unrealized appreciation (depreciation) | | | 127,889,641 | | | | (1,164,736,462 | ) | |
| Net increase (decrease) in net assets from operations | | | 156,975,781 | | | | (1,367,210,794 | ) | |
| Distributions to shareholders from: | |
| Net investment income—Class I | | | (28,952,323 | ) | | | (47,221,721 | ) | |
| Net investment income—Class II | | | (126,188 | ) | | | (109,460 | ) | |
| Net realized gain—Class I | | | 0 | | | | (453,949,363 | ) | |
| Net realized gain—Class II | | | 0 | | | | (3,023,620 | ) | |
| Total distributions to shareholders | | | (29,078,511 | ) | | | (504,304,164 | ) | |
| From Fund share transactions: | |
| Proceeds from shares sold—Class I | | | 270,845,580 | | | | 434,582,524 | | |
| Proceeds from shares sold—Class II | | | 1,984,081 | | | | 6,382,536 | | |
| Reinvestment of distributions—Class I | | | 27,926,539 | | | | 475,037,841 | | |
| Reinvestment of distributions—Class II | | | 63,894 | | | | 1,916,898 | | |
| Payment for shares redeemed—Class I | | | (721,496,614 | ) | | | (1,888,941,538 | ) | |
| Payment for shares redeemed—Class II | | | (8,267,436 | ) | | | (17,433,503 | ) | |
| Redemption fees—Class I | | | 414,153 | | | | 388,517 | | |
| Redemption fees—Class II | | | 1,807 | | | | 2,582 | | |
Net decrease in net assets from Fund
share transactions | | | (428,527,996 | ) | | | (988,064,143 | ) | |
| Total decrease in net assets | | | (300,630,726 | ) | | | (2,859,579,101 | ) | |
| Net assets: | |
| Beginning of year | | | 2,574,036,332 | | | | 5,433,615,433 | | |
| End of year | | $ | 2,273,405,606 | | | $ | 2,574,036,332 | | |
| Undistributed net investment income | | $ | 4,878,712 | | | $ | 25,275,328 | | |
| Fund Share Transactions—Class I: | |
| Shares sold | | | 15,736,623 | | | | 17,349,363 | | |
| Shares issued in reinvestment of dividends | | | 1,777,628 | | | | 18,055,426 | | |
| Less shares redeemed | | | (43,456,463 | ) | | | (72,910,322 | ) | |
| Net decrease in shares outstanding | | | (25,942,212 | ) | | | (37,505,533 | ) | |
| Fund Share Transactions—Class II: | |
| Shares sold | | | 115,311 | | | | 252,902 | | |
| Shares issued in reinvestment of dividends | | | 4,065 | | | | 72,941 | | |
| Less shares redeemed | | | (509,370 | ) | | | (683,111 | ) | |
| Net decrease in shares outstanding | | | (389,994 | ) | | | (357,268 | ) | |
See accompanying Notes to Financial Statements.
THE OAKMARK FUNDS
65
THE OAKMARK FUNDS
Statements of Changes in Net Assets
| | | Oakmark
Equity and Income Fund | |
| | | Year Ended
September 30, 2009 | | Year Ended
September 30, 2008 | |
| From Operations: | |
| Net investment income | | $ | 205,052,676 | | | $ | 271,023,392 | | |
| Net realized gain (loss) | | | (810,231,732 | ) | | | 481,017,499 | | |
| Net change in unrealized appreciation (depreciation) | | | 829,750,677 | | | | (1,377,194,710 | ) | |
| Net increase (decrease) in net assets from operations | | | 224,571,621 | | | | (625,153,819 | ) | |
| Distributions to shareholders from: | |
| Net investment income—Class I | | | (196,363,442 | ) | | | (267,024,200 | ) | |
| Net investment income—Class II | | | (12,072,699 | ) | | | (16,634,567 | ) | |
| Net realized gain—Class I | | | (292,455,172 | ) | | | (664,948,149 | ) | |
| Net realized gain—Class II | | | (23,185,484 | ) | | | (48,763,636 | ) | |
| Total distributions to shareholders | | | (524,076,797 | ) | | | (997,370,552 | ) | |
| From Fund share transactions: | |
| Proceeds from shares sold—Class I | | | 4,553,696,475 | | | | 3,585,440,574 | | |
| Proceeds from shares sold—Class II | | | 468,653,474 | | | | 445,155,517 | | |
| Reinvestment of distributions—Class I | | | 465,034,081 | | | | 889,650,962 | | |
| Reinvestment of distributions—Class II | | | 30,396,980 | | | | 54,888,687 | | |
| Payment for shares redeemed—Class I | | | (3,583,840,792 | ) | | | (2,190,825,510 | ) | |
| Payment for shares redeemed—Class II | | | (378,630,866 | ) | | | (293,563,855 | ) | |
| Redemption fees—Class I | | | 0 | | | | 112,554 | | |
| Redemption fees—Class II | | | 0 | | | | 8,242 | | |
Net increase in net assets from Fund
share transactions | | | 1,555,309,352 | | | | 2,490,867,171 | | |
| Total increase in net assets | | | 1,255,804,176 | | | | 868,342,800 | | |
| Net assets: | |
| Beginning of year | | | 14,273,014,371 | | | | 13,404,671,571 | | |
| End of year | | $ | 15,528,818,547 | | | $ | 14,273,014,371 | | |
| Undistributed net investment income | | $ | 139,130,487 | | | $ | 217,855,622 | | |
| Fund Share Transactions—Class I: | |
| Shares sold | | | 207,589,903 | | | | 131,246,453 | | |
| Shares issued in reinvestment of dividends | | | 21,781,456 | | | | 32,913,467 | | |
| Less shares redeemed | | | (164,669,008 | ) | | | (81,153,863 | ) | |
| Net increase in shares outstanding | | | 64,702,351 | | | | 83,006,057 | | |
| Fund Share Transactions—Class II: | |
| Shares sold | | | 21,325,989 | | | | 16,431,464 | | |
| Shares issued in reinvestment of dividends | | | 1,428,429 | | | | 2,038,956 | | |
| Less shares redeemed | | | (17,306,728 | ) | | | (10,835,135 | ) | |
| Net increase in shares outstanding | | | 5,447,690 | | | | 7,635,285 | | |
THE OAKMARK FUNDS
66
| | | Oakmark
Global Fund | |
| | | Year Ended
September 30, 2009 | | Year Ended
September 30, 2008 | |
| From Operations: | |
| Net investment income | | $ | 10,590,906 | | | $ | 24,515,760 | | |
| Net realized gain (loss) | | | (196,701,663 | ) | | | 30,592,142 | | |
| Net change in unrealized appreciation (depreciation) | | | 143,211,113 | | | | (697,313,187 | ) | |
| Net decrease in net assets from operations | | | (42,899,644 | ) | | | (642,205,285 | ) | |
| Distributions to shareholders from: | |
| Net investment income—Class I | | | (64,685,003 | ) | | | (3,870,141 | ) | |
| Net investment income—Class II | | | (1,812,855 | ) | | | (32,286 | ) | |
| Net realized gain—Class I | | | (2,594,712 | ) | | | (320,109,533 | ) | |
| Net realized gain—Class II | | | (83,374 | ) | | | (9,616,102 | ) | |
| Total distributions to shareholders | | | (69,175,944 | ) | | | (333,628,062 | ) | |
| From Fund share transactions: | |
| Proceeds from shares sold—Class I | | | 287,084,767 | | | | 533,804,675 | | |
| Proceeds from shares sold—Class II | | | 5,216,475 | | | | 5,683,298 | | |
| Reinvestment of distributions—Class I | | | 64,695,585 | | | | 313,392,738 | | |
| Reinvestment of distributions—Class II | | | 1,830,946 | | | | 9,333,596 | | |
| Payment for shares redeemed—Class I | | | (512,253,586 | ) | | | (958,997,589 | ) | |
| Payment for shares redeemed—Class II | | | (8,715,081 | ) | | | (19,949,158 | ) | |
| Redemption fees—Class I | | | 262,503 | | | | 235,186 | | |
| Redemption fees—Class II | | | 8,345 | | | | 6,748 | | |
Net decrease in net assets from Fund
share transactions | | | (161,870,046 | ) | | | (116,490,506 | ) | |
| Total decrease in net assets | | | (273,945,634 | ) | | | (1,092,323,853 | ) | |
| Net assets: | |
| Beginning of year | | | 2,004,210,880 | | | | 3,096,534,733 | | |
| End of year | | $ | 1,730,265,246 | | | $ | 2,004,210,880 | | |
| Undistributed net investment income | | $ | 14,174,091 | | | $ | 17,630,590 | | |
| Fund Share Transactions—Class I: | |
| Shares sold | | | 18,845,160 | | | | 23,088,428 | | |
| Shares issued in reinvestment of dividends | | | 4,715,422 | | | | 12,822,943 | | |
| Less shares redeemed | | | (35,258,775 | ) | | | (42,758,112 | ) | |
| Net decrease in shares outstanding | | | (11,698,193 | ) | | | (6,846,741 | ) | |
| Fund Share Transactions—Class II: | |
| Shares sold | | | 358,217 | | | | 248,561 | | |
| Shares issued in reinvestment of dividends | | | 135,827 | | | | 389,224 | | |
| Less shares redeemed | | | (598,309 | ) | | | (875,330 | ) | |
| Net decrease in shares outstanding | | | (104,265 | ) | | | (237,545 | ) | |
See accompanying Notes to Financial Statements.
THE OAKMARK FUNDS
67
THE OAKMARK FUNDS
Statements of Changes in Net Assets
| | | Oakmark
Global Select Fund | |
| | | Year Ended
September 30, 2009 | | Year Ended
September 30, 2008 | |
| From Operations: | |
| Net investment income | | $ | 1,832,904 | | | $ | 4,135,149 | | |
| Net realized gain (loss) | | | (18,437,462 | ) | | | (36,159,688 | ) | |
| Net change in unrealized appreciation (depreciation) | | | 65,481,056 | | | | (56,384,290 | ) | |
| Net increase (decrease) in net assets from operations | | | 48,876,498 | | | | (88,408,829 | ) | |
| Distributions to shareholders from: | |
| Net investment income—Class I | | | (10,153,233 | ) | | | (725,540 | ) | |
| Net realized gain—Class I | | | 0 | | | | (13,372,501 | ) | |
| Total distributions to shareholders | | | (10,153,233 | ) | | | (14,098,041 | ) | |
| From Fund share transactions: | |
| Proceeds from shares sold—Class I | | | 74,545,401 | | | | 152,328,234 | | |
| Reinvestment of distributions—Class I | | | 8,870,711 | | | | 13,571,933 | | |
| Payment for shares redeemed—Class I | | | (88,825,014 | ) | | | (208,397,143 | ) | |
| Redemption fees—Class I | | | 90,792 | | | | 157,379 | | |
Net decrease in net assets from Fund
share transactions | | | (5,318,110 | ) | | | (42,339,597 | ) | |
| Total increase (decrease) in net assets | | | 33,405,155 | | | | (144,846,467 | ) | |
| Net assets: | |
| Beginning of year | | | 232,841,694 | | | | 377,688,161 | | |
| End of year | | $ | 266,246,849 | | | $ | 232,841,694 | | |
| Undistributed net investment income | | $ | 1,840,311 | | | $ | 5,201,770 | | |
| Fund Share Transactions—Class I: | |
| Shares sold | | | 10,813,158 | | | | 15,695,713 | | |
| Shares issued in reinvestment of dividends | | | 1,377,440 | | | | 1,303,740 | | |
| Less shares redeemed | | | (12,573,902 | ) | | | (21,253,051 | ) | |
| Net decrease in shares outstanding | | | (383,304 | ) | | | (4,253,598 | ) | |
THE OAKMARK FUNDS
68
| | | Oakmark
International Fund | |
| | | Year Ended
September 30, 2009 | | Year Ended
September 30, 2008 | |
| From Operations: | |
| Net investment income | | $ | 39,215,376 | | | $ | 149,365,461 | | |
| Net realized gain (loss) | | | (775,177,662 | ) | | | (31,565,882 | ) | |
| Net change in unrealized appreciation (depreciation) | | | 1,201,617,475 | | | | (2,183,467,749 | ) | |
| Net increase (decrease) in net assets from operations | | | 465,655,189 | | | | (2,065,668,170 | ) | |
| Distributions to shareholders from: | |
| Net investment income—Class I | | | (299,576,482 | ) | | | (51,882,590 | ) | |
| Net investment income—Class II | | | (7,710,397 | ) | | | (959,117 | ) | |
| Net realized gain—Class I | | | (21,453,694 | ) | | | (1,274,258,080 | ) | |
| Net realized gain—Class II | | | (657,046 | ) | | | (85,876,351 | ) | |
| Total distributions to shareholders | | | (329,397,619 | ) | | | (1,412,976,138 | ) | |
| From Fund share transactions: | |
| Proceeds from shares sold—Class I | | | 1,090,830,667 | | | | 843,973,862 | | |
| Proceeds from shares sold—Class II | | | 35,647,741 | | | | 154,989,608 | | |
| Reinvestment of distributions—Class I | | | 294,321,631 | | | | 1,166,912,506 | | |
| Reinvestment of distributions—Class II | | | 4,861,449 | | | | 62,134,167 | | |
| Payment for shares redeemed—Class I | | | (1,230,588,646 | ) | | | (3,432,270,289 | ) | |
| Payment for shares redeemed—Class II | | | (62,999,921 | ) | | | (466,708,322 | ) | |
| Redemption fees—Class I | | | 423,456 | | | | 557,708 | | |
| Redemption fees—Class II | | | 12,713 | | | | 36,364 | | |
Net increase (decrease) in net assets from Fund
share transactions | | | 132,509,090 | | | | (1,670,374,396 | ) | |
| Total increase (decrease) in net assets | | | 268,766,660 | | | | (5,149,018,704 | ) | |
| Net assets: | |
| Beginning of year | | | 3,884,457,849 | | | | 9,033,476,553 | | |
| End of year | | $ | 4,153,224,509 | | | $ | 3,884,457,849 | | |
| Undistributed net investment income | | $ | 44,949,878 | | | $ | 187,993,621 | | |
| Fund Share Transactions—Class I: | |
| Shares sold | | | 86,532,075 | | | | 41,879,271 | | |
| Shares issued in reinvestment of dividends | | | 27,252,128 | | | | 54,991,164 | | |
| Less shares redeemed | | | (103,702,336 | ) | | | (175,636,861 | ) | |
| Net increase (decrease) in shares outstanding | | | 10,081,867 | | | | (78,766,426 | ) | |
| Fund Share Transactions—Class II: | |
| Shares sold | | | 2,873,917 | | | | 7,714,499 | | |
| Shares issued in reinvestment of dividends | | | 447,235 | | | | 2,948,940 | | |
| Less shares redeemed | | | (5,151,939 | ) | | | (24,543,341 | ) | |
| Net decrease in shares outstanding | | | (1,830,787 | ) | | | (13,879,902 | ) | |
See accompanying Notes to Financial Statements.
THE OAKMARK FUNDS
69
THE OAKMARK FUNDS
Statements of Changes in Net Assets
| | | Oakmark
International Small Cap Fund | |
| | | Year Ended
September 30, 2009 | | Year Ended
September 30, 2008 | |
| From Operations: | |
| Net investment income | | $ | 8,872,082 | | | $ | 19,984,041 | | |
| Net realized gain (loss) | | | (123,312,931 | ) | | | 9,096,217 | | |
| Net change in unrealized appreciation (depreciation) | | | 199,157,596 | | | | (380,516,076 | ) | |
| Net increase (decrease) in net assets from operations | | | 84,716,747 | | | | (351,435,818 | ) | |
| Distributions to shareholders from: | |
| Net investment income—Class I | | | (47,097,607 | ) | | | (8,925,646 | ) | |
| Net investment income—Class II | | | (24,604 | ) | | | (4,217 | ) | |
| Net realized gain—Class I | | | (6,559,210 | ) | | | (278,426,262 | ) | |
| Net realized gain—Class II | | | (3,537 | ) | | | (164,501 | ) | |
| Total distributions to shareholders | | | (53,684,958 | ) | | | (287,520,626 | ) | |
| From Fund share transactions: | |
| Proceeds from shares sold—Class I | | | 272,684,138 | | | | 286,377,418 | | |
| Proceeds from shares sold—Class II | | | 654,499 | | | | 142,977 | | |
| Reinvestment of distributions—Class I | | | 51,693,701 | | | | 274,317,138 | | |
| Reinvestment of distributions—Class II | | | 17,043 | | | | 93,759 | | |
| Payment for shares redeemed—Class I | | | (251,181,117 | ) | | | (585,285,695 | ) | |
| Payment for shares redeemed—Class II | | | (195,669 | ) | | | (541,602 | ) | |
| Redemption fees—Class I | | | 281,121 | | | | 223,596 | | |
| Redemption fees—Class II | | | 176 | | | | 138 | | |
Net increase (decrease) in net assets from Fund
share transactions | | | 73,953,892 | | | | (24,672,271 | ) | |
| Total increase (decrease) in net assets | | | 104,985,681 | | | | (663,628,715 | ) | |
| Net assets: | |
| Beginning of year | | | 663,839,433 | | | | 1,327,468,148 | | |
| End of year | | $ | 768,825,114 | | | $ | 663,839,433 | | |
| Undistributed net investment income | | $ | 9,278,603 | | | $ | 23,572,192 | | |
| Fund Share Transactions—Class I: | |
| Shares sold | | | 32,249,686 | | | | 19,764,158 | | |
| Shares issued in reinvestment of dividends | | | 7,199,680 | | | | 17,778,168 | | |
| Less shares redeemed | | | (31,178,851 | ) | | | (36,305,356 | ) | |
| Net increase in shares outstanding | | | 8,270,515 | | | | 1,236,970 | | |
| Fund Share Transactions—Class II: | |
| Shares sold | | | 64,516 | | | | 9,539 | | |
| Shares issued in reinvestment of dividends | | | 2,374 | | | | 6,080 | | |
| Less shares redeemed | | | (19,870 | ) | | | (31,659 | ) | |
| Net increase (decrease) in shares outstanding | | | 47,020 | | | | (16,040 | ) | |
THE OAKMARK FUNDS
70
THE OAKMARK FUNDS
Notes to Financial Statements
1. SIGNIFICANT ACCOUNTING POLICIES
The following are the significant accounting policies of Oakmark Fund ("Oakmark"), Oakmark Select Fund ("Select"), Oakmark Equity and Income Fund ("Equity and Income"), Oakmark Global Fund ("Global"), Oakmark Global Select Fund ("Global Select"), Oakmark International Fund ("International"), and Oakmark International Small Cap Fund ("Int'l Small Cap"), collectively referred to as "the Funds", each a series of Harris Associates Investment Trust (the "Trust"), a Massachusetts business trust organized on February 1, 1991, which is registered as an open-end management investment company under the Investment Company Act of 1940. Each Fund, other than Select and Global Select, is diversified. These policies are in conformity with accounting principles generally accepted in the United States of America ("GAAP"). The presentation of financial statements in conformity with GAAP requires management to make estimates and assumptions that a ffect the reported amounts of assets and liabilities at the date of the financial statements and the reported amounts of revenues and expenses during the reporting period. Actual results could differ from those estimates and assumptions.
Class Disclosure—
Each Fund offers two classes of shares: Class I Shares and Class II Shares. Class I Shares are offered to the general public. Class II Shares are offered to certain retirement plans such as 401(k) and profit sharing plans. Class II Shares pay a service fee at the annual rate of up to 0.25% of average net assets of Class II Shares of the Funds. This service fee is paid to a third-party administrator for performing the services associated with the administration of such retirement plans. Class I Shares do not have an associated service fee. Global Select Class II had no outstanding shares at September 30, 2009.
Income, realized and unrealized capital gains and losses, and expenses of the Funds not directly attributable to a specific class of shares are allocated to each class pro rata based on the relative net assets of each class. Transfer and dividend disbursing agent fees and other shareholder servicing fees are specific to each class.
Redemption fees—
Each Fund, except Equity and Income, imposes a short-term trading fee on redemptions of shares held for 90 days or less to offset two types of costs to the Fund caused by short-term trading: portfolio transaction and market impact costs associated with erratic redemption activity and administrative costs associated with processing redemptions. The fee is 2% of the redemption value and is deducted from either the redemption proceeds or from the balance in the account. The "first-in, first-out" ("FIFO") method is used to determine the holding period.
Security valuation—
The Funds' share prices or net asset values ("NAVs") are calculated as of the close of regular session trading (usually 4:00 pm Eastern time) on the New York Stock Exchange ("NYSE") on any day on which the NYSE is open for trading. Equity securities principally traded on securities exchanges in the United States and over-the-counter securities are valued at the last sales price or the official closing price on the day of valuation, or lacking any reported sales that day, at the most recent bid quotation. Securities traded on the NASDAQ National Market are valued at the NASDAQ Official Closing Price ("NOCP"), or lacking an NOCP, at the most recent bid quotation on the NASDAQ National Market. Equity securities principally traded on securities exchanges outside the United States shall be valued, depending on local convention or regulation, at the last sales price, the last bid or asked price, the mean between the last bid and asked prices, or the official closing price, or shall be based on a pricing composite as of the close of the regular trading hours on the appropriate exchange or other designated time. Debt obligations and money market instruments maturing in more than 60 days from the date of purchase are valued by independent professional pricing services using the latest bid quotation or at fair value based upon data of instruments with similar characteristics. Debt obligations and money market instruments maturing in less than 61 days from the date of purchase are valued on an amortized cost basis, which approximates value. Options are valued at the last reported sales price on the day of valuation or, lacking any reported sale price on the valuation date, at the mean of the most recent bid and asked quotations or, if the mean is not available, at the most recent bid quotation.
Securities for which quotations are not readily available or securities that may have been affected by a significant event occurring between the close of a foreign market and the close of the NYSE are valued at fair values, determined by or under the direction of the pricing committee established by the Board of Trustees. A significant event may include the performance of U.S. markets since the close of foreign markets. The Funds may use a systematic fair valuation model provided by an independent professional pricing service to value foreign securities in order to adjust for stale pricing, which may occur between the close of certain foreign exchanges and the NYSE. At September 30, 2009 Equity and Income and Int'l Small Cap held securities for which market quotations were not readily available and which were valued by the pricing committee at a fair value determined in good faith in accordance with procedures established by the Board of Trustees.
THE OAKMARK FUNDS
71
THE OAKMARK FUNDS
Notes to Financial Statements (cont.)
Fair Value Measurement—
The Funds adopted Financial Accounting Standards Board ("FASB") Accounting Standards Codification ("ASC") Topic 820 ("Topic 820"), Fair Value Measurements and Disclosures, effective October 1, 2008. Under Topic 820, various inputs are used in determining the value of each Fund's investments. These inputs are prioritized into three broad levels as follows:
Level 1—quoted prices in active markets for identical securities
Level 2—other significant observable inputs (including quoted prices for similar investments, interest rates, prepayment speeds, credit risk, and others)
Level 3—significant unobservable inputs (including the Fund's own assumptions in determining the fair value of investments)
Observable inputs are those based on market data obtained from independent sources, and unobservable inputs reflect the Funds' own assumptions based on the best information available. The input levels are not necessarily an indication of risk or liquidity associated with investing in those securities.
In April 2009 the FASB issued FASB ASC Topic 820-10 ("Topic 820-10"). Topic 820-10 provides additional guidance for estimating fair value in accordance with Topic 820 when the volume and level of activity for the asset or liability have significantly decreased as well as guidance on identifying circumstances that indicate a transaction is not orderly. Topic 820-10 is effective for fiscal years and interim periods ending after June 15, 2009. The Funds have adopted this topic as of September 30, 2009.
The following is a summary of the inputs used as of September 30, 2009 in valuing each Fund's assets and liabilities. Except for the industries or investment types separately stated below, the total amounts for common stocks, fixed income and short term investments in the table below are presented by industry or investment type in each Fund's Schedule of Investments. Forward foreign currency contracts are presented by contract in the notes following this summary:
| | | Quoted Prices
in Active
Markets for
Identical
Assets
(Level 1) | | Other
Significant
Observable
Inputs
(Level 2) | | Significant
Unobservable
Inputs
(Level 3) | |
| Oakmark | | | | | | | | | | | | | |
| Common Stocks | | $ | 2,996,456,092 | �� | | $ | 0 | | | $ | 0 | | |
| Short Term Investments | | | 0 | | | | 141,820,975 | | | | 0 | | |
| Total | | $ | 2,996,456,092 | | | $ | 141,820,975 | | | $ | 0 | | |
| Select | | | | | | | | | | | | | |
| Common Stocks | | $ | 2,146,061,364 | | | $ | 0 | | | $ | 0 | | |
| Short Term Investments | | | 0 | | | | 127,176,309 | | | | 0 | | |
| Total | | $ | 2,146,061,364 | | | $ | 127,176,309 | | | $ | 0 | | |
| Equity and Income | | | | | | | | | | | | | |
| Common Stocks - Packaged Food & Meats | | $ | 492,685,154 | | | $ | 389,312,368 | | | $ | 0 | | |
| Common Stocks - All Other | | | 8,769,346,727 | | | | 0 | | | | 0 | | |
| Fixed Income | | | 0 | | | | 5,021,117,632 | | | | 0 | | |
| Short Term Investments | | | 0 | | | | 906,090,352 | | | | 0 | | |
| Total | | $ | 9,262,031,881 | | | $ | 6,316,520,352 | | | $ | 0 | | |
| Global | | | | | | | | | | | | | |
| Common Stocks | | $ | 1,680,280,987 | | | $ | 0 | | | $ | 0 | | |
| Short Term Investments | | | 0 | | | | 46,830,418 | | | | 0 | | |
| Forward Foreign Currency Contracts - Assets | | | 320,148 | | | | 0 | | | | 0 | | |
| Forward Foreign Currency Contracts - Liabilities | | | (6,116,154 | ) | | | 0 | | | | 0 | | |
| Total | | $ | 1,674,484,981 | | | $ | 46,830,418 | | | $ | 0 | | |
THE OAKMARK FUNDS
72
THE OAKMARK FUNDS
Notes to Financial Statements (cont.)
| | | Quoted Prices
in Active
Markets for
Identical
Assets
(Level 1) | | Other
Significant
Observable
Inputs
(Level 2) | | Significant
Unobservable
Inputs
(Level 3) | |
| Global Select | | | | | | | | | | | | | |
| Common Stocks | | $ | 255,590,069 | | | $ | 0 | | | $ | 0 | | |
| Short Term Investments | | | 0 | | | | 10,780,184 | | | | 0 | | |
| Forward Foreign Currency Contracts - Assets | | | 41,115 | | | | 0 | | | | 0 | | |
| Forward Foreign Currency Contracts - Liabilities | | | (826,123 | ) | | | 0 | | | | 0 | | |
| Total | | $ | 254,805,061 | | | $ | 10,780,184 | | | $ | 0 | | |
| International | | | | | | | | | | | | | |
| Common Stocks | | $ | 3,973,688,698 | | | $ | 0 | | | $ | 0 | | |
| Short Term Investments | | | 0 | | | | 156,154,852 | | | | 0 | | |
| Forward Foreign Currency Contracts - Assets | | | 734,586 | | | | 0 | | | | 0 | | |
| Forward Foreign Currency Contracts - Liabilities | | | (15,492,760 | ) | | | 0 | | | | 0 | | |
| Total | | $ | 3,958,930,524 | | | $ | 156,154,852 | | | $ | 0 | | |
| Int'l Small Cap | | | | | | | | | | | | | |
| Common Stocks | | $ | 730,740,833 | | | $ | 0 | | | $ | 0+ | | |
| Short Term Investments | | | 0 | | | | 35,169,154 | | | | 0 | | |
| Forward Foreign Currency Contracts - Assets | | | 97,799 | | | | 0 | | | | 0 | | |
| Forward Foreign Currency Contracts - Liabilities | | | (1,319,564 | ) | | | 0 | | | | 0 | | |
| Total | | $ | 729,519,068 | | | $ | 35,169,154 | | | $ | 0 | | |
+ On September 30, 2008, Int'l Small Cap did not hold any securities classified as Level 3, and for the 12-month period ending September 30, 2009, the Fund had no purchases or sales of Level 3 securities. During the 12-month period ending September 30, 2009, a common stock within the Investment Banking and Brokerage category was transferred into the Level 3 with a market value of zero and remained at that value on September 30, 2009.
Foreign currency translation—
Certain Funds invest in foreign securities, which may involve a number of risk factors and special considerations not present with investments in securities of U.S. corporations. Values of investments and other assets and liabilities denominated in foreign currencies are translated into U.S. dollars at current exchange rates obtained by a recognized bank, dealer, or independent pricing service on the day of valuation. Purchases and sales of investments and dividend and interest income are converted at the prevailing rate of exchange on the respective dates of such transactions.
The Funds do not isolate that portion of the results of operations resulting from changes in foreign exchange rates on investments from the fluctuations arising from changes in market prices of securities held. Such fluctuations are included in net realized and change in unrealized appreciation (depreciation) on investments in the Statements of Operations. Net realized gains and losses on foreign currency transactions arising from the sale of foreign currencies, currency gains or losses realized between the trade and settlement dates on securities transactions and the difference between the amounts of dividends, interest, foreign withholding taxes and tax reclaims recorded and the U.S. dollar equivalent of the amounts actually received or paid are included in net realized gain (loss) on foreign currency transactions in the Statement of Operations. Unrealized gains and losses arising from changes in the fair value of assets and l iabilities, other than investments in securities, resulting from changes in exchange rates are included in net change in unrealized appreciation (depreciation) on foreign currency translation in the Statements of Operations.
Forward foreign currency contracts—
Forward foreign currency contracts are agreements to exchange one currency for another at a future date and at a specified price. The Funds' transactions in forward foreign currency contracts are limited to transaction and portfolio hedging. The contractual amounts of forward foreign currency contracts do not necessarily represent the amounts potentially subject to risk. The measurement of the risks associated with these
THE OAKMARK FUNDS
73
THE OAKMARK FUNDS
Notes to Financial Statements (cont.)
instruments is meaningful only when all related and offsetting transactions are considered and could exceed the net unrealized value shown in the tables below. Risks arise from the possible inability of counterparties to meet the terms of their contracts and from movements in currency values. Forward foreign currency contracts are valued at the current day's interpolated foreign exchange rates. Unrealized gain or loss on the contracts as measured by the difference between the forward foreign exchange rates at the dates of entry into the contracts and the forward rates at the end of the period is included in the Statements of Assets and Liabilities. Realized gains and losses and the change in unrealized gains and losses on forward foreign currency contracts for the period are included in the Statements of Operations.
The Funds have adopted FASB ASC Topic 815-10 ("Topic 815-10"). Topic 815-10, Disclosures about Derivative Instruments and Hedging Activities, was issued in March 2008 and is effective for fiscal years and interim periods beginning after November 15, 2008. At September 30, 2009 Global, Global Select, International, and Int'l Small Cap held forward foreign currency contracts which are considered derivative instruments under Topic 815-10 as follows:
Oakmark Global Fund
| | | Contract
Amount | | Settlement
Date | | Valuation at
9/30/2009 | | Unrealized
Appreciation/
(Depreciation) | |
| Foreign Currency Sold: | |
| Euro | | | 37,300,000 | | | 9/15/10 | | $ | 54,546,636 | | | $ | (51,336 | ) | |
| Japanese Yen | | | 2,585,000,000 | | | 3/3/10 | | | 28,830,666 | | | | (2,033,938 | ) | |
| Japanese Yen | | | 2,515,000,000 | | | 9/7/10 | | | 28,150,984 | | | | (870,368 | ) | |
| Swiss Franc | | | 23,300,000 | | | 3/3/10 | | | 22,514,823 | | | | (2,319,807 | ) | |
| Swiss Franc | | | 37,700,000 | | | 6/4/10 | | | 36,480,713 | | | | (840,705 | ) | |
| Swiss Franc | | | 29,200,000 | | | 9/24/10 | | | 28,326,963 | | | | 320,148 | | |
| | | | | | | | | $ | 198,850,785 | | | $ | (5,796,006 | ) | |
During the year ended September 30, 2009 the proceeds from sales and the cost of purchases of forward foreign currency contracts for Global were $239,640,195 and $463,261,203, respectively.
Oakmark Global Select Fund
| | | Contract
Amount | | Settlement
Date | | Valuation at
9/30/2009 | | Unrealized
Appreciation/
(Depreciation) | |
| Foreign Currency Sold: | |
| Euro | | | 4,210,000 | | | 9/15/10 | | $ | 6,156,604 | | | $ | (5,794 | ) | |
| Japanese Yen | | | 273,000,000 | | | 3/3/10 | | | 3,044,786 | | | | (214,803 | ) | |
| Japanese Yen | | | 192,000,000 | | | 9/7/10 | | | 2,149,101 | | | | (66,445 | ) | |
| Swiss Franc | | | 3,850,000 | | | 3/3/10 | | | 3,720,261 | | | | (383,316 | ) | |
| Swiss Franc | | | 6,985,000 | | | 6/4/10 | | | 6,759,092 | | | | (155,765 | ) | |
| Swiss Franc | | | 3,750,000 | | | 9/24/10 | | | 3,637,881 | | | | 41,115 | | |
| | | | | | | | | $ | 25,467,725 | | | $ | (785,008 | ) | |
During the year ended September 30, 2009 the proceeds from sales and the cost of purchases of forward foreign currency contracts for Global Select were $30,229,107 and $47,991,801, respectively.
THE OAKMARK FUNDS
74
THE OAKMARK FUNDS
Notes to Financial Statements (cont.)
Oakmark International Fund
| | | Contract
Amount | | Settlement
Date | | Valuation at
9/30/2009 | | Unrealized
Appreciation/
(Depreciation) | |
| Foreign Currency Sold: | |
| Euro | | | 124,500,000 | | | 09/15/10 | | $ | 182,065,849 | | | $ | (171,349 | ) | |
| Japanese Yen | | | 5,250,000,000 | | | 03/03/10 | | | 58,553,577 | | | | (4,130,821 | ) | |
| Japanese Yen | | | 4,600,000,000 | | | 09/07/10 | | | 51,488,877 | | | | (1,591,926 | ) | |
| Swiss Franc | | | 67,000,000 | | | 03/03/10 | | | 64,742,195 | | | | (6,670,689 | ) | |
| Swiss Franc | | | 131,300,000 | | | 06/04/10 | | | 127,053,519 | | | | (2,927,975 | ) | |
| Swiss Franc | | | 67,000,000 | | | 09/24/10 | | | 64,996,799 | | | | 734,586 | | |
| | | | | | | | | $ | 548,900,816 | | | $ | (14,758,174 | ) | |
During the year ended September 30, 2009 the proceeds from sales and the cost of purchases of forward foreign currency contracts for International were $636,202,065 and $1,388,593,319, respectively.
Oakmark Int'l Small Cap Fund
| | | Contract
Amount | | Settlement
Date | | Valuation at
9/30/2009 | | Unrealized
Appreciation/
(Depreciation) | |
| Foreign Currency Sold: | |
| Euro | | | 25,500,000 | | | 09/15/10 | | $ | 37,290,596 | | | $ | (35,096 | ) | |
| Japanese Yen | | | 572,000,000 | | | 03/03/10 | | | 6,379,552 | | | | (450,063 | ) | |
| Japanese Yen | | | 822,000,000 | | | 09/07/10 | | | 9,200,838 | | | | (284,470 | ) | |
| Swiss Franc | | | 2,950,000 | | | 03/03/10 | | | 2,850,589 | | | | (293,709 | ) | |
| Swiss Franc | | | 11,490,000 | | | 06/04/10 | | | 11,118,392 | | | | (256,226 | ) | |
| Swiss Franc | | | 8,920,000 | | | 09/24/10 | | | 8,653,305 | | | | 97,799 | | |
| | | | | | | | | $ | 75,493,272 | | | $ | (1,221,765 | ) | |
During the year ended September 30, 2009 the proceeds from sales and the cost of purchases of forward foreign currency contracts for Int'l Small Cap were $83,839,243 and $183,579,952, respectively.
Security transactions and investment income—
Security transactions are accounted for on the trade date (date the order to buy or sell is executed) and dividend income is recorded on the ex-dividend date. Interest income and expenses are recorded on an accrual basis. Bond discount is accreted and premium is amortized over the expected life of each applicable security using the yield to maturity method. Withholding taxes and tax reclaims on foreign dividends have been provided for in accordance with the Funds' understanding of the applicable country's tax rules and rates. Net realized gains and losses on investments are determined by the specific identification method.
Short sales—
Each Fund may sell "short" a security it does not own in anticipation of a decline in the value of that security. When the Fund sells a security short, it must borrow the security sold short and deliver it to the broker-dealer through which it made the short sale. A gain, limited to the price at which the Fund sold the security short, or loss, unlimited in size, will be recognized upon the termination of the short sale. At September 30, 2009 none of the Funds had short sales.
Accounting for options—
When a Fund writes an option, the premium received by the Fund is recorded as a liability and is subsequently adjusted to the current market value of the option written. Premiums received from writing options that expire are recorded by the Fund on the expiration date as realized
THE OAKMARK FUNDS
75
THE OAKMARK FUNDS
Notes to Financial Statements (cont.)
gains from option transactions. The difference between the premium and the amount paid on effecting a closing purchase transaction, including brokerage commissions, is also treated as a realized gain, or if the premium is less than the amount paid for the closing purchase transaction, as a realized loss. If a call option is exercised, the premium is added to the proceeds from the sale of the underlying security or currency in determining whether the Fund has realized a gain or a loss. If a put option is exercised, the premium reduces the cost basis of the security or currency purchased by the Fund. In writing an option, the Fund bears the market risk of an unfavorable change in the price of the security or currency underlying the written option. Exercise of an option written by the Fund could result in the Fund selling or buying a security or currency at a price different from the current market value. Options written by the Fun d do not give rise to counterparty credit risk, as they obligate the Fund, not its counterparties, to perform.
When a Fund purchases an option, the premium paid by the Fund is recorded as an asset and is subsequently adjusted to the current value of the option purchased. Purchasing call options tends to increase the Fund's exposure to the underlying instrument. Purchasing put options tends to decrease the Fund's exposure to the underlying instrument. Premiums paid for purchasing options that expire are treated as realized losses. Premiums paid for purchasing options that are exercised or closed are added to the amounts paid or offset against the proceeds on the underlying security to determine the realized gain or loss. The risks associated with purchasing put and call options are potential loss of the premium paid and the failure of the counterparty to honor its obligation under the contract.
At September 30, 2009, the Funds had no outstanding options.
Committed line of credit—
The Trust has an unsecured committed line of credit (the "Facility") with State Street Bank and Trust Company ("State Street") in the amount of $450 million. Borrowings under that arrangement bear interest at 0.75% above the greater of the Federal Funds Effective Rate or LIBOR, as defined in the credit agreement. To maintain the Facility, an annualized commitment fee of 0.125% on the unused portion is charged to the Trust as well as an annual renewal fee of 0.02% of the Facility amount. Fees and interest expense, if any, related to the facility are included in other expenses in the Statements of Operations. There were no borrowings outstanding under the Facility at September 30, 2009.
Expense offset arrangement—
State Street serves as custodian of the Funds. State Street's fee may be reduced by credits that are an earnings allowance calculated on the average daily cash balances each Fund maintains with State Street. Credit balances used to reduce the Funds' custodian fees, if any, are reported as a reduction of total expenses in the Statements of Operations. During the year ended September 30, 2009 none of the Funds received an expense offset credit.
Repurchase agreements—
Each Fund may invest in repurchase agreements, which are short-term investments whereby the Fund acquires ownership of a debt security and the seller agrees to repurchase the security at a future date at a specified price.
The Funds' custodian receives delivery of the underlying securities collateralizing repurchase agreements. It is the Funds' policy that the value of the collateral be at least equal to 102% of the repurchase price, including interest. Harris Associates L.P. ("the Adviser") is responsible for determining that the value of the collateral is at all times at least equal to 102% of the repurchase price, including interest. Repurchase agreements could involve certain risks in the event of default or insolvency of the counterparty including possible delays or restrictions upon a Fund's ability to dispose of the underlying securities.
Security lending—
Each Fund, except Oakmark, may lend its portfolio securities to broker-dealers and banks. Any such loan must be continuously secured by collateral in cash, cash equivalents or U.S. Treasuries maintained on a current basis in an amount at least equal to the fair value of the securities loaned by the Fund. Collateral is marked to market and monitored daily. The Fund would continue to receive the equivalent of the interest or dividends paid by the issuer on the securities loaned, and would also receive an additional return that may be in the form of a fixed fee or a percentage of the earnings on the collateral. The Fund would have the right to call the loan and attempt to obtain the securities loaned at any time on notice of not more than five business days. In the event of bankruptcy or other default of the borrower, the Fund could experience delays in liquidating the loan collateral or recovering the loaned securities and incur e xpenses related to enforcing its rights. In addition, there could be a decline in the value of the collateral or in the fair value of the securities loaned while the Fund seeks to enforce its rights thereto and the Fund could experience subnormal levels of income or lack of access to income during that period.
THE OAKMARK FUNDS
76
THE OAKMARK FUNDS
Notes to Financial Statements (cont.)
At September 30, 2009, none of the Funds had securities on loan.
Restricted securities—
The following investments, the sales of which are restricted to qualified institutional buyers, have been valued according to the securities valuation procedures for debt obligations and money market instruments (as stated in the Security valuation section) since their acquisition dates. These securities are priced using market quotations and there are no unrestricted securities with the same maturity dates and yields for the issuer.
At September 30, 2009 Equity and Income held the following restricted securities:
| Quantity | | Security
Name | | Acquisition
Date | | Carrying
Value | | Cost | | Value | | Percentage of
Net Assets | |
| $ | 3,000,000 | | | Sealed Air Corporation,
144A, 5.625% due
7/15/2013 | | 6/27/2003 | | | 101.2732 | | | | 100.68 | | | | 3,038,196 | | | | 0.02 | % | |
| | 3,740,000 | | | Sealed Air Corporation,
144A, 5.625% due
7/15/2013 | | 8/20/2003 | | | 101.2732 | | | | 96.41 | | | | 3,787,618 | | | | 0.02 | % | |
| | 300,000 | | | Sealed Air Corporation,
144A, 5.625% due
7/15/2013 | | 8/21/2003 | | | 101.2732 | | | | 96.79 | | | | 303,820 | | | | 0.00 | % | |
| | 11,700,000 | | | Sealed Air Corporation,
144A, 5.625% due
7/15/2013 | | 4/6/2004 | | | 101.2732 | | | | 103.31 | | | | 11,848,964 | | | | 0.08 | % | |
| | | | | | | | | | | | | | | | | | 18,978,598 | | | | 0.12 | % | |
Federal income taxes—
It is each Fund's policy to comply with the requirements of the Internal Revenue Code applicable to regulated investment companies and to distribute substantially all of its net taxable income, including any net realized gains on investments, to its shareholders. Therefore, no federal income tax provision is required.
The Funds implemented the provisions of the FASB ASC Topic 740 ("Topic 740") Accounting for Uncertainty in Income Taxes. This topic prescribes a recognition threshold and measurement attribute for the financial statement recognition and measurement of a tax position taken or expected to be taken in a tax return. It also provides guidance on de-recognition, classification, interest and penalties, accounting in interim periods, disclosure and transition. The implementation of Topic 740 resulted in no material liability for unrecognized tax benefits in the accompanying financial statements. Generally, each of the tax years in the four year period ended September 30, 2009 remains subject to examination by taxing authorities.
2. TRANSACTIONS WITH AFFILIATES
Each Fund has an investment advisory agreement with the Adviser. For management services and facilities furnished, the Funds pay the Adviser monthly fees. Each fee is calculated on the total net assets as determined at the end of each preceding calendar month. Annual fee rates are as follows:
| Fund | | Advisory Fees | | Fund | | Advisory Fees | |
Oakmark
| | 1.00% up to $2 billion;
0.90% on the next $1 billion;
0.80% on the next $2 billion;
0.75% on the next $2.5 billion;
0.70% on the next $2.5 billion; and
0.65% over $10 billion
| | Global
Global Select
| | 1.00% up to $2 billion;
0.95% on the next $2 billion;
0.90% on the next $4 billion; and
0.875% over $8 billion
1.00% up to $2 billion;
0.95% on the next $1 billion;
0.875% on the next $4 billion; and
0.85% over $7 billion | |
|
THE OAKMARK FUNDS
77
THE OAKMARK FUNDS
Notes to Financial Statements (cont.)
| Fund | | Advisory Fees | | Fund | | Advisory Fees | |
Select
| | 1.00% up to $1 billion;
0.95% on the next $500 million;
0.90% on the next $500 million;
0.85% on the next $500 million;
0.80% on the next $2.5 billion;
0.75% on the next $5 billion; and
0.725% over $10 billion
| | International
| | 1.00% up to $2 billion;
0.95% on the next $1 billion;
0.85% on the next $2 billion;
0.825% on the next $2.5 billion;
0.815% on the next $3.5 billion;
0.805% on the next $5.5 billion; and
0.80% over $16.5 billion | |
|
Equity and Income
| | 0.75% up to $5 billion;
0.70% on the next $2.5 billion;
0.675% on the next $2.5 billion;
0.65% on the next $2.5 billion;
0.60% on the next $3.5 billion;
0.585% on the next $5 billion;
0.5775% on the next $7 billion; and
0.5725% over $28 billion | | Int'l Small Cap
| | 1.25% up to $500 million;
1.10% on the next $1 billion;
1.05% on the next $2 billion; and
1.025% over $3.5 billion
| |
|
The Adviser is contractually obligated through January 31, 2010 to reimburse each Fund Class to the extent, but only to the extent, that its annualized expenses (excluding taxes, interest, all commissions and other normal charges incident to the purchase and sale of portfolio securities, and extraordinary charges such as litigation costs, but including fees paid to the Adviser) exceed the percent set forth below of average daily net assets of the Fund Class.
| Fund | | Class I | | Class II | |
| Oakmark | | | 1.50 | % | | | 1.75 | % | |
| Select | | | 1.50 | | | | 1.75 | | |
| Equity and Income | | | 1.00 | | | | 1.25 | | |
| Global | | | 1.75 | | | | 2.00 | | |
| Global Select | | | 1.75 | | | | 2.00 | | |
| International | | | 2.00 | | | | 2.25 | | |
| Int'l Small Cap | | | 2.00 | | | | 2.25 | | |
The Adviser is entitled to recoup from any Fund Class, in any fiscal year through the Funds' fiscal year ending September 30, 2013, amounts reimbursed to that Fund Class, except to the extent that the Fund Class already has paid such recoupment to the Adviser or such recoupment would cause the annual ordinary operating expense of a Fund Class for that fiscal year to exceed the applicable limit stated above. As of September 30, 2009 there were no amounts subject to recoupment.
The Adviser and the Funds have entered into agreements with financial intermediaries to provide recordkeeping, processing, shareholder communications and other services to customers of the intermediaries and have agreed to compensate the intermediaries for providing those services. Certain of those services would be provided by the Funds if the shares of those customers were registered directly with the Funds' transfer agent. Accordingly, the Funds pay a portion of the intermediary fees pursuant to an agreement with the Adviser, which calls for each Fund to pay a portion of the intermediary fees attributable to shares of the Fund held by the intermediary (which generally are a percentage of the value of the shares held) not exceeding the lesser of 75% of the fees charged by the intermediary or what the Fund would have paid its transfer agent had each customer's shares been registered directly with the transfer agent instead of h eld through the intermediary. The Adviser pays the remainder of the fees. The fees incurred by the Funds are reflected as other shareholder servicing fees in the Statements of Operations.
The non-interested Trustees of the Trust may participate in the Trust's Deferred Compensation Plan for Independent Trustees. Participants in the plan may elect to defer all or a portion of their compensation. Amounts deferred are retained by the Trust and represent an unfunded obligation of the Trust. The value of a participant's deferral account is determined by reference to the change in value of Class I shares of one or more of the Funds or a money market fund as specified by the participant. Benefits would be payable after a stated number of years or retirement from the board. The accrued obligations of the Funds under the plan are reflected as deferred Trustee compensation in the Statements of Assets and Liabilities. The Trust pays the compensation of the Trustees other than those affiliated with the Adviser and all expenses incurred in connection with their services to the Trust. The Trust does not provide any pension or r etirement benefits to its Trustees.
THE OAKMARK FUNDS
78
THE OAKMARK FUNDS
Notes to Financial Statements (cont.)
The Funds reimburse the adviser for a portion of the compensation paid to the Funds' Chief Compliance Officer (CCO). The CCO expenses incurred by the Funds are included in other expenses in the Statements of Operations.
3. FEDERAL INCOME TAXES
At September 30, 2009 cost of investments for federal income tax purposes and related composition of unrealized gains and losses for each Fund were as follows:
| Fund | | Cost of Investments
for Federal Income
Tax Purposes | | Gross Unrealized
Appreciation | | Gross Unrealized
(Depreciation) | | Net Unrealized
Appreciation
(Depreciation) | |
| Oakmark | | $ | 2,216,206,936 | | | $ | 926,329,009 | | | $ | (4,258,878 | ) | | $ | 922,070,131 | | |
| Select | | | 1,796,151,483 | | | | 657,311,294 | | | | (180,225,104 | ) | | | 477,086,190 | | |
| Equity and Income | | | 13,685,191,202 | | | | 2,116,622,257 | | | | (223,261,226 | ) | | | 1,893,361,031 | | |
| Global | | | 1,630,317,183 | | | | 264,382,407 | | | | (167,588,185 | ) | | | 96,794,222 | | |
| Global Select | | | 250,875,397 | | | | 38,174,359 | | | | (22,679,503 | ) | | | 15,494,856 | | |
| International | | | 3,822,082,787 | | | | 572,984,090 | | | | (265,223,327 | ) | | | 307,760,763 | | |
| Int'l Small Cap | | | 823,123,201 | | | | 108,343,862 | | | | (165,557,076 | ) | | | (57,213,214 | ) | |
For the period ended September 30, 2009 the following Funds incurred net capital losses which each Fund intends to treat as incurred in the following fiscal year:
| Fund | | Net Capital Losses | |
| Oakmark | | $ | 427,464,073 | | |
| Equity and Income | | | 573,426,392 | | |
| Global | | | 235,354,635 | | |
| Global Select | | | 21,964,550 | | |
| International | | | 794,595,567 | | |
| Int'l Small Cap | | | 128,319,975 | | |
On September 30, 2009, the tax year end of the Funds, the following Funds had available capital loss carryforwards that may be utilized to offset future net capital gains through the indicated expiration dates as follows:
| Fund | | Expires
September 30, 2017 | |
| Oakmark | | $ | 661,249 | | |
| Select | | | 250,277,761 | | |
| Equity and Income | | | 233,021,030 | | |
| Global | | | 41,801,493 | | |
| Global Select | | | 43,527,970 | | |
| International | | | 303,277,583 | | |
| Int'l Small Cap | | | 36,357,966 | | |
For the year ended September 30, 2009 the components of distributable earnings on a tax basis (excluding unrealized appreciation (depreciation)) were as follows:
| Fund | | Undistributed
Ordinary Income | | Undistributed Long-
Term Gain | | Total Distributable
Earnings | |
| Oakmark | | $ | 17,093,275 | | | $ | 0 | | | $ | 17,093,275 | | |
| Select | | | 5,617,295 | | | | 0 | | | | 5,617,295 | | |
| Equity and Income | | | 139,836,664 | | | | 0 | | | | 139,836,664 | | |
| Global | | | 12,580,534 | | | | 0 | | | | 12,580,534 | | |
| Global Select | | | 1,090,355 | | | | 0 | | | | 1,090,355 | | |
| International | | | 30,769,486 | | | | 0 | | | | 30,769,486 | | |
| Int'l Small Cap | | | 11,471,845 | | | | 0 | | | | 11,471,845 | | |
THE OAKMARK FUNDS
79
THE OAKMARK FUNDS
Notes to Financial Statements (cont.)
During the years ended September 30, 2009 and September 30, 2008, the tax character of distributions paid was as follows:
| | | Year Ended
September 30, 2009 | | Year Ended
September 30, 2008 | |
| Fund | | Distributions Paid
from Ordinary
Income | | Distributions Paid
from Long-Term
Capital Gain | | Distributions Paid
from Ordinary
Income | | Distributions Paid
from Long-Term
Capital Gain | |
| Oakmark | | $ | 42,797,994 | | | $ | 93,707,504 | | | $ | 63,543,967 | | | $ | 391,986,830 | | |
| Select | | | 29,078,511 | | | | 0 | | | | 47,324,894 | | | | 456,979,270 | | |
| Equity and Income | | | 208,469,706 | | | | 315,607,090 | | | | 283,658,767 | | | | 713,711,785 | | |
| Global | | | 69,175,944 | | | | 0 | | | | 37,019,816 | | | | 296,608,246 | | |
| Global Select | | | 10,153,233 | | | | 0 | | | | 13,614,523 | | | | 483,518 | | |
| International | | | 312,062,206 | | | | 17,335,413 | | | | 152,440,649 | | | | 1,260,535,489 | | |
| Int'l Small Cap | | | 48,127,188 | | | | 5,557,770 | | | | 23,990,953 | | | | 263,529,673 | | |
On September 30, 2009 the Funds had temporary book/tax differences in undistributed earnings that were primarily attributable to trustee deferred compensation expenses, passive foreign investment companies, foreign currency contracts, post October losses and deferrals of capital losses on wash sales. Temporary differences will reverse over time. The Funds have permanent differences in book/tax undistributed earnings primarily attributable to currency gains and losses and equalization debits. Permanent differences have been recorded in their respective component of the Analysis of Net Assets.
4. INVESTMENT TRANSACTIONS
For the year ended September 30, 2009 transactions in investment securities (excluding short term and U.S. Government securities) were as follows (in thousands):
| | | Oakmark | | Select | | Equity and
Income | | Global | | Global
Select | | International | | Int'l
Small Cap | |
| Purchases | | $ | 1,585,498 | | | $ | 631,614 | | | $ | 5,822,497 | | | $ | 455,497 | | | $ | 83,392 | | | $ | 1,564,696 | | | $ | 271,722 | | |
| Proceeds from sales | | | 1,976,315 | | | | 1,070,960 | | | | 2,464,166 | | | | 615,897 | | | | 88,625 | | | | 1,608,955 | | | | 224,705 | | |
Purchases at cost and proceeds from sales (in thousands) of long-term U.S. Government securities for the year ended September 30, 2009, were $6,634,840 and $7,046,631, respectively, for Equity and Income.
For the year ended September 30, 2009 the proceeds from in-kind sales (in thousands) were $423,361 for Equity and Income. Gains and losses on in-kind transactions are not taxable for federal income tax purposes.
5. INVESTMENT IN AFFILIATED ISSUERS
An issuer in which a Fund's ownership represents 5% or more of the outstanding voting securities of the issuer is an affiliated issuer as defined under the Investment Company Act of 1940. A schedule of each Fund's investments in securities of affiliated issuers for the year ended September 30, 2009 is set forth below:
Schedule of Transactions with Affiliated Issuers
Oakmark Equity and Income Fund
| Affiliates | | Shares Held | | Purchases
(Cost) | | Sales
(Proceeds) | | Dividend
Income | | Value
September 30,
2008 | | Value
September 30,
2009 | |
| EchoStar Corp.*** | | | 0 | | | $ | 18,201,426 | | | $ | 77,830,304 | | | $ | 0 | | | $ | 96,400,000 | | | $ | 0 | | |
| Hospira, Inc.+* | | | 7,728,000 | | | | 44,398,550 | | | | 9,079,295 | | | | 0 | | | | 248,300,000 | | | | 344,668,800 | | |
Mueller Water Products, Inc.,
Class A* | | | 2,000,000 | | | | 0 | | | | 9,788,780 | | | | 295,012 | | | | 39,000,000 | | | | 10,960,000 | | |
| Walter Energy, Inc. | | | 3,000,000 | | | | 24,482,270 | | | | 3,022,915 | | | | 5,206,718 | | | | 115,099,465 | (a) | | | 180,180,000 | | |
Walter Investment
Management Corp. | | | 1,093,695 | | | | 0 | | | | 355,430 | | | | 546,848 | | | | 0 | (b) | | | 17,520,994 | | |
| TOTALS | | | | | | $ | 87,082,246 | | | $ | 100,076,724 | ** | | $ | 6,048,578 | | | $ | 498,799,465 | | | $ | 553,329,794 | | |
(a) At September 30, 2008 the Fund held shares of Walter Industries, Inc. with a market value of $115,099,465. During 2009, Walter Industries changed its name to Walter Energy, Inc.
(b) During 2009 Walter Industries, Inc. spun off Walter Investment Management Corp.
THE OAKMARK FUNDS
80
THE OAKMARK FUNDS
Notes to Financial Statements (cont.)
Schedule of Transactions with Affiliated Issuers
Oakmark International Fund
| Affiliates | | Shares Held | | Purchases
(Cost) | | Sales
(Proceeds) | | Dividend
Income | | Value
September 30,
2008 | | Value
September 30,
2009 | |
| Meitec Corp. | | | 2,475,100 | | | $ | 0 | | | $ | 229,249 | | | $ | 1,376,660 | | | $ | 66,531,330 | | | $ | 42,021,416 | | |
| Signet Jewelers, Ltd. | | | 4,659,636 | | | | 13,630,664 | | | | 45,123,346 | | | | 0 | | | | 125,992,108 | | | | 122,688,216 | | |
| TOTALS | | | | $ | 13,630,664 | | | $ | 45,352,595 | | | $ | 1,376,660 | | | $ | 192,523,438 | | | $ | 164,709,632 | | |
Schedule of Transactions with Affiliated Issuers
Oakmark Int'l Small Cap Fund
| Affiliates | | Shares Held | | Purchases
(Cost) | | Sales
(Proceeds) | | Dividend
Income | | Value
September 30,
2008 | | Value
September 30,
2009 | |
| Alaska Milk Corp. | | | 56,360,000 | | | $ | 0 | | | $ | 0 | | | $ | 290,324 | | | $ | 5,733,847 | | | $ | 6,304,517 | | |
| Chargeurs SA*** | | | 0 | | | | 0 | | | | 5,516,182 | | | | 0 | | | | 11,120,369 | | | | 0 | | |
| Freightways Ltd.* | | | 5,657,300 | | | | 366,461 | | | | 3,560,306 | | | | 668,105 | | | | 16,545,059 | | | | 12,543,105 | | |
| Interpump Group SpA+ | | | 4,169,700 | | | | 8,375,703 | | | | 0 | | | | 0 | | | | 13,252,163 | | | | 26,710,306 | | |
| JJB Sports PLC+ | | | 17,927,180 | | | | 2,947,387 | | | | 1,113,161 | | | | 0 | | | | 10,104,786 | | | | 9,239,736 | | |
LSL Property
Services PLC+ | | | 6,569,064 | | | | 0 | | | | 9,002,687 | | | | 0 | | | | 13,512,585 | | | | 24,329,944 | | |
| Media Prima Berhad | | | 42,704,400 | | | | 8,619,352 | | | | 6,466,634 | | | | 869,481 | | | | 12,519,762 | | | | 19,865,381 | | |
| Monitise PLC+* | | | 3,061,088 | | | | 0 | | | | 2,078,632 | | | | 0 | | | | 4,333,962 | | | | 721,582 | | |
| Pasona Group, Inc. | | | 23,842 | | | | 0 | | | | 2,451,835 | | | | 313,396 | | | | 20,951,003 | | | | 17,583,027 | | |
| Raymarine PLC*** | | | 0 | | | | 0 | | | | 776,039 | | | | 0 | | | | 8,027,106 | | | | 0 | | |
| Vitec Group PLC | | | 3,035,979 | | | | 1,162,410 | | | | 0 | | | | 814,520 | | | | 17,495,105 | | | | 17,709,631 | | |
| TOTALS | | | | | | $ | 21,471,313 | | | $ | 30,965,476 | | | $ | 2,955,826 | | | $ | 133,595,747 | | | $ | 135,007,229 | | |
+ Non-income producing security.
* Due to transactions during the period ended September 30, 2009, the company is no longer an affiliated security.
** Includes proceeds from in-kind transactions of $15,352,818.
*** Position in issuer liquidated during the year.
6. SUBSEQUENT EVENT
In accordance with the provisions set forth in FASB ASC Topic 855 Subsequent Events, adopted by the Funds as of June 30, 2009, management has evaluated the possibility of subsequent events existing in the Funds' financial statements through November 4, 2009. Management has determined that there are no material events that would require disclosure in the Funds' financial statements through this date.
THE OAKMARK FUNDS
81
THE OAKMARK FUNDS
FINANCIAL HIGHLIGHTS
The following tables are intended to help you understand each Fund's financial performance during the last 5 years (or since it began operations, if less than five years). Certain information reflects financial results for a single Fund share. Total returns represent the rate you would have earned (or lost) on an investment, assuming reinvestment of all dividends and distributions. Deloitte & Touche LLP, an independent registered public accounting firm, has audited the information for the fiscal years ended September 30, 2009, 2008, 2007, 2006, and 2005. For each year shown, all information is for the fiscal year ended September 30, unless otherwise noted.
THE OAKMARK FUNDS
82
OAKMARK FUND
Financial Highlights–Class I
For a share outstanding throughout each period
| | | Year Ended
September 30,
2009 | | Year Ended
September 30,
2008 | | Year Ended
September 30,
2007 | | Year Ended
September 30,
2006 | | Year Ended
September 30,
2005 | |
| Net Asset Value, Beginning of Year | | $ | 35.31 | | | $ | 47.28 | | | $ | 44.64 | | | $ | 40.75 | | | $ | 38.68 | | |
| Income From Investment Operations: | |
| Net Investment Income | | | 0.29 | (a) | | | 0.52 | | | | 0.47 | (a) | | | 0.39 | (a) | | | 0.34 | | |
| Net Gain (Loss) on Investments (both realized and unrealized) | | | 0.39 | | | | (8.51 | ) | | | 4.60 | | | | 3.85 | | | | 1.90 | | |
| Total From Investment Operations | | | 0.68 | | | | (7.99 | ) | | | 5.07 | | | | 4.24 | | | | 2.24 | | |
| Less Distributions: | |
| Dividends (from net investment income) | | | (0.45 | ) | | | (0.56 | ) | | | (0.43 | ) | | | (0.35 | ) | | | (0.17 | ) | |
| Dividends (from capital gains) | | | (0.99 | ) | | | (3.42 | ) | | | (2.00 | ) | | | 0.00 | | | | 0.00 | | |
| Total Distributions | | | (1.44 | ) | | | (3.98 | ) | | | (2.43 | ) | | | (0.35 | ) | | | (0.17 | ) | |
| Redemption Fees | | | 0.00 | (b) | | | 0.00 | (b) | | | 0.00 | (b) | | | 0.00 | (b) | | | 0.00 | (b) | |
| Net Asset Value, End of Year | | $ | 34.55 | | | $ | 35.31 | | | $ | 47.28 | | | $ | 44.64 | | | $ | 40.75 | | |
| Total Return | | | 3.38 | % | | | -18.14 | % | | | 11.51 | % | | | 10.46 | % | | | 5.79 | % | |
| Ratios/Supplemental Data: | |
| Net Assets, End of Year ($million) | | $ | 3,144.2 | | | $ | 3,610.1 | | | $ | 5,656.9 | | | $ | 5,486.2 | | | $ | 6,340.4 | | |
| Ratio of Expenses to Average Net Assets* | | | 1.23 | % | | | 1.10 | % | | | 1.01 | % | | | 1.05 | % | | | 1.03 | % | |
| Ratio of Net Investment Income to Average Net Assets | | | 1.06 | % | | | 1.17 | % | | | 1.01 | % | | | 0.94 | % | | | 0.79 | % | |
| Portfolio Turnover Rate | | | 62 | % | | | 32 | % | | | 12 | % | | | 9 | % | | | 16 | % | |
Financial Highlights–Class II
For a share outstanding throughout each period
| | | Year Ended
September 30,
2009 | | Year Ended
September 30,
2008 | | Year Ended
September 30,
2007 | | Year Ended
September 30,
2006 | | Year Ended
September 30,
2005 | |
| Net Asset Value, Beginning of Year | | $ | 35.12 | | | $ | 46.97 | | | $ | 44.35 | | | $ | 40.51 | | | $ | 38.45 | | |
| Income From Investment Operations: | |
| Net Investment Income | | | 0.24 | (a) | | | 0.54 | | | | 0.32 | (a) | | | 0.25 | (a) | | | 0.26 | (a) | |
| Net Gain (Loss) on Investments (both realized and unrealized) | | | 0.45 | | | | (8.64 | ) | | | 4.55 | | | | 3.82 | | | | 1.87 | | |
| Total From Investment Operations | | | 0.69 | | | | (8.10 | ) | | | 4.87 | | | | 4.07 | | | | 2.13 | | |
| Less Distributions: | |
| Dividends (from net investment income) | | | (0.26 | ) | | | (0.33 | ) | | | (0.25 | ) | | | (0.23 | ) | | | (0.07 | ) | |
| Distributions (from capital gains) | | | (0.99 | ) | | | (3.42 | ) | | | (2.00 | ) | | | 0.00 | | | | 0.00 | | |
| Total Distributions | | | (1.25 | ) | | | (3.75 | ) | | | (2.25 | ) | | | (0.23 | ) | | | (0.07 | ) | |
| Redemption Fees | | | 0.00 | (b) | | | 0.00 | (b) | | | 0.00 | (b) | | | 0.00 | (b) | | | 0.00 | (b) | |
| Net Asset Value, End of Year | | $ | 34.56 | | | $ | 35.12 | | | $ | 46.97 | | | $ | 44.35 | | | $ | 40.51 | | |
| Total Return | | | 3.22 | % | | | -18.44 | % | | | 11.11 | % | | | 10.08 | % | | | 5.55 | % | |
| Ratios/Supplemental Data: | |
| Net Assets, End of Year ($million) | | $ | 8.2 | | | $ | 12.4 | | | $ | 29.1 | | | $ | 37.5 | | | $ | 43.7 | | |
| Ratio of Expenses to Average Net Assets* | | | 1.44 | % | | | 1.47 | % | | | 1.36 | % | | | 1.40 | % | | | 1.26 | % | |
| Ratio of Net Investment Income to Average Net Assets | | | 0.88 | % | | | 0.81 | % | | | 0.67 | % | | | 0.59 | % | | | 0.58 | % | |
| Portfolio Turnover Rate | | | 62 | % | | | 32 | % | | | 12 | % | | | 9 | % | | | 16 | % | |
* The ratio excludes expense offset arrangement.
(a) Computed using average shares outstanding throughout the period.
(b) Amount rounds to less than $0.01 per share.
See accompanying Notes to Financial Statements.
THE OAKMARK FUNDS
83
OAKMARK SELECT FUND
Financial Highlights–Class I
For a share outstanding throughout each period
| | | Year Ended
September 30,
2009 | | Year Ended
September 30,
2008 | | Year Ended
September 30,
2007 | | Year Ended
September 30,
2006 | | Year Ended
September 30,
2005 | |
| Net Asset Value, Beginning of Year | | $ | 20.34 | | | $ | 33.05 | | | $ | 34.48 | | | $ | 33.44 | | | $ | 31.20 | | |
| Income From Investment Operations: | |
| Net Investment Income | | | 0.11 | (a) | | | 0.35 | | | | 0.38 | (a) | | | 0.36 | (a) | | | 0.29 | | |
| Net Gain (Loss) on Investments (both realized and unrealized) | | | 2.48 | | | | (9.63 | ) | | | 2.11 | | | | 2.76 | | | | 2.19 | | |
| Total From Investment Operations | | | 2.59 | | | | (9.28 | ) | | | 2.49 | | | | 3.12 | | | | 2.48 | | |
| Less Distributions: | |
| Dividends (from net investment income) | | | (0.25 | ) | | | (0.32 | ) | | | (0.39 | ) | | | (0.29 | ) | | | (0.24 | ) | |
| Dividends (from capital gains) | | | 0.00 | | | | (3.11 | ) | | | (3.53 | ) | | | (1.79 | ) | | | 0.00 | | |
| Total Distributions | | | (0.25 | ) | | | (3.43 | ) | | | (3.92 | ) | | | (2.08 | ) | | | (0.24 | ) | |
| Redemption Fees | | | 0.00 | (b) | | | 0.00 | (b) | | | 0.00 | (b) | | | 0.00 | (b) | | | 0.00 | (b) | |
| Net Asset Value, End of Year | | $ | 22.68 | | | $ | 20.34 | | | $ | 33.05 | | | $ | 34.48 | | | $ | 33.44 | | |
| Total Return | | | 13.30 | % | | | -30.43 | % | | | 7.00 | % | | | 9.58 | % | | | 7.98 | % | |
| Ratios/Supplemental Data: | |
| Net Assets, End of Year ($million) | | $ | 2,265.3 | | | $ | 2,558.9 | | | $ | 5,397.4 | | | $ | 5,776.6 | | | $ | 5,908.0 | | |
| Ratio of Expenses to Average Net Assets* | | | 1.19 | % | | | 1.08 | % | | | 0.97 | % | | | 0.99 | % | | | 1.00 | % | |
| Ratio of Net Investment Income to Average Net Assets | | | 0.66 | % | | | 1.16 | % | | | 1.11 | % | | | 1.08 | % | | | 0.87 | % | |
| Portfolio Turnover Rate | | | 34 | % | | | 26 | % | | | 10 | % | | | 22 | % | | | 21 | % | |
Financial Highlights–Class II
For a share outstanding throughout each period
| | | Year Ended
September 30,
2009 | | Year Ended
September 30,
2008 | | Year Ended
September 30,
2007 | | Year Ended
September 30,
2006 | | Year Ended
September 30,
2005 | |
| Net Asset Value, Beginning of Year | | $ | 20.29 | | | $ | 32.82 | | | $ | 34.23 | | | $ | 33.24 | | | $ | 31.00 | | |
| Income From Investment Operations: | |
| Net Investment Income | | | 0.12 | (a) | | | 0.34 | | | | 0.27 | (a) | | | 0.26 | (a) | | | 0.21 | | |
| Net Gain (Loss) on Investments (both realized and unrealized) | | | 2.49 | | | | (9.65 | ) | | | 2.09 | | | | 2.72 | | | | 2.18 | | |
| Total From Investment Operations | | | 2.61 | | | | (9.31 | ) | | | 2.36 | | | | 2.98 | | | | 2.39 | | |
| Less Distributions: | |
| Dividends (from net investment income) | | | (0.20 | ) | | | (0.11 | ) | | | (0.24 | ) | | | (0.20 | ) | | | (0.15 | ) | |
| Distributions (from capital gains) | | | 0.00 | | | | (3.11 | ) | | | (3.53 | ) | | | (1.79 | ) | | | 0.00 | | |
| Total Distributions | | | (0.20 | ) | | | (3.22 | ) | | | (3.77 | ) | | | (1.99 | ) | | | (0.15 | ) | |
| Redemption Fees | | | 0.00 | (b) | | | 0.00 | (b) | | | 0.00 | (b) | | | 0.00 | (b) | | | 0.00 | (b) | |
| Net Asset Value, End of Year | | $ | 22.70 | | | $ | 20.29 | | | $ | 32.82 | | | $ | 34.23 | | | $ | 33.24 | | |
| Total Return | | | 13.34 | % | | | -30.64 | % | | | 6.65 | % | | | 9.18 | % | | | 7.72 | % | |
| Ratios/Supplemental Data: | |
| Net Assets, End of Year ($million) | | $ | 8.1 | | | $ | 15.1 | | | $ | 36.2 | | | $ | 68.1 | | | $ | 85.2 | | |
| Ratio of Expenses to Average Net Assets* | | | 1.28 | % | | | 1.37 | % | | | 1.35 | % | | | 1.34 | % | | | 1.25 | % | |
| Ratio of Net Investment Income to Average Net Assets | | | 0.72 | % | | | 0.88 | % | | | 0.79 | % | | | 0.78 | % | | | 0.65 | % | |
| Portfolio Turnover Rate | | | 34 | % | | | 26 | % | | | 10 | % | | | 22 | % | | | 21 | % | |
* The ratio excludes expense offset arrangement.
(a) Computed using average shares outstanding throughout the period.
(b) Amount rounds to less than $0.01 per share.
THE OAKMARK FUNDS
84
OAKMARK EQUITY AND INCOME FUND
Financial Highlights–Class I
For a share outstanding throughout each period
| | | Year Ended
September 30,
2009 | | Year Ended
September 30,
2008 | | Year Ended
September 30,
2007 | | Year Ended
September 30,
2006 | | Year Ended
September 30,
2005 | |
| Net Asset Value, Beginning of Year | | $ | 25.57 | | | $ | 28.67 | | | $ | 26.49 | | | $ | 25.41 | | | $ | 23.12 | | |
| Income From Investment Operations: | |
| Net Investment Income | | | 0.35 | (a) | | | 0.53 | (a) | | | 0.58 | (a) | | | 0.44 | | | | 0.31 | | |
| Net Gain (Loss) on Investments (both realized and unrealized) | | | (0.24 | ) | | | (1.52 | ) | | | 3.41 | | | | 1.18 | | | | 2.77 | | |
| Total From Investment Operations | | | 0.11 | | | | (0.99 | ) | | | 3.99 | | | | 1.62 | | | | 3.08 | | |
| Less Distributions: | |
| Dividends (from net investment income) | | | (0.39 | ) | | | (0.60 | ) | | | (0.50 | ) | | | (0.34 | ) | | | (0.20 | ) | |
| Dividends (from capital gains) | | | (0.57 | ) | | | (1.51 | ) | | | (1.31 | ) | | | (0.20 | ) | | | (0.59 | ) | |
| Total Distributions | | | (0.96 | ) | | | (2.11 | ) | | | (1.81 | ) | | | (0.54 | ) | | | (0.79 | ) | |
| Redemption Fees | | | 0.00 | | | | 0.00 | (b) | | | 0.00 | (b) | | | 0.00 | (b) | | | 0.00 | (b) | |
| Net Asset Value, End of Year | | $ | 24.72 | | | $ | 25.57 | | | $ | 28.67 | | | $ | 26.49 | | | $ | 25.41 | | |
| Total Return | | | 1.02 | % | | | -3.85 | % | | | 15.77 | % | | | 6.51 | % | | | 13.65 | % | |
| Ratios/Supplemental Data: | |
| Net Assets, End of Year ($million) | | $ | 14,418.4 | | | $ | 13,263.3 | | | $ | 12,489.5 | | | $ | 10,414.5 | | | $ | 9,223.2 | | |
| Ratio of Expenses to Average Net Assets* | | | 0.85 | % | | | 0.81 | % | | | 0.83 | % | | | 0.86 | % | | | 0.89 | % | |
| Ratio of Net Investment Income to Average Net Assets | | | 1.59 | % | | | 1.93 | % | | | 2.14 | % | | | 1.88 | % | | | 1.36 | % | |
| Portfolio Turnover Rate | | | 78 | %(c) | | | 65 | %(c) | | | 67 | % | | | 81 | % | | | 112 | % | |
Financial Highlights–Class II
For a share outstanding throughout each period
| | | Year Ended
September 30,
2009 | | Year Ended
September 30,
2008 | | Year Ended
September 30,
2007 | | Year Ended
September 30,
2006 | | Year Ended
September 30,
2005 | |
| Net Asset Value, Beginning of Year | | $ | 25.40 | | | $ | 28.50 | | | $ | 26.35 | | | $ | 25.29 | | | $ | 23.03 | | |
| Income From Investment Operations: | |
| Net Investment Income | | | 0.28 | (a) | | | 0.43 | (a) | | | 0.48 | (a) | | | 0.35 | | | | 0.28 | | |
| Net Gain (Loss) on Investments (both realized and unrealized) | | | (0.24 | ) | | | (1.51 | ) | | | 3.40 | | | | 1.19 | | | | 2.72 | | |
| Total From Investment Operations | | | 0.04 | | | | (1.08 | ) | | | 3.88 | | | | 1.54 | | | | 3.00 | | |
| Less Distributions: | |
| Dividends (from net investment income) | | | (0.30 | ) | | | (0.51 | ) | | | (0.42 | ) | | | (0.28 | ) | | | (0.15 | ) | |
| Distributions (from capital gains) | | | (0.57 | ) | | | (1.51 | ) | | | (1.31 | ) | | | (0.20 | ) | | | (0.59 | ) | |
| Total Distributions | | | (0.87 | ) | | | (2.02 | ) | | | (1.73 | ) | | | (0.48 | ) | | | (0.74 | ) | |
| Redemption Fees | | | 0.00 | | | | 0.00 | (b) | | | 0.00 | (b) | | | 0.00 | (b) | | | 0.00 | | |
| Net Asset Value, End of Year | | $ | 24.57 | | | $ | 25.40 | | | $ | 28.50 | | | $ | 26.35 | | | $ | 25.29 | | |
| Total Return | | | 0.70 | % | | | -4.19 | % | | | 15.38 | % | | | 6.18 | % | | | 13.34 | % | |
| Ratios/Supplemental Data: | |
| Net Assets, End of Year ($million) | | $ | 1,110.4 | | | $ | 1,009.7 | | | $ | 915.1 | | | $ | 718.1 | | | $ | 582.0 | | |
| Ratio of Expenses to Average Net Assets* | | | 1.18 | % | | | 1.16 | % | | | 1.17 | % | | | 1.18 | % | | | 1.14 | % | |
| Ratio of Net Investment Income to Average Net Assets | | | 1.26 | % | | | 1.59 | % | | | 1.82 | % | | | 1.57 | % | | | 1.11 | % | |
| Portfolio Turnover Rate | | | 78 | %(c) | | | 65 | %(c) | | | 67 | % | | | 81 | % | | | 112 | % | |
* The ratio excludes expense offset arrangement.
(a) Computed using average shares outstanding throughout the period.
(b) Amount rounds to less than $0.01 per share.
(c) The ratio excludes in-kind transactions.
See accompanying Notes to Financial Statements.
THE OAKMARK FUNDS
85
OAKMARK GLOBAL FUND
Financial Highlights–Class I
For a share outstanding throughout each period
| | | Year Ended
September 30,
2009 | | Year Ended
September 30,
2008 | | Year Ended
September 30,
2007 | | Year Ended
September 30,
2006 | | Year Ended
September 30,
2005 | |
| Net Asset Value, Beginning of Year | | $ | 19.43 | | | $ | 28.08 | | | $ | 26.69 | | | $ | 23.91 | | | $ | 19.73 | | |
| Income From Investment Operations: | |
| Net Investment Income | | | 0.11 | | | | 0.25 | | | | 0.18 | (a) | | | 0.27 | | | | 0.17 | | |
| Net Gain (Loss) on Investments (both realized and unrealized) | | | 0.13 | | | | (5.82 | ) | | | 5.06 | | | | 3.74 | | | | 4.48 | | |
| Total From Investment Operations | | | 0.24 | | | | (5.57 | ) | | | 5.24 | | | | 4.01 | | | | 4.65 | | |
| Less Distributions: | |
| Dividends (from net investment income) | | | (0.70 | ) | | | (0.04 | ) | | | (0.31 | ) | | | (0.26 | ) | | | (0.10 | ) | |
| Dividends (from capital gains) | | | (0.03 | ) | | | (3.04 | ) | | | (3.54 | ) | | | (0.97 | ) | | | (0.37 | ) | |
| Total Distributions | | | (0.73 | ) | | | (3.08 | ) | | | (3.85 | ) | | | (1.23 | ) | | | (0.47 | ) | |
| Redemption Fees | | | 0.00 | (b) | | | 0.00 | (b) | | | 0.00 | (b) | | | 0.00 | (b) | | | 0.00 | (b) | |
| Net Asset Value, End of Year | | $ | 18.94 | | | $ | 19.43 | | | $ | 28.08 | | | $ | 26.69 | | | $ | 23.91 | | |
| Total Return | | | 2.65 | % | | | -22.10 | % | | | 21.29 | % | | | 17.46 | % | | | 23.88 | % | |
| Ratios/Supplemental Data: | |
| Net Assets, End of Year ($million) | | $ | 1,675.9 | | | $ | 1,946.6 | | | $ | 3,006.2 | | | $ | 2,282.2 | | | $ | 1,842.9 | | |
| Ratio of Expenses to Average Net Assets* | | | 1.23 | % | | | 1.16 | % | | | 1.13 | % | | | 1.18 | % | | | 1.20 | % | |
| Ratio of Net Investment Income to Average Net Assets | | | 0.76 | % | | | 0.95 | % | | | 0.66 | % | | | 1.18 | % | | | 0.81 | % | |
| Portfolio Turnover Rate | | | 32 | % | | | 41 | % | | | 35 | % | | | 41 | % | | | 17 | % | |
Financial Highlights–Class II
For a share outstanding throughout each period
| | | Year Ended
September 30,
2009 | | Year Ended
September 30,
2008 | | Year Ended
September 30,
2007 | | Year Ended
September 30,
2006 | | Year Ended
September 30,
2005 | |
| Net Asset Value, Beginning of Year | | $ | 19.01 | | | $ | 27.62 | | | $ | 26.31 | | | $ | 23.63 | | | $ | 19.53 | | |
| Income From Investment Operations: | |
| Net Investment Income | | | 0.07 | (a) | | | 0.13 | | | | 0.07 | (a) | | | 0.18 | | | | 0.11 | | |
| Net Gain (Loss) on Investments (both realized and unrealized) | | | 0.14 | | | | (5.69 | ) | | | 4.99 | | | | 3.69 | | | | 4.43 | | |
| Total From Investment Operations | | | 0.21 | | | | (5.56 | ) | | | 5.06 | | | | 3.87 | | | | 4.54 | | |
| Less Distributions: | |
| Dividends (from net investment income) | | | (0.61 | ) | | | (0.01 | ) | | | (0.21 | ) | | | (0.22 | ) | | | (0.07 | ) | |
| Distributions (from capital gains) | | | (0.03 | ) | | | (3.04 | ) | | | (3.54 | ) | | | (0.97 | ) | | | (0.37 | ) | |
| Total Distributions | | | (0.64 | ) | | | (3.05 | ) | | | (3.75 | ) | | | (1.19 | ) | | | (0.44 | ) | |
| Redemption Fees | | | 0.00 | (b) | | | 0.00 | (b) | | | 0.00 | (b) | | | 0.00 | (b) | | | 0.00 | (b) | |
| Net Asset Value, End of Year | | $ | 18.58 | | | $ | 19.01 | | | $ | 27.62 | | | $ | 26.31 | | | $ | 23.63 | | |
| Total Return | | | 2.43 | % | | | -22.46 | % | | | 20.82 | % | | | 17.01 | % | | | 23.53 | % | |
| Ratios/Supplemental Data: | |
| Net Assets, End of Year ($million) | | $ | 54.4 | | | $ | 57.6 | | | $ | 90.3 | | | $ | 77.1 | | | $ | 58.6 | | |
| Ratio of Expenses to Average Net Assets* | | | 1.54 | % | | | 1.57 | % | | | 1.53 | % | | | 1.56 | % | | | 1.45 | % | |
| Ratio of Net Investment Income to Average Net Assets | | | 0.46 | % | | | 0.54 | % | | | 0.25 | % | | | 0.80 | % | | | 0.63 | % | |
| Portfolio Turnover Rate | | | 32 | % | | | 41 | % | | | 35 | % | | | 41 | % | | | 17 | % | |
* The ratio excludes expense offset arrangement.
(a) Computed using average shares outstanding throughout the period.
(b) Amount rounds to less than $0.01 per share.
THE OAKMARK FUNDS
86
OAKMARK GLOBAL SELECT FUND
Financial Highlights–Class I
For a share outstanding throughout each period
| | | Year Ended
September 30,
2009 | | Year Ended
September 30,
2008 | | October 2, 2006
through
September 30,
2007 (a) | |
| Net Asset Value, Beginning of Year | | $ | 8.23 | | | $ | 11.61 | | | $ | 10.00 | | |
| Income From Investment Operations: | |
| Net Investment Income | | | 0.06 | | | | 0.14 | (b) | | | 0.12 | (b) | |
| Net Gain (Loss) on Investments (both realized and unrealized) | | | 1.60 | | | | (3.07 | ) | | | 1.49 | | |
| Total From Investment Operations | | | 1.66 | | | | (2.93 | ) | | | 1.61 | | |
| Less Distributions: | |
| Dividends (from net investment income) | | | (0.35 | ) | | | (0.02 | ) | | | (0.01 | ) | |
| Dividends (from capital gains) | | | 0.00 | | | | (0.44 | ) | | | 0.00 | | |
| Total Distributions | | | (0.35 | ) | | | (0.46 | ) | | | (0.01 | ) | |
| Redemption Fees | | | 0.00 | (c) | | | 0.01 | | | | 0.01 | | |
| Net Asset Value, End of Year | | $ | 9.54 | | | $ | 8.23 | | | $ | 11.61 | | |
| Total Return | | | 22.24 | % | | | -25.95 | % | | | 16.23 | % | |
| Ratios/Supplemental Data: | |
| Net Assets, End of Year ($million) | | $ | 266.2 | | | $ | 232.8 | | | $ | 377.7 | | |
| Ratio of Expenses to Average Net Assets* | | | 1.43 | % | | | 1.35 | % | | | 1.31 | %† | |
| Ratio of Net Investment Income to Average Net Assets | | | 0.88 | % | | | 1.41 | % | | | 1.01 | %† | |
| Portfolio Turnover Rate | | | 41 | % | | | 62 | % | | | 33 | % | |
 Data has not been annualized.
† Data has been annualized.
* The ratio excludes expense offset arrangement.
(a) The date on which fund shares were first offered for sale to the public was October 2, 2006.
(b) Computed using average shares outstanding throughout the period.
(c) Amount rounds to less than $0.01 per share.
See accompanying Notes to Financial Statements.
THE OAKMARK FUNDS
87
OAKMARK INTERNATIONAL FUND
Financial Highlights–Class I
For a share outstanding throughout each period
| | | Year Ended
September 30,
2009 | | Year Ended
September 30,
2008 | | Year Ended
September 30,
2007 | | Year Ended
September 30,
2006 | | Year Ended
September 30,
2005 | |
| Net Asset Value, Beginning of Year | | $ | 15.71 | | | $ | 26.59 | | | $ | 26.83 | | | $ | 23.52 | | | $ | 18.98 | | |
| Income From Investment Operations: | |
| Net Investment Income | | | 0.16 | (a) | | | 0.65 | | | | 0.43 | | | | 0.41 | | | | 0.27 | | |
| Net Gain (Loss) on Investments (both realized and unrealized) | | | 1.87 | | | | (7.11 | ) | | | 3.25 | | | | 4.49 | | | | 4.59 | | |
| Total From Investment Operations | | | 2.03 | | | | (6.46 | ) | | | 3.68 | | | | 4.90 | | | | 4.86 | | |
| Less Distributions: | |
| Dividends (from net investment income) | | | (1.39 | ) | | | (0.17 | ) | | | (0.44 | ) | | | (0.59 | ) | | | (0.27 | ) | |
| Dividends (from capital gains) | | | (0.10 | ) | | | (4.25 | ) | | | (3.48 | ) | | | (1.00 | ) | | | (0.05 | ) | |
| Total Distributions | | | (1.49 | ) | | | (4.42 | ) | | | (3.92 | ) | | | (1.59 | ) | | | (0.32 | ) | |
| Redemption Fees | | | 0.00 | (b) | | | 0.00 | (b) | | | 0.00 | (b) | | | 0.00 | (b) | | | 0.00 | (b) | |
| Net Asset Value, End of Year | | $ | 16.25 | | | $ | 15.71 | | | $ | 26.59 | | | $ | 26.83 | | | $ | 23.52 | | |
| Total Return | | | 17.71 | % | | | -28.59 | % | | | 14.53 | % | | | 22.14 | % | | | 25.85 | % | |
| Ratios/Supplemental Data: | |
| Net Assets, End of Year ($million) | | $ | 4,045.4 | | | $ | 3,753.6 | | | $ | 8,446.6 | | | $ | 7,200.5 | | | $ | 5,627.4 | | |
| Ratio of Expenses to Average Net Assets* | | | 1.17 | % | | | 1.10 | % | | | 1.05 | % | | | 1.08 | % | | | 1.11 | % | |
| Ratio of Net Investment Income to Average Net Assets | | | 1.32 | % | | | 2.32 | % | | | 1.65 | % | | | 1.80 | % | | | 1.32 | % | |
| Portfolio Turnover Rate | | | 53 | % | | | 41 | % | | | 50 | % | | | 37 | % | | | 14 | % | |
Financial Highlights–Class II
For a share outstanding throughout each period
| | | Year Ended
September 30,
2009 | | Year Ended
September 30,
2008 | | Year Ended
September 30,
2007 | | Year Ended
September 30,
2006 | | Year Ended
September 30,
2005 | |
| Net Asset Value, Beginning of Year | | $ | 15.55 | | | $ | 26.32 | | | $ | 26.61 | | | $ | 23.36 | | | $ | 18.86 | | |
| Income From Investment Operations: | |
| Net Investment Income | | | 0.14 | (a) | | | 0.39 | (a) | | | 0.35 | | | | 0.34 | | | | 0.22 | | |
| Net Gain (Loss) on Investments (both realized and unrealized) | | | 1.96 | | | | (6.86 | ) | | | 3.19 | | | | 4.45 | | | | 4.55 | | |
| Total From Investment Operations | | | 2.10 | | | | (6.47 | ) | | | 3.54 | | | | 4.79 | | | | 4.77 | | |
| Less Distributions: | |
| Dividends (from net investment income) | | | (1.17 | ) | | | (0.05 | ) | | | (0.35 | ) | | | (0.54 | ) | | | (0.22 | ) | |
| Distributions (from capital gains) | | | (0.10 | ) | | | (4.25 | ) | | | (3.48 | ) | | | (1.00 | ) | | | (0.05 | ) | |
| Total Distributions | | | (1.27 | ) | | | (4.30 | ) | | | (3.83 | ) | | | (1.54 | ) | | | (0.27 | ) | |
| Redemption Fees | | | 0.00 | (b) | | | 0.00 | (b) | | | 0.00 | (b) | | | 0.00 | (b) | | | 0.00 | | |
| Net Asset Value, End of Year | | $ | 16.38 | | | $ | 15.55 | | | $ | 26.32 | | | $ | 26.61 | | | $ | 23.36 | | |
| Total Return | | | 17.70 | % | | | -28.91 | % | | | 14.04 | % | | | 21.71 | % | | | 25.50 | % | |
| Ratios/Supplemental Data: | |
| Net Assets, End of Year ($million) | | $ | 107.8 | | | $ | 130.8 | | | $ | 586.9 | | | $ | 496.0 | | | $ | 362.9 | | |
| Ratio of Expenses to Average Net Assets* | | | 1.32 | % | | | 1.52 | % | | | 1.44 | % | | | 1.47 | % | | | 1.38 | % | |
| Ratio of Net Investment Income to Average Net Assets | | | 1.15 | % | | | 1.96 | % | | | 1.31 | % | | | 1.43 | % | | | 1.08 | % | |
| Portfolio Turnover Rate | | | 53 | % | | | 41 | % | | | 50 | % | | | 37 | % | | | 14 | % | |
* The ratio excludes expense offset arrangement.
(a) Computed using average shares outstanding throughout the period.
(b) Amount rounds to less than $0.01 per share.
THE OAKMARK FUNDS
88
OAKMARK INTERNATIONAL SMALL CAP FUND
Financial Highlights–Class I
For a share outstanding throughout each period
| | | Year Ended
September 30,
2009 | | Year Ended
September 30,
2008 | | Year Ended
September 30,
2007 | | Year Ended
September 30,
2006 | | Year Ended
September 30,
2005 | |
| Net Asset Value, Beginning of Year | | $ | 11.36 | | | $ | 23.19 | | | $ | 24.09 | | | $ | 22.79 | | | $ | 18.26 | | |
| Income From Investment Operations: | |
| Net Investment Income | | | 0.15 | (a) | | | 0.37 | | | | 0.32 | | | | 0.42 | | | | 0.20 | | |
| Net Gain (Loss) on Investments (both realized and unrealized) | | | 1.06 | | | | (6.36 | ) | | | 2.77 | | | | 5.12 | | | | 4.98 | | |
| Total From Investment Operations | | | 1.21 | | | | (5.99 | ) | | | 3.09 | | | | 5.54 | | | | 5.18 | | |
| Less Distributions: | |
| Dividends (from net investment income) | | | (0.93 | ) | | | (0.18 | ) | | | (0.56 | ) | | | (0.70 | ) | | | (0.27 | ) | |
| Dividends (from capital gains) | | | (0.13 | ) | | | (5.66 | ) | | | (3.43 | ) | | | (3.54 | ) | | | (0.38 | ) | |
| Total Distributions | | | (1.06 | ) | | | (5.84 | ) | | | (3.99 | ) | | | (4.24 | ) | | | (0.65 | ) | |
| Redemption Fees | | | 0.00 | (b) | | | 0.00 | (b) | | | 0.00 | (b) | | | 0.00 | (b) | | | 0.00 | (b) | |
| Net Asset Value, End of Year | | $ | 11.51 | | | $ | 11.36 | | | $ | 23.19 | | | $ | 24.09 | | | $ | 22.79 | | |
| Total Return | | | 16.28 | % | | | -32.47 | % | | | 13.35 | % | | | 28.50 | % | | | 29.04 | % | |
| Ratios/Supplemental Data: | |
| Net Assets, End of Year ($million) | | $ | 768.0 | | | $ | 663.6 | | | $ | 1,326.5 | | | $ | 1,274.5 | | | $ | 1,007.2 | | |
| Ratio of Expenses to Average Net Assets* | | | 1.54 | % | | | 1.41 | % | | | 1.34 | % | | | 1.37 | % | | | 1.41 | % | |
| Ratio of Net Investment Income to Average Net Assets | | | 1.77 | % | | | 2.17 | % | | | 1.19 | % | | | 1.73 | % | | | 0.96 | % | |
| Portfolio Turnover Rate | | | 46 | % | | | 50 | % | | | 57 | % | | | 44 | % | | | 47 | % | |
Financial Highlights–Class II
For a share outstanding throughout each period
| | | Year Ended
September 30,
2009 | | Year Ended
September 30,
2008 | | Year Ended
September 30,
2007 | | Year Ended
September 30,
2006 | | Year Ended
September 30,
2005 | |
| Net Asset Value, Beginning of Year | | $ | 11.33 | | | $ | 23.15 | | | $ | 24.05 | | | $ | 22.77 | | | $ | 18.25 | | |
| Income From Investment Operations: | |
| Net Investment Income | | | 0.14 | (a) | | | 0.47 | | | | 0.29 | | | | 0.41 | | | | 0.18 | | |
| Net Gain (Loss) on Investments (both realized and unrealized) | | | 1.06 | | | | (6.48 | ) | | | 2.79 | | | | 5.10 | | | | 4.98 | | |
| Total From Investment Operations | | | 1.20 | | | | (6.01 | ) | | | 3.08 | | | | 5.51 | | | | 5.16 | | |
| Less Distributions: | |
| Dividends (from net investment income) | | | (0.90 | ) | | | (0.15 | ) | | | (0.55 | ) | | | (0.69 | ) | | | (0.26 | ) | |
| Distributions (from capital gains) | | | (0.13 | ) | | | (5.66 | ) | | | (3.43 | ) | | | (3.54 | ) | | | (0.38 | ) | |
| Total Distributions | | | (1.03 | ) | | | (5.81 | ) | | | (3.98 | ) | | | (4.23 | ) | | | (0.64 | ) | |
| Redemption Fees | | | 0.00 | (b) | | | 0.00 | (b) | | | 0.00 | (b) | | | 0.00 | (b) | | | 0.00 | (b) | |
| Net Asset Value, End of Year | | $ | 11.50 | | | $ | 11.33 | | | $ | 23.15 | | | $ | 24.05 | | | $ | 22.77 | | |
| Total Return | | | 16.08 | % | | | -32.63 | % | | | 13.29 | % | | | 28.33 | % | | | 28.94 | % | |
| Ratios/Supplemental Data: | |
| Net Assets, End of Year ($million) | | $ | 0.8 | | | $ | 0.3 | | | $ | 0.9 | | | $ | 0.8 | | | $ | 0.6 | | |
| Ratio of Expenses to Average Net Assets* | | | 1.71 | % | | | 1.54 | % | | | 1.43 | % | | | 1.47 | % | | | 1.49 | % | |
| Ratio of Net Investment Income to Average Net Assets | | | 1.66 | % | | | 2.12 | % | | | 1.12 | % | | | 1.62 | % | | | 0.87 | % | |
| Portfolio Turnover Rate | | | 46 | % | | | 50 | % | | | 57 | % | | | 44 | % | | | 47 | % | |
* The ratio excludes expense offset arrangement.
(a) Computed using average shares outstanding throughout the period.
(b) Amount rounds to less than $0.01 per share.
See accompanying Notes to Financial Statements.
THE OAKMARK FUNDS
89
THE OAKMARK FUNDS
Report of Independent Registered Public Accounting Firm
To the Board of Trustees and Shareholders of Harris
Associates Investment Trust:
We have audited the accompanying statements of assets and liabilities, including the schedules of investments, of Harris Associates Investment Trust comprising Oakmark Fund, Oakmark Select Fund, Oakmark Equity and Income Fund, Oakmark Global Fund, Oakmark Global Select Fund, Oakmark International Fund, and Oakmark International Small Cap Fund (collectively the "Funds"), as of September 30, 2009, and the related statements of operations for the period then ended, the statements of changes in net assets for each of the two years in the period then ended, the financial highlights for each of the Funds, except Oakmark Global Select Fund, for each of the five years in the period then ended, and the financial highlights of Oakmark Global Select Fund for the period from October 2, 2006 (commencement of operations) to September 30, 2007 and for each of the two years in the period then ended. These financial statements and financial h ighlights are the responsibility of the Funds' management. Our responsibility is to express an opinion on these financial statements and financial highlights based on our audits.
We conducted our audits in accordance with the standards of the Public Company Accounting Oversight Board (United States). Those standards require that we plan and perform the audit to obtain reasonable assurance about whether the financial statements and financial highlights are free of material misstatement. The Funds are not required to have, nor were we engaged to perform, an audit of their internal control over financial reporting. Our audits included consideration of internal control over financial reporting as a basis for designing audit procedures that are appropriate in the circumstances, but not for the purpose of expressing an opinion on the effectiveness of the Funds' internal control over financial reporting. Accordingly, we express no such opinion. An audit also includes examining, on a test basis, evidence supporting the amounts and disclosures in the financial statements, assessing the accounting principles us ed and significant estimates made by management, as well as evaluating the overall financial statement presentation. Our procedures included confirmation of securities owned as of September 30, 2009, by correspondence with the Funds' custodian and brokers; where replies were not received from brokers, we performed other auditing procedures. We believe that our audits provide a reasonable basis for our opinion.
In our opinion, the financial statements and financial highlights referred to above present fairly, in all material respects, the financial position of each of the Funds as of September 30, 2009, the results of their operations for the period then ended, and the changes in their net assets and the financial highlights for the respective stated periods, in conformity with accounting principles generally accepted in the United States of America.

Chicago, Illinois
November 4, 2009
THE OAKMARK FUNDS
90
Federal Tax Information (Unaudited)
Global, Global Select, International and Int'l Small Cap paid qualifying foreign taxes of $2,010,741, $247,189, $7,503,898 and $1,340,404 and earned $21,325,668, $2,901,832, $79,593,568 and $18,117,295 foreign source income during the year ended September 30, 2009, respectively. Pursuant to Section 853 of the Internal Revenue Code, Global, Global Select, International, and Int'l Small Cap designated $0.02, $0.01, $0.03 and $0.02 per share as foreign taxes paid and $0.23, $0.10, $0.31 and $0.27 per share as income earned from foreign sources for the year ended September 30, 2009, respectively.
Qualified dividend income ("QDI") received by the Funds through September 30, 2009 that qualified for a reduced tax rate pursuant to the Jobs and Growth Tax Relief Reconciliation Act of 2003 are as follows:
| Fund | | | |
| Oakmark | | $ | 42,800,911 | | |
| Select | | | 29,078,511 | | |
| Equity and Income | | | 121,855,795 | | |
| Global | | | 27,983,296 | | |
| Global Select | | | 4,995,426 | | |
| International | | | 79,494,330 | | |
| Int'l Small Cap | | | 17,134,555 | | |
For corporate shareholders, a portion of the ordinary dividends paid during the Funds' year ended September 30, 2009 qualified for the dividends received deduction, as follows:
| Fund | | | |
| Oakmark | | | 100.00 | % | |
| Select | | | 100.00 | % | |
| Equity and Income | | | 26.18 | % | |
| Global | | | 17.26 | % | |
| Global Select | | | 30.08 | % | |
| International | | | 0.00 | % | |
| Int'l Small Cap | | | 0.00 | % | |
THE OAKMARK FUNDS
91
For a prospectus and more information about The Oakmark Funds, including management fees and expenses and the special risks of investing, please visit oakmark.com or call 1-800-OAKMARK (1-800-625-6275). Please read the prospectus carefully before investing. An investor should consider a fund's investment objectives, risks, and charges and expenses carefully before investing. This and other information about The Oakmark Funds are contained in the Funds' prospectus.
The discussion of the Funds' investments and investment strategy (including current investment themes, the portfolio managers' research and investment process, and portfolio characteristics) represents the Funds' investments and the views of the portfolio managers and Harris Associates L.P., the Funds' investment adviser, at the time of this letter, and are subject to change without notice.
The performance data quoted represents past performance. The performance information for the Funds does not reflect the imposition of a 2% redemption fee on shares of all Funds, other than Oakmark Equity & Income Fund, redeemed within 90 days. If reflected, the fee would reduce the performance quoted. Past performance is no guarantee of future results. The investment return and principal value will fluctuate so that an investor's shares, when redeemed, may be worth more or less than their original cost. Current performance may be lower or higher than the performance data quoted. Average annual total return measures annualized change, while total return measures aggregate change. To obtain current month end performance data, visit oakmark.com.
Current and future portfolio holdings are subject to risk.
Investing in value stocks presents the risk that value stocks may fall out of favor with investors and underperform growth stocks during given periods.
Because Oakmark Select Fund and Oakmark Global Select Fund are non-diversified, the performance of each holding will have a greater impact on each Fund's total return, and may make the Funds' returns more volatile than a more diversified fund.
Oakmark Equity and Income Fund invests in medium- and lower-quality debt securities that have higher yield potential but present greater investment and credit risk than higher-quality securities, which may result in greater share price volatility. An economic downturn could severely disrupt the market in medium or lower grade debt securities and adversely affect the value of outstanding bonds and the ability of the issuers to repay principal and interest.
Investing in foreign securities represents risks which in some way may be greater than in U.S. investments. Those risks include: currency fluctuation; different regulation, accounting standards, trading practices and levels of available information; generally higher transaction costs; and political risks.
The stocks of smaller companies often involve more risk than the stocks of larger companies. Stocks of small companies tend to be more volatile and have a smaller public market than stocks of larger companies. Small companies may have a shorter history of operations than larger companies, may not have as great an ability to raise additional capital and may have a less diversified product line, making them more susceptible to market pressure.
1. The S&P 500 Index is a broad market-weighted average of U.S. blue-chip companies. This index is unmanaged and investors cannot actually make investments in this index.
2. Total return includes change in share prices and in each case includes reinvestment of any dividends and capital gain distributions.
3. Portfolio holdings are subject to change without notice and are not intended as recommendations of individual stocks.
4. The Dow Jones Industrial Average is an unmanaged index that includes only 30 big companies. This index is unmanaged and investors cannot invest directly in this index.
5. The Lipper Large Cap Value Fund Index is an equally weighted index of the largest 30 funds within the large cap value funds investment objective as defined by Lipper Inc. The index is adjusted for the reinvestment of capital gains and income dividends. This index is unmanaged and investors cannot invest directly in this index.
6. The Lipper Multi-Cap Value Funds Index tracks the results of the 30 largest mutual funds in the Lipper Multi-Cap Value Funds category. This index is unmanaged and investors cannot invest directly in this index.
THE OAKMARK FUNDS
92
7. The Lipper Balanced Fund Index measures the performance of the 30 largest U.S. balanced funds tracked by Lipper. This index is unmanaged and investors cannot invest directly in this index.
8. The Barclays Capital U.S. Government / Credit Index measures performance of U.S. dollar denominated U.S. Treasuries, government-related, and investment grade U.S. corporate securities that have a remaining maturity of greater than or equal to 1 year. In addition, the securities have $250 million or more of outstanding face value, and must be fixed rate and non-convertible.
9. "Bonds: Why Bother?" Robert Arnott, Journal of Indexes, April 20, 2009.
10. The MSCI World Index is a free float-adjusted market capitalization weighted index that is designed to measure the equity market performance of developed markets. The MSCI World Index currently consists of the following 23 developed market country indices: Australia, Austria, Belgium, Canada, Denmark, Finland, France, Germany, Greece, Hong Kong, Ireland, Italy, Japan, Netherlands, New Zealand, Norway, Portugal, Singapore, Spain, Sweden, Switzerland, the United Kingdom, and the United States. This index is unmanaged and investors cannot invest directly in this index.
11. The Lipper Global Fund Index is an unmanaged index of the 30 largest funds, based on total year-end net asset value, in the Global fund category, which consists of funds that invest at least 25% in securities traded outside of the United States. It assumes the reinvestment of dividends and capital gains and does not include any management fees or expenses. This index is unmanaged and investors cannot actually make investments in this index.
12. The MSCI World Index ex U.S. is a free float-adjusted market capitalization weighted index that is designed to measure the equity market performance of developed markets. The MSCI World Index currently consists of the following 22 developed market country indices: Australia, Austria, Belgium, Canada, Denmark, Finland, France, Germany, Greece, Hong Kong, Ireland, Italy, Japan, Netherlands, New Zealand, Norway, Portugal, Singapore, Spain, Sweden, Switzerland, and the United Kingdom. This index is unmanaged and investors cannot invest directly in this index.
13. The MSCI EAFE Index (Europe, Australasia, Far East) is a free float-adjusted market capitalization index that is designed to measure developed market equity performance, excluding the US & Canada. The MSCI EAFE Index currently consists of the following 21 developed market country indices: Australia, Austria, Belgium, Denmark, Finland, France, Germany, Greece, Hong Kong, Ireland, Italy, Japan, the Netherlands, New Zealand, Norway, Portugal, Singapore, Spain, Sweden, Switzerland, and the United Kingdom. This index is unmanaged and investors cannot invest directly in this index.
14. The Lipper International Fund Index reflects the net asset value weighted total return of the 30 largest international equity funds. This index is unmanaged and investors cannot invest directly in this index.
15. The MSCI World ex U.S. Small Cap Index is a free float-adjusted market capitalization index that is designed to measure global developed market equity performance, excluding the U.S. The MSCI World ex U.S. Small Cap Index currently consists of 22 developed market country indices. The MSCI Small Cap Indices target 40% of the eligible Small Cap universe within each industry group, within each country. MSCI defines the Small Cap universe as all listed securities that have a market capitalization in the range of USD200-1,500 million. This index is unmanaged and investors cannot actually make investments in this index.
16. The Lipper International Small Cap Funds Index measures the performance of the 10 largest international small-cap funds tracked by Lipper. This index is unmanaged and investors cannot invest directly in this index.
OAKMARK, OAKMARK FUNDS, OAKMARK INTERNATIONAL, and OAKMARK and tree design are trademarks owned or registered by Harris Associates L.P. in the U.S. and/or other countries.
THE OAKMARK FUNDS
93
THE OAKMARK FUNDS
Trustees and Officers
The Board of Trustees has overall responsibility for the conduct of the affairs of Harris Associates Investment Trust ("Trust"), and its seven series, The Oakmark Funds. Each trustee serves until the next annual meeting of shareholders and until the election and qualification of his or her successor, or until he or she dies, resigns or is removed. Each trustee must retire at the end of the calendar year in which the trustee attains the age of 72. The Board of Trustees may fill any vacancy on the board provided that after such appointment, at least two-thirds of the trustees have been elected by the shareholders. No person shall be appointed or elected to serve as a trustee for the first time after attaining the age of 65. A majority of trustees then in office may remove a trustee with or without cause. The shareholders may remove a trustee by a vote of two-thirds of the outstanding shares of the Trust at any meeting of shareholders called fo r the purpose of removing such trustee.
The Board of Trustees elects or appoints the Trust's officers. The president, any vice president, treasurer and secretary serves until the election and qualification of his or her successor, or until he or she dies, resigns, or is removed or disqualified. Each other officer shall serve at the pleasure of the Board of Trustees. The Board of Trustees may remove any officer at any time, with or without cause, by the vote of a majority of the trustees then in office.
The names and ages of the trustees and officers, the position each holds with the Trust, the date each was first elected to office, their principal business occupations during the last five years and other directorships held are shown below.
Name and Age at September 30, 2009, Position(s) Held with the Trust, Date First Elected or Appointed to Office
Principal Occupations During the Past 5 Years. Other Directorships Held by Trustee, if any.
Trustees who are "interested persons"*
Peter S. Voss, 62, Trustee, 1995**
Retired since 2007; Chairman and Chief Executive Officer, IXIS Asset Management Group; Chairman, President and Chief Executive Officer, IXIS Asset Management US Corporation (investment management); Chairman, IXIS Asset Management US, LLC; Member of the Supervisory Board, IXIS Asset Management; Director, Harris Associates, Inc. ("HAI") prior thereto.
John R. Raitt, 54, Trustee and President, 2003
President and Chief Executive Officer, HAI, Harris Associates L.P. ("HALP") and Harris Associates Securities L.P. ("HASLP").
* Mr. Voss is a trustee who is deemed to be an "interested person" of the Trust as defined in the Investment Company Act of 1940, because he was a director of HAI, the general partner and manager of HALP, the investment adviser to the Funds. Mr. Raitt is a trustee who is deemed to be an "interested person" of the Trust because he is the President and Chief Executive Officer of HAI, HASLP and HALP.
** Effective October 22, 2008, Mr. Voss was determined to be a trustee who is not an "interested person."
Trustees who are not "interested persons"
Gary N. Wilner, M.D., 69, Trustee and Chairman of the Board of Trustees, 1993
Retired since 2004; Senior Attending Physician, Evanston Hospital; Medical Director of Cardiopulmonary Wellness Program, Evanston Hospital Corporation prior thereto. Chairman of the Board of Directors, North American Scientific, Inc. (developer of radioisotopic products for the treatment and diagnosis of disease).
THE OAKMARK FUNDS
94
Trustees and Officers cont.
Michael J. Friduss, 66, Trustee, 1995
Principal, MJ Friduss & Associates, Inc. (telecommunications consultants).
Thomas H. Hayden, 58, Trustee, 1995
Lecturer, Department of Integrated Marketing Communications, Medill Northwestern University, since July 2006; Principal, TerraNova Market Strategies, LLC (market research and strategic consulting practice) since July 2006; President and Chief Strategy Officer, Greenhouse Communications (advertising agency) from 2004 to 2006; Executive Vice President, Campbell Mithun (advertising and marketing communication agency) prior thereto.
Christine M. Maki, 48, Trustee, 1995
Senior Vice President–Tax, RR Donnelley & Sons Company, since August 2008; Senior Vice President–Tax, Global Hyatt Corporation (hotel management) from 1995 to 2008.
Allan J. Reich, 61, Trustee, 1993
Partner, Seyfarth Shaw LLP (law firm).
Steven S. Rogers, 52, Trustee, 2006
Clinical Professor of Finance & Management, Kellogg Graduate School of Management, Northwestern University; Entrepreneur-in-Residence, Ewing Marion Kauffman Foundation. Director, SC Johnson Wax (manufacturer of household cleaning, personal care and insecticide products), SuperValu, Inc. (supermarket retailer and food distributor), AMCORE Financial, Inc. (bank holding company), and W.S. Darley & Co. (fire fighting and emergency equipment manufacturers).
Burton W. Ruder, 65, Trustee, 1995
President, The Academy Financial Group (venture capital investment and transaction financing firm); Manager, Cedar Green Associates (real estate management firm).
Officers of the Trust
Henry R. Berghoef, 60, Vice President and Portfolio Manager (Oakmark Select Fund), 2000 Director of Domestic Research, HALP, since 2003; Portfolio Manager and Analyst, HALP.
John N. Desmond, 48, Vice President, 2009
Chief Operating Officer, HALP, since 2007; Vice President and Director for Nuveen Investments, 2005-2007; Director, Investment Operations and Business Manager for Scudder/Deutsche Asset Management prior thereto.
Richard J. Gorman, 43, Vice President, Chief Compliance Officer and Assistant Secretary, 2006
Chief Compliance Officer of the Trust, since 2006; Senior Special Counsel, Investment Management Regulation, United States Securities and Exchange Commission, prior thereto.
Kevin G. Grant, 45, Vice President and Portfolio Manager (Oakmark Fund), 2000
Portfolio Manager and Analyst, HALP.
David G. Herro, 48, Vice President and Portfolio Manager (Oakmark Global Select Fund, Oakmark International Fund and Oakmark International Small Cap Fund), 1992
Chief Investment Officer of International Equity, HALP; Portfolio Manager and Analyst, HALP.
THE OAKMARK FUNDS
95
Trustees and Officers cont.
John J. Kane, 38, Treasurer, 2005
Manager, Mutual Fund and Institutional Services, HALP. Assistant Treasurer to the Trust, 1999 to 2005;
Robert M. Levy, 59, Executive Vice President, 2004
Chairman, HAI; Chief Investment Officer of Domestic Equity, HALP; Portfolio Manager, HALP.
Clyde S. McGregor, 56, Vice President and Portfolio Manager (Oakmark Equity and Income Fund and Oakmark Global Fund), 1995
Portfolio Manager, HALP.
William C. Nygren, 51, Vice President and Portfolio Manager (Oakmark Fund, Oakmark Select Fund and Oakmark Global Select Fund), 1996
Portfolio Manager and Analyst, HALP.
Vineeta D. Raketich, 38, Vice President, 2003
Director, International Operations and Client Relations, HALP.
Janet L. Reali, 58, Vice President and Secretary, 2001
Vice President, General Counsel and Secretary, HAI, HALP and HASLP.
Kristi L. Rowsell, 43, Vice President and Principal Financial Officer, 2005
Director, Chief Financial Officer and Treasurer, HAI; Chief Financial Officer, HALP and HASLP prior thereto.
Edward A. Studzinski, 60, Vice President and Portfolio Manager (Oakmark Equity and Income Fund), 2000
Portfolio Manager and Analyst, HALP.
Robert A. Taylor, 37, Vice President and Portfolio Manager (Oakmark Global Fund), 2005
Director of International Research, since 2004; Portfolio Manager and Analyst, HALP.
Andrew Tedeschi, 44, Assistant Treasurer, 2008
Accounting Manager of Mutual Fund Financial Administration, Van Kampen Funds, Morgan Stanley; Assistant Treasurer, Henderson Global North America prior thereto.
Christopher P. Wright, 35, Vice President, 2005
Director of Mutual Fund Operations, HALP, since 2004; Assistant Director of Mutual Fund Operations, HALP prior thereto.
The business address of the officers and trustees is Two North LaSalle Street, Suite 500, Chicago, Illinois 60602.
The Statement of Additional Information (SAI) contains further information about the trustees and is available without charge upon your request by calling 1-800-625-6275.
THE OAKMARK FUNDS
96
Oakmark Glossary
Book value – A company's common stock equity as it appears on a balance sheet, equal to total assets minus liabilities, preferred stock, and intangible assets such as goodwill. A company's book value often differs substantially from economic value, especially in industries such as media.
Business value/Intrinsic value – The perceived or estimated actual value of a security, as opposed to its current market price or book value. Business value can be evaluated based on what a knowledgeable buyer would pay for a business if the company were sold in its entirety.
Growth investing – Investors who look for companies based on whether the stock of a company is growing earnings and/or revenue faster than the industry as a whole or the overall market. Growth investors generally expect high rates of growth to persist, and the stock, in turn, to deliver returns exceeding the market's. A growth mutual fund is generally one that emphasizes stocks believed to offer above-average growth prospects, with little to no emphasis on the stock's current price.
M & A (Mergers & Acquisitions) – Merger: the combining of two or more entities into one, through a purchase acquisition or a pooling of interests. Acquisition: can also be called a takeover, and is defined as acquiring control of a corporation, called a target, by stock purchase or exchange, either hostile or friendly.
Market capitalization (market cap or cap) – The market price of an entire company on any given day, calculated by multiplying the number of shares outstanding by the price per share.
Momentum investing – Approach to investing based on the belief that stock price trends are likely to continue. Momentum investors tend to buy stocks that have been outperforming the market and to sell those stocks when their relative performance deteriorates. Momentum investors do not consider a company's underlying value or fundamentals in their investment decisions.
Multiple – A ratio used to measure a stock's valuation, usually greater than 1. Sometimes used to mean price/earnings ratio.
P/B or Price-to-Book Ratio – A stock's capitalization divided by its book value. The value is the same whether the calculation is done for the whole company or on a per-share basis.
P/E or Price-to-Earnings Ratio – The most common measure of a stock's valuation. It is equal to a stock's capitalization divided by its after-tax earnings over a 12-month period. The value is the same whether the calculation is done for the whole company or on a per-share basis. Equivalently, the cost an investor in a given stock must pay per dollar of current annual earnings. Also called earnings multiple.
Share repurchase – Program through which a corporation buys back its own shares in the open market, typically an indication that the corporation's management believes the stock price is undervalued.
Value investing – Investors who utilize valuation measures such as business value (including growth rate), price/earnings ratio, price/book ratio, and yield to gauge the attractiveness of a company. Managers who employ a value investment style believe that the true, underlying value of a company is not reflected in its current share price, and, over time, the price has potential to increase as the market recognizes the overall value of the business. Value stocks sell at relatively low prices in relation to their underlying business value, earnings, or book value.
Stocks become undervalued for a variety of reasons, including an overall market decline, or when a specific industry falls into disfavor and investors view all companies in that industry in the same light. Consequently, an individual company's stock price may fall, even though it may be only temporarily affected by the industry's problems and its underlying value has remained unchanged.
"x times earnings" (e.g. "12 times earnings") – Another way to express a stock's price-to-earnings (P/E) ratio. A stock with a P/E ratio of 12 sells at 12 times earnings.
THE OAKMARK FUNDS
97

(This page has been intentionally left blank.)
THE OAKMARK FUNDS
98
THE OAKMARK FUNDS
Other Information
Investment Adviser
Harris Associates L.P.
Two North LaSalle Street
Chicago, Illinois 60602-3790
Transfer Agent
Boston Financial Data Services, Inc.
Quincy, Massachusetts
Legal Counsel
K&L Gates LLP
Chicago, Illinois
Independent Registered Public
Accounting Firm
Deloitte & Touche LLP
Chicago, Illinois
Contact Us
Please call 1-800-OAKMARK
(1-800-625-6275)
or 617-483-3250
Website
oakmark.com
To obtain a prospectus, an application or periodic reports, access our web site at oakmark.com, or call 1-800-OAKMARK (1-800-625-6275) or (617) 483-3250.
The Funds will file its complete schedule of portfolio holdings with the Securities and Exchange Commission (the "SEC") for the first and third quarters of each fiscal year on Form N-Q. The Funds' Forms N-Q are available on the SEC's website at www.sec.gov. The Funds' Forms N-Q may be reviewed and copied at the SEC's Public Reference Room in Washington, DC, and information on the operation of the Public Reference Room may be obtained by calling 1-800-SEC-0330.
A description of the policies and procedures the Funds use to determine how to vote proxies relating to portfolio securities is available without charge, upon request, by calling toll-free 1-800-625-6275; on the Funds' website at oakmark.com; and on the SEC's website at www.sec.gov.
No later than August 31 of each year, information regarding how the Adviser, on behalf of the Funds, voted proxies relating to the Funds' portfolio securities for the twelve months ended the preceding June 30 will be available through a link on the Funds' website at oakmark.com and on the SEC's website at www.sec.gov.
This report is submitted for the general information of the Funds' shareholders. The report is not authorized for distribution to prospective investors in the Funds unless it is accompanied or preceded by the Funds' currently effective prospectus.
No sales charge to the shareholder or to the new investor is made in offering the shares of the Funds, however, a shareholder may incur a 2% redemption fee on an exchange or redemption of shares redeemed within 90 days from any Fund other than Oakmark Equity and Income Fund.

1-800-OAKMARK
oakmark.com
The Oakmark Funds are distributed by Harris Associates Securities L.P., member FINRA. Date of first use: November 2009.
OAKMARK FUND CLASS II
THE VALUE OF A $10,000 INVESTMENT IN OAKMARK FUND FROM ITS
INCEPTION (4/5/01) TO PRESENT (9/30/09) AS COMPARED TO THE
STANDARD & POOR'S 500 INDEX (UNAUDITED)
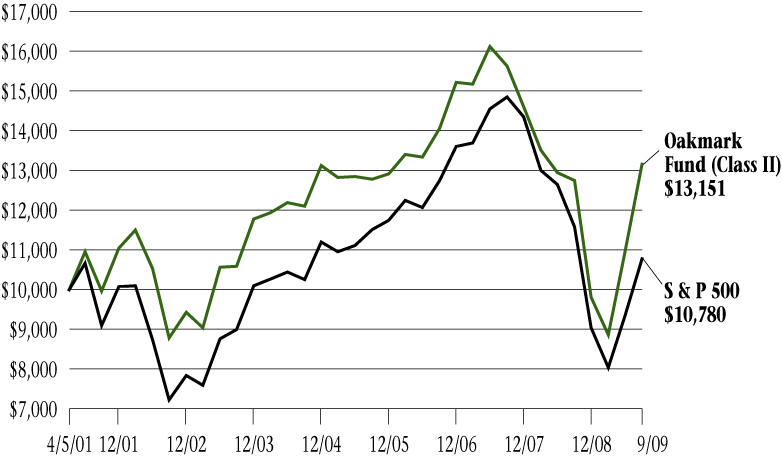
Average Annual Total Returns
(as of 9/30/09)
| (Unaudited) | | 1-year | | 5-year | | Since
Inception
(4/5/01) | |
| Oakmark Fund (Class II) | | | 3.22 | % | | | 1.68 | % | | | 3.28 | % | |
| S&P 500 Index | | | -6.91 | % | | | 1.02 | % | | | 0.89 | % | |
The graph and table do not reflect the deduction of taxes that a shareholder would pay on fund distributions or the redemption of fund shares.
The expense ratio for Class II shares as of 9/30/08 was 1.47%.
The performance data quoted represents past performance. The above performance information does not reflect the imposition of a 2% redemption fee on shares held for 90 days or less. If reflected, the fee would reduce the performance quoted. Past performance does not guarantee future results. The investment return and principal value will fluctuate so that an investor's shares, when redeemed, may be worth more or less than their original cost. Current performance may be lower or higher than the performance data quoted. Average annual total return measures annualized change, while total return measures aggregate change. To obtain most recent month-end performance data, visit oakmark.com.
Harris Associates Securities L.P., member FINRA, November 2009
OAKMARK SELECT FUND CLASS II
THE VALUE OF A $10,000 INVESTMENT IN OAKMARK SELECT FUND FROM ITS
INCEPTION (12/31/99) TO PRESENT (9/30/09) AS COMPARED TO THE
STANDARD & POOR'S 500 INDEX (UNAUDITED)
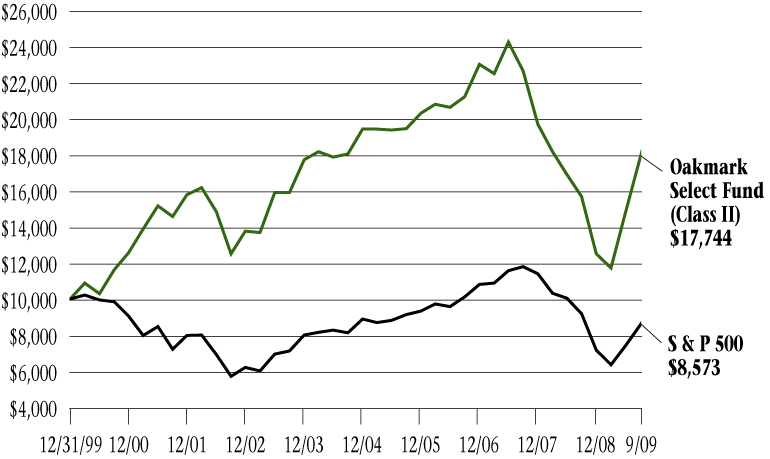
Average Annual Total Returns
(as of 9/30/09)
| (Unaudited) | | 1-year | | 5-year | | Since
Inception
(12/31/99) | |
| Oakmark Select Fund (Class II) | | | 13.34 | % | | | -0.28 | % | | | 6.06 | % | |
| S&P 500 Index | | | -6.91 | % | | | 1.02 | % | | | -1.57 | % | |
The graph and table do not reflect the deduction of taxes that a shareholder would pay on fund distributions or the redemption of fund shares.
The expense ratio for Class II shares as of 9/30/08 was 1.37%.
The performance data quoted represents past performance. The above performance information does not reflect the imposition of a 2% redemption fee on shares held for 90 days or less. If reflected, the fee would reduce the performance quoted. Past performance does not guarantee future results. The investment return and principal value will fluctuate so that an investor's shares, when redeemed, may be worth more or less than their original cost. Current performance may be lower or higher than the performance data quoted. Average annual total return measures annualized change, while total return measures aggregate change. To obtain most recent month-end performance data, visit oakmark.com.
Harris Associates Securities L.P., member FINRA, November 2009
OAKMARK EQUITY AND INCOME FUND CLASS II
THE VALUE OF A $10,000 INVESTMENT IN OAKMARK EQUITY AND INCOME
FUND FROM ITS INCEPTION (7/12/00) TO PRESENT (9/30/09) AS COMPARED TO
THE LIPPER BALANCED FUND INDEX (UNAUDITED)
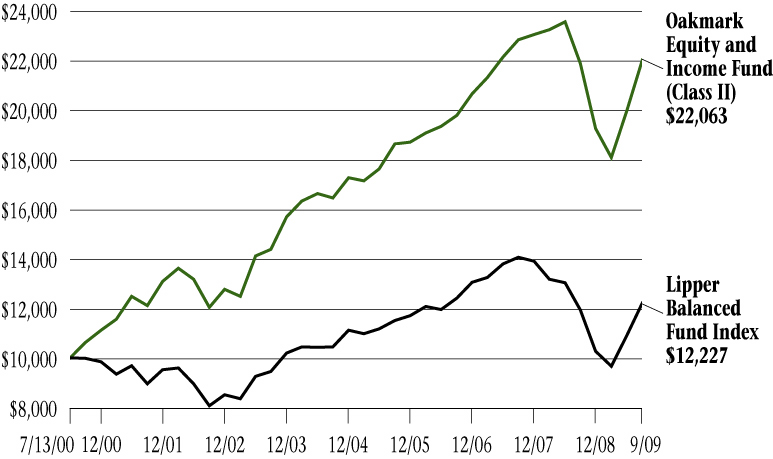
Average Annual Total Returns
(as of 9/30/09)
| (Unaudited) | | 1-year | | 5-year | | Since
Inception
(7/13/00) | |
| Oakmark Equity & Income Fund (Class II) | | | 0.70 | % | | | 6.02 | % | | | 8.96 | % | |
| Lipper Balanced Fund Index | | | 2.34 | % | | | 3.17 | % | | | 2.20 | % | |
The graph and table do not reflect the deduction of taxes that a shareholder would pay on fund distributions or the redemption of fund shares.
The expense ratio for Class II shares as of 9/30/08 was 1.16%.
The performance data quoted represents past performance. Past performance does not guarantee future results. The investment return and principal value will fluctuate so that an investor's shares, when redeemed, may be worth more or less than their original cost. Current performance may be lower or higher than the performance data quoted. Average annual total return measures annualized change, while total return measures aggregate change. To obtain most recent month-end performance data, visit oakmark.com.
Harris Associates Securities L.P., member FINRA, November 2009
OAKMARK GLOBAL FUND CLASS II
THE VALUE OF A $10,000 INVESTMENT IN OAKMARK GLOBAL FUND
FROM ITS INCEPTION (10/10/01) TO PRESENT (9/30/09) AS COMPARED TO THE
MSCI WORLD INDEX (UNAUDITED)
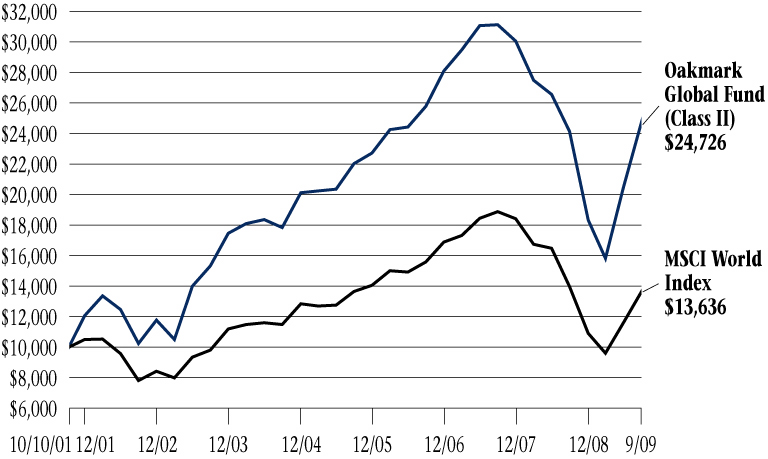
Average Annual Total Returns
(as of 9/30/09)
| (Unaudited) | | 1-year | | 5-year | | Since
Inception
(10/10/01) | |
| Oakmark Global Fund (Class II) | | | 2.43 | % | | | 6.76 | % | | | 12.02 | % | |
| MSCI World Index | | | -2.29 | % | | | 3.51 | % | | | 3.97 | % | |
The graph and table do not reflect the deduction of taxes that a shareholder would pay on fund distributions or the redemption of fund shares.
The expense ratio for Class II shares as of 9/30/08 was 1.57%.
The performance data quoted represents past performance. The above performance information does not reflect the imposition of a 2% redemption fee on shares held for 90 days or less. If reflected, the fee would reduce the performance quoted. Past performance does not guarantee future results. The investment return and principal value will fluctuate so that an investor's shares, when redeemed, may be worth more or less than their original cost. Current performance may be lower or higher than the performance data quoted. Average annual total return measures annualized change, while total return measures aggregate change. To obtain most recent month-end performance data, visit oakmark.com.
Harris Associates Securities L.P., member FINRA, November 2009
OAKMARK INTERNATIONAL FUND CLASS II
THE VALUE OF A $10,000 INVESTMENT IN OAKMARK INTERNATIONAL FUND
FROM ITS INCEPTION (11/4/99) TO PRESENT (9/30/09) AS COMPARED TO THE
MSCI WORLD EX U.S. INDEX (UNAUDITED)
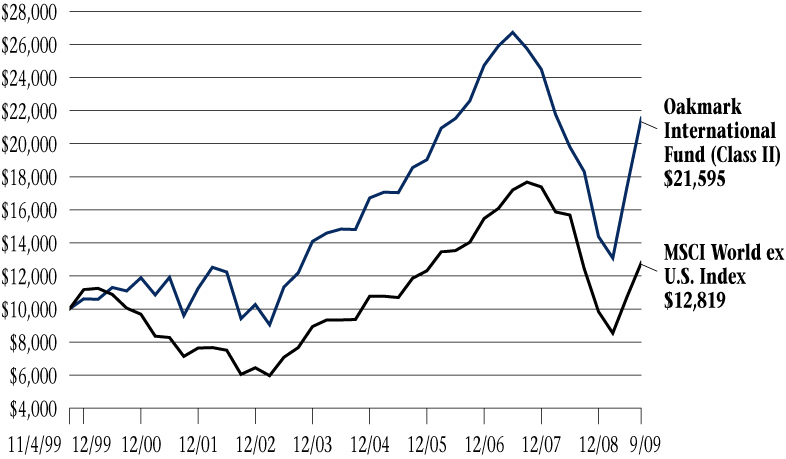
Average Annual Total Returns
(as of 9/30/09)
| (Unaudited) | | 1-year | | 5-year | | Since
Inception
(11/4/99) | |
| Oakmark International Fund (Class II) | | | 17.70 | % | | | 7.83 | % | | | 8.08 | % | |
| MSCI World ex U.S. Index | | | 2.89 | % | | | 6.53 | % | | | 2.54 | % | |
The graph and table do not reflect the deduction of taxes that a shareholder would pay on fund distributions or the redemption of fund shares.
The expense ratio for Class II shares as of 9/30/08 was 1.52%.
The performance data quoted represents past performance. The above performance information does not reflect the imposition of a 2% redemption fee on shares held for 90 days or less. If reflected, the fee would reduce the performance quoted. Past performance does not guarantee future results. The investment return and principal value will fluctuate so that an investor's shares, when redeemed, may be worth more or less than their original cost. Current performance may be lower or higher than the performance data quoted. Average annual total return measures annualized change, while total return measures aggregate change. To obtain most recent month-end performance data, visit oakmark.com.
Harris Associates Securities L.P., member FINRA, November 2009
OAKMARK INTERNATIONAL
SMALL CAP FUND CLASS II
THE VALUE OF A $10,000 INVESTMENT IN OAKMARK INTERNATIONAL SMALL CAP FUND FROM ITS INCEPTION (1/8/01) TO PRESENT (9/30/09) AS COMPARED TO THE MSCI WORLD EX U.S. SMALL CAP AND THE MSCI WORLD EX U.S. INDEXES (UNAUDITED)†
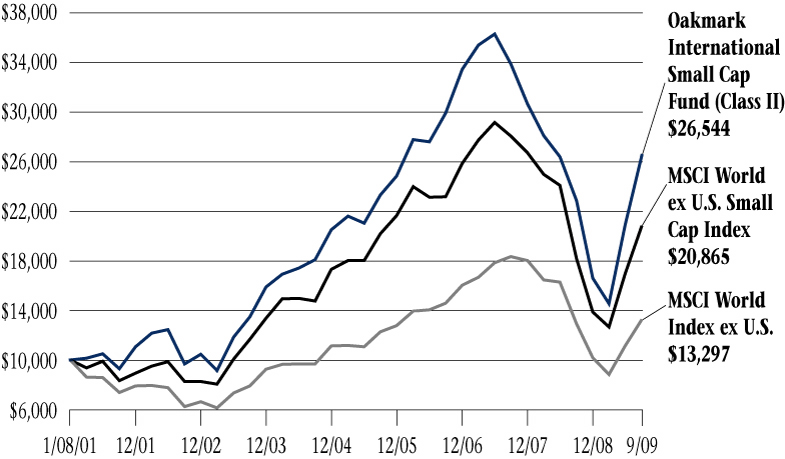
Average Annual Total Returns
(as of 9/30/09)
| (Unaudited) | | 1-year | | 5-year | | Since
Inception
(1/8/01) | |
| Oakmark International Small Cap Fund (Class II) | | | 16.08 | % | | | 7.95 | % | | | 11.84 | % | |
| MSCI World ex U.S. Small Cap Index | | | 14.75 | % | | | 7.12 | % | | | 8.79 | % | |
| MSCI World ex U.S. Index | | | 2.89 | % | | | 6.53 | % | | | 3.32 | % | |
The graph and table do not reflect the deduction of taxes that a shareholder would pay on fund distributions or the redemption of fund shares.
The expense ratio for Class II shares as of 9/30/08 was 1.54%.
The performance data quoted represents past performance. The above performance information does not reflect the imposition of a 2% redemption fee on shares held for 90 days or less. If reflected, the fee would reduce the performance quoted. Past performance does not guarantee future results. The investment return and principal value will fluctuate so that an investor's shares, when redeemed, may be worth more or less than their original cost. Current performance may be lower or higher than the performance data quoted. Average annual total return measures annualized change, while total return measures aggregate change. To obtain most recent month-end performance data, visit oakmark.com.
† Prior to January 1, 2009, the Fund's primary benchmark was the MSCI World ex U.S. Index, an unmanaged index that includes countries throughout the world, excluding the U.S., in proportion to world stock market capitalization. The Fund changed its primary benchmark because the MSCI World ex U.S. Small Cap Index reached its tenth anniversary on December 31, 2008 and now provides an historical perspective to make a more meaningful comparison given the small cap focus of the Fund.
Harris Associates Securities L.P., member FINRA, November 2009
FUND EXPENSES
A shareholder of each Fund incurs two types of costs: (1) transaction costs, such as redemption fees, and (2) ongoing costs, including investment advisory fees, transfer agent fees, and other fund expenses. The examples below are intended to help shareholders understand the ongoing cost (in dollars) of investing in each Fund and to compare these costs with the ongoing costs of investing in other funds.
Actual Expenses
The following table provides information about actual account values and actual fund expenses for Class II of each Fund. The table shows the expenses a Class II shareholder would have paid on a $1,000 investment in each Fund from April 1, 2009, to September 30, 2009, as well as how much a $1,000 investment would be worth at the close of the period, assuming actual fund returns and expenses. Class II shareholders can estimate expenses incurred for the period by dividing their account value at September 30, 2009, by $1,000 and multiplying the result by the number in the Expenses Paid During Period row as shown below.
Shares of all Funds, other than Oakmark Equity & Income Fund, invested for 90 days or less may be charged a 2% redemption fee. Please consult the Funds' prospectus at oakmark.com for more information.
| | | Oakmark
Fund | | Oakmark
Select Fund | | Oakmark
Equity and
Income Fund | | Oakmark
Global Fund | | Oakmark
International
Fund | | Oakmark
International
Small Cap
Fund | |
| Beginning Account Value | | $ | 1,000.00 | | | $ | 1,000.00 | | | $ | 1,000.00 | | | $ | 1,000.00 | | | $ | 1,000.00 | | | $ | 1,000.00 | | |
| Ending Account Value | | $ | 1,483.30 | | | $ | 1,513.30 | | | $ | 1,218.10 | | | $ | 1,564.00 | | | $ | 1,649.50 | | | $ | 1,822.50 | | |
| Expenses Paid During Period* | | $ | 8.40 | | | $ | 8.13 | | | $ | 6.34 | | | $ | 9.51 | | | $ | 9.50 | | | $ | 11.32 | | |
| Annualized Expense Ratio | | | 1.35 | % | | | 1.29 | % | | | 1.14 | % | | | 1.48 | % | | | 1.43 | % | | | 1.60 | % | |
* Expenses are equal to each Fund's annualized expense ratio for Class II, multiplied by the average account value over the period, multiplied by the number of days in the most recent fiscal half-year divided by 365 (to reflect the one-half year period).
Hypothetical Example for Comparison Purposes
The following table provides information about hypothetical account values and hypothetical expenses for Class II of each Fund based on actual expense ratios and an assumed rate of return of 5% per year before expenses, which are not the Funds' actual returns. The hypothetical account values and expenses may not be used to estimate the actual ending account balances or expenses shareholders paid for the period. Shareholders may use this information to compare the ongoing costs of investing in a Fund and other funds. To do so, compare this 5% hypothetical example with the 5% hypothetical examples that appear in the shareholder reports of the other funds.
Please note that the expenses shown in the table are meant to highlight your ongoing costs only and do not reflect any transaction costs, such as redemption fees. Therefore, the third line of the table is useful in comparing ongoing costs only, and will not help you determine the relative total costs of owning different funds. In addition, if these transaction costs were included, the total costs would have been higher.
| | | Oakmark
Fund | | Oakmark
Select Fund | | Oakmark
Equity and
Income Fund | | Oakmark
Global Fund | | Oakmark
International
Fund | | Oakmark
International
Small Cap
Fund | |
| Beginning Account Value | | $ | 1,000.00 | | | $ | 1,000.00 | | | $ | 1,000.00 | | | $ | 1,000.00 | | | $ | 1,000.00 | | | $ | 1,000.00 | | |
| Ending Account Value | | $ | 1,018.30 | | | $ | 1,018.60 | | | $ | 1,019.35 | | | $ | 1,017.65 | | | $ | 1,017.90 | | | $ | 1,017.05 | | |
| Expenses Paid During Period* | | $ | 6.83 | | | $ | 6.53 | | | $ | 5.77 | | | $ | 7.49 | | | $ | 7.23 | | | $ | 8.09 | | |
| Annualized Expense Ratio | | | 1.35 | % | | | 1.29 | % | | | 1.14 | % | | | 1.48 | % | | | 1.43 | % | | | 1.60 | % | |
* Expenses are equal to each Fund's annualized expense ratio for Class II, multiplied by the average account value over the period, multiplied by the number of days in the most recent fiscal half-year divided by 365 (to reflect the one-half year period).
Item 2. Code of Ethics.
(a) Registrant has adopted a code of ethics (the “Code”) that applies to its Principal Executive Officer, Principal Financial Officer and Principal Accounting Officer.
(b) No disclosures are required by this Item 2(b).
(c) During the period covered by the report, no amendments were made to the provisions of the Code.
(d) During the period covered by the report, Registrant did not grant any waivers, including implicit waivers, from the provisions of the Code.
(e) Not applicable.
(f) A copy of the Code is filed as Exhibit (a)(1) to this Form N-CSR. Copies of the Code will also be made available free of charge upon request, by writing or calling The Oakmark Funds, P.O. Box 8510, Boston, MA 02266-8510, 1-800-OAKMARK, (1-800-625-6275).
Item 3. Audit Committee Financial Expert.
Registrant’s board of trustees has determined that each of the following five members of the Registrant’s audit committee qualifies as an “audit committee financial expert,” as such term is defined in Instruction 2(b) to Item 3 of Form N-CSR: Michael J. Friduss, Christine M. Maki, Allan J. Reich, Stephen S. Rogers and Gary N. Wilner, M.D. Each of those members of Registrant’s audit committee is “independent” as such term is defined in paragraph (a)(2) of Item 3 of Form N-CSR.
Under applicable securities laws, a person who is determined to be an audit committee financial expert will not be deemed an “expert” for any purpose, including without limitation for the purposes of Section 11 of the Securities Act of 1933, as a result of being designated or identified as an audit committee financial expert. The designation or identification of a person as an audit committee financial expert does not impose on such person any duties, obligations, or liability that are greater than the duties, obligations, and liability imposed on such person as a member of the audit committee and board of trustees in the absence of such designation or identification. The designation or identification of a person as an audit committee financial expert does not affect the duties, obligations, or liability of any other member of the audit committee or board of trustees.
Item 4. Principal Accountant Fees and Services.
Aggregate fees billed to the Registrant for professional services rendered by the Registrant’s principal accountant were as follows:
| | Fiscal Year
Ended
September 30,
2009 | | Fiscal Year
Ended
September 30,
2008 | |
Audit Fees(1) | | $ | 230,000 | | $ | 212,000 | |
Audit-Related Fees(2) | | $ | 0 | | $ | 67,000 | |
Tax Fees(3) | | $ | 36,550 | | $ | 29,100 | |
All Other Fees(4) | | $ | 0 | | $ | 0 | |
During its regularly scheduled periodic meetings, the Registrant’s audit committee will pre-approve all audit, audit-related, tax and other services to be provided by the principal accountants of the Registrant. The audit committee has authorized its chairman to exercise that authority in the intervals between meetings; and the chairman presents any such pre-approvals to the audit committee at its next regularly scheduled meeting. Under paragraph (c)(7)(i)(C) of Rule 2-01 of Regulation S-X, pre-approval of non-audit services may be waived provided that: 1) the aggregate amount for all such services provided constitutes no more than five percent of the total amount of revenues paid by the Registrant to its principal accountant during the fiscal year in which such services are provided; 2) such services were not recognized by management at the time of engagement as non-audit services; and 3) such services are promptly brought to the attention of the Registrant’s audit committee by management and approved prior to the completion of the audit by the audit committee or by one or more members of the audit committee who are members of the board of trustees to whom authority to grant such approvals has been delegated by the audit committee.
No audit-related, tax or non-audit services were approved by waiver pursuant to paragraph (c)(7)(i)(C) of Rule 2-01 of Regulation S-X.
(1) “Audit Fees” include amounts for professional services rendered by the principal accountant for the audit of the Registrant’s annual financial statements and services that are normally provided by the accountant in connection with statutory and regulatory filings or engagements.
(2) “Audit-Related Fees” include amounts for assurance and related services by the principal accountant that are reasonably related to the performance of the audit of the Registrant’s financial statements, specifically the semi-annual reviews of the Funds in fiscal year 2008.
(3) “Tax Fees” include amounts for professional services rendered by the principal accountant for tax compliance, tax advice and tax planning, specifically distribution consultation.
(4) “All Other Fees” include amounts for products and services provided by the principal accountant.
Less than 50 percent of the hours expended on the principal accountant’s engagement to audit the Registrant’s financial statements for the most recent fiscal year were attributed to work performed by persons other than the principal accountant’s full-time, permanent employees.
The aggregate non-audit fees billed for the fiscal years ended September 30, 2009 and September 30, 2008 by the Registrant’s principal accountant for services rendered to the Registrant, its investment adviser and any entity controlling, controlled by or under common control with the investment adviser that provides ongoing services to the Registrant were $0 and $2,500, respectively.
The audit committee of Registrant’s board of trustees has considered whether the provision of non-audit services that were rendered by Registrant’s principal accountant to Registrant’s investment adviser, and any entity controlling, controlled by or under common control with the investment adviser that provides ongoing services to the Registrant that were not pre-approved pursuant to paragraph (c)(7)(ii) of Rule 2-01 of Regulation S-X is compatible with maintaining the principal accountant’s independence.
Item 5. Audit Committee of Listed Registrants.
Not applicable.
Item 6. Investments.
(a) The Schedule of Investments in securities of unaffiliated issuers as of the close of the reporting period is included as part of the annual report to shareholders filed under Item 1 of this Form.
(b) No disclosures are required by this Item 6(b).
Item 7. Disclosure of Proxy Voting Policies and Procedures for Closed-End Management Investment Companies.
Not applicable.
Item 8. Portfolio Managers of Closed-End Management Investment Companies.
Not applicable.
Item 9. Purchases of Equity Securities by Closed-End Management Investment Company and Affiliated Purchasers.
Not applicable.
Item 10. Submission of Matters to a Vote of Security Holders.
During the period covered by this report, no material changes were made to the procedures by which shareholders may recommend nominees to the Registrant’s board of trustees that were adopted in fiscal year 2004.
Item 11. Controls and Procedures.
(a) Based on an evaluation of the Registrant’s disclosure controls and procedures (as defined in Rule 30a-3(c) under the Investment Company Act of 1940, the “Disclosure Controls”), the Disclosure Controls are effectively designed to ensure that information required to be disclosed by the Registrant in this report is recorded, processed, summarized, and reported within 90 days prior to the filing of this report, including ensuring that information required to be disclosed in this report is accumulated and communicated to the Registrant’s management, including the Registrant’s principal executive officer and principal financial officer, as appropriate to allow timely decisions regarding required disclosure.
(b) There were no changes in the Registrant’s internal controls over financial reporting (as defined in Rule 30a-3(d) under the Investment Company Act of 1940) that occurred during the Registrant’s second fiscal quarter of the time period covered by this report that has materially affected, or is reasonably likely to materially affect, the Registrant’s internal control over financial reporting.
Item 12. Exhibits.
(a)(1) Code of Ethics for Principal Executive Officer and Senior Financial Officers (as referenced in Item 2 above), attached hereto as Exhibit (a)(1).
(2) Certifications of John R. Raitt, Principal Executive Officer, and Kristi L. Rowsell, Principal Financial Officer, pursuant to Rule 30a-2 under the Investment Company Act of 1940 (17 CFR 270.30a-2), attached hereto as Exhibits (a)(2)(i) and (a)(2)(ii).
(3) Not applicable.
(b) Certification of John R. Raitt, Principal Executive Officer and Kristi L. Rowsell, Principal Financial Officer, pursuant to Section 906 of the Sarbanes-Oxley Act of 2002, attached hereto as Exhibit (b).
SIGNATURES
Pursuant to the requirements of the Securities Exchange Act of 1934 and the Investment Company Act of 1940, the Registrant has duly caused this report to be signed on its behalf by the undersigned, thereunto duly authorized.
Harris Associates Investment Trust
By: | /s/ John R. Raitt | |
| John R. Raitt | |
| Principal Executive Officer | |
Date: | November 17, 2009 | |
Pursuant to the requirements of the Securities Exchange Act of 1934 and the Investment Company Act of 1940, this report has been signed below by the following persons on behalf of the Registrant and in the capacities and on the dates indicated.
By: | /s/ John R. Raitt | |
| John R. Raitt | |
| Principal Executive Officer | |
Date: | November 17, 2009 | |
| | |
| | |
By: | /s/ Kristi L. Rowsell | |
| Kristi L. Rowsell | |
| Principal Financial Officer | |
Date: | November 17, 2009 | |