UNITED STATES
SECURITIES AND EXCHANGE COMMISSION
Washington, D.C. 20549
FORM N-CSR
CERTIFIED SHAREHOLDER REPORT OF REGISTERED
MANAGEMENT INVESTMENT COMPANIES
Investment Company Act file number | 811-06279 |
|
Harris Associates Investment Trust |
(Exact name of registrant as specified in charter) |
|
Two North La Salle Street, Suite 500 Chicago, Illinois | | 60602-3790 |
(Address of principal executive offices) | | (Zip code) |
|
John R. Raitt | | Cameron S. Avery |
Harris Associates L.P. | | Bell, Boyd & Lloyd LLP |
Two North La Salle Street, #500 | | Three First National Plaza, #3100 |
Chicago, Illinois 60602 | | Chicago, Illinois 60602 |
(Name and address of agent for service) |
|
Registrant’s telephone number, including area code: | (312) 621-0600 | |
|
Date of fiscal year end: | 09/30/08 | |
|
Date of reporting period: | 09/30/08 | |
| | | | | | | | | | |
Item 1. Reports to Shareholders.
ANNUAL REPORT
SEPTEMBER 30, 2008


Advised by Harris Associates L.P.
THE OAKMARK FUNDS
2008 Annual Report
| President's Letter | | | 1 | | |
|
| Summary Information | | | 2 | | |
|
| Fund Expenses | | | 4 | | |
|
| Commentary on Oakmark and Oakmark Select Funds | | | 6 | | |
|
| Oakmark Fund | |
|
| Letter from the Portfolio Managers | | | 8 | | |
|
| Schedule of Investments | | | 9 | | |
|
| Oakmark Select Fund | |
|
| Letter from the Portfolio Managers | | | 13 | | |
|
| Schedule of Investments | | | 14 | | |
|
| Oakmark Equity and Income Fund | |
|
| Letter from the Portfolio Managers | | | 16 | | |
|
| Schedule of Investments | | | 18 | | |
|
| Oakmark Global Fund | |
|
| Letter from the Portfolio Managers | | | 23 | | |
|
| Global Diversification Chart | | | 25 | | |
|
| Schedule of Investments | | | 26 | | |
|
| Oakmark Global Select Fund | |
|
| Letter from the Portfolio Managers | | | 30 | | |
|
| Global Diversification Chart | | | 32 | | |
|
| Schedule of Investments | | | 33 | | |
|
| Commentary on International and International Small Cap Funds | | | 35 | | |
|
| Oakmark International Fund | |
|
| Letter from the Portfolio Manager | | | 36 | | |
|
| Global Diversification Chart | | | 38 | | |
|
| Schedule of Investments | | | 39 | | |
|
| Oakmark International Small Cap Fund | |
|
| Letter from the Portfolio Managers | | | 44 | | |
|
| Global Diversification Chart | | | 46 | | |
|
| Schedule of Investments | | | 47 | | |
|
| Financial Statements | |
|
| Statements of Assets and Liabilities | | | 52 | | |
|
| Statements of Operations | | | 54 | | |
|
| Statements of Changes in Net Assets | | | 56 | | |
|
| Notes to Financial Statements | | | 63 | | |
|
| Trustees and Officers | | | 84 | | |
|
| Oakmark Glossary | | | 87 | | |
|
FORWARD-LOOKING STATEMENT DISCLOSURE
One of our most important responsibilities as mutual fund managers is to communicate with shareholders in an open and direct manner. Some of our comments in our letters to shareholders are based on current management expectations and are considered "forward-looking statements". Actual future results, however, may prove to be different from our expectations. You can identify forward-looking statements by words such as "estimate", "may", "will", "expect", "believe", "plan" and other similar terms. We cannot promise future returns. Our opinions are a reflection of our best judgment at the time this report is compiled, and we disclaim any obligation to update or alter forward-looking statements as a result of new information, future events, or otherwise.
President's Letter

Dear Fellow Shareholders,
The third quarter was extremely difficult for investors around the world as the deepening problems in the banking system continued to depress global markets. Through the end of the third quarter, the broad U.S. and global market indexes fell over 25% from their peak last fall. The weakness has continued into the early days of October. While our Funds all performed better than the market averages in the third quarter, we are disappointed that recent returns fell short of our long-term goal of positive absolute returns.
The Economy and Stock Valuation
The world banking system is facing its most difficult challenge in decades. Debt markets are in disarray, and with the decline of equity markets that has continued into early October, the market's decline is now one of the deepest in many years. Although economic data indicate that the economy is very weak, if not in recession, it is important to note that recent market weakness does not seem to be a product of lower business values, but instead a crisis of market liquidity and confidence. The credit crunch is creating forced selling across broad sectors of the capital markets. Limited liquidity and a surplus of sellers have pushed prices down quickly. Other investors, spooked by market declines, have also run for the exits, adding fuel to the fire.
Last fall, before the current market decline set in, we believed that average equity valuations were reasonable. Although our outlook for corporate earnings is lower today, we do not believe that the change justifies the 40%+ declines of the broader market indexes. In fact, for our list of approved securities that our Funds can purchase, the average stock now sells at less than 40% of our estimate of intrinsic value—an historic extreme.
As we step back and examine the market from an unemotional perspective, we are sobered by the challenges facing the world's financial system, but we are won over by low valuations and investors' deeply negative sentiments. This is consistent with our belief that the best time to buy stocks is when it is emotionally hardest to do.
Cash Management and Securities Lending
Investment managers and money market funds recently made headlines when two activities believed to be relatively low risk—cash management and securities lending—produced surprise losses for investors. In good economic times, it is easy for investors to reach for extra returns by accepting what they think is a small amount of additional risk. We have often spoken about the importance of capital preservation and our desire to take risk only when we believe that we are generously rewarded for doing so. We take this approach because we understand that the unexpected often occurs and that in turbulent times, outcomes can be extreme. Last month, for example, investors learned this lesson anew as Lehman's bankruptcy filing triggered a long chain of losses for investors and money market funds that held Lehman Brothers commercial paper or participated in securities lending programs exposed to the credit of Lehman and/or other low quality collateral.
We have received many inquiries from shareholders asking about our cash management and securities lending practices. You should know that the Funds' approach to these matters is entirely consistent with the principles stated above. The Funds' cash management strategy stresses capital preservation. We generally invest only in: 1) short–term U.S. Treasury securities, 2) U.S. agencies and 3) overnight repurchase agreements secured by U.S. Treasury or agency securities.
Securities lending is a means by which funds earn a fee by making a temporary loan of a security from their portfolio to a broker/dealer to support that firm's trading activities. The lending fund then receives collateral from the borrower that it may retain if the borrower is unable to return the securities when required.
Each of our Funds, except Oakmark Fund, is permitted to engage in securities lending. Historically, however, we have only done so infrequently and selectively. Generally, we limit our securities lending to special circumstances when the market is willing to pay fees that we believe are well above average. When we lend securities, we take the conservative approach of only accepting U.S. Treasury securities as collateral for the loaned securities. These requirements typically reduce the fees that we earn, but they also provide us with greater security and limit our exposure to losses on collateral and collateral pools. For more information about these practices, please read our Statement of Additional Information at Oakmark.com.
Capital Gains Distributions
In line with our desire to minimize the taxes that our shareholders pay, our portfolio managers pay close attention to taxable gains and losses and try to minimize required tax distributions. While volatile markets can make this more challenging, we are pleased to announce that estimated capital gains distributions for all of our Funds will be substantially smaller this year, and will equal zero for some Funds.
We would like to thank you for your continued patience and support. We welcome your comments and questions. You can reach us via e-mail at ContactOakmark@oakmark.com.
John R. Raitt
President and CEO of The Oakmark Funds
President and CEO of Harris Associates L.P.
October 9, 2008
1
THE OAKMARK FUNDS
Summary Information
Performance for Periods
Ended September 30, 20081 | | Oakmark
Fund—Class I
(OAKMX) | | Oakmark
Select Fund—Class I
(OAKLX) | | Oakmark
Equity and Income
Fund—Class I
(OAKBX) | | Oakmark
Global Fund—Class I
(OAKGX) | |
| 3 Months* | | | -1.42 | % | | | -7.08 | % | | | -7.09 | % | | | -8.95 | % | |
| 1 Year | | | -18.14 | % | | | -30.43 | % | | | -3.85 | % | | | -22.10 | % | |
Average Annual Total
Return for: | |
| 3 Year | | | 0.28 | % | | | -6.56 | % | | | 5.84 | % | | | 3.53 | % | |
| 5 Year | | | 4.12 | % | | | 0.02 | % | | | 9.09 | % | | | 9.89 | % | |
| 10 Year | | | 4.62 | % | | | 8.38 | % | | | 11.15 | % | | | N/A | | |
| Since inception | | | 12.75%
(8/5/91) | | | | 11.82%
(11/1/96) | | | | 12.10%
(11/1/95) | | | | 12.11%
(8/4/99) | | |
Top Five Equity
Holdings as of
September 30, 20082
Company and % of Total
Net Assets | | | Yum! Brands, Inc. 3.2%
Anheuser-Busch
Companies, Inc. 3.1%
Capital One
Financial Corp. 2.9%
JPMorgan Chase &
Co. 2.8%
Schering-Plough
Corp. 2.8% | | | | H&R Block, Inc. 9.7%
Yum! Brands, Inc. 7.8%
Capital One
Financial Corp. 5.8%
JPMorgan Chase &
Co. 5.3%
Bristol-Myers
Squibb Co. 4.9% | | | | XTO Energy, Inc. 4.7%
CVS Caremark
Corp. 2.9%
Nestle SA 2.9%
General Dynamics
Corp. 2.8%
Apache Corp. 2.7% | | | | Credit Suisse Group 5.4%
Snap-on Inc. 4.6%
Daiwa Securities
Group Inc. 4.4%
Neopost SA 4.0%
Oracle Corp. 3.9% | | |
Sector
Allocation as of
September 30, 2008
Sector and % of
Market Value | | | Consumer
Discretionary 39.3%
Consumer Staples 16.1%
Information
Technology 15.0%
Financials 14.9%
Health Care 10.2%
Industrials 4.5% | | | | Consumer
Discretionary 57.9%
Information
Technology 17.3%
Financials 15.3%
Health Care 9.5% | | | | U.S. Government
Securities 38.3%
Consumer Staples 15.5%
Energy 13.7%
Industrials 11.1%
Consumer
Discretionary 9.8%
Health Care 7.4%
Information
Technology 2.2%
Financials 1.4%
Foreign Government
Securities 0.4%
Materials 0.2% | | | | Consumer
Discretionary 27.8%
Information
Technology 18.8%
Financials 18.2%
Health Care 17.2%
Industrials 10.8%
Energy 5.9%
Consumer Staples 1.3% | | |
The performance data quoted represents past performance. The above performance information for the Funds does not reflect the imposition of a 2% redemption fee on shares of all Funds, other than Oakmark Equity and Income Fund, redeemed within 90 days, in order to deter market timers. If reflected, the fee would reduce the performance quoted. Past performance does not guarantee future results. The investment return and principal value will fluctuate so that an investor's shares, when redeemed, may be worth more or less than their original cost. Current performance may be lower or higher than the performance data quoted. Average annual total return measures annualized change, while total return measures aggregate change. To obtain current month end performance data, visit oakmark.com.
* Not annualized
THE OAKMARK FUNDS
2
Performance for Periods
Ended September 30, 20081 | | Oakmark
Global Select
Fund—Class I
(OAKWX) | | Oakmark
International
Fund—Class I
(OAKIX) | | Oakmark
International
Small Cap Fund—Class I
(OAKEX) | |
| 3 Months* | | | -3.74 | % | | | -7.42 | % | | | -13.41 | % | |
| 1 Year | | | -25.95 | % | | | -28.59 | % | | | -32.47 | % | |
Average Annual Total
Return for: | |
| 3 Year | | | N/A | | | | -0.04 | % | | | -0.55 | % | |
| 5 Year | | | N/A | | | | 8.92 | % | | | 11.20 | % | |
| 10 Year | | | N/A | | | | 11.05 | % | | | 15.53 | % | |
| Since inception | | | -7.25%
(10/2/06) | | | | 10.09%
(9/30/92) | | | | 10.14%
(11/1/95) | | |
Top Five Equity
Holdings as of
September 30, 20082
Company and % of Total
Net Assets | | | Adecco SA 6.9%
Societe Television
Francaise 1 6.5%
Daiwa Securities
Group Inc. 6.0%
Credit Suisse Group 5.8%
GlaxoSmithKline PLC 5.4% | | | | Publicis Groupe 4.1%
Credit Suisse Group 4.1%
Adecco SA 4.0%
Daiwa Securities
Group Inc. 3.5%
Signet Jewelers Ltd. 3.2% | | | | Ichiyoshi Securities
Co., Ltd. 3.5%
M6 Metropole
Television 3.4%
Pasona Group Inc. 3.2%
Neopost SA 3.1%
Tomkins PLC 3.0% | | |
Sector
Allocation as of
September 30, 2008
Sector and % of
Market Value | | | Consumer
Discretionary 35.8%
Financials 23.0%
Health Care 19.4%
Information
Technology 14.4%
Industrials 7.4% | | | | Consumer
Discretionary 35.2%
Financials 28.3%
Industrials 13.5%
Information
Technology 13.1%
Health Care 5.0%
Materials 2.7%
Consumer Staples 2.2% | | | | Industrials 31.4%
Consumer
Discretionary 28.8%
Financials 14.5%
Information
Technology 14.4%
Consumer Staples 5.0%
Materials 4.3%
Health Care 1.6% | | |
As of 9/30/08, the expense ratio for Class I shares was 1.10% for Oakmark Fund, 1.08% for Oakmark Select Fund, 0.81% for Oakmark Equity and Income Fund, 1.16% for Oakmark Global Fund, 1.35% for Oakmark Global Select Fund, 1.10% for Oakmark International Fund and 1.41% for Oakmark International Small Cap Fund.
THE OAKMARK FUNDS
3
FUND EXPENSES
A shareholder of each Fund incurs two types of costs: (1) transaction costs, such as redemption fees, and (2) ongoing costs, including investment advisory fees, transfer agent fees, and other fund expenses. The examples below are intended to help shareholders understand the ongoing cost (in dollars) of investing in each Fund and to compare these costs with the ongoing costs of investing in other funds.
Actual Expenses
The following table provides information about actual account values and actual fund expenses for Class I of each Fund. The table shows the expenses a Class I shareholder would have paid on a $1,000 investment in each Fund from April 1, 2008 to September 30, 2008, as well as how much a $1,000 investment would be worth at the close of the period, assuming actual fund returns and expenses. A Class I shareholder can estimate expenses incurred for the period by dividing the account value at September 30, 2008, by $1,000 and multiplying the result by the number in the Expenses Paid During Period row as shown below.
Shares of all Funds, other than Oakmark Equity and Income Fund, invested for 90 days or less may be charged a 2% redemption fee. Please consult the Funds' prospectus at oakmark.com for more information.
| | | Oakmark Fund | | Oakmark Select Fund | | Oakmark Equity and Income Fund | | Oakmark Global Fund | | Oakmark Global Select Fund | | Oakmark International Fund | | Oakmark International Small Cap Fund | |
Beginning
Account
Value | | $ | 1,000.00 | | | $ | 1,000.00 | | | $ | 1,000.00 | | | $ | 1,000.00 | | | $ | 1,000.00 | | | $ | 1,000.00 | | | $ | 1,000.00 | | |
Ending
Account
Value | | $ | 944.10 | | | $ | 864.80 | | | $ | 942.20 | | | $ | 880.40 | | | $ | 906.40 | | | $ | 842.90 | | | $ | 812.00 | | |
Expenses
Paid
During
Period* | | $ | 5.39 | | | $ | 4.99 | | | $ | 3.88 | | | $ | 5.31 | | | $ | 6.39 | | | $ | 4.98 | | | $ | 6.16 | | |
Annualized
Expense
Ratio | | | 1.11 | % | | | 1.07 | % | | | 0.80 | % | | | 1.13 | % | | | 1.34 | % | | | 1.08 | % | | | 1.36 | % | |
* Expenses are equal to each Fund's annualized expense ratio for Class I, multiplied by the average account value over the period, multiplied by the number of days in the most recent fiscal half-year divided by 366 (to reflect the one-half year period).
THE OAKMARK FUNDS
4
Hypothetical Example for Comparison Purposes
The following table provides information about hypothetical account values and hypothetical expenses for Class I of each Fund based on actual expense ratios and an assumed rate of return of 5% per year before expenses, which are not the Funds' actual returns. The hypothetical account values and expenses may not be used to estimate the actual ending account balances or expenses shareholders paid for the period. Shareholders may use this information to compare the ongoing costs of investing in a Fund and other funds. To do so, compare this 5% hypothetical example with the 5% hypothetical examples that appear in the shareholder reports of the other funds.
Please note that the expenses shown in the table are meant to highlight your ongoing costs only and do not reflect any transaction costs, such as redemption fees. Therefore, the third line of the table is useful in comparing ongoing costs only, and will not help you determine the relative total costs of owning different funds. In addition, if these transaction costs were included, the total costs would have been higher.
| | | Oakmark Fund | | Oakmark Select Fund | | Oakmark Equity and Income Fund | | Oakmark Global Fund | | Oakmark Global Select Fund | | Oakmark International Fund | | Oakmark International Small Cap Fund | |
Beginning
Account
Value | | $ | 1,000.00 | | | $ | 1,000.00 | | | $ | 1,000.00 | | | $ | 1,000.00 | | | $ | 1,000.00 | | | $ | 1,000.00 | | | $ | 1,000.00 | | |
Ending
Account
Value | | $ | 1,019.45 | | | $ | 1,019.65 | | | $ | 1,021.00 | | | $ | 1,019.35 | | | $ | 1,018.30 | | | $ | 1,019.60 | | | $ | 1,018.20 | | |
Expenses
Paid
During
Period* | | $ | 5.60 | | | $ | 5.40 | | | $ | 4.04 | | | $ | 5.70 | | | $ | 6.76 | | | $ | 5.45 | | | $ | 6.86 | | |
Annualized
Expense
Ratio | | | 1.11 | % | | | 1.07 | % | | | 0.80 | % | | | 1.13 | % | | | 1.34 | % | | | 1.08 | % | | | 1.36 | % | |
* Expenses are equal to each Fund's annualized expense ratio for Class I, multiplied by the average account value over the period, multiplied by the number of days in the most recent fiscal half-year divided by 366 (to reflect the one-half year period).
THE OAKMARK FUNDS
5
OAKMARK AND OAKMARK SELECT FUNDS
At Oakmark, we are long-term investors. We attempt to identify growing businesses that are managed to benefit their shareholders. We will purchase stock in those businesses only when priced substantially below our estimate of intrinsic value. After purchase, we patiently wait for the gap between stock price and intrinsic value to close.
 I'm writing this letter on the last day of the quarter. The stock market fell more points yesterday than it ever has before, the S&P 5003 is down 19% for the year, and the House has voted down the Treasury's plan to stabilize the credit markets. During the quarter we witnessed the demise of Fannie Mae, Freddie Mac, Lehman Brothers, AIG, Washington Mutual and Wachovia Bank. Just one year ago those companies had a combined market value of over $400 billion. In such unsettled times I thought it might be useful to answer some basic questions that our shareholders have been frequently asking.
Should I sell stocks now?
It's unfortunate that this question is always asked after large declines rather than before. Everyone's risk tolerance is different, but if you can't sleep at night because you are so worried about stocks falling more, then yes, you should sell enough so you can sleep. It's never worth risking your health. You should also sell if you have invested money in the stock market that you know you will need to spend soon. We always encourage limiting stock market investments to capital that you aren't likely to need within the next five years.
If you are sleeping well and won't be a forced seller anytime soon, then we strongly believe you should not sell. In fact, we believe the decline in the market has created a very attractive environment for investing new capital. For most people, the right question to ask after a big decline is: "Should I be investing more?" We believe this is a very good time to be a cautiously optimistic buyer. I say "cautiously" because volatility has been so extreme that it seems prudent to keep some capital in reserve so that if prices fall further you can take advantage of them. Finally, remember that our Funds, like most equity mutual funds, are usually close to fully invested, so if you want to own more stocks, you need to invest additional capital.
Why do you say stocks are attractive?
Our view on whether a stock is attractive or not is based on the difference between our estimate of long-term value and the current stock price. When the stock price is well below our business value estimate, we say that stock is attractive. We started 2008 believing that many stocks were attractive—priced well below business value and likely to produce long-term returns that would significantly exceed returns on fixed income investments. Most of the businesses we own, with the exception of financial services companies, have grown business value this year more slowly than we expected, but they did grow. With stock prices down and business value up slightly, the discount to estimated fair value has increased. We therefore believe that stocks have become even more attractive investments.
You thought stocks were cheap last year, what went wrong?
Bear markets typically follow periods of excessive valuation, meaning stocks were selling at very high multiples of earnings. When price-to-earnings ratios become elevated, other investment opportunities, such as fixed income, become attractive substitutes. Investors sell stocks, driving down prices and increasing their prospective returns, and they buy bonds, reducing their yields. Eventually stocks look more attractive than bonds and the whole cycle repeats. This time, however, stock P/E4 ratios were not historically high, and competing bond yields did not look compelling in comparison. This market has been less about correcting overly generous valuations, and more about the fear that the losses in the banking system will spread to the rest of the economy. It wasn't the typical valuation correction, and we didn't anticipate the financial services collapse.
Why do you own any financial services companies?
Financial services companies are the exception to my comment that most of our stocks have slightly higher business value estimates today than they did a year ago. Mortgage losses for financials far exceeded our expectations and resulted in significant decreases to our value estimates. However, for most of these companies, stock prices have declined far more than estimated value. Therefore, their discount to value has grown. And for the survivors, the current turmoil has provided opportunities to make acquisitions that appear to have been real bargains. JPMorgan purchased Bear Stearns and Washington Mutual for almost nothing. Citigroup has announced the same with Wachovia. These companies sell at low price-to-earnings and price-to-book ratios, have value additive acquisition opportunities, and face less competition than they previously did. We believe the winners will emerge as very strong companies.
OAKMARK AND OAKMARK SELECT FUNDS
6
What did you miss on Washington Mutual?
Washington Mutual was held in all three Funds I co-manage. We sold our position during the quarter when it appeared that regulators were increasingly looking at mark-to-market implied losses, which eliminated the chance that Washington Mutual could, over time, earn back its mortgage losses. Selling was the right decision but by the time we sold, the damage had been done. Owning Washington Mutual was a big mistake for which I fully accept responsibility. Though we believed home prices had been rising at an unsustainable pace, we took comfort that previous home price bubbles had corrected with home prices plateauing for several years rather than sharply falling. Expecting that to continue, I took too much comfort in the fact that the overwhelming majority of mortgages Washington Mutual owned had balances of less than 80% of appraised value. Believing that the collateral was so valuable, I wasn't as concerned as I should have been with softening underwriting standards. After all, if the borrower defaulted, the house could still be sold for more than the mortgage debt. After nationwide prices fell 20%—and further in hot markets—the collateral was no longer worth more than the loan, and serious losses resulted. A mortgage market previously viewed as secure became viewed as very risky. Sellers flooded the market, and prices fell sharply. Because of its leverage, Washington Mutual's assets, marked-to-market, were no longer greater than its liabilities. Ironically, the asset we've always believed was under appreciated, its strong retail deposit base, is now owned by another of our holdings, JP Morgan. Though there are many lessons to be learned from this error, perhaps the most important is that in today's economic climate, we need to consider a broader array of outcomes than we previously considered, especially for companies that employ financial leverage.
Do you think the Paulson plan can work?
Yes. Every banking executive we talk to says their models show that mortgages are worth much more than they are selling for in the market. It makes sense to us that mortgages have become undervalued because so many financial firms have been forced to sell their positions. Market prices of mortgages fell which created losses and reduced the equity of the firms that held them. With typical leverage ratios of 15:1, each $1 loss forced the sale of $14 of assets, primarily mortgages. That further depressed prices, increasing losses, decreasing equity, and forcing more sales. The downward spiral fed on itself. In most markets, value buyers step in to take advantage of low prices and reverse that vicious cycle. But because the mortgage market is so large, that process will take a long time unless a very large investor intervenes. The government, borrowing for thirty years at less than a 5% interest rate, has more attractive access to capital than any private investor. That makes it especially well-suited to step in and eliminate the supply-demand imbalance. As Warren Buffett said, "People who are buying these instruments in the market are expecting to make 15 to 20 percent...If they (the government) do it right...I think they'll make a lot of money." I agree. Many say the proposal forces Main Street to bail out Wall Street. I see it as Main Street taking advantage of Wall Street's mistakes. Investing $700 billion in cheap mortgages should yield annual profits of double-digit billions, and have the nice side-effect of reversing the downward spiral in prices. If the process is not politicized, and the money is simply invested in attractively priced debt securities, we could be arguing several years from now about whether the profits should be spent on increased services or returned through lower taxes.
The market decline has been unpleasant and the landscape is changing rapidly, so it is hard to anticipate what will happen tomorrow or next week. But as long-term investors we think about five years from now, and it is easy to be excited about the opportunities we see today.
William C. Nygren, CFA
Portfolio Manager
oakmx@oakmark.com
oaklx@oakmark.com
September 30, 2008
OAKMARK AND OAKMARK SELECT FUNDS
7
OAKMARK FUND
Report from Bill Nygren and Kevin Grant, Portfolio Managers


THE VALUE OF A $10,000 INVESTMENT IN OAKMARK FUND FROM ITS INCEPTION (8/5/91) TO PRESENT (9/30/08) AS COMPARED TO THE STANDARD & POOR'S 500 INDEX3 (UNAUDITED)

| | | | | Average Annual Total Returns
(as of 9/30/08) | |
| (Unaudited) | | Total Return
Last 3 Months* | | 1-year | | 5-year | | 10-year | | Since
Inception
(8/5/91) | |
| Oakmark Fund (Class I) | | | -1.42 | % | | | -18.14 | % | | | 4.12 | % | | | 4.62 | % | | | 12.75 | % | |
| S&P 500 | | | -8.37 | % | | | -21.98 | % | | | 5.17 | % | | | 3.06 | % | | | 8.82 | % | |
| Dow Jones Average5 | | | -3.72 | % | | | -19.86 | % | | | 5.60 | % | | | 5.46 | % | | | 10.27 | % | |
Lipper Large Cap
Value Index6 | | | -8.64 | % | | | -23.89 | % | | | 5.48 | % | | | 3.73 | % | | | 8.52 | % | |
The graph and table do not reflect the deduction of taxes that a shareholder would pay on fund distributions or the redemption of fund shares.
The expense ratio for Class I shares as of 9/30/08 was 1.10%.
The performance data quoted represents past performance. The above performance information for the Fund does not reflect the imposition of a 2% redemption fee on shares redeemed within 90 days, in order to deter market timers. If reflected, the fee would reduce the performance quoted. Past performance does not guarantee future results. The investment return and principal value will fluctuate so that an investor's shares, when redeemed, may be worth more or less than their original cost. Current performance may be lower or higher than the performance data quoted. Average annual total return measures annualized change, while total return measures aggregate change. To obtain most recent month-end performance data, visit oakmark.com.
* Not annualized
Oakmark Fund lost 1% of its value last quarter. That loss was relatively minor compared to the 8% drop in the S&P 500. We have two goals for our Fund. Number one is to grow your capital. Number two is to outperform our competitors. Losing a little money when competitors lose a lot doesn't thrill us. However, limiting losses in tough times is perhaps the single most important requirement for achieving long-term capital growth. As Warren Buffett said, "Over the years, a number of very smart people have learned the hard way that a long stream of impressive numbers multiplied by a single zero always equals zero."
In a quarter when many financial services stocks were obliterated, our three best performers, oddly, were financials: Bank of America, Capital One and JP Morgan. We believe all three have significantly improved their competitive position during this crisis. As the saying goes, what doesn't kill you makes you stronger. At the other extreme, stocks that hurt the Fund the most were Viacom, Texas Instruments and Merrill Lynch. A slowing economy reduced sales forecasts for both Viacom and Texas Instruments. We don't believe that the value of either company meaningfully declined. We sold Merrill Lynch after its agreement to merge with Bank of America. We also sold US Bancorp because it neared our sell target as other financials traded at increasing discounts. We sold Washington Mutual and Sprint because we were disappointed with their fundamental performance. New stocks in the portfolio include Ascent Media (spun-off from Discovery), American Express and Boeing. The American Express purchase is explained on our web site.
Boeing (BA – $57)
The Boeing Company is a leading defense contractor and commercial jet manufacturer. Last year Boeing stock reached $108 because investors were excited about prospects for commercial aviation. As oil prices rose, concerns mounted about the health of the airline industry, especially airlines based in the United States. Though we share those concerns, we note the strength of non-U.S. airlines and also the compelling economics, driven by better fuel efficiency, for modernizing the fleet. More importantly, we focus on the value of Boeing's defense division, which attracts far less attention than commercial aviation does. We believe that if one values its defense business as other publicly traded defense contractors are valued, it is nearly worth Boeing's current stock price, which means the price for commercial aviation is trivial. We believe Boeing is an exceptional value selling at only 8 times expected 2009 earnings.
William C. Nygren, CFA
Portfolio Manager
oakmx@oakmark.com | | Kevin G. Grant, CFA
Portfolio Manager
oakmx@oakmark.com | |
|
September 30, 2008
OAKMARK FUND
8
OAKMARK FUND
Schedule of Investments—September 30, 2008
| Name | | Shares Held | | Value | |
| Common Stocks—95.1% | |
| Apparel Retail—1.8% | |
| Limited Brands | | | 3,814,647 | | | $ | 66,069,686 | | |
| Broadcasting—0.6% | |
| Discovery Communications, Inc. Class A (a) | | | 770,070 | | | $ | 10,973,498 | | |
| Discovery Communications, Inc. Class C (a) | | | 770,070 | | | | 10,904,191 | | |
| | | | 21,877,689 | | |
| Cable & Satellite—4.5% | |
| Liberty Media Corp. - Entertainment (a) | | | 3,398,680 | | | $ | 84,865,040 | | |
| Comcast Corp., Class A | | | 4,000,000 | | | | 78,880,000 | | |
| | | | 163,745,040 | | |
| Catalog Retail—1.3% | |
| Liberty Media Holding Corp. - Interactive, Class A (a) | | | 3,699,850 | | | $ | 47,765,063 | | |
| Computer & Electronics Retail—2.5% | |
| Best Buy Co., Inc. | | | 2,419,400 | | | $ | 90,727,500 | | |
| Department Stores—2.5% | |
| Kohl's Corp. (a) | | | 1,976,900 | | | $ | 91,095,552 | | |
| Home Improvement Retail—2.1% | |
| The Home Depot, Inc. | | | 2,881,500 | | | $ | 74,602,035 | | |
| Household Appliances—2.3% | |
| The Black & Decker Corp. | | | 1,350,000 | | | $ | 82,012,500 | | |
| Housewares & Specialties—2.2% | |
| Fortune Brands, Inc. | | | 1,350,000 | | | $ | 77,436,000 | | |
| Motorcycle Manufacturers—1.8% | |
| Harley-Davidson, Inc. | | | 1,762,000 | | | $ | 65,722,600 | | |
| Movies & Entertainment—7.3% | |
| The Walt Disney Co. | | | 3,000,000 | | | $ | 92,070,000 | | |
| Time Warner, Inc. | | | 6,947,700 | | | | 91,084,347 | | |
| Viacom, Inc., Class B (a) | | | 2,739,745 | | | | 68,055,266 | | |
| Liberty Media Holding Corp. - Capital, Class A (a) | | | 949,670 | | | | 12,706,584 | | |
| Ascent Media Corp. Class A (a) | | | 77,007 | | | | 1,879,741 | | |
| | | | 265,795,938 | | |
| Restaurants—5.7% | |
| Yum! Brands, Inc. | | | 3,564,000 | | | $ | 116,222,040 | | |
| McDonald's Corp. | | | 1,444,000 | | | | 89,094,800 | | |
| | | | 205,316,840 | | |
OAKMARK FUND
9
OAKMARK FUND
Schedule of Investments—September 30, 2008 cont.
| Name | | Shares Held | | Value | |
| Common Stocks—95.1% (cont.) | |
| Specialized Consumer Services—2.8% | |
| H&R Block, Inc. | | | 4,458,600 | | | $ | 101,433,150 | | |
| Brewers—4.8% | |
| Anheuser-Busch Cos., Inc. | | | 1,750,000 | | | $ | 113,540,000 | | |
| InBev NV (b) (c) | | | 1,000,000 | | | | 59,494,704 | | |
| | | | 173,034,704 | | |
| Distillers & Vintners—1.9% | |
| Diageo PLC (d) | | | 1,021,000 | | | $ | 70,306,060 | | |
| Drug Retail—1.4% | |
| Walgreen Co. | | | 1,600,000 | | | $ | 49,536,000 | | |
| Hypermarkets & Super Centers—2.6% | |
| Wal-Mart Stores, Inc. | | | 1,600,000 | | | $ | 95,824,000 | | |
| Packaged Foods & Meats—4.6% | |
| General Mills, Inc. | | | 1,256,000 | | | $ | 86,312,320 | | |
| H.J. Heinz Co. | | | 1,600,000 | | | | 79,952,000 | | |
| | | | 166,264,320 | | |
| Asset Management & Custody Banks—1.7% | |
| Bank of New York Mellon Corp. | | | 1,839,630 | | | $ | 59,935,145 | | |
| Consumer Finance—3.9% | |
| Capital One Financial Corp. | | | 2,064,800 | | | $ | 105,304,800 | | |
| American Express Co. | | | 1,000,000 | | | | 35,430,000 | | |
| | | | 140,734,800 | | |
| Investment Banking & Brokerage—1.2% | |
| Morgan Stanley | | | 1,900,000 | | | $ | 43,700,000 | | |
| Other Diversified Financial Services—7.4% | |
| JPMorgan Chase & Co. | | | 2,200,000 | | | $ | 102,740,000 | | |
| Bank of America Corp. | | | 2,700,000 | | | | 94,500,000 | | |
| Citigroup, Inc. | | | 3,500,000 | | | | 71,785,000 | | |
| | | | 269,025,000 | | |
| Health Care Equipment—2.4% | |
| Medtronic, Inc. | | | 1,750,000 | | | $ | 87,675,000 | | |
| Pharmaceuticals—7.3% | |
| Schering-Plough Corp. | | | 5,501,135 | | | $ | 101,605,964 | | |
| GlaxoSmithKline PLC (d) | | | 2,000,000 | | | | 86,920,000 | | |
| Bristol-Myers Squibb Co. | | | 3,600,000 | | | | 75,060,000 | | |
| | | | 263,585,964 | | |
OAKMARK FUND
10
OAKMARK FUND
Schedule of Investments—September 30, 2008 cont.
| Name | | Shares Held | | Value | |
| Common Stocks—95.1% (cont.) | |
| Aerospace & Defense—1.1% | |
| The Boeing Co. | | | 700,000 | | | $ | 40,145,000 | | |
| Air Freight & Logistics—2.1% | |
| FedEx Corp. | | | 950,000 | | | $ | 75,088,000 | | |
| Industrial Conglomerates—1.1% | |
| Tyco International, Ltd. | | | 1,139,500 | | | $ | 39,905,290 | | |
| Communications Equipment—1.5% | |
| Cisco Systems, Inc. (a) | | | 2,500,000 | | | $ | 56,400,000 | | |
| Computer Hardware—4.0% | |
| Hewlett-Packard Co. | | | 1,725,000 | | | $ | 79,764,000 | | |
| Dell Inc. (a) | | | 3,900,000 | | | | 64,272,000 | | |
| | | | 144,036,000 | | |
| Data Processing & Outsourced Services—1.7% | |
| Western Union Co. | | | 2,575,000 | | | $ | 63,525,250 | | |
| Electronic Manufacturing Services—1.1% | |
| Tyco Electronics, Ltd. | | | 1,439,500 | | | $ | 39,816,570 | | |
| Office Electronics—1.7% | |
| Xerox Corp. | | | 5,272,400 | | | $ | 60,790,772 | | |
| Semiconductors—4.2% | |
| Intel Corp. | | | 4,400,000 | | | $ | 82,412,000 | | |
| Texas Instruments Inc. | | | 3,200,000 | | | | 68,800,000 | | |
| | | | 151,212,000 | | |
| Total Common Stocks (Cost: $2,894,160,960) | | | | | | | 3,444,139,468 | | |
OAKMARK FUND
11
OAKMARK FUND
Schedule of Investments—September 30, 2008 cont.
| Name | | Par Value | | Value | |
| Short Term Investment—4.7% | |
| Repurchase Agreement—4.7% | |
Fixed Income Clearing Corp. Repurchase Agreement,
1.70% dated 9/30/2008 due 10/1/2008, repurchase price
$172,706,159, collateralized by Federal National Mortgage
Association Bonds, with rates from 5.225% - 6.110%,
with maturities from 1/27/2023 - 8/24/2027, and with an
aggregate market value plus accrued interest of
$176,154,703 | | $ | 172,698,004 | | | $ | 172,698,004 | | |
| Total Repurchase Agreement (Cost: $172,698,004) | | | | | 172,698,004 | | |
| Total Short Term Investment (Cost: $172,698,004) | | | | | 172,698,004 | | |
| Total Investments (Cost: $3,066,858,964)—99.8% | | | | $ | 3,616,837,472 | | |
| Other Assets In Excess of Liabilities—0.2% | | | | | 5,660,284 | | |
| Total Net Assets—100% | | | | $ | 3,622,497,756 | | |
(a) Non income-producing security.
(b) Represents a foreign domiciled corporation.
(c) Market value is determined in accordance with procedures established in good faith by the Board of Trustees.
(d) Represents an American Depositary Receipt.
See accompanying Notes to Financial Statements.
OAKMARK FUND
12
OAKMARK SELECT FUND
Report from Bill Nygren and Henry Berghoef, Portfolio Managers


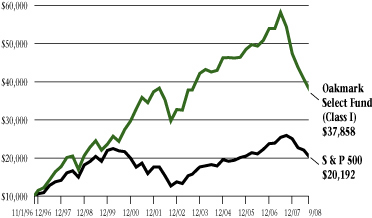
THE VALUE OF A $10,000 INVESTMENT IN OAKMARK SELECT FUND FROM ITS INCEPTION (11/1/96) TO PRESENT (9/30/08) AS COMPARED TO THE STANDARD & POOR'S 500 INDEX3 (UNAUDITED)
| | | | | Average Annual Total Returns
(as of 9/30/08) | |
| (Unaudited) | | Total Return
Last 3 Months* | | 1-year | | 5-year | | 10-year | | Since
Inception
(11/1/96) | |
Oakmark Select Fund
(Class I) | | | -7.08 | % | | | -30.43 | % | | | 0.02 | % | | | 8.38 | % | | | 11.82 | % | |
| S&P 500 | | | -8.37 | % | | | -21.98 | % | | | 5.17 | % | | | 3.06 | % | | | 6.08 | % | |
Lipper Multi-Cap
Value Index7 | | | -9.24 | % | | | -25.26 | % | | | 4.88 | % | | | 5.19 | % | | | 6.32 | % | |
The graph and table do not reflect the deduction of taxes that a shareholder would pay on fund distributions or the redemption of fund shares.
The expense ratio for Class I shares as of 9/30/08 was 1.08%.
The performance data quoted represents past performance. The above performance information for the Fund does not reflect the imposition of a 2% redemption fee on shares redeemed within 90 days, in order to deter market timers. If reflected, the fee would reduce the performance quoted. Past performance does not guarantee future results. The investment return and principal value will fluctuate so that an investor's shares, when redeemed, may be worth more or less than their original cost. Current performance may be lower or higher than the performance data quoted. Average annual total return measures annualized change, while total return measures aggregate change. To obtain most recent month-end performance data, visit oakmark.com.
* Not annualized
Oakmark Select Fund lost 7% last quarter, slightly less than the 8% loss for the S&P 500. Despite the larger losses many of our competitors suffered, we are always disappointed when we nearly match a market decline. Our best performer in the quarter was JP Morgan, which increased in value by more than a third. Last quarter we highlighted its bargain purchase of Bear Stearns. This quarter it added another bargain, Washington Mutual, which was one of our most negative performers. JP Morgan appears to have dodged the bullets from this financial crisis. It is now reaping the rewards of being capital rich, while its competition is capital starved.
Last quarter we stated that our three largest positions—Yum! Brands, H&R Block and Discovery Holdings—would likely be the most important factors for our future performance. H&R Block continued to be positively recognized for its new-found focus on its tax business, making it one of our best performers. Yum! Brands gave back some of its gains due to concern about a slowing Chinese economy. The performance of those two stocks basically offset each other. The other large holding, Discovery, had the most negative effect on Fund performance. Declining expectations for advertising in a weakening economy hurt many media companies, including Discovery. We believe Discovery's business value is not only intact, but growing, so we view the decline as a significant over-reaction. Discovery completed its restructuring last quarter, spinning off Ascent Media and eliminating its holding company structure. We view those changes as important positives, and we believe other investors will, too, after the financial industry settles down and investors focus more on fundamentals and less on price momentum.
If portfolio managers add value through their stock selection, then over the long run, their favorite stocks perform better than those they have less conviction about. Investing only in their favorite stocks, rather than fully diversifying, amplifies the effect, plus or minus, that stock selection has on their results. Concentrated investing has served us well over the life of the Fund. Although we are chastised by this year's performance, we remain confident that our stock selection will add value and that our focused approach will improve long-term results. Thank you for your continued confidence.
William C. Nygren, CFA
Portfolio Manager
oaklx@oakmark.com | | Henry R. Berghoef, CFA
Portfolio Manager
oaklx@oakmark.com | |
|
September 30, 2008
OAKMARK SELECT FUND
13
OAKMARK SELECT FUND
Schedule of Investments—September 30, 2008
| Name | | Shares Held | | Value | |
| Common Stocks—94.8% | |
| Apparel Retail—4.5% | |
| Limited Brands | | | 6,680,981 | | | $ | 115,714,591 | | |
| Broadcasting—5.5% | |
| Discovery Communications, Inc. Class A (a) | | | 5,425,150 | | | $ | 77,308,387 | | |
| Discovery Communications, Inc. Class C (a) | | | 4,484,350 | | | | 63,498,396 | | |
| | | | 140,806,783 | | |
| Cable & Satellite—4.4% | |
| Comcast Corp., Class A | | | 5,750,000 | | | $ | 113,390,000 | | |
| Catalog Retail—4.7% | |
| Liberty Media Holding Corp. - Interactive, Class A (a) | | | 9,400,000 | | | $ | 121,354,000 | | |
| Computer & Electronics Retail—4.1% | |
| Best Buy Co., Inc. | | | 2,800,000 | | | $ | 105,000,000 | | |
| Movies & Entertainment—9.3% | |
| Viacom, Inc., Class B (a) | | | 4,675,000 | | | $ | 116,127,000 | | |
| Time Warner, Inc. | | | 8,617,000 | | | | 112,968,870 | | |
| Ascent Media Corp. Class A (a) | | | 472,197 | | | | 11,526,329 | | |
| | | | 240,622,199 | | |
| Restaurants—12.7% | |
| Yum! Brands, Inc. | | | 6,165,000 | | | $ | 201,040,650 | | |
| McDonald's Corp. | | | 2,028,000 | | | | 125,127,600 | | |
| | | | 326,168,250 | | |
| Specialized Consumer Services—9.7% | |
| H&R Block, Inc. | | | 11,019,600 | | | $ | 250,695,900 | | |
| Consumer Finance—5.8% | |
| Capital One Financial Corp. | | | 2,910,600 | | | $ | 148,440,600 | | |
| Investment Banking & Brokerage—3.4% | |
| Morgan Stanley | | | 3,850,000 | | | $ | 88,550,000 | | |
| Other Diversified Financial Services—5.3% | |
| JPMorgan Chase & Co. | | | 2,894,000 | | | $ | 135,149,800 | | |
| Pharmaceuticals—9.0% | |
| Bristol-Myers Squibb Co. | | | 6,010,200 | | | $ | 125,312,670 | | |
| Schering-Plough Corp. | | | 5,782,954 | | | | 106,811,161 | | |
| | | | 232,123,831 | | |
| Computer Hardware—3.3% | |
| Dell Inc. (a) | | | 5,113,000 | | | $ | 84,262,240 | | |
OAKMARK SELECT FUND
14
OAKMARK SELECT FUND
Schedule of Investments—September 30, 2008 cont.
| Name | | Shares Held/
Par Value | | Value | |
| Common Stocks—94.8% (cont.) | |
| Data Processing & Outsourced Services—4.8% | |
| Western Union Co. | | | 5,065,400 | | | $ | 124,963,418 | | |
| Office Electronics—3.8% | |
| Xerox Corp. | | | 8,546,400 | | | $ | 98,539,992 | | |
| Semiconductors—4.5% | |
| Intel Corp. | | | 6,147,000 | | | $ | 115,133,309 | | |
| Total Common Stocks (Cost: $2,091,039,340) | | | | | | | 2,440,914,913 | | |
| Short Term Investment—5.2% | |
| Repurchase Agreement—5.2% | |
Fixed Income Clearing Corp. Repurchase Agreement,
1.70% dated 9/30/2008 due 10/1/2008, repurchase price
$133,273,667, collaterized by a Federal National
Mortgage Association Bond, with a rate of 5.225%,
with a maturity of 1/27/2023, and with an aggregate
market value plus accrued interest of $135,935,694 | | $ | 133,267,374 | | | $ | 133,267,374 | | |
| Total Repurchase Agreement (Cost: $133,267,374) | | | | | | | 133,267,374 | | |
| Total Short Term Investment (Cost: $133,267,374) | | | | | | | 133,267,374 | | |
| Total Investments (Cost: $2,224,306,714)—100.0% | | | | | | $ | 2,574,182,287 | | |
| Liabilities In Excess of Other Assets—0.0% | | | | | | | (145,955 | ) | |
| Total Net Assets—100% | | | | | | $ | 2,574,036,332 | | |
(a) Non income-producing security.
See accompanying Notes to Financial Statements.
OAKMARK SELECT FUND
15
OAKMARK EQUITY AND INCOME FUND
Report from Clyde S. McGregor and Edward A. Studzinski, Portfolio Managers


THE VALUE OF A $10,000 INVESTMENT IN OAKMARK EQUITY AND INCOME FUND FROM ITS INCEPTION (11/1/95) TO PRESENT (9/30/08) AS COMPARED TO THE LIPPER BALANCED FUND INDEX8 (UNAUDITED)

| | | | | Average Annual Total Returns
(as of 9/30/08) | |
| (Unaudited) | | Total Return
Last 3 Months* | | 1-year | | 5-year | | 10-year | | Since
Inception
(11/1/95) | |
Oakmark Equity &
Income Fund (Class I) | | | -7.09 | % | | | -3.85 | % | | | 9.09 | % | | | 11.15 | % | | | 12.10 | % | |
Lipper Balanced
Fund Index | | | -8.39 | % | | | -15.11 | % | | | 4.78 | % | | | 4.20 | % | | | 6.33 | % | |
| S&P 5003 | | | -8.37 | % | | | -21.98 | % | | | 5.17 | % | | | 3.06 | % | | | 7.32 | % | |
Lehman Govt./
Corp. Bond9 | | | -1.64 | % | | | 2.41 | % | | | 3.34 | % | | | 5.00 | % | | | 5.79 | % | |
The graph and table do not reflect the deduction of taxes that a shareholder would pay on fund distributions or the redemption of fund shares.
The expense ratio for Class I shares as of 9/30/08 was 0.81%.
The performance data quoted represents past performance. Past performance does not guarantee future results. The investment return and principal value will fluctuate so that an investor's shares, when redeemed, may be worth more or less than their original cost. Current performance may be lower or higher than the performance data quoted. Average annual total return measures annualized change, while total return measures aggregate change. To obtain most recent month-end performance data, visit oakmark.com.
* Not annualized
Quarter and Fiscal Year Review
Earlier this year one of our firm's equity traders quipped that "flat is the new up." At the time, we found this amusing, but sadly it now appears to be prophetic. Oakmark Equity and Income Fund declined in value by 7% for the quarter ended September 30, which contrasts to an 8% loss for the Lipper Balanced Fund Index, the Equity and Income Fund's primary standard for comparison. For the September 30 fiscal year, the numbers are -4% for the Fund and -15% for the Lipper Balanced Fund Index. Long-time readers of these reports have endured regular pronouncements concerning your managers' unstinting focus on generating positive rates of return regardless of the environment, and we ask your indulgence as we reiterate that part of our philosophy.
Anyone reading this report is probably well aware of the math of investing, especially the discouraging power of negative returns. The simplest example is the one where a fund loses 50% in the first year requiring it to gain 100% in the second year just to return to breakeven. Negative return outcomes rapidly degrade even very long-term compounded growth rates. For the Equity and Income Fund, the past fiscal year's loss has been sufficient to reduce the annualized rate of return since inception (13 years) by more than one full percentage point. Of course, the Fund's returns have compared well to many others, and some of you have generously commented on that when you write to us. But in all honesty, your managers would be happier if the Fund were up 10% for the year. We are not in the business of besting competitors. Rather, we are in the business of stewarding our client-partners hard-earned assets so that they may maintain or even improve their lifestyles. Negative returns do not achieve that end no matter the comparative realities.
Both of the Fund's managers have had the privilege and daunting responsibility of serving on investment committees for eleemosynary endowment funds. One of us also serves as the chair of an organization's budget and finance committee. We experience first hand how negative returns harm endowments. The spending drain on the endowment continues during negative market periods, amplifying the shrinkage, a pattern that some of you have experienced personally. Eleemosynary institutions have the possibility of fund-raising their way back to breakeven (although that is easier said than done in the present environment), but for retired individuals who use the Equity and Income Fund as their entire investment program, fund-raising is not an option. Given the above, your managers must express how honored we are to have client-partners who have placed so much trust in Harris Associates generally and us specifically. We always strive to treat your assets with the respect that they deserve.
OAKMARK EQUITY AND INCOME FUND
16
Activity
We are well aware that turnover of investments in the Fund is expensive for our shareholders, and we aim to hold turnover of equities to less than 40%. Extraordinary times produce higher turnover levels, however, and the September quarter was certainly an extraordinary time. We eliminated nine equity holdings, all U.S. Treasury inflation-indexed securities, and all Fannie Mae and Freddie Mac issued long-term debt. We initiated three new equity positions, received shares of Scripps Networks Interactive from a spinoff distribution, and meaningfully increased the Fund's U.S. Treasury holdings, while maintaining the Fund's duration in the fixed income portfolio at 2.5 years. The net effect of this activity left the Fund at its historical low for the percentage allocated to equities and, concomitantly, its highest short-term investment position.
The quarter saw the culmination of the Fund's second investing experience with UST, the smokeless tobacco and wine company. Altria Group has agreed to purchase the company for $68.50 per share, which made UST the biggest positive contributor to the Fund's return in the quarter. For many years UST's prodigious cash flow enabled the company to maintain a high dividend payout. While we were happy simply to enjoy the benefits of ownership of this business, we have long believed that it made sense for one of the cigarette companies to acquire UST. Altria's limited success in attacking the smokeless market with a Marlboro-branded product may have driven their management to the same conclusion.
Other strong contributors in the quarter (yes, there were a few) included Avon Products (solid earnings abroad), Foot Locker (fundamental results exceeded expectations that had become overly pessimistic), and the stocks of several mid-capitalization companies that bounced from extreme valuation levels. The bottom of the contributor/detractor list for the quarter featured previous winners, all energy-related. During the quarter, the price of natural gas declined to levels that make gas exceptionally cheap on a BTU-equivalent basis to crude oil. Some believe that the U.S. is entering a period of natural gas surpluses (remember the gas bubble earlier this decade?) that will hold down prices. Given this possibility, it is important that investments in this industry be with companies that are low-cost producers, and we believe that our holdings satisfy this criterion.
As mentioned above, we eliminated the Fund's substantial holdings of U.S. Treasury inflation-indexed securities. These notes had become too richly priced, in our judgment. As well, we perceived the risk of an inflationary surge to be less than the probability of no inflation or even deflation. Finally, we sold all long-term holdings of Fannie Mae and Freddie Mac during the quarter. In hindsight, this proved to be a mistake as the government chose to protect the interests of debt-holders. While we foresaw this as a likely outcome, we sold the securities because the upside from the actual outcome was small and the downside could have been severe. We always prefer to assume risk in the equity portion of the portfolio, where upside is unlimited, rather than in the fixed income portion of the portfolio, where upside potential is always capped.
Mistake Buckets
In a recent interview, a consultant probed for our investing weaknesses and noted that he had categorized our missteps into various "mistake buckets." As you may well imagine, we spend a lot of time considering our mistakes, including the one mentioned in the preceding paragraph, but we had not spent time categorizing them. Since we focus our equity analysis on valuation, business fundamentals, and management, most of our equity mistakes derive from errors in those areas. In this discussion with the consultant, we found another type of error we make—one we might call "getting it half right," or not extending an insightful judgment far enough.
Oakmark Equity and Income is intended to be the least volatile Fund in the Oakmark Family. To that end, your managers seek to craft a balanced portfolio of stocks and bonds and pay considerable attention to the downside risk of each security. Several years ago our assessment of risk in the financial sector led us to limit the Fund's financial industry exposures to well-capitalized insurance companies. We failed to draw the conclusion, however, that our risk assessment on financials, if correct, would also portend difficult times for all leveraged companies. This failure resulted in our holding of IDEARC, the yellow pages business spun off from Verizon, which became the largest loser in dollar terms in the Fund's history.
We make plenty of mistakes, of course. In fact, we make so many that we think playing baseball is excellent experience for investors. Even the best hitters make outs in the majority of their at bats. But just like baseball batters as they anticipate the next pitch, we intend to be successful with every investment that we make for our clients. And similar to the batter who has trouble hitting curve balls, we must learn from our mistakes and develop the disciplines that make them less likely in the future.
As always, we thank you for being our shareholders and invite your comments and questions.
Clyde S. McGregor, CFA
Portfolio Manager
oakbx@oakmark.com | | Edward A. Studzinski, CFA
Portfolio Manager
oakbx@oakmark.com | |
|
September 30, 2008
OAKMARK EQUITY AND INCOME FUND
17
OAKMARK EQUITY AND INCOME FUND
Schedule of Investments—September 30, 2008
| Name | | Shares Held | | Value | |
| Equity and Equivalents—51.6% | |
| Common Stocks—51.6% | |
| Apparel Retail—1.4% | |
| Foot Locker, Inc. | | | 7,050,000 | | | $ | 113,928,000 | | |
| The TJX Cos., Inc. | | | 2,813,000 | | | | 85,852,760 | | |
| | | | 199,780,760 | | |
| Automobile Manufacturers—0.3% | |
| Thor Industries, Inc. | | | 1,710,600 | | | $ | 42,457,092 | | |
| Cable & Satellite—2.8% | |
| Scripps Networks Interactive, Inc., Class A | | | 6,208,000 | | | $ | 225,412,480 | | |
| DISH Network Corp. (a) | | | 8,002,500 | | | | 168,052,500 | | |
| | | | 393,464,980 | | |
| Home Furnishings—1.8% | |
| Mohawk Industries, Inc. (a) | | | 3,320,000 | | | $ | 223,734,800 | | |
| Leggett & Platt, Inc. | | | 1,279,056 | | | | 27,870,630 | | |
| | | | 251,605,430 | | |
| Hotels, Resorts & Cruise Lines—0.7% | |
| Carnival Corp. | | | 3,000,000 | | | $ | 106,050,000 | | |
| Publishing—1.3% | |
| The Washington Post Co., Class B | | | 315,200 | | | $ | 175,490,752 | | |
| The E.W. Scripps Co., Class A | | | 2,069,333 | | | | 14,630,185 | | |
| | | | 190,120,937 | | |
| Distillers & Vintners—2.3% | |
| Diageo PLC (c) | | | 4,782,314 | | | $ | 329,310,142 | | |
| Drug Retail—2.9% | |
| CVS Caremark Corp. | | | 12,170,000 | | | $ | 409,642,200 | | |
| Packaged Foods & Meats—4.6% | |
| Nestle SA (c) (d) | | | 9,457,500 | | | $ | 408,734,235 | | |
| ConAgra Foods, Inc. | | | 12,500,000 | | | | 243,250,000 | | |
| | | | 651,984,235 | | |
| Personal Products—1.6% | |
| Avon Products, Inc. | | | 5,548,500 | | | $ | 230,651,145 | | |
| Tobacco—1.7% | |
| UST, Inc. | | | 3,742,096 | | | $ | 248,999,068 | | |
| Coal & Consumable Fuels—0.8% | |
| Walter Industries, Inc. | | | 2,425,700 | | | $ | 115,099,465 | | |
OAKMARK EQUITY AND INCOME FUND
18
OAKMARK EQUITY AND INCOME FUND
Schedule of Investments—September 30, 2008 cont.
| Name | | Shares Held | | Value | |
| Equity and Equivalents—51.6% (cont.) | |
| Oil & Gas Exploration & Production—10.8% | |
| XTO Energy, Inc. | | | 14,305,572 | | | $ | 665,495,209 | | |
| Apache Corp. | | | 3,734,500 | | | | 389,433,660 | | |
| EnCana Corp. (b) | | | 5,508,500 | | | | 362,073,705 | | |
| Newfield Exploration Co. (a) (e) | | | 3,831,100 | | | | 122,556,889 | | |
| | | | 1,539,559,463 | | |
| Reinsurance—1.0% | |
| PartnerRe, Ltd. (b) | | | 2,100,000 | | | $ | 142,989,000 | | |
| Health Care Equipment—4.3% | |
| Medtronic, Inc. | | | 7,000,000 | | | $ | 350,700,000 | | |
| Hospira, Inc. (a) | | | 6,500,000 | | | | 248,300,000 | | |
| Advanced Medical Optics, Inc. (a) | | | 850,000 | | | | 15,113,000 | | |
| | | | 614,113,000 | | |
| Health Care Services—1.6% | |
| Laboratory Corp. of America Holdings (a) | | | 3,236,539 | | | $ | 224,939,461 | | |
| Life Sciences Tools & Services—0.4% | |
| Varian, Inc. (a) (e) | | | 1,409,400 | | | $ | 60,463,260 | | |
| Aerospace & Defense—5.6% | |
| General Dynamics Corp. | | | 5,500,000 | | | $ | 404,910,000 | | |
| Rockwell Collins, Inc. | | | 5,782,601 | | | | 278,085,282 | | |
| Alliant Techsystems, Inc. (a) | | | 1,285,200 | | | | 120,731,688 | | |
| | | | 803,726,970 | | |
| Industrial Machinery—3.4% | |
| ITT Corp. | | | 5,670,500 | | | $ | 315,336,505 | | |
| Pentair, Inc. | | | 3,707,437 | | | | 128,166,097 | | |
| Mueller Water Products, Inc., Class B (e) | | | 6,000,000 | | | | 39,000,000 | | |
| | | | 482,502,602 | | |
| Marine—0.4% | |
| Kirby Corp. (a) | | | 1,704,150 | | | $ | 64,655,451 | | |
| Application Software—0.3% | |
| Mentor Graphics Corp. (a) | | | 3,189,718 | | | $ | 36,203,299 | | |
| Communications Equipment—0.7% | |
| EchoStar Corp. (a) | | | 4,000,000 | | | $ | 96,400,000 | | |
| Computer Hardware—0.2% | |
| Teradata Corp. (a) | | | 1,757,600 | | | $ | 34,273,200 | | |
OAKMARK EQUITY AND INCOME FUND
19
OAKMARK EQUITY AND INCOME FUND
Schedule of Investments—September 30, 2008 cont.
| Name | | Shares Held/
Par Value | | Value | |
| Equity and Equivalents—51.6% (cont.) | |
| Electronic Manufacturing Services—0.7% | |
| Tyco Electronics, Ltd. | | | 3,636,600 | | | $ | 100,588,356 | | |
| Total Common Stocks (Cost: $6,443,478,014) | | | | | | | 7,369,579,516 | | |
| Total Equity and Equivalents (Cost: $6,443,478,014) | | | | | | | 7,369,579,516 | | |
| Fixed Income—33.3% | |
| Corporate Bonds—0.4% | |
| Paper Packaging—0.2% | |
| Sealed Air Corp., 144A, 5.625%, due 7/15/2013 (f) | | $ | 19,400,000 | | | $ | 19,052,080 | | |
| Other Diversified Financial Services—0.1% | |
Private Export Funding Corp. Secured Note, Series 1,
7.20%, due 1/15/2010 | | $ | 15,000,000 | | | $ | 15,738,645 | | |
| Consumer Finance—0.1% | |
| Toyota Motor Credit Corp., 4.00%, due 6/25/2010 | | $ | 15,000,000 | | | $ | 14,949,915 | | |
| Total Corporate Bonds (Cost: $50,267,521) | | | | | | | 49,740,640 | | |
| Government and Agency Securities—32.9% | |
| France Government Bonds—0.3% | |
France Government, 3.00%, due 7/25/2012 ,
Inflation Indexed | | EUR | 33,570,432 | | | $ | 49,319,604 | | |
| U.S. Government Agencies—3.9% | |
| Federal Farm Credit Bank, 3.50%, due 10/3/2011 | | $ | 100,000,000 | | | $ | 99,625,400 | | |
| Federal Farm Credit Bank, 3.078%, due 2/22/2012 (g) | | | 97,000,000 | | | | 96,431,677 | | |
| Tennessee Valley Authority, 6.79%, due 5/23/2012 | | | 58,730,000 | | | | 64,461,813 | | |
| Federal Farm Credit Bank, 2.75%, due 5/4/2010 | | | 50,000,000 | | | | 49,578,200 | | |
| Federal Farm Credit Bank, 2.25%, due 7/1/2010 | | | 50,000,000 | | | | 49,104,900 | | |
| Federal Farm Credit Bank, 3.15%, due 5/19/2011 | | | 35,000,000 | | | | 34,676,670 | | |
| Federal Farm Credit Bank, 4.25%, due 4/15/2013 | | | 25,000,000 | | | | 24,888,700 | | |
| Federal Farm Credit Bank, 4.92%, due 1/11/2010 | | | 19,400,000 | | | | 19,806,546 | | |
| Federal Farm Credit Bank, 2.75%, due 11/20/2009 | | | 15,000,000 | | | | 14,926,785 | | |
| Federal Farm Credit Bank, 5.15%, due 7/20/2009 | | | 10,216,000 | | | | 10,374,297 | | |
| Federal Farm Credit Bank, 5.25%, due 7/16/2010 | | | 9,700,000 | | | | 10,023,689 | | |
| Tennessee Valley Authority, 4.375%, due 6/15/2015 | | | 10,000,000 | | | | 9,987,400 | | |
| Tennessee Valley Authority, 5.625%, due 1/18/2011 | | | 8,721,000 | | | | 9,163,765 | | |
| Federal Farm Credit Bank, 5.28%, due 8/16/2013 | | | 7,500,000 | | | | 7,858,718 | | |
| Federal Farm Credit Bank, 4.85%, due 12/16/2009 | | | 6,305,000 | | | | 6,420,375 | | |
| Federal Farm Credit Bank, 5.125%, due 6/6/2011 | | | 5,435,000 | | | | 5,654,009 | | |
OAKMARK EQUITY AND INCOME FUND
20
OAKMARK EQUITY AND INCOME FUND
Schedule of Investments—September 30, 2008 cont.
| Name | | Par Value | | Value | |
| Fixed Income��33.3% (cont.) | |
| U.S. Government Agencies—3.9% (cont.) | |
| Federal Farm Credit Bank, 5.10%, due 8/9/2011 | | $ | 4,850,000 | | | $ | 5,047,308 | | |
| Federal Farm Credit Bank, 4.75%, due 5/7/2010 | | | 4,850,000 | | | | 4,958,737 | | |
| Federal Farm Credit Bank, 4.90%, due 9/2/2009 | | | 4,850,000 | | | | 4,925,791 | | |
| Federal Farm Credit Bank, 4.125%, due 7/17/2009 | | | 4,850,000 | | | | 4,885,686 | | |
| Federal Farm Credit Bank, 3.539%, due 7/29/2009 (g) | | | 4,850,000 | | | | 4,841,842 | | |
| Federal Farm Credit Bank, 4.85%, due 3/9/2011 | | | 4,322,000 | | | | 4,461,156 | | |
| Federal Farm Credit Bank, 5.05%, due 5/25/2011 | | | 3,880,000 | | | | 4,028,352 | | |
| Federal Farm Credit Bank, 4.50%, due 8/8/2011 | | | 2,910,000 | | | | 2,961,853 | | |
| Federal Farm Credit Bank, 4.82%, due 10/12/2012 | | | 2,425,000 | | | | 2,503,827 | | |
| | | | 551,597,496 | | |
| U.S. Government Notes—28.7% | |
| United States Treasury Notes, 5.125%, due 6/30/2011 | | $ | 485,000,000 | | | $ | 523,307,240 | | |
| United States Treasury Notes, 4.875%, due 2/15/2012 | | | 485,000,000 | | | | 521,223,680 | | |
| United States Treasury Notes, 2.125%, due 4/30/2010 | | | 500,000,000 | | | | 502,383,000 | | |
| United States Treasury Notes, 2.875%, due 1/31/2013 | | | 500,000,000 | | | | 501,289,000 | | |
| Unites States Treasury Notes, 4.25%, due 1/15/2011 | | | 250,000,000 | | | | 263,047,000 | | |
| United States Treasury Notes, 5.00%, due 8/15/2011 | | | 242,500,000 | | | | 261,786,267 | | |
| United States Treasury Notes, 4.75%, due 3/31/2011 | | | 242,500,000 | | | | 258,451,893 | | |
| United States Treasury Notes, 2.875%, due 6/30/2010 | | | 250,000,000 | | | | 254,121,000 | | |
| United States Treasury Notes, 2.75%, due 7/31/2010 | | | 250,000,000 | | | | 253,886,750 | | |
| United States Treasury Notes, 2.375%, due 8/31/2010 | | | 250,000,000 | | | | 251,914,000 | | |
| United States Treasury Notes, 4.00%, due 4/15/2010 | | | 242,500,000 | | | | 250,419,080 | | |
| United States Treasury Notes, 2.75%, due 2/28/2013 | | | 250,000,000 | | | | 248,711,000 | | |
| | | | 4,090,539,910 | | |
| Total Government and Agency Securities (Cost: $4,543,020,657) | | | | | | | 4,691,457,010 | | |
| Total Fixed Income (Cost: $4,593,288,178) | | | | | | | 4,741,197,650 | | |
| Short Term Investments—16.0% | |
| Canadian Treasury Bills—1.6% | |
Canadian Treasury Bills, 2.42% - 2.81%,
due 11/13/2008 - 8/6/2009 | | CAD | 250,000,000 | | | $ | 232,940,569 | | |
| Total Canadian Treasury Bills (Cost: $244,717,372) | | | | | | | 232,940,569 | | |
| U.S. Government Agencies—1.5% | |
Federal National Mortgage Association, 2.38%,
due 10/6/2008 | | | 50,000,000 | | | $ | 49,996,550 | | |
OAKMARK EQUITY AND INCOME FUND
21
OAKMARK EQUITY AND INCOME FUND
Schedule of Investments—September 30, 2008 cont.
| Name | | Par Value | | Value | |
| Short Term Investments—16.0% (cont.) | |
| U.S. Government Agencies—1.5% (cont.) | |
Federal Home Loan Mortgage Corp., 2.42%,
due 10/30/2008 | | $ | 50,000,000 | | | $ | 49,979,850 | | |
Federal Farm Credit Bank, 1.93% - 2.74%,
due 10/8/2008 - 6/5/2009 | | | 83,000,000 | | | | 82,853,571 | | |
| Federal Home Loan Bank, 2.56%, due 11/24/2008 | | | 30,000,000 | | | | 29,912,250 | | |
| Total U.S. Government Agencies (Cost: $212,760,380) | | | 212,742,221 | | |
| U.S. Government Bills—7.7% | |
United States Treasury Bills, 1.57% - 2.20%,
due 10/23/2008 - 8/27/2009 | | $ | 1,100,000,000 | | | $ | 1,092,621,547 | | |
| Total U.S. Government Bills (Cost: $1,090,066,292) | | | | | | | 1,092,621,547 | | |
| Repurchase Agreement—5.2% | |
Fixed Income Clearing Corp. Repurchase Agreement,
1.70% dated 9/30/2008 due 10/1/2008, repurchase price
$746,460,886, collateralized by Federal National
Mortgage Association Bonds, with rates from
5.210% - 5.500%, with maturities from
12/14/2022 - 1/27/2023 and with an aggregate
market value plus accrued interest of $761,359,764 | | $ | 746,425,638 | | | $ | 746,425,638 | | |
| Total Repurchase Agreement (Cost: $746,425,638) | | | | | | | 746,425,638 | | |
| Total Short Term Investments (Cost: $2,293,969,682) | | | | | | | 2,284,729,975 | | |
| Total Investments (Cost: $13,330,735,874)—100.9% | | | | | | $ | 14,395,507,141 | | |
| Liabilities In Excess of Other Assets—(0.9)% | | | | | | | (122,492,770 | ) | |
| Total Net Assets—100% | | | | | | $ | 14,273,014,371 | | |
(a) Non income-producing security.
(b) Represents a foreign domiciled corporation.
(c) Represents an American Depositary Receipt.
(d) Market value is determined in accordance with procedures established in good faith by the Board of Trustees.
(e) See footnote number five in the Notes to the Financial Statements regarding investments in affiliated issuers.
(f) Security exempt from registration pursuant to Rule 144A under the Securities Act of 1933. These securities may be resold in transactions exempt from registration, normally to qualified institutional buyers.
(g) Floating Rate Note. Rate shown is as of September 30, 2008.
Key to abbreviations:
CAD: Canadian Dollar
EUR: Euro Dollar
See accompanying Notes to Financial Statements.
OAKMARK EQUITY AND INCOME FUND
22
OAKMARK GLOBAL FUND
Report from Clyde S. McGregor and Robert A. Taylor, Portfolio Managers


THE VALUE OF A $10,000 INVESTMENT IN OAKMARK GLOBAL FUND FROM ITS INCEPTION (8/4/99) TO PRESENT (9/30/08) AS COMPARED TO THE MSCI WORLD INDEX10 (UNAUDITED)

| | | | | Average Annual Total Returns
(as of 9/30/08) | |
| (Unaudited) | | Total Return
Last 3 Months* | | 1-year | | 5-year | | Since
Inception
(8/4/99) | |
| Oakmark Global Fund (Class I) | | | -8.95 | % | | | -22.10 | % | | | 9.89 | % | | | 12.11 | % | |
| MSCI World | | | -15.24 | % | | | -26.04 | % | | | 7.33 | % | | | 1.26 | % | |
| Lipper Global Fund Index11 | | | -13.61 | % | | | -24.80 | % | | | 7.90 | % | | | 2.95 | % | |
The graph and table do not reflect the deduction of taxes that a shareholder would pay on fund distributions or the redemption of fund shares.
The expense ratio for Class I shares as of 9/30/08 was 1.16%.
The performance data quoted represents past performance. The above performance information for the Fund does not reflect the imposition of a 2% redemption fee on shares redeemed within 90 days, in order to deter market timers. If reflected, the fee would reduce the performance quoted. Past performance does not guarantee future results. The investment return and principal value will fluctuate so that an investor's shares, when redeemed, may be worth more or less than their original cost. Current performance may be lower or higher than the performance data quoted. Average annual total return measures annualized change, while total return measures aggregate change. To obtain most recent month-end performance data, visit oakmark.com.
* Not annualized
"Bull markets are born on pessimism, grow on skepticism, mature on optimism, and die on euphoria. The time of maximum pessimism is the best time to buy, and time of maximum optimism is the best time to sell."
Sir John Templeton
We write this letter at what, to use John Templeton's phrase, feels like a time of maximum pessimism. The great Sir John, an early advocate of global value investing, passed away early in the summer, so we will not be able to learn his opinion about whether we have reached the height of the current pessimism. Sir John is also credited with having said that the five most dangerous words in investing are "This time things are different." While we agree with his aphorism, we do believe that the current investing landscape differs greatly from others, especially given the increasing degree of economic globalization. The recent loss of faith in financial structures has come at a time of unprecedented leverage, which has produced a worldwide bear market of significant proportions.
In any event, we can filibuster no longer. For the quarter ended September 30, Oakmark Global Fund recorded a loss of 9%, compared to the 15% drop of the MSCI World Index, the industry's benchmark for global funds. The Lipper Global Fund Index registered a 14% decline. Countries where holdings contributed positively to relative performance were France, the U.K., and Italy, while the Fund's Irish, U.S., and Japanese positions had the largest negative impact on relative performance. Concerning individual holdings, it is often the case that a poor performer in one quarter may reverse and be a leader in the next, and the opposite occasionally occurs. During this quarter both phenomena occurred. XTO Energy, historically a strong contributor to Fund returns, was a detractor to the Fund's return, while Live Nation, the concert promotion and venue concern, rebounded strongly from its June 30 price to rise to the top of the contributors. For the Fund's fiscal year, which ended September 30, the returns are -22% for the Global Fund, -26% for the MSCI World Index, and -25% for the Lipper Global Fund Index.
We hate these returns as much as we imagine our shareholders do. Readers who are primarily familiar with U.S. investing returns may find it surprising to learn that the U.S. stock market has outperformed almost all other national stock markets for 2008 to date, at least in U.S. dollar terms. The stupefying volatility that U.S. investors witnessed in late September was foreshadowed elsewhere. For example, the Russian stock market declined roughly 40% in the first half of September before government intervention catalyzed a vigorous, if short-lived, rally. Less than two years ago we wrote about stock market volatility and
OAKMARK GLOBAL FUND
23
the fact that moderate single-digit rates of return are rare. Sometimes we are sorry to be correct!
We remain pleased to be able to report that the annualized rate of return from the Fund's inception is 12%. Testing a fund's long-term record at a time of great stress in the markets is probably the fairest measuring stick for investors. We sincerely hope that we never have the opportunity to test our long term record against a bear market more vicious than the current period.
Activity Review
Given that the breakdown between the U.S. and international investments remained nearly flat for the quarter, one could assume that we were rather inactive in trading. This was true in terms of new purchases—we made none. The Fund did receive shares of Ascent Media as a spinoff distribution from Discovery Holdings. Discovery itself transformed from a tracking stock to an operating company, changing its name to Discovery Communications.
We were more active on the sell side, eliminating holdings of Samsung (Korea), Cadbury (U.K.), Dr. Pepper Snapple Group (U.S.), Teradata (U.S.), and Viacom (U.S.). We attempt to be tax-sensitive as we manage the Fund, and most of these sales contributed to this tax-management effort.
Our hedges performed well during the quarter, adding approximately 2.6% to performance. As the dollar has strengthened versus the Pound and the Euro, we have reduced our hedges from approximately 65% to 40% and 60% to 50%, respectively. Our Swiss Franc hedge was maintained at approximately 75%, because the franc remains expensive versus the dollar and because of our heavy Swiss exposure.
Core Principles
When events have severely perturbed the markets, it often is helpful to review core principles. Before we invest in an equity, we must decide that a company's shares sell at a substantial discount to intrinsic value, that the company has demonstrated a history of growth in intrinsic value per share, and that the company's managers act as owners of the business and have a history of treating their shareholders as their partners. We also assess qualitative factors, since value without quality is likely to be a losing proposition. For the rest of this letter, we will discuss these core principles in relation to two of the Fund's largest holdings, Snap-on (U.S.) and Neopost (France).
Our domestic director of research recommended Snap-on for the Global Fund in late 2004. Snap-on is best known for its fine line of mechanics tools. Many readers have seen Snap-on trucks servicing gasoline stations, tire stores and car dealers. The company's core business generates free cash flow, which always is a desirable factor, but it was our view that previous management teams had not effectively capitalized on this attribute. Although our research department had long monitored this company, our analysts were dismayed by the management's capital allocation decisions. In 2004, however, Snap-on's Board of Directors installed a new CEO, Jack Michaels, and his prior experience at Hon Industries indicated that positive change was likely. Our checks suggested that the company's brand name and the quality of its products were still unmatched in its field. Our financial analysis determined that the shares appeared to be priced at a great discount to private market value. With Michaels in place we believed that the company's history of sluggish growth in intrinsic value would improve. The stock generated an attractive dividend yield on our original cost, again an outgrowth of the company's strong internal cash flow generation and the share's low price. In the nearly four years since we initiated the Snap-on position, market volatility has afforded us multiple attractive opportunities to build up the holding, and the company's solid earning performance has eventually rewarded the Fund with attractive returns.
Neopost makes franking machines for corporate mailrooms. This is the machine that puts pre-paid stamps on mail. Since a stamp is recognized currency, this is literally a business that prints money. To avoid counterfeiting, governments limit the number of companies that can be involved in this industry. Worldwide, Neopost is the second most successful competitor with 25% of market share, while Pitney Bowes is clearly at the top. Because Neopost earns a fee per stamp and income from the rental of their franking machines, 70% of their sales are recurring. Its concentrated market share and the recurring nature of its business mean that its returns and cash flows are strong and steady. In early 2003, however, the company was incurring losses due to its failing on-line business and its difficulties with integrating Hasler, a weak Swiss franking company that had a large U.S. presence. As with Snap-on, we were able to look beyond these short-term issues and recognized the tremendous profitability of the core business. This enabled us to initiate a position while shares were selling at a significant discount to the company's value. As the on-line business was shut down and Hasler was integrated, profits grew. On top of this, Jean-Paul Villot (then CEO, now Chairman) and Denis Thiery (then CFO, now CEO) did an excellent job allocating capital. The Hasler deal was done at a very attractive multiple, and excess capital was then returned to shareholders. Since 2005, the company has used dividends and buybacks to return to shareholders over $750 million—more than 100% of profits earned over that time and equal to almost 30% of Neopost's current market cap. Since we initiated our position in 2003 until the end of Q3 2008, Neopost was up over 300%. Even with Neopost's strong performance, we still find its shares exceptionally undervalued, and it remains one of our top holdings.
Clyde S. McGregor, CFA
Portfolio Manager
oakgx@oakmark.com | | Robert A. Taylor, CFA
Portfolio Manager
oakgx@oakmark.com | |
|
September 30, 2008
OAKMARK GLOBAL FUND
24
OAKMARK GLOBAL FUND
Global Diversification—September 30, 2008 (Unaudited)
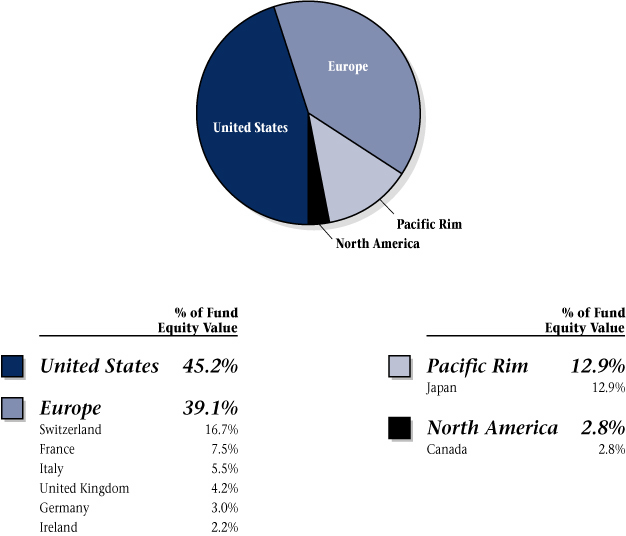
OAKMARK GLOBAL FUND
25
OAKMARK GLOBAL FUND
Schedule of Investments—September 30, 2008
| Name | | Description | | Shares Held | | Value | |
| Common Stocks—95.6% | |
| Apparel, Accessories & Luxury Goods—5.3% | |
| Bulgari SpA (Italy) | | Jewelry Manufacturer & Retailer | | | 6,493,700 | | | $ | 58,127,669 | | |
Luxottica Group SpA
(Italy) | | Manufacturer and Retailer of
Eyeglass Frames and Sunglasses | | | 2,068,200 | | | | 47,585,950 | | |
| | | | 105,713,619 | | |
| Automobile Manufacturers—5.1% | |
Daimler AG Registered
(Germany) | | Automobile Manufacturer | | | 1,166,000 | | | $ | 57,895,320 | | |
Toyota Motor Corp.
(Japan) | | Automobile Manufacturer | | | 1,026,000 | | | | 43,864,038 | | |
| | | | 101,759,358 | | |
| Broadcasting—5.4% | |
Societe Television
Francaise 1 (France) | | Broadcasting & Cable TV | | | 3,517,200 | | | $ | 62,309,686 | | |
Discovery
Communications, Inc.
Class A
(United States) (a) | | Media Management &
Network Services | | | 1,656,850 | | | | 23,610,113 | | |
Discovery
Communications, Inc.
Class C
(United States) (a) | | Media Management &
Network Services | | | 1,656,850 | | | | 23,460,996 | | |
| | | | 109,380,795 | | |
| Household Appliances—4.6% | |
Snap-On Inc.
(United States) | | Tool & Equipment Manufacturer | | | 1,760,000 | | | $ | 92,681,600 | | |
| Motorcycle Manufacturers—1.6% | |
Harley-Davidson, Inc.
(United States) | | Motorcycle Manufacturer | | | 844,700 | | | $ | 31,507,310 | | |
| Movies & Entertainment—2.9% | |
Live Nation, Inc.
(United States) (a) | | Live Events Producer, Operator, &
Promoter | | | 3,419,900 | | | $ | 55,641,773 | | |
Ascent Media Corp. Class A
(United States) (a) | | Creative & Network Services For
Television & Motion Pictures | | | 126,425 | | | | 3,086,034 | | |
| | | | 58,727,807 | | |
OAKMARK GLOBAL FUND
26
OAKMARK GLOBAL FUND
Schedule of Investments—September 30, 2008 cont.
| Name | | Description | | Shares Held | | Value | |
| Common Stocks—95.6% (cont.) | |
| Publishing—1.6% | |
The Washington Post Co.,
| |
| Class B (United States) | | Newspaper & Magazine Publishing; | | | | | | |
| | |
| | Educational & Career Development | | | | | | |
| | |
| | Service Provider | | | 56,760 | | | $ | 31,601,698 | | |
| Distillers & Vintners—1.3% | |
Diageo PLC
(United Kingdom) | | Beverages, Wines, & Spirits
Manufacturer | | | 1,471,800 | | | $ | 25,108,124 | | |
| Oil & Gas Exploration & Production—5.7% | |
XTO Energy, Inc.
(United States) | | Oil & Natural Gas Exploration &
Production | | | 1,527,400 | | | $ | 71,054,648 | | |
Apache Corp.
(United States) | | Oil & Natural Gas Exploration &
Production | | | 411,400 | | | | 42,900,792 | | |
| | | | 113,955,440 | | |
| Asset Management & Custody Banks—2.3% | |
Julius Baer Holding AG
(Switzerland) | | Asset Management | | | 952,700 | | | $ | 47,378,168 | | |
| Diversified Banks—2.1% | |
| Bank of Ireland (Ireland) | | Commercial Bank | | | 7,477,200 | | | $ | 41,684,826 | | |
| Diversified Capital Markets—8.6% | |
Credit Suisse Group
(Switzerland) | | Wealth Management & Investment
Banking | | | 2,332,000 | | | $ | 108,908,951 | | |
| UBS AG (Switzerland) (a) | | Wealth Management & Investment
Banking | | | 3,720,356 | | | | 63,589,922 | | |
| | | | 172,498,873 | | |
| Investment Banking & Brokerage—4.4% | |
Daiwa Securities Group, Inc.
(Japan) | | Stock Broker | | | 12,014,000 | | | $ | 87,506,791 | | |
| Health Care Equipment—5.5% | |
Covidien Ltd.
(United States) | | Health Care Equipment & Supplies | | | 1,039,700 | | | $ | 55,894,272 | | |
Medtronic, Inc.
(United States) | | Health Care Equipment | | | 1,075,700 | | | | 53,892,570 | | |
| | | | 109,786,842 | | |
OAKMARK GLOBAL FUND
27
OAKMARK GLOBAL FUND
Schedule of Investments—September 30, 2008 cont.
| Name | | Description | | Shares Held | | Value | |
| Common Stocks—95.6% (cont.) | |
| Health Care Services—3.4% | |
Laboratory Corp. of
America Holdings
(United States) (a) | | Medical Laboratory & Testing
Services | | | 992,000 | | | $ | 68,944,000 | | |
| Life Sciences Tools & Services—2.7% | |
| MDS, Inc. (Canada) (a) | | Products & Services for Medical
Product Manufacturers | | | 4,466,000 | | | $ | 53,368,700 | | |
| Pharmaceuticals—4.8% | |
GlaxoSmithKline PLC
(United Kingdom) | | Pharmaceuticals | | | 2,566,100 | | | $ | 55,588,638 | | |
| Novartis AG (Switzerland) | | Pharmaceuticals | | | 788,900 | | | | 41,535,216 | | |
| | | | 97,123,854 | | |
| Aerospace & Defense—1.3% | |
Alliant Techsystems, Inc.
(United States) (a) | | Propulsion Systems & Munitions | | | 269,087 | | | $ | 25,278,033 | | |
| Human Resource & Employment Services—2.9% | |
| Adecco SA (Switzerland) | | Temporary Employment Services | | | 1,335,100 | | | $ | 57,998,789 | | |
| Industrial Machinery—1.7% | |
| ITT Corp. (United States) | | Designs & Manufactures Variety of | | | | | | |
| | |
| | Engineered Products and Military | | | | | | |
| | |
| | Defense Systems | | | 626,500 | | | $ | 34,839,665 | | |
| Railroads—3.6% | |
Union Pacific Corp.
(United States) | | Rail Transportation Provider | | | 1,024,600 | | | $ | 72,910,536 | | |
| Research & Consulting Services—0.8% | |
| Meitec Corp. (Japan) | | Software Engineering Services | | | 580,900 | | | $ | 15,560,049 | | |
| Electronic Components—2.3% | |
| OMRON Corp. (Japan) | | Component, Equipment, & System
Manufacturer | | | 2,963,700 | | | $ | 46,003,453 | | |
| Electronic Manufacturing Services—2.0% | |
Tyco Electronics, Ltd.
(United States) | | Manufactures Electronic
Components | | | 1,433,900 | | | $ | 39,661,674 | | |
| Office Electronics—4.0% | |
| Neopost SA (France) | | Mailroom Equipment Supplier | | | 856,450 | | | $ | 80,759,447 | | |
| Semiconductors—5.8% | |
| Intel Corp. (United States) | | Computer Component
Manufacturer & Designer | | | 3,313,000 | | | $ | 62,052,490 | | |
OAKMARK GLOBAL FUND
28
OAKMARK GLOBAL FUND
Schedule of Investments—September 30, 2008 cont.
| Name | | Description | | Shares Held/
Par Value | | Value | |
| Common Stocks—95.6% (cont.) | |
| Semiconductors—5.8% (cont.) | |
| Rohm Co., Ltd. (Japan) | | Integrated Circuits & Semiconductor
Devices Manufacturer | | | 976,400 | | | $ | 53,705,502 | | |
| | | | 115,757,992 | | |
| Systems Software—3.9% | |
Oracle Corp.
(United States) (a) | | Software Services | | | 3,840,800 | | | $ | 78,006,648 | | |
| Total Common Stocks (Cost: $1,995,933,499) | | | | | | | | | 1,915,504,091 | | |
| Short Term Investment—5.6% | |
| Repurchase Agreement—5.6% | |
Fixed Income Clearing Corp. Repurchase Agreement,
1.70% dated 9/30/2008 due 10/1/2008, repurchase
price $112,891,171, collateralized by a Federal
National Mortgage Association Bond, with a rate
of 6.110%, with a maturity of 8/24/2027, and with
an aggregate market value plus accrued interest of
$115,148,723 | | | | $ | 112,885,840 | | | $ | 112,885,840 | | |
| Total Repurchase Agreement (Cost: $112,885,840) | | | | 112,885,840 | |
| Total Short Term Investment (Cost: $112,885,840) | | | | 112,885,840 | |
| Total Investments (Cost: $2,108,819,339)—101.2% | | | | | | | | $ | 2,028,389,931 | | |
| Liabilities In Excess of Other Assets—(1.2)% | | | | (24,179,051) | |
| Total Net Assets—100% | | | | | | | | $ | 2,004,210,880 | | |
Securities of aggregate value of $995,110,512 were valued at a fair value in accordance with procedures established by the Board of Trustees.
(a) Non income-producing security.
See accompanying Notes to Financial Statements.
OAKMARK GLOBAL FUND
29
OAKMARK GLOBAL SELECT FUND
Report from Bill Nygren and David Herro, Portfolio Managers


THE VALUE OF A $10,000 INVESTMENT IN OAKMARK GLOBAL SELECT FUND FROM ITS INCEPTION (10/2/06) TO PRESENT (9/30/08) AS COMPARED TO THE MSCI WORLD INDEX10 (UNAUDITED)
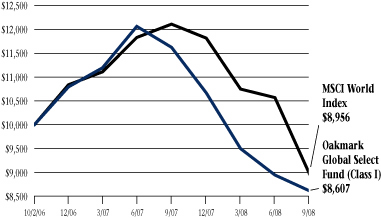
| | | Total Returns
(as of 9/30/08) | |
| (Unaudited) | | Last 3 Months* | | 1-year | | Average Annual
Total Return
Since Inception
(10/2/06) | |
Oakmark Global
Select Fund (Class I) | | | -3.74 | % | | | -25.95 | % | | | -7.25 | % | |
| MSCI World | | | -15.24 | % | | | -26.04 | % | | | -5.38 | % | |
| Lipper Global Fund Index11 | | | -13.61 | % | | | -24.80 | % | | | -4.62 | % | |
The graph and table do not reflect the deduction of taxes that a shareholder would pay on fund distributions or the redemption of fund shares.
The expense ratio for Class I shares as of 9/30/08 was 1.35%.
The performance data quoted represents past performance. The above performance information for the Fund does not reflect the imposition of a 2% redemption fee on shares redeemed within 90 days, in order to deter market timers. If reflected, the fee would reduce the performance quoted. Past performance does not guarantee future results. The investment return and principal value will fluctuate so that an investor's shares, when redeemed, may be worth more or less than their original cost. Current performance may be lower or higher than the performance data quoted. Average annual total return measures annualized change, while total return measures aggregate change. To obtain most recent month-end performance data, visit oakmark.com.
* Not annualized
Oakmark Global Select Fund finished the quarter ended September 30, 2008 down 4%, which compared favorably to the MSCI World Index which ended down 15%.
Impact Players
The top contributor this quarter was Capital One Financial, a U.S.-based financial institution, which rose 35%. Despite the global financial crisis, Capital One Financial reported solid earnings due to management's ability to keep credit costs under control. We believe Capital One Financial will weather the storm because the company is conservatively managed, maintains strong capital ratios, has limited mortgage exposure, and oversees a strong, stable deposit base.
Another top contributor was The Home Depot, Inc., a U.S.-based home improvement retail chain, which was up 11.2% for the quarter. Home Depot shares recovered from depressed levels at the beginning of the quarter as the company reported better than expected second quarter earnings. Despite a very difficult environment, the company's gross margins improved, and the new CEO's profit improvement initiatives gained traction. The business continues to generate a lot of cash, and management is committed to repurchasing a substantial amount of stock once the markets stabilize.
Rounding out the top three contributors to the Fund was Comcast Corp, a U.S. cable system and programming provider, which returned 5.4%. Comcast's quarterly performance confirmed the generally traditional defensive characteristics of cable companies in times of economic uncertainty. Comcast has increased its phone and high speed data market share and reduced video churn. Its ongoing capital discipline, combined with its strong performance, drove 44% free cash flow growth in the second quarter.
One of the largest detractors to the Fund was U.S.-based Washington Mutual. We sold our position during the quarter once it became apparent that a new regulatory focus would make it extremely difficult for Washington Mutual to recoup its mortgage losses. For a full commentary on Washington Mutual, please refer to Oakmark and Oakmark Select Funds Letter.
Daiwa Securities, Japan's second largest broker, was another detractor, falling 23.5% during the quarter. Shares were hurt by numerous factors, including global financial instability, recessionary fears about the Japanese economy, and decreased equity and capital market activity.
Adecco S.A., a leading global temporary employment agency, rounds out the bottom three detractors and declined 13.6% during the quarter. Even though revenue growth is slowing across many of Adecco's markets, the company reported gross
OAKMARK GLOBAL SELECT FUND
30
margins improvement in the first half of 2008. The new U.K. management team's restructuring efforts appear to be generating positive results, including enabling Adecco to exit its lower margin contracts. Adecco is a cyclical business that will be hurt by poor economic conditions in the short-term. However, given management's recent actions to improve the quality of the underlying business, we contend that the company's margins should hold up better during this downturn than in the past. In a more normal economic environment, the company's profitability would likely exceed its historical levels, but current valuations do not reflect this.
Portfolio Composition
Contrary to last quarter, our lack of exposure to energy and materials companies, combined with our stock selection in the consumer discretionary sector, contributed to the Fund's relative outperformance.
Our currency hedges performed well during the quarter adding approximately 2.8% to performance. However, due to the strengthening U.S. dollar we decreased the weighting of our Pound Sterling hedges from approximately 55% to 35% and our Euro hedges from approximately 80% to 35%. Our Swiss Franc hedge was maintained at around 75% because the Franc remains expensive versus the U.S. dollar and because of our heavy Swiss exposure.
While uncertain and volatile times can definitely cause a loss of value, such times also present unique opportunities to invest in quality companies trading at significant discounts to fair value. We continue to focus on our long-term valuation approach, and we thank you, our shareholders, for your patience and continued support.
William C. Nygren, CFA
Portfolio Manager
oakwx@oakmark.com | | David G. Herro, CFA
Portfolio Manager
oakwx@oakmark.com | |
|
September 30, 2008
OAKMARK GLOBAL SELECT FUND
31
OAKMARK GLOBAL SELECT FUND
Global Diversification—September 30, 2008 (Unaudited)
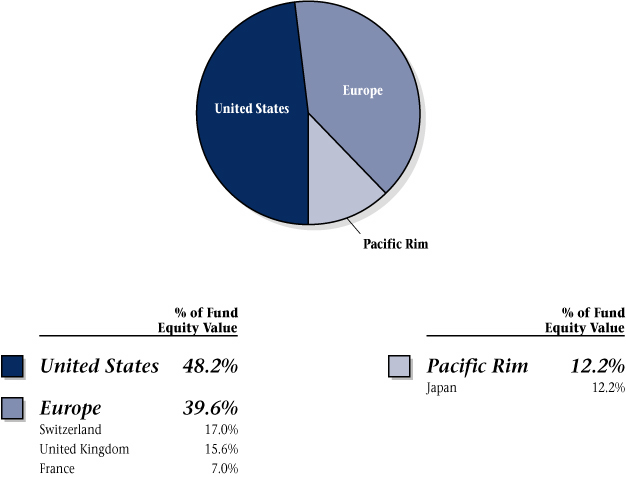
OAKMARK GLOBAL SELECT FUND
32
OAKMARK GLOBAL SELECT FUND
Schedule of Investments—September 30, 2008
| Name | | Description | | Shares Held | | Value | |
| Common Stocks—92.6% | |
| Broadcasting—6.5% | |
Societe Television
Francaise 1 (France) | | Broadcasting & Cable TV | | | 849,700 | | | $ | 15,053,037 | | |
| Cable & Satellite—8.9% | |
Comcast Corp., Class A
(United States) | | Cable Communication Networks
Provider | | | 557,400 | | | $ | 10,991,928 | | |
British Sky Broadcasting
Group PLC
(United Kingdom) | | Television Production &
Broadcasting | | | 1,297,400 | | | | 9,652,550 | | |
| | | | 20,644,478 | | |
| Computer & Electronics Retail—4.6% | |
Best Buy Co., Inc.
(United States) | | Computer & Electronics Retailer | | | 285,000 | | | $ | 10,687,500 | | |
| Home Improvement Retail—4.4% | |
The Home Depot, Inc.
(United States) | | Home Improvement Retailer | | | 400,000 | | | $ | 10,356,000 | | |
| Movies & Entertainment—8.8% | |
Time Warner, Inc.
(United States) | | Filmed Entertainment & Television
Networks | | | 820,000 | | | $ | 10,750,200 | | |
Viacom, Inc., Class B
(United States) (a) | | Publishing Company | | | 394,000 | | | | 9,786,960 | | |
| | | | 20,537,160 | | |
| Asset Management & Custody Banks—4.9% | |
Schroders PLC
(United Kingdom) | | International Asset Management | | | 621,600 | | | $ | 11,467,275 | | |
| Consumer Finance—4.5% | |
Capital One Financial Corp.
(United States) | | Credit Card Products & Services
Provider | | | 205,000 | | | $ | 10,455,000 | | |
| Diversified Capital Markets—5.8% | |
Credit Suisse Group
(Switzerland) | | Wealth Management & Investment
Banking | | | 291,000 | | | $ | 13,590,268 | | |
| Investment Banking & Brokerage—6.0% | |
Daiwa Securities Group, Inc.
(Japan) | | Stock Broker | | | 1,916,000 | | | $ | 13,955,636 | | |
OAKMARK GLOBAL SELECT FUND
33
OAKMARK GLOBAL SELECT FUND
Schedule of Investments—September 30, 2008 cont.
| Name | | Description | | Shares Held/
Par Value | | Value | |
| Common Stocks—92.6% (cont.) | |
| Pharmaceuticals—18.0% | |
GlaxoSmithKline PLC
(United Kingdom) | | Pharmaceuticals | | | 581,000 | | | $ | 12,586,025 | | |
Schering-Plough Corp.
(United States) | | Pharmaceuticals | | | 640,000 | | | | 11,820,800 | | |
Bristol-Myers Squibb Co.
(United States) | | Health & Personal Care | | | 500,000 | | | | 10,425,000 | | |
| Novartis AG (Switzerland) | | Pharmaceuticals | | | 134,200 | | | | 7,065,567 | | |
| | | | 41,897,392 | | |
| Human Resource & Employment Services—6.9% | |
| Adecco SA (Switzerland) | | Temporary Employment Services | | | 367,700 | | | $ | 15,973,451 | | |
| Computer Hardware—3.6% | |
| Dell Inc. (United States) (a) | | Technology Products & Services | | | 508,000 | | | $ | 8,371,840 | | |
| Semiconductors—9.7% | |
| Rohm Co., Ltd. (Japan) | | Integrated Circuits & Semiconductor
Devices Manufacturer | | | 226,000 | | | $ | 12,430,811 | | |
| Intel Corp. (United States) | | Computer Component
Manufacturer & Designer | | | 542,000 | | | | 10,151,660 | | |
| | | | 22,582,471 | | |
| Total Common Stocks (Cost: $267,525,298) | | | | | | | | | 215,571,508 | | |
| Short Term Investment—4.8% | |
| Repurchase Agreement—4.8% | |
Fixed Income Clearing Corp. Repurchase Agreement,
1.70% dated 9/30/2008 due 10/1/2008, repurchase
price $11,131,385, collateralized by a Federal National
Mortgage Association Bond, with a rate of 5.500%,
with a maturity of 12/14/2022, and with an aggregate
market value plus accrued interest of $11,354,066 | | | | $ | 11,130,860 | | | $ | 11,130,860 | | |
| Total Repurchase Agreement (Cost: $11,130,860) | | | | | | | | | 11,130,860 | | |
| Total Short Term Investment (Cost: $11,130,860) | | | | | | | | | 11,130,860 | | |
| Total Investments (Cost: $278,656,158)—97.4% | | | | | | | | $ | 226,702,368 | | |
| Other Assets In Excess of Liabilities—2.6% | | | | 6,139,326 | |
| Total Net Assets—100% | | | | | | | | $ | 232,841,694 | | |
Securities of aggregate value of $111,774,615 were valued at a fair value in accordance with procedures established by the Board of Trustees
(a) Non income-producing security.
See accompanying Notes to Financial Statements.
OAKMARK GLOBAL SELECT FUND
34
OAKMARK INTERNATIONAL AND
OAKMARK INTERNATIONAL SMALL CAP FUNDS

Fellow Shareholders,
Your International Funds had very strong relative performance for the quarter, though absolute performance was weak.
There was also an extremely high amount of market instability this quarter as concerns about the global financial markets intensified. Despite this volatility and alarmism, we remain confident and focused on our task ahead: to find, value and invest in the best international companies that are available at the lowest prices. In this regard, given our long-term value approach, we are cautiously optimistic about the prospects for all of our International and Global Funds.
Endings...
In the past nearly 23 years of my investment career I have witnessed all kinds of financial market calamity, starting with the stock market crash of 1987, the Japanese financial crisis that started in '90, the demise of the European Monetary System in '92, the collapse of the Nordic Banking system in '92, the Tequila Crisis in '94, the Asian Crisis of '97-'98, and the TMT implosion that began in 2000. And now we experience the granddaddy of them all, the liquidity/credit crunch that began late in the summer of 2007. No one could have guessed that such stalwarts as Bear Stearns, AIG, HBOS, Bradford and Bingley, Northern Rock, and Lehman Bros. would have all disappeared in the space of less than one year. For the most part, however, it is now easy to see why they and many others have departed. Their managements made poor business decisions that were magnified by their use of leverage. The global nature of our financial system and its rapid growth made the underlying financial problems difficult to deal with, especially because the ability to regulate the financial markets did not keep up with the pace with which those markets grew. Hence, greed, speculation, poor policy and stupidity simply out-gunned conservatism and regulation. We see the results in yesterday's and today's headlines.
...And Beginnings
Despite the above, and utterances from the likes of Hugo Chavez, capitalism will survive. It is our view that from this mess will arise a stronger system that, at least for a while, has cleansed itself of the weak and marginal players. As in nature, the weak have perished, and the strong not only have survived but will better their positions. Crisis also brings focus, and with focus, combined with the desire to survive, brings more prudent practice, more careful risk-taking and improved regulation. I do believe that good will ultimately come from this crisis, and our financial system will make the necessary improvements to keep up with growth and globalization.
In the meantime, despite political rhetoric, we believe the global economy is solidly positioned to grow at a stronger pace over the next 20 years than in the past 20. Consider the transformation occurring in the emerging markets where three-fifths of the world's population is slowly moving from a state of poverty to one that is more prosperous. Further, technological advances are enabling massive increases in productivity. In our opinion, these two factors will continue to influence global growth very positively.
We mentioned above that the weak have either disappeared or learned harsh lessons, and the strong have actually improved their positions. We own financial stocks such as Credit Suisse, Julius Baer and Lloyds TSB that have gone from strong franchises to even stronger ones. Others, like UBS and Barclays, seem to have learned and survived. We believe once stability returns, our investments in the financial sector will perform quite well. In other sectors, like media and technology, excessive fear appears to have created exceptional investment opportunity. When looking at prospects, we remain focused on company value as opposed to price movement. And, we seek to exploit volatility because it is our experience that company value is not determined by what happens in the next three to nine months, but is instead determined by what happens over the next three to nine years. Because "the market" is focused on the former, we feel that we are in a position to benefit over the long-term if we stay disciplined.
In closing, we know these times are unique and challenging. And, worse, most of us who are invested in the financial markets have experienced a diminution of value in the past year or so. However, I still strongly believe this is also a period of distinct investment opportunity. By staying disciplined and vigilant, we will continue to work hard to garner these abundant opportunities we believe lie before us. Thanks for your patience and support.
David G. Herro, CFA
Portfolio Manager
oakix@oakmark.com
oakex@oakmark.com
September 30, 2008
OAKMARK INTERNATIONAL AND OAKMARK INTERNATIONAL SMALL CAP FUNDS
35
OAKMARK INTERNATIONAL FUND
Report from David G. Herro

THE VALUE OF A $10,000 INVESTMENT IN OAKMARK INTERNATIONAL FUND FROM ITS INCEPTION (9/30/92) TO PRESENT (9/30/08) AS COMPARED TO THE MSCI WORLD EX U.S. INDEX12 (UNAUDITED)
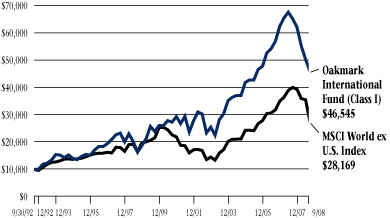
| | | | | Average Annual Total Returns
(as of 9/30/08) | |
| (Unaudited) | | Total Return
Last 3 Months * | | 1-year | | 5-year | | 10-year | | Since
Inception
(9/30/92) | |
Oakmark International
Fund (Class I) | | | -7.42 | % | | | -28.59 | % | | | 8.92 | % | | | 11.05 | % | | | 10.09 | % | |
| MSCI World ex U.S. | | | -20.68 | % | | | -29.58 | % | | | 10.28 | % | | | 5.56 | % | | | 6.69 | % | |
| MSCI EAFE13 | | | -20.56 | % | | | -30.51 | % | | | 9.69 | % | | | 5.02 | % | | | 6.35 | % | |
Lipper International
Fund Index14 | | | -19.56 | % | | | -29.24 | % | | | 10.24 | % | | | 6.11 | % | | | 7.65 | % | |
The graph and table do not reflect the deduction of taxes that a shareholder would pay on fund distributions or the redemption of fund shares.
The expense ratio for Class I shares as of 9/30/08 was 1.10%.
The performance data quoted represents past performance. The above performance information for the Fund does not reflect the imposition of a 2% redemption fee on shares redeemed within 90 days, in order to deter market timers. If reflected, the fee would reduce the performance quoted. Past performance does not guarantee future results. The investment return and principal value will fluctuate so that an investor's shares, when redeemed, may be worth more or less than their original cost. Current performance may be lower or higher than the performance data quoted. Average annual total return measures annualized change, while total return measures aggregate change. To obtain most recent month-end performance data, visit oakmark.com.
* Not annualized
Oakmark International Fund declined 7% for the quarter ended September 30, 2008, comparing favorably to the MSCI World ex U.S. Index, which lost 21%. Since its inception in September 1992, the Fund is up an average of 10% per year, which compares favorably with the MSCI World ex U.S. Index's return of 7% over the same period.
Impact Players
Signet Jewelers, which operates the Kay Jewelers and Jared's chains in the U.S., was the Fund's top performer during the quarter, returning 18.3%. Despite the poor economic climate affecting the entire jewelry sector, Signet's U.S. business continues to outperform financially, and it is increasing its already strong strategic position. Approximately 10% of its competitors have been forced to close their doors, and most survivors have had to cut back aggressively on marketing and services. Unlike the rest of the industry, Signet is still expanding its retail footprint, as well as its marketing efforts, albeit cautiously. The group is also performing well in the U.K. aided by its long-term refurbishment program. We believe these strengths will help Signet emerge from this downturn in a far superior competitive position than any other jewelry retailer.
Another top contributor to the Fund was BNP Paribas, France's largest bank, which rose 2.4% this past quarter. BNP reported better-than-expected results in its French banking and asset management divisions during the quarter, while its investment bank division appeared to continue to weather the current "credit crisis" much better than its peers. While losses and write-downs remain a top concern in global financial markets, BNP's funding position appears strong relative to its peers, as indicated by the fact that its CDS spreads are the lowest in Europe. The company's liquidity appears sufficient, and the group has successfully raised new capital in the wholesale market year to date.
Rounding out the top three contributors to the Fund is Societe Television Francaise 1 (TF1), France's largest television broadcaster, which returned 4.1%. During the quarter the market reacted positively to evidence that the new management team is quietly following through on expected operational improvements. Concurrently, the French government's reform of media regulations is advancing, which could help boost the business.
As mentioned in the International lead letter, world markets this quarter were extremely volatile due to concerns about global financial instability and the "credit crisis." During this quarter, the market experienced some nasty events, including the failures of Lehman Brothers, Fannie Mae and AIG; liquidity contraction; and
OAKMARK INTERNATIONAL FUND
36
plummeting consumer confidence. This global weakness hurt the Fund's three largest detractors this quarter—Bank of Ireland, Lloyds TSB Group, and Daiwa Securities.
Bank of Ireland, the largest Irish bank, declined 36.2% this quarter, making it the Fund's largest detractor. Downward revisions in Irish GDP from approximately 1-1.5% real GDP to -1% real GDP, coupled with general Irish market weakness, weakened shares of Bank of Ireland. Management continues to increase non-performing loan provisioning guidance as the credit situation continues to deteriorate in Ireland. Importantly, the bank's liquidity remains stable and is well in excess of Ireland's liquidity requirements. Additionally, the Irish government announced it will guarantee and safeguard all deposits at the nation's six largest financial institutions, including Bank of Ireland. This move is designed to reassure those who conduct business with these institutions, which could bode well for Bank of Ireland.
Global credit and liquidity problems have also hurt Lloyds TSB Group, which declined 32.4% during the quarter. Though Lloyd's shares have performed poorly, the company maintains a strong balance sheet relative to its peers and has increased its market share. Some investors have been worried about the recently announced merger with HBOS, a financial institution that is more reliant on short-term financing and that has an investment portfolio exposed to the troubled Alt-A mortgage sector, which Lloyds has avoided thus far. Even after writing down these investments to much lower levels, the combined entity will be well capitalized with a Tier 1 ratio greater than 8%. However, we believe that Lloyd's purchase of HBOS will create significant value for shareholders because Lloyd's purchased HBOS at a meaningful discount to its book value. The combined entity could benefit from at least £1B in annual cost saving and have 30% of the U.K. deposit base. Finally, Lloyd's management team has allocated capital exceptionally well in the past, and we continue to have faith in their abilities.
Rounding out the bottom of the Fund's detractors, Daiwa Securities, Japan's second largest broker, declined 23.5% during the quarter. Fears that the Japanese economy could be heading for a recession, combined with decreased equity and capital market activity, took their toll on Daiwa's share price.
Portfolio Composition
During the quarter we sold our positions in HSBC Holdings, Philips Electronics, Kookmin Bank and Trinity Mirror plc because they approached fair value or because we identified better investment opportunities at a deeper discount to value. As a result, we added Akzo Nobel, a specialty chemical manufacturer; Assa Abloy, the world's largest manufacturer of locks, security, and access control systems; Kuehne & Nagel, a global freight transporter; and Thomson Reuters, a global electronic information and solutions company.
We held significant positions in the financial and consumer discretionary sectors, which performed poorly during the quarter. Those two sectors detracted approximately 9.5% from the Fund's performance. However, our lack of exposure to energy and our relative underweight in materials boosted our relative performance against the benchmark.
Our currency hedges performed well during the quarter adding approximately 5.6% to performance. However, due to the strengthening U.S. dollar, we decreased the weighting of our hedges from approximately 70% of the Pound Sterling to 40%; 75% of the Euro to 50%; and 75% of the Swiss Franc to 60%.
Despite these difficult times, we believe our valuation process has allowed us to identify high quality names that can weather the storm and provide our shareholders significant return in the long-term. We would like to thank you for your continued support and patience.
David G. Herro, CFA
Portfolio Manager
oakix@oakmark.com | |
|
September 30, 2008
OAKMARK INTERNATIONAL FUND
37
OAKMARK INTERNATIONAL FUND
Global Diversification—September 30, 2008 (Unaudited)
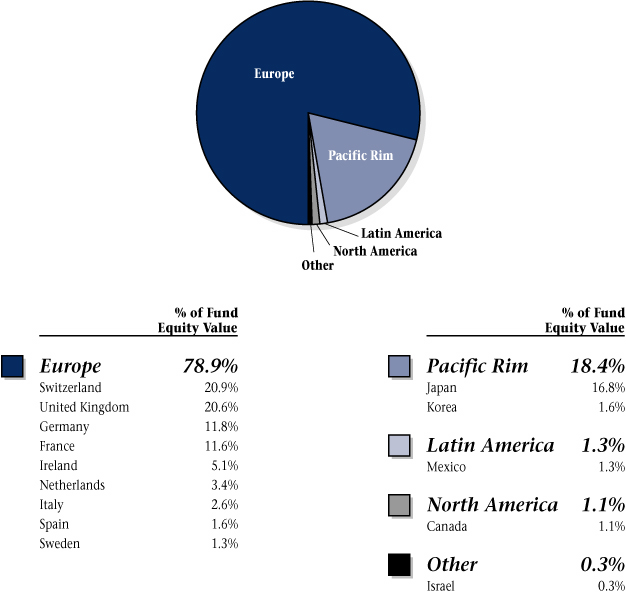
OAKMARK INTERNATIONAL FUND
38
OAKMARK INTERNATIONAL FUND
Schedule of Investments—September 30, 2008
| Name | | Description | | Shares Held | | Value | |
| Common Stocks—94.3% | |
| Advertising—4.1% | |
| Publicis Groupe (France) | | Advertising & Media Services | | | 5,063,000 | | | $ | 159,469,097 | | |
| Apparel, Accessories & Luxury Goods—7.7% | |
Compagnie Financiere
Richemont SA
(Switzerland) | | Manufacturer and Retailer of
Luxury Goods | | | 2,203,000 | | | $ | 97,336,085 | | |
Luxottica Group SpA
(Italy) | | Manufacturer and Retailer of
Eyeglass Frames and Sunglasses | | | 4,064,000 | | | | 93,506,093 | | |
LVMH Moet Hennessy
Louis Vuitton SA
(France) | | Diversified Luxury Goods
Conglomerate | | | 661,900 | | | | 58,110,640 | | |
Swatch Group AG,
Bearer Shares
(Switzerland) | | Watch Manufacturer | | | 273,100 | | | | 50,410,094 | | |
| | | | 299,362,912 | | |
| Automobile Manufacturers—8.4% | |
Daimler AG Registered
(Germany) | | Automobile Manufacturer | | | 2,374,900 | | | $ | 117,920,752 | | |
Bayerische Motoren Werke
(BMW) AG (Germany) | | Luxury Automobile Manufacturer | | | 2,797,900 | | | | 108,448,730 | | |
Toyota Motor Corp.
(Japan) | | Automobile Manufacturer | | | 1,245,000 | | | | 53,226,829 | | |
Honda Motor Co., Ltd.
(Japan) | | Automobile & Motorcycle
Manufacturer | | | 1,526,000 | | | | 46,287,787 | | |
| | | | 325,884,098 | | |
| Broadcasting—5.9% | |
Societe Television
Francaise 1 (France) | | Broadcasting & Cable TV | | | 7,020,200 | | | $ | 124,367,809 | | |
Gestevision Telecinco SA
(Spain) (b) | | Television Production &
Broadcasting | | | 5,750,954 | | | | 58,775,988 | | |
Grupo Televisa SA
(Mexico) (c) | | Television Production &
Broadcasting | | | 2,159,000 | | | | 47,217,330 | | |
| | | | 230,361,127 | | |
| Cable & Satellite—2.3% | |
British Sky Broadcasting
Group PLC
(United Kingdom) | | Television Production &
Broadcasting | | | 11,818,400 | | | $ | 87,927,932 | | |
OAKMARK INTERNATIONAL FUND
39
OAKMARK INTERNATIONAL FUND
Schedule of Investments—September 30, 2008 cont.
| Name | | Description | | Shares Held | | Value | |
| Common Stocks—94.3% (cont.) | |
| Publishing—1.5% | |
Thomson Reuters PLC
(Canada) | | Electronic Information & Solutions
Company | | | 1,908,200 | | | $ | 42,638,815 | | |
Johnston Press PLC
(United Kingdom) (d) | | Newspaper Publishing | | | 28,048,968 | | | | 16,100,018 | | |
| | | | 58,738,833 | | |
| Specialty Stores—3.3% | |
Signet Jewelers, Ltd.
(United Kingdom) (d) | | Jewelry Retailer | | | 5,388,884 | | | $ | 125,992,108 | | |
| Distillers & Vintners—2.1% | |
Diageo PLC
(United Kingdom) | | Beverages, Wines, & Spirits
Manufacturer | | | 4,750,800 | | | $ | 81,046,117 | | |
| Asset Management & Custody Banks—3.0% | |
Schroders PLC
(United Kingdom) | | International Asset Management | | | 6,298,800 | | | $ | 116,200,243 | | |
| Diversified Banks—8.9% | |
Lloyds TSB Group PLC
(United Kingdom) | | Commercial Bank | | | 26,569,000 | | | $ | 106,762,055 | | |
| Bank of Ireland (Ireland) | | Commercial Bank | | | 17,500,178 | | | | 97,562,172 | | |
| BNP Paribas SA (France) | | Commercial Bank | | | 862,600 | | | | 82,341,647 | | |
Barclays PLC
(United Kingdom) | | Commercial & Investment
Banking, Insurance, Financial,
Asset Management and
Related Services | | | 9,890,900 | | | | 58,766,183 | | |
| | | | 345,432,057 | | |
| Diversified Capital Markets—6.4% | |
Credit Suisse Group
(Switzerland) | | Wealth Management & Investment
Banking | | | 3,397,500 | | | $ | 158,669,880 | | |
| UBS AG (Switzerland) (a) | | Wealth Management & Investment
Banking | | | 5,324,500 | | | | 91,008,640 | | |
| | | | 249,678,520 | | |
| Investment Banking & Brokerage—5.9% | |
Daiwa Securities
Group, Inc. (Japan) | | Stock Broker | | | 18,578,000 | | | $ | 135,317,227 | | |
Nomura Holdings, Inc.
(Japan) | | Financial Services | | | 7,370,600 | | | | 96,187,116 | | |
| | | | 231,504,343 | | |
OAKMARK INTERNATIONAL FUND
40
OAKMARK INTERNATIONAL FUND
Schedule of Investments—September 30, 2008 cont.
| Name | | Description | | Shares Held | | Value | |
| Common Stocks—94.3% (cont.) | |
| Multi-line Insurance—2.4% | |
| Allianz SE (Germany) | | Insurance, Banking & Financial
Services | | | 670,500 | | | $ | 91,924,368 | | |
| Pharmaceuticals—4.7% | |
GlaxoSmithKline PLC
(United Kingdom) | | Pharmaceuticals | | | 4,760,000 | | | $ | 103,114,422 | | |
| Novartis AG (Switzerland) | | Pharmaceuticals | | | 1,541,700 | | | | 81,169,784 | | |
| | | | 184,284,206 | | |
| Building Products—2.3% | |
Assa Abloy AB, Series B
(Sweden) | | Develops, Designs, & Manufactures
Security Locks | | | 4,034,600 | | | $ | 48,857,039 | | |
Geberit AG, Registered
Shares (Switzerland) | | Building Products | | | 333,730 | | | | 40,927,960 | | |
| | | | 89,784,999 | | |
| Human Resource & Employment Services—4.0% | |
| Adecco SA (Switzerland) | | Temporary Employment Services | | | 3,563,600 | | | $ | 154,808,242 | | |
| Marine—0.9% | |
Kuehne + Nagel
International AG
(Switzerland) | | Sea, Land, & Rail Freight
Transportion Businesses | | | 510,600 | | | $ | 34,068,574 | | |
| Research & Consulting Services—4.0% | |
Experian Group, Ltd.
(Ireland) | | Credit and Marketing Services | | | 13,540,000 | | | $ | 89,735,211 | | |
| Meitec Corp. (Japan) (d) | | Software Engineering Services | | | 2,483,800 | | | | 66,531,330 | | |
| | | | 156,266,541 | | |
| Security & Alarm Services—1.5% | |
G4S PLC
(United Kingdom) | | Security Services | | | 16,369,000 | | | $ | 59,194,034 | | |
| Application Software—2.9% | |
| SAP AG (Germany) | | Develops Business Software | | | 2,134,400 | | | $ | 113,675,839 | | |
| Electronic Components—2.7% | |
| OMRON Corp. (Japan) | | Component, Equipment, &
System Manufacturer | | | 6,688,500 | | | $ | 103,820,933 | | |
| Electronic Equipment & Instruments—0.2% | |
| Orbotech, Ltd. (Israel) (a) | | Optical Inspection Systems | | | 1,237,700 | | | $ | 9,889,223 | | |
| Office Electronics—0.3% | |
| Canon, Inc. (Japan) | | Computers & Information | | | 265,200 | | | $ | 10,053,961 | | |
OAKMARK INTERNATIONAL FUND
41
OAKMARK INTERNATIONAL FUND
Schedule of Investments—September 30, 2008 cont.
| Name | | Description | | Shares Held | | Value | |
| Common Stocks—94.3% (cont.) | |
| Semiconductor Equipment—2.1% | |
ASML Holding NV
| |
| (Netherlands) | | Develop, Produce and Market | | | | | | |
| | |
| | Semiconductor Manufacturing | | | | | | |
| | |
| | Equipment | | | 4,645,000 | | | $ | 81,178,733 | | |
| Semiconductors—4.2% | |
| Rohm Co., Ltd. (Japan) | | Integrated Circuits & | | | | | | |
| | |
| | Semiconductor Devices | | | | | | |
| | |
| | Manufacturer | | | 1,904,500 | | | $ | 104,754,330 | | |
Samsung Electronics
Co., Ltd. (Korea) | | Consumer & Industrial Electronic
Equipment Manufacturer | | | 123,900 | | | | 56,777,594 | | |
| | | | 161,531,924 | | |
| Diversified Chemicals—1.1% | |
Akzo Nobel NV
(Netherlands) | | Produces & Markets Chemicals,
Coatings, & Paints | | | 898,500 | | | $ | 43,135,845 | | |
| Specialty Chemicals—1.5% | |
| Givaudan SA (Switzerland) | | Manufactures and Markets
Fragrances | | | 68,400 | | | $ | 57,131,438 | | |
| Total Common Stocks (Cost: $4,633,780,519) | | | | | | | | | 3,662,346,247 | | |
OAKMARK INTERNATIONAL FUND
42
OAKMARK INTERNATIONAL FUND
Schedule of Investments—September 30, 2008 cont.
| Name | | Description | | Par Value | | Value | |
| Short Term Investment—1.8% | |
| Repurchase Agreement—1.8% | |
Fixed Income Clearing Corp. Repurchase Agreement,
1.70% dated 9/30/2008 due 10/1/2008, repurchase
price $69,318,098, collateralized by a Federal National
Mortgage Association Bond, with a rate of 5.500%,
with a maturity of 12/14/2022, and with an aggregate
market value plus accrued interest of $70,706,016 | | $ | 69,314,825 | | | $ | 69,314,825 | | |
| Total Repurchase Agreement (Cost: $69,314,825) | | | | | 69,314,825 | | |
| Total Short Term Investment (Cost: $69,314,825) | | | | | 69,314,825 | | |
| Total Investments (Cost: $4,703,095,344)—96.1% | | | | $ | 3,731,661,072 | | |
| Other Assets In Excess of Liabilities—3.9% | | | | | 152,796,777 | | |
| Total Net Assets—100% | | | | $ | 3,884,457,849 | | |
Securities of aggregate value of $3,479,247,451 were valued at a fair value in accordance with procedures established by the Board of Trustees.
(a) Non income-producing security.
(b) A portion of security out on loan.
(c) Represents an American Depositary Receipt.
(d) See footnote number five in the Notes to the Financial Statements regarding investments in affiliated issuers.
See accompanying Notes to Financial Statements.
OAKMARK INTERNATIONAL FUND
43
OAKMARK INTERNATIONAL
SMALL CAP FUND
Report from David G. Herro and Chad M. Clark, Portfolio Managers


THE VALUE OF A $10,000 INVESTMENT IN OAKMARK INTERNATIONAL SMALL CAP FUND FROM ITS INCEPTION (11/1/95) TO PRESENT (9/30/08) AS COMPARED TO THE MSCI WORLD EX U.S. INDEX12 (UNAUDITED)

| | | | | Average Annual Total Returns
(as of 9/30/08) | |
| (Unaudited) | | Total Return
Last 3 Months* | | 1-year | | 5-year | | 10-year | | Since
Inception
(11/1/95) | |
Oakmark International
Small Cap Fund
(Class I) | | | -13.41 | % | | | -32.47 | % | | | 11.20 | % | | | 15.53 | % | | | 10.14 | % | |
| MSCI World ex U.S. | | | -20.68 | % | | | -29.58 | % | | | 10.28 | % | | | 5.56 | % | | | 5.42 | % | |
MSCI World ex U.S.
Small Cap15 | | | -24.64 | % | | | -35.34 | % | | | 9.25 | % | | | N/A | | | N/A | |
Lipper International
Small Cap Index16 | | | -24.40 | % | | | -35.84 | % | | | 11.80 | % | | | 10.64 | % | | N/A | |
The graph and table do not reflect the deduction of taxes that a shareholder would pay on fund distributions or the redemption of fund shares.
The expense ratio for Class I shares as of 9/30/08 was 1.41%.
The performance data quoted represents past performance. The above performance information for the Fund does not reflect the imposition of a 2% redemption fee on shares redeemed within 90 days, in order to deter market timers. If reflected, the fee would reduce the performance quoted. Past performance does not guarantee future results. The investment return and principal value will fluctuate so that an investor's shares, when redeemed, may be worth more or less than their original cost. Current performance may be lower or higher than the performance data quoted. Average annual total return measures annualized change, while total return measures aggregate change. To obtain most recent month-end performance data, visit oakmark.com.
* Not annualized
Oakmark International Small Cap Fund declined 13% for the quarter ended September 30th 2008. While we are not pleased with the decline, the Fund's returns compare favorably to the MSCI World ex U.S. Index, which fell 21%, and the MSCI World ex U.S. Small Cap Index, which declined 25%. Since inception, your Fund has returned 10% annualized, compared to the MSCI World ex U.S. Index, which returned 5% for the same period.
The quarter was extremely volatile with the Fund's out-performance generally arising from strong stock selection in a number of markets.
Contributors
Pasona, a Japanese placement and staffing company, was the Fund's top contributor this quarter. The company announced it will spend JPY 3.5 billion to repurchase 12% of its outstanding equity over the next quarter and will also retire 4% of the shares currently held in its treasury. Because the share price has been relatively weak throughout the year and the valuation has become extremely attractive, we commend management's commitment to good capital allocation. Although we believe profits will decline next year due to increased health insurance expenses, a tight job recruitment market, and a slowing domestic economy, we continue to like the secular trends for temporary employment in Japan.
Shares of U.K. reinsurance broker Benfield surged after Chicago-based insurance company Aon Corp. agreed to buy Benfield for almost $1.6 billion in cash. Aon believes that Benfield will strengthen its existing reinsurance operations, creating a diverse global franchise that would enhance Aon's capabilities in the southern U.S. as well as in the growing Asian and Latin American markets. Because the shares reached its target price, we sold our position in Benfield.
Despite tough market conditions, Japanese brokerage firm Ichiyoshi Securities continues to gain net new accounts and net new money. In the past, we've written about the difficulty of finding investments in Japan that meet both of our criteria: low share price and high quality. Ichiyoshi is an example of a Japanese company that has a management team focused on building value per share by increasing returns and by allocating capital intelligently. In fact, Ichiyoshi is one of only 53 TOPIX-listed companies to have independent committees (nominating, remuneration and audit) to monitor the board of directors and officers of the company. They are also one of the few Japanese companies with a 50/50 split between internal and external directors. Over the years management has repurchased over 20% of shares outstanding. These are all examples of why we believe the firm has an exceptional culture.
OAKMARK INTERNATIONAL SMALL CAP FUND
44
Detractors
JJB Sports, a U.K. sporting good retailer, continues to suffer as British consumers rein in their spending. Sales were also hurt by the English soccer team's failure to reach the finals in this summer's European championships, and JJB incurred an operating loss at the Original Shoe Company, which it acquired earlier this year. To overcome this slowdown, JJB is working to bring back customers by adding its own branded goods, by expanding its highly profitable fitness club format and by refurbishing its stores' appearance.
Ementor, a large supplier of IT infrastructure products and services in the Nordic and Baltic regions, was down this quarter, even though new services and hardware sales continue to grow at a steady rate. During the quarter, one of Ementor's subsidiaries agreed to acquire all shares of another IT company, Kongsberg Systec. This acquisition will boost Ementor's position as the leading IT infrastructure supplier in Norway's Buskerud region. Although Ementor's stock declined this quarter, we believe that the company is poised for continued growth and value creation.
Despite sluggish automobile sales, profits and sales at Duerr, a German supplier of plant and equipment for the automotive industry, have grown over the past quarter. Surprisingly, investment in paint shops is not always correlated to automobile production as existing capacity is outdated and in need of modernization. Incoming paint orders continue to increase due to the estimated EUR 2.5 billion worth of new paint shops, and Duerr could secure about 40% of that new business. Duerr is an industry leader, selling for under 3x EBIT, which gives it a very compelling risk-return profile.
Portfolio Composition
It was an another active quarter of trading with the Fund exiting five positions, including Aegis Group, Anadolu Efes, Benfield Group, Square Enix and Trigano. As always, we will sell a position if the shares reach fair value, we over-estimate the company's business value, or we identify more attractive investment opportunities. We added three new holdings to the Fund, including U.K.'s ICAP plc, the largest broker of transactions between banks in the world; Kaba Holdings, a large Swiss maker of security systems; and Panalpina Welttransport, a Swiss freight forwarding company.
Geographically, our portfolio weightings have shifted slightly this quarter. Europe and the U.K. decreased to approximately 75% of investments, and the Pacific Rim increased slightly to approximately 21% of the total portfolio. The balance of the portfolio, excluding cash, was invested in the Middle East, North America and Latin America.
We continue to hedge the Fund defensively and our hedges performed well during the quarter, adding approximately 4.7% to performance. However, due to weakening foreign currencies, we decreased the weightings of the hedges from approximately 60% of the Pound Sterling to 40%; 65% of the Swiss Franc to 45%; and 65% of the Euro to 45%.
During these turbulent times we continue to thank you for your patience and support. We will remain steadfast in our pursuit of finding attractive, undervalued foreign companies with management teams dedicated to building shareholder value to add to the Fund.
David G. Herro, CFA
Portfolio Manager
oakex@oakmark.com | | Chad M. Clark, CFA
Portfolio Manager
oakex@oakmark.com | |
|
September 30, 2008
OAKMARK INTERNATIONAL SMALL CAP FUND
45
OAKMARK INTERNATIONAL SMALL CAP FUND
Global Diversification—September 30, 2008 (Unaudited)

OAKMARK INTERNATIONAL SMALL CAP FUND
46
OAKMARK INTERNATIONAL SMALL CAP FUND
Schedule of Investments—September 30, 2008
| Name | | Description | | Shares Held | | Value | |
| Common Stocks—93.3% | |
| Advertising—1.6% | |
| Asatsu-DK, Inc. (Japan) | | Advertising Services Provider | | | 373,500 | | | $ | 10,638,857 | | |
| Apparel, Accessories & Luxury Goods—2.9% | |
| Bulgari SpA (Italy) | | Jewelry Manufacturer & Retailer | | | 2,119,400 | | | $ | 18,971,585 | | |
| Automotive Retail—1.2% | |
| USS Co., Ltd. (Japan) | | Used Car Auction Facility Manager | | | 125,500 | | | $ | 8,071,567 | | |
| Broadcasting—7.7% | |
M6 Metropole Television
(France) | | Television Entertainment Channel
Owner & Operator | | | 1,020,200 | | | $ | 22,429,334 | | |
Ten Network Holdings Ltd.
(Australia) | | Operates Commercial Television
Stations | | | 12,635,000 | | | | 16,384,337 | | |
Media Prima Berhad
(Malaysia) | | Film Producer & Sports Promoter | | | 32,765,800 | | | | 12,519,762 | | |
| | | | 51,333,433 | | |
| Home Furnishing Retail—1.9% | |
Beter Bed Holding NV
(Netherlands) | | Bedroom Furniture Retailer | | | 936,070 | | | $ | 12,865,254 | | |
| Home Improvement Retail—2.9% | |
Carpetright PLC
(United Kingdom) | | Carpet Retailer | | | 1,809,410 | | | $ | 19,572,440 | | |
| Movies & Entertainment—1.3% | |
CTS Eventim AG
(Germany) | | Entertainment Tickets Producer &
Distributor | | | 228,018 | | | $ | 8,313,335 | | |
| Photographic Products—2.6% | |
Vitec Group PLC
(United Kingdom) (b) | | Photo Equipment & Supplies | | | 2,812,479 | | | $ | 17,495,105 | | |
| Publishing—1.5% | |
| Tamedia AG (Switzerland) | | TV Broadcasting & Publishing | | | 98,151 | | | $ | 9,785,941 | | |
| Specialty Stores—1.5% | |
JJB Sports PLC
(United Kingdom) (b) | | Sportswear & Sports Equipment
Retailer | | | 12,672,200 | | | $ | 10,104,786 | | |
| Textiles—1.7% | |
| Chargeurs SA (France) (b) | | Wool, Textile Production & Trading | | | 790,182 | | | $ | 11,120,369 | | |
OAKMARK INTERNATIONAL SMALL CAP FUND
47
OAKMARK INTERNATIONAL SMALL CAP FUND
Schedule of Investments—September 30, 2008 cont.
| Name | | Description | | Shares Held | | Value | |
| Common Stocks—93.3% (cont.) | |
| Household Products—1.2% | |
Kimberly-Clark de Mexico
S.A.B. de C.V. (Mexico) | | Hygiene Products Manufacturer,
Marketer & Distributor | | | 1,855,400 | | | $ | 8,000,792 | | |
| Packaged Foods & Meats—1.6% | |
Alaska Milk Corp.
(Philippines) (b) | | Milk Producer | | | 56,360,000 | | | $ | 5,733,847 | | |
Binggrae Co., Ltd.
(Korea) (b) | | Dairy Products Manufacturer | | | 165,500 | | | | 4,650,214 | | |
| | | | 10,384,061 | | |
| Soft Drinks—1.9% | |
Britvic PLC
(United Kingdom) | | Soft Drink Manufacturer &
Marketer | | | 3,531,000 | | | $ | 12,856,235 | | |
| Asset Management & Custody Banks—5.5% | |
| MLP AG (Germany) | | Asset Management | | | 1,008,096 | | | $ | 18,635,508 | | |
Julius Baer Holding AG
(Switzerland) | | Asset Management | | | 361,100 | | | | 17,957,653 | | |
| | | | 36,593,161 | | |
| Investment Banking & Brokerage—5.8% | |
Ichiyoshi Securities Co.,
Ltd. (Japan) (b) | | Stock Broker | | | 2,237,200 | | | $ | 23,463,644 | | |
D. Carnegie & Co. AB
(Sweden) | | Diversified Financials Services | | | 1,465,000 | | | | 10,866,418 | | |
ICAP PLC
(United Kingdom) | | Provides Independent Broking
Financials Services | | | 663,300 | | | | 4,278,288 | | |
| | | | 38,608,350 | | |
| Real Estate Development—0.2% | |
| Estavis AG (Germany) (a) | | Real Estate Investment Company | | | 232,354 | | | $ | 987,055 | | |
| Real Estate Services—2.0% | |
LSL Property Services PLC
(United Kingdom) (b) | | Residential Property Service
Provider | | | 10,362,200 | | | $ | 13,512,585 | | |
| Life Sciences Tools & Services—1.5% | |
| MDS, Inc. (Canada) (a) | | Products & Services for Medical
Product Manufacturer | | | 821,000 | | | $ | 9,804,942 | | |
| Air Freight & Logistics—3.8% | |
Freightways Ltd.
(New Zealand) (b) | | Express Package Services | | | 7,624,568 | | | $ | 16,545,059 | | |
OAKMARK INTERNATIONAL SMALL CAP FUND
48
OAKMARK INTERNATIONAL SMALL CAP FUND
Schedule of Investments—September 30, 2008 cont.
| Name | | Description | | Shares Held | | Value | |
| Common Stocks—93.3% (cont.) | |
| Air Freight & Logistics—3.8% (cont.) | |
Panalpina Welttransport
Holding AG
(Switzerland) | | Freight Shipping & Supply Chain
Management Services | | | 124,800 | | | $ | 8,368,133 | | |
| | | | 24,913,192 | | |
| Airport Services—2.5% | |
BBA Aviation PLC
(United Kingdom) | | Flight Support & Aftermarket
Services & Systems Provider | | | 7,925,900 | | | $ | 16,307,956 | | |
| Building Products—0.9% | |
Kaba Holding AG
(Switzerland) | | Provides Mechanical & Electronic
Security Systems | | | 22,900 | | | $ | 6,045,387 | | |
| Human Resource & Employment Services—6.5% | |
Pasona Group, Inc.
(Japan) (b) | | Placement Service Provider | | | 27,400 | | | $ | 20,951,003 | | |
Michael Page
International PLC
(United Kingdom) | | Recruitment Consultancy Services | | | 3,493,300 | | | | 14,527,710 | | |
Robert Walters PLC
(United Kingdom) | | International Recruitment
Company | | | 3,787,900 | | | | 7,348,827 | | |
| | | | 42,827,540 | | |
| Industrial Conglomerates—4.8% | |
Tomkins PLC
(United Kingdom) | | International Manufacturing | | | 7,226,600 | | | $ | 20,177,299 | | |
| Rheinmetall AG (Germany) | | Automotive Pump Manufacturer | | | 223,200 | | | | 12,012,877 | | |
| | | | 32,190,176 | | |
| Industrial Machinery—6.6% | |
| Duerr AG (Germany) | | Automotive Industry Machinery
Manufacturer | | | 691,800 | | | $ | 19,045,189 | | |
Interpump Group SpA
(Italy) | | Pump & Piston Manufacturer | | | 2,020,376 | | | | 13,252,163 | | |
Heidelberger
Druckmaschinen AG
(Germany) | | Manufactures of Printing &
Binding Equipment | | | 732,300 | | | | 11,535,719 | | |
| | | | 43,833,071 | | |
OAKMARK INTERNATIONAL SMALL CAP FUND
49
OAKMARK INTERNATIONAL SMALL CAP FUND
Schedule of Investments—September 30, 2008 cont.
| Name | | Description | | Shares Held | | Value | |
| Common Stocks—93.3% (cont.) | |
| Office Services & Supplies—3.6% | |
| Sperian Protection (France) | | Manufactures Protection Equipment | | | | | | |
| | |
| | For People In Hazardous Work | | | | | | |
| | |
| | Environments | | | 180,600 | | | $ | 18,519,816 | | |
| Societe BIC SA (France) | | Manufactures lighters, shavers, and
office supplies | | | 104,800 | | | | 5,444,686 | | |
| | | | 23,964,502 | | |
| Research & Consulting Services—0.6% | |
| Cision AB (Sweden) | | Business & Communication
Intelligence | | | 3,139,100 | | | $ | 4,139,668 | | |
| Communications Equipment—1.2% | |
Raymarine PLC
(United Kingdom) (b) | | Leisure Marine Electronics Products | | | 4,093,379 | | | $ | 8,027,106 | | |
| Computer Hardware—1.8% | |
Wincor Nixdorf AG
(Germany) | | Banking Machines & Cash Registers
Manufacturer | | | 203,500 | | | $ | 11,983,698 | | |
| Electronic Components—1.4% | |
Hirose Electric Co., Ltd.
(Japan) | | Develops & Sells Electronic
Equipment | | | 95,000 | | | $ | 9,054,333 | | |
| Electronic Equipment & Instruments—1.7% | |
Orbotech, Ltd.
(Israel) (a) (b) | | Optical Inspection Systems | | | 1,395,300 | | | $ | 11,148,447 | | |
| IT Consulting & Other Services—2.8% | |
| Ementor ASA (Norway) (a) | | Management & IT Consulting
Services | | | 4,297,800 | | | $ | 18,538,495 | | |
| Office Electronics—4.0% | |
| Neopost SA (France) | | Mailroom Equipment Supplier | | | 220,400 | | | $ | 20,782,745 | | |
Boewe Systec AG
(Germany) | | Automated Paper Management
Systems Producer | | | 285,039 | | | | 5,637,956 | | |
| | | | 26,420,701 | | |
| Systems Software—0.6% | |
Monitise PLC
(United Kingdom) (a) (b) | | Mobile Banking Service Solutions | | | 31,454,888 | | | $ | 4,333,962 | | |
| Construction Materials—2.2% | |
Titan Cement Co. SA
(Greece) | | Cement & Building Materials
Producer & Distributor | | | 444,500 | | | $ | 14,680,109 | | |
OAKMARK INTERNATIONAL SMALL CAP FUND
50
OAKMARK INTERNATIONAL SMALL CAP FUND
Schedule of Investments—September 30, 2008 cont.
| Name | | Description | | Shares Held/
Par Value | | Value | |
| Common Stocks—93.3% (cont.) | |
| Specialty Chemicals—1.8% | |
| Altana AG (Germany) | | Develops & Manufactures Specialty
Chemical Products | | | 808,700 | | | $ | 11,982,550 | | |
| Total Common Stocks (Cost: $879,709,705) | | | | | | | 619,410,746 | | |
| Short Term Investment—1.9% | |
| Repurchase Agreement—1.9% | |
Fixed Income Clearing Corp. Repurchase Agreement,
1.70% dated 9/30/2008 due 10/1/2008, repurchase
price $12,805,880, collateralized by a Federal National
Mortgage Association Bond, with a rate of 6.110%,
with a maturity of 8/24/2027, and with an aggregate
market value plus accrued interest of $13,065,826 | | | | $ | 12,805,275 | | | $ | 12,805,275 | | |
| Total Repurchase Agreement (Cost: $12,805,275) | | | | | | | 12,805,275 | | |
| Total Short Term Investment (Cost: $12,805,275) | | | | | | | 12,805,275 | | |
| Total Investments (Cost: $892,514,980)—95.2% | | | | | | $ | 632,216,021 | | |
| Foreign Currencies (Cost: $1,756,122)—0.3% | | | | | | $ | 1,712,465 | | |
| Other Assets In Excess of Liabilities—4.5% | | | | | | | 29,910,947 | | |
| Total Net Assets—100% | | | | | | $ | 663,839,433 | | |
Securities of aggregate value of $580,484,570 were valued at a fair value in accordance with procedures established by the Board of Trustees.
(a) Non income-producing security.
(b) See footnote number five in the Notes to the Financial Statements regarding investments in affiliated issuers.
See accompanying Notes to Financial Statements.
OAKMARK INTERNATIONAL SMALL CAP FUND
51
THE OAKMARK FUNDS
Statements of Assets and Liabilities—September 30, 2008
| | | | | Oakmark
Fund | | Oakmark
Select
Fund | | Oakmark
Equity and
Income Fund | |
| Assets | |
| Investments in unaffiliated securities, at value | | (a) | | $ | 3,616,837,472 | | | $ | 2,574,182,287 | | | $ | 14,356,507,141 | | |
| Investments in affiliated securities, at value | | (b) | | | 0 | | | | 0 | | | | 39,000,000 | | |
| Foreign currency, at value | | (c) | | | 0 | | | | 0 | | | | 0 | | |
| Receivable for: | |
| Securities sold | | | | | 0 | | | | 736,039 | | | | 62,693,279 | | |
| Fund shares sold | | | | | 7,824,918 | | | | 4,629,133 | | | | 60,518,363 | | |
| Dividends and interest (Net of foreign tax withheld) | | | | | 5,185,288 | | | | 2,022,455 | | | | 44,492,103 | | |
| Foreign currency exchange contracts | | | | | 0 | | | | 0 | | | | 0 | | |
| Tax reclaim | | | | | 656,035 | | | | 0 | | | | 782,844 | | |
| Total receivables | | | | | 13,666,241 | | | | 7,387,627 | | | | 168,486,589 | | |
| Other assets | | | | | 0 | | | | 0 | | | | 0 | | |
| Total assets | | | | $ | 3,630,503,713 | | | $ | 2,581,569,914 | | | $ | 14,563,993,730 | | |
| Liabilities and Net Assets | |
| Payable for: | |
| Securities purchased | | | | $ | 169,808 | | | $ | 0 | | | $ | 246,050,960 | | |
| Fund shares redeemed | | | | | 5,200,378 | | | | 5,499,930 | | | | 39,286,681 | | |
| Investment advisory fee | | | | | 201,963 | | | | 153,215 | | | | 571,565 | | |
| Other shareholder servicing fees | | | | | 691,546 | | | | 473,112 | | | | 2,495,683 | | |
| Transfer and dividend disbursing agent fees | | | | | 297,287 | | | | 185,887 | | | | 258,245 | | |
| Trustee fees | | | | | 1,179 | | | | 1,064 | | | | 1,242 | | |
| Deferred trustee compensation | | | | | 913,813 | | | | 804,614 | | | | 733,813 | | |
| Other | | | | | 529,983 | | | | 415,760 | | | | 1,581,170 | | |
| Total liabilities | | | | | 8,005,957 | | | | 7,533,582 | | | | 290,979,359 | | |
| Net assets applicable to Fund shares outstanding | | | | $ | 3,622,497,756 | | | $ | 2,574,036,332 | | | $ | 14,273,014,371 | | |
| Analysis of Net Assets | |
| Paid in capital | | | | $ | 2,930,321,131 | | | $ | 2,466,495,830 | | | $ | 12,652,391,633 | | |
Accumulated undistributed net realized gain (loss) on investments, forward
contracts, options, short sales and foreign currency transactions | | | | | 105,320,517 | | | | (267,610,399 | ) | | | 338,091,578 | | |
| Net unrealized appreciation (depreciation) on investments and foreign currencies | | | | | 549,978,508 | | | | 349,875,573 | | | | 1,064,771,267 | | |
| Net unrealized appreciation (depreciation)—other | | | | | (16,500 | ) | | | 0 | | | | (95,729 | ) | |
| Accumulated undistributed net investment income | | | | | 36,894,100 | | | | 25,275,328 | | | | 217,855,622 | | |
| Net assets applicable to Fund shares outstanding | | | | $ | 3,622,497,756 | | | $ | 2,574,036,332 | | | $ | 14,273,014,371 | | |
| Price of Shares | |
| Net asset value per share: Class I | | | | $ | 35.31 | | | $ | 20.34 | | | $ | 25.57 | | |
| Class I—Net assets | | | | $ | 3,610,080,224 | | | $ | 2,558,899,693 | | | $ | 13,263,270,735 | | |
| Class I—Shares outstanding (Unlimited shares authorized) | | | | | 102,236,165 | | | | 125,812,154 | | | | 518,628,547 | | |
| Net asset value per share: Class II | | | | $ | 35.12 | | | $ | 20.29 | | | $ | 25.40 | | |
| Class II—Net assets | | | | $ | 12,417,532 | | | $ | 15,136,639 | | | $ | 1,009,743,636 | | |
| Class II—Shares outstanding (Unlimited shares authorized) | | | | | 353,564 | | | | 746,193 | | | | 39,748,632 | | |
| (a) Identified cost of investments in unaffiliated securities | | | | $ | 3,066,858,964 | | | $ | 2,224,306,714 | | | $ | 13,240,692,147 | | |
| (b) Identified cost of investments in affiliated securities | | | | | 0 | | | | 0 | | | | 90,043,727 | | |
| (c) Identified cost of foreign currency | | | | | 0 | | | | 0 | | | | 0 | | |
THE OAKMARK FUNDS
52
| | | Oakmark
Global
Fund | | Oakmark
Global Select
Fund | | Oakmark
International
Fund | | Oakmark
International
Small Cap Fund | |
| Assets | |
| Investments in unaffiliated securities, at value | | $ | 2,028,389,931 | | | $ | 226,702,368 | | | $ | 3,539,137,634 | | | $ | 524,392,199 | | |
| Investments in affiliated securities, at value | | | 0 | | | | 0 | | | | 192,523,438 | | | | 107,823,822 | | |
| Foreign currency, at value | | | 0 | | | | 0 | | | | 0 | | | | 1,712,465 | | |
| Receivable for: | |
| Securities sold | | | 94,680,416 | | | | 2,450,921 | | | | 52,670,737 | | | | 14,074,695 | | |
| Fund shares sold | | | 4,534,878 | | | | 281,484 | | | | 3,470,835 | | | | 1,007,944 | | |
| Dividends and interest (Net of foreign tax withheld) | | | 4,504,689 | | | | 282,235 | | | | 17,136,608 | | | | 1,277,410 | | |
| Foreign currency exchange contracts | | | 33,824,584 | | | | 3,519,893 | | | | 116,528,397 | | | | 17,582,911 | | |
| Tax reclaim | | | 4,766,605 | | | | 422,351 | | | | 13,630,282 | | | | 1,161,856 | | |
| Total receivables | | | 142,311,172 | | | | 6,956,884 | | | | 203,436,859 | | | | 35,104,816 | | |
| Other assets | | | 0 | | | | 186 | | | | 0 | | | | 0 | | |
| Total assets | | $ | 2,170,701,103 | | | $ | 233,659,438 | | | $ | 3,935,097,931 | | | $ | 669,033,302 | | |
| Liabilities and Net Assets | |
| Payable for: | |
| Securities purchased | | $ | 2,437,233 | | | $ | 0 | | | $ | 33,046,273 | | | $ | 3,226,419 | | |
| Fund shares redeemed | | | 162,752,687 | | | | 634,525 | | | | 14,431,789 | | | | 1,292,690 | | |
| Investment advisory fee | | | 133,794 | | | | 14,426 | | | | 236,633 | | | | 52,090 | | |
| Other shareholder servicing fees | | | 286,021 | | | | 39,089 | | | | 1,034,394 | | | | 51,149 | | |
| Transfer and dividend disbursing agent fees | | | 108,032 | | | | 29,513 | | | | 163,112 | | | | 29,200 | | |
| Trustee fees | | | 868 | | | | 533 | | | | 1,499 | | | | 615 | | |
| Deferred trustee compensation | | | 381,333 | | | | 12,006 | | | | 633,841 | | | | 364,889 | | |
| Other | | | 390,255 | | | | 87,652 | | | | 1,092,541 | | | | 176,817 | | |
| Total liabilities | | | 166,490,223 | | | | 817,744 | | | | 50,640,082 | | | | 5,193,869 | | |
| Net assets applicable to Fund shares outstanding | | $ | 2,004,210,880 | | | $ | 232,841,694 | | | $ | 3,884,457,849 | | | $ | 663,839,433 | | |
| Analysis of Net Assets | |
| Paid in capital | | $ | 2,052,119,434 | | | $ | 319,402,441 | | | $ | 4,696,990,919 | | | $ | 897,166,344 | | |
Accumulated undistributed net realized gain (loss) on investments, forward
contracts, options, short sales and foreign currency transactions | | | (18,904,225 | ) | | | (43,295,504 | ) | | | (144,940,714 | ) | | | (14,154,091 | ) | |
| Net unrealized appreciation (depreciation) on investments and foreign currencies | | | (44,776,018 | ) | | | (48,350,388 | ) | | | (854,719,777 | ) | | | (242,663,764 | ) | |
| Net unrealized appreciation (depreciation)—other | | | (1,858,901 | ) | | | (116,625 | ) | | | (866,200 | ) | | | (81,248 | ) | |
| Accumulated undistributed net investment income | | | 17,630,590 | | | | 5,201,770 | | | | 187,993,621 | | | | 23,572,192 | | |
| Net assets applicable to Fund shares outstanding | | $ | 2,004,210,880 | | | $ | 232,841,694 | | | $ | 3,884,457,849 | | | $ | 663,839,433 | | |
| Price of Shares | |
| Net asset value per share: Class I | | $ | 19.43 | | | $ | 8.23 | | | $ | 15.71 | | | $ | 11.36 | | |
| Class I—Net assets | | $ | 1,946,586,383 | | | $ | 232,841,694 | | | $ | 3,753,645,408 | | | $ | 663,557,583 | | |
| Class I—Shares outstanding (Unlimited shares authorized) | | | 100,194,244 | | | | 28,290,356 | | | | 238,911,260 | | | | 58,432,069 | | |
| Net asset value per share: Class II | | $ | 19.01 | | | $ | 0 | | | $ | 15.55 | | | $ | 11.33 | | |
| Class II—Net assets | | $ | 57,624,497 | | | $ | 0 | | | $ | 130,812,441 | | | $ | 281,850 | | |
| Class II—Shares outstanding (Unlimited shares authorized) | | | 3,031,915 | | | | 0 | | | | 8,414,738 | | | | 24,884 | | |
| (a) Identified cost of investments in unaffiliated securities | | $ | 2,108,819,339 | | | $ | 278,656,158 | | | $ | 4,470,697,569 | | | $ | 677,815,459 | | |
| (b) Identified cost of investments in affiliated securities | | | 0 | | | | 0 | | | | 232,397,775 | | | | 214,699,521 | | |
| (c) Identified cost of foreign currency | | | 0 | | | | 0 | | | | 0 | | | | 1,756,122 | | |
See accompanying Notes to Financial Statements.
THE OAKMARK FUNDS
53
THE OAKMARK FUNDS
Statements of Operations—September 30, 2008
| | | Oakmark
Fund | | Oakmark
Select
Fund | | Oakmark
Equity and
Income Fund | | Oakmark
Global
Fund | |
| Investment Income: | |
| Dividends from unaffiliated securities | | $ | 91,642,297 | | | $ | 75,034,102 | | | $ | 110,727,335 | | | $ | 56,800,909 | | |
| Dividends from affiliated securities | | | 0 | | | | 0 | | | | 441,318 | | | | 0 | | |
| Interest income | | | 6,883,572 | | | | 5,610,030 | | | | 283,923,351 | | | | 1,688,058 | | |
| Security lending income | | | 0 | | | | 0 | | | | 0 | | | | 1,131,853 | | |
| Other income | | | 2,762,785 | | | | 1,389,318 | | | | 113,252 | | | | 110,814 | | |
| Foreign taxes withheld | | | (569,825 | ) | | | 0 | | | | (5,988,328 | ) | | | (4,546,567 | ) | |
| Total investment income | | | 100,718,829 | | | | 82,033,450 | | | | 389,216,928 | | | | 55,185,067 | | |
| Expenses: | |
| Investment advisory fee | | | 41,394,880 | | | | 34,091,184 | | | | 98,087,432 | | | | 26,447,872 | | |
| Transfer and dividend disbursing agent fees | | | 1,661,679 | | | | 1,042,413 | | | | 1,402,459 | | | | 609,597 | | |
| Other shareholder servicing fees | | | 3,972,254 | | | | 2,982,806 | | | | 12,142,401 | | | | 1,625,961 | | |
| Service fee—Class II | | | 48,232 | | | | 51,332 | | | | 2,464,638 | | | | 183,827 | | |
| Reports to shareholders | | | 925,419 | | | | 686,673 | | | | 1,379,967 | | | | 374,707 | | |
| Custody and accounting fees | | | 476,587 | | | | 350,005 | | | | 1,508,695 | | | | 963,614 | | |
| Registration and blue sky expenses | | | 38,839 | | | | 44,098 | | | | 266,869 | | | | 72,848 | | |
| Legal fees | | | 104,373 | | | | 97,032 | | | | 213,668 | | | | 85,327 | | |
| Audit fees | | | 46,175 | | | | 42,354 | | | | 95,765 | | | | 37,406 | | |
| Other | | | 236,464 | | | | 231,303 | | | | 632,311 | | | | 268,148 | | |
| Total expenses | | | 48,904,902 | | | | 39,619,200 | | | | 118,194,205 | | | | 30,669,307 | | |
| Expense offset credit | | | 0 | | | | 0 | | | | (669 | ) | | | 0 | | |
| Net expenses | | | 48,904,902 | | | | 39,619,200 | | | | 118,193,536 | | | | 30,669,307 | | |
| Net Investment Income: | | | 51,813,927 | | | | 42,414,250 | | | | 271,023,392 | | | | 24,515,760 | | |
Net realized and unrealized gain (loss) on
investments and foreign currency transactions: | |
| Net realized gain (loss) on unaffiliated securities | | | 137,304,734 | | | | (244,888,582 | ) | | | 442,362,478 | | | | 41,778,664 | | |
| Net realized gain (loss) on affiliated securities | | | 0 | | | | 0 | | | | (46,925,985 | ) | | | 0 | | |
| Net realized gain (loss) on unaffiliated in-kind transactions | | | 0 | | | | 0 | | | | 85,904,717 | | | | 0 | | |
| Net realized gain (loss) on affiliated in-kind transactions | | | 0 | | | | 0 | | | | 1,972,610 | | | | 0 | | |
| Net realized gain (loss) on foreign currency transactions | | | (1,701 | ) | | | 0 | | | | (2,296,321 | ) | | | (11,186,522 | ) | |
Net change in unrealized appreciation (depreciation) on
investments and foreign currencies | | | (1,115,666,009 | ) | | | (1,164,736,462 | ) | | | (1,376,779,294 | ) | | | (695,307,787 | ) | |
| Net change in unrealized appreciation (depreciation)—other | | | (40,409 | ) | | | 0 | | | | (415,416 | ) | | | (2,005,400 | ) | |
Net realized and unrealized gain (loss) on
investments and foreign currency transactions: | | | (978,403,385 | ) | | | (1,409,625,044 | ) | | | (896,177,211 | ) | | | (666,721,045 | ) | |
| Net decrease in net assets resulting from operations | | $ | (926,589,458 | ) | | $ | (1,367,210,794 | ) | | $ | (625,153,819 | ) | | $ | (642,205,285 | ) | |
THE OAKMARK FUNDS
54
| | | Oakmark
Global Select
Fund | | Oakmark
International
Fund | | Oakmark
International
Small Cap Fund | |
| Investment Income: | |
| Dividends from unaffiliated securities | | $ | 8,038,577 | | | $ | 209,212,341 | | | $ | 24,475,255 | | |
| Dividends from affiliated securities | | | 0 | | | | 21,900,111 | | | | 10,185,939 | | |
| Interest income | | | 467,345 | | | | 4,794,640 | | | | 712,966 | | |
| Security lending income | | | 0 | | | | 4,248,700 | | | | 270,723 | | |
| Other income | | | 0 | | | | 291,530 | | | | 0 | | |
| Foreign taxes withheld | | | (426,927 | ) | | | (17,791,947 | ) | | | (2,657,306 | ) | |
| Total investment income | | | 8,078,995 | | | | 222,655,375 | | | | 32,987,577 | | |
| Expenses: | |
| Investment advisory fee | | | 2,994,968 | | | | 60,880,991 | | | | 11,252,085 | | |
| Transfer and dividend disbursing agent fees | | | 151,459 | | | | 929,261 | | | | 156,089 | | |
| Other shareholder servicing fees | | | 240,100 | | | | 5,441,514 | | | | 531,385 | | |
| Service fee—Class II | | | 0 | | | | 1,033,699 | | | | 634 | | |
| Reports to shareholders | | | 103,473 | | | | 887,977 | | | | 121,281 | | |
| Custody and accounting fees | | | 117,110 | | | | 3,449,642 | | | | 581,751 | | |
| Registration and blue sky expenses | | | 39,087 | | | | 97,207 | | | | 91,893 | | |
| Legal fees | | | 59,009 | | | | 112,870 | | | | 56,494 | | |
| Audit fees | | | 18,474 | | | | 61,244 | | | | 27,644 | | |
| Other | | | 220,166 | | | | 395,509 | | | | 184,280 | | |
| Total expenses | | | 3,943,846 | | | | 73,289,914 | | | | 13,003,536 | | |
| Expense offset credit | | | 0 | | | | 0 | | | | 0 | | |
| Net expenses | | | 3,943,846 | | | | 73,289,914 | | | | 13,003,536 | | |
| Net Investment Income: | | | 4,135,149 | | | | 149,365,461 | | | | 19,984,041 | | |
Net realized and unrealized gain (loss) on
investments and foreign currency transactions: | |
| Net realized gain (loss) on unaffiliated securities | | | (36,205,681 | ) | | | 129,217,019 | | | | 48,714,899 | | |
| Net realized gain (loss) on affiliated securities | | | 0 | | | | (156,329,302 | ) | | | (38,844,242 | ) | |
| Net realized gain (loss) on unaffiliated in-kind transactions | | | 0 | | | | 0 | | | | 0 | | |
| Net realized gain (loss) on affiliated in-kind transactions | | | 0 | | | | 0 | | | | 0 | | |
| Net realized gain (loss) on foreign currency transactions | | | 45,993 | | | | (4,453,599 | ) | | | (774,440 | ) | |
Net change in unrealized appreciation (depreciation) on
investments and foreign currencies | | | (56,222,021 | ) | | | (2,181,656,978 | ) | | | (380,342,817 | ) | |
| Net change in unrealized appreciation (depreciation)—other | | | (162,269 | ) | | | (1,810,771 | ) | | | (173,259 | ) | |
Net realized and unrealized gain (loss) on
investments and foreign currency transactions: | | | (92,543,978 | ) | | | (2,215,033,631 | ) | | | (371,419,859 | ) | |
| Net decrease in net assets resulting from operations | | $ | (88,408,829 | ) | | $ | (2,065,668,170 | ) | | $ | (351,435,818 | ) | |
See accompanying Notes to Financial Statements.
THE OAKMARK FUNDS
55
THE OAKMARK FUNDS
Statements of Changes in Net Assets—September 30, 2008
| | | Oakmark Fund | |
| | | Year Ended
September 30, 2008 | | Year Ended
September 30, 2007 | |
| From Operations: | |
| Net investment income | | $ | 51,813,927 | | | $ | 59,659,681 | | |
| Net realized gain (loss) on investments | | | 137,304,734 | | | | 420,551,189 | | |
| Net realized gain (loss) on foreign currency transactions | | | (1,701 | ) | | | (15,670 | ) | |
Net change in unrealized appreciation (depreciation)
on investments | | | (1,115,666,009 | ) | | | 156,908,305 | | |
Net change in unrealized appreciation
(depreciation)—other | | | (40,409 | ) | | | 22,000 | | |
| Net increase (decrease) in net assets from operations | | | (926,589,458 | ) | | | 637,125,505 | | |
| Distributions to shareholders from: | |
| Net investment income—Class I | | | (63,360,741 | ) | | | (53,539,601 | ) | |
| Net investment income—Class II | | | (183,226 | ) | | | (208,772 | ) | |
| Net realized gain—Class I | | | (390,074,654 | ) | | | (247,108,056 | ) | |
| Net realized gain—Class II | | | (1,912,176 | ) | | | (1,637,719 | ) | |
| Total distributions to shareholders | | | (455,530,797 | ) | | | (302,494,148 | ) | |
| From Fund share transactions: | |
| Proceeds from shares sold—Class I | | | 506,525,729 | | | | 861,518,944 | | |
| Proceeds from shares sold—Class II | | | 3,714,709 | | | | 9,068,112 | | |
| Reinvestment of distributions—Class I | | | 430,870,683 | | | | 284,353,008 | | |
| Reinvestment of distributions—Class II | | | 1,896,434 | | | | 1,632,253 | | |
| Payment for shares redeemed—Class I | | | (1,608,697,232 | ) | | | (1,307,641,112 | ) | |
| Payment for shares redeemed—Class II | | | (15,906,999 | ) | | | (21,478,972 | ) | |
| Redemption fees—Class I | | | 222,124 | | | | 247,506 | | |
| Redemption fees—Class II | | | 1,034 | | | | 1,510 | | |
Net decrease in net assets from Fund
share transactions | | | (681,373,518 | ) | | | (172,298,751 | ) | |
| Total increase (decrease) in net assets | | | (2,063,493,773 | ) | | | 162,332,606 | | |
| Net assets: | |
| Beginning of year | | | 5,685,991,529 | | | | 5,523,658,923 | | |
| End of year | | $ | 3,622,497,756 | | | $ | 5,685,991,529 | | |
| Undistributed net investment income | | $ | 36,894,100 | | | $ | 56,183,788 | | |
| Fund Share Transactions—Class I: | |
| Shares sold | | | 12,842,108 | | | | 18,391,432 | | |
| Shares issued in reinvestment of dividends | | | 10,404,991 | | | | 6,185,622 | | |
| Less shares redeemed | | | (40,648,554 | ) | | | (27,830,195 | ) | |
| Net decrease in shares outstanding | | | (17,401,455 | ) | | | (3,253,141 | ) | |
| Fund Share Transactions—Class II: | |
| Shares sold | | | 94,005 | | | | 194,191 | | |
| Shares issued in reinvestment of dividends | | | 45,918 | | | | 35,647 | | |
| Less shares redeemed | | | (404,846 | ) | | | (456,470 | ) | |
| Net decrease in shares outstanding | | | (264,923 | ) | | | (226,632 | ) | |
THE OAKMARK FUNDS
56
| | | Oakmark Select Fund | |
| | | Year Ended
September 30, 2008 | | Year Ended
September 30, 2007 | |
| From Operations: | |
| Net investment income | | $ | 42,414,250 | | | $ | 66,533,144 | | |
| Net realized gain (loss) on investments | | | (244,888,582 | ) | | | 507,407,977 | | |
Net change in unrealized appreciation (depreciation)
on investments | | | (1,164,736,462 | ) | | | (160,141,522 | ) | |
| Net increase (decrease) in net assets from operations | | | (1,367,210,794 | ) | | | 413,799,599 | | |
| Distributions to shareholders from: | |
| Net investment income—Class I | | | (47,221,721 | ) | | | (64,072,754 | ) | |
| Net investment income—Class II | | | (109,460 | ) | | | (433,784 | ) | |
| Net realized gain—Class I | | | (453,949,363 | ) | | | (576,351,927 | ) | |
| Net realized gain—Class II | | | (3,023,620 | ) | | | (6,348,277 | ) | |
| Total distributions to shareholders | | | (504,304,164 | ) | | | (647,206,742 | ) | |
| From Fund share transactions: | |
| Proceeds from shares sold—Class I | | | 434,582,524 | | | | 774,598,160 | | |
| Proceeds from shares sold—Class II | | | 6,382,536 | | | | 15,646,313 | | |
| Reinvestment of distributions—Class I | | | 475,037,841 | | | | 618,361,472 | | |
| Reinvestment of distributions—Class II | | | 1,916,898 | | | | 3,215,331 | | |
| Payment for shares redeemed—Class I | | | (1,888,941,538 | ) | | | (1,541,125,659 | ) | |
| Payment for shares redeemed—Class II | | | (17,433,503 | ) | | | (48,592,972 | ) | |
| Redemption fees—Class I | | | 388,517 | �� | | | 223,491 | | |
| Redemption fees—Class II | | | 2,582 | | | | 2,154 | | |
Net decrease in net assets from Fund
share transactions | | | (988,064,143 | ) | | | (177,671,710 | ) | |
| Total decrease in net assets | | | (2,859,579,101 | ) | | | (411,078,853 | ) | |
| Net assets: | |
| Beginning of year | | | 5,433,615,433 | | | | 5,844,694,286 | | |
| End of year | | $ | 2,574,036,332 | | | $ | 5,433,615,433 | | |
| Undistributed net investment income | | $ | 25,275,328 | | | $ | 39,662,331 | | |
| Fund Share Transactions—Class I: | |
| Shares sold | | | 17,349,363 | | | | 22,573,030 | | |
| Shares issued in reinvestment of dividends | | | 18,055,426 | | | | 18,359,901 | | |
| Less shares redeemed | | | (72,910,322 | ) | | | (45,169,924 | ) | |
| Net decrease in shares outstanding | | | (37,505,533 | ) | | | (4,236,993 | ) | |
| Fund Share Transactions—Class II: | |
| Shares sold | | | 252,902 | | | | 459,298 | | |
| Shares issued in reinvestment of dividends | | | 72,941 | | | | 95,865 | | |
| Less shares redeemed | | | (683,111 | ) | | | (1,441,127 | ) | |
| Net decrease in shares outstanding | | | (357,268 | ) | | | (885,964 | ) | |
See accompanying Notes to Financial Statements.
THE OAKMARK FUNDS
57
THE OAKMARK FUNDS
Statements of Changes in Net Assets—September 30, 2008
| | | Oakmark
Equity and Income Fund | |
| | | Year Ended
September 30, 2008 | | Year Ended
September 30, 2007 | |
| From Operations: | |
| Net investment income | | $ | 271,023,392 | | | $ | 262,368,113 | | |
| Net realized gain (loss) on investments | | | 483,313,820 | | | | 755,956,267 | | |
| Net realized gain (loss) on foreign currency transactions | | | (2,296,321 | ) | | | (1,022,336 | ) | |
Net change in unrealized appreciation (depreciation)
on investments | | | (1,376,779,294 | ) | | | 777,795,316 | | |
Net change in unrealized appreciation
(depreciation)—other | | | (415,416 | ) | | | (164,029 | ) | |
| Net increase (decrease) in net assets from operations | | | (625,153,819 | ) | | | 1,794,933,331 | | |
| Distributions to shareholders from: | |
| Net investment income—Class I | | | (267,024,200 | ) | | | (197,295,609 | ) | |
| Net investment income—Class II | | | (16,634,567 | ) | | | (11,590,883 | ) | |
| Net realized gain—Class I | | | (664,948,149 | ) | | | (514,829,367 | ) | |
| Net realized gain—Class II | | | (48,763,636 | ) | | | (36,037,949 | ) | |
| Total distributions to shareholders | | | (997,370,552 | ) | | | (759,753,808 | ) | |
| From Fund share transactions: | |
| Proceeds from shares sold—Class I | | | 3,585,440,574 | | | | 2,268,150,133 | | |
| Proceeds from shares sold—Class II | | | 445,155,517 | | | | 303,169,618 | | |
| Reinvestment of distributions—Class I | | | 889,650,962 | | | | 676,419,126 | | |
| Reinvestment of distributions—Class II | | | 54,888,687 | | | | 38,550,451 | | |
| Payment for shares redeemed—Class I | | | (2,190,825,510 | ) | | | (1,835,852,952 | ) | |
| Payment for shares redeemed—Class II | | | (293,563,855 | ) | | | (213,986,804 | ) | |
| Redemption fees—Class I | | | 112,554 | | | | 396,816 | | |
| Redemption fees—Class II | | | 8,242 | | | | 28,756 | | |
Net increase in net assets from Fund
share transactions | | | 2,490,867,171 | | | | 1,236,875,144 | | |
| Total increase in net assets | | | 868,342,800 | | | | 2,272,054,667 | | |
| Net assets: | |
| Beginning of year | | | 13,404,671,571 | | | | 11,132,616,904 | | |
| End of year | | $ | 14,273,014,371 | | | $ | 13,404,671,571 | | |
| Undistributed net investment income | | $ | 217,855,622 | | | $ | 247,021,572 | | |
| Fund Share Transactions—Class I: | |
| Shares sold | | | 131,246,453 | | | | 84,094,622 | | |
| Shares issued in reinvestment of dividends | | | 32,913,467 | | | | 26,036,152 | | |
| Less shares redeemed | | | (81,153,863 | ) | | | (67,666,574 | ) | |
| Net increase in shares outstanding | | | 83,006,057 | | | | 42,464,200 | | |
| Fund Share Transactions—Class II: | |
| Shares sold | | | 16,431,464 | | | | 11,303,525 | | |
| Shares issued in reinvestment of dividends | | | 2,038,956 | | | | 1,489,010 | | |
| Less shares redeemed | | | (10,835,135 | ) | | | (7,935,650 | ) | |
| Net increase in shares outstanding | | | 7,635,285 | | | | 4,856,885 | | |
THE OAKMARK FUNDS
58
| | | Oakmark
Global Fund | |
| | | Year Ended
September 30, 2008 | | Year Ended
September 30, 2007 | |
| From Operations: | |
| Net investment income | | $ | 24,515,760 | | | $ | 18,208,414 | | |
| Net realized gain (loss) on investments | | | 41,778,664 | | | | 324,857,952 | | |
| Net realized gain (loss) on foreign currency transactions | | | (11,186,522 | ) | | | (3,749,056 | ) | |
Net change in unrealized appreciation (depreciation)
on investments and foreign currencies | | | (695,307,787 | ) | | | 180,426,535 | | |
Net change in unrealized appreciation
(depreciation)—other | | | (2,005,400 | ) | | | 106,323 | | |
| Net increase (decrease) in net assets from operations | | | (642,205,285 | ) | | | 519,850,168 | | |
| Distributions to shareholders from: | |
| Net investment income—Class I | | | (3,870,141 | ) | | | (27,704,385 | ) | |
| Net investment income—Class II | | | (32,286 | ) | | | (645,340 | ) | |
| Net realized gain—Class I | | | (320,109,533 | ) | | | (312,319,850 | ) | |
| Net realized gain—Class II | | | (9,616,102 | ) | | | (10,681,345 | ) | |
| Total distributions to shareholders | | | (333,628,062 | ) | | | (351,350,920 | ) | |
| From Fund share transactions: | |
| Proceeds from shares sold—Class I | | | 533,804,675 | | | | 609,489,866 | | |
| Proceeds from shares sold—Class II | | | 5,683,298 | | | | 17,269,919 | | |
| Reinvestment of distributions—Class I | | | 313,392,738 | | | | 326,216,720 | | |
| Reinvestment of distributions—Class II | | | 9,333,596 | | | | 10,756,868 | | |
| Payment for shares redeemed—Class I | | | (958,997,589 | ) | | | (375,481,639 | ) | |
| Payment for shares redeemed—Class II | | | (19,949,158 | ) | | | (19,691,332 | ) | |
| Redemption fees—Class I | | | 235,186 | | | | 161,035 | | |
| Redemption fees—Class II | | | 6,748 | | | | 5,156 | | |
Net increase (decrease) in net assets from Fund
share transactions | | | (116,490,506 | ) | | | 568,726,593 | | |
| Total increase (decrease) in net assets | | | (1,092,323,853 | ) | | | 737,225,841 | | |
| Net assets: | |
| Beginning of year | | | 3,096,534,733 | | | | 2,359,308,892 | | |
| End of year | | $ | 2,004,210,880 | | | $ | 3,096,534,733 | | |
| Undistributed net investment income | | $ | 17,630,590 | | | $ | 8,856,800 | | |
| Fund Share Transactions—Class I: | |
| Shares sold | | | 23,088,428 | | | | 22,540,232 | | |
| Shares issued in reinvestment of dividends | | | 12,822,943 | | | | 12,934,841 | | |
| Less shares redeemed | | | (42,758,112 | ) | | | (13,937,033 | ) | |
| Net increase (decrease) in shares outstanding | | | (6,846,741 | ) | | | 21,538,040 | | |
| Fund Share Transactions—Class II: | |
| Shares sold | | | 248,561 | | | | 643,786 | | |
| Shares issued in reinvestment of dividends | | | 389,224 | | | | 432,350 | | |
| Less shares redeemed | | | (875,330 | ) | | | (737,986 | ) | |
| Net increase (decrease) in shares outstanding | | | (237,545 | ) | | | 338,150 | | |
See accompanying Notes to Financial Statements.
THE OAKMARK FUNDS
59
THE OAKMARK FUNDS
Statements of Changes in Net Assets—September 30, 2008
| | | Oakmark
Global Select Fund | |
| | | Year Ended
September 30, 2008 | | For the Period from
October 2, 2006 (a) to
September 30, 2007 | |
| From Operations: | |
| Net investment income | | $ | 4,135,149 | | | $ | 2,383,876 | | |
| Net realized gain (loss) on investments | | | (36,205,681 | ) | | | 7,145,836 | | |
| Net realized gain (loss) on foreign currency transactions | | | 45,993 | | | | (448,111 | ) | |
Net change in unrealized appreciation (depreciation)
on investments and foreign currencies | | | (56,222,021 | ) | | | 7,871,633 | | |
Net change in unrealized appreciation
(depreciation)—other | | | (162,269 | ) | | | 45,644 | | |
| Net increase (decrease) in net assets from operations | | | (88,408,829 | ) | | | 16,998,878 | | |
| Distributions to shareholders from: | |
| Net investment income—Class I | | | (725,540 | ) | | | (114,308 | ) | |
| Net realized gain—Class I | | | (13,372,501 | ) | | | — | | |
| Total distributions to shareholders | | | (14,098,041 | ) | | | (114,308 | ) | |
| From Fund share transactions: | |
| Proceeds from shares sold—Class I | | | 152,328,234 | | | | 417,863,246 | | |
| Reinvestment of distributions—Class I | | | 13,571,933 | | | | 113,161 | | |
| Payment for shares redeemed—Class I | | | (208,397,143 | ) | | | (57,339,417 | ) | |
| Redemption fees—Class I | | | 157,379 | | | | 166,601 | | |
Net increase (decrease) in net assets from Fund
share transactions | | | (42,339,597 | ) | | | 360,803,591 | | |
| Total increase (decrease) in net assets | | | (144,846,467 | ) | | | 377,688,161 | | |
| Net assets: | |
| Beginning of period | | | 377,688,161 | | | | — | | |
| End of period | | $ | 232,841,694 | | | $ | 377,688,161 | | |
| Undistributed net investment income | | $ | 5,201,770 | | | $ | 1,821,456 | | |
| Fund Share Transactions—Class I: | |
| Shares sold | | | 15,695,713 | | | | 37,547,411 | | |
| Shares issued in reinvestment of dividends | | | 1,303,740 | | | | 10,576 | | |
| Less shares redeemed | | | (21,253,051 | ) | | | (5,014,033 | ) | |
| Net increase (decrease) in shares outstanding | | | (4,253,598 | ) | | | 32,543,954 | | |
(a) The date on which fund shares were first offered for sale to the public was October 2, 2006.
THE OAKMARK FUNDS
60
| | | Oakmark
International Fund | |
| | | Year Ended
September 30, 2008 | | Year Ended
September 30, 2007 | |
| From Operations: | |
| Net investment income | | $ | 149,365,461 | | | $ | 146,096,746 | | |
| Net realized gain (loss) on investments | | | (27,112,283 | ) | | | 1,426,186,914 | | |
| Net realized gain (loss) on foreign currency transactions | | | (4,453,599 | ) | | | (27,388,159 | ) | |
Net change in unrealized appreciation (depreciation)
on investments and foreign currencies | | | (2,181,656,978 | ) | | | (406,414,072 | ) | |
Net change in unrealized appreciation
(depreciation)—other | | | (1,810,771 | ) | | | 1,025,662 | | |
| Net increase (decrease) in net assets from operations | | | (2,065,668,170 | ) | | | 1,139,507,091 | | |
| Distributions to shareholders from: | |
| Net investment income—Class I | | | (51,882,590 | ) | | | (122,435,261 | ) | |
| Net investment income—Class II | | | (959,117 | ) | | | (6,951,720 | ) | |
| Net realized gain—Class I | | | (1,274,258,080 | ) | | | (961,546,440 | ) | |
| Net realized gain—Class II | | | (85,876,351 | ) | | | (69,459,593 | ) | |
| Total distributions to shareholders | | | (1,412,976,138 | ) | | | (1,160,393,014 | ) | |
| From Fund share transactions: | |
| Proceeds from shares sold—Class I | | | 843,973,862 | | | | 1,677,032,856 | | |
| Proceeds from shares sold—Class II | | | 154,989,608 | | | | 382,659,739 | | |
| Reinvestment of distributions—Class I | | | 1,166,912,506 | | | | 957,801,465 | | |
| Reinvestment of distributions—Class II | | | 62,134,167 | | | | 53,952,152 | | |
| Payment for shares redeemed—Class I | | | (3,432,270,289 | ) | | | (1,369,590,984 | ) | |
| Payment for shares redeemed—Class II | | | (466,708,322 | ) | | | (344,460,679 | ) | |
| Redemption fees—Class I | | | 557,708 | | | | 397,544 | | |
| Redemption fees—Class II | | | 36,364 | | | | 29,502 | | |
Net increase (decrease) in net assets from Fund
share transactions | | | (1,670,374,396 | ) | | | 1,357,821,595 | | |
| Total increase (decrease) in net assets | | | (5,149,018,704 | ) | | | 1,336,935,672 | | |
| Net assets: | |
| Beginning of year | | | 9,033,476,553 | | | | 7,696,540,881 | | |
| End of year | | $ | 3,884,457,849 | | | $ | 9,033,476,553 | | |
| Undistributed net investment income | | $ | 187,993,621 | | | $ | 104,342,170 | | |
| Fund Share Transactions—Class I: | |
| Shares sold | | | 41,879,271 | | | | 62,804,278 | | |
| Shares issued in reinvestment of dividends | | | 54,991,164 | | | | 38,038,184 | | |
| Less shares redeemed | | | (175,636,861 | ) | | | (51,521,932 | ) | |
| Net increase (decrease) in shares outstanding | | | (78,766,426 | ) | | | 49,320,530 | | |
| Fund Share Transactions—Class II: | |
| Shares sold | | | 7,714,499 | | | | 14,470,106 | | |
| Shares issued in reinvestment of dividends | | | 2,948,940 | | | | 2,157,223 | | |
| Less shares redeemed | | | (24,543,341 | ) | | | (12,976,190 | ) | |
| Net increase (decrease) in shares outstanding | | | (13,879,902 | ) | | | 3,651,139 | | |
See accompanying Notes to Financial Statements.
THE OAKMARK FUNDS
61
THE OAKMARK FUNDS
Statements of Changes in Net Assets—September 30, 2008
| | | Oakmark International
Small Cap Fund | |
| | | Year Ended
September 30, 2008 | | Year Ended
September 30, 2007 | |
| From Operations: | |
| Net investment income | | $ | 19,984,041 | | | $ | 16,938,125 | | |
| Net realized gain (loss) on investments | | | 9,870,657 | | | | 335,034,721 | | |
| Net realized gain (loss) on foreign currency transactions | | | (774,440 | ) | | | (3,567,638 | ) | |
Net change in unrealized appreciation (depreciation)
on investments and foreign currencies | | | (380,342,817 | ) | | | (175,792,106 | ) | |
Net change in unrealized appreciation
(depreciation)—other | | | (173,259 | ) | | | 97,505 | | |
| Net increase (decrease) in net assets from operations | | | (351,435,818 | ) | | | 172,710,607 | | |
| Distributions to shareholders from: | |
| Net investment income—Class I | | | (8,925,646 | ) | | | (29,840,093 | ) | |
| Net investment income—Class II | | | (4,217 | ) | | | (20,129 | ) | |
| Net realized gain—Class I | | | (278,426,262 | ) | | | (181,349,841 | ) | |
| Net realized gain—Class II | | | (164,501 | ) | | | (126,536 | ) | |
| Total distributions to shareholders | | | (287,520,626 | ) | | | (211,336,599 | ) | |
| From Fund share transactions: | |
| Proceeds from shares sold—Class I | | | 286,377,418 | | | | 239,079,369 | | |
| Proceeds from shares sold—Class II | | | 142,977 | | | | 334,644 | | |
| Reinvestment of distributions—Class I | | | 274,317,138 | | | | 201,840,075 | | |
| Reinvestment of distributions—Class II | | | 93,759 | | | | 74,623 | | |
| Payment for shares redeemed—Class I | | | (585,285,695 | ) | | | (350,389,665 | ) | |
| Payment for shares redeemed—Class II | | | (541,602 | ) | | | (200,687 | ) | |
| Redemption fees—Class I | | | 223,596 | | | | 43,370 | | |
| Redemption fees—Class II | | | 138 | | | | 32 | | |
Net increase (decrease) in net assets from Fund
share transactions | | | (24,672,271 | ) | | | 90,781,761 | | |
| Total increase (decrease) in net assets | | | (663,628,715 | ) | | | 52,155,769 | | |
| Net assets: | |
| Beginning of year | | | 1,327,468,148 | | | | 1,275,312,379 | | |
| End of year | | $ | 663,839,433 | | | $ | 1,327,468,148 | | |
| Undistributed net investment income | | $ | 23,572,192 | | | $ | 2,424,644 | | |
| Fund Share Transactions—Class I: | |
| Shares sold | | | 19,764,158 | | | | 10,010,170 | | |
| Shares issued in reinvestment of dividends | | | 17,778,168 | | | | 8,962,703 | | |
| Less shares redeemed | | | (36,305,356 | ) | | | (14,693,607 | ) | |
| Net increase in shares outstanding | | | 1,236,970 | | | | 4,279,266 | | |
| Fund Share Transactions—Class II: | |
| Shares sold | | | 9,539 | | | | 14,067 | | |
| Shares issued in reinvestment of dividends | | | 6,080 | | | | 3,318 | | |
| Less shares redeemed | | | (31,659 | ) | | | (8,271 | ) | |
| Net increase (decrease) in shares outstanding | | | (16,040 | ) | | | 9,114 | | |
THE OAKMARK FUNDS
62
THE OAKMARK FUNDS
Notes to Financial Statements
1. SIGNIFICANT ACCOUNTING POLICIES
The following are the significant accounting policies of Oakmark Fund ("Oakmark"), Oakmark Select Fund ("Select"), Oakmark Equity and Income Fund ("Equity and Income"), Oakmark Global Fund ("Global"), Oakmark Global Select Fund ("Global Select"), Oakmark International Fund ("International"), and Oakmark International Small Cap Fund ("Int'l Small Cap"), collectively referred to as "the Funds", each a series of Harris Associates Investment Trust (the "Trust"), a Massachusetts business trust, organized on February 1, 1991, which is registered as an investment company under the Investment Company Act of 1940. These policies are in conformity with accounting principles generally accepted in the United States of America ("GAAP"). The presentation of financial statements in conformity with GAAP requires management to make estimates and assumptions that affect the reported amounts of assets and liabilities at the date of the financial statements and the reported amounts of revenues and expenses during the reporting period. Actual results could differ from those estimates and assumptions.
Class Disclosure—
Each Fund offers two classes of shares: Class I Shares and Class II Shares. Class I Shares are offered to the general public. Class II Shares are offered to certain retirement plans such as 401(k) and profit sharing plans. Class II Shares pay a service fee at the annual rate of up to 0.25% of average net assets of Class II Shares of the Funds. This service fee is paid to an administrator for performing the services associated with the administration of such retirement plans. Class I Shares do not have an associated service fee.
Income, realized and unrealized capital gains and losses and expenses of the Funds that are not directly attributable to a specific class of shares are prorated among the classes based on the relative net assets of each class.
Redemption fees—
Each Fund (except Equity and Income) imposes a short-term trading fee on redemptions of shares held for 90 days or less to offset two types of costs to the Fund caused by short-term trading: portfolio transaction and market impact costs associated with erratic redemption activity and administrative costs associated with processing redemptions. The fee is 2% of the redemption value and is deducted from the redemption proceeds. The "first-in, first-out" ("FIFO") method is used to determine the holding period.
Security valuation—
The Funds' share prices or net asset values ("NAVs") are calculated as of the close of regular session trading (usually 4:00 pm Eastern time) on the New York Stock Exchange ("NYSE") on any day on which the NYSE is open for trading. Equity securities principally traded on securities exchanges in the United States and over-the-counter securities are valued at the last sales price or the official closing price on the day of valuation, or lacking any reported sales that day, at the most recent bid quotation. Securities traded on the NASDAQ National Market are valued at the NASDAQ Official Closing Price ("NOCP"), or lacking an NOCP, at the most recent bid quotation on the NASDAQ National Market. Equity securities principally traded on securities exchanges outside the United States shall be valued, depending on local convention or regulation, at the last sales price, the last bid or asked price, the mean between the last bid and asked prices, or the official closing price, or shall be based on a pricing composite as of the close of the regular trading hours on the appropriate exchange or other designated time. Debt obligations and money market instruments maturing in more than 60 days from the date of purchase are valued at the latest bid quotation. Debt obligations and money market instruments maturing in less than 61 days from the date of purchase are valued on an amortized cost basis, which approximates value. Options are valued at the last reported sales price on the day of valuation or, lacking any reported sale price on the valuation date, at the mean of the most recent bid and asked quotations or, if the mean is not available, at the most recent bid quotation.
Securities for which quotations are not readily available or securities that may have been affected by a significant event occurring between the close of a foreign market and the close of the NYSE are valued at fair values, determined by or under the direction of the pricing committee established by the Board of Trustees. A significant event may include the performance of U.S. markets since the close of foreign markets. The Funds may use a systematic fair valuation model provided by an independent third party to value foreign securities to adjust for stale pricing, which may occur between the close of certain foreign exchanges and the NYSE. At September 30, 2008, no Fund, except Equity and Income, held securities for which market quotations were not readily available. At September 30, 2008, Equity and Income held a security for which market quotations were not readily available and was valued at a fair value determined in accordance with procedures established in good faith by the Board of Trustees. At September 30, 2008, Oakmark, Global, Global Select, International and Int'l Small Cap held securities that were valued at a fair value using a systematic fair valuation model due to the performance of the U.S. markets since the close of the foreign markets.
Foreign currency translations—
Certain Funds invest in foreign securities, which may involve a number of risk factors and special considerations not present with investments in securities of U.S. corporations. Values of investments and other assets and liabilities denominated in foreign currencies are translated into U.S. dollars
THE OAKMARK FUNDS
63
THE OAKMARK FUNDS
Notes to Financial Statements (cont.)
at current exchange rates obtained by a recognized bank, dealer, or independent pricing service on the day of valuation. Purchases and sales of investments and dividend and interest income are converted at the prevailing rate of exchange on the respective dates of such transactions. Forward foreign currency contracts are valued at the current day's interpolated foreign exchange rates.
The Funds do not isolate the changes in foreign exchange rates on investments from changes in market prices of securities held. Such fluctuations are included in the net realized and unrealized gains and losses from securities.
Net realized gains and losses on foreign currency transactions arise from sales of foreign currencies, currency gains or losses realized between the trade and settlement dates on securities transactions, the difference between the amounts of dividends, interest, and foreign withholding taxes recorded and the U.S. dollar equivalent of the amounts actually received or paid, and the realized gains or losses resulting from portfolio and transaction hedges. Net unrealized foreign exchange gains and losses arise from changes in the fair value of assets and liabilities, other than investments in securities, at year-end resulting from changes in exchange rates.
At September 30, 2008, net unrealized appreciation (depreciation) - other included the following components:
| | | Oakmark | | Equity and
Income | | Global | | Global Select | | International | | Int'l
Small Cap | |
Unrealized appreciation
(depreciation) on
interest, dividends and
tax reclaims receivable | | $ | (16,500 | ) | | $ | (95,729 | ) | | $ | (110,280 | ) | | $ | (29,669 | ) | | $ | (639,874 | ) | | $ | 58,492 | | |
Unrealized appreciation
(depreciation) on open
securities purchases and
sales | | | 0 | | | | 0 | | | | (1,748,621 | ) | | | (86,956 | ) | | | (226,326 | ) | | | (139,740 | ) | |
Net unrealized
appreciation
(depreciation) - other | | $ | (16,500 | ) | | $ | (95,729 | ) | | $ | (1,858,901 | ) | | $ | (116,625 | ) | | $ | (866,200 | ) | | $ | (81,248 | ) | |
Forward foreign currency contracts—
The Funds' currency transactions are limited to transaction hedging and portfolio hedging. The contractual amounts of forward foreign currency contracts do not necessarily represent the amounts potentially subject to risk. The measurement of the risks associated with these instruments is meaningful only when all related and offsetting transactions are considered. Risks arise from the possible inability of counterparties to meet the terms of their contracts and from movements in currency values. At September 30, 2008, Global, Global Select, International, and Int'l Small Cap held forward foreign currency contracts as follows:
Oakmark Global Fund
| | | Contract
Amount | | Settlement
Date | | Valuation at
9/30/2008 | | Unrealized
Appreciation/
(Depreciation) | |
Foreign Currency Sold:
British Pound Sterling | | | 18,760,000 | | | 4/21/09 | | $ | 33,292,651 | | | $ | 2,991,065 | | |
| Euro | | | 18,700,000 | | | 2/27/09 | | | 26,401,352 | | | | 1,413,028 | | |
| Euro | | | 61,200,000 | | | 3/31/09 | | | 86,379,848 | | | | 8,329,599 | | |
| Euro | | | 26,300,000 | | | 4/20/09 | | | 37,098,243 | | | | 4,121,747 | | |
| Euro | | | 11,300,000 | | | 5/26/09 | | | 15,920,807 | | | | 1,530,913 | | |
| Swiss Franc | | | 25,500,000 | | | 12/9/08 | | | 22,836,109 | | | | 1,693,028 | | |
| Swiss Franc | | | 27,740,000 | | | 3/19/09 | | | 24,927,427 | | | | 3,067,890 | | |
| Swiss Franc | | | 8,200,000 | | | 4/20/09 | | | 7,373,749 | | | | 831,585 | | |
| Swiss Franc | | | 105,300,000 | | | 5/11/09 | | | 94,735,138 | | | | 4,878,894 | | |
| Swiss Franc | | | 64,000,000 | | | 5/26/09 | | | 57,593,279 | | | | 4,507,071 | | |
| Swiss Franc | | | 42,000,000 | | | 8/28/09 | | | 37,882,394 | | | | 459,764 | | |
| | | | | | | | | $ | 444,440,997 | | | $ | 33,824,584 | | |
THE OAKMARK FUNDS
64
THE OAKMARK FUNDS
Notes to Financial Statements (cont.)
Oakmark Global Select Fund
| | | Contract
Amount | | Settlement
Date | | Valuation at
9/30/2008 | | Unrealized
Appreciation/
(Depreciation) | |
Foreign Currency Sold:
British Pound Sterling | | | 1,870,000 | | | 5/20/09 | | $ | 3,314,632 | | | $ | 229,392 | | |
| British Pound Sterling | | | 5,230,000 | | | 6/5/09 | | | 9,264,198 | | | | 750,833 | | |
| Euro | | | 1,000,000 | | | 2/27/09 | | | 1,411,837 | | | | 75,563 | | |
| Euro | | | 948,000 | | | 4/20/09 | | | 1,337,230 | | | | 148,571 | | |
| Euro | | | 100,000 | | | 5/26/09 | | | 140,892 | | | | 13,548 | | |
| Euro | | | 1,877,000 | | | 7/21/09 | | | 2,640,106 | | | | 280,881 | | |
| Swiss Franc | | | 4,170,000 | | | 12/9/08 | | | 3,734,376 | | | | 276,860 | | |
| Swiss Franc | | | 4,740,000 | | | 3/19/09 | | | 4,259,409 | | | | 524,218 | | |
| Swiss Franc | | | 1,320,000 | | | 4/20/09 | | | 1,186,885 | | | | 133,973 | | |
| Swiss Franc | | | 12,980,000 | | | 5/11/09 | | | 11,677,703 | | | | 601,406 | | |
| Swiss Franc | | | 6,890,000 | | | 5/26/09 | | | 6,200,843 | | | | 484,648 | | |
| | | | | | | | | $ | 45,168,111 | | | $ | 3,519,893 | | |
Oakmark International Fund
| | | Contract
Amount | | Settlement
Date | | Valuation at
9/30/2008 | | Unrealized
Appreciation/
(Depreciation) | |
Foreign Currency Sold:
British Pound Sterling | | | 172,300,000 | | | 4/21/09 | | $ | 305,774,190 | | | $ | 27,471,240 | | |
| Euro | | | 200,500,000 | | | 3/31/09 | | | 282,992,804 | | | | 27,288,966 | | |
| Euro | | | 98,000,000 | | | 4/20/09 | | | 138,254,882 | | | | 15,340,518 | | |
| Euro | | | 129,000,000 | | | 5/26/09 | | | 181,750,804 | | | | 17,476,796 | | |
| Swiss Franc | | | 309,000,000 | | | 5/11/09 | | | 277,997,697 | | | | 14,316,981 | | |
| Swiss Franc | | | 207,800,000 | | | 5/26/09 | | | 186,998,179 | | | | 14,633,896 | | |
| | | | | | | | | $ | 1,373,768,556 | | | $ | 116,528,397 | | |
Oakmark Int'l Small Cap Fund
| | | Contract
Amount | | Settlement
Date | | Valuation at
9/30/2008 | | Unrealized
Appreciation/
(Depreciation) | |
Foreign Currency Sold:
British Pound Sterling | | | 31,800,000 | | | 4/21/09 | | $ | 56,434,238 | | | $ | 5,070,142 | | |
| Euro | | | 11,200,000 | | | 3/31/09 | | | 15,808,077 | | | | 1,524,371 | | |
| Euro | | | 24,800,000 | | | 4/20/09 | | | 34,986,950 | | | | 3,882,090 | | |
| Euro | | | 43,800,000 | | | 5/26/09 | | | 61,710,738 | | | | 5,933,982 | | |
| Swiss Franc | | | 1,380,000 | | | 10/27/08 | | | 1,231,142 | | | | 128,183 | | |
| Swiss Franc | | | 12,580,000 | | | 5/11/09 | | | 11,317,835 | | | | 582,873 | | |
| Swiss Franc | | | 6,550,000 | | | 5/26/09 | | | 5,894,312 | | | | 461,270 | | |
| | | | | | | | | $ | 187,383,292 | | | $ | 17,582,911 | | |
Security transactions and investment income—
Security transactions are accounted for on the trade date (date the order to buy or sell is executed) and dividend income is recorded on the ex-dividend date. Interest income and expenses are recorded on an accrual basis. Bond discount is accreted and premium is amortized over the
THE OAKMARK FUNDS
65
THE OAKMARK FUNDS
Notes to Financial Statements (cont.)
expected life of each applicable security using the effective yield method. Withholding taxes on foreign dividends have been provided for in accordance with the Funds' understanding of the applicable country's tax rules and rates. Net realized gains and losses on investments are determined by the specific identification method.
Short sales—
Each Fund may sell "short" a security in anticipation of a decline in the value of that security. When the Fund sells a security short, it must borrow the security sold short and deliver it to the broker-dealer through which it made the short sale. A gain, limited to the price at which the Fund sold the security short, or loss, unlimited in size, will be recognized upon the termination of the short sale. At September 30, 2008, none of the Funds had short sales.
Accounting for options—
When a Fund writes an option, the premium received by the Fund is recorded as a liability and is subsequently adjusted to the current market value of the option written. Premiums received from writing options that expire are recorded by the Fund on the expiration date as realized gains from option transactions. The difference between the premium and the amount paid on effecting a closing purchase transaction, including brokerage commissions, is also treated as a realized gain, or if the premium is less than the amount paid for the closing purchase transaction, as a realized loss. If a call option is exercised, the premium is added to the proceeds from the sale of the underlying security or currency in determining whether the Fund has realized a gain or a loss. If a put option is exercised, the premium reduces the cost basis of the security or currency purchased by the Fund. In writing an option, the Fund bears the market risk of an unfavorable change in the price of the security or currency underlying the written option. Exercise of an option written by the Fund could result in the Fund selling or buying a security or currency at a price different from the current market value. Options written by the Fund do not give rise to counterparty credit risk, as they obligate the Fund, not its counterparties, to perform.
When a Fund purchases an option, the premium paid by the Fund is recorded as an asset and is subsequently adjusted to the current value of the option purchased. Purchasing call options tends to increase the Fund's exposure to the underlying instrument. Purchasing put options tends to decrease the Fund's exposure to the underlying instrument. Premiums paid for purchasing options that expire are treated as realized losses. Premiums paid for purchasing options that are exercised or closed are added to the amounts paid or offset against the proceeds on the underlying security to determine the realized gain or loss. The risks associated with purchasing put and call options are potential loss of the premium paid and the failure of the counterparty to honor its obligation under the contract.
At September 30, 2008, the Funds had no outstanding options.
Committed line of credit—
The Trust has an unsecured committed line of credit with State Street Bank and Trust Company ("State Street") in the amount of $500 million. Borrowings under that arrangement bear interest at 0.45% above the Federal Funds Effective Rate, as defined in the credit agreement. There were no borrowings outstanding under the arrangement at September 30, 2008.
Expense offset arrangement—
State Street serves as custodian of the Funds. State Street's fee may be reduced by credits that are an earnings allowance calculated on the average daily cash balances each Fund maintains with State Street. Credit balances used to reduce the Funds' custodian fees, if any, are reported as a reduction of total expenses in the Statements of Operations. During the year ended September 30, 2008, Equity and Income received an expense offset credit of $669.
Repurchase agreements—
Each Fund may invest in repurchase agreements, which are short-term investments whereby the Fund acquires ownership of a debt security and the seller agrees to repurchase the security at a future date at a specified price.
The Fund, through State Street, receives delivery of the underlying securities collateralizing repurchase agreements. It is the Funds' policy that the value of the collateral be at least equal to 102% of the repurchase price, including interest. Harris Associates L.P. ("the Adviser") is responsible for determining that the value of the collateral is at all times at least equal to 102% of the repurchase price, including interest. Repurchase agreements could involve certain risks in the event of default or insolvency of the counterparty including possible delays or restrictions upon a Fund's ability to dispose of the underlying securities.
THE OAKMARK FUNDS
66
THE OAKMARK FUNDS
Notes to Financial Statements (cont.)
Security lending—
Each Fund, except Oakmark, may lend its portfolio securities to broker-dealers and banks. Any such loan must be continuously secured by collateral in cash or cash equivalents maintained on a current basis in an amount at least equal to the fair value of the securities loaned by the Fund. Collateral is marked to market and monitored daily. The Fund would continue to receive the equivalent of the interest or dividends paid by the issuer on the securities loaned, and would also receive an additional return that may be in the form of a fixed fee or a percentage of the earnings on the collateral. The Fund would have the right to call the loan and obtain the securities loaned at any time, and the counterparty is required to return the securities within five business days or less. In the event of bankruptcy or other default of the borrower, the Fund could experience delays in liquidating the loan collateral or recovering the loaned securities and incur expenses related to enforcing its rights. In addition, there could be a decline in the value of the collateral or in the fair value of the securities loaned while the Fund seeks to enforce its rights thereto and the Fund could experience subnormal levels of income or lack of access to income during that period.
At September 30, 2008, International had securities on loan with a value of $19,083,338, and held as collateral for the loan U.S. Treasury securities with a value of $20,100,171. On October 1, 2008, the loan was terminated and the shares were returned.
Restricted securities—
The following investments, the sales of which are restricted to qualified institutional buyers, have been valued according to the securities valuation procedures for debt obligations and money market instruments (as stated in the Security valuation section) since their acquisition dates. These securities are priced using market quotations and there are no unrestricted securities with the same maturity dates and yields for the issuer.
At September 30, 2008, Equity and Income held the following restricted securities:
| Quantity | | Security
Name | | Acquisition
Date | | Carrying
Value | | Cost | | Value | | Percentage of
Net Assets | |
| $ | 3,000,000 | | | Sealed Air Corporation,
144A, 5.625% due
7/15/2013 | | 6/27/2003 | | | 98.2065 | | | | 100.68 | | | | 2,946,198 | | | | 0.02 | % | |
| | 4,400,000 | | | Sealed Air Corporation,
144A, 5.625% due
7/15/2013 | | 8/20/2003 | | | 98.2065 | | | | 96.41 | | | | 4,321,090 | | | | 0.03 | % | |
| | 300,000 | | | Sealed Air Corporation,
144A, 5.625% due
7/15/2013 | | 8/21/2003 | | | 98.2065 | | | | 96.79 | | | | 294,620 | | | | 0.00 | % | |
| | 11,700,000 | | | Sealed Air Corporation,
144A, 5.625% due
7/15/2013 | | 4/6/2004 | | | 98.2065 | | | | 103.31 | | | | 11,490,172 | | | | 0.08 | % | |
| | | | | | | | | | | | | | | | | | 19,052,080 | | | | 0.13 | % | |
Federal income taxes—
It is each Fund's policy to comply with the requirements of the Internal Revenue Code applicable to regulated investment companies and to distribute substantially all of its net taxable income, including any net realized gains on investments, to its shareholders. Therefore, no federal income tax provision is required.
The Funds implemented the provisions of the Financial Accounting Standards Board ("FASB") Interpretation No. 48 ("FIN48") "Accounting for Uncertainty in Income Taxes—an interpretation of FASB Statement No. 109". This interpretation prescribes a recognition threshold and measurement attribute for the financial statement recognition and measurement of a tax position taken or expected to be taken in a tax return. It also provides guidance on de-recognition, classification, interest and penalties, accounting in interim periods, disclosure and transition. The implementation of FIN 48 resulted in no material liability for unrecognized tax benefits in the accompanying financial statements.
Recently issued accounting pronouncement—
In September 2006, the FASB issued Statement of Financial Accounting Standards No. 157 ("FAS 157") "Fair Value Measurements." FAS 157 defines fair value, establishes a framework for measuring fair value in accordance with generally accepted accounting principles and expands required disclosure about fair value measurements. FAS 157 is effective for fiscal years beginning after November 15, 2007.
THE OAKMARK FUNDS
67
THE OAKMARK FUNDS
Notes to Financial Statements (cont.)
In February 2007, FASB issued Statement of Financial Accounting Standards No. 159 ("FAS 159") "The Fair Value Option for Financial Assets and Financial Liabilities—including an amendment of FASB Statement No. 115." FAS 159 permits entities to elect to measure certain financial assets and liabilities at fair value. Unrealized gains and losses on items for which the fair value option has been elected will be reported in earnings at each subsequent reporting date. FAS 159 is effective for fiscal years beginning after November 15, 2007.
In March 2008, FASB issued Statement of Financial Accounting Standards No. 161 ("FAS 161") "Disclosures about Derivative Instruments and Hedging Activities"—an amendment of FASB Statement No. 133 ("FAS 133")," which expands the disclosure requirements in FAS 133 about an entity's derivative instruments and hedging activities. FAS 161 is effective for fiscal years and interim periods beginning after November 15, 2008.
Management is currently evaluating the impact the adoption of these accounting pronouncements will have on the Funds' financial statements and related disclosures.
2. TRANSACTIONS WITH AFFILIATES
Each Fund has an investment advisory agreement with the Adviser. For management services and facilities furnished, the Funds pay the Adviser monthly fees. Each fee is calculated on the total net assets as determined at the end of each preceding calendar month. Annual fee rates are as follows:
| Fund | | Advisory Fees | | Fund | | Advisory Fees | |
Oakmark
| | 1.00% up to $2 billion;
0.90% on the next $1 billion;
0.80% on the next $2 billion;
0.75% on the next $2.5 billion;
0.70% on the next $2.5 billion; and
0.65% over 10 billion | | Global
Global Select | | 1.00% up to $2 billion;
0.95% on the next $2 billion;
0.90% on the next $4 billion; and
0.875% over $8 billion
1.00% up to $2 billion;
0.95% on the next $1 billion; | |
|
Select
| | 1.00% up to $1 billion;
0.95% on the next $500 million;
0.85% on the next $500 million;
0.80% on the next $2.5 billion;
0.75% on the next $5 billion; and
0.725% over 10 billion | |
International | | 0.875% on the next $4 billion; and
0.85% over $7 billion
0.90% on the next $500 million;
1.00% up to $2 billion;
0.95% on the next $1 billion;
0.85% on the next $2 billion;
0.825% on the next $2.5 billion;
0.815% on the next $3.5 billion; | |
|
| Equity and Income | | 0.75% up to $5 billion;
0.70% on the next $2.5 billion;
0.65% on the next $2.5 billion;
0.60% on the next $3.5 billion; and
0.585% over $16 billion | | Int'l Small Cap | | 0.805% on the next $5.5 billion; and
0.80% over $16.5 billion
0.675% on the next $2.5 billion;
1.25% up to $500 million;
1.10% on the next $1 billion;
1.05% on the next $2 billion; and
1.025% over $3.5 billion | |
|
The Adviser is contractually obligated through January 31, 2009 to reimburse each Fund Class to the extent, but only to the extent, that its annualized expenses (excluding taxes, interest, all commissions and other normal charges incident to the purchase and sale of portfolio securities, and extraordinary charges such as litigation costs, but including fees paid to the Adviser) exceed the percent set forth below of average daily net assets of the Fund Class.
| Fund | | Class I | | Class II | |
| Oakmark | | | 1.50 | % | | | 1.75 | % | |
| Select | | | 1.50 | | | | 1.75 | | |
| Equity and Income | | | 1.00 | | | | 1.25 | | |
| Global | | | 1.75 | | | | 2.00 | | |
| Global Select | | | 1.75 | | | | 2.00 | | |
| International | | | 2.00 | | | | 2.25 | | |
| Int'l Small Cap | | | 2.00 | | | | 2.25 | | |
THE OAKMARK FUNDS
68
THE OAKMARK FUNDS
Notes to Financial Statements (cont.)
The Adviser and the Funds have entered into agreements with financial intermediaries to provide recordkeeping, processing, shareholder communications and other services to customers of the intermediaries and have agreed to compensate the intermediaries for providing those services. Certain of those services would be provided by the Funds if the shares of those customers were registered directly with the Funds' transfer agent. Accordingly, the Funds pay a portion of the intermediary fees pursuant to an agreement with the Adviser, which calls for each Fund to pay a portion of the intermediary fees attributable to shares of the Fund held by the intermediary (which generally are a percentage of value of the shares held) not exceeding the lesser of 75% of the fees charged by the intermediary or what the Fund would have paid its transfer agent had each customer's shares been registered directly with the transfer agent instead of held through the intermediary. The Adviser pays the remainder of the fees. The fees incurred by the Funds are reflected as other shareholder servicing fees in the Statements of Operations.
The non-interested Trustees of the Trust may participate in the Trust's Deferred Compensation Plan for Independent Trustees. Participants in the plan may elect to defer all or a portion of their compensation. Amounts deferred are retained by the Trust and represent an unfunded obligation of the Trust. The value of a participant's deferral account is determined by reference to the change in value of Class I shares of one or more of the Funds or a money market fund as specified by the participant. Benefits would be payable after a stated number of years or retirement from the board. The accrued obligations of the Funds under the plan are reflected as deferred trustee compensation in the Statements of Assets and Liabilities. The interested trustees are not compensated by the Funds.
3. FEDERAL INCOME TAXES
At September 30, 2008, cost of investments for federal income tax purposes and related composition of unrealized gains and losses for each fund were as follows:
| Fund | | Cost of Investments
for Federal Income
Tax Purposes | | Gross Unrealized
Appreciation | | Gross Unrealized
(Depreciation) | | Net Unrealized
Appreciation
(Depreciation) | |
| Oakmark | | $ | 3,067,048,216 | | | $ | 744,861,741 | | | $ | (195,072,485 | ) | | $ | 549,789,256 | | |
| Select | | | 2,225,842,898 | | | | 610,842,374 | | | | (262,502,985 | ) | | | 348,339,389 | | |
| Equity and Income | | | 13,330,735,874 | | | | 1,588,738,948 | | | | (523,967,681 | ) | | | 1,064,771,267 | | |
| Global | | | 2,111,272,439 | | | | 225,150,912 | | | | (308,033,420 | ) | | | (82,882,508 | ) | |
| Global Select | | | 281,669,879 | | | | 4,827,236 | | | | (59,794,747 | ) | | | (54,967,511 | ) | |
| International | | | 4,715,427,897 | | | | 170,457,683 | | | | (1,154,224,508 | ) | | | (983,766,825 | ) | |
| Int'l Small Cap | | | 897,923,873 | | | | 32,399,078 | | | | (298,106,930 | ) | | | (265,707,852 | ) | |
For the period ended September 30, 2008, the following Funds incurred net capital losses which each Fund intends to treat as incurred in the following fiscal year: $266,074,215 for Select, $19,574,157 for Global, $40,281,783 for Global Select, $161,947,798 for International, and $16,648,504 for Int'l Small Cap. As of September 30, 2008, none of the Funds had a net capital loss carryforward available to offset future realized gains.
For the year ended September 30, 2008, the components of distributable earnings on a tax basis (excluding unrealized appreciation (depreciation)) were as follows:
| Fund | | Undistributed
Ordinary Income | | Undistributed Long-
Term Gain | | Total Distributable
Earnings | |
| Oakmark | | $ | 37,942,933 | | | $ | 105,509,769 | | | $ | 143,452,702 | | |
| Select | | | 26,196,981 | | | | 0 | | | | 26,196,981 | | |
| Equity and Income | | | 218,676,726 | | | | 338,091,578 | | | | 556,768,304 | | |
| Global | | | 55,008,962 | | | | 0 | | | | 55,008,962 | | |
| Global Select | | | 8,761,378 | | | | 0 | | | | 8,761,378 | | |
| International | | | 311,567,881 | | | | 23,014,930 | | | | 334,582,811 | | |
| Int'l Small Cap | | | 42,780,108 | | | | 6,692,664 | | | | 49,472,772 | | |
THE OAKMARK FUNDS
69
THE OAKMARK FUNDS
Notes to Financial Statements (cont.)
During the year ended September 30, 2008 and the year ended September 30, 2007, the tax character of distributions paid was as follows:
| | | Year Ended
September 30, 2008 | | Year Ended
September 30, 2007 | |
| Fund | | Distributions Paid
from Ordinary
Income | | Distributions Paid
from Long-Term
Capital Gain | | Distributions Paid
from Ordinary
Income | | Distributions Paid
from Long-Term
Capital Gain | |
| Oakmark | | $ | 63,543,967 | | | $ | 391,986,830 | | | $ | 53,748,373 | | | $ | 248,745,775 | | |
| Select | | | 47,324,894 | | | | 456,979,270 | | | | 64,506,538 | | | | 582,700,204 | | |
| Equity and Income | | | 283,658,767 | | | | 713,711,785 | | | | 208,886,492 | | | | 550,867,316 | | |
| Global | | | 37,019,816 | | | | 296,608,246 | | | | 28,349,725 | | | | 323,001,195 | | |
| Global Select | | | 13,614,523 | | | | 483,518 | | | | 114,308 | | | | 0 | | |
| International | | | 152,440,649 | | | | 1,260,535,489 | | | | 144,238,130 | | | | 1,016,154,884 | | |
| Int'l Small Cap | | | 23,990,953 | | | | 263,529,673 | | | | 55,312,279 | | | | 156,024,320 | | |
On September 30, 2008, the Funds had temporary book/tax differences in undistributed earnings that were primarily attributable to trustee deferred compensation expenses, passive foreign investment companies, foreign currency contracts, post October losses and deferrals of capital losses on wash sales. Temporary differences will reverse over time. The Funds have permanent differences in book/tax undistributed earnings primarily attributable to currency gains and losses and equalization debits. Permanent differences have been recorded in their respective component of the Analysis of Net Assets.
4. INVESTMENT TRANSACTIONS
For the year ended September 30, 2008, transactions in investment securities (excluding short term, U.S. Government securities and in-kind transactions) were as follows (in thousands):
| | | Oakmark | | Select | | Equity and
Income | | Global | | Global
Select | | International | | Int'l
Small Cap | |
| Purchases | | $ | 1,350,496 | | | $ | 921,024 | | | $ | 4,137,354 | | | $ | 1,051,404 | | | $ | 173,521 | | | $ | 2,593,903 | | | $ | 451,766 | | |
| Proceeds from sales | | | 2,345,320 | | | | 2,267,205 | | | | 3,493,066 | | | | 1,415,016 | | | | 214,025 | | | | 5,327,768 | | | | 710,389 | | |
Purchases at cost and proceeds from sales, excluding in-kind transactions (in thousands) of long-term U.S. Government securities for the year ended September 30, 2008, were $4,987,151 and $5,099,626 respectively for Equity and Income.
For the year ended September 30, 2008, the proceeds from in-kind sales (in thousands) were $375,871 for Equity and Income. Gains and losses on in-kind transactions are not taxable for federal income tax purposes.
5. INVESTMENT IN AFFILIATED ISSUERS
An issuer in which a Fund's holdings represents 5% or more of the outstanding voting securities of the issuer is an affiliated issuer as defined under the Investment Company Act of 1940. A schedule of each Fund's investments in securities of affiliated issuers for the year ended September 30, 2008, is set forth below:
Schedule of Transactions with Affiliated Issuers
Oakmark Equity and Income Fund
| Affiliates | | Shares Held | | Purchases
(Cost) | | Sales
(Proceeds) | | Dividend
Income | | Value
September 30,
2008 | |
Mueller Water Products, Inc.,
Class B | | | 6,000,000 | | | $ | 0 | | | $ | 6,161,019 | | | $ | 441,318 | | | $ | 39,000,000 | | |
| Newfield Exploration Co.*+ | | | 3,831,100 | | | | 93,665,851 | | | | 132,056,686 | | | | 0 | | | | 122,556,889 | | |
| Varian, Inc.*+ | | | 1,409,400 | | | | 0 | | | | 15,773,425 | | | | 0 | | | | 60,463,260 | | |
| TOTALS | | | | | | $ | 93,665,851 | | | $ | 153,991,130 | ® | | $ | 441,318 | | | $ | 222,020,149 | | |
THE OAKMARK FUNDS
70
THE OAKMARK FUNDS
Notes to Financial Statements (cont.)
Schedule of Transactions with Affiliated Issuers
Oakmark International Fund
| Affiliates | | Shares Held | | Purchases
(Cost) | | Sales
(Proceeds) | | Dividend
Income | | Value
September 30,
2008 | |
| Giordano International Ltd.** | | | 0 | | | $ | 0 | | | $ | 49,882,149 | | | $ | 0 | | | $ | 0 | | |
| Johnston Press PLC* | | | 28,048,968 | | | | 61,720,563 | | | | 46,562,108 | | | | 3,298,253 | | | | 16,100,018 | | |
| Lotte Chilsung Beverage Co., Ltd.** | | | 0 | | | | 0 | | | | 99,499,295 | | | | 146,165 | | | | 0 | | |
| Meitec Corp. | | | 2,483,800 | | | | 0 | | | | 0 | | | | 2,000,238 | | | | 66,531,330 | | |
| Signet Jewelers, Ltd. | | | 5,388,884 | | | | 37,642,283 | | | | 64,695,788 | | | | 9,459,183 | | | | 125,992,108 | | |
| Trinity Mirror PLC** | | | 0 | | | | 0 | | | | 54,075,352 | | | | 6,996,272 | | | | 0 | | |
| TOTALS | | | | | | $ | 99,362,846 | | | $ | 314,714,692 | | | $ | 21,900,111 | | | $ | 208,623,456 | | |
Schedule of Transactions with Affiliated Issuers
Oakmark Int'l Small Cap Fund
| Affiliates | | Shares Held | | Purchases
(Cost) | | Sales
(Proceeds) | | Dividend
Income | | Value
September 30,
2008 | |
| Alaska Milk Corp. | | | 56,360,000 | | | $ | 0 | | | $ | 0 | | | $ | 365,705 | | | $ | 5,733,847 | | |
| Binggrae Co., Ltd.* | | | 165,500 | | | | 0 | | | | 15,739,046 | | | | 567,811 | | | | 4,650,214 | | |
| Chargeurs SA | | | 790,182 | | | | 0 | | | | 0 | | | | 794,079 | | | | 11,120,369 | | |
| Freightways Ltd. | | | 7,624,568 | | | | 0 | | | | 0 | | | | 1,229,626 | | | | 16,545,059 | | |
| Ichiyoshi Securities Co., Ltd.* | | | 2,237,200 | | | | 0 | | | | 1,516,537 | | | | 722,938 | | | | 23,463,644 | | |
| Kongsberg Automotive ASA** | | | 0 | | | | 0 | | | | 21,782,126 | | | | 0 | | | | 0 | | |
| JJB Sports PLC | | | 12,672,200 | | | | 22,298,355 | | | | 6,240,693 | | | | 2,616,026 | | | | 10,104,786 | | |
| LSL Property Services PLC | | | 10,362,200 | | | | 12,566,363 | | | | 3,768,241 | | | | 628,960 | | | | 13,512,585 | | |
| Monitise PLC+ | | | 31,454,888 | | | | 2,027,658 | | | | 0 | | | | 0 | | | | 4,333,962 | | |
| Morse PLC** | | | 0 | | | | 0 | | | | 12,957,699 | | | | 1,086,458 | | | | 0 | | |
| Orbotech, Ltd.*+ | | | 1,395,300 | | | | 0 | | | | 5,789,295 | | | | 0 | | | | 11,148,447 | | |
| Pasona Group, Inc. | | | 27,400 | | | | 9,127,166 | | | | 5,991,108 | | | | 620,229 | | | | 20,951,003 | | |
| Raymarine PLC | | | 4,093,379 | | | | 18,128,324 | | | | 1,507,789 | | | | 561,519 | | | | 8,027,106 | | |
| Vitec Group PLC | | | 2,812,479 | | | | 0 | | | | 1,118,824 | | | | 992,588 | | | | 17,495,105 | | |
| TOTALS | | | | | | $ | 64,147,866 | | | $ | 76,411,358 | | | $ | 10,185,939 | | | $ | 147,086,127 | | |
+ Non-income producing security.
* Due to transactions during the year ended September 30, 2008, the company is no longer an affiliated security.
** Position in issuer liquidated during the year ended September 30, 2008.
® Includes proceeds from in-kind transactions of $14,663,698.
THE OAKMARK FUNDS
71
THE OAKMARK FUNDS
FINANCIAL HIGHLIGHTS
The following tables are intended to help you understand each Fund's financial performance during the last 5 years (or since it began operations, if less than five years). Certain information reflects financial results for a single Fund share. Total returns represent the rate you would have earned (or lost) on an investment, assuming reinvestment of all dividends and distributions. For each year shown, all information is for the fiscal year ended September 30, unless otherwise noted.
THE OAKMARK FUNDS
72
OAKMARK FUND
Financial Highlights–Class I
For a share outstanding throughout each period
| | | Year Ended
September 30,
2008 | | Year Ended
September 30,
2007 | | Year Ended
September 30,
2006 | | Year Ended
September 30,
2005 | | Year Ended
September 30,
2004 | |
| Net Asset Value, Beginning of Year | | $ | 47.28 | | | $ | 44.64 | | | $ | 40.75 | | | $ | 38.68 | | | $ | 33.85 | | |
| Income From Investment Operations: | |
| Net Investment Income | | | 0.52 | | | | 0.47 | (a) | | | 0.39 | (a) | | | 0.34 | | | | 0.16 | | |
| Net Gain (Loss) on Investments (both realized and unrealized) | | | (8.51 | ) | | | 4.60 | | | | 3.85 | | | | 1.90 | | | | 4.81 | | |
| Total From Investment Operations | | | (7.99 | ) | | | 5.07 | | | | 4.24 | | | | 2.24 | | | | 4.97 | | |
| Less Distributions: | |
| Dividends (from net investment income) | | | (0.56 | ) | | | (0.43 | ) | | | (0.35 | ) | | | (0.17 | ) | | | (0.14 | ) | |
| Dividends (from capital gains) | | | (3.42 | ) | | | (2.00 | ) | | | 0.00 | | | | 0.00 | | | | 0.00 | | |
| Total Distributions | | | (3.98 | ) | | | (2.43 | ) | | | (0.35 | ) | | | (0.17 | ) | | | (0.14 | ) | |
| Redemption Fees | | | 0.00 | (b) | | | 0.00 | (b) | | | 0.00 | (b) | | | 0.00 | (b) | | | 0.00 | (b) | |
| Net Asset Value, End of Year | | $ | 35.31 | | | $ | 47.28 | | | $ | 44.64 | | | $ | 40.75 | | | $ | 38.68 | | |
| Total Return | | | –18.14 | % | | | 11.51 | % | | | 10.46 | % | | | 5.79 | % | | | 14.73 | % | |
| Ratios/ Supplemental Data: | |
| Net Assets, End of Year ($million) | | $ | 3,610.1 | | | $ | 5,656.9 | | | $ | 5,486.2 | | | $ | 6,340.4 | | | $ | 6,474.0 | | |
| Ratio of Expenses to Average Net Assets | | | 1.10 | %* | | | 1.01 | %* | | | 1.05 | %* | | | 1.03 | %* | | | 1.05 | % | |
| Ratio of Net Investment Income to Average Net Assets | | | 1.17 | % | | | 1.01 | % | | | 0.94 | % | | | 0.79 | % | | | 0.47 | % | |
| Portfolio Turnover Rate | | | 32 | % | | | 12 | % | | | 9 | % | | | 16 | % | | | 19 | % | |
Financial Highlights–Class II
For a share outstanding throughout each period
| | | Year Ended
September 30,
2008 | | Year Ended
September 30,
2007 | | Year Ended
September 30,
2006 | | Year Ended
September 30,
2005 | | Year Ended
September 30,
2004 | |
| Net Asset Value, Beginning of Year | | $ | 46.97 | | | $ | 44.35 | | | $ | 40.51 | | | $ | 38.45 | | | $ | 33.68 | | |
| Income From Investment Operations: | |
| Net Investment Income | | | 0.54 | | | | 0.32 | (a) | | | 0.25 | (a) | | | 0.26 | (a) | | | 0.04 | (a) | |
| Net Gain (Loss) on Investments (both realized and unrealized) | | | (8.64 | ) | | | 4.55 | | | | 3.82 | | | | 1.87 | | | | 4.78 | | |
| Total From Investment Operations | | | (8.10 | ) | | | 4.87 | | | | 4.07 | | | | 2.13 | | | | 4.82 | | |
| Less Distributions: | |
| Dividends (from net investment income) | | | (0.33 | ) | | | (0.25 | ) | | | (0.23 | ) | | | (0.07 | ) | | | (0.05 | ) | |
| Distributions (from capital gains) | | | (3.42 | ) | | | (2.00 | ) | | | 0.00 | | | | 0.00 | | | | 0.00 | | |
| Total Distributions | | | (3.75 | ) | | | (2.25 | ) | | | (0.23 | ) | | | (0.07 | ) | | | (0.05 | ) | |
| Redemption Fees | | | 0.00 | (b) | | | 0.00 | (b) | | | 0.00 | (b) | | | 0.00 | | | | 0.00 | | |
| Net Asset Value, End of Year | | $ | 35.12 | | | $ | 46.97 | | | $ | 44.35 | | | $ | 40.51 | | | $ | 38.45 | | |
| Total Return | | | –18.44 | % | | | 11.11 | % | | | 10.08 | % | | | 5.55 | % | | | 14.32 | % | |
| Ratios/Supplemental Data: | |
| Net assets, end of year ($million) | | $ | 12.4 | | | $ | 29.1 | | | $ | 37.5 | | | $ | 43.7 | | | $ | 51.9 | | |
| Ratio of Expenses to Average Net Assets | | | 1.47 | %* | | | 1.36 | %* | | | 1.40 | %* | | | 1.26 | %* | | | 1.40 | % | |
| Ratio of Net Investment Income to Average Net Assets | | | 0.81 | % | | | 0.67 | % | | | 0.59 | % | | | 0.58 | % | | | 0.11 | % | |
| Portfolio Turnover Rate | | | 32 | % | | | 12 | % | | | 9 | % | | | 16 | % | | | 19 | % | |
* The ratio excludes expense offset arrangement.
(a) Computed using average shares outstanding throughout the period.
(b) Amount rounds to less than $0.01 per share.
See accompanying Notes to Financial Statements.
THE OAKMARK FUNDS
73
OAKMARK SELECT FUND
Financial Highlights–Class I
For a share outstanding throughout each period
| | | Year Ended
September 30,
2008 | | Year Ended
September 30,
2007 | | Year Ended
September 30,
2006 | | Year Ended
September 30,
2005 | | Year Ended
September 30,
2004 | |
| Net Asset Value, Beginning of Year | | $ | 33.05 | | | $ | 34.48 | | | $ | 33.44 | | | $ | 31.20 | | | $ | 27.55 | | |
| Income From Investment Operations: | |
| Net Investment Income | | | 0.35 | | | | 0.38 | (a) | | | 0.36 | (a) | | | 0.29 | | | | 0.15 | (a) | |
| Net Gain (Loss) on Investments (both realized and unrealized) | | | (9.63 | ) | | | 2.11 | | | | 2.76 | | | | 2.19 | | | | 3.60 | | |
| Total From Investment Operations | | | (9.28 | ) | | | 2.49 | | | | 3.12 | | | | 2.48 | | | | 3.75 | | |
| Less Distributions: | |
| Dividends (from net investment income) | | | (0.32 | ) | | | (0.39 | ) | | | (0.29 | ) | | | (0.24 | ) | | | (0.10 | ) | |
| Dividends (from capital gains) | | | (3.11 | ) | | | (3.53 | ) | | | (1.79 | ) | | | 0.00 | | | | 0.00 | | |
| Total Distributions | | | (3.43 | ) | | | (3.92 | ) | | | (2.08 | ) | | | (0.24 | ) | | | (0.10 | ) | |
| Redemption Fees | | | 0.00 | (b) | | | 0.00 | (b) | | | 0.00 | (b) | | | 0.00 | (b) | | | 0.00 | (b) | |
| Net Asset Value, End of Year | | $ | 20.34 | | | $ | 33.05 | | | $ | 34.48 | | | $ | 33.44 | | | $ | 31.20 | | |
| Total Return | | | –30.43 | % | | | 7.00 | % | | | 9.58 | % | | | 7.98 | % | | | 13.64 | % | |
| Ratios/ Supplemental Data: | |
| Net Assets, End of Year ($million) | | $ | 2,558.9 | | | $ | 5,397.4 | | | $ | 5,776.6 | | | $ | 5,908.0 | | | $ | 5,463.0 | | |
| Ratio of Expenses to Average Net Assets | | | 1.08 | %* | | | 0.97 | %* | | | 0.99 | %* | | | 1.00 | %* | | | 1.00 | % | |
| Ratio of Net Investment Income to Average Net Assets | | | 1.16 | % | | | 1.11 | % | | | 1.08 | % | | | 0.87 | % | | | 0.50 | % | |
| Portfolio Turnover Rate | | | 26 | % | | | 10 | % | | | 22 | % | | | 21 | % | | | 14 | % | |
Financial Highlights–Class II
For a share outstanding throughout each period
| | | Year Ended
September 30,
2008 | | Year Ended
September 30,
2007 | | Year Ended
September 30,
2006 | | Year Ended
September 30,
2005 | | Year Ended
September 30,
2004 | |
| Net Asset Value, Beginning of Year | | $ | 32.82 | | | $ | 34.23 | | | $ | 33.24 | | | $ | 31.00 | | | $ | 27.37 | | |
| Income From Investment Operations: | |
| Net Investment Income | | | 0.34 | | | | 0.27 | (a) | | | 0.26 | (a) | �� | | 0.21 | | | | 0.09 | (a) | |
| Net Gain (Loss) on Investments (both realized and unrealized) | | | (9.65 | ) | | | 2.09 | | | | 2.72 | | | | 2.18 | | | | 3.58 | | |
| Total From Investment Operations | | | (9.31 | ) | | | 2.36 | | | | 2.98 | | | | 2.39 | | | | 3.67 | | |
| Less Distributions: | |
| Dividends (from net investment income) | | | (0.11 | ) | | | (0.24 | ) | | | (0.20 | ) | | | (0.15 | ) | | | (0.04 | ) | |
| Distributions (from capital gains) | | | (3.11 | ) | | | (3.53 | ) | | | (1.79 | ) | | | 0.00 | | | | 0.00 | | |
| Total Distributions | | | (3.22 | ) | | | (3.77 | ) | | | (1.99 | ) | | | (0.15 | ) | | | (0.04 | ) | |
| Redemption Fees | | | 0.00 | (b) | | | 0.00 | (b) | | | 0.00 | (b) | | | 0.00 | | | | 0.00 | | |
| Net Asset Value, End of Year | | $ | 20.29 | | | $ | 32.82 | | | $ | 34.23 | | | $ | 33.24 | | | $ | 31.00 | | |
| Total Return | | | –30.64 | % | | | 6.65 | % | | | 9.18 | % | | | 7.72 | % | | | 13.40 | % | |
| Ratios/Supplemental Data: | |
| Net assets, end of year ($million) | | $ | 15.1 | | | $ | 36.2 | | | $ | 68.1 | | | $ | 85.2 | | | $ | 98.0 | | |
| Ratio of Expenses to Average Net Assets | | | 1.37 | %* | | | 1.35 | %* | | | 1.34 | %* | | | 1.25 | %* | | | 1.21 | % | |
| Ratio of Net Investment Income to Average Net Assets | | | 0.88 | % | | | 0.79 | % | | | 0.78 | % | | | 0.65 | % | | | 0.29 | % | |
| Portfolio Turnover Rate | | | 26 | % | | | 10 | % | | | 22 | % | | | 21 | % | | | 14 | % | |
* The ratio excludes expense offset arrangement.
(a) Computed using average shares outstanding throughout the period.
(b) Amount rounds to less than $0.01 per share.
THE OAKMARK FUNDS
74
OAKMARK EQUITY AND INCOME FUND
Financial Highlights–Class I
For a share outstanding throughout each period
| | | Year Ended
September 30,
2008 | | Year Ended
September 30,
2007 | | Year Ended
September 30,
2006 | | Year Ended
September 30,
2005 | | Year Ended
September 30,
2004 | |
| Net Asset Value, Beginning of Year | | $ | 28.67 | | | $ | 26.49 | | | $ | 25.41 | | | $ | 23.12 | | | $ | 20.30 | | |
| Income From Investment Operations: | |
| Net Investment Income | | | 0.53 | (a) | | | 0.58 | (a) | | | 0.44 | | | | 0.31 | | | | 0.15 | | |
| Net Gain (Loss) on Investments (both realized and unrealized) | | | (1.52 | ) | | | 3.41 | | | | 1.18 | | | | 2.77 | | | | 2.81 | | |
| Total From Investment Operations | | | (0.99 | ) | | | 3.99 | | | | 1.62 | | | | 3.08 | | | | 2.96 | | |
| Less Distributions: | |
| Dividends (from net investment income) | | | (0.60 | ) | | | (0.50 | ) | | | (0.34 | ) | | | (0.20 | ) | | | (0.14 | ) | |
| Dividends (from capital gains) | | | (1.51 | ) | | | (1.31 | ) | | | (0.20 | ) | | | (0.59 | ) | | | 0.00 | | |
| Total Distributions | | | (2.11 | ) | | | (1.81 | ) | | | (0.54 | ) | | | (0.79 | ) | | | (0.14 | ) | |
| Redemption Fees | | | 0.00 | (b) | | | 0.00 | (b) | | | 0.00 | (b) | | | 0.00 | (b) | | | 0.00 | (b) | |
| Net Asset Value, End of Year | | $ | 25.57 | | | $ | 28.67 | | | $ | 26.49 | | | $ | 25.41 | | | $ | 23.12 | | |
| Total Return | | | –3.85 | % | | | 15.77 | % | | | 6.51 | % | | | 13.65 | % | | | 14.64 | % | |
| Ratios/ Supplemental Data: | |
| Net Assets, End of Year ($million) | | $ | 13,263.3 | | | $ | 12,489.5 | | | $ | 10,414.5 | | | $ | 9,223.2 | | | $ | 7,577.9 | | |
| Ratio of Expenses to Average Net Assets | | | 0.81 | %* | | | 0.83 | %* | | | 0.86 | %* | | | 0.89 | %* | | | 0.92 | % | |
| Ratio of Net Investment Income to Average Net Assets | | | 1.93 | % | | | 2.14 | % | | | 1.88 | % | | | 1.36 | % | | | 0.78 | % | |
| Portfolio Turnover Rate | | | 65 | %(c) | | | 67 | % | | | 81 | % | | | 112 | % | | | 72 | % | |
Financial Highlights–Class II
For a share outstanding throughout each period
| | | Year Ended
September 30,
2008 | | Year Ended
September 30,
2007 | | Year Ended
September 30,
2006 | | Year Ended
September 30,
2005 | | Year Ended
September 30,
2004 | |
| Net Asset Value, Beginning of Year | | $ | 28.50 | | | $ | 26.35 | | | $ | 25.29 | | | $ | 23.03 | | | $ | 20.24 | | |
| Income From Investment Operations: | |
| Net Investment Income | | | 0.43 | (a) | | | 0.48 | (a) | | | 0.35 | | | | 0.28 | | | | 0.11 | | |
| Net Gain (Loss) on Investments (both realized and unrealized) | | | (1.51 | ) | | | 3.40 | | | | 1.19 | | | | 2.72 | | | | 2.79 | | |
| Total From Investment Operations | | | (1.08 | ) | | | 3.88 | | | | 1.54 | | | | 3.00 | | | | 2.90 | | |
| Less Distributions: | |
| Dividends (from net investment income) | | | (0.51 | ) | | | (0.42 | ) | | | (0.28 | ) | | | (0.15 | ) | | | (0.11 | ) | |
| Distributions (from capital gains) | | | (1.51 | ) | | | (1.31 | ) | | | (0.20 | ) | | | (0.59 | ) | | | 0.00 | | |
| Total Distributions | | | (2.02 | ) | | | (1.73 | ) | | | (0.48 | ) | | | (0.74 | ) | | | (0.11 | ) | |
| Redemption Fees | | | 0.00 | (b) | | | 0.00 | (b) | | | 0.00 | (b) | | | 0.00 | | | | 0.00 | | |
| Net Asset Value, End of Year | | $ | 25.40 | | | $ | 28.50 | | | $ | 26.35 | | | $ | 25.29 | | | $ | 23.03 | | |
| Total Return | | | –4.19 | % | | | 15.38 | % | | | 6.18 | % | | | 13.34 | % | | | 14.36 | % | |
| Ratios/Supplemental Data: | |
| Net assets, end of year ($million) | | $ | 1,009.7 | | | $ | 915.1 | | | $ | 718.1 | | | $ | 582.0 | | | $ | 478.7 | | |
| Ratio of Expenses to Average Net Assets | | | 1.16 | %* | | | 1.17 | %* | | | 1.18 | %* | | | 1.14 | %* | | | 1.17 | % | |
| Ratio of Net Investment Income to Average Net Assets | | | 1.59 | % | | | 1.82 | % | | | 1.57 | % | | | 1.11 | % | | | 0.53 | % | |
| Portfolio Turnover Rate | | | 65 | %(c) | | | 67 | % | | | 81 | % | | | 112 | % | | | 72 | % | |
* The ratio excludes expense offset arrangement.
(a) Computed using average shares outstanding throughout the period.
(b) Amount rounds to less than $0.01 per share.
(c) The ratio excludes in-kind transactions.
See accompanying Notes to Financial Statements.
THE OAKMARK FUNDS
75
OAKMARK GLOBAL FUND
Financial Highlights–Class I
For a share outstanding throughout each period
| | | Year Ended
September 30,
2008 | | Year Ended
September 30,
2007 | | Year Ended
September 30,
2006 | | Year Ended
September 30,
2005 | | Year Ended
September 30,
2004 | |
| Net Asset Value, Beginning of Year | | $ | 28.08 | | | $ | 26.69 | | | $ | 23.91 | | | $ | 19.73 | | | $ | 16.98 | | |
| Income From Investment Operations: | |
| Net Investment Income | | | 0.25 | | | | 0.18 | (a) | | | 0.27 | | | | 0.17 | | | | 0.09 | | |
| Net Gain (Loss) on Investments (both realized and unrealized) | | | (5.82 | ) | | | 5.06 | | | | 3.74 | | | | 4.48 | | | | 2.71 | | |
| Total From Investment Operations | | | (5.57 | ) | | | 5.24 | | | | 4.01 | | | | 4.65 | | | | 2.80 | | |
| Less Distributions: | |
| Dividends (from net investment income) | | | (0.04 | ) | | | (0.31 | ) | | | (0.26 | ) | | | (0.10 | ) | | | 0.00 | (b) | |
| Dividends (from capital gains) | | | (3.04 | ) | | | (3.54 | ) | | | (0.97 | ) | | | (0.37 | ) | | | (0.05 | ) | |
| Total Distributions | | | (3.08 | ) | | | (3.85 | ) | | | (1.23 | ) | | | (0.47 | ) | | | (0.05 | ) | |
| Redemption Fees | | | 0.00 | (b) | | | 0.00 | (b) | | | 0.00 | (b) | | | 0.00 | (b) | | | 0.00 | (b) | |
| Net Asset Value, End of Year | | $ | 19.43 | | | $ | 28.08 | | | $ | 26.69 | | | $ | 23.91 | | | $ | 19.73 | | |
| Total Return | | | –22.10 | % | | | 21.29 | % | | | 17.46 | % | | | 23.88 | % | | | 16.54 | % | |
| Ratios/ Supplemental Data: | |
| Net Assets, End of Year ($million) | | $ | 1,946.6 | | | $ | 3,006.2 | | | $ | 2,282.2 | | | $ | 1,842.9 | | | $ | 1,336.3 | | |
| Ratio of Expenses to Average Net Assets | | | 1.16 | %* | | | 1.13 | %* | | | 1.18 | %* | | | 1.20 | %* | | | 1.26 | % | |
| Ratio of Net Investment Income to Average Net Assets | | | 0.95 | % | | | 0.66 | % | | | 1.18 | % | | | 0.81 | % | | | 0.47 | % | |
| Portfolio Turnover Rate | | | 41 | % | | | 35 | % | | | 41 | % | | | 17 | % | | | 16 | % | |
Financial Highlights–Class II
For a share outstanding throughout each period
| | | Year Ended
September 30,
2008 | | Year Ended
September 30,
2007 | | Year Ended
September 30,
2006 | | Year Ended
September 30,
2005 | | Year Ended
September 30,
2004 | |
| Net Asset Value, Beginning of Year | | $ | 27.62 | | | $ | 26.31 | | | $ | 23.63 | | | $ | 19.53 | | | $ | 16.84 | | |
| Income From Investment Operations: | |
| Net Investment Income | | | 0.13 | | | | 0.07 | (a) | | | 0.18 | | | | 0.11 | | | | 0.05 | | |
| Net Gain (Loss) on Investments (both realized and unrealized) | | | (5.69 | ) | | | 4.99 | | | | 3.69 | | | | 4.43 | | | | 2.69 | | |
| Total From Investment Operations | | | (5.56 | ) | | | 5.06 | | | | 3.87 | | | | 4.54 | | | | 2.74 | | |
| Less Distributions: | |
| Dividends (from net investment income) | | | (0.01 | ) | | | (0.21 | ) | | | (0.22 | ) | | | (0.07 | ) | | | 0.00 | | |
| Distributions (from capital gains) | | | (3.04 | ) | | | (3.54 | ) | | | (0.97 | ) | | | (0.37 | ) | | | (0.05 | ) | |
| Total Distributions | | | (3.05 | ) | | | (3.75 | ) | | | (1.19 | ) | | | (0.44 | ) | | | (0.05 | ) | |
| Redemption Fees | | | 0.00 | (b) | | | 0.00 | (b) | | | 0.00 | (b) | | | 0.00 | | | | 0.00 | | |
| Net Asset Value, End of Year | | $ | 19.01 | | | $ | 27.62 | | | $ | 26.31 | | | $ | 23.63 | | | $ | 19.53 | | |
| Total Return | | | –22.46 | % | | | 20.82 | % | | | 17.01 | % | | | 23.53 | % | | | 16.32 | % | |
| Ratios/Supplemental Data: | |
| Net assets, end of year ($million) | | $ | 57.6 | | | $ | 90.3 | | | $ | 77.1 | | | $ | 58.6 | | | $ | 24.7 | | |
| Ratio of Expenses to Average Net Assets | | | 1.57 | %* | | | 1.53 | %* | | | 1.56 | %* | | | 1.45 | %* | | | 1.50 | % | |
| Ratio of Net Investment Income to Average Net Assets | | | 0.54 | % | | | 0.25 | % | | | 0.80 | % | | | 0.63 | % | | | 0.37 | % | |
| Portfolio Turnover Rate | | | 41 | % | | | 35 | % | | | 41 | % | | | 17 | % | | | 16 | % | |
* The ratio excludes expense offset arrangement.
(a) Computed using average shares outstanding throughout the period.
(b) Amount rounds to less than $0.01 per share.
THE OAKMARK FUNDS
76
OAKMARK GLOBAL SELECT FUND
Financial Highlights–Class I
For a share outstanding throughout each period
| | | Year Ended
September 30,
2008 | | October 2, 2006
through
September 30,
2007(a) | |
| Net Asset Value, Beginning of Year | | $ | 11.61 | | | $ | 10.00 | | |
| Income From Investment Operations: | |
| Net Investment Income | | | 0.14 | (b) | | | 0.12 | (b) | |
| Net Gain (Loss) on Investments (both realized and unrealized) | | | (3.07 | ) | | | 1.49 | | |
| Total From Investment Operations | | | (2.93 | ) | | | 1.61 | | |
| Less Distributions: | |
| Dividends (from net investment income) | | | (0.02 | ) | | | (0.01 | ) | |
| Dividends (from capital gains) | | | (0.44 | ) | | | 0.00 | | |
| Total Distributions | | | (0.46 | ) | | | (0.01 | ) | |
| Redemption Fees | | | 0.01 | | | | 0.01 | | |
| Net Asset Value, End of Year | | $ | 8.23 | | | $ | 11.61 | | |
| Total Return –25.95% | | | 16.23 | % | | |  | | |
| Ratios/ Supplemental Data: | |
| Net Assets, End of Year ($million) | | $ | 232.8 | | | $ | 377.7 | | |
| Ratio of Expenses to Average Net Assets | | | 1.35 | %* | | | 1.31 | %†* | |
| Ratio of Net Investment Income to Average Net Assets | | | 1.41 | % | | | 1.01 | % | |
| Portfolio Turnover Rate | | | 62 | % | | | 33 | % | |
 Data has not been annualized.
† Data has been annualized.
* The ratio excludes expense offset arrangement.
(a) The date on which fund shares were first offered for sale to the public was October 2, 2006.
(b) Computed using average shares outstanding throughout the period.
See accompanying Notes to Financial Statements.
THE OAKMARK FUNDS
77
OAKMARK INTERNATIONAL FUND
Financial Highlights–Class I
For a share outstanding throughout each period
| | | Year Ended
September 30,
2008 | | Year Ended
September 30,
2007 | | Year Ended
September 30,
2006 | | Year Ended
September 30,
2005 | | Year Ended
September 30,
2004 | |
| Net Asset Value, Beginning of Year | | $ | 26.59 | | | $ | 26.83 | | | $ | 23.52 | | | $ | 18.98 | | | $ | 15.67 | | |
| Income From Investment Operations: | |
| Net Investment Income | | | 0.65 | | | | 0.43 | | | | 0.41 | | | | 0.27 | | | | 0.24 | | |
| Net Gain (Loss) on Investments (both realized and unrealized) | | | (7.11 | ) | | | 3.25 | | | | 4.49 | | | | 4.59 | | | | 3.18 | | |
| Total From Investment Operations | | | (6.46 | ) | | | 3.68 | | | | 4.90 | | | | 4.86 | | | | 3.42 | | |
| Less Distributions: | |
| Dividends (from net investment income) | | | (0.17 | ) | | | (0.44 | ) | | | (0.59 | ) | | | (0.27 | ) | | | (0.11 | ) | |
| Dividends (from capital gains) | | | (4.25 | ) | | | (3.48 | ) | | | (1.00 | ) | | | (0.05 | ) | | | 0.00 | | |
| Total Distributions | | | (4.42 | ) | | | (3.92 | ) | | | (1.59 | ) | | | (0.32 | ) | | | (0.11 | ) | |
| Redemption Fees | | | 0.00 | (a) | | | 0.00 | (a) | | | 0.00 | (a) | | | 0.00 | (a) | | | 0.00 | (a) | |
| Net Asset Value, End of Year | | $ | 15.71 | | | $ | 26.59 | | | $ | 26.83 | | | $ | 23.52 | | | $ | 18.98 | | |
| Total Return | | | –28.59 | % | | | 14.53 | % | | | 22.14 | % | | | 25.85 | % | | | 21.92 | % | |
| Ratios/ Supplemental Data: | |
| Net Assets, End of Year ($million) | | $ | 3,753.6 | | | $ | 8,446.6 | | | $ | 7,200.5 | | | $ | 5,627.4 | | | $ | 4,036.9 | | |
| Ratio of Expenses to Average Net Assets | | | 1.10 | %* | | | 1.05 | %* | | | 1.08 | %* | | | 1.11 | %* | | | 1.20 | % | |
| Ratio of Net Investment Income to Average Net Assets | | | 2.32 | % | | | 1.65 | % | | | 1.80 | % | | | 1.32 | % | | | 1.40 | % | |
| Portfolio Turnover Rate | | | 41 | % | | | 50 | % | | | 37 | % | | | 14 | % | | | 21 | % | |
Financial Highlights–Class II
For a share outstanding throughout each period
| | | Year Ended
September 30,
2008 | | Year Ended
September 30,
2007 | | Year Ended
September 30,
2006 | | Year Ended
September 30,
2005 | | Year Ended
September 30,
2004 | |
| Net Asset Value, Beginning of Year | | $ | 26.32 | | | $ | 26.61 | | | $ | 23.36 | | | $ | 18.86 | | | $ | 15.58 | | |
| Income From Investment Operations: | |
| Net Investment Income | | | 0.39 | (a) | | | 0.35 | | | | 0.34 | | | | 0.22 | | | | 0.18 | | |
| Net Gain (Loss) on Investments (both realized and unrealized) | | | (6.86 | ) | | | 3.19 | | | | 4.45 | | | | 4.55 | | | | 3.16 | | |
| Total From Investment Operations | | | (6.47 | ) | | | 3.54 | | | | 4.79 | | | | 4.77 | | | | 3.34 | | |
| Less Distributions: | |
| Dividends (from net investment income) | | | (0.05 | ) | | | (0.35 | ) | | | (0.54 | ) | | | (0.22 | ) | | | (0.06 | ) | |
| Distributions (from capital gains) | | | (4.25 | ) | | | (3.48 | ) | | | (1.00 | ) | | | (0.05 | ) | | | 0.00 | | |
| Total Distributions | | | (4.30 | ) | | | (3.83 | ) | | | (1.54 | ) | | | (0.27 | ) | | | (0.06 | ) | |
| Redemption Fees | | | 0.00 | (b) | | | 0.00 | (b) | | | 0.00 | (b) | | | 0.00 | | | | 0.00 | | |
| Net Asset Value, End of Year | | $ | 15.55 | | | $ | 26.32 | | | $ | 26.61 | | | $ | 23.36 | | | $ | 18.86 | | |
| Total Return | | | –28.91 | % | | | 14.04 | % | | | 21.71 | % | | | 25.50 | % | | | 21.52 | % | |
| Ratios/Supplemental Data: | |
| Net assets, end of year ($million) | | $ | 130.8 | | | $ | 586.9 | | | $ | 496.0 | | | $ | 362.9 | | | $ | 259.2 | | |
| Ratio of Expenses to Average Net Assets | | | 1.52 | %* | | | 1.44 | %* | | | 1.47 | %* | | | 1.38 | %* | | | 1.53 | % | |
| Ratio of Net Investment Income to Average Net Assets | | | 1.96 | % | | | 1.31 | % | | | 1.43 | % | | | 1.08 | % | | | 1.18 | % | |
| Portfolio Turnover Rate | | | 41 | % | | | 50 | % | | | 37 | % | | | 14 | % | | | 21 | % | |
* The ratio excludes expense offset arrangement.
(a) Computed using average shares outstanding throughout the period.
(b) Amount rounds to less than $0.01 per share.
THE OAKMARK FUNDS
78
OAKMARK INTERNATIONAL SMALL CAP FUND
Financial Highlights–Class I
For a share outstanding throughout each period
| | | Year Ended
September 30,
2008 | | Year Ended
September 30,
2007 | | Year Ended
September 30,
2006 | | Year Ended
September 30,
2005 | | Year Ended
September 30,
2004 | |
| Net Asset Value, Beginning of Year | | $ | 23.19 | | | $ | 24.09 | | | $ | 22.79 | | | $ | 18.26 | | | $ | 13.74 | | |
| Income From Investment Operations: | |
| Net Investment Income | | | 0.37 | | | | 0.32 | | | | 0.42 | | | | 0.20 | | | | 0.11 | | |
| Net Gain (Loss) on Investments (both realized and unrealized) | | | (6.36 | ) | | | 2.77 | | | | 5.12 | | | | 4.98 | | | | 4.52 | | |
| Total From Investment Operations | | | (5.99 | ) | | | 3.09 | | | | 5.54 | | | | 5.18 | | | | 4.63 | | |
| Less Distributions: | |
| Dividends (from net investment income) | | | (0.18 | ) | | | (0.56 | ) | | | (0.70 | ) | | | (0.27 | ) | | | (0.12 | ) | |
| Dividends (from capital gains) | | | (5.66 | ) | | | (3.43 | ) | | | (3.54 | ) | | | (0.38 | ) | | | 0.00 | | |
| Total Distributions | | | (5.84 | ) | | | (3.99 | ) | | | (4.24 | ) | | | (0.65 | ) | | | (0.12 | ) | |
| Redemption Fees | | | 0.00 | (a) | | | 0.00 | (a) | | | 0.00 | (a) | | | 0.00 | (a) | | | 0.01 | | |
| Net Asset Value, End of Year | | $ | 11.36 | | | $ | 23.19 | | | $ | 24.09 | | | $ | 22.79 | | | $ | 18.26 | | |
| Total Return | | | –32.47 | % | | | 13.35 | % | | | 28.50 | % | | | 29.04 | % | | | 33.94 | % | |
| Ratios/ Supplemental Data: | |
| Net Assets, End of Year ($million) | | $ | 663.6 | | | $ | 1,326.5 | | | $ | 1,274.5 | | | $ | 1,007.2 | | | $ | 734.1 | | |
| Ratio of Expenses to Average Net Assets | | | 1.41 | %* | | | 1.34 | %* | | | 1.37 | %* | | | 1.41 | %* | | | 1.49 | % | |
| Ratio of Net Investment Income to Average Net Assets | | | 2.17 | % | | | 1.19 | % | | | 1.73 | % | | | 0.96 | % | | | 0.72 | % | |
| Portfolio Turnover Rate | | | 50 | % | | | 57 | % | | | 44 | % | | | 47 | % | | | 29 | % | |
Financial Highlights–Class II
For a share outstanding throughout each period
| | | Year Ended
September 30,
2008 | | Year Ended
September 30,
2007 | | Year Ended
September 30,
2006 | | Year Ended
September 30,
2005 | | Year Ended
September 30,
2004 | |
| Net Asset Value, Beginning of Year | | $ | 23.15 | | | $ | 24.05 | | | $ | 22.77 | | | $ | 18.25 | | | $ | 13.69 | | |
| Income From Investment Operations: | |
| Net Investment Income | | | 0.47 | | | | 0.29 | | | | 0.41 | | | | 0.18 | | | | 0.13 | | |
| Net Gain (Loss) on Investments (both realized and unrealized) | | | (6.48 | ) | | | 2.79 | | | | 5.10 | | | | 4.98 | | | | 4.52 | | |
| Total From Investment Operations | | | (6.01 | ) | | | 3.08 | | | | 5.51 | | | | 5.16 | | | | 4.65 | | |
| Less Distributions: | |
| Dividends (from net investment income) | | | (0.15 | ) | | | (0.55 | ) | | | (0.69 | ) | | | (0.26 | ) | | | (0.09 | ) | |
| Distributions (from capital gains) | | | (5.66 | ) | | | (3.43 | ) | | | (3.54 | ) | | | (0.38 | ) | | | 0.00 | | |
| Total Distributions | | | (5.81 | ) | | | (3.98 | ) | | | (4.23 | ) | | | (0.64 | ) | | | (0.09 | ) | |
| Redemption Fees | | | 0.00 | (a) | | | 0.00 | (a) | | | 0.00 | (a) | | | 0.00 | | | | 0.00 | | |
| Net Asset Value, End of Year | | $ | 11.33 | | | $ | 23.15 | | | $ | 24.05 | | | $ | 22.77 | | | $ | 18.25 | | |
| Total Return | | | –32.63 | % | | | 13.29 | % | | | 28.33 | % | | | 28.94 | % | | | 34.11 | % | |
| Ratios/Supplemental Data: | |
| Net assets, end of year ($million) | | $ | 0.3 | | | $ | 0.9 | | | $ | 0.8 | | | $ | 0.6 | | | $ | 0.5 | | |
| Ratio of Expenses to Average Net Assets | | | 1.54 | %* | | | 1.43 | %* | | | 1.47 | %* | | | 1.49 | %* | | | 1.39 | % | |
| Ratio of Net Investment Income to Average Net Assets | | | 2.12 | % | | | 1.12 | % | | | 1.62 | % | | | 0.87 | % | | | 0.75 | % | |
| Portfolio Turnover Rate | | | 50 | % | | | 57 | % | | | 44 | % | | | 47 | % | | | 29 | % | |
* The ratio excludes expense offset arrangement.
(a) Amount rounds to less than $0.01 per share.
See accompanying Notes to Financial Statements.
THE OAKMARK FUNDS
79
THE OAKMARK FUNDS
Report of Independent Registered Public Accounting Firm
To the Board of Trustees and Shareholders of Harris
Associates Investment Trust:
We have audited the accompanying statements of assets and liabilities, including the schedules of investments, of Harris Associates Investment Trust comprising Oakmark Fund, Oakmark Select Fund, Oakmark Equity and Income Fund, Oakmark Global Fund, Oakmark Global Select Fund, Oakmark International Fund, and Oakmark International Small Cap Fund (collectively the "Funds"), as of September 30, 2008, the related statements of operations for the period then ended, and the statements of changes in net assets and the financial highlights for the respective stated periods. These financial statements and financial highlights are the responsibility of the Funds' management. Our responsibility is to express an opinion on these financial statements and financial highlights based on our audits.
We conducted our audits in accordance with the standards of the Public Company Accounting Oversight Board (United States). Those standards require that we plan and perform the audit to obtain reasonable assurance about whether the financial statements and financial highlights are free of material misstatement. The Funds are not required to have, nor were we engaged to perform, an audit of their internal control over financial reporting. Our audits included consideration of internal control over financial reporting as a basis for designing audit procedures that are appropriate in the circumstances, but not for the purpose of expressing an opinion on the effectiveness of the Funds' internal control over financial reporting. Accordingly, we express no such opinion. An audit also includes examining, on a test basis, evidence supporting the amounts and disclosures in the financial statements, assessing the accounting principles used and significant estimates made by management, as well as evaluating the overall financial statement presentation. Our procedures included confirmation of securities owned as of September 30, 2008, by correspondence with the Funds' custodian and brokers; where replies were not received from brokers, we performed other auditing procedures. We believe that our audits provide a reasonable basis for our opinion.
In our opinion, the financial statements and financial highlights referred to above present fairly, in all material respects, the financial position of each of the Funds as of September 30, 2008, the results of their operations for the period then ended, and the changes in their net assets and the financial highlights for the respective stated periods, in conformity with accounting principles generally accepted in the United States of America.

Chicago, Illinois
October 29, 2008
THE OAKMARK FUNDS
80
Federal Tax Information (Unaudited)
Global, International and Int'l Small Cap paid qualifying foreign taxes of $4,546,567, $17,506,826 and $2,126,811 and earned $40,163,797, $148,312,515 and $19,845,912, respectively, foreign source income during the year ended September 30, 2008. Pursuant to Section 853 of the Internal Revenue Code, Global, International, and Int'l Small Cap designated $0.04, $0.07 and $0.04 per share as foreign taxes paid and $0.39, $0.60 and $0.34 per share as income earned from foreign sources for the year ended September 30, 2008, respectively.
Qualified dividend income ("QDI") received by the Funds through September 30, 2008 that qualified for a reduced tax rate pursuant to the Jobs and Growth Tax Relief Reconciliation Act of 2003 are as follows:
| Fund | | Amount | |
| Oakmark | | $ | 91,131,732 | | |
| Select | | | 75,020,602 | | |
| Equity and Income | | | 109,757,341 | | |
| Global | | | 44,503,891 | | |
| Global Select | | | 7,991,877 | | |
| International | | | 180,259,263 | | |
| Int'l Small Cap | | | 30,810,478 | | |
For corporate shareholders, a portion of the ordinary dividends paid during the Funds' year ended September 30, 2008 qualified for the dividends received deduction, as follows:
| Fund | | Amount | |
| Oakmark | | | 100.00 | % | |
| Select | | | 100.00 | % | |
| Equity and Income | | | 41.10 | % | |
| Global | | | 19.26 | % | |
| Global Select | | | 40.30 | % | |
| International | | | 0.00 | % | |
| Int'l Small Cap | | | 0.00 | % | |
Additionally, the Funds designated the character of long-term capital gains distributions during the year ended September 30, 2008 as follows:
| Fund | | Amount | |
| Oakmark | | $ | 403,789,095 | | |
| Select | | | 456,979,270 | | |
| Equity and Income | | | 736,196,273 | | |
| Global | | | 297,053,792 | | |
| Global Select | | | 483,518 | | |
| International | | | 1,266,215,006 | | |
| Int'l Small Cap | | | 264,664,567 | | |
THE OAKMARK FUNDS
81
For a prospectus and more information about The Oakmark Funds, including management fees and expenses and the special risks of investing, please visit oakmark.com or call 1-800-OAKMARK (1-800-625-6275). Please read the prospectus carefully before investing. An investor should consider a fund's investment objectives, risks, and charges and expenses carefully before investing. This and other information about The Oakmark Funds are contained in the Funds' prospectus.
The discussion of the Funds' investments and investment strategy (including current investment themes, the portfolio managers' research and investment process, and portfolio characteristics) represents the Funds' investments and the views of the portfolio managers and Harris Associates L.P., the Funds' investment adviser, at the time of this letter, and are subject to change without notice.
The performance data quoted represents past performance. The performance information for the Funds does not reflect the imposition of a 2% redemption fee on shares of all Funds, other than Oakmark Equity and Income Fund, redeemed within 90 days, in order to deter market timers. If reflected, the fee would reduce the performance quoted. Past performance is no guarantee of future results. The investment return and principal value will fluctuate so that an investor's shares, when redeemed, may be worth more or less than their original cost. Current performance may be lower or higher than the performance data quoted. Average annual total return measures annualized change, while total return measures aggregate change. To obtain current month end performance data, visit oakmark.com.
Current and future portfolio holdings are subject to risk.
Investing in value stocks presents the risk that value stocks may fall out of favor with investors and underperform growth stocks during given periods.
Oakmark Equity and Income Fund closed to certain new investors as of 5/7/04 and reopened as of 11/3/08.
Because Oakmark Select Fund and Oakmark Global Select Fund are non-diversified, the performance of each holding will have a greater impact on each Fund's total return, and may make the Funds' returns more volatile than a more diversified fund.
Oakmark Equity and Income Fund invests in medium- and lower-quality debt securities that have higher yield potential but present greater investment and credit risk than higher-quality securities, which may result in greater share price volatility. An economic downturn could severely disrupt the market in medium or lower grade debt securities and adversely affect the value of outstanding bonds and the ability of the issuers to repay principal and interest.
Investing in foreign securities represents risks which in some way may be greater than in U.S. investments. Those risks include: currency fluctuation; different regulation, accounting standards, trading practices and levels of available information; generally higher transaction costs; and political risks.
The stocks of smaller companies often involve more risk than the stocks of larger companies. Stocks of small companies tend to be more volatile and have a smaller public market than stocks of larger companies. Small companies may have a shorter history of operations than larger companies, may not have as great an ability to raise additional capital and may have a less diversified product line, making them more susceptible to market pressure.
1. Total return includes change in share prices and, in each case, includes reinvestment of any dividends and capital gain distributions.
2. Portfolio holdings are subject to change without notice and are not intended as recommendations of individual stocks.
3. The S&P 500 Index is a broad market-weighted average of U.S. blue-chip companies. This index is unmanaged and investors cannot actually make investments in this index.
4. The Price-Earnings Ratio ("P/E") is the most common measure of the expensiveness of a stock.
5. The Dow Jones Industrial Average is an unmanaged index that includes only 30 big companies. This index is unmanaged and investors cannot invest directly in this index.
THE OAKMARK FUNDS
82
6. The Lipper Large Cap Value Fund Index is an equally weighted index of the largest 30 funds within the large cap value funds investment objective as defined by Lipper Inc. The index is adjusted for the reinvestment of capital gains and income dividends. This index is unmanaged and investors cannot invest directly in this index.
7. The Lipper Multi-Cap Value Funds Index tracks the results of the 30 largest mutual funds in the Lipper Multi-Cap Value Funds category. This index is unmanaged and investors cannot invest directly in this index.
8. The Lipper Balanced Fund Index measures the performance of the 30 largest U.S. balanced funds tracked by Lipper. This index is unmanaged and investors cannot invest directly in this index.
9. Lehman Brothers Government/Corporate Bond Index is a benchmark index made up of the Lehman Brothers Government and Corporate Bond indexes, including U.S. government Treasury and agency securities as well as corporate and Yankee bonds. This index is unmanaged and investors cannot invest directly in this index.
10. The MSCI World Index is a free float-adjusted market capitalization weighted index that is designed to measure the equity market performance of developed markets. The MSCI World Index currently consists of the following 23 developed market country indices: Australia, Austria, Belgium, Canada, Denmark, Finland, France, Germany, Greece, Hong Kong, Ireland, Italy, Japan, Netherlands, New Zealand, Norway, Portugal, Singapore, Spain, Sweden, Switzerland, the United Kingdom, and the United States. This index is unmanaged and investors cannot invest directly in this index.
11. The Lipper Global Fund Index is an unmanaged index of the 30 largest funds, based on total year-end net asset value, in the Global fund category, which consists of funds that invest at least 25% in securities traded outside of the United States. It assumes the reinvestment of dividends and capital gains and does not include any management fees or expenses. This index is unmanaged and investors cannot actually make investments in this index.
12. The MSCI World Index ex U.S. is a free float-adjusted market capitalization weighted index that is designed to measure the equity market performance of developed markets. The MSCI World Index currently consists of the following 22 developed market country indices: Australia, Austria, Belgium, Canada, Denmark, Finland, France, Germany, Greece, Hong Kong, Ireland, Italy, Japan, Netherlands, New Zealand, Norway, Portugal, Singapore, Spain, Sweden, Switzerland, and the United Kingdom. This index is unmanaged and investors cannot invest directly in this index.
13. The MSCI EAFE Index (Europe, Australasia, Far East) is a free float-adjusted market capitalization index that is designed to measure developed market equity performance, excluding the US & Canada. As of June 2006 the MSCI EAFE Index consisted of the following 21 developed market country indices: Australia, Austria, Belgium, Denmark, Finland, France, Germany, Greece, Hong Kong, Ireland, Italy, Japan, the Netherlands, New Zealand, Norway, Portugal, Singapore, Spain, Sweden, Switzerland and the United Kingdom. This index is unmanaged and investors cannot invest directly in this index.
14. The Lipper International Fund Index reflects the net asset value weighted total return of the 30 largest international equity funds. This index is unmanaged and investors cannot invest directly in this index.
15. The MSCI World ex U.S. Small Cap Index is a free float-adjusted market capitalization index that is designed to measure global developed market equity performance, excluding the U.S. The MSCI World ex U.S. Small Cap Index currently consists of 22 developed market country indices. The MSCI Small Cap Indices target 40% of the eligible Small Cap universe within each industry group, within each country. MSCI defines the Small Cap universe as all listed securities that have a market capitalization in the range of USD200-1,500 million. This index is unmanaged and investors cannot actually make investments in this index.
16. The Lipper International Small Cap Funds Index measures the performance of the 10 largest international small-cap funds tracked by Lipper. This index is unmanaged and investors cannot invest directly in this index.
OAKMARK, OAKMARK FUNDS, OAKMARK INTERNATIONAL, and OAKMARK and tree design are trademarks owned or registered by Harris Associates L.P. in the U.S. and/or other countries.
THE OAKMARK FUNDS
83
THE OAKMARK FUNDS
Trustees and Officers
The Board of Trustees has overall responsibility for the conduct of the affairs of Harris Associates Investment Trust ("Trust"), and its series, The Oakmark Funds. Each trustee serves until the next annual meeting of shareholders and until the election and qualification of his or her successor, or until he or she dies, resigns or is removed. Each trustee must retire at the end of the calendar year in which the trustee attains the age of 72. The Board of Trustees may fill any vacancy on the board provided that after such appointment, at least two-thirds of the trustees have been elected by the shareholders. No person shall be appointed or elected to serve as a trustee for the first time after attaining the age of 65. A majority of trustees then in office may remove a trustee with or without cause. The shareholders may remove a trustee by a vote of two-thirds of the outstanding shares of the Trust at any meeting of shareholders called for the purpose of removing such trustee.
The Board of Trustees elects or appoints the Trust's officers. The president, any vice president, treasurer and secretary serves until the election and qualification of his or her successor, or until he or she dies, resigns, or is removed or disqualified. Each other officer shall serve at the pleasure of the Board of Trustees. The Board of Trustees may remove any officer at any time, with or without cause, by the vote of a majority of the trustees then in office.
The names and ages of the trustees and officers, the position each holds with the Trust, the date each was first elected to office, their principal business occupations during the last five years and other directorships held are shown below.
Name and Age at September 30, 2008, Position(s) Held with the Trust, Date First Elected or Appointed to Office
Principal Occupations During the Past 5 Years. Other Directorships Held by Trustee, if any.
Trustees who are "interested persons"*
Peter S. Voss, 61, Trustee, 1995**
Retired since 2007; Chairman and Chief Executive Officer, IXIS Asset Management Group; Chairman, President and Chief Executive Officer, IXIS Asset Management US Corporation (investment management); Chairman, IXIS Asset Management US, LLC; Member of the Supervisory Board, IXIS Asset Management; Director, Harris Associates, Inc. ("HAI") prior thereto.
John R. Raitt, 53, Trustee and President, 2003
President and Chief Executive Officer, HAI, Harris Associates L.P. ("HALP") and Harris Associates Securities L.P. ("HASLP").
* Mr. Voss is a trustee who is deemed to be an "interested person" of the Trust as defined in the Investment Company Act of 1940, because he was a director of HAI, the general partner and manager of HALP, the investment adviser to the Funds. Mr. Raitt is a trustee who is deemed to be an "interested person" of the Trust because he is the President and Chief Executive Officer of HAI, HASLP and HALP.
** Effective October 22, 2008, Mr. Voss was determined to be a trustee who is not an "interested person."
Trustees who are not "interested persons"
Gary N. Wilner, M.D., 68, Trustee and Chairman of the Board of Trustees, 1993
Retired since 2004; Senior Attending Physician, Evanston Hospital; Medical Director of Cardiopulmonary Wellness Program, Evanston Hospital Corporation prior thereto. Chairman of the Board of Directors, North American Scientific, Inc. (developer of radioisotopic products for the treatment and diagnosis of disease).
THE OAKMARK FUNDS
84
Trustees and Officers cont.
Michael J. Friduss, 65, Trustee, 1995
Principal, MJ Friduss & Associates, Inc. (telecommunications consultants).
Thomas H. Hayden, 57, Trustee, 1995
Lecturer, Department of Integrated Marketing Communications, Medill Northwestern University, since July 2006; Principal, TerraNova Market Strategies, LLC (market research and strategic consulting practice) since July 2006; President and Chief Strategy Officer, Greenhouse Communications (advertising agency) from 2004 to 2006; Executive Vice President, Campbell Mithun (advertising and marketing communication agency) prior thereto.
Christine M. Maki, 47, Trustee, 1995
Senior Vice President–Tax, RR Donnelley & Sons Company, since August 2008; Senior Vice President–Tax, Global Hyatt Corporation (hotel management) from 1995 to 2008.
Allan J. Reich, 60, Trustee, 1993
Partner, Seyfarth Shaw LLP (law firm).
Steven S. Rogers, 51, Trustee, 2006
Clinical Professor of Finance & Management, Kellogg Graduate School of Management, Northwestern University; Entrepreneur-in-Residence, Ewing Marion Kauffman Foundation. Director, SC Johnson Wax (manufacturer of household cleaning, personal care and insecticide products), SuperValu, Inc. (supermarket retailer and food distributor), AMCORE Financial, Inc. (bank holding company), and W.S. Darley & Co. (fire fighting and emergency equipment manufacturers).
Burton W. Ruder, 64, Trustee, 1995
President, The Academy Financial Group (venture capital investment and transaction financing firm); Manager, Cedar Green Associates (real estate management firm).
Officers of the Trust
Henry R. Berghoef, 59, Vice President and Portfolio Manager (Oakmark Select Fund), 2000 Director of Domestic Research, HALP, since 2003; Portfolio Manager and Analyst, HALP.
Chad M. Clark, 36, Vice President and Portfolio Manager (Oakmark International Small Cap Fund), 2005
Portfolio Manager, HALP; International Analyst, HALP.
Richard J. Gorman, 42, Vice President, Chief Compliance Officer and Assistant Secretary, 2006
Chief Compliance Officer of the Trust, since 2006; Senior Special Counsel, Investment Management Regulation, United States Securities and Exchange Commission, prior thereto.
Kevin G. Grant, 44, Vice President and Portfolio Manager (Oakmark Fund), 2000
Portfolio Manager and Analyst, HALP.
David G. Herro, 47, Vice President and Portfolio Manager (Oakmark Global Select Fund, Oakmark International Fund and Oakmark International Small Cap Fund), 1992
Chief Investment Officer of International Equity, HALP; Portfolio Manager and Analyst, HALP.
John J. Kane, 37, Treasurer, 2005
Manager, Mutual Fund and Institutional Services, HALP. Assistant Treasurer to the Trust, 1999 to 2005;
THE OAKMARK FUNDS
85
Trustees and Officers cont.
Robert M. Levy, 58, Executive Vice President, 2004
Chairman, HAI; Chief Investment Officer of Domestic Equity, HALP; Portfolio Manager, HALP.
Clyde S. McGregor, 55, Vice President and Portfolio Manager (Oakmark Equity and Income Fund and Oakmark Global Fund), 1995
Portfolio Manager, HALP.
William C. Nygren, 50, Vice President and Portfolio Manager (Oakmark Fund, Oakmark Select Fund and Oakmark Global Select Fund), 1996
Portfolio Manager and Analyst, HALP.
Vineeta D. Raketich, 37, Vice President, 2003
Director, International Operations and Client Relations, HALP.
Janet L. Reali, 57, Vice President and Secretary, 2001
Vice President, General Counsel and Secretary, HAI, HALP and HASLP.
Kristi L. Rowsell, 42, Vice President and Principal Financial Officer, 2005
Director, Chief Financial Officer and Treasurer, HAI; Chief Financial Officer, HALP and HASLP prior thereto.
Edward A. Studzinski, 59, Vice President and Portfolio Manager (Oakmark Equity and Income Fund), 2000
Portfolio Manager and Analyst, HALP.
Robert A. Taylor, 36, Vice President and Portfolio Manager (Oakmark Global Fund), 2005
Director of International Research, since 2004; Portfolio Manager and Analyst, HALP.
Andrew Tedeschi, 43, Assistant Treasurer, 2008
Accounting Manager of Mutual Fund Financial Administration, Van Kampen Funds, Morgan Stanley; Treasurer, Henderson Global North America prior thereto.
Christopher P. Wright, 34, Vice President, 2005
Director of Mutual Fund Operations, HALP, since 2004; Assistant Director of Mutual Fund Operations, HALP prior thereto.
The business address of the officers and trustees is Two North LaSalle Street, Suite 500, Chicago, Illinois 60602.
The Statement of Additional Information (SAI) contains further information about the trustees and is available without charge upon your request by calling 1-800-625-6275.
THE OAKMARK FUNDS
86
Oakmark Glossary
Book value – A company's common stock equity as it appears on a balance sheet, equal to total assets minus liabilities, preferred stock, and intangible assets such as goodwill. A company's book value often differs substantially from economic value, especially in industries such as media.
Business value/Intrinsic value – The perceived or estimated actual value of a security, as opposed to its current market price or book value. Business value can be evaluated based on what a knowledgeable buyer would pay for a business if the company were sold in its entirety.
Growth investing – Investors who look for companies based on whether the stock of a company is growing earnings and/or revenue faster than the industry as a whole or the overall market. Growth investors generally expect high rates of growth to persist, and the stock, in turn, to deliver returns exceeding the market's. A growth mutual fund is generally one that emphasizes stocks believed to offer above-average growth prospects, with little to no emphasis on the stock's current price.
M & A (Mergers & Acquisitions) – Merger: the combining of two or more entities into one, through a purchase acquisition or a pooling of interests. Acquisition: can also be called a takeover, and is defined as acquiring control of a corporation, called a target, by stock purchase or exchange, either hostile or friendly.
Market capitalization (market cap or cap) – The market price of an entire company on any given day, calculated by multiplying the number of shares outstanding by the price per share.
Momentum investing – Approach to investing based on the belief that stock price trends are likely to continue. Momentum investors tend to buy stocks that have been outperforming the market and to sell those stocks when their relative performance deteriorates. Momentum investors do not consider a company's underlying value or fundamentals in their investment decisions.
Multiple – A ratio used to measure a stock's valuation, usually greater than 1. Sometimes used to mean price/earnings ratio.
P/B or Price-to-Book Ratio – A stock's capitalization divided by its book value. The value is the same whether the calculation is done for the whole company or on a per-share basis.
P/E or Price-to-Earnings Ratio – The most common measure of a stock's valuation. It is equal to a stock's capitalization divided by its after-tax earnings over a 12-month period. The value is the same whether the calculation is done for the whole company or on a per-share basis. Equivalently, the cost an investor in a given stock must pay per dollar of current annual earnings. Also called earnings multiple.
Share repurchase – Program through which a corporation buys back its own shares in the open market, typically an indication that the corporation's management believes the stock price is undervalued.
Value investing – Investors who utilize valuation measures such as business value (including growth rate), price/earnings ratio, price/book ratio, and yield to gauge the attractiveness of a company. Managers who employ a value investment style believe that the true, underlying value of a company is not reflected in its current share price, and, over time, the price has potential to increase as the market recognizes the overall value of the business. Value stocks sell at relatively low prices in relation to their underlying business value, earnings, or book value.
Stocks become undervalued for a variety of reasons, including an overall market decline, or when a specific industry falls into disfavor and investors view all companies in that industry in the same light. Consequently, an individual company's stock price may fall, even though it may be only temporarily affected by the industry's problems and its underlying value has remained unchanged.
"x times earnings" ("12 times earnings") – Another way to express a stock's price-to-earnings (P/E) ratio. A stock with a P/E ratio of 12 sells at 12 times earnings.
THE OAKMARK FUNDS
87

(This page has been intentionally left blank.)
THE OAKMARK FUNDS
88
THE OAKMARK FUNDS
Other Information
Investment Adviser
Harris Associates L.P.
Two North LaSalle Street
Chicago, Illinois 60602-3790
Transfer Agent
Boston Financial Data Services, Inc.
Quincy, Massachusetts
Legal Counsel
Bell, Boyd & Lloyd LLP
Chicago, Illinois
Independent Registered Public
Accounting Firm
Deloitte & Touche LLP
Chicago, Illinois
Contact Us
Please call 1-800-OAKMARK
(1-800-625-6275)
or 617-483-3250
Website
oakmark.com
To obtain a prospectus, an application or periodic reports, access our web site at oakmark.com, or call 1-800-OAKMARK (1-800-625-6275) or (617) 483-3250.
The Funds will file its complete schedule of portfolio holdings with the Securities and Exchange Commission (the "SEC") for the first and third quarters of each fiscal year on Form N-Q. The Funds' Forms N-Q are available on the SEC's website at www.sec.gov. The Funds' Forms N-Q may be reviewed and copied at the SEC's Public Reference Room in Washington, DC, and information on the operation of the Public Reference Room may be obtained by calling 1-800-SEC-0330.
A description of the policies and procedures the Funds use to determine how to vote proxies relating to portfolio securities is available without charge, upon request, by calling toll-free 1-800-625-6275; on the Funds' website at oakmark.com; and on the SEC's website at www.sec.gov.
No later than August 31 of each year, information regarding how the Adviser, on behalf of the Funds, voted proxies relating to the Funds' portfolio securities for the twelve months ended the preceding June 30 will be available through a link on the Funds' website at oakmark.com and on the SEC's website at www.sec.gov.
This report is submitted for the general information of the Funds' shareholders. The report is not authorized for distribution to prospective investors in the Funds unless it is accompanied or preceded by the Funds' currently effective prospectus.
No sales charge to the shareholder or to the new investor is made in offering the shares of the Funds, however, a shareholder may incur a 2% redemption fee on an exchange or redemption of Class I shares redeemed within 90 days from any Fund other than Oakmark Equity and Income Fund.

1-800-OAKMARK
oakmark.com
The Oakmark Funds are distributed by Harris Associates Securities L.P., member FINRA. Date of first use: November 2008.
OAKMARK FUND CLASS II
THE VALUE OF A $10,000 INVESTMENT IN OAKMARK FUND FROM ITS
INCEPTION (4/5/01) TO PRESENT (9/30/08) AS COMPARED TO THE
STANDARD & POOR'S 500 INDEX (UNAUDITED)
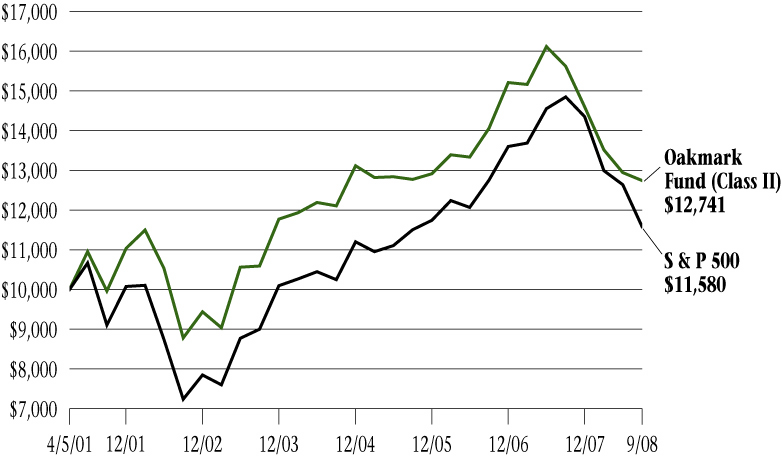
Average Annual Total Returns
(as of 9/30/08)
| (Unaudited) | | 1-year | | 5-year | | Since
Inception
(4/5/01) | |
| Oakmark Fund (Class II) | | | -18.44 | % | | | 3.78 | % | | | 3.29 | % | |
| S&P 500 | | | -21.98 | % | | | 5.17 | % | | | 1.98 | % | |
The graph and table do not reflect the deduction of taxes that a shareholder would pay on fund distributions or the redemption of fund shares.
The expense ratio for Class II shares as of 9/30/08 was 1.47%.
The performance data quoted represents past performance. The above performance information does not reflect the imposition of a 2% redemption fee on shares held for 90 days or less to deter market timers. If reflected, the fee would reduce the performance quoted. Past performance does not guarantee future results. The investment return and principal value will fluctuate so that an investor's shares, when redeemed, may be worth more or less than their original cost. Current performance may be lower or higher than the performance data quoted. Average annual total return measures annualized change, while total return measures aggregate change. To obtain most recent month-end performance data, visit oakmark.com.
Harris Associates Securities L.P., member FINRA, November 2008
OAKMARK SELECT FUND CLASS II
THE VALUE OF A $10,000 INVESTMENT IN OAKMARK SELECT FUND FROM ITS
INCEPTION (12/31/99) TO PRESENT (9/30/08) AS COMPARED TO THE
STANDARD & POOR'S 500 INDEX (UNAUDITED)
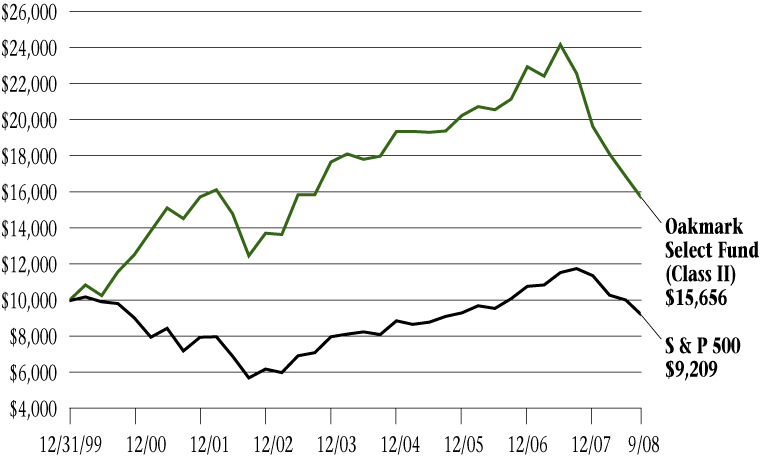
Average Annual Total Returns
(as of 9/30/08)
| (Unaudited) | | 1-year | | 5-year | | Since
Inception
(12/31/99) | |
| Oakmark Select Fund (Class II) | | | -30.64 | % | | | -0.27 | % | | | 5.26 | % | |
| S&P 500 | | | -21.98 | % | | | 5.17 | % | | | -0.94 | % | |
The graph and table do not reflect the deduction of taxes that a shareholder would pay on fund distributions or the redemption of fund shares.
The expense ratio for Class II shares as of 9/30/08 was 1.37%.
The performance data quoted represents past performance. The above performance information does not reflect the imposition of a 2% redemption fee on shares held for 90 days or less to deter market timers. If reflected, the fee would reduce the performance quoted. Past performance does not guarantee future results. The investment return and principal value will fluctuate so that an investor's shares, when redeemed, may be worth more or less than their original cost. Current performance may be lower or higher than the performance data quoted. Average annual total return measures annualized change, while total return measures aggregate change. To obtain most recent month-end performance data, visit oakmark.com.
Harris Associates Securities L.P., member FINRA, November 2008
OAKMARK EQUITY AND INCOME FUND CLASS II
THE VALUE OF A $10,000 INVESTMENT IN OAKMARK EQUITY AND INCOME
FUND FROM ITS INCEPTION (7/12/00) TO PRESENT (9/30/08) AS COMPARED TO
THE LIPPER BALANCED FUND INDEX (UNAUDITED)
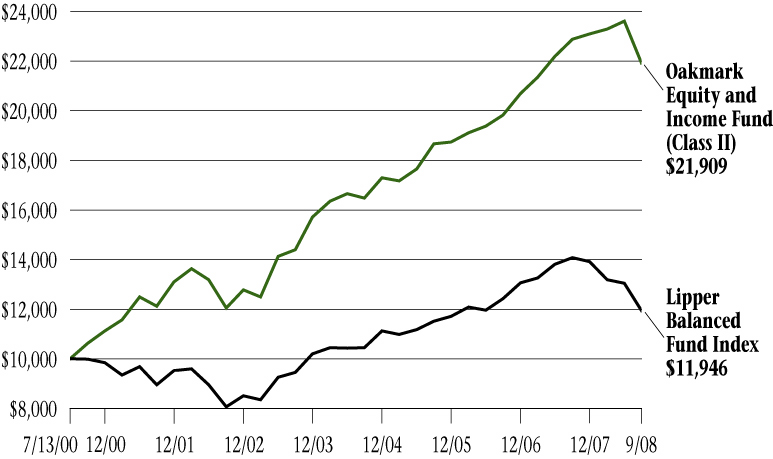
Average Annual Total Returns
(as of 9/30/08)
| (Unaudited) | | 1-year | | 5-year | | Since
Inception
(7/13/00) | |
| Oakmark Equity & Income Fund (Class II) | | | -4.19 | % | | | 8.75 | % | | | 10.01 | % | |
| Lipper Balanced Fund Index | | | -15.11 | % | | | 4.78 | % | | | 2.19 | % | |
The graph and table do not reflect the deduction of taxes that a shareholder would pay on fund distributions or the redemption of fund shares.
The expense ratio for Class II shares as of 9/30/08 was 1.16%.
The performance data quoted represents past performance. Past performance does not guarantee future results. The investment return and principal value will fluctuate so that an investor's shares, when redeemed, may be worth more or less than their original cost. Current performance may be lower or higher than the performance data quoted. Average annual total return measures annualized change, while total return measures aggregate change. To obtain most recent month-end performance data, visit oakmark.com.
Harris Associates Securities L.P., member FINRA, November 2008
OAKMARK GLOBAL FUND CLASS II
THE VALUE OF A $10,000 INVESTMENT IN OAKMARK GLOBAL FUND
FROM ITS INCEPTION (10/10/01) TO PRESENT (9/30/08) AS COMPARED TO THE
MSCI WORLD INDEX (UNAUDITED)
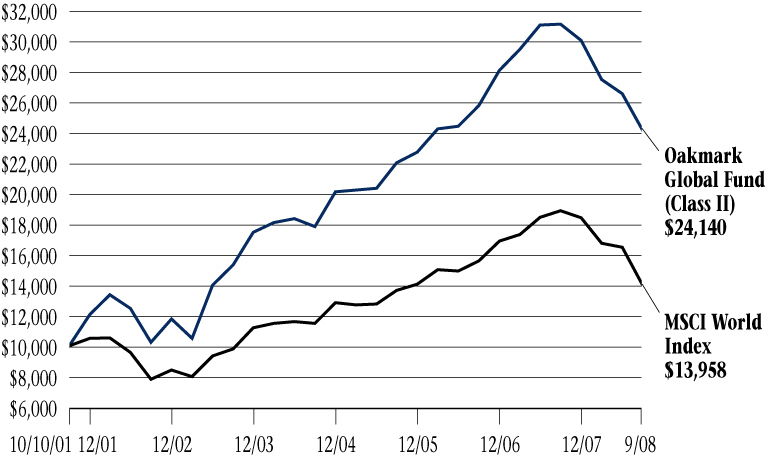
Average Annual Total Returns
(as of 9/30/08)
| (Unaudited) | | 1-year | | 5-year | | Since
Inception
(10/10/01) | |
| Oakmark Global Fund (Class II) | | | -22.46 | % | | | 9.51 | % | | | 13.47 | % | |
| MSCI World | | | -26.04 | % | | | 7.33 | % | | | 4.90 | % | |
The graph and table do not reflect the deduction of taxes that a shareholder would pay on fund distributions or the redemption of fund shares.
The expense ratio for Class II shares as of 9/30/08 was 1.57%.
The performance data quoted represents past performance. The above performance information does not reflect the imposition of a 2% redemption fee on shares held for 90 days or less to deter market timers. If reflected, the fee would reduce the performance quoted. Past performance does not guarantee future results. The investment return and principal value will fluctuate so that an investor's shares, when redeemed, may be worth more or less than their original cost. Current performance may be lower or higher than the performance data quoted. Average annual total return measures annualized change, while total return measures aggregate change. To obtain most recent month-end performance data, visit oakmark.com.
Harris Associates Securities L.P., member FINRA, November 2008
OAKMARK INTERNATIONAL FUND CLASS II
THE VALUE OF A $10,000 INVESTMENT IN OAKMARK INTERNATIONAL FUND
FROM ITS INCEPTION (11/4/99) TO PRESENT (9/30/08) AS COMPARED TO THE
MSCI WORLD EX U.S. INDEX (UNAUDITED)
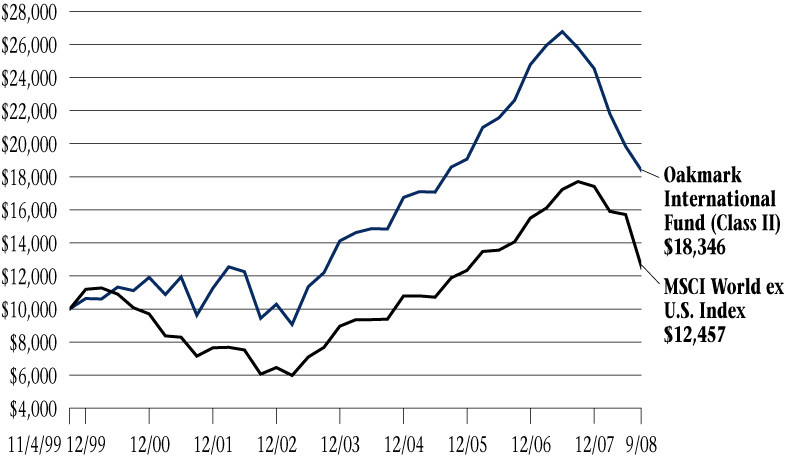
Average Annual Total Returns
(as of 9/30/08)
| (Unaudited) | | 1-year | | 5-year | | Since
Inception
(11/4/99) | |
| Oakmark International Fund (Class II) | | | -28.91 | % | | | 8.52 | % | | | 7.05 | % | |
| MSCI World ex U.S. | | | -29.58 | % | | | 10.28 | % | | | 2.50 | % | |
The graph and table do not reflect the deduction of taxes that a shareholder would pay on fund distributions or the redemption of fund shares.
The expense ratio for Class II shares as of 9/30/08 was 1.52%.
The performance data quoted represents past performance. The above performance information does not reflect the imposition of a 2% redemption fee on shares held for 90 days or less to deter market timers. If reflected, the fee would reduce the performance quoted. Past performance does not guarantee future results. The investment return and principal value will fluctuate so that an investor's shares, when redeemed, may be worth more or less than their original cost. Current performance may be lower or higher than the performance data quoted. Average annual total return measures annualized change, while total return measures aggregate change. To obtain most recent month-end performance data, visit oakmark.com.
Harris Associates Securities L.P., member FINRA, November 2008
OAKMARK INTERNATIONAL
SMALL CAP FUND CLASS II
THE VALUE OF A $10,000 INVESTMENT IN OAKMARK INTERNATIONAL SMALL
CAP FUND FROM ITS INCEPTION (1/8/01) TO PRESENT (9/30/08) AS COMPARED
TO THE MSCI WORLD EX U.S. INDEX (UNAUDITED)

Average Annual Total Returns
(as of 9/30/08)
| (Unaudited) | | 1-year | | 5-year | | Since
Inception
(1/8/01) | |
| Oakmark International Small Cap Fund (Class II) | | | -32.63 | % | | | 11.11 | % | | | 11.30 | % | |
| MSCI World ex U.S. | | | -29.58 | % | | | 10.28 | % | | | 3.37 | % | |
The graph and table do not reflect the deduction of taxes that a shareholder would pay on fund distributions or the redemption of fund shares.
The expense ratio for Class II shares as of 9/30/08 was 1.54%.
The performance data quoted represents past performance. The above performance information does not reflect the imposition of a 2% redemption fee on shares held for 90 days or less to deter market timers. If reflected, the fee would reduce the performance quoted. Past performance does not guarantee future results. The investment return and principal value will fluctuate so that an investor's shares, when redeemed, may be worth more or less than their original cost. Current performance may be lower or higher than the performance data quoted. Average annual total return measures annualized change, while total return measures aggregate change. To obtain most recent month-end performance data, visit oakmark.com.
Harris Associates Securities L.P., member FINRA, November 2008
FUND EXPENSES
A shareholder of each Fund incurs two types of costs: (1) transaction costs, such as redemption fees, and (2) ongoing costs, including investment advisory fees, transfer agent fees, and other fund expenses. The examples below are intended to help shareholders understand the ongoing cost (in dollars) of investing in each Fund and to compare these costs with the ongoing costs of investing in other funds.
Actual Expenses
The following table provides information about actual account values and actual fund expenses for Class II of each Fund. The table shows the expenses a Class II shareholder would have paid on a $1,000 investment in each Fund from April 1, 2008, to September 30, 2008, as well as how much a $1,000 investment would be worth at the close of the period, assuming actual fund returns and expenses. Class II shareholders can estimate expenses incurred for the period by dividing their account value at September 30, 2008, by $1,000 and multiplying the result by the number in the Expenses Paid During Period row as shown below.
Shares of all Funds, other than Oakmark Equity & Income Fund, invested for 90 days or less may be charged a 2% redemption fee. Please consult the Funds' prospectus at oakmark.com for more information.
| | | Oakmark
Fund | | Oakmark
Select Fund | | Oakmark
Equity and
Income Fund | | Oakmark
Global Fund | | Oakmark
International
Fund | | Oakmark
International
Small Cap
Fund | |
| Beginning Account Value | | $ | 1,000.00 | | | $ | 1,000.00 | | | $ | 1,000.00 | | | $ | 1,000.00 | | | $ | 1,000.00 | | | $ | 1,000.00 | | |
| Ending Account Value | | $ | 943.00 | | | $ | 864.40 | | | $ | 940.70 | | | $ | 878.40 | | | $ | 840.90 | | | $ | 812.20 | | |
| Expenses Paid During Period* | | $ | 6.56 | | | $ | 4.66 | | | $ | 5.58 | | | $ | 7.04 | | | $ | 6.44 | | | $ | 5.80 | | |
| Annualized Expense Ratio | | | 1.35 | % | | | 1.00 | % | | | 1.15 | % | | | 1.50 | % | | | 1.40 | % | | | 1.28 | % | |
* Expenses are equal to each Fund's annualized expense ratio for Class II, multiplied by the average account value over the period, multiplied by the number of days in the most recent fiscal half-year divided by 366 (to reflect the one-half year period).
Hypothetical Example for Comparison Purposes
The following table provides information about hypothetical account values and hypothetical expenses for Class II of each Fund based on actual expense ratios and an assumed rate of return of 5% per year before expenses, which are not the Funds' actual returns. The hypothetical account values and expenses may not be used to estimate the actual ending account balances or expenses shareholders paid for the period. Shareholders may use this information to compare the ongoing costs of investing in a Fund and other funds. To do so, compare this 5% hypothetical example with the 5% hypothetical examples that appear in the shareholder reports of the other funds.
Please note that the expenses shown in the table are meant to highlight your ongoing costs only and do not reflect any transaction costs, such as redemption fees. Therefore, the third line of the table is useful in comparing ongoing costs only, and will not help you determine the relative total costs of owning different funds. In addition, if these transaction costs were included, the total costs would have been higher.
| | | Oakmark
Fund | | Oakmark
Select Fund | | Oakmark
Equity and
Income Fund | | Oakmark
Global Fund | | Oakmark
International
Fund | | Oakmark
International
Small Cap
Fund | |
| Beginning Account Value | | $ | 1,000.00 | | | $ | 1,000.00 | | | $ | 1,000.00 | | | $ | 1,000.00 | | | $ | 1,000.00 | | | $ | 1,000.00 | | |
| Ending Account Value | | $ | 1,018.25 | | | $ | 1,020.00 | | | $ | 1,019.25 | | | $ | 1,017.50 | | | $ | 1,018.00 | | | $ | 1,018.60 | | |
| Expenses Paid During Period* | | $ | 6.81 | | | $ | 5.05 | | | $ | 5.81 | | | $ | 7.57 | | | $ | 7.06 | | | $ | 6.46 | | |
| Annualized Expense Ratio | | | 1.35 | % | | | 1.00 | % | | | 1.15 | % | | | 1.50 | % | | | 1.40 | % | | | 1.28 | % | |
* Expenses are equal to each Fund's annualized expense ratio for Class II, multiplied by the average account value over the period, multiplied by the number of days in the most recent fiscal half-year divided by 366 (to reflect the one-half year period).
Item 2. Code of Ethics.
(a) Registrant has adopted a code of ethics (the “Code”) that applies to its Principal Executive Officer, Principal Financial Officer and Principal Accounting Officer.
(b) No disclosures are required by this Item 2(b).
(c) During the period covered by the report, no amendments were made to the provisions of the Code.
(d) During the period covered by the report, Registrant did not grant any waivers, including implicit waivers, from the provisions of the Code.
(e) Not applicable.
(f) A copy of the Code is filed as Exhibit (a)(1) to this Form N-CSR. Copies of the Code will also be made available free of charge upon request, by writing or calling The Oakmark Funds, P.O. Box 8510, Boston, MA 02266-8510, 1-800-OAKMARK, (1-800-625-6275).
Item 3. Audit Committee Financial Expert.
Registrant’s board of trustees has determined that each of the following five members of the Registrant’s audit committee qualifies as an “audit committee financial expert,” as such term is defined in Instruction 2(b) to Item 3 of Form N-CSR: Michael J. Friduss, Christine M. Maki, Allan J. Reich, Stephen S. Rogers and Gary N. Wilner, M.D. Each of those members of Registrant’s audit committee is “independent” as such term is defined in paragraph (a)(2) of Item 3 of Form N-CSR.
Under applicable securities laws, a person who is determined to be an audit committee financial expert will not be deemed an “expert” for any purpose, including without limitation for the purposes of Section 11 of the Securities Act of 1933, as a result of being designated or identified as an audit committee financial expert. The designation or identification of a person as an audit committee financial expert does not impose on such person any duties, obligations, or liability that are greater than the duties, obligations, and liability imposed on such person as a member of the audit committee and board of trustees in the absence of such designation or identification. The designation or identification of a person as an audit committee financial expert does not affect the duties, obligations, or liability of any other member of the audit committee or board of trustees.
Item 4. Principal Accountant Fees and Services.
Aggregate fees billed to the Registrant for professional services rendered by the Registrant’s principal accountant were as follows:
| | Fiscal Year
Ended
September 30,
2008 | | Fiscal Year
Ended
September 30,
2007 | |
Audit Fees(1) | | $ | 218,800 | | $ | 214,900 | |
Audit-Related Fees(2) | | $ | 67,000 | | $ | 62,000 | |
Tax Fees(3) | | $ | 31,550 | | $ | 27,600 | |
All Other Fees(4) | | $ | 0 | | $ | 0 | |
During its regularly scheduled periodic meetings, the Registrant’s audit committee will pre-approve all audit, audit-related, tax and other services to be provided by the principal accountants of the Registrant. The audit committee has authorized its chairman to exercise that authority in the intervals between meetings; and the chairman presents any such pre-approvals to the audit committee at its next regularly scheduled meeting. Under paragraph (c)(7)(i)(C) of Rule 2-01 of Regulation S-X, pre-approval of non-audit services may be waived provided that: 1) the aggregate amount for all such services provided constitutes no more than five percent of the total amount of revenues paid by the Registrant to its principal accountant during the fiscal year in which such services are provided; 2) such services were not recognized by management at the time of engagement as non-audit services; and 3) such services are promptly brought to the attention of the Registrant’s audit committee by management and approved prior to the completion of the audit by the audit committee or by one or more members of the audit committee who are members of the board of trustees to whom authority to grant such approvals has been delegated by the audit committee.
No audit-related, tax or non-audit services were approved by waiver pursuant to paragraph (c)(7)(i)(C) of Rule 2-01 of Regulation S-X.
(1) | | “Audit Fees” include amounts for professional services rendered by the principal accountant for the audit of the Registrant’s annual financial statements and services that are normally provided by the accountant in connection with statutory and regulatory filings or engagements. |
| | |
(2) | | “Audit-Related Fees” include amounts for assurance and related services by the principal accountant that are reasonably related to the performance of the audit of the Registrant’s financial statements, specifically the semi-annual reviews of the Funds in fiscal years 2007 and 2008. |
| | |
(3) | | “Tax Fees” include amounts for professional services rendered by the principal accountant for tax compliance, tax advice and tax planning, specifically distribution consultation. |
| | |
(4) | | “All Other Fees” include amounts for products and services provided by the principal accountant. No such products and services were provided. |
Less than 50 percent of the hours expended on the principal accountant’s engagement to audit the Registrant’s financial statements for the most recent fiscal year were attributed to work performed by persons other than the principal accountant’s full-time, permanent employees.
The aggregate non-audit fees billed for the fiscal years ended September 30, 2008 and September 30, 2007 by the Registrant’s principal accountant for services rendered to the Registrant, its investment adviser and any entity controlling, controlled by or under common control with the investment adviser that provides ongoing services to the Registrant were $2,500 and $0, respectively.
The audit committee of Registrant’s board of trustees has considered whether the provision of non-audit services that were rendered by Registrant’s principal accountant to Registrant’s investment adviser, and any entity controlling, controlled by or under common control with the investment adviser that provides ongoing services to the Registrant that were not pre-approved pursuant to paragraph (c)(7)(ii) of Rule 2-01 of Regulation S-X is compatible with maintaining the principal accountant’s independence.
Item 5. Audit Committee of Listed Registrants.
Not applicable.
Item 6. Investments.
(a) The Schedule of Investments in securities of unaffiliated issuers as of the close of the reporting period is included as part of the annual report to shareholders filed under Item 1 of this Form.
(b) No disclosures are required by this Item 6(b).
Item 7. Disclosure of Proxy Voting Policies and Procedures for Closed-End Management Investment Companies.
Not applicable.
Item 8. Portfolio Managers of Closed-End Management Investment Companies.
Not applicable.
Item 9. Purchases of Equity Securities by Closed-End Management Investment Company and Affiliated Purchasers.
Not applicable.
Item 10. Submission of Matters to a Vote of Security Holders.
During the period covered by this report, no material changes were made to the procedures by which shareholders may recommend nominees to the Registrant’s board of trustees that were adopted in fiscal year 2004.
Item 11. Controls and Procedures.
(a) Based on an evaluation of the Registrant’s disclosure controls and procedures (as defined in Rule 30a-3(c) under the Investment Company Act of 1940, the “Disclosure Controls”), the Disclosure Controls are effectively designed to ensure that information required to be disclosed by the Registrant in this report is recorded, processed, summarized, and reported within 90 days prior to the filing of this report, including ensuring that information required to be disclosed in this report is accumulated and communicated to the Registrant’s management, including the Registrant’s principal executive officer and principal financial officer, as appropriate to allow timely decisions regarding required disclosure.
(b) There were no changes in the Registrant’s internal controls over financial reporting (as defined in Rule 30a-3(d) under the Investment Company Act of 1940) that occurred during the Registrant’s second fiscal quarter of the time period covered by this report that has materially affected, or is reasonably likely to materially affect, the Registrant’s internal control over financial reporting.
Item 12. Exhibits.
(a)(1) | | Code of Ethics for Principal Executive Officer and Senior Financial Officers (as referenced in Item 2 above), attached hereto as Exhibit (a)(1). |
| | |
(2) | | Certifications of John R. Raitt, Principal Executive Officer, and Kristi L. Rowsell, Principal Financial Officer, pursuant to Rule 30a-2 under the Investment Company Act of 1940 (17 CFR 270.30a-2), attached hereto as Exhibits (a)(2)(i) and (a)(2)(ii). |
| | |
(3) | | Not applicable. |
| | |
(b) | | Certification of John R. Raitt, Principal Executive Officer and Kristi L. Rowsell, Principal Financial Officer, pursuant to Section 906 of the Sarbanes-Oxley Act of 2002, attached hereto as Exhibit (b). |
SIGNATURES
Pursuant to the requirements of the Securities Exchange Act of 1934 and the Investment Company Act of 1940, the Registrant has duly caused this report to be signed on its behalf by the undersigned, thereunto duly authorized.
Harris Associates Investment Trust
By: | /s/ John R. Raitt | |
| John R. Raitt |
| Principal Executive Officer |
Date: | November 19, 2008 | |
Pursuant to the requirements of the Securities Exchange Act of 1934 and the Investment Company Act of 1940, this report has been signed below by the following persons on behalf of the Registrant and in the capacities and on the dates indicated.
By: | /s/ John R. Raitt | |
| John R. Raitt |
| Principal Executive Officer |
Date: | November 19, 2008 | |
| |
| |
By: | /s/ Kristi L. Rowsell | |
| Kristi L. Rowsell | |
| Principal Financial Officer |
Date: | November 19, 2008 | |