UNITED STATES
SECURITIES AND EXCHANGE COMMISSION
Washington, D.C. 20549
FORM N-CSR
CERTIFIED SHAREHOLDER REPORT OF REGISTERED
MANAGEMENT INVESTMENT COMPANIES
Investment Company Act file number: 811-06241
Loomis Sayles Funds II
(Exact name of Registrant as specified in charter)
| | |
| 399 Boylston Street, Boston, Massachusetts 02116 |
| (Address of principal executive offices) (Zip code) |
Coleen Downs Dinneen, Esq.
Natixis Distributors, L.P.
399 Boylston Street
Boston, Massachusetts 02116
(Name and address of agent for service)
Registrant’s telephone number, including area code: (617) 449-2810
Date of fiscal year end: September 30
Date of reporting period: March 31, 2008
| Item 1. | Reports to Stockholders. |
The Registrant’s semi-annual report transmitted to shareholders pursuant to Rule 30e-1 under the Investment Company Act of 1940 is as follows:
INCOME FUNDS
SEMIANNUAL REPORT
March 31, 2008
Loomis Sayles Core Plus Bond Fund
Loomis Sayles High Income Fund
Loomis Sayles International Bond Fund
Loomis Sayles Limited Term Government and Agency Fund
Loomis Sayles Massachusetts Tax Free Income Fund
Loomis Sayles Municipal Income Fund
Loomis Sayles Strategic Income Fund


TABLE OF CONTENTS
Management Discussion and Performancepage 1
Portfolio of Investmentspage 23
Financial Statementspage 53
LOOMIS SAYLES CORE PLUS BOND FUND
PORTFOLIO PROFILE
Objective:
Seeks a high level of current income consistent with what the fund considers reasonable risk
Strategy:
Invests primarily in U.S. corporate and U.S. government bonds
Fund Inception:
November 7, 1973
Managers:
Peter W. Palfrey, CFA
Richard G. Raczkowski
Loomis, Sayles & Company, L.P.
Symbols:
| | |
| Class A | | NEFRX |
| Class B | | NERBX |
| Class C | | NECRX |
| Class Y | | NERYX |
What You Should Know:
Fixed-income securities are subject to credit risk and interest rate risk; their value generally rises when prevailing interest rates fall and falls when rates rise.
The fund can invest a significant percentage of assets in debt securities that are rated below investment grade and the value of fund shares can be adversely affected by changes in economic conditions or other circumstances. Lower rated debt securities have speculative characteristics and may be subject to greater price volatility than higher rated investments. In addition, the secondary market for these securities may lack liquidity. Accordingly, the purchase of fund shares should be viewed as a long-term investment. The fund can also invest a significant percentage of assets in foreign securities and the value of the fund shares can be adversely affected by changes in currency exchange rates, political, and economic developments. In emerging markets, these risks can be significant. Fund shares should be viewed as a long-term investment.
Management Discussion
As the credit crunch gained momentum and economic conditions deteriorated during the six months ended March 31, 2008, investors put a premium on safety. The housing market continued to slump, consumer confidence fell, banks became less willing to lend money and the subprime mortgage crisis spread to the prime markets. The Federal Reserve Board’s efforts to restore normalcy by giving banks access to its lending window and cutting interest rates by 2% during the period did little to stem the tide.
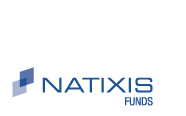
Despite all the negative news, for the six months ended March 31, 2008, Loomis Sayles Core Plus Bond Fund provided a total return of 3.58%, based on the net asset value of Class A shares and $0.32 in reinvested dividends. Although the fund underperformed the 5.23% return on its benchmark, Lehman Aggregate Bond Index, it outperformed the 2.23% average return on the funds in its Morningstar Intermediate-Term Bond peer group. The fund’s 30-day SEC yield as of March 31, 2008 was 4.60%.
NON-US DOLLAR HOLDINGS, HIGHER-QUALITY ISSUES PROVIDED SOME SUPPORT
As the U.S. dollar continued to slide, we built up the fund’s allocation to non-dollar securities, notably in Asian countries, reflecting our positive outlook for the region. Although the Asian markets were also volatile, the Japanese yen gained in five out of the past six months, and the net effect of our strategy was positive.
Domestically we were biased toward higher-quality securities, including U.S. government and agency mortgage-backed securities (MBS). Agency-backed MBS fared relatively well, but still lagged Treasury securities, as spreads (the difference in yield available from higher-risk assets versus U.S. Treasuries) widened. Moreover, concerns about defaults pushed spreads on commercial MBS to record highs, while U.S. investment-grade and high-yield corporate bonds were hurt as economic fears spread to broader markets. Bright spots included bonds issued by financial companies, which recovered somewhat after JP Morgan Chase announced plans to buy out Bear Stearns, and the energy sector, which benefited from the rise in oil and gas prices.
The fund’s allocation to Treasury Inflation-Protected Securities (TIPS) has been positive for the past several quarters. However, we believe the TIPS market peaked late in the first quarter so we sold the position, locking in significant gains. The fund’s holdings in long-duration Treasury securities added to returns as this sector rallied. We also added to the fund’s agency-backed MBS at increasingly attractive levels during the fiscal period including a significant position in GNMA MBS.
ECONOMIC AND MARKET CONDITIONS DEPRESSED CORPORATE BONDS
Growing concerns about a U.S. recession and illiquidity in the corporate markets weighed on corporate bonds during the past six months, and investors’ risk appetite decreased markedly. In particular, long-term bonds issued by cable and telecommunications companies were hard hit, as investors grew increasingly concerned that companies’ access to capital would be limited. While higher-yielding, longer-dated issues provide more income, they lagged higher-quality and shorter-term issues during the period, as rising interest rates caused prices to fall. Our very modest exposure to the ABS home-equity sector also did poorly despite their high ratings and solid performance of the underlying assets.
U.S. ECONOMY APPEARS TO HAVE POCKETS OF STRENGTH
We think bond values in many sectors may already reflect a more negative scenario than is warranted, and some securities may be undervalued. Positive factors we perceive include the relative strength of industrials, the prospect that the weak U.S. dollar will stimulate exports, disciplined corporate spending and solid non-residential construction. We believe the Fed may ease interest rates once more and then hold them steady, while continuing to use other methods to support business. In fact, we believe the real economy (adjusted for inflation) may show signs of a modest recovery in momentum by the end of 2008. The shaky economic picture poses a high-risk environment, but we believe patient investors willing to accept the risks should be rewarded.
1
LOOMIS SAYLES CORE PLUS BOND FUND
Investment Results through March 31, 2008
PERFORMANCE IN PERSPECTIVE
The charts comparing the fund’s performance to an index provide you with a general sense of how it performed. The fund’s total return for the period shown below appears with and without sales charges and includes fund expenses and fees. An index measures the performance of a theoretical portfolio. Unlike a fund, the index is unmanaged and does not have expenses that affect the results. It is not possible to invest directly in an index. Investors would incur transaction costs and other expenses if they purchased the securities necessary to match the index.
Growth of a $10,000 Investment in Class A Shares4
Average Annual Returns — March 31, 20084
| | | | | | | | | | | | |
| | | | | |
| | | 6 MONTHS | | | 1 YEAR | | | 5 YEARS | | | 10 YEARS | |
CLASS A (Inception 11/7/73) | | | | | | | | | | | | |
Net Asset Value1 | | 3.58 | % | | 5.78 | % | | 5.02 | % | | 5.00 | % |
With Maximum Sales Charge2 | | -1.06 | | | 0.98 | | | 4.05 | | | 4.51 | |
| | | | | |
CLASS B (inception 9/13/93) | | | | | | | | | | | | |
Net Asset Value1 | | 3.34 | | | 5.06 | | | 4.25 | | | 4.24 | |
With CDSC3 | | -1.66 | | | 0.06 | | | 3.91 | | | 4.24 | |
| | | | | |
CLASS C (Inception 12/30/94) | | | | | | | | | | | | |
Net Asset Value1 | | 3.20 | | | 5.02 | | | 4.22 | | | 4.22 | |
With CDSC3 | | 2.20 | | | 4.02 | | | 4.22 | | | 4.22 | |
| | | | | |
CLASS Y (Inception 12/30/94) | | | | | | | | | | | | |
Net Asset Value1 | | 3.69 | | | 6.03 | | | 5.31 | | | 5.36 | |
| | | | | |
| COMPARATIVE PERFORMANCE | | 6 MONTHS | | | 1 YEAR | | | 5 YEARS | | | 10 YEARS | |
Lehman Aggregate Bond Index | | 5.23 | % | | 7.67 | % | | 4.58 | % | | 6.04 | % |
Lehman U.S. Credit Index | | 2.63 | | | 3.99 | | | 4.43 | | | 5.93 | |
Morningstar Int.-Term Bond Fund Avg. | | 2.23 | | | 3.73 | | | 3.75 | | | 5.06 | |
See page 15 for a description of the indexes.
All returns represent past performance and do not guarantee future results. Periods of less than one year are not annualized. Share price and return will vary and you may have a gain or loss when you sell your shares. All results include reinvestment of any dividends and capital gains. Current returns may be higher or lower than those shown. For performance current to the most recent month-end, visit www.funds.natixis.com. Class Y shares are available to certain investors, as described in the prospectus.
The table and graph do not reflect taxes shareholders might owe on any fund distributions or when they redeem their shares.
PORTFOLIO FACTS
| | | | |
| |
| | | % of Net Assets as of |
| CREDIT QUALITY | | 3/31/08 | | 9/30/07 |
Aaa | | 60.5 | | 66.4 |
Aa | | 3.0 | | 1.4 |
A | | 5.1 | | 3.4 |
Baa | | 13.9 | | 13.1 |
Ba | | 5.5 | | 6.4 |
B | | 6.1 | | 3.9 |
Caa | | 0.7 | | 0.8 |
Not Rated* | | 2.7 | | 1.9 |
Short-term and other | | 2.5 | | 2.7 |
Credit quality is based on ratings from Moody’s Investors Service.
* Securities that are not rated by Moody’s may be rated by another rating agency or by Loomis Sayles.
| | | | | | |
| |
| | | % of Net Assets as of | |
| EFFECTIVE DURATION | | 3/31/08 | | | 9/30/07 | |
1 year or less | | 5.1 | | | 6.5 | |
1-5 years | | 50.7 | | | 46.8 | |
5-10 years | | 28.1 | | | 27.0 | |
10+ years | | 16.1 | | | 19.7 | |
Average Effective Duration | | 5.9 | years | | 5.8 | years |
Portfolio characteristics will vary.
EXPENSE RATIOS AS STATED IN THE MOST RECENT PROSPECTUS
| | | | | | |
| Share Class | | Gross Expense Ratio5 | | | Net Expense Ratio6 | |
A | | 1.09 | % | | 0.90 | % |
B | | 1.85 | | | 1.65 | |
C | | 1.82 | | | 1.65 | |
Y | | 0.75 | | | 0.65 | |
NOTES TO CHARTS
1 | Does not include a sales charge. |
2 | Includes maximum sales charge of 4.50%. |
3 | Performance for Class B shares assumes a maximum of 5% contingent deferred sales charge (“CDSC”) applied when you sell shares, which declines annually between years 1-6 according to the following schedule: 5, 4, 3, 3, 2, 1, 0%. Class C shares performance assumes a 1% CDSC applied when you sell shares within one year of purchase. |
4 | Fund performance has been increased by expense reductions and reimbursements, if any, without which performance would have been lower. |
5 | Before reductions and reimbursements. |
6 | After reductions and reimbursements. Expense reductions are contractual and are set to expire on 1/31/09. |
2
LOOMIS SAYLES HIGH INCOME FUND
PORTFOLIO PROFILE
Objective:
Seeks high current income plus the opportunity for capital appreciation to produce a high total return
Strategy:
Invests primarily in lower-quality fixed-income securities
Fund Inception:
February 22, 1984
Managers:
Matthew J. Eagan, CFA
Kathleen C. Gaffney, CFA
Elaine M. Stokes
Loomis, Sayles & Company, L.P.
Symbols:
| | |
| Class A | | NEFHX |
| Class B | | NEHBX |
| Class C | | NEHCX |
| Class Y | | NEHYX |
What You Should Know:
Fixed-income securities are subject to credit risk and interest rate risk; their value generally rises when prevailing interest rates fall and falls when rates rise.
The fund can invest a significant percentage of assets in debt securities that are rated below investment grade and the value of fund shares can be adversely affected by changes in economic conditions or other circumstances. Lower rated debt securities have speculative characteristics and may be subject to greater price volatility than higher rated investments. In addition, the secondary market for these securities may lack liquidity. Accordingly, the purchase of fund shares should be viewed as a long-term investment. The fund can also invest a significant percentage of assets in foreign securities and the value of the fund shares can be adversely affected by changes in currency exchange rates, political, and economic developments. In emerging markets, these risks can be significant. Fund shares should be viewed as a long-term investment.
Management Discussion
With the subprime mortgage debacle and ensuing credit crisis undermining the economy, investors moved out of corporate bonds and sought safety in high-quality government securities. Treasuries delivered strong performance, while lower-quality markets declined. The Federal Reserve Board cut short-term interest rates twice in the first quarter of 2008 and sought to calm markets by opening its lending operations to brokerage firms. Overseas credit markets fared better, thanks in part to the weak U.S. dollar.
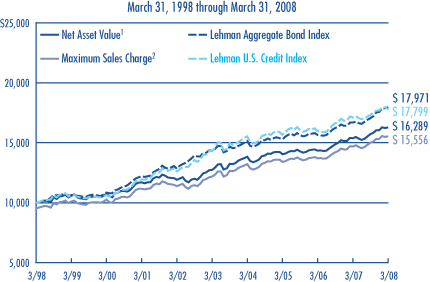
For the six months ended March 31, 2008, the total return on Loomis Sayles High Income Fund was -2.54% based on the net asset value of Class A shares and $0.18 in reinvested dividends. The fund held up better than its benchmark, the Lehman High Yield Composite Index, which returned -4.27% for the period, and surpassed the -5.02% average return on the funds in Morningstar’s High Yield Bond category. As of March 31, 2008, the fund’s 30-day SEC yield was 7.25%.
FUND’S RETURNS BENEFITED FROM MOVING AMONG MARKETS
The fund’s flexible investment policies allowed us to shift its emphasis from U.S. Treasuries to overseas markets, where the weak dollar benefited bonds denominated in stronger currencies. Neither Treasuries nor foreign bonds are represented in the benchmark, which gave the fund an edge. Strong security selection among high-quality corporate issues also contributed to the fund’s performance. In strategic terms, we trimmed long-term Treasuries as valuations rose during the period, using the proceeds to purchase selected issues where valuations looked more attractive.
DOLLAR WEAKNESS BROUGHT GAINS OVERSEAS
Non-dollar issues led fund performance during the period. The U.S. dollar’s persistent weakness, combined with falling interest rates and a dimming economic outlook, fueled gains in markets whose currencies gained ground. Yen-denominated issues rode the strength of Japan’s currency, and the fund’s holdings denominated in the Brazilian real contributed, as that country’s economy continued to expand. Economic growth in Mexico aided the fund’s peso-based investments. In Asia, healthy business conditions and favorable exchange rates brought solid returns on issues denominated in Singapore’s dollar and the Malaysian ringgit.
Foreign government bonds did not match the strength of U.S. Treasuries in absolute terms, but when currency gains are factored in, the sector was a net positive. Domestically, successful selection among high-quality financial services issues contributed to the fund’s return despite the turmoil in the sector as a whole. Natural gas and other energy issues also rose, but the fund was underweight in these issues relative to the Index.
CREDIT CONCERNS UNDERCUT HIGH-YIELD ISSUES
As investors turned away from corporate issues, yield spreads – the yield difference between bonds of higher and lower quality – expanded to levels not seen in years, depressing bond prices. High-yield, lower-quality holdings were particularly hard hit, which detracted from the fund’s results. Disappointments were greatest among lower-rated financial companies, transportation firms and consumer cyclicals, but the fund’s underweight stake in these sectors relative to the benchmark partially offset their negative impact. Bonds issued by technology and telecommunications companies also declined, as a large supply of new issues found very few buyers. Chemical and electric companies were also weak, and sectors relying on consumer spending suffered, as falling housing prices and rising fuel prices shrank household wealth. Equities also lagged, due to heightened market volatility and company-specific factors.
DESPITE SLUGGISH OUTLOOK, MANAGER SEES OPPORTUNITIES
Although overall economic expectations remain spotty, we see enough areas of strength to doubt that a recession is inevitable. We anticipate some renewed momentum by the end of 2008. Industrial activity is fairly healthy, exporters may benefit from the weak dollar and trends in non-residential construction are solid. In addition, the upcoming federal tax rebate program could rekindle consumer spending.
3
LOOMIS SAYLES HIGH INCOME FUND
Investment Results through March 31, 2008
PERFORMANCE IN PERSPECTIVE
The charts comparing the fund’s performance to an index provide you with a general sense of how it performed. The fund’s total return for the period shown below appears with and without sales charges and includes fund expenses and fees. An index measures the performance of a theoretical portfolio. Unlike a fund, the index is unmanaged and does not have expenses that affect the results. It is not possible to invest directly in an index. Investors would incur transaction costs and other expenses if they purchased the securities necessary to match the index.
Growth of a $10,000 Investment in Class A Shares4
Average Annual Returns — March 31, 20084
| | | | | | | | | | | | | | | |
| | | | | | |
| | | 6 MONTHS | | | 1 YEAR | | | 5 YEARS | | | 10 YEARS | | | SINCE
INCEPTION | |
CLASS A (Inception 2/22/84) | | | | | | | | | | | | | | | |
Net Asset Value1 | | -2.54 | % | | -2.04 | % | | 9.71 | % | | 1.42 | % | | — | |
With Maximum Sales Charge2 | | -6.90 | | | -6.48 | | | 8.72 | | | 0.96 | | | — | |
| | | | | | |
CLASS B (Inception 9/20/93) | | | | | | | | | | | | | | | |
Net Asset Value1 | | -2.91 | | | -2.79 | | | 8.87 | | | 0.68 | | | — | |
With CDSC3 | | -7.61 | | | -7.35 | | | 8.59 | | | 0.68 | | | — | |
| | | | | | |
CLASS C (Inception 3/2/98) | | | | | | | | | | | | | | | |
Net Asset Value1 | | -2.90 | | | -2.96 | | | 8.83 | | | 0.66 | | | — | |
With CDSC3 | | -3.84 | | | -3.87 | | | 8.83 | | | 0.66 | | | — | |
| | | | | | |
CLASS Y (Inception 2/29/08) | | | | | | | | | | | | | | | |
Net Asset Value1 | | — | | | — | | | — | | | — | | | -0.59 | % |
| | | | | | |
| COMPARATIVE PERFORMANCE | | 6 MONTHS | | | 1 YEAR | | | 5 YEARS | | | 10 YEARS | | | SINCE CLASS Y
INCEPTION7 | |
Lehman High Yield Composite Index | | -4.27 | % | | -3.74 | % | | 8.62 | % | | 4.84 | % | | -0.34 | % |
Morningstar High Yield Bond Fund Avg. | | -5.02 | | | -4.65 | | | 7.47 | | | 3.44 | | | -0.28 | |
See page 15 for a description of the indexes.
All returns represent past performance and do not guarantee future results. Periods of less than one year are not annualized. Share price and return will vary and you may have a gain or loss when you sell your shares. All results include reinvestment of dividends and capital gains. Current returns may be higher or lower than those shown. For performance current to the most recent month-end, visit www.funds.natixis.com. Performance history includes periods from a predecessor fund. Class Y shares are available to certain investors, as described in the prospectus.
The table and graph do not reflect taxes shareholders might owe on any fund distributions or when they redeem their shares.
PORTFOLIO FACTS
| | | | |
| |
| | | % of Net Assets as of |
| CREDIT QUALITY | | 3/31/08 | | 9/30/07 |
Aaa | | 11.6 | | 15.5 |
Aa | | 2.0 | | 1.9 |
A | | 0.3 | | 0.7 |
Baa | | 9.8 | | 8.9 |
Ba | | 12.9 | | 17.4 |
B | | 27.7 | | 24.9 |
Caa | | 20.4 | | 15.9 |
Not Rated* | | 8.2 | | 11.7 |
Short-term and other | | 7.1 | | 3.1 |
Credit quality is based on ratings from Moody’s Investors Service.
* Securities that are not rated by Moody’s may be rated by another rating agency or by Loomis Sayles.
| | | | | | |
| |
| | | % of Net Assets as of | |
| EFFECTIVE MATURITY | | 3/31/08 | | | 9/30/07 | |
1 year or less | | 9.2 | | | 4.2 | |
1-5 years | | 28.4 | | | 21.9 | |
5-10 years | | 19.9 | | | 19.4 | |
10+ years | | 42.5 | | | 54.5 | |
Average Effective Maturity | | 10.6 | years | | 13.8 | years |
Portfolio characteristics will vary.
EXPENSE RATIOS AS STATED IN THE MOST RECENT PROSPECTUS
| | | | | | |
| Share Class | | Gross Expense Ratio5 | | | Net Expense Ratio6 | |
A | | 1.43 | % | | 1.15 | % |
B | | 2.18 | | | 1.90 | |
C | | 2.17 | | | 1.90 | |
Y | | 1.16 | | | 0.90 | |
NOTES TO CHARTS
1 | Does not include a sales charge. |
2 | Includes maximum sales charge of 4.50%. |
3 | Performance for Class B shares assumes a maximum of 5% contingent deferred sales charge (“CDSC”) applied when you sell shares, which declines annually between years 1-6 according to the following schedule: 5, 4, 3, 3, 2, 1, 0%. Class C shares performance assumes a 1% CDSC applied when you sell shares within one year of purchase. |
4 | Fund performance has been increased by expense reductions and reimbursements, if any, without which performance would have been lower. |
5 | Before reductions and reimbursements. |
6 | After reductions and reimbursements. Expense reductions are contractual and are set to expire on 1/31/09. |
7 | The since-inception comparative performance figures shown for Class Y shares are calculated from 3/1/08. |
4
LOOMIS SAYLES INTERNATIONAL BOND FUND
PORTFOLIO PROFILE
Objective:
Seeks high total return through a combination of current income and capital appreciation
Strategy:
Invests primarily in fixed-income securities located outside the U.S.
Fund Inception:
February 1, 2008
Managers:
Lynda L. Schweitzer, CFA
Kenneth M. Buntrock, CFA, CIC
David W. Rolley, CFA
Loomis, Sayles & Company, L.P.
Symbols:
| | |
| Class A | | LSIAX |
| Class C | | LSICX |
| Class Y | | LSIYX |
What You Should Know:
Fixed-income securities are subject to credit risk and interest rate risk; their value generally rises when prevailing interest rates fall and falls when interest rates rise. The fund may also invest in public or private debt obligations issued or guaranteed by U.S. or non-U.S. issuers. The fund can invest a significant percentage of assets in foreign securities and the value of the fund shares can be adversely affected by changes in currency exchange rates, political, and economic developments. In emerging markets these risks can be significant. The fund can invest a significant percentage of assets in debt securities that are rated below investment grade. Lower-rated debt securities have speculative characteristics and may be subject to greater price volatility than higher-rated investments. In addition, the secondary market for these securities may lack liquidity. Fund shares should be viewed as a long-term investment.
Management Discussion
Concerns about the credit markets spread throughout the global fixed-income markets early in 2008, as part of the fallout from the U.S. credit crisis. This prompted investors to seek out the highest quality securities in order to minimize credit risk. Sovereign debt of developed economies produced the best relative returns in this environment, while corporate bonds generally lagged other fixed-income sectors.
Loomis Sayles International Bond Fund began operations on February 1, 2008 with a strategy of investing in foreign, investment-grade, fixed-income securities. It has the flexibility to invest in fixed-income markets around the world. While the fund’s portfolio is focused on international fixed-income investments, investors may benefit from exposure to this market because, historically, it tends to have a low correlation with the performance of U.S. fixed-income and equity investments.
From its inception at the beginning of February through March 31, 2008, the fund’s Class A shares generated a total return of 4.82% based on net asset value and $0.04 in reinvested dividends. During the same two months, the benchmark Lehman Global Aggregate Bond ex-USD Index, returned 5.74%, while the average return on the funds in Morningstar’s World Bond category was 2.65%. Bear in mind that the fund was not fully invested during this two-month period because the portfolio was under construction.
FUND’S CURRENCY EXPOSURE, U.K. TREASURIES AND MATURITY WERE POSITIVE
In the fund’s first two months of investment operations, we constructed a portfolio that overweighted positions in the Singapore dollar, Mexican peso and Swiss franc, all of which contributed positively to performance. The fund’s top-performing securities during the two-month period included U.K. Treasury securities and currency-linked notes denominated in the Malaysian ringgit. Relative to its benchmark, the fund was overweight in corporate and government-related securities and underweight both in Treasury securities of sovereign governments and in securitized fixed-income issues.
EMPHASIS ON CORPORATE BONDS DETRACTED
The fund’s emphasis on higher-yielding corporate bonds, particularly those issued by European companies, detracted from its performance during the period. The potential for a worldwide economic slowdown, stemming largely from a tightening of bank lending standards, remains a concern, as even major companies have difficulty raising capital to fund expansion. The fund’s underweight in the Japanese yen also detracted as the currency rose sharply. However, we believe the yen’s strength primarily reflected technical market conditions rather than any economic fundamentals. In fact, we are anticipating a softening of the Japanese economy, with decelerating manufacturing activity and declining consumer confidence.
OUTLOOK FAVORS CORPORATE BONDS
We believe the U.S. economy will experience a slowdown before returning to a cycle of positive growth. Consequently, we favor corporate securities in general, including high-yield bonds issued by companies with the potential to sustain consistent cash flows. We have been rotating out of the securitized sector and adding to corporate bonds. Securitized investments are collections of similar debt instruments, like mortgages, that are sold as negotiable securities. Because they are diversified over multiple loans, securitized investments may pose less risk of default than a single security, but they may also cut into returns.
We are approaching a duration-neutral position in the euro and the Japanese yen. We also expect to maintain an overweight position in Asian currencies (other than Japan) where we anticipate the strongest growth.
5
LOOMIS SAYLES INTERNATIONAL BOND FUND
Average Annual Returns — March 31, 20084
PERFORMANCE IN PERSPECTIVE
The table comparing the fund’s performance to an index and a Morningstar average provides a general sense of how it performed. The fund’s total return for the period shown below appears with and without sales charges and includes fund expenses and fees. An index measures the performance of a theoretical portfolio. Unlike a fund, an index is unmanaged and does not have expenses that affect the results. It is not possible to invest directly in an index. Investors would incur transaction costs and other expenses if they purchased the securities necessary to match the index.
| | | |
| | |
| | | SINCE
INCEPTION | |
CLASS A (Inception 2/1/08) | | | |
Net Asset Value1 | | 4.82 | % |
With Maximum Sales Charge2 | | 0.11 | |
| | |
CLASS C (Inception 2/1/08) | | | |
Net Asset Value1 | | 4.74 | |
With CDSC3 | | 3.74 | |
| | |
CLASS Y (Inception 2/1/08) | | | |
Net Asset Value1 | | 4.84 | |
| | |
| COMPARATIVE PERFORMANCE | | SINCE
INCEPTION7 | |
Lehman Global Aggregate Bond ex-USD Index | | 5.74 | % |
Morningstar World Bond Fund Avg. | | 2.65 | |
See page 15 for a description of the indexes.
All returns represent past performance and do not guarantee future results. Periods of less than one year are not annualized. Share price and return will vary and you may have a gain or loss when you sell your shares. All results include reinvestment of dividends and capital gains. Current returns may be higher or lower than those shown. For performance current to the most recent month-end, visit www.funds.natixis.com. Performance history includes periods from a predecessor fund. Class Y shares are available to certain investors, as described in the prospectus.
The table does not reflect taxes shareholders might owe on any fund distributions or when they redeem their shares.
PORTFOLIO FACTS
| | | |
| | | % of Net
Assets as of | |
CREDIT QUALITY | | 3/31/08 | |
Aaa | | 71.0 | |
Aa | | 14.1 | |
A | | 8.4 | |
Baa | | 3.0 | |
Ba | | 0.2 | |
Caa | | 0.4 | |
Not Rated* | | 0.0 | |
Short-term and other | | 2.9 | |
|
Credit quality is based on ratings from Moody’s Investors Service. * Securities that are not rated by Moody’s may be rated by another rating agency or by Loomis Sayles. | |
| | | % of Net
Assets
as of | |
| EFFECTIVE MATURITY | | 3/31/08 | |
1 year or less | | 5.8 | |
1-5 years | | 46.3 | |
5-10 years | | 36.4 | |
10+ years | | 11.5 | |
Average Effective Maturity | | 7.2 | years |
Portfolio characteristics will vary.
EXPENSE RATIOS AS STATED IN THE MOST RECENT PROSPECTUS
| | | | | | |
| Share Class | | Gross Expense Ratio5 | | | Net Expense Ratio6 | |
A | | 1.15 | % | | 1.10 | % |
C | | 1.90 | | | 1.85 | |
Y | | 0.90 | | | 0.85 | |
NOTES TO CHARTS
1 | Does not include a sales charge. |
2 | Includes maximum sales charge of 4.50%. |
3 | Class C shares performance assumes a 1% CDSC applied when you sell shares within one year of purchase. |
4 | Fund performance has been increased by expense reductions and reimbursements, if any, without which performance would have been lower. |
5 | Before reductions and reimbursements. |
6 | After reductions and reimbursements. Expense reductions are contractual and are set to expire on 1/31/09. |
7 | The since-inception comparative performance figures shown for Class Y shares are calculated from 2/1/08. |
6
LOOMIS SAYLES LIMITED TERM GOVERNMENTAND AGENCY FUND
PORTFOLIO PROFILE
Objective:
Seeks a high current return consistent with preservation of capital
Strategy:
Invests primarily in securities issued or guaranteed by the U.S. government, its agencies or instrumentalities
Fund Inception:
January 3, 1989
Managers:
John Hyll
Clifton V. Rowe, CFA
Loomis, Sayles & Company, L.P.
Symbols:
| | |
| Class A | | NEFLX |
| Class B | | NELBX |
| Class C | | NECLX |
| Class Y | | NELYX |
What You Should Know:
Fixed-income securities are subject to credit risk and interest rate risk; their value generally rises when prevailing interest rates fall and falls when rates rise. Securities issued by the U.S. government are guaranteed by the U.S. government if held to maturity; mutual funds that invest in these securities are not guaranteed. Securities issued by U.S. government agencies may not be government guaranteed.
Management Discussion
As the credit crunch gained momentum and economic conditions deteriorated during the six months ended March 31, 2008, investors put a premium on safety. The housing market continued to slump, consumer confidence fell, banks became less willing to lend money and the subprime mortgage crisis spread to prime markets. This occurred despite the Federal Reserve Board’s efforts to restore normalcy by giving banks access to its lending window and cutting the federal funds rate to 2.25% as of the end of the fiscal period.
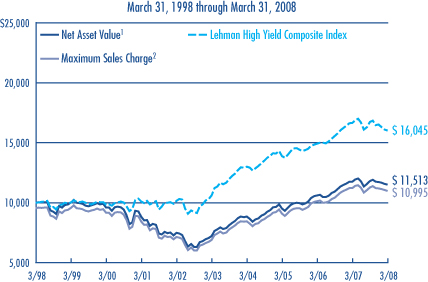
For the fiscal period ended March 31, 2008, Loomis Sayles Limited Term Government and Agency Fund’s total return was 3.75% based on the net asset value of Class A shares and $0.26 in reinvested dividends. However, the fund lagged its benchmark and a peer group of mutual funds for the period. The Lehman 1-5 Year Government Bond Index returned 6.41%, and the average return on the funds in Morningstar’s Short Government category was 4.16%. The fund’s 30-day SEC yield was 3.57% as of March 31, 2008.
SHORTER-TERM SECURITIES DETRACTED FROM PERFORMANCE
The Fed’s recent rate cuts caused bond prices to rise, and short-term Treasury securities were among the first to respond, followed by intermediate- and long-term bonds. For the period as a whole, Treasury bonds with relatively long maturities were the best performers as their prices are more sensitive to interest rate moves. The fund’s emphasis on high quality was a positive, but its orientation toward shorter-term, more liquid securities limited its participation in the rally and contributed to its performance lag.
REAL ESTATE MARKET WOES HURT MORTGAGE-BACKED MARKETS
The principal reason the fund underperformed its benchmark was its emphasis on mortgage-backed securities (MBS). During the fiscal period, credit concerns spread from the subprime mortgage market to higher quality mortgages and corporate bonds. MBS fell from favor partly because they are associated with the troubled mortgage market. This was true even for MBS issued by government-sponsored entities (GSEs). While the U.S. government does not guarantee GSE MBS, their credit is enhanced by guarantees from the issuing government agency and, like other government agency securities, they are viewed as having very low default risk. Although MBS issued by government agencies outperformed privately issued MBS, they still underperformed U.S. Treasuries as the real estate market continued to languish. By the end of March 2008, MBS backed by commercial issuers had partially recovered, but the market as a whole appears undervalued.
FUND STRATEGY SEEKS COMBINATION OF CURRENT INCOME AND SAFETY
During the period we emphasized mortgage-backed securities issued by GSEs because we appreciate the combination of strong credit quality and their yield advantage over Treasuries. We also added to the fund’s position in short-duration, high-quality, asset-backed securities, including bonds backed by automobile loans and credit-card receivables, as well as some high-quality, commercial mortgage-backed securities at attractive yields.
SELECTIVITY WILL BE KEY IF MARKET OUTLOOK IMPROVES
As a result of the Federal Reserve rate cuts, the yield curve is steep by historical standards, so that longer-maturity issues now offer an unusually wide yield advantage over shorter alternatives. Consequently, we are looking for specific opportunities to take advantage of this situation.
We believe bond valuations in many sectors may already reflect the possibility of a recession, or something close to it. We view this as an overreaction typical in periods of uncertainty and we are anticipating a recovery, with improving risk appetites. However, we expect the recovery to focus on specific market sectors, as numerous sector-specific hurdles remain. Although the outlook is brightening, the ride is likely to remain a bumpy one.
7
LOOMIS SAYLES LIMITED TERM GOVERNMENTAND AGENCY FUND
Investment Results through March 31, 2008
PERFORMANCE IN PERSPECTIVE
The charts comparing the fund’s performance to an index provide you with a general sense of how it performed. The fund’s total return for the period shown below appears with and without sales charges and includes fund expenses and fees. An index measures the performance of a theoretical portfolio. Unlike a fund, the index is unmanaged and does not have expenses that affect the results. It is not possible to invest directly in an index. Investors would incur transaction costs and other expenses if they purchased the securities necessary to match the index.
Growth of a $10,000 Investment in Class A Shares4
Average Annual Returns — March 31, 20084
| | | | | | | | | | | | |
| | | | | |
| | | 6 MONTHS | | | 1 YEAR | | | 5 YEARS | | | 10 YEARS | |
Class A (Inception 1/3/89) | | | | | | | | | | | | |
Net Asset Value1 | | 3.75 | % | | 5.87 | % | | 2.96 | % | | 4.33 | % |
With Maximum Sales Charge2 | | 0.64 | | | 2.70 | | | 2.33 | | | 4.01 | |
| | | | | |
Class B (Inception 9/27/93) | | | | | | | | | | | | |
Net Asset Value1 | | 3.37 | | | 5.09 | | | 2.21 | | | 3.61 | |
With CDSC3 | | -1.63 | | | 0.09 | | | 1.85 | | | 3.61 | |
| | | | | |
Class C (Inception 12/30/94) | | | | | | | | | | | | |
Net Asset Value1 | | 3.36 | | | 4.99 | | | 2.21 | | | 3.61 | |
With CDSC3 | | 2.36 | | | 3.99 | | | 2.21 | | | 3.61 | |
| | | | | |
Class Y (Inception 3/31/94) | | | | | | | | | | | | |
Net Asset Value1 | | 3.87 | | | 6.04 | | | 3.22 | | | 4.68 | |
| | | | | |
| COMPARATIVE PERFORMANCE | | 6 MONTHS | | | 1 YEAR | | | 5 YEARS | | | 10 YEARS | |
Lehman 1-5 Yr Gov’t Bond Index | | 6.41 | % | | 9.98 | % | | 3.93 | % | | 5.37 | % |
Morningstar Short Gov’t Fund Avg. | | 4.16 | | | 6.71 | | | 2.95 | | | 4.38 | |
See page 15 for a description of the indexes.
All returns represent past performance and do not guarantee future results. Periods of less than one year are not annualized. Share price and return will vary and you may have a gain or loss when you sell your shares. All results include reinvestment of dividends and capital gains. Current returns may be higher or lower than those shown. For performance current to the most recent month-end, visit www.funds.natixis.com. Performance history includes periods from a predecessor fund. Class Y shares are available to certain investors, as described in the prospectus.
The table and graph do not reflect taxes shareholders might owe on any fund distributions or when they redeem their shares.
PORTFOLIO FACTS
| | | | | | |
| |
| | | % of Net Assets as of | |
| FUND COMPOSITION | | 3/31/08 | | | 9/30/07 | |
Mortgage Related | | 57.6 | | | 60.7 | |
Treasuries | | 9.1 | | | 9.3 | |
Asset-Backed Securities | | 5.7 | | | 5.7 | |
Agency | | 3.4 | | | 3.3 | |
Hybrid ARMs | | 2.4 | | | 2.5 | |
Mortgage Backed Securities | | 2.4 | | | 1.1 | |
Credit Card ABS | | 1.6 | | | — | |
Automotive | | 1.0 | | | — | |
Collateralized Mortgage Obligation | | 0.2 | | | 0.2 | |
Short Term Investments & Other | | 16.6 | | | 17.2 | |
| |
| | | % of Net Assets as of | |
| EFFECTIVE MATURITY | | 3/31/08 | | | 9/30/07 | |
1 year or less | | 24.7 | | | 20.9 | |
1-5 years | | 56.2 | | | 63.2 | |
5-10 years | | 19.1 | | | 15.9 | |
10+ years | | n/a | | | n/a | |
Average Effective Maturity | | 3.4 | years | | 3.2 | years |
Portfolio characteristics will vary.
EXPENSE RATIOS AS STATED IN THE MOST RECENT PROSPECTUS
| | | | | | |
| Share Class | | Gross Expense Ratio5 | | | Net Expense Ratio6 | |
A | | 1.10 | % | | 0.90 | % |
B | | 1.85 | | | 1.65 | |
C | | 1.85 | | | 1.65 | |
Y | | 0.75 | | | 0.65 | |
NOTES TO CHARTS
1 | Does not include a sales charge. |
2 | Includes maximum sales charge of 3.00%. |
3 | Performance for Class B shares assumes a maximum of 5% contingent deferred sales charge (“CDSC”) applied when you sell shares, which declines annually between years 1-6 according to the following schedule: 5, 4, 3, 3, 2, 1, 0%. Class C shares performance assumes a 1% CDSC applied when you sell shares within one year of purchase. |
4 | Fund performance has been increased by expense reductions and reimbursements, if any, without which performance would have been lower. |
5 | Before reductions and reimbursements. |
6 | After reductions and reimbursements. Expense reductions are contractual and are set to expire on 1/31/09. |
8
LOOMIS SAYLES MASSACHUSETTS TAX FREE INCOME FUND
PORTFOLIO PROFILE
Objective:
Seeks to maintain a high level of current income exempt from federal and Massachusetts personal income taxes
Strategy:
Invests primarily in Massachusetts municipal bonds, including general obligation bonds and issues secured by specific revenue streams
Inception Date:
March 23, 1984
Manager:
Martha A. Strom
Loomis, Sayles & Company, L.P.
Symbols:
| | |
| Class A | | NEFMX |
| Class B | | NEMBX |
What You Should Know:
Fixed-income securities are subject to credit risk and interest rate risk; their value generally rises when prevailing interest rates fall and falls when rates rise. This fund concentrates in a single geographic region, which can affect your fund’s performance. Some income may be subject to federal and state taxes. Realized capital gains are fully taxable. Some investors may be subject to the Alternative Minimum Tax (AMT). Lower-rated bonds entail higher risks.
Special Notice to Shareholders
On February 29, 2008, the fund’s Board of Trustees approved the liquidation and termination of the fund. After extensive analysis, the Trustees concluded that this fund’s small asset level does not provide the scale needed to remain viable for shareholders. It is expected that the sale of the fund’s assets and the corresponding liquidating distributions will be completed on or about June 13, 2008. The following is a discussion of the factors that materially affected the fund’s performance during the six months ended March 31, 2008. Because the fund is being liquidated, the discussion does not include forward-looking comments.
MANAGEMENT DISCUSSION
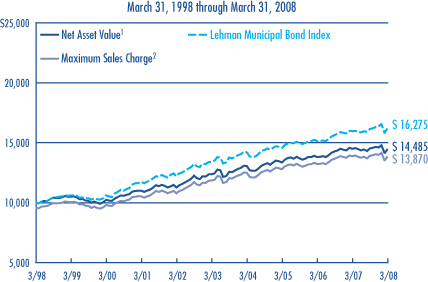
For the six months ended March 31, 2008, the total return on Loomis Sayles Massachusetts Tax Free Income Fund was -0.37%, based on the net asset value of Class A shares and $0.32 in reinvested dividends. The fund’s results were below the 0.75% return on the fund’s benchmark, the Lehman Municipal Bond Index, and about the same as the -0.38% average return on Morningstar’s Muni Massachusetts category. The fund’s 30-day SEC yield at the end of March was 3.86%, equivalent to a taxable yield of 6.31% based on the combined maximum federal income tax rate and the Massachusetts income tax rate of 38.45%.
NEGATIVE PRESS ABOUT INSURERS UNDERMINES INSURED MUNICIPAL BONDS
Recent news stories regarding monoline insurers caused safety-conscious investors to retreat from municipal bonds. Monoline insurers – so named because they provide services to only one industry – guarantee the timely repayment of bond principal and interest if an issuer defaults. AMBAC Financial and MBIA are two of the biggest U.S. insurers of municipal bonds. In exchange for their premium payments, the insured municipalities receive the benefit of the insurers’ AAA rating, which helps them attract safety-conscious investors. However, monoline insurers started covering collateralized debt obligations, which are mortgage-related securities. As the mortgage crisis eroded the credit status of mortgagors, ratings companies like Standard & Poor’s and Moody’s Investor Services began cutting ratings of monoline insurers, including AMBAC, MBIA and other similar companies. Even though defaults by municipalities are rare, the credit ratings and market value of many insured municipal bonds declined as safety-oriented investors retreated to Treasuries and other top-rated (but taxable) securities.
INSURED LONG-TERM BONDS AND HOUSING-RELATED ISSUES DECLINED
Insured bonds issued for Simmons College had the most negative impact on fund performance due to news stories about monoline insurers’ rating downgrades. Municipal bonds issued for housing also declined in value because their exposure to a troubled industry and their longer maturity structure caused them to fall out of favor with investors. The fund’s healthcare bonds issued in Texas were also poor performers because they were long-term and lower rated. In general, this fund’s relatively aggressive posture did not work in its favor during the fiscal period.
UTILITIES AND SHORT-TERM BONDS WERE POSITIVE
The utilities sector benefited the fund during the six-month period because their relatively high income and short maturity structure appealed to safety-conscious investors. Some of the fund’s shorter maturity, higher coupon bonds issued by municipalities in Puerto Rico also found favor during the first quarter of 2008, recovering from poor performance late in 2007. Although the fund was underweight in shorter maturity bonds relative to the Index, the issues in the portfolio provided price support during a difficult period for the market.
9
LOOMIS SAYLES MASSACHUSETTS TAX FREE INCOME FUND
Investment Results through March 31, 2008
PERFORMANCE IN PERSPECTIVE
The charts comparing the fund’s performance to an index provide you with a general sense of how it performed. The fund’s total return for the period shown below appears with and without sales charges and includes fund expenses and fees. An index measures the performance of a theoretical portfolio. Unlike a fund, the index is unmanaged and does not have expenses that affect the results. It is not possible to invest directly in an index. Investors would incur transaction costs and other expenses if they purchased the securities necessary to match the index.
Growth of a $10,000 Investment in Class A Shares4
Average Annual Returns — March 31, 20084
| | | | | | | | | | | | |
| | | | | |
| | | 6 MONTHS | | | 1 YEAR | | | 5 YEARS | | | 10 YEARS | |
CLASS A (Inception 3/23/84) | | | | | | | | | | | | |
Net Asset Value1 | | -0.37 | % | | -0.24 | % | | 3.18 | % | | 3.78 | % |
With Maximum Sales Charge2 | | -4.59 | | | -4.50 | | | 2.29 | | | 3.34 | |
| | | | | |
CLASS B (Inception 9/13/93) | | | | | | | | | | | | |
Net Asset Value1 | | -0.75 | | | -0.94 | | | 2.45 | | | 3.08 | |
With CDSC3 | | -5.64 | | | -5.74 | | | 2.10 | | | 3.08 | |
| | | | | |
| COMPARATIVE PERFORMANCE | | 6 MONTHS | | | 1 YEAR | | | 5 YEARS | | | 10 YEARS | |
Lehman Municipal Bond Index | | 0.75 | % | | 1.90 | % | | 3.92 | % | | 4.99 | % |
Morningstar Muni Massachusetts Fund Avg. | | -0.38 | | | 0.18 | | | 3.07 | | | 4.03 | |
Yields as of March 31, 2008
| | | | | | |
| | | |
| | | CLASS A | | | CLASS B | |
SEC 30-Day Yield5 | | 3.86 | % | | 3.33 | % |
Taxable Equivalent Yield6 | | 6.31 | | | 5.47 | |
See page 15 for a description of the indexes.
All returns represent past performance and do not guarantee future results. Periods of less than one year are not annualized. Share price and return will vary and you may have a gain or loss when you sell your shares. All results include reinvestment of dividends and capital gains. Current returns may be higher or lower than those shown. For performance current to the most recent month-end, visit www.funds.natixis.com.
The table and graph do not reflect taxes shareholders might owe on any fund distributions or when they redeem their shares.
PORTFOLIO FACTS
| | | | |
| |
| | | % of Net Assets as of |
| CREDIT QUALITY | | 3/31/08 | | 9/30/07 |
Aaa | | 27.3 | | 38.7 |
Aa | | 20.4 | | 18.0 |
A | | 27.4 | | 16.1 |
Baa | | 12.8 | | 12.2 |
Ba | | 5.4 | | 4.7 |
Not Rated* | | 2.3 | | 8.4 |
Short-term and other | | 4.4 | | 1.9 |
Credit quality is based on ratings from Moody’s Investors Service.
* Securities that are not rated by Moody’s may be rated by another rating agency or by Loomis Sayles.
| | | | | | |
| |
| | | % of Net Assets as of | |
| EFFECTIVE MATURITY | | 3/31/08 | | | 9/30/07 | |
1 year or less | | 4.4 | | | 1.0 | |
1-5 years | | 31.4 | | | 31.1 | |
5-10 years | | 24.6 | | | 40.6 | |
10+ years | | 39.6 | | | 27.3 | |
Average Effective Maturity | | 11.6 | years | | 8.9 | years |
Portfolio characteristics will vary.
EXPENSE RATIOS AS STATED IN THE MOST RECENT PROSPECTUS
| | | | |
| Share Class | | Gross Expense Ratio7 | | Net Expense Ratio8 |
A | | 1.16% | | 0.90% |
B | | 1.91 | | 1.65 |
NOTES TO CHARTS
1 | Does not include a sales charge. |
2 | Includes maximum sales charge of 4.25%. |
3 | Performance for Class B shares assumes a maximum of 5% contingent deferred sales charge (“CDSC”) applied when you sell shares, which declines annually between years 1-6 according to the following schedule: 5, 4, 3, 3, 2, 1, 0%. |
4 | Fund performance has been increased by expense reductions and reimbursements, if any, without which performance would have been lower. |
5 | SEC Yield is based on the fund’s net investment income over a 30-day period and is calculated in accordance with SEC guidelines. |
6 | Taxable equivalent yield is based on the maximum combined federal and MA income tax bracket of 38.45%. A portion of income may be subject to federal, state and/or alternative minimum tax. Capital gains, if any, are subject to capital gains tax. |
7 | Before reductions and reimbursements. |
8 | After reductions and reimbursements. Expense reductions are contractual and are set to expire on 1/31/09. |
10
LOOMIS SAYLES MUNICIPAL INCOME FUND
PORTFOLIO PROFILE
Objective:
Seeks as high a level of current income exempt from federal income taxes as is consistent with reasonable risk and protection of shareholders’ capital
Strategy:
Invests primarily in municipal securities that pay interest exempt from federal income tax other than the alternative minimum tax
Fund Inception:
May 9, 1977
Managers:
Martha A. Strom
Loomis, Sayles & Company, L.P.
Symbols:
| | |
| Class A | | NEFTX |
| Class B | | NETBX |
What You Should Know:
Fixed-income securities are subject to credit risk and interest rate risk; their value generally rises when prevailing interest rates fall and falls when rates rise. Some income may be subject to federal and state taxes. Realized capital gains are fully taxable. Some investors may be subject to the Alternative Minimum Tax (AMT). Lower-rated bonds entail higher risks.
Special Notice to Shareholders
On February 29, 2008, the fund’s Board of Trustees approved the liquidation and termination of the fund. After extensive analysis, the Trustees concluded that this fund’s small asset level does not provide the scale needed to remain viable for shareholders. It is expected that the sale of the fund’s assets and the corresponding liquidating distributions will be completed on or about June 13, 2008. The following is a discussion of the factors that materially affected the fund’s performance during the six months ended March 31, 2008. Because the fund is being liquidated, the discussion does not include forward-looking comments.
MANAGEMENT DISCUSSION
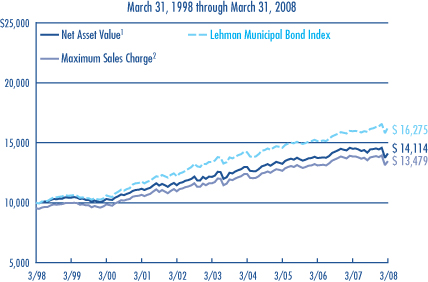
For the six months ended March 31, 2008, the total return on Loomis Sayles Municipal Income Fund was -2.34%, based on the net asset value of Class A shares, $0.14 in dividends and $0.06 in capital gains reinvested during the period. The fund’s results were below the 0.75% return on its benchmark, the Lehman Municipal Bond Index, and the -1.08% average return on Morningstar’s Muni National Long category. The fund’s 30-day SEC yield at the end of March was 3.91%, equivalent to a taxable yield of 6.04% based on the maximum federal income tax rate of 35.00%.
NEGATIVE PRESS ABOUT INSURERS UNDERMINES INSURED MUNICIPAL MARKETS
Recent news stories regarding monoline insurers caused safety-conscious investors to retreat from municipal bonds. Monoline insurers – so named because they provide services to only one industry – guarantee the timely repayment of bond principal and interest if an issuer defaults. AMBAC Financial and MBIA are two of the biggest U.S. insurers of municipal bonds. In exchange for their premium payments, the insured municipalities receive the benefit of the insurers’ AAA rating, which help them attract safety-conscious investors. However, monoline insurers started covering collateralized debt obligations, which are mortgage-related securities. As the credit crisis and rising mortgage default rates eroded the credit status of mortgagors, ratings companies like Standard & Poor’s and Moody’s Investor Services began cutting ratings of monoline insurers, including AMBAC, MBIA and other similar companies. Even though defaults by municipalities are rare, the credit ratings and market value of many insured municipal bonds declined as safety-oriented investors fled to Treasuries and other top-rated (but taxable) securities.
LONG-MATURITY, INSURED BONDS HURT FUND PERFORMANCE
Not surprisingly, long maturity, insured municipal bonds had the most negative impact on fund performance, as their maturity structure and the controversy surrounding monoline insurers caused investors to look elsewhere. Relative to its national benchmark, the fund was underweight in higher-quality, shorter-term bonds, which provide lower yields but are regarded as safer. Industrial development bonds issued for corporations had the most negative impact on fund performance, as demand for this type of issue declined. The fund’s healthcare bonds issued in Texas were the worst performers, because they were long-term and lower-rated. In general, this fund’s relatively aggressive posture did not work in its favor during the period.
HIGHER EDUCATION AND TWO SHORTER-TERM NEW YORK BONDS WERE POSITIVE
The higher education sector contributed most to the fund’s performance during the six-month period because their higher income and shorter maturity structure appealed to retail investors. Two higher-yielding New York municipal bonds were also positive contributors over the period, as their shorter maturity structure and short supply combined to stimulate demand. Although the fund was underweight in shorter maturity bonds relative to the index, those held in the fund provided price support in a volatile market environment.
11
LOOMIS SAYLES MUNICIPAL INCOME FUND
Investment Results through March 31, 2008
PERFORMANCE IN PERSPECTIVE
The charts comparing the fund’s performance to an index provide you with a general sense of how it performed. The fund’s total return for the period shown below appears with and without sales charges and includes fund expenses and fees. An index measures the performance of a theoretical portfolio. Unlike a fund, the index is unmanaged and does not have expenses that affect the results. It is not possible to invest directly in an index. Investors would incur transaction costs and other expenses if they purchased the securities necessary to match the index.
Growth of a $10,000 Investment in Class A Shares6
Average Annual Returns — March 31, 20086
| | | | | | | | | | | | |
| | | | | |
| | | 6 MONTHS | | | 1 YEAR | | | 5 YEARS | | | 10 YEARS | |
CLASS A (Inception 5/9/77) | | | | | | | | | | | | |
Net Asset Value1 | | -2.34 | % | | -2.77 | % | | 3.01 | % | | 3.50 | % |
With Maximum Sales Charge2 | | -6.79 | | | -7.10 | | | 2.05 | | | 3.03 | |
| | | | | |
CLASS B (Inception 9/13/93) | | | | | | | | | | | | |
Net Asset Value1 | | -2.70 | | �� | -3.48 | | | 2.24 | | | 2.71 | |
With CDSC3 | | -7.46 | | | -8.13 | | | 1.89 | | | 2.71 | |
| | | | | |
| COMPARATIVE PERFORMANCE | | 6 MONTHS | | | 1 YEAR | | | 5 YEARS | | | 10 YEARS | |
Lehman Municipal Bond Index | | 0.75 | % | | 1.90 | % | | 3.92 | % | | 4.99 | % |
Morningstar Muni National Long Fund Avg. | | -1.08 | | | -0.87 | | | 3.13 | | | 3.91 | |
Yields as of March 31, 2008
| | | | | | |
| | | |
| | | CLASS A | | | CLASS B | |
SEC 30-Day Yield4 | | 3.91 | % | | 3.33 | % |
Taxable Equivalent Yield5 | | 6.04 | | | 5.16 | |
See page 15 for a description of the indexes.
All returns represent past performance and do not guarantee future results. Periods of less than one year are not annualized. Share price and return will vary and you may have a gain or loss when you sell your shares. All results include reinvestment of dividends and capital gains. Current returns may be higher or lower than those shown. Performance history includes performance from a predecessor fund. For performance current to the most recent month-end, visit www.funds.natixis.com.
The table and graph do not reflect taxes shareholders might owe on any fund distributions or when they redeem their shares.
PORTFOLIO FACTS
| | | | |
| |
| | | % of Net Assets as of |
| CREDIT QUALITY | | 3/31/08 | | 9/30/07 |
Aaa | | 26.2 | | 31.2 |
Aa | | 21.6 | | 18.3 |
A | | 28.8 | | 22.5 |
Baa | | 10.1 | | 12.9 |
Ba | | 4.0 | | 3.7 |
Not Rated* | | 5.4 | | 10.2 |
Short-term and other | | 3.9 | | 1.2 |
Credit quality is based on ratings from Moody’s Investors Service.
* Securities that are not rated by Moody’s may be rated by another rating agency or by Loomis Sayles.
| | | | | | |
| |
| | | % of Net Assets as of | |
| EFFECTIVE MATURITY | | 3/31/08 | | | 9/30/07 | |
1 year or less | | 3.9 | | | 0.2 | |
1-5 years | | 18.9 | | | 12.1 | |
5-10 years | | 31.1 | | | 58.4 | |
10+ years | | 46.1 | | | 29.3 | |
Average Effective Maturity | | 12.7 | years | | 10.1 | years |
Portfolio characteristics will vary.
EXPENSE RATIOS AS STATED IN THE MOST RECENT PROSPECTUS
| | | | |
| Share Class | | Gross Expense Ratio7 | | Net Expense Ratio8 |
A | | 1.03% | | 0.90% |
B | | 1.78 | | 1.65 |
NOTES TO CHARTS
1 | Does not include a sales charge. |
2 | Includes maximum sales charge of 4.50%. |
3 | Performance for Class B shares assumes a maximum of 5% contingent deferred sales charge (“CDSC”) applied when you sell shares, which declines annually between years 1-6 according to the following schedule: 5, 4, 3, 3, 2, 1, 0%. |
4 | SEC Yield is based on the fund’s net investment income over a 30-day period and is calculated in accordance with SEC guidelines. |
5 | Taxable equivalent yield is based on the maximum federal income tax bracket of 35%. A portion of income may be subject to federal, state and/or alternative minimum tax. Capital gains, if any, are subject to capital gains tax. |
6 | Fund performance has been increased by expense reductions and reimbursements, if any, without which performance would have been lower. |
7 | Before reductions and reimbursements. |
8 | After reductions and reimbursements. Expense reductions are contractual and are set to expire on 1/31/09. |
12
LOOMIS SAYLES STRATEGIC INCOME FUND
PORTFOLIO PROFILE
Objective:
Seeks high current income, with a secondary objective of capital growth
Strategy:
Invests primarily in income-producing securities in the U.S. and around the world
Fund Inception:
May 1, 1995
Managers:
Daniel J. Fuss, CFA, CIC
Kathleen C. Gaffney, CFA
Associate Managers:
Matthew J. Eagan, CFA
Elaine M. Stokes
Loomis, Sayles & Company, L.P.
Symbols:
| | |
| Class A | | NEFZX |
| Class B | | NEZBX |
| Class C | | NECZX |
| Class Y | | NEZYX |
What You Should Know:
Fixed-income securities are subject to credit risk and interest rate risk; their value generally rises when prevailing interest rates fall and falls when rates rise.
The fund can invest a significant percentage of assets in debt securities that are rated below investment grade and the value of fund shares can be adversely affected by changes in economic conditions or other circumstances. Lower rated debt securities have speculative characteristics and may be subject to greater price volatility than higher rated investments. In addition, the secondary market for these securities may lack liquidity. Accordingly, the purchase of fund shares should be viewed as a long-term investment. The fund can also invest a significant percentage of assets in foreign securities and the value of the fund shares can be adversely affected by changes in currency exchange rates, political, and economic developments. In emerging markets, these risks can be significant. Fund shares should be viewed as a long-term investment.
Management Discussion
Risk aversion has characterized investors for the past several months, as the credit crisis in the United States intensified and the economy slowed. Investors sought greater safety by moving out of corporate issues and into Treasury securities, while the weakening U.S. dollar boosted bonds denominated in stronger foreign currencies. In an effort to stabilize the markets, the Federal Reserve Board cut the federal funds rate twice in the past six months and opened its lending facility to brokerage firms.
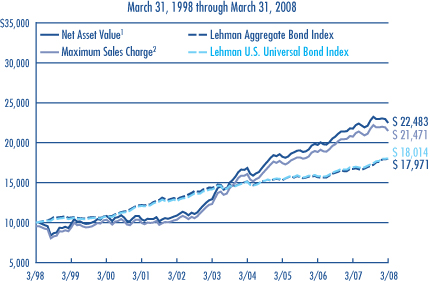
For the six months ended March 31, 2008, Loomis Sayles Strategic Income Fund’s total return was -1.34%, based on the net asset value of Class A shares and $0.52 in reinvested dividends. The fund’s results trailed those of its benchmark, the Lehman Aggregate Bond Index, which returned 5.23% for the period. Its results also lagged Morningstar’s Multisector Bond category, which had an average return of 0.20%. The fund’s 30-day SEC yield on March 31, 2008 was 6.47%.
TREASURIES, BETTER-GRADE CORPORATES AND NON-DOLLAR HOLDINGS WERE POSITIVE
As concerns mounted that the slowing economy would increase default risks for some issuers, demand for higher-quality bonds grew. Heavy demand enhanced returns in the Treasury markets, but led to falling prices for corporate issues in most rating categories. Investors in lower-rated market tiers continued to demand wider spreads (extra yield) over Treasuries, extending the decline in high-yield issues that began last year.
We increased the fund’s emphasis on Treasuries and higher-grade corporate bonds during the period, and this defensive positioning helped. However, this was not sufficient to overcome declines among the fund’s lower-quality holdings. The financial sector was especially hard hit, although the price recovery in Bear Stearns securities that followed its takeover by JP Morgan Chase had a positive effect on this sector, and rising energy prices powered positive results among energy providers.
Despite weakness in municipal bonds and selected real estate investment trusts (REITs), our security selection in these areas provided some price support. Overseas, bonds denominated in Singapore’s dollar and Malaysia’s ringgit added to the fund’s returns as the U.S. dollar slid further. Record commodity prices keyed the strong performance of bonds denominated in the Mexican peso and the Australian dollar. However, the fund’s commitment to Canadian securities, which was large relative to the benchmark, detracted from performance as Canada’s close ties to the sagging U.S. economy had a negative impact on its currency.
A RANGE OF CORPORATE ISSUES HELD BACK PERFORMANCE
High-yield issues, especially those rated BB and B, were important detractors from the fund’s performance during the period. Our sizeable stake among lower-rated industrial holdings hurt results, as economic uncertainty meant diminishing order flow for many manufacturers. Even some better-rated industrial issues suffered, as turmoil in the credit markets undercut investment-grade financial issuers. Communications companies were weighed down by concerns over reduced access to capital. Consumer cyclicals – companies whose profits tend to track economic cycles – fell victim to wavering consumer confidence and rising energy prices, which also dampened consumer spending. In addition, the portfolio was underweight in AAA-rated issues relative to its benchmark, which detracted from performance comparisons.
DESPITE SLOWING ECONOMY, MANAGERS SEE AREAS OF STRENGTH
Although overall economic expectations remain spotty, we see enough areas of strength to doubt that a recession is inevitable. We also believe there could be some recovery by year-end. We believe the Federal Reserve Board may cut interest rates once more, and a lower cost of capital could stimulate corporate spending. Persistent dollar weakness brightens the outlook for U.S. exports, and the upcoming federal rebate program could rekindle consumer spending. Although housing remains in a slump, non-residential construction is strong. Selected U.S. high-yield bonds appear to offer compelling value, but there are many good reasons for caution.
13
LOOMIS SAYLES STRATEGIC INCOME FUND
Investment Results through March 31, 2008
PERFORMANCE IN PERSPECTIVE
The charts comparing the fund’s performance to an index provide you with a general sense of how it performed. The fund’s total return for the period shown below appears with and without sales charges and includes fund expenses and fees. An index measures the performance of a theoretical portfolio. Unlike a fund, the index is unmanaged and does not have expenses that affect the results. It is not possible to invest directly in an index. Investors would incur transaction costs and other expenses if they purchased the securities necessary to match the index.
Growth of a $10,000 Investment in Class A Shares4
Average Annual Returns — March 31, 20084
| | | | | | | | | | | | | | | |
| | | | | | |
| | | 6 MONTHS | | | 1 YEAR | | | 5 YEARS | | | 10 YEARS | | | SINCE
INCEPTION | |
CLASS A (Inception 5/1/95) | | | | | | | | | | | | | | | |
Net Asset Value1 | | -1.34 | % | | 3.40 | % | | 11.74 | % | | 8.44 | % | | — | |
With Maximum Sales Charge2 | | -5.80 | | | -1.24 | | | 10.71 | | | 7.94 | | | — | |
| | | | | | |
CLASS B (Inception 5/1/95) | | | | | | | | | | | | | | | |
Net Asset Value1 | | -1.71 | | | 2.61 | | | 10.89 | | | 7.62 | | | — | |
With CDSC3 | | -6.47 | | | -2.25 | | | 10.63 | | | 7.62 | | | — | |
| | | | | | |
CLASS C (Inception 5/1/95) | | | | | | | | | | | | | | | |
Net Asset Value1 | | -1.63 | | | 2.62 | | | 10.91 | | | 7.63 | | | — | |
With CDSC3 | | -2.59 | | | 1.65 | | | 10.91 | | | 7.63 | | | — | |
| | | | | | |
CLASS Y (Inception 12/1/99) | | | | | | | | | | | | | | | |
Net Asset Value1 | | -1.15 | | | 3.67 | | | 12.04 | | | — | | | 10.34 | % |
| | | | | | |
| COMPARATIVE PERFORMANCE | | 6 MONTHS | | | 1 YEAR | | | 5 YEARS | | | 10 YEARS | | | SINCE
CLASS Y
INCEPTION5 | |
Lehman Aggregate Bond Index | | 5.23 | % | | 7.67 | % | | 4.58 | % | | 6.04 | % | | 6.46 | % |
Lehman U.S. Universal Bond Index | | 4.37 | | | 6.57 | | | 4.96 | | | 6.06 | | | 6.60 | |
Morningstar Multisector Bond Fund Avg. | | 0.20 | | | 2.09 | | | 7.29 | | | 5.35 | | | 6.59 | |
See page 15 for a description of the indexes.
All returns represent past performance and do not guarantee future results. Periods of less than one year are not annualized. Share price and return will vary and you may have a gain or loss when you sell your shares. All results include reinvestment of dividends and capital gains. Current returns may be higher or lower than those shown. Performance history includes periods from a predecessor fund. For performance current to the most recent month-end, visit www.funds.natixis.com. Class Y shares are available to certain investors, as described in the prospectus.
The table and graph do not reflect taxes shareholders might owe on any fund distributions or when they redeem their shares.
PORTFOLIO FACTS
| | | | |
| |
| | | % of Net Assets as of |
| CREDIT QUALITY | | 3/31/08 | | 9/30/07 |
Aaa | | 21.9 | | 32.6 |
Aa | | 4.4 | | 2.7 |
A | | 11.0 | | 6.5 |
Baa | | 26.1 | | 22.7 |
Ba | | 8.9 | | 9.9 |
B | | 10.8 | | 9.5 |
Caa | | 7.7 | | 5.6 |
Not Rated* | | 5.8 | | 7.4 |
Short-term and other | | 3.4 | | 3.1 |
Credit quality is based on ratings from Moody’s Investor Service.
* Securities that are not rated by Moody’s may be rated by another rating agency or by Loomis Sayles.
| | | | | | |
| |
| | | % of Net Assets as of | |
| EFFECTIVE MATURITY | | 3/31/08 | | | 9/30/07 | |
1 year or less | | 11.7 | | | 10.9 | |
1-5 years | | 17.4 | | | 17.6 | |
5-10 years | | 26.1 | | | 19.4 | |
10+ years | | 44.8 | | | 52.1 | |
Average Effective Maturity | | 14.3 | years | | 15.6 | years |
Portfolio characteristics will vary.
EXPENSE RATIOS AS STATED IN THE MOST RECENT PROSPECTUS
| | | | |
| Share Class | | Gross Expense Ratio6 | | Net Expense Ratio7 |
A | | 1.01% | | 1.01% |
B | | 1.77 | | 1.77 |
C | | 1.75 | | 1.75 |
Y | | 0.74 | | 0.74 |
NOTES TO CHARTS
1 | Does not include a sales charge. |
2 | Includes maximum sales charge of 4.50%. |
3 | Performance for Class B shares assumes a maximum of 5% contingent deferred sales charge (“CDSC”) applied when you sell shares, which declines annually between years 1-6 according to the following schedule: 5, 4, 3, 3, 2, 1, 0%. Class C share performance assumes a 1.00% CDSC applied when you sell shares within one year of purchase. |
4 | Fund performance has been increased by expense reductions and reimbursements, if any, without which performance would have been lower. |
5 | The since-inception comparative performance figures shown for Class Y are calculated from 12/1/99. |
6 | Before reductions and reimbursements. |
7 | After reductions and reimbursements. Expense reductions are contractual and are set to expire on 1/31/09. |
14
ADDITIONAL INFORMATION
The views expressed in this report reflect those of the portfolio managers as of the dates indicated. The managers’ views are subject to change at any time without notice based on changes in market or other conditions. References to specific securities or industries should not be regarded as investment advice. Because the funds are actively managed, there is no assurance that they will continue to invest in the securities or industries mentioned.
For more complete information on any Natixis Fund, contact your financial professional or call Natixis Funds and ask for a free prospectus, which contains more complete information including charges and other ongoing expenses. Investors should consider a fund’s objective, risks and expenses carefully before investing. This and other fund information can be found in the prospectus. Please read the prospectus carefully before investing.
INDEX/AVERAGE DESCRIPTIONS
Lehman Aggregate Bond Index is an unmanaged index of investment-grade bonds with one- to ten-year maturities issued by the U.S. government, its agencies and U.S. corporations.
Lehman Global Aggregate Bond ex-USD Index is an unmanaged index which provides a broad-based measure of the international investment-grade bond market.
Lehman High Yield Composite Index is a market-weighted, unmanaged index of fixed-rate, non-investment grade debt.
Lehman Municipal Bond Index is an unmanaged index of bonds issued by municipalities and other government entities having maturities of more than one year.
Lehman 1-5 Year Government Bond Index is an unmanaged, market-weighted index of bonds issued by the U.S. government and its agencies, with maturities between one and five years.
Lehman U.S. Credit Index is an unmanaged index that includes all publicly issued, fixed-rate, nonconvertible, dollar-denominated, SEC-registered, U.S. investment-grade corporate debt, and foreign debt that meets specific maturity, liquidity and quality requirements.
Lehman U.S. Universal Bond Index is an unmanaged index representing a blend of the Lehman Aggregate Bond Index, the High Yield Index, and the Emerging Market Index, among other indexes.
Morningstar Fund Averages are the average performance without sales charge of funds with similar investment objectives, as calculated by Morningstar, Inc.
PROXY VOTING INFORMATION
A description of the funds’ proxy voting policies and procedures is available without charge, upon request, by calling Natixis Funds at 800-225-5478; on the funds’ website at www.funds.natixis.com; and on the Securities and Exchange Commission’s (SEC’s) website at www.sec.gov. Information regarding how the funds voted proxies relating to portfolio securities during the 12-month period ended June 30, 2007 is available from the funds’ website and the SEC’s website.
QUARTERLY PORTFOLIO SCHEDULES
The funds file a complete schedule of portfolio holdings with the SEC for the first and third quarters of each fiscal year on Form N-Q. The funds’ Forms N-Q are available on the SEC’s website at www.sec.gov and may be reviewed and copied at the SEC’s Public Reference Room in Washington, DC. Information on the operation of the Public Reference Room may be obtained by calling 1-800-SEC-0330.
| | | | |
| NOT FDIC INSURED | | MAY LOSE VALUE | | NO BANK GUARANTEE |
15
UNDERSTANDING FUND EXPENSES
As a mutual fund shareholder, you incur different costs: transaction costs, including sales charges (loads) on purchases, redemption fees and certain exchange fees and ongoing costs, including management fees, distribution and/or service fees (12b-1 fees), and other fund expenses. In addition, each fund assesses a minimum balance fee of $20 on an annual basis for accounts that fall below the required minimum to establish an account. Certain exemptions may apply. These costs are described in more detail in the funds’ prospectus. The examples below are intended to help you understand the ongoing costs of investing in the funds and help you compare these with the ongoing costs of investing in other mutual funds.
The first line in the table of each Class of fund shares shows the actual account values and actual fund expenses you would have paid on a $1,000 investment in the fund from October 1, 2007 through March 31, 2008. To estimate the expenses you paid over the period, simply divide your account value by $1,000 (for example $8,600 account value divided by $1,000 = 8.60) and multiply the result by the number in the Expenses Paid During Period column as shown below for your Class.
The second line in the table of each Class of fund shares provides information about hypothetical account values and hypothetical expenses based on the fund’s actual expense ratios and an assumed rate of return of 5% per year before expenses, which is not the fund’s actual return. The hypothetical account values and expenses may not be used to estimate the actual ending account balance or expenses you paid on your investment for the period. You may use this information to compare the ongoing costs of investing in the fund and other funds. To do so, compare this 5% hypothetical example with the 5% hypothetical examples that appear in the shareholder reports of the other funds.
Please note that the expenses shown reflect ongoing costs only, and do not include any transaction costs such as sales charges, redemption fees, or exchange fees. Therefore, the second line in the table of each fund is useful in comparing ongoing costs only, and will not help you determine the relative costs of owning different funds. If transaction costs were included, total costs would be higher.
| | | | | | |
| LOOMIS SAYLES CORE PLUS BOND FUND | | BEGINNING ACCOUNT VALUE
10/1/2007 | | ENDING ACCOUNT VALUE
3/31/2008 | | EXPENSES PAID DURING PERIOD*
10/1/2007 – 3/31/2008 |
CLASS A | | | | | | |
Actual | | $1,000.00 | | $1,035.80 | | $4.94 |
Hypothetical (5% return before expenses) | | $1,000.00 | | $1,020.15 | | $4.90 |
CLASS B | | | | | | |
Actual | | $1,000.00 | | $1,033.40 | | $8.79 |
Hypothetical (5% return before expenses) | | $1,000.00 | | $1,016.35 | | $8.72 |
CLASS C | | | | | | |
Actual | | $1,000.00 | | $1,032.00 | | $8.69 |
Hypothetical (5% return before expenses) | | $1,000.00 | | $1,016.45 | | $8.62 |
CLASS Y | | | | | | |
Actual | | $1,000.00 | | $1,036.90 | | $3.67 |
Hypothetical (5% return before expenses) | | $1,000.00 | | $1,021.40 | | $3.64 |
| * | Expenses are equal to the Fund’s annualized expense ratio (after fee reduction/reimbursement) :0.97%, 1.73%, 1.71% and 0.72% for Class A, B, C and Y respectively, multiplied by the average account value over the period, multiplied by the number of days in the most recent fiscal half-year, divided by 366 (to reflect the half-year period). |
16
UNDERSTANDING FUND EXPENSES
| | | | | | |
| LOOMIS SAYLES HIGH INCOME FUND | | BEGINNING ACCOUNT VALUE
10/1/2007 | | ENDING ACCOUNT VALUE
3/31/2008 | | EXPENSES PAID DURING PERIOD*
10/1/2007 – 3/31/2008 |
CLASS A | | | | | | |
Actual | | $1,000.00 | | $974.60 | | $5.68 |
Hypothetical (5% return before expenses) | | $1,000.00 | | $1,019.25 | | $5.81 |
CLASS B | | | | | | |
Actual | | $1,000.00 | | $970.90 | | $9.36 |
Hypothetical (5% return before expenses) | | $1,000.00 | | $1,015.50 | | $9.57 |
CLASS C | | | | | | |
Actual | | $1,000.00 | | $971.00 | | $9.36 |
Hypothetical (5% return before expenses) | | $1,000.00 | | $1,015.50 | | $9.57 |
CLASS Y1 | | | | | | |
Actual | | $1,000.00 | | $994.10 | | $0.76 |
Hypothetical (5% return before expenses) | | $1,000.00 | | $1,003.47 | | $0.76 |
| * | Expenses are equal to the Fund’s annualized expense ratio (after fee reduction/reimbursement): 1.15%, 1.90%, 1.90% and 0.90%, for Class A, B, C, and Y, respectively, multiplied by the average account value over the period, multiplied by the number of days in the most recent fiscal half-year, or from commencement of operations for Class Y, divided by 366 (to reflect the half-year period). |
1 | Class Y commenced operations on February 29, 2008. |
| | | | | | |
| LOOMIS SAYLES INTERNATIONAL BOND FUND | | BEGINNING ACCOUNT VALUE
2/1/2008 | | ENDING ACCOUNT VALUE
3/31/2008 | | EXPENSES PAID DURING PERIOD*
2/1/2008 – 3/31/081 |
CLASS A | | | | | | |
Actual | | $1,000.00 | | $1,048.20 | | $1.82 |
Hypothetical (5% return before expenses) | | $1,000.00 | | $1,006.29 | | $1.78 |
CLASS C | | | | | | |
Actual | | $1,000.00 | | $1,047.40 | | $3.05 |
Hypothetical (5% return before expenses) | | $1,000.00 | | $1,005.08 | | $2.99 |
CLASS Y | | | | | | |
Actual | | $1,000.00 | | $1,048.40 | | $1.40 |
Hypothetical (5% return before expenses) | | $1,000.00 | | $1,006.69 | | $1.37 |
| * | Expenses are equal to the Fund’s annualized expense ratio (after fee reduction/reimbursement): 1.10%, 1.85% and .85% for Class A, Class C and Class Y, respectively, multiplied by the average account value over the period multiplied by the number of days from commencement of operations, divided by 366 (to reflect the period the fund was in operation). |
1 | Fund commenced operations on February 1, 2008. |
17
UNDERSTANDING FUND EXPENSES
| | | | | | |
LOOMIS SAYLES LIMITED TERM GOVERNMENT AND
AGENCY FUND | | BEGINNING ACCOUNT VALUE
10/1/2007 | | ENDING ACCOUNT VALUE
3/31/2008 | | EXPENSES PAID DURING PERIOD*
10/1/2007 – 3/31/2008 |
CLASS A | | | | | | |
Actual | | $1,000.00 | | $1,037.50 | | $4.74 |
Hypothetical (5% return before expenses) | | $1,000.00 | | $1,020.35 | | $4.70 |
CLASS B | | | | | | |
Actual | | $1,000.00 | | $1,033.70 | | $8.54 |
Hypothetical (5% return before expenses) | | $1,000.00 | | $1,016.60 | | $8.47 |
CLASS C | | | | | | |
Actual | | $1,000.00 | | $1,033.60 | | $8.54 |
Hypothetical (5% return before expenses) | | $1,000.00 | | $1,016.60 | | $8.47 |
CLASS Y | | | | | | |
Actual | | $1,000.00 | | $1,038.70 | | $3.47 |
Hypothetical (5% return before expenses) | | $1,000.00 | | $1,021.60 | | $3.44 |
| * | Expenses are equal to the Fund’s annualized expense ratio (after fee reduction/reimbursement): 0.93%, 1.68%, 1.68% and 0.68% for Class A, B, C and Y, respectively, multiplied by the average account value over the period, multiplied by the number of days in the most recent fiscal half-year, divided by 366 (to reflect the half-year period). |
| | | | | | |
LOOMIS SAYLES MASSACHUSETTS TAX FREE
INCOME FUND | | BEGINNING ACCOUNT VALUE
10/1/2007 | | ENDING ACCOUNT VALUE
3/31/2008 | | EXPENSES PAID DURING PERIOD*
10/1/2007 – 3/31/2008 |
CLASS A | | | | | | |
Actual | | $1,000.00 | | $996.30 | | $4.64 |
Hypothetical (5% return before expenses) | | $1,000.00 | | $1,020.35 | | $4.70 |
CLASS B | | | | | | |
Actual | | $1,000.00 | | $992.50 | | $8.37 |
Hypothetical (5% return before expenses) | | $1,000.00 | | $1,016.60 | | $8.47 |
| * | Expenses are equal to the Fund’s annualized expense ratio (after fee reduction/reimbursement): 0.93% and 1.68% for Class A and B, respectively, multiplied by the average account value over the period, multiplied by the number of days in the most recent fiscal half-year, divided by 366 (to reflect the half-year period). |
| | | | | | |
| LOOMIS SAYLES MUNICIPAL INCOME FUND | | BEGINNING ACCOUNT VALUE
10/1/2007 | | ENDING ACCOUNT VALUE
3/31/2008 | | EXPENSES PAID DURING PERIOD*
10/1/2007 – 3/31/2008 |
CLASS A | | | | | | |
Actual | | $1,000.00 | | $976.60 | | $4.60 |
Hypothetical (5% return before expenses) | | $1,000.00 | | $1,020.35 | | $4.70 |
CLASS B | | | | | | |
Actual | | $1,000.00 | | $973.00 | | $8.29 |
Hypothetical (5% return before expenses) | | $1,000.00 | | $1,016.60 | | $8.47 |
| * | Expenses are equal to the Fund’s annualized expense ratio (after fee reduction/reimbursement): 0.93% and 1.68% for Class A and B, respectively, multiplied by the average account value over the period, multiplied by the number of days in the most recent fiscal half-year, divided by 366 (to reflect the half-year period). |
18
UNDERSTANDING FUND EXPENSES
| | | | | | |
| LOOMIS SAYLES STRATEGIC INCOME FUND | | BEGINNING ACCOUNT VALUE
10/1/2007 | | ENDING ACCOUNT VALUE
3/31/2008 | | EXPENSES PAID DURING PERIOD*
10/1/2007 – 3/31/2008 |
CLASS A | | | | | | |
Actual | | $1,000.00 | | $986.60 | | $4.87 |
Hypothetical (5% return before expenses) | | $1,000.00 | | $1,020.10 | | $4.95 |
CLASS B | | | | | | |
Actual | | $1,000.00 | | $982.90 | | $8.58 |
Hypothetical (5% return before expenses) | | $1,000.00 | | $1,016.35 | | $8.72 |
CLASS C | | | | | | |
Actual | | $1,000.00 | | $983.70 | | $8.58 |
Hypothetical (5% return before expenses) | | $1,000.00 | | $1,016.35 | | $8.72 |
CLASS Y | | | | | | |
Actual | | $1,000.00 | | $988.50 | | $3.63 |
Hypothetical (5% return before expenses) | | $1,000.00 | | $1,021.35 | | $3.69 |
| * | Expenses are equal to the Fund’s annualized expense ratio (after fee reduction/reimbursement): 0.98%, 1.73%, 1.73% and 0.73% for Class A, B, C and Y, respectively, multiplied by the average account value over the period, multiplied by the number of days in the most recent fiscal half-year, divided by 366 (to reflect the half-year period). |
19
BOARD APPROVALOFTHE EXISTING ADVISORY AGREEMENTFOR
LOOMIS SAYLES STRATEGIC INCOME FUND
The Board of Trustees, including the Independent Trustees, considers matters bearing on each Fund’s advisory agreements (collectively, the “Agreements”) at most of its meetings throughout the year. The Contract Review and Governance Committee of the Board meets to review the Agreements to determine whether to recommend that the full Board approve the continuation of the Agreements. After the Committee has made its recommendation, the full Board, including the Independent Trustees, determines whether to approve the continuation of the Agreements.
In connection with these meetings, the Trustees receive materials that the Funds’ investment advisers believe to be reasonably necessary for the Trustees to evaluate the Agreements. These materials generally include, among other items, (i) information on the investment performance of the Funds and the performance of peer groups of funds and the Funds’ performance benchmarks, (ii) information on the Funds’ advisory fees and other expenses, including information comparing the Funds’ expenses to those of peer groups of funds and information about any applicable expense caps and fee “breakpoints,” (iii) sales and redemption data in respect of the Funds, (iv) information about the profitability of the Agreements to Loomis, Sayles & Company, L.P., adviser to each of the Funds (the “Adviser”), and (v) information obtained through the completion of a questionnaire by the Adviser (the Trustees are consulted as to the information requested through that questionnaire). The Board of Trustees, including the Independent Trustees, also consider other matters such as (i) the Adviser’s financial results and financial condition, (ii) each Fund’s investment objective and strategies and the size, education and experience of the Adviser’s investment staff and its use of technology, external research and trading cost measurement tools, (iii) arrangements in respect of the distribution of the Funds’ shares, (iv) the procedures employed to determine the value of the Funds’ assets, (v) the allocation of the Funds’ brokerage, if any, including allocations to brokers affiliated with the Adviser and the use of “soft” commission dollars to pay Fund expenses and to pay for research and other similar services, (vi) the resources devoted to, and the record of compliance with, the Funds’ investment policies and restrictions, policies on personal securities transactions and other compliance policies, and (vii) the general economic outlook with particular emphasis on the mutual fund industry. Throughout the process, the Trustees are afforded the opportunity to ask questions of and request additional materials from the Adviser.
In addition to the materials requested by the Trustees in connection with their consideration of the continuation of the Agreements, the Trustees receive materials in advance of each regular quarterly meeting of the Board of Trustees that provide detailed information about each Fund’s investment performance and the fees charged to the Funds for advisory and other services. This information generally includes, among other things, an internal performance rating for each Fund based on agreed-upon criteria, graphs showing performance and fee differentials against each Fund’s peer group, performance ratings provided by a third-party, total return information for various periods, and third-party performance rankings for various periods comparing a Fund against its peer group. The portfolio management team for each Fund makes periodic presentations to the Contract Review and Governance Committee and/or the full Board of Trustees, and Funds identified as presenting possible performance concerns may be subject to more frequent board presentations and reviews. In addition, each quarter the Trustees are provided with detailed statistical information about each Fund’s portfolio.
At the June 2007 Board meeting, the Board of Trustees, including the Independent Trustees, authorized the extension of the Advisory Agreement for the Loomis Sayles Strategic Income Fund (the “Loomis Sayles Strategic Income Fund Agreement”) through November 30, 2007. At the meeting held in November 2007, the Board of Trustees approved the continuation of the Loomis Sayles Strategic Income Fund Agreement through June 30, 2008. In considering whether to approve the continuation of the Loomis Sayles Strategic Income Fund Agreement, the Board of Trustees, including the Independent Trustees, did not identify any single factor as determinative. In considering the continuation of the Loomis Sayles Strategic Income Fund Agreement in November 2007, the Trustees considered the information that had been provided to them in the spring in connection with their regularly scheduled consideration of the Agreements, updates to that information, and their discussions at such meetings. Matters considered by the Trustees, including the Independent Trustees, in connection with their approval of the Loomis Sayles Strategic Income Fund Agreement included the following:
The nature, extent and quality of the services provided to the Fund under the Agreement. The Trustees considered the nature, extent and quality of the services provided by the Adviser and its affiliates to the Fund and the resources dedicated to the Fund by the Adviser and its affiliates, including recent or planned investments by the Adviser in additional personnel or other resources. They also took note of the competitive market for talented personnel, in particular, for personnel who have contributed to the generation of strong investment performance. They considered the need for the Adviser to offer competitive compensation in order to attract and retain capable personnel. The Trustees also recalled that at the June 2007 Board meeting, they discussed the following factors pertaining to the Fund: (1) the additional efforts required to manage the Fund’s portfolio in periods of rapid growth (including the need to
20
BOARD APPROVALOFTHE EXISTING ADVISORY AGREEMENTFOR
LOOMIS SAYLES STRATEGIC INCOME FUND
identify additional portfolio securities for investment as the Fund’s assets grow), (2) the additional personnel and other resources required to manage the portfolio in such circumstances, (3) the possible effects of such cash inflows on the Fund’s ability to achieve attractive investment returns and (4) the benefits to the Fund of such net cash inflows and asset growth (including lower expense ratios).
The Trustees also considered the administrative services provided by Natixis Advisors (an affiliate of the Adviser) and its affiliates to the Fund.
The Trustees also considered the benefits to Fund shareholders of investing in a mutual fund that is part of a family of funds offering a variety of investment disciplines and providing for a variety of fund and shareholder services.
After reviewing these and related factors, the Trustees concluded, within the context of their overall conclusions regarding the Agreement, that the nature, extent and quality of services provided supported the renewal of the Agreement.
Investment performance of the Fund and the Adviser. As noted above, the Trustees received information about the performance of the Fund over various time periods, including information which compared the performance of the Fund to the performance of peer groups of funds and the Fund’s respective performance benchmarks. In addition, the Trustees also reviewed data prepared by an independent third party which analyzed the performance of the Fund using a variety of performance metrics, including metrics which also measured the performance of the Fund on a risk adjusted basis.
The Board concluded that the Fund’s performance or other relevant factors supported the renewal of the Agreement. The Trustees also considered the Adviser’s performance and reputation generally, the performance of the fund family generally, and the historical responsiveness of the Adviser to Trustee concerns about performance and the willingness of the Adviser to take steps intended to improve performance.
After reviewing these and related factors, the Trustees concluded, within the context of their overall conclusions regarding the Agreement, that the performance of the Fund and the Adviser supported the renewal of the Agreement.
The costs of the services to be provided and profits to be realized by the Adviser and its affiliates from its relationships with the Fund. The Trustees considered the fees charged to the Fund for advisory services as well as the total expense levels of the Fund. This information included comparisons (provided both by management and also by an independent third party) of the Fund’s advisory fees and total expense levels to those of their peer groups and information about the advisory fees charged by the Adviser to comparable accounts. In considering the fees charged to comparable accounts, the Trustees considered, among other things, management’s representations about the differences between managing mutual funds as compared to other types of accounts, including the additional resources required to effectively manage mutual fund assets. In evaluating the Fund’s advisory fees, the Trustees also took into account the demands, complexity and quality of the investment management of the Fund. The Trustees noted that the Fund has an expense cap in place, and they considered the amount waived or reimbursed by the Adviser under the cap.
The Trustees also considered the compensation directly or indirectly received by the Adviser and its affiliates from their relationships with the Fund. The Trustees reviewed information provided by management as to the profitability of the Adviser’s and its affiliates relationships with the Fund, and information about the allocation of expenses used to calculate profitability. They also reviewed information provided by management about the effect of distribution costs and Fund growth on Adviser profitability, including information regarding resources spent on distribution activities and the increase in net sales for the family of funds. When reviewing profitability, the Trustees also considered information about court cases in which adviser profitability was an issue, the performance of the Fund, the expense levels of the Fund, and that the Adviser had implemented an expense cap for the Fund.
After reviewing these and related factors, the Trustees concluded, within the context of their overall conclusions regarding the Agreement, that the advisory fees charged to the Fund was fair and reasonable, and that the costs of these services generally and the related profitability of the Adviser and its affiliates in respect of their relationships with the Fund supported the renewal of the Agreement.
Economies of Scale. The Trustees considered the existence of any economies of scale in the provision of services by the Adviser and whether those economies are shared with the Fund through breakpoints in their investment advisory fees or other means, such as expense waivers. The Trustees noted that the Fund was subject to an expense cap. The Trustees noted that in connection with the
21
BOARD APPROVALOFTHE EXISTING ADVISORY AGREEMENTFOR
LOOMIS SAYLES STRATEGIC INCOME FUND
June 2007 meeting, they had received a report and presentation from management on the effect of recent growth in net assets of the Fund and the benefits of economies of scale realized and expected to be realized by the Fund (including decreases in the Fund’s expense ratio resulting from increases in assets). The Trustees also noted that at the June 2007 meeting, they approved the continuation of the Loomis Sayles Strategic Income Fund Agreement for the Fund for five months rather than a full year to allow further review of the growth of the Fund’s net assets and the effects of such growth on the Fund and the Adviser, and considered updated information on such growth. In considering these issues, the Trustees also took note of the costs of the services provided (both on an absolute and a relative basis) and the profitability to the Adviser and its affiliates of their relationships with the Fund, as discussed above.
After reviewing these and related factors, the Trustees considered, within the context of their overall conclusions regarding the Agreement, that the extent to which economies of scale were shared with the Fund supported the renewal of the Agreement.
The Trustees also considered other factors, which included but were not limited to the following:
| · | | whether the Fund has operated in accordance with its investment objective and the Fund’s record of compliance with its investment restrictions, and the compliance programs of the Fund and the Adviser. They also considered the compliance-related resources the Adviser and its affiliates were providing to the Fund. |
| · | | the nature, quality, cost and extent of administrative and shareholder services performed by the Adviser and its affiliates, both under the Loomis Sayles Strategic Income Fund Agreement and under a separate agreement covering administrative services. |
| · | | so-called “fallout benefits” to the Adviser, such as the engagement of affiliates of the Adviser to provide distribution, administrative and brokerage services to the Fund, and the benefits of research made available to the Adviser by reason of brokerage commissions generated by the Fund’s securities transactions. The Trustees also considered the fact that Natixis Advisors’ parent company benefits from the retention. of affiliated advisers and other service providers, including the Adviser. The Trustees considered the possible conflicts of interest associated with these fallout and other benefits, and the reporting, disclosure and other processes in place to disclose and monitor such possible conflicts of interest |
Based on their evaluation of all factors that they deemed to be material, including those factors described above, and assisted by the advice of independent counsel, the Trustees, including the Independent Trustees, concluded that the Loomis Sayles Strategic Income Fund Agreement should be continued through June 30, 2008.
22
LOOMIS SAYLES CORE PLUS BOND FUND — PORTFOLIOOF INVESTMENTS
Investments as of March 31, 2008 (Unaudited)
| | | | | | |
Principal
Amount (‡) | | Description | | Value (†) |
| | | | | | |
| | Bonds and Notes — 98.5% of Net Assets | | | |
| | | Asset-Backed Securities — 3.4% | | | |
| $ | 261,268 | | AmeriCredit Automobile Receivables Trust, Series 2005-CF, Class A-3,
4.470%, 5/06/2010 | | $ | 261,405 |
| | 294,100 | | Countrywide Asset-Backed Certificates, Series 2004-S1, Class A2,
3.872%, 3/25/2020 | | | 281,890 |
| | 1,095,000 | | Countrywide Asset-Backed Certificates, Series 2004-S1, Class A3,
4.615%, 2/25/2035 | | | 870,509 |
| | 3,315,000 | | Countrywide Asset-Backed Certificates, Series 2006-S4, Class A3,
5.804%, 7/25/2034 | | | 2,545,935 |
| | 1,345,340 | | Residential Asset Securities Corp., Series 2003-KS10, Class AI4,
4.470%, 3/25/2032 | | | 1,283,323 |
| | 402,976 | | WFS Financial Owner Trust, Series 2004-4, Class A4,
3.440%, 5/17/2012 | | | 402,618 |
| | | | | | |
| | | | | | 5,645,680 |
| | | | | | |
| | | Automotive — 0.8% | | | |
| | 955,000 | | Ford Motor Co.,
7.450%, 7/16/2031(c) | | | 630,300 |
| | 810,000 | | Ford Motor Credit Co.,
8.000%, 12/15/2016 | | | 634,072 |
| | | | | | |
| | | | | | 1,264,372 |
| | | | | | |
| | | Banking — 0.5% | | | |
| | 735,000 | | HSBC Finance Corp.,
7.000%, 5/15/2012 | | | 762,351 |
| | | | | | |
| | | Brokerage — 1.9% | | | |
| | 625,000 | | Goldman Sachs Group, Inc.,
5.300%, 2/14/2012(c) | | | 633,135 |
| | 1,040,000 | | Goldman Sachs Group, Inc.,
6.150%, 4/01/2018 | | | 1,038,457 |
| | 810,000 | | Lehman Brothers Holdings, Inc.,
5.625%, 1/24/2013 | | | 787,616 |
| | 800,000 | | Morgan Stanley,
4.000%, 1/15/2010(c) | | | 790,420 |
| | | | | | |
| | | | | | 3,249,628 |
| | | | | | |
| | | Building Materials — 0.7% | | | |
| | 815,000 | | Owens Corning, Inc.,
7.000%, 12/01/2036 | | | 589,324 |
| | 795,000 | | USG Corp.,
6.300%, 11/15/2016 | | | 628,050 |
| | | | | | |
| | | | | | 1,217,374 |
| | | | | | |
| | | Construction Machinery — 1.0% | | | |
| | 1,645,000 | | Caterpillar Financial Service Corp.,
5.450%, 4/15/2018 | | | 1,673,478 |
| | | | | | |
| | | Data Processing & Management — 0.7% | | | |
| | 1,180,000 | | Fiserv, Inc.,
6.125%, 11/20/2012 | | | 1,216,007 |
| | | | | | |
| | | Diversified Financial Services — 4.0% | | | |
| | 22,000 | | CIT Group, Inc.,
5.400%, 1/30/2016 | | | 17,409 |
| | 138,000 | | CIT Group, Inc.,
5.650%, 2/13/2017 | | | 107,012 |
| | 440,000 | | CIT Group, Inc., Series A, MTN,
6.000%, 4/01/2036 | | | 334,400 |
| | 890,000 | | Citigroup Inc,
6.875%, 3/05/2038 | | | 889,371 |
| | | | | | |
Principal
Amount (‡) | | Description | | Value (†) |
| | | | | | |
| | | Diversified Financial Services — continued | | | |
| $ | 3,135,000 | | General Electric Capital Corp.,
5.625%, 9/15/2017 | | $ | 3,207,917 |
| | 825,000 | | JPMorgan Chase & Co,
6.000%, 1/15/2018 | | | 860,327 |
| | 1,230,000 | | Merrill Lynch & Co., Inc.,
5.450%, 2/05/2013 | | | 1,210,146 |
| | | | | | |
| | | | | | 6,626,582 |
| | | | | | |
| | | Diversified Manufacturing — 0.7% | | | |
| | 1,200,000 | | Crane Co.,
6.550%, 11/15/2036 | | | 1,115,408 |
| | | | | | |
| | | Electric — 2.7% | | | |
| | 290,000 | | AES Corp.,
7.750%, 10/15/2015(c) | | | 292,175 |
| | 570,000 | | AES Corp.,
8.000%, 10/15/2017 | | | 577,125 |
| | 635,000 | | Duke Energy Corp., Senior Note,
4.200%, 10/01/2008 | | | 637,232 |
| | 950,000 | | Enersis SA, Chile,
7.375%, 1/15/2014(c) | | | 1,047,974 |
| | 1,325,000 | | Ipalco Enterprises, Inc., Senior Secured Note,
8.375%, 11/14/2008 | | | 1,341,563 |
| | 590,000 | | Southern California Edison Co.,
7.625%, 1/15/2010 | | | 627,288 |
| | | | | | |
| | | | | | 4,523,357 |
| | | | | | |
| | | Food — 0.8% | | | |
| | 410,000 | | Dean Foods Co.,
7.000%, 6/01/2016(c) | | | 358,750 |
| | 925,000 | | Kraft Foods, Inc.,
6.875%, 2/01/2038 | | | 910,288 |
| | | | | | |
| | | | | | 1,269,038 |
| | | | | | |
| | | Government Guaranteed — 5.6% | | | |
| | 138,000,000 | | Kreditanstalt fuer Wiederaufbau,
1.850%, 9/20/2010 (JPY) | | | 1,419,879 |
| | 472,000,000 | | Kreditanstalt fuer Wiederaufbau, Series EMTN,
2.050%, 9/21/2009(c) (JPY) | | | 4,819,623 |
| | 303,000,000 | | Oesterreichische Kontrollbank AG,
1.800%, 3/22/2010 (JPY) | | | 3,100,102 |
| | | | | | |
| | | | | | 9,339,604 |
| | | | | | |
| | | Government Owned — No Guarantee — 0.7% | | | |
| | 1,098,000 | | Pemex Project Funding Master Trust,
7.875%, 2/01/2009 | | | 1,137,178 |
| | | | | | |
| | | Healthcare — 1.0% | | | |
| | 575,000 | | HCA, Inc.,
7.500%, 12/15/2023 | | | 451,488 |
| | 485,000 | | Hospira, Inc.,
6.050%, 3/30/2017 | | | 480,697 |
| | 670,000 | | Medco Health Solutions,
7.250%, 8/15/2013 | | | 752,861 |
| | | | | | |
| | | | | | 1,685,046 |
| | | | | | |
| | | Hybrid ARMs — 0.5% | | | |
| | 873,314 | | JPMorgan Mortgage Trust, Series 2006-A7, Class 1A3,
5.929%, 1/25/2037(b) | | | 882,686 |
| | | | | | |
| | | Independent Energy — 0.9% | | | |
| | 65,000 | | Anadarko Petroleum Corp.,
6.450%, 9/15/2036 | | | 66,193 |
See accompanying notes to financial statements.
23
LOOMIS SAYLES CORE PLUS BOND FUND — PORTFOLIOOF INVESTMENTS (continued)
Investments as of March 31, 2008 (Unaudited)
| | | | | | |
Principal
Amount (‡) | | Description | | Value (†) |
| | | | | | |
| | | Independent Energy — continued | | | |
| $ | 290,000 | | Chesapeake Energy Corp.,
6.500%, 8/15/2017 | | $ | 279,850 |
| | 385,000 | | Chesapeake Energy Corp.,
6.875%, 11/15/2020 | | | 373,450 |
| | 830,000 | | Teppco Partners L P,
7.550%, 4/15/2038 | | | 836,832 |
| | | | | | |
| | | | | | 1,556,325 |
| | | | | | |
| | | Media Cable — 2.5% | | | |
| | 1,470,000 | | Comcast Corp.,
6.950%, 8/15/2037 | | | 1,472,947 |
| | 755,000 | | Cox Communications, Inc.,
6.750%, 3/15/2011 | | | 786,541 |
| | 1,085,000 | | CSC Holdings, Inc., Senior Note, Series B,
7.625%, 4/01/2011 | | | 1,072,794 |
| | 873,000 | | Time Warner Cable, Inc.,
6.550%, 5/01/2037 | | | 824,095 |
| | | | | | |
| | | | | | 4,156,377 |
| | | | | | |
| | | Metals & Mining — 0.9% | | | |
| | 890,000 | | Steel Dynamics, Inc., 144A,
7.375%, 11/01/2012 | | | 898,900 |
| | 710,000 | | United States Steel Corp.,
6.650%, 6/01/2037 | | | 600,165 |
| | | | | | |
| | | | | | 1,499,065 |
| | | | | | |
| | | Mortgage Backed Securities — 4.8% | | | |
| | 795,000 | | Banc of America Commercial Mortgage, Inc., Series 2005-6, Class A2,
5.165%, 9/10/2047 | | | 789,329 |
| | 850,000 | | Banc of America Commercial Mortgage, Inc., Series 2006-1, Class A2,
5.334%, 9/10/2045 | | | 840,694 |
| | 1,305,000 | | Banc of America Commercial Mortgage, Inc., Series 2007-2, Class A2,
5.634%, 4/10/2049 | | | 1,283,459 |
| | 1,245,000 | | Bear Stearns Commercial Mortgage Securities, Inc., Series 2005-PW10, Class A2,
5.270%, 12/11/2040 | | | 1,239,066 |
| | 710,000 | | Citigroup/Deutsche Bank Commercial Mortgage Trust, Series 2006-CD2, Class A2,
5.408%, 1/15/2046 | | | 703,231 |
| | 1,500,000 | | GS Mortgage Securities Corp. II, Series 2005-GG4, Class A4A,
4.751%, 7/10/2039 | | | 1,455,656 |
| | 1,710,000 | | LB-UBS Commercial Mortgage Trust, Series 2005-C3, Class A3,
4.647%, 7/15/2030 | | | 1,659,161 |
| | | | | | |
| | | | | | 7,970,596 |
| | | | | | |
| | | Mortgage Related — 35.1% | | | |
| | 1,951,303 | | FHLMC,
4.000%, 7/01/2019 | | | 1,910,401 |
| | 2,194,925 | | FHLMC,
4.500%, 12/01/2034 | | | 2,117,930 |
| | 5,164,078 | | FHLMC,
5.000%, with various maturities from 2018 to 2035(d) | | | 5,132,686 |
| | 7,349,471 | | FHLMC,
5.500%, with various maturities from 2018 to 2037(d)(e) | | | 7,449,669 |
| | 1,779,956 | | FHLMC,
5.947%, 11/01/2036 | | | 1,813,662 |
| | 193,335 | | FHLMC,
6.000%, 6/01/2035 | | | 199,340 |
| | | | | | |
Principal
Amount (‡) | | Description | | Value (†) |
| | | | | | |
| | | Mortgage Related — continued | | | |
| $ | 782,459 | | FNMA,
4.000%, 6/01/2019 | | $ | 766,108 |
| | 5,368,148 | | FNMA,
4.500%, with various maturities from 2019 to 2035(d)(e) | | | 5,289,820 |
| | 3,747,488 | | FNMA,
5.500%, with various maturities from 2018 to 2034(d) | | | 3,808,847 |
| | 4,574,788 | | FNMA,
6.000%, with various maturities from 2016 to 2036(d) | | | 4,700,852 |
| | 1,428,415 | | FNMA,
6.048%, 2/01/2037(b) | | | 1,457,687 |
| | 3,822,645 | | FNMA,
6.500%, with various maturities from 2029 to 2037(d) | | | 3,966,174 |
| | 250,173 | | FNMA,
7.000%, with various maturities in 2030(d) | | | 266,348 |
| | 225,061 | | FNMA,
7.500%, with various maturities from 2024 to 2032(d) | | | 242,987 |
| | 3,440,000 | | GNMA, TBA,
5.000%, 3/01/2034 | | | 3,438,927 |
| | 2,595,868 | | GNMA,
5.500%, with various maturities from 2034 to 2038(d) | | | 2,649,393 |
| | 3,275,000 | | GNMA, TBA,
5.500%, 8/01/2034 | | | 3,338,453 |
| | 6,380,902 | | GNMA,
6.000%, with various maturities from 2029 to 2037(d) | | | 6,596,303 |
| | 726,586 | | GNMA,
6.500%, with various maturities from 2028 to 2032(d) | | | 759,053 |
| | 409,442 | | GNMA,
7.000%, with various maturities from 2025 to 2029(d) | | | 438,500 |
| | 131,757 | | GNMA,
7.500%, with various maturities from 2025 to 2030(d) | | | 142,174 |
| | 88,516 | | GNMA,
8.000%, 11/15/2029 | | | 97,107 |
| | 122,950 | | GNMA,
8.500%, with various maturities from 2017 to 2023(d) | | | 135,468 |
| | 21,699 | | GNMA,
9.000%, with various maturities in 2016(d) | | | 23,689 |
| | 45,565 | | GNMA,
11.500%, with various maturities from 2013 to 2015(d) | | | 54,139 |
| | 1,800,000 | | Greenwich Capital Commercial Funding Corp., Series 2005-GG5, Class A2,
5.117%, 4/10/2037 | | | 1,788,885 |
| | | | | | |
| | | | | | 58,584,602 |
| | | | | | |
| | | Non Captive Consumer — 0.4% | | | |
| | 245,000 | | SLM Corp., (MTN),
5.050%, 11/14/2014 | | | 178,183 |
| | 420,000 | | SLM Corp., (MTN),
5.625%, 8/01/2033 | | | 290,850 |
| | 215,000 | | SLM Corp., Series A, (MTN),
5.000%, 10/01/2013 | | | 161,831 |
| | 120,000 | | SLM Corp., Series A, (MTN),
5.000%, 6/15/2018 | | | 85,800 |
| | 35,000 | | SLM Corp., Series A, (MTN),
5.375%, 5/15/2014 | | | 26,266 |
| | | | | | |
| | | | | | 742,930 |
| | | | | | |
| | | Non-Captive Diversified — 1.1% | | | |
| | 1,520,000 | | GMAC LLC,
6.625%, 5/15/2012 | | | 1,149,853 |
| | 930,000 | | GMAC LLC,
8.000%, 11/01/2031(c) | | | 666,523 |
| | | | | | |
| | | | | | 1,816,376 |
| | | | | | |
See accompanying notes to financial statements.
24
LOOMIS SAYLES CORE PLUS BOND FUND — PORTFOLIOOF INVESTMENTS (continued)
Investments as of March 31, 2008 (Unaudited)
| | | | | | |
Principal
Amount (‡) | | Description | | Value (†) |
| | | | | | |
| | | Oil Field Services — 0.5% | | | |
| $ | 190,000 | | Nabors Industries, Inc., 144A,
6.150%, 2/15/2018 | | $ | 194,500 |
| | 750,000 | | Weatherford International, Ltd.,
6.500%, 8/01/2036 | | | 714,579 |
| | | | | | |
| | | | | | 909,079 |
| | | | | | |
| | | Paper — 1.2% | | | |
| | 565,000 | | Georgia-Pacific Corp.,
7.375%, 12/01/2025(c) | | | 468,950 |
| | 755,000 | | Georgia-Pacific Corp.,
7.750%, 11/15/2029 | | | 634,200 |
| | 735,000 | | Georgia-Pacific Corp.,
8.000%, 1/15/2024(c) | | | 646,800 |
| | 365,000 | | Georgia-Pacific Corp.,
8.875%, 5/15/2031 | | | 324,850 |
| | | | | | |
| | | | | | 2,074,800 |
| | | | | | |
| | | Pharmaceuticals — 0.6% | | | |
| | 1,095,000 | | Valeant Pharmaceuticals International, Senior Note,
7.000%, 12/15/2011 | | | 1,042,987 |
| | | | | | |
| | | Pipelines — 0.7% | | | |
| | 1,150,000 | | NGPL Pipeco LLC, 144A,
6.514%, 12/15/2012 | | | 1,194,326 |
| | | | | | |
| | | Property & Casualty Insurance — 0.3% | | | |
| | 475,000 | | Willis North America, Inc.,
6.200%, 3/28/2017 | | | 474,024 |
| | | | | | |
| | | Real Estate Investment Trusts — 1.0% | | | |
| | 195,000 | | Colonial Realty, LP, Senior Note,
4.750%, 2/01/2010 | | | 192,019 |
| | 640,000 | | Colonial Realty, LP, Senior Note,
5.500%, 10/01/2015 | | | 522,355 |
| | 1,250,000 | | iStar Financial, Inc., Senior Note,
6.000%, 12/15/2010 | | | 975,000 |
| | | | | | |
| | | | | | 1,689,374 |
| | | | | | |
| | | Sovereigns — 1.8% | | | |
| | 296,000,000 | | Canadian Government,
1.900%, 3/23/2009(c) (JPY) | | | 2,999,756 |
| | | | | | |
| | | Supermarkets — 0.8% | | | |
| | 1,245,000 | | Kroger Co.,
6.900%, 4/15/2038 | | | 1,263,961 |
| | | | | | |
| | | Supranational — 0.9% | | | |
| | 140,000,000 | | Inter-American Development Bank,
1.900%, 7/08/2009 (JPY) | | | 1,423,806 |
| | | | | | |
| | | Technology — 3.4% | | | |
| | 745,000 | | Corning, Inc.,
7.250%, 8/15/2036 | | | 803,630 |
| | 540,000 | | Equifax, Inc.,
7.000%, 7/01/2037 | | | 482,257 |
| | 1,660,000 | | Freescale Semiconductor, Inc.,
10.125%, 12/15/2016(c) | | | 1,120,500 |
| | 70,000 | | Motorola, Inc.,
6.500%, 11/15/2028(c) | | | 54,614 |
| | 85,000 | | Motorola, Inc.,
6.625%, 11/15/2037 | | | 65,742 |
| | 295,000 | | Nortel Networks Corp.,
6.875%, 9/01/2023 | | | 181,425 |
| | | | | | |
Principal
Amount (‡) | | Description | | Value (†) |
| | | | | | |
| | | Technology — continued | | | |
| $ | 920,000 | | Northern Telecom Capital Corp.,
7.875%, 6/15/2026 | | $ | 575,000 |
| | 1,715,000 | | Pitney Bowes, Inc.,
5.250%, 1/15/2037 | | | 1,697,360 |
| | 683,000 | | Xerox Corp.,
6.400%, 3/15/2016 | | | 706,583 |
| | | | | | |
| | | | �� | | 5,687,111 |
| | | | | | |
| | | Tobacco — 0.7% | | | |
| | 1,185,000 | | Reynolds American, Inc.,
7.250%, 6/15/2037 | | | 1,173,039 |
| | | | | | |
| | | Treasuries — 10.3% | | | |
| | 4,570,000 | | U.S Treasury Bond,
4.375%, 2/15/2038(c) | | | 4,624,269 |
| | 3,106,000 | | U.S. Treasury Bond,
4.500%, 2/15/2036(c) | | | 3,208,644 |
| | 1,790,000 | | U.S. Treasury Bond,
4.750%, 2/15/2037(c) | | | 1,925,229 |
| | 1,090,000 | | U.S. Treasury Bond,
5.000%, 5/15/2037(c) | | | 1,219,352 |
| | 715,000 | | U.S. Treasury Bond,
5.375%, 2/15/2031(c) | | | 826,942 |
| | 5,270,000 | | U.S Treasury Note,
3.500%, 2/15/2018(c) | | | 5,300,466 |
| | | | | | |
| | | | | | 17,104,902 |
| | | | | | |
| | | Wireless — 2.8% | | | |
| | 10,000 | | Nextel Communications, Inc., Series D,
7.375%, 8/01/2015 | | | 7,700 |
| | 5,000 | | Nextel Communications, Inc., Series F,
5.950%, 3/15/2014 | | | 3,700 |
| | 1,385,000 | | SK Telecom Co., Ltd., 144A,
6.625%, 7/20/2027 | | | 1,293,894 |
| | 520,000 | | Sprint Capital Corp.,
6.125%, 11/15/2008 | | | 516,100 |
| | 1,990,000 | | Sprint Capital Corp.,
6.875%, 11/15/2028 | | | 1,482,550 |
| | 15,000 | | Sprint Capital Corp.,
6.900%, 5/01/2019(c) | | | 11,812 |
| | 1,420,000 | | True Move Co., Ltd., 144A,
10.750%, 12/16/2013 | | | 1,334,800 |
| | | | | | |
| | | | | | 4,650,556 |
| | | | | | |
| | | Wirelines — 2.8% | | | |
| | 935,000 | | Citizens Communications Co.,
7.875%, 1/15/2027 | | | 801,763 |
| | 1,785,000 | | Embarq Corp.,
7.995%, 6/01/2036 | | | 1,630,164 |
| | 210,000 | | Qwest Capital Funding, Inc., Guaranteed Note,
6.500%, 11/15/2018 | | | 170,100 |
| | 850,000 | | Qwest Corp.,
7.250%, 9/15/2025 | | | 739,500 |
| | 255,000 | | Qwest Corp.,
7.250%, 10/15/2035 | | | 210,375 |
| | 1,190,000 | | Qwest Corp.,
7.500%, 6/15/2023 | | | 1,038,275 |
| | | | | | |
| | | | | | 4,590,177 |
| | | | | | |
| | | Total Bonds and Notes (Identified Cost $165,529,261) | | | 164,211,958 |
| | | | | | |
See accompanying notes to financial statements.
25
LOOMIS SAYLES CORE PLUS BOND FUND — PORTFOLIOOF INVESTMENTS (continued)
Investments as of March 31, 2008 (Unaudited)
| | | | | | | |
Shares/
Principal
Amount (‡) | | Description | | Value (†) | |
| | | | | | | |
| | | Short-Term Investments — 17.4% | | | | |
| | 24,906,801 | | State Street Navigator Securities Lending Prime Portfolio(f) | | $ | 24,906,801 | |
| $ | 4,183,283 | | Tri-Party Repurchase Agreement with Fixed Income Clearing Corporation, dated 3/31/08 at 1.250% to be repurchased at $4,183,428 on 4/1/08, collateralized by $4,255,000 Federal Home Loan Mortgage Corp., 3.375% due 3/05/10 valued at $4,270,956, including accrued interest (Note 2g of Notes to Financial Statements) | | | 4,183,283 | |
| | | | | | | |
| | | Total Short-Term Investments (Identified Cost $29,090,084) | | | 29,090,084 | |
| | | | | | | |
| | | | | | | |
| | | Total Investments — 115.9%
(Identified Cost $194,619,345)(a) | | | 193,302,042 | |
| | | Other assets less liabilities — (15.9)% | | | (26,526,165 | ) |
| | | | | | | |
| | | Net Assets — 100% | | $ | 166,775,877 | |
| | | | | | | |
| | | | | | | |
| | (‡) | | Principal amount is in U.S. dollars unless otherwise noted. | | | | |
| | (†) | | See Note 2a of Notes to Financial Statements. | | | | |
| | (a) | | Federal Tax Information (Amounts exclude certain adjustments made at the end of the Fund’s fiscal year for tax purposes. Amortization of premium on debt securities is excluded for tax purposes): At March 31, 2008, the net unrealized depreciation on investments based on a cost of $194,970,476 for federal income tax purposes was as follows: | | | | |
| | | Aggregate gross unrealized appreciation for all investments in which there is an excess of value over tax cost | | $ | 3,838,393 | |
| | | Aggregate gross unrealized depreciation for all investments in which there is an excess of tax cost over value | | | (5,506,827 | ) |
| | | | | | | |
| | | Net unrealized depreciation | | $ | (1,668,434 | ) |
| | | | | | | |
| | (b) | | Variable rate security. Rate as of March 31, 2008 is disclosed. | |
| | (c) | | All or a portion of this security was on loan to brokers at March 31, 2008. | |
| | (d) | | The Fund’s investment in mortgage related securities of the Federal Home Loan Mortgage Corporation, Federal National Mortgage Association and Government National Mortgage Association are interests in separate pools of mortgages. All separate investments in securities of each issuer which have the same coupon rate have been aggregated for the purpose of presentation in the portfolio of investments. | |
| | (e) | | All or a portion of this security has been segregated to cover collateral requirements on TBA obligations. | |
| | (f) | | Represents investment of securities lending collateral. | |
| | | | | | | |
| | 144A | | Securities exempt from registration under Rule 144A of the Securities Act of 1933. These securities may be resold in transactions exempt from registration, normally to qualified institutional buyers. At the period end, the value of these amounted to $4,916,420 or 2.9% of net assets. | |
| |
| | ARMs | | Adjustable Rate Mortgages | |
| | EMTN | | Euro Medium Term Note | |
| | FHLMC | | Federal Home Loan Mortgage Corporation | |
| | FNMA | | Federal National Mortgage Association | |
| | GNMA | | Government National Mortgage Association | |
| | MTN | | Medium Term Note | |
| | TBA | | To Be Announced | |
| | | | | | | |
| | JPY | | Japanese Yen | |
Holdings at March 31, 2008 as a Percentage of Net Assets (unaudited)
| | | |
| Mortgage Related | | 35.1 | % |
| Treasuries | | 10.3 | |
| Government Guaranteed | | 5.6 | |
| Mortgage Backed Securities | | 4.8 | |
| Diversified Financial Services | | 4.0 | |
| Asset-Backed Securities | | 3.4 | |
| Technology | | 3.4 | |
| Wireless | | 2.8 | |
| Wirelines | | 2.8 | |
| Electric | | 2.7 | |
| Media Cable | | 2.5 | |
| Other, less than 2% each | | 21.1 | |
See accompanying notes to financial statements.
26
LOOMIS SAYLES HIGH INCOME FUND — PORTFOLIOOF INVESTMENTS
Investments as of March 31, 2008 (Unaudited)
| | | | | | |
Principal
Amount (‡) | | Description | | Value (†) |
| | | | | | |
| | Bonds and Notes — 87.3% of Net Assets | | | |
| | | Airlines — 0.2% | | | |
| $ | 62,381 | | Continental Airlines, Inc., Series 1997-4, Class 4B,
6.900%, 1/02/2017 | | $ | 56,143 |
| | 27,077 | | Continental Airlines, Inc., Series 1999-1, Class C,
6.954%, 8/02/2009 | | | 25,452 |
| | | | | | |
| | | | | | 81,595 |
| | | | | | |
| | | Automotive — 3.2% | | | |
| | 420,000 | | Ford Motor Co.,
6.375%, 2/01/2029 | | | 252,000 |
| | 65,000 | | Ford Motor Co.,
6.625%, 2/15/2028 | | | 39,650 |
| | 1,220,000 | | Ford Motor Co.,
6.625%, 10/01/2028 | | | 744,200 |
| | 210,000 | | Ford Motor Co.,
7.450%, 7/16/2031 | | | 138,600 |
| | 40,000 | | Ford Motor Co.,
7.500%, 8/01/2026 | | | 25,600 |
| | 10,000 | | General Motors Corp.,
8.250%, 7/15/2023 | | | 7,000 |
| | 10,000 | | General Motors Corp.,
8.375%, 7/15/2033(b) | | | 7,050 |
| | 130,000 | | Goodyear Tire & Rubber Co.,
7.000%, 3/15/2028 | | | 105,950 |
| | | | | | |
| | | | | | 1,320,050 |
| | | | | | |
| | | Banking — 3.4% | | | |
| | 250,000,000 | | Barclays Financial LLC, 144A,
4.060%, 9/16/2010 (KRW) | | | 262,887 |
| | 400,000,000 | | Barclays Financial LLC, 144A,
4.470%, 12/04/2011 (KRW) | | | 430,353 |
| | 500,000 | | HSBC Bank USA, 144A,
3.310%, 8/25/2010 | | | 603,600 |
| | 1,436,358,000 | | JPMorgan Chase & Co., 144A,
Zero Coupon, 3/28/2011 (IDR) | | | 114,986 |
| | | | | | |
| | | | | | 1,411,826 |
| | | | | | |
| | | Brokerage — 0.5% | | | |
| | 5,000 | | Bear Stearns Cos., Inc. (The),
4.650%, 7/02/2018(b) | | | 4,268 |
| | 5,000 | | Bear Stearns Cos., Inc. (The),
5.300%, 10/30/2015 | | | 4,694 |
| | 15,000 | | Bear Stearns Cos., Inc. (The),
6.400%, 10/02/2017 | | | 14,811 |
| | 120,000 | | Bear Stearns Cos., Inc. (The),
7.250%, 2/01/2018 | | | 124,007 |
| | 55,000 | | Bear Stearns Cos., Inc. (The), Series MTN,
3.190%, 5/18/2010(c) | | | 51,151 |
| | | | | | |
| | | | | | 198,931 |
| | | | | | |
| | | Building Materials — 0.4% | | | |
| | 185,000 | | USG Corp.,
6.300%, 11/15/2016 | | | 146,150 |
| | | | | | |
| | | Chemicals — 2.5% | | | |
| | 450,000 | | Borden, Inc.,
7.875%, 2/15/2023 | | | 279,000 |
| | 550,000 | | Borden, Inc.,
9.200%, 3/15/2021 | | | 368,500 |
| | 130,000 | | Georgia Gulf Corp.,
10.750%, 10/15/2016(b) | | | 85,150 |
| | | | | | |
Principal
Amount (‡) | | Description | | Value (†) |
| | | | | | |
| | | Chemicals — continued | | | |
| $ | 380,000 | | Hercules, Inc., Subordinated Note,
6.500%, 6/30/2029 | | $ | 304,000 |
| | | | | | |
| | | | | | 1,036,650 |
| | | | | | |
| | | Construction Machinery — 1.0% | | | |
| | 500,000 | | United Rentals North America, Inc.,
7.000%, 2/15/2014 | | | 392,500 |
| | | | | | |
| | | Electric — 4.1% | | | |
| | 375,000 | | Dynegy Holdings, Inc.,
7.125%, 5/15/2018 | | | 337,500 |
| | 180,000 | | Dynegy Holdings, Inc.,
7.625%, 10/15/2026 | | | 152,550 |
| | 165,000 | | Dynegy Holdings, Inc.,
7.750%, 6/01/2019 | | | 154,275 |
| | 140,000 | | NGC Corp. Capital Trust I, Series B,
8.316%, 6/01/2027 | | | 120,050 |
| | 205,000 | | NRG Energy, Inc.,
7.375%, 1/15/2017 | | | 199,362 |
| | 75,000 | | TXU Corp.,
5.550%, 11/15/2014 | | | 58,563 |
| | 590,000 | | TXU Corp., Series Q,
6.500%, 11/15/2024 | | | 418,946 |
| | 370,000 | | TXU Corp., Series R,
6.550%, 11/15/2034 | | | 261,212 |
| | | | | | |
| | | | | | 1,702,458 |
| | | | | | |
| | | Financial Services — 0.2% | | | |
| | 135,000 | | Residential Capital LLC,
8.500%, 4/17/2013 | | | 65,475 |
| | | | | | |
| | | Food & Beverage — 1.6% | | | |
| | 200,000 | | Aramark Services, Inc.,
5.000%, 6/01/2012 | | | 174,000 |
| | 315,000 | | Dean Foods Co.,
7.000%, 6/01/2016(b) | | | 275,625 |
| | 230,000 | | Dole Food Co., Inc.,
8.625%, 5/01/2009 | | | 200,100 |
| | | | | | |
| | | | | | 649,725 |
| | | | | | |
| | | Gaming — 0.8% | | | |
| | 45,000 | | Harrah’s Operating Co., Inc.,
5.750%, 10/01/2017 | | | 25,200 |
| | 365,000 | | Harrah’s Operating Co., Inc., 144A,
10.750%, 2/01/2016 | | | 307,513 |
| | | | | | |
| | | | | | 332,713 |
| | | | | | |
| | | Government Guaranteed — 2.3% | | | |
| | 28,000,000 | | Kreditanstalt fuer Wiederaufbau,
1.850%, 9/20/2010 (JPY) | | | 288,091 |
| | 1,205,000 | | Kreditanstalt fuer Wiederaufbau, Series E, (MTN),
8.500%, 7/16/2010 (ZAR) | | | 140,857 |
| | 51,000,000 | | Oesterreichische Kontrollbank AG,
1.800%, 3/22/2010 (JPY) | | | 521,800 |
| | | | | | |
| | | | | | 950,748 |
| | | | | | |
| | | Government Sponsored — 0.4% | | | |
| | 160,000 | | Federal Home Loan Mortgage Corp.,
4.625%, 10/25/2012(b) | | | 169,744 |
| | | | | | |
| | | Healthcare — 4.2% | | | |
| | 5,000 | | Boston Scientific Corp.,
5.450%, 6/15/2014 | | | 4,588 |
See accompanying notes to financial statements.
27
LOOMIS SAYLES HIGH INCOME FUND — PORTFOLIOOF INVESTMENTS (continued)
Investments as of March 31, 2008 (Unaudited)
| | | | | | |
Principal
Amount (‡) | | Description | | Value (†) |
| | | | | | |
| | | Healthcare — continued | | | |
| $ | 105,000 | | Boston Scientific Corp.,
6.400%, 6/15/2016 | | $ | 97,913 |
| | 95,000 | | Boston Scientific Corp.,
7.000%, 11/15/2035 | | | 82,650 |
| | 220,000 | | Community Health Systems, Inc.,
8.875%, 7/15/2015 | | | 220,825 |
| | 25,000 | | HCA, Inc.,
6.375%, 1/15/2015 | | | 21,156 |
| | 205,000 | | HCA, Inc.,
6.500%, 2/15/2016(b) | | | 172,712 |
| | 15,000 | | HCA, Inc.,
7.050%, 12/01/2027 | | | 10,938 |
| | 220,000 | | HCA, Inc.,
7.500%, 12/15/2023 | | | 172,743 |
| | 700,000 | | HCA, Inc.,
7.500%, 11/06/2033 | | | 540,750 |
| | 315,000 | | HCA, Inc.,
7.580%, 9/15/2025 | | | 246,564 |
| | 35,000 | | HCA, Inc.,
7.690%, 6/15/2025 | | | 27,739 |
| | 40,000 | | HCA, Inc.,
7.750%, 7/15/2036 | | | 30,715 |
| | 40,000 | | HCA, Inc.,
8.360%, 4/15/2024 | | | 33,203 |
| | 40,000 | | Invitrogen Corp.,
1.500%, 2/15/2024 | | | 40,600 |
| | 60,000 | | Tenet Healthcare Corp.,
6.875%, 11/15/2031 | | | 42,000 |
| | | | | | |
| | | | | | 1,745,096 |
| | | | | | |
| | | Home Construction — 4.5% | | | |
| | 410,000 | | Desarrolladora Homex SAB de CV,
7.500%, 9/28/2015 | | | 406,925 |
| | 385,000 | | K. Hovnanian Enterprises, Inc.,
6.250%, 1/15/2015(b) | | | 257,950 |
| | 365,000 | | K. Hovnanian Enterprises, Inc., Senior Note,
6.250%, 1/15/2016 | | | 246,375 |
| | 30,000 | | K. Hovnanian Enterprises, Inc., Guaranteed Note,
6.500%, 1/15/2014(b) | | | 20,250 |
| | 100,000 | | KB Home, Guaranteed Note,
5.875%, 1/15/2015 | | | 86,500 |
| | 590,000 | | KB Home, Guaranteed Note,
7.250%, 6/15/2018 | | | 528,050 |
| | 5,000 | | Lennar Corp., Series B, Guaranteed Note,
5.600%, 5/31/2015 | | | 3,700 |
| | 5,000 | | Lennar Corp. Series B,
5.125%, 10/01/2010 | | | 4,350 |
| | 155,000 | | Pulte Homes, Inc.,
6.000%, 2/15/2035 | | | 119,350 |
| | 230,000 | | Pulte Homes, Inc.,
6.375%, 5/15/2033 | | | 179,400 |
| | | | | | |
| | | | | | 1,852,850 |
| | | | | | |
| | | Independent Energy — 3.1% | | | |
| | 625,000 | | Chesapeake Energy Corp.,
6.500%, 8/15/2017 | | | 603,125 |
| | 175,000 | | Chesapeake Energy Corp.,
6.875%, 11/15/2020 | | | 169,750 |
| | 10,000 | | Hilcorp Energy I LP, 144A,
7.750%, 11/01/2015 | | | 9,375 |
| | | | | | |
Principal
Amount (‡) | | Description | | Value (†) |
| | | | | | |
| | | Independent Energy — continued | | | |
| $ | 170,000 | | Pioneer Natural Resources Co.,
6.875%, 5/01/2018 | | $ | 161,073 |
| | 385,000 | | Pioneer Natural Resources Co.,
7.200%, 1/15/2028 | | | 334,658 |
| | | | | | |
| | | | | | 1,277,981 |
| | | | | | |
| | | Industrial Other — 0.3% | | | |
| | 140,000 | | Ranhill Labuan Ltd., 144A,
12.500%, 10/26/2011 | | | 112,000 |
| | | | | | |
| | | Media Non-Cable — 1.4% | | | |
| | 25,000 | | Clear Channel Communications, Inc.,
4.900%, 5/15/2015 | | | 16,750 |
| | 50,000 | | Clear Channel Communications, Inc.,
5.500%, 12/15/2016 | | | 33,000 |
| | 175,000 | | Intelsat Corp.,
6.875%, 1/15/2028 | | | 138,250 |
| | 75,000 | | R.H. Donnelley Corp.,
6.875%, 1/15/2013 | | | 45,750 |
| | 15,000 | | R.H. Donnelley Corp.,
8.875%, 1/15/2016(b) | | | 9,487 |
| | 155,000 | | R.H. Donnelley Corp., 144A,
8.875%, 10/15/2017(b) | | | 96,875 |
| | 15,000 | | R.H. Donnelley Corp., Series A-1,
6.875%, 1/15/2013 | | | 9,150 |
| | 540,000 | | Tribune Co.,
5.250%, 8/15/2015(b) | | | 207,900 |
| | | | | | |
| | | | | | 557,162 |
| | | | | | |
| | | Metals & Mining — 2.7% | | | |
| | 740,000 | | Algoma Acquistion Corp., 144A,
9.875%, 6/15/2015 | | | 640,100 |
| | 285,000 | | Steel Dynamics, Inc., 144A,
7.375%, 11/01/2012 | | | 287,850 |
| | 195,000 | | Vale Overseas, Ltd.,
6.875%, 11/21/2036 | | | 190,264 |
| | | | | | |
| | | | | | 1,118,214 |
| | | | | | |
| | | Non-Captive Consumer — 2.0% | | | |
| | 70,000 | | Countrywide Financial Corp., Convertible,
0.758%, 4/15/2037(b)(c) | | | 61,950 |
| | 60,000 | | Countrywide Financial Corp., Convertible,
0.815%, 5/15/2037(c) | | | 51,300 |
| | 35,000 | | Countrywide Home Loans, Inc., Series L, MTN,
4.000%, 3/22/2011 | | | 31,215 |
| | 90,000 | | SLM Corp., Series A, (MTN),
4.000%, 1/15/2010 | | | 75,640 |
| | 60,000 | | SLM Corp., (MTN),
5.050%, 11/14/2014 | | | 43,637 |
| | 5,000 | | SLM Corp., (MTN),
5.625%, 8/01/2033 | | | 3,462 |
| | 20,000 | | SLM Corp., Series A, (MTN),
5.000%, 10/01/2013 | | | 15,054 |
| | 10,000 | | SLM Corp., Series A, (MTN),
5.000%, 6/15/2018 | | | 7,150 |
| | 735,000 | | SLM Corp., Series A, (MTN),
6.500%, 6/15/2010 (NZD) | | | 504,463 |
| | | | | | |
| | | | | | 793,871 |
| | | | | | |
| | | Non-Captive Diversified — 4.4% | | | |
| | 1,300,000 | | General Electric Capital Corp., Series A, (MTN),
2.960%, 5/18/2012 (SGD) | | | 946,870 |
See accompanying notes to financial statements.
28
LOOMIS SAYLES HIGH INCOME FUND — PORTFOLIOOF INVESTMENTS (continued)
Investments as of March 31, 2008 (Unaudited)
| | | | | | |
Principal
Amount (‡) | | Description | | Value (†) |
| | | | | | |
| | | Non-Captive Diversified — continued | | | |
| $ | 430,000 | | GMAC LLC,
6.000%, 12/15/2011 | | $ | 321,422 |
| | 330,000 | | GMAC LLC,
6.625%, 5/15/2012 | | | 249,639 |
| | 385,000 | | GMAC LLC, (MTN),
6.750%, 12/01/2014 | | | 272,465 |
| | 20,000 | | GMAC LLC,
8.000%, 11/01/2031 | | | 14,334 |
| | | | | | |
| | | | | | 1,804,730 |
| | | | | | |
| | | Packaging — 0.3% | | | |
| | 135,000 | | Owens-Illinois, Inc., Senior Note,
7.800%, 5/15/2018 | | | 133,650 |
| | | | | | |
| | | Paper — 3.7% | | | |
| | 485,000 | | Bowater, Inc.,
6.500%, 6/15/2013 | | | 320,100 |
| | 75,000 | | Georgia-Pacific Corp.,
7.250%, 6/01/2028 | | | 61,125 |
| | 155,000 | | Georgia-Pacific Corp.,
7.375%, 12/01/2025(b) | | | 128,650 |
| | 375,000 | | Georgia-Pacific Corp.,
7.750%, 11/15/2029 | | | 315,000 |
| | 270,000 | | Georgia-Pacific Corp.,
8.000%, 1/15/2024 | | | 237,600 |
| | 530,000 | | Georgia-Pacific Corp.,
8.875%, 5/15/2031 | | | 471,700 |
| | | | | | |
| | | | | | 1,534,175 |
| | | | | | |
| | | Pharmaceuticals — 6.5% | | | |
| | 110,000 | | Elan Finance PLC,
8.875%, 12/01/2013 | | | 103,400 |
| | 755,000 | | Elan Finance PLC, Senior Note,
7.750%, 11/15/2011 | | | 702,150 |
| | 127,000 | | EPIX Pharmaceuticals, Inc., Senior Note, Convertible,
3.000%, 6/15/2024 | | | 63,500 |
| | 215,000 | | Human Genome Sciences, Inc.,
2.250%, 8/15/2012 | | | 155,875 |
| | 245,000 | | Incyte Corp., Convertible,
3.500%, 2/15/2011 | | | 260,619 |
| | 96,000 | | Nektar Therapeutics,
3.250%, 9/28/2012 | | | 74,160 |
| | 345,000 | | Regeneron Pharmaceuticals, Inc.,
Subordinated Note, Convertible,
5.500%, 10/17/2008 | | | 343,706 |
| | 190,000 | | Valeant Pharmaceuticals International,
Subordinated Note, Convertible,
3.000%, 8/16/2010 | | | 172,900 |
| | 505,000 | | Valeant Pharmaceuticals International,
Subordinated Note, Convertible,
4.000%, 11/15/2013 | | | 419,781 |
| | 305,000 | | Vertex Pharmaceuticals, Inc., Convertible,
4.750%, 2/15/2013(b) | | | 363,713 |
| | | | | | |
| | | | | | 2,659,804 |
| | | | | | |
| | | Pipelines — 0.9% | | | |
| | 415,000 | | El Paso Corp.,
6.950%, 6/01/2028 | | | 388,024 |
| | | | | | |
| | | Retailers — 3.5% | | | |
| | 500,000 | | Blockbuster, Inc.,
9.000%, 9/01/2012(b) | | | 407,500 |
| | | | | | | |
Principal
Amount (‡) | | | Description | | Value (†) |
| | | | | | | |
| | | | Retailers — continued | | | |
| $ | 250,000 | | | Dillard’s, Inc.,
6.625%, 1/15/2018(b) | | $ | 187,500 |
| | 105,000 | | | Dillard’s, Inc.,
7.130%, 8/01/2018 | | | 81,375 |
| | 30,000 | | | Macys Retail Holdings, Inc.,
6.790%, 7/15/2027 | | | 24,611 |
| | 1,070,000 | | | Toys R Us, Inc.,
7.375%, 10/15/2018 | | | 740,975 |
| | 20,000 | | | Toys R Us, Inc.,
7.875%, 4/15/2013(b) | | | 15,000 |
| | | | | | | |
| | | | | | | 1,456,961 |
| | | | | | | |
| | | | Sovereigns — 5.5% | | | |
| | 44,200 | (††) | | Mexican Fixed Rate Bonds, Series M-20,
8.000%, 12/07/2023 (MXN) | | | 432,375 |
| | 148,500 | (††) | | Mexican Fixed Rate Bonds, Series M-10,
9.000%, 12/20/2012 (MXN) | | | 1,484,756 |
| | 1,050,000 | | | Republic of South Africa,
13.000%, 8/31/2011 (ZAR) | | | 138,322 |
| | 3,993,436 | | | Republic of Uruguay,
4.250%, 4/05/2027 (UYU) | | | 196,755 |
| | | | | | | |
| | | | | | | 2,252,208 |
| | | | | | | |
| | | | Supermarkets — 2.9% | | | |
| | 190,000 | | | Albertson’s, Inc.,
7.750%, 6/15/2026 | | | 179,172 |
| | 750,000 | | | Albertson’s, Inc., Senior Note,
7.450%, 8/01/2029 | | | 690,605 |
| | 130,000 | | | Albertson’s, Inc., Senior Note,
8.000%, 5/01/2031 | | | 123,924 |
| | 245,000 | | | Albertson’s, Inc., Series C, (MTN),
6.625%, 6/01/2028 | | | 208,429 |
| | | | | | | |
| | | | | | | 1,202,130 |
| | | | | | | |
| | | | Supranational — 2.7% | | | |
| | 700,000 | | | Eurofima, Series EMTN,
10.000%, 11/03/2008 (ISK) | | | 9,168 |
| | 1,900,000 | | | Inter-American Development Bank, Series EMTN,
Zero Coupon, 5/11/2009 (BRL) | | | 913,889 |
| | 13,400,000 | | | Inter-American Development Bank,
13.000%, 6/20/2008 (ISK) | | | 176,007 |
| | 800,000 | | | Nordic Investment Bank, Series EMTN,
11.250%, 4/16/2009 (ISK) | | | 10,518 |
| | | | | | | |
| | | | | | | 1,109,582 |
| | | | | | | |
| | | | Technology — 5.4% | | | |
| | 75,000 | | | Amkor Technology, Inc.,
7.750%, 5/15/2013 | | | 68,438 |
| | 325,000 | | | Freescale Semiconductor, Inc.,
10.125%, 12/15/2016(b) | | | 219,375 |
| | 345,000 | | | JDS Uniphase Corp., Convertible,
1.000%, 5/15/2026 | | | 272,981 |
| | 215,000 | | | Kulicke & Soffa Industries, Inc., Convertible,
0.500%, 11/30/2008 | | | 201,025 |
| | 35,000 | | | Kulicke & Soffa Industries, Inc., Convertible,
1.000%, 6/30/2010 | | | 27,650 |
| | 910,000 | | | Lucent Technologies, Inc.,
6.450%, 3/15/2029 | | | 650,650 |
| | 243,000 | | | Maxtor Corp., Subordinated Note,
5.750%, 3/01/2012(d) | | | 228,420 |
| | 200,000 | | | Nortel Networks Corp., 144A, Convertible,
2.125%, 4/15/2014 | | | 124,250 |
See accompanying notes to financial statements.
29
LOOMIS SAYLES HIGH INCOME FUND — PORTFOLIOOF INVESTMENTS (continued)
Investments as of March 31, 2008 (Unaudited)
| | | | | | |
Principal
Amount (‡) | | Description | | Value (†) |
| | | | | | |
| | | Technology — continued | | | |
| $ | 530,000 | | Nortel Networks Corp.,
6.875%, 9/01/2023 | | $ | 325,950 |
| | 40,000 | | Northern Telecom Capital Corp.,
7.875%, 6/15/2026 | | | 25,000 |
| | 85,000 | | Unisys Corp., Senior Note,
8.000%, 10/15/2012 | | | 73,100 |
| | | | | | |
| | | | | | 2,216,839 |
| | | | | | |
| | | Telecommunications — 1.0% | | | |
| | 205,000 | | Fairpoint Communications, Inc., 144A,
13.125%, 4/01/2018 | | | 196,800 |
| | 30,000 | | Nextel Communications, Inc., Series D,
7.375%, 8/01/2015 | | | 23,100 |
| | 5,000 | | Nextel Communications, Inc., Series F,
5.950%, 3/15/2014 | | | 3,700 |
| | 230,000 | | NII Holdings, Inc.,
3.125%, 6/15/2012(b) | | | 182,563 |
| | | | | | |
| | | | | | 406,163 |
| | | | | | |
| | | Textile — 0.3% | | | |
| | 210,000 | | Jones Apparel Group, Inc.,
6.125%, 11/15/2034 | | | 142,800 |
| | | | | | |
| | | Transportation Services — 1.2% | | | |
| | 275,000 | | APL Ltd., Senior Note,
8.000%, 1/15/2024(d) | | | 223,437 |
| | 300,000 | | Overseas Shipholding Group, Senior Note,
7.500%, 2/15/2024 | | | 261,750 |
| | | | | | |
| | | | | | 485,187 |
| | | | | | |
| | | Wireless — 1.2% | | | |
| | 160,000 | | ALLTEL Corp.,
7.875%, 7/01/2032 | | | 105,600 |
| | 193,000 | | Sprint Capital Corp.,
6.875%, 11/15/2028 | | | 143,786 |
| | 70,000 | | Sprint Capital Corp.,
6.900%, 5/01/2019 | | | 55,125 |
| | 200,000 | | True Move Co. Ltd., 144A,
10.375%, 8/01/2014 | | | 176,000 |
| | | | | | |
| | | | | | 480,511 |
| | | | | | |
| | | Wirelines — 9.0% | | | |
| | 255,000 | | Bell Canada, Series M-17,
6.100%, 3/16/2035 (CAD) | | | 181,788 |
| | 5,000 | | Bell Canada, 144A,
6.550%, 5/01/2029 (CAD) | | | 3,681 |
| | 65,000 | | Cincinnati Bell Telephone Co.,
6.300%, 12/01/2028 | | | 52,000 |
| | 50,000 | | Cincinnati Bell, Inc.,
8.375%, 1/15/2014(b) | | | 46,875 |
| | 95,000 | | Citizens Communications Co.,
7.000%, 11/01/2025 | | | 68,875 |
| | 410,000 | | Embarq Corp.,
7.995%, 6/01/2036 | | | 374,435 |
| | 435,000 | | Level 3 Communications, Inc., Convertible,
2.875%, 7/15/2010 | | | 303,956 |
| | 350,000 | | Level 3 Communications, Inc., Convertible,
6.000%, 9/15/2009 | | | 310,625 |
| | 320,000 | | Level 3 Communications, Inc., Convertible,
6.000%, 3/15/2010(b) | | | 258,400 |
| | 145,000 | | Level 3 Financing, Inc.,
8.750%, 2/15/2017 | | | 110,200 |
| | | | | | |
Principal
Amount (‡) | | Description | | Value (†) |
| | | | | | |
| | | Wirelines — continued | | | |
| $ | 125,000 | | Level 3 Financing, Inc.,
9.250%, 11/01/2014 | | $ | 102,188 |
| | 1,890,000 | | Qwest Capital Funding, Inc.,
7.750%, 2/15/2031 | | | 1,587,600 |
| | 375,000 | | Qwest Capital Funding, Inc., Guaranteed Note,
6.875%, 7/15/2028(b) | | | 294,375 |
| | | | | | |
| | | | | | 3,694,998 |
| | | | | | |
| | | Total Bonds and Notes (Identified Cost $37,827,599) | | | 35,883,501 |
| | | | | | |
| Shares | | | | |
| | Common Stocks — 2.3% | | | |
| | | Biotechnology — 0.5% | | | |
| | 8,147 | | Vertex Pharmaceuticals, Inc.(b)(e) | | | 194,632 |
| | | | | | |
| | | Chemicals — 0.5% | | | |
| | 11,695 | | Hercules, Inc.(b) | | | 213,902 |
| | | | | | |
| | | Household Durables — 0.1% | | | |
| | 1,775 | | KB Home(b) | | | 43,896 |
| | | | | | |
| | | Pharmaceuticals — 0.8% | | | |
| | 6,875 | | Merck & Co., Inc.(b) | | | 260,906 |
| | 1,717 | | Teva Pharmaceutical Industries, Ltd., Sponsored ADR(b) | | | 79,308 |
| | | | | | |
| | | | | | 340,214 |
| | | | | | |
| | | Thrifts & Mortgage Finance — 0.4% | | | |
| | 5,500 | | Federal Home Loan Mortgage Corp.(b) | | | 139,260 |
| | | | | | |
| | | Total Common Stocks (Identified Cost $838,628) | | | 931,904 |
| | | | | | |
| | Preferred Stocks — 2.0% | | | |
| | | Electric Utilities — 0.7% | | | |
| | 6,475 | | AES Trust III, Convertible,
6.750% | | | 301,087 |
| | | | | | |
| | | Machinery — 0.1% | | | |
| | 650 | | United Rentals Trust I, Convertible,
6.500% | | | 19,541 |
| | | | | | |
| | | Oil, Gas & Consumable Fuels — 0.8% | | | |
| | 9,500 | | El Paso Energy Capital Trust I, Convertible,
4.750% | | | 345,800 |
| | | | | | |
| | | Technology — 0.4% | | | |
| | 249 | | Lucent Technologies Capital Trust I, Convertible,
7.750% | | | 174,300 |
| | | | | | |
| | | Total Preferred Stocks (Identified Cost $856,761) | | | 840,728 |
| | | | | | |
| | Closed-End Investment Companies — 0.1% | | | |
| | 3,835 | | Morgan Stanley Emerging Markets Debt Fund, Inc. | | | 36,815 |
| | 2,175 | | Western Asset High Income Opportunity Fund, Inc. | | | 12,311 |
| | | | | | |
| | | Total Closed-End Investment Companies (Identified Cost $45,443) | | | 49,126 |
| | | | | | |
Shares/
Principal
Amount (‡) | | | | |
| | Short-Term Investments — 16.3% | | | |
| | 3,750,635 | | State Street Navigator Securities Lending Prime Portfolio(f) | | | 3,750,635 |
| $ | 2,936,065 | | Tri-Party Repurchase Agreement with Fixed Income Clearing Corporation, dated 3/31/2008 at 1.250% to be repurchased at $2,936,167 on 4/01/2008, collateralized by $2,985,000 Federal Home Loan Mortgage Corp., 3.375% due 3/05/2010 valued at $2,996,194, including accrued interest (Note 2g of Notes to Financial Statements) | | | 2,936,065 |
| | | | | | |
| | | Total Short-Term Investments (Identified Cost $6,686,700) | | | 6,686,700 |
| | | | | | |
See accompanying notes to financial statements.
30
LOOMIS SAYLES HIGH INCOME FUND — PORTFOLIOOF INVESTMENTS (continued)
Investments as of March 31, 2008 (Unaudited)
| | | | | | |
| | | | | Value (†) | |
| | Total Investments — 108.0%
(Identified Cost $46,255,131)(a) | | $ | 44,391,959 | |
| | Other assets less liabilities —(8.0)% | | | (3,280,212 | ) |
| | | | | | |
| | Net Assets — 100% | | $ | 41,111,747 | |
| | | | | | |
| (‡) | | Principal amount is in U.S. dollars unless otherwise noted. | | | | |
| (†) | | See Note 2a of Notes to Financial Statements. | | | | |
| (††) | | Amount shown represents units. One unit represents a principal amount of 100. | | | | |
| (a) | | Federal Tax Information (Amounts exclude certain adjustments made at the end of the Fund’s fiscal year for tax purposes. Such adjustments are primarily due to wash sales. Amortization of premium on debt securities is excluded for tax purposes): At March 31, 2008, the net unrealized depreciation on investments based on a cost of $46,269,359 for federal income tax purposes was as follows: | | | | |
| | Aggregate gross unrealized appreciation for all investments in which there is an excess of value over tax cost | | $ | 1,823,024 | |
| | Aggregate gross unrealized depreciation for all investments in which there is an excess of tax cost over value | | | (3,700,424 | ) |
| | | | | | |
| | Net unrealized depreciation | | $ | (1,877,400 | ) |
| | | | | | |
| (b) | | All or a portion of this security was on loan to brokers at March 31, 2008. | | | | |
| (c) | | Variable rate security. Rate as of March 31, 2008 is disclosed. | | | | |
| (d) | | Illiquid security. At March 31, 2008, the value of these securities amounted to $451,857 or 1.1% of net assets. | | | | |
| (e) | | Non-income producing security. | | | | |
| (f) | | Represents investment of securities lending collateral. | | | | |
| | | | | | |
| ADR | | An American Depositary Receipt is a certificate issued by a custodian bank representing the right to receive securities of the foreign issuer described. The values of ADRs are significantly influenced by trading on exchanges not located in the United States. | | | | |
| EMTN | | Euro Medium Term Note | | | | |
| MTN | | Medium Term Note | | | | |
| 144A | | Securities exempt from registration under Rule 144A of the Securities Act of 1933. These securities may be resold in transactions exempt from registration, normally to qualified institutional buyers. At the period end, the value of these amounted to $3,366,270 or 8.2% of net assets. | | | | |
| | | | | | |
| BRL | | Brazilian Real | | | | |
| CAD | | Canadian Dollar | | | | |
| IDR | | Indonesian Rupiah | | | | |
| ISK | | Iceland Krona | | | | |
| JPY | | Japanese Yen | | | | |
| KRW | | South Korean Won | | | | |
| MXN | | Mexican Peso | | | | |
| NZD | | New Zealand Dollar | | | | |
| SGD | | Singapore Dollar | | | | |
| UYU | | Uruguayan Peso | | | | |
| ZAR | | South African Rand | | | | |
Holdings at March 31, 2008 as a Percentage of Net Assets (unaudited)
| | | |
| Wirelines | | 9.0 | % |
| Pharmaceuticals | | 7.3 | |
| Technology | | 5.8 | |
| Sovereigns | | 5.5 | |
| Home Construction | | 4.5 | |
| Non-Captive Diversified | | 4.4 | |
| Healthcare | | 4.2 | |
| Electric | | 4.1 | |
| Paper | | 3.7 | |
| Banking | | 3.4 | |
| Automotive | | 3.2 | |
| Independent Energy | | 3.1 | |
| Chemicals | | 3.0 | |
| Supermarkets | | 2.9 | |
| Metals & Mining | | 2.7 | |
| Supranational | | 2.7 | |
| Retailers | | 2.5 | |
| Government Guaranteed | | 2.3 | |
| Non-Captive Consumer | | 2.0 | |
| Other, less than 2% each | | 15.4 | |
See accompanying notes to financial statements.
31
LOOMIS SAYLES INTERNATIONAL BOND FUND — PORTFOLIOOF INVESTMENTS
Investments as of March 31, 2008 (Unaudited)
| | | | | | |
Principal
Amount (‡) | | | Description | | Value (†) |
| | | | | | |
| Bonds and Notes — 96.4% of Net Assets | | | |
| Non-Convertible Bonds — 96.4% | | | |
| | | Austria — 0.9% | | | |
| 105,000 | | | Oesterreichische Kontrollbank AG,
2.750%, 6/14/2011, (CHF) | | $ | 105,697 |
| | | | | | |
| | | Belgium — 8.0% | | | |
| 210,000 | | | Kingdom of Belgium,
3.750%, 3/28/2009, (EUR) | | | 331,088 |
| 360,000 | | | Kingdom of Belgium,
5.500%, 9/28/2017, (EUR) | | | 624,553 |
| | | | | | |
| | | | | | 955,641 |
| | | | | | |
| | | Canada — 2.5% | | | |
| 300,000 | | | Canadian Government,
4.250%, 9/01/2009, (CAD) | | | 298,816 |
| | | | | | |
| | | France — 2.9% | | | |
| 20,000 | | | Alcatel-Lucent, Series EMTN,
6.375%, 4/07/2014, (EUR) | | | 25,102 |
| 35,000 | | | France Telecom SA, Series EMTN,
3.625%, 10/14/2015, (EUR) | | | 49,782 |
| 50,000 | | | France Telecom SA, Series EMTN,
4.750%, 2/21/2017, (EUR) | | | 75,412 |
| 40,000 | | | Lafarge SA, Series EMTN,
4.750%, 3/23/2020, (EUR) | | | 52,200 |
| 20,000 | | | PPR, Series EMTN,
4.000%, 1/29/2013, (EUR) | | | 28,534 |
| 35,000 | | | Veolia Environnement, Series EMTN,
5.125%, 5/24/2022, (EUR) | | | 48,929 |
| 50,000 | | | Wendel,
4.875%, 5/26/2016, (EUR) | | | 62,014 |
| | | | | | |
| | | | | | 341,973 |
| | | | | | |
| | | Germany — 35.3% | | | |
| 205,000 | | | Hypothekenbank in Essen AG, Series REGS,
3.000%, 9/28/2009, (EUR) | | | 318,400 |
| 24,000,000 | | | Kreditanstalt fuer Wiederaufbau,
2.050%, 2/16/2026, (JPY) | | | 248,424 |
| 275,000 | | | Kreditanstalt fuer Wiederaufbau,
2.500%, 10/11/2010, (EUR) | | | 420,312 |
| 5,000,000 | | | Kreditanstalt fuer Wiederaufbau,
2.600%, 6/20/2037, (JPY) | | | 51,703 |
| 260,000 | | | Muenchener Hypothekenbank eG,
5.000%, 1/16/2012, (EUR) | | | 423,877 |
| 820,000 | | | Republic of Germany,
3.750%, 1/04/2017, (EUR) | | | 1,278,651 |
| 680,000 | | | Republic of Germany,
4.000%, 4/13/2012, (EUR) | | | 1,089,706 |
| 265,000 | | | Republic of Germany,
4.000%, 1/04/2037, (EUR) | | | 382,033 |
| | | | | | |
| | | | | | 4,213,106 |
| | | | | | |
| | | Japan — 3.9% | | | |
| 26,000,000 | | | Development Bank of Japan,
1.750%, 6/21/2010, (JPY) | | | 266,492 |
| 20,800,000 | | | Japan Government,
0.800%, 3/10/2016, (JPY) | | | 204,495 |
| | | | | | |
| | | | | | 470,987 |
| | | | | | |
| | | Mexico — 0.8% | | | |
| 10,000 | (††) | | Mexican Fixed Rate Bonds, Series M-20,
8.000%, 12/07/2023, (MXN) | | | 97,822 |
| | | | | | |
| | | | | |
Principal
Amount (‡) | | Description | | Value (†) |
| | | | | |
| | Singapore — 7.6% | | | |
| 390,000 | | Government of Singapore,
3.625%, 7/01/2011, (SGD) | | $ | 305,018 |
| 770,000 | | Government of Singapore,
4.625%, 7/01/2010, (SGD) | | | 604,772 |
| | | | | |
| | | | | 909,790 |
| | | | | |
| | Spain — 3.5% | | | |
| 42,000,000 | | Instituto de Credito Oficial, Series EMTN,
0.800%, 9/28/2009, (JPY) | | | 421,347 |
| | | | | |
| | Supranational — 13.7% | | | |
| 67,600,000 | | European Investment Bank,
1.400%, 6/20/2017, (JPY) | | | 688,093 |
| 52,000,000 | | Inter-American Development Bank,
1.900%, 7/08/2009, (JPY) | | | 528,843 |
| 40,000,000 | | Nordic Investment Bank,
1.700%, 4/27/2017, (JPY) | | | 417,164 |
| | | | | |
| | | | | 1,634,100 |
| | | | | |
| | United Kingdom — 6.4% | | | |
| 50,000 | | BAT International Finance PLC, Series EMTN,
5.375%, 6/29/2017, (EUR) | | | 73,661 |
| 50,000 | | BP Capital Markets PLC, Series EMTN,
5.750%, 2/26/2010, (GBP) | | | 100,689 |
| 50,000 | | BSKYB Finance UK PLC, Series EMTN,
5.750%, 10/20/2017, (GBP) | | | 91,395 |
| 65,000 | | Lloyds TSB Group PLC,
5.875%, 7/08/2014, (EUR) | | | 106,589 |
| 50,000 | | Network Rail MTN Finance PLC, Series EMTN,
4.875%, 3/06/2009, (GBP) | | | 99,381 |
| 20,000 | | United Kingdom Treasury,
4.000%, 3/07/2009, (GBP) | | | 39,674 |
| 55,000 | | United Kingdom Treasury,
4.000%, 9/07/2016, (GBP) | | | 107,654 |
| 75,000 | | United Kingdom Treasury,
4.250%, 3/07/2036, (GBP) | | | 145,440 |
| | | | | |
| | | | | 764,483 |
| | | | | |
| | United States — 10.9% | | | |
| 25,000 | | Ahold Finance USA, Inc., Series EMTN,
6.500%, 3/14/2017, (GBP) | | | 47,284 |
| 100,000 | | AT&T, Inc., Series EMTN,
6.125%, 4/02/2015, (EUR) | | | 158,767 |
| 97,930,000 | | Barclays Financial LLC, 144A,
5.780%, 3/23/2009, (KRW) | | | 101,515 |
| 50,000 | | Bristol-Myers Squibb Co.,
4.625%, 11/15/2021, (EUR) | | | 69,635 |
| 50,000 | | Cargill, Inc., Series EMTN,
5.375%, 3/02/2037, (GBP) | | | 81,060 |
| 50,000 | | Cit Group, Inc., Series EMTN,
3.800%, 11/14/2012, (EUR) | | | 47,916 |
| 50,000 | | Cit Group, Inc., Series GMTN,
4.250%, 9/22/2011, (EUR) | | | 50,620 |
| 35,000 | | General Motors Corp.,
7.250%, 7/03/2013, (EUR) | | | 43,652 |
| 50,000 | | Goldman Sachs Group, Inc. (The),
6.875%, 1/18/2038, (GBP) | | | 92,997 |
| 100,000 | | HSBC Bank USA, 144A,
Zero Coupon, 11/28/2011 | | | 69,500 |
| 400,000 | | HSBC Bank USA, Series MYR, 144A,
Zero Coupon, 5/17/2012, (MYR) | | | 122,545 |
See accompanying notes to financial statements.
32
LOOMIS SAYLES INTERNATIONAL BOND FUND — PORTFOLIOOF INVESTMENTS (continued)
Investments as of March 31, 2008 (Unaudited)
| | | | | | | |
Principal
Amount (‡) | | Description | | Value (†) | |
| | | | | | | |
| | | United States — continued | | | | |
| $ | 91,600,000 | | JPMorgan Chase & Co., 144A,
Zero Coupon, 11/01/2012 | | $ | 73,171 | |
| | 336,500 | | JPMorgan Chase & Co., Series EMTN, 144A,
Zero Coupon, 11/01/2012, (MYR) | | | 92,497 | |
| | 25,000 | | Lehman Brothers Holdings, Inc., Series EMTN,
5.000%, 1/26/2010, (GBP) | | | 46,106 | |
| | 25,000 | | Morgan Stanley,
5.375%, 11/14/2013, (GBP) | | | 45,538 | |
| | 50,000 | | Textron, Inc.,
3.875%, 3/11/2013, (EUR) | | | 75,471 | |
| | 50,000 | | Wells Fargo & Co.,
4.625%, 11/02/2035, (GBP) | | | 76,834 | |
| | | | | | | |
| | | | | | 1,295,108 | |
| | | | | | | |
| | | Total Bonds and Notes (Identified Cost $11,083,491) | | | 11,508,870 | |
| | | | | | | |
| | | | | | |
| | Short-Term Investments — 2.9% | | | | |
| | 349,000 | | Tri-Party Repurchase Agreement with Fixed Income Clearing Corporation, dated 3/31/2008 at 1.250% to be repurchased at $349,012 on 4/1/2008, collateralized by $345,000 Federal National Mortgage Association, 5.400% due 12/14/2022 valued at $360,094 including accrued interest (Note 2g of Notes to Financial Statements) (Identified Cost $349,000) | | | 349,000 | |
| | | | | | | |
| | | | | | | |
| | | Total Investments — 99.3%
(Identified Cost $11,432,491)(a) | | | 11,857,870 | |
| | | Other assets less liabilities — 0.7% | | | 83,297 | |
| | | | | | | |
| | | Net Assets — 100% | | $ | 11,941,167 | |
| | | | | | | |
| | | | | | | |
| | (‡) | | Principal amount is in U.S. dollars unless otherwise noted. | |
| | (†) | | See Note 2a of Notes to Financial Statements. | |
| | (††) | | Amount shown represents units. One unit represents a principal amount of 100. | |
| | (a) | | Federal Tax Information: (Amounts exclude certain adjustments made at the end of the Fund’s fiscal year for tax purposes. Amortization of premium on debt securities is excluded for tax purposes.) At March 31, 2008, the net unrealized appreciation on investments based on a cost of $11,439,820 for federal income tax purposes was as follows: | |
| | | Aggregate gross unrealized appreciation for all investments in which there is an excess of value over tax cost | | $ | 467,908 | |
| | | Aggregate gross unrealized depreciation for all investments in which there is an excess of tax cost over value | | | (49,858 | ) |
| | | | | | | |
| | | Net unrealized appreciation | | $ | 418,050 | |
| | | | | | | |
| | (b) | | Variable rate security. Rate as of March 31, 2008 is disclosed. | |
| | | | | | | |
| | 144A | | Securities exempt from registration under Rule 144A of the Securities Act of 1933. These securities may be resold in transactions exempt from registration, normally to qualified institutional buyers. At March 31, 2008, the total value of these securities amounted to $459,228 or 3.8% of net assets. | |
| |
| | EMTN | | Euro Medium Term Note | |
| | GMTN | | Global Medium Term Note | |
| | | | | | | |
| | CAD | | Canadian Dollar | |
| | CHF | | Swiss Franc | |
| | EUR | | Euro | |
| | GBP | | British Pound | |
| | JPY | | Japanese Yen | |
| | KRW | | South Korean Won | |
| | MXN | | Mexican Peso | |
| | MYR | | Malaysian Ringgit | |
| | SGD | | Singapore Dollar | |
Holdings at March 31, 2008 as a Percentage of Net Assets (unaudited)
| | | |
| Sovereigns | | 46.1 | % |
| Supranational Bank | | 13.7 | |
| Special Purpose Banks | | 10.5 | |
| Mortgage Banks | | 6.2 | |
| Finance-Investment Banker/Broker | | 2.9 | |
| Telephone-Integrated | | 2.4 | |
| Sovereign Agency | | 2.2 | |
| Other, less than 2% each | | 12.4 | |
See accompanying notes to financial statements.
33
LOOMIS SAYLES LIMITED TERM GOVERNMENTAND AGENCY FUND
PORTFOLIOOF INVESTMENTS
Investments as of March 31, 2008 (Unaudited)
| | | | | | |
Principal
Amount | | Description | | Value (†) |
| | | | | | |
| | Bonds and Notes — 83.4% of Net Assets | | | |
| | | Agency — 3.4% | | | |
| $ | 4,200,000 | | Federal Home Loan Bank,
3.625%, 11/14/2008 | | $ | 4,233,562 |
| | | | | | |
| | | Asset-Backed Securities — 5.7% | | | |
| | 905,000 | | Americredit Automobiles Receivables Trust, Series 2007-DF, Class A2A,
5.660%, 1/06/2011 | | | 904,059 |
| | 615,000 | | Americredit Prime Automobile, Series 2007-2M, Class A2B,
3.438%, 11/08/2010(b) | | | 611,676 |
| | 1,155,000 | | CNH Equipment Trust, Series 2007-B, Class A2A,
5.460%, 6/15/2010 | | | 1,163,566 |
| | 1,035,000 | | Countrywide Asset-Backed Certificates, Series 2004-S1, Class A3,
4.615%, 2/25/2035 | | | 822,810 |
| | 2,026,244 | | Countrywide Asset-Backed Certificates, Series 2006-S1, Class A2,
5.549%, 8/25/2021 | | | 1,976,454 |
| | 238,489 | | Residential Funding Mortgage Securities II, Series 2004-HI3, Class A4,
4.630%, 1/25/2020 | | | 226,468 |
| | 660,000 | | Residential Funding Mortgage Securities II, Series 2005-HI3, Class A4,
5.490%, 9/25/2035 | | | 553,829 |
| | 853,476 | | Residential Funding Mortgage Securities II, Series 2002-HI5, Class A7,
5.700%, 1/25/2028 | | | 850,213 |
| | | | | | |
| | | | | | 7,109,075 |
| | | | | | |
| | | Automotive — 1.0% | | | |
| | 1,200,000 | | USAA Auto Owner Trust,
4.270%, 10/15/2010 | | | 1,207,622 |
| | | | | | |
| | | Collateralized Mortgage Obligation — 0.2% | | | |
| | 178,000 | | Federal Home Loan Mortgage Corporation, Series 3145, Class KA,
5.000%, 8/15/2024 | | | 181,221 |
| | | | | | |
| | | Credit Card Asset Backed Securities — 1.6% | | | |
| | 2,000,000 | | Citibank Credit Card Issuance Trust,
3.770%, 5/18/2011(b) | | | 2,000,000 |
| | | | | | |
| | | Hybrid ARMs — 2.4% | | | |
| | 1,122,832 | | JPMorgan Mortgage Trust, Series 2006-A7, Class 1A3,
5.929%, 1/25/2037(b) | | | 1,134,881 |
| | 1,875,656 | | Morgan Stanley Mortgage Loan Trust, Series 2005-3AR, Class 5A,
5.588%, 7/25/2035(b) | | | 1,889,133 |
| | | | | | |
| | | | | | 3,024,014 |
| | | | | | |
| | | Mortgage Backed Securities — 2.4% | | | |
| | 1,400,000 | | Commercial Mortgage Pass Through Certificates, Series 2006-C7, Class A4,
5.961%, 6/10/2046(b) | | | 1,416,711 |
| | 1,560,000 | | GS Mortgage Securities Corp. II, Series 2006-GG8, Class A2,
5.479%, 11/10/2039 | | | 1,541,467 |
| | | | | | |
| | | | | | 2,958,178 |
| | | | | | |
| | | Mortgage Related — 57.6% | | | |
| | 786,454 | | FHLMC,
4.500%, 5/01/2034 | | | 758,866 |
| | 6,405,105 | | FHLMC,
5.000%, with various maturities from 2019 to 2030(c) | | | 6,501,829 |
| | 2,367,779 | | FHLMC,
5.500%, 12/01/2034 | | | 2,396,892 |
| | 5,856,937 | | FHLMC,
6.000%, with various maturities from 2019 to 2021(c) | | | 6,031,898 |
| | | | | | |
Principal
Amount | | Description | | Value (†) |
| | | | | | |
| | | Mortgage Related — continued | | | |
| $ | 9,609,672 | | FHLMC,
6.500%, with various maturities from 2014 to 2034(c) | | $ | 10,031,378 |
| | 229,856 | | FHLMC,
7.000%, 2/01/2016 | | | 241,659 |
| | 34,873 | | FHLMC,
7.500%, with various maturities from 2012 to 2026(c) | | | 36,519 |
| | 17,872 | | FHLMC,
8.000%, with various maturities from 2010 to 2015(c) | | | 18,962 |
| | 5,662 | | FHLMC,
10.000%, 7/01/2019 | | | 6,727 |
| | 219,589 | | FHLMC,
11.500%, with various maturities from 2015 to 2020(c) | | | 249,055 |
| | 12,653,106 | | FNMA,
4.000%, with various maturities from 2018 to 2019(c ) | | | 12,414,027 |
| | 2,590,648 | | FNMA,
4.500%, with various maturities from 2019 to 2035(c) | | | 2,536,232 |
| | 1,966,931 | | FNMA,
5.000%, 6/01/2035 | | | 1,949,642 |
| | 4,322,478 | | FNMA,
5.500%, with various maturities from 2017 to 2036(c) | | | 4,384,693 |
| | 10,072,729 | | FNMA,
6.000%, with various maturities from 2017 to 2034(c) | | | 10,374,350 |
| | 3,258,430 | | FNMA,
6.051%, 2/01/2037(b) | | | 3,325,202 |
| | 6,500,677 | | FNMA,
6.500%, with various maturities from 2017 to 2037(c) | | | 6,749,624 |
| | 600,000 | | FNMA,
6.625%, 9/15/2009(d) | | | 637,277 |
| | 286,363 | | FNMA,
7.000%, 12/01/2022 | | | 304,275 |
| | 527,113 | | FNMA,
7.500%, with various maturities from 2015 to 2032(c) | | | 563,456 |
| | 86,257 | | FNMA,
8.000%, with various maturities from 2015 to 2016(c) | | | 91,225 |
| | 123,185 | | GNMA,
6.000%, 12/15/2031 | | | 127,713 |
| | 469,942 | | GNMA,
6.500%, 5/15/2031 | | | 491,115 |
| | 327,932 | | GNMA,
7.000%, 10/15/2028 | | | 350,823 |
| | 8,384 | | GNMA,
9.000%, with various maturities from 2008 to 2009(c) | | | 8,534 |
| | 3,209 | | GNMA,
9.500%, 8/15/2009 | | | 3,342 |
| | 7,830 | | GNMA,
12.500%, with various maturities from 2014 to 2015(c) | | | 9,356 |
| | 97,793 | | GNMA,
16.000%, with various maturities from 2011 to 2012(c) | | | 116,047 |
| | 32,053 | | GNMA,
17.000%, with various maturities in 2011(c) | | | 38,294 |
| | 985,000 | | Greenwich Capital Commercial Funding Corp., Series 2005-GG5, Class A2,
5.117%, 4/10/2037 | | | 978,918 |
| | | | | | |
| | | | | | 71,727,930 |
| | | | | | |
| | | Treasuries — 9.1% | | | |
| | 4,285,000 | | U.S. Treasury Notes,
4.250%, 11/15/2017(d) | | | 4,571,894 |
| | 2,335,000 | | U.S. Treasury Notes,
4.500%, 11/30/2011(d) | | | 2,534,570 |
See accompanying notes to financial statements.
34
LOOMIS SAYLES LIMITED TERM GOVERNMENTAND AGENCY FUND
PORTFOLIOOF INVESTMENTS (continued)
Investments as of March 31, 2008 (Unaudited)
| | | | | | | |
Principal
Amount | | Description | | Value (†) | |
| | | | | | | |
| | | Treasuries — continued | | | | |
| $ | 4,000,000 | | U.S. Treasury STRIPS,
Zero Coupon, 11/15/2009 | | $ | 3,894,468 | |
| | 360,000 | | U.S. Treasury Notes,
3.625%, 12/31/2012(d) | | | 379,322 | |
| | | | | | | |
| | | | | | 11,380,254 | |
| | | | | | | |
| | | Total Bonds and Notes (Identified Cost $102,847,082) | | | 103,821,856 | |
| | | | | | | |
Shares/
Principal
Amount | | | | | |
| | Short-Term Investments — 36.0% | | | | |
| | 24,412,261 | | State Street Navigator Securities Lending Prime Portfolio(e) | | | 24,412,261 | |
| $ | 2,900,000 | | Federal Home Loan Bank, Discount Notes, Zero Coupon, 4/14/2008 | | | 2,897,696 | |
| | 15,000,000 | | Federal Home Loan Mortgage Corp., Discount Notes, Zero Coupon, 4/3/2008(d) | | | 14,997,734 | |
| | 1,000,000 | | Federal National Mortgage Association, Discount Notes, 1.000%, 4/2/2008(d) | | | 999,926 | |
| | 1,502,061 | | Tri-Party Repurchase Agreement with Fixed Income Clearing Corporation, dated 3/31/2008 at 1.250% to be repurchased at $1,502,113 on 4/01/2008, collateralized by $1,530,000 Federal National Mortgage Association, 5.210% due 3/03/2023 valued at $1,533,917 including accrued interest (Note 2g of Notes to Financial Statements) | | | 1,502,061 | |
| | | | | | | |
| | | Total Short-Term Investments (Identified Cost $44,809,678) | | | 44,809,678 | |
| | | | | | | |
| | | Total Investments — 119.4%
(Identified Cost $147,656,760)(a) | | | 148,631,534 | |
| | | Other assets less liabilities —(19.4)% | | | (24,145,865 | ) |
| | | | | | | |
| | | Net Assets — 100% | | $ | 124,485,669 | |
| | | | | | | |
| | | | | | | |
| | (†) | | See Note 2a of Notes to Financial Statements. | |
| | (a) | | Federal Tax Information (Amounts exclude certain adjustments made at the end of the Fund’s fiscal year for tax purposes. Amortization of premium on debt securities is excluded for tax purposes.): At March 31, 2008, the net unrealized appreciation on investments based on a cost of $147,722,921 for federal income tax purposes was as follows: | |
| | | Aggregate gross unrealized appreciation for all investments in which there is an excess of value over tax cost | | $ | 1,333,295 | |
| | | Aggregate gross unrealized depreciation for all investments in which there is an excess of tax cost over value | | | (424,682 | ) |
| | | | | | | |
| | | Net unrealized appreciation | | $ | 908,613 | |
| | | | | | | |
| | (b) | | Variable rate security. Rate as of March 31, 2008 is disclosed. | |
| | (c) | | The Fund’s investment in mortgage related securities of the Federal Home Loan Mortgage Corporation, Federal National Mortgage Association and Government National Mortgage Association are interests in separate pools of mortgages. All separate investments in securities of each issuer which have the same coupon rate have been aggregated for the purpose of presentation in the Portfolio of Investments. | |
| | (d) | | All or a portion of this security was on loan to brokers at March 31, 2008. | |
| | (e) | | Represents investment of securities lending collateral. | |
| | | | | | | |
| | ARMs | | Adjustable Rate Mortgages | |
| | FHLMC | | Federal Home Loan Mortgage Corporation | |
| | FNMA | | Federal National Mortgage Association | |
| | GNMA | | Government National Mortgage Association | |
| | STRIPS | | Separate Trading of Registered Interest and Principal of Securities | |
Holdings at March 31, 2008 as a Percentage of Net Assets (unaudited)
| | | |
| Mortgage Related | | 57.6 | % |
| Treasuries | | 9.1 | |
| Asset-Backed Securities | | 5.7 | |
| Agency | | 3.4 | |
| Hybrid ARMs | | 2.4 | |
| Mortgage Backed Securities | | 2.4 | |
| Other, less than 2% each | | 2.8 | |
See accompanying notes to financial statements.
35
LOOMIS SAYLES MASSACHUSETTS TAX FREE INCOME FUND
PORTFOLIOOF INVESTMENTS
Investments as of March 31, 2008 (Unaudited)
| | | | | | |
Principal
Amount | | Description | | Value (†) |
| | | | | | |
| | Tax Exempt Obligations — 94.9% of Net Assets | | | |
| | | Commonwealth of Massachusetts — 3.6% | | | |
| $ | 2,000,000 | | Consolidated Loan, Series C,
5.250%, 8/01/2022 (FSA insured) | | $ | 2,135,100 |
| | | | | | |
| | | Martha’s Vineyard, MA — 1.7% | | | |
| | 1,000,000 | | Land Bank Revenue,
5.000%, 5/01/2032 (AMBAC insured) | | | 998,570 |
| | | | | | |
| | | Massachusetts Bay Transportation Authority — 4.5% | | | |
| | 2,200,000 | | Series A, Unrefunded,
6.500%, 11/01/2014 (AMBAC insured) | | | 2,640,484 |
| | | | | | |
| | | Massachusetts Development Finance Agency — 13.8% | | | |
| | 1,000,000 | | Cambridge Street Development, Series A,
5.125%, 2/01/2034 (MBIA insured) | | | 997,800 |
| | 1,000,000 | | Hampshire College,
5.625%, 10/01/2024 | | | 999,460 |
| | 2,000,000 | | Simmons College, Series H,
5.250%, 10/01/2033 (XLCA Insured) | | | 1,972,500 |
| | 2,800,000 | | Springfield Resource Recovery, Series A,
5.625%, 6/01/2019 | | | 2,873,416 |
| | 1,100,000 | | Visual and Performing Arts,
6.000%, 8/01/2021 | | | 1,280,279 |
| | | | | | |
| | | | | | 8,123,455 |
| | | | | | |
| | | Massachusetts Health & Educational Facilities Authority — 39.2% |
| | 1,160,000 | | Baystate Medical Center, Series F,
5.700%, 7/01/2027 | | | 1,174,686 |
| | 1,500,000 | | Berklee College of Music, Series A,
5.000%, 10/01/2032 | | | 1,402,500 |
| | 2,000,000 | | Boston University, Series S,
5.000%, 10/01/2039 (FGIC insured) | | | 1,905,640 |
| | 1,000,000 | | Catholic Health East,
5.500%, 11/15/2032 | | | 1,112,010 |
| | 2,200,000 | | Harvard University, Series N,
6.250%, 4/01/2020 | | | 2,646,952 |
| | 1,000,000 | | Lahey Clinic Medical Center, Series D,
5.250%, 8/15/2037 | | | 979,410 |
| | 750,000 | | Milford Regional Medical Center, Series E,
5.000%, 7/15/2032 | | | 632,760 |
| | 2,568,000 | | Nichols College, Series C,
6.000%, 10/01/2017 | | | 2,588,056 |
| | 2,000,000 | | Partners Healthcare Systems, Series B,
5.250%, 7/01/2029 | | | 2,024,800 |
| | 2,500,000 | | Partners Healthcare Systems, Series C,
5.750%, 7/01/2021 | | | 2,621,750 |
| | 1,500,000 | | Sterling & Francine Clark, Series A,
5.000%, 7/01/2036 | | | 1,502,895 |
| | 2,000,000 | | University of Massachusetts, Series C,
5.125%, 10/01/2034 (FGIC insured) | | | 1,987,080 |
| | 1,315,000 | | Wheaton College, Series E,
5.000%, 7/01/2017 | | | 1,367,784 |
| | 1,030,000 | | Williams College, Series H,
5.000%, 7/01/2017 | | | 1,092,233 |
| | | | | | |
| | | | | | 23,038,556 |
| | | | | | |
| | | Massachusetts Housing Finance Agency — 3.6% | | | |
| | 545,000 | | Series A,
5.200%, 12/01/2037 | | | 496,806 |
| | 1,985,000 | | Single Family Housing, Series 126,
4.700%, 6/01/2038(b) | | | 1,663,092 |
| | | | | | |
| | | | | | 2,159,898 |
| | | | | | |
| | | | | | | |
Principal
Amount | | Description | | Value (†) | |
| | | | | | | |
| | | Massachusetts Port Authority — 5.0% | | | | |
| $ | 1,750,000 | | Delta Air Lines, Inc. Project, Series A,
5.500%, 1/01/2019 (AMBAC insured) | | $ | 1,778,805 | |
| | 1,200,000 | | Series A,
5.000%, 7/01/2033 (MBIA insured) | | | 1,198,200 | |
| | | | | | | |
| | | | | | 2,977,005 | |
| | | | | | | |
| | | Massachusetts Water Resources Authority — 6.3% | | | | |
| | 1,000,000 | | General, Series A,
5.250%, 8/01/2020 (MBIA insured) | | | 1,088,340 | |
| | 2,200,000 | | Series A,
6.500%, 7/15/2019 (FGIC insured) | | | 2,613,336 | |
| | | | | | | |
| | | | | | 3,701,676 | |
| | | | | | | |
| | | Michigan Hospital Finance Authority — 1.8% | | | | |
| | 1,000,000 | | Oakwood Obligated Group,
5.500%, 11/01/2017 | | | 1,053,340 | |
| | | | | | | |
| | | New Jersey Economic Development Authority — 1.7% | | | | |
| | 1,000,000 | | Cigarette Tax,
5.625%, 6/15/2018 | | | 1,001,230 | |
| | | | | | | |
| | | Puerto Rico Commonwealth Aqueduct & Sewer Authority — 5.9% | |
| | 3,000,000 | | Aqueduct & Sewer Authority,
6.250%, 7/01/2013 | | | 3,471,300 | |
| | | | | | | |
| | | Puerto Rico Commonwealth Infrastructure Financing Authority — 2.4% | |
| | 1,500,000 | | Series B,
5.000%, 7/01/2031 | | | 1,395,675 | |
| | | | | | | |
| | | Puerto Rico Public Finance Corp. — 5.4% | |
| | 3,000,000 | | Commonwealth Appropriation, Series A,
5.750%, 8/01/2027(b) | | | 3,156,150 | |
| | | | | | | |
| | | Total Tax Exempt Obligations (Identified Cost $55,482,794) | | | 55,852,439 | |
| | | | | | | |
| | | | | | |
| | Short-Term Investments — 4.4% | | | | |
| | 2,570,418 | | Tri-Party Repurchase Agreement with Fixed Income Clearing Corporation, dated 3/31/2008 at 1.250% to be repurchased at $2,570,508 on 4/01/2008, collateralized by $2,615,000 Federal Home Loan Mortgage Corp., 3.375% due 3/05/2010 valued at $2,624,806 including accrued interest (Note 2g of Notes to Financial Statements) (Identified Cost $2,570,418) | | | 2,570,418 | |
| | | | | | | |
| | | | | | | |
| | | Total Investments — 99.3%
(Identified Cost $58,053,212)(a) | | | 58,422,857 | |
| | | Other assets less liabilities — 0.7% | | | 403,066 | |
| | | | | | | |
| | | Net Assets — 100% | | $ | 58,825,923 | |
| | | | | | | |
| | | | | | | |
| | (†) | | See Note 2a of Notes to Financial Statements. | |
| | (a) | | Federal Tax Information (Amounts exclude certain adjustments made at the end of the Fund’s fiscal year for tax purposes. Accretion of market discount on debt securities and straddle loss deferrals are excluded for tax purposes): At March 31, 2008, the net unrealized appreciation on investments based on a cost of $58,053,196 for federal income tax purposes was as follows: | |
| | | Aggregate gross unrealized appreciation for all investments in which there is an excess of value over tax cost | | $ | 1,813,367 | |
| | | Aggregate gross unrealized depreciation for all investments in which there is an excess of tax cost over value | | | (1,443,706 | ) |
| | | | | | | |
| | | Net unrealized appreciation | | $ | 369,661 | |
| | | | | | | |
See accompanying notes to financial statements.
36
LOOMIS SAYLES MASSACHUSETTS TAX FREE INCOME FUND
PORTFOLIOOF INVESTMENTS (continued)
Investments as of March 31, 2008 (Unaudited)
| | | | |
| (b) | | Variable rate security whose interest rate varies with changes in a designated base rate (such as the prime interest rate) on a specified date (such as coupon date or interest payment date). The coupon rate shown represents the rate at period end. |
| | | | |
| AMBAC | | American Municipal Bond Assurance Corp. |
| FGIC | | Financial Guarantee Insurance Company |
| FSA | | Financial Security Assurance, Inc. |
| MBIA | | Municipal Bond Investors Assurance Corp. |
| XLCA | | XL Capital Assurance, Inc. |
Holdings at March 31, 2008 as a Percentage of Net Assets (unaudited)
| | | |
| College & Universities | | 28.5 | % |
| Water & Sewer | | 14.6 | |
| Hospital | | 14.5 | |
| State Appropriation | | 13.5 | |
| Airport | | 5.1 | |
| Resource Recovery | | 4.9 | |
| Single-Family Housing | | 3.7 | |
| Insurance | | 3.4 | |
| Other, less than 2% each | | 6.7 | |
See accompanying notes to financial statements.
37
LOOMIS SAYLES MUNICIPAL INCOME FUND — PORTFOLIOOF INVESTMENTS
Investments as of March 31, 2008 (Unaudited)
| | | | | | |
Principal
Amount | | Description | | Value (†) |
| | | | | | |
| | Tax Exempt Obligations — 95.4% of Net Assets | | | |
| | | California — 9.6% | | | |
| $ | 1,000,000 | | California Health Facilities Financing Authority (Catholic Healthcare West), Series I,
4.950%, 7/01/2026(b) | | $ | 1,042,990 |
| | 1,000,000 | | California Health Facilities Financing Authority (Cedar-Sinai Medical Center),
5.000%, 11/15/2027 | | | 977,940 |
| | 2,655,000 | | California Statewide Communities Development Authority (California Endowment),
5.250%, 7/01/2023 | | | 2,755,704 |
| | 1,500,000 | | California Statewide Communities Development Authority (Sutter Health), Series A,
5.000%, 11/15/2043 | | | 1,403,220 |
| | 1,200,000 | | Long Beach California Bond Financing Authority (Natural Gas Purchase), Series A,
5.500%, 11/15/2027 | | | 1,115,676 |
| | | | | | |
| | | | | | 7,295,530 |
| | | | | | |
| | | Colorado — 2.8% | | | |
| | 2,500,000 | | Colorado Health Facilities Authority,
5.000%, 12/01/2035 | | | 2,093,775 |
| | | | | | |
| | | District of Columbia — 3.8% | | | |
| | 3,000,000 | | Metropolitan Washington D.C. Airports Authority,
5.125%, 10/01/2029 (FGIC insured) | | | 2,848,290 |
| | | | | | |
| | | Florida — 1.3% | | | |
| | 1,000,000 | | Jacksonville, FL, Economic Development Community Health Care Facilities (Mayo Clinic),
5.000%, 11/15/2036 | | | 966,000 |
| | | | | | |
| | | Guam — 1.2% | | | |
| | 1,000,000 | | Guam Government Waterworks Authority,
5.875%, 7/01/2035 | | | 913,450 |
| | | | | | |
| | | Louisiana — 2.5% | | | |
| | 2,000,000 | | DeSoto Parish, LA, Environmental Improvement,
5.000%, 11/01/2018 | | | 1,856,420 |
| | | | | | |
| | | Massachusetts — 2.5% | | | |
| | 1,000,000 | | Massachusetts Development Finance Agency (Simmons College), Series H,
5.250%, 10/01/2033 (XLCA Insured) | | | 986,250 |
| | 1,045,000 | | Massachusetts State Health & Educational Facilities Authority (Lahey Clinic Medical Center),
4.500%, 8/15/2035 (FGIC insured) | | | 933,937 |
| | | | | | |
| | | | | | 1,920,187 |
| | | | | | |
| | | Michigan — 7.4% | | | |
| | 1,500,000 | | Michigan State Hospital Finance Authority Revenue (Henry Ford Health System), Series A,
5.000%, 11/15/2038 | | | 1,359,900 |
| | 1,100,000 | | Michigan State Hospital Finance Authority Revenue (Oakwood Obligated Group),
5.500%, 11/01/2014 | | | 1,172,666 |
| | 1,000,000 | | Taylor Brownfield Redevelopment Authority, MI,
5.000%, 5/01/2025 (MBIA insured) | | | 1,011,840 |
| | 2,000,000 | | University of Michigan Hospital,
5.250%, 12/01/2020 | | | 2,063,160 |
| | | | | | |
| | | | | | 5,607,566 |
| | | | | | |
| | | Minnesota — 4.1% | | | |
| | 1,000,000 | | Chaska Minnesota Electric Revenue,
5.250%, 10/01/2025 | | | 1,026,140 |
| | | | | | |
Principal
Amount | | Description | | Value (†) |
| | | | | | |
| | | Minnesota — continued | | | |
| $ | 2,000,000 | | Minnesota State Municipal Power Agency,
5.250%, 10/01/2024 | | $ | 2,055,320 |
| | | | | | |
| | | | | | 3,081,460 |
| | | | | | |
| | | Mississippi — 4.7% | | | |
| | 2,500,000 | | Lowndes County, MS, Solid Waste Disposal & Pollution Control,
6.800%, 4/01/2022 | | | 2,600,925 |
| | 1,000,000 | | Mississippi, Hospital Equipment & Facilities Authority (Delta Regional Medical Center),
5.000%, 2/01/2035 (MBIA, FHA insured) | | | 948,590 |
| | | | | | |
| | | | | | 3,549,515 |
| | | | | | |
| | | New Jersey — 4.2% | | | |
| | 1,000,000 | | New Jersey Economic Development Authority Revenue, Cigarette Tax, 5.625%, 6/15/2018 | | | 1,001,230 |
| | 2,000,000 | | New Jersey Transportation Trust Fund Authority, Series A,
5.500%, 12/15/2023 | | | 2,166,840 |
| | | | | | |
| | | | | | 3,168,070 |
| | | | | | |
| | | New York — 18.4% | | | |
| | 1,020,000 | | New York, NY,
6.000%, 1/15/2020 | | | 1,102,865 |
| | 1,000,000 | | New York, NY, City Health & Hospital Corp.,
5.000%, 2/15/2020 (FSA insured) | | | 1,034,360 |
| | 1,000,000 | | New York, NY, City Industrial Development Agency,
5.500%, 1/01/2024(b) | | | 1,003,660 |
| | 2,000,000 | | New York, NY, City Municipal Water Finance Authority, Series C,
5.000%, 6/15/2025 (MBIA insured) | | | 2,041,060 |
| | 1,000,000 | | New York, NY, City Municipal Water Finance Authority, Series A,
5.125%, 6/15/2034 (FSA insured) | | | 1,009,890 |
| | 2,000,000 | | New York State Dormitory Authority,
5.500%, 5/15/2013 | | | 2,181,860 |
| | 2,200,000 | | New York State Dormitory Authority,
5.750%, 7/01/2013 | | | 2,389,706 |
| | 3,000,000 | | New York State Municipal Bond Bank Agency, Series C,
5.250%, 6/01/2020 | | | 3,138,960 |
| | | | | | |
| | | | | | 13,902,361 |
| | | | | | |
| | | North Carolina — 1.8% | | | |
| | 1,300,000 | | North Carolina Eastern Municipal Power Agency, Series A,
5.500%, 1/01/2012 | | | 1,384,318 |
| | | | | | |
| | | Oregon — 3.6% | | | |
| | 1,750,000 | | Multnomah County, OR, Hospital Facilities Authority (Providence Health System),
5.250%, 10/01/2012 | | | 1,867,338 |
| | 500,000 | | Oregon, Western Generation Agency, Wauna Cogeneration Project, Series A,
5.000%, 1/01/2020 | | | 452,360 |
| | 485,000 | | Oregon, Western Generation Agency, Wauna Cogeneration Project, Series A,
5.000%, 1/01/2021 | | | 432,620 |
| | | | | | |
| | | | | | 2,752,318 |
| | | | | | |
| | | Pennsylvania — 3.5% | | | |
| | 2,500,000 | | Pennsylvania State Industrial Development Authority,
5.500%, 7/01/2019 (AMBAC insured) | | | 2,662,000 |
| | | | | | |
| | | Puerto Rico — 4.1% | | | |
| | 1,000,000 | | Puerto Rico Commonwealth Infrastructure Financing Authority, Series A,
5.500%, 10/01/2040 | | | 1,036,130 |
See accompanying notes to financial statements.
38
LOOMIS SAYLES MUNICIPAL INCOME FUND — PORTFOLIOOF INVESTMENTS (continued)
Investments as of March 31, 2008 (Unaudited)
| | | | | | |
Principal
Amount | | Description | | Value (†) |
| | | | | | |
| | | Puerto Rico — continued | | | |
| $ | 2,000,000 | | Puerto Rico Public Finance Corp., Commonwealth Appropriation, Series A, 5.750%, 8/01/2027(b) | | $ | 2,104,100 |
| | | | | | |
| | | | | | 3,140,230 |
| | | | | | |
| | | South Carolina — 4.0% | | | |
| | 1,100,000 | | Charleston Educational Excellence Finance Corp.,
5.250%, 12/01/2030 | | | 1,088,417 |
| | 1,155,000 | | Lexington One School Facilities Corp.,
5.000%, 12/01/2026 | | | 1,114,171 |
| | 800,000 | | Newberry Investing in Children’s Education (Newberry County School District),
5.250%, 12/01/2022 | | | 794,288 |
| | | | | | |
| | | | | | 2,996,876 |
| | | | | | |
| | | South Dakota — 1.6% | | | |
| | 1,250,000 | | South Dakota Health & Educational Facilities Authority (Sioux Valley Hospital),
5.250%, 11/01/2027 | | | 1,225,975 |
| | | | | | |
| | | Tennessee — 5.2% | | | |
| | 2,000,000 | | Knox County, TN Health Educational & Housing Facilities Board, Hospital Facilities Revenue, Series A,
Zero Coupon, 1/01/2035 | | | 358,340 |
| | 2,500,000 | | Tennessee Energy Acquisition Corp., Gas Revenue, Series A,
5.250%, 9/01/2026 | | | 2,309,375 |
| | 1,285,000 | | Tennessee Housing Development Agency, Series A,
5.200%, 7/01/2023 | | | 1,296,976 |
| | | | | | |
| | | | | | 3,964,691 |
| | | | | | |
| | | Texas — 6.2% | | | |
| | 1,130,000 | | Conroe, TX, Independent School District,
4.500%, 2/15/2030 | | | 1,039,871 |
| | 1,260,000 | | Keller, TX, Independent School District, Series A,
4.500%, 8/15/2031 | | | 1,159,011 |
| | 1,650,000 | | SA Energy Acquisition Public Facility Corp., Texas Gas Supply Revenue,
5.500%, 8/01/2027 | | | 1,558,739 |
| | 1,000,000 | | Tarrant County, TX,Cultural Education Facilities Finance Corp. Revenue (Texas Health Resources), Series A,
5.000%, 2/15/2036 | | | 934,460 |
| | | | | | |
| | | | | | 4,692,081 |
| | | | | | |
| | | Washington — 2.9% | | | |
| | 2,000,000 | | Energy Northwest, WA, Electric, Project No. 1, Series A,
5.500%, 7/01/2014 | | | 2,229,640 |
| | | | | | |
| | | Total Tax Exempt Obligations (Identified Cost $74,663,312) | | | 72,250,753 |
| | | | | | |
| | | | | |
| | Short-Term Investments — 3.9% | | | |
| | 2,941,215 | | Tri-Party Repurchase Agreement with Fixed Income Clearing Corporation, dated 3/31/08 at 1.250% to be repurchased at $2,941,317 on 4/01/08, collateralized by $2,980,000 Federal Home Loan Mortgage Corp., 3.500% due 2/12/10 valued at $3,002,350, including accrued interest (Note 2g of Notes to Financial Statements) (Identified Cost $2,941,215) | | | 2,941,215 |
| | | | | | |
| | | | | | |
| | | Total Investments — 99.3%
(Identified Cost $77,604,527)(a) | | | 75,191,968 |
| | | Other assets less liabilities — 0.7% | | | 533,904 |
| | | | | | |
| | | Net Assets — 100% | | $ | 75,725,872 |
| | | | | | |
| | | | | | |
| (†) | | See Note 2a of Notes to Financial Statements. | |
| (a) | | Federal Tax Information (Amounts exclude certain adjustments made at the end of the Fund’s fiscal year for tax purposes. Accretion of market discount on debt securities and straddle loss deferrals are excluded for tax purposes.): At March 31, 2008, the net unrealized depreciation on investments based on a cost of $77,300,033 for federal income tax purposes was as follows: | |
| | Aggregate gross unrealized appreciation for all investments in which there is an excess of value over tax cost | | $ | 1,276,074 | |
| | Aggregate gross unrealized depreciation for all investments in which there is an excess of tax cost over value | | | (3,384,139 | ) |
| | | | | | |
| | Net unrealized depreciation | | $ | (2,108,065 | ) |
| | | | | | |
| (b) | | Variable rate security whose interest rate varies with changes in a designated base rate (such as the prime interest rate) on a specified date (such as coupon date or interest payment date). The coupon rate shown represents the rate at period end. | |
| | | |
| AMBAC | | American Municipal Bond Assurance Corp. | |
| FGIC | | Financial Guarantee Insurance Company | |
| FHA | | Federal Housing Administration | |
| FSA | | Financial Security Assurance, Inc. | |
| MBIA | | Municipal Bond Investors Assurance Corp. | |
| XLCA | | XL Capital Assurance, Inc. | |
Holdings at March 31, 2008 as a Percentage of Net Assets (unaudited)
| | | |
| Hospital | | 10.2 | % |
| Hospital Obligated Group | | 10.0 | |
| Electric | | 10.0 | |
Corporate Backed/Industrial Revenue/Pollution Control | | 9.4 | |
| College & Universities | | 6.0 | |
| State Appropriation | | 5.6 | |
| Lease | | 5.3 | |
| Water & Sewer | | 5.2 | |
| Gas | | 5.1 | |
| Bond Bank/Pooled Loan Program | | 4.1 | |
| Airport | | 3.8 | |
| Non-Profit | | 3.6 | |
| School District | | 2.9 | |
| City & Town | | 2.8 | |
| Senior Living | | 2.8 | |
| Other, less than 2% each | | 8.6 | |
See accompanying notes to financial statements.
39
LOOMIS SAYLES STRATEGIC INCOME FUND — PORTFOLIOOF INVESTMENTS
Investments as of March 31, 2008 (Unaudited)
| | | | | |
Principal
Amount (‡) | | Description | | Value (†) |
| | | | | |
| Bonds and Notes — 89.3% of Net Assets | | | |
| Non-Convertible Bonds — 85.5% | | | |
| | Australia — 2.6% | | | |
| 119,520,000 | | New South Wales Treasury Corp., Series 10RG,
7.000%, 12/01/2010, (AUD) | | $ | 109,643,051 |
| 61,765,000 | | New South Wales Treasury Corp., Series 12RG,
6.000%, 5/01/2012, (AUD) | | | 54,722,558 |
| 1,500,000 | | Qantas Airways, Ltd., 144A,
5.125%, 6/20/2013 | | | 1,583,118 |
| 32,710,000 | | Qantas Airways, Ltd., 144A,
6.050%, 4/15/2016 | | | 34,936,471 |
| 50,000,000 | | Queensland Treasury Corp., 144A,
7.125%, 9/18/2017, (NZD) | | | 38,697,039 |
| 79,205,000 | | Queensland Treasury Corp. Series 11G,
6.000%, 6/14/2011, (AUD) | | | 70,786,792 |
| | | | | |
| | | | | 310,369,029 |
| | | | | |
| | Bermuda — 0.1% | | | |
| 11,855,000 | | Weatherford International, Ltd.,
6.500%, 8/01/2036 | | | 11,295,112 |
| | | | | |
| | Brazil — 1.7% | | | |
| 9,922,000 | | Republic of Brazil,
8.250%, 1/20/2034 | | | 11,856,790 |
| 6,000,000 | | Republic of Brazil,
8.875%, 4/15/2024(b) | | | 7,440,000 |
| 55,200,000 | | Republic of Brazil,
10.250%, 1/10/2028, (BRL) | | | 29,287,742 |
| 140,235,000 | | Republic of Brazil,
12.500%, 1/05/2016, (BRL) | | | 85,825,706 |
| 107,840,000 | | Republic of Brazil,
12.500%, 1/05/2022, (BRL) | | | 66,681,712 |
| | | | | |
| | | | | 201,091,950 |
| | | | | |
| | Canada — 8.9% | | | |
| 250,000 | | Abitibi-Consolidated, Inc.,
6.000%, 6/20/2013 | | | 122,500 |
| 8,125,000 | | Abitibi-Consolidated, Inc.,
7.400%, 4/01/2018 | | | 3,575,000 |
| 12,310,000 | | Abitibi-Consolidated, Inc.,
7.500%, 4/01/2028 | | | 5,047,100 |
| 2,960,000 | | Abitibi-Consolidated, Inc.,
8.500%, 8/01/2029 | | | 1,346,800 |
| 39,846,000 | | Abitibi-Consolidated, Inc.,
8.850%, 8/01/2030(b) | | | 17,731,470 |
| 9,785,000 | | Algoma Acquistion Corp., 144A,
9.875%, 6/15/2015 | | | 8,464,025 |
| 750,000 | | Avenor, Inc.,
10.850%, 11/30/2014, (CAD) | | | 365,980 |
| 4,370,000 | | Bell Canada, 144A,
6.550%, 5/01/2029, (CAD) | | | 3,217,056 |
| 5,925,000 | | Bell Canada, (MTN),
5.000%, 2/15/2017, (CAD) | | | 4,515,515 |
| 8,445,000 | | Bell Canada, (MTN),
7.300%, 2/23/2032, (CAD) | | | 6,729,919 |
| 33,455,000 | | Bell Canada, Series M-17,
6.100%, 3/16/2035, (CAD) | | | 23,849,867 |
| 1,950,000 | | Bombardier, Inc., 144A,
6.300%, 5/01/2014 | | | 1,852,500 |
| 2,795,000 | | Bombardier, Inc.,
7.350%, 12/22/2026, (CAD) | | | 2,536,780 |
| | | | | | |
Principal
Amount (‡) | | Description | | Value (†) |
| | | | | | |
| | | Canada — continued | | | |
| $ | 15,600,000 | | Bombardier, Inc., 144A,
7.450%, 5/01/2034 | | $ | 14,586,000 |
| | 121,095,000 | | Canada Housing Trust,
4.100%, 12/15/2008, (CAD) | | | 119,212,126 |
| | 14,525,000 | | Canadian Government,
4.000%, 6/01/2016, (CAD) | | | 14,842,825 |
| | 137,895,000 | | Canadian Government,
4.250%, 9/01/2008, (CAD) | | | 135,311,610 |
| | 436,930,000 | | Canadian Government,
4.250%, 12/01/2008, (CAD) | | | 430,472,571 |
| | 21,565,000 | | Canadian Government,
4.250%, 9/01/2009, (CAD) | | | 21,479,912 |
| | 35,580,000 | | Canadian Government,
5.750%, 6/01/2033, (CAD) | | | 44,574,743 |
| | 24,200,000 | | Canadian Government,
6.000%, 6/01/2008, (CAD)(b) | | | 23,727,293 |
| | 9,870,000 | | Canadian Pacific Railway Co.,
5.950%, 5/15/2037 | | | 8,185,369 |
| | 6,067,000 | | CIT Group Funding Co., Canada,
5.200%, 6/01/2015 | | | 4,538,019 |
| | 30,000,000 | | Connacher Oil and Gas Ltd., 144A,
10.250%, 12/15/2015 | | | 30,225,000 |
| | 335,000 | | GMAC Canada, Ltd., Series E, (MTN),
6.625%, 12/17/2010, (GBP) | | | 531,886 |
| | 945,000 | | GMAC Canada, Ltd.,
7.750%, 9/26/2008, (NZD) | | | 714,786 |
| | 9,790,000 | | Kinder Morgan Finance Co. ULC, Guaranteed Note,
5.700%, 1/05/2016 | | | 9,276,025 |
| | 11,570,000 | | Nortel Networks Corp.,
6.875%, 9/01/2023 | | | 7,115,550 |
| | 25,890,000 | | Nortel Networks Ltd,
10.125%, 7/15/2013 | | | 23,689,350 |
| | 22,930,000 | | North American Energy Partners, Inc., Senior Note,
8.750%, 12/01/2011 | | | 22,700,700 |
| | 9,365,000 | | Northern Telecom Capital Corp.,
7.875%, 6/15/2026 | | | 5,853,125 |
| | 2,525,000 | | Rogers Wireless Communications, Inc., Senior Secured Note,
6.375%, 3/01/2014 | | | 2,503,439 |
| | 2,085,000 | | Rogers Wireless Communications, Inc., Senior Note,
7.625%, 12/15/2011, (CAD)(b) | | | 2,244,150 |
| | 10,000,000 | | Shaw Communications, Inc.,
5.700%, 3/02/2017, (CAD) | | | 8,988,163 |
| | 9,170,000 | | Talisman Energy, Inc.,
5.850%, 2/01/2037 | | | 8,039,944 |
| | 24,260,000 | | Talisman Energy, Inc.,
6.250%, 2/01/2038 | | | 22,351,078 |
| | 31,690,000 | | Telus Corp.,
4.950%, 3/15/2017, (CAD) | | | 28,594,324 |
| | | | | | |
| | | | | | 1,069,112,500 |
| | | | | | |
| | | Cayman Islands — 0.0% | | | |
| | 555,000 | | Enersis SA, Cayman Island,
7.400%, 12/01/2016 | | | 599,822 |
| | | | | | |
| | | Chile — 0.1% | | | |
| | 4,875,000 | | Empresa Nacional de Electricidad SA, Chile,
7.875%, 2/01/2027(b) | | | 5,369,423 |
| | 250,000 | | Empresa Nacional de Electricidad SA, Chile,
8.350%, 8/01/2013 | | | 287,864 |
| | | | | | |
| | | | | | 5,657,287 |
| | | | | | |
See accompanying notes to financial statements.
40
LOOMIS SAYLES STRATEGIC INCOME FUND — PORTFOLIOOF INVESTMENTS (continued)
Investments as of March 31, 2008 (Unaudited)
| | | | | | |
Principal
Amount (‡) | | | Description | | Value (†) |
| | | | | | |
| | | Finland — 0.4% | | | |
| 62,300,000 | | | Nordic Investment Bank, Series E, (MTN),
11.250%, 4/16/2009, (ISK) | | $ | 819,083 |
| 3,680,200,000 | | | Nordic Investment Bank,
13.000%, 9/12/2008, (ISK) | | | 48,295,185 |
| | | | | | |
| | | | | | 49,114,268 |
| | | | | | |
| | | France — 0.1% | | | |
| 224,520,000,000 | | | BNP Paribas SA, Series E, (MTN), 144A,
Zero Coupon, 6/13/2011, (IDR) | | | 17,512,804 |
| | | | | | |
| | | Germany — 0.1% | | | |
| 565,300,000 | | | Kreditanstalt fuer Wiederaufbau, Series E, (MTN),
10.000%, 10/27/2008, (ISK) | | | 7,422,524 |
| 60,000,000 | | | Kreditanstalt fuer Wiederaufbau, Series E, (MTN),
10.750%, 2/01/2010, (ISK) | | | 784,844 |
| | | | | | |
| | | | | | 8,207,368 |
| | | | | | |
| | | India — 0.1% | | | |
| 9,090,000 | | | ICICI Bank Ltd., 144A,
6.375%, 4/30/2022(d) | | | 7,817,355 |
| | | | | | |
| | | Indonesia — 0.2% | | | |
| 104,626,000,000 | | | Indonesia Treasury Bond, Series FR43,
10.250%, 7/15/2022, (IDR) | | | 10,007,326 |
| 10,000,000,000 | | | Indonesia Treasury Bond, Series FR47,
10.000%, 2/15/2028, (IDR) | | | 910,252 |
| 272,460,000,000 | | | Indonesia Treasury Bond, Series ZCE,
0.010%, 11/20/2012, (IDR) | | | 18,545,898 |
| | | | | | |
| | | | | | 29,463,476 |
| | | | | | |
| | | Ireland — 0.6% | | | |
| 32,520,000 | | | Elan Finance PLC,
8.875%, 12/01/2013 | | | 30,568,800 |
| 46,445,000 | | | Elan Finance PLC, Senior Note,
7.750%, 11/15/2011 | | | 43,193,850 |
| | | | | | |
| | | | | | 73,762,650 |
| | | | | | |
| | | Luxembourg — 0.3% | | | |
| 23,000,000 | | | Telecom Italia Capital,
6.000%, 9/30/2034 | | | 19,439,278 |
| 19,635,000 | | | Telecom Italia Capital,
6.375%, 11/15/2033 | | | 17,168,392 |
| | | | | | |
| | | | | | 36,607,670 |
| | | | | | |
| | | Malaysia — 0.1% | | | |
| 20,000,000 | | | Ranhill Labuan Ltd., 144A,
12.500%, 10/26/2011 | | | 16,000,000 |
| | | | | | |
| | | Mexico — 3.0% | | | |
| 11,265,000 | | | Desarrolladora Homex SAB de CV,
7.500%, 9/28/2015(b) | | | 11,180,513 |
| 3,245,000 | (††) | | Mexican Fixed Rate Bonds, Series M-10,
8.000%, 12/17/2015, (MXN) | | | 31,520,810 |
| 27,728,881 | (††) | | Mexican Fixed Rate Bonds, Series M-20,
8.000%, 12/07/2023, (MXN) | | | 271,250,739 |
| 4,738,000 | (††) | | Mexican Fixed Rate Bonds, Series M-10,
9.000%, 12/20/2012, (MXN) | | | 47,372,209 |
| | | | | | |
| | | | | | 361,324,271 |
| | | | | | |
| | | Netherlands — 1.3% | | | |
| 1,800,000 | | | Koninklijke (Royal) KPN NV, Series G, (MTN),
4.000%, 6/22/2015, (EUR) | | | 2,476,015 |
| 1,120,000 | | | Koninklijke (Royal) KPN NV, Series E, (MTN),
5.750%, 3/18/2016, (GBP) | | | 2,063,878 |
| | | | | | |
Principal
Amount (‡) | | Description | | Value (†) |
| | | | | | |
| | | Netherlands — continued | | | |
| $ | 8,098,000 | | Koninklijke (Royal) KPN NV,
8.375%, 10/01/2030 | | $ | 9,266,452 |
| | 1,450,000 | | OI European Group BV, 144A,
6.875%, 3/31/2017, (EUR) | | | 2,151,835 |
| | 460,000,000 | | Rabobank Nederland, Series E, (MTN),
12.500%, 2/17/2009, (ISK) | | | 6,042,339 |
| | 9,984,000,000 | | Rabobank Nederland, 144A,
14.000%, 1/28/2009, (ISK) | | | 132,469,734 |
| | | | | | |
| | | | | | 154,470,253 |
| | | | | | |
| | | Philippines — 0.1% | | | |
| | 3,700,000 | | Philippine Long Distance Telephone Co., Series E, (MTN),
8.350%, 3/06/2017 | | | 4,116,250 |
| | 1,628,875 | | Quezon Power (Philippines), Ltd., Senior Secured Note,
8.860%, 6/15/2017 | | | 1,645,164 |
| | | | | | |
| | | | | | 5,761,414 |
| | | | | | |
| | | Republic of Korea — 0.1% | | | |
| | 5,470,000 | | Hanarotelecom, Inc., 144A,
7.000%, 2/01/2012 | | | 5,558,888 |
| | 300,000 | | Samsung Electronics Co., Ltd., 144A,
7.700%, 10/01/2027 | | | 326,427 |
| | | | | | |
| | | | | | 5,885,315 |
| | | | | | |
| | | Scotland — 1.6% | | | |
| | 169,620,000 | | Astrazeneca PLC,
6.450%, 9/15/2037 | | | 181,999,546 |
| | 6,500,000 | | FCE Bank PLC, Series E, (MTN),
7.125%, 1/16/2012, (EUR) | | | 8,209,494 |
| | 4,500,000 | | FCE Bank PLC, Series E, (MTN),
7.125%, 1/15/2013, (EUR) | | | 5,612,452 |
| | | | | | |
| | | | | | 195,821,492 |
| | | | | | |
| | | Singapore — 0.0% | | | |
| | 1,050,000 | | SP PowerAssets, Ltd., Series E, (MTN),
3.730%, 10/22/2010, (SGD) | | | 790,948 |
| | | | | | |
| | | Spain — 1.0% | | | |
| | 113,785,000 | | Telefonica Emisiones SAU, Guaranteed Note,
7.045%, 6/20/2036 | | | 118,967,679 |
| | | | | | |
| | | Supranational — 2.0% | | | |
| | 15,543,570 | | European Investment Bank, 144A,
Zero Coupon, 9/12/2008, (BRL) | | | 8,394,963 |
| | 128,250,000 | | European Investment Bank, Senior Note,
Zero Coupon, 3/10/2021, (AUD) | | | 50,004,762 |
| | 134,330,000 | | European Investment Bank, 144A,
4.600%, 1/30/2037, (CAD) | | | 126,654,561 |
| | 80,000,000 | | Inter-American Development Bank,
Series E, (MTN),
Zero Coupon, 5/11/2009, (BRL) | | | 38,479,512 |
| | 24,450,000 | | Inter-American Development Bank,
Series E, (MTN),
6.000%, 12/15/2017, (NZD) | | | 17,296,102 |
| | | | | | |
| | | | | | 240,829,900 |
| | | | | | |
| | | Switzerland — 0.1% | | | |
| | 403,600,000 | | Eurofima, Series E, (MTN),
10.000%, 11/03/2008, (ISK) | | | 5,286,044 |
| | 175,000,000 | | Eurofima, Series E, (MTN),
11.000%, 2/05/2010, (ISK) | | | 2,330,830 |
| | | | | | |
| | | | | | 7,616,874 |
| | | | | | |
See accompanying notes to financial statements.
41
LOOMIS SAYLES STRATEGIC INCOME FUND — PORTFOLIOOF INVESTMENTS (continued)
Investments as of March 31, 2008 (Unaudited)
| | | | | | |
Principal
Amount (‡) | | Description | | Value (†) |
| | | | | | |
| | | Thailand — 0.2% | | | |
| $ | 28,355,000 | | True Move Co., Ltd., 144A,
10.750%, 12/16/2013 | | $ | 26,653,700 |
| | | | | | |
| | | United Kingdom — 0.1% | | | |
| | 76,496,404,750 | | JPMorgan Chase Bank, 144A,
Zero Coupon, 10/21/2010, (IDR) | | | 6,458,773 |
| | 1,000,000 | | Virgin Media Finance PLC,
9.125%, 8/15/2016 | | | 895,000 |
| | 4,570,000 | | Virgin Media Finance PLC,
9.750%, 4/15/2014, (GBP) | | | 7,698,038 |
| | 1,605,000 | | Vodafone Group PLC,
6.150%, 2/27/2037 | | | 1,496,014 |
| | | | | | |
| | | | | | 16,547,825 |
| | | | | | |
| | | United States — 60.7% | | | |
| | 5,565,000 | | AES Corp. (The),
8.375%, 3/01/2011, (GBP) | | | 10,889,957 |
| | 4,020,000 | | AES Corp. (The), Senior Note,
7.750%, 3/01/2014 | | | 4,045,125 |
| | 1,190,000 | | Affiliated Computer Services, Inc.,
5.200%, 6/01/2015 | | | 990,675 |
| | 41,705,000 | | Agilent Technologies, Inc.,
6.500%, 11/01/2017 | | | 41,849,383 |
| | 19,060,000 | | Albertson’s, Inc.,
7.750%, 6/15/2026 | | | 17,973,809 |
| | 72,866,000 | | Albertson’s, Inc., Senior Note,
7.450%, 8/01/2029(b) | | | 67,095,450 |
| | 4,895,000 | | Albertson’s, Inc., Senior Note,
8.000%, 5/01/2031 | | | 4,666,208 |
| | 1,510,000 | | Albertson’s, Inc., Senior Note,
8.700%, 5/01/2030 | | | 1,515,274 |
| | 13,242,000 | | Albertson’s, Inc., Series C, (MTN),
6.625%, 6/01/2028 | | | 11,265,380 |
| | 4,785,000 | | Allstate Corp.,
5.950%, 4/01/2036 | | | 4,278,824 |
| | 2,075,000 | | ALLTEL Corp.,
6.500%, 11/01/2013 | | | 1,525,125 |
| | 8,065,000 | | ALLTEL Corp.,
6.800%, 5/01/2029 | | | 5,161,600 |
| | 23,685,000 | | ALLTEL Corp.,
7.000%, 7/01/2012 | | | 18,948,000 |
| | 2,225,000 | | ALLTEL Corp.,
7.000%, 3/15/2016 | | | 1,602,000 |
| | 67,525,000 | | ALLTEL Corp., Senior Note,
7.875%, 7/01/2032 | | | 44,566,500 |
| | 825,000 | | American Airlines, Inc., Series 1999-1, Class B,
7.324%, 4/15/2011 | | | 791,505 |
| | 995,863 | | American Airlines, Inc., Series 93A6,
8.040%, 9/16/2011 | | | 962,253 |
| | 218,655,000 | | American General Finance Corp.,
6.900%, 12/15/2017 | | | 213,685,846 |
| | 6,950,000 | | Amkor Technology, Inc., Senior Note,
7.125%, 3/15/2011 | | | 6,533,000 |
| | 10,070,000 | | Amkor Technology, Inc.,
7.750%, 5/15/2013 | | | 9,188,875 |
| | 37,190,000 | | Anadarko Petroleum Corp.,
5.950%, 9/15/2016 | | | 38,459,964 |
| | 45,910,000 | | Anadarko Petroleum Corp.,
6.450%, 9/15/2036 | | | 46,752,586 |
| | 10,503,000 | | APL Ltd., Senior Note,
8.000%, 1/15/2024(f) | | | 8,533,688 |
| | | | | | |
Principal
Amount (‡) | | Description | | Value (†) |
| | | | | | |
| | | United States — continued | | | |
| $ | 2,085,000 | | Aramark Services, Inc.,
5.000%, 6/01/2012 | | $ | 1,813,950 |
| | 4,640,000 | | Arrow Electronics, Inc.,
6.875%, 6/01/2018 | | | 4,784,782 |
| | 8,000,000 | | ASIF Global Financing, 144A,
2.380%, 2/26/2009, (SGD) | | | 5,811,309 |
| | 10,245,000 | | AT&T Corp.,
6.500%, 3/15/2029 | | | 9,922,733 |
| | 8,500,000 | | AT&T, Inc.,
6.150%, 9/15/2034 | | | 8,164,514 |
| | 127,100,000 | | AT&T, Inc.,
6.500%, 9/01/2037 | | | 125,726,303 |
| | 17,574,841 | | Atlas Air, Inc., Series 1998-1, Class 1B,
7.680%, 1/02/2014(g) | | | 20,386,815 |
| | 320,321 | | Atlas Air, Inc., Series 1999-1, Class A2,
6.880%, 7/02/2009 | | | 313,915 |
| | 12,740,207 | | Atlas Air, Inc., Series 1999-1, Class B,
7.630%, 1/02/2015(g) | | | 14,014,228 |
| | 4,744,556 | | Atlas Air, Inc., Series 1999-1, Class C,
8.770%, 1/02/2011(g) | | | 4,697,110 |
| | 5,323,737 | | Atlas Air, Inc., Series 2000-1, Class B,
9.057%, 7/02/2017(g) | | | 6,335,247 |
| | 6,862,758 | | Atlas Air, Inc., Series C,
8.010%, 1/02/2010(g) | | | 5,901,972 |
| | 30,125,000 | | Avnet, Inc.,
5.875%, 3/15/2014 | | | 31,158,860 |
| | 35,630,000 | | Avnet, Inc.,
6.000%, 9/01/2015 | | | 35,715,227 |
| | 11,345,000 | | Avnet, Inc.,
6.625%, 9/15/2016 | | | 11,710,593 |
| | 22,125,000 | | BAC Capital Trust VI,
5.625%, 3/08/2035 | | | 18,575,641 |
| | 17,310,000,000 | | Barclays Financial LLC, 144A,
4.060%, 9/16/2010, (KRW) | | | 18,202,286 |
| | 1,006,000,000 | | Barclays Financial LLC, 144A,
4.160%, 2/22/2010, (THB) | | | 32,677,799 |
| | 21,340,000,000 | | Barclays Financial LLC, 144A,
4.460%, 9/23/2010, (KRW) | | | 22,651,192 |
| | 56,650,000,000 | | Barclays Financial LLC, 144A,
4.470%, 12/04/2011, (KRW) | | | 60,948,730 |
| | 135,000,000 | | Barclays Financial LLC, Series E, (MTN), 144A,
4.100%, 3/22/2010, (THB) | | | 4,382,185 |
| | 380,000 | | Bear Stearns Cos., Inc.(The),
4.650%, 7/02/2018 | | | 324,385 |
| | 1,004,000 | | Bear Stearns Cos., Inc.(The),
5.300%, 10/30/2015 | | | 942,496 |
| | 2,220,000 | | Bear Stearns Cos., Inc.(The),
6.400%, 10/02/2017 | | | 2,192,030 |
| | 17,430,000 | | Bear Stearns Cos., Inc.(The),
7.250%, 2/01/2018 | | | 18,012,005 |
| | 7,755,000 | | Bear Stearns Cos., Inc.(The), Series B, (MTN),
3.190%, 5/18/2010(d) | | | 7,212,313 |
| | 15,195,000 | | BellSouth Corp.,
6.000%, 11/15/2034(b) | | | 14,268,819 |
| | 23,584,000 | | Borden, Inc.,
7.875%, 2/15/2023 | | | 14,622,080 |
| | 6,920,000 | | Borden, Inc.,
8.375%, 4/15/2016 | | | 4,705,600 |
| | 8,757,000 | | Borden, Inc.,
9.200%, 3/15/2021 | | | 5,867,190 |
See accompanying notes to financial statements.
42
LOOMIS SAYLES STRATEGIC INCOME FUND — PORTFOLIOOF INVESTMENTS (continued)
Investments as of March 31, 2008 (Unaudited)
| | | | | | |
Principal
Amount (‡) | | Description | | Value (†) |
| | | | | | |
| | | United States — continued | | | |
| $ | 2,765,000 | | Boston Scientific Corp.,
5.450%, 6/15/2014 | | $ | 2,536,888 |
| | 10,590,000 | | Boston Scientific Corp.,
6.400%, 6/15/2016 | | | 9,875,175 |
| | 16,510,000 | | Boston Scientific Corp.,
7.000%, 11/15/2035 | | | 14,363,700 |
| | 2,685,000 | | Bowater, Inc.,
6.500%, 6/15/2013(b) | | | 1,772,100 |
| | 71,400,000 | | Bruce Mansfield Unit,
6.850%, 6/01/2034 | | | 76,706,448 |
| | 13,020,000 | | Camden Property Trust,
5.700%, 5/15/2017 | | | 11,273,601 |
| | 2,840,000 | | Centex Corp.,
5.250%, 6/15/2015 | | | 2,201,000 |
| | 4,185,000 | | Chesapeake Energy Corp.,
6.250%, 1/15/2017, (EUR) | | | 5,979,393 |
| | 21,390,000 | | Chesapeake Energy Corp.,
6.500%, 8/15/2017 | | | 20,641,350 |
| | 22,690,000 | | Chesapeake Energy Corp.,
6.875%, 11/15/2020 | | | 22,009,300 |
| | 15,325,000 | | CIGNA Corp.,
6.150%, 11/15/2036 | | | 13,340,351 |
| | 425,000 | | Cincinnati Bell, Inc.,
8.375%, 1/15/2014(b) | | | 398,438 |
| | 14,910,000 | | CIT Group, Inc., Series E, (MTN),
3.800%, 11/14/2012, (EUR) | | | 14,288,520 |
| | 18,360,000 | | CIT Group, Inc., Series G, (MTN),
4.250%, 9/22/2011, (EUR) | | | 18,587,771 |
| | 12,950,000 | | CIT Group, Inc., Series E, (MTN),
4.650%, 9/19/2016, (EUR) | | | 12,243,428 |
| | 4,495,000 | | CIT Group, Inc.,
5.000%, 2/13/2014 | | | 3,537,358 |
| | 2,555,000 | | CIT Group, Inc., Series G, (MTN),
5.000%, 5/13/2014, (EUR) | | | 2,581,856 |
| | 205,000 | | CIT Group, Inc.,
5.000%, 2/01/2015(b) | | | 160,584 |
| | 205,000 | | CIT Group, Inc.,
5.400%, 1/30/2016 | | | 162,220 |
| | 20,050,000 | | CIT Group, Inc., Series E, Senior Note, (MTN),
5.500%, 12/01/2014, (GBP) | | | 24,547,956 |
| | 8,050,000 | | CIT Group, Inc., Series E, (MTN),
5.500%, 12/20/2016, (GBP) | | | 9,967,572 |
| | 2,000,000 | | CIT Group, Inc.,
5.600%, 4/27/2011 | | | 1,613,196 |
| | 840,000 | | CIT Group, Inc.,
5.650%, 2/13/2017 | | | 651,375 |
| | 850,000 | | CIT Group, Inc.,
5.800%, 10/01/2036(b) | | | 661,450 |
| | 246,450,000 | | CIT Group, Inc.,
7.625%, 11/30/2012(b) | | | 204,833,221 |
| | 20,095,000 | | CIT Group, Inc. (MTN),
4.250%, 3/17/2015, (EUR) | | | 18,675,594 |
| | 10,100,000 | | CIT Group, Inc.,, Series (MTN),
5.125%, 9/30/2014 | | | 7,777,000 |
| | 3,055,000 | | CIT Group, Inc., Series A, (MTN),
6.000%, 4/01/2036 | | | 2,321,800 |
| | 18,650,000 | | Citibank NA, 144A,
15.000%, 7/02/2010, (BRL) | | | 11,506,360 |
| | 35,260,000 | | Citizens Communications Co.,
7.875%, 1/15/2027 | | | 30,235,450 |
| | | | | | |
Principal
Amount (‡) | | Description | | Value (†) |
| | | | | | |
| | | United States — continued | | | |
| $ | 10,685,000 | | Clear Channel Communications, Inc.,
4.900%, 5/15/2015 | | $ | 7,158,950 |
| | 4,970,000 | | Clear Channel Communications, Inc.,
5.500%, 9/15/2014 | | | 3,578,400 |
| | 14,240,000 | | Clear Channel Communications, Inc.,
5.500%, 12/15/2016(b) | | | 9,398,400 |
| | 2,080,000 | | Clear Channel Communications, Inc.,
5.750%, 1/15/2013 | | | 1,653,600 |
| | 585,000 | | Clear Channel Communications, Inc.,
6.875%, 6/15/2018 | | | 424,125 |
| | 20,720,000 | | Cleveland Electric Illuminating Co.,
5.950%, 12/15/2036 | | | 17,852,642 |
| | 2,935,000 | | Colonial Realty LP,
6.050%, 9/01/2016 | | | 2,405,541 |
| | 766,000 | | Colorado Interstate Gas Co.,
5.950%, 3/15/2015 | | | 758,260 |
| | 2,670,000 | | Colorado Interstate Gas Co.,
6.800%, 11/15/2015 | | | 2,752,789 |
| | 49,030,000 | | Comcast Corp.,
5.650%, 6/15/2035 | | | 41,635,246 |
| | 33,675,000 | | Comcast Corp.,
6.450%, 3/15/2037 | | | 31,733,266 |
| | 20,175,000 | | Comcast Corp.,
6.500%, 11/15/2035 | | | 19,081,192 |
| | 166,000,000 | | Comcast Corp.,
6.950%, 8/15/2037 | | | 166,332,830 |
| | 14,824,000 | | Continental Airlines, Inc., Series B,
6.903%, 4/19/2022 | | | 12,378,040 |
| | 5,589,326 | | Continental Airlines, Inc., Series 1997-4, Class 4B,
6.900%, 1/02/2017 | | | 5,030,393 |
| | 5,992,300 | | Continental Airlines, Inc., Series 1998-1, Class 1B,
6.748%, 3/15/2017 | | | 5,393,070 |
| | 6,643,125 | | Continental Airlines, Inc., Series 1999-1, Class B,
6.795%, 8/02/2018 | | | 5,978,813 |
| | 1,748,369 | | Continental Airlines, Inc., Series 1999-1, Class C,
6.954%, 8/02/2009 | | | 1,643,467 |
| | 4,322,115 | | Continental Airlines, Inc., Series 1999-2, Class B,
7.566%, 3/15/2020 | | | 3,976,346 |
| | 7,533,087 | | Continental Airlines, Inc., Series 2000-2, Class B,
8.307%, 10/02/2019 | | | 7,043,436 |
| | 2,549,134 | | Continental Airlines, Inc., Series 2001-1, Class B,
7.373%, 6/15/2017 | | | 2,306,966 |
| | 235,419 | | Continental Airlines, Inc., Series 96-A,
6.940%, 10/15/2013 | | | 228,356 |
| | 5,682,266 | | Continental Airlines, Inc., Series 971A,
7.461%, 4/01/2015 | | | 5,284,508 |
| | 14,420,000 | | Continental Airlines, Inc., Series A,
5.983%, 4/19/2022 | | | 12,846,922 |
| | 23,710,000 | | Corn Products International, Inc.,
6.625%, 4/15/2037 | | | 24,893,579 |
| | 6,225,000 | | Corning, Inc.,
5.900%, 3/15/2014 | | | 6,527,566 |
| | 6,220,000 | | Corning, Inc.,
6.200%, 3/15/2016 | | | 6,455,800 |
| | 6,150,000 | | Corning, Inc.,
6.850%, 3/01/2029(b) | | | 6,266,389 |
| | 4,725,000 | | Corning, Inc.,
7.250%, 8/15/2036 | | | 5,096,848 |
| | 4,110,000 | | Countrywide Financial Corp.,
2.849%, 12/19/2008(d) | | | 3,760,650 |
See accompanying notes to financial statements.
43
LOOMIS SAYLES STRATEGIC INCOME FUND — PORTFOLIOOF INVESTMENTS (continued)
Investments as of March 31, 2008 (Unaudited)
| | | | | | |
Principal
Amount (‡) | | Description | | Value (†) |
| | | | | | |
| | | United States — continued | | | |
| $ | 11,799,000 | | Countrywide Home Loans, Inc., Series L, (MTN),
4.000%, 3/22/2011 | | $ | 10,522,915 |
| | 18,130,000 | | Covidien International Finance SA, 144A,
6.000%, 10/15/2017 | | | 18,686,645 |
| | 18,265,000 | | Covidien International Finance SA, 144A,
6.550%, 10/15/2037 | | | 18,667,561 |
| | 400,000 | | CSC Holdings, Inc., Senior Note,
7.875%, 2/15/2018 | | | 370,000 |
| | 250,000 | | CSC Holdings, Inc., Series B, Senior Note,
8.125%, 7/15/2009 | | | 252,500 |
| | 37,345,000 | | CSX Corp.,
6.000%, 10/01/2036(b) | | | 32,149,713 |
| | 5,000,000 | | CSX Corp.,
6.250%, 3/15/2018 | | | 4,934,375 |
| | 2,145,000 | | Cummings Engine, Inc.,
7.125%, 3/01/2028 | | | 2,116,776 |
| | 1,853,000 | | Cummins, Inc.,
6.750%, 2/15/2027 | | | 1,843,029 |
| | 19,745,000 | | DCP Midstream LP, 144A
6.450%, 11/03/2036 | | | 18,563,992 |
| | 14,195,000 | | Dean Foods Co.,
7.000%, 6/01/2016(b) | | | 12,420,625 |
| | 972,839 | | Delta Air Lines, Inc., Class A, 144A,
6.821%, 8/10/2022 | | | 914,469 |
| | 32,897,438 | | Delta Air Lines, Inc., Class C, 144A,
8.954%, 8/10/2014 | | | 30,594,617 |
| | 8,758,000 | | Dillard’s, Inc.,
6.625%, 1/15/2018(b) | | | 6,568,500 |
| | 4,187,000 | | Dillard’s, Inc.,
7.130%, 8/01/2018 | | | 3,244,925 |
| | 1,500,000 | | Dillard’s, Inc.,
7.750%, 7/15/2026 | | | 1,110,000 |
| | 425,000 | | Dillard’s, Inc.,
7.875%, 1/01/2023 | | | 327,250 |
| | 3,325,000 | | Dillard’s, Inc., Class A,
7.000%, 12/01/2028 | | | 2,252,688 |
| | 1,935,000 | | Dole Food Co., Inc.,
8.625%, 5/01/2009(b) | | | 1,683,450 |
| | 8,180,000 | | Dominion Resources, Inc., Senior Note, Series B,
5.950%, 6/15/2035(b) | | | 7,724,636 |
| | 7,955,000 | | Domtar Corp.,
5.375%, 12/01/2013 | | | 6,960,625 |
| | 43,470,000 | | DR Horton, Inc., Senior Note,
5.250%, 2/15/2015 | | | 36,080,100 |
| | 4,335,000 | | DR Horton, Inc.,
5.625%, 9/15/2014 | | | 3,684,750 |
| | 16,160,000 | | DR Horton, Inc., Guaranteed Note,
5.625%, 1/15/2016 | | | 13,493,600 |
| | 1,625,000 | | DR Horton, Inc.,
6.500%, 4/15/2016 | | | 1,446,250 |
| | 4,030,000 | | Duke Realty LP,
5.950%, 2/15/2017 | | | 3,494,824 |
| | 11,275,000 | | Dynegy Holdings, Inc.,
7.125%, 5/15/2018(b) | | | 10,147,500 |
| | 10,185,000 | | Dynegy Holdings, Inc.,
7.625%, 10/15/2026 | | | 8,631,788 |
| | 500,000 | | Dynegy Holdings, Inc.,
7.750%, 6/01/2019 | | | 467,500 |
| | 7,455,000 | | Dynegy Holdings, Inc.,
8.375%, 5/01/2016(b) | | | 7,380,450 |
| | | | | | |
Principal
Amount (‡) | | Description | | Value (†) |
| | | | | | |
| | | United States — continued | | | |
| $ | 95,200,000 | | Edison Mission Energy,
7.625%, 5/15/2027(b) | | $ | 89,488,000 |
| | 15,685,000 | | El Paso Corp.,
6.950%, 6/01/2028 | | | 14,665,444 |
| | 1,500,000 | | El Paso Corp.,
7.420%, 2/15/2037 | | | 1,462,755 |
| | 750,000 | | El Paso Corp., Senior Note, (MTN),
7.800%, 8/01/2031 | | | 770,054 |
| | 1,000,000 | | El Paso Energy Corp., (MTN),
7.750%, 1/15/2032 | | | 1,027,035 |
| | 5,330,000 | | Embarq Corp.,
7.995%, 6/01/2036 | | | 4,867,660 |
| | 5,255,000 | | Energy Transfer Partners LP,
6.125%, 2/15/2017 | | | 5,112,936 |
| | 11,315,000 | | Energy Transfer Partners LP,
6.625%, 10/15/2036 | | | 10,492,535 |
| | 13,175,000 | | Enterprise Products Operating LP,
6.300%, 9/15/2017 | | | 13,239,558 |
| | 14,385,000 | | Equifax, Inc.,
7.000%, 7/01/2037 | | | 12,846,798 |
| | 3,300,000 | | ERP Operating LP,
5.125%, 3/15/2016 | | | 2,858,853 |
| | 23,725,000 | | Federal Home Loan Mortgage Corp.,
4.625%, 10/25/2012(b) | | | 25,169,876 |
| | 35,900,000 | | Federal National Mortgage Association,
2.290%, 2/19/2009, (SGD) | | | 26,236,381 |
| | 17,816,000 | | Ford Motor Co.,
6.375%, 2/01/2029 | | | 10,689,600 |
| | 1,705,000 | | Ford Motor Co.,
6.500%, 8/01/2018(b) | | | 1,142,350 |
| | 500,000 | | Ford Motor Co.,
6.625%, 2/15/2028 | | | 305,000 |
| | 73,114,000 | | Ford Motor Co.,
6.625%, 10/01/2028 | | | 44,599,540 |
| | 1,940,000 | | Ford Motor Co.,
7.125%, 11/15/2025 | | | 1,280,400 |
| | 86,090,000 | | Ford Motor Co.,
7.450%, 7/16/2031(b) | | | 56,819,400 |
| | 800,000 | | Ford Motor Co.,
7.500%, 8/01/2026 | | | 512,000 |
| | 1,645,000 | | Ford Motor Credit Co LLC,
9.750%, 9/15/2010 | | | 1,465,322 |
| | 46,122,000 | | Ford Motor Credit Co.,
5.700%, 1/15/2010 | | | 40,068,395 |
| | 14,595,000 | | Ford Motor Credit Co.,
8.000%, 12/15/2016 | | | 11,425,039 |
| | 7,640,000 | | Ford Motor Credit Co. LLC, Series E, (MTN),
4.875%, 1/15/2010, (EUR) | | | 10,148,761 |
| | 10,685,000 | | Ford Motor Credit Co. LLC,
7.000%, 10/01/2013 | | | 8,334,503 |
| | 15,465,000 | | Ford Motor Credit Co. LLC,
7.250%, 10/25/2011 | | | 12,703,322 |
| | 1,030,000 | | Ford Motor Credit Co. LLC,
7.875%, 6/15/2010 | | | 898,095 |
| | 10,625,000 | | Ford Motor Credit Co. LLC,
8.625%, 11/01/2010 | | | 9,257,520 |
| | 29,605,000 | | Freescale Semiconductor, Inc.,
10.125%, 12/15/2016(b) | | | 19,983,375 |
| | 60,900,000 | | General Electric Capital Corp., Series G, (MTN),
2.960%, 5/18/2012, (SGD) | | | 44,357,207 |
See accompanying notes to financial statements.
44
LOOMIS SAYLES STRATEGIC INCOME FUND — PORTFOLIOOF INVESTMENTS (continued)
Investments as of March 31, 2008 (Unaudited)
| | | | | |
Principal
Amount (‡) | | Description | | Value (†) |
| | | | | |
| | United States — continued | | | |
| 243,057,000 | | General Electric Capital Corp.,
6.500%, 9/28/2015, (NZD) | | $ | 176,641,269 |
| 30,350,000 | | General Electric Capital Corp., Series A, (MTN),
6.625%, 2/04/2010, (NZD) | | | 23,210,571 |
| 500,000 | | General Electric Capital Corp., Series E, (MTN),
1.725%, 6/27/2008, (SGD) | | | 363,304 |
| 3,100,000 | | General Electric Capital Corp., Series E, (MTN),
6.125%, 5/17/2012, (GBP) | | | 6,326,894 |
| 79,035,000 | | General Electric Capital Corp., Series E, (MTN),
6.750%, 9/26/2016, (NZD) | | | 58,674,093 |
| 115,000,000 | | General Electric Capital Corp., Series G, (MTN),
3.485%, 3/08/2012, (SGD) | | | 84,967,743 |
| 2,005,000 | | General Motors Corp.,
7.250%, 7/03/2013, (EUR)(b) | | | 2,500,659 |
| 7,365,000 | | General Motors Corp.,
7.400%, 9/01/2025(b) | | | 4,934,550 |
| 52,725,000 | | General Motors Corp.,
8.250%, 7/15/2023(b) | | | 36,907,500 |
| 2,530,000 | | General Motors Corp.,
8.375%, 7/15/2033(b) | | | 1,783,650 |
| 6,745,000 | | Georgia Gulf Corp.,
10.750%, 10/15/2016(b) | | | 4,417,975 |
| 11,720,000 | | Georgia-Pacific Corp.,
7.250%, 6/01/2028 | | | 9,551,800 |
| 11,605,000 | | Georgia-Pacific Corp.,
7.375%, 12/01/2025 | | | 9,632,150 |
| 120,000 | | Georgia-Pacific Corp.,
7.700%, 6/15/2015(b) | | | 112,800 |
| 42,425,000 | | Georgia-Pacific Corp.,
7.750%, 11/15/2029 | | | 35,637,000 |
| 15,555,000 | | Georgia-Pacific Corp.,
8.000%, 1/15/2024 | | | 13,688,400 |
| 18,378,000 | | Georgia-Pacific Corp.,
8.875%, 5/15/2031 | | | 16,356,420 |
| 37,130,000 | | GMAC LLC, Series E, (MTN),
5.375%, 6/06/2011, (EUR) | | | 40,561,201 |
| 54,070,000 | | GMAC LLC,
6.000%, 12/15/2011 | | | 40,416,947 |
| 24,015,000 | | GMAC LLC,
6.625%, 5/15/2012 | | | 18,166,915 |
| 35,424,000 | | GMAC LLC, (MTN),
6.750%, 12/01/2014 | | | 25,069,600 |
| 6,585,000 | | GMAC LLC,
6.875%, 9/15/2011 | | | 5,039,922 |
| 4,655,000 | | GMAC LLC,
6.875%, 8/28/2012 | | | 3,537,474 |
| 12,165,000 | | GMAC LLC,
7.000%, 2/01/2012 | | | 9,251,227 |
| 42,272,000 | | GMAC LLC,
8.000%, 11/01/2031(b) | | | 30,296,004 |
| 4,902,000 | | Goodyear Tire & Rubber Co.,
7.000%, 3/15/2028 | | | 3,995,130 |
| 2,590,000 | | Great Lakes Dredge & Dock Corp., Senior Subordinated Note,
7.750%, 12/15/2013(b) | | | 2,369,850 |
| 5,790,000 | | GTE Corp.,
6.940%, 4/15/2028 | | | 5,844,235 |
| 867,000 | | HCA, Inc.,
6.250%, 2/15/2013 | | | 754,290 |
| | | | | | |
Principal
Amount (‡) | | Description | | Value (†) |
| | | | | | |
| | | United States — continued | | | |
| $ | 15,930,000 | | HCA, Inc.,
6.375%, 1/15/2015 | | $ | 13,480,762 |
| | 49,350,000 | | HCA, Inc.,
6.500%, 2/15/2016(b) | | | 41,577,375 |
| | 2,074,000 | | HCA, Inc.,
6.750%, 7/15/2013 | | | 1,835,490 |
| | 14,405,000 | | HCA, Inc.,
7.050%, 12/01/2027 | | | 10,503,896 |
| | 4,775,000 | | HCA, Inc.,
7.190%, 11/15/2015 | | | 4,062,255 |
| | 15,637,000 | | HCA, Inc.,
7.500%, 12/15/2023 | | | 12,278,125 |
| | 18,745,000 | | HCA, Inc.,
7.500%, 11/06/2033 | | | 14,480,512 |
| | 13,015,000 | | HCA, Inc.,
7.580%, 9/15/2025 | | | 10,187,400 |
| | 39,203,000 | | HCA, Inc.,
7.690%, 6/15/2025 | | | 31,070,181 |
| | 6,920,000 | | HCA, Inc.,
7.750%, 7/15/2036 | | | 5,313,737 |
| | 22,778,000 | | HCA, Inc.,
8.360%, 4/15/2024 | | | 18,907,585 |
| | 17,510,000 | | HCA, Inc., Senior Note,
5.750%, 3/15/2014 | | | 14,445,750 |
| | 14,550,000 | | Hercules, Inc., Subordinated Note,
6.500%, 6/30/2029 | | | 11,640,000 |
| | 45,430,000 | | Highwoods Properties, Inc.,
5.850%, 3/15/2017 | | | 38,806,170 |
| | 6,495,000 | | Hilcorp Energy I LP, 144A,
7.750%, 11/01/2015 | | | 6,089,063 |
| | 108,005,000 | | Home Depot, Inc.,
5.875%, 12/16/2036 | | | 88,171,826 |
| | 11,370,000 | | Hospira, Inc.,
6.050%, 3/30/2017 | | | 11,269,114 |
| | 66,372,000 | | HSBC Bank PLC, 144A,
Zero Coupon, 4/18/2012, (MYR) | | | 20,481,214 |
| | 119,806,078 | | HSBC Bank USA, 144A,
Zero Coupon, 11/28/2011 | | | 83,265,224 |
| | 16,050,000 | | HSBC Bank USA, 144A,
3.310%, 8/25/2010 | | | 19,375,560 |
| | 225,000 | | Intelsat Corp.,
6.875%, 1/15/2028 | | | 177,750 |
| | 20,645,000 | | International Lease Finance Corp.,
6.375%, 3/25/2013 | | | 20,629,083 |
| | 23,752,000 | | iStar Financial, Inc.,
5.150%, 3/01/2012 | | | 17,576,480 |
| | 5,255,000 | | iStar Financial, Inc.,
5.375%, 4/15/2010(b) | | | 4,151,450 |
| | 1,660,000 | | iStar Financial, Inc.,
5.500%, 6/15/2012 | | | 1,228,400 |
| | 17,150,000 | | iStar Financial, Inc.,
5.650%, 9/15/2011 | | | 13,034,000 |
| | 4,040,000 | | iStar Financial, Inc.,
5.800%, 3/15/2011 | | | 3,151,200 |
| | 1,565,000 | | iStar Financial, Inc.,
5.850%, 3/15/2017 | | | 1,079,850 |
| | 7,970,000 | | iStar Financial, Inc.,
5.875%, 3/15/2016 | | | 5,579,000 |
| | 3,890,000 | | iStar Financial, Inc.,
6.050%, 4/15/2015 | | | 2,761,900 |
See accompanying notes to financial statements.
45
LOOMIS SAYLES STRATEGIC INCOME FUND — PORTFOLIOOF INVESTMENTS (continued)
Investments as of March 31, 2008 (Unaudited)
| | | | | | |
Principal
Amount (‡) | | Description | | Value (†) |
| | | | | | |
| | | United States — continued | | | |
| $ | 1,780,000 | | iStar Financial, Inc., Series B,
5.125%, 4/01/2011 | | $ | 1,370,600 |
| | 27,710,000 | | iStar Financial, Inc., Series B,
5.950%, 10/15/2013 | | | 20,228,300 |
| | 5,310,000 | | ITC Holdings Corp., 144A,
6.375%, 9/30/2036 | | | 4,852,230 |
| | 3,685,000 | | J.C. Penney Corp., Inc.,
5.750%, 2/15/2018 | | | 3,402,331 |
| | 71,200,000 | | J.C. Penney Corp., Inc., Senior Note,
6.375%, 10/15/2036 | | | 60,507,682 |
| | 350,000 | | J.C. Penney Corp., Inc.,
7.125%, 11/15/2023(b) | | | 363,416 |
| | 3,445,000 | | Jefferson Smurfit Corp.,
7.500%, 6/01/2013(b) | | | 2,962,700 |
| | 1,425,000 | | Joy Global, Inc.,
6.625%, 11/15/2036 | | | 1,321,229 |
| | 709,038,100,000 | | JPMorgan Chase & Co., 144A
Zero Coupon, 3/28/2011 , (IDR) | | | 56,753,249 |
| | 229,157,783,660 | | JPMorgan Chase & Co., 144A,
Zero Coupon, 4/12/2012, (IDR) | | | 16,092,079 |
| | 150,760,200 | | JPMorgan Chase & Co., Series E, (MTN), 144A,
1.000%, 6/08/2012, (MYR) | | | 42,011,120 |
| | 92,000,000 | | JPMorgan Chase Bank, 144A,
Zero Coupon, 5/17/2010, (BRL) | | | 41,796,271 |
| | 1,235,000 | | K Hovnanian Enterprises, Inc.,
8.875%, 4/01/2012(b) | | | 685,425 |
| | 4,830,000 | | K. Hovnanian Enterprises, Inc., Guaranteed Note,
6.250%, 1/15/2015(b) | | | 3,236,100 |
| | 16,075,000 | | K. Hovnanian Enterprises, Inc., Senior Note,
6.250%, 1/15/2016(b) | | | 10,850,625 |
| | 6,040,000 | | K. Hovnanian Enterprises, Inc., Guaranteed Note,
6.375%, 12/15/2014(b) | | | 4,077,000 |
| | 2,490,000 | | K. Hovnanian Enterprises, Inc., Guaranteed Note,
6.500%, 1/15/2014(b) | | | 1,680,750 |
| | 6,290,000 | | K. Hovnanian Enterprises, Inc.,
7.500%, 5/15/2016(b) | | | 4,371,550 |
| | 1,935,000 | | K. Hovnanian Enterprises, Inc.,
7.750%, 5/15/2013(b) | | | 1,025,550 |
| | 1,685,000 | | KB Home,
5.750%, 2/01/2014 | | | 1,449,100 |
| | 8,340,000 | | KB Home, Guaranteed Note,
5.875%, 1/15/2015 | | | 7,214,100 |
| | 5,805,000 | | KB Home, Guaranteed Note,
6.250%, 6/15/2015(b) | | | 5,144,681 |
| | 11,315,000 | | KB Home, Guaranteed Note,
7.250%, 6/15/2018 | | | 10,126,925 |
| | 10,360,000 | | KB Home,
7.750%, 2/01/2010(b) | | | 9,906,750 |
| | 7,515,000 | | Kellwood Co.,
7.625%, 10/15/2017(f) | | | 4,884,750 |
| | 500,000 | | Kinder Morgan Energy Partners, LP,
5.800%, 3/15/2035 | | | 422,918 |
| | 11,288,000 | | Kinder Morgan, Inc., Senior Note,
5.150%, 3/01/2015 | | | 10,384,960 |
| | 1,650,000 | | Koppers Holdings, Inc., (step to
9.875% on 11/15/2009),
Zero Coupon, 11/15/2014(e) | | | 1,431,375 |
| | 37,705,000 | | Kraft Foods, Inc.,
6.500%, 8/11/2017 | | | 38,683,407 |
| | | | | | |
Principal
Amount (‡) | | Description | | Value (†) |
| | | | | | |
| | | United States — continued | | | |
| $ | 30,680,000 | | Kraft Foods, Inc.,
7.000%, 8/11/2037 | | $ | 30,676,226 |
| | 6,015,000 | | Kulicke & Soffa Industries, Inc.,
0.875%, 6/01/2012 | | | 4,150,350 |
| | 4,795,000 | | Lennar Corp., Series B, Guaranteed Note,
5.600%, 5/31/2015 | | | 3,548,300 |
| | 23,885,000 | | Lennar Corp., Series A,
6.500%, 4/15/2016 | | | 18,152,600 |
| | 3,495,000 | | Lennar Corp.,
7.625%, 3/01/2009 | | | 3,355,200 |
| | 2,720,000 | | Lennar Corp. Series B,
5.125%, 10/01/2010 | | | 2,366,400 |
| | 13,715,000 | | Lennar Corp., Series B,
5.500%, 9/01/2014(b) | | | 10,423,400 |
| | 35,110,000 | | Level 3 Communications, Inc.,
2.875%, 7/15/2010 | | | 24,533,112 |
| | 33,440,000 | | Level 3 Communications, Inc.,
3.500%, 6/15/2012(b) | | | 22,906,400 |
| | 12,604,000 | | Level 3 Communications, Inc.,
5.250%, 12/15/2011 | | | 9,894,140 |
| | 32,435,000 | | Level 3 Financing, Inc.,
8.750%, 2/15/2017 | | | 24,650,600 |
| | 13,010,000 | | Level 3 Financing, Inc.,
9.250%, 11/01/2014(b) | | | 10,635,675 |
| | 41,535,000 | | Lowes Cos., Inc.,
6.650%, 9/15/2037 | | | 41,639,917 |
| | 41,104,000 | | Lucent Technologies, Inc.,
6.450%, 3/15/2029 | | | 29,389,360 |
| | 2,840,000 | | Lucent Technologies, Inc.,
6.500%, 1/15/2028 | | | 2,030,600 |
| | 15,135,000 | | Macy’s Retail Holdings, Inc.,
6.375%, 3/15/2037 | | | 11,984,483 |
| | 8,855,000 | | Macys Retail Holdings, Inc.,
6.790%, 7/15/2027 | | | 7,264,421 |
| | 5,785,000 | | Macys Retail Holdings, Inc.,
6.900%, 4/01/2029 | | | 4,895,591 |
| | 6,365,000 | | Marks & Spencer PLC, Series 144A,
7.125%, 12/01/2037 | | | 5,744,413 |
| | 2,660,000 | | Marsh & McLennan Cos., Inc.,
5.375%, 7/15/2014 | | | 2,569,818 |
| | 11,710,000 | | Marsh & McLennan Cos., Inc.,
5.750%, 9/15/2015 | | | 11,464,992 |
| | 9,075,000 | | Marsh & McLennan Cos., Inc.,
5.875%, 8/01/2033(b) | | | 7,608,816 |
| | 2,520,000 | | MBIA Insurance Co., 144A,
14.000%, 1/15/2033(b)(d) | | | 2,469,600 |
| | 1,250,000 | | McDonalds Corp., Series E, (MTN),
3.628%, 10/10/2010, (SGD) | | | 942,114 |
| | 176,070,000 | | Medco Health Solutions, Inc.,
7.125%, 3/15/2018 | | | 180,408,189 |
| | 51,500,000 | | Merrill Lynch & Co., Inc.,
10.710%, 3/08/2017, (BRL) | | | 26,121,274 |
| | 5,350,000 | | Methanex Corp., Senior Note,
6.000%, 8/15/2015 | | | 5,189,500 |
| | 13,405,000 | | Michigan Tobacco Settlement Finance Authority, Taxable Turbo Series A,
7.309%, 6/01/2034 | | | 13,019,874 |
| | 1,000,000 | | MidAmerican Energy Holdings Co.,
6.125%, 4/01/2036 | | | 966,536 |
See accompanying notes to financial statements.
46
LOOMIS SAYLES STRATEGIC INCOME FUND — PORTFOLIOOF INVESTMENTS (continued)
Investments as of March 31, 2008 (Unaudited)
| | | | | | |
Principal
Amount (‡) | | Description | | Value (†) |
| | | | | | |
| | | United States — continued | | | |
| $ | 40,255,000 | | MidAmerican Energy Holdings Co.,
6.500%, 9/15/2037 | | $ | 40,342,555 |
| | 1,153,000 | | Missouri Pacific Railroad Co.,
5.000%, 1/01/2045 | | | 749,450 |
| | 33,015,000 | | Morgan Stanley, Inc., Series F, (MTN),
6.625%, 4/01/2018 | | | 33,026,621 |
| | 6,465,000 | | Mosaic Global Holdings, Inc.,
7.300%, 1/15/2028 | | | 6,400,350 |
| | 5,820,000 | | Mosaic Global Holdings, Inc.,
7.375%, 8/01/2018 | | | 5,936,400 |
| | 9,739,000 | | Motorola, Inc.,
5.220%, 10/01/2097 | | | 5,251,074 |
| | 7,655,000 | | Motorola, Inc.,
6.500%, 9/01/2025 | | | 6,286,018 |
| | 11,368,000 | | Motorola, Inc.,
6.500%, 11/15/2028(b) | | | 8,869,348 |
| | 11,315,000 | | Motorola, Inc.,
6.625%, 11/15/2037 | | | 8,751,440 |
| | 3,346,000 | | New England Telephone & Telegraph Co.,
7.875%, 11/15/2029 | | | 3,668,136 |
| | 54,190,000 | | News America, Inc.,
6.150%, 3/01/2037 | | | 51,189,608 |
| | 11,140,000 | | News America, Inc.,
6.200%, 12/15/2034 | | | 10,609,535 |
| | 14,360,000 | | News America, Inc.,
6.400%, 12/15/2035 | | | 13,936,653 |
| | 7,975,000 | | Nextel Communications, Inc., Series D,
7.375%, 8/01/2015 | | | 6,140,750 |
| | 4,305,000 | | Nextel Communications, Inc., Series E,
6.875%, 10/31/2013 | | | 3,400,950 |
| | 27,110,000 | | Nextel Communications, Inc., Series F,
5.950%, 3/15/2014 | | | 20,061,400 |
| | 31,735,000 | | NGC Corp. Capital Trust I, Series B,
8.316%, 6/01/2027 | | | 27,212,762 |
| | 84,710,000 | | NGPL Pipeco LLC, 144A,
7.119%, 12/15/2017 | | | 87,627,412 |
| | 12,515,000 | | NII Holdings, Inc.,
3.125%, 6/15/2012(b) | | | 9,933,781 |
| | 48,500,000 | | Nisource Finance Corp.,
6.400%, 3/15/2018 | | | 48,570,082 |
| | 745,000 | | Nortel Networks Corp., 144A
1.750%, 4/15/2012 | | | 502,875 |
| | 26,990,000 | | Northwest Airlines, Inc., Series 07-1,
Class B,
8.028%, 11/01/2017(b) | | | 25,370,600 |
| | 2,500,000 | | NRG Energy, Inc.,
7.250%, 2/01/2014 | | | 2,468,750 |
| | 5,000,000 | | NRG Energy, Inc.,
7.375%, 2/01/2016 | | | 4,900,000 |
| | 4,530,000 | | ONEOK Partners LP,
6.650%, 10/01/2036 | | | 4,371,577 |
| | 3,260,000 | | Owens & Minor, Inc.,
6.350%, 4/15/2016 | | | 3,294,582 |
| | 500,000 | | Owens Brockway Glass Container, Inc.,
6.750%, 12/01/2014, (EUR) | | | 749,906 |
| | 14,610,000 | | Owens Corning, Inc.,
6.500%, 12/01/2016 | | | 12,111,778 |
| | 34,690,000 | | Owens Corning, Inc.,
7.000%, 12/01/2036 | | | 25,084,235 |
| | | | | | |
Principal
Amount (‡) | | Description | | Value (†) |
| | | | | | |
| | | United States — continued | | | |
| $ | 42,043,000 | | Owens-Illinois, Inc., Senior Note,
7.800%, 5/15/2018 | | $ | 41,622,570 |
| | 7,175,000 | | Pioneer Natural Resources Co.,
5.875%, 7/15/2016(b) | | | 6,534,366 |
| | 1,760,000 | | Pioneer Natural Resources Co.,
6.875%, 5/01/2018 | | | 1,667,581 |
| | 4,798,000 | | Pioneer Natural Resources Co.,
7.200%, 1/15/2028 | | | 4,170,618 |
| | 20,770,000 | | Plains All American Pipeline LP,
6.125%, 1/15/2017 | | | 21,112,954 |
| | 44,730,000 | | Plains All American Pipeline LP,
6.650%, 1/15/2037(b) | | | 42,373,713 |
| | 3,733,000 | | Ply Gem Industries, Inc.,
9.000%, 2/15/2012(b) | | | 2,725,090 |
| | 1,880,000 | | Prologis,
5.625%, 11/15/2015 | | | 1,716,002 |
| | 1,535,000 | | Prologis,
5.750%, 4/01/2016 | | | 1,409,310 |
| | 4,240,000 | | Pulte Homes, Inc.,
5.200%, 2/15/2015 | | | 3,604,000 |
| | 46,260,000 | | Pulte Homes, Inc.,
6.000%, 2/15/2035 | | | 35,620,200 |
| | 13,190,000 | | Pulte Homes, Inc.,
6.375%, 5/15/2033(b) | | | 10,288,200 |
| | 32,155,000 | | Qwest Capital Funding, Inc.,
7.750%, 2/15/2031 | | | 27,010,200 |
| | 16,335,000 | | Qwest Capital Funding, Inc., Guaranteed Note,
6.500%, 11/15/2018 | | | 13,231,350 |
| | 44,630,000 | | Qwest Capital Funding, Inc., Guaranteed Note,
6.875%, 7/15/2028(b) | | | 35,034,550 |
| | 10,675,000 | | Qwest Capital Funding, Inc., Guaranteed Note,
7.625%, 8/03/2021 | | | 9,020,375 |
| | 21,670,000 | | Qwest Corp.,
6.875%, 9/15/2033 | | | 17,336,000 |
| | 1,290,000 | | Qwest Corp.,
7.200%, 11/10/2026 | | | 1,086,825 |
| | 3,689,000 | | Qwest Corp.,
7.250%, 9/15/2025 | | | 3,209,430 |
| | 3,543,000 | | Qwest Corp.,
7.500%, 6/15/2023 | | | 3,091,268 |
| | 1,090,000 | | R.H. Donnelley Corp., Series A-2,
6.875%, 1/15/2013 | | | 664,900 |
| | 470,000 | | R.H. Donnelley Corp., Series A-3,
8.875%, 1/15/2016 | | | 297,275 |
| | 4,845,000 | | R.H. Donnelley Corp., 144A,
8.875%, 10/15/2017 | | | 3,028,125 |
| | 4,335,000 | | R.H. Donnelley Corp., Series A-1,
6.875%, 1/15/2013 | | | 2,644,350 |
| | 25,230,000 | | Reliant Energy, Inc., Senior Note,
7.875%, 6/15/2017(b) | | | 25,103,850 |
| | 895,000 | | Residential Capital LLC,
8.125%, 11/21/2008(b)(d) | | | 617,550 |
| | 4,170,000 | | Residential Capital LLC,
8.375%, 6/30/2010(d) | | | 2,095,425 |
| | 39,170,000 | | Residential Capital LLC,
8.375%, 5/17/2013, (GBP)(d) | | | 33,427,670 |
| | 2,740,000 | | Residential Capital LLC,
8.500%, 6/01/2012(d) | | | 1,342,600 |
| | 121,645,000 | | Residential Capital LLC,
8.500%, 4/17/2013(d) | | | 58,997,825 |
See accompanying notes to financial statements.
47
LOOMIS SAYLES STRATEGIC INCOME FUND — PORTFOLIOOF INVESTMENTS (continued)
Investments as of March 31, 2008 (Unaudited)
| | | | | | |
Principal
Amount (‡) | | Description | | Value (†) |
| | | | | | |
| | | United States — continued | | | |
| $ | 12,335,000 | | Residential Capital LLC,
8.875%, 6/30/2015(b) | | $ | 5,982,475 |
| | 19,055,000 | | Residential Capital LLC, Series E, (MTN),
9.875%, 7/01/2014, (GBP) | | | 16,261,533 |
| | 52,930,000 | | Reynolds American, Inc.,
6.750%, 6/15/2017 | | | 53,536,737 |
| | 13,400,000 | | Reynolds American, Inc.,
7.250%, 6/15/2037(b) | | | 13,264,740 |
| | 14,120,000 | | Sara Lee Corp.,
6.125%, 11/01/2032(b) | | | 13,308,862 |
| | 2,435,000 | | Simon Property Group LP,
5.750%, 12/01/2015 | | | 2,316,335 |
| | 10,690,000 | | Six Flags, Inc.,
9.625%, 6/01/2014(b) | | | 6,039,850 |
| | 2,785,000 | | Six Flags, Inc.,
9.750%, 4/15/2013(b) | | | 1,601,375 |
| | 7,160,000 | | SLM Corp.,
4.000%, 1/15/2010 | | | 6,017,622 |
| | 37,670,000 | | SLM Corp., Series A, (MTN),
5.000%, 4/15/2015 | | | 26,840,666 |
| | 20,890,000 | | SLM Corp., Series A, (MTN),
5.375%, 5/15/2014 | | | 15,677,318 |
| | 20,590,000 | | SLM Corp., (MTN),
5.050%, 11/14/2014 | | | 14,974,613 |
| | 48,768,000 | | SLM Corp., Series A, (MTN),
5.000%, 10/01/2013 | | | 36,707,722 |
| | 13,370,000 | | SLM Corp., Series A, (MTN),
5.000%, 6/15/2018 | | | 9,559,550 |
| | 19,385,000 | | SLM Corp., Series A, (MTN),
5.375%, 1/15/2013 | | | 15,120,300 |
| | 28,150,000 | | SLM Corp., Series A, (MTN),
5.625%, 8/01/2033 | | | 19,493,875 |
| | 6,100,000 | | SLM Corp., Series A, (MTN),
6.500%, 6/15/2010, (NZD) | | | 4,186,698 |
| | 1,900,000 | | SLM Corp., Series E, (MTN), Series 7,
4.750%, 3/17/2014, (EUR) | | | 1,944,745 |
| | 2,550,000 | | Southern Natural Gas Co.,
7.350%, 2/15/2031 | | | 2,611,636 |
| | 30,186,000 | | Sprint Capital Corp.,
6.875%, 11/15/2028 | | | 22,488,570 |
| | 16,480,000 | | Sprint Capital Corp.,
6.900%, 5/01/2019 | | | 12,978,000 |
| | 11,309,000 | | Sprint Nextel Corp.,
6.000%, 12/01/2016 | | | 8,792,748 |
| | 4,035,000 | | Stanley-Martin Communities LLC,
9.750%, 8/15/2015(b) | | | 1,936,800 |
| | 148,785,000 | | Target Corp.,
7.000%, 1/15/2038 | | | 152,929,853 |
| | 25,754,000 | | Tenet Healthcare Corp.,
6.875%, 11/15/2031 | | | 18,027,800 |
| | 4,480,000 | | Tenet Healthcare Corp.,
9.250%, 2/01/2015(b) | | | 4,188,800 |
| | 7,872,000 | | Tennessee Gas Pipeline Co.
7.000%, 10/15/2028(b) | | | 7,843,700 |
| | 9,240,000 | | Time Warner, Inc.,
6.500%, 11/15/2036 | | | 8,477,072 |
| | 11,145,000 | | Time Warner, Inc.,
6.625%, 5/15/2029 | | | 10,450,198 |
| | 4,795,000 | | Time Warner, Inc.,
6.950%, 1/15/2028 | | | 4,657,566 |
| | | | | | |
Principal
Amount (‡) | | Description | | Value (†) |
| | | | | | |
| | | United States — continued | | | |
| $ | 3,150,000 | | Time Warner, Inc.,
7.625%, 4/15/2031 | | $ | 3,294,613 |
| | 2,025,000 | | Time Warner, Inc.,
7.700%, 5/01/2032 | | | 2,131,934 |
| | 8,785,000 | | Toledo Edison Co.,
6.150%, 5/15/2037 | | | 7,779,451 |
| | 4,245,000 | | Toll Brothers Financial Corp.,
5.150%, 5/15/2015 | | | 3,839,598 |
| | 5,245,000 | | Toll Corp.,
8.250%, 12/01/2011 | | | 4,772,950 |
| | 32,675,000 | | Toys R Us, Inc.,
7.375%, 10/15/2018(b) | | | 22,627,437 |
| | 8,355,000 | | Toys R Us, Inc.,
7.875%, 4/15/2013(b) | | | 6,266,250 |
| | 31,135,000 | | Travelers Cos., Inc. (The), (MTN),
6.250%, 6/15/2037 | | | 28,859,125 |
| | 4,000,000 | | Travelers Cos., Inc. (The),
6.750%, 6/20/2036 | | | 3,963,484 |
| | 1,000,000 | | Travelers Property Casualty Corp.,
6.375%, 3/15/2033(b) | | | 969,048 |
| | 36,080,000 | | Tribune Co.,
5.250%, 8/15/2015(b) | | | 13,890,800 |
| | 25,455,000 | | TXU Corp., 5.550%,
11/15/2014 | | | 19,876,308 |
| | 101,030,000 | | TXU Corp., Series Q,
6.500%, 11/15/2024 | | | 71,739,180 |
| | 4,870,000 | | TXU Corp., Series R,
6.550%, 11/15/2034 | | | 3,438,113 |
| | 109,685,000 | | U.S. Treasury Bond,
4.500%, 2/15/2036(b) | | | 113,309,760 |
| | 150,750,000 | | U.S. Treasury Bond,
5.375%, 2/15/2031(b) | | | 174,351,721 |
| | 16,032,011 | | United Air Lines, Inc., Series 2007-1,
Class A,
6.636%, 1/02/2024 | | | 14,909,770 |
| | 12,959,000 | | United Rentals North America, Inc.,
7.000%, 2/15/2014 | | | 10,172,815 |
| | 7,000,000 | | United States Steel Corp.,
6.050%, 6/01/2017 | | | 6,474,804 |
| | 5,375,000 | | United States Steel Corp.,
6.650%, 6/01/2037 | | | 4,543,504 |
| | 16,435,000 | | United States Steel Corp.,
7.000%, 2/01/2018(b) | | | 16,053,642 |
| | 28,355,000 | | USG Corp.,
6.300%, 11/15/2016 | | | 22,400,450 |
| | 12,880,000 | | USG Corp.,
8.000%, 1/15/2018 | | | 11,463,200 |
| | 51,815,000 | | Verizon Global Funding Corp., Senior Note,
5.850%, 9/15/2035 | | | 47,201,030 |
| | 6,230,000 | | Verizon Maryland, Inc., Series B,
5.125%, 6/15/2033 | | | 4,990,074 |
| | 12,050,000 | | Verizon New York, Inc., Series A,
7.375%, 4/01/2032(b) | | | 12,596,046 |
| | 32,790,000 | | Viacom, Inc., Senior Note,
6.875%, 4/30/2036 | | | 31,575,327 |
| | 132,865,000 | | Virginia Tobacco Settlement Financing Corp., Series A-1,
6.706%, 6/01/2046 | | | 120,533,799 |
| | 50,000,000 | | WellPoint, Inc.,
6.375%, 6/15/2037(b) | | | 44,823,550 |
See accompanying notes to financial statements.
48
LOOMIS SAYLES STRATEGIC INCOME FUND — PORTFOLIOOF INVESTMENTS (continued)
Investments as of March 31, 2008 (Unaudited)
| | | | | | |
Principal
Amount (‡) | | Description | | Value (†) |
| | | | | | |
| | | United States — continued | | | |
| $ | 101,985,000 | | Western Union Co.,
6.200%, 11/17/2036 | | $ | 93,349,420 |
| | 7,300,000 | | White Pine Hydro LLC,
6.310%, 7/10/2017(f) | | | 7,158,957 |
| | 10,935,000 | | White Pine Hydro LLC,
6.960%, 7/10/2037(f) | | | 9,401,716 |
| | 4,000,000 | | White Pine Hydro LLC,
7.260%, 7/20/2015(f) | | | 4,101,588 |
| | 600,000 | | Williams Cos., Inc.,
7.875%, 9/01/2021 | | | 650,250 |
| | 965,000 | | Williams Cos., Inc., Senior Note,
7.750%, 6/15/2031 | | | 1,025,313 |
| | 8,600,000 | | Williams Cos., Inc., Series A,
7.500%, 1/15/2031 | | | 8,965,500 |
| | 11,205,000 | | Willis North America, Inc.,
6.200%, 3/28/2017 | | | 11,181,985 |
| | 10,270,000 | | Woolworth Corp.,
8.500%, 1/15/2022 | | | 9,037,600 |
| | 18,050,000 | | Xerox Capital Trust I, Guaranteed Note,
8.000%, 2/01/2027 | | | 17,817,390 |
| | 1,730,000 | | Xerox Corp., (MTN),
7.200%, 4/01/2016(b) | | | 1,850,114 |
| | 8,885,000 | | XTO Energy, Inc.,
6.750%, 8/01/2037 | | | 9,502,890 |
| | | | | | |
| | | | | | 7,279,484,012 |
| | | | | | |
| | | Total Non-Convertible Bonds (Identified Cost $10,472,244,288) | | | 10,250,764,974 |
| | | | | | |
| | Convertible Bonds — 3.1% | | | |
| | | Canada — 0.0% | | | |
| | 2,185,000 | | Nortel Networks Corp., Guaranteed Senior Note,
4.250%, 9/01/2008 | | | 2,157,687 |
| | | | | | |
| | | United States — 3.1% | | | |
| | 12,755,000 | | Avnet, Inc.,
2.000%, 3/15/2034(b) | | | 14,349,375 |
| | 200,000 | | Builders Transport, Inc., Subordinated Note,
6.500%, 5/01/2011(c) | | | — |
| | 1,000,000 | | Builders Transport, Inc., Subordinated Note,
8.000%, 8/15/2005(c) | | | — |
| | 8,330,000 | | Countrywide Financial Corp.,
0.758%, 4/15/2037(b)(d) | | | 7,372,050 |
| | 23,395,000 | | Countrywide Financial Corp.,
0.815%, 5/15/2037(d) | | | 20,002,725 |
| | 139,000 | | Dixie Group, Inc., Subordinated Note,
7.000%, 5/15/2012 | | | 129,965 |
| | 5,111,000 | | EPIX Pharmaceuticals, Inc., Senior Note, Convertible,
3.000%, 6/15/2024 | | | 2,555,500 |
| | 19,513,000 | | Host Hotels & Resorts, Inc., 144A,
2.625%, 4/15/2027 | | | 16,342,138 |
| | 29,610,000 | | Human Genome Sciences, Inc.,
2.250%, 8/15/2012 | | | 21,467,250 |
| | 30,860,000 | | Incyte Corp., Convertible,
3.500%, 2/15/2011(b) | | | 32,827,325 |
| | 12,005,000 | | Invitrogen Corp.,
1.500%, 2/15/2024 | | | 12,185,075 |
| | 44,035,000 | | iStar Financial, Inc.,
5.229%, 10/01/2012(b)(d) | | | 30,978,622 |
| | 15,995,000 | | Kellwood Co., (step to 0.000% on 6/15/2011),
3.500%, 6/15/2034(e) | | | 16,074,975 |
| | | | | | |
Principal
Amount (‡) | | Description | | Value (†) |
| | | | | | |
| | | United States — continued | | | |
| $ | 6,670,000 | | Kulicke & Soffa Industries, Inc., Convertible,
0.500%, 11/30/2008 | | $ | 6,236,450 |
| | 3,790,000 | | Kulicke & Soffa Industries, Inc., Convertible,
1.000%, 6/30/2010 | | | 2,994,100 |
| | 28,648,000 | | Level 3 Communications, Inc.,
6.000%, 9/15/2009 | | | 25,425,100 |
| | 35,920,000 | | Level 3 Communications, Inc.,
6.000%, 3/15/2010(b) | | | 29,005,400 |
| | 7,846,542 | | Liberty Media LLC, Convertible,
3.500%, 1/15/2031 | | | 5,482,772 |
| | 4,196,000 | | Maxtor Corp., Subordinated Note,
5.750%, 3/01/2012(f) | | | 3,944,240 |
| | 24,081,000 | | Nektar Therapeutics,
3.250%, 9/28/2012 | | | 18,602,572 |
| | 625,000 | | Nextel Communications, Inc., Senior Note,
5.250%, 1/15/2010 | | | 573,438 |
| | 28,237,000 | | Nortel Networks Corp., 144A,
2.125%, 4/15/2014(b) | | | 17,542,236 |
| | 500,000 | | Preston Corp., Subordinated Note,
7.000%, 5/01/2011 | | | 473,855 |
| | 20,000,000 | | Regeneron Pharmaceuticals, Inc., Subordinated Note, Convertible,
5.500%, 10/17/2008 | | | 19,925,000 |
| | 311,000 | | Richardson Electronics Ltd.,
7.750%, 12/15/2011 | | | 286,120 |
| | 7,716,000 | | Sinclair Broadcast Group, Inc., (step to
2.000% on 1/15/2011),
4.875%, 7/15/2018(b)(e) | | | 7,021,560 |
| | 22,735,000 | | Valeant Pharmaceuticals International, Subordinated Note, Convertible,
3.000%, 8/16/2010 | | | 20,688,850 |
| | 28,222,000 | | Valeant Pharmaceuticals International, Subordinated Note,
4.000%, 11/15/2013 | | | 23,459,537 |
| | 11,035,000 | | Vertex Pharmaceuticals, Inc., 4.750%, 2/15/2013 | | | 13,159,238 |
| | | | | | |
| | | | | | 369,105,468 |
| | | | | | |
| | | Total Convertible Bonds
(Identified Cost $396,916,871) | | | 371,263,155 |
| | | | | | |
| | Municipals — 0.7% of Net Assets | | | |
| | | United States — 0.7% | | | |
| | 3,270,000 | | Alabama Public School & College Authority ( Capital Improvement),
4.500%, 12/01/2026 | | | 3,088,646 |
| | 5,650,000 | | Chicago Board of Education, Series B, (FSA insured),
4.750%, 12/01/2031 | | | 5,409,592 |
| | 1,725,000 | | Chicago O’Hare International Airport, Series A, (FSA insured),
4.500%, 1/01/2038 | | | 1,569,767 |
| | 9,320,000 | | County of Harris TX, Series B,
4.500%, 10/01/2031 | | | 8,365,073 |
| | 3,270,000 | | District of Columbia, Series A, (FGIC insured),
4.750%, 6/01/2036 | | | 3,005,065 |
| | 3,270,000 | | Florida State Turnpike Authority (Department of Transportation), Series A, (MBIA insured),
3.500%, 7/01/2027 | | | 2,564,236 |
| | 4,645,000 | | Green Bay Wisconsin Water System Revenue, (FSA insured),
3.500%, with various maturities to 2029(b) | | | 3,669,638 |
See accompanying notes to financial statements.
49
LOOMIS SAYLES STRATEGIC INCOME FUND — PORTFOLIOOF INVESTMENTS (continued)
Investments as of March 31, 2008 (Unaudited)
| | | | | | |
Principal
Amount (‡) | | Description | | Value (†) |
| | | | | | |
| | | United States — continued | | | |
| $ | 1,975,000 | | Grosse Pointe Public School System, (FGIC insured),
3.000%, 5/01/2027 | | $ | 1,395,338 |
| | 3,275,000 | | Massachusetts School Building Authority, Series A, (AMBAC insured),
4.750%, 8/15/2032 | | | 3,137,974 |
| | 8,175,000 | | Omaha Public Power District, Series AA, (FGIC insured),
4.500%, 2/01/2034 | | | 7,342,785 |
| | 3,435,000 | | San Diego Unified School District (Election 1998), Series F-1, (FSA insured),
4.500%, 7/01/2029 | | | 3,195,374 |
| | 1,530,000 | | San Jose California Redevelopment Agency Tax Allocation (Merged Area Redevelopment), Series C,
3.750%, 8/01/2028 | | | 1,273,618 |
| | 4,170,000 | | San Jose Redevelopment Agency Tax Allocation (Merged Area), Series C, (MBIA insured),
3.750%, 8/01/2028 | | | 3,298,095 |
| | 5,175,000 | | State of California, (AMBAC insured),
4.500%, 8/01/2027 | | | 4,827,809 |
| | 14,415,000 | | State of California, (AMBAC insured),
4.500%, 10/01/2029 | | | 13,008,096 |
| | 4,190,000 | | State of California, (AMBAC insured),
4.500%, 8/01/2030 | | | 3,791,866 |
| | 3,620,000 | | State of California,
4.500%, 8/01/2030 | | | 3,256,190 |
| | 2,680,000 | | State of California (Various Purpose), (MBIA insured),
3.250%, 12/01/2027 | | | 2,010,188 |
| | 12,645,000 | | State of California (Various Purpose), (AMBAC insured),
4.500%, 12/01/2033 | | | 11,296,411 |
| | 3,270,000 | | State of Louisiana, Series C, (FSA insured),
3.250%, 5/01/2026 | | | 2,436,379 |
| | 895,000 | | University of California Regents Medical Center,
Series A, (MBIA Insured),
4.750%, 5/15/2031 | | | 855,047 |
| | 835,000 | | Wisconsin Housing & Economic Development Authority, Series E,
4.900%, 11/01/2035 | | | 778,830 |
| | | | | | |
| | | Total Municipals (Identified Cost $89,583,593) | | | 89,576,017 |
| | | | | | |
| | | Total Bonds and Notes
(Identified Cost $10,958,744,752) | | | 10,711,604,146 |
| | | | | | |
| | Bank Loans — 0.8% of Net Assets | | | |
| | | United States — 0.8% | | | |
| | 11,164,436 | | ALLTEL Corp., Term Loan B2,
5.5500%, 5/16/2015(h) | | | 10,031,692 |
| | 20,937,525 | | Calpine Corp., Dip Term Loan,
5.575%, 3/29/2009(h) | | | 18,676,900 |
| | 2,964,059 | | Community Health System, Term Loan B,
5.335%, 7/25/2014(h) | | | 2,729,839 |
| | 255,926 | | Dole Food Co., Inc.,
LOC, 4/12/2013(i) | | | 219,457 |
| | 560,440 | | Dole Food Co., Inc., Term
Loan, 4/12/2013(i) | | | 480,577 |
| | 1,862,229 | | Dole Food Co., Inc., Tranche C Term
Loan, 4/12/2013(i) | | | 1,596,862 |
| | 2,485,000 | | Dresser, Inc., Second Lien Term Loan,
8.820%, 5/04/2015(h) | | | 2,207,500 |
| | 1,245,000 | | Dresser, Inc., Term Loan B,
5.556%, 5/04/2014(h) | | | 1,161,996 |
| | 1,645,833 | | Freescale Semiconductor, Term Loan B,
4.869%, 12/01/2013(h) | | | 1,387,536 |
| | | | | | |
Principal
Amount (‡) | | Description | | Value (†) |
| | | | | | |
| | | United States — continued | | | |
| $ | 14,851,237 | | Georgia Pacific Corp., First Lien Term Loan,
4.727%, 12/20/2012(h) | | $ | 13,774,523 |
| | 2,059,785 | | Georgia Pacific Corp., Term Loan B2,
4.684%, 12/29/2012(h) | | | 1,914,323 |
| | 8,425,000 | | Hawaiian Telecom Communications, Inc., Term Loan
C, 4.946%, 6/01/2014(h) | | | 6,360,875 |
| | 8,254,104 | | HCA, Inc., Term Loan B,
4.946%, 11/17/2013(h) | | | 7,590,639 |
| | 1,655,000 | | Idearc, Inc., Term Loan B,
11/17/2014(i) | | | 1,321,518 |
| | 11,595,791 | | Nuance Communication, Inc., Term Loan B2,
5.210%, 6/30/2008(h) | | | 9,943,391 |
| | 19,396,654 | | TXU Tech Co., Term Loan B2,
6.579%, 10/10/2014(h) | | | 17,655,029 |
| | | | | | |
| | | Total Bank Loans (Identified Cost $96,867,234) | | | 97,052,657 |
| | | | | | |
| Shares | | | | |
| | Common Stocks — 2.3% of Net Assets | | | |
| | | Israel — 0.0% | | | |
| | 2,288 | | Teva Pharmaceutical Industries, Ltd., Sponsored ADR(b) | | | 105,683 |
| | | | | | |
| | | United States — 2.3% | | | |
| | 209,757 | | Apartment Investment & Management Co., Class A(b) | | | 7,511,398 |
| | 889,730 | | Associated Estates Realty Corp., (REIT)(b) | | | 10,178,511 |
| | 2,845,662 | | Bristol-Myers Squibb Co.(b) | | | 60,612,601 |
| | 53,260 | | Chesapeake Energy Corp.(b) | | | 2,457,949 |
| | 2,309,175 | | ConAgra Foods, Inc.(b) | | | 55,304,741 |
| | 41,343 | | Corning, Inc.(b) | | | 993,886 |
| | 182,500 | | Developers Diversified Realty Corp., (REIT)(b) | | | 7,643,100 |
| | 282,500 | | Duke Energy Corp.(b) | | | 5,042,625 |
| | 460,000 | | Equity Residential, (REIT)(b) | | | 19,085,400 |
| | 1,450,636 | | Federal Home Loan Mortgage Corp.(b) | | | 36,730,103 |
| | 477,725 | | KB Home(b) | | | 11,814,139 |
| | 549,450 | | Lennar Corp., Class A(b) | | | 10,335,154 |
| | 460,656 | | Owens-Illinois, Inc.(b)(g) | | | 25,994,818 |
| | 117,700 | | Simon Property Group, Inc., (REIT)(b) | | | 10,935,507 |
| | 141,249 | | Spectra Energy Corp.(b) | | | 3,213,415 |
| | 359,449 | | Vertex Pharmaceuticals, Inc.(b)(g) | | | 8,587,237 |
| | | | | | |
| | | | | | 276,440,584 |
| | | | | | |
| | | Total Common Stocks (Identified Cost $282,708,444) | | | 276,546,267 |
| | | | | | |
| | Preferred Stocks — 2.6% | | | |
| | | United States — 2.6% | | | |
| | 366,477 | | AES Trust III, Convertible,
6.750%(b) | | | 17,041,180 |
| | 278,685 | | Chesapeake Energy Corp., Convertible,
4.500% | | | 36,441,575 |
| | 52,020 | | Chesapeake Energy Corp.,
5.000%(b) | | | 6,063,451 |
| | 107,725 | | CMS Energy Trust I, Convertible,
7.750% | | | 4,847,625 |
| | 154,977 | | El Paso Energy Capital Trust I, Convertible,
4.750% | | | 5,641,163 |
| | 393 | | Entergy New Orleans, Inc.,
4.750% | | | 29,929 |
| | 2,200,803 | | Federal Home Loan Mortgage Corp., Series Z,
8.375%(b) | | | 53,699,593 |
| | 373,500 | | Federal Home Loan Mortgage Corp.,
5.570% | | | 7,133,850 |
| | 92,200 | | Federal National Mortgage Association
5.125%(b) | | | 3,273,100 |
See accompanying notes to financial statements.
50
LOOMIS SAYLES STRATEGIC INCOME FUND — PORTFOLIOOF INVESTMENTS (continued)
Investments as of March 31, 2008 (Unaudited)
| | | | | | | |
| Shares | | Description | | Value (†) | |
| | | | | | | |
| | 4,385,000 | | Federal National Mortgage Association
8.250%(b) | | $ | 105,459,250 | |
| | 42,700 | | FelCor Lodging Trust, Inc., (REIT) Convertible,
1.950% | | | 842,898 | |
| | 1,458,359 | | Ford Motor Co. Capital Trust II, Convertible,
6.500%(b) | | | 42,759,086 | |
| | 26,419 | | Lucent Technologies Capital Trust I, Convertible,
7.750% | | | 18,493,300 | |
| | 81,975 | | Newell Financial Trust I, Convertible,
5.250% | | | 3,709,369 | |
| | 332,275 | | Six Flags, Inc.,
7.250%(b) | | | 4,037,141 | |
| | 57,205 | | Sovereign Capital Trust,
4.375% | | | 1,744,753 | |
| | 43,931 | | United Rentals Trust I, Convertible,
6.500% | | | 1,320,676 | |
| | | | | | | |
| | | Total Preferred Stocks (Identified Cost $328,016,437) | | | 312,537,939 | |
| | | | | | | |
| | Closed-End Investment Companies — 0.3% | | | | |
| | 199,046 | | BlackRock Senior High Income Fund, Inc. | | | 969,354 | |
| | 1,033,275 | | Dreyfus High Yield Strategies | | | 3,585,464 | |
| | 177,910 | | DWS High Income Trust | | | 813,049 | |
| | 860,000 | | Highland Credit Strategies Fund | | | 11,197,200 | |
| | 110,211 | | Morgan Stanley Emerging Markets Debt Fund, Inc. | | | 1,058,025 | |
| | 141,612 | | Van Kampen High Income Trust II(b) | | | 504,139 | |
| | 2,055,800 | | Western Asset High Income Opportunity Fund, Inc. | | | 11,635,828 | |
| | 1,368,400 | | Western Asset Managed High Income Fund, Inc.(b) | | | 7,498,831 | |
| | | | | | | |
| | | Total Closed-End Investment Companies
(Identified Cost $41,292,759) | | | 37,261,890 | |
| | | | | | | |
Shares/
Principal Amount (‡) | | | | | |
| | Short-Term Investments — 10.0% of Net Assets | |
| | 783,942,770 | | State Street Navigator Securities Lending Prime Portfolio(j) | | | 783,942,770 | |
| $ | 411,842,318 | | Tri-Party Repurchase Agreement with Fixed Income Clearing Corporation, dated 3/31/2008 at 1.250% to be repurchased at $411,856,618 on 4/01/2008, collateralized by $251,600,000 Federal Home Loan Mortgage Corp., Discount Note, Zero Coupon due 6/30/2008 valued at $250,971,000; $49,395,000 Federal Home Loan Bank, 5.250% due 6/25/2008 valued at $50,408,141; $93,555,000 Federal National Mortgage Association, Discount Note, Zero Coupon due 6/13/2008 valued at $93,204,169; $25,000,000 Federal National Mortgage Association, 5.250% due 6/15/2008 valued at $25,500,000 including accrued interest (Note 2g of Notes to Financial Statements) | | | 411,842,318 | |
| | | | | | | |
| | | Total Short-Term Investments
(Identified Cost $1,195,785,088) | | | 1,195,785,088 | |
| | | | | | | |
| | | | | | | |
| | | Total Investments — 105.3%
(Identified Cost $12,903,414,714)(a) | | | 12,630,787,987 | |
| | | Other assets less liabilities — (5.3)% | | | (640,936,953 | ) |
| | | | | | | |
| | | Net Assets — 100% | | $ | 11,989,851,034 | |
| | | | | | | |
| | | | | | | |
| | (‡) | | Principal amount stated in U.S. dollars unless otherwise noted. | | | | |
| | (†) | | See Note 2a of Notes to Financial Statements. | | | | |
| | | | | | |
| (††) | | Amount shown represents units. One unit represents a principal amount of 100. | | | | |
| (a) | | Federal Tax Information (Amounts exclude certain adjustments made at the end of the Fund’s fiscal year for tax purposes. Such adjustments are primarily due to return of capital dividends received from the Fund’s investments in REITs. Amortization of premium on debt securities is excluded for tax purposes.): At March 31, 2008, the net unrealized depreciation on investments based on a cost of $12,907,538,028 for federal income tax purposes was as follows: | | | | |
| | Aggregate gross unrealized appreciation for all investments in which there is an excess of value over tax cost | | $ | 486,020,062 | |
| | Aggregate gross unrealized depreciation for all investments in which there is an excess of tax cost over value | | | (762,770,103 | ) |
| | | | | | |
| | Net unrealized depreciation | | $ | (276,750,041 | ) |
| | | | | | |
| (b) | | All or a portion of this security was on loan to brokers at March 31, 2008. | | | | |
| (c) | | Bankrupt issuer. Security remains in the Portfolio of Investments pending final resolution of bankruptcy proceedings. | | | | |
| (d) | | Variable rate security. Rate as of March 31, 2008 is disclosed. | | | | |
| (e) | | Step Bond: Coupon rate is a fixed rate for an initial period and then resets at a specified date and rate. | | | | |
| (f) | | Illiquid security. At March 31, 2008, the value of these securities amounted to $38,024,939 or 0.3% of net assets. | | | | |
| (g) | | Non-income producing security. | | | | |
| (h) | | Variable rate security. Rate shown represents the weighted average rate at March 31, 2008. | | | | |
| (i) | | Security has not settled. Contract rates do not take effect until settlement date. | | | | |
| (j) | | Represents investment of securities lending collateral. | | | | |
| | | | | | |
| 144A | | Securities exempt from registration under Rule 144A of the Securities Act of 1933. These securities may be resold in transactions exempt from registrations, normally to qualified institutional buyers. At the period end, the value of these amounted to $1,151,140,203 or 9.6% of net assets. | | | | |
| ADR | | An American Depositary Receipt is a certificate issued by a custodian bank representing the right to receive securities of the foreign issuer described. The values of ADRs are significantly influenced by trading on exchanges not located in the United States. | | | | |
| AMBAC | | American Municipal Bond Assurance Corp. | | | | |
| EMTN | | Euro Medium Term Note | | | | |
| FGIC | | Financial Guarantee Insurance Company | | | | |
| FHLMC | | Federal Home Loan Mortgage Corporation | | | | |
| FNMA | | Federal National Mortgage Association | | | | |
| FSA | | Financial Security Assurance, Inc. | | | | |
| LOC | | Letter of Credit | | | | |
| MBIA | | Municipal Bond Investors Assurance Corp. | | | | |
| MTN | | Medium Term Note | | | | |
| REIT | | Real Estate Investment Trust | | | | |
| | | | | | |
| AUD | | Australian Dollar | | | | |
| BRL | | Brazilian Real | | | | |
| CAD | | Canadian Dollar | | | | |
| EUR | | Euro | | | | |
| GBP | | British Pound | | | | |
| IDR | | Indonesian Rupiah | | | | |
| ISK | | Iceland Krona | | | | |
| KRW | | South Korean Won | | | | |
| MXN | | Mexican Peso | | | | |
| MYR | | Malaysian Ringgit | | | | |
| NZD | | New Zealand Dollar | | | | |
| SGD | | Singapore Dollar | | | | |
| THB | | Thailand Baht | | | | |
See accompanying notes to financial statements.
51
LOOMIS SAYLES STRATEGIC INCOME FUND — PORTFOLIOOF INVESTMENTS (continued)
Investments as of March 31, 2008 (Unaudited)
Holdings at March 31, 2008 as a Percentage of Net Assets (unaudited)
| | | |
| Sovereigns | | 13.4 | % |
| Banking | | 5.4 | |
| Pharmaceuticals | | 5.4 | |
| Wirelines | | 5.2 | |
| Electric | | 4.3 | |
| Diversified Financial Services | | 3.8 | |
| Non-Captive Consumer | | 3.8 | |
| Retailers | | 3.5 | |
| Non-Captive Finance | | 3.3 | |
| Supranational | | 2.5 | |
| Healthcare | | 2.5 | |
| Treasuries | | 2.4 | |
| Media Cable | | 2.3 | |
| Technology | | 2.3 | |
| Pipelines | | 2.1 | |
| Automotive | | 2.1 | |
| Other, less than 2% each | | 31.0 | |
See accompanying notes to financial statements.
52
STATEMENTSOF ASSETSAND LIABILITIES
March 31, 2008 (Unaudited)
| | | | | | | | | | | | |
| | | |
| | | Core Plus Bond Fund | | | High Income Fund | | | International
Bond Fund | |
| | | | | | | | | | | | |
ASSETS | | | | | | | | | | | | |
Investments at cost | | $ | 194,619,345 | | | $ | 46,255,131 | | | $ | 11,432,491 | |
Net unrealized appreciation (depreciation) | | | (1,317,303 | ) | | | (1,863,172 | ) | | | 425,379 | |
| | | | | | | | | | | | |
Investments at value(a) | | | 193,302,042 | | | | 44,391,959 | | | | 11,857,870 | |
Cash | | | 14 | | | | 322,466 | | | | 893 | |
Foreign currency at value (identified cost $68,193, $4,602, $290,641, $0, $0, $0, $7,978,846) | | | 68,220 | | | | 4,605 | | | | 290,390 | |
Receivable for Fund shares sold | | | 875,876 | | | | 232,854 | | | | 68,323 | |
Receivable for securities sold | | | 7,934,449 | | | | — | | | | 124,744 | |
Receivable from investment advisor (Note 4) | | | 15,943 | | | | 7,211 | | | | 8,866 | |
Dividends and interest receivable | | | 1,697,891 | | | | 740,575 | | | | 148,365 | |
Tax reclaims receivable | | | — | | | | — | | | | — | |
Receivable for open forward currency contracts | | | — | | | | — | | | | 25,911 | |
Securities lending income receivable | | | 26,643 | | | | 2,566 | | | | — | |
Other assets | | | — | | | | — | | | | — | |
| | | | | | | | | | | | |
TOTAL ASSETS | | | 203,921,078 | | | | 45,702,236 | | | | 12,525,362 | |
| | | | | | | | | | | | |
LIABILITIES | | | | | | | | | | | | |
Collateral on securities loaned, at value (Note 2) | | | 24,906,801 | | | | 3,750,635 | | | | — | |
Payable for securities purchased | | | 11,492,261 | | | | 690,988 | | | | 549,275 | |
Payable for Fund shares redeemed | | | 305,479 | | | | 31,446 | | | | 800 | |
Dividends payable | | | — | | | | — | | | | — | |
Management fees payable (Note 4) | | | 74,912 | | | | 23,558 | | | | 5,707 | |
Deferred Trustees’ fees (Note 4) | | | 276,828 | | | | 83,191 | | | | 1,780 | |
Administrative fees payable (Note 4) | | | 14,559 | | | | 3,693 | | | | 3,553 | |
Payable for open forward foreign currency contracts | | | — | | | | — | | | | 10,017 | |
Deferred foreign taxes payable | | | — | | | | — | | | | — | |
Other accounts payable and accrued expenses | | | 74,361 | | | | 6,978 | | | | 13,063 | |
| | | | | | | | | | | | |
TOTAL LIABILITIES | | | 37,145,201 | | | | 4,590,489 | | | | 584,195 | |
| | | | | | | | | | | | |
NET ASSETS | | $ | 166,775,877 | | | $ | 41,111,747 | | | $ | 11,941,167 | |
| | | | | | | | | | | | |
NET ASSETS CONSIST OF: | | | | | | | | | | | | |
Paid-in capital | | $ | 187,774,654 | | | $ | 123,851,199 | | | $ | 11,479,005 | |
Undistributed (overdistributed) net investment income | | | (424,849 | ) | | | (85,472 | ) | | | (7,728 | ) |
Accumulated net realized gain (loss) on investments and foreign currency transactions | | | (19,260,805 | ) | | | (80,786,942 | ) | | | 22,938 | |
Net unrealized appreciation (depreciation) on investments and foreign currency translations | | | (1,313,123 | ) | | | (1,867,038 | ) | | | 446,952 | |
| | | | | | | | | | | | |
NET ASSETS | | $ | 166,775,877 | | | $ | 41,111,747 | | | $ | 11,941,167 | |
| | | | | | | | | | | | |
COMPUTATION OF NET ASSET VALUE AND OFFERING PRICE: | | | | | | | | | | | | |
Class A shares: | | | | | | | | | | | | |
Net assets | | $ | 116,439,506 | | | $ | 31,976,906 | | | $ | 887,307 | |
| | | | | | | | | | | | |
Shares of beneficial interest | | | 10,220,867 | | | | 6,647,246 | | | | 84,956 | |
| | | | | | | | | | | | |
Net asset value and redemption price per share | | $ | 11.39 | | | $ | 4.81 | | | $ | 10.44 | |
| | | | | | | | | | | | |
Offering price per share (100/[100-maximum sales charge] of net asset value) (Note 1) | | $ | 11.93 | | | $ | 5.04 | | | $ | 10.93 | |
| | | | | | | | | | | | |
Class B shares: (redemption price per share is equal to net asset value less any applicable contingent deferred sales charge) (Note 1) | | | | | | | | | | | | |
Net assets | | $ | 15,432,279 | | | $ | 3,202,159 | | | $ | — | |
| | | | | | | | | | | | |
Shares of beneficial interest | | | 1,351,242 | | | | 664,678 | | | | — | |
| | | | | | | | | | | | |
Net asset value and offering price per share | | $ | 11.42 | | | $ | 4.82 | | | $ | — | |
| | | | | | | | | | | | |
Class C shares: (redemption price per share is equal to net asset value less any applicable contingent deferred sales charge) (Note 1) | | | | | | | | | | | | |
Net assets | | $ | 16,800,720 | | | $ | 5,931,689 | | | $ | 269,564 | |
| | | | | | | | | | | | |
Shares of beneficial interest | | | 1,473,277 | | | | 1,232,178 | | | | 25,811 | |
| | | | | | | | | | | | |
Net asset value and offering price per share | | $ | 11.40 | | | $ | 4.81 | | | $ | 10.44 | |
| | | | | | | | | | | | |
Class Y shares: | | | | | | | | | | | | |
Net assets | | $ | 18,103,372 | | | $ | 993 | | | $ | 10,784,296 | |
| | | | | | | | | | | | |
Shares of beneficial interest | | | 1,581,637 | | | | 207 | | | | 1,032,541 | |
| | | | | | | | | | | | |
Net asset value, offering and redemption price per share | | $ | 11.45 | | | $ | 4.81 | | | $ | 10.44 | |
| | | | | | | | | | | | |
(a) Including securities on loan with market values of: | | $ | 24,368,052 | | | $ | 3,735,821 | | | $ | — | |
| | | | | | | | | | | | |
See accompanying notes to financial statements.
53
| | | | | | | | | | | | | | |
Limited Term Government
and Agency Fund | | | Massachusetts
Tax Free
Income Fund | | | Municipal
Income Fund | | | Strategic
Income Fund | |
| | | | | | | | | | | | | | |
| | | | | | | | | | | | | | |
| $ | 147,656,760 | | | $ | 58,053,212 | | | $ | 77,604,527 | | | $ | 12,903,414,714 | |
| | 974,774 | | | | 369,645 | | | | (2,412,559 | ) | | | (272,626,727 | ) |
| | | | | | | | | | | | | | | |
| | 148,631,534 | | | | 58,422,857 | | | | 75,191,968 | | | | 12,630,787,987 | |
| | — | | | | — | | | | — | | | | 478,033 | |
| | — | | | | — | | | | — | | | | 7,978,846 | |
| | 393,234 | | | | 2,577 | | | | 6,536 | | | | 53,880,585 | |
| | — | | | | — | | | | — | | | | 677,633 | |
| | 15,066 | | | | 11,624 | | | | 6,024 | | | | — | |
| | 558,634 | | | | 949,795 | | | | 1,211,565 | | | | 194,612,482 | |
| | — | | | | — | | | | — | | | | 24,415 | |
| | — | | | | — | | | | — | | | | — | |
| | 15,406 | | | | — | | | | — | | | | 509,381 | |
| | — | | | | — | | | | — | | | | 1,611 | |
| | | | | | | | | | | | | | | |
| | 149,613,874 | | | | 59,386,853 | | | | 76,416,093 | | | | 12,888,950,973 | |
| | | | | | | | | | | | | | | |
| | | | | | | | | | | | | | |
| | 24,412,261 | | | | — | | | | — | | | | 783,942,770 | |
| | 126,666 | | | | — | | | | — | | | | 88,903,011 | |
| | 93,394 | | | | 352,744 | | | | 359,214 | | | | 17,054,058 | |
| | 145,106 | | | | 48,783 | | | | 85,469 | | | | — | |
| | 45,192 | | | | 34,857 | | | | 33,417 | | | | 5,664,396 | |
| | 242,096 | | | | 94,454 | | | | 170,212 | | | | 445,608 | |
| | 10,550 | | | | 5,687 | | | | 7,487 | | | | 1,013,673 | |
| | — | | | | — | | | | — | | | | — | |
| | — | | | | — | | | | — | | | | 126,137 | |
| | 52,940 | | | | 24,405 | | | | 34,422 | | | | 1,950,286 | |
| | | | | | | | | | | | | | | |
| | 25,128,205 | | | | 560,930 | | | | 690,221 | | | | 899,099,939 | |
| | | | | | | | | | | | | | | |
| $ | 124,485,669 | | | $ | 58,825,923 | | | $ | 75,725,872 | | | $ | 11,989,851,034 | |
| | | | | | | | | | | | | | | |
| | | | | | | | | | | | | | |
| $ | 140,969,940 | | | $ | 59,064,246 | | | $ | 78,298,023 | | | $ | 12,092,740,832 | |
| | (457,885 | ) | | | 15,445 | | | | 243,229 | | | | (11,542,775 | ) |
| | (17,001,160 | ) | | | (623,413 | ) | | | (402,821 | ) | | | 182,507,465 | |
| | 974,774 | | | | 369,645 | | | | (2,412,559 | ) | | | (273,854,488 | ) |
| | | | | | | | | | | | | | | |
| $ | 124,485,669 | | | $ | 58,825,923 | | | $ | 75,725,872 | | | $ | 11,989,851,034 | |
| | | | | | | | | | | | | | | |
| | | | | | | | | | | | | | |
| | | | | | | | | | | | | | |
| $ | 106,055,735 | | | $ | 57,548,356 | | | $ | 72,985,978 | | | $ | 6,494,293,930 | |
| | | | | | | | | | | | | | | |
| | 9,512,164 | | | | 3,612,363 | | | | 10,471,265 | | | | 448,989,556 | |
| | | | | | | | | | | | | | | |
| $ | 11.15 | | | $ | 15.93 | | | $ | 6.97 | | | $ | 14.46 | |
| | | | | | | | | | | | | | | |
| $ | 11.49 | | | $ | 16.64 | | | $ | 7.30 | | | $ | 15.14 | |
| | | | | | | | | | | | | | | |
| | | | | | | | | | | | | | |
| $ | 5,957,276 | | | $ | 1,277,567 | | | $ | 2,739,894 | | | $ | 207,028,003 | |
| | | | | | | | | | | | | | | |
| | 534,899 | | | | 80,374 | | | | 392,622 | | | | 14,244,581 | |
| | | | | | | | | | | | | | | |
| $ | 11.14 | | | $ | 15.90 | | | $ | 6.98 | | | $ | 14.53 | |
| | | | | | | | | | | | | | | |
| | | | | | | | | | | | | | |
| $ | 6,885,346 | | | $ | — | | | $ | — | | | $ | 4,442,404,635 | |
| | | | | | | | | | | | | | | |
| | 617,207 | | | | — | | | | — | | | | 305,803,005 | |
| | | | | | | | | | | | | | | |
| $ | 11.16 | | | $ | — | | | $ | — | | | $ | 14.53 | |
| | | | | | | | | | | | | | | |
| | | | | | | | | | | | | | |
| $ | 5,587,312 | | | $ | — | | | $ | — | | | $ | 846,124,466 | |
| | | | | | | | | | | | | | | |
| | 499,628 | | | | — | | | | — | | | | 58,524,716 | |
| | | | | | | | | | | | | | | |
| $ | 11.18 | | | $ | — | | | $ | — | | | $ | 14.46 | |
| | | | | | | | | | | | | | | |
| $ | 23,983,418 | | | $ | — | | | $ | — | | | $ | 769,257,993 | |
| | | | | | | | | | | | | | | |
54
STATEMENTSOF OPERATIONS
For the Six Months Ended March 31, 2008 (Unaudited)
| | | | | | | | | | | | |
| | | Core Plus Bond Fund | | | High Income Fund | | | International
Bond Fund (a) | |
| | | | | | | | | | | | |
| | | | | | | | | | | | |
INVESTMENT INCOME | | | | | | | | | | | | |
Dividends | | $ | — | | | $ | 51,487 | | | $ | — | |
Interest | | | 4,482,169 | | | | 1,566,712 | | | | 52,271 | |
Securities lending income (Note 2) | | | 130,601 | | | | 21,433 | | | | — | |
Less net foreign taxes withheld | | | — | | | | (427 | ) | | | — | |
| | | | | | | | | | | | |
| | | 4,612,770 | | | | 1,639,205 | | | | 52,271 | |
| | | | | | | | | | | | |
Expenses | | | | | | | | | | | | |
Management fees (Note 4) | | | 371,350 | | | | 125,181 | | | | 10,267 | |
Service fees - Class A (Note 4) | | | 139,411 | | | | 40,515 | | | | 120 | |
Service and distribution fees - Class B (Note 4) | | | 106,416 | | | | 18,493 | | | | — | |
Service and distribution fees - Class C (Note 4) | | | 74,362 | | | | 28,082 | | | | 142 | |
Trustees’ fees and expenses (Note 4) | | | 5,603 | | | | 4,015 | | | | 1,262 | |
Administrative fees (Note 4) | | | 43,543 | | | | 11,033 | | | | 3,553 | |
Custodian fees and expenses | | | 16,993 | | | | 10,539 | | | | 3,031 | |
Transfer agent fees and expenses - Class A (Note 4) | | | 94,879 | | | | 23,285 | | | | 451 | |
Transfer agent fees and expenses - Class B (Note 4) | | | 20,390 | | | | 2,666 | | | | — | |
Transfer agent fees and expenses - Class C (Note 4) | | | 12,547 | | | | 4,025 | | | | 134 | |
Transfer agent fees and expenses - Class Y (Note 4) | | | 12,207 | | | | 2 | | | | 165 | |
Audit fees | | | 19,910 | | | | 19,711 | | | | 12,190 | |
Legal fees | | | 4,350 | | | | 1,383 | | | | 32 | |
Shareholder reporting expenses | | | 28,559 | | | | 5,395 | | | | 1,723 | |
Registration fees | | | 28,001 | | | | 22,458 | | | | 805 | |
Miscellaneous expenses | | | 8,006 | | | | 3,676 | | | | 169 | |
| | | | | | | | | | | | |
Total expenses | | | 986,527 | | | | 320,459 | | | | 34,044 | |
Less fee reduction and/or reimbursement (Note 4) | | | (75,783 | ) | | | (45,600 | ) | | | (19,237 | ) |
| | | | | | | | | | | | |
Net expenses | | | 910,744 | | | | 274,859 | | | | 14,807 | |
| | | | | | | | | | | | |
Net investment income | | | 3,702,026 | | | | 1,364,346 | | | | 37,464 | |
| | | | | | | | | | | | |
NET REALIZED AND UNREALIZED GAIN (LOSS) ON INVESTMENTS AND
FOREIGN CURRENCY TRANSACTIONS | | | | | | | | | | | | |
Net realized gain (loss) on: | | | | | | | | | | | | |
Investments | | | 1,807,224 | | | | 535,049 | | | | 32,411 | |
Foreign currency transactions | | | 9,988 | | | | 648 | | | | (9,473 | ) |
Net change in unrealized appreciation (depreciation) on: | | | | | | | | | | | | |
Investments (including change in foreign capital gains tax accrual of ($126,137) for Strategic Income Fund) | | | (98,462 | ) | | | (3,005,166 | ) | | | 425,379 | |
Foreign currency translations | | | (3,894 | ) | | | (5,405 | ) | | | 21,573 | |
| | | | | | | | | | | | |
Total net realized and unrealized gain (loss) on investments and foreign currency transactions | | | 1,714,856 | | | | (2,474,874 | ) | | | 469,890 | |
| | | | | | | | | | | | |
NET INCREASE (DECREASE) IN NET ASSETS RESULTING FROM OPERATIONS | | $ | 5,416,882 | | | $ | (1,110,528 | ) | | $ | 507,354 | |
| | | | | | | | | | | | |
| (a) | From commencement of operations on February 1, 2008 through March 31, 2008. |
See accompanying notes to financial statements.
55
| | | | | | | | | | | | | | |
Limited Term Government
and Agency Fund | | | Massachusetts Tax
Free Income Fund | | | Municipal
Income Fund | | | Strategic
Income Fund | |
| | | | | | | | | | | | | | |
| | | | | | | | | | | | | | |
| | | | | | | | | | | | | | |
| $ | — | | | $ | — | | | $ | — | | | $ | 17,058,661 | |
| | 3,086,606 | | | | 1,612,139 | | | | 1,973,602 | | | | 393,008,988 | |
| | 43,295 | | | | — | | | | — | | | | 4,550,819 | |
| | — | | | | — | | | | — | | | | (328,835 | ) |
| | | | | | | | | | | | | | | |
| | 3,129,901 | | | | 1,612,139 | | | | 1,973,602 | | | | 414,289,633 | |
| | | | | | | | | | | | | | | |
| | | | | | | | | | | | | | |
| | 308,514 | | | | 198,658 | | | | 208,938 | | | | 32,110,216 | |
| | 133,304 | | | | 80,942 | | | | 100,262 | | | | 7,850,865 | |
| | 30,406 | | | | 7,330 | | | | 16,828 | | | | 1,110,081 | |
| | 27,890 | | | | — | | | | — | | | | 21,061,568 | |
| | 4,758 | | | | 4,247 | | | | 4,403 | | | | 91,496 | |
| | 32,623 | | | | 17,513 | | | | 22,103 | | | | 3,032,693 | |
| | 13,559 | | | | 9,542 | | | | 9,856 | | | | 372,335 | |
| | 67,608 | | | | 20,650 | | | | 21,555 | | | | 2,930,624 | |
| | 3,859 | | | | 469 | | | | 909 | | | | 104,144 | |
| | 3,527 | | | | — | | | | — | | | | 1,964,018 | |
| | 422 | | | | — | | | | — | | | | 340,591 | |
| | 20,011 | | | | 18,278 | | | | 17,162 | | | | 21,411 | |
| | 2,493 | | | | 1,416 | | | | 1,890 | | | | 142,458 | |
| | 9,004 | | | | 5,743 | | | | 3,400 | | | | 488,628 | |
| | 29,611 | | | | 9,884 | | | | 18,435 | | | | 244,177 | |
| | 5,616 | | | | 4,322 | | | | 4,551 | | | | 110,090 | |
| | | | | | | | | | | | | | | |
| | 693,205 | | | | 378,994 | | | | 430,292 | | | | 71,975,395 | |
| | (79,817 | ) | | | (64,190 | ) | | | (27,322 | ) | | | (143,903 | ) |
| | | | | | | | | | | | | | | |
| | 613,388 | | | | 314,804 | | | | 402,970 | | | | 71,831,492 | |
| | | | | | | | | | | | | | | |
| | 2,516,513 | | | | 1,297,335 | | | | 1,570,632 | | | | 342,458,141 | |
| | | | | | | | | | | | | | | |
| | | | | | | | | | | | | | |
| | | | | | | | | | | | | | |
| | 100,482 | | | | (127,409 | ) | | | (297,469 | ) | | | 191,846,621 | |
| | — | | | | — | | | | — | | | | 2,484,969 | |
| | | | | | | | | | | | | | |
| | 1,913,582 | | | | (1,395,345 | ) | | | (3,235,656 | ) | | | (719,421,935 | ) |
| | — | | | | — | | | | — | | | | (3,181,323 | ) |
| | | | | | | | | | | | | | | |
| | 2,014,064 | | | | (1,522,754 | ) | �� | | (3,533,125 | ) | | | (528,271,668 | ) |
| | | | | | | | | | | | | | | |
| $ | 4,530,577 | | | $ | (225,419 | ) | | $ | (1,962,493 | ) | | $ | (185,813,527 | ) |
| | | | | | | | | | | | | | | |
56
STATEMENTSOF CHANGESIN NET ASSETS
| | | | | | | | | | | | | | | | | | | | |
| | | Core Plus Bond Fund | | | High Income Fund | | | International Bond
Fund | |
| | | Six Months Ended
March 31,
2008
(unaudited) | | | Year Ended
September 30,
2007 | | | Six Months Ended
March 31,
2008
(unaudited) | | | Year Ended
September 30,
2007 | | | Six Months Ended
March 31,
2008
(unaudited)(a) | |
| | | | | | | | | | | | | | | | | | | | |
| | | | | | | | | | | | | | | | | | | | |
FROM OPERATIONS: | | | | | | | | | | | | | | | | | | | | |
Net investment income | | $ | 3,702,026 | | | $ | 8,937,252 | | | $ | 1,364,346 | | | $ | 2,616,602 | | | $ | 37,464 | |
Net realized gain (loss) on investments and foreign currency transactions | | | 1,817,212 | | | | 3,057,453 | | | | 535,697 | | | | 2,071,153 | | | | 22,938 | |
Net change in unrealized appreciation (depreciation) on investments and foreign currency translations | | | (102,356 | ) | | | (455,077 | ) | | | (3,010,571 | ) | | | (1,570,220 | ) | | | 446,952 | |
| | | | | | | | | | | | | | | | | | | | |
Net increase (decrease) in net assets resulting from operations | | | 5,416,882 | | | | 11,539,628 | | | | (1,110,528 | ) | | | 3,117,535 | | | | 507,354 | |
| | | | | | | | | | | | | | | | | | | | |
FROM DISTRIBUTIONS TO SHAREHOLDERS: | | | | | | | | | | | | | | | | | | | | |
Net investment income | | | | | | | | | | | | | | | | | | | | |
Class A | | | (3,138,795 | ) | | | (4,791,156 | ) | | | (1,188,078 | ) | | | (2,276,050 | ) | | | (1,855 | ) |
Class B | | | (405,910 | ) | | | (4,164,404 | ) | | | (118,515 | ) | | | (385,580 | ) | | | — | |
Class C | | | (368,823 | ) | | | (393,045 | ) | | | (187,449 | ) | | | (290,234 | ) | | | (455 | ) |
Class Y | | | (500,276 | ) | | | (746,123 | ) | | | (6 | ) | | | — | | | | (42,882 | ) |
Net realized capital gain | | | | | | | | | | | | | | | | | | | | |
Class A | | | — | | | | — | | | | — | | | | — | | | | — | |
Class B | | | — | | | | — | | | | — | | | | — | | | | — | |
Class C | | | — | | | | — | | | | — | | | | — | | | | — | |
Class Y | | | — | | | | — | | | | — | | | | — | | | | — | |
| | | | | | | | | | | | | | | | | | | | |
Total distributions | | | (4,413,804 | ) | | | (10,094,728 | ) | | | (1,494,048 | ) | | | (2,951,864 | ) | | | (45,192 | ) |
| | | | | | | | | | | | | | | | | | | | |
NET INCREASE (DECREASE) IN NET ASSETS FROM CAPITAL SHARE TRANSACTIONS (NOTE 8) | | | (55,755,313 | ) | | | (150,880 | ) | | | 1,637,146 | | | | 2,103,465 | | | | 11,479,005 | |
| | | | | | | | | | | | | | | | | | | | |
Redemption fees | | | | | | | | | | | | | | | | | | | | |
Class A | | | 6,599 | | | | 4,164 | | | | 231 | | | | 1,239 | | | | — | |
Class B | | | 1,035 | | | | 3,852 | | | | 26 | | | | 221 | | | | — | |
Class C | | | 897 | | | | 451 | | | | 40 | | | | 191 | | | | — | |
Class Y | | | 1,015 | | | | 627 | | | | — | | | | — | | | | — | |
| | | | | | | | | | | | | | | | | | | | |
| | | 9,546 | | | | 9,094 | | | | 297 | | | | 1,651 | | | | — | |
| | | | | | | | | | | | | | | | | | | | |
Net increase (decrease) in net assets | | | (54,742,689 | ) | | | 1,303,114 | | | | (967,133 | ) | | | 2,270,787 | | | | 11,941,167 | |
| | | | | | | | | | | | | | | | | | | | |
NET ASSETS | | | | | | | | | | | | | | | | | | | | |
Beginning of the period | | | 221,518,566 | | | | 220,215,452 | | | | 42,078,880 | | | | 39,808,093 | | | | — | |
| | | | | | | | | | | | | | | | | | | | |
End of the period | | $ | 166,775,877 | | | $ | 221,518,566 | | | $ | 41,111,747 | | | $ | 42,078,880 | | | $ | 11,941,167 | |
| | | | | | | | | | | | | | | | | | | | |
UNDISTRIBUTED (OVERDISTRIBUTED) NET INVESTMENT INCOME (LOSS) | | $ | (424,849 | ) | | $ | 286,929 | | | $ | (85,472 | ) | | $ | 44,230 | | | $ | (7,728 | ) |
| | | | | | | | | | | | | | | | | | | | |
| (a) | From commencement of operations on February 1, 2008 through March 31, 2008. |
See accompanying notes to financial statements.
57
| | | | | | | | | | | | | | | | | | | | | | | | | | | | | | |
| Limited Term Government and Agency Fund | | | Massachusetts Tax Free Income Fund | | | Municipal Income Fund | | | Strategic Income Fund | |
Six Months Ended
March 31,
2008
(unaudited) | | | Year Ended
September 30,
2007 | | | Six Months Ended
March 31,
2008
(unaudited) | | | Year Ended
September 30,
2007 | | | Six Months Ended
March 31,
2008
(unaudited) | | | Year Ended
September 30,
2007 | | | Six Months Ended
March 31,
2008
(unaudited) | | | Year Ended
September 30,
2007 | |
| | | | | | | | | | | | | | | | | | | | | | | | | | | | | | |
| | | | | | | | | | | | | | | | | | | | | | | | | | | | | | |
| $ | 2,516,513 | | | $ | 5,111,524 | | | $ | 1,297,335 | | | $ | 2,742,720 | | | $ | 1,570,632 | | | $ | 3,455,146 | | | $ | 342,458,141 | | | $ | 404,960,779 | |
| 100,482 | | | | 65,262 | | | | (127,409 | ) | | | 915,434 | | | | (297,469 | ) | | | 635,763 | | | | 194,331,590 | | | | 72,055,207 | |
| 1,913,582 | | | | 261,814 | | | | (1,395,345 | ) | | | (2,461,854 | ) | | | (3,235,656 | ) | | | (2,985,337 | ) | | | (722,603,258 | ) | | | 228,448,541 | |
| | | | | | | | | | | | | | | | | | | | | | | | | | | | | | | |
| | 4,530,577 | | | | 5,438,600 | | | | (225,419 | ) | | | 1,196,300 | | | | (1,962,493 | ) | | | 1,105,572 | | | | (185,813,527 | ) | | | 705,464,527 | |
| | | | | | | | | | | | | | | | | | | | | | | | | | | | | | | |
| | | | | | | | | | | | | | | | | | | | | | | | | | | | | | |
| | | | | | | | | | | | | | | | | | | | | | | | | | | | | | |
| | (2,489,791 | ) | | | (4,778,111 | ) | | | (1,276,223 | ) | | | (2,677,791 | ) | | | (1,513,104 | ) | | | (3,282,541 | ) | | | (217,032,888 | ) | | | (239,664,878 | ) |
| | (119,112 | ) | | | (288,517 | ) | | | (23,323 | ) | | | (60,488 | ) | | | (51,014 | ) | | | (136,525 | ) | | | (6,658,488 | ) | | | (10,008,544 | ) |
| | (108,275 | ) | | | (166,306 | ) | | | — | | | | — | | | | — | | | | — | | | | (129,403,235 | ) | | | (137,066,220 | ) |
| | (126,798 | ) | | | (164,290 | ) | | | — | | | | — | | | | — | | | | — | | | | (27,508,266 | ) | | | (26,439,067 | ) |
| | | | | | | | | | | | | | | | | | | | | | | | | | | | | | |
| | — | | | | — | | | | — | | | | — | | | | (610,790 | ) | | | (425,469 | ) | | | (5,233,811 | ) | | | — | |
| | — | | | | — | | | | — | | | | — | | | | (25,089 | ) | | | (23,297 | ) | | | (183,665 | ) | | | — | |
| | — | | | | — | | | | — | | | | — | | | | — | | | | — | | | | (3,481,864 | ) | | | — | |
| | — | | | | — | | | | — | | | | — | | | | — | | | | — | | | | (634,289 | ) | | | — | |
| | | | | | | | | | | | | | | | | | | | | | | | | | | | | | | |
| | (2,843,976 | ) | | | (5,397,224 | ) | | | (1,299,546 | ) | | | (2,738,279 | ) | | | (2,199,997 | ) | | | (3,867,832 | ) | | | (390,136,506 | ) | | | (413,178,709 | ) |
| | | | | | | | | | | | | | | | | | | | | | | | | | | | | | | |
| (1,985,826 | ) | | | (6,079,674 | ) | | | (7,893,764 | ) | | | (5,036,768 | ) | | | (6,052,879 | ) | | | (9,932,346 | ) | | | 2,100,045,497 | | | | 5,126,647,863 | |
| | | | | | | | | | | | | | | | | | | | | | | | | | | | | | | |
| | | | | | | | | | | | | | | | | | | | | | | | | | | | | | |
| | — | | | | — | | | | — | | | | — | | | | — | | | | — | | | | 181,728 | | | | 182,774 | |
| | — | | | | — | | | | — | | | | — | | | | — | | | | — | | | | 6,366 | | | | 8,908 | |
| | — | | | | — | | | | — | | | | — | | | | — | | | | — | | | | 121,959 | | | | 122,627 | |
| | — | | | | — | | | | — | | | | — | | | | — | | | | — | | | | 22,162 | | | | 19,120 | |
| | | | | | | | | | | | | | | | | | | | | | | | | | | | | | | |
| | — | | | | — | | | | — | | | | — | | | | — | | | | — | | | | 332,215 | | | | 333,429 | |
| | | | | | | | | | | | | | | | | | | | | | | | | | | | | | | |
| | (299,225 | ) | | | (6,038,298 | ) | | | (9,418,729 | ) | | | (6,578,747 | ) | | | (10,215,369 | ) | | | (12,694,606 | ) | | | 1,524,427,679 | | | | 5,419,267,110 | |
| | | | | | | | | | | | | | | | | | | | | | | | | | | | | | | |
| | | | | | | | | | | | | | | | | | | | | | | | | | | | | | |
| | 124,784,894 | | | | 130,823,192 | | | | 68,244,652 | | | | 74,823,399 | | | | 85,941,241 | | | | 98,635,847 | | | | 10,465,423,355 | | | | 5,046,156,245 | |
| | | | | | | | | | | | | | | | | | | | | | | | | | | | | | | |
| $ | 124,485,669 | | | $ | 124,784,894 | | | $ | 58,825,923 | | | $ | 68,244,652 | | | $ | 75,725,872 | | | $ | 85,941,241 | | | $ | 11,989,851,034 | | | $ | 10,465,423,355 | |
| | | | | | | | | | | | | | | | | | | | | | | | | | | | | | | |
$ | (457,885 | ) | | $ | (130,422 | ) | | $ | 15,445 | | | $ | 17,656 | | | $ | 243,229 | | | $ | 236,715 | | | $ | (11,542,775 | ) | | $ | 26,601,961 | |
| | | | | | | | | | | | | | | | | | | | | | | | | | | | | | | |
58
FINANCIAL HIGHLIGHTS
For a share outstanding throughout each period.
| | | | | | | | | | | | | | | | | | | | | | | | | |
| | | | | Income (Loss) from Investment Operations: | | | Less Distributions: | | | |
| | | | | | | |
| | | Net asset
value,
beginning
of
the period | | Net
investment
income (c) | | Net realized
and unrealized
gain (loss) | | | Total from
investment
operations | | | Dividends
from
net investment
income | | | Total
distributions | | | Redemption
fees (e) |
| | | | | | | | | | | | | | | | | | | | | | | | | |
CORE PLUS BOND FUND | | | | | | | | | | | | | | | | | | | | | | | | | |
Class A | | | | | | | | | | | | | | | | | | | | | | | | | |
3/31/2008(j) | | $ | 11.31 | | $ | 0.27 | | $ | 0.13 | | | $ | 0.40 | | | $ | (0.32 | ) | | $ | (0.32 | ) | | $ | 0.00 |
9/30/2007 | | | 11.23 | | | 0.50 | | | 0.14 | | | | 0.64 | | | | (0.56 | ) | | | (0.56 | ) | | | 0.00 |
9/30/2006 | | | 11.41 | | | 0.50 | | | (0.07 | ) | | | 0.43 | | | | (0.61 | ) | | | (0.61 | ) | | | 0.00 |
9/30/2005 | | | 11.69 | | | 0.46 | | | (0.18 | ) | | | 0.28 | | | | (0.56 | ) | | | (0.56 | ) | | | 0.00 |
9/30/2004 | | | 11.63 | | | 0.47 | | | 0.13 | | | | 0.60 | | | | (0.54 | ) | | | (0.54 | ) | | | 0.00 |
9/30/2003(i) | | | 11.28 | | | 0.37 | | | 0.34 | | | | 0.71 | | | | (0.36 | ) | | | (0.36 | ) | | | — |
12/31/2002 | | | 11.59 | | | 0.63 | | | (0.32 | ) | | | 0.31 | | | | (0.62 | ) | | | (0.62 | ) | | | — |
Class B | | | | | | | | | | | | | | | | | | | | | | | | | |
3/31/2008(j) | | | 11.31 | | | 0.21 | | | 0.16 | | | | 0.37 | | | | (0.26 | ) | | | (0.26 | ) | | | 0.00 |
9/30/2007 | | | 11.24 | | | 0.41 | | | 0.13 | | | | 0.54 | | | | (0.47 | ) | | | (0.47 | ) | | | 0.00 |
9/30/2006 | | | 11.41 | | | 0.41 | | | (0.05 | ) | | | 0.36 | | | | (0.53 | ) | | | (0.53 | ) | | | 0.00 |
9/30/2005 | | | 11.70 | | | 0.37 | | | (0.18 | ) | | | 0.19 | | | | (0.48 | ) | | | (0.48 | ) | | | 0.00 |
9/30/2004 | | | 11.62 | | | 0.38 | | | 0.14 | | | | 0.52 | | | | (0.44 | ) | | | (0.44 | ) | | | 0.00 |
9/30/2003(i) | | | 11.28 | | | 0.30 | | | 0.34 | | | | 0.64 | | | | (0.30 | ) | | | (0.30 | ) | | | — |
12/31/2002 | | | 11.59 | | | 0.55 | | | (0.32 | ) | | | 0.23 | | | | (0.54 | ) | | | (0.54 | ) | | | — |
Class C | | | | | | | | | | | | | | | | | | | | | | | | | |
3/31/2008(j) | | | 11.32 | | | 0.22 | | | 0.14 | | | | 0.36 | | | | (0.28 | ) | | | (0.28 | ) | | | 0.00 |
9/30/2007 | | | 11.25 | | | 0.41 | | | 0.13 | | | | 0.54 | | | | (0.47 | ) | | | (0.47 | ) | | | 0.00 |
9/30/2006 | | | 11.42 | | | 0.41 | | | (0.05 | ) | | | 0.36 | | | | (0.53 | ) | | | (0.53 | ) | | | 0.00 |
9/30/2005 | | | 11.71 | | | 0.37 | | | (0.18 | ) | | | 0.19 | | | | (0.48 | ) | | | (0.48 | ) | | | 0.00 |
9/30/2004 | | | 11.63 | | | 0.38 | | | 0.14 | | | | 0.52 | | | | (0.44 | ) | | | (0.44 | ) | | | 0.00 |
9/30/2003(i) | | | 11.29 | | | 0.30 | | | 0.34 | | | | 0.64 | | | | (0.30 | ) | | | (0.30 | ) | | | — |
12/31/2002 | | | 11.60 | | | 0.55 | | | (0.32 | ) | | | 0.23 | | | | (0.54 | ) | | | (0.54 | ) | | | — |
Class Y | | | | | | | | | | | | | | | | | | | | | | | | | |
3/31/2008(j) | | | 11.36 | | | 0.28 | | | 0.14 | | | | 0.42 | | | | (0.33 | ) | | | (0.33 | ) | | | 0.00 |
9/30/2007 | | | 11.29 | | | 0.54 | | | 0.13 | | | | 0.67 | | | | (0.60 | ) | | | (0.60 | ) | | | 0.00 |
9/30/2006 | | | 11.46 | | | 0.51 | | | (0.04 | ) | | | 0.47 | | | | (0.64 | ) | | | (0.64 | ) | | | 0.00 |
9/30/2005 | | | 11.74 | | | 0.49 | | | (0.18 | ) | | | 0.31 | | | | (0.59 | ) | | | (0.59 | ) | | | 0.00 |
9/30/2004 | | | 11.69 | | | 0.50 | | | 0.13 | | | | 0.63 | | | | (0.58 | ) | | | (0.58 | ) | | | 0.00 |
9/30/2003(i) | | | 11.33 | | | 0.41 | | | 0.35 | | | | 0.76 | | | | (0.40 | ) | | | (0.40 | ) | | | — |
12/31/2002 | | | 11.63 | | | 0.69 | | | (0.32 | ) | | | 0.37 | | | | (0.67 | ) | | | (0.67 | ) | | | — |
HIGH INCOME FUND* | | | | | | | | | | | | | | | | | | | | | | | | | |
Class A | | | | | | | | | | | | | | | | | | | | | | | | | |
3/31/2008(j) | | $ | 5.12 | | $ | 0.17 | | $ | (0.30 | ) | | $ | (0.13 | ) | | $ | (0.18 | ) | | $ | (0.18 | ) | | $ | 0.00 |
9/30/2007 | | | 5.09 | | | 0.33 | | | 0.08 | | | | 0.41 | | | | (0.38 | ) | | | (0.38 | ) | | | 0.00 |
9/30/2006 | | | 4.98 | | | 0.34 | | | 0.11 | | | | 0.45 | | | | (0.34 | ) | | | (0.34 | ) | | | 0.00 |
9/30/2005 | | | 4.82 | | | 0.33 | | | 0.16 | | | | 0.49 | | | | (0.33 | ) | | | (0.33 | ) | | | 0.00 |
9/30/2004 | | | 4.65 | | | 0.33 | | | 0.17 | | | | 0.50 | | | | (0.33 | ) | | | (0.33 | ) | | | 0.00 |
9/30/2003(i) | | | 4.12 | | | 0.25 | | | 0.53 | | | | 0.78 | | | | (0.25 | ) | | | (0.25 | ) | | | — |
12/31/2002 | | | 4.94 | | | 0.39 | | | (0.82 | ) | | | (0.43 | ) | | | (0.39 | ) | | | (0.39 | ) | | | — |
Class B | | | | | | | | | | | | | | | | | | | | | | | | | |
3/31/2008(j) | | | 5.13 | | | 0.15 | | | (0.30 | ) | | | (0.15 | ) | | | (0.16 | ) | | | (0.16 | ) | | | 0.00 |
9/30/2007 | | | 5.10 | | | 0.29 | | | 0.07 | | | | 0.36 | | | | (0.33 | ) | | | (0.33 | ) | | | 0.00 |
9/30/2006 | | | 4.98 | | | 0.30 | | | 0.12 | | | | 0.42 | | | | (0.30 | ) | | | (0.30 | ) | | | 0.00 |
9/30/2005 | | | 4.83 | | | 0.29 | | | 0.15 | | | | 0.44 | | | | (0.29 | ) | | | (0.29 | ) | | | 0.00 |
9/30/2004 | | | 4.65 | | | 0.30 | | | 0.18 | | | | 0.48 | | | | (0.30 | ) | | | (0.30 | ) | | | 0.00 |
9/30/2003(i) | | | 4.12 | | | 0.23 | | | 0.53 | | | | 0.76 | | | | (0.23 | ) | | | (0.23 | ) | | | — |
12/31/2002 | | | 4.95 | | | 0.36 | | | (0.83 | ) | | | (0.47 | ) | | | (0.36 | ) | | | (0.36 | ) | | | — |
| (a) | A sales charge for Class A and Class C (prior to February 1, 2004) shares and a contingent deferred sales charge for Class B and Class C shares are not reflected in total return calculations. Periods less than one year, if applicable, are not annualized. |
| (b) | Computed on an annualized basis for periods less than one year, if applicable. |
| (c) | Per share net investment income has been calculated using the average shares outstanding during the period. |
| (d) | Represents the total expenses prior to fee reductions and/or reimbursement of a portion of the Fund’s expenses. |
| (e) | Amount rounds to less than $0.01 per share, if applicable. |
| (f) | Had certain expenses not been reduced during the period, if applicable, total return would have been lower. Periods less than one year, if applicable, are not annualized. |
See accompanying notes to financial statements.
59
| | | | | | | | | | | | | | | | | |
| | | | | | | | Ratios to Average Net Assets: | | |
| | | | | | |
Net asset
value,
end of
the period | | Total
return
(%) (a)(f) | | | Net assets,
end of
the period
(000’s) | | Net
expenses
(%) (b)(g) | | | Gross
expenses
(%) (b)(d) | | | Net investment
income
(%) (b) | | Portfolio
turnover
rate (%) |
| | | | | | | | | | | | | | | | | |
| | | | | | | | | | | | | | | | | |
| | | | | | | | | | | | | | | | | |
| $ | 11.39 | | 3.6 | | | $ | 116,440 | | 0.97 | | | 1.06 | | | 4.66 | | 33 |
| | 11.31 | | 5.7 | | | | 105,780 | | 1.04 | | | 1.09 | | | 4.41 | | 69 |
| | 11.23 | | 4.0 | | | | 91,464 | | 1.05 | | | 1.08 | | | 4.46 | | 91 |
| | 11.41 | | 2.4 | | | | 105,111 | | 1.13 | | | 1.18 | | | 3.93 | | 64 |
| | 11.69 | | 5.3 | | | | 120,009 | | 1.19 | | | 1.22 | | | 4.05 | | 69 |
| | 11.63 | | 6.4 | | | | 133,887 | | 1.28 | | | 1.28 | | | 4.31 | | 61 |
| | 11.28 | | 2.8 | | | | 147,647 | | 1.18 | | | 1.18 | | | 5.65 | | 65 |
| | | | | | | | | | | | | | | | | |
| | 11.42 | | 3.3 | | | | 15,432 | | 1.73 | | | 1.81 | | | 3.71 | | 33 |
| | 11.31 | | 4.9 | | | | 87,101 | | 1.79 | | | 1.85 | | | 3.64 | | 69 |
| | 11.24 | | 3.3 | | | | 109,782 | | 1.80 | | | 1.83 | | | 3.72 | | 91 |
| | 11.41 | | 1.6 | | | | 132,221 | | 1.88 | | | 1.93 | | | 3.18 | | 64 |
| | 11.70 | | 4.6 | | | | 148,556 | | 1.94 | | | 1.97 | | | 3.29 | | 69 |
| | 11.62 | | 5.8 | | | | 161,317 | | 2.03 | | | 2.03 | | | 3.55 | | 61 |
| | 11.28 | | 2.1 | | | | 141,188 | | 1.93 | | | 1.93 | | | 4.90 | | 65 |
| | | | | | | | | | | | | | | | | |
| | 11.40 | | 3.2 | | | | 16,801 | | 1.71 | | | 1.81 | | | 3.92 | | 33 |
| | 11.32 | | 4.9 | | | | 12,690 | | 1.78 | | | 1.82 | | | 3.66 | | 69 |
| | 11.25 | | 3.3 | | | | 6,983 | | 1.80 | | | 1.82 | | | 3.63 | | 91 |
| | 11.42 | | 1.6 | | | | 6,065 | | 1.88 | | | 1.93 | | | 3.17 | | 64 |
| | 11.71 | | 4.6 | | | | 6,162 | | 1.94 | | | 1.98 | | | 3.30 | | 69 |
| | 11.63 | | 5.8 | | | | 7,612 | | 2.03 | | | 2.03 | | | 3.55 | | 61 |
| | 11.29 | | 2.1 | | | | 9,024 | | 1.93 | | | 1.93 | | | 4.90 | | 65 |
| | | | | | | | | | | | | | | | | |
| | 11.45 | | 3.7 | | | | 18,103 | | 0.72 | | | 0.79 | | | 4.91 | | 33 |
| | 11.36 | | 6.1 | | | | 15,946 | | 0.70 | | | 0.75 | | | 4.75 | | 69 |
| | 11.29 | | 4.3 | | | | 11,986 | | 0.80 | (h) | | 0.80 | (h) | | 4.58 | | 91 |
| | 11.46 | | 2.7 | | | | 9,060 | | 0.88 | | | 0.99 | | | 4.18 | | 64 |
| | 11.74 | | 5.5 | | | | 10,941 | | 0.94 | | | 0.98 | | | 4.30 | | 69 |
| | 11.69 | | 6.9 | | | | 17,889 | | 0.73 | | | 0.73 | | | 4.85 | | 61 |
| | 11.33 | | 3.5 | | | | 18,346 | | 0.67 | | | 0.67 | | | 6.15 | | 65 |
| | | | | | | | | | | | | | | | | |
| | | | | | | | | | | | | | | | | |
| $ | 4.81 | | (2.5 | ) | | $ | 31,977 | | 1.15 | | | 1.37 | | | 6.69 | | 17 |
| | 5.12 | | 8.1 | | | | 32,603 | | 1.18 | | | 1.43 | | | 6.40 | | 41 |
| | 5.09 | | 9.4 | | | | 29,069 | | 1.31 | | | 1.48 | | | 6.70 | | 41 |
| | 4.98 | | 10.3 | | | | 25,817 | | 1.58 | | | 1.72 | | | 6.60 | | 42 |
| | 4.82 | | 11.1 | | | | 24,641 | | 1.65 | | | 1.65 | | | 6.97 | | 51 |
| | 4.65 | | 19.5 | | | | 23,809 | | 1.71 | | | 1.71 | | | 7.62 | | 41 |
| | 4.12 | | (8.9 | ) | | | 22,454 | | 1.58 | | | 1.58 | | | 8.85 | | 114 |
| | | | | | | | | | | | | | | | | |
| | 4.82 | | (2.9 | ) | | | 3,202 | | 1.90 | | | 2.12 | | | 5.90 | | 17 |
| | 5.13 | | 7.2 | | | | 4,201 | | 1.94 | | | 2.18 | | | 5.63 | | 41 |
| | 5.10 | | 8.8 | | | | 7,283 | | 2.08 | | | 2.25 | | | 6.00 | | 41 |
| | 4.98 | | 9.3 | | | | 12,034 | | 2.33 | | | 2.47 | | | 5.85 | | 42 |
| | 4.83 | | 10.5 | | | | 17,967 | | 2.40 | | | 2.40 | | | 6.22 | | 51 |
| | 4.65 | | 18.8 | | | | 23,405 | | 2.46 | | | 2.46 | | | 6.89 | | 41 |
| | 4.12 | | (9.7 | ) | | | 23,031 | | 2.33 | | | 2.33 | | | 8.10 | | 114 |
| (g) | The investment adviser and/or administrator has agreed to reimburse a portion of the Fund’s expenses and/or reduce its fee during the period. Without this reimbursement/fee reduction, expenses would have been higher. |
| (h) | Includes expense recapture of 0.06%. |
| (i) | For the nine months ended September 30, 2003. |
| (j) | For the six months ended March 31,2008 (Unaudited). |
| * | The financial information for periods prior to September 30, 2004 reflects the financial information for the CDC Nvest High Income Fund’s Class A and Class B shares, which were reorganized into Class A and Class B shares, respectively, of the Loomis Sayles High Income Fund, effective September 12, 2003. Prior to September 1, 2003, the predecessor Fund was advised by CDC IXIS Asset Management Advisers, L.P. and subadvised by Loomis, Sayles & Company, L.P. (the Fund’s current adviser) and, prior to September 12, 2003, had a December 31 fiscal year end. The Fund’s current fiscal year end is September 30. |
60
FINANCIAL HIGHLIGHTS (continued)
For a share outstanding throughout each period.
| | | | | | | | | | | | | | | | | | | | | | | | | |
| | | | | Income (Loss) from Investment Operations: | | | Less Distributions: | | | |
| | | | | | | |
| | | Net asset
value,
beginning
of
the period | | Net
investment
income (c) | | Net realized
and unrealized
gain (loss) | | | Total from
investment
operations | | | Dividends
from
net investment
income | | | Total
distributions | | | Redemption
fees (e) |
| | | | | | | | | | | | | | | | | | | | | | | | | |
HIGH INCOME FUND* (continued) | | | | | | | | | | | | | | | | | | | | | | | | | |
Class C | | | | | | | | | | | | | | | | | | | | | | | | | |
3/31/2008(i) | | $ | 5.12 | | $ | 0.15 | | $ | (0.30 | ) | | $ | (0.15 | ) | | $ | (0.16 | ) | | $ | (0.16 | ) | | $ | 0.00 |
9/30/2007 | | | 5.09 | | | 0.29 | | | 0.07 | | | | 0.36 | | | | (0.33 | ) | | | (0.33 | ) | | | 0.00 |
9/30/2006 | | | 4.98 | | | 0.30 | | | 0.11 | | | | 0.41 | | | | (0.30 | ) | | | (0.30 | ) | | | 0.00 |
9/30/2005 | | | 4.83 | | | 0.29 | | | 0.15 | | | | 0.44 | | | | (0.29 | ) | | | (0.29 | ) | | | 0.00 |
9/30/2004 | | | 4.65 | | | 0.30 | | | 0.18 | | | | 0.48 | | | | (0.30 | ) | | | (0.30 | ) | | | 0.00 |
9/30/2003(h) | | | 4.12 | | | 0.23 | | | 0.53 | | | | 0.76 | | | | (0.23 | ) | | | (0.23 | ) | | | — |
12/31/2002 | | | 4.94 | | | 0.36 | | | (0.82 | ) | | | (0.46 | ) | | | (0.36 | ) | | | (0.36 | ) | | | — |
Class Y | | | | | | | | | | | | | | | | | | | | | | | | | |
3/31/2008(j) | | | 4.87 | | | 0.03 | | | (0.06 | ) | | | (0.03 | ) | | | (0.03 | ) | | | (0.03 | ) | | | — |
INTERNATIONAL BOND FUND | | | | | | | | | | | | | | | | | | | | | | | | | |
Class A | | | | | | | | | | | | | | | | | | | | | | | | | |
3/31/2008(k) | | $ | 10.00 | | $ | 0.04 | | $ | 0.44 | | | $ | 0.48 | | | $ | (0.04 | ) | | $ | (0.04 | ) | | $ | — |
Class C | | | | | | | | | | | | | | | | | | | | | | | | | |
3/31/2008(k) | | | 10.00 | | | 0.03 | | | 0.44 | | | | 0.47 | | | | (0.03 | ) | | | (0.03 | ) | | | — |
Class Y | | | | | | | | | | | | | | | | | | | | | | | | | |
3/31/2008(k) | | | 10.00 | | | 0.04 | | | 0.44 | | | | 0.48 | | | | (0.04 | ) | | | (0.04 | ) | | | — |
| (a) | A sales charge for Class A and Class C (prior to February 1, 2004) shares and a contingent deferred sales charge for Class C shares are not reflected in total return calculations. Periods less than one year, if applicable, are not annualized. |
| (b) | Computed on an annualized basis for periods less than one year, if applicable. |
| (c) | Per share net investment income has been calculated using the average shares outstanding during the period. |
| (d) | Represents the total expenses prior to fee reduction and/or reimbursement of a portion of the Fund’s expenses. |
| (e) | Amount rounds to less than $0.01 per share, if applicable. |
| (f) | Had certain expenses not been reduced during the period, if applicable, total return would have been lower. Periods less than one year, if applicable, are not annualized. |
| (g) | The investment adviser and/or administrator has agreed to reimburse a portion of the Fund’s expenses and/or reduce its fee during the period. Without this reimbursement/fee reduction, expenses would have been higher. |
See accompanying notes to financial statements.
61
| | | | | | | | | | | | | | | |
| | | | | | | | Ratios to Average Net Assets: | | |
| | | | | | |
Net asset
value,
end of
the period | | Total
return
(%) (a)(f) | | | Net assets,
end of
the period
(000’s) | | Net
expenses
(%) (b)(g) | | Gross
expenses
(%) (b)(d) | | Net investment
income
(%) (b) | | Portfolio
turnover
rate (%) |
| | | | | | | | | | | | | | | |
| | | | | | | | | | | | | | | |
| | | | | | | | | | | | | | | |
| $ | 4.81 | | (2.9 | ) | | $ | 5,932 | | 1.90 | | 2.12 | | 5.95 | | 17 |
| | 5.12 | | 7.2 | | | | 5,275 | | 1.93 | | 2.17 | | 5.63 | | 41 |
| | 5.09 | | 8.6 | | | | 3,457 | | 2.07 | | 2.23 | | 5.96 | | 41 |
| | 4.98 | | 9.3 | | | | 3,554 | | 2.33 | | 2.47 | | 5.82 | | 42 |
| | 4.83 | | 10.5 | | | | 2,608 | | 2.40 | | 2.40 | | 6.22 | | 51 |
| | 4.65 | | 18.8 | | | | 2,858 | | 2.46 | | 2.46 | | 6.89 | | 41 |
| | 4.12 | | (9.5 | ) | | | 2,605 | | 2.33 | | 2.33 | | 8.10 | | 114 |
| | | | | | | | | | | | | | | |
| | 4.81 | | (0.6 | ) | | | 1 | | 0.90 | | 2.39 | | 6.94 | | 17 |
| | | | | | | | | | | | | | | |
| | | | | | | | | | | | | | | |
| $ | 10.44 | | 4.8 | | | $ | 887 | | 1.10 | | 3.11 | | 2.54 | | 19 |
| | | | | | | | | | | | | | | |
| | 10.44 | | 4.7 | | | | 270 | | 1.85 | | 3.75 | | 1.55 | | 19 |
| | | | | | | | | | | | | | | |
| | 10.44 | | 4.8 | | | | 10,784 | | 0.85 | | 1.94 | | 2.18 | | 19 |
| (h) | For the nine months ended September 30, 2003. |
| (i) | For the six months ended March 31, 2008 (Unaudited). |
| (j) | From commencement of class operations on February 29, 2008 through March 31, 2008. |
| (k) | For the period February 1, 2008 (inception) through March 31, 2008. |
| * | The financial information for periods prior to September 30, 2004 reflects the financial information for the CDC Nvest High Income Fund’s Class C shares, which were reorganized into Class C shares of the Loomis Sayles High Income Fund, effective September 12, 2003. Prior to September 1, 2003, the predecessor Fund was advised by CDC IXIS Asset Management Advisers, L.P. and subadvised by Loomis, Sayles & Company, L.P. (the Fund’s current adviser) and, prior to September 12, 2003, had a December 31 fiscal year end. The Fund’s current fiscal year end is September 30. |
62
FINANCIAL HIGHLIGHTS (continued)
For a share outstanding throughout each period.
| | | | | | | | | | | | | | | | | | | | | |
| | | | | Income (Loss) from Investment Operations: | | Less Distributions: | |
| | | | | | |
| | | Net asset
value,
beginning
of
the period | | Net
investment
income (c) | | Net realized
and unrealized
gain (loss) | | | Total from
investment
operations | | Dividends from
net investment
income | | | Total
distributions | |
| | | | | | | | | | | | | | | | | | | | | |
LIMITED TERM GOVERNMENT AND AGENCY FUND* | | | | | | | | | | | | | | | | | | | | | |
Class A | | | | | | | | | | | | | | | | | | | | | |
3/31/2008(i) | | $ | 11.00 | | $ | 0.23 | | $ | 0.18 | | | $ | 0.41 | | $ | (0.26 | ) | | $ | (0.26 | ) |
9/30/2007 | | | 11.00 | | | 0.45 | | | 0.03 | | | | 0.48 | | | (0.48 | ) | | | (0.48 | ) |
9/30/2006 | | | 11.09 | | | 0.39 | | | (0.05 | ) | | | 0.34 | | | (0.43 | ) | | | (0.43 | ) |
9/30/2005 | | | 11.30 | | | 0.28 | | | (0.16 | ) | | | 0.12 | | | (0.33 | ) | | | (0.33 | ) |
9/30/2004 | | | 11.51 | | | 0.30 | | | (0.09 | ) | | | 0.21 | | | (0.42 | ) | | | (0.42 | ) |
9/30/2003(d) | | | 11.73 | | | 0.21 | | | (0.07 | ) | | | 0.14 | | | (0.36 | ) | | | (0.36 | ) |
12/31/2002 | | | 11.36 | | | 0.42 | | | 0.49 | | | | 0.91 | | | (0.54 | ) | | | (0.54 | ) |
Class B | | | | | | | | | | | | | | | | | | | | | |
3/31/2008(i) | | | 10.99 | | | 0.19 | | | 0.18 | | | | 0.37 | | | (0.22 | ) | | | (0.22 | ) |
9/30/2007 | | | 10.98 | | | 0.37 | | | 0.03 | | | | 0.40 | | | (0.39 | ) | | | (0.39 | ) |
9/30/2006 | | | 11.07 | | | 0.31 | | | (0.05 | ) | | | 0.26 | | | (0.35 | ) | | | (0.35 | ) |
9/30/2005 | | | 11.28 | | | 0.20 | | | (0.17 | ) | | | 0.03 | | | (0.24 | ) | | | (0.24 | ) |
9/30/2004 | | | 11.49 | | | 0.22 | | | (0.09 | ) | | | 0.13 | | | (0.34 | ) | | | (0.34 | ) |
9/30/2003(d) | | | 11.71 | | | 0.15 | | | (0.06 | ) | | | 0.09 | | | (0.31 | ) | | | (0.31 | ) |
12/31/2002 | | | 11.34 | | | 0.35 | | | 0.48 | | | | 0.83 | | | (0.46 | ) | | | (0.46 | ) |
Class C | | | | | | | | | | | | | | | | | | | | | |
3/31/2008(i) | | | 11.00 | | | 0.19 | | | 0.19 | | | | 0.38 | | | (0.22 | ) | | | (0.22 | ) |
9/30/2007 | | | 10.99 | | | 0.37 | | | 0.03 | | | | 0.40 | | | (0.39 | ) | | | (0.39 | ) |
9/30/2006 | | | 11.08 | | | 0.31 | | | (0.05 | ) | | | 0.26 | | | (0.35 | ) | | | (0.35 | ) |
9/30/2005 | | | 11.30 | | | 0.20 | | | (0.18 | ) | | | 0.02 | | | (0.24 | ) | | | (0.24 | ) |
9/30/2004 | | | 11.50 | | | 0.22 | | | (0.08 | ) | | | 0.14 | | | (0.34 | ) | | | (0.34 | ) |
9/30/2003(d) | | | 11.72 | | | 0.15 | | | (0.06 | ) | | | 0.09 | | | (0.31 | ) | | | (0.31 | ) |
12/31/2002 | | | 11.35 | | | 0.35 | | | 0.48 | | | | 0.83 | | | (0.46 | ) | | | (0.46 | ) |
Class Y | | | | | | | | | | | | | | | | | | | | | |
3/31/2008(i) | | | 11.03 | | | 0.24 | | | 0.18 | | | | 0.42 | | | (0.27 | ) | | | (0.27 | ) |
9/30/2007 | | | 11.03 | | | 0.49 | | | 0.03 | | | | 0.52 | | | (0.52 | ) | | | (0.52 | ) |
9/30/2006 | | | 11.13 | | | 0.43 | | | (0.06 | ) | | | 0.37 | | | (0.47 | ) | | | (0.47 | ) |
9/30/2005 | | | 11.34 | | | 0.31 | | | (0.17 | ) | | | 0.14 | | | (0.35 | ) | | | (0.35 | ) |
9/30/2004 | | | 11.55 | | | 0.32 | | | (0.09 | ) | | | 0.23 | | | (0.44 | ) | | | (0.44 | ) |
9/30/2003(d) | | | 11.78 | | | 0.25 | | | (0.08 | ) | | | 0.17 | | | (0.40 | ) | | | (0.40 | ) |
12/31/2002 | | | 11.41 | | | 0.48 | | | 0.48 | | | | 0.96 | | | (0.59 | ) | | | (0.59 | ) |
| (a) | A sales charge for Class A and Class C (prior to February 1, 2004) shares and a contingent deferred sales charge for Class B and Class C shares are not reflected in total return calculations. Periods less than one year, if applicable, are not annualized. |
| (b) | Computed on an annualized basis for periods less than one year, if applicable. |
| (c) | Per share net investment income has been calculated using the average shares outstanding during the period. |
| (d) | For the nine months ended September 30, 2003. |
| (e) | Represents the total expenses prior to reduction of a portion of the class’s transfer agent expenses |
| (f) | Had certain expenses not been reduced during the period, if applicable, total return would have been lower. Periods less than one year, if applicable, are not annualized. |
See accompanying notes to financial statements.
63
| | | | | | | | | | | | | | | |
| | | | | | | Ratios to Average Net Assets: | | |
| | | | | | |
Net asset
value,
end of
the period | | Total
return
(%) (a)(f) | | Net assets,
end of
the period
(000’s) | | Net
expenses
(%) (b)(h) | | Gross
expenses
(%) (b)(g) | | | Net investment
income
(%) (b) | | Portfolio
turnover
rate (%) |
| | | | | | | | | | | | | | | |
| | | | | | | | | | | | | | | |
| | | | | | | | | | | | | | | |
| $ | 11.15 | | 3.8 | | $ | 106,056 | | 0.93 | | 1.07 | | | 4.14 | | 26 |
| | 11.00 | | 4.5 | | | 108,536 | | 0.99 | | 1.10 | | | 4.13 | | 45 |
| | 11.00 | | 3.2 | | | 114,180 | | 1.04 | | 1.09 | | | 3.57 | | 50 |
| | 11.09 | | 1.1 | | | 141,417 | | 1.24 | | 1.24 | | | 2.50 | | 93 |
| | 11.30 | | 1.9 | | | 106,701 | | 1.32 | | 1.32 | | | 2.60 | | 80 |
| | 11.51 | | 1.2 | | | 117,225 | | 1.37 | | 1.37 | | | 2.41 | | 53 |
| | 11.73 | | 8.2 | | | 106,013 | | 1.35 | | 1.35 | | | 3.66 | | 88 |
| | | | | | | | | | | | | | | |
| | 11.14 | | 3.4 | | | 5,957 | | 1.68 | | 1.82 | | | 3.39 | | 26 |
| | 10.99 | | 3.7 | | | 6,787 | | 1.74 | | 1.85 | | | 3.37 | | 45 |
| | 10.98 | | 2.4 | | | 9,952 | | 1.79 | | 1.84 | | | 2.79 | | 50 |
| | 11.07 | | 0.3 | | | 15,114 | | 1.99 | | 1.99 | | | 1.75 | | 93 |
| | 11.28 | | 1.2 | | | 10,107 | | 2.00 | | 2.00 | | | 1.95 | | 80 |
| | 11.49 | | 0.7 | | | 14,637 | | 2.02 | | 2.02 | | | 1.77 | | 53 |
| | 11.71 | | 7.5 | | | 16,263 | | 2.00 | | 2.00 | | | 3.01 | | 88 |
| | | | | | | | | | | | | | | |
| | 11.16 | | 3.4 | | | 6,885 | | 1.68 | | 1.82 | | | 3.38 | | 26 |
| | 11.00 | | 3.6 | | | 5,261 | | 1.74 | | 1.85 | | | 3.38 | | 45 |
| | 10.99 | | 2.5 | | | 4,230 | | 1.79 | | 1.84 | | | 2.81 | | 50 |
| | 11.08 | | 0.2 | | | 5,715 | | 1.99 | | 1.99 | | | 1.75 | | 93 |
| | 11.30 | | 1.3 | | | 6,949 | | 2.00 | | 2.00 | | | 1.94 | | 80 |
| | 11.50 | | 0.7 | | | 8,704 | | 2.02 | | 2.02 | | | 1.77 | | 53 |
| | 11.72 | | 7.5 | | | 8,079 | | 2.02 | | 2.00 | | | 3.01 | | 88 |
| | | | | | | | | | | | | | | |
| | 11.18 | | 3.9 | | | 5,587 | | 0.68 | | 0.71 | | | 4.38 | | 26 |
| | 11.03 | | 4.8 | | | 4,201 | | 0.71 | | 0.75 | | | 4.43 | | 45 |
| | 11.03 | | 3.4 | | | 2,461 | | 0.74 | | 0.74 | | | 3.89 | | 50 |
| | 11.13 | | 1.2 | | | 2,533 | | 1.02 | | 1.59 | (e) | | 2.77 | | 93 |
| | 11.34 | | 2.1 | | | 4,233 | | 1.13 | | 1.13 | | | 2.82 | | 80 |
| | 11.55 | | 1.5 | | | 6,886 | | 0.93 | | 0.93 | | | 2.87 | | 53 |
| | 11.78 | | 8.6 | | | 8,529 | | 0.88 | | 0.88 | | | 4.14 | | 88 |
| (g) | Represents the total expenses prior to fee reduction and/or reimbursement of a portion of the Fund’s expenses, if applicable. |
| (h) | The investment adviser and/or administrator agreed to reimburse a portion of the Fund’s expenses and/or reduce its fee during the period. Without this reimbursement/fee reduction, expenses would have been higher. |
| (i) | For the six months ended March 31, 2008 (Unaudited). |
| * | The financial information for periods prior to September 30, 2004 reflects the financial information for the CDC Nvest Limited Term U.S. Government Fund’s Class A, Class B, Class C, and Class Y shares which were reorganized into Class A, Class B, Class C, and Class Y shares, respectively, of the Loomis Sayles Limited Term Government and Agency Fund, effective September 12, 2003. Prior to September 1, 2003, the predecessor Fund was advised by CDC IXIS Asset Management Advisers, L.P. and subadvised by Loomis, Sayles & Company, L.P. (the Fund’s current adviser) and, prior to September 12, 2003, had a December 31 fiscal year end. The Fund’s current fiscal year end is September 30. |
64
FINANCIAL HIGHLIGHTS (continued)
For a share outstanding throughout each period.
| | | | | | | | | | | | | | | | | | | | | | | | | | | |
| | | | | Income (Loss) from Investment Operations: | | | Less Distributions: | |
| | | | | | | |
| | | Net asset
value,
beginning
of
the period | | Net
investment
income | | | Net realized
and unrealized
gain (loss) | | | Total from
investment
operations | | | Dividends
from
net investment
income | | | Distributions
from net
realized
capital gains | | | Total
distributions | |
| | | | | | | | | | | | | | | | | | | | | | | | | | | |
MASSACHUSETTS TAX FREE INCOME FUND | | | | | | | | | | | | | | | | | | | | | | | | | | | |
Class A | | | | | | | | | | | | | | | | | | | | | | | | | | | |
3/31/2008(i) | | $ | 16.31 | | $ | 0.32 | (h) | | $ | (0.38 | ) | | $ | (0.06 | ) | | $ | (0.32 | ) | | $ | — | | | $ | (0.32 | ) |
9/30/2007 | | | 16.67 | | | 0.64 | (h) | | | (0.36 | ) | | | 0.28 | | | | (0.64 | ) | | | — | | | | (0.64 | ) |
9/30/2006 | | | 16.62 | | | 0.64 | | | | 0.05 | | | | 0.69 | | | | (0.64 | ) | | | — | | | | (0.64 | ) |
9/30/2005 | | | 16.58 | | | 0.60 | | | | 0.04 | | | | 0.64 | | | | (0.60 | ) | | | — | | | | (0.60 | ) |
9/30/2004 | | | 16.41 | | | 0.61 | | | | 0.17 | | | | 0.78 | | | | (0.61 | ) | | | — | | | | (0.61 | ) |
9/30/2003(e) | | | 16.40 | | | 0.49 | | | | 0.01 | | | | 0.50 | | | | (0.49 | ) | | | — | | | | (0.49 | ) |
12/31/2002 | | | 15.82 | | | 0.67 | | | | 0.59 | | | | 1.26 | | | | (0.68 | ) | | | — | | | | (0.68 | ) |
Class B | | | | | | | | | | | | | | | | | | | | | | | | | | | |
3/31/2008(i) | | | 16.28 | | | 0.26 | (h) | | | (0.38 | ) | | | (0.12 | ) | | | (0.26 | ) | | | — | | | | (0.26 | ) |
9/30/2007 | | | 16.64 | | | 0.52 | (h) | | | (0.36 | ) | | | 0.16 | | | | (0.52 | ) | | | — | | | | (0.52 | ) |
9/30/2006 | | | 16.58 | | | 0.51 | | | | 0.06 | | | | 0.57 | | | | (0.51 | ) | | | — | | | | (0.51 | ) |
9/30/2005 | | | 16.54 | | | 0.46 | | | | 0.05 | | | | 0.51 | | | | (0.47 | ) | | | — | | | | (0.47 | ) |
9/30/2004 | | | 16.37 | | | 0.49 | | | | 0.18 | | | | 0.67 | | | | (0.50 | ) | | | — | | | | (0.50 | ) |
9/30/2003(e) | | | 16.36 | | | 0.41 | | | | 0.01 | | | | 0.42 | | | | (0.41 | ) | | | — | | | | (0.41 | ) |
12/31/2002 | | | 15.78 | | | 0.57 | | | | 0.58 | | | | 1.15 | | | | (0.57 | ) | | | — | | | | (0.57 | ) |
MUNICIPAL INCOME FUND | | | | | | | | | | | | | | | | | | | | | | | | | | | |
Class A | | | | | | | | | | | | | | | | | | | | | | | | | | | |
3/31/2008(i) | | $ | 7.33 | | $ | 0.14 | (h) | | $ | (0.30 | ) | | $ | (0.16 | ) | | $ | (0.14 | ) | | $ | (0.06 | ) | | $ | (0.20 | ) |
9/30/2007 | | | 7.55 | | | 0.28 | (h) | | | (0.19 | ) | | | 0.09 | | | | (0.28 | ) | | | (0.03 | ) | | | (0.31 | ) |
9/30/2006 | | | 7.48 | | | 0.28 | | | | 0.07 | | | | 0.35 | | | | (0.28 | ) | | | — | | | | (0.28 | ) |
9/30/2005 | | | 7.47 | | | 0.28 | | | | 0.01 | | | | 0.29 | | | | (0.28 | ) | | | — | | | | (0.28 | ) |
9/30/2004 | | | 7.41 | | | 0.29 | | | | 0.06 | | | | 0.35 | | | | (0.29 | ) | | | — | | | | (0.29 | ) |
9/30/2003(e) | | | 7.43 | | | 0.23 | | | | (0.02 | ) | | | 0.21 | | | | (0.23 | ) | | | — | | | | (0.23 | ) |
12/31/2002 | | | 7.25 | | | 0.34 | | | | 0.18 | | | | 0.52 | | | | (0.34 | ) | | | — | | | | (0.34 | ) |
Class B | | | | | | | | | | | | | | | | | | | | | | | | | | | |
3/31/2008(i) | | | 7.34 | | | 0.11 | (h) | | | (0.30 | ) | | | (0.19 | ) | | | (0.11 | ) | | | (0.06 | ) | | | (0.17 | ) |
9/30/2007 | | | 7.56 | | | 0.22 | (h) | | | (0.19 | ) | | | 0.03 | | | | (0.22 | ) | | | (0.03 | ) | | | (0.25 | ) |
9/30/2006 | | | 7.49 | | | 0.23 | | | | 0.07 | | | | 0.30 | | | | (0.23 | ) | | | — | | | | (0.23 | ) |
9/30/2005 | | | 7.48 | | | 0.22 | | | | 0.01 | | | | 0.23 | | | | (0.22 | ) | | | — | | | | (0.22 | ) |
9/30/2004 | | | 7.41 | | | 0.24 | | | | 0.07 | | | | 0.31 | | | | (0.24 | ) | | | — | | | | (0.24 | ) |
9/30/2003(e) | | | 7.44 | | | 0.19 | | | | (0.03 | ) | | | 0.16 | | | | (0.19 | ) | | | — | | | | (0.19 | ) |
12/31/2002 | | | 7.25 | | | 0.29 | | | | 0.19 | | | | 0.48 | | | | (0.29 | ) | | | — | | | | (0.29 | ) |
| (a) | A sales charge for Class A and contingent deferred sales charge for Class B shares are not reflected in total return calculations. Periods less than one year, if applicable, are not annualized. |
| (b) | Computed on an annualized basis for periods less than one year, if applicable. |
| (c) | Represents the total expenses prior to fee reduction and/or reimbursement of a portion of the Fund’s expenses, if applicable. |
| (d) | Had certain expenses not been reduced during the period, if applicable, total return would have been lower. Periods less than one year, if applicable, are not annualized. |
| (e) | For the nine months ended September 30, 2003. |
See accompanying notes to financial statements.
65
| | | | | | | | | | | | | | | | | |
| | | | | | | | Ratios to Average Net Assets: | | |
| | | | | | |
Net asset
value,
end of
the period | | Total
return
(%) (a)(d) | | | Net assets,
end of
period
(000’s) | | Net
expenses
(%) (b)(f) | | | Gross
expenses
(%) (b)(c) | | | Net investment
income
(%) (b) | | Portfolio
turnover
rate (%) |
| | | | | | | | | | | | | | | | | |
| | | | | | | | | | | | | | | | | |
| | | | | | | | | | | | | | | | | |
| $ | 15.93 | | (0.4 | ) | | $ | 57,548 | | 0.93 | | | 1.13 | | | 3.94 | | 0 |
| | 16.31 | | 1.7 | | | | 66,585 | | 0.95 | | | 1.16 | | | 3.89 | | 23 |
| | 16.67 | | 4.2 | | | | 72,479 | | 1.02 | (g) | | 1.14 | (g) | | 3.86 | | 8 |
| | 16.62 | | 3.9 | | | | 77,018 | | 1.22 | | | 1.22 | | | 3.59 | | 5 |
| | 16.58 | | 4.9 | | | | 81,427 | | 1.33 | | | 1.33 | | | 3.74 | | 21 |
| | 16.41 | | 3.1 | | | | 86,368 | | 1.38 | | | 1.38 | | | 3.99 | | 9 |
| | 16.40 | | 8.1 | | | | 92,053 | | 1.34 | | | 1.34 | | | 4.19 | | 33 |
| | | | | | | | | | | | | | | | | |
| | 15.90 | | (0.8 | ) | | | 1,278 | | 1.68 | | | 1.88 | | | 3.17 | | 0 |
| | 16.28 | | 0.9 | | | | 1,660 | | 1.70 | | | 1.91 | | | 3.13 | | 23 |
| | 16.64 | | 3.5 | | | | 2,345 | | 1.77 | (g) | | 1.89 | (g) | | 3.10 | | 8 |
| | 16.58 | | 3.1 | | | | 3,207 | | 1.97 | | | 1.97 | | | 2.84 | | 5 |
| | 16.54 | | 4.2 | | | | 4,435 | | 2.00 | | | 2.00 | | | 3.08 | | 21 |
| | 16.37 | | 2.6 | | | | 6,185 | | 2.03 | | | 2.03 | | | 3.34 | | 9 |
| | 16.36 | | 7.4 | | | | 6,742 | | 1.99 | | | 1.99 | | | 3.54 | | 33 |
| | | | | | | | | | | | | | | | | |
| | | | | | | | | | | | | | | | | |
| $ | 6.97 | | (2.3 | ) | | $ | 72,986 | | 0.93 | | | 1.00 | | | 3.79 | | 0 |
| | 7.33 | | 1.2 | | | | 82,144 | | 0.95 | | | 1.03 | | | 3.72 | | 17 |
| | 7.55 | | 4.8 | | | | 93,448 | | 0.97 | | | 0.99 | | | 3.83 | | 14 |
| | 7.48 | | 3.9 | | | | 102,255 | | 1.07 | | | 1.07 | | | 3.65 | | 29 |
| | 7.47 | | 4.9 | | | | 111,801 | | 1.11 | | | 1.11 | | | 4.00 | | 35 |
| | 7.41 | | 2.9 | | | | 126,906 | | 1.10 | | | 1.10 | | | 4.14 | | 42 |
| | 7.43 | | 7.3 | | | | 133,005 | | 1.06 | | | 1.06 | | | 4.67 | | 33 |
| | | | | | | | | | | | | | | | | |
| | 6.98 | | (2.7 | ) | | | 2,740 | | 1.68 | | | 1.75 | | | 3.03 | | 0 |
| | 7.34 | | 0.4 | | | | 3,797 | | 1.70 | | | 1.78 | | | 2.97 | | 17 |
| | 7.56 | | 4.0 | | | | 5,188 | | 1.72 | | | 1.75 | | | 3.07 | | 14 |
| | 7.49 | | 3.1 | | | | 7,610 | | 1.82 | | | 1.82 | | | 2.90 | | 29 |
| | 7.48 | | 4.2 | | | | 9,087 | | 1.86 | | | 1.86 | | | 3.25 | | 35 |
| | 7.41 | | 2.2 | | | | 10,884 | | 1.85 | | | 1.85 | | | 3.39 | | 42 |
| | 7.44 | | 6.7 | | | | 12,326 | | 1.81 | | | 1.81 | | | 3.92 | | 33 |
| (f) | The investment adviser and/or administrator has agreed to reimburse a portion of the Fund’s expenses and/or reduce its fee during the period. Without this reimbursement/fee reduction, if applicable, expenses would have been higher. |
| (g) | Includes expense recapture of 0.01%. |
| (h) | Per share net investment income has been calculated using the average shares outstanding during the period. |
| (i) | For the six months ended March 31, 2008 (Unaudited). |
66
FINANCIAL HIGHLIGHTS (continued)
For a share outstanding throughout each period.
| | | | | | | | | | | | | | | | | | | | | | | | | | | | | |
| | | | | Income (Loss) from Investment Operations: | | | Less Distributions: | | | |
| | | | | | | | |
| | | Net asset
value,
beginning
of
the period | | Net
investment
income (c) | | Net realized
and unrealized
gain (loss) | | | Total from
investment
operations | | | Dividends
from
net investment
income | | | Distributions
from net
realized
capital gains | | | Total
distributions | | | Redemption
fees (f) |
| | | | | | | | | | | | | | | | | | | | | | | | | | | | | |
STRATEGIC INCOME FUND* | | | | | | | | | | | | | | | | | | | | | | | | | | | | | |
Class A | | | | | | | | | | | | | | | | | | | | | | | | | | | | | |
3/31/2008(i) | | $ | 15.18 | | $ | 0.47 | | $ | (0.67 | ) | | $ | (0.20 | ) | | $ | (0.51 | ) | | $ | (0.01 | ) | | $ | (0.52 | ) | | $ | 0.00 |
9/30/2007 | | | 14.60 | | | 0.80 | | | 0.60 | | | | 1.40 | | | | (0.82 | ) | | | — | | | | (0.82 | ) | | | 0.00 |
9/30/2006 | | | 14.17 | | | 0.71 | | | 0.53 | | | | 1.24 | | | | (0.81 | ) | | | — | | | | (0.81 | ) | | | 0.00 |
9/30/2005 | | | 13.57 | | | 0.66 | | | 0.70 | | | | 1.36 | | | | (0.76 | ) | | | — | | | | (0.76 | ) | | | 0.00 |
9/30/2004 | | | 12.57 | | | 0.75 | | | 1.11 | | | | 1.86 | | | | (0.86 | ) | | | — | | | | (0.86 | ) | | | 0.00 |
9/30/2003(d) | | | 10.72 | | | 0.57 | | | 1.93 | | | | 2.50 | | | | (0.65 | ) | | | — | | | | (0.65 | ) | | | — |
12/31/2002 | | | 9.88 | | | 0.75 | | | 0.72 | | | | 1.47 | | | | (0.63 | ) | | | — | | | | (0.63 | ) | | | — |
Class B | | | | | | | | | | | | | | | | | | | | | | | | | | | | | |
3/31/2008(i) | | | 15.25 | | | 0.41 | | | (0.66 | ) | | | (0.25 | ) | | | (0.46 | ) | | | (0.01 | ) | | | (0.47 | ) | | | 0.00 |
9/30/2007 | | | 14.66 | | | 0.69 | | | 0.60 | | | | 1.29 | | | | (0.70 | ) | | | — | | | | (0.70 | ) | | | 0.00 |
9/30/2006 | | | 14.22 | | | 0.61 | | | 0.52 | | | | 1.13 | | | | (0.69 | ) | | | — | | | | (0.69 | ) | | | 0.00 |
9/30/2005 | | | 13.60 | | | 0.56 | | | 0.71 | | | | 1.27 | | | | (0.65 | ) | | | — | | | | (0.65 | ) | | | 0.00 |
9/30/2004 | | | 12.59 | | | 0.65 | | | 1.10 | | | | 1.75 | | | | (0.74 | ) | | | — | | | | (0.74 | ) | | | 0.00 |
9/30/2003(d) | | | 10.71 | | | 0.51 | | | 1.92 | | | | 2.43 | | | | (0.55 | ) | | | — | | | | (0.55 | ) | | | — |
12/31/2002 | | | 9.88 | | | 0.67 | | | 0.73 | | | | 1.40 | | | | (0.57 | ) | | | — | | | | (0.57 | ) | | | — |
Class C | | | | | | | | | | | | | | | | | | | | | | | | | | | | | |
3/31/2008(i) | | | 15.24 | | | 0.41 | | | (0.65 | ) | | | (0.24 | ) | | | (0.46 | ) | | | (0.01 | ) | | | (0.47 | ) | | | 0.00 |
9/30/2007 | | | 14.65 | | | 0.69 | | | 0.60 | | | | 1.29 | | | | (0.70 | ) | | | — | | | | (0.70 | ) | | | 0.00 |
9/30/2006 | | | 14.22 | | | 0.61 | | | 0.51 | | | | 1.12 | | | | (0.69 | ) | | | — | | | | (0.69 | ) | | | 0.00 |
9/30/2005 | | | 13.60 | | | 0.55 | | | 0.72 | | | | 1.27 | | | | (0.65 | ) | | | — | | | | (0.65 | ) | | | 0.00 |
9/30/2004 | | | 12.58 | | | 0.64 | | | 1.11 | | | | 1.75 | | | | (0.73 | ) | | | — | | | | (0.73 | ) | | | 0.00 |
9/30/2003(d) | | | 10.70 | | | 0.50 | | | 1.93 | | | | 2.43 | | | | (0.55 | ) | | | — | | | | (0.55 | ) | | | — |
12/31/2002 | | | 9.87 | | | 0.67 | | | 0.73 | | | | 1.40 | | | | (0.57 | ) | | | — | | | | (0.57 | ) | | | — |
Class Y | | | | | | | | | | | | | | | | | | | | | | | | | | | | | |
3/31/2008(i) | | | 15.17 | | | 0.49 | | | (0.66 | ) | | | (0.17 | ) | | | (0.53 | ) | | | (0.01 | ) | | | (0.54 | ) | | | 0.00 |
9/30/2007 | | | 14.59 | | | 0.85 | | | 0.59 | | | | 1.44 | | | | (0.86 | ) | | | — | | | | (0.86 | ) | | | 0.00 |
9/30/2006 | | | 14.17 | | | 0.76 | | | 0.51 | | | | 1.27 | | | | (0.85 | ) | | | — | | | | (0.85 | ) | | | 0.00 |
9/30/2005 | | | 13.57 | | | 0.70 | | | 0.70 | | | | 1.40 | | | | (0.80 | ) | | | — | | | | (0.80 | ) | | | 0.00 |
9/30/2004 | | | 12.58 | | | 0.78 | | | 1.11 | | | | 1.89 | | | | (0.90 | ) | | | — | | | | (0.90 | ) | | | 0.00 |
9/30/2003(d) | | | 10.74 | | | 0.60 | | | 1.93 | | | | 2.53 | | | | (0.69 | ) | | | — | | | | (0.69 | ) | | | — |
12/31/2002 | | | 9.90 | | | 0.80 | | | 0.71 | | | | 1.51 | | | | (0.67 | ) | | | — | | | | (0.67 | ) | | | — |
| (a) | A sales charge for Class A and Class C (prior to February 1, 2004) shares and a contingent deferred sales charge for Class B and Class C shares are not reflected in total return calculations. Periods less than one year, if applicable, are not annualized. |
| (b) | Computed on an annualized basis for periods less than one year, if applicable. |
| (c) | Per share net investment income has been calculated using the average shares outstanding during the period. |
| (d) | For the nine months ended September 30, 2003. |
| (e) | Had certain expenses not been reduced during the period, if applicable, total return would have been lower. Periods less than one year, if applicable, are not annualized. |
| (f) | Amount rounds to less than $0.01 per share, if applicable. |
See accompanying notes to financial statements.
67
| | | | | | | | | | | | | | | |
| | | | | | | | Ratios to Average Net Assets: | | |
| | | | | | |
Net asset
value,
end of
the period | | Total
return
(%) (a)(e) | | | Net assets,
end of
the period
(000’s) | | Net
expenses
(%) (b)(h) | | Gross
expenses
(%) (b)(g) | | Net investment
income (loss)
(%) (b) | | Portfolio
turnover
rate (%) |
| | | | | | | | | | | | | | | |
| | | | | | | | | | | | | | | |
| | | | | | | | | | | | | | | |
| $ | 14.46 | | (1.3 | ) | | $ | 6,494,294 | | 0.98 | | 0.98 | | 6.24 | | 21 |
| | 15.18 | | 9.9 | | | | 5,749,315 | | 1.00 | | 1.00 | | 5.39 | | 22 |
| | 14.60 | | 9.0 | | | | 2,782,887 | | 1.05 | | 1.05 | | 5.01 | | 21 |
| | 14.17 | | 10.2 | | | | 977,198 | | 1.18 | | 1.18 | | 4.71 | | 14 |
| | 13.57 | | 15.2 | | | | 343,586 | | 1.23 | | 1.23 | | 5.66 | | 28 |
| | 12.57 | | 23.7 | | | | 140,576 | | 1.28 | | 1.31 | | 6.49 | | 27 |
| | 10.72 | | 15.5 | | | | 92,303 | | 1.33 | | 1.33 | | 7.38 | | 30 |
| | | | | | | | | | | | | | | |
| | 14.53 | | (1.7 | ) | | | 207,028 | | 1.73 | | 1.73 | | 5.45 | | 21 |
| | 15.25 | | 9.1 | | | | 233,418 | | 1.76 | | 1.76 | | 4.61 | | 22 |
| | 14.66 | | 8.2 | | | | 179,927 | | 1.79 | | 1.79 | | 4.26 | | 21 |
| | 14.22 | | 9.5 | | | | 144,081 | | 1.93 | | 1.93 | | 3.98 | | 14 |
| | 13.60 | | 14.3 | | | | 128,714 | | 1.98 | | 1.98 | | 4.91 | | 28 |
| | 12.59 | | 23.0 | | | | 118,217 | | 2.03 | | 2.06 | | 5.73 | | 27 |
| | 10.71 | | 14.6 | | | | 98,501 | | 2.08 | | 2.08 | | 6.63 | | 30 |
| | | | | | | | | | | | | | | |
| | 14.53 | | (1.6 | ) | | | 4,442,405 | | 1.73 | | 1.73 | | 5.49 | | 21 |
| | 15.24 | | 9.1 | | | | 3,843,823 | | 1.75 | | 1.75 | | 4.63 | | 22 |
| | 14.65 | | 8.1 | | | | 1,812,278 | | 1.79 | | 1.79 | | 4.24 | | 21 |
| | 14.22 | | 9.5 | | | | 765,200 | | 1.93 | | 1.93 | | 3.93 | | 14 |
| | 13.60 | | 14.3 | | | | 255,705 | | 1.98 | | 1.98 | | 4.87 | | 28 |
| | 12.58 | | 23.0 | | | | 66,394 | | 2.03 | | 2.06 | | 5.73 | | 27 |
| | 10.70 | | 14.7 | | | | 27,727 | | 2.08 | | 2.08 | | 6.63 | | 30 |
| | | | | | | | | | | | | | | |
| | 14.46 | | (1.2 | ) | | | 846,124 | | 0.73 | | 0.73 | | 6.52 | | 21 |
| | 15.17 | | 10.2 | | | | 638,868 | | 0.74 | | 0.74 | | 5.67 | | 22 |
| | 14.59 | | 9.3 | | | | 271,065 | | 0.78 | | 0.78 | | 5.30 | | 21 |
| | 14.17 | | 10.5 | | | | 50,369 | | 0.91 | | 0.91 | | 4.98 | | 14 |
| | 13.57 | | 15.5 | | | | 10,833 | | 1.00 | | 1.08 | | 5.93 | | 28 |
| | 12.58 | | 24.0 | | | | 2,193 | | 0.97 | | 0.97 | | 6.83 | | 27 |
| | 10.74 | | 15.9 | | | | 1,039 | | 0.94 | | 0.94 | | 7.77 | | 30 |
| (g) | Represents the total expenses prior to fee reduction and/or reimbursement of a portion of the Fund’s expenses, if applicable. |
| (h) | The investment adviser and/or administrator has agreed to reimburse a portion of the Fund’s expenses and/or reduce its fee during the period. Without this reimbursement/fee reduction, expenses would have been higher. |
| (i) | For the six months ended March 31, 2008 (Unaudited). |
| * | The financial information for periods prior to September 30, 2004 reflects the financial information for CDC Nvest Strategic Income Fund’s Class A, Class B, Class C and Class Y shares, which were reorganized into Class A, Class B, Class C and Class Y shares, respectively, of Loomis Sayles Strategic Income Fund, effective September 12, 2003. Prior to September 1, 2003, the predecessor Fund was advised by CDC IXIS Asset Management Advisers, L.P. and subadvised by Loomis, Sayles & Company, L.P. (the Fund’s current adviser) and, prior to September 12, 2003, had a December 31 fiscal year end. The Fund’s current fiscal year end is September 30. |
68
NOTESTO FINANCIAL STATEMENTS
March 31, 2008 (Unaudited)
1. Organization. Natixis Funds Trust I, Natixis Funds Trust II and Loomis Sayles Funds II (the “Trusts” and each a “Trust”) are each organized as a Massachusetts business trust. Each Trust is registered under the Investment Company Act of 1940, as amended (“the 1940 Act”), as an open-end management investment company. Each Declaration of Trust permits the Board of Trustees to authorize the issuance of an unlimited number of shares of the Trust in multiple series. Information presented in these financial statements pertains to certain fixed income funds of the Trusts; the financial statements for the other funds of the Trusts are presented in separate reports. The following funds (individually, a “Fund” and collectively, the “Funds”) are included in this report:
Natixis Funds Trust I:
Loomis Sayles Core Plus Bond Fund (the “Core Plus Bond Fund”)
Natixis Funds Trust II:
Loomis Sayles Massachusetts Tax Free Income Fund (the “Massachusetts Tax Free Income Fund”)
Loomis Sayles Funds II:
Loomis Sayles High Income Fund (the “High Income Fund”)
Loomis Sayles International Bond Fund (the “International Bond Fund”)
Loomis Sayles Limited Term Government and Agency Fund (the “Limited Term Government and Agency Fund”)
Loomis Sayles Municipal Income Fund (the “Municipal Income Fund”)
Loomis Sayles Strategic Income Fund (the “Strategic Income Fund”)
Core Plus Bond Fund, High Income Fund, International Bond Fund, Limited Term Government and Agency Fund, and Strategic Income Fund each offer Class A, Class C and Class Y shares. Massachusetts Tax Free Income Fund and Municipal Income Fund each offer Class A shares. Effective October 12, 2007, Class B shares are no longer offered. Existing Class B shareholders may continue to reinvest dividends into Class B shares and exchange their Class B shares for Class B shares of other Natixis Funds subject to existing exchange privileges as described in the Prospectus. On February 29, 2008, High Income Fund began offering Class Y Shares.
On February 29, 2008, the Board of Trustees approved the liquidation and termination of the Massachusetts Tax Free Income Fund and the Municipal Income Fund. Effective at the close of business on March 14, 2008, no new accounts may be opened in Class A shares of the Massachusetts Tax Free Income and Municipal Income Funds. Effective at the close of business on April 11, 2008, no additional investments may be made in Class A shares of the Massachusetts Tax Free Income and Municipal Income Funds. It is expected that the sale of the Massachusetts Tax Free Income and Municipal Income Funds’ assets and the corresponding liquidating distributions to shareholders will be completed by June 13, 2008.
Class A shares of all Funds except Limited Term Government and Agency Fund and Massachusetts Tax Free Income Fund are sold with a maximum front-end sales charge of 4.50%. Class A shares of Limited Term Government and Agency Fund are sold with a maximum front-end sales charge of 3.00% and Class A shares of Massachusetts Tax Free Income Fund are sold with a maximum front-end sales charge of 4.25%. Class B shares do not pay a front-end sales charge, but pay higher Rule 12b-1 fees than Class A shares for eight years (at which point they automatically convert to Class A shares), and are subject to a contingent deferred sales charge (“CDSC”) if those shares are redeemed within six years of purchase. Class C shares do not pay a front-end sales charge, do not convert to any other Class of shares and pay higher Rule 12b-1 fees than Class A shares and may be subject to a CDSC of 1.00% if those shares are redeemed within one year. Class Y shares do not pay a front-end sales charge, a CDSC or Rule 12b-1 fees. They are generally intended for institutional investors with a minimum initial investment of $100,000, though some categories of investors are excepted from the minimum investment amount as outlined in the Fund’s prospectus.
Most expenses of the Trusts can be directly attributed to a fund. Expenses which cannot be directly attributed to a fund are generally apportioned based on the relative net assets of each of the funds in the Trusts. Expenses of a fund are borne pro rata by the holders of each class of shares, except that each class bears expenses unique to that class (including the Rule 12b-1 service and distribution fees and transfer agent fees applicable to such class). In addition, each class votes as a class only with respect to its own Rule 12b-1 Plan. Shares of each class would receive their pro rata share of the net assets of a fund if the fund were liquidated. The Trustees approve separate dividends from net investment income on each class of shares.
2. Significant Accounting Policies. The following is a summary of significant accounting policies consistently followed by each Fund in the preparation of its financial statements. The Funds’ financial statements are prepared in accordance with accounting principles generally accepted in the United States of America which require the use of management estimates that affect the reported amounts and disclosures in the financial statements. Actual results could differ from those estimates.
a. Security Valuation. Debt securities (other than short-term obligations purchased with an original or remaining maturity of sixty days or less) are generally valued on the basis of evaluated bids furnished to the Funds by a pricing service recommended by the investment adviser and approved by the Board of Trustees, which service determines valuations for normal, institutional-size trading units of such securities using market information, transactions for comparable securities and various relationships between securities which are generally recognized by institutional traders. Equity securities, including closed-end investment companies and exchange-traded funds, for which market quotations are readily available are valued at market value, as reported by pricing services recommended by the investment adviser and approved by the Board of Trustees. Such pricing services generally use the security’s last sale price on the exchange or market where the security is primarily traded or, if there is no reported sale during the day, the closing bid price. Securities traded on the NASDAQ Global Select Market, NASDAQ Global Market and NASDAQ Capital Market are valued at the NASDAQ Official Closing Price (“NOCP”), or if lacking a NOCP, at the most recent bid quotation on the applicable NASDAQ market. Broker-dealer bid quotations may also be used to value debt and equity securities where a pricing service does not price a security or where a pricing service does not provide a reliable price for the security. In instances where broker-dealer bid quotations are not available, certain securities held by the Funds may be valued on the basis of a price provided by a principal market maker. Short-term obligations purchased with an original or remaining maturity of sixty days or less are valued at amortized cost, which approximates market value. Securities for which market quotations
69
NOTESTO FINANCIAL STATEMENTS (continued)
March 31, 2008 (Unaudited)
are not readily available are valued at fair value as determined in good faith by the Funds’ investment adviser using consistently applied procedures under the general supervision of the Board of Trustees. Investments in other open-end investment companies are valued at their net asset value each day.
Certain Funds may hold securities traded in foreign markets. Foreign securities are valued at the market price in the foreign market. However, if events occurring after the close of the foreign market (but before the close of regular trading on the New York Stock Exchange) are believed to materially affect the value of those securities, such securities are fair valued pursuant to procedures approved by the Board of Trustees. When fair valuing securities, the Funds may, among other things, use modeling tools or other processes that may take into account factors such as securities market activity and/or significant events that occur after the close of the foreign market and before the Funds calculate their net asset values.
b. Security Transactions and Related Investment Income. Security transactions are accounted for on trade date. Dividend income is recorded on ex-dividend date, or in the case of certain foreign securities, as soon as the Fund is notified, and interest income is recorded on an accrual basis. Interest income is increased by the accretion of discount and decreased by the amortization of premium. Investment income is recorded net of foreign taxes withheld when applicable. In determining net gain or loss on securities sold, the cost of securities has been determined on an identified cost basis. Investment income, non-class specific expenses and realized and unrealized gains and losses are allocated on a pro rata basis to each class based on the relative net assets of each class to the total net assets of the Fund.
c. Foreign Currency Translation. The books and records of the Funds are maintained in U.S. dollars. The value of securities, currencies and other assets and liabilities denominated in currencies other than U.S. dollars are translated into U.S. dollars based upon foreign exchange rates prevailing at the end of the period. Purchases and sales of investment securities, income and expenses are translated on the respective dates of such transactions.
Since the values of investment securities are presented at the foreign exchange rates prevailing at the end of the period, it is not practical to isolate that portion of the results of operations arising from changes in exchange rates from fluctuations which arise due to changes in market prices of the investment securities. Such changes are included with the net realized and unrealized gain or loss on investments.
Net realized foreign exchange gains or losses arise from sales of foreign currency, currency gains or losses realized between the trade and settlement dates on securities transactions, and the difference between the amounts of dividends, interest and foreign withholding taxes recorded on the Funds’ books and the U.S. dollar equivalent of the amounts actually received or paid. Net unrealized foreign exchange gains and losses arise from changes in the value of assets and liabilities, other than investment securities, at the end of the fiscal period, resulting from changes in exchange rates.
Each Fund may use foreign currency exchange contracts to facilitate transactions in foreign-denominated investments. Losses may arise from changes in the value of the foreign currency or if the counterparties do not perform under the contracts’ terms.
Each Fund (except Massachusetts Tax Free Income Fund and Municipal Income Fund) may purchase investments of foreign issuers. Investing in securities of foreign issuers involves special risks and considerations not typically associated with investing in U.S. companies and securities of the U.S. government. These risks include revaluation of currencies and the risk of appropriation. Moreover, the markets for securities of many foreign issuers may be less liquid and the prices of such securities may be more volatile than those of comparable U.S. companies and the U.S. government.
d. Forward Foreign Currency Contracts. International Bond Fund may enter into forward foreign currency exchange contracts. Contracts to buy generally are used to acquire exposure to foreign currencies, while contracts to sell generally are used to hedge a fund’s investments against currency fluctuation. Also, a contract to buy or sell can offset a previous contract. These contracts involve market risk in excess of the unrealized gain or loss reflected in the Fund’s Statement of Assets and Liabilities. The U.S. dollar value of the currencies a Fund has committed to buy or sell represents the aggregate exposure to each currency the Fund has acquired or hedged through currency contracts outstanding at period end.
All contracts are “marked-to-market” daily at the applicable exchange rates and any gains or losses are recorded for financial statement purposes as unrealized until settlement date. Risks may arise upon entering into these contracts from the potential inability of counterparties to meet the terms of their contracts and from unanticipated movements in the value of a foreign currency relative to the U.S. dollar. At March 31, 2008, the International Bond Fund had the following open forward foreign currency exchange contracts:
| | | | | | | | | | | | | |
Contract to Buy/Sell | | Delivery
Date | | Currency | | Units | |
Value
| | Unrealized Appreciation (Depreciation) | |
| | | | | | | | | | | | | |
Buy | | 6/18/2008 | | Australian Dollar | | 220,000 | | $ | 198,731 | | $ | (5,143 | ) |
Sell | | 6/18/2008 | | Australian Dollar | | 220,000 | | | 198,730 | | | 5,097 | |
Sell | | 6/18/2008 | | Canadian Dollar | | 300,000 | | | 291,519 | | | 9,901 | |
Buy | | 6/18/2008 | | Iceland Krona | | 5,500,000 | | | 72,163 | | | 2,521 | |
Sell | | 6/18/2008 | | New Zealand Dollar | | 252,087 | | | 195,482 | | | 8,392 | |
| Buy | | 6/18/2008 | | New Zealand Dollar | | 256,564 | | | 198,953 | | | (4,874 | ) |
70
NOTESTO FINANCIAL STATEMENTS (continued)
March 31, 2008 (Unaudited)
e. Federal and Foreign Income Taxes. The Trusts treat each Fund as a separate entity for federal income tax purposes. Each Fund intends to meet the requirements of the Internal Revenue Code applicable to regulated investment companies, and to distribute to its shareholders substantially all of its net investment income and any net realized capital gains at least annually. Financial Accounting Standards Board (“FASB”) Interpretation No. 48, Accounting for Uncertainty in Income Taxes – an Interpretation of FASB Statement 109 (“FIN 48”) was issued and became effective for fiscal years beginning after December 15, 2006. FIN 48 sets forth a threshold for financial statement recognition, measurement and disclosure of a tax position taken or expected to be taken on a tax return. Management has performed an analysis of the Fund’s tax positions taken on federal and state tax returns that remain subject to examinations (tax years ended September 30, 2004-2007) and has concluded that no provisions for income tax are required. Fund Management is not aware of any events that are reasonably possible to occur in the next six months that would result in the amounts of any unrecognized tax benefits significantly increasing or decreasing for the Fund. However, management’s conclusions regarding FIN 48 may be subject to review and adjustment at a later date based on factors including, but not limited to, further implementation guidance from the FASB, new tax laws, regulations and interpretations thereof.
A Fund may be subject to foreign taxes on income and gains on investments that are accrued based upon the Fund’s understanding of the tax rules and regulations that exist in the countries in which the Fund invests. Foreign governments may also impose taxes or other payments on investments with respect to foreign securities. Such taxes are accrued as applicable.
f. Dividends and Distributions to Shareholders. Dividends and distributions are recorded on ex-dividend date. The timing and characterization of certain income and capital gain distributions are determined annually in accordance with federal tax regulations, which may differ from accounting principles generally accepted in the United States of America. Permanent differences are primarily due to differing treatments for book and tax purposes of items such as foreign currency transactions, premium amortization, paydowns gains and losses, expired capital loss carryforwards, return of capital and capital gains distributions from REITS and market discount adjustments. Permanent book and tax basis differences relating to shareholder distributions will result in reclassifications to capital accounts. Temporary differences between book and tax distributable earnings are primarily due to deferred Trustees’ fees, wash sales, premium amortization accruals, dividends payable, straddle loss deferrals, REIT basis adjustments, TIP discount accretion, defaulted bond interest, capital loss carryforwards and post-October capital loss deferrals. Distributions from net investment income and short-term capital gains are considered to be ordinary income for tax purposes.
The tax characterization of distributions is determined on an annual basis. The tax character of distributions paid to shareholders during the year ended September 30, 2007 was as follows:
| | | | | | | | | | | | |
| | | 2007 Distributions Paid From: |
Fund | | Ordinary Income | | Long-Term Capital Gains | | Exempt
Interest
Dividends | | Total |
Core Plus Bond Fund | | $ | 10,094,728 | | $ | — | | $ | — | | $ | 10,094,728 |
High Income Fund | | | 2,951,864 | | | — | | | — | | | 2,951,864 |
Limited Term Government and Agency Fund | | | 5,397,224 | | | — | | | — | | | 5,397,224 |
Massachusetts Tax Free Income Fund | | | 42,308 | | | — | | | 2,695,971 | | | 2,738,279 |
Municipal Income Fund | | | 80,874 | | | 448,766 | | | 3,338,192 | | | 3,867,832 |
Strategic Income Fund | | | 413,178,709 | | | — | | | — | | | 413,178,709 |
As of September 30, 2007, the capital loss carryforwards and post-October losses were as follows:
| | | | | | | | | | | | | | | | | | |
Capital Loss Carryforward | | Core Plus
Bond Fund | | High Income
Fund | | Limited Term
Government
and Agency
Fund | | Massachusetts
Tax Free Income Fund | | Municipal
Income
Fund | | Strategic
Income
Fund |
Expires September 30, 2008 | | $ | — | | $ | 11,101,868 | | $ | 4,165,768 | | $ | — | | $ | — | | $ | — |
Expires September 30, 2009 | | | — | | | 43,374,721 | | | 4,128,091 | | | — | | | — | | | — |
Expires September 30, 2010 | | | 20,430,847 | | | 26,826,634 | | | 663,109 | | | 204,147 | | | — | | | — |
Expires September 30, 2011 | | | — | | | — | | | 425,323 | | | — | | | — | | | — |
Expires September 30, 2012 | | | — | | | — | | | 193,904 | | | — | | | — | | | — |
Expires September 30, 2013 | | | — | | | — | | | — | | | 154,156 | | | — | | | — |
Expires September 30, 2014 | | | 181,728 | | | — | | | 2,770,324 | | | — | | | — | | | — |
Expires September 30, 2015 | | | — | | | — | | | 4,336,746 | | | — | | | — | | | — |
| | | | | | | | | | | | | | | | | | |
Total capital loss carryforward | | $ | 20,612,575 | | $ | 81,303,223 | | $ | 16,683,265 | | $ | 358,303 | | $ | — | | $ | — |
Deferred net capital losses (post-October 2006) | | | — | | | — | | | 368,090 | | | — | | | — | | | — |
71
NOTESTO FINANCIAL STATEMENTS (continued)
March 31, 2008 (Unaudited)
g. Repurchase Agreements. Each Fund, through its custodian, receives delivery of the underlying securities collateralizing repurchase agreements. It is each Fund’s policy that the market value of the collateral be at least equal to 102% of the repurchase price, including interest. The repurchase agreements are tri-party arrangements whereby the collateral is held at the custodian bank in a segregated account for the benefit of the Fund and on behalf of the counterparty. Repurchase agreements could involve certain risks in the event of default or insolvency of the counterparty including possible delays or restrictions upon a Fund’s ability to dispose of the underlying securities.
h. Securities Lending. The Funds have entered into an agreement with State Street Bank and Trust Company (“State Street Bank”), as agent of the Funds, to lend securities to certain designated borrowers. The loans are collateralized with cash or securities in an amount equal to at least 105% or 102% of the market value of the loaned international or domestic securities, respectively, when the loan is initiated. Thereafter, the value of the collateral must remain at least 102% of the market value of loaned securities for U.S. equities and U.S. corporate debt; at least 105% of the market value of loaned securities for non-U.S. equities; and at least 100% of the market value of loaned securities for U.S. government securities, sovereign debt issued by non-U.S. governments and non-U.S. corporate debt. In the event that the market value of the collateral falls below the required percentages described above, the borrower will deliver additional collateral on the next business day. As with other extensions of credit, the Funds may bear the risk of loss with respect to the investment of the collateral. The Funds invest cash collateral in short-term investments, a portion of the income from which is remitted to the borrowers and the remainder allocated between the Funds and State Street Bank as lending agent. The value of securities on loan to borrowers and the value of collateral held by the Funds with respect to such loans at March 31, 2008 were as follows:
| | | | | | |
Fund | | Value of
Securities on Loan | | Value of Collateral
Received |
Core Plus Bond Fund | | $ | 24,368,052 | | $ | 24,906,801 |
High Income Fund | | | 3,735,821 | | | 3,750,635 |
International Bond Fund | | | — | | | — |
Limited Term Government and Agency Fund | | | 23,983,418 | | | 24,412,261 |
Massachusetts Tax Free Income Fund | | | — | | | — |
Municipal Income Fund | | | — | | | — |
Strategic Income Fund | | | 769,257,993 | | | 783,942,770 |
i. Delayed Delivery Commitments. Each Fund may purchase or sell securities on a when-issued or forward commitment basis. Payment and delivery may take place a month or more after the date of the transaction. The price of the underlying securities and the date when the securities will be delivered and paid for are fixed at the time the transaction is negotiated. Losses may arise due to changes in the market value of the underlying securities or if the counterparty does not perform under the contract. Collateral consisting of liquid securities or cash and cash equivalents is maintained in an amount at least equal to these commitments with the custodian.
j. Indemnifications. Under the Trusts’ organizational documents, their officers and Trustees are indemnified against certain liability arising out of the performance of their duties to the Funds. Additionally, in the normal course of business, the Funds enter into contracts with service providers that contain general indemnification clauses. The Funds’ maximum exposure under these arrangements is unknown as this would involve future claims that may be made against the Funds that have not yet occurred. However, based on experience, the Funds expect the risk of loss to be remote.
k. New Accounting Pronouncements. In September 2006, Statement of Financial Accounting Standards No. 157, Fair Value Measurements (“FAS 157”), was issued and is effective for fiscal years beginning after November 15, 2007. FAS 157 defines fair value, establishes a framework for measuring fair value and expands disclosures about fair value measurements. Management has evaluated the impact the adoption of FAS 157 will have on the Funds’ financial statements and believes that such impact will be limited to expanded disclosure in the Funds’ financial statements regarding inputs used in determining the value of the Funds’ investments and will not have a material impact on the Funds’ net assets or results of operations.
In March 2008, Statement of Financial Accounting Standards No. 161, Disclosures about Derivative Instruments and Hedging Activities (“FAS 161”), was issued and will be effective for fiscal years and interim periods beginning after November 15, 2008. FAS 161 requires enhanced disclosures about funds’ derivative and hedging activities. Management is currently evaluating the impact the adoption of FAS 161 will have on the Funds’ financial statement disclosures.
72
NOTESTO FINANCIAL STATEMENTS (continued)
March 31, 2008 (Unaudited)
3. Purchases and Sales of Securities. For the six months ended March 31, 2008, purchases and sales of securities (excluding short-term investments and including paydowns) were as follows:
| | | | | | | | | | | | |
| | | U.S. Government and Agency Securities | | Other Securities |
Fund | | Purchases | | Sales | | Purchases | | Sales |
Core Plus Bond Fund | | $ | 37,052,238 | | $ | 74,090,035 | | $ | 18,143,638 | | $ | 34,075,298 |
High Income Fund | | | 515,073 | | | 4,400,440 | | | 6,384,095 | | | 3,297,374 |
International Bond Fund | | | — | | | — | | | 13,065,047 | | | 2,009,458 |
Limited Term Government and Agency Fund | | | 21,128,653 | | | 27,537,953 | | | 5,512,243 | | | 677,374 |
Massachusetts Tax Free Income Fund | | | — | | | — | | | — | | | 9,495,079 |
Municipal Income Fund | | | — | | | — | | | — | | | 8,973,755 |
Strategic Income Fund | | | 214,163,354 | | | 827,165,920 | | | 3,365,273,883 | | | 1,530,202,491 |
4. Management Fees and Other Transactions with Affiliates.
a. Management Fees. Loomis, Sayles & Company, L.P. (“Loomis Sayles”) serves as investment adviser to each Fund. Under the terms of the management agreements, each Fund pays a management fee at the following annual rates, calculated daily and payable monthly, based on each Fund’s average daily net assets:
| | | | | | | | |
| | | Percentage of Average Daily Net Assets |
Fund | | First $100 million | | Next $100 million | | Next $1.8 billion | | Over $2 billion |
Core Plus Bond Fund | | 0.2500% | | 0.1875% | | 0.1875% | | 0.1875% |
High Income Fund | | 0.6000% | | 0.6000% | | 0.6000% | | 0.6000% |
International Bond Fund | | 0.6000% | | 0.6000% | | 0.6000% | | 0.6000% |
Limited Term Government and Agency Fund | | 0.5000% | | 0.5000% | | 0.5000% | | 0.5000% |
Massachusetts Tax Free Income Fund | | 0.3000% | | 0.2500% | | 0.2500% | | 0.2500% |
Municipal Income Fund | | 0.5000% | | 0.3750% | | 0.3750% | | 0.3750% |
Strategic Income Fund | | 0.6500% | | 0.6500% | | 0.6000% | | 0.5500% |
Natixis Asset Management Advisors, L.P. (“Natixis Advisors”), serves as the advisory administrator to Core Plus Bond Fund and Massachusetts Tax Free Income Fund. Under the terms of the advisory administration agreements, each pays an advisory administration fee at the following annual rates, calculated daily and payable monthly, based on its average daily net assets:
| | | | |
| | | Percentage of Average Daily
Net Assets |
Fund | | First $100 million | | Over $100 million |
Core Plus Bond Fund | | 0.2500% | | 0.1875% |
Massachusetts Tax Free Income Fund | | 0.3000% | | 0.2500% |
Management and advisory administration fees are presented in the Statements of Operations as management fees.
73
NOTESTO FINANCIAL STATEMENTS (continued)
March 31, 2008 (Unaudited)
Loomis Sayles has given binding undertakings to the Funds to reduce its management fees and/or reimburse certain expenses associated with these Funds to limit their operating expenses. These undertakings are in effect until January 31, 2009 and will be reevaluated on an annual basis. For the period from February 1, 2008 to March 31, 2008, the expense limits as a percentage of average daily net assets under the expense limitation agreements were as follows:
| | | | | | | | | | | | |
| | | Expense Limit as a Percentage of Average
Daily Net Assets | |
Fund | | Class A | | | Class B | | | Class C | | | Class Y | |
Core Plus Bond Fund | | 0.90 | % | | 1.65 | % | | 1.65 | % | | 0.65 | % |
High Income Fund | | 1.15 | % | | 1.90 | % | | 1.90 | % | | 0.90 | % |
International Bond Fund | | 1.10 | % | | — | | | 1.85 | % | | 0.85 | % |
Limited Term Government and Agency Fund | | 0.90 | % | | 1.65 | % | | 1.65 | % | | 0.65 | % |
Massachusetts Tax Free Income Fund | | 0.90 | % | | 1.65 | % | | — | | | — | |
Municipal Income Fund | | 0.90 | % | | 1.65 | % | | — | | | — | |
Strategic Income Fund | | 1.25 | % | | 2.00 | % | | 2.00 | % | | 1.00 | % |
Prior to February 1, 2008, the expense limits as a percentage of average daily net assets were as follows:
| | | | | | | | | | | | |
Fund | | Class A | | | Class B | | | Class C | | | Class Y | |
Core Plus Bond Fund | | 1.00 | % | | 1.75 | % | | 1.75 | % | | 0.75 | % |
High Income Fund | | 1.15 | % | | 1.90 | % | | 1.90 | % | | — | |
Limited Term Government and Agency Fund | | 0.95 | % | | 1.70 | % | | 1.70 | % | | 0.70 | % |
Massachusetts Tax Free Income Fund | | 0.95 | % | | 1.70 | % | | — | | | — | |
Municipal Income Fund | | 0.95 | % | | 1.70 | % | | — | | | — | |
Strategic Income Fund | | 1.25 | % | | 2.00 | % | | 2.00 | % | | 1.00 | % |
Loomis Sayles and Natixis Advisors have agreed to equally bear the fee reductions and/or expense reimbursements for the Core Plus Bond Fund and Massachusetts Tax Free Income Fund.
For the six months ended March 31, 2008, the management fees and reductions of management fees for each Fund were as follows:
| | | | | | | | | | | | | |
Fund | | Gross
Management
Fee | | Reduction of
Management
Fee | | Net
Management
Fee | | Percentage of
Average Daily Net
Assets |
| | | | | Gross | | Net |
Core Plus Bond Fund | | $ | 185,675 | | $ | — | | $ | 185,675 | | 0.226% | | 0.226% |
High Income Fund | | | 125,181 | | | 15,201 | | | 109,980 | | 0.600% | | 0.527% |
International Bond Fund | | | 10,267 | | | 10,267 | | | — | | 0.600% | | — |
Limited Term Government and Agency Fund | | | 308,514 | | | 3,387 | | | 305,127 | | 0.500% | | 0.495% |
Massachusetts Tax Free Income Fund | | | 99,329 | | | 21,129 | | | 78,200 | | 0.300% | | 0.236% |
Municipal Income Fund | | | 208,938 | | | 3,830 | | | 205,108 | | 0.500% | | 0.490% |
Strategic Income Fund | | | 32,110,216 | | | — | | | 32,110,216 | | 0.560% | | 0.560% |
For the six months ended March 31, 2008, the advisory administration fees and fee reductions for each Fund were as follows:
| | | | | | | | | | | | | |
Fund | | Gross
Advisory
Administration Fee | | Reduction of Advisory
Administration Fee | | Net Advisory
Administration Fee | | Percentage of
Average Daily Net
Assets |
| | | | | Gross | | Net |
Core Plus Bond Fund | | $ | 185,675 | | $ | — | | $ | 185,675 | | 0.226% | | 0.226% |
Massachusetts Tax Free Income Fund | | | 99,329 | | | 21,129 | | | 78,200 | | 0.300% | | 0.236% |
74
NOTESTO FINANCIAL STATEMENTS (continued)
March 31, 2008 (Unaudited)
For the six months ended March 31, 2008, expenses have been reimbursed as follows:
| | | |
Fund | | Reimbursement |
Core Plus Bond Fund | | $ | 73,719 |
High Income Fund | | | 29,878 |
International Bond Fund | | | 8,970 |
Limited Term Government and Agency Fund | | | 74,887 |
Massachusetts Tax Free Income Fund | | | 21,104 |
Municipal Income Fund | | | 22,446 |
Loomis Sayles and Natixis Advisors shall be permitted to recover expenses they have borne under the expense limitation agreement (whether through a reduction of its fee or otherwise) on a class by class basis in later periods to the extent the expenses of a class fall below a class’ expense limits, provided, however, that a class is not obligated to pay such reduced fees/expenses more than one year after the end of the fiscal year in which the fee/expense was reduced. The amounts subject to possible reimbursement under the expense limitation agreements at March 31, 2008 were as follows:
| | | | | | | | | | | | | | | |
| | | Expenses Subject to Possible Reimbursement until September 30, 2008 |
Fund | | Class A | | Class B | | Class C | | Class Y | | Total |
Core Plus Bond Fund | | $ | 53,063 | | $ | 63,776 | | $ | 3,785 | | $ | 7,570 | | $ | 128,194 |
High Income Fund | | | 77,322 | | | 14,686 | | | 11,135 | | | — | | | 103,143 |
Limited Term Government and Agency Fund | | | 123,524 | | | 9,302 | | | 5,322 | | | 1,520 | | | 139,668 |
Massachusetts Tax Free Income Fund | | | 145,281 | | | 4,112 | | | — | | | — | | | 149,393 |
Municipal Income Fund | | | 72,756 | | | 3,765 | | | — | | | — | | | 76,521 |
| |
| | | Expenses Subject to Possible Reimbursement until September 30, 2009 |
Fund | | Class A | | Class B | | Class C | | Class Y | | Total |
Core Plus Bond Fund | | $ | 51,872 | | $ | 9,147 | | $ | 7,037 | | $ | 5,663 | | $ | 73,719 |
High Income Fund | | | 35,036 | | | 3,970 | | | 6,071 | | | 2 | | | 45,079 |
International Bond | | | 962 | | | — | | | 272 | | | 18,003 | | | 19,237 |
Limited Term Government and Agency Fund | | | 70,042 | | | 3,992 | | | 3,680 | | | 560 | | | 78,274 |
Massachusetts Tax Free Income Fund | | | 61,972 | | | 1,390 | | | — | | | — | | | 63,362 |
Municipal Income Fund | | | 25,231 | | | 1,045 | | | — | | | — | | | 26,276 |
Certain officers and directors of Loomis Sayles and Natixis Advisors are also Trustees of the Funds. Loomis Sayles and Natixis Advisors are both limited partnerships whose sole general partner is indirectly owned by Natixis Global Asset Management, L.P. (“Natixis US”), which is part of Natixis Global Asset Management, an international asset management group based in Paris, France.
b. Administrative Fees. Natixis Advisors provides certain administrative services for the Funds and subcontracts with State Street Bank to serve as sub-administrator. Natixis Advisors is a wholly-owned subsidiary of Natixis US. Pursuant to an agreement among Natixis Funds Trust I, Natixis Funds Trust II, Natixis Funds Trust III, Natixis Funds Trust IV, Natixis Cash Management Trust, Gateway Trust (“Natixis Funds Trusts”), Loomis Sayles Funds I, Loomis Sayles Funds II (“Loomis Sayles Funds Trusts”), the Hansberger International Series and Natixis Advisors, each Fund pays Natixis Advisors monthly its pro rata portion of fees equal to an annual rate of 0.0675% of the first $5 billion of the average daily net assets of the Natixis Funds Trusts, Loomis Sayles Funds Trusts and the Hansberger International Series, 0.0625% of the next $5 billion, 0.0500% of the next $20 billion and 0.045% of such assets in excess of $30 billion, subject to an annual aggregate minimum fee for the Natixis Funds Trusts , Loomis Sayles Funds Trusts and the Hansberger International Series of $5 million, which is reevaluated on an annual basis. New Funds are subject to an annual fee of $50,000 plus $12,500 per class and an additional $50,000 if managed by multiple subadvisors in their first calendar year of operations.
Effective October 1, 2007, State Street Bank reduced the fees it receives from Natixis Advisors for serving as sub-administrator to the Funds. Also, effective October 1, 2007, Natixis Advisors has given a binding contractual undertaking to the Funds to waive the administrative fees paid by the Fund in an amount equal to the reduction in sub-administrative fees discussed above. The waiver is in effect through June 30, 2008.
75
NOTESTO FINANCIAL STATEMENTS (continued)
March 31, 2008 (Unaudited)
For the six months ended March 31, 2008, amounts paid to Natixis Advisors for administrative fees were as follows:
| | | | | | | | | |
Fund | | Gross Administrative Fees | | Waiver of
Administrative Fees | | Net
Administrative Fees |
Core Plus Bond Fund | | $ | 43,543 | | $ | 2,064 | | $ | 41,479 |
High Income Fund | | | 11,033 | | | 521 | | | 10,512 |
International Bond Fund | | | 3,553 | | | — | | | 3,553 |
Limited Term Government and Agency Fund | | | 32,623 | | | 1,543 | | | 31,080 |
Massachusetts Tax Free Income Fund | | | 17,513 | | | 828 | | | 16,685 |
Municipal Income Fund | | | 22,103 | | | 1,046 | | | 21,057 |
Strategic Income Fund | | | 3,032,693 | | | 143,903 | | | 2,888,790 |
c. Service and Distribution Fees. Natixis Distributors, L.P. (“Natixis Distributors”), a wholly owned subsidiary of Natixis US, has entered into a distribution agreement with the Trust. Pursuant to this agreement, Natixis Distributors serves as principal underwriter of each fund.
Pursuant to Rule 12b-1 under the 1940 Act, the Trusts have adopted a Service Plan relating to each Fund’s Class A shares (the “Class A Plans”) and Service and Distribution Plans relating to each Fund’s Class B and Class C shares (the “Class B and Class C Plans”).
Under the Class A Plans, each Fund pays Natixis Distributors a monthly service fee at an annual rate not to exceed 0.25% of the average daily net assets attributable to the Fund’s Class A shares, as reimbursement for expenses incurred by Natixis Distributors in providing personal services to investors in Class A shares and/or the maintenance of shareholder accounts.
Under the Class B and Class C Plans, each Fund pays Natixis Distributors a monthly service fee at an annual rate not to exceed 0.25% of the average daily net assets attributable to the Fund’s Class B and Class C shares, as compensation for services provided and expenses incurred by Natixis Distributors in providing personal services to investors in Class B and Class C shares and/or the maintenance of shareholder accounts.
Also under the Class B and Class C Plans, each Fund pays Natixis Distributors a monthly distribution fee at the annual rate of 0.75% of the average daily net assets attributable to the Fund’s Class B and Class C shares, as compensation for services provided and expenses incurred by Natixis Distributors in connection with the marketing or sale of Class B and Class C shares.
For the six months ended March 31, 2008, the Funds paid the following service and distribution fees:
| | | | | | | | | | | | | | | |
| | | Service Fee | | Distribution Fee |
Fund | | Class A | | Class B | | Class C | | Class B | | Class C |
| | | | | | | | | | | | | | | |
Core Plus Bond Fund | | $ | 139,411 | | $ | 26,604 | | $ | 18,591 | | $ | 79,812 | | $ | 55,771 |
High Income Fund | | | 40,515 | | | 4,623 | | | 7,021 | | | 13,870 | | | 21,061 |
International Bond Fund | | | 120 | | | — | | | 35 | | | — | | | 107 |
Limited Term Government and Agency Fund | | | 133,304 | | | 7,602 | | | 6,973 | | | 22,804 | | | 20,917 |
Massachusetts Tax Free Income Fund | | | 80,942 | | | 1,832 | | | — | | | 5,498 | | | — |
Municipal Income Fund | | | 100,262 | | | 4,207 | | | — | | | 12,621 | | | — |
Strategic Income Fund | | | 7,850,865 | | | 277,520 | | | 5,265,392 | | | 832,561 | | | 15,796,176 |
d. Sub-Transfer Agent Fees and Expenses. Natixis Distributors has entered into agreements with financial intermediaries to provide certain recordkeeping, processing, shareholder communications and other services to customers of the intermediaries and have agreed to compensate the intermediaries for providing those services. Certain services would be provided by the Funds if the shares of those customers were registered directly with the Funds’ transfer agent. Accordingly, the Funds agreed to pay a portion of the intermediary fees attributable to shares of the Fund held by the intermediary (which generally are a percentage of the value of shares held) not exceeding what the Funds would have paid its transfer agent had each customer’s shares been registered directly with the transfer agent instead of held through the intermediary. Natixis Distributors pays the remainder of the fees. Listed below are the fees incurred by the Funds which are included in the transfer agent fees and expenses in the Statements of Operations.
76
NOTESTO FINANCIAL STATEMENTS (continued)
March 31, 2008 (Unaudited)
| | | | | | | | | | | | |
| | | Sub-Transfer Agent Expense |
Fund | | Class A | | Class B | | Class C | | Class Y |
Core Plus Bond Fund | | $ | 30,386 | | $ | 11,144 | | $ | 4,766 | | $ | 11,563 |
High Income Fund | | | 12,263 | | | 1,387 | | | 2,168 | | | — |
International Bond Fund | | | — | | | — | | | — | | | — |
Limited Term Government and Agency Fund | | | 13,399 | | | 807 | | | 670 | | | 365 |
Massachusetts Tax Free
Income Fund | | | 2,086 | | | 58 | | | — | | | — |
Municipal Income Fund | | | 1,582 | | | 76 | | | — | | | — |
Strategic Income Fund | | | 1,543,148 | | | 63,663 | | | 1,172,828 | | | 254,851 |
e. Commissions. The Funds have been informed that commissions (including CDSC) on Fund shares paid to Natixis Distributors by investors in shares of the Funds during the six months ended March 31, 2008 were as follows:
| | | |
Fund | | Commission |
Core Plus Bond Fund | | $ | 59,568 |
High Income Fund | | | 40,529 |
International Bond Fund | | | — |
Limited Term Government and Agency Fund | | | 39,620 |
Massachusetts Tax Free Income Fund | | | 16,952 |
Municipal Income Fund | | | 73,069 |
Strategic Income Fund | | | 6,026,957 |
f. Trustees Fees and Expenses. The Fund does not pay any compensation directly to its officers or Trustees who are directors, officers or employees of Natixis Advisors, Natixis Distributors, Natixis US, or their affiliates. The Chairperson of the Board receives a retainer fee at the annual rate of $200,000. The Chairperson does not receive any meeting attendance fees for Board of Trustees meetings or committee meetings that she attends. Each independent Trustee (other than the Chairperson) receives, in the aggregate, a retainer fee at the annual rate of $65,000. Each independent Trustee also receives a meeting attendance fee of $7,500 for each meeting of the Board of Trustees that he or she attends in person and $3,750 for each meeting of the Board of Trustees that he or she attends telephonically. In addition, each committee chair receives an additional retainer fee at the annual rate of $10,000. Each Contract Review and Governance Committee member is compensated $5,000 for each Committee meeting that he or she attends in person and $2,500 for each meeting that he or she attends telephonically. Each Audit Committee member is compensated $6,250 for each Committee meeting that he or she attends in person and $3,125 for each meeting that he or she attends telephonically. These fees are allocated among the Funds in the Natixis Funds Trusts, Loomis Sayles Funds Trusts and the Hansberger International Series based on a formula that takes into account, among other factors, the relative net assets of each Fund. Trustees are reimbursed for travel expenses in connection with attendance at meetings.
Prior to January 1, 2008, each Independent Trustee (other than the Chairperson) received, in the aggregate, a retainer fee at the annual rate of $55,000. Each Independent Trustee also received a meeting attendance fee of $6,000 for each meeting of the Board of Trustees that he or she attended in person and $3,000 for each meeting that he or she attended telephonically. In addition, each Contract Review and Governance Committee member received $4,000 for each committee meeting that he or she attended in person and $2,000 for each committee meeting that he or she attended telephonically. Each Audit Committee member received $5,000 for each committee meeting that he or she attended in person and $2,500 for each committee meeting that he or she attended telephonically. The Chairperson of the Board and committee chair retainers were $200,000 and $10,000, respectively.
A deferred compensation plan (the “Plan”) is available to the Trustees on a voluntary basis. Each participating Trustee will receive an amount equal to the value that such deferred compensation would have been had it been invested in a designated Fund or certain other Funds of the Natixis Funds Trusts, Loomis Sayles Funds Trusts and the Hansberger International Series on the normal payment date. Deferred amounts remain in the Funds until distributed in accordance with the Plan.
g. Redemption Fees. Shareholders of Class A shares of Core Plus Bond Fund, High Income Fund, International Bond Fund and Strategic Income Fund and shareholders of Class Y shares of Core Plus Bond Fund, International Bond Fund and Strategic Income Fund are charged a 2% redemption fee if they redeem, including redeeming by exchange, Class A shares and Class Y shares within 60 days of their acquisition (including acquisition by exchange). The redemption fee is intended to offset the costs to the Funds of short-term trading, such as portfolio transaction and market impact costs associated with redemption activity and administrative costs associated with processing redemptions. The redemption fee is deducted from the shareholder’s redemption or exchange proceeds and is paid to the Fund. The “first-in, first-out” method is used to determine the holding period of redeemed or exchanged shares, which means that if a shareholder acquired shares on different days, the shares acquired first will be redeemed or exchanged first for
77
NOTESTO FINANCIAL STATEMENTS (continued)
March 31, 2008 (Unaudited)
purposes of determining whether the redemption fee applies. A new holding period begins with each purchase or exchange. These fees are accounted for as an addition to paid-in capital and are presented on the Statements of Changes in Net Assets.
5. Line of Credit. Each Fund except Municipal Income Fund and Massachusetts Tax Free Income Fund, together with certain other funds of Natixis Funds Trusts, Loomis Sayles Funds Trusts and the Hansberger International Series, participates in a $200,000,000 committed line of credit provided by State Street Bank, with an individual limit of $125,000,000 for each Fund that participates in the line of credit. Interest is charged to each participating fund based on its borrowings at a rate per annum equal to the Federal Funds rate plus 0.50%. In addition, a commitment fee of 0.09% per annum, payable at the end of each calendar quarter, is accrued and apportioned among the participating funds based on their average daily unused portion of the line of credit. For the six months ended March 31, 2008, the Funds had no borrowings under this agreement.
Prior to March 12, 2008, High Income Fund and Strategic Income Fund together with certain other funds of Natixis Funds Trusts, Loomis Sayles Funds Trusts and Hansberger International Series, participated in a $75,000,000 committed line of credit provided by State Street Bank.
6. Concentrations. Massachusetts Tax Free Income Fund primarily invests in debt obligations issued by the Commonwealth of Massachusetts and its political subdivisions, agencies and public authorities to obtain funds for various public purposes. The Fund is more susceptible to factors adversely affecting issuers of Massachusetts municipal securities than is a comparable municipal bond fund that is not so concentrated. Uncertain economic and fiscal conditions may affect the ability of issuers of Massachusetts municipal securities to meet their financial obligations.
International Bond Fund is a non-diversified fund. Compared with diversified mutual funds, the International Bond Fund may invest a greater percentage of its assets in a particular company. Therefore, the International Bond Fund’s returns could be significantly affected by the performance of any one of the small number of bonds in its portfolio.
7. Shareholders. At March 31, 2008, the Loomis Sayles Employees’ Profit Sharing Retirement Plan held 36,703 shares of beneficial interest of Limited Term Government and Agency Fund.
8. Capital Shares. Each Fund may issue an unlimited number of shares of beneficial interest, without par value. Transactions in capital shares were as follows:
| | | | | | | | | | | | | | |
| | Six Months EndedMarch 31, 2008 | | | Year EndedSeptember 30, 2007 | |
Core Plus Bond Fund | | Shares | | | | Amount | | | Shares | | | | Amount | |
| Class A | | | | | | | | | | | | | | |
Issued from the sale of shares | | 1,826,424 | | | $ | 20,848,544 | | | 2,862,355 | | | $ | 32,253,428 | |
Issued in connection with the reinvestment of distributions | | 210,266 | | | | 2,389,787 | | | 327,958 | | | | 3,693,825 | |
Redeemed | | (1,169,444 | ) | | | (13,318,471 | ) | | (1,977,946 | ) | | | (22,285,053 | ) |
| | | | | | | | | | | | | | |
Net change | | 867,246 | | | $ | 9,919,860 | | | 1,212,367 | | | $ | 13,662,200 | |
| | | | | | | | | | | | | | |
| Class B | | | | | | | | | | | | | | |
Issued from the sale of shares | | 62,203 | | | $ | 707,859 | | | 2,199,092 | | | $ | 24,806,440 | |
Issued in connection with the reinvestment of distributions | | 25,513 | | | | 290,676 | | | 70,968 | | | | 800,778 | |
Redeemed | | (6,434,926 | ) | | | (72,725,481 | ) | | (4,340,292 | ) | | | (48,938,825 | ) |
| | | | | | | | | | | | | | |
Net change | | (6,347,210 | ) | | $ | (71,726,946 | ) | | (2,070,232 | ) | | $ | (23,331,607 | ) |
| | | | | | | | | | | | | | |
| Class C | | | | | | | | | | | | | | |
Issued from the sale of shares | | 610,921 | | | $ | 6,975,458 | | | 686,381 | | | $ | 7,745,373 | |
Issued in connection with the reinvestment of distributions | | 11,631 | | | | 132,281 | | | 13,038 | | | | 146,800 | |
Redeemed | | (270,247 | ) | | | (3,076,386 | ) | | (199,397 | ) | | | (2,240,505 | ) |
| | | | | | | | | | | | | | |
Net change | | 352,305 | | | $ | 4,031,353 | | | 500,022 | | | $ | 5,651,668 | |
| | | | | | | | | | | | | | |
| Class Y | | | | | | | | | | | | | | |
Issued from the sale of shares | | 345,813 | | | $ | 3,953,494 | | | 598,492 | | | $ | 6,770,657 | |
Issued in connection with the reinvestment of distributions | | 20,992 | | | | 239,666 | | | 36,251 | | | | 410,202 | |
Redeemed | | (188,873 | ) | | | (2,172,740 | ) | | (293,171 | ) | | | (3,314,000 | ) |
| | | | | | | | | | | | | | |
Net change | | 177,932 | | | $ | 2,020,420 | | | 341,572 | | | $ | 3,866,859 | |
| | | | | | | | | | | | | | |
Increase (decrease) from capital share transactions | | (4,949,727 | ) | | $ | (55,755,313 | ) | | (16,271 | ) | | $ | (150,880 | ) |
| | | | | | | | | | | | | | |
78
NOTESTO FINANCIAL STATEMENTS (continued)
March 31, 2008 (Unaudited)
| | | | | | | | | | | | | | |
| | Six Months EndedMarch 31, 2008 | | | Year EndedSeptember 30, 2007 | |
High Income Fund | | Shares | | | | Amount | | | Shares | | | | Amount | |
| Class A | | | | | | | | | | | | | | |
Issued from the sale of shares | | 1,187,514 | | | $ | 5,909,935 | | | 2,247,757 | | | $ | 11,689,925 | |
Issued in connection with the reinvestment of distributions | | 173,875 | | | | 860,495 | | | 295,946 | | | | 1,539,928 | |
Redeemed | | (1,081,769 | ) | | | (5,374,201 | ) | | (1,884,840 | ) | | | (9,783,658 | ) |
| | | | | | | | | | | | | | |
Net change | | 279,620 | | | $ | 1,396,229 | | | 658,863 | | | $ | 3,446,195 | |
| | | | | | | | | | | | | | |
| Class B | | | | | | | | | | | | | | |
Issued from the sale of shares | | 1,077 | | | $ | 5,391 | | | 106,656 | | | $ | 557,060 | |
Issued in connection with the reinvestment of distributions | | 14,974 | | | | 74,291 | | | 39,879 | | | | 208,208 | |
Redeemed | | (170,635 | ) | | | (851,933 | ) | | (756,563 | ) | | | (3,941,404 | ) |
| | | | | | | | | | | | | | |
Net change | | (154,584 | ) | | $ | (772,251 | ) | | (610,028 | ) | | $ | (3,176,136 | ) |
| | | | | | | | | | | | | | |
| Class C | | | | | | | | | | | | | | |
Issued from the sale of shares | | 367,618 | | | $ | 1,828,190 | | | 479,271 | | | $ | 2,499,368 | |
Issued in connection with the reinvestment of distributions | | 20,224 | | | | 100,100 | | | 30,663 | | | | 159,675 | |
Redeemed | | (185,138 | ) | | | (916,128 | ) | | (159,243 | ) | | | (825,637 | ) |
| | | | | | | | | | | | | | |
Net change | | 202,704 | | | $ | 1,012,162 | | | 350,691 | | | $ | 1,833,406 | |
| | | | | | | | | | | | | | |
| Class Y* | | | | | | | | | | | | | | |
Issued from the sale of shares | | 205 | | | $ | 1,000 | | | — | | | $ | — | |
Issued in connection with the reinvestment of distributions | | 2 | | | | 6 | | | — | | | | — | |
Redeemed | | — | | | | — | | | — | | | | — | |
| | | | | | | | | | | | | | |
Net change | | 207 | | | $ | 1,006 | | | — | | | $ | — | |
| | | | | | | | | | | | | | |
Increase (decrease) from capital share transactions | | 327,947 | | | $ | 1,637,146 | | | 399,526 | | | $ | 2,103,465 | |
| | | | | | | | | | | | | | |
* From commencement of operations on February 29, 2008 through March 31, 2008.
| | | | | | | | | | | | |
| | Period EndedMarch 31, 2008** | | | Year EndedSeptember 30, 2007 |
International Bond Fund | | Shares | | | | Amount | | | Shares | | | Amount |
| Class A | | | | | | | | | | | | |
Issued from the sale of shares | | 84,777 | | | $ | 873,366 | | | — | | $ | — |
Issued in connection with the reinvestment of distributions | | 179 | | | | 1,855 | | | — | | | — |
Redeemed | | — | | | | — | | | — | | | — |
| | | | | | | | | | | | |
Net change | | 84,956 | | | $ | 875,221 | | | — | | $ | — |
| | | | | | | | | | | | |
| Class C | | | | | | | | | | | | |
Issued from the sale of shares | | 25,852 | | | $ | 266,332 | | | — | | $ | — |
Issued in connection with the reinvestment of distributions | | 36 | | | | 369 | | | — | | | — |
Redeemed | | (77 | ) | | | (800 | ) | | — | | | — |
| | | | | | | | | | | | |
Net change | | 25,811 | | | $ | 265,901 | | | — | | $ | — |
| | | | | | | | | | | | |
| Class Y | | | | | | | | | | | | |
Issued from the sale of shares | | 1,028,328 | | | $ | 10,295,001 | | | — | | $ | — |
Issued in connection with the reinvestment of distributions | | 4,213 | | | | 42,882 | | | — | | | — |
Redeemed | | — | | | | — | | | — | | | — |
| | | | | | | | | | | | |
Net change | | 1,032,541 | | | $ | 10,337,885 | | | — | | $ | — |
| | | | | | | | | | | | |
Increase (decrease) from capital share transactions | | 1,143,308 | | | $ | 11,479,005 | | | — | | $ | — |
| | | | | | | | | | | | |
** From commencement of operations on February 1, 2008 through March 31, 2008.
79
NOTESTO FINANCIAL STATEMENTS (continued)
March 31, 2008 (Unaudited)
| | | | | | | | | | | | | | |
| | Six Months EndedMarch 31, 2008 | | | Year EndedSeptember 30, 2007 | |
Limited Term Government and Agency Fund | | Shares | | | | Amount | | | Shares | | | | Amount | |
| Class A | | | | | | | | | | | | | | |
Issued from the sale of shares | | 410,336 | | | $ | 4,547,548 | | | 1,309,019 | | | $ | 14,378,605 | |
Issued in connection with the reinvestment of distributions | | 144,935 | | | | 1,609,250 | | | 292,426 | | | | 3,213,916 | |
Redeemed | | (911,251 | ) | | | (10,094,561 | ) | | (2,117,193 | ) | | | (23,272,778 | ) |
| | | | | | | | | | | | | | |
Net change | | (355,980 | ) | | $ | (3,937,763 | ) | | (515,748 | ) | | $ | (5,680,257 | ) |
| | | | | | | | | | | | | | |
| Class B | | | | | | | | | | | | | | |
Issued from the sale of shares | | 41,436 | | | $ | 461,491 | | | 52,757 | | | $ | 579,223 | |
Issued in connection with the reinvestment of distributions | | 9,366 | | | | 103,824 | | | 22,869 | | | | 251,120 | |
Redeemed | | (133,670 | ) | | | (1,477,192 | ) | | (364,484 | ) | | | (3,999,981 | ) |
| | | | | | | | | | | | | | |
Net change | | (82,868 | ) | | $ | (911,877 | ) | | (288,858 | ) | | $ | (3,169,638 | ) |
| | | | | | | | | | | | | | |
| Class C | | | | | | | | | | | | | | |
Issued from the sale of shares | | 255,216 | | | $ | 2,839,915 | | | 217,432 | | | $ | 2,387,379 | |
Issued in connection with the reinvestment of distributions | | 5,679 | | | | 63,076 | | | 9,729 | | | | 106,924 | |
Redeemed | | (121,800 | ) | | | (1,353,114 | ) | | (133,821 | ) | | | (1,470,673 | ) |
| | | | | | | | | | | | | | |
Net change | | 139,095 | | | $ | 1,549,877 | | | 93,340 | | | $ | 1,023,630 | |
| | | | | | | | | | | | | | |
| Class Y | | | | | | | | | | | | | | |
Issued from the sale of shares | | 201,113 | | | $ | 2,233,241 | | | 217,392 | | | $ | 2,396,763 | |
Issued in connection with the reinvestment of distributions | | 7,492 | | | | 83,420 | | | 12,038 | | | | 132,694 | |
Redeemed | | (89,807 | ) | | | (1,002,724 | ) | | (71,670 | ) | | | (782,866 | ) |
| | | | | | | | | | | | | | |
Net change | | 118,798 | | | $ | 1,313,937 | | | 157,760 | | | $ | 1,746,591 | |
| | | | | | | | | | | | | | |
Increase (decrease) from capital share transactions | | (180,955 | ) | | $ | (1,985,826 | ) | | (553,506 | ) | | $ | (6,079,674 | ) |
| | | | | | | | | | | | | | |
| | |
| | Six Months EndedMarch 31, 2008 | | | Year EndedSeptember 30, 2007 | |
Massachusetts Tax Free Income Fund | | Shares | | | | Amount | | | Shares | | | | Amount | |
| Class A | | | | | | | | | | | | | | |
Issued from the sale of shares | | 58,204 | | | $ | 948,659 | | | 138,166 | | | $ | 2,283,448 | |
Issued in connection with the reinvestment of distributions | | 58,965 | | | | 951,382 | | | 122,828 | | | | 2,029,190 | |
Redeemed | | (586,547 | ) | | | (9,443,916 | ) | | (526,246 | ) | | | (8,703,580 | ) |
| | | | | | | | | | | | | | |
Net change | | (469,378 | ) | | $ | (7,543,875 | ) | | (265,252 | ) | | $ | (4,390,942 | ) |
| | | | | | | | | | | | | | |
| Class B | | | | | | | | | | | | | | |
Issued from the sale of shares | | 1,640 | | | $ | 25,977 | | | 5,884 | | | $ | 96,247 | |
Issued in connection with the reinvestment of distributions | | 997 | | | | 16,046 | | | 2,630 | | | | 43,409 | |
Redeemed | | (24,246 | ) | | | (391,912 | ) | | (47,481 | ) | | | (785,482 | ) |
| | | | | | | | | | | | | | |
Net change | | (21,609 | ) | | $ | (349,889 | ) | | (38,967 | ) | | $ | (645,826 | ) |
| | | | | | | | | | | | | | |
Increase (decrease) from capital share transactions | | (490,987 | ) | | $ | (7,893,764 | ) | | (304,219 | ) | | $ | (5,036,768 | ) |
| | | | | | | | | | | | | | |
| | |
| | Six Months EndedMarch 31, 2008 | | | Year EndedSeptember 30, 2007 | |
Municipal Income Fund | | Shares | | | | Amount | | | Shares | | | | Amount | |
| | | | | | | | | | | | | | |
| Class A | | | | | | | | | | | | | | |
Issued from the sale of shares | | 533,273 | | | $ | 3,795,732 | | | 441,328 | | | $ | 3,284,696 | |
Issued in connection with the reinvestment of distributions | | 209,100 | | | | 1,498,785 | | | 348,809 | | | | 2,605,901 | |
Redeemed | | (1,473,828 | ) | | | (10,455,189 | ) | | (1,967,484 | ) | | | (14,568,025 | ) |
| | | | | | | | | | | | | | |
Net change | | (731,455 | ) | | $ | (5,160,672 | ) | | (1,177,347 | ) | | $ | (8,677,428 | ) |
| | | | | | | | | | | | | | |
| Class B | | | | | | | | | | | | | | |
Issued from the sale of shares | | 1,505 | | | $ | 10,867 | | | 23,490 | | | $ | 176,022 | |
Issued in connection with the reinvestment of distributions | | 5,701 | | | | 40,958 | | | 13,044 | | | | 97,685 | |
Redeemed | | (131,775 | ) | | | (944,032 | ) | | (205,834 | ) | | | (1,528,625 | ) |
| | | | | | | | | | | | | | |
Net change | | (124,569 | ) | | $ | (892,207 | ) | | (169,300 | ) | | $ | (1,254,918 | ) |
| | | | | | | | | | | | | | |
Increase (decrease) from capital share transactions | | (856,024 | ) | | $ | (6,052,879 | ) | | (1,346,647 | ) | | $ | (9,932,346 | ) |
| | | | | | | | | | | | | | |
80
NOTESTO FINANCIAL STATEMENTS (continued)
March 31, 2008 (Unaudited)
| | | | | | | | | | | | | | |
| | Six Months EndedMarch 31, 2008 | | | Year EndedSeptember 30, 2007 | |
Strategic Income Fund | | Shares | | | | Amount | | | Shares | | | | Amount | |
| | | | | | | | | | | | | | |
| Class A | | | | | | | | | | | | | | |
Issued from the sale of shares | | 111,604,410 | | | $ | 1,676,415,779 | | | 227,999,564 | | | $ | 3,401,598,542 | |
Issued in connection with the reinvestment of distributions | | 10,882,089 | | | | 162,328,505 | | | 11,338,684 | | | | 169,415,802 | |
Redeemed | | (52,237,695 | ) | | | (779,243,539 | ) | | (51,264,181 | ) | | | (764,388,527 | ) |
| | | | | | | | | | | | | | |
Net change | | 70,248,804 | | | $ | 1,059,500,745 | | | 188,074,067 | | | $ | 2,806,625,817 | |
| | | | | | | | | | | | | | |
| Class B | | | | | | | | | | | | | | |
Issued from the sale of shares | | 221,465 | | | $ | 3,336,904 | | | 5,257,203 | | | $ | 78,803,755 | |
Issued in connection with the reinvestment of distributions | | 208,942 | | | | 3,134,928 | | | 304,859 | | | | 4,574,346 | |
Redeemed | | (1,492,466 | ) | | | (22,509,646 | ) | | (2,532,198 | ) | | | (37,899,012 | ) |
| | | | | | | | | | | | | | |
Net change | | (1,062,059 | ) | | $ | (16,037,814 | ) | | 3,029,864 | | | $ | 45,479,089 | |
| | | | | | | | | | | | | | |
| Class C | | | | | | | | | | | | | | |
Issued from the sale of shares | | 68,092,393 | | | $ | 1,026,263,085 | | | 144,314,933 | | | $ | 2,160,951,327 | |
Issued in connection with the reinvestment of distributions | | 3,283,539 | | | | 49,174,923 | | | 3,151,961 | | | | 47,297,035 | |
Redeemed | | (17,722,779 | ) | | | (265,711,718 | ) | | (19,028,982 | ) | | | (284,966,223 | ) |
| | | | | | | | | | | | | | |
Net change | | 53,653,153 | | | $ | 809,726,290 | | | 128,437,912 | | | $ | 1,923,282,139 | |
| | | | | | | | | | | | | | |
| Class Y | | | | | | | | | | | | | | |
Issued from the sale of shares | | 23,405,297 | | | $ | 351,024,555 | | | 29,854,706 | | | $ | 445,418,950 | |
Issued in connection with the reinvestment of distributions | | 435,015 | | | | 6,482,671 | | | 346,573 | | | | 5,174,756 | |
Redeemed | | (7,420,418 | ) | | | (110,650,950 | ) | | (6,672,173 | ) | | | (99,332,888 | ) |
| | | | | | | | | | | | | | |
Net change | | 16,419,894 | | | $ | 246,856,276 | | | 23,529,106 | | | $ | 351,260,818 | |
| | | | | | | | | | | | | | |
Increase (decrease) from capital share transactions | | 139,259,792 | | | $ | 2,100,045,497 | | | 343,070,949 | | | $ | 5,126,647,863 | |
| | | | | | | | | | | | | | |
10. Unfunded Loan Commitments. As of March 31, 2008, the Strategic Income Fund had one unfunded loan commitment which could be funded at the option of the following Borrower, pursuant to the loan agreement:
| | | |
Borrower | | Unfunded Loan Commitment |
Community Health Systems, Inc. | | $ | 150,489 |
81

EQUITY FUNDS
SEMIANNUAL REPORT
March 31, 2008
Loomis Sayles Global Markets Fund
Loomis Sayles Growth Fund
Loomis Sayles Research Fund
Loomis Sayles Value Fund


TABLE OF CONTENTS
Management Discussion and Performance page 1
Portfolio of Investments page 13
Financial Statements page 27
LOOMIS SAYLES GLOBAL MARKETS FUND
PORTFOLIO PROFILE
Objective:
Seeks high total return through a combination of capital appreciation and current income
Strategy:
Invests primarily in equity and fixed-income securities of U.S. and foreign issuers, including securities of issuers located in emerging markets
Fund Inception:
May 1, 1996
Managers:
Mark Baribeau, CFA
Dan Fuss, CFA, CIC
Warren Koontz, CFA, CIC
David Rolley, CFA
Loomis, Sayles & Company, L.P.
Symbols:
| | |
| Class A | | LGMAX |
| Class C | | LGMCX |
| Class Y | | LSWWX |
What You Should Know:
The fund can invest a significant percentage of assets in foreign securities and the value of the fund shares can be adversely affected by changes in currency exchange rates, political, and economic developments. In emerging markets these risks can be significant. The fund can invest a significant percentage of assets in debt securities that are rated below investment grade and the value of fund shares can be adversely affected by changes in economic conditions or other circumstances. In addition, the secondary market for these securities may lack liquidity. Fund shares should be viewed as a long-term investment.
Management Discussion
Amid worldwide volatility in both the stock and bond markets, Loomis Sayles Global Markets Fund returned -4.91% for the six months ended March 31, 2008, based on the net asset value of Class A shares, with $0.53 in dividends and $0.44 in capital gains reinvested. For the period, the fund’s primary benchmark, the MSCI World Index (common stocks from developed countries around the world) returned -11.06%, while its secondary benchmark, Citigroup World Government Bond Index (government bonds issued in the United States and other developed countries) returned 13.96%. The average return on Morningstar’s World Allocation category (primarily global equity funds) was -4.29% for the period.
QUALITY BONDS OUTPERFORM HIGH-YIELD BONDS AND COMMON STOCKS
Global equity securities dominated the portfolio throughout the fiscal period, but this group significantly underperformed bonds, as illustrated by the divergent results of the fund’s two benchmarks. Fixed-income performance was led by select local currency market securities as the dollar continued to decline. From a currency perspective, Brazil, Uruguay, Poland and Singapore held up better than most, as most world economies sagged. Reflecting investors’ increasing risk aversion during the period, high-quality bonds outperformed higher-risk issues. Our U.S. Treasury notes performed well, as did certain bonds issued in local currencies.
Poor performers included high-yield corporate bonds issued by Residential Capital, a U.S. mortgage originator; R.H. Donnelley, a Yellow Pages publisher operating primarily in the United States; Edcon Proprietary, a leading South African retailer of clothing, footwear and textiles; and Sappi Papier Holding AG, a South African pulp, paper and timber company. Ranked by country, the hardest hit bonds were issued by companies in Austria, Argentina, Luxembourg and South Africa. Finance and retail were the weakest sectors.
STRONG STOCK SELECTION COULD NOT COMPENSATE FOR PRICE DECLINES
Stock selection in the materials and healthcare sectors benefited the equity segment. These included packaging giant Owens-Illinois, which beat earnings estimates; fertilizer company Potash Corp., which is experiencing strong demand for its products; and two healthcare leaders – biopharmaceutical specialist Gilead Sciences and Intuitive Surgical Inc., which designs and builds robotically assisted surgical systems. The top three individual stocks were international transaction processing company MasterCard; First Solar, a leader in solar energy; and Monsanto, a leader in agricultural biotechnology.
Unfortunately, the strength of our equity selections could not compensate for declining values, most notably in the financial and information technology sectors. Even such well known financial giants as Goldman Sachs and Lehman Brothers fell amid the turmoil, and we sold Lehman Brothers. Individual stocks with the most negative impact included graphics processor specialist NVIDIA, which was under pressure from competitors; internet search giant Google, which declined when its revenues fell short of expectations; and Precision Castparts, a leading industrial goods and metal fabrication company that missed revenue expectations. We sold NVIDIA and Precision and trimmed the fund’s holdings in Google.
OUTLOOK IS FOR A MILD RECESSION AND SLOWLY IMPROVING LIQUIDITY
Credit spreads – the difference in yield between lower-quality bonds and U.S. Treasuries – appeared to reach a peak in early March, as virtually all major banks and broker dealers in the United States and Europe experienced difficulties. The collapse and subsequent rescue of Bear Stearns, and the Federal Reserve Board’s efforts to support the U.S. financial markets, may have marked a turning point in the credit crisis.
Going forward, we expect the U.S. economy to navigate the current slowdown. We also believe the slide in the U.S. dollar may be nearing an end. Consequently, our bond strategy has been to reduce the fund’s exposure to U.S. Treasuries and avoid the more volatile foreign currencies, while increasing the fund’s position in high-yield bonds. On the equity side, our strategy is to maintain a global portfolio consisting of the best value and growth ideas we can find, and to focus on stock selection rather than country allocation.
1
LOOMIS SAYLES GLOBAL MARKETS FUND
Investment Results through March 31, 2008
PERFORMANCE IN PERSPECTIVE
The charts comparing the fund’s performance to an index provide you with a general sense of how it performed. The fund’s total return for the period shown below appears with and without sales charges and includes fund expenses and fees. An index measures the performance of a theoretical portfolio. Unlike a fund, the index is unmanaged and does not have expenses that affect the results. It is not possible to invest directly in an index. Investors would incur transaction costs and other expenses if they purchased the securities necessary to match the index.
Growth of a $10,000 Investment in Class A Shares1,5
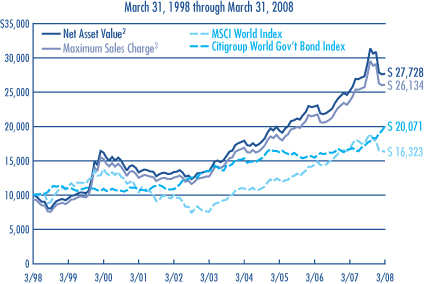
Average Annual Returns — March 31, 20085
| | | | | | | | | | | | |
| | | | | |
| | | 6 MONTHS | | | 1 YEAR | | | 5 YEARS | | | 10 YEARS | |
CLASS A1 | | | | | | | | | | | | |
Net Asset Value2 | | -4.91 | % | | 10.05 | % | | 15.48 | % | | 10.74 | % |
With Maximum Sales Charge3 | | -10.40 | | | 3.75 | | | 14.12 | | | 10.08 | |
| | | | | |
CLASS C1 | | | | | | | | | | | | |
Net Asset Value2 | | -5.23 | | | 9.25 | | | 14.62 | | | 9.91 | |
With CDSC4 | | -6.13 | | | 8.25 | | | 14.62 | | | 9.91 | |
| | | | | |
CLASS Y1 | | | | | | | | | | | | |
Net Asset Value2 | | -4.79 | | | 10.31 | | | 15.75 | | | 11.01 | |
| | | | | |
| COMPARATIVE PERFORMANCE | | 6 MONTHS | | | 1 YEAR | | | 5 YEARS | | | 10 YEARS | |
MSCI World Index | | -11.06 | % | | -2.77 | % | | 16.52 | % | | 5.02 | % |
Citigroup World Government Bond Index | | 13.96 | | | 20.29 | | | 8.14 | | | 7.22 | |
Morningstar World Allocation Fund Avg. | | -4.29 | | | 3.35 | | | 15.04 | | | 8.19 | |
All returns represent past performance and do not guarantee future results. Periods of less than one year are not annualized. Share price and return will vary and you may have a gain or loss when you sell your shares. All results include reinvestment of dividends and capital gains. Current returns may be higher or lower than those shown. For performance current to the most recent month-end, visit www.funds.natixis.com.
Class Y shares, the successor to the fund’s Institutional Class, are available to certain investors, as described in the prospectus.
The table and graph do not reflect taxes shareholders might owe on any fund distributions or when they redeem their shares.
PORTFOLIO FACTS
| | | | |
| |
| | | % of Net Assets as of |
| FUND COMPOSITION | | 3/31/08 | | 9/30/07 |
Common Stocks | | 69.6 | | 66.6 |
Preferred Stocks | | 0.2 | | 0.0 |
Bonds & Notes | | 26.4 | | 27.2 |
Short-Term Investments and Other | | 3.8 | | 6.2 |
| |
| | | % of Net Assets as of |
| TEN LARGEST HOLDINGS | | 3/31/08 | | 9/30/07 |
Monsanto Co. | | 2.6 | | 1.4 |
ABB Ltd. | | 2.5 | | 2.3 |
MasterCard, Inc., Class A | | 2.3 | | 1.4 |
America Movil SAB de CV, Series L | | 1.9 | | 1.2 |
Research In Motion Ltd. | | 1.8 | | 1.8 |
Nintendo Co. Ltd. | | 1.7 | | 2.4 |
Apple, Inc. | | 1.6 | | 2.1 |
Southwestern Energy Co. | | 1.6 | | 0.0 |
Petroleo Brasileiro SA | | 1.6 | | 0.0 |
McDonald's Corp. | | 1.5 | | 1.3 |
| |
| | | % of Net Assets as of |
| FIVE LARGEST INDUSTRIES | | 3/31/08 | | 9/30/07 |
Electrical Equipment | | 7.6 | | 2.3 |
Wireless Telecommunication Services | | 5.9 | | 3.2 |
Capital Markets | | 4.8 | | 3.6 |
Oil, Gas & Consumable Fuels | | 4.4 | | 1.4 |
Chemicals | | 4.1 | | 3.1 |
Portfolio holdings and asset allocations will vary.
EXPENSE RATIOS AS STATED IN THE MOST RECENT PROSPECTUS
| | | | |
| Share Class | | Gross Expense Ratio6 | | Net Expense Ratio7 |
A | | 1.37% | | 1.25% |
C | | 2.11 | | 2.00 |
Y | | 1.02 | | 1.00 |
NOTES TO CHARTS
See page 9 for a description of the indexes.
1 | Returns shown in the chart include performance of the fund’s Institutional Class shares, which were redesignated as Class Y shares on 2/1/06. For periods prior to the inception of Class A and Class C shares (2/1/06), the prior Institutional Class performance has been restated to reflect the loads and expenses of Class A and Class C shares, respectively. The restatement of the fund’s performance to reflect Class A expenses is based on the net expenses of the Class after taking into effect the fund’s then current expense cap arrangements. Class Y performance has been restated to reflect the net expenses of the Institutional Class after taking into effect the fund’s then current expense cap arrangements. The growth of $10,000 chart compares the performance of Class A shares, at net asset value, to the performance of Class A shares including the maximum sales charge of 5.75%. This chart reflects the performance of Class A Shares rather than Class Y shares because Class A shares have the highest sales charge. Prior to 2/1/06, the fund was offered without a sales charge. |
2 | Does not include a sales charge. |
3 | Includes the maximum sales charge of 5.75%. |
4 | Performance for Class C shares assumes a 1% contingent deferred sales charge (“CDSC”) applied when you sell shares within one year of purchase. |
5 | Fund performance has been increased by expense reductions and reimbursements, if any, without which performance would have been lower. |
6 | Before reductions and reimbursements. |
7 | After reductions and reimbursements. Expense reductions are contractual and are set to expire 1/31/09. |
2
LOOMIS SAYLES GROWTH FUND
PORTFOLIO PROFILE
Objective:
Long-term growth of capital
Strategy:
Invests primarily in equity securities, including common stocks, convertible securities, and warrants; focuses on stocks of large-capitalization companies, but may invest in companies of any size
Fund Inception:
May 16, 1991
Managers:
Mark Baribeau, CFA
Pamela Czekanski, CFA
Richard Skaggs, CFA
Loomis, Sayles &
Company, L.P.
Symbols:
| | |
| Class A | | LGRRX |
| Class B | | LGRBX |
| Class C | | LGRCX |
| Class Y | | LSGRX |
What You Should Know:
Growth stocks are generally more sensitive to market movements because their stock prices are based on future expectations. Frequent portfolio turnover may result in increased tax liabilities that will reduce the fund’s overall return. The fund can invest a significant percentage of assets in foreign securities and the value of the fund shares can be adversely affected by changes in currency exchange rates, political, and economic developments. In emerging markets these risks can be significant. Fund shares should be viewed as a long-term investment.
Management Discussion
Concerns that problems originating in the mortgage and housing industries might lead to a general economic slowdown depressed equity prices during the six months ending March 31, 2008. In a volatile period for equities, Loomis Sayles Growth Fund’s Class A shares returned -12.41% at net asset value, while the fund’s benchmark, the Russell 1000 Growth Index, fell -10.87% and the average return on the funds in Morningstar’s Large Growth category was -12.28%.
SECTOR ALLOCATIONS OFFSET GAINS FROM POSITIVE STOCK SELECTION
Our sector allocation is the primary reason that the fund lagged its benchmark. For example, relative to the Russell 1000 Growth Index, the fund was overweight in the financial and information technology sectors, both of which performed poorly, and underweight in the consumer staples and healthcare sectors. The negative effects of these allocations offset the largely positive results of our stock selection process.
TOP PERFORMERS WERE IN DISPARATE SECTORS
MasterCard, Monsanto, XTO Energy and Mosaic were the strongest contributors. MasterCard’s stock appreciated after it reported strong gains in quarterly profits, as this transaction processing company benefited from international growth and its lack of exposure to consumer credit receivables. Shares of Monsanto, a leader in agricultural biotechnology, rose after the company announced strategic initiatives intended to double gross profits by 2012. The stock price of XTO, one of the nation’s largest independent oil and gas producers, rose in value when earnings exceeded expectations because of improving company output and rising oil prices. Mosaic’s share price jumped after the company reported strong earnings as a result of international demand for fertilizer potash to support food, animal feed and fuel needs. We sold the position at a profit.
SEVERAL TECHNOLOGY AND FINANCIAL INVESTMENTS DETRACTED
Disappointments included Microsoft, Google, Cisco Systems and VMware. Microsoft’s share price declined when investors reacted negatively to the company’s plans to acquire Yahoo! We sold the stock. Google shares declined after the internet search company’s revenue fell short of expectations. Shares of Cisco, an information network equipment company, fell after the company lowered its revenue forecasts based on weakening corporate spending. VMware, a producer of software that allows one computer to do the work of several, saw its share price decline after the company reported disappointing earnings in a competitive market. We sold VMware, but Google and Cisco remain in the portfolio.
Other disappointments included Precision Castparts, a manufacturer of industrial components, and National Oilwell Varco (NOV), a producer of pumps and other specialized equipment for the energy industry. Despite strong earnings growth, Precision Castparts’ share price declined after it reported revenues that were below expectations. NOV’s stock price declined on general market uncertainty and concerns about volatility in crude oil prices. Investors also reacted unenthusiastically to NOV’s plans to acquire Grant Prideco, a supplier of oil and gas drilling products. We sold NOV, but Precision Castparts remains in the portfolio.
CONSUMER HOLDINGS BUILT UP, TECHNOLOGY TRIMMED
We adjusted the portfolio during the fiscal period to take advantage of opportunities we perceived in sectors that did poorly in 2007. For example, we added positions in U.S.-based retailers, as we saw evidence that domestic consumer spending may be stabilizing. We also believe that consumer spending should be stimulated by the federal government’s fiscal actions, including tax rebates. At the same time, we trimmed the fund’s holdings in information technology, where slowing corporate spending may cut into profits. The Fund continues to maintain exposure to financials, emphasizing exchanges and specialty finance companies that are not sensitive to credit issues.
Going forward, we plan to continue our strategy of seeking large-cap growth companies with solid fundamentals and leadership positions in their markets. While the first quarter of 2008 was particularly volatile for equities, we believe such periods often create buying opportunities in the shares of fundamentally sound companies.
3
LOOMIS SAYLES GROWTH FUND
Investment Results through March 31, 2008
PERFORMANCE IN PERSPECTIVE
The charts comparing the fund’s performance to an index provide you with a general sense of how it performed. The fund’s total return for the period shown below appears with and without sales charges and includes fund expenses and fees. An index measures the performance of a theoretical portfolio. Unlike a fund, the index is unmanaged and does not have expenses that affect the results. It is not possible to invest directly in an index. Investors would incur transaction costs and other expenses if they purchased the securities necessary to match the index.
Growth of a $10,000 Investment in Class A Shares1,5
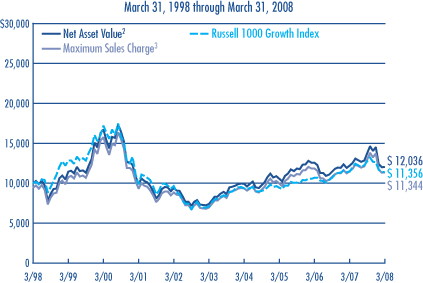
Average Annual Returns — March 31, 20085
| | | | | | | | | | | | |
| | | | | |
| | | 6 MONTHS | | | 1 YEAR | | | 5 YEARS | | | 10 YEARS | |
CLASS A1 | | | | | | | | | | | | |
Net Asset Value2 | | -12.41 | % | | -1.29 | % | | 10.31 | % | | 1.86 | % |
With Maximum Sales Charge3 | | -17.47 | | | -6.97 | | | 9.00 | | | 1.26 | |
| | | | | |
CLASS B1 | | | | | | | | | | | | |
Net Asset Value2 | | -12.67 | | | -1.98 | | | 9.48 | | | 1.10 | |
With CDSC4 | | -17.03 | | | -6.88 | | | 9.20 | | | 1.10 | |
| | | | | |
CLASS C1 | | | | | | | | | | | | |
Net Asset Value2 | | -12.79 | | | -2.15 | | | 9.48 | | | 1.10 | |
With CDSC4 | | -13.67 | | | -3.12 | | | 9.48 | | | 1.10 | |
| | | | | |
CLASS Y1 | | | | | | | | | | | | |
Net Asset Value2 | | -12.16 | | | -0.92 | | | 10.63 | | | 2.13 | |
| | | | | |
| COMPARATIVE PERFORMANCE | | 6 MONTHS | | | 1 YEAR | | | 5 YEARS | | | 10 YEARS | |
Russell 1000 Growth Index | | -10.87 | % | | -0.75 | % | | 9.96 | % | | 1.28 | % |
Morningstar Large Growth Fund Avg. | | -12.28 | | | -1.28 | | | 10.32 | | | 2.66 | |
All returns represent past performance and do not guarantee future results. Periods of less than one year are not annualized. Share price and return will vary and you may have a gain or loss when you sell your shares. All results include reinvestment of dividends and capital gains. Current returns may be higher or lower than those shown. For performance current to the most recent month-end, visit www.funds.natixis.com.
Class Y shares, the successor to the fund’s Institutional Class, are available to certain investors, as described in the prospectus.
The table and graph do not reflect taxes shareholders might owe on any fund distributions or when they redeem their shares.
PORTFOLIO FACTS
| | | | |
| |
| | | % of Net Assets as of |
| FUND COMPOSITION | | 3/31/08 | | 9/30/07 |
Common Stocks | | 98.8 | | 99.2 |
Short-Term Investments and Other | | 1.2 | | 0.8 |
| |
| | | % of Net Assets as of |
| TEN LARGEST HOLDINGS | | 3/31/08 | | 9/30/07 |
Monsanto Co. | | 4.4 | | 2.7 |
Coca-Cola Co. (The) | | 3.9 | | 0.0 |
XTO Energy, Inc. | | 3.6 | | 1.5 |
Apple, Inc. | | 3.4 | | 4.3 |
MasterCard, Inc., Class A | | 2.8 | | 2.5 |
Transocean, Inc. | | 2.7 | | 0.0 |
Gilead Sciences, Inc. | | 2.7 | | 1.4 |
BlackRock, Inc. | | 2.7 | | 0.0 |
CME Group, Inc. | | 2.6 | | 2.3 |
MEMC Electronic Materials, Inc. | | 2.4 | | 0.0 |
| |
| | | % of Net Assets as of |
| FIVE LARGEST INDUSTRIES | | 3/31/08 | | 9/30/07 |
Capital Markets | | 8.4 | | 4.8 |
Oil, Gas & Consumable Fuels | | 6.6 | | 2.5 |
Health Care Equipment & Supplies | | 6.5 | | 2.9 |
IT Services | | 6.2 | | 2.5 |
Computers & Peripherals | | 5.7 | | 11.8 |
Portfolio holdings and asset allocations will vary.
EXPENSE RATIOS AS STATED IN THE MOST RECENT PROSPECTUS
| | | | |
| Share Class | | Gross Expense Ratio6 | | Net Expense Ratio7 |
A | | 1.14% | | 1.14% |
B | | 1.85 | | 1.85 |
C | | 1.88 | | 1.88 |
Y | | 0.67 | | 0.67 |
NOTES TO CHARTS
See page 9 for a description of the indexes.
1 | Returns shown in the chart include performance of the fund’s Retail Class shares, which were converted to Class A shares on 9/12/03. The prior Retail Class performance has been restated to reflect expenses of Class A shares. For periods before the inception of Retail Class shares (12/31/96), performance shown for Class A has been based on the performance of the fund’s Institutional Class shares, adjusted to reflect the higher expenses paid by Class A shares. The restatement of the fund’s performance to reflect Class A expenses is based on the net expenses of the Class after taking into effect the fund’s then current expense cap arrangements. For periods prior to the inception of Class B and Class C shares (9/12/03), performance is based on prior Institutional Class performance, restated to reflect the loads and expenses of Class B and Class C shares, respectively. Class Y performance has been restated to reflect the net expenses of the Institutional Class after taking into effect the fund’s then current expense cap arrangements. The growth of $10,000 chart compares the performance of Class A shares, at net asset value, to the performance of Class A shares including the maximum sales charge of 5.75%. This chart reflects the performance of Class A Shares rather than Class Y shares because Class A shares have the highest sales charge. Prior to 9/12/03, the fund was offered without a sales charge. |
2 | Does not include a sales charge. |
3 | Includes maximum sales charge of 5.75%. |
4 | Performance for Class B shares assumes a maximum of 5% contingent deferred sales charge (“CDSC”) applied when you sell shares, which declines annually between years 1-6 according to the following schedule: 5, 4, 3, 3, 2, 1, 0%. Class C shares performance assumes a 1% CDSC applied when you sell shares within one year of purchase. |
5 | Fund performance has been increased by expense reductions and reimbursements, if any, without which performance would have been lower. |
6 | Before reductions and reimbursements. |
7 | After reductions and reimbursements. Expense reductions are contractual and are set to expire 1/31/09. |
4
LOOMIS SAYLES RESEARCH FUND
PORTFOLIO PROFILE
Objective:
Long-term growth of capital
Strategy:
Invests primarily in equity securities, including common stocks, convertible securities, and warrants; focuses on stocks of large-capitalization companies, but may invest in companies of any size
Fund Inception:
July 31, 2000
Managers:
Maureen G. Depp, CFA
Brian James, CFA
Loomis, Sayles & Company, L.P.
Symbols:
| | |
| Class A | | LSRRX |
| Class B | | LSCBX |
| Class C | | LSCCX |
| Class Y | | LISRX |
What You Should Know:
Growth stocks are generally more sensitive to market movements than value stocks. Small-cap stocks are generally more volatile than the market. The fund can invest a significant percentage of assets in foreign securities and the value of the fund shares can be adversely affected by changes in currency exchange rates, political, and economic developments. In emerging markets these risks can be significant. Fund shares should be viewed as a long-term investment.
Management Discussion
Equity prices declined sharply during the six months ended March 31, 2008, as investors worried that the crisis in the credit markets might pull the domestic economy into a major slump. While Loomis Sayles Research Fund was not immune to the general downdraft, it held up better than the overall market. The fund’s Class A shares returned -10.60% at net asset value, including $0.06 in dividends and $0.97 in capital gains reinvested during the period. For the same period, the fund’s benchmark, the S&P 500 Index returned -12.46%, while the average return on the funds in Morningstar’s Large Blend category was - -12.19%.
ALTHOUGH FINANCE LAGGED, DEFENSIVE SELECTIONS HELPED
Financial stocks were especially volatile during the fiscal period, but the defensive characteristics of the stocks we selected helped the fund avoid most of the damage from the credit crisis. These included exchanges, investment companies and specialty finance companies. While investors looked for signs that the credit crunch was easing, they were also concerned about the exposure of financial companies to the depressed housing industry and deteriorating consumer credit.
INVESTMENTS IN MATERIALS AND ENERGY SUPPORTED RESULTS
Stocks of companies in the materials and energy sectors also supported the fund during this difficult period, as both sectors benefited from rising commodity prices. In materials, the fund benefitted from its position in Owens-Illinois, a leading glass container producer, and Potash Corp., a Canadian producer of nitrogen, phosphate and potash. Owens-Illinois exceeded earnings expectations as it was able to raise prices, reducing debt and lowering expenses. Potash benefited from agricultural demand for its products, coupled with limited global supply.
Led by Hess Corp. and XTO Energy Inc., the energy stocks we selected performed particularly well. Energy stock valuations increased as crude oil prices rose to more than $100 per barrel during the period. Hess, an integrated oil company, prospered both from rising oil prices and from its own improving prospects from an oil field discovery off Brazil’s coast. We sold the position at a profit. XTO, one of the nation’s largest independent oil and gas producers, also benefited from rising oil prices.
SOME FINANCIAL AND TECHNOLOGY STOCKS PROVED DISAPPOINTING
Poor results from the fund’s cyclical holdings offset much of the gains realized elsewhere, as investors grew more risk-averse in the face of mounting evidence that the economy’s expansion was starting to slow. While our relative performance in financials was positive, we nevertheless had disappointments in the group, notably American International Group (AIG) and Prudential Financial. One of the world’s largest financial companies, AIG’s earnings proved disappointing and the company disclosed problems in its mortgage guarantee and consumer finance businesses. In addition, questions arose about how AIG accounted for the value of its derivatives holdings. Prudential also announced disappointing earnings while lowering its forecast for 2008. We sold both positions.
Information technology stocks fell from favor during the past six months, as investors worried about the effects a recession might have on corporate spending for technology. The fund’s holdings in Cisco Systems, a producer of infrastructure for information networks, were part of this negative trend.
EMPHASIS REMAINS ON FUNDAMENTAL ANALYSIS
We are maintaining our policy of seeking superior investment ideas developed from our bottom-up analysis of industries and competitive dynamics. Rather than attempt to align the fund’s portfolio with future macroeconomic prospects, we keep our overall sector weightings consistent with those of the benchmark S&P 500 Index. Our focus is on seeking the best investment ideas revealed by our intensive research.
While uncertainties abound, we do not anticipate a prolonged continuation of the volatility we saw in equity prices during 2008’s first quarter. We believe the fund is well positioned for an eventual stabilization in market conditions and a time when investors again focus on normalized earnings and cash flow growth.
5
LOOMIS SAYLES RESEARCH FUND
Investment Results through March 31, 2008
PERFORMANCE IN PERSPECTIVE
The charts comparing the fund’s performance to an index provide you with a general sense of how it performed. The fund’s total return for the period shown below appears with and without sales charges and includes fund expenses and fees. An index measures the performance of a theoretical portfolio. Unlike a fund, the index is unmanaged and does not have expenses that affect the results. It is not possible to invest directly in an index. Investors would incur transaction costs and other expenses if they purchased the securities necessary to match the index.
Growth of a $10,000 Investment in Class A Shares1,6
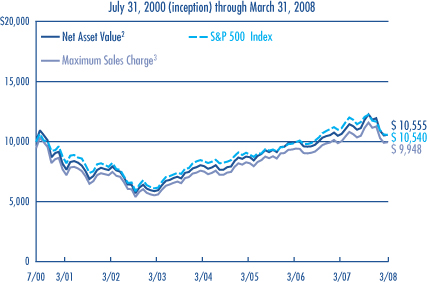
Average Annual Returns — March 31, 20086
| | | | | | | | | | | | |
| | | | | |
| | | 6 MONTHS | | | 1 YEAR | | | 5 YEARS | | | SINCE FUND INCEPTION | |
CLASS A1 | | | | | | | | | | | | |
Net Asset Value2 | | -10.60 | % | | -0.63 | % | | 12.23 | % | | 0.71 | % |
With Maximum Sales Charge3 | | -15.77 | | | -6.38 | | | 10.91 | | | -0.06 | |
| | | | | |
CLASS B1 | | | | | | | | | | | | |
Net Asset Value2 | | -10.90 | | | -1.30 | | | 11.40 | | | -0.10 | |
With CDSC4 | | -14.92 | | | -5.75 | | | 11.14 | | | -0.10 | |
| | | | | |
CLASS C1 | | | | | | | | | | | | |
Net Asset Value2 | | -11.06 | | | -1.43 | | | 11.28 | | | -0.17 | |
With CDSC4 | | -11.86 | | | -2.32 | | | 11.28 | | | -0.17 | |
| | | | | |
CLASS Y1 | | | | | | | | | | | | |
Net Asset Value2 | | -10.41 | | | -0.17 | | | 12.68 | | | 1.05 | |
| | | | | |
| COMPARATIVE PERFORMANCE | | 6 MONTHS | | | 1 YEAR | | | 5 YEARS | | | SINCE FUND INCEPTION5 | |
S&P 500 Index | | -12.46 | % | | -5.08 | % | | 11.32 | % | | 0.69 | % |
Morningstar Large Blend Fund Avg. | | -12.19 | | | -5.13 | | | 11.15 | | | 1.48 | |
All returns represent past performance and do not guarantee future results. Periods of less than one year are not annualized. Share price and return will vary and you may have a gain or loss when you sell your shares. All results include reinvestment of dividends and capital gains. Current returns may be higher or lower than those shown. For performance current to the most recent month-end, visit www.funds.natixis.com.
Class Y shares, the successor to the fund’s Institutional Class, are available to certain investors, as described in the prospectus.
The table and graph do not reflect taxes shareholders might owe on any fund distributions or when they redeem their shares.
PORTFOLIO FACTS
| | | | |
| |
| | | % of Net Assets as of |
| FUND COMPOSITION | | 3/31/08 | | 9/30/07 |
Common Stocks | | 99.5 | | 99.8 |
Short-Term Investments and Other | | 0.5 | | 0.2 |
| |
| | | % of Net Assets as of |
| TEN LARGEST HOLDINGS | | 3/31/08 | | 9/30/07 |
ExxonMobil Corp. | | 4.9 | | 3.9 |
AT&T, Inc. | | 3.6 | | 3.6 |
Hewlett-Packard Co. | | 3.5 | | 1.5 |
Coca-Cola Co. (The) | | 3.1 | | 2.4 |
Oracle Corp. | | 2.8 | | 1.7 |
Costco Wholesale Corp. | | 2.5 | | 0.0 |
Metlife, Inc. | | 2.4 | | 0.0 |
Apple, Inc. | | 2.2 | | 2.3 |
JPMorgan Chase & Co. | | 2.2 | | 0.0 |
Danaher Corp. | | 2.1 | | 1.7 |
| |
| | | % of Net Assets as of |
| FIVE LARGEST INDUSTRIES | | 3/31/08 | | 9/30/07 |
Oil, Gas & Consumable Fuels | | 8.5 | | 7.0 |
Insurance | | 6.2 | | 6.4 |
Health Care Equipment & Supplies | | 6.0 | | 2.6 |
Computers & Peripherals | | 5.7 | | 4.8 |
Communications Equipment | | 4.8 | | 4.4 |
Portfolio holdings and asset allocations will vary.
EXPENSE RATIOS AS STATED IN THE MOST RECENT PROSPECTUS
| | | | |
| Share Class | | Gross Expense Ratio7 | | Net Expense Ratio8 |
A | | 1.50% | | 1.25% |
B | | 2.31 | | 2.00 |
C | | 2.29 | | 2.00 |
Y | | 1.11 | | 0.85 |
NOTES TO CHARTS
See page 9 for a description of the indexes.
1 | Returns shown in the chart include performance of the fund’s Retail Class shares, which were converted to Class A shares on 9/12/03. The prior Retail Class performance has been restated to reflect expenses of Class A shares. For periods before the inception of Retail Class shares (11/30/01), performance shown for Class A has been based on the performance of the fund’s Institutional Class shares, adjusted to reflect the higher expenses paid by Class A shares. The restatement of the fund’s performance to reflect Class A expenses is based on the net expenses of the Class after taking into effect the fund’s then current expense cap arrangements. For periods prior to the inception of Class B and Class C shares (9/12/03), performance is based on prior Institutional Class performance, restated to reflect the loads and expenses of Class B and Class C shares, respectively. Class Y performance has been restated to reflect the net expenses of the Institutional Class after taking into effect the fund’s then current expense cap arrangements. The growth of $10,000 chart compares the performance of Class A shares, at net asset value, to the performance of Class A shares including the maximum sales charge of 5.75%. This chart reflects the performance of Class A Shares rather than Class Y shares because Class A shares have the highest sales charge. Prior to 9/12/03, the fund was offered without a sales charge. |
2 | Does not include a sales charge. |
3 | Includes maximum sales charge of 5.75%. |
4 | Performance for Class B shares assumes a maximum of 5% contingent deferred sales charge (“CDSC”) applied when you sell shares, which declines annually between years 1-6 according to the following schedule: 5, 4, 3, 3, 2, 1, 0%. Class C shares performance assumes a 1% CDSC applied when you sell shares within one year of purchase. |
5 | The since-inception performance comparisons shown are calculated from 8/1/00. |
6 | Fund performance has been increased by expense reductions and reimbursements, if any, without which performance would have been lower. |
7 | Before reductions and reimbursements. |
8 | After reductions and reimbursements. Expense reductions are contractual and are set to expire 1/31/09. |
6
LOOMIS SAYLES VALUE FUND
PORTFOLIO PROFILE
Objective:
Long-term growth of capital and income
Strategy:
Invests primarily in equity securities, including common stocks, convertible securities, and warrants. The fund invests primarily in medium-sized and large-sized companies, but may invest in companies of any size
Fund Inception:
May 13, 1991
Managers:
Arthur Barry, CFA
James L. Carroll, CFA
Warren N. Koontz, CFA, CIC
Loomis, Sayles & Company, L.P.
Symbols:
| | |
| Class A | | LSVRX |
| Class B | | LSVBX |
| Class C | | LSCVX |
| Class Y | | LSGIX |
What You Should Know:
While the fund offers potential for long-term capital growth, it invests in value stocks, which can fall out of favor with investors and may underperform growth stocks during certain market conditions. The fund can invest a significant percentage of assets in foreign securities and the value of the fund shares can be adversely affected by changes in currency exchange rates, political, and economic developments. In emerging markets these risks can be significant. Fund shares should be viewed as a long-term investment.
Management Discussion
Volatility linked to the worsening credit crisis and deteriorating economic data troubled equity markets during the six months ended March 31, 2008. In response, the Federal Reserve Board sought to avert a recession by cutting short-term interest rates twice in the last six months, and taking the unprecedented step of giving brokerage firms access to its lending facilities in an effort to calm the markets. The intense volatility that began the fiscal period seemed to stabilize somewhat, at least in some areas, as we moved through the month of March.
Successful stock selection helped Loomis Sayles Value Fund hold its own during the period. For the six months ended March 31, 2008, Class A shares of the fund returned -9.25% at net asset value, including $0.18 in dividends and $1.15 in capital gains reinvested during the period. For the same period, the Russell 1000 Value Index returned -14.01%, while the average return of the funds in Morningstar’s Large Value category was -13.97%.
ENERGY, INDUSTRIAL AND RETAIL HOLDINGS LED THE WAY
Hess Corp., Owens-Illinois, Wal-Mart and Berkshire Hathaway were the strongest contributors to performance. The energy and integrated oil sectors, as a whole, enjoyed further gains, as crude oil prices set records and the cost of natural gas moved higher. Hess was an outstanding performer, thanks to rising oil prices and the prospective benefits of a substantial discovery in Brazil’s offshore waters. We sold the position at a profit. Another top performer, Owens-Illinois, continued to beat expectations as their pricing in Europe remained strong. Owens has also cut its debt burden and associated interest expenses. In retail, Wal-Mart benefited from renewed focus on its traditional pricing leadership and an emphasis on household staples to attract consumers during the current economic slowdown. General Electric’s shares also rose as the company continued to grow its global footprint.
FINANCIAL AND TECHNOLOGY COMPANIES STRUGGLED
Even though the financial sector contributed the least to return, stock selection was strong and we benefited from our underweight. Insurer Berkshire Hathaway turned in solid performance due to a strong balance sheet and lack of exposure to the credit crunch. However, holdings like Citigroup and American International Group (AIG) underperformed as their mortgage and consumer finance businesses suffered. Technology was also weak, as investors feared the impact of a possible recession on demand for technology products. For example, Motorola’s share of the telephone handset market shrank further in the wake of new product delays.
OUTLOOK IS FOR IMPROVING MARKET CONDITIONS
The market volatility of the past few months is not surprising, given simultaneous concerns about credit markets, commodity-driven inflation and a slowing economy. In our view, the Federal Reserve Board’s recent actions and vigilance will help calm markets and restore investor confidence in time. However, at this juncture, pessimism dominates, risk appetites are low and investor assumptions about future growth are modest. The result has been sharply reduced equity valuations.
We believe better conditions in the equity markets are possible later this year, once the economy rights itself, earnings begin to recover and investors shake off their uncertainty. In the meantime, we hope to use the prevailing negative mood to explore new ideas where we see attractive upside potential. In that pursuit, we will remain true to our value-based strategy, looking for stocks that are trading at levels below what our research team considers to be each company’s intrinsic value. Our premise is that, in time, prices may rise as stocks close the valuation gap.
7
LOOMIS SAYLES VALUE FUND
Investment Results through March 31, 2008
PERFORMANCE IN PERSPECTIVE
The charts comparing the fund’s performance to an index provide you with a general sense of how it performed. The fund’s total return for the period shown below appears with and without sales charges and includes fund expenses and fees. An index measures the performance of a theoretical portfolio. Unlike a fund, the index is unmanaged and does not have expenses that affect the results. It is not possible to invest directly in an index. Investors would incur transaction costs and other expenses if they purchased the securities necessary to match the index.
Growth of a $10,000 Investment in Class A Shares1,5
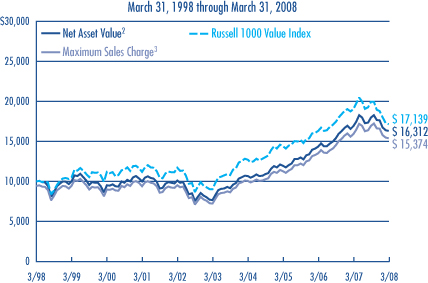
Average Annual Returns — March 31, 20085
| | | | | | | | | | | | |
| | | | | |
| | | 6 MONTHS | | | 1 YEAR | | | 5 YEARS | | | 10 YEARS | |
CLASS A1 | | | | | | | | | | | | |
Net Asset Value2 | | -9.25 | % | | -3.44 | % | | 16.27 | % | | 5.01 | % |
With Maximum Sales Charge3 | | -14.46 | | | -9.01 | | | 14.89 | | | 4.39 | |
| | | | | |
CLASS B1 | | | | | | | | | | | | |
Net Asset Value2 | | -9.62 | | | -4.15 | | | 15.23 | | | 3.90 | |
With CDSC4 | | -13.89 | | | -8.67 | | | 15.00 | | | 3.90 | |
| | | | | |
CLASS C1 | | | | | | | | | | | | |
Net Asset Value2 | | -9.59 | | | -4.11 | | | 15.24 | | | 3.90 | |
With CDSC4 | | -10.44 | | | -5.01 | | | 15.24 | | | 3.90 | |
| | | | | |
CLASS Y1 | | | | | | | | | | | | |
Net Asset Value2 | | -9.04 | | | -3.03 | | | 16.60 | | | 5.34 | |
| | | | | |
| COMPARATIVE PERFORMANCE | | 6 MONTHS | | | 1 YEAR | | | 5 YEARS | | | 10 YEARS | |
Russell 1000 Value Index | | -14.01 | % | | -9.99 | % | | 13.68 | % | | 5.54 | % |
Morningstar Large Value Fund Avg. | | -13.97 | | | -9.18 | | | 12.08 | | | 4.56 | |
All returns represent past performance and do not guarantee future results. Periods of less than one year are not annualized. Share price and return will vary and you may have a gain or loss when you sell your shares. All results include reinvestment of dividends and capital gains. Current returns may be higher or lower than those shown. For performance current to the most recent month-end, visit www.funds.natixis.com.
Class Y shares, the successor to the fund’s Institutional Class, are available to certain investors, as described in the prospectus.
The table and graph do not reflect taxes shareholders might owe on any fund distributions or when they redeem their shares.
PORTFOLIO FACTS
| | | | |
| |
| | | % of Net Assets as of |
| FUND COMPOSITION | | 3/31/08 | | 9/30/07 |
Common Stocks | | 95.9 | | 96.9 |
Short-Term Investments and Other | | 4.1 | | 3.1 |
| |
| | | % of Net Assets as of |
| TEN LARGEST HOLDINGS | | 3/31/08 | | 9/30/07 |
AT&T, Inc. | | 4.4 | | 4.5 |
ExxonMobil Corp. | | 3.9 | | 3.9 |
JPMorgan Chase & Co. | | 2.3 | | 2.4 |
Owens-Illinois, Inc. | | 2.0 | | 1.6 |
Halliburton Co. | | 1.9 | | 2.3 |
Northrop Grumman Corp. | | 1.9 | | 1.8 |
News Corp., Class A | | 1.9 | | 1.5 |
Berkshire Hathaway, Inc., Class B | | 1.9 | | 1.8 |
General Electric Co. | | 1.9 | | 0.0 |
Allstate Corp. | | 1.9 | | 2.0 |
| |
| | | % of Net Assets as of |
| FIVE LARGEST INDUSTRIES | | 3/31/08 | | 9/30/07 |
Oil, Gas & Consumable Fuels | | 8.2 | | 10.4 |
Insurance | | 7.5 | | 7.6 |
Pharmaceuticals | | 6.8 | | 6.0 |
Media | | 6.6 | | 6.1 |
Capital Markets | | 5.4 | | 6.1 |
Portfolio holdings and asset allocations will vary.
EXPENSE RATIOS AS STATED IN THE MOST RECENT PROSPECTUS
| | | | |
| Share Class | | Gross Expense Ratio6 | | Net Expense Ratio7 |
A | | 1.09% | | 1.09% |
B | | 1.89 | | 1.85 |
C | | 1.94 | | 1.85 |
Y | | 0.72 | | 0.72 |
NOTES TO CHARTS
See page 9 for a description of the indexes.
1 | Returns shown in the chart include performance of the fund’s Retail Class shares, which were redesignated to Class A shares on 6/1/07. Performance has been restated to reflect the current load of Class A shares. For periods before the inception of Retail Class shares (6/30/06), performance shown for Class A has been based on the performance of the fund’s Institutional Class shares, adjusted to reflect the higher fees and expenses paid by Class A shares. The restatement of the fund’s performance to reflect Class A expenses is based on the net expenses of the Class after taking into effect the fund’s then current expense cap arrangements. For periods prior to the inception of Class B and Class C shares (6/1/07), performance is based on prior Institutional Class performance, restated to reflect the loads and expenses of Class B and Class C shares, respectively. Class Y performance has been restated to reflect the net expenses of the Institutional Class after taking into effect the fund’s then current expense cap arrangements. The growth of $10,000 chart compares the performance of Class A shares, at net asset value, to the performance of Class A shares including the maximum sales charge of 5.75%. This chart reflects the performance of Class A Shares rather than Class Y shares because Class A shares have the highest sales charge. Prior to 6/1/07, the fund was offered without a sales charge. |
2 | Does not include a sales charge. |
3 | Includes maximum sales charge of 5.75%. |
4 | Performance for Class B shares assumes a maximum of 5% contingent deferred sales charge (“CDSC”) applied when you sell shares, which declines annually between years 1-6 according to the following schedule: 5, 4, 3, 3, 2, 1, 0%. Class C shares performance assumes a 1% CDSC applied when you sell shares within one year of purchase. |
5 | Fund performance has been increased by expense reductions and reimbursements, if any, without which performance would have been lower. |
6 | Before reductions and reimbursements. |
7 | After reductions and reimbursements. Expense reductions are contractual and are set to expire 1/31/09. |
8
ADDITIONAL INFORMATION
The views expressed in this report reflect those of the portfolio managers as of the dates indicated. The managers’ views are subject to change at any time without notice based on changes in market or other conditions. References to specific securities or industries should not be regarded as investment advice. Because these funds are actively managed, there is no assurance that they will continue to invest in the securities or industries mentioned.
For more complete information on any Natixis Fund, contact your financial professional or call Natixis Funds and ask for a free prospectus, which contains more complete information including charges and other ongoing expenses. Investors should consider a fund’s objective, risks and expenses carefully before investing. This and other fund information can be found in the prospectus. Please read the prospectus carefully before investing.
INDEX/AVERAGE DESCRIPTIONS:
Citigroup World Government Bond Index (“Citigroup WGBI”) is an unmanaged index that measures the most significant and liquid government bond indices located around the world with a rating of at least investment grade.
Morgan Stanley Capital International World Index (“MSCI World”) is an unmanaged index that measures global developed market equity performance.
Russell 1000 Growth Index is an unmanaged index that measures the performance of those Russell 1000 companies with higher price-to-book ratios and higher forecasted growth values.
Russell 1000 Value Index is an unmanaged index that measures the performance of those Russell 1000 companies with lower price-to-book ratios and lower forecasted growth values.
Standard & Poor’s 500 Index (“S&P 500”) is an unmanaged index of U.S. common stock performance.
Morningstar Fund Averages are the average performance without sales charges of funds with similar investment objectives, as calculated by Morningstar, Inc.
PROXY VOTING INFORMATION
A description of the funds’ proxy voting policies and procedures is available without charge, upon request, by calling Natixis Funds at 800-225-5478; on the funds’ website at www.funds.natixis.com; and on the Securities and Exchange Commission’s website at www.sec.gov. Information regarding how the funds voted proxies relating to portfolio securities during the 12-month period ended June 30, 2007 is available from the funds’ website and the SEC’s website.
QUARTERLY PORTFOLIO SCHEDULES
The funds will file a complete schedule of portfolio holdings with the SEC for the first and third quarters of each fiscal year on Form N-Q. The funds’ Forms N-Q are available on the SEC’s website at www.sec.gov and may be reviewed and copied at the SEC’s Public Reference Room in Washington, DC. Information on the operation of the Public Reference Room may be obtained by calling 1-800-SEC-0330.
| | | | |
| NOT FDIC INSURED | | MAY LOSE VALUE | | NO BANK GUARANTEE |
9
UNDERSTANDING FUND EXPENSES
As a mutual fund shareholder, you incur different types of costs: transaction costs, including sales charges (loads) on purchases and contingent deferred sales charges on redemptions; redemption fees; certain exchange fees; and minimum account fee charges; and ongoing costs, including management fees, distribution and/or service fees (12b-1 fees), and other fund expenses. In addition, each fund assesses a minimum balance fee of $20 on an annual basis for accounts that fall below the required minimum to establish an account (certain exceptions may apply). These costs are described in more detail in the funds’ prospectus. The examples below are intended to help you understand the ongoing costs of investing in the funds and help you compare these with the ongoing costs of investing in other mutual funds.
The first line in the table for each Class shows the actual amount of fund expenses you would have paid on a $1,000 investment in the fund from October 1, 2007 through March 31, 2008. It also shows how much a $1,000 investment would be worth at the close of the period, assuming actual fund returns and expenses. To estimate the expenses you paid over the period, simply divide your account value by $1,000 (for example $8,600 account value divided by $1,000 = 8.6) and multiply the result by the number in the Expenses Paid During the Period row as shown below for your class.
The second line in the table for each Class provides information about hypothetical account values and hypothetical expenses based on the fund’s actual expense ratios and an assumed rate of return of 5% per year before expenses, which is not the fund’s actual return. The hypothetical account values and expenses may not be used to estimate the actual ending account balance or expenses you paid on your investment for the period. You may use this information to compare the ongoing costs of investing in the fund and other funds. To do so, compare this 5% hypothetical example with the 5% hypothetical examples that appear in the shareholder reports of the other funds.
Please note that the expenses shown reflect ongoing costs only, and do not include any transaction costs. Therefore, the second line in the table of each fund is useful in comparing ongoing costs only, and will not help you determine the relative costs of owning different funds. If transaction costs were included, total costs would be higher.
| | | | | | |
| LOOMIS SAYLES GLOBAL MARKETS | | BEGINNING ACCOUNT VALUE 10/1/2007 | | ENDING ACCOUNT VALUE 3/31/2008 | | EXPENSES PAID DURING PERIOD* 10/1/2007 – 3/31/2008 |
CLASS A | | | | | | |
Actual | | $1,000.00 | | $950.90 | | $6.10 |
Hypothetical (5% return before expenses) | | $1,000.00 | | $1,018.75 | | $6.31 |
CLASS C | | | | | | |
Actual | | $1,000.00 | | $947.70 | | $9.74 |
Hypothetical (5% return before expenses) | | $1,000.00 | | $1,015.00 | | $10.08 |
CLASS Y | | | | | | |
Actual | | $1,000.00 | | $952.10 | | $4.88 |
Hypothetical (5% return before expenses) | | $1,000.00 | | $1,020.00 | | $5.05 |
| * | Expenses are equal to the Fund's annualized expense ratio (after fee reduction/reimbursement): 1.25%, 2.00% and 1.00% for Class A, C and Y, respectively, multiplied by the average account value over the period, multiplied by the number of days in the most recent fiscal half-year, divided by 366 (to reflect the half-year period). |
10
UNDERSTANDING FUND EXPENSES
| | | | | | |
| LOOMIS SAYLES GROWTH FUND | | BEGINNING ACCOUNT VALUE 10/1/2007 | | ENDING ACCOUNT VALUE 3/31/2008 | | EXPENSES PAID DURING PERIOD* 10/1/2007 – 3/31/2008 |
CLASS A | | | | | | |
Actual | | $1,000.00 | | $875.90 | | $5.30 |
Hypothetical (5% return before expenses) | | $1,000.00 | | $1,019.35 | | $5.70 |
CLASS B | | | | | | |
Actual | | $1,000.00 | | $873.30 | | $8.85 |
Hypothetical (5% return before expenses) | | $1,000.00 | | $1,015.55 | | $9.52 |
CLASS C | | | | | | |
Actual | | $1,000.00 | | $872.10 | | $8.71 |
Hypothetical (5% return before expenses) | | $1,000.00 | | $1,015.70 | | $9.37 |
CLASS Y | | | | | | |
Actual | | $1,000.00 | | $878.40 | | $3.10 |
Hypothetical (5% return before expenses) | | $1,000.00 | | $1,021.70 | | $3.34 |
| * | Expenses are equal to the Fund's annualized expense ratio (after fee reduction/reimbursement): 1.13%, 1.89%, 1.86% and 0.66% for Class A, B, C, and Y, respectively, multiplied by the average account value over the period, multiplied by the number of days in the most recent fiscal half-year, divided by 366 (to reflect the half-year period). |
| | | | | | |
| LOOMIS SAYLES RESEARCH FUND | | BEGINNING ACCOUNT VALUE 10/1/2007 | | ENDING ACCOUNT VALUE 3/31/2008 | | EXPENSES PAID DURING PERIOD* 10/1/2007 – 3/31/2008 |
CLASS A | | | | | | |
Actual | | $1,000.00 | | $894.00 | | $5.92 |
Hypothetical (5% return before expenses) | | $1,000.00 | | $1,018.75 | | $6.31 |
CLASS B | | | | | | |
Actual | | $1,000.00 | | $891.00 | | $9.46 |
Hypothetical (5% return before expenses) | | $1,000.00 | | $1,015.00 | | $10.08 |
CLASS C | | | | | | |
Actual | | $1,000.00 | | $889.40 | | $9.45 |
Hypothetical (5% return before expenses) | | $1,000.00 | | $1,015.00 | | $10.08 |
CLASS Y | | | | | | |
Actual | | $1,000.00 | | $895.90 | | $4.03 |
Hypothetical (5% return before expenses) | | $1,000.00 | | $1,020.75 | | $4.29 |
| * | Expenses are equal to the Fund's annualized expense ratio (after fee reduction/reimbursement): 1.25%, 2.00%, 2.00% and 0.85%, for Class A, B, C and Y, respectively, multiplied by the average account value over the period, multiplied by the number of days in the most recent fiscal half-year, divided by 366 (to reflect the half-year period). |
11
UNDERSTANDING FUND EXPENSES
| | | | | | |
| LOOMIS SAYLES VALUE FUND | | BEGINNING ACCOUNT VALUE 10/1/2007 | | ENDING ACCOUNT VALUE 3/31/2008 | | EXPENSES PAID DURING PERIOD* 10/1/07 – 3/31/08 |
CLASS A | | | | | | |
Actual | | $1,000.00 | | $907.50 | | $5.10 |
Hypothetical (5% return before expenses) | | $1,000.00 | | $1,019.65 | | $5.40 |
CLASS B | | | | | | |
Actual | | $1,000.00 | | $903.80 | | $8.66 |
Hypothetical (5% return before expenses) | | $1,000.00 | | $1,015.90 | | $9.17 |
CLASS C | | | | | | |
Actual | | $1,000.00 | | $904.10 | | $8.66 |
Hypothetical (5% return before expenses) | | $1,000.00 | | $1,015.90 | | $9.17 |
CLASS Y | | | | | | |
Actual | | $1,000.00 | | $909.60 | | $3.15 |
Hypothetical (5% return before expenses) | | $1,000.00 | | $1,021.70 | | $3.34 |
| * | Expenses are equal to the Fund's annualized expense ratio (after fee reduction/reimbursement): 1.07%, 1.82%, 1.82% and 0.66% for Class A, B, C and Y, respectively, multiplied by the average account value over the period, multiplied by the number of days in the most recent fiscal half-year, divided by 366 (to reflect the half-year period). |
12
LOOMIS SAYLES GLOBAL MARKETS FUND — PORTFOLIOOF INVESTMENTS
Investments as of March 31, 2008 (Unaudited)
| | | | | | |
Principal
Amount (‡) | | Description | | Value (†) |
| | | | | | |
| | Bonds and Notes — 26.4% of Net Assets | | | |
| | Non-Convertible Bonds — 25.3% | | | |
| | | Argentina — 0.2% | | | |
| $ | 68,750 | | Republic of Argentina,
3.092%, 8/03/2012(b) | | $ | 58,243 |
| | 570,000 | | Transportadora de Gas del Sur SA,
7.875%, 5/14/2017, 144A | | | 456,000 |
| | | | | | |
| | | | | | 514,243 |
| | | | | | |
| | | Australia — 0.2% | | | |
| | 925,000 | | New South Wales Treasury Corp., Series 10RG,
7.000%, 12/01/2010, (AUD) | | | 848,559 |
| | | | | | |
| | | Austria — 0.0% | | | |
| | 95,000 | | Sappi Papier Holding AG,
7.500%, 6/15/2032, 144A | | | 64,963 |
| | | | | | |
| | | Brazil — 0.3% | | | |
| | 170,000 | | Marfrig Overseas Ltd.,
9.625%, 11/16/2016, 144A(c) | | | 162,350 |
| | 1,525,000 | | Republic of Brazil,
10.250%, 1/10/2028, (BRL) | | | 809,127 |
| | | | | | |
| | | | | | 971,477 |
| | | | | | |
| | | Canada — 0.1% | | | |
| | 25,000 | | Canadian Pacific Railway Ltd.,
4.900%, 6/15/2010, (CAD), 144A | | | 24,598 |
| | 100,000 | | GMAC Canada Ltd., Series EMTN,
6.625%, 12/17/2010, (GBP) | | | 158,772 |
| | 50,000 | | Nortel Networks Corp.,
6.875%, 9/01/2023 | | | 30,750 |
| | 180,000 | | Shaw Communications, Inc.,
6.150%, 5/09/2016, (CAD) | | | 168,612 |
| | | | | | |
| | | | | | 382,732 |
| | | | | | |
| | | Cayman Islands — 0.4% | | | |
| | 370,000 | | Embraer Overseas Ltd.,
6.375%, 1/24/2017 | | | 369,075 |
| | 100,000 | | LPG International, Inc.,
7.250%, 12/20/2015(c) | | | 99,625 |
| | 175,000 | | Odebrecht Finance Ltd.,
7.500%, 10/18/2017, 144A | | | 181,125 |
| | 781,000 | | Vale Overseas Ltd.,
6.875%, 11/21/2036 | | | 762,033 |
| | | | | | |
| | | | | | 1,411,858 |
| | | | | | |
| | | Colombia — 0.3% | | | |
| | 40,000 | | Republic of Colombia,
8.125%, 5/21/2024(c) | | | 46,520 |
| | 45,000,000 | | Republic of Colombia,
9.850%, 6/28/2027, (COP) | | | 22,014 |
| | 94,000,000 | | Republic of Colombia,
11.750%, 3/01/2010, (COP) | | | 52,183 |
| | 1,361,000,000 | | Republic of Colombia,
12.000%, 10/22/2015, (COP) | | | 776,875 |
| | | | | | |
| | | | | | 897,592 |
| | | | | | |
| | | Egypt — 0.2% | | | |
| | 2,700,000 | | Arab Republic of Egypt,
8.750%, 7/18/2012, (EGP), 144A | | | 506,722 |
| | | | | | |
| | | France — 0.5% | | | |
| | 65,000 | | Alcatel-Lucent, Series EMTN,
6.375%, 4/07/2014, (EUR) | | | 81,582 |
| | | | | |
Principal
Amount (‡) | | Description | | Value (†) |
| | | | | |
| | France — continued | | | |
| 100,000 | | BNP Paribas,
4.730%, 4/12/2016, (EUR)(b) | | $ | 130,180 |
| 1,665,190,000 | | BNP Paribas SA, Series EMTN,
Zero Coupon, 6/13/2011, (IDR), 144A | | | 129,887 |
| 75,000 | | France Telecom SA, Series EMTN,
3.625%, 10/14/2015, (EUR) | | | 106,676 |
| 35,000 | | Lafarge SA, Series EMTN,
4.750%, 3/23/2020, (EUR) | | | 45,675 |
| 250,000 | | Lafarge SA, Series EMTN,
5.375%, 6/26/2017, (EUR) | | | 359,363 |
| 35,000 | | PPR, Series EMTN,
4.000%, 1/29/2013, (EUR) | | | 49,934 |
| 240,000 | | Veolia Environnement, Series EMTN,
4.000%, 2/12/2016, (EUR) | | | 340,792 |
| 25,000 | | Veolia Environnement, Series EMTN,
5.125%, 5/24/2022, (EUR) | | | 34,949 |
| 100,000 | | Wendel,
4.375%, 8/09/2017, (EUR) | | | 110,592 |
| 200,000 | | Wendel,
4.875%, 5/26/2016, (EUR) | | | 248,055 |
| | | | | |
| | | | | 1,637,685 |
| | | | | |
| | Germany — 0.9% | | | |
| 12,000,000 | | Kreditanstalt fuer Wiederaufbau,
2.050%, 2/16/2026, (JPY) | | | 124,212 |
| 160,000 | | Republic of Germany,
3.750%, 7/04/2013, (EUR) | | | 254,368 |
| 1,105,000 | | Republic of Germany,
4.000%, 1/04/2037, (EUR) | | | 1,593,006 |
| 705,000 | | Republic of Germany, Series 150,
4.000%, 4/13/2012, (EUR) | | | 1,129,769 |
| | | | | |
| | | | | 3,101,355 |
| | | | | |
| | India — 0.2% | | | |
| 500,000 | | Canara Bank Ltd.,
6.365%, 11/28/2021(b) | | | 445,155 |
| 100,000 | | ICICI Bank Ltd.,
6.375%, 4/30/2022, 144A(b) | | | 86,000 |
| | | | | |
| | | | | 531,155 |
| | | | | |
| | Indonesia — 0.1% | | | |
| 2,959,000,000 | | Indonesia Treasury Bond,
11.000%, 12/15/2012, (IDR) | | | 328,484 |
| | | | | |
| | Ireland — 0.2% | | | |
| 10,000,000 | | Depfa ACS Bank,
0.750%, 9/22/2008, (JPY) | | | 100,221 |
| 100,000 | | Depfa ACS Bank,
4.875%, 5/21/2019, (EUR) | | | 162,756 |
| 555,000 | | Elan Financial PLC,
7.750%, 11/15/2011 | | | 516,150 |
| | | | | |
| | | | | 779,127 |
| | | | | |
| | Japan — 0.4% | | | |
| 145,000,000 | | Japan Government,
0.900%, 9/15/2009, (JPY) | | | 1,461,691 |
| | | | | |
| | Korea — 0.2% | | | |
| 460,000 | | Hanarotelecom, Inc.,
7.000%, 2/01/2012, 144A | | | 467,475 |
| 140,000 | | SK Telecom Co., Ltd.,
6.625%, 7/20/2027, 144A | | | 130,791 |
| | | | | |
| | | | | 598,266 |
| | | | | |
See accompanying notes to financial statements.
13
LOOMIS SAYLES GLOBAL MARKETS FUND — PORTFOLIOOF INVESTMENTS (continued)
Investments as of March 31, 2008 (Unaudited)
| | | | | | |
Principal
Amount (‡) | | Description | | Value (†) |
| | | | | | |
| | | Luxembourg — 0.0% | | | |
| $ | 10,000 | | Telecom Italia Capital,
6.000%, 9/30/2034 | | $ | 8,452 |
| | 10,000 | | Telecom Italia Capital,
6.375%, 11/15/2033 | | | 8,744 |
| | | | | | |
| | | | | | 17,196 |
| | | | | | |
| | | Malaysia — 0.0% | | | |
| | 200,000 | | Ranhill Labuan Ltd.,
12.500%, 10/26/2011, 144A | | | 160,000 |
| | | | | | |
| | | Mexico — 0.4% | | | |
| | 340,000 | | Axtel SAB de CV,
7.625%, 2/01/2017, 144A | | | 341,700 |
| | 295,000 | | Desarrolladora Homex SAB de CV,
7.500%, 9/28/2015 | | | 292,788 |
| | 75,000(††) | | Mexican Fixed Rate Bonds, Series M-20,
8.000%, 12/07/2023, (MXN) | | | 733,668 |
| | | | | | |
| | | | | | 1,368,156 |
| | | | | | |
| | | Netherlands — 0.3% | | | |
| | 50,000 | | Bite Finance International,
8.106%, 3/15/2014, (EUR), 144A(b) | | | 63,150 |
| | 230,000 | | Excelcomindo Finance Co.,
7.125%, 1/18/2013, 144A | | | 225,400 |
| | 50,000 | | Koninklijke KPN NV, Series GMTN,
4.750%, 1/17/2017, (EUR) | | | 69,397 |
| | 100,000 | | Majapahit Holding BV,
7.250%, 6/28/2017, 144A | | | 95,000 |
| | 385,000 | | Netherlands Government Bond,
4.000%, 1/15/2037, (EUR) | | | 545,468 |
| | | | | | |
| | | | | | 998,415 |
| | | | | | |
| | | Poland — 0.3% | | | |
| | 2,600,000 | | Poland Government Bond,
5.750%, 3/24/2010, (PLN) | | | 1,155,389 |
| | | | | | |
| | | Singapore — 0.6% | | | |
| | 2,705,000 | | Government of Singapore,
4.625%, 7/01/2010, (SGD) | | | 2,124,556 |
| | | | | | |
| | | South Africa — 0.3% | | | |
| | 450,000 | | Edcon Proprietary Ltd.,
7.856%, 6/15/2014, (EUR)(b) | | | 468,888 |
| | 130,000 | | Edcon Proprietary Ltd.,
7.856%, 6/15/2014, (EUR), 144A(b) | | | 135,457 |
| | 285,000 | | Republic of South Africa,
4.500%, 4/05/2016, (EUR) | | | 392,801 |
| | | | | | |
| | | | | | 997,146 |
| | | | | | |
| | | Spain — 0.0% | | | |
| | 100,000 | | Telefonica Emisiones SAU,
6.221%, 7/03/2017 | | | 100,623 |
| | | | | | |
| | | Supranational — 1.0% | | | |
| | 190,000,000 | | Asia Development Bank,
2.350%, 6/21/2027, (JPY) | | | 2,028,193 |
| | 67,000,000 | | European Investment Bank,
1.250%, 9/20/2012, (JPY) | | | 684,360 |
| | 40,000,000 | | European Investment Bank,
1.400%, 6/20/2017, (JPY) | | | 407,156 |
| | 530,000 | | European Investment Bank, Series EMTN,
6.500%, 8/12/2014, (PLN) | | | 248,192 |
| | | | | | |
| | | | | | 3,367,901 |
| | | | | | |
| | | | | | |
Principal
Amount (‡) | | Description | | Value (†) |
| | | | | | |
| | | Thailand — 0.1% | | | |
| $ | 330,000 | | True Move Co. Ltd.,
10.375%, 8/01/2014 | | $ | 308,417 |
| | 100,000 | | True Move Co. Ltd.,
10.375%, 8/01/2014, 144A | | | 88,000 |
| | | | | | |
| | | | | | 396,417 |
| | | | | | |
| | | United Kingdom — 0.2% | | | |
| | 60,000 | | BSKYB Finance UK PLC,
5.750%, 10/20/2017, (GBP) | | | 109,674 |
| | 100,000 | | FCE Bank PLC, Series EMTN,
7.875%, 2/15/2011, (GBP) | | | 166,711 |
| | 1,229,424,500 | | JPMorgan Chase London,
Zero Coupon, 10/21/2010, (IDR), 144A | | | 103,803 |
| | 165,000 | | Lloyds TSB Bank PLC,
4.385%, 5/29/2049, (EUR)(b) | | | 205,867 |
| | 65,000 | | United Kingdom Treasury,
5.250%, 6/07/2012, (GBP) | | | 135,449 |
| | | | | | |
| | | | | | 721,504 |
| | | | | | |
| | | United States — 17.4% | | | |
| | 50,000 | | Albertson’s, Inc.,
6.625%, 6/01/2028 | | | 42,537 |
| | 500,000 | | Albertson’s, Inc.,
7.450%, 8/01/2029 | | | 460,403 |
| | 15,000 | | Amkor Technology, Inc.,
7.750%, 5/15/2013 | | | 13,687 |
| | 100,000 | | Anadarko Petroleum Corp.,
5.950%, 9/15/2016 | | | 103,415 |
| | 75,000 | | Anadarko Petroleum Corp.,
6.450%, 9/15/2036 | | | 76,376 |
| | 60,000 | | Arrow Electronics, Inc.,
6.875%, 7/01/2013 | | | 63,904 |
| | 100,000 | | ASIF Global Financing XXVII,
2.380%, 2/26/2009, (SGD), 144A | | | 72,641 |
| | 325,000 | | AT&T, Inc.,
6.500%, 9/01/2037 | | | 321,487 |
| | 42,865 | | Atlas Air, Inc., Series B,
7.680%, 1/02/2014(f) | | | 49,724 |
| | 145,000 | | Avnet, Inc.,
6.000%, 9/01/2015 | | | 145,347 |
| | 349,720,000 | | Barclays Financial LLC,
1.000%, 3/23/2009, (KRW), 144A | | | 362,521 |
| | 110,000,000 | | Barclays Financial LLC,
4.060%, 9/16/2010, (KRW), 144A | | | 115,670 |
| | 220,000,000 | | Barclays Financial LLC,
4.460%, 9/23/2010, (KRW), 144A | | | 233,517 |
| | 310,000 | | Borden, Inc.,
7.875%, 2/15/2023(c) | | | 192,200 |
| | 410,000 | | Borden, Inc.,
8.375%, 4/15/2016 | | | 278,800 |
| | 5,000 | | Boston Scientific Corp.,
5.450%, 6/15/2014 | | | 4,588 |
| | 30,000 | | Boston Scientific Corp.,
6.400%, 6/15/2016 | | | 27,975 |
| | 60,000 | | Boston Scientific Corp.,
7.000%, 11/15/2035 | | | 52,200 |
| | 50,000 | | Bristol-Myers Squibb Co.,
4.625%, 11/15/2021, (EUR) | | | 69,635 |
| | 250,000 | | Chesapeake Energy Corp.,
6.250%, 1/15/2017, (EUR) | | | 357,192 |
See accompanying notes to financial statements.
14
LOOMIS SAYLES GLOBAL MARKETS FUND — PORTFOLIOOF INVESTMENTS (continued)
Investments as of March 31, 2008 (Unaudited)
| | | | | | |
Principal
Amount (‡) | | Description | | Value (†) |
| | | | | | |
| | | United States — continued | | | |
| $ | 15,000 | | Chesapeake Energy Corp.,
6.500%, 8/15/2017 | | $ | 14,475 |
| | 70,000 | | Chesapeake Energy Corp.,
6.875%, 1/15/2016 | | | 69,300 |
| | 75,000 | | Chesapeake Energy Corp.,
6.875%, 11/15/2020 | | | 72,750 |
| | 10,000 | | CIT Group, Inc.,
5.000%, 2/13/2014 | | | 7,870 |
| | 25,000 | | CIT Group, Inc.,
5.125%, 9/30/2014 | | | 19,250 |
| | 25,000 | | CIT Group, Inc.,
5.600%, 4/27/2011 | | | 20,165 |
| | 2,702,000 | | CIT Group, Inc.,
7.625%, 11/30/2012 | | | 2,245,727 |
| | 50,000 | | CIT Group, Inc. Series MTN,
4.250%, 3/17/2015, (EUR) | | | 46,468 |
| | 270,000 | | CIT Group, Inc., Series EMTN,
3.800%, 11/14/2012, (EUR) | | | 258,746 |
| | 50,000 | | CIT Group, Inc., Series EMTN,
5.500%, 12/20/2016, (GBP) | | | 61,910 |
| | 150,000 | | CIT Group, Inc., Series GMTN,
4.250%, 9/22/2011, (EUR) | | | 151,861 |
| | 120,000 | | Citi Credit Card Issuance Trust,
5.375%, 4/10/2013, (EUR) | | | 187,266 |
| | 5,000 | | Clear Channel Communications, Inc.,
4.900%, 5/15/2015 | | | 3,350 |
| | 820,000 | | Clear Channel Communications, Inc.,
5.500%, 12/15/2016 | | | 541,200 |
| | 75,000 | | Clear Channel Communications, Inc.,
5.750%, 1/15/2013 | | | 59,625 |
| | 25,000 | | Colonial Realty LP,
6.050%, 9/01/2016 | | | 20,490 |
| | 35,000 | | Comcast Corp.,
5.650%, 6/15/2035 | | | 29,721 |
| | 965,000 | | Comcast Corp.,
6.950%, 8/15/2037 | | | 966,935 |
| | 131,515 | | Continental Airlines, Inc., Series 1999-1C,
6.954%, 8/02/2009 | | | 123,624 |
| | 30,000 | | Countrywide Financial Corp., Series A, MTN,
2.849%, 12/19/2008(b) | | | 27,450 |
| | 90,000 | | Countrywide Home Loans, Inc., Series L, MTN,
4.000%, 3/22/2011 | | | 80,266 |
| | 190,000 | | CSX Corp.,
6.250%, 3/15/2018 | | | 187,506 |
| | 160,000 | | Cummins, Inc.,
7.125%, 3/01/2028 | | | 157,895 |
| | 10,000 | | D.R. Horton, Inc.,
5.250%, 2/15/2015 | | | 8,300 |
| | 368,385 | | Delta Air Lines, Inc.,
8.021%, 8/10/2022 | | | 335,230 |
| | 372,998 | | Delta Air Lines, Inc.,
8.954%, 8/10/2014 | | | 346,888 |
| | 50,000 | | Dillard’s, Inc.,
6.625%, 1/15/2018(c) | | | 37,500 |
| | 50,000 | | Dillard’s, Inc.,
7.000%, 12/01/2028 | | | 33,875 |
| | 3,010,000 | | Energy Future Holdings Corp., Series P,
5.550%, 11/15/2014 | | | 2,350,331 |
| | 2,570,000 | | Energy Future Holdings Corp., Series Q,
6.500%, 11/15/2024 | | | 1,824,900 |
| | | | | | |
Principal
Amount (‡) | | Description | | Value (†) |
| | | | | | |
| | | United States — continued | | | |
| $ | 17,000 | | ESI Tractebel Acquisition Corp., Series B,
7.990%, 12/30/2011 | | $ | 17,369 |
| | 200,000 | | Federal National Mortgage Association,
2.290%, 2/19/2009, (SGD) | | | 146,164 |
| | 150,000 | | Foot Locker, Inc.,
8.500%, 1/15/2022 | | | 132,000 |
| | 10,000 | | Ford Motor Co.,
6.625%, 2/15/2028 | | | 6,100 |
| | 1,750,000 | | Ford Motor Co.,
6.625%, 10/01/2028 | | | 1,067,500 |
| | 15,000 | | Ford Motor Co.,
7.125%, 11/15/2025 | | | 9,900 |
| | 595,000 | | Ford Motor Co.,
7.450%, 7/16/2031 | | | 392,700 |
| | 1,405,000 | | Ford Motor Credit Co. LLC,
5.700%, 1/15/2010 | | | 1,220,591 |
| | 2,250,000 | | Ford Motor Credit Co. LLC,
7.000%, 10/01/2013 | | | 1,755,043 |
| | 105,000 | | Ford Motor Credit Co. LLC,
8.000%, 12/15/2016 | | | 82,195 |
| | 170,000 | | Ford Motor Credit Co. LLC,
8.625%, 11/01/2010 | | | 148,120 |
| | 390,000 | | Ford Motor Credit Co. LLC,
9.750%, 9/15/2010 | | | 347,401 |
| | 388,000 | | Freescale Semiconductor, Inc.,
10.125%, 12/15/2016(c) | | | 261,900 |
| | 9,000,000 | | General Electric Capital Corp., Series EMTN,
0.550%, 10/14/2008, (JPY) | | | 89,931 |
| | 90,000 | | General Motors Corp.,
7.250%, 7/03/2013, (EUR) | | | 112,249 |
| | 45,000 | | General Motors Corp.,
7.400%, 9/01/2025 | | | 30,150 |
| | 710,000 | | General Motors Corp.,
8.250%, 7/15/2023 | | | 497,000 |
| | 3,015,000 | | General Motors Corp.,
8.375%, 7/15/2033(c) | | | 2,125,575 |
| | 120,000 | | Georgia Gulf Corp.,
10.750%, 10/15/2016(c) | | | 78,600 |
| | 3,375,000 | | Georgia-Pacific Corp.,
7.250%, 6/01/2028 | | | 2,750,625 |
| | 35,000 | | Georgia-Pacific Corp.,
7.750%, 11/15/2029 | | | 29,400 |
| | 525,000 | | Georgia-Pacific LLC,
8.000%, 1/15/2024 | | | 462,000 |
| | 505,000 | | Georgia-Pacific LLC,
8.875%, 5/15/2031 | | | 449,450 |
| | 435,000 | | GMAC LLC,
6.000%, 12/15/2011 | | | 325,159 |
| | 145,000 | | GMAC LLC,
6.625%, 5/15/2012 | | | 109,690 |
| | 420,000 | | GMAC LLC,
6.750%, 12/01/2014 | | | 297,234 |
| | 45,000 | | GMAC LLC,
6.875%, 9/15/2011 | | | 34,441 |
| | 95,000 | | GMAC LLC,
6.875%, 8/28/2012 | | | 72,193 |
| | 100,000 | | GMAC LLC,
7.000%, 2/01/2012 | | | 76,048 |
| | 3,170,000 | | GMAC LLC,
8.000%, 11/01/2031 | | | 2,271,914 |
See accompanying notes to financial statements.
15
LOOMIS SAYLES GLOBAL MARKETS FUND — PORTFOLIOOF INVESTMENTS (continued)
Investments as of March 31, 2008 (Unaudited)
| | | | | | |
Principal
Amount (‡) | | Description | | Value (†) |
| | | | | | |
| | | United States — continued | | | |
| $ | 150,000 | | Goldman Sachs Group, Inc. (The),
4.723%, 5/23/2016, (EUR)(b) | | $ | 204,639 |
| | 400,000 | | Goldman Sachs Group, Inc. (The),
6.875%, 1/18/2038, (GBP) | | | 743,974 |
| | 165,000 | | Goodyear Tire & Rubber Co.,
7.000%, 3/15/2028 | | | 134,475 |
| | 25,000 | | GTE Corp.,
6.940%, 4/15/2028 | | | 25,234 |
| | 20,000 | | HCA, Inc.,
5.750%, 3/15/2014 | | | 16,500 |
| | 15,000 | | HCA, Inc.,
6.250%, 2/15/2013 | | | 13,050 |
| | 75,000 | | HCA, Inc.,
6.375%, 1/15/2015 | | | 63,469 |
| | 15,000 | | HCA, Inc.,
6.500%, 2/15/2016 | | | 12,638 |
| | 40,000 | | HCA, Inc.,
6.750%, 7/15/2013 | | | 35,400 |
| | 225,000 | | HCA, Inc.,
7.050%, 12/01/2027 | | | 164,066 |
| | 130,000 | | HCA, Inc.,
7.190%, 11/15/2015 | | | 110,595 |
| | 70,000 | | HCA, Inc.,
7.500%, 12/15/2023 | | | 54,964 |
| | 250,000 | | HCA, Inc.,
7.500%, 11/06/2033 | | | 193,125 |
| | 100,000 | | HCA, Inc.,
7.580%, 9/15/2025 | | | 78,274 |
| | 1,240,000 | | HCA, Inc.,
7.690%, 6/15/2025 | | | 982,757 |
| | 50,000 | | HCA, Inc.,
7.750%, 7/15/2036 | | | 38,394 |
| | 305,000 | | HCA, Inc.,
8.360%, 4/15/2024 | | | 253,175 |
| | 395,000 | | Highwoods Properties, Inc.,
5.850%, 3/15/2017 | | | 337,408 |
| | 260,000 | | Hilcorp Energy I LP,
7.750%, 11/01/2015 | | | 243,750 |
| | 1,165,000 | | Home Depot, Inc.,
5.875%, 12/16/2036 | | | 951,069 |
| | 960,000 | | HSBC Bank USA,
Zero Coupon, 4/18/2012, (MYR), 144A | | | 296,239 |
| | 500,000 | | HSBC Bank USA,
Zero Coupon, 5/17/2012, (MYR), 144A | | | 153,181 |
| | 100,000 | | HSBC Bank USA,
3.310%, 8/25/2010, 144A | | | 120,720 |
| | 195,000 | | iStar Financial, Inc.,
5.150%, 3/01/2012 | | | 144,300 |
| | 60,000 | | iStar Financial, Inc.,
5.500%, 6/15/2012 | | | 44,400 |
| | 50,000 | | iStar Financial, Inc.,
5.650%, 9/15/2011 | | | 38,000 |
| | 55,000 | | iStar Financial, Inc.,
5.850%, 3/15/2017 | | | 37,950 |
| | 275,000 | | iStar Financial, Inc.,
5.875%, 3/15/2016 | | | 192,500 |
| | 135,000 | | iStar Financial, Inc.,
6.050%, 4/15/2015 | | | 95,850 |
| | 580,000 | | iStar Financial, Inc., Series B,
5.950%, 10/15/2013 | | | 423,400 |
| | | | | | |
Principal
Amount (‡) | | Description | | Value (†) |
| | | | | | |
| | | United States — continued | | | |
| $ | 5,000 | | J.C. Penney Corp., Inc.,
5.750%, 2/15/2018 | | $ | 4,616 |
| | 120,000 | | J.C. Penney Corp., Inc.,
6.375%, 10/15/2036 | | | 101,979 |
| | 15,000 | | J.C. Penney Corp., Inc.,
7.125%, 11/15/2023 | | | 15,575 |
| | 780,965 | | JPMorgan Chase & Co., Series EMTN,
Zero Coupon, 6/08/2012, (MYR), 144A | | | 217,625 |
| | 260,000 | | K. Hovnanian Enterprises, Inc.,
6.250%, 1/15/2016 | | | 175,500 |
| | 15,000 | | K. Hovnanian Enterprises, Inc.,
6.375%, 12/15/2014 | | | 10,125 |
| | 250,000 | | Kellwood Co.,
7.625%, 10/15/2017 | | | 162,500 |
| | 30,000 | | Lennar Corp.,
5.125%, 10/01/2010 | | | 26,100 |
| | 15,000 | | Lennar Corp., Series B,
5.500%, 9/01/2014 | | | 11,400 |
| | 90,000 | | Lennar Corp., Series B,
5.600%, 5/31/2015 | | | 66,600 |
| | 55,000 | | Lennar Corp., Series B,
6.500%, 4/15/2016 | | | 41,800 |
| | 15,000 | | Level 3 Financing, Inc.,
8.750%, 2/15/2017 | | | 11,400 |
| | 10,000 | | Level 3 Financing, Inc.,
9.250%, 11/01/2014 | | | 8,175 |
| | 155,000 | | Lucent Technologies, Inc.,
6.450%, 3/15/2029 | | | 110,825 |
| | 130,000 | | MBNA Credit Card Master Note Trust,
4.150%, 4/19/2010, (EUR) | | | 200,088 |
| | 500,000 | | Merrill Lynch & Co., Inc.,
10.710%, 3/08/2017, (BRL) | | | 253,605 |
| | 90,000 | | MidAmerican Energy Holdings Co.,
6.500%, 9/15/2037 | | | 90,196 |
| | 230,000 | | Morgan Stanley,
5.375%, 11/14/2013, (GBP) | | | 418,946 |
| | 100,000 | | Mosaic Global Holdings, Inc.,
7.375%, 8/01/2018 | | | 102,000 |
| | 80,000 | | News America, Inc.,
6.150%, 3/01/2037 | | | 75,571 |
| | 25,000 | | News America, Inc.,
6.400%, 12/15/2035 | | | 24,263 |
| | 145,000 | | Nextel Communications, Inc., Series D,
7.375%, 8/01/2015 | | | 111,650 |
| | 10,000 | | Nextel Communications, Inc., Series E,
6.875%, 10/31/2013 | | | 7,900 |
| | 55,000 | | Nextel Communications, Inc., Series F,
5.950%, 3/15/2014 | | | 40,700 |
| | 250,000 | | NGC Corporation Capital Trust I, Series B,
8.316%, 6/01/2027 | | | 214,375 |
| | 170,000 | | Northern Telecom Capital Corp.,
7.875%, 6/15/2026 | | | 106,250 |
| | 1,000,000 | | NRG Energy, Inc.,
7.375%, 2/01/2016 | | | 980,000 |
| | 100,000 | | Owens Brockway Glass Container, Inc.,
6.750%, 12/01/2014, (EUR) | | | 149,981 |
| | 510,000 | | Owens Corning, Inc.,
6.500%, 12/01/2016 | | | 422,793 |
| | 360,000 | | Owens Corning, Inc.,
7.000%, 12/01/2036 | | | 260,315 |
See accompanying notes to financial statements.
16
LOOMIS SAYLES GLOBAL MARKETS FUND — PORTFOLIOOF INVESTMENTS (continued)
Investments as of March 31, 2008 (Unaudited)
| | | | | | |
Principal
Amount (‡) | | Description | | Value (†) |
| | | | | | |
| | | United States — continued | | | |
| $ | 40,000 | | Owens-Illinois, Inc.,
7.800%, 5/15/2018 | | $ | 39,600 |
| | 950,000 | | Petrobras International Finance Co.,
5.875%, 3/01/2018 | | | 914,419 |
| | 275,000 | | Pulte Homes, Inc.,
4.875%, 7/15/2009 | | | 259,875 |
| | 50,000 | | Pulte Homes, Inc.,
5.200%, 2/15/2015 | | | 42,500 |
| | 540,000 | | Pulte Homes, Inc.,
6.000%, 2/15/2035 | | | 415,800 |
| | 695,000 | | Pulte Homes, Inc.,
6.375%, 5/15/2033 | | | 542,100 |
| | 1,335,000 | | Qwest Capital Funding, Inc.,
6.500%, 11/15/2018 | | | 1,081,350 |
| | 670,000 | | Qwest Capital Funding, Inc.,
6.875%, 7/15/2028 | | | 525,950 |
| | 400,000 | | Qwest Capital Funding, Inc.,
7.625%, 8/03/2021 | | | 338,000 |
| | 60,000 | | Qwest Capital Funding, Inc.,
7.750%, 2/15/2031 | | | 50,400 |
| | 45,000 | | Qwest Corp.,
6.875%, 9/15/2033 | | | 36,000 |
| | 115,000 | | Qwest Corp.,
7.250%, 9/15/2025 | | | 100,050 |
| | 40,000 | | R.H. Donnelley Corp.,
6.875%, 1/15/2013 | | | 24,400 |
| | 735,000 | | R.H. Donnelley Corp.,
8.875%, 10/15/2017 | | | 459,375 |
| | 35,000 | | R.H. Donnelley Corp., Series A-1,
6.875%, 1/15/2013 | | | 21,350 |
| | 40,000 | | R.H. Donnelley Corp., Series A-2,
6.875%, 1/15/2013 | | | 24,400 |
| | 18,000 | | R.H. Donnelley Corp., Series A-3,
8.875%, 1/15/2016 | | | 11,385 |
| | 155,000 | | RBS Capital Trust,
4.243%, 12/29/2049, (EUR)(b) | | | 189,263 |
| | 345,000 | | Residential Capital LLC,
8.500%, 4/17/2013(b) | | | 167,325 |
| | 5,000 | | Residential Capital LLC,
8.375%, 6/30/2010(b) | | | 2,513 |
| | 195,000 | | Residential Capital LLC,
8.500%, 6/01/2012(b) | | | 95,550 |
| | 175,000 | | Residential Capital LLC,
8.875%, 6/30/2015(b) | | | 84,875 |
| | 80,000 | | Reynolds American, Inc.,
6.750%, 6/15/2017 | | | 80,917 |
| | 20,000 | | Reynolds American, Inc.,
7.250%, 6/15/2037 | | | 19,798 |
| | 415,000 | | Six Flags, Inc.,
9.625%, 6/01/2014(c) | | | 234,475 |
| | 100,000 | | Six Flags, Inc.,
9.750%, 4/15/2013(c) | | | 57,500 |
| | 20,000 | | SLM Corp.,
4.000%, 1/15/2010 | | | 16,809 |
| | 138,000 | | SLM Corp., Series A, MTN,
5.000%, 10/01/2013 | | | 103,873 |
| | 10,000 | | SLM Corp., Series A, MTN,
5.000%, 6/15/2018 | | | 7,150 |
| | 75,000 | | SLM Corp., Series A, MTN,
5.375%, 1/15/2013 | | | 58,500 |
| | | | | | |
Principal
Amount (‡) | | Description | | Value (†) |
| | | | | | |
| | | United States — continued | | | |
| $ | 65,000 | | SLM Corp., Series A, MTN,
5.375%, 5/15/2014 | | $ | 48,781 |
| | 20,000 | | SLM Corp., Series A, MTN,
5.625%, 8/01/2033 | | | 13,850 |
| | 120,000 | | SLM Corp., Series MTN,
5.050%, 11/14/2014 | | | 87,273 |
| | 434,000 | | Sprint Capital Corp.,
6.875%, 11/15/2028 | | | 323,330 |
| | 295,000 | | Sprint Capital Corp.,
6.900%, 5/01/2019 | | | 232,312 |
| | 26,000 | | Sprint Nextel Corp.,
6.000%, 12/01/2016 | | | 20,215 |
| | 185,000 | | Tenet Healthcare Corp.,
6.875%, 11/15/2031 | | | 129,500 |
| | 750,000 | | Tennessee Gas Pipeline Co.,
7.000%, 10/15/2028(c) | | | 747,304 |
| | 10,000 | | Time Warner, Inc.,
6.500%, 11/15/2036 | | | 9,174 |
| | 395,000 | | Time Warner, Inc.,
6.625%, 5/15/2029 | | | 370,375 |
| | 160,000 | | Time Warner, Inc.,
6.950%, 1/15/2028 | | | 155,414 |
| | 115,000 | | Time Warner, Inc.,
7.625%, 4/15/2031 | | | 120,280 |
| | 75,000 | | Time Warner, Inc.,
7.700%, 5/01/2032 | | | 78,961 |
| | 105,000 | | Toll Brothers Finance Corp.,
5.150%, 5/15/2015 | | | 94,972 |
| | 375,000 | | Toys R Us, Inc.,
7.375%, 10/15/2018 | | | 259,687 |
| | 200,000 | | Transcontinental Gas Pipe Line Corp.,
6.400%, 4/15/2016 | | | 205,250 |
| | 20,000 | | TXU Corp., Series R,
6.550%, 11/15/2034 | | | 14,120 |
| | 3,700,000 | | U.S. Treasury Bonds,
4.250%, 11/15/2017(c) | | | 3,947,726 |
| | 3,385,000 | | U.S. Treasury Bonds,
4.500%, 2/15/2036(c) | | | 3,496,864 |
| | 1,110,000 | | United Rentals North America, Inc.,
7.000%, 2/15/2014 | | | 871,350 |
| | 2,050,000 | | United Rentals North America, Inc.,
7.750%, 11/15/2013(c) | | | 1,670,750 |
| | 525,000 | | United States Steel Corp.,
6.650%, 6/01/2037 | | | 443,784 |
| | 50,000 | | USG Corp.,
6.300%, 11/15/2016 | | | 39,500 |
| | 230,000 | | USG Corp.,
7.750%, 1/15/2018 | | | 204,700 |
| | 90,000 | | Verizon Communications,
5.850%, 9/15/2035 | | | 81,986 |
| | 5,000 | | Verizon Maryland, Inc.,
5.125%, 6/15/2033 | | | 4,005 |
| | 250,000 | | Verizon New York, Inc., Series B,
7.375%, 4/01/2032 | | | 261,329 |
| | 70,000 | | Viacom, Inc., Class B,
6.875%, 4/30/2036 | | | 67,407 |
| | 140,000 | | Virginia Tobacco Settlement Financing Corp., Series A-1,
6.706%, 6/01/2046 | | | 127,007 |
| | 185,000 | | Wells Fargo & Co.,
4.625%, 11/02/2035, (GBP) | | | 284,285 |
See accompanying notes to financial statements.
17
LOOMIS SAYLES GLOBAL MARKETS FUND — PORTFOLIOOF INVESTMENTS (continued)
Investments as of March 31, 2008 (Unaudited)
| | | | | | |
Principal
Amount (‡) | | Description | | Value (†) |
| | | | | | |
| | | United States — continued | | | |
| $ | 100,000 | | Williams Cos., Inc.,
7.500%, 1/15/2031 | | $ | 104,250 |
| | 20,000 | | Xerox Corp.,
7.200%, 4/01/2016 | | | 21,389 |
| | | | | | |
| | | | | | 59,902,316 |
| | | | | | |
| | | Uruguay — 0.5% | | | |
| | 33,739,688 | | Republic of Uruguay,
4.250%, 4/05/2027, (UYU) | | | 1,662,343 |
| | | | | | |
| | | Total Non-Convertible Bonds (Identified Cost $88,979,801) | | | 87,007,871 |
| | | | | | |
| | Convertible Bonds — 1.1% | | | |
| | | United States — 1.1% | | | |
| | 95,000 | | Builders Transportation, Inc.,
8.000%, 8/15/2005(d) | | | — |
| | 56,000 | | Countrywide Financial Corp.,
0.758%, 4/15/2037(b) | | | 49,560 |
| | 178,000 | | Countrywide Financial Corp.,
0.815%, 5/15/2037(b) | | | 152,190 |
| | 430,000 | | iStar Financial, Inc.,
3.198%, 10/01/2012(b) | | | 302,505 |
| | 550,000 | | Kellwood Co., (Step to 0.000% on 6/15/2011),
3.500%, 6/15/2034(e) | | | 552,750 |
| | 365,000 | | Kulicke & Soffa Industries, Inc.,
0.875%, 6/01/2012 | | | 251,850 |
| | 140,000 | | Level 3 Communications, Inc.,
2.875%, 7/15/2010 | | | 97,825 |
| | 440,000 | | Level 3 Communications, Inc.,
3.500%, 6/15/2012 | | | 301,400 |
| | 185,000 | | Level 3 Communications, Inc.,
5.250%, 12/15/2011 | | | 145,225 |
| | 145,000 | | Level 3 Communications, Inc.,
6.000%, 3/15/2010 | | | 117,088 |
| | 95,000 | | Level 3 Communications, Inc.,
6.000%, 9/15/2009 | | | 84,313 |
| | 200,000 | | NII Holdings, Inc.,
3.125%, 6/15/2012 | | | 158,750 |
| | 500,000 | | Regeneron Pharmaceuticals, Inc.,
5.500%, 10/17/2008 | | | 498,125 |
| | 500,000 | | Valeant Pharmaceuticals International,
3.000%, 8/16/2010 | | | 455,000 |
| | 80,000 | | Valeant Pharmaceuticals International,
4.000%, 11/15/2013 | | | 66,500 |
| | 583,000 | | Vertex Pharmaceuticals, Inc.,
4.750%, 2/15/2013 | | | 695,227 |
| | | | | | |
| | | Total Convertible Bonds (Identified Cost $4,114,243) | | | 3,928,308 |
| | | | | | |
| | | Total Bonds and Notes (Identified Cost $93,094,044) | | | 90,936,179 |
| | | | | | |
| | |
| Shares | | | | |
| | Common Stocks — 69.6% | | | |
| | | Brazil — 2.5% | | | |
| | 340,302 | | Bolsa de Mercadorias e Futuros | | | 3,102,999 |
| | 105,935 | | Petroleo Brasileiro SA | | | 5,413,570 |
| | | | | | |
| | | | | | 8,516,569 |
| | | | | | |
| | | Canada — 3.0% | | | |
| | 27,226 | | Potash Corp. of Saskatchewan, Inc. | | | 4,225,748 |
| | 53,314 | | Research In Motion Ltd.(f) | | | 5,983,430 |
| | | | | | |
| | | | | | 10,209,178 |
| | | | | | |
| | | | | |
| | |
| Shares | | Description | | Value (†) |
| | | | | |
| | Cayman Islands — 0.2% | | | |
| 210,005 | | Li Ning Co. Ltd. | | $ | 592,293 |
| | | | | |
| | China — 1.7% | | | |
| 1,030,819 | | China Communications Construction Co. Ltd. | | | 2,316,574 |
| 1,976,748 | | China Overseas Land & Investment Ltd. | | | 3,653,111 |
| | | | | |
| | | | | 5,969,685 |
| | | | | |
| | Denmark — 1.1% | | | |
| 55,670 | | Novo Nordisk AS, Class B(c) | | | 3,830,942 |
| | | | | |
| | France — 0.7% | | | |
| 30,554 | | Total SA | | | 2,263,559 |
| | | | | |
| | Hong Kong — 2.5% | | | |
| 349,925 | | China Mobile Ltd. | | | 5,257,521 |
| 289,200 | | Esprit Holdings Ltd. | | | 3,511,122 |
| | | | | |
| | | | | 8,768,643 |
| | | | | |
| | India — 2.8% | | | |
| 84,666 | | Bharat Heavy Electricals Ltd. | | | 4,298,524 |
| 257,001 | | Bharti Airtel Ltd.(f) | | | 5,256,388 |
| | | | | |
| | | | | 9,554,912 |
| | | | | |
| | Japan — 1.7% | | | |
| 11,300 | | Nintendo Co. Ltd.(c) | | | 5,912,209 |
| | | | | |
| | Luxembourg — 1.0% | | | |
| 40,166 | | ArcelorMittal | | | 3,285,579 |
| | | | | |
| | Mexico — 1.9% | | | |
| 2,046,128 | | America Movil SAB de CV, Series L | | | 6,517,464 |
| | | | | |
| | Spain — 1.4% | | | |
| 108,186 | | Gamesa Corporation Tecnologica SA | | | 4,938,846 |
| | | | | |
| | Switzerland — 4.9% | | | |
| 323,158 | | ABB Ltd. | | | 8,676,294 |
| 91,523 | | Actelion Ltd.(f) | | | 4,994,980 |
| 45,669 | | Julius Baer Holding, Ltd., Registered | | | 3,371,038 |
| | | | | |
| | | | | 17,042,312 |
| | | | | |
| | Turkey — 0.9% | | | |
| 389,454 | | Turkcell Iletisim Hizmet AS | | | 3,226,919 |
| | | | | |
| | United Kingdom — 3.7% | | | |
| 301,560 | | Capita Group PLC | | | 4,063,151 |
| 477,182 | | Man Group PLC | | | 5,252,757 |
| 7,993 | | Rio Tinto PLC(c) | | | 3,291,837 |
| | | | | |
| | | | | 12,607,745 |
| | | | | |
| | United States — 39.6% | | | |
| 39,110 | | Apple, Inc.(f) | | | 5,612,285 |
| 86,495 | | AT&T, Inc. | | | 3,312,758 |
| 41,191 | | Avery Dennison Corp. | | | 2,028,657 |
| 119,127 | | BJ Services Co. | | | 3,396,311 |
| 22,940 | | BlackRock, Inc.(c) | | | 4,683,889 |
| 7,176 | | CME Group, Inc.(c) | | | 3,366,262 |
| 89,750 | | Covidien Ltd. | | | 3,971,437 |
| 41,133 | | Deere & Co. | | | 3,308,738 |
| 25,747 | | ExxonMobil Corp. | | | 2,177,681 |
| 22,599 | | First Solar, Inc.(f) | | | 5,223,533 |
| 35,176 | | Flowserve Corp. | | | 3,671,671 |
| 41,769 | | Freeport-McMoRan Copper & Gold, Inc.(c) | | | 4,019,013 |
| 50,637 | | General Cable Corp.(c)(f) | | | 2,991,128 |
| 98,545 | | Gilead Sciences, Inc.(f) | | | 5,078,024 |
| 20,356 | | Goldman Sachs Group, Inc. | | | 3,366,679 |
| 4,959 | | Google, Inc. Class A(f) | | | 2,184,291 |
See accompanying notes to financial statements.
18
LOOMIS SAYLES GLOBAL MARKETS FUND — PORTFOLIOOF INVESTMENTS (continued)
Investments as of March 31, 2008 (Unaudited)
| | | | | | | |
| Shares | | Description | | Value (†) | |
| | | | | | | |
| | | United States — continued | | | | |
| | 64,885 | | Halliburton Co. | | $ | 2,551,927 | |
| | 16,505 | | IntercontinentalExchange, Inc.(f) | | | 2,153,902 | |
| | 11,827 | | Intuitive Surgical, Inc.(f) | | | 3,836,087 | |
| | 100,911 | | JPMorgan Chase & Co. | | | 4,334,127 | |
| | 35,043 | | MasterCard, Inc., Class A(c) | | | 7,814,239 | |
| | 95,562 | | McDonald’s Corp. | | | 5,329,493 | |
| | 58,822 | | MEMC Electronic Materials, Inc.(f) | | | 4,170,480 | |
| | 81,452 | | Monsanto Co. | | | 9,081,898 | |
| | 185,995 | | News Corp., Class A | | | 3,487,406 | |
| | 44,883 | | Nike, Inc., Class B | | | 3,052,044 | |
| | 173,611 | | Oracle Corp.(f) | | | 3,395,831 | |
| | 65,211 | | Owens-Illinois, Inc.(f) | | | 3,679,857 | |
| | 25,989 | | Priceline.com, Inc.(c)(f) | | | 3,141,031 | |
| | 161,294 | | Southwestern Energy Co.(f) | | | 5,433,995 | |
| | 106,842 | | TJX Cos., Inc. | | | 3,533,265 | |
| | 37,613 | | Transocean, Inc.(f) | | | 5,085,278 | |
| | 94,868 | | Urban Outfitters, Inc.(c)(f) | | | 2,974,112 | |
| | 79,884 | | Visa, Inc., Class A(f) | | | 4,981,565 | |
| | | | | | | |
| | | | | | 136,428,894 | |
| | | | | | | |
| | | Total Common Stocks (Identified Cost $239,026,319) | | | 239,665,749 | |
| | | | | | | |
| | Preferred Stocks — 0.2% | | | | |
| | | United States — 0.2% | | | | |
| | 10,540 | | Federal Home Loan Mortgage Corp., 8.375% | | | 257,176 | |
| | 15,000 | | Federal National Mortgage Association, 8.250% | | | 360,750 | |
| | 175 | | Lucent Technologies Capital Trust, 7.750% | | | 122,500 | |
| | | | | | | |
| | | | | | 740,426 | |
| | | | | | | |
| | | Total Preferred Stocks (Identified Cost $779,081) | | | 740,426 | |
| | | | | | | |
Shares/ Principal
Amount (‡) | | | | | |
| | Short-Term Investments — 15.8% | | | | |
| | 46,998,736 | | State Street Navigator Securities Lending Prime Portfolio(g) | | | 46,998,736 | |
| $ | 7,312,000 | | Tri-Party Repurchase Agreement with Fixed Income Clearing Corporation, dated 3/31/08 at 1.250% to be repurchased at $7,312,254 on 4/1/08 collateralized by $7,435,000 Federal Home Loan Mortgage Corp., 3.375% due 3/5/2010 valued at $7,462,881 including accrued interest (Note 2g of Notes to Financial Statements) | | | 7,312,000 | |
| | | | | | | |
| | | Total Short-Term Investments (Identified Cost $54,310,736) | | | 54,310,736 | |
| | | | | | | |
| | | | | | | |
| | | Total Investments — 112.0%
(Identified Cost $387,210,180)(a) | | | 385,653,090 | |
| | | Other assets less liabilities — (12.0)% | | | (41,377,146 | ) |
| | | | | | | |
| | | Net Assets — 100.0% | | $ | 344,275,944 | |
| | | | | | | |
| | | | | | | |
| | | | | | |
| (‡) | | Principal amount stated in U.S. dollars unless otherwise noted. | |
| (†) | | See Note 2a of Notes to Financial Statements. | |
| (††) | | Amount shown represents units. One unit represents a principal amount of 100. | |
| (a) | | Federal Tax Information (Amounts exclude certain adjustments made at the end of the Fund’s fiscal year for tax purposes. Such adjustments are primarily due to wash sales and gains realized from passive foreign investment companies. Amortization of premium on debt securities is excluded for tax purposes): At March 31, 2008, the net unrealized depreciation on investments based on a cost of $387,263,003 for federal income tax purposes was as follows: | |
| | Aggregate gross unrealized appreciation for all investments in which there is an excess of value over tax cost | | $ | 16,660,546 | |
| | Aggregate gross unrealized depreciation for all investments in which there is an excess of tax cost over value | | | (18,270,459 | ) |
| | | | | | |
| | Net unrealized depreciation | | $ | (1,609,913 | ) |
| | | | | | |
| | | | | | |
| (b) | | Variable rate security. Rate as of March 31, 2008 is disclosed. | |
| (c) | | All or a portion of this security was on loan to brokers at March 31, 2008. | |
| (d) | | Bankrupt issuer. Security remains in the Portfolio of Investments pending final resolution of bankruptcy proceedings. | |
| (e) | | Step Bond: Coupon is a fixed rate for an initial period then resets at a specified date and rate. | |
| (f) | | Non-income producing security. | |
| (g) | | Represents investment of securities lending collateral. | |
| | | |
| 144A | | Securities exempt from registration under Rule 144A of the Securities Act of 1933. These securities may be resold in transactions exempt from registration, normally to qualified institutional buyers. At March 31, 2008, the total value of these securities amounted to $4,994,535 or 1.5% of net assets. | |
| EMTN | | Euro Medium Term Note | |
| GMTN | | Global Medium Term Note | |
| MTN | | Medium Term Note | |
| | | |
| AUD | | Australian Dollar | |
| BRL | | Brazilian Real | |
| CAD | | Canadian Dollar | |
| COP | | Colombian Peso | |
| EGP | | Egyptian Pound | |
| EUR | | Euro | |
| GBP | | British Pound | |
| IDR | | Indonesian Rupiah | |
| JPY | | Japanese Yen | |
| KRW | | South Korean Won | |
| MXN | | Mexican Peso | |
| MYR | | Malaysian Ringgit | |
| PLN | | Polish Zloty | |
| SGD | | Singapore Dollar | |
| UYU | | Uruguayan Peso | |
See accompanying notes to financial statements.
19
LOOMIS SAYLES GLOBAL MARKETS FUND — PORTFOLIOOF INVESTMENTS (continued)
Investments as of March 31, 2008 (Unaudited)
Holdings at March 31, 2008 as a Percentage of Net Assets (unaudited)
| | | |
| Electrical Equipment | | 7.6 | % |
| Wireless Telecommunication Services | | 5.9 | |
| Capital Markets | | 4.8 | |
| Oil, Gas & Consumable Fuels | | 4.4 | |
| Chemicals | | 4.1 | |
| Treasuries | | 3.9 | |
| Diversified Financial Services | | 3.8 | |
| IT Services | | 3.7 | |
| Metal & Mining | | 3.4 | |
| Energy Equipment & Services | | 3.2 | |
| Biotechnology | | 2.9 | |
| Specialty Retail | | 2.9 | |
| Software | | 2.7 | |
| Sovereigns | | 2.5 | |
| Automotive | | 2.4 | |
| Heath Care Equipment & Supplies | | 2.3 | |
| Non-Captive Diversified | | 2.2 | |
| Machinery | | 2.0 | |
| Other, less than 2% each | | 31.5 | |
See accompanying notes to financial statements.
20
LOOMIS SAYLES GROWTH FUND — PORTFOLIOOF INVESTMENTS
Investments as of March 31, 2008 (Unaudited)
| | | | | |
| | |
| Shares | | Description | | Value (†) |
| | | | | |
| Common Stocks — 98.8% of Net Assets | | | |
| | Aerospace & Defense — 1.4% | | | |
| 50,445 | | Precision Castparts Corp. | | $ | 5,149,426 |
| | | | | |
| | Beverages — 3.9% | | | |
| 227,913 | | Coca-Cola Co. (The) | | | 13,873,064 |
| | | | | |
| | Biotechnology — 5.3% | | | |
| 79,689 | | Celgene Corp.(c) | | | 4,884,139 |
| 58,554 | | Genzyme Corp.(c) | | | 4,364,615 |
| 187,165 | | Gilead Sciences, Inc.(c) | | | 9,644,612 |
| | | | | |
| | | | | 18,893,366 |
| | | | | |
| | Capital Markets — 8.4% | | | |
| 46,421 | | BlackRock, Inc.(b) | | | 9,478,240 |
| 269,122 | | Charles Schwab Corp. (The) | | | 5,067,567 |
| 35,418 | | Goldman Sachs Group, Inc. | | | 5,857,783 |
| 68,423 | | State Street Corp. | | | 5,405,417 |
| 86,411 | | T. Rowe Price Group, Inc. | | | 4,320,550 |
| | | | | |
| | | | | 30,129,557 |
| | | | | |
| | Chemicals — 4.4% | | | |
| 140,568 | | Monsanto Co. | | | 15,673,332 |
| | | | | |
| | Communications Equipment — 5.7% | | | |
| 191,395 | | Cisco Systems, Inc.(c) | | | 4,610,705 |
| 192,719 | | Corning, Inc. | | | 4,632,965 |
| 209,262 | | Juniper Networks, Inc.(c) | | | 5,231,550 |
| 147,012 | | QUALCOMM, Inc. | | | 6,027,492 |
| | | | | |
| | | | | 20,502,712 |
| | | | | |
| | Computers & Peripherals — 5.7% | | | |
| 85,575 | | Apple, Inc.(c) | | | 12,280,012 |
| 71,990 | | International Business Machines Corp. | | | 8,288,929 |
| | | | | |
| | | | | 20,568,941 |
| | | | | |
| | Containers & Packaging — 1.4% | | | |
| 88,746 | | Owens-Illinois, Inc.(c) | | | 5,007,937 |
| | | | | |
| | Diversified Financial Services — 3.9% | | | |
| 19,667 | | CME Group, Inc. | | | 9,225,790 |
| 35,550 | | IntercontinentalExchange, Inc.(c) | | | 4,639,275 |
| | | | | |
| | | | | 13,865,065 |
| | | | | |
| | Electrical Equipment — 1.9% | | | |
| 28,659 | | First Solar, Inc.(c) | | | 6,624,241 |
| | | | | |
| | Electronic Equipment & Instruments — 0.9% | | | |
| 85,629 | | Dolby Laboratories, Inc., Class A(c) | | | 3,104,908 |
| | | | | |
| | Energy Equipment & Services — 2.7% | | | |
| 72,660 | | Transocean, Inc.(c) | | | 9,823,632 |
| | | | | |
| | Food & Staples Retailing — 2.2% | | | |
| 146,806 | | Wal-Mart Stores, Inc. | | | 7,733,740 |
| | | | | |
| | Health Care Equipment & Supplies — 6.5% | | | |
| 53,118 | | C.R. Bard, Inc. | | | 5,120,575 |
| 96,344 | | Hologic, Inc.(c) | | | 5,356,727 |
| 25,326 | | Intuitive Surgical, Inc.(c) | | | 8,214,488 |
| 67,726 | | Stryker Corp. | | | 4,405,576 |
| | | | | |
| | | | | 23,097,366 |
| | | �� | | |
| | Health Care Providers & Services — 1.3% | | | |
| 74,301 | | Express Scripts, Inc.(c) | | | 4,779,040 |
| | | | | |
| | | | | |
| | |
| Shares | | Description | | Value (†) |
| | | | | |
| | Hotels, Restaurants & Leisure — 1.6% | | | |
| 100,175 | | McDonald’s Corp. | | $ | 5,586,760 |
| | | | | |
| | Internet & Catalog Retail — 3.6% | | | |
| 77,368 | | Amazon.com, Inc.(b)(c) | | | 5,516,339 |
| 61,041 | | Priceline.com, Inc.(b)(c) | | | 7,377,415 |
| | | | | |
| | | | | 12,893,754 |
| | | | | |
| | Internet Software & Services — 1.2% | | | |
| 10,096 | | Google, Inc., Class A(c) | | | 4,446,985 |
| | | | | |
| | IT Services — 6.2% | | | |
| 160,574 | | Cognizant Technology Solutions Corp., Class A(c) | | | 4,629,349 |
| 45,267 | | MasterCard, Inc., Class A(b) | | | 10,094,088 |
| 119,098 | | Visa, Inc., Class A(c) | | | 7,426,951 |
| | | | | |
| | | | | 22,150,388 |
| | | | | |
| | Life Sciences Tools & Services — 0.9% | | | |
| 58,879 | | Thermo Fisher Scientific, Inc.(c) | | | 3,346,682 |
| | | | | |
| | Machinery — 5.3% | | | |
| 90,015 | | AGCO Corp.(b)(c) | | | 5,390,098 |
| 83,138 | | Deere & Co. | | | 6,687,621 |
| 64,720 | | Flowserve Corp. | | | 6,755,473 |
| | | | | |
| | | | | 18,833,192 |
| | | | | |
| | Metals & Mining — 1.2% | | | |
| 133,434 | | Steel Dynamics, Inc.(b) | | | 4,408,659 |
| | | | | |
| | Oil, Gas & Consumable Fuels — 6.6% | | | |
| 44,623 | | EOG Resources, Inc. | | | 5,354,760 |
| 161,430 | | Southwestern Energy Co.(c) | | | 5,438,577 |
| 205,085 | | XTO Energy, Inc. | | | 12,686,558 |
| | | | | |
| | | | | 23,479,895 |
| | | | | |
| | Pharmaceuticals — 1.5% | | | |
| 95,298 | | Allergan, Inc. | | | 5,373,854 |
| | | | | |
| | Road & Rail — 1.5% | | | |
| 96,168 | | CSX Corp. | | | 5,392,140 |
| | | | | |
| | Semiconductors & Semiconductor Equipment — 2.4% | | | |
| 122,671 | | MEMC Electronic Materials, Inc.(c) | | | 8,697,374 |
| | | | | |
| | Software — 4.9% | | | |
| 231,636 | | Activision, Inc.(c) | | | 6,325,979 |
| 432,948 | | Oracle Corp.(c) | | | 8,468,463 |
| 48,861 | | Salesforce.com, Inc.(c) | | | 2,827,586 |
| | | | | |
| | | | | 17,622,028 |
| | | | | |
| | Specialty Retail — 3.3% | | | |
| 178,832 | | TJX Cos., Inc. | | | 5,913,974 |
| 185,950 | | Urban Outfitters, Inc.(b)(c) | | | 5,829,533 |
| | | | | |
| | | | | 11,743,507 |
| | | | | |
| | Textiles, Apparel & Luxury Goods — 3.0% | | | |
| 78,041 | | Nike, Inc., Class B | | | 5,306,788 |
| 70,115 | | VF Corp. | | | 5,434,614 |
| | | | | |
| | | | | 10,741,402 |
| | | | | |
| | Total Common Stocks (Identified Cost $340,783,092) | | | 353,542,947 |
| | | | | |
See accompanying notes to financial statements.
21
LOOMIS SAYLES GROWTH FUND — PORTFOLIOOF INVESTMENTS (continued)
Investments as of March 31, 2008 (Unaudited)
| | | | | | | |
Shares/
Principal
Amount | | Description | | Value (†) | |
| | | | | | | |
| | Short-Term Investments — 12.7% | | | | |
| | 42,909,346 | | State Street Navigator Securities Lending Prime Portfolio(d) | | $ | 42,909,346 | |
| $ | 2,308,000 | | Tri-Party Repurchase Agreement with Fixed Income Clearing Corporation, dated 3/31/08 at 1.250% to be repurchased at $2,308,080 on 4/1/08 collateralized by $2,275,000 Federal National Mortgage Association, 5.020% due 11/21/2012 valued at $2,354,625 including accrued interest (Note 2g of Notes to Financial Statements) | | | 2,308,000 | |
| | | | | | | |
| | | Total Short-Term Investments
(Identified Cost $45,217,346) | | | 45,217,346 | |
| | | | | | | |
| | | Total Investments — 111.5%
(Identified Cost $386,000,438)(a) | | | 398,760,293 | |
| | | Other assets less liabilities — (11.5)% | | | (40,993,813 | ) |
| | | | | | | |
| | | Net Assets — 100.0% | | $ | 357,766,480 | |
| | | | | | | |
| | | | | | | |
| | (†) | | See Note 2a of Notes to Financial Statements. | | | | |
| | (a) | | Federal Tax Information (Amounts exclude certain adjustments made at the end of the Fund’s fiscal year for tax purposes. Such adjustments are primarily due to wash sales.): At March 31, 2008, the net unrealized appreciation on investments based on a cost of $386,000,438 for federal income tax purposes was as follows: | | | | |
| | | Aggregate gross unrealized appreciation for all investments in which there is an excess of value over tax cost | | $ | 27,130,624 | |
| | | Aggregate gross unrealized depreciation for all investments in which there is an excess of tax cost over value | | | (14,370,769 | ) |
| | | | | | | |
| | | Net unrealized appreciation | | $ | 12,759,855 | |
| | | | | | | |
| | (b) | | All or a portion of this security was on loan to brokers at March 31, 2008. | | | | |
| | (c) | | Non-income producing security. | | | | |
| | (d) | | Represents investment of securities lending collateral. | | | | |
Holdings at March 31, 2008 as a Percentage of Net Assets (unaudited)
| | | |
| Capital Markets | | 8.4 | % |
| Oil, Gas & Consumable Fuels | | 6.6 | |
| Health Care Equipment & Supplies | | 6.5 | |
| IT Services | | 6.2 | |
| Computers & Peripherals | | 5.7 | |
| Communications Equipment | | 5.7 | |
| Biotechnology | | 5.3 | |
| Machinery | | 5.3 | |
| Software | | 4.9 | |
| Chemicals | | 4.4 | |
| Beverages | | 3.9 | |
| Diversified Financial Services | | 3.9 | |
| Internet & Catalog Retail | | 3.6 | |
| Specialty Retail | | 3.3 | |
| Textiles, Apparel & Luxury Goods | | 3.0 | |
| Energy Equipment & Services | | 2.7 | |
| Semiconductors & Semiconductor Equipment | | 2.4 | |
| Food & Staples Retailing | | 2.2 | |
| Other, less than 2% each | | 14.8 | |
See accompanying notes to financial statements.
22
LOOMIS SAYLES RESEARCH FUND — PORTFOLIOOF INVESTMENTS
Investments as of March 31, 2008 (Unaudited)
| | | | | |
| | |
| Shares | | Description | | Value (†) |
| | | | | |
| Common Stocks — 99.5% of Net Assets | | | |
| | Aerospace & Defense — 3.5% | | | |
| 3,615 | | Boeing Co. | | $ | 268,847 |
| 4,060 | | Lockheed Martin Corp.(b) | | | 403,158 |
| 1,608 | | Precision Castparts Corp. | | | 164,145 |
| 1,638 | | United Technologies Corp. | | | 112,727 |
| | | | | |
| | | | | 948,877 |
| | | | | |
| | Beverages — 4.4% | | | |
| 13,693 | | Coca-Cola Co. (The) | | | 833,493 |
| 4,937 | | PepsiCo, Inc. | | | 356,451 |
| | | | | |
| | | | | 1,189,944 |
| | | | | |
| | Biotechnology — 3.0% | | | |
| 3,840 | | Celgene Corp.(b)(c) | | | 235,354 |
| 4,101 | | Genzyme Corp.(c) | | | 305,688 |
| 5,253 | | Gilead Sciences, Inc.(b)(c) | | | 270,687 |
| | | | | |
| | | | | 811,729 |
| | | | | |
| | Capital Markets — 2.5% | | | |
| 1,838 | | Goldman Sachs Group, Inc. | | | 303,987 |
| 4,756 | | State Street Corp.(b) | | | 375,724 |
| | | | | |
| | | | | 679,711 |
| | | | | |
| | Chemicals — 1.5% | | | |
| 2,569 | | Monsanto Co. | | | 286,444 |
| 764 | | Potash Corp. of Saskatchewan, Inc. | | | 118,580 |
| | | | | |
| | | | | 405,024 |
| | | | | |
| | Commercial Banks — 2.7% | | | |
| 6,219 | | PNC Financial Services Group, Inc.(b) | | | 407,780 |
| 11,048 | | Wells Fargo & Co.(b) | | | 321,497 |
| | | | | |
| | | | | 729,277 |
| | | | | |
| | Communications Equipment — 4.8% | | | |
| 4,516 | | Ciena Corp.(b)(c) | | | 139,228 |
| 19,736 | | Cisco Systems, Inc.(b)(c) | | | 475,440 |
| 15,511 | | Corning, Inc. | | | 372,885 |
| 2,882 | | Research In Motion Ltd.(c) | | | 323,447 |
| | | | | |
| | | | | 1,311,000 |
| | | | | |
| | Computers & Peripherals — 5.7% | | | |
| 4,194 | | Apple, Inc.(c) | | | 601,839 |
| 20,853 | | Hewlett-Packard Co.(b) | | | 952,148 |
| | | | | |
| | | | | 1,553,987 |
| | | | | |
| | Consumer Finance — 1.1% | | | |
| 6,499 | | American Express Co.(b) | | | 284,136 |
| | | | | |
| | Containers & Packaging — 1.5% | | | |
| 5,508 | | Owens-Illinois, Inc.(c) | | | 310,817 |
| 3,425 | | Pactiv Corp.(b)(c) | | | 89,769 |
| | | | | |
| | | | | 400,586 |
| | | | | |
| | Diversified Financial Services — 4.6% | | | |
| 13,311 | | Bank of America Corp. | | | 504,620 |
| 342 | | CME Group, Inc. | | | 160,432 |
| 13,832 | | JPMorgan Chase & Co. | | | 594,085 |
| | | | | |
| | | | | 1,259,137 |
| | | | | |
| | Diversified Telecommunication Services — 3.6% | | | |
| 25,376 | | AT&T, Inc. | | | 971,901 |
| | | | | |
| | Electric Utilities — 2.4% | | | |
| 2,419 | | Exelon Corp. | | | 196,592 |
| 4,091 | | FirstEnergy Corp. | | | 280,725 |
| | | | | |
| | |
| Shares | | Description | | Value (†) |
| | | | | |
| | Electric Utilities — continued | | | |
| 2,737 | | FPL Group, Inc. | | $ | 171,719 |
| | | | | |
| | | | | 649,036 |
| | | | | |
| | Electrical Equipment — 1.0% | | | |
| 5,474 | | Emerson Electric Co. | | | 281,692 |
| | | | | |
| | Energy Equipment & Services — 4.6% | | | |
| 9,758 | | Halliburton Co.(b) | | | 383,782 |
| 5,810 | | Nabors Industries Ltd.(b)(c) | | | 196,204 |
| 3,148 | | Schlumberger Ltd. | | | 273,876 |
| 2,850 | | Transocean, Inc.(b)(c) | | | 385,320 |
| | | | | |
| | | | | 1,239,182 |
| | | | | |
| | Food & Staples Retailing — 4.1% | | | |
| 10,411 | | Costco Wholesale Corp.(b) | | | 676,402 |
| 8,188 | | Wal-Mart Stores, Inc. | | | 431,344 |
| | | | | |
| | | | | 1,107,746 |
| | | | | |
| | Health Care Equipment & Supplies — 6.0% | | | |
| 2,719 | | Baxter International, Inc. | | | 157,213 |
| 4,148 | | Becton, Dickinson & Co.(b) | | | 356,106 |
| 2,680 | | C.R. Bard, Inc.(b) | | | 258,352 |
| 8,281 | | Covidien Ltd.(b) | | | 366,434 |
| 2,839 | | Hologic, Inc.(b)(c) | | | 157,848 |
| 2,097 | | Stryker Corp.(b) | | | 136,410 |
| 2,466 | | Zimmer Holdings, Inc.(c) | | | 192,003 |
| | | | | |
| | | | | 1,624,366 |
| | | | | |
| | Health Care Providers & Services — 0.5% | | | |
| 3,222 | | Medco Health Solutions, Inc.(b)(c) | | | 141,091 |
| | | | | |
| | Hotels, Restaurants & Leisure — 2.0% | | | |
| 6,455 | | International Game Technology(b) | | | 259,556 |
| 4,978 | | McDonald’s Corp. | | | 277,623 |
| | | | | |
| | | | | 537,179 |
| | | | | |
| | Household Products — 1.1% | | | |
| 3,719 | | Colgate-Palmolive Co.(b) | | | 289,747 |
| | | | | |
| | Independent Power Producers & Energy Traders — 1.3% | | | |
| 2,502 | | Constellation Energy Group | | | 220,852 |
| 3,548 | | NRG Energy, Inc.(b)(c) | | | 138,336 |
| | | | | |
| | | | | 359,188 |
| | | | | |
| | Industrial Conglomerates — 1.0% | | | |
| 4,889 | | Textron, Inc. | | | 270,948 |
| | | | | |
| | Insurance — 6.2% | | | |
| 9,613 | | ACE Ltd.(b) | | | 529,291 |
| 10,135 | | Chubb Corp. (The)(b) | | | 501,480 |
| 10,811 | | Metlife, Inc. | | | 651,471 |
| | | | | |
| | | | | 1,682,242 |
| | | | | |
| | Internet & Catalog Retail — 1.7% | | | |
| 3,886 | | Priceline.com, Inc.(b)(c) | | | 469,662 |
| | | | | |
| | Internet Software & Services — 0.7% | | | |
| 6,662 | | Akamai Technologies, Inc.(b)(c) | | | 187,602 |
| | | | | |
| | IT Services — 1.0% | | | |
| 9,028 | | Cognizant Technology Solutions Corp., Class A(b)(c) | | | 260,277 |
| | | | | |
| | Machinery — 3.8% | | | |
| 7,402 | | Danaher Corp.(b) | | | 562,774 |
| 4,258 | | Deere & Co.(b) | | | 342,514 |
| 1,654 | | Eaton Corp. | | | 131,774 |
| | | | | |
| | | | | 1,037,062 |
| | | | | |
See accompanying notes to financial statements.
23
LOOMIS SAYLES RESEARCH FUND — PORTFOLIOOF INVESTMENTS (continued)
Investments as of March 31, 2008 (Unaudited)
| | | | | | | |
| | |
| Shares | | Description | | Value (†) | |
| | | | | | | |
| | | Media — 2.5% | | | | |
| | 13,736 | | DIRECTV Group, Inc. (The)(b)(c) | | $ | 340,516 | |
| | 17,331 | | News Corp., Class A | | | 324,956 | |
| | | | | | | |
| | | | | | 665,472 | |
| | | | | | | |
| | | Metals & Mining — 0.7% | | | | |
| | 5,890 | | Steel Dynamics, Inc.(b) | | | 194,605 | |
| | | | | | | |
| | | Oil, Gas & Consumable Fuels — 8.5% | | | | |
| | 4,938 | | ConocoPhillips | | | 376,325 | |
| | 1,297 | | Devon Energy Corp. | | | 135,316 | |
| | 15,822 | | ExxonMobil Corp.(b) | | | 1,338,225 | |
| | 3,172 | | Marathon Oil Corp. | | | 144,643 | |
| | 5,065 | | XTO Energy, Inc.(b) | | | 313,321 | |
| | | | | | | |
| | | | | | 2,307,830 | |
| | | | | | | |
| | | Pharmaceuticals — 2.7% | | | | |
| | 2,741 | | Allergan, Inc.(b) | | | 154,565 | |
| | 3,223 | | Eli Lilly & Co. | | | 166,274 | |
| | 6,270 | | Johnson & Johnson | | | 406,735 | |
| | | | | | | |
| | | | | | 727,574 | |
| | | | | | | |
| | | Road & Rail — 2.0% | | | | |
| | 2,867 | | Burlington Northern Santa Fe Corp. | | | 264,395 | |
| | 2,177 | | Union Pacific Corp.(b) | | | 272,952 | |
| | | | | | | |
| | | | | | 537,347 | |
| | | | | | | |
| | | Semiconductors & Semiconductor Equipment — 0.7% | | | | |
| | 2,839 | | MEMC Electronic Materials, Inc.(c) | | | 201,285 | |
| | | | | | | |
| | | Software — 2.8% | | | | |
| | 39,403 | | Oracle Corp.(c) | | | 770,723 | |
| | | | | | | |
| | | Specialty Retail — 1.3% | | | | |
| | 12,944 | | Home Depot, Inc.(b) | | | 362,044 | |
| | | | | | | |
| | | Textiles, Apparel & Luxury Goods — 1.1% | | | | |
| | 4,468 | | Nike, Inc., Class B | | | 303,824 | |
| | | | | | | |
| | | Tobacco — 0.9% | | | | |
| | 3,411 | | Loews Corp. — Carolina Group(b) | | | 247,469 | |
| | | | | | | |
| | | Total Common Stocks (Identified Cost $26,398,176) | | | 27,000,502 | |
| | | | | | | |
Shares/
Principal
Amount | | | | | |
| | Short-Term Investments — 29.8% | | | | |
| | 7,921,170 | | State Street Navigator Securities Lending Prime Portfolio(d) | | | 7,921,170 | |
| $ | 174,000 | | Tri-Party Repurchase Agreement with Fixed Income Clearing Corporation, dated 3/31/2008 at 1.250% to be repurchased at $174,006 on 4/1/2008 collateralized by $170,000 Federal Home Loan Mortgage Corp., 5.625% due 11/23/2035 valued at $182,113 including accrued interest (Note 2g of Notes to Financial Statements) | | | 174,000 | |
| | | | | | | |
| | | Total Short-Term Investments (Identified Cost $8,095,170) | | | 8,095,170 | |
| | | | | | | |
| | | | | | | |
| | | Total Investments — 129.3% | | | | |
| | | (Identified Cost $34,493,346)(a) | | | 35,095,672 | |
| | | Other assets less liabilities — (29.3)% | | | (7,962,403 | ) |
| | | | | | | |
| | | Net Assets — 100.0% | | $ | 27,133,269 | |
| | | | | | | |
| | | | | | |
| (†) | | See Note 2a of Notes to Financial Statements. | | | | |
| (a) | | Federal Tax Information (Amounts exclude certain adjustments made at the end of the Fund’s fiscal year for tax purposes. Such adjustments are primarily due to wash sales.): At March 31, 2008, the net unrealized appreciation on investments based on a cost of $34,493,346 for federal income tax purposes was as follows: | | | | |
| | Aggregate gross unrealized appreciation for all investments in which there is an excess of value over tax cost | | $ | 1,545,181 | |
| | Aggregate gross unrealized depreciation for all investments in which there is an excess of tax cost over value | | | (942,855 | ) |
| | | | | | |
| | Net unrealized appreciation | | $ | 602,326 | |
| | | | | | |
| | | | | | |
| (b) | | All or a portion of this security was on loan to brokers at March 31, 2008. | |
| (c) | | Non-income producing security. | |
| (d) | | Represents investment of securities lending collateral. | |
Holdings at March 31, 2008 as a Percentage of Net Assets (unaudited)
| | | |
| Oil, Gas & Consumable Fuels | | 8.5 | % |
| Insurance | | 6.2 | |
| Health Care Equipment & Supplies | | 6.0 | |
| Computers & Peripherals | | 5.7 | |
| Communications Equipment | | 4.8 | |
| Diversified Financial Services | | 4.6 | |
| Energy Equipment & Services | | 4.6 | |
| Beverages | | 4.4 | |
| Food & Staples Retailing | | 4.1 | |
| Machinery | | 3.8 | |
| Diversified Telecommunication Services | | 3.6 | |
| Aerospace & Defense | | 3.5 | |
| Biotechnology | | 3.0 | |
| Software | | 2.8 | |
| Commercial Banks | | 2.7 | |
| Pharmaceuticals | | 2.7 | |
| Capital Markets | | 2.5 | |
| Media | | 2.5 | |
| Electric Utilities | | 2.4 | |
| Road & Rail | | 2.0 | |
| Hotels, Restaurants & Leisure | | 2.0 | |
| Other, less than 2% each | | 17.1 | |
See accompanying notes to financial statements.
24
LOOMIS SAYLES VALUE FUND — PORTFOLIOOF INVESTMENTS
Investments as of March 31, 2008 (Unaudited)
| | | | | |
| | |
| Shares | | Description | | Value (†) |
| | | | | |
| Common Stocks — 95.9% of Net Assets |
| | Aerospace & Defense — 3.0% | | | |
| 78,380 | | Northrop Grumman Corp. | | $ | 6,098,748 |
| 47,139 | | United Technologies Corp. | | | 3,244,106 |
| | | | | |
| | | | | 9,342,854 |
| | | | | |
| | Beverages — 2.8% | | | |
| 176,886 | | Coca-Cola Enterprises, Inc. | | | 4,280,641 |
| 84,749 | | Molson Coors Brewing Co., Class B | | | 4,455,255 |
| | | | | |
| | | | | 8,735,896 |
| | | | | |
| | Capital Markets — 5.4% | | | |
| 80,448 | | Ameriprise Financial, Inc. | | | 4,171,229 |
| 138,350 | | Bank of New York Mellon Corp. | | | 5,773,345 |
| 52,144 | | Merrill Lynch & Co., Inc.(b) | | | 2,124,346 |
| 105,468 | | Morgan Stanley | | | 4,819,888 |
| | | | | |
| | | | | 16,888,808 |
| | | | | |
| | Chemicals — 2.9% | | | |
| 93,519 | | E.I. du Pont de Nemours & Co. | | | 4,372,948 |
| 57,968 | | Praxair, Inc. | | | 4,882,645 |
| | | | | |
| | | | | 9,255,593 |
| | | | | |
| | Commercial Banks — 3.4% | | | |
| 75,861 | | PNC Financial Services Group, Inc. | | | 4,974,206 |
| 179,155 | | U.S. Bancorp | | | 5,797,456 |
| | | | | |
| | | | | 10,771,662 |
| | | | | |
| | Commercial Services & Supplies — 1.2% | | | |
| 79,606 | | Avery Dennison Corp. | | | 3,920,596 |
| | | | | |
| | Communications Equipment — 0.9% | | | |
| 308,528 | | Motorola, Inc. | | | 2,869,310 |
| | | | | |
| | Computers & Peripherals — 3.2% | | | |
| 118,745 | | Hewlett-Packard Co. | | | 5,421,896 |
| 40,870 | | International Business Machines Corp. | | | 4,705,772 |
| | | | | |
| | | | | 10,127,668 |
| | | | | |
| | Consumer Finance — 0.7% | | | |
| 136,547 | | Discover Financial Services | | | 2,235,274 |
| | | | | |
| | Containers & Packaging — 3.3% | | | |
| 113,071 | | Owens-Illinois, Inc.(c) | | | 6,380,596 |
| 154,366 | | Pactiv Corp.(c) | | | 4,045,933 |
| | | | | |
| | | | | 10,426,529 |
| | | | | |
| | Diversified Financial Services — 5.1% | | | |
| 130,790 | | Bank of America Corp. | | | 4,958,249 |
| 182,338 | | Citigroup, Inc. | | | 3,905,680 |
| 166,905 | | JPMorgan Chase & Co. | | | 7,168,570 |
| | | | | |
| | | | | 16,032,499 |
| | | | | |
| | Diversified Telecommunication Services — 4.4% | | | |
| 365,688 | | AT&T, Inc. | | | 14,005,850 |
| | | | | |
| | Electric Utilities — 1.7% | | | |
| 67,058 | | Exelon Corp. | | | 5,449,804 |
| | | | | |
| | Electrical Equipment — 2.8% | | | |
| 195,089 | | ABB Ltd. ADR | | | 5,251,796 |
| 62,604 | | General Cable Corp.(b)(c) | | | 3,698,018 |
| | | | | |
| | | | | 8,949,814 |
| | | | | |
| | Energy Equipment & Services — 4.6% | | | |
| 150,093 | | BJ Services Co. | | | 4,279,151 |
| 155,132 | | Halliburton Co. | | | 6,101,342 |
| 75,991 | | Tidewater, Inc.(b) | | | 4,187,864 |
| | | | | |
| | | | | 14,568,357 |
| | | | | |
| | | | | |
| | |
| Shares | | Description | | Value (†) |
| | | | | |
| | Food & Staples Retailing — 1.6% | | | |
| 92,951 | | Wal-Mart Stores, Inc. | | $ | 4,896,659 |
| | | | | |
| | Food Products — 2.8% | | | |
| 202,426 | | ConAgra Foods, Inc. | | | 4,848,103 |
| 125,248 | | Kraft Foods, Inc., Class A | | | 3,883,940 |
| | | | | |
| | | | | 8,732,043 |
| | | | | |
| | Gas Utilities — 1.6% | | | |
| 87,371 | | Equitable Resources, Inc. | | | 5,146,152 |
| | | | | |
| | Health Care Equipment & Supplies — 1.8% | | | |
| 126,160 | | Covidien Ltd. | | | 5,582,580 |
| | | | | |
| | Health Care Providers & Services — 0.9% | | | |
| 80,154 | | UnitedHealth Group, Inc. | | | 2,754,091 |
| | | | | |
| | Hotels, Restaurants & Leisure — 1.6% | | | |
| 92,917 | | McDonald’s Corp. | | | 5,181,981 |
| | | | | |
| | Household Durables — 0.8% | | | |
| 65,113 | | Sony Corp., ADR | | | 2,609,078 |
| | | | | |
| | Independent Power Producers & Energy Traders — 1.1% | | | |
| 87,812 | | NRG Energy, Inc.(b)(c) | | | 3,423,790 |
| | | | | |
| | Industrial Conglomerates — 1.9% | | | |
| 159,665 | | General Electric Co. | | | 5,909,202 |
| | | | | |
| | Insurance — 7.5% | | | |
| 122,056 | | Allstate Corp. | | | 5,866,011 |
| 115,444 | | American International Group, Inc. | | | 4,992,953 |
| 1,356 | | Berkshire Hathaway, Inc., Class B(c) | | | 6,065,252 |
| 67,772 | | Metlife, Inc. | | | 4,083,941 |
| 32,142 | | Prudential Financial, Inc. | | | 2,515,112 |
| | | | | |
| | | | | 23,523,269 |
| | | | | |
| | IT Services — 0.9% | | | |
| 158,794 | | Broadridge Financial Solutions, Inc. | | | 2,794,774 |
| | | | | |
| | Media — 6.6% | | | |
| 216,817 | | Comcast Corp., Class A(b) | | | 4,193,241 |
| 195,560 | | DIRECTV Group, Inc. (The)(c) | | | 4,847,932 |
| 324,912 | | News Corp., Class A | | | 6,092,100 |
| 414,332 | | Time Warner, Inc. | | | 5,808,935 |
| | | | | |
| | | | | 20,942,208 |
| | | | | |
| | Multi-Utilities & Unregulated Power — 1.1% | | | |
| 98,428 | | PG&E Corp.(b) | | | 3,624,119 |
| | | | | |
| | Oil, Gas & Consumable Fuels — 8.2% | | | |
| 144,264 | | ExxonMobil Corp. | | | 12,201,849 |
| 184,732 | | Spectra Energy Corp. | | | 4,202,653 |
| 74,127 | | Total SA, Sponsored ADR | | | 5,486,140 |
| 62,456 | | XTO Energy, Inc. | | | 3,863,528 |
| | | | | |
| | | | | 25,754,170 |
| | | | | |
| | Personal Products — 1.0% | | | |
| 68,243 | | Estee Lauder Cos., Inc./The, Class A(b) | | | 3,128,942 |
| | | | | |
| | Pharmaceuticals — 6.8% | | | |
| 172,124 | | Bristol-Myers Squibb Co. | | | 3,666,241 |
| 74,885 | | Johnson & Johnson | | | 4,857,790 |
| 71,816 | | Novartis AG, ADR | | | 3,679,134 |
| 221,022 | | Pfizer, Inc. | | | 4,625,991 |
| 322,001 | | Schering-Plough Corp. | | | 4,640,034 |
| | | | | |
| | | | | 21,469,190 |
| | | | | |
| | Semiconductors & Semiconductor Equipment — 1.2% | | | |
| 194,258 | | Applied Materials, Inc. | | | 3,789,974 |
| | | | | |
See accompanying notes to financial statements.
25
LOOMIS SAYLES VALUE FUND — PORTFOLIOOF INVESTMENTS (continued)
Investments as of March 31, 2008 (Unaudited)
| | | | | | | |
| | |
| Shares | | Description | | Value (†) | |
| | | | | | | |
| | | Software — 1.4% | | | | |
| | 150,526 | | Microsoft Corp. | | $ | 4,271,928 | |
| | | | | | | |
| | | Specialty Retail — 1.0% | | | | |
| | 160,496 | | Gap, Inc. (The) | | | 3,158,561 | |
| | | | | | | |
| | | Textiles, Apparel & Luxury Goods — 0.7% | | | | |
| | 129,862 | | Liz Claiborne, Inc.(b) | | | 2,356,995 | |
| | | | | | | |
| | | Total Common Stocks (Identified Cost $306,495,689) | | | 302,630,220 | |
| | | | | | | |
Principal
Amount/ Shares | | | | | |
| | Short-Term Investments — 11.1% | | | | |
| $ | 13,271,000 | | San Paolo U.S. Financial, Commercial Paper, 1.000%, 4/1/2008(d) | | | 13,271,000 | |
| | 21,825,478 | | State Street Navigator Securities Lending Prime Portfolio(e) | | | 21,825,478 | |
| | | | | | | |
| | | Total Short-Term Investments (Identified Cost $35,096,478) | | | 35,096,478 | |
| | | | | | | |
| | | | | | | |
| | | Total Investments — 107.0%
(Identified Cost $341,592,167)(a) | | | 337,726,698 | |
| | | Other assets less liabilities — (7.0)% | | | (22,037,756 | ) |
| | | | | | | |
| | | Net Assets — 100.0% | | $ | 315,688,942 | |
| | | | | | | |
| | | | | | | |
| | (†) | | See Note 2a of Notes to Financial Statements. | |
| | (a) | | Federal Tax Information (Amounts exclude certain adjustments made at the end of the Fund’s fiscal year for tax purposes. Such adjustments are primarily due to wash sales.): At March 31, 2008, the net unrealized depreciation on investments based on a cost of $341,592,167 for federal income tax purposes was as follows: | |
| | | Aggregate gross unrealized appreciation for all investments in which there is an excess of value over tax cost | | $ | 24,058,950 | |
| | | Aggregate gross unrealized depreciation for all investments in which there is an excess of tax cost over value | | | (27,924,419 | ) |
| | | | | | | |
| | | Net unrealized depreciation | | $ | (3,865,469 | ) |
| | | | | | | |
| | | | | | | |
| | (b) | | All or a portion of this security was on loan to brokers at March 31, 2008. | |
| | (c) | | Non-income producing security. | |
| | (d) | | Interest Rate represents annualized yield at time of purchase; not a coupon rate. | |
| | (e) | | Represents investment of securities lending collateral. | |
| | | | | | | |
| | ADR | | An American Depositary Receipt is a certificate issued by a custodian bank representing the right to receive securities of the foreign issuer described. The values of ADRs are significantly influenced by trading on exchanges not located in the United States. | |
Holdings at March 31, 2008 as a Percentage of Net Assets (unaudited)
| | | |
| Oil, Gas & Consumable Fuels | | 8.2 | % |
| Insurance | | 7.5 | |
| Pharmaceuticals | | 6.8 | |
| Media | | 6.6 | |
| Capital Markets | | 5.4 | |
| Diversified Financial Services | | 5.1 | |
| Energy Equipment & Services | | 4.6 | |
| Diversified Telecommunication Services | | 4.4 | |
| Commercial Banks | | 3.4 | |
| Containers & Packaging | | 3.3 | |
| Computers & Peripherals | | 3.2 | |
| Aerospace & Defense | | 3.0 | |
| Chemicals | | 2.9 | |
| Electrical Equipment | | 2.8 | |
| Beverages | | 2.8 | |
| Food Products | | 2.8 | |
| Other, less than 2% each | | 23.1 | |
See accompanying notes to financial statements.
26
STATEMENTSOF ASSETSAND LIABILITIES
March 31, 2008 (Unaudited)
| | | | | | | | | | | | | | | | |
| | | Global Markets Fund | | | Growth Fund | | | Research Fund | | | Value Fund | |
| | | | | | | | | | | | | | | | |
ASSETS | | | | | | | | | | | | | | | | |
Investments at cost | | $ | 387,210,180 | | | $ | 386,000,438 | | | $ | 34,493,346 | | | $ | 341,592,167 | |
Net unrealized appreciation (depreciation) | | | (1,557,090 | ) | | | 12,759,855 | | | | 602,326 | | | | (3,865,469 | ) |
| | | | | | | | | | | | | | | | |
Investments at value(a) | | | 385,653,090 | | | | 398,760,293 | | | | 35,095,672 | | | | 337,726,698 | |
Cash | | | 1,160 | | | | 306 | | | | 149 | | | | 1,083 | |
Foreign currency at value (identified cost $376,548) | | | 385,202 | | | | — | | | | — | | | | — | |
Receivable for Fund shares sold | | | 1,879,633 | | | | 1,597,472 | | | | 11,115 | | | | 1,316,156 | |
Receivable for securities sold | | | 3,342,687 | | | | 1,250,872 | | | | 535,495 | | | | — | |
Dividends and interest receivable | | | 2,288,391 | | | | 231,770 | | | | 27,929 | | | | 486,549 | |
Unrealized appreciation on forward foreign currency contracts | | | 8,967 | | | | — | | | | — | | | | — | |
Receivable from investment adviser (Note 4) | | | 16,656 | | | | — | | | | 6,104 | | | | — | |
Securities lending income receivable | | | 34,472 | | | | 24,760 | | | | 2,795 | | | | 10,124 | |
Other assets | | | 1,050 | | | | — | | | | — | | | | — | |
| | | | | | | | | | | | | | | | |
TOTAL ASSETS | | | 393,611,308 | | | | 401,865,473 | | | | 35,679,259 | | | | 339,540,610 | |
| | | | | | | | | | | | | | | | |
LIABILITIES | | | | | | | | | | | | | | | | |
Collateral on securities loaned, at value (Note 2) | | | 46,998,736 | | | | 42,909,346 | | | | 7,921,170 | | | | 21,825,478 | |
Payable for securities purchased | | | 807,131 | | | | 290,249 | | | | 548,291 | | | | 1,153,445 | |
Payable for Fund shares redeemed | | | 1,143,902 | | | | 399,984 | | | | 905 | | | | 331,676 | |
Unrealized depreciation on forward foreign currency contracts | | | 48,510 | | | | — | | | | — | | | | — | |
Management fees payable (Note 4) | | | 214,565 | | | | 151,215 | | | | 11,379 | | | | 130,553 | |
Administrative fees payable (Note 4) | | | 27,912 | | | | 30,302 | | | | 2,265 | | | | 25,824 | |
Deferred Trustees’ fees (Note 4) | | | 42,828 | | | | 88,697 | | | | 39,520 | | | | 288,200 | |
Service and distribution fees payable (Note 4) | | | 12,824 | | | | 8,505 | | | | 98 | | | | 3,550 | |
Other accounts payable and accrued expenses | | | 38,956 | | | | 220,695 | | | | 22,362 | | | | 92,942 | |
| | | | | | | | | | | | | | | | |
TOTAL LIABILITIES | | | 49,335,364 | | | | 44,098,993 | | | | 8,545,990 | | | | 23,851,668 | |
| | | | | | | | | | | | | | | | |
NET ASSETS | | $ | 344,275,944 | | | $ | 357,766,480 | | | $ | 27,133,269 | | | $ | 315,688,942 | |
| | | | | | | | | | | | | | | | |
NET ASSETS CONSIST OF: | | | | | | | | | | | | | | | | |
Paid-in capital | | $ | 351,339,916 | | | $ | 561,352,288 | | | $ | 26,891,327 | | | $ | 315,304,165 | |
Undistributed (overdistributed) net investment income (loss) | | | (4,088,804 | ) | | | (460,825 | ) | | | (99,367 | ) | | | 1,038,559 | |
Accumulated net realized gain (loss) on investments and foreign currency transactions | | | (1,408,725 | ) | | | (215,884,838 | ) | | | (261,017 | ) | | | 3,211,687 | |
Net unrealized appreciation (depreciation) on investments and foreign currency translations | | | (1,566,443 | ) | | | 12,759,855 | | | | 602,326 | | | | (3,865,469 | ) |
| | | | | | | | | | | | | | | | |
NET ASSETS | | $ | 344,275,944 | | | $ | 357,766,480 | | | $ | 27,133,269 | | | $ | 315,688,942 | |
| | | | | | | | | | | | | | | | |
COMPUTATION OF NET ASSET VALUE AND OFFERING PRICE: | | | | | | | | | | | | | | | | |
Class A shares: | | | | | | | | | | | | | | | | |
Net assets | | $ | 68,434,292 | | | $ | 199,049,716 | | | $ | 974,928 | | | $ | 108,498,202 | |
| | | | | | | | | | | | | | | | |
Shares of beneficial interest | | | 4,826,719 | | | | 32,431,502 | | | | 124,337 | | | | 5,402,450 | |
| | | | | | | | | | | | | | | | |
Net asset value and redemption price per share | | $ | 14.18 | | | $ | 6.14 | | | $ | 7.84 | | | $ | 20.08 | |
| | | | | | | | | | | | | | | | |
Offering price per share (100/94.25 of net asset value) (Note 1) | | $ | 15.05 | | | $ | 6.51 | | | $ | 8.32 | | | $ | 21.31 | |
| | | | | | | | | | | | | | | | |
Class B shares: (redemption price per share is equal to net asset value less any applicable contingent deferred sales charge) (Note 1) | | | | | | | | | | | | | | | | |
Net assets | | $ | — | | | $ | 18,823,617 | | | $ | 317,944 | | | $ | 11,359,020 | |
| | | | | | | | | | | | | | | | |
Shares of beneficial interest | | | — | | | | 3,175,845 | | | | 41,470 | | | | 567,512 | |
| | | | | | | | | | | | | | | | |
Net asset value and offering price per share | | $ | — | | | $ | 5.93 | | | $ | 7.67 | | | $ | 20.02 | |
| | | | | | | | | | | | | | | | |
Class C shares: (redemption price per share is equal to net asset value less any applicable contingent deferred sales charge) (Note 1) | | | | | | | | | | | | | | | | |
Net assets | | $ | 139,464,799 | | | $ | 36,119,509 | | | $ | 639,077 | | | $ | 5,032,202 | |
| | | | | | | | | | | | | | | | |
Shares of beneficial interest | | | 9,921,171 | | | | 6,088,131 | | | | 83,799 | | | | 251,559 | |
| | | | | | | | | | | | | | | | |
Net asset value and offering price per share | | $ | 14.06 | | | $ | 5.93 | | | $ | 7.63 | | | $ | 20.00 | |
| | | | | | | | | | | | | | | | |
Class Y shares: | | | | | | | | | | | | | | | | |
Net assets | | $ | 136,376,853 | | | $ | 103,773,638 | | | $ | 25,201,320 | | | $ | 190,799,518 | |
| | | | | | | | | | | | | | | | |
Shares of beneficial interest | | | 9,591,548 | | | | 16,140,582 | | | | 3,195,088 | | | | 9,477,950 | |
| | | | | | | | | | | | | | | | |
Net asset value, offering and redemption price per share | | $ | 14.22 | | | $ | 6.43 | | | $ | 7.89 | | | $ | 20.13 | |
| | | | | | | | | | | | | | | | |
(a) Including securities on loan with market values of: | | $ | 46,177,788 | | | $ | 40,807,599 | | | $ | 7,658,942 | | | $ | 21,687,553 | |
| | | | | | | | | | | | | | | | |
See accompanying notes to financial statements.
27
STATEMENTSOF OPERATIONS
For the Six Months Ended March 31, 2008 (Unaudited)
| | | | | | | | | | | | | | | | |
| | | Global Markets Fund | | | Growth Fund | | | Research Fund | | | Value Fund | |
| | | | | | | | | | | | | | | | |
INVESTMENT INCOME | | | | | | | | | | | | | | | | |
Dividends | | $ | 1,454,066 | | | $ | 1,569,151 | | | $ | 222,987 | | | $ | 3,295,660 | |
Interest | | | 2,798,143 | | | | 85,374 | | | | 4,198 | | | | 90,302 | |
Securities lending income (Note 2) | | | 170,660 | | | | 198,123 | | | | 16,708 | | | | 59,807 | |
Less net foreign taxes withheld | | | (43,423 | ) | | | — | | | | (23 | ) | | | (21,900 | ) |
| | | | | | | | | | | | | | | | |
| | | 4,379,446 | | | | 1,852,648 | | | | 243,870 | | | | 3,423,869 | |
| | | | | | | | | | | | | | | | |
Expenses | | | | | | | | | | | | | | | | |
Management fees (Note 4) | | | 1,074,615 | | | | 1,012,885 | | | | 73,358 | | | | 734,101 | |
Service fees - Class A (Note 4) | | | 77,423 | | | | 274,243 | | | | 1,417 | | | | 122,182 | |
Service and distribution fees - Class B (Note 4) | | | — | | | | 124,187 | | | | 1,733 | | | | 55,287 | |
Service and distribution fees - Class C (Note 4) | | | 547,495 | | | | 193,393 | | | | 4,462 | | | | 21,856 | |
Trustees’ fees and expenses (Note 4) | | | 6,709 | | | | 9,749 | | | | 5,140 | | | | 8,047 | |
Administrative fees (Note 4) | | | 74,839 | | | | 106,123 | | | | 7,684 | | | | 76,792 | |
Custodian fees and expenses | | | 146,813 | | | | 14,242 | | | | 13,175 | | | | 15,848 | |
Transfer agent fees and expenses - Class A (Note 4) | | | 16,747 | | | | 277,820 | | | | 1,210 | | | | 90,957 | |
Transfer agent fees and expenses - Class B (Note 4) | | | — | | | | 33,574 | | | | 361 | | | | 10,337 | |
Transfer agent fees and expenses - Class C (Note 4) | | | 32,693 | | | | 46,660 | | | | 1,094 | | | | 4,046 | |
Transfer agent fees and expenses - Class Y (Note 4) | | | 25,307 | | | | 21,078 | | | | 7,528 | | | | 23,289 | |
Audit and tax services fees | | | 24,933 | | | | 19,038 | | | | 19,232 | | | | 16,828 | |
Legal fees | | | 1,967 | | | | 6,898 | | | | 507 | | | | 4,448 | |
Shareholder reporting expenses | | | 6,612 | | | | 55,076 | | | | 1,946 | | | | 19,942 | |
Registration fees | | | 34,837 | | | | 33,693 | | | | 29,139 | | | | 48,206 | |
Expense recapture - Class B (Note 4) | | | — | | | | — | | | | — | | | | 8 | |
Expense recapture - Class C (Note 4) | | | — | | | | — | | | | — | | | | 137 | |
Miscellaneous expenses | | | 7,006 | | | | 7,896 | | | | 2,811 | | | | 7,619 | |
| | | | | | | | | | | | | | | | |
Total expenses | | | 2,077,996 | | | | 2,236,555 | | | | 170,797 | | | | 1,259,930 | |
Less fee reduction and/or expense reimbursement (Note 4) | | | (20,284 | ) | | | (5,118 | ) | | | (36,695 | ) | | | (3,869 | ) |
| | | | | | | | | | | | | | | | |
Net expenses | | | 2,057,712 | | | | 2,231,437 | | | | 134,102 | | | | 1,256,061 | |
| | | | | | | | | | | | | | | | |
Net investment income (loss) | | | 2,321,734 | | | | (378,789 | ) | | | 109,768 | | | | 2,167,808 | |
| | | | | | | | | | | | | | | | |
NET REALIZED AND UNREALIZED GAIN (LOSS) ON INVESTMENTS
AND FOREIGN CURRENCY TRANSACTIONS | | | | | | | | | | | | | | | | |
Net realized gain (loss) on: | | | | | | | | | | | | | | | | |
Investments (including foreign capital gains taxes paid of $18,501 for Global Markets Fund) | | | 1,086,623 | | | | (682,945 | ) | | | (162,481 | ) | | | 4,108,636 | |
Foreign currency transactions | | | (254,711 | ) | | | — | | | | — | | | | — | |
Net change in unrealized appreciation (depreciation) on: | | | | | | | | | | | | | | | | |
Investments (including change in foreign capital gains tax accrual of $71,379 for Global Markets Fund) | | | (28,546,868 | ) | | | (51,455,691 | ) | | | (3,201,399 | ) | | | (36,425,354 | ) |
Foreign currency translations | | | (20,582 | ) | | | — | | | | — | | | | — | |
| | | | | | | | | | | | | | | | |
Net realized and unrealized loss on investments and foreign currency transactions | | | (27,735,538 | ) | | | (52,138,636 | ) | | | (3,363,880 | ) | | | (32,316,718 | ) |
| | | | | | | | | | | | | | | | |
NET DECREASE IN NET ASSETS RESULTING FROM OPERATIONS | | $ | (25,413,804 | ) | | $ | (52,517,425 | ) | | $ | (3,254,112 | ) | | $ | (30,148,910 | ) |
| | | | | | | | | | | | | | | | |
See accompanying notes to financial statements.
28
STATEMENTSOF CHANGESIN NET ASSETS
| | | | | | | | | | | | | | | | |
| | | Global Markets Fund | | | Growth Fund | |
| | | Six Months Ended
March 31, 2008
(Unaudited) | | | Year Ended
September 30,
2007 | | | Six Months Ended
March 31, 2008
(Unaudited) | | | Year Ended
September 30,
2007 | |
| | | | | | | | | | | | | | | | |
FROM OPERATIONS: | | | | | | | | | | | | | | | | |
Net investment income (loss) | | $ | 2,321,734 | | | $ | 1,533,353 | | | $ | (378,789 | ) | | $ | (1,945,087 | ) |
Net realized gain (loss) on investments and foreign currency transactions | | | 831,912 | | | | 5,807,960 | | | | (682,945 | ) | | | 26,173,209 | |
Net change in net unrealized appreciation (depreciation) on investments and foreign currency translations | | | (28,567,450 | ) | | | 22,222,672 | | | | (51,455,691 | ) | | | 50,265,940 | |
| | | | | | | | | | | | | | | | |
Net increase (decrease) in net assets resulting from operations | | | (25,413,804 | ) | | | 29,563,985 | | | | (52,517,425 | ) | | | 74,494,062 | |
| | | | | | | | | | | | | | | | |
FROM DISTRIBUTIONS TO SHAREHOLDERS: | | | | | | | | | | | | | | | | |
Net investment income | | | | | | | | | | | | | | | | |
Class A | | | (1,576,341 | ) | | | (238,081 | ) | | | — | | | | — | |
Class B | | | — | | | | — | | | | — | | | | — | |
Class C | | | (2,867,382 | ) | | | (346,135 | ) | | | — | | | | — | |
Class Y | | | (3,658,690 | ) | | | (1,143,953 | ) | | | — | | | | — | |
Net realized capital gains | | | | | | | | | | | | | | | | |
Class A | | | (1,305,191 | ) | | | — | | | | — | | | | — | |
Class B | | | — | | | | — | | | | — | | | | — | |
Class C | | | (2,671,988 | ) | | | — | | | | — | | | | — | |
Class Y | | | (2,927,616 | ) | | | — | | | | — | | | | — | |
| | | | | | | | | | | | | | | | |
Total distributions | | | (15,007,208 | ) | | | (1,728,169 | ) | | | — | | | | — | |
| | | | | | | | | | | | | | | | |
INCREASE (DECREASE) IN NET ASSETS FROM CAPITAL SHARE TRANSACTIONS (NOTE 8) | | | 214,713,992 | | | | 52,772,239 | | | | (10,423,988 | ) | | | (76,568,270 | ) |
| | | | | | | | | | | | | | | | |
Redemption Fees | | | | | | | | | | | | | | | | |
Class A | | | 12,268 | | | | 743 | | | | — | | | | — | |
Class C | | | 20,748 | | | | 1,591 | | | | — | | | | — | |
Class Y | | | 20,670 | | | | 3,115 | | | | — | | | | — | |
| | | | | | | | | | | | | | | | |
Net increase (decrease) in net assets | | | 174,346,666 | | | | 80,613,504 | | | | (62,941,413 | ) | | | (2,074,208 | ) |
| | | | | | | | | | | | | | | | |
NET ASSETS | | | | | | | | | | | | | | | | |
Beginning of period | | | 169,929,278 | | | | 89,315,774 | | | | 420,707,893 | | | | 422,782,101 | |
| | | | | | | | | | | | | | | | |
End of period | | $ | 344,275,944 | | | $ | 169,929,278 | | | $ | 357,766,480 | | | $ | 420,707,893 | |
| | | | | | | | | | | | | | | | |
UNDISTRIBUTED (OVERDISTRIBUTED) NET INVESTMENT INCOME (LOSS) | | $ | (4,088,804 | ) | | $ | 1,691,875 | | | $ | (460,825 | ) | | $ | (82,036 | ) |
| | | | | | | | | | | | | | | | |
See accompanying notes to financial statements.
29
| | | | | | | | | | | | | | |
| Research Fund | | | Value Fund | |
Six Months Ended
March 31, 2008
(Unaudited) | | | Year Ended
September 30,
2007 | | | Six Months Ended
March 31, 2008
(Unaudited) | | | Year Ended
September 30,
2007 | |
| | | | | | | | | | | | | | |
| | | | | | | | | | | | | | |
| $ | 109,768 | | | $ | 153,496 | | | $ | 2,167,808 | | | $ | 1,698,014 | |
| | (162,481 | ) | | | 3,421,566 | | | | 4,108,636 | | | | 9,941,092 | |
| (3,201,399 | ) | | | 1,282,288 | | | | (36,425,354 | ) | | | 8,063,036 | |
| | | | | | | | | | | | | | | |
| | (3,254,112 | ) | | | 4,857,350 | | | | (30,148,910 | ) | | | 19,702,142 | |
| | | | | | | | | | | | | | | |
| | | | | | | | | | | | | | |
| | | | | | | | | | | | | | |
| | (6,624 | ) | | | (9,859 | ) | | | (444,319 | ) | | | (33,688 | ) |
| | — | | | | (509 | ) | | | (25,511 | ) | | | — | |
| | — | | | | (2,662 | ) | | | (19,019 | ) | | | — | |
| | (277,956 | ) | | | (260,548 | ) | | | (1,990,862 | ) | | | (673,111 | ) |
| | | | | | | | | | | | | | |
| | (123,072 | ) | | | (161,282 | ) | | | (1,119,214 | ) | | | (226,188 | ) |
| | (37,858 | ) | | | (48,393 | ) | | | (44,036 | ) | | | — | |
| | (97,901 | ) | | | (147,505 | ) | | | (96,784 | ) | | | — | |
| | (2,801,426 | ) | | | (2,907,435 | ) | | | (8,863,000 | ) | | | (4,162,095 | ) |
| | | | | | | | | | | | | | | |
| | (3,344,837 | ) | | | (3,538,193 | ) | | | (12,602,745 | ) | | | (5,095,082 | ) |
| | | | | | | | | | | | | | | |
| | 3,614,126 | | | | 2,841,472 | | | | 157,440,511 | | | | 114,779,649 | |
| | | | | | | | | | | | | | | |
| | | | | | | | | | | | | | |
| | — | | | | — | | | | — | | | | — | |
| | — | | | | — | | | | — | | | | — | |
| | — | | | | — | | | | — | | | | — | |
| | | | | | | | | | | | | | | |
| | (2,984,823 | ) | | | 4,160,629 | | | | 114,688,856 | | | | 129,386,709 | |
| | | | | | | | | | | | | | | |
| | | | | | | | | | | | | | |
| | 30,118,092 | | | | 25,957,463 | | | | 201,000,086 | | | | 71,613,377 | |
| | | | | | | | | | | | | | | |
| $ | 27,133,269 | | | $ | 30,118,092 | | | $ | 315,688,942 | | | $ | 201,000,086 | |
| | | | | | | | | | | | | | | |
| $ | (99,367 | ) | | $ | 75,445 | | | $ | 1,038,559 | | | $ | 1,350,462 | |
| | | | | | | | | | | | | | | |
30
FINANCIAL HIGHLIGHTS
For a share outstanding throughout each period.
| | | | | | | | | | | | | | | | | | | | | | | | | | | | | |
| | | | | Income (Loss) from Investment Operations: | | | Less Distributions: | | | |
| | | | | | | | |
| | | Net asset
value,
beginning
of
the period | | Net
investment
income
(loss) (c) | | Net realized
and unrealized
gain (loss) | | | Total from
investment
operations | | | Dividends
from
net investment
income | | | Distributions
from net
realized
capital gains | | | Total
distributions | | | Redemption
fees (d) |
| | | | | | | | | | | | | | | | | | | | | | | | | | | | | |
GLOBAL MARKETS FUND | | | | | | | | | | | | | | | | | | | | | | | | | | | | | |
Class A | | | | | | | | | | | | | | | | | | | | | | | | | | | | | |
3/31/2008(g) | | $ | 15.83 | | $ | 0.13 | | $ | (0.81 | ) | | $ | (0.68 | ) | | $ | (0.53 | ) | | $ | (0.44 | ) | | $ | (0.97 | ) | | $ | 0.00 |
9/30/2007 | | | 12.49 | | | 0.20 | | | 3.39 | | | | 3.59 | | | | (0.25 | ) | | | — | | | | (0.25 | ) | | | 0.00 |
9/30/2006* | | | 12.71 | | | 0.12 | | | (0.34 | ) | | | (0.22 | ) | | | — | | | | — | | | | — | | | | — |
Class C | | | | | | | | | | | | | | | | | | | | | | | | | | | | | |
3/31/2008(g) | | | 15.70 | | | 0.08 | | | (0.81 | ) | | | (0.73 | ) | | | (0.47 | ) | | | (0.44 | ) | | | (0.91 | ) | | | 0.00 |
9/30/2007 | | | 12.43 | | | 0.10 | | | 3.36 | | | | 3.46 | | | | (0.19 | ) | | | — | | | | (0.19 | ) | | | 0.00 |
9/30/2006* | | | 12.71 | | | 0.06 | | | (0.34 | ) | | | (0.28 | ) | | | — | | | | — | | | | — | | | | — |
Class Y | | | | | | | | | | | | | | | | | | | | | | | | | | | | | |
3/31/2008(g) | | | 15.87 | | | 0.16 | | | (0.82 | ) | | | (0.66 | ) | | | (0.55 | ) | | | (0.44 | ) | | | (0.99 | ) | | | 0.00 |
9/30/2007 | | | 12.51 | | | 0.24 | | | 3.39 | | | | 3.63 | | | | (0.27 | ) | | | — | | | | (0.27 | ) | | | 0.00 |
9/30/2006** | | | 11.84 | | | 0.19 | | | 0.64 | | | | 0.83 | | | | (0.16 | ) | | | — | | | | (0.16 | ) | | | 0.00 |
9/30/2005 | | | 10.19 | | | 0.19 | | | 1.73 | | | | 1.92 | | | | (0.27 | ) | | | — | | | | (0.27 | ) | | | — |
9/30/2004 | | | 9.32 | | | 0.25 | | | 0.96 | | | | 1.21 | | | | (0.34 | ) | | | — | | | | (0.34 | ) | | | — |
9/30/2003 | | | 7.53 | | | 0.32 | | | 1.74 | | | | 2.06 | | | | (0.27 | ) | | | — | | | | (0.27 | ) | | | — |
| * | From commencement of Class operations on February 1, 2006 through September 30, 2006. |
| ** | Prior to the close of business on February 1, 2006, the Fund offered Institutional Class shares, which were redesignated as Class Y shares on that date. |
| (a) | Had certain expenses not been reduced during the period, if applicable, total returns would have been lower. Periods less than one year, if applicable, are not annualized. |
| (b) | The investment adviser and/or administrator has agreed to reimburse a portion of the Fund’s expenses and/or reduce its fees during the period. Without this reimbursement/fee reduction, if applicable, expenses would have been higher. |
| (c) | Per share net investment income (loss) has been calculated using all of the weighted average shares outstanding during the period. |
See accompanying notes to financial statements.
31
| | | | | | | | | | | | | | | |
| | | | | | | | Ratios to Average Net Assets: | | |
| | | | | | |
Net asset
value, end
of the period | | Total
return
(%) (a)(e) | | | Net assets,
end of
the period
(000’s) | | Net
expenses
(%) (b)(f) | | Gross
expenses
(%) (f) | | Net investment
income (loss)
(%) (f) | | Portfolio
turnover
rate (%) |
| | | | | | | | | | | | | | | |
| | | | | | | | | | | | | | | |
| | | | | | | | | | | | | | | |
| $ | 14.18 | | (4.9 | ) | | $ | 68,434 | | 1.25 | | 1.26 | | 1.71 | | 68 |
| | 15.83 | | 29.1 | | | | 28,927 | | 1.25 | | 1.37 | | 1.44 | | 78 |
| | 12.49 | | (1.7 | ) | | | 10,438 | | 1.25 | | 1.56 | | 1.52 | | 103 |
| | | | | | | | | | | | | | | |
| | 14.06 | | (5.2 | ) | | | 139,465 | | 2.00 | | 2.03 | | 1.08 | | 68 |
| | 15.70 | | 28.0 | | | | 60,179 | | 2.00 | | 2.11 | | 0.69 | | 78 |
| | 12.43 | | (2.1 | ) | | | 20,228 | | 2.00 | | 2.32 | | 0.78 | | 103 |
| | | | | | | | | | | | | | | |
| | 14.22 | | (4.8 | ) | | | 136,377 | | 1.00 | | 1.00 | | 2.09 | | 68 |
| | 15.87 | | 29.4 | | | | 80,824 | | 1.00 | | 1.02 | | 1.70 | | 78 |
| | 12.51 | | 7.1 | | | | 58,650 | | 1.00 | | 1.19 | | 1.58 | | 103 |
| | 11.84 | | 19.1 | | | | 47,712 | | 1.00 | | 1.46 | | 1.72 | | 78 |
| | 10.19 | | 13.2 | | | | 17,274 | | 1.00 | | 1.87 | | 2.55 | | 69 |
| | 9.32 | | 28.0 | | | | 10,499 | | 1.00 | | 2.23 | | 3.81 | | 94 |
| (d) | Amount rounds to less than $0.01 per share, if applicable. |
| (e) | A sales charge for Class A shares and a contingent deferred sales charge for Class C shares are not reflected in total return calculations. Periods less than one year, if applicable, are not annualized. |
| (f) | Computed on an annualized basis for periods less than one year, if applicable. |
| (g) | For the six months ended March 31, 2008 (unaudited). |
32
FINANCIAL HIGHLIGHTS (continued)
For a share outstanding throughout each period.
| | | | | | | | | | | | | | | | | | | | | | | | |
| | | | | Income (Loss) from Investment Operations: | | | Less Distributions: |
| | | | | | | |
| | | Net asset
value,
beginning
of
the period | | Net
investment
income
(loss) (c)(d) | | | Net realized
and unrealized
gain (loss) | | | Total from
investment
operations | | | Dividends
from
net investment
income | | Distributions
from net
realized
capital gains | | Total
distributions |
| | | | | | | | | | | | | | | | | | | | | | | | |
GROWTH FUND | | | | | | | | | | | | | | | | | | | | | | | | |
Class A | | | | | | | | | | | | | | | | | | | | | | | | |
3/31/2008(j) | | $ | 7.01 | | $ | (0.01 | ) | | $ | (0.86 | ) | | $ | (0.87 | ) | | $ | — | | $ | — | | $ | — |
9/30/2007 | | | 5.84 | | | (0.03 | ) | | | 1.20 | | | | 1.17 | | | | — | | | — | | | — |
9/30/2006 | | | 6.03 | | | (0.00 | ) | | | (0.19 | ) | | | (0.19 | ) | | | — | | | — | | | — |
9/30/2005 | | | 4.98 | | | (0.02 | ) | | | 1.07 | | | | 1.05 | | | | — | | | — | | | — |
9/30/2004 | | | 4.41 | | | (0.03 | ) | | | 0.60 | | | | 0.57 | | | | — | | | — | | | — |
9/30/2003 | | | 3.65 | | | (0.02 | ) | | | 0.78 | | | | 0.76 | | | | — | | | — | | | — |
Class B | | | | | | | | | | | | | | | | | | | | | | | | |
3/31/2008(j) | | | 6.79 | | | (0.03 | ) | | | (0.83 | ) | | | (0.86 | ) | | | — | | | — | | | — |
9/30/2007 | | | 5.70 | | | (0.07 | ) | | | 1.16 | | | | 1.09 | | | | — | | | — | | | — |
9/30/2006 | | | 5.94 | | | (0.05 | ) | | | (0.19 | ) | | | (0.24 | ) | | | — | | | — | | | — |
9/30/2005 | | | 4.94 | | | (0.06 | ) | | | 1.06 | | | | 1.00 | | | | — | | | — | | | — |
9/30/2004 | | | 4.41 | | | (0.07 | ) | | | 0.60 | | | | 0.53 | | | | — | | | — | | | — |
9/30/2003* | | | 4.54 | | | (0.00 | ) | | | (0.13 | ) | | | (0.13 | ) | | | — | | | — | | | — |
Class C | | | | | | | | | | | | | | | | | | | | | | | | |
3/31/2008(j) | | | 6.80 | | | (0.03 | ) | | | (0.84 | ) | | | (0.87 | ) | | | — | | | — | | | — |
9/30/2007 | | | 5.71 | | | (0.08 | ) | | | 1.17 | | | | 1.09 | | | | — | | | — | | | — |
9/30/2006 | | | 5.94 | | | (0.04 | ) | | | (0.19 | ) | | | (0.23 | ) | | | — | | | — | | | — |
9/30/2005 | | | 4.94 | | | (0.06 | ) | | | 1.06 | | | | 1.00 | | | | — | | | — | | | — |
9/30/2004 | | | 4.41 | | | (0.06 | ) | | | 0.59 | | | | 0.53 | | | | — | | | — | | | — |
9/30/2003* | | | 4.54 | | | (0.00 | ) | | | (0.13 | ) | | | (0.13 | ) | | | — | | | — | | | — |
Class Y | | | | | | | | | | | | | | | | | | | | | | | | |
3/31/2008(j) | | | 7.32 | | | 0.01 | | | | (0.90 | ) | | | (0.89 | ) | | | — | | | — | | | — |
9/30/2007 | | | 6.08 | | | (0.00 | ) | | | 1.24 | | | | 1.24 | | | | — | | | — | | | — |
9/30/2006 | | | 6.26 | | | 0.02 | | | | (0.20 | ) | | | (0.18 | ) | | | — | | | — | | | — |
9/30/2005 | | | 5.15 | | | (0.00 | ) | | | 1.11 | | | | 1.11 | | | | — | | | — | | | — |
9/30/2004 | | | 4.55 | | | (0.02 | ) | | | 0.62 | | | | 0.60 | | | | — | | | — | | | — |
9/30/2003 | | | 3.75 | | | (0.01 | ) | | | 0.81 | | | | 0.80 | | | | — | | | — | | | — |
| * | From commencement of Class operations on September 12, 2003 through September 30, 2003. |
| (a) | Had certain expenses not been reduced during the period, if applicable, total returns would have been lower. Periods less than one year, if applicable, are not annualized. |
| (b) | The investment adviser and/or administrator has agreed to reimburse a portion of the Fund’s expenses and/or reduce its fees during the period. Without this reimbursement/fee reduction, if applicable, expenses would have been higher. |
| (c) | Per share net investment income (loss) has been calculated using the average shares outstanding during the period. |
| (d) | Amount rounds to less than $0.01 per share, if applicable. |
See accompanying notes to financial statements.
33
| | | | | | | | | | | | | | | | | | |
| | | | | | | | Ratios to Average Net Assets: | | | |
| | | | | | |
Net asset
value, end
of the period | | Total
return
(%) (a) | | | Net assets,
end of
the period
(000’s) | | Net
expenses
(%) (b)(g) | | | Gross
expenses
(%) (g) | | | Net investment
income (loss)
(%) (g) | | | Portfolio
turnover
rate (%) |
| | | | | | | | | | | | | | | | | | |
| | | | | | | | | | | | | | | | | | |
| | | | | | | | | | | | | | | | | | |
| $ | 6.14 | | (12.4 | )(e) | | $ | 199,050 | | 1.13 | | | 1.13 | | | (0.21 | ) | | 99 |
| | 7.01 | | 20.0 | (e) | | | 228,629 | | 1.14 | (i) | | 1.14 | (i) | | (0.49 | ) | | 134 |
| | 5.84 | | (3.2 | )(e) | | | 225,729 | | 1.10 | | | 1.17 | | | (0.03 | ) | | 174 |
| | 6.03 | | 21.1 | (e) | | | 51,248 | | 1.10 | | | 1.60 | | | (0.38 | ) | | 164 |
| | 4.98 | | 12.9 | (e) | | | 14,072 | | 1.10 | | | 1.70 | | | (0.58 | ) | | 171 |
| | 4.41 | | 20.8 | (f) | | | 947 | | 1.10 | | | 3.11 | | | (0.45 | ) | | 201 |
| | | | | | | | | | | | | | | | | | |
| | 5.93 | | (12.7 | )(e) | | | 18,824 | | 1.89 | | | 1.89 | | | (0.98 | ) | | 99 |
| | 6.79 | | 19.1 | (e) | | | 28,258 | | 1.85 | (i) | | 1.85 | (i) | | (1.20 | ) | | 134 |
| | 5.70 | | (4.0 | )(e) | | | 32,160 | | 1.95 | | | 2.11 | | | (0.85 | ) | | 174 |
| | 5.94 | | 20.2 | (e) | | | 38,538 | | 1.85 | | | 2.33 | | | (1.14 | ) | | 164 |
| | 4.94 | | 12.0 | (e) | | | 12,532 | | 1.85 | | | 2.45 | | | (1.33 | ) | | 171 |
| | 4.41 | | (2.9 | )(f) | | | 2 | | 1.85 | | | 7.92 | | | (1.29 | ) | | 201 |
| | | | | | | | | | | | | | | | | | |
| | 5.93 | | (12.8 | )(e) | | | 36,120 | | 1.86 | | | 1.87 | | | (0.95 | ) | | 99 |
| | 6.80 | | 19.1 | (e) | | | 39,157 | | 1.88 | | | 1.88 | | | (1.23 | ) | | 134 |
| | 5.71 | | (3.9 | )(e) | | | 43,415 | | 1.85 | | | 1.95 | | | (0.76 | ) | | 174 |
| | 5.94 | | 20.2 | (e) | | | 25,734 | | 1.85 | | | 2.35 | | | (1.10 | ) | | 164 |
| | 4.94 | | 12.0 | (e) | | | 6,826 | | 1.85 | | | 2.45 | | | (1.30 | ) | | 171 |
| | 4.41 | | (2.9 | )(f) | | | 2 | | 1.85 | | | 7.92 | | | (1.29 | ) | | 201 |
| | | | | | | | | | | | | | | | | | |
| | 6.43 | | (12.2 | ) | | | 103,774 | | 0.66 | | | 0.66 | | | 0.26 | | | 99 |
| | 7.32 | | 20.4 | | | | 124,663 | | 0.67 | | | 0.67 | | | (0.02 | ) | | 134 |
| | 6.08 | | (2.9 | ) | | | 121,478 | | 0.80 | (h) | | 0.80 | (h) | | 0.31 | | | 174 |
| | 6.26 | | 21.6 | | | | 95,534 | | 0.85 | | | 0.97 | | | (0.05 | ) | | 164 |
| | 5.15 | | 13.2 | | | | 40,165 | | 0.85 | | | 1.04 | | | (0.32 | ) | | 171 |
| | 4.55 | | 21.3 | | | | 28,898 | | 0.85 | | | 1.18 | | | (0.20 | ) | | 201 |
| (e) | A sales charge for Class A shares and a contingent deferred sales charge for Class B and Class C shares are not reflected in total return calculations. Periods less than one year, if applicable, are not annualized. |
| (f) | A sales charge for Class A and Class C shares and a contingent deferred sales charge for Class B and Class C shares are not reflected in total return calculations. Periods less than one year, if applicable, are not annualized. |
| (g) | Computed on an annualized basis for periods less than one year, if applicable. |
| (h) | Includes expense recapture of 0.07%. |
| (i) | Includes expense recapture of 0.001% and 0.08% for Class A and Class B, respectively. |
| (j) | For the six months ended March 31, 2008 (unaudited). |
34
FINANCIAL HIGHLIGHTS (continued)
For a share outstanding throughout each period.
| | | | | | | | | | | | | | | | | | | | | | | | | | | |
| | | | | Income (Loss) from Investment Operations: | | | Less Distributions: | |
| | | | | | | |
| | | Net asset
value,
beginning
of
the period | | Net
investment
income
(loss) (c)(d) | | | Net realized
and unrealized
gain (loss) | | | Total from
investment
operations | | | Dividends
from
net investment
income (d) | | | Distributions
from net
realized
capital gains | | | Total
distributions (d) | |
| | | | | | | | | | | | | | | | | | | | | | | | | | | |
RESEARCH FUND | | | | | | | | | | | | | | | | | | | | | | | | | | | |
Class A | | | | | | | | | | | | | | | | | | | | | | | | | | | |
3/31/2008(g) | | $ | 9.77 | | $ | 0.02 | | | $ | (0.92 | ) | | $ | (0.90 | ) | | $ | (0.06 | ) | | $ | (0.97 | ) | | $ | (1.03 | ) |
9/30/2007 | | | 9.42 | | | 0.02 | | | | 1.53 | | | | 1.55 | | | | (0.07 | ) | | | (1.13 | ) | | | (1.20 | ) |
9/30/2006 | | | 9.22 | | | 0.05 | | | | 0.64 | | | | 0.69 | | | | (0.03 | ) | | | (0.46 | ) | | | (0.49 | ) |
9/30/2005 | | | 7.79 | | | 0.00 | | | | 1.43 | | | | 1.43 | | | | (0.00 | ) | | | — | | | | (0.00 | ) |
9/30/2004 | | | 6.90 | | | 0.01 | | | | 0.90 | | | | 0.91 | | | | (0.02 | ) | | | — | | | | (0.02 | ) |
9/30/2003 | | | 5.69 | | | 0.02 | | | | 1.20 | | | | 1.22 | | | | (0.01 | ) | | | — | | | | (0.01 | ) |
Class B | | | | | | | | | | | | | | | | | | | | | | | | | | | |
3/31/2008(g) | | | 9.56 | | | (0.01 | ) | | | (0.91 | ) | | | (0.92 | ) | | | — | | | | (0.97 | ) | | | (0.97 | ) |
9/30/2007 | | | 9.25 | | | (0.05 | ) | | | 1.50 | | | | 1.45 | | | | (0.01 | ) | | | (1.13 | ) | | | (1.14 | ) |
9/30/2006 | | | 9.10 | | | (0.02 | ) | | | 0.63 | | | | 0.61 | | | | — | | | | (0.46 | ) | | | (0.46 | ) |
9/30/2005 | | | 7.73 | | | (0.06 | ) | | | 1.43 | | | | 1.37 | | | | (0.00 | ) | | | — | | | | (0.00 | ) |
9/30/2004 | | | 6.90 | | | (0.05 | ) | | | 0.90 | | | | 0.85 | | | | (0.02 | ) | | | — | | | | (0.02 | ) |
9/30/2003* | | | 7.05 | | | 0.00 | | | | (0.15 | ) | | | (0.15 | ) | | | — | | | | — | | | | — | |
Class C | | | | | | | | | | | | | | | | | | | | | | | | | | | |
3/31/2008(g) | | | 9.52 | | | (0.02 | ) | | | (0.90 | ) | | | (0.92 | ) | | | — | | | | (0.97 | ) | | | (0.97 | ) |
9/30/2007 | | | 9.22 | | | (0.05 | ) | | | 1.50 | | | | 1.45 | | | | (0.02 | ) | | | (1.13 | ) | | | (1.15 | ) |
9/30/2006 | | | 9.08 | | | (0.02 | ) | | | 0.63 | | | | 0.61 | | | | (0.01 | ) | | | (0.46 | ) | | | (0.47 | ) |
9/30/2005 | | | 7.73 | | | (0.07 | ) | | | 1.42 | | | | 1.35 | | | | (0.00 | ) | | | — | | | | (0.00 | ) |
9/30/2004 | | | 6.90 | | | (0.05 | ) | | | 0.88 | | | | 0.83 | | | | — | | | | — | | | | — | |
9/30/2003* | | | 7.05 | | | 0.00 | | | | (0.15 | ) | | | (0.15 | ) | | | — | | | | — | | | | — | |
Class Y | | | | | | | | | | | | | | | | | | | | | | | | | | | |
3/31/2008(g) | | | 9.85 | | | 0.04 | | | | (0.93 | ) | | | (0.89 | ) | | | (0.10 | ) | | | (0.97 | ) | | | (1.07 | ) |
9/30/2007 | | | 9.49 | | | 0.06 | | | | 1.53 | | | | 1.59 | | | | (0.10 | ) | | | (1.13 | ) | | | (1.23 | ) |
9/30/2006 | | | 9.27 | | | 0.09 | | | | 0.64 | | | | 0.73 | | | | (0.05 | ) | | | (0.46 | ) | | | (0.51 | ) |
9/30/2005 | | | 7.82 | �� | | 0.04 | | | | 1.44 | | | | 1.48 | | | | (0.03 | ) | | | — | | | | (0.03 | ) |
9/30/2004 | | | 6.92 | | | 0.03 | | | | 0.90 | | | | 0.93 | | | | (0.03 | ) | | | — | | | | (0.03 | ) |
9/30/2003 | | | 5.71 | | | 0.04 | | | | 1.20 | | | | 1.24 | | | | (0.03 | ) | | | — | | | | (0.03 | ) |
| * | From commencement of Class operations on September 12, 2003 through September 30, 2003. |
| (a) | Had certain expenses not been reduced during the period, if applicable, total returns would have been lower. Periods less than one year, if applicable, are not annualized. |
| (b) | The investment adviser and/or administrator has agreed to reimburse a portion of the Fund’s expenses and/or reduce its fees during the period. Without this reimbursement/fee reduction, if applicable, expenses would have been higher. |
| (c) | Per share net investment income (loss) has been calculated using the average shares outstanding during the period. |
| (d) | Amount rounds to less than $0.01 per share, if applicable. |
See accompanying notes to financial statements.
35
| | | | | | | | | | | | | | | | |
| | | | | | | | Ratios to Average Net Assets: | | | |
| | | | | | |
Net asset
value, end
of the period | | Total
return
(%) (a) | | |
Net assets,
end of
the period
(000’s) | | Net
expenses
(%) (b)(h) | | Gross
expenses
(%) (h) | | Net investment
income (loss)
(%) (h) | | | Portfolio
turnover
rate (%) |
| | | | | | | | | | | | | | | | |
| | | | | | | | | | | | | | | | |
| | | | | | | | | | | | | | | | |
| $ | 7.84 | | (10.6 | )(e) | | $ | 975 | | 1.25 | | 1.50 | | 0.41 | | | 82 |
| | 9.77 | | 18.0 | (e) | | | 1,198 | | 1.25 | | 1.50 | | 0.22 | | | 148 |
| | 9.42 | | 7.7 | (e) | | | 1,331 | | 1.25 | | 1.68 | | 0.56 | | | 143 |
| | 9.22 | | 18.4 | (e) | | | 344 | | 1.25 | | 34.73 | | 0.03 | | | 133 |
| | 7.79 | | 13.2 | (e) | | | 106 | | 1.21 | | 39.85 | | 0.07 | | | 151 |
| | 6.90 | | 21.5 | (f) | | | 41 | | 1.10 | | 28.75 | | 0.35 | | | 138 |
| | | | | | | | | | | | | | | | |
| | 7.67 | | (10.9 | )(e) | | | 318 | | 2.00 | | 2.25 | | (0.33 | ) | | 82 |
| | 9.56 | | 17.1 | (e) | | | 356 | | 2.00 | | 2.31 | | (0.51 | ) | | 148 |
| | 9.25 | | 6.9 | (e) | | | 331 | | 2.00 | | 2.33 | | (0.19 | ) | | 143 |
| | 9.10 | | 17.8 | (e) | | | 210 | | 2.00 | | 41.40 | | (0.71 | ) | | 133 |
| | 7.73 | | 12.3 | (e) | | | 57 | | 2.00 | | 40.60 | | (0.71 | ) | | 151 |
| | 6.90 | | (2.1 | )(f) | | | 2 | | 2.00 | | 125.11 | | (0.72 | ) | | 138 |
| | | | | | | | | | | | | | | | |
| | 7.63 | | (11.1 | )(e) | | | 639 | | 2.00 | | 2.28 | | (0.38 | ) | | 82 |
| | 9.52 | | 17.2 | (e) | | | 1,164 | | 2.00 | | 2.29 | | (0.54 | ) | | 148 |
| | 9.22 | | 6.9 | (e) | | | 1,198 | | 2.00 | | 2.37 | | (0.18 | ) | | 143 |
| | 9.08 | | 17.5 | (e) | | | 140 | | 2.00 | | 37.60 | | (0.76 | ) | | 133 |
| | 7.73 | | 12.0 | (e) | | | 3 | | 2.00 | | 40.60 | | (0.59 | ) | | 151 |
| | 6.90 | | (2.1 | )(f) | | | 2 | | 2.00 | | 125.11 | | (0.72 | ) | | 138 |
| | | | | | | | | | | | | | | | |
| | 7.89 | | (10.4 | ) | | | 25,201 | | 0.85 | | 1.10 | | 0.81 | | | 82 |
| | 9.85 | | 18.4 | | | | 27,400 | | 0.85 | | 1.11 | | 0.62 | | | 148 |
| | 9.49 | | 8.1 | | | | 23,096 | | 0.85 | | 1.26 | | 0.98 | | | 143 |
| | 9.27 | | 19.0 | | | | 24,651 | | 0.85 | | 1.31 | | 0.43 | | | 133 |
| | 7.82 | | 13.5 | | | | 21,721 | | 0.85 | | 1.50 | | 0.44 | | | 151 |
| | 6.92 | | 21.8 | | | | 21,881 | | 0.85 | | 1.31 | | 0.59 | | | 138 |
| (e) | A sales charge for Class A shares and a contingent deferred sales charge for Class B and Class C shares are not reflected in total return calculations. Periods less than one year, if applicable, are not annualized. |
| (f) | A sales charge for Class A and Class C shares and a contingent deferred sales charge for Class B and Class C shares are not reflected in total return calculations. Periods less than one year, if applicable, are not annualized. |
| (g) | For the six months ended March 31, 2008 (unaudited). |
| (h) | Computed on an annualized basis for periods less than one year, if applicable. |
36
FINANCIAL HIGHLIGHTS (continued)
For a share outstanding throughout each period.
| | | | | | | | | | | | | | | | | | | | | | | | | | |
| | | | | Income (Loss) from Investment Operations: | | | Less Distributions: | |
| | | | | | | |
| | | Net asset
value,
beginning
of
the period | | Net
investment
income
(loss) (d)(e) | | Net realized
and unrealized
gain (loss) | | | Total from
investment
operations | | | Dividends
from
net investment
income | | | Distributions
from
net realized
capital gains | | | Total
distributions | |
| | | | | | | | | | | | | | | | | | | | | | | | | | |
VALUE FUND | | | | | | | | | | | | | | | | | | | | | | | | | | |
Class A**** | | | | | | | | | | | | | | | | | | | | | | | | | | |
3/31/2008(a) | | $ | 23.46 | | $ | 0.14 | | $ | (2.19 | ) | | $ | (2.05 | ) | | $ | (0.18 | ) | | $ | (1.15 | ) | | $ | (1.33 | ) |
9/30/2007 | | | 21.04 | | | 0.19 | | | 3.27 | | | | 3.46 | | | | (0.13 | ) | | | (0.91 | ) | | | (1.04 | ) |
9/30/2006* | | | 19.69 | | | 0.02 | | | 1.33 | | | | 1.35 | | | | — | | | | — | | | | — | |
Class B | | | | | | | | | | | | | | | | | | | | | | | | | | |
3/31/2008(a) | | | 23.46 | | | 0.06 | | | (2.19 | ) | | | (2.13 | ) | | | (0.16 | ) | | | (1.15 | ) | | | (1.31 | ) |
9/30/2007** | | | 24.00 | | | 0.00 | | | (0.54 | ) | | | (0.54 | ) | | | — | | | | — | | | | — | |
Class C | | | | | | | | | | | | | | | | | | | | | | | | | | |
3/31/2008(a) | | | 23.46 | | | 0.06 | | | (2.19 | ) | | | (2.13 | ) | | | (0.18 | ) | | | (1.15 | ) | | | (1.33 | ) |
9/30/2007** | | | 24.00 | | | 0.01 | | | (0.55 | ) | | | (0.54 | ) | | | — | | | | — | | | | — | |
Class Y*** | | | | | | | | | | | | | | | | | | | | | | | | | | |
3/31/2008(a) | | | 23.54 | | | 0.17 | | | (2.18 | ) | | | (2.01 | ) | | | (0.25 | ) | | | (1.15 | ) | | | (1.40 | ) |
9/30/2007 | | | 21.05 | | | 0.27 | | | 3.27 | | | | 3.54 | | | | (0.14 | ) | | | (0.91 | ) | | | (1.05 | ) |
9/30/2006 | | | 18.72 | | | 0.22 | | | 3.17 | | | | 3.39 | | | | (0.27 | ) | | | (0.79 | ) | | | (1.06 | ) |
9/30/2005 | | | 15.95 | | | 0.20 | | | 2.83 | | | | 3.03 | | | | (0.26 | ) | | | — | | | | (0.26 | ) |
9/30/2004 | | | 13.52 | | | 0.21 | | | 2.39 | | | | 2.60 | | | | (0.17 | ) | | | — | | | | (0.17 | ) |
9/30/2003 | | | 11.17 | | | 0.15 | | | 2.29 | | | | 2.44 | | | | (0.09 | ) | | | — | | | | (0.09 | ) |
| * | From commencement of Class operations on June 30, 2006 through September 30, 2006. |
| ** | From commencement of Class operations on June 1, 2007 through September 30, 2007. |
| *** | Prior to the close of business on June 1, 2007, the Fund offered Institutional Class shares, which were redesignated as Class Y shares on that date. |
| **** | Prior to the close of business on June 1, 2007, the Fund offered Retail Class shares, which were redesignated as Class A shares on that date. |
| (a) | For the six months ended March 31, 2008 (unaudited). |
| (b) | Had certain expenses not been reduced during the period, if applicable, total return would have been lower. Periods less than one year, if applicable, are not annualized. |
| (c) | The investment adviser and/or administrator has agreed to reimburse a portion of the Fund’s expenses and/or reduce its fees during the period. Without this reimbursement/fee reduction, if applicable, expenses would have been higher. |
See accompanying notes to financial statements.
37
| | | | | | | | | | | | | | | | | | |
| | | | | | | | Ratios to Average Net Assets: | | | |
| | | | | | |
Net asset
value, end
of the period | | Total
return
(%) (b)(h) | | |
Net assets,
end of
the period
(000’s) | | Net
expenses
(%) (c)(g) | | | Gross
expenses
(%) (g) | | | Net investment
income (loss)
(%) (g) | | Portfolio
turnover
rate (%) | |
| | | | | | | | | | | | | | | | | | |
| | | | | | | | | | | | | | | | | | |
| | | | | | | | | | | | | | | | | | |
| $ | 20.08 | | (9.3 | ) | | $ | 108,498 | | 1.07 | | | 1.07 | | | 1.33 | | 16 | (j) |
| | 23.46 | | 16.9 | | | | 17,500 | | 1.09 | (f) | | 1.09 | (f) | | 0.79 | | 41 | |
| | 21.04 | | 6.9 | | | | 466 | | 1.10 | | | 8.65 | | | 0.42 | | 36 | |
| | | | | | | | | | | | | | | | | | |
| | 20.02 | | (9.6 | ) | | | 11,359 | | 1.82 | (i) | | 1.82 | (i) | | 0.60 | | 16 | (j) |
| | 23.46 | | (2.3 | ) | | | 108 | | 1.85 | | | 1.89 | | | 0.03 | | 41 | |
| | | | | | | | | | | | | | | | | | |
| | 20.00 | | (9.6 | ) | | | 5,032 | | 1.82 | (i) | | 1.83 | (i) | | 0.53 | | 16 | (j) |
| | 23.46 | | (2.3 | ) | | | 1,390 | | 1.85 | | | 1.94 | | | 0.10 | | 41 | |
| | | | | | | | | | | | | | | | | | |
| | 20.13 | | (9.0 | ) | | | 190,800 | | 0.66 | | | 0.66 | | | 1.63 | | 16 | (j) |
| | 23.54 | | 17.3 | | | | 182,002 | | 0.72 | (f) | | 0.72 | (f) | | 1.19 | | 41 | |
| | 21.05 | | 18.9 | | | | 71,147 | | 0.85 | | | 0.91 | | | 1.13 | | 36 | |
| | 18.72 | | 19.2 | | | | 37,255 | | 0.85 | | | 0.92 | | | 1.13 | | 34 | |
| | 15.95 | | 19.4 | | | | 33,563 | | 0.85 | | | 0.93 | | | 1.38 | | 47 | |
| | 13.52 | | 22.0 | | | | 37,959 | | 0.85 | | | 0.92 | | | 1.23 | | 56 | |
| (d) | Per share net investment income (loss) has been calculated using the average shares outstanding during the period. |
| (e) | Amount rounds to less than $0.01 per share, if applicable. |
| (f) | Includes expense recapture of 0.02% and 0.01% for Class A and Class Y, respectively. |
| (g) | Computed on an annualized basis for periods less than one year, if applicable. |
| (h) | A sales charge for Class A shares and a contingent deferred sales charge for Class B and Class C shares are not reflected in total return calculations. Periods less than one year, if applicable, are not annualized. |
| (i) | Includes expense recapture of less than 0.01% and 0.01% for Class B and Class C, respectively. |
| (j) | Portfolio turnover excludes the impact of assets resulting from a merger with another fund. (See Note 9 of Notes to Financial Statements.) |
38
NOTESTO FINANCIAL STATEMENTS
March 31, 2008 (Unaudited)
1. Organization. Loomis Sayles Funds II (the “Trust”) is organized as a Massachusetts business trust. The Trust is registered under the Investment Company Act of 1940, as amended, (the “1940 Act”), as an open-end management investment company. The Declaration of Trust permits the Board of Trustees to authorize the issuance of an unlimited number of shares of the Trust in multiple series. Information presented in these financial statements pertains to certain equity funds of the Trust; the financial statements for the remaining equity funds and the fixed income funds of the Trust are presented in separate reports. The following funds (individually, a “Fund” and collectively, the “Funds”) are included in this report:
Loomis Sayles Global Markets Fund (the “Global Markets Fund”)
Loomis Sayles Growth Fund (the “Growth Fund”)
Loomis Sayles Research Fund (the “Research Fund”)
Loomis Sayles Value Fund (the “Value Fund”)
Each Fund offers Class A, Class C and Class Y shares. Effective October 12, 2007, Class B shares are no longer offered. Existing Class B shareholders may continue to reinvest dividends into Class B shares and exchange their Class B shares for Class B shares of other Natixis Funds subject to existing exchange privileges as described in the Prospectus.
Class A shares are sold with a maximum front-end sales charge of 5.75%. Class B shares do not pay a front-end sales charge, but pay higher Rule 12b-1 fees than Class A shares for eight years (at which point they automatically convert to Class A shares), and are subject to a contingent deferred sales charge (“CDSC”) if those shares are redeemed within six years of purchase. Class C shares do not pay a front-end sales charge, do not convert to any other class of shares and pay higher Rule 12b-1 fees than Class A shares and may be subject to a CDSC of 1.00% if those shares are redeemed within one year. Class Y shares do not pay a front-end sales charge, a CDSC or distribution fees. They are generally intended for institutional investors with a minimum initial investment of $100,000 though some categories of investors are exempted from the minimum investment amount as outlined in the Funds’ prospectus.
Most expenses of the Trust can be directly attributed to a fund. Expenses which can not be directly attributed to a fund are generally apportioned based on the relative net assets of each of the funds in the Trust. Expenses of a fund are borne pro rata by the holders of each class of shares, except that each class bears expenses unique to that class (including the Rule 12b-1 service and distribution fees and transfer agent fees applicable to such class). In addition, each class votes as a class only with respect to its own Rule 12b-1 Plan. Shares of each class would receive their pro rata share of the net assets of a fund if the fund were liquidated. The Trustees approve separate dividends from net investment income on each class of shares.
2. Significant Accounting Policies. The following is a summary of significant accounting policies consistently followed by each Fund in the preparation of its financial statements. The Funds’ financial statements are prepared in accordance with accounting principles generally accepted in the United States of America which require the use of management estimates that affect the reported amounts and disclosures in the financial statements. Actual results could differ from those estimates.
a. Security Valuation. Equity securities, including closed-end investment companies and exchange-traded funds, for which market quotations are readily available are valued at market value, as reported by pricing services recommended by the investment adviser and approved by the Board of Trustees. Such pricing services generally use the security’s last sale price on the exchange or market where the security is primarily traded or, if there is no reported sale during the day, the closing bid price. Securities traded on the NASDAQ Global Select Market, NASDAQ Global Market and NASDAQ Capital Market are valued at the NASDAQ Official Closing Price (“NOCP”), or if lacking a NOCP, at the most recent bid quotation on the applicable NASDAQ Market. Debt securities (other than short-term obligations purchased with an original or remaining maturity of sixty days or less) are generally valued on the basis of evaluated bids furnished to the Fund by a pricing service recommended by the investment adviser and approved by the Board of Trustees, which service determines valuations for normal, institutional-size trading units of such securities using market information, transactions for comparable securities and various relationships between securities which are generally recognized by institutional traders. Broker-dealer bid quotations may also be used to value debt and equity securities where a pricing service does not price a security or where a pricing service does not provide a reliable price for the security. In instances where broker-dealer bid quotations are not available, certain securities held by the Fund may be valued on the basis of a price provided by a principal market maker. Short-term obligations purchased with an original or remaining maturity of sixty days or less are valued at amortized cost, which approximates market value. Securities for which market quotations are not readily available are valued at fair value as determined in good faith by the Fund’s adviser using consistently applied procedures under the general supervision of the Board of Trustees. Investments in other open-end investment companies are valued at their net asset value each day.
The Funds may hold securities traded in foreign markets. Foreign securities are valued at the market price in the foreign market. However, if events occurring after the close of the foreign market (but before the close of regular trading on the New York Stock Exchange) are believed to materially affect the value of those securities, such securities are fair valued pursuant to procedures approved by the Board of Trustees. When fair valuing securities, the Funds may, among other things, use modeling tools or other processes that may take into account factors such as securities market activity and/or significant events that occur after the close of the foreign market and before the Funds calculate their net asset values. At March 31, 2008, approximately 19% of the market value of investments of the Global Markets Fund was fair valued pursuant to procedures approved by the Board of Trustees.
b. Security Transactions and Related Investment Income. Security transactions are accounted for on trade date. Dividend income is recorded on ex-dividend date, or in the case of certain foreign securities, as soon as the Fund is notified and interest income is recorded on an accrual basis. Interest income is increased by the accretion of
39
NOTESTO FINANCIAL STATEMENTS (continued)
March 31, 2008 (Unaudited)
discount and decreased by the amortization of premium. Investment income is recorded net of foreign taxes withheld when applicable. In determining net gain or loss on securities sold, the cost of securities has been determined on an identified cost basis. Investment income, non-class specific expenses and realized and unrealized gains and losses are allocated on a pro rata basis to each class based on the relative net assets of each class to the total net assets of the Fund.
c. Foreign Currency Translation. The books and records of the Funds are maintained in U.S. dollars. The value of securities, currencies and other assets and liabilities denominated in currencies other than U.S. dollars are translated into U.S. dollars based upon foreign exchange rates prevailing at the end of the period. Purchases and sales of investment securities, income and expenses are translated on the respective dates of such transactions.
Since the values of investment securities are presented at the foreign exchange rates prevailing at the end of the period, it is not practical to isolate that portion of the results of operations arising from changes in exchange rates from fluctuations which arise due to changes in market prices of the investment securities. Such changes are included with the net realized and unrealized gain or loss on investments.
Net realized foreign exchange gains or losses arise from sales of foreign currency, currency gains or losses realized between the trade and settlement dates on securities transactions and the difference between the amounts of dividends, interest and foreign withholding taxes recorded on the Funds’ books and the U.S. dollar equivalent of the amounts actually received or paid. Net unrealized foreign exchange gains and losses arise from changes in the value of assets and liabilities, other than investment securities, at the end of the fiscal period, resulting from changes in exchange rates.
Each Fund may use foreign currency exchange contracts to facilitate transactions in foreign-denominated investments. Losses may arise from changes in the value of the foreign currency or if the counterparties do not perform under the contracts’ terms.
Each Fund may purchase investments of foreign issuers. Investing in securities of foreign issuers involves special risks and considerations not typically associated with investing in U.S. companies and securities of the U.S. government. These risks include revaluation of currencies and the risk of appropriation. Moreover, the markets for securities of many foreign issuers may be less liquid and the prices of such securities may be more volatile than those of comparable U.S. companies and the U.S. Government.
d. Forward Foreign Currency Contracts. Each Fund may enter into forward foreign currency exchange contracts. Contracts to buy generally are used to acquire exposure to foreign currencies, while contracts to sell generally are used to hedge a Fund’s investments against currency fluctuation. Also, a contract to buy or sell can offset a previous contract. These contracts involve market risk in excess of the unrealized gain or loss reflected in the Fund’s Statement of Assets and Liabilities. The U.S. dollar value of the currencies a Fund has committed to buy or sell represents the aggregate exposure to each currency the Fund has acquired or hedged through currency contracts outstanding at period end.
All contracts are “marked-to-market” daily at the applicable exchange rates and any gains or losses are recorded for financial statement purposes as unrealized until settlement date. Risks may arise upon entering into these contracts from the potential inability of counterparties to meet the terms of their contracts and from unanticipated movements in the value of a foreign currency relative to the U.S. dollar. At March 31, 2008, the Global Markets Fund had the following open forward foreign currency exchange contracts:
| | | | | | | | | | | | | |
Contract to Buy/Sell | | Delivery
Date | | Currency | | Units | | Value | | Unrealized Appreciation (Depreciation) | |
| | | | | | | | | | | | | |
Sell | | 6/12/2008 | | Canadian Dollar | | 280,000 | | $ | 272,358 | | $ | 8,967 | |
Sell | | 6/12/2008 | | Colombian Peso | | 1,680,000,000 | | | 901,834 | | | (3,438 | ) |
Sell | | 6/12/2008 | | Euro | | 1,230,000 | | | 1,934,950 | | | (28,265 | ) |
Sell | | 6/12/2008 | | Japanese Yen | | 57,000,000 | | | 574,381 | | | (16,807 | ) |
e. Federal and Foreign Income Taxes. The Trust treats each Fund as a separate entity for federal income tax purposes. Each Fund intends to meet the requirements of the Internal Revenue Code applicable to regulated investment companies, and to distribute to its shareholders substantially all of its net investment income and any net realized capital gains, at least annually. Financial Accounting Standards Board (“FASB”) Interpretation No. 48, Accounting for Uncertainty in Income Taxes—an Interpretation of FASB Statement 109 (“FIN48”) was issued and became effective for fiscal years beginning after December 15, 2006. FIN48 sets forth a threshold for financial statement recognition, measurement and disclosure of a tax position taken or expected to be taken on a tax return. Management has performed an analysis of the Funds’ tax positions taken on federal and state tax returns that remain subject to examinations (tax years ended September 30, 2004-2007) and has concluded that no provisions for income tax are required. Fund Management is not aware of any events that are reasonably possible to occur in the next six months that would result in the amounts of any unrecognized tax benefits significantly increasing or decreasing for the Funds. However, management’s conclusions regarding FIN 48 may be subject to review and adjustment at a later date based on factors including, but not limited to, further implementation guidance from the FASB, new tax laws, regulations and interpretations thereof.
A Fund may be subject to foreign taxes on income and gains on investments that are accrued based upon the Fund’s understanding of the tax rules and regulations that exist in the countries in which the Fund invests. Foreign governments may also impose taxes or other payments on investments with respect to foreign securities. Such taxes are accrued as applicable.
40
NOTESTO FINANCIAL STATEMENTS (continued)
March 31, 2008 (Unaudited)
f. Dividends and Distributions to Shareholders. Dividends and distributions are recorded on ex-dividend date. The timing and characterization of certain income and capital gain distributions are determined annually in accordance with federal tax regulations, which may differ from accounting principles generally accepted in the United States of America. These differences are primarily due to differing treatments for book and tax purposes of items such as net operating losses, foreign currency transactions, gains realized from passive foreign investment companies (“PFICs”) and premium amortization accruals. Permanent book and tax basis differences relating to shareholder distributions will result in reclassifications to capital accounts. Temporary differences between book and tax distributable earnings are primarily due to deferred Trustees’ fees, wash sales, unrealized gains on PFICs, premium amortization accruals and defaulted bond interest. Distributions from net investment income and short-term capital gains are considered to be ordinary income for tax purposes.
The tax characterization of distributions is determined on an annual basis. The tax character of distributions paid to shareholders during the year ended September 30, 2007 was as follows:
| | | | | | | | | |
| | | 2007 Distributions Paid From: |
Fund | | Ordinary Income | | Long-Term
Capital
Gains | | Total |
| | | | | | | | | |
Global Markets Fund | | $ | 1,728,169 | | $ | — | | $ | 1,728,169 |
Growth Fund | | | — | | | — | | | — |
Research Fund | | | 1,006,557 | | | 2,531,636 | | | 3,538,193 |
Value Fund | | | 958,359 | | | 4,136,723 | | | 5,095,082 |
As of September 30, 2007, capital loss carryforwards were as follows:
| | | | | | | | | | | | | |
Capital Loss Carryforward: | | Global
Markets
Fund | | Growth Fund | | | Research
Fund | | Value Fund |
| | | | | | | | | | | | | |
Expires September 30, 2010 | | $ | — | | $ | 12,659,581 | * | | $ | — | | $ | — |
Expires September 30, 2011 | | | — | | | 6,192,314 | * | | | — | | | — |
| | | | | | | | | | | | | |
Total capital loss carryforward | | $ | — | | $ | 18,851,895 | | | $ | — | | $ | — |
| | | | | | | | | | | | | |
* A significant portion of the Loomis Sayles Growth Fund’s carryforward losses are result of prior year mergers; therefore these losses have been limited under Section 382 of the Internal Revenue Code.
g. Repurchase Agreements. Each Fund, through its custodian, receives delivery of the underlying securities collateralizing repurchase agreements. It is each Fund’s policy that the market value of the collateral be at least equal to 102% of the repurchase price, including interest. The repurchase agreements are tri-party arrangements whereby the collateral is held at the custodian bank in a segregated account for the benefit of the Fund and on behalf of the counterparty. Repurchase agreements could involve certain risks in the event of default or insolvency of the counterparty including possible delays or restrictions upon a Fund’s ability to dispose of the underlying securities.
h. Securities Lending. The Funds have entered into an agreement with State Street Bank and Trust Company (“State Street Bank”), as agent of the Funds, to lend securities to certain designated borrowers. The loans are collateralized with cash or securities in an amount equal to at least 105% or 102% of the market value of the loaned international or domestic securities, respectively, when the loan is initiated. Thereafter, the value of the collateral must remain at least 102% of the market value of loaned securities for U.S. equities and U.S. corporate debt; at least 105% of the market value of loaned securities for non-U.S. equities; and at least 100% of the market value of loaned securities for U.S. government securities, sovereign debt issued by non-U.S. governments and non-U.S. corporate debt. In the event that the market value of the collateral falls below the required percentages described above, the borrower will deliver additional collateral on the next business day. As with other extensions of credit, the Funds may bear the risk of loss with respect to the investment of the collateral. The Funds invest cash collateral in short-term investments, a portion of the income from which is remitted to the borrowers and the remainder allocated between the Funds and State Street Bank as lending agent. The value of securities on loan to borrowers and the value of collateral held by the Funds with respect to such loans at March 31, 2008 were as follows:
| | | | | | |
| | | Market Value
of Securities
on Loan | | Value of
Collateral |
| | | | | | |
Global Markets Fund | | $ | 46,177,788 | | $ | 46,998,736 |
Growth Fund | | | 40,807,599 | | | 42,909,346 |
Research Fund | | | 7,658,942 | | | 7,921,170 |
Value Fund | | | 21,687,553 | | | 21,825,478 |
41
NOTESTO FINANCIAL STATEMENTS (continued)
March 31, 2008 (Unaudited)
i. Indemnifications. Under the Trust’s organizational documents, its officers and Trustees are indemnified against certain liability arising out of the performance of their duties to the Funds. Additionally, in the normal course of business, the Funds enter into contracts with service providers that contain general indemnification clauses. The Funds’ maximum exposure under these arrangements is unknown as this would involve future claims that may be made against Funds that have not yet occurred. However, based on experience, the Funds expect the risk of loss to be remote.
j. New Accounting Pronouncements. In September 2006, Statement of Financial Accounting Standards No. 157, Fair Value Measurements (“FAS 157”), was issued and is effective for fiscal years beginning after November 15, 2007. FAS 157 defines fair value, establishes a framework for measuring fair value and expands disclosures about fair value measurements. Management has evaluated the impact the adoption of FAS 157 will have on the Funds’ financial statements and believes that such impact will be limited to expanded disclosure in the Funds’ financial statements regarding inputs used in determining the value of the Funds’ investments and will not have a material impact on the Funds’ net assets or results of operations.
In March 2008, Statement of Financial Accounting Standards No. 161, Disclosures about Derivative Instruments and Hedging Activities (“FAS 161”) was issued and will be effective for fiscal years and interim periods beginning after November 15, 2008. FAS 161 requires enhanced disclosures about funds’ derivative and hedging activities. Management is currently evaluating the impact the adoption of FAS 161 will have on the Funds’ financial statement disclosures.
3. Purchases and Sales of Securities. For the six months ended March 31, 2008, purchases and sales of securities (excluding short-term investments and U.S. Government/Agency Securities and including paydowns) were as follows:
| | | | | | |
Fund | | Purchases | | Sales |
| | | | | | |
Global Markets Fund | | $ | 369,676,026 | | $ | 163,630,067 |
Growth Fund | | | 397,418,925 | | | 408,717,184 |
Research Fund | | | 24,576,511 | | | 24,265,704 |
Value Fund | | | 64,617,823 | | | 46,981,193 |
For the six months ended March 31, 2008, purchases and sales of U.S. Government/Agency Securities by the Global Markets Fund were $10,330,903 and $17,652,769, respectively. Purchases and sales of the Value Fund exclude the impact of assets resulting from a merger with another fund. (See Note 9.)
4. Management Fees and Other Transactions with Affiliates.
a. Management Fees. Loomis, Sayles & Company, L.P. (“Loomis Sayles”) serves as investment adviser to each Fund. Under the terms of the management agreements, each Fund pays a management fee at the following annual rates, calculated daily and payable monthly, based on each Fund’s average daily net assets:
| | | |
Fund | | Percentage of
Average
Daily Net Assets | |
Global Markets Fund | | 0.75 | % |
Growth Fund | | 0.50 | % |
Research Fund | | 0.50 | % |
Value Fund | | 0.50 | % |
Loomis Sayles has given binding undertakings to the Funds to reduce its management fees and/or reimburse certain expenses associated with the Funds to limit their operating expenses. These undertakings are in effect until January 31, 2009 and will be reevaluated on an annual basis. For the six months ended March 31, 2008, the expense limits as a percentage of average daily net assets under the expense limitation agreements were as follows:
| | | | | | | | | | | | |
| | | Expense Limit as a Percentage of Average
Daily Net Assets | |
Fund | | Class A | | | Class B | | | Class C | | | Class Y | |
Global Markets Fund | | 1.25 | % | | N/A | | | 2.00 | % | | 1.00 | % |
Growth Fund | | 1.25 | % | | 2.00 | % | | 2.00 | % | | 0.85 | % |
Research Fund | | 1.25 | % | | 2.00 | % | | 2.00 | % | | 0.85 | % |
Value Fund | | 1.10 | % | | 1.85 | % | | 1.85 | % | | 0.85 | % |
42
NOTESTO FINANCIAL STATEMENTS (continued)
March 31, 2008 (Unaudited)
For the six months ended March 31, 2008, the management fees and reductions of management fees for each Fund were as follows:
| | | | | | | | | | | | | | | |
| | | Gross Management Fee | | Reduction of Management Fee | | Net
Management Fee | | Percentage of
Average
Daily Net Assets | |
Fund | | | | | Gross | | | Net | |
Global Markets Fund | | $ | 1,074,615 | | $ | — | | $ | 1,074,615 | | 0.75 | % | | 0.74 | % |
Growth Fund | | | 1,012,885 | | | — | | | 1,012,885 | | 0.50 | % | | 0.50 | % |
Research Fund | | | 73,358 | | | 27,953 | | | 45,405 | | 0.50 | % | | 0.31 | % |
Value Fund | | | 734,101 | | | — | | | 734,101 | | 0.50 | % | | 0.50 | % |
For the six months ended March 31, 2008, class specific expenses have been reimbursed as follows:
| | | |
Fund | | Reimbursement |
Global Markets Fund | | $ | 16,656 |
Growth Fund | | | — |
Research Fund | | | 8,371 |
Value Fund | | | — |
Loomis Sayles shall be permitted to recover expenses borne under the expense limitation agreement (whether through a reduction of its management fee or otherwise) on a class by class basis in later periods to the extent a class’ expenses fall below a class’ expense limits, provided, however, that a class is not obligated to pay such reduced fees/expenses more than one year after the end of the fiscal year in which the fee/expense was reduced. The amounts subject to possible reimbursement under the expense limitation agreements at March 31, 2008 were as follows:
| | | | | | | | | | | | | | | |
| | | Expenses Subject to Possible Reimbursement until
September 30, 2008 |
Fund | | Class A | | Class B | | Class C | | Class Y | | Total |
| | | | | | | | | | | | | | | |
Global Markets Fund | | $ | 17,795 | | $ | — | | $ | 34,787 | | $ | 15,192 | | $ | 67,774 |
Growth Fund | | | — | | | — | | | — | | | — | | | — |
Research Fund | | | 3,536 | | | 1,134 | | | 3,826 | | | 67,244 | | | 75,740 |
Value Fund | | | — | | | 8 | | | 138 | | | — | | | 146 |
| | | | | | | | | | | | | | | |
| | | Expenses Subject to Possible Reimbursement until
September 30, 2009 |
Fund | | Class A | | Class B | | Class C | | Class Y | | Total |
| | | | | | | | | | | | | | | |
Global Markets Fund | | $ | 2,613 | | $ | — | | $ | 12,817 | | $ | 1,226 | | $ | 16,656 |
Growth Fund | | | — | | | — | | | — | | | — | | | — |
Research Fund | | | 1,429 | | | 431 | | | 1,244 | | | 33,220 | | | 36,324 |
Value Fund | | | — | | | — | | | — | | | — | | | — |
Certain officers and employees of Loomis Sayles are also officers or Trustees of the Trust. Loomis Sayles’ general partner is indirectly owned by Natixis Global Asset Management, L.P. (“Natixis US”), which is part of Natixis Global Asset Management Group, an international asset management group based in Paris, France.
b. Administrative Fees. Natixis Asset Management Advisors, L.P. (“Natixis Advisors”) provides certain administrative services for the Funds and subcontracts with State Street Bank to serve as sub-administrator. Natixis Advisors is a wholly-owned subsidiary of Natixis US. Pursuant to an agreement among Natixis Funds Trust I, Natixis Funds Trust II, Natixis Funds Trust III, Natixis Funds Trust IV, Natixis Cash Management Trust, Gateway Trust (“Natixis Funds Trusts”), Loomis Sayles Funds I, Loomis Sayles Funds II (“Loomis Sayles Funds Trusts”), Hansberger International Series and Natixis Advisors, each Fund pays Natixis Advisors monthly its pro rata portion of fees equal to an annual rate of 0.0675% of the first $5 billion of the average daily net assets of the Natixis Funds Trusts, Loomis Sayles Funds Trusts and the Hansberger International Series, 0.0625% of the next $5 billion, 0.0500% of the next $20 billion and 0.045% of such assets in excess of $30 billion, subject to an annual aggregate minimum fee for the Natixis Funds Trusts , Loomis Sayles Funds Trusts and the Hansberger International Series of $5 million, which is reevaluated on an annual basis. New funds are subject to an annual fee of $50,000 plus $12,500 per class and an additional $50,000 if managed by multiple subadvisors in their first calendar year of operations.
43
NOTESTO FINANCIAL STATEMENTS (continued)
March 31, 2008 (Unaudited)
Effective October 1, 2007, State Street Bank reduced the fees it receives from Natixis Advisors for serving as sub-administrator to the Funds. Also, effective October 1, 2007, Natixis Advisors has given a binding contractual undertaking to the Funds to waive the administrative fees paid by the Funds in an amount equal to the reduction in sub-administrative fees discussed above. The waiver is in effect through June 30, 2008.
For the six months ended March 31, 2008, amounts paid to Natixis Advisors for administrative fees were as follows:
| | | | | | | | | |
Fund | | Gross Administrative Fees | | Waiver of
Administrative Fees | | Net
Administrative Fees |
| | | | | | | | | |
Global Markets Fund | | $ | 74,839 | | $ | 3,628 | | $ | 71,211 |
Growth Fund | | | 106,123 | | | 5,118 | | | 101,005 |
Research Fund | | | 7,684 | | | 371 | | | 7,313 |
Value Fund | | | 76,792 | | | 3,869 | | | 72,923 |
c. Service and Distribution Fees. Natixis Distributors, L.P. (“Natixis Distributors”) a wholly owned subsidiary of Natixis US, has entered into a distribution agreement with The Trust. Pursuant to this agreement, Natixis Distributors serves as principal underwriter of each fund.
Pursuant to Rule 12b-1 under the 1940 Act, the Funds have adopted a Service Plan relating to each Fund’s Class A shares (the “Class A Plans”), Service and Distribution Plans relating to the Growth Fund’s, Research Fund’s and Value Fund’s Class B shares (the “Class B Plans”), and Service and Distribution Plans relating to each Fund’s Class C shares (the “Class C Plans”).
Under the Class A Plans, each Fund pays Natixis Distributors a monthly service fee at an annual rate not to exceed 0.25% of the average daily net assets attributable to the Fund’s Class A shares, as reimbursement for expenses incurred by Natixis Distributors in providing personal services to investors in Class A shares and/or the maintenance of shareholder accounts.
Under the Class B and Class C Plans, each applicable Fund pays Natixis Distributors a monthly service fee at an annual rate not to exceed 0.25% of the average daily net assets attributable to the Fund’s Class B and Class C shares, as compensation for services provided and expenses incurred by Natixis Distributors in providing personal services to investors in Class B and Class C shares and/or the maintenance of shareholder accounts.
Also under the Class B and Class C Plans, each applicable Fund pays Natixis Distributors a monthly distribution fee at an annual rate of 0.75% of the average daily net assets attributable to the Fund’s Class B and Class C shares, as compensation for services provided and expenses incurred by Natixis Distributors in connection with the marketing or sale of Class B and Class C shares.
For the six months ended March 31, 2008, the Funds paid the following service and distribution fees:
| | | | | | | | | | | | | | | |
| | | Service Fee | | Distribution Fee |
Fund | | Class A | | Class B | | Class C | | Class B | | Class C |
| | | | | | | | | | | | | | | |
Global Markets Fund | | $ | 77,423 | | $ | — | | $ | 136,874 | | $ | — | | $ | 410,621 |
Growth Fund | | | 274,243 | | | 31,047 | | | 48,348 | | | 93,140 | | | 145,045 |
Research Fund | | | 1,417 | | | 433 | | | 1,116 | | | 1,300 | | | 3,346 |
Value Fund | | | 122,182 | | | 13,822 | | | 5,464 | | | 41,465 | | | 16,392 |
d. Sub-Transfer Agent Fees. Natixis Distributors has entered into agreements with financial intermediaries to provide certain recordkeeping, processing, shareholder communications and other services to customers of the intermediaries and has agreed to compensate the intermediaries for providing those services. Certain services would be provided by the Funds if the shares of those customers were registered directly with the Funds’ transfer agent. Accordingly, the Funds agreed to pay a portion of the intermediary fees attributable to shares of the Fund held by the intermediary (which generally is a percentage of the value of shares held) not exceeding what the Funds would have paid its transfer agent had each customer’s shares been registered directly with the transfer agent instead of held through the intermediary. Natixis Distributors pays the remainder of the fees. Listed below are the fees incurred by the Funds which are included in the transfer agent fees and expenses in the Statements of Operations.
| | | | | | | | | | | | |
| | | Sub-Transfer Agent Fees |
Fund | | Class A | | Class B | | Class C | | Class Y |
| | | | | | | | | | | | |
Global Markets Fund | | $ | 11,010 | | $ | — | | $ | 29,945 | | $ | 17,774 |
Growth Fund | | | 168,816 | | | 18,858 | | | 27,881 | | | 17,429 |
Research Fund | | | 505 | | | 150 | | | 423 | | | 7,348 |
Value Fund | | | 12,158 | | | 1,409 | | | 463 | | | 20,254 |
44
NOTESTO FINANCIAL STATEMENTS (continued)
March 31, 2008 (Unaudited)
e. Commissions. The Funds have been informed that commissions (including CDSCs) on Fund shares paid to Natixis Distributors by investors in shares of the Funds for the six months ended March 31, 2008, were as follows:
| | | |
Fund | | Commissions |
| | | |
Global Markets Fund | | $ | 615,316 |
Growth Fund | | | 138,234 |
Research Fund | | | 1,484 |
Value Fund | | | — |
f. Trustees Fees and Expenses. The Fund does not pay any compensation directly to its officers or Trustees who are directors, officers or employees of Natixis Advisors, Natixis Distributors, Natixis US, or their affiliates. The Chairperson of the Board receives a retainer fee at the annual rate of $200,000. The Chairperson does not receive any meeting attendance fees for Board of Trustees meetings or committee meetings that she attends. Each independent Trustee (other than the Chairperson) receives, in the aggregate, a retainer fee at the annual rate of $65,000. Each independent Trustee also receives a meeting attendance fee of $7,500 for each meeting of the Board of Trustees that he or she attends in person and $3,750 for each meeting of the Board of Trustees that he or she attends telephonically. In addition, each committee chair receives an additional retainer fee at the annual rate of $10,000. Each Contract Review and Governance Committee member is compensated $5,000 for each Committee meeting that he or she attends in person and $2,500 for each meeting that he or she attends telephonically. Each Audit Committee member is compensated $6,250 for each Committee meeting that he or she attends in person and $3,125 for each meeting that he or she attends telephonically. These fees are allocated among the Funds in the Natixis Funds Trusts, Loomis Sayles Funds Trusts and the Hansberger International Series based on a formula that takes into account, among other factors, the relative net assets of each Fund. Trustees are reimbursed for travel expenses in connection with attendance at meetings.
Prior to January 1, 2008, each Independent Trustee (other than the Chairperson) received, in the aggregate, a retainer fee at the annual rate of $55,000. Each Independent Trustee also received a meeting attendance fee of $6,000 for each meeting of the Board of Trustees that he or she attended in person and $3,000 for each meeting that he or she attended telephonically. In addition, each Contract Review and Governance Committee member received $4,000 for each committee meeting that he or she attended in person and $2,000 for each committee meeting that he or she attended telephonically. Each Audit Committee member received $5,000 for each committee meeting that he or she attended in person and $2,500 for each committee meeting that he or she attended telephonically. The Chairperson of the Board and committee chair retainers were $200,000 and $10,000, respectively.
A deferred compensation plan (the “Plan”) is available to the Trustees on a voluntary basis. Each participating Trustee will receive an amount equal to the value that such deferred compensation would have been had it been invested in a designated Fund or certain other Funds of the Natixis Funds Trusts, Loomis Sayles Funds Trusts and the Hansberger International Series on the normal payment date. Deferred amounts remain in the Funds until distributed in accordance with the Plan.
g. Redemption Fees. Shareholders of Class A and Class Y shares of the Global Markets Fund are charged a 2% redemption fee if they redeem, including redeeming by exchange, such shares within 60 days of their acquisition (including acquisition by exchange). The redemption fee is intended to offset the costs to the Fund of short-term trading, such as portfolio transaction and market impact costs associated with redemption activity and administrative costs associated with processing redemptions. The redemption fee is deducted from the shareholder’s redemption or exchange proceeds and is paid to the Fund.
The “first-in, first-out” method is used to determine the holding period of redeemed or exchanged shares, which means that if a shareholder acquired shares on different days, the shares acquired first will be redeemed or exchanged first for purposes of determining whether the redemption fee applies. A new holding period begins with each purchase or exchange. These fees are accounted for as an addition to paid-in capital and are presented on the Statements of Changes in Net Assets.
5. Line of Credit. Each Fund, together with certain other funds of Natixis Funds Trusts, Loomis Sayles Funds Trusts and the Hansberger International Series, participates in a $200,000,000 committed line of credit provided by State Street Bank, with an individual limit of $125,000,000 for each Fund that participates in the line of credit. Interest is charged to each participating fund based on its borrowings at a rate per annum equal to the Federal Funds rate plus 0.50%. In addition, a commitment fee of 0.09% per annum, payable at the end of each calendar quarter, is accrued and apportioned among the participating funds based on their average daily unused portion of the line of credit. For the six months ended March 31, 2008, the Funds had no borrowings under this agreement.
Prior to March 12, 2008, each fund together with certain other funds of Natixis Funds Trusts and Loomis Sayles Funds Trusts and Hansberger International Series, participated in a $75,000,000 committed line of credit provided by State Street Bank.
6. Brokerage Commission Recapture. Each Fund has entered into agreements with certain brokers whereby the brokers will rebate a portion of brokerage commissions. All amounts rebated by the brokers are returned to the Funds under such agreements and are included in realized gains in the Statements of Operations. For the six months ended March 31, 2008, amounts rebated under these agreements were as follows:
| | | |
Fund | | Rebates |
| | | |
Global Markets Fund | | $ | 45,158 |
Growth Fund | | | 127,313 |
Research Fund | | | 8,305 |
Value Fund | | | 18,226 |
45
NOTESTO FINANCIAL STATEMENTS (continued)
March 31, 2008 (Unaudited)
7. Shareholders. At March 31, 2008, Loomis Sayles Funded Pension Plan and Loomis Sayles Employees’ Profit Sharing Retirement Plan held shares of beneficial interest in the Funds as follows:
| | | | |
Fund | | Pension Plan | | Profit Sharing
Retirement Plan |
Global Markets Fund | | 966,513 | | 559,874 |
Growth Fund | | 1,365,599 | | 2,365,309 |
Research Fund | | 1,125,651 | | 787,694 |
Value Fund | | 507,892 | | 602,503 |
At March 31, 2008, two shareholders individually owned more than 5% of the Research Fund’s total outstanding shares, representing, in aggregate, 29.15% of the Fund; and one shareholder individually owned more than 5% of the Global Markets Fund’s total outstanding shares, representing, 50.49% of the Fund.
8. Capital Shares. Each Fund may issue an unlimited number of shares of beneficial interest, without par value. Transactions in capital shares were as follows:
| | | | | | | | | | | | | | |
| | Six Months Ended March 31, 2008 | | | Year Ended September 30, 2007 | |
Global Markets Fund | | Shares | | | | Amount | | | Shares | | | | Amount | |
| | | | | | | | | | | | | | |
| Class A | | | | | | | | | | | | | | |
Issued from the sale of shares | | 5,047,168 | | | $ | 78,976,975 | | | 1,323,460 | | | $ | 19,376,888 | |
Issued in connection with the reinvestment of distributions | | 131,139 | | | | 2,095,597 | | | 12,909 | | | | 170,145 | |
Redeemed | | (2,179,070 | ) | | | (30,951,760 | ) | | (344,626 | ) | | | (4,798,240 | ) |
| | | | | | | | | | | | | | |
Net change | | 2,999,237 | | | $ | 50,120,812 | | | 991,743 | | | $ | 14,748,793 | |
| | | | | | | | | | | | | | |
| Class C | | | | | | | | | | | | | | |
Issued from the sale of shares | | 6,903,312 | | | $ | 105,989,859 | | | 2,428,865 | | | $ | 34,758,519 | |
Issued in connection with the reinvestment of distributions | | 105,648 | | | | 1,677,700 | | | 6,914 | | | | 90,915 | |
Redeemed | | (920,136 | ) | | | (13,090,904 | ) | | (230,238 | ) | | | (3,164,913 | ) |
| | | | | | | | | | | | | | |
Net change | | 6,088,824 | | | $ | 94,576,655 | | | 2,205,541 | | | $ | 31,684,521 | |
| | | | | | | | | | | | | | |
| Class Y | | | | | | | | | | | | | | |
Issued from the sale of shares | | 5,703,664 | | | $ | 86,592,272 | | | 1,157,288 | | | $ | 16,511,186 | |
Issued in connection with the reinvestment of distributions | | 307,775 | | | | 4,927,469 | | | 78,467 | | | | 1,034,975 | |
Redeemed | | (1,513,793 | ) | | | (21,503,216 | ) | | (830,965 | ) | | | (11,207,236 | ) |
| | | | | | | | | | | | | | |
Net change | | 4,497,646 | | | $ | 70,016,525 | | | 404,790 | | | $ | 6,338,925 | |
| | | | | | | | | | | | | | |
Increase (decrease) from capital share transactions | | 13,585,707 | | | $ | 214,713,992 | | | 3,602,074 | | | $ | 52,772,239 | |
| | | | | | | | | | | | | | |
| | |
| | Six Months Ended March 31, 2008 | | | Year Ended September 30, 2007 | |
Growth Fund | | Shares | | | | Amount | | | Shares | | | | Amount | |
| | | | | | | | | | | | | | |
| Class A | | | | | | | | | | | | | | |
Issued from the sale of shares | | 4,125,161 | | | $ | 27,648,469 | | | 7,089,532 | | | $ | 44,698,435 | |
Issued in connection with the reinvestment of distributions | | — | | | | — | | | — | | | | — | |
Redeemed | | (4,323,514 | ) | | | (29,134,411 | ) | | (13,109,095 | ) | | | (81,970,028 | ) |
| | | | | | | | | | | | | | |
Net change | | (198,353 | ) | | $ | (1,485,942 | ) | | (6,019,563 | ) | | $ | (37,271,593 | ) |
| | | | | | | | | | | | | | |
| Class B | | | | | | | | | | | | | | |
Issued from the sale of shares | | 43,925 | | | $ | 289,201 | | | 225,868 | | | $ | 1,376,484 | |
Issued in connection with the reinvestment of distributions | | — | | | | — | | | — | | | | — | |
Redeemed | | (1,028,192 | ) | | | (6,525,806 | ) | | (1,705,839 | ) | | | (10,426,523 | ) |
| | | | | | | | | | | | | | |
Net change | | (984,267 | ) | | $ | (6,236,605 | ) | | (1,479,971 | ) | | $ | (9,050,039 | ) |
| | | | | | | | | | | | | | |
| Class C | | | | | | | | | | | | | | |
Issued from the sale of shares | | 783,715 | | | $ | 5,071,985 | | | 1,278,833 | | | $ | 7,816,200 | |
Issued in connection with the reinvestment of distributions | | — | | | | — | | | — | | | | — | |
Redeemed | | (455,710 | ) | | | (2,919,450 | ) | | (3,124,017 | ) | | | (19,027,646 | ) |
| | | | | | | | | | | | | | |
Net change | | 328,005 | | | $ | 2,152,535 | | | (1,845,184 | ) | | $ | (11,211,446 | ) |
| | | | | | | | | | | | | | |
| Class Y | | | | | | | | | | | | | | |
Issued from the sale of shares | | 3,445,649 | | | $ | 24,245,015 | | | 3,152,372 | | | $ | 20,891,933 | |
Issued in connection with the reinvestment of distributions | | — | | | | — | | | — | | | | — | |
Redeemed | | (4,329,167 | ) | | | (29,098,991 | ) | | (6,121,890 | ) | | | (39,927,125 | ) |
| | | | | | | | | | | | | | |
Net change | | (883,518 | ) | | $ | (4,853,976 | ) | | (2,969,518 | ) | | $ | (19,035,192 | ) |
| | | | | | | | | | | | | | |
Increase (decrease) from capital share transactions | | (1,738,133 | ) | | $ | (10,423,988 | ) | | (12,314,236 | ) | | $ | (76,568,270 | ) |
| | | | | | | | | | | | | | |
46
NOTESTO FINANCIAL STATEMENTS (continued)
March 31, 2008 (Unaudited)
8. Capital Shares (continued).
| | | | | | | | | | | | | | |
| | Six Months Ended
March 31, 2008 | | | Year Ended
September 30, 2007 | |
Research Fund | | Shares | | | | Amount | | | Shares | | | | Amount | |
| | | | | | | | | | | | | | |
| Class A | | | | | | | | | | | | | | |
Issued from the sale of shares | | 28,810 | | | $ | 256,714 | | | 119,265 | | | $ | 1,061,187 | |
Issued in connection with the reinvestment of distributions | | 5,586 | | | | 50,215 | | | 5,961 | | | | 51,978 | |
Redeemed | | (32,658 | ) | | | (272,678 | ) | | (143,887 | ) | | | (1,318,176 | ) |
| | | | | | | | | | | | | | |
Net change | | 1,738 | | | $ | 34,251 | | | (18,661 | ) | | $ | (205,011 | ) |
| | | | | | | | | | | | | | |
| Class B | | | | | | | | | | | | | | |
Issued from the sale of shares | | 4,020 | | | $ | 37,193 | | | 13,946 | | | $ | 127,879 | |
Issued in connection with the reinvestment of distributions | | 2,116 | | | | 18,641 | | | 3,004 | | | | 25,776 | |
Redeemed | | (1,897 | ) | | | (16,234 | ) | | (15,550 | ) | | | (137,306 | ) |
| | | | | | | | | | | | | | |
Net change | | 4,239 | | | $ | 39,600 | | | 1,400 | | | $ | 16,349 | |
| | | | | | | | | | | | | | |
| Class C | | | | | | | | | | | | | | |
Issued from the sale of shares | | 17,969 | | | $ | 154,844 | | | 58,235 | | | $ | 506,509 | |
Issued in connection with the reinvestment of distributions | | 625 | | | | 5,472 | | | 604 | | | | 5,155 | |
Redeemed | | (57,137 | ) | | | (484,857 | ) | | (66,416 | ) | | | (595,377 | ) |
| | | | | | | | | | | | | | |
Net change | | (38,543 | ) | | $ | (324,541 | ) | | (7,577 | ) | | $ | (83,713 | ) |
| | | | | | | | | | | | | | |
| Class Y | | | | | | | | | | | | | | |
Issued from the sale of shares | | 236,941 | | | $ | 2,162,719 | | | 390,426 | | | $ | 3,634,934 | |
Issued in connection with the reinvestment of distributions | | 340,293 | | | | 3,072,854 | | | 353,735 | | | | 3,098,721 | |
Redeemed | | (163,869 | ) | | | (1,370,757 | ) | | (396,917 | ) | | | (3,619,808 | ) |
| | | | | | | | | | | | | | |
Net change | | 413,365 | | | $ | 3,864,816 | | | 347,244 | | | $ | 3,113,847 | |
| | | | | | | | | | | | | | |
Increase (decrease) from capital share transactions | | 380,799 | | | $ | 3,614,126 | | | 322,406 | | | $ | 2,841,472 | |
| | | | | | | | | | | | | | |
| | |
| | Six Months Ended
March 31, 2008 | | | Year Ended
September 30, 2007 | |
Value Fund | | Shares | | | | Amount | | | Shares | | | | Amount | |
| | | | | | | | | | | | | | |
| Class A | | | | | | | | | | | | | | |
Issued from the sale of shares | | 628,960 | | | $ | 13,057,772 | | | 1,007,378 | | | $ | 22,480,490 | |
Issued in connection with the acquisition of assets from Natixis Value Fund (Note 9) | | 4,677,827 | | | | 105,017,209 | | | — | | | | — | |
Issued in connection with the reinvestment of distributions | | 66,481 | | | | 1,479,502 | | | 11,954 | | | | 259,876 | |
Redeemed | | (716,775 | ) | | | (15,222,801 | ) | | (295,544 | ) | | | (6,787,734 | ) |
| | | | | | | | | | | | | | |
Net change | | 4,656,493 | | | $ | 104,331,682 | | | 723,788 | | | $ | 15,952,632 | |
| | | | | | | | | | | | | | |
| Class B* | | | | | | | | | | | | | | |
Issued from the sale of shares | | 11,453 | | | $ | 239,015 | | | 4,592 | | | $ | 109,794 | |
Issued in connection with the acquisition of assets from Natixis Value Fund (Note 9) | | 653,035 | | | | 14,641,036 | | | — | | | | — | |
Issued in connection with the reinvestment of distributions | | 3,039 | | | | 67,865 | | | — | | | | — | |
Redeemed | | (104,601 | ) | | | (2,171,171 | ) | | (6 | ) | | | (133 | ) |
| | | | | | | | | | | | | | |
Net change | | 562,926 | | | $ | 12,776,745 | | | 4,586 | | | $ | 109,661 | |
| | | | | | | | | | | | | | |
| Class C* | | | | | | | | | | | | | | |
Issued from the sale of shares | | 94,809 | | | $ | 2,045,309 | | | 61,363 | | | $ | 1,408,850 | |
Issued in connection with the acquisition of assets from Natixis Value Fund (Note 9) | | 127,550 | | | | 2,857,122 | | | — | | | | — | |
Issued in connection with the reinvestment of distributions | | 1,900 | | | | 42,151 | | | — | | | | — | |
Redeemed | | (31,978 | ) | | | (677,879 | ) | | (2,085 | ) | | | (48,751 | ) |
| | | | | | | | | | | | | | |
Net change | | 192,281 | | | $ | 4,266,703 | | | 59,278 | | | $ | 1,360,099 | |
| | | | | | | | | | | | | | |
| Class Y | | | | | | | | | | | | | | |
Issued from the sale of shares | | 3,085,227 | | | $ | 64,517,021 | | | 6,373,521 | | | $ | 144,020,544 | |
Issued in connection with the reinvestment of distributions | | 436,903 | | | | 9,700,986 | | | 186,666 | | | | 4,059,991 | |
Redeemed | | (1,776,824 | ) | | | (38,152,626 | ) | | (2,207,571 | ) | | | (50,723,278 | ) |
| | | | | | | | | | | | | | |
Net change | | 1,745,306 | | | $ | 36,065,381 | | | 4,352,616 | | | $ | 97,357,257 | |
| | | | | | | | | | | | | | |
Increase (decrease) from capital share transactions | | 7,157,006 | | | $ | 157,440,511 | | | 5,140,268 | | | $ | 114,779,649 | |
| | | | | | | | | | | | | | |
* From commencement of Class operations on June 1, 2007 through September 30, 2007.
47
NOTESTO FINANCIAL STATEMENTS (continued)
March 31, 2008 (Unaudited)
9. Acquisition of Assets. After the close of business on October 26, 2007, the Value Fund acquired all assets and liabilities of Natixis Value Fund, pursuant to a plan of reorganization approved by Natixis Value Fund shareholders on October 12, 2007. The acquisition was accomplished by a tax-free exchange of 4,677,827 Class A shares of the Value Fund for 14,004,395 shares of the Natixis Value Fund Class A, 653,035 Class B shares of the Value Fund for 2,297,374 shares of the Natixis Value Fund Class B; and 127,550 Class C shares of the Value Fund for 448,235 shares of the Natixis Value Fund Class C. Natixis Value Fund net assets at that date of $122,515,367, including $13,382,872 of net unrealized appreciation, were combined with those of the Value Fund. The aggregate net assets of the Value Fund immediately before the acquisition were $200,528,438. The combined net assets of the Value Fund immediately following the acquisition were $323,043,805.
48

Loomis Sayles Mid Cap Growth Fund
Loomis Sayles Small Cap Growth Fund
Loomis Sayles Small Cap Value Fund
Loomis Sayles Tax-Managed Equity Fund
SEMIANNUAL REPORT
MARCH 31, 2008 (Unaudited)
FUND AND MANAGER REVIEW
Loomis Sayles Mid Cap Growth Fund

Phil Fine, CFA
Manager since February 1999
FUND FACTS
Symbol | Institutional: LSAIX;
Retail: LAGRX
Objective | Long-term capital growth from investments in common stocks or similar securities
Strategy | Invests at least 80% of its net assets (plus any borrowings made for investment purposes) in common stocks or other equity securities (which may include securities offered in the secondary markets or in initial public offerings) of companies with market capitalizations that fall within the capitalization range of the Russell Midcap Growth Index, although the Fund may invest in companies of any size
Fund Inception Date | 12/31/96
Commencement of Operations of Class | Institutional: 1/2/97;
Retail: 1/2/97
Total Net Assets | $123.5 million
PORTFOLIO REVIEW
In a difficult period for the securities markets, the Fund held up better than its Benchmark, the Russell Midcap Growth Index, for the six months ended March 31, 2008. The Fund’s outperformance was primarily due to good stock selection in the materials and processing, healthcare, consumer discretionary and technology sectors. Stock selection in the financial services and utilities sectors detracted from relative performance.
The materials and processing and energy sectors were the only sectors posting positive absolute returns for the Fund. Good stock selection in the overweight materials sector had the greatest positive impact on performance, both in absolute and relative terms. Our strongest performers included steel and fertilizer stocks, which benefited from rising commodity prices, supported by structural imbalances between supply and demand. Mosaic, a phosphate and potash producer, was the Fund’s top performer. Prices and cash margins for both nutrients have risen sharply, due to strong demand, low inventories and supply constraints. We were modestly underweight in energy, but our holdings outperformed the Benchmark’s energy stocks. Our top contributors included two exploration and production companies, Range Resources and Southwestern Energy.
The Fund’s weakest sector on an absolute basis was financial services. The technology and consumer discretionary sectors were also weak on an absolute basis, but when viewed on a relative basis, these sectors added value because of good stock selection. In the first quarter of 2008, virtually every company related to the capital markets came under pressure, due to the turmoil in the credit markets. For example, FCStone, a commodities broker and consultant, plunged in value due to its perceived exposure to counterparty credit risk and concerns that trading volumes could suffer if hedge fund clients were forced to deleverage. We sold the stock. In technology, the Fund experienced losses in telecommunication equipment and computer stocks, and our solar stocks were hit by profit-taking. Nevertheless, our position in First Solar, a producer of solar modules, was a top contributor. We believe the company’s proprietary technology gives it a cost advantage relative to competitors, and management has done an exceptional job ramping up new capacity.
NII Holdings, a provider of wireless communication services in Latin America, detracted from the Fund’s performance. The company reported disappointing net subscriber additions in its two largest markets, Mexico and Brazil, and announced price cuts to match competitor promotions. We sold the position.
OUTLOOK
Uncertainty and fear often create attractive buying opportunities, as emotion overcomes fundamentals. We anticipate improving conditions in the equity markets during 2008. We believe pessimism is high, risk appetites are low, and concerns about corporate profit growth may be overstated. In our view, this suggests that valuations are attractive, and the market is well-positioned for a recovery if the fog of uncertainty begins to clear and investors return to looking at normalized earnings and cash-flow growth rates.
1
AVERAGE ANNUAL TOTAL RETURNS
Periods Ended March 31, 2008
| | | | | | | | | | | | | |
| 6 Months | | | 1 Year | | | 5 Years | | | 10 Years | | | Since
Inception | |
| Loomis Sayles Mid Cap Growth: Institutional | |
| -7.74 | % | | 9.82 | % | | 19.85 | % | | 8.76 | % | | 10.28 | % |
| Loomis Sayles Mid Cap Growth: Retail | |
| -7.86 | | | 9.57 | | | 19.54 | | | 8.46 | | | 9.98 | |
| Russell Midcap Growth Index(c) | |
| -12.46 | | | -4.55 | | | 15.20 | | | 5.15 | | | 7.55 | |
| Lipper Mid-Cap Growth Funds Index(c) | |
| -12.81 | | | 1.09 | | | 15.12 | | | 5.12 | | | 6.61 | |
| | | | | | | | |
| Gross expense ratio (before reductions and reimbursements)* |
| Institutional: 1.10% | | Retail: 1.43% | | |
| Net expense ratio (after reductions and reimbursements)* |
| Institutional: 1.00% | | Retail: 1.25% | | |
* As stated in the most recent prospectus
CUMULATIVE PERFORMANCE
Inception to March 31, 2008(a)(b)
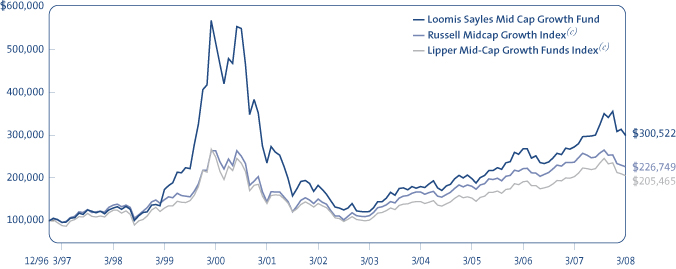
Data quoted reflects past performance and cannot guarantee future results. Average annual total returns assume reinvestment of dividends and capital gain distributions. Investment return and principal value will fluctuate so that shares, when redeemed, may be worth more or less than their original cost. For performance current to the most recent month end, please visit the Loomis Sayles website. Current performance may be higher or lower than quoted.
Returns do not reflect the taxes that a shareholder would pay on fund distributions or the redemption of shares. Periods of less than one year are not annualized. Performance data reflects certain fee reductions and reimbursements, if any, without which performance would be lower.
(a) Cumulative performance is shown for the Institutional Class of Shares. Performance of the Retail Class would be lower due to higher fees. (b) The mountain chart is based on the initial investment minimum of $100,000 for the Institutional Class. (c) See page 9 for a description of the Indices.
WHAT YOU SHOULD KNOW
Small- and mid-cap stocks may be more volatile than larger, more established companies. The secondary market for these stocks may be less liquid, which could adversely impact the Fund’s value. Growth funds involve increased risks, in part, because the value of the underlying securities is based on future expectations that may or may not be met.
The Fund can invest a significant percentage of assets in foreign securities and the value of the fund shares can be adversely affected by changes in currency exchange rates, political, and economic developments. In emerging markets these risks can be significant. The Fund is subject to currency risk, which is the risk that fluctuations in exchange rates between the US dollar and foreign currencies may cause the value of a Fund’s investments to decline. Fund shares should be viewed as a long-term investment.
2
FUND AND MANAGER REVIEW
Loomis Sayles Small Cap Growth Fund

Mark F. Burns, CFA
Manager since January 2005

John Slavik, CFA
Manager since April 2005
FUND FACTS
Symbol | Institutional: LSSIX;
Retail: LCGRX
Objective | Long-term capital growth from investments in common stocks or other equity securities
Strategy | Invests at least 80% of its net assets (plus any borrowings made for investment purposes) in equity securities of companies with market capitalizations that fall within the capitalization range of the Russell 2000 Index. Unlike the Index, the Fund may invest in companies of any size
Fund Inception Date | 12/31/96
Commencement of Operations of Class | Institutional: 1/2/97;
Retail: 1/2/97
Total Net Assets | $103.1 million
PORTFOLIO REVIEW
The Fund underperformed its Benchmarks, the Russell 2000 Growth and the Russell 2000 Indices, for the six months ended March 31, 2008. Poor stock selection in the financial services and healthcare sectors accounted for the majority of the performance shortfall versus the Benchmarks.
On an absolute basis, energy was the only sector in the Fund’s portfolio that offered a positive return for the period. The technology, healthcare and consumer discretionary sectors made the largest negative contributions to the Fund’s absolute performance. Within these sectors, Inverness Medical Innovations, a diagnostic testing company; Life Time Fitness, a nationwide owner of health clubs; and Tessera Technologies, a semiconductor company, were among the Fund’s worst performers. Each of these positions was sold.
In light of the recent stock market volatility, we sought to limit the Fund’s risk by reducing exposure to the technology and financial services sectors. In financial services, we cut exposure to companies that were influenced by the ongoing credit crisis. In the technology sector, we reduced exposure to the semiconductor industry, which was experiencing a cyclical slowdown.
We also reduced the Fund’s consumer discretionary exposure aggressively in the fourth quarter of 2007, as it became evident the US consumer was becoming more cautious about the economy, but we started adding back exposure in the first quarter of 2008. To offset these reductions, we increased the Fund’s exposure to the healthcare, producer durables and energy sectors.
OUTLOOK
Although we expected some challenges as the market adjusted to the economic slowdown, the depth of the markets’ sell-off across nearly every sector was larger than we had anticipated. Turmoil in the credit markets led to fears about the financial system’s vulnerability, and this, combined with growing inflationary pressures, fueled the rise in volatility. Economic uncertainty is never pleasant, but the market has a long history of coping with it. The Federal Reserve has been working to support the economy and instill order and confidence in the financial markets.
Uncertainty and fear often create attractive buying opportunities, as emotion overcomes fundamentals. We anticipate improvements in the equity markets during 2008. We believe pessimism is high, risk appetites are low, and concerns about corporate profit growth may be overstated. In our view, this suggests valuations are attractive, and the market is well-positioned for a recovery if the fog of uncertainty begins to clear and investors return to looking at normalized earnings and cash-flow growth rates.
3
We expect the stocks of companies that benefit from corporate spending, non-US earnings streams and strong emerging-market economies to perform better than those tied to the US economy in general and to US consumer spending in particular.
AVERAGE ANNUAL TOTAL RETURNS
Periods Ended March 31, 2008
| | | | | | | | | | | | | |
| 6 Months | | | 1 Year | | | 5 Years | | | 10 Years | | | Since
Inception | |
| Loomis Sayles Small Cap Growth: Institutional | |
| -15.75 | % | | -1.11 | % | | 17.03 | % | | 1.15 | % | | 3.68 | % |
| Loomis Sayles Small Cap Growth: Retail | |
| -15.86 | | | -1.29 | | | 16.76 | | | 0.89 | | | 3.42 | |
| Russell 2000 Growth Index(c) | |
| -14.66 | | | -8.94 | | | 14.24 | | | 1.75 | | | 3.69 | |
| Russell 2000 Index(c) | |
| -14.02 | | | -13.00 | | | 14.90 | | | 4.96 | | | 7.20 | |
| Lipper Small-Cap Growth Funds Index(c) | |
| -16.90 | | | -9.53 | | | 12.68 | | | 3.98 | | | 5.51 | |
| Gross expense ratio (before reductions and reimbursements)* | |
| Institutional: 1.23% | | | Retail: 1.50% | | | | |
| Net expense ratio (after reductions and reimbursements)* | |
| Institutional: 1.00% | | | Retail: 1.25% | | | | |
* As stated in the most recent prospectus
CUMULATIVE PERFORMANCE
Inception to March 31, 2008(a)(b)
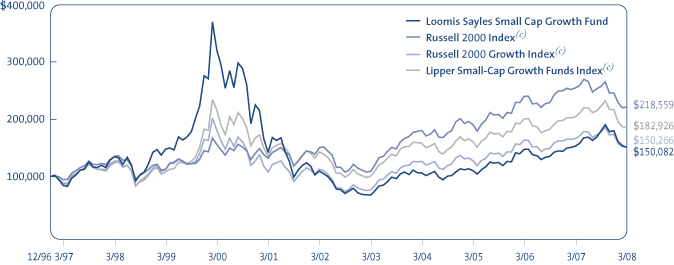
Data quoted reflects past performance and cannot guarantee future results. Average annual total returns assume reinvestment of dividends and capital gains distributions. Investment return and principal value will fluctuate so that shares, when redeemed, may be worth more or less than their original cost. For performance current to the most recent month end, please visit the Loomis Sayles website. Current performance may be higher or lower than quoted.
Returns do not reflect the taxes that a shareholder would pay on fund distributions or the redemption of shares. Periods of less than one year are not annualized. Performance data reflects certain fee reductions and reimbursements, if any, without which performance would be lower.
(a) Cumulative performance is shown for the Institutional Class of Shares. Performance of the Retail Class would be lower due to higher fees. (b) The mountain chart is based on the initial investment minimum of $100,000 for the Institutional Class. (c) See page 9 for a description of the Indices.
WHAT YOU SHOULD KNOW
Small- and mid-cap stocks may be more volatile than larger, more established companies. The secondary market for these stocks may be less liquid, which could adversely impact the Fund’s value. Growth funds involve increased risks, in part, because the value of the underlying securities is based on future expectations that may or may not be met.
The Fund can invest a significant percentage of assets in foreign securities and the value of the fund shares can be adversely affected by changes in currency exchange rates, political, and economic developments. In emerging markets these risks can be significant. The Fund is subject to currency risk, which is the risk that fluctuations in exchange rates between the US dollar and foreign currencies may cause the value of a Fund’s investments to decline. Fund shares should be viewed as a long-term investment.
4
FUND AND MANAGER REVIEW
Loomis Sayles Small Cap Value Fund

Manager since January 2000

Manager since April 2000
FUND FACTS
Symbol | Institutional: LSSCX;
Retail: LSCRX; Admin: LSVAX
Objective | Long-term capital growth from investments in common stocks or other equity securities
Strategy | Invests at least 80% of its net assets (plus any borrowings made for investment purposes) in equity securities of companies with market capitalizations that fall within the capitalization range of the Russell 2000 Index. Unlike the Index, the Fund may invest in companies of any size
Fund Inception Date | 5/13/91
Commencement of Operations of Class | Institutional: 5/13/91;
Retail: 1/2/97; Admin: 1/2/98
Total Net Assets | $1,008.8 million
PORTFOLIO REVIEW
The Fund underperformed one of its Benchmarks, the Russell 2000 Value Index, and outperformed its other Benchmark, the Russell 2000 Index, during the six months ended March 31, 2008. The Fund’s underperformance was primarily due to poor stock selection in the financial services and energy sectors. However, stock selection in the autos and transportation and technology sectors aided the Fund’s relative performance.
The Fund’s worst performing sector was financial services. Our cautious stance and underweight positions were positive factors late in 2007, but we were not positioned for the surprising resilience demonstrated by small banks and real estate investment trusts in early 2008. They held up remarkably well, despite significantly negative revisions to earnings estimates, a broadening of the liquidity crisis, and the near collapse of several high-profile financial institutions. In addition, a handful of financial services names suffered, from a fundamental perspective, including National Financial Partners, a distributor of financial services products to businesses and individuals, and Advanta Corp., a provider of credit cards and related products to business. We sold both positions.
The automotive and transportation sector was one of the Fund’s strongest positions. Transportation stocks generally perform well in anticipation of an economic recovery after a recession. Short-line railroad operator Genesee & Wyoming, which has been in the portfolio for a long time, paced the sector with a strongly positive return.
“Broken-deal” stocks are a new theme pursued in the portfolio as opportunities appeared. These are situations where leveraged buyouts collapsed as buyers and banks felt the pressure of the weakening debt and credit markets, causing the deals to fall through. These situations included new positions in Alliance Data Systems, a financial data-services provider, Myers Industries, a rubber and plastics manufacturer, and PHH Corp., a provider of mortgage management services.
OUTLOOK
Although we expected some challenges as the market adjusted to the economic slowdown, the depth of the markets’ sell-off across nearly every sector was larger than we had anticipated. Turmoil in the credit markets led to fears about the financial system’s vulnerability. This, along with growing inflation pressures, fueled the rise in volatility. Economic uncertainty is never pleasant, but the market has a long history of coping with it. The Federal Reserve has been working to support the economy and instill order and confidence in the financial markets.
Uncertainty and fear often create attractive buying opportunities, as emotion overcomes fundamentals. We anticipate improvements in the equity markets during 2008. We believe pessimism is high, risk appetites are low, and concerns over corporate profit growth may be overstated. In our view, this suggests valuations are attractive, and the market is well-positioned for a recovery if the fog of uncertainty begins to clear and investors return to looking at normalized earnings and cash-flow growth rates.
5
AVERAGE ANNUAL TOTAL RETURNS
Periods Ended March 31, 2008
| | | | | | | | | | | | |
| 6 Months | | | 1 Year | | | 5 Years | | | 10 Years | | | Since
Inception(a)(b) |
| Loomis Sayles Small Cap Value: Institutional |
| -13.74 | % | | -10.22 | % | | 15.13 | % | | 7.88 | % | | 13.56% |
| Loomis Sayles Small Cap Value: Retail(a) |
| -13.85 | | | -10.43 | | | 14.83 | | | 7.61 | | | 13.36 |
| Loomis Sayles Small Cap Value: Admin(a) |
| -13.98 | | | -10.68 | | | 14.53 | | | 7.32 | | | 13.01 |
| Russell 2000 Value Index(c) |
| -13.33 | | | -16.88 | | | 15.45 | | | 7.46 | | | 12.81 |
| Russell 2000 Index(c) |
| -14.02 | | | -13.00 | | | 14.90 | | | 4.96 | | | 10.11 |
| Lipper Small-Cap Core Funds Index(b)(c) |
| -13.03 | | | -10.26 | | | 14.76 | | | 6.20 | | | N/A |
| Gross expense ratio (before reductions and reimbursements)* |
| Institutional: 0.89% | | | Retail: 1.24% | | | Admin: 1.57% |
| Net expense ratio (after reductions and reimbursements)* |
| Institutional: 0.89% | | | Retail: 1.16% | | | Admin: 1.41% |
* As stated in the most recent prospectus
CUMULATIVE PERFORMANCE
Inception to March 31, 2008(d)(e)
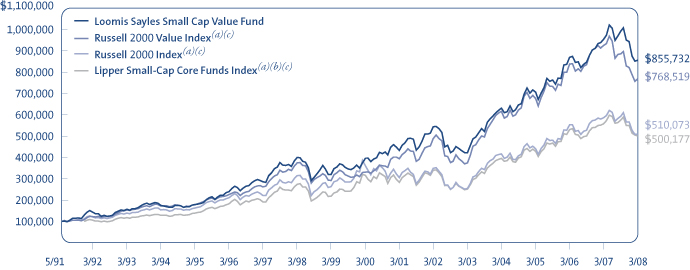
Data quoted reflects past performance and cannot guarantee future results. Average annual total returns assume reinvestment of dividends and capital gains distributions. Investment return and principal value will fluctuate so that shares, when redeemed, may be worth more or less than their original cost. For performance current to the most recent month end, please visit the Loomis Sayles website. Current performance may be higher or lower than quoted.
Returns do not reflect the taxes that a shareholder would pay on fund distributions or the redemption of shares. Periods of less than one year are not annualized. Performance data reflects certain fee reductions and reimbursements, if any, without which performance would be lower.
(a) Performance shown for periods prior to the inception date of the Retail Class (12/31/96) and Admin Class (1/02/98) represents the performance of the Institutional Class of shares during the periods shown, adjusted to reflect current levels of 12b-1 fees payable by the respective Classes. Since index performance data is not available coincident with the Fund’s inception date, the beginning value of the index is the value as of the month end closest to the Fund’s inception date. (b) The Lipper Small-Cap Core Funds Index performance data is not available prior to January 1, 1992. (c) See page 9 for a description of the Indices. (d) Cumulative performance is shown for the Institutional Class of Shares. Performance of the Retail and Admin Classes would be lower due to higher fees and expenses. (e) The mountain chart is based on the initial investment minimum of $100,000 for the Institutional Class.
WHAT YOU SHOULD KNOW
Value stocks may fall out of favor with investors and underperform the overall equity market during any given period. Small- and mid-cap stocks may be more volatile than larger, more established companies. The secondary market for these stocks may be less liquid, which could adversely impact the Fund’s value. Foreign investments involve special risks, including greater economic, political and currency fluctuation risks, which may be even greater in emerging markets. Foreign countries may have different accounting standards than US standards.
The Fund can invest a significant percentage of assets in foreign securities and the value of the fund shares can be adversely affected by changes in currency exchange rates, political, and economic developments. In emerging markets these risks can be significant. The Fund is subject to currency risk, which is the risk that fluctuations in exchange rates between the US dollar and foreign currencies may cause the value of a Fund’s investments to decline. Fund shares should be viewed as a long-term investment.
6
FUND AND MANAGER REVIEW
Loomis Sayles Tax-Managed Equity Fund

Mark Shank, CFA, CIC
Manager since June 2003

David Sowerby, CFA
Manager since August 2005
FUND FACTS
Symbol | LSCGX
Objective | Long-term capital growth
Strategy | Invests at least 80% of net assets (plus any borrowings made for investment purposes) in equity securities and may invest in companies of any size; the Fund uses a tax-managed approach in an effort to minimize the effect of US federal income tax
Fund Inception Date | 10/1/95
Fund Registration Date | 3/7/97
Total Net Assets | $6.5 million
PORTFOLIO REVIEW
The Fund outperformed its Benchmark, the S&P 500 Index, for the six months ended March 31, 2008, primarily due to stock selection and an underweight in the financials sector, which was the worst-performing sector for the period. For example, our positions in Aflac and State Street were both up significantly, while the Benchmark financials fell sharply. In addition, our stock selection in the energy and consumer discretionary sectors helped performance, while our underweights in consumer staples and utilities, which outperformed during the period, modestly detracted from relative results.
On an absolute basis, consumer staples and energy were the only sectors that generated a positive total return for the Fund. In the consumer staples sector, Alberto-Culver and Colgate-Palmolive both appreciated significantly, while the S&P 500 Index’s consumer staples sector only managed a small gain. Alberto-Culver specializes in personal care products and manufactures such brand names as Tresemme and Nexxus. The company’s operating profit margins have improved due to double-digit revenue growth and cost savings from more efficient manufacturing operations. Colgate-Palmolive, which has been a steady wealth creator, was added to the Fund in the fourth quarter at what appeared to be an attractive valuation relative to other consumer staples companies. In the energy sector, Devon Energy and Transocean were among our best performers. Devon Energy explores and produces oil and gas and has recently witnessed a favorable acceleration in earnings. Devon has been a Fund holding for over seven years. The world’s largest offshore drilling contractor, Transocean last year merged with another drilling company, Global Santa Fe.
The information technology, industrials and financials sectors—the Fund’s largest sector weights—had the greatest negative impact on absolute return. Within information technology, Cisco Systems was among the Fund’s worst performers, declining on concerns about worldwide economic growth. The company supplies such data networking products as routers for the internet. While Cisco detracted from performance for the period, the stock has been a positive contributor to investment returns following our increased allocation in early 2006. We believe the stock remains attractive, so we took advantage of low prices to modestly add to our position during the period. Overall, though, we reduced the Fund’s information technology weighting.
In the industrials sector, Boeing experienced delays in delivering its new aircraft, which resulted in a strong stock-price decline. Financial stocks faced a series of ongoing challenges primarily related to asset write-downs resulting from the subprime lending crisis, which led to disappointing performance. We reduced the Fund’s financial holdings by selling positions in Allstate, Citigroup and Zions, and by reducing positions in Goldman Sachs and State Street.
OUTLOOK
Although we expected some challenges as the market adjusted to the economic slowdown, the depth of the sell-off across nearly every sector was larger than we had anticipated. Turmoil in the credit markets led to fears about the financial system’s vulnerability, and this, coupled with growing inflationary pressures, fueled the
7
rise in volatility. Economic and market uncertainty is never pleasant, but the market has a long history of coping with it. The Federal Reserve has been working to support the economy and instill order and confidence in the financial markets.
Uncertainty and fear often create attractive buying opportunities, as emotion overcomes investors’ ability to evaluate fundamentals. We anticipate improvements in the equity markets during 2008. We believe pessimism is high, risk appetites are low, and concerns about corporate profit growth may be overstated. In our view, this suggests that valuations are attractive and the market is well-positioned for a recovery, if the fog of uncertainty begins to clear and investors return to looking at normalized earnings and cash-flow growth rates.
AVERAGE ANNUAL TOTAL RETURNS
Periods Ended March 31, 2008
| | | | | | | | | | | | | | | |
| 6 Months | | 1 Year | | | 5 Years | | | 10 Years | | | Since Registration(a)(b) | | | Since Inception(a)(b) | |
| Loomis Sayles Tax Managed Equity: Institutional | |
| -9.67% | | -1.61 | % | | 10.22 | % | | 7.01 | % | | 8.29 | % | | 9.27 | % |
| Return After Taxes on Distributions(c) | |
| -10.08 | | -2.05 | | | 9.93 | | | 4.28 | | | 5.59 | | | 6.82 | |
| Return After Taxes on Distributions and Sale of Fund Shares(c) | |
| -6.12 | | -0.86 | | | 8.80 | | | 4.51 | | | 5.70 | | | 6.78 | |
| S&P 500 Index(c) | |
| -12.46 | | -5.08 | | | 11.32 | | | 3.50 | | | 6.47 | | | 8.57 | |
| Lipper Large-Cap Core Funds Index(c) | |
| -11.72 | | -4.32 | | | 10.04 | | | 2.87 | | | 5.70 | | | 7.43 | |
| Gross expense ratio (before reductions and reimbursements)* | |
| Institutional: 1.92% | | | | | | | |
| Net expense ratio (after reductions and reimbursements)* | |
| Institutional: 0.65% | | | | | | | |
* As stated in the most recent prospectus
CUMULATIVE PERFORMANCE
Registration to March 31, 2008(d)
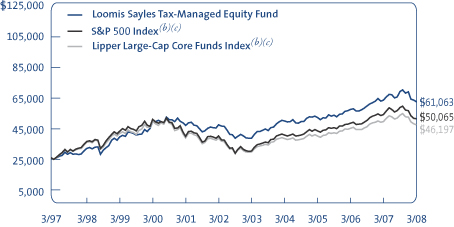
Inception to March 31, 2008(d)

Data quoted reflects past performance and cannot guarantee future results. Average annual total returns assume reinvestment of dividends and capital gains distributions. Investment return and principal value will fluctuate so that shares, when redeemed, may be worth more or less than their original cost. For performance current to the most recent month end, please visit the Loomis Sayles website. Current performance may be higher or lower than quoted.
Performance data reflects certain fee reductions and reimbursements, if any, without which performance would be lower. Except as indicated in the table above, returns do not reflect the taxes that a shareholder would pay on fund distributions or the redemption of shares.
After-tax returns are calculated using the historical highest individual federal marginal income tax rates and do not reflect the impact of state and local taxes. Actual after-tax returns depend on an investor’s tax situation and may differ from those shown. After-tax returns shown are not relevant to investors who hold their shares through tax-deferred arrangements, such as 401(k) plans, qualified plans, education savings accounts or individual retirement accounts. Under certain circumstances, the addition of the tax benefits from capital losses resulting from redemptions may cause the Return After Taxes on Distributions and Sale of Fund Shares to be greater than the Return After Taxes on Distributions or even the Return Before Taxes.
(a) Shares of the Fund were registered for offer under the Securities Act of 1933 on March 7, 1997. In accordance with regulations, performance information is provided for the period beginning on March 7, 1997 (“Registration”). Performance from inception is also provided for the convenience of our shareholders. (b) Index performance is not available coincident with the Fund’s inception and registration dates; comparative performance is presented from the month end closest to the Fund’s inception and registration dates. (c) See page 9 for a description of the Indices and disclosure related to after-tax returns. (d) The mountain chart is based on the Fund’s initial minimum investment of $25,000.
WHAT YOU SHOULD KNOW
Growth funds involve increased risks, in part, because the value of the underlying securities is based on future expectations that may or may not be met. The Fund can invest a significant percentage of assets in foreign securities and the value of the Fund shares can be adversely affected by changes in currency exchange rates, political, and economic developments. In emerging markets these risks can be significant. The Fund is subject to currency risk, which is the risk that fluctuations in exchange rates between the US dollar and foreign currencies may cause the value of a Fund’s investments to decline. Fund shares should be viewed as a long-term investment.
8
ADDITIONAL INFORMATION
Index Definitions
Indexes are unmanaged and do not have expenses that affect results, unlike mutual funds. Index returns are adjusted for the reinvestment of capital gain distributions and income dividends. It is not possible to invest directly in an index.
Lipper Mid-Cap Growth Funds Index is an equally weighted index of typically the 30 largest mutual funds within the mid-cap growth funds investment objective.
Lipper Large-Cap Core Funds Index is an equally weighted index of typically the 30 largest mutual funds within the large-cap core funds investment objective.
Lipper Small-Cap Core Funds Index is an equally weighted index of typically the 30 largest mutual funds within the small-cap core funds investment objective.
Lipper Small-Cap Growth Funds Index is an equally weighted index of typically the 30 largest mutual funds within the small-cap growth funds investment objective.
Source: Lipper, Inc.
Russell Midcap Growth Index is a market capitalization weighted index of medium capitalization stocks determined by Russell to be growth stocks as measured by their price-to-book ratios and forecasted growth values. The stocks are also members of the Russell 1000 Growth Index.
Russell 2000 Growth Index is an index comprised of those Russell 2000 companies with higher price-to-book ratios and higher forecasted growth values.
Russell 2000 Index is an index comprised of the 2,000 smallest companies in the Russell 3000 Index (a broad market index), representing approximately 8% of the Russell 3000 total market capitalization.
Russell 2000 Value Index is an index comprised of those Russell 2000 companies with lower price-to-book ratios and lower forecasted growth values.
S&P 500 Index consists of 500 stocks chosen for market size, liquidity, and industry group representation. A commonly used benchmark of US equity securities, it is a market-value weighted index (stock price times number of shares outstanding), with each stock’s weight in the index proportionate to its market value.
After-Tax Returns
After-tax returns are calculated using the historical highest individual federal marginal income tax rates and do not reflect the impact of state and local taxes. Actual after-tax returns depend on an investor’s tax situation and may differ from those shown. After-tax returns shown are not relevant to investors who hold their shares through tax-deferred arrangements, such as 401(k) plans, qualified plans, education savings accounts or individual retirement accounts. Under certain circumstances, the addition of the tax benefits from capital losses resulting from redemptions may cause the return after taxes on distributions and sale of fund shares to be greater than the return after taxes on distribution or even the return before taxes.
Proxy Voting Information
A description of the Funds’ proxy voting policies and procedures is available without charge, upon request, (i) by calling Loomis Sayles at 800-633-3330; (ii) on the Funds’ website, www.loomissayles.com, and (iii) on the SEC’s website, www.sec.gov. Information about how the Funds voted proxies relating to portfolio securities during the 12 months ended June 30, 2007 is available on (i) the Funds’ website and (ii) the SEC’s website.
Quarterly Portfolio Schedules
The Funds file a complete schedule of portfolio holdings with the SEC for the first and third quarters of each fiscal year on Form N-Q. The Funds’ Forms N-Q are available on the SEC’s website at www.sec.gov and may be reviewed and copied at the SEC’s Public Reference Room in Washington, DC. Information on the operation of the Public Reference Room may be obtained by calling 800-SEC-0330.
UNDERSTANDING YOUR FUND’S EXPENSES
As a mutual fund shareholder you incur two types of costs: (1) transaction costs, including redemption fees and certain exchange fees; and (2) ongoing costs, including management fees, distribution and/or service fees (12b-1 fees), and other Fund expenses. These costs are described in more detail in the Funds’ prospectus. The examples below are intended to help you understand the ongoing costs of investing in the Funds and help you compare these with the ongoing costs of investing in other mutual funds.
The first line in the table of each Fund shows the actual amount of Fund expenses you would have paid on a $1,000 investment in the Fund from October 1, 2007 through March 31, 2008. It also shows how much a $1,000 investment would be worth at the close of the period, assuming actual fund returns and expenses. To estimate the expenses you paid over the period, simply divide your account value by $1,000 (for example $8,600 account value divided by $1,000 = 8.6) and multiply the result by the number in the Expenses Paid During the Period column as shown below for your class.
The second line in the table of each Fund provides information about hypothetical account values and hypothetical expenses based on the Fund’s actual expense ratios and an assumed rate of return of 5% per year before expenses, which is not the Fund’s actual return. The hypothetical account values and expenses may not be used to estimate the actual ending account balance or expenses you paid on your investment for the period. You may use this information to compare the ongoing costs of investing in the Funds and other funds. To do so, compare this 5% hypothetical example with the 5% hypothetical examples that appear in the shareholder reports of other funds.
9
Please note that the expenses shown reflect ongoing costs only, and do not include any transaction costs. Therefore, the second line in the table is useful in comparing ongoing costs only, and will not help you determine the relative costs of owning different funds. If transaction costs were included, total costs would be higher.
Loomis Sayles Mid Cap Growth Fund
| | | | | | |
Institutional Class | | Beginning
Account Value
10/1/07 | | Ending
Account Value
3/31/08 | | Expenses Paid
During Period*
10/1/07 – 3/31/08 |
Actual | | $1,000.00 | | $ 922.60 | | $4.81 |
Hypothetical (5% return before expenses) | | $1,000.00 | | $1,020.00 | | $5.05 |
| | | |
Retail Class | | | | | | |
Actual | | $1,000.00 | | $ 921.40 | | $6.00 |
Hypothetical (5% return before expenses) | | $1,000.00 | | $1,018.75 | | $6.31 |
* Expenses are equal to the Fund’s annualized expense ratio (after fee reduction/reimbursement): 1.00% and 1.25% for the Institutional and Retail Class, respectively, multiplied by the average account value over the period, multiplied by 183/366 (to reflect the half-year period). |
Loomis Sayles Small Cap Growth Fund
| | | | | | |
Institutional Class | | Beginning
Account Value
10/1/07 | | Ending
Account Value
3/31/08 | | Expenses Paid
During Period*
10/1/07 – 3/31/08 |
Actual | | $1,000.00 | | $ 842.50 | | $4.61 |
Hypothetical (5% return before expenses) | | $1,000.00 | | $1,020.00 | | $5.05 |
| | | |
Retail Class | | | | | | |
Actual | | $1,000.00 | | $ 841.40 | | $5.75 |
Hypothetical (5% return before expenses) | | $1,000.00 | | $1,018.75 | | $6.31 |
* Expenses are equal to the Fund’s annualized expense ratio (after fee reduction/reimbursement): 1.00% and 1.25% for Institutional and Retail Class, respectively, multiplied by the average account value over the period, multiplied by 183/366 (to reflect the half-year period). |
Loomis Sayles Small Cap Value Fund
| | | | | | |
Institutional Class | | Beginning
Account Value
10/1/07 | | Ending
Account Value
3/31/08 | | Expenses Paid
During Period*
10/1/07 – 3/31/08 |
Actual | | $1,000.00 | | $ 862.60 | | $4.10 |
Hypothetical (5% return before expenses) | | $1,000.00 | | $1,020.60 | | $4.45 |
| | | |
Retail Class | | | | | | |
Actual | | $1,000.00 | | $ 861.50 | | $5.35 |
Hypothetical (5% return before expenses) | | $1,000.00 | | $1,019.25 | | $5.81 |
| | | |
Administrative Class | | | | | | |
Actual | | $1,000.00 | | $860.20 | | $6.51 |
Hypothetical (5% return before expenses) | | $1,000.00 | | $1,018.00 | | $7.06 |
* Expenses are equal to the Fund’s annualized expense ratio (after fee reduction/reimbursement) of 0.88%, 1.15% and 1.40% for the Institutional Class, Retail and Admin Class, respectively, multiplied by the average account value over the period, multiplied by 183/366 (to reflect the half-year period). |
Loomis Sayles Taxed-Managed Equity Fund
| | | | | | |
Institutional Class | | Beginning
Account Value
10/1/07 | | Ending
Account Value
3/31/08 | | Expenses Paid
During Period*
10/1/07 – 3/31/08 |
Actual | | $1,000.00 | | $ 903.30 | | $3.09 |
Hypothetical (5% return before expenses) | | $1,000.00 | | $1,021.75 | | $3.29 |
* Expenses are equal to the Fund’s annualized expense ratio (after fee reduction/reimbursement) of 0.65%, multiplied by the average account value over the period, multiplied by 183/366 (to reflect the half-year period). |
10
PORTFOLIO OF INVESTMENTS – as of March 31, 2008 (Unaudited)
Loomis Sayles Mid Cap Growth Fund
| | | | | | | |
| | | | | Shares | | Value (†) |
| | | | | | | |
| | | |
| COMMON STOCKS – 93.6% of Net Assets | | | | | | | |
| | | |
| Beverages – 1.6% | | | | | | | |
Central European Distribution Corp.(b)(c) | | | | 34,080 | | $ | 1,983,115 |
| | | | | | | |
| Biotechnology – 2.5% | | | | | | | |
BioMarin Pharmaceutical, Inc.(b)(c) | | | | 36,708 | | | 1,298,362 |
Genzyme Corp.(b)(c) | | | | 24,136 | | | 1,799,097 |
| | | | | | | |
| | | | | | | 3,097,459 |
| | | | | | | |
| Capital Markets – 4.3% | | | | | | | |
BlackRock, Inc.(b) | | | | 14,547 | | | 2,970,207 |
Waddell & Reed Financial, Inc.(b) | | | | 70,878 | | | 2,277,310 |
| | | | | | | |
| | | | | | | 5,247,517 |
| | | | | | | |
| Chemicals – 4.1% | | | | | | | |
CF Industries Holdings, Inc.(b) | | | | 19,448 | | | 2,015,202 |
Mosaic Co. (The)(c) | | | | 29,871 | | | 3,064,764 |
| | | | | | | |
| | | | | | | 5,079,966 |
| | | | | | | |
| Commercial Services & Supplies – 5.9% | | | | | | | |
Corrections Corp. of America(b)(c) | | | | 87,478 | | | 2,407,395 |
FTI Consulting, Inc.(b)(c) | | | | 26,533 | | | 1,884,904 |
Stericycle, Inc.(b)(c) | | | | 59,036 | | | 3,040,354 |
| | | | | | | |
| | | | | | | 7,332,653 |
| | | | | | | |
| Containers & Packaging – 1.6% | | | | | | | |
Crown Holdings, Inc.(c) | | | | 77,669 | | | 1,954,152 |
| | | | | | | |
| Distributors – 2.0% | | | | | | | |
LKQ Corp.(b)(c) | | | | 112,158 | | | 2,520,190 |
| | | | | | | |
| Diversified Financial Services – 3.8% | | | | | | | |
IntercontinentalExchange, Inc.(b)(c) | | | | 19,769 | | | 2,579,855 |
Nasdaq Stock Market, Inc.(b)(c) | | | | 54,309 | | | 2,099,586 |
| | | | | | | |
| | | | | | | 4,679,441 |
| | | | | | | |
| Electrical Equipment – 2.1% | | | | | | | |
First Solar, Inc.(b)(c) | | | | 11,246 | | | 2,599,401 |
| | | | | | | |
| Electronic Equipment & Instruments – 2.0% | | | | | | | |
Mettler-Toledo International, Inc.(c) | | | | 24,851 | | | 2,413,529 |
| | | | | | | |
| Energy Equipment & Services – 3.6% | | | | | | | |
Cameron International Corp.(b)(c) | | | | 46,104 | | | 1,919,770 |
Nabors Industries Ltd.(b)(c) | | | | 75,205 | | | 2,539,673 |
| | | | | | | |
| | | | | | | 4,459,443 |
| | | | | | | |
| Health Care Equipment & Supplies – 4.9% | | | | | | | |
Idexx Laboratories, Inc.(b)(c) | | | | 43,437 | | | 2,139,707 |
Intuitive Surgical, Inc.(b)(c) | | | | 12,066 | | | 3,913,607 |
| | | | | | | |
| | | | | | | 6,053,314 |
| | | | | | | |
| Hotels, Restaurants & Leisure – 3.9% | | | | | | | |
Ctrip.com International Ltd., ADR(b) | | | | 42,567 | | | 2,256,902 |
Yum! Brands, Inc.(b) | | | | 70,286 | | | 2,615,342 |
| | | | | | | |
| | | | | | | 4,872,244 |
| | | | | | | |
| Insurance – 1.4% | | | | | | | |
Fairfax Financial Holdings Ltd.(b) | | | | 5,923 | | | 1,700,493 |
| | | | | | | |
11
| | | | | | | |
| | | | | Shares | | Value (†) |
| | | | | | | |
| | | |
| COMMON STOCKS – continued | | | | | | | |
| | | |
| Internet & Catalog Retail – 3.1% | | | | | | | |
Priceline.com, Inc.(b)(c) | | | | 31,476 | | $ | 3,804,189 |
| | | | | | | |
| IT Services – 2.7% | | | | | | | |
MasterCard, Inc., Class A(b) | | | | 15,122 | | | 3,372,055 |
| | | | | | | |
| Life Sciences Tools & Services – 6.6% | | | | | | | |
Covance, Inc.(c) | | | | 27,667 | | | 2,295,531 |
Illumina, Inc.(b)(c) | | | | 46,561 | | | 3,533,980 |
Pharmaceutical Product Development, Inc. | | | | 56,683 | | | 2,375,018 |
| | | | | | | |
| | | | | | | 8,204,529 |
| | | | | | | |
| Machinery – 4.4% | | | | | | | |
AGCO Corp.(b)(c) | | | | 42,257 | | | 2,530,349 |
Flowserve Corp.(b) | | | | 27,306 | | | 2,850,201 |
| | | | | | | |
| | | | | | | 5,380,550 |
| | | | | | | |
| Marine – 1.6% | | | | | | | |
Genco Shipping & Trading Ltd.(b) | | | | 34,554 | | | 1,949,882 |
| | | | | | | |
| Metals & Mining – 5.6% | | | | | | | |
Agnico-Eagle Mines Ltd. | | | | 15,698 | | | 1,062,912 |
Kinross Gold Corp. | | | | 114,921 | | | 2,540,903 |
Steel Dynamics, Inc.(b) | | | | 101,274 | | | 3,346,093 |
| | | | | | | |
| | | | | | | 6,949,908 |
| | | | | | | |
| Oil, Gas & Consumable Fuels – 10.4% | | | | | | | |
Arena Resources, Inc.(b)(c) | | | | 50,568 | | | 1,957,487 |
Denbury Resources, Inc.(c) | | | | 94,020 | | | 2,684,271 |
Petrohawk Energy Corp.(c) | | | | 62,432 | | | 1,259,253 |
Range Resources Corp.(b) | | | | 55,995 | | | 3,552,883 |
Southwestern Energy Co.(b)(c) | | | | 98,830 | | | 3,329,583 |
| | | | | | | |
| | | | | | | 12,783,477 |
| | | | | | | |
| Semiconductors & Semiconductor Equipment – 3.0% | | | | | | | |
Intersil Corp., Class A(b) | | | | 73,972 | | | 1,898,861 |
MEMC Electronic Materials, Inc.(c) | | | | 25,199 | | | 1,786,609 |
| | | | | | | |
| | | | | | | 3,685,470 |
| | | | | | | |
| Software – 4.4% | | | | | | | |
Concur Technologies, Inc.(c) | | | | 36,683 | | | 1,139,007 |
Micros Systems, Inc.(b)(c) | | | | 68,330 | | | 2,299,988 |
Salesforce.com, Inc.(b)(c) | | | | 34,522 | | | 1,997,788 |
| | | | | | | |
| | | | | | | 5,436,783 |
| | | | | | | |
| Specialty Retail – 4.2% | | | | | | | |
TJX Cos., Inc.(b) | | | | 70,689 | | | 2,337,685 |
Urban Outfitters, Inc.(b)(c) | | | | 91,514 | | | 2,868,964 |
| | | | | | | |
| | | | | | | 5,206,649 |
| | | | | | | |
| Wireless Telecommunication Services – 3.9% | | | | | | | |
Millicom International Cellular SA(b)(c) | | | | 18,601 | | | 1,758,725 |
Turkcell Iletisim Hizmet AS, ADR | | | | 58,282 | | | 1,217,511 |
Vimpel-Communications, ADR | | | | 61,272 | | | 1,831,420 |
| | | | | | | |
| | | | | | | 4,807,656 |
| | | | | | | |
| | | |
| TOTAL COMMON STOCKS | | | | | | | |
(Identified Cost $109,720,584) | | | | | | | 115,574,065 |
| | | | | | | |
12
PORTFOLIO OF INVESTMENTS – as of March 31, 2008 (Unaudited)
Loomis Sayles Mid Cap Growth Fund – continued
| | | | | | | | |
| | | | | Shares/
Principal Amount | | Value (†) |
| | | | | | | | |
| | | |
| SHORT-TERM INVESTMENTS – 46.3% | | | | | | | | |
| State Street Navigator Securities Lending Prime Portfolio(d) | | | | | 49,772,699 | | $ | 49,772,699 |
| Tri-Party Repurchase Agreement with Fixed Income Clearing Corporation, dated 3/31/2008 at 1.250% to be repurchased at $7,369,256 on 4/01/2008 collateralized by $7,265,000 Federal National Mortgage Association, 5.020% due 11/21/2012 valued at $7,519,275, including accrued interest (Note 2g of Notes to Financial Statements) | | | | $ | 7,369,000 | | | 7,369,000 |
| | | | | | | | |
| | | |
| TOTAL SHORT-TERM INVESTMENTS | | | | | | | | |
(Identified Cost $57,141,699) | | | | | | | | 57,141,699 |
| | | | | | | | |
| | | |
| TOTAL INVESTMENTS – 139.9% | | | | | | | | |
(Identified Cost $166,862,283)(a) | | | | | | | $ | 172,715,764 |
Other assets less liabilities—(39.9)% | | | | | | | | (49,213,624) |
| | | | | | | | |
| | | |
| NET ASSETS – 100.0% | | | | | | | $ | 123,502,140 |
| | | | | | | | |
| |
(†) See Note 2a of Notes to Financial Statements. | | | |
(a) Federal Tax Information (Amounts exclude certain adjustments made at the end of the Fund’s fiscal year for tax purposes. Such adjustments are primarily due to wash sales.): | | | |
At March 31, 2008, the net unrealized appreciation on investments based on a cost of $166,862,283 for federal income tax purposes was as follows: | | | |
Aggregate gross unrealized appreciation for all investments in which there is an excess of value over tax cost | | $ | 8,919,935 |
Aggregate gross unrealized depreciation for all investments in which there is an excess of tax cost over value | | | (3,066,454) |
| | | | | | | | |
Net unrealized appreciation | | $ | 5,853,481 |
| | | | | | | | |
| (b) | All or a portion of this security was on loan to brokers at March 31, 2008. |
| (c) | Non-income producing security. |
| (d) | Represents investment of securities lending collateral. |
| ADR | An American Depositary Receipt is a certificate issued by a custodian bank representing the right to receive securities of the foreign issuer described. The values of ADRs are significantly influenced by trading on exchanges not located in the United States. |
HOLDINGS AT MARCH 31, 2008 AS A PERCENTAGE OF NET ASSETS (Unaudited)
| | | |
Oil, Gas & Consumable Fuels | | 10.4 | % |
Life Sciences Tools & Services | | 6.6 | |
Commercial Services & Supplies | | 5.9 | |
Metals & Mining | | 5.6 | |
Health Care Equipment & Supplies | | 4.9 | |
Software | | 4.4 | |
Machinery | | 4.4 | |
Capital Markets | | 4.3 | |
Specialty Retail | | 4.2 | |
Chemicals | | 4.1 | |
Hotels, Restaurants & Leisure | | 3.9 | |
Wireless Telecommunication Services | | 3.9 | |
Diversified Financial Services | | 3.8 | |
Energy Equipment & Services | | 3.6 | |
Internet & Catalog Retail | | 3.1 | |
Semiconductors & Semiconductor Equipment | | 3.0 | |
IT Services | | 2.7 | |
Biotechnology | | 2.5 | |
Electrical Equipment | | 2.1 | |
Distributors | | 2.0 | |
Electronic Equipment & Instruments | | 2.0 | |
Other, less than 2% each | | 6.2 | |
See accompanying notes to financial statements.
13
PORTFOLIO OF INVESTMENTS – as of March 31, 2008 (Unaudited)
Loomis Sayles Small Cap Growth Fund
| | | | | | | |
| | | | | Shares | | Value (†) |
| | | | | | | |
| | | |
| COMMON STOCKS – 97.4% of Net Assets | | | | | | | |
| | | |
| Aerospace & Defense – 3.1% | | | | | | | |
American Science & Engineering, Inc.(b) | | | | 18,201 | | $ | 993,229 |
Moog, Inc., Class A(b)(c) | | | | 35,487 | | | 1,497,906 |
Taser International, Inc.(b)(c) | | | | 78,806 | | | 740,776 |
| | | | | | | |
| | | | | | | 3,231,911 |
| | | | | | | |
| Biotechnology – 2.8% | | | | | | | |
BioMarin Pharmaceutical, Inc.(b)(c) | | | | 21,655 | | | 765,937 |
Indevus Pharmaceuticals, Inc.(b)(c) | | | | 130,240 | | | 621,245 |
Myriad Genetics, Inc.(b)(c) | | | | 16,305 | | | 656,928 |
United Therapeutics Corp.(c) | | | | 10,034 | | | 869,948 |
| | | | | | | |
| | | | | | | 2,914,058 |
| | | | | | | |
| Chemicals – 0.9% | | | | | | | |
Penford Corp.(b) | | | | 40,706 | | | 884,541 |
| | | | | | | |
| Commercial Banks – 1.3% | | | | | | | |
PrivateBankcorp, Inc.(b) | | | | 26,454 | | | 832,507 |
Westamerica Bancorporation | | | | 10,025 | | | 527,315 |
| | | | | | | |
| | | | | | | 1,359,822 |
| | | | | | | |
| Commercial Services & Supplies – 11.3% | | | | | | | |
Advisory Board Co.(b)(c) | | | | 25,870 | | | 1,421,298 |
FTI Consulting, Inc.(b)(c) | | | | 26,396 | | | 1,875,172 |
Geo Group, Inc. (The)(b)(c) | | | | 47,833 | | | 1,360,371 |
ICF International, Inc.(b)(c) | | | | 45,226 | | | 906,781 |
IHS, Inc., Class A(b)(c) | | | | 20,640 | | | 1,327,358 |
Innerworkings, Inc.(b)(c) | | | | 87,091 | | | 1,221,887 |
Interface, Inc., Class A(b) | | | | 55,208 | | | 775,672 |
Team, Inc.(b)(c) | | | | 40,037 | | | 1,093,010 |
Waste Connections, Inc.(b)(c) | | | | 52,923 | | | 1,626,853 |
| | | | | | | |
| | | | | | | 11,608,402 |
| | | | | | | |
| Communications Equipment – 1.3% | | | | | | | |
Foundry Networks, Inc.(b)(c) | | | | 75,449 | | | 873,699 |
Sonus Networks, Inc.(b)(c) | | | | 147,770 | | | 508,329 |
| | | | | | | |
| | | | | | | 1,382,028 |
| | | | | | | |
| Computers & Peripherals – 1.0% | | | | | | | |
Brocade Communications Systems, Inc.(b)(c) | | | | 137,585 | | | 1,004,371 |
| | | | | | | |
| Construction & Engineering – 1.7% | | | | | | | |
Northwest Pipe Co.(b)(c) | | | | 40,542 | | | 1,722,630 |
| | | | | | | |
| Distributors – 1.6% | | | | | | | |
LKQ Corp.(c) | | | | 73,535 | | | 1,652,331 |
| | | | | | | |
| Diversified Consumer Services – 4.8% | | | | | | | |
American Public Education, Inc.(c) | | | | 26,755 | | | 812,549 |
Bright Horizons Family Solutions, Inc.(b)(c) | | | | 22,076 | | | 950,151 |
Capella Education Co.(b)(c) | | | | 19,739 | | | 1,077,750 |
DeVry, Inc.(b) | | | | 23,457 | | | 981,441 |
INVESTools, Inc.(b)(c) | | | | 105,221 | | | 1,156,379 |
| | | | | | | |
| | | | | | | 4,978,270 |
| | | | | | | |
| Diversified Telecommunication Services – 2.0% | | | | | | | |
Cogent Communications Group, Inc.(b)(c) | | | | 50,663 | | | 927,640 |
NTELOS Holdings Corp. | | | | 48,632 | | | 1,176,894 |
| | | | | | | |
| | | | | | | 2,104,534 |
| | | | | | | |
14
PORTFOLIO OF INVESTMENTS – as of March 31, 2008 (Unaudited)
Loomis Sayles Small Cap Growth Fund – continued
| | | | | | | |
| | | | | Shares | | Value (†) |
| | | | | | | |
| | | |
| COMMON STOCKS – continued | | | | | | | |
| | | |
| Electric Utilities – 1.1% | | | | | | | |
ITC Holdings Corp.(b) | | | | 22,511 | | $ | 1,171,923 |
| | | | | | | |
| Electronic Equipment & Instruments – 0.9% | | | | | | | |
IPG Photonics Corp.(b)(c) | | | | 58,877 | | | 923,780 |
| | | | | | | |
| Energy Equipment & Services – 4.5% | | | | | | | |
Exterran Holdings, Inc.(b)(c) | | | | 16,744 | | | 1,080,658 |
Mitcham Industries, Inc.(b)(c) | | | | 53,292 | | | 949,664 |
T-3 Energy Services, Inc.(b)(c) | | | | 25,290 | | | 1,076,342 |
Tesco Corp.(b)(c) | | | | 29,858 | | | 715,099 |
Trico Marine Services, Inc.(b)(c) | | | | 20,775 | | | 809,602 |
| | | | | | | |
| | | | | | | 4,631,365 |
| | | | | | | |
| Health Care Equipment & Supplies – 7.2% | | | | | | | |
Conceptus, Inc.(b)(c) | | | | 52,110 | | | 967,162 |
Masimo Corp.(b)(c) | | | | 38,963 | | | 1,013,038 |
Meridian Bioscience, Inc.(b) | | | | 27,034 | | | 903,747 |
Natus Medical, Inc.(b)(c) | | | | 62,843 | | | 1,140,600 |
NuVasive, Inc.(b)(c) | | | | 31,566 | | | 1,089,343 |
Orthofix International NV(b)(c) | | | | 19,242 | | | 765,254 |
Quidel Corp.(b)(c) | | | | 47,639 | | | 765,082 |
SonoSite, Inc.(b)(c) | | | | 28,865 | | | 820,632 |
| | | | | | | |
| | | | | | | 7,464,858 |
| | | | | | | |
| Health Care Providers & Services – 7.4% | | | | | | | |
athenahealth, Inc.(c) | | | | 28,425 | | | 672,820 |
CardioNet, Inc.(c) | | | | 41,636 | | | 749,032 |
HealthExtras, Inc.(b)(c) | | | | 50,128 | | | 1,245,179 |
MWI Veterinary Supply, Inc.(b)(c) | | | | 26,305 | | | 927,514 |
Psychiatric Solutions, Inc.(b)(c) | | | | 43,699 | | | 1,482,270 |
RadNet, Inc.(b)(c) | | | | 143,266 | | | 1,008,593 |
Sun Healthcare Group, Inc.(b)(c) | | | | 117,603 | | | 1,545,303 |
| | | | | | | |
| | | | | | | 7,630,711 |
| | | | | | | |
| Health Care Technology – 1.7% | | | | | | | |
Phase Forward, Inc.(b)(c) | | | | 59,931 | | | 1,023,621 |
Trizetto Group(b)(c) | | | | 46,840 | | | 781,760 |
| | | | | | | |
| | | | | | | 1,805,381 |
| | | | | | | |
| Household Durables – 0.7% | | | | | | | |
Jarden Corp.(b)(c) | | | | 32,425 | | | 704,920 |
| | | | | | | |
| Insurance – 3.5% | | | | | | | |
AmTrust Financial Services, Inc. | | | | 25,367 | | | 411,199 |
Arch Capital Group Ltd.(c) | | | | 18,238 | | | 1,252,403 |
eHealth, Inc.(b)(c) | | | | 43,183 | | | 953,049 |
Navigators Group, Inc.(c) | | | | 9,597 | | | 522,077 |
ProAssurance Corp.(b)(c) | | | | 9,206 | | | 495,559 |
| | | | | | | |
| | | | | | | 3,634,287 |
| | | | | | | |
| Internet Software & Services – 3.7% | | | | | | | |
Ariba, Inc.(b)(c) | | | | 128,049 | | | 1,236,953 |
VistaPrint Ltd.(b)(c) | | | | 40,941 | | | 1,430,888 |
Vocus, Inc.(b)(c) | | | | 43,022 | | | 1,135,781 |
| | | | | | | |
| | | | | | | 3,803,622 |
| | | | | | | |
15
| | | | | | | |
| | | | | Shares | | Value (†) |
| | | | | | | |
| | | |
| COMMON STOCKS – continued | | | | | | | |
| | | |
| IT Services – 1.4% | | | | | | | |
Information Services Group, Inc.(b)(c) | | | | 95,105 | | $ | 490,742 |
Syntel, Inc.(b) | | | | 35,021 | | | 933,309 |
| | | | | | | |
| | | | | | | 1,424,051 |
| | | | | | | |
| Life Sciences Tools & Services – 3.6% | | | | | | | |
Exelixis, Inc.(b)(c) | | | | 85,166 | | | 591,904 |
Icon PLC, Sponsored ADR(b)(c) | | | | 17,285 | | | 1,121,624 |
Parexel International Corp.(b)(c) | | | | 44,799 | | | 1,169,254 |
Third Wave Technologies(b)(c) | | | | 90,038 | | | 830,150 |
| | | | | | | |
| | | | | | | 3,712,932 |
| | | | | | | |
| Machinery – 3.2% | | | | | | | |
Kadant, Inc.(c) | | | | 49,238 | | | 1,446,612 |
Middleby Corp.(b)(c) | | | | 12,076 | | | 753,422 |
RBC Bearings, Inc.(b)(c) | | | | 29,870 | | | 1,109,073 |
| | | | | | | |
| | | | | | | 3,309,107 |
| | | | | | | |
| Media – 3.1% | | | | | | | |
DG FastChannel, Inc.(b)(c) | | | | 53,746 | | | 1,030,849 |
Knology, Inc.(b)(c) | | | | 80,677 | | | 1,044,767 |
Morningstar, Inc.(b)(c) | | | | 17,875 | | | 1,096,631 |
| | | | | | | |
| | | | | | | 3,172,247 |
| | | | | | | |
| Oil, Gas & Consumable Fuels – 4.3% | | | | | | | |
Arena Resources, Inc.(c) | | | | 22,682 | | | 878,020 |
Carrizo Oil & Gas, Inc.(b)(c) | | | | 15,666 | | | 928,524 |
Petrohawk Energy Corp.(b)(c) | | | | 44,526 | | | 898,089 |
Petroleum Development Corp.(b)(c) | | | | 13,965 | | | 967,356 |
TXCO Resources, Inc.(b)(c) | | | | 60,383 | | | 747,542 |
| | | | | | | |
| | | | | | | 4,419,531 |
| | | | | | | |
| Personal Products – 0.9% | | | | | | | |
Bare Escentuals, Inc.(b)(c) | | | | 38,096 | | | 892,208 |
| | | | | | | |
| Pharmaceuticals – 0.8% | | | | | | | |
K-V Pharmaceutical Co.(b)(c) | | | | 31,351 | | | 782,521 |
| | | | | | | |
| Semiconductors & Semiconductor Equipment – 3.4% | | | | | | | |
ATMI, Inc.(b)(c) | | | | 39,189 | | | 1,090,630 |
Cavium Network, Inc.(b)(c) | | | | 53,397 | | | 875,711 |
Netlogic Microsystems, Inc.(b)(c) | | | | 40,258 | | | 971,828 |
Varian Semiconductor Equipment Associates, Inc.(c) | | | | 18,666 | | | 525,448 |
| | | | | | | |
| | | | | | | 3,463,617 |
| | | | | | | |
| Software – 8.8% | | | | | | | |
Blackbaud, Inc.(b) | | | | 50,104 | | | 1,216,525 |
Blackboard, Inc.(c) | | | | 37,830 | | | 1,260,874 |
BladeLogic, Inc.(b)(c) | | | | 34,677 | | | 972,690 |
Informatica Corp.(b)(c) | | | | 83,128 | | | 1,418,164 |
Solera Holdings, Inc.(c) | | | | 33,588 | | | 818,204 |
Taleo Corp., Class A(b)(c) | | | | 35,163 | | | 682,162 |
Tyler Technologies, Inc.(b)(c) | | | | 103,180 | | | 1,442,456 |
Ultimate Software Group, Inc.(b)(c) | | | | 40,538 | | | 1,218,572 |
| | | | | | | |
| | | | | | | 9,029,647 |
| | | | | | | |
16
PORTFOLIO OF INVESTMENTS – as of March 31, 2008 (Unaudited)
Loomis Sayles Small Cap Growth Fund – continued
| | | | | | | | |
| | | | | Shares | | Value (†) |
| | | | | | | | |
| | | |
| COMMON STOCKS – continued | | | | | | | | |
| | | |
| Specialty Retail – 2.6% | | | | | | | | |
Aeropostale, Inc.(b)(c) | | | | | 29,940 | | $ | 811,673 |
Dick’s Sporting Goods, Inc.(b)(c) | | | | | 39,722 | | | 1,063,755 |
Gymboree Corp.(b)(c) | | | | | 20,593 | | | 821,249 |
| | | | | | | | |
| | | | | | | | 2,696,677 |
| | | | | | | | |
| Textiles, Apparel & Luxury Goods – 0.4% | | | | | | | | |
Movado Group, Inc.(b) | | | | | 22,245 | | | 433,555 |
| | | | | | | | |
| Trading Companies & Distributors – 1.0% | | | | | | | | |
Kaman Corp.(b) | | | | | 35,355 | | | 1,000,193 |
| | | | | | | | |
| Wireless Telecommunication Services – 1.4% | | | | | | | | |
SBA Communications Corp., Class A(b)(c) | | | | | 47,798 | | | 1,425,814 |
| | | | | | | | |
| | | |
| TOTAL COMMON STOCKS | | | | | | | | |
(Identified Cost $102,936,522) | | | | | | | | 100,375,845 |
| | | | | | | | |
| | | |
| | | | | Shares/
Principal Amount | | |
| | | |
| SHORT-TERM INVESTMENTS – 50.7% | | | | | | | | |
| State Street Navigator Securities Lending Prime Portfolio(d) | | | | | 50,220,457 | | | 50,220,457 |
| Tri-Party Repurchase Agreement with Fixed Income Clearing Corporation, dated 3/31/08 at 1.250% to be repurchased at $2,096,073 on 4/01/08 collateralized by $2,130,000 Federal Home Loan Mortgage Corp., 5.510% due 1/23/23 valued at $2,141,161 including accrued interest (Note 2g of Notes to Financial Statements) | | | | $ | 2,096,000 | | | 2,096,000 |
| | | | | | | | |
| | | |
| TOTAL SHORT-TERM INVESTMENTS | | | | | | | | |
(Identified Cost $52,316,457) | | | | | | | | 52,316,457 |
| | | | | | | | |
| | | |
| TOTAL INVESTMENTS – 148.1% | | | | | | | | |
(Identified Cost $155,252,979)(a) | | | | | | | | 152,692,302 |
Other assets less liabilities—(48.1)% | | | | | | | | (49,581,723) |
| | | | | | | | |
| | | |
| NET ASSETS – 100.0% | | | | | | | $ | 103,110,579 |
| | | | | | | | |
| |
(†) See Note 2a of Notes to Financial Statements. | | | |
(a) Federal Tax Information (Amounts exclude certain adjustments made at the end of the Fund’s fiscal year for tax purposes. Such adjustments are primarily due to wash sales.): | | | |
At March 31, 2008, the net unrealized depreciation on investments based on a cost of $155,252,979 for federal income tax purposes was as follows: | | | |
Aggregate gross unrealized appreciation for all investments in which there is an excess of value over tax cost | | $ | 3,002,601 |
Aggregate gross unrealized depreciation for all investments in which there is an excess of tax cost over value | | | (5,563,278) |
| | | | | | | | |
Net unrealized depreciation | | | | | $ | (2,560,677) |
| | | | | | | | |
| (b) | All or a portion of this security was on loan to brokers at March 31, 2008. |
| (c) | Non-income producing security. |
| (d) | Represents investment of securities lending collateral. |
ADR An American Depositary Receipt is a certificate issued by a custodian bank representing the right to receive securities of the foreign issuer described. The values of ADRs are significantly influenced by trading on exchanges not located in the United States.
17
HOLDINGS AT MARCH 31, 2008 AS A PERCENTAGE OF NET ASSETS (Unaudited)
| | | |
Commercial Services & Supplies | | 11.3 | % |
Software | | 8.8 | |
Health Care Providers & Services | | 7.4 | |
Health Care Equipment & Supplies | | 7.2 | |
Diversified Consumer Services | | 4.8 | |
Energy Equipment & Services | | 4.5 | |
Oil, Gas & Consumable Fuels | | 4.3 | |
Internet Software & Services | | 3.7 | |
Life Sciences Tools & Services | | 3.6 | |
Insurance | | 3.5 | |
Semiconductors & Semiconductor Equipment | | 3.4 | |
Machinery | | 3.2 | |
Aerospace & Defense | | 3.1 | |
Media | | 3.1 | |
Biotechnology | | 2.8 | |
Specialty Retail | | 2.6 | |
Diversified Telecommunication Services | | 2.0 | |
Other, less than 2% each | | 18.1 | |
See accompanying notes to financial statements.
18
PORTFOLIO OF INVESTMENTS – as of March 31, 2008 (Unaudited)
Loomis Sayles Small Cap Value Fund
| | | | | | | |
| | | | | Shares | | Value (†) |
| | | | | | | |
| | | |
| COMMON STOCKS – 93.2% of Net Assets | | | | | | | |
| | | |
| Aerospace & Defense – 3.6% | | | | | | | |
AAR Corp.(b)(c) | | | | 132,450 | | $ | 3,611,912 |
BE Aerospace, Inc.(c) | | | | 163,519 | | | 5,714,989 |
Ducommun, Inc.(c) | | | | 181,638 | | | 5,025,923 |
Moog, Inc., Class A(c) | | | | 255,144 | | | 10,769,628 |
Teledyne Technologies, Inc.(c) | | | | 243,109 | | | 11,426,123 |
| | | | | | | |
| | | | | | | 36,548,575 |
| | | | | | | |
| Air Freight & Logistics – 0.8% | | | | | | | |
Hub Group, Inc., Class A(c) | | | | 229,667 | | | 7,553,748 |
| | | | | | | |
| Auto Components – 0.6% | | | | | | | |
Drew Industries, Inc.(b)(c) | | | | 46,020 | | | 1,125,649 |
Gentex Corp.(b) | | | | 298,422 | | | 5,117,938 |
| | | | | | | |
| | | | | | | 6,243,587 |
| | | | | | | |
| Automobiles – 0.2% | | | | | | | |
Winnebago Industries, Inc.(b) | | | | 119,847 | | | 2,025,414 |
| | | | | | | |
| Building Products – 0.7% | | | | | | | |
Armstrong World Industries, Inc. | | | | 205,788 | | | 7,338,400 |
| | | | | | | |
| Capital Markets – 1.8% | | | | | | | |
Investment Technology Group, Inc.(c) | | | | 166,685 | | | 7,697,513 |
JMP Group, Inc.(b) | | | | 356,233 | | | 2,493,631 |
Stifel Financial Corp.(b)(c) | | | | 166,015 | | | 7,454,074 |
| | | | | | | |
| | | | | | | 17,645,218 |
| | | | | | | |
| Chemicals – 2.7% | | | | | | | |
Cytec Industries, Inc. | | | | 99,270 | | | 5,345,689 |
FMC Corp. | | | | 143,416 | | | 7,958,154 |
Minerals Technologies, Inc.(b) | | | | 96,191 | | | 6,040,795 |
Scotts Miracle-Gro Co., Class A | | | | 142,935 | | | 4,633,953 |
Zep, Inc.(b) | | | | 167,579 | | | 2,718,131 |
| | | | | | | |
| | | | | | | 26,696,722 |
| | | | | | | |
| Commercial Banks – 6.0% | | | | | | | |
Bank of the Ozarks, Inc.(b) | | | | 195,451 | | | 4,671,279 |
CVB Financial Corp.(b) | | | | 452,459 | | | 4,710,098 |
East West Bancorp, Inc.(b) | | | | 355,616 | | | 6,312,184 |
First State Bancorporation(b) | | | | 310,157 | | | 4,153,002 |
Hancock Holding Co.(b) | | | | 199,734 | | | 8,392,823 |
IBERIABANK Corp.(b) | | | | 110,759 | | | 4,901,086 |
Old National Bancorp.(b) | | | | 196,430 | | | 3,535,740 |
Pennsylvania Commerce Bancorp, Inc.(b)(c) | | | | 105,394 | | | 2,766,592 |
Prosperity Bancshares, Inc.(b) | | | | 245,189 | | | 7,027,117 |
Signature Bank(b)(c) | | | | 145,458 | | | 3,709,179 |
Sterling Bancshares, Inc.(b) | | | | 722,735 | | | 7,183,986 |
United Community Banks, Inc.(b) | | | | 205,643 | | | 3,491,818 |
| | | | | | | |
| | | | | | | 60,854,904 |
| | | | | | | |
| Commercial Services & Supplies – 6.4% | | | | | | | |
ABM Industries, Inc. | | | | 345,259 | | | 7,747,612 |
American Ecology Corp. | | | | 215,698 | | | 5,463,630 |
Geo Group, Inc. (The)(b)(c) | | | | 259,868 | | | 7,390,646 |
McGrath Rentcorp(b) | | | | 302,894 | | | 7,302,774 |
PHH Corp.(c) | | | | 170,632 | | | 2,974,116 |
Rollins, Inc. | | | | 823,475 | | | 14,567,273 |
19
| | | | | | | |
| | | | | Shares | | Value (†) |
| | | | | | | |
| | | |
| COMMON STOCKS – continued | | | | | | | |
| | | |
| Commercial Services & Supplies – continued | | | | | | | |
Standard Parking Corp.(b)(c) | | | | 481,547 | | $ | 10,093,225 |
Waste Connections, Inc.(c) | | | | 302,690 | | | 9,304,691 |
| | | | | | | |
| | | | | | | 64,843,967 |
| | | | | | | |
| Communications Equipment – 2.5% | | | | | | | |
ADTRAN, Inc. | | | | 350,473 | | | 6,483,750 |
Anaren, Inc.(b)(c) | | | | 316,301 | | | 4,004,371 |
Black Box Corp. | | | | 112,911 | | | 3,483,304 |
CommScope, Inc.(b)(c) | | | | 74,336 | | | 2,589,123 |
Harris Stratex Networks, Inc., Class A(b)(c) | | | | 223,458 | | | 2,241,284 |
Tekelec(b)(c) | | | | 527,089 | | | 6,562,258 |
| | | | | | | |
| | | | | | | 25,364,090 |
| | | | | | | |
| Computers & Peripherals – 0.5% | | | | | | | |
Emulex Corp.(c) | | | | 315,984 | | | 5,131,580 |
| | | | | | | |
| Construction & Engineering – 0.4% | | | | | | | |
Granite Construction, Inc.(b) | | | | 83,247 | | | 2,723,009 |
Michael Baker Corp.(c) | | | | 69,561 | | | 1,562,340 |
| | | | | | | |
| | | | | | | 4,285,349 |
| | | | | | | |
| Construction Materials – 0.6% | | | | | | | |
Texas Industries, Inc.(b) | | | | 101,723 | | | 6,114,570 |
| | | | | | | |
| Consumer Finance – 1.0% | | | | | | | |
Dollar Financial Corp.(b)(c) | | | | 307,638 | | | 7,075,674 |
First Cash Financial Services, Inc.(b)(c) | | | | 285,707 | | | 2,951,353 |
| | | | | | | |
| | | | | | | 10,027,027 |
| | | | | | | |
| Containers & Packaging – 1.4% | | | | | | | |
Greif, Inc. | | | | 66,346 | | | 4,506,884 |
Myers Industries, Inc.(b) | | | | 261,593 | | | 3,434,716 |
Rock-Tenn Co., Class A | | | | 205,117 | | | 6,147,356 |
| | | | | | | |
| | | | | | | 14,088,956 |
| | | | | | | |
| Distributors – 0.2% | | | | | | | |
Core-Mark Holding Co., Inc.(b)(c) | | | | 57,420 | | | 1,650,251 |
| | | | | | | |
| Diversified Consumer Services – 0.6% | | | | | | | |
INVESTools, Inc.(b)(c) | | | | 408,757 | | | 4,492,240 |
Jackson Hewitt Tax Service, Inc.(b) | | | | 122,022 | | | 1,399,592 |
| | | | | | | |
| | | | | | | 5,891,832 |
| | | | | | | |
| Electric Utilities – 1.8% | | | | | | | |
ALLETE, Inc.(b) | | | | 169,935 | | | 6,562,889 |
ITC Holdings Corp.(b) | | | | 122,562 | | | 6,380,578 |
Portland General Electric Co. | | | | 230,716 | | | 5,202,646 |
| | | | | | | |
| | | | | | | 18,146,113 |
| | | | | | | |
| Electrical Equipment – 3.0% | | | | | | | |
Acuity Brands, Inc.(b) | | | | 137,851 | | | 5,920,700 |
Belden, Inc.(b) | | | | 69,862 | | | 2,467,526 |
General Cable Corp.(b)(c) | | | | 133,851 | | | 7,906,579 |
II-VI, Inc.(b)(c) | | | | 228,348 | | | 8,672,657 |
Polypore International, Inc.(b)(c) | | | | 242,680 | | | 5,021,049 |
| | | | | | | |
| | | | | | | 29,988,511 |
| | | | | | | |
20
PORTFOLIO OF INVESTMENTS – as of March 31, 2008 (Unaudited)
Loomis Sayles Small Cap Value Fund – continued
| | | | | | | |
| | | | | Shares | | Value (†) |
| | | | | | | |
| | | |
| COMMON STOCKS – continued | | | | | | | |
| | | |
| Electronic Equipment & Instruments – 3.9% | | | | | | | |
Agilysys, Inc.(b) | | | | 246,591 | | $ | 2,860,456 |
Anixter International, Inc.(b)(c) | | | | 72,597 | | | 4,649,112 |
Excel Technology, Inc.(c) | | | | 161,670 | | | 4,358,623 |
Littelfuse, Inc.(c) | | | | 330,808 | | | 11,568,356 |
Plexus Corp.(c) | | | | 154,220 | | | 4,325,871 |
Rofin-Sinar Technologies, Inc.(c) | | | | 118,661 | | | 5,327,879 |
Vishay Intertechnology, Inc.(c) | | | | 514,017 | | | 4,656,994 |
X-Rite, Inc.(b)(c) | | | | 244,088 | | | 1,457,205 |
| | | | | | | |
| | | | | | | 39,204,496 |
| | | | | | | |
| Energy Equipment & Services – 2.6% | | | | | | | |
Dresser-Rand Group, Inc.(c) | | | | 207,410 | | | 6,377,858 |
Exterran Holdings, Inc.(b)(c) | | | | 77,026 | | | 4,971,258 |
Helix Energy Solutions Group, Inc.(c) | | | �� | 130,358 | | | 4,106,277 |
Oceaneering International, Inc.(c) | | | | 117,421 | | | 7,397,523 |
TETRA Technologies, Inc.(b)(c) | | | | 185,237 | | | 2,934,154 |
| | | | | | | |
| | | | | | | 25,787,070 |
| | | | | | | |
| Food & Staples Retailing – 1.3% | | | | | | | |
Casey’s General Stores, Inc.(b) | | | | 231,251 | | | 5,226,273 |
Spartan Stores, Inc.(b) | | | | 388,250 | | | 8,095,012 |
| | | | | | | |
| | | | | | | 13,321,285 |
| | | | | | | |
| Food Products – 1.2% | | | | | | | |
J & J Snack Foods Corp. | | | | 142,510 | | | 3,914,750 |
Ralcorp Holdings, Inc.(b)(c) | | | | 141,367 | | | 8,220,491 |
| | | | | | | |
| | | | | | | 12,135,241 |
| | | | | | | |
| Gas Utilities – 1.4% | | | | | | | |
UGI Corp. | | | | 552,790 | | | 13,775,527 |
| | | | | | | |
| Health Care Equipment & Supplies – 1.3% | | | | | | | |
Orthofix International NV(c) | | | | 121,813 | | | 4,844,503 |
West Pharmaceutical Services, Inc.(b) | | | | 194,888 | | | 8,619,896 |
| | | | | | | |
| | | | | | | 13,464,399 |
| | | | | | | |
| Health Care Providers & Services – 3.2% | | | | | | | |
Amedisys, Inc.(b)(c) | | | | 153,931 | | | 6,055,645 |
CorVel Corp.(c) | | | | 208,162 | | | 6,367,676 |
Healthspring, Inc.(c) | | | | 182,675 | | | 2,572,064 |
inVentiv Health, Inc.(c) | | | | 263,574 | | | 7,593,567 |
MWI Veterinary Supply, Inc.(b)(c) | | | | 120,394 | | | 4,245,092 |
Skilled Healthcare Group, Inc., Class A(b)(c) | | | | 476,366 | | | 5,230,499 |
| | | | | | | |
| | | | | | | 32,064,543 |
| | | | | | | |
| Hotels, Restaurants & Leisure – 1.7% | | | | | | | |
Bob Evans Farms, Inc.(b) | | | | 213,375 | | | 5,887,016 |
CEC Entertainment, Inc.(c) | | | | 259,820 | | | 7,503,602 |
Cosi, Inc.(b)(c) | | | | 1,391,575 | | | 3,993,820 |
| | | | | | | |
| | | | | | | 17,384,438 |
| | | | | | | |
| Industrial Conglomerates – 0.9% | | | | | | | |
Teleflex, Inc. | | | | 128,379 | | | 6,124,962 |
Walter Industries, Inc. | | | | 43,550 | | | 2,727,537 |
| | | | | | | |
| | | | | | | 8,852,499 |
| | | | | | | |
21
| | | | | | | |
| | | | | Shares | | Value (†) |
| | | | | | | |
| | | |
| COMMON STOCKS – continued | | | | | | | |
| | | |
| Insurance – 4.8% | | | | | | | |
American Equity Investment Life Holding Co.(b) | | | | 555,085 | | $ | 5,151,189 |
American Physicians Capital, Inc. | | | | 96,826 | | | 4,488,853 |
Delphi Financial Group, Inc. | | | | 210,969 | | | 6,166,624 |
Employers Holdings, Inc. | | | | 336,817 | | | 6,244,587 |
First Mercury Financial Corp.(c) | | | | 94,334 | | | 1,642,355 |
Midland Co. (The)(b) | | | | 124,506 | | | 8,084,175 |
Navigators Group, Inc.(c) | | | | 103,178 | | | 5,612,883 |
ProAssurance Corp.(b)(c) | | | | 96,672 | | | 5,203,854 |
RLI Corp.(b) | | | | 120,788 | | | 5,987,461 |
| | | | | | | |
| | | | | | | 48,581,981 |
| | | | | | | |
| Internet Software & Services – 0.4% | | | | | | | |
United Online, Inc.(b) | | | | 418,576 | | | 4,420,163 |
| | | | | | | |
| IT Services – 3.7% | | | | | | | |
Alliance Data Systems Corp.(c) | | | | 209,706 | | | 9,963,132 |
Broadridge Financial Solutions, Inc. | | | | 512,615 | | | 9,022,024 |
Perot Systems Corp., Class A(c) | | | | 410,651 | | | 6,176,191 |
Wright Express Corp.(c) | | | | 408,653 | | | 12,557,907 |
| | | | | | | |
| | | | | | | 37,719,254 |
| | | | | | | |
| Leisure Equipment & Products – 0.5% | | | | | | | |
Steinway Musical Instruments, Inc.(b)(c) | | | | 158,470 | | | 4,519,564 |
| | | | | | | |
| Life Sciences Tools & Services – 0.7% | | | | | | | |
PerkinElmer, Inc. | | | | 280,637 | | | 6,805,447 |
| | | | | | | |
| Machinery – 4.7% | | | | | | | |
Actuant Corp., Class A(b) | | | | 332,237 | | | 10,036,880 |
CLARCOR, Inc.(b) | | | | 145,721 | | | 5,180,382 |
Commercial Vehicle Group, Inc.(b)(c) | | | | 210,155 | | | 2,082,636 |
ESCO Technologies, Inc.(b)(c) | | | | 121,429 | | | 4,823,160 |
Harsco Corp. | | | | 135,666 | | | 7,513,183 |
Nordson Corp.(b) | | | | 59,559 | | | 3,207,252 |
RBC Bearings, Inc.(c) | | | | 195,392 | | | 7,254,905 |
Wabtec Corp. | | | | 179,423 | | | 6,757,070 |
| | | | | | | |
| | | | | | | 46,855,468 |
| | | | | | | |
| Media – 3.0% | | | | | | | |
A H Belo Corp., Class A(b) | | | | 323,897 | | | 3,702,143 |
Alloy, Inc.(c) | | | | 231,904 | | | 1,704,494 |
Belo Corp., Class A | | | | 298,257 | | | 3,152,576 |
Interactive Data Corp. | | | | 342,107 | | | 9,739,786 |
John Wiley & Sons, Inc., Class A | | | | 296,265 | | | 11,761,721 |
| | | | | | | |
| | | | | | | 30,060,720 |
| | | | | | | |
| Metals & Mining – 1.2% | | | | | | | |
Haynes International, Inc.(b)(c) | | | | 54,118 | | | 2,969,996 |
Reliance Steel & Aluminum Co.(b) | | | | 159,568 | | | 9,551,740 |
| | | | | | | |
| | | | | | | 12,521,736 |
| | | | | | | |
| Multi-Utilities & Unregulated Power – 0.4% | | | | | | | |
NorthWestern Corp. | | | | 170,590 | | | 4,157,278 |
| | | | | | | |
| Multiline Retail – 0.4% | | | | | | | |
Dollar Tree Stores, Inc.(c) | | | | 157,223 | | | 4,337,783 |
| | | | | | | |
22
PORTFOLIO OF INVESTMENTS – as of March 31, 2008 (Unaudited)
Loomis Sayles Small Cap Value Fund – continued
| | | | | | | |
| | | | | Shares | | Value (†) |
| | | | | | | |
| | | |
| COMMON STOCKS – continued | | | | | | | |
| | | |
| Oil, Gas & Consumable Fuels – 2.9% | | | | | | | |
Mariner Energy, Inc.(b)(c) | | | | 285,875 | | $ | 7,721,484 |
Parallel Petroleum Corp.(b)(c) | | | | 366,057 | | | 7,163,736 |
Penn Virginia Corp. | | | | 223,748 | | | 9,865,049 |
St. Mary Land & Exploration Co. | | | | 114,504 | | | 4,408,404 |
| | | | | | | |
| | | | | | | 29,158,673 |
| | | | | | | |
| Personal Products – 1.2% | | | | | | | |
Alberto-Culver Co. | | | | 444,192 | | | 12,175,303 |
| | | | | | | |
| Pharmaceuticals – 1.6% | | | | | | | |
Perrigo Co. | | | | 230,454 | | | 8,695,029 |
Sciele Pharma, Inc.(b)(c) | | | | 374,419 | | | 7,301,171 |
| | | | | | | |
| | | | | | | 15,996,200 |
| | | | | | | |
| Real Estate Investment Trusts (REITs) – 2.5% | | | | | | | |
Capstead Mortgage Corp.(b) | | | | 247,432 | | | 2,820,725 |
Health Care REIT, Inc.(b) | | | | 149,267 | | | 6,736,420 |
Kite Realty Group Trust | | | | 389,506 | | | 5,453,084 |
MFA Mortgage Investments, Inc.(b) | | | | 488,148 | | | 3,075,332 |
Potlatch Corp. | | | | 177,994 | | | 7,345,812 |
| | | | | | | |
| | | | | | | 25,431,373 |
| | | | | | | |
| Real Estate Management & Development – 0.7% | | | | | | | |
Forestar Real Estate Group, Inc.(b)(c) | | | | 268,443 | | | 6,686,915 |
| | | | | | | |
| Road & Rail – 1.4% | | | | | | | |
Genesee & Wyoming, Inc., Class A(b)(c) | | | | 202,540 | | | 6,967,376 |
Ryder System, Inc.(b) | | | | 122,931 | | | 7,487,727 |
| | | | | | | |
| | | | | | | 14,455,103 |
| | | | | | | |
| Semiconductors & Semiconductor Equipment – 2.0% | | | | | | | |
Cohu, Inc.(b) | | | | 275,771 | | | 4,481,279 |
Exar Corp.(b)(c) | | | | 411,801 | | | 3,389,122 |
Fairchild Semiconductor International, Inc., Class A(c) | | | | 380,475 | | | 4,535,262 |
Verigy Ltd.(c) | | | | 407,870 | | | 7,684,271 |
| | | | | | | |
| | | | | | | 20,089,934 |
| | | | | | | |
| Software – 3.0% | | | | | | | |
Epicor Software Corp.(b)(c) | | | | 349,079 | | | 3,909,685 |
Intervoice, Inc.(c) | | | | 598,351 | | | 4,762,874 |
Progress Software Corp.(c) | | | | 269,392 | | | 8,060,208 |
Quest Software, Inc.(b)(c) | | | | 172,926 | | | 2,260,143 |
Radiant Systems, Inc.(c) | | | | 368,295 | | | 5,145,081 |
Sybase, Inc.(c) | | | | 243,400 | | | 6,401,420 |
| | | | | | | |
| | | | | | | 30,539,411 |
| | | | | | | |
| Specialty Retail – 2.1% | | | | | | | |
Genesco, Inc.(b)(c) | | | | 181,941 | | | 4,204,656 |
Jo-Ann Stores, Inc.(b)(c) | | | | 151,104 | | | 2,225,762 |
Sally Beauty Holdings, Inc.(b)(c) | | | | 968,029 | | | 6,679,400 |
Sonic Automotive, Inc., Class A(b) | | | | 404,089 | | | 8,304,029 |
| | | | | | | |
| | | | | | | 21,413,847 |
| | | | | | | |
| Textiles, Apparel & Luxury Goods – 2.5% | | | | | | | |
Carter’s, Inc.(c) | | | | 250,422 | | | 4,044,315 |
FGX International Holdings Ltd.(c) | | | | 226,561 | | | 2,709,670 |
23
| | | | | | | | |
| | | | | Shares | | Value (†) |
| | | | | | | | |
| | | |
| COMMON STOCKS – continued | | | | | | | | |
| | | |
| Textiles, Apparel & Luxury Goods – continued | | | | | | | | |
Fossil, Inc.(b)(c) | | | | | 283,252 | | $ | 8,650,516 |
Hanesbrands, Inc.(b)(c) | | | | | 343,492 | | | 10,029,966 |
| | | | | | | | |
| | | | | | | | 25,434,467 |
| | | | | | | | |
| Thrifts & Mortgage Finance – 0.2% | | | | | | | | |
Westfield Financial, Inc. | | | | | 197,422 | | | 1,928,813 |
| | | | | | | | |
| Trading Companies & Distributors – 0.3% | | | | | | | | |
Genesis Lease Ltd., ADR | | | | | 226,882 | | | 3,301,133 |
| | | | | | | | |
| Water Utilities – 0.7% | | | | | | | | |
American States Water Co.(b) | | | | | 107,990 | | | 3,887,640 |
Middlesex Water Co. | | | | | 182,987 | | | 3,323,044 |
| | | | | | | | |
| | | | | | | | 7,210,684 |
| | | | | | | | |
| | | |
| TOTAL COMMON STOCKS | | | | | | | | |
(Identified Cost $910,883,519) | | | | | | | | 940,229,562 |
| | | | | | | | |
| | | |
| EXCHANGE TRADED FUND – 1.0% | | | | | | | | |
| | | |
| Diversified Financial Services – 1.0% | | | | | | | | |
iShares Russell 2000 Value Index Fund(b) | | | | | | | | |
(Identified Cost $10,705,095) | | | | | 148,664 | | | 9,747,899 |
| | | | | | | | |
| | | |
| | | | | Shares/
Principal Amount | | |
| | | |
| SHORT-TERM INVESTMENTS – 32.1% | | | | | | | | |
State Street Navigator Securities Lending Prime Portfolio(e) | | | | | 255,144,557 | | | 255,144,557 |
| San Paolo U.S. Financial, Commercial Paper, 1.000%, 4/1/2008(d) | | | | $ | 68,946,000 | | | 68,946,000 |
| | | | | | | | |
| | | |
| TOTAL SHORT-TERM INVESTMENTS | | | | | | | | |
(Identified Cost $324,090,557) | | | | | | | | 324,090,557 |
| | | | | | | | |
| | | |
| TOTAL INVESTMENTS – 126.3% | | | | | | | | |
(Identified Cost $1,245,679,171)(a) | | | | | | | | 1,274,068,018 |
Other assets less liabilities—(26.3)% | | | | | | | | (265,290,539) |
| | | | | | | | |
| | | |
| NET ASSETS – 100.0% | | | | | | | $ | 1,008,777,479 |
| | | | | | | | |
| |
(†) See Note 2a of Notes to Financial Statements. | | | |
(a) Federal Tax Information (Amounts exclude certain adjustments made at the end of the Fund’s fiscal year for tax purposes. Such adjustments are primarily due to wash sales.): | | | |
At March 31, 2008, the net unrealized appreciation on investments based on a cost of $1,246,145,209 for federal income tax purposes was as follows: | | | |
Aggregate gross unrealized appreciation for all investments in which there is an excess of value over tax cost | | $ | 106,698,557 |
Aggregate gross unrealized depreciation for all investments in which there is an excess of tax cost over value | | | (78,775,748) |
| | | | | | | | |
Net unrealized appreciation | | $ | 27,922,809 |
| | | | | | | | |
| (b) | All or a portion of this security was on loan to brokers at March 31, 2008. |
| (c) | Non-income producing security. |
| (d) | Interest rate represents annualized yield at time of purchase; not a coupon rate. |
| (e) | Represents investment of securities lending collateral. |
| ADR | An American Depositary Receipt is a certificate issued by a custodian bank representing the right to receive securities of the foreign issuer described. The values of ADRs are significantly influenced by trading on exchanges not located in the United States. |
24
PORTFOLIO OF INVESTMENTS – as of March 31, 2008 (Unaudited)
Loomis Sayles Small Cap Value Fund – continued
HOLDINGS AT MARCH 31, 2008 AS A PERCENTAGE OF NET ASSETS (Unaudited)
| | | |
Commercial Services & Supplies | | 6.4 | % |
Commercial Banks | | 6.0 | |
Insurance | | 4.8 | |
Machinery | | 4.7 | |
Electronic Equipment & Instruments | | 3.9 | |
IT Services | | 3.7 | |
Aerospace & Defense | | 3.6 | |
Health Care Providers & Services | | 3.2 | |
Software | | 3.0 | |
Media | | 3.0 | |
Electrical Equipment | | 3.0 | |
Oil, Gas & Consumable Fuels | | 2.9 | |
Chemicals | | 2.7 | |
Energy Equipment & Services | | 2.6 | |
Textiles, Apparel & Luxury Goods | | 2.5 | |
Real Estate Investment Trusts (REITs) | | 2.5 | |
Communications Equipment | | 2.5 | |
Specialty Retail | | 2.1 | |
Semiconductors & Semiconductor Equipment | | 2.0 | |
Other, less than 2% each | | 29.1 | |
See accompanying notes to financial statements.
25
PORTFOLIO OF INVESTMENTS – as of March 31, 2008 (Unaudited)
Loomis Sayles Tax-Managed Equity Fund
| | | | | | | |
| | | | | Shares | | Value (†) |
| | | | | | | |
| | | |
| COMMON STOCKS – 94.0% of Net Assets | | | | | | | |
| | | |
| Aerospace & Defense – 5.3% | | | | | | | |
Boeing Co.(b) | | | | 1,925 | | $ | 143,162 |
United Technologies Corp. | | | | 2,963 | | | 203,914 |
| | | | | | | |
| | | | | | | 347,076 |
| | | | | | | |
| Beverages – 2.1% | | | | | | | |
PepsiCo, Inc.(b) | | | | 1,890 | | | 136,458 |
| | | | | | | |
| Capital Markets – 6.0% | | | | | | | |
Franklin Resources, Inc.(b) | | | | 1,934 | | | 187,579 |
Goldman Sachs Group, Inc. | | | | 700 | | | 115,773 |
State Street Corp.(b) | | | | 1,100 | | | 86,900 |
| | | | | | | |
| | | | | | | 390,252 |
| | | | | | | |
| Chemicals – 4.5% | | | | | | | |
Ecolab, Inc.(b) | | | | 3,376 | | | 146,620 |
Praxair, Inc.(b) | | | | 1,730 | | | 145,718 |
| | | | | | | |
| | | | | | | 292,338 |
| | | | | | | |
| Communications Equipment – 8.8% | | | | | | | |
Cisco Systems, Inc.(c) | | | | 9,698 | | | 233,625 |
Corning, Inc.(b) | | | | 8,925 | | | 214,557 |
Harris Corp.(b) | | | | 2,565 | | | 124,479 |
| | | | | | | |
| | | | | | | 572,661 |
| | | | | | | |
| Computers & Peripherals – 8.1% | | | | | | | |
Apple, Inc.(c) | | | | 1,250 | | | 179,375 |
EMC Corp.(b)(c) | | | | 9,251 | | | 132,659 |
Hewlett-Packard Co.(b) | | | | 4,732 | | | 216,063 |
| | | | | | | |
| | | | | | | 528,097 |
| | | | | | | |
| Diversified Telecommunication Services – 2.7% | | | | | | | |
AT&T, Inc. | | | | 4,551 | | | 174,303 |
| | | | | | | |
| Energy Equipment & Services – 1.9% | | | | | | | |
Transocean, Inc.(b)(c) | | | | 916 | | | 123,843 |
| | | | | | | |
| Food & Staples Retailing – 3.8% | | | | | | | |
Costco Wholesale Corp.(b) | | | | 2,150 | | | 139,685 |
Spartan Stores, Inc.(b) | | | | 5,050 | | | 105,293 |
| | | | | | | |
| | | | | | | 244,978 |
| | | | | | | |
| Health Care Equipment & Supplies – 5.6% | | | | | | | |
Covidien Ltd.(b) | | | | 3,300 | | | 146,025 |
Hologic, Inc.(b)(c) | | | | 1,725 | | | 95,910 |
Zimmer Holdings, Inc.(c) | | | | 1,581 | | | 123,097 |
| | | | | | | |
| | | | | | | 365,032 |
| | | | | | | |
| Hotels, Restaurants & Leisure – 1.7% | | | | | | | |
Marriott International, Inc., Class A(b) | | | | 3,300 | | | 113,388 |
| | | | | | | |
| Household Products – 2.4% | | | | | | | |
Colgate-Palmolive Co. | | | | 2,000 | | | 155,820 |
| | | | | | | |
| Insurance – 6.0% | | | | | | | |
Aflac, Inc.(b) | | | | 3,331 | | | 216,348 |
Everest Re Group Ltd. | | | | 1,943 | | | 173,957 |
| | | | | | | |
| | | | | | | 390,305 |
| | | | | | | |
26
PORTFOLIO OF INVESTMENTS – as of as of March 31, 2008 (Unaudited)
Loomis Sayles Tax-Managed Equity Fund – continued
| | | | | | | | |
| | | | | Shares | | Value (†) |
| | | | | | | | |
| | | |
| COMMON STOCKS – continued | | | | | | | | |
| IT Services – 1.8% | | | | | | | | |
Broadridge Financial Solutions, Inc.(b) | | | | | 6,800 | | $ | 119,680 |
| | | | | | | | |
| Machinery – 9.2% | | | | | | | | |
Danaher Corp.(b) | | | | | 2,653 | | | 201,708 |
Eaton Corp. | | | | | 2,350 | | | 187,224 |
Joy Global, Inc. | | | | | 1,900 | | | 123,804 |
Terex Corp.(b)(c) | | | | | 1,350 | | | 84,375 |
| | | | | | | | |
| | | | | | | | 597,111 |
| | | | | | | | |
| Media – 2.5% | | | | | | | | |
DIRECTV Group, Inc. (The)(b)(c) | | | | | 6,515 | | | 161,507 |
| | | | | | | | |
| Oil, Gas & Consumable Fuels – 10.1% | | | | | | | | |
ConocoPhillips | | | | | 2,310 | | | 176,045 |
Devon Energy Corp. | | | | | 2,488 | | | 259,573 |
ExxonMobil Corp.(b) | | | | | 2,593 | | | 219,316 |
| | | | | | | | |
| | | | | | | | 654,934 |
| | | | | | | | |
| Personal Products – 1.9% | | | | | | | | |
Alberto-Culver Co.(b) | | | | | 4,540 | | | 124,441 |
| | | | | | | | |
| Pharmaceuticals – 4.7% | | | | | | | | |
Abbott Laboratories(b) | | | | | 3,175 | | | 175,101 |
Novartis AG, ADR | | | | | 2,480 | | | 127,051 |
| | | | | | | | |
| | | | | | | | 302,152 |
| | | | | | | | |
| Semiconductors & Semiconductor Equipment – 1.8% | | | | | | | | |
Texas Instruments, Inc.(b) | | | | | 4,155 | | | 117,462 |
| | | | | | | | |
| Specialty Retail – 1.6% | | | | | | | | |
Gap, Inc. (The)(b) | | | | | 5,370 | | | 105,681 |
| | | | | | | | |
| Wireless Telecommunication Services – 1.5% | | | | | | | | |
NII Holdings, Inc.(b)(c) | | | | | 3,000 | | | 95,340 |
| | | | | | | | |
| | | |
| TOTAL COMMON STOCKS | | | | | | | | |
(Identified Cost $5,127,443) | | | | | | | | 6,112,859 |
| | | | | | | | |
| | | |
| | | | | Shares/
Principal Amount | | |
| | | |
| SHORT-TERM INVESTMENTS – 41.3% | | | | | | | | |
State Street Navigator Securities Lending Prime Portfolio(d) | | | | | 2,250,228 | | | 2,250,228 |
| Tri-Party Repurchase Agreement with Fixed Income Clearing Corporation, dated 3/31/08 at 1.25% to be repurchased at $437,015 on 4/01//08 collateralized by $445,000 Federal Home Loan Mortgage Corp., 3.375% due 3/5/10 with value of $446,669, including accrued interest (Note 2g of Notes to Financial Statements) | | | | $ | 437,000 | | | 437,000 |
| | | | | | | | |
| | | |
| TOTAL SHORT-TERM INVESTMENTS | | | | | | | | |
(Identified Cost $2,687,228) | | | | | | | | 2,687,228 |
| | | | | | | | |
| | | |
| TOTAL INVESTMENTS – 135.3% | | | | | | | | |
(Identified Cost $7,814,671)(a) | | | | | | | | 8,800,087 |
Other assets less liabilities—(35.3)% | | | | | | | | (2,296,479) |
| | | | | | | | |
| | | |
| NET ASSETS – 100.0% | | | | | | | $ | 6,503,608 |
| | | | | | | | |
27
| | | | | | | |
| |
(†) See Note 2a of Notes to Financial Statements. | | | |
(a) Federal Tax Information (Amounts exclude certain adjustments made at the end of the Fund’s fiscal year for tax purposes. Such adjustments are primarily due to wash sales.): | | | |
At March 31, 2008, the net unrealized appreciation on investments based on cost of $7,814,671 for federal income tax purposes was as follows: | | | |
Aggregate gross unrealized appreciation for all investments in which there is an excess of value over tax cost | | $ | 1,207,806 |
Aggregate gross unrealized depreciation for all investments in which there is an excess of tax cost over value | | | (222,390) |
| | | | | | | |
Net unrealized appreciation | | $ | 985,416 |
| | | | | | | |
| (b) | All or a portion of this security was on loan to brokers at March 31, 2008. |
| (c) | Non-income producing security. |
| (d) | Represents investment of securities lending collateral. |
| ADR | An American Depositary Receipt is a certificate issued by a custodian bank representing the right to receive securities of the foreign issuer described. The values of ADRs are significantly influenced by trading on exchanges not located in the United States. |
HOLDINGS AT MARCH 31, 2008 AS A PERCENTAGE OF NET ASSETS (Unaudited)
| | | |
Oil, Gas & Consumable Fuels | | 10.1 | % |
Machinery | | 9.2 | |
Communications Equipment | | 8.8 | |
Computers & Peripherals | | 8.1 | |
Insurance | | 6.0 | |
Capital Markets | | 6.0 | |
Health Care Equipment & Supplies | | 5.6 | |
Aerospace & Defense | | 5.3 | |
Pharmaceuticals | | 4.7 | |
Chemicals | | 4.5 | |
Food & Staples Retailing | | 3.8 | |
Diversified Telecommunication Services | | 2.7 | |
Media | | 2.5 | |
Household Products | | 2.4 | |
Beverages | | 2.1 | |
Other, less than 2% each | | 12.2 | |
See accompanying notes to financial statements.
28
STATEMENTS OF ASSETS AND LIABILITIES
March 31, 2008 (Unaudited)
| | | | | | | | |
| | | Mid Cap
Growth Fund | | | Small Cap
Growth Fund | |
| | | | | | | | |
Assets | | | | | | | | |
Investments at cost | | $ | 166,862,283 | | | $ | 155,252,979 | |
Net unrealized appreciation (depreciation) | | | 5,853,481 | | | | (2,560,677 | ) |
| | | | | | | | |
Investments at value | | | 172,715,764 | | | | 152,692,302 | |
Cash | | | 95,457 | | | | 467,345 | |
Receivable for Fund shares sold | | | 984,966 | | | | 288,488 | |
Receivable for securities sold | | | 1,058,955 | | | | 3,192,965 | |
Dividends and interest receivable | | | 21,888 | | | | 17,336 | |
Receivable from investment adviser (Note 4) | | | — | | | | — | |
Securities lending income receivable | | | 15,545 | | | | 16,408 | |
Other assets | | | 27,426 | | | | — | |
| | | | | | | | |
Total Assets | | | 174,920,001 | | | | 156,674,844 | |
| | | | | | | | |
| | |
| Liabilities | | | | | | | | |
Collateral on securities loaned, at value (Note 2) | | | 49,772,699 | | | | 50,220,457 | |
Payable for securities purchased | | | 1,349,044 | | | | 2,955,227 | |
Payable for Fund shares redeemed | | | 143,739 | | | | 273,348 | |
Management fees payable (Note 4) | | | 81,919 | | | | 64,706 | |
Administrative fees payable (Note 4) | | | 9,312 | | | | 7,165 | |
Deferred Trustees’ fees (Note 4) | | | 42,769 | | | | 40,124 | |
Service and distribution fees payable (Note 4) | | | 2,128 | | | | 1,260 | |
Other accounts payable and accrued expenses | | | 16,251 | | | | 1,978 | |
| | | | | | | | |
Total Liabilities | | | 51,417,861 | | | | 53,564,265 | |
| | | | | | | | |
Net Assets | | $ | 123,502,140 | | | $ | 103,110,579 | |
| | | | | | | | |
Net Assets consist of: | | | | | | | | |
Paid-in capital | | $ | 207,277,021 | | | $ | 306,815,825 | |
Undistributed (accumulated) net investment income (loss) | | | (241,655 | ) | | | (225,297 | ) |
Accumulated net realized loss on investments and foreign currency transactions | | | (89,386,707 | ) | | | (200,919,272 | ) |
Net unrealized appreciation (depreciation) on investments and foreign currency translations | | | 5,853,481 | | | | (2,560,677 | ) |
| | | | | | | | |
Net Assets | | $ | 123,502,140 | | | $ | 103,110,579 | |
| | | | | | | | |
| | |
| Net Asset Value and Offering Price | | | | | | | | |
Institutional Class | | | | | | | | |
Net assets | | $ | 28,013,518 | | | $ | 41,839,649 | |
| | | | | | | | |
Shares of beneficial interest | | | 1,103,750 | | | | 3,129,080 | |
| | | | | | | | |
Net asset value, offering and redemption price per share | | $ | 25.38 | | | $ | 13.37 | |
| | | | | | | | |
Retail Class | | | | | | | | |
Net assets | | $ | 95,488,622 | | | $ | 61,270,930 | |
| | | | | | | | |
Shares of beneficial interest | | | 3,860,333 | | | | 4,713,803 | |
| | | | | | | | |
Net asset value, offering and redemption price per share | | $ | 24.74 | | | $ | 13.00 | |
| | | | | | | | |
Admin Class | | | | | | | | |
Net assets | | $ | — | | | $ | — | |
| | | | | | | | |
Shares of beneficial interest | | | — | | | | — | |
| | | | | | | | |
Net asset value, offering and redemption price per share | | $ | — | | | $ | — | |
| | | | | | | | |
Value of securities on loan (Note 2) | | $ | 47,347,527 | | | $ | 49,117,532 | |
| | | | | | | | |
See accompanying notes to financial statements.
29
| | | | | | |
Small Cap
Value Fund | | | Tax-Managed
Equity Fund | |
| | | | | | |
| | | | | | |
| $ | 1,245,679,171 | | | $ | 7,814,671 | |
| | 28,388,847 | | | | 985,416 | |
| | 1,274,068,018 | | | | 8,800,087 | |
| | 2,620 | | | | 826 | |
| | 2,560,411 | | | | — | |
| | 1,160,184 | | | | — | |
| | 718,272 | | | | 5,346 | |
| | 74,544 | | | | 6,526 | |
| | 117,833 | | | | 630 | |
| | — | | | | — | |
| | 1,278,701,882 | | | | 8,813,415 | |
| |
| | | | | | |
| | 255,144,557 | | | | 2,250,228 | |
| | 12,942,977 | | | | — | |
| | 961,519 | | | | — | |
| | 622,209 | | | | 2,714 | |
| | 82,048 | | | | 533 | |
| | 123,112 | | | | 37,234 | |
| | 12,115 | | | | — | |
| | 35,866 | | | | 19,098 | |
| | 269,924,403 | | | | 2,309,807 | |
| $ | 1,008,777,479 | | | $ | 6,503,608 | |
| | | | | | |
| $ | 1,008,538,190 | | | $ | 9,146,200 | |
| | 1,345,731 | | | | (5,394 | ) |
| | (29,495,289 | ) | | | (3,622,614 | ) |
| |
| | 28,388,847 | | | | 985,416 | |
| $ | 1,008,777,479 | | | $ | 6,503,608 | |
| |
| | | | | | |
| | | | | | |
| $ | 486,432,863 | | | $ | 6,503,608 | |
| | 21,778,798 | | | | 625,118 | |
| $ | 22.34 | | | $ | 10.40 | |
| | | | | | |
| $ | 446,379,759 | | | $ | — | |
| | 20,167,086 | | | | — | |
| $ | 22.13 | | | $ | — | |
| | | | | | |
| $ | 75,964,857 | | | $ | — | |
| | 3,490,006 | | | | — | |
| $ | 21.77 | | | $ | — | |
| $ | 250,993,030 | | | $ | 2,216,019 | |
See accompanying notes to financial statements.
30
STATEMENTS OF OPERATIONS
For the Six Months Ended March 31, 2008 (Unaudited)
| | | | | | | | |
| | | Mid Cap
Growth Fund | | | Small Cap
Growth Fund | |
| | | | | | | | |
Investment Income | | | | | | | | |
Dividends | | $ | 97,075 | | | $ | 77,284 | |
Interest | | | 90,993 | | | | 64,387 | |
Securities lending income (Note 2) | | | 71,741 | | | | 52,075 | |
Less net foreign taxes withheld | | | (679 | ) | | | — | |
| | | | | | | | |
| | | 259,130 | | | | 193,746 | |
| | | | | | | | |
| | |
| Expenses | | | | | | | | |
Management fees (Note 4) | | | 298,263 | | | | 256,422 | |
Distribution fees—Retail Class (Note 4) | | | 64,933 | | | | 41,549 | |
Service and distribution fees—Admin Class (Note 4) | | | — | | | | — | |
Trustees’ fees and expenses (Note 4) | | | 5,429 | | | | 5,334 | |
Administrative fees (Note 4) | | | 20,740 | | | | 17,848 | |
Custodian fees and expenses | | | 8,618 | | | | 14,140 | |
Transfer agent fees and expenses—Institutional Class (Note 4) | | | 5,093 | | | | 5,548 | |
Transfer agent fees and expenses—Retail Class (Note 4) | | | 16,439 | | | | 14,531 | |
Transfer agent fees and expenses—Admin Class (Note 4) | | | — | | | | — | |
Audit and tax services fees | | | 16,979 | | | | 16,765 | |
Registration fees | | | 19,070 | | | | 16,710 | |
Shareholder reporting expenses | | | 4,064 | | | | 3,079 | |
Legal fees | | | 705 | | | | 424 | |
Expense recapture—Institutional Class (Note 4) | | | 1,930 | | | | — | |
Miscellaneous expenses | | | 2,822 | | | | 2,696 | |
| | | | | | | | |
Total expenses | | | 465,085 | | | | 395,046 | |
Less fee reduction and/or expense reimbursement (Note 4) | | | (2,469 | ) | | | (11,574 | ) |
| | | | | | | | |
Net expenses | | | 462,616 | | | | 383,472 | |
| | | | | | | | |
Net investment income (loss) | | | (203,486 | ) | | | (189,726 | ) |
| | | | | | | | |
| | |
| Net Realized And Unrealized Gain (Loss) On Investments and Foreign Currency Transactions | | | | | | | | |
Net Realized Gain (Loss) on: | | | | | | | | |
Investments | | | (1,265,859 | ) | | | (2,092,546 | ) |
Foreign currency transactions | | | 166 | | | | — | |
| | |
| Net Change in Unrealized Appreciation (Depreciation) on: | | | | | | | | |
Investments | | | (7,172,815 | ) | | | (10,342,691 | ) |
Foreign currency translations | | | (109 | ) | | | — | |
| | | | | | | | |
Net realized and unrealized loss on investments and foreign currency transactions | | | (8,438,617 | ) | | | (12,435,237 | ) |
| | | | | | | | |
| | |
| Net Decrease in Net Assets Resulting from Operations | | $ | (8,642,103 | ) | | $ | (12,624,963 | ) |
| | | | | | | | |
| * | Amount includes a special dividend of $926,046 in which the source of the dividend has not been determined by the issuer. |
See accompanying notes to financial statements.
31
| | | | | | |
Small Cap
Value Fund | | | Tax-Managed
Equity Fund | |
| | | | | | |
| | | | | | |
| $ | 6,025,435 | * | | $ | 40,087 | |
| | 665,580 | | | | 5,219 | |
| | 755,942 | | | | 4,061 | |
| | — | | | | (508 | ) |
| | 7,446,957 | | | | 48,859 | |
| | | | | | | |
| |
| | | | | | |
| | 3,843,560 | | | | 16,375 | |
| | 558,399 | | | | — | |
| | 188,924 | | | | — | |
| | 16,255 | | | | 4,876 | |
| | 268,358 | | | | 1,715 | |
| | 24,325 | | | | 6,666 | |
| | 94,735 | | | | 1,308 | |
| | 362,284 | | | | — | |
| | 113,952 | | | | — | |
| | 19,088 | | | | 15,029 | |
| | 48,074 | | | | 12,676 | |
| | 66,586 | | | | 814 | |
| | 14,513 | | | | 94 | |
| | — | | | | — | |
| | 15,661 | | | | 1,993 | |
| | | | | | | |
| | 5,634,714 | | | | 61,546 | |
| | (332,131 | ) | | | (40,256 | ) |
| | | | | | | |
| | 5,302,583 | | | | 21,290 | |
| | | | | | | |
| | 2,144,374 | | | | 27,569 | |
| | | | | | | |
| |
| | | | | | |
| | | | | | |
| | (16,356,684 | ) | | | (136,888 | ) |
| | — | | | | — | |
| |
| | | | | | |
| | (138,660,144 | ) | | | (554,050 | ) |
| | — | | | | — | |
| | | | | | | |
| | (155,016,828 | ) | | | (690,938 | ) |
| | | | | | | |
| |
| $ | (152,872,454 | ) | | $ | (663,369 | ) |
| | | | | | | |
See accompanying notes to financial statements.
32
STATEMENTS OF CHANGES IN NET ASSETS
Mid Cap Growth Fund
| | | | | | | | |
| | | Six Months Ended
March 31, 2008
(Unaudited) | | | Year Ended
September 30, 2007 | |
From Operations: | | | | | | | | |
Net investment loss | | $ | (203,486 | ) | | $ | (288,083 | ) |
Net realized gain (loss) on investments and foreign currency transactions | | | (1,265,693 | ) | | | 7,015,246 | |
Net change in net unrealized appreciation (depreciation) on investments and foreign currency translations | | | (7,172,924 | ) | | | 8,067,259 | |
| | | | | | | | |
Increase (decrease) in net assets from operations | | | (8,642,103 | ) | | | 14,794,422 | |
| | | | | | | | |
From Distributions to Shareholders: | | | | | | | | |
Net Investment Income: | | | | | | | | |
Institutional Class | | | — | | | | — | |
Retail Class | | | — | | | | — | |
Capital Gains: | | | | | | | | |
Institutional Class | | | — | | | | — | |
Retail Class | | | — | | | | — | |
| | | | | | | | |
Total distributions | | | — | | | | — | |
| | | | | | | | |
Increase (Decrease) in Net Assets Derived from Capital Shares Transactions (Note 8) | | | 77,347,619 | | | | (4,132,735 | ) |
| | | | | | | | |
Total increase in net assets | | | 68,705,516 | | | | 10,661,687 | |
Net Assets | | | | | | | | |
Beginning of period | | | 54,796,624 | | | | 44,134,937 | |
| | | | | | | | |
End of period | | $ | 123,502,140 | | | $ | 54,796,624 | |
| | | | | | | | |
Undistributed Net Investment Income/Accumulated Net Investment Loss | | $ | (241,655 | ) | | $ | (38,169 | ) |
| | | | | | | | |
Small Cap Growth Fund
| | | | | | | | |
| | | Six Months Ended
March 31, 2008
(Unaudited) | | | Year Ended
September 30, 2007 | |
From Operations: | | | | | | | | |
Net investment loss | | $ | (189,726 | ) | | $ | (143,375 | ) |
Net realized gain (loss) on investments | | | (2,092,546 | ) | | | 3,362,779 | |
Net change in net unrealized appreciation (depreciation) on investments | | | (10,342,691 | ) | | | 5,500,407 | |
| | | | | | | | |
Increase (decrease) in net assets from operations | | | (12,624,963 | ) | | | 8,719,811 | |
| | | | | | | | |
From Distributions to Shareholders: | | | | | | | | |
Net Investment Income: | | | | | | | | |
Institutional Class | | | — | | | | — | |
Retail Class | | | — | | | | — | |
Capital Gains: | | | | | | | | |
Institutional Class | | | — | | | | — | |
Retail Class | | | — | | | | — | |
| | | | | | | | |
Total distributions | | | — | | | | — | |
| | | | | | | | |
Increase in Net Assets Derived from Capital Shares Transactions (Note 8) | | | 66,713,844 | | | | 16,896,224 | |
| | | | | | | | |
Redemption Fees | | | | | | | | |
Institutional Class | | | 4,430 | | | | 346 | |
Retail Class | | | 5,074 | | | | 186 | |
| | | | | | | | |
Total increase in net assets | | | 54,098,385 | | | | 25,616,567 | |
Net Assets | | | | | | | | |
Beginning of period | | | 49,012,194 | | | | 23,395,627 | |
| | | | | | | | |
End of period | �� | $ | 103,110,579 | | | $ | 49,012,194 | |
| | | | | | | | |
Undistributed Net Investment Income/Accumulated Net Investment Loss | | $ | (225,297 | ) | | $ | (35,571 | ) |
| | | | | | | | |
See accompanying notes to financial statements.
33
STATEMENTS OF CHANGES IN NET ASSETS – continued
Small Cap Value Fund
| | | | | | | | |
| | | Six Months Ended
March 31, 2008
(Unaudited) | | | Year Ended
September 30, 2007 | |
From Operations: | | | | | | | | |
Net investment income | | $ | 2,144,374 | | | $ | 2,636,586 | |
Net realized gain (loss) on investments | | | (16,356,684 | ) | | | 100,922,002 | |
Net change in net unrealized appreciation (depreciation) on investments | | | (138,660,144 | ) | | | 34,456,656 | |
| | | | | | | | |
Increase (decrease) in net assets from operations | | | (152,872,454 | ) | | | 138,015,244 | |
| | | | | | | | |
From Distributions to Shareholders: | | | | | | | | |
Net Investment Income: | | | | | | | | |
Institutional Class | | | (1,132,960 | ) | | | (2,801,001 | ) |
Retail Class | | | — | | | | (1,058,622 | ) |
Admin Class | | | — | | | | (101,702 | ) |
Capital Gains: | | | | | | | | |
Institutional Class | | | (51,944,174 | ) | | | (50,563,842 | ) |
Retail Class | | | (47,065,282 | ) | | | (32,749,822 | ) |
Admin Class | | | (8,031,853 | ) | | | (7,983,100 | ) |
| | | | | | | | |
Total distributions | | | (108,174,269 | ) | | | (95,258,089 | ) |
| | | | | | | | |
Increase in Net Assets Derived from Capital Shares Transactions (Note 8) | | | 193,183,889 | | | | 235,053,214 | |
| | | | | | | | |
Redemption Fees | | | | | | | | |
Institutional Class | | | 12,943 | | | | 16,563 | |
Retail Class | | | 11,514 | | | | 13,201 | |
Admin Class | | | 1,942 | | | | 2,493 | |
| | | | | | | | |
Total increase (decrease) in net assets | | | (67,836,435 | ) | | | 277,842,626 | |
Net Assets | | | | | | | | |
Beginning of period | | | 1,076,613,914 | | | | 798,771,288 | |
| | | | | | | | |
End of period | | $ | 1,008,777,479 | | | $ | 1,076,613,914 | |
| | | | | | | | |
Undistributed Net Investment Income | | $ | 1,345,731 | | | $ | 334,317 | |
| | | | | | | | |
Tax-Managed Equity Fund
| | | | | | | | |
| | | Six Months Ended
March 31, 2008
(Unaudited) | | | Year Ended
September 30, 2007 | |
From Operations: | | | | | | | | |
Net investment income | | $ | 27,569 | | | $ | 102,751 | |
Net realized gain (loss) on investments | | | (136,888 | ) | | | 1,153,272 | |
Net change in net unrealized appreciation (depreciation) on investments | | | (554,050 | ) | | | (241,314 | ) |
| | | | | | | | |
Increase (decrease) in net assets from operations | | | (663,369 | ) | | | 1,014,709 | |
| | | | | | | | |
From Distributions to Shareholders: | | | | | | | | |
Net Investment Income: | | | | | | | | |
Institutional Class | | | (114,263 | ) | | | (75,417 | ) |
Capital Gains: | | | | | | | | |
Institutional Class | | | — | | | | — | |
| | | | | | | | |
Total distributions | | | (114,263 | ) | | | (75,417 | ) |
| | | | | | | | |
Increase (Decrease) in Net Assets Derived from Capital Shares Transactions (Note 8) | | | 611,128 | | | | (3,344,828 | ) |
| | | | | | | | |
Total decrease in net assets | | | (166,504 | ) | | | (2,405,536 | ) |
Net Assets | | | | | | | | |
Beginning of period | | | 6,670,112 | | | | 9,075,648 | |
| | | | | | | | |
End of period | | $ | 6,503,608 | | | $ | 6,670,112 | |
| | | | | | | | |
Undistributed (Overdistributed) Net Investment Income (Loss) | | $ | (5,394 | ) | | $ | 81,300 | |
| | | | | | | | |
See accompanying notes to financial statements.
34
FINANCIAL HIGHLIGHTS
For a share outstanding throughout each period.
| | | | | | | | | | | | | | | | | | | | | | | | |
| | | | | Income (Loss) from Investment Operations: | | | | | Less Distributions: |
| | | Net asset
value,
beginning
of the period | | Net
investment
loss(c) | | | Net realized
and unrealized
gain (loss) | | | Total from
investment
operations | | | | | Dividends
from
net investment
income | | | Distributions
from net
realized
capital gains |
| Mid Cap Growth Fund | | | | | | | | | | | | | | | | | | | | | |
| | | | | | | |
| Institutional Class | | | | | | | | | | | | | | | | | | | | | | | | |
3/31/2008(e) | | $ | 27.51 | | $ | (0.06 | ) | | $ | (2.07 | ) | | $ | (2.13 | ) | | | | $ | — | | | $ | — |
9/30/2007 | | | 20.13 | | | (0.11 | )(d) | | | 7.49 | | | | 7.38 | | | | | | — | | | | — |
9/30/2006 | | | 19.00 | | | (0.10 | ) | | | 1.23 | | | | 1.13 | | | | | | — | | | | — |
9/30/2005 | | | 15.50 | | | (0.10 | ) | | | 3.78 | | | | 3.68 | | | | | | (0.18 | ) | | | — |
9/30/2004 | | | 13.69 | | | (0.13 | ) | | | 1.94 | | | | 1.81 | | | | | | — | | | | — |
9/30/2003 | | | 10.70 | | | (0.10 | ) | | | 3.09 | | | | 2.99 | | | | | | — | | | | — |
| | | | | | | |
| Retail Class | | | | | | | | | | | | | | | | | | | | | | | | |
3/31/2008(e) | | $ | 26.84 | | $ | (0.07 | ) | | $ | (2.03 | ) | | $ | (2.10 | ) | | | | $ | — | | | $ | — |
9/30/2007 | | | 19.69 | | | (0.16 | )(d) | | | 7.31 | | | | 7.15 | | | | | | — | | | | — |
9/30/2006 | | | 18.63 | | | (0.15 | ) | | | 1.21 | | | | 1.06 | | | | | | — | | | | — |
9/30/2005 | | | 15.20 | | | (0.14 | ) | | | 3.70 | | | | 3.56 | | | | | | (0.13 | ) | | | — |
9/30/2004 | | | 13.46 | | | (0.16 | ) | | | 1.90 | | | | 1.74 | | | | | | — | | | | — |
9/30/2003 | | | 10.55 | | | (0.13 | ) | | | 3.04 | | | | 2.91 | | | | | | — | | | | — |
(a) Had certain expenses not been reduced during the period, if applicable, total returns would have been lower. Periods less than one year, if applicable, are not annualized.
(b) The investment adviser and/or administrator has agreed to reimburse a portion of the Fund’s expenses and/or reduce its fees during the period. Without this reimbursement/fee reduction, if applicable, expenses would have been higher.
(c) Per share net investment loss has been calculated using the average shares outstanding during the period.
(d) Includes a non-recurring payment of $0.02 per share.
(e) For the six months ended March 31, 2008 (Unaudited).
(f) Computed on an annualized basis for periods less than one year, if applicable.
(g) Includes expense recapture of 0.01%.
See accompanying notes to financial statements.
35
| | | | | | | | | | | | | | | | | | | | | | |
| | | | | | | | | | | Ratios to Average Net Assets: | | | |
Total
distributions | | | Net asset
value,
end of the
period | | Total
return (%)(a) | | | Net assets,
end of the
period
(000’s) | | Net
expenses (%)(b)(f) | | | Gross
expenses (%)(f) | | | Net
investment
loss (%)(f) | | | Portfolio
turnover
rate (%) |
| | | | | | | | | | | | | | | | | | | | | | |
| | | | | | | |
| | | | | | | | | | | | | | | | | | | | | | |
| $ | — | | | $ | 25.38 | | (7.7 | ) | | $ | 28,014 | | 1.00 | (g) | | 1.00 | (g) | | (0.40 | ) | | 102 |
| | — | | | | 27.51 | | 36.7 | | | | 24,143 | | 1.00 | | | 1.10 | | | (0.47 | ) | | 194 |
| | — | | | | 20.13 | | 6.0 | | | | 17,467 | | 1.00 | | | 1.12 | | | (0.49 | ) | | 211 |
| | (0.18 | ) | | | 19.00 | | 23.9 | | | | 26,159 | | 1.00 | | | 1.21 | | | (0.60 | ) | | 280 |
| | — | | | | 15.50 | | 13.2 | | | | 25,191 | | 1.00 | | | 1.17 | | | (0.84 | ) | | 284 |
| | — | | | | 13.69 | | 27.9 | | | | 23,866 | | 1.00 | | | 1.23 | | | (0.88 | ) | | 248 |
| | | | | | | |
| | | | | | | | | | | | | | | | | | | | | | |
| $ | — | | | $ | 24.74 | | (7.9 | ) | | $ | 95,489 | | 1.25 | | | 1.26 | | | (0.57 | ) | | 102 |
| | — | | | | 26.84 | | 36.3 | | | | 30,654 | | 1.25 | | | 1.43 | | | (0.71 | ) | | 194 |
| | — | | | | 19.69 | | 5.7 | | | | 26,668 | | 1.25 | | | 1.52 | | | (0.72 | ) | | 211 |
| | (0.13 | ) | | | 18.63 | | 23.6 | | | | 25,802 | | 1.25 | | | 1.50 | | | (0.85 | ) | | 280 |
| | — | | | | 15.20 | | 12.9 | | | | 25,382 | | 1.25 | | | 1.42 | | | (1.10 | ) | | 284 |
| | — | | | | 13.46 | | 27.6 | | | | 32,813 | | 1.25 | | | 1.47 | | | (1.13 | ) | | 248 |
See accompanying notes to financial statements.
36
FINANCIAL HIGHLIGHTS – continued
For a share outstanding throughout each period.
| | | | | | | | | | | | | | | | | | | | | | | | | |
| | | | | Income (Loss) from Investment Operations: | | | | | Less Distributions: | |
| | | Net asset
value,
beginning
of the period | | Net
investment
income
(loss)(c)(d) | | | Net realized
and unrealized
gain (loss) | | | Total from
investment
operations | | | | | Dividends
from
net investment
income | | | Distributions
from net
realized
capital gains | |
| Small Cap Growth Fund | | | | | | | | | | | | | | | | | | | | | | |
| | | | | | | |
| Institutional Class | | | | | | | | | | | | | | | | | | | | | | | | | |
3/31/2008(i) | | $ | 15.87 | | $ | (0.03 | ) | | $ | (2.47 | ) | | $ | (2.50 | ) | | | | $ | — | | | $ | — | |
9/30/2007 | | | 12.00 | | | (0.06 | )(f) | | | 3.93 | | | | 3.87 | | | | | | — | | | | — | |
9/30/2006 | | | 11.08 | | | (0.08 | ) | | | 0.99 | | | | 0.91 | | | | | | — | | | | — | |
9/30/2005 | | | 8.96 | | | (0.08 | ) | | | 2.20 | | | | 2.12 | | | | | | — | | | | — | |
9/30/2004 | | | 8.59 | | | (0.09 | ) | | | 0.46 | | | | 0.37 | | | | | | — | | | | — | |
9/30/2003 | | | 6.35 | | | (0.06 | ) | | | 2.30 | | | | 2.24 | | | | | | — | | | | — | |
| | | | | | | |
| Retail Class | | | | | | | | | | | | | | | | | | | | | | | | | |
3/31/2008(i) | | $ | 15.45 | | $ | (0.05 | ) | | $ | (2.40 | ) | | $ | (2.45 | ) | | | | $ | — | | | $ | — | |
9/30/2007 | | | 11.71 | | | (0.09 | )(f) | | | 3.83 | | | $ | 3.74 | | | | | | — | | | | — | |
9/30/2006 | | | 10.84 | | | (0.11 | ) | | | 0.97 | | | $ | 0.86 | | | | | | — | | | | — | |
9/30/2005 | | | 8.78 | | | (0.11 | ) | | | 2.17 | | | $ | 2.06 | | | | | | — | | | | — | |
9/30/2004 | | | 8.45 | | | (0.11 | ) | | | 0.44 | | | $ | 0.33 | | | | | | — | | | | — | |
9/30/2003 | | | 6.26 | | | (0.08 | ) | | | 2.27 | | | $ | 2.19 | | | | | | — | | | | — | |
| | | | | | |
| Small Cap Value Fund | | | | | | | | | | | | | | | | | | | | | | |
| | | | | | | |
| Institutional Class | | | | | | | | | | | | | | | | | | | | | | | | | |
3/31/2008(i) | | $ | 28.77 | | $ | 0.07 | (j) | | $ | (3.66 | ) | | $ | (3.59 | ) | | | | $ | (0.06 | ) | | $ | (2.78 | ) |
9/30/2007 | | | 27.69 | | | 0.12 | (f)(g) | | | 4.29 | | | | 4.41 | | | | | | (0.17 | ) | | | (3.16 | ) |
9/30/2006 | | | 27.43 | | | 0.13 | | | | 2.70 | | | | 2.83 | | | | | | (0.15 | ) | | | (2.42 | ) |
9/30/2005 | | | 25.75 | | | 0.13 | | | | 4.22 | | | | 4.35 | | | | | | (0.02 | ) | | | (2.65 | ) |
9/30/2004 | | | 21.34 | | | 0.04 | | | | 4.97 | | | | 5.01 | | | | | | (0.05 | ) | | | (0.55 | ) |
9/30/2003 | | | 17.28 | | | 0.05 | | | | 4.01 | | | | 4.06 | | | | | | — | | | | — | |
| | | | | | | |
| Retail Class | | | | | | | | | | | | | | | | | | | | | | | | | |
3/31/2008(i) | | $ | 28.52 | | $ | 0.04 | (j) | | $ | (3.65 | ) | | $ | (3.61 | ) | | | | $ | — | | | $ | (2.78 | ) |
9/30/2007 | | | 27.46 | | | 0.04 | (f)(g) | | | 4.28 | | | | 4.32 | | | | | | (0.10 | ) | | | (3.16 | ) |
9/30/2006 | | | 27.23 | | | 0.06 | | | | 2.67 | | | | 2.73 | | | | | | (0.08 | ) | | | (2.42 | ) |
9/30/2005 | | | 25.62 | | | 0.06 | | | | 4.20 | | | | 4.26 | | | | | | — | | | | (2.65 | ) |
9/30/2004 | | | 21.25 | | | (0.02 | ) | | | 4.95 | | | | 4.93 | | | | | | (0.01 | ) | | | (0.55 | ) |
9/30/2003 | | | 17.25 | | | (0.00 | ) | | | 4.00 | | | | 4.00 | | | | | | — | | | | — | |
| | | | | | | |
| Admin Class | | | | | | | | | | | | | | | | | | | | | | | | | |
3/31/2008(i) | | $ | 28.13 | | $ | 0.01 | (j) | | $ | (3.59 | ) | | $ | (3.58 | ) | | | | $ | — | | | $ | (2.78 | ) |
9/30/2007 | | | 27.14 | | | (0.03 | )(f)(g) | | | 4.22 | | | | 4.19 | | | | | | (0.04 | ) | | | (3.16 | ) |
9/30/2006 | | | 26.94 | | | (0.01 | ) | | | 2.65 | | | | 2.64 | | | | | | (0.02 | ) | | | (2.42 | ) |
9/30/2005 | | | 25.43 | | | (0.00 | ) | | | 4.16 | | | | 4.16 | | | | | | — | | | | (2.65 | ) |
9/30/2004 | | | 21.13 | | | (0.08 | ) | | | 4.93 | | | | 4.85 | | | | | | — | | | | (0.55 | ) |
9/30/2003 | | | 17.20 | | | (0.05 | ) | | | 3.98 | | | | 3.93 | | | | | | — | | | | — | |
(a) Had certain expenses not been reduced during the period, if applicable, total returns would have been lower. Periods less than one year, if applicable, are not annualized.
(b) The investment adviser and/or administrator has agreed to reimburse a portion of the Fund’s expenses and/or reduce its fees during the period. Without this reimbursement/fee reduction, if applicable, expenses would have been higher.
(c) Per share net investment income (loss) has been calculated using the average shares outstanding during the period.
(d) Amount rounds to less than $0.01 per share, if applicable.
(e) Includes expense recapture of 0.02%.
(f) Includes a non-recurring payment of $0.01 per share and $0.00 per share for Small Cap Growth Fund and Small Cap Value Fund, respectively.
(g) Includes a non-recurring special dividend of $0.05 per share in which the source of the dividend has not been determined by the issuer.
(h) Computed on an annualized basis for periods less than one year, if applicable.
(i) For the six months ended March 31, 2008 (Unaudited).
(j) Includes a special dividend of $.02 per share in which the source of the dividend has not been determined by the issuer.
See accompanying notes to financial statements.
37
| | | | | | | | | | | | | | | | | | | | | | | | | |
| | | | | | | | | | | | | Ratios to Average Net Assets: | | | |
Total
distributions | | | Redemption
fees(d) | | Net asset
value,
end of
the period | | Total
return (%)(a) | | | Net assets,
end of
the period
(000’s) | | Net
expenses (%)(b)(h) | | | Gross
expenses (%)(h) | | | Net
investment
income (loss) (%)(h) | | | Portfolio
turnover
rate (%) |
| | | | | | | | | | | | | | | | | | | | | | | | | |
| | | | | | | | |
| | | | | | | | | | | | | | | | | | | | | | | | | |
| $ | — | | | $ | 0.00 | | $ | 13.37 | | (15.8 | ) | | $ | 41,840 | | 1.00 | | | 1.01 | | | (0.46 | ) | | 44 |
| | — | | | | 0.00 | | | 15.87 | | 32.3 | | | | 28,088 | | 1.00 | | | 1.23 | | | (0.47 | ) | | 83 |
| | — | | | | 0.01 | | | 12.00 | | 8.3 | | | | 20,414 | | 1.00 | | | 1.38 | | | (0.69 | ) | | 100 |
| | — | | | | 0.00 | | | 11.08 | | 23.7 | | | | 15,785 | | 1.00 | | | 1.70 | | | (0.85 | ) | | 227 |
| | — | | | | 0.00 | | | 8.96 | | 4.3 | | | | 15,867 | | 1.00 | | | 1.31 | | | (0.95 | ) | | 217 |
| | — | | | | — | | | 8.59 | | 35.3 | | | | 22,519 | | 1.00 | | | 1.19 | | | (0.91 | ) | | 190 |
| | | | | | | | |
| | | | | | | | | | | | | | | | | | | | | | | | | |
| $ | — | | | $ | 0.00 | | $ | 13.00 | | (15.9 | ) | | $ | 61,271 | | 1.25 | | | 1.31 | | | (0.66 | ) | | 44 |
| | — | | | | 0.00 | | | 15.45 | | 31.9 | | | | 20,924 | | 1.25 | | | 1.50 | | | (0.66 | ) | | 83 |
| | — | | | | 0.01 | | | 11.71 | | 8.0 | | | | 2,981 | | 1.25 | | | 1.92 | | | (0.94 | ) | | 100 |
| | — | | | | 0.00 | | | 10.84 | | 23.5 | | | | 3,592 | | 1.25 | | | 1.87 | | | (1.14 | ) | | 227 |
| | — | | | | 0.00 | | | 8.78 | | 3.9 | | | | 14,589 | | 1.25 | | | 1.52 | | | (1.19 | ) | | 217 |
| | — | | | | — | | | 8.45 | | 35.0 | | | | 30,345 | | 1.25 | | | 1.43 | | | (1.17 | ) | | 190 |
| | | | | | | | |
| | | | | | | | | | | | | | | | | | | | | | | | | |
| | | | | | | | |
| | | | | | | | | | | | | | | | | | | | | | | | | |
| $ | (2.84 | ) | | $ | 0.00 | | $ | 22.34 | | (13.7 | ) | | $ | 486,433 | | 0.88 | | | 0.88 | | | 0.57 | | | 29 |
| | (3.33 | ) | | | 0.00 | | | 28.77 | | 17.0 | | | | 534,776 | | 0.89 | | | 0.89 | | | 0.43 | | | 57 |
| | (2.57 | ) | | | 0.00 | | | 27.69 | | 11.2 | | | | 442,714 | | 0.89 | (e) | | 0.89 | (e) | | 0.47 | | | 62 |
| | (2.67 | ) | | | 0.00 | | | 27.43 | | 18.0 | | | | 403,110 | | 0.90 | | | 0.93 | | | 0.48 | | | 59 |
| | (0.60 | ) | | | 0.00 | | | 25.75 | | 23.8 | | | | 346,356 | | 0.90 | | | 0.93 | | | 0.16 | | | 70 |
| | — | | | | — | | | 21.34 | | 23.5 | | | | 289,945 | | 0.90 | | | 0.94 | | | 0.26 | | | 74 |
| | | | | | | | |
| | | | | | | | | | | | | | | | | | | | | | | | | |
| $ | (2.78 | ) | | $ | 0.00 | | $ | 22.13 | | (13.9 | ) | | $ | 446,380 | | 1.15 | | | 1.25 | | | 0.30 | | | 29 |
| | (3.26 | ) | | | 0.00 | | | 28.52 | | 16.7 | | | | 465,055 | | 1.15 | | | 1.24 | | | 0.15 | | | 57 |
| | (2.50 | ) | | | 0.00 | | | 27.46 | | 10.9 | | | | 291,690 | | 1.15 | | | 1.20 | | | 0.21 | | | 62 |
| | (2.65 | ) | | | 0.00 | | | 27.23 | | 17.7 | | | | 235,948 | | 1.15 | | | 1.20 | | | 0.24 | | | 59 |
| | (0.56 | ) | | | 0.00 | | | 25.62 | | 23.5 | | | | 173,411 | | 1.15 | | | 1.18 | | | (0.08 | ) | | 70 |
| | — | | | | — | | | 21.25 | | 23.2 | | | | 140,152 | | 1.15 | | | 1.20 | | | (0.01 | ) | | 74 |
| | | | | | | | |
| | | | | | | | | | | | | | | | | | | | | | | | | |
| $ | (2.78 | ) | | $ | 0.00 | | $ | 21.77 | | (14.0 | ) | | $ | 75,965 | | 1.40 | | | 1.64 | | | 0.06 | | | 29 |
| | (3.20 | ) | | | 0.00 | | | 28.13 | | 16.4 | | | | 76,783 | | 1.40 | | | 1.56 | | | (0.10 | ) | | 57 |
| | (2.44 | ) | | | 0.00 | | | 27.14 | | 10.6 | | | | 64,367 | | 1.40 | | | 1.46 | | | (0.04 | ) | | 62 |
| | (2.65 | ) | | | 0.00 | | | 26.94 | | 17.4 | | | | 67,505 | | 1.40 | | | 1.43 | | | (0.01 | ) | | 59 |
| | (0.55 | ) | | | 0.00 | | | 25.43 | | 23.3 | | | | 62,680 | | 1.40 | | | 1.43 | | | (0.33 | ) | | 70 |
| | — | | | | — | | | 21.13 | | 22.9 | | | | 37,411 | | 1.40 | | | 1.47 | | | (0.27 | ) | | 74 |
See accompanying notes to financial statements.
38
FINANCIAL HIGHLIGHTS – continued
For a share outstanding throughout each period.
| | | | | | | | | | | | | | | | | | | | | | | | |
| | | | | Income (Loss) from Investment Operations: | | | | | Less Distributions: |
| | | Net asset
value,
beginning
of the period | | Net
investment
income(c) | | | Net realized
and unrealized
gain (loss) | | | Total from
investment
operations | | | | | Dividends
from
net investment
income | | | Distributions
from net
realized
capital gains |
| Tax-Managed Equity Fund | | | | | | | | | | | | | | | | | | | | | |
| | | | | | | |
| Institutional Class | | | | | | | | | | | | | | | | | | | | | | | | |
3/31/2008(f) | | $ | 11.71 | | $ | 0.05 | | | $ | (1.16 | ) | | $ | (1.11 | ) | | | | $ | (0.20 | ) | | $ | — |
9/30/2007 | | | 10.18 | | | 0.16 | (d) | | | 1.45 | | | | 1.61 | | | | | | (0.08 | ) | | | — |
9/30/2006 | | | 9.20 | | | 0.07 | | | | 0.97 | | | | 1.04 | | | | | | (0.06 | ) | | | — |
9/30/2005 | | | 8.49 | | | 0.05 | | | | 0.69 | | | | 0.74 | | | | | | (0.03 | ) | | | — |
9/30/2004 | | | 7.66 | | | 0.05 | | | | 0.97 | | | | 1.02 | | | | | | (0.19 | ) | | | — |
9/30/2003 | | | 6.78 | | | 0.06 | | | | 0.85 | | | | 0.91 | | | | | | (0.03 | ) | | | — |
(a) Had certain expenses not been reduced during the period, if applicable, total returns would have been lower. Periods less than one year, if applicable, are not annualized.
(b) The investment adviser and/or administrator has agreed to reimburse a portion of the Fund’s expenses and/or reduce its fees during the period. Without this reimbursement/fee reduction, if applicable, expenses would have been higher.
(c) Per share net investment income has been calculated using the average shares outstanding during the period.
(d) Includes a non-recurring special dividend of $0.08 per share in which the source of the dividend has not been determined by the issuer.
(e) Computed on an annualized basis for periods less than one year, if applicable.
(f) For the six months ended March 31, 2008 (Unaudited).
See accompanying notes to financial statements.
39
| | | | | | | | | | | | | | | | | | | |
| | | | | | | | | | | Ratios to Average Net Assets: | | |
Total
distributions | | | Net asset
value,
end of
the period | | Total
return (%)(a) | | | Net assets,
end of
the period
(000’s) | | Net
expenses (%)(b)(e) | | Gross
expenses (%)(e) | | Net
investment
income (%)(e) | | Portfolio
turnover
rate (%) |
| | | | | | | | | | | | | | | | | | | |
| | | | | | | |
| | | | | | | | | | | | | | | | | | | |
| $ | (0.20 | ) | | $ | 10.40 | | (9.7 | ) | | $ | 6,504 | | 0.65 | | 1.88 | | 0.84 | | 20 |
| | (0.08 | ) | | | 11.71 | | 15.9 | | | | 6,670 | | 0.65 | | 1.92 | | 1.51 | | 45 |
| | (0.06 | ) | | | 10.18 | | 11.3 | | | | 9,076 | | 0.65 | | 1.64 | | 0.71 | | 40 |
| | (0.03 | ) | | | 9.20 | | 8.7 | | | | 9,230 | | 0.65 | | 2.02 | | 0.59 | | 38 |
| | (0.19 | ) | | | 8.49 | | 13.4 | | | | 5,202 | | 0.65 | | 3.39 | | 0.59 | | 27 |
| | (0.03 | ) | | | 7.66 | | 13.5 | | | | 2,490 | | 0.65 | | 1.82 | | 0.81 | | 200 |
See accompanying notes to financial statements.
40
NOTES TO FINANCIAL STATEMENTS
March 31, 2008 (Unaudited)
1. Organization. Loomis Sayles Funds I and Loomis Sayles Funds II (the “Trusts” and each a “Trust”) are each organized as a Massachusetts business trust. Each Trust is registered under the Investment Company Act of 1940, as amended (the “1940 Act”), as an open-end management investment company. Each Declaration of Trust permits the Board of Trustees to authorize the issuance of an unlimited number of shares of the Trusts in multiple series. Shares of Loomis Sayles Tax-Managed Equity Fund were first registered under the Securities Act of 1933 (the “1933 Act”) effective March 7, 1997 (subsequent to its commencement of investment operations). Information presented in these financial statements pertains to certain equity funds of the Trusts; the financial statements for the remaining equity funds and the fixed income funds of the Trusts are presented in separate reports. The following funds (individually, a “Fund” and collectively, the “Funds”) are included in this report:
Loomis Sayles Funds I:
Loomis Sayles Small Cap Value Fund (the “Small Cap Value Fund”)
Loomis Sayles Funds II:
Loomis Sayles Mid Cap Growth Fund (the “Mid Cap Growth Fund”)
Loomis Sayles Small Cap Growth Fund (the “Small Cap Growth Fund”)
Loomis Sayles Tax-Managed Equity Fund (the “Tax-Managed Equity Fund”)
Each Fund offers Institutional Class Shares. Mid Cap Growth Fund, Small Cap Growth Fund and Small Cap Value Fund also offer Retail Class Shares. In addition, Small Cap Value Fund offers Admin Class Shares.
Most expenses of the Trusts can be directly attributed to a fund. Expenses which cannot be directly attributed to a fund are generally apportioned based on the relative net assets of each of the funds in the Trusts. Expenses of a fund are borne pro rata by the holders of each class of shares, except that each class bears expenses unique to that class (including the Rule 12b-1 service and distribution fees and transfer agent fees applicable to such class). In addition, each class votes as a class only with respect to its own Rule 12b-1 Plan. Shares of each class would receive their pro rata share of the net assets of a fund if the fund were liquidated. The Trustees approve separate dividends from net investment income on each class of shares.
2. Significant Accounting Policies. The following is a summary of significant accounting policies consistently followed by each Fund in the preparation of its financial statements. The Funds’ financial statements are prepared in accordance with accounting principles generally accepted in the United States of America which require the use of management estimates that affect the reported amounts and disclosures in the financial statements. Actual results could differ from those estimates.
a. Security Valuation. Equity securities, including closed-end investment companies and exchange-traded funds, for which market quotations are readily available are valued at market value, as reported by pricing services recommended by the investment adviser and approved by the Board of Trustees. Such pricing services generally use the security’s last sale price on the exchange or market where the security is primarily traded or, if there is no reported sale during the day, the closing bid price. Securities traded on the NASDAQ Global Select Market, NASDAQ Global Market and NASDAQ Capital Market are valued at the NASDAQ Official Closing Price (“NOCP”), or if lacking a NOCP, at the most recent bid quotation on the applicable NASDAQ Market. Debt securities (other than short-term obligations purchased with an original or remaining maturity of sixty days or less) are generally valued on the basis of evaluated bids furnished to the Fund by a pricing service recommended by the investment adviser and approved by the Board of Trustees, which service determines valuations for normal, institutional-size trading units of such securities using market information, transactions for comparable securities and various relationships between securities which are generally recognized by institutional traders. Broker-dealer bid quotations may also be used to value debt and equity securities where a pricing service does not price a security or where a pricing service does not provide a reliable price for the security. In instances where broker-dealer bid quotations are not available, certain securities held by the Fund may be valued on the basis of a price provided by a principal market maker. Short-term obligations purchased with an original or remaining maturity of sixty days or less are valued at amortized cost, which approximates market value. Securities for which market quotations are not readily available are valued at fair value as determined in good faith by the Fund’s adviser using consistently applied procedures under the general supervision of the Board of Trustees. Investments in other open-end investment companies are valued at their net asset value each day.
The Funds may hold securities traded in foreign markets. Foreign securities are valued at the market price in the foreign market. However, if events occurring after the close of the foreign market (but before the close of regular trading on the New York Stock Exchange) are believed to materially affect the value of those securities, such securities are fair valued pursuant to procedures approved by the Board of Trustees. When fair valuing securities, the Funds may, among other things, use modeling tools or other processes that may take into account factors such as securities market activity and/or significant events that occur after the close of the foreign market and before the Funds calculate their net asset values.
41
b. Security Transactions and Related Investment Income. Security transactions are accounted for on trade date. Dividend income is recorded on ex-dividend date, or in the case of certain foreign securities, as soon as the Fund is notified, and interest income is recorded on an accrual basis. Interest income is increased by the accretion of discount and decreased by the amortization of premium. Investment income is recorded net of foreign taxes withheld when applicable. The Small Cap Value Fund estimates the recharacterization of distributions received from Real Estate Investment Trusts (REITs) into the following categories: ordinary income, long-term and short-term capital gains, and return of capital. In determining net gain or loss on securities sold, the cost of securities has been determined on an identified cost basis. Investment income, non-class specific expenses and realized and unrealized gains and losses are allocated on a pro rata basis to each class based on the relative net assets of each class to the total net assets of the Fund.
c. Foreign Currency Translation. The books and records of the Funds are maintained in U.S. dollars. The value of securities, currencies and other assets and liabilities denominated in currencies other than U.S. dollars are translated into U.S. dollars based upon foreign exchange rates prevailing at the end of the period. Purchases and sales of investment securities, income and expenses are translated on the respective dates of such transactions.
Since the values of investment securities are presented at the foreign exchange rates prevailing at the end of the period, it is not practical to isolate that portion of the results of operations arising from changes in exchange rates caused by fluctuations which arise due to changes in market prices of the investment securities. Such changes are included with the net realized and unrealized gain or loss on investments.
Net realized foreign exchange gains or losses arise from sales of foreign currency, currency gains or losses realized between the trade and settlement dates on securities transactions and the difference between the amounts of dividends, interest and foreign withholding taxes recorded on the Funds’ books and the U.S. dollar equivalent of the amounts actually received or paid. Net unrealized foreign exchange gains and losses arise from changes in the value of assets and liabilities, other than investment securities, at the end of the fiscal period, resulting from changes in exchange rates.
Each Fund may use foreign currency exchange contracts to facilitate transactions in foreign-denominated investments. Losses may arise from changes in the value of the foreign currency or if the counterparties do not perform under the contracts’ terms.
Each Fund may purchase investments of foreign issuers. Investing in securities of foreign issuers involves special risks and considerations not typically associated with investing in U.S. companies and securities of the U.S. government. These risks include revaluation of currencies and the risk of appropriation. Moreover, the markets for securities of many foreign issuers may be less liquid and the price of such securities may be more volatile than those of comparable U.S. companies and the U.S. Government.
d. Forward Foreign Currency Contracts. Each Fund may enter into forward foreign currency contracts. Contracts to buy generally are used to acquire exposure to foreign currencies, while contracts to sell generally are used to hedge a Fund’s investments against currency fluctuation. Also, a contract to buy or sell can offset a previous contract. These contracts involve market risk in excess of the unrealized gain or loss reflected in the Fund’s Statement of Assets and Liabilities. The U.S. dollar value of the currencies a Fund has committed to buy or sell represents the aggregate exposure to each currency the Fund has acquired or hedged through currency contracts outstanding at period end.
All contracts are “marked-to-market” daily at the applicable exchange rates and any gains or losses are recorded for financial statement purposes as unrealized until settlement date. Risks may arise upon entering into these contracts from the potential inability of counterparties to meet the terms of their contracts and from unanticipated movements in the value of a foreign currency relative to the U.S. dollar. At March 31, 2008, there were no open forward currency contracts.
e. Federal and Foreign Income Taxes. Each Trust treats each Fund as a separate entity for federal income tax purposes. Each Fund intends to meet the requirements of the Internal Revenue Code applicable to regulated investment companies, and to distribute to its shareholders substantially all of its net investment income and any net realized capital gains, at least annually. Financial Accounting Standards Board (“FASB”) Interpretation No. 48, Accounting for Uncertainty in Income Taxes—an Interpretation of FASB Statement 109 (“FIN 48”) was issued and became effective for fiscal years beginning after December 15, 2006. FIN 48 sets forth a threshold for financial statement recognition, measurement and disclosure of a tax position taken or expected to be taken on a tax return. Management has performed an analysis of the Fund’s tax positions taken on federal and state tax returns that remain subject to examinations (tax years ended September 30, 2004-2007) and has concluded that no provisions for income tax are required. Fund Management is not aware of any events that are reasonably possible to occur in the next six months that would result in the amounts of any unrecognized tax benefits significantly increasing or decreasing for the Fund. However, management’s conclusions regarding FIN 48 may be subject to review and adjustment at a later date based on factors including, but not limited to, further implementation guidance from the FASB, new tax laws, regulations and interpretations thereof.
A Fund may be subject to foreign taxes on income and gains on investments that are accrued based upon the Fund’s understanding of the tax rules and regulations that exist in the countries in which the Fund invests. Foreign governments may also impose taxes or other payments on investments with respect to foreign securities. Such taxes are accrued as applicable.
42
NOTES TO FINANCIAL STATEMENTS – continued
March 31, 2008 (Unaudited)
f. Dividends and Distributions to Shareholders. Dividends and distributions are recorded on ex-dividend date. The timing and characterization of certain income and capital gain distributions are determined annually in accordance with federal tax regulations, which may differ from accounting principles generally accepted in the United States of America. Permanent differences are primarily due to differing treatments for book and tax purposes of items such as distributions from REITs, net operating losses and redemption in kind transactions. Permanent book and tax basis differences relating to shareholder distributions will result in reclassifications to capital accounts. Temporary differences between book and tax distributable earnings are primarily due to deferred Trustees’ fees and wash sales. Distributions from net investment income and short-term capital gains are considered to be distributed from ordinary income for tax purposes.
The tax characterization of distributions is determined on an annual basis. The tax character of distributions paid to shareholders during the year ended September 30, 2007 was as follows:
| | | | | | | | | |
| | | 2007 Distributions Paid From: |
Fund | | Ordinary
Income | | Long-Term
Capital Gains | | Total |
Mid Cap Growth Fund | | $ | — | | $ | — | | $ | — |
Small Cap Growth Fund | | | — | | | — | | | — |
Small Cap Value Fund | | | 19,298,487 | | | 75,959,602 | | | 95,258,089 |
Tax-Managed Equity Fund | | | 75,417 | | | — | | | 75,417 |
As of September 30, 2007, the capital loss carryforwards were as follows:
| | | | | | | | | | | | |
Capital Loss Carryforward | | Mid Cap
Growth Fund | | Small Cap
Growth Fund | | Small Cap
Value Fund | | Tax-Managed
Equity Fund |
Expires September 30, 2010 | | $ | 66,978,246 | | $ | 139,524,244 | | $ | — | | $ | 1,693,070 |
Expires September 30, 2011 | | | 21,142,388 | | | 59,283,040 | | | — | | | 1,662,157 |
Expires September 30, 2012 | | | — | | | — | | | — | | | 110,150 |
Expires September 30, 2013 | | | — | | | — | | | — | | | 17,395 |
| | | | | | | | | | | | |
Total capital loss carryforward | | $ | 88,120,634 | | $ | 198,807,284 | | $ | — | | $ | 3,482,772 |
| | | | | | | | | | | | |
g. Repurchase Agreements. Each Fund, through its custodian, receives delivery of the underlying securities collateralizing repurchase agreements. It is each Fund’s policy that the market value of the collateral be at least equal to 102% of the repurchase price, including interest. The repurchase agreements are tri-party arrangements whereby the collateral is held at the custodian bank in a segregated account for the benefit of the Fund and on behalf of the counterparty. Repurchase agreements could involve certain risks in the event of default or insolvency of the counterparty including possible delays or restrictions upon a Fund’s ability to dispose of the underlying securities.
h. Securities Lending. The Funds have entered into an agreement with State Street Bank and Trust Company (“State Street Bank”), as agent of the Funds, to lend securities to certain designated borrowers. The loans are collateralized with cash or securities in an amount equal to at least 105% or 102% of the market value of the loaned international or domestic securities, respectively, when the loan is initiated. Thereafter, the value of the collateral must remain at least 102% of the market value of loaned securities for U.S. equities and U.S. corporate debt; at least 105% of the market value of loaned securities for non-U.S. equities; and at least 100% of the market value of loaned securities for U.S. government securities, sovereign debt issued by non-U.S. governments and non-U.S. corporate debt. In the event that the market value of the collateral falls below the required percentages described above, the borrower will deliver additional collateral on the next business day. As with other extensions of credit, the Funds may bear the risk of loss with respect to the investment of the collateral. The Funds invest cash collateral in short-term investments, a portion of the income from which is remitted to the borrowers and the remainder allocated between the Funds and State Street Bank as lending agent. The value of securities on loan to borrowers and the value of collateral held by the Funds with respect to such loans at March 31, 2008 were as follows:
| | | | | | |
| | | Value
of Securities
on Loan | | Value of
Collateral |
Mid Cap Growth Fund | | $ | 47,347,527 | | $ | 49,772,699 |
Small Cap Growth Fund | | | 49,117,532 | | | 50,220,457 |
Small Cap Value Fund | | | 250,993,030 | | | 255,144,557 |
Tax-Managed Equity Fund | | | 2,216,019 | | | 2,250,228 |
43
i. Indemnifications. Under the Trusts’ organizational documents, their officers and Trustees are indemnified against certain liability arising out of the performance of their duties to the Funds. Additionally, in the normal course of business, the Funds enter into contracts with service providers that contain general indemnification clauses. The Funds’ maximum exposure under these arrangements is unknown as this would involve future claims that may be made against Funds that have not yet occurred. However, based on experience, the Funds expect the risk of loss to be remote.
j. New Accounting Pronouncements. In September 2006, Statement of Financial Accounting Standards No. 157, Fair Value Measurements (“FAS 157”), was issued and is effective for fiscal years beginning after November 15, 2007. FAS 157 defines fair value, establishes a framework for measuring fair value and expands disclosures about fair value measurements. Management has evaluated the impact the adoption of FAS 157 will have on the Funds’ financial statements and believes that such impact will be limited to expanded disclosure in the Funds’ financial statements regarding inputs used in determining the value of the Funds’ investments and will not have a material impact on the Funds’ net assets or results of operations.
In March 2008, Statement of Financial Accounting Standards No. 161, Disclosures about Derivative Instruments and Hedging Activities (“FAS 161”), was issued and will be effective for fiscal years and interim periods beginning after November 15, 2008. FAS 161 requires enhanced disclosures about funds’ derivative and hedging activities. Management is currently evaluating the impact the adoption of FAS 161 will have on the Funds’ financial statement disclosures.
3. Purchases and Sales of Securities. For the six months ended March 31, 2008, purchases and sales of securities (excluding short-term investments) were as follows:
| | | | | | |
Fund | | Purchases | | Sales |
Mid Cap Growth Fund | | $ | 149,071,907 | | $ | 78,074,079 |
Small Cap Growth Fund | | | 94,755,704 | | | 29,459,975 |
Small Cap Value Fund | | | 379,573,777 | | | 289,781,724 |
Tax-Managed Equity Fund | | | 1,622,344 | | | 1,264,822 |
4. Management Fees and Other Transactions with Affiliates.
a. Management Fees. Loomis, Sayles & Company, L.P. (“Loomis Sayles”) serves as investment adviser to each Fund. Under the terms of the management agreements, each Fund pays a management fee at the following annual rates, calculated daily and payable monthly, based on each Fund’s average daily net assets:
| | |
Fund | | Percentage of
Average Daily
Net Assets |
Mid Cap Growth Fund | | 0.75% |
Small Cap Growth Fund | | 0.75% |
Small Cap Value Fund | | 0.75% |
Tax-Managed Equity Fund | | 0.50% |
Loomis Sayles has given binding undertakings to the Funds to reduce management fees and/or reimburse certain expenses associated with the Funds to limit their operating expenses. These undertakings are in effect until January 31, 2009 and will be reevaluated on an annual basis. For the six months ended March 31, 2008, the expense limits as a percentage of average daily net assets under the expense limitation agreements were as follows:
| | | | | | |
| | | Expense Limit as a Percentage
of Average Daily Net Assets |
Fund | | Institutional Class | | Retail Class | | Admin Class |
Mid Cap Growth Fund | | 1.00% | | 1.25% | | — |
Small Cap Growth Fund | | 1.00% | | 1.25% | | — |
Small Cap Value Fund | | 0.90% | | 1.15% | | 1.40% |
Tax-Managed Equity Fund | | 0.65% | | — | | — |
44
NOTES TO FINANCIAL STATEMENTS – continued
March 31, 2008 (Unaudited)
For the six months ended March 31, 2008, the management fees for each Fund were as follows:
| | | | | |
Fund | | Management
Fee | | Percentage of
Average Daily
Net Assets |
Mid Cap Growth Fund | | $ | 298,263 | | 0.75% |
Small Cap Growth Fund | | | 256,422 | | 0.75% |
Small Cap Value Fund | | | 3,843,560 | | 0.75% |
Tax-Managed Equity Fund | | | 16,375 | | 0.50% |
For the six months ended March 31, 2008, expenses have been reimbursed as follows:
| | | |
Fund | | Reimbursement |
Mid Cap Growth Fund | | $ | 1,459 |
Small Cap Growth Fund | | | 10,707 |
Small Cap Value Fund | | | 319,176 |
Tax-Managed Equity Fund | | | 40,173 |
Loomis Sayles shall be permitted to recover expenses they have borne under the expense limitation agreement (whether through a reduction of its management fee or otherwise) on a class by class basis in later periods to the extent the expenses of a class fall below a class’ expense limits, provided, however, that a class is not obligated to pay such deferred fees/expenses more than one year after the end of the fiscal year in which the fee/expense was deferred. The amounts subject to possible reimbursement under the expense limitation agreements at March 31, 2008 were as follows:
| | | | | | | | | | | | |
| | | Expenses Subject to Possible Reimbursement Until
September 30, 2008 |
Fund | | Institutional Class | | Retail Class | | Admin Class | | Total |
Mid Cap Growth Fund | | $ | 20,701 | | $ | 49,919 | | $ | — | | $ | 70,620 |
Small Cap Growth Fund | | | 53,263 | | | 12,411 | | | — | | | 65,674 |
Small Cap Value Fund | | | — | | | 325,613 | | | 125,266 | | | 450,879 |
Tax-Managed Equity Fund | | | 86,601 | | | — | | | — | | | 86,601 |
| | | | | | | | | | | | |
| | | Expenses Subject to Possible Reimbursement Until
September 30, 2009 |
Fund | | Institutional Class | | Retail Class | | Admin Class | | Total |
Mid Cap Growth Fund | | $ | — | | $ | 1,459 | | $ | — | | $ | 1,459 |
Small Cap Growth Fund | | | 976 | | | 9,731 | | | — | | | 10,707 |
Small Cap Value Fund | | | — | | | 227,718 | | | 91,458 | | | 319,176 |
Tax-Managed Equity Fund | | | 40,173 | | | — | | | — | | | 40,173 |
Certain officers and employees of Loomis Sayles are also officers or Trustees of the Trust. Loomis Sayles’ general partner is indirectly owned by Natixis Global Asset Management, L.P. (“Natixis US”), which is part of Natixis Global Asset Management, an international asset management group based in Paris, France.
b. Administrative Fees. Natixis Asset Management Advisors, L.P. (“Natixis Advisors”) provides certain administrative services for the Funds and subcontracts with State Street Bank to serve as sub-administrator. Natixis Advisors is a wholly-owned subsidiary of Natixis US. Pursuant to an agreement among Natixis Funds Trust I, Natixis Funds Trust II, Natixis Funds Trust III, Natixis Funds Trust IV, Natixis Cash Management Trust, Gateway Trust (“Natixis Funds Trusts”), Loomis Sayles Funds I, Loomis Sayles Funds II (“Loomis Sayles Funds Trusts”), the Hansberger International Series and Natixis Advisors, each Fund pays Natixis Advisors monthly its pro rata portion of fees equal to an annual rate of 0.0675% of the first $5 billion of the average daily net assets of the Natixis Funds Trusts, Loomis Sayles Funds Trusts and the Hansberger International Series, 0.0625% of the next $5 billion, 0.0500% of the next $20 billion and 0.045% of such assets in excess of $30 billion, subject to an annual aggregate minimum fee for the Natixis Funds Trusts , Loomis Sayles Funds Trusts and the Hansberger International Series of $5 million, which is reevaluated on an annual basis. New funds are subject to an annual fee of $50,000 plus $12,500 per class and an additional $50,000 if managed by multiple subadvisors in their first calendar year of operations.
Effective October 1, 2007, State Street Bank reduced the fees it receives from Natixis Advisors for serving as sub-administrator to the Funds. Also, effective October 1, 2007, Natixis Advisors has given a binding contractual undertaking to the Funds to waive
45
the administrative fees paid by the Funds in an amount equal to the reduction in sub-administrative fees discussed above. The waiver is in effect through June 30, 2008.
For the six months ended March 31, 2008, amounts paid to Natixis Advisors for administrative fees were as follows:
| | | | | | | | | |
Fund | | Gross
Administrative
Fees | | Waiver of
Administrative
Fees | | Net
Administrative
Fees |
Mid Cap Growth Fund | | $ | 20,740 | | $ | 1,010 | | $ | 19,730 |
Small Cap Growth Fund | | | 17,848 | | | 867 | | | 16,981 |
Small Cap Value Fund | | | 268,358 | | | 12,955 | | | 255,403 |
Tax-Managed Equity Fund | | | 1,715 | | | 83 | | | 1,632 |
c. Service and Distribution Fees. Natixis Distributors, L.P. (“Natixis Distributors”), a wholly owned subsidiary of Natixis US, has entered into a distribution agreement with the Trust. Pursuant to this agreement, Natixis Distributors serves as principal underwriter of each Fund.
Pursuant to Rule 12b-1 under the 1940 Act, the Mid Cap Growth Fund, the Small Cap Growth Fund and the Small Cap Value Fund have adopted Distribution Plans relating to their Retail Class shares (the “Retail Class Plan”) and the Small Cap Value Fund has adopted a separate Distribution Plan relating to its Admin Class shares (the “Admin Class Plan”).
Under the respective Retail Class and Admin Class Plans, each Fund pays Natixis Distributors a monthly distribution fee at an annual rate not to exceed 0.25% of the average daily net assets attributable to the Fund’s Retail Class and Admin Class Shares, as reimbursement for expenses incurred by Natixis Distributors in providing personal services to investors in Retail Class and Admin Class Shares and/or maintenance of shareholder accounts. In addition, the Admin Class shares of the Small Cap Value Fund may pay an administrative service fee, at an annual rate not to exceed 0.25% of the average daily net assets attributable to Admin Class shares, to securities dealers or financial intermediaries for providing personal service and account maintenance for their customers who hold such shares.
For the six months ended March 31, 2008, the Funds paid the following service and distribution fees:
| | | | | | | | | |
| | | Service Fees | | Distribution Fees |
Fund | | Admin
Class | | Retail
Class | | Admin
Class |
Mid Cap Growth Fund | | $ | — | | $ | 64,933 | | $ | — |
Small Cap Growth Fund | | | — | | | 41,549 | | | — |
Small Cap Value Fund | | | 94,462 | | | 558,399 | | | 94,462 |
Tax-Managed Equity Fund | | | — | | | — | | | — |
d. Sub-Transfer Agent Fees. Natixis Distributors has entered into agreements with financial intermediaries to provide certain recordkeeping, processing, shareholder communications and other services to customers of the intermediaries and has agreed to compensate the intermediaries for providing those services. Certain services would be provided by the Funds if the shares of those customers were registered directly with the Funds’ transfer agent. Accordingly, the Funds agreed to pay a portion of the intermediary fees attributable to shares of the Fund held by the intermediary (which generally is a percentage of the value of shares held) not exceeding what the Funds would have paid its transfer agent had each customer’s shares been registered directly with the transfer agent instead of held through the intermediary. Natixis Distributors pays the remainder of the fees. Listed below are the fees incurred by the Funds which are included in the transfer agent fees and expenses in the Statements of Operations.
| | | | | | | | | |
| | | Sub-Transfer Agent Fees |
Fund | | Institutional
Class | | Retail
Class | | Admin
Class |
Mid Cap Growth Fund | | $ | 3,728 | | $ | 14,071 | | $ | — |
Small Cap Growth Fund | | | 4,005 | | | 12,866 | | | — |
Small Cap Value Fund | | | 81,523 | | | 346,925 | | | 111,203 |
Tax-Managed Equity Fund | | | 72 | | | — | | | — |
e. Trustees Fees and Expenses. The Fund does not pay any compensation directly to its officers or Trustees who are directors, officers or employees of Natixis Advisors, Natixis Distributors, Natixis US, or their affiliates. The Chairperson of the Board
46
NOTES TO FINANCIAL STATEMENTS – continued
March 31, 2008 (Unaudited)
receives a retainer fee at the annual rate of $200,000. The Chairperson does not receive any meeting attendance fees for Board of Trustees meetings or committee meetings that she attends. Each independent Trustee (other than the Chairperson) receives, in the aggregate, a retainer fee at the annual rate of $65,000. Each independent Trustee also receives a meeting attendance fee of $7,500 for each meeting of the Board of Trustees that he or she attends in person and $3,750 for each meeting of the Board of Trustees that he or she attends telephonically. In addition, each committee chairman receives an additional retainer fee at the annual rate of $10,000. Each Contract Review and Governance Committee member is compensated $5,000 for each Committee meeting that he or she attends in person and $2,500 for each meeting that he or she attends telephonically. Each Audit Committee member is compensated $6,250 for each Committee meeting that he or she attends in person and $3,125 for each meeting that he or she attends telephonically. These fees are allocated among the Funds in the Natixis Funds Trusts, Loomis Sayles Funds Trusts and the Hansberger International Series based on a formula that takes into account, among other factors, the relative net assets of each Fund. Trustees are reimbursed for travel expenses in connection with attendance at meetings.
Prior to January 1, 2008, each Independent Trustee (other than the Chairperson) received, in the aggregate, a retainer fee at the annual rate of $55,000. Each Independent Trustee also received a meeting attendance fee of $6,000 for each meeting of the Board of Trustees that he or she attended in person and $3,000 for each meeting that he or she attended telephonically. In addition, each Contract Review and Governance Committee member received $4,000 for each committee meeting that he or she attended in person and $2,000 for each committee meeting that he or she attended telephonically. Each Audit Committee member received $5,000 for each committee meeting that he or she attended in person and $2,500 for each committee meeting that he or she attended telephonically. The Chairperson of the Board and committee chair retainers were $200,000 and $10,000, respectively.
A deferred compensation plan (the “Plan”) is available to the Trustees on a voluntary basis. Each participating Trustee will receive an amount equal to the value that such deferred compensation would have been had it been invested in a designated Fund or certain other Funds of the Natixis Funds Trusts, Loomis Sayles Funds Trusts and the Hansberger International Series on the normal payment date. Deferred amounts remain in the Funds until distributed in accordance with the Plan.
f. Redemption Fees. Shareholders of Small Cap Growth Fund and Small Cap Value Fund are charged a 2% redemption fee if they redeem, including redeeming by exchange, any class of shares of such Funds within 60 days of their acquisition (including acquisition by exchange). The redemption fee is intended to offset the costs to the Funds of short-term trading, such as portfolio transaction and market impact costs associated with redemption activity and administrative costs associated with processing redemptions. The redemption fee is deducted from the shareholder’s redemption or exchange proceeds and is paid to the Fund.
The “first-in, first-out” method is used to determine the holding period of redeemed or exchanged shares, which means that if a shareholder acquired shares on different days, the shares acquired first will be redeemed or exchanged first for purposes of determining whether the redemption fee applies. A new holding period begins with each purchase or exchange. These fees are accounted for as an addition to paid-in capital and are presented on the Statements of Changes in Net Assets.
5. Line of Credit. Each Fund, together with certain other funds of Natixis Funds Trusts, Loomis Sayles Funds Trusts and the Hansberger International Series, participates in a $200,000,000 committed line of credit provided by State Street Bank, with an individual limit of $125,000,000 for each Fund that participates in the line of credit. Interest is charged to each participating fund based on its borrowings at a rate per annum equal to the Federal Funds rate plus 0.50%. In addition, a commitment fee of 0.09% per annum, payable at the end of each calendar quarter, is accrued and apportioned among the participating funds based on their average daily unused portion of the line of credit. For the six months ended March 31, 2008, the Funds had no borrowings under this agreement.
Prior to March 12, 2008, each fund together with certain other funds of Natixis Funds Trusts, Loomis Sayles Funds Trusts and Hansberger International Series, participated in a $75,000,000 committed line of credit provided by State Street Bank.
6. Brokerage Commission Recapture. Each Fund has entered into agreements with certain brokers whereby the brokers will rebate a portion of brokerage commissions. All amounts rebated by the brokers are returned to the Funds under such agreements and are included in realized gains in the Statements of Operations. For the six months ended March 31, 2008, amounts rebated under these agreements were as follows:
| | | |
Fund | | Rebates |
Mid Cap Growth Fund | | $ | 14,520 |
Small Cap Growth Fund | | | 6,996 |
Small Cap Value Fund | | | 62,006 |
Tax-Managed Equity Fund | | | 616 |
47
7. Shareholders. At March 31, 2008, the Loomis Sayles Funded Pension Plan (“Pension Plan”) and the Loomis Sayles Employees’ Profit Sharing Retirement Plan held shares of beneficial interest in the Funds as follows:
| | | | |
Fund | | Pension Plan | | Profit Sharing
Retirement Plan |
Mid Cap Growth Fund | | 325,144 | | 343,288 |
Small Cap Growth Fund | | 381,184 | | 382,009 |
Small Cap Value Fund | | 371,979 | | 733,841 |
Tax-Managed Equity Fund | | — | | — |
At March 31, 2008, three shareholders individually owned more than 5% of the Tax-Managed Equity Fund’s total outstanding shares, representing, in aggregate, 19.03% of the Fund.
8. Capital Shares. Each Fund may issue an unlimited number of shares of beneficial interest, without par value. Transactions in capital shares were as follows:
| | | | | | | | | | | | | | |
| | | Mid Cap Growth Fund | |
| | |
| | | Six Months Ended March 31, 2008 | | | Year Ended September 30, 2007 | |
| | | | |
| Institutional Class | | Shares | | | Amount | | | Shares | | | Amount | |
Issued from the sale of shares | | 434,821 | | | $ | 12,366,299 | | | 122,987 | | | $ | 2,932,877 | |
Issued in connection with the
reinvestment of distributions | | — | | | | — | | | — | | | | — | |
Redeemed | | (208,611 | ) | | | (5,464,972 | ) | | (113,087 | ) | | | (2,616,811 | ) |
| | | | | | | | | | | | | | |
Net change | | 226,210 | | | $ | 6,901,327 | | | 9,900 | | | $ | 316,066 | |
| | | | | | | | | | | | | | |
| | | | |
| Retail Class | | Shares | | | Amount | | | Shares | | | Amount | |
Issued from the sale of shares | | 3,157,549 | | | $ | 81,916,486 | | | 404,396 | | | $ | 9,618,611 | |
Issued in connection with the
reinvestment of distributions | | — | | | | — | | | — | | | | — | |
Redeemed | | (439,102 | ) | | | (11,470,194 | ) | | (616,665 | ) | | | (14,067,412 | ) |
| | | | | | | | | | | | | | |
Net change | | 2,718,447 | | | $ | 70,446,292 | | | (212,269 | ) | | $ | (4,448,801 | ) |
| | | | | | | | | | | | | | |
Increase (decrease) from capital
share transactions | | 2,944,657 | | | $ | 77,347,619 | | | (202,369 | ) | | $ | (4,132,735 | ) |
| | | | | | | | | | | | | | |
| |
| | | Small Cap Growth Fund | |
| | |
| | | Six Months Ended March 31, 2008 | | | Year Ended September 30, 2007 | |
| | | | |
| Institutional Class | | Shares | | | Amount | | | Shares | | | Amount | |
Issued from the sale of shares | | 1,611,457 | | | $ | 23,847,625 | | | 227,764 | | | $ | 3,236,460 | |
Issued in connection with the
reinvestment of distributions | | — | | | | — | | | — | | | | — | |
Redeemed | | (252,417 | ) | | | (3,596,454 | ) | | (158,397 | ) | | | (2,160,742 | ) |
| | | | | | | | | | | | | | |
Net change | | 1,359,040 | | | $ | 20,251,171 | | | 69,367 | | | $ | 1,075,718 | |
| | | | | | | | | | | | | | |
| | | | |
| Retail Class | | Shares | | | Amount | | | Shares | | | Amount | |
Issued from the sale of shares | | 4,312,171 | | | $ | 59,434,837 | | | 1,247,066 | | | $ | 17,800,763 | |
Issued in connection with the
reinvestment of distributions | | — | | | | — | | | — | | | | — | |
Redeemed | | (952,937 | ) | | | (12,972,164 | ) | | (147,091 | ) | | | (1,980,257 | ) |
| | | | | | | | | | | | | | |
Net change | | 3,359,234 | | | $ | 46,462,673 | | | 1,099,975 | | | $ | 15,820,506 | |
| | | | | | | | | | | | | | |
Increase (decrease) from capital
share transactions | | 4,718,274 | | | $ | 66,713,844 | | | 1,169,342 | | | $ | 16,896,224 | |
| | | | | | | | | | | | | | |
48
NOTES TO FINANCIAL STATEMENTS – continued
March 31, 2008 (Unaudited)
| | | | | | | | | | | | | | |
| | | Small Cap Value Fund | |
| | |
| | | Six Months Ended March 31, 2008 | | | Year Ended September 30, 2007 | |
| | | | |
| Institutional Class | | Shares | | | Amount | | | Shares | | | Amount | |
Issued from the sale of shares | | 3,787,839 | | | $ | 93,018,647 | | | 3,665,690 | | | $ | 103,476,796 | |
Issued in connection with the
reinvestment of distributions | | 1,942,238 | | | | 49,352,283 | | | 1,908,336 | | | | 50,494,585 | |
Redeemed | | (2,536,374 | ) | | | (63,077,483 | ) | | (2,978,936 | ) | | | (83,598,708 | ) |
| | | | | | | | | | | | | | |
Net change | | 3,193,703 | | | $ | 79,293,447 | | | 2,595,090 | | | $ | 70,372,673 | |
| | | | | | | | | | | | | | |
| | | | |
| Retail Class | | Shares | | | Amount | | | Shares | | | Amount | |
Issued from the sale of shares | | 5,640,655 | | | $ | 136,600,853 | | | 9,567,844 | | | $ | 267,672,472 | |
Issued in connection with the
reinvestment of distributions | | 1,850,508 | | | | 46,632,804 | | | 1,279,692 | | | | 33,617,503 | |
Redeemed | | (3,632,498 | ) | | | (88,303,370 | ) | | (5,159,588 | ) | | | (145,568,951 | ) |
| | | | | | | | | | | | | | |
Net change | | 3,858,665 | | | $ | 94,930,287 | | | 5,687,948 | | | $ | 155,721,024 | |
| | | | | | | | | | | | | | |
| | | | |
| Admin Class | | Shares | | | Amount | | | Shares | | | Amount | |
Issued from the sale of shares | | 1,164,673 | | | $ | 28,348,156 | | | 1,317,587 | | | $ | 35,992,658 | |
Issued in connection with the
reinvestment of distributions | | 271,956 | | | | 6,747,215 | | | 292,721 | | | | 7,599,049 | |
Redeemed | | (676,254 | ) | | | (16,135,216 | ) | | (1,252,476 | ) | | | (34,632,190 | ) |
| | | | | | | | | | | | | | |
Net change | | 760,375 | | | $ | 18,960,155 | | | 357,832 | | | $ | 8,959,517 | |
| | | | | | | | | | | | | | |
Increase (decrease) from capital
share transactions | | 7,812,743 | | | $ | 193,183,889 | | | 8,640,870 | | | $ | 235,053,214 | |
| | | | | | | | | | | | | | |
| |
| | | Tax-Managed Equity Fund | |
| | |
| | | Six Months Ended March 31, 2008 | | | Year Ended September 30, 2007 | |
| | | | |
| Institutional Class | | Shares | | | Amount | | | Shares | | | Amount | |
Issued from the sale of shares | | 58,225 | | | $ | 632,094 | | | 136,117 | | | $ | 1,473,501 | |
Issued in connection with the
reinvestment of distributions | | 9,661 | | | | 111,971 | | | 6,824 | | | | 70,495 | |
Redemptions-in-kind* | | | | | | | | | (261,354 | ) | | | (2,702,405 | ) |
Redeemed | | (12,413 | ) | | | (132,937 | ) | | (203,597 | ) | | | (2,186,419 | ) |
| | | | | | | | | | | | | | |
Increase (decrease) from capital
share transactions | | 55,473 | | | $ | 611,128 | | | (322,010 | ) | | $ | (3,344,828 | ) |
| | | | | | | | | | | | | | |
* On October 20, 2006, Natixis US liquidated its position of 261,354 shares. This was accomplished through a redemption-in-kind which included $2,453,150 of securities and $249,255 in cash. | |
49

SEMIANNUAL REPORT
March 31, 2008
Loomis Sayles Investment Grade Bond Fund


TABLE OF CONTENTS
Management Discussion and Performance page 1
Portfolio of Investments page 5
Financial Statements page 15
LOOMIS SAYLES INVESTMENT GRADE BOND FUND
PORTFOLIO PROFILE
Objective:
High total investment return through a combination of current income and capital appreciation
Strategy:
Invests primarily in investment-grade, fixed-income securities, although it may invest up to 10% of its assets in lower quality fixed-income securities. The fund may invest any portion of its assets in securities of Canadian issuers and up to 20% in other foreign securities, including emerging markets.
Fund Inception:
December 31, 1996
Managers:
Daniel Fuss, CFA, CIC
Steven Kaseta, CFA
Associate Managers:
Matthew J. Eagan, CFA
Kathleen Gaffney, CFA
Elaine Stokes
Loomis, Sayles & Company, L.P.
Symbols:
| | |
| Class A | | LIGRX |
| Class B | | LGBBX |
| Class C | | LGBCX |
| Class Y | | LSIIX |
| Class J | | LIGJX |
What You Should Know:
This fund invests in fixed-income securities that are subject to credit risk, interest rate risk and liquidity risk. It may also invest in mortgage-related securities that are subject to prepayment risk. The fund can invest a significant percentage of assets in foreign securities and the value of fund shares can be adversely affected by changes in currency exchange rates, political, and economic developments. In emerging markets these risks can be significant. The fund is subject to currency risk, which is the risk that fluctuations in exchange rates between the U.S. dollar and foreign currencies may cause the value of a fund’s investments to decline. Lower rated debt securities have speculative characteristics and may be subject to greater price volatility than higher rated investments. In addition, the secondary market for these securities may lack liquidity. Fund shares should be viewed as a long-term investment.
Management Discussion
Fixed-income investors retreated to safety during the six months ended March 31, 2008, as the U.S. economy slowed and the credit crisis spread around the world. With the capital markets in turmoil, the U.S. Federal Reserve Board acted dramatically, cutting interest rates and taking other steps designed to restore normalcy to the markets. With two separate rate cuts, the target federal funds rate dropped to 2.25% by the end of March 2008.
In this volatile environment, Class A shares of Loomis Sayles Investment Grade Bond Fund provided a total return of 2.95% at net asset value for the six months ended March 31, 2008, including $0.33 in reinvested dividends. The fund’s return trailed the 5.71% return on the Lehman U.S. Government/Credit Index, but was above the 2.23% average return on the funds in Morningstar’s Intermediate-Term Bond category. The fund’s 30-day SEC yield as of the end of March 2008 was 4.11%.
BOND INVESTORS PUT A PREMIUM ON SAFETY
As the market responded to the Fed’s actions, the spread (or difference) between yields on high- and low-quality securities widened. Securities issued by government agencies, including mortgage-backed securities, fared relatively well, but still lagged U.S. Treasury securities as volatility remained high. The first quarter of 2008 was particularly difficult. U.S. investment-grade corporate bonds declined on concerns about possible recession and there was a widespread flight to quality. High-quality bonds with shorter maturities were most highly sought after because they are perceived as safe investments. Overall, Treasuries substantially outperformed higher-risk assets, including both investment-grade and high-yielding corporate debt.
FUND’S LONG TREASURIES CONTRIBUTED TO RESULTS
Relative to the Lehman benchmark, the fund was underweight in longer-term Treasuries.
Although its relatively small position was a disadvantage, the fund gained some benefit
because demand for these issues was strong.
Another positive was the fact that we had trimmed the fund’s holdings in corporate bonds, which fell from favor during the period. Bonds issued by financial companies were especially hard hit when turbulence in the subprime mortgage market began to affect valuations throughout the credit markets.
EXPOSURE TO CORPORATE AND SOME FOREIGN DEBT DETRACTED
The fund’s position in both investment-grade and high-yield corporate bonds held back
results, most notably in the first quarter of 2008, due to growing concerns that corporations might have difficulty accessing the capital markets to meet their funding needs. A large supply of corporate bonds found few buyers.
Although the fund’s foreign holdings generally constituted a major source of strength in 2007, selected investments in securities denominated in the Canadian dollar and the Icelandic krona proved detrimental during the six-month period ended March 31, 2008. Support for those currencies waned amid widespread expectations that major foreign central banks would begin cutting short-term interest rates, motivated by many of the same factors that were present in the U.S. markets.
CAPITAL MARKETS SHOULD REWARD PATIENCE
Despite recent challenges, we see pockets of economic strength in a variety of places, including some resiliency in the industrials sector, where the weak U.S. dollar may stimulate exports. Moreover, corporate spending appears to be tightly disciplined, and non-residential construction seems solid. We also believe the Fed is likely to continue to encourage growth by lowering the fed funds rate further and by taking other measures to maintain liquidity in the financial markets.
After a period of outperformance by Treasuries, we believe we may see attractive valuations in other fixed-income sectors. We think current valuations of many bonds reflect a more dismal scenario for the economy than we feel is warranted. While additional fallout in the high-yield sector is possible, we believe many high-yield bonds offer compelling values. In time, we think patient investors should be rewarded.
1
LOOMIS SAYLES INVESTMENT GRADE BOND FUND
Investment Results through March 31, 2008
PERFORMANCE IN PERSPECTIVE
The charts comparing the fund’s performance to an index provide you with a general sense of how it performed. The fund’s total return for the period shown below appears with and without sales charges and includes fund expenses and fees. An index measures the performance of a theoretical portfolio. Unlike a fund, the index is unmanaged and does not have expenses that affect the results. It is not possible to invest directly in an index. Investors would incur transaction costs and other expenses if they purchased the securities necessary to match the index.
Growth of a $10,000 Investment in Class A Shares1,4
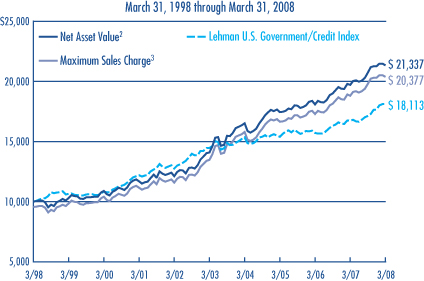
Average Annual Returns - March 31, 20084
| | | | | | | | | | | | |
| | | | | |
| | | 6 MONTHS | | | 1 YEAR | | | 5 YEARS | | | 10 YEARS | |
Class A1 | | | | | | | | | | | | |
Net Asset Value2 | | 2.95 | % | | 8.29 | % | | 8.64 | % | | 7.87 | % |
With Maximum Sales Charge3 | | -1.66 | | | 3.40 | | | 7.65 | | | 7.38 | |
| | | | | |
Class B1 | | | | | | | | | | | | |
Net Asset Value2 | | 2.51 | | | 7.30 | | | 7.71 | | | 6.93 | |
With CDSC5 | | -2.49 | | | 2.30 | | | 7.41 | | | 6.93 | |
| | | | | |
Class C1 | | | | | | | | | | | | |
Net Asset Value2 | | 2.60 | | | 7.50 | | | 7.76 | | | 6.95 | |
With CDSC5 | | 1.60 | | | 6.50 | | | 7.76 | | | 6.95 | |
| | | | | |
Class Y1 | | | | | | | | | | | | |
Net Asset Value2 | | 3.07 | | | 8.47 | | | 8.96 | | | 8.16 | |
| | | | | |
CLASS J1 | | | | | | | | | | | | |
Net Asset Value2 | | 2.70 | | | 7.68 | | | 8.16 | | | 7.36 | |
With Sales Charge5 | | -0.86 | | | 3.95 | | | 7.39 | | | 6.97 | |
| | | | | |
| COMPARATIVE PERFORMANCE | | 6 MONTHS | | | 1 YEAR | | | 5 YEARS | | | 10 YEARS | |
Lehman U.S. Government/Credit Index | | 5.71 | % | | 8.35 | % | | 4.62 | % | | 6.12 | % |
Morningstar Intermediate-Term Bond Fund Avg. | | 2.23 | | | 3.73 | | | 3.75 | | | 5.06 | |
| | | | | | | | | | | | | |
See page 3 for a description of the index/average.
All returns represent past performance and do not guarantee future results. Share price and return will vary and you may have a gain or loss when you sell your shares. All results include reinvestment of any dividends and capital gains. Current returns may be higher or lower than those shown. For performance current to the most recent month-end, visit www.funds.natixis.com. Class Y, the successor to the fund’s Institutional Class, is only available to certain investors as described in the prospectus. Class J shares are not offered for sale in the United States and are not eligible for sale to U.S. investors.
PORTFOLIO FACTS
| | | | |
| |
| | | % of Net Assets as of |
| Credit Quality | | 3/31/08 | | 9/30/07 |
Aaa | | 44.4 | | 40.4 |
Aa | | 2.8 | | 2.0 |
A | | 13.6 | | 7.6 |
Baa | | 28.2 | | 37.1 |
Ba | | 3.3 | | 3.9 |
B | | 1.7 | | 1.2 |
Caa | | 1.3 | | 1.8 |
Not Rated | | 2.9 | | 3.4 |
Short-term and other | | 1.8 | | 2.6 |
Credit quality is based on ratings from Moody’s Investors Service.
* Securities that are not rated by Moody’s may be rated by another rating agency or by Loomis Sayles.
EXPENSE RATIOS AS STATED IN THE MOST RECENT PROSPECTUS
| | | | |
| Share Class | | Gross Expense Ratio6 | | Net Expense Ratio7 |
A | | 0.83% | | 0.83% |
B | | 1.71 | | 1.70 |
C | | 1.57 | | 1.57 |
Y | | 0.55 | | 0.55 |
J | | 1.28 | | 1.28 |
NOTES TO CHARTS
The table and graph do not reflect taxes shareholders might owe on any fund distributions or when they redeem their shares.
1 | Returns shown in the chart include performance of the fund’s Retail Class shares (inception: 12/31/96), which were converted to Class A shares on 9/12/03. Retail Class was closed on 12/18/00 and recommenced operations on 1/31/02; Institutional Class performance is shown for the intervening period, adjusted to reflect the higher expenses paid by Class A shares. The restatement of the fund’s performance to reflect Class A expenses is based on the net expenses of the Class after taking into effect the fund’s then current expense cap arrangements. For periods prior to the inception of Class B and Class C shares (9/12/03), performance is based on prior Institutional Class performance, restated to reflect the loads and expenses of Class B and Class C shares, respectively. Institutional Class became the Class Y on 9/12/03. Class Y performance has been restated to reflect the net expenses of the Institutional Class after taking into effect Class Y’s then current expense cap arrangements. For periods prior to the inception of Class J Shares (5/24/99), performance is based on prior Institutional Class performance, restated to reflect the load and expenses of Class J shares. The growth of $10,000 chart compares the performance of Class A shares at net asset value, to the performance of Class A shares including the maximum sales charge of 4.50%. This chart reflects the performance of Class A shares rather than Class Y shares because Class A shares have the highest sales charge. Prior to 9/12/03, the fund (except Class J) was offered without a sales charge. |
2 | Does not include a sales charge. |
3 | Includes maximum sales charge of 4.50%. |
4 | Fund performance has been increased by expense reductions and reimbursements, if any, without which performance would have been lower. |
5 | Performance for Class B shares assumes a maximum of 5% contingent deferred sales charge (“CDSC”) applied when you sell shares, which declines annually between years 1-6 according to the following schedule: 5, 4, 3, 3, 2, 1, 0%. Class C shares performance assumes a 1% CDSC applied when you sell shares within one year of purchase. Performance for Class J assumes a 3.50% sales charge. |
6 | Before reductions and reimbursements. |
7 | After reductions and reimbursements. Expense reductions are contractual and are set to expire on 1/31/09. |
2
ADDITIONAL INFORMATION
The views expressed in this report reflect those of the portfolio managers as of the dates indicated. The managers’ views are subject to change at any time without notice based on changes in market or other conditions. References to specific securities or industries should not be regarded as investment advice. Because the fund is actively managed, there is no assurance that it will continue to invest in the securities, countries or industries mentioned.
For more complete information on any Natixis Fund, contact your financial professional or call Natixis Funds and ask for a free prospectus, which contains more complete information including charges and other ongoing expenses. Investors should consider a fund’s objective, risks and expenses carefully before investing. This and other fund information can be found in the prospectus. Please read the prospectus carefully before investing.
INDEX/AVERAGE DESCRIPTIONS:
Lehman U.S. Government/Credit Index is an unmanaged index of publicly traded bonds, including U.S. government bonds, U.S. Treasury securities and corporate bonds.
Morningstar Intermediate-Term Bond Fund Average is the average performance without sales charges of funds with similar investment objectives, as calculated by Morningstar, Inc.
PROXY VOTING INFORMATION
A description of the fund’s proxy voting policies and procedures is available without charge, upon request, by calling Natixis Funds at 800-225-5478; on the fund’s website at www.funds.natixis.com; and on the Securities and Exchange Commission’s (SEC’s) website at www.sec.gov. Information regarding how the fund voted proxies relating to portfolio securities during the 12-month period ended June 30, 2007 is available from the fund’s website and the SEC’s website.
QUARTERLY PORTFOLIO SCHEDULES
The fund files a complete schedule of portfolio holdings with the SEC for the first and third quarters of each fiscal year on Form N-Q. The fund’s Forms N-Q are available on the SEC’s website at www.sec.gov and may be reviewed and copied at the SEC’s Public Reference Room in Washington, DC. Information on the operation of the Public Reference Room may be obtained by calling 1-800-SEC-0330.
| | | | |
| NOT FDIC INSURED | | MAY LOSE VALUE | | NO BANK GUARANTEE |
3
UNDERSTANDING YOUR FUND’S EXPENSES
As a mutual fund shareholder, you incur different types of costs: transaction costs, including sales charges (loads) on purchases and contingent deferred sales charges on redemptions; redemption fees; certain exchange fees; and minimum account fee charges; and ongoing costs, including management fees, distribution fees (12b-1 fees) and/or service fees, and other fund expenses. In addition, the fund assesses a minimum balance fee of $20 on an annual basis for accounts that fall below the required minimum to establish an account (certain exceptions may apply). These costs are described in more detail in the fund’s prospectus. The examples below are intended to help you understand the ongoing costs of investing in the fund and help you compare these with the ongoing costs of investing in other mutual funds.
The first line in the table for each Class shows the actual amount of fund expenses you would have paid on a $1,000 investment in the fund from October 1, 2007 through March 31, 2008. It also shows how much a $1,000 investment would be worth at the close of the period, assuming actual fund returns and expenses. To estimate the expenses you paid over the period, simply divide your account value by $1,000 (for example $8,600 account value divided by $1,000 = 8.6) and multiply the result by the number in the Expenses Paid During the Period row as shown below for your class.
The second line in the table for each Class provides information about hypothetical account values and hypothetical expenses based on the fund’s actual expense ratios and an assumed rate of return of 5% per year before expenses, which is not the fund’s actual return. The hypothetical account values and expenses may not be used to estimate the actual ending account balance or expenses you paid on your investment for the period. You may use this information to compare the ongoing costs of investing in the fund and other funds. To do so, compare this 5% hypothetical example with the 5% hypothetical examples that appear in the shareholder reports of the other funds.
Please note that the expenses shown reflect ongoing costs only, and do not include any transaction costs. Therefore, the second line in the table of the fund is useful in comparing ongoing costs only, and will not help you determine the relative costs of owning different funds. If transaction costs were included, total costs would be higher.
| | | | | | |
| LOOMIS SAYLES INVESTMENT GRADE BOND FUND | | BEGINNING ACCOUNT VALUE
10/1/2007 | | ENDING ACCOUNT VALUE
3/31/2008 | | EXPENSES PAID DURING PERIOD*
10/1/2007 – 3/31/2008 |
Class A | | | | | | |
Actual | | $1,000.00 | | $1,029.50 | | $3.96 |
Hypothetical (5% return before expenses) | | $1,000.00 | | $1,021.10 | | $3.94 |
Class B | | | | | | |
Actual | | $1,000.00 | | $1,025.10 | | $8.35 |
Hypothetical (5% return before expenses) | | $1,000.00 | | $1,016.75 | | $8.32 |
Class C | | | | | | |
Actual | | $1,000.00 | | $1,026.00 | | $7.75 |
Hypothetical (5% return before expenses) | | $1,000.00 | | $1,017.35 | | $7.72 |
Class Y | | | | | | |
Actual | | $1,000.00 | | $1,030.70 | | $2.64 |
Hypothetical (5% return before expenses) | | $1,000.00 | | $1,022.40 | | $2.63 |
Class J | | | | | | |
Actual | | $1,000.00 | | $1,027.00 | | $6.44 |
Hypothetical (5% return before expenses) | | $1,000.00 | | $1,018.65 | | $6.41 |
| * | Expenses are equal to the Fund’s annualized expense ratio (after fee reduction/reimbursement): 0.78%, 1.65%, 1.53%, 0.52% and 1.27% for Class A, B, C, Y and J, respectively, multiplied by the average account value over the period, multiplied by the number of days in the most recent fiscal half-year, divided by 366 (to reflect the half-year period). |
4
LOOMIS SAYLES INVESTMENT GRADE BOND FUND — PORTFOLIOOF INVESTMENTS
Investments as of March 31, 2008 (Unaudited)
| | | | | | |
Principal Amount (‡) | | Description | | Value (†) |
| | | | | | |
| | Bonds and Notes — 71.7% of Net Assets | | | |
| | Non-Convertible Bonds — 70.1% | | | |
| | | Airlines — 2.2% | | | |
| $ | 741,423 | | Continental Airlines, Inc., Series 971A,
7.461%, 4/01/2015 | | $ | 689,523 |
| | 19,830,000 | | Continental Airlines, Inc., Series A,
5.983%, 4/19/2022 | | | 17,666,745 |
| | 8,624,000 | | Continental Airlines, Inc., Series B,
6.903%, 4/19/2022 | | | 7,201,040 |
| | 895,012 | | Delta Air Lines, Inc.,
6.821%, 8/10/2022, 144A | | | 841,311 |
| | 18,831,237 | | Delta Air Lines, Inc.,
8.021%, 8/10/2022, 144A | | | 17,136,426 |
| | 11,415,000 | | Northwest Airlines, Inc., Series 07-1,
8.028%, 11/01/2017 | | | 10,730,100 |
| | 8,115,000 | | Qantas Airways Ltd.,
6.050%, 4/15/2016, 144A | | | 8,667,364 |
| | 28,362,457 | | United Air Lines, Inc.,
6.636%, 7/02/2022 | | | 26,377,085 |
| | | | | | |
| | | | | | 89,309,594 |
| | | | | | |
| | | Asset-Backed Securities — 0.1% | | | |
| | 589,956 | | Community Program Loan Trust, Series 1987-A, Class A4,
4.500%, 10/01/2018 | | | 587,208 |
| | 1,700,000 | | Community Program Loan Trust, Series 1987-A, Class A5,
4.500%, 4/01/2029 | | | 1,510,145 |
| | | | | | |
| | | | | | 2,097,353 |
| | | | | | |
| | | Automotive — 1.1% | | | |
| | 10,665,000 | | Cummins, Inc.,
5.650%, 3/01/2098 | | | 8,257,451 |
| | 1,389,000 | | Cummins, Inc.,
6.750%, 2/15/2027 | | | 1,381,526 |
| | 665,000 | | Cummins, Inc.,
7.125%, 3/01/2028 | | | 656,250 |
| | 1,990,000 | | Ford Motor Co.,
6.375%, 2/01/2029 | | | 1,194,000 |
| | 130,000 | | Ford Motor Co.,
6.500%, 8/01/2018(b) | | | 87,100 |
| | 260,000 | | Ford Motor Co.,
6.625%, 2/15/2028 | | | 158,600 |
| | 5,185,000 | | Ford Motor Co.,
6.625%, 10/01/2028 | | | 3,162,850 |
| | 8,730,000 | | Ford Motor Co.,
7.450%, 7/16/2031 | | | 5,761,800 |
| | 245,000 | | Ford Motor Co.,
7.500%, 8/01/2026 | | | 156,800 |
| | 11,270,000 | | Ford Motor Credit Co. LLC,
5.700%, 1/15/2010 | | | 9,790,790 |
| | 700,000 | | Ford Motor Credit Co. LLC,
7.375%, 10/28/2009 | | | 637,793 |
| | 1,540,000 | | Ford Motor Credit Co. LLC,
8.000%, 12/15/2016 | | | 1,205,520 |
| | 935,000 | | Ford Motor Credit Co. LLC,
8.625%, 11/01/2010 | | | 814,662 |
| | 2,135,000 | | Ford Motor Credit Co. LLC,
9.750%, 9/15/2010 | | | 1,901,800 |
| | 575,000 | | General Motors Corp.,
7.400%, 9/01/2025 | | | 385,250 |
| | 8,985,000 | | General Motors Corp.,
8.250%, 7/15/2023 | | | 6,289,500 |
| | | | | | |
Principal Amount (‡) | | Description | | Value (†) |
| | | | | | |
| | | Automotive — continued | | | |
| $ | 245,000 | | General Motors Corp.,
8.375%, 7/15/2033(b) | | $ | 172,725 |
| | | | | | |
| | | | | | 42,014,417 |
| | | | | | |
| | | Banking — 2.7% | | | |
| | 2,595,000 | | BAC Capital Trust VI,
5.625%, 3/08/2035 | | | 2,178,702 |
| | 3,120,000,000 | | Barclays Financial LLC,
4.060%, 9/16/2010, (KRW), 144A | | | 3,280,828 |
| | 180,000,000 | | Barclays Financial LLC,
4.160%, 2/22/2010, (THB), 144A | | | 5,846,922 |
| | 3,500,000,000 | | Barclays Financial LLC,
4.460%, 9/23/2010, (KRW), 144A | | | 3,715,050 |
| | 52,000,000 | | Barclays Financial LLC, Series EMTN,
4.100%, 3/22/2010, (THB), 144A | | | 1,687,953 |
| | 16,371,250,000 | | BNP Paribas SA, Series EMTN,
Zero Coupon, 6/13/2011, (IDR), 144A | | | 1,276,975 |
| | 9,860,000 | | Citibank NA,
15.000%, 7/02/2010, (BRL), 144A | | | 6,083,255 |
| | 20,990,000 | | HSBC Bank USA,
Zero Coupon, 4/18/2012, (MYR), 144A | | | 6,477,139 |
| | 28,000,000 | | HSBC Bank USA,
Zero Coupon, 5/17/2012, (MYR), 144A | | | 8,578,146 |
| | 4,500,000 | | HSBC Bank USA,
3.310%, 8/25/2010, 144A | | | 5,432,400 |
| | 700,000 | | ICICI Bank Ltd.,
6.375%, 4/30/2022, 144A(c) | | | 601,997 |
| | 18,000,000 | | JPMorgan Chase & Co.,
Zero Coupon, 5/17/2010, (BRL), 144A | | | 8,177,531 |
| | 22,683,264,000 | | JPMorgan Chase & Co.,
Zero Coupon, 3/28/2011, (IDR), 144A | | | 1,815,893 |
| | 17,920,000,000 | | JPMorgan Chase & Co.,
Zero Coupon, 3/28/2011, (IDR), 144A | | | 1,433,211 |
| | 68,827,366,920 | | JPMorgan Chase & Co.,
Zero Coupon, 4/12/2012, (IDR), 144A | | | 4,833,244 |
| | 24,108,050 | | JPMorgan Chase & Co., Series EMTN,
Zero Coupon, 6/08/2012, (MYR), 144A | | | 6,717,995 |
| | 24,124,936,500 | | JPMorgan Chase London,
Zero Coupon, 10/21/2010, (IDR), 144A | | | 2,036,926 |
| | 100,000 | | Keybank NA,
6.950%, 2/01/2028 | | | 91,696 |
| | 329,700,000 | | Kreditanstalt fuer Wiederaufbau, Series EMTN,
10.000%, 10/27/2008, (ISK) | | | 4,329,040 |
| | 30,000,000 | | Kreditanstalt Fuer Wiederaufbau, Series EMTN,
10.750%, 2/01/2010, (ISK) | | | 392,422 |
| | 13,950,000 | | PNC Bank NA,
6.875%, 4/01/2018 | | | 14,186,634 |
| | 330,000,000 | | Rabobank Nederland, Series EMTN,
12.500%, 2/17/2009, (ISK) | | | 4,334,722 |
| | 1,176,000,000 | | Rabobank Nederland, Series EMTN,
14.000%, 1/28/2009, (ISK), 144A | | | 15,603,406 |
| | | | | | |
| | | | | | 109,112,087 |
| | | | | | |
| | | Brokerage — 2.2% | | | |
| | 370,000 | | Bear Stearns Cos., Inc. (The),
4.650%, 7/02/2018 | | | 315,849 |
| | 975,000 | | Bear Stearns Cos., Inc. (The),
5.300%, 10/30/2015 | | | 915,272 |
| | 2,150,000 | | Bear Stearns Cos., Inc. (The),
6.400%, 10/02/2017 | | | 2,122,912 |
See accompanying notes to financial statements.
5
LOOMIS SAYLES INVESTMENT GRADE BOND FUND — PORTFOLIOOF INVESTMENTS (continued)
Investments as of March 31, 2008 (Unaudited)
| | | | | | |
Principal Amount (‡) | | Description | | Value (†) |
| | | | | | |
| | | Brokerage — continued | | | |
| $ | 16,850,000 | | Bear Stearns Cos., Inc. (The),
7.250%, 2/01/2018 | | $ | 17,412,638 |
| | 7,500,000 | | Bear Stearns Cos., Inc. (The), Series MTN,
3.190%, 5/18/2010(c) | | | 6,975,157 |
| | 16,100,000 | | Merrill Lynch & Co., Inc.,
6.110%, 1/29/2037 | | | 12,725,537 |
| | 10,000,000 | | Merrill Lynch & Co., Inc.,
10.710%, 3/08/2017, (BRL) | | | 5,072,092 |
| | 43,590,000 | | Morgan Stanley, Series F, MTN,
6.625%, 4/01/2018 | | | 43,605,344 |
| | | | | | |
| | | | | | 89,144,801 |
| | | | | | |
| | | Building Materials — 0.7% | | | |
| | 10,000,000 | | Masco Corp.,
5.850%, 3/15/2017(b) | | | 9,106,690 |
| | 5,925,000 | | Owens Corning, Inc.,
6.500%, 12/01/2016 | | | 4,911,860 |
| | 18,618,000 | | Owens Corning, Inc.,
7.000%, 12/01/2036 | | | 13,462,620 |
| | 1,060,000 | | USG Corp.,
6.300%, 11/15/2016 | | | 837,400 |
| | | | | | |
| | | | | | 28,318,570 |
| | | | | | |
| | | Chemicals — 2.0% | | | |
| | 6,305,000 | | Lubrizol Corp.,
6.500%, 10/01/2034 | | | 6,320,832 |
| | 2,400,000 | | Methanex Corp.,
6.000%, 8/15/2015 | | | 2,328,000 |
| | 68,560,000 | | PPG Industries, Inc.,
6.650%, 3/15/2018 | | | 72,651,249 |
| | | | | | |
| | | | | | 81,300,081 |
| | | | | | |
| | | Construction Machinery — 0.2% | | | |
| | 6,935,000 | | Toro Co.,
6.625%, 5/01/2037 | | | 7,329,387 |
| | | | | | |
| | | Consumer Cyclical Services — 0.2% | | | |
| | 10,015,000 | | Western Union Co.,
6.200%, 11/17/2036 | | | 9,166,980 |
| | | | | | |
| | | Distributors — 1.6% | | | |
| | 61,345,000 | | Equitable Resources, Inc.,
6.500%, 4/01/2018 | | | 61,657,676 |
| | 3,865,000 | | ONEOK, Inc.,
6.000%, 6/15/2035 | | | 3,425,870 |
| | | | | | |
| | | | | | 65,083,546 |
| | | | | | |
| | | Electric — 2.6% | | | |
| | 11,360,000 | | Bruce Mansfield Unit,
6.850%, 6/01/2034 | | | 12,204,275 |
| | 21,505,000 | | Cleveland Electric Illuminating Co. (The),
5.950%, 12/15/2036 | | | 18,529,009 |
| | 895,000 | | Commonwealth Edison Co.,
4.700%, 4/15/2015 | | | 852,179 |
| | 1,700,000 | | Commonwealth Edison Co.,
5.875%, 2/01/2033 | | | 1,534,464 |
| | 2,750,000 | | Constellation Energy Group, Inc.,
4.550%, 6/15/2015 | | | 2,529,986 |
| | 960,000 | | Dominion Resources, Inc.,
5.950%, 6/15/2035 | | | 906,559 |
| | 5,500,000 | | Empresa Nacional de Electricidad SA (Endesa-Chile),
7.875%, 2/01/2027 | | | 6,057,810 |
| | | | | | |
Principal Amount (‡) | | Description | | Value (†) |
| | | | | | |
| | | Electric — continued | | | |
| $ | 1,000,000 | | Empresa Nacional de Electricidad SA (Endesa-Chile),
8.350%, 8/01/2013 | | $ | 1,151,456 |
| | 1,905,000 | | ITC Holdings Corp.,
5.875%, 9/30/2016, 144A | | | 1,885,586 |
| | 2,830,000 | | ITC Holdings Corp.,
6.375%, 9/30/2036, 144A | | | 2,586,029 |
| | 10,206,405 | | Mackinaw Power LLC,
6.296%, 10/31/2023, 144A | | | 10,985,562 |
| | 1,500,000 | | MidAmerican Energy Holdings Co.,
5.875%, 10/01/2012 | | | 1,585,077 |
| | 1,000,000 | | MidAmerican Energy Holdings Co.,
6.125%, 4/01/2036 | | | 966,536 |
| | 7,185,000 | | MidAmerican Energy Holdings Co.,
6.500%, 9/15/2037 | | | 7,200,627 |
| | 27,500,000 | | Nisource Finance Corp.,
6.400%, 3/15/2018 | | | 27,539,737 |
| | 39,250 | | Quezon Power Philippines Co.,
8.860%, 6/15/2017 | | | 39,643 |
| | 500,000 | | SP Powerassets Ltd.,
3.730%, 10/22/2010, (SGD) | | | 376,642 |
| | 6,570,000 | | Toledo Edison Co.,
6.150%, 5/15/2037(b) | | | 5,817,985 |
| | 1,075,000 | | White Pine Hydro LLC,
6.310%, 7/10/2017(d) | | | 1,054,230 |
| | 1,600,000 | | White Pine Hydro LLC,
6.960%, 7/10/2037(d) | | | 1,375,651 |
| | | | | | |
| | | | | | 105,179,043 |
| | | | | | |
| | | Entertainment — 0.3% | | | |
| | 3,565,000 | | Time Warner, Inc.,
6.500%, 11/15/2036 | | | 3,270,645 |
| | 1,805,000 | | Time Warner, Inc.,
6.625%, 5/15/2029 | | | 1,692,473 |
| | 755,000 | | Time Warner, Inc.,
6.950%, 1/15/2028 | | | 733,360 |
| | 505,000 | | Time Warner, Inc.,
7.625%, 4/15/2031 | | | 528,184 |
| | 330,000 | | Time Warner, Inc.,
7.700%, 5/01/2032 | | | 347,426 |
| | 3,590,000 | | Viacom, Inc., Class B,
6.875%, 4/30/2036 | | | 3,457,012 |
| | | | | | |
| | | | | | 10,029,100 |
| | | | | | |
| | | Food & Beverage — 1.4% | | | |
| | 6,845,000 | | Anheuser-Busch Cos, Inc.,
5.950%, 1/15/2033(b) | | | 6,861,935 |
| | 8,760,000 | | Anheuser-Busch Cos, Inc.,
6.450%, 9/01/2037(b) | | | 9,454,142 |
| | 2,500,000 | | Cargill, Inc.,
5.375%, 3/02/2037, (GBP) | | | 4,053,019 |
| | 1,525,000 | | Cia Brasileira de Bebidas,
8.750%, 9/15/2013 | | | 1,784,250 |
| | 6,080,000 | | Corn Products International, Inc.,
6.625%, 4/15/2037 | | | 6,383,508 |
| | 9,925,000 | | Kraft Foods, Inc.,
6.500%, 8/11/2017 | | | 10,182,544 |
| | 7,895,000 | | Kraft Foods, Inc.,
6.500%, 11/01/2031 | | | 7,415,931 |
| | 8,080,000 | | Kraft Foods, Inc.,
7.000%, 8/11/2037 | | | 8,079,006 |
| | | | | | |
| | | | | | 54,214,335 |
| | | | | | |
See accompanying notes to financial statements.
6
LOOMIS SAYLES INVESTMENT GRADE BOND FUND — PORTFOLIOOF INVESTMENTS (continued)
Investments as of March 31, 2008 (Unaudited)
| | | | | |
Principal
Amount (‡) | | Description | | Value (†) |
| | | | | |
| | Foreign Agency — 0.0% | | | |
| 220,000 | | Alberta Municipal Funding Corp.,
5.700%, 9/01/2011, (CAD) | | $ | 230,888 |
| | | | | |
| | Foreign Local Governments — 0.0% | | | |
| 28,763 | | Province of Alberta,
5.930%, 9/16/2016, (CAD) | | | 31,024 |
| 500,000 | | Province of Nova Scotia,
6.600%, 6/01/2027, (CAD) | | | 608,471 |
| | | | | |
| | | | | 639,495 |
| | | | | |
| | Government Guaranteed — 1.1% | | | |
| 45,000,000 | | Canada Housing Trust,
4.100%, 12/15/2008, (CAD) | | | 44,300,307 |
| | | | | |
| | Government Sponsored — 0.3% | | | |
| 15,000,000 | | Queensland Treasury Corp.,
7.125%, 9/18/2017, (NZD), 144A | | | 11,609,112 |
| | | | | |
| | Healthcare — 3.3% | | | |
| 7,535,000 | | Covidien International Finance,
6.000%, 10/15/2017, 144A | | | 7,766,347 |
| 7,590,000 | | Covidien International Finance,
6.550%, 10/15/2037, 144A | | | 7,757,284 |
| 9,130,000 | | HCA, Inc.,
5.750%, 3/15/2014 | | | 7,532,250 |
| 955,000 | | HCA, Inc.,
6.250%, 2/15/2013 | | | 830,850 |
| 3,250,000 | | HCA, Inc.,
6.300%, 10/01/2012 | | | 2,892,500 |
| 3,205,000 | | HCA, Inc.,
6.375%, 1/15/2015 | | | 2,712,231 |
| 3,660,000 | | HCA, Inc.,
6.500%, 2/15/2016 | | | 3,083,550 |
| 365,000 | | HCA, Inc.,
6.750%, 7/15/2013 | | | 323,025 |
| 3,000,000 | | HCA, Inc.,
7.050%, 12/01/2027 | | | 2,187,552 |
| 900,000 | | HCA, Inc.,
7.190%, 11/15/2015 | | | 765,661 |
| 1,695,000 | | HCA, Inc.,
7.500%, 12/15/2023 | | | 1,330,909 |
| 250,000 | | HCA, Inc.,
7.500%, 11/06/2033 | | | 193,125 |
| 1,135,000 | | HCA, Inc.,
7.580%, 9/15/2025 | | | 888,413 |
| 3,265,000 | | HCA, Inc.,
7.690%, 6/15/2025 | | | 2,587,663 |
| 1,430,000 | | HCA, Inc.,
7.750%, 7/15/2036 | | | 1,098,070 |
| 3,030,000 | | HCA, Inc.,
8.360%, 4/15/2024 | | | 2,515,145 |
| 2,865,000 | | Hospira, Inc.,
6.050%, 3/30/2017 | | | 2,839,579 |
| 57,190,000 | | Medco Health Solutions, Inc.,
7.125%, 3/15/2018 | | | 58,599,104 |
| 530,000 | | Owens & Minor, Inc.,
6.350%, 4/15/2016 | | | 535,622 |
| 27,070,000 | | WellPoint, Inc.,
6.375%, 6/15/2037 | | | 24,267,470 |
| | | | | |
| | | | | 130,706,350 |
| | | | | |
| | | | | | |
Principal
Amount (‡) | | Description | | Value (†) |
| | | | | | |
| | | Healthcare Insurance — 0.1% | | | |
| $ | 5,455,000 | | CIGNA Corp.,
6.150%, 11/15/2036 | | $ | 4,748,556 |
| | | | | | |
| | | Home Construction — 0.6% | | | |
| | 850,000 | | Centex Corp.,
5.250%, 6/15/2015 | | | 658,750 |
| | 3,685,000 | | D.R. Horton, Inc.,
5.250%, 2/15/2015 | | | 3,058,550 |
| | 2,050,000 | | Desarrolladora Homex SAB de CV,
7.500%, 9/28/2015(b) | | | 2,034,625 |
| | 2,605,000 | | Lennar Corp., Series B,
5.600%, 5/31/2015 | | | 1,927,700 |
| | 1,870,000 | | Lennar Corp., Series B,
6.500%, 4/15/2016(b) | | | 1,421,200 |
| | 2,945,000 | | Pulte Homes, Inc.,
5.200%, 2/15/2015 | | | 2,503,250 |
| | 250,000 | | Pulte Homes, Inc.,
5.250%, 1/15/2014 | | | 215,625 |
| | 9,400,000 | | Pulte Homes, Inc.,
6.000%, 2/15/2035 | | | 7,238,000 |
| | 3,645,000 | | Pulte Homes, Inc.,
6.375%, 5/15/2033 | | | 2,843,100 |
| | 3,605,000 | | Toll Brothers Finance Corp.,
5.150%, 5/15/2015 | | | 3,260,719 |
| | | | | | |
| | | | | | 25,161,519 |
| | | | | | |
| | | Independent Energy — 1.1% | | | |
| | 4,020,000 | | Anadarko Petroleum Corp.,
5.950%, 9/15/2016 | | | 4,157,275 |
| | 13,905,000 | | Anadarko Petroleum Corp.,
6.450%, 9/15/2036 | | | 14,160,198 |
| | 10,875,000 | | Apache Corp.,
6.000%, 1/15/2037 | | | 10,978,323 |
| | 1,190,000 | | Chesapeake Energy Corp.,
6.250%, 1/15/2017, (EUR) | | | 1,700,234 |
| | 500,000 | | Devon Financing Corp. LLC,
7.875%, 9/30/2031 | | | 614,361 |
| | 2,885,000 | | Talisman Energy, Inc.,
5.850%, 2/01/2037 | | | 2,529,470 |
| | 3,515,000 | | Talisman Energy, Inc.,
6.250%, 2/01/2038 | | | 3,238,419 |
| | 160,000 | | XTO Energy, Inc.,
6.100%, 4/01/2036 | | | 158,305 |
| | 6,230,000 | | XTO Energy, Inc.,
6.750%, 8/01/2037 | | | 6,663,253 |
| | | | | | |
| | | | | | 44,199,838 |
| | | | | | |
| | | Integrated Energy — 0.0% | | | |
| | 1,638,076 | | PF Export Receivables Master Trust,
6.436%, 6/01/2015, 144A | | | 1,719,980 |
| | | | | | |
| | | Life Insurance — 0.4% | | | |
| | 15,400,000 | | ASIF Global Financing XXVII,
2.380%, 2/26/2009, (SGD), 144A | | | 11,186,769 |
| | 4,260,000 | | Mutual of Omaha Insurance Co.,
6.800%, 6/15/2036, 144A | | | 4,191,197 |
| | | | | | |
| | | | | | 15,377,966 |
| | | | | | |
| | | Local Authorities — 0.7% | | | |
| | 19,325,000 | | Queensland Treasury Corp., Series 11G,
6.000%, 6/14/2011, (AUD) | | | 17,271,066 |
See accompanying notes to financial statements.
7
LOOMIS SAYLES INVESTMENT GRADE BOND FUND — PORTFOLIOOF INVESTMENTS (continued)
Investments as of March 31, 2008 (Unaudited)
| | | | | | |
Principal
Amount (‡) | | Description | | Value (†) |
| | | | | | |
| | | Local Authorities — continued | | | |
| $ | 13,640,000 | | Virginia Tobacco Settlement Financing Corp.,
6.706%, 6/01/2046 | | $ | 12,374,071 |
| | | | | | |
| | | | | | 29,645,137 |
| | | | | | |
| | | Media Cable — 1.4% | | | |
| | 16,501,000 | | Comcast Corp.,
5.650%, 6/15/2035 | | | 14,012,303 |
| | 2,195,000 | | Comcast Corp.,
6.450%, 3/15/2037 | | | 2,068,434 |
| | 4,610,000 | | Comcast Corp.,
6.500%, 11/15/2035 | | | 4,360,064 |
| | 32,715,000 | | Comcast Corp.,
6.950%, 8/15/2037 | | | 32,780,594 |
| | 3,750,000 | | Cox Communications, Inc., Class A,
6.750%, 3/15/2011 | | | 3,906,660 |
| | 350,000 | | Virgin Media Finance PLC,
9.750%, 4/15/2014, (GBP) | | | 589,565 |
| | | | | | |
| | | | | | 57,717,620 |
| | | | | | |
| | | Media Non-Cable — 0.7% | | | |
| | 2,500,000 | | Clear Channel Communications, Inc.,
4.250%, 5/15/2009 | | | 2,425,000 |
| | 1,000,000 | | Clear Channel Communications, Inc.,
5.750%, 1/15/2013 | | | 795,000 |
| | 7,700,000 | | News America, Inc.,
6.150%, 3/01/2037 | | | 7,273,666 |
| | 4,095,000 | | News America, Inc.,
6.200%, 12/15/2034 | | | 3,900,004 |
| | 9,760,000 | | News America, Inc.,
6.400%, 12/15/2035 | | | 9,472,266 |
| | 865,000 | | R.H. Donnelley Corp.,
6.875%, 1/15/2013 | | | 527,650 |
| | 555,000 | | R.H. Donnelley Corp.,
8.875%, 10/15/2017, 144A | | | 346,875 |
| | 1,570,000 | | R.H. Donnelley Corp., Series A-1,
6.875%, 1/15/2013 | | | 957,700 |
| | 1,820,000 | | R.H. Donnelley Corp., Series A-2,
6.875%, 1/15/2013 | | | 1,110,200 |
| | 1,760,000 | | R.H. Donnelley Corp., Series A-3,
8.875%, 1/15/2016 | | | 1,113,200 |
| | | | | | |
| | | | | | 27,921,561 |
| | | | | | |
| | | Metals & Mining — 1.3% | | | |
| | 12,775,000 | | Newmont Mining Corp.,
5.875%, 4/01/2035 | | | 10,487,036 |
| | 1,500,000 | | Teck Cominco Ltd.,
7.000%, 9/15/2012 | | | 1,683,167 |
| | 1,985,000 | | United States Steel Corp.,
6.050%, 6/01/2017 | | | 1,836,069 |
| | 3,452,000 | | United States Steel Corp.,
6.650%, 6/01/2037 | | | 2,917,986 |
| | 31,890,000 | | United States Steel Corp.,
7.000%, 2/01/2018 | | | 31,150,024 |
| | 3,735,000 | | Vale Overseas Ltd.,
6.875%, 11/21/2036 | | | 3,644,296 |
| | | | | | |
| | | | | | 51,718,578 |
| | | | | | |
| | | Mortgage Related — 0.1% | | | |
| | 3,000,000 | | Bank of America-First Union NB Commercial Mortgage, Series 2001-3, Class A2,
5.464%, 4/11/2037 | | | 2,992,513 |
| | | | | | |
Principal
Amount (‡) | | Description | | Value (†) |
| | | | | | |
| | | Mortgage Related — continued | | | |
| $ | 1,979,104 | | CS First Boston Mortgage Securities Corp.,
Series 2005-7, Class 3A1,
5.000%, 8/25/2020 | | $ | 1,863,746 |
| | 187,316 | | Federal Home Loan Mortgage Corp.,
5.000%, 12/01/2031 | | | 187,373 |
| | 37,834 | | Federal National Mortgage Association,
6.000%, 7/01/2029 | | | 39,096 |
| | | | | | |
| | | | | | 5,082,728 |
| | | | | | |
| | | Non-Captive Consumer — 2.9% | | | |
| | 81,395,000 | | American General Finance Corp., Series J, MTN,
6.900%, 12/15/2017 | | | 79,545,217 |
| | 400,000 | | Countrywide Financial Corp., Series A, MTN,
2.849%, 12/19/2008(c) | | | 366,000 |
| | 1,170,000 | | Countrywide Home Loans, Inc., Series L, MTN,
4.000%, 3/22/2011 | | | 1,043,462 |
| | 180,000 | | Residential Capital LLC,
8.125%, 11/21/2008(b)(c) | | | 124,200 |
| | 840,000 | | Residential Capital LLC,
8.375%, 6/30/2010(c) | | | 422,100 |
| | 9,150,000 | | Residential Capital LLC,
8.375%, 5/17/2013(c), (GBP) | | | 7,808,608 |
| | 20,645,000 | | Residential Capital LLC,
8.500%, 4/17/2013(c) | | | 10,012,825 |
| | 385,000 | | Residential Capital LLC,
8.875%, 6/30/2015(c) | | | 186,725 |
| | 4,770,000 | | Residential Capital LLC, Series EMTN,
9.875%, 7/01/2014(c), (GBP) | | | 4,070,717 |
| | 200,000 | | SLM Corp.,
4.000%, 1/15/2010 | | | 168,090 |
| | 5,150,000 | | SLM Corp.,
6.500%, 6/15/2010, (NZD) | | | 3,534,672 |
| | 1,990,000 | | SLM Corp., Series A, MTN,
5.000%, 10/01/2013 | | | 1,497,875 |
| | 2,090,000 | | SLM Corp., Series A, MTN,
5.000%, 4/15/2015 | | | 1,489,169 |
| | 960,000 | | SLM Corp., Series A, MTN,
5.000%, 6/15/2018 | | | 686,400 |
| | 1,190,000 | | SLM Corp., Series A, MTN,
5.375%, 1/15/2013 | | | 928,200 |
| | 1,300,000 | | SLM Corp., Series A, MTN,
5.375%, 5/15/2014 | | | 975,611 |
| | 300,000 | | SLM Corp., Series EMTN,
4.750%, 3/17/2014, (EUR) | | | 307,065 |
| | 630,000 | | SLM Corp., Series MTN,
5.050%, 11/14/2014 | | | 458,184 |
| | 690,000 | | SLM Corp., Series MTN,
5.625%, 8/01/2033 | | | 477,825 |
| | | | | | |
| | | | | | 114,102,945 |
| | | | | | |
| | | Non-Captive Diversified — 4.3% | | | |
| | 900,000 | | CIT Group, Inc.,
4.250%, 3/17/2015, (EUR) | | | 836,429 |
| | 450,000 | | CIT Group, Inc.,
5.000%, 2/13/2014 | | | 354,129 |
| | 780,000 | | CIT Group, Inc.,
5.125%, 9/30/2014 | | | 600,600 |
| | 500,000 | | CIT Group, Inc.,
5.400%, 2/13/2012 | | | 399,205 |
| | 7,550,000 | | CIT Group, Inc.,
5.500%, 12/01/2014, (GBP) | | | 9,243,744 |
See accompanying notes to financial statements.
8
LOOMIS SAYLES INVESTMENT GRADE BOND FUND — PORTFOLIOOF INVESTMENTS (continued)
Investments as of March 31, 2008 (Unaudited)
| | | | | | |
Principal
Amount (‡) | | Description | | Value (†) |
| | | | | | |
| | | Non-Captive Diversified — continued | | | |
| $ | 2,370,000 | | CIT Group, Inc.,
6.000%, 4/01/2036 | | $ | 1,801,200 |
| | 87,745,000 | | CIT Group, Inc., Series A,
7.625%, 11/30/2012 | | | 72,927,941 |
| | 1,750,000 | | CIT Group, Inc., Series EMTN,
3.800%, 11/14/2012, (EUR) | | | 1,677,056 |
| | 950,000 | | CIT Group, Inc., Series EMTN,
5.500%, 12/20/2016, (GBP) | | | 1,176,297 |
| | 5,450,000 | | CIT Group, Inc., Series GMTN,
4.250%, 9/22/2011, (EUR) | | | 5,517,612 |
| | 2,050,000 | | CIT Group, Inc., Series GMTN,
5.000%, 5/13/2014, (EUR) | | | 2,071,548 |
| | 21,120,000 | | General Electric Capital Corp.,
6.500%, 9/28/2015, (NZD) | | | 15,348,925 |
| | 4,200,000 | | General Electric Capital Corp.,
6.625%, 2/04/2010, (NZD) | | | 3,212,007 |
| | 13,400,000 | | General Electric Capital Corp., Series A, GMTN,
3.485%, 3/08/2012, (SGD) | | | 9,900,589 |
| | 12,325,000 | | General Electric Capital Corp., Series EMTN,
6.750%, 9/26/2016, (NZD) | | | 9,149,847 |
| | 4,000,000 | | General Electric Capital Corp., Series GMTN,
2.960%, 5/18/2012, (SGD) | | | 2,913,445 |
| | 1,345,000 | | GMAC LLC,
6.000%, 12/15/2011 | | | 1,005,378 |
| | 1,310,000 | | GMAC LLC,
6.625%, 5/15/2012 | | | 990,991 |
| | 1,670,000 | | GMAC LLC,
6.750%, 12/01/2014 | | | 1,181,861 |
| | 1,500,000 | | GMAC LLC,
6.875%, 9/15/2011 | | | 1,148,046 |
| | 400,000 | | GMAC LLC,
6.875%, 8/28/2012 | | | 303,972 |
| | 1,210,000 | | GMAC LLC,
7.000%, 2/01/2012 | | | 920,180 |
| | 2,335,000 | | GMAC LLC,
8.000%, 11/01/2031 | | | 1,673,476 |
| | 2,750,000 | | GMAC LLC, Series EMTN,
5.375%, 6/06/2011, (EUR) | | | 3,004,129 |
| | 7,500,000 | | International Lease Finance Corp.,
6.375%, 3/25/2013 | | | 7,494,217 |
| | 4,925,000 | | iStar Financial, Inc.,
5.150%, 3/01/2012 | | | 3,644,500 |
| | 1,000,000 | | iStar Financial, Inc.,
5.375%, 4/15/2010 | | | 790,000 |
| | 310,000 | | iStar Financial, Inc.,
5.500%, 6/15/2012 | | | 229,400 |
| | 3,670,000 | | iStar Financial, Inc.,
5.650%, 9/15/2011 | | | 2,789,200 |
| | 765,000 | | iStar Financial, Inc.,
5.800%, 3/15/2011 | | | 596,700 |
| | 295,000 | | iStar Financial, Inc.,
5.850%, 3/15/2017 | | | 203,550 |
| | 1,515,000 | | iStar Financial, Inc.,
5.875%, 3/15/2016 | | | 1,060,500 |
| | 740,000 | | iStar Financial, Inc.,
6.050%, 4/15/2015 | | | 525,400 |
| | 335,000 | | iStar Financial, Inc., Series B,
5.125%, 4/01/2011 | | | 257,950 |
| | 5,265,000 | | iStar Financial, Inc., Series B,
5.950%, 10/15/2013 | | | 3,843,450 |
| | | | | | |
Principal
Amount (‡) | | Description | | Value (†) |
| | | | | | |
| | | Non-Captive Diversified — continued | | | |
| $ | 234,000 | | iStar Financial, Inc., Series REGS,
5.700%, 3/01/2014 | | $ | 168,480 |
| | 575,000 | | Prologis,
5.625%, 11/15/2015 | | | 524,841 |
| | 470,000 | | Prologis,
5.750%, 4/01/2016 | | | 431,515 |
| | 745,000 | | Simon Property Group LP,
5.750%, 12/01/2015 | | | 708,694 |
| | | | | | |
| | | | | | 170,627,004 |
| | | | | | |
| | | Oil Field Services — 0.1% | | | |
| | 600,000 | | Transocean Sedco Forex, Inc.,
7.375%, 4/15/2018 | | | 679,274 |
| | 3,840,000 | | Weatherford International Ltd.,
6.500%, 8/01/2036 | | | 3,658,644 |
| | | | | | |
| | | | | | 4,337,918 |
| | | | | | |
| | | Paper — 0.2% | | | |
| | 1,395,000 | | Bowater, Inc.,
6.500%, 6/15/2013 | | | 920,700 |
| | 575,000 | | Georgia-Pacific Corp.,
7.250%, 6/01/2028 | | | 468,625 |
| | 2,460,000 | | Georgia-Pacific Corp.,
7.375%, 12/01/2025 (b) | | | 2,041,800 |
| | 285,000 | | Georgia-Pacific Corp.,
7.750%, 11/15/2029 | | | 239,400 |
| | 1,340,000 | | Georgia-Pacific Corp.,
8.000%, 1/15/2024 | | | 1,179,200 |
| | 2,280,000 | | Georgia-Pacific LLC,
8.875%, 5/15/2031 | | | 2,029,200 |
| | 750,000 | | International Paper Co.,
4.000%, 4/01/2010 | | | 737,180 |
| | 300,000 | | International Paper Co.,
5.250%, 4/01/2016 | | | 266,077 |
| | | | | | |
| | | | | | 7,882,182 |
| | | | | | |
| | | Pharmaceuticals — 1.3% | | | |
| | 20,830,000 | | Astrazeneca PLC,
6.450%, 9/15/2037 | | | 22,350,257 |
| | 28,670,000 | | Johnson & Johnson,
5.950%, 8/15/2037 | | | 30,406,427 |
| | 500,000 | | Schering-Plough Corp.,
5.550%, 12/01/2013 | | | 516,410 |
| | | | | | |
| | | | | | 53,273,094 |
| | | | | | |
| | | Pipelines — 2.3% | | | |
| | 1,174,000 | | Colorado Interstate Gas Co.,
5.950%, 3/15/2015 | | | 1,162,138 |
| | 125,000 | | Colorado Interstate Gas Co.,
6.800%, 11/15/2015 | | | 128,876 |
| | 2,010,000 | | DCP Midstream LP,
6.450%, 11/03/2036, 144A | | | 1,889,776 |
| | 2,470,000 | | El Paso Corp.,
6.950%, 6/01/2028 | | | 2,309,445 |
| | 540,000 | | Energy Transfer Partners LP,
6.125%, 2/15/2017 | | | 525,402 |
| | 1,605,000 | | Energy Transfer Partners LP,
6.625%, 10/15/2036 | | | 1,488,336 |
| | 9,455,000 | | Enterprise Products Operating LP,
6.300%, 9/15/2017 | | | 9,501,329 |
See accompanying notes to financial statements.
9
LOOMIS SAYLES INVESTMENT GRADE BOND FUND — PORTFOLIOOF INVESTMENTS (continued)
Investments as of March 31, 2008 (Unaudited)
| | | | | | |
Principal
Amount (‡) | | Description | | Value (†) |
| | | | | | |
| | | Pipelines — continued | | | |
| $ | 4,390,000 | | Kinder Morgan Energy Partners LP,
5.800%, 3/15/2035 | | $ | 3,713,220 |
| | 310,000 | | Kinder Morgan Finance,
5.700%, 1/05/2016 | | | 293,725 |
| | 320,000 | | Kinder Morgan, Inc., Senior Note,
5.150%, 3/01/2015 | | | 294,400 |
| | 31,430,000 | | NGPL Pipeco LLC,
7.119%, 12/15/2017, 144A | | | 32,512,449 |
| | 4,665,000 | | ONEOK Partners LP,
6.650%, 10/01/2036 | | | 4,501,856 |
| | 2,130,000 | | Plains All American Pipeline LP,
6.125%, 1/15/2017 | | | 2,165,170 |
| | 4,595,000 | | Plains All American Pipeline LP,
6.650%, 1/15/2037 | | | 4,352,945 |
| | 4,215,000 | | Southern Natural Gas Co.,
5.900%, 4/01/2017, 144A | | | 4,120,293 |
| | 2,415,000 | | Tennessee Gas Pipeline Co.,
7.000%, 10/15/2028 | | | 2,406,318 |
| | 20,000,000 | | Texas Eastern Transmission LP,
6.000%, 9/15/2017, 144A | | | 20,934,600 |
| | | | | | |
| | | | | | 92,300,278 |
| | | | | | |
| | | Property & Casualty Insurance – 1.2% | | | |
| | 3,460,000 | | Marsh & McLennan Cos., Inc.,
5.375%, 7/15/2014 | | | 3,342,696 |
| | 12,652,000 | | Marsh & McLennan Cos., Inc.,
5.750%, 9/15/2015 | | | 12,387,282 |
| | 10,125,000 | | Marsh & McLennan Cos., Inc.,
5.875%, 8/01/2033 | | | 8,489,175 |
| | 15,875,000 | | Travelers Cos., Inc.,
6.250%, 6/15/2037 | | | 14,714,585 |
| | 2,830,000 | | Travelers Property Casualty Corp.,
6.375%, 3/15/2033 | | | 2,742,406 |
| | 4,830,000 | | Willis North America, Inc.,
6.200%, 3/28/2017 | | | 4,820,079 |
| | | | | | |
| | | | | | 46,496,223 |
| | | | | | |
| | | Railroads – 1.1% | | | |
| | 5,000,000 | | Canadian Pacific Railway Ltd.,
4.900%, 6/15/2010, (CAD), 144A | | | 4,919,528 |
| | 10,840,000 | | Canadian Pacific Railway Ltd.,
5.950%, 5/15/2037 | | | 8,989,807 |
| | 10,105,000 | | CSX Corp.,
6.000%, 10/01/2036(b) | | | 8,699,233 |
| | 18,555,000 | | CSX Corp.,
6.250%, 3/15/2018 | | | 18,311,466 |
| | 195,000 | | Missouri Pacific Railroad Co.,
4.750%, 1/01/2020 | | | 165,750 |
| | 243,000 | | Missouri Pacific Railroad Co.,
4.750%, 1/01/2030 | | | 206,550 |
| | 1,738,000 | | Missouri Pacific Railroad Co.,
5.000%, 1/01/2045 | | | 1,129,700 |
| | 1,700,000 | | Union Pacific Corp.,
5.375%, 6/01/2033 | | | 1,490,419 |
| | | | | | |
| | | | | | 43,912,453 |
| | | | | | |
| | | Real Estate Investment Trusts – 1.4% | | | |
| | 3,980,000 | | Camden Property Trust,
5.700%, 5/15/2017 | | | 3,446,155 |
| | 4,000,000 | | Colonial Realty LP,
4.800%, 4/01/2011 | | | 3,786,468 |
| | | | | | |
Principal
Amount (‡) | | Description | | Value (†) |
| | | | | | |
| | | Real Estate Investment Trusts – continued | | | |
| $ | 625,000 | | Colonial Realty LP,
5.500%, 10/01/2015 | | $ | 510,113 |
| | 525,000 | | Colonial Realty LP,
6.050%, 9/01/2016 | | | 430,293 |
| | 1,230,000 | | Duke Realty LP,
5.950%, 2/15/2017 | | | 1,066,658 |
| | 20,000,000 | | Duke Realty LP,
6.500%, 1/15/2018 | | | 17,809,520 |
| | 5,000,000 | | Equity One, Inc.,
6.000%, 9/15/2017 | | | 4,415,955 |
| | 1,010,000 | | ERP Operating LP,
5.125%, 3/15/2016 | | | 874,982 |
| | 2,420,000 | | ERP Operating LP,
5.750%, 6/15/2017 | | | 2,203,756 |
| | 10,500,000 | | First Industrial LP,
5.950%, 5/15/2017 | | | 9,084,831 |
| | 3,500,000 | | Highwoods Properties, Inc.,
5.850%, 3/15/2017 | | | 2,989,690 |
| | 2,195,000 | | Highwoods Properties, Inc.,
7.500%, 4/15/2018 | | | 2,042,873 |
| | 7,075,000 | | Realty Income Corp.,
6.750%, 8/15/2019 | | | 6,709,201 |
| | | | | | |
| | | | | | 55,370,495 |
| | | | | | |
| | | Restaurants – 0.0% | | | |
| | 1,000,000 | | McDonald’s Corp.,
3.628%, 10/10/2010, (SGD) | | | 753,691 |
| | | | | | |
| | | Retailers – 2.6% | | | |
| | 15,295,000 | | Home Depot, Inc.,
5.875%, 12/16/2036 | | | 12,486,348 |
| | 8,170,000 | | J.C. Penney Corp., Inc.,
5.750%, 2/15/2018 | | | 7,543,296 |
| | 13,140,000 | | J.C. Penney Corp., Inc.,
6.375%, 10/15/2036 | | | 11,166,727 |
| | 12,000 | | J.C. Penney Corp., Inc.,
7.125%, 11/15/2023 (b) | | | 12,460 |
| | 7,575,000 | | Lowes Cos., Inc.,
6.650%, 9/15/2037 | | | 7,594,134 |
| | 15,790,000 | | Macy’s Retail Holdings, Inc.,
6.375%, 3/15/2037 | | | 12,503,138 |
| | 6,715,000 | | Macy’s Retail Holdings, Inc.,
6.790%, 7/15/2027 | | | 5,508,818 |
| | 6,730,000 | | Macy’s Retail Holdings, Inc.,
6.900%, 4/01/2029 | | | 5,695,303 |
| | 2,040,000 | | Marks & Spencer PLC,
7.125%, 12/01/2037, 144A | | | 1,841,100 |
| | 39,950,000 | | Target Corp.,
7.000%, 1/15/2038 | | | 41,062,927 |
| | | | | | |
| | | | | | 105,414,251 |
| | | | | | |
| | | Sovereigns – 5.0% | | | |
| | 4,250,000 | | Canadian Government,
4.000%, 6/01/2016, (CAD) | | | 4,342,995 |
| | 26,235,000 | | Canadian Government,
4.250%, 9/01/2008, (CAD) | | | 25,743,501 |
| | 5,600,000 | | Canadian Government,
4.250%, 12/01/2008, (CAD) | | | 5,517,237 |
| | 38,265,000 | | Canadian Government,
4.250%, 9/01/2009, (CAD) | | | 38,114,020 |
See accompanying notes to financial statements.
10
LOOMIS SAYLES INVESTMENT GRADE BOND FUND — PORTFOLIOOF INVESTMENTS (continued)
Investments as of March 31, 2008 (Unaudited)
| | | | | |
Principal
Amount (‡) | | Description | | Value (†) |
| | | | | |
| | Sovereigns – continued | | | |
| 9,600,000 | | Canadian Government,
5.500%, 6/01/2010, (CAD) | | $ | 9,921,730 |
| 3,430,000 | | Canadian Government,
5.750%, 6/01/2033, (CAD) | | | 4,297,116 |
| 5,000,000 | | Canadian Government, Series WH31,
6.000%, 6/01/2008, (CAD) | | | 4,902,333 |
| 4,200,900(††) | | Mexican Fixed Rate Bonds, Series M-20,
8.000%, 12/07/2023, (MXN) | | | 41,094,238 |
| 770,000(††) | | Mexican Fixed Rate Bonds, Series MI-10,
9.000%, 12/20/2012, (MXN) | | | 7,698,734 |
| 29,165,000 | | New South Wales Treasury Corp., Series 10RG,
7.000%, 12/01/2010, (AUD) | | | 26,754,849 |
| 15,145,000 | | New South Wales Treasury Corp., Series 12RG,
6.000%, 5/01/2012, (AUD) | | | 13,418,168 |
| 325,000 | | Republic of Brazil,
8.875%, 4/15/2024(b) | | | 403,000 |
| 22,205,000 | | Republic of Brazil,
10.250%, 1/10/2028, (BRL) | | | 11,781,418 |
| 250,000 | | Republic of Brazil,
11.000%, 8/17/2040 | | | 334,750 |
| 6,285,000 | | Republic of Brazil,
12.500%, 1/05/2022, (BRL) | | | 3,886,263 |
| | | | | |
| | | | | 198,210,352 |
| | | | | |
| | Supermarkets — 0.5% | | | |
| 1,000,000 | | Albertson’s, Inc.,
6.625%, 6/01/2028 | | | 850,731 |
| 1,900,000 | | Albertson’s, Inc.,
7.450%, 8/01/2029 | | | 1,749,532 |
| 3,340,000 | | Kroger Co.,
6.400%, 8/15/2017(b) | | | 3,524,949 |
| 11,100,000 | | Safeway, Inc.,
6.350%, 8/15/2017 | | | 11,732,622 |
| | | | | |
| | | | | 17,857,834 |
| | | | | |
| | Supranational — 1.3% | | | |
| 80,900,000 | | Eurofima, Series EMTN,
10.000%, 11/03/2008, (ISK) | | | 1,059,566 |
| 90,000,000 | | Eurofima, Series EMTN,
11.000%, 2/05/2010, (ISK) | | | 1,198,713 |
| 15,500,000 | | European Investment Bank,
4.600%, 1/30/2037, (CAD), 144A | | | 14,614,351 |
| 22,000,000 | | Inter-American Development Bank, Series EMTN,
Zero Coupon, 5/11/2009, (BRL) | | | 10,581,866 |
| 13,265,000 | | Inter-American Development Bank, Series EMTN,
6.000%, 12/15/2017, (NZD) | | | 9,383,754 |
| 1,023,800,000 | | Nordic Investment Bank,
13.000%, 9/12/2008, (ISK) | | | 13,435,305 |
| 26,200,000 | | Nordic Investment Bank, Series EMTN,
11.250%, 4/16/2009, (ISK) | | | 344,462 |
| | | | | |
| | | | | 50,618,017 |
| | | | | |
| | Technology — 3.9% | | | |
| 8,895,000 | | Agilent Technologies, Inc.,
6.500%, 11/01/2017 | | | 8,925,794 |
| 2,035,000 | | Arrow Electronics, Inc.,
6.875%, 7/01/2013 | | | 2,167,409 |
| 2,000,000 | | Arrow Electronics, Inc.,
6.875%, 6/01/2018 | | | 2,062,406 |
| 9,000,000 | | Avnet, Inc.,
5.875%, 3/15/2014 | | | 9,308,871 |
| | | | | | |
Principal
Amount (‡) | | Description | | Value (†) |
| | | | | | |
| | | Technology — continued | | | |
| $ | 6,230,000 | | Avnet, Inc.,
6.000%, 9/01/2015 | | $ | 6,244,902 |
| | 1,540,000 | | Avnet, Inc.,
6.625%, 9/15/2016 | | | 1,589,627 |
| | 260,000 | | Corning, Inc.,
6.850%, 3/01/2029 | | | 264,921 |
| | 6,650,000 | | Corning, Inc.,
7.250%, 8/15/2036 | | | 7,173,342 |
| | 56,440,000 | | Dun & Bradstreet Corp.,
6.000%, 4/01/2013 | | | 56,607,965 |
| | 2,495,000 | | Equifax, Inc.,
7.000%, 7/01/2037 | | | 2,228,207 |
| | 1,660,000 | | Freescale Semiconductor, Inc.,
10.125%, 12/15/2016(b) | | | 1,120,500 |
| | 2,965,000 | | Intuit, Inc.,
5.750%, 3/15/2017 | | | 2,872,305 |
| | 38,725,000 | | Koninklijke (Royal) Philips Electronics N.V.,
6.875%, 3/11/2038 | | | 41,306,834 |
| | 4,700,000 | | Lucent Technologies, Inc.,
6.450%, 3/15/2029 | | | 3,360,500 |
| | 4,680,000 | | Motorola, Inc.,
5.220%, 10/01/2097 | | | 2,523,362 |
| | 1,000,000 | | Motorola, Inc.,
6.500%, 9/01/2025 | | | 821,165 |
| | 2,235,000 | | Motorola, Inc.,
6.500%, 11/15/2028 | | | 1,743,754 |
| | 3,125,000 | | Motorola, Inc.,
6.625%, 11/15/2037 | | | 2,416,991 |
| | 1,625,000 | | Motorola, Inc.,
8.000%, 11/01/2011 | | | 1,651,553 |
| | 2,920,000 | | Samsung Electronics Co. Ltd.,
7.700%, 10/01/2027, 144A | | | 3,177,223 |
| | | | | | |
| | | | | | 157,567,631 |
| | | | | | |
| | | Textile — 0.4% | | | |
| | 25,000 | | Kellwood Co.,
7.625%, 10/15/2017(d) | | | 16,250 |
| | 15,228,000 | | VF Corp.,
6.450%, 11/01/2037 | | | 14,588,652 |
| | | | | | |
| | | | | | 14,604,902 |
| | | | | | |
| | | Tobacco — 0.3% | | | |
| | 8,305,000 | | Reynolds American, Inc.,
6.750%, 6/15/2017 | | | 8,400,200 |
| | 2,035,000 | | Reynolds American, Inc.,
7.250%, 6/15/2037 | | | 2,014,459 |
| | | | | | |
| | | | | | 10,414,659 |
| | | | | | |
| | | Transportation Services — 0.8% | | | |
| | 7,155,000 | | Erac USA Finance Co.,
6.375%, 10/15/2017, 144A | | | 6,392,885 |
| | 2,110,000 | | Erac USA Finance Co.,
6.700%, 6/01/2034, 144A | | | 1,744,974 |
| | 30,565,000 | | Erac USA Finance Co.,
7.000%, 10/15/2037, 144A | | | 25,126,570 |
| | | | | | |
| | | | | | 33,264,429 |
| | | | | | |
| | | Treasuries — 8.8% | | | |
| | 329,500,000 | | U.S. Treasury Bonds,
4.250%, 11/15/2017(b) | | | 351,561,013 |
| | | | | | |
See accompanying notes to financial statements.
11
LOOMIS SAYLES INVESTMENT GRADE BOND FUND — PORTFOLIOOF INVESTMENTS (continued)
Investments as of March 31, 2008 (Unaudited)
| | | | | | |
Principal
Amount (‡) | | Description | | Value (†) |
| | | | | | |
| | | Wireless — 0.9% | | | |
| $ | 1,000,000 | | America Movil SAB de CV,
4.125%, 3/01/2009 | | $ | 1,002,001 |
| | 785,000 | | Nextel Communications, Inc., Series D,
7.375%, 8/01/2015 | | | 604,450 |
| | 35,000 | | Nextel Communications, Inc., Series E,
6.875%, 10/31/2013 | | | 27,650 |
| | 14,095,000 | | Nextel Communications, Inc., Series F,
5.950%, 3/15/2014 | | | 10,430,300 |
| | 1,400,000 | | Philippine Long Distance Telephone Co., Series EMTN,
8.350%, 3/06/2017 | | | 1,557,500 |
| | 2,412,000 | | Sprint Capital Corp.,
6.875%, 11/15/2028 | | | 1,796,940 |
| | 1,640,000 | | Sprint Capital Corp.,
6.900%, 5/01/2019 | | | 1,291,500 |
| | 93,000 | | Sprint Nextel Corp.,
6.000%, 12/01/2016 | | | 72,308 |
| | 5,345,000 | | Vodafone Group Plc,
5.000%, 9/15/2015 | | | 5,079,813 |
| | 12,805,000 | | Vodafone Group Plc,
6.150%, 2/27/2037 | | | 11,935,489 |
| | | | | | |
| | | | | | 33,797,951 |
| | | | | | |
| | | Wirelines — 2.4% | | | |
| | 12,735,000 | | AT&T Corp.,
6.500%, 3/15/2029 | | | 12,334,408 |
| | 1,205,000 | | AT&T, Inc.,
6.150%, 9/15/2034 | | | 1,157,440 |
| | 14,830,000 | | AT&T, Inc.,
6.500%, 9/01/2037 | | | 14,669,717 |
| | 1,590,000 | | Bell Canada,
5.000%, 2/15/2017, (CAD) | | | 1,211,758 |
| | 415,000 | | Bell Canada,
7.300%, 2/23/2032, (CAD) | | | 330,718 |
| | 3,215,000 | | Bell Canada, Series M-17,
6.100%, 3/16/2035, (CAD) | | | 2,291,954 |
| | 8,125,000 | | BellSouth Corp.,
6.000%, 11/15/2034(b) | | | 7,629,757 |
| | 350,000 | | GTE Corp.,
6.940%, 4/15/2028 | | | 353,278 |
| | 1,625,000 | | Koninklijke (Royal) KPN NV,
8.375%, 10/01/2030 | | | 1,859,470 |
| | 65,000 | | Level 3 Financing, Inc.,
8.750%, 2/15/2017 | | | 49,400 |
| | 560,000 | | Level 3 Financing, Inc.,
9.250%, 11/01/2014(b) | | | 457,800 |
| | 620,000 | | New England Telephone & Telegraph,
7.875%, 11/15/2029 | | | 679,691 |
| | 1,735,000 | | Qwest Capital Funding, Inc.,
6.500%, 11/15/2018 | | | 1,405,350 |
| | 2,955,000 | | Qwest Capital Funding, Inc.,
6.875%, 7/15/2028(b) | | | 2,319,675 |
| | 3,215,000 | | Qwest Capital Funding, Inc.,
7.625%, 8/03/2021 | | | 2,716,675 |
| | 1,140,000 | | Qwest Capital Funding, Inc.,
7.750%, 2/15/2031 | | | 957,600 |
| | 700,000 | | Qwest Corp.,
6.875%, 9/15/2033 | | | 560,000 |
| | 630,000 | | Qwest Corp.,
7.200%, 11/10/2026 | | | 530,775 |
| | | | | | |
Principal
Amount (‡) | | Description | | Value (†) |
| | | | | | |
| | | Wirelines — continued | | | |
| $ | 460,000 | | Qwest Corp.,
7.250%, 9/15/2025 | | $ | 400,200 |
| | 1,725,000 | | Qwest Corp.,
7.500%, 6/15/2023 | | | 1,505,063 |
| | 2,905,000 | | Telecom Italia Capital,
6.000%, 9/30/2034 | | | 2,455,265 |
| | 2,850,000 | | Telecom Italia Capital,
6.375%, 11/15/2033 | | | 2,491,974 |
| | 10,520,000 | | Telefonica Emisiones SAU,
7.045%, 6/20/2036 | | | 10,999,165 |
| | 1,000,000 | | Telekom Malaysia Berhad,
7.875%, 8/01/2025, 144A | | | 1,154,919 |
| | 14,445,000 | | Telus Corp.,
4.950%, 3/15/2017, (CAD) | | | 13,033,923 |
| | 7,175,000 | | Verizon Communications,
5.850%, 9/15/2035 | | | 6,536,088 |
| | 4,484,000 | | Verizon Maryland, Inc.,
5.125%, 6/15/2033 | | | 3,591,572 |
| | 1,330,000 | | Verizon New York, Inc., Series B,
7.375%, 4/01/2032 | | | 1,390,269 |
| | | | | | |
| | | | | | 95,073,904 |
| | | | | | |
| | | Total Non-Convertible Bonds (Identified Cost $2,802,735,199) | | | 2,800,520,155 |
| | | | | | |
| | Convertible Bonds — 0.7% | | | |
| | | Independent Energy — 0.1% | | | |
| | 500,000 | | Devon Energy Corp.,
4.900%, 8/15/2008 | | | 797,500 |
| | 1,750,000 | | Devon Energy Corp.,
4.950%, 8/15/2008 | | | 2,791,250 |
| | | | | | |
| | | | | | 3,588,750 |
| | | | | | |
| | | Media Non-Cable — 0.0% | | | |
| | 540,568 | | Liberty Media LLC,
3.500%, 1/15/2031 | | | 377,722 |
| | | | | | |
| | | Non-Captive Consumer — 0.1% | | | |
| | 810,000 | | Countrywide Financial Corp., Series A,
0.758%, 4/15/2037(c) | | | 716,850 |
| | 2,260,000 | | Countrywide Financial Corp., Series B,
0.815%, 5/15/2037(c) | | | 1,932,300 |
| | | | | | |
| | | | | | 2,649,150 |
| | | | | | |
| | | Non-Captive Diversified — 0.2% | | | |
| | 9,920,000 | | iStar Financial, Inc.,
5.229%, 10/01/2012(c) | | | 6,978,720 |
| | | | | | |
| | | Pharmaceuticals — 0.1% | | | |
| | 3,997,000 | | Vertex Pharmaceuticals, Inc.,
4.750%, 2/15/2013 | | | 4,766,423 |
| | 360,000 | | Watson Pharmaceuticals, Inc.,
1.750%, 3/15/2023 | | | 346,500 |
| | | | | | |
| | | | | | 5,112,923 |
| | | | | | |
| | | Technology — 0.0% | | | |
| | 710,000 | | Avnet, Inc.,
2.000%, 3/15/2034 | | | 798,750 |
| | | | | | |
| | | Wireless — 0.1% | | | |
| | 2,995,000 | | NII Holdings, Inc.,
3.125%, 6/15/2012 | | | 2,377,281 |
| | | | | | |
See accompanying notes to financial statements.
12
LOOMIS SAYLES INVESTMENT GRADE BOND FUND — PORTFOLIOOF INVESTMENTS (continued)
Investments as of March 31, 2008 (Unaudited)
| | | | | | |
Principal
Amount (‡) | | Description | | Value (†) |
| | | | | | |
| | | Wirelines — 0.1% | | | |
| $ | 2,735,000 | | Level 3 Communications, Inc.,
3.500%, 6/15/2012 | | $ | 1,873,475 |
| | 230,000 | | Level 3 Communications, Inc.,
5.250%, 12/15/2011 | | | 180,550 |
| | 275,000 | | Level 3 Communications, Inc.,
6.000%, 9/15/2009 | | | 244,062 |
| | 3,760,000 | | Level 3 Communications, Inc.,
6.000%, 3/15/2010 | | | 3,036,200 |
| | | | | | |
| | | | | | 5,334,287 |
| | | | | | |
| | | Total Convertible Bonds (Identified Cost $29,337,385) | | | 27,217,583 |
| | | | | | |
| | Municipals — 0.9% | | | |
| | | Alabama — 0.0% | | | |
| | 1,025,000 | | Alabama Public School & College Authority ( Capital Improvement),
4.500%, 12/01/2026 | | | 968,153 |
| | | | | | |
| | | California — 0.4% | | | |
| | 1,075,000 | | San Diego Unified School District (Election 1998),
4.500%, 7/01/2029, Series F-1, (FSA insured) | | | 1,000,008 |
| | 1,785,000 | | San Jose Redevelopment Agency Tax Allocation (Merged Area),
3.750%, 8/01/2028, Series C, (MBIA insured) | | | 1,431,704 |
| | 1,620,000 | | State of California,
4.500%, 8/01/2027, (AMBAC insured) | | | 1,511,314 |
| | 1,315,000 | | State of California,
4.500%, 8/01/2030, (AMBAC insured) | | | 1,190,049 |
| | 1,135,000 | | State of California,
4.500%, 8/01/2030 | | | 1,020,932 |
| | 4,515,000 | | State of California,
4.500%, 10/01/2029 | | | 4,074,336 |
| | 840,000 | | State of California (Various Purpose),
3.250%, 12/01/2027, (MBIA insured) | | | 630,059 |
| | 3,965,000 | | State of California (Various Purpose),
4.500%, 12/01/2033, (AMBAC insured) | | | 3,542,133 |
| | 280,000 | | University of California Regents Medical Center,
4.750%, 5/15/2031, Series A, (MBIA Insured) | | | 267,501 |
| | | | | | |
| | | | | | 14,668,036 |
| | | | | | |
| | | Illinois — 0.1% | | | |
| | 1,770,000 | | Chicago Board of Education,
4.750%, 12/01/2031, Series B, (FSA insured) | | | 1,694,687 |
| | 540,000 | | Chicago O’Hare International Airport,
4.500%, 1/01/2038, Series A, (FSA insured) | | | 491,405 |
| | | | | | |
| | | | | | 2,186,092 |
| | | | | | |
| | | District Of Columbia — 0.0% | | | |
| | 1,025,000 | | District of Columbia,
4.750%, 6/01/2036, Series A, (FGIC insured) | | | 941,954 |
| | | | | | |
| | | Florida — 0.0% | | | |
| | 1,025,000 | | Florida State Turnpike Authority (Department of Transportation),
3.500%, 7/01/2027, Series A, (MBIA insured) | | | 803,774 |
| | | | | | |
| | | Louisiana — 0.0% | | | |
| | 1,025,000 | | State of Louisiana,
3.250%, 5/01/2026, Series C, (FSA insured) | | | 763,697 |
| | | | | | |
| | | | | | |
Principal
Amount (‡) | | Description | | Value (†) |
| | | | | | |
| | | Massachusetts — 0.0% | | | |
| $ | 1,025,000 | | Massachusetts School Building Authority,
4.750%, 8/15/2032, Series A, (AMBAC insured) | | $ | 982,114 |
| | | | | | |
| | | Michigan — 0.1% | | | |
| | 620,000 | | Grosse Pointe Public School System,
3.000%, 5/01/2027, (FGIC insured) | | | 438,030 |
| | 2,730,000 | | Michigan Tobacco Settlement Finance Authority,
7.309%, 6/01/2034 | | | 2,651,567 |
| | | | | | |
| | | | | | 3,089,597 |
| | | | | | |
| | | Nebraska — 0.1% | | | |
| | 2,560,000 | | Omaha Public Power District,
4.500%, 2/01/2034, Series AA, (FGIC insured) | | | 2,299,392 |
| | | | | | |
| | | Ohio — 0.1% | | | |
| | 6,570,000 | | Buckeye Tobacco Settlement Financing Authority, Series A-2,
5.875%, 6/01/2047 | | | 5,780,812 |
| | | | | | |
| | | Texas — 0.1% | | | |
| | 2,920,000 | | Harris County, TX,
4.500%, 10/01/2031, Series B | | | 2,620,817 |
| | | | | | |
| | | Wisconsin — 0.0% | | | |
| | 700,000 | | Green Bay Wisconsin Water System Revenue,
3.500%, 11/01/2026, (FSA insured) | | | 565,369 |
| | 755,000 | | Green Bay Wisconsin Water System Revenue,
3.500%, 11/01/2029, (FSA insured) | | | 584,106 |
| | 260,000 | | Wisconsin Housing & Economic Development Authority,
4.900%, 11/01/2035, Series E | | | 242,510 |
| | | | | | |
| | | | | | 1,391,985 |
| | | | | | |
| | | Total Municipals (Identified Cost $37,175,368) | | | 36,496,423 |
| | | | | | |
| | | Total Bonds and Notes (Identified Cost $2,869,247,952) | | | 2,864,234,161 |
| | | | | | |
| Shares | | | | |
| | Short-Term Investments – 33.5% | | | |
| | 368,245,624 | | State Street Navigator Securities Lending Prime Portfolio(e) | | | 368,245,624 |
See accompanying notes to financial statements.
13
LOOMIS SAYLES INVESTMENT GRADE BOND FUND — PORTFOLIOOF INVESTMENTS (continued)
Investments as of March 31, 2008 (Unaudited)
| | | | | | | |
Principal
Amount (‡) | | Description | | Value (†) | |
| | | | | | | |
| | Short-Term Investments — continued | | | | |
| $ | 970,000,000 | | Tri-Party Repurchase Agreement with Fixed Income Clearing Corporation, dated 3/31/08 at 1.250% to be repurchased at $970,033,681 on 4/01/08 collateralized by $110,000 Federal Home Loan Mortgage Corp., 5.625% due 11/23/2035 valued at $117,838; $135,125,000 Federal Home Loan Mortgage Corp., 5.500% due 3/09/2017 valued at $138,103,155; $100,000,000 Federal Home Loan Mortgage Corp., 5.750% due 1/23/2017 valued at $103,750,000; $3,600,000 Federal Home Loan Mortgage Corp., 5.510% due 1/23/2023 valued at $3,618,864; $145,000 Federal Home Loan Mortgage Corp., 5.000% due 1/02/2015 valued at $155,875; $50,000,000 Federal Farm Credit Bank, 4.875% due 12/16/2015 valued at $53,625,000; $2,235,000 Federal Farm Credit Bank, 5.150% due 11/15/2019 valued at $2,426,361; $825,000 Federal Farm Credit Bank, 5.210% due 12/19/2022 valued at $891,759; $100,000,000 Federal Home Loan Bank, 5.125% due 8/14/2013 valued at $108,937,185; $50,000,000 Federal Home Loan Mortgage Corp., 5.750% due 6/27/2016 valued at $53,500,000; $505,000 Federal National Mortgage Association, 5.570% due 6/30/2028 valued at $509,419; $3,640,000 Federal National Mortgage Association, 5.400% due 12/14/2022 valued at $3,799,250; $39,565,000 Federal National Mortgage Association, 4.750% due 1/02/2013 valued at $40,566,786; $57,320,000 Federal Home Loan Mortgage Corp., 3.500% due 2/12/2010 valued at $57,749,900; $4,595,000 Federal Home Loan Bank, 5.250% due 6/12/2009 valued at $4,841,981; $60,000,000 Federal Home Loan Bank, 5.250% due 9/11/2009 valued at $62,850,000; $80,000,000 Federal Home Loan Bank, 4.500% due 10/09/2009 valued at $84,900,000; $50,000,000 Federal Home Loan Bank, 4.500% due 11/13/2009 valued at $51,500,000; $34,425,000 Federal Home Loan Bank, 3.600% due 1/29/2010 valued at $34,683,188; $100,000,000 Federal Home Loan Bank, 3.500% due 2/5/2010 valued at $100,875,000; $80,000,000 Federal National Mortgage Association, 5.200% due 11/20/2009 valued at $82,000,000 including accrued interest (Note 2g of Notes to Financial Statements) | | $ | 970,000,000 | |
| | | | | | | |
| | | Total Short-Term Investments (Identified Cost $1,338,245,624) | | | 1,338,245,624 | |
| | | | | | | |
| | | | | | | |
| | | Total Investments — 105.2%
(Identified Cost $4,207,493,576)(a) | | | 4,202,479,785 | |
| | | Other assets less liabilities — (5.2)% | | | (208,258,101 | ) |
| | | | | | | |
| | | Net Assets — 100.0% | | $ | 3,994,221,684 | |
| | | | | | | |
| | | | | | | |
| | (‡) | | Principal amount stated in U.S. dollars unless otherwise noted. | |
| | (†) | | See Note 2a of Notes to Financial Statements. | |
| | (††) | | Amount shown represents units. One unit represents a principal amount of 100. | |
| | (a) | | Federal Tax Information (Amounts exclude certain adjustments made at the end of the fiscal year for tax purposes. Such adjustments are primarily due to wash sales. Amortization of premium on debt securities is excluded for tax purposes.): At March 31, 2008, the net unrealized depreciation on investments based on a cost of $4,208,496,114 for federal income tax purposes was as follows: | |
| | | Aggregate gross unrealized appreciation for all investments in which there is an excess of value over tax cost | | $ | 107,816,873 | |
| | | Aggregate gross unrealized depreciation for all investments in which there is an excess of tax cost over value | | | (113,833,202 | ) |
| | | | | | | |
| | | Net unrealized depreciation | | $ | (6,016,329 | ) |
| | | | | | | |
| | | | |
| (b) | | All or a portion of this security was on loan to brokers at March 31, 2008. |
| (c) | | Variable rate security. The coupon rate shown represents the rate at period end. |
| (d) | | Illiquid Security. At March 31, 2008, the value of these securities amounted to $2,446,131 or 0.06% of net assets. |
| (e) | | Represents investment of securities lending collateral. |
| | |
| 144A | | Securities exempt from registration under Rule 144A of the Securities Act of 1933. These securities may be resold in transactions exempt from registration, normally to qualified institutional buyers. At March 31, 2008, the total value of these securities amounted to $288,707,381 or 7.2% of net assets. |
| | | | |
| AMBAC | | American Municipal Bond Assurance Corp. | | |
| EMTN | | Euro Medium Term Note | | |
| FGIC | | Financial Guarantee Insurance Company | | |
| FSA | | Financial Security Assurance, Inc. | | |
| GMTN | | Global Medium Term Note | | |
| MBIA | | Municipal Bond Investors Assurance Corp. | | |
| MTN | | Medium Term Note | | |
| | | | |
| AUD | | Australian Dollar | | |
| BRL | | Brazilian Real | | |
| CAD | | Canadian Dollar | | |
| EUR | | Euro | | |
| GBP | | British Pound | | |
| IDR | | Indonesian Rupiah | | |
| ISK | | Iceland Krona | | |
| KRW | | South Korean Won | | |
| MXN | | Mexican Peso | | |
| MYR | | Malaysian Ringgit | | |
| NZD | | New Zealand Dollar | | |
| SGD | | Singapore Dollar | | |
| THB | | Thailand Baht | | |
Holdings at March 31, 2008 as a Percentage of Net Assets (unaudited)
| | | |
| Treasuries | | 8.8 | % |
| Sovereigns | | 5.0 | |
| Non-Captive Diversified | | 4.5 | |
| Technology | | 3.9 | |
| Healthcare | | 3.3 | |
| Non-Captive Consumer | | 3.0 | |
| Banking | | 2.7 | |
| Retailers | | 2.6 | |
| Electric | | 2.6 | |
| Wirelines | | 2.5 | |
| Pipelines | | 2.3 | |
| Airlines | | 2.2 | |
| Brokerage | | 2.2 | |
| Chemicals | | 2.0 | |
| Other, less than 2% each | | 24.1 | |
Currency Exposure at March 31, 2008 as a Percentage of Net Assets (unaudited)
| | | |
| United States Dollar | | 58.3 | % |
| Canadian Dollar | | 4.4 | |
| Other, less than 2% each | | 9.0 | |
See accompanying notes to financial statements.
14
STATEMENTOF ASSETSAND LIABILITIES
March 31, 2008 (Unaudited)
| | | | |
| | | Investment Grade
Bond Fund | |
| | | | |
ASSETS | | | | |
Investments at cost | | $ | 4,207,493,576 | |
Net unrealized depreciation | | | (5,013,791 | ) |
| | | | |
Investments at value(a) | | | 4,202,479,785 | |
Cash | | | 191,660,775 | |
Foreign currency at value (identified cost $546,752) | | | 539,648 | |
Receivable for Fund shares sold | | | 42,630,465 | |
Interest receivable | | | 43,688,431 | |
Securities lending income receivable | | | 435,572 | |
| | | | |
TOTAL ASSETS | | | 4,481,434,676 | |
| | | | |
LIABILITIES | | | | |
Collateral on securities loaned, at value (Note 2) | | | 368,245,624 | |
Payable for securities purchased | | | 105,019,451 | |
Payable for Fund shares redeemed | | | 12,015,915 | |
Foreign taxes payable | | | 30,238 | |
Management fees payable (Note 4) | | | 1,311,617 | |
Administrative fees payable (Note 4) | | | 306,690 | |
Deferred Trustees’ fees (Note 4) | | | 105,596 | |
Service and distribution fees payable (Note 4) | | | 143,115 | |
Other accounts payable and accrued expenses | | | 34,746 | |
| | | | |
TOTAL LIABILITIES | | | 487,212,992 | |
| | | | |
NET ASSETS | | $ | 3,994,221,684 | |
| | | | |
NET ASSETS CONSIST OF : | | | | |
Paid-in capital | | $ | 3,929,150,039 | |
Undistributed net investment income | | | 13,952,162 | |
Accumulated net realized gain on investments and foreign currency transactions | | | 56,420,328 | |
Net unrealized depreciation on investments and foreign currency transactions | | | (5,300,845 | ) |
| | | | |
NET ASSETS | | $ | 3,994,221,684 | |
| | | | |
COMPUTATION OF NET ASSET VALUE AND OFFERING PRICE: | | | | |
Class A shares: | | | | |
Net assets | | $ | 1,699,104,053 | |
| | | | |
Shares of beneficial interest | | | 144,761,432 | |
| | | | |
Net asset value and redemption price per share | | $ | 11.74 | |
| | | | |
Offering price per share (100/95.5 of net asset value) (Note 1) | | $ | 12.29 | |
| | | | |
Class B shares: (redemption price per share is equal to net asset value less any applicable contingent deferred sales charge) (Note 1) | | | | |
Net assets | | $ | 17,957,902 | |
| | | | |
Shares of beneficial interest | | | 1,536,522 | |
| | | | |
Net asset value and offering price per share | | $ | 11.69 | |
| | | | |
Class C shares: (redemption price per share is equal to net asset value less any applicable contingent deferred sales charge) (Note 1) | | | | |
Net assets | | $ | 1,182,457,279 | |
| | | | |
Shares of beneficial interest | | | 101,356,962 | |
| | | | |
Net asset value and offering price per share (Note 1) | | $ | 11.67 | |
| | | | |
Class Y shares: | | | | |
Net assets | | $ | 921,851,691 | |
| | | | |
Shares of beneficial interest | | | 78,501,065 | |
| | | | |
Net asset value, offering and redemption price per share | | $ | 11.74 | |
| | | | |
Class J shares: | | | | |
Net assets | | $ | 172,850,759 | |
| | | | |
Shares of beneficial interest | | | 14,744,230 | |
| | | | |
Net asset value and offering price per share | | $ | 11.72 | |
| | | | |
Offering price per share (100/96.50 of net asset value) (Note 1) | | $ | 12.15 | |
| | | | |
(a) Including securities on loan with market value of: | | $ | 363,242,041 | |
| | | | |
See accompanying notes to financial statements.
15
STATEMENTOF OPERATIONS
For the Six Months Ended March 31, 2008 (Unaudited)
| | | | |
| | | Investment Grade
Bond Fund | |
| | | | |
INVESTMENT INCOME | | | | |
Interest | | $ | 84,429,945 | |
Securities lending income (Note 2) | | | 2,661,314 | |
| | | | |
| | | 87,091,259 | |
| | | | |
Expenses | | | | |
Management fees (Note 4) | | | 6,111,109 | |
Service fees - Class A (Note 4) | | | 1,601,272 | |
Service and distribution fees - Class B (Note 4) | | | 87,891 | |
Service and distribution fees - Class C (Note 4) | | | 4,476,231 | |
Service and distribution fees - Class J (Note 4) | | | 665,802 | |
Trustees’ fees and expenses (Note 4) | | | 26,570 | |
Administrative fees (Note 4) | | | 797,932 | |
Custodian fees and expenses | | | 78,885 | |
Transfer agent fees and expenses - Class A | | | 316,089 | |
Transfer agent fees and expenses - Class B | | | 6,797 | |
Transfer agent fees and expenses - Class C | | | 219,328 | |
Transfer agent fees and expenses - Class Y | | | 144,117 | |
Transfer agent fees and expenses - Class J | | | 4,169 | |
Audit and tax services fees | | | 24,319 | |
Legal fees - Class A | | | 7,661 | |
Legal fees - Class B | | | 205 | |
Legal fees - Class C | | | 5,482 | |
Legal fees - Class Y | | | 3,989 | |
Legal fees - Class J | | | 9,156 | |
Shareholder reporting expenses - Class A | | | 34,265 | |
Shareholder reporting expenses - Class B | | | 1,923 | |
Shareholder reporting expenses - Class C | | | 29,710 | |
Shareholder reporting expenses - Class Y | | | 10,951 | |
Shareholder reporting expenses - Class J | | | 39,688 | |
Registration fees - Class A | | | 73,303 | |
Registration fees - Class B | | | 7,348 | |
Registration fees - Class C | | | 37,092 | |
Registration fees - Class Y | | | 36,948 | |
Registration fees - J | | | 1,179 | |
Expense recapture - Class B (Note 4) | | | 830 | |
Miscellaneous expenses | | | 26,099 | |
| | | | |
Total expenses | | | 14,886,340 | |
Less fee reduction and/or expense reimbursement (Note 4) | | | (38,711 | ) |
| | | | |
Net expenses | | | 14,847,629 | |
| | | | |
Net investment income | | | 72,243,630 | |
| | | | |
NET REALIZED AND UNREALIZED GAIN (LOSS) ON INVESTMENTS AND FOREIGN CURRENCY TRANSACTIONS | | | | |
Net realized gain on: | | | | |
Investments | | | 60,050,701 | |
Foreign currency transactions | | | 133,416 | |
Net change in unrealized appreciation (depreciation) on: | | | | |
Investments (net of change in foreign capital gains tax accrual of $30,238) | | | (65,627,903 | ) |
Foreign currency translations | | | (447,170 | ) |
| | | | |
Net realized and unrealized loss on investments and foreign currency transactions | | | (5,890,956 | ) |
| | | | |
NET INCREASE IN NET ASSETS RESULTING FROM OPERATIONS | | $ | 66,352,674 | |
| | | | |
See accompanying notes to financial statements.
16
STATEMENTOF CHANGESIN NET ASSETS
| | | | | | | | |
| | | Investment Grade Bond Fund | |
| | | Six Months Ended
March 31, 2008
(Unaudited) | | | Year Ended
September 30,
2007 | |
| | | | | | | | |
FROM OPERATIONS: | | | | | | | | |
Net investment income | | $ | 72,243,630 | | | $ | 54,015,656 | |
Net realized gain on investments and foreign currency transactions | | | 60,184,117 | | | | 15,696,855 | |
Net change in net unrealized appreciation (depreciation) on investments and foreign currency translations | | | (66,075,073 | ) | | | 35,540,172 | |
| | | | | | | | |
Net increase in net assets resulting from operations | | | 66,352,674 | | | | 105,252,683 | |
| | | | | | | | |
FROM DISTRIBUTIONS TO SHAREHOLDERS: | | | | | | | | |
Net investment income | | | | | | | | |
Class A | | | (34,393,751 | ) | | | (20,224,906 | ) |
Class B | | | (417,664 | ) | | | (482,009 | ) |
Class C | | | (21,248,867 | ) | | | (12,175,921 | ) |
Class Y | | | (19,054,507 | ) | | | (11,008,683 | ) |
Class J | | | (4,604,914 | ) | | | (9,643,008 | ) |
| | | | | | | | |
Total distributions | | | (79,719,703 | ) | | | (53,534,527 | ) |
| | | | | | | | |
INCREASE IN NET ASSETS FROM CAPITAL SHARE TRANSACTIONS (NOTE 7) | | | 1,920,511,140 | | | | 1,503,474,421 | |
| | | | | | | | |
Net increase in net assets | | | 1,907,144,111 | | | | 1,555,192,577 | |
| | | | | | | | |
NET ASSETS | | | | | | | | |
Beginning of period | | | 2,087,077,573 | | | | 531,884,996 | |
| | | | | | | | |
End of period | | $ | 3,994,221,684 | | | $ | 2,087,077,573 | |
| | | | | | | | |
UNDISTRIBUTED NET INVESTMENT INCOME | | $ | 13,952,162 | | | $ | 21,428,235 | |
| | | | | | | | |
See accompanying notes to financial statements.
17
This Page Intentionally Left Blank
18
FINANCIAL HIGHLIGHTS
For a share outstanding throughout each period.
| | | | | | | | | | | | | | | | | | | | | | | | |
| | | | | Income (Loss) from Investment Operations: | | Less Distributions: | |
| | | Net asset
value,
beginning
of
the period | | Net
investment
income(d) | | Net realized
and unrealized
gain (loss) | | Total from
investment
operations | | Dividends
from
net investment
income | | | Distributions
from net
realized
capital gains | | | Total
distributions | |
| | | | | | | | | | | | | | | | | | | | | | | | |
Class A | | | | | | | | | | | | | | | | | | | | | | | | |
3/31/2008(i) | | $ | 11.73 | | $ | 0.29 | | $ | 0.05 | | $ | 0.34 | | $ | (0.33 | ) | | $ | — | | | $ | (0.33 | ) |
9/30/2007 | | | 11.35 | | | 0.58 | | | 0.42 | | | 1.00 | | | (0.62 | ) | | | — | | | | (0.62 | ) |
9/30/2006 | | | 11.71 | | | 0.51 | | | 0.10 | | | 0.61 | | | (0.75 | ) | | | (0.22 | ) | | | (0.97 | ) |
9/30/2005 | | | 11.84 | | | 0.49 | | | 0.29 | | | 0.78 | | | (0.74 | ) | | | (0.17 | ) | | | (0.91 | ) |
9/30/2004 | | | 11.54 | | | 0.52 | | | 0.45 | | | 0.97 | | | (0.60 | ) | | | (0.07 | ) | | | (0.67 | ) |
9/30/2003 | | | 10.23 | | | 0.58 | | | 1.46 | | | 2.04 | | | (0.59 | ) | | | (0.14 | ) | | | (0.73 | ) |
Class B | | | | | | | | | | | | | | | | | | | | | | | | |
3/31/2008(i) | | | 11.68 | | | 0.24 | | | 0.05 | | | 0.29 | | | (0.28 | ) | | | — | | | | (0.28 | ) |
9/30/2007 | | | 11.31 | | | 0.47 | | | 0.43 | | | 0.90 | | | (0.53 | ) | | | — | | | | (0.53 | ) |
9/30/2006 | | | 11.67 | | | 0.42 | | | 0.10 | | | 0.52 | | | (0.66 | ) | | | (0.22 | ) | | | (0.88 | ) |
9/30/2005 | | | 11.82 | | | 0.41 | | | 0.27 | | | 0.68 | | | (0.66 | ) | | | (0.17 | ) | | | (0.83 | ) |
9/30/2004 | | | 11.53 | | | 0.43 | | | 0.45 | | | 0.88 | | | (0.52 | ) | | | (0.07 | ) | | | (0.59 | ) |
9/30/2003(f) | | | 11.21 | | | 0.02 | | | 0.30 | | | 0.32 | | | — | | | | — | | | | — | |
Class C | | | | | | | | | | | | | | | | | | | | | | | | |
3/31/2008(i) | | | 11.66 | | | 0.25 | | | 0.05 | | | 0.30 | | | (0.29 | ) | | | — | | | | (0.29 | ) |
9/30/2007 | | | 11.30 | | | 0.49 | | | 0.42 | | | 0.91 | | | (0.55 | ) | | | — | | | | (0.55 | ) |
9/30/2006 | | | 11.66 | | | 0.42 | | | 0.11 | | | 0.53 | | | (0.67 | ) | | | (0.22 | ) | | | (0.89 | ) |
9/30/2005 | | | 11.81 | | | 0.40 | | | 0.28 | | | 0.68 | | | (0.66 | ) | | | (0.17 | ) | | | (0.83 | ) |
9/30/2004 | | | 11.53 | | | 0.43 | | | 0.45 | | | 0.88 | | | (0.53 | ) | | | (0.07 | ) | | | (0.60 | ) |
9/30/2003(f) | | | 11.21 | | | 0.02 | | | 0.30 | | | 0.32 | | | — | | | | — | | | | — | |
Class Y | | | | | | | | | | | | | | | | | | | | | | | | |
3/31/2008(i) | | | 11.73 | | | 0.31 | | | 0.05 | | | 0.36 | | | (0.35 | ) | | | — | | | | (0.35 | ) |
9/30/2007 | | | 11.36 | | | 0.61 | | | 0.41 | | | 1.02 | | | (0.65 | ) | | | — | | | | (0.65 | ) |
9/30/2006 | | | 11.71 | | | 0.55 | | | 0.11 | | | 0.66 | | | (0.79 | ) | | | (0.22 | ) | | | (1.01 | ) |
9/30/2005 | | | 11.85 | | | 0.54 | | | 0.28 | | | 0.82 | | | (0.79 | ) | | | (0.17 | ) | | | (0.96 | ) |
9/30/2004 | | | 11.54 | | | 0.57 | | | 0.45 | | | 1.02 | | | (0.64 | ) | | | (0.07 | ) | | | (0.71 | ) |
9/30/2003 | | | 10.23 | | | 0.61 | | | 1.46 | | | 2.07 | | | (0.62 | ) | | | (0.14 | ) | | | (0.76 | ) |
Class J | | | | | | | | | | | | | | | | | | | | | | | | |
3/31/2008(i) | | | 11.71 | | | 0.26 | | | 0.06 | | | 0.32 | | | (0.31 | ) | | | — | | | | (0.31 | ) |
9/30/2007 | | | 11.34 | | | 0.52 | | | 0.42 | | | 0.94 | | | (0.57 | ) | | | — | | | | (0.57 | ) |
9/30/2006 | | | 11.69 | | | 0.46 | | | 0.11 | | | 0.57 | | | (0.70 | ) | | | (0.22 | ) | | | (0.92 | ) |
9/30/2005 | | | 11.83 | | | 0.46 | | | 0.27 | | | 0.73 | | | (0.70 | ) | | | (0.17 | ) | | | (0.87 | ) |
9/30/2004 | | | 11.53 | | | 0.48 | | | 0.44 | | | 0.92 | | | (0.55 | ) | | | (0.07 | ) | | | (0.62 | ) |
9/30/2003 | | | 10.22 | | | 0.52 | | | 1.47 | | | 1.99 | | | (0.54 | ) | | | (0.14 | ) | | | (0.68 | ) |
| (a) | Had certain expenses not been reduced during the period, if applicable, total returns would have been lower. Periods of less than one year, if applicable, are not annualized. |
| (b) | The investment adviser and/or administrator has agreed to reimburse a portion of the Fund’s expenses and/or reduce its fees during the period. Without this reimbursement/fee reduction, if applicable, expenses would have been higher. |
| (c) | Computed on an annualized basis for periods less than one year, if applicable. |
| (d) | Per share net investment income has been calculated using the average shares outstanding during the period. |
See accompanying notes to financial statements.
19
| | | | | | | | | | | | | | | | |
| | | | | | | Ratios to Average Net Assets: | | |
| | | | | | |
Net asset
value,
end of
the period | | Total
return
(%) (a)(e) | | Net assets,
end of
the period
(000’s) | | Net
expenses
(%) (b)(c) | | | Gross
expenses
(%) (c) | | | Net investment
income
(%) (c) | | Portfolio
turnover
rate (%) |
| | | | | | | | | | | | | | | | |
| | | | | | | | | | | | | | | | |
| $ | 11.74 | | 3.0 | | $ | 1,699,104 | | 0.78 | | | 0.78 | | | 4.92 | | 26 |
| | 11.73 | | 9.1 | | | 834,736 | | 0.83 | | | 0.83 | | | 5.05 | | 35 |
| | 11.35 | | 5.6 | | | 152,054 | | 0.92 | (g) | | 0.92 | (g) | | 4.59 | | 35 |
| | 11.71 | | 6.8 | | | 39,168 | | 0.95 | | | 1.14 | | | 4.21 | | 28 |
| | 11.84 | | 8.8 | | | 9,506 | | 0.93 | | | 1.67 | | | 4.52 | | 29 |
| | 11.54 | | 20.6 | | | 1,128 | | 0.80 | | | 4.67 | | | 5.21 | | 34 |
| | | | | | | | | | | | | | | | |
| | 11.69 | | 2.5 | | | 17,958 | | 1.65 | (h) | | 1.66 | (h) | | 4.06 | | 26 |
| | 11.68 | | 8.2 | | | 17,082 | | 1.70 | | | 1.71 | | | 4.16 | | 35 |
| | 11.31 | | 4.8 | | | 5,525 | | 1.70 | | | 1.89 | | | 3.75 | | 35 |
| | 11.67 | | 5.9 | | | 3,443 | | 1.70 | | | 2.18 | | | 3.47 | | 28 |
| | 11.82 | | 7.9 | | | 1,797 | | 1.70 | | | 2.42 | | | 3.77 | | 29 |
| | 11.53 | | 2.9 | | | 160 | | 1.70 | | | 7.81 | | | 5.83 | | 34 |
| | | | | | | | | | | | | | | | |
| | 11.67 | | 2.6 | | | 1,182,457 | | 1.53 | | | 1.53 | | | 4.17 | | 26 |
| | 11.66 | | 8.3 | | | 605,934 | | 1.57 | | | 1.57 | | | 4.30 | | 35 |
| | 11.30 | | 4.9 | | | 82,863 | | 1.70 | (g) | | 1.70 | (g) | | 3.79 | | 35 |
| | 11.66 | | 5.9 | | | 27,992 | | 1.70 | | | 1.97 | | | 3.45 | | 28 |
| | 11.81 | | 7.9 | | | 9,191 | | 1.70 | | | 2.42 | | | 3.74 | | 29 |
| | 11.53 | | 2.9 | | | 3 | | 1.70 | | | 7.81 | | | 4.35 | | 34 |
| | | | | | | | | | | | | | | | |
| | 11.74 | | 3.1 | | | 921,852 | | 0.52 | | | 0.52 | | | 5.18 | | 26 |
| | 11.73 | | 9.3 | | | 448,873 | | 0.55 | (h) | | 0.55 | (h) | | 5.33 | | 35 |
| | 11.36 | | 6.1 | | | 76,548 | | 0.55 | | | 0.63 | | | 4.94 | | 35 |
| | 11.71 | | 7.1 | | | 26,012 | | 0.55 | | | 0.82 | | | 4.61 | | 28 |
| | 11.85 | | 9.2 | | | 12,543 | | 0.55 | | | 1.08 | | | 4.92 | | 29 |
| | 11.54 | | 20.9 | | | 10,230 | | 0.55 | | | 1.34 | | | 5.58 | | 34 |
| | | | | | | | | | | | | | | | |
| | 11.72 | | 2.7 | | | 172,851 | | 1.27 | | | 1.27 | | | 4.45 | | 26 |
| | 11.71 | | 8.5 | | | 180,453 | | 1.28 | | | 1.28 | | | 4.57 | | 35 |
| | 11.34 | | 5.3 | | | 214,894 | | 1.30 | (g) | | 1.30 | (g) | | 4.09 | | 35 |
| | 11.69 | | 6.4 | | | 314,418 | | 1.30 | | | 1.35 | | | 3.89 | | 28 |
| | 11.83 | | 8.3 | | | 342,871 | | 1.30 | | | 1.33 | | | 4.15 | | 29 |
| | 11.53 | | 20.0 | | | 335,666 | | 1.30 | | | 1.36 | | | 4.79 | | 34 |
| (e) | A sales charge for Class A, Class C (prior to February 1, 2004) and Class J and a contingent deferred sales charge for Class B and Class C shares are not reflected in total return calculations. Periods of less than one year, if applicable, are not annualized. |
| (f) | From commencement of Class operations on September 12, 2003 through September 30, 2003. |
| (g) | Includes expense recapture of 0.06%, 0.09% and 0.03% for Class A, Class C and Class J, respectively. |
| (h) | Includes expense recapture of less than 0.01% . |
| (i) | For the six months ended March 31, 2008 (Unaudited). |
20
NOTESTO FINANCIAL STATEMENTS
March 31, 2008 (Unaudited)
1. Organization. Loomis Sayles Funds II (the “Trust”) is organized as a Massachusetts business trust. The Trust is registered under the Investment Company Act of 1940, as amended (the “1940 Act”), as an open-end management investment company. The Declaration of Trust permits the Board of Trustees to authorize the issuance of an unlimited number of shares of the Trust in multiple series. Information presented in these financial statements pertains to Loomis Sayles Investment Grade Bond Fund (the “Fund” or the “Investment Grade Bond Fund”); the financial statements for the remaining fixed income funds and the equity funds of the Trust are presented in separate reports.
The Fund offers Class A, Class C, Class Y and Class J shares. Effective October 12, 2007, Class B shares are no longer offered. Existing Class B shareholders may continue to reinvest dividends into Class B shares and exchange their Class B shares for Class B shares of other Natixis Funds subject to existing exchange privileges as described in the Prospectus.
Class A shares are sold with a maximum front-end sales charge of 4.50%. Class B shares do not pay a front-end sales charge, but pay higher Rule 12b-1 fees than Class A shares for eight years (at which point they automatically convert to Class A shares) and are subject to a contingent deferred sales charge (“CDSC”) if those shares are redeemed within six years of purchase. Class C shares do not pay a front-end sales charge, do not convert to any other Class of shares, pay higher Rule 12b-1 fees than Class A shares and may be subject to a CDSC of 1.00% if those shares are redeemed within one year. Class Y shares do not pay a front-end sales charge, a CDSC or distribution fees. The minimum initial investment for Class Y shares is $100,000, though some categories of investors are exempted from the minimum investment amount as outlined in the Fund’s prospectus. Class J shares are only offered to non-U.S. investors and are sold with a maximum front-end sales charge of 3.50%.
Most expenses of the Trust can be directly attributed to a fund. Expenses which can not be directly attributed to a fund are generally apportioned based on the relative net assets of each of the funds in the Trust. Expenses of the Fund are borne pro rata by the holders of each Class of shares, except that each Class bears expenses unique to that Class (including the Rule 12b-1 service and distribution fees, registration, legal, shareholder reporting and transfer agent fees applicable to such class). In addition, each Class votes as a Class only with respect to its own Rule 12b-1 Plan. Shares of each Class would receive their pro rata share of the net assets of the Fund if the Fund were liquidated. The Trustees approve separate dividends from net investment income on each Class of shares.
2. Significant Accounting Policies. The following is a summary of significant accounting policies consistently followed by the Fund in the preparation of its financial statements. The Fund’s financial statements are prepared in accordance with accounting principles generally accepted in the United States of America which require the use of management estimates that affect the reported amounts and disclosures in the financial statements. Actual results could differ from those estimates.
a. Security Valuation. Debt securities (other than short-term obligations purchased with an original or remaining maturity of sixty days or less) are generally valued on the basis of evaluated bids furnished to the Fund by a pricing service recommended by the investment adviser and approved by the Board of Trustees, which service determines valuations for normal, institutional size-trading units of such securities using market information, transactions for comparable securities and various relationships between securities which are generally recognized by institutional traders. Equity securities, including closed-end investment companies and exchange-traded funds, for which market quotations are readily available, are valued at market value, as reported by pricing services recommended by the investment adviser and approved by the Board of Trustees. Such pricing services generally use the security’s last sale price on the exchange or market where the security is primarily traded or, if there is no reported sale during the day, the closing bid price. Securities traded on the NASDAQ Global Select Market, NASDAQ Global Market and NASDAQ Capital Market are valued at the NASDAQ Official Closing Price (“NOCP”), or if lacking a NOCP, at the most recent bid quotation on the applicable NASDAQ Market. Broker-dealer bid quotations may also be used to value debt and equity securities where a pricing service does not price a security or where a pricing service does not provide a reliable price for the security. In instances where broker-dealer bid quotations are not available, certain securities held by the Fund may be valued on the basis of a price provided by a principal market maker. Short-term obligations purchased with an original or remaining maturity of sixty days or less are valued at amortized cost, which approximates market value. Securities for which market quotations are not readily available are valued at fair value as determined in good faith by the Fund’s adviser using consistently applied procedures under the general supervision of the Board of Trustees. Investments in other open-end investment companies are valued at their net asset value each day.
The Fund may hold securities traded in foreign markets. Foreign securities are valued at the market price in the foreign market. However, if events occurring after the close of the foreign market (but before the close of regular trading on the New York Stock Exchange) are believed to materially affect the value of those securities, such securities are fair valued pursuant to procedures approved by the Board of Trustees. When fair valuing securities, the Fund may, among other things, use modeling tools or other processes that may take into account factors such as securities market activity and/or significant events that occur after the close of the foreign market and before the Fund calculates its net asset value.
b. Security Transactions and Related Investment Income. Security transactions are accounted for on trade date. Dividend income is recorded on ex-dividend date, or in the case of certain foreign securities, as soon as the Fund is notified, and interest income is recorded on an accrual basis. Interest income is increased by the accretion of discount and decreased by the amortization of premium. Investment income is recorded net of foreign taxes withheld when applicable. In determining net gain or loss on securities sold, the cost of securities has been determined on an identified cost basis. Investment income, non-class specific expenses and realized and unrealized gains and losses are allocated on a pro rata basis to each class based on the relative net assets of each class to the total net assets of the Fund.
c. Foreign Currency Translation. The books and records of the Fund are maintained in U.S. dollars. The value of securities, currencies and other assets and liabilities denominated in currencies other than U.S. dollars are translated into U.S. dollars based upon foreign exchange rates prevailing at the end of the period. Purchases and sales of investment securities, income and expenses are translated on the respective dates of such transactions.
21
NOTESTO FINANCIAL STATEMENTS (continued)
March 31, 2008 (Unaudited)
Since the values of investment securities are presented at the foreign exchange rates prevailing at the end of the period, it is not practical to isolate that portion of the results of operations arising from changes in exchange rates caused by fluctuations which arise due to changes in market prices of the investment securities. Such changes are included with the net realized and unrealized gain or loss on investments.
Net realized foreign exchange gains or losses arise from sales of foreign currency, currency gains or losses realized between the trade and settlement dates on securities transactions and the difference between the amounts of dividends, interest and foreign withholding taxes recorded on the Fund’s books and the U.S. dollar equivalent of the amounts actually received or paid. Net unrealized foreign exchange gains and losses arise from changes in the value of assets and liabilities, other than investment securities, at the end of the fiscal period, resulting from changes in exchange rates.
The Fund may use foreign currency exchange contracts to facilitate transactions in foreign-denominated investments. Losses may arise from changes in the value of the foreign currency or if the counterparties do not perform under the contracts’ terms.
The Fund may purchase investments of foreign issuers. Investing in securities of foreign issuers involves special risks and considerations not typically associated with investing in U.S. companies and securities of the U.S. government. These risks include revaluation of currencies and the risk of appropriation. Moreover, the markets for securities of many foreign issuers may be less liquid and the prices of such securities may be more volatile than those of comparable U.S. companies and the U.S. government.
d. Forward Foreign Currency Contracts. The Fund may enter into forward foreign currency contracts. Contracts to buy generally are used to acquire exposure to foreign currencies, while contracts to sell generally are used to hedge the Fund’s investments against currency fluctuation. Also, a contract to buy or sell can offset a previous contract. These contracts involve market risk in excess of the unrealized gain or loss reflected in the Fund’s Statement of Assets and Liabilities. The U.S. dollar value of the currencies the Fund has committed to buy or sell represents the aggregate exposure to each currency the Fund has acquired or hedged through currency contracts outstanding at period end.
All contracts are “marked-to-market” daily at the applicable exchange rates and any gains or losses are recorded for financial statement purposes as unrealized until settlement date. Risks may arise upon entering into these contracts from the potential inability of counterparties to meet the terms of their contracts and from unanticipated movements in the value of a foreign currency relative to the U.S. dollar. At March 31, 2008, there were no open forward currency contracts.
e. Federal and Foreign Income Taxes. The Trust treats each Fund as a separate entity for federal income tax purposes. Each Fund intends to meet the requirements of the Internal Revenue Code applicable to regulated investment companies, and to distribute to its shareholders substantially all of its net investment income and any net realized capital gains, at least annually. Financial Accounting Standards Board (“FASB”) Interpretation No. 48, Accounting for Uncertainty in Income Taxes—an Interpretation of FASB Statement 109 (“FIN 48”) was issued and became effective for fiscal years beginning after December 15, 2006. FIN 48 sets forth a threshold for financial statement recognition, measurement and disclosure of a tax position taken or expected to be taken on a tax return. Management has performed an analysis of the Fund’s tax positions taken on federal and state tax returns that remain subject to examinations (tax years ended September 30, 2004-2007) and has concluded that no provisions for income tax are required. Fund Management is not aware of any events that are reasonably possible to occur in the next six months that would result in the amounts of any unrecognized tax benefits significantly increasing or decreasing for the Fund. However, management’s conclusions regarding FIN 48 may be subject to review and adjustment at a later date based on factors including, but not limited to, further implementation guidance from the FASB, new tax laws, regulations and interpretations thereof.
The Fund may be subject to foreign taxes on income and gains on investments that are accrued based upon the Fund’s understanding of the tax rules and regulations that exist in the countries in which the Fund invests. Foreign governments may also impose taxes or other payments on investments with respect to foreign securities. Such taxes are accrued as applicable.
f. Dividends and Distributions to Shareholders. Dividends and distributions are recorded on ex-dividend date. The timing and characterization of certain income and capital gains distributions are determined annually in accordance with federal tax regulations, which may differ from accounting principles generally accepted in the United States of America. Permanent differences are primarily due to differing treatments for book and tax purposes of items such as foreign currency transactions and premium amortization accruals. Permanent book and tax basis differences relating to shareholder distributions will result in reclassifications to capital accounts. Temporary differences between book and tax distributable earnings are primarily due to premium amortization accruals, deferred Trustees’ fees, capital loss carryforwards, post-October loss deferrals and wash sales. Distributions from net investment income and short-term capital gains are considered to be distributed from ordinary income for tax purposes.
The tax characterization of distributions is determined on an annual basis. The tax character of distributions paid to shareholders during the year ended September 30, 2007 was as follows:
| | | | | | | | | |
| | | 2007 Distributions Paid From: |
| | | Ordinary Income | | Long-Term
Capital Gains | | Total |
| | $ | 53,534,527 | | $ | — | | $ | 53,534,527 |
22
NOTESTO FINANCIAL STATEMENTS (continued)
March 31, 2008 (Unaudited)
As of September 30, 2007, the capital loss carryforwards and post-October losses were as follows:
| | | |
Capital Loss Carryforward | | | |
Expires September 30, 2014 | | $ | 215,200 |
Expires September 30, 2015 | | | 1,753,185 |
| | | |
Total capital loss carryforward | | | 1,968,385 |
| | | |
Deferred net capital losses (post-October 2006) | | | 497,678 |
| | | |
g. Repurchase Agreements. The Fund, through its custodian, receives delivery of the underlying securities collateralizing repurchase agreements. It is the Fund’s policy that the market value of the collateral be at least equal to 102% of the repurchase price, including interest. The repurchase agreements are tri-party arrangements whereby the collateral is held at the custodian bank in a segregated account for the benefit of the Fund and on behalf of the counterparty. Repurchase agreements could involve certain risks in the event of default or insolvency of the counterparty including possible delays or restrictions upon the Fund’s ability to dispose of the underlying securities.
h. Securities Lending. The Fund has entered into an agreement with State Street Bank and Trust Company (“State Street Bank”), as agent of the Fund, to lend securities to certain designated borrowers. The loans are collateralized with cash or securities in an amount equal to at least 105% or 102% of the market value of the loaned international or domestic securities, respectively, when the loan is initiated. Thereafter, the value of the collateral must remain at least 102% of the market value of loaned securities for U.S. equities and U.S. corporate debt; at least 105% of the market value of loaned securities for non-U.S. equities; and at least 100% of the market value of loaned securities for U.S. government securities, sovereign debt issued by non-U.S. governments and non-U.S. corporate debt. In the event that the market value of the collateral falls below the required percentages described above, the borrower will deliver additional collateral on the next business day. As with other extensions of credit, the Fund may bear the risk of loss with respect to the investment of the collateral. The Fund invests cash collateral in short-term investments, a portion of the income from which is remitted to the borrowers and the remainder allocated between the Fund and State Street Bank as lending agent. The value of securities on loan to borrowers and the value of collateral held by the Fund with respect to such loans at March 31, 2008 were $363,242,041 and $368,245,624, respectively.
i. Indemnifications. Under the Trust’s organizational documents, its officers and Trustees are indemnified against certain liability arising out of the performance of their duties to the Fund. Additionally, in the normal course of business, the Fund enters into contracts with service providers that contain general indemnification clauses. The Fund’s maximum exposure under these arrangements is unknown as this would involve future claims that may be made against the Fund that have not yet occurred. However, based on experience, the Fund expects the risk of loss to be remote.
j. New Accounting Pronouncements. In September 2006, Statement of Financial Accounting Standards No. 157, Fair Value Measurements (“FAS 157”), was issued and is effective for fiscal years beginning after November 15, 2007. FAS 157 defines fair value, establishes a framework for measuring fair value and expands disclosures about fair value measurements. Management has evaluated the impact the adoption of FAS 157 will have on the Fund’s financial statements and believes that such impact will be limited to expanded disclosure in the Fund’s financial statements regarding inputs used in determining the value of the Fund’s investments and will not have a material impact on the Fund’s net assets or results of operations.
In March 2008, Statement of Financial Accounting Standards No. 161, Disclosures about Derivative Instruments and Hedging Activities (“FAS 161”), was issued and will be effective for fiscal years and interim periods beginning after November 15, 2008. FAS 161 requires enhanced disclosures about funds’ derivative and hedging activities. Management is currently evaluating the impact the adoption of FAS 161 will have on the Fund’s financial statement disclosures.
3. Purchases and Sales of Securities. For the six months ended March 31, 2008, purchases and sales of securities (excluding short-term investments and U.S. government/agency securities and including paydowns) were $1,135,671,989 and $82,776,748, respectively. Purchases and sales of U.S. government/agency securities (excluding short-term investments and including paydowns) were $466,481,188 and $533,831,986, respectively.
4. Management Fees and Other Transactions with Affiliates.
a. Management Fees. Loomis, Sayles & Company, L.P. (“Loomis Sayles”) serves as investment adviser to the Fund. Under the terms of the management agreement, the Fund pays a management fee at the annual rate of 0.40% of average daily net assets, calculated daily and payable monthly.
Loomis Sayles has given a binding undertaking to the Fund to reduce its management fees and/or reimburse certain expenses associated with the Fund to limit its operating expenses. This undertaking is in effect until January 31, 2009 and will be reevaluated on an annual basis. For the six months ended March 31, 2008, the expense limits as a percentage of average daily net assets under the expense limitation agreement were as follows:
| | | | | | | | | | | | | | |
| | | Expense Limit as a Percentage of
Average Daily Net Assets | |
| | | Class A | | Class B | | | Class C | | | Class Y | | | Class J | |
| | 0.95% | | 1.70 | % | | 1.70 | % | | 0.55 | % | | 1.30 | % |
23
NOTESTO FINANCIAL STATEMENTS (continued)
March 31, 2008 (Unaudited)
For the six months ended March 31, 2008, the management fees for the Fund were $6,111,109 (0.40% of average daily net assets).
Loomis Sayles shall be permitted to recover expenses it has borne under the expense limitation agreement (whether through reduction of the management fees or otherwise) on a class by class basis in later periods to the extent the expenses of a class fall below a class expense limits, provided, however, that a class is not obligated to pay such reduced fees/expenses more than one year after the end of the fiscal year in which the fee/expense was reduced. The amounts subject to possible reimbursement under the expense limitation agreement at March 31, 2008 were as follows:
| | | |
Class | | Expenses Subject to
Possible Reimbursement
until September 30, 2008 |
A | | $ | — |
B | | | 830 |
C | | | — |
Y | | | — |
J | | | — |
| | | |
Total | | $ | 830 |
| | | |
Certain officers and employees of Loomis Sayles are also officers or Trustees of the Trust. Loomis Sayles’ general partner is indirectly owned by Natixis Global Asset Management, L.P. (“Natixis US”), which is part of Natixis Global Asset Management, an international asset management group based in Paris, France.
b. Administrative Expense. Natixis Asset Management Advisors, L.P. (“Natixis Advisors”) provides certain administrative services for the Fund and subcontracts with State Street Bank to serve as sub-administrator. Natixis Advisors is a wholly-owned subsidiary of Natixis US. Pursuant to an agreement among Natixis Funds Trust I, Natixis Funds Trust II, Natixis Funds Trust III, Natixis Funds Trust IV, Natixis Cash Management Trust, Gateway Trust (effective February 16, 2008) (“Natixis Funds Trusts”), Loomis Sayles Funds I, Loomis Sayles Funds II (“Loomis Sayles Funds Trusts”), Hansberger International Series (effective September 17, 2007) and Natixis Advisors, each Fund pays Natixis Advisors monthly its pro rata portion of fees equal to an annual rate of 0.0675% of the first $5 billion of the average daily net assets of the Natixis Funds Trusts, Loomis Sayles Funds Trusts and the Hansberger International Series, 0.0625% of the next $5 billion, 0.0500% of the next $20 billion and 0.045% of such assets in excess of $30 billion, subject to an annual aggregate minimum fee for the Natixis Funds Trusts, Loomis Sayles Funds Trusts and the Hansberger International Series of $5 million, which is reevaluated on an annual basis. New funds are subject to an annual fee of $50,000 plus $12,500 per class and an additional $50,000 if managed by multiple subadvisors in their first calendar year of operations.
Effective October 1, 2007, State Street Bank reduced the fees it receives from Natixis Advisors for serving as sub-administrator to the Fund. Also, effective October 1, 2007, Natixis Advisors has given a binding contractual undertaking to the Fund to waive the administrative fees paid by the Fund in an amount equal to the reduction in sub-administrative fees discussed above. The waiver is in effect through June 30, 2008.
For the six months ended March 31, 2008, the Fund paid the following for administrative fees to Natixis Advisors:
| | | | | | | | | |
| | | Gross
Administrative
Fees | | Waiver of
Administrative
Fees | | Net
Administrative
Fees |
| | $ | 797,932 | | $ | 38,711 | | $ | 759,221 |
c. Service and Distribution Fees. Natixis Distributors, L.P. (“Natixis Distributors”), a wholly-owned subsidiary of Natixis US, has entered into a distribution agreement with the Trust. Pursuant to this agreement, Natixis Distributors serves as principal underwriter of the Fund, except Class J shares of the Fund. The Fund has entered into a distribution agreement relating to Class J shares with Loomis Sayles Distributors, L.P. (“Loomis Sayles Distributors”), a wholly-owned subsidiary of Natixis US.
Pursuant to Rule 12b-1 under the 1940 Act, the Fund has adopted a Service Plan relating to the Fund’s Class A shares (the “Class A Plan”) and Service and Distribution Plans relating to the Fund’s Class B and Class C shares (the “Class B and Class C Plans”).
Under the Class A Plan, the Fund pays Natixis Distributors a monthly service fee at an annual rate not to exceed 0.25% of the average daily net assets attributable to the Fund’s Class A shares, as reimbursement for expenses incurred by Natixis Distributors in providing personal services to investors in Class A shares and/or the maintenance of shareholder accounts.
24
NOTESTO FINANCIAL STATEMENTS (continued)
March 31, 2008 (Unaudited)
Under the Class B and Class C Plans, the Fund pays Natixis Distributors a monthly service fee at an annual rate of 0.25% of the average daily net assets attributable to the Fund’s Class B and Class C shares, as compensation for services provided and expenses incurred by Natixis Distributors in providing personal services to investors in Class B and Class C shares and/or the maintenance of shareholder accounts.
Also under the Class B and Class C Plans, the Fund pays Natixis Distributors a monthly distribution fee at an annual rate of 0.75% of the average daily net assets attributable to the Fund’s Class B and Class C shares, as compensation for services provided and expenses incurred by Natixis Distributors in connection with the marketing or sale of Class B and Class C shares.
Class J shares are subject to a monthly shareholder service fee at an annual rate of 0.25% and a monthly distribution fee, at an annual rate of 0.50% of the average daily net assets attributable to the Fund’s Class J shares, both payable to Loomis Sayles Distributors, pursuant to a shareholder service and distribution plan adopted under Rule 12b-1.
For the six months ended March 31, 2008 the Fund paid the following service and distribution fees:
| | | | | | | | | | | | | | | | | | | | | |
| | | Service Fees | | Distribution Fees |
| | | Class A | | Class B | | Class C | | Class J | | Class B | | Class C | | Class J |
| | | | | | | | | | | | | | | | | | | | | |
| | $ | 1,601,272 | | $ | 21,973 | | $ | 1,119,058 | | $ | 166,451 | | $ | 65,918 | | $ | 3,357,173 | | $ | 499,351 |
d. Sub-Transfer Agent Fee. Natixis Distributors has entered into agreements with financial intermediaries to provide certain recordkeeping, processing, shareholder communications and other services to customers of the intermediaries and has agreed to compensate the intermediaries for providing those services. Certain services would be provided by the Fund if the shares of those customers were registered directly with the Fund’s transfer agent. Accordingly, the Fund agreed to pay a portion of the intermediary fees attributable to shares of the Fund held by intermediaries (which generally are a percentage of the value of shares sold) not exceeding what the Fund would have paid its transfer agent had each customer’s shares been registered directly with the transfer agent instead of held through the intermediary. Natixis Distributors pays the remainder of the fees. Listed below are the fees incurred by the Fund which are reflected in the transfer agent fees and expenses in the Statement of Operations.
| | | | | | | | | | | | | | | |
| | | Class A | | Class B | | Class C | | Class Y | | Class J |
| | $ | 224,894 | | $ | 3,407 | | $ | 152,706 | | $ | 128,616 | | $ | — |
e. Commissions. The Fund has been informed that commissions (including CDSCs) on Fund shares paid to Natixis Distributors by investors in Class A, B and C shares of the Fund were $3,844,832 and commissions paid to Loomis Sayles Distributors by investors in Class J shares of the Fund were $34,370 for the six months ended March 31, 2008.
f. Trustees Fees and Expenses. The Fund does not pay any compensation directly to its officers or Trustees who are directors, officers or employees of Natixis Advisors, Natixis Distributors, Natixis US, or their affiliates. The Chairperson of the Board receives a retainer fee at the annual rate of $200,000. The Chairperson does not receive any meeting attendance fees for Board of Trustees meetings or committee meetings that she attends. Each independent Trustee (other than the Chairperson) receives, in the aggregate, a retainer fee at the annual rate of $65,000. Each independent Trustee also receives a meeting attendance fee of $7,500 for each meeting of the Board of Trustees that he or she attends in person and $3,750 for each meeting of the Board of Trustees that he or she attends telephonically. In addition, each committee chair receives an additional retainer fee at the annual rate of $10,000. Each Contract Review and Governance Committee member is compensated $5,000 for each Committee meeting that he or she attends in person and $2,500 for each meeting that he or she attends telephonically. Each Audit Committee member is compensated $6,250 for each Committee meeting that he or she attends in person and $3,125 for each meeting that he or she attends telephonically. These fees are allocated among the Funds in the Natixis Funds Trusts, Loomis Sayles Funds Trusts and the Hansberger International Series based on a formula that takes into account, among other factors, the relative net assets of each Fund. Trustees are reimbursed for travel expenses in connection with attendance at meetings.
Prior to January 1, 2008, each Independent Trustee (other than the Chairperson) received, in the aggregate, a retainer fee at the annual rate of $55,000. Each Independent Trustee also received a meeting attendance fee of $6,000 for each meeting of the Board of Trustees that he or she attended in person and $3,000 for each meeting that he or she attended telephonically. In addition, each Contract Review and Governance Committee member received $4,000 for each committee meeting that he or she attended in person and $2,000 for each committee meeting that he or she attended telephonically. Each Audit Committee member received $5,000 for each committee meeting that he or she attended in person and $2,500 for each committee meeting that he or she attended telephonically. The Chairperson of the Board and committee chair retainers were $200,000 and $10,000, respectively.
A deferred compensation plan (the “Plan”) is available to the Trustees on a voluntary basis. Each participating Trustee will receive an amount equal to the value that such deferred compensation would have been had it been invested in a designated Fund or certain other Funds of the Natixis Funds Trusts, Loomis Sayles Funds Trusts and the Hansberger International Series on the normal payment date. Deferred amounts remain in the Funds until distributed in accordance with the Plan.
5. Line of Credit. The Fund, together with certain other funds of Natixis Funds Trusts, Loomis Sayles Funds Trusts and the Hansberger International Series, participates in a $200,000,000 committed line of credit provided by State Street Bank, with an individual limit of $125,000,000 for each Fund that participates in the line of credit. Interest is
25
NOTESTO FINANCIAL STATEMENTS (continued)
March 31, 2008 (Unaudited)
charged to each participating fund based on its borrowings at a rate per annum equal to the Federal Funds rate plus 0.50%. In addition, a commitment fee of 0.09% per annum, payable at the end of each calendar quarter, is accrued and apportioned among the participating funds based on their average daily unused portion of the line of credit. For six months ended March 31, 2008, the Fund had no borrowings under this agreement.
Prior to March 12, 2008, the Fund, together with certain other funds of Natixis Funds Trusts, Loomis Sayles Funds Trusts and Hansberger International Series, participated in a $75,000,000 committed line of credit provided by State Street Bank.
6. Shareholders. At March 31, 2008, the Loomis Sayles Employees’ Profit Sharing Retirement Plan held 262,302 shares of beneficial interest of Class Y shares.
7. Capital Shares. The Fund may issue an unlimited number of shares of beneficial interest, without par value. Transactions in capital shares were as follows:
| | | | | | | | | | | | | | |
| | Six Months Ended March 31, 2008 | | | Year Ended September 30, 2007 | |
| | Shares | | | | Amount | | | Shares | | | | Amount | |
| | | | | | | | | | | | | | |
| Class A | | | | | | | | | | | | | | |
Issued from the sale of shares | | 83,071,579 | | | $ | 981,980,472 | | | 62,683,448 | | | $ | 718,750,421 | |
Issued in connection with the reinvestment of distributions | | 2,059,439 | | | | 24,354,218 | | | 1,215,478 | | | | 13,890,899 | |
Redeemed | | (11,539,739 | ) | | | (136,092,090 | ) | | (6,122,274 | ) | | | (70,007,079 | ) |
| | | | | | | | | | | | | | |
Net change | | 73,591,279 | | | $ | 870,242,600 | | | 57,776,652 | | | $ | 662,634,241 | |
| | | | | | | | | | | | | | |
| Class B | | | | | | | | | | | | | | |
Issued from the sale of shares | | 136,573 | | | $ | 1,604,173 | | | 1,066,683 | | | $ | 12,151,938 | |
Issued in connection with the reinvestment of distributions | | 16,605 | | | | 195,627 | | | 21,567 | | | | 245,601 | |
Redeemed | | (79,231 | ) | | | (931,891 | ) | | (114,073 | ) | | | (1,298,212 | ) |
| | | | | | | | | | | | | | |
Net change | | 73,947 | | | $ | 867,909 | | | 974,177 | | | $ | 11,099,327 | |
| | | | | | | | | | | | | | |
| Class C | | | | | | | | | | | | | | |
Issued from the sale of shares | | 52,000,342 | | | $ | 611,421,350 | | | 46,067,893 | | | $ | 525,272,541 | |
Issued in connection with the reinvestment of distributions | | 763,282 | | | | 8,978,281 | | | 406,871 | | | | 4,631,767 | |
Redeemed | | (3,366,637 | ) | | | (39,478,758 | ) | | (1,848,031 | ) | | | (21,049,506 | ) |
| | | | | | | | | | | | | | |
Net change | | 49,396,987 | | | $ | 580,920,873 | | | 44,626,733 | | | $ | 508,854,802 | |
| | | | | | | | | | | | | | |
| Class Y | | | | | | | | | | | | | | |
Issued from the sale of shares | | 44,944,441 | | | $ | 531,696,233 | | | 34,163,364 | | | $ | 391,585,504 | |
Issued in connection with the reinvestment of distributions | | 1,048,487 | | | | 12,400,247 | | | 578,308 | | | | 6,613,133 | |
Redeemed | | (5,750,162 | ) | | | (67,812,586 | ) | | (3,224,099 | ) | | | (36,901,729 | ) |
| | | | | | | | | | | | | | |
Net change | | 40,242,766 | | | $ | 476,283,894 | | | 31,517,573 | | | $ | 361,296,908 | |
| | | | | | | | | | | | | | |
| Class J | | | | | | | | | | | | | | |
Issued from the sale of shares | | 582,000 | | | $ | 6,834,738 | | | 550,000 | | | $ | 6,284,374 | |
Issued in connection with the reinvestment of distributions | | — | | | | — | | | — | | | | — | |
Redeemed | | (1,241,470 | ) | | | (14,638,874 | ) | | (4,100,330 | ) | | | (46,695,231 | ) |
| | | | | | | | | | | | | | |
Net change | | (659,470 | ) | | $ | (7,804,136 | ) | | (3,550,330 | ) | | $ | (40,410,857 | ) |
| | | | | | | | | | | | | | |
Increase (decrease) from capital share transactions | | 162,645,509 | | | $ | 1,920,511,140 | | | 131,344,805 | | | $ | 1,503,474,421 | |
| | | | | | | | | | | | | | |
26
Not applicable.
| Item 3. | Audit Committee Financial Expert. |
Not applicable.
| Item 4. | Principal Accountant Fees and Services. |
Not applicable.
| Item 5. | Audit Committee of Listed Registrants. |
Not applicable.
| Item 6. | Schedule of Investments. |
Included as part of the Report to Shareholders filed as Item 1 herewith.
| Item 7. | Disclosure of Proxy Voting Policies and Procedures for Closed-End Management Investment Companies. |
Not applicable.
| Item 8. | Portfolio Managers of Closed-End Management Investment Companies. |
Not applicable.
| Item 9. | Purchases of Equity Securities by Closed-End Management Investment Companies and Affiliated Purchasers. |
Not applicable.
| Item 10. | Submission of Matters to a Vote of Securities Holders. |
There were no material changes to the procedures by which shareholders may recommend nominees to the Trust’s Board of Trustees.
| Item 11. | Controls and Procedures. |
The Registrant’s principal executive officer and principal financial officer have concluded that the Registrant’s disclosure controls and procedures are sufficient to ensure that information required to be disclosed by the Registrant in this Form N-CSR was recorded, processed, summarized and reported within the time periods specified in the Securities and Exchange Commission’s rules and forms, based upon such officers’ evaluation of these controls and procedures as of a date within 90 days of the filing date of the report.
There was no change in the Registrant’s internal control over financial reporting that occurred during the Registrant’s last fiscal quarter of the period covered by the report that has materially affected, or is reasonably likely to materially affect, the Registrant’s internal control over financial reporting.
| | |
| (a) (1) | | Not applicable. |
| |
| (a) (2) | | Certifications of Principal Executive Officer and Principal Financial Officer pursuant to Rule 30a-2(a) under the Investment Company Act of 1940 (17 CFR 270.30a-2(a)), filed herewith as Exhibits (a)(2)(1) and a(2)(2), respectively. |
| |
| (a) (3) | | Not applicable. |
| |
| (b) | | Certifications of Principal Executive Officer and Principal Financial Officer pursuant to Section 906 of Sarbanes-Oxley Act of 2002 are filed herewith as Exhibit (b). |
SIGNATURES
Pursuant to the requirements of the Securities Exchange Act of 1934 and the Investment Company Act of 1940, the Registrant has duly caused this report to be signed on its behalf by the undersigned, thereunto duly authorized.
| | |
| Loomis Sayles Funds II |
| |
| By: | | /s/ Robert J. Blanding |
| Name: | | Robert J. Blanding |
| Title: | | Chief Executive Officer |
| Date: | | May 22, 2008 |
Pursuant to the requirements of the Securities Exchange Act of 1934 and the Investment Company Act of 1940, this report has been signed by the following persons on behalf of the Registrant and in the capacities and on the dates indicated.
| | |
| |
| By: | | /s/ Robert J. Blanding |
| Name: | | Robert J. Blanding |
| Title: | | Chief Executive Officer |
| Date: | | May 22, 2008 |
| |
| By: | | /s/ Michael C. Kardok |
| Name: | | Michael C. Kardok |
| Title: | | Treasurer |
| Date: | | May 22, 2008 |