UNITED STATES
SECURITIES AND EXCHANGE COMMISSION
Washington, D.C. 20549
FORM N-CSR
CERTIFIED SHAREHOLDER REPORT OF REGISTERED
MANAGEMENT INVESTMENT COMPANIES
| | |
Investment Company Act file number | | 811-06241 |
Loomis Sayles Funds II
|
| (Exact name of registrant as specified in charter) |
| | |
| 399 Boylston Street, Boston, Massachusetts | | 02116 |
| (Address of principal executive offices) | | (Zip code) |
Coleen Downs Dinneen, Esq.
Natixis Distributors, L.P.
399 Boylston Street
Boston, Massachusetts 02116
|
| (Name and address of agent for service) |
Registrant’s telephone number, including area code: (617) 449-2810
Date of fiscal year end: September 30
Date of reporting period: March 31, 2009
| Item 1. | Reports to Stockholders. |
The Registrant’s semi-annual report transmitted to shareholders pursuant to Rule 30e-1 under the Investment Company Act of 1940 is as follows:

INCOME FUNDS
SEMIANNUAL REPORT
March 31, 2009
Loomis Sayles Core Plus Bond Fund
Loomis Sayles High Income Fund
Loomis Sayles International Bond Fund
Loomis Sayles Limited Term Government and Agency Fund
Loomis Sayles Strategic Income Fund


TABLE OF CONTENTS
Management Discussion and Performancepage 1
Portfolio of Investmentspage 15
Financial Statementspage 65
LOOMIS SAYLES CORE PLUS BOND FUND
PORTFOLIO PROFILE
Objective:
Seeks a high level of current income consistent with what the fund considers reasonable risk
Strategy:
Invests primarily in U.S. corporate and U.S. government bonds
Fund Inception:
November 7, 1973
Managers:
Peter W. Palfrey, CFA
Richard G. Raczkowski
Loomis, Sayles & Company, L.P.
Symbols:
| | |
| Class A | | NEFRX |
| Class B | | NERBX |
| Class C | | NECRX |
| Class Y | | NERYX |
What You Should Know:
Fixed-income securities are subject to credit risk and interest rate risk; their value generally rises when prevailing interest rates fall and falls when rates rise.
The fund can invest a significant percentage of assets in debt securities that are rated below investment grade and the value of fund shares can be adversely affected by changes in economic conditions or other circumstances. Lower rated debt securities have speculative characteristics and may be subject to greater price volatility than higher rated investments. In addition, the secondary market for these securities may lack liquidity. The fund can also invest a significant percentage of assets in foreign securities and the value of the fund shares can be adversely affected by changes in currency exchange rates, political, and economic developments. In emerging markets, these risks can be significant. Fund shares should be viewed as a long-term investment.
Management Discussion
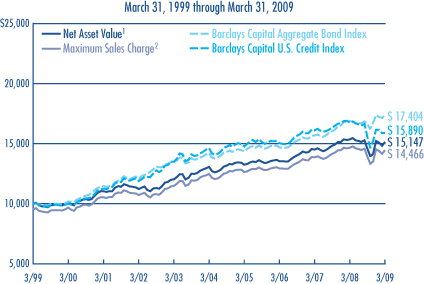
As Loomis Sayles Core Plus Bond Fund’s fiscal year got underway last fall, widespread concern about the world’s financial markets troubled investors, although the market’s risk tolerance appeared to increase modestly in March of 2009. For the six months ended March 31, 2009, the fund returned 3.80% based on the net asset value of Class A shares and $0.36 in reinvested dividends. The fund lagged its broad-based benchmark, Barclays Capital Aggregate Bond Index, which returned 4.70%, but its results were better than the -0.49% average return on the funds in its Morningstar Intermediate-Term Bond peer group. The fund’s 30-day SEC yield as of March 31, 2009 was 5.80%.
WHAT HELPED THE FUND OUTPERFORM ITS PEER GROUP?
As part of a gradual, tactical shift during the period, we capitalized on strength in certain high-yield assets and invested the proceeds in what we felt were attractive, investment-grade names, which did relatively well in December. We added to these positions primarily by investing in new issues that were brought to market at what we saw as significant discounts. In the first quarter of 2009 the fund benefited from rising valuations of higher-yielding, lower-quality issues as risk aversion began to diminish.
The fund’s holdings in U.S. government agency securities were positive after the Treasury announced targeted purchases. While commercial mortgage-backed securities (CMBS) modestly underperformed the broader market, our combination of well-seasoned, high-quality CMBS did relatively well. U.S. government agency securities also contributed to performance.
Generally speaking, our non-U.S. dollar allocations were positive for the fund during the past six months. We had a significant allocation to securities denominated in the Japanese yen as a defensive measure late in 2008, but we sold most of these positions at a profit later in the period and redeployed assets to securities denominated in Canadian and Australian dollars. These shifts proved to be opportune.
WHAT CAUSED THE FUND TO LAG ITS BENCHMARK?
Our allocation to mortgage-backed securities included 30-year, higher-quality issues in an effort to lengthen spread duration while keeping a lid on risk. Government support caused this sector to do well, but the fund was underweight in these issues relative to the benchmark, which limited its ability to benefit from the rally.
Treasury securities were the top performers during the final three months of 2008. However, this trend reversed in the first quarter of 2009 as interest rates rose and risk aversion diminished. The fund’s holdings in 20-year Treasury Inflation Protected Securities (TIPS) provided attractive returns in the first quarter of 2009, but this did not outweigh negative returns late in 2008. We recently reduced the fund’s TIPS exposure and redeployed the assets into a combination of shorter- and longer-maturity nominal (non-TIPS) Treasuries.
We took advantage of low prices late in 2008, adding to the fund’s position in financials. This strategy worked well in the closing quarter of 2008, although it detracted from performance early in 2009 as spreads (the price differential between lower- and higher-quality issues) narrowed. However, for the full six-month period, the fund’s overweight in financials was a net positive. Negative security selection among high-yield industrials made this the fund’s worst-performing group for the period.
WHAT NOW?
We plan to continue adding opportunistically to investment-grade corporate bonds, focusing on the new-issue market. We also plan to add to high-quality CMBS and cautiously extend the fund’s position in high-yielding securities if the credit markets show further signs of stabilizing. We are currently focusing on investment-grade, non-financial companies. Our goal is to build longer-term value while reducing interest rate sensitivity as the recovery in the financial markets gains traction.
1
LOOMIS SAYLES CORE PLUS BOND FUND
Investment Results through March 31, 2009
PERFORMANCE IN PERSPECTIVE
The charts comparing the fund’s performance to two indexes provide you with a general sense of how it performed. The fund’s total return for the period shown below appears with and without sales charges and includes fund expenses and fees. An index measures the performance of a theoretical portfolio. Unlike a fund, the index is unmanaged and does not have expenses that affect the results. It is not possible to invest directly in an index. Investors would incur transaction costs and other expenses if they purchased the securities necessary to match the index.
Growth of a $10,000 Investment in Class A Shares4
Average Annual Returns — March 31, 20094
| | | | | | | | | | | | |
| | | | | |
| | | 6 MONTHS | | | 1 YEAR | | | 5 YEARS | | | 10 YEARS | |
CLASS A (Inception 11/7/73) | | | | | | | | | | | | |
Net Asset Value1 | | 3.80 | % | | -1.40 | % | | 3.01 | % | | 4.24 | % |
With Maximum Sales Charge2 | | -0.90 | | | -5.86 | | | 2.06 | | | 3.76 | |
| | | | | |
CLASS B (inception 9/13/93) | | | | | | | | | | | | |
Net Asset Value1 | | 3.40 | | | -2.15 | | | 2.26 | | | 3.48 | |
With CDSC3 | | -1.60 | | | -6.80 | | | 1.93 | | | 3.48 | |
| | | | | |
CLASS C (Inception 12/30/94) | | | | | | | | | | | | |
Net Asset Value1 | | 3.44 | | | -2.09 | | | 2.25 | | | 3.47 | |
With CDSC3 | | 2.44 | | | -3.01 | | | 2.25 | | | 3.47 | |
| | | | | |
CLASS Y (Inception 12/30/94) | | | | | | | | | | | | |
Net Asset Value1 | | 3.91 | | | -1.15 | | | 3.28 | | | 4.60 | |
| | | | | |
| COMPARATIVE PERFORMANCE | | 6 MONTHS | | | 1 YEAR | | | 5 YEARS | | | 10 YEARS | |
Barclays Capital Aggregate Bond Index | | 4.70 | % | | 3.13 | % | | 4.13 | % | | 5.70 | % |
Barclays Capital U.S. Credit Index | | 2.18 | | | -5.21 | | | 1.62 | | | 4.74 | |
Morningstar Int.-Term Bond Fund Avg. | | -0.49 | | | -4.94 | | | 1.36 | | | 3.92 | |
See page 11 for a description of the indexes.
All returns represent past performance and do not guarantee future results. Periods of less than one year are not annualized. Share price and return will vary and you may have a gain or loss when you sell your shares. All results include reinvestment of any dividends and capital gains. Current returns may be higher or lower than those shown. For performance current to the most recent month-end, visit www.funds.natixis.com. Class Y shares are available to certain investors, as described in the prospectus.
The table and graph do not reflect taxes shareholders might owe on any fund distributions or when they redeem their shares.
PORTFOLIO FACTS
| | | | |
| |
| | | % of Net Assets as of |
| CREDIT QUALITY | | 3/31/09 | | 9/30/08 |
Aaa | | 48.2 | | 59.1 |
Aa | | 4.9 | | 5.6 |
A | | 11.2 | | 4.8 |
Baa | | 20.4 | | 14.6 |
Ba | | 5.0 | | 4.8 |
B | | 3.5 | | 5.7 |
Caa | | 0.8 | | 0.5 |
Ca | | 0.2 | | 0.3 |
Not Rated* | | 5.0 | | 3.8 |
Short-term and other | | 0.8 | | 0.8 |
Credit quality is based on ratings from Moody’s Investors Service.
* Securities that are not rated by Moody’s may be rated by another rating agency or by Loomis Sayles.
| | | | | | |
| |
| | | % of Net Assets as of | |
| EFFECTIVE DURATION | | 3/31/09 | | | 9/30/08 | |
1 year or less | | 5.0 | | | 8.8 | |
1-5 years | | 48.4 | | | 39.7 | |
5-10 years | | 34.7 | | | 40.0 | |
10+ years | | 11.9 | | | 11.5 | |
Average Effective Duration | | 5.4 | years | | 5.7 | years |
Portfolio characteristics will vary.
EXPENSE RATIOS AS STATED IN THE MOST RECENT PROSPECTUS
| | | | | | |
| Share Class | | Gross Expense Ratio5 | | | Net Expense Ratio6 | |
A | | 1.04 | % | | 0.90 | % |
B | | 1.80 | | | 1.65 | |
C | | 1.79 | | | 1.65 | |
Y | | 0.75 | | | 0.65 | |
NOTES TO CHARTS
1 | Does not include a sales charge. |
2 | Includes maximum sales charge of 4.50%. |
3 | Performance for Class B shares assumes a maximum 5% contingent deferred sales charge (“CDSC”) applied when you sell shares, which declines annually between years 1-6 according to the following schedule: 5, 4, 3, 3, 2, 1, 0%. Class C shares performance assumes a 1% CDSC applied when you sell shares within one year of purchase. |
4 | Fund performance has been increased by expense reductions and reimbursements, if any, without which performance would have been lower. |
5 | Before reductions and reimbursements. |
6 | After reductions and reimbursements. Expense reductions are contractual and are set to expire on 1/31/10. |
2
LOOMIS SAYLES HIGH INCOME FUND
PORTFOLIO PROFILE
Objective:
Seeks high current income plus the opportunity for capital appreciation to produce a high total return
Strategy:
Invests primarily in lower-quality fixed-income securities
Fund Inception:
February 22, 1984
Managers:
Matthew J. Eagan, CFA
Kathleen C. Gaffney, CFA
Elaine M. Stokes
Loomis, Sayles & Company, L.P.
Symbols:
| | |
| Class A | | NEFHX |
| Class B | | NEHBX |
| Class C | | NEHCX |
| Class Y | | NEHYX |
What You Should Know:
Fixed-income securities are subject to credit risk and interest rate risk; their value generally rises when prevailing interest rates fall and falls when rates rise.
The fund can invest a significant percentage of assets in debt securities that are rated below investment grade and the value of fund shares can be adversely affected by changes in economic conditions or other circumstances. Lower rated debt securities have speculative characteristics and may be subject to greater price volatility than higher rated investments. In addition, the secondary market for these securities may lack liquidity. The fund can also invest a significant percentage of assets in foreign securities and the value of the fund shares can be adversely affected by changes in currency exchange rates, political, and economic developments. In emerging markets, these risks can be significant. Fund shares should be viewed as a long-term investment.
Management Discussion
With the exception of U.S. government issues, bond markets suffered significant declines last fall, as credit markets remained frozen and the global economy continued to contract. However, conditions became more stable in December and for much of the first quarter of 2009. Massive government stimulus packages and loan programs brought a measure of reassurance, encouraging investors to move tentatively into corporate sectors.
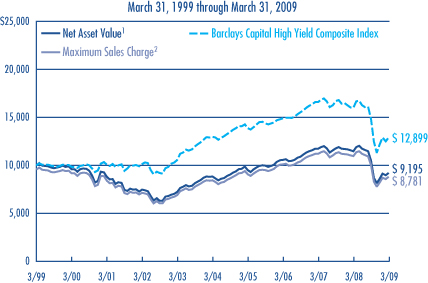
For the six-month fiscal period ended March 31, 2009, the total return on Loomis Sayles High Income Fund was -12.25% based on the net asset value of Class A shares and $0.19 in reinvested dividends. Although these results are disappointing in absolute terms, the fund achieved a slim lead over its benchmark, Barclays Capital High Yield Composite Index, which returned -12.97% for the period, and outperformed the -15.47% average return on Morningstar’s High Yield Bond category. The fund’s 30-day SEC yield as of March 31, 2009 was 9.51%.
WHICH FACTORS WERE THE MOST HARMFUL?
Stretches of severe illiquidity that began last fall fueled investors’ risk aversion, as bond dealers were unwilling to take positions in the turbulent markets. The result was falling prices for corporate issues across all quality ranges, as nervous investors shifted assets into Treasury issues. The fund’s returns suffered from the marked weakness in holdings rated below investment grade, especially securities of companies burdened by heavy debt levels.
A combination of rising unemployment, recession and unwieldy debt loads also drove down the price of bonds that had been issued as part of leveraged buy-outs – corporate acquisitions that had been financed largely by borrowing when credit was abundant. Lower-rated holdings in the industrial and utilities sectors were especially hard hit as balance sheets weakened and defaults increased. Reduced consumer spending also drove down valuations on fund holdings in the consumer discretionary and staples sectors.
WHAT HELPED STABILIZE THE MARKETS?
A series of government measures in the past several months pumped large amounts of capital into the credit markets, allaying our concerns of a possible system-wide meltdown. We took advantage of the market’s improving tone to expand holdings of higher-quality banking issues selling at low prices. By the end of March 2009, this strategy had aided absolute and relative returns, as investment-grade issues staged a partial recovery.
The Federal Reserve introduced one program aimed at supporting the credit needs of households and small businesses and another designed to provide liquidity for banks with “toxic” assets on their balance sheets. These initiatives bolstered confidence in bonds backed by commercial mortgages and those secured by auto and student loans. We responded by increasing the fund’s exposure to AAA-rated Commercial Mortgage Backed Securities and Asset Backed Securities tied to credit card debt. This boosted both relative and absolute returns in the first three months of 2009, when investors began to take interest in better quality, high-yield issues – those rated BB – where default risks appeared lower. Unfortunately, this renewed interest was not enough to erase earlier declines.
WHAT DO YOU SEE AHEAD?
We believe high-yield issues will continue to be volatile, as defaults continue to increase over the course of the year. We remain underweight the CCC-rated portion of the market, as we believe most defaults will come from this space. We believe investment-grade credit continues to offer strong relative value, as spreads remain at relatively wide levels. As the markets grow more convinced the global recovery has taken hold, we eventually expect to see more demand for riskier assets, such as high-yield and investment-grade credit, as well as commodity currencies.
3
LOOMIS SAYLES HIGH INCOME FUND
Investment Results through March 31, 2009
PERFORMANCE IN PERSPECTIVE
The charts comparing the fund’s performance to an index provide you with a general sense of how it performed. The fund’s total return for the period shown below appears with and without sales charges and includes fund expenses and fees. An index measures the performance of a theoretical portfolio. Unlike a fund, the index is unmanaged and does not have expenses that affect the results. It is not possible to invest directly in an index. Investors would incur transaction costs and other expenses if they purchased the securities necessary to match the index.
Growth of a $10,000 Investment in Class A Shares4
Average Annual Returns — March 31, 20094
| | | | | | | | | | | | | | | |
| | | | | | |
| | | 6 MONTHS | | | 1 YEAR | | | 5 YEARS | | | 10 YEARS | | | SINCE
INCEPTION | |
CLASS A (Inception 2/22/84) | | | | | | | | | | | | | | | |
Net Asset Value1 | | -12.25 | % | | -19.85 | % | | 0.80 | % | | -0.83 | % | | — | |
With Maximum Sales Charge2 | | -16.21 | | | -23.51 | | | -0.12 | | | -1.29 | | | — | |
| | | | | | |
CLASS B (Inception 9/20/93) | | | | | | | | | | | | | | | |
Net Asset Value1 | | -12.81 | | | -20.65 | | | 0.02 | | | -1.59 | | | — | |
With CDSC3 | | -16.95 | | | -24.30 | | | -0.27 | | | -1.59 | | | — | |
| | | | | | |
CLASS C (Inception 3/2/98) | | | | | | | | | | | | | | | |
Net Asset Value1 | | -12.59 | | | -20.44 | | | 0.04 | | | -1.58 | | | — | |
With CDSC3 | | -13.42 | | | -21.17 | | | 0.04 | | | -1.58 | | | — | |
| | | | | | |
CLASS Y (Inception 2/29/08) | | | | | | | | | | | | | | | |
Net Asset Value1 | | -12.14 | | | -19.66 | | | — | | | — | | | -18.72 | % |
| | | | | | |
| COMPARATIVE PERFORMANCE | | 6 MONTHS | | | 1 YEAR | | | 5 YEARS | | | 10 YEARS | | | SINCE
CLASS Y
INCEPTION7 | |
Barclays Capital High Yield Composite Index | | -12.97 | % | | -19.31 | % | | -0.10 | % | | 2.58 | % | | -18.22 | % |
Morningstar High Yield Bond Fund Avg. | | -15.47 | | | -20.97 | | | -1.42 | | | 0.99 | | | -19.77 | |
See page 11 for a description of the indexes.
All returns represent past performance and do not guarantee future results. Periods of less than one year are not annualized. Share price and return will vary and you may have a gain or loss when you sell your shares. All results include reinvestment of dividends and capital gains. Current returns may be higher or lower than those shown. For performance current to the most recent month-end, visit www.funds.natixis.com. Performance history includes periods from a predecessor fund. Class Y shares are available to certain investors, as described in the prospectus.
The table and graph do not reflect taxes shareholders might owe on any fund distributions or when they redeem their shares.
PORTFOLIO FACTS
| | | | |
| |
| | | % of Net Assets as of |
| CREDIT QUALITY | | 3/31/09 | | 9/30/08 |
Aaa | | 20.1 | | 17.3 |
Aa | | 1.2 | | 2.0 |
A | | 2.0 | | 1.0 |
Baa | | 7.2 | | 7.6 |
Ba | | 19.0 | | 14.9 |
B | | 26.4 | | 28.9 |
Caa | | 9.2 | | 16.4 |
Ca | | 1.3 | | 0.5 |
C | | 0.0 | | 0.0 |
Not Rated* | | 11.4 | | 10.1 |
Short-term and other | | 2.2 | | 1.3 |
Credit quality is based on ratings from Moody’s Investors Service.
* Securities that are not rated by Moody’s may be rated by another rating agency or by Loomis Sayles.
| | | | | | |
| |
| | | % of Net Assets as of | |
| EFFECTIVE MATURITY | | 3/31/09 | | | 9/30/08 | |
1 year or less | | 21.3 | | | 16.0 | |
1-5 years | | 24.4 | | | 25.7 | |
5-10 years | | 31.3 | | | 28.5 | |
10+ years | | 23.0 | | | 29.8 | |
Average Effective Maturity | | 7.8 | years | | 8.8 | years |
Portfolio characteristics will vary.
EXPENSE RATIOS AS STATED IN THE MOST RECENT PROSPECTUS
| | | | | | |
| Share Class | | Gross Expense Ratio5 | | | Net Expense Ratio6 | |
A | | 1.40 | % | | 1.15 | % |
B | | 2.15 | | | 1.90 | |
C | | 2.15 | | | 1.90 | |
Y | | 1.15 | | | 0.90 | |
NOTES TO CHARTS
1 | Does not include a sales charge. |
2 | Includes maximum sales charge of 4.50%. |
3 | Performance for Class B shares assumes a maximum 5% contingent deferred sales charge (“CDSC”) applied when you sell shares, which declines annually between years 1-6 according to the following schedule: 5, 4, 3, 3, 2, 1, 0%. Class C shares performance assumes a 1% CDSC applied when you sell shares within one year of purchase. |
4 | Fund performance has been increased by expense reductions and reimbursements, if any, without which performance would have been lower. |
5 | Before reductions and reimbursements. |
6 | After reductions and reimbursements. Expense reductions are contractual and are set to expire on 1/31/10. |
7 | The since-inception comparative performance figures shown for Class Y shares are calculated from 3/1/08. |
4
LOOMIS SAYLES INTERNATIONAL BOND FUND
PORTFOLIO PROFILE
Objective:
Seeks high total return through a combination of high current income and capital appreciation
Strategy:
Invests primarily in fixed-income securities located outside the U.S.
Fund Inception:
February 1, 2008
Managers:
Lynda L. Schweitzer, CFA
Kenneth M. Buntrock, CFA, CIC
David W. Rolley, CFA
Loomis, Sayles & Company, L.P.
Symbols:
| | |
| Class A | | LSIAX |
| Class C | | LSICX |
| Class Y | | LSIYX |
What You Should Know:
Fixed-income securities are subject to credit risk and interest rate risk; their value generally rises when prevailing interest rates fall and falls when rates rise. The fund may also invest in public or private debt obligations issued or guaranteed by U.S. or non-U.S. issuers. The fund can invest a significant percentage of assets in foreign securities and the value of the fund shares can be adversely affected by changes in currency exchange rates, political, and economic developments. In emerging markets these risks can be significant. The fund can invest a significant percentage of assets in debt securities that are rated below investment grade. Lower-rated debt securities have speculative characteristics and may be subject to greater price volatility than higher-rated investments. In addition, the secondary market for these securities may lack liquidity. Fund shares should be viewed as a long-term investment.
Management Discussion
Investors in capital markets around the world continued to be strongly risk averse as the credit crisis worsened and the global economy contracted during the six months ended March 31, 2009. Fixed-income securities with higher credit risk performed poorly throughout most of the period, while government bonds and other high-quality issues did relatively well. In the international currency markets, the U.S. dollar gained in strength against most foreign currencies, including the euro and the Japanese yen.
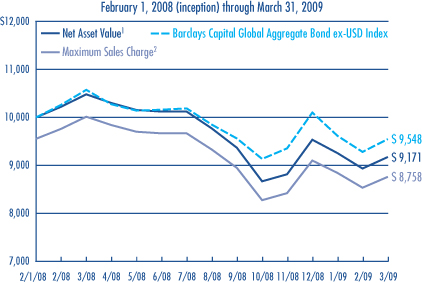
For the six months ended March 31, 2009, Class A shares of Loomis Sayles International Bond Fund returned -2.04% at net asset value, including $0.10 in dividends reinvested during the period. For the same six months, the fund’s benchmark, Barclays Capital Global Aggregate Bond ex-USD Index, returned -0.08%, while the average return on the funds in Morningstar’s World Bond category was -1.35%. The fund’s 30-day SEC yield as of March 31, 2009 was 3.95%.
WHAT CAUSED THE FUND TO LAG ITS BENCHMARK?
The fund’s emphasis on investment-grade corporate bonds and securities not represented in the benchmark detracted from results. Continuing reports of slowing worldwide economic activity during the period intensified risk aversion, causing the fund’s investment-grade holdings to become a drag on performance. The worst performers were investment-grade bonds issued by financial companies in the United Kingdom and Europe. Although high-yield corporate issues recovered somewhat in the March of 2009, the improvement was not enough to offset their poor results in October and November. The fund’s non-benchmark country position in U.S. dollar-denominated assets detracted from results when dollar-denominated bonds underperformed in foreign markets, despite strength in the dollar itself.
WHICH STRATEGIES PROVED SUPPORTIVE?
Despite disappointing results from some U.S. dollar-denominated assets, the fund’s overall currency strategy was positive. Our strategy of underweighting the euro and the Canadian dollar benefited the fund as those currencies weakened in value relative to the U.S. dollar. The fund’s non-benchmark exposure to the U.S. dollar also helped results, as did our de-emphasis of the Japanese market. As the yen weakened against the U.S. dollar in March, we reduced the fund’s exposure to Japan. Meanwhile, the fund had little or no exposure to such emerging-market currencies as the Korean won or the Polish zloty, which are represented in the benchmark.
WHAT CHANGED IN THE FIRST QUARTER OF 2009?
Even as some economic indicators in the United States and Japan appeared to worsen in the first three months of 2009, market attitudes about risk seemed to improve, as stock markets, high-yield bonds and currencies of commodity-rich countries all recovered. As a consequence, riskier assets began outperforming the higher-quality securities that had led the market since mid-2008. Meanwhile, long-duration U.S. Treasuries came under selling pressure as investors became concerned that inflationary pressures might begin to increase.
WHAT DO YOU SEE AHEAD?
Investor sentiment appears focused on the positives. In April, the Group of 20 (G-20) international policy makers agreed to pledge up to $1 trillion in emergency assistance to the global economy. This action seems to have further contributed to investors’ willingness to accept risk.
Consequently we have positioned the fund for the global economic recovery we see ahead by maintaining the fund’s underweight in the Japanese yen and continuing to emphasize investment-grade and high-yield corporate bonds. We think it is possible the market may pull back somewhat after the recent recovery by higher-risk securities. If this occurs, we intend to take advantage of the resulting lower prices to add to our positions in investments that we believe will benefit in an economic recovery. This would include increasing exposure to currencies linked to commodity prices, emerging-market bonds and high-yield corporate bonds.
5
LOOMIS SAYLES INTERNATIONAL BOND FUND
Investment Results through March 31, 2009
PERFORMANCE IN PERSPECTIVE
The charts comparing the fund’s performance to an index provide you with general sense of how it performed. The fund’s total return for the period shown below appears with and without sales charges and includes fund expenses and fees. An index measures the performance of a theoretical portfolio. Unlike a fund, an index is unmanaged and does not have expenses that affect the results. It is not possible to invest directly in an index. Investors would incur transaction costs and other expenses if they purchased the securities necessary to match the index.
Growth of $10,000 Investment in Class A Shares4
Average Annual Returns — March 31, 20094
| | | | | | | | | |
| | | | |
| | | 6 MONTHS | | | 1 YEAR | | | SINCE
INCEPTION | |
CLASS A (Inception 2/1/08) | | | | | | | | | |
Net Asset Value1 | | -2.04 | % | | -12.50 | % | | -7.17 | % |
With Maximum Sales Charge2 | | -6.42 | | | -16.42 | | | -10.77 | |
| | | | |
CLASS C (Inception 2/1/08) | | | | | | | | | |
Net Asset Value1 | | -2.41 | | | -13.30 | | | -7.96 | |
With CDSC3 | | -3.38 | | | -14.16 | | | -7.96 | |
| | | | |
CLASS Y (Inception 2/1/08) | | | | | | | | | |
Net Asset Value1 | | -1.82 | | | -12.33 | | | -7.01 | |
| | | | |
| COMPARATIVE PERFORMANCE | | 6 MONTHS | | | 1 YEAR | | | SINCE
INCEPTION | |
Barclays Capital Global Aggregate Bond ex-USD Index | | -0.08 | % | | -9.70 | % | | -3.89 | % |
Morningstar World Bond Fund Avg. | | -1.35 | | | -9.45 | | | -5.91 | |
See page 11 for a description of the indexes.
All returns represent past performance and do not guarantee future results. Periods of less than one year are not annualized. Share price and return will vary and you may have a gain or loss when you sell your shares. All results include reinvestment of dividends and capital gains. Current returns may be higher or lower than those shown. For performance current to the most recent month-end, visit www.funds.natixis.com. Class Y shares are available to certain investors, as described in the prospectus.
The table does not reflect taxes shareholders might owe on any fund distributions or when they redeem their shares.
PORTFOLIO FACTS
| | | | |
| |
| | | % of Net Assets as of |
| CREDIT QUALITY | | 3/31/09 | | 9/30/08 |
Aaa | | 41.7 | | 54.2 |
Aa | | 16.8 | | 18.7 |
A | | 11.3 | | 8.3 |
Baa | | 15.4 | | 10.5 |
Ba | | 5.6 | | 3.1 |
B | | 1.4 | | 0.5 |
Caa | | 0.5 | | 0.7 |
Not Rated* | | 6.2 | | 2.3 |
Short-term and other | | 1.1 | | 1.7 |
Credit quality is based on ratings from Moody’s Investors Service.
* Securities that are not rated by Moody’s may be rated by another rating agency or by Loomis Sayles.
| | | | | | |
| |
| | | % of Net Assets as of | |
| EFFECTIVE MATURITY | | 3/31/09 | | | 9/30/08 | |
1 year or less | | 14.0 | | | 12.5 | |
1-5 years | | 24.5 | | | 18.4 | |
5-10 years | | 42.9 | | | 55.2 | |
10+ years | | 18.6 | | | 13.9 | |
Average Effective Maturity | | 8.0 | years | | 8.1 | years |
Portfolio characteristics will vary.
EXPENSE RATIOS AS STATED IN THE MOST RECENT PROSPECTUS
| | | | | | |
| Share Class | | Gross Expense Ratio5 | | | Net Expense Ratio6 | |
A | | 2.20 | % | | 1.10 | % |
C | | 2.93 | | | 1.85 | |
Y | | 1.83 | | | 0.85 | |
NOTES TO CHARTS
1 | Does not include a sales charge. |
2 | Includes maximum sales charge of 4.50%. |
3 | Class C shares performance assumes a 1% CDSC applied when you sell shares within one year of purchase. |
4 | Fund performance has been increased by expense reductions and reimbursements, if any, without which performance would have been lower. |
5 | Before reductions and reimbursements. |
6 | After reductions and reimbursements. Expense reductions are contractual and are set to expire on 1/31/10. |
6
LOOMIS SAYLES LIMITED TERM GOVERNMENTAND AGENCY FUND
PORTFOLIO PROFILE
Objective:
Seeks a high current return consistent with preservation of capital
Strategy:
Invests primarily in securities issued or guaranteed by the U.S. government, its agencies or instrumentalities
Fund Inception:
January 3, 1989
Managers:
John Hyll
Clifton V. Rowe, CFA
Loomis, Sayles & Company, L.P.
Symbols:
| | |
| Class A | | NEFLX |
| Class B | | NELBX |
| Class C | | NECLX |
| Class Y | | NELYX |
What You Should Know:
Fixed-income securities are subject to credit risk and interest rate risk; their value generally rises when prevailing interest rates fall and falls when rates rise. Securities issued by the U.S. government are guaranteed by the U.S. government if held to maturity; mutual funds that invest in these securities are not guaranteed. Securities issued by U.S. government agencies may not be government guaranteed.
Management Discussion
Government attempts to stabilize the financial system and reinvigorate the economy gradually worked to improve investors’ willingness to accept risk in the first half of Loomis Sayles Limited Term Government and Agency Fund’s fiscal year. Investors appear to believe that steps taken by global governments have, at a minimum, reduced the risk of an extended global depression. However, the staggering cost of this extensive government intervention is beginning to trouble investors.
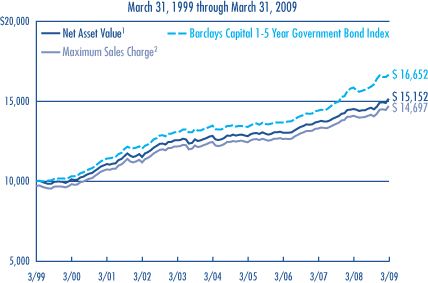
During the six months ended March 31, 2009, the fund returned 3.79% based on the net asset value of Class A shares and $0.15 in dividends reinvested during the period. The fund lagged its benchmark, Barclays Capital 1-5 Year Government Bond Index, which returned 4.64% for the period, but came in ahead of the average 3.32% return on Morningstar’s Short Government category. The fund’s 30-day SEC yield was 2.41% at March 31, 2009.
WHAT WORKED WELL FOR THE FUND?
Mortgage-backed securities (MBS) backed by 30-year loans were the focus of the Federal Reserve’s purchase program, and the fund benefited from its emphasis on these securities during the period. Specifically, we focused on MBS issued by government-sponsored agencies, which have the advantage of indirect support from the U.S. government. High-quality, short duration, asset-backed securities (ABS), including those backed by automobile loans and credit card receivables, were another area of focus. These securities currently offer attractive yields and have strong credit quality due to their secured status and other credit enhancements. The fund’s position in Treasury inflation protected securities (TIPS) also performed well as deflation concerns eased during the period.
Relative to its benchmark, the fund is also overweight in commercial mortgage-backed securities (CMBS). In this sector, the fund holds senior securities backed by first mortgages on commercial properties. We see relatively little risk of rating downgrades in these holdings.
WHICH SECURITIES PROVED DISADVANTAGEOUS?
The worst performers during the period were MBS that were not issued by government-sponsored enterprises because they do not benefit from the implied government support. As the real estate markets continued to deteriorate, this weakness also spread into the corporate bond market and to non-residential mortgages, such as CMBS. Although the CMBS market recovered in the first quarter of 2009, it had lagged for the full period, and this contributed to the fund’s performance shortfall relative to the benchmark.
HOW DID YOU POSITION THE PORTFOLIO?
We increased the fund’s holdings in TIPS and CMBS, and reduced holdings in MBS issued by government-sponsored enterprises. We believe MBS will continue to benefit from the support of the U.S. government, given their critical function in the mortgage market, but we see limited additional upside potential.
High-quality CMBS have suffered as real estate concerns grew, so we used this as an opportunity to purchase the most senior securities – those we believe to have ample credit protection. We also added to the fund’s TIPS holdings because the sector had underperformed nominal (non-TIPS) Treasuries.
WHAT’S YOUR CURRENT OUTLOOK?
Near term, we are not expecting any changes in the Federal Funds rate, although we think longer-maturity interest rates will move modestly higher. Accordingly, we are more focused on identifying income opportunities than on looking for significant principal appreciation. U.S. Treasuries may do well near term, as the economy struggles along, but their yields are so low that any hint of a recovery or inflation could have a negative impact. We believe the income advantage offered by MBS holdings should make them perform well provided the interest rate environment remains relatively stable.
7
LOOMIS SAYLES LIMITED TERM GOVERNMENTAND AGENCY FUND
Investment Results through March 31, 2009
PERFORMANCE IN PERSPECTIVE
The charts comparing the fund’s performance to an index provide you with a general sense of how it performed. The fund’s total return for the period shown below appears with and without sales charges and includes fund expenses and fees. An index measures the performance of a theoretical portfolio. Unlike a fund, the index is unmanaged and does not have expenses that affect the results. It is not possible to invest directly in an index. Investors would incur transaction costs and other expenses if they purchased the securities necessary to match the index.
Growth of a $10,000 Investment in Class A Shares4
Average Annual Returns — March 31, 20094
| | | | | | | | | | | | |
| | | | | |
| | | 6 MONTHS | | | 1 YEAR | | | 5 YEARS | | | 10 YEARS | |
CLASS A (Inception 1/3/89) | | | | | | | | | | | | |
Net Asset Value1 | | 3.79 | % | | 4.33 | % | | 3.35 | % | | 4.24 | % |
With Maximum Sales Charge2 | | 0.67 | | | 1.25 | | | 2.72 | | | 3.92 | |
| | | | | |
CLASS B (Inception 9/27/93) | | | | | | | | | | | | |
Net Asset Value1 | | 3.32 | | | 3.47 | | | 2.56 | | | 3.50 | |
With CDSC3 | | -1.68 | | | -1.53 | | | 2.21 | | | 3.50 | |
| | | | | |
CLASS C (Inception 12/30/94) | | | | | | | | | | | | |
Net Asset Value1 | | 3.32 | | | 3.57 | | | 2.57 | | | 3.51 | |
With CDSC3 | | 2.32 | | | 2.57 | | | 2.57 | | | 3.51 | |
| | | | | |
CLASS Y (Inception 3/31/94) | | | | | | | | | | | | |
Net Asset Value1 | | 3.91 | | | 4.59 | | | 3.59 | | | 4.57 | |
| | | | | |
| COMPARATIVE PERFORMANCE | | 6 MONTHS | | | 1 YEAR | | | 5 YEARS | | | 10 YEARS | |
Barclays Capital 1-5 Yr Gov’t Bond Index | | 4.64 | % | | 4.97 | % | | 4.33 | % | | 5.23 | % |
Morningstar Short Gov’t Fund Avg. | | 3.32 | | | 3.51 | | | 3.30 | | | 4.22 | |
See page 11 for a description of the indexes.
All returns represent past performance and do not guarantee future results. Periods of less than one year are not annualized. Share price and return will vary and you may have a gain or loss when you sell your shares. All results include reinvestment of dividends and capital gains. Current returns may be higher or lower than those shown. For performance current to the most recent month-end, visit www.funds.natixis.com. Performance history includes periods from a predecessor fund. Class Y shares are available to certain investors, as described in the prospectus.
The table and graph do not reflect taxes shareholders might owe on any fund distributions or when they redeem their shares.
PORTFOLIO FACTS
| | | | | | |
| |
| | | % of Net Assets as of | |
| FUND COMPOSITION | | 3/31/09 | | | 9/30/08 | |
Mortgage Related | | 37.6 | | | 67.6 | |
Treasuries | | 21.7 | | | 4.6 | |
Government Sponsored | | 10.1 | | | — | |
Government Owned - No Guarantee | | 10.1 | | | — | |
Commercial Mortgage-Backed Securities | | 7.9 | | | — | |
ABS Credit Card | | 2.7 | | | 2.7 | |
Hybrid ARMs | | 2.0 | | | 1.6 | |
ABS Home Equity | | 1.1 | | | — | |
ABS Car Loan | | 1.1 | | | — | |
Collateralized Mortgage Obligations | | 0.5 | | | 0.1 | |
ABS Other | | 0.0 | | | — | |
Asset-Backed Securities | | — | | | 3.5 | |
Mortgage-Backed Securities | | — | | | 2.0 | |
Automotive | | — | | | 1.8 | |
Short-Term Investments & Other | | 5.2 | | | 13.1 | |
| |
| | | % of Net Assets as of | |
| EFFECTIVE MATURITY | | 3/31/09 | | | 9/30/08 | |
1 year or less | | 8.7 | | | 19.0 | |
1-5 years | | 78.9 | | | 74.5 | |
5-10 years | | 12.4 | | | 6.5 | |
10+ years | | n/a | | | n/a | |
Average Effective Maturity | | 3.2 | years | | 3.0 | years |
Portfolio characteristics will vary.
EXPENSE RATIOS AS STATED IN THE MOST RECENT PROSPECTUS
| | | | | | |
| Share Class | | Gross Expense Ratio5 | | | Net Expense Ratio6 | |
A | | 1.07 | % | | 0.90 | % |
B | | 1.82 | | | 1.65 | |
C | | 1.83 | | | 1.65 | |
Y | | 0.72 | | | 0.65 | |
NOTES TO CHARTS
1 | Does not include a sales charge. |
2 | Includes maximum sales charge of 3.00%. |
3 | Performance for Class B shares assumes a maximum 5% contingent deferred sales charge (“CDSC”) applied when you sell shares, which declines annually between years 1-6 according to the following schedule: 5, 4, 3, 3, 2, 1, 0%. Class C shares performance assumes a 1% CDSC applied when you sell shares within one year of purchase. |
4 | Fund performance has been increased by expense reductions and reimbursements, if any, without which performance would have been lower. |
5 | Before reductions and reimbursements. |
6 | After reductions and reimbursements. Expense reductions are contractual and are set to expire on 1/31/10. |
8
LOOMIS SAYLES STRATEGIC INCOME FUND
PORTFOLIO PROFILE
Objective:
Seeks high current income, with a secondary objective of capital growth
Strategy:
Invests primarily in income-producing securities in the U.S. and around the world
Fund Inception:
May 1, 1995
Managers:
Daniel J. Fuss, CFA, CIC
Kathleen C. Gaffney, CFA
Associate Managers:
Matthew J. Eagan, CFA
Elaine M. Stokes
Loomis, Sayles & Company, L.P.
Symbols:
| | |
| Class A | | NEFZX |
| Class B | | NEZBX |
| Class C | | NECZX |
| Class Y | | NEZYX |
What You Should Know:
Fixed-income securities are subject to credit risk and interest rate risk; their value generally rises when prevailing interest rates fall and falls when rates rise.
The fund can invest a significant percentage of assets in debt securities that are rated below investment grade and the value of fund shares can be adversely affected by changes in economic conditions or other circumstances. Lower rated debt securities have speculative characteristics and may be subject to greater price volatility than higher rated investments. In addition, the secondary market for these securities may lack liquidity. The fund can also invest a significant percentage of assets in foreign securities and the value of the fund shares can be adversely affected by changes in currency exchange rates, political, and economic developments. In emerging markets, these risks can be significant. Fund shares should be viewed as a long-term investment.
Management Discussion
With the exception of U.S. government issues, bond markets suffered significant declines last fall, as credit markets remained frozen and the global economy continued to contract. However, conditions became more stable in December and for much of the first quarter of 2009. Massive government stimulus packages and loan programs brought a measure of reassurance, encouraging investors to move tentatively into corporate sectors.
For the six months ended March 31, 2009, Class A shares of Loomis Sayles Strategic Income Fund provided a total return at net asset value of -9.47%, including $0.49 in dividends and $0.08 in capital gains reinvested during the period. The fund underperformed its benchmark, Barclays Capital Aggregate Bond Index, which returned 4.70% for the period. The fund also lagged Morningstar’s Multisector Bond category, which had an average return of -8.03%. The fund’s 30-day SEC yield at the end of March was 10.20%.
WHAT FACTORS WERE FAVORABLE FOR THE FUND?
The fund’s financial holdings rallied in response to the Treasury department’s lending programs. In the non-investment-grade arena, results got a boost when the financing arm of a major auto maker gained access to federal funding. Renewed confidence in the global financial system at the beginning of 2009 partially reversed losses incurred in the fourth quarter of 2008 across many sectors.
WHICH STRATEGIES HURT RETURNS?
At the sector level, the fund trailed its benchmark and Morningstar peers due to limited exposure to U.S. Treasury and agency securities – by far the period’s best performers. Investors poured money into these safe havens, siphoning assets from corporate bonds and driving down prices of investment-grade and high-yield segments where the fund held major stakes.
As the global economy weakened, demand for industrial products of all kinds declined. Fears grew that credit would become even tighter and companies carrying high levels of debt were especially hard hit. Fund holdings in telecommunications, healthcare and the troubled auto sector fell sharply. In December and January, prices firmed and spreads narrowed. However, this improved performance was not enough to offset losses incurred prior to December 2008. High-yield convertibles also held back performance, with losses only partially mitigated by improved market conditions in the first three months of 2009.
Falling commodity prices tied to shrinking global demand undercut the currencies of countries dependent on commodity exports. The U.S. dollar strengthened against many of these currencies as investors moved out of commodity-related areas and turned to the greenback for greater stability. As a result, the fund suffered declines in holdings denominated in the currencies of Canada, Indonesia, Brazil, Mexico and New Zealand. There were modest rebounds late in the period, but they were not able to recover losses sustained earlier.
WHAT DO YOU SEE AHEAD?
We believe high-yield issues will continue to be volatile, as defaults continue to increase over the course of the year. We remain underweight the CCC-rated portion of the market, as we believe most defaults will come from this space. We believe investment-grade credit continues to offer strong relative value, as spreads remain at relatively wide levels. As the markets grow more convinced the global recovery has taken hold, we eventually expect to see more demand for riskier assets, such as high-yield and investment-grade credit, as well as commodity currencies.
9
LOOMIS SAYLES STRATEGIC INCOME FUND
Investment Results through March 31, 2009
PERFORMANCE IN PERSPECTIVE
The charts comparing the fund’s performance to two indexes provide you with a general sense of how it performed. The fund’s total return for the period shown below appears with and without sales charges and includes fund expenses and fees. An index measures the performance of a theoretical portfolio. Unlike a fund, the index is unmanaged and does not have expenses that affect the results. It is not possible to invest directly in an index. Investors would incur transaction costs and other expenses if they purchased the securities necessary to match the index.
Growth of a $10,000 Investment in Class A Shares4

Average Annual Returns — March 31, 20094
| | | | | | | | | | | | | | | |
| | | | | | |
| | | 6 MONTHS | | | 1 YEAR | | | 5 YEARS | | | 10 YEARS | | | SINCE
INCEPTION | |
CLASS A (Inception 5/1/95) | | | | | | | | | | | | | | | |
Net Asset Value1 | | -9.47 | % | | -21.58 | % | | 0.94 | % | | 6.03 | % | | — | |
With Maximum Sales Charge2 | | -13.54 | | | -25.10 | | | 0.02 | | | 5.55 | | | — | |
| | | | | | |
CLASS B (Inception 5/1/95) | | | | | | | | | | | | | | | |
Net Asset Value1 | | -9.86 | | | -22.22 | | | 0.17 | | | 5.23 | | | — | |
With CDSC3 | | -14.14 | | | -25.80 | | | -0.13 | | | 5.23 | | | — | |
| | | | | | |
CLASS C (Inception 5/1/95) | | | | | | | | | | | | | | | |
Net Asset Value1 | | -9.77 | | | -22.21 | | | 0.19 | | | 5.24 | | | — | |
With CDSC3 | | -10.63 | | | -22.92 | | | 0.19 | | | 5.24 | | | — | |
| | | | | | |
CLASS Y (Inception 12/1/99) | | | | | | | | | | | | | | | |
Net Asset Value1 | | -9.36 | | | -21.45 | | | 1.20 | | | — | | | 6.40 | % |
| | | | | | |
| COMPARATIVE PERFORMANCE | | 6 MONTHS | | | 1 YEAR | | | 5 YEARS | | | 10 YEARS | | | SINCE
CLASS Y
INCEPTION | |
Barclays Capital Aggregate Bond Index | | 4.70 | % | | 3.13 | % | | 4.13 | % | | 5.70 | % | | 6.10 | % |
Barclays Capital U.S. Universal Bond Index | | 3.12 | | | 1.10 | | | 3.83 | | | 5.64 | | | 5.99 | |
Morningstar Multisector Bond Fund Avg. | | -8.03 | | | -14.37 | | | 0.89 | | | 3.78 | | | 3.99 | |
See page 11 for a description of the indexes.
All returns represent past performance and do not guarantee future results. Periods of less than one year are not annualized. Share price and return will vary and you may have a gain or loss when you sell your shares. All results include reinvestment of dividends and capital gains. Current returns may be higher or lower than those shown. Performance history includes periods from a predecessor fund. For performance current to the most recent month-end, visit www.funds.natixis.com. Class Y shares are available to certain investors, as described in the prospectus.
The table and graph do not reflect taxes shareholders might owe on any fund distributions or when they redeem their shares.
PORTFOLIO FACTS
| | | | |
| |
| | | % of Net Assets as of |
| CREDIT QUALITY | | 3/31/09 | | 9/30/08 |
Aaa | | 14.1 | | 18.3 |
Aa | | 6.9 | | 4.1 |
A | | 7.7 | | 8.1 |
Baa | | 35.8 | | 32.0 |
Ba | | 10.4 | | 10.0 |
B | | 7.3 | | 10.3 |
Caa | | 5.2 | | 7.4 |
Ca | | 1.0 | | 0.8 |
C | | 0.1 | | 0.0 |
Not Rated* | | 8.3 | | 8.8 |
Short-term and other | | 3.2 | | 0.2 |
Credit quality is based on ratings from Moody’s Investors Service.
* Securities that are not rated by Moody’s may be rated by another rating agency or by Loomis Sayles.
| | | | | | |
| |
| | | % of Net Assets as of | |
| EFFECTIVE MATURITY | | 3/31/09 | | | 9/30/08 | |
1 year or less | | 6.8 | | | 8.6 | |
1-5 years | | 22.4 | | | 20.6 | |
5-10 years | | 29.5 | | | 28.2 | |
10+ years | | 41.3 | | | 42.6 | |
Average Effective Maturity | | 13.3 | years | | 13.8 | years |
Portfolio characteristics will vary.
EXPENSE RATIOS AS STATED IN THE MOST RECENT PROSPECTUS
| | | | | | |
| Share Class | | Gross Expense Ratio5 | | | Net Expense Ratio6 | |
A | | 0.98 | % | | 0.98 | % |
B | | 1.73 | | | 1.73 | |
C | | 1.73 | | | 1.73 | |
Y | | 0.73 | | | 0.73 | |
NOTES TO CHARTS
1 | Does not include a sales charge. |
2 | Includes maximum sales charge of 4.50%. |
3 | Performance for Class B shares assumes a maximum 5% contingent deferred sales charge (“CDSC”) applied when you sell shares, which declines annually between years 1-6 according to the following schedule: 5, 4, 3, 3, 2, 1, 0%. Class C share performance assumes a 1.00% CDSC applied when you sell shares within one year of purchase. |
4 | Fund performance has been increased by expense reductions and reimbursements, if any, without which performance would have been lower. |
5 | Before reductions and reimbursements. |
6 | After reductions and reimbursements. Expense reductions are contractual and are set to expire on 1/31/10. |
10
ADDITIONAL INFORMATION
The views expressed in this report reflect those of the portfolio managers as of the dates indicated. The managers’ views are subject to change at any time without notice based on changes in market or other conditions. References to specific securities or industries should not be regarded as investment advice. Because the funds are actively managed, there is no assurance that they will continue to invest in the securities or industries mentioned.
For more complete information on any Natixis Fund, contact your financial professional or call Natixis Funds and ask for a free prospectus, which contains more complete information including charges and other ongoing expenses. Investors should consider a fund’s objective, risks and expenses carefully before investing. This and other fund information can be found in the prospectus. Please read the prospectus carefully before investing.
INDEX/AVERAGE DESCRIPTIONS
Barclays Capital Aggregate Bond Index is an unmanaged index of investment-grade bonds with one- to ten-year maturities issued by the U.S. government, its agencies and U.S. corporations.
Barclays Capital Global Aggregate Bond ex-USD Index is an unmanaged index which provides a broad-based measure of the international investment-grade bond market.
Barclays Capital High Yield Composite Index is a market-weighted, unmanaged index of fixed-rate, non-investment grade debt.
Barclays Capital 1-5 Year Government Bond Index is an unmanaged, market-weighted index of bonds issued by the U.S. government and its agencies, with maturities between one and five years.
Barclays Capital U.S. Credit Index is an unmanaged index that includes all publicly issued, fixed-rate, nonconvertible, dollar-denominated, SEC-registered, U.S. investment-grade corporate debt, and foreign debt that meets specific maturity, liquidity and quality requirements.
Barclays Capital U.S. Universal Bond Index is an unmanaged index representing a blend of the Lehman Aggregate Bond Index, the High Yield Index, and the Emerging Market Index, among other indexes.
Morningstar Fund Averages are the average performance without sales charge of funds with similar investment objectives, as calculated by Morningstar, Inc.
PROXY VOTING INFORMATION
A description of the funds’ proxy voting policies and procedures is available without charge, upon request, by calling Natixis Funds at 800-225-5478; on the funds’ website at www.funds.natixis.com; and on the Securities and Exchange Commission’s (SEC’s) website at www.sec.gov. Information regarding how the funds voted proxies relating to portfolio securities during the 12-month period ended June 30, 2008 is available from the funds’ website and the SEC’s website.
QUARTERLY PORTFOLIO SCHEDULES
The funds file a complete schedule of portfolio holdings with the SEC for the first and third quarters of each fiscal year on Form N-Q. The funds’ Forms N-Q are available on the SEC’s website at www.sec.gov and may be reviewed and copied at the SEC’s Public Reference Room in Washington, DC. Information on the operation of the Public Reference Room may be obtained by calling
1-800-SEC-0330.
Effective November 3, 2008, the Lehman indices were rebranded to the Barclays Capital indices. There has been no change in the calculation or definition of the index data.
| | | | |
| NOT FDIC INSURED | | MAY LOSE VALUE | | NO BANK GUARANTEE |
11
UNDERSTANDING FUND EXPENSES
As a mutual fund shareholder, you incur different costs: transaction costs, including sales charges (loads) on purchases, redemption fees and certain exchange fees and ongoing costs, including management fees, distribution and/or service fees (12b-1 fees), and other fund expenses. In addition, each fund may assess a minimum balance fee of $20 on an annual basis for accounts that fall below the required minimum to establish an account. Certain exemptions may apply. These costs are described in more detail in the funds’ prospectuses. The examples below are intended to help you understand the ongoing costs of investing in the funds and help you compare these with the ongoing costs of investing in other mutual funds.
The first line in the table of each Class of fund shares shows the actual account values and actual fund expenses you would have paid on a $1,000 investment in the fund from October 1, 2008 through March 31, 2009. To estimate the expenses you paid over the period, simply divide your account value by $1,000 (for example $8,600 account value divided by $1,000 = 8.60) and multiply the result by the number in the Expenses Paid During Period column as shown below for your Class.
The second line in the table of each Class of fund shares provides information about hypothetical account values and hypothetical expenses based on the fund’s actual expense ratios and an assumed rate of return of 5% per year before expenses, which is not the fund’s actual return. The hypothetical account values and expenses may not be used to estimate the actual ending account balance or expenses you paid on your investment for the period. You may use this information to compare the ongoing costs of investing in the fund and other funds. To do so, compare this 5% hypothetical example with the 5% hypothetical examples that appear in the shareholder reports of the other funds.
Please note that the expenses shown reflect ongoing costs only, and do not include any transaction costs such as sales charges, redemption fees, or exchange fees. Therefore, the second line in the table of each fund is useful in comparing ongoing costs only, and will not help you determine the relative costs of owning different funds. If transaction costs were included, total costs would be higher.
| | | | | | |
| LOOMIS SAYLES CORE PLUS BOND FUND | | BEGINNING ACCOUNT VALUE
10/1/2008 | | ENDING ACCOUNT VALUE
3/31/2009 | | EXPENSES PAID DURING PERIOD*
10/1/2008 – 3/31/2009 |
CLASS A | | | | | | |
Actual | | $1,000.00 | | $1,038.00 | | $4.57 |
Hypothetical (5% return before expenses) | | $1,000.00 | | $1,020.44 | | $4.53 |
CLASS B | | | | | | |
Actual | | $1,000.00 | | $1,034.00 | | $8.37 |
Hypothetical (5% return before expenses) | | $1,000.00 | | $1,016.70 | | $8.30 |
CLASS C | | | | | | |
Actual | | $1,000.00 | | $1,034.40 | | $8.37 |
Hypothetical (5% return before expenses) | | $1,000.00 | | $1,016.70 | | $8.30 |
CLASS Y | | | | | | |
Actual | | $1,000.00 | | $1,039.10 | | $3.30 |
Hypothetical (5% return before expenses) | | $1,000.00 | | $1,021.69 | | $3.28 |
| * | Expenses are equal to the Fund’s annualized expense ratio (after fee reduction/reimbursement): 0.90%, 1.65%, 1.65% and 0.65% for Class A, B, C and Y respectively, multiplied by the average account value over the period, multiplied by the number of days in the most recent fiscal half-year, divided by 365 (to reflect the half-year period). |
12
UNDERSTANDING FUND EXPENSES
| | | | | | |
| LOOMIS SAYLES HIGH INCOME FUND | | BEGINNING ACCOUNT VALUE
10/1/2008 | | ENDING ACCOUNT VALUE
3/31/2009 | | EXPENSES PAID DURING PERIOD*
10/1/2008 – 3/31/2009 |
CLASS A | | | | | | |
Actual | | $1,000.00 | | $877.50 | | $5.38 |
Hypothetical (5% return before expenses) | | $1,000.00 | | $1,019.20 | | $5.79 |
CLASS B | | | | | | |
Actual | | $1,000.00 | | $871.90 | | $8.87 |
Hypothetical (5% return before expenses) | | $1,000.00 | | $1,015.46 | | $9.55 |
CLASS C | | | | | | |
Actual | | $1,000.00 | | $874.10 | | $8.88 |
Hypothetical (5% return before expenses) | | $1,000.00 | | $1,015.46 | | $9.55 |
CLASS Y | | | | | | |
Actual | | $1,000.00 | | $878.60 | | $4.22 |
Hypothetical (5% return before expenses) | | $1,000.00 | | $1,020.44 | | $4.53 |
| * | Expenses are equal to the Fund’s annualized expense ratio (after fee reduction/reimbursement): 1.15%, 1.90%, 1.90% and 0.90%, for Class A, B, C, and Y, respectively, multiplied by the average account value over the period, multiplied by the number of days in the most recent fiscal half-year, divided by 365 (to reflect the half-year period). |
| | | | | | |
| LOOMIS SAYLES INTERNATIONAL BOND FUND | | BEGINNING ACCOUNT VALUE
10/1/2008 | | ENDING ACCOUNT VALUE
3/31/2009 | | EXPENSES PAID DURING PERIOD*
10/1/2008 – 3/31/2009 |
CLASS A | | | | | | |
Actual | | $1,000.00 | | $979.60 | | $5.43 |
Hypothetical (5% return before expenses) | | $1,000.00 | | $1,019.45 | | $5.54 |
CLASS C | | | | | | |
Actual | | $1,000.00 | | $975.90 | | $9.11 |
Hypothetical (5% return before expenses) | | $1,000.00 | | $1,015.71 | | $9.30 |
CLASS Y | | | | | | |
Actual | | $1,000.00 | | $981.80 | | $4.20 |
Hypothetical (5% return before expenses) | | $1,000.00 | | $1,020.69 | | $4.28 |
| * | Expenses are equal to the Fund’s annualized expense ratio (after fee reduction/reimbursement): 1.10%, 1.85% and 0.85%, for Class A, C and Y, respectively, multiplied by the average account value over the period, multiplied by the number of days in the most recent fiscal half-year, divided by 365 (to reflect the half-year period). |
13
UNDERSTANDING FUND EXPENSES
| | | | | | |
LOOMIS SAYLES LIMITED TERM GOVERNMENT AND
AGENCY FUND | | BEGINNING ACCOUNT VALUE
10/1/2008 | | ENDING ACCOUNT VALUE
3/31/2009 | | EXPENSES PAID DURING PERIOD*
10/1/2008 – 3/31/2009 |
CLASS A | | | �� | | | |
Actual | | $1,000.00 | | $1,037.90 | | $4.57 |
Hypothetical (5% return before expenses) | | $1,000.00 | | $1,020.44 | | $4.53 |
CLASS B | | | | | | |
Actual | | $1,000.00 | | $1,033.20 | | $8.36 |
Hypothetical (5% return before expenses) | | $1,000.00 | | $1,016.70 | | $8.30 |
CLASS C | | | | | | |
Actual | | $1,000.00 | | $1,033.20 | | $8.36 |
Hypothetical (5% return before expenses) | | $1,000.00 | | $1,016.70 | | $8.30 |
CLASS Y | | | | | | |
Actual | | $1,000.00 | | $1,039.10 | | $3.30 |
Hypothetical (5% return before expenses) | | $1,000.00 | | $1,021.69 | | $3.28 |
| * | Expenses are equal to the Fund’s annualized expense ratio (after fee reduction/reimbursement): 0.90%, 1.65%, 1.65% and 0.65% for Class A, B, C and Y, respectively, multiplied by the average account value over the period, multiplied by the number of days in the most recent fiscal half-year, divided by 365 (to reflect the half-year period). |
| | | | | | |
| LOOMIS SAYLES STRATEGIC INCOME FUND | | BEGINNING ACCOUNT VALUE
10/1/2008 | | ENDING ACCOUNT VALUE
3/31/2009 | | EXPENSES PAID DURING PERIOD*
10/1/2008 – 3/31/2009 |
CLASS A | | | | | | |
Actual | | $1,000.00 | | $905.30 | | $4.75 |
Hypothetical (5% return before expenses) | | $1,000.00 | | $1,019.95 | | $5.04 |
CLASS B | | | | | | |
Actual | | $1,000.00 | | $901.40 | | $8.30 |
Hypothetical (5% return before expenses) | | $1,000.00 | | $1,016.21 | | $8.80 |
CLASS C | | | | | | |
Actual | | $1,000.00 | | $902.30 | | $8.30 |
Hypothetical (5% return before expenses) | | $1,000.00 | | $1,016.21 | | $8.80 |
CLASS Y | | | | | | |
Actual | | $1,000.00 | | $906.40 | | $3.52 |
Hypothetical (5% return before expenses) | | $1,000.00 | | $1,021.24 | | $3.73 |
| * | Expenses are equal to the Fund’s annualized expense ratio: 1.00%, 1.75%, 1.75% and 0.74% for Class A, B, C and Y, respectively, multiplied by the average account value over the period, multiplied by the number of days in the most recent fiscal half-year, divided by 365 (to reflect the half-year period). |
14
LOOMIS SAYLES CORE PLUS BOND FUND — PORTFOLIOOF INVESTMENTS
Investments as of March 31, 2009 (Unaudited)
| | | | | | |
Principal
Amount (‡) | | Description | | Value (†) |
| | | | | | |
| | Bonds and Notes — 97.9% of Net Assets | | | |
| | | ABS Home Equity — 1.1% | | | |
| $ | 69,948 | | Countrywide Asset-Backed Certificates, Series 2004-S1, Class A2, 3.872%, 3/25/2020 | | $ | 68,153 |
| | 1,095,000 | | Countrywide Asset-Backed Certificates, Series 2004-S1, Class A3, 4.615%, 2/25/2035 | | | 661,057 |
| | 3,240,517 | | Countrywide Asset-Backed Certificates, Series 2006-S4, Class A3, 5.804%, 7/25/2034 | | | 816,286 |
| | 984,522 | | Residential Asset Securities Corp., Series 2003-KS10, Class AI4, 4.470%, 3/25/2032 | | | 700,223 |
| | | | | | |
| | | | | | 2,245,719 |
| | | | | | |
| | | Automotive — 0.7% | | | |
| | 955,000 | | Ford Motor Co., 7.450%, 7/16/2031 | | | 303,212 |
| | 865,000 | | Ford Motor Credit Co. LLC, 7.000%, 10/01/2013 | | | 578,393 |
| | 810,000 | | Ford Motor Credit Co. LLC, 8.000%, 12/15/2016 | | | 532,357 |
| | | | | | |
| | | | | | 1,413,962 |
| | | | | | |
| | | Banking — 6.8% | | | |
| | 970,000 | | Bank of America Corp., 5.750%, 12/01/2017 | | | 814,592 |
| | 1,365,000 | | Bear Stearns Cos., Inc. (The), 6.400%, 10/02/2017 | | | 1,328,481 |
| | 2,135,000 | | Citigroup, Inc., 6.500%, 8/19/2013 | | | 1,961,884 |
| | 625,000 | | Goldman Sachs Group, Inc. (The), 5.300%, 2/14/2012 | | | 603,076 |
| | 1,040,000 | | Goldman Sachs Group, Inc. (The), 6.150%, 4/01/2018 | | | 949,955 |
| | 2,160,000 | | Goldman Sachs Group, Inc. (The), 6.750%, 10/01/2037 | | | 1,460,897 |
| | 1,560,000 | | JPMorgan Chase & Co., 6.000%, 1/15/2018 | | | 1,575,729 |
| | 1,670,000 | | Merrill Lynch & Co., Inc., MTN, 6.875%, 4/25/2018 | | | 1,306,095 |
| | 1,230,000 | | Merrill Lynch & Co., Inc., Series C, MTN, 5.450%, 2/05/2013 | | | 1,008,305 |
| | 800,000 | | Morgan Stanley, 4.000%, 1/15/2010 | | | 794,357 |
| | 615,000 | | Morgan Stanley, 5.375%, 10/15/2015 | | | 555,603 |
| | 100,000 | | Morgan Stanley, 6.750%, 4/15/2011 | | | 100,077 |
| | 835,000 | | Morgan Stanley, Series F, GMTN, 6.625%, 4/01/2018 | | | 796,178 |
| | 515,000 | | Morgan Stanley, Series F, MTN, 5.550%, 4/27/2017 | | | 458,269 |
| | | | | | |
| | | | | | 13,713,498 |
| | | | | | |
| | | Building Materials — 0.4% | | | |
| | 815,000 | | Owens Corning, Inc., 7.000%, 12/01/2036 | | | 456,711 |
| | 795,000 | | USG Corp., 6.300%, 11/15/2016 | | | 421,350 |
| | | | | | |
| | | | | | 878,061 |
| | | | | | |
| | | | | | |
Principal
Amount (‡) | | Description | | Value (†) |
| | | | | | |
| | | Commercial Mortgage-Backed Securities — 7.4% | | | |
| $ | 795,000 | | Banc of America Commercial Mortgage, Inc., Series 2005-6, Class A2, 5.165%, 9/10/2047 | | $ | 730,085 |
| | 850,000 | | Banc of America Commercial Mortgage, Inc., Series 2006-1, Class A2, 5.334%, 9/10/2045 | | | 771,678 |
| | 1,305,000 | | Banc of America Commercial Mortgage, Inc., Series 2007-2, Class A2, 5.634%, 4/10/2049 | | | 1,065,845 |
| | 1,245,000 | | Bear Stearns Commercial Mortgage Securities, Inc., Series 2005-PW10, Class A2, 5.270%, 12/11/2040 | | | 1,148,070 |
| | 1,200,000 | | Bear Stearns Commercial Mortgage Securities, Inc., Series 2007-PW16, Class A2, 5.857%, 6/11/2040(b) | | | 1,002,517 |
| | 990,000 | | Bear Stearns Commercial Mortgage Securities, Series 2006-PW13, Class A4,
5.540%, 9/11/2041 | | | 821,762 |
| | 145,000 | | Bear Stearns Commercial Mortgage Securities, Series 2007-PW15, Class A4, 5.331%, 2/11/2044 | | | 105,692 |
| | 710,000 | | Citigroup/Deutsche Bank Commercial Mortgage Trust, Series 2006-CD2, Class A2, 5.408%, 1/15/2046 | | | 645,803 |
| | 960,000 | | Credit Suisse Mortgage Capital Certificates, Series 2008-C1, Class A3, 6.425%, 2/15/2041(b) | | | 657,514 |
| | 1,800,000 | | Greenwich Capital Commercial Funding Corp., Series 2005-GG5, Class A2, 5.117%, 4/10/2037 | | | 1,613,393 |
| | 900,000 | | Greenwich Capital Commercial Funding Corp., Series 2007-GG11, Class A4, 5.736%, 12/10/2049 | | | 647,404 |
| | 543,000 | | Greenwich Capital Commercial Funding Corp., Series 2007-GG9, Class A4, 5.444%, 3/10/2039 | | | 391,159 |
| | 1,500,000 | | GS Mortgage Securities Corp. II, Series 2005-GG4, Class A4A, 4.751%, 7/10/2039 | | | 1,109,583 |
| | 1,140,000 | | GS Mortgage Securities Corp. II, Series 2006-GG8, Class A4, 5.560%, 11/10/2039 | | | 855,980 |
| | 250,000 | | JP Morgan Chase Commercial Mortgage Securities Corp., Series 2007-LD11, Class A4, 6.007%, 6/15/2049(b) | | | 171,940 |
| | 375,000 | | JP Morgan Chase Commercial Mortgage Securities Corp., Series 2006-LDP7, Class A4,
6.065%, 4/15/2045(b) | | | 282,902 |
| | 1,710,000 | | LB-UBS Commercial Mortgage Trust, Series 2005-C3, Class A3, 4.647%, 7/15/2030 | | | 1,540,079 |
| | 900,000 | | Morgan Stanley Capital I, Series 2007-T27, Class A4, 5.803%, 6/11/2042(b) | | | 678,507 |
| | 775,000 | | Morgan Stanley Capital I, Series 2008-T29, Class A4, 6.458%, 1/11/2043(b) | | | 601,596 |
| | | | | | |
| | | | | | 14,841,509 |
| | | | | | |
| | | Construction Machinery — 0.5% | | | |
| | 220,000 | | Caterpillar Financial Service Corp., 5.450%, 4/15/2018 | | | 188,748 |
| | 830,000 | | Caterpillar Financial Services Corp., 7.150%, 2/15/2019 | | | 759,159 |
| | | | | | |
| | | | | | 947,907 |
| | | | | | |
See accompanying notes to financial statements.
15
LOOMIS SAYLES CORE PLUS BOND FUND — PORTFOLIOOF INVESTMENTS (continued)
Investments as of March 31, 2009 (Unaudited)
| | | | | | |
Principal
Amount (‡) | | Description | | Value (†) |
| | | | | | |
| | | Diversified Manufacturing — 1.4% | | | |
| $ | 1,200,000 | | Crane Co., 6.550%, 11/15/2036(c) | | $ | 895,217 |
| | 2,145,000 | | General Electric Co., 5.250%, 12/06/2017 | | | 1,983,717 |
| | | | | | |
| | | | | | 2,878,934 |
| | | | | | |
| | | Electric — 1.9% | | | |
| | 290,000 | | AES Corp. (The), 7.750%, 10/15/2015 | | | 253,025 |
| | 570,000 | | AES Corp. (The), 8.000%, 10/15/2017 | | | 488,775 |
| | 715,000 | | AES Corp. (The), 144A, 8.000%, 6/01/2020 | | | 579,150 |
| | 950,000 | | Enersis SA, Chile, 7.375%, 1/15/2014 | | | 986,412 |
| | 355,000 | | Florida Power & Light Co., 4.950%, 6/01/2035 | | | 311,581 |
| | 690,000 | | Ipalco Enterprises, Inc., 144A, 7.250%, 4/01/2016 | | | 610,650 |
| | 590,000 | | Southern California Edison Co., 7.625%, 1/15/2010 | | | 609,724 |
| | | | | | |
| | | | | | 3,839,317 |
| | | | | | |
| | | Entertainment — 0.9% | | | |
| | 1,760,000 | | Time Warner Cable, Inc., 8.250%, 4/01/2019 | | | 1,808,615 |
| | | | | | |
| | | Environmental — 0.3% | | | |
| | 545,000 | | Waste Management, Inc., 7.375%, 3/11/2019 | | | 555,859 |
| | | | | | |
| | | Financial Other — 0.8% | | | |
| | 1,430,000 | | HKCG Finance Ltd., 144A, 6.250%, 8/07/2018 | | | 1,518,586 |
| | | | | | |
| | | Food & Beverage — 1.9% | | | |
| | 560,000 | | Anheuser-Busch Cos., Inc., 4.500%, 4/01/2018 | | | 473,042 |
| | 805,000 | | Anheuser-Busch Cos., Inc., 6.450%, 9/01/2037 | | | 668,068 |
| | 815,000 | | Dr Pepper Snapple Group, Inc., 6.820%, 5/01/2018 | | | 769,206 |
| | 915,000 | | Kraft Foods, Inc., 6.125%, 8/23/2018 | | | 917,193 |
| | 925,000 | | Kraft Foods, Inc., 6.875%, 2/01/2038 | | | 908,384 |
| | | | | | |
| | | | | | 3,735,893 |
| | | | | | |
| | | Government Guaranteed — 1.9% | | | |
| | 74,000,000 | | Development Bank of Japan, 1.750%, 6/21/2010 (JPY) | | | 755,604 |
| | 910,000 | | JPMorgan Chase & Co., 2.125%, 6/22/2012 | | | 914,388 |
| | 210,000,000 | | Oesterreichische Kontrollbank AG, 1.800%, 3/22/2010 (JPY) | | | 2,130,370 |
| | | | | | |
| | | | | | 3,800,362 |
| | | | | | |
| | | Government Owned - No Guarantee — 4.7% | | | |
| | 1,280,000 | | Export-Import Bank of Korea, 8.125%, 1/21/2014 | | | 1,323,045 |
| | 5,617,000 | | Federal National Mortgage Association, 4.375%, 9/13/2010 | | | 5,874,253 |
| | | | | | |
Principal
Amount (‡) | | Description | | Value (†) |
| | | | | | |
| | | Government Owned - No Guarantee — continued | | | |
| $ | 2,139,000 | | Federal National Mortgage Association, 5.375%, 6/12/2017 | | $ | 2,387,986 |
| | | | | | |
| | | | | | 9,585,284 |
| | | | | | |
| | | Health Insurance — 0.7% | | | |
| | 1,470,000 | | WellPoint, Inc., 7.000%, 2/15/2019 | | | 1,470,792 |
| | | | | | |
| | | Healthcare — 1.3% | | | |
| | 575,000 | | HCA, Inc., 7.500%, 12/15/2023 | | | 304,653 |
| | 450,000 | | HCA, Inc., 9.125%, 11/15/2014 | | | 423,000 |
| | 485,000 | | Hospira, Inc., 6.050%, 3/30/2017 | | | 432,857 |
| | 680,000 | | McKesson Corp., 7.500%, 2/15/2019 | | | 721,750 |
| | 670,000 | | Medco Health Solutions, 7.250%, 8/15/2013 | | | 694,415 |
| | | | | | |
| | | | | | 2,576,675 |
| | | | | | |
| | | Hybrid ARMs — 1.5% | | | |
| | 1,368,872 | | FHLMC, 5.949%, 11/01/2036(b) | | | 1,413,833 |
| | 1,217,858 | | FNMA, 6.039%, 2/01/2037(b) | | | 1,265,740 |
| | 373,992 | | JPMorgan Mortgage Trust, Series 2006-A7, Class 1A3, 5.874%, 1/25/2037(b) | | | 273,762 |
| | | | | | |
| | | | | | 2,953,335 |
| | | | | | |
| | | Independent Energy — 1.0% | | | |
| | 290,000 | | Chesapeake Energy Corp., 6.500%, 8/15/2017 | | | 236,350 |
| | 385,000 | | Chesapeake Energy Corp., 6.875%, 11/15/2020 | | | 301,263 |
| | 1,735,000 | | XTO Energy, Inc., 6.375%, 6/15/2038 | | | 1,545,810 |
| | | | | | |
| | | | | | 2,083,423 |
| | | | | | |
| | | Media Cable — 2.5% | | | |
| | 590,000 | | Comcast Corp., 6.450%, 3/15/2037 | | | 515,453 |
| | 1,470,000 | | Comcast Corp., 6.950%, 8/15/2037 | | | 1,368,882 |
| | 755,000 | | Cox Communications, Inc., 6.750%, 3/15/2011 | | | 754,368 |
| | 1,085,000 | | CSC Holdings, Inc., Senior Note, Series B, 7.625%, 4/01/2011 | | | 1,076,862 |
| | 60,000 | | CSC Holdings, Inc., 7.875%, 2/15/2018 | | | 54,900 |
| | 105,000 | | CSC Holdings, Inc., 144A, 8.500%, 4/15/2014 | | | 103,425 |
| | 380,000 | | CSC Holdings, Inc., 144A, 8.625%, 2/15/2019 | | | 365,750 |
| | 873,000 | | Time Warner Cable, Inc., 6.550%, 5/01/2037 | | | 734,718 |
| | | | | | |
| | | | | | 4,974,358 |
| | | | | | |
| | | Metals & Mining — 0.9% | | | |
| | 655,000 | | Barrick Gold Corp., 6.950%, 4/01/2019 | | | 657,989 |
See accompanying notes to financial statements.
16
LOOMIS SAYLES CORE PLUS BOND FUND — PORTFOLIOOF INVESTMENTS (continued)
Investments as of March 31, 2009 (Unaudited)
| | | | | | |
Principal
Amount (‡) | | Description | | Value (†) |
| | | | | | |
| | | Metals & Mining — continued | | | |
| $ | 890,000 | | Steel Dynamics, Inc., 7.375%, 11/01/2012 | | $ | 694,200 |
| | 710,000 | | United States Steel Corp., 6.650%, 6/01/2037 | | | 400,071 |
| | | | | | |
| | | | | | 1,752,260 |
| | | | | | |
| | | Mortgage Related — 22.2% | | | |
| | 842,669 | | FHLMC, 4.000%, 7/01/2019 | | | 860,523 |
| | 1,594,204 | | FHLMC, 4.500%, 12/01/2034 | | | 1,630,852 |
| | 401,293 | | FHLMC, 5.000%, 11/01/2018 | | | 417,168 |
| | 1,122,203 | | FHLMC 5.500%, with various maturities in 2018(d) | | | 1,175,055 |
| | 165,997 | | FHLMC, 6.000%, 6/01/2035 | | | 174,331 |
| | 653,714 | | FNMA, 4.000%, 6/01/2019 | | | 668,382 |
| | 6,375,346 | | FNMA 4.500%, with various maturities from 2019 to 2035(d) | | | 6,559,896 |
| | 866,929 | | FNMA, 5.500%, 5/01/2018 | | | 909,119 |
| | 8,074,871 | | FNMA 6.000%, with various maturities from 2016 to 2039(d) | | | 8,451,151 |
| | 3,683,130 | | FNMA 6.500%, with various maturities from 2029 to 2037(d) | | | 3,887,640 |
| | 174,059 | | FNMA 7.000%, with various maturities in 2030(d) | | | 187,570 |
| | 197,125 | | FNMA 7.500%, with various maturities from 2024 to 2032(d) | | | 213,443 |
| | 5,572,003 | | GNMA 5.000%, with various maturities from 2035 to 2038(d) | | | 5,790,997 |
| | 8,468,164 | | GNMA 5.500%, with various maturities from 2034 to 2038(d) | | | 8,826,035 |
| | 3,471,416 | | GNMA 6.000%, with various maturities from 2029 to 2037(d) | | | 3,636,376 |
| | 612,690 | | GNMA 6.500%, with various maturities from 2028 to 2032(d) | | | 652,361 |
| | 298,811 | | GNMA 7.000%, with various maturities from 2025 to 2029(d) | | | 320,482 |
| | 111,268 | | GNMA 7.500%, with various maturities from 2025 to 2030(d) | | | 119,811 |
| | 59,675 | | GNMA, 8.000%, 11/15/2029 | | | 64,899 |
| | 100,263 | | GNMA 8.500%, with various maturities from 2017 to 2023(d) | | | 108,414 |
| | 19,592 | | GNMA 9.000%, with various maturities in 2016(d) | | | 21,135 |
| | 39,622 | | GNMA 11.500%, with various maturities from 2013 to 2015(d) | | | 44,713 |
| | | | | | |
| | | | | | 44,720,353 |
| | | | | | |
| | | Non-Captive Consumer — 0.8% | | | |
| | 735,000 | | HSBC Finance Corp.,
7.000%, 5/15/2012 | | | 589,985 |
| | 245,000 | | SLM Corp., MTN,
5.050%, 11/14/2014 | | | 129,691 |
| | 215,000 | | SLM Corp., Series A, MTN,
5.000%, 10/01/2013 | | | 114,330 |
| | | | | | |
Principal
Amount (‡) | | Description | | Value (†) |
| | | | | | |
| | | Non-Captive Consumer — continued | | | |
| $ | 120,000 | | SLM Corp., Series A, MTN, 5.000%, 6/15/2018 | | $ | 62,124 |
| | 35,000 | | SLM Corp., Series A, MTN, 5.375%, 5/15/2014 | | | 18,137 |
| | 420,000 | | SLM Corp., Series A, MTN, 5.625%, 8/01/2033 | | | 155,400 |
| | 1,135,000 | | SLM Corp., Series A, MTN, 8.450%, 6/15/2018 | | | 613,046 |
| | | | | | |
| | | | | | 1,682,713 |
| | | | | | |
| | | Non-Captive Diversified — 2.9% | | | |
| | 7,000 | | CIT Group, Inc., 5.400%, 2/13/2012 | | | 4,513 |
| | 63,000 | | CIT Group, Inc., 5.400%, 1/30/2016 | | | 37,760 |
| | 120,000 | | CIT Group, Inc., 5.800%, 10/01/2036 | | | 66,095 |
| | 11,000 | | CIT Group, Inc., 5.850%, 9/15/2016 | | | 6,221 |
| | 1,090,000 | | CIT Group, Inc., 144A, 12.000%, 12/18/2018 | | | 564,075 |
| | 109,000 | | CIT Group, Inc., GMTN, 5.000%, 2/13/2014 | | | 64,310 |
| | 103,000 | | CIT Group, Inc., GMTN, 5.000%, 2/01/2015 | | | 62,712 |
| | 35,000 | | CIT Group, Inc., MTN, 5.125%, 9/30/2014 | | | 21,157 |
| | 1,089,000 | | CIT Group, Inc., Series A, GMTN, 6.000%, 4/01/2036 | | | 513,421 |
| | 120,000 | | CIT Group, Inc., Series A, MTN, 5.650%, 2/13/2017 | | | 69,495 |
| | 745,000 | | General Electric Capital Corp., 5.875%, 1/14/2038 | | | 532,143 |
| | 1,180,000 | | General Electric Capital Corp., Series A, MTN, 5.625%, 9/15/2017 | | | 1,034,225 |
| | 1,842,000 | | GMAC LLC, 144A, 6.625%, 5/15/2012 | | | 1,235,669 |
| | 571,000 | | GMAC LLC, 144A, 8.000%, 11/01/2031 | | | 274,742 |
| | 465,000 | | International Lease Finance Corp., 5.000%, 4/15/2010 | | | 369,366 |
| | 205,000 | | International Lease Finance Corp., 6.375%, 3/25/2013 | | | 113,283 |
| | 120,000 | | International Lease Finance Corp., Series R, MTN, 5.300%, 5/01/2012 | | | 66,600 |
| | 40,000 | | International Lease Finance Corp., Series R, MTN, 5.550%, 9/05/2012 | | | 22,176 |
| | 285,000 | | International Lease Finance Corp., Series R, MTN, 5.650%, 6/01/2014 | | | 148,499 |
| | 1,250,000 | | iStar Financial, Inc., Senior Note,
6.000%, 12/15/2010 | | | 700,000 |
| | | | | | |
| | | | | | 5,906,462 |
| | | | | | |
| | | Oil Field Services — 1.4% | | | |
| | 1,455,000 | | Halliburton Co., 7.450%, 9/15/2039 | | | 1,456,635 |
| | 190,000 | | Nabors Industries, Inc., 6.150%, 2/15/2018 | | | 148,651 |
| | 730,000 | | Nabors Industries, Inc., 144A, 9.250%, 1/15/2019 | | | 692,207 |
See accompanying notes to financial statements.
17
LOOMIS SAYLES CORE PLUS BOND FUND — PORTFOLIOOF INVESTMENTS (continued)
Investments as of March 31, 2009 (Unaudited)
| | | | | | |
Principal
Amount (‡) | | Description | | Value (†) |
| | | | | | |
| | | Oil Field Services — continued | | | |
| $ | 750,000 | | Weatherford International Ltd., 6.500%, 8/01/2036 | | $ | 527,975 |
| | | | | | |
| | | | | | 2,825,468 |
| | | | | | |
| | | Paper — 0.9% | | | |
| | 565,000 | | Georgia-Pacific Corp., 7.375%, 12/01/2025 | | | 402,563 |
| | 755,000 | | Georgia-Pacific Corp., 7.750%, 11/15/2029 | | | 558,700 |
| | 365,000 | | Georgia-Pacific Corp., 8.875%, 5/15/2031 | | | 292,000 |
| | 735,000 | | Georgia-Pacific LLC, 8.000%, 1/15/2024 | | | 584,325 |
| | | | | | |
| | | | | | 1,837,588 |
| | | | | | |
| | | Pharmaceuticals — 2.0% | | | |
| | 1,945,000 | | Pfizer, Inc., 7.200%, 3/15/2039 | | | 2,085,845 |
| | 1,990,000 | | Roche Holdings, Inc., 144A, 6.000%, 3/01/2019 | | | 2,048,230 |
| | | | | | |
| | | | | | 4,134,075 |
| | | | | | |
| | | Pipelines — 1.2% | | | |
| | 1,150,000 | | NGPL Pipeco LLC, 144A, 6.514%, 12/15/2012 | | | 1,098,550 |
| | 705,000 | | ONEOK Partners LP, 8.625%, 3/01/2019 | | | 711,389 |
| | 830,000 | | TEPPCO Partners LP, 7.550%, 4/15/2038 | | | 643,583 |
| | | | | | |
| | | | | | 2,453,522 |
| | | | | | |
| | | Property & Casualty Insurance — 0.5% | | | |
| | 760,000 | | Marsh & McLennan Co., Inc., 9.250%, 4/15/2019 | | | 774,750 |
| | 475,000 | | Willis North America, Inc., 6.200%, 3/28/2017 | | | 332,939 |
| | | | | | |
| | | | | | 1,107,689 |
| | | | | | |
| | | Refining — 0.5% | | | |
| | 965,000 | | Valero Energy Corp., 9.375%, 3/15/2019 | | | 996,237 |
| | | | | | |
| | | REITs — 0.2% | | | |
| | 640,000 | | Colonial Realty, LP, Senior Note, 5.500%, 10/01/2015 | | | 383,945 |
| | | | | | |
| | | Retailers — 0.5% | | | |
| | 1,295,000 | | Home Depot, Inc., 5.875%, 12/16/2036 | | | 917,094 |
| | | | | | |
| | | Sovereigns — 0.7% | | | |
| | 180,000 | | Indonesia Government International Bond, 144A, 6.625%, 2/17/2037 | | | 121,500 |
| | 1,705,000 | | Indonesia Government International Bond, 144A, 7.750%, 1/17/2038 | | | 1,312,850 |
| | | | | | |
| | | | | | 1,434,350 |
| | | | | | |
| | | Supermarkets — 1.0% | | | |
| | 2,095,000 | | Kroger Co. (The), 6.900%, 4/15/2038 | | | 2,115,992 |
| | | | | | |
| | | Technology — 2.1% | | | |
| | 745,000 | | Corning, Inc., 7.250%, 8/15/2036 | | | 561,273 |
| | | | | | |
Principal
Amount (‡) | | Description | | Value (†) |
| | | | | | |
| | | Technology — continued | | | |
| $ | 540,000 | | Equifax, Inc., 7.000%, 7/01/2037 | | $ | 383,549 |
| | 1,180,000 | | Fiserv, Inc., 6.125%, 11/20/2012 | | | 1,167,429 |
| | 1,420,000 | | Freescale Semiconductor, Inc., 10.125%, 12/15/2016 | | | 255,600 |
| | 85,000 | | Motorola, Inc., 6.500%, 9/01/2025 | | | 53,975 |
| | 115,000 | | Motorola, Inc., 6.500%, 11/15/2028 | | | 72,450 |
| | 185,000 | | Motorola, Inc., 6.625%, 11/15/2037 | | | 117,013 |
| | 195,000 | | Pitney Bowes, Inc., 5.250%, 1/15/2037 | | | 189,386 |
| | 279,000 | | Xerox Corp., 5.500%, 5/15/2012 | | | 241,634 |
| | 910,000 | | Xerox Corp., 6.350%, 5/15/2018 | | | 677,950 |
| | 683,000 | | Xerox Corp., 6.400%, 3/15/2016 | | | 520,762 |
| | | | | | |
| | | | | | 4,241,021 |
| | | | | | |
| | | Tobacco — 1.4% | | | |
| | 1,840,000 | | Altria Group, Inc., 9.700%, 11/10/2018 | | | 2,002,840 |
| | 1,185,000 | | Reynolds American, Inc., 7.250%, 6/15/2037 | | | 865,251 |
| | | | | | |
| | | | | | 2,868,091 |
| | | | | | |
| | | Treasuries — 14.1% | | | |
| | 6,500,000 | | Canadian Government, 5.000%, 6/01/2014 (CAD) | | | 5,975,484 |
| | 3,535,000 | | U.S. Treasury Bond, 3.500%, 2/15/2039 | | | 3,493,040 |
| | 566,000 | | U.S. Treasury Bond, 4.500%, 2/15/2036 | | | 652,138 |
| | 1,905,000 | | U.S. Treasury Bond, 5.375%, 2/15/2031 | | | 2,401,788 |
| | 5,851,896 | | U.S. Treasury Inflation Indexed Bond, 2.375%, 1/15/2025 | | | 6,080,482 |
| | 720,000 | | U.S. Treasury Note, 2.750%, 2/15/2019 | | | 723,938 |
| | 8,980,000 | | U.S. Treasury Notes, 0.875%, with various maturities in 2011(e) | | | 8,993,669 |
| | | | | | |
| | | | | | 28,320,539 |
| | | | | | |
| | | Wireless — 2.3% | | | |
| | 10,000 | | Nextel Communications, Inc., Series D, 7.375%, 8/01/2015 | | | 5,300 |
| | 15,000 | | Nextel Communications, Inc., Series F, 5.950%, 3/15/2014 | | | 8,325 |
| | 1,385,000 | | SK Telecom Co., Ltd., 144A,
6.625%, 7/20/2027 | | | 1,149,205 |
| | 4,715,000 | | Sprint Capital Corp., 6.875%, 11/15/2028 | | | 2,876,150 |
| | 15,000 | | Sprint Capital Corp., 6.900%, 5/01/2019 | | | 10,575 |
| | 1,420,000 | | True Move Co. Ltd., 144A, 10.750%, 12/16/2013 | | | 668,536 |
| | | | | | |
| | | | | | 4,718,091 |
| | | | | | |
See accompanying notes to financial statements.
18
LOOMIS SAYLES CORE PLUS BOND FUND — PORTFOLIOOF INVESTMENTS (continued)
Investments as of March 31, 2009 (Unaudited)
| | | | | | |
Principal
Amount (‡) | | Description | | Value (†) |
| | | | | | |
| | | Wirelines — 4.6% | | | |
| $ | 1,935,000 | | AT&T, Inc., 5.800%, 2/15/2019 | | $ | 1,894,233 |
| | 3,213,000 | | Embarq Corp., 7.995%, 6/01/2036 | | | 2,409,750 |
| | 935,000 | | Frontier Communications Corp., 7.875%, 1/15/2027 | | | 631,125 |
| | 210,000 | | Qwest Capital Funding, Inc., 6.500%, 11/15/2018 | | | 142,800 |
| | 460,000 | | Qwest Corp., 6.875%, 9/15/2033 | | | 301,300 |
| | 850,000 | | Qwest Corp., 7.250%, 9/15/2025 | | | 561,000 |
| | 255,000 | | Qwest Corp., 7.250%, 10/15/2035 | | | 165,750 |
| | 1,790,000 | | Qwest Corp., 7.500%, 6/15/2023 | | | 1,351,450 |
| | 590,000 | | Telecom Italia Capital SA, 6.000%, 9/30/2034 | | | 402,530 |
| | 1,700,000 | | Telecom Italia Capital SA, 7.200%, 7/18/2036 | | | 1,345,152 |
| | | | | | |
| | | | | | 9,205,090 |
| | | | | | |
| | | Total Bonds and Notes (Identified Cost $211,183,837) | | | 197,442,669 |
| | | | | | |
| Shares | | | | |
| | Preferred Stocks — 0.1% | | | |
| | | Diversified Financial Services — 0.0% | | | |
| | 532 | | Preferred Blocker, Inc., 144A, 7.000% | | | 105,918 |
| | | | | | |
| | | Thrifts & Mortgage Finance — 0.1% | | | |
| | 256,000 | | Federal National Mortgage Association, 6.750%(f)(g) | | | 128,000 |
| | 4,200 | | Federal National Mortgage Association, 8.250%(f)(g) | | | 2,982 |
| | | | | | |
| | | | | | 130,982 |
| | | | | | |
| | | Total Preferred Stocks (Identified Cost $1,717,400) | | | 236,900 |
| | | | | | |
Principal
Amount (‡) | | | | |
| | Short-Term Investments — 0.8% | | | |
| $ | 1,583,349 | | Tri-Party Repurchase Agreement with Fixed Income Clearing Corporation, dated 3/31/2009 at 0.000% to be repurchased at $1,583,349 on 4/01/2009, collateralized by $1,220,000 Federal National Mortgage Association, 6.625% due 11/15/2030 valued at $1,618,025, including accrued interest (Note 2g of Notes to Financial Statements) (Identified Cost $1,583,349) | | | 1,583,349 |
| | | | | | |
| | | | | | |
| | | Total Investments — 98.8%
(Identified Cost $214,484,586)(a) | | | 199,262,918 |
| | | Other assets less liabilities—1.2% | | | 2,483,552 |
| | | | | | |
| | | Net Assets — 100.0% | | $ | 201,746,470 |
| | | | | | |
| | | | |
| | | | |
| (‡) | | Principal amount stated in U.S. dollars unless otherwise noted. |
| (†) | | See Note 2a of Notes to Financial Statements |
| | | | | | |
| (a) | | Federal Tax Information (Amounts exclude certain adjustments made at the end of the Fund’s fiscal year for tax purposes. Such adjustments are primarily due to wash sales. Amortization of premium on debt securities is excluded for tax purposes.): At March 31, 2009, the net unrealized depreciation on investments based on a cost of $214,546,289 for federal income tax purposes was as follows: | |
| | Aggregate gross unrealized appreciation for all investments in which there is an excess of value over tax cost | | $ | 5,164,344 | |
| | Aggregate gross unrealized depreciation for all investments in which there is an excess of tax cost over value | | | (20,447,715 | ) |
| | | | | | |
| | Net unrealized depreciation | | $ | (15,283,371 | ) |
| | | | | | |
| (b) | | Variable rate security. Rate as of March 31, 2009 is disclosed. | |
| (c) | | Illiquid security. At March 31, 2009, the value of this security amounted to $895,217 or 0.4% of net assets. | |
| (d) | | The Fund’s investment in mortgage related securities of the Federal Home Loan Mortgage Corporation, Federal National Mortgage Association and Government National Mortgage Association are interests in separate pools of mortgages. All separate investments in securities of each issuer which have the same coupon rate have been aggregated for the purpose of presentation in the Portfolio of Investments. | |
| (e) | | All separate investments in U.S. Treasury securities which have the same coupon rate have been aggregated for the purpose of presentation in the Portfolio of Investments. | |
| (f) | | Non-income producing security. | |
| (g) | | Future dividend payments have been eliminated as the issuer has been placed in conservatorship. | |
| | | | | | |
| 144A | | Securities exempt from registration under Rule 144A of the Securities Act of 1933. These securities may be resold in transactions exempt from registration, normally to qualified institutional buyers. At March 31, 2009, the value of these securities amounted to $12,449,043 or 6.2% of net assets. | |
| | | | | | |
| ABS | | Asset-Backed Securities | |
| ARM | | Adjustable Rate Mortgage | |
| FHLMC | | Federal Home Loan Mortgage Corporation | |
| FNMA | | Federal National Mortgage Association | |
| GMTN | | Global Medium Term Note | |
| GNMA | | Government National Mortgage Association | |
| MTN | | Medium Term Note | |
| REITs | | Real Estate Investment Trusts | |
| | | | | | |
| CAD | | Canadian Dollar | |
| JPY | | Japanese Yen | |
Net Asset Summary at March 31, 2009 (Unaudited)
| | | |
| Mortgage Related | | 22.2 | % |
| Treasuries | | 14.1 | |
| Commercial Mortgage-Backed Securities | | 7.4 | |
| Banking | | 6.8 | |
| Government Owned—No Guarantee | | 4.7 | |
| Wirelines | | 4.6 | |
| Non-Captive Diversified | | 2.9 | |
| Media Cable | | 2.5 | |
| Wireless | | 2.3 | |
| Technology | | 2.1 | |
| Pharmaceuticals | | 2.0 | |
| Other Investments, less than 2% each | | 26.4 | |
| Short-Term Investments | | 0.8 | |
| | | |
| Total Investments | | 98.8 | |
| Other assets less liabilities | | 1.2 | |
| | | |
| Net Assets | | 100.0 | % |
| | | |
See accompanying notes to financial statements.
19
LOOMIS SAYLES HIGH INCOME FUND — PORTFOLIOOF INVESTMENTS
Investments as of March 31, 2009 (Unaudited)
| | | | | | |
Principal
Amount (‡) | | Description | | Value (†) |
| | | | | | |
| | Bonds and Notes — 79.4% of Net Assets |
| | | ABS Car Loan — 0.6% | | | |
| $ | 85,000 | | Capital One Auto Finance Trust, Series 2006-C, Class A4,
0.586%, 5/15/2013(b) | | $ | 62,235 |
| | 248,175 | | Capital One Auto Finance Trust, Series 2007-C, Class A3B,
1.066%, 4/16/2012(b) | | | 223,009 |
| | 100,000 | | Capital One Auto Finance Trust, Series 2007-C, Class A4,
5.230%, 7/15/2014 | | | 74,769 |
| | | | | | |
| | | | | | 360,013 |
| | | | | | |
| | | ABS Credit Card — 1.1% | | | |
| | 100,000 | | Bank One Issuance Trust, Series 2004-C2, Class C2,
1.356%, 2/15/2017(b) | | | 39,000 |
| | 650,000 | | Citibank Credit Card Issuance Trust, Series 2005-C3, Class C3,
0.966%, 7/15/2014(b) | | | 376,968 |
| | 205,000 | | Citibank Credit Card Issuance Trust, Series 2006-C1, Class C1,
0.945%, 2/20/2015(b) | | | 103,470 |
| | 100,000 | | HSBC Private Label Credit Card Master Note Trust, Series 2007-1, Class B,
0.666%, 12/16/2013(b) | | | 80,928 |
| | 70,000 | | MBNA Credit Card Master Note Trust, Series 2006-C3, Class C3,
0.846%, 10/15/2013(b) | | | 48,047 |
| | | | | | |
| | | | | | 648,413 |
| | | | | | |
| | | Aerospace & Defense — 1.0% | | | |
| | 260,000 | | BE Aerospace, Inc.,
8.500%, 7/01/2018 | | | 216,775 |
| | 500,000 | | Bombardier, Inc., 144A,
6.300%, 5/01/2014 | | | 352,500 |
| | | | | | |
| | | | | | 569,275 |
| | | | | | |
| | | Airlines — 0.2% | | | |
| | 49,961 | | Continental Airlines, Inc., Series 1997-4, Class 4B,
6.900%, 7/02/2018 | | | 34,973 |
| | 14,137 | | Continental Airlines, Inc., Series 1999-1, Class C,
6.954%, 2/02/2011 | | | 13,607 |
| | 180,000 | | Continental Airlines, Inc., Series 2007-1, Class B,
6.903%, 4/19/2022 | | | 95,400 |
| | | | | | |
| | | | | | 143,980 |
| | | | | | |
| | | Automotive — 3.0% | | | |
| | 420,000 | | Ford Motor Co.,
6.375%, 2/01/2029 | | | 118,650 |
| | 65,000 | | Ford Motor Co.,
6.625%, 2/15/2028 | | | 18,362 |
| | 1,220,000 | | Ford Motor Co.,
6.625%, 10/01/2028 | | | 344,650 |
| | 210,000 | | Ford Motor Co.,
7.450%, 7/16/2031 | | | 66,675 |
| | 40,000 | | Ford Motor Co.,
7.500%, 8/01/2026 | | | 11,200 |
| | 550,000 | | Ford Motor Credit Co. LLC,
5.700%, 1/15/2010 | | | 471,109 |
| | 66,000 | | GMAC LLC, 144A,
5.375%, 6/06/2011 | | | 46,860 |
| | 635,000 | | Goodyear Tire & Rubber Co.,
7.000%, 3/15/2028 | | | 355,600 |
| | 85,000 | | Goodyear Tire & Rubber Co.,
7.857%, 8/15/2011 | | | 69,700 |
| | 310,000 | | Goodyear Tire & Rubber Co.,
9.000%, 7/01/2015 | | | 238,700 |
| | | | | | |
| | | | | | 1,741,506 |
| | | | | | |
| | | | | | |
Principal
Amount (‡) | | Description | | Value (†) |
| | | | | | |
| | | Banking — 2.1% | | | |
| $ | 290,000 | | Citigroup, Inc.,
5.000%, 9/15/2014 | | $ | 192,241 |
| | 340,000 | | Goldman Sachs Group, Inc. (The),
5.000%, 10/01/2014 | | | 307,387 |
| | 175,000 | | Goldman Sachs Group, Inc. (The),
5.150%, 1/15/2014 | | | 159,716 |
| | 80,000 | | Morgan Stanley,
4.750%, 4/01/2014 | | | 65,406 |
| | 350,000 | | Morgan Stanley,
5.375%, 10/15/2015 | | | 316,197 |
| | 130,000 | | Morgan Stanley,
6.750%, 4/15/2011 | | | 130,100 |
| | 100,000 | | Morgan Stanley, MTN,
6.250%, 8/09/2026 | | | 82,711 |
| | | | | | |
| | | | | | 1,253,758 |
| | | | | | |
| | | Building Materials — 0.6% | | | |
| | 50,000 | | Masco Corp.,
4.800%, 6/15/2015 | | | 32,221 |
| | 50,000 | | Masco Corp.,
6.500%, 8/15/2032 | | | 25,294 |
| | 565,000 | | USG Corp.,
6.300%, 11/15/2016 | | | 299,450 |
| | | | | | |
| | | | | | 356,965 |
| | | | | | |
| | | Chemicals — 0.4% | | | |
| | 450,000 | | Borden, Inc.,
7.875%, 2/15/2023 | | | 45,000 |
| | 550,000 | | Borden, Inc.,
9.200%, 3/15/2021 | | | 55,000 |
| | 20,000 | | Georgia Gulf Corp.,
10.750%, 10/15/2016 | | | 1,300 |
| | 380,000 | | Hercules, Inc., Subordinated Note,
6.500%, 6/30/2029(c) | | | 133,000 |
| | | | | | |
| | | | | | 234,300 |
| | | | | | |
| | | Commercial Mortgage-Backed Securities — 2.6% | | | |
| | 100,000 | | Bear Stearns Commercial Mortgage Securities, Series 2006-PW13, Class A4,
5.540%, 9/11/2041 | | | 83,006 |
| | 100,000 | | Bear Stearns Commercial Mortgage Securities, Series 2007-PW15, Class A4,
5.331%, 2/11/2044 | | | 72,891 |
| | 100,000 | | Credit Suisse Mortgage Capital Certificates, Series 2007-C4, Class A4, 6.004%, 9/15/2039(b) | | | 63,463 |
| | 500,000 | | Greenwich Capital Commercial Funding Corp., Series 2007-GG11, Class A4, 5.736%, 12/10/2049 | | | 359,669 |
| | 400,000 | | Greenwich Capital Commercial Funding Corp., Series 2007-GG9, Class A4, 5.444%, 3/10/2039 | | | 288,146 |
| | 300,000 | | JP Morgan Chase Commercial Mortgage Securities Corp., Series 2007-LD11, Class A4, 6.007%, 6/15/2049(b) | | | 206,328 |
| | 100,000 | | JP Morgan Chase Commercial Mortgage Securities Corp., Series 2007-LDPX, Class A3, 5.420%, 1/15/2049 | | | 67,582 |
| | 300,000 | | Morgan Stanley Capital I, Series 2007-T27, Class A4, 5.803%, 6/11/2042(b) | | | 226,169 |
See accompanying notes to financial statements.
20
LOOMIS SAYLES HIGH INCOME FUND — PORTFOLIOOF INVESTMENTS (continued)
Investments as of March 31, 2009 (Unaudited)
| | | | | | |
Principal
Amount (‡) | | Description | | Value (†) |
| | | | | | |
| | | Commercial Mortgage-Backed Securities — continued | | | |
| $ | 200,000 | | Morgan Stanley Capital I, Series 2008-T29, Class A4, 6.458%, 1/11/2043(b) | | $ | 155,251 |
| | | | | | |
| | | | | | 1,522,505 |
| | | | | | |
| | | Construction Machinery — 1.5% | | | |
| | 185,000 | | Joy Global, Inc., 6.000%, 11/15/2016 | | | 154,830 |
| | 40,000 | | Joy Global, Inc., 6.625%, 11/15/2036 | | | 26,691 |
| | 165,000 | | United Rentals North America, Inc., 1.875%, 10/15/2023 | | | 122,100 |
| | 1,065,000 | | United Rentals North America, Inc., 7.000%, 2/15/2014 | | | 537,825 |
| | 15,000 | | United Rentals North America, Inc., 7.750%, 11/15/2013 | | | 8,175 |
| | | | | | |
| | | | | | 849,621 |
| | | | | | |
| | | Electric — 3.5% | | | |
| | 35,000 | | AES Corp. (The), 8.000%, 10/15/2017 | | | 30,013 |
| | 415,000 | | AES Corp. (The), 144A, 8.000%, 6/01/2020(f) | | | 336,150 |
| | 133,984 | | AES Ironwood LLC, 8.857%, 11/30/2025 | | | 117,906 |
| | 24,355 | | AES Red Oak LLC, Series A, 8.540%, 11/30/2019 | | | 22,163 |
| | 380,000 | | CMS Energy Corp., 7.750%, 8/01/2010 | | | 377,257 |
| | 375,000 | | Dynegy Holdings, Inc., 7.125%, 5/15/2018 | | | 198,750 |
| | 180,000 | | Dynegy Holdings, Inc., 7.625%, 10/15/2026 | | | 75,600 |
| | 165,000 | | Dynegy Holdings, Inc., 7.750%, 6/01/2019 | | | 107,250 |
| | 170,000 | | Edison Mission Energy, 7.625%, 5/15/2027 | | | 102,000 |
| | 140,000 | | NGC Corp. Capital Trust I, Series B, 8.316%, 6/01/2027 | | | 56,000 |
| | 205,000 | | NRG Energy, Inc., 7.375%, 1/15/2017 | | | 190,650 |
| | 195,000 | | TXU Corp., Series P, 5.550%, 11/15/2014 | | | 67,275 |
| | 1,015,000 | | TXU Corp., Series Q, 6.500%, 11/15/2024 | | | 284,733 |
| | 370,000 | | TXU Corp., Series R, 6.550%, 11/15/2034 | | | 100,281 |
| | | | | | |
| | | | | | 2,066,028 |
| | | | | | |
| | | Entertainment — 0.1% | | | |
| | 70,000 | | Viacom, Inc., 6.125%, 10/05/2017 | | | 59,562 |
| | | | | | |
| | | Food & Beverage — 2.3% | | | |
| | 400,000 | | ARAMARK Corp., 8.500%, 2/01/2015 | | | 368,000 |
| | 585,000 | | Aramark Services, Inc., 5.000%, 6/01/2012 | | | 511,875 |
| | 570,000 | | Tyson Foods, Inc., 7.850%, 4/01/2016 | | | 491,053 |
| | | | | | |
| | | | | | 1,370,928 |
| | | | | | |
| | | | | | |
Principal
Amount (‡) | | Description | | Value (†) |
| | | | | | |
| | | Gaming — 0.2% | | | |
| $ | 35,000 | | Harrah’s Operating Co., Inc., 5.750%, 10/01/2017 | | $ | 5,600 |
| | 535,000 | | Harrah’s Operating Co., Inc., 10.750%, 2/01/2016 | | | 101,650 |
| | | | | | |
| | | | | | 107,250 |
| | | | | | |
| | | Government Guaranteed — 0.4% | | | |
| | 275,000 | | Canada Housing Trust, 3.550%, 9/15/2013 (CAD) | | | 231,944 |
| | | | | | |
| | | Government Owned - No Guarantee — 0.3% | | | |
| | 160,000 | | Federal Home Loan Mortgage Corp., 4.625%, 10/25/2012(f) | | | 173,617 |
| | | | | | |
| | | Healthcare — 5.6% | | | |
| | 660,000 | | Affymetrix, Inc., 3.500%, 1/15/2038 | | | 346,500 |
| | 5,000 | | Boston Scientific Corp., 5.450%, 6/15/2014 | | | 4,575 |
| | 105,000 | | Boston Scientific Corp., 6.400%, 6/15/2016 | | | 97,650 |
| | 95,000 | | Boston Scientific Corp., 7.000%, 11/15/2035 | | | 80,750 |
| | 385,000 | | CHS/Community Health Systems, Inc., 8.875%, 7/15/2015 | | | 363,825 |
| | 127,000 | | EPIX Pharmaceuticals, Inc., Senior Note, 3.000%, 6/15/2024(c)(d) | | | 25,400 |
| | 150,000 | | HCA, Inc., 5.750%, 3/15/2014 | | | 98,250 |
| | 155,000 | | HCA, Inc., 6.250%, 2/15/2013 | | | 116,250 |
| | 10,000 | | HCA, Inc.,
6.300%, 10/01/2012 | | | 8,350 |
| | 50,000 | | HCA, Inc.,
6.375%, 1/15/2015 | | | 32,750 |
| | 205,000 | | HCA, Inc.,
6.500%, 2/15/2016 | | | 134,275 |
| | 35,000 | | HCA, Inc.,
7.050%, 12/01/2027 | | | 18,200 |
| | 440,000 | | HCA, Inc.,
7.190%, 11/15/2015 | | | 297,238 |
| | 225,000 | | HCA, Inc.,
7.500%, 12/15/2023 | | | 119,212 |
| | 700,000 | | HCA, Inc.,
7.500%, 11/06/2033 | | | 350,000 |
| | 40,000 | | HCA, Inc.,
7.690%, 6/15/2025 | | | 20,832 |
| | 40,000 | | HCA, Inc.,
8.360%, 4/15/2024 | | | 22,429 |
| | 445,000 | | HCA, Inc., MTN,
7.580%, 9/15/2025 | | | 228,334 |
| | 40,000 | | HCA, Inc., MTN,
7.750%, 7/15/2036 | | | 20,232 |
| | 360,000 | | Health Management Associates, Inc.,
6.125%, 4/15/2016 | | | 294,300 |
| | 70,000 | | Hologic, Inc. (Step to Zero Coupon on 12/15/2013),
2.000%, 12/15/2037(e) | | | 47,775 |
| | 40,000 | | Life Technologies Corp.,
1.500%, 2/15/2024 | | | 35,650 |
| | 300,000 | | Omnicare, Inc.,
3.250%, 12/15/2035 | | | 196,500 |
See accompanying notes to financial statements.
21
LOOMIS SAYLES HIGH INCOME FUND — PORTFOLIOOF INVESTMENTS (continued)
Investments as of March 31, 2009 (Unaudited)
| | | | | | |
Principal
Amount (‡) | | Description | | Value (†) |
| | | | | | |
| | | Healthcare — continued | | | |
| $ | 255,000 | | Tenet Healthcare Corp.,
6.875%, 11/15/2031 | | $ | 126,225 |
| | 190,000 | | Tenet Healthcare Corp.,
7.375%, 2/01/2013 | | | 151,050 |
| | 60,000 | | Tenet Healthcare Corp.,
9.875%, 7/01/2014 | | | 46,800 |
| | | | | | |
| | | | | | 3,283,352 |
| | | | | | |
| | | Home Construction — 4.5% | | | |
| | 375,000 | | Centex Corp.,
5.250%, 6/15/2015 | | | 281,250 |
| | 350,000 | | D.R. Horton, Inc.,
5.250%, 2/15/2015 | | | 268,187 |
| | 15,000 | | D.R. Horton, Inc.,
6.500%, 4/15/2016 | | | 11,775 |
| | 410,000 | | Desarrolladora Homex SAB de CV,
7.500%, 9/28/2015 | | | 270,600 |
| | 385,000 | | K. Hovnanian Enterprises, Inc.,
6.250%, 1/15/2015 | | | 98,175 |
| | 365,000 | | K. Hovnanian Enterprises, Inc., Guaranteed Note,
6.250%, 1/15/2016 | | | 98,550 |
| | 30,000 | | K. Hovnanian Enterprises, Inc., Guaranteed Note,
6.500%, 1/15/2014 | | | 7,800 |
| | 315,000 | | KB Home,
5.750%, 2/01/2014 | | | 249,244 |
| | 360,000 | | KB Home, Guaranteed Note,
5.875%, 1/15/2015 | | | 278,820 |
| | 590,000 | | KB Home, Guaranteed Note,
7.250%, 6/15/2018 | | | 445,450 |
| | 5,000 | | Lennar Corp., Series B,
5.125%, 10/01/2010 | | | 4,375 |
| | 580,000 | | Lennar Corp., Series B, Guaranteed Note,
5.600%, 5/31/2015 | | | 413,250 |
| | 155,000 | | Pulte Homes, Inc.,
6.000%, 2/15/2035 | | | 94,550 |
| | 230,000 | | Pulte Homes, Inc.,
6.375%, 5/15/2033 | | | 140,300 |
| | | | | | |
| | | | | | 2,662,326 |
| | | | | | |
| | | Independent Energy — 5.1% | | | |
| | 40,000 | | Chesapeake Energy Corp.,
6.375%, 6/15/2015 | | | 33,700 |
| | 1,240,000 | | Chesapeake Energy Corp.,
6.500%, 8/15/2017 | | | 1,010,600 |
| | 195,000 | | Chesapeake Energy Corp.,
6.875%, 11/15/2020 | | | 152,588 |
| | 40,000 | | Chesapeake Energy Corp., Convertible,
2.250%, 12/15/2038 | | | 20,600 |
| | 620,000 | | Connacher Oil and Gas Ltd., 144A,
10.250%, 12/15/2015 | | | 195,300 |
| | 755,000 | | Hilcorp Energy I LP, 144A,
7.750%, 11/01/2015 | | | 551,150 |
| | 335,000 | | PetroHawk Energy Corp., 144A,
7.875%, 6/01/2015 | | | 294,800 |
| | 355,000 | | Pioneer Natural Resources Co.,
5.875%, 7/15/2016 | | | 261,948 |
| | 200,000 | | Pioneer Natural Resources Co.,
6.875%, 5/01/2018 | | | 147,002 |
| | | | | | |
Principal
Amount (‡) | | Description | | Value (†) |
| | | | | | |
| | | Independent Energy — continued | | | |
| $ | 505,000 | | Pioneer Natural Resources Co.,
7.200%, 1/15/2028 | | $ | 309,751 |
| | | | | | |
| | | | | | 2,977,439 |
| | | | | | |
| | | Industrial Other — 0.3% | | | |
| | 245,000 | | Incyte Corp.,
3.500%, 2/15/2011 | | | 121,275 |
| | 140,000 | | Ranhill Labuan Ltd., 144A,
12.500%, 10/26/2011 | | | 79,800 |
| | | | | | |
| | | | | | 201,075 |
| | | | | | |
| | | Local Authorities — 0.4% | | | |
| | 350,000 | | New South Wales Treasury Corp., Series 10RG,
7.000%, 12/01/2010 (AUD) | | | 257,236 |
| | | | | | |
| | | Lodging — 1.1% | | | |
| | 145,000 | | FelCor Lodging LP,
9.000%, 6/01/2011 | | | 87,000 |
| | 105,000 | | Host Hotels & Resorts LP, Convertible, 144A,
3.250%, 4/15/2024 | | | 95,288 |
| | 665,000 | | Host Hotels & Resorts, Inc., 144A,
2.625%, 4/15/2027 | | | 462,175 |
| | | | | | |
| | | | | | 644,463 |
| | | | | | |
| | | Media Cable — 2.0% | | | |
| | 655,000 | | CSC Holdings, Inc., Senior Note,
7.625%, 7/15/2018 | | | 589,500 |
| | 250,000 | | CSC Holdings, Inc.,
7.875%, 2/15/2018 | | | 228,750 |
| | 180,000 | | CSC Holdings, Inc., 144A,
8.625%, 2/15/2019 | | | 173,250 |
| | 180,000 | | Virgin Media Finance PLC,
8.750%, 4/15/2014 | | | 170,100 |
| | | | | | |
| | | | | | 1,161,600 |
| | | | | | |
| | | Media Non-Cable — 1.1% | | | |
| | 25,000 | | Clear Channel Communications, Inc.,
4.900%, 5/15/2015 | | | 3,500 |
| | 50,000 | | Clear Channel Communications, Inc.,
5.500%, 12/15/2016 | | | 7,000 |
| | 475,000 | | Clear Channel Communications, Inc.,
6.875%, 6/15/2018 | | | 68,875 |
| | 175,000 | | Intelsat Corp., 6.875%, 1/15/2028 | | | 119,000 |
| | 240,000 | | Intelsat Subsidiary Holding Co. Ltd., 144A,
8.500%, 1/15/2013 | | | 226,200 |
| | 160,000 | | Intelsat Subsidiary Holding Co. Ltd., 144A,
8.875%, 1/15/2015 | | | 148,400 |
| | 85,000 | | R.H. Donnelley Corp.,
6.875%, 1/15/2013 | | | 3,613 |
| | 25,000 | | R.H. Donnelley Corp., Series A-1,
6.875%, 1/15/2013 | | | 1,063 |
| | 160,000 | | R.H. Donnelley Corp., Series A-2,
6.875%, 1/15/2013 | | | 6,800 |
| | 615,000 | | R.H. Donnelley Corp., Series A-3,
8.875%, 1/15/2016 | | | 35,362 |
| | 155,000 | | R.H. Donnelley Corp., Series A-4,
8.875%, 10/15/2017 | | | 8,137 |
| | | | | | |
| | | | | | 627,950 |
| | | | | | |
| | | Metals & Mining — 0.9% | | | |
| | 140,000 | | Ispat Inland ULC,
9.750%, 4/01/2014 | | | 127,400 |
See accompanying notes to financial statements.
22
LOOMIS SAYLES HIGH INCOME FUND — PORTFOLIOOF INVESTMENTS (continued)
Investments as of March 31, 2009 (Unaudited)
| | | | | | |
Principal
Amount (‡) | | Description | | Value (†) |
| | | | | | |
| | | Metals & Mining — continued | | | |
| $ | 285,000 | | Steel Dynamics, Inc.,
7.375%, 11/01/2012 | | $ | 222,300 |
| | 190,000 | | United States Steel Corp.,
6.050%, 6/01/2017 | | | 117,558 |
| | 95,000 | | United States Steel Corp.,
7.000%, 2/01/2018 | | | 64,829 |
| | | | | | |
| | | | | | 532,087 |
| | | | | | |
| | | Non-Captive Consumer — 1.0% | | | |
| | 60,000 | | SLM Corp., MTN,
5.050%, 11/14/2014 | | | 31,761 |
| | 50,000 | | SLM Corp., Series A, MTN,
4.000%, 1/15/2010 | | | 42,193 |
| | 40,000 | | SLM Corp., Series A, MTN,
4.500%, 7/26/2010 | | | 30,000 |
| | 20,000 | | SLM Corp., Series A, MTN,
5.000%, 10/01/2013 | | | 10,635 |
| | 10,000 | | SLM Corp., Series A, MTN,
5.000%, 6/15/2018 | | | 5,177 |
| | 5,000 | | SLM Corp., Series A, MTN,
5.625%, 8/01/2033 | | | 1,850 |
| | 735,000 | | SLM Corp., Series A, MTN,
6.500%, 6/15/2010 (NZD)(c)(d) | | | 304,783 |
| | 245,000 | | SLM Corp., Series A, MTN,
8.450%, 6/15/2018 | | | 132,331 |
| | | | | | |
| | | | | | 558,730 |
| | | | | | |
| | | Non-Captive Diversified — 3.2% | | | |
| | 95,000 | | CIT Group, Inc.,
4.750%, 12/15/2010 | | | 76,611 |
| | 7,000 | | CIT Group, Inc.,
5.400%, 2/13/2012 | | | 4,513 |
| | 20,000 | | CIT Group, Inc.,
5.400%, 1/30/2016 | | | 11,987 |
| | 85,000 | | CIT Group, Inc.,
5.800%, 10/01/2036 | | | 46,817 |
| | 8,000 | | CIT Group, Inc.,
5.850%, 9/15/2016 | | | 4,525 |
| | 335,000 | | CIT Group, Inc., 144A,
12.000%, 12/18/2018 | | | 173,362 |
| | 44,000 | | CIT Group, Inc., GMTN,
5.000%, 2/13/2014 | | | 25,960 |
| | 20,000 | | CIT Group, Inc., GMTN,
5.000%, 2/01/2015 | | | 12,177 |
| | 32,000 | | CIT Group, Inc., MTN,
5.125%, 9/30/2014 | | | 19,344 |
| | 8,000 | | CIT Group, Inc., Series A, MTN,
5.650%, 2/13/2017 | | | 4,633 |
| | 1,300,000 | | General Electric Capital Corp., Series A, MTN,
2.960%, 5/18/2012 (SGD) | | | 713,671 |
| | 22,000 | | GMAC LLC, 144A,
4.750%, 9/14/2009 | | | 18,735 |
| | 172,000 | | GMAC LLC, 144A,
5.750%, 9/27/2010 | | | 130,720 |
| | 398,000 | | GMAC LLC, 144A,
6.000%, 12/15/2011 | | | 270,962 |
| | 208,000 | | GMAC LLC, 144A,
6.625%, 5/15/2012 | | | 139,533 |
| | 346,000 | | GMAC LLC, 144A,
6.750%, 12/01/2014 | | | 201,074 |
| | | | | | |
Principal
Amount (‡) | | Description | | Value (†) |
| | | | | | |
| | | Non-Captive Diversified — continued | | | |
| $ | 24,000 | | GMAC LLC, 144A,
8.000%, 11/01/2031 | | $ | 11,548 |
| | 80,000 | | iStar Financial, Inc.,
5.850%, 3/15/2017 | | | 23,200 |
| | 10,000 | | iStar Financial, Inc.,
5.875%, 3/15/2016 | | | 2,900 |
| | 15,000 | | iStar Financial, Inc., Series B,
5.950%, 10/15/2013 | | | 4,575 |
| | | | | | |
| | | | | | 1,896,847 |
| | | | | | |
| | | Oil & Gas — 0.4% | | | |
| | 330,000 | | SandRidge Energy, Inc., 144A,
8.000%, 6/01/2018 | | | 242,550 |
| | | | | | |
| | | Oil Field Services — 1.1% | | | |
| | 490,000 | | Basic Energy Services, Inc.,
7.125%, 4/15/2016 | | | 284,200 |
| | 120,000 | | Complete Production Services, Inc.,
8.000%, 12/15/2016 | | | 76,200 |
| | 30,000 | | Key Energy Services, Inc.,
8.375%, 12/01/2014 | | | 18,900 |
| | 325,000 | | North American Energy Partners, Inc.,
8.750%, 12/01/2011 | | | 237,250 |
| | | | | | |
| | | | | | 616,550 |
| | | | | | |
| | | Packaging — 0.3% | | | |
| | 175,000 | | Owens-Illinois, Inc., Senior Note,
7.800%, 5/15/2018 | | | 169,750 |
| | | | | | |
| | | Paper — 3.2% | | | |
| | 75,000 | | Georgia-Pacific Corp.,
7.250%, 6/01/2028 | | | 52,125 |
| | 160,000 | | Georgia-Pacific Corp.,
7.375%, 12/01/2025 | | | 114,000 |
| | 415,000 | | Georgia-Pacific Corp.,
7.750%, 11/15/2029 | | | 307,100 |
| | 1,060,000 | | Georgia-Pacific Corp.,
8.875%, 5/15/2031 | | | 848,000 |
| | 35,000 | | Georgia-Pacific LLC, 144A,
7.125%, 1/15/2017 | | | 32,375 |
| | 270,000 | | Georgia-Pacific LLC,
8.000%, 1/15/2024 | | | 214,650 |
| | 200,000 | | Georgia-Pacific LLC,
9.500%, 12/01/2011 | | | 199,750 |
| | 200,000 | | Jefferson Smurfit Corp.,
7.500%, 6/01/2013(g) | | | 23,250 |
| | 485,000 | | Smurfit-Stone Container Enterprises, Inc.,
8.000%, 3/15/2017(g) | | | 56,381 |
| | 270,000 | | Stone Container Finance,
7.375%, 7/15/2014(g) | | | 39,150 |
| | | | | | |
| | | | | | 1,886,781 |
| | | | | | |
| | | Pharmaceuticals — 4.8% | | | |
| | 640,000 | | Elan Finance PLC,
8.875%, 12/01/2013 | | | 512,000 |
| | 1,190,000 | | Elan Finance PLC, Senior Note,
7.750%, 11/15/2011 | | | 999,600 |
| | 170,000 | | Human Genome Sciences, Inc.,
2.250%, 10/15/2011 | | | 62,475 |
| | 600,000 | | Human Genome Sciences, Inc.,
2.250%, 8/15/2012 | | | 199,500 |
See accompanying notes to financial statements.
23
LOOMIS SAYLES HIGH INCOME FUND — PORTFOLIOOF INVESTMENTS (continued)
Investments as of March 31, 2009 (Unaudited)
| | | | | | |
Principal
Amount (‡) | | Description | | Value (†) |
| | | | | | |
| | | Pharmaceuticals — continued | | | |
| $ | 306,000 | | Nektar Therapeutics,
3.250%, 9/28/2012 | | $ | 198,135 |
| | 505,000 | | Valeant Pharmaceuticals International, Subordinated Note, Convertible,
4.000%, 11/15/2013 | | | 446,925 |
| | 305,000 | | Vertex Pharmaceuticals, Inc.,
4.750%, 2/15/2013 | | | 400,694 |
| | | | | | |
| | | | | | 2,819,329 |
| | | | | | |
| | | Pipelines — 1.6% | | | |
| | 95,000 | | El Paso Corp.,
6.875%, 6/15/2014 | | | 84,618 |
| | 415,000 | | El Paso Corp.,
6.950%, 6/01/2028 | | | 286,191 |
| | 225,000 | | El Paso Corp.,
7.000%, 6/15/2017 | | | 191,628 |
| | 130,000 | | El Paso Natural Gas Co.,
8.375%, 6/15/2032 | | | 123,686 |
| | 75,000 | | Kinder Morgan Finance Co., Guaranteed Note,
5.700%, 1/05/2016 | | | 63,000 |
| | 175,000 | | Knight, Inc.,
6.500%, 9/01/2012 | | | 163,188 |
| | 20,000 | | Tennessee Gas Pipeline Co.,
7.000%, 10/15/2028 | | | 17,013 |
| | 20,000 | | Tennessee Gas Pipeline Co.,
7.500%, 4/01/2017 | | | 19,263 |
| | | | | | |
| | | | | | 948,587 |
| | | | | | |
| | | Refining — 0.7% | | | |
| | 150,000 | | Petroplus Finance Ltd., 144A,
6.750%, 5/01/2014 | | | 111,000 |
| | 375,000 | | Petroplus Finance Ltd., 144A,
7.000%, 5/01/2017 | | | 270,000 |
| | | | | | |
| | | | | | 381,000 |
| | | | | | |
| | | Retailers — 0.8% | | | |
| | 250,000 | | Dillard’s, Inc.,
6.625%, 1/15/2018 | | | 90,000 |
| | 105,000 | | Dillard’s, Inc.,
7.130%, 8/01/2018 | | | 36,750 |
| | 30,000 | | Macy’s Retail Holdings, Inc.,
6.790%, 7/15/2027 | | | 15,340 |
| | 1,070,000 | | Toys R Us, Inc.,
7.375%, 10/15/2018 | | | 342,400 |
| | 20,000 | | Toys R Us, Inc.,
7.875%, 4/15/2013 | | | 7,025 |
| | | | | | |
| | | | | | 491,515 |
| | | | | | |
| | | Sovereigns — 0.5% | | | |
| | 24,600(††) | | Mexican Fixed Rate Bonds, Series M-20,
8.000%, 12/07/2023 (MXN) | | | 172,441 |
| | 4,318,267 | | Republic of Uruguay,
4.250%, 4/05/2027 (UYU) | | | 94,864 |
| | | | | | |
| | | | | | 267,305 |
| | | | | | |
| | | Supermarkets — 2.3% | | | |
| | 300,000 | | American Stores Co.,
8.000%, 6/01/2026 | | | 256,500 |
| | 750,000 | | New Albertson’s, Inc.,
7.450%, 8/01/2029 | | | 622,500 |
| | | | | | |
Principal
Amount (‡) | | Description | | Value (†) |
| | | | | | |
| | | Supermarkets — continued | | | |
| $ | 190,000 | | New Albertson’s, Inc.,
7.750%, 6/15/2026 | | $ | 159,125 |
| | 130,000 | | New Albertson’s, Inc.,
8.000%, 5/01/2031 | | | 106,275 |
| | 310,000 | | New Albertson’s, Inc., Series C, MTN,
6.625%, 6/01/2028 | | | 227,850 |
| | | | | | |
| | | | | | 1,372,250 |
| | | | | | |
| | | Supranational — 2.2% | | | |
| | 9,210,000,000 | | European Investment Bank, EMTN, 144A,
Zero Coupon,
4/24/2013 (IDR)(f) | | | 395,819 |
| | 1,900,000 | | Inter-American Development Bank, EMTN,
Zero Coupon,
5/11/2009 (BRL) | | | 806,768 |
| | 13,400,000 | | International Bank for Reconstruction & Development,
9.500%, 5/27/2010 (ISK) | | | 65,819 |
| | 800,000 | | Nordic Investment Bank, EMTN,
11.250%, 4/16/2009 (ISK) | | | 3,904 |
| | | | | | |
| | | | | | 1,272,310 |
| | | | | | |
| | | Technology — 4.8% | | | |
| | 300,000 | | Affiliated Computer Services, Inc.,
5.200%, 6/01/2015 | | | 246,750 |
| | 585,000 | | Amkor Technology, Inc.,
7.750%, 5/15/2013 | | | 470,925 |
| | 115,000 | | Amkor Technology, Inc.,
9.250%, 6/01/2016 | | | 88,550 |
| | 660,000 | | Freescale Semiconductor, Inc.,
10.125%, 12/15/2016 | | | 118,800 |
| | 345,000 | | JDS Uniphase Corp., Convertible,
1.000%, 5/15/2026 | | | 211,744 |
| | 210,000 | | Kla-Tencor Corp.,
6.900%, 5/01/2018 | | | 165,997 |
| | 475,000 | | Kulicke & Soffa Industries, Inc.,
0.875%, 6/01/2012 | | | 225,031 |
| | 35,000 | | Kulicke & Soffa Industries, Inc.,
1.000%, 6/30/2010 | | | 27,606 |
| | 1,040,000 | | Lucent Technologies, Inc.,
6.450%, 3/15/2029 | | | 395,200 |
| | 175,000 | | Lucent Technologies, Inc.,
6.500%, 1/15/2028 | | | 66,500 |
| | 50,000 | | Lucent Technologies, Inc., Series A, Convertible,
2.875%, 6/15/2023 | | | 43,688 |
| | 216,000 | | Maxtor Corp., Subordinated Note,
5.750%, 3/01/2012(c) | | | 162,000 |
| | 340,000 | | Nortel Networks Capital Corp.,
7.875%, 6/15/2026(g) | | | 54,400 |
| | 280,000 | | Nortel Networks Corp.,
2.125%, 4/15/2014(g) | | | 39,900 |
| | 580,000 | | Nortel Networks Ltd.,
6.875%, 9/01/2023(g) | | | 37,700 |
| | 475,000 | | Nortel Networks Ltd.,
10.125%, 7/15/2013(g) | | | 89,062 |
| | 255,000 | | Seagate Technology HDD Holdings,
6.375%, 10/01/2011 | | | 186,150 |
| | 205,000 | | Seagate Technology HDD Holdings,
6.800%, 10/01/2016 | | | 118,900 |
| | 105,000 | | Xerox Capital Trust I,
8.000%, 2/01/2027 | | | 73,948 |
| | | | | | |
| | | | | | 2,822,851 |
| | | | | | |
See accompanying notes to financial statements.
24
LOOMIS SAYLES HIGH INCOME FUND — PORTFOLIOOF INVESTMENTS (continued)
Investments as of March 31, 2009 (Unaudited)
| | | | | | |
Principal
Amount (‡) | | Description | | Value (†) |
| | | | | | |
| | | Textile — 0.3% | | | |
| $ | 375,000 | | Jones Apparel Group, Inc.,
6.125%, 11/15/2034 | | $ | 187,500 |
| | | | | | |
| | | Transportation Services — 0.6% | | | |
| | 275,000 | | APL Ltd., Senior Note,
8.000%, 1/15/2024(c) | | | 193,207 |
| | 300,000 | | Overseas Shipholding Group, Senior Note,
7.500%, 2/15/2024 | | | 177,000 |
| | | | | | |
| | | | | | 370,207 |
| | | | | | |
| | | Wireless — 3.1% | | | |
| | 5,000 | | ALLTEL Corp.,
6.800%, 5/01/2029 | | | 4,605 |
| | 440,000 | | ALLTEL Corp.,
7.875%, 7/01/2032 | | | 447,234 |
| | 130,000 | | Crown Castle International Corp.,
9.000%, 1/15/2015 | | | 130,325 |
| | 255,000 | | Nextel Communications, Inc., Senior Note,
5.250%, 1/15/2010 | | | 245,756 |
| | 48,000 | | Nextel Communications, Inc., Series D,
7.375%, 8/01/2015 | | | 25,440 |
| | 614,000 | | Nextel Communications, Inc., Series E,
6.875%, 10/31/2013 | | | 349,980 |
| | 25,000 | | Nextel Communications, Inc., Series F,
5.950%, 3/15/2014 | | | 13,875 |
| | 365,000 | | NII Holdings, Inc.,
3.125%, 6/15/2012 | | | 253,675 |
| | 326,000 | | Sprint Capital Corp.,
6.875%, 11/15/2028 | | | 198,860 |
| | 55,000 | | Sprint Capital Corp.,
6.900%, 5/01/2019 | | | 38,775 |
| | 20,000 | | Sprint Capital Corp.,
8.750%, 3/15/2032 | | | 13,400 |
| | 200,000 | | True Move Co. Ltd., 144A,
10.375%, 8/01/2014 | | | 88,160 |
| | | | | | |
| | | | | | 1,810,085 |
| | | | | | |
| | | Wirelines — 7.6% | | | |
| | 255,000 | | Bell Canada, Series M-17,
6.100%, 3/16/2035 (CAD) | | | 159,814 |
| | 5,000 | | Bell Canada, MTN, 144A,
6.550%, 5/01/2029 (CAD) | | | 3,314 |
| | 65,000 | | Cincinnati Bell Telephone Co., 6.300%, 12/01/2028 | | | 44,200 |
| | 365,000 | | Cincinnati Bell, Inc.,
8.375%, 1/15/2014 | | | 343,100 |
| | 410,000 | | Embarq Corp., 7.995%, 6/01/2036 | | | 307,500 |
| | 285,000 | | Fairpoint Communications, Inc., 144A,
13.125%, 4/01/2018 | | | 65,550 |
| | 95,000 | | Frontier Communications Corp.,
7.000%, 11/01/2025 | | | 53,913 |
| | 30,000 | | Frontier Communications Corp., 7.125%, 3/15/2019 | | | 23,550 |
| | 540,000 | | Frontier Communications Corp.,
7.875%, 1/15/2027 | | | 364,500 |
| | 65,000 | | Frontier Communications Corp.,
9.000%, 8/15/2031 | | | 44,606 |
| | 80,000 | | Hawaiian Telcom Communications, Inc., Series B,
12.500%, 5/01/2015(g) | | | 400 |
| | | | | | |
Principal
Amount (‡) | | Description | | Value (†) |
| | | | | | |
| | | Wirelines — continued | | | |
| $ | 490,000 | | Level 3 Communications, Inc., Convertible,
2.875%, 7/15/2010 | | $ | 358,312 |
| | 45,000 | | Level 3 Communications, Inc.,
3.500%, 6/15/2012 | | | 18,675 |
| | 350,000 | | Level 3 Communications, Inc., Convertible,
6.000%, 9/15/2009 | | | 337,750 |
| | 325,000 | | Level 3 Communications, Inc., Convertible,
6.000%, 3/15/2010 | | | 276,250 |
| | 770,000 | | Level 3 Financing, Inc., 8.750%, 2/15/2017 | | | 492,800 |
| | 125,000 | | Level 3 Financing, Inc., 9.250%, 11/01/2014 | | | 86,250 |
| | 1,890,000 | | Qwest Capital Funding, Inc.,
7.750%, 2/15/2031(f) | | | 1,247,400 |
| | 365,000 | | Qwest Capital Funding, Inc., Guaranteed Note,
6.875%, 7/15/2028 | | | 229,950 |
| | 10,000 | | Qwest Corp.,
6.875%, 9/15/2033 | | | 6,550 |
| | | | | | |
| | | | | | 4,464,384 |
| | | | | | |
| | | Total Bonds and Notes (Identified Cost $60,820,335) | | | 46,615,724 |
| | | | | | |
| | Bank Loans — 0.3% |
| | | Consumer Products — 0.0% | | | |
| | 24,807 | | Mega Brands, Inc., Term Loan B,
8.750%, 7/26/2012(h) | | | 6,739 |
| | | | | | |
| | | Food & Beverage — 0.0% | | | |
| | 1,306 | | Dole Food Co., Inc., Credit Link Deposit,
2.790%, 4/12/2013(h) | | | 1,200 |
| | 848 | | Dole Food Co., Inc., Tranche B Term Loan,
7.960%, 4/12/2013(h) | | | 780 |
| | 4,154 | | Dole Food Co., Inc., Tranche C Term Loan,
7.969%, 4/12/2013(h) | | | 3,819 |
| | | | | | |
| | | | | | 5,799 |
| | | | | | |
| | | Media Non-Cable — 0.1% | | | |
| | 114,227 | | Idearc, Inc., Term Loan B,
6.250%, 11/17/2014(g)(h) | | | 44,513 |
| | 224,012 | | Tribune Co., Term Loan X,
5.000%, 6/04/2009(g)(h) | | | 58,454 |
| | | | | | |
| | | | | | 102,967 |
| | | | | | |
| | | Technology — 0.1% | | | |
| | 69,821 | | Sungard Data Systems, Inc., Term Loan B,
2.697%, 2/28/2014(h) | | | 58,821 |
| | | | | | |
| | | Wirelines — 0.1% | | | |
| | 35,000 | | Hawaiian Telcom Communications, Inc., Tranche C Term Loan,
4.750%, 6/01/2014(h)(i) | | | 15,675 |
| | 25,000 | | Level 3 Financing, Inc., New Term Loan,
3.309%, 3/13/2014(h) | | | 18,766 |
| | | | | | |
| | | | | | 34,441 |
| | | | | | |
| | | Total Bank Loans (Identified Cost $440,912) | | | 208,767 |
| | | | | | |
See accompanying notes to financial statements.
25
LOOMIS SAYLES HIGH INCOME FUND — PORTFOLIOOF INVESTMENTS (continued)
Investments as of March 31, 2009 (Unaudited)
| | | | | |
Shares | | Description | | Value (†) |
| | | | | |
| Preferred Stocks — 1.6% |
| Convertible Preferred Stocks — 1.5% |
| | Capital Markets — 0.1% | | | |
| 4,790 | | Newell Financial Trust I, 5.250% | | $ | 86,220 |
| | | | | |
| | Diversified Financial Services — 0.1% | | | |
| 3,732 | | Sovereign Capital Trust IV, 4.375% | | | 73,707 |
| | | | | |
| | Electric Utilities — 0.4% | | | |
| 6,475 | | AES Trust III, 6.750% | | | 220,150 |
| | | | | |
| | Machinery — 0.1% | | | |
| 2,550 | | United Rentals Trust I, 6.500% | | | 28,050 |
| | | | | |
| | Oil, Gas & Consumable Fuels — 0.4% | | | |
| 9,500 | | El Paso Energy Capital Trust I, 4.750% | | | 237,500 |
| | | | | |
| | Semiconductors & Semiconductor Equipment — 0.4% | | | |
| 799 | | Lucent Technologies Capital Trust I, 7.750% | | | 231,749 |
| | | | | |
| | Total Convertible Preferred Stocks (Identified Cost $1,501,377) | | | 877,376 |
| | | | | |
| Non-Convertible Preferred Stocks — 0.1% |
| | Diversified Financial Services — 0.1% | | | |
| 274 | | Preferred Blocker, Inc., 144A, 7.000% | | | 54,551 |
| | | | | |
| | Thrifts & Mortgage Finance — 0.0% | | | |
| 300 | | Federal Home Loan Mortgage Corp., 5.000%(j)(k) | | | 270 |
| 7,900 | | Federal Home Loan Mortgage Corp., 5.570%(j)(k) | | | 3,002 |
| 2,850 | | Federal Home Loan Mortgage Corp., 5.660%(j)(k) | | | 1,140 |
| 1,000 | | Federal Home Loan Mortgage Corp., 5.700%(j)(k) | | | 830 |
| 1,800 | | Federal Home Loan Mortgage Corp., 5.790%(j)(k) | | | 1,386 |
| 650 | | Federal Home Loan Mortgage Corp., 5.810%(j)(k) | | | 507 |
| 1,400 | | Federal Home Loan Mortgage Corp., 5.900%(j)(k) | | | 644 |
| 350 | | Federal Home Loan Mortgage Corp., 6.000%(j)(k) | | | 312 |
| 600 | | Federal Home Loan Mortgage Corp., 6.420%(j)(k) | | | 480 |
| 1,350 | | Federal Home Loan Mortgage Corp., 6.550%(j)(k) | | | 553 |
| 7,400 | | Federal Home Loan Mortgage Corp., 8.375%(j)(k) | | | 3,404 |
| 1,200 | | Federal National Mortgage Association, 4.750%(j)(k) | | | 876 |
| 200 | | Federal National Mortgage Association, 5.125%(j)(k) | | | 138 |
| 400 | | Federal National Mortgage Association, 5.375%(j)(k) | | | 572 |
| 350 | | Federal National Mortgage Association, 5.810%(j)(k) | | | 403 |
| 550 | | Federal National Mortgage Association, 6.750%(j)(k) | | | 275 |
| 10,250 | | Federal National Mortgage Association, 8.325%(j)(k) | | | 7,277 |
| | | | | |
| | | | | 22,069 |
| | | | | |
| | Total Non-Convertible Preferred Stocks (Identified Cost $634,132) | | | 76,620 |
| | | | | |
| | Total Preferred Stocks (Identified Cost $2,135,509) | | | 953,996 |
| | | | | |
| Common Stocks — 0.8% | | | |
| | Biotechnology — 0.4% | | | |
| 8,147 | | Vertex Pharmaceuticals, Inc.(j) | | | 234,063 |
| | | | | |
| | Chemicals — 0.0% | | | |
| 1,087 | | Ashland, Inc. | | | 11,229 |
| | | | | |
| | Household Durables — 0.1% | | | |
| 1,775 | | KB Home | | | 23,395 |
| | | | | |
| | Pharmaceuticals — 0.3% | | | |
| 6,875 | | Merck & Co., Inc. | | | 183,906 |
| | | | | |
| | Thrifts & Mortgage Finance — 0.0% | | | |
| 5,500 | | Federal Home Loan Mortgage Corp. | | | 4,180 |
| | | | | |
| | Total Common Stocks (Identified Cost $591,205) | | | 456,773 |
| | | | | |
| Closed-End Investment Companies — 0.1% | | | |
| 3,835 | | Morgan Stanley Emerging Markets Debt Fund, Inc. | | | 27,305 |
| 2,175 | | Western Asset High Income Opportunity Fund, Inc. | | | 9,048 |
| | | | | |
| | Total Closed-End Investment Companies (Identified Cost $45,443) | | | 36,353 |
| | | | | |
| | | | | | | |
Principal
Amount (‡) | | Description | | Value (†) | |
| | | | | | | |
| | Short-Term Investments — 17.0% | | | | |
| $ | 273 | | Repurchase Agreement with State Street Corp., dated 3/31/2009 at 0.000% to be repurchased at $273 on 4/01/2009, collateralized by $5,000 U.S. Treasury Bill, due 5/28/2009 valued at $4,999, including accrued interest (Note 2g of Notes to Financial Statements) | | $ | 273 | |
| | 9,967,549 | | Tri-Party Repurchase Agreement with Fixed Income Clearing Corporation, dated 3/31/2009 at 0.000% to be repurchased at $9,967,549 on 4/01/2009, collateralized by $9,970,000 Federal Home Loan Mortgage Corp., 2.680% due 11/16/2009 valued at $10,169,400, including accrued interest (Note 2g of Notes to Financial Statements) | | | 9,967,549 | |
| | | | | | | |
| | | Total Short-Term Investments (Identified Cost $9,967,822) | | | 9,967,822 | |
| | | | | | | |
| | | | | | | |
| | | Total Investments — 99.2%
(Identified Cost $74,001,226)(a) | | | 58,239,435 | |
| | | Other assets less liabilities — 0.8% | | | 447,316 | |
| | | | | | | |
| | | Net Assets — 100.0% | | $ | 58,686,751 | |
| | | | | | | |
| | | | | | | |
| | (‡) | | Principal amount stated in U.S. dollars unless otherwise noted. | | | | |
| | (†) | | See Note 2a of Notes to Financial Statements. | | | | |
| | (††) | | Amount shown represents units. One unit represents a principal amount of 100. | |
| | (a) | | Federal Tax Information (Amounts exclude certain adjustments made at the end of the Fund’s fiscal year for tax purposes. Such adjustments are primarily due to wash sales. Amortization of premium on debt securities is excluded for tax purposes.): | |
| | | At March 31, 2009, the net unrealized depreciation on investments based on a cost of $74,016,748 for federal income tax purposes was as follows: | |
| | | Aggregate gross unrealized appreciation for all investments in which there is an excess of value over tax cost | | $ | 1,561,025 | |
| | | Aggregate gross unrealized depreciation for all investments in which there is an excess of tax cost over value | | | (17,338,338 | ) |
| | | | | | | |
| | | Net unrealized depreciation | | $ | (15,777,313 | ) |
| | | | | | | |
| | | | | | | |
| | (b) | | Variable rate security. Rate as of March 31, 2009 is disclosed. | |
| | (c) | | Illiquid security. At March 31, 2009, the value of these securities amounted to $818,390 or 1.4% of net assets. | |
| | (d) | | Valued by management. At March 31, 2009 the value of these securities amounted to $330,183 or 0.6% of net assets. | |
| | (e) | | Step Bond: Coupon rate is a fixed rate for an initial period then resets at a specified date and rate. | |
| | (f) | | All or a portion of this security is held as collateral for open forward contracts. | |
| | (g) | | Non-income producing due to bankruptcy filing. | |
| | (h) | | Variable rate security. Rate shown represents the weighted average rate at March 31, 2009. | |
| | (i) | | All or a portion of interest payment is paid in-kind. | |
| | (j) | | Non-income producing security. | |
| | (k) | | Future dividend payments have been eliminated as the issuer has been placed in conservatorship. | |
| | | | |
| | ABS | | Asset-Backed Securities | |
| | EMTN | | Euro Medium Term Note | |
| | GMTN | | Global Medium Term Note | |
| | MTN | | Medium Term Note | |
| | 144A | | Securities exempt from registration under Rule 144A of the Securities Act of 1933. These securities may be resold in transactions exempt from registration, normally to qualified institutional buyers. At March 31, 2009, the value of these securities amounted to $5,171,126 or 8.8% of net assets. | |
See accompanying notes to financial statements.
26
LOOMIS SAYLES HIGH INCOME FUND — PORTFOLIOOF INVESTMENTS (continued)
Investments as of March 31, 2009 (Unaudited)
| | | | |
| AUD | | Australian Dollar | | |
| BRL | | Brazilian Real | | |
| CAD | | Canadian Dollar | | |
| IDR | | Indonesian Rupiah | | |
| ISK | | Icelandic Krona | | |
| MXN | | Mexican Peso | | |
| NZD | | New Zealand Dollar | | |
| SGD | | Singapore Dollar | | |
| UYU | | Uruguayan Peso | | |
At March 31, 2009, the Fund had the following open forward foreign currency contracts:
| | | | | | | | | | | | |
Contract to Buy/Sell | | Delivery Date | | Currency | | Units | | Value | | Unrealized
Appreciation |
| Sell1 | | 4/29/2009 | | Singapore
Dollar | | 1,140,000 | | $ | 749,012 | | $ | 6,715 |
1 Counterparty is Barclays Bank.
Net Asset Summary at March 31, 2009 (Unaudited)
| | | |
| Wirelines | | 7.7 | % |
| Healthcare | | 5.6 | |
| Pharmaceuticals | | 5.1 | |
| Independent Energy | | 5.1 | |
| Technology | | 4.9 | |
| Home Construction | | 4.5 | |
| Electric | | 3.5 | |
| Non-Captive Diversified | | 3.2 | |
| Paper | | 3.2 | |
| Wireless | | 3.1 | |
| Automotive | | 3.0 | |
| Commercial Mortgage-Backed Securities | | 2.6 | |
| Food & Beverage | | 2.3 | |
| Supermarkets | | 2.3 | |
| Supranational | | 2.2 | |
| Banking | | 2.1 | |
| Other Investments, less than 2% each | | 21.8 | |
| Short-Term Investments | | 17.0 | |
| | | |
| Total Investments | | 99.2 | |
| Other assets less liabilities (including open Forward Foreign Currency Contracts) | | 0.8 | |
| | | |
| Net Assets | | 100.0 | % |
| | | |
See accompanying notes to financial statements.
27
LOOMIS SAYLES INTERNATIONAL BOND FUND — PORTFOLIOOF INVESTMENTS
Investments as of March 31, 2009 (Unaudited)
| | | | | |
Principal
Amount (‡) | | Description | | Value (†) |
| | | | | |
| Bonds and Notes — 96.5% of Net Assets | | | |
| Non-Convertible Bonds — 96.3% | | | |
| | Australia — 0.9% | | | |
| 165,000 | | New South Wales Treasury Corp., Series 10RG, 7.000%, 12/01/2010, (AUD) | | $ | 121,268 |
| | | | | |
| | Austria — 1.3% | | | |
| 17,000,000 | | Oesterreichische Kontrollbank AG, 1.800%, 3/22/2010, (JPY) | | | 172,458 |
| | | | | |
| | Belgium — 7.1% | | | |
| 625,000 | | Kingdom of Belgium, 5.500%, 9/28/2017, (EUR) | | | 930,684 |
| | | | | |
| | Brazil — 0.0% | | | |
| 5,000 | | Republic of Brazil, 7.125%, 1/20/2037(b) | | | 5,013 |
| | | | | |
| | Canada — 2.8% | | | |
| 40,000 | | Bell Canada, Series M-17, 6.100%, 3/16/2035, (CAD) | | | 25,069 |
| 50,000 | | Bombardier, Inc., 144A, 7.250%, 11/15/2016, (EUR) | | | 43,180 |
| 255,000 | | Canadian Government, 4.250%, 9/01/2009, (CAD) | | | 205,387 |
| 105,000 | | Canadian Government, 4.500%, 6/01/2015, (CAD) | | | 95,512 |
| | | | | |
| | | | | 369,148 |
| | | | | |
| | Cayman Islands — 2.3% | | | |
| 60,000 | | DASA Finance Corp., 144A, 8.750%, 5/29/2018(b) | | | 46,200 |
| 75,000 | | DASA Finance Corp., 8.750%, 5/29/2018(b) | | | 57,750 |
| 100,000 | | Hutchison Whampoa Finance Ltd., 4.625%, 9/21/2016, (EUR) | | | 108,645 |
| 100,000 | | Odebrecht Finance Ltd., 144A, 7.500%, 10/18/2017(b) | | | 87,000 |
| | | | | |
| | | | | 299,595 |
| | | | | |
| | France — 4.2% | | | |
| 50,000 | | Credit Agricole SA, 5.971%, 2/01/2018, (EUR) | | | 66,991 |
| 40,000 | | Lafarge SA, EMTN, 4.750%, 3/23/2020, (EUR) | | | 33,454 |
| 50,000 | | Lafarge SA, EMTN, 5.375%, 6/26/2017, (EUR) | | | 47,698 |
| 85,000 | | PPR, EMTN, 4.000%, 1/29/2013, (EUR) | | | 101,966 |
| 50,000 | | Societe Generale, EMTN, 5.250%, 3/28/2013, (EUR) | | | 69,191 |
| 70,000 | | Veolia Environnement, 6.125%, 11/25/2033, (EUR) | | | 80,464 |
| 35,000 | | Veolia Environnement, EMTN, 5.125%, 5/24/2022, (EUR) | | | 39,184 |
| 10,000 | | Vivendi, 3.875%, 2/15/2012, (EUR) | | | 13,042 |
| 50,000 | | Vivendi, 4.500%, 10/03/2013, (EUR) | | | 62,760 |
| 50,000 | | Wendel, 4.875%, 5/26/2016, (EUR) | | | 35,208 |
| | | | | |
| | | | | 549,958 |
| | | | | |
| | | | | |
Principal
Amount (‡) | | Description | | Value (†) |
| | | | | |
| | Germany — 15.1% | | | |
| 50,000 | | Bertelsmann AG, 3.625%, 10/06/2015, (EUR) | | $ | 54,942 |
| 30,000 | | Bundesschatzanweisungen, 4.000%, 12/11/2009, (EUR) | | | 40,668 |
| 125,000 | | Hypothekenbank in Essen AG, 3.000%, 9/28/2009, (EUR) | | | 166,699 |
| 21,000,000 | | Kreditanstalt fuer Wiederaufbau, 1.350%, 1/20/2014, (JPY) | | | 210,463 |
| 16,000,000 | | Kreditanstalt fuer Wiederaufbau, 1.750%, 3/23/2010, (JPY) | | | 163,317 |
| 24,000,000 | | Kreditanstalt fuer Wiederaufbau, 2.050%, 2/16/2026, (JPY) | | | 230,299 |
| 185,000 | | Kreditanstalt fuer Wiederaufbau, 2.500%, 10/11/2010, (EUR)(b) | | | 249,044 |
| 5,000,000 | | Kreditanstalt fuer Wiederaufbau, 2.600%, 6/20/2037, (JPY) | | | 48,843 |
| 105,000 | | Muenchener Hypothekenbank eG, 5.000%, 1/16/2012, (EUR) | | | 148,183 |
| 255,000 | | Republic of Germany, 3.750%, 1/04/2017, (EUR)(b) | | | 360,933 |
| 225,000 | | Republic of Germany, 4.000%, with various maturities to 2037 | | | 311,894 |
| | | | | |
| | | | | 1,985,285 |
| | | | | |
| | India — 1.0% | | | |
| 100,000 | | Canara Bank Ltd., (fixed rate to 11/28/2016, variable rate thereafter), 6.365%, 11/28/2021 | | | 76,467 |
| 100,000 | | ICICI Bank Ltd., (fixed rate to 4/30/2017, variable rate thereafter), 144A, 6.375%, 4/30/2022(b) | | | 56,226 |
| | | | | |
| | | | | 132,693 |
| | | | | |
| | Indonesia — 0.8% | | | |
| 100,000 | | Republic of Indonesia, 144A, 11.625%, 3/04/2019 | | | 108,750 |
| | | | | |
| | Ireland — 1.5% | | | |
| 30,000,000 | | Depfa ACS Bank, Series 686, 1.650%, 12/20/2016, (JPY) | | | 193,308 |
| | | | | |
| | Italy — 0.8% | | | |
| 100,000 | | Finmeccanica SpA, 4.875%, 3/24/2025, (EUR) | | | 99,117 |
| | | | | |
| | Japan — 10.2% | | | |
| 18,000,000 | | Development Bank of Japan, 1.750%, 6/21/2010, (JPY) | | | 183,796 |
| 63,000,000 | | Japan Finance Corp. for Municipal Enterprises, 1.350%, 11/26/2013, (JPY) | | | 647,072 |
| 10,000,000 | | Japan Finance Corp. for Municipal Enterprises, 1.900%, 6/22/2018, (JPY) | | | 102,539 |
| 20,966,400 | | Japan Government, 0.800%, 3/10/2016, (JPY) | | | 181,884 |
| 20,000,000 | | Japan Government, 1.300%, 3/20/2019, (JPY) | | | 201,552 |
| 2,000,000 | | Japan Government, 1.400%, 6/20/2011, (JPY) | | | 20,628 |
| | | | | |
| | | | | 1,337,471 |
| | | | | |
See accompanying notes to financial statements.
28
LOOMIS SAYLES INTERNATIONAL BOND FUND — PORTFOLIOOF INVESTMENTS (continued)
Investments as of March 31, 2009 (Unaudited)
| | | | | | |
Principal
Amount (‡) | | Description | | Value (†) |
| | | | | | |
| | | Korea — 1.3% | | | |
| $ | 100,000 | | Export-Import Bank of Korea, 8.125%, 1/21/2014(b) | | $ | 103,363 |
| | 75,000 | | SK Broadband Co. Ltd., 144A, 7.000%, 2/01/2012(b) | | | 67,125 |
| | | | | | |
| | | | | | 170,488 |
| | | | | | |
| | | Luxembourg — 0.9% | | | |
| | 2,000,000 | | European Investment Bank, 1.250%, 9/20/2012, (JPY) | | | 20,196 |
| | 105,000 | | Telecom Italia Capital SA, 6.000%, 9/30/2034(b) | | | 71,637 |
| | 35,000 | | Telecom Italia Capital SA, 6.375%, 11/15/2033(b) | | | 25,501 |
| | | | | | |
| | | | | | 117,334 |
| | | | | | |
| | | Mexico — 1.1% | | | |
| | 85,000 | | Desarrolladora Homex SAB de CV, 7.500%, 9/28/2015(b) | | | 56,100 |
| | 10,000(††) | | Mexican Fixed Rate Bonds, Series M-20, 8.000%, 12/07/2023, (MXN) | | | 70,098 |
| | 18,000 | | Mexican Government, 6.050%, 1/11/2040(b) | | | 15,390 |
| | | | | | |
| | | | | | 141,588 |
| | | | | | |
| | | Netherlands — 1.3% | | | |
| | 50,000 | | Cemex Finance Europe BV, 4.750%, 3/05/2014, (EUR) | | | 30,226 |
| | 50,000 | | Koninklijke (Royal) KPN NV, GMTN, 4.750%, 1/17/2017, (EUR) | | | 61,387 |
| | 10,000 | | Wolters Kluwer NV, 5.125%, 1/27/2014, (EUR) | | | 13,303 |
| | 50,000 | | Wolters Kluwer NV, 6.375%, 4/10/2018, (EUR) | | | 62,432 |
| | | | | | |
| | | | | | 167,348 |
| | | | | | |
| | | Norway — 3.8% | | | |
| | 275,000 | | Norwegian Government, 4.250%, 5/19/2017, (NOK) | | | 42,775 |
| | 1,650,000 | | Norwegian Government, 5.500%, 5/15/2009, (NOK) | | | 246,286 |
| | 1,235,000 | | Norwegian Government, 6.500%, 5/15/2013, (NOK) | | | 210,166 |
| | | | | | |
| | | | | | 499,227 |
| | | | | | |
| | | Philippines — 0.8% | | | |
| | 100,000 | | Republic of Philippines, 8.375%, 6/17/2019(b) | | | 109,000 |
| | | | | | |
| | | Spain — 2.5% | | | |
| | 23,000,000 | | Instituto de Credito Oficial, EMTN, 0.800%, 9/28/2009, (JPY) | | | 232,496 |
| | 100,000 | | Santander Issurance SA, EMTN, (fixed rate to 5/29/14, variable rate thereafter), 4.750%, 5/29/2019, (EUR) | | | 96,684 |
| | | | | | |
| | | | | | 329,180 |
| | | | | | |
| | | Supranational — 5.6% | | | |
| | 11,100,000 | | European Investment Bank, 1.400%, 6/20/2017, (JPY) | | | 109,471 |
| | 921,000,000 | | European Investment Bank, EMTN, 144A,
Zero Coupon, 4/24/2013, (IDR) | | | 39,582 |
| | | | | |
Principal
Amount (‡) | | Description | | Value (†) |
| | | | | |
| | Supranational — continued | | | |
| 28,000,000 | | Inter-American Development Bank, 1.900%, 7/08/2009, (JPY) | | $ | 283,814 |
| 30,000,000 | | Nordic Investment Bank, 1.700%, 4/27/2017, (JPY)(b) | | | 301,203 |
| | | | | |
| | | | | 734,070 |
| | | | | |
| | Sweden — 0.8% | | | |
| 100,000 | | Telefonaktiebolaget LM Ericsson, EMTN, 5.375%, 6/27/2017, (EUR)(b) | | | 108,341 |
| | | | | |
| | United Arab Emirates — 0.9% | | | |
| 100,000 | | Abu Dhabi National Energy Co., 144A, 6.500%, 10/27/2036(b) | | | 74,113 |
| 100,000 | | DP World Ltd., 144A, 6.850%, 7/02/2037(b) | | | 47,845 |
| | | | | |
| | | | | 121,958 |
| | | | | |
| | United Kingdom — 10.2% | | | |
| 50,000 | | BAT International Finance PLC, EMTN, 5.375%, 6/29/2017, (EUR) | | | 61,223 |
| 50,000 | | BAT International Finance PLC, 5.875%, 3/12/2015, (EUR) | | | 65,626 |
| 50,000 | | BP Capital Markets PLC, EMTN, 5.750%, 2/26/2010, (GBP) | | | 73,835 |
| 50,000 | | BSKYB Finance UK PLC, EMTN, 5.750%, 10/20/2017, (GBP) | | | 65,629 |
| 100,000 | | Imperial Tobacco Finance PLC, EMTN, 4.375%, 11/22/2013, (EUR) | | | 118,501 |
| 65,000 | | Lloyds TSB Group PLC, 5.875%, 7/08/2014, (EUR) | | | 77,550 |
| 100,000 | | Standard Chartered Bank, Series 17, 5.875%, 9/26/2017, (EUR) | | | 100,514 |
| 190,000 | | United Kingdom Treasury, 4.000%, 9/07/2016, (GBP) | | | 295,639 |
| 135,000 | | United Kingdom Treasury, 4.250%, 3/07/2036, (GBP) | | | 195,070 |
| 100,000 | | United Kingdom Treasury, 4.750%, 3/07/2020, (GBP) | | | 161,801 |
| 100,000 | | Vodafone Group PLC, EMTN, 5.375%, 6/06/2022, (EUR) | | | 124,410 |
| | | | | |
| | | | | 1,339,798 |
| | | | | |
| | United States — 19.1% | | | |
| 50,000 | | 3M Co., 5.000%, 7/14/2014, (EUR) | | | 70,078 |
| 25,000 | | Ahold Finance USA, Inc., EMTN, 6.500%, 3/14/2017, (GBP) | | | 33,360 |
| 100,000 | | AT&T, Inc., EMTN, 6.125%, 4/02/2015, (EUR) | | | 138,612 |
| 100,000 | | Bristol-Myers Squibb Co., 4.625%, 11/15/2021, (EUR) | | | 121,876 |
| 50,000 | | Cargill, Inc., EMTN, 5.375%, 3/02/2037, (GBP) | | | 52,473 |
| 20,000 | | Chesapeake Energy Corp., 6.375%, 6/15/2015 | | | 16,850 |
| 60,000 | | Chesapeake Energy Corp., 6.500%, 8/15/2017(b) | | | 48,900 |
| 50,000 | | CIT Group, Inc., EMTN, 3.800%, 11/14/2012, (EUR) | | | 30,558 |
| 50,000 | | CIT Group, Inc., GMTN, 4.250%, 9/22/2011, (EUR) | | | 39,858 |
See accompanying notes to financial statements.
29
LOOMIS SAYLES INTERNATIONAL BOND FUND — PORTFOLIOOF INVESTMENTS (continued)
Investments as of March 31, 2009 (Unaudited)
| | | | | | |
Principal
Amount (‡) | | Description | | Value (†) |
| | | | | | |
| | | United States — continued | | | |
| $ | 50,000 | | Couche-Tard US/Finance,
7.500%, 12/15/2013(b) | | $ | 49,125 |
| | 60,000 | | CSX Corp.,
5.600%, 5/01/2017(b) | | | 50,471 |
| | 65,000 | | Energy Transfer Partners LP,
6.625%, 10/15/2036(b) | | | 48,333 |
| | 60,000 | | Frontier Communications Corp.,
6.250%, 1/15/2013(b) | | | 54,375 |
| | 20,000 | | Frontier Communications Corp.,
7.875%, 1/15/2027(b) | | | 13,500 |
| | 10,000,000 | | General Electric Capital Corp., GMTN,
1.450%, 11/10/2011, (JPY) | | | 86,106 |
| | 100,000 | | Georgia-Pacific LLC,
8.000%, 1/15/2024(b) | | | 79,500 |
| | 50,000 | | Goldman Sachs Group, Inc. (The),
6.875%, 1/18/2038, (GBP) | | | 46,195 |
| | 55,000 | | HCA, Inc.,
5.750%, 3/15/2014(b) | | | 36,025 |
| | 45,000 | | HCA, Inc.,
8.360%, 4/15/2024(b) | | | 25,233 |
| | 85,000 | | Host Hotels & Resorts LP, 6.375%, 3/15/2015(b) | | | 62,900 |
| | 90,000 | | International Paper Co.,
8.700%, 6/15/2038(b) | | | 59,839 |
| | 50,000 | | Kraft Food, Inc.,
6.250%, 3/20/2015, (EUR) | | | 68,821 |
| | 100,000 | | Merrill Lynch & Co., Inc., EMTN,
4.625%, 9/14/2018, (EUR) | | | 74,118 |
| | 50,000 | | Morgan Stanley, 3.750%, 3/01/2013, (EUR) | | | 54,510 |
| | 25,000 | | Morgan Stanley,
5.375%, 11/14/2013, (GBP) | | | 30,469 |
| | 75,000 | | Motorola, Inc.,
6.625%, 11/15/2037(b) | | | 47,437 |
| | 5,000 | | New Albertson’s, Inc.,
7.450%, 8/01/2029(b) | | | 4,150 |
| | 5,000 | | New Albertson’s, Inc.,
7.750%, 6/15/2026(b) | | | 4,188 |
| | 95,000 | | New Albertson’s, Inc.,
8.000%, 5/01/2031(b) | | | 77,662 |
| | 5,000 | | New Albertson’s, Inc.,
8.700%, 5/01/2030(b) | | | 4,275 |
| | 20,000 | | NGPL Pipeco LLC, 144A,
6.514%, 12/15/2012 | | | 19,105 |
| | 50,000 | | Owens Brockway Glass Container, Inc.,
6.750%, 12/01/2014, (EUR) | | | 59,787 |
| | 100,000 | | Pfizer, Inc.,
4.750%, 12/15/2014, (EUR) | | | 135,855 |
| | 50,000 | | Philip Morris International, Inc., GMTN, 5.875%, 9/04/2015, (EUR) | | | 68,013 |
| | 95,000 | | Qwest Corp.,
6.875%, 9/15/2033(b) | | | 62,225 |
| | 100,000 | | Schering-Plough Corp.,
5.375%, 10/01/2014, (EUR) | | | 132,655 |
| | 50,000 | | Simon Property Group LP,
10.350%, 4/01/2019 | | | 48,594 |
| | 70,000 | | SLM Corp., Series A, MTN,
4.500%, 7/26/2010(b) | | | 52,500 |
| | | | | | | |
Principal
Amount (‡) | | Description | | Value (†) | |
| | | | | | | |
| | | United States — continued | | | | |
| $ | 100,000 | | Sprint Nextel Corp.,
6.000%, 12/01/2016(b) | | $ | 71,500 | |
| | 90,000 | | Talisman Energy, Inc.,
5.750%, 5/15/2035 | | | 60,620 | |
| | 100,000 | | Textron, Inc.,
3.875%, 3/11/2013, (EUR) | | | 66,511 | |
| | 95,000 | | Verizon Wireless Capital LLC,
8.750%, 12/18/2015, (EUR) | | | 142,079 | |
| | 50,000 | | Wells Fargo & Co.,
4.625%, 11/02/2035, (GBP) | | | 51,847 | |
| | | | | | | |
| | | | | | 2,501,088 | |
| | | | | | | |
| | | Total Non-Convertible Bonds (Identified Cost $13,875,088) | | | 12,644,168 | |
| | | | | | | |
| | Convertible Bonds — 0.2% | | | | |
| | | United States — 0.2% | | | | |
| | 50,000 | | Hologic, Inc. (Step to Zero Coupon on
12/15/2013), 2.000%, 12/15/2037(c) (Identified Cost $34,625) | | | 34,125 | |
| | | | | | | |
| | | Total Bonds and Notes (Identified Cost $13,909,713) | | | 12,678,293 | |
| | | | | | | |
| | Short-Term Investments — 1.1% | | | | |
| | 144,855 | | Tri-Party Repurchase Agreement with Fixed Income Clearing Corporation, dated 3/31/2009 at 0.000% to be repurchased at $144,855 on 4/01/2009, collateralized by $145,000 Federal National Mortgage Association, 4.750% due 3/12/2010 valued
at $150,510 including accrued interest (Note 2g of Notes to Financial Statements)
(Identified Cost $144,855) | | | 144,855 | |
| | | | | | | |
| | | | | | | |
| | | Total Investments — 97.6% (Identified Cost $14,054,568)(a) | | | 12,823,148 | |
| | | Other assets less liabilities — 2.4% | | | 310,491 | |
| | | | | | | |
| | | Net Assets — 100.0% | | $ | 13,133,639 | |
| | | | | | | |
| | | | | | | |
| | (‡) | | Principal amount stated in U.S. dollars unless otherwise noted. | |
| | (†) | | See Note 2a of Notes to Financial Statements. | |
| | (††) | | Amount shown represents units. One unit represents a principal amount of 100. | |
| | (a) | | Federal Tax Information (Amounts exclude certain adjustments made at the end of the Fund’s fiscal year for tax purposes. Such adjustments are primarily due to wash sales. Amortization of premium on debt securities is excluded for tax purposes.): At March 31, 2009, the net unrealized depreciation on investments based on a cost of $14,076,623 for federal income tax purposes was as follows: | |
| | | Aggregate gross unrealized appreciation for all investments in which there is an excess of value over tax cost | | $ | 237,937 | |
| | | Aggregate gross unrealized depreciation for all investments in which there is an excess of tax cost over value | | | (1,491,412 | ) |
| | | | | | | |
| | | Net unrealized depreciation | | $ | (1,253,475 | ) |
| | | | | | | |
| | (b) | | All or a portion of this security is held as collateral for open forward foreign currency contracts. | |
| | (c) | | Step Bond: Coupon rate is a fixed rate for an initial period then resets at a specified date and rate. | |
| | | | | | | |
| | 144A | | Securities exempt from registration under Rule 144A of the Securities Act of 1933. These securities may be resold in transactions exempt from registration, normally to qualified institutional buyers. At March 31, 2009, the value of these securities amounted to $589,126 or 4.5% of net assets. | |
See accompanying notes to financial statements.
30
LOOMIS SAYLES INTERNATIONAL BOND FUND — PORTFOLIOOF INVESTMENTS (continued)
Investments as of March 31, 2009 (Unaudited)
| | | | |
| | | | |
| EMTN | | Euro Medium Term Note |
| GMTN | | Global Medium Term Note |
| MTN | | Medium Term Note |
| |
| AUD | | Australian Dollar |
| CAD | | Canadian Dollar |
| EUR | | Euro |
| GBP | | British Pound |
| IDR | | Indonesian Rupiah |
| JPY | | Japanese Yen |
| MXN | | Mexican Peso |
| NOK | | Norwegian Krone |
At March 31, 2009, the Fund had the following open forward foreign currency contracts:
| | | | | | | | | | | | | |
Contract to Buy/Sell | | Delivery Date | | Currency | | Units | | Value | | Unrealized Appreciation (Depreciation) | |
| Buy1 | | 6/15/2009 | | Chinese Yuan Renminbi | | 800,000 | | $ | 117,119 | | $ | (5,167 | ) |
| Sell1 | | 6/15/2009 | | Chinese Yuan Renminbi | | 800,000 | | | 117,119 | | | 3,101 | |
| Buy2 | | 6/17/2009 | | Euro | | 635,000 | | | 843,740 | | | 31,575 | |
| Buy2 | | 6/17/2009 | | Euro | | 100,000 | | | 132,873 | | | (1,854 | ) |
| Buy1 | | 6/17/2009 | | Japenese Yen | | 38,500,000 | | | 389,416 | | | (2,666 | ) |
| Sell1 | | 6/17/2009 | | Japenese Yen | | 12,000,000 | | | 121,376 | | | (99 | ) |
| Buy3 | | 4/14/2009 | | South Korean Won | | 248,000,000 | | | 179,390 | | | 18,089 | |
| Total | | | | | | | | | | | $ | 42,979 | |
1 Counterparty is JP Morgan Chase.
2 Counterparty is Credit Suisse.
3 Counterpary is UBS.
Net Assets Summary at March 31, 2009 (Unaudited)
| | | |
| Treasuries | | 19.6 | % |
| Government Guaranteed | | 17.1 | |
| Banking | | 10.0 | |
| Sovereigns | | 9.4 | |
| Supranational | | 5.7 | |
| Pharmaceuticals | | 3.0 | |
| Wirelines | | 2.9 | |
| Wireless | | 2.6 | |
| Tobacco | | 2.4 | |
| Other Investments, less than 2% each | | 23.8 | |
| Short-Term Investments | | 1.1 | |
| | | |
| Total Investments | | 97.6 | |
| Other assets less liabilities (including open Forward Foreign Currency Contracts) | | 2.4 | |
| | | |
| Net Assets | | 100.0 | % |
| | | |
Currency Exposure at March 31, 2009 as a Percentage of Net Assets (Unaudited)
| | | |
| Euro | | 39.5 | % |
| Japanese Yen | | 25.8 | |
| United States Dollar | | 16.6 | |
| British Pound | | 7.7 | |
| Norwegian Krone | | 3.8 | |
| Canadian Dollar | | 2.5 | |
| Other, less than 2% each | | 1.7 | |
| | | |
| Total Investments | | 97.6 | |
| Other assets less liabilities (including open Forward Foreign Currency Contracts) | | 2.4 | |
| | | |
| Net Assets | | 100.0 | % |
| | | |
See accompanying notes to financial statements.
31
LOOMIS SAYLES LIMITED TERM GOVERNMENT AND AGENCY FUND — PORTFOLIOOF INVESTMENTS
Investments as of March 31, 2009 (Unaudited)
| | | | | | |
Principal
Amount | | Description | | Value (†) |
| | | | | | |
| | Bonds and Notes — 94.8% of Net Assets | | | |
| | | ABS Car Loan — 1.1% | | | |
| $ | 77,769 | | Americredit Prime Automobile, Series 2007-2M, Class A2B,
0.913%, 11/08/2010(b) | | $ | 77,346 |
| | 342,222 | | Honda Auto Receivables Owner Trust, Series 2008-1, Class A2,
3.770%, 9/20/2010 | | | 343,722 |
| | 565,000 | | Merrill Auto Trust Securitization, Series 2008-1, Class 3A3,
5.500%, 3/15/2012 | | | 573,541 |
| | 425,000 | | Nissan Auto Receivables Owner Trust, Series 2008-B, Class A3,
4.460%, 4/16/2012 | | | 432,724 |
| | 444,083 | | USAA Auto Owner Trust, Series 2008-1, Class A2,
4.270%, 10/15/2010 | | | 445,939 |
| | 429,000 | | USAA Auto Owner Trust, Series 2008-3, Class A3,
4.280%, 10/15/2012 | | | 433,314 |
| | | | | | |
| | | | | | 2,306,586 |
| | | | | | |
| | | ABS Credit Card — 2.7% | | | |
| | 1,150,000 | | Capital One Multi-Asset Execution Trust, Series 2008-A6, Class A6,
1.656%, 3/17/2014(b) | | | 1,079,196 |
| | 3,000,000 | | Citibank Credit Card Issuance Trust, Series 2006-A8, Class A8,
1.134%, 12/17/2018(b) | | | 2,272,993 |
| | 2,000,000 | | Citibank Credit Card Issuance Trust, Series 2008-A3, Class A3,
1.436%, 5/18/2011(b) | | | 1,995,079 |
| | 600,000 | | Discover Card Master Trust, Series 2008-A3, Class A3,
5.100%, 10/15/2013 | | | 588,774 |
| | | | | | |
| | | | | | 5,936,042 |
| | | | | | |
| | | ABS Home Equity — 1.1% | | | |
| | 1,035,000 | | Countrywide Asset-Backed Certificates, Series 2004-S1, Class A3,
4.615%, 2/25/2035 | | | 624,835 |
| | 1,266,515 | | Countrywide Asset-Backed Certificates, Series 2006-S1, Class A2,
5.549%, 8/25/2021 | | | 746,104 |
| | 20,113 | | Residential Funding Mortgage Securities II,
Series 2004-HI3, Class A4,
4.630%, 1/25/2020 | | | 19,966 |
| | 660,000 | | Residential Funding Mortgage Securities II,
Series 2005-HI3, Class A4,
5.490%, 9/25/2035(c) | | | 449,936 |
| | 754,685 | | Residential Funding Mortgage Securities II,
Series 2002-HI5, Class A7,
5.700%, 1/25/2028 | | | 576,661 |
| | | | | | |
| | | | | | 2,417,502 |
| | | | | | |
| | | ABS Other — 0.0% | | | |
| | 98,818 | | CNH Equipment Trust, Series 2007-B, Class A2A,
5.460%, 6/15/2010 | | | 98,992 |
| | | | | | |
| | | Collateralized Mortgage Obligations — 0.5% | | | |
| | 115,986 | | Federal Home Loan Mortgage Corp., Series 3145, Class KA,
5.000%, 8/15/2024 | | | 118,922 |
| | 876,454 | | Federal Home Loan Mortgage Corp.,
5.000%, 1/15/2030 | | | 911,211 |
| | | | | | |
| | | | | | 1,030,133 |
| | | | | | |
| | | Commercial Mortgage-Backed Securities — 7.9% | | | |
| | 1,120,000 | | Banc of America Commercial Mortgage, Inc.,
Series 2006-4, Class A2,
5.522%, 7/10/2046 | | | 994,283 |
| | 1,005,000 | | Banc of America Commercial Mortgage, Inc.,
Series 2007-2, Class A2,
5.634%, 4/10/2049 | | | 820,823 |
| | | | | | |
Principal
Amount | | Description | | Value (†) |
| | | | | | |
| | | Commercial Mortgage-Backed Securities — continued | | | |
| $ | 2,425,000 | | Bear Stearns Commercial Mortgage Securities, Inc.,
Series 2007-PW16, Class A2,
5.857%, 6/11/2040(b) | | $ | 2,025,921 |
| | 790,000 | | Citigroup/Deutsche Bank Commercial Mortgage Trust,
Series 2007-CD4, Class A2B,
5.205%, 12/11/2049 | | | 633,418 |
| | 1,400,000 | | Commercial Mortgage Pass Through Certificates,
Series 2006-C7, Class A4,
5.961%, 6/10/2046(b) | | | 1,069,639 |
| | 1,610,000 | | Credit Suisse Mortgage Capital Certificates,
Series 2007-C3, Class A4,
5.912%, 6/15/2039(b) | | | 965,787 |
| | 1,535,000 | | Greenwich Capital Commercial Funding Corp.,
Series 2005-GG5, Class A2,
5.117%, 4/10/2037 | | | 1,375,865 |
| | 1,850,000 | | Greenwich Capital Commercial Funding Corp.,
Series 2007-GG9, Class A2,
5.381%, 3/10/2039 | | | 1,549,414 |
| | 1,800,000 | | GS Mortgage Securities Corp. II, Series 2006-GG8, Class A2,
5.479%, 11/10/2039 | | | 1,588,580 |
| | 1,590,000 | | LB-UBS Commercial Mortgage Trust, Series 2006-C7, Class A2,
5.300%, 11/15/2038 | | | 1,334,631 |
| | 975,000 | | Merrill Lynch/Countrywide Commercial Mortgage Trust,
Series 2006-4, Class A2,
5.112%, 12/12/2049 | | | 839,714 |
| | 3,325,000 | | Merrill Lynch/Countrywide Commercial Mortgage Trust,
Series 2006-1, Class A2,
5.439%, 2/12/2039 | | | 3,022,146 |
| | 905,000 | | Morgan Stanley Capital I, Series 2006-T23, Series A2,
5.915%, 8/12/2041(b) | | | 817,394 |
| | | | | | |
| | | | | | 17,037,615 |
| | | | | | |
| | | Government Owned - No Guarantee — 10.1% | | | |
| | 6,000,000 | | Federal Home Loan Mortgage Corp.,
2.125%, 3/23/2012 | | | 6,045,468 |
| | 6,500,000 | | Federal Home Loan Mortgage Corp.,
3.875%, 6/29/2011 | | | 6,833,021 |
| | 1,600,000 | | Federal Home Loan Mortgage Corp., 4.125%, 10/18/2010 | | | 1,676,446 |
| | 3,420,000 | | Federal National Mortgage Association, 2.000%, 1/09/2012 | | | 3,454,474 |
| | 3,500,000 | | Federal National Mortgage Association, 5.000%, 10/15/2011 | | | 3,786,720 |
| | | | | | |
| | | | | | 21,796,129 |
| | | | | | |
| | | Government Sponsored — 10.1% | | | |
| | 3,000,000 | | Federal Home Loan Bank,
3.375%, 10/20/2010 | | | 3,098,331 |
| | 5,000,000 | | Federal Home Loan Bank,
3.375%, 6/24/2011 | | | 5,176,345 |
| | 8,500,000 | | Federal Home Loan Bank,
3.625%, 9/16/2011 | | | 8,890,362 |
| | 3,950,000 | | Federal Home Loan Bank,
5.000%, 9/18/2009 | | | 4,024,908 |
| | 600,000 | | Federal National Mortgage Association,
6.625%, 9/15/2009 | | | 615,653 |
| | | | | | |
| | | | | | 21,805,599 |
| | | | | | |
See accompanying notes to financial statements.
32
LOOMIS SAYLES LIMITED TERM GOVERNMENTAND AGENCY FUND
PORTFOLIOOF INVESTMENTS (continued)
Investments as of March 31, 2009 (Unaudited)
| | | | | | |
Principal
Amount | | Description | | Value (†) |
| | | | | | |
| | | Hybrid ARMs — 2.0% | | | |
| $ | 2,778,116 | | FNMA,
6.039%, 2/01/2037(b) | | $ | 2,887,344 |
| | 480,847 | | JPMorgan Mortgage Trust, Series 2006-A7, Class 1A3,
5.874%, 1/25/2037(b) | | | 351,980 |
| | 1,793,880 | | Morgan Stanley Mortgage Loan Trust, Series 2005-3AR, Class 5A,
5.592%, 7/25/2035(b) | | | 1,053,484 |
| | | | | | |
| | | | | | 4,292,808 |
| | | | | | |
| | | Mortgage Related — 37.6% | | | |
| | 729,961 | | FHLMC, 4.500%, 5/01/2034 | | | 746,741 |
| | 21,857,410 | | FHLMC 5.500%, with various maturities from 2011 to 2023(d) | | | 23,063,637 |
| | 4,754,039 | | FHLMC 6.000%, with various maturities from 2019 to 2021(d) | | | 4,984,660 |
| | 7,817,093 | | FHLMC 6.500%, with various maturities from 2014 to 2034(d) | | | 8,266,606 |
| | 185,853 | | FHLMC, 7.000%, 2/01/2016 | | | 196,202 |
| | 24,092 | | FHLMC 7.500%, with various maturities from 2012 to 2026(d) | | | 25,347 |
| | 13,730 | | FHLMC, 8.000%, 9/01/2015 | | | 14,647 |
| | 4,634 | | FHLMC, 10.000%, 7/01/2019 | | | 5,213 |
| | 151,989 | | FHLMC 11.500%, with various maturities from 2015 to 2020(d) | | | 167,044 |
| | 5,000,000 | | FNMA, 1.750%, 3/23/2011 | | | 5,032,175 |
| | 10,781,597 | | FNMA 4.000%, with various maturities from 2018 to 2019(d) | | | 11,041,571 |
| | 955,892 | | FNMA, 4.500%, 9/01/2019 | | | 990,026 |
| | 2,149,280 | | FNMA 5.500%, with various maturities from 2017 to 2036(d) | | | 2,242,119 |
| | 15,841,456 | | FNMA 6.000%, with various maturities from 2017 to 2034(d) | | | 16,608,432 |
| | 5,708,883 | | FNMA 6.500%, with various maturities from 2017 to 2037(d) | | | 6,025,345 |
| | 270,456 | | FNMA, 7.000%, 12/01/2022 | | | 286,325 |
| | 429,033 | | FNMA 7.500%, with various maturities from 2015 to 2032(d) | | | 460,608 |
| | 69,328 | | FNMA 8.000%, with various maturities from 2015 to 2016(d) | | | 73,443 |
| | 106,381 | | GNMA, 6.000%, 12/15/2031 | | | 111,994 |
| | 387,188 | | GNMA, 6.500%, 5/15/2031 | | | 413,435 |
| | 313,746 | | GNMA, 7.000%, 10/15/2028 | | | 336,673 |
| | 644 | | GNMA, 9.500%, 8/15/2009 | | | 658 |
| | 4,915 | | GNMA 12.500%, with various maturities from 2014 to 2015(d) | | | 5,716 |
| | 53,395 | | GNMA 16.000%, with various maturities from 2011 to 2012(d) | | | 61,478 |
| | 23,486 | | GNMA 17.000%, with various maturities in 2011(d) | | | 26,944 |
| | | | | | |
| | | | | | 81,187,039 |
| | | | | | |
| | | | | | | |
Principal
Amount | | Description | | Value (†) | |
| | | | | | | |
| | | Treasuries — 21.7% | | | | |
| $ | 18,576,715 | | U.S. Treasury Inflation Indexed Bond, 1.375%, 7/15/2018 | | $ | 18,425,779 | |
| | 12,420,000 | | U.S. Treasury Note, 0.875%, 2/28/2011 | | | 12,443,722 | |
| | 9,145,000 | | U.S. Treasury Note, 1.125%, 1/15/2012 | | | 9,150,716 | |
| | 5,360,000 | | U.S. Treasury Note, 3.625%, 12/31/2012 | | | 5,809,318 | |
| | 1,030,000 | | U.S. Treasury Note, 4.500%, 11/30/2011 | | | 1,124,792 | |
| | | | | | | |
| | | | | | 46,954,327 | |
| | | | | | | |
| | | Total Bonds and Notes (Identified Cost $202,147,774) | | | 204,862,772 | |
| | | | | | | |
| | Short-Term Investments — 5.0% | | | | |
| | 500,000 | | Federal Home Loan Bank, Discount Notes 2.300%, 4/20/2009(e) | | | 499,987 | |
| | 6,500,000 | | Federal National Mortgage Association, Discount Notes 0.430%, 8/03/2009(e) | | | 6,493,507 | |
| | 1,760,000 | | Federal National Mortgage Association, Discount Notes 3.020%, 8/07/2009(e) | | | 1,758,185 | |
| | 1,949,858 | | Tri-Party Repurchase Agreement with Fixed Income Clearing Corporation, dated 3/31/2009 at 0.000% to be repurchased at $1,949,858 on 4/01/2009, collateralized by $1,920,000 Federal National Mortgage Association, 4.750% due 3/12/2010 valued at $1,992,960 including accrued interest (Note 2g of Notes to Financial Statements) | | | 1,949,858 | |
| | | | | | | |
| | | Total Short-Term Investments (Identified Cost $10,680,547) | | | 10,701,537 | |
| | | | | | | |
| | | | | | | |
| | | Total Investments — 99.8% (Identified Cost $212,828,321)(a) | | | 215,564,309 | |
| | | Other assets less liabilities — 0.2% | | | 482,372 | |
| | | | | | | |
| | | Net Assets — 100.0% | | $ | 216,046,681 | |
| | | | | | | |
| | | | | | | |
| | (†) | | See Note 2a of Notes to Financial Statements. | |
| | (a) | | Federal Tax Information (Amounts exclude certain adjustments made at the end of the Fund’s fiscal year for tax purposes. Such adjustments are primarily due to wash sales. Amortization of premium on debt securities is excluded for tax purposes.): At March 31, 2009, the net unrealized appreciation on investments based on a cost of $212,368,047 for federal income tax purposes was as follows: | |
| | | Aggregate gross unrealized appreciation for all investments in which there is an excess of value over tax cost | | $ | 6,306,100 | |
| | | Aggregate gross unrealized depreciation for all investments in which there is an excess of tax cost over value | | | (3,109,838 | ) |
| | | | | | | |
| | | Net unrealized appreciation | | $ | 3,196,262 | |
| | | | | | | |
| | | | | | | |
| | (b) | | Variable rate security. Rate as of March 31, 2009 is disclosed. | |
| | (c) | | Valued by management. At March 31, 2009 the value of this security amounted to $449,936 or 0.2% of net assets. | |
| | (d) | | The Fund’s investment in mortgage related securities of the Federal Home Loan Mortgage Corporation, Federal National Mortgage Association and Government National Mortgage Association are interests in separate pools of mortgages. All separate investments in securities of each issuer which have the same coupon rate have been aggregated for the purpose of presentation in the Portfolio of Investments. | |
| | (e) | | Rate represents discount rate at time of purchase. | |
| | | | | | | |
See accompanying notes to financial statements.
33
LOOMIS SAYLES LIMITED TERM GOVERNMENTAND AGENCY FUND
PORTFOLIOOF INVESTMENTS (continued)
Investments as of March 31, 2009 (Unaudited)
| | | | |
| | | | |
| ABS | | Asset-Backed Securities |
| ARM | | Adjustable Rate Mortgage |
| FHLMC | | Federal Home Loan Mortgage Corporation |
| FNMA | | Federal National Mortgage Association |
| GNMA | | Government National Mortgage Association |
Net Asset Summary at March 31, 2009 (Unaudited)
| | | |
| Mortgage Related | | 37.6 | % |
| Treasuries | | 21.7 | |
| Government Sponsored | | 10.1 | |
| Government Owned - No Guarantee | | 10.1 | |
| Commercial Mortgage-Backed Securities | | 7.9 | |
| ABS Credit Card | | 2.7 | |
| Hybrid ARMs | | 2.0 | |
| Other Investments, less than 2% each | | 2.7 | |
| Short-Term Investments | | 5.0 | |
| | | |
| Total Investments | | 99.8 | |
| Other assets less liabilities | | 0.2 | |
| | | |
| Net Assets | | 100.0 | % |
| | | |
See accompanying notes to financial statements.
34
LOOMIS SAYLES STRATEGIC INCOME FUND — PORTFOLIOOF INVESTMENTS
Investments as of March 31, 2009 (Unaudited)
| | | | | | |
Principal
Amount (‡) | | Description | | Value (†) |
| | | | | | |
| | Bonds and Notes — 89.4% of Net Assets |
| | Non-Convertible Bonds — 85.0% |
| | | ABS Credit Card — 0.6% | | | |
| $ | 80,700,000 | | Citibank Credit Card Issuance Trust, Series 2008-C6, Class C6, 6.300%, 6/20/2014 | | $ | 50,841,000 |
| | | | | | |
| | | Aerospace & Defense — 0.1% | | | |
| | 1,380,000 | | Bombardier, Inc., 144A, 6.300%, 5/01/2014 | | | 972,900 |
| | 2,795,000 | | Bombardier, Inc.,
7.350%, 12/22/2026, (CAD) | | | 1,440,950 |
| | 11,700,000 | | Bombardier, Inc., 144A, 7.450%, 5/01/2034 | | | 6,786,000 |
| | | | | | |
| | | | | | 9,199,850 |
| | | | | | |
| | | Airlines — 1.4% | | | |
| | 825,000 | | American Airlines, Inc., Series 1999-1, Class B, 7.324%, 4/15/2011 | | | 767,250 |
| | 673,443 | | American Airlines, Inc., Series 93A6, 8.040%, 9/16/2011 | | | 431,004 |
| | 178,186 | | Continental Airlines, Inc., Series 1996-1, Class A, 6.940%, 4/15/2015 | | | 152,794 |
| | 4,476,537 | | Continental Airlines, Inc., Series 1997-4, Class 4B, 6. 900%, 7/02/2018 | | | 3,133,576 |
| | 4,102,503 | | Continental Airlines, Inc., Series 1998-1, Class 1B, 6.748%, 9/15/2018 | | | 3,035,852 |
| | 6,973,957 | | Continental Airlines, Inc., Series 1999-1, Class B, 6.795%, 2/02/2020 | | | 4,951,509 |
| | 912,841 | | Continental Airlines, Inc., Series 1999-1, Class C, 6.954%, 2/02/2011 | | | 878,610 |
| | 4,159,411 | | Continental Airlines, Inc., Series 1999-2, Class B, 7.566%, 9/15/2021 | | | 3,119,559 |
| | 7,323,915 | | Continental Airlines, Inc., Series 2000-2, Class B, 8.307%, 10/02/2019 | | | 5,236,599 |
| | 2,398,957 | | Continental Airlines, Inc., Series 2001-1, Class B, 7.373%, 6/15/2017 | | | 1,487,353 |
| | 11,915,000 | | Continental Airlines, Inc., Series 2007-1, Class A, 5.983%, 4/19/2022 | | | 8,817,100 |
| | 16,802,000 | | Continental Airlines, Inc., Series 2007-1, Class B, 6.903%, 4/19/2022 | | | 8,905,060 |
| | 5,377,930 | | Continental Airlines, Inc., Series 971A, 7.461%, 10/01/2016 | | | 3,764,551 |
| | 907,561 | | Delta Air Lines, Inc., Series 2007-1, Class A, 6.821%, 2/10/2024 | | | 612,603 |
| | 9,187,700 | | Delta Air Lines, Inc., Series 2007-1, Class B, 8.021%, 2/10/2024 | | | 5,099,173 |
| | 30,735,143 | | Delta Air Lines, Inc., Series 2007-1, Class C, 8.954%, 8/10/2014 | | | 18,133,735 |
| | 26,990,000 | | Northwest Airlines, Inc., Series 07-1, Class B, 8.028%, 11/01/2017 | | | 15,519,250 |
| | 1,500,000 | | Qantas Airways Ltd., 144A, 5.125%, 6/20/2013 | | | 1,376,165 |
| | 32,710,000 | | Qantas Airways Ltd., 144A, 6.050%, 4/15/2016 | | | 27,705,763 |
| | 18,704,404 | | United Air Lines, Inc., Series 2007-1, Class A, 6.636%, 1/02/2024 | | | 12,718,995 |
| | | | | | |
| | | | | | 125,846,501 |
| | | | | | |
| | | | | | |
Principal
Amount (‡) | | Description | | Value (†) |
| | | | | | |
| | | Automotive — 2.2% | | | |
| $ | 1,853,000 | | Cummins, Inc., 6.750%, 2/15/2027 | | $ | 1,167,390 |
| | 2,145,000 | | Cummins, Inc., 7.125%, 3/01/2028 | | | 1,477,403 |
| | 6,500,000 | | FCE Bank PLC, EMTN, 7.125%, 1/16/2012, (EUR) | | | 5,872,412 |
| | 4,500,000 | | FCE Bank PLC, EMTN, 7.125%, 1/15/2013, (EUR) | | | 3,975,835 |
| | 17,816,000 | | Ford Motor Co., 6.375%, 2/01/2029 | | | 5,033,020 |
| | 1,705,000 | | Ford Motor Co., 6.500%, 8/01/2018 | | | 494,450 |
| | 500,000 | | Ford Motor Co., 6.625%, 2/15/2028 | | | 141,250 |
| | 73,114,000 | | Ford Motor Co., 6.625%, 10/01/2028 | | | 20,654,705 |
| | 1,940,000 | | Ford Motor Co., 7.125%, 11/15/2025 | | | 523,800 |
| | 86,090,000 | | Ford Motor Co., 7.450%, 7/16/2031 | | | 27,333,575 |
| | 800,000 | | Ford Motor Co., 7.500%, 8/01/2026 | | | 224,000 |
| | 46,872,000 | | Ford Motor Credit Co. LLC, 5.700%, 1/15/2010 | | | 40,148,727 |
| | 10,685,000 | | Ford Motor Credit Co. LLC, 7.000%, 10/01/2013 | | | 7,144,653 |
| | 15,465,000 | | Ford Motor Credit Co. LLC, 7.250%, 10/25/2011 | | | 11,010,400 |
| | 1,030,000 | | Ford Motor Credit Co. LLC, 7.875%, 6/15/2010 | | | 851,197 |
| | 14,595,000 | | Ford Motor Credit Co. LLC, 8.000%, 12/15/2016 | | | 9,592,286 |
| | 10,625,000 | | Ford Motor Credit Co. LLC, 8.625%, 11/01/2010 | | | 8,462,823 |
| | 1,645,000 | | Ford Motor Credit Co. LLC, 9.750%, 9/15/2010 | | | 1,353,253 |
| | 7,640,000 | | Ford Motor Credit Co. LLC, EMTN, 4.875%, 1/15/2010, (EUR) | | | 8,475,671 |
| | 2,005,000 | | General Motors Corp., 7.250%, 7/03/2013, (EUR) | | | 479,492 |
| | 7,365,000 | | General Motors Corp., 7.400%, 9/01/2025 | | | 846,975 |
| | 52,725,000 | | General Motors Corp., 8.250%, 7/15/2023 | | | 6,524,719 |
| | 2,530,000 | | General Motors Corp., 8.375%, 7/15/2033 | | | 316,250 |
| | 43,074,000 | | GMAC LLC, 144A, 5.375%, 6/06/2011 | | | 30,582,540 |
| | 4,977,000 | | Goodyear Tire & Rubber Co., 7.000%, 3/15/2028 | | | 2,787,120 |
| | | | | | |
| | | | | | 195,473,946 |
| | | | | | |
| | | Banking — 4.3% | | | |
| | 22,125,000 | | BAC Capital Trust VI, 5.625%, 3/08/2035 | | | 9,405,736 |
| | 1,006,000,000 | | Barclays Financial LLC, 144A, 4.160%, 2/22/2010, (THB) | | | 28,076,662 |
| | 56,650,000,000 | | Barclays Financial LLC, 144A, 4.470%, 12/04/2011, (KRW) | | | 42,305,765 |
See accompanying notes to financial statements.
35
LOOMIS SAYLES STRATEGIC INCOME FUND — PORTFOLIOOF INVESTMENTS (continued)
Investments as of March 31, 2009 (Unaudited)
| | | | | | |
Principal
Amount (‡) | | Description | | Value (†) |
| | | | | | |
| | | Banking — continued | | | |
| $ | 17,310,000,000 | | Barclays Financial LLC, EMTN, 144A, 4.060%, 9/16/2010, (KRW) | | $ | 12,831,863 |
| | 135,000,000 | | Barclays Financial LLC, EMTN, 144A, 4.100%, 3/22/2010, (THB) | | | 3,732,342 |
| | 21,340,000,000 | | Barclays Financial LLC, EMTN, 144A, 4.460%, 9/23/2010, (KRW) | | | 15,908,771 |
| | 224,520,000,000 | | BNP Paribas SA, EMTN, 144A, Zero Coupon, 6/13/2011, (IDR) | | | 12,565,736 |
| | 2,165,000 | | Capital One Financial Corp., 6.150%, 9/01/2016 | | | 1,370,452 |
| | 18,650,000 | | Citibank NA, 144A, 15.000%, 7/02/2010, (BRL) | | | 8,460,857 |
| | 2,575,000 | | Citigroup, Inc., 5.000%, 9/15/2014 | | | 1,706,970 |
| | 2,540,000 | | Goldman Sachs Group, Inc. (The), 5.000%, 10/01/2014 | | | 2,296,361 |
| | 1,285,000 | | Goldman Sachs Group, Inc. (The), 5.150%, 1/15/2014 | | | 1,172,768 |
| | 119,806,078 | | HSBC Bank USA, 144A, Zero Coupon, 11/28/2011(b) | | | 78,664,671 |
| | 9,090,000 | | ICICI Bank Ltd., (fixed rate to 4/30/2017, variable rate thereafter), 144A, 6.375%, 4/30/2022 | | | 5,110,943 |
| | 109,312,000,000 | | JPMorgan Chase & Co., 144A, Zero Coupon, 3/28/2011, (IDR) | | | 6,313,702 |
| | 229,157,783,700 | | JPMorgan Chase & Co., 144A, Zero Coupon, 4/12/2012, (IDR) | | | 10,639,823 |
| | 599,726,100,000 | | JPMorgan Chase & Co., EMTN, 144A, Zero Coupon, 3/28/2011, (IDR) | | | 34,639,308 |
| | 92,000,000 | | JPMorgan Chase Bank, 144A, Zero Coupon, 5/17/2010, (BRL) | | | 33,142,883 |
| | 76,496,404,750 | | JPMorgan Chase Bank, EMTN, 144A, Zero Coupon, 10/21/2010, (IDR) | | | 4,953,233 |
| | 2,500,000 | | Kaupthing Bank Hf, 144A, 1/15/2010(c) | | | 128,125 |
| | 36,300,000 | | Kaupthing Bank Hf, Series D, 144A, 5.750%, 10/04/2011(c) | | | 1,860,375 |
| | 9,300,000 | | Kaupthing Bank Hf, Series E, 144A, 6.125%, 10/04/2016(c) | | | 476,625 |
| | 60,000,000 | | Kreditanstalt fuer Wiederaufbau, EMTN, 10.750%, 2/01/2010, (ISK) | | | 295,320 |
| | 2,200,000 | | Merrill Lynch & Co., Inc., 6.110%, 1/29/2037 | | | 1,093,426 |
| | 51,500,000 | | Merrill Lynch & Co., Inc., 10.710%, 3/08/2017, (BRL) | | | 18,204,548 |
| | 3,450,000 | | Merrill Lynch & Co., Inc., EMTN, 4.625%, 9/14/2018, (EUR) | | | 2,557,055 |
| | 26,665,000 | | Morgan Stanley, 4.750%, 4/01/2014 | | | 21,800,691 |
| | 5,050,000 | | Morgan Stanley, 5.125%, 11/30/2015, (GBP) | | | 5,736,449 |
| | 500,000 | | Morgan Stanley, 5.375%, 10/15/2015 | | | 451,710 |
| | 205,000 | | Morgan Stanley, 6.750%, 4/15/2011 | | | 205,158 |
| | 110,000 | | Morgan Stanley, EMTN, 5.450%, 1/09/2017 | | | 96,250 |
| | 600,000 | | Morgan Stanley, MTN, 6.250%, 8/09/2026 | | | 496,264 |
| | | | | | |
Principal
Amount (‡) | | Description | | Value (†) |
| | | | | | |
| | | Banking — continued | | | |
| $ | 910,000 | | Morgan Stanley, Series F, MTN, 5.950%, 12/28/2017 | | $ | 826,647 |
| | 3,283,000,000 | | Rabobank Nederland, EMTN, 144A, 10.250%, 9/10/2009, (ISK) | | | 15,614,268 |
| | | | | | |
| | | | | | 383,141,757 |
| | | | | | |
| | | Brokerage — 0.0% | | | |
| | 91,745,000 | | Lehman Brothers Holdings, Inc., 6.875%, 7/17/2037(c) | | | 9,175 |
| | 7,370,000 | | Lehman Brothers Holdings, Inc., MTN, (fixed rate to 5/03/2027, variable rate thereafter), 6.000%, 5/03/2032(c) | | | 737 |
| | | | | | |
| | | | | | 9,912 |
| | | | | | |
| | | Building Materials — 0.7% | | | |
| | 17,995,000 | | Owens Corning, Inc., 6.500%, 12/01/2016 | | | 13,202,122 |
| | 35,980,000 | | Owens Corning, Inc., 7.000%, 12/01/2036 | | | 20,162,544 |
| | 43,962,000 | | USG Corp., 6.300%, 11/15/2016 | | | 23,299,860 |
| | 12,880,000 | | USG Corp., 9.250%, 1/15/2018 | | | 7,856,800 |
| | | | | | |
| | | | | | 64,521,326 |
| | | | | | |
| | | Chemicals — 0.3% | | | |
| | 23,584,000 | | Borden, Inc., 7.875%, 2/15/2023 | | | 2,358,400 |
| | 6,920,000 | | Borden, Inc., 8.375%, 4/15/2016 | | | 692,000 |
| | 8,757,000 | | Borden, Inc., 9.200%, 3/15/2021 | | | 875,700 |
| | 990,000 | | Georgia Gulf Corp., 10.750%, 10/15/2016 | | | 64,350 |
| | 14,550,000 | | Hercules, Inc., Subordinated Note, 6.500%, 6/30/2029(d) | | | 5,092,500 |
| | 1,575,000 | | Hexion US Finance Corp./Hexion Nova Scotia Finance ULC, 9.750%, 11/15/2014 | | | 346,500 |
| | 1,650,000 | | Koppers Holdings, Inc., (Step to 9.875% on 11/15/2009), Zero Coupon, 11/15/2014(e) | | | 1,344,750 |
| | 5,350,000 | | Methanex Corp., Senior Note, 6.000%, 8/15/2015 | | | 3,637,861 |
| | 6,465,000 | | Mosaic Global Holdings, Inc., 7.300%, 1/15/2028 | | | 4,848,750 |
| | 5,820,000 | | Mosaic Global Holdings, Inc., 7.375%, 8/01/2018 | | | 5,499,900 |
| | | | | | |
| | | | | | 24,760,711 |
| | | | | | |
| | | Construction Machinery — 1.2% | | | |
| | 5,560,000 | | Caterpillar Financial Services Corp., MTN, 5.450%, 4/15/2018 | | | 4,770,180 |
| | 94,265,000 | | Caterpillar Financial Services Corp., MTN, 6.125%, 2/17/2014 | | | 91,542,815 |
| | 2,700,000 | | Caterpillar Financial Services Corp., Series F, MTN, 5.850%, 9/01/2017 | | | 2,345,871 |
| | 1,425,000 | | Joy Global, Inc., 6.625%, 11/15/2036 | | | 950,855 |
| | 18,243,000 | | United Rentals North America, Inc., 7.000%, 2/15/2014 | | | 9,212,715 |
See accompanying notes to financial statements.
36
LOOMIS SAYLES STRATEGIC INCOME FUND — PORTFOLIOOF INVESTMENTS (continued)
Investments as of March 31, 2009 (Unaudited)
| | | | | | |
Principal
Amount (‡) | | Description | | Value (†) |
| | | | | | |
| | | Construction Machinery — continued | | | |
| $ | 1,630,000 | | United Rentals North America, Inc., 7.750%, 11/15/2013 | | $ | 888,350 |
| | | | | | |
| | | | | | 109,710,786 |
| | | | | | |
| | | Consumer Cyclical Services — 0.9% | | | |
| | 101,985,000 | | Western Union Co. (The), 6.200%, 11/17/2036 | | | 81,466,842 |
| | | | | | |
| | | Electric — 4.2% | | | |
| | 4,020,000 | | AES Corp. (The), 7.750%, 3/01/2014 | | | 3,597,900 |
| | 5,565,000 | | AES Corp. (The), 8.375%, 3/01/2011, (GBP) | | | 7,186,446 |
| | 5,987,408 | | AES Ironwood LLC, 8.857%, 11/30/2025 | | | 5,268,919 |
| | 1,152,824 | | AES Red Oak LLC, Series A, 8.540%, 11/30/2019 | | | 1,049,070 |
| | 71,400,000 | | Bruce Mansfield Unit, 6.850%, 6/01/2034(d) | | | 53,040,204 |
| | 3,741,696 | | CE Generation LLC, 7.416%, 12/15/2018 | | | 3,464,552 |
| | 32,125,000 | | Cleveland Electric Illuminating Co., 5.950%, 12/15/2036 | | | 24,767,893 |
| | 3,755,000 | | Dominion Resources, Inc., Series B, 5.950%, 6/15/2035 | | | 3,177,714 |
| | 11,275,000 | | Dynegy Holdings, Inc., 7.125%, 5/15/2018 | | | 5,975,750 |
| | 1,000,000 | | Dynegy Holdings, Inc., 7.500%, 6/01/2015 | | | 682,500 |
| | 10,185,000 | | Dynegy Holdings, Inc., 7.625%, 10/15/2026 | | | 4,277,700 |
| | 500,000 | | Dynegy Holdings, Inc., 7.750%, 6/01/2019 | | | 325,000 |
| | 7,455,000 | | Dynegy Holdings, Inc., 8.375%, 5/01/2016 | | | 5,050,763 |
| | 4,744,113 | | Dynegy Roseton/Danskammer Pass Through Trust, Series A, 7.270%, 11/08/2010 | | | 4,459,466 |
| | 95,200,000 | | Edison Mission Energy, 7.625%, 5/15/2027 | | | 57,120,000 |
| | 250,000 | | Empresa Nacional de Electricidad SA, (Endesa-Chile), 8.350%, 8/01/2013 | | | 273,281 |
| | 4,875,000 | | Empresa-Chile Overseas Co., 7.875%, 2/01/2027 | | | 4,999,122 |
| | 555,000 | | Enersis SA, Cayman Island, 7.400%, 12/01/2016 | | | 575,025 |
| | 5,310,000 | | ITC Holdings Corp., 144A, 6.375%, 9/30/2036 | | | 4,473,861 |
| | 1,000,000 | | MidAmerican Energy Holdings Co., 6.125%, 4/01/2036 | | | 886,818 |
| | 40,255,000 | | MidAmerican Energy Holdings Co., 6.500%, 9/15/2037 | | | 37,226,576 |
| | 31,735,000 | | NGC Corp. Capital Trust I, Series B, 8.316%, 6/01/2027 | | | 12,694,000 |
| | 955,000 | | NiSource Finance Corp., 5.400%, 7/15/2014 | | | 764,393 |
| | 1,700,000 | | NiSource Finance Corp., 6.150%, 3/01/2013 | | | 1,484,797 |
| | 43,450,000 | | NiSource Finance Corp., 6.400%, 3/15/2018 | | | 35,157,872 |
| | | | | | |
Principal
Amount (‡) | | Description | | Value (†) |
| | | | | | |
| | | Electric — continued | | | |
| $ | 2,500,000 | | NRG Energy, Inc., 7.250%, 2/01/2014 | | $ | 2,350,000 |
| | 5,000,000 | | NRG Energy, Inc., 7.375%, 2/01/2016 | | | 4,650,000 |
| | 1,504,375 | | Quezon Power (Philippines) Ltd., Senior Secured Note, 8.860%, 6/15/2017 | | | 1,353,938 |
| | 25,230,000 | | Reliant Energy, Inc., Senior Note, 7.875%, 6/15/2017 | | | 19,931,700 |
| | 1,050,000 | | SP PowerAssets Ltd., EMTN, 3.730%, 10/22/2010, (SGD) | | | 686,576 |
| | 655,000 | | Texas Competitive Electric Holdings Co. LLC, Series A, 10.250%, 11/01/2015 | | | 327,500 |
| | 8,785,000 | | Toledo Edison Co., 6.150%, 5/15/2037 | | | 6,189,217 |
| | 46,215,000 | | TXU Corp., Series P, 5.550%, 11/15/2014 | | | 15,944,175 |
| | 101,030,000 | | TXU Corp., Series Q, 6.500%, 11/15/2024 | | | 28,341,441 |
| | 6,245,000 | | TXU Corp., Series R, 6.550%, 11/15/2034 | | | 1,692,582 |
| | 7,300,000 | | White Pine Hydro LLC, 6.310%, 7/10/2017(d) | | | 6,495,635 |
| | 10,935,000 | | White Pine Hydro LLC, 6.960%, 7/10/2037(d) | | | 8,366,073 |
| | 4,000,000 | | White Pine Hydro LLC, 7.260%, 7/20/2015(d) | | | 3,599,916 |
| | | | | | |
| | | | | | 377,908,375 |
| | | | | | |
| | | Entertainment — 0.3% | | | |
| | 12,440,000 | | Six Flags, Inc., 9.625%, 6/01/2014 | | | 1,026,300 |
| | 1,035,000 | | Six Flags, Inc., 9.750%, 4/15/2013 | | | 85,388 |
| | 39,640,000 | | Viacom, Inc., Class B, 6.875%, 4/30/2036 | | | 28,921,621 |
| | | | | | |
| | | | | | 30,033,309 |
| | | | | | |
| | | Food & Beverage — 1.1% | | | |
| | 2,085,000 | | Aramark Services, Inc., 5.000%, 6/01/2012 | | | 1,824,375 |
| | 23,710,000 | | Corn Products International, Inc., 6.625%, 4/15/2037 | | | 19,545,125 |
| | 35,447,000 | | Kraft Foods, Inc., 6.500%, 8/11/2017 | | | 36,501,123 |
| | 30,680,000 | | Kraft Foods, Inc., 7.000%, 8/11/2037 | | | 30,414,771 |
| | 14,120,000 | | Sara Lee Corp.,
6.125%, 11/01/2032 | | | 11,891,130 |
| | | | | | |
| | | | | | 100,176,524 |
| | | | | | |
| | | Government Owned - No Guarantee — 0.3% | | | |
| | 26,435,000 | | Abu Dhabi National Energy Co., 144A,
7.250%, 8/01/2018 | | | 25,168,050 |
| | 10,300,000 | | DP World Ltd., 144A,
6.850%, 7/02/2037 | | | 4,928,024 |
| | | | | | |
| | | | | | 30,096,074 |
| | | | | | |
See accompanying notes to financial statements.
37
LOOMIS SAYLES STRATEGIC INCOME FUND — PORTFOLIOOF INVESTMENTS (continued)
Investments as of March 31, 2009 (Unaudited)
| | | | | | |
Principal
Amount (‡) | | Description | | Value (†) |
| | | | | | |
| | | Health Insurance — 0.6% | | | |
| $ | 15,325,000 | | CIGNA Corp.,
6.150%, 11/15/2036 | | $ | 10,778,686 |
| | 50,000,000 | | WellPoint, Inc.,
6.375%, 6/15/2037 | | | 43,070,950 |
| | | | | | |
| | | | | | 53,849,636 |
| | | | | | |
| | | Healthcare — 4.2% | | | |
| | 2,765,000 | | Boston Scientific Corp.,
5.450%, 6/15/2014 | | | 2,529,975 |
| | 8,230,000 | | Boston Scientific Corp.,
6.400%, 6/15/2016 | | | 7,653,900 |
| | 16,510,000 | | Boston Scientific Corp., 7.000%, 11/15/2035 | | | 14,033,500 |
| | 17,785,000 | | HCA, Inc.,
5.750%, 3/15/2014 | | | 11,649,175 |
| | 3,800,000 | | HCA, Inc.,
6.250%, 2/15/2013 | | | 2,850,000 |
| | 17,035,000 | | HCA, Inc.,
6.375%, 1/15/2015 | | | 11,157,925 |
| | 49,350,000 | | HCA, Inc.,
6.500%, 2/15/2016 | | | 32,324,250 |
| | 2,074,000 | | HCA, Inc.,
6.750%, 7/15/2013 | | | 1,550,315 |
| | 14,405,000 | | HCA, Inc.,
7.050%, 12/01/2027 | | | 7,490,600 |
| | 10,694,000 | | HCA, Inc.,
7.190%, 11/15/2015 | | | 7,224,225 |
| | 17,172,000 | | HCA, Inc.,
7.500%, 12/15/2023 | | | 9,098,275 |
| | 18,745,000 | | HCA, Inc.,
7.500%, 11/06/2033 | | | 9,372,500 |
| | 43,253,000 | | HCA, Inc.,
7.690%, 6/15/2025 | | | 22,526,422 |
| | 27,895,000 | | HCA, Inc.,
8.360%, 4/15/2024 | | | 15,641,368 |
| | 13,545,000 | | HCA, Inc., MTN,
7.580%, 9/15/2025 | | | 6,950,089 |
| | 8,112,000 | | HCA, Inc., MTN,
7.750%, 7/15/2036 | | | 4,103,025 |
| | 11,370,000 | | Hospira, Inc.,
6.050%, 3/30/2017 | | | 10,147,600 |
| | 176,070,000 | | Medco Health Solutions, Inc.,
7.125%, 3/15/2018 | | | 174,743,136 |
| | 3,260,000 | | Owens & Minor, Inc.,
6.350%, 4/15/2016(d) | | | 2,931,783 |
| | 1,900,000 | | Tenet Healthcare Corp.,
6.500%, 6/01/2012 | | | 1,616,763 |
| | 31,009,000 | | Tenet Healthcare Corp.,
6.875%, 11/15/2031 | | | 15,349,455 |
| | 1,570,000 | | Tenet Healthcare Corp.,
7.375%, 2/01/2013 | | | 1,248,150 |
| | 4,480,000 | | Tenet Healthcare Corp.,
9.250%, 2/01/2015 | | | 3,449,600 |
| | | | | | |
| | | | | | 375,642,031 |
| | | | | | |
| | | Home Construction — 2.0% | | | |
| | 2,840,000 | | Centex Corp.,
5.250%, 6/15/2015 | | | 2,130,000 |
| | 43,470,000 | | D.R. Horton, Inc.,
5.250%, 2/15/2015 | | | 33,308,888 |
| | | | | | |
Principal
Amount (‡) | | Description | | Value (†) |
| | | | | | |
| | | Home Construction — continued | | | |
| $ | 4,335,000 | | D.R. Horton, Inc.,
5.625%, 9/15/2014 | | $ | 3,402,975 |
| | 1,625,000 | | D.R. Horton, Inc.,
6.500%, 4/15/2016 | | | 1,275,625 |
| | 16,160,000 | | D.R. Horton, Inc., Guaranteed Note,
5.625%, 1/15/2016 | | | 12,281,600 |
| | 11,265,000 | | Desarrolladora Homex SAB de CV,
7.500%, 9/28/2015 | | | 7,434,900 |
| | 6,290,000 | | K. Hovnanian Enterprises, Inc.,
7.500%, 5/15/2016 | | | 1,729,750 |
| | 1,935,000 | | K. Hovnanian Enterprises, Inc.,
7.750%, 5/15/2013 | | | 474,075 |
| | 1,235,000 | | K. Hovnanian Enterprises, Inc.,
8.875%, 4/01/2012 | | | 432,250 |
| | 4,830,000 | | K. Hovnanian Enterprises, Inc.,
Guaranteed Note,
6.250%, 1/15/2015 | | | 1,231,650 |
| | 16,075,000 | | K. Hovnanian Enterprises, Inc.,
Guaranteed Note,
6.250%, 1/15/2016 | | | 4,340,250 |
| | 6,040,000 | | K. Hovnanian Enterprises, Inc.,
Guaranteed Note,
6.375%, 12/15/2014 | | | 1,661,000 |
| | 2,490,000 | | K. Hovnanian Enterprises, Inc.,
Guaranteed Note,
6.500%, 1/15/2014 | | | 647,400 |
| | 1,685,000 | | KB Home,
5.750%, 2/01/2014 | | | 1,333,256 |
| | 8,340,000 | | KB Home, Guaranteed Note,
5.875%, 1/15/2015 | | | 6,459,330 |
| | 5,805,000 | | KB Home, Guaranteed Note,
6.250%, 6/15/2015 | | | 4,498,875 |
| | 11,315,000 | | KB Home, Guaranteed Note,
7.250%, 6/15/2018 | | | 8,542,825 |
| | 23,885,000 | | Lennar Corp., Series A,
6.500%, 4/15/2016 | | | 17,197,200 |
| | 2,720,000 | | Lennar Corp., Series B,
5.125%, 10/01/2010 | | | 2,380,000 |
| | 16,755,000 | | Lennar Corp., Series B,
5.500%, 9/01/2014 | | | 12,063,600 |
| | 5,970,000 | | Lennar Corp., Series B,
5.600%, 5/31/2015 | | | 4,253,625 |
| | 4,240,000 | | Pulte Homes, Inc.,
5.200%, 2/15/2015 | | | 3,354,900 |
| | 46,260,000 | | Pulte Homes, Inc.,
6.000%, 2/15/2035 | | | 28,218,600 |
| | 13,190,000 | | Pulte Homes, Inc.,
6.375%, 5/15/2033 | | | 8,045,900 |
| | 4,245,000 | | Toll Brothers Financial Corp., 5.150%, 5/15/2015 | | | 3,580,649 |
| | 5,245,000 | | Toll Corp., 8.250%, 12/01/2011 | | | 5,087,650 |
| | | | | | |
| | | | | | 175,366,773 |
| | | | | | |
| | | Independent Energy — 1.7% | | | |
| | 34,690,000 | | Anadarko Petroleum Corp., 5.950%, 9/15/2016 | | | 29,877,803 |
| | 48,410,000 | | Anadarko Petroleum Corp., 6.450%, 9/15/2036 | | | 33,836,896 |
See accompanying notes to financial statements.
38
LOOMIS SAYLES STRATEGIC INCOME FUND — PORTFOLIOOF INVESTMENTS (continued)
Investments as of March 31, 2009 (Unaudited)
| | | | | |
Principal
Amount (‡) | | Description | | Value (†) |
| | | | | |
| | Independent Energy — continued | | | |
| 4,185,000 | | Chesapeake Energy Corp., 6.250%, 1/15/2017, (EUR) | | $ | 4,114,541 |
| 14,650,000 | | Chesapeake Energy Corp., 6.500%, 8/15/2017 | | | 11,939,750 |
| 22,690,000 | | Chesapeake Energy Corp., 6.875%, 11/15/2020 | | | 17,754,925 |
| 15,054,000 | | Connacher Oil and Gas Ltd., 144A, 10.250%, 12/15/2015 | | | 4,742,010 |
| 6,495,000 | | Hilcorp Energy I LP, 144A, 7.750%, 11/01/2015 | | | 4,741,350 |
| 7,175,000 | | Pioneer Natural Resources Co., 5.875%, 7/15/2016 | | | 5,294,296 |
| 1,760,000 | | Pioneer Natural Resources Co., 6.875%, 5/01/2018 | | | 1,293,621 |
| 4,798,000 | | Pioneer Natural Resources Co., 7.200%, 1/15/2028 | | | 2,942,945 |
| 9,170,000 | | Talisman Energy, Inc., 5.850%, 2/01/2037 | | | 6,188,961 |
| 24,260,000 | | Talisman Energy, Inc., 6.250%, 2/01/2038 | | | 17,113,683 |
| 8,885,000 | | XTO Energy, Inc., 6.750%, 8/01/2037 | | | 8,086,381 |
| | | | | |
| | | | | 147,927,162 |
| | | | | |
| | Industrial Other — 0.2% | | | |
| 2,590,000 | | Great Lakes Dredge & Dock Corp., Senior Subordinated Note, 7.750%, 12/15/2013 | | | 2,072,000 |
| 20,000,000 | | Ranhill Labuan Ltd., 144A, 12.500%, 10/26/2011 | | | 11,400,000 |
| | | | | |
| | | | | 13,472,000 |
| | | | | |
| | Local Authorities — 2.4% | | | |
| 79,755,000 | | New South Wales Treasury Corp., Series 10RG, 7.000%, 12/01/2010, (AUD) | | | 58,616,660 |
| 10,530,000 | | New South Wales Treasury Corp., Series 12RG, 6.000%, 5/01/2012, (AUD) | | | 7,700,495 |
| 66,305,000 | | New South Wales Treasury Corp., Series 17RG, 5.500%, 3/01/2017, (AUD) | | | 46,930,178 |
| 66,595,000 | | Queensland Treasury Corp., 144A, 7.125%, 9/18/2017, (NZD) | | | 41,183,024 |
| 131,890,000 | | Virginia Tobacco Settlement Financing Corp., Series A-1, 6.706%, 6/01/2046(d) | | | 64,943,955 |
| | | | | |
| | | | | 219,374,312 |
| | | | | |
| | Media Cable — 2.6% | | | |
| 49,030,000 | | Comcast Corp., 5.650%, 6/15/2035 | | | 38,826,906 |
| 12,560,000 | | Comcast Corp., 6.500%, 11/15/2035 | | | 11,093,833 |
| 161,264,000 | | Comcast Corp., 6.950%, 8/15/2037 | | | 150,170,972 |
| 400,000 | | CSC Holdings, Inc., 7.875%, 2/15/2018 | | | 366,000 |
| 10,000,000 | | Shaw Communications, Inc., 5.700%, 3/02/2017, (CAD) | | | 7,251,666 |
| 17,959,000 | | Time Warner Cable, Inc., 6.750%, 7/01/2018 | | | 16,858,185 |
| 2,720,000 | | Virgin Media Finance PLC, 9.125%, 8/15/2016 | | | 2,529,600 |
| | | | | | |
Principal
Amount (‡) | | Description | | Value (†) |
| | | | | | |
| | | Media Cable — continued | | | |
| $ | 5,070,000 | | Virgin Media Finance PLC, 9.750%, 4/15/2014, (GBP) | | $ | 6,438,100 |
| | | | | | |
| | | | | | 233,535,262 |
| | | | | | |
| | | Media Non-Cable — 0.6% | | | |
| | 14,215,000 | | Clear Channel Communications, Inc., 4.900%, 5/15/2015 | | | 1,990,100 |
| | 4,970,000 | | Clear Channel Communications, Inc., 5.500%, 9/15/2014 | | | 745,500 |
| | 14,910,000 | | Clear Channel Communications, Inc., 5.500%, 12/15/2016 | | | 2,087,400 |
| | 2,080,000 | | Clear Channel Communications, Inc., 5.750%, 1/15/2013 | | | 312,000 |
| | 585,000 | | Clear Channel Communications, Inc., 6.875%, 6/15/2018 | | | 84,825 |
| | 225,000 | | Intelsat Corp., 6.875%, 1/15/2028 | | | 153,000 |
| | 46,000,000 | | News America, Inc., 6.150%, 3/01/2037 | | | 33,539,152 |
| | 11,140,000 | | News America, Inc., 6.200%, 12/15/2034 | | | 8,013,659 |
| | 14,360,000 | | News America, Inc., 6.400%, 12/15/2035 | | | 10,638,477 |
| | 4,335,000 | | R.H. Donnelley Corp., Series A-1, 6.875%, 1/15/2013 | | | 184,238 |
| | 1,910,000 | | R.H. Donnelley Corp., Series A-2, 6.875%, 1/15/2013 | | | 81,175 |
| | 470,000 | | R.H. Donnelley Corp., Series A-3, 8.875%, 1/15/2016 | | | 27,025 |
| | 4,845,000 | | R.H. Donnelley Corp., Series A-4, 8.875%, 10/15/2017 | | | 254,362 |
| | | | | | |
| | | | | | 58,110,913 |
| | | | | | |
| | | Metals & Mining — 0.4% | | | |
| | 9,785,000 | | Algoma Acquistion Corp., 144A, 9.875%, 6/15/2015 | | | 3,767,225 |
| | 7,125,000 | | ArcelorMittal, 5.375%, 6/01/2013 | | | 5,530,496 |
| | 65,000 | | ArcelorMittal, 6.125%, 6/01/2018 | | | 47,024 |
| | 10,850,000 | | Ispat Inland ULC, 9.750%, 4/01/2014 | | | 9,873,500 |
| | 7,000,000 | | United States Steel Corp., 6.050%, 6/01/2017 | | | 4,331,075 |
| | 6,779,000 | | United States Steel Corp., 6.650%, 6/01/2037 | | | 3,819,831 |
| | 16,435,000 | | United States Steel Corp., 7.000%, 2/01/2018 | | | 11,215,507 |
| | | | | | |
| | | | | | 38,584,658 |
| | | | | | |
| | | Non-Captive Consumer — 2.7% | | | |
| | 4,900,000 | | American General Finance Corp., MTN, 5.750%, 9/15/2016 | | | 1,772,423 |
| | 229,130,000 | | American General Finance Corp., Series J, MTN, 6.900%, 12/15/2017 | | | 84,778,100 |
| | 109,950(†††) | | SLM Corp., 6.000%, 12/15/2043 | | | 1,010,165 |
| | 20,590,000 | | SLM Corp., MTN, 5.050%, 11/14/2014 | | | 10,899,358 |
See accompanying notes to financial statements.
39
LOOMIS SAYLES STRATEGIC INCOME FUND — PORTFOLIOOF INVESTMENTS (continued)
Investments as of March 31, 2009 (Unaudited)
| | | | | | |
Principal
Amount (‡) | | Description | | Value (†) |
| | | | | | |
| | | Non-Captive Consumer — continued | | | |
| $ | 1,450,000 | | SLM Corp., MTN, 5.125%, 8/27/2012 | | $ | 781,312 |
| | 4,700,000 | | SLM Corp., Series 7, EMTN, 4.750%, 3/17/2014, (EUR) | | | 3,028,544 |
| | 3,675,000 | | SLM Corp., Series A, MTN, 4.000%, 1/15/2010 | | | 3,101,171 |
| | 3,485,000 | | SLM Corp., Series A, MTN, 4.500%, 7/26/2010 | | | 2,613,750 |
| | 51,943,000 | | SLM Corp., Series A, MTN, 5.000%, 10/01/2013 | | | 27,621,625 |
| | 37,670,000 | | SLM Corp., Series A, MTN, 5.000%, 4/15/2015 | | | 16,951,500 |
| | 13,370,000 | | SLM Corp., Series A, MTN, 5.000%, 6/15/2018 | | | 6,921,649 |
| | 19,605,000 | | SLM Corp., Series A, MTN, 5.375%, 1/15/2013 | | | 10,757,597 |
| | 22,420,000 | | SLM Corp., Series A, MTN, 5.375%, 5/15/2014 | | | 11,617,999 |
| | 1,390,000 | | SLM Corp., Series A, MTN, 5.400%, 10/25/2011 | | | 861,800 |
| | 28,150,000 | | SLM Corp., Series A, MTN, 5.625%, 8/01/2033 | | | 10,415,500 |
| | 6,100,000 | | SLM Corp., Series A, MTN, 6.500%, 6/15/2010, (NZD)(d)(f) | | | 2,529,488 |
| | 88,180,000 | | SLM Corp., Series A, MTN, 8.450%, 6/15/2018 | | | 47,628,487 |
| | | | | | |
| | | | | | 243,290,468 |
| | | | | | |
| | | Non-Captive Diversified — 7.0% | | | |
| | 6,067,000 | | CIT Group Funding Co. of Canada, 5.200%, 6/01/2015 | | | 3,549,195 |
| | 90,000 | | CIT Group, Inc., 4.750%, 12/15/2010 | | | 72,579 |
| | 461,000 | | CIT Group, Inc., 5.400%, 2/13/2012 | | | 297,213 |
| | 365,000 | | CIT Group, Inc., 5.400%, 1/30/2016 | | | 218,768 |
| | 1,381,000 | | CIT Group, Inc., 5.600%, 4/27/2011 | | | 1,008,028 |
| | 3,581,000 | | CIT Group, Inc., 5.800%, 10/01/2036 | | | 1,972,379 |
| | 7,000 | | CIT Group, Inc., 5.850%, 9/15/2016 | | | 3,959 |
| | 132,159,000 | | CIT Group, Inc., 144A, 12.000%, 12/18/2018 | | | 68,392,282 |
| | 15,060,000 | | CIT Group, Inc., EMTN, 3.800%, 11/14/2012, (EUR) | | | 9,204,009 |
| | 15,150,000 | | CIT Group, Inc., EMTN, 4.650%, 9/19/2016, (EUR) | | | 8,453,882 |
| | 10,500,000 | | CIT Group, Inc., EMTN, 5.500%, 12/20/2016, (GBP) | | | 6,327,688 |
| | 60,000 | | CIT Group, Inc., GMTN, 4.250%, 2/01/2010 | | | 51,432 |
| | 18,360,000 | | CIT Group, Inc., GMTN, 4.250%, 9/22/2011, (EUR) | | | 14,635,857 |
| | 2,533,000 | | CIT Group, Inc., GMTN, 5.000%, 2/13/2014 | | | 1,494,470 |
| | 4,855,000 | | CIT Group, Inc., GMTN, 5.000%, 5/13/2014, (EUR) | | | 2,773,652 |
| | | | | | |
Principal
Amount (‡) | | Description | | Value (†) |
| | | | | | |
| | | Non-Captive Diversified — continued | | | |
| $ | 341,000 | | CIT Group, Inc., GMTN, 5.000%, 2/01/2015 | | $ | 207,618 |
| | 20,730,000 | | CIT Group, Inc., MTN, 4.250%, 3/17/2015, (EUR) | | | 13,220,101 |
| | 3,065,000 | | CIT Group, Inc., MTN, 5.125%, 9/30/2014 | | | 1,852,753 |
| | 20,350,000 | | CIT Group, Inc., MTN, 5.500%, 12/01/2014, (GBP) | | | 12,263,662 |
| | 934,000 | | CIT Group, Inc., Series A, GMTN, 6.000%, 4/01/2036 | | | 440,345 |
| | 724,000 | | CIT Group, Inc., Series A, MTN, 5.650%, 2/13/2017 | | | 419,286 |
| | 75,990,000 | | CIT Group, Inc., Series A, MTN, 7.625%, 11/30/2012 | | | 55,930,996 |
| | 3,100,000 | | General Electric Capital Corp., EMTN, 6.125%, 5/17/2012, (GBP) | | | 4,047,712 |
| | 79,035,000 | | General Electric Capital Corp., Series A, EMTN, 6.750%, 9/26/2016, (NZD)(d)(f) | | | 36,961,832 |
| | 65,300,000 | | General Electric Capital Corp., Series A, GMTN, 2.960%, 5/18/2012, (SGD) | | | 35,848,260 |
| | 30,350,000 | | General Electric Capital Corp., Series A, GMTN, 6.625%, 2/04/2010, (NZD) | | | 17,016,018 |
| | 115,000,000 | | General Electric Capital Corp., Series A, MTN, 3.485%, 3/08/2012, (SGD) | | | 64,866,744 |
| | 243,057,000 | | General Electric Capital Corp., Series A, MTN, 6.500%, 9/28/2015, (NZD)(d)(f) | | | 114,406,398 |
| | 7,187,000 | | GMAC LLC, 144A, 4.750%, 9/14/2009 | | | 6,120,234 |
| | 3,390,000 | | GMAC LLC, 144A, 5.750%, 9/27/2010 | | | 2,576,400 |
| | 34,490,000 | | GMAC LLC, 144A, 6.000%, 12/15/2011 | | | 23,481,137 |
| | 311,000 | | GMAC LLC, 144A, 6.625%, 12/17/2010 | | | 230,140 |
| | 15,206,000 | | GMAC LLC, 144A, 6.625%, 5/15/2012 | | | 10,200,641 |
| | 22,211,000 | | GMAC LLC, 144A, 6.750%, 12/01/2014 | | | 12,907,700 |
| | 4,169,000 | | GMAC LLC, 144A, 6.875%, 9/15/2011 | | | 2,962,575 |
| | 2,947,000 | | GMAC LLC, 144A, 6.875%, 8/28/2012 | | | 1,979,117 |
| | 7,702,000 | | GMAC LLC, 144A, 7.000%, 2/01/2012 | | | 5,319,925 |
| | 17,038,000 | | GMAC LLC, 144A, 7.500%, 12/31/2013 | | | 8,189,826 |
| | 32,711,000 | | GMAC LLC, 144A, 8.000%, 12/31/2018 | | | 9,496,330 |
| | 25,955,000 | | GMAC LLC, 144A, 8.000%, 11/01/2031 | | | 12,488,508 |
| | 34,782,000 | | iStar Financial, Inc., 5.150%, 3/01/2012 | | | 12,521,520 |
| | 5,255,000 | | iStar Financial, Inc., 5.375%, 4/15/2010 | | | 3,363,200 |
| | 3,010,000 | | iStar Financial, Inc., 5.500%, 6/15/2012 | | | 1,023,400 |
| | 19,110,000 | | iStar Financial, Inc., 5.650%, 9/15/2011 | | | 7,835,100 |
See accompanying notes to financial statements.
40
LOOMIS SAYLES STRATEGIC INCOME FUND — PORTFOLIOOF INVESTMENTS (continued)
Investments as of March 31, 2009 (Unaudited)
| | | | | | |
Principal
Amount (‡) | | Description | | Value (†) |
| | | | | | |
| | | Non-Captive Diversified — continued | | | |
| $ | 1,530,000 | | iStar Financial, Inc., 5.700%, 3/01/2014 | | $ | 443,700 |
| | 4,040,000 | | iStar Financial, Inc., 5.800%, 3/15/2011 | | | 1,727,100 |
| | 4,815,000 | | iStar Financial, Inc., 5.850%, 3/15/2017 | | | 1,396,350 |
| | 8,815,000 | | iStar Financial, Inc., 5.875%, 3/15/2016 | | | 2,556,350 |
| | 4,300,000 | | iStar Financial, Inc., 6.050%, 4/15/2015 | | | 1,247,000 |
| | 35,130,000 | | iStar Financial, Inc., 8.625%, 6/01/2013 | | | 10,978,125 |
| | 1,780,000 | | iStar Financial, Inc., Series B, 5.125%, 4/01/2011 | | | 734,250 |
| | 44,610,000 | | iStar Financial, Inc., Series B, 5.950%, 10/15/2013 | | | 13,606,050 |
| | | | | | |
| | | | | | 629,321,796 |
| | | | | | |
| | | Oil Field Services — 2.7% | | | |
| | 1,880,000 | | Nabors Industries, Inc., 6.150%, 2/15/2018 | | | 1,470,861 |
| | 126,385,000 | | Nabors Industries, Inc., 144A, 9.250%, 1/15/2019 | | | 119,841,796 |
| | 22,930,000 | | North American Energy Partners, Inc., 8.750%, 12/01/2011 | | | 16,738,900 |
| | 15,520,000 | | Weatherford International Ltd., 6.500%, 8/01/2036 | | | 10,925,568 |
| | 2,975,000 | | Weatherford International Ltd., 6.800%, 6/15/2037 | | | 2,110,209 |
| | 9,580,000 | | Weatherford International Ltd., 7.000%, 3/15/2038 | | | 6,964,861 |
| | 84,140,000 | | Weatherford International Ltd., 9.625%, 3/01/2019 | | | 87,027,096 |
| | | | | | |
| | | | | | 245,079,291 |
| | | | | | |
| | | Packaging — 0.4% | | | |
| | 2,450,000 | | OI European Group BV, 144A, 6.875%, 3/31/2017, (EUR) | | | 2,799,360 |
| | 1,750,000 | | Owens Brockway Glass Container, Inc., 6.750%, 12/01/2014, (EUR) | | | 2,092,545 |
| | 33,261,000 | | Owens-Illinois, Inc., Senior Note, 7.800%, 5/15/2018 | | | 32,263,170 |
| | | | | | |
| | | | | | 37,155,075 |
| | | | | | |
| | | Paper — 2.5% | | | |
| | 250,000 | | Abitibi-Consolidated, Inc., 6.000%, 6/20/2013 | | | 20,000 |
| | 8,125,000 | | Abitibi-Consolidated, Inc., 7.400%, 4/01/2018 | | | 731,250 |
| | 12,310,000 | | Abitibi-Consolidated, Inc., 7.500%, 4/01/2028 | | | 984,800 |
| | 2,960,000 | | Abitibi-Consolidated, Inc., 8.500%, 8/01/2029 | | | 236,800 |
| | 39,846,000 | | Abitibi-Consolidated, Inc., 8.850%, 8/01/2030 | | | 3,187,680 |
| | 750,000 | | Avenor, Inc., 10.850%, 11/30/2014, (CAD) | | | 53,537 |
| | 630,000 | | Bowater, Inc., 6.500%, 6/15/2013 | | | 50,400 |
| | | | | | |
Principal
Amount (‡) | | Description | | Value (†) |
| | | | | | |
| | | Paper — continued | | | |
| $ | 7,955,000 | | Domtar Corp., 5.375%, 12/01/2013 | | $ | 5,329,850 |
| | 11,720,000 | | Georgia-Pacific Corp., 7.250%, 6/01/2028 | | | 8,145,400 |
| | 11,605,000 | | Georgia-Pacific Corp., 7.375%, 12/01/2025 | | | 8,268,563 |
| | 120,000 | | Georgia-Pacific Corp., 7.700%, 6/15/2015 | | | 108,600 |
| | 42,425,000 | | Georgia-Pacific Corp., 7.750%, 11/15/2029 | | | 31,394,500 |
| | 15,555,000 | | Georgia-Pacific Corp., 8.000%, 1/15/2024 | | | 12,366,225 |
| | 18,378,000 | | Georgia-Pacific Corp., 8.875%, 5/15/2031 | | | 14,702,400 |
| | 149,788,000 | | International Paper Co., 7.950%, 6/15/2018 | | | 114,166,466 |
| | 3,995,000 | | Jefferson Smurfit Corp., 7.500%, 6/01/2013(c) | | | 464,419 |
| | 100,000 | | Smurfit-Stone Container Enterprises, Inc., 8.000%, 3/15/2017(c) | | | 11,625 |
| | 14,140,000 | | Westvaco Corp., 7.950%, 2/15/2031 | | | 10,809,394 |
| | 17,065,000 | | Westvaco Corp., 8.200%, 1/15/2030 | | | 13,453,380 |
| | | | | | |
| | | | | | 224,485,289 |
| | | | | | |
| | | Pharmaceuticals — 1.1% | | | |
| | 20,522,000 | | Astrazeneca PLC, 6.450%, 9/15/2037 | | | 21,287,101 |
| | 41,300,000 | | Elan Finance PLC, 8.875%, 12/01/2013 | | | 33,040,000 |
| | 50,820,000 | | Elan Finance PLC, Senior Note, 7.750%, 11/15/2011 | | | 42,688,800 |
| | | | | | |
| | | | | | 97,015,901 |
| | | | | | |
| | | Pipelines — 2.2% | | | |
| | 766,000 | | Colorado Interstate Gas Co., 5.950%, 3/15/2015 | | | 691,546 |
| | 340,000 | | Colorado Interstate Gas Co., 6.800%, 11/15/2015 | | | 318,714 |
| | 19,745,000 | | DCP Midstream LP, 144A, 6.450%, 11/03/2036 | | | 12,799,775 |
| | 15,685,000 | | El Paso Corp., 6.950%, 6/01/2028 | | | 10,816,658 |
| | 1,500,000 | | El Paso Corp., 7.420%, 2/15/2037 | | | 1,043,784 |
| | 750,000 | | El Paso Corp., GMTN, 7.800%, 8/01/2031 | | | 560,401 |
| | 1,000,000 | | El Paso Energy Corp., GMTN,
7.750%, 1/15/2032 | | | 745,037 |
| | 5,255,000 | | Energy Transfer Partners LP,
6.125%, 2/15/2017 | | | 4,688,532 |
| | 9,115,000 | | Energy Transfer Partners LP,
6.625%, 10/15/2036 | | | 6,777,750 |
| | 13,175,000 | | Enterprise Products Operating LLP,
6.300%, 9/15/2017 | | | 12,143,701 |
| | 500,000 | | Kinder Morgan Energy Partners LP,
5.800%, 3/15/2035 | | | 370,971 |
See accompanying notes to financial statements.
41
LOOMIS SAYLES STRATEGIC INCOME FUND — PORTFOLIOOF INVESTMENTS (continued)
Investments as of March 31, 2009 (Unaudited)
| | | | | | |
Principal
Amount (‡) | | Description | | Value (†) |
| | | | | | |
| | | Pipelines — continued | | | |
| $ | 4,663,000 | | Kinder Morgan Finance Co. ULC, Guaranteed Note,
5.700%, 1/05/2016 | | $ | 3,916,920 |
| | 10,498,000 | | Kinder Morgan, Inc., Senior Note,
5.150%, 3/01/2015 | | | 8,818,320 |
| | 81,710,000 | | NGPL Pipeco LLC, 144A,
7.119%, 12/15/2017 | | | 74,920,308 |
| | 3,425,000 | | ONEOK Partners LP,
6.650%, 10/01/2036 | | | 2,563,749 |
| | 20,770,000 | | Plains All American Pipeline LP,
6.125%, 1/15/2017 | | | 17,647,355 |
| | 44,730,000 | | Plains All American Pipeline LP,
6.650%, 1/15/2037 | | | 32,420,483 |
| | 5,272,000 | | Tennessee Gas Pipeline Co.,
7.000%, 10/15/2028 | | | 4,484,664 |
| | 600,000 | | Williams Cos., Inc.,
7.875%, 9/01/2021 | | | 555,000 |
| | 965,000 | | Williams Cos., Inc., Senior Note,
7.750%, 6/15/2031 | | | 781,650 |
| | 4,030,000 | | Williams Cos., Inc., Series A,
7.500%, 1/15/2031 | | | 3,183,700 |
| | | | | | |
| | | | | | 200,249,018 |
| | | | | | |
| | | Property & Casualty Insurance — 0.8% | | | |
| | 4,785,000 | | Allstate Corp.,
5.950%, 4/01/2036 | | | 3,461,995 |
| | 2,660,000 | | Marsh & McLennan Cos., Inc.,
5.375%, 7/15/2014 | | | 2,345,511 |
| | 11,710,000 | | Marsh & McLennan Cos., Inc.,
5.750%, 9/15/2015 | | | 10,440,718 |
| | 9,075,000 | | Marsh & McLennan Cos., Inc.,
5.875%, 8/01/2033 | | | 6,022,261 |
| | 2,000,000 | | Marsh & McLennan Cos., Inc.,
9.250%, 4/15/2019 | | | 2,038,816 |
| | 6,080,000 | | MBIA Insurance Corp., (fixed rate to 1/15/2013, variable rate thereafter), 144A,
14.000%, 1/15/2033 | | | 1,884,800 |
| | 4,000,000 | | Travelers Cos., Inc. (The),
6.750%, 6/20/2036 | | | 3,862,328 |
| | 31,135,000 | | Travelers Cos., Inc. (The), MTN,
6.250%, 6/15/2037 | | | 28,487,529 |
| | 1,000,000 | | Travelers Property Casualty Corp.,
6.375%, 3/15/2033 | | | 932,275 |
| | 11,205,000 | | Willis North America, Inc.,
6.200%, 3/28/2017 | | | 7,853,864 |
| | | | | | |
| | | | | | 67,330,097 |
| | | | | | |
| | | Railroads — 0.5% | | | |
| | 2,700,000 | | Canadian Pacific Railway Co.,
5.750%, 3/15/2033 | | | 1,920,002 |
| | 16,410,000 | | Canadian Pacific Railway Co.,
5.950%, 5/15/2037 | | | 11,451,555 |
| | 5,000,000 | | CSX Corp.,
6.250%, 3/15/2018 | | | 4,307,300 |
| | 32,889,000 | | CSX Corp., MTN,
6.000%, 10/01/2036 | | | 23,099,721 |
| | 1,153,000 | | Missouri Pacific Railroad Co.,
5.000%, 1/01/2045(d) | | | 634,150 |
| | | | | | |
| | | | | | 41,412,728 |
| | | | | | |
| | | | | | |
Principal
Amount (‡) | | Description | | Value (†) |
| | | | | | |
| | | Refining — 0.0% | | | |
| $ | 1,335,000 | | Valero Energy Corp.,
6.625%, 6/15/2037 | | $ | 943,684 |
| | | | | | |
| | | REITs — 0.7% | | | |
| | 27,950,000 | | Camden Property Trust,
5.700%, 5/15/2017 | | | 20,519,213 |
| | 2,935,000 | | Colonial Realty LP,
6.050%, 9/01/2016 | | | 1,780,588 |
| | 4,030,000 | | Duke Realty LP,
5.950%, 2/15/2017 | | | 2,410,109 |
| | 3,300,000 | | ERP Operating LP,
5.125%, 3/15/2016 | | | 2,603,895 |
| | 47,305,000 | | Highwoods Properties, Inc.,
5.850%, 3/15/2017 | | | 29,252,229 |
| | 2,935,000 | | ProLogis,
5.625%, 11/15/2015 | | | 1,584,900 |
| | 1,000,000 | | ProLogis,
5.625%, 11/15/2016 | | | 499,802 |
| | 1,535,000 | | ProLogis,
5.750%, 4/01/2016 | | | 843,573 |
| | 1,500,000 | | Simon Property Group LP,
5.250%, 12/01/2016 | | | 1,117,295 |
| | 125,000 | | Simon Property Group LP,
5.750%, 5/01/2012 | | | 108,124 |
| | 4,900,000 | | Simon Property Group LP,
5.750%, 12/01/2015 | | | 3,783,118 |
| | 550,000 | | Simon Property Group LP,
5.875%, 3/01/2017 | | | 424,247 |
| | 450,000 | | Simon Property Group LP,
6.125%, 5/30/2018 | | | 353,737 |
| | | | | | |
| | | | | | 65,280,830 |
| | | | | | |
| | | Restaurants — 0.0% | | | |
| | 1,250,000 | | McDonald’s Corp., EMTN,
3.628%, 10/10/2010, (SGD) | | | 840,980 |
| | | | | | |
| | | Retailers — 4.1% | | | |
| | 8,758,000 | | Dillard’s, Inc., 6.625%, 1/15/2018 | | | 3,152,880 |
| | 4,187,000 | | Dillard’s, Inc.,
7.130%, 8/01/2018 | | | 1,465,450 |
| | 1,500,000 | | Dillard’s, Inc.,
7.750%, 7/15/2026 | | | 495,000 |
| | 425,000 | | Dillard’s, Inc.,
7.875%, 1/01/2023 | | | 140,250 |
| | 3,325,000 | | Dillard’s, Inc., Class A,
7.000%, 12/01/2028 | | | 1,130,500 |
| | 1,588,000 | | Home Depot, Inc.,
5.400%, 3/01/2016 | | | 1,427,455 |
| | 122,775,000 | | Home Depot, Inc.,
5.875%, 12/16/2036 | | | 86,946,922 |
| | 3,685,000 | | J.C. Penney Corp., Inc.,
5.750%, 2/15/2018 | | | 2,591,487 |
| | 635,000 | | J.C. Penney Corp., Inc., 7.125%, 11/15/2023 | | | 443,517 |
| | 3,330,000 | | J.C. Penney Corp., Inc., 7.400%, 4/01/2037 | | | 2,114,837 |
| | 3,985,000 | | J.C. Penney Corp., Inc., 7.625%, 3/01/2097 | | | 2,527,331 |
| | 72,470,000 | | J.C. Penney Corp., Inc., Senior Note, 6.375%, 10/15/2036 | | | 45,305,200 |
See accompanying notes to financial statements.
42
LOOMIS SAYLES STRATEGIC INCOME FUND — PORTFOLIOOF INVESTMENTS (continued)
Investments as of March 31, 2009 (Unaudited)
| | | | | | |
Principal
Amount (‡) | | Description | | Value (†) |
| | | | | | |
| | | Retailers — continued | | | |
| $ | 1,095,000 | | Lowe’s Cos., Inc., 5.500%, 10/15/2035 | | $ | 961,111 |
| | 40,440,000 | | Lowe’s Cos., Inc., 6.650%, 9/15/2037 | | | 39,778,927 |
| | 19,146,000 | | Macy’s Retail Holdings, Inc., 6.375%, 3/15/2037 | | | 10,662,044 |
| | 12,275,000 | | Macy’s Retail Holdings, Inc., 6.790%, 7/15/2027 | | | 6,276,600 |
| | 2,365,000 | | Macy’s Retail Holdings, Inc., 6.900%, 4/01/2029 | | | 1,193,062 |
| | 6,365,000 | | Marks & Spencer PLC, 144A, 7.125%, 12/01/2037 | | | 3,720,419 |
| | 7,793,000 | | Target Corp., 6.500%, 10/15/2037 | | | 6,905,603 |
| | 134,773,000 | | Target Corp., 7.000%, 1/15/2038 | | | 126,246,047 |
| | 32,675,000 | | Toys R Us, Inc., 7.375%, 10/15/2018 | | | 10,456,000 |
| | 8,355,000 | | Toys R Us, Inc., 7.875%, 4/15/2013 | | | 2,934,694 |
| | 10,270,000 | | Woolworth Corp., 8.500%, 1/15/2022 | | | 8,267,350 |
| | | | | | |
| | | | | | 365,142,686 |
| | | | | | |
| | | Sovereigns — 2.5% | | | |
| | 104,626,000,000 | | Indonesia Treasury Bond, Series FR43, 10.250%, 7/15/2022, (IDR) | | | 7,541,638 |
| | 10,000,000,000 | | Indonesia Treasury Bond, Series FR47, 10.000%, 2/15/2028, (IDR) | | | 671,714 |
| | 272,460,000,000 | | Indonesia Treasury Bond, Series ZC3, Zero Coupon, 11/20/2012, (IDR) | | | 16,068,208 |
| | 9,922,000 | | Republic of Brazil, 8.250%, 1/20/2034 | | | 11,013,420 |
| | 4,705,000 | | Republic of Brazil, 8.875%, 4/15/2024 | | | 5,422,512 |
| | 56,700,000 | | Republic of Brazil, 10.250%, 1/10/2028, (BRL) | | | 22,364,694 |
| | 140,235,000 | | Republic of Brazil, 12.500%, 1/05/2016, (BRL) | | | 63,475,267 |
| | 107,840,000 | | Republic of Brazil, 12.500%, 1/05/2022, (BRL) | | | 48,579,718 |
| | 3,240,000,000 | | Republic of Iceland, Zero Coupon, 4/15/2009, (ISK) | | | 15,699,755 |
| | 2,981,242,000 | | Republic of Iceland, 7.000%, 3/17/2010, (ISK) | | | 14,200,892 |
| | 1,398,590,000 | | Republic of Iceland, 8.500%, 6/12/2009, (ISK) | | | 6,747,344 |
| | 1,877,910,000 | | Republic of Iceland, 13.750%, 12/10/2010, (ISK) | | | 9,683,603 |
| | | | | | |
| | | | | | 221,468,765 |
| | | | | | |
| | | Supermarkets — 1.0% | | | |
| | 2,000,000 | | American Stores Co., 7.900%, 5/01/2017 | | | 1,815,000 |
| | 72,681,000 | | New Albertson’s, Inc., 7.450%, 8/01/2029 | | | 60,325,230 |
| | 19,060,000 | | New Albertson’s, Inc., 7.750%, 6/15/2026 | | | 15,962,750 |
| | 4,895,000 | | New Albertson’s, Inc., 8.000%, 5/01/2031 | | | 4,001,663 |
| | | | | | |
Principal
Amount (‡) | | Description | | Value (†) |
| | | | | | |
| | | Supermarkets — continued | | | |
| $ | 1,510,000 | | New Albertson’s, Inc., 8.700%, 5/01/2030 | | $ | 1,291,050 |
| | 13,242,000 | | New Albertson’s, Inc., Series C, MTN, 6.625%, 6/01/2028 | | | 9,732,870 |
| | | | | | |
| | | | | | 93,128,563 |
| | | | | | |
| | | Supranational — 2.8% | | | |
| | 175,000,000 | | Eurofima, EMTN, 11.000%, 2/05/2010, (ISK) | | | 874,778 |
| | 128,250,000 | | European Investment Bank, Zero Coupon, 3/10/2021, (AUD) | | | 45,940,098 |
| | 16,375,000 | | European Investment Bank, 11.250%, 2/14/2013, (BRL) | | | 7,327,896 |
| | 413,529,000,000 | | European Investment Bank, EMTN, 144A, Zero Coupon, 4/24/2013, (IDR) | | | 17,772,263 |
| | 134,330,000 | | European Investment Bank, EMTN, 144A, 4.600%, 1/30/2037, (CAD) | | | 97,831,405 |
| | 11,330,000 | | European Investment Bank, EMTN, 7.000%, 1/18/2012, (NZD) | | | 6,822,654 |
| | 80,000,000 | | Inter-American Development Bank, EMTN, Zero Coupon, 5/11/2009, (BRL) | | | 33,969,178 |
| | 244,840,000,000 | | Inter-American Development Bank, EMTN, Zero Coupon, 5/20/2013, (IDR) | | | 12,308,746 |
| | 24,450,000 | | Inter-American Development Bank, EMTN, 6.000%, 12/15/2017, (NZD) | | | 13,791,219 |
| | 8,300,000 | | International Bank for Reconstruction & Development, 1.430%, 3/05/2014, (SGD) | | | 5,331,329 |
| | 1,385,900,000 | | International Bank for Reconstruction & Development, 9.500%, 5/27/2010, (ISK) | | | 6,807,406 |
| | 62,300,000 | | Nordic Investment Bank, EMTN, 11.250%, 4/16/2009, (ISK) | | | 304,027 |
| | | | | | |
| | | | | | 249,080,999 |
| | | | | | |
| | | Technology — 2.5% | | | |
| | 1,730,000 | | Affiliated Computer Services, Inc., 5.200%, 6/01/2015 | | | 1,422,925 |
| | 41,705,000 | | Agilent Technologies, Inc., 6.500%, 11/01/2017 | | | 34,174,120 |
| | 832,000 | | Alcatel-Lucent, EMTN, 6.375%, 4/07/2014, (EUR) | | | 635,602 |
| | 10,650,000 | | Amkor Technology, Inc., 7.750%, 5/15/2013 | | | 8,573,250 |
| | 1,225,000 | | Amkor Technology, Inc., 9.250%, 6/01/2016 | | | 943,250 |
| | 6,950,000 | | Amkor Technology, Inc., Senior Note, 7.125%, 3/15/2011 | | | 6,437,437 |
| | 2,435,000 | | Arrow Electronics, Inc., 6.875%, 6/01/2018 | | | 2,159,334 |
| | 30,125,000 | | Avnet, Inc., 5.875%, 3/15/2014 | | | 25,910,241 |
| | 35,630,000 | | Avnet, Inc., 6.000%, 9/01/2015 | | | 29,318,181 |
| | 11,345,000 | | Avnet, Inc., 6.625%, 9/15/2016 | | | 9,449,421 |
| | 6,225,000 | | Corning, Inc., 5.900%, 3/15/2014 | | | 5,823,961 |
| | 6,220,000 | | Corning, Inc., 6.200%, 3/15/2016 | | | 5,563,417 |
| | 6,150,000 | | Corning, Inc., 6.850%, 3/01/2029 | | | 4,642,414 |
See accompanying notes to financial statements.
43
LOOMIS SAYLES STRATEGIC INCOME FUND — PORTFOLIOOF INVESTMENTS (continued)
Investments as of March 31, 2009 (Unaudited)
| | | | | | |
Principal
Amount (‡) | | Description | | Value (†) |
| | | | | | |
| | | Technology — continued | | | |
| $ | 4,725,000 | | Corning, Inc., 7.250%, 8/15/2036 | | $ | 3,559,754 |
| | 14,385,000 | | Equifax, Inc., 7.000%, 7/01/2037 | | | 10,217,320 |
| | 29,605,000 | | Freescale Semiconductor, Inc., 10.125%, 12/15/2016 | | | 5,328,900 |
| | 41,104,000 | | Lucent Technologies, Inc., 6.450%, 3/15/2029 | | | 15,619,520 |
| | 2,840,000 | | Lucent Technologies, Inc., 6.500%, 1/15/2028 | | | 1,079,200 |
| | 9,739,000 | | Motorola, Inc., 5.220%, 10/01/2097 | | | 3,919,655 |
| | 9,345,000 | | Motorola, Inc., 6.500%, 9/01/2025 | | | 5,934,103 |
| | 17,028,000 | | Motorola, Inc., 6.500%, 11/15/2028 | | | 10,727,640 |
| | 18,715,000 | | Motorola, Inc., 6.625%, 11/15/2037 | | | 11,837,237 |
| | 9,365,000 | | Nortel Networks Capital Corp., 7.875%, 6/15/2026(c) | | | 1,498,400 |
| | 11,770,000 | | Nortel Networks Ltd., 6.875%, 9/01/2023(c) | | | 765,050 |
| | 25,890,000 | | Nortel Networks Ltd., 10.125%, 7/15/2013(c) | | | 4,854,375 |
| | 285,000 | | Samsung Electronics Co. Ltd., 144A, 7.700%, 10/01/2027 | | | 272,853 |
| | 18,050,000 | | Xerox Capital Trust I, 8.000%, 2/01/2027 | | | 12,712,073 |
| | 1,730,000 | | Xerox Corp., MTN, 7.200%, 4/01/2016 | | | 1,332,100 |
| | | | | | |
| | | | | | 224,711,733 |
| | | | | | |
| | | Textile — 0.0% | | | |
| | 7,515,000 | | Kellwood Co., 7.625%, 10/15/2017(d) | | | 338,175 |
| | | | | | |
| | | Tobacco — 2.1% | | | |
| | 63,335,000 | | Altria Group, Inc., 8.500%, 11/10/2013 | | | 68,689,974 |
| | 63,135,000 | | Altria Group, Inc., 9.250%, 8/06/2019 | | | 67,503,563 |
| | 52,930,000 | | Reynolds American, Inc., 6.750%, 6/15/2017 | | | 45,185,971 |
| | 13,400,000 | | Reynolds American, Inc., 7.250%, 6/15/2037 | | | 9,784,278 |
| | | | | | |
| | | | | | 191,163,786 |
| | | | | | |
| | | Transportation Services — 0.5% | | | |
| | 10,503,000 | | APL Ltd., Senior Note, 8.000%, 1/15/2024(d) | | | 7,379,093 |
| | 17,574,841 | | Atlas Air, Inc., Series 1998-1, Class 1B, 7.680%, 1/02/2014(g) | | | 13,181,131 |
| | 9,128,302 | | Atlas Air, Inc., Series 1999-1, Class A1, 7.200%, 7/02/2020 | | | 6,572,378 |
| | 306,955 | | Atlas Air, Inc., Series 1999-1, Class A2, 6.880%, 1/02/2011 | | | 236,355 |
| | 12,740,207 | | Atlas Air, Inc., Series 1999-1, Class B, 7.630%, 7/02/2016(g) | | | 8,535,939 |
| | 4,744,556 | | Atlas Air, Inc., Series 1999-1, Class C, 8.770%, 7/02/2012(g) | | | 2,229,941 |
| | | | | | |
Principal
Amount (‡) | | Description | | Value (†) |
| | | | | | |
| | | Transportation Services — continued | | | |
| $ | 5,323,737 | | Atlas Air, Inc., Series 2000-1, Class B, 9.057%, 7/02/2017(g) | | $ | 5,217,262 |
| | 6,862,758 | | Atlas Air, Inc., Series C, 8.010%, 1/02/2010(g) | | | 2,950,986 |
| | | | | | |
| | | | | | 46,303,085 |
| | | | | | |
| | | Treasuries — 8.5% | | | |
| | 130,000,000 | | Canadian Government, 2.750%, 12/01/2010, (CAD) | | | 106,173,541 |
| | 28,000,000 | | Canadian Government, 3.750%, 6/01/2012, (CAD) | | | 23,851,967 |
| | 171,980,000 | | Canadian Government, 3.750%, 6/01/2019, (CAD) | | | 148,233,174 |
| | 25,445,000 | | Canadian Government, 4.250%, 6/01/2018, (CAD) | | | 22,743,083 |
| | 21,565,000 | | Canadian Government, 4.250%, 9/01/2009, (CAD) | | | 17,369,335 |
| | 62,140,000 | | Canadian Government, 5.250%, 6/01/2012, (CAD) | | | 55,222,686 |
| | 4,125,000(††) | | Mexican Fixed Rate Bonds, Series M-10, 9.000%, 12/20/2012, (MXN) | | | 31,124,603 |
| | 18,686,981(††) | | Mexican Fixed Rate Bonds, Series M-20, 8.000%, 12/07/2023, (MXN) | | | 130,992,241 |
| | 22,670,000 | | New Zealand Government Bond, 6.000%, 12/15/2017, (NZD) | | | 13,589,237 |
| | 457,420,000 | | Norwegian Government, 4.250%, 5/19/2017, (NOK) | | | 71,149,495 |
| | 221,050,000 | | Norwegian Government, 5.000%, 5/15/2015, (NOK) | | | 36,009,684 |
| | 366,200,000 | | Norwegian Government, 6.000%, 5/16/2011, (NOK) | | | 58,811,005 |
| | 262,545,000 | | Norwegian Government, 6.500%, 5/15/2013, (NOK) | | | 44,678,516 |
| | | | | | |
| | | | | | 759,948,567 |
| | | | | | |
| | | Wireless — 1.9% | | | |
| | 8,524,000 | | ALLTEL Corp., 6.800%, 5/01/2029 | | | 7,851,303 |
| | 58,210,000 | | ALLTEL Corp., Senior Note, 7.875%, 7/01/2032 | | | 59,166,973 |
| | 29,340,000 | | Nextel Communications, Inc., Series D, 7.375%, 8/01/2015 | | | 15,550,200 |
| | 15,386,000 | | Nextel Communications, Inc., Series E, 6.875%, 10/31/2013 | | | 8,770,020 |
| | 38,855,000 | | Nextel Communications, Inc., Series F, 5.950%, 3/15/2014 | | | 21,564,525 |
| | 2,085,000 | | Rogers Wireless, Inc., 7.625%, 12/15/2011, (CAD) | | | 1,734,413 |
| | 2,525,000 | | Rogers Wireless, Inc., Senior Secured Note, 6.375%, 3/01/2014 | | | 2,556,257 |
| | 20,886,000 | | Sprint Capital Corp., 6.875%, 11/15/2028 | | | 12,740,460 |
| | 18,070,000 | | Sprint Capital Corp., 6.900%, 5/01/2019 | | | 12,739,350 |
| | 6,260,000 | | Sprint Capital Corp., 8.750%, 3/15/2032 | | | 4,194,200 |
| | 11,309,000 | | Sprint Nextel Corp., 6.000%, 12/01/2016 | | | 8,085,935 |
| | 28,355,000 | | True Move Co. Ltd., 144A, 10.750%, 12/16/2013 | | | 13,349,534 |
See accompanying notes to financial statements.
44
LOOMIS SAYLES STRATEGIC INCOME FUND — PORTFOLIOOF INVESTMENTS (continued)
Investments as of March 31, 2009 (Unaudited)
| | | | | | |
Principal
Amount (‡) | | Description | | Value (†) |
| | | | | | |
| | | Wireless — continued | | | |
| $ | 1,285,000 | | Vodafone Group PLC, 6.150%, 2/27/2037 | | $ | 1,211,598 |
| | | | | | |
| | | | | | 169,514,768 |
| | | | | | |
| | | Wirelines — 6.2% | | | |
| | 10,245,000 | | AT&T Corp., 6.500%, 3/15/2029 | | | 8,982,652 |
| | 8,500,000 | | AT&T, Inc., 6.150%, 9/15/2034 | | | 7,447,054 |
| | 125,100,000 | | AT&T, Inc., 6.500%, 9/01/2037 | | | 112,892,992 |
| | 7,605,000 | | AT&T, Inc., 6.700%, 11/15/2013 | | | 8,122,551 |
| | 4,370,000 | | Bell Canada, 144A, 6.550%, 5/01/2029, (CAD) | | | 2,896,442 |
| | 5,925,000 | | Bell Canada, MTN, 5.000%, 2/15/2017, (CAD) | | | 4,307,468 |
| | 8,445,000 | | Bell Canada, MTN, 7.300%, 2/23/2032, (CAD) | | | 6,055,778 |
| | 33,640,000 | | Bell Canada, Series M-17, 6.100%, 3/16/2035, (CAD) | | | 21,082,899 |
| | 860,000 | | BellSouth Corp., 6.550%, 6/15/2034 | | | 798,116 |
| | 2,715,000 | | BellSouth Telecommunications, Inc., 7.000%, 12/01/2095 | | | 2,142,474 |
| | 425,000 | | Cincinnati Bell, Inc., 8.375%, 1/15/2014 | | | 399,500 |
| | 5,330,000 | | Embarq Corp., 7.995%, 6/01/2036 | | | 3,997,500 |
| | 35,260,000 | | Frontier Communications Corp., 7.875%, 1/15/2027 | | | 23,800,500 |
| | 10,555,000 | | GTE Corp., 6.940%, 4/15/2028 | | | 9,451,390 |
| | 525,000 | | Hawaiian Telcom Communications, Inc., Series B, 12.500%, 5/01/2015(c) | | | 2,625 |
| | 8,098,000 | | Koninklijke (Royal) KPN NV, 8.375%, 10/01/2030 | | | 8,390,249 |
| | 1,120,000 | | Koninklijke (Royal) KPN NV, EMTN, 5.750%, 3/18/2016, (GBP) | | | 1,615,019 |
| | 1,800,000 | | Koninklijke (Royal) KPN NV, GMTN, 4.000%, 6/22/2015, (EUR) | | | 2,226,683 |
| | 32,435,000 | | Level 3 Financing, Inc., 8.750%, 2/15/2017 | | | 20,758,400 |
| | 13,010,000 | | Level 3 Financing, Inc., 9.250%, 11/01/2014 | | | 8,976,900 |
| | 3,346,000 | | New England Telephone & Telegraph Co., 7.875%, 11/15/2029 | | | 3,122,256 |
| | 16,335,000 | | Qwest Capital Funding, Inc., 6.500%, 11/15/2018 | | | 11,107,800 |
| | 32,155,000 | | Qwest Capital Funding, Inc., 7.750%, 2/15/2031 | | | 21,222,300 |
| | 42,460,000 | | Qwest Capital Funding, Inc., Guaranteed Note, 6.875%, 7/15/2028 | | | 26,749,800 |
| | 10,675,000 | | Qwest Capital Funding, Inc., Guaranteed Note, 7.625%, 8/03/2021 | | | 7,579,250 |
| | 33,130,000 | | Qwest Corp., 6.875%, 9/15/2033 | | | 21,700,150 |
| | 1,290,000 | | Qwest Corp., 7.200%, 11/10/2026 | | | 877,200 |
| | | | | | |
Principal
Amount (‡) | | Description | | Value (†) |
| | | | | | |
| | | Wirelines — continued | | | |
| $ | 3,689,000 | | Qwest Corp., 7.250%, 9/15/2025 | | $ | 2,434,740 |
| | 2,598,000 | | Qwest Corp., 7.500%, 6/15/2023 | | | 1,961,490 |
| | 5,470,000 | | SK Broadband Co. Ltd., 144A, 7.000%, 2/01/2012 | | | 4,895,650 |
| | 1,430,000 | | Telecom Italia Capital SA, 5.250%, 11/15/2013 | | | 1,284,191 |
| | 1,575,000 | | Telecom Italia Capital SA, 5.250%, 10/01/2015 | | | 1,327,968 |
| | 23,000,000 | | Telecom Italia Capital SA, 6.000%, 9/30/2034 | | | 15,691,842 |
| | 19,635,000 | | Telecom Italia Capital SA, 6.375%, 11/15/2033 | | | 14,306,179 |
| | 89,917,000 | | Telefonica Emisiones SAU, Guaranteed Note, 7.045%, 6/20/2036 | | | 92,392,235 |
| | 31,690,000 | | Telus Corp., 4.950%, 3/15/2017, (CAD) | | | 23,341,967 |
| | 41,882,000 | | Verizon Global Funding Corp., Senior Note, 5.850%, 9/15/2035 | | | 35,583,617 |
| | 6,230,000 | | Verizon Maryland, Inc., Series B, 5.125%, 6/15/2033 | | | 4,315,758 |
| | 12,050,000 | | Verizon New York, Inc., Series A, 7.375%, 4/01/2032 | | | 11,180,424 |
| | | | | | |
| | | | | | 555,422,009 |
| | | | | | |
| | | Total Non-Convertible Bonds
(Identified Cost $10,195,917,819) | | | 7,627,677,953 |
| | | | | | |
| | Convertible Bonds — 3.3% | | | |
| | | Healthcare — 0.3% | | | |
| | 26,280,000 | | Affymetrix, Inc., 3.500%, 1/15/2038 | | | 13,797,000 |
| | 5,111,000 | | EPIX Pharmaceuticals, Inc., Senior Note, 3.000%, 6/15/2024(d)(f) | | | 1,022,200 |
| | 12,005,000 | | Life Technologies Corp., 1.500%, 2/15/2024 | | | 10,699,456 |
| | | | | | |
| | | | | | 25,518,656 |
| | | | | | |
| | | Industrial Other — 0.2% | | | |
| | 30,860,000 | | Incyte Corp., 3.500%, 2/15/2011 | | | 15,275,700 |
| | | | | | |
| | | Lodging — 0.2% | | | |
| | 22,413,000 | | Host Hotels & Resorts, Inc., 144A, 2.625%, 4/15/2027 | | | 15,577,035 |
| | | | | | |
| | | Media Cable — 0.0% | | | |
| | 2,540,000 | | CSC Holdings, Inc., 144A, 8.500%, 4/15/2014 | | | 2,501,900 |
| | | | | | |
| | | Media Non-Cable — 0.1% | | | |
| | 7,790,466 | | Liberty Media LLC, 3.500%, 1/15/2031 | | | 2,785,091 |
| | 7,716,000 | | Sinclair Broadcast Group, Inc., (Step to 2.000% on 1/15/2011), 4.875%, 7/15/2018(e) | | | 3,240,720 |
| | | | | | |
| | | | | | 6,025,811 |
| | | | | | |
| | | Non-Captive Diversified — 0.1% | | | |
| | 44,035,000 | | iStar Financial, Inc., 1.935%, 10/01/2012(b) | | | 13,210,500 |
| | | | | | |
See accompanying notes to financial statements.
45
LOOMIS SAYLES STRATEGIC INCOME FUND — PORTFOLIOOF INVESTMENTS (continued)
Investments as of March 31, 2009 (Unaudited)
| | | | | | |
Principal
Amount (‡) | | Description | | Value (†) |
| | | | | | |
| | | Pharmaceuticals — 1.0% | | | |
| $ | 635,000 | | Human Genome Sciences, Inc., 2.250%, 10/15/2011 | | $ | 233,363 |
| | 37,690,000 | | Human Genome Sciences, Inc., 2.250%, 8/15/2012 | | | 12,531,925 |
| | 24,081,000 | | Nektar Therapeutics, 3.250%, 9/28/2012 | | | 15,592,448 |
| | 22,735,000 | | Valeant Pharmaceuticals International, Subordinated Note, 3.000%, 8/16/2010 | | | 21,768,762 |
| | 28,222,000 | | Valeant Pharmaceuticals International, Subordinated Note, 4.000%, 11/15/2013 | | | 24,976,470 |
| | 11,035,000 | | Vertex Pharmaceuticals, Inc., 4.750%, 2/15/2013 | | | 14,497,231 |
| | | | | | |
| | | | | | 89,600,199 |
| | | | | | |
| | | Technology — 0.1% | | | |
| | 9,077,000 | | Kulicke & Soffa Industries, Inc., 0.875%, 6/01/2012 | | | 4,300,229 |
| | 3,880,000 | | Kulicke & Soffa Industries, Inc., 1.000%, 6/30/2010 | | | 3,060,350 |
| | 3,730,000 | | Maxtor Corp., Subordinated Note, 5.750%, 3/01/2012(d) | | | 2,797,500 |
| | 745,000 | | Nortel Networks Corp., 1.750%, 4/15/2012(c) | | | 106,163 |
| | 30,767,000 | | Nortel Networks Corp., 2.125%, 4/15/2014(c) | | | 4,384,297 |
| | 311,000 | | Richardson Electronics Ltd., 7.750%, 12/15/2011 | | | 248,800 |
| | | | | | |
| | | | | | 14,897,339 |
| | | | | | |
| | | Textile — 0.0% | | | |
| | 121,000 | | Dixie Group, Inc., Subordinated Note, 7.000%, 5/15/2012 | | | 109,354 |
| | | | | | |
| | | Wireless — 0.1% | | | |
| | 625,000 | | Nextel Communications, Inc., Senior Note, 5.250%, 1/15/2010 | | | 602,344 |
| | 15,695,000 | | NII Holdings, Inc., 3.125%, 6/15/2012 | | | 10,908,025 |
| | | | | | |
| | | | | | 11,510,369 |
| | | | | | |
| | | Wirelines — 1.2% | | | |
| | 35,110,000 | | Level 3 Communications, Inc., 2.875%, 7/15/2010 | | | 25,674,187 |
| | 33,440,000 | | Level 3 Communications, Inc., 3.500%, 6/15/2012 | | | 13,877,600 |
| | 12,604,000 | | Level 3 Communications, Inc., 5.250%, 12/15/2011 | | | 6,428,040 |
| | 28,648,000 | | Level 3 Communications, Inc., 6.000%, 9/15/2009 | | | 27,645,320 |
| | 35,920,000 | | Level 3 Communications, Inc., 6.000%, 3/15/2010 | | | 30,532,000 |
| | 2,470,000 | | Level 3 Communications, Inc., 10.000%, 5/01/2011 | | | 1,602,413 |
| | 1,000,000 | | Qwest Communications International, Inc., 3.500%, 11/15/2025 | | | 922,500 |
| | | | | | |
| | | | | | 106,682,060 |
| | | | | | |
| | | Total Convertible Bonds (Identified Cost $452,136,328) | | | 300,908,923 |
| | | | | | |
| | | | | | |
Principal
Amount (‡) | | Description | | Value (†) |
| | | | | | |
| | Municipals — 1.1% | | | |
| | | Alabama — 0.0% | | | |
| $ | 3,270,000 | | Alabama Public School & College Authority
(Capital Improvement), 4.500%, 12/01/2026 | | $ | 3,153,882 |
| | | | | | |
| | | California — 0.5% | | | |
| | 3,435,000 | | San Diego Unified School District (Election 1998), Series F-1, (FSA insured), 4.500%, 7/01/2029 | | | 3,103,213 |
| | 1,530,000 | | San Jose California Redevelopment Agency Tax Allocation (Merged Area Redevelopment), Series C, (MBIA insured), 3.750%, 8/01/2028 | | | 1,091,471 |
| | 4,170,000 | | San Jose California Redevelopment Agency Tax Allocation (Merged Area), Series C, (MBIA insured), 3.750%, 8/01/2028 | | | 2,854,740 |
| | 5,175,000 | | State of California, (AMBAC insured), 4.500%, 8/01/2027 | | | 4,391,971 |
| | 14,415,000 | | State of California, 4.500%, 10/01/2029 | | | 11,948,594 |
| | 4,190,000 | | State of California, (AMBAC insured), 4.500%, 8/01/2030 | | | 3,442,756 |
| | 3,620,000 | | State of California, 4.500%, 8/01/2030 | | | 2,974,409 |
| | 2,680,000 | | State of California (Various Purpose), (MBIA insured), 3.250%, 12/01/2027 | | | 1,795,332 |
| | 12,645,000 | | State of California (Various Purpose), (AMBAC insured), 4.500%, 12/01/2033 | | | 10,055,051 |
| | 895,000 | | University of California Regents Medical Center,
Series A, (MBIA insured), 4.750%, 5/15/2031 | | | 796,783 |
| | | | | | |
| | | | | | 42,454,320 |
| | | | | | |
| | | District of Columbia — 0.0% | | | |
| | 3,270,000 | | District of Columbia, Series A, (FGIC insured), 4.750%, 6/01/2036 | | | 2,919,096 |
| | | | | | |
| | | Florida — 0.1% | | | |
| | 3,270,000 | | Florida State Turnpike Authority (Department of Transportation), Series A, (MBIA insured), 3.500%, 7/01/2027 | | | 2,516,952 |
| | 5,185,000 | | Jacksonville Electric Authority, Florida Water & Sewer Systems Revenue, (MBIA insured), 4.750%, 10/01/2041 | | | 4,505,246 |
| | | | | | |
| | | | | | 7,022,198 |
| | | | | | |
| | | Illinois — 0.1% | | | |
| | 5,650,000 | | Chicago Board of Education, Series B, (FSA insured), 4.750%, 12/01/2031 | | | 5,117,826 |
| | 1,725,000 | | Chicago O’Hare International Airport, Series A, (FSA insured), 4.500%, 1/01/2038 | | | 1,506,236 |
| | | | | | |
| | | | | | 6,624,062 |
| | | | | | |
| | | Louisiana — 0.0% | | | |
| | 3,270,000 | | State of Louisiana, Series C, (FSA insured), 3.250%, 5/01/2026 | | | 2,330,889 |
| | | | | | |
| | | Massachusetts — 0.0% | | | |
| | 3,275,000 | | Massachusetts School Building
Authority, Series A, (AMBAC insured),
4.750%, 8/15/2032 | | | 3,064,188 |
| | | | | | |
See accompanying notes to financial statements.
46
LOOMIS SAYLES STRATEGIC INCOME FUND — PORTFOLIOOF INVESTMENTS (continued)
Investments as of March 31, 2009 (Unaudited)
| | | | | | |
Principal
Amount (‡) | | Description | | Value (†) |
| | | | | | |
| | | Michigan — 0.1% | | | |
| $ | 1,975,000 | | Grosse Pointe Public School System, (FGIC insured),
3.000%, 5/01/2027 | | $ | 1,456,286 |
| | 13,095,000 | | Michigan Tobacco Settlement Finance
Authority, Taxable Turbo Series A,
7.309%, 6/01/2034(d) | | | 7,644,206 |
| | | | | | |
| | | | | | 9,100,492 |
| | | | | | |
| | | Nebraska — 0.1% | | | |
| | 8,175,000 | | Omaha Public Power District, Series AA, (FGIC insured),
4.500%, 2/01/2034 | | | 7,331,177 |
| | | | | | |
| | | Texas — 0.1% | | | |
| | 9,320,000 | | County of Harris TX, Series B,
4.500%, 10/01/2031 | | | 8,641,597 |
| | | | | | |
| | | Wisconsin — 0.1% | | | |
| | 2,235,000 | | Green Bay Wisconsin Water System Revenue, (FSA insured),
3.500%, 11/01/2026 | | | 1,839,696 |
| | 2,410,000 | | Green Bay Wisconsin Water System Revenue, (FSA insured),
3.500%, 11/01/2029 | | | 1,862,978 |
| | 835,000 | | Wisconsin Housing & Economic Development Authority,
Series E,
4.900%, 11/01/2035 | | | 753,596 |
| | | | | | |
| | | | | | 4,456,270 |
| | | | | | |
| | | Total Municipals (Identified Cost $107,632,254) | | | 97,098,171 |
| | | | | | |
| | | Total Bonds and Notes (Identified Cost $10,755,686,401) | | | 8,025,685,047 |
| | | | | | |
| | Bank Loans — 0.9% | | | |
| | | Automotive — 0.2% | | | |
| | 110,873,581 | | Chrysler LLC, First Lien Term Loan,
5.260%, 8/03/2013(h) | | | 17,093,380 |
| | | | | | |
| | | Consumer Products — 0.0% | | | |
| | 5,953,728 | | Mega Brands, Inc., Term Loan B,
8.750%, 7/26/2012(h) | | | 1,617,449 |
| | | | | | |
| | | Food & Beverage — 0.0% | | | |
| | 361,942 | | Dole Food Co., Inc., Credit Link Deposit,
2.790%, 4/12/2013(h) | | | 332,762 |
| | 517,059 | | Dole Food Co., Inc., Tranche B Term Loan,
7.960%, 4/12/2013(h) | | | 475,374 |
| | 2,338,605 | | Dole Food Co., Inc., Tranche C Term Loan,
7.969%, 4/12/2013(h) | | | 2,150,066 |
| | | | | | |
| | | | | | 2,958,202 |
| | | | | | |
| | | Media Non-Cable — 0.2% | | | |
| | 31,027,629 | | Idearc, Inc., Term Loan B,
6.250%, 11/17/2014(c)(h) | | | 12,091,157 |
| | 2,797,946 | | Tribune Co., Term Loan X,
5.000%, 6/04/2009(c)(h) | | | 730,096 |
| | | | | | |
| | | | | | 12,821,253 |
| | | | | | |
| | | Oil Field Services — 0.0% | | | |
| | 2,485,000 | | Dresser, Inc., Second Lien Term Loan,
6.988%, 5/04/2015(h) | | | 969,150 |
| | 1,230,373 | | Dresser, Inc., Term Loan,
3.456%, 5/04/2014(h) | | | 904,324 |
| | | | | | |
| | | | | | 1,873,474 |
| | | | | | |
| | | Paper — 0.1% | | | |
| | 4,748,522 | | Georgia-Pacific Corp., New Term Loan B,
3.258%, 12/20/2012(h) | | | 4,199,878 |
| | | | | | |
Principal
Amount (‡) | | Description | | Value (†) |
| | | | | | |
| | | Paper — continued | | | |
| $ | 1,824,340 | | Georgia-Pacific Corp., Term Loan B1,
2.982%, 12/20/2012(h) | | $ | 1,613,555 |
| | | | | | |
| | | | | | 5,813,433 |
| | | | | | |
| | | Retailers — 0.0% | | | |
| | 1,627,348 | | Harbor Freight Tools USA, Inc., Tranche C Term Loan,
9.581%, 2/12/2013(h) | | | 1,151,349 |
| | | | | | |
| | | Technology — 0.3% | | | |
| | 11,804,341 | | Nuance Communications, Inc., Incremental Term Loan,
2.520%, 3/29/2013(h) | | | 10,299,288 |
| | 515,405 | | Nuance Communications, Inc., Term Loan,
2.520%, 3/31/2013(h) | | | 449,691 |
| | 12,498,036 | | Sungard Data Systems, Inc., Term Loan B,
2.697%, 2/28/2014(h) | | | 10,528,845 |
| | | | | | |
| | | | | | 21,277,824 |
| | | | | | |
| | | Wirelines — 0.1% | | | |
| | 16,754,207 | | Hawaiian Telcom Communications, Inc.,
Tranche C Term Loan,
4.750%, 6/01/2014(h)(i) | | | 7,489,131 |
| | 5,395,000 | | Level 3 Financing, Inc., New Term Loan, 3.309%, 3/13/2014(h) | | | 4,049,649 |
| | | | | | |
| | | | | | 11,538,780 |
| | | | | | |
| | | Total Bank Loans (Identified Cost $163,716,507) | | | 76,145,144 |
| | | | | | |
| | |
| Shares | | | | |
| | Common Stocks — 3.0% |
| | | Biotechnology — 0.1% | | | |
| | 359,449 | | Vertex Pharmaceuticals, Inc.(g) | | | 10,326,970 |
| | | | | | |
| | | Communications Equipment — 0.0% | | | |
| | 41,343 | | Corning, Inc. | | | 548,621 |
| | | | | | |
| | | Containers & Packaging — 0.1% | | | |
| | 460,656 | | Owens-Illinois, Inc.(g) | | | 6,651,873 |
| | | | | | |
| | | Electric Utilities — 0.1% | | | |
| | 282,500 | | Duke Energy Corp. | | | 4,045,400 |
| | | | | | |
| | | Food Products — 0.4% | | | |
| | 2,309,175 | | ConAgra Foods, Inc. | | | 38,955,782 |
| | | | | | |
| | | Household Durables — 0.1% | | | |
| | 477,725 | | KB Home | | | 6,296,415 |
| | 549,450 | | Lennar Corp., Class A | | | 4,126,370 |
| | | | | | |
| | | | | | 10,422,785 |
| | | | | | |
| | | Oil, Gas & Consumable Fuels — 0.2% | | | |
| | 846,398 | | Chesapeake Energy Corp. | | | 14,439,550 |
| | 141,249 | | Spectra Energy Corp. | | | 1,997,261 |
| | | | | | |
| | | | | | 16,436,811 |
| | | | | | |
| | | Pharmaceuticals — 1.8% | | | |
| | 7,238,800 | | Bristol-Myers Squibb Co. | | | 158,674,496 |
| | 2,288 | | Teva Pharmaceutical Industries Ltd., Sponsored ADR | | | 103,074 |
| | | | | | |
| | | | | | 158,777,570 |
| | | | | | |
| | | REITs — 0.2% | | | |
| | 290,904 | | Apartment Investment & Management Co., Class A | | | 1,594,154 |
| | 889,730 | | Associated Estates Realty Corp. | | | 5,053,666 |
| | 182,500 | | Developers Diversified Realty Corp. | | | 388,725 |
| | 460,000 | | Equity Residential | | | 8,441,000 |
| | 120,484 | | Simon Property Group, Inc. | | | 4,173,566 |
| | | | | | |
| | | | | | 19,651,111 |
| | | | | | |
See accompanying notes to financial statements.
47
LOOMIS SAYLES STRATEGIC INCOME FUND — PORTFOLIOOF INVESTMENTS (continued)
Investments as of March 31, 2009 (Unaudited)
| | | | | |
Shares | | Description | | Value (†) |
| | | | | |
| | Thrifts & Mortgage Finance — 0.0% | | | |
| 4,794,025 | | Federal Home Loan Mortgage Corp.(g)(j) | | $ | 3,643,459 |
| | | | | |
| | Total Common Stocks (Identified Cost $433,542,961) | | | 269,460,382 |
| | | | | |
| Preferred Stocks — 1.0% |
| Convertible Preferred Stocks — 0.7% |
| | Automotive — 0.1% | | | |
| 1,458,359 | | Ford Motor Co. Capital Trust II, 6.500% | | | 11,710,623 |
| 79,502 | | General Motors Corp., 6.250% | | | 201,935 |
| | | | | |
| | | | | 11,912,558 |
| | | | | |
| | Capital Markets — 0.0% | | | |
| 28,950 | | Lehman Brothers Holdings, Inc., 7.250%(c)$ | | | 21,423 |
| 145,155 | | Newell Financial Trust I, 5.250% | | | 2,612,790 |
| | | | | |
| | | | | 2,634,213 |
| | | | | |
| | Commercial Banks — 0.0% | | | |
| 5,933 | | Wells Fargo & Co., Series L, Class A, 7.500% | | | 2,841,848 |
| | | | | |
| | Diversified Consumer Services — 0.0% | | | |
| 79,986 | | Six Flags, Inc., 7.250% | | | 54,390 |
| | | | | |
| | Diversified Financial Services — 0.2% | | | |
| 16,622 | | Bank of America Corp., 7.250% | | | 6,773,465 |
| 5,000 | | CIT Group, Inc., 8.750% | | | 91,000 |
| 129,508 | | Sovereign Capital Trust IV, 4.375% | | | 2,557,783 |
| | | | | |
| | | | | 9,422,248 |
| | | | | |
| | Electric Utilities — 0.2% | | | |
| 380,577 | | AES Trust III, 6.750% | | | 12,939,618 |
| 107,725 | | CMS Energy Trust I, 7.750%(d)(f) | | | 3,231,750 |
| | | | | |
| | | | | 16,171,368 |
| | | | | |
| | Machinery — 0.0% | | | |
| 171,240 | | United Rentals Trust I, 6.500% | | | 1,883,640 |
| | | | | |
| | Oil, Gas & Consumable Fuels — 0.1% | | | |
| 52,020 | | Chesapeake Energy Corp., 4.500% | | | 3,199,230 |
| 158,777 | | El Paso Energy Capital Trust I, 4.750% | | | 3,969,425 |
| | | | | |
| | | | | 7,168,655 |
| | | | | |
| | REITs — 0.0% | | | |
| 42,700 | | FelCor Lodging Trust, Inc., Series A, 7.800% | | | 160,125 |
| | | | | |
| | Semiconductors & Semiconductor Equipment — 0.1% | | | |
| 32,320 | | Lucent Technologies Capital Trust I, 7.750% | | | 9,374,367 |
| | | | | |
| | Total Convertible Preferred Stocks
(Identified Cost $171,354,391) | | | 61,623,412 |
| | | | | |
| Non-Convertible Preferred Stocks — 0.3% |
| | Capital Markets — 0.0% | | | |
| 39,450 | | Lehman Brothers Holdings Capital Trust V, 6.000%(c) | | | 789 |
| 73,204 | | Lehman Brothers Holdings, Inc., 5.670%(c) | | | 439 |
| 77,610 | | Lehman Brothers Holdings, Inc., 5.940%(c) | | | 78 |
| 340,116 | | Lehman Brothers Holdings, Inc., 6.500%(c) | | | 850 |
| 357,592 | | Lehman Brothers Holdings, Inc., 7.950%(c) | | | 1,967 |
| | | | | |
| | | | | 4,123 |
| | | | | |
| | Diversified Financial Services — 0.1% | | | |
| 35,000 | | Bank of America Corp., 6.375% | | | 285,250 |
| 552,770 | | CIT Group, Inc., 6.350% | | | 3,515,617 |
| 36,916 | | Preferred Blocker, Inc. 144A, 7.000% | | | 7,349,747 |
| | | | | |
| | | | | 11,150,614 |
| | | | | |
| | | | | |
Shares | | Description | | Value (†) |
| | | | | |
| | Electric Utilities — 0.0% | | | |
| 393 | | Entergy New Orleans, Inc., 4.750% | | $ | 27,203 |
| | | | | |
| | Thrifts & Mortgage Finance — 0.2% | | | |
| 389,800 | | Countrywide Capital IV, 6.750% | | | 3,726,488 |
| 75,100 | | Federal Home Loan Mortgage Corp., 5.000%(g)(j) | | | 67,590 |
| 1,741,500 | | Federal Home Loan Mortgage Corp., 5.570%(g)(j) | | | 661,770 |
| 444,350 | | Federal Home Loan Mortgage Corp., 5.660%(g)(j) | | | 177,740 |
| 120,695 | | Federal Home Loan Mortgage Corp., 5.700%(g)(j) | | | 100,177 |
| 283,000 | | Federal Home Loan Mortgage Corp., 5.790%(g)(j) | | | 217,910 |
| 81,450 | | Federal Home Loan Mortgage Corp., 5.810%(g)(j) | | | 63,531 |
| 219,750 | | Federal Home Loan Mortgage Corp., 5.900%(g)(j) | | | 101,085 |
| 96,600 | | Federal Home Loan Mortgage Corp., 6.000%(g)(j) | | | 85,974 |
| 89,300 | | Federal Home Loan Mortgage Corp., 6.420%(g)(j) | | | 71,440 |
| 392,116 | | Federal Home Loan Mortgage Corp., 6.550%(g)(j) | | | 160,768 |
| 3,856,103 | | Federal Home Loan Mortgage Corp., 8.375%(g)(j) | | | 1,773,807 |
| 192,100 | | Federal National Mortgage Association, 4.750%(g)(j) | | | 140,233 |
| 144,900 | | Federal National Mortgage Association, 5.125%(g)(j) | | | 99,981 |
| 104,850 | | Federal National Mortgage Association, 5.375%(g)(j) | | | 149,935 |
| 56,600 | | Federal National Mortgage Association, 5.810%(g)(j) | | | 65,090 |
| 87,300 | | Federal National Mortgage Association, 6.750%(g)(j) | | | 43,650 |
| 6,747,525 | | Federal National Mortgage Association, 8.250%(g)(j) | | | 4,790,743 |
| 250,000 | | Federal National Mortgage Association, 8.250%(g)(j) | | | 175,000 |
| | | | | |
| | | | | 12,672,912 |
| | | | | |
| | Total Non-Convertible Preferred Stocks (Identified Cost $326,610,515) | | | 23,854,852 |
| | | | | |
| | Total Preferred Stocks (Identified Cost $497,964,906) | | | 85,478,264 |
| | | | | |
| Closed-End Investment Companies — 0.2% | | | |
| 191,930 | | BlackRock Senior High Income Fund, Inc. | | | 441,439 |
| 1,033,275 | | Dreyfus High Yield Strategies | | | 2,531,524 |
| 177,910 | | DWS High Income Trust | | | 523,055 |
| 860,000 | | Highland Credit Strategies Fund | | | 3,990,400 |
| 110,211 | | Morgan Stanley Emerging Markets Debt Fund, Inc. | | | 784,702 |
| 141,612 | | Van Kampen High Income Trust II | | | 269,063 |
| 2,055,800 | | Western Asset High Income Opportunity Fund, Inc. | | | 8,552,128 |
| 1,217,820 | | Western Asset Managed High Income Fund, Inc. | | | 5,151,379 |
| | | | | |
| | Total Closed-End Investment Companies (Identified Cost $40,372,613) | | | 22,243,690 |
| | | | | |
See accompanying notes to financial statements.
48
LOOMIS SAYLES STRATEGIC INCOME FUND — PORTFOLIOOF INVESTMENTS (continued)
Investments as of March 31, 2009 (Unaudited)
| | | | | | | |
Principal
Amount (‡) | | Description | | Value (†) | |
| | | | | | | |
| | Short-Term Investments — 3.1% | | | | |
| $ | 130,242 | | Repurchase Agreement with State Street Corp., dated 3/31/2009 at 0.000% to be repurchased at $130,242 on 4/01/2009, collateralized by $135,000 U.S. Treasury Bill, due 5/28/2009 valued at $130,242, including accrued interest (Note 2g of Notes to Financial Statements) | | $ | 130,242 | |
| | 279,846,483 | | Tri-Party Repurchase Agreement with Fixed Income Clearing Corporation, dated 3/31/2009 at 0.000% to be repurchased at $279,846,483 on 4/01/2009, collateralized by $260,640,000 Federal Home Loan Mortgage Corp., 2.680% 11/16/2009 valued at $265,852,800; $2,390,000 Federal Home Loan Bank Discount Note, due 11/17/2009 valued at $2,381,038; $3,165,000 Federal Home Loan Mortgage Corp., 6.875% due 9/15/2010 valued at $3,430,069; $4,740,000 Federal Home Loan Bank Discount Note, due 11/16/2009 valued at $4,728,150; $4,880,000 Federal National Mortgage Association, 6.625% due 11/15/2030 valued at $6,472,100; $2,530,000 Federal National Mortgage Association, 4.500% due 4/29/2013 valued at $2,583,763, including accrued interest (Note 2g of Notes to Financial Statements) | | | 279,846,483 | |
| | | | | | | |
| | | Total Short-Term Investments (Identified Cost $279,976,725) | | | 279,976,725 | |
| | | | | | | |
| | | | | | | |
| | | Total Investments — 97.6% (Identified Cost $12,171,260,113)(a) | | | 8,758,989,252 | |
| | | Other assets less liabilities—2.4% | | | 217,391,616 | |
| | | | | | | |
| | | Net Assets — 100.0% | | $ | 8,976,380,868 | |
| | | | | | | |
| | | | | | | |
| | (‡) | | Principal amount stated in U.S. dollars unless otherwise noted. | |
| | (†) | | See Note 2a of Notes to Financial Statements. | |
| | (††) | | Amount shown represents units. One unit represents a principal amount of 100. | |
| | (†††) | | Amount shown represents units. One unit represents a principal amount of 25. | |
| | (a) | | Federal Tax Information (Amounts exclude certain adjustments made at the end of the Fund’s fiscal year for tax purposes. Such adjustments are primarily due to wash sales. Amortization of premium on debt securities is excluded for tax purposes.): At March 31, 2009, the net unrealized depreciation on investments based on a cost of $12,177,225,873 for federal income tax purposes was as follows: | |
| | | Aggregate gross unrealized appreciation for all investments in which there is an excess of value over tax cost | | $ | 70,666,072 | |
| | | Aggregate gross unrealized depreciation for all investments in which there is an excess of tax cost over value | | | (3,488,902,693 | ) |
| | | | | | | |
| | | Net unrealized depreciation | | $ | (3,418,236,621 | ) |
| | | | | | | |
| | | | | | | |
| | (b) | | Variable rate security. Rate as of March 31, 2009 is disclosed. | |
| | (c) | | Non-income producing security due to bankruptcy filing. | |
| | (d) | | Illiquid security. At March 31, 2009, the value of these securities amounted to $321,414,858 or 3.6% of net assets. | |
| | (e) | | Step Bond: Coupon rate is a fixed rate for an initial period then resets at a specified date and rate. | |
| | (f) | | Valued by management. At March 31, 2009 the value of these securities amounted to $158,151,668 or 1.8% of net assets. | |
| | (g) | | Non-income producing security. | |
| | (h) | | Variable rate security. Rate shown represents the weighted average rate at March 31, 2009. | |
| | (i) | | All or a portion of interest payment is paid in-kind. | |
| | (j) | | Future dividend payments have been eliminated as the issuer has been placed in conservatorship. | |
| | | | | | | |
| | | | |
| | | | |
| 144A | | Securities exempt from registration under Rule 144A of the Securities Act of 1933. These securities may be resold in transactions exempt from registration, normally to qualified institutional buyers. At March 31, 2009, the value of these securities amounted to $1,026,010,966 or 11.4% of net assets. |
| ADR | | An American Depositary Receipt is a certificate issued by a custodian bank representing the right to receive securities of the foreign issuer described. The values of ADRs are significantly influenced by trading on exchanges not located in the United States. |
| | | | |
| ABS | | Asset-Backed Securities |
| AMBAC | | American Municipal Bond Assurance Corp. |
| EMTN | | Euro Medium Term Note |
| FGIC | | Financial Guarantee Insurance Company |
| FSA | | Financial Security Assurance, Inc. |
| GMTN | | Global Medium Term Note |
| MBIA | | Municipal Bond Investors Assurance Corp. |
| MTN | | Medium Term Note |
| REITs | | Real Estate Investment Trusts |
| | | | |
| AUD | | Australian Dollar |
| BRL | | Brazilian Real |
| CAD | | Canadian Dollar |
| EUR | | Euro |
| GBP | | British Pound |
| IDR | | Indonesian Rupiah |
| ISK | | Icelandic Krona |
| KRW | | South Korean Won |
| MXN | | Mexican Peso |
| NOK | | Norwegian Krone |
| NZD | | New Zealand Dollar |
| SGD | | Singapore Dollar |
| THB | | Thai Baht |
Net Asset Summary at March 31, 2009 (Unaudited)
| | | |
| Treasuries | | 8.5 | % |
| Wirelines | | 7.5 | |
| Non-Captive Diversified | | 7.1 | |
| Healthcare | | 4.5 | |
| Banking | | 4.3 | |
| Electric | | 4.2 | |
| Retailers | | 4.1 | |
| Pharmaceuticals | | 3.9 | |
| Technology | | 2.9 | |
| Supranational | | 2.8 | |
| Oil Field Services | | 2.7 | |
| Non-Captive Consumer | | 2.7 | |
| Media Cable | | 2.6 | |
| Paper | | 2.6 | |
| Sovereigns | | 2.5 | |
| Automotive | | 2.5 | |
| Local Authorities | | 2.4 | |
| Pipelines | | 2.2 | |
| Tobacco | | 2.1 | |
| Wireless | | 2.0 | |
| Home Construction | | 2.0 | |
| Other Investments, less than 2% each | | 18.4 | |
| Short-Term Investments | | 3.1 | |
| | | |
| Total Investments | | 97.6 | |
| Other assets less liabilities | | 2.4 | |
| | | |
| Net Assets | | 100.0 | % |
| | | |
See accompanying notes to financial statements.
49
LOOMIS SAYLES STRATEGIC INCOME FUND — PORTFOLIOOF INVESTMENTS (continued)
Investments as of March 31, 2009 (Unaudited)
Currency Exposure at March 31, 2009 as a Percentage of Net Assets (Unaudited)
| | | |
| United States Dollar | | 74.3 | % |
| Canadian Dollar | | 6.0 | |
| New Zealand Dollar | | 2.7 | |
| Brazilian Real | | 2.6 | |
| Norwegian Krone | | 2.3 | |
| Other, less than 2% each | | 9.7 | |
| | | |
| Total Investments | | 97.6 | |
| Other assets less liabilities | | 2.4 | |
| | | |
| Net Assets | | 100.0 | % |
| | | |
See accompanying notes to financial statements.
50
STATEMENTSOF ASSETSAND LIABILITIES
March 31, 2009 (Unaudited)
| | | | | | | | | | | | |
| | | |
| | | Core Plus Bond Fund | | | High Income Fund | | | International
Bond Fund | |
| | | | | | | | | | | | |
ASSETS | | | | | | | | | | | | |
Investments at cost | | $ | 212,901,237 | | | $ | 64,033,404 | | | $ | 13,909,713 | |
Repurchase agreement(s) at cost | | | 1,583,349 | | | | 9,967,822 | | | | 144,855 | |
Net unrealized appreciation (depreciation) | | | (15,221,668 | ) | | | (15,761,791 | ) | | | (1,231,420 | ) |
| | | | | | | | | | | | |
Investments at value | | | 199,262,918 | | | | 58,239,435 | | | | 12,823,148 | |
Cash | | | 289,441 | | | | — | | | | 34,919 | |
Foreign currency at value (identified cost $0, $0, $71,926, $0 and $6,158,286) | | | — | | | | — | | | | 69,911 | |
Receivable for Fund shares sold | | | 620,976 | | | | 175,102 | | | | — | |
Receivable for securities sold | | | 7,307,612 | | | | 16,551 | | | | — | |
Receivable for foreign currency sold (identified cost $0, $0, $0, $0 and $1,816,327) | | | — | | | | — | | | | — | |
Receivable from investment advisor (Note 5) | | | 5,719 | | | | 12,805 | | | | 11,724 | |
Dividends and interest receivable | | | 2,673,567 | | | | 1,266,441 | | | | 220,084 | |
Unrealized appreciation on forward foreign currency contracts (Note 2) | | | — | | | | 6,715 | | | | 52,765 | |
Tax reclaims receivable | | | — | | | | 1,107 | | | | 800 | |
| | | | | | | | | | | | |
TOTAL ASSETS | | | 210,160,233 | | | | 59,718,156 | | | | 13,213,351 | |
| | | | | | | | | | | | |
LIABILITIES | | | | | | | | | | | | |
Payable for securities purchased | | | 7,582,257 | | | | 850,408 | | | | 34,919 | |
Payable for Fund shares redeemed | | | 427,587 | | | | 30,585 | | | | — | |
Unrealized depreciation on forward foreign currency contracts (Note 2) | | | — | | | | — | | | | 9,786 | |
Dividends payable | | | — | | | | — | | | | — | |
Management fees payable (Note 5) | | | 85,142 | | | | 30,898 | | | | 6,603 | |
Deferred Trustees’ fees (Note 5) | | | 218,570 | | | | 77,382 | | | | 11,037 | |
Administrative fees payable (Note 5) | | | 7,998 | | | | 2,294 | | | | 1,023 | |
Foreign taxes payable | | | — | | | | — | | | | — | |
Other accounts payable and accrued expenses | | | 92,209 | | | | 39,838 | | | | 16,344 | |
| | | | | | | | | | | | |
TOTAL LIABILITIES | | | 8,413,763 | | | | 1,031,405 | | | | 79,712 | |
| | | | | | | | | | | | |
NET ASSETS | | $ | 201,746,470 | | | $ | 58,686,751 | | | $ | 13,133,639 | |
| | | | | | | | | | | | |
NET ASSETS CONSIST OF: | | | | | | | | | | | | |
Paid-in capital | | $ | 235,409,851 | | | $ | 147,313,724 | | | $ | 14,719,424 | |
Undistributed net investment income/Distributions in excess of net investment income | | | (1,071,339 | ) | | | (199,183 | ) | | | 37,523 | |
Accumulated net realized loss on investments and foreign currency transactions | | | (17,372,178 | ) | | | (72,671,141 | ) | | | (432,326 | ) |
Net unrealized appreciation (depreciation) on investments and foreign currency translations | | | (15,219,864 | ) | | | (15,756,649 | ) | | | (1,190,982 | ) |
| | | | | | | | | | | | |
NET ASSETS | | $ | 201,746,470 | | | $ | 58,686,751 | | | $ | 13,133,639 | |
| | | | | | | | | | | | |
COMPUTATION OF NET ASSET VALUE AND OFFERING PRICE: | | | | | | | | | | | | |
Class A shares: | | | | | | | | | | | | |
Net assets | | $ | 124,039,686 | | | $ | 38,997,620 | | | $ | 2,595,446 | |
| | | | | | | | | | | | |
Shares of beneficial interest | | | 11,734,638 | | | | 11,087,456 | | | | 291,585 | |
| | | | | | | | | | | | |
Net asset value and redemption price per share | | $ | 10.57 | | | $ | 3.52 | | | $ | 8.90 | |
| | | | | | | | | | | | |
Offering price per share (100/[100-maximum sales charge] of net asset value) (Note 1) | | $ | 11.07 | | | $ | 3.69 | | | $ | 9.32 | |
| | | | | | | | | | | | |
Class B shares: (redemption price per share is equal to net asset value less any applicable contingent deferred sales charge) (Note 1) | | | | | | | | | | | | |
Net assets | | $ | 8,180,041 | | | $ | 1,459,687 | | | $ | — | |
| | | | | | | | | | | | |
Shares of beneficial interest | | | 771,577 | | | | 414,300 | | | | — | |
| | | | | | | | | | | | |
Net asset value and offering price per share | | $ | 10.60 | | | $ | 3.52 | | | $ | — | |
| | | | | | | | | | | | |
Class C shares: (redemption price per share is equal to net asset value less any applicable contingent deferred sales charge) (Note 1) | | | | | | | | | | | | |
Net assets | | $ | 52,710,003 | | | $ | 10,920,617 | | | $ | 920,897 | |
| | | | | | | | | | | | |
Shares of beneficial interest | | | 4,983,131 | | | | 3,099,696 | | | | 103,651 | |
| | | | | | | | | | | | |
Net asset value and offering price per share | | $ | 10.58 | | | $ | 3.52 | | | $ | 8.88 | |
| | | | | | | | | | | | |
Class Y shares: | | | | | | | | | | | | |
Net assets | | $ | 16,816,740 | | | $ | 7,308,827 | | | $ | 9,617,296 | |
| | | | | | | | | | | | |
Shares of beneficial interest | | | 1,582,788 | | | | 2,080,194 | | | | 1,082,278 | |
| | | | | | | | | | | | |
Net asset value, offering and redemption price per share | | $ | 10.62 | | | $ | 3.51 | | | $ | 8.89 | |
| | | | | | | | | | | | |
See accompanying notes to financial statements.
51
| | | | | | |
Limited Term
Government and
Agency Fund | | | Strategic
Income Fund | |
| | | | | | |
| | | | | | |
| $ | 210,878,463 | | | $ | 11,891,283,388 | |
| | 1,949,858 | | | | 279,976,725 | |
| | 2,735,988 | | | | (3,412,270,861 | ) |
| | | | | | | |
| | 215,564,309 | | | | 8,758,989,252 | |
| | — | | | | 23,607 | |
| | — | | | | 6,217,638 | |
| | 583,257 | | | | 40,739,109 | |
| | 29 | | | | 17,023,521 | |
| | — | | | | 1,017,985 | |
| | 13,403 | | | | — | |
| | 962,595 | | | | 183,611,942 | |
| | — | | | | — | |
| | — | | | | 17,443 | |
| | | | | | | |
| | 217,123,593 | | | | 9,007,640,497 | |
| | | | | | | |
| | | | | | |
| | — | | | | — | |
| | 500,397 | | | | 24,734,195 | |
| | — | | | | — | |
| | 206,628 | | | | — | |
| | 81,368 | | | | 4,198,174 | |
| | 204,064 | | | | 459,797 | |
| | 7,957 | | | | 338,541 | |
| | — | | | | 9,217 | |
| | 76,498 | | | | 1,519,705 | |
| | | | | | | |
| | 1,076,912 | | | | 31,259,629 | |
| | | | | | | |
| $ | 216,046,681 | | | $ | 8,976,380,868 | |
| | | | | | | |
| | | | | | |
| $ | 225,587,409 | | | $ | 12,683,735,746 | |
| | 110,374 | | | | 67,503,979 | |
| | (12,387,090 | ) | | | (362,339,741 | ) |
| | 2,735,988 | | | | (3,412,519,116 | ) |
| | | | | | | |
| $ | 216,046,681 | | | $ | 8,976,380,868 | |
| | | | | | | |
| | | | | | |
| | | | | | |
| $ | 140,427,106 | | | $ | 4,427,060,515 | |
| | | | | | | |
| | 12,498,344 | | | | 427,108,964 | |
| | | | | | | |
| $ | 11.24 | | | $ | 10.37 | |
| | | | | | | |
| $ | 11.59 | | | $ | 10.86 | |
| | | | | | | |
| | | | | | |
| | | | | | |
| $ | 4,667,165 | | | $ | 123,118,042 | |
| | | | | | | |
| | 415,820 | | | | 11,813,338 | |
| | | | | | | |
| $ | 11.22 | | | $ | 10.42 | |
| | | | | | | |
| | | | | | |
| | | | | | |
| $ | 59,970,032 | | | $ | 3,504,845,314 | |
| | | | | | | |
| | 5,333,550 | | | | 336,517,793 | |
| | | | | | | |
| $ | 11.24 | | | $ | 10.42 | |
| | | | | | | |
| | | | | | |
| $ | 10,982,378 | | | $ | 921,356,997 | |
| | | | | | | |
| | 974,455 | | | | 88,947,400 | |
| | | | | | | |
| $ | 11.27 | | | $ | 10.36 | |
| | | | | | | |
52
STATEMENTSOF OPERATIONS
For the Six Months Ended March 31, 2009 (Unaudited)
| | | | | | | | | | | | |
| | | |
| | | Core Plus Bond Fund | | | High Income Fund | | | International
Bond Fund | |
| | | | | | | | | | | | |
INVESTMENT INCOME | | | | | | | | | | | | |
Dividends | | $ | 5,336 | | | $ | 76,875 | | | $ | — | |
Interest | | | 5,913,148 | | | | 2,624,770 | | | | 270,678 | |
Securities lending income (Note 2) | | | 3,323 | | | | 648 | | | | — | |
Less net foreign taxes withheld | | | — | | | | — | | | | — | |
| | | | | | | | | | | | |
| | | 5,921,807 | | | | 2,702,293 | | | | 270,678 | |
| | | | | | | | | | | | |
Expenses | | | | | | | | | | | | |
Management fees (Note 5) | | | 410,254 | | | | 143,945 | | | | 37,680 | |
Service fees- Class A (Note 5) | | | 147,015 | | | | 41,309 | | | | 2,794 | |
Service and distribution fees - Class B (Note 5) | | | 44,745 | | | | 7,742 | | | | — | |
Service and distribution fees - Class C (Note 5) | | | 206,274 | | | | 48,335 | | | | 3,920 | |
Trustees’ fees and expenses (Note 5) | | | 6,342 | | | | 6,323 | | | | 4,804 | |
Administrative fees (Note 5) | | | 46,493 | | | | 12,027 | | | | 35,013 | |
Custodian fees and expenses | | | 12,821 | | | | 13,474 | | | | 12,945 | |
Transfer agent fees and expenses - Class A (Note 5) | | | 85,397 | | | | 23,888 | | | | 1,132 | |
Transfer agent fees and expenses - Class B (Note 5) | | | 6,526 | | | | 1,085 | | | | — | |
Transfer agent fees and expenses - Class C (Note 5) | | | 29,713 | | | | 7,011 | | | | 402 | |
Transfer agent fees and expenses - Class Y (Note 5) | | | 10,082 | | | | 2,324 | | | | 477 | |
Audit and tax services fees | | | 23,858 | | | | 24,088 | | | | 24,280 | |
Legal fees | | | 2,817 | | | | 1,026 | | | | 203 | |
Shareholder reporting expenses | | | 22,860 | | | | 8,600 | | | | 1,704 | |
Registration fees | | | 34,283 | | | | 40,310 | | | | 22,101 | |
Miscellaneous expenses (Note 5) | | | (16,950 | ) | | | (4,202 | ) | | | 1,764 | |
| | | | | | | | | | | | |
Total expenses | | | 1,072,530 | | | | 377,285 | | | | 149,219 | |
Less fee reduction and/or expense reimbursement (Note 5) | | | (71,407 | ) | | | (63,981 | ) | | | (89,126 | ) |
| | | | | | | | | | | | |
Net expenses | | | 1,001,123 | | | | 313,304 | | | | 60,093 | |
| | | | | | | | | | | | |
Net investment income | | | 4,920,684 | | | | 2,388,989 | | | | 210,585 | |
| | | | | | | | | | | | |
NET REALIZED AND UNREALIZED GAIN (LOSS) ON INVESTMENTS AND FOREIGN CURRENCY TRANSACTIONS | | | | | | | | | | | | |
Net realized gain (loss) on: | | | | | | | | | | | | |
Investments | | | 2,640,633 | | | | (2,418,277 | ) | | | (184,341 | ) |
Foreign currency transactions | | | 20,938 | | | | (9,486 | ) | | | (162,980 | ) |
Net change in unrealized appreciation (depreciation) on: | | | | | | | | | | | | |
Investments (including change in foreign capital gains tax accrual of $(300) for Strategic Income Fund) | | | (541,584 | ) | | | (6,528,403 | ) | | | (225,756 | ) |
Foreign currency translations | | | 1,733 | | | | 9,854 | | | | 87,506 | |
| | | | | | | | | | | | |
Net realized and unrealized gain (loss) on investments and foreign currency transactions | | | 2,121,720 | | | | (8,946,312 | ) | | | (485,571 | ) |
| | | | | | | | | | | | |
NET INCREASE (DECREASE) IN NET ASSETS RESULTING FROM OPERATIONS | | $ | 7,042,404 | | | $ | (6,557,323 | ) | | $ | (274,986 | ) |
| | | | | | | | | | | | |
See accompanying notes to financial statements.
53
| | | | | | |
Limited Term
Government and
Agency Fund | | | Strategic
Income Fund | |
| | | | | | |
| | | | | | |
| | | | | | |
| $ | — | | | $ | 15,860,777 | |
| | 3,817,252 | | | | 396,578,051 | |
| | 291 | | | | 106,954 | |
| | — | | | | (228,454 | ) |
| | | | | | | |
| | 3,817,543 | | | | 412,317,328 | |
| | | | | | | |
| | | | | | |
| | 466,195 | | | | 24,372,296 | |
| | 147,577 | | | | 5,521,146 | |
| | 24,146 | | | | 651,754 | |
| | 269,680 | | | | 16,820,998 | |
| | 6,277 | | | | 86,957 | |
| | 46,721 | | | | 2,169,973 | |
| | 12,156 | | | | 234,357 | |
| | 66,839 | | | | 2,357,863 | |
| | 2,739 | | | | 69,320 | |
| | 30,427 | | | | 1,800,845 | |
| | 1,479 | | | | 344,692 | |
| | 24,435 | | | | 29,334 | |
| | 2,530 | | | | 166,734 | |
| | 6,217 | | | | 661,519 | |
| | 44,301 | | | | 114,595 | |
| | (19,920 | ) | | | 127,951 | |
| | | | | | | |
| | 1,131,799 | | | | 55,530,334 | |
| | (84,347 | ) | | | — | |
| | | | | | | |
| | 1,047,452 | | | | 55,530,334 | |
| | | | | | | |
| | 2,770,091 | | | | 356,786,994 | |
| | | | | | | |
| | | | | | |
| | | | | | |
| | 323,328 | | | | (356,404,108 | ) |
| | — | | | | (1,801,952 | ) |
| | | | | | |
| | 4,081,924 | | | | (1,050,593,785 | ) |
| | — | | | | 6,624,651 | |
| | | | | | | |
| | 4,405,252 | | | | (1,402,175,194 | ) |
| | | | | | | |
| $ | 7,175,343 | | | $ | (1,045,388,200 | ) |
| | | | | | | |
54
STATEMENTSOF CHANGESIN NET ASSETS
| | | | | | | | | | | | | | | | | | | | | | | | |
| | | Core Plus Bond Fund | | | High Income Fund | | | International Bond Fund | |
| | | Six Months
Ended
March 31,
2009
(Unaudited) | | | Year Ended
September 30,
2008 | | | Six Months
Ended
March 31,
2009
(Unaudited) | | | Year Ended
September 30,
2008 | | | Six Months
Ended
March 31,
2009
(Unaudited) | | | Year Ended
September 30,
2008 (a) | |
| | | | | | | | | | | | | | | | | | | | | | | | |
FROM OPERATIONS: | | | | | | | | | | | | | | | | | | | | | | | | |
Net investment income | | $ | 4,920,684 | | | $ | 7,889,395 | | | $ | 2,388,989 | | | $ | 3,149,292 | | | $ | 210,585 | | | $ | 212,713 | |
Net realized gain (loss) on investments and foreign currency transactions | | | 2,661,571 | | | | 1,986,851 | | | | (2,427,763 | ) | | | 555,245 | | | | (347,321 | ) | | | (76,409 | ) |
Net change in unrealized appreciation (depreciation) on investments and foreign currency translations | | | (539,851 | ) | | | (13,469,246 | ) | | | (6,518,549 | ) | | | (10,381,633 | ) | | | (138,250 | ) | | | (1,052,732 | ) |
| | | | | | | | | | | | | | | | | | | | | | | | |
Net increase (decrease) in net assets resulting from operations | | | 7,042,404 | | | | (3,593,000 | ) | | | (6,557,323 | ) | | | (6,677,096 | ) | | | (274,986 | ) | | | (916,428 | ) |
| | | | | | | | | | | | | | | | | | | | | | | | |
FROM DISTRIBUTIONS TO SHAREHOLDERS: | | | | | | | | | | | | | | | | | | | | | | | | |
Net investment income | | | | | | | | | | | | | | | | | | | | | | | | |
Class A | | | (4,097,262 | ) | | | (6,214,311 | ) | | | (1,796,207 | ) | | | (2,552,225 | ) | | | (24,982 | ) | | | (20,706 | ) |
Class B | | | (272,259 | ) | | | (690,101 | ) | | | (76,458 | ) | | | (205,884 | ) | | | — | | | | — | |
Class C | | | (1,346,461 | ) | | | (812,461 | ) | | | (491,887 | ) | | | (471,489 | ) | | | (5,605 | ) | | | (5,728 | ) |
Class Y | | | (647,218 | ) | | | (1,030,857 | ) | | | (209,530 | ) | | | (54,867 | ) | | | (120,349 | ) | | | (217,001 | ) |
Net realized capital gain | | | | | | | | | | | | | | | | | | | | | | | | |
Class A | | | — | | | | — | | | | — | | | | — | | | | — | | | | — | |
Class B | | | — | | | | — | | | | — | | | | — | | | | — | | | | — | |
Class C | | | — | | | | — | | | | — | | | | — | | | | — | | | | — | |
Class Y | | | — | | | | — | | | | — | | | | — | | | | — | | | | — | |
| | | | | | | | | | | | | | | | | | | | | | | | |
Total distributions | | | (6,363,200 | ) | | | (8,747,730 | ) | | | (2,574,082 | ) | | | (3,284,465 | ) | | | (150,936 | ) | | | (243,435 | ) |
| | | | | | | | | | | | | | | | | | | | | | | | |
NET INCREASE (DECREASE) IN NET ASSETS FROM CAPITAL SHARE TRANSACTIONS (NOTE 9) | | | 27,609,180 | | | | (35,735,068 | ) | | | 13,177,111 | | | | 22,486,017 | | | | 942,214 | | | | 13,763,336 | |
| | | | | | | | | | | | | | | | | | | | | | | | |
Redemption fees | | | | | | | | | | | | | | | | | | | | | | | | |
Class A | | | — | | | | 10,657 | | | | 13,774 | | | | 12,665 | | | | — | | | | 259 | |
Class B | | | — | | | | 1,520 | | | | 575 | | | | 782 | | | | — | | | | — | |
Class C | | | — | | | | 1,489 | | | | 3,899 | | | | 3,312 | | | | — | | | | 275 | |
Class Y | | | — | | | | 1,652 | | | | 1,677 | | | | 1,025 | | | | — | | | | 13,340 | |
| | | | | | | | | | | | | | | | | | | | | | | | |
| | | — | | | | 15,318 | | | | 19,925 | | | | 17,784 | | | | — | | | | 13,874 | |
| | | | | | | | | | | | | | | | | | | | | | | | |
Net increase (decrease) in net assets | | | 28,288,384 | | | | (48,060,480 | ) | | | 4,065,631 | | | | 12,542,240 | | | | 516,292 | | | | 12,617,347 | |
NET ASSETS | | | | | | | | | | | | | | | | | | | | | | | | |
Beginning of the period | | | 173,458,086 | | | | 221,518,566 | | | | 54,621,120 | | | | 42,078,880 | | | | 12,617,347 | | | | — | |
| | | | | | | | | | | | | | | | | | | | | | | | |
End of the period | | $ | 201,746,470 | | | $ | 173,458,086 | | | $ | 58,686,751 | | | $ | 54,621,120 | | | $ | 13,133,639 | | | $ | 12,617,347 | |
| | | | | | | | | | | | | | | | | | | | | | | | |
UNDISTRIBUTED NET INVESTMENT INCOME/DISTRIBUTIONS IN EXCESS OF NET INVESTMENT INCOME | | $ | (1,071,339 | ) | | $ | 371,177 | | | $ | (199,183 | ) | | $ | (14,090 | ) | | $ | 37,523 | | | $ | (22,126 | ) |
| | | | | | | | | | | | | | | | | | | | | | | | |
| (a) | From commencement of operations on February 1, 2008 through September 30, 2008. |
See accompanying notes to financial statements.
55
| | | | | | | | | | | | | | |
| Limited Term Government and Agency Fund | | | Strategic Income Fund | |
Six Months
Ended
March 31,
2009
(Unaudited) | | | Year Ended
September 30,
2008 | | | Six Months
Ended
March 31,
2009
(Unaudited) | | | Year Ended
September 30,
2008 | |
| | | | | | | | | | | | | | |
| | | | | | | | | | | | | | |
| $ | 2,770,091 | | | $ | 4,755,700 | | | $ | 356,786,994 | | | $ | 754,292,599 | |
| | | | | | | | | | | | | | |
| | 323,328 | | | | 498,940 | | | | (358,206,060 | ) | | | 183,690,261 | |
| | | | | | | | | | | | | | |
| | | | | | | | | | | | | | |
| | 4,081,924 | | | | (407,128 | ) | | | (1,043,969,134 | ) | | | (2,817,298,752 | ) |
| | | | | | | | | | | | | | | |
| | | | | | | | | | | | | | |
| | 7,175,343 | | | | 4,847,512 | | | | (1,045,388,200 | ) | | | (1,879,315,892 | ) |
| | | | | | | | | | | | | | | |
| | | | | | | | | | | | | | |
| | | | | | | | | | | | | | |
| | | | | | | | | | | | | | |
| | (1,639,489 | ) | | | (4,474,145 | ) | | | (203,268,431 | ) | | | (448,782,373 | ) |
| | (48,928 | ) | | | (205,652 | ) | | | (5,505,729 | ) | | | (12,700,249 | ) |
| | (539,347 | ) | | | (262,151 | ) | | | (142,184,940 | ) | | | (272,297,986 | ) |
| | (144,602 | ) | | | (244,165 | ) | | | (35,709,703 | ) | | | (61,058,261 | ) |
| | | | | | | | | | | | | | |
| | — | | | | — | | | | (33,148,981 | ) | | | (5,233,811 | ) |
| | — | | | | — | | | | (1,003,570 | ) | | | (183,665 | ) |
| | — | | | | — | | | | (25,254,965 | ) | | | (3,481,864 | ) |
| | — | | | | — | | | | (5,262,204 | ) | | | (634,289 | ) |
| | | | | | | | | | | | | | | |
| | (2,372,366 | ) | | | (5,186,113 | ) | | | (451,338,523 | ) | | | (804,372,498 | ) |
| | | | | | | | | | | | | | | |
| | | | | | | | | | | | | | |
| | | | | | | | | | | | | | |
| | 72,376,421 | | | | 14,420,990 | | | | (6,971,587 | ) | | | 2,697,961,138 | |
| | | | | | | | | | | | | | | |
| | | | | | | | | | | | | | |
| | — | | | | — | | | | — | | | | 209,238 | |
| | — | | | | — | | | | — | | | | 7,216 | |
| | — | | | | — | | | | — | | | | 140,777 | |
| | — | | | | — | | | | — | | | | 25,844 | |
| | | | | | | | | | | | | | | |
| | — | | | | — | | | | — | | | | 383,075 | |
| | | | | | | | | | | | | | | |
| | 77,179,398 | | | | 14,082,389 | | | | (1,503,698,310 | ) | | | 14,655,823 | |
| | | | | | | | | | | | | | |
| | 138,867,283 | | | | 124,784,894 | | | | 10,480,079,178 | | | | 10,465,423,355 | |
| | | | | | | | | | | | | | | |
| $ | 216,046,681 | | | $ | 138,867,283 | | | $ | 8,976,380,868 | | | $ | 10,480,079,178 | |
| | | | | | | | | | | | | | | |
| | | | | | | | | | | | | | |
| | | | | | | | | | | | | | |
| $ | 110,374 | | | $ | (287,351 | ) | | $ | 67,503,979 | | | $ | 97,385,788 | |
| | | | | | | | | | | | | | | |
56
FINANCIAL HIGHLIGHTS
For a share outstanding throughout each period
| | | | | | | | | | | | | | | | | | | | | | | | | | |
| | | Income (loss) from Investment Operations: | | | Less Distributions: | | | | |
| | | | | | | |
| | | Net asset
value,
beginning
of
the period | | Net
investment
income (a) | | Net realized
and unrealized
gain (loss) | | | Total from
investment
operations | | | Dividends
from
net investment
income | | | Total
distributions | | | Redemption
fees (b) | |
| | | | | | | | | | | | | | | | | | | | | | | | | | |
CORE PLUS BOND FUND | | | | | | | | | | | | | | | | | | | | | | | | | | |
Class A | | | | | | | | | | | | | | | | | | | | | | | | | | |
3/31/2009(i) | | $ | 10.54 | | $ | 0.29 | | $ | 0.10 | | | $ | 0.39 | | | $ | (0.36 | ) | | $ | (0.36 | ) | | $ | — | |
9/30/2008 | | | 11.31 | | | 0.55 | | | (0.71 | ) | | | (0.16 | ) | | | (0.61 | ) | | | (0.61 | ) | | | 0.00 | (h) |
9/30/2007 | | | 11.23 | | | 0.50 | | | 0.14 | | | | 0.64 | | | | (0.56 | ) | | | (0.56 | ) | | | 0.00 | |
9/30/2006 | | | 11.41 | | | 0.50 | | | (0.07 | ) | | | 0.43 | | | | (0.61 | ) | | | (0.61 | ) | | | 0.00 | |
9/30/2005 | | | 11.69 | | | 0.46 | | | (0.18 | ) | | | 0.28 | | | | (0.56 | ) | | | (0.56 | ) | | | 0.00 | |
9/30/2004 | | | 11.63 | | | 0.47 | | | 0.13 | | | | 0.60 | | | | (0.54 | ) | | | (0.54 | ) | | | 0.00 | |
Class B | | | | | | | | | | | | | | | | | | | | | | | | | | |
3/31/2009(i) | | | 10.57 | | | 0.25 | | | 0.10 | | | | 0.35 | | | | (0.32 | ) | | | (0.32 | ) | | | — | |
9/30/2008 | | | 11.31 | | | 0.44 | | | (0.67 | ) | | | (0.23 | ) | | | (0.51 | ) | | | (0.51 | ) | | | 0.00 | (h) |
9/30/2007 | | | 11.24 | | | 0.41 | | | 0.13 | | | | 0.54 | | | | (0.47 | ) | | | (0.47 | ) | | | 0.00 | |
9/30/2006 | | | 11.41 | | | 0.41 | | | (0.05 | ) | | | 0.36 | | | | (0.53 | ) | | | (0.53 | ) | | | 0.00 | |
9/30/2005 | | | 11.70 | | | 0.37 | | | (0.18 | ) | | | 0.19 | | | | (0.48 | ) | | | (0.48 | ) | | | 0.00 | |
9/30/2004 | | | 11.62 | | | 0.38 | | | 0.14 | | | | 0.52 | | | | (0.44 | ) | | | (0.44 | ) | | | 0.00 | |
Class C | | | | | | | | | | | | | | | | | | | | | | | | | | |
3/31/2009(i) | | | 10.55 | | | 0.25 | | | 0.11 | | | | 0.36 | | | | (0.33 | ) | | | (0.33 | ) | | | — | |
9/30/2008 | | | 11.32 | | | 0.47 | | | (0.71 | ) | | | (0.24 | ) | | | (0.53 | ) | | | (0.53 | ) | | | 0.00 | (h) |
9/30/2007 | | | 11.25 | | | 0.41 | | | 0.13 | | | | 0.54 | | | | (0.47 | ) | | | (0.47 | ) | | | 0.00 | |
9/30/2006 | | | 11.42 | | | 0.41 | | | (0.05 | ) | | | 0.36 | | | | (0.53 | ) | | | (0.53 | ) | | | 0.00 | |
9/30/2005 | | | 11.71 | | | 0.37 | | | (0.18 | ) | | | 0.19 | | | | (0.48 | ) | | | (0.48 | ) | | | 0.00 | |
9/30/2004 | | | 11.63 | | | 0.38 | | | 0.14 | | | | 0.52 | | | | (0.44 | ) | | | (0.44 | ) | | | 0.00 | |
Class Y | | | | | | | | | | | | | | | | | | | | | | | | | | |
3/31/2009(i) | | | 10.60 | | | 0.30 | | | 0.10 | | | | 0.40 | | | | (0.38 | ) | | | (0.38 | ) | | | — | |
9/30/2008 | | | 11.36 | | | 0.58 | | | (0.70 | ) | | | (0.12 | ) | | | (0.64 | ) | | | (0.64 | ) | | | 0.00 | (h) |
9/30/2007 | | | 11.29 | | | 0.54 | | | 0.13 | | | | 0.67 | | | | (0.60 | ) | | | (0.60 | ) | | | 0.00 | |
9/30/2006 | | | 11.46 | | | 0.51 | | | (0.04 | ) | | | 0.47 | | | | (0.64 | ) | | | (0.64 | ) | | | 0.00 | |
9/30/2005 | | | 11.74 | | | 0.49 | | | (0.18 | ) | | | 0.31 | | | | (0.59 | ) | | | (0.59 | ) | | | 0.00 | |
9/30/2004 | | | 11.69 | | | 0.50 | | | 0.13 | | | | 0.63 | | | | (0.58 | ) | | | (0.58 | ) | | | 0.00 | |
HIGH INCOME FUND | | | | | | | | | | | | | | | | | | | | | | | | | | |
Class A | | | | | | | | | | | | | | | | | | | | | | | | | | |
3/31/2009(i) | | $ | 4.24 | | $ | 0.17 | | $ | (0.70 | ) | | $ | (0.53 | ) | | $ | (0.19 | ) | | $ | (0.19 | ) | | $ | 0.00 | |
9/30/2008 | | | 5.12 | | | 0.34 | | | (0.87 | ) | | | (0.53 | ) | | | (0.35 | ) | | | (0.35 | ) | | | 0.00 | |
9/30/2007 | | | 5.09 | | | 0.33 | | | 0.08 | | | | 0.41 | | | | (0.38 | ) | | | (0.38 | ) | | | 0.00 | |
9/30/2006 | | | 4.98 | | | 0.34 | | | 0.11 | | | | 0.45 | | | | (0.34 | ) | | | (0.34 | ) | | | 0.00 | |
9/30/2005 | | | 4.82 | | | 0.33 | | | 0.16 | | | | 0.49 | | | | (0.33 | ) | | | (0.33 | ) | | | 0.00 | |
9/30/2004 | | | 4.65 | | | 0.33 | | | 0.17 | | | | 0.50 | | | | (0.33 | ) | | | (0.33 | ) | | | 0.00 | |
Class B | | | | | | | | | | | | | | | | | | | | | | | | | | |
3/31/2009(i) | | | 4.25 | | | 0.16 | | | (0.72 | ) | | | (0.56 | ) | | | (0.17 | ) | | | (0.17 | ) | | | 0.00 | |
9/30/2008 | | | 5.13 | | | 0.30 | | | (0.87 | ) | | | (0.57 | ) | | | (0.31 | ) | | | (0.31 | ) | | | 0.00 | |
9/30/2007 | | | 5.10 | | | 0.29 | | | 0.07 | | | | 0.36 | | | | (0.33 | ) | | | (0.33 | ) | | | 0.00 | |
9/30/2006 | | | 4.98 | | | 0.30 | | | 0.12 | | | | 0.42 | | | | (0.30 | ) | | | (0.30 | ) | | | 0.00 | |
9/30/2005 | | | 4.83 | | | 0.29 | | | 0.15 | | | | 0.44 | | | | (0.29 | ) | | | (0.29 | ) | | | 0.00 | |
9/30/2004 | | | 4.65 | | | 0.30 | | | 0.18 | | | | 0.48 | | | | (0.30 | ) | | | (0.30 | ) | | | 0.00 | |
| (a) | Per share net investment income has been calculated using the average shares outstanding during the period. |
| (b) | Amount rounds to less than $0.01 per share, if applicable. |
| (c) | A sales charge for Class A and Class C (prior to February 1, 2004) shares and a contingent deferred sales charge for Class B and Class C shares are not reflected in total return calculations. Periods less than one year, if applicable, are not annualized. |
| (d) | Had certain expenses not been reduced during the period, if applicable, total return would have been lower. |
| (e) | Computed on an annualized basis for periods less than one year, if applicable. |
See accompanying notes to financial statements.
57
| | | | | | | | | | | | | | | | | |
| | | | | | | | Ratios to Average Net Assets: |
| | | | | | |
Net asset
value,
end of
the period | | Total
return
(%) (c)(d) | | | Net assets,
end of
the period
(000’s) | | Net
expenses
(%) (e)(f) | | | Gross
expenses
(%) (e) | | | Net investment
income
(%) (e) | | Portfolio
turnover
rate (%) |
| | | | | | | | | | | | | | | | | |
| | | | | | | | | | | | | | | | | |
| | | | | | | | | | | | | | | | | |
| $ | 10.57 | | 3.8 | | | $ | 124,040 | | 0.90 | | | 0.98 | | | 5.49 | | 55 |
| | 10.54 | | (1.6 | ) | | | 115,873 | | 0.93 | | | 1.04 | | | 4.86 | | 82 |
| | 11.31 | | 5.7 | | | | 105,780 | | 1.04 | | | 1.09 | | | 4.41 | | 69 |
| | 11.23 | | 4.0 | | | | 91,464 | | 1.05 | | | 1.08 | | | 4.46 | | 91 |
| | 11.41 | | 2.4 | | | | 105,111 | | 1.13 | | | 1.18 | | | 3.93 | | 64 |
| | 11.69 | | 5.3 | | | | 120,009 | | 1.19 | | | 1.22 | | | 4.05 | | 69 |
| | | | | | | | | | | | | | | | | |
| | 10.60 | | 3.4 | | | | 8,180 | | 1.65 | | | 1.73 | | | 4.72 | | 55 |
| | 10.57 | | (2.2 | ) | | | 10,481 | | 1.70 | | | 1.80 | | | 3.92 | | 82 |
| | 11.31 | | 4.9 | | | | 87,101 | | 1.79 | | | 1.85 | | | 3.64 | | 69 |
| | 11.24 | | 3.3 | | | | 109,782 | | 1.80 | | | 1.83 | | | 3.72 | | 91 |
| | 11.41 | | 1.6 | | | | 132,221 | | 1.88 | | | 1.93 | | | 3.18 | | 64 |
| | 11.70 | | 4.6 | | | | 148,556 | | 1.94 | | | 1.97 | | | 3.29 | | 69 |
| | | | | | | | | | | | | | | | | |
| | 10.58 | | 3.4 | | | | 52,710 | | 1.65 | | | 1.73 | | | 4.73 | | 55 |
| | 10.55 | | (2.3 | ) | | | 26,698 | | 1.68 | | | 1.79 | | | 4.17 | | 82 |
| | 11.32 | | 4.9 | | | | 12,690 | | 1.78 | | | 1.82 | | | 3.66 | | 69 |
| | 11.25 | | 3.3 | | | | 6,983 | | 1.80 | | | 1.82 | | | 3.63 | | 91 |
| | 11.42 | | 1.6 | | | | 6,065 | | 1.88 | | | 1.93 | | | 3.17 | | 64 |
| | 11.71 | | 4.6 | | | | 6,162 | | 1.94 | | | 1.98 | | | 3.30 | | 69 |
| | | | | | | | | | | | | | | | | |
| | 10.62 | | 3.9 | | | | 16,817 | | 0.65 | | | 0.70 | | | 5.72 | | 55 |
| | 10.60 | | (1.4 | ) | | | 20,407 | | 0.68 | | | 0.75 | | | 5.14 | | 82 |
| | 11.36 | | 6.1 | | | | 15,946 | | 0.70 | | | 0.75 | | | 4.75 | | 69 |
| | 11.29 | | 4.3 | | | | 11,986 | | 0.80 | (g) | | 0.80 | (g) | | 4.58 | | 91 |
| | 11.46 | | 2.7 | | | | 9,060 | | 0.88 | | | 0.99 | | | 4.18 | | 64 |
| | 11.74 | | 5.5 | | | | 10,941 | | 0.94 | | | 0.98 | | | 4.30 | | 69 |
| | | | | | | | | | | | | | | | | |
| | | | | | | | | | | | | | | | | |
| $ | 3.52 | | (12.3 | ) | | $ | 38,998 | | 1.15 | | | 1.42 | | | 10.11 | | 16 |
| | 4.24 | | (11.0 | ) | | | 38,577 | | 1.15 | | | 1.40 | | | 7.01 | | 27 |
| | 5.12 | | 8.1 | | | | 32,603 | | 1.18 | | | 1.43 | | | 6.40 | | 41 |
| | 5.09 | | 9.4 | | | | 29,069 | | 1.31 | | | 1.48 | | | 6.70 | | 41 |
| | 4.98 | | 10.3 | | | | 25,817 | | 1.58 | | | 1.72 | | | 6.60 | | 42 |
| | 4.82 | | 11.1 | | | | 24,641 | | 1.65 | | | 1.65 | | | 6.97 | | 51 |
| | | | | | | | | | | | | | | | | |
| | 3.52 | | (12.8 | ) | | | 1,460 | | 1.90 | | | 2.16 | | | 9.36 | | 16 |
| | 4.25 | | (11.6 | ) | | | 2,267 | | 1.90 | | | 2.15 | | | 6.15 | | 27 |
| | 5.13 | | 7.2 | | | | 4,201 | | 1.94 | | | 2.18 | | | 5.63 | | 41 |
| | 5.10 | | 8.8 | | | | 7,283 | | 2.08 | | | 2.25 | | | 6.00 | | 41 |
| | 4.98 | | 9.3 | | | | 12,034 | | 2.33 | | | 2.47 | | | 5.85 | | 42 |
| | 4.83 | | 10.5 | | | | 17,967 | | 2.40 | | | 2.40 | | | 6.22 | | 51 |
| (f) | The investment adviser and/or administrator agreed to reimburse a portion of the Fund’s expenses and/or reduce its fees during the period. Without this reimbursement/fee reduction, if applicable, expenses would have been higher. |
| (g) | Includes fee/expense recovery of 0.06%. |
| (h) | Effective June 2, 2008 redemption fees were eliminated. |
| (i) | For the six months ended March 31, 2009 (Unaudited). |
58
FINANCIAL HIGHLIGHTS (continued)
For a share outstanding throughout each period
| | | | | | | | | | | | | | | | | | | | | | | | | | |
| | | Income (loss) from Investment Operation | | | | | | Less Distributions: | | | | |
| | | | | | | |
| | | Net asset
value,
beginning
of
the period | | Net
investment
income (b) | | Net realized
and unrealized
gain (loss) | | | Total from
investment
operations | | | Dividends
from
net investment
income | | | Total
distributions | | | Redemption
fees (c) | |
| | | | | | | | | | | | | | | | | | | | | | | | | | |
HIGH INCOME FUND (continued) | | | | | | | | | | | | | | | | | | | | | | | | | | |
Class C | | | | | | | | | | | | | | | | | | | | | | | | | | |
3/31/2009(i) | | $ | 4.24 | | $ | 0.16 | | $ | (0.71 | ) | | $ | (0.55 | ) | | $ | (0.17 | ) | | $ | (0.17 | ) | | $ | 0.00 | |
9/30/2008 | | | 5.12 | | | 0.31 | | | (0.87 | ) | | | (0.56 | ) | | | (0.32 | ) | | | (0.32 | ) | | | 0.00 | |
9/30/2007 | | | 5.09 | | | 0.29 | | | 0.07 | | | | 0.36 | | | | (0.33 | ) | | | (0.33 | ) | | | 0.00 | |
9/30/2006 | | | 4.98 | | | 0.30 | | | 0.11 | | | | 0.41 | | | | (0.30 | ) | | | (0.30 | ) | | | 0.00 | |
9/30/2005 | | | 4.83 | | | 0.29 | | | 0.15 | | | | 0.44 | | | | (0.29 | ) | | | (0.29 | ) | | | 0.00 | |
9/30/2004 | | | 4.65 | | | 0.30 | | | 0.18 | | | | 0.48 | | | | (0.30 | ) | | | (0.30 | ) | | | 0.00 | |
Class Y | | | | | | | | | | | | | | | | | | | | | | | | | | |
3/31/2009(i) | | | 4.24 | | | 0.18 | | | (0.72 | ) | | | (0.54 | ) | | | (0.19 | ) | | | (0.19 | ) | | | 0.00 | |
9/30/2008(f) | | | 4.87 | | | 0.22 | | | (0.65 | ) | | | (0.43 | ) | | | (0.21 | ) | | | (0.21 | ) | | | 0.01 | |
INTERNATIONAL BOND FUND | | | | | | | | | | | | | | | | | | | | | | | | | | |
Class A | | | | | | | | | | | | | | | | | | | | | | | | | | |
3/31/2009(i) | | $ | 9.19 | | $ | 0.14 | | $ | (0.33 | ) | | $ | (0.19 | ) | | $ | (0.10 | ) | | $ | (0.10 | ) | | $ | – | |
9/30/2008(g) | | | 10.00 | | | 0.17 | | | (0.79 | ) | | | (0.62 | ) | | | (0.19 | ) | | | (0.19 | ) | | | 0.00 | (h) |
Class C | | | | | | | | | | | | | | | | | | | | | | | | | | |
3/31/2009(i) | | | 9.18 | | | 0.12 | | | (0.35 | ) | | | (0.23 | ) | | | (0.07 | ) | | | (0.07 | ) | | | – | |
9/30/2008(g) | | | 10.00 | | | 0.13 | | | (0.81 | ) | | | (0.68 | ) | | | (0.15 | ) | | | (0.15 | ) | | | 0.01 | (h) |
Class Y | | | | | | | | | | | | | | | | | | | | | | | | | | |
3/31/2009(i) | | | 9.18 | | | 0.15 | | | (0.33 | ) | | | (0.18 | ) | | | (0.11 | ) | | | (0.11 | ) | | | – | |
9/30/2008(g) | | | 10.00 | | | 0.18 | | | (0.81 | ) | | | (0.63 | ) | | | (0.20 | ) | | | (0.20 | ) | | | 0.01 | (h) |
| (a) | A sales charge for Class A and Class C (prior to February 1, 2004) shares and a contingent deferred sales charge for Class C shares are not reflected in total return calculations. Periods less than one year, if applicable, are not annualized. |
| (b) | Per share net investment income has been calculated using the average shares outstanding during the period. |
| (c) | Amount rounds to less than $0.01 per share, if applicable. |
| (d) | Had certain expenses not been reduced during the period, if applicable, total return would have been lower. |
See accompanying notes to financial statements.
59
| | | | | | | | | | | | | | | |
| | | | | | | | | | Ratios to Average Net Assets: |
| | | | | | |
Net asset
value, end
of the period | | Total
return
(%) (a)(d) | | | Net assets,
end of
the period
(000’s) | | Net
expenses
(%) (e)(j) | | Gross
expenses
(%) (j) | | Net investment
income
(%) (j) | | Portfolio
turnover
rate (%) |
| | | | | | | | | | | | | | | |
| | | | | | | | | | | | | | | |
| | | | | | | | | | | | | | | |
| $ | 3.52 | | (12.6 | ) | | $ | 10,921 | | 1.90 | | 2.17 | | 9.38 | | 16 |
| | 4.24 | | (11.6 | ) | | | 9,945 | | 1.90 | | 2.15 | | 6.32 | | 27 |
| | 5.12 | | 7.2 | | | | 5,275 | | 1.93 | | 2.17 | | 5.63 | | 41 |
| | 5.09 | | 8.6 | | | | 3,457 | | 2.07 | | 2.23 | | 5.96 | | 41 |
| | 4.98 | | 9.3 | | | | 3,554 | | 2.33 | | 2.47 | | 5.82 | | 42 |
| | 4.83 | | 10.5 | | | | 2,608 | | 2.40 | | 2.40 | | 6.22 | | 51 |
| | | | | | | | | | | | | | | |
| | 3.51 | | (12.1 | ) | | | 7,309 | | 0.90 | | 1.15 | | 10.32 | | 16 |
| | 4.24 | | (9.1 | ) | | | 3,833 | | 0.90 | | 1.15 | | 8.03 | | 27 |
| | | | | | | | | | | | | | | |
| | | | | | | | | | | | | | | |
| $ | 8.90 | | (2.0 | ) | | $ | 2,595 | | 1.10 | | 2.56 | | 3.23 | | 30 |
| | 9.19 | | (6.4 | ) | | | 1,953 | | 1.10 | | 2.95 | | 2.66 | | 60 |
| | | | | | | | | | | | | | | |
| | 8.88 | | (2.4 | ) | | | 921 | | 1.85 | | 3.31 | | 2.47 | | 30 |
| | 9.18 | | (7.0 | ) | | | 683 | | 1.85 | | 3.70 | | 1.92 | | 60 |
| | | | | | | | | | | | | | | |
| | 8.89 | | (1.8 | ) | | | 9,617 | | 0.85 | | 2.26 | | 3.45 | | 30 |
| | 9.18 | | (6.4 | ) | | | 9,981 | | 0.85 | | 2.48 | | 2.74 | | 60 |
| (e) | The investment adviser and/or administrator agreed to reimburse a portion of the Fund’s expenses and/or reduce its fees during the period. Without this reimbursement/fee reduction, if applicable, expenses would have been higher. |
| (f) | From commencement of class operations on February 29, 2008 through September 30, 2008. |
| (g) | For the period February 1, 2008 (inception) through September 30, 2008. |
| (h) | Effective June 2, 2008, redemption fees were eliminated. |
| (i) | For the six months ended March 31, 2009 (Unaudited). |
| (j) | Computed on an annualized basis for periods less than one year, if applicable. |
60
FINANCIAL HIGHLIGHTS (continued)
For a share outstanding throughout each period
| | | | | | | | | | | | | | | | | | | | | |
| | | | | Income (loss) from Investment Operations: | | Less Distributions: | |
| | | | | | |
| | | Net asset
value,
beginning
of
the period | | Net
investment
income (c) | | Net realized
and unrealized
gain (loss) | | | Total from
investment
operations | | Dividends
from
net investment
income | | | Total
distributions | |
| | | | | | | | | | | | | | | | | | | | | |
LIMITED TERM GOVERNMENTAND AGENCY FUND | | | | | | | | | | | | | | | | | | | | | |
Class A | | | | | | | | | | | | | | | | | | | | | |
3/31/2009(g) | | $ | 10.98 | | $ | 0.18 | | $ | 0.23 | | | $ | 0.41 | | $ | (0.15 | ) | | $ | (0.15 | ) |
9/30/2008 | | | 11.00 | | | 0.45 | | | 0.02 | | | | 0.47 | | | (0.49 | ) | | | (0.49 | ) |
9/30/2007 | | | 11.00 | | | 0.45 | | | 0.03 | | | | 0.48 | | | (0.48 | ) | | | (0.48 | ) |
9/30/2006 | | | 11.09 | | | 0.39 | | | (0.05 | ) | | | 0.34 | | | (0.43 | ) | | | (0.43 | ) |
9/30/2005 | | | 11.30 | | | 0.28 | | | (0.16 | ) | | | 0.12 | | | (0.33 | ) | | | (0.33 | ) |
9/30/2004 | | | 11.51 | | | 0.30 | | | (0.09 | ) | | | 0.21 | | | (0.42 | ) | | | (0.42 | ) |
Class B | | | | | | | | | | | | | | | | | | | | | |
3/31/2009(g) | | | 10.97 | | | 0.14 | | | 0.22 | | | | 0.36 | | | (0.11 | ) | | | (0.11 | ) |
9/30/2008 | | | 10.99 | | | 0.36 | | | 0.02 | | | | 0.38 | | | (0.40 | ) | | | (0.40 | ) |
9/30/2007 | | | 10.98 | | | 0.37 | | | 0.03 | | | | 0.40 | | | (0.39 | ) | | | (0.39 | ) |
9/30/2006 | | | 11.07 | | | 0.31 | | | (0.05 | ) | | | 0.26 | | | (0.35 | ) | | | (0.35 | ) |
9/30/2005 | | | 11.28 | | | 0.20 | | | (0.17 | ) | | | 0.03 | | | (0.24 | ) | | | (0.24 | ) |
9/30/2004 | | | 11.49 | | | 0.22 | | | (0.09 | ) | | | 0.13 | | | (0.34 | ) | | | (0.34 | ) |
Class C | | | | | | | | | | | | | | | | | | | | | |
3/31/2009(g) | | | 10.99 | | | 0.13 | | | 0.23 | | | | 0.36 | | | (0.11 | ) | | | (0.11 | ) |
9/30/2008 | | | 11.00 | | | 0.36 | | | 0.03 | | | | 0.39 | | | (0.40 | ) | | | (0.40 | ) |
9/30/2007 | | | 10.99 | | | 0.37 | | | 0.03 | | | | 0.40 | | | (0.39 | ) | | | (0.39 | ) |
9/30/2006 | | | 11.08 | | | 0.31 | | | (0.05 | ) | | | 0.26 | | | (0.35 | ) | | | (0.35 | ) |
9/30/2005 | | | 11.30 | | | 0.20 | | | (0.18 | ) | | | 0.02 | | | (0.24 | ) | | | (0.24 | ) |
9/30/2004 | | | 11.50 | | | 0.22 | | | (0.08 | ) | | | 0.14 | | | (0.34 | ) | | | (0.34 | ) |
Class Y | | | | | | | | | | | | | | | | | | | | | |
3/31/2009(g) | | | 11.01 | | | 0.19 | | | 0.24 | | | | 0.43 | | | (0.17 | ) | | | (0.17 | ) |
9/30/2008 | | | 11.03 | | | 0.47 | | | 0.02 | | | | 0.49 | | | (0.51 | ) | | | (0.51 | ) |
9/30/2007 | | | 11.03 | | | 0.49 | | | 0.03 | | | | 0.52 | | | (0.52 | ) | | | (0.52 | ) |
9/30/2006 | | | 11.13 | | | 0.43 | | | (0.06 | ) | | | 0.37 | | | (0.47 | ) | | | (0.47 | ) |
9/30/2005 | | | 11.34 | | | 0.31 | | | (0.17 | ) | | | 0.14 | | | (0.35 | ) | | | (0.35 | ) |
9/30/2004 | | | 11.55 | | | 0.32 | | | (0.09 | ) | | | 0.23 | | | (0.44 | ) | | | (0.44 | ) |
| (a) | A sales charge for Class A and Class C (prior to February 1, 2004) shares and a contingent deferred sales charge for Class B and Class C shares are not reflected in total return calculations. Periods less than one year, if applicable, are not annualized. |
| (b) | Computed on an annualized basis for periods less than one year, if applicable. |
| (c) | Per share net investment income has been calculated using the average shares outstanding during the period. |
| (d) | Had certain expenses not been reduced during the period, if applicable, total return would have been lower. |
See accompanying notes to financial statements.
61
| | | | | | | | | | | | | | | |
| | | | | | | | | Ratios to Average Net Assets: | | |
| | | | | | |
Net asset
value, end
of the period | | Total
return
(%) (a)(d) | | Net assets,
end of
the period
(000’s) | | Net
expenses
(%) (b)(e) | | Gross
expenses
(%) (b) | | | Net investment
income
(%) (b) | | Portfolio
turnover
rate (%) |
| | | | | | | | | | | | | | | |
| | | | | | | | | | | | | | | |
| | | | | | | | | | | | | | | |
| $ | 11.24 | | 3.8 | | $ | 140,427 | | 0.90 | | 0.99 | | | 3.20 | | 14 |
| | 10.98 | | 4.3 | | | 105,047 | | 0.92 | | 1.07 | | | 4.04 | | 52 |
| | 11.00 | | 4.5 | | | 108,536 | | 0.99 | | 1.10 | | | 4.13 | | 45 |
| | 11.00 | | 3.2 | | | 114,180 | | 1.04 | | 1.09 | | | 3.57 | | 50 |
| | 11.09 | | 1.1 | | | 141,417 | | 1.24 | | 1.24 | | | 2.50 | | 93 |
| | 11.30 | | 1.9 | | | 106,701 | | 1.32 | | 1.32 | | | 2.60 | | 80 |
| | | | | | | | | | | | | | | |
| | 11.22 | | 3.3 | | | 4,667 | | 1.65 | | 1.75 | | | 2.45 | | 14 |
| | 10.97 | | 3.5 | | | 4,532 | | 1.67 | | 1.82 | | | 3.29 | | 52 |
| | 10.99 | | 3.7 | | | 6,787 | | 1.74 | | 1.85 | | | 3.37 | | 45 |
| | 10.98 | | 2.4 | | | 9,952 | | 1.79 | | 1.84 | | | 2.79 | | 50 |
| | 11.07 | | 0.3 | | | 15,114 | | 1.99 | | 1.99 | | | 1.75 | | 93 |
| | 11.28 | | 1.2 | | | 10,107 | | 2.00 | | 2.00 | | | 1.95 | | 80 |
| | | | | | | | | | | | | | | |
| | 11.24 | | 3.3 | | | 59,970 | | 1.65 | | 1.75 | | | 2.43 | | 14 |
| | 10.99 | | 3.6 | | | 22,711 | | 1.66 | | 1.83 | | | 3.29 | | 52 |
| | 11.00 | | 3.6 | | | 5,261 | | 1.74 | | 1.85 | | | 3.38 | | 45 |
| | 10.99 | | 2.5 | | | 4,230 | | 1.79 | | 1.84 | | | 2.81 | | 50 |
| | 11.08 | | 0.2 | | | 5,715 | | 1.99 | | 1.99 | | | 1.75 | | 93 |
| | 11.30 | | 1.3 | | | 6,949 | | 2.00 | | 2.00 | | | 1.94 | | 80 |
| | | | | | | | | | | | | | | |
| | 11.27 | | 3.9 | | | 10,982 | | 0.65 | | 0.66 | | | 3.42 | | 14 |
| | 11.01 | | 4.6 | | | 6,577 | | 0.67 | | 0.72 | | | 4.28 | | 52 |
| | 11.03 | | 4.8 | | | 4,201 | | 0.71 | | 0.75 | | | 4.43 | | 45 |
| | 11.03 | | 3.4 | | | 2,461 | | 0.74 | | 0.74 | | | 3.89 | | 50 |
| | 11.13 | | 1.2 | | | 2,533 | | 1.02 | | 1.59 | (f) | | 2.77 | | 93 |
| | 11.34 | | 2.1 | | | 4,233 | | 1.13 | | 1.13 | | | 2.82 | | 80 |
| (e) | The investment adviser and/or administrator agreed to reimburse a portion of the Fund’s expenses and/or reduce its fees during the period. Without this reimbursement/fee reduction, if applicable, expenses would have been higher. |
| (f) | Represents the total expenses prior to reduction of a portion of the class’s transfer agent expenses. |
| (g) | For the six months ended March 31, 2009 (Unaudited). |
62
FINANCIAL HIGHLIGHTS (continued)
For a share outstanding throughout each period
| | | | | | | | | | | | | | | | | | | | | | | | | | |
| | | | | Income (loss) from Investment Operations: | | | Less Distributions: | |
| | | | | | | |
| | | Net asset
value,
beginning
of
the period | | Net
investment
income (a) | | Net realized
and unrealized
gain (loss) | | | Total from
investment
operations | | | Dividends
from net
investment
income | | | Distributions
from net
realized
capital gains | | | Total
distributions | |
| | | | | | | | | | | | | | | | | | | | | | | | | | |
STRATEGIC INCOME FUND | | | | | | | | | | | | | | | | | | | | | | | | | | |
Class A | | | | | | | | | | | | | | | | | | | | | | | | | | |
3/31/2009(h) | | $ | 12.10 | | $ | 0.44 | | $ | (1.60 | ) | | $ | (1.16 | ) | | $ | (0.49 | ) | | $ | (0.08 | ) | | $ | (0.57 | ) |
9/30/2008 | | | 15.18 | | | 0.96 | | | (3.02 | ) | | | (2.06 | ) | | | (1.01 | ) | | | (0.01 | ) | | | (1.02 | ) |
9/30/2007 | | | 14.60 | | | 0.80 | | | 0.60 | | | | 1.40 | | | | (0.82 | ) | | | — | | | | (0.82 | ) |
9/30/2006 | | | 14.17 | | | 0.71 | | | 0.53 | | | | 1.24 | | | | (0.81 | ) | | | — | | | | (0.81 | ) |
9/30/2005 | | | 13.57 | | | 0.66 | | | 0.70 | | | | 1.36 | | | | (0.76 | ) | | | — | | | | (0.76 | ) |
9/30/2004 | | | 12.57 | | | 0.75 | | | 1.11 | | | | 1.86 | | | | (0.86 | ) | | | — | | | | (0.86 | ) |
Class B | | | | | | | | | | | | | | | | | | | | | | | | | | |
3/31/2009(h) | | | 12.16 | | | 0.41 | | | (1.62 | ) | | | (1.21 | ) | | | (0.45 | ) | | | (0.08 | ) | | | (0.53 | ) |
9/30/2008 | | | 15.25 | | | 0.85 | | | (3.04 | ) | | | (2.19 | ) | | | (0.89 | ) | | | (0.01 | ) | | | (0.90 | ) |
9/30/2007 | | | 14.66 | | | 0.69 | | | 0.60 | | | | 1.29 | | | | (0.70 | ) | | | — | | | | (0.70 | ) |
9/30/2006 | | | 14.22 | | | 0.61 | | | 0.52 | | | | 1.13 | | | | (0.69 | ) | | | — | | | | (0.69 | ) |
9/30/2005 | | | 13.60 | | | 0.56 | | | 0.71 | | | | 1.27 | | | | (0.65 | ) | | | — | | | | (0.65 | ) |
9/30/2004 | | | 12.59 | | | 0.65 | | | 1.10 | | | | 1.75 | | | | (0.74 | ) | | | — | | | | (0.74 | ) |
Class C | | | | | | | | | | | | | | | | | | | | | | | | | | |
3/31/2009(h) | | | 12.15 | | | 0.41 | | | (1.61 | ) | | | (1.20 | ) | | | (0.45 | ) | | | (0.08 | ) | | | (0.53 | ) |
9/30/2008 | | | 15.24 | | | 0.85 | | | (3.03 | ) | | | (2.18 | ) | | | (0.90 | ) | | | (0.01 | ) | | | (0.91 | ) |
9/30/2007 | | | 14.65 | | | 0.69 | | | 0.60 | | | | 1.29 | | | | (0.70 | ) | | | — | | | | (0.70 | ) |
9/30/2006 | | | 14.22 | | | 0.61 | | | 0.51 | | | | 1.12 | | | | (0.69 | ) | | | — | | | | (0.69 | ) |
9/30/2005 | | | 13.60 | | | 0.55 | | | 0.72 | | | | 1.27 | | | | (0.65 | ) | | | — | | | | (0.65 | ) |
9/30/2004 | | | 12.58 | | | 0.64 | | | 1.11 | | | | 1.75 | | | | (0.73 | ) | | | — | | | | (0.73 | ) |
Class Y | | | | | | | | | | | | | | | | | | | | | | | | | | |
3/31/2009(h) | | | 12.09 | | | 0.46 | | | (1.61 | ) | | | (1.15 | ) | | | (0.50 | ) | | | (0.08 | ) | | | (0.58 | ) |
9/30/2008 | | | 15.17 | | | 1.00 | | | (3.03 | ) | | | (2.03 | ) | | | (1.04 | ) | | | (0.01 | ) | | | (1.05 | ) |
9/30/2007 | | | 14.59 | | | 0.85 | | | 0.59 | | | | 1.44 | | | | (0.86 | ) | | | — | | | | (0.86 | ) |
9/30/2006 | | | 14.17 | | | 0.76 | | | 0.51 | | | | 1.27 | | | | (0.85 | ) | | | — | | | | (0.85 | ) |
9/30/2005 | | | 13.57 | | | 0.70 | | | 0.70 | | | | 1.40 | | | | (0.80 | ) | | | — | | | | (0.80 | ) |
9/30/2004 | | | 12.58 | | | 0.78 | | | 1.11 | | | | 1.89 | | | | (0.90 | ) | | | — | | | | (0.90 | ) |
| (a) | Per share net investment income has been calculated using the average shares outstanding during the period. |
| (b) | Amount rounds to less than $0.01 per share, if applicable. |
| (c) | Effective June 2, 2008, redemption fees were eliminated. |
| (d) | A sales charge for Class A and Class C (prior to February 1, 2004) shares and a contingent deferred sales charge for Class B and Class C shares are not reflected in total return calculations. Periods less than one year, if applicable, are not annualized. |
See accompanying notes to financial statements.
63
| | | | | | | | | | | | | | | | | | |
| | | | | | | | | | Ratios to Average Net Assets: | | |
| | | | | | | |
Redemption
fees (b)(c) | | Net asset
value, end
of
the period | | Total
return
(%) (d)(e) | | | Net assets,
end of
the period
(000’s) | | Net
expenses
(%) (f)(g) | | Gross
expenses
(%) (f) | | Net investment
income (%) (f) | | Portfolio
turnover
rate (%) |
| | | | | | | | | | | | | | | | | | |
| | | | | | | | | | | | | | | | | | |
| | | | | | | | | | | | | | | | | | |
| $ | — | | $ | 10.37 | | (9.5 | ) | | $ | 4,427,061 | | 1.00 | | 1.00 | | 8.52 | | 18 |
| | 0.00 | | | 12.10 | | (14.5 | ) | | | 5,551,066 | | 0.97 | | 0.98 | | 6.59 | | 24 |
| | 0.00 | | | 15.18 | | 9.9 | | | | 5,749,315 | | 1.00 | | 1.00 | | 5.39 | | 22 |
| | 0.00 | | | 14.60 | | 9.0 | | | | 2,782,887 | | 1.05 | | 1.05 | | 5.01 | | 21 |
| | 0.00 | | | 14.17 | | 10.2 | | | | 977,198 | | 1.18 | | 1.18 | | 4.71 | | 14 |
| | 0.00 | | | 13.57 | | 15.2 | | | | 343,586 | | 1.23 | | 1.23 | | 5.66 | | 28 |
| | | | | | | | | | | | | | | | | | |
| | — | | | 10.42 | | (9.9 | ) | | | 123,118 | | 1.75 | | 1.75 | | 7.77 | | 18 |
| | 0.00 | | | 12.16 | | (15.2 | ) | | | 161,751 | | 1.72 | | 1.73 | | 5.78 | | 24 |
| | 0.00 | | | 15.25 | | 9.1 | | | | 233,418 | | 1.76 | | 1.76 | | 4.61 | | 22 |
| | 0.00 | | | 14.66 | | 8.2 | | | | 179,927 | | 1.79 | | 1.79 | | 4.26 | | 21 |
| | 0.00 | | | 14.22 | | 9.5 | | | | 144,081 | | 1.93 | | 1.93 | | 3.98 | | 14 |
| | 0.00 | | | 13.60 | | 14.3 | | | | 128,714 | | 1.98 | | 1.98 | | 4.91 | | 28 |
| | | | | | | | | | | | | | | | | | |
| | — | | | 10.42 | | (9.8 | ) | | | 3,504,845 | | 1.75 | | 1.75 | | 7.77 | | 18 |
| | 0.00 | | | 12.15 | | (15.2 | ) | | | 3,984,204 | | 1.72 | | 1.73 | | 5.85 | | 24 |
| | 0.00 | | | 15.24 | | 9.1 | | | | 3,843,823 | | 1.75 | | 1.75 | | 4.63 | | 22 |
| | 0.00 | | | 14.65 | | 8.1 | | | | 1,812,278 | | 1.79 | | 1.79 | | 4.24 | | 21 |
| | 0.00 | | | 14.22 | | 9.5 | | | | 765,200 | | 1.93 | | 1.93 | | 3.93 | | 14 |
| | 0.00 | | | 13.60 | | 14.3 | | | | 255,705 | | 1.98 | | 1.98 | | 4.87 | | 28 |
| | | | | | | | | | | | | | | | | | |
| | — | | | 10.36 | | (9.4 | ) | | | 921,357 | | 0.74 | | 0.74 | | 8.77 | | 18 |
| | 0.00 | | | 12.09 | | (14.3 | ) | | | 783,058 | | 0.72 | | 0.72 | | 6.88 | | 24 |
| | 0.00 | | | 15.17 | | 10.2 | | | | 638,868 | | 0.74 | | 0.74 | | 5.67 | | 22 |
| | 0.00 | | | 14.59 | | 9.3 | | | | 271,065 | | 0.78 | | 0.78 | | 5.30 | | 21 |
| | 0.00 | | | 14.17 | | 10.5 | | | | 50,369 | | 0.91 | | 0.91 | | 4.98 | | 14 |
| | 0.00 | | | 13.57 | | 15.5 | | | | 10,833 | | 1.00 | | 1.08 | | 5.93 | | 28 |
| (e) | Had certain expenses not been reduced during the period, if applicable, total return would have been lower. |
| (f) | Computed on an annualized basis for periods less than one year, if applicable. |
| (g) | The investment adviser and/or administrator agreed to reimburse a portion of the Fund’s expenses and/or reduce its fees during the period. Without this reimbursement/fee reduction, if applicable, expenses would have been higher. |
| (h) | For the six months ended March 31, 2009 (Unaudited). |
64
NOTESTO FINANCIAL STATEMENTS
March 31, 2009 (Unaudited)
1. Organization. Natixis Funds Trust I and Loomis Sayles Funds II (the “Trusts” and each a “Trust”) are each organized as a Massachusetts business trust. Each Trust is registered under the Investment Company Act of 1940, as amended (“1940 Act”), as an open-end management investment company. Each Declaration of Trust permits the Board of Trustees to authorize the issuance of an unlimited number of shares of the Trust in multiple series. Information presented in these financial statements pertains to certain fixed income funds of the Trusts; the financial statements for the other funds of the Trusts are presented in separate reports. The following funds (individually, a “Fund” and collectively, the “Funds”) are included in this report:
Natixis Funds Trust I:
Loomis Sayles Core Plus Bond Fund (the “Core Plus Bond Fund”)
Loomis Sayles Funds II:
Loomis Sayles High Income Fund (the “High Income Fund”)
Loomis Sayles International Bond Fund (the “International Bond Fund”)
Loomis Sayles Limited Term Government and Agency Fund (the “Limited Term Government and Agency Fund”)
Loomis Sayles Strategic Income Fund (the “Strategic Income Fund”)
The Funds each offer Class A, Class C and Class Y shares. Effective October 12, 2007, Class B shares are no longer offered. Existing Class B shareholders may continue to reinvest dividends into Class B shares and exchange their Class B shares for Class B shares of other Natixis Funds subject to existing exchange privileges as described in the Prospectus.
Class A shares of all Funds except Limited Term Government and Agency Fund are sold with a maximum front-end sales charge of 4.50%. Class A shares of Limited Term Government and Agency Fund are sold with a maximum front-end sales charge of 3.00%. Class B shares do not pay a front-end sales charge, but pay higher Rule 12b-1 fees than Class A shares for eight years (at which point they automatically convert to Class A shares), and are subject to a contingent deferred sales charge (“CDSC”) if those shares are redeemed within six years of purchase. Class C shares do not pay a front-end sales charge, do not convert to any other Class of shares and pay higher Rule 12b-1 fees than Class A shares and may be subject to a CDSC of 1.00% if those shares are redeemed within one year. Class Y shares do not pay a front-end sales charge, a CDSC or Rule 12b-1 fees. Class Y shares are generally intended for institutional investors with a minimum initial investment of $100,000, though some categories of investors are excepted from the minimum investment amount as outlined in the Fund’s Prospectus.
Most expenses of the Trusts can be directly attributed to a fund. Expenses which cannot be directly attributed to a fund are generally apportioned based on the relative net assets of each of the funds in the Trusts. Expenses of a fund are borne pro rata by the holders of each class of shares, except that each class bears expenses unique to that class (including the Rule 12b-1 service and distribution fees and transfer agent fees applicable to such class). In addition, each class votes as a class only with respect to its own Rule 12b-1 Plan. Shares of each class would receive their pro rata share of the net assets of a fund if the fund were liquidated. The Trustees approve separate dividends from net investment income on each class of shares.
2. Significant Accounting Policies. The following is a summary of significant accounting policies consistently followed by each Fund in the preparation of its financial statements. The Funds’ financial statements are prepared in accordance with accounting principles generally accepted in the United States of America which require the use of management estimates that affect the reported amounts and disclosures in the financial statements. Actual results could differ from those estimates.
a. Valuation. Debt securities (other than short-term obligations purchased with an original or remaining maturity of sixty days or less) are generally valued on the basis of evaluated bids furnished to the Funds by a pricing service recommended by the investment adviser and approved by the Board of Trustees, which service determines valuations for normal, institutional-size trading units of such securities using market information, transactions for comparable securities and various relationships between securities which are generally recognized by institutional traders. Equity securities, including closed-end investment companies and exchange-traded funds, for which market quotations are readily available are valued at market value, as reported by pricing services recommended by the investment adviser and approved by the Board of Trustees. Such pricing services generally use the security’s last sale price on the exchange or market where the security is primarily traded or, if there is no reported sale during the day, the closing bid price. Securities traded on the NASDAQ Global Select Market, NASDAQ Global Market and NASDAQ Capital Market are valued at the NASDAQ Official Closing Price (“NOCP”), or if lacking a NOCP, at the most recent bid quotation on the applicable NASDAQ market. Broker-dealer bid quotations may also be used to value debt and equity securities where a pricing service does not price a security or where a pricing service does not provide a reliable price for the security. In instances where broker-dealer bid quotations are not available, certain securities held by the Funds may be valued on the basis of a price provided by a principal market maker. Forward foreign currency contracts are “marked-to-market” daily utilizing interpolated prices determined from information provided by an independent pricing service. Short-term obligations purchased with an original or remaining maturity of sixty days or less are valued at amortized cost, which approximates market value. Securities for which market quotations are not readily available are valued at fair value as determined in good faith by the Funds’ investment adviser using consistently applied procedures under the general supervision of the Board of Trustees. Investments in other open-end investment companies are valued at their net asset value each day.
Certain Funds may hold securities traded in foreign markets. Foreign securities are valued at the market price in the foreign market. However, if events occurring after the close of the foreign market (but before the close of regular trading on the New York Stock Exchange) are believed to materially affect the value of those securities, such securities
65
NOTESTO FINANCIAL STATEMENTS (continued)
March 31, 2009 (Unaudited)
are fair valued pursuant to procedures approved by the Board of Trustees. When fair valuing securities, the Funds may, among other things, use modeling tools or other processes that may take into account factors such as securities market activity and/or significant events that occur after the close of the foreign market and before the Funds calculate their net asset values.
b. Security Transactions and Related Investment Income. Security transactions are accounted for on trade date. Dividend income is recorded on ex-dividend date, or in the case of certain foreign securities, as soon as the Fund is notified, and interest income is recorded on an accrual basis. Interest income is increased by the accretion of discount and decreased by the amortization of premium. Periodic principal adjustments for inflation-protected securities are recorded to interest income. Principal adjustments (in the event of deflation) are recorded as reductions of interest income to the extent of interest income earned. The amount by which deflationary principal adjustments exceed interest income earned is recorded as an increase to the cost basis of the security. Additionally, the amount by which deflationary principal adjustments exceed rising inflationary principal adjustments on a cumulative basis, if any, is recorded as an increase to the cost basis of the security. Distributions received from investments in securities that represent a return of capital or capital gain are recorded as a reduction of cost of investments or as a realized gain, respectively. The calendar year-end amounts of ordinary income, capital gains, and return of capital included in distributions received from the Funds’ investments in real estate investment trusts (“REITs”) are reported to the Funds after the end of the fiscal year; accordingly, the Funds estimate these amounts for accounting purposes until the characterization of REIT distributions is reported to the Funds after the end of the fiscal year. Estimates are based on the most recent REIT distribution information available. Investment income is recorded net of foreign taxes withheld when applicable. In determining net gain or loss on securities sold, the cost of securities has been determined on an identified cost basis. Investment income, non-class specific expenses and realized and unrealized gains and losses are allocated on a pro rata basis to each class based on the relative net assets of each class to the total net assets of the Fund.
c. Foreign Currency Translation. The books and records of the Funds are maintained in U.S. dollars. The value of securities, currencies and other assets and liabilities denominated in currencies other than U.S. dollars are translated into U.S. dollars based upon foreign exchange rates prevailing at the end of the period. Purchases and sales of investment securities, income and expenses are translated on the respective dates of such transactions.
Since the values of investment securities are presented at the foreign exchange rates prevailing at the end of the period, it is not practical to isolate that portion of the results of operations arising from changes in exchange rates from fluctuations which arise due to changes in market prices of the investment securities. Such changes are included with the net realized and unrealized gain or loss on investments.
Net realized foreign exchange gains or losses arise from sales of foreign currency, currency gains or losses realized between the trade and settlement dates on securities transactions, and the difference between the amounts of dividends, interest and foreign withholding taxes recorded on the Funds’ books and the U.S. dollar equivalent of the amounts actually received or paid. Net unrealized foreign exchange gains and losses arise from changes in the value of assets and liabilities, other than investment securities, at the end of the fiscal period, resulting from changes in exchange rates.
Each Fund may use foreign currency exchange contracts to facilitate transactions in foreign-denominated investments. Losses may arise from changes in the value of the foreign currency or if the counterparties do not perform under the contracts’ terms.
Each Fund may purchase investments of foreign issuers. Investing in securities of foreign issuers involves special risks and considerations not typically associated with investing in U.S. companies and securities of the U.S. government. These risks include revaluation of currencies and the risk of expropriation. Moreover, the markets for securities of many foreign issuers may be less liquid and the prices of such securities may be more volatile than those of comparable U.S. companies and the U.S. government.
d. Forward Foreign Currency Contracts. Each Fund may enter into forward foreign currency contracts. Contracts generally are used to acquire exposure to foreign currencies and may also be used for hedging purposes. Also, a contract to buy or sell can offset a previous contract. These contracts involve market risk in excess of the unrealized gain or loss reflected in the Fund’s Statement of Assets and Liabilities. The U.S. dollar value of the currencies a Fund has committed to buy or sell represents the aggregate exposure to each currency the Fund has acquired or hedged through currency contracts outstanding at period end. Gains or losses are recorded for financial statement purposes as unrealized until settlement date. Risks may arise upon entering into these contracts from the potential inability of counterparties to meet the terms of their contracts and from unanticipated movements in the value of a foreign currency relative to the U.S. dollar.
e. Federal and Foreign Income Taxes. Each Trust treats each Fund as a separate entity for federal income tax purposes. Each Fund intends to meet the requirements of the Internal Revenue Code applicable to regulated investment companies, and to distribute to its shareholders substantially all of its net investment income and any net realized capital gains at least annually. Management has performed an analysis of the Funds’ tax positions taken on federal and state tax returns that remain subject to examination (tax years ended September 30, 2005-2008), where applicable, and has concluded that no provisions for income tax are required. Fund management is not aware of any events that are reasonably possible to occur in the next six months that would result in the amounts of any unrecognized tax benefits significantly increasing or decreasing for the Funds. However, management’s conclusions regarding tax positions taken may be subject to review and adjustment at a later date based on factors including, but not limited to, new tax laws and accounting regulations and interpretations thereof.
A Fund may be subject to foreign taxes on income and gains on investments that are accrued based upon the Fund’s understanding of the tax rules and regulations that exist in the countries in which the Fund invests. Foreign governments may also impose taxes or other payments on investments with respect to foreign securities. Such taxes are accrued as applicable, and are reflected as foreign taxes payable on the Statements of Assets and Liabilities.
66
NOTESTO FINANCIAL STATEMENTS (continued)
March 31, 2009 (Unaudited)
f. Dividends and Distributions to Shareholders. Dividends and distributions are recorded on ex-dividend date. The timing and characterization of certain income and capital gain distributions are determined annually in accordance with federal tax regulations, which may differ from accounting principles generally accepted in the United States of America. Permanent differences are primarily due to differing treatments for book and tax purposes for items such as foreign currency transactions, premium amortization, defaulted bond adjustments, paydown gains and losses, expired capital loss carryforwards and return of capital and capital gains distributions from REITS. Permanent book and tax basis differences relating to shareholder distributions will result in reclassifications to capital accounts. Temporary differences between book and tax distributable earnings are primarily due to deferred Trustees’ fees, wash sales, premium amortization accruals, forward contracts mark to market, dividends payable, securities lending collateral gain/loss adjustment, straddle loss deferrals, REIT basis adjustments, discount accretion on inflation-protected securities, defaulted bond interest, capital loss carryforwards and post-October capital loss deferrals. Distributions from net investment income and short-term capital gains are considered to be distributed from ordinary income for tax purposes.
The tax characterization of distributions is determined on an annual basis. The tax character of distributions paid to shareholders during the year ended September 30, 2008 was as follows:
| | | | | | | | | |
| | | 2008 Distributions Paid From: |
Fund | | Ordinary Income | | Long-Term Capital Gains | | Total |
Core Plus Bond Fund | | $ | 8,747,730 | | $ | — | | $ | 8,747,730 |
High Income Fund | | | 3,284,465 | | | — | | | 3,284,465 |
International Bond Fund | | | 243,435 | | | — | | | 243,435 |
Limited Term Government and Agency Fund | | | 5,186,113 | | | — | | | 5,186,113 |
Strategic Income Fund | | | 794,838,869 | | | 9,533,629 | | | 804,372,498 |
Differences between these amounts and those reported in the Statements of Changes in Net Assets, if any, are primarily attributable to different book and tax treatment for short-term capital gains.
As of September 30, 2008, the capital loss carryforwards and post-October losses were as follows:
| | | | | | | | | | | | | | | | | | | |
| | | Core Plus
Bond Fund | | | High Income
Fund | | | International
Bond Fund | | | Limited Term
Government and
Agency Fund | | | Strategic Income
Fund |
Capital loss carryforward: | | | | | | | | | | | | | | | | | | | |
Expires September 30, 2009 | | $ | — | | | $ | (43,374,722 | ) | | $ | — | | | $ | (4,128,091 | ) | | $ | — |
Expires September 30, 2010 | | | (19,514,453 | ) | | | (26,826,634 | ) | | | — | | | | (663,109 | ) | | | — |
Expires September 30, 2011 | | | — | | | | — | | | | — | | | | (425,323 | ) | | | — |
Expires September 30, 2012 | | | — | | | | — | | | | — | | | | (193,904 | ) | | | — |
Expires September 30, 2013 | | | — | | | | — | | | | — | | | | — | | | | — |
Expires September 30, 2014 | | | (181,728 | ) | | | — | | | | — | | | | (2,770,324 | ) | | | — |
Expires September 30, 2015 | | | — | | | | — | | | | — | | | | (4,336,746 | ) | | | — |
Expires September 30, 2016 | | | — | | | | — | | | | — | | | | (115,630 | ) | | | — |
| | | | | | | | | | | | | | | | | | | |
Total capital loss carryforward | | $ | (19,696,181 | ) | | $ | (70,201,356 | ) | | $ | — | | | $ | (12,633,127 | ) | | $ | — |
| | | | | | | | | | | | | | | | | | | |
Deferred net capital and currency losses (post-October 2007) | | $ | — | | | $ | — | | | $ | (87,381 | ) | | $ | — | | | $ | — |
| | | | | | | | | | | | | | | | | | | |
g. Repurchase Agreements. It is each Fund’s policy that the market value of the collateral for repurchase agreements be at least equal to 100% of the repurchase price, including interest. Certain repurchase agreements are tri-party arrangements whereby the collateral is held in a segregated account for the benefit of the Fund and on behalf of the counterparty. It is each Fund’s policy, regarding tri-party arrangements, that the market value of the collateral be at least equal to 102% of the repurchase price, including interest. Repurchase agreements could involve certain risks in the event of default or insolvency of the counterparty including possible delays or restrictions upon a Fund’s ability to dispose of the underlying securities.
h. Securities Lending. The Funds have entered into an agreement with State Street Bank and Trust Company (“State Street Bank”), as agent of the Funds, to lend securities to certain designated borrowers. The loans are collateralized with cash or securities in an amount equal to at least 105% or 102% of the market value (including accrued interest) of the loaned international or domestic securities, respectively, when the loan is initiated. Thereafter, the value of the collateral must remain at least 102% of the market value (including accrued interest) of loaned securities for U.S. equities and U.S. corporate debt; at least 105% of the market value (including accrued interest) of loaned secu-
67
NOTESTO FINANCIAL STATEMENTS (continued)
March 31, 2009 (Unaudited)
rities for non-U.S. equities; and at least 100% of the market value (including accrued interest) of loaned securities for U.S. government securities, sovereign debt issued by non-U.S. governments and non-U.S. corporate debt. In the event that the market value of the collateral falls below the required percentages described above, the borrower will deliver additional collateral on the next business day. As with other extensions of credit, the Funds bear the risk of loss with respect to the investment of the collateral. The Funds invest cash collateral in short-term investments, a portion of the income from which is remitted to the borrowers and the remainder allocated between the Funds and State Street Bank as lending agent.
As of March 31, 2009, there were no securities on loan.
i. Delayed Delivery Commitments. Certain transactions, such as forward transactions, or purchases of when-issued or delayed delivery instruments may have a similar effect on a Fund’s net asset value as if the Fund had created a degree of leverage in its portfolio. The price of the underlying instruments and the date when they will be paid for are fixed at the time the transaction is negotiated. If a Fund enters into such a transaction, collateral consisting of liquid securities or cash and cash equivalents will be maintained in an amount at least equal to the commitment with the custodian and/ or broker. Losses may arise due to changes in the market value of the underlying instruments or if the counterparty does not perform under the contract.
j. Indemnifications. Under the Trusts’ organizational documents, their officers and Trustees are indemnified against certain liabilities arising out of the performance of their duties to the Funds. Additionally, in the normal course of business, the Funds enter into contracts with service providers that contain general indemnification clauses. The Funds’ maximum exposure under these arrangements is unknown as this would involve future claims that may be made against the Funds that have not yet occurred. However, based on experience, the Funds expect the risk of loss to be remote.
k. New Accounting Pronouncement. In March 2008, Statement of Financial Accounting Standards No. 161, Disclosures about Derivative Instruments and Hedging Activities (“FAS 161”), was issued and will be effective for fiscal years and interim periods beginning after November 15, 2008. FAS 161 requires enhanced disclosures about funds’ derivative and hedging activities. Management is currently evaluating the impact the adoption of FAS 161 may have on the Funds’ financial statement disclosures.
3. Fair Value Measurements. The Funds adopted Financial Accounting Standards Board Statement of Financial Accounting Standards No. 157 (“FAS 157”), Fair Value Measurements, effective October 1, 2008. FAS 157 establishes a hierarchy for net asset value determination purposes in which various inputs are used in determining the value of the Fund’s investments. These inputs are summarized in the three broad levels listed below:
| | • | | Level 1 — quoted prices in active markets for identical investments; |
| | • | | Level 2 — prices determined using other significant observable inputs that are observable either directly, or indirectly through corroboration with observable market data (which could include quoted prices for similar investments, interest rates, credit risk, etc.); |
| | • | | Level 3 — prices determined using significant unobservable inputs for situations where quoted prices or observable inputs are unavailable such as when there is little or no market activity for an investment (unobservable inputs reflect the Fund’s own assumptions in determining the fair value of investments and would be based on the best information available). |
The inputs or methodology used for valuing securities are not necessarily an indication of the risk associated with investing in those securities.
Other financial instruments are derivative instruments not reflected in investments carried at value and include forward contracts, which are valued at the unrealized appreciation/depreciation on the instrument.
The following is a summary of the inputs used to value the Funds’ investments as of March 31, 2009:
Core Plus Bond Fund
| | | |
Valuation Inputs | | Investments in
Securities |
Level 1 – Quoted Prices | | $ | 1,711,349 |
Level 2 – Other Significant Observable Inputs | | | 193,529,154 |
Level 3 – Significant Unobservable Inputs | | | 4,022,415 |
| | | |
Total | | $ | 199,262,918 |
| | | |
68
NOTESTO FINANCIAL STATEMENTS (continued)
March 31, 2009 (Unaudited)
High Income Fund
| | | |
Securities Purchased Valuation Inputs | | Investments in
Securities |
Level 1 – Quoted Prices | | $ | 10,470,400 |
Level 2 – Other Significant Observable Inputs | | | 43,789,798 |
Level 3 – Significant Unobservable Inputs | | | 3,979,237 |
| | | |
Total | | $ | 58,239,435 |
| | | |
| | | |
Forward Currency Contracts Valuation Inputs | | Other Financial Instruments |
Level 1 – Quoted Prices | | $ | — |
Level 2 – Other Significant Observable Inputs | | | 6,715 |
Level 3 – Significant Unobservable Inputs | | | — |
| | | |
Total | | $ | 6,715 |
| | | |
International Bond Fund
| | | |
Securities Purchased Valuation Inputs | | Investments in
Securities |
Level 1 – Quoted Prices | | $ | 144,855 |
Level 2 – Other Significant Observable Inputs | | | 12,398,247 |
Level 3 – Significant Unobservable Inputs | | | 280,046 |
| | | |
Total | | $ | 12,823,148 |
| | | |
| | | |
Forward Currency Contracts Valuation Inputs | | Other Financial Instruments |
Level 1 – Quoted Prices | | $ | — |
Level 2 – Other Significant Observable Inputs | | | 42,979 |
Level 3 – Significant Unobservable Inputs | | | — |
| | | |
Total | | $ | 42,979 |
| | | |
Limited Term Government and Agency Fund
| | | |
Valuation Inputs | | Investments in
Securities |
Level 1 – Quoted Prices | | $ | 1,949,858 |
Level 2 – Other Significant Observable Inputs | | | 212,066,431 |
Level 3 – Significant Unobservable Inputs | | | 1,548,020 |
| | | |
Total | | $ | 215,564,309 |
| | | |
Strategic Income Fund
| | | |
Valuation Inputs | | Investments in
Securities |
Level 1 – Quoted Prices | | $ | 600,212,043 |
Level 2 – Other Significant Observable Inputs | | | 7,356,882,829 |
Level 3 – Significant Unobservable Inputs | | | 801,894,380 |
| | | |
Total | | $ | 8,758,989,252 |
| | | |
69
NOTESTO FINANCIAL STATEMENTS (continued)
March 31, 2009 (Unaudited)
The following is a reconciliation of Level 3 investments for which significant unobservable inputs were used to determine fair value as of March 31, 2009:
Core Plus Bond Fund
| | | | |
Assets | | Investments in Securities | |
Balance as of September 30, 2008 | | $ | 7,086,547 | |
Realized gain (loss) | | | (988,704 | ) |
Change in unrealized appreciation (depreciation)(a) | | | (1,868,519 | ) |
Net purchases (sales) | | | 303,146 | |
Net reclassifications to/from Level 3 | | | (510,055 | ) |
| | | | |
Balance as of March 31, 2009 | | $ | 4,022,415 | |
| | | | |
High Income Fund
| | | | |
Assets | | Investments in Securities | |
Balance as of September 30, 2008 | | $ | 2,758,373 | |
Realized gain (loss) | | | (494,476 | ) |
Change in unrealized appreciation (depreciation)(a) | | | (2,869,434 | ) |
Net purchases (sales) | | | 504,098 | |
Net reclassifications to/from Level 3 | | | 4,080,676 | |
| | | | |
Balance as of March 31, 2009 | | $ | 3,979,237 | |
| | | | |
International Bond Fund
| | | | |
Assets | | Investments in Securities | |
Balance as of September 30, 2008 | | $ | 126,992 | |
Realized gain (loss) | | | — | |
Change in unrealized appreciation (depreciation)(a) | | | (102,116 | ) |
Net purchases (sales) | | | 62,475 | |
Net reclassifications to/from Level 3 | | | 192,695 | |
| | | | |
Balance as of March 31, 2009 | | $ | 280,046 | |
| | | | |
Limited Term Government and Agency Fund
| | | | |
Assets | | Investments in Securities | |
Balance as of September 30, 2008 | | $ | 743,234 | |
Realized gain (loss) | | | 7,779 | |
Change in unrealized appreciation (depreciation)(a) | | | (777,843 | ) |
Net purchases (sales) | | | (579,761 | ) |
Net reclassifications to/from Level 3 | | | 2,154,611 | |
| | | | |
Balance as of March 31, 2009 | | $ | 1,548,020 | |
| | | | |
70
NOTESTO FINANCIAL STATEMENTS (continued)
March 31, 2009 (Unaudited)
Strategic Income Fund
| | | | |
Assets | | Investments in Securities | |
Balance as of September 30, 2008 | | $ | 217,545,454 | |
Realized gain (loss) | | | (15,207,519 | ) |
Change in unrealized appreciation (depreciation)(a) | | | (371,428,123 | ) |
Net purchases (sales) | | | 173,717,724 | |
Net reclassifications to/from Level 3 | | | 797,266,844 | |
| | | | |
Balance as of March 31, 2009 | | $ | 801,894,380 | |
| | | | |
(a) Change in unrealized appreciation (depreciation) is included in net change in unrealized appreciation (depreciation) on investments within the Statement of Operations
In April 2009, the Financial Accounting Standards Board (“FASB”) issued FASB Staff Position No. 157-4, Determining Fair Value When the Volume and Level of Activity for the Asset or Liability Have Significantly Decreased and Identifying Transactions That Are Not Orderly (“FSP 157-4”). FSP 157-4 provides additional guidance for estimating fair value in accordance with FAS 157, when the volume and level of activity for the asset or liability have significantly decreased as well as guidance on identifying circumstances that indicate a transaction is not orderly. FSP 157-4 is effective for fiscal years and interim periods ending after June 15, 2009. Management is currently evaluating the impact the adoption of FSP 157-4 will have on the Funds’ financial statement disclosures.
4. Purchases and Sales of Securities. For the six months ended March 31, 2009, purchases and sales of securities (excluding short-term investments and including paydowns) were as follows:
| | | | | | | | | | | | |
| | | U.S. Government and
Agency Securities | | Other Securities |
Fund | | Purchases | | Sales | | Purchases | | Sales |
Core Plus Bond Fund | | $ | 57,660,939 | | $ | 61,349,268 | | $ | 69,488,277 | | $ | 37,998,580 |
High Income Fund | | | — | | | — | | | 16,486,294 | | | 6,931,247 |
International Bond Fund | | | — | | | — | | | 4,491,520 | | | 3,648,491 |
Limited Term Government and Agency Fund | | | 88,030,394 | | | 21,480,168 | | | 15,949,559 | | | 2,459,961 |
Strategic Income Fund | | | 91,170 | | | 50,965,350 | | | 1,543,764,978 | | | 1,934,802,540 |
5. Management Fees and Other Transactions with Affiliates.
a. Management Fees. Loomis, Sayles & Company, L.P. (“Loomis Sayles”) serves as investment adviser to each Fund. Under the terms of the management agreements, each Fund pays a management fee at the following annual rates, calculated daily and payable monthly, based on each Fund’s average daily net assets:
| | | | | | | | | | |
| | | Percentage of Average Daily Net Assets |
Fund | | First $100 million | | Next $100 million | | Next $1.8 billion | | Next $13 billion | | Over $15 billion |
Core Plus Bond Fund | | 0.2500% | | 0.1875% | | 0.1875% | | 0.1875% | | 0.1875% |
High Income Fund | | 0.6000% | | 0.6000% | | 0.6000% | | 0.6000% | | 0.6000% |
International Bond Fund | | 0.6000% | | 0.6000% | | 0.6000% | | 0.6000% | | 0.6000% |
Limited Term Government and Agency Fund | | 0.5000% | | 0.5000% | | 0.5000% | | 0.5000% | | 0.5000% |
Strategic Income Fund | | 0.6500% | | 0.6500% | | 0.6000% | | 0.5500% | | 0.5400% |
Natixis Asset Management Advisors, L.P. (“Natixis Advisors”), serves as the advisory administrator to Core Plus Bond Fund. Under the terms of the advisory administration agreement, the Fund pays an advisory administration fee at the following annual rates, calculated daily and payable monthly, based on its average daily net assets:
| | | | |
| | | Percentage of Average Daily Net Assets |
Fund | | First $100 million | | Over $100 million |
Core Plus Bond Fund | | 0.2500% | | 0.1875% |
71
NOTESTO FINANCIAL STATEMENTS (continued)
March 31, 2009 (Unaudited)
Management and advisory administration fees are presented in the Statements of Operations as management fees.
Loomis Sayles has given binding undertakings to the Funds to reduce management fees and/or reimburse certain expenses associated with these Funds to limit their operating expenses, exclusive of brokerage expenses, interest expense, taxes and extraordinary expenses. These undertakings are in effect until January 31, 2010 and will be reevaluated on an annual basis. For the six months ended March 31, 2009, the expense limits as a percentage of average daily net assets under the expense limitation agreements were as follows:
| | | | | | | | |
| | | Expense Limit as a Percentage of
Average Daily Net Assets |
Fund | | Class A | | Class B | | Class C | | Class Y |
Core Plus Bond Fund | | 0.90% | | 1.65% | | 1.65% | | 0.65% |
High Income Fund | | 1.15% | | 1.90% | | 1.90% | | 0.90% |
International Bond Fund | | 1.10% | | — | | 1.85% | | 0.85% |
Limited Term Government and Agency Fund | | 0.90% | | 1.65% | | 1.65% | | 0.65% |
Strategic Income Fund | | 1.25% | | 2.00% | | 2.00% | | 1.00% |
Loomis Sayles and Natixis Advisors have agreed to equally bear the fee reductions and/or expense reimbursements for the Core Plus Bond Fund.
For the six months ended March 31, 2009, the management fees and reductions of management fees for each Fund were as follows:
| | | | | | | | | | | | | |
Fund | | Gross
Management
Fee | | Reduction of
Management
Fee | | Net
Management
Fee | | Percentage of
Average
Daily Net Assets |
| | | | | Gross | | Net |
Core Plus Bond Fund | | $ | 205,127 | | $ | — | | $ | 205,127 | | 0.221% | | 0.221% |
High Income Fund | | | 143,945 | | | 30,797 | | | 113,148 | | 0.600% | | 0.472% |
International Bond Fund | | | 37,680 | | | 37,680 | | | — | | 0.600% | | — % |
Limited Term Government and Agency Fund | | | 466,195 | | | — | | | 466,195 | | 0.500% | | 0.500% |
Strategic Income Fund | | | 24,372,296 | | | — | | | 24,372,296 | | 0.560% | | 0.560% |
For the six months ended March 31, 2009, the advisory administration fees and fee reductions for Core Plus Bond Fund were as follows:
| | | | | | | | | | | | |
Gross
Advisory
Administration
Fee | | Reduction of
Advisory
Administration
Fee | | Net
Advisory
Administration
Fee | | Percentage of
Average
Daily Net Assets | |
| | | | Gross | | | Net | |
| $205,127 | | $ | — | | $ | 205,127 | | 0.221 | % | | 0.221 | % |
For the six months ended March 31, 2009, expenses have been reimbursed as follows:
| | | |
Fund | | Reimbursement |
Core Plus Bond Fund | | $ | 71,407 |
High Income Fund | | | 33,184 |
International Bond Fund | | | 51,446 |
Limited Term Government and Agency Fund | | | 84,347 |
Loomis Sayles (and Natixis Advisors for Core Plus Bond Fund) shall be permitted to recover expenses borne under the expense limitation agreement (whether through reduction of its management fees or otherwise) on a class by class basis in later periods to the extent the expenses of a class fall below a class’ expense limits, provided, however, that a class is not obligated to pay such reduced fees/expenses more than one year after the end of the fiscal year in which the fee/expense was reduced. The amounts subject to possible recovery under the expense limitation agreements at March 31, 2009 were as follows:
| | | | | | | | | | | | | | | |
| | | Expenses Subject to Possible Recovery
until September 30, 2009 |
Fund | | Class A | | Class B | | Class C | | Class Y | | Total |
Core Plus Bond Fund | | $ | 119,781 | | $ | 16,829 | | $ | 18,008 | | $ | 11,848 | | $ | 166,466 |
High Income Fund | | | 87,268 | | | 7,993 | | | 17,578 | | | 1,236 | | | 114,075 |
International Bond Fund | | | 11,799 | | | — | | | 4,529 | | | 113,483 | | | 129,811 |
Limited Term Government and Agency Fund | | | 156,243 | | | 8,567 | | | 11,794 | | | 2,867 | | | 179,471 |
72
NOTESTO FINANCIAL STATEMENTS (continued)
March 31, 2009 (Unaudited)
| | | | | | | | | | | | | | | |
| | | Expenses Subject to Possible Recovery
until September 30, 2010 |
Fund | | Class A | | Class B | | Class C | | Class Y | | Total |
Core Plus Bond Fund | | $ | 47,491 | | $ | 3,706 | | $ | 15,633 | | $ | 4,577 | | $ | 71,407 |
High Income Fund | | | 44,236 | | | 2,042 | | | 12,992 | | | 4,711 | | | 63,981 |
International Bond Fund | | | 16,357 | | | — | | | 5,724 | | | 67,045 | | | 89,126 |
Limited Term Government and Agency Fund | | | 55,314 | | | 2,326 | | | 26,182 | | | 525 | | | 84,347 |
Certain officers and directors of Loomis Sayles and Natixis Advisors are also Trustees of the Funds. Loomis Sayles and Natixis Advisors are both limited partnerships indirectly owned by Natixis Global Asset Management, L.P. (“Natixis US”), which is part of Natixis Global Asset Management, an international asset management group based in Paris, France.
b. Administrative Fees. Natixis Advisors provides certain administrative services for the Funds and subcontracts with State Street Bank to serve as sub-administrator. Natixis Advisors is a wholly-owned subsidiary of Natixis US. Pursuant to an agreement among Natixis Funds Trust I, Natixis Funds Trust II, Natixis Funds Trust III, Natixis Funds Trust IV, Natixis Cash Management Trust, Gateway Trust (“Natixis Funds Trusts”), Loomis Sayles Funds I, Loomis Sayles Funds II (“Loomis Sayles Funds Trusts”), Hansberger International Series and Natixis Advisors, each Fund pays Natixis Advisors monthly its pro rata portion of fees equal to an annual rate of 0.0575% of the first $15 billion of the average daily net assets of the Natixis Funds Trusts, Loomis Sayles Funds Trusts and the Hansberger International Series, 0.0500% of the next $15 billion, 0.0425% of the next $30 billion and 0.0375% of such assets in excess of $60 billion, subject to an annual aggregate minimum fee for the Natixis Funds Trusts, Loomis Sayles Funds Trusts and the Hansberger International Series of $10 million, which is reevaluated on an annual basis. New funds are subject to a fee for the first twelve months of operations of $75,000 plus $12,500 per class and an additional $75,000 if managed by multiple subadvisors.
For the six months ended March 31, 2009, each Fund paid the following for administrative fees to Natixis Advisors:
| | | |
Fund | | Administrative Fees |
Core Plus Bond Fund | | $ | 46,493 |
High Income Fund | | | 12,027 |
International Bond Fund | | | 35,013 |
Limited Term Government and Agency Fund | | | 46,721 |
Strategic Income Fund | | | 2,169,973 |
c. Service and Distribution Fees. Natixis Distributors, L.P. (“Natixis Distributors”), a wholly-owned subsidiary of Natixis US, has entered into a distribution agreement with the Trusts. Pursuant to this agreement, Natixis Distributors serves as principal underwriter of each Fund.
Pursuant to Rule 12b-1 under the 1940 Act, the Trusts have adopted a Service Plan relating to each Fund’s Class A shares (the “Class A Plans”) and a Distribution and Service Plan relating to each Fund’s Class B and Class C shares (the “Class B and Class C Plans”).
Under the Class A Plans, each Fund pays Natixis Distributors a monthly service fee at an annual rate not to exceed 0.25% of the average daily net assets attributable to the Fund’s Class A shares, as reimbursement for expenses incurred by Natixis Distributors in providing personal services to investors in Class A shares and/or the maintenance of shareholder accounts.
Under the Class B, if applicable, and Class C Plans, each Fund pays Natixis Distributors a monthly service fee at an annual rate not to exceed 0.25% of the average daily net assets attributable to the Fund’s Class B and Class C shares, as compensation for services provided and expenses incurred by Natixis Distributors in providing personal services to investors in Class B and Class C shares and/or the maintenance of shareholder accounts.
Also under the Class B, if applicable, and Class C Plans, each Fund pays Natixis Distributors a monthly distribution fee at the annual rate of 0.75% of the average daily net assets attributable to the Fund’s Class B and Class C shares, as compensation for services provided and expenses incurred by Natixis Distributors in connection with the marketing or sale of Class B and Class C shares.
73
NOTESTO FINANCIAL STATEMENTS (continued)
March 31, 2009 (Unaudited)
For the six months ended March 31, 2009, the Funds paid the following service and distribution fees:
| | | | | | | | | | | | | | | |
| | | Service Fee | | Distribution Fee |
Fund | | Class A | | Class B | | Class C | | Class B | | Class C |
| | | | | | | | | | | | | | | |
Core Plus Bond Fund | | $ | 147,015 | | $ | 11,186 | | $ | 51,568 | | $ | 33,559 | | $ | 154,706 |
High Income Fund | | | 41,309 | | | 1,936 | | | 12,084 | | | 5,806 | | | 36,251 |
International Bond Fund | | | 2,794 | | | — | | | 980 | | | — | | | 2,940 |
Limited Term Government and Agency Fund | | | 147,577 | | | 6,036 | | | 67,420 | | | 18,110 | | | 202,260 |
Strategic Income Fund | | | 5,521,146 | | | 162,938 | | | 4,205,249 | | | 488,816 | | | 12,615,749 |
d. Sub-Transfer Agent Fees. Natixis Distributors has entered into agreements with financial intermediaries to provide certain recordkeeping, processing, shareholder communications and other services to customers of the intermediaries and has agreed to compensate the intermediaries for providing those services. Certain services would be provided by the Funds if the shares of those customers were registered directly with the Funds’ transfer agent. Accordingly, the Funds agreed to pay a portion of the intermediary fees attributable to shares of the Fund held by the intermediaries (which generally are a percentage of the value of shares held) not exceeding what the Funds would have paid its transfer agent had each customer’s shares been registered directly with the transfer agent instead of held through the intermediaries. Natixis Distributors pays the remainder of the fees. Listed below are the fees incurred by the Funds which are included in the transfer agent fees and expenses in the Statements of Operations.
| | | | | | | | | | | | |
| | | Sub-Transfer Agent Fees |
Fund | | Class A | | Class B | | Class C | | Class Y |
| | | | | | | | | | | | |
| | | | | | | | | | | | |
Core Plus Bond Fund | | $ | 47,029 | | $ | 3,887 | | $ | 14,563 | | $ | 9,838 |
High Income Fund | | | 10,071 | | | 501 | | | 3,011 | | | 2,286 |
International Bond Fund | | | 607 | | | — | | | 201 | | | 32 |
Limited Term Government and Agency Fund | | | 34,611 | | | 1,482 | | | 11,284 | | | 1,307 |
Strategic Income Fund | | | 1,735,053 | | | 51,976 | | | 1,305,383 | | | 274,194 |
e. Commissions. The Funds have been informed that commissions (including CDSCs) on Fund shares retained by Natixis Distributors during the six months ended March 31, 2009 were as follows:
| | | |
Fund | | Commission |
Core Plus Bond Fund | | $ | 144,252 |
High Income Fund | | | 34,036 |
International Bond Fund | | | 5,856 |
Limited Term Government and Agency Fund | | | 104,663 |
Strategic Income Fund | | | 4,582,541 |
f. Trustees Fees and Expenses. The Funds do not pay any compensation directly to their officers or Trustees who are directors, officers or employees of Natixis Advisors, Natixis Distributors, Natixis US, or their affiliates. The Chairperson of the Board receives a retainer fee at the annual rate of $200,000. The Chairperson does not receive any meeting attendance fees for Board of Trustees meetings or committee meetings that she attends. Each Independent Trustee (other than the Chairperson) receives, in the aggregate, a retainer fee at the annual rate of $65,000. Each Independent Trustee also receives a meeting attendance fee of $7,500 for each meeting of the Board of Trustees that he or she attends in person and $3,750 for each meeting of the Board of Trustees that he or she attends telephonically. In addition, each committee chair receives an additional retainer fee at the annual rate of $10,000. Each Contract Review and Governance Committee member is compensated $5,000 for each Committee meeting that he or she attends in person and $2,500 for each meeting that he or she attends telephonically. Each Audit Committee member is compensated $6,250 for each Committee meeting that he or she attends in person and $3,125 for each meeting that he or she attends telephonically. These fees are allocated among the funds in the Natixis Funds Trusts, Loomis Sayles Funds Trusts and the Hansberger International Series based on a formula that takes into account, among other factors, the relative net assets of each Fund. Trustees are reimbursed for travel expenses in connection with attendance at meetings.
A deferred compensation plan (the “Plan”) is available to the Trustees on a voluntary basis. Deferred amounts remain in the Funds until distributed in accordance with the provisions of the Plan. The value of a participating Trustee’s deferral account is based on theoretical investments of deferred amounts, on the normal payment dates, in certain funds of the Natixis Funds Trusts, Loomis Sayles Funds Trusts and Hansberger International Series as designated by the participating Trustees. Changes in the value of participants’ deferral accounts are allocated pro rata among the funds in the Natixis Funds Trusts, Loomis Sayles Funds Trusts, and Hansberger International Series, and are normally reflected as Trustees’ fees and expenses in the Statements of Operations. The portions of the accrued obligations allocated to the Funds under the Plan are reflected as Deferred Trustees’ fees in the Statements of Assets and Liabilities.
74
NOTESTO FINANCIAL STATEMENTS (continued)
March 31, 2009 (Unaudited)
For the six months ended March 31, 2009, net depreciation in the value of participants’ deferral accounts has been included in Miscellaneous expenses in the Statements of Operations, as follows:
| | | |
Fund | | Amount |
Core Plus Bond Fund | | $ | 46,493 |
High Income Fund | | | 6,879 |
International Bond Fund | | | 516 |
Limited Term Government and Agency Fund | | | 24,719 |
Strategic Income Fund | | | 39,732 |
g. Redemption Fees. Shareholders of Class A shares of High Income Fund are charged a 2% redemption fee if they redeem, including redeeming by exchange within 60 days of acquisition (including acquisition by exchange). The redemption fee is intended to offset the cost to the Fund of short-term trading, such as portfolio transaction and market impact costs associated with redemption activity and administrative costs associated with processing redemptions. The redemption fee is deducted from the shareholder’s redemption or exchange proceeds and is paid to the Fund. The “first-in, first-out” method is used to determine the holding period of redeemed or exchanged shares, which means that if a shareholder acquired shares on different days, the shares acquired first will be redeemed or exchanged first for purposes of determining whether the redemption fee applies. A new holding period begins with each purchase or exchange. These fees are accounted for as an addition to paid-in capital and are presented in the Statements of Changes in Net Assets.
On March 27, 2009, the Trustees approved the elimination of redemption fees on High Income Fund effective June 1, 2009.
6. Line of Credit. Each Fund, together with certain other funds of Natixis Funds Trusts, Loomis Sayles Funds Trusts and the Hansberger International Series, participates in a $200,000,000 committed line of credit provided by State Street Bank, with an individual limit of $125,000,000 for each Fund that participates in the line of credit. Interest is charged to each participating fund based on its borrowings at a rate per annum equal to the greater of the Federal Funds rate or overnight LIBOR, plus 0.75%. In addition, a commitment fee of 0.125% per annum, payable at the end of each calendar quarter, is accrued and apportioned among the participating funds based on their average daily unused portion of the line of credit.
Prior to March 11, 2009, each Fund, together with certain other funds of Natixis Funds Trusts, Loomis Sayles Funds Trusts and Hansberger International Series, participated in a $200,000,000 committed line of credit provided by State Street Bank, with an individual limit of $125,000,000 for each Fund that participated in the line of credit. Interest was charged to each participating fund based on its borrowings at a rate per annum equal to the greater of the Federal Funds rate plus 0.50%. In addition, a commitment fee of 0.09% per annum, payable at the end of each calendar quarter, was accrued and apportioned among the participating funds based on their average daily unused portion of the line of credit.
For the six months ended March 31, 2009, the Funds had no borrowings under these agreements.
7. Concentration of Risk. International Bond Fund is a non-diversified fund. Compared with diversified mutual funds, the International Bond Fund may invest a greater percentage of its assets in a particular country. Therefore, the International Bond Fund’s returns could be significantly affected by the performance of any one of the small number of countries in its portfolio.
8. Shareholders. At March 31, 2009, the Loomis Sayles Employees’ Profit Sharing Retirement Plan held 39,874 shares of beneficial interest of Limited Term Government and Agency Fund. At March 31, 2009, Natixis US owned shares equating to 69.93% of International Bond Fund’s net assets.
75
NOTESTO FINANCIAL STATEMENTS (continued)
March 31, 2009 (Unaudited)
9. Capital Shares. Each Fund may issue an unlimited number of shares of beneficial interest, without par value. Transactions in capital shares were as follows:
| | | | | | | | | | | | | | |
| | Six Months Ended
March 31, 2009 | | | Year Ended September 30, 2008 | |
Core Plus Bond Fund | | Shares | | | | Amount | | | Shares | | | | Amount | |
| | | | | | | | | | | | | | |
| Class A | | | | | | | | | | | | | | |
Issued from the sale of shares | | 3,048,715 | | | $ | 31,786,087 | | | 3,961,377 | | | $ | 44,610,104 | |
Issued in connection with the reinvestment of distributions | | 288,083 | | | | 3,018,813 | | | 416,060 | | | | 4,674,418 | |
Redeemed | | (2,591,197 | ) | | | (26,900,820 | ) | | (2,742,021 | ) | | | (30,840,053 | ) |
| | | | | | | | | | | | | | |
Net change | | 745,601 | | | $ | 7,904,080 | | | 1,635,416 | | | $ | 18,444,469 | |
| | | | | | | | | | | | | | |
| Class B | | | | | | | | | | | | | | |
Issued from the sale of shares | | 53,784 | | | $ | 564,727 | | | 81,830 | | | $ | 928,726 | |
Issued in connection with the reinvestment of distributions | | 17,755 | | | | 186,468 | | | 43,582 | | | | 492,099 | |
Redeemed | | (291,259 | ) | | | (3,037,950 | ) | | (6,832,567 | ) | | | (77,200,182 | ) |
| | | | | | | | | | | | | | |
Net change | | (219,720 | ) | | $ | (2,286,755 | ) | | (6,707,155 | ) | | $ | (75,779,357 | ) |
| | | | | | | | | | | | | | |
| Class C | | | | | | | | | | | | | | |
Issued from the sale of shares | | 3,524,790 | | | $ | 36,891,543 | | | 1,866,796 | | | $ | 20,868,873 | |
Issued in connection with the reinvestment of distributions | | 37,229 | | | | 392,375 | | | 25,095 | | | | 281,730 | |
Redeemed | | (1,108,682 | ) | | | (11,633,325 | ) | | (483,069 | ) | | | (5,447,710 | ) |
| | | | | | | | | | | | | | |
Net change | | 2,453,337 | | | $ | 25,650,593 | | | 1,408,822 | | | $ | 15,702,893 | |
| | | | | | | | | | | | | | |
| Class Y | | | | | | | | | | | | | | |
Issued from the sale of shares | | 769,890 | | | $ | 8,068,372 | | | 1,132,575 | | | $ | 12,755,055 | |
Issued in connection with the reinvestment of distributions | | 33,663 | | | | 353,671 | | | 44,572 | | | | 502,262 | |
Redeemed | | (1,146,744 | ) | | | (12,080,781 | ) | | (654,873 | ) | | | (7,360,390 | ) |
| | | | | | | | | | | | | | |
Net change | | (343,191 | ) | | $ | (3,658,738 | ) | | 522,274 | | | $ | 5,896,927 | |
| | | | | | | | | | | | | | |
Increase (decrease) from capital share transactions | | 2,636,027 | | | $ | 27,609,180 | | | (3,140,643 | ) | | $ | (35,735,068 | ) |
| | | | | | | | | | | | | | |
76
NOTESTO FINANCIAL STATEMENTS (continued)
March 31, 2009 (Unaudited)
9. Capital Shares (continued).
| | | | | | | | | | | | | | |
| | Six Months Ended March 31, 2009 | | | Year Ended September 30, 2008* | |
High Income Fund | | Shares | | | | Amount | | | Shares | | | | Amount | |
| | | | | | | | | | | | | | |
| Class A | | | | | | | | | | | | | | |
Issued from the sale of shares | | 3,967,690 | | | $ | 13,837,785 | | | 4,904,752 | | | $ | 23,822,307 | |
Issued in connection with the reinvestment of distributions | | 377,024 | | | | 1,273,086 | | | 378,438 | | | | 1,831,932 | |
Redeemed | | (2,352,663 | ) | | | (8,202,681 | ) | | (2,555,411 | ) | | | (12,401,358 | ) |
| | | | | | | | | | | | | | |
Net change | | 1,992,051 | | | $ | 6,908,190 | | | 2,727,779 | | | $ | 13,252,881 | |
| | | | | | | | | | | | | | |
| Class B | | | | | | | | | | | | | | |
Issued from the sale of shares | | 10,222 | | | $ | 35,319 | | | 44,248 | | | $ | 206,339 | |
Issued in connection with the reinvestment of distributions | | 14,056 | | | | 47,382 | | | 26,234 | | | | 128,112 | |
Redeemed | | (143,550 | ) | | | (508,165 | ) | | (356,172 | ) | | | (1,746,563 | ) |
| | | | | | | | | | | | | | |
Net change | | (119,272 | ) | | $ | (425,464 | ) | | (285,690 | ) | | $ | (1,412,112 | ) |
| | | | | | | | | | | | | | |
| Class C | | | | | | | | | | | | | | |
Issued from the sale of shares | | 1,232,923 | | | $ | 4,274,320 | | | 1,607,159 | | | $ | 7,812,971 | |
Issued in connection with the reinvestment of distributions | | 88,241 | | | | 297,951 | | | 53,048 | | | | 255,350 | |
Redeemed | | (564,529 | ) | | | (1,924,227 | ) | | (346,620 | ) | | | (1,670,004 | ) |
| | | | | | | | | | | | | | |
Net change | | 756,635 | | | $ | 2,648,044 | | | 1,313,587 | | | $ | 6,398,317 | |
| | | | | | | | | | | | | | |
| Class Y | | | | | | | | | | | | | | |
Issued from the sale of shares | | 1,199,156 | | | $ | 4,136,501 | | | 922,271 | | | $ | 4,329,547 | |
Issued in connection with the reinvestment of distributions | | 47,481 | | | | 160,195 | | | 9,401 | | | | 42,724 | |
Redeemed | | (70,579 | ) | | | (250,355 | ) | | (27,536 | ) | | | (125,340 | ) |
| | | | | | | | | | | | | | |
Net change | | 1,176,058 | | | $ | 4,046,341 | | | 904,136 | | | $ | 4,246,931 | |
| | | | | | | | | | | | | | |
Increase (decrease) from capital share transactions | | 3,805,472 | | | $ | 13,177,111 | | | 4,659,812 | | | $ | 22,486,017 | |
| | | | | | | | | | | | | | |
* From February 29, 2008 (commencement of operations) through September 30, 2008 for Class Y shares.
77
NOTESTO FINANCIAL STATEMENTS (continued)
March 31, 2009 (Unaudited)
9. Capital Shares (continued).
| | | | | | | | | | | | | | |
| | Six Months Ended
March 31, 2009 | | | Period Ended September 30, 2008** | |
International Bond Fund | | Shares | | | | Amount | | | Shares | | | | Amount | |
| | | | | | | | | | | | | | |
| Class A | | | | | | | | | | | | | | |
Issued from the sale of shares | | 133,756 | | | $ | 1,204,515 | | | 327,200 | | | $ | 3,256,979 | |
Issued in connection with the reinvestment of distributions | | 2,157 | | | | 19,128 | | | 1,505 | | | | 14,727 | |
Redeemed | | (56,799 | ) | | | (512,936 | ) | | (116,234 | ) | | | (1,149,151 | ) |
| | | | | | | | | | | | | | |
Net change | | 79,114 | | | $ | 710,707 | | | 212,471 | | | $ | 2,122,555 | |
| | | | | | | | | | | | | | |
| Class C | | | | | | | | | | | | | | |
Issued from the sale of shares | | 40,613 | | | $ | 374,835 | | | 101,736 | | | $ | 1,017,705 | |
Issued in connection with the reinvestment of distributions | | 284 | | | | 2,501 | | | 284 | | | | 2,804 | |
Redeemed | | (11,678 | ) | | | (103,539 | ) | | (27,588 | ) | | | (272,845 | ) |
| | | | | | | | | | | | | | |
Net change | | 29,219 | | | $ | 273,797 | | | 74,432 | | | $ | 747,664 | |
| | | | | | | | | | | | | | |
| Class Y | | | | | | | | | | | | | | |
Issued from the sale of shares | | 12,504 | | | $ | 113,141 | | | 1,079,358 | | | $ | 10,809,876 | |
Issued in connection with the reinvestment of distributions | | 13,482 | | | | 119,109 | | | 21,719 | | | | 215,650 | |
Redeemed | | (31,238 | ) | | | (274,540 | ) | | (13,547 | ) | | | (132,409 | ) |
| | | | | | | | | | | | | | |
Net change | | (5,252 | ) | | $ | (42,290 | ) | | 1,087,530 | | | $ | 10,893,117 | |
| | | | | | | | | | | | | | |
Increase (decrease) from capital share transactions | | 103,081 | | | $ | 942,214 | | | 1,374,433 | | | $ | 13,763,336 | |
| | | | | | | | | | | | | | |
** From February 1, 2008 (commencement of operations) through September 30, 2008.
78
NOTESTO FINANCIAL STATEMENTS (continued)
March 31, 2009 (Unaudited)
9. Capital Shares (continued).
| | | | | | | | | | | | | | |
| | Six Months Ended
March 31, 2009 |
| | Year Ended September 30, 2008 | |
Limited Term Government and Agency Fund | | Shares | | | | Amount | | | Shares | | | | Amount | |
| | | | | | | | | | | | | | |
| Class A | | | | | | | | | | | | | | |
Issued from the sale of shares | | 5,501,575 | | | $ | 60,798,193 | | | 2,035,015 | | | $ | 22,451,140 | |
Issued in connection with the reinvestment of distributions | | 107,177 | | | | 1,186,217 | | | 269,896 | | | | 2,982,151 | |
Redeemed | | (2,678,679 | ) | | | (29,632,603 | ) | | (2,604,784 | ) | | | (28,704,540 | ) |
| | | | | | | | | | | | | | |
Net change | | 2,930,073 | | | $ | 32,351,807 | | | (299,873 | ) | | $ | (3,271,249 | ) |
| | | | | | | | | | | | | | |
| Class B | | | | | | | | | | | | | | |
Issued from the sale of shares | | 106,852 | | | $ | 1,170,446 | | | 67,405 | | | $ | 747,264 | |
Issued in connection with the reinvestment of distributions | | 3,286 | | | | 36,258 | | | 16,247 | | | | 179,371 | |
Redeemed | | (107,571 | ) | | | (1,186,892 | ) | | (288,166 | ) | | | (3,175,026 | ) |
| | | | | | | | | | | | | | |
Net change | | 2,567 | | | $ | 19,812 | | | (204,514 | ) | | $ | (2,248,391 | ) |
| | | | | | | | | | | | | | |
| Class C | | | | | | | | | | | | | | |
Issued from the sale of shares | | 5,121,936 | | | $ | 56,344,175 | | | 1,833,502 | | | $ | 20,260,185 | |
Issued in connection with the reinvestment of distributions | | 16,982 | | | | 188,007 | | | 13,505 | | | | 149,095 | |
Redeemed | | (1,872,524 | ) | | | (20,691,075 | ) | | (257,963 | ) | | | (2,855,031 | ) |
| | | | | | | | | | | | | | |
Net change | | 3,266,394 | | | $ | 35,841,107 | | | 1,589,044 | | | $ | 17,554,249 | |
| | | | | | | | | | | | | | |
| Class Y | | | | | | | | | | | | | | |
Issued from the sale of shares | | 699,015 | | | $ | 7,744,184 | | | 367,309 | | | $ | 4,065,238 | |
Issued in connection with the reinvestment of distributions | | 5,281 | | | | 58,627 | | | 13,550 | | | | 150,194 | |
Redeemed | | (327,105 | ) | | | (3,639,116 | ) | | (164,425 | ) | | | (1,829,051 | ) |
| | | | | | | | | | | | | | |
Net change | | 377,191 | | | $ | 4,163,695 | | | 216,434 | | | $ | 2,386,381 | |
| | | | | | | | | | | | | | |
Increase (decrease) from capital share transactions | | 6,576,225 | | | $ | 72,376,421 | | | 1,301,091 | | | $ | 14,420,990 | |
| | | | | | | | | | | | | | |
79
NOTESTO FINANCIAL STATEMENTS (continued)
March 31, 2009 (Unaudited)
9. Capital Shares (continued).
| | | | | | | | | | | | | | |
| | Six Months Ended
March 31, 2009 | | | Year Ended
September 30, 2008 | |
Strategic Income Fund | | Shares | | | | Amount | | | Shares | | | | Amount | |
| Class A | | | | | | | | | | | | | | |
Issued from the sale of shares | | 117,167,706 | | | $ | 1,225,032,059 | | | 197,552,720 | | | $ | 2,901,194,415 | |
Issued in connection with the reinvestment of distributions | | 17,048,640 | | | | 175,135,929 | | | 22,956,546 | | | | 331,016,205 | |
Redeemed | | (165,918,822 | ) | | | (1,737,906,588 | ) | | (140,438,578 | ) | | | (1,990,731,186 | ) |
| | | | | | | | | | | | | | |
Net change | | (31,702,476 | ) | | $ | (337,738,600 | ) | | 80,070,688 | | | $ | 1,241,479,434 | |
| | | | | | | | | | | | | | |
| Class B | | | | | | | | | | | | | | |
Issued from the sale of shares | | 318,784 | | | $ | 3,292,227 | | | 410,099 | | | $ | 6,009,632 | |
Issued in connection with the reinvestment of distributions | | 293,175 | | | | 3,027,767 | | | 401,421 | | | | 5,839,477 | |
Redeemed | | (2,100,537 | ) | | | (21,948,074 | ) | | (2,816,244 | ) | | | (41,124,244 | ) |
| | | | | | | | | | | | | | |
Net change | | (1,488,578 | ) | | $ | (15,628,080 | ) | | (2,004,724 | ) | | $ | (29,275,135 | ) |
| | | | | | | | | | | | | | |
| Class C | | | | | | | | | | | | | | |
Issued from the sale of shares | | 68,173,097 | | | $ | 715,901,964 | | | 118,265,590 | | | $ | 1,746,293,697 | |
Issued in connection with the reinvestment of distributions | | 6,736,752 | | | | 69,589,898 | | | 7,195,646 | | | | 104,006,617 | |
Redeemed | | (66,217,737 | ) | | | (695,031,426 | ) | | (49,785,407 | ) | | | (709,035,285 | ) |
| | | | | | | | | | | | | | |
Net change | | 8,692,112 | | | $ | 90,460,436 | | | 75,675,829 | | | $ | 1,141,265,029 | |
| | | | | | | | | | | | | | |
| Class Y | | | | | | | | | | | | | | |
Issued from the sale of shares | | 49,167,331 | | | $ | 516,799,527 | | | 47,274,736 | | | $ | 690,204,820 | |
Issued in connection with the reinvestment of distributions | | 1,422,004 | | | | 14,660,375 | | | 1,084,519 | | | | 15,512,730 | |
Redeemed | | (26,401,796 | ) | | | (275,525,245 | ) | | (25,704,216 | ) | | | (361,225,740 | ) |
| | | | | | | | | | | | | | |
Net change | | 24,187,539 | | | $ | 255,934,657 | | | 22,655,039 | | | $ | 344,491,810 | |
| | | | | | | | | | | | | | |
Increase (decrease) from capital share transactions | | (311,403 | ) | | $ | (6,971,587 | ) | | 176,396,832 | | | $ | 2,697,961,138 | |
| | | | | | | | | | | | | | |
80

EQUITY FUNDS
SEMIANNUAL REPORT
March 31, 2009
Loomis Sayles Global Markets Fund
Loomis Sayles Growth Fund
Loomis Sayles Mid Cap Growth Fund
Loomis Sayles Research Fund
Loomis Sayles Value Fund


TABLE OF CONTENTS
Management Discussion and Performance page 1
Portfolio of Investments page 15
Financial Statements page 33
LOOMIS SAYLES GLOBAL MARKETS FUND
PORTFOLIO PROFILE
Objective:
Seeks high total return through a combination of capital appreciation and current income
Strategy:
Invests primarily in equity and fixed-income securities of U.S. and foreign issuers, including securities of issuers located in emerging markets
Fund Inception:
May 1, 1996
Managers:
Mark Baribeau, CFA
Dan Fuss, CFA, CIC
Warren Koontz, CFA, CIC
David Rolley, CFA
Loomis, Sayles & Company, L.P.
Symbols:
| | |
| Class A | | LGMAX |
| Class C | | LGMCX |
| Class Y | | LSWWX |
What You Should Know:
The fund can invest a significant percentage of assets in foreign securities and the value of the fund shares can be adversely affected by changes in currency exchange rates, political, and economic developments. In emerging markets these risks can be significant. The fund can invest a significant percentage of assets in debt securities that are rated below investment grade and the value of fund shares can be adversely affected by changes in economic conditions or other circumstances. In addition, the secondary market for these securities may lack liquidity. Fund shares should be viewed as a long-term investment.
Management Discussion
Last fall’s negative financial news continued through the first quarter of 2009. Investors who were glad to see the end of 2008 found little or no relief in January and February. Although many felt that selling pressure had been overdone by the time March rolled in, most simply felt numb. Low valuation levels coupled with nascent signs of stabilization – or at least slower rates of decline in some sectors – prompted investors to venture back into the market, which helped elevate prices. Even so, for the full six-month period ended March 31, 2009, the most conservative investments (notably government bonds) emerged with the least damage.
Loomis Sayles Global Markets Fund returned -19.90% for the six months ended March 31, 2009, based on the net asset value of Class A shares and $0.25 in reinvested dividends. For the same period, the fund’s primary benchmark, the MSCI World Index (common stocks from developed countries around the world) returned - -30.88%, while its secondary benchmark, Citigroup World Government Bond Index (government bonds issued in the United States and other developed countries) returned 3.57%. The average return on Morningstar’s World Allocation category (primarily global equity funds) was -20.71% for the period.
WHICH STRATEGIES OR STOCKS HELPED FUND PERFORMANCE?
Relative to the benchmark, the fund was overweight in information technology and held a substantial portion of assets in globally diversified bonds, both government and corporate. These allocations, along with strong stock selection within technology, aided relative performance. Solid earnings reports made Apple a strong performer. Monsanto also performed well in the first quarter of 2009, driven by increasing market share and other factors.
Other good performers included Amazon.com, which reported profits and sales that were above estimates, and Samsung Electronics which benefited from an increase in the price of its handsets. They rose in price with increasing demand for smartphones. In a recent reversal, Goldman Sachs reported an improved outlook on its first-quarter results, in part driven by Federal Deposit Insurance Corporation actions and several private equity gains.
WHICH SECTORS OR STOCKS WERE THE WORST?
Telecom and energy were the worst sectors. Telecom is a subscription-heavy business that lagged during the period. As for energy, in the last six months oil prices fell from $100 per barrel to less than $45 by the end of December 2008, settling in the $40 range by the end of March 2009. The worst individual stocks included such financial companies as JPMorgan Chase and Standard Chartered PLC, which declined on general concerns about credit quality, equity dilution and possible nationalization. The changing rules related to government bail-out funds also weighed on investors. JPMorgan was sold.
HOW DID THE FUND RESPOND?
While there has been no change in our underlying strategy, we have adjusted the portfolio to ensure it includes companies we think will benefit from a global recovery and are likely to move through the upcoming earnings season relatively unscathed. We will continue to take action as we receive updates from the companies’ management teams. We also reduced the fund’s consumer staples exposure in order to seek better growth opportunities.
WHAT NOW?
As the improved market environment we witnessed in March carries over into April, the inevitable question is whether the recent rally is just a breather or the start of a new trend. The stock market is widely regarded as a forward-looking indicator, suggesting that it should rise before the negative economic news dissipates. Timing is a key question. We are looking for confirmation that the rate of economic decline is indeed slowing, that the housing market is bottoming and that the credit markets have truly recovered. We believe that when these signposts are passed (or confidence increases that they soon may be), the market should be on firmer ground.
1
LOOMIS SAYLES GLOBAL MARKETS FUND
Investment Results through March 31, 2009
PERFORMANCE IN PERSPECTIVE
The charts comparing the fund’s performance to two indexes provide you with a general sense of how it performed. The fund’s total return for the period shown below appears with and without sales charges and includes fund expenses and fees. An index measures the performance of a theoretical portfolio. Unlike a fund, the index is unmanaged and does not have expenses that affect the results. It is not possible to invest directly in an index. Investors would incur transaction costs and other expenses if they purchased the securities necessary to match the index.
Growth of a $10,000 Investment in Class A Shares1,5
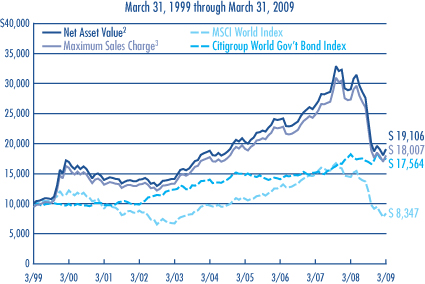
Average Annual Returns — March 31, 20095
| | | | | | | | | | | | |
| | | | | |
| | | 6 MONTHS | | | 1 YEAR | | | 5 YEARS | | | 10 YEARS | |
Class A (Inception 2/1/06)1 | | | | | | | | | | | | |
Net Asset Value2 | | -19.90 | % | | -34.19 | % | | 0.32 | % | | 6.69 | % |
With Maximum Sales Charge3 | | -24.50 | | | -37.99 | | | -0.86 | | | 6.06 | |
| | | | | |
Class C (Inception 2/1/06)1 | | | | | | | | | | | | |
Net Asset Value2 | | -20.18 | | | -34.66 | | | -0.41 | | | 5.90 | |
With CDSC4 | | -20.97 | | | -35.30 | | | -0.41 | | | 5.90 | |
| | | | | |
Class Y (Inception 5/1/96)1 | | | | | | | | | | | | |
Net Asset Value2 | | -19.85 | | | -34.05 | | | 0.57 | | | 6.95 | |
| | | | | |
| COMPARATIVE PERFORMANCE | | 6 MONTHS | | | 1 YEAR | | | 5 YEARS | | | 10 YEARS | |
MSCI World Index | | -30.88 | % | | -42.19 | % | | -3.00 | % | | -1.79 | % |
Citigroup World Government Bond Index | | 3.57 | | | -3.75 | | | 4.63 | | | 5.79 | |
Morningstar World Allocation Fund Avg. | | -20.71 | | | -30.47 | | | 1.19 | | | 4.08 | |
All returns represent past performance and do not guarantee future results. Periods of less than one year are not annualized. Share price and return will vary and you may have a gain or loss when you sell your shares. All results include reinvestment of dividends and capital gains. Current returns may be higher or lower than those shown. For performance current to the most recent month-end, visit www.funds.natixis.com.
Class Y shares are available to certain investors, as described in the prospectus.
The table and graph do not reflect taxes shareholders might owe on any fund distributions or when they redeem their shares.
PORTFOLIO FACTS
| | | | |
| |
| | | % of Net Assets as of |
| FUND COMPOSITION | | 3/31/09 | | 9/30/08 |
Common Stocks | | 53.9 | | 65.5 |
Bonds & Notes | | 42.7 | | 26.6 |
Preferred Stocks | | 1.0 | | 0.1 |
Bank Loans | | 0.1 | | 0.0 |
Short-Term Investments and Other | | 2.3 | | 7.8 |
| |
| | | % of Net Assets as of |
| TEN LARGEST HOLDINGS | | 3/31/09 | | 9/30/08 |
Monsanto Co. | | 2.9 | | 2.3 |
Apple, Inc. | | 2.6 | | 2.1 |
QUALCOMM, Inc. | | 2.5 | | 2.3 |
China Overseas Land & Investment Ltd. | | 1.6 | | — |
Visa, Inc., Class A | | 1.6 | | 2.0 |
Amazon.com, Inc. | | 1.5 | | — |
First Solar, Inc. | | 1.4 | | 1.4 |
Goldman Sachs Group, Inc. (The) | | 1.4 | | — |
Georgia-Pacific LLC, 7.250%, 6/01/2028 | | 1.4 | | 0.9 |
Fidelity National Financial, Inc., Class A | | 1.4 | | — |
| |
| | | % of Net Assets as of |
| FIVE LARGEST INDUSTRIES | | 3/31/09 | | 9/30/08 |
Oil, Gas & Consumable Fuels | | 4.9 | | 5.6 |
Banking | | 4.5 | | 0.6 |
Chemicals | | 4.2 | | 2.5 |
Communications Equipment | | 3.9 | | 3.1 |
Computers & Peripherals | | 3.8 | | 4.6 |
Portfolio holdings and asset allocations will vary.
EXPENSE RATIOS AS STATED IN THE MOST RECENT PROSPECTUS
| | | | |
| Share Class | | Gross Expense Ratio6 | | Net Expense Ratio7 |
A | | 1.27% | | 1.25% |
C | | 2.02 | | 2.00 |
Y | | 0.99 | | 0.99 |
NOTES TO CHARTS
See page 11 for a description of the indexes.
1 | Returns shown in the chart include performance of the fund’s Institutional Class shares, which were redesignated as Class Y shares on 2/1/06. For periods prior to the inception of Class A and Class C shares (2/1/06), the prior Institutional Class performance has been restated to reflect the sales loads and expenses of Class A and Class C shares. The restatement of the fund’s performance to reflect Class A and Class C expenses is based on the net expenses of the Class after taking into account the fund’s then current expense cap arrangements. The growth of $10,000 chart compares the performance of Class A shares, at net asset value, to the performance of Class A shares including the maximum sales charge of 5.75%. This chart reflects the performance of Class A Shares rather than Class Y shares because Class A shares have the highest sales charge. Prior to 2/1/06, the fund was offered without a sales charge. |
2 | Does not include a sales charge. |
3 | Includes the maximum sales charge of 5.75%. |
4 | Performance for Class C shares assumes a 1% contingent deferred sales charge (“CDSC”) applied when you sell shares within one year of purchase. |
5 | Fund performance has been increased by expense reductions and reimbursements, if any, without which performance would have been lower. |
6 | Before reductions and reimbursements. |
7 | After reductions and reimbursements. Expense reductions are contractual and are set to expire 1/31/10. |
2
LOOMIS SAYLES GROWTH FUND
PORTFOLIO PROFILE
Objective:
Long-term growth of capital
Strategy:
Invests primarily in equity securities, including common stocks, convertible securities, and warrants; focuses on stocks of large-capitalization companies, but may invest in companies of any size
Fund Inception:
May 16, 1991
Managers:
Mark Baribeau, CFA
Pamela Czekanski, CFA
Richard Skaggs, CFA
Loomis, Sayles &
Company, L.P.
Symbols:
| | |
| Class A | | LGRRX |
| Class B | | LGRBX |
| Class C | | LGRCX |
| Class Y | | LSGRX |
What You Should Know:
Growth stocks are generally more sensitive to market movements because their stock prices are based on future expectations. Frequent portfolio turnover may result in increased tax liabilities that will reduce the fund’s overall return. The fund can invest a significant percentage of assets in foreign securities and the value of the fund shares can be adversely affected by changes in currency exchange rates, political, and economic developments. In emerging markets these risks can be significant. Fund shares should be viewed as a long-term investment.
Management Discussion
Worsening economic news and rising investor anxiety sent U.S. stocks into a tailspin during the six months ended March 31, 2009. Stocks across the board tumbled as a succession of reports detailed deterioration in the economy and the financial markets. However, market sentiment showed signs of improving in March, as evidence began to appear that the economy was stabilizing. The news helped push equity prices up for the month, but not by enough to overcome the steep losses of the previous five months.
In this volatile environment, Class A shares of Loomis Sayles Growth Fund returned -27.20% at net asset value for the six months ended March 31, 2009. For the same period, the Russell 1000 Growth Index returned -25.97%, while the average return on the funds in Morningstar’s Large Growth category was -26.80%.
WHICH STOCKS OR SECTORS DETRACTED FROM THE FUND’S PERFORMANCE?
Healthcare and financial stocks were detractors during the period. Within healthcare, Celgene Corp. and Covance, Inc. produced particularly weak results. Celgene’s share price declined after the company lowered its revenue guidance for Revlimid, a drug used in the treatment of anemia and multiple myeloma. Biopharmaceutical drug maker Covance’s stock fell after the company announced possible delays in several projects. We sold Covance, but Celgene remained in the fund’s portfolio at the end of March.
The fund’s emphasis on the underperforming financial sector held the fund back. In particular, slumping capital markets affected revenues of three market sensitive holdings: discount broker Charles Schwab, asset manager BlackRock, and CME Group, the world’s largest futures and options exchange. CSX Corporation also detracted from performance. A major transportation services and logistics company, CSX was impacted by declines in commodity prices and factory orders, prompting concern that freight volumes would begin to dry up as well. All four positions were sold.
WHICH STOCKS WERE SUPPORTIVE?
On-line retailer Amazon.com and discount consumer electronics chain Best Buy Co. both posted solid quarterly earnings, supported by surprisingly stable consumer spending patterns. In the energy sector, the fund benefited on a relative basis from holding Southwestern Energy Co., an integrated corporation focusing on natural gas exploration and production operations. The company continued to have strong results from its operations in the Fayetteville Shale region of Arkansas. Although financial stocks generally struggled, investment bank Goldman Sachs Group gained ground early in 2009 as investors began to perceive that the company may be well positioned for a potential market rebound.
WHAT DO YOU SEE AHEAD?
While most of the first half of the fund’s fiscal year proved disappointing, the period ended on an up note for stocks in March. This gave some credence to the hope that the economy may be in a bottoming process, at least for some of the hardest-hit sectors. However, we are mindful that this process is never straightforward. We prefer to focus on facts and adhere to our long-term discipline of seeking to identify large-cap growth companies with strong fundamentals and leading products.
Having said that, we acknowledge that the stock market historically has been a forward-looking indicator, turning up in anticipation of positive changes. We have kept sector weightings relatively consistent, although we recently added to the fund’s holdings in the materials and processing groups. We believe the federal government’s stimulus efforts should result in increased infrastructure spending and help some companies that stand to benefit from such cyclical trends.
3
LOOMIS SAYLES GROWTH FUND
Investment Results through March 31, 2009
PERFORMANCE IN PERSPECTIVE
The charts comparing the fund’s performance to an index provide you with a general sense of how it performed. The fund’s total return for the period shown below appears with and without sales charges and includes fund expenses and fees. An index measures the performance of a theoretical portfolio. Unlike a fund, the index is unmanaged and does not have expenses that affect the results. It is not possible to invest directly in an index. Investors would incur transaction costs and other expenses if they purchased the securities necessary to match the index.
Growth of a $10,000 Investment in Class A Shares1,5
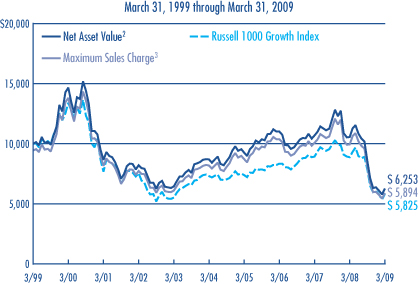
Average Annual Returns — March 31, 20095
| | | | | | | | | | | | |
| | | | | |
| | | 6 MONTHS | | | 1 YEAR | | | 5 YEARS | | | 10 YEARS | |
Class A (Inception 12/31/96)1 | | | | | | | | | | | | |
Net Asset Value2 | | -27.20 | % | | -40.72 | % | | -6.38 | % | | -4.59 | % |
With Maximum Sales Charge3 | | -31.45 | | | -44.09 | | | -7.48 | | | -5.15 | |
| | | | | |
Class B (Inception 9/12/03)1 | | | | | | | | | | | | |
Net Asset Value2 | | -27.44 | | | -41.15 | | | -7.09 | | | -5.31 | |
With CDSC4 | | -31.07 | | | -44.09 | | | -7.46 | | | -5.31 | |
| | | | | |
Class C (Inception 9/12/03)1 | | | | | | | | | | | | |
Net Asset Value2 | | -27.44 | | | -41.15 | | | -7.09 | | | -5.31 | |
With CDSC4 | | -28.17 | | | -41.74 | | | -7.09 | | | -5.31 | |
| | | | | |
Class Y (Inception 5/16/91)1 | | | | | | | | | | | | |
Net Asset Value2 | | -26.91 | | | -40.44 | | | -6.00 | | | -4.31 | |
| | | | | |
| COMPARATIVE PERFORMANCE | | 6 MONTHS | | | 1 YEAR | | | 5 YEARS | | | 10 YEARS | |
Russell 1000 Growth Index | | -25.97 | % | | -34.28 | % | | -4.38 | % | | -5.26 | % |
Morningstar Large Growth Fund Avg. | | -26.80 | | | -35.94 | | | -4.54 | | | -3.55 | |
All returns represent past performance and do not guarantee future results. Periods of less than one year are not annualized. Share price and return will vary and you may have a gain or loss when you sell your shares. All results include reinvestment of dividends and capital gains. Current returns may be higher or lower than those shown. For performance current to the most recent month-end, visit www.funds.natixis.com.
Class Y shares are available to certain investors, as described in the prospectus.
The table and graph do not reflect taxes shareholders might owe on any fund distributions or when they redeem their shares.
PORTFOLIO FACTS
| | | | |
| |
| | | % of Net Assets as of |
| FUND COMPOSITION | | 3/31/09 | | 9/30/08 |
Common Stocks | | 98.3 | | 96.0 |
Short-Term Investments and Other | | 1.7 | | 4.0 |
| |
| | | % of Net Assets as of |
| TEN LARGEST HOLDINGS | | 3/31/09 | | 9/30/08 |
Apple, Inc. | | 4.9 | | 3.5 |
Amazon.com, Inc. | | 4.7 | | 2.7 |
QUALCOMM, Inc. | | 4.1 | | 4.1 |
International Business Machines Corp. | | 3.8 | | 3.5 |
Visa, Inc., Class A | | 3.7 | | 2.9 |
Oracle Corp. | | 3.7 | | 2.9 |
Monsanto Co. | | 3.6 | | 3.9 |
Google, Inc., Class A | | 3.3 | | 3.2 |
MasterCard, Inc., Class A | | 3.0 | | 1.6 |
Southwestern Energy Co. | | 3.0 | | 1.6 |
| |
| | | % of Net Assets as of |
| FIVE LARGEST INDUSTRIES | | 3/31/09 | | 9/30/08 |
Computers & Peripherals | | 9.9 | | 9.1 |
Communications Equipment | | 7.8 | | 4.1 |
Oil, Gas & Consumable Fuels | | 7.0 | | 5.8 |
IT Services | | 6.7 | | 6.0 |
Chemicals | | 6.4 | | 3.9 |
Portfolio holdings and asset allocations will vary.
EXPENSE RATIOS AS STATED IN THE MOST RECENT PROSPECTUS
| | | | |
| Share Class | | Gross Expense Ratio6 | | Net Expense Ratio7 |
A | | 1.10% | | 1.10% |
B | | 1.85 | | 1.85 |
C | | 1.85 | | 1.85 |
Y | | 0.66 | | 0.66 |
NOTES TO CHARTS
See page 11 for a description of the indexes.
1 | Returns shown in the chart include performance of the fund’s Retail Class shares, which were converted to Class A shares on 9/12/03. The prior Retail Class performance has been restated to reflect expenses and sales loads of Class A shares. For periods prior to the inception of Class B and Class C shares (9/12/03), performance is based on prior Institutional Class performance, restated to reflect the loads and expenses of Class B and Class C shares. The restatement of the fund’s performance to reflect Class A expenses is based on the net expenses of the Class after taking into effect the fund’s then current expense cap arrangements. Class Y performance includes performance of the prior Institutional Class, which was redesignated as Class Y shares on 9/12/03, Institutional Class performance has been restated to reflect the net expenses of Class Y after taking into effect the fund’s then current expense cap arrangements. The growth of $10,000 chart compares the performance of Class A shares, at net asset value, to the performance of Class A shares including the maximum sales charge of 5.75%. This chart reflects the performance of Class A Shares rather than Class Y shares because Class A shares have the highest sales charge. Prior to 9/12/03, the fund was offered without a sales charge. |
2 | Does not include a sales charge. |
3 | Includes maximum sales charge of 5.75%. |
4 | Performance for Class B shares assumes a maximum of 5% contingent deferred sales charge (“CDSC”) applied when you sell shares, which declines annually between years 1-6 according to the following schedule: 5, 4, 3, 3, 2, 1, 0%. Class C shares performance assumes a 1% CDSC applied when you sell shares within one year of purchase. |
5 | Fund performance has been increased by expense reductions and reimbursements, if any, without which performance would have been lower. |
6 | Before reductions and reimbursements. |
7 | After reductions and reimbursements. Expense reductions are contractual and are set to expire 1/31/10. |
4
LOOMIS SAYLES MID CAP GROWTH FUND
PORTFOLIO PROFILE
Objective:
Long-term growth of capital
Strategy:
Invests primarily in common stocks or other equity securities; focuses on stocks of companies that fall within the capitalization range of the companies included in the Russell Midcap Growth Index.
Fund Inception:
December 31, 1996
Manager:
Philip C. Fine, CFA
Symbols:
| | |
| Class A | | LAGRX |
| Class C | | LSACX |
| Class Y | | LSAIX |
What You Should Know
Small- and mid-cap stocks may be more volatile than larger, more established companies. The secondary market for these stocks may be less liquid, which could adversely impact the fund’s value. Growth funds involve increased risks, in part, because the value of the underlying securities is based on future expectations that may or may not be met. The fund can invest a significant percentage of assets in foreign securities and the value of the fund shares can be adversely affected by changes in currency exchange rates, political, and economic developments. In emerging markets these risks can be significant. The fund is subject to currency decline. Fund shares should be viewed as a long-term investment.
Management Discussion
The market volatility that started last fall continued into 2009. We maintained Loomis Sayles Mid Cap Growth Fund’s defensive strategy by emphasizing sectors like healthcare and consumer staples that are typically regarded as being less volatile. January and February brought such steep declines in stock prices that, by March, investors were numb. However, as so often happens when the situation appears most bleak, signs of recovery began to appear. Low stock prices, along with signs of stabilization – or at least of slowing declines – encouraged some investors to venture into the markets again, elevating stock prices.
Unfortunately, for the six months ended March 31, 2009, the major equity indexes were down. For the period, Class A shares of the fund returned -29.20% at net asset value. The fund’s benchmark, the Russell Midcap Growth Index, returned -29.81%, while the average return on the funds in Morningstar’s Mid-Cap Growth category was -29.57%.
WHICH SECTORS AND STOCKS WORKED IN FAVOR OF THE FUND?
Energy was the strongest sector during the period. We emphasized exploration and production companies, as well as some equipment and services companies. Among individual holdings, good performers included deepwater service providers like Oceaneering International. Also in the services area, we emphasized oil rather than natural gas, which slumped along with natural gas prices. One of the fund’s best performing individual stocks was Broadcom Corp. This leading producer of semiconductors for broadband communications demonstrated good control of operating expenses during the downturn. Other positive performers included Dollar Tree, Inc., a leading “extreme value” retailer enjoying strong same-store sales, driven in part by the expansion of its customer base to middle-income shoppers. In healthcare, two stocks grew into our largest holdings: Illumina, Inc. (a life sciences tool company) and Myriad Genetics (a molecular diagnostics company).
WHAT STOCKS OR STRATEGIES PROVED DISAPPOINTING?
Technology was the fund’s worst performing sector, primarily as a result of stock selection, even though it was one of the benchmark’s stronger sectors. Financial companies also hurt performance, although here the drawdown was primarily the result of capital markets exposure. Pockets of weakness included investment management companies and stock and futures exchanges. For example, NASDAQ OMX Group experienced pricing pressures from competitors, notably electronic trading platforms. SVB Financial Group, the holding company for Silicon Valley Bank, was also a poor performer. Despite the fact that the bank’s customers work in the technology and life sciences industries, it did not escape the deteriorating credit environment. Concerns about the potential vulnerability of SVB’s core customer base to capital funding restraints deterred investors. One of our exploration and production companies, Continental Resources, was also one of the fund’s worst performers for the period. The steep fall in oil prices caused the company to curtail its drilling program, lowering production estimates for 2008 and 2009. All three stocks were sold during the period.
WHAT DO YOU SEE AHEAD?
This spring we began to emerge from our defensive positioning, moving toward a more balanced portfolio. We believe the massive, global trends toward monetary easing and fiscal stimulus will eventually gain traction. However, we also believe the path to recovery will not be linear. Signs of a recovery are likely to mix with lingering economic concerns. Consequently we have adopted a strategy that combines defensive, less cyclical stocks (healthcare, value retailers and auto parts retailers, for example) and stocks of companies with more exposure to the economic cycle (including apparel retailers, technology, energy and materials companies).
5
LOOMIS SAYLES MID CAP GROWTH FUND
Investment Results through March 31, 2009
PERFORMANCE IN PERSPECTIVE
The charts comparing the fund’s performance to an index provide you with a general sense of how it performed. The fund’s total return for the period shown below appears with and without sales charges and includes fund expenses and fees. An index measures the performance of a theoretical portfolio. Unlike a fund, the index is unmanaged and does not have expenses that affect the results. It is not possible to invest directly in an index. Investors would incur transaction costs and other expenses if they purchased the securities necessary to match the index.
Growth of a $10,000 Investment in Class A Shares1,5
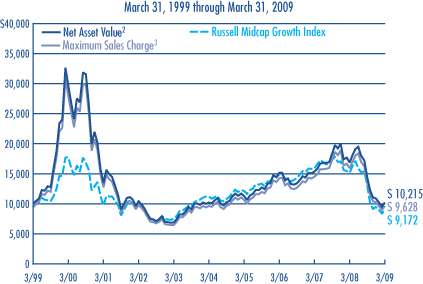
Average Annual Returns — March 31, 20095
| | | | | | | | | | | | |
| | | | | |
| | | 6 MONTHS | | | 1 YEAR | | | 5 YEARS | | | 10 YEARS | |
Class A (Inception 12/31/96)1 | | | | | | | | | | | | |
Net Asset Value2 | | -29.20 | % | | -39.51 | % | | -0.05 | % | | 0.21 | % |
With Maximum Sales Charge3 | | -33.27 | | | -42.99 | | | -1.23 | | | -0.38 | |
| | | | | |
Class C (Inception 2/2/09)1 | | | | | | | | | | | | |
Net Asset Value2 | | -29.50 | | | -39.98 | | | -0.86 | | | -0.62 | |
With CDSC4 | | -30.20 | | | -40.58 | | | -0.86 | | | -0.62 | |
| | | | | |
Class Y (Inception 12/31/96)1 | | | | | | | | | | | | |
Net Asset Value2 | | -29.08 | | | -39.36 | | | 0.19 | | | 0.48 | |
| | | | | |
| COMPARATIVE PERFORMANCE | | 6 MONTHS | | | 1 YEAR | | | 5 YEARS | | | 10 YEARS | |
Russell Midcap Growth Index | | -29.81 | % | | -39.58 | % | | -3.91 | % | | -0.86 | % |
Morningstar Mid-Cap Growth Fund Avg. | | -29.57 | | | -38.47 | | | -4.13 | | | 0.19 | |
All returns represent past performance and do not guarantee future results. Periods of less than one year are not annualized. Share price and return will vary and you may have a gain or loss when you sell your shares. All results include reinvestment of dividends and capital gains. Current returns may be higher or lower than those shown. For performance current to the most recent month-end, visit www.funds.natixis.com.
Class Y shares are available to certain investors, as described in the prospectus.
The table and graph do not reflect taxes shareholders might owe on any fund distributions or when they redeem their shares.
PORTFOLIO FACTS
| | | | |
| |
| | | % of Net Assets as of |
| FUND COMPOSITION | | 3/31/09 | | 9/30/08 |
Common Stocks | | 96.1 | | 93.6 |
Put Options | | 0.8 | | — |
Short-Term Investments and Other | | 3.1 | | 6.4 |
| |
| | | % of Net Assets as of |
| TEN LARGEST HOLDINGS | | 3/31/09 | | 9/30/08 |
Illumina, Inc. | | 3.5 | | 3.1 |
Myriad Genetics, Inc. | | 3.3 | | 1.8 |
Kinross Gold Corp. | | 2.8 | | — |
Agnico-Eagle Mines Ltd. | | 2.7 | | — |
Broadcom Corp., Class A | | 2.5 | | — |
Northern Trust Corp. | | 2.5 | | — |
Freeport-McMoRan Copper & Gold, Inc. | | 2.4 | | — |
Autozone, Inc. | | 2.4 | | — |
Ross Stores, Inc. | | 2.2 | | 2.9 |
Quanta Services, Inc. | | 2.1 | | — |
| |
| | | % of Net Assets as of |
| FIVE LARGEST INDUSTRIES | | 3/31/09 | | 9/30/08 |
Specialty Retail | | 10.8 | | 11.7 |
Metals & Mining | | 7.8 | | — |
Semiconductors & Semiconductor Equipment | | 7.1 | | — |
Multiline Retail | | 7.0 | | 3.0 |
Biotechnology | | 6.9 | | 4.4 |
Portfolio holdings and asset allocations will vary.
EXPENSE RATIOS AS STATED IN THE MOST RECENT PROSPECTUS
| | | | |
| Share Class | | Gross Expense Ratio6 | | Net Expense Ratio7 |
A | | 1.32% | | 1.25% |
C | | 2.19 | | 2.00 |
Y | | 1.00 | | 1.00 |
NOTES TO CHARTS
See page 11 for a description of the indexes.
1 | Returns shown in the chart include performance of the fund’s Retail Class shares, which were redesignated to Class A shares on 2/2/09. Performance has been restated to reflect the current sales load of Class A shares. For the periods prior to the inception of Class C shares (2/2/09), performance is based on prior Retail Class performance, restated to reflect the sales loads and expenses of Class C shares. The restatement of the fund’s performance to reflect Class C expenses is based on the net expenses of the Class after taking into effect the fund’s then current expense cap arrangements. Class Y performance includes performance of the prior Institutional Class shares, which were redesignated as Class Y shares on 2/2/09. |
2 | Does not include a sales charge. |
3 | Includes maximum sales charge of 5.75%. |
4 | Class C shares performance assumes a 1% CDSC applied when you sell shares within one year of purchase. |
5 | Fund performance has been increased by expense reductions and reimbursements, if any, without which performance would have been lower. |
6 | Before reductions and reimbursements. |
7 | After reductions and reimbursements. Expense reductions are contractual and are set to expire 1/31/10. |
6
LOOMIS SAYLES RESEARCH FUND
PORTFOLIO PROFILE
Objective:
Long-term growth of capital
Strategy:
Invests primarily in equity securities, including common stocks, convertible securities, and warrants; focuses on stocks of large-capitalization companies, but may invest in companies of any size
Fund Inception:
July 31, 2000
Managers:
Maureen G. Depp, CFA
Brian James, CFA
Loomis, Sayles & Company, L.P.
Symbols:
| | |
| Class A | | LSRRX |
| Class B | | LSCBX |
| Class C | | LSCCX |
| Class Y | | LISRX |
What You Should Know:
Growth stocks are generally more sensitive to market movements than value stocks. Small-cap stocks are generally more volatile than the market. The fund can invest a significant percentage of assets in foreign securities and the value of the fund shares can be adversely affected by changes in currency exchange rates, political, and economic developments. In emerging markets these risks can be significant. Fund shares should be viewed as a long-term investment.
Management Discussion
The financial markets rode a roller coaster throughout the six months ended March 31, 2009. Against a backdrop of worsening news about the capital markets and the economy, equity prices fell during the final quarter of 2008 and the first two months of 2009. But they abruptly shifted direction in March, when low price levels and nascent signs of stabilization – or at least slowing rates of economic decline – began to raise investors’ appetite for risk. Unfortunately, the stock market’s gains in March were insufficient to offset the losses of the previous five months.
In this environment, we focused on high-quality stocks and maintained a defensive posture in most sectors. Class A shares of Loomis Sayles Research Fund produced a total return of -27.46% at net asset value for the six months ended March 31, 2009, with $0.05 in reinvested dividends. The fund outperformed its benchmark, the S&P 500 Index, which returned -30.54%. Over the same six months, the average return of funds in Morningstar’s Large Growth category was -26.80%.
WHAT STRATEGIES HELPED THE FUND THROUGH THIS PERIOD?
Selections in the energy and industrials sectors proved particularly successful. In energy, we positioned the fund defensively as oil prices declined early in the period by emphasizing large, integrated oil companies and oil service corporations. When oil prices appeared to recover late in the period, we began cautiously increasing weightings in enterprises with greater sensitivity to oil prices, including high-quality exploration and production companies and large-cap oil producers. We also pared back our holdings in oil services companies and in ExxonMobil, a world leader in the energy industry. In the industrials group, we reduced the fund’s exposure to General Electric Company and other commercial aerospace and industrial companies that had been overweight versus the benchmark. This move was positive for the fund when these stocks’ prices faded during the period.
WHICH STOCKS WERE THE STRONGEST CONTRIBUTORS?
Two retailers, Kohl’s Corp. and Nordstrom Inc., and technology corporation NVIDIA Corp. were among the top performers during the six months. Kohl’s gained as strong inventory controls improved its competitive position, while Nordstrom raised its projections for earnings in 2009. NVIDIA, a leader in producing semiconductors for graphics applications, outpaced the broader technology sector when excess inventories were reduced and investors focused on stocks of companies with improving prospects in a cyclical recovery.
WHICH STOCKS HURT PERFORMANCE?
The fund’s selections in consumer staples and telecommunication services held back returns. In the staples group, our emphasis on international companies produced disappointing results as business conditions deteriorated overseas at a faster pace than anticipated, while the strengthening U.S. dollar eroded profits from foreign operations. Stocks of the telecom companies we selected were only modestly sensitive to economic cycles, but this proved to be a disadvantage in the first quarter of 2009, when investors began moving to companies with the potential to improve earnings in a cyclical resurgence. Banks, diversified financial corporations and life insurers were weak. The poorest performing individual holdings included three financial companies: Bank of America Corp., Wells Fargo & Co. and Metlife Inc. We eliminated the fund’s position in Bank of America.
WHAT DO YOU SEE AHEAD?
The inevitable question at this juncture is whether the recent rally was just a breather or the start of a new trend. We are encouraged by recent economic data that suggest the economy may be bottoming, at least for some of the hardest-hit sectors, but the bottoming process never runs smoothly.
In general, we prefer not to predict the timing of market cycles. We are watching for confirmation that the rate of economic decline is indeed slowing, that the housing market is bottoming, the credit markets improving, and indications that financial institutions are truly on their way to being recapitalized.
7
LOOMIS SAYLES RESEARCH FUND
Investment Results through March 31, 2009
PERFORMANCE IN PERSPECTIVE
The charts comparing the fund’s performance to an index provide you with a general sense of how it performed. The fund’s total return for the period shown below appears with and without sales charges and includes fund expenses and fees. An index measures the performance of a theoretical portfolio. Unlike a fund, the index is unmanaged and does not have expenses that affect the results. It is not possible to invest directly in an index. Investors would incur transaction costs and other expenses if they purchased the securities necessary to match the index.
Growth of a $10,000 Investment in Class A Shares1,6
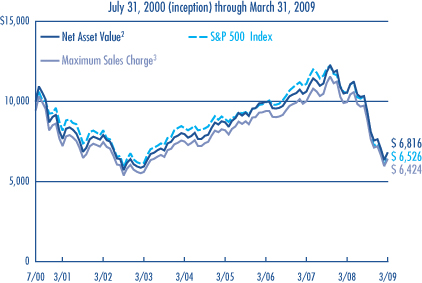
Average Annual Returns — March 31, 20096
| | | | | | | | | | | | |
| | | | | |
| | | 6 MONTHS | | | 1 YEAR | | | 5 YEARS | | | SINCE FUND
INCEPTION | |
Class A (Inception 11/30/01)1 | | | | | | | | | | | | |
Net Asset Value2 | | -27.46 | % | | -35.42 | % | | -3.02 | % | | -4.32 | % |
With Maximum Sales Charge3 | | -31.67 | | | -39.14 | | | -4.16 | | | -4.97 | |
| | | | | |
Class B (Inception 9/12/03)1 | | | | | | | | | | | | |
Net Asset Value2 | | -27.79 | | | -35.98 | | | -3.73 | | | -5.10 | |
With CDSC4 | | -31.40 | | | -39.19 | | | -4.02 | | | -5.10 | |
Class C (Inception 9/12/03)1 | | | | | | | | | | | | |
Net Asset Value2 | | -27.80 | | | -35.95 | | | -3.81 | | | -5.15 | |
With CDSC4 | | -28.52 | | | -36.59 | | | -3.81 | | | -5.15 | |
| | | | | |
Class Y (Inception 7/31/00)1 | | | | | | | | | | | | |
Net Asset Value2 | | -27.27 | | | -35.20 | | | -2.62 | | | -4.00 | |
| | | | | |
| COMPARATIVE PERFORMANCE | | 6 MONTHS | | | 1 YEAR | | | 5 YEARS | | | SINCE FUND
INCEPTION5 | |
S&P 500 Index | | -30.54 | % | | -38.09 | % | | -4.76 | % | | -4.81 | % |
Morningstar Large Growth Fund Avg. | | -26.80 | | | -35.94 | | | -4.54 | | | -7.02 | |
All returns represent past performance and do not guarantee future results. Periods of less than one year are not annualized. Share price and return will vary and you may have a gain or loss when you sell your shares. All results include reinvestment of dividends and capital gains. Current returns may be higher or lower than those shown. For performance current to the most recent month-end, visit www.funds.natixis.com.
Class Y shares are available to certain investors, as described in the prospectus.
The table and graph do not reflect taxes shareholders might owe on any fund distributions or when they redeem their shares.
PORTFOLIO FACTS
| | | | | |
| |
| | | % of Net Assets as of |
| FUND COMPOSITION | | 3/31/09 | | | 9/30/08 |
Common Stocks | | 100.2 | | | 100.0 |
Short-Term Investments and Other | | (0.2 | ) | | 0.0 |
| |
| | | % of Net Assets as of |
| TEN LARGEST HOLDINGS | | 3/31/09 | | | 9/30/08 |
ExxonMobil Corp. | | 4.0 | | | 3.9 |
Apple, Inc. | | 3.1 | | | 2.6 |
AT&T, Inc. | | 2.9 | | | 2.0 |
Wal-Mart Stores, Inc. | | 2.9 | | | 4.6 |
QUALCOMM, Inc. | | 2.7 | | | 3.0 |
Chevron Corp. | | 2.6 | | | 1.5 |
Google, Inc., Class A | | 2.6 | | | - |
Hewlett-Packard Co. | | 2.5 | | | 2.8 |
JPMorgan Chase & Co. | | 2.2 | | | 3.1 |
Lockheed Martin Corp. | | 2.0 | | | 1.5 |
| |
| | | % of Net Assets as of |
| FIVE LARGEST INDUSTRIES | | 3/31/09 | | | 9/30/08 |
Oil, Gas & Consumable Fuels | | 12.9 | | | 10.8 |
Aerospace & Defense | | 6.8 | | | 3.9 |
Biotechnology | | 6.4 | | | 4.0 |
Food & Staples Retailing | | 5.8 | | | 7.1 |
Computers & Peripherals | | 5.5 | | | 6.4 |
Portfolio holdings and asset allocations will vary.
EXPENSE RATIOS AS STATED IN THE MOST RECENT PROSPECTUS
| | | | |
| Share Class | | Gross Expense Ratio7 | | Net Expense Ratio8 |
A | | 1.55% | | 1.25% |
B | | 2.30 | | 2.00 |
C | | 2.30 | | 2.00 |
Y | | 1.15 | | 0.85 |
NOTES TO CHARTS
See page 11 for a description of the indexes.
1 | Returns shown in the chart include performance of the fund’s Retail Class shares, which were converted to Class A shares on 9/12/03. The prior Retail Class performance has been restated to reflect expenses and sales loads of Class A shares. For periods before the inception of Retail Class shares (11/30/01), performance shown for Class A has been based on the performance of the fund’s Institutional Class shares, adjusted to reflect the higher expenses and sales load paid by Class A shares. For periods prior to the inception of Class B and Class C shares (9/12/03), performance is based on prior Institutional Class performance, restated to reflect the sales loads and expenses of Class B and Class C shares. The restatement of the fund’s performance to reflect Class A, Class B, and Class C expenses is based on the net expenses of the Class after taking into effect the fund’s then current expense cap arrangements. Class Y performance includes performance of the prior Institutional Class shares, which were redesignated as Class Y shares on 9/12/03. Institutional Class performance has been restated to reflect the net expenses of Class Y after taking into account the fund’s then current expense cap arrangements. The growth of $10,000 chart compares the performance of Class A shares, at net asset value, to the performance of Class A shares including the maximum sales charge of 5.75%. This chart reflects the performance of Class A shares rather than Class Y shares because Class A shares have the highest sales charge. Prior to 9/12/03, the fund was offered without a sales charge. |
2 | Does not include a sales charge. |
3 | Includes maximum sales charge of 5.75%. |
4 | Performance for Class B shares assumes a maximum of 5% contingent deferred sales charge (“CDSC”) applied when you sell shares, which declines annually between years 1-6 according to the following schedule: 5, 4, 3, 3, 2, 1, 0%. Class C shares performance assumes a 1% CDSC applied when you sell shares within one year of purchase. |
5 | The since-inception performance comparisons shown are calculated from 8/1/00. |
6 | Fund performance has been increased by expense reductions and reimbursements, if any, without which performance would have been lower. |
7 | Before reductions and reimbursements. |
8 | After reductions and reimbursements. Expense reductions are contractual and are set to expire 1/31/10. |
8
LOOMIS SAYLES VALUE FUND
PORTFOLIO PROFILE
Objective:
Long-term growth of capital and income
Strategy:
Invests primarily in equity securities, including common stocks, convertible securities, and warrants. The fund invests primarily in medium-sized and large-sized companies, but may invest in companies of any size
Fund Inception:
May 13, 1991
Managers:
Arthur Barry, CFA
James L. Carroll, CFA
Warren N. Koontz, CFA, CIC
Loomis, Sayles & Company, L.P.
Symbols:
| | |
| Class A | | LSVRX |
| Class B | | LSVBX |
| Class C | | LSCVX |
| Class Y | | LSGIX |
What You Should Know:
While the fund offers potential for long-term capital growth, it invests in value stocks, which can fall out of favor with investors and may underperform growth stocks during certain market conditions. The fund can invest a significant percentage of assets in foreign securities and the value of the fund shares can be adversely affected by changes in currency exchange rates, political, and economic developments. In emerging markets these risks can be significant. Fund shares should be viewed as a long-term investment.
Management Discussion
The equity market roller coaster ride that began last fall continued into the first quarter of 2009. January and February brought steep declines in stock prices, so that most investors were numb by the time March rolled in. As often happens when the situation looks bleakest, a ray of sunshine emerged. Nascent signs of stabilization, or at least slower rates of decline in some sectors, coupled with low valuation levels, encouraged some investors to put money to work, which led to an improving market in March. However, for the quarter and the six months ended March 31, 2009, both the S&P 500 and the Russell 1000 indexes were down.
Although Loomis Sayles Value Fund shared the market’s pain, good stock selection in key sectors helped the fund hold up better than its benchmark and its Morningstar peer group. For the six months ended March 31, 2009, Class A shares of the fund returned -30.14% at net asset value, including reinvestment of $0.21 in dividends. The fund’s benchmark, the Russell 1000 Value Index, returned -35.22%, while the average return on the funds in Morningstar’s Large Value category was -31.51%.
WHICH STRATEGIES SUPPORTED FUND PERFORMANCE?
Selections in healthcare and energy helped the fund’s relative performance. As oil prices tumbled from record highs, we gradually reduced the fund’s focus on integrated oil companies like ExxonMobil, which experienced weak demand for refined products during the downturn. At the same time we added to holdings in exploration and production companies and large-cap oil producers in an effort to capitalize on what we see as a possible energy price rebound in an economic recovery.
Stock selection was of particular benefit in healthcare, which has long been viewed as a defensive sector during difficult times. The pharmaceutical industry, which is well financed and needs no government assistance, has been consolidating through mergers, two of which benefited the fund. Schering-Plough agreed to be acquired by Merck on very favorable terms, while Wyeth rose when it agreed to be acquired by Pfizer. Bristol-Myers Squibb also contributed positively, thanks to solid operating results, an attractive dividend and a competitor’s difficulties in bringing an important product to market.
WHICH STOCKS DETRACTED FROM RESULTS?
The period’s worst performers were in the volatile banking sector. Slack business conditions, frozen lending markets and fears over possible nationalization slashed valuations on several banking issues, including Bank of America Corp. and JPMorgan Chase, although both issues staged modest comebacks late in the period. We sold Bank of America. General Electric (GE) was a significant detractor due to the impact of credit-crisis concerns on its financial segment. GE’s industrial businesses were also weak, reflecting the deteriorating economy. Results among utilities were also disappointing, due in part to some of our allocations within the sector. Utilities carry a low risk profile and we believe their currently attractive dividend yields should have a positive impact on the price of the stocks over time.
WHAT DO YOU SEE AHEAD?
Our policy is to apply intensive, bottom-up research in choosing stocks, emphasizing firms with solid balance sheets, strong cash flows and market valuations that represent discounts to our assessment of their intrinsic worth. We believe companies meeting these criteria have the capacity to capture market share and may be able to make acquisitions at reasonable prices.
Even though the market environment improved in March, it remains to be seen whether the rally was an interruption of an ongoing bear market or the beginning of a sustainable uptrend. We believe that recent economic data suggest that a bottoming process may be underway in some of the economy’s hardest hit sectors. Uncertainty and volatile markets historically have provided investment opportunities for those who do their homework. Bear in mind that historically the stock market has tended to be a forward-looking economic indicator, recovering before the bad news ends.
9
LOOMIS SAYLES VALUE FUND
Investment Results through March 31, 2009
PERFORMANCE IN PERSPECTIVE
The charts comparing the fund’s performance to an index provide you with a general sense of how it performed. The fund’s total return for the period shown below appears with and without sales charges and includes fund expenses and fees. An index measures the performance of a theoretical portfolio. Unlike a fund, the index is unmanaged and does not have expenses that affect the results. It is not possible to invest directly in an index. Investors would incur transaction costs and other expenses if they purchased the securities necessary to match the index.
Growth of a $10,000 Investment in Class A Shares1,5
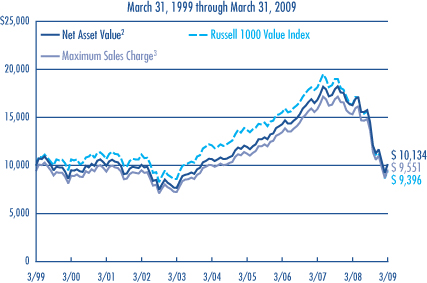
Average Annual Returns — March 31, 20095
| | | | | | | | | | | | |
| | | | | |
| | | 6 MONTHS | | | 1 YEAR | | | 5 YEARS | | | 10 YEARS | |
Class A (Inception 6/30/06)1 | | | | | | | | | | | | |
Net Asset Value2 | | -30.14 | % | | -37.66 | % | | -0.99 | % | | 0.13 | % |
With Maximum Sales Charge3 | | -34.15 | | | -41.25 | | | -2.16 | | | -0.46 | |
| | | | | |
Class B (Inception 6/1/07)1 | | | | | | | | | | | | |
Net Asset Value2 | | -30.38 | | | -38.10 | | | -1.83 | | | -0.83 | |
With CDSC4 | | -33.85 | | | -41.19 | | | -2.16 | | | -0.83 | |
| | | | | |
Class C (Inception 6/1/07)1 | | | | | | | | | | | | |
Net Asset Value2 | | -30.39 | | | -38.11 | | | -1.82 | | | -0.83 | |
With CDSC4 | | -31.08 | | | -38.73 | | | -1.82 | | | -0.83 | |
| | | | | |
Class Y (Inception 5/13/91)1 | | | | | | | | | | | | |
Net Asset Value2 | | -30.07 | | | -37.47 | | | -0.69 | | | 0.44 | |
| | | | | |
| COMPARATIVE PERFORMANCE | | 6 MONTHS | | | 1 YEAR | | | 5 YEARS | | | 10 YEARS | |
Russell 1000 Value Index | | -35.22 | % | | -42.42 | % | | -4.94 | % | | -0.62 | % |
Morningstar Large Value Fund Avg. | | -31.51 | | | -39.36 | | | -4.89 | | | -0.52 | |
All returns represent past performance and do not guarantee future results. Periods of less than one year are not annualized. Share price and return will vary and you may have a gain or loss when you sell your shares. All results include reinvestment of dividends and capital gains. Current returns may be higher or lower than those shown. For performance current to the most recent month-end, visit www.funds.natixis.com.
Class Y shares are available to certain investors, as described in the prospectus.
The table and graph do not reflect taxes shareholders might owe on any fund distributions or when they redeem their shares.
PORTFOLIO FACTS
| | | | |
| |
| | | % of Net Assets as of |
| FUND COMPOSITION | | 3/31/09 | | 9/30/08 |
Common Stocks | | 93.7 | | 97.3 |
Short-Term Investments and Other | | 6.3 | | 2.7 |
| |
| | | % of Net Assets as of |
| TEN LARGEST HOLDINGS | | 3/31/09 | | 9/30/08 |
AT&T, Inc. | | 4.5 | | 4.0 |
ExxonMobil Corp. | | 4.0 | | 4.3 |
Schering-Plough Corp. | | 3.4 | | 2.1 |
Wyeth | | 2.8 | | 1.3 |
Total SA, Sponsored ADR | | 2.6 | | 2.2 |
JPMorgan Chase & Co. | | 2.5 | | 3.1 |
Northrop Grumman Corp. | | 2.2 | | 1.9 |
DIRECTV Group, Inc. (The) | | 2.0 | | 1.8 |
Hewlett-Packard Co. | | 2.0 | | 2.0 |
Berkshire Hathaway, Inc., Class B | | 2.0 | | 2.2 |
| |
| | | % of Net Assets as of |
| FIVE LARGEST INDUSTRIES | | 3/31/09 | | 9/30/08 |
Pharmaceuticals | | 12.9 | | 9.8 |
Oil, Gas & Consumable Fuels | | 12.4 | | 7.9 |
Diversified Telecommunication Services | | 5.9 | | 4.0 |
Insurance | | 5.7 | | 7.4 |
Media | | 4.1 | | 6.4 |
Portfolio holdings and asset allocations will vary.
EXPENSE RATIOS AS STATED IN THE MOST RECENT PROSPECTUS
| | | | |
| Share Class | | Gross Expense Ratio6 | | Net Expense Ratio7 |
A | | 1.05% | | 1.05% |
B | | 1.80 | | 1.80 |
C | | 1.80 | | 1.80 |
Y | | 0.66 | | 0.66 |
NOTES TO CHARTS
See page 11 for a description of the indexes.
1 | Returns shown in the chart include performance of the fund’s Retail Class shares, which were redesignated to Class A shares on 6/1/07. Performance has been restated to reflect the current sales load of Class A shares. For periods before the inception of Retail Class shares (6/30/06), performance shown for Class A has been based on the performance of the fund’s Institutional Class shares, adjusted to reflect the higher fees and expenses paid by Class A shares. The restatement of the fund’s performance to reflect Class A expenses is based on the net expenses of the Class after taking into effect the fund’s then current expense cap arrangements. For periods prior to the inception of Class B and Class C shares (6/1/07), performance is based on prior Institutional Class performance, restated to reflect the sales loads and expenses of Class B and Class C shares, respectively. The growth of $10,000 chart compares the performance of Class A shares, at net asset value, to the performance of Class A shares including the maximum sales charge of 5.75%. This chart reflects the performance of Class A Shares rather than Class Y shares because Class A shares have the highest sales charge. Prior to 6/1/07, the fund was offered without a sales charge. |
2 | Does not include a sales charge. |
3 | Includes maximum sales charge of 5.75%. |
4 | Performance for Class B shares assumes a maximum of 5% contingent deferred sales charge (“CDSC”) applied when you sell shares, which declines annually between years 1-6 according to the following schedule: 5, 4, 3, 3, 2, 1, 0%. Class C shares performance assumes a 1% CDSC applied when you sell shares within one year of purchase. |
5 | Fund performance has been increased by expense reductions and reimbursements, if any, without which performance would have been lower. |
6 | Before reductions and reimbursements. |
7 | After reductions and reimbursements. Expense reductions are contractual and are set to expire 1/31/10. |
10
ADDITIONAL INFORMATION
The views expressed in this report reflect those of the portfolio managers as of the dates indicated. The managers’ views are subject to change at any time without notice based on changes in market or other conditions. References to specific securities or industries should not be regarded as investment advice. Because these funds are actively managed, there is no assurance that they will continue to invest in the securities or industries mentioned.
For more complete information on any Natixis Fund, contact your financial professional or call Natixis Funds and ask for a free prospectus, which contains more complete information including charges and other ongoing expenses. Investors should consider a fund’s objective, risks and expenses carefully before investing. This and other fund information can be found in the prospectus. Please read the prospectus carefully before investing.
INDEX/AVERAGE DESCRIPTIONS:
Citigroup World Government Bond Index (“Citigroup WGBI”) is an unmanaged index that measures the most significant and liquid government bond indices located around the world with a rating of at least investment grade.
Morgan Stanley Capital International World Index (“MSCI World”) is an unmanaged index that measures global developed market equity performance.
Russell 1000 Growth Index is an unmanaged index that measures the performance of those Russell 1000 companies with higher price-to-book ratios and higher forecasted growth values.
Russell 1000 Value Index is an unmanaged index that measures the performance of those Russell 1000 companies with lower price-to-book ratios and lower forecasted growth values.
Russell Midcap Growth Index is an unmanaged index that measures the performance of those Russell Midcap Index companies with higher price-to-book ratios and higher forecasted growth values.
Standard & Poor’s 500 Index (“S&P 500”) is an unmanaged index of U.S. common stock performance.
Morningstar Fund Averages are the average performance without sales charges of funds with similar investment objectives, as calculated by Morningstar, Inc.
PROXY VOTING INFORMATION
A description of the funds’ proxy voting policies and procedures is available without charge, upon request, by calling Natixis Funds at 800-225-5478; on the funds’ website at www.funds.natixis.com; and on the Securities and Exchange Commission’s website at www.sec.gov. Information regarding how the funds voted proxies relating to portfolio securities during the 12-month period ended June 30, 2008 is available from the funds’ website and the SEC’s website.
QUARTERLY PORTFOLIO SCHEDULES
The funds will file a complete schedule of portfolio holdings with the SEC for the first and third quarters of each fiscal year on Form N-Q. The funds’ Forms N-Q are available on the SEC’s website at www.sec.gov and may be reviewed and copied at the SEC’s Public Reference Room in Washington, DC. Information on the operation of the Public Reference Room may be obtained by calling
1-800-SEC-0330.
| | | | |
| NOT FDIC INSURED | | MAY LOSE VALUE | | NO BANK GUARANTEE |
11
UNDERSTANDING FUND EXPENSES
As a mutual fund shareholder, you incur different types of costs: transaction costs, including sales charges (loads) on purchases and contingent deferred sales charges on redemptions, certain exchange fees, and minimum account fee charges; and ongoing costs, including management fees, distribution and/or service fees (12b-1 fees), and other fund expenses. In addition, each fund may assess a minimum balance fee of $20 on an annual basis for accounts that fall below the required minimum to establish an account (certain exceptions may apply). These costs are described in more detail in the funds’ prospectus. The examples below are intended to help you understand the ongoing costs of investing in the funds and help you compare these with the ongoing costs of investing in other mutual funds.
The first line in the table for each class shows the actual amount of fund expenses you would have paid on a $1,000 investment in the fund from October 1, 2008 through March 31, 2009. It also shows how much a $1,000 investment would be worth at the close of the period, assuming actual fund returns and expenses. To estimate the expenses you paid over the period, simply divide your account value by $1,000 (for example $8,600 account value divided by $1,000 = 8.6) and multiply the result by the number in the Expenses Paid During the Period row as shown below for your class.
The second line in the table for each class provides information about hypothetical account values and hypothetical expenses based on the fund’s actual expense ratios and an assumed rate of return of 5% per year before expenses, which is not the fund’s actual return. The hypothetical account values and expenses may not be used to estimate the actual ending account balance or expenses you paid on your investment for the period. You may use this information to compare the ongoing costs of investing in the fund and other funds. To do so, compare this 5% hypothetical example with the 5% hypothetical examples that appear in the shareholder reports of the other funds.
Please note that the expenses shown reflect ongoing costs only, and do not include any transaction costs. Therefore, the second line in the table of each fund is useful in comparing ongoing costs only, and will not help you determine the relative costs of owning different funds. If transaction costs were included, total costs would be higher.
| | | | | | |
| LOOMIS SAYLES GLOBAL MARKETS FUND | | BEGINNING ACCOUNT VALUE
10/1/2008 | | ENDING ACCOUNT VALUE
3/31/2009 | | EXPENSES PAID DURING PERIOD*
10/1/2008 – 3/31/2009 |
Class A | | | | | | |
Actual | | $1,000.00 | | $801.00 | | $5.61 |
Hypothetical (5% return before expenses) | | $1,000.00 | | $1,018.70 | | $6.29 |
Class C | | | | | | |
Actual | | $1,000.00 | | $798.20 | | $8.97 |
Hypothetical (5% return before expenses) | | $1,000.00 | | $1,014.96 | | $10.05 |
Class Y | | | | | | |
Actual | | $1,000.00 | | $801.50 | | $4.49 |
Hypothetical (5% return before expenses) | | $1,000.00 | | $1,019.95 | | $5.04 |
| * | Expenses are equal to the Fund’s annualized expense ratio (after fee reduction/reimbursement): 1.25%, 2.00% and 1.00% for Class A, C and Y, respectively, multiplied by the average account value over the period, multiplied by the number of days in the most recent fiscal half-year, divided by 365 (to reflect the half-year period). |
12
UNDERSTANDING FUND EXPENSES
| | | | | | |
| LOOMIS SAYLES GROWTH FUND | | BEGINNING ACCOUNT VALUE
10/1/2008 | | ENDING ACCOUNT VALUE
3/31/2009 | | EXPENSES PAID DURING PERIOD*
10/1/2008 – 3/31/2009 |
Class A | | | | | | |
Actual | | $1,000.00 | | $728.00 | | $5.39 |
Hypothetical (5% return before expenses) | | $1,000.00 | | $1,018.70 | | $6.29 |
Class B | | | | | | |
Actual | | $1,000.00 | | $725.60 | | $8.60 |
Hypothetical (5% return before expenses) | | $1,000.00 | | $1,014.96 | | $10.05 |
Class C | | | | | | |
Actual | | $1,000.00 | | $725.60 | | $8.60 |
Hypothetical (5% return before expenses) | | $1,000.00 | | $1,014.96 | | $10.05 |
Class Y | | | | | | |
Actual | | $1,000.00 | | $730.90 | | $3.02 |
Hypothetical (5% return before expenses) | | $1,000.00 | | $1,021.44 | | $3.53 |
| * | Expenses are equal to the Fund’s annualized expense ratio (after fee reduction/reimbursement): 1.25%, 2.00%, 2.00% and 0.70% for Class A, B, C, and Y, respectively, multiplied by the average account value over the period, multiplied by the number of days in the most recent fiscal half-year, divided by 365 (to reflect the half-year period). |
| | | | | | | | |
| LOOMIS SAYLES MID CAP GROWTH FUND | | BEGINNING ACCOUNT VALUE
10/1/2008 | | | ENDING ACCOUNT VALUE
3/31/2009 | | EXPENSES PAID DURING PERIOD
10/1/2008 – 3/31/2009 | |
Class A | | | | | | | | |
Actual1 | | $1,000.00 | 1 | | $708.00 | | $5.32 | 1 |
Hypothetical (5% return before expenses) | | $1,000.00 | | | $1,018.70 | | $6.29 | * |
Class C | | | | | | | | |
Actual2 | | $1,000.00 | 2 | | $987.40 | | $3.10 | 2 |
Hypothetical (5% return before expenses) | | $1,000.00 | | | $1,004.68 | | $10.00 | * |
Class Y | | | | | | | | |
Actual1 | | $1,000.00 | 1 | | $709.20 | | $4.26 | 1 |
Hypothetical (5% return before expenses) | | $1,000.00 | | | $1,019.95 | | $5.04 | * |
| * | Hypothetical expenses are equal to the Fund’s annualized expense ratio (after fee reduction/reimbursement): 1.25%, 2.00% and 1.00%, for Class A, C and Y, respectively, multiplied by the average account value over the period, multiplied by the number of days in the most recent fiscal half-year (182), divided by 365 (to reflect the half-year period). |
| 1 | Actual expenses for Class A and Y are equal to the Fund’s annualized expense ratio (after fee reduction/reimbursement): 1.25% and 1.00%, respectively, multiplied by the average account value over the period, multiplied by the number of days in the most recent fiscal half-year (182), divided by 365 (to reflect the half-year period). |
| 2 | Class C commenced operations on February 2, 2009. Actual expenses are equal to Fund’s annualized expense ratio (after fee reduction/reimbursement): 2.00% for Class C, multiplied by the average account value over the period, multiplied by the number of days in the most recent fiscal period (57), divided by 365 (to reflect the partial period). |
13
UNDERSTANDING FUND EXPENSES
| | | | | | |
| LOOMIS SAYLES RESEARCH FUND | | BEGINNING ACCOUNT VALUE
10/1/2008 | | ENDING ACCOUNT VALUE
3/31/2009 | | EXPENSES PAID DURING PERIOD*
10/1/2008 – 3/31/2009 |
Class A | | | | | | |
Actual | | $1,000.00 | | $725.40 | | $5.38 |
Hypothetical (5% return before expenses) | | $1,000.00 | | $1,018.70 | | $6.29 |
Class B | | | | | | |
Actual | | $1,000.00 | | $722.10 | | $8.59 |
Hypothetical (5% return before expenses) | | $1,000.00 | | $1,014.96 | | $10.05 |
Class C | | | | | | |
Actual | | $1,000.00 | | $722.00 | | $8.59 |
Hypothetical (5% return before expenses) | | $1,000.00 | | $1,014.96 | | $10.05 |
Class Y | | | | | | |
Actual | | $1,000.00 | | $727.30 | | $3.66 |
Hypothetical (5% return before expenses) | | $1,000.00 | | $1,020.69 | | $4.28 |
| * | Expenses are equal to the Fund’s annualized expense ratio (after fee reduction/reimbursement): 1.25%, 2.00%, 2.00% and 0.85%, for Class A, B, C, and Y, respectively, multiplied by the average account value over the period, multiplied by the number of days in the most recent fiscal half-year, divided by 365 (to reflect the half-year period). |
| | | | | | |
| LOOMIS SAYLES VALUE FUND | | BEGINNING ACCOUNT VALUE
10/1/2008 | | ENDING ACCOUNT VALUE
3/31/2009 | | EXPENSES PAID DURING PERIOD*
10/1/08 – 3/31/09 |
Class A | | | | | | |
Actual | | $1,000.00 | | $698.60 | | $4.40 |
Hypothetical (5% return before expenses) | | $1,000.00 | | $1,019.75 | | $5.24 |
Class B | | | | | | |
Actual | | $1,000.00 | | $696.20 | | $7.57 |
Hypothetical (5% return before expenses) | | $1,000.00 | | $1,016.01 | | $9.00 |
Class C | | | | | | |
Actual | | $1,000.00 | | $696.10 | | $7.61 |
Hypothetical (5% return before expenses) | | $1,000.00 | | $1,015.96 | | $9.05 |
Class Y | | | | | | |
Actual | | $1,000.00 | | $699.30 | | $2.71 |
Hypothetical (5% return before expenses) | | $1,000.00 | | $1,021.74 | | $3.23 |
| * | Expenses are equal to the Fund’s annualized expense ratio: 1.04%, 1.79%, 1.80% and 0.64% for Class A, B, C and Y, respectively, multiplied by the average account value over the period, multiplied by the number of days in the most recent fiscal half-year, divided by 365 (to reflect the half-year period). |
14
LOOMIS SAYLES GLOBAL MARKETS FUND — PORTFOLIOOF INVESTMENTS
Investments as of March 31, 2009 (Unaudited)
| | | | | |
| Shares | | Description | | Value (†) |
| | | | | |
| Common Stocks — 53.9% of Net Assets | | | |
| | Australia — 0.8% | | | |
| 64,931 | | CSL Ltd. | | $ | 1,467,214 |
| | | | | |
| | Brazil — 2.3% | | | |
| 76,222 | | Companhia Vale do Rio Doce, ADR | | | 1,013,753 |
| 125,200 | | Petroleo Brasileiro SA | | | 1,909,506 |
| 83,200 | | Redecard SA | | | 1,006,039 |
| | | | | |
| | | | | 3,929,298 |
| | | | | |
| | Cayman Islands — 0.6% | | | |
| 2,051,000 | | Want Want China Holdings Ltd. | | | 951,791 |
| | | | | |
| | Chile — 0.7% | | | |
| 46,266 | | Sociedad Quimica y Minera de Chile SA, Sponsored ADR | | | 1,228,825 |
| | | | | |
| | China — 2.3% | | | |
| 1,778,880 | | China Overseas Land & Investment Ltd. | | | 2,797,181 |
| 2,470,000 | | China South Locomotive and Rolling Stock Corp., Series H(b) | | | 1,128,397 |
| | | | | |
| | | | | 3,925,578 |
| | | | | |
| | Denmark — 1.1% | | | |
| 40,468 | | Novo Nordisk A/S, Class B | | | 1,940,273 |
| | | | | |
| | Finland — 0.5% | | | |
| 72,751 | | Nokia Oyj, Sponsored ADR | | | 849,004 |
| | | | | |
| | Germany — 1.0% | | | |
| 30,489 | | Siemens AG (Registered) | | | 1,740,603 |
| | | | | |
| | Israel — 0.7% | | | |
| 24,949 | | Teva Pharmaceutical Industries Ltd. | | | 1,123,953 |
| | | | | |
| | Japan — 0.6% | | | |
| 3,707 | | Nintendo Co. Ltd. | | | 1,084,415 |
| | | | | |
| | Korea — 0.9% | | | |
| 3,639 | | Samsung Electronics Co., Ltd. | | | 1,503,478 |
| | | | | |
| | Spain — 0.9% | | | |
| 39,484 | | Industria de Diseno Textil SA | | | 1,538,650 |
| | | | | |
| | Switzerland — 1.7% | | | |
| 116,508 | | ABB Ltd. (Registered)(b) | | | 1,623,567 |
| 28,709 | | Actelion Ltd. (Registered)(b) | | | 1,310,173 |
| | | | | |
| | | | | 2,933,740 |
| | | | | |
| | Taiwan, Province Of China — 0.7% | | | |
| 129,000 | | MediaTek, Inc. | | | 1,214,363 |
| | | | | |
| | Turkey — 0.4% | | | |
| 29,580 | | BIM Birlesik Magazalar A/S | | | 627,443 |
| | | | | |
| | United Kingdom — 2.9% | | | |
| 97,786 | | BG Group PLC | | | 1,475,047 |
| 207,128 | | Capita Group PLC | | | 2,014,503 |
| 124,684 | | Standard Chartered PLC | | | 1,548,240 |
| | | | | |
| | | | | 5,037,790 |
| | | | | |
| | United States — 35.8% | | | |
| 34,858 | | Amazon.com, Inc.(b) | | | 2,559,972 |
| 42,040 | | Apple, Inc.(b) | | | 4,419,245 |
| 52,161 | | AT&T, Inc. | | | 1,314,457 |
| 9,280 | | Autozone, Inc.(b) | | | 1,509,114 |
| 68,296 | | Broadcom Corp., Class A(b) | | | 1,364,554 |
| 90,730 | | Cisco Systems, Inc.(b) | | | 1,521,542 |
| 25,946 | | Covidien Ltd. | | | 862,445 |
| 119,561 | | Fidelity National Financial, Inc., Class A | | | 2,332,635 |
| 18,173 | | First Solar, Inc.(b) | | | 2,411,557 |
| 27,285 | | Freeport-McMoRan Copper & Gold, Inc. | | | 1,039,831 |
| 37,215 | | Gilead Sciences, Inc.(b) | | | 1,723,799 |
| | | | | | |
| Shares | | Description | | Value (†) |
| | | | | | |
| | | United States — continued | | | |
| | 22,674 | | Goldman Sachs Group, Inc. (The) | | $ | 2,403,898 |
| | 33,720 | | Goodrich Corp. | | | 1,277,651 |
| | 5,481 | | Google, Inc., Class A(b) | | | 1,907,717 |
| | 22,510 | | International Business Machines Corp. | | | 2,180,994 |
| | 26,667 | | Jacobs Engineering Group, Inc.(b) | | | 1,030,946 |
| | 12,007 | | MasterCard, Inc., Class A | | | 2,010,932 |
| | 67,829 | | McAfee, Inc.(b) | | | 2,272,272 |
| | 24,602 | | McDonald’s Corp. | | | 1,342,531 |
| | 59,163 | | Monsanto Co. | | | 4,916,445 |
| | 49,248 | | Morgan Stanley | | | 1,121,377 |
| | 100,108 | | Mylan, Inc.(b) | | | 1,342,448 |
| | 32,288 | | Myriad Genetics, Inc.(b) | | | 1,468,135 |
| | 124,298 | | News Corp., Class A | | | 822,853 |
| | 76,134 | | Oracle Corp.(b) | | | 1,375,741 |
| | 28,127 | | PNC Financial Services Group, Inc. | | | 823,840 |
| | 17,270 | | Priceline.com, Inc.(b) | | | 1,360,531 |
| | 110,417 | | QUALCOMM, Inc. | | | 4,296,325 |
| | 41,183 | | Range Resources Corp. | | | 1,695,092 |
| | 63,389 | | Southwestern Energy Co.(b) | | | 1,882,019 |
| | 23,750 | | URS Corp.(b) | | | 959,738 |
| | 48,035 | | Visa, Inc., Class A | | | 2,670,746 |
| | 45,403 | | XTO Energy, Inc. | | | 1,390,240 |
| | | | | | |
| | | | | | 61,611,622 |
| | | | | | |
| | | Total Common Stocks (Identified Cost $110,890,694) | | | 92,708,040 |
| | | | | | |
Principal
Amount (‡) | | | | |
| | Bonds and Notes — 42.7% | | | |
| | Non-Convertible Bonds — 41.3% | | | |
| | | Argentina — 0.2% | | | |
| $ | 570,000 | | Transportadora de Gas del Sur SA,
7.875%, 5/14/2017, 144A | | | 324,900 |
| | | | | | |
| | | Australia — 0.1% | | | |
| | 230,000 | | New South Wales Treasury Corp., Series 10RG,
7.000%, 12/01/2010, (AUD) | | | 169,041 |
| | | | | | |
| | | Austria — 0.2% | | | |
| | 30,000,000 | | Oesterreichische Kontrollbank AG,
1.800%, 3/22/2010, (JPY) | | | 304,339 |
| | 95,000 | | Sappi Papier Holding AG,
7.500%, 6/15/2032, 144A | | | 42,750 |
| | | | | | |
| | | | | | 347,089 |
| | | | | | |
| | | Bermuda — 0.0% | | | |
| | 100,000 | | Noble Group Ltd.,
8.500%, 5/30/2013, 144A | | | 78,500 |
| | | | | | |
| | | Brazil — 0.5% | | | |
| | 1,449,573 | | Brazil Notas do Tesouro Nacional, Series B,
6.000%, 8/15/2010, (BRL) | | | 625,473 |
| | 450,000 | | Brazil Notas do Tesouro Nacional, Series F,
10.000%, 1/01/2014, (BRL) | | | 181,478 |
| | 170,000 | | Marfrig Overseas Ltd.,
9.625%, 11/16/2016, 144A | | | 102,000 |
| | 36,000 | | Republic of Brazil,
7.125%, 1/20/2037 | | | 36,090 |
| | | | | | |
| | | | | | 945,041 |
| | | | | | |
| | | Canada — 0.5% | | | |
| | 100,000 | | Bombardier, Inc.,
7.250%, 11/15/2016, (EUR), 144A | | | 86,359 |
See accompanying notes to financial statements.
15
LOOMIS SAYLES GLOBAL MARKETS FUND — PORTFOLIOOF INVESTMENTS (continued)
Investments as of March 31, 2009 (Unaudited)
| | | | | | |
Principal
Amount (‡) | | Description | | Value (†) |
| | | | | | |
| | | Canada — continued | | | |
| $ | 530,000 | | Canadian Government,
4.500%, 6/01/2015, (CAD) | | $ | 482,108 |
| | 25,000 | | Canadian Pacific Railway Ltd., MTN,
4.900%, 6/15/2010, (CAD), 144A | | | 19,973 |
| | 343,000 | | Ispat Inland, Inc.,
9.750%, 4/01/2014 | | | 312,130 |
| | 50,000 | | Nortel Networks Ltd.,
6.875%, 9/01/2023(c) | | | 3,250 |
| | | | | | |
| | | | | | 903,820 |
| | | | | | |
| | | Cayman Islands — 1.3% | | | |
| | 360,000 | | DASA Finance Corp.,
8.750%, 5/29/2018, 144A | | | 277,200 |
| | 370,000 | | Embraer Overseas Ltd.,
6.375%, 1/24/2017 | | | 299,700 |
| | 100,000 | | LPG International, Inc.,
7.250%, 12/20/2015 | | | 92,250 |
| | 175,000 | | Odebrecht Finance Ltd.,
7.500%, 10/18/2017, 144A | | | 152,250 |
| | 950,000 | | Petrobras International Finance Co.,
5.875%, 3/01/2018 | | | 883,759 |
| | 536,000 | | Vale Overseas Ltd.,
6.875%, 11/21/2036 | | | 462,857 |
| | | | | | |
| | | | | | 2,168,016 |
| | | | | | |
| | | Colombia — 0.2% | | | |
| | 40,000 | | Republic of Colombia,
8.125%, 5/21/2024 | | | 40,200 |
| | 20,000,000 | | Republic of Colombia,
9.850%, 6/28/2027, (COP) | | | 7,771 |
| | 47,000,000 | | Republic of Colombia,
11.750%, 3/01/2010, (COP) | | | 19,048 |
| | 685,000,000 | | Republic of Colombia,
12.000%, 10/22/2015, (COP) | | | 301,887 |
| | | | | | |
| | | | | | 368,906 |
| | | | | | |
| | | France — 0.6% | | | |
| | 35,000 | | Lafarge SA, EMTN,
4.750%, 3/23/2020, (EUR) | | | 29,272 |
| | 250,000 | | Lafarge SA, EMTN,
5.375%, 6/26/2017, (EUR) | | | 238,487 |
| | 130,000 | | PPR SA, EMTN,
4.000%, 1/29/2013, (EUR) | | | 155,948 |
| | 240,000 | | Veolia Environnement, EMTN,
4.000%, 2/12/2016, (EUR) | | | 292,760 |
| | 25,000 | | Veolia Environnement, EMTN,
5.125%, 5/24/2022, (EUR) | | | 27,989 |
| | 100,000 | | Wendel,
4.375%, 8/09/2017, (EUR) | | | 69,752 |
| | 200,000 | | Wendel,
4.875%, 5/26/2016, (EUR) | | | 140,832 |
| | | | | | |
| | | | | | 955,040 |
| | | | | | |
| | | Germany — 0.7% | | | |
| | 28,000,000 | | Kreditanstalt fuer Wiederaufbau,
1.350%, 1/20/2014, (JPY) | | | 280,617 |
| | 30,000,000 | | Kreditanstalt fuer Wiederaufbau,
1.850%, 9/20/2010, (JPY) | | | 307,892 |
| | 12,000,000 | | Kreditanstalt fuer Wiederaufbau,
2.050%, 2/16/2026, (JPY) | | | 115,150 |
| | 375,000 | | Republic of Germany,
4.000%, 1/04/2037, (EUR) | | | 503,979 |
| | | | | | |
| | | | | | 1,207,638 |
| | | | | | |
| | | | | | | |
Principal
Amount (‡) | | | Description | | Value (†) |
| | | | | | | |
| | | | India — 0.3% | | | |
| $ | 500,000 | | | Canara Bank Ltd., (fixed rate to 11/28/2016, variable rate thereafter),
6.365%, 11/28/2021 | | $ | 382,334 |
| | 100,000 | | | ICICI Bank Ltd., (fixed rate to 4/30/2017, variable rate thereafter),
6.375%, 4/30/2022, 144A | | | 56,226 |
| | | | | | | |
| | | | | | | 438,560 |
| | | | | | | |
| | | | Indonesia — 0.4% | | | |
| | 700,000 | | | Indonesia Government International Bond,
7.750%, 1/17/2038, 144A | | | 539,000 |
| | 100,000 | | | Republic of Indonesia,
11.625%, 3/04/2019, 144A | | | 108,750 |
| | | | | | | |
| | | | | | | 647,750 |
| | | | | | | |
| | | | Ireland — 0.3% | | | |
| | 555,000 | | | Elan Financial PLC,
7.750%, 11/15/2011 | | | 466,200 |
| | | | | | | |
| | | | Italy — 0.2% | | | |
| | 250,000 | | | Finmeccanica SpA, EMTN,
4.875%, 3/24/2025, (EUR) | | | 247,793 |
| | 100,000 | | | Telecom Italia SpA, EMTN,
5.375%, 1/29/2019, (EUR) | | | 108,214 |
| | | | | | | |
| | | | | | | 356,007 |
| | | | | | | |
| | | | Japan — 1.0% | | | |
| | 32,000,000 | | | Japan Finance Corp. for Municipal Enterprises,
1.350%, 11/26/2013, (JPY) | | | 328,671 |
| | 40,000,000 | | | Japan Finance Corp. for Small and Medium Enterprises,
1.100%, 9/20/2011, (JPY) | | | 403,299 |
| | 105,000,000 | | | Japan Government,
0.900%, 9/15/2009, (JPY) | | | 1,063,843 |
| | | | | | | |
| | | | | | | 1,795,813 |
| | | | | | | |
| | | | Korea — 0.5% | | | |
| | 400,000 | | | Export-Import Bank of Korea,
8.125%, 1/21/2014 | | | 413,452 |
| | 460,000 | | | SK Broadband Co. Ltd.,
7.000%, 2/01/2012, 144A | | | 411,700 |
| | 140,000 | | | SK Telecom Co. Ltd.,
6.625%, 7/20/2027, 144A | | | 116,165 |
| | | | | | | |
| | | | | | | 941,317 |
| | | | | | | |
| | | | Luxembourg — 0.1% | | | |
| | 125,000 | | | Telecom Italia Capital SA,
6.000%, 9/30/2034 | | | 85,282 |
| | 10,000 | | | Telecom Italia Capital SA,
6.375%, 11/15/2033 | | | 7,286 |
| | | | | | | |
| | | | | | | 92,568 |
| | | | | | | |
| | | | Malaysia — 0.1% | | | |
| | 200,000 | | | Ranhill Labuan Ltd.,
12.500%, 10/26/2011, 144A | | | 114,000 |
| | | | | | | |
| | | | Mexico — 0.9% | | | |
| | 340,000 | | | Axtel SAB de CV,
7.625%, 2/01/2017, 144A | | | 224,400 |
| | 295,000 | | | Desarrolladora Homex SAB de CV,
7.500%, 9/28/2015 | | | 194,700 |
| | 100,000 | (††) | | Mexican Bonos, Series MI7,
9.000%, 12/24/2009, (MXN) | | | 719,308 |
See accompanying notes to financial statements.
16
LOOMIS SAYLES GLOBAL MARKETS FUND — PORTFOLIOOF INVESTMENTS (continued)
Investments as of March 31, 2009 (Unaudited)
| | | | | | |
Principal
Amount (‡) | | Description | | Value (†) |
| | | | | | |
| | | Mexico — continued | | | |
| $ | 106,000 | | Mexico Government International Bond, Series A, MTN,
6.050%, 1/11/2040 | | $ | 90,630 |
| | 330,000 | | Petroleos Mexicanos,
8.000%, 5/03/2019, 144A | | | 321,750 |
| | | | | | |
| | | | | | 1,550,788 |
| | | | | | |
| | | Netherlands — 0.5% | | | |
| | 50,000 | | Bite Finance International,
5.150%, 3/15/2014, (EUR), 144A(d) | | | 26,572 |
| | 150,000 | | Cemex Finance Europe BV,
4.750%, 3/05/2014, (EUR) | | | 90,677 |
| | 150,000 | | Koninklijke KPN NV, GMTN,
4.750%, 1/17/2017, (EUR) | | | 184,160 |
| | 100,000 | | Majapahit Holding BV,
7.250%, 6/28/2017, 144A | | | 70,000 |
| | 220,000 | | Netherlands Government Bond,
4.000%, 1/15/2037, (EUR) | | | 288,708 |
| | 50,000 | | OI European Group BV,
6.875%, 3/31/2017, (EUR), 144A | | | 57,130 |
| | 125,000 | | Wolters Kluwer NV,
6.375%, 4/10/2018, (EUR) | | | 156,081 |
| | | | | | |
| | | | | | 873,328 |
| | | | | | |
| | | Norway — 0.7% | | | |
| | 635,000 | | Norwegian Government,
4.250%, 5/19/2017, (NOK) | | | 98,771 |
| | 4,000,000 | | Norwegian Government,
5.500%, 5/15/2009, (NOK) | | | 597,057 |
| | 2,860,000 | | Norwegian Government,
6.500%, 5/15/2013, (NOK) | | | 486,699 |
| | | | | | |
| | | | | | 1,182,527 |
| | | | | | |
| | | Philippines — 0.2% | | | |
| | 310,000 | | Philippine Government International Bond,
8.375%, 6/17/2019 | | | 337,900 |
| | | | | | |
| | | South Africa — 0.3% | | | |
| | 130,000 | | Edcon Proprietary Ltd.,
4.900%, 6/15/2014, (EUR), 144A(d) | | | 64,769 |
| | 450,000 | | Edcon Proprietary Ltd.,
4.900%, 6/15/2014, (EUR)(d) | | | 224,201 |
| | 285,000 | | Republic of South Africa, EMTN,
4.500%, 4/05/2016, (EUR) | | | 313,826 |
| | | | | | |
| | | | | | 602,796 |
| | | | | | |
| | | Spain — 0.1% | | | |
| | 100,000 | | Santander Issuances SA Unipersonal, (fixed rate to 9/30/2014, variable rate thereafter),
4.500%, 9/30/2019, (EUR) | | | 91,034 |
| | 150,000 | | Santander Issuances SA Unipersonal, EMTN, (fixed rate to 5/29/2014, variable rate thereafter),
4.750%, 5/29/2019, (EUR) | | | 145,026 |
| | | | | | |
| | | | | | 236,060 |
| | | | | | |
| | | Supranational — 0.7% | | | |
| | 80,000,000 | | Asia Development Bank,
2.350%, 6/21/2027, (JPY) | | | 781,315 |
| | 42,000,000 | | European Investment Bank,
1.250%, 9/20/2012, (JPY) | | | 424,129 |
| | | | | | |
| | | | | | 1,205,444 |
| | | | | | |
| | | | | | |
Principal
Amount (‡) | | Description | | Value (†) |
| | | | | | |
| | | Thailand — 0.1% | | | |
| $ | 330,000 | | True Move Co. Ltd.,
10.375%, 8/01/2014 | | $ | 145,464 |
| | 100,000 | | True Move Co. Ltd.,
10.375%, 8/01/2014, 144A | | | 44,080 |
| | | | | | |
| | | | | | 189,544 |
| | | | | | |
| | | United Arab Emirates — 0.5% | | | |
| | 400,000 | | Abu Dhabi National Energy Co.,
6.500%, 10/27/2036, 144A | | | 296,453 |
| | 400,000 | | Abu Dhabi National Energy Co.,
7.250%, 8/01/2018, 144A | | | 380,829 |
| | 500,000 | | DP World Ltd.,
6.850%, 7/02/2037, 144A | | | 239,225 |
| | | | | | |
| | | | | | 916,507 |
| | | | | | |
| | | United Kingdom — 0.4% | | | |
| | 100,000 | | BAT International Finance PLC,
5.875%, 3/12/2015, (EUR) | | | 131,252 |
| | 60,000 | | BSKYB Finance UK PLC,
5.750%, 10/20/2017, (GBP) | | | 78,755 |
| | 100,000 | | Imperial Tobacco Finance PLC, EMTN,
4.375%, 11/22/2013, (EUR) | | | 118,501 |
| | 250,000 | | Standard Chartered Bank, EMTN,
5.875%, 9/26/2017, (EUR) | | | 251,286 |
| | 70,000 | | United Kingdom Treasury,
4.250%, 6/07/2032, (GBP) | | | 103,880 |
| | | | | | |
| | | | | | 683,674 |
| | | | | | |
| | | United States — 29.2% | | | |
| | 15,000 | | Amkor Technology, Inc.,
7.750%, 5/15/2013 | | | 12,075 |
| | 100,000 | | Anadarko Petroleum Corp.,
5.950%, 9/15/2016 | | | 86,128 |
| | 780,000 | | Anadarko Petroleum Corp.,
6.450%, 9/15/2036 | | | 545,193 |
| | 610,000 | | Anheuser-Busch Cos., Inc.,
4.950%, 1/15/2014(e) | | | 591,523 |
| | 105,000 | | Anheuser-Busch Cos., Inc.,
6.450%, 9/01/2037 | | | 87,139 |
| | 35,000 | | Anheuser-Busch Cos., Inc.,
6.500%, 5/01/2042 | | | 27,224 |
| | 250,000 | | Anheuser-Busch InBev Worldwide, Inc.,
7.750%, 1/15/2019, 144A | | | 249,275 |
| | 60,000 | | Arrow Electronics, Inc.,
6.875%, 7/01/2013 | | | 57,136 |
| | 325,000 | | AT&T, Inc.,
6.500%, 9/01/2037 | | | 293,287 |
| | 42,865 | | Atlas Air, Inc., Series B,
7.680%, 1/02/2014(b) | | | 32,149 |
| | 145,000 | | Avnet, Inc.,
6.000%, 9/01/2015 | | | 119,313 |
| | 400,000,000 | | Barclays Financial LLC,
4.060%, 9/16/2010, (KRW), 144A | | | 296,519 |
| | 310,000 | | Borden, Inc.,
7.875%, 2/15/2023 | | | 31,000 |
| | 410,000 | | Borden, Inc.,
8.375%, 4/15/2016 | | | 41,000 |
| | 5,000 | | Boston Scientific Corp.,
5.450%, 6/15/2014 | | | 4,575 |
| | 30,000 | | Boston Scientific Corp.,
6.400%, 6/15/2016 | | | 27,900 |
See accompanying notes to financial statements.
17
LOOMIS SAYLES GLOBAL MARKETS FUND — PORTFOLIOOF INVESTMENTS (continued)
Investments as of March 31, 2009 (Unaudited)
| | | | | | |
Principal
Amount (‡) | | Description | | Value (†) |
| | | | | | |
| | | United States — continued | | | |
| $ | 60,000 | | Boston Scientific Corp.,
7.000%, 11/15/2035 | | $ | 51,000 |
| | 50,000 | | Bristol-Myers Squibb Co.,
4.625%, 11/15/2021, (EUR) | | | 60,938 |
| | 700,000 | | Capital One Multi-Asset Execution Trust, Series 2005-A10, Class A,
0.636%, 9/15/2015(d) | | | 586,484 |
| | 2,335,000 | | Capital One Multi-Asset Execution Trust, Series 2006-A5, Class A5,
0.616%, 1/15/2016(d)(e) | | | 1,921,443 |
| | 325,000 | | Caterpillar Financial Services Corp., MTN,
6.125%, 2/17/2014 | | | 315,615 |
| | 250,000 | | Chesapeake Energy Corp.,
6.250%, 1/15/2017, (EUR) | | | 245,791 |
| | 15,000 | | Chesapeake Energy Corp.,
6.500%, 8/15/2017 | | | 12,225 |
| | 70,000 | | Chesapeake Energy Corp.,
6.875%, 1/15/2016 | | | 58,800 |
| | 75,000 | | Chesapeake Energy Corp.,
6.875%, 11/15/2020 | | | 58,688 |
| | 11,000 | | CIT Group, Inc.,
5.400%, 2/13/2012 | | | 7,092 |
| | 112,000 | | CIT Group, Inc.,
5.400%, 3/07/2013 | | | 69,858 |
| | 7,000 | | CIT Group, Inc.,
5.400%, 1/30/2016 | | | 4,196 |
| | 17,000 | | CIT Group, Inc.,
5.600%, 4/27/2011 | | | 12,409 |
| | 153,000 | | CIT Group, Inc.,
5.800%, 10/01/2036 | | | 84,271 |
| | 1,656,000 | | CIT Group, Inc.,
12.000%, 12/18/2018, 144A | | | 856,980 |
| | 270,000 | | CIT Group, Inc., EMTN,
3.800%, 11/14/2012, (EUR) | | | 165,012 |
| | 50,000 | | CIT Group, Inc., EMTN,
5.500%, 12/20/2016, (GBP) | | | 30,132 |
| | 150,000 | | CIT Group, Inc., GMTN,
4.250%, 9/22/2011, (EUR) | | | 119,574 |
| | 60,000 | | CIT Group, Inc., GMTN,
5.000%, 2/13/2014 | | | 35,400 |
| | 7,000 | | CIT Group, Inc., GMTN,
5.000%, 2/01/2015 | | | 4,262 |
| | 50,000 | | CIT Group, Inc., MTN,
4.250%, 3/17/2015, (EUR) | | | 31,886 |
| | 28,000 | | CIT Group, Inc., MTN,
5.125%, 9/30/2014 | | | 16,926 |
| | 11,000 | | CIT Group, Inc., Series A, MTN,
5.650%, 2/13/2017 | | | 6,370 |
| | 706,000 | | CIT Group, Inc., Series A, MTN,
7.625%, 11/30/2012 | | | 519,638 |
| | 120,000 | | Citi Credit Card Issuance Trust, Series 2001-A4, Class A4,
5.375%, 4/10/2013, (EUR) | | | 153,769 |
| | 5,000 | | Clear Channel Communications, Inc.,
4.900%, 5/15/2015 | | | 700 |
| | 820,000 | | Clear Channel Communications, Inc.,
5.500%, 12/15/2016 | | | 114,800 |
| | 75,000 | | Clear Channel Communications, Inc.,
5.750%, 1/15/2013 | | | 11,250 |
| | 25,000 | | Colonial Realty LP,
6.050%, 9/01/2016 | | | 15,167 |
| | 1,000,000 | | Comcast Corp.,
5.650%, 6/15/2035 | | | 791,901 |
| | | | | | |
Principal
Amount (‡) | | Description | | Value (†) |
| | | | | | |
| | | United States — continued | | | |
| $ | 68,665 | | Continental Airlines, Inc., Series 1999-1C,
6.954%, 8/02/2009 | | $ | 66,090 |
| | 90,000 | | Countrywide Home Loans, Inc., Series L, MTN,
4.000%, 3/22/2011 | | | 80,091 |
| | 190,000 | | CSX Corp.,
6.250%, 3/15/2018 | | | 163,677 |
| | 265,000 | | Cummins, Inc.,
5.650%, 3/01/2098 | | | 110,956 |
| | 160,000 | | Cummins, Inc.,
7.125%, 3/01/2028 | | | 110,203 |
| | 10,000 | | D.R. Horton, Inc.,
5.250%, 2/15/2015 | | | 7,663 |
| | 349,133 | | Delta Air Lines, Inc., Series 2007-1, Class B,
8.021%, 8/10/2022 | | | 193,769 |
| | 348,481 | | Delta Air Lines, Inc., Series 2007-1, Class C,
8.954%, 8/10/2014 | | | 205,604 |
| | 50,000 | | Dillard’s, Inc.,
6.625%, 1/15/2018 | | | 18,000 |
| | 50,000 | | Dillard’s, Inc.,
7.000%, 12/01/2028 | | | 17,000 |
| | 15,000 | | ESI Tractebel Acquisition Corp., Series B,
7.990%, 12/30/2011 | | | 14,696 |
| | 250,000 | | Exelon Corp.,
4.900%, 6/15/2015 | | | 212,269 |
| | 150,000 | | Foot Locker, Inc.,
8.500%, 1/15/2022 | | | 120,750 |
| | 10,000 | | Ford Motor Co.,
6.625%, 2/15/2028 | | | 2,825 |
| | 1,750,000 | | Ford Motor Co.,
6.625%, 10/01/2028 | | | 494,375 |
| | 15,000 | | Ford Motor Co.,
7.125%, 11/15/2025 | | | 4,050 |
| | 595,000 | | Ford Motor Co.,
7.450%, 7/16/2031 | | | 188,913 |
| | 1,405,000 | | Ford Motor Credit Co. LLC,
5.700%, 1/15/2010 | | | 1,203,468 |
| | 2,250,000 | | Ford Motor Credit Co. LLC,
7.000%, 10/01/2013 | | | 1,504,489 |
| | 105,000 | | Ford Motor Credit Co. LLC,
8.000%, 12/15/2016 | | | 69,009 |
| | 170,000 | | Ford Motor Credit Co. LLC,
8.625%, 11/01/2010 | | | 135,405 |
| | 390,000 | | Ford Motor Credit Co. LLC,
9.750%, 9/15/2010 | | | 320,832 |
| | 388,000 | | Freescale Semiconductor, Inc.,
10.125%, 12/15/2016 | | | 69,840 |
| | 150,000 | | General Electric Capital Corp.,
5.625%, 5/01/2018 | | | 130,428 |
| | 8,000,000 | | General Electric Capital Corp., EMTN,
1.500%, 4/26/2012, (JPY) | | | 67,471 |
| | 13,000,000 | | General Electric Capital Corp., GMTN,
1.450%, 11/10/2011, (JPY) | | | 111,937 |
| | 100,000 | | General Electric Capital Corp., MTN,
5.875%, 1/14/2038 | | | 71,429 |
| | 750,000 | | General Electric Capital Corp., Series A, MTN,
4.875%, 3/04/2015 | | | 665,711 |
| | 45,000 | | General Motors Corp.,
7.400%, 9/01/2025 | | | 5,175 |
See accompanying notes to financial statements.
18
LOOMIS SAYLES GLOBAL MARKETS FUND — PORTFOLIOOF INVESTMENTS (continued)
Investments as of March 31, 2009 (Unaudited)
| | | | | | |
Principal
Amount (‡) | | Description | | Value (†) |
| | | | | | |
| | | United States — continued | | | |
| $ | 710,000 | | General Motors Corp.,
8.250%, 7/15/2023 | | $ | 87,863 |
| | 3,015,000 | | General Motors Corp.,
8.375%, 7/15/2033 | | | 376,875 |
| | 20,000 | | Georgia Gulf Corp.,
10.750%, 10/15/2016 | | | 1,300 |
| | 3,375,000 | | Georgia-Pacific LLC,
7.250%, 6/01/2028 | | | 2,345,625 |
| | 35,000 | | Georgia-Pacific LLC,
7.750%, 11/15/2029 | | | 25,900 |
| | 525,000 | | Georgia-Pacific LLC,
8.000%, 1/15/2024 | | | 417,375 |
| | 505,000 | | Georgia-Pacific LLC,
8.875%, 5/15/2031 | | | 404,000 |
| | 288,000 | | GMAC LLC,
6.000%, 12/15/2011, 144A | | | 196,073 |
| | 129,000 | | GMAC LLC,
6.625%, 5/15/2012, 144A | | | 86,537 |
| | 257,000 | | GMAC LLC,
6.750%, 12/01/2014, 144A | | | 149,353 |
| | 28,000 | | GMAC LLC,
6.875%, 9/15/2011, 144A | | | 19,897 |
| | 60,000 | | GMAC LLC,
6.875%, 8/28/2012, 144A | | | 40,294 |
| | 63,000 | | GMAC LLC,
7.000%, 2/01/2012, 144A | | | 43,515 |
| | 63,000 | | GMAC LLC,
7.250%, 3/02/2011, 144A | | | 46,648 |
| | 55,000 | | GMAC LLC,
7.500%, 12/31/2013, 144A | | | 26,437 |
| | 129,000 | | GMAC LLC,
8.000%, 12/31/2018, 144A | | | 37,450 |
| | 1,946,000 | | GMAC LLC,
8.000%, 11/01/2031, 144A | | | 936,337 |
| | 150,000 | | Goldman Sachs Group, Inc. (The),
2.238%, 5/23/2016, (EUR)(d) | | | 137,593 |
| | 150,000 | | Goldman Sachs Group, Inc. (The),
4.750%, 1/28/2014, (EUR) | | | 171,465 |
| | 1,190,000 | | Goldman Sachs Group, Inc. (The),
5.000%, 10/01/2014 | | | 1,075,854 |
| | 605,000 | | Goldman Sachs Group, Inc. (The),
5.150%, 1/15/2014 | | | 552,159 |
| | 170,000 | | Goldman Sachs Group, Inc. (The),
6.125%, 2/15/2033 | | | 141,579 |
| | 285,000 | | Goldman Sachs Group, Inc. (The),
6.750%, 10/01/2037 | | | 192,757 |
| | 400,000 | | Goldman Sachs Group, Inc. (The),
6.875%, 1/18/2038, (GBP) | | | 369,560 |
| | 165,000 | | Goodyear Tire & Rubber Co. (The),
7.000%, 3/15/2028 | | | 92,400 |
| | 25,000 | | GTE Corp.,
6.940%, 4/15/2028 | | | 22,386 |
| | 20,000 | | HCA, Inc.,
5.750%, 3/15/2014 | | | 13,100 |
| | 55,000 | | HCA, Inc.,
6.250%, 2/15/2013 | | | 41,250 |
| | 90,000 | | HCA, Inc.,
6.375%, 1/15/2015 | | | 58,950 |
| | 15,000 | | HCA, Inc.,
6.500%, 2/15/2016 | | | 9,825 |
| | | | | | |
Principal
Amount (‡) | | Description | | Value (†) |
| | | | | | |
| | | United States — continued | | | |
| $ | 40,000 | | HCA, Inc.,
6.750%, 7/15/2013 | | $ | 29,900 |
| | 225,000 | | HCA, Inc.,
7.050%, 12/01/2027 | | | 117,000 |
| | 245,000 | | HCA, Inc.,
7.190%, 11/15/2015 | | | 165,507 |
| | 90,000 | | HCA, Inc.,
7.500%, 12/15/2023 | | | 47,685 |
| | 250,000 | | HCA, Inc.,
7.500%, 11/06/2033 | | | 125,000 |
| | 1,295,000 | | HCA, Inc.,
7.690%, 6/15/2025 | | | 674,444 |
| | 395,000 | | HCA, Inc.,
8.360%, 4/15/2024 | | | 221,486 |
| | 125,000 | | HCA, Inc.,
8.750%, 11/01/2010, (GBP) | | | 166,801 |
| | 110,000 | | HCA, Inc., MTN,
7.580%, 9/15/2025 | | | 56,442 |
| | 75,000 | | HCA, Inc., MTN,
7.750%, 7/15/2036 | | | 37,935 |
| | 470,000 | | Highwoods Properties, Inc.,
5.850%, 3/15/2017 | | | 290,636 |
| | 260,000 | | Hilcorp Energy I LP,
7.750%, 11/01/2015, 144A | | | 189,800 |
| | 25,000 | | Home Depot, Inc. (The),
5.400%, 3/01/2016 | | | 22,473 |
| | 1,685,000 | | Home Depot, Inc. (The),
5.875%, 12/16/2036 | | | 1,193,285 |
| | 250,000 | | iStar Financial, Inc.,
5.150%, 3/01/2012 | | | 90,000 |
| | 95,000 | | iStar Financial, Inc.,
5.500%, 6/15/2012 | | | 32,300 |
| | 105,000 | | iStar Financial, Inc.,
5.650%, 9/15/2011 | | | 43,050 |
| | 70,000 | | iStar Financial, Inc.,
5.850%, 3/15/2017 | | | 20,300 |
| | 300,000 | | iStar Financial, Inc.,
5.875%, 3/15/2016 | | | 87,000 |
| | 145,000 | | iStar Financial, Inc.,
6.050%, 4/15/2015 | | | 42,050 |
| | 985,000 | | iStar Financial, Inc.,
8.625%, 6/01/2013 | | | 307,813 |
| | 35,000 | | iStar Financial, Inc., Series B,
5.700%, 3/01/2014 | | | 10,150 |
| | 950,000 | | iStar Financial, Inc., Series B,
5.950%, 10/15/2013 | | | 289,750 |
| | 5,000 | | J.C. Penney Corp., Inc.,
5.750%, 2/15/2018 | | | 3,516 |
| | 125,000 | | J.C. Penney Corp., Inc.,
6.375%, 10/15/2036 | | | 78,145 |
| | 15,000 | | J.C. Penney Corp., Inc.,
7.125%, 11/15/2023 | | | 10,477 |
| | 5,000 | | J.C. Penney Corp., Inc.,
7.400%, 4/01/2037 | | | 3,175 |
| | 5,000 | | J.C. Penney Corp., Inc.,
7.625%, 3/01/2097 | | | 3,171 |
| | 260,000 | | K. Hovnanian Enterprises, Inc.,
6.250%, 1/15/2016 | | | 70,200 |
| | 15,000 | | K. Hovnanian Enterprises, Inc.,
6.375%, 12/15/2014 | | | 4,125 |
See accompanying notes to financial statements.
19
LOOMIS SAYLES GLOBAL MARKETS FUND — PORTFOLIOOF INVESTMENTS (continued)
Investments as of March 31, 2009 (Unaudited)
| | | | | | |
Principal
Amount (‡) | | Description | | Value (†) |
| | | | | | |
| | | United States — continued | | | |
| $ | 250,000 | | Kellwood Co.,
7.625%, 10/15/2017(f) | | $ | 11,250 |
| | 150,000 | | Kraft Food, Inc.,
6.250%, 3/20/2015, (EUR) | | | 206,464 |
| | 1,800,000 | | Lehman Brothers Holdings, Inc.,
6.875%, 7/17/2037(c) | | | 180 |
| | 135,000 | | Lehman Brothers Holdings, Inc., MTN, (fixed rate to 5/03/2027, variable rate thereafter),
6.000%, 5/03/2032(c) | | | 14 |
| | 30,000 | | Lennar Corp., Series B,
5.125%, 10/01/2010 | | | 26,250 |
| | 15,000 | | Lennar Corp., Series B,
5.500%, 9/01/2014 | | | 10,800 |
| | 1,090,000 | | Lennar Corp., Series B,
5.600%, 5/31/2015 | | | 776,625 |
| | 55,000 | | Lennar Corp., Series B,
6.500%, 4/15/2016 | | | 39,600 |
| | 15,000 | | Level 3 Financing, Inc.,
8.750%, 2/15/2017 | | | 9,600 |
| | 10,000 | | Level 3 Financing, Inc.,
9.250%, 11/01/2014 | | | 6,900 |
| | 1,000,000 | | Lubrizol Corp.,
6.500%, 10/01/2034 | | | 763,650 |
| | 155,000 | | Lucent Technologies, Inc.,
6.450%, 3/15/2029 | | | 58,900 |
| | 130,000 | | MBNA Credit Card Master Note Trust, Series 03A5,
4.150%, 4/19/2010, (EUR) | | | 169,863 |
| | 150,000 | | Merrill Lynch & Co., Inc., EMTN,
4.625%, 9/14/2018, (EUR) | | | 111,176 |
| | 90,000 | | MidAmerican Energy Holdings Co.,
6.500%, 9/15/2037 | | | 83,229 |
| | 610,000 | | Morgan Stanley,
4.750%, 4/01/2014 | | | 498,722 |
| | 230,000 | | Morgan Stanley,
5.375%, 11/14/2013, (GBP) | | | 280,317 |
| | 1,400,000 | | Morgan Stanley,
5.375%, 10/15/2015 | | | 1,264,788 |
| | 300,000 | | Morgan Stanley, EMTN,
5.450%, 1/09/2017 | | | 262,500 |
| | 500,000 | | Morgan Stanley, MTN,
6.250%, 8/09/2026 | | | 413,554 |
| | 950,000 | | Morgan Stanley, Series F, MTN,
5.950%, 12/28/2017 | | | 862,983 |
| | 100,000 | | Mosaic Global Holdings, Inc.,
7.375%, 8/01/2018 | | | 94,500 |
| | 500,000 | | New Albertson’s, Inc.,
7.450%, 8/01/2029 | | | 415,000 |
| | 50,000 | | New Albertson’s, Inc., Series C, MTN,
6.625%, 6/01/2028 | | | 36,750 |
| | 80,000 | | News America, Inc.,
6.150%, 3/01/2037 | | | 58,329 |
| | 25,000 | | News America, Inc.,
6.400%, 12/15/2035 | | | 18,521 |
| | 925,000 | | Nextel Communications, Inc., Series D,
7.375%, 8/01/2015 | | | 490,250 |
| | 140,000 | | Nextel Communications, Inc., Series E,
6.875%, 10/31/2013 | | | 79,800 |
| | 230,000 | | Nextel Communications, Inc., Series F,
5.950%, 3/15/2014 | | | 127,650 |
| | | | | | | |
Principal
Amount (‡) | | | Description | | Value (†) |
| | | | | | | |
| | | | United States — continued | | | |
| $ | 250,000 | | | NGC Corp. Capital Trust I, Series B,
8.316%, 6/01/2027 | | $ | 100,000 |
| | 35,000 | | | Nortel Networks Capital Corp.,
7.875%, 6/15/2026(c) | | | 5,600 |
| | 1,000,000 | | | NRG Energy, Inc.,
7.375%, 2/01/2016 | | | 930,000 |
| | 50,000 | | | Ohio Edison Co.,
6.875%, 7/15/2036 | | | 43,937 |
| | 150,000 | | | Owens Brockway Glass Container, Inc.,
6.750%, 12/01/2014, (EUR) | | | 179,361 |
| | 565,000 | | | Owens Corning, Inc.,
6.500%, 12/01/2016 | | | 414,515 |
| | 535,000 | | | Owens Corning, Inc.,
7.000%, 12/01/2036 | | | 299,804 |
| | 40,000 | | | Owens-Illinois, Inc.,
7.800%, 5/15/2018 | | | 38,800 |
| | 200,000 | | | Philip Morris International, Inc., GMTN,
5.875%, 9/04/2015, (EUR) | | | 272,053 |
| | 50,000 | | | Pulte Homes, Inc.,
5.200%, 2/15/2015 | | | 39,563 |
| | 540,000 | | | Pulte Homes, Inc.,
6.000%, 2/15/2035 | | | 329,400 |
| | 695,000 | | | Pulte Homes, Inc.,
6.375%, 5/15/2033 | | | 423,950 |
| | 1,335,000 | | | Qwest Capital Funding, Inc.,
6.500%, 11/15/2018 | | | 907,800 |
| | 650,000 | | | Qwest Capital Funding, Inc.,
6.875%, 7/15/2028 | | | 409,500 |
| | 400,000 | | | Qwest Capital Funding, Inc.,
7.625%, 8/03/2021 | | | 284,000 |
| | 60,000 | | | Qwest Capital Funding, Inc.,
7.750%, 2/15/2031 | | | 39,600 |
| | 560,000 | | | Qwest Corp.,
6.875%, 9/15/2033 | | | 366,800 |
| | 115,000 | | | Qwest Corp.,
7.250%, 9/15/2025 | | | 75,900 |
| | 58,000 | | | R.H. Donnelley Corp.,
6.875%, 1/15/2013 | | | 2,465 |
| | 50,000 | | | R.H. Donnelley Corp., Series A-1,
6.875%, 1/15/2013 | | | 2,125 |
| | 60,000 | | | R.H. Donnelley Corp., Series A-2,
6.875%, 1/15/2013 | | | 2,550 |
| | 18,000 | | | R.H. Donnelley Corp., Series A-3,
8.875%, 1/15/2016 | | | 1,035 |
| | 735,000 | | | R.H. Donnelley Corp., Series A-4,
8.875%, 10/15/2017 | | | 38,588 |
| | 305,000 | | | R.H. Donnelley, Inc.,
11.750%, 5/15/2015, 144A | | | 36,600 |
| | 80,000 | | | Reynolds American, Inc.,
6.750%, 6/15/2017 | | | 68,295 |
| | 20,000 | | | Reynolds American, Inc.,
7.250%, 6/15/2037 | | | 14,603 |
| | 515,000 | | | Six Flags, Inc.,
9.625%, 6/01/2014 | | | 42,488 |
| | 1,600 | (†††) | | SLM Corp.,
6.000%, 12/15/2043 | | | 14,693 |
| | 120,000 | | | SLM Corp., MTN,
5.050%, 11/14/2014 | | | 63,522 |
| | 30,000 | | | SLM Corp., MTN,
5.125%, 8/27/2012 | | | 16,165 |
See accompanying notes to financial statements.
20
LOOMIS SAYLES GLOBAL MARKETS FUND — PORTFOLIOOF INVESTMENTS (continued)
Investments as of March 31, 2009 (Unaudited)
| | | | | | |
Principal
Amount (‡) | | Description | | Value (†) |
| | | | | | |
| | | United States — continued | | | |
| $ | 10,000 | | SLM Corp., Series A, MTN,
4.000%, 1/15/2010 | | $ | 8,439 |
| | 10,000 | | SLM Corp., Series A, MTN,
4.500%, 7/26/2010 | | | 7,500 |
| | 228,000 | | SLM Corp., Series A, MTN,
5.000%, 10/01/2013 | | | 121,243 |
| | 10,000 | | SLM Corp., Series A, MTN,
5.000%, 6/15/2018 | | | 5,177 |
| | 115,000 | | SLM Corp., Series A, MTN,
5.375%, 1/15/2013 | | | 63,102 |
| | 75,000 | | SLM Corp., Series A, MTN,
5.375%, 5/15/2014 | | | 38,865 |
| | 30,000 | | SLM Corp., Series A, MTN,
5.400%, 10/25/2011 | | | 18,600 |
| | 20,000 | | SLM Corp., Series A, MTN,
5.625%, 8/01/2033 | | | 7,400 |
| | 625,000 | | SLM Corp., Series A, MTN,
8.450%, 6/15/2018 | | | 337,580 |
| | 100,000 | | Southern Natural Gas Co.,
7.350%, 2/15/2031 | | | 84,159 |
| | 294,000 | | Sprint Capital Corp.,
6.875%, 11/15/2028 | | | 179,340 |
| | 320,000 | | Sprint Capital Corp.,
6.900%, 5/01/2019 | | | 225,600 |
| | 110,000 | | Sprint Capital Corp.,
8.750%, 3/15/2032 | | | 73,700 |
| | 26,000 | | Sprint Nextel Corp.,
6.000%, 12/01/2016 | | | 18,590 |
| | 20,000 | | Tenet Healthcare Corp.,
6.500%, 6/01/2012 | | | 17,019 |
| | 265,000 | | Tenet Healthcare Corp.,
6.875%, 11/15/2031 | | | 131,175 |
| | 23,000 | | Tenet Healthcare Corp.,
7.375%, 2/01/2013 | | | 18,285 |
| | 240,000 | | Tennessee Gas Pipeline Co.,
7.000%, 3/15/2027 | | | 205,766 |
| | 750,000 | | Tennessee Gas Pipeline Co.,
7.000%, 10/15/2028 | | | 637,993 |
| | 250,000 | | Textron, Inc.,
3.875%, 3/11/2013, (EUR) | | | 166,278 |
| | 10,000 | | Time Warner, Inc.,
6.500%, 11/15/2036 | | | 8,225 |
| | 395,000 | | Time Warner, Inc.,
6.625%, 5/15/2029 | | | 333,468 |
| | 160,000 | | Time Warner, Inc.,
6.950%, 1/15/2028 | | | 141,390 |
| | 115,000 | | Time Warner, Inc.,
7.625%, 4/15/2031 | | | 102,755 |
| | 75,000 | | Time Warner, Inc.,
7.700%, 5/01/2032 | | | 67,443 |
| | 105,000 | | Toll Brothers Finance Corp.,
5.150%, 5/15/2015 | | | 88,567 |
| | 375,000 | | Toys R Us, Inc.,
7.375%, 10/15/2018 | | | 120,000 |
| | 200,000 | | Transcontinental Gas Pipe Line Corp.,
6.400%, 4/15/2016 | | | 195,188 |
| | 3,150,000 | | TXU Corp., Series P,
5.550%, 11/15/2014 | | | 1,086,750 |
| | 2,570,000 | | TXU Corp., Series Q,
6.500%, 11/15/2024 | | | 720,949 |
| | | | | | |
Principal
Amount (‡) | | Description | | Value (†) |
| | | | | | |
| | | United States — continued | | | |
| $ | 30,000 | | TXU Corp., Series R,
6.550%, 11/15/2034 | | $ | 8,131 |
| | 2,320,000 | | United Rentals North America, Inc.,
7.000%, 2/15/2014 | | | 1,171,600 |
| | 840,000 | | United Rentals North America, Inc.,
7.750%, 11/15/2013 | | | 457,800 |
| | 770,000 | | United States Steel Corp.,
6.650%, 6/01/2037 | | | 433,880 |
| | 50,000 | | USG Corp.,
6.300%, 11/15/2016 | | | 26,500 |
| | 230,000 | | USG Corp.,
9.250%, 1/15/2018 | | | 140,300 |
| | 249,000 | | Verizon Communications, Inc.,
5.850%, 9/15/2035 | | | 211,554 |
| | 120,000 | | Verizon Communications, Inc.,
6.400%, 2/15/2038 | | | 108,786 |
| | 5,000 | | Verizon Maryland, Inc.,
5.125%, 6/15/2033 | | | 3,464 |
| | 250,000 | | Verizon New York, Inc., Series B,
7.375%, 4/01/2032 | | | 231,959 |
| | 110,000 | | Verizon Wireless Capital LLC,
8.750%, 12/18/2015, (EUR) | | | 164,512 |
| | 775,000 | | Viacom, Inc., Class B,
6.875%, 4/30/2036 | | | 565,445 |
| | 140,000 | | Virginia Tobacco Settlement Financing Corp., Series A-1,
6.706%, 6/01/2046(f) | | | 68,937 |
| | 185,000 | | Wells Fargo & Co.,
4.625%, 11/02/2035, (GBP) | | | 191,834 |
| | 100,000 | | Williams Cos., Inc. (The),
7.500%, 1/15/2031 | | | 79,000 |
| | 310,000 | | Williams Cos., Inc. (The),
7.875%, 9/01/2021 | | | 286,750 |
| | 420,000 | | Xerox Corp.,
6.350%, 5/15/2018 | | | 312,900 |
| | 125,000 | | Xerox Corp.,
6.750%, 2/01/2017 | | | 95,469 |
| | 20,000 | | Xerox Corp., MTN,
7.200%, 4/01/2016 | | | 15,400 |
| | | | | | |
| | | | | | 50,230,755 |
| | | | | | |
| | | Uruguay — 0.5% | | | |
| | 36,484,120 | | Republic of Uruguay,
4.250%, 4/05/2027, (UYU) | | | 801,494 |
| | | | | | |
| | | Total Non-Convertible Bonds (Identified Cost $97,086,731) | | | 71,131,023 |
| | | | | | |
| | Convertible Bonds — 1.4% | | | |
| | | United States — 1.4% | | | |
| | 430,000 | | iStar Financial, Inc.,
1.935%, 10/01/2012(d) | | | 129,000 |
| | 365,000 | | Kulicke & Soffa Industries, Inc.,
0.875%, 6/01/2012 | | | 172,919 |
| | 140,000 | | Level 3 Communications, Inc.,
2.875%, 7/15/2010 | | | 102,375 |
| | 440,000 | | Level 3 Communications, Inc.,
3.500%, 6/15/2012 | | | 182,600 |
| | 185,000 | | Level 3 Communications, Inc.,
5.250%, 12/15/2011 | | | 94,350 |
| | 95,000 | | Level 3 Communications, Inc.,
6.000%, 9/15/2009 | | | 91,675 |
See accompanying notes to financial statements.
21
LOOMIS SAYLES GLOBAL MARKETS FUND — PORTFOLIOOF INVESTMENTS (continued)
Investments as of March 31, 2009 (Unaudited)
| | | | | | |
Principal
Amount (‡) | | Description | | Value (†) |
| | | | | | |
| | | United States — continued | | | |
| $ | 145,000 | | Level 3 Communications, Inc.,
6.000%, 3/15/2010 | | $ | 123,250 |
| | 200,000 | | NII Holdings, Inc.,
3.125%, 6/15/2012 | | | 139,000 |
| | 500,000 | | Valeant Pharmaceuticals International,
3.000%, 8/16/2010 | | | 478,750 |
| | 80,000 | | Valeant Pharmaceuticals International,
4.000%, 11/15/2013 | | | 70,800 |
| | 583,000 | | Vertex Pharmaceuticals, Inc.,
4.750%, 2/15/2013 | | | 765,916 |
| | | | | | |
| | | Total Convertible Bonds (Identified Cost $2,918,955) | | | 2,350,635 |
| | | | | | |
| | | Total Bonds and Notes (Identified Cost $100,005,686) | | | 73,481,658 |
| | | | | | |
| | Bank Loans — 0.1% | | | |
| | | United States — 0.1% | | | |
| | 1,958 | | Dole Food Co., Inc., Credit Link Deposit,
2.790%, 4/12/2013(g) | | | 1,800 |
| | 1,273 | | Dole Food Co., Inc., Tranche B Term Loan,
7.960%, 4/12/2013(g) | | | 1,170 |
| | 6,245 | | Dole Food Co., Inc., Tranche C Term Loan,
7.969%, 4/12/2013(g) | | | 5,742 |
| | 56,488 | | Hawaiian Telcom Communications, Inc., Tranche C Term Loan,
4.750%, 6/01/2014(g)(h) | | | 25,250 |
| | 163,848 | | Idearc, Inc., Term Loan B,
6.250%, 11/17/2014(c)(g) | | | 65,488 |
| | 40,000 | | Level 3 Financing, Inc., New Term Loan,
3.309%, 3/13/2014(g) | | | 30,025 |
| | 79,796 | | Sungard Data Systems, Inc., Term Loan B,
2.697%, 2/28/2014(g) | | | 67,223 |
| | 7,314 | | Tribune Co., Term Loan X,
5.000%, 6/04/2009(c)(g) | | | 1,909 |
| | | | | | |
| | | | | | 198,607 |
| | | | | | |
| | | Total Bank Loans (Identified Cost $283,408) | | | 198,607 |
| | | | | | |
| | | | | | |
| Shares | | | | |
| | Preferred Stocks — 1.0% | | | |
| | | United States — 0.2% | | | |
| | 12,940 | | Federal Home Loan Mortgage Corp.,
8.375%(b)(i) | | | 5,952 |
| | 17,500 | | Federal National Mortgage Association,
8.250%(b)(i) | | | 12,425 |
| | 820 | | Lucent Technologies Capital Trust,
7.750% | | | 237,840 |
| | 682 | | Preferred Blocker, Inc.,
7.000%, 144A | | | 135,782 |
| | | | | | |
| | | | | | 391,999 |
| | | | | | |
| | | Brazil — 0.8% | | | |
| | 118,556 | | Banco Itau Holding Financeira SA, Zero Coupon | | | 1,310,900 |
| | | | | | |
| | | Total Preferred Stocks (Identified Cost $3,023,631) | | | 1,702,899 |
| | | | | | |
Principal
Amount (‡) | | | | |
| | Short-Term Investments — 0.0% | | | |
| $ | 354 | | Repurchase Agreement with State Street Corp., dated 3/31/2009 at 0.000%, to be repurchased at $354 on 4/01/2009 collateralized by $5,000 U.S. Treasury Bill, due 5/28/2009 valued at $4,999 including accrued interest (Note 2h of Notes to Financial Statements) (Identified Cost $354) | | | 354 |
| | | | | | |
| | | | | | |
| | | | | | |
| | Total Investments — 97.7%
(Identified Cost $214,203,773)(a) | | $ | 168,091,558 | |
| | Other assets less liabilities — 2.3% | | | 4,014,607 | |
| | | | | | |
| | Net Assets — 100.0% | | $ | 172,106,165 | |
| | | | | | |
| | | | | | |
| (‡) | | Principal amount stated in U.S. dollars unless otherwise noted. | |
| (†) | | See Note 2a of Notes to Financial Statements. | |
| (††) | | Amount shown represents units. One unit represents a principal amount of 100. | |
| (†††) | | Amount shown represents units. One unit represents a principal amount of 25. | |
| (a) | | Federal Tax Information (Amounts exclude certain adjustments made at the end of the Fund’s fiscal year for tax purposes. Such adjustments are primarily due to wash sales and unrealized gains on passive foreign investment companies. Amortization of premium on debt securities is excluded for tax purposes.): | |
| | At March 31, 2009, the net unrealized depreciation on investments based on a cost of $214,253,391 for federal income tax purposes was as follows: | | | | |
| | Aggregate gross unrealized appreciation for all investments in which there is an excess of value over tax cost | | $ | 5,651,580 | |
| | Aggregate gross unrealized depreciation for all investments in which there is an excess of tax cost over value | | | (51,813,413 | ) |
| | | | | | |
| | Net unrealized depreciation | | $ | (46,161,833 | ) |
| | | | | | |
| | | | | | |
| (b) | | Non-income producing security. | |
| (c) | | Non-income producing due to bankruptcy filing. | |
| (d) | | Variable rate security. Rate as of March 31, 2009 is disclosed. | |
| (e) | | All or a portion of this security is held as collateral for open forward foreign currency contracts. | |
| (f) | | Illiquid security. At March 31, 2009, the value of these securities amounted to $80,187 or 0.0% of net assets. | |
| (g) | | Variable rate security. Rate shown represents the weighted average rate at March 31, 2009. | |
| (h) | | All or a portion of interest payment is paid in-kind. | |
| (i) | | Future dividend payments have been eliminated as the issuer has been placed in conservatorship. | |
| | | |
| 144A | | Securities exempt from registration under Rule 144A of the Securities Act of 1933. These securities may be resold in transactions exempt from registration, normally to qualified institutional buyers. At March 31, 2009, the total value of these securities amounted to $7,502,478 or 4.4% of net assets. | |
| ADR | | An American Depositary Receipt is a certificate issued by a custodian bank representing the right to receive securities of the foreign issuer described. The values of ADRs are significantly influenced by trading on exchanges not located in the United States. | |
| | | |
| EMTN | | Euro Medium Term Note | |
| GMTN | | Global Medium Term Note | |
| MTN | | Medium Term Note | |
| |
| AUD | | Australian Dollar | |
| BRL | | Brazilian Real | |
| CAD | | Canadian Dollar | |
| COP | | Colombian Peso | |
| EUR | | Euro | |
| GBP | | British Pound | |
| JPY | | Japanese Yen | |
| KRW | | South Korean Won | |
| MXN | | Mexican Peso | |
| NOK | | Norwegian Krone | |
| UYU | | Uruguayan Peso | |
See accompanying notes to financial statements.
22
LOOMIS SAYLES GLOBAL MARKETS FUND — PORTFOLIOOF INVESTMENTS (continued)
Investments as of March 31, 2009 (Unaudited)
At March 31, 2009, the fund had the following open forward foreign currency contracts:
| | | | | | | | | | | | | |
Contract to Buy/Sell | | Delivery Date | | Currency | | Units | | Value | | Unrealized Appreciation (Depreciation) | |
| Buy | | 6/15/2009 | | Chinese Yuan Renminbi | | 5,300,000 | | $ | 775,913 | | $ | (34,237 | ) |
| Sell | | 6/15/2009 | | Chinese Yuan Renminbi | | 5,300,000 | | | 775,913 | | | 20,549 | |
| Sell | | 6/17/2009 | | Japanese Yen | | 57,000,000 | | | 576,537 | | | 3,946 | |
| Sell | | 6/17/2009 | | Japanese Yen | | 25,000,000 | | | 252,867 | | | (207 | ) |
| | | | | | | | | | | | | |
| Total | | | | | | | | | | | $ | (9,949 | ) |
| | | | | | | | | | | | | |
Net Asset Summary at March 31, 2009 (Unaudited)
| | | |
| Oil, Gas & Consumable Fuels | | 4.9 | % |
| Banking | | 4.5 | |
| Chemicals | | 4.2 | |
| Communications Equipment | | 3.9 | |
| Computers & Peripherals | | 3.8 | |
| Pharmaceuticals | | 3.6 | |
| Biotechnology | | 3.5 | |
| IT Services | | 3.3 | |
| Non-Captive Diversified | | 3.2 | |
| Software | | 2.7 | |
| Automotive | | 2.7 | |
| Wirelines | | 2.7 | |
| Semiconductors & Semiconductor Equipment | | 2.5 | |
| Sovereigns | | 2.4 | |
| Electrical Equipment | | 2.3 | |
| Internet & Catalog Retail | | 2.3 | |
| Commercial Banks | | 2.1 | |
| Treasuries | | 2.1 | |
| Capital Markets | | 2.0 | |
| Other Investments, less than 2% each | | 39.0 | |
| Short-Term Investments | | 0.0 | |
| | | |
| Total Investments | | 97.7 | |
| Other assets less liabilities (including open Forward Foreign Currency Contracts) | | 2.3 | |
| | | |
| Net Assets | | 100.0 | % |
| | | |
Currency Exposure at March 31, 2009 as Percentage of Net Assets (Unaudited)
| | | |
| United States Dollar | | 71.6 | % |
| Euro | | 5.6 | |
| British Pound | | 3.6 | |
| Japanese Yen | | 3.1 | |
| Brazilian Real | | 2.9 | |
| Hong Kong Dollar | | 2.8 | |
| Other, less than 2% each | | 8.1 | |
| | | |
| Total Investments | | 97.7 | |
| Other assets less liabilities (including open Forward Foreign Currency Contracts) | | 2.3 | |
| | | |
| Net Assets | | 100.0 | % |
| | | |
See accompanying notes to financial statements.
23
LOOMIS SAYLES GROWTH FUND — PORTFOLIOOF INVESTMENTS
Investments as of March 31, 2009 (Unaudited)
| | | | | |
| Shares | | Description | | Value (†) |
| | | | | |
| Common Stocks — 98.3% of Net Assets | | | |
| | Aerospace & Defense — 2.0% | | | |
| 35,471 | | Goodrich Corp. | | $ | 1,343,996 |
| 21,419 | | Precision Castparts Corp. | | | 1,282,998 |
| | | | | |
| | | | | 2,626,994 |
| | | | | |
| | Air Freight & Logistics — 1.2% | | | |
| 35,463 | | C.H. Robinson Worldwide, Inc. | | | 1,617,468 |
| | | | | |
| | Biotechnology — 4.5% | | | |
| 36,867 | | Celgene Corp.(b) | | | 1,636,895 |
| 59,339 | | Gilead Sciences, Inc.(b) | | | 2,748,583 |
| 35,084 | | Myriad Genetics, Inc.(b) | | | 1,595,269 |
| | | | | |
| | | | | 5,980,747 |
| | | | | |
| | Capital Markets — 5.6% | | | |
| 29,034 | | Goldman Sachs Group, Inc. (The) | | | 3,078,185 |
| 82,224 | | Morgan Stanley | | | 1,872,240 |
| 41,207 | | Northern Trust Corp. | | | 2,465,003 |
| | | | | |
| | | | | 7,415,428 |
| | | | | |
| | Chemicals — 6.4% | | | |
| 57,839 | | Monsanto Co. | | | 4,806,421 |
| 39,389 | | The Mosaic Co. | | | 1,653,550 |
| 30,816 | | Praxair, Inc. | | | 2,073,609 |
| | | | | |
| | | | | 8,533,580 |
| | | | | |
| | Communications Equipment — 7.8% | | | |
| 144,958 | | Cisco Systems, Inc.(b) | | | 2,430,945 |
| 78,816 | | Corning, Inc. | | | 1,045,888 |
| 96,129 | | Juniper Networks, Inc.(b) | | | 1,447,703 |
| 140,670 | | QUALCOMM, Inc. | | | 5,473,470 |
| | | | | |
| | | | | 10,398,006 |
| | | | | |
| | Computers & Peripherals — 9.9% | | | |
| 62,107 | | Apple, Inc.(b) | | | 6,528,688 |
| 52,060 | | Hewlett-Packard Co. | | | 1,669,043 |
| 51,675 | | International Business Machines Corp. | | | 5,006,791 |
| | | | | |
| | | | | 13,204,522 |
| | | | | |
| | Construction & Engineering — 2.0% | | | |
| 23,560 | | Fluor Corp. | | | 813,998 |
| 48,482 | | Jacobs Engineering Group, Inc.(b) | | | 1,874,314 |
| | | | | |
| | | | | 2,688,312 |
| | | | | |
| | Diversified Consumer Services — 1.2% | | | |
| 13,278 | | ITT Educational Services, Inc.(b) | | | 1,612,215 |
| | | | | |
| | Electrical Equipment — 1.5% | | | |
| 15,121 | | First Solar, Inc.(b) | | | 2,006,557 |
| | | | | |
| | Health Care Equipment & Supplies — 3.7% | | | |
| 33,283 | | Baxter International, Inc. | | | 1,704,755 |
| 15,208 | | C.R. Bard, Inc. | | | 1,212,382 |
| 55,454 | | St. Jude Medical, Inc.(b) | | | 2,014,644 |
| | | | | |
| | | | | 4,931,781 |
| | | | | |
| | Health Care Providers & Services — 1.7% | | | |
| 55,689 | | Medco Health Solutions, Inc.(b) | | | 2,302,183 |
| | | | | |
| | Hotels, Restaurants & Leisure — 1.7% | | | |
| 41,479 | | McDonald’s Corp. | | | 2,263,509 |
| | | | | |
| | Insurance — 1.9% | | | |
| 132,132 | | Fidelity National Financial, Inc., Class A | | | 2,577,895 |
| | | | | |
| | Internet & Catalog Retail — 6.3% | | | |
| 84,981 | | Amazon.com, Inc.(b) | | | 6,241,005 |
| 28,393 | | Priceline.com, Inc.(b) | | | 2,236,800 |
| | | | | |
| | | | | 8,477,805 |
| | | | | |
| | | | | | |
| Shares | | Description | | Value (†) |
| | | | | | |
| | | Internet Software & Services — 3.3% | | | |
| | 12,736 | | Google, Inc., Class A(b) | | $ | 4,432,892 |
| | | | | | |
| | | IT Services — 6.7% | | | |
| | 24,114 | | MasterCard, Inc., Class A | | | 4,038,613 |
| | 87,743 | | Visa, Inc., Class A | | | 4,878,511 |
| | | | | | |
| | | | | | 8,917,124 |
| | | | | | |
| | | Life Sciences Tools & Services — 1.6% | | | |
| | 56,871 | | Illumina, Inc.(b) | | | 2,117,876 |
| | | | | | |
| | | Metals & Mining — 1.5% | | | |
| | 52,030 | | Freeport-McMoRan Copper & Gold, Inc. | | | 1,982,863 |
| | | | | | |
| | | Multiline Retail — 3.6% | | | |
| | 75,858 | | Family Dollar Stores, Inc. | | | 2,531,382 |
| | 54,445 | | Kohl’s Corp.(b) | | | 2,304,112 |
| | | | | | |
| | | | | | 4,835,494 |
| | | | | | |
| | | Oil, Gas & Consumable Fuels — 7.0% | | | |
| | 39,256 | | Hess Corp. | | | 2,127,675 |
| | 44,918 | | Range Resources Corp. | | | 1,848,825 |
| | 134,708 | | Southwestern Energy Co.(b) | | | 3,999,481 |
| | 43,921 | | XTO Energy, Inc. | | | 1,344,861 |
| | | | | | |
| | | | | | 9,320,842 |
| | | | | | |
| | | Pharmaceuticals — 2.7% | | | |
| | 35,110 | | Abbott Laboratories | | | 1,674,747 |
| | 145,201 | | Mylan, Inc.(b) | | | 1,947,145 |
| | | | | | |
| | | | | | 3,621,892 |
| | | | | | |
| | | Semiconductors & Semiconductor Equipment — 3.4% | | | |
| | 122,989 | | Broadcom Corp., Class A(b) | | | 2,457,320 |
| | 139,435 | | Intel Corp. | | | 2,098,497 |
| | | | | | |
| | | | | | 4,555,817 |
| | | | | | |
| | | Software — 5.3% | | | |
| | 65,398 | | McAfee, Inc.(b) | | | 2,190,833 |
| | 269,687 | | Oracle Corp.(b) | | | 4,873,244 |
| | | | | | |
| | | | | | 7,064,077 |
| | | | | | |
| | | Specialty Retail — 5.8% | | | |
| | 15,279 | | Autozone, Inc.(b) | | | 2,484,671 |
| | 102,836 | | Best Buy Co., Inc. | | | 3,903,654 |
| | 48,880 | | GameStop Corp., Class A(b) | | | 1,369,618 |
| | | | | | |
| | | | | | 7,757,943 |
| | | | | | |
| | | Total Common Stocks (Identified Cost $139,776,439) | | | 131,243,822 |
| | | | | | |
Principal
Amount | | | | |
| | Short-Term Investments — 1.4% | | | |
| $ | 1,961,716 | | Tri-Party Repurchase Agreement with Fixed Income Clearing Corporation, dated 3/31/2009 at 0.000% to be repurchased at $1,961,716 on 4/01/2009 collateralized by $1,930,000 Federal National Mortgage Association, 4.750% due 3/12/2010 valued at $2,003,340 including accrued interest (Note 2h of Notes to Financial Statements) (Identified Cost $1,961,716) | | | 1,961,716 |
| | | | | | |
| | | | | | |
| | | Total Investments — 99.7%
(Identified Cost $141,738,155)(a) | | | 133,205,538 |
| | | Other assets less liabilities — 0.3% | | | 335,734 |
| | | | | | |
| | | Net Assets — 100.0% | | $ | 133,541,272 |
| | | | | | |
| | | | | | |
| | (†) | | See Note 2a of Notes to Financial Statements. | | | |
See accompanying notes to financial statements.
24
LOOMIS SAYLES GROWTH FUND — PORTFOLIOOF INVESTMENTS (continued)
Investments as of March 31, 2009 (Unaudited)
| | | | | | |
| | | | | | |
| | | | | | |
| | | | | | |
| | | | | | |
| | | | | | |
| | | | | | |
| (a) | | Federal Tax Information (Amounts exclude certain adjustments made at the end of the Fund’s fiscal year for tax purposes. Such adjustments are primarily due to wash sales.): At March 31, 2009, the net unrealized depreciation on investments based on a cost of $141,738,155 for federal income tax purposes was as follows: | | | | |
| | Aggregate gross unrealized appreciation for all investments in which there is an excess of value over tax cost | | $ | 5,217,154 | |
| | Aggregate gross unrealized depreciation for all investments in which there is an excess of tax cost over value | | | (13,749,771 | ) |
| | | | | | |
| | Net unrealized depreciation | | $ | (8,532,617 | ) |
| | | | | | |
| (b) | | Non-income producing security. | | | | |
Net Asset Summary at March 31, 2009 (Unaudited)
| | | |
| Computers & Peripherals | | 9.9 | % |
| Communications Equipment | | 7.8 | |
| Oil, Gas & Consumable Fuels | | 7.0 | |
| IT Services | | 6.7 | |
| Chemicals | | 6.4 | |
| Internet & Catalog Retail | | 6.3 | |
| Specialty Retail | | 5.8 | |
| Capital Markets | | 5.6 | |
| Software | | 5.3 | |
| Biotechnology | | 4.5 | |
| Health Care Equipment & Supplies | | 3.7 | |
| Multiline Retail | | 3.6 | |
| Semiconductors & Semiconductor Equipment | | 3.4 | |
| Internet Software & Services | | 3.3 | |
| Pharmaceuticals | | 2.7 | |
| Construction & Engineering | | 2.0 | |
| Aerospace & Defense | | 2.0 | |
| Other Investments, less than 2% each | | 12.3 | |
| Short-Term Investments | | 1.4 | |
| | | |
| Total Investments | | 99.7 | |
| Other assets less liabilities | | 0.3 | |
| | | |
| Net Assets | | 100.0 | % |
| | | |
See accompanying notes to financial statements.
25
LOOMIS SAYLES MID CAP GROWTH FUND — PORTFOLIOOF INVESTMENTS
Investments as of March 31, 2009 (Unaudited)
| | | | | |
| Shares | | Description | | Value (†) |
| | | | | |
| Common Stocks — 96.1% of Net Assets | | | |
| | Beverages — 1.9% | | | |
| 43,730 | | Hansen Natural Corp.(b) | | $ | 1,574,280 |
| | | | | |
| | Biotechnology — 6.9% | | | |
| 34,673 | | Alexion Pharmaceuticals, Inc.(b) | | | 1,305,785 |
| 60,386 | | Myriad Genetics, Inc.(b)(c) | | | 2,745,751 |
| 33,592 | | Onyx Pharmaceuticals, Inc.(b) | | | 959,052 |
| 26,365 | | Vertex Pharmaceuticals, Inc.(b) | | | 757,467 |
| | | | | |
| | | | | 5,768,055 |
| | | | | |
| | Capital Markets — 5.7% | | | |
| 29,121 | | Affiliated Managers Group, Inc.(b) | | | 1,214,637 |
| 66,861 | | Eaton Vance Corp. | | | 1,527,774 |
| 34,331 | | Northern Trust Corp.(c) | | | 2,053,680 |
| | | | | |
| | | | | 4,796,091 |
| | | | | |
| | Chemicals — 1.8% | | | |
| 52,678 | | Terra Industries, Inc.(c) | | | 1,479,725 |
| | | | | |
| | Commercial Services & Supplies — 1.4% | | | |
| 57,479 | | Tetra Tech, Inc.(b) | | | 1,171,422 |
| | | | | |
| | Computers & Peripherals — 1.5% | | | |
| 85,478 | | NetApp, Inc.(b) | | | 1,268,494 |
| | | | | |
| | Construction & Engineering — 3.6% | | | |
| 47,555 | | Aecom Technology Corp.(b)(c) | | | 1,240,234 |
| 82,180 | | Quanta Services, Inc.(b) | | | 1,762,761 |
| | | | | |
| | | | | 3,002,995 |
| | | | | |
| | Diversified Consumer Services — 1.5% | | | |
| 10,068 | | ITT Educational Services, Inc.(b) | | | 1,222,457 |
| | | | | |
| | Electrical Equipment — 1.6% | | | |
| 9,790 | | First Solar, Inc.(b)(c) | | | 1,299,133 |
| | | | | |
| | Energy Equipment & Services — 5.3% | | | |
| 20,362 | | Core Laboratories N.V. | | | 1,489,684 |
| 37,572 | | FMC Technologies, Inc.(b) | | | 1,178,634 |
| 47,242 | | Oceaneering International, Inc.(b) | | | 1,741,812 |
| | | | | |
| | | | | 4,410,130 |
| | | | | |
| | Health Care Equipment & Supplies — 3.2% | | | |
| 17,377 | | C. R. Bard, Inc. | | | 1,385,294 |
| 20,919 | | Edwards Lifesciences Corp.(b) | | | 1,268,319 |
| | | | | |
| | | | | 2,653,613 |
| | | | | |
| | Hotels, Restaurants & Leisure — 1.6% | | | |
| 39,970 | | Darden Restaurants, Inc. | | | 1,369,372 |
| | | | | |
| | Insurance — 1.5% | | | |
| 62,512 | | Fidelity National Financial, Inc., Class A | | | 1,219,609 |
| | | | | |
| | Internet & Catalog Retail — 2.2% | | | |
| 19,420 | | NetFlix, Inc.(b) | | | 833,506 |
| 13,169 | | Priceline.com, Inc.(b) | | | 1,037,454 |
| | | | | |
| | | | | 1,870,960 |
| | | | | |
| | Internet Software & Services — 2.0% | | | |
| 29,950 | | Equinix, Inc.(b) | | | 1,681,693 |
| | | | | |
| | IT Services — 2.0% | | | |
| 9,980 | | MasterCard, Inc., Class A | | | 1,671,450 |
| | | | | |
| | Life Sciences Tools & Services — 3.5% | | | |
| 78,878 | | Illumina, Inc.(b)(c) | | | 2,937,417 |
| | | | | |
| | Metals & Mining — 7.8% | | | |
| 38,905 | | Agnico-Eagle Mines Ltd. | | | 2,214,473 |
| 52,981 | | Freeport-McMoRan Copper & Gold, Inc.(c) | | | 2,019,106 |
| 128,336 | | Kinross Gold Corp.(c) | | | 2,293,364 |
| | | | | |
| | | | | 6,526,943 |
| | | | | |
| | | | | |
| Shares | | Description | | Value (†) |
| | | | | |
| | Multiline Retail — 7.0% | | | |
| 38,096 | | Dollar Tree, Inc.(b)(c) | | $ | 1,697,177 |
| 41,437 | | Family Dollar Stores, Inc. | | | 1,382,753 |
| 35,884 | | Kohl’s Corp.(b)(c) | | | 1,518,611 |
| 73,750 | | Nordstrom, Inc. | | | 1,235,312 |
| | | | | |
| | | | | 5,833,853 |
| | | | | |
| | Oil, Gas & Consumable Fuels — 4.8% | | | |
| 60,021 | | Concho Resources, Inc.(b) | | | 1,535,937 |
| 76,593 | | Denbury Resources, Inc.(b) | | | 1,138,172 |
| 69,346 | | Petrohawk Energy Corp.(b)(c) | | | 1,333,524 |
| | | | | |
| | | | | 4,007,633 |
| | | | | |
| | Pharmaceuticals — 1.7% | | | |
| 30,472 | | Allergan, Inc. | | | 1,455,343 |
| | | | | |
| | Semiconductors & Semiconductor Equipment — 7.1% | | | |
| 103,681 | | Broadcom Corp., Class A(b)(c) | | | 2,071,546 |
| 51,939 | | Linear Technology Corp.(c) | | | 1,193,558 |
| 155,673 | | Marvell Technology Group Ltd.(b) | | | 1,425,965 |
| 64,066 | | Xilinx, Inc. | | | 1,227,505 |
| | | | | |
| | | | | 5,918,574 |
| | | | | |
| | Software — 6.4% | | | |
| 38,231 | | BMC Software, Inc.(b) | | | 1,261,623 |
| 50,322 | | McAfee, Inc.(b) | | | 1,685,787 |
| 47,530 | | Salesforce.com, Inc.(b) | | | 1,555,657 |
| 35,720 | | VMware, Inc., Class A(b) | | | 843,706 |
| | | | | |
| | | | | 5,346,773 |
| | | | | |
| | Specialty Retail — 10.8% | | | |
| 12,206 | | Autozone, Inc.(b)(c) | | | 1,984,940 |
| 44,753 | | GameStop Corp., Class A(b)(c) | | | 1,253,979 |
| 65,432 | | Guess?, Inc. | | | 1,379,307 |
| 37,697 | | O’Reilly Automotive, Inc.(b) | | | 1,319,772 |
| 50,216 | | Ross Stores, Inc. | | | 1,801,750 |
| 40,722 | | The Buckle, Inc. | | | 1,300,253 |
| | | | | |
| | | | | 9,040,001 |
| | | | | |
| | Thrifts & Mortgage Finance — 1.6% | | | |
| 72,435 | | People’s United Financial, Inc. | | | 1,301,657 |
| | | | | |
| | Wireless Telecommunication Services — 1.7% | | | |
| 46,215 | | American Tower Corp., Class A(b) | | | 1,406,322 |
| | | | | |
| | Total Common Stocks (Identified Cost $78,337,715) | | | 80,233,995 |
| | | | | |
| Contracts | | | | |
| Put Options — 0.8% | | | |
| 510 | | Broadcom Corp. expiring August 22, 2009 at 19 | | | 135,150 |
| 264 | | Freeport-McMoRan Copper & Gold, Inc. expiring August 22, 2009 at 40 | | | 216,480 |
| 180 | | Northern Trust Corp. expiring July 18, 2009 at 60 | | | 170,100 |
| 505 | | Terra Industries, Inc. expiring June 20, 2009 at 25 | | | 126,250 |
| | | | | |
| | Total Put Options (Identified Cost $624,868) | | | 647,980 |
| | | | | |
See accompanying notes to financial statements.
26
LOOMIS SAYLES MID CAP GROWTH FUND — PORTFOLIOOF INVESTMENTS (continued)
Investments as of March 31, 2009 (Unaudited)
| | | | | | | |
Principal
Amount | | Description | | Value (†) | |
| | | | | | | |
| | Short-Term Investments — 0.7% | | | | |
| $ | 619,061 | | Tri-Party Repurchase Agreement with Fixed Income Clearing Corporation, dated 3/31/2009 at 0.000% to be repurchased at $619,061 on 4/01/2009 collateralized by $610,000 Federal National Mortgage Association, 4.750% due 3/12/2010 valued at $633,180, including accrued interest (Note 2h of Notes to Financial Statements) (Identified Cost $619,061) | | $ | 619,061 | |
| | | | | | | |
| | | | | | | |
| | | Total Investments — 97.6% (Identified Cost $79,581,644)(a) | | | 81,501,036 | |
| | | Other assets less liabilities — 2.4% | | $ | 2,036,092 | |
| | | | | | | |
| | | Net Assets — 100.0% | | $ | 83,537,128 | |
| | | | | | | |
| Contracts | | | | | |
| | Call Options Written — (1.3)% | | | | |
| | 225 | | Aecom Technology Corp. expiring June 20, 2009 at 25 | | | (81,000 | ) |
| | 48 | | Autozone Inc. expiring June 20, 2009 at 180 | | | (26,640 | ) |
| | 483 | | Broadcom Corp. expiring May 16, 2009 at 21 | | | (71,243 | ) |
| | 363 | | Dollar Tree, Inc. expiring May 16, 2009 at 42.5 | | | (145,200 | ) |
| | 46 | | First Solar, Inc. expiring April 18, 2009 at 150 | | | (14,490 | ) |
| | 264 | | Freeport-McMoRan Copper & Gold, Inc. expiring May 16, 2009 at 47 | | | (36,432 | ) |
| | 421 | | Gamestop Corp. expiring July 18, 2009 at 35 | | | (61,045 | ) |
| | 390 | | Illumina, Inc. expiring June 20, 2009 at 40 | | | (111,150 | ) |
| | 601 | | Kinross Gold Corp. expiring May 16, 2009 at 20 | | | (57,095 | ) |
| | 182 | | Kohl’s Corp. expiring April 18, 2009 at 40 | | | (60,060 | ) |
| | 300 | | Linear Technology Corp. expiring May 16, 2009 at 25 | | | (20,250 | ) |
| | 300 | | Myriad Genetics, Inc. expiring May 16, 2009 at 47.5 | | | (87,000 | ) |
| | 180 | | Northern Trust Corp. expiring July 18, 2009 at 80 | | | (39,150 | ) |
| | 660 | | Petrohawk Energy Corp. expiring June 20, 2009 at 22.5 | | | (89,100 | ) |
| | 514 | | Terra Industries, Inc. expiring June 20, 2009 at 30 | | | (158,055 | ) |
| | | | | | | |
| | | Total Call Options Written (Premium Received $603,836) | | | (1,057,910 | ) |
| | | | | | | |
| | Put Options Written — (0.2)% | | | | |
| | 510 | | Broadcom Corp. expiring May 16, 2009 at 15 | | | (21,675 | ) |
| | 264 | | Freeport-McMoRan Copper & Gold, Inc. expiring May 16, 2009 at 30 | | | (36,036 | ) |
| | 180 | | Northern Trust Corp. expiring July 18, 2009 at 50 | | | (95,400 | ) |
| | 505 | | Terra Industries, Inc. expiring June 20, 2009 at 25 | | | (49,237 | ) |
| | | | | | | |
| | | Total Put Options Written (Premium Received $180,170) | | | (202,348 | ) |
| | | | | | | |
| | | | | | | |
| | (†) | | See Note 2a of Notes to Financial Statements. | | | | |
| | (a) | | Federal Tax Information (Amounts exclude certain adjustments made at the end of the Fund’s fiscal year for tax purposes. Such adjustments are primarily due to wash sales.): At March 31, 2009, the net unrealized appreciation on investments based on a cost of $79,581,644 for federal income tax purposes was as follows: | | | | |
| | | Aggregate gross unrealized appreciation for all investments in which there is an excess of value over tax cost | | $ | 5,429,108 | |
| | | Aggregate gross unrealized depreciation for all investments in which there is an excess of tax cost over value | | | (3,509,716 | ) |
| | | | | | | |
| | | Net unrealized appreciation | | $ | 1,919,392 | |
| | | | | | | |
| | (b) | | Non-income producing security. | | | | |
| | (c) | | All or portion of this security is held as collateral for outstanding options written. | | | | |
Net Asset Summary at March 31, 2009 (Unaudited)
| | | |
| Specialty Retail | | 10.8 | % |
| Metals & Mining | | 7.8 | |
| Semiconductors & Semiconductor Equipment | | 7.1 | |
| Multiline Retail | | 7.0 | |
| Biotechnology | | 6.9 | |
| Software | | 6.4 | |
| Capital Markets | | 5.7 | |
| Energy Equipment & Services | | 5.3 | |
| Oil, Gas & Consumable Fuels | | 4.8 | |
| Construction & Engineering | | 3.6 | |
| Life Sciences Tools & Services | | 3.5 | |
| Health Care Equipment & Supplies | | 3.2 | |
| Internet & Catalog Retail | | 2.2 | |
| Internet Software & Services | | 2.0 | |
| IT Services | | 2.0 | |
| Other Investments, less than 2% each | | 18.6 | |
| Short-Term Investments | | 0.7 | |
| | | |
| Total Investments | | 97.6 | |
| Other assets less liabilities (including Options Written) | | 2.4 | |
| | | |
| Net Assets | | 100.0 | % |
| | | |
See accompanying notes to financial statements.
27
LOOMIS SAYLES RESEARCH FUND — PORTFOLIOOF INVESTMENTS
Investments as of March 31, 2009 (Unaudited)
| | | | | |
| Shares | | Description | | Value (†) |
| | | | | |
| Common Stocks — 100.2% of Net Assets | | | |
| | Aerospace & Defense — 6.8% | | | |
| 4,347 | | General Dynamics Corp. | | $ | 180,792 |
| 6,257 | | Goodrich Corp. | | | 237,078 |
| 5,826 | | Lockheed Martin Corp. | | | 402,169 |
| 5,503 | | Precision Castparts Corp. | | | 329,629 |
| 2,735 | | Rockwell Collins, Inc. | | | 89,270 |
| 2,311 | | United Technologies Corp. | | | 99,327 |
| | | | | |
| | | | | 1,338,265 |
| | | | | |
| | Beverages — 3.0% | | | |
| 11,430 | | Dr Pepper Snapple Group, Inc.(b) | | | 193,281 |
| 7,700 | | PepsiCo, Inc. | | | 396,396 |
| | | | | |
| | | | | 589,677 |
| | | | | |
| | Biotechnology — 6.4% | | | |
| 5,760 | | Amgen, Inc.(b) | | | 285,235 |
| 4,347 | | Celgene Corp.(b) | | | 193,007 |
| 4,297 | | Genzyme Corp.(b) | | | 255,199 |
| 7,232 | | Gilead Sciences, Inc.(b) | | | 334,986 |
| 4,343 | | Myriad Genetics, Inc.(b) | | | 197,476 |
| | | | | |
| | | | | 1,265,903 |
| | | | | |
| | Capital Markets — 2.3% | | | |
| 2,436 | | Goldman Sachs Group, Inc. (The) | | | 258,265 |
| 3,151 | | Northern Trust Corp. | | | 188,493 |
| | | | | |
| | | | | 446,758 |
| | | | | |
| | Chemicals — 2.5% | | | |
| 3,931 | | Ecolab, Inc. | | | 136,524 |
| 2,104 | | Monsanto Co. | | | 174,842 |
| 2,843 | | Praxair, Inc. | | | 191,306 |
| | | | | |
| | | | | 502,672 |
| | | | | |
| | Commercial Banks — 2.0% | | | |
| 5,261 | | PNC Financial Services Group, Inc. | | | 154,094 |
| 16,878 | | Wells Fargo & Co. | | | 240,343 |
| | | | | |
| | | | | 394,437 |
| | | | | |
| | Communications Equipment — 4.6% | | | |
| 22,745 | | Cisco Systems, Inc.(b) | | | 381,434 |
| 13,804 | | QUALCOMM, Inc. | | | 537,113 |
| | | | | |
| | | | | 918,547 |
| | | | | |
| | Computers & Peripherals — 5.5% | | | |
| 5,742 | | Apple, Inc.(b) | | | 603,599 |
| 15,286 | | Hewlett-Packard Co. | | | 490,069 |
| | | | | |
| | | | | 1,093,668 |
| | | | | |
| | Construction & Engineering — 1.1% | | | |
| 2,098 | | Jacobs Engineering Group, Inc.(b) | | | 81,109 |
| 3,176 | | URS Corp.(b) | | | 128,342 |
| | | | | |
| | | | | 209,451 |
| | | | | |
| | Diversified Consumer Services — 0.7% | | | |
| 1,735 | | Apollo Group, Inc., Class A(b) | | | 135,903 |
| | | | | |
| | Diversified Financial Services — 2.9% | | | |
| 561 | | CME Group, Inc. | | | 138,225 |
| 16,294 | | JPMorgan Chase & Co. | | | 433,094 |
| | | | | |
| | | | | 571,319 |
| | | | | |
| | Diversified Telecommunication Services — 3.7% | | | |
| 22,782 | | AT&T, Inc. | | | 574,106 |
| 4,156 | | Embarq Corp. | | | 157,305 |
| | | | | |
| | | | | 731,411 |
| | | | | |
| | | | | |
| Shares | | Description | | Value (†) |
| | | | | |
| | Electric Utilities — 0.6% | | | |
| 4,493 | | American Electric Power Co., Inc. | | $ | 113,493 |
| | | | | |
| | Energy Equipment & Services — 1.1% | | | |
| 5,672 | | Halliburton Co. | | | 87,746 |
| 3,340 | | Schlumberger Ltd. | | | 135,671 |
| | | | | |
| | | | | 223,417 |
| | | | | |
| | Food & Staples Retailing — 5.8% | | | |
| 10,550 | | Kroger Co. (The) | | | 223,871 |
| 10,847 | | Wal-Mart Stores, Inc. | | | 565,129 |
| 14,089 | | Walgreen Co. | | | 365,750 |
| | | | | |
| | | | | 1,154,750 |
| | | | | |
| | Food Products — 0.8% | | | |
| 4,201 | | J.M. Smucker Co. (The) | | | 156,571 |
| | | | | |
| | Health Care Equipment & Supplies — 3.2% | | | |
| 3,487 | | Baxter International, Inc. | | | 178,604 |
| 3,560 | | C. R. Bard, Inc. | | | 283,803 |
| 4,898 | | St. Jude Medical, Inc.(b) | | | 177,945 |
| | | | | |
| | | | | 640,352 |
| | | | | |
| | Health Care Providers & Services — 1.7% | | | |
| 5,593 | | Medco Health Solutions, Inc.(b) | | | 231,214 |
| 5,204 | | UnitedHealth Group, Inc. | | | 108,920 |
| | | | | |
| | | | | 340,134 |
| | | | | |
| | Household Products — 1.5% | | | |
| 5,016 | | Colgate-Palmolive Co. | | | 295,844 |
| | | | | |
| | Industrial Conglomerates — 0.8% | | | |
| 15,500 | | General Electric Co. | | | 156,705 |
| | | | | |
| | Insurance — 3.3% | | | |
| 3,180 | | Chubb Corp. (The) | | | 134,577 |
| 9,210 | | Metlife, Inc. | | | 209,712 |
| 7,537 | | Travelers Cos., Inc. (The) | | | 306,304 |
| | | | | |
| | | | | 650,593 |
| | | | | |
| | Internet Software & Services — 2.6% | | | |
| 1,456 | | Google, Inc., Class A(b) | | | 506,775 |
| | | | | |
| | IT Services — 2.3% | | | |
| 12,471 | | Cognizant Technology Solutions Corp., Class A(b) | | | 259,272 |
| 3,436 | | Visa, Inc., Class A | | | 191,042 |
| | | | | |
| | | | | 450,314 |
| | | | | |
| | Life Sciences Tools & Services — 1.3% | | | |
| 8,233 | | Life Technologies Corp.(b) | | | 267,408 |
| | | | | |
| | Machinery — 1.1% | | | |
| 2,639 | | Danaher Corp. | | | 143,087 |
| 2,024 | | ITT Corp. | | | 77,863 |
| | | | | |
| | | | | 220,950 |
| | | | | |
| | Media — 2.1% | | | |
| 8,112 | | DIRECTV Group, Inc. (The)(b) | | | 184,873 |
| 9,882 | | McGraw-Hill Cos., Inc. (The) | | | 226,001 |
| | | | | |
| | | | | 410,874 |
| | | | | |
| | Metals & Mining — 0.3% | | | |
| 1,388 | | Freeport-McMoRan Copper & Gold, Inc. | | | 52,897 |
| | | | | |
| | Multi-Utilities — 0.9% | | | |
| 9,140 | | Xcel Energy, Inc. | | | 170,278 |
| | | | | |
| | Multi-Utilities & Unregulated Power — 2.3% | | | |
| 7,420 | | PG&E Corp. | | | 283,593 |
| 5,941 | | Public Service Enterprise Group, Inc. | | | 175,081 |
| | | | | |
| | | | | 458,674 |
| | | | | |
See accompanying notes to financial statements.
28
LOOMIS SAYLES RESEARCH FUND — PORTFOLIOOF INVESTMENTS (continued)
Investments as of March 31, 2009 (Unaudited)
| | | | | | | |
| Shares | | Description | | Value (†) | |
| | | | | | | |
| | | Multiline Retail — 3.2% | | | | |
| | 7,837 | | Kohl’s Corp.(b) | | $ | 331,662 | |
| | 17,678 | | Nordstrom, Inc. | | | 296,106 | |
| | | | | | | |
| | | | | | 627,768 | |
| | | | | | | |
| | | Oil, Gas & Consumable Fuels — 12.9% | | | | |
| | 7,569 | | Chevron Corp. | | | 508,940 | |
| | 11,710 | | ExxonMobil Corp. | | | 797,451 | |
| | 4,397 | | Kinder Morgan Management LLC(b) | | | 179,222 | |
| | 7,800 | | Marathon Oil Corp. | | | 205,062 | |
| | 3,474 | | Noble Energy, Inc. | | | 187,179 | |
| | 6,316 | | Occidental Petroleum Corp. | | | 351,485 | |
| | 10,624 | | Petrohawk Energy Corp.(b) | | | 204,299 | |
| | 3,877 | | XTO Energy, Inc. | | | 118,714 | |
| | | | | | | |
| | | | | | 2,552,352 | |
| | | | | | | |
| | | Personal Products — 0.7% | | | | |
| | 4,868 | | Mead Johnson Nutrition Co.(b) | | | 140,539 | |
| | | | | | | |
| | | Pharmaceuticals — 2.6% | | | | |
| | 4,702 | | Allergan, Inc. | | | 224,568 | |
| | 21,201 | | Mylan, Inc.(b) | | | 284,305 | |
| | | | | | | |
| | | | | | 508,873 | |
| | | | | | | |
| | | Semiconductors & Semiconductor Equipment — 1.6% | | | | |
| | 18,726 | | Applied Materials, Inc. | | | 201,304 | |
| | 11,360 | | NVIDIA Corp.(b) | | | 112,010 | |
| | | | | | | |
| | | | | | 313,314 | |
| | | | | | | |
| | | Software — 2.8% | | | | |
| | 6,286 | | McAfee, Inc.(b) | | | 210,581 | |
| | 18,692 | | Oracle Corp.(b) | | | 337,764 | |
| | | | | | | |
| | | | | | 548,345 | |
| | | | | | | |
| | | Specialty Retail — 3.2% | | | | |
| | 4,117 | | Best Buy Co., Inc. | | | 156,281 | |
| | 8,288 | | GameStop Corp., Class A(b) | | | 232,230 | |
| | 6,762 | | Ross Stores, Inc. | | | 242,621 | |
| | | | | | | |
| | | | | | 631,132 | |
| | | | | | | |
| | | Total Common Stocks (Identified Cost $22,305,269) | | | 19,790,363 | |
| | | | | | | |
Principal
Amount | | | | | |
| | Short-Term Investments — 1.0% | | | | |
| $ | 205,486 | | Tri-Party Repurchase Agreement with Fixed Income Clearing Corporation, dated 3/31/2009 at 0.000% to be repurchased at $205,486 on 4/01/2009 collateralized by $210,000 Federal Home Loan Mortgage Association, 3.375% due 4/15/2009 valued at $213,413 including accrued interest (Note 2h of Notes to Financial Statements) (Identified Cost $205,486) | | | 205,486 | |
| | | | | | | |
| | | | | | | |
| | | Total Investments — 101.2% (Identified Cost $22,510,755)(a) | | | 19,995,849 | |
| | | Other assets less liabilities — (1.2)% | | | (240,447 | ) |
| | | | | | | |
| | | Net Assets — 100.0% | | $ | 19,755,402 | |
| | | | | | | |
| | | | | | | |
| | (†) | | See Note 2a of Notes to Financial Statements. | | | | |
| | | | | | |
| | | | | | |
| (a) | | Federal Tax Information (Amounts exclude certain adjustments made at the end of the Fund’s fiscal year for tax purposes. Such adjustments are primarily due to wash sales.): At March 31, 2009, the net unrealized depreciation on investments based on a cost of $22,523,213 for federal income tax purposes was as follows: | | | | |
| | Aggregate gross unrealized appreciation for all investments in which there is an excess of value over tax cost | | $ | 570,509 | |
| | Aggregate gross unrealized depreciation for all investments in which there is an excess of tax cost over value | | | (3,097,873 | ) |
| | | | | | |
| | Net unrealized depreciation | | $ | (2,527,364 | ) |
| | | | | | |
| (b) | | Non-income producing security. | | | | |
Net Asset Summary at March 31, 2009 (Unaudited)
| | | |
| Oil, Gas & Consumable Fuels | | 12.9 | % |
| Aerospace & Defense | | 6.8 | |
| Biotechnology | | 6.4 | |
| Food & Staples Retailing | | 5.8 | |
| Computers & Peripherals | | 5.5 | |
| Communications Equipment | | 4.6 | |
| Diversified Telecommunication Services | | 3.7 | |
| Insurance | | 3.3 | |
| Health Care Equipment & Supplies | | 3.2 | |
| Specialty Retail | | 3.2 | |
| Multiline Retail | | 3.2 | |
| Beverages | | 3.0 | |
| Diversified Financial Services | | 2.9 | |
| Software | | 2.8 | |
| Pharmaceuticals | | 2.6 | |
| Internet Software & Services | | 2.6 | |
| Chemicals | | 2.5 | |
| Multi-Utilities & Unregulated Power | | 2.3 | |
| IT Services | | 2.3 | |
| Capital Markets | | 2.3 | |
| Media | | 2.1 | |
| Commercial Banks | | 2.0 | |
| Other Investments, less than 2% each | | 14.2 | |
| Short-Term Investments | | 1.0 | |
| | | |
| Total Investments | | 101.2 | |
| Other assets less liabilities | | (1.2 | ) |
| | | |
| Net Assets | | 100.0 | % |
| | | |
See accompanying notes to financial statements.
29
LOOMIS SAYLES VALUE FUND — PORTFOLIOOF INVESTMENTS
Investments as of March 31, 2009 (Unaudited)
| | | | | |
| Shares | | Description | | Value (†) |
| | | | | |
| Common Stocks — 93.7% of Net Assets | | | |
| | Aerospace & Defense — 4.1% | | | |
| 120,616 | | Goodrich Corp. | | $ | 4,570,140 |
| 183,686 | | Northrop Grumman Corp. | | | 8,016,057 |
| 54,161 | | United Technologies Corp. | | | 2,327,840 |
| | | | | |
| | | | | 14,914,037 |
| | | | | |
| | Beverages — 3.6% | | | |
| 290,935 | | Dr Pepper Snapple Group, Inc.(b) | | | 4,919,711 |
| 133,810 | | Molson Coors Brewing Co., Class B | | | 4,587,007 |
| 158,828 | | Pepsi Bottling Group, Inc. (The) | | | 3,516,452 |
| | | | | |
| | | | | 13,023,170 |
| | | | | |
| | Capital Markets — 3.9% | | | |
| 194,864 | | Ameriprise Financial, Inc. | | | 3,992,763 |
| 195,930 | | Bank of New York Mellon Corp. | | | 5,535,022 |
| 143,879 | | State Street Corp. | | | 4,428,596 |
| | | | | |
| | | | | 13,956,381 |
| | | | | |
| | Chemicals — 2.9% | | | |
| 203,699 | | E.I. du Pont de Nemours & Co. | | | 4,548,599 |
| 88,694 | | Praxair, Inc. | | | 5,968,219 |
| | | | | |
| | | | | 10,516,818 |
| | | | | |
| | Commercial Banks — 1.9% | | | |
| 113,967 | | PNC Financial Services Group, Inc. | | | 3,338,093 |
| 246,785 | | U.S. Bancorp | | | 3,605,529 |
| | | | | |
| | | | | 6,943,622 |
| | | | | |
| | Communications Equipment — 2.1% | | | |
| 217,106 | | Cisco Systems, Inc.(b) | | | 3,640,868 |
| 331,330 | | Nokia Oyj, Sponsored ADR | | | 3,866,621 |
| | | | | |
| | | | | 7,507,489 |
| | | | | |
| | Computers & Peripherals — 3.3% | | | |
| 224,358 | | Hewlett-Packard Co. | | | 7,192,918 |
| 50,471 | | International Business Machines Corp. | | | 4,890,135 |
| | | | | |
| | | | | 12,083,053 |
| | | | | |
| | Consumer Finance — 0.5% | | | |
| 258,031 | | Discover Financial Services | | | 1,628,176 |
| | | | | |
| | Containers & Packaging — 1.0% | | | |
| 242,934 | | Owens-Illinois, Inc.(b) | | | 3,507,967 |
| | | | | |
| | Diversified Financial Services — 2.5% | | | |
| 346,540 | | JPMorgan Chase & Co. | | | 9,211,033 |
| | | | | |
| | Diversified Telecommunication Services — 5.9% | | | |
| 647,806 | | AT&T, Inc. | | | 16,324,711 |
| 180,613 | | CenturyTel, Inc. | | | 5,078,838 |
| | | | | |
| | | | | 21,403,549 |
| | | | | |
| | Electric Utilities — 1.1% | | | |
| 158,258 | | American Electric Power Co., Inc. | | | 3,997,597 |
| | | | | |
| | Electrical Equipment — 1.0% | | | |
| 263,478 | | ABB Ltd., Sponsored ADR | | | 3,672,883 |
| | | | | |
| | Energy Equipment & Services — 2.2% | | | |
| 205,293 | | Smith International, Inc. | | | 4,409,694 |
| 94,420 | | Tidewater, Inc. | | | 3,505,814 |
| | | | | |
| | | | | 7,915,508 |
| | | | | |
| | Food & Staples Retailing — 2.4% | | | |
| 177,370 | | CVS Caremark Corp. | | | 4,875,902 |
| 72,332 | | Wal-Mart Stores, Inc. | | | 3,768,497 |
| | | | | |
| | | | | 8,644,399 |
| | | | | |
| | | | | |
| Shares | | Description | | Value (†) |
| | | | | |
| | Food Products — 3.0% | | | |
| 356,707 | | ConAgra Foods, Inc. | | $ | 6,017,647 |
| 208,828 | | Kraft Foods, Inc., Class A | | | 4,654,776 |
| | | | | |
| | | | | 10,672,423 |
| | | | | |
| | Gas Utilities — 1.4% | | | |
| 164,774 | | EQT Corp. | | | 5,162,369 |
| | | | | |
| | Health Care Equipment & Supplies — 1.7% | | | |
| 189,693 | | Covidien Ltd. | | | 6,305,395 |
| | | | | |
| | Health Care Providers & Services — 1.6% | | | |
| 282,629 | | UnitedHealth Group, Inc. | | | 5,915,425 |
| | | | | |
| | Hotels, Restaurants & Leisure — 1.0% | | | |
| 65,942 | | McDonald’s Corp. | | | 3,598,455 |
| | | | | |
| | Household Durables — 0.7% | | | |
| 220,004 | | Pulte Homes, Inc. | | | 2,404,644 |
| | | | | |
| | Industrial Conglomerates — 1.9% | | | |
| 272,146 | | General Electric Co. | | | 2,751,396 |
| 75,340 | | Siemens AG, Sponsored ADR | | | 4,292,120 |
| | | | | |
| | | | | 7,043,516 |
| | | | | |
| | Insurance — 5.7% | | | |
| 150,496 | | Allstate Corp. | | | 2,881,998 |
| 2,547 | | Berkshire Hathaway, Inc., Class B(b) | | | 7,182,540 |
| 209,645 | | Metlife, Inc. | | | 4,773,617 |
| 141,621 | | Travelers Cos., Inc. (The) | | | 5,755,478 |
| | | | | |
| | | | | 20,593,633 |
| | | | | |
| | Internet Software & Services — 0.5% | | | |
| 131,518 | | eBay, Inc.(b) | | | 1,651,866 |
| | | | | |
| | Media — 4.1% | | | |
| 319,038 | | Comcast Corp., Class A | | | 4,351,678 |
| 323,511 | | DIRECTV Group, Inc. (The)(b) | | | 7,372,816 |
| 32,274 | | Time Warner Cable, Inc. | | | 800,403 |
| 128,578 | | Time Warner, Inc. | | | 2,481,556 |
| | | | | |
| | | | | 15,006,453 |
| | | | | |
| | Multi-Utilities & Unregulated Power — 3.2% | | | |
| 165,136 | | PG&E Corp. | | | 6,311,498 |
| 180,413 | | Public Service Enterprise Group, Inc. | | | 5,316,771 |
| | | | | |
| | | | | 11,628,269 |
| | | | | |
| | Oil, Gas & Consumable Fuels — 12.4% | | | |
| 86,421 | | Chevron Corp. | | | 5,810,948 |
| 212,050 | | ExxonMobil Corp. | | | 14,440,605 |
| 267,552 | | Marathon Oil Corp. | | | 7,033,942 |
| 149,524 | | Royal Dutch Shell PLC, ADR | | | 6,623,913 |
| 191,665 | | Total SA, Sponsored ADR | | | 9,403,085 |
| 48,567 | | XTO Energy, Inc. | | | 1,487,122 |
| | | | | |
| | | | | 44,799,615 |
| | | | | |
| | Paper & Forest Products — 1.0% | | | |
| 131,564 | | Weyerhaeuser Co. | | | 3,627,219 |
| | | | | |
| | Personal Products — 1.0% | | | |
| 147,996 | | Estee Lauder Cos., Inc. (The), Class A | | | 3,648,101 |
| | | | | |
| | Pharmaceuticals — 12.9% | | | |
| 322,342 | | Bristol-Myers Squibb Co. | | | 7,065,737 |
| 124,194 | | Johnson & Johnson | | | 6,532,604 |
| 124,367 | | Novartis AG, ADR | | | 4,704,804 |
| 444,684 | | Pfizer, Inc. | | | 6,056,596 |
| 516,853 | | Schering-Plough Corp. | | | 12,171,888 |
| 232,431 | | Wyeth | | | 10,003,830 |
| | | | | |
| | | | | 46,535,459 |
| | | | | |
See accompanying notes to financial statements.
30
LOOMIS SAYLES VALUE FUND — PORTFOLIOOF INVESTMENTS (continued)
Investments as of March 31, 2009 (Unaudited)
| | | | | | | |
| Shares | | Description | | Value (†) | |
| | | | | | | |
| | | Semiconductors & Semiconductor Equipment – 1.4% | | | | |
| | 467,761 | | Applied Materials, Inc. | | $ | 5,028,431 | |
| | | | | | | |
| | | Software – 1.0% | | | | |
| | 201,200 | | Microsoft Corp. | | | 3,696,044 | |
| | | | | | | |
| | | Specialty Retail – 0.8% | | | | |
| | 214,994 | | Gap, Inc. (The) | | | 2,792,772 | |
| | | | | | | |
| | | Total Common Stocks (Identified Cost $448,019,984) | | | 339,035,771 | |
| | | | | | | |
Principal
Amount | | | | | |
| | Short-Term Investments – 5.0% | | | | |
| $ | 18,074,015 | | Tri-Party Repurchase Agreement with Fixed Income Clearing Corporation, dated 3/31/2009 at 0.000% to be repurchased at $18,074,015 on 4/01/2009 collateralized by $17,765,000 Federal National Mortgage Association, 4.750% due 3/12/2010 with a value of $18,440,070 including accrued interest (Note 2h of Notes to Financial Statements) (Identified Cost $18,074,015) | | | 18,074,015 | |
| | | | | | | |
| | | | | | | |
| | | Total Investments — 98.7% (Identified Cost $466,093,999)(a) | | | 357,109,786 | |
| | | Other assets less liabilities — 1.3% | | | 4,846,789 | |
| | | | | | | |
| | | Net Assets — 100.0% | | $ | 361,956,575 | |
| | | | | | | |
| | | | | | | |
| | (†) | | See Note 2a of Notes to Financial Statements. | | | | |
| | (a) | | Federal Tax Information (Amounts exclude certain adjustments made at the end of the Fund’s fiscal year for tax purposes. Such adjustments are primarily due to wash sales.): At March 31, 2009, the net unrealized depreciation on investments based on a cost of $466,093,999 for federal income tax purposes was as follows: | | | | |
| | | Aggregate gross unrealized appreciation for all investments in which there is an excess of value over tax cost | | $ | 5,308,750 | |
| | | Aggregate gross unrealized depreciation for all investments in which there is an excess of tax cost over value | | | (114,292,963 | ) |
| | | | | | | |
| | | Net unrealized depreciation | | $ | (108,984,213 | ) |
| | | | | | | |
| | (b) | | Non-income producing security. | | | | |
| | | | | | | |
| | ADR | | An American Depositary Receipt is a certificate issued by a custodian bank representing the right to receive securities of the foreign issuer described. The values of ADRs are significantly influenced by trading on exchanges not located in the United States. | | | | |
Net Asset Summary at March 31, 2009 (Unaudited)
| | | |
| Pharmaceuticals | | 12.9 | % |
| Oil, Gas & Consumable Fuels | | 12.4 | |
| Diversified Telecommunication Services | | 5.9 | |
| Insurance | | 5.7 | |
| Media | | 4.1 | |
| Aerospace & Defense | | 4.1 | |
| Capital Markets | | 3.9 | |
| Beverages | | 3.6 | |
| Computers & Peripherals | | 3.3 | |
| Multi-Utilities & Unregulated Power | | 3.2 | |
| Food Products | | 3.0 | |
| Chemicals | | 2.9 | |
| Diversified Financial Services | | 2.5 | |
| Food & Staples Retailing | | 2.4 | |
| Energy Equipment & Services | | 2.2 | |
| Communications Equipment | | 2.1 | |
| Other Investments, less than 2% each | | 19.5 | |
| Short-Term Investments | | 5.0 | |
| | | |
| Total Investments | | 98.7 | |
| Other assets less liabilities | | 1.3 | |
| | | |
| Net Assets | | 100.0 | % |
| | | |
See accompanying notes to financial statements.
31
This Page Intentionally Left Blank
32
STATEMENTSOF ASSETSAND LIABILITIES
March 31, 2009 (Unaudited)
| | | | | | | | | | | | |
| | | Global Markets Fund | | | Growth Fund | | | Mid Cap
Growth Fund | |
| | | | | | | | | | | | |
ASSETS | | | | | | | | | | | | |
Investments at cost | | $ | 214,203,773 | | | $ | 141,738,155 | | | $ | 79,581,644 | |
Net unrealized appreciation (depreciation) | | | (46,112,215 | ) | | | (8,532,617 | ) | | | 1,919,392 | |
| | | | | | | | | | | | |
Investments at value | | | 168,091,558 | | | | 133,205,538 | | | | 81,501,036 | |
Cash | | | 65,915 | | | | — | | | | — | |
Foreign currency at value (identified cost $889,531, $0, $0, $0 and $0) | | | 886,984 | | | | — | | | | — | |
Receivable for Fund shares sold | | | 206,650 | | | | 770,552 | | | | 2,556,532 | |
Receivable for securities sold | | | 2,131,311 | | | | — | | | | 998,431 | |
Dividends and interest receivable | | | 2,224,895 | | | | 56,326 | | | | 25,628 | |
Unrealized appreciation on forward foreign currency contracts (Note 2) | | | 24,495 | | | | — | | | | — | |
Receivable from investment adviser (Note 5) | | | 17,680 | | | | 895 | | | | 12,537 | |
Tax reclaims receivable | | | 21,170 | | | | — | | | | — | |
Foreign taxes receivable (Note 2) | | | 2,874 | | | | — | | | | — | |
Other assets | | | 1,054 | | | | 72 | | | | — | |
| | | | | | | | | | | | |
TOTAL ASSETS | | | 173,674,586 | | | | 134,033,383 | | | | 85,094,164 | |
| | | | | | | | | | | | |
LIABILITIES | | | | | | | | | | | | |
Payable for securities purchased | | | 986,558 | | | | — | | | | 79,956 | |
Payable for Fund shares redeemed | | | 322,091 | | | | 208,328 | | | | 81,467 | |
Unrealized depreciation on forward foreign currency contracts (Note 2) | | | 34,444 | | | | — | | | | — | |
Management fees payable (Note 5) | | | 107,055 | | | | 54,203 | | | | 49,756 | |
Administrative fees payable (Note 5) | | | 5,615 | | | | 4,081 | | | | 2,604 | |
Deferred Trustees’ fees (Note 5) | | | 43,188 | | | | 76,055 | | | | 41,674 | |
Service and distribution fees payable (Note 5) | | | 2,176 | | | | 997 | | | | 401 | |
Options written, at value (premium received $0, $0, $784,006, $0 and $0) (Note 2e) | | | — | | | | — | | | | 1,260,258 | |
Other accounts payable and accrued expenses | | | 67,294 | | | | 148,447 | | | | 40,920 | |
| | | | | | | | | | | | |
TOTAL LIABILITIES | | | 1,568,421 | | | | 492,111 | | | | 1,557,036 | |
| | | | | | | | | | | | |
NET ASSETS | | $ | 172,106,165 | | | $ | 133,541,272 | | | $ | 83,537,128 | |
| | | | | | | | | | | | |
NET ASSETS CONSIST OF: | | | | | | | | | | | | |
Paid-in capital | | $ | 318,235,864 | | | $ | 272,065,863 | | | $ | 239,333,985 | |
Undistributed (Distributions in excess of) net investment income/Accumulated net investment (loss) | | | 1,311,510 | | | | (177,924 | ) | | | (84,630 | ) |
Accumulated net realized loss on investments, options written and foreign currency transactions | | | (101,329,603 | ) | | | (129,814,050 | ) | | | (157,155,367 | ) |
Net unrealized appreciation (depreciation) on investments, options written and foreign currency translations | | | (46,111,606 | ) | | | (8,532,617 | ) | | | 1,443,140 | |
| | | | | | | | | | | | |
NET ASSETS | | $ | 172,106,165 | | | $ | 133,541,272 | | | $ | 83,537,128 | |
| | | | | | | | | | | | |
COMPUTATION OF NET ASSET VALUE AND OFFERING PRICE: | | | | | | | | | | | | |
Class A shares: | | | | | | | | | | | | |
Net assets | | $ | 29,519,799 | | | $ | 64,869,242 | | | $ | 61,120,624 | |
| | | | | | | | | | | | |
Shares of beneficial interest | | | 3,251,924 | | | | 17,829,511 | | | | 4,086,453 | |
| | | | | | | | | | | | |
Net asset value and redemption price per share | | $ | 9.08 | | | $ | 3.64 | | | $ | 14.96 | |
| | | | | | | | | | | | |
Offering price per share (100/94.25 of net asset value) (Note 1) | | $ | 9.63 | | | $ | 3.86 | | | $ | 15.87 | |
| | | | | | | | | | | | |
Class B shares: (redemption price per share is equal to net asset value less any applicable contingent deferred sales charge) (Note 1) | | | | | | | | | | | | |
Net assets | | $ | — | | | $ | 5,200,923 | | | $ | — | |
| | | | | | | | | | | | |
Shares of beneficial interest | | | — | | | | 1,491,044 | | | | — | |
| | | | | | | | | | | | |
Net asset value and offering price per share | | $ | — | | | $ | 3.49 | | | $ | — | |
| | | | | | | | | | | | |
Class C shares: (redemption price per share is equal to net asset value less any applicable contingent deferred sales charge) (Note 1) | | | | | | | | | | | | |
Net assets | | $ | 72,660,208 | | | $ | 15,480,665 | | | $ | 986 | |
| | | | | | | | | | | | |
Shares of beneficial interest | | | 8,042,622 | | | | 4,434,521 | | | | 66 | |
| | | | | | | | | | | | |
Net asset value and offering price per share | | $ | 9.03 | | | $ | 3.49 | | | $ | 14.94 | |
| | | | | | | | | | | | |
Class Y shares: | | | | | | | | | | | | |
Net assets | | $ | 69,926,158 | | | $ | 47,990,442 | | | $ | 22,415,518 | |
| | | | | | | | | | | | |
Shares of beneficial interest | | | 7,690,154 | | | | 12,529,285 | | | | 1,456,895 | |
| | | | | | | | | | | | |
Net asset value, offering and redemption price per share | | $ | 9.09 | | | $ | 3.83 | | | $ | 15.39 | |
| | | | | | | | | | | | |
See accompanying notes to financial statements.
33
| | | | | | |
| Research Fund | | | Value Fund | |
| | | | | | |
| | | | | | |
| $ | 22,510,755 | | | $ | 466,093,999 | |
| | (2,514,906 | ) | | | (108,984,213 | ) |
| | | | | | | |
| | 19,995,849 | | | | 357,109,786 | |
| | 670 | | | | — | |
| | — | | | | — | |
| | 618 | | | | 9,768,458 | |
| | 595,149 | | | | — | |
| | 18,558 | | | | 645,133 | |
| | — | | | | — | |
| | 8,898 | | | | — | |
| | — | | | | 19,388 | |
| | — | | | | — | |
| | — | | | | 45 | |
| | | | | | | |
| | 20,619,742 | | | | 367,542,810 | |
| | | | | | | |
| | | | | | |
| | 779,491 | | | | 4,954,037 | |
| | 8,779 | | | | 189,407 | |
| | — | | | | — | |
| | 7,960 | | | | 137,409 | |
| | 682 | | | | 11,961 | |
| | 38,265 | | | | 211,105 | |
| | 45 | | | | 866 | |
| | — | | | | — | |
| | 29,118 | | | | 81,450 | |
| | | | | | | |
| | 864,340 | | | | 5,586,235 | |
| | | | | | | |
| $ | 19,755,402 | | | $ | 361,956,575 | |
| | | | | | | |
| | | | | | |
| $ | 30,178,819 | | | $ | 551,231,103 | |
| | (43,236 | ) | | | 1,589,318 | |
| | (7,865,275 | ) | | | (81,879,633 | ) |
| | (2,514,906 | ) | | | (108,984,213 | ) |
| | | | | | | |
| $ | 19,755,402 | | | $ | 361,956,575 | |
| | | | | | | |
| | | | | | |
| | | | | | |
| $ | 1,413,147 | | | $ | 84,422,198 | |
| | | | | | | |
| | 281,347 | | | | 6,846,678 | |
| | | | | | | |
| $ | 5.02 | | | $ | 12.33 | |
| | | | | | | |
| $ | 5.33 | | | $ | 13.08 | |
| | | | | | | |
| |
| | | | | | |
| $ | 127,194 | | | $ | 4,744,063 | |
| | | | | | | |
| | 25,894 | | | | 383,950 | |
| | | | | | | |
| $ | 4.91 | | | $ | 12.36 | |
| | | | | | | |
| |
| | | | | | |
| $ | 1,193,648 | | | $ | 6,270,928 | |
| | | | | | | |
| | 245,426 | | | | 511,823 | |
| | | | | | | |
| $ | 4.86 | | | $ | 12.25 | |
| | | | | | | |
| | | | | | |
| $ | 17,021,413 | | | $ | 266,519,386 | |
| | | | | | | |
| | 3,366,578 | | | | 21,595,182 | |
| | | | | | | |
| $ | 5.06 | | | $ | 12.34 | |
| | | | | | | |
34
STATEMENTSOF OPERATIONS
For the Six Months Ended March 31, 2009 (Unaudited)
| | | | | | | | | | | | |
| | | Global Markets Fund | | | Growth Fund | | | Mid Cap
Growth Fund | |
| | | | | | | | | | | | |
INVESTMENT INCOME | | | | | | | | | | | | |
Dividends | | $ | 860,581 | | | $ | 886,419 | | | $ | 498,494 | |
Interest | | | 4,309,305 | | | | 1,820 | | | | 5,460 | |
Securities lending income (Note 2) | | | 5,876 | | | | 3,137 | | | | 4,169 | |
Less net foreign taxes withheld | | | (22,197 | ) | | | — | | | | (7,618 | ) |
| | | | | | | | | | | | |
| | | 5,153,565 | | | | 891,376 | | | | 500,505 | |
| | | | | | | | | | | | |
Expenses | | | | | | | | | | | | |
Management fees (Note 5) | | | 757,632 | | | | 414,234 | | | | 341,942 | |
Service fees - Class A (Note 5) | | | 50,231 | | | | 113,650 | | | | 86,616 | |
Service and distribution fees - Class B (Note 5) | | | — | | | | 30,725 | | | | — | |
Service and distribution fees - Class C (Note 5) | | | 424,140 | | | | 90,688 | | | | 2 | |
Trustees’ fees and expenses (Note 5) | | | 6,862 | | | | 6,654 | | | | 5,737 | |
Administrative fees (Note 5) | | | 51,562 | | | | 42,276 | | | | 23,271 | |
Custodian fees and expenses | | | 54,098 | | | | 15,536 | | | | 12,288 | |
Transfer agent fees and expenses - Class A (Note 5) | | | 28,062 | | | | 157,403 | | | | 105,794 | |
Transfer agent fees and expenses - Class B (Note 5) | | | — | | | | 10,915 | | | | — | |
Transfer agent fees and expenses - Class C (Note 5) | | | 56,994 | | | | 32,300 | | | | — | |
Transfer agent fees and expenses - Class Y (Note 5) | | | 31,105 | | | | — | | | | 7,709 | |
Audit and tax services fees | | | 27,889 | | | | 22,106 | | | | 20,414 | |
Legal fees | | | 4,532 | | | | 4,075 | | | | 2,309 | |
Shareholder reporting expenses | | | 23,163 | | | | 43,943 | | | | 8,506 | |
Registration fees | | | 53,933 | | | | 37,543 | | | | 62,064 | |
Miscellaneous expenses (Note 5) | | | 1,447 | | | | (7,488 | ) | | | (1,939 | ) |
| | | | | | | | | | | | |
Total expenses | | | 1,571,650 | | | | 1,014,560 | | | | 674,713 | |
Less fee reduction and/or expense reimbursement (Note 5) | | | (87,104 | ) | | | (26,914 | ) | | | (132,154 | ) |
| | | | | | | | | | | | |
Net expenses | | | 1,484,546 | | | | 987,646 | | | | 542,559 | |
| | | | | | | | | | | | |
Net investment income (loss) | | | 3,669,019 | | | | (96,270 | ) | | | (42,054 | ) |
| | | | | | | | | | | | |
NET REALIZED AND UNREALIZED GAIN (LOSS) ON INVESTMENTS, OPTIONS WRITTEN AND
FOREIGN CURRENCY TRANSACTIONS | | | | | | | | | | | | |
Net realized gain (loss) on: | | | | | | | | | | | | |
Investments | | | (69,724,212 | ) | | | (81,757,073 | ) | | | (52,729,904 | ) |
Options written | | | — | | | | — | | | | 496,598 | |
Foreign currency transactions | | | 128,135 | | | | — | | | | — | |
Net change in unrealized appreciation (depreciation) on: | | | | | | | | | | | | |
Investments (including change in foreign capital gains tax accrual of $515 for Global Markets Fund) | | | 4,552,240 | | | | 8,874,077 | | | | 13,241,818 | |
Options written | | | — | | | | — | | | | (476,252 | ) |
Foreign currency translations | | | 69,830 | | | | — | | | | — | |
| | | | | | | | | | | | |
Net realized and unrealized loss on investments, options written and foreign currency transactions | | | (64,974,007 | ) | | | (72,882,996 | ) | | | (39,467,740 | ) |
| | | | | | | | | | | | |
NET DECREASE IN NET ASSETS RESULTING FROM OPERATIONS | | $ | (61,304,988 | ) | | $ | (72,979,266 | ) | | $ | (39,509,794 | ) |
| | | | | | | | | | | | |
See accompanying notes to financial statements.
35
| | | | | | |
Research Fund | | | Value Fund | |
| | | | | | |
| | | | | | |
| $ | 238,467 | | | $ | 5,796,020 | |
| | 55 | | | | 11,820 | |
| | 1,793 | | | | 9,582 | |
| | — | | | | (88,848 | ) |
| | | | | | | |
| | 240,315 | | | | 5,728,574 | |
| | | | | | | |
| | | | | | |
| | 52,701 | | | | 852,824 | |
| | 2,366 | | | | 110,530 | |
| | 681 | | | | 28,828 | |
| | 6,280 | | | | 31,116 | |
| | 4,965 | | | | 7,962 | |
| | 5,388 | | | | 87,146 | |
| | 18,847 | | | | 12,502 | |
| | 1,292 | | | | 86,085 | |
| | 104 | | | | 5,543 | |
| | 889 | | | | 6,099 | |
| | 6,493 | | | | 48,124 | |
| | 21,931 | | | | 18,689 | |
| | 370 | | | | 6,009 | |
| | 2,851 | | | | 20,921 | |
| | 39,453 | | | | 54,410 | |
| | (2,837 | ) | | | (37,673 | ) |
| | | | | | | |
| | 161,774 | | | | 1,339,115 | |
| | (60,415 | ) | | | — | |
| | | | | | | |
| | 101,359 | | | | 1,339,115 | |
| | | | | | | |
| | 138,956 | | | | 4,389,459 | |
| | | | | | | |
| |
| | | | | | |
| | | | | | |
| | (6,613,177 | ) | | | (69,367,390 | ) |
| | — | | | | — | |
| | — | | | | — | |
| | | | | | |
| | (936,418 | ) | | | (68,923,688 | ) |
| | — | | | | — | |
| | — | | | | — | |
| | | | | | | |
| | (7,549,595 | ) | | | (138,291,078 | ) |
| | | | | | | |
| $ | (7,410,639 | ) | | $ | (133,901,619 | ) |
| | | | | | | |
36
STATEMENTSOF CHANGESIN NET ASSETS
| | | | | | | | | | | | | | | | |
| | | Global Markets Fund | | | Growth Fund | |
| | | Six Months Ended
March 31, 2009
(Unaudited) | | | Year Ended
September 30,
2008 | | | Six Months Ended
March 31, 2009
(Unaudited) | | | Year Ended
September 30,
2008 | |
| | | | | | | | | | | | | | | | |
FROM OPERATIONS: | | | | | | | | | | | | | | | | |
Net investment income (loss) | | $ | 3,669,019 | | | $ | 5,317,926 | | | $ | (96,270 | ) | | $ | (1,167,160 | ) |
Net realized loss on investments, options written and foreign currency transactions | | | (69,596,077 | ) | | | (25,759,987 | ) | | | (81,757,073 | ) | | | (32,148,656 | ) |
Net change in net unrealized appreciation (depreciation) on investments, options written and foreign currency translations | | | 4,622,070 | | | | (77,734,683 | ) | | | 8,874,077 | | | | (81,622,240 | ) |
| | | | | | | | | | | | | | | | |
Net decrease in net assets resulting from operations | | | (61,304,988 | ) | | | (98,176,744 | ) | | | (72,979,266 | ) | | | (114,938,056 | ) |
| | | | | | | | | | | | | | | | |
FROM DISTRIBUTIONS TO SHAREHOLDERS: | | | | | | | | | | | | | | | | |
Net investment income | | | | | | | | | | | | | | | | |
Class A | | | (1,215,467 | ) | | | (1,576,341 | ) | | | — | | | | — | |
Class B | | | — | | | | — | | | | — | | | | — | |
Class C | | | (1,365,584 | ) | | | (2,867,382 | ) | | | — | | | | — | |
Class Y | | | (2,348,859 | ) | | | (3,658,690 | ) | | | — | | | | — | |
Net realized capital gains | | | | | | | | | | | | | | | | |
Class A | | | (14,673 | ) | | | (1,305,191 | ) | | | — | | | | — | |
Class B | | | — | | | | — | | | | — | | | | — | |
Class C | | | (28,430 | ) | | | (2,671,987 | ) | | | — | | | | — | |
Class Y | | | (24,786 | ) | | | (2,927,617 | ) | | | — | | | | — | |
| | | | | | | | | | | | | | | | |
Total distributions | | | (4,997,799 | ) | | | (15,007,208 | ) | | | — | | | | — | |
| | | | | | | | | | | | | | | | |
NET INCREASE (DECREASE) IN NET ASSETS FROM CAPITAL SHARE TRANSACTIONS (NOTE 9) | | | (73,738,316 | ) | | | 255,345,464 | | | | (63,004,803 | ) | | | (36,244,496 | ) |
| | | | | | | | | | | | | | | | |
Redemption Fees | | | | | | | | | | | | | | | | |
Class A | | | — | | | | 12,818 | | | | — | | | | — | |
Class C | | | — | | | | 21,877 | | | | — | | | | — | |
Class Y | | | — | | | | 21,783 | | | | — | | | | — | |
| | | | | | | | | | | | | | | | |
Net increase (decrease) in net assets | | | (140,041,103 | ) | | | 142,217,990 | | | | (135,984,069 | ) | | | (151,182,552 | ) |
NET ASSETS | | | | | | | | | | | | | | | | |
Beginning of period | | | 312,147,268 | | | | 169,929,278 | | | | 269,525,341 | | | | 420,707,893 | |
| | | | | | | | | | | | | | | | |
End of period | | $ | 172,106,165 | | | $ | 312,147,268 | | | $ | 133,541,272 | | | $ | 269,525,341 | |
| | | | | | | | | | | | | | | | |
UNDISTRIBUTED (DISTRIBUTIONS IN EXCESS OF) NET INVESTMENT INCOME/ACCUMULATED NET INVESTMENT (LOSS) | | $ | 1,311,510 | | | $ | 2,572,401 | | | $ | (177,924 | ) | | $ | (81,654 | ) |
| | | | | | | | | | | | | | | | |
See accompanying notes to financial statements.
37
| | | | | | | | | | | | | | | | | | | | | | |
| Mid Cap Growth Fund | | | Research Fund | | | Value Fund | |
Six Months Ended
March 31, 2009
(Unaudited) | | | Year Ended
September 30,
2008 | | | Six Months Ended
March 31, 2009
(Unaudited) | | | Year Ended
September 30,
2008 | | | Six Months Ended
March 31, 2009
(Unaudited) | | | Year Ended
September 30,
2008 | |
| | | | | | | | | | | | | | | | | | | | | | |
| | | | | | | | | | | | | | | | | | | | | | |
| $ | (42,054 | ) | | $ | (637,739 | ) | | $ | 138,956 | | | $ | 204,565 | | | $ | 4,389,459 | | | $ | 4,768,470 | |
| | (52,233,306 | ) | | | (16,800,881 | ) | | | (6,613,177 | ) | | | (1,114,622 | ) | | | (69,367,390 | ) | | | (11,245,452 | ) |
| | | | | |
| | 12,765,566 | | | | (24,348,831 | ) | | | (936,418 | ) | | | (5,382,213 | ) | | | (68,923,688 | ) | | | (72,620,410 | ) |
| | | | | | | | | | | | | | | | | | | | | | | |
| | (39,509,794 | ) | | | (41,787,451 | ) | | | (7,410,639 | ) | | | (6,292,270 | ) | | | (133,901,619 | ) | | | (79,097,392 | ) |
| | | | | | | | | | | | | | | | | | | | | | | |
| | | | | | | | | | | | | | | | | | | | | | |
| | | | | | | | | | | | | | | | | | | | | | |
| | — | | | | — | | | | (16,599 | ) | | | (6,624 | ) | | | (1,386,476 | ) | | | (444,319 | ) |
| | — | | | | — | | | | — | | | | — | | | | (12,761 | ) | | | (25,511 | ) |
| | — | | | | — | | | | (6,028 | ) | | | — | | | | (69,166 | ) | | | (19,019 | ) |
| | — | | | | — | | | | (193,935 | ) | | | (277,956 | ) | | | (4,718,484 | ) | | | (1,991,889 | ) |
| | | | | | | | | | | | | | | | | | | | | | |
| | — | | | | — | | | | — | | | | (123,072 | ) | | | — | | | | (1,119,214 | ) |
| | — | | | | — | | | | — | | | | (37,858 | ) | | | — | | | | (44,036 | ) |
| | — | | | | — | | | | — | | | | (97,901 | ) | | | — | | | | (96,784 | ) |
| | — | | | | — | | | | — | | | | (2,801,426 | ) | | | — | | | | (8,863,000 | ) |
| | | | | | | | | | | | | | | | | | | | | | | |
| | — | | | | — | | | | (216,562 | ) | | | (3,344,837 | ) | | | (6,186,887 | ) | | | (12,603,772 | ) |
| | | | | | | | | | | | | | | | | | | | | | | |
| | | | | |
| | (23,256,421 | ) | | | 133,294,170 | | | | 1,932,870 | | | | 4,968,748 | | | | 71,721,649 | | | | 321,024,510 | |
| | | | | | | | | | | | | | | | | | | | | | | |
| | | | | | | | | | | | | | | | | | | | | | |
| | — | | | | — | | | | — | | | | — | | | | — | | | | — | |
| | — | | | | — | | | | — | | | | — | | | | — | | | | — | |
| | — | | | | — | | | | — | | | | — | | | | — | | | | — | |
| | | | | | | | | | | | | | | | | | | | | | | |
| | (62,766,215 | ) | | | 91,506,719 | | | | (5,694,331 | ) | | | (4,668,359 | ) | | | (68,366,857 | ) | | | 229,323,346 | |
| | | | | | | | | | | | | | | | | | | | | | |
| | 146,303,343 | | | | 54,796,624 | | | | 25,449,733 | | | | 30,118,092 | | | | 430,323,432 | | | | 201,000,086 | |
| | | | | | | | | | | | | | | | | | | | | | | |
| $ | 83,537,128 | | | $ | 146,303,343 | | | $ | 19,755,402 | | | $ | 25,449,733 | | | $ | 361,956,575 | | | $ | 430,323,432 | |
| | | | | | | | | | | | | | | | | | | | | | | |
| | | | | |
| $ | (84,630 | ) | | $ | (42,576 | ) | | $ | (43,236 | ) | | $ | 34,370 | | | $ | 1,589,318 | | | $ | 3,386,746 | |
| | | | | | | | | | | | | | | | | | | | | | | |
38
FINANCIAL HIGHLIGHTS
For a share outstanding throughout each period.
| | | | | | | | | | | | | | | | | | | | | | | | | | | | | |
| | | | | Income (Loss) from Investment Operations: | | | Less Distributions: | | | |
| | | | | | | | |
| | | Net asset
value,
beginning
of
the period | | Net
investment
income (c) | | Net realized
and unrealized
gain (loss) | | | Total from
investment
operations | | | Dividends
from
net investment
income | | | Distributions
from net
realized
capital gains | | | Total
distributions | | | Redemption
fees (d)(h) |
| | | | | | | | | | | | | | | | | | | | | | | | | | | | | |
GLOBAL MARKETS FUND | | | | | | | | | | | | | | | | | | | | | | | | | | | | | |
Class A | | | | | | | | | | | | | | | | | | | | | | | | | | | | | |
3/31/2009(i) | | $ | 11.65 | | $ | 0.18 | | $ | (2.50 | ) | | $ | (2.32 | ) | | $ | (0.25 | ) | | $ | (0.00 | ) | | $ | (0.25 | ) | | $ | — |
9/30/2008 | | | 15.83 | | | 0.25 | | | (3.46 | ) | | | (3.21 | ) | | | (0.53 | ) | | | (0.44 | ) | | | (0.97 | ) | | | 0.00 |
9/30/2007 | | | 12.49 | | | 0.20 | | | 3.39 | | | | 3.59 | | | | (0.25 | ) | | | — | | | | (0.25 | ) | | | 0.00 |
9/30/2006* | | | 12.71 | | | 0.12 | | | (0.34 | ) | | | (0.22 | ) | | | — | | | | — | | | | — | | | | — |
Class C | | | | | | | | | | | | | | | | | | | | | | | | | | | | | |
3/31/2009(i) | | | 11.51 | | | 0.14 | | | (2.48 | ) | | | (2.34 | ) | | | (0.14 | ) | | | (0.00 | ) | | | (0.14 | ) | | | — |
9/30/2008 | | | 15.70 | | | 0.15 | | | (3.43 | ) | | | (3.28 | ) | | | (0.47 | ) | | | (0.44 | ) | | | (0.91 | ) | | | 0.00 |
9/30/2007 | | | 12.43 | | | 0.10 | | | 3.36 | | | | 3.46 | | | | (0.19 | ) | | | — | | | | (0.19 | ) | | | 0.00 |
9/30/2006* | | | 12.71 | | | 0.06 | | | (0.34 | ) | | | (0.28 | ) | | | — | | | | — | | | | — | | | | — |
Class Y | | | | | | | | | | | | | | | | | | | | | | | | | | | | | |
3/31/2009(i) | | | 11.70 | | | 0.19 | | | (2.52 | ) | | | (2.33 | ) | | | (0.28 | ) | | | (0.00 | ) | | | (0.28 | ) | | | — |
9/30/2008 | | | 15.87 | | | 0.30 | | | (3.48 | ) | | | (3.18 | ) | | | (0.55 | ) | | | (0.44 | ) | | | (0.99 | ) | | | 0.00 |
9/30/2007 | | | 12.51 | | | 0.24 | | | 3.39 | | | | 3.63 | | | | (0.27 | ) | | | — | | | | (0.27 | ) | | | 0.00 |
9/30/2006** | | | 11.84 | | | 0.19 | | | 0.64 | | | | 0.83 | | | | (0.16 | ) | | | — | | | | (0.16 | ) | | | 0.00 |
9/30/2005 | | | 10.19 | | | 0.19 | | | 1.73 | | | | 1.92 | | | | (0.27 | ) | | | — | | | | (0.27 | ) | | | — |
9/30/2004 | | | 9.32 | | | 0.25 | | | 0.96 | | | | 1.21 | | | | (0.34 | ) | | | — | | | | (0.34 | ) | | | — |
| * | From commencement of Class operations on February 1, 2006 through September 30, 2006. |
| ** | Prior to the close of business on February 1, 2006, the Fund offered Institutional Class shares, which were redesignated as Class Y shares on that date. |
| (a) | Had certain expenses not been reduced during the period, if applicable, total returns would have been lower. |
| (b) | The investment advisor and/or administrator agreed to reimburse a portion of the Fund’s expenses and/or reduce its fees during the period. Without this reimbursement/fee reduction, if applicable, expenses would have been higher. |
| (c) | Per share net investment income has been calculated using the average shares outstanding during the period. |
See accompanying notes to financial statements.
39
| | | | | | | | | | | | | | | | | |
| | | | | | | | Ratios to Average Net Assets: | | |
| | | | | | |
Net asset
value, end
of
the period | | Total
return
(%) (a)(e) | | | Net assets,
end of
the period
(000’s) | | Net
expenses
(%) (b)(f) | | | Gross
expenses
(%) (f) | | | Net investment
income
(%) (f) | | Portfolio
turnover
rate (%) |
| | | | | | | | | | | | | | | | | |
| | | | | | | | | | | | | | | | | |
| | | | | | | | | | | | | | | | | |
| $ | 9.08 | | (19.9 | ) | | $ | 29,520 | | 1.25 | | | 1.36 | | | 3.79 | | 58 |
| | 11.65 | | (21.9 | ) | | | 67,647 | | 1.25 | | | 1.27 | | | 1.74 | | 133 |
| | 15.83 | | 29.1 | | | | 28,927 | | 1.25 | | | 1.37 | | | 1.44 | | 78 |
| | 12.49 | | (1.7 | ) | | | 10,438 | | 1.25 | | | 1.56 | | | 1.52 | | 103 |
| | | | | | | | | | | | | | | | | |
| | 9.03 | | (20.2 | ) | | | 72,660 | | 2.00 | | | 2.11 | | | 3.11 | | 58 |
| | 11.51 | | (22.4 | ) | | | 124,178 | | 2.00 | | | 2.02 | | | 1.04 | | 133 |
| | 15.70 | | 28.0 | | | | 60,179 | | 2.00 | | | 2.11 | | | 0.69 | | 78 |
| | 12.43 | | (2.1 | ) | | | 20,228 | | 2.00 | | | 2.32 | | | 0.78 | | 103 |
| | | | | | | | | | | | | | | | | |
| | 9.09 | | (19.9 | ) | | | 69,926 | | 1.00 | | | 1.05 | | | 4.13 | | 58 |
| | 11.70 | | (21.7 | ) | | | 120,322 | | 0.99 | (g) | | 0.99 | (g) | | 2.06 | | 133 |
| | 15.87 | | 29.4 | | | | 80,824 | | 1.00 | | | 1.02 | | | 1.70 | | 78 |
| | 12.51 | | 7.1 | | | | 58,650 | | 1.00 | | | 1.19 | | | 1.58 | | 103 |
| | 11.84 | | 19.1 | | | | 47,712 | | 1.00 | | | 1.46 | | | 1.72 | | 78 |
| | 10.19 | | 13.2 | | | | 17,274 | | 1.00 | | | 1.87 | | | 2.55 | | 69 |
| (d) | Amount rounds to less than $0.01 per share, if applicable. |
| (e) | A sales charge for Class A shares and a contingent deferred sales charge for Class C shares are not reflected in total return calculations. Periods less than one year, if applicable, are not annualized. |
| (f) | Computed on an annualized basis for periods less than one year, if applicable. |
| (g) | Includes fee/expense recovery of less than 0.01% |
| (h) | Effective June 2, 2008, redemption fees were eliminated. |
| (i) | For the six months ended March 31, 2009 (Unaudited). |
40
FINANCIAL HIGHLIGHTS (continued)
For a share outstanding throughout each period.
| | | | | | | | | | | | | | | | | | | | | | | | |
| | | | | Income (Loss) from Investment Operations: | | | Less Distributions: |
| | | | | | | |
| | | Net asset
value,
beginning
of
the period | | Net
investment
income
(loss) (c)(d) | | | Net realized
and unrealized
gain (loss) | | | Total from
investment
operations | | | Dividends
from
net investment
income | | Distributions
from net
realized
capital gains | | Total
distributions |
| | | | | | | | | | | | | | | | | | | | | | | | |
GROWTH FUND | | | | | | | | | | | | | | | | | | | | | | | | |
Class A | | | | | | | | | | | | | | | | | | | | | | | | |
3/31/2009(i) | | $ | 4.99 | | $ | (0.00 | ) | | $ | (1.35 | ) | | $ | (1.35 | ) | | $ | — | | $ | — | | $ | — |
9/30/2008 | | | 7.01 | | | (0.02 | ) | | | (2.00 | ) | | | (2.02 | ) | | | — | | | — | | | — |
9/30/2007 | | | 5.84 | | | (0.03 | ) | | | 1.20 | | | | 1.17 | | | | — | | | — | | | — |
9/30/2006 | | | 6.03 | | | (0.00 | ) | | | (0.19 | ) | | | (0.19 | ) | | | — | | | — | | | — |
9/30/2005 | | | 4.98 | | | (0.02 | ) | | | 1.07 | | | | 1.05 | | | | — | | | — | | | — |
9/30/2004 | | | 4.41 | | | (0.03 | ) | | | 0.60 | | | | 0.57 | | | | — | | | — | | | — |
Class B | | | | | | | | | | | | | | | | | | | | | | | | |
3/31/2009(i) | | | 4.81 | | | (0.02 | ) | | | (1.30 | ) | | | (1.32 | ) | | | — | | | — | | | — |
9/30/2008 | | | 6.79 | | | (0.07 | ) | | | (1.91 | ) | | | (1.98 | ) | | | — | | | — | | | — |
9/30/2007 | | | 5.70 | | | (0.07 | ) | | | 1.16 | | | | 1.09 | | | | — | | | — | | | — |
9/30/2006 | | | 5.94 | | | (0.05 | ) | | | (0.19 | ) | | | (0.24 | ) | | | — | | | — | | | — |
9/30/2005 | | | 4.94 | | | (0.06 | ) | | | 1.06 | | | | 1.00 | | | | — | | | — | | | — |
9/30/2004 | | | 4.41 | | | (0.07 | ) | | | 0.60 | | | | 0.53 | | | | — | | | — | | | — |
Class C | | | | | | | | | | | | | | | | | | | | | | | | |
3/31/2009(i) | | | 4.81 | | | (0.02 | ) | | | (1.30 | ) | | | (1.32 | ) | | | — | | | — | | | — |
9/30/2008 | | | 6.80 | | | (0.07 | ) | | | (1.92 | ) | | | (1.99 | ) | | | — | | | — | | | — |
9/30/2007 | | | 5.71 | | | (0.08 | ) | | | 1.17 | | | | 1.09 | | | | — | | | — | | | — |
9/30/2006 | | | 5.94 | | | (0.04 | ) | | | (0.19 | ) | | | (0.23 | ) | | | — | | | — | | | — |
9/30/2005 | | | 4.94 | | | (0.06 | ) | | | 1.06 | | | | 1.00 | | | | — | | | — | | | — |
9/30/2004 | | | 4.41 | | | (0.06 | ) | | | 0.59 | | | | 0.53 | | | | — | | | — | | | — |
Class Y | | | | | | | | | | | | | | | | | | | | | | | | |
3/31/2009(i) | | | 5.24 | | | 0.01 | | | | (1.42 | ) | | | (1.41 | ) | | | — | | | — | | | — |
9/30/2008 | | | 7.32 | | | 0.01 | | | | (2.09 | ) | | | (2.08 | ) | | | — | | | — | | | — |
9/30/2007 | | | 6.08 | | | (0.00 | ) | | | 1.24 | | | | 1.24 | | | | — | | | — | | | — |
9/30/2006 | | | 6.26 | | | 0.02 | | | | (0.20 | ) | | | (0.18 | ) | | | — | | | — | | | — |
9/30/2005 | | | 5.15 | | | (0.00 | ) | | | 1.11 | | | | 1.11 | | | | — | | | — | | | — |
9/30/2004 | | | 4.55 | | | (0.02 | ) | | | 0.62 | | | | 0.60 | | | | — | | | — | | | — |
| (a) | Had certain expenses not been reduced during the period, if applicable, total returns would have been lower. |
| (b) | The investment adviser and/or administrator agreed to reimburse a portion of the Fund’s expenses and/or reduce its fees during the period. Without this reimbursement/fee reduction, if applicable, expenses would have been higher. |
| (c) | Per share net investment income (loss) has been calculated using the average shares outstanding during the period. |
| (d) | Amount rounds to less than $0.01 per share, if applicable. |
See accompanying notes to financial statements.
41
| | | | | | | | | | | | | | | | | | |
| | | | | | | | Ratios to Average Net Assets: | | | |
| | | | | | |
Net asset
value,
end of
the period | | Total
return
(%) (a)(e) | | | Net assets,
end of
the period
(000’s) | | Net
expenses
(%) (b)(h) | | | Gross
expenses
(%) (h) | | | Net investment
income (loss)
(%) (h) | | | Portfolio
turnover
rate (%) |
| | | | | | | | | | | | | | | | | | |
| | | | | | | | | | | | | | | | | | |
| | | | | | | | | | | | | | | | | | |
| $ | 3.64 | | (27.2 | ) | | $ | 64,869 | | 1.25 | | | 1.29 | | | (0.17 | ) | | 99 |
| | 4.99 | | (28.7 | ) | | | 156,841 | | 1.10 | | | 1.10 | | | (0.33 | ) | | 179 |
| | 7.01 | | 20.0 | | | | 228,629 | | 1.14 | (g) | | 1.14 | (g) | | (0.49 | ) | | 134 |
| | 5.84 | | (3.2 | ) | | | 225,729 | | 1.10 | | | 1.17 | | | (0.03 | ) | | 174 |
| | 6.03 | | 21.1 | | | | 51,248 | | 1.10 | | | 1.60 | | | (0.38 | ) | | 164 |
| | 4.98 | | 12.9 | | | | 14,072 | | 1.10 | | | 1.70 | | | (0.58 | ) | | 171 |
| | | | | | | | | | | | | | | | | | |
| | 3.49 | | (27.4 | ) | | | 5,201 | | 2.00 | | | 2.06 | | | (0.93 | ) | | 99 |
| | 4.81 | | (29.2 | ) | | | 9,553 | | 1.85 | | | 1.85 | | | (1.05 | ) | | 179 |
| | 6.79 | | 19.1 | | | | 28,258 | | 1.85 | (g) | | 1.85 | (g) | | (1.20 | ) | | 134 |
| | 5.70 | | (4.0 | ) | | | 32,160 | | 1.95 | | | 2.11 | | | (0.85 | ) | | 174 |
| | 5.94 | | 20.2 | | | | 38,538 | | 1.85 | | | 2.33 | | | (1.14 | ) | | 164 |
| | 4.94 | | 12.0 | | | | 12,532 | | 1.85 | | | 2.45 | | | (1.33 | ) | | 171 |
| | | | | | | | | | | | | | | | | | |
| | 3.49 | | (27.4 | ) | | | 15,481 | | 2.00 | | | 2.06 | | | (0.93 | ) | | 99 |
| | 4.81 | | (29.3 | ) | | | 27,743 | | 1.85 | | | 1.85 | | | (1.08 | ) | | 179 |
| | 6.80 | | 19.1 | | | | 39,157 | | 1.88 | | | 1.88 | | | (1.23 | ) | | 134 |
| | 5.71 | | (3.9 | ) | | | 43,415 | | 1.85 | | | 1.95 | | | (0.76 | ) | | 174 |
| | 5.94 | | 20.2 | | | | 25,734 | | 1.85 | | | 2.35 | | | (1.10 | ) | | 164 |
| | 4.94 | | 12.0 | | | | 6,826 | | 1.85 | | | 2.45 | | | (1.30 | ) | | 171 |
| | | | | | | | | | | | | | | | | | |
| | 3.83 | | (26.9 | ) | | | 47,990 | | 0.70 | | | 0.70 | | | 0.37 | | | 99 |
| | 5.24 | | (28.4 | ) | | | 75,389 | | 0.66 | | | 0.66 | | | 0.11 | | | 179 |
| | 7.32 | | 20.4 | | | | 124,663 | | 0.67 | | | 0.67 | | | (0.02 | ) | | 134 |
| | 6.08 | | (2.9 | ) | | | 121,478 | | 0.80 | (f) | | 0.80 | (f) | | 0.31 | | | 174 |
| | 6.26 | | 21.6 | | | | 95,534 | | 0.85 | | | 0.97 | | | (0.05 | ) | | 164 |
| | 5.15 | | 13.2 | | | | 40,165 | | 0.85 | | | 1.04 | | | (0.32 | ) | | 171 |
| (e) | A sales charge for Class A shares and a contingent deferred sales charge for Class B and Class C shares are not reflected in total return calculations. Periods less than one year, if applicable, are not annualized. |
| (f) | Includes fee/expense recovery of 0.07%. |
| (g) | Includes fee/expense recovery of less than 0.01% and 0.08% for Class A and Class B shares, respectively. |
| (h) | Computed on an annualized basis for periods less than one year, if applicable. |
| (i) | For the six months ended March 31, 2009 (Unaudited). |
42
FINANCIAL HIGHLIGHTS (continued)
For a share outstanding throughout each period.
| | | | | | | | | | | | | | | | | | | | | | | | | | |
| | | | | Income (Loss) from Investment Operations: | | | Less Distributions: | |
| | | | | | | |
| | | Net asset
value,
beginning
of
the period | | Net
investment
income
(loss) (a)(b) | | | Net realized
and unrealized
gain (loss) | | | Total from
investment
operations | | | Dividends
from
net investment
income | | | Distributions
from net
realized
capital gains | | Total
distributions | |
| | | | | | | | | | | | | | | | | | | | | | | | | | |
MID CAP GROWTH FUND | | | | | | | | | | | | | | | | | | | | | | | | | | |
Class A** | | | | | | | | | | | | | | | | | | | | | | | | | | |
3/31/2009(f) | | $ | 21.12 | | $ | (0.01 | )(j) | | $ | (6.15 | ) | | $ | (6.16 | ) | | $ | — | | | $ | — | | $ | — | |
9/30/2008 | | | 26.84 | | | (0.15 | ) | | | (5.57 | ) | | | (5.72 | ) | | | — | | | | — | | | — | |
9/30/2007 | | | 19.69 | | | (0.16 | )(g) | | | 7.31 | | | | 7.15 | | | | — | | | | — | | | — | |
9/30/2006 | | | 18.63 | | | (0.15 | ) | | | 1.21 | | | | 1.06 | | | | — | | | | — | | | — | |
9/30/2005 | | | 15.20 | | | (0.14 | ) | | | 3.70 | | | | 3.56 | | | | (0.13 | ) | | | — | | | (0.13 | ) |
9/30/2004 | | | 13.46 | | | (0.16 | ) | | | 1.90 | | | | 1.74 | | | | — | | | | — | | | — | |
Class C | | | | | | | | | | | | | | | | | | | | | | | | | | |
3/31/2009* | | | 15.13 | | | (0.04 | ) | | | (0.15 | ) | | | (0.19 | ) | | | — | | | | — | | | — | |
Class Y*** | | | | | | | | | | | | | | | | | | | | | | | | | | |
3/31/2009(f) | | | 21.70 | | | 0.00 | (j) | | | (6.31 | ) | | | (6.31 | ) | | | — | | | | — | | | — | |
9/30/2008 | | | 27.51 | | | (0.10 | ) | | | (5.71 | ) | | | (5.81 | ) | | | — | | | | — | | | — | |
9/30/2007 | | | 20.13 | | | (0.11 | )(g) | | | 7.49 | | | | 7.38 | | | | — | | | | — | | | — | |
9/30/2006 | | | 19.00 | | | (0.10 | ) | | | 1.23 | | | | 1.13 | | | | — | | | | — | | | — | |
9/30/2005 | | | 15.50 | | | (0.10 | ) | | | 3.78 | | | | 3.68 | | | | (0.18 | ) | | | — | | | (0.18 | ) |
9/30/2004 | | | 13.69 | | | (0.13 | ) | | | 1.94 | | | | 1.81 | | | | — | | | | — | | | — | |
| * | From commencement of Class operations on February 2, 2009 through March 31, 2009. |
| ** | Prior to the close of business on February 2, 2009, the Fund offered Retail Class shares, which were redesignated as Class A shares on that date. |
| *** | Prior to the close of business on February 2, 2009, the Fund offered Institutional Class shares, which were redesignated as Class Y shares on that date. |
| (a) | Per share net investment income (loss) has been calculated using the average shares outstanding during the period. |
| (b) | Amount rounds to less than $0.01 per share, if applicable. |
| (c) | Had certain expenses not been reduced during the period, if applicable, total returns would have been lower. |
| (d) | The investment adviser and/or administrator agreed to reimburse a portion of the Fund’s expenses and/or reduce its fees during the period. Without this reimbursement/fee reduction, if applicable, expenses would have been higher. |
See accompanying notes to financial statements.
43
| | | | | | | | | | | | | | | | | | |
| | | | | | | | Ratios to Average Net Assets: | | | |
| | | | | | |
Net asset
value,
end of
the period | | Total
return
(%) (c)(i) | | | Net assets,
end of
the period
(000’s) | | Net
expenses
(%) (d)(e) | | | Gross
expenses
(%) (e) | | | Net investment
income (loss)
(%) (e) | | | Portfolio
turnover
rate (%) |
| | | | | | | | | | | | | | | | | | |
| | | | | | | | | | | | | | | | | | |
| | | | | | | | | | | | | | | | | | |
| $ | 14.96 | | (29.2 | ) | | $ | 61,121 | | 1.25 | | | 1.59 | | | (0.14 | )(j) | | 149 |
| | 21.12 | | (21.3 | ) | | | 120,524 | | 1.25 | | | 1.32 | | | (0.58 | ) | | 299 |
| | 26.84 | | 36.3 | | | | 30,654 | | 1.25 | | | 1.43 | | | (0.71 | ) | | 194 |
| | 19.69 | | 5.7 | | | | 26,668 | | 1.25 | | | 1.52 | | | (0.72 | ) | | 211 |
| | 18.63 | | 23.6 | | | | 25,802 | | 1.25 | | | 1.50 | | | (0.85 | ) | | 280 |
| | 15.20 | | 12.9 | | | | 25,382 | | 1.25 | | | 1.42 | | | (1.10 | ) | | 284 |
| | | | | | | | | | | | | | | | | | |
| | 14.94 | | (1.3 | ) | | | 1 | | 2.00 | | | 2.40 | | | (1.46 | ) | | 149 |
| | | | | | | | | | | | | | | | | | |
| | 15.39 | | (29.1 | ) | | | 22,416 | | 1.00 | | | 1.12 | | | 0.06 | (j) | | 149 |
| | 21.70 | | (21.1 | ) | | | 25,779 | | 1.00 | (h) | | 1.00 | (h) | | (0.36 | ) | | 299 |
| | 27.51 | | 36.7 | | | | 24,143 | | 1.00 | | | 1.10 | | | (0.47 | ) | | 194 |
| | 20.13 | | 6.0 | | | | 17,467 | | 1.00 | | | 1.12 | | | (0.49 | ) | | 211 |
| | 19.00 | | 23.9 | | | | 26,159 | | 1.00 | | | 1.21 | | | (0.60 | ) | | 280 |
| | 15.50 | | 13.2 | | | | 25,191 | | 1.00 | | | 1.17 | | | (0.84 | ) | | 284 |
| (e) | Computed on an annualized basis for periods less than one year, if applicable. |
| (f) | For the six months ended March 31, 2009 (Unaudited). |
| (g) | Includes a non-recurring payment of $0.02 per share. |
| (h) | Includes fee/expense recovery of less than 0.01%. |
| (i) | A sales charge for Class A shares and a contingent deferred sales charge for Class C shares are not reflected in total return calculations. Periods less than one year, if applicable, are not annualized. |
| (j) | Includes special one-time distribution from Buckle, Inc. Without this distribution, net investment income (loss) per share would have been $(0.04) and $(0.02) for Class A and Class Y shares, respectively, and the ratio of net investment (loss) to average net assets would have been (0.49)% and (0.29)% for Class A and Class Y shares, respectively. |
44
FINANCIAL HIGHLIGHTS (continued)
For a share outstanding throughout each period.
| | | | | | | | | | | | | | | | | | | | | | | | | | | |
| | | | | Income (Loss) from Investment Operations: | | | Less Distributions: | |
| | | | | | | |
| | | Net asset
value,
beginning
of
the period | | Net
investment
income
(loss) (c)(d) | | | Net realized
and unrealized
gain (loss) | | | Total from
investment
operations | | | Dividends
from
net investment
income (b) | | | Distributions
from net
realized
capital gains | | | Total
distributions (d) | |
| | | | | | | | | | | | | | | | | | | | | | | | | | | |
RESEARCH FUND | | | | | | | | | | | | | | | | | | | | | | | | | | | |
Class A | | | | | | | | | | | | | | | | | | | | | | | | | | | |
3/31/2009(g) | | $ | 6.98 | | $ | 0.03 | | | $ | (1.94 | ) | | $ | (1.91 | ) | | $ | (0.05 | ) | | $ | — | | | $ | (0.05 | ) |
9/30/2008 | | | 9.77 | | | 0.03 | | | | (1.80 | ) | | | (1.77 | ) | | | (0.05 | ) | | | (0.97 | ) | | | (1.02 | ) |
9/30/2007 | | | 9.42 | | | 0.02 | | | | 1.53 | | | | 1.55 | | | | (0.07 | ) | | | (1.13 | ) | | | (1.20 | ) |
9/30/2006 | | | 9.22 | | | 0.05 | | | | 0.64 | | | | 0.69 | | | | (0.03 | ) | | | (0.46 | ) | | | (0.49 | ) |
9/30/2005 | | | 7.79 | | | 0.00 | | | | 1.43 | | | | 1.43 | | | | (0.00 | ) | | | — | | | | (0.00 | ) |
9/30/2004 | | | 6.90 | | | 0.01 | | | | 0.90 | | | | 0.91 | | | | (0.02 | ) | | | — | | | | (0.02 | ) |
Class B | | | | | | | | | | | | | | | | | | | | | | | | | | | |
3/31/2009(g) | | | 6.80 | | | 0.01 | | | | (1.90 | ) | | | (1.89 | ) | | | — | | | | — | | | | — | |
9/30/2008 | | | 9.56 | | | (0.03 | ) | | | (1.76 | ) | | | (1.79 | ) | | | — | | | | (0.97 | ) | | | (0.97 | ) |
9/30/2007 | | | 9.25 | | | (0.05 | ) | | | 1.50 | | | | 1.45 | | | | (0.01 | ) | | | (1.13 | ) | | | (1.14 | ) |
9/30/2006 | | | 9.10 | | | (0.02 | ) | | | 0.63 | | | | 0.61 | | | | — | | | | (0.46 | ) | | | (0.46 | ) |
9/30/2005 | | | 7.73 | | | (0.06 | ) | | | 1.43 | | | | 1.37 | | | | (0.00 | ) | | | — | | | | (0.00 | ) |
9/30/2004 | | | 6.90 | | | (0.05 | ) | | | 0.90 | | | | 0.85 | | | | (0.02 | ) | | | — | | | | (0.02 | ) |
Class C | | | | | | | | | | | | | | | | | | | | | | | | | | | |
3/31/2009(g) | | | 6.76 | | | 0.01 | | | | (1.89 | ) | | | (1.88 | ) | | | (0.02 | ) | | | — | | | | (0.02 | ) |
9/30/2008 | | | 9.52 | | | (0.03 | ) | | | (1.76 | ) | | | (1.79 | ) | | | — | | | | (0.97 | ) | | | (0.97 | ) |
9/30/2007 | | | 9.22 | | | (0.05 | ) | | | 1.50 | | | | 1.45 | | | | (0.02 | ) | | | (1.13 | ) | | | (1.15 | ) |
9/30/2006 | | | 9.08 | | | (0.02 | ) | | | 0.63 | | | | 0.61 | | | | (0.01 | ) | | | (0.46 | ) | | | (0.47 | ) |
9/30/2005 | | | 7.73 | | | (0.07 | ) | | | 1.42 | | | | 1.35 | | | | (0.00 | ) | | | — | | | | (0.00 | ) |
9/30/2004 | | | 6.90 | | | (0.05 | ) | | | 0.88 | | | | 0.83 | | | | — | | | | — | | | | — | |
Class Y | | | | | | | | | | | | | | | | | | | | | | | | | | | |
3/31/2009(g) | | | 7.03 | | | 0.04 | | | | (1.95 | ) | | | (1.91 | ) | | | (0.06 | ) | | | — | | | | (0.06 | ) |
9/30/2008 | | | 9.85 | | | 0.07 | | | | (1.82 | ) | | | (1.75 | ) | | | (0.10 | ) | | | (0.97 | ) | | | (1.07 | ) |
9/30/2007 | | | 9.49 | | | 0.06 | | | | 1.53 | | | | 1.59 | | | | (0.10 | ) | | | (1.13 | ) | | | (1.23 | ) |
9/30/2006 | | | 9.27 | | | 0.09 | | | | 0.64 | | | | 0.73 | | | | (0.05 | ) | | | (0.46 | ) | | | (0.51 | ) |
9/30/2005 | | | 7.82 | | | 0.04 | | | | 1.44 | | | | 1.48 | | | | (0.03 | ) | | | — | | | | (0.03 | ) |
9/30/2004 | | | 6.92 | | | 0.03 | | | | 0.90 | | | | 0.93 | | | | (0.03 | ) | | | — | | | | (0.03 | ) |
| (a) | Had certain expenses not been reduced during the period, if applicable, total returns would have been lower. |
| (b) | The investment adviser and/or administrator agreed to reimburse a portion of the Fund’s expenses and/or reduce its fees during the period. Without this reimbursement/fee reduction, if applicable, expenses would have been higher. |
| (c) | Per share net investment income (loss) has been calculated using the average shares outstanding during the period. |
See accompanying notes to financial statements.
45
| | | | | | | | | | | | | | | | |
| | | | | | | | Ratios to Average Net Assets: | | | |
| | | | | | |
Net asset
value,
end of
the period | | Total
return
(%) (a)(e) | | | Net assets,
end of
the period
(000’s) | | Net
expenses
(%) (b)(f) | | Gross
expenses
(%) (f) | | Net investment
income (loss)
(%) (f) | | | Portfolio
turnover
rate (%) |
| | | | | | | | | | | | | | | | |
| | | | | | | | | | | | | | | | |
| | | | | | | | | | | | | | | | |
| $ | 5.02 | | (27.5 | ) | | $ | 1,413 | | 1.25 | | 1.83 | | 1.08 | | | 102 |
| | 6.98 | | (20.4 | ) | | | 736 | | 1.25 | | 1.55 | | 0.38 | | | 149 |
| | 9.77 | | 18.0 | | | | 1,198 | | 1.25 | | 1.50 | | 0.22 | | | 148 |
| | 9.42 | | 7.7 | | | | 1,331 | | 1.25 | | 1.68 | | 0.56 | | | 143 |
| | 9.22 | | 18.4 | | | | 344 | | 1.25 | | 34.73 | | 0.03 | | | 133 |
| | 7.79 | | 13.2 | | | | 106 | | 1.21 | | 39.85 | | 0.07 | | | 151 |
| | | | | | | | | | | | | | | | |
| | 4.91 | | (27.8 | ) | | | 127 | | 2.00 | | 2.50 | | 0.28 | | | 102 |
| | 6.80 | | (21.0 | ) | | | 227 | | 2.00 | | 2.30 | | (0.37 | ) | | 149 |
| | 9.56 | | 17.1 | | | | 356 | | 2.00 | | 2.31 | | (0.51 | ) | | 148 |
| | 9.25 | | 6.9 | | | | 331 | | 2.00 | | 2.33 | | (0.19 | ) | | 143 |
| | 9.10 | | 17.8 | | | | 210 | | 2.00 | | 41.40 | | (0.71 | ) | | 133 |
| | 7.73 | | 12.3 | | | | 57 | | 2.00 | | 40.60 | | (0.71 | ) | | 151 |
| | | | | | | | | | | | | | | | |
| | 4.86 | | (27.8 | ) | | | 1,194 | | 2.00 | | 2.54 | | 0.25 | | | 102 |
| | 6.76 | | (21.1 | ) | | | 949 | | 2.00 | | 2.30 | | (0.39 | ) | | 149 |
| | 9.52 | | 17.2 | | | | 1,164 | | 2.00 | | 2.29 | | (0.54 | ) | | 148 |
| | 9.22 | | 6.9 | | | | 1,198 | | 2.00 | | 2.37 | | (0.18 | ) | | 143 |
| | 9.08 | | 17.5 | | | | 140 | | 2.00 | | 37.60 | | (0.76 | ) | | 133 |
| | 7.73 | | 12.0 | | | | 3 | | 2.00 | | 40.60 | | (0.59 | ) | | 151 |
| | | | | | | | | | | | | | | | |
| | 5.06 | | (27.3 | ) | | | 17,021 | | 0.85 | | 1.42 | | 1.43 | | | 102 |
| | 7.03 | | (20.2 | ) | | | 23,538 | | 0.85 | | 1.15 | | 0.78 | | | 149 |
| | 9.85 | | 18.4 | | | | 27,400 | | 0.85 | | 1.11 | | 0.62 | | | 148 |
| | 9.49 | | 8.1 | | | | 23,096 | | 0.85 | | 1.26 | | 0.98 | | | 143 |
| | 9.27 | | 19.0 | | | | 24,651 | | 0.85 | | 1.31 | | 0.43 | | | 133 |
| | 7.82 | | 13.5 | | | | 21,721 | | 0.85 | | 1.50 | | 0.44 | | | 151 |
| (d) | Amount rounds to less than $0.01 per share, if applicable. |
| (e) | A sales charge for Class A shares and a contingent deferred sales charge for Class B and Class C shares are not reflected in total return calculations. Periods less than one year, if applicable, are not annualized. |
| (f) | Computed on an annualized basis for periods less than one year, if applicable. |
| (g) | For the six months ended March 31, 2009 (Unaudited). |
46
FINANCIAL HIGHLIGHTS (continued)
For a share outstanding throughout each period.
| | | | | | | | | | | | | | | | | | | | | | | | | | |
| | | | | Income (Loss) from Investment Operations: | | | Less Distributions: | |
| | | | | | | |
| | | Net asset
value,
beginning
of
the period | | Net
investment
income (c)(d) | | Net realized
and unrealized
gain (loss) | | | Total from
investment
operations | | | Dividends
from
net investment
income | | | Distributions
from net
realized
capital gains | | | Total
distributions | |
| | | | | | | | | | | | | | | | | | | | | | | | | | |
VALUE FUND | | | | | | | | | | | | | | | | | | | | | | | | | | |
Class A**** | | | | | | | | | | | | | | | | | | | | | | | | | | |
3/31/2009(j) | | $ | 17.93 | | $ | 0.15 | | $ | (5.54 | ) | | $ | (5.39 | ) | | $ | (0.21 | ) | | $ | — | | | $ | (0.21 | ) |
9/30/2008 | | | 23.46 | | | 0.25 | | | (4.45 | ) | | | (4.20 | ) | | | (0.18 | ) | | | (1.15 | ) | | | (1.33 | ) |
9/30/2007 | | | 21.04 | | | 0.19 | | | 3.27 | | | | 3.46 | | | | (0.13 | ) | | | (0.91 | ) | | | (1.04 | ) |
9/30/2006* | | | 19.69 | | | 0.02 | | | 1.33 | | | | 1.35 | | | | — | | | | — | | | | — | |
Class B | | | | | | | | | | | | | | | | | | | | | | | | | | |
3/31/2009(j) | | | 17.80 | | | 0.11 | | | (5.52 | ) | | | (5.41 | ) | | | (0.03 | ) | | | — | | | | (0.03 | ) |
9/30/2008 | | | 23.46 | | | 0.10 | | | (4.45 | ) | | | (4.35 | ) | | | (0.16 | ) | | | (1.15 | ) | | | (1.31 | ) |
9/30/2007** | | | 24.00 | | | 0.00 | | | (0.54 | ) | | | (0.54 | ) | | | — | | | | — | | | | — | |
Class C | | | | | | | | | | | | | | | | | | | | | | | | | | |
3/31/2009(j) | | | 17.79 | | | 0.10 | | | (5.50 | ) | | | (5.40 | ) | | | (0.14 | ) | | | — | | | | (0.14 | ) |
9/30/2008 | | | 23.46 | | | 0.09 | | | (4.43 | ) | | | (4.34 | ) | | | (0.18 | ) | | | (1.15 | ) | | | (1.33 | ) |
9/30/2007** | | | 24.00 | | | 0.01 | | | (0.55 | ) | | | (0.54 | ) | | | — | | | | — | | | | — | |
Class Y*** | | | | | | | | | | | | | | | | | | | | | | | | | | |
3/31/2009(j) | | | 18.01 | | | 0.18 | | | (5.57 | ) | | | (5.39 | ) | | | (0.28 | ) | | | — | | | | (0.28 | ) |
9/30/2008 | | | 23.54 | | | 0.32 | | | (4.45 | ) | | | (4.13 | ) | | | (0.25 | ) | | | (1.15 | ) | | | (1.40 | ) |
9/30/2007 | | | 21.05 | | | 0.27 | | | 3.27 | | | | 3.54 | | | | (0.14 | ) | | | (0.91 | ) | | | (1.05 | ) |
9/30/2006 | | | 18.72 | | | 0.22 | | | 3.17 | | | | 3.39 | | | | (0.27 | ) | | | (0.79 | ) | | | (1.06 | ) |
9/30/2005 | | | 15.95 | | | 0.20 | | | 2.83 | | | | 3.03 | | | | (0.26 | ) | | | — | | | | (0.26 | ) |
| * | From commencement of Class operations on June 30, 2006 through September 30, 2006. |
| ** | From commencement of Class operations on June 1, 2007 through September 30, 2007. |
| *** | Prior to the close of business on June 1, 2007, the Fund offered Institutional Class shares, which were redesignated as Class Y shares on that date. |
| **** | Prior to the close of business on June 1, 2007, the Fund offered Retail Class shares, which were redesignated as Class A shares on that date. |
| (a) | Had certain expenses not been reduced during the period, if applicable, total return would have been lower. |
| (b) | The investment adviser and/or administrator agreed to reimburse a portion of the Fund’s expenses and/or reduce its fees during the period. Without this reimbursement/fee reduction, if applicable, expenses would have been higher. |
| (c) | Per share net investment income has been calculated using the average shares outstanding during the period. |
See accompanying notes to financial statements.
47
| | | | | | | | | | | | | | | | | | |
| | | | | | | | Ratios to Average Net Assets: | | | |
| | | | | | |
Net asset
value,
end of
the period | | Total
return
(%) (a)(g) | | | Net assets,
end of
the period
(000’s) | | Net
expenses
(%) (b)(f) | | | Gross
expenses
(%) (f) | | | Net investment
income (loss)
(%) (f) | | Portfolio
turnover
rate (%) | |
| | | | | | | | | | | | | | | | | | |
| | | | | | | | | | | | | | | | | | |
| | | | | | | | | | | | | | | | | | |
| $ | 12.33 | | (30.1 | ) | | $ | 84,422 | | 1.04 | | | 1.04 | | | 2.32 | | 24 | |
| | 17.93 | | (19.0 | ) | | | 112,274 | | 1.05 | | | 1.05 | | | 1.24 | | 36 | (i) |
| | 23.46 | | 16.9 | | | | 17,500 | | 1.09 | (e) | | 1.09 | (e) | | 0.79 | | 41 | |
| | 21.04 | | 6.9 | | | | 466 | | 1.10 | | | 8.65 | | | 0.42 | | 36 | |
| | | | | | | | | | | | | | | | | | |
| | 12.36 | | (30.4 | ) | | | 4,744 | | 1.79 | | | 1.79 | | | 1.58 | | 24 | |
| | 17.80 | | (19.7 | ) | | | 8,385 | | 1.80 | (h) | | 1.80 | (h) | | 0.51 | | 36 | (i) |
| | 23.46 | | (2.3 | ) | | | 108 | | 1.85 | | | 1.89 | | | 0.03 | | 41 | |
| | | | | | | | | | | | | | | | | | |
| | 12.25 | | (30.4 | ) | | | 6,271 | | 1.80 | | | 1.80 | | | 1.56 | | 24 | |
| | 17.79 | | (19.6 | ) | | | 6,483 | | 1.80 | (h) | | 1.80 | (h) | | 0.46 | | 36 | (i) |
| | 23.46 | | (2.3 | ) | | | 1,390 | | 1.85 | | | 1.94 | | | 0.10 | | 41 | |
| | | | | | | | | | | | | | | | | | |
| | 12.34 | | (30.1 | ) | | | 266,519 | | 0.64 | | | 0.64 | | | 2.72 | | 24 | |
| | 18.01 | | (18.7 | ) | | | 303,182 | | 0.65 | | | 0.66 | | | 1.58 | | 36 | (i) |
| | 23.54 | | 17.3 | | | | 182,002 | | 0.72 | (e) | | 0.72 | (e) | | 1.19 | | 41 | |
| | 21.05 | | 18.9 | | | | 71,147 | | 0.85 | | | 0.91 | | | 1.13 | | 36 | |
| | 18.72 | | 19.2 | | | | 37,255 | | 0.85 | | | 0.92 | | | 1.13 | | 34 | |
| (d) | Amount rounds to less than $0.01 per share, if applicable. |
| (e) | Includes fee/expense recovery of 0.02% and 0.01% for Class A and Class Y shares, respectively. |
| (f) | Computed on an annualized basis for periods less than one year, if applicable. |
| (g) | A sales charge for Class A shares and a contingent deferred sales charge for Class B and Class C shares are not reflected in total return calculations. Periods less than one year, if applicable, are not annualized. |
| (h) | Includes fee/expense recovery of less than 0.01% for Class B and Class C shares, respectively. |
| (i) | Portfolio turnover excludes the impact of assets resulting from a merger with another fund. (See Note 10 of Notes to Financial Statements) |
| (j) | For the six months ended March 31, 2009 (Unaudited). |
48
NOTESTO FINANCIAL STATEMENTS
March 31, 2009 (Unaudited)
1. Organization. Loomis Sayles Funds II (the “Trust”) is organized as a Massachusetts business trust. The Trust is registered under the Investment Company Act of 1940, as amended (the “1940 Act”), as an open-end management investment company. The Declaration of Trust permits the Board of Trustees to authorize the issuance of an unlimited number of shares of the Trust in multiple series. Information presented in these financial statements pertains to certain equity funds of the Trust; the financial statements for the remaining equity funds and the fixed income funds of the Trust are presented in separate reports. The following funds (individually, a “Fund” and collectively, the “Funds”) are included in this report:
Loomis Sayles Global Markets Fund (the “Global Markets Fund”)
Loomis Sayles Growth Fund (the “Growth Fund”)
Loomis Sayles Mid Cap Growth Fund (the “Mid Cap Growth Fund”)
Loomis Sayles Research Fund (the “Research Fund”)
Loomis Sayles Value Fund (the “Value Fund”)
Each Fund offers Class A, Class C and Class Y shares. Effective October 12, 2007, Class B shares are no longer offered. Existing Class B shareholders may continue to reinvest dividends into Class B shares and exchange their Class B shares for Class B shares of other Natixis Funds subject to existing exchange privileges as described in the Prospectus.
Effective February 2, 2009, the Mid Cap Growth Fund redesignated its Retail Class and Institutional Class shares as Class A and Class Y shares, respectively. In addition, on February 2, 2009, the Mid Cap Growth Fund began offering Class C shares.
Class A shares are sold with a maximum front-end sales charge of 5.75%. Class B shares do not pay a front-end sales charge, but pay higher Rule 12b-1 fees than Class A shares for eight years (at which point they automatically convert to Class A shares), and are subject to a contingent deferred sales charge (“CDSC”) if those shares are redeemed within six years of purchase. Class C shares do not pay a front-end sales charge, do not convert to any other class of shares and pay higher Rule 12b-1 fees than Class A shares and may be subject to a CDSC of 1.00% if those shares are redeemed within one year. Class Y shares do not pay a front-end sales charge, a CDSC or distribution fees. Class Y shares are generally intended for institutional investors with a minimum initial investment of $100,000, though some categories of investors are exempted from the minimum investment amount as outlined in the Funds’ Prospectus.
Most expenses of the Trust can be directly attributed to a fund. Expenses which can not be directly attributed to a fund are generally apportioned based on the relative net assets of each of the funds in the Trust. Expenses of a fund are borne pro rata by the holders of each class of shares, except that each class bears expenses unique to that class (including the Rule 12b-1 service and distribution fees and transfer agent fees applicable to such class). In addition, each class votes as a class only with respect to its own Rule 12b-1 Plan. Shares of each class would receive their pro rata share of the net assets of a fund if the fund were liquidated. The Trustees approve separate dividends from net investment income on each class of shares.
2. Significant Accounting Policies. The following is a summary of significant accounting policies consistently followed by each Fund in the preparation of its financial statements. The Funds’ financial statements are prepared in accordance with accounting principles generally accepted in the United States of America which require the use of management estimates that affect the reported amounts and disclosures in the financial statements. Actual results could differ from those estimates.
a. Valuation. Equity securities, including closed-end investment companies and exchange-traded funds, for which market quotations are readily available are valued at market value, as reported by pricing services recommended by the investment adviser and approved by the Board of Trustees. Such pricing services generally use the security’s last sale price on the exchange or market where the security is primarily traded or, if there is no reported sale during the day, the closing bid price. Securities traded on the NASDAQ Global Select Market, NASDAQ Global Market and NASDAQ Capital Market are valued at the NASDAQ Official Closing Price (“NOCP”), or if lacking a NOCP, at the most recent bid quotation on the applicable NASDAQ Market. Debt securities (other than short-term obligations purchased with an original or remaining maturity of sixty days or less) are generally valued on the basis of evaluated bids furnished to the Funds by a pricing service recommended by the investment adviser and approved by the Board of Trustees, which service determines valuations for normal, institutional-size trading units of such securities using market information, transactions for comparable securities and various relationships between securities which are generally recognized by institutional traders. Broker-dealer bid quotations may also be used to value debt and equity securities where a pricing service does not price a security or where a pricing service does not provide a reliable price for the security. In instances where broker-dealer bid quotations are not available, certain securities held by the Funds may be valued on the basis of a price provided by a principal market maker. Forward foreign currency contracts are “marked-to-market” daily using interpolated prices determined by an independent pricing service. Domestic exchange-traded single equity option contracts are valued at the mean of the National Best Bid and Offer quotations. Exchange-traded index options and foreign exchange-traded single equity options are valued at the average of the closing bid and asked quotations. Short-term obligations purchased with an original or remaining maturity of sixty days or less are valued at amortized cost, which approximates market value. Securities for which market quotations are not readily available are valued at fair value as determined in good faith by the Funds’ investment adviser using consistently applied procedures under the general supervision of the Board of Trustees. Investments in other open-end investment companies are valued at their net asset value each day.
The Funds may hold securities traded in foreign markets. Foreign securities are valued at the market price in the foreign market. However, if events occurring after the close of the foreign market (but before the close of regular trading on the New York Stock Exchange) are believed to materially affect the value of those securities, such securities are
49
NOTESTO FINANCIAL STATEMENTS (continued)
March 31, 2009 (Unaudited)
fair valued pursuant to procedures approved by the Board of Trustees. When fair valuing securities, the Funds may, among other things, use modeling tools or other processes that may take into account factors such as securities market activity and/or significant events that occur after the close of the foreign market and before the Funds calculate their net asset values. As of March 31, 2009, approximately 14% of the market value of the Global Markets Fund’s investments was fair valued pursuant to procedures approved by the Board of Trustees.
b. Security Transactions and Related Investment Income. Security transactions are accounted for on trade date. Dividend income is recorded on ex-dividend date, or in the case of certain foreign securities, as soon as the Fund is notified, and interest income is recorded on an accrual basis. Interest income is increased by the accretion of discount and decreased by the amortization of premium. Periodic principal adjustments for inflation-protected securities are recorded to interest income. Investment income is recorded net of foreign taxes withheld when applicable. In determining net gain or loss on securities sold, the cost of securities has been determined on an identified cost basis. Investment income, non-class specific expenses and realized and unrealized gains and losses are allocated on a pro rata basis to each class based on the relative net assets of each class to the total net assets of the Fund.
c. Foreign Currency Translation. The books and records of the Funds are maintained in U.S. dollars. The value of securities, currencies and other assets and liabilities denominated in currencies other than U.S. dollars are translated into U.S. dollars based upon foreign exchange rates prevailing at the end of the period. Purchases and sales of investment securities, income and expenses are translated on the respective dates of such transactions.
Since the values of investment securities are presented at the foreign exchange rates prevailing at the end of the period, it is not practical to isolate that portion of the results of operations arising from changes in exchange rates from fluctuations which arise due to changes in market prices of the investment securities. Such changes are included with the net realized and unrealized gain or loss on investments.
Net realized foreign exchange gains or losses arise from sales of foreign currency, currency gains or losses realized between the trade and settlement dates on securities transactions and the difference between the amounts of dividends, interest and foreign withholding taxes recorded on the Funds’ books and the U.S. dollar equivalent of the amounts actually received or paid. Net unrealized foreign exchange gains and losses arise from changes in the value of assets and liabilities, other than investment securities, at the end of the fiscal period, resulting from changes in exchange rates.
Each Fund may use foreign currency exchange contracts to facilitate transactions in foreign-denominated investments. Losses may arise from changes in the value of the foreign currency or if the counterparties do not perform under the contracts’ terms.
Each Fund may purchase investments of foreign issuers. Investing in securities of foreign issuers involves special risks and considerations not typically associated with investing in U.S. companies and securities of the U.S. government. These risks include revaluation of currencies and the risk of expropriation. Moreover, the markets for securities of many foreign issuers may be less liquid and the prices of such securities may be more volatile than those of comparable U.S. companies and the U.S. government.
d. Forward Foreign Currency Contracts. Each Fund may enter into forward foreign currency contracts. Contracts to buy generally are used to acquire exposure to foreign currencies, while contracts to sell generally are used to hedge a Fund’s investments against currency fluctuation. Also, a contract to buy or sell can offset a previous contract. These contracts involve market risk in excess of the unrealized gain or loss reflected in the Fund’s Statement of Assets and Liabilities. The U.S. dollar value of the currencies a Fund has committed to buy or sell represents the aggregate exposure to each currency the Fund has acquired or hedged through currency contracts outstanding at period end. Gains or losses are recorded for financial statement purposes as unrealized until settlement date. Risks may arise upon entering into these contracts from the potential inability of counterparties to meet the terms of their contracts and from unanticipated movements in the value of a foreign currency relative to the U.S. dollar.
e. Option Contracts. The Funds may enter into option contracts. An option contract is a contract in which the writer of the option grants the buyer of the option the right to purchase from (call option) or sell to (put option) the writer a designated instrument at a specified price within a specified period of time.
When the Fund writes an option, an amount equal to the net premium received (the premium less commission) is recorded as a liability and is subsequently adjusted to the current value until the option expires or the Fund enters into a closing purchase transaction. When a written option expires on its stipulated expiration date or the Fund enters into a closing purchase transaction, the difference between the net premium received and any amount paid at expiration or on effecting a closing purchase transaction, including commission, is treated as a realized gain or, if the net premium received is less than the amount paid, as a realized loss. The Fund, as writer of a written option, bears the risk of an unfavorable change in the market value of the equity underlying the written option.
When a Fund purchases an option, it pays a premium and the option is subsequently marked to market to reflect current value. Premiums paid for purchasing options which expire are treated as realized losses. Premiums paid for purchasing options which are exercised or closed are added to the cost or deducted from the proceeds on the underlying instrument to determine the realized gain or loss. The risk associated with purchasing options is limited to the premium paid.
50
NOTESTO FINANCIAL STATEMENTS (continued)
March 31, 2009 (Unaudited)
The following is a summary of Mid Cap Growth Fund’s written option activity during the period:
| | | | | | | |
| | | Number of
Contracts | | | Premiums | |
Outstanding at 9/30/2008 | | — | | | $ | — | |
Options written | | 19,412 | | | | 2,363,676 | |
Options terminated in closing purchase transactions | | (12,976 | ) | | | (1,579,670 | ) |
Options expired unexercised | | — | | | | — | |
| | | | | | | |
Outstanding at 3/31/2009 | | 6,436 | | | $ | 784,006 | |
| | | | | | | |
f. Federal and Foreign Income Taxes. The Trust treats each Fund as a separate entity for federal income tax purposes. Each Fund intends to meet the requirements of the Internal Revenue Code applicable to regulated investment companies, and to distribute to its shareholders substantially all of its net investment income and any net realized capital gains at least annually. Management has performed an analysis of the Funds’ tax positions taken on federal and state tax returns that remain subject to examination (tax years ended September 30, 2005-2008) and has concluded that no provisions for income tax are required. Fund management is not aware of any events that are reasonably possible to occur in the next six months that would result in the amounts of any unrecognized tax benefits significantly increasing or decreasing for the Funds. However, management’s conclusions regarding tax positions taken may be subject to review and adjustment at a later date based on factors including, but not limited to, new tax laws and accounting regulations and interpretations thereof.
A Fund may be subject to foreign taxes on income and gains on investments that are accrued based upon the Fund’s understanding of the tax rules and regulations that exist in the countries in which the Fund invests. Foreign governments may also impose taxes or other payments on investments with respect to foreign securities. Such taxes are accrued as applicable, and are reflected as foreign taxes payable on the Statements of Assets and Liabilities.
g. Dividends and Distributions to Shareholders. Dividends and distributions are recorded on ex-dividend date. The timing and characterization of certain income and capital gain distributions are determined annually in accordance with federal tax regulations, which may differ from accounting principles generally accepted in the United States of America. Permanent differences are primarily due to differing treatments for book and tax purposes for items such as net operating losses, distribution redesignations, capital gain taxes, paydown adjustments, capital loss carryforwards permanently lost due to a merger, wash sales and deferred trustee fees inherited in a merger, foreign currency transactions, gains realized from passive foreign investment companies (“PFICs”) and premium amortization accruals. Permanent book and tax basis differences relating to shareholder distributions will result in reclassifications to capital accounts. Temporary differences between book and tax distributable earnings are primarily due to deferred Trustees’ fees, forward contracts mark to market, securities lending collateral gain/loss adjustment, wash sales, unrealized gains on PFICs, premium amortization accruals and defaulted bond interest. Distributions from net investment income and short-term capital gains are considered to be distributed from ordinary income for tax purposes.
The tax characterization of distributions is determined on an annual basis. The tax character of distributions paid to shareholders during the year ended September 30, 2008 was as follows:
| | | | | | | | | |
| | | 2008 Distributions Paid From: |
Fund | | Ordinary Income | | Long-Term
Capital Gains | | Total |
Global Markets Fund | | $ | 9,975,891 | | $ | 5,031,317 | | $ | 15,007,208 |
Growth Fund | | | — | | | — | | | — |
Mid Cap Growth Fund | | | — | | | — | | | — |
Research Fund | | | 1,651,307 | | | 1,693,530 | | | 3,344,837 |
Value Fund | | | 6,455,247 | | | 6,148,525 | | | 12,603,772 |
Differences between these amounts and those reported in the Statements of Changes in Net Assets, if any, are primarily attributable to different book and tax treatment for short-term capital gains.
51
NOTESTO FINANCIAL STATEMENTS (continued)
March 31, 2009 (Unaudited)
As of September 30, 2008, the capital loss carryforwards and post-October losses were as follows:
| | | | | | | | | | | | | | | | | | | | |
| | | Global
Markets Fund | | | Growth
Fund | | | Mid Cap
Growth Fund | | | Research
Fund | | | Value
Fund | |
Capital loss carryforward: | | | | | | | | | | | | | | | | | | | | |
Expires September 30, 2010 | | $ | — | | | $ | (9,606,459 | )* | | $ | (65,130,772 | ) | | $ | — | | | $ | — | |
Expires September 30, 2011 | | | — | | | | (6,192,314 | )* | | | (21,142,388 | ) | | | — | | | | — | |
Expires September 30, 2016 | | | — | | | | (75,866 | ) | | | — | | | | — | | | | — | |
| | | | | | | | | | | | | | | | | | | | |
Total capital loss carryforward | | $ | — | | | $ | (15,874,639 | ) | | $ | (86,273,160 | ) | | $ | — | | | $ | — | |
| | | | | | | | | | | | | | | | | | | | |
Deferred net capital losses (post-October 2007) | | $ | (29,837,961 | ) | | $ | (31,323,857 | ) | | $ | (18,347,531 | ) | | $ | (1,121,319 | ) | | $ | (12,052,896 | ) |
| | | | | | | | | | | | | | | | | | | | |
* A significant portion of the Loomis Sayles Growth Fund’s carryforward losses are a result of prior year mergers; therefore, utilization of these losses has been limited under section 382 of the Internal Revenue Code.
h. Repurchase Agreements. It is each Fund’s policy that the market value of the collateral for repurchase agreements be at least equal to 100% of the repurchase price, including interest. Certain repurchase agreements are tri-party arrangements whereby the collateral is held in a segregated account for the benefit of the Fund and on behalf of the counterparty. It is each Fund’s policy, regarding tri-party arrangements, that the market value of the collateral be at least equal to 102% of the repurchase price, including interest. Repurchase agreements could involve certain risks in the event of default or insolvency of the counterparty including possible delays or restrictions upon a Fund’s ability to dispose of the underlying securities.
i. Securities Lending. The Funds have entered into an agreement with State Street Bank and Trust Company (��State Street Bank”), as agent of the Funds, to lend securities to certain designated borrowers. The loans are collateralized with cash or securities in an amount equal to at least 105% or 102% of the market value (including accrued interest) of the loaned international or domestic securities, respectively, when the loan is initiated. Thereafter, the value of the collateral must remain at least 102% of the market value (including accrued interest) of loaned securities for U.S. equities and U.S. corporate debt; at least 105% of the market value (including accrued interest) of loaned securities for non-U.S. equities; and at least 100% of the market value (including accrued interest) of loaned securities for U.S. government securities, sovereign debt issued by non-U.S. governments and non-U.S. corporate debt. In the event that the market value of the collateral falls below the required percentages described above, the borrower will deliver additional collateral on the next business day. As with other extensions of credit, the Funds bear the risk of loss with respect to the investment of the collateral. The Funds invest cash collateral in short-term investments, a portion of the income from which is remitted to the borrowers and the remainder allocated between the Funds and State Street Bank as lending agent.
As of March 31, 2009, there were no securities on loan.
j. Indemnifications. Under the Trust’s organizational documents, its officers and Trustees are indemnified against certain liabilities arising out of the performance of their duties to the Funds. Additionally, in the normal course of business, the Funds enter into contracts with service providers that contain general indemnification clauses. The Funds’ maximum exposure under these arrangements is unknown as this would involve future claims that may be made against the Funds that have not yet occurred. However, based on experience, the Funds expect the risk of loss to be remote.
k. New Accounting Pronouncement. In March 2008, Statement of Financial Accounting Standards No. 161, Disclosures about Derivative Instruments and Hedging Activities (“FAS 161”), was issued and will be effective for fiscal years and interim periods beginning after November 15, 2008. FAS 161 requires enhanced disclosures about funds’ derivative and hedging activities. Management is currently evaluating the impact the adoption of FAS 161 may have on the Funds’ financial statement disclosures.
3. Fair Value Measurements. The Funds adopted Financial Accounting Standards Board Statement of Financial Accounting Standards No. 157 (“FAS 157”), Fair Value Measurements, effective October 1, 2008. FAS 157 establishes a hierarchy for net asset value determination purposes in which various inputs are used in determining the value of the Fund’s investments. These inputs are summarized in the three broad levels listed below:
| | • | | Level 1 — quoted prices in active markets for identical investments; |
| | • | | Level 2 — prices determined using other significant observable inputs that are observable either directly, or indirectly through corroboration with observable market data (which could include quoted prices for similar investments, interest rates, credit risk, etc.); |
| | • | | Level 3 — prices determined using significant unobservable inputs for situations where quoted prices or observable inputs are unavailable such as when there is little or no market activity for an investment (unobservable inputs reflect the Fund’s own assumptions in determining the fair value of investments and would be based on the best information available). |
52
NOTESTO FINANCIAL STATEMENTS (continued)
March 31, 2009 (Unaudited)
The inputs or methodology used for valuing securities are not necessarily an indication of the risk associated with investing in those securities.
Other financial instruments are derivative instruments not reflected in investments carried at value and may include such instruments as written options and forward contracts (which are valued at the unrealized appreciation/depreciation on the instrument).
The following is a summary of the inputs used to value the Funds’ investments as of March 31, 2009:
Global Markets Fund
| | | | |
Securities Purchased
Valuation Inputs | | Investments in
Securities | |
Level 1 — Quoted Prices | | $ | 70,059,908 | |
Level 2 — Other Significant Observable Inputs | | | 92,184,403 | |
Level 3 — Significant Unobservable Inputs | | | 5,847,247 | |
| | | | |
Total | | $ | 168,091,558 | |
| | | | |
| |
Forwards Valuation Inputs | | Other Financial
Instruments | |
Level 1 — Quoted Prices | | $ | — | |
Level 2 — Other Significant Observable Inputs | | | (9,949 | ) |
Level 3 — Significant Unobservable Inputs | | | — | |
| | | | |
Total | | $ | (9,949 | ) |
| | | | |
Growth Fund
| | | |
Valuation Inputs | | Investments in
Securities |
Level 1 — Quoted Prices | | $ | 133,205,538 |
Level 2 — Other Significant Observable Inputs | | | — |
Level 3 — Significant Unobservable Inputs | | | — |
| | | |
Total | | $ | 133,205,538 |
| | | |
Mid Cap Growth Fund
| | | | |
Securities Purchased Valuation Inputs | | Investments in
Securities | |
Level 1 — Quoted Prices | | $ | 81,501,036 | |
Level 2 — Other Significant Observable Inputs | | | — | |
Level 3 — Significant Unobservable Inputs | | | — | |
| | | | |
Total | | $ | 81,501,036 | |
| | | | |
| |
Options Written Valuation Inputs | | Other Financial
Instruments | |
Level 1 — Quoted Prices | | $ | (1,260,258 | ) |
Level 2 — Other Significant Observable Inputs | | | — | |
Level 3 — Significant Unobservable Inputs | | | — | |
| | | | |
Total | | $ | (1,260,258 | ) |
| | | | |
53
NOTESTO FINANCIAL STATEMENTS (continued)
March 31, 2009 (Unaudited)
Research Fund
| | | |
Valuation Inputs | | Investments in
Securities |
Level 1 — Quoted Prices | | $ | 19,995,849 |
Level 2 — Other Significant Observable Inputs | | | — |
Level 3 — Significant Unobservable Inputs | | | — |
| | | |
Total | | $ | 19,995,849 |
| | | |
Value Fund
| | | |
Valuation Inputs | | Investments in
Securities |
Level 1 — Quoted Prices | | $ | 357,109,786 |
Level 2 — Other Significant Observable Inputs | | | — |
Level 3 — Significant Unobservable Inputs | | | — |
| | | |
Total | | $ | 357,109,786 |
| | | |
The following is a reconciliation of Level 3 investments for which significant unobservable inputs were used to determine fair values as of March 31, 2009:
Global Markets Fund
| | | | |
Assets | | Investments in
Securities | |
Balance as of September 30, 2008 | | $ | 2,942,969 | |
Realized gain (loss) | | | (183,418 | ) |
Change in unrealized appreciation (depreciation)(a) | | | (5,068,024 | ) |
Net purchases (sales) | | | 884,301 | |
Net reclassifications to/from Level 3 | | | 7,271,419 | |
| | | | |
Balance as of March 31, 2009 | | $ | 5,847,247 | |
| | | | |
(a) Change in unrealized appreciation (depreciation) is included in net change in unrealized appreciation (depreciation) on investments within the Statement of Operations.
In April 2009, the Financial Accounting Standards Board (“FASB”) issued FASB Staff Position No. 157-4, Determining Fair Value When the Volume and Level of Activity for the Asset or Liability Have Significantly Decreased and Identifying Transactions That Are Not Orderly (“FSP 157-4”). FSP 157-4 provides additional guidance for estimating fair value in accordance with FAS 157, when the volume and level of activity for the asset or liability have significantly decreased as well as guidance on identifying circumstances that indicate a transaction is not orderly. FSP 157-4 is effective for fiscal years and interim periods ending after June 15, 2009. Management is currently evaluating the impact the adoption of FSP 157-4 will have on the Funds’ financial statement disclosures.
4. Purchases and Sales of Securities. For the six months ended March 31, 2009, purchases and sales of securities (excluding short-term investments and U.S. government/agency securities and including paydowns) were as follows:
| | | | | | |
Fund | | Purchases | | Sales |
Global Markets Fund | | $ | 115,717,487 | | $ | 168,290,508 |
Growth Fund | | | 169,291,840 | | | 223,757,877 |
Mid Cap Growth Fund | | | 139,414,948 | | | 156,848,926 |
Research Fund | | | 24,068,994 | | | 22,169,194 |
Value Fund | | | 142,432,858 | | | 83,643,136 |
For the six months ended March 31, 2009, purchases and sales of U.S. government/agency securities by the Global Markets Fund were $1,548,126 and $4,338,293 respectively. Purchases and sales of the Value Fund exclude the impact of assets resulting from a merger with another fund. (See Note 10).
54
NOTESTO FINANCIAL STATEMENTS (continued)
March 31, 2009 (Unaudited)
5. Management Fees and Other Transactions with Affiliates.
a. Management Fees. Loomis, Sayles & Company, L.P. (“Loomis Sayles”) serves as investment adviser to each Fund. Separate management agreements for each Fund in effect for the six months ended March 31, 2009, provided for fees at the following annual percentage rates of each Fund’s average daily net assets:
| | | |
Fund | | Percentage of
Average
Daily Net Assets | |
Global Markets Fund | | 0.75 | % |
Growth Fund | | 0.50 | % |
Mid Cap Growth Fund | | 0.75 | % |
Research Fund | | 0.50 | % |
Value Fund | | 0.50 | % |
Loomis Sayles has given binding undertakings to the Funds to reduce management fees and/or reimburse certain expenses associated with the Funds to limit their operating expenses, exclusive of brokerage expenses, interest expense, taxes and extraordinary expenses. These undertakings are in effect until January 31, 2010 and will be reevaluated on an annual basis. For the six months ended March 31, 2009, the expense limits as a percentage of average daily net assets under the expense limitation agreements were as follows:
| | | | | | | | | | | | | | | | |
| | | Expense Limit as a Percentage of
Average
Daily Net Assets | | | | | |
Fund | | Class A | | | Class B | | | Class C | | | Class Y | | | | | |
Global Markets Fund | | 1.25 | % | | N/A | | | 2.00 | % | | 1.00 | % | | | | |
Growth Fund | | 1.25 | % | | 2.00 | % | | 2.00 | % | | 0.85 | % | | | | |
Mid Cap Growth Fund | | 1.25 | % | | N/A | | | 2.00 | % | | 1.00 | % | | | | |
Research Fund | | 1.25 | % | | 2.00 | % | | 2.00 | % | | 0.85 | % | | | | |
Value Fund | | 1.10 | % | | 1.85 | % | | 1.85 | % | | 0.85 | % | | | | |
For the six months ended March 31, 2009, the management fees for each Fund were as follows:
| | | | | | | | | | | | | | | |
| | | Gross Management Fee | | Reduction of Management Fee | | Net
Management Fee | | Percentage of
Average
Daily Net Assets | |
Fund | | | | | Gross | | | Net | |
Global Markets Fund | | $ | 757,632 | | $ | — | | $ | 757,632 | | 0.75 | % | | 0.75 | % |
Growth Fund | | | 414,234 | | | — | | | 414,234 | | 0.50 | % | | 0.50 | % |
Mid Cap Growth Fund | | | 341,942 | | | 22,413 | | | 319,529 | | 0.75 | % | | 0.70 | % |
Research Fund | | | 52,701 | | | 52,701 | | | — | | 0.50 | % | | 0.00 | % |
Value Fund | | | 852,824 | | | — | | | 852,824 | | 0.50 | % | | 0.50 | % |
For the six months ended March 31, 2009, expenses have been reimbursed as follows:
| | | |
Fund | | Reimbursement |
Global Markets Fund | | $ | 87,104 |
Growth Fund | | | 26,914 |
Mid Cap Growth Fund | | | 109,741 |
Research Fund | | | 7,714 |
Value Fund | | | — |
55
NOTESTO FINANCIAL STATEMENTS (continued)
March 31, 2009 (Unaudited)
Loomis Sayles shall be permitted to recover expenses it has borne under the expense limitation agreement (whether through reduction of its management fees or otherwise) on a class by class basis in later periods to the extent a class’ expenses fall below a class’ expense limits, provided, however, that a class is not obligated to pay such reduced fees/expenses more than one year after the end of the fiscal year in which the fee/expense was reduced. The amounts subject to possible recovery under the expense limitation agreements at March 31, 2009 were as follows:
| | | | | | | | | | | | | | | |
| | | Expenses Subject to Possible Recovery until
September 30, 2009 |
Fund | | Class A | | Class B | | Class C | | Class Y | | Total |
Global Markets Fund | | $ | 13,645 | | $ | — | | $ | 29,204 | | $ | — | | $ | 42,849 |
Growth Fund | | | — | | | — | | | — | | | — | | | — |
Mid Cap Growth Fund | | | 64,519 | | | — | | | — | | | — | | | 64,519 |
Research Fund | | | 2,990 | | | 927 | | | 2,471 | | | 77,644 | | | 84,032 |
Value Fund | | | — | | | — | | | — | | | — | | | — |
| |
| | | Expenses Subject to Possible Recovery until
September 30, 2010 |
Fund | | Class A | | Class B | | Class C | | Class Y | | Total |
Global Markets Fund | | $ | 21,335 | | $ | — | | $ | 45,311 | | $ | 20,458 | | $ | 87,104 |
Growth Fund | | | 19,594 | | | 1,818 | | | 5,502 | | | — | | | 26,914 |
Mid Cap Growth Fund | | | 119,063 | | | — | | | 1 | | | 13,090 | | | 132,154 |
Research Fund | | | 5,534 | | | 342 | | | 3,408 | | | 51,131 | | | 60,415 |
Value Fund | | | — | | | — | | | — | | | — | | | — |
Certain officers and employees of Loomis Sayles are also officers or Trustees of the Trust. Loomis Sayles’ general partner is indirectly owned by Natixis Global Asset Management, L.P. (“Natixis US”), which is part of Natixis Global Asset Management, an international asset management group based in Paris, France.
For the six months ended March 31, 2009, Loomis Sayles reimbursed the Research Fund $420 for losses incurred in connection with a trading error.
b. Administrative Fees. Natixis Asset Management Advisors, L.P. (“Natixis Advisors”) provides certain administrative services for the Funds and subcontracts with State Street Bank to serve as sub-administrator. Natixis Advisors is a wholly-owned subsidiary of Natixis US. Pursuant to an agreement among Natixis Funds Trust I, Natixis Funds Trust II, Natixis Funds Trust III, Natixis Funds Trust IV, Natixis Cash Management Trust, Gateway Trust (“Natixis Funds Trusts”), Loomis Sayles Funds I, Loomis Sayles Funds II (“Loomis Sayles Funds Trusts”), Hansberger International Series and Natixis Advisors, each Fund pays Natixis Advisors monthly its pro rata portion of fees equal to an annual rate of 0.0575% of the first $15 billion of the average daily net assets of the Natixis Funds Trusts, Loomis Sayles Funds Trusts and the Hansberger International Series, 0.0500% of the next $15 billion, 0.0425% of the next $30 billion and 0.0375% of such assets in excess of $60 billion, subject to an annual aggregate minimum fee for the Natixis Funds Trusts , Loomis Sayles Funds Trusts and the Hansberger International Series of $10 million, which is reevaluated on an annual basis. New funds are subject to a fee for the first twelve months of operations of $75,000 plus $12,500 per class and an additional $75,000 if managed by multiple subadvisors.
For the six months ended March 31, 2009, each Fund paid the following for administrative fees to Natixis Advisors:
| | | |
Fund | | Administrative Fees |
Global Markets Fund | | $ | 51,562 |
Growth Fund | | | 42,276 |
Mid Cap Growth Fund | | | 23,271 |
Research Fund | | | 5,388 |
Value Fund | | | 87,146 |
c. Service and Distribution Fees. Natixis Distributors, L.P. (“Natixis Distributors”) a wholly owned subsidiary of Natixis US, has entered into a distribution agreement with the Trust. Pursuant to this agreement, Natixis Distributors serves as principal underwriter of the funds of the Trust.
Pursuant to Rule 12b-1 under the 1940 Act, the Trust has adopted a Service Plan relating to each Fund’s Class A shares (the “Class A Plans”); Distribution and Service Plan relating to the Growth Fund’s, Research Fund’s and Value Fund’s Class B shares (the “Class B Plans”), and a Distribution and Service Plan relating to each Fund’s Class C shares (the “Class C Plans”).
56
NOTESTO FINANCIAL STATEMENTS (continued)
March 31, 2009 (Unaudited)
Under the Class A Plans, each Fund pays Natixis Distributors a monthly service fee at an annual rate not to exceed 0.25% of the average daily net assets attributable to the Fund’s Class A shares, as reimbursement for expenses incurred by Natixis Distributors in providing personal services to investors in Class A shares and/or the maintenance of shareholder accounts.
Under the Class B, if applicable, and Class C Plans, each applicable Fund pays Natixis Distributors a monthly service fee at an annual rate not to exceed 0.25% of the average daily net assets attributable to the Fund’s Class B and Class C shares, as compensation for services provided and expenses incurred by Natixis Distributors in providing personal services to investors in Class B and Class C shares and/or the maintenance of shareholder accounts.
Also under the Class B, if applicable, and Class C Plans, each applicable Fund pays Natixis Distributors a monthly distribution fee at an annual rate of 0.75% of the average daily net assets attributable to the Fund’s Class B and Class C shares, as compensation for services provided and expenses incurred by Natixis Distributors in connection with the marketing or sale of Class B and Class C shares.
For the six months ended March 31, 2009, the Funds paid the following service and distribution fees:
| | | | | | | | | | | | | | | |
| | | Service Fee | | Distribution Fee |
Fund | | Class A | | Class B | | Class C | | Class B | | Class C |
| | | | | | | | | | | | | | | |
Global Markets Fund | | $ | 50,231 | | $ | — | | $ | 106,035 | | $ | — | | $ | 318,105 |
Growth Fund | | | 113,650 | | | 7,681 | | | 22,672 | | | 23,044 | | | 68,016 |
Mid Cap Growth Fund | | | 86,616 | | | — | | | — | | | — | | | 2 |
Research Fund | | | 2,366 | | | 170 | | | 1,570 | | | 511 | | | 4,710 |
Value Fund | | | 110,530 | | | 7,207 | | | 7,779 | | | 21,621 | | | 23,337 |
d. Sub-Transfer Agent Fees. Natixis Distributors has entered into agreements with financial intermediaries to provide certain recordkeeping, processing, shareholder communications and other services to customers of the intermediaries and has agreed to compensate the intermediaries for providing those services. Certain services would be provided by the Funds if the shares of those customers were registered directly with the Funds’ transfer agent. Accordingly, the Funds agreed to pay a portion of the intermediary fees attributable to shares of the Fund held by the intermediaries (which generally is a percentage of the value of shares held) not exceeding what the Funds would have paid its transfer agent had each customer’s shares been registered directly with the transfer agent instead of held through the intermediaries. Natixis Distributors pays the remainder of the fees. Listed below are the fees incurred by the Funds which are included in the transfer agent fees and expenses in the Statements of Operations.
| | | | | | | | | | | | |
| | | Sub-Transfer Agent Fees |
Fund | | Class A | | Class B | | Class C | | Class Y |
| | | | | | | | | | | | |
Global Markets Fund | | $ | 19,977 | | $ | — | | $ | 40,235 | | $ | 22,195 |
Growth Fund | | | 94,894 | | | 6,167 | | | 18,278 | | | — |
Mid Cap Growth Fund | | | 72,583 | | | — | | | — | | | 6,249 |
Research Fund | | | 533 | | | 51 | | | 387 | | | 5,775 |
Value Fund | | | 22,880 | | | 1,501 | | | 1,703 | | | 44,295 |
e. Commissions. The Funds have been informed that commissions (including CDSCs) on Fund shares retained by Natixis Distributors during the six months ended March 31, 2009, were as follows:
| | | |
Fund | | Commissions |
Global Markets Fund | | $ | 90,839 |
Growth Fund | | | 23,857 |
Mid Cap Growth Fund | | | 7,853 |
Research Fund | | | 17,127 |
Value Fund | | | 35,496 |
f. Trustees Fees and Expenses. The Funds do not pay any compensation directly to their officers or Trustees who are directors, officers or employees of Natixis Advisors, Natixis Distributors, Natixis US, or their affiliates. The Chairperson of the Board receives a retainer fee at the annual rate of $200,000. The Chairperson does not receive any meeting attendance fees for Board of Trustees meetings or committee meetings that she attends. Each Independent Trustee (other than the Chairperson) receives, in the aggregate, a retainer fee at the annual rate of $65,000. Each Independent Trustee also receives a meeting attendance fee of $7,500 for each meeting of the Board of Trustees that he or she attends in person and $3,750 for each meeting of the Board of Trustees that he or she attends telephonically. In addition, each committee chair receives an additional retainer fee at the annual rate of $10,000. Each Contract Review and Governance Committee member is compensated $5,000 for each Committee meeting that he or she attends in person and $2,500 for each meeting that he or she attends telephonically. Each Audit Committee member is compensated $6,250 for each Committee meeting that
57
NOTESTO FINANCIAL STATEMENTS (continued)
March 31, 2009 (Unaudited)
he or she attends in person and $3,125 for each meeting that he or she attends telephonically. These fees are allocated among the funds in the Natixis Funds Trusts, Loomis Sayles Funds Trusts and the Hansberger International Series based on a formula that takes into account, among other factors, the relative net assets of each Fund. Trustees are reimbursed for travel expenses in connection with attendance at meetings.
A deferred compensation plan (the “Plan”) is available to the Trustees on a voluntary basis. Deferred amounts remain in the Funds until distributed in accordance with the provisions of the Plan. The value of a participating Trustee’s deferral account is based on theoretical investments of deferred amounts, on the normal payment dates, in certain funds of the Natixis Funds Trusts, Loomis Sayles Funds Trusts and Hansberger International Series as designated by the participating Trustees. Changes in the value of participants’ deferral accounts are allocated pro rata among the funds in the Natixis Funds Trusts, Loomis Sayles Funds Trusts, and Hansberger International Series, and are normally reflected as Trustees’ fees and expenses in the Statements of Operations. The portions of the accrued obligations allocated to the Funds under the Plan are reflected as Deferred Trustees’ fees in the Statements of Assets and Liabilities.
For the six months ended March 31, 2009, net depreciation in the value of participants’ deferral accounts has been included in Miscellaneous expenses in the Statements of Operations, as follows:
| | | |
Fund | | Amount |
Global Markets Fund | | $ | 7,404 |
Growth Fund | | | 14,303 |
Mid Cap Growth Fund | | | 7,337 |
Research | | | 6,862 |
Value Fund | | | 47,666 |
6. Line of Credit. Each Fund, together with certain other funds of Natixis Funds Trusts, Loomis Sayles Funds Trusts and the Hansberger International Series, participates in a $200,000,000 committed line of credit provided by State Street Bank, with an individual limit of $125,000,000 for each fund that participates in the line of credit. Interest is charged to each participating fund based on its borrowings at a rate per annum equal to the greater of the Federal Funds rate or overnight LIBOR, plus 0.75%. In addition, a commitment fee of 0.125% per annum, payable at the end of each calendar quarter, is accrued and apportioned among the participating funds based on their average daily unused portion of the line of credit.
Prior to March 11, 2009, each Fund, together with certain other funds of Natixis Funds Trusts, Loomis Sayles Funds Trusts and Hansberger International Series, participated in a $200,000,000 committed line of credit provided by State Street Bank, with an individual limit of $125,000,000 for each fund that participated in the line of credit. Interest was charged to each participating fund based on its borrowings at a rate per annum equal to the Federal Funds rate plus 0.50%. In addition, a commitment fee of 0.09% per annum, payable at the end of each calendar quarter, was accrued and apportioned among the participating funds based on their average daily unused portion of the line of credit.
For the six months ended March 31, 2009, the Funds had no borrowings under these agreements.
7. Brokerage Commission Recapture. Each Fund has entered into agreements with certain brokers whereby the brokers will rebate a portion of brokerage commissions. All amounts rebated by the brokers are returned to the Funds under such agreements and are included in realized gains in the Statements of Operations. For the six months ended March 31, 2009, amounts rebated under these agreements were as follows:
| | | |
Fund | | Rebates |
Global Markets Fund | | $ | 24,783 |
Growth Fund | | | 53,685 |
Mid Cap Growth Fund | | | 33,773 |
Research Fund | | | 7,987 |
Value Fund | | | 33,155 |
8. Shareholders. At March 31, 2009, Loomis Sayles Funded Pension Plan and Loomis Sayles Employees’ Profit Sharing Retirement Plan held shares of beneficial interest in the Funds as follows:
| | | | |
Fund | | Pension Plan | | Profit Sharing
Retirement Plan |
Global Markets Fund | | 966,530 | | 468,491 |
Growth Fund | | 1,322,392 | | 1,901,372 |
Mid Cap Growth Fund | | 315,098 | | 361,892 |
Research Fund | | 1,102,829 | | 593,926 |
Value Fund | | 501,904 | | 697,730 |
58
NOTESTO FINANCIAL STATEMENTS (continued)
March 31, 2009 (Unaudited)
At March 31, 2009, one shareholder individually owned more than 5% of the Global Markets Fund’s total outstanding shares, representing in aggregate, 10.13% of the Fund; one shareholder individually owned more than 5% of the Mid Cap Growth Fund’s total outstanding shares, representing in aggregate, 5.08% of the Fund; and two shareholders individually owned more than 5% of the Research Fund’s total outstanding shares, representing, in aggregate, 26.70% of the Fund.
9. Capital Shares. Each Fund may issue an unlimited number of shares of beneficial interest, without par value. Transactions in capital shares were as follows:
| | | | | | | | | | | | | | |
| | Six Months Ended
March 31, 2009 | | | Year Ended
September 30, 2008 | |
Global Markets Fund | | Shares | | | | Amount | | | Shares | | | | Amount | |
| | | | | | | | | | | | | | |
| Class A | | | | | | | | | | | | | | |
Issued from the sale of shares | | 517,552 | | | $ | 4,842,248 | | | 7,795,589 | | | $ | 116,072,629 | |
Issued in connection with the reinvestment of distributions | | 101,852 | | | | 922,775 | | | 131,139 | | | | 2,095,597 | |
Redeemed | | (3,172,664 | ) | | | (29,365,505 | ) | | (3,949,026 | ) | | | (54,699,917 | ) |
| | | | | | | | | | | | | | |
Net change | | (2,553,260 | ) | | $ | (23,600,482 | ) | | 3,977,702 | | | $ | 63,468,309 | |
| | | | | | | | | | | | | | |
| Class C | | | | | | | | | | | | | | |
Issued from the sale of shares | | 927,866 | | | $ | 8,537,665 | | | 9,661,731 | | | $ | 145,592,794 | |
Issued in connection with the reinvestment of distributions | | 53,944 | | | | 487,650 | | | 105,649 | | | | 1,677,700 | |
Redeemed | | (3,728,527 | ) | | | (34,217,159 | ) | | (2,810,388 | ) | | | (38,148,474 | ) |
| | | | | | | | | | | | | | |
Net change | | (2,746,717 | ) | | $ | (25,191,844 | ) | | 6,956,992 | | | $ | 109,122,020 | |
| | | | | | | | | | | | | | |
| Class Y | | | | | | | | | | | | | | |
Issued from the sale of shares | | 1,292,387 | | | $ | 11,935,647 | | | 8,797,937 | | | $ | 131,551,316 | |
Issued in connection with the reinvestment of distributions | | 162,878 | | | | 1,477,305 | | | 307,774 | | | | 4,927,469 | |
Redeemed | | (4,048,120 | ) | | | (38,358,942 | ) | | (3,916,604 | ) | | | (53,723,650 | ) |
| | | | | | | | | | | | | | |
Net change | | (2,592,855 | ) | | $ | (24,945,990 | ) | | 5,189,107 | | | $ | 82,755,135 | |
| | | | | | | | | | | | | | |
Increase (decrease) from capital share transactions | | (7,892,832 | ) | | $ | (73,738,316 | ) | | 16,123,801 | | | $ | 255,345,464 | |
| | | | | | | | | | | | | | |
| | |
| | Six Months Ended
March 31, 2009 | | | Year Ended
September 30, 2008 | |
Growth Fund | | Shares | | | | Amount | | | Shares | | | | Amount | |
| | | | | | | | | | | | | | |
| Class A | | | | | | | | | | | | | | |
Issued from the sale of shares | | 4,736,293 | | | $ | 17,818,080 | | | 7,680,209 | | | $ | 49,883,063 | |
Issued in connection with the reinvestment of distributions | | — | | | | — | | | — | | | | — | |
Redeemed | | (18,308,486 | ) | | | (66,589,769 | ) | | (8,908,360 | ) | | | (57,264,265 | ) |
| | | | | | | | | | | | | | |
Net change | | (13,572,193 | ) | | $ | (48,771,689 | ) | | (1,228,151 | ) | | $ | (7,381,202 | ) |
| | | | | | | | | | | | | | |
| Class B | | | | | | | | | | | | | | |
Issued from the sale of shares | | 16,431 | | | $ | 60,432 | | | 63,680 | | | $ | 406,401 | |
Issued in connection with the reinvestment of distributions | | — | | | | — | | | — | | | | — | |
Redeemed | | (513,001 | ) | | | (1,821,773 | ) | | (2,236,178 | ) | | | (13,949,200 | ) |
| | | | | | | | | | | | | | |
Net change | | (496,570 | ) | | $ | (1,761,341 | ) | | (2,172,498 | ) | | $ | (13,542,799 | ) |
| | | | | | | | | | | | | | |
| Class C | | | | | | | | | | | | | | |
Issued from the sale of shares | | 333,628 | | | $ | 1,172,660 | | | 1,220,476 | | | $ | 7,692,403 | |
Issued in connection with the reinvestment of distributions | | — | | | | — | | | — | | | | — | |
Redeemed | | (1,667,416 | ) | | | (5,890,109 | ) | | (1,212,293 | ) | | | (7,365,990 | ) |
| | | | | | | | | | | | | | |
Net change | | (1,333,788 | ) | | $ | (4,717,449 | ) | | 8,183 | | | $ | 326,413 | |
| | | | | | | | | | | | | | |
| Class Y | | | | | | | | | | | | | | |
Issued from the sale of shares | | 1,561,781 | | | $ | 6,718,947 | | | 4,435,371 | | | $ | 30,672,809 | |
Issued in connection with the reinvestment of distributions | | — | | | | — | | | — | | | | — | |
Redeemed | | (3,411,843 | ) | | | (14,473,271 | ) | | (7,080,124 | ) | | | (46,319,717 | ) |
| | | | | | | | | | | | | | |
Net change | | (1,850,062 | ) | | $ | (7,754,324 | ) | | (2,644,753 | ) | | $ | (15,646,908 | ) |
| | | | | | | | | | | | | | |
Increase (decrease) from capital share transactions | | (17,252,613 | ) | | $ | (63,004,803 | ) | | (6,037,219 | ) | | $ | (36,244,496 | ) |
| | | | | | | | | | | | | | |
59
NOTESTO FINANCIAL STATEMENTS (continued)
March 31, 2009 (Unaudited)
9. Capital Shares (continued).
| | | | | | | | | | | | | | |
| | Six Months Ended
March 31, 2009 | | | Year Ended
September 30, 2008 | |
Mid Cap Growth Fund | | Shares | | | | Amount | | | Shares | | | | Amount | |
| | | | | | | | | | | | | | |
| Class A | | | | | | | | | | | | | | |
Issued from the sale of shares | | 5,342,903 | | | $ | 81,712,570 | | | 7,376,061 | | | $ | 191,485,150 | |
Issued in connection with the reinvestment of distributions | | — | | | | — | | | — | | | | — | |
Redeemed | | (6,963,175 | ) | | | (109,257,673 | ) | | (2,811,222 | ) | | | (67,626,524 | ) |
| | | | | | | | | | | | | | |
Net change | | (1,620,272 | ) | | $ | (27,545,103 | ) | | 4,564,839 | | | $ | 123,858,626 | |
| | | | | | | | | | | | | | |
| Class C* | | | | | | | | | | | | | | |
Issued from the sale of shares | | 66 | | | $ | 1,000 | | | — | | | $ | — | |
Issued in connection with the reinvestment of distributions | | — | | | | — | | | — | | | | — | |
Redeemed | | — | | | | — | | | — | | | | — | |
| | | | | | | | | | | | | | |
Net change | | 66 | | | $ | 1,000 | | | — | | | $ | — | |
| | | | | | | | | | | | | | |
| Class Y | | | | | | | | | | | | | | |
Issued from the sale of shares | | 1,875,466 | | | $ | 29,514,489 | | | 835,746 | | | $ | 23,099,020 | |
Issued in connection with the reinvestment of distributions | | — | | | | — | | | — | | | | — | |
Redeemed | | (1,606,742 | ) | | | (25,226,807 | ) | | (525,115 | ) | | | (13,663,476 | ) |
| | | | | | | | | | | | | | |
Net change | | 268,724 | | | $ | 4,287,682 | | | 310,631 | | | $ | 9,435,544 | |
| | | | | | | | | | | | | | |
Increase (decrease) from capital share transactions | | (1,351,482 | ) | | $ | (23,256,421 | ) | | 4,875,470 | | | $ | 133,294,170 | |
| | | | | | | | | | | | | | |
| * | From commencement of Class operations on February 2, 2009 through March 31, 2009. |
| | | | | | | | | | | | | | |
| | Six Months Ended
March 31, 2009 | | | Year Ended
September 30, 2008 | |
Research Fund | | Shares | | | | Amount | | | Shares | | | | Amount | |
| | | | | | | | | | | | | | |
| Class A | | | | | | | | | | | | | | |
Issued from the sale of shares | | 443,339 | | | $ | 2,532,867 | | | 41,128 | | | $ | 353,240 | |
Issued in connection with the reinvestment of distributions | | 2,476 | | | | 13,914 | | | 5,586 | | | | 50,215 | |
Redeemed | | (269,902 | ) | | | (1,259,458 | ) | | (63,879 | ) | | | (518,171 | ) |
| | | | | | | | | | | | | | |
Net change | | 175,913 | | | $ | 1,287,323 | | | (17,165 | ) | | $ | (114,716 | ) |
| | | | | | | | | | | | | | |
| Class B | | | | | | | | | | | | | | |
Issued from the sale of shares | | 8,647 | | | $ | 46,108 | | | 4,050 | | | $ | 37,443 | |
Issued in connection with the reinvestment of distributions | | — | | | | — | | | 2,116 | | | | 18,641 | |
Redeemed | | (16,135 | ) | | | (88,488 | ) | | (10,015 | ) | | | (79,179 | ) |
| | | | | | | | | | | | | | |
Net change | | (7,488 | ) | | $ | (42,380 | ) | | (3,849 | ) | | $ | (23,095 | ) |
| | | | | | | | | | | | | | |
| Class C | | | | | | | | | | | | | | |
Issued from the sale of shares | | 372,491 | | | $ | 1,978,307 | | | 122,016 | | | $ | 929,529 | |
Issued in connection with the reinvestment of distributions | | 300 | | | | 1,642 | | | 625 | | | | 5,472 | |
Redeemed | | (267,708 | ) | | | (1,360,844 | ) | | (104,640 | ) | | | (837,295 | ) |
| | | | | | | | | | | | | | |
Net change | | 105,083 | | | $ | 619,105 | | | 18,001 | | | $ | 97,706 | |
| | | | | | | | | | | | | | |
| Class Y | | | | | | | | | | | | | | |
Issued from the sale of shares | | 374,608 | | | $ | 1,967,772 | | | 445,607 | | | $ | 3,756,330 | |
Issued in connection with the reinvestment of distributions | | 34,089 | | | | 192,942 | | | 340,294 | | | | 3,072,854 | |
Redeemed | | (388,838 | ) | | | (2,091,892 | ) | | (220,905 | ) | | | (1,820,331 | ) |
| | | | | | | | | | | | | | |
Net change | | 19,859 | | | $ | 68,822 | | | 564,996 | | | $ | 5,008,853 | |
| | | | | | | | | | | | | | |
Increase (decrease) from capital share transactions | | 293,367 | | | $ | 1,932,870 | | | 561,983 | | | $ | 4,968,748 | |
| | | | | | | | | | | | | | |
60
NOTESTO FINANCIAL STATEMENTS (continued)
March 31, 2009 (Unaudited)
9. Capital Shares (continued).
| | | | | | | | | | | | | | |
| | Six Months Ended
March 31, 2009 | | | Year Ended
September 30, 2008 | |
Value Fund | | Shares | | | | Amount | | | Shares | | | | Amount | |
| | | | | | | | | | | | | | |
| Class A | | | | | | | | | | | | | | |
Issued from the sale of shares | | 1,977,528 | | | $ | 26,448,690 | | | 2,540,370 | | | $ | 50,973,973 | |
Issued in connection with the acquisition of assets from Natixis Value Fund (Note 10) | | — | | | | — | | | 4,677,827 | | | | 105,017,209 | |
Issued in connection with the reinvestment of distributions | | 94,079 | | | | 1,308,638 | | | 66,481 | | | | 1,479,502 | |
Redeemed | | (1,485,833 | ) | | | (19,262,187 | ) | | (1,769,731 | ) | | | (35,781,927 | ) |
| | | | | | | | | | | | | | |
Net change | | 585,774 | | | $ | 8,495,141 | | | 5,514,947 | | | $ | 121,688,757 | |
| | | | | | | | | | | | | | |
| Class B | | | | | | | | | | | | | | |
Issued from the sale of shares | | 15,143 | | | $ | 207,698 | | | 15,504 | | | $ | 318,803 | |
Issued in connection with the acquisition of assets from Natixis Value Fund (Note 10) | | — | | | | — | | | 653,035 | | | | 14,641,036 | |
Issued in connection with the reinvestment of distributions | | 888 | | | | 12,403 | | | 3,039 | | | | 67,865 | |
Redeemed | | (103,113 | ) | | | (1,339,348 | ) | | (205,132 | ) | | | (4,185,244 | ) |
| | | | | | | | | | | | | | |
Net change | | (87,082 | ) | | $ | (1,119,247 | ) | | 466,446 | | | $ | 10,842,460 | |
| | | | | | | | | | | | | | |
| Class C | | | | | | | | | | | | | | |
Issued from the sale of shares | | 230,916 | | | $ | 3,160,046 | | | 237,371 | | | $ | 4,858,951 | |
Issued in connection with the acquisition of assets from Natixis Value Fund (Note 10) | | — | | | | — | | | 127,550 | | | | 2,857,122 | |
Issued in connection with the reinvestment of distributions | | 3,005 | | | | 41,620 | | | 1,900 | | | | 42,151 | |
Redeemed | | (86,437 | ) | | | (1,102,523 | ) | | (61,760 | ) | | | (1,258,832 | ) |
| | | | | | | | | | | | | | |
Net change | | 147,484 | | | $ | 2,099,143 | | | 305,061 | | | $ | 6,499,392 | |
| | | | | | | | | | | | | | |
| Class Y | | | | | | | | | | | | | | |
Issued from the sale of shares | | 9,729,251 | | | $ | 126,357,849 | | | 11,928,797 | | | $ | 239,360,963 | |
Issued in connection with the reinvestment of distributions | | 306,125 | | | | 4,258,197 | | | 436,948 | | | | 9,702,013 | |
Redeemed | | (5,273,137 | ) | | | (68,369,434 | ) | | (3,265,447 | ) | | | (67,069,075 | ) |
| | | | | | | | | | | | | | |
Net change | | 4,762,239 | | | $ | 62,246,612 | | | 9,100,298 | | | $ | 181,993,901 | |
| | | | | | | | | | | | | | |
Increase (decrease) from capital share transactions | | 5,408,415 | | | $ | 71,721,649 | | | 15,386,752 | | | $ | 321,024,510 | |
| | | | | | | | | | | | | | |
10. Acquisition of Assets. After the close of business on October 26, 2007, the Value Fund acquired all assets and liabilities of Natixis Value Fund, pursuant to a plan of reorganization approved by Natixis Value Fund shareholders on October 12, 2007. The acquisition was accomplished by a tax-free exchange of 4,677,827 Class A shares of the Value Fund for 14,004,395 shares of the Natixis Value Fund Class A, 653,035 Class B shares of the Value Fund for 2,297,374 shares of the Natixis Value Fund Class B; and 127,550 Class C shares of the Value Fund for 448,235 shares of the Natixis Value Fund Class C. Natixis Value Fund net assets at that date of $122,515,367, including $13,382,872 of net unrealized appreciation, were combined with those of the Value Fund. The aggregate net assets of the Value Fund immediately before the acquisition were $200,528,438. The combined net assets of the Value Fund immediately following the acquisition were $323,043,805.
61

Loomis Sayles Small Cap Growth Fund
Loomis Sayles Small Cap Value Fund
SEMI ANNUAL REPORT
MARCH 31, 2009 (Unaudited)
FUND AND MANAGER REVIEW
Loomis Sayles Small Cap Growth Fund

Mark F. Burns, CFA
Manager since January 2005

John Slavik, CFA
Manager since April 2005
FUND FACTS
Symbol | Institutional: LSSIX;
Retail: LCGRX
Objective | Long-term capital growth from investments in common stocks or other equity securities
Strategy | Invests at least 80% of its net assets (plus any borrowings made for investment purposes) in equity securities of companies with market capitalizations that fall within the capitalization range of the Russell 2000 Index. Unlike the Index, the Fund may invest in companies of any size
Fund Inception Date | 12/31/96
Total Net Assets | $79.8 million
PORTFOLIO REVIEW
For the six months ended March 31, 2009, the Fund outperformed its Benchmark, the Russell 2000 Growth Index, primarily due to strong stock selection in the technology, utilities, producer durables and energy sectors. In addition, an overweight position in technology helped relative performance.
Throughout the six-month period, we shifted allocations in an effort to adapt the Fund to the current market environment. In particular, we increased the Fund’s technology weighting in anticipation of an improving economic environment in the second half of 2009. Many technology stocks were priced in anticipation of a worst-case scenario. This gave us the opportunity to buy stocks of companies with strong balance sheets and excellent fundamentals at reduced prices. NetLogic Microsystems, a semiconductor company, was one of the Fund’s top performing stocks, advancing with the semiconductor industry’s inventory re-build cycle.
In the utilities sector, we added exposure to the telecommunication services industry as fundamentals improved. Neutral Tandem Inc. was the industry’s top performer, reporting solid earnings in January and providing better-than-expected guidance driven by higher-than-forecasted billed minutes.
Additional allocation changes included reducing our health care weighting in search of more growth-oriented names. Health care had a negative impact on the portfolio as a result of poor performance from a handful of holdings. We also trimmed the Fund’s materials and processing exposure, waiting for economic conditions to improve. The sector detracted from Fund performance, primarily due to disappointing results from Hill International, a construction consulting firm that declined
as the construction industry continued to struggle. Hill International was sold.
Consumer staples was one of the few sectors in the Fund that had a positive absolute return for the period. On a relative basis, our stock selection within this sector was helpful. However, the Fund’s holdings in the consumer discretionary sector were among the largest detractors to performance, reflecting poor stock selection and an underweight position.
OUTLOOK
With the market rallying in the final weeks of the quarter, there are many reasons to believe that the worst is behind us. There is an unprecedented amount of stimulus being pumped into the global economy, the credit markets are starting to thaw, financial companies’ balance sheets are being repaired and consumer companies are reporting news that matters are not as dire as feared. It is our belief that we are more than half way through the recession and we’ve seen the lows in the market. However, we think the market’s strength will be retested. With this as a backdrop, we expect new leadership to emerge in the market and we are structuring the portfolio for this scenario, in pursuit of strong results over the long term.
1
AVERAGE ANNUAL TOTAL RETURNS
Periods Ended March 31, 2009
| | | | | | | | | | | | | |
| 6 Months | | | 1 Year | | | 5 Years | | | 10 Years | | | Since
Inception | |
| Loomis Sayles Small Cap Growth: Institutional | |
| -33.05 | % | | -34.55 | % | | -1.55 | % | | -3.96 | % | | -0.14 | % |
| Loomis Sayles Small Cap Growth: Retail | |
| -33.18 | | | -34.77 | | | -1.81 | | | -4.21 | | | -0.40 | |
| Russell 2000 Growth Index(c) | |
| -34.51 | | | -36.36 | | | -5.37 | | | -1.60 | | | -0.36 | |
| Russell 2000 Index(c) | |
| -37.17 | | | -37.50 | | | -5.24 | | | 1.93 | | | 2.58 | |
| Lipper Small-Cap Growth Funds Index(c) | |
| -31.12 | | | -36.88 | | | -5.94 | | | 0.61 | | | 1.18 | |
| Gross expense ratio (before reductions and reimbursements)* | |
| Institutional: 1.01% | | | Retail: 1.42% | |
| Net expense ratio (after reductions and reimbursements)* | |
| Institutional: 1.00% | | | Retail: 1.25% | |
* As stated in the most recent prospectus
CUMULATIVE PERFORMANCE
Inception to March 31, 2009(a)(b)
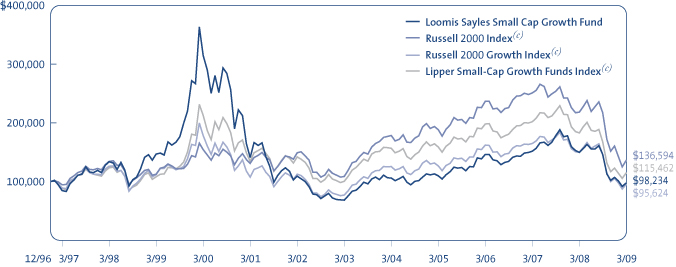
Data quoted reflects past performance and cannot guarantee future results. Average annual total returns assume reinvestment of dividends and capital gains distributions. Investment return and principal value will fluctuate so that shares, when redeemed, may be worth more or less than their original cost. For performance current to the most recent month end, please visit the Loomis Sayles website. Current performance may be higher or lower than quoted.
Returns do not reflect the taxes that a shareholder would pay on fund distributions or the redemption of shares. Periods of less than one year are not annualized. Performance data reflects certain fee reductions and reimbursements, if any, without which performance would be lower.
(a) Cumulative performance is shown for the Institutional Class of Shares. Performance of the Retail Class would be lower due to higher fees. (b) The mountain chart is based on the initial investment minimum of $100,000 for the Institutional Class. (c) See page 5 for a description of the Indices.
WHAT YOU SHOULD KNOW
Small- and mid-cap stocks may be more volatile than larger, more established companies. The secondary market for these stocks may be less liquid, which could adversely impact the Fund’s value. Growth funds involve increased risks, in part, because the value of the underlying securities is based on future expectations that may or may not be met.
The Fund can invest a significant percentage of assets in foreign securities and the value of the fund shares can be adversely affected by changes in currency exchange rates, political, and economic developments. In emerging markets these risks can be significant. The Fund is subject to currency risk, which is the risk that fluctuations in exchange rates between the US dollar and foreign currencies may cause the value of a Fund’s investments to decline. Fund shares should be viewed as a long-term investment.
2
FUND AND MANAGER REVIEW
Loomis Sayles Small Cap Value Fund

Joseph Gatz, CFA
Manager since January 2000

Daniel Thelen, CFA
Manager since April 2000
FUND FACTS
Symbol | Institutional: LSSCX;
Retail: LSCRX; Admin: LSVAX
Objective | Long-term capital growth from investments in common stocks or other equity securities
Strategy | Invests at least 80% of its net assets (plus any borrowings made for investment purposes) in equity securities of companies with market capitalizations that fall within the capitalization range of the Russell 2000 Index. Unlike the Index, the Fund may invest in companies of any size
Fund Inception Date | 5/13/91
Class Inception Date | Institutional: 5/13/91
Retail: 12/31/96
Admin: 1/2/98
Total Net Assets | $696.3 million
PORTFOLIO REVIEW
The Fund outperformed its Benchmark, the Russell 2000 Value Index, for the six months ended March 31, 2009, primarily due to stock selection in the financial services and consumer discretionary sectors.
Financial services, the largest sector in the Fund and the Benchmark, was one of the weakest performing sectors in the market. Our cautious view of the fundamentals of bank stocks and our significant weighting in non-credit-sensitive financial data service companies resulted in exceptionally strong stock selection and significant outperformance relative to the Benchmark. Broadridge Financial Solutions Inc., a provider of trade processing and investor communication services to the financial services industry, was the Fund’s top performer for the period. The company’s stable business model was a key attraction for investors during the recent market upheaval. PHH Corp., an outsource provider of mortgage services and vehicle fleet management, was another top performer.
Although consumer discretionary was another weak sector in the market for the six-month period, the Fund’s consumer holdings emphasized less-cyclical companies, such as services companies and discount stores, which held up reasonably well during the market downturn. In addition, we made timely additions to the restaurant industry just before the stocks rebounded in March.
Technology was among the Fund’s weakest sectors for the period, primarily due to our holdings in semiconductors and electronics, which declined sharply on weakened demand and reduced earnings estimates. Health care also performed poorly, as reimbursement and regulatory concerns lead to negative earnings estimates and lower valuations throughout the sector.
Substantial volatility during the period provided opportunities to add to certain sectors and reduce others. With economic prospects declining, we actively reduced or eliminated several of our most economically sensitive holdings in the basic materials and energy sectors, replacing them with less-cyclical consumer staples and utility stocks. Throughout the period, we selectively added to financial services stocks, while maintaining an underweight relative to the Benchmark. We also reduced our health care exposure, due to mounting reimbursement and regulatory uncertainty stemming from November’s election results.
OUTLOOK
In light of the stock market rally in the March 2009, the inevitable question is whether the recent rally is a breather or the start of a new trend. The stock market is often considered a forward-looking indicator, and historically it has recovered before all the negative economic news dissipated. Indeed, we are encouraged by recent economic data that suggest the economy may be bottoming, at least for some of the hardest hit sectors. However, we recognize that market bottoms never progress evenly. Nevertheless, bumpy scenarios historically have often provided investment opportunities for those who do their homework.
3
AVERAGE ANNUAL TOTAL RETURNS
Periods Ended March 31, 2009
| | | | | | | | | | | | | |
| 6 Months | | | 1 Year | | | 5 Years | | | 10 Years | | | Since Fund
Inception(a)(b) | |
| Loomis Sayles Small Cap Value: Institutional | |
| -32.29 | % | | -33.29 | % | | -1.99 | % | | 5.92 | % | | 10.23 | % |
| Loomis Sayles Small Cap Value: Retail(a) | |
| -32.39 | | | -33.46 | | | -2.24 | | | 5.66 | | | 10.03 | |
| Loomis Sayles Small Cap Value: Admin(a) | |
| -32.45 | | | -33.60 | | | 2.49 | | | 5.39 | | | 9.70 | |
| Russell 2000 Value Index(c) | |
| -39.64 | | | -38.89 | | | -5.30 | | | 4.87 | | | 9.02 | |
| Russell 2000 Index(c) | |
| -37.17 | | | -37.50 | | | -5.24 | | | 1.93 | | | 6.68 | |
| Lipper Small-Cap Core Funds Index(b)(c) | |
| -34.02 | | | -37.19 | | | -4.53 | | | 3.71 | | | N/A | |
| | | | | | | | |
| Gross expense ratio (before reductions and reimbursements)* |
| Institutional: 0.90% | | Retail: 1.27% | | Admin: 1.69% |
| Net expense ratio (after reductions and reimbursements)* |
| Institutional: 0.90% | | Retail: 1.15% | | Admin: 1.41% |
* As stated in the most recent prospectus
CUMULATIVE PERFORMANCE
Inception to March 31, 2009(d)(e)
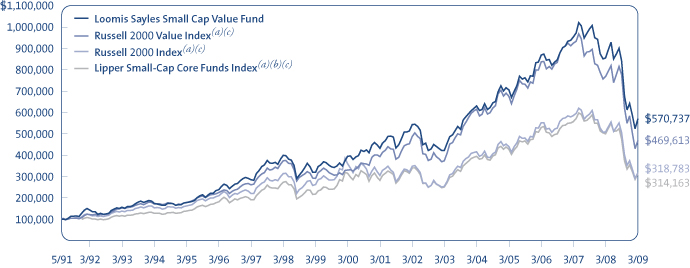
Data quoted reflects past performance and cannot guarantee future results. Average annual total returns assume reinvestment of dividends and capital gains distributions. Investment return and principal value will fluctuate so that shares, when redeemed, may be worth more or less than their original cost. For performance current to the most recent month end, please visit the Loomis Sayles website. Current performance may be higher or lower than quoted.
Returns do not reflect the taxes that a shareholder would pay on fund distributions or the redemption of shares. Periods of less than one year are not annualized. Performance data reflects certain fee reductions and reimbursements, if any, without which performance would be lower.
(a) Performance shown for periods prior to the inception date of the Retail Class (12/31/96) and Admin Class (1/02/98) represents the performance of the Institutional Class of shares during the periods shown, adjusted to reflect current levels of 12b-1 fees payable by the respective Classes. Since index performance data is not available coincident with the Fund’s inception date, the beginning value of the index is the value as of the month end closest to the Fund’s inception date. (b) The Lipper Small-Cap Core Funds Index performance data is not available prior to January 1, 1992. (c) See page 5 for a description of the Indices. (d) Cumulative performance is shown for the Institutional Class of Shares. Performance of the Retail and Admin Classes would be lower due to higher fees and expenses. (e) The mountain chart is based on the initial investment minimum of $100,000 for the Institutional Class.
WHAT YOU SHOULD KNOW
Value stocks may fall out of favor with investors and underperform the overall equity market during any given period. Small- and mid-cap stocks may be more volatile than larger, more established companies. The secondary market for these stocks may be less liquid, which could adversely impact the Fund’s value.
The Fund can invest a significant percentage of assets in foreign securities and the value of the fund shares can be adversely affected by changes in currency exchange rates, political, and economic developments. In emerging markets these risks can be significant. The Fund is subject to currency risk, which is the risk that fluctuations in exchange rates between the US dollar and foreign currencies may cause the value of a Fund’s investments to decline. Fund shares should be viewed as a long-term investment.
4
ADDITIONAL INFORMATION
Index Definitions
Indexes are unmanaged and do not have expenses that affect results, unlike mutual funds. Index returns are adjusted for the reinvestment of capital gain distributions and income dividends. It is not possible to invest directly in an index.
Lipper Small-Cap Core Funds Index is an equally weighted index of typically the 30 largest mutual funds within the small-cap core funds investment objective.
Lipper Small-Cap Growth Funds Index is an equally weighted index of typically the 30 largest mutual funds within the small-cap growth funds investment objective.
Source: Lipper, Inc.
Russell 2000 Growth Index is an index comprised of those Russell 2000 companies with higher price-to-book ratios and higher forecasted growth values.
Russell 2000 Index is an index comprised of the 2,000 smallest companies in the Russell 3000 Index (a broad market index), representing approximately 10% of the Russell 3000 total market capitalization.
Russell 2000 Value Index is an index comprised of those Russell 2000 companies with lower price-to-book ratios and lower forecasted growth values.
Proxy Voting Information
A description of the Funds’ proxy voting policies and procedures is available without charge, upon request, (i) by calling Loomis Sayles at 800-633-3330; (ii) on the Funds’ website, www.loomissayles.com, and (iii) on the SEC’s website, www.sec.gov. Information about how the Funds voted proxies relating to portfolio securities during the 12 months ended June 30, 2008 is available on (i) the Funds’ website and (ii) the SEC’s website.
Quarterly Portfolio Schedules
The Funds file a complete schedule of portfolio holdings with the SEC for the first and third quarters of each fiscal year on Form N-Q. The Funds’ Forms N-Q are available on the SEC’s website at www.sec.gov and may be reviewed and copied at the SEC’s Public Reference Room in Washington, DC. Information on the operation of the Public Reference Room may be obtained by calling 800-SEC-0330.
UNDERSTANDING YOUR FUND’S EXPENSES
As a mutual fund shareholder you incur two types of costs: (1) transaction costs, including redemption fees and certain exchange fees; and (2) ongoing costs, including management fees, distribution and/or service fees (12b-1 fees), and other Fund expenses. These costs are described in more detail in the Funds’ prospectus. The examples below are intended to help you understand the ongoing costs of investing in the Funds and help you compare these with the ongoing costs of investing in other mutual funds.
The first line in the table of each Fund shows the actual amount of Fund expenses you would have paid on a $1,000 investment in the Fund from October 1, 2008 through March 31, 2009. It also shows how much a $1,000 investment would be worth at the close of the period, assuming actual fund returns and expenses. To estimate the expenses you paid over the period, simply divide your account value by $1,000 (for example $8,600 account value divided by $1,000 = 8.6) and multiply the result by the number in the Expenses Paid During the Period column as shown below for your class.
The second line in the table of each Fund provides information about hypothetical account values and hypothetical expenses based on the Fund’s actual expense ratios and an assumed rate of return of 5% per year before expenses, which is not the Fund’s actual return. The hypothetical account values and expenses may not be used to estimate the actual ending account balance or expenses you paid on your investment for the period. You may use this information to compare the ongoing costs of investing in the Funds and other funds. To do so, compare this 5% hypothetical example with the 5% hypothetical examples that appear in the shareholder reports of other funds.
5
Please note that the expenses shown reflect ongoing costs only, and do not include any transaction costs. Therefore, the second line in the table is useful in comparing ongoing costs only, and will not help you determine the relative costs of owning different funds. If transaction costs were included, total costs would be higher.
Loomis Sayles Small Cap Growth Fund
| | | | | | |
Institutional Class | | Beginning
Account Value
10/1/2008 | | Ending
Account Value
3/31/2009 | | Expenses Paid
During Period*
10/1/2008 – 3/31/2009 |
Actual | | $1,000.00 | | $ 669.50 | | $4.16 |
Hypothetical (5% return before expenses) | | $1,000.00 | | $1,019.95 | | $5.04 |
| | | |
Retail Class | | | | | | |
Actual | | $1,000.00 | | $ 668.20 | | $5.20 |
Hypothetical (5% return before expenses) | | $1,000.00 | | $1,018.70 | | $6.29 |
* Expenses are equal to the Fund’s annualized expense ratio (after fee reduction/reimbursement): 1.00% and 1.25% for Institutional and Retail Class, respectively, multiplied by the average account value over the period, multiplied by the number of days in the most recent fiscal half-year, divided by 365 (to reflect the half-year period). |
Loomis Sayles Small Cap Value Fund
| | | | | | |
Institutional Class | | Beginning
Account Value
10/1/2008 | | Ending
Account Value
3/31/2009 | | Expenses Paid
During Period*
10/1/2008 – 3/31/2009 |
Actual | | $1,000.00 | | $ 677.10 | | $3.76 |
Hypothetical (5% return before expenses) | | $1,000.00 | | $1,020.44 | | $4.53 |
| | | |
Retail Class | | | | | | |
Actual | | $1,000.00 | | $ 676.10 | | $4.81 |
Hypothetical (5% return before expenses) | | $1,000.00 | | $1,019.20 | | $5.79 |
|
Admin Class |
Actual | | $1,000.00 | | $ 675.50 | | $5.85 |
Hypothetical (5% return before expenses) | | $1,000.00 | | $1,017.95 | | $7.04 |
* Expenses are equal to the Fund’s annualized expense ratio (after fee reduction/reimbursement): 0.90%, 1.15% and 1.40% for Institutional, Retail and Admin Class, respectively, multiplied by the average account value over the period, multiplied by the number of days in the most recent fiscal half-year, divided by 365 (to reflect the half-year period). |
6
PORTFOLIO OF INVESTMENTS – as of March 31, 2009 (Unaudited)
Loomis Sayles Small Cap Growth Fund
| | | | | | | |
| | | | | Shares | | Value (†) |
| | | | | | | |
| | | |
| COMMON STOCKS – 96.5% of Net Assets | | | | | | | |
| | | |
| Aerospace & Defense – 1.8% | | | | | | | |
Curtiss-Wright Corp. | | | | 28,105 | | $ | 788,345 |
Orbital Sciences Corp.(b) | | | | 57,693 | | | 685,970 |
| | | | | | | |
| | | | | | | 1,474,315 |
| | | | | | | |
| Beverages – 0.7% | | | | | | | |
Heckmann Corp.(b) | | | | 108,343 | | | 522,213 |
| | | | | | | |
| Biotechnology – 6.3% | | | | | | | |
Acorda Therapeutics, Inc.(b) | | | | 20,104 | | | 398,260 |
Alexion Pharmaceuticals, Inc.(b) | | | | 18,083 | | | 681,006 |
Array Biopharma, Inc.(b) | | | | 130,512 | | | 344,552 |
Genomic Health, Inc.(b) | | | | 32,213 | | | 785,353 |
Isis Pharmaceuticals, Inc.(b) | | | | 49,143 | | | 737,636 |
Onyx Pharmaceuticals, Inc.(b) | | | | 21,222 | | | 605,888 |
OSI Pharmaceuticals, Inc.(b) | | | | 13,981 | | | 534,913 |
Osiris Therapeutics, Inc.(b) | | | | 29,987 | | | 413,821 |
Regeneron Pharmaceuticals, Inc.(b) | | | | 35,963 | | | 498,447 |
| | | | | | | |
| | | | | | | 4,999,876 |
| | | | | | | |
| Capital Markets – 4.2% | | | | | | | |
Greenhill & Co., Inc. | | | | 12,328 | | | 910,423 |
KBW, Inc.(b) | | | | 33,264 | | | 676,922 |
Riskmetrics Group, Inc.(b) | | | | 55,793 | | | 797,282 |
Stifel Financial Corp.(b) | | | | 21,893 | | | 948,186 |
| | | | | | | |
| | | | | | | 3,332,813 |
| | | | | | | |
| Commercial Banks – 1.7% | | | | | | | |
IBERIABANK Corp. | | | | 12,131 | | | 557,298 |
Signature Bank(b) | | | | 27,211 | | | 768,167 |
| | | | | | | |
| | | | | | | 1,325,465 |
| | | | | | | |
| Commercial Services & Supplies – 2.9% | | | | | | | |
Clean Harbors, Inc.(b) | | | | 16,878 | | | 810,144 |
Sykes Enterprises, Inc.(b) | | | | 44,296 | | | 736,642 |
Waste Connections, Inc.(b) | | | | 30,888 | | | 793,822 |
| | | | | | | |
| | | | | | | 2,340,608 |
| | | | | | | |
| Communications Equipment – 8.2% | | | | | | | |
Brocade Communications Systems, Inc.(b) | | | | 196,425 | | | 677,666 |
Ciena Corp.(b) | | | | 50,373 | | | 391,902 |
DG FastChannel, Inc.(b) | | | | 68,387 | | | 1,283,624 |
F5 Networks, Inc.(b) | | | | 33,707 | | | 706,162 |
Neutral Tandem, Inc.(b) | | | | 46,850 | | | 1,152,978 |
Nice Systems Ltd., ADR(b) | | | | 26,055 | | | 647,727 |
Riverbed Technology, Inc.(b) | | | | 74,272 | | | 971,478 |
Tellabs, Inc.(b) | | | | 157,846 | | | 722,935 |
| | | | | | | |
| | | | | | | 6,554,472 |
| | | | | | | |
| Construction & Engineering – 2.6% | | | | | | | |
MasTec, Inc.(b) | | | | 103,119 | | | 1,246,709 |
Northwest Pipe Co.(b) | | | | 29,316 | | | 834,626 |
| | | | | | | |
| | | | | | | 2,081,335 |
| | | | | | | |
7
| | | | | | | |
| | | | | Shares | | Value (†) |
| | | | | | | |
| | | |
| COMMON STOCKS – continued | | | | | | | |
| | | |
| Diversified Consumer Services – 4.0% | | | | | | | |
American Public Education, Inc.(b) | | | | 23,806 | | $ | 1,001,280 |
Capella Education Co.(b) | | | | 13,938 | | | 738,714 |
DeVry, Inc. | | | | 16,809 | | | 809,858 |
Grand Canyon Education, Inc.(b) | | | | 38,094 | | | 657,503 |
| | | | | | | |
| | | | | | | 3,207,355 |
| | | | | | | |
| Diversified Telecommunication Services – 2.4% | | | | | | | |
Cbeyond, Inc.(b) | | | | 56,760 | | | 1,068,791 |
NTELOS Holdings Corp. | | | | 46,069 | | | 835,692 |
| | | | | | | |
| | | | | | | 1,904,483 |
| | | | | | | |
| Electric Utilities – 1.1% | | | | | | | |
ITC Holdings Corp. | | | | 20,749 | | | 905,071 |
| | | | | | | |
| Electronic Equipment Instruments & Components – 1.5% | | | | | | | |
Cogent, Inc.(b) | | | | 44,299 | | | 527,158 |
IPG Photonics Corp.(b) | | | | 75,336 | | | 634,329 |
| | | | | | | |
| | | | | | | 1,161,487 |
| | | | | | | |
| Energy Equipment & Services – 3.7% | | | | | | | |
Dresser-Rand Group, Inc.(b) | | | | 33,182 | | | 733,322 |
Hornbeck Offshore Services, Inc.(b) | | | | 42,787 | | | 652,074 |
Oceaneering International, Inc.(b) | | | | 19,956 | | | 735,778 |
Tesco Corp.(b) | | | | 97,800 | | | 764,796 |
| | | | | | | |
| | | | | | | 2,885,970 |
| | | | | | | |
| Food Products – 3.1% | | | | | | | |
Diamond Foods, Inc. | | | | 27,052 | | | 755,562 |
Green Mountain Coffee Roasters, Inc.(b) | | | | 22,525 | | | 1,081,200 |
Smart Balance, Inc.(b) | | | | 100,314 | | | 605,897 |
| | | | | | | |
| | | | | | | 2,442,659 |
| | | | | | | |
| Health Care Equipment & Supplies – 6.4% | | | | | | | |
Haemonetics Corp.(b) | | | | 11,017 | | | 606,816 |
Masimo Corp.(b) | | | | 24,302 | | | 704,272 |
Merit Medical Systems, Inc.(b) | | | | 48,280 | | | 589,499 |
NuVasive, Inc.(b) | | | | 19,586 | | | 614,609 |
ResMed, Inc.(b) | | | | 11,505 | | | 406,587 |
SonoSite, Inc.(b) | | | | 42,904 | | | 767,123 |
Vnus Medical Technologies(b) | | | | 36,254 | | | 771,122 |
Volcano Corp.(b) | | | | 42,883 | | | 623,948 |
| | | | | | | |
| | | | | | | 5,083,976 |
| | | | | | | |
| Health Care Providers & Services – 4.0% | | | | | | | |
Bio-Reference Labs, Inc.(b) | | | | 27,497 | | | 574,962 |
CardioNet, Inc.(b) | | | | 39,150 | | | 1,098,549 |
Catalyst Health Solutions, Inc.(b) | | | | 47,622 | | | 943,868 |
Sun Healthcare Group, Inc.(b) | | | | 71,659 | | | 604,802 |
| | | | | | | |
| | | | | | | 3,222,181 |
| | | | | | | |
| Health Care Technology – 3.3% | | | | | | | |
athenahealth, Inc.(b) | | | | 25,308 | | | 610,176 |
MedAssets, Inc.(b) | | | | 71,662 | | | 1,021,184 |
Phase Forward, Inc.(b) | | | | 78,828 | | | 1,008,210 |
| | | | | | | |
| | | | | | | 2,639,570 |
| | | | | | | |
8
PORTFOLIO OF INVESTMENTS – as of March 31, 2009 (Unaudited)
Loomis Sayles Small Cap Growth Fund – continued
| | | | | | | |
| | | | | Shares | | Value (†) |
| | | | | | | |
| | | |
| COMMON STOCKS – continued | | | | | | | |
| | | |
| Hotels, Restaurants & Leisure – 2.4% | | | | | | | |
Buffalo Wild Wings, Inc.(b) | | | | 16,389 | | $ | 599,509 |
Panera Bread Co., Class A(b) | | | | 11,112 | | | 621,161 |
Texas Roadhouse, Inc., Class A(b) | | | | 75,824 | | | 722,603 |
| | | | | | | |
| | | | | | | 1,943,273 |
| | | | | | | |
| Insurance – 0.9% | | | | | | | |
AmTrust Financial Services, Inc. | | | | 73,092 | | | 698,029 |
| | | | | | | |
| Internet Software & Services – 2.3% | | | | | | | |
Constant Contact, Inc.(b) | | | | 54,217 | | | 758,496 |
SkillSoft PLC, ADR(b) | | | | 99,923 | | | 668,485 |
Vocus, Inc.(b) | | | | 31,899 | | | 423,937 |
| | | | | | | |
| | | | | | | 1,850,918 |
| | | | | | | |
| IT Services – 1.1% | | | | | | | |
CyberSource Corp.(b) | | | | 57,594 | | | 852,967 |
| | | | | | | |
| Machinery – 3.1% | | | | | | | |
Energy Recovery, Inc.(b) | | | | 83,988 | | | 638,309 |
ESCO Technologies, Inc.(b) | | | | 18,848 | | | 729,418 |
Freightcar America, Inc. | | | | 32,738 | | | 573,897 |
Wabtec Corp. | | | | 21,133 | | | 557,488 |
| | | | | | | |
| | | | | | | 2,499,112 |
| | | | | | | |
| Oil, Gas & Consumable Fuels – 3.1% | | | | | | | |
Arena Resources, Inc.(b) | | | | 30,780 | | | 784,275 |
Comstock Resources, Inc.(b) | | | | 23,453 | | | 698,899 |
Concho Resources, Inc.(b) | | | | 38,498 | | | 985,164 |
| | | | | | | |
| | | | | | | 2,468,338 |
| | | | | | | |
| Pharmaceuticals – 2.0% | | | | | | | |
Auxilium Pharmaceuticals, Inc.(b) | | | | 20,703 | | | 573,887 |
Eurand NV(b) | | | | 62,127 | | | 692,095 |
Inspire Pharmaceuticals, Inc.(b) | | | | 89,653 | | | 363,991 |
| | | | | | | |
| | | | | | | 1,629,973 |
| | | | | | | |
| Professional Services – 3.9% | | | | | | | |
Huron Consulting Group, Inc.(b) | | | | 17,435 | | | 739,767 |
ICF International, Inc.(b) | | | | 61,027 | | | 1,401,790 |
IHS, Inc., Class A(b) | | | | 23,968 | | | 987,002 |
| | | | | | | |
| | | | | | | 3,128,559 |
| | | | | | | |
| Semiconductors & Semiconductor Equipment – 6.4% | | | | | | | |
Cavium Network, Inc.(b) | | | | 62,011 | | | 715,607 |
Hittite Microwave Corp.(b) | | | | 18,665 | | | 582,348 |
Lam Research Corp.(b) | | | | 34,753 | | | 791,326 |
Netlogic Microsystems, Inc.(b) | | | | 29,821 | | | 819,481 |
Power Integrations, Inc. | | | | 30,816 | | | 530,035 |
Silicon Laboratories, Inc.(b) | | | | 30,976 | | | 817,767 |
Varian Semiconductor Equipment Associates, Inc.(b) | | | | 41,102 | | | 890,269 |
| | | | | | | |
| | | | | | | 5,146,833 |
| | | | | | | |
| Software – 8.6% | | | | | | | |
Ariba, Inc.(b) | | | | 106,344 | | | 928,383 |
Blackboard, Inc.(b) | | | | 33,198 | | | 1,053,704 |
Concur Technologies, Inc.(b) | | | | 26,477 | | | 508,094 |
DemandTec, Inc.(b) | | | | 75,858 | | | 663,757 |
9
| | | | | | | | |
| | | | | Shares | | Value (†) |
| | | | | | | | |
| | | |
| COMMON STOCKS – continued | | | | | | | | |
| | | |
| Software – continued | | | | | | | | |
Informatica Corp.(b) | | | | | 72,191 | | $ | 957,253 |
Solera Holdings, Inc.(b) | | | | | 37,587 | | | 931,406 |
Tyler Technologies, Inc.(b) | | | | | 73,820 | | | 1,079,987 |
Ultimate Software Group, Inc. (The)(b) | | | | | 43,670 | | | 753,744 |
| | | | | | | | |
| | | | | | | | 6,876,328 |
| | | | | | | | |
| Specialty Retail – 3.0% | | | | | | | | |
American Eagle Outfitters, Inc. | | | | | 50,774 | | | 621,474 |
Hibbett Sports, Inc.(b) | | | | | 42,596 | | | 818,695 |
Lumber Liquidators, Inc.(b) | | | | | 34,742 | | | 442,960 |
Monro Muffler Brake, Inc. | | | | | 19,357 | | | 529,027 |
| | | | | | | | |
| | | | | | | | 2,412,156 |
| | | | | | | | |
| Textiles, Apparel & Luxury Goods – 1.8% | | | | | | | | |
Phillips-Van Heusen Corp. | | | | | 35,336 | | | 801,421 |
Under Armour, Inc., Class A(b) | | | | | 38,670 | | | 635,348 |
| | | | | | | | |
| | | | | | | | 1,436,769 |
| | | | | | | | |
| | | |
| TOTAL COMMON STOCKS | | | | | | | | |
(Identified Cost $87,549,107) | | | | | | | | 77,027,104 |
| | | | | | | | |
| | | | | Principal Amount | | |
| | | |
| SHORT-TERM INVESTMENTS – 3.2% | | | | | | | | |
Tri-Party Repurchase Agreement with Fixed Income Clearing Corporation, dated 3/31/09 at 0.000% to be repurchased at $2,594,744 on 4/01/09 collateralized by $2,550,000 Federal National Mortgage Association, 4.750% due 3/12/10 valued at $2,646,900 including accrued interest (Note 2g of Notes to Financial Statements)
(Identified Cost $2,594,744) | | | | $ | 2,594,744 | | | 2,594,744 |
| | | | | | | | |
| | | |
| TOTAL INVESTMENTS – 99.7% | | | | | | | | |
(Identified Cost $90,143,851)(a) | | | | | | | | 79,621,848 |
Other assets less liabilities—0.3% | | | | | | | | 210,788 |
| | | | | | | | |
| | | |
| NET ASSETS – 100.0% | | | | | | | $ | 79,832,636 |
| | | | | | | | |
| |
(†) See Note 2a of Notes to Financial Statements. | | | |
(a) Federal Tax Information (Amounts exclude certain adjustments made at the end of the Fund’s fiscal year for tax purposes. Such adjustments are primarily due to wash sales.): | | | |
At March 31, 2009, the net unrealized depreciation on investments based on a cost of $89,992,009 for federal income tax purposes was as follows: | | | |
Aggregate gross unrealized appreciation for all investments in which there is an excess of value over tax cost | | $ | 4,596,476 |
Aggregate gross unrealized depreciation for all investments in which there is an excess of tax cost over value | | | (14,966,637) |
| | | | | | | | |
Net unrealized depreciation | | $ | (10,370,161) |
| | | | | | | | |
(b) Non-income producing security. | | | |
ADR An American Depositary Receipt is a certificate issued by a custodian bank representing the right to receive securities of the foreign issuer described. The values of ADRs are significantly influenced by trading on exchanges not located in the United States. |
10
PORTFOLIO OF INVESTMENTS – as of March 31, 2009 (Unaudited)
Loomis Sayles Small Cap Growth Fund – continued
NET ASSET SUMMARY AT MARCH 31, 2009 (Unaudited)
| | | |
Software | | 8.6 | % |
Communications Equipment | | 8.2 | |
Semiconductors & Semiconductor Equipment | | 6.4 | |
Health Care Equipment & Supplies | | 6.4 | |
Biotechnology | | 6.3 | |
Capital Markets | | 4.2 | |
Health Care Providers & Services | | 4.0 | |
Diversified Consumer Services | | 4.0 | |
Professional Services | | 3.9 | |
Energy Equipment & Services | | 3.7 | |
Health Care Technology | | 3.3 | |
Machinery | | 3.1 | |
Oil, Gas & Consumable Fuels | | 3.1 | |
Food Products | | 3.1 | |
Specialty Retail | | 3.0 | |
Commercial Services & Supplies | | 2.9 | |
Construction & Engineering | | 2.6 | |
Hotels, Restaurants & Leisure | | 2.4 | |
Diversified Telecommunication Services | | 2.4 | |
Internet Software & Services | | 2.3 | |
Pharmaceuticals | | 2.0 | |
Other Investments, less than 2% each | | 10.6 | |
Short-Term Investments | | 3.2 | |
| | | |
Total Investments | | 99.7 | |
Other assets less liabilities | | 0.3 | |
| | | |
Net Assets | | 100.0 | % |
| | | |
See accompanying notes to financial statements.
11
PORTFOLIO OF INVESTMENTS – as of March 31, 2009 (Unaudited)
Loomis Sayles Small Cap Value Fund
| | | | | | | |
| | | | | Shares | | Value (†) |
| | | | | | | |
| | | |
| COMMON STOCKS – 98.4% of Net Assets | | | | | | | |
| | | |
| Aerospace & Defense – 1.3% | | | | | | | |
Ducommun, Inc. | | | | 213,213 | | $ | 3,100,117 |
Teledyne Technologies, Inc.(b) | | | | 217,796 | | | 5,810,797 |
| | | | | | | |
| | | | | | | 8,910,914 |
| | | | | | | |
| Air Freight & Logistics – 0.8% | | | | | | | |
Atlas Air Worldwide Holdings, Inc.(b) | | | | 236,556 | | | 4,104,247 |
Hub Group, Inc., Class A(b) | | | | 77,936 | | | 1,324,912 |
| | | | | | | |
| | | | | | | 5,429,159 |
| | | | | | | |
| Auto Components – 1.1% | | | | | | | |
Gentex Corp. | | | | 404,821 | | | 4,032,017 |
Goodyear Tire & Rubber Co. (The)(b) | | | | 543,160 | | | 3,400,182 |
| | | | | | | |
| | | | | | | 7,432,199 |
| | | | | | | |
| Building Products – 0.3% | | | | | | | |
Armstrong World Industries, Inc.(b) | | | | 220,314 | | | 2,425,657 |
| | | | | | | |
| Capital Markets – 2.1% | | | | | | | |
Investment Technology Group, Inc.(b) | | | | 176,321 | | | 4,499,712 |
JMP Group, Inc. | | | | 161,713 | | | 777,840 |
Stifel Financial Corp.(b) | | | | 214,727 | | | 9,299,826 |
| | | | | | | |
| | | | | | | 14,577,378 |
| | | | | | | |
| Chemicals – 1.4% | | | | | | | |
Koppers Holdings, Inc. | | | | 173,959 | | | 2,525,885 |
LSB Industries, Inc.(b) | | | | 264,500 | | | 2,615,905 |
Lubrizol Corp. (The) | | | | 89,693 | | | 3,050,459 |
Minerals Technologies, Inc. | | | | 42,169 | | | 1,351,516 |
| | | | | | | |
| | | | | | | 9,543,765 |
| | | | | | | |
| Commercial Banks – 7.8% | | | | | | | |
Bank of the Ozarks, Inc. | | | | 303,976 | | | 7,015,766 |
Comerica, Inc. | | | | 261,183 | | | 4,782,261 |
First Horizon National Corp. | | | | 405,057 | | | 4,350,316 |
Glacier Bancorp, Inc. | | | | 228,082 | | | 3,583,168 |
Hancock Holding Co. | | | | 85,415 | | | 2,671,781 |
IBERIABANK Corp. | | | | 151,907 | | | 6,978,608 |
Pennsylvania Commerce Bancorp, Inc.(b) | | | | 119,404 | | | 2,197,034 |
Prosperity Bancshares, Inc. | | | | 228,423 | | | 6,247,369 |
Signature Bank(b) | | | | 281,675 | | | 7,951,685 |
Sterling Bancshares, Inc. | | | | 899,189 | | | 5,880,696 |
SVB Financial Group(b) | | | | 138,774 | | | 2,776,868 |
| | | | | | | |
| | | | | | | 54,435,552 |
| | | | | | | |
| Commercial Services & Supplies – 7.2% | | | | | | | |
ABM Industries, Inc. | | | | 391,160 | | | 6,415,024 |
American Ecology Corp. | | | | 172,703 | | | 2,407,480 |
Brink’s Co. (The) | | | | 155,422 | | | 4,112,466 |
Geo Group, Inc. (The)(b) | | | | 192,380 | | | 2,549,035 |
McGrath Rentcorp | | | | 191,717 | | | 3,021,460 |
Rollins, Inc. | | | | 833,861 | | | 14,300,716 |
Standard Parking Corp.(b) | | | | 537,509 | | | 8,815,148 |
Waste Connections, Inc.(b) | | | | 342,932 | | | 8,813,352 |
| | | | | | | |
| | | | | | | 50,434,681 |
| | | | | | | |
12
PORTFOLIO OF INVESTMENTS – as of March 31, 2009 (Unaudited)
Loomis Sayles Small Cap Value Fund – continued
| | | | | | | |
| | | | | Shares | | Value (†) |
| | | | | | | |
| | | |
| COMMON STOCKS – continued | | | | | | | |
| | | |
| Communications Equipment – 2.6% | | | | | | | |
ADC Telecommunications, Inc.(b) | | | | 977,555 | | $ | 4,291,466 |
ADTRAN, Inc. | | | | 236,180 | | | 3,828,478 |
Anaren, Inc.(b) | | | | 214,118 | | | 2,342,451 |
CommScope, Inc.(b) | | | | 208,323 | | | 2,366,549 |
Tekelec(b) | | | | 402,900 | | | 5,330,367 |
| | | | | | | |
| | | | | | | 18,159,311 |
| | | | | | | |
| Computers & Peripherals – 1.2% | | | | | | | |
Intevac, Inc.(b) | | | | 313,197 | | | 1,631,757 |
NCR Corp.(b) | | | | 159,882 | | | 1,271,062 |
Teradata Corp.(b) | | | | 332,688 | | | 5,396,199 |
| | | | | | | |
| | | | | | | 8,299,018 |
| | | | | | | |
| Construction & Engineering – 0.6% | | | | | | | |
MYR Group, Inc.(b) | | | | 277,270 | | | 4,228,367 |
| | | | | | | |
| Construction Materials – 0.7% | | | | | | | |
Eagle Materials, Inc. | | | | 193,956 | | | 4,703,433 |
| | | | | | | |
| Consumer Finance – 0.7% | | | | | | | |
Dollar Financial Corp.(b) | | | | 519,036 | | | 4,941,223 |
| | | | | | | |
| Containers & Packaging – 1.0% | | | | | | | |
Myers Industries, Inc. | | | | 260,956 | | | 1,602,270 |
Rock-Tenn Co., Class A | | | | 191,835 | | | 5,189,137 |
| | | | | | | |
| | | | | | | 6,791,407 |
| | | | | | | |
| Distributors – 0.2% | | | | | | | |
Core-Mark Holding Co., Inc.(b) | | | | 61,813 | | | 1,126,233 |
| | | | | | | |
| Diversified Consumer Services – 0.9% | | | | | | | |
Hillenbrand, Inc. | | | | 383,099 | | | 6,133,415 |
| | | | | | | |
| Diversified Financial Services – 1.2% | | | | | | | |
PHH Corp.(b) | | | | 604,906 | | | 8,498,929 |
| | | | | | | |
| Electric Utilities – 2.7% | | | | | | | |
ALLETE, Inc. | | | | 175,546 | | | 4,685,323 |
ITC Holdings Corp. | | | | 147,590 | | | 6,437,876 |
Portland General Electric Co. | | | | 425,252 | | | 7,480,182 |
| | | | | | | |
| | | | | | | 18,603,381 |
| | | | | | | |
| Electrical Equipment – 0.6% | | | | | | | |
II-VI, Inc.(b) | | | | 207,444 | | | 3,563,888 |
LaBarge, Inc.(b) | | | | 49,401 | | | 413,486 |
Polypore International, Inc.(b) | | | | 136,892 | | | 550,306 |
| | | | | | | |
| | | | | | | 4,527,680 |
| | | | | | | |
| Electronic Equipment Instruments & Components – 1.9% | | | | | | | |
Amphenol Corp., Class A | | | | 106,393 | | | 3,031,136 |
Daktronics, Inc. | | | | 226,280 | | | 1,482,134 |
Littelfuse, Inc.(b) | | | | 271,237 | | | 2,980,895 |
Mettler-Toledo International, Inc.(b) | | | | 42,357 | | | 2,174,185 |
Scansource, Inc.(b) | | | | 90,860 | | | 1,688,179 |
TTM Technologies, Inc.(b) | | | | 321,945 | | | 1,867,281 |
| | | | | | | |
| | | | | | | 13,223,810 |
| | | | | | | |
13
| | | | | | | |
| | | | | Shares | | Value (†) |
| | | | | | | |
| | | |
| COMMON STOCKS – continued | | | | | | | |
| | | |
| Energy Equipment & Services – 1.1% | | | | | | | |
Hornbeck Offshore Services, Inc.(b) | | | | 115,082 | | $ | 1,753,850 |
Oceaneering International, Inc.(b) | | | | 158,835 | | | 5,856,246 |
| | | | | | | |
| | | | | | | 7,610,096 |
| | | | | | | |
| Food & Staples Retailing – 0.9% | | | | | | | |
Spartan Stores, Inc. | | | | 416,992 | | | 6,425,847 |
| | | | | | | |
| Food Products – 3.1% | | | | | | | |
Flowers Foods, Inc. | | | | 231,281 | | | 5,430,478 |
J & J Snack Foods Corp. | | | | 201,646 | | | 6,974,935 |
J.M.Smucker Co. (The) | | | | 98,421 | | | 3,668,151 |
Ralcorp Holdings, Inc.(b) | | | | 109,245 | | | 5,886,120 |
| | | | | | | |
| | | | | | | 21,959,684 |
| | | | | | | |
| Gas Utilities – 2.5% | | | | | | | |
ONEOK, Inc. | | | | 195,907 | | | 4,433,376 |
UGI Corp. | | | | 550,215 | | | 12,990,576 |
| | | | | | | |
| | | | | | | 17,423,952 |
| | | | | | | |
| Health Care Equipment & Supplies – 2.0% | | | | | | | |
Hill-Rom Holdings, Inc. | | | | 133,631 | | | 1,321,611 |
Medical Action Industries, Inc.(b) | | | | 261,297 | | | 2,166,152 |
Teleflex, Inc. | | | | 156,254 | | | 6,107,969 |
West Pharmaceutical Services, Inc. | | | | 144,562 | | | 4,743,079 |
| | | | | | | |
| | | | | | | 14,338,811 |
| | | | | | | |
| Health Care Providers & Services – 2.3% | | | | | | | |
Amedisys, Inc.(b) | | | | 101,773 | | | 2,797,740 |
CorVel Corp.(b) | | | | 140,317 | | | 2,837,210 |
MEDNAX, Inc.(b) | | | | 119,792 | | | 3,530,270 |
MWI Veterinary Supply, Inc.(b) | | | | 109,983 | | | 3,132,316 |
Skilled Healthcare Group, Inc., Class A(b) | | | | 424,170 | | | 3,482,435 |
| | | | | | | |
| | | | | | | 15,779,971 |
| | | | | | | |
| Hotels, Restaurants & Leisure – 2.5% | | | | | | | |
Bob Evans Farms, Inc. | | | | 181,897 | | | 4,078,131 |
California Pizza Kitchen, Inc.(b) | | | | 251,170 | | | 3,285,304 |
Cracker Barrel Old Country Store, Inc. | | | | 123,285 | | | 3,530,882 |
Dover Downs Gaming & Entertainment, Inc. | | | | 301,983 | | | 927,088 |
Penn National Gaming, Inc.(b) | | | | 232,242 | | | 5,608,644 |
| | | | | | | |
| | | | | | | 17,430,049 |
| | | | | | | |
| Household Durables – 0.6% | | | | | | | |
Leggett & Platt, Inc. | | | | 310,132 | | | 4,028,615 |
| | | | | | | |
| Household Products – 0.6% | | | | | | | |
Church & Dwight Co., Inc. | | | | 85,136 | | | 4,446,653 |
| | | | | | | |
| Insurance – 8.7% | | | | | | | |
American Physicians Capital, Inc. | | | | 109,698 | | | 4,488,842 |
Aspen Insurance Holdings Ltd. | | | | 187,545 | | | 4,212,261 |
Fidelity National Financial, Inc., Class A | | | | 267,137 | | | 5,211,843 |
Hanover Insurance Group Inc. (The) | | | | 134,037 | | | 3,862,946 |
HCC Insurance Holdings, Inc. | | | | 334,373 | | | 8,422,856 |
Markel Corp.(b) | | | | 6,522 | | | 1,851,465 |
Navigators Group, Inc.(b) | | | | 116,894 | | | 5,515,059 |
PartnerRe Ltd. | | | | 76,466 | | | 4,746,244 |
14
PORTFOLIO OF INVESTMENTS – as of March 31, 2009 (Unaudited)
Loomis Sayles Small Cap Value Fund – continued
| | | | | | | |
| | | | | Shares | | Value (†) |
| | | | | | | |
| | | |
| COMMON STOCKS – continued | | | | | | | |
| | | |
| Insurance – continued | | | | | | | |
ProAssurance Corp.(b) | | | | 77,083 | | $ | 3,593,609 |
Reinsurance Group of America, Inc. | | | | 139,456 | | | 4,516,980 |
RLI Corp. | | | | 113,569 | | | 5,701,164 |
W.R. Berkley Corp. | | | | 216,756 | | | 4,887,848 |
Zenith National Insurance Corp. | | | | 139,933 | | | 3,373,785 |
| | | | | | | |
| | | | | | | 60,384,902 |
| | | | | | | |
| Internet & Catalog Retail – 0.4% | | | | | | | |
HSN, Inc.(b) | | | | 598,882 | | | 3,078,253 |
| | | | | | | |
| Internet Software & Services – 0.2% | | | | | | | |
United Online, Inc. | | | | 291,792 | | | 1,301,392 |
| | | | | | | |
| IT Services – 6.0% | | | | | | | |
Alliance Data Systems Corp.(b) | | | | 103,751 | | | 3,833,600 |
Broadridge Financial Solutions, Inc. | | | | 570,804 | | | 10,622,662 |
Global Payments, Inc. | | | | 124,931 | | | 4,173,945 |
Lender Processing Services, Inc. | | | | 262,910 | | | 8,047,675 |
Perot Systems Corp., Class A(b) | | | | 465,246 | | | 5,992,369 |
SRA International, Inc., Class A(b) | | | | 200,139 | | | 2,942,043 |
Wright Express Corp.(b) | | | | 345,664 | | | 6,297,998 |
| | | | | | | |
| | | | | | | 41,910,292 |
| | | | | | | |
| Life Sciences Tools & Services – 0.2% | | | | | | | |
PerkinElmer, Inc. | | | | 100,578 | | | 1,284,381 |
| | | | | | | |
| Machinery – 2.3% | | | | | | | |
Altra Holdings, Inc.(b) | | | | 310,114 | | | 1,203,242 |
Badger Meter, Inc. | | | | 63,477 | | | 1,833,851 |
CLARCOR, Inc. | | | | 81,919 | | | 2,063,540 |
John Bean Technologies Corp. | | | | 430,098 | | | 4,498,825 |
Middleby Corp. (The)(b) | | | | 101,259 | | | 3,283,829 |
Wabtec Corp. | | | | 114,115 | | | 3,010,354 |
| | | | | | | |
| | | | | | | 15,893,641 |
| | | | | | | |
| Marine – 0.6% | | | | | | | |
Kirby Corp.(b) | | | | 153,324 | | | 4,084,551 |
| | | | | | | |
| Media – 3.5% | | | | | | | |
Alloy, Inc.(b) | | | | 244,628 | | | 1,027,438 |
Interactive Data Corp. | | | | 387,591 | | | 9,635,512 |
John Wiley & Sons, Inc. Class A | | | | 345,554 | | | 10,290,598 |
Scholastic Corp. | | | | 211,104 | | | 3,181,337 |
| | | | | | | |
| | | | | | | 24,134,885 |
| | | | | | | |
| Metals & Mining – 0.7% | | | | | | | |
Reliance Steel & Aluminum Co. | | | | 180,242 | | | 4,745,772 |
| | | | | | | |
| Multi-Utilities & Unregulated Power – 0.6% | | | | | | | |
NorthWestern Corp. | | | | 193,268 | | | 4,151,397 |
| | | | | | | |
| Multiline Retail – 1.2% | | | | | | | |
Dollar Tree, Inc.(b) | | | | 187,582 | | | 8,356,778 |
| | | | | | | |
| Oil, Gas & Consumable Fuels – 1.6% | | | | | | | |
Comstock Resources, Inc.(b) | | | | 108,339 | | | 3,228,502 |
Mariner Energy, Inc.(b) | | | | 214,418 | | | 1,661,739 |
15
| | | | | | | |
| | | | | Shares | | Value (†) |
| | | | | | | |
| | | |
| COMMON STOCKS – continued | | | | | | | |
| | | |
| Oil, Gas & Consumable Fuels – continued | | | | | | | |
Newfield Exploration Co.(b) | | | | 72,847 | | $ | 1,653,627 |
Penn Virginia Corp. | | | | 447,071 | | | 4,908,840 |
| | | | | | | |
| | | | | | | 11,452,708 |
| | | | | | | |
| Paper & Forest Products – 0.2% | | | | | | | |
Clearwater Paper Corp.(b) | | | | 200,371 | | | 1,608,979 |
| | | | | | | |
| Personal Products – 1.1% | | | | | | | |
Alberto-Culver Co. | | | | 329,152 | | | 7,442,127 |
| | | | | | | |
| Pharmaceuticals – 2.2% | | | | | | | |
Endo Pharmaceuticals Holdings, Inc.(b) | | | | 217,094 | | | 3,838,222 |
Obagi Medical Products, Inc.(b) | | | | 385,567 | | | 2,074,351 |
Perrigo Co. | | | | 375,698 | | | 9,328,581 |
| | | | | | | |
| | | | | | | 15,241,154 |
| | | | | | | |
| Professional Services – 0.3% | | | | | | | |
Duff & Phelps Corp., Class A(b) | | | | 131,386 | | | 2,069,329 |
| | | | | | | |
| Real Estate Management & Development – 0.6% | | | | | | | |
Forestar Group, Inc.(b) | | | | 548,186 | | | 4,193,623 |
| | | | | | | |
| REITs – 4.9% | | | | | | | |
American Campus Communities, Inc. | | | | 286,358 | | | 4,971,175 |
Capstead Mortgage Corp. | | | | 673,066 | | | 7,228,729 |
Chimera Investment Corp. | | | | 484,728 | | | 1,628,686 |
Digital Realty Trust, Inc. | | | | 174,840 | | | 5,801,191 |
Health Care REIT, Inc. | | | | 229,884 | | | 7,032,152 |
Potlatch Corp. | | | | 309,934 | | | 7,187,369 |
| | | | | | | |
| | | | | | | 33,849,302 |
| | | | | | | |
| Road & Rail – 0.4% | | | | | | | |
Genesee & Wyoming, Inc., Class A(b) | | | | 128,810 | | | 2,737,212 |
| | | | | | | |
| Semiconductors & Semiconductor Equipment – 2.1% | | | | | | | |
Atmel Corp.(b) | | | | 852,355 | | | 3,094,049 |
Cohu, Inc. | | | | 230,704 | | | 1,661,069 |
ON Semiconductor Corp.(b) | | | | 630,040 | | | 2,457,156 |
Semtech Corp.(b) | | | | 191,765 | | | 2,560,063 |
Teradyne, Inc.(b) | | | | 693,254 | | | 3,036,452 |
TriQuint Semiconductor, Inc.(b) | | | | 783,377 | | | 1,934,941 |
| | | | | | | |
| | | | | | | 14,743,730 |
| | | | | | | |
| Software – 2.5% | | | | | | | |
Informatica Corp.(b) | | | | 168,353 | | | 2,232,361 |
Mentor Graphics Corp.(b) | | | | 651,777 | | | 2,893,890 |
Progress Software Corp.(b) | | | | 156,761 | | | 2,721,371 |
Quest Software, Inc.(b) | | | | 227,499 | | | 2,884,687 |
Sybase, Inc.(b) | | | | 214,720 | | | 6,503,869 |
| | | | | | | |
| | | | | | | 17,236,178 |
| | | | | | | |
| Specialty Retail – 1.8% | | | | | | | |
Genesco, Inc.(b) | | | | 166,373 | | | 3,132,804 |
Jo-Ann Stores, Inc.(b) | | | | 200,926 | | | 3,283,131 |
Sally Beauty Holdings, Inc.(b) | | | | 1,127,717 | | | 6,405,432 |
| | | | | | | |
| | | | | | | 12,821,367 |
| | | | | | | |
16
PORTFOLIO OF INVESTMENTS – as of March 31, 2009 (Unaudited)
Loomis Sayles Small Cap Value Fund – continued
| | | | | | | | | |
| | | | | Shares | | Value (†) | |
| | | | | | | | | |
| | | |
| COMMON STOCKS – continued | | | | | | | | | |
| | | |
| Textiles, Apparel & Luxury Goods – 2.0% | | | | | | | | | |
Carter’s, Inc.(b) | | | | | 388,247 | | $ | 7,302,926 | |
FGX International Holdings Ltd.(b) | | | | | 275,446 | | | 3,200,683 | |
Fossil, Inc.(b) | | | | | 202,625 | | | 3,181,212 | |
| | | | | | | | | |
| | | | | | | | 13,684,821 | |
| | | | | | | | | |
| Thrifts & Mortgage Finance – 1.2% | | | | | | | | | |
Beneficial Mutual Bancorp, Inc.(b) | | | | | 480,075 | | | 4,728,739 | |
Westfield Financial, Inc. | | | | | 407,901 | | | 3,589,529 | |
| | | | | | | | | |
| | | | | | | | 8,318,268 | |
| | | | | | | | | |
| Water Utilities – 1.2% | | | | | | | | | |
American States Water Co. | | | | | 122,345 | | | 4,443,570 | |
Middlesex Water Co. | | | | | 272,189 | | | 3,919,522 | |
| | | | | | | | | |
| | | | | | | | 8,363,092 | |
| | | | | | | | | |
| | | |
| TOTAL COMMON STOCKS | | | | | | | | | |
(Identified Cost $862,998,879) | | | | | | | | 684,957,324 | |
| | | | | | | | | |
| | | |
| | | | | Principal Amount | | | |
|
| SHORT-TERM INVESTMENTS – 1.0% | |
Tri-Party Repurchase Agreement with Fixed Income Clearing Corporation, dated 3/31/2009 at 0.000% to be repurchased at $7,314,430 on 4/01/2009 collateralized by $7,310,000 Federal National Mortgage Association, 4.500% due 4/29/2013 with a value of $7,465,338 including accrued interest (Note 2g of Notes to Financial Statements)
(Identified Cost $7,314,430) | | | | $ | 7,314,430 | | | 7,314,430 | |
| |
| TOTAL INVESTMENTS – 99.4% | | | | |
(Identified Cost $870,313,309)(a) | | | 692,271,754 | |
Other assets less liabilities—0.6% | | | 4,028,132 | |
| | | | | | | | | |
| |
| NET ASSETS – 100.0% | | $ | 696,299,886 | |
| | | | | | | | | |
| | | |
(†) See Note 2a of Notes to Financial Statements. | | | | | | | | | |
(a) Federal Tax Information (Amounts exclude certain adjustments made at the end of the Fund’s fiscal year for tax purposes. Such adjustments are primarily due to wash sales.): At March 31, 2009, the net unrealized depreciation on investments based on a cost of $870,169,125 for federal income tax purposes was as follows: | | | | |
Aggregate gross unrealized appreciation for all investments in which there is an excess of value over tax cost | | $ | 27,888,272 | |
Aggregate gross unrealized depreciation for all investments in which there is an excess of tax cost over value | | | (205,785,643 | ) |
| | | | | | | | | |
Net unrealized depreciation | | | | | | | $ | (177,897,371 | ) |
| | | | | | | | | |
(b) Non-income producing security. | | | | | | | | | |
REITsReal Estate Investment Trusts | | | | | | | | | |
17
NET ASSET SUMMARY AT MARCH 31, 2009 (Unaudited)
| | | |
Insurance | | 8.7 | % |
Commercial Banks | | 7.8 | |
Commercial Services & Supplies | | 7.2 | |
IT Services | | 6.0 | |
REITs | | 4.9 | |
Media | | 3.5 | |
Food Products | | 3.1 | |
Electric Utilities | | 2.7 | |
Communications Equipment | | 2.6 | |
Hotels, Restaurants & Leisure | | 2.5 | |
Gas Utilities | | 2.5 | |
Software | | 2.5 | |
Machinery | | 2.3 | |
Health Care Providers & Services | | 2.3 | |
Pharmaceuticals | | 2.2 | |
Capital Markets | | 2.1 | |
Semiconductors & Semiconductor Equipment | | 2.1 | |
Health Care Equipment & Supplies | | 2.0 | |
Textiles, Apparel & Luxury Goods | | 2.0 | |
Other Investments, less than 2% each | | 29.4 | |
Short-Term Investments | | 1.0 | |
| | | |
Total Investments | | 99.4 | |
Other assets less liabilities | | 0.6 | |
| | | |
Net Assets | | 100.0 | % |
| | | |
See accompanying notes to financial statements.
18
STATEMENTS OF ASSETS AND LIABILITIES
March 31, 2009 (Unaudited)
| | | | | | | | |
| | | Small Cap
Growth Fund | | | Small Cap
Value Fund | |
| | | | | | | | |
Assets | | | | | | | | |
Investments at cost | | $ | 90,143,851 | | | $ | 870,313,309 | |
Net unrealized depreciation | | | (10,522,003 | ) | | | (178,041,555 | ) |
| | | | | | | | |
Investments at value | | | 79,621,848 | | | | 692,271,754 | |
Receivable for Fund shares sold | | | 150,040 | | | | 1,373,658 | |
Receivable for securities sold | | | 2,153,110 | | | | 6,768,115 | |
Dividends receivable | | | 24,834 | | | | 963,531 | |
Receivable from investment adviser (Note 5) | | | 7,872 | | | | 87,708 | |
| | | | | | | | |
Total Assets | | | 81,957,704 | | | | 701,464,766 | |
| | | | | | | | |
| | |
| Liabilities | | | | | | | | |
Payable for securities purchased | | | 1,634,556 | | | | 4,128,013 | |
Payable for Fund shares redeemed | | | 354,212 | | | | 378,097 | |
Management fees payable (Note 5) | | | 48,874 | | | | 414,699 | |
Administrative fees payable (Note 5) | | | 2,701 | | | | 22,761 | |
Deferred Trustees’ fees (Note 5) | | | 39,462 | | | | 99,504 | |
Service and distribution fees payable (Note 5) | | | 331 | | | | 2,615 | |
Other accounts payable and accrued expenses | | | 44,932 | | | | 119,191 | |
| | | | | | | | |
Total Liabilities | | | 2,125,068 | | | | 5,164,880 | |
| | | | | | | | |
Net Assets | | $ | 79,832,636 | | | $ | 696,299,886 | |
| | | | | | | | |
Net Assets consist of: | | | | | | | | |
Paid-in capital | | $ | 329,214,858 | | | $ | 1,074,657,076 | |
Accumulated net investment (loss)/Undistributed net investment income | | | (331,381 | ) | | | 599,727 | |
Accumulated net realized loss on investments | | | (238,528,838 | ) | | | (200,915,362 | ) |
Net unrealized depreciation on investments | | | (10,522,003 | ) | | | (178,041,555 | ) |
| | | | | | | | |
Net Assets | | $ | 79,832,636 | | | $ | 696,299,886 | |
| | | | | | | | |
| | |
| Net Asset Value and Offering Price | | | | | | | | |
Institutional Class | | | | | | | | |
Net assets | | $ | 31,364,377 | | | $ | 359,476,601 | |
| | | | | | | | |
Shares of beneficial interest | | | 3,586,171 | | | | 24,299,604 | |
| | | | | | | | |
Net asset value, offering and redemption price per share | | $ | 8.75 | | | $ | 14.79 | |
| | | | | | | | |
Retail Class | | | | | | | | |
Net assets | | $ | 48,468,259 | | | $ | 283,656,602 | |
| | | | | | | | |
Shares of beneficial interest | | | 5,714,722 | | | | 19,332,325 | |
| | | | | | | | |
Net asset value, offering and redemption price per share | | $ | 8.48 | | | $ | 14.67 | |
| | | | | | | | |
Admin Class | | | | | | | | |
Net assets | | $ | — | | | $ | 53,166,683 | |
| | | | | | | | |
Shares of beneficial interest | | | — | | | | 3,682,521 | |
| | | | | | | | |
Net asset value, offering and redemption price per share | | $ | — | | | $ | 14.44 | |
| | | | | | | | |
See accompanying notes to financial statements.
19
STATEMENTS OF OPERATIONS
For the Six Months Ended March 31, 2009 (Unaudited)
| | | | | | | | |
| | | Small Cap
Growth Fund | | | Small Cap
Value Fund | |
| | | | | | | | |
Investment Income | | | | | | | | |
Dividends | | $ | 205,733 | | | $ | 6,273,797 | |
Interest | | | 2,360 | | | | 21,622 | |
Securities lending income (Note 2) | | | 7,998 | | | | 49,006 | |
| | | | | | | | |
| | | 216,091 | | | | 6,344,425 | |
| | | | | | | | |
Expenses | | | | | | | | |
Management fees (Note 5) | | | 329,014 | | | | 2,824,151 | |
Distribution fees—Retail Class (Note 5) | | | 68,684 | | | | 394,212 | |
Service and distribution fees—Admin Class (Note 5) | | | — | | | | 137,046 | |
Trustees’ fees and expenses (Note 5) | | | 5,627 | | | | 12,412 | |
Administrative fees (Note 5) | | | 22,403 | | | | 192,274 | |
Custodian fees and expenses | | | 11,376 | | | | 21,047 | |
Transfer agent fees and expenses—Institutional Class (Note 5) | | | 9,124 | | | | 203,740 | |
Transfer agent fees and expenses—Retail Class (Note 5) | | | 63,218 | | | | 390,485 | |
Transfer agent fees and expenses—Admin Class (Note 5) | | | — | | | | 132,941 | |
Audit and tax services fees | | | 19,496 | | | | 23,724 | |
Registration fees | | | 31,081 | | | | 56,137 | |
Shareholder reporting expenses | | | 11,427 | | | | 98,874 | |
Legal fees | | | 1,780 | | | | 15,692 | |
Miscellaneous expenses (Note 5) | | | (2,824 | ) | | | 5,877 | |
| | | | | | | | |
Total expenses | | | 570,406 | | | | 4,508,612 | |
Less fee reduction and/or expense reimbursement (Note 5) | | | (63,037 | ) | | | (588,374 | ) |
| | | | | | | | |
Net expenses | | | 507,369 | | | | 3,920,238 | |
| | | | | | | | |
Net investment income (loss) | | | (291,278 | ) | | | 2,424,187 | |
| | | | | | | | |
| | |
| Net Realized and Unrealized Loss on Investments | | | | | | | | |
Net Realized Loss | | | (33,540,315 | ) | | | (150,978,022 | ) |
Net Change in Unrealized Appreciation (Depreciation) | | | (7,981,921 | ) | | | (203,880,583 | ) |
| | | | | | | | |
Net realized and unrealized loss on investments | | | (41,522,236 | ) | | | (354,858,605 | ) |
| | | | | | | | |
| | |
| Net Decrease in Net Assets Resulting from Operations | | $ | (41,813,514 | ) | | $ | (352,434,418 | ) |
| | | | | | | | |
See accompanying notes to financial statements.
20
STATEMENTS OF CHANGES IN NET ASSETS
Small Cap Growth Fund
| | | | | | | | |
| | | Six Months Ended
March 31, 2009
(Unaudited) | | | Year Ended
September 30, 2008 | |
From Operations: | | | | | | | | |
Net investment loss | | $ | (291,278 | ) | | $ | (584,280 | ) |
Net realized loss on investments | | | (33,540,315 | ) | | | (6,171,517 | ) |
Net change in unrealized appreciation (depreciation) on investments | | | (7,981,921 | ) | | | (10,322,096 | ) |
| | | | | | | | |
Net decrease in net assets resulting from operations | | | (41,813,514 | ) | | | (17,077,893 | ) |
| | | | | | | | |
From Distributions to Shareholders: | | | | | | | | |
Net Investment Income: | | | | | | | | |
Institutional Class | | | — | | | | — | |
Retail Class | | | — | | | | — | |
Capital Gains: | | | | | | | | |
Institutional Class | | | — | | | | — | |
Retail Class | | | — | | | | — | |
| | | | | | | | |
Total distributions | | | — | | | | — | |
| | | | | | | | |
Increase (Decrease) in Net Assets Derived from Capital Share Transactions (Note 9) | | | (2,790,950 | ) | | | 92,473,941 | |
| | | | | | | | |
Redemption Fees | | | | | | | | |
Institutional Class | | | — | | | | 11,629 | |
Retail Class | | | — | | | | 17,229 | |
| | | | | | | | |
Total Redemption Fees | | | — | | | | 28,858 | |
| | | | | | | | |
Total increase (decrease) in net assets | | | (44,604,464 | ) | | | 75,424,906 | |
Net Assets | | | | | | | | |
Beginning of period | | | 124,437,100 | | | | 49,012,194 | |
| | | | | | | | |
End of period | | $ | 79,832,636 | | | $ | 124,437,100 | |
| | | | | | | | |
Accumulated Net Investment Loss | | $ | (331,381 | ) | | $ | (40,103 | ) |
| | | | | | | | |
Small Cap Value Fund
| | | | | | | | |
| | | Six Months Ended
March 31, 2009
(Unaudited) | | | Year Ended
September 30, 2008 | |
From Operations: | | | | | | | | |
Net investment income | | $ | 2,424,187 | | | $ | 3,447,311 | |
Net realized loss on investments | | | (150,978,022 | ) | | | (37,271,375 | ) |
Net change in unrealized appreciation (depreciation) on investments | | | (203,880,583 | ) | | | (141,209,963 | ) |
| | | | | | | | |
Net decrease in net assets resulting from operations | | | (352,434,418 | ) | | | (175,034,027 | ) |
| | | | | | | | |
From Distributions to Shareholders: | | | | | | | | |
Net Investment Income: | | | | | | | | |
Institutional Class | | | (2,585,541 | ) | | | (1,132,960 | ) |
Retail Class | | | (1,071,277 | ) | | | — | |
Admin Class | | | (9,660 | ) | | | — | |
Capital Gains: | | | | | | | | |
Institutional Class | | | (167,987 | ) | | | (51,944,175 | ) |
Retail Class | | | (141,335 | ) | | | (47,065,282 | ) |
Admin Class | | | (24,687 | ) | | | (8,031,853 | ) |
| | | | | | | | |
Total distributions | | | (4,000,487 | ) | | | (108,174,270 | ) |
| | | | | | | | |
Increase (Decrease) in Net Assets Derived from Capital Share Transactions (Note 9) | | | (42,940,893 | ) | | | 302,201,210 | |
| | | | | | | | |
Redemption Fees | | | | | | | | |
Institutional Class | | | 13,620 | | | | 20,568 | |
Retail Class | | | 11,287 | | | | 18,348 | |
Admin Class | | | 1,950 | | | | 3,084 | |
| | | | | | | | |
Total Redemption Fees | | | 26,857 | | | | 42,000 | |
| | | | | | | | |
Total increase (decrease) in net assets | | | (399,348,941 | ) | | | 19,034,913 | |
Net Assets | | | | | | | | |
Beginning of period | | | 1,095,648,827 | | | | 1,076,613,914 | |
| | | | | | | | |
End of period | | $ | 696,299,886 | | | $ | 1,095,648,827 | |
| | | | | | | | |
Undistributed Net Investment Income | | $ | 599,727 | | | $ | 1,842,018 | |
| | | | | | | | |
See accompanying notes to financial statements.
21
THIS PAGE INTENTIONALLY LEFT BLANK
22
FINANCIAL HIGHLIGHTS
For a share outstanding throughout each period.
| | | | | | | | | | | | | | | | | | | | | | | | | | | | | |
| | | | | Income (Loss) from Investment Operations: | | | | | Less Distributions: | |
| | | Net asset
value,
beginning
of the period | | Net
investment
income
(loss)(a)(b) | | | Net realized
and
unrealized
gain (loss) | | | Total from
investment
operations | | | | | Dividends
from
net investment
income(b) | | | Distributions
from net
realized
capital gains | | | Total
distributions | |
| Small Cap Growth Fund | | | | | | | | | | | | | | | | | | | | | | | |
| | | | | | | |
| Institutional Class | | | | | | | | | | | | | | | | | | | | | | | | | | |
3/31/2009(g) | | $ | 13.07 | | $ | (0.02 | ) | | $ | (4.30 | ) | | $ | (4.32 | ) | | | | $ | — | | | $ | — | | | $ | — | |
9/30/2008 | | | 15.87 | | | (0.07 | ) | | | (2.73 | ) | | | (2.80 | ) | | | | | — | | | | — | | | | — | |
9/30/2007 | | | 12.00 | | | (0.06 | )(f) | | | 3.93 | | | | 3.87 | | | | | | — | | | | — | | | | — | |
9/30/2006 | | | 11.08 | | | (0.08 | ) | | | 0.99 | | | | 0.91 | | | | | | — | | | | — | | | | — | |
9/30/2005 | | | 8.96 | | | (0.08 | ) | | | 2.20 | | | | 2.12 | | | | | | — | | | | — | | | | — | |
9/30/2004 | | | 8.59 | | | (0.09 | ) | | | 0.46 | | | | 0.37 | | | | | | — | | | | — | | | | — | |
| | | | | | | |
| Retail Class | | | | | | | | | | | | | | | | | | | | | | | | | | |
3/31/2009(g) | | | 12.69 | | | (0.03 | ) | | | (4.18 | ) | | | (4.21 | ) | | | | | — | | | | — | | | | — | |
9/30/2008 | | | 15.45 | | | (0.10 | ) | | | (2.66 | ) | | | (2.76 | ) | | | | | — | | | | — | | | | — | |
9/30/2007 | | | 11.71 | | | (0.09 | )(f) | | | 3.83 | | | | 3.74 | | | | | | — | | | | — | | | | — | |
9/30/2006 | | | 10.84 | | | (0.11 | ) | | | 0.97 | | | | 0.86 | | | | | | — | | | | — | | | | — | |
9/30/2005 | | | 8.78 | | | (0.11 | ) | | | 2.17 | | | | 2.06 | | | | | | — | | | | — | | | | — | |
9/30/2004 | | | 8.45 | | | (0.11 | ) | | | 0.44 | | | | 0.33 | | | | | | — | | | | — | | | | — | |
| | | | | | | |
| Small Cap Value Fund | | | | | | | | | | | | | | | | | | | | | | | | | | |
| | | | | | | |
| Institutional Class | | | | | | | | | | | | | | | | | | | | | | | | | | |
3/31/2009(g) | | $ | 22.01 | | $ | 0.06 | | | $ | (7.17 | ) | | $ | (7.11 | ) | | | | $ | (0.10 | ) | | $ | (0.01 | ) | | $ | (0.11 | ) |
9/30/2008 | | | 28.77 | | | 0.11 | (h) | | | (4.03 | ) | | | (3.92 | ) | | | | | (0.06 | ) | | | (2.78 | ) | | | (2.84 | ) |
9/30/2007 | | | 27.69 | | | 0.12 | (f)(i) | | | 4.29 | | | | 4.41 | | | | | | (0.17 | ) | | | (3.16 | ) | | | (3.33 | ) |
9/30/2006 | | | 27.43 | | | 0.13 | | | | 2.70 | | | | 2.83 | | | | | | (0.15 | ) | | | (2.42 | ) | | | (2.57 | ) |
9/30/2005 | | | 25.75 | | | 0.13 | | | | 4.22 | | | | 4.35 | | | | | | (0.02 | ) | | | (2.65 | ) | | | (2.67 | ) |
9/30/2004 | | | 21.34 | | | 0.04 | | | | 4.97 | | | | 5.01 | | | | | | (0.05 | ) | | | (0.55 | ) | | | (0.60 | ) |
| | | | | | | |
| Retail Class | | | | | | | | | | | | | | | | | | | | | | | | | | |
3/31/2009(g) | | | 21.79 | | | 0.04 | | | | (7.10 | ) | | | (7.06 | ) | | | | | (0.05 | ) | | | (0.01 | ) | | | (0.06 | ) |
9/30/2008 | | | 28.52 | | | 0.05 | (h) | | | (4.00 | ) | | | (3.95 | ) | | | | | — | | | | (2.78 | ) | | | (2.78 | ) |
9/30/2007 | | | 27.46 | | | 0.04 | (f)(i) | | | 4.28 | | | | 4.32 | | | | | | (0.10 | ) | | | (3.16 | ) | | | (3.26 | ) |
9/30/2006 | | | 27.23 | | | 0.06 | | | | 2.67 | | | | 2.73 | | | | | | (0.08 | ) | | | (2.42 | ) | | | (2.50 | ) |
9/30/2005 | | | 25.62 | | | 0.06 | | | | 4.20 | | | | 4.26 | | | | | | — | | | | (2.65 | ) | | | (2.65 | ) |
9/30/2004 | | | 21.25 | | | (0.02 | ) | | | 4.95 | | | | 4.93 | | | | | | (0.01 | ) | | | (0.55 | ) | | | (0.56 | ) |
| | | | | | | |
| Admin Class | | | | | | | | | | | | | | | | | | | | | | | | | | |
3/31/2009(g) | | | 21.40 | | | 0.02 | | | | (6.97 | ) | | | (6.95 | ) | | | | | (0.00 | ) | | | (0.01 | ) | | | (0.01 | ) |
9/30/2008 | | | 28.13 | | | (0.01 | )(h) | | | (3.94 | ) | | | (3.95 | ) | | | | | — | | | | (2.78 | ) | | | (2.78 | ) |
9/30/2007 | | | 27.14 | | | (0.03 | )(f)(i) | | | 4.22 | | | | 4.19 | | | | | | (0.04 | ) | | | (3.16 | ) | | | (3.20 | ) |
9/30/2006 | | | 26.94 | | | (0.01 | ) | | | 2.65 | | | | 2.64 | | | | | | (0.02 | ) | | | (2.42 | ) | | | (2.44 | ) |
9/30/2005 | | | 25.43 | | | (0.00 | ) | | | 4.16 | | | | 4.16 | | | | | | — | | | | (2.65 | ) | | | (2.65 | ) |
9/30/2004 | | | 21.13 | | | (0.08 | ) | | | 4.93 | | | | 4.85 | | | | | | — | | | | (0.55 | ) | | | (0.55 | ) |
(a) Per share net investment income (loss) has been calculated using the average shares outstanding during the period.
(b) Amount rounds to less than $0.01 per share, if applicable.
(c) Had certain expenses not been reduced during the period, if applicable, total returns would have been lower. Periods less than one year, if applicable, are not annualized.
(d) The investment adviser and/or administrator agreed to reimburse a portion of the Fund’s expenses and/or reduce its fees during the period. Without this reimbursement/fee reduction, if applicable, expenses would have been higher.
(e) Computed on an annualized basis for periods less than one year, if applicable.
(f) Includes a non-recurring payment of $0.01 per share and $0.00 per share for Small Cap Growth Fund and Small Cap Value Fund, respectively.
(g) For the six months ended March 31, 2009 (Unaudited).
(h) Includes a non-recurring dividend of $0.02 per share.
(i) Includes a non-recurring dividend of $0.05 per share.
(j) Includes fee/expense recovery of 0.02%.
See accompanying notes to financial statements.
23
| | | | | | | | | | | | | | | | | | | | | |
| | | | | | | | | | Ratios to Average Net Assets: | | | |
Redemption
fees(b) | | Net asset
value,
end of
the period | | Total
return (%)(c) | | | Net assets,
end of
the period
(000’s) | | Net
expenses (%)(d)(e) | | | Gross
expenses (%)(e) | | | Net
investment
income
(loss) (%)(e) | | | Portfolio
turnover
rate (%) |
| | | | | | | | | | | | | | | | | | | | | |
| | | | | | | |
| | | | | | | | | | | | | | | | | | | | | |
| $ | — | | $ | 8.75 | | (33.1 | ) | | $ | 31,364 | | 1.00 | | | 1.03 | | | (0.51 | ) | | 57 |
| | 0.00 | | | 13.07 | | (17.6 | ) | | | 44,540 | | 1.00 | | | 1.01 | | | (0.47 | ) | | 92 |
| | 0.00 | | | 15.87 | | 32.3 | | | | 28,088 | | 1.00 | | | 1.23 | | | (0.47 | ) | | 83 |
| | 0.01 | | | 12.00 | | 8.3 | | | | 20,414 | | 1.00 | | | 1.38 | | | (0.69 | ) | | 100 |
| | 0.00 | | | 11.08 | | 23.7 | | | | 15,785 | | 1.00 | | | 1.70 | | | (0.85 | ) | | 227 |
| | 0.00 | | | 8.96 | | 4.3 | | | | 15,867 | | 1.00 | | | 1.31 | | | (0.95 | ) | | 217 |
| | | | | | | |
| | | | | | | | | | | | | | | | | | | | | |
| | — | | | 8.48 | | (33.2 | ) | | | 48,468 | | 1.25 | | | 1.46 | | | (0.76 | ) | | 57 |
| | 0.00 | | | 12.69 | | (17.9 | ) | | | 79,897 | | 1.25 | | | 1.42 | | | (0.70 | ) | | 92 |
| | 0.00 | | | 15.45 | | 31.9 | | | | 20,924 | | 1.25 | | | 1.50 | | | (0.66 | ) | | 83 |
| | 0.01 | | | 11.71 | | 8.0 | | | | 2,981 | | 1.25 | | | 1.92 | | | (0.94 | ) | | 100 |
| | 0.00 | | | 10.84 | | 23.5 | | | | 3,592 | | 1.25 | | | 1.87 | | | (1.14 | ) | | 227 |
| | 0.00 | | | 8.78 | | 3.9 | | | | 14,589 | | 1.25 | | | 1.52 | | | (1.19 | ) | | 217 |
| | | | | | | |
| | | | | | | | | | | | | | | | | | | | | |
| | | | | | | |
| | | | | | | | | | | | | | | | | | | | | |
| $ | 0.00 | | $ | 14.79 | | (32.3 | ) | | $ | 359,477 | | 0.90 | | | 0.97 | | | 0.79 | | | 28 |
| | 0.00 | | | 22.01 | | (15.0 | ) | | | 553,268 | | 0.89 | | | 0.89 | | | 0.47 | | | 61 |
| | 0.00 | | | 28.77 | | 17.0 | | | | 534,776 | | 0.89 | | | 0.89 | | | 0.43 | | | 57 |
| | 0.00 | | | 27.69 | | 11.2 | | | | 442,714 | | 0.89 | (j) | | 0.89 | (j) | | 0.47 | | | 62 |
| | 0.00 | | | 27.43 | | 18.0 | | | | 403,110 | | 0.90 | | | 0.93 | | | 0.48 | | | 59 |
| | 0.00 | | | 25.75 | | 23.8 | | | | 346,356 | | 0.90 | | | 0.93 | | | 0.16 | | | 70 |
| | | | | | | |
| | | | | | | | | | | | | | | | | | | | | |
| | 0.00 | | | 14.67 | | (32.4 | ) | | | 283,657 | | 1.15 | | | 1.36 | | | 0.53 | | | 28 |
| | 0.00 | | | 21.79 | | (15.2 | ) | | | 464,525 | | 1.15 | | | 1.27 | | | 0.21 | | | 61 |
| | 0.00 | | | 28.52 | | 16.7 | | | | 465,055 | | 1.15 | | | 1.24 | | | 0.15 | | | 57 |
| | 0.00 | | | 27.46 | | 10.9 | | | | 291,690 | | 1.15 | | | 1.20 | | | 0.21 | | | 62 |
| | 0.00 | | | 27.23 | | 17.7 | | | | 235,948 | | 1.15 | | | 1.20 | | | 0.24 | | | 59 |
| | 0.00 | | | 25.62 | | 23.5 | | | | 173,411 | | 1.15 | | | 1.18 | | | (0.08 | ) | | 70 |
| | | | | | | |
| | | | | | | | | | | | | | | | | | | | | |
| | 0.00 | | | 14.44 | | (32.5 | ) | | | 53,167 | | 1.40 | | | 1.85 | | | 0.30 | | | 28 |
| | 0.00 | | | 21.40 | | (15.4 | ) | | | 77,855 | | 1.40 | | | 1.68 | | | (0.04 | ) | | 61 |
| | 0.00 | | | 28.13 | | 16.4 | | | | 76,783 | | 1.40 | | | 1.56 | | | (0.10 | ) | | 57 |
| | 0.00 | | | 27.14 | | 10.6 | | | | 64,367 | | 1.40 | | | 1.46 | | | (0.04 | ) | | 62 |
| | 0.00 | | | 26.94 | | 17.4 | | | | 67,505 | | 1.40 | | | 1.43 | | | (0.01 | ) | | 59 |
| | 0.00 | | | 25.43 | | 23.3 | | | | 62,680 | | 1.40 | | | 1.43 | | | (0.33 | ) | | 70 |
See accompanying notes to financial statements.
24
NOTES TO FINANCIAL STATEMENTS
March 31, 2009 (Unaudited)
1. Organization. Loomis Sayles Funds I and Loomis Sayles Funds II (the “Trusts” and each a “Trust”) are each organized as a Massachusetts business trust. Each Trust is registered under the Investment Company Act of 1940, as amended (the “1940 Act”), as an open-end management investment company. Each Declaration of Trust permits the Board of Trustees to authorize the issuance of an unlimited number of shares of the Trusts in multiple series. Information presented in these financial statements pertains to certain equity funds of the Trusts; the financial statements for the remaining equity funds and the fixed income funds of the Trusts are presented in separate reports. The following funds (individually, a “Fund” and collectively, the “Funds”) are included in this report:
Loomis Sayles Funds I:
Loomis Sayles Small Cap Value Fund (the “Small Cap Value Fund”)
Loomis Sayles Funds II:
Loomis Sayles Small Cap Growth Fund (the “Small Cap Growth Fund”)
Each Fund offers Institutional Class Shares and Retail Class Shares. In addition, Small Cap Value Fund offers Admin Class Shares.
Most expenses of the Trusts can be directly attributed to a fund. Expenses which cannot be directly attributed to a fund are generally apportioned based on the relative net assets of each of the funds in the Trusts. Expenses of a fund are borne pro rata by the holders of each class of shares, except that each class bears expenses unique to that class (including the Rule 12b-1 service and distribution fees and transfer agent fees applicable to such class). In addition, each class votes as a class only with respect to its own Rule 12b-1 Plan. Shares of each class would receive their pro rata share of the net assets of a fund if the fund were liquidated. The Trustees approve separate dividends from net investment income on each class of shares.
2. Significant Accounting Policies. The following is a summary of significant accounting policies consistently followed by each Fund in the preparation of its financial statements. The Funds’ financial statements are prepared in accordance with accounting principles generally accepted in the United States of America which require the use of management estimates that affect the reported amounts and disclosures in the financial statements. Actual results could differ from those estimates.
a. Valuation. Equity securities, including closed-end investment companies and exchange-traded funds, for which market quotations are readily available are valued at market value, as reported by pricing services recommended by the investment adviser and approved by the Board of Trustees. Such pricing services generally use the security’s last sale price on the exchange or market where the security is primarily traded or, if there is no reported sale during the day, the closing bid price. Securities traded on the NASDAQ Global Select Market, NASDAQ Global Market and NASDAQ Capital Market are valued at the NASDAQ Official Closing Price (“NOCP”), or if lacking a NOCP, at the most recent bid quotation on the applicable NASDAQ Market. Debt securities (other than short-term obligations purchased with an original or remaining maturity of sixty days or less) are generally valued on the basis of evaluated bids furnished to the Funds by a pricing service recommended by the investment adviser and approved by the Board of Trustees, which service determines valuations for normal, institutional-size trading units of such securities using market information, transactions for comparable securities and various relationships between securities which are generally recognized by institutional traders. Broker-dealer bid quotations may also be used to value debt and equity securities where a pricing service does not price a security or where a pricing service does not provide a reliable price for the security. In instances where broker-dealer bid quotations are not available, certain securities held by the Funds may be valued on the basis of a price provided by a principal market maker. Forward foreign currency contracts are “marked-to-market” daily utilizing interpolated prices determined from information provided by an independent pricing service. Short-term obligations purchased with an original or remaining maturity of sixty days or less are valued at amortized cost, which approximates market value. Securities for which market quotations are not readily available are valued at fair value as determined in good faith by the Funds’ investment adviser using consistently applied procedures under the general supervision of the Board of Trustees. Investments in other open-end investment companies are valued at their net asset value each day.
The Funds may hold securities traded in foreign markets. Foreign securities are valued at the market price in the foreign market. However, if events occurring after the close of the foreign market (but before the close of regular trading on the New York Stock Exchange) are believed to materially affect the value of those securities, such securities are fair valued pursuant to procedures approved by the Board of Trustees. When fair valuing securities, the Funds may, among other things, use modeling tools or other processes that may take into account factors such as securities market activity and/or significant events that occur after the close of the foreign market and before the Funds calculate their net asset values.
b. Security Transactions and Related Investment Income. Security transactions are accounted for on trade date. Dividend income is recorded on ex-dividend date, or in the case of certain foreign securities, as soon as the Fund is notified, and interest income
25
is recorded on an accrual basis. Interest income is increased by the accretion of discount and decreased by the amortization of premium. Distributions received from investments in securities that represent a return of capital or capital gain are recorded as a reduction of cost of investments or as a realized gain, respectively. The calendar year-end amounts of ordinary income, capital gains, and return of capital included in distributions received from the Funds’ investments in real estate investment trusts (“REITs”) are reported to the Funds after the end of the fiscal year; accordingly, the Funds estimate these amounts for accounting purposes until the characterization of REIT distributions is reported to the Funds after the end of the fiscal year. Estimates are based on the most recent REIT distribution information available. Investment income is recorded net of foreign taxes withheld when applicable. In determining net gain or loss on securities sold, the cost of securities has been determined on an identified cost basis. Investment income, non-class specific expenses and realized and unrealized gains and losses are allocated on a pro rata basis to each class based on the relative net assets of each class to the total net assets of the Fund.
c. Foreign Currency Translation. The books and records of the Funds are maintained in U.S. dollars. The value of securities, currencies and other assets and liabilities denominated in currencies other than U.S. dollars are translated into U.S. dollars based upon foreign exchange rates prevailing at the end of the period. Purchases and sales of investment securities, income and expenses are translated on the respective dates of such transactions.
Since the values of investment securities are presented at the foreign exchange rates prevailing at the end of the period, it is not practical to isolate that portion of the results of operations arising from changes in exchange rates from fluctuations which arise due to changes in market prices of the investment securities. Such changes are included with the net realized and unrealized gain or loss on investments.
Net realized foreign exchange gains or losses arise from sales of foreign currency, currency gains or losses realized between the trade and settlement dates on securities transactions and the difference between the amounts of dividends, interest and foreign withholding taxes recorded on the Funds’ books and the U.S. dollar equivalent of the amounts actually received or paid. Net unrealized foreign exchange gains and losses arise from changes in the value of assets and liabilities, other than investment securities, at the end of the fiscal period, resulting from changes in exchange rates.
Each Fund may use foreign currency exchange contracts to facilitate transactions in foreign-denominated investments. Losses may arise from changes in the value of the foreign currency or if the counterparties do not perform under the contracts’ terms.
Each Fund may purchase investments of foreign issuers. Investing in securities of foreign issuers involves special risks and considerations not typically associated with investing in U.S. companies and securities of the U.S. government. These risks include revaluation of currencies and the risk of expropriation. Moreover, the markets for securities of many foreign issuers may be less liquid and the price of such securities may be more volatile than those of comparable U.S. companies and the U.S. government.
d. Forward Foreign Currency Contracts. Each Fund may enter into forward foreign currency contracts. Contracts generally are used to acquire exposure to foreign currencies and may also be used for hedging purposes. Also, a contract to buy or sell can offset a previous contract. These contracts involve market risk in excess of the unrealized gain or loss reflected in the Fund’s Statement of Assets and Liabilities. The U.S. dollar value of the currencies a Fund has committed to buy or sell represents the aggregate exposure to each currency the Fund has acquired or hedged through currency contracts outstanding at period end. Gains or losses are recorded for financial statement purposes as unrealized until settlement date. Risks may arise upon entering into these contracts from the potential inability of counterparties to meet the terms of their contracts and from unanticipated movements in the value of a foreign currency relative to the U.S. dollar.
At March 31, 2009, there were no open forward foreign currency contracts.
e. Federal and Foreign Income Taxes. Each Trust treats each Fund as a separate entity for federal income tax purposes. Each Fund intends to meet the requirements of the Internal Revenue Code applicable to regulated investment companies, and to distribute to its shareholders substantially all of its net investment income and any net realized capital gains at least annually. Management has performed an analysis of the Funds’ tax positions taken on federal and state tax returns that remain subject to examination (tax years ended September 30, 2005-2008) and has concluded that no provisions for income tax are required. Fund management is not aware of any events that are reasonably possible to occur in the next six months that would result in the amounts of any unrecognized tax benefits significantly increasing or decreasing for the Funds. However, management’s conclusions regarding tax positions taken may be subject to review and adjustment at a later date based on factors including, but not limited to, new tax laws and accounting regulations and interpretations thereof.
A Fund may be subject to foreign taxes on income and gains on investments that are accrued based upon the Fund’s understanding of the tax rules and regulations that exist in the countries in which the Fund invests. Foreign governments may also
26
NOTES TO FINANCIAL STATEMENTS – continued
March 31, 2009 (Unaudited)
impose taxes or other payments on investments with respect to foreign securities. Such taxes are accrued as applicable, and are reflected as foreign taxes payable on the Statements of Assets and Liabilities.
f. Dividends and Distributions to Shareholders. Dividends and distributions are recorded on ex-dividend date. The timing and characterization of certain income and capital gain distributions are determined annually in accordance with federal tax regulations, which may differ from accounting principles generally accepted in the United States of America. Permanent differences are primarily due to differing treatments for book and tax purposes for items such as distributions from REITs, foreign currency transactions and net operating losses. Permanent book and tax basis differences relating to shareholder distributions will result in reclassifications to capital accounts. Temporary differences between book and tax distributable earnings are primarily due to securities lending collateral gain/loss adjustment, deferred Trustees’ fees, REIT basis adjustments and wash sales. Distributions from net investment income and short-term capital gains are considered to be distributed from ordinary income for tax purposes.
The tax characterization of distributions is determined on an annual basis. The tax character of distributions paid to shareholders during the year ended September 30, 2008 was as follows:
| | | | | | | | | |
| | | 2008 Distributions Paid From: |
Fund | | Ordinary
Income | | Long-Term
Capital Gains | | Total |
Small Cap Growth Fund | | $ | — | | $ | — | | $ | — |
Small Cap Value Fund | | | 16,873,484 | | | 91,300,786 | | | 108,174,270 |
Differences between these amounts and those reported in the Statements of Changes in Net Assets, if any, are primarily attributable to different book and tax treatment for short-term capital gains.
As of September 30, 2008, capital loss carryforwards and post-October losses were as follows:
| | | | | | | | |
Capital loss carryforward: | | Small Cap
Growth Fund | | | Small Cap
Value Fund | |
Expires September 30, 2010 | | $ | (138,314,515 | ) | | $ | — | |
Expires September 30, 2011 | | | (59,283,040 | ) | | | — | |
| | | | | | | | |
Total capital loss carryforward | | $ | (197,597,555 | ) | | $ | — | |
| | | | | | | | |
Deferred net capital losses (post-October 2007) | | $ | (7,364,469 | ) | | $ | (47,743,728 | ) |
| | | | | | | | |
g. Repurchase Agreements. It is each Fund’s policy that the market value of the collateral for repurchase agreements be at least equal to 102% of the repurchase price, including interest. The repurchase agreements are tri-party arrangements whereby the collateral is held in a segregated account for the benefit of the Fund and on behalf of the counterparty. Repurchase agreements could involve certain risks in the event of default or insolvency of the counterparty including possible delays or restrictions upon a Fund’s ability to dispose of the underlying securities.
h. Securities Lending. The Funds have entered into an agreement with State Street Bank and Trust Company (“State Street Bank”), as agent of the Funds, to lend securities to certain designated borrowers. The loans are collateralized with cash or securities in an amount equal to at least 105% or 102% of the market value (including accrued interest) of the loaned international or domestic securities, respectively, when the loan is initiated. Thereafter, the value of the collateral must remain at least 102% of the market value (including accrued interest) of loaned securities for U.S. equities and U.S. corporate debt; at least 105% of the market value (including accrued interest) of loaned securities for non-U.S. equities; and at least 100% of the market value (including accrued interest) of loaned securities for U.S. government securities, sovereign debt issued by non-U.S. governments and non-U.S. corporate debt. In the event that the market value of the collateral falls below the required percentages described above, the borrower will deliver additional collateral on the next business day. As with other extensions of credit, the Funds bear the risk of loss with respect to the investment of the collateral. The Funds invest cash collateral in short-term investments, a portion of the income from which is remitted to the borrowers and the remainder allocated between the Funds and State Street Bank as lending agent.
As of March 31, 2009, there were no securities on loan.
27
i. Indemnifications. Under the Trusts’ organizational documents, their officers and Trustees are indemnified against certain liabilities arising out of the performance of their duties to the Funds. Additionally, in the normal course of business, the Funds enter into contracts with service providers that contain general indemnification clauses. The Funds’ maximum exposure under these arrangements is unknown as this would involve future claims that may be made against the Funds that have not yet occurred. However, based on experience, the Funds expect the risk of loss to be remote.
j. New Accounting Pronouncement. In March 2008, Statement of Financial Accounting Standards No. 161, Disclosures about Derivative Instruments and Hedging Activities (“FAS 161”), was issued and will be effective for fiscal years and interim periods beginning after November 15, 2008. FAS 161 requires enhanced disclosures about funds’ derivative and hedging activities. Management is currently evaluating the impact the adoption of FAS 161 may have on the Funds’ financial statement disclosures.
3. Fair Value Measurements. The Funds adopted Financial Accounting Standards Board Statement of Financial Accounting Standards No. 157 (“FAS 157”), Fair Value Measurements, effective October 1, 2008. FAS 157 establishes a hierarchy for net asset value determination purposes in which various inputs are used in determining the value of the Fund’s investments. These inputs are summarized in the three broad levels listed below:
| | • | | Level 1—quoted prices in active markets for identical investments; |
| | • | | Level 2—prices determined using other significant observable inputs that are observable either directly, or indirectly through corroboration with observable market data (which could include quoted prices for similar investments, interest rates, credit risk, etc.); |
| | • | | Level 3—prices determined using significant unobservable inputs for situations where quoted prices or observable inputs are unavailable such as when there is little or no market activity for an investment (unobservable inputs reflect the Fund’s own assumptions in determining the fair value of investments and would be based on the best information available). |
The inputs or methodology used for valuing securities are not necessarily an indication of the risk associated with investing in those securities.
The following is a summary of the inputs used to value the Funds’ investments as of March 31, 2009:
Small Cap Growth Fund
| | | |
Valuation Inputs | | Investments in
Securities |
Level 1 – Quoted Prices | | $ | 79,621,848 |
Level 2 – Other Significant Observable Inputs | | | — |
Level 3 – Significant Unobservable Inputs | | | — |
| | | |
Total | | $ | 79,621,848 |
| | | |
Small Cap Value Fund
| | | |
Valuation Inputs | | Investments in
Securities |
Level 1 – Quoted Prices | | $ | 692,271,754 |
Level 2 – Other Significant Observable Inputs | | | — |
Level 3 – Significant Unobservable Inputs | | | — |
| | | |
Total | | $ | 692,271,754 |
| | | |
In April 2009, the Financial Accounting Standards Board (“FASB”) issued FASB Staff Position No. 157-4, Determining Fair Value When the Volume and Level of Activity for the Asset or Liability Have Significantly Decreased and Identifying Transactions That Are Not Orderly (“FSP 157-4”). FSP 157-4 provides additional guidance for estimating fair value in accordance with FAS 157, when the volume and level of activity for the asset or liability have significantly decreased as well as guidance on identifying circumstances that indicate a transaction is not orderly. FSP 157-4 is effective for fiscal years and interim periods ending after June 15, 2009. Management is currently evaluating the impact the adoption of FSP 157-4 will have on the Funds’ financial statement disclosures.
4. Purchases and Sales of Securities. For the six months ended March 31, 2009, purchases and sales of securities (excluding short-term investments) were as follows:
| | | | | | |
Fund | | Purchases | | Sales |
Small Cap Growth Fund | | $ | 50,712,748 | | $ | 53,755,781 |
Small Cap Value Fund | | | 218,290,842 | | | 249,613,897 |
28
NOTES TO FINANCIAL STATEMENTS – continued
March 31, 2009 (Unaudited)
5. Management Fees and Other Transactions with Affiliates.
a. Management Fees. Loomis, Sayles & Company, L.P. (“Loomis Sayles”) serves as investment adviser to each Fund. Under the terms of the management agreements, each Fund pays a management fee at the following annual rates, calculated daily and payable monthly, based on each Fund’s average daily net assets:
| | |
Fund | | Percentage of
Average Daily
Net Assets |
Small Cap Growth Fund | | 0.75% |
Small Cap Value Fund | | 0.75% |
Loomis Sayles has given binding undertakings to the Funds to reduce management fees and/or reimburse certain expenses associated with the Funds to limit their operating expenses, exclusive of brokerage expenses, interest expense, taxes and extraordinary expenses. These undertakings are in effect until January 31, 2010 and will be reevaluated on an annual basis. For the six months ended March 31, 2009, the expense limits as a percentage of average daily net assets under the expense limitation agreements were as follows:
| | | | | | |
| | | Expense Limit as a Percentage of
Average Daily Net Assets |
Fund | | Institutional
Class | | Retail
Class | | Admin
Class |
Small Cap Growth Fund | | 1.00% | | 1.25% | | — |
Small Cap Value Fund | | 0.90% | | 1.15% | | 1.40% |
For the six months ended March 31, 2009, the management fees for each Fund were as follows:
| | | |
Fund | | Management
Fee |
Small Cap Growth Fund | | $ | 329,014 |
Small Cap Value Fund | | | 2,824,151 |
For the six months ended March 31, 2009, class specific expenses have been reimbursed as follows:
| | | |
Fund | | Reimbursement |
Small Cap Growth Fund | | $ | 63,037 |
Small Cap Value Fund | | | 588,374 |
Loomis Sayles shall be permitted to recover expenses it has borne under the expense limitation agreement (whether through reduction of its management fees or otherwise) on a class by class basis in later periods to the extent the expenses of a class fall below a class’ expense limits, provided, however, that a class is not obligated to pay such reduced fees/expenses more than one year after the end of the fiscal year in which the fee/expense was reduced. The amounts subject to possible recovery under the expense limitation agreements at March 31, 2009 were as follows:
| | | | | | | | | | | | |
| | | Expenses Subject to Possible Recovery Until
September 30, 2009 |
Fund | | Institutional Class | | Retail Class | | Admin Class | | Total |
Small Cap Growth Fund | | $ | 2,492 | | $ | 92,689 | | $ | — | | $ | 95,181 |
Small Cap Value Fund | | | — | | | 546,480 | | | 220,966 | | | 767,446 |
| | | | | | | | | | | | |
| | | Expenses Subject to Possible Recovery Until
September 30, 2010 |
Fund | | Institutional Class | | Retail Class | | Admin Class | | Total |
Small Cap Growth Fund | | $ | 5,718 | | $ | 57,319 | | $ | — | | $ | 63,037 |
Small Cap Value Fund | | | 133,834 | | | 331,457 | | | 123,083 | | | 588,374 |
Certain officers and employees of Loomis Sayles are also officers or Trustees of the Trust. Loomis Sayles’ general partner is indirectly owned by Natixis Global Asset Management, L.P. (“Natixis US”), which is part of Natixis Global Asset Management, an international asset management group based in Paris, France.
29
b. Administrative Fees. Natixis Asset Management Advisors, L.P. (“Natixis Advisors”) provides certain administrative services for the Funds and subcontracts with State Street Bank to serve as sub-administrator. Natixis Advisors is a wholly-owned subsidiary of Natixis US. Pursuant to an agreement among Natixis Funds Trust I, Natixis Funds Trust II, Natixis Funds Trust III, Natixis Funds Trust IV, Natixis Cash Management Trust, Gateway Trust (“Natixis Funds Trusts”), Loomis Sayles Funds I, Loomis Sayles Funds II (“Loomis Sayles Funds Trusts”), Hansberger International Series and Natixis Advisors, each Fund pays Natixis Advisors monthly its pro rata portion of fees equal to an annual rate of 0.0575% of the first $15 billion of the average daily net assets of the Natixis Funds Trusts, Loomis Sayles Funds Trusts and the Hansberger International Series, 0.0500% of the next $15 billion, 0.0425% of the next $30 billion and 0.0375% of such assets in excess of $60 billion, subject to an annual aggregate minimum fee for the Natixis Funds Trusts, Loomis Sayles Funds Trusts and the Hansberger International Series of $10 million, which is reevaluated on an annual basis. New funds are subject to a fee for the first twelve months of operations of $75,000 plus $12,500 per class and an additional $75,000 if managed by multiple subadvisors.
For the six months ended March 31, 2009, each Fund paid the following for administrative fees to Natixis Advisors:
| | | |
Fund | | Administrative
Fees |
Small Cap Growth Fund | | $ | 22,403 |
Small Cap Value Fund | | | 192,274 |
c. Service and Distribution Fees. Natixis Distributors, L.P. (“Natixis Distributors”), a wholly owned subsidiary of Natixis US, has entered into a distribution agreement with the Trusts. Pursuant to this agreement, Natixis Distributors serves as principal underwriter of each Fund.
Pursuant to Rule 12b-1 under the 1940 Act, the Small Cap Growth Fund and the Small Cap Value Fund have adopted a Distribution Plan relating to their Retail Class shares (the “Retail Class Plans”) and the Small Cap Value Fund has adopted a separate Distribution Plan relating to its Admin Class shares (the “Admin Class Plan”).
Under the respective Retail Class and Admin Class Plans, each Fund pays Natixis Distributors a monthly distribution fee at an annual rate not to exceed 0.25% of the average daily net assets attributable to the Fund’s Retail Class and Admin Class Shares, as reimbursement for expenses incurred by Natixis Distributors in providing personal services to investors in Retail Class and Admin Class Shares and/or maintenance of shareholder accounts. In addition, the Admin Class shares of the Small Cap Value Fund may pay an administrative service fee, at an annual rate not to exceed 0.25% of the average daily net assets attributable to Admin Class shares, to securities dealers or financial intermediaries for providing personal service and account maintenance for their customers who hold such shares.
For the six months ended March 31, 2009, the Funds paid the following service and distribution fees:
| | | | | | | | | |
| | | Service Fees | | Distribution Fees |
Fund | | Admin
Class | | Retail
Class | | Admin
Class |
Small Cap Growth Fund | | $ | — | | $ | 68,684 | | $ | — |
Small Cap Value Fund | | | 68,523 | | | 394,212 | | | 68,523 |
d. Sub-Transfer Agent Fees. Natixis Distributors has entered into agreements with financial intermediaries to provide certain recordkeeping, processing, shareholder communications and other services to customers of the intermediaries and has agreed to compensate the intermediaries for providing those services. Certain services would be provided by the Funds if the shares of those customers were registered directly with the Funds’ transfer agent. Accordingly, the Funds agreed to pay a portion of the intermediary fees attributable to shares of the Fund held by the intermediaries (which generally is a percentage of the value of shares held) not exceeding what the Funds would have paid its transfer agent had each customer’s shares been registered directly with the transfer agent instead of held through the intermediaries. Natixis Distributors pays the remainder of the fees. Listed below are the fees incurred by the Funds which are included in the transfer agent fees and expenses in the Statements of Operations.
| | | | | | | | | |
| | | Sub-Transfer Agent Fees |
Fund | | Institutional
Class | | Retail
Class | | Admin
Class |
Small Cap Growth Fund | | $ | 8,531 | | $ | 26,518 | | $ | — |
Small Cap Value Fund | | | 163,381 | | | 352,268 | | | 130,763 |
30
NOTES TO FINANCIAL STATEMENTS – continued
March 31, 2009 (Unaudited)
e. Trustees Fees and Expenses. The Funds do not pay any compensation directly to their officers or Trustees who are directors, officers or employees of Natixis Advisors, Natixis Distributors, Natixis US, or their affiliates. The Chairperson of the Board receives a retainer fee at the annual rate of $200,000. The Chairperson does not receive any meeting attendance fees for Board of Trustees meetings or committee meetings that she attends. Each Independent Trustee (other than the Chairperson) receives, in the aggregate, a retainer fee at the annual rate of $65,000. Each Independent Trustee also receives a meeting attendance fee of $7,500 for each meeting of the Board of Trustees that he or she attends in person and $3,750 for each meeting of the Board of Trustees that he or she attends telephonically. In addition, each committee chair receives an additional retainer fee at the annual rate of $10,000. Each Contract Review and Governance Committee member is compensated $5,000 for each Committee meeting that he or she attends in person and $2,500 for each meeting that he or she attends telephonically. Each Audit Committee member is compensated $6,250 for each Committee meeting that he or she attends in person and $3,125 for each meeting that he or she attends telephonically. These fees are allocated among the funds in the Natixis Funds Trusts, Loomis Sayles Funds Trusts and the Hansberger International Series based on a formula that takes into account, among other factors, the relative net assets of each Fund. Trustees are reimbursed for travel expenses in connection with attendance at meetings.
A deferred compensation plan (the “Plan”) is available to the Trustees on a voluntary basis. Deferred amounts remain in the Funds until distributed in accordance with the provisions of the Plan. The value of a participating Trustee’s deferral account is based on theoretical investments of deferred amounts, on the normal payment dates, in certain funds of the Natixis Funds Trusts, Loomis Sayles Funds Trusts and Hansberger International Series as designated by the participating Trustees. Changes in the value of participants’ deferral accounts are allocated pro rata among the funds in the Natixis Funds Trusts, Loomis Sayles Funds Trusts, and Hansberger International Series, and are normally reflected as Trustees’ fees and expenses in the Statements of Operations. The portions of the accrued obligations allocated to the Funds under the Plan are reflected as Deferred Trustees’ fees in the Statements of Assets and Liabilities.
For the six months ended March 31, 2009, net depreciation in the value of participants’ deferral accounts has been included in Miscellaneous expenses in the Statements of Operations, as follows:
| | | |
Fund | | Amount |
Small Cap Growth Fund | | $ | 8,037 |
Small Cap Value Fund | | | 14,867 |
f. Redemption Fees. Shareholders of Small Cap Growth Fund and Small Cap Value Fund are charged a 2% redemption fee if they redeem, including redeeming by exchange, any class of shares of such Funds within 60 days of their acquisition (including acquisition by exchange). The redemption fee is intended to offset the costs to the Funds of short-term trading, such as portfolio transaction and market impact costs associated with redemption activity and administrative costs associated with processing redemptions. The redemption fee is deducted from the shareholder’s redemption or exchange proceeds and is paid to the Fund.
The “first-in, first-out” method is used to determine the holding period of redeemed or exchanged shares, which means that if a shareholder acquired shares on different days, the shares acquired first will be redeemed or exchanged first for purposes of determining whether the redemption fee applies. A new holding period begins with each purchase or exchange. These fees are accounted for as an addition to paid-in capital and are presented in the Statements of Changes in Net Assets.
On March 27, 2009, the Trustees approved the elimination of redemption fees on Small Cap Growth Fund and Small Cap Value Fund effective June 1, 2009.
6. Line of Credit. Each Fund, together with certain other funds of Natixis Funds Trusts, Loomis Sayles Funds Trusts and the Hansberger International Series, participates in a $200,000,000 committed line of credit provided by State Street Bank, with an individual limit of $125,000,000 for each Fund that participates in the line of credit. Interest is charged to each participating fund based on its borrowings at a rate per annum equal to the greater of the Federal Funds rate or overnight LIBOR, plus 0.75%. In addition, a commitment fee of 0.125% per annum, payable at the end of each calendar quarter, is accrued and apportioned among the participating funds based on their average daily unused portion of the line of credit.
Prior to March 11, 2009, each Fund, together with certain other funds of Natixis Funds Trusts, Loomis Sayles Funds Trusts and Hansberger International Series, participated in a $200,000,000 committed line of credit provided by State Street Bank, with an individual limit of $125,000,000 for each Fund that participated in the line of credit. Interest was charged to each participating fund based on its borrowings at a rate per annum equal to the Federal Funds rate plus 0.50%. In addition, a commitment fee of 0.09% per annum, payable at the end of each calendar quarter, was accrued and apportioned among the participating funds based on their average daily unused portion of the line of credit.
31
For the six months ended March 31, 2009, the Funds had no borrowings under these agreements.
7. Brokerage Commission Recapture. Each Fund has entered into agreements with certain brokers whereby the brokers will rebate a portion of brokerage commissions. All amounts rebated by the brokers are returned to the Funds under such agreements and are included in realized gains in the Statements of Operations. For the six months ended March 31, 2009, amounts rebated under these agreements were as follows:
| | | |
Fund | | Rebates |
Small Cap Growth Fund | | $ | 9,340 |
Small Cap Value Fund | | | 38,679 |
8. Shareholders. At March 31, 2009, the Loomis Sayles Funded Pension Plan and the Loomis Sayles Employees’ Profit Sharing Retirement Plan held Institutional Class shares of beneficial interest in the Funds as follows:
| | | | |
Fund | | Pension Plan | | Profit Sharing
Retirement Plan |
Small Cap Growth Fund | | 368,786 | | 367,113 |
Small Cap Value Fund | | 362,408 | | 751,956 |
9. Capital Shares. Each Fund may issue an unlimited number of shares of beneficial interest, without par value. Transactions in capital shares were as follows:
| | | | | | | | | | | | | | |
| | | Small Cap Growth Fund | |
| | |
| | | Six Months Ended March 31, 2009 | | | Year Ended September 30, 2008 | |
| | | | |
| Institutional Class | | Shares | | | Amount | | | Shares | | | Amount | |
Issued from the sale of shares | | 1,189,564 | | | $ | 11,077,773 | | | 2,094,507 | | | $ | 30,602,699 | |
Issued in connection with the
reinvestment of distributions | | — | | | | — | | | — | | | | — | |
Redeemed | | (1,011,198 | ) | | | (9,103,938 | ) | | (456,742 | ) | | | (6,441,388 | ) |
| | | | | | | | | | | | | | |
Net change | | 178,366 | | | $ | 1,973,835 | | | 1,637,765 | | | $ | 24,161,311 | |
| | | | | | | | | | | | | | |
| | | | |
| Retail Class | | Shares | | | Amount | | | Shares | | | Amount | |
Issued from the sale of shares | | 1,004,037 | | | $ | 9,188,291 | | | 6,898,095 | | | $ | 94,809,730 | |
Issued in connection with the reinvestment of distributions | | — | | | | — | | | — | | | | — | |
Redeemed | | (1,585,593 | ) | | | (13,953,076 | ) | | (1,956,386 | ) | | | (26,497,100 | ) |
| | | | | | | | | | | | | | |
Net change | | (581,556 | ) | | $ | (4,764,785 | ) | | 4,941,709 | | | $ | 68,312,630 | |
| | | | | | | | | | | | | | |
Increase (decrease) from capital
share transactions | | (403,190 | ) | | $ | (2,790,950 | ) | | 6,579,474 | | | $ | 92,473,941 | |
| | | | | | | | | | | | | | |
| |
| | | Small Cap Value Fund | |
| | |
| | | Six Months Ended March 31, 2009 | | | Year Ended September 30, 2008 | |
| | | | |
| Institutional Class | | Shares | | | Amount | | | Shares | | | Amount | |
Issued from the sale of shares | | 2,539,102 | | | $ | 41,335,220 | | | 9,681,674 | | | $ | 228,728,526 | |
Issued in connection with the reinvestment of distributions | | 156,833 | | | | 2,488,947 | | | 1,942,239 | | | | 49,352,283 | |
Redeemed | | (3,528,623 | ) | | | (57,105,563 | ) | | (5,076,716 | ) | | | (120,789,687 | ) |
| | | | | | | | | | | | | | |
Net change | | (832,688 | ) | | $ | (13,281,396 | ) | | 6,547,197 | | | $ | 157,291,122 | |
| | | | | | | | | | | | | | |
32
NOTES TO FINANCIAL STATEMENTS – continued
March 31, 2009 (Unaudited)
| | | | | | | | | | | | | | |
| | | Small Cap Value Fund — continued | |
| | |
| | | Six Months Ended March 31, 2009 | | | Year Ended September 30, 2008 | |
| | | | |
| Retail Class | | Shares | | | Amount | | | Shares | | | Amount | |
Issued from the sale of shares | | 2,749,459 | | | $ | 47,397,068 | | | 10,268,147 | | | $ | 242,357,595 | |
Issued in connection with the reinvestment of distributions | | 76,628 | | | | 1,206,896 | | | 1,850,508 | | | | 46,632,804 | |
Redeemed | | (4,812,609 | ) | | | (78,633,739 | ) | | (7,108,230 | ) | | | (166,486,060 | ) |
| | | | | | | | | | | | | | |
Net change | | (1,986,522 | ) | | $ | (30,029,775 | ) | | 5,010,425 | | | $ | 122,504,339 | |
| | | | | | | | | | | | | | |
| | | | |
| Admin Class | | Shares | | | Amount | | | Shares | | | Amount | |
Issued from the sale of shares | | 901,058 | | | $ | 13,680,755 | | | 2,168,929 | | | $ | 51,105,918 | |
Issued in connection with the reinvestment of distributions | | 1,691 | | | | 26,231 | | | 271,955 | | | | 6,747,215 | |
Redeemed | | (858,256 | ) | | | (13,336,708 | ) | | (1,532,487 | ) | | | (35,447,384 | ) |
| | | | | | | | | | | | | | |
Net change | | 44,493 | | | $ | 370,278 | | | 908,397 | | | $ | 22,405,749 | |
| | | | | | | | | | | | | | |
Increase (decrease) from capital
share transactions | | (2,774,717 | ) | | $ | (42,940,893 | ) | | 12,466,019 | | | $ | 302,201,210 | |
| | | | | | | | | | | | | | |
33

SEMIANNUAL REPORT
March 31, 2009
Loomis Sayles Investment Grade Bond Fund


TABLE OF CONTENTS
Management Discussion and Performance page 1
Portfolio of Investments page 5
Financial Statements page 18
LOOMIS SAYLES INVESTMENT GRADE BOND FUND
PORTFOLIO PROFILE
Objective:
High total investment return through a combination of current income and capital appreciation
Strategy:
Invests primarily in investment-grade, fixed-income securities, although it may invest up to 10% of its assets in lower quality fixed-income securities. The fund may invest any portion of its assets in securities of Canadian issuers and up to 20% in other foreign securities, including emerging markets.
Fund Inception:
December 31, 1996
Managers:
Daniel Fuss, CFA, CIC
Associate Managers:
Matthew J. Eagan, CFA
Kathleen Gaffney, CFA
Elaine Stokes
Loomis, Sayles & Company, L.P.
Symbols:
| | |
| Class A | | LIGRX |
| Class B | | LGBBX |
| Class C | | LGBCX |
| Class Y | | LSIIX |
| Class J | | LIGJX |
What You Should Know:
This fund invests in fixed-income securities that are subject to credit risk, interest rate risk and liquidity risk. It may also invest in mortgage-related securities that are subject to prepayment risk. The fund can invest a significant percentage of assets in foreign securities and the value of fund shares can be adversely affected by changes in currency exchange rates, political, and economic developments. In emerging markets these risks can be significant. The fund is subject to currency risk, which is the risk that fluctuations in exchange rates between the U.S. dollar and foreign currencies may cause the value of a fund’s investments to decline. Lower rated debt securities have speculative characteristics and may be subject to greater price volatility than higher rated investments. In addition, the secondary market for these securities may lack liquidity. Fund shares should be viewed as a long-term investment.
Management Discussion
Faced with growing weakness in the global economy, bond investors continued to favor higher-quality issues during the six months ended March 31, 2009, driving up prices of U.S. Treasuries and other high-quality securities. Corporate bonds continued to slump, although the market’s acceptance of risk appeared to increase modestly late in the period. Meanwhile, investors trimmed positions in currencies with heavy exposure to commodities, which helped strengthen the U.S. dollar at the end of 2008.
In a difficult climate for companies exposed to credit risk, the total return on Class A shares of Loomis Sayles Investment Grade Bond Fund was -4.16% at net asset value for the six months ended March 31, 2009. Returns included $0.30 in dividends and $0.13 in capital gains reinvested during the period. The fund underperformed the 5.06% return of its benchmark, Barclays Capital U.S. Government/Credit Index, and the -0.49% average return of the funds in Morningstar’s Intermediate-Term Bond Category. The fund’s 30-day SEC yield as of March 31, 2009 was 6.51%.
WHAT CAUSED THE FUND TO UNDERPERFORM THE BENCHMARK?
Security selection, primarily in industrial bonds, was the primary cause of the fund’s underperformance. As the global economy reeled, the acknowledgement of recession and increasing liquidity fears drove already battered investment-grade issues in manufacturing, retail and auto-related industries even lower. High-yield issues did not fare any better. The fund’s high-yield bonds issued by companies in manufacturing, home building, airlines and auto-related industries hurt performance. Its exposure to commodity-linked currencies also hurt performance, especially in the closing weeks of 2008 when currencies of such countries as Canada, Indonesia, Mexico, New Zealand and Brazil weakened relative to the U.S. dollar. While there was a shift in these markets early in 2009, the fund’s gains could not make up for prior losses.
WHICH STRATEGIES BENEFITED THE FUND?
Investors’ widespread aversion to risk led to solid relative performance from the fund’s longer-maturity government agency and government-related securities. We maintained a longer-than-benchmark duration throughout the six-month period, which generally helped performance when prices of Treasuries and other high-quality securities rose in value as yields declined. The fund’s exposure to commercial mortgage-backed securities also contributed positively. These securities benefited from rising demand in response to government stimulus programs. Similarly, the fund’s investment-grade bonds in the financial sector were positive contributors after the U.S. Treasury department introduced new lending programs at the end of 2008. Higher-quality issues in banking and finance were the early leaders, with brokerage companies providing a boost later in the period.
The federal government’s stimulus programs, especially in their most recent versions, appeared to reduce investors’ concerns that the global economy would enter an extended recession. New programs, such as the Targeted Asset Loan Fund (TALF) and the Public-Private Investment Program (PPIP), have raised the prospect of increasing support for banks and the securities markets, despite concerns about the long-term cost of these measures.
WHAT’S AHEAD?
We believe high-yield issues will continue to be volatile, as defaults continue to increase over the course of the year. We remain underweight in the CCC-rated portion of the market, as we believe most defaults will come from this space. We believe investment-grade credit continues to offer strong relative value, as spreads remain at relatively wide levels. As the markets grow more convinced the global recovery has taken hold, we eventually expect to see more demand for riskier assets, such as high-yield and investment-grade credit, as well as commodity currencies.
1
LOOMIS SAYLES INVESTMENT GRADE BOND FUND
Investment Results through March 31, 2009
PERFORMANCE IN PERSPECTIVE
The charts comparing the fund’s performance to an index provide you with a general sense of how it performed. The fund’s total return for the period shown below appears with and without sales charges and includes fund expenses and fees. An index measures the performance of a theoretical portfolio. Unlike a fund, the index is unmanaged and does not have expenses that affect the results. It is not possible to invest directly in an index. Investors would incur transaction costs and other expenses if they purchased the securities necessary to match the index.
Growth of a $10,000 Investment in Class A Shares1,4
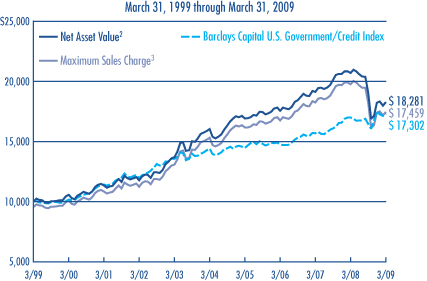
Average Annual Returns — March 31, 20094
| | | | | | | | | | | | |
| | | | | |
| | | 6 MONTHS | | | 1 YEAR | | | 5 YEARS | | | 10 YEARS | |
CLASS A (Inception 12/31/96)1 | | | | | | | | | | | | |
Net Asset Value2 | | -4.16 | % | | -11.68 | % | | 2.66 | % | | 6.22 | % |
With Maximum Sales Charge3 | | -8.50 | | | -15.63 | | | 1.72 | | | 5.73 | |
| | | | | |
CLASS B (Inception 9/12/03)1 | | | | | | | | | | | | |
Net Asset Value2 | | -4.60 | | | -12.41 | | | 1.83 | | | 5.28 | |
With CDSC5 | | -9.18 | | | -16.52 | | | 1.53 | | | 5.28 | |
| | | | | |
CLASS C (Inception 9/12/03)1 | | | | | | | | | | | | |
Net Asset Value2 | | -4.44 | | | -12.30 | | | 1.89 | | | 5.31 | |
With CDSC5 | | -5.36 | | | -13.13 | | | 1.89 | | | 5.31 | |
| | | | | |
CLASS Y (Inception 12/31/96)1 | | | | | | | | | | | | |
Net Asset Value2 | | -4.12 | | | -11.44 | | | 2.98 | | | 6.49 | |
| | | | | |
CLASS J (Inception 5/24/99)1 | | | | | | | | | | | | |
Net Asset Value2 | | -4.41 | | | -12.04 | | | 2.23 | | | 5.71 | |
With Sales Charge5 | | -7.74 | | | -15.16 | | | 1.51 | | | 5.34 | |
| | | | | |
| COMPARATIVE PERFORMANCE | | 6 MONTHS | | | 1 YEAR | | | 5 YEARS | | | 10 YEARS | |
Barclays Capital U.S. Government/Credit Index | | 5.06 | % | | 1.78 | % | | 3.74 | % | | 5.64 | % |
Morningstar Intermediate-Term Bond Fund Avg. | | -0.49 | | | -4.94 | | | 1.36 | | | 3.92 | |
See page 3 for a description of the index/average.
All returns represent past performance and do not guarantee future results. Share price and return will vary and you may have a gain or loss when you sell your shares. All results include reinvestment of any dividends and capital gains. Current returns may be higher or lower than those shown. For performance current to the most recent month-end, visit www.funds.natixis.com. Class Y, the successor to the fund’s Institutional Class, is only available to certain investors as described in the prospectus. Class J shares are not offered for sale in the United States and are not eligible for sale to U.S. investors.
PORTFOLIO FACTS
| | | | |
| |
| | | % of Net Assets as of |
| CREDIT QUALITY | | 3/31/09 | | 9/30/08 |
Aaa | | 29.6 | | 28.6 |
Aa | | 3.2 | | 4.5 |
A | | 18.0 | | 14.6 |
Baa | | 38.3 | | 41.3 |
Ba | | 2.9 | | 3.7 |
B | | 0.5 | | 1.0 |
Caa | | 0.8 | | 1.2 |
Ca | | 0.1 | | 0.1 |
C | | 0.3 | | — |
Not Rated* | | 0.8 | | 3.0 |
Short-term and other | | 5.5 | | 2.0 |
Credit quality is based on ratings from Moody’s Investors Service.
* Securities that are not rated by Moody’s may be rated by another rating agency or by Loomis Sayles. Portfolio characteristics will vary.
| | | | | |
| |
| | | % of Net Assets as of | |
| EFFECTIVE MATURITY | | 3/31/09 | | 9/30/08 | |
1 year or less | | 8.3 | | 14.6 | |
1-5 years | | 25.5 | | 24.1 | |
5-10 years | | 39.8 | | 33.1 | |
10+ years | | 26.4 | | 28.2 | |
Average Effective Maturity | | 10.7 years | | 11.1 | years |
Portfolio characteristics will vary.
EXPENSE RATIOS AS STATED IN THE MOST RECENT PROSPECTUS
| | | | |
| Share Class | | Gross Expense Ratio6 | | Net Expense Ratio7 |
A | | 0.80% | | 0.80% |
B | | 1.65 | | 1.65 |
C | | 1.55 | | 1.55 |
Y | | 0.53 | | 0.53 |
J | | 1.28 | | 1.28 |
NOTES TO CHARTS
The table and graph do not reflect taxes shareholders might owe on any fund distributions or when they redeem their shares.
1 | Returns shown in the chart include performance of the fund’s Retail Class shares, which were converted to Class A shares on 9/12/03. The prior Retail Class performance has been restated to reflect the expenses and sales loads of Class A shares. Retail Class was closed on 12/18/00 and recommenced operations on 1/31/02; Institutional Class performance is shown for the intervening period, adjusted to reflect the expenses and sales loads paid by Class A shares. The restatement of the fund’s performance to reflect Class A expenses is based on the net expenses of the Class after taking into effect the fund’s then current expense cap arrangements. For periods prior to the inception of Class B and Class C shares (9/12/03), performance is based on prior Institutional Class performance, restated to reflect the sales loads and expenses of Class B and Class C shares. Institutional Class became Class Y on 9/12/03. Institutional Class performance has been restated to reflect the expenses of Class Y shares after taking into effect Class Y’s then current expense cap arrangements. For periods prior to the inception of Class J Shares (5/24/99), performance is based on prior Institutional Class performance, restated to reflect the sales loads and expenses of Class J shares. The growth of $10,000 chart compares the performance of Class A shares at net asset value, to the performance of Class A shares including the maximum sales charge of 4.50%. This chart reflects the performance of Class A shares rather than Class Y shares because Class A shares have the highest sales charge. Prior to 9/12/03, the fund (except Class J) was offered without a sales charge. |
2 | Does not include a sales charge. |
3 | Includes maximum sales charge of 4.50%. |
4 | Fund performance has been increased by expense reductions and reimbursements, if any, without which performance would have been lower. |
5 | Performance for Class B shares assumes a maximum 5% contingent deferred sales charge (“CDSC”) applied when you sell shares, which declines annually between years 1-6 according to the following schedule: 5, 4, 3, 3, 2, 1, 0%. Class C shares performance assumes a 1% CDSC applied when you sell shares within one year of purchase. Performance for Class J assumes a 3.50% sales charge. |
6 | Before reductions and reimbursements. |
7 | After reductions and reimbursements. Expense reductions are contractual and are set to expire on 1/31/10. |
2
ADDITIONAL INFORMATION
The views expressed in this report reflect those of the portfolio managers as of the dates indicated. The managers’ views are subject to change at any time without notice based on changes in market or other conditions. References to specific securities or industries should not be regarded as investment advice. Because the fund is actively managed, there is no assurance that it will continue to invest in the securities, countries or industries mentioned.
For more complete information on any Natixis Fund, contact your financial professional or call Natixis Funds and ask for a free prospectus, which contains more complete information including charges and other ongoing expenses. Investors should consider a fund’s objective, risks and expenses carefully before investing. This and other fund information can be found in the prospectus. Please read the prospectus carefully before investing.
INDEX/AVERAGE DESCRIPTIONS:
Barclays Capital U.S. Government/Credit Index is an unmanaged index of publicly traded bonds, including U.S. government bonds, U.S. Treasury securities and corporate bonds. Effective 11/3/08 the Lehman U.S. Government/Credit Index was rebranded to the Barclays Capital U.S. Government/Credit Index. There has been no change in the calculation or definition of the index data.
Morningstar Intermediate-Term Bond Fund Average is the average performance without sales charges of funds with similar investment objectives, as calculated by Morningstar, Inc.
PROXY VOTING INFORMATION
A description of the fund’s proxy voting policies and procedures is available without charge, upon request, by calling Natixis Funds at 800-225-5478; on the fund’s website at www.funds.natixis.com; and on the Securities and Exchange Commission’s (SEC’s) website at www.sec.gov. Information regarding how the fund voted proxies relating to portfolio securities during the 12-month period ended June 30, 2008 is available from the fund’s website and the SEC’s website.
QUARTERLY PORTFOLIO SCHEDULES
The fund files a complete schedule of portfolio holdings with the SEC for the first and third quarters of each fiscal year on Form N-Q. The fund’s Forms N-Q are available on the SEC’s website at www.sec.gov and may be reviewed and copied at the SEC’s Public Reference Room in Washington, DC. Information on the operation of the Public Reference Room may be obtained by calling 1-800-SEC-0330.
| | | | |
| NOT FDIC INSURED | | MAY LOSE VALUE | | NO BANK GUARANTEE |
3
UNDERSTANDING YOUR FUND’S EXPENSES
As a mutual fund shareholder, you incur different types of costs: transaction costs, including sales charges (loads) on purchases and contingent deferred sales charges on redemptions; certain exchange fees; and minimum account fee charges; and ongoing costs, including management fees, distribution fees (12b-1 fees) and/or service fees, and other fund expenses. In addition, the fund may assess a minimum balance fee of $20 on an annual basis for accounts that fall below the required minimum to establish an account (certain exceptions may apply). These costs are described in more detail in the fund’s prospectus. The examples below are intended to help you understand the ongoing costs of investing in the fund and help you compare these with the ongoing costs of investing in other mutual funds.
The first line in the table for each Class shows the actual amount of fund expenses you would have paid on a $1,000 investment in the fund from October 1, 2008 through March 31, 2009. It also shows how much a $1,000 investment would be worth at the close of the period, assuming actual fund returns and expenses. To estimate the expenses you paid over the period, simply divide your account value by $1,000 (for example $8,600 account value divided by $1,000 =8.6) and multiply the result by the number in the Expenses Paid During the Period row as shown below for your class.
The second line in the table for each Class provides information about hypothetical account values and hypothetical expenses based on the fund’s actual expense ratios and an assumed rate of return of 5% per year before expenses, which is not the fund’s actual return. The hypothetical account values and expenses may not be used to estimate the actual ending account balance or expenses you paid on your investment for the period. You may use this information to compare the ongoing costs of investing in the fund and other funds. To do so, compare this 5% hypothetical example with the 5% hypothetical examples that appear in the shareholder reports of the other funds.
Please note that the expenses shown reflect ongoing costs only, and do not include any transaction costs. Therefore, the second line in the table of the fund is useful in comparing ongoing costs only, and will not help you determine the relative costs of owning different funds. If transaction costs were included, total costs would be higher.
| | | | | | |
| LOOMIS SAYLES INVESTMENT GRADE BOND FUND | | BEGINNING ACCOUNT VALUE
10/1/08 | | ENDING ACCOUNT VALUE
3/31/09 | | EXPENSES PAID DURING PERIOD*
10/1/08 – 3/31/09 |
CLASS A | | | | | | |
Actual | | $1,000.00 | | $958.40 | | $3.95 |
Hypothetical (5% return before expenses) | | $1,000.00 | | $1,020.89 | | $4.08 |
CLASS B | | | | | | |
Actual | | $1,000.00 | | $954.00 | | $8.28 |
Hypothetical (5% return before expenses) | | $1,000.00 | | $1,016.45 | | $8.55 |
CLASS C | | | | | | |
Actual | | $1,000.00 | | $955.60 | | $7.61 |
Hypothetical (5% return before expenses) | | $1,000.00 | | $1,017.15 | | $7.85 |
CLASS Y | | | | | | |
Actual | | $1,000.00 | | $958.80 | | $2.69 |
Hypothetical (5% return before expenses) | | $1,000.00 | | $1,022.19 | | $2.77 |
CLASS J | | | | | | |
Actual | | $1,000.00 | | $955.90 | | $6.29 |
Hypothetical (5% return before expenses) | | $1,000.00 | | $1,018.50 | | $6.49 |
| * | Expenses are equal to the Fund’s annualized expense ratio (after fee reduction/reimbursement): 0.81%, 1.70%, 1.56%, 0.55% and 1.29% for Class A, B, C, Y and J, respectively, multiplied by the average account value over the period, multiplied by the number of days in the most recent fiscal half-year, divided by 365 (to reflect the half-year period). |
4
LOOMIS SAYLES INVESTMENT GRADE BOND FUND — PORTFOLIOOF INVESTMENTS
Investments as of March 31, 2009 (Unaudited)
| | | | | | |
Principal
Amount (‡) | | Description | | Value (†) |
| | | | | | |
| | Bonds and Notes — 91.8% of Net Assets | | | |
| | Non-Convertible Bonds — 90.9% | | | |
| | | ABS Car Loan — 1.2% | | | |
| $ | 60,855,000 | | ARG Funding Corp., Series 2005-2A, Class A5,
0.682%, 5/20/2011, 144A(b) | | $ | 48,391,287 |
| | 26,520,000 | | Capital One Auto Finance Trust, Series 2006-C, Class A4,
0.586%, 5/15/2013(b) | | | 19,417,467 |
| | 7,199,000 | | Merrill Auto Trust Securitization Asset, Series 2008-1, Class B,
6.750%, 4/15/2015 | | | 5,820,736 |
| | | | | | |
| | | | | | 73,629,490 |
| | | | | | |
| | | ABS Credit Card — 1.6% | | | |
| | 9,995,000 | | American Express Issuance Trust, Series 2005-2, Class A,
0.626%, 8/15/2013(b) | | | 8,718,933 |
| | 3,400,000 | | Bank One Issuance Trust, Series 2004-C2, Class C2,
1.356%, 2/15/2017(b) | | | 1,326,000 |
| | 24,955,000 | | Capital One Multi-Asset Execution Trust, Series 2005-A10, Class A,
0.636%, 9/15/2015(b) | | | 20,908,140 |
| | 2,550,000 | | Capital One Multi-Asset Execution Trust, Series 2006-C2, Class C,
0.856%, 6/16/2014(b) | | | 1,478,397 |
| | 29,215,000 | | Chase Issuance Trust, Series 2007-B1, Class B1,
0.806%, 4/15/2019(b) | | | 11,069,242 |
| | 4,000,000 | | Citibank Credit Card Issuance Trust, Series 2008-A1, Class A1,
5.350%, 2/07/2020 | | | 3,698,725 |
| | 29,395,000 | | Citibank Credit Card Issuance Trust, Series 2008-C6, Class C6,
6.300%, 6/20/2014 | | | 18,518,850 |
| | 10,000,000 | | MBNA Credit Card Master Note Trust, Series 2002-C1, Class C1,
6.800%, 7/15/2014 | | | 7,175,904 |
| | 19,060,000 | | MBNA Credit Card Master Note Trust, Series 2005-B2, Class B,
0.736%, 12/17/2012(b) | | | 16,533,155 |
| | 5,000,000 | | World Financial Network Credit Card, Series 2008-B, Class M,
7.800%, 10/15/2013 | | | 4,732,954 |
| | | | | | |
| | | | | | 94,160,300 |
| | | | | | |
| | | ABS Other — 0.3% | | | |
| | 16,965,000 | | CIT Equipment Collateral, Series 2008-VT1, Class A3,
6.590%, 12/22/2014 | | | 16,703,377 |
| | 446,778 | | Community Program Loan Trust, Series 1987-A, Class A4,
4.500%, 10/01/2018 | | | 449,132 |
| | 1,700,000 | | Community Program Loan Trust, Series 1987-A, Class A5,
4.500%, 4/01/2029 | | | 1,566,881 |
| | | | | | |
| | | | | | 18,719,390 |
| | | | | | |
| | | Airlines — 1.3% | | | |
| | 37,300,000 | | Continental Airlines, Inc., Series 2007-1, Class A,
5.983%, 4/19/2022 | | | 27,602,000 |
| | 12,208,000 | | Continental Airlines, Inc., Series 2007-1, Class B,
6.903%, 4/19/2022 | | | 6,470,240 |
| | 701,713 | | Continental Airlines, Inc., Series 971A,
7.461%, 10/01/2016 | | | 491,199 |
| | 542,857 | | Continental Airlines, Inc., Series 991A, Class B,
6.545%, 8/02/2020 | | | 466,857 |
| | 834,956 | | Delta Air Lines, Inc., Series 2007-1, Class A,
6.821%, 2/10/2024 | | | 563,595 |
| | 18,765,877 | | Delta Air Lines, Inc., Series 2007-1, Class B,
8.021%, 2/10/2024 | | | 10,415,062 |
| | 11,415,000 | | Northwest Airlines, Inc., Series 07-1, Class B,
8.028%, 11/01/2017 | | | 6,563,625 |
| | 8,115,000 | | Qantas Airways Ltd.,
6.050%, 4/15/2016, 144A | | | 6,873,503 |
| | 29,383,325 | | United Air Lines, Inc., Series 2007-1, Class A,
6.636%, 1/02/2024 | | | 19,980,661 |
| | | | | | |
| | | | | | 79,426,742 |
| | | | | | |
| | | | | | |
Principal
Amount (‡) | | Description | | Value (†) |
| | | | | | |
| | | Automotive — 0.6% | | | |
| $ | 31,835,000 | | Cummins, Inc.,
5.650%, 3/01/2098 | | $ | 13,329,315 |
| | 3,389,000 | | Cummins, Inc.,
6.750%, 2/15/2027 | | | 2,135,070 |
| | 665,000 | | Cummins, Inc.,
7.125%, 3/01/2028 | | | 458,029 |
| | 1,990,000 | | Ford Motor Co.,
6.375%, 2/01/2029 | | | 562,175 |
| | 130,000 | | Ford Motor Co.,
6.500%, 8/01/2018 | | | 37,700 |
| | 260,000 | | Ford Motor Co.,
6.625%, 2/15/2028 | | | 73,450 |
| | 5,185,000 | | Ford Motor Co.,
6.625%, 10/01/2028 | | | 1,464,763 |
| | 8,730,000 | | Ford Motor Co.,
7.450%, 7/16/2031 | | | 2,771,775 |
| | 245,000 | | Ford Motor Co.,
7.500%, 8/01/2026 | | | 68,600 |
| | 11,830,000 | | Ford Motor Credit Co. LLC,
5.700%, 1/15/2010 | | | 10,133,117 |
| | 345,000 | | Ford Motor Credit Co. LLC,
7.000%, 10/01/2013 | | | 230,688 |
| | 700,000 | | Ford Motor Credit Co. LLC,
7.375%, 10/28/2009 | | | 627,795 |
| | 1,540,000 | | Ford Motor Credit Co. LLC,
8.000%, 12/15/2016 | | | 1,012,136 |
| | 935,000 | | Ford Motor Credit Co. LLC,
8.625%, 11/01/2010 | | | 744,728 |
| | 2,135,000 | | Ford Motor Credit Co. LLC,
9.750%, 9/15/2010 | | | 1,756,349 |
| | 575,000 | | General Motors Corp.,
7.400%, 9/01/2025 | | | 66,125 |
| | 8,985,000 | | General Motors Corp.,
8.250%, 7/15/2023 | | | 1,111,894 |
| | 245,000 | | General Motors Corp.,
8.375%, 7/15/2033 | | | 30,625 |
| | | | | | |
| | | | | | 36,614,334 |
| | | | | | |
| | | Banking — 5.6% | | | |
| | 7,450,000 | | American Express Centurion Bank, Series BKN1,
6.000%, 9/13/2017 | | | 6,270,650 |
| | 2,595,000 | | BAC Capital Trust VI,
5.625%, 3/08/2035 | | | 1,103,181 |
| | 3,120,000,000 | | Barclays Financial LLC,
4.060%, 9/16/2010, (KRW), 144A | | | 2,312,849 |
| | 180,000,000 | | Barclays Financial LLC,
4.160%, 2/22/2010, (THB), 144A | | | 5,023,657 |
| | 3,500,000,000 | | Barclays Financial LLC,
4.460%, 9/23/2010, (KRW), 144A | | | 2,609,217 |
| | 52,000,000 | | Barclays Financial LLC, EMTN,
4.100%, 3/22/2010, (THB), 144A | | | 1,437,643 |
| | 2,220,000 | | Bear Stearns Cos., Inc. (The),
4.650%, 7/02/2018 | | | 1,849,913 |
| | 975,000 | | Bear Stearns Cos., Inc. (The),
5.300%, 10/30/2015 | | | 903,956 |
| | 2,150,000 | | Bear Stearns Cos., Inc. (The),
6.400%, 10/02/2017 | | | 2,092,479 |
| | 12,745,000 | | Bear Stearns Cos., Inc. (The),
7.250%, 2/01/2018 | | | 13,161,940 |
See accompanying notes to financial statements.
5
LOOMIS SAYLES INVESTMENT GRADE BOND FUND — PORTFOLIOOF INVESTMENTS (continued)
Investments as of March 31, 2009 (Unaudited)
| | | | | | |
Principal
Amount (‡) | | Description | | Value (†) |
| | | | | | |
| | | Banking — continued | | | |
| $ | 16,371,250,000 | | BNP Paribas SA, EMTN,
Zero Coupon, 6/13/2011, (IDR), 144A | | $ | 916,252 |
| | 9,305,000 | | Capital One Financial Corp.,
6.150%, 9/01/2016 | | | 5,890,093 |
| | 9,860,000 | | Citibank NA,
15.000%, 7/02/2010, (BRL), 144A | | | 4,473,139 |
| | 10,400,000 | | Citigroup, Inc.,
5.000%, 9/15/2014 | | | 6,894,170 |
| | 984,000 | | Countrywide Home Loans, Inc., Series L, MTN,
4.000%, 3/22/2011 | | | 875,660 |
| | 13,400,000 | | Goldman Sachs Group, Inc. (The),
5.000%, 10/01/2014 | | | 12,114,659 |
| | 6,790,000 | | Goldman Sachs Group, Inc. (The),
5.150%, 1/15/2014 | | | 6,196,961 |
| | 67,770,000 | | Goldman Sachs Group, Inc. (The),
6.750%, 10/01/2037 | | | 45,835,630 |
| | 700,000 | | ICICI Bank Ltd.,
(fixed rate to 4/30/2017, variable rate thereafter),
6.375%, 4/30/2022, 144A | | | 393,582 |
| | 18,000,000 | | JPMorgan Chase & Co.,
Zero Coupon, 5/17/2010, (BRL), 144A | | | 6,484,477 |
| | 22,683,264,000 | | JPMorgan Chase & Co.,
Zero Coupon, 3/28/2011, (IDR), 144A | | | 1,310,152 |
| | 17,920,000,000 | | JPMorgan Chase & Co.,
Zero Coupon, 3/28/2011, (IDR), 144A | | | 1,035,033 |
| | 68,827,366,920 | | JPMorgan Chase & Co.,
Zero Coupon, 4/12/2012, (IDR), 144A | | | 3,195,663 |
| | 24,124,936,500 | | JPMorgan Chase London, EMTN,
Zero Coupon, 10/21/2010, (IDR), 144A | | | 1,562,118 |
| | 1,700,000 | | Kaupthing Bank,
1/15/2010, 144A(c) | | | 87,125 |
| | 18,400,000 | | Kaupthing Bank, Series D,
5.750%, 10/04/2011, 144A(c) | | | 943,000 |
| | 2,700,000 | | Kaupthing Bank, Series E,
6.125%, 10/04/2016, 144A(c) | | | 138,375 |
| | 100,000 | | Keybank NA,
6.950%, 2/01/2028 | | | 71,629 |
| | 30,000,000 | | Kreditanstalt fuer Wiederaufbau, EMTN,
10.750%, 2/01/2010, (ISK) | | | 147,660 |
| | 109,500,000 | | Merrill Lynch & Co., Inc.,
6.110%, 1/29/2037 | | | 54,422,814 |
| | 10,000,000 | | Merrill Lynch & Co., Inc.,
10.710%, 3/08/2017, (BRL) | | | 3,534,864 |
| | 3,200,000 | | Merrill Lynch & Co., Inc., EMTN,
4.625%, 9/14/2018, (EUR) | | | 2,371,761 |
| | 12,975,000 | | Morgan Stanley,
4.000%, 1/15/2010 | | | 12,883,474 |
| | 51,525,000 | | Morgan Stanley,
4.750%, 4/01/2014 | | | 42,125,655 |
| | 7,000,000 | | Morgan Stanley,
5.375%, 10/15/2015 | | | 6,323,940 |
| | 10,000,000 | | Morgan Stanley,
5.750%, 4/01/2009, (EUR) | | | 13,286,000 |
| | 11,350,000 | | Morgan Stanley,
6.750%, 4/15/2011 | | | 11,358,739 |
| | 1,510,000 | | Morgan Stanley, EMTN,
5.450%, 1/09/2017 | | | 1,321,250 |
| | 2,850,000 | | Morgan Stanley, GMTN,
5.125%, 11/30/2015, (GBP) | | | 3,237,402 |
| | | | | | |
Principal
Amount (‡) | | Description | | Value (†) |
| | | | | | |
| | | Banking — continued | | | |
| $ | 6,400,000 | | Morgan Stanley, MTN,
6.250%, 8/09/2026 | | $ | 5,293,485 |
| | 11,800,000 | | Morgan Stanley, Series F, MTN,
5.550%, 4/27/2017 | | | 10,500,147 |
| | 10,710,000 | | Morgan Stanley, Series F, MTN,
5.950%, 12/28/2017 | | | 9,728,996 |
| | 2,875,000 | | National City Bank of Indiana,
4.250%, 7/01/2018 | | | 2,271,627 |
| | 1,325,000 | | National City Bank, MTN,
5.800%, 6/07/2017 | | | 1,205,771 |
| | 9,826,000 | | National City Corp.,
6.875%, 5/15/2019 | | | 8,318,957 |
| | 1,181,000,000 | | Rabobank Nederland, EMTN,
10.250%, 9/10/2009, (ISK), 144A | | | 5,616,951 |
| | | | | | |
| | | | | | 329,132,696 |
| | | | | | |
| | | Brokerage — 0.0% | | | |
| | 31,730,000 | | Lehman Brothers Holdings, Inc.,
6.875%, 7/17/2037(c) | | | 3,173 |
| | 2,520,000 | | Lehman Brothers Holdings, Inc., MTN,
(fixed rate to 5/03/2027, variable rate thereafter),
6.000%, 5/03/2032(c) | | | 252 |
| | | | | | |
| | | | | | 3,425 |
| | | | | | |
| | | Building Materials — 0.4% | | | |
| | 10,000,000 | | Masco Corp.,
5.850%, 3/15/2017 | | | 6,254,900 |
| | 6,465,000 | | Owens Corning, Inc.,
6.500%, 12/01/2016 | | | 4,743,080 |
| | 20,368,000 | | Owens Corning, Inc.,
7.000%, 12/01/2036 | | | 11,413,860 |
| | 1,060,000 | | USG Corp.,
6.300%, 11/15/2016 | | | 561,800 |
| | | | | | |
| | | | | | 22,973,640 |
| | | | | | |
| | | Chemicals — 1.5% | | | |
| | 25,165,000 | | Lubrizol Corp.,
6.500%, 10/01/2034 | | | 19,217,252 |
| | 2,400,000 | | Methanex Corp.,
6.000%, 8/15/2015 | | | 1,631,938 |
| | 68,560,000 | | PPG Industries, Inc.,
6.650%, 3/15/2018 | | | 67,051,406 |
| | | | | | |
| | | | | | 87,900,596 |
| | | | | | |
| | | Collateralized Mortgage Obligations — 0.0% | | | |
| | 1,693,443 | | CS First Boston Mortgage Securities Corp.,
Series 2005-7, Class 3A1,
5.000%, 8/25/2020 | | | 1,591,836 |
| | 138,286 | | Wells Fargo Mortgage Backed Securities Trust,
Series 2006-AR12, Class 1A1,
6.031%, 9/25/2036(b) | | | 75,862 |
| | | | | | |
| | | | | | 1,667,698 |
| | | | | | |
| | | Commercial Mortgage-Backed Securities — 3.3% | | | |
| | 3,000,000 | | Bank of America-First Union NB Commercial Mortgage,
Series 2001-3, Class A2,
5.464%, 4/11/2037 | | | 2,896,046 |
| | 8,100,000 | | Bear Stearns Commercial Mortgage Securities,
Series 2007-PW15, Class A4,
5.331%, 2/11/2044 | | | 5,904,173 |
See accompanying notes to financial statements.
6
LOOMIS SAYLES INVESTMENT GRADE BOND FUND — PORTFOLIOOF INVESTMENTS (continued)
Investments as of March 31, 2009 (Unaudited)
| | | | | | |
Principal
Amount (‡) | | Description | | Value (†) |
| | | | | | |
| | | Commercial Mortgage-Backed Securities — continued |
| $ | 62,975,000 | | Credit Suisse Mortgage Capital Certificates,
Series 2007-C3, Class A4,
5.912%, 6/15/2039(b) | | $ | 37,776,681 |
| | 35,130,000 | | Credit Suisse Mortgage Capital Certificates,
Series 2007-C4, Class A4,
6.004%, 9/15/2039(b) | | | 22,294,418 |
| | 5,110,000 | | Credit Suisse Mortgage Capital Certificates,
Series 2007-C5, Class A4,
5.695%, 9/15/2040 | | | 3,337,811 |
| | 24,057,000 | | Greenwich Capital Commercial Funding Corp.,
Series 2007-GG11, Class A4,
5.736%, 12/10/2049 | | | 17,305,109 |
| | 15,360,000 | | Greenwich Capital Commercial Funding Corp.,
Series 2007-GG9, Class A4,
5.444%, 3/10/2039 | | | 11,064,820 |
| | 20,220,000 | | JP Morgan Chase Commercial Mortgage Securities Corp.,
Series 2006-LDP6, Class A4,
5.475%, 4/15/2043 | | | 14,647,394 |
| | 8,930,000 | | JP Morgan Chase Commercial Mortgage Securities Corp.,
Series 2006-LDP7, Class A4,
6.065%, 4/15/2045(b) | | | 6,736,842 |
| | 60,634,099 | | JP Morgan Chase Commercial Mortgage Securities Corp.,
Series 2007-LD11, Class A4,
6.007%, 6/15/2049(b) | | | 41,701,702 |
| | 21,993,000 | | JP Morgan Chase Commercial Mortgage Securities Corp.,
Series 2007-LDPX, Class A3,
5.420%, 1/15/2049 | | | 14,863,349 |
| | 3,200,000 | | LB-UBS Commercial Mortgage Trust, Series 2006-C4, Class A4,
6.080%, 6/15/2038(b) | | | 2,424,878 |
| | 1,340,000 | | Merrill Lynch/Countrywide Commercial Mortgage Trust,
Series 2007-6, Class A4,
5.485%, 3/12/2051 | | | 720,250 |
| | 12,700,000 | | Morgan Stanley Capital I, Series 2008-T29, Class A4,
6.458%, 1/11/2043(b) | | | 9,858,407 |
| | 3,700,000 | | Wachovia Bank Commercial Mortgage Trust,
Series 2006-C29, Class A4,
5.308%, 11/15/2048 | | | 2,456,991 |
| | | | | | |
| | | | | | 193,988,871 |
| | | | | | |
| | | Construction Machinery — 1.1% | | | |
| | 3,330,000 | | Caterpillar Financial Services Corp., MTN,
5.450%, 4/15/2018 | | | 2,856,960 |
| | 56,455,000 | | Caterpillar Financial Services Corp., MTN,
6.125%, 2/17/2014 | | | 54,824,692 |
| | 1,625,000 | | Caterpillar Financial Services Corp., Series F, MTN,
5.850%, 9/01/2017 | | | 1,411,867 |
| | 6,935,000 | | Toro Co.,
6.625%, 5/01/2037(d) | | | 4,161,000 |
| | | | | | |
| | | | | | 63,254,519 |
| | | | | | |
| | | Consumer Cyclical Services — 1.2% | | | |
| | 15,350,000 | | Western Union Co. (The),
5.930%, 10/01/2016 | | | 14,230,279 |
| | 19,330,000 | | Western Union Co. (The),
6.200%, 11/17/2036 | | | 15,441,036 |
| | 40,000,000 | | Western Union Co. (The),
6.500%, 2/26/2014 | | | 40,783,880 |
| | | | | | |
| | | | | | 70,455,195 |
| | | | | | |
| | | | | | |
Principal
Amount (‡) | | Description | | Value (†) |
| | | | | | |
| | | Consumer Products — 1.0% | | | |
| $ | 38,725,000 | | Koninklijke (Royal) Philips Electronics N.V.,
6.875%, 3/11/2038 | | $ | 37,565,961 |
| | 10,210,000 | | Snap-on, Inc.,
5.850%, 3/01/2014 | | | 10,330,508 |
| | 12,010,000 | | Snap-on, Inc.,
6.700%, 3/01/2019 | | | 12,190,919 |
| | | | | | |
| | | | | | 60,087,388 |
| | | | | | |
| | | Distributors — 1.0% | | | |
| | 61,345,000 | | Equitable Resources, Inc.,
6.500%, 4/01/2018 | | | 54,137,944 |
| | 5,865,000 | | ONEOK, Inc.,
6.000%, 6/15/2035 | | | 4,008,839 |
| | | | | | |
| | | | | | 58,146,783 |
| | | | | | |
| | | Electric — 4.6% | | | |
| | 40,400,000 | | AmerenEnergy Generating Co., Series H,
7.000%, 4/15/2018 | | | 37,992,402 |
| | 500,000 | | Baltimore Gas & Electric Co.,
5.200%, 6/15/2033 | | | 329,122 |
| | 11,360,000 | | Bruce Mansfield Unit,
6.850%, 6/01/2034(d) | | | 8,438,890 |
| | 2,000,000 | | Cleveland Electric Illuminating Co. (The),
5.700%, 4/01/2017 | | | 1,776,946 |
| | 26,290,000 | | Cleveland Electric Illuminating Co. (The),
5.950%, 12/15/2036 | | | 20,269,196 |
| | 895,000 | | Commonwealth Edison Co.,
4.700%, 4/15/2015 | | | 818,299 |
| | 1,700,000 | | Commonwealth Edison Co.,
5.875%, 2/01/2033 | | | 1,400,044 |
| | 2,750,000 | | Constellation Energy Group, Inc.,
4.550%, 6/15/2015 | | | 2,259,290 |
| | 960,000 | | Dominion Resources, Inc.,
5.950%, 6/15/2035 | | | 812,412 |
| | 5,500,000 | | Empresa Nacional de Electricidad SA (Endesa-Chile),
7.875%, 2/01/2027 | | | 5,640,035 |
| | 1,000,000 | | Empresa Nacional de Electricidad SA (Endesa-Chile),
8.350%, 8/01/2013 | | | 1,093,125 |
| | 3,681,000 | | Exelon Corp.,
4.900%, 6/15/2015 | | | 3,125,452 |
| | 47,570,000 | | Illinois Power Co.,
6.250%, 4/01/2018 | | | 43,480,217 |
| | 1,905,000 | | ITC Holdings Corp.,
5.875%, 9/30/2016, 144A | | | 1,793,719 |
| | 2,830,000 | | ITC Holdings Corp.,
6.375%, 9/30/2036, 144A | | | 2,384,374 |
| | 9,757,409 | | Mackinaw Power LLC,
6.296%, 10/31/2023, 144A | | | 8,506,021 |
| | 1,500,000 | | MidAmerican Energy Holdings Co.,
5.875%, 10/01/2012 | | | 1,557,263 |
| | 1,000,000 | | MidAmerican Energy Holdings Co.,
6.125%, 4/01/2036 | | | 886,818 |
| | 7,185,000 | | MidAmerican Energy Holdings Co.,
6.500%, 9/15/2037 | | | 6,644,465 |
| | 24,635,000 | | NiSource Finance Corp.,
6.400%, 3/15/2018 | | | 19,933,583 |
| | 22,085,000 | | NiSource Finance Corp.,
6.800%, 1/15/2019 | | | 17,747,992 |
| | 1,565,000 | | Ohio Edison Co.,
6.875%, 7/15/2036 | | | 1,375,220 |
See accompanying notes to financial statements.
7
LOOMIS SAYLES INVESTMENT GRADE BOND FUND — PORTFOLIOOF INVESTMENTS (continued)
Investments as of March 31, 2009 (Unaudited)
| | | | | | |
Principal
Amount (‡) | | Description | | Value (†) |
| | | | | | |
| | | Electric — continued | | | |
| $ | 36,250 | | Quezon Power Philippines Co.,
8.860%, 6/15/2017 | | $ | 32,625 |
| | 51,115,000 | | Southwestern Electric Power Co.,
6.450%, 1/15/2019 | | | 47,313,577 |
| | 500,000 | | SP Powerassets Ltd., EMTN,
3.730%, 10/22/2010, (SGD) | | | 326,941 |
| | 8,785,000 | | Toledo Edison Co.,
6.150%, 5/15/2037 | | | 6,189,217 |
| | 23,000,000 | | Virginia Electric and Power Co.,
8.875%, 11/15/2038 | | | 28,118,719 |
| | 1,075,000 | | White Pine Hydro LLC,
6.310%, 7/10/2017(d) | | | 956,549 |
| | 1,600,000 | | White Pine Hydro LLC,
6.960%, 7/10/2037(d) | | | 1,224,117 |
| | | | | | |
| | | | | | 272,426,630 |
| | | | | | |
| | | Entertainment — 0.3% | | | |
| | 3,565,000 | | Time Warner, Inc.,
6.500%, 11/15/2036 | | | 2,932,298 |
| | 1,805,000 | | Time Warner, Inc.,
6.625%, 5/15/2029 | | | 1,523,821 |
| | 755,000 | | Time Warner, Inc.,
6.950%, 1/15/2028 | | | 667,183 |
| | 505,000 | | Time Warner, Inc.,
7.625%, 4/15/2031 | | | 451,230 |
| | 330,000 | | Time Warner, Inc.,
7.700%, 5/01/2032 | | | 296,748 |
| | 3,695,000 | | Viacom, Inc.,
6.125%, 10/05/2017 | | | 3,144,020 |
| | 2,655,000 | | Viacom, Inc.,
6.250%, 4/30/2016 | | | 2,330,936 |
| | 6,490,000 | | Viacom, Inc., Class B,
6.875%, 4/30/2036 | | | 4,735,149 |
| | | | | | |
| | | | | | 16,081,385 |
| | | | | | |
| | | Food & Beverage — 1.0% | | | |
| | 6,845,000 | | Anheuser-Busch Cos., Inc.,
5.950%, 1/15/2033 | | | 5,290,254 |
| | 8,760,000 | | Anheuser-Busch Cos., Inc.,
6.450%, 9/01/2037 | | | 7,269,907 |
| | 2,500,000 | | Cargill, Inc., EMTN,
5.375%, 3/02/2037, (GBP) | | | 2,623,630 |
| | 1,525,000 | | Cia Brasileira de Bebidas,
8.750%, 9/15/2013 | | | 1,662,250 |
| | 6,080,000 | | Corn Products International, Inc.,
6.625%, 4/15/2037 | | | 5,011,993 |
| | 9,925,000 | | Kraft Foods, Inc.,
6.500%, 8/11/2017 | | | 10,220,150 |
| | 21,385,000 | | Kraft Foods, Inc.,
6.500%, 11/01/2031 | | | 19,837,282 |
| | 8,080,000 | | Kraft Foods, Inc.,
7.000%, 8/11/2037 | | | 8,010,148 |
| | | | | | |
| | | | | | 59,925,614 |
| | | | | | |
| | | Government Owned – No Guarantee — 1.1% | | | |
| | 3,820,000 | | Abu Dhabi National Energy Co.,
6.500%, 10/27/2036, 144A | | | 2,831,124 |
| | 37,780,000 | | Abu Dhabi National Energy Co.,
7.250%, 8/01/2018, 144A | | | 35,969,318 |
| | | | | | |
Principal
Amount (‡) | | Description | | Value (†) |
| | | | | | |
| | | Government Owned – No Guarantee — continued | | | |
| $ | 52,220,000 | | DP World Ltd.,
6.850%, 7/02/2037, 144A | | $ | 24,984,607 |
| | 1,000,000 | | Telekom Malaysia Berhad,
7.875%, 8/01/2025, 144A | | | 991,234 |
| | | | | | |
| | | | | | 64,776,283 |
| | | | | | |
| | | Health Insurance — 0.9% | | | |
| | 5,455,000 | | CIGNA Corp.,
6.150%, 11/15/2036 | | | 3,836,720 |
| | 24,355,000 | | UnitedHealth Group, Inc.,
5.800%, 3/15/2036 | | | 18,858,588 |
| | 565,000 | | UnitedHealth Group, Inc.,
6.500%, 6/15/2037 | | | 469,491 |
| | 4,556,000 | | UnitedHealth Group, Inc.,
6.625%, 11/15/2037 | | | 3,781,006 |
| | 3,042,000 | | UnitedHealth Group, Inc.,
6.875%, 2/15/2038 | | | 2,698,436 |
| | 27,070,000 | | WellPoint, Inc.,
6.375%, 6/15/2037 | | | 23,318,612 |
| | | | | | |
| | | | | | 52,962,853 |
| | | | | | |
| | | Healthcare — 1.7% | | | |
| | 7,535,000 | | Covidien International Finance SA,
6.000%, 10/15/2017 | | | 7,642,193 |
| | 7,590,000 | | Covidien International Finance SA,
6.550%, 10/15/2037 | | | 7,474,192 |
| | 9,480,000 | | HCA, Inc.,
5.750%, 3/15/2014 | | | 6,209,400 |
| | 1,950,000 | | HCA, Inc.,
6.250%, 2/15/2013 | | | 1,462,500 |
| | 3,930,000 | | HCA, Inc.,
6.300%, 10/01/2012 | | | 3,281,550 |
| | 3,810,000 | | HCA, Inc.,
6.375%, 1/15/2015 | | | 2,495,550 |
| | 4,015,000 | | HCA, Inc.,
6.500%, 2/15/2016 | | | 2,629,825 |
| | 365,000 | | HCA, Inc.,
6.750%, 7/15/2013 | | | 272,837 |
| | 3,000,000 | | HCA, Inc.,
7.050%, 12/01/2027 | | | 1,560,000 |
| | 2,290,000 | | HCA, Inc.,
7.190%, 11/15/2015 | | | 1,546,987 |
| | 2,155,000 | | HCA, Inc.,
7.500%, 12/15/2023 | | | 1,141,788 |
| | 1,310,000 | | HCA, Inc.,
7.500%, 11/06/2033 | | | 655,000 |
| | 3,890,000 | | HCA, Inc.,
7.690%, 6/15/2025 | | | 2,025,935 |
| | 4,255,000 | | HCA, Inc.,
8.360%, 4/15/2024 | | | 2,385,876 |
| | 1,225,000 | | HCA, Inc., MTN,
7.580%, 9/15/2025 | | | 628,561 |
| | 3,135,000 | | HCA, Inc., MTN,
7.750%, 7/15/2036 | | | 1,585,674 |
| | 2,865,000 | | Hospira, Inc.,
6.050%, 3/30/2017 | | | 2,556,981 |
| | 57,190,000 | | Medco Health Solutions, Inc.,
7.125%, 3/15/2018 | | | 56,759,016 |
| | 530,000 | | Owens & Minor, Inc.,
6.350%, 4/15/2016(d) | | | 476,640 |
| | | | | | |
| | | | | | 102,790,505 |
| | | | | | |
See accompanying notes to financial statements.
8
LOOMIS SAYLES INVESTMENT GRADE BOND FUND — PORTFOLIOOF INVESTMENTS (continued)
Investments as of March 31, 2009 (Unaudited)
| | | | | | |
Principal
Amount (‡) | | Description | | Value (†) |
| | | | | | |
| | | Home Construction — 0.4% | | | |
| $ | 850,000 | | Centex Corp.,
5.250%, 6/15/2015 | | $ | 637,500 |
| | 3,685,000 | | D.R. Horton, Inc.,
5.250%, 2/15/2015 | | | 2,823,631 |
| | 2,050,000 | | Desarrolladora Homex SAB de CV,
7.500%, 9/28/2015 | | | 1,353,000 |
| | 2,605,000 | | Lennar Corp., Series B,
5.600%, 5/31/2015 | | | 1,856,063 |
| | 1,870,000 | | Lennar Corp., Series B,
6.500%, 4/15/2016 | | | 1,346,400 |
| | 2,945,000 | | Pulte Homes, Inc.,
5.200%, 2/15/2015 | | | 2,330,231 |
| | 250,000 | | Pulte Homes, Inc.,
5.250%, 1/15/2014 | | | 210,000 |
| | 9,400,000 | | Pulte Homes, Inc.,
6.000%, 2/15/2035 | | | 5,734,000 |
| | 3,645,000 | | Pulte Homes, Inc.,
6.375%, 5/15/2033 | | | 2,223,450 |
| | 3,605,000 | | Toll Brothers Finance Corp.,
5.150%, 5/15/2015 | | | 3,040,810 |
| | | | | | |
| | | | | | 21,555,085 |
| | | | | | |
| | | Independent Energy — 2.4% | | | |
| | 3,715,000 | | Anadarko Petroleum Corp.,
5.950%, 9/15/2016 | | | 3,199,655 |
| | 15,680,000 | | Anadarko Petroleum Corp.,
6.450%, 9/15/2036 | | | 10,959,771 |
| | 10,875,000 | | Apache Corp.,
6.000%, 1/15/2037 | | | 10,489,720 |
| | 1,940,000 | | Chesapeake Energy Corp.,
6.250%, 1/15/2017, (EUR) | | | 1,907,338 |
| | 500,000 | | Devon Financing Corp. LLC,
7.875%, 9/30/2031 | | | 510,899 |
| | 55,085,000 | | Noble Energy, Inc.,
8.250%, 3/01/2019 | | | 56,423,125 |
| | 48,640,000 | | Questar Market Resources, Inc.,
6.800%, 4/01/2018 | | | 43,538,394 |
| | 3,585,000 | | Talisman Energy, Inc.,
5.850%, 2/01/2037 | | | 2,419,567 |
| | 10,865,000 | | Talisman Energy, Inc.,
6.250%, 2/01/2038 | | | 7,664,475 |
| | 160,000 | | XTO Energy, Inc.,
6.100%, 4/01/2036 | | | 135,355 |
| | 6,230,000 | | XTO Energy, Inc.,
6.750%, 8/01/2037 | | | 5,670,023 |
| | | | | | |
| | | | | | 142,918,322 |
| | | | | | |
| | | Integrated Energy — 0.4% | | | |
| | 21,450,000 | | Marathon Oil Corp.,
7.500%, 2/15/2019 | | | 21,610,639 |
| | 1,412,142 | | PF Export Receivables Master Trust, Series A,
6.436%, 6/01/2015, 144A | | | 1,426,263 |
| | | | | | |
| | | | | | 23,036,902 |
| | | | | | |
| | | Life Insurance — 0.1% | | | |
| | 9,260,000 | | Mutual of Omaha Insurance Co.,
6.800%, 6/15/2036, 144A | | | 6,458,924 |
| | | | | | |
| | | Local Authorities — 2.0% | | | |
| | 220,000 | | Alberta Municipal Funding Corp.,
5.700%, 9/01/2011, (CAD) | | | 190,523 |
| | 7,070,000 | | Manitoba (Province of), GMTN,
6.375%, 9/01/2015, (NZD) | | | 4,051,247 |
| | | | | | |
Principal
Amount (‡) | | Description | | Value (†) |
| | | | | | |
| | | Local Authorities — continued | | | |
| $ | 29,165,000 | | New South Wales Treasury Corp., Series 10RG,
7.000%, 12/01/2010, (AUD) | | $ | 21,435,081 |
| | 31,140,000 | | New South Wales Treasury Corp., Series 12RG,
6.000%, 5/01/2012, (AUD) | | | 22,772,404 |
| | 20,000,000 | | New South Wales Treasury Corp., Series 17RG,
5.500%, 3/01/2017, (AUD) | | | 14,155,849 |
| | 26,071 | | Province of Alberta,
5.930%, 9/16/2016, (CAD) | | | 23,353 |
| | 500,000 | | Province of Nova Scotia,
6.600%, 6/01/2027, (CAD) | | | 460,922 |
| | 30,440,000 | | Quebec Province, Series QC,
6.750%, 11/09/2015, (NZD) | | | 17,259,622 |
| | 24,230,000 | | Queensland Treasury Corp.,
7.125%, 9/18/2017, (NZD), 144A | | | 14,984,078 |
| | 19,325,000 | | Queensland Treasury Corp., Series 11G,
6.000%, 6/14/2011, (AUD) | | | 14,092,949 |
| | 14,895,000 | | Virginia Tobacco Settlement Financing Corp., Series A-1,
6.706%, 6/01/2046(d) | | | 7,334,447 |
| | | | | | |
| | | | | | 116,760,475 |
| | | | | | |
| | | Media Cable — 2.3% | | | |
| | 16,941,000 | | Comcast Corp.,
5.650%, 6/15/2035 | | | 13,415,595 |
| | 2,195,000 | | Comcast Corp.,
6.450%, 3/15/2037 | | | 1,917,662 |
| | 4,610,000 | | Comcast Corp.,
6.500%, 11/15/2035 | | | 4,071,861 |
| | 32,715,000 | | Comcast Corp.,
6.950%, 8/15/2037 | | | 30,464,600 |
| | 4,100,000 | | Cox Communications, Inc., Class A,
6.250%, 6/01/2018, 144A | | | 3,642,178 |
| | 3,750,000 | | Cox Communications, Inc., Class A,
6.750%, 3/15/2011 | | | 3,746,861 |
| | 4,190,000 | | Time Warner Cable, Inc.,
5.850%, 5/01/2017 | | | 3,756,318 |
| | 79,880,000 | | Time Warner Cable, Inc.,
6.750%, 7/01/2018 | | | 74,983,675 |
| | 350,000 | | Virgin Media Finance PLC,
9.750%, 4/15/2014, (GBP) | | | 444,445 |
| | | | | | |
| | | | | | 136,443,195 |
| | | | | | |
| | | Media Non-Cable — 0.3% | | | |
| | 2,500,000 | | Clear Channel Communications, Inc.,
4.250%, 5/15/2009 | | | 2,225,000 |
| | 1,000,000 | | Clear Channel Communications, Inc.,
5.750%, 1/15/2013 | | | 150,000 |
| | 7,700,000 | | News America, Inc.,
6.150%, 3/01/2037 | | | 5,614,162 |
| | 4,095,000 | | News America, Inc.,
6.200%, 12/15/2034 | | | 2,945,775 |
| | 9,760,000 | | News America, Inc.,
6.400%, 12/15/2035 | | | 7,230,608 |
| | 1,005,000 | | R.H. Donnelley Corp.,
6.875%, 1/15/2013 | | | 42,713 |
| | 1,665,000 | | R.H. Donnelley Corp., Series A-1,
6.875%, 1/15/2013 | | | 70,762 |
| | 1,950,000 | | R.H. Donnelley Corp., Series A-2,
6.875%, 1/15/2013 | | | 82,875 |
| | 1,760,000 | | R.H. Donnelley Corp., Series A-3,
8.875%, 1/15/2016 | | | 101,200 |
| | 555,000 | | R.H. Donnelley Corp., Series A-4,
8.875%, 10/15/2017 | | | 29,138 |
| | | | | | |
| | | | | | 18,492,233 |
| | | | | | |
See accompanying notes to financial statements.
9
LOOMIS SAYLES INVESTMENT GRADE BOND FUND — PORTFOLIOOF INVESTMENTS (continued)
Investments as of March 31, 2009 (Unaudited)
| | | | | | | |
Principal
Amount (‡) | | | Description | | Value (†) |
| | | | | | | |
| | | | Metals & Mining — 0.7% | | | |
| $ | 3,605,000 | | | Barrick Gold Finance Co.,
5.800%, 11/15/2034 | | $ | 2,732,796 |
| | 12,775,000 | | | Newmont Mining Corp.,
5.875%, 4/01/2035 | | | 8,904,175 |
| | 1,500,000 | | | Teck Cominco Ltd.,
7.000%, 9/15/2012 | | | 1,125,000 |
| | 1,985,000 | | | United States Steel Corp.,
6.050%, 6/01/2017 | | | 1,228,169 |
| | 4,712,000 | | | United States Steel Corp.,
6.650%, 6/01/2037 | | | 2,655,118 |
| | 31,890,000 | | | United States Steel Corp.,
7.000%, 2/01/2018 | | | 21,762,246 |
| | 3,735,000 | | | Vale Overseas Ltd.,
6.875%, 11/21/2036 | | | 3,225,318 |
| | | | | | | |
| | | | | | | 41,632,822 |
| | | | | | | |
| | | | Mortgage Related — 0.1% | | | |
| | 4,465,000 | | | Federal Home Loan Mortgage Corp., MTN,
5.000%, 12/14/2018 | | | 4,311,328 |
| | 171,679 | | | FHLMC,
5.000%, 12/01/2031 | | | 178,039 |
| | 31,605 | | | FNMA,
6.000%, 7/01/2029 | | | 33,320 |
| | | | | | | |
| | | | | | | 4,522,687 |
| | | | | | | |
| | | | Non-Captive Consumer — 1.5% | | | |
| | 5,000,000 | | | American General Finance Corp., Series I, MTN,
5.400%, 12/01/2015 | | | 1,849,945 |
| | 88,895,000 | | | American General Finance Corp., Series J, MTN,
6.900%, 12/15/2017 | | | 32,891,150 |
| | 25,000,000 | | | HSBC Finance Corp.,
6.375%, 11/27/2012 | | | 20,767,750 |
| | 63,775 | (†††) | | SLM Corp.,
6.000%, 12/15/2043 | | | 585,933 |
| | 6,200,000 | | | SLM Corp., EMTN,
4.750%, 3/17/2014, (EUR) | | | 3,995,100 |
| | 630,000 | | | SLM Corp., MTN,
5.050%, 11/14/2014 | | | 333,492 |
| | 310,000 | | | SLM Corp., MTN,
5.125%, 8/27/2012 | | | 167,039 |
| | 105,000 | | | SLM Corp., Series A, MTN,
4.000%, 1/15/2010 | | | 88,605 |
| | 95,000 | | | SLM Corp., Series A, MTN,
4.500%, 7/26/2010 | | | 71,250 |
| | 3,190,000 | | | SLM Corp., Series A, MTN,
5.000%, 10/01/2013 | | | 1,696,340 |
| | 2,120,000 | | | SLM Corp., Series A, MTN,
5.000%, 4/15/2015 | | | 954,000 |
| | 960,000 | | | SLM Corp., Series A, MTN,
5.000%, 6/15/2018 | | | 496,992 |
| | 1,680,000 | | | SLM Corp., Series A, MTN,
5.375%, 1/15/2013 | | | 921,844 |
| | 1,470,000 | | | SLM Corp., Series A, MTN,
5.375%, 5/15/2014 | | | 761,751 |
| | 300,000 | | | SLM Corp., Series A, MTN,
5.400%, 10/25/2011 | | | 186,000 |
| | 690,000 | | | SLM Corp., Series A, MTN,
5.625%, 8/01/2033 | | | 255,300 |
| | 7,590,000 | | | SLM Corp., Series A, MTN,
6.500%, 6/15/2010, (NZD)(d)(e) | | | 3,147,346 |
| | 31,335,000 | | | SLM Corp., Series A, MTN,
8.450%, 6/15/2018 | | | 16,924,911 |
| | | | | | | |
| | | | | | | 86,094,748 |
| | | | | | | |
| | | | | | |
Principal
Amount (‡) | | Description | | Value (†) |
| | | | | | |
| | | Non-Captive Diversified — 3.2% | | | |
| $ | 4,152,000 | | CIT Group, Inc.,
5.400%, 2/13/2012 | | $ | 2,676,853 |
| | 7,550,000 | | CIT Group, Inc.,
5.500%, 12/01/2014, (GBP) | | | 4,549,909 |
| | 42,719,000 | | CIT Group, Inc.,
12.000%, 12/18/2018, 144A | | | 22,107,082 |
| | 1,750,000 | | CIT Group, Inc., EMTN,
3.800%, 11/14/2012, (EUR) | | | 1,069,523 |
| | 350,000 | | CIT Group, Inc., EMTN,
4.650%, 9/19/2016, (EUR) | | | 195,304 |
| | 2,050,000 | | CIT Group, Inc., EMTN,
5.000%, 5/13/2014, (EUR) | | | 1,171,161 |
| | 4,250,000 | | CIT Group, Inc., EMTN,
5.500%, 12/20/2016, (GBP) | | | 2,561,207 |
| | 5,450,000 | | CIT Group, Inc., GMTN,
4.250%, 9/22/2011, (EUR) | | | 4,344,522 |
| | 137,000 | | CIT Group, Inc., GMTN,
5.000%, 2/13/2014 | | | 80,830 |
| | 1,450,000 | | CIT Group, Inc., MTN,
4.250%, 3/17/2015, (EUR) | | | 924,706 |
| | 236,000 | | CIT Group, Inc., MTN,
5.125%, 9/30/2014 | | | 142,659 |
| | 717,000 | | CIT Group, Inc., Series A, GMTN,
6.000%, 4/01/2036 | | | 338,038 |
| | 22,522,000 | | CIT Group, Inc., Series A, MTN,
7.625%, 11/30/2012 | | | 16,576,890 |
| | 7,515,000 | | General Electric Capital Australia Funding, EMTN,
8.000%, 2/13/2012, (AUD) | | �� | 4,900,384 |
| | 3,410,000 | | General Electric Capital Corp.,
5.625%, 5/01/2018 | | | 2,965,067 |
| | 2,355,000 | | General Electric Capital Corp., MTN,
5.875%, 1/14/2038 | | | 1,682,144 |
| | 14,535,000 | | General Electric Capital Corp., Series A, EMTN,
6.750%, 9/26/2016, (NZD)(d)(e) | | | 6,797,498 |
| | 6,200,000 | | General Electric Capital Corp., Series A, GMTN,
2.960%, 5/18/2012, (SGD) | | | 3,403,663 |
| | 13,400,000 | | General Electric Capital Corp., Series A, GMTN,
3.485%, 3/08/2012, (SGD) | | | 7,558,386 |
| | 4,200,000 | | General Electric Capital Corp., Series A, GMTN,
6.625%, 2/04/2010, (NZD) | | | 2,354,770 |
| | 15,170,000 | | General Electric Capital Corp., Series A, GMTN,
7.625%, 12/10/2014, (NZD)(d)(e) | | | 7,822,252 |
| | 17,060,000 | | General Electric Capital Corp., Series A, MTN,
4.875%, 3/04/2015 | | | 15,142,712 |
| | 22,137,000 | | General Electric Capital Corp., Series A, MTN,
6.500%, 9/28/2015, (NZD)(d)(e) | | | 10,419,837 |
| | 1,345,000 | | GMAC LLC,
6.000%, 12/15/2011 | | | 755,254 |
| | 1,310,000 | | GMAC LLC,
6.625%, 5/15/2012 | | | 723,256 |
| | 1,670,000 | | GMAC LLC,
6.750%, 12/01/2014 | | | 788,425 |
| | 1,500,000 | | GMAC LLC,
6.875%, 9/15/2011 | | | 946,441 |
| | 400,000 | | GMAC LLC,
6.875%, 8/28/2012 | | | 220,854 |
| | 1,210,000 | | GMAC LLC,
7.000%, 2/01/2012 | | | 690,902 |
| | 3,142,000 | | GMAC LLC,
7.500%, 12/31/2013, 144A | | | 1,510,297 |
See accompanying notes to financial statements.
10
LOOMIS SAYLES INVESTMENT GRADE BOND FUND — PORTFOLIOOF INVESTMENTS (continued)
Investments as of March 31, 2009 (Unaudited)
| | | | | | |
Principal
Amount (‡) | | Description | | Value (†) |
| | | | | | |
| | | Non-Captive Diversified — continued | | | |
| $ | 5,664,000 | | GMAC LLC,
8.000%, 12/31/2018, 144A | | $ | 1,644,316 |
| | 2,335,000 | | GMAC LLC,
8.000%, 11/01/2031 | | | 867,154 |
| | 2,805,000 | | GMAC LLC, EMTN,
4.750%, 9/14/2009, (EUR) | | | 3,167,714 |
| | 5,045,000 | | GMAC LLC, EMTN,
5.375%, 6/06/2011, (EUR) | | | 3,954,644 |
| | 380,000 | | GMAC LLC, EMTN,
5.750%, 9/27/2010, (EUR) | | | 328,164 |
| | 6,820,000 | | International Lease Finance Corp.,
3.500%, 4/01/2009 | | | 6,820,000 |
| | 8,250,000 | | International Lease Finance Corp.,
4.750%, 7/01/2009 | | | 7,755,767 |
| | 9,590,000 | | International Lease Finance Corp.,
5.000%, 4/15/2010 | | | 7,617,682 |
| | 2,285,000 | | International Lease Finance Corp.,
5.000%, 9/15/2012 | | | 1,242,441 |
| | 3,280,000 | | International Lease Finance Corp.,
6.375%, 3/25/2013 | | | 1,812,521 |
| | 16,000,000 | | International Lease Finance Corp., EMTN,
6.625%, 12/07/2009, (GBP) | | | 17,677,030 |
| | 655,000 | | International Lease Finance Corp., Series R, MTN,
5.550%, 9/05/2012 | | | 363,129 |
| | 2,755,000 | | International Lease Finance Corp., Series R, MTN,
5.625%, 9/15/2010 | | | 2,033,904 |
| | 5,225,000 | | iStar Financial, Inc.,
5.150%, 3/01/2012 | | | 1,881,000 |
| | 1,000,000 | | iStar Financial, Inc.,
5.375%, 4/15/2010 | | | 640,000 |
| | 330,000 | | iStar Financial, Inc.,
5.500%, 6/15/2012 | | | 112,200 |
| | 3,700,000 | | iStar Financial, Inc.,
5.650%, 9/15/2011 | | | 1,517,000 |
| | 765,000 | | iStar Financial, Inc.,
5.800%, 3/15/2011 | | | 327,037 |
| | 385,000 | | iStar Financial, Inc.,
5.850%, 3/15/2017 | | | 111,650 |
| | 1,605,000 | | iStar Financial, Inc.,
5.875%, 3/15/2016 | | | 465,450 |
| | 745,000 | | iStar Financial, Inc.,
6.050%, 4/15/2015 | | | 216,050 |
| | 535,000 | | iStar Financial, Inc.,
8.625%, 6/01/2013 | | | 167,187 |
| | 335,000 | | iStar Financial, Inc., Series B,
5.125%, 4/01/2011 | | | 138,187 |
| | 254,000 | | iStar Financial, Inc., Series B,
5.700%, 3/01/2014 | | | 73,660 |
| | 5,680,000 | | iStar Financial, Inc., Series B,
5.950%, 10/15/2013 | | | 1,732,400 |
| | | | | | |
| | | | | | 188,087,113 |
| | | | | | |
| | | Oil Field Services — 2.2% | | | |
| | 1,025,000 | | Nabors Industries, Inc.,
6.150%, 2/15/2018 | | | 801,932 |
| | 72,440,000 | | Nabors Industries, Inc.,
9.250%, 1/15/2019, 144A | | | 68,689,636 |
| | 600,000 | | Transocean Ltd.,
7.375%, 4/15/2018 | | | 615,967 |
| | | | | | |
Principal
Amount (‡) | | Description | | Value (†) |
| | | | | | |
| | | Oil Field Services — continued | | | |
| $ | 5,905,000 | | Weatherford International Ltd.,
6.500%, 8/01/2036 | | $ | 4,156,925 |
| | 1,680,000 | | Weatherford International Ltd.,
6.800%, 6/15/2037 | | | 1,191,648 |
| | 5,405,000 | | Weatherford International Ltd.,
7.000%, 3/15/2038 | | | 3,929,549 |
| | 47,455,000 | | Weatherford International Ltd.,
9.625%, 3/01/2019 | | | 49,083,323 |
| | | | | | |
| | | | | | 128,468,980 |
| | | | | | |
| | | Paper — 1.5% | | | |
| | 330,000 | | Bowater, Inc.,
6.500%, 6/15/2013 | | | 26,400 |
| | 575,000 | | Georgia-Pacific LLC,
7.250%, 6/01/2028 | | | 399,625 |
| | 2,460,000 | | Georgia-Pacific LLC,
7.375%, 12/01/2025 | | | 1,752,750 |
| | 285,000 | | Georgia-Pacific LLC,
7.750%, 11/15/2029 | | | 210,900 |
| | 1,340,000 | | Georgia-Pacific LLC,
8.000%, 1/15/2024 | | | 1,065,300 |
| | 2,280,000 | | Georgia-Pacific LLC,
8.875%, 5/15/2031 | | | 1,824,000 |
| | 750,000 | | International Paper Co.,
4.000%, 4/01/2010 | | | 713,627 |
| | 300,000 | | International Paper Co.,
5.250%, 4/01/2016 | | | 197,643 |
| | 989,000 | | International Paper Co.,
5.500%, 1/15/2014 | | | 784,972 |
| | 87,495,000 | | International Paper Co.,
7.950%, 6/15/2018 | | | 66,687,552 |
| | 22,860,000 | | Weyerhaeuser Co.,
6.875%, 12/15/2033 | | | 14,035,720 |
| | 5,055,000 | | Weyerhaeuser Co.,
7.375%, 3/15/2032 | | | 3,377,857 |
| | | | | | |
| | | | | | 91,076,346 |
| | | | | | |
| | | Pharmaceuticals — 2.5% | | | |
| | 20,830,000 | | Astrazeneca PLC,
6.450%, 9/15/2037 | | | 21,606,584 |
| | 800,000 | | Elan Financial PLC,
7.750%, 11/15/2011 | | | 672,000 |
| | 2,280,000 | | Elan Financial PLC,
8.875%, 12/01/2013 | | | 1,824,000 |
| | 28,670,000 | | Johnson & Johnson,
5.950%, 8/15/2037 | | | 30,296,736 |
| | 90,000,000 | | Roche Holdings, Inc.,
5.000%, 3/01/2014, 144A | | | 92,117,430 |
| | 500,000 | | Schering-Plough Corp.,
5.550%, 12/01/2013 | | | 525,509 |
| | | | | | |
| | | | | | 147,042,259 |
| | | | | | |
| | | Pipelines — 4.0% | | | |
| | 1,174,000 | | Colorado Interstate Gas Co.,
5.950%, 3/15/2015 | | | 1,059,890 |
| | 125,000 | | Colorado Interstate Gas Co.,
6.800%, 11/15/2015 | | | 117,174 |
| | 2,010,000 | | DCP Midstream LP,
6.450%, 11/03/2036, 144A | | | 1,302,991 |
| | 2,470,000 | | El Paso Corp.,
6.950%, 6/01/2028 | | | 1,703,357 |
See accompanying notes to financial statements.
11
LOOMIS SAYLES INVESTMENT GRADE BOND FUND — PORTFOLIOOF INVESTMENTS (continued)
Investments as of March 31, 2009 (Unaudited)
| | | | | | |
Principal
Amount (‡) | | Description | | Value (†) |
| | | | | | |
| | | Pipelines — continued | | | |
| $ | 1,000,000 | | El Paso Corp.,
12.000%, 12/12/2013 | | $ | 1,052,500 |
| | 540,000 | | Energy Transfer Partners LP,
6.125%, 2/15/2017 | | | 481,790 |
| | 1,605,000 | | Energy Transfer Partners LP,
6.625%, 10/15/2036 | | | 1,193,449 |
| | 9,455,000 | | Enterprise Products Operating LLP,
6.300%, 9/15/2017 | | | 8,714,891 |
| | 4,390,000 | | Kinder Morgan Energy Partners LP,
5.800%, 3/15/2035 | | | 3,257,130 |
| | 82,600,000 | | Kinder Morgan Energy Partners LP,
5.950%, 2/15/2018 | | | 75,204,161 |
| | 310,000 | | Kinder Morgan Finance Co.,
5.700%, 1/05/2016 | | | 260,400 |
| | 320,000 | | Knight, Inc., Senior Note,
5.150%, 3/01/2015 | | | 268,800 |
| | 5,835,000 | | NGPL PipeCo LLC,
6.514%, 12/15/2012, 144A | | | 5,573,948 |
| | 31,430,000 | | NGPL PipeCo LLC,
7.119%, 12/15/2017, 144A | | | 28,818,324 |
| | 5,430,000 | | NGPL PipeCo LLC,
7.768%, 12/15/2037, 144A | | | 4,735,101 |
| | 4,665,000 | | ONEOK Partners LP,
6.650%, 10/01/2036 | | | 3,491,939 |
| | 10,115,000 | | Panhandle Eastern Pipeline Co.,
6.200%, 11/01/2017 | | | 8,669,910 |
| | 48,630,000 | | Panhandle Eastern Pipeline Co.,
7.000%, 6/15/2018 | | | 43,499,292 |
| | 2,130,000 | | Plains All American Pipeline LP,
6.125%, 1/15/2017 | | | 1,809,767 |
| | 16,025,000 | | Plains All American Pipeline LP,
6.500%, 5/01/2018 | | | 13,850,792 |
| | 4,595,000 | | Plains All American Pipeline LP,
6.650%, 1/15/2037 | | | 3,330,474 |
| | 4,215,000 | | Southern Natural Gas Co.,
5.900%, 4/01/2017, 144A | | | 3,673,377 |
| | 2,415,000 | | Tennessee Gas Pipeline Co.,
7.000%, 10/15/2028 | | | 2,054,337 |
| | 20,000,000 | | Texas Eastern Transmission LP,
6.000%, 9/15/2017, 144A | | | 19,364,800 |
| | | | | | |
| | | | | | 233,488,594 |
| | | | | | |
| | | Property & Casualty Insurance — 1.7% | | | |
| | 3,460,000 | | Marsh & McLennan Cos., Inc.,
5.375%, 7/15/2014 | | | 3,050,928 |
| | 12,652,000 | | Marsh & McLennan Cos., Inc.,
5.750%, 9/15/2015 | | | 11,280,612 |
| | 26,460,000 | | Marsh & McLennan Cos., Inc.,
5.875%, 8/01/2033 | | | 17,559,121 |
| | 43,870,000 | | Marsh & McLennan Cos., Inc.,
9.250%, 4/15/2019 | | | 44,721,429 |
| | 965,000 | | MBIA Insurance Corp.,
(fixed rate to 1/15/2013, variable rate thereafter),
14.000%, 1/15/2033, 144A | | | 299,150 |
| | 15,875,000 | | Travelers Cos., Inc. (The), MTN,
6.250%, 6/15/2037 | | | 14,525,117 |
| | 2,830,000 | | Travelers Property Casualty Corp.,
6.375%, 3/15/2033 | | | 2,638,338 |
| | 2,950,000 | | White Mountains RE Group,
6.375%, 3/20/2017, 144A | | | 2,152,172 |
| | 4,830,000 | | Willis North America, Inc.,
6.200%, 3/28/2017 | | | 3,385,468 |
| | | | | | |
| | | | | | 99,612,335 |
| | | | | | |
| | | | | | |
Principal
Amount (‡) | | Description | | Value (†) |
| | | | | | |
| | | Railroads — 0.7% | | | |
| $ | 2,390,000 | | Canadian Pacific Railway Co.,
5.750%, 3/15/2033 | | $ | 1,699,558 |
| | 15,830,000 | | Canadian Pacific Railway Co.,
5.950%, 5/15/2037 | | | 11,046,807 |
| | 5,000,000 | | Canadian Pacific Railway Ltd., MTN,
4.900%, 6/15/2010, (CAD), 144A | | | 3,994,686 |
| | 1,550,000 | | CSX Corp.,
6.150%, 5/01/2037 | | | 1,095,732 |
| | 18,555,000 | | CSX Corp.,
6.250%, 3/15/2018 | | | 15,984,390 |
| | 10,105,000 | | CSX Corp., MTN,
6.000%, 10/01/2036 | | | 7,097,287 |
| | 195,000 | | Missouri Pacific Railroad Co.,
4.750%, 1/01/2020(d) | | | 131,138 |
| | 243,000 | | Missouri Pacific Railroad Co.,
4.750%, 1/01/2030(d) | | | 145,800 |
| | 1,738,000 | | Missouri Pacific Railroad Co.,
5.000%, 1/01/2045(d) | | | 955,900 |
| | 1,700,000 | | Union Pacific Corp.,
5.375%, 6/01/2033 | | | 1,352,656 |
| | | | | | |
| | | | | | 43,503,954 |
| | | | | | |
| | | Refining — 0.0% | | | |
| | 3,740,000 | | Valero Energy Corp.,
6.625%, 6/15/2037 | | | 2,643,727 |
| | | | | | |
| | | REITs — 1.4% | | | |
| | 12,015,000 | | Camden Property Trust,
5.700%, 5/15/2017 | | | 8,820,692 |
| | 4,000,000 | | Colonial Realty LP,
4.800%, 4/01/2011 | | | 3,480,688 |
| | 625,000 | | Colonial Realty LP,
5.500%, 10/01/2015 | | | 374,946 |
| | 525,000 | | Colonial Realty LP,
6.050%, 9/01/2016 | | | 318,504 |
| | 4,230,000 | | Duke Realty LP,
5.950%, 2/15/2017 | | | 2,529,718 |
| | 20,000,000 | | Duke Realty LP,
6.500%, 1/15/2018 | | | 11,779,500 |
| | 5,000,000 | | Equity One, Inc.,
6.000%, 9/15/2017 | | | 3,250,000 |
| | 1,010,000 | | ERP Operating LP,
5.125%, 3/15/2016 | | | 796,950 |
| | 1,800,000 | | ERP Operating LP,
5.375%, 8/01/2016 | | | 1,418,560 |
| | 2,420,000 | | ERP Operating LP,
5.750%, 6/15/2017 | | | 1,915,360 |
| | 10,500,000 | | First Industrial LP,
5.950%, 5/15/2017 | | | 5,041,334 |
| | 14,130,000 | | Highwoods Properties, Inc.,
5.850%, 3/15/2017 | | | 8,737,639 |
| | 2,195,000 | | Highwoods Properties, Inc.,
7.500%, 4/15/2018 | | | 1,446,496 |
| | 575,000 | | ProLogis,
5.625%, 11/15/2015 | | | 310,500 |
| | 470,000 | | ProLogis,
5.750%, 4/01/2016 | | | 258,293 |
| | 7,075,000 | | Realty Income Corp.,
6.750%, 8/15/2019 | | | 4,883,759 |
| | 1,270,000 | | Simon Property Group LP,
5.250%, 12/01/2016 | | | 945,976 |
See accompanying notes to financial statements.
12
LOOMIS SAYLES INVESTMENT GRADE BOND FUND — PORTFOLIOOF INVESTMENTS (continued)
Investments as of March 31, 2009 (Unaudited)
| | | | | | | |
Principal
Amount (‡) | | | Description | | Value (†) |
| | | | | | | |
| | | | REITs — continued | | | |
| $ | 2,040,000 | | | Simon Property Group LP,
5.300%, 5/30/2013 | | $ | 1,665,709 |
| | 820,000 | | | Simon Property Group LP,
5.750%, 5/01/2012 | | | 709,290 |
| | 5,405,000 | | | Simon Property Group LP,
5.750%, 12/01/2015 | | | 4,173,011 |
| | 1,930,000 | | | Simon Property Group LP,
5.875%, 3/01/2017 | | | 1,488,723 |
| | 19,525,000 | | | Simon Property Group LP,
10.350%, 4/01/2019 | | | 18,975,937 |
| | | | | | | |
| | | | | | | 83,321,585 |
| | | | | | | |
| | | | Restaurants — 0.0% | | | |
| | 1,000,000 | | | McDonald’s Corp.,
3.628%, 10/10/2010, (SGD) | | | 672,784 |
| | | | | | | |
| | | | Retailers — 2.0% | | | |
| | 1,415,000 | | | Home Depot, Inc. (The),
5.400%, 3/01/2016 | | | 1,271,945 |
| | 32,022,000 | | | Home Depot, Inc. (The),
5.875%, 12/16/2036 | | | 22,677,372 |
| | 8,170,000 | | | J.C. Penney Corp., Inc.,
5.750%, 2/15/2018 | | | 5,745,577 |
| | 16,260,000 | | | J.C. Penney Corp., Inc.,
6.375%, 10/15/2036 | | | 10,165,069 |
| | 12,000 | | | J.C. Penney Corp., Inc.,
7.125%, 11/15/2023 | | | 8,381 |
| | 7,385,000 | | | J.C. Penney Corp., Inc.,
7.400%, 4/01/2037 | | | 4,690,110 |
| | 8,845,000 | | | J.C. Penney Corp., Inc.,
7.625%, 3/01/2097 | | | 5,609,596 |
| | 200,000 | | | Lowe’s Cos., Inc.,
5.500%, 10/15/2035 | | | 175,545 |
| | 4,000,000 | | | Lowe’s Cos., Inc.,
5.800%, 10/15/2036 | | | 3,518,408 |
| | 3,375,000 | | | Lowe’s Cos., Inc.,
6.650%, 9/15/2037 | | | 3,319,829 |
| | 17,730,000 | | | Macy’s Retail Holdings, Inc.,
6.375%, 3/15/2037 | | | 9,873,500 |
| | 10,695,000 | | | Macy’s Retail Holdings, Inc.,
6.790%, 7/15/2027 | | | 5,468,696 |
| | 2,750,000 | | | Macy’s Retail Holdings, Inc.,
6.900%, 4/01/2029 | | | 1,387,282 |
| | 8,240,000 | | | Marks & Spencer PLC,
7.125%, 12/01/2037, 144A | | | 4,816,379 |
| | 2,078,000 | | | Target Corp.,
6.500%, 10/15/2037 | | | 1,841,376 |
| | 37,872,000 | | | Target Corp.,
7.000%, 1/15/2038 | | | 35,475,877 |
| | | | | | | |
| | | | | | | 116,044,942 |
| | | | | | | |
| | | | Sovereigns — 0.9% | | | |
| | 4,200,900 | (††) | | Mexican Fixed Rate Bonds, Series M-20,
8.000%, 12/07/2023, (MXN) | | | 29,447,523 |
| | 770,000 | (††) | | Mexican Fixed Rate Bonds, Series MI-10,
9.000%, 12/20/2012, (MXN) | | | 5,809,926 |
| | 325,000 | | | Republic of Brazil,
8.875%, 4/15/2024 | | | 374,562 |
| | 24,705,000 | | | Republic of Brazil,
10.250%, 1/10/2028, (BRL) | | | 9,744,617 |
| | | | | | |
Principal
Amount (‡) | | Description | | Value (†) |
| | | | | | |
| | | Sovereigns — continued | | | |
| $ | 250,000 | | Republic of Brazil,
11.000%, 8/17/2040 | | $ | 317,500 |
| | 6,285,000 | | Republic of Brazil,
12.500%, 1/05/2022, (BRL) | | | 2,831,264 |
| | 487,000,000 | | Republic of Iceland,
Zero Coupon, 4/15/2009, (ISK) | | | 2,359,809 |
| | 234,380,000 | | Republic of Iceland,
7.000%, 3/17/2010, (ISK) | | | 1,116,449 |
| | 132,700,000 | | Republic of Iceland,
8.500%, 6/12/2009, (ISK) | | | 640,197 |
| | 138,627,000 | | Republic of Iceland,
13.750%, 12/10/2010, (ISK) | | | 714,842 |
| | | | | | |
| | | | | | 53,356,689 |
| | | | | | |
| | | Supermarkets — 0.3% | | | |
| | 4,220,000 | | American Stores Co., Series B, MTN,
7.100%, 3/20/2028 | | | 3,270,500 |
| | 3,340,000 | | Kroger Co.,
6.400%, 8/15/2017 | | | 3,428,784 |
| | 1,900,000 | | New Albertson’s, Inc.,
7.450%, 8/01/2029 | | | 1,577,000 |
| | 1,000,000 | | New Albertson’s, Inc., Series C, MTN,
6.625%, 6/01/2028 | | | 735,000 |
| | 11,100,000 | | Safeway, Inc.,
6.350%, 8/15/2017 | | | 11,375,458 |
| | | | | | |
| | | | | | 20,386,742 |
| | | | | | |
| | | Supranational — 1.7% | | | |
| | 90,000,000 | | Eurofima, EMTN,
11.000%, 2/05/2010, (ISK) | | | 449,886 |
| | 113,651,400,000 | | European Investment Bank, EMTN,
Zero Coupon, 4/24/2013, (IDR), 144A | | | 4,884,404 |
| | 15,500,000 | | European Investment Bank, EMTN,
4.600%, 1/30/2037, (CAD), 144A | | | 11,288,519 |
| | 26,194,000 | | European Investment Bank, EMTN,
7.000%, 1/18/2012, (NZD) | | | 15,773,398 |
| | 22,000,000 | | Inter-American Development Bank, EMTN,
Zero Coupon, 5/11/2009, (BRL) | | | 9,341,524 |
| | 331,380,000,000 | | Inter-American Development Bank, EMTN,
Zero Coupon, 5/20/2013, (IDR) | | | 16,659,337 |
| | 418,960,000,000 | | Inter-American Development Bank, EMTN,
Zero Coupon, 9/23/2013, (IDR) | | | 20,300,797 |
| | 13,265,000 | | Inter-American Development Bank, EMTN,
6.000%, 12/15/2017, (NZD) | | | 7,482,230 |
| | 15,400,000 | | International Bank for Reconstruction & Development,
1.430%, 3/05/2014, (SGD) | | | 9,891,864 |
| | 429,100,000 | | International Bank for Reconstruction & Development,
9.500%, 5/27/2010, (ISK) | | | 2,107,697 |
| | 26,200,000 | | Nordic Investment Bank, EMTN,
11.250%, 4/16/2009, (ISK) | | | 127,857 |
| | | | | | |
| | | | | | 98,307,513 |
| | | | | | |
| | | Technology — 3.2% | | | |
| | 8,895,000 | | Agilent Technologies, Inc.,
6.500%, 11/01/2017 | | | 7,288,785 |
| | 2,035,000 | | Arrow Electronics, Inc.,
6.875%, 7/01/2013 | | | 1,937,873 |
| | 1,050,000 | | Arrow Electronics, Inc.,
6.875%, 6/01/2018 | | | 931,130 |
| | 9,000,000 | | Avnet, Inc.,
5.875%, 3/15/2014 | | | 7,740,819 |
See accompanying notes to financial statements.
13
LOOMIS SAYLES INVESTMENT GRADE BOND FUND — PORTFOLIOOF INVESTMENTS (continued)
Investments as of March 31, 2009 (Unaudited)
| | | | | | |
Principal
Amount (‡) | | Description | | Value (†) |
| | | | | | |
| | | Technology — continued | | | |
| $ | 6,230,000 | | Avnet, Inc.,
6.000%, 9/01/2015 | | $ | 5,126,362 |
| | 1,540,000 | | Avnet, Inc.,
6.625%, 9/15/2016 | | | 1,282,689 |
| | 13,695,000 | | BMC Software, Inc.,
7.250%, 6/01/2018(d) | | | 12,384,347 |
| | 260,000 | | Corning, Inc.,
6.850%, 3/01/2029 | | | 196,265 |
| | 7,650,000 | | Corning, Inc.,
7.250%, 8/15/2036 | | | 5,763,411 |
| | 56,440,000 | | Dun & Bradstreet Corp.,
6.000%, 4/01/2013 | | | 57,581,160 |
| | 8,915,000 | | Equifax, Inc.,
7.000%, 7/01/2037 | | | 6,332,111 |
| | 1,660,000 | | Freescale Semiconductor, Inc.,
10.125%, 12/15/2016 | | | 298,800 |
| | 7,965,000 | | Intuit, Inc.,
5.750%, 3/15/2017 | | | 6,936,296 |
| | 55,000,000 | | KLA-Tencor Corp.,
6.900%, 5/01/2018 | | | 43,475,300 |
| | 4,700,000 | | Lucent Technologies, Inc.,
6.450%, 3/15/2029 | | | 1,786,000 |
| | 4,680,000 | | Motorola, Inc.,
5.220%, 10/01/2097 | | | 1,883,560 |
| | 1,730,000 | | Motorola, Inc.,
6.500%, 9/01/2025 | | | 1,098,555 |
| | 4,150,000 | | Motorola, Inc.,
6.500%, 11/15/2028 | | | 2,614,500 |
| | 6,145,000 | | Motorola, Inc.,
6.625%, 11/15/2037 | | | 3,886,712 |
| | 1,625,000 | | Motorola, Inc.,
8.000%, 11/01/2011 | | | 1,490,580 |
| | 2,774,000 | | Samsung Electronics Co. Ltd.,
7.700%, 10/01/2027, 144A | | | 2,655,769 |
| | 782,000 | | Xerox Corp.,
5.500%, 5/15/2012 | | | 677,267 |
| | 11,067,000 | | Xerox Corp.,
6.350%, 5/15/2018 | | | 8,244,915 |
| | 7,265,000 | | Xerox Corp.,
6.750%, 2/01/2017 | | | 5,548,636 |
| | | | | | |
| | | | | | 187,161,842 |
| | | | | | |
| | | Textile — 0.2% | | | |
| | 15,228,000 | | VF Corp.,
6.450%, 11/01/2037 | | | 13,148,845 |
| | | | | | |
| | | Tobacco — 2.2% | | | |
| | 100,000,000 | | Altria Group, Inc.,
8.500%, 11/10/2013 | | | 108,455,000 |
| | 14,604,000 | | Altria Group, Inc.,
9.250%, 8/06/2019 | | | 15,614,509 |
| | 8,305,000 | | Reynolds American, Inc.,
6.750%, 6/15/2017 | | | 7,089,921 |
| | 2,035,000 | | Reynolds American, Inc.,
7.250%, 6/15/2037 | | | 1,485,896 |
| | | | | | |
| | | | | | 132,645,326 |
| | | | | | |
| | | Transportation Services — 0.5% | | | |
| | 8,620,000 | | Erac USA Finance Co.,
6.375%, 10/15/2017, 144A | | | 5,550,452 |
| | 2,885,000 | | Erac USA Finance Co.,
6.700%, 6/01/2034, 144A | | | 1,594,338 |
| | 42,736,000 | | Erac USA Finance Co.,
7.000%, 10/15/2037, 144A | | | 24,875,002 |
| | | | | | |
| | | | | | 32,019,792 |
| | | | | | |
| | | | | | |
Principal
Amount (‡) | | Description | | Value (†) |
| | | | | | |
| | | Treasuries — 17.0% | | | |
| $ | 26,235,000 | | Canadian Government,
2.750%, 12/01/2010, (CAD) | | $ | 21,426,637 |
| | 50,600,000 | | Canadian Government,
3.750%, 9/01/2011, (CAD) | | | 42,579,370 |
| | 133,990,000 | | Canadian Government,
3.750%, 6/01/2012, (CAD) | | | 114,140,181 |
| | 198,720,000 | | Canadian Government,
3.750%, 6/01/2019, (CAD) | | | 171,280,942 |
| | 4,250,000 | | Canadian Government,
4.000%, 6/01/2016, (CAD) | | | 3,769,380 |
| | 38,265,000 | | Canadian Government,
4.250%, 9/01/2009, (CAD) | | | 30,820,199 |
| | 187,955,000 | | Canadian Government,
4.250%, 6/01/2018, (CAD) | | | 167,996,707 |
| | 275,170,000 | | Canadian Government,
5.250%, 6/01/2012, (CAD) | | | 244,538,568 |
| | 9,600,000 | | Canadian Government,
5.500%, 6/01/2010, (CAD) | | | 8,054,772 |
| | 3,430,000 | | Canadian Government,
5.750%, 6/01/2033, (CAD) | | | 3,617,632 |
| | 12,530,000 | | New Zealand Government,
6.000%, 12/15/2017, (NZD) | | | 7,510,946 |
| | 742,220,000 | | Norwegian Government,
4.250%, 5/19/2017, (NOK) | | | 115,448,775 |
| | 120,965,000 | | Norwegian Government,
5.000%, 5/15/2015, (NOK) | | | 19,705,548 |
| | 199,940,000 | | Norwegian Government,
6.000%, 5/16/2011, (NOK) | | | 32,109,974 |
| | 142,485,000 | | Norwegian Government,
6.500%, 5/15/2013, (NOK) | | | 24,247,342 |
| | | | | | |
| | | | | | 1,007,246,973 |
| | | | | | |
| | | Wireless — 1.4% | | | |
| | 10,334,000 | | ALLTEL Corp.,
7.875%, 7/01/2032 | | | 10,503,891 |
| | 8,650,000 | | Nextel Communications, Inc., Series D,
7.375%, 8/01/2015 | | | 4,584,500 |
| | 1,220,000 | | Nextel Communications, Inc., Series E,
6.875%, 10/31/2013 | | | 695,400 |
| | 15,710,000 | | Nextel Communications, Inc., Series F,
5.950%, 3/15/2014 | | | 8,719,050 |
| | 6,512,000 | | Sprint Capital Corp.,
6.875%, 11/15/2028 | | | 3,972,320 |
| | 1,800,000 | | Sprint Capital Corp.,
6.900%, 5/01/2019 | | | 1,269,000 |
| | 625,000 | | Sprint Capital Corp.,
8.750%, 3/15/2032 | | | 418,750 |
| | 93,000 | | Sprint Nextel Corp.,
6.000%, 12/01/2016 | | | 66,495 |
| | 32,100,000 | | Verizon Wireless Capital LLC,
8.500%, 11/15/2018, 144A | | | 36,668,504 |
| | 1,654,000 | | Vodafone Group PLC,
5.000%, 9/15/2015 | | | 1,610,774 |
| | 13,415,000 | | Vodafone Group PLC,
6.150%, 2/27/2037 | | | 12,648,709 |
| | | | | | |
| | | | | | 81,157,393 |
| | | | | | |
| | | Wirelines — 4.4% | | | |
| | 19,610,000 | | AT&T Corp.,
6.500%, 3/15/2029 | | | 17,193,734 |
| | 5,705,000 | | AT&T, Inc.,
6.150%, 9/15/2034 | | | 4,998,287 |
See accompanying notes to financial statements.
14
LOOMIS SAYLES INVESTMENT GRADE BOND FUND — PORTFOLIOOF INVESTMENTS (continued)
Investments as of March 31, 2009 (Unaudited)
| | | | | | |
Principal
Amount (‡) | | Description | | Value (†) |
| | | | | | |
| | | Wirelines — continued | | | |
| $ | 14,830,000 | | AT&T, Inc.,
6.500%, 9/01/2037 | | $ | 13,382,918 |
| | 32,800,000 | | AT&T, Inc.,
6.700%, 11/15/2013 | | | 35,032,171 |
| | 1,590,000 | | Bell Canada, MTN,
5.000%, 2/15/2017, (CAD) | | | 1,155,928 |
| | 415,000 | | Bell Canada, MTN,
7.300%, 2/23/2032, (CAD) | | | 297,590 |
| | 3,250,000 | | Bell Canada, Series M-17,
6.100%, 3/16/2035, (CAD) | | | 2,036,844 |
| | 1,915,000 | | BellSouth Corp.,
6.000%, 11/15/2034 | | | 1,715,294 |
| | 1,710,000 | | BellSouth Corp.,
6.550%, 6/15/2034 | | | 1,586,952 |
| | 3,000,000 | | BellSouth Telecommunications, Inc.,
5.850%, 11/15/2045 | | | 2,091,594 |
| | 6,810,000 | | BellSouth Telecommunications, Inc.,
7.000%, 12/01/2095 | | | 5,373,941 |
| | 3,350,000 | | GTE Corp.,
6.940%, 4/15/2028 | | | 2,999,731 |
| | 1,625,000 | | Koninklijke (Royal) KPN NV,
8.375%, 10/01/2030 | | | 1,683,645 |
| | 65,000 | | Level 3 Financing, Inc.,
8.750%, 2/15/2017 | | | 41,600 |
| | 560,000 | | Level 3 Financing, Inc.,
9.250%, 11/01/2014 | | | 386,400 |
| | 2,700,000 | | New England Telephone & Telegraph,
7.875%, 11/15/2029 | | | 2,519,454 |
| | 1,735,000 | | Qwest Capital Funding, Inc.,
6.500%, 11/15/2018 | | | 1,179,800 |
| | 2,815,000 | | Qwest Capital Funding, Inc.,
6.875%, 7/15/2028 | | | 1,773,450 |
| | 4,465,000 | | Qwest Capital Funding, Inc.,
7.625%, 8/03/2021 | | | 3,170,150 |
| | 970,000 | | Qwest Capital Funding, Inc.,
7.750%, 2/15/2031 | | | 640,200 |
| | 340,000 | | Qwest Corp.,
6.500%, 6/01/2017 | | | 282,200 |
| | 10,720,000 | | Qwest Corp.,
6.875%, 9/15/2033 | | | 7,021,600 |
| | 890,000 | | Qwest Corp.,
7.200%, 11/10/2026 | | | 605,200 |
| | 1,050,000 | | Qwest Corp.,
7.250%, 9/15/2025 | | | 693,000 |
| | 4,295,000 | | Qwest Corp.,
7.250%, 10/15/2035 | | | 2,791,750 |
| | 1,815,000 | | Qwest Corp.,
7.500%, 6/15/2023 | | | 1,370,325 |
| | 17,170,000 | | Telecom Italia Capital SA,
4.875%, 10/01/2010 | | | 16,800,416 |
| | 4,735,000 | | Telecom Italia Capital SA,
5.250%, 11/15/2013 | | | 4,252,200 |
| | 5,770,000 | | Telecom Italia Capital SA,
5.250%, 10/01/2015 | | | 4,864,999 |
| | 11,215,000 | | Telecom Italia Capital SA,
6.000%, 9/30/2034 | | | 7,651,479 |
| | 4,180,000 | | Telecom Italia Capital SA,
6.375%, 11/15/2033 | | | 3,045,573 |
| | 10,520,000 | | Telefonica Emisiones SAU,
7.045%, 6/20/2036 | | | 10,809,595 |
| | | | | | |
Principal
Amount (‡) | | Description | | Value (†) |
| | | | | | |
| | | Wirelines — continued | | | |
| $ | 4,265,000 | | Telefonica Europe BV,
7.750%, 9/15/2010 | | $ | 4,453,777 |
| | 14,445,000 | | Telus Corp.,
4.950%, 3/15/2017, (CAD) | | | 10,639,783 |
| | 9,454,000 | | Verizon Communications, Inc.,
5.850%, 9/15/2035 | | | 8,032,270 |
| | 3,676,000 | | Verizon Communications, Inc.,
6.100%, 4/15/2018 | | | 3,641,758 |
| | 1,720,000 | | Verizon Communications, Inc.,
6.400%, 2/15/2038 | | | 1,559,271 |
| | 31,485,000 | | Verizon Communications, Inc.,
8.950%, 3/01/2039 | | | 36,182,373 |
| | 5,674,000 | | Verizon Maryland, Inc.,
5.125%, 6/15/2033 | | | 3,930,595 |
| | 14,540,000 | | Verizon New England, Inc.,
6.500%, 9/15/2011 | | | 15,067,758 |
| | 8,041,000 | | Verizon New England, Inc., Series C,
4.750%, 10/01/2013 | | | 7,650,698 |
| | 12,422,000 | | Verizon New York, Inc., Series B,
7.375%, 4/01/2032 | | | 11,525,579 |
| | | | | | |
| | | | | | 262,131,882 |
| | | | | | |
| | | Total Non-Convertible Bonds (Identified Cost $6,156,221,795) | | | 5,378,565,346 |
| | | | | | |
| | Convertible Bonds — 0.4% | | | |
| | | Media Non-Cable — 0.0% | | | |
| | 536,704 | | Liberty Media LLC,
3.500%, 1/15/2031 | | | 191,872 |
| | | | | | |
| | | Non-Captive Diversified — 0.0% | | | |
| | 9,920,000 | | iStar Financial, Inc.,
1.935%, 10/01/2012(b) | | | 2,976,000 |
| | | | | | |
| | | Oil Field Services — 0.1% | | | |
| | 4,225,000 | | Transocean Ltd.,
1.500%, 12/15/2037 | | | 3,459,219 |
| | 505,000 | | Transocean Ltd.,
1.500%, 12/15/2037 | | | 433,037 |
| | | | | | |
| | | | | | 3,892,256 |
| | | | | | |
| | | Pharmaceuticals — 0.1% | | | |
| | 3,997,000 | | Vertex Pharmaceuticals, Inc.,
4.750%, 2/15/2013 | | | 5,251,059 |
| | 360,000 | | Watson Pharmaceuticals, Inc.,
1.750%, 3/15/2023 | | | 346,950 |
| | | | | | |
| | | | | | 5,598,009 |
| | | | | | |
| | | REITs — 0.0% | | | |
| | 1,400,000 | | ERP Operating LP,
3.850%, 8/15/2026 | | | 1,237,320 |
| | | | | | |
| | | Wireless — 0.1% | | | |
| | 5,200,000 | | NII Holdings, Inc.,
3.125%, 6/15/2012 | | | 3,614,000 |
| | | | | | |
| | | Wirelines — 0.1% | | | |
| | 2,735,000 | | Level 3 Communications, Inc.,
3.500%, 6/15/2012 | | | 1,135,025 |
| | 230,000 | | Level 3 Communications, Inc.,
5.250%, 12/15/2011 | | | 117,300 |
| | 275,000 | | Level 3 Communications, Inc.,
6.000%, 9/15/2009 | | | 265,375 |
| | 3,760,000 | | Level 3 Communications, Inc.,
6.000%, 3/15/2010 | | | 3,196,000 |
| | | | | | |
| | | | | | 4,713,700 |
| | | | | | |
| | | Total Convertible Bonds (Identified Cost $31,046,832) | | | 22,223,157 |
| | | | | | |
See accompanying notes to financial statements.
15
LOOMIS SAYLES INVESTMENT GRADE BOND FUND — PORTFOLIOOF INVESTMENTS (continued)
Investments as of March 31, 2009 (Unaudited)
| | | | | | |
Principal
Amount (‡) | | Description | | Value (†) |
| | | | | | |
| | Municipals — 0.5% | | | |
| | | Alabama — 0.0% | | | |
| $ | 1,025,000 | | Alabama Public School & College Authority
(Capital Improvement),
4.500%, 12/01/2026 | | $ | 988,602 |
| | | | | | |
| | | California — 0.2% | | | |
| | 1,075,000 | | San Diego Unified School District (Election 1998),
4.500%, 7/01/2029,
Series F-1, (FSA insured) | | | 971,166 |
| | 1,305,000 | | San Jose California Redevelopment Agency Tax Allocation (Merged Area Redevelopment), 3.750%, 8/01/2028,
Series C, (MBIA insured) | | | 893,390 |
| | 480,000 | | San Jose California Redevelopment Agency Tax Allocation (Merged Area Redevelopment), 3.750%, 8/01/2028,
Series C, (Registered), (MBIA insured) | | | 342,422 |
| | 1,620,000 | | State of California,
4.500%, 8/01/2027, (AMBAC insured) | | | 1,374,878 |
| | 4,515,000 | | State of California,
4.500%, 10/01/2029 | | | 3,742,483 |
| | 1,315,000 | | State of California,
4.500%, 8/01/2030, (AMBAC insured) | | | 1,080,483 |
| | 1,135,000 | | State of California,
4.500%, 8/01/2030 | | | 932,584 |
| | 840,000 | | State of California (Various Purpose),
3.250%, 12/01/2027, (MBIA insured) | | | 562,716 |
| | 3,965,000 | | State of California (Various Purpose),
4.500%, 12/01/2033, (AMBAC insured) | | | 3,152,889 |
| | 280,000 | | University of California Regents Medical Center,
4.750%, 5/15/2031, Series A, (MBIA insured) | | | 249,273 |
| | | | | | |
| | | | | | 13,302,284 |
| | | | | | |
| | | District Of Columbia — 0.0% | | | |
| | 1,025,000 | | District of Columbia,
4.750%, 6/01/2036,
Series A, (FGIC insured) | | | 915,007 |
| | | | | | |
| | | Florida — 0.0% | | | |
| | 1,025,000 | | Florida State Turnpike Authority
(Department of Transportation),
3.500%, 7/01/2027, Series A, (MBIA insured) | | | 788,953 |
| | 1,625,000 | | Jacksonville Electric Authority, Florida
Water & Sewer Systems Revenue,
4.750%, 10/01/2041, Series B,
(MBIA insured) | | | 1,411,962 |
| | | | | | |
| | | | | | 2,200,915 |
| | | | | | |
| | | Illinois — 0.0% | | | |
| | 1,770,000 | | Chicago Board of Education,
4.750%, 12/01/2031, Series B,
(FSA insured) | | | 1,603,284 |
| | 540,000 | | Chicago O’Hare International Airport,
4.500%, 1/01/2038, Series A,
(FSA insured) | | | 471,517 |
| | | | | | |
| | | | | | 2,074,801 |
| | | | | | |
| | | Louisiana — 0.0% | | | |
| | 1,025,000 | | State of Louisiana,
3.250%, 5/01/2026, Series C,
(FSA insured) | | | 730,630 |
| | | | | | |
| | | | | | |
Principal
Amount (‡) | | Description | | Value (†) |
| | | | | | |
| | | Massachusetts — 0.0% | | | |
| $ | 1,025,000 | | Massachusetts School Building Authority,
4.750%, 8/15/2032, Series A,
(AMBAC insured) | | $ | 959,021 |
| | | | | | |
| | | Michigan — 0.0% | | | |
| | 620,000 | �� | Grosse Pointe Public School System,
3.000%, 5/01/2027, (FGIC insured) | | | 457,163 |
| | 2,665,000 | | Michigan Tobacco Settlement Finance Authority,
7.309%, 6/01/2034(d) | | | 1,555,694 |
| | | | | | |
| | | | | | 2,012,857 |
| | | | | | |
| | | Nebraska — 0.1% | | | |
| | 2,560,000 | | Omaha Public Power District,
4.500%, 2/01/2034, Series AA,
(FGIC insured) | | | 2,295,757 |
| | | | | | |
| | | Ohio — 0.1% | | | |
| | 6,570,000 | | Buckeye Tobacco Settlement Financing Authority, Series A-2,
5.875%, 6/01/2047(d) | | | 3,601,280 |
| | | | | | |
| | | Texas — 0.1% | | | |
| | 2,920,000 | | Harris County, TX,
4.500%, 10/01/2031, Series B | | | 2,707,453 |
| | | | | | |
| | | Wisconsin — 0.0% | | | |
| | 700,000 | | Green Bay Wisconsin Water System Revenue,
3.500%, 11/01/2026, (FSA insured) | | | 576,191 |
| | 755,000 | | Green Bay Wisconsin Water System Revenue,
3.500%, 11/01/2029, (FSA insured) | | | 583,630 |
| | 260,000 | | Wisconsin Housing & Economic Development Authority,
4.900%, 11/01/2035, Series E | | | 234,653 |
| | | | | | |
| | | | | | 1,394,474 |
| | | | | | |
| | | Total Municipals (Identified Cost $38,675,350) | | | 33,183,081 |
| | | | | | |
| | | Total Bonds and Notes (Identified Cost $6,225,943,977) | | | 5,433,971,584 |
| | | | | | |
| | Short-Term Investments — 5.6% | | | |
| | 330,939,191 | | Tri-Party Repurchase Agreement with Fixed Income Clearing Corporation, dated 3/31/2009 at 0.000% to be repurchased at $330,939,191 on 4/01/2009 collateralized by $250,000,000 Federal Home Loan Bank Discount Note, due 1/04/2010 valued at $248,625,000; $10,265,000 Federal Home Loan Mortgage Corp. Discount Note, due 12/31/2009 valued at $10,213,675; $25,000,000 Federal Home Loan Bank, 1.000% due 2/05/2010 valued at $25,031,250; $1,065,000 Federal National Mortgage Association, 4.750% due 3/12/2010 valued at $1,105,470; $27,085,000 Federal National Mortgage Association, 7.250% due 1/15/2010 valued at $28,845,525; $23,405,000 U.S. Treasury Note, 2.000% due 2/28/2010 valued at $23,739,692, including accrued interest (Note 2g of Notes to Financial Statements) (Identified Cost $330,939,191) | | | 330,939,191 |
| | | | | | |
| | | | | | |
| | | Total Investments — 97.4%
(Identified Cost $6,556,883,168)(a) | | | 5,764,910,775 |
| | | Other assets less liabilities — 2.6% | | | 151,755,516 |
| | | | | | |
| | | Net Assets — 100.0% | | $ | 5,916,666,291 |
| | | | | | |
See accompanying notes to financial statements.
16
LOOMIS SAYLES INVESTMENT GRADE BOND FUND — PORTFOLIOOF INVESTMENTS (continued)
Investments as of March 31, 2009 (Unaudited)
| | | | | | |
| (‡) | | Principal amount stated in U.S. dollars unless otherwise noted. | |
| (†) | | See Note 2a of Notes to Financial Statements. | |
| (††) | | Amount shown represents units. One unit represents a principal amount of 100. | |
| (†††) | | Amount shown represents units. One unit represents a principal amount of 25. | |
| (a) | | Federal Tax Information (Amounts exclude certain adjustments made at the end of the Fund’s fiscal year for tax purposes. Such adjustments are primarily due to wash sales. Amortization of premium on debt securities is excluded for tax purposes.): | |
| | At March 31, 2009, the net unrealized depreciation on investments based on a cost of $6,564,054,614 for federal income tax purposes was as follows: | |
| | Aggregate gross unrealized appreciation for all investments in which there is an excess of value over tax cost | | $ | 107,457,852 | |
| | Aggregate gross unrealized depreciation for all investments in which there is an excess of tax cost over value | | | (906,601,691 | ) |
| | | | | | |
| | Net unrealized depreciation | | $ | (799,143,839 | ) |
| | | | | | |
| (b) | | Variable rate security. Rate as of March 31, 2009 is disclosed. | | | | |
| (c) | | Non-income producing due to bankruptcy filing. | |
| (d) | | Illiquid security. At March 31, 2009, the value of these securities amounted to $69,552,735 or 1.2% of net assets. | |
| (e) | | Valued by management. At March 31, 2009 the value of these securities amounted to $28,186,933 or 0.5% of net assets. | |
| | | |
| 144A | | Securities exempt from registration under Rule 144A of the Securities Act of 1933. These securities may be resold in transactions exempt from registration, normally to qualified institutional buyers. At March 31, 2009, the total value of these securities amounted to $545,092,540 or 9.2% of net assets. | |
| | | |
| ABS | | Asset-Backed Securities | | | | |
| AMBAC | | American Municipal Bond Assurance Corp. | | | | |
| EMTN | | Euro Medium Term Note | | | | |
| FGIC | | Financial Guaranty Insurance Company | | | | |
| FHLMC | | Federal Home Loan Mortgage Corp. | | | | |
| FNMA | | Federal National Mortgage Association | | | | |
| FSA | | Financial Security Assurance, Inc. | | | | |
| GMTN | | Global Medium Term Note | | | | |
| MBIA | | Municipal Bond Investor Assurance Corp. | | | | |
| MTN | | Medium Term Note | | | | |
| REITs | | Real Estate Investment Trusts | | | | |
| | | | | | |
| AUD | | Australian Dollar | | | | |
| BRL | | Brazilian Real | | | | |
| CAD | | Canadian Dollar | | | | |
| EUR | | Euro | | | | |
| GBP | | British Pound | | | | |
| IDR | | Indonesian Rupiah | | | | |
| ISK | | Icelandic Krona | | | | |
| KRW | | South Korean Won | | | | |
| MXN | | Mexican Peso | | | | |
| NOK | | Norwegian Krone | | | | |
| NZD | | New Zealand Dollar | | | | |
| SGD | | Singapore Dollar | | | | |
| THB | | Thai Baht | | | | |
Net Asset Summary at March 31, 2009 (Unaudited)
| | | |
| Treasuries | | 17.0 | % |
| Banking | | 5.6 | |
| Electric | | 4.6 | |
| Wirelines | | 4.5 | |
| Pipelines | | 4.0 | |
| Commercial Mortgage-Backed Securities | | 3.3 | |
| Non-Captive Diversified | | 3.2 | |
| Technology | | 3.2 | |
| Pharmaceuticals | | 2.6 | |
| Independent Energy | | 2.4 | |
| Media Cable | | 2.3 | |
| Oil Field Services | | 2.3 | |
| Tobacco | | 2.2 | |
| Local Authorities | | 2.0 | |
| Retailers | | 2.0 | |
| Other Investments, less than 2% each | | 30.6 | |
| Short-Term Investments | | 5.6 | |
| | | |
| Total Investments | | 97.4 | |
| Other assets less liabilities | | 2.6 | |
| | | |
| Net Assets | | 100.0 | % |
| | | |
Currency Exposure at March 31, 2009 as a Percentage of Net Assets (Unaudited)
| | | |
| United States Dollar | | 73.1 | % |
| Canadian Dollar | | 14.2 | |
| Norwegian Krone | | 3.2 | |
| Other, less than 2% each | | 6.9 | |
| | | |
| Total Investments | | 97.4 | |
| Other assets less liabilities | | 2.6 | |
| | | |
| Net Assets | | 100.0 | % |
| | | |
See accompanying notes to financial statements.
17
STATEMENTOF ASSETSAND LIABILITIES
March 31, 2009 (Unaudited)
| | | | |
ASSETS | | | | |
Investments at cost | | $ | 6,556,883,168 | |
Net unrealized depreciation | | | (791,972,393 | ) |
| | | | |
Investments at value | | | 5,764,910,775 | |
Cash | | | 301,454 | |
Foreign currency at value (identified cost $715,771) | | | 720,121 | |
Receivable for foreign currency sold (identified cost $142,796) | | | 80,032 | |
Receivable for Fund shares sold | | | 68,009,868 | |
Interest receivable | | | 101,404,923 | |
Receivable from investment adviser (Note 5) | | | 1,423 | |
Tax reclaims receivable | | | 25,433 | |
Other assets | | | 43 | |
| | | | |
TOTAL ASSETS | | | 5,935,454,072 | |
| | | | |
LIABILITIES | | | | |
Payable for securities purchased | | | 3,221,700 | |
Payable for Fund shares redeemed | | | 12,470,052 | |
Foreign taxes payable | | | 3,084 | |
Management fees payable (Note 5) | | | 1,926,974 | |
Administrative fees payable (Note 5) | | | 221,458 | |
Deferred Trustees’ fees (Note 5) | | | 123,354 | |
Service and distribution fees payable (Note 5) | | | 65,508 | |
Other accounts payable and accrued expenses | | | 755,651 | |
| | | | |
TOTAL LIABILITIES | | | 18,787,781 | |
| | | | |
NET ASSETS | | $ | 5,916,666,291 | |
| | | | |
NET ASSETS CONSIST OF : | | | | |
Paid-in capital | | $ | 6,714,534,472 | |
Undistributed net investment income | | | 36,127,131 | |
Accumulated net realized loss on investments and foreign currency transactions | | | (42,265,026 | ) |
Net unrealized depreciation on investments and foreign currency translations | | | (791,730,286 | ) |
| | | | |
NET ASSETS | | $ | 5,916,666,291 | |
| | | | |
COMPUTATION OF NET ASSET VALUE AND OFFERING PRICE: | | | | |
Class A shares: | | | | |
Net assets | | $ | 2,280,909,009 | |
| | | | |
Shares of beneficial interest | | | 236,118,291 | |
| | | | |
Net asset value and redemption price per share | | $ | 9.66 | |
| | | | |
Offering price per share (100/95.50 of $9.66) (Note 1) | | $ | 10.12 | |
| | | | |
Class B shares: (redemption price per share is equal to net asset value less any applicable contingent deferred sales charge) (Note 1) | | | | |
Net assets | | $ | 15,480,084 | |
| | | | |
Shares of beneficial interest | | | 1,609,753 | |
| | | | |
Net asset value and offering price per share | | $ | 9.62 | |
| | | | |
Class C shares: (redemption price per share is equal to net asset value less any applicable contingent deferred sales charge) (Note 1) | | | | |
Net assets | | $ | 1,710,961,790 | |
| | | | |
Shares of beneficial interest | | | 178,306,096 | |
| | | | |
Net asset value and offering price per share | | $ | 9.60 | |
| | | | |
Class Y shares: | | | | |
Net assets | | $ | 1,759,949,027 | |
| | | | |
Shares of beneficial interest | | | 182,092,912 | |
| | | | |
Net asset value, offering and redemption price per share | | $ | 9.67 | |
| | | | |
Class J shares: | | | | |
Net assets | | $ | 149,366,381 | |
| | | | |
Shares of beneficial interest | | | 15,480,860 | |
| | | | |
Net asset value and redemption price per share | | $ | 9.65 | |
| | | | |
Offering price per share (100/96.50 of $9.65) (Note 1) | | $ | 10.00 | |
| | | | |
See accompanying notes to financial statements.
18
STATEMENTOF OPERATIONS
For the Six Months Ended March 31, 2009 (Unaudited)
| | | | |
INVESTMENT INCOME | | | | |
Interest | | $ | 173,909,980 | |
Securities lending income (Note 2) | | | 12,173 | |
| | | | |
| | | 173,922,153 | |
| | | | |
Expenses | | | | |
Management fees (Note 5) | | | 9,482,169 | |
Service fees - Class A (Note 5) | | | 2,378,805 | |
Service and distribution fees - Class B (Note 5) | | | 74,617 | |
Service and distribution fees - Class C (Note 5) | | | 6,976,352 | |
Service and distribution fees - Class J (Note 5) | | | 571,854 | |
Trustees’ fees and expenses (Note 5) | | | 23,168 | |
Administrative fees (Note 5) | | | 1,211,864 | |
Custodian fees and expenses | | | 95,615 | |
Transfer agent fees and expenses - Class A (Note 5) | | | 776,003 | |
Transfer agent fees and expenses - Class B (Note 5) | | | 7,301 | |
Transfer agent fees and expenses - Class C (Note 5) | | | 584,869 | |
Transfer agent fees and expenses - Class Y (Note 5) | | | 392,721 | |
Transfer agent fees and expenses - Class J (Note 5) | | | 4,547 | |
Audit and tax services fees | | | 27,907 | |
Legal fees - Class A | | | 38,067 | |
Legal fees - Class B | | | 235 | |
Legal fees - Class C | | | 19,256 | |
Legal fees - Class Y | | | 25,968 | |
Legal fees - Class J | | | 8,977 | |
Shareholder reporting expenses - Class A | | | 76,940 | |
Shareholder reporting expenses - Class B | | | 1,457 | |
Shareholder reporting expenses - Class C | | | 67,595 | |
Shareholder reporting expenses - Class Y | | | 33,272 | |
Shareholder reporting expenses - Class J | | | 47,673 | |
Registration fees - Class A | | | 90,487 | |
Registration fees - Class B | | | 10,819 | |
Registration fees - Class C | | | 32,442 | |
Registration fees - Class Y | | | 113,865 | |
Registration fees - Class J | | | 2,212 | |
Miscellaneous expenses (Note 5) | | | 72,351 | |
| | | | |
Total expenses | | | 23,249,408 | |
Less fee reduction and/or expense reimbursement (Note 5) | | | (1,848 | ) |
| | | | |
Net expenses | | | 23,247,560 | |
| | | | |
Net investment income | | | 150,674,593 | |
| | | | |
NET REALIZED AND UNREALIZED GAIN (LOSS) ON INVESTMENTS
AND FOREIGN CURRENCY TRANSACTIONS | | | | |
Net realized loss on: | | | | |
Investments | | | (35,742,147 | ) |
Foreign currency transactions | | | (3,296,718 | ) |
Net change in unrealized appreciation (depreciation) on: | | | | |
Investments (including change in foreign capital gains tax accrual of $(567)) | | | (285,642,752 | ) |
Foreign currency translations | | | 1,705,151 | |
| | | | |
Net realized and unrealized loss on investments and foreign currency transactions | | | (322,976,466 | ) |
| | | | |
NET DECREASE IN NET ASSETS RESULTING FROM OPERATIONS | | $ | (172,301,873 | ) |
| | | | |
See accompanying notes to financial statements.
19
STATEMENTOF CHANGESIN NET ASSETS
| | | | | | | | |
| | | Six Months Ended
March 31, 2009
(unaudited) | | | Year Ended
September 30,
2008 | |
FROM OPERATIONS: | | | | | | | | |
Net investment income | | $ | 150,674,593 | | | $ | 187,092,207 | |
Net realized gain (loss) on investments and foreign currency transactions | | | (39,038,865 | ) | | | 70,516,187 | |
Net change in unrealized appreciation (depreciation) on investments and foreign currency translations | | | (283,937,601 | ) | | | (568,566,913 | ) |
| | | | | | | | |
Net decrease in net assets resulting from operations | | | (172,301,873 | ) | | | (310,958,519 | ) |
| | | | | | | | |
FROM DISTRIBUTIONS TO SHAREHOLDERS: | | | | | | | | |
Net investment income | | | | | | | | |
Class A | | | (57,897,220 | ) | | | (83,130,555 | ) |
Class B | | | (402,357 | ) | | | (806,347 | ) |
Class C | | | (37,612,717 | ) | | | (50,818,767 | ) |
Class Y | | | (39,884,302 | ) | | | (47,348,532 | ) |
Class J | | | (4,417,764 | ) | | | (8,734,457 | ) |
Net realized capital gains | | | | | | | | |
Class A | | | (24,679,708 | ) | | | — | |
Class B | | | (203,042 | ) | | | — | |
Class C | | | (18,444,267 | ) | | | — | |
Class Y | | | (16,568,771 | ) | | | — | |
Class J | | | (2,097,657 | ) | | | — | |
| | | | | | | | |
Total distributions | | | (202,207,805 | ) | | | (190,838,658 | ) |
| | | | | | | | |
INCREASE IN NET ASSETS FROM CAPITAL SHARE TRANSACTIONS (NOTE 8) | | | 1,862,590,076 | | | | 2,843,305,497 | |
| | | | | | | | |
Net increase in net assets | | | 1,488,080,398 | | | | 2,341,508,320 | |
NET ASSETS | | | | | | | | |
Beginning of period | | | 4,428,585,893 | | | | 2,087,077,573 | |
| | | | | | | | |
End of period | | $ | 5,916,666,291 | | | $ | 4,428,585,893 | |
| | | | | | | | |
UNDISTRIBUTED NET INVESTMENT INCOME | | $ | 36,127,131 | | | $ | 25,666,898 | |
| | | | | | | | |
See accompanying notes to financial statements.
20
FINANCIAL HIGHLIGHTS
For a share outstanding throughout each period.
| | | | | | | | | | | | | | | | | | | | | | | | | | |
| | | | | Income (loss) from Investment Operations: | | | Less Distributions: | | | | |
| | | | | | | |
| | | Net asset
value,
beginning
of
the period | | Net
investment
income (b) | | Net realized
and unrealized
gain (loss) | | | Total from
investment
operations | | | Dividends
from
net investment
income | | | Distributions
from net
realized
capital gains | | | Total
distributions | |
| | | | | | | | | | | | | | | | | | | | | | | | | | |
INVESTMENT GRADE BOND FUND | | | | | | | | | | | | | | | | | | | | | | | | | | |
Class A | | | | | | | | | | | | | | | | | | | | | | | | | | |
3/31/2009(h) | | $ | 10.54 | | $ | 0.31 | | $ | (0.76 | ) | | $ | (0.45 | ) | | $ | (0.30 | ) | | $ | (0.13 | ) | | $ | (0.43 | ) |
9/30/2008 | | | 11.73 | | | 0.60 | | | (1.15 | ) | | | (0.55 | ) | | | (0.64 | ) | | | — | | | | (0.64 | ) |
9/30/2007 | | | 11.35 | | | 0.58 | | | 0.42 | | | | 1.00 | | | | (0.62 | ) | | | — | | | | (0.62 | ) |
9/30/2006 | | | 11.71 | | | 0.51 | | | 0.10 | | | | 0.61 | | | | (0.75 | ) | | | (0.22 | ) | | | (0.97 | ) |
9/30/2005 | | | 11.84 | | | 0.49 | | | 0.29 | | | | 0.78 | | | | (0.74 | ) | | | (0.17 | ) | | | (0.91 | ) |
9/30/2004 | | | 11.54 | | | 0.52 | | | 0.45 | | | | 0.97 | | | | (0.60 | ) | | | (0.07 | ) | | | (0.67 | ) |
Class B | | | | | | | | | | | | | | | | | | | | | | | | | | |
3/31/2009(h) | | | 10.50 | | | 0.27 | | | (0.76 | ) | | | (0.49 | ) | | | (0.26 | ) | | | (0.13 | ) | | | (0.39 | ) |
9/30/2008 | | | 11.68 | | | 0.50 | | | (1.14 | ) | | | (0.64 | ) | | | (0.54 | ) | | | — | | | | (0.54 | ) |
9/30/2007 | | | 11.31 | | | 0.47 | | | 0.43 | | | | 0.90 | | | | (0.53 | ) | | | — | | | | (0.53 | ) |
9/30/2006 | | | 11.67 | | | 0.42 | | | 0.10 | | | | 0.52 | | | | (0.66 | ) | | | (0.22 | ) | | | (0.88 | ) |
9/30/2005 | | | 11.82 | | | 0.41 | | | 0.27 | | | | 0.68 | | | | (0.66 | ) | | | (0.17 | ) | | | (0.83 | ) |
9/30/2004 | | | 11.53 | | | 0.43 | | | 0.45 | | | | 0.88 | | | | (0.52 | ) | | | (0.07 | ) | | | (0.59 | ) |
Class C | | | | | | | | | | | | | | | | | | | | | | | | | | |
3/31/2009(h) | | | 10.47 | | | 0.28 | | | (0.75 | ) | | | (0.47 | ) | | | (0.27 | ) | | | (0.13 | ) | | | (0.40 | ) |
9/30/2008 | | | 11.66 | | | 0.51 | | | (1.15 | ) | | | (0.64 | ) | | | (0.55 | ) | | | — | | | | (0.55 | ) |
9/30/2007 | | | 11.30 | | | 0.49 | | | 0.42 | | | | 0.91 | | | | (0.55 | ) | | | — | | | | (0.55 | ) |
9/30/2006 | | | 11.66 | | | 0.42 | | | 0.11 | | | | 0.53 | | | | (0.67 | ) | | | (0.22 | ) | | | (0.89 | ) |
9/30/2005 | | | 11.81 | | | 0.40 | | | 0.28 | | | | 0.68 | | | | (0.66 | ) | | | (0.17 | ) | | | (0.83 | ) |
9/30/2004 | | | 11.53 | | | 0.43 | | | 0.45 | | | | 0.88 | | | | (0.53 | ) | | | (0.07 | ) | | | (0.60 | ) |
Class Y | | | | | | | | | | | | | | | | | | | | | | | | | | |
3/31/2009(h) | | | 10.55 | | | 0.33 | | | (0.76 | ) | | | (0.43 | ) | | | (0.32 | ) | | | (0.13 | ) | | | (0.45 | ) |
9/30/2008 | | | 11.73 | | | 0.64 | | | (1.15 | ) | | | (0.51 | ) | | | (0.67 | ) | | | — | | | | (0.67 | ) |
9/30/2007 | | | 11.36 | | | 0.61 | | | 0.41 | | | | 1.02 | | | | (0.65 | ) | | | — | | | | (0.65 | ) |
9/30/2006 | | | 11.71 | | | 0.55 | | | 0.11 | | | | 0.66 | | | | (0.79 | ) | | | (0.22 | ) | | | (1.01 | ) |
9/30/2005 | | | 11.85 | | | 0.54 | | | 0.28 | | | | 0.82 | | | | (0.79 | ) | | | (0.17 | ) | | | (0.96 | ) |
9/30/2004 | | | 11.54 | | | 0.57 | | | 0.45 | | | | 1.02 | | | | (0.64 | ) | | | (0.07 | ) | | | (0.71 | ) |
Class J | | | | | | | | | | | | | | | | | | | | | | | | | | |
3/31/2009(h) | | | 10.53 | | | 0.29 | | | (0.76 | ) | | | (0.47 | ) | | | (0.28 | ) | | | (0.13 | ) | | | (0.41 | ) |
9/30/2008 | | | 11.71 | | | 0.54 | | | (1.14 | ) | | | (0.60 | ) | | | (0.58 | ) | | | — | | | | (0.58 | ) |
9/30/2007 | | | 11.34 | | | 0.52 | | | 0.42 | | | | 0.94 | | | | (0.57 | ) | | | — | | | | (0.57 | ) |
9/30/2006 | | | 11.69 | | | 0.46 | | | 0.11 | | | | 0.57 | | | | (0.70 | ) | | | (0.22 | ) | | | (0.92 | ) |
9/30/2005 | | | 11.83 | | | 0.46 | | | 0.27 | | | | 0.73 | | | | (0.70 | ) | | | (0.17 | ) | | | (0.87 | ) |
9/30/2004 | | | 11.53 | | | 0.48 | | | 0.44 | | | | 0.92 | | | | (0.55 | ) | | | (0.07 | ) | | | (0.62 | ) |
| (a) | Had certain expenses not been reduced during the period, if applicable, total returns would have been lower. |
| (b) | Per share net investment income has been calculated using the average shares outstanding during the period. |
| (c) | A sales charge for Class A, Class C (prior to February 1, 2004) and Class J and a contingent deferred sales charge for Class B and Class C shares are not reflected in total return calculations. Periods less than one year, if applicable, are not annualized. |
| (d) | The investment adviser and/or administrator agreed to reimburse a portion of the Fund’s expenses and/or reduce its fees during the period. Without this reimbursement/fee reduction, if applicable, expenses would have been higher. |
See accompanying notes to financial statements.
21
| | | | | | | | | | | | | | | | | |
| | | | | | | | Ratios to Average Net Assets: | | | | | |
| | | | | | |
Net asset
value,
end of
the period | | Total
return
(%) (a)(c) | | | Net assets,
end of
the period
(000’s) | | Net
expenses
(%) (d)(e) | | | Gross
expenses
(%) (e) | | | Net investment
income
(%) (e) | | Portfolio
turnover
rate (%) |
| | | | | | | | | | | | | | | | | |
| | | | | | | | | | | | | | | | | |
| | | | | | | | | | | | | | | | | |
| $ | 9.66 | | (4.2 | ) | | $ | 2,280,909 | | 0.81 | | | 0.81 | | | 6.52 | | 6 |
| | 10.54 | | (5.1 | ) | | | 1,867,335 | | 0.80 | | | 0.80 | | | 5.20 | | 35 |
| | 11.73 | | 9.1 | | | | 834,736 | | 0.83 | | | 0.83 | | | 5.05 | | 35 |
| | 11.35 | | 5.6 | | | | 152,054 | | 0.92 | (f) | | 0.92 | (f) | | 4.59 | | 35 |
| | 11.71 | | 6.8 | | | | 39,168 | | 0.95 | | | 1.14 | | | 4.21 | | 28 |
| | 11.84 | | 8.8 | | | | 9,506 | | 0.93 | | | 1.67 | | | 4.52 | | 29 |
| | | | | | | | | | | | | | | | | |
| | 9.62 | | (4.6 | ) | | | 15,480 | | 1.70 | | | 1.72 | | | 5.65 | | 6 |
| | 10.50 | | (5.9 | ) | | | 16,009 | | 1.65 | (g) | | 1.65 | (g) | | 4.29 | | 35 |
| | 11.68 | | 8.2 | | | | 17,082 | | 1.70 | | | 1.71 | | | 4.16 | | 35 |
| | 11.31 | | 4.8 | | | | 5,525 | | 1.70 | | | 1.89 | | | 3.75 | | 35 |
| | 11.67 | | 5.9 | | | | 3,443 | | 1.70 | | | 2.18 | | | 3.47 | | 28 |
| | 11.82 | | 7.9 | | | | 1,797 | | 1.70 | | | 2.42 | | | 3.77 | | 29 |
| | | | | | | | | | | | | | | | | |
| | 9.60 | | (4.4 | ) | | | 1,710,962 | | 1.56 | | | 1.56 | | | 5.78 | | 6 |
| | 10.47 | | (5.8 | ) | | | 1,333,421 | | 1.55 | | | 1.55 | | | 4.45 | | 35 |
| | 11.66 | | 8.3 | | | | 605,934 | | 1.57 | | | 1.57 | | | 4.30 | | 35 |
| | 11.30 | | 4.9 | | | | 82,863 | | 1.70 | (f) | | 1.70 | (f) | | 3.79 | | 35 |
| | 11.66 | | 5.9 | | | | 27,992 | | 1.70 | | | 1.97 | | | 3.45 | | 28 |
| | 11.81 | | 7.9 | | | | 9,191 | | 1.70 | | | 2.42 | | | 3.74 | | 29 |
| | | | | | | | | | | | | | | | | |
| | 9.67 | | (4.1 | ) | | | 1,759,949 | | 0.55 | | | 0.55 | | | 6.79 | | 6 |
| | 10.55 | | (4.8 | ) | | | 1,044,046 | | 0.53 | | | 0.53 | | | 5.48 | | 35 |
| | 11.73 | | 9.3 | | | | 448,873 | | 0.55 | (g) | | 0.55 | (g) | | 5.33 | | 35 |
| | 11.36 | | 6.1 | | | | 76,548 | | 0.55 | | | 0.63 | | | 4.94 | | 35 |
| | 11.71 | | 7.1 | | | | 26,012 | | 0.55 | | | 0.82 | | | 4.61 | | 28 |
| | 11.85 | | 9.2 | | | | 12,543 | | 0.55 | | | 1.08 | | | 4.92 | | 29 |
| | | | | | | | | | | | | | | | | |
| | 9.65 | | (4.4 | ) | | | 149,366 | | 1.29 | | | 1.29 | | | 6.06 | | 6 |
| | 10.53 | | (5.5 | ) | | | 167,775 | | 1.28 | | | 1.28 | | | 4.66 | | 35 |
| | 11.71 | | 8.5 | | | | 180,453 | | 1.28 | | | 1.28 | | | 4.57 | | 35 |
| | 11.34 | | 5.3 | | | | 214,894 | | 1.30 | (f) | | 1.30 | (f) | | 4.09 | | 35 |
| | 11.69 | | 6.4 | | | | 314,418 | | 1.30 | | | 1.35 | | | 3.89 | | 28 |
| | 11.83 | | 8.3 | | | | 342,871 | | 1.30 | | | 1.33 | | | 4.15 | | 29 |
| (e) | Computed on an annualized basis for periods less than one year, if applicable. |
| (f) | Includes fee/expense recovery of 0.06%, 0.09% and 0.03% for Class A, Class C and Class J shares, respectively. |
| (g) | Includes fee/expense recovery of less than 0.01% for Class B and Class Y shares, respectively. |
| (h) | For the six months ended March 31, 2009 (Unaudited). |
22
NOTESTO FINANCIAL STATEMENTS
March 31, 2009 (Unaudited)
1. Organization. Loomis Sayles Funds II (the “Trust”) is organized as a Massachusetts business trust. The Trust is registered under the Investment Company Act of 1940, as amended (the “1940 Act”), as an open-end management investment company. The Declaration of Trust permits the Board of Trustees to authorize the issuance of an unlimited number of shares of the Trust in multiple series. Information presented in these financial statements pertains to Loomis Sayles Investment Grade Bond Fund (the “Fund” or the “Investment Grade Bond Fund”); the financial statements for the remaining fixed income funds and the equity funds of the Trust are presented in separate reports.
The Fund offers Class A, Class C, Class Y and Class J shares. Effective October 12, 2007, Class B shares are no longer offered. Existing Class B shareholders may continue to reinvest dividends into Class B shares and exchange their Class B shares for Class B shares of other Natixis Funds subject to existing exchange privileges as described in the Fund’s Prospectus.
Class A shares are sold with a maximum front-end sales charge of 4.50%. Class B shares do not pay a front-end sales charge, but pay higher Rule 12b-1 fees than Class A shares for eight years (at which point they automatically convert to Class A shares) and are subject to a contingent deferred sales charge (“CDSC”) if those shares are redeemed within six years of purchase. Class C shares do not pay a front-end sales charge, do not convert to any other Class of shares, pay higher Rule 12b-1 fees than Class A shares and may be subject to a CDSC of 1.00% if those shares are redeemed within one year. Class Y shares do not pay a front-end sales charge, a CDSC or Rule 12b-1 fees. Class Y shares are generally intended for institutional investors with a minimum initial investment of $100,000, though some categories of investors are exempted from the minimum investment amount as outlined in the Fund’s Prospectus. Class J shares are only offered to non-U.S. investors and are sold with a maximum front-end sales charge of 3.50%.
Most expenses of the Trust can be directly attributed to a fund. Expenses which can not be directly attributed to a fund are generally apportioned based on the relative net assets of each of the funds in the Trust. Expenses of the Fund are borne pro rata by the holders of each class of shares, except that each class bears expenses unique to that class (including the Rule 12b-1 service and distribution fees, registration, legal, shareholder reporting and transfer agent fees applicable to such class). In addition, each class votes as a class only with respect to its own Rule 12b-1 Plan. Shares of each class would receive their pro rata share of the net assets of the Fund if the Fund were liquidated. The Trustees approve separate dividends from net investment income on each class of shares.
2. Significant Accounting Policies. The following is a summary of significant accounting policies consistently followed by the Fund in the preparation of its financial statements. The Fund’s financial statements are prepared in accordance with accounting principles generally accepted in the United States of America which require the use of management estimates that affect the reported amounts and disclosures in the financial statements. Actual results could differ from those estimates.
a. Valuation. Debt securities (other than short-term obligations purchased with an original or remaining maturity of sixty days or less) are generally valued on the basis of evaluated bids furnished to the Fund by a pricing service recommended by the investment adviser and approved by the Board of Trustees, which service determines valuations for normal, institutional-size trading units of such securities using market information, transactions for comparable securities and various relationships between securities which are generally recognized by institutional traders. Broker-dealer bid quotations may also be used to value debt securities where a pricing service does not price a security or where a pricing service does not provide a reliable price for the security. In instances where broker-dealer bid quotations are not available, certain securities held by the Fund may be valued on the basis of a price provided by a principal market maker. Forward foreign currency contracts are “marked-to-market” daily utilizing interpolated prices determined from information provided by an independent pricing service. Short-term obligations purchased with an original or remaining maturity of sixty days or less are valued at amortized cost, which approximates market value. Securities for which market quotations are not readily available are valued at fair value as determined in good faith by the Fund’s investment adviser using consistently applied procedures under the general supervision of the Board of Trustees. Investments in other open-end investment companies are valued at their net asset value each day.
The Fund may hold securities traded in foreign markets. Foreign securities are valued at the market price in the foreign market. However, if events occurring after the close of the foreign market (but before the close of regular trading on the New York Stock Exchange) are believed to materially affect the value of those securities, such securities are fair valued pursuant to procedures approved by the Board of Trustees. When fair valuing securities, the Fund may, among other things, use modeling tools or other processes that may take into account factors such as securities market activity and/or significant events that occur after the close of the foreign market and before the Fund calculates its net asset value.
b. Security Transactions and Related Investment Income. Security transactions are accounted for on trade date. Interest income is recorded on an accrual basis. Interest income is increased by the accretion of discount and decreased by the amortization of premium. Periodic principal adjustments for inflation-protected securities are recorded to interest income. Investment income is recorded net of foreign taxes withheld when applicable. In determining net gain or loss on securities sold, the cost of securities has been determined on an identified cost basis. Investment income, non-class specific expenses and realized and unrealized gains and losses are allocated on a pro rata basis to each class based on the relative net assets of each class to the total net assets of the Fund.
c. Foreign Currency Translation. The books and records of the Fund are maintained in U.S. dollars. The value of securities, currencies and other assets and liabilities denominated in currencies other than U.S. dollars are translated into U.S. dollars based upon foreign exchange rates prevailing at the end of the period. Purchases and sales of investment securities, income and expenses are translated on the respective dates of such transactions.
23
NOTESTO FINANCIAL STATEMENTS (continued)
March 31, 2009 (Unaudited)
Since the values of investment securities are presented at the foreign exchange rates prevailing at the end of the period, it is not practical to isolate that portion of the results of operations arising from changes in exchange rates from fluctuations which arise due to changes in market prices of the investment securities. Such changes are included with the net realized and unrealized gain or loss on investments.
Net realized foreign exchange gains or losses arise from sales of foreign currency, currency gains or losses realized between the trade and settlement dates on securities transactions and the difference between the amounts of interest and foreign withholding taxes recorded on the Fund’s books and the U.S. dollar equivalent of the amounts actually received or paid. Net unrealized foreign exchange gains and losses arise from changes in the value of assets and liabilities, other than investment securities, at the end of the fiscal period, resulting from changes in exchange rates.
The Fund may use foreign currency exchange contracts to facilitate transactions in foreign-denominated investments. Losses may arise from changes in the value of the foreign currency or if the counterparties do not perform under the contracts’ terms.
The Fund may purchase investments of foreign issuers. Investing in securities of foreign issuers involves special risks and considerations not typically associated with investing in U.S. companies and securities of the U.S. government. These risks include revaluation of currencies and the risk of expropriation. Moreover, the markets for securities of many foreign issuers may be less liquid and the prices of such securities may be more volatile than those of comparable U.S. companies and the U.S. government.
d. Forward Foreign Currency Contracts. The Fund may enter into forward foreign currency contracts. Contracts generally are used to acquire exposure to foreign currencies and may also be used for hedging purposes. Also, a contract to buy or sell can offset a previous contract. These contracts involve market risk in excess of the unrealized gain or loss reflected in the Fund’s Statement of Assets and Liabilities. The U.S. dollar value of the currencies the Fund has committed to buy or sell represents the aggregate exposure to each currency the Fund has acquired or hedged through currency contracts outstanding at period end. Gains or losses are recorded for financial statement purposes as unrealized until settlement date. Risks may arise upon entering into these contracts from the potential inability of counterparties to meet the terms of their contracts and from unanticipated movements in the value of a foreign currency relative to the U.S. dollar. At March 31, 2009, there were no open forward foreign currency contracts.
e. Federal and Foreign Income Taxes. The Trust treats each Fund as a separate entity for federal income tax purposes. The Fund intends to meet the requirements of the Internal Revenue Code applicable to regulated investment companies, and to distribute to its shareholders substantially all of its net investment income and any net realized capital gains at least annually. Management has performed an analysis of the Fund’s tax positions taken on federal and state tax returns that remain subject to examination (tax years ended September 30, 2005-2008) and has concluded that no provisions for income tax are required. Fund management is not aware of any events that are reasonably possible to occur in the next six months that would result in the amounts of any unrecognized tax benefits significantly increasing or decreasing for the Fund. However, management’s conclusions regarding tax positions taken may be subject to review and adjustment at a later date based on factors including, but not limited to, new tax laws and accounting regulations and interpretations thereof.
The Fund may be subject to foreign taxes on income and gains on investments that are accrued based upon the Fund’s understanding of the tax rules and regulations that exist in the countries in which the Fund invests. Foreign governments may also impose taxes or other payments on investments with respect to foreign securities. Such taxes are accrued as applicable, and are reflected as foreign taxes payable on the Statement of Assets and Liabilities.
f. Dividends and Distributions to Shareholders. Dividends and distributions are recorded on ex-dividend date. The timing and characterization of certain income and capital gain distributions are determined annually in accordance with federal tax regulations, which may differ from accounting principles generally accepted in the United States of America. Permanent differences are primarily due to differing treatments for book and tax purposes for items such as foreign currency transactions, paydown adjustments and premium amortization accruals. Permanent book and tax basis differences relating to shareholder distributions will result in reclassifications to capital accounts. Temporary differences between book and tax distributable earnings are primarily due to premium amortization accruals, deferred Trustees’ fees, forward contracts mark-to-market, defaulted bond accruals, securities lending collateral gain/loss adjustments and wash sales. Distributions from net investment income and short-term capital gains are considered to be distributed from ordinary income for tax purposes.
The tax characterization of distributions is determined on an annual basis. The tax character of distributions paid to shareholders during the year ended September 30, 2008 was as follows:
| | | | | | |
2008 Distributions Paid From: |
Ordinary Income | | Long-Term
Capital Gains | | Total |
$190,838,658 | | $ | — | | $ | 190,838,658 |
Differences between these amounts and those reported in the Statement of Changes in Net Assets, if any, are primarily attributable to different book and tax treatment for short-term capital gains.
24
NOTESTO FINANCIAL STATEMENTS (continued)
March 31, 2009 (Unaudited)
g. Repurchase Agreements. It is the Fund’s policy that the market value of the collateral for repurchase agreements be at least equal to 100% of the repurchase price, including interest. Certain repurchase agreements are tri-party arrangements whereby the collateral is held in a segregated account for the benefit of the Fund and on behalf of the counterparty. It is the Fund’s policy, regarding tri-party arrangements, that the market value of the collateral be at least equal to 102% of the repurchase price, including interest. Repurchase agreements could involve certain risks in the event of default or insolvency of the counterparty including possible delays or restrictions upon a Fund’s ability to dispose of the underlying securities.
h. Securities Lending. The Fund has entered into an agreement with State Street Bank and Trust Company (“State Street Bank”), as agent of the Fund, to lend securities to certain designated borrowers. The loans are collateralized with cash or securities in an amount equal to at least 105% or 102% of the market value (including accrued interest) of the loaned international or domestic securities, respectively, when the loan is initiated. Thereafter, the value of the collateral must remain at least 102% of the market value (including accrued interest) of loaned securities for U.S. equities and U.S. corporate debt; at least 105% of the market value (including accrued interest) of loaned securities for non-U.S. equities; and at least 100% of the market value (including accrued interest) of loaned securities for U.S. government securities, sovereign debt issued by non-U.S. governments and non-U.S. corporate debt. In the event that the market value of the collateral falls below the required percentages described above, the borrower will deliver additional collateral on the next business day. As with other extensions of credit, the Fund bears the risk of loss with respect to the investment of the collateral. The Fund invests cash collateral in short-term investments, a portion of the income from which is remitted to the borrowers and the remainder allocated between the Fund and State Street Bank as lending agent.
As of March 31, 2009 there were no securities on loan.
i. Indemnifications. Under the Trust’s organizational documents, its officers and Trustees are indemnified against certain liabilities arising out of the performance of their duties to the Fund. Additionally, in the normal course of business, the Fund enters into contracts with service providers that contain general indemnification clauses. The Fund’s maximum exposure under these arrangements is unknown as this would involve future claims that may be made against the Fund that have not yet occurred. However, based on experience, the Fund expects the risk of loss to be remote.
j. New Accounting Pronouncement. In March 2008, Statement of Financial Accounting Standards No. 161, Disclosures about Derivative Instruments and Hedging Activities (“FAS 161”), was issued and will be effective for fiscal years and interim periods beginning after November 15, 2008. FAS 161 requires enhanced disclosures about a fund’s derivative and hedging activities. Management is currently evaluating the impact the adoption of FAS 161 may have on the Fund’s financial statement disclosures.
3. Fair Value Measurements. The Funds adopted Financial Accounting Standards Board Statement of Financial Accounting Standards No. 157 (“FAS 157”), Fair Value Measurements, effective October 1, 2008. FAS 157 establishes a hierarchy for net asset value determination purposes in which various inputs are used in determining the value of the Fund’s investments. These inputs are summarized in the three broad levels listed below:
| | • | | Level 1 — quoted prices in active markets for identical investments; |
| | • | | Level 2 — prices determined using other significant observable inputs that are observable either directly, or indirectly through corroboration with observable market data (which could include quoted prices for similar investments, interest rates, credit risk, etc.); |
| | • | | Level 3 — prices determined using significant unobservable inputs for situations where quoted prices or observable inputs are unavailable such as when there is little or no market activity for an investment (unobservable inputs reflect the Fund’s own assumptions in determining the fair value of investments and would be based on the best information available). |
The inputs or methodology used for valuing securities are not necessarily an indication of the risk associated with investing in those securities.
The following is a summary of the inputs used to value the Fund’s investments as of March 31, 2009:
| | | |
Valuation Inputs | | Investments in
Securities |
Level 1 — Quoted Prices | | $ | 330,939,191 |
Level 2 — Other Significant Observable Inputs | | | 5,184,824,348 |
Level 3 — Significant Unobservable Inputs | | | 249,147,236 |
| | | |
Total | | $ | 5,764,910,775 |
| | | |
25
NOTESTO FINANCIAL STATEMENTS (continued)
March 31, 2009 (Unaudited)
The following is a reconciliation of Level 3 investments for which significant unobservable inputs were used to determine fair value as of March 31, 2009:
| | | | |
Assets | | Investments in
Securities | |
Balance as of September 30, 2008 | | $ | 108,924,567 | |
Realized gain (loss) | | | (314,036 | ) |
Change in unrealized appreciation (depreciation)(a) | | | (90,964,795 | ) |
Net purchases (sales) | | | 52,869,117 | |
Net reclassifications to/from Level 3 | | | 178,632,383 | |
| | | | |
Balance as of March 31, 2009 | | $ | 249,147,236 | |
| | | | |
(a) Change in unrealized appreciation (depreciation) is included in net change in unrealized appreciation (depreciation) on investments within the Statement of Operations.
In April 2009, the Financial Accounting Standards Board (“FASB”) issued FASB Staff Position No. 157-4, Determining Fair Value When the Volume and Level of Activity for the Asset or Liability Have Significantly Decreased and Identifying Transactions That Are Not Orderly (“FSP 157-4”). FSP 157-4 provides additional guidance for estimating fair value in accordance with FAS 157, when the volume and level of activity for the asset or liability have significantly decreased as well as guidance on identifying circumstances that indicate a transaction is not orderly. FSP 157-4 is effective for fiscal years and interim periods ending after June 15, 2009. Management is currently evaluating the impact the adoption of FSP 157-4 will have on the Funds’ financial statement disclosures.
4. Purchases and Sales of Securities. For the six months ended March 31, 2009, purchases and sales of securities (excluding short-term investments and U.S. government/agency securities and including paydowns) were $2,142,907,033 and $285,176,734, respectively. Purchases and sales of U.S. government/agency securities (excluding short-term investments and including paydowns) were $0 and $11,324, respectively.
5. Management Fees and Other Transactions with Affiliates.
a. Management Fees. Loomis, Sayles & Company, L.P. (“Loomis Sayles”) serves as investment adviser to the Fund. Under the terms of the management agreement, the Fund pays a management fee at the annual rate of 0.40% of average daily net assets, calculated daily and payable monthly.
Loomis Sayles has given a binding undertaking to the Fund to reduce management fees and/or reimburse certain expenses associated with the Fund to limit its operating expenses, exclusive of brokerage expenses, interest expense, taxes and extraordinary expenses. This undertaking is in effect until January 31, 2010 and will be reevaluated on an annual basis. For the six months ended March 31, 2009, the expense limits as a percentage of average daily net assets under the expense limitation agreement were as follows:
| | | | | | | | |
Expense Limit as a Percentage of Average
Daily Net Assets |
Class A | | Class B | | Class C | | Class Y | | Class J |
| 0.95% | | 1.70% | | 1.70% | | 0.55% | | 1.30% |
For the six months ended March 31, 2009, the management fees for the Fund were $9,482,169 (0.40% of average daily net assets).
For the six months ended March 31, 2009, class specific expenses have been reimbursed in the amount of $1,848.
Loomis Sayles shall be permitted to recover expenses it has borne under the expense limitation agreement (whether through reduction of its management fees or otherwise) on a class by class basis in later periods to the extent the expenses of a class fall below a class’ expense limits, provided, however, that a class is not obligated to pay such reduced fees/expenses more than one year after the end of the fiscal year in which the fee/expense was reduced. The amounts subject to possible recovery under the expense limitation agreements at March 31, 2009 were as follows:
| | | | | | | | | | | | | | | |
Expenses Subject to Possible Recovery
until September 30, 2010 |
Class A | | Class B | | Class C | | Class Y | | Class J | | Total |
| $— | | $ | 1,848 | | $ | — | | $ | — | | $ | — | | $ | 1,848 |
26
NOTESTO FINANCIAL STATEMENTS (continued)
March 31, 2009 (Unaudited)
Certain officers and employees of Loomis Sayles are also officers or Trustees of the Trust. Loomis Sayles’ general partner is indirectly owned by Natixis Global Asset Management, L.P. (“Natixis US”), which is part of Natixis Global Asset Management, an international asset management group based in Paris, France.
b. Administrative Fees. Natixis Asset Management Advisors, L.P. (“Natixis Advisors”) provides certain administrative services for the Fund and subcontracts with State Street Bank to serve as sub-administrator. Natixis Advisors is a wholly-owned subsidiary of Natixis US. Pursuant to an agreement among Natixis Funds Trust I, Natixis Funds Trust II, Natixis Funds Trust III, Natixis Funds Trust IV, Natixis Cash Management Trust, Gateway Trust (“Natixis Funds Trusts”), Loomis Sayles Funds I, Loomis Sayles Funds II (“Loomis Sayles Funds Trusts”), Hansberger International Series and Natixis Advisors, each Fund pays Natixis Advisors monthly its pro rata portion of fees equal to an annual rate of 0.0575% of the first $15 billion of the average daily net assets of the Natixis Funds Trusts, Loomis Sayles Funds Trusts and the Hansberger International Series, 0.0500% of the next $15 billion, 0.0425% of the next $30 billion and 0.0375% of such assets in excess of $60 billion, subject to an annual aggregate minimum fee for the Natixis Funds Trusts, Loomis Sayles Funds Trusts and the Hansberger International Series of $10 million, which is reevaluated on an annual basis. New funds are subject to a fee for the first twelve months of operations of $75,000 plus $12,500 per class and an additional $75,000 if managed by multiple subadvisors.
For the six months ended March 31, 2009, the Fund paid $1,211,864 in administrative fees to Natixis Advisors.
c. Service and Distribution Fees. Natixis Distributors, L.P. (“Natixis Distributors”), a wholly-owned subsidiary of Natixis US, has entered into a distribution agreement with the Trust. Pursuant to this agreement, Natixis Distributors serves as principal underwriter of the Fund, except Class J shares of the Fund. The Fund has entered into a distribution agreement relating to Class J shares with Loomis Sayles Distributors, L.P. (“Loomis Sayles Distributors”), a wholly-owned subsidiary of Natixis US.
Pursuant to Rule 12b-1 under the 1940 Act, the Fund has adopted a Service Plan relating to the Fund’s Class A shares (the “Class A Plan”) and a Distribution and Service Plan relating to the Fund’s Class B and Class C shares (the “Class B and Class C Plans”).
Under the Class A Plan, the Fund pays Natixis Distributors a monthly service fee at an annual rate not to exceed 0.25% of the average daily net assets attributable to the Fund’s Class A shares, as reimbursement for expenses incurred by Natixis Distributors in providing personal services to investors in Class A shares and/or the maintenance of shareholder accounts.
Under the Class B and Class C Plans, the Fund pays Natixis Distributors a monthly service fee at an annual rate not to exceed 0.25% of the average daily net assets attributable to the Fund’s Class B and Class C shares, as compensation for services provided and expenses incurred by Natixis Distributors in providing personal services to investors in Class B and Class C shares and/or the maintenance of shareholder accounts.
Also under the Class B and Class C Plans, the Fund pays Natixis Distributors a monthly distribution fee at an annual rate of 0.75% of the average daily net assets attributable to the Fund’s Class B and Class C shares, as compensation for services provided and expenses incurred by Natixis Distributors in connection with the marketing or sale of Class B and Class C shares.
Class J shares are subject to a monthly shareholder service fee at an annual rate of 0.25% and a monthly distribution fee, at an annual rate of 0.50% of the average daily net assets attributable to the Fund’s Class J shares, both payable to Loomis Sayles Distributors, pursuant to a shareholder service and distribution plan adopted under Rule 12b-1.
For the six months ended March 31, 2009 the Fund paid the following service and distribution fees:
| | | | | | | | | | | | | | | | | | |
| Service Fees | | Distribution Fees |
Class A | | Class B | | Class C | | Class J | | Class B | | Class C | | Class J |
| $2,378,805 | | $ | 18,654 | | $ | 1,744,088 | | $ | 190,618 | | $ | 55,963 | | $ | 5,232,264 | | $ | 381,236 |
d. Sub-Transfer Agent Fees. Natixis Distributors has entered into agreements with financial intermediaries to provide certain recordkeeping, processing, shareholder communications and other services to customers of the intermediaries and has agreed to compensate the intermediaries for providing those services. Certain services would be provided by the Fund if the shares of those customers were registered directly with the Fund’s transfer agent. Accordingly, the Fund agreed to pay a portion of the intermediary fees attributable to shares of the Fund held by intermediaries (which generally are a percentage of the value of shares held) not exceeding what the Fund would have paid its transfer agent had each customer’s shares been registered directly with the transfer agent instead of held through the intermediaries. Natixis Distributors pays the remainder of the fees. Listed below are the fees incurred by the Fund which are reflected in the transfer agent fees and expenses in the Statement of Operations.
| | | | | | | | | | | | |
| Sub-Transfer Agent Fees |
Class A | | Class B | | Class C | | Class Y | | Class J |
| $548,719 | | $ | 4,184 | | $ | 374,730 | | $ | 351,663 | | $ | — |
27
NOTESTO FINANCIAL STATEMENTS (continued)
March 31, 2009 (Unaudited)
e. Commissions. The Fund has been informed that commissions (including CDSCs) on Fund shares retained by Natixis Distributors were $3,797,742 and commissions on Fund shares retained by Loomis Sayles Distributors by investors in Class J shares of the Fund were $53,597 for the six months ended March 31, 2009.
f. Trustees Fees and Expenses. The Fund does not pay any compensation directly to its officers or Trustees who are directors, officers or employees of Natixis Advisors, Natixis Distributors, Natixis US, or their affiliates. The Chairperson of the Board receives a retainer fee at the annual rate of $200,000. The Chairperson does not receive any meeting attendance fees for Board of Trustees meetings or committee meetings that she attends. Each Independent Trustee (other than the Chairperson) receives, in the aggregate, a retainer fee at the annual rate of $65,000. Each Independent Trustee also receives a meeting attendance fee of $7,500 for each meeting of the Board of Trustees that he or she attends in person and $3,750 for each meeting of the Board of Trustees that he or she attends telephonically. In addition, each committee chair receives an additional retainer fee at the annual rate of $10,000. Each Contract Review and Governance Committee member is compensated $5,000 for each Committee meeting that he or she attends in person and $2,500 for each meeting that he or she attends telephonically. Each Audit Committee member is compensated $6,250 for each Committee meeting that he or she attends in person and $3,125 for each meeting that he or she attends telephonically. These fees are allocated among the funds in the Natixis Funds Trusts, Loomis Sayles Funds Trusts and the Hansberger International Series based on a formula that takes into account, among other factors, the relative net assets of each fund. Trustees are reimbursed for travel expenses in connection with attendance at meetings.
A deferred compensation plan (the “Plan”) is available to the Trustees on a voluntary basis. Deferred amounts remain in the Funds until distributed in accordance with the provisions of the Plan. The value of a participating Trustee’s deferral account is based on theoretical investments of deferred amounts, on the normal payment dates, in certain funds of the Natixis Funds Trusts, Loomis Sayles Funds Trusts and Hansberger International Series as designated by the participating Trustees. Changes in the value of participants’ deferral accounts are allocated pro rata among the funds in the Natixis Funds Trusts, Loomis Sayles Funds Trusts, and Hansberger International Series, and are normally reflected as Trustees’ fees and expenses in the Statement of Operations. The portions of the accrued obligations allocated to the Funds under the Plan are reflected as Deferred Trustees’ fees in the Statement of Assets and Liabilities.
6. Line of Credit. The Fund, together with certain other funds of Natixis Funds Trusts, Loomis Sayles Funds Trusts and the Hansberger International Series, participates in a $200,000,000 committed line of credit provided by State Street Bank, with an individual limit of $125,000,000 for each fund that participates in the line of credit. Interest is charged to each participating fund based on its borrowings at a rate per annum equal to the greater of the Federal Funds rate or overnight LIBOR rate, plus 0.75%. In addition, a commitment fee of 0.125% per annum, payable at the end of each calendar quarter, is accrued and apportioned among the participating funds based on their average daily unused portion of the line of credit.
Prior to March 11, 2009, the Fund, together with certain other funds of Natixis Funds Trusts, Loomis Sayles Funds Trusts and Hansberger International Series, participated in a $200,000,000 committed line of credit provided by State Street Bank, with an individual limit of $125,000,000 for each fund that participated in the line of credit. Interest was charged to each participating fund based on its borrowings at a rate per annum equal to the Federal Funds rate plus 0.50%. In addition, a commitment fee of 0.09% per annum, payable at the end of each calendar quarter, was accrued and apportioned among the participating funds based on their average daily unused portion of the line of credit.
For the six months ended March 31, 2009, the Fund had no borrowings under these agreements.
7. Shareholders. At March 31, 2009, the Loomis Sayles Employees’ Profit Sharing Retirement Plan held 519,562 shares of beneficial interest of Class Y shares.
28
NOTESTO FINANCIAL STATEMENTS (continued)
March 31, 2009 (Unaudited)
8. Capital Shares. The Fund may issue an unlimited number of shares of beneficial interest, without par value. Transactions in capital shares were as follows:
| | | | | | | | | | | | | | |
| | Six Months Ended
March 31, 2009 | | | Year Ended
September 30, 2008 | |
| | Shares | | | | Amount | | | Shares | | | | Amount | |
| | | | | | | | | | | | | | |
| Class A | | | | | | | | | | | | | | |
Issued from the sale of shares | | 116,727,916 | | | $ | 1,127,696,830 | | | 141,854,364 | | | $ | 1,656,977,467 | |
Issued in connection with the reinvestment of distributions | | 6,182,634 | | | | 59,776,965 | | | 5,123,079 | | | | 59,622,406 | |
Redeemed | | (63,939,508 | ) | | | (614,964,738 | ) | | (41,000,347 | ) | | | (471,380,105 | ) |
| | | | | | | | | | | | | | |
Net change | | 58,971,042 | | | $ | 572,509,057 | | | 105,977,096 | | | $ | 1,245,219,768 | |
| | | | | | | | | | | | | | |
| Class B | | | | | | | | | | | | | | |
Issued from the sale of shares | | 274,320 | | | $ | 2,626,161 | | | 238,331 | | | $ | 2,759,530 | |
Issued in connection with the reinvestment of distributions | | 30,017 | | | | 289,226 | | | 32,911 | | | | 382,852 | |
Redeemed | | (219,671 | ) | | | (2,104,287 | ) | | (208,730 | ) | | | (2,405,675 | ) |
| | | | | | | | | | | | | | |
Net change | | 84,666 | | | $ | 811,100 | | | 62,512 | | | $ | 736,707 | |
| | | | | | | | | | | | | | |
| Class C | | | | | | | | | | | | | | |
Issued from the sale of shares | | 72,396,253 | | | $ | 695,437,716 | | | 86,193,536 | | | $ | 1,001,609,060 | |
Issued in connection with the reinvestment of distributions | | 2,611,222 | | | | 25,092,505 | | | 1,861,389 | | | | 21,543,304 | |
Redeemed | | (23,998,316 | ) | | | (229,578,162 | ) | | (12,717,963 | ) | | | (145,036,821 | ) |
| | | | | | | | | | | | | | |
Net change | | 51,009,159 | | | $ | 490,952,059 | | | 75,336,962 | | | $ | 878,115,543 | |
| | | | | | | | | | | | | | |
| Class Y | | | | | | | | | | | | | | |
Issued from the sale of shares | | 121,074,378 | | | $ | 1,166,125,088 | | | 84,132,384 | | | $ | 980,528,103 | |
Issued in connection with the reinvestment of distributions | | 4,143,709 | | | | 40,034,398 | | | 2,701,331 | | | | 31,421,337 | |
Redeemed | | (42,111,774 | ) | | | (403,586,964 | ) | | (26,105,415 | ) | | | (298,275,048 | ) |
| | | | | | | | | | | | | | |
Net change | | 83,106,313 | | | $ | 802,572,522 | | | 60,728,300 | | | $ | 713,674,392 | |
| | | | | | | | | | | | | | |
| Class J | | | | | | | | | | | | | | |
Issued from the sale of shares | | 1,088,300 | | | $ | 10,656,670 | | | 2,839,200 | | | $ | 32,261,445 | |
Issued in connection with the reinvestment of distributions | | — | | | | — | | | — | | | | — | |
Redeemed | | (1,543,470 | ) | | | (14,911,332 | ) | | (2,306,870 | ) | | | (26,702,358 | ) |
| | | | | | | | | | | | | | |
Net change | | (455,170 | ) | | $ | (4,254,662 | ) | | 532,330 | | | $ | 5,559,087 | |
| | | | | | | | | | | | | | |
Increase (decrease) from capital share transactions | | 192,716,010 | | | $ | 1,862,590,076 | | | 242,637,200 | | | $ | 2,843,305,497 | |
| | | | | | | | | | | | | | |
29
Not applicable.
| Item 3. | Audit Committee Financial Expert. |
Not applicable.
| Item 4. | Principal Accountant Fees and Services. |
Not applicable.
| Item 5. | Audit Committee of Listed Registrants. |
Not applicable.
| Item 6. | Schedule of Investments. |
Included as part of the Report to Shareholders filed as Item 1 herewith.
| Item 7. | Disclosure of Proxy Voting Policies and Procedures for Closed-End Management Investment Companies. |
Not applicable.
| Item 8. | Portfolio Managers of Closed-End Management Investment Companies. |
Not applicable.
| Item 9. | Purchases of Equity Securities by Closed-End Management Investment Companies and Affiliated Purchasers. |
Not applicable.
| Item 10. | Submission of Matters to a Vote of Securities Holders. |
There were no material changes to the procedures by which shareholders may recommend nominees to the Trust’s Board of Trustees.
| Item 11. | Controls and Procedures. |
The Registrant’s principal executive officer and principal financial officer have concluded that the Registrant’s disclosure controls and procedures are sufficient to ensure that information required to be disclosed by the Registrant in this Form N-CSR was recorded, processed, summarized and reported within the time periods specified in the Securities and Exchange Commission’s rules and forms, based upon such officers’ evaluation of these controls and procedures as of a date within 90 days of the filing date of the report.
There was no change in the Registrant’s internal control over financial reporting that occurred during the Registrant’s last fiscal quarter of the period covered by the report that has materially affected, or is reasonably likely to materially affect, the Registrant’s internal control over financial reporting.
| | | | |
| (a) | | (1) | | Not applicable. |
| (a) | | (2) | | Certifications of Principal Executive Officer and Principal Financial Officer pursuant to Rule 30a-2(a) under the Investment Company Act of 1940 (17 CFR 270.30a-2(a)), filed herewith as Exhibits (a)(2)(1) and a(2)(2), respectively. |
| (a) | | (3) | | Not applicable. |
| (b) | | | | Certifications of Principal Executive Officer and Principal Financial Officer pursuant to Section 906 of Sarbanes-Oxley Act of 2002 are filed herewith as Exhibit (b). |
SIGNATURES
Pursuant to the requirements of the Securities Exchange Act of 1934 and the Investment Company Act of 1940, the Registrant has duly caused this report to be signed on its behalf by the undersigned, thereunto duly authorized.
| | |
| Loomis Sayles Funds II |
| |
| By: | | /s/ Robert J. Blanding |
| |
Name: Title: Date: | | Robert J. Blanding Chief Executive Officer May 27, 2009 |
Pursuant to the requirements of the Securities Exchange Act of 1934 and the Investment Company Act of 1940, this report has been signed by the following persons on behalf of the Registrant and in the capacities and on the dates indicated.
| | |
| By: | | /s/ Robert J. Blanding |
| |
Name: Title: Date: | | Robert J. Blanding Chief Executive Officer May 27, 2009 |
| | |
| |
| By: | | /s/ Michael C. Kardok |
| |
Name: Title: Date: | | Michael C. Kardok Treasurer May 27, 2009 |