UNITED STATES
SECURITIES AND EXCHANGE COMMISSION
Washington, D.C. 20549
FORM N-CSR
CERTIFIED SHAREHOLDER REPORT OF REGISTERED
MANAGEMENT INVESTMENT COMPANIES
Investment Company Act file number: 811-06241
(Exact name of Registrant as specified in charter)
|
399 Boylston Street, Boston, Massachusetts 02116 |
(Address of principal executive offices) (Zip code)
|
Coleen Downs Dinneen, Esq. NGAM Distribution, L.P. 399 Boylston Street Boston, Massachusetts 02116 |
(Name and address of agent for service)
Registrant’s telephone number, including area code: (617) 449-2810
Date of fiscal year end: September 30
Date of reporting period: March 31, 2012
| Item 1. | Reports to Stockholders. |
The Registrant’s semi-annual report transmitted to shareholders pursuant to Rule 30e-1 under the Investment Company Act of 1940 is as follows:
SEMIANNUAL REPORT
March 31, 2012

Loomis Sayles Global Equity and Income Fund
Loomis Sayles Growth Fund
Loomis Sayles Mid Cap Growth Fund
Loomis Sayles Value Fund
TABLE OF CONTENTS
Management Discussion and Performance page 1
Portfolio of Investments page 21
Financial Statements page 49
LOOMIS SAYLES GLOBAL EQUITY AND INCOME FUND
Management Discussion
Managers:
Dan Fuss, CFA, CIC
Warren Koontz, CFA, CIC
David Rolley, CFA
Loomis, Sayles & Company, L.P.
Objective:
Seeks high total return through a combination of capital appreciation and current income
Strategy:
Invests primarily in equity and fixed-income securities of U.S. and foreign issuers, including securities of issuers located in emerging markets
Fund Inception:
May 1, 1996
Symbols:
| | |
| Class A | | LGMAX |
| Class C | | LGMCX |
| Class Y | | LSWWX |
Market Conditions
Positive equity market trends that were evident at the end of 2011 continued through the first quarter of 2012, as investors reacted favorably to the approval of a second bailout package for Greece and several positive economic data releases. Similarly, investor optimism led most fixed-income markets higher during the period. As U.S. macroeconomic data appeared to strengthen and the European Central Bank created ample liquidity within the financial system through a long-term refinancing operation, market sentiment steadily improved. This helped demand for yield and stoked investor appetite for relatively riskier assets.
Performance Results
For the six months ended March 31, 2012, Class A shares of Loomis Sayles Global Equity and Income Fund returned 19.75% at net asset value. The fund underperformed its primary benchmark, the Morgan Stanley Capital International (MSCI) World Index, which returned 20.34% for the period. The fund outperformed its secondary benchmark, the Citigroup World Government Bond Index, which returned -0.63%. The fund also outperformed the 11.19% average return of the Morningstar World Allocation category.
Explanation of Fund Performance
Within the fund’s equity segment, all sectors contributed positively. Positions in Apple, Novo Nordisk and priceline.com were the strongest contributors. Computer and electronic device maker Apple continued its strong run. Pharmaceutical company Novo Nordisk reported strong results, as its insulin franchise recovered and sales of its Victoza drug beat expectations. After strong upward movement in its share price, we recently trimmed the fund’s position. Online travel company priceline.com was up during the period, reporting strong financial results despite weak economic conditions in Europe.
Positions in Arcos Dorados Holdings, Wynn Macau and China Overseas Land & Investments slightly detracted from performance. Arco Dorados,
1 |
McDonald’s largest franchise in Latin America, underperformed as analysts reduced estimates because of a weaker currency exchange rate related to Brazilian real and imported raw material costs. We still believe the company offers a good way to invest in the region’s economic growth and took advantage of price weakness to add to the position. Wynn Macau, a destination casino resort, underperformed as investors worried about market growth in Macau in 2012 and the sustainability of the high-end business given economic uncertainty in China. China Overseas, a property development and investment company, underperformed, as current inventory reached a record high and home prices in China declined. We exited positions in Wynn Macau and China Overseas Land & Investment.
Within the fund’s fixed income segment, out-of-benchmark positioning in corporate bonds, and security selection within this sector, drove performance. The fund’s preference for lower-quality U.S. corporates over euro-area corporates and selections in industrials were particularly favorable. From a currency perspective, a substantial underweight in the yen and corresponding overweight positions in the U.S. dollar, Colombian peso, Mexican peso, New Zealand dollar, Norwegian krone, Singapore dollar and South Korean won contributed positively. Selective yield curve positioning in the U.S. corporate market also helped results. (The yield curve charts bond yields across the maturity spectrum.)
Euro-zone assets benefited as fears of a banking-system breakdown in Europe eased. The fund’s underweight in European markets, in both currency and bonds, detracted from performance. From a country allocation perspective, an underweight in the U.K. local markets modestly detracted.
Outlook
We anticipate additional volatility in the coming months and continue to assess opportunities. In the near term, we are concerned about factors that could increase oil prices. Looking out further, expiring U.S. tax measures, the nation’s debt ceiling, and November elections introduce another level of uncertainty. Factors from abroad, including Europe and potentially slower growth in China, are important variables. However, there are reasons to be optimistic. U.S. economic data have improved in recent months, and the health of the U.S. banking system has improved. Euro zone banks have also taken steps to address their challenges.
Stock market valuation indicators suggest equities are attractively valued relative to history. Additionally, dividends are positioned to grow faster than earnings this year. We believe equities should remain attractive longer-term investment alternatives. Within the fund’s fixed income component, we will retain positions in corporate bonds and seek to add some high-quality longer-duration holdings.
What You Should Know:
Investments in the fund are subject to a number of risks. Please see the “Principal Risks” section of the fund’s prospectus. The purchase of fund shares should be seen as a long-term investment.
| 2
LOOMIS SAYLES GLOBAL EQUITY AND INCOME FUND
Investment Results through March 31, 2012
The charts comparing the fund’s performance to two indexes provide you with a general sense of how it performed. The fund’s total return for the period shown below appears with and without sales charges and includes fund expenses and fees. An index measures the performance of a theoretical portfolio. Unlike a fund, the index is unmanaged and does not have expenses that affect the results. It is not possible to invest directly in an index. Investors would incur transaction costs and other expenses if they purchased the securities necessary to match the index.
Growth of a $10,000 Investment in Class A Shares1,6
March 31, 2002 through March 31, 2012
Average Annual Total Returns — March 31, 20126
| | | | | | | | | | | | | | | | |
| | | | | |
| | | 6 Months | | | 1 Year | | | 5 Years | | | 10 Years | |
| | | | | |
| Class A (Inception 2/1/06)1 | | | | | | | | | | | | | | | | |
| NAV | | | 19.75 | % | | | 5.00 | % | | | 7.20 | % | | | 10.31 | % |
| With 5.75% Maximum Sales Charge | | | 12.85 | | | | -1.03 | | | | 5.95 | | | | 9.66 | |
| | | | | |
| Class C (Inception 2/1/06)1 | | | | | | | | | | | | | | | | |
| NAV | | | 19.33 | | | | 4.25 | | | | 6.42 | | | | 9.50 | |
| With CDSC2 | | | 18.33 | | | | 3.25 | | | | 6.42 | | | | 9.50 | |
| | | | | |
| Class Y (Inception 5/1/96) | | | | | | | | | | | | | | | | |
| NAV | | | 19.90 | | | | 5.33 | | | | 7.48 | | | | 10.59 | |
| | | | | |
| Comparative Performance | | | | | | | | | | | | | | | | |
| MSCI World Index3 | | | 20.34 | | | | 1.14 | | | | -0.13 | | | | 5.27 | |
| Citigroup World Government Bond Index4 | | | -0.63 | | | | 5.12 | | | | 6.78 | | | | 7.89 | |
| Morningstar World Allocation Fund Avg.5 | | | 11.19 | | | | -0.13 | | | | 2.76 | | | | 6.93 | |
Performance data quoted represents past performance and is no guarantee of future results. Total return and value will vary and you may have a gain or loss when shares are sold. Current performance may be lower or higher than quoted. For most recent month-end performance, visit ngam.natixis.com. Performance for other share classes will be greater or less than shown based on differences in fees and sales charges. Performance for periods less than one year is cumulative, not annualized. Returns reflect changes in share price and reinvestment of dividends and capital gains, if any. Class Y shares are not available for purchase by all investors. The table and graph do not reflect taxes shareholders might owe on any fund distributions or when they redeem their shares.
3 |
| | | | |
| Fund Composition | | % of Net
Assets as of
3/31/12 | |
Common Stocks | | | 66.2 | |
Bonds and Notes | | | 25.1 | |
Preferred Stocks | | | 0.6 | |
Senior Loans | | | 0.2 | |
Short-Term Investments and Other | | | 7.9 | |
| |
| Ten Largest Holdings | | % of Net
Assets as of
3/31/12 | |
Apple, Inc. | | | 3.0 | |
Priceline.com, Inc. | | | 2.1 | |
Baidu, Inc., Sponsored ADR | | | 2.0 | |
Novo Nordisk A/S, Class B | | | 1.8 | |
PNC Financial Services Group, Inc. | | | 1.8 | |
Standard Chartered PLC | | | 1.8 | |
Anheuser-Busch InBev NV | | | 1.7 | |
Google, Inc., Class A | | | 1.7 | |
National Oilwell Varco, Inc. | | | 1.6 | |
Diageo PLC | | | 1.6 | |
| | | | |
| Five Largest Industries | | % of Net
Assets as of
3/31/12 | |
Beverages | | | 5.6 | |
Treasuries | | | 5.6 | |
Commercial Banks | | | 4.8 | |
Pharmaceuticals | | | 4.5 | |
Energy Equipment & Services | | | 4.4 | |
Portfolio holdings and asset allocations will vary.
Expense Ratios
as stated in the most recent prospectus
| | | | | | | | |
| Share Class | | Gross Expense Ratio7 | | | Net Expense Ratio8 | |
| A | | | 1.24 | % | | | 1.24 | % |
| C | | | 1.99 | | | | 1.99 | |
| Y | | | 0.99 | | | | 0.99 | |
NOTES TO CHARTS
| 1 | Prior to the inception of Class A and C shares (2/1/06), performance is that of Institutional Class shares, restated to reflect the higher net expenses and sales loads of Class A and C shares. |
| 2 | Performance for Class C shares assumes a 1% contingent deferred sales charge (“CDSC”) applied when you sell shares within one year of purchase. |
| 3 | MSCI World Index is an unmanaged index that is designed to measure the equity market performance of developed markets. |
| 4 | Citigroup World Government Bond Index is an unmanaged index that includes the most significant and liquid government bond markets globally that carry at least an investment-grade rating. |
| 5 | Morningstar World Allocation Fund Average is the average performance without sales charges of funds with similar investment objectives, as calculated by Morningstar, Inc. |
| 6 | Fund performance has been increased by fee waivers and/or expense reimbursements, if any, without which performance would have been lower. |
| 7 | Before fee waivers and/or expense reimbursements. |
| 8 | After fee waivers and/or expense reimbursements. Waivers/reimbursements are contractual and are set to expire 1/31/13. Contracts are reevaluated on an annual basis. |
| 4
LOOMIS SAYLES GROWTH FUND
Management Discussion
Manager:
Aziz Hamzaogullari, CFA
Loomis, Sayles & Company, L.P.
Objective:
Long-term growth of capital
Strategy:
Invests primarily in equity securities, including common stocks, convertible securities, and warrants; focuses on stocks of large-capitalization companies, but may invest in companies of any size
Fund Inception:
May 16, 1991
Symbols:
| | |
| Class A | | LGRRX |
| Class B | | LGRBX |
| Class C | | LGRCX |
| Class Y | | LSGRX |
Market Conditions
Following a tumultuous summer, investor sentiment began to improve at the end of 2011, helped along by the European Central Bank’s decision to extend low-cost financing to European banks. The U.S. economic recovery gained traction during the fourth quarter, with improvements in consumer spending and employment. As global macroeconomic concerns marginally subsided, equity markets posted strong returns.
Performance Results
For the six months ended March 31, 2012, Class A shares of Loomis Sayles Growth Fund returned 20.97% at net asset value. The fund underperformed its benchmark, the Russell 1000 Growth Index, which returned 26.85% for the period. The fund underperformed the 26.56% average return of the Morningstar Large Growth category.
Explanation of Fund Performance
The swift rebound in stock returns during the period was difficult to track. While the fund experienced solid results, it underperformed the benchmark due to stock selection within the consumer discretionary and technology sectors.
In terms of positive contributors, Visa, a payments technology company, and networking company Cisco were leading performers. Visa, which is among the fund’s largest holdings, benefited after the U.S. government announced less onerous guidelines for future regulations. A continued shift to card-based payments also helped drive Visa’s share price higher. Cisco began to reap the benefits of a restructuring plan that has the firm refocusing on its main products: switches and routers. Additionally, the company benefited from the anticipated increase in bandwidth capacity, given the proliferation of video communication over the Internet and mobile data. On a sector level, financials aided relative performance, primarily due to strong performance from Visa and SEI Investments. Shares of SEI Investments, an investment processing and management outsourcing company, advanced as the company began to see increasing sales from making investments in its global wealth platform.
5 |
Within the consumer discretionary sector, the fund lost ground relative to the index primarily due to online retailer Amazon.com, one of the fund’s largest holdings. The company’s stock came under pressure as Amazon increased investments in its fulfillment centers and digital content offerings, which led to short-term concerns about margins. Nevertheless, our long-term investment thesis remains intact. In the technology sector, the fund generated strong returns but lagged the index largely due to an overweight position in software maker Oracle. Oracle faced short-term obstacles related to the length of time it is taking to close contracts with customers. We believe this challenge will subside as the economy improves and companies become more willing to spend cash. Therefore, we remain confident in our investment thesis for Oracle.
Outlook
Our investment process is characterized by bottom-up fundamental research and a long-term time horizon. We believe that the nature of the process creates a portfolio with lower turnover and sector positioning derived from our fundamental research. We approach investing as if we were buying into a private business; therefore, we are selective about the investments we make. Through our proprietary seven-step, bottom-up fundamental analysis, we look for high-quality businesses we believe are best positioned to benefit from long-term secular growth drivers, and whose stock is selling significantly below our estimate of its intrinsic value. Our “ownership mindset” informs each step in our investment process. The result is a cohesive, integrated investment discipline that seeks to apply the team’s skills and talents to generate outperformance at or below benchmark risk. As of the end of March, our individual stock decisions led to overweight positions in the financial services, healthcare and consumer staples sectors and underweight positions in the energy, materials and processing, producer durables, consumer discretionary and technology sectors.
What You Should Know:
Investments in the fund are subject to a number of risks. Please see the “Principal Risks” section of the fund’s prospectus. The purchase of fund shares should be seen as a long-term investment.
| 6
LOOMIS SAYLES GROWTH FUND
Investment Results through March 31, 2012
The charts comparing the fund’s performance to an index provide you with a general sense of how it performed. The fund’s total return for the period shown below appears with and without sales charges and includes fund expenses and fees. An index measures the performance of a theoretical portfolio. Unlike a fund, the index is unmanaged and does not have expenses that affect the results. It is not possible to invest directly in an index. Investors would incur transaction costs and other expenses if they purchased the securities necessary to match the index.
Growth of a $10,000 Investment in Class A Shares1,5
March 31, 2002 through March 31, 2012
Average Annual Total Returns — March 31, 20125
| | | | | | | | | | | | | | | | |
| | | | | |
| | | 6 Months | | | 1 Year | | | 5 Years | | | 10 Years | |
| | | | | |
| Class A (Inception 12/31/96)1 | | | | | | | | | | | | | | | | |
| NAV | | | 20.97 | % | | | 10.24 | % | | | 0.38 | % | | | 2.86 | % |
| With 5.75% Maximum Sales Charge | | | 14.01 | | | | 3.92 | | | | -0.80 | | | | 2.26 | |
| | | | | |
| Class B (Inception 9/12/03)1 | | | | | | | | | | | | | | | | |
| NAV | | | 20.24 | | | | 9.19 | | | | -0.37 | | | | 2.09 | |
| With CDSC2 | | | 15.24 | | | | 4.19 | | | | -0.77 | | | | 2.09 | |
| | | | | |
| Class C (Inception 9/12/03)1 | | | | | | | | | | | | | | | | |
| NAV | | | 20.45 | | | | 9.38 | | | | -0.37 | | | | 2.11 | |
| With CDSC2 | | | 19.45 | | | | 8.38 | | | | -0.37 | | | | 2.11 | |
| | | | | |
| Class Y (Inception 5/16/91) | | | | | | | | | | | | | | | | |
| NAV | | | 21.14 | | | | 10.60 | | | | 0.75 | | | | 3.21 | |
| | | | | |
| Comparative Performance | | | | | | | | | | | | | | | | |
| Russell 1000 Growth Index3 | | | 26.85 | | | | 11.02 | | | | 5.10 | | | | 4.28 | |
| Morningstar Large Growth Fund Avg.4 | | | 26.56 | | | | 6.93 | | | | 3.53 | | | | 4.04 | |
Performance data quoted represents past performance and is no guarantee of future results. Total return and value will vary and you may have a gain or loss when shares are sold. Current performance may be lower or higher than quoted. For most recent month-end performance, visit ngam.natixis.com. Performance for other share classes will be greater or less than shown based on differences in fees and sales charges. Performance for periods less than one year is cumulative, not annualized. Returns reflect changes in share price and reinvestment of dividends and capital gains, if any. Class Y shares are not available for purchase by all investors. The table and graph do not reflect taxes shareholders might owe on any fund distributions or when they redeem their shares.
7 |
| | | | |
| Fund Composition | | % of Net
Assets as of
3/31/12 | |
Common Stocks | | | 98.8 | |
Short-Term Investments and Other | | | 1.2 | |
| |
| Ten Largest Holdings | | % of Net
Assets as of
3/31/12 | |
Cisco Systems, Inc. | | | 6.0 | |
Google, Inc., Class A | | | 5.8 | |
Visa, Inc., Class A | | | 5.8 | |
QUALCOMM, Inc. | | | 5.5 | |
Amazon.com, Inc. | | | 5.3 | |
Oracle Corp. | | | 4.7 | |
SEI Investments Co. | | | 4.4 | |
Danone S.A., Sponsored ADR | | | 4.3 | |
Amgen, Inc. | | | 4.3 | |
Zimmer Holdings, Inc. | | | 4.1 | |
| | | | |
| Five Largest Industries | | % of Net
Assets as of
3/31/12 | |
Communications Equipment | | | 11.5 | |
Software | | | 10.7 | |
Capital Markets | | | 9.3 | |
IT Services | | | 7.3 | |
Air Freight & Logistics | | | 6.8 | |
Portfolio holdings and asset allocations will vary.
Expense Ratios
as stated in the most recent prospectus
| | | | | | | | |
| Share Class | | Gross Expense Ratio6 | | | Net Expense Ratio7 | |
| A | | | 1.14 | % | | | 1.14 | % |
| B | | | 1.89 | | | | 1.89 | |
| C | | | 1.89 | | | | 1.89 | |
| Y | | | 0.89 | | | | 0.89 | |
NOTES TO CHARTS
| 1 | Prior to 9/15/03, performance of Class A shares is that of Retail Class shares, which were redesignated as Class A shares, restated to reflect the sales load of Class A shares. Prior to the inception of Class B and C shares (9/12/03), performance is that of Institutional Class shares, restated to reflect the higher net expenses and sales loads of Class B and C shares. |
| 2 | Performance for Class B shares assumes a maximum of 5% contingent deferred sales charge (“CDSC”) applied when you sell shares, which declines annually between years 1-6 according to the following schedule: 5, 4, 3, 3, 2, 1, 0%. Class C shares performance assumes a 1% CDSC applied when you sell shares within one year of purchase. |
| 3 | Russell 1000 Growth Index is an unmanaged index that measures the performance of the large-cap growth segment of the U.S. equity universe. If includes those Russell 1000 companies with higher price-to-book ratios and higher forecasted growth values. |
| 4 | Morningstar Large Growth Fund Average is the average performance without sales charges of funds with similar investment objectives, as calculated by Morningstar, Inc. |
| 5 | Fund performance has been increased by fee waivers and/or expense reimbursements, if any, without which performance would have been lower. |
| 6 | Before fee waivers and/or expense reimbursements. |
| 7 | After fee waivers and/or expense reimbursements. Waivers/reimbursements are contractual and are set to expire 1/31/13. Contracts are reevaluated on an annual basis. |
| 8
LOOMIS SAYLES MID CAP GROWTH FUND
Management Discussion
Manager:
Philip C. Fine, CFA
Loomis, Sayles & Company, L.P.
Objective:
Long-term growth of capital
Strategy:
Invests primarily in common stocks or other equity securities; focuses on stocks of companies that fall within the capitalization range of the companies included in the Russell Midcap Growth Index.
Fund Inception:
December 31, 1996
Symbols:
| | |
| Class A | | LAGRX |
| Class C | | LSACX |
| Class Y | | LSAIX |
Market Conditions
Fears of a disorderly Greek default and the resulting financial contagion roiled financial markets as the period began. In December, the European Central Bank launched a low-interest financing program for the banking system, restoring confidence to global financial markets and enabling a rally in riskier assets. Meanwhile, the U.S. expansion gained traction as the period wore on. In addition, it appeared that low global interest rates and central bank actions not only reduced the likelihood of a double-dip recession but promoted strong performance among sectors such as consumer discretionary, financials and technology, which tend to perform well in the early stages of economic recoveries.
Performance Results
For the six months ended March 31, 2012, Class A shares of Loomis Sayles Mid Cap Growth Fund returned 19.23% at net asset value. The fund underperformed its benchmark, the Russell Midcap Growth Index, which returned 27.39% for the period. It also underperformed the 26.41% average return of the funds in the Morningstar Mid-Cap Growth category
Explanation of Fund Performance
The healthcare, consumer discretionary and producer durables sectors contributed most to fund performance. In healthcare, the fund benefited from favorable stock selection, particularly in the biotechnology industry. Positions in Alexion, a commercial-stage biotech company, and Pharmasset, a clinical-stage biotech company, drove results. Alexion experienced growth from increasing patient awareness of its lead drug in the United States and Europe, and from recent launches in other countries. Pharmasset was acquired at a significant premium by Gilead. In consumer discretionary, the fund generated favorable returns but underperformed the benchmark, primarily due to higher-quality positioning during the fourth quarter of 2011. Strength in producer durables was broad based, with machinery, transportation and aerospace
9 |
contributing. The technology sector also contributed to performance, led by Rackspace Hosting, an IT infrastructure and cloud computing solutions provider.
The largest detractors included the consumer staples, materials and processing, and financial services sectors. In consumer staples, Green Mountain Coffee Roasters, the manufacturer of Keurig brewers and K-cup beverage packs, reported disappointing September quarter revenues, resulting from inventory destocking at grocery and club retail stores. Diamond Foods, a snack and culinary nuts company, had performed well during the first nine months of 2011. But, results suffered when the company’s acquisition of Pringles brand potato chips was cancelled following allegations that Diamond improperly accounted for large payments to walnut growers. We sold the stock before the allegations were proven.
In materials, the fund lagged during the fourth-quarter 2011 rally, as it was underexposed to better-performing industry groups, such as building materials, metals and chemicals. The fund also owned a few disappointing stocks. In financials, we were late in buying the more market-sensitive stocks that rebounded sharply off the market bottom, which hurt fourth-quarter 2011 performance. Although energy was a positive sector, a position in Alpha Natural Resources, a leading producer of metallurgical coal, detracted from relative performance. We exited this stock in the fourth quarter of 2011.
During the period the fund utilized options (puts and calls) on several exchange-traded funds and one individual stock, primarily for hedging purposes. While these instruments generally performed as expected, the combined returns had a negative impact on performance.
Outlook
Stock market valuation indicators suggest equities are attractively valued relative to history, and we believe that stocks remain attractively valued relative to interest rates. Furthermore, investors appear less distracted than they have been by macroeconomic issues and more focused on the performance of individual companies. Another favorable factor for equities is dividend growth: dividends are positioned to grow faster than earnings this year.
In the near term, we are most concerned about factors that could cause a spike in oil prices. Looking out further, U.S. Congress and President Obama will be required to act on a long list of expiring tax measures and the debt ceiling, while the November elections introduce another level of uncertainty. However, we believe the market’s current attractive valuation may already reflect some of these risks. Elsewhere, a slowdown in China and a potential recession in the euro zone remain as risks. At the same time, there are reasons to be optimistic. The U.S. banking system is in substantially better shape than it was in recent years, and the euro zone banks have taken important steps to address their challenges. Considering the key positive and negative factors, we believe equities should remain attractive longer-term investment alternatives.
What You Should Know
Investments in the fund are subject to a number of risks. Please see the “Principal Risks” section of the fund’s prospectus. The purchase of fund shares should be seen as a long-term investment.
| 10
LOOMIS SAYLES MID CAP GROWTH FUND
Investment Results through March 31, 2012
The charts comparing the fund’s performance to an index provide you with a general sense of how it performed. The fund’s total return for the period shown below appears with and without sales charges and includes fund expenses and fees. An index measures the performance of a theoretical portfolio. Unlike a fund, the index is unmanaged and does not have expenses that affect the results. It is not possible to invest directly in an index. Investors would incur transaction costs and other expenses if they purchased the securities necessary to match the index.
Growth of a $10,000 Investment in Class A Shares1,5
March 31, 2002 through March 31, 2012
Average Annual Total Returns — March 31, 20125
| | | | | | | | | | | | | | | | |
| | | | | |
| | | 6 Months | | | 1 Year | | | 5 Years | | | 10 Years | |
| | | | | |
| Class A (Inception 12/31/96)1 | | | | | | | | | | | | | | | | |
| NAV | | | 19.23 | % | | | -4.40 | % | | | 5.20 | % | | | 6.63 | % |
| With 5.75% Maximum Sales Charge | | | 12.36 | | | | -9.91 | | | | 3.96 | | | | 6.00 | |
| | | | | |
| Class C (Inception 2/2/09)1 | | | | | | | | | | | | | | | | |
| NAV | | | 18.76 | | | | -5.08 | | | | 4.41 | | | | 5.80 | |
| With CDSC2 | | | 17.76 | | | | -6.03 | | | | 4.41 | | | | 5.80 | |
| | | | | |
| Class Y (Inception 12/31/96) | | | | | | | | | | | | | | | | |
| NAV | | | 19.36 | | | | -4.13 | | | | 5.46 | | | | 6.90 | |
| | | | | |
| Comparative Performance | | | | | | | | | | | | | | | | |
| Russell Midcap Growth Index3 | | | 27.39 | | | | 4.43 | | | | 4.44 | | | | 6.92 | |
| Morningstar Mid-Cap Growth Avg.4 | | | 26.41 | | | | 2.00 | | | | 3.93 | | | | 5.97 | |
Performance data quoted represents past performance and is no guarantee of future results. Total return and value will vary and you may have a gain or loss when shares are sold. Current performance may be lower or higher than quoted. For most recent month-end performance, visit ngam.natixis.com. Performance for other share classes will be greater or less than shown based on differences in fees and sales charges. Performance for periods less than one year is cumulative, not annualized. Returns reflect changes in share price and reinvestment of dividends and capital gains, if any. Class Y shares are not available for purchase by all investors. The table and graph do not reflect taxes shareholders might owe on any fund distributions or when they redeem their shares.
11 |
| | | | |
| Fund Composition | | % of Net
Assets as of
3/31/12 | |
Common Stocks | | | 96.8 | |
Purchased Options | | | 0.0 | |
Short-Term Investments and Other | | | 3.2 | |
| |
| Ten Largest Holdings | | % of Net
Assets as of
3/31/12 | |
Rackspace Hosting, Inc. | | | 3.4 | |
Alexion Pharmaceuticals, Inc. | | | 3.1 | |
Affiliated Managers Group, Inc. | | | 2.5 | |
Intuitive Surgical, Inc. | | | 2.4 | |
F5 Networks, Inc. | | | 2.3 | |
Chipotle Mexican Grill, Inc. | | | 2.3 | |
Monster Beverage Corp. | | | 2.3 | |
Dollar Tree, Inc. | | | 2.3 | |
Verisk Analytics, Inc., Class A | | | 2.2 | |
Ulta Salon, Cosmetics & Fragrance, Inc. | | | 2.2 | |
| | | | |
Five Largest Industries | | % of Net
Assets as of
3/31/12 | |
Software | | | 10.2 | |
Specialty Retail | | | 9.3 | |
Biotechnology | | | 8.0 | |
Oil, Gas & Consumable Fuels | | | 6.8 | |
Internet Software & Services | | | 6.5 | |
Portfolio holdings and asset allocations will vary.
Expense Ratios
as stated in the most recent prospectus
| | | | | | | | |
| Share Class | | Gross Expense Ratio6 | | | Net Expense Ratio7 | |
| A | | | 1.32 | % | | | 1.25 | % |
| C | | | 2.08 | | | | 2.01 | |
| Y | | | 1.07 | | | | 1.00 | |
NOTES TO CHARTS
| 1 | Prior to 2/1/09, performance of Class A shares is that of Retail Class shares, which were redesignated as Class A shares, restated to reflect the sales load of Class A shares. Prior to the inception of Class C shares (2/2/09), performance is that of Retail Class shares, restated to reflect the higher net expenses and sales loads of Class C shares. The fund revised its investment strategies on 2/1/07; performance may have been different had the current strategies been in place for all periods shown. |
| 2 | Class C shares performance assumes a 1% CDSC applied when you sell shares within one year of purchase. |
| 3 | Russell Midcap Growth Index is an unmanaged index that measures the performance of the mid-cap growth segment of the U.S. equity universe. It includes those Russell Midcap Index companies with higher price-to-book ratios and higher forecasted growth values. |
| 4 | Morningstar Mid-Cap Growth Average is the average performance without sales charges of funds with similar investment objectives, as calculated by Morningstar, Inc. |
| 5 | Fund performance has been increased by fee waivers and/or expense reimbursements, if any, without which performance would have been lower. |
| 6 | Before fee waivers and/or expense reimbursements. |
| 7 | After fee waivers and/or expense reimbursements. Waivers/reimbursements are contractual and are set to expire 1/31/13. Contracts are reevaluated on an annual basis. |
| 12
LOOMIS SAYLES VALUE FUND
Management Discussion
Managers:
Arthur Barry, CFA
James L. Carroll, CFA
Warren N. Koontz, CFA, CIC
Loomis, Sayles & Company, L.P.
Objective:
Long-term growth of capital and income
Strategy:
Invests primarily in equity securities, including common stocks, convertible securities, and warrants.
Fund Inception:
May 13, 1991
Symbols:
| | |
| Class A | | LSVRX |
| Class B | | LSVBX |
| Class C | | LSCVX |
| Class Y | | LSGIX |
| Admin Class | | LSAVX |
Market Conditions
Following a tumultuous summer, investor sentiment began to improve at the end of 2011, helped along by the European Central Bank’s decision to extend low-cost financing to European banks. As global macroeconomic concerns marginally subsided, stocks staged a fourth-quarter rebound, and the rally continued into the new year. A more positive outlook for the United States economy and steady employment gains helped boost consumer confidence.
Performance Results
For the six months ended March 31, 2012, Class A shares of Loomis Sayles Value Fund returned 25.96% at net asset value. The fund outperformed its benchmark, the Russell 1000 Value Index, which returned 25.68% for the period. The fund also outperformed the 24.40% average return of funds in its peer group, the Morningstar Large Value category.
Explanation of Fund Performance
All sectors contributed positively to the fund’s outperformance during the six-month period. The fund’s slight tilt toward economically-sensitive sectors (predicated on where we had been finding good value among individual names) bolstered performance in a rising market. In particular, strong stock selection in the financial services and healthcare sectors, as well as a large overweight in consumer discretionary, were the largest contributors to performance. Our underweight in utilities, which we believed to be expensive, along with strong stock selection in the sector also boosted overall outperformance.
In terms of individual holdings, El Paso, JP Morgan and Comcast contributed the most to the fund’s outperformance relative to the index. Better-than-expected earnings and production combined with a friendly acquisition deal from Kinder Morgan led to strong results from the fund’s overweight position in El Paso, a natural gas company. A position in global financial services provider JP Morgan contributed significantly, due to decent revenues buoyed by strength
13 |
in commercial banking, credit cards and custody/processing business. The company continues to take market share in most of its businesses, and better economic growth should drive its commercial loan growth in the United States. Cable TV and Internet provider Comcast has also remained well positioned in a competitive market. Its data product offers a speed advantage compared to DSL, and, as consumers continue to access more data over the Internet, we believe this advantage should become more relevant. Comcast’s acquisition of NBCU was well timed, and we expect investments in programming to improve the company’s positioning.
While no sectors generated negative returns, the technology sector lagged on a relative basis. This was largely due to a position in Alcatel-Lucent, a networking and communication technology company, which suffered from poor operational performance and declining end-markets as 2011 progressed. Decreasing confidence in management’s ability to execute the turnaround prompted our exit from the position in the fourth quarter of 2011.
Electric utility Exelon and food producer Kellogg also detracted from returns. Disappointing power-price projections weakened Exelon’s 2012 outlook, however, we believe the stock could still offer value based on the company’s strong cash flow and solid financial position. We sold the fund’s position in Kellogg to fund a purchase of Unilever, a consumer goods company. We believed Unilever offered better top-line growth potential than Kellogg, due to its product and geographic exposure, while offering a similar price-to-earnings multiple (the ratio of a stock’s price to its earnings per share) and yield (a stock’s dividend as a percentage of its share price).
Outlook
We believe the underlying fundamentals of the companies owned in the fund help make it well-positioned for an equity market rally. Stock market valuation indicators suggest equities are attractively valued relative to history, and we believe that stocks remain attractively valued relative to interest rates. Furthermore, investors appear less distracted than they have been by macroeconomic issues and more focused on the performance of individual companies. Another favorable factor for equities is dividend growth: dividends are positioned to grow faster than earnings this year.
In the near term, we are most concerned about factors that could cause a spike in oil prices. Looking out further, U.S. Congress and President Obama will be required to act on a long list of expiring tax measures and the debt ceiling, while the November elections introduce another level of uncertainty. However, we believe the market’s current attractive valuation may already reflect some of these risks. Elsewhere, a slowdown in China and a potential recession in the euro zone remain as risks. At the same time, there are reasons to be optimistic. The U.S. banking system is in substantially better shape than it was in recent years, and the euro zone banks have taken important steps to address their challenges. Considering the key positive and negative factors, we believe equities should remain attractive longer-term investment alternatives.
What You Should Know:
Investments in the fund are subject to a number of risks. Please see the “Principal Risks” section of the fund’s prospectus. The purchase of fund shares should be seen as a long-term investment.
| 14
LOOMIS SAYLES VALUE FUND
Investment Results through March 31, 2012
The charts comparing the fund’s performance to an index provide you with a general sense of how it performed. The fund’s total return for the period shown below appears with and without sales charges and includes fund expenses and fees. An index measures the performance of a theoretical portfolio. Unlike a fund, the index is unmanaged and does not have expenses that affect the results. It is not possible to invest directly in an index. Investors would incur transaction costs and other expenses if they purchased the securities necessary to match the index.
Growth of a $10,000 Investment in Class A Shares1,5
March 31, 2002 through March 31, 2012
Average Annual Total Returns — March 31, 20125
| | | | | | | | | | | | | | | | |
| | | | | |
| | | 6 Months | | | 1 Year | | | 5 Years | | | 10 Years | |
| | | | | |
| Class A (Inception 6/30/06)1 | | | | | | | | | | | | | | | | |
| NAV | | | 25.96 | % | | | 1.63 | % | | | 0.13 | % | | | 5.36 | % |
| With 5.75% Maximum Sales Charge | | | 18.71 | | | | -4.20 | | | | -1.06 | | | | 4.74 | |
| | | | | |
| Class B (Inception 6/1/07)1 | | | | | | | | | | | | | | | | |
| NAV | | | 25.49 | | | | 0.85 | | | | -0.62 | | | | 4.48 | |
| With CDSC2 | | | 20.49 | | | | -4.15 | | | | -1.00 | | | | 4.48 | |
| | | | | |
| Class C (Inception 6/1/07)1 | | | | | | | | | | | | | | | | |
| NAV | | | 25.52 | | | | 0.89 | | | | -0.61 | | | | 4.49 | |
| With CDSC2 | | | 24.52 | | | | -0.11 | | | | -0.61 | | | | 4.49 | |
| | | | | |
| Class Y (Inception 5/13/91) | | | | | | | | | | | | | | | | |
| NAV | | | 26.12 | | | | 1.91 | | | | 0.44 | | | | 5.65 | |
| | | | | |
| Admin Class (Inception 2/1/10)1 | | | | | | | | | | | | | | | | |
| NAV | | | 25.80 | | | | 1.40 | | | | -0.14 | | | | 5.06 | |
| | | | | |
| Comparative Performance | | | | | | | | | | | | | | | | |
| Russell 1000 Value Index3 | | | 25.68 | | | | 4.79 | | | | -0.81 | | | | 4.58 | |
| Morningstar Large Value Fund Avg.4 | | | 24.40 | | | | 3.93 | | | | -0.24 | | | | 4.09 | |
Performance data quoted represents past performance and is no guarantee of future results. Total return and value will vary and you may have a gain or loss when shares are sold. Current performance may be lower or higher than quoted. For most recent month-end performance, visit ngam.natixis.com. Performance for other share classes will be greater or less than shown based on differences in fees and sales charges. Performance for periods less than one year is cumulative, not annualized. Returns reflect changes in share price and reinvestment of dividends and capital gains, if any. Class Y shares are not available for purchase by all investors. The table and graph do not reflect taxes shareholders might owe on any fund distributions or when they redeem their shares.
15 |
| | | | |
| Fund Composition | | % of Net
Assets as of
3/31/12 | |
Common Stocks | | | 98.4 | |
Short-Term Investments and Other | | | 1.6 | |
| |
| Ten Largest Holdings | | % of Net
Assets as of
3/31/12 | |
JPMorgan Chase & Co. | | | 2.7 | |
ExxonMobil Corp. | | | 2.6 | |
Comcast Corp., Class A | | | 2.5 | |
Wells Fargo & Co. | | | 2.2 | |
Merck & Co., Inc. | | | 2.1 | |
Chevron Corp. | | | 2.1 | |
UnitedHealth Group, Inc. | | | 2.0 | |
Pfizer, Inc. | | | 1.9 | |
General Electric Co. | | | 1.9 | |
PNC Financial Services Group, Inc. | | | 1.8 | |
| | | | |
| Five Largest Industries | | % of Net
Assets as of
3/31/12 | |
Oil, Gas & Consumable Fuels | | | 9.0 | |
Media | | | 6.9 | |
Commercial Banks | | | 6.5 | |
Pharmaceuticals | | | 6.4 | |
Diversified Financial Services | | | 5.4 | |
Portfolio holdings and asset allocations will vary.
Expense Ratios
as stated in the most recent prospectus
| | | | | | | | |
| Share Class | | Gross Expense Ratio6 | | | Net Expense Ratio7 | |
| A | | | 0.98 | % | | | 0.98 | % |
| B | | | 1.73 | | | | 1.73 | |
| C | | | 1.73 | | | | 1.73 | |
| Y | | | 0.74 | | | | 0.74 | |
| Admin | | | 1.17 | | | | 1.17 | |
NOTES TO CHARTS
| 1 | Prior to 6/1/07, performance of Class A shares is that of Retail Class shares, which were redesignated as Class A shares, restated to reflect the sales load of Class A shares. Prior to the inception of Retail Class shares (6/30/06), performance is that of Institutional Class shares, restated to reflect the higher net expenses and sales loads of Class A shares. Prior to the inception of Class B and C shares (6/1/07), performance is that of Institutional Class shares, restated to reflect the higher net expenses and sales loads of Class B and C shares. Prior to the inception of Admin Class shares (2/1/10), performance is that of Class A shares, restated to reflect the higher net expenses of Admin Class shares. |
| 2 | Performance for Class B shares assumes a maximum of 5% contingent deferred sales charge (“CDSC”) applied when you sell shares, which declines annually between years 1-6 according to the following schedule: 5, 4, 3, 3, 2, 1, 0%. Class C shares performance assumes a 1% CDSC applied when you sell shares within one year of purchase. |
| 3 | Russell 1000 Value Index is an unmanaged index that measures the performance of the large-cap value segment of the U.S. equity universe. It includes those Russell 1000 companies with lower price-to-book ratios and higher forecasted growth values. |
| 4 | Morningstar Large Value Fund Average is the average performance without sales charges of funds with similar investment objectives, as calculated by Morningstar, Inc. |
| 5 | Fund performance has been increased by fee waivers and/or expense reimbursements, if any, without which performance would have been lower. |
| 6 | Before fee waivers and/or expense reimbursements. |
| 7 | After fee waivers and/or expense reimbursements. Waivers/reimbursements are contractual and are set to expire 1/31/13. Contracts are reevaluated on an annual basis. |
| 16
ADDITIONAL INFORMATION
The views expressed in this report reflect those of the portfolio managers as of the dates indicated. The managers’ views are subject to change at any time without notice based on changes in market or other conditions. References to specific securities or industries should not be regarded as investment advice. Because these funds are actively managed, there is no assurance that they will continue to invest in the securities or industries mentioned.
Before investing, consider the fund’s investment objectives, risks, charges and expenses. Visit ngam.natixis.com or call 800-225-5478 for a prospectus and/or a summary prospectus, both of which contain this and other information. Read it carefully.
PROXY VOTING INFORMATION
A description of the funds’ proxy voting policies and procedures is available without charge, upon request, by calling Natixis Funds at 800-225-5478; on the funds’ website at ngam.natixis.com; and on the Securities and Exchange Commission’s website at www.sec.gov. Information regarding how the funds voted proxies relating to portfolio securities during the 12-month period ended June 30, 2011 is available from the funds’ website and the SEC’s website.
QUARTERLY PORTFOLIO SCHEDULES
The funds will file a complete schedule of portfolio holdings with the SEC for the first and third quarters of each fiscal year on Form N-Q. The funds’ Forms N-Q are available on the SEC’s website at www.sec.gov and may be reviewed and copied at the SEC’s Public Reference Room in Washington, DC. Information on the operation of the Public Reference Room may be obtained by calling
800-SEC-0330.
17 |
UNDERSTANDING FUND EXPENSES
As a mutual fund shareholder, you incur different types of costs: transaction costs, including sales charges (loads) on purchases and contingent deferred sales charges on redemptions, and ongoing costs, including management fees, distribution and/or service fees (12b-1 fees), and other fund expenses. These costs are described in more detail in the funds’ prospectus. The examples below are intended to help you understand the ongoing costs of investing in the funds and help you compare these with the ongoing costs of investing in other mutual funds.
The first line in the table for each class shows the actual amount of fund expenses you would have paid on a $1,000 investment in the fund from October 1, 2011 through March 31, 2012. It also shows how much a $1,000 investment would be worth at the close of the period, assuming actual fund returns and expenses. To estimate the expenses you paid over the period, simply divide your account value by $1,000 (for example, $8,600 account value divided by $1,000 = 8.6) and multiply the result by the number in the Expenses Paid During Period row as shown below for your class.
The second line in the table for each class provides information about hypothetical account values and hypothetical expenses based on the fund’s actual expense ratios and an assumed rate of return of 5% per year before expenses, which is not the fund’s actual return. The hypothetical account values and expenses may not be used to estimate the actual ending account balance or expenses you paid on your investment for the period. You may use this information to compare the ongoing costs of investing in the fund and other funds. To do so, compare this 5% hypothetical example with the 5% hypothetical examples that appear in the shareholder reports of the other funds.
Please note that the expenses shown reflect ongoing costs only, and do not include any transaction costs, such as sales charges. Therefore, the second line in the table of each fund is useful in comparing ongoing costs only, and will not help you determine the relative costs of owning different funds. If transaction costs were included, total costs would be higher.
| | | | | | | | | | | | |
LOOMIS SAYLES GLOBAL EQUITY AND
INCOME FUND | | BEGINNING
ACCOUNT VALUE
10/1/2011 | | | ENDING
ACCOUNT VALUE
3/31/2012 | | | EXPENSES PAID
DURING PERIOD*
10/1/2011 – 3/31/2012 | |
Class A | | | | | | | | | | | | |
Actual | | | $1,000.00 | | | | $1,197.50 | | | | $6.70 | |
Hypothetical (5% return before expenses) | | | $1,000.00 | | | | $1,018.90 | | | | $6.16 | |
Class C | | | | | | | | | | | | |
Actual | | | $1,000.00 | | | | $1,193.30 | | | | $10.80 | |
Hypothetical (5% return before expenses) | | | $1,000.00 | | | | $1,015.15 | | | | $9.92 | |
Class Y | | | | | | | | | | | | |
Actual | | | $1,000.00 | | | | $1,199.00 | | | | $5.33 | |
Hypothetical (5% return before expenses) | | | $1,000.00 | | | | $1,020.15 | | | | $4.90 | |
| * | Expenses are equal to the Fund’s annualized expense ratio: 1.22%, 1.97% and 0.97% for Class A, C and Y, respectively, multiplied by the average account value over the period, multiplied by the number of days in the most recent fiscal half-year, divided by 366 (to reflect the half-year period). |
| 18
| | | | | | | | | | | | |
| LOOMIS SAYLES GROWTH FUND | | BEGINNING
ACCOUNT VALUE
10/1/2011 | | | ENDING
ACCOUNT VALUE
3/31/2012 | | | EXPENSES PAID
DURING PERIOD*
10/1/2011 – 3/31/2012 | |
Class A | | | | | | | | | | | | |
Actual | | | $1,000.00 | | | | $1,209.70 | | | | $6.13 | |
Hypothetical (5% return before expenses) | | | $1,000.00 | | | | $1,019.45 | | | | $5.60 | |
Class B | | | | | | | | | | | | |
Actual | | | $1,000.00 | | | | $1,202.40 | | | | $10.19 | |
Hypothetical (5% return before expenses) | | | $1,000.00 | | | | $1,015.75 | | | | $9.32 | |
Class C | | | | | | | | | | | | |
Actual | | | $1,000.00 | | | | $1,204.50 | | | | $10.25 | |
Hypothetical (5% return before expenses) | | | $1,000.00 | | | | $1,015.70 | | | | $9.37 | |
Class Y | | | | | | | | | | | | |
Actual | | | $1,000.00 | | | | $1,211.40 | | | | $4.75 | |
Hypothetical (5% return before expenses) | | | $1,000.00 | | | | $1,020.70 | | | | $4.34 | |
| * | Expenses are equal to the Fund’s annualized expense ratio: 1.11%, 1.85%, 1.86% and 0.86% for Class A, B, C and Y, respectively, multiplied by the average account value over the period, multiplied by the number of days in the most recent fiscal half-year, divided by 366 (to reflect the half-year period). |
| | | | | | | | | | | | |
| LOOMIS SAYLES MID CAP GROWTH FUND | | BEGINNING
ACCOUNT VALUE
10/1/2011 | | | ENDING
ACCOUNT VALUE
3/31/2012 | | | EXPENSES PAID
DURING PERIOD*
10/1/2011 – 3/31/2012 | |
Class A | | | | | | | | | | | | |
Actual | | | $1,000.00 | | | | $1,192.30 | | | | $6.85 | |
Hypothetical (5% return before expenses) | | | $1,000.00 | | | | $1,018.75 | | | | $6.31 | |
Class C | | | | | | | | | | | | |
Actual | | | $1,000.00 | | | | $1,187.60 | | | | $10.94 | |
Hypothetical (5% return before expenses) | | | $1,000.00 | | | | $1,015.00 | | | | $10.08 | |
Class Y | | | | | | | | | | | | |
Actual | | | $1,000.00 | | | | $1,193.60 | | | | $5.48 | |
Hypothetical (5% return before expenses) | | | $1,000.00 | | | | $1,020.00 | | | | $5.05 | |
| * | Expenses are equal to the Fund’s annualized expense ratio (after waiver/reimbursement): 1.25%, 2.00% and 1.00% for Class A, C and Y, respectively, multiplied by the average account value over the period, multiplied by the number of days in the most recent fiscal half-year, divided by 366 (to reflect the half-year period). |
19 |
| | | | | | | | | | | | |
| LOOMIS SAYLES VALUE FUND | | BEGINNING
ACCOUNT VALUE
10/1/2011 | | | ENDING
ACCOUNT VALUE
3/31/2012 | | | EXPENSES PAID
DURING PERIOD*
10/1/2011 – 3/31/2012 | |
Class A | | | | | | | | | | | | |
Actual | | | $1,000.00 | | | | $1,259.60 | | | | $5.54 | |
Hypothetical (5% return before expenses) | | | $1,000.00 | | | | $1,020.10 | | | | $4.95 | |
Class B | | | | | | | | | | | | |
Actual | | | $1,000.00 | | | | $1,254.90 | | | | $9.75 | |
Hypothetical (5% return before expenses) | | | $1,000.00 | | | | $1,016.35 | | | | $8.72 | |
Class C | | | | | | | | | | | | |
Actual | | | $1,000.00 | | | | $1,255.20 | | | | $9.75 | |
Hypothetical (5% return before expenses) | | | $1,000.00 | | | | $1,016.35 | | | | $8.72 | |
Class Y | | | | | | | | | | | | |
Actual | | | $1,000.00 | | | | $1,261.20 | | | | $4.13 | |
Hypothetical (5% return before expenses) | | | $1,000.00 | | | | $1,021.35 | | | | $3.69 | |
Admin Class | | | | | | | | | | | | |
Actual | | | $1,000.00 | | | | $1,258.00 | | | | $7.17 | |
Hypothetical (5% return before expenses) | | | $1,000.00 | | | | $1,018.65 | | | | $6.41 | |
| * | Expenses are equal to the Fund’s annualized expense ratio: 0.98%, 1.73%, 1.73%, 0.73% and 1.27% for Class A, B, C, Y and Admin Class, respectively, multiplied by the average account value over the period, multiplied by the number of days in the most recent fiscal half-year, divided by 366 (to reflect the half-year period). |
| 20
Portfolio of Investments – as of March 31, 2012 (Unaudited)
Loomis Sayles Global Equity and Income Fund
| | | | | | | | |
Shares | | | Description | | Value (†) | |
| | | | | | | | |
| | Common Stocks — 66.2% of Net Assets | | | | |
| | | | Argentina — 1.1% | | | | |
| | 441,216 | | | Arcos Dorados Holdings, Inc., Class A | | $ | 7,981,597 | |
| | | | | | | | |
| | | | Belgium — 1.7% | | | | |
| | 170,419 | | | Anheuser-Busch InBev NV | | | 12,411,404 | |
| | | | | | | | |
| | | | Brazil — 4.6% | | | | |
| | 386,800 | | | Cia Hering | | | 9,990,753 | |
| | 296,727 | | | Embraer S.A., ADR | | | 9,489,329 | |
| | 377,600 | | | Mills Estruturas e Servicos de Engenharia S.A. | | | 4,819,677 | |
| | 386,700 | | | Natura Cosmeticos S.A. | | | 8,409,976 | |
| | | | | | | | |
| | | | | | | 32,709,735 | |
| | | | | | | | |
| | | | Canada — 0.1% | | | | |
| | 9,996 | | | Valeant Pharmaceuticals International, Inc.(b) | | | 536,685 | |
| | | | | | | | |
| | | | Chile — 2.6% | | | | |
| | 110,997 | | | Banco Santander Chile, ADR | | | 9,555,732 | |
| | 917,268 | | | S.A.C.I. Falabella | | | 8,870,428 | |
| | | | | | | | |
| | | | | | | 18,426,160 | |
| | | | | | | | |
| | | | China — 2.7% | | | | |
| | 100,942 | | | Baidu, Inc., Sponsored ADR(b) | | | 14,714,315 | |
| | 466,000 | | | China Mobile Ltd. | | | 5,131,393 | |
| | | | | | | | |
| | | | | | | 19,845,708 | |
| | | | | | | | |
| | | | Denmark — 1.8% | | | | |
| | 93,318 | | | Novo Nordisk A/S, Class B | | | 12,958,103 | |
| | | | | | | | |
| | | | France — 1.6% | | | | |
| | 145,646 | | | Sanofi | | | 11,300,894 | |
| | | | | | | | |
| | | | Germany — 0.9% | | | | |
| | 62,871 | | | Siemens AG, (Registered) | | | 6,340,163 | |
| | | | | | | | |
| | | | Hong Kong — 0.5% | | | | |
| | 1,044,000 | | | Hang Lung Properties Ltd. | | | 3,843,703 | |
| | | | | | | | |
| | | | Japan — 1.4% | | | | |
| | 56,600 | | | FANUC Corp. | | | 10,137,918 | |
| | | | | | | | |
| | | | Korea — 0.8% | | | | |
| | 16,732 | | | LG Chem Ltd. | | | 5,477,870 | |
| | | | | | | | |
| | | | Mexico — 0.9% | | | | |
| | 3,671,600 | | | Genomma Lab Internacional S.A. de CV, Class B(b) | | | 6,715,397 | |
| | | | | | | | |
| | | | Russia — 0.7% | | | | |
| | 128,994 | | | Mail.ru Group Ltd., GDR, 144A(b) | | | 4,974,009 | |
| | | | | | | | |
| | | | Sweden — 2.0% | �� | | | |
| | 338,522 | | | Atlas Copco AB, Class A | | | 8,190,219 | |
| | 127,251 | | | Elekta AB, Class B | | | 6,441,436 | |
| | | | | | | | |
| | | | | | | 14,631,655 | |
| | | | | | | | |
See accompanying notes to financial statements.
21 |
Portfolio of Investments – as of March 31, 2012 (Unaudited)
Loomis Sayles Global Equity and Income Fund – (continued)
| | | | | | | | |
Shares | | | Description | | Value (†) | |
| | | | | | | | |
| | | | Switzerland — 1.3% | | | | |
| | 122,947 | | | ACE Ltd. | | $ | 8,999,720 | |
| | | | | | | | |
| | | | United Kingdom — 9.0% | | | | |
| | 308,797 | | | Antofagasta PLC | | | 5,706,483 | |
| | 213,417 | | | British American Tobacco PLC | | | 10,750,794 | |
| | 219,656 | | | Burberry Group PLC | | | 5,266,092 | |
| | 487,076 | | | Diageo PLC | | | 11,726,760 | |
| | 126,427 | | | Royal Dutch Shell PLC, ADR | | | 8,866,325 | |
| | 503,579 | | | Standard Chartered PLC | | | 12,575,200 | |
| | 3,648,699 | | | Vodafone Group PLC | | | 10,064,368 | |
| | | | | | | | |
| | | | | | | 64,956,022 | |
| | | | | | | | |
| | | | United States — 32.5% | | | | |
| | 193,898 | | | American Express Co. | | | 11,218,938 | |
| | 35,458 | | | Apple, Inc.(b) | | | 21,256,007 | |
| | 211,838 | | | AT&T, Inc. | | | 6,615,701 | |
| | 564,973 | | | Calpine Corp.(b) | | | 9,723,185 | |
| | 102,247 | | | Caterpillar, Inc. | | | 10,891,350 | |
| | 211,714 | | | CenturyLink, Inc. | | | 8,182,746 | |
| | 253,263 | | | Citigroup, Inc. | | | 9,256,763 | |
| | 317,837 | | | Coca-Cola Enterprises, Inc. | | | 9,090,138 | |
| | 159,251 | | | CVS Caremark Corp. | | | 7,134,445 | |
| | 1,679 | | | Dex One Corp.(b) | | | 2,384 | |
| | 204,157 | | | FMC Technologies, Inc.(b) | | | 10,293,596 | |
| | 19,230 | | | Google, Inc., Class A(b) | | | 12,331,045 | |
| | 955 | | | Hawaiian Telcom Holdco, Inc.(b) | | | 16,464 | |
| | 90,623 | | | Jones Lang LaSalle, Inc. | | | 7,549,802 | |
| | 281,614 | | | Microsoft Corp. | | | 9,082,052 | |
| | 148,049 | | | National Oilwell Varco, Inc. | | | 11,765,454 | |
| | 292,067 | | | Oracle Corp. | | | 8,516,674 | |
| | 103,608 | | | PepsiCo, Inc. | | | 6,874,391 | |
| | 195,218 | | | PNC Financial Services Group, Inc. | | | 12,589,609 | |
| | 95,636 | | | Praxair, Inc. | | | 10,963,711 | |
| | 27,542 | | | Precision Castparts Corp. | | | 4,762,012 | |
| | 21,172 | | | Priceline.com, Inc.(b) | | | 15,190,910 | |
| | 130,699 | | | QUALCOMM, Inc. | | | 8,890,146 | |
| | 142,551 | | | Schlumberger Ltd. | | | 9,968,591 | |
| | 299 | | | SuperMedia, Inc.(b) | | | 715 | |
| | 137,735 | | | Texas Instruments, Inc. | | | 4,629,273 | |
| | 26,818 | | | Vertex Pharmaceuticals, Inc.(b) | | | 1,099,806 | |
| | 51,707 | | | VMware, Inc., Class A(b) | | | 5,810,316 | |
| | | | | | | | |
| | | | | | | 233,706,224 | |
| | | | | | | | |
| | | | Total Common Stocks
(Identified Cost $416,637,263) | | | 475,952,967 | |
| | | | | | | | |
See accompanying notes to financial statements.
| 22
Portfolio of Investments – as of March 31, 2012 (Unaudited)
Loomis Sayles Global Equity and Income Fund – (continued)
| | | | | | | | |
Principal
Amount (‡) | | | Description | �� | Value (†) | |
| | | | | | | | |
| | Bonds and Notes — 25.1% | |
| | Non-Convertible Bonds — 24.0% | |
| | | | Argentina — 0.2% | | | | |
| $ | 626,891 | | | Argentina Government International Bond, 8.280%, 12/31/2033 | | $ | 461,705 | |
| | 180,000 | | | Pan American Energy LLC, 7.875%, 5/07/2021, 144A | | | 175,500 | |
| | 500,000 | | | Transportadora de Gas del Sur S.A., 7.875%, 5/14/2017, 144A | | | 442,500 | |
| | | | | | | | |
| | | | | | | 1,079,705 | |
| | | | | | | | |
| | | | Australia — 0.1% | | | | |
| | 500,000 | | | Macquarie Bank Ltd., 6.625%, 4/07/2021, 144A | | | 501,910 | |
| | 250,000 | | | New South Wales Treasury Corp., 6.000%, 5/01/2012, (AUD) | | | 259,341 | |
| | 155,000 | | | Sydney Airport Finance Co., 5.125%, 2/22/2021, 144A | | | 159,527 | |
| | | | | | | | |
| | | | | | | 920,778 | |
| | | | | | | | |
| | | | Brazil — 1.1% | | | | |
| | 400,000 | | | Banco Santander Brasil S.A., 4.500%, 4/06/2015, 144A | | | 407,000 | |
| | 1,146,386 | | | Banco Votorantim S.A., 6.250%, 5/16/2016, 144A, (BRL) | | | 643,352 | |
| | 200,000 | | | Braskem Finance Ltd., 5.750%, 4/15/2021, 144A | | | 209,360 | |
| | 640,060(††) | | | Brazil Notas do Tesouro Nacional, Series B, 6.000%, 8/15/2014, (BRL) | | | 365,813 | |
| | 512,048(††) | | | Brazil Notas do Tesouro Nacional, Series B, 6.000%, 5/15/2015, (BRL) | | | 294,331 | |
| | 1,115(†††) | | | Brazil Notas do Tesouro Nacional, Series F, 10.000%, 1/01/2021, (BRL) | | | 574,499 | |
| | 200,000 | | | Centrais Eletricas Brasileiras S.A., 5.750%, 10/27/2021, 144A | | | 218,900 | |
| | 100,000 | | | CSN Resources S.A., 6.500%, 7/21/2020, 144A | | | 112,000 | |
| | 300,000 | | | Fibria Overseas Finance Ltd., 6.750%, 3/03/2021, 144A | | | 306,750 | |
| | 119,000 | | | Fibria Overseas Finance Ltd., 7.500%, 5/04/2020, 144A | | | 125,700 | |
| | 300,000 | | | Itau Unibanco Holding S.A., 6.200%, 12/21/2021, 144A | | | 313,500 | |
| | 100,000 | | | LPG International, Inc., 7.250%, 12/20/2015 | | | 109,500 | |
| | 300,000 | | | Marfrig Overseas Ltd., 9.500%, 5/04/2020, 144A | | | 274,740 | |
| | 200,000 | | | OGX Petroleo e Gas Participacoes S.A, 8.500%, 6/01/2018, 144A | | | 207,800 | |
| | 196,000 | | | Odebrecht Drilling Norbe VIII/IX Ltd., 6.350%, 6/30/2021, 144A | | | 208,740 | |
| | 500,000 | | | Odebrecht Finance Ltd., 6.000%, 4/05/2023, 144A | | | 519,650 | |
| | 1,200,000 | | | Oi S.A., 9.750%, 9/15/2016, 144A, (BRL) | | | 680,380 | |
| | 320,000 | | | Petrobras International Finance Co., 5.375%, 1/27/2021 | | | 344,556 | |
| | 300,000 | | | Petrobras International Finance Co., 6.875%, 1/20/2040 | | | 352,461 | |
| | 129,000 | | | Telemar Norte Leste S.A., 5.500%, 10/23/2020, 144A | | | 132,612 | |
| | 536,000 | | | Vale Overseas Ltd., 6.875%, 11/21/2036 | | | 621,674 | |
| | 400,000 | | | Votorantim Cimentos S.A., 7.250%, 4/05/2041, 144A | | | 406,000 | |
| | 200,000 | | | Voto-Votorantim Ltd., 6.750%, 4/05/2021, 144A | | | 223,960 | |
| | | | | | | | |
| | | | | | | 7,653,278 | |
| | | | | | | | |
| | | | Canada — 0.5% | | | | |
| | 2,265,000 | | | Canadian Government, 3.000%, 12/01/2015, (CAD)(c) | | | 2,395,911 | |
| | 650,000 | | | Canadian Government, 3.500%, 6/01/2013, (CAD) | | | 669,674 | |
| | 180,000 | | | Corus Entertainment, Inc., 7.250%, 2/10/2017, 144A, (CAD) | | | 191,288 | |
| | 465,000 | | | Pacific Rubiales Energy Corp., 7.250%, 12/12/2021, 144A | | | 508,942 | |
| | 100,000 | | | Shaw Communications, Inc., 5.650%, 10/01/2019, (CAD) | | | 112,465 | |
| | | | | | | | |
| | | | | | | 3,878,280 | |
| | | | | | | | |
See accompanying notes to financial statements.
23 |
Portfolio of Investments – as of March 31, 2012 (Unaudited)
Loomis Sayles Global Equity and Income Fund – (continued)
| | | | | | | | |
Principal
Amount (‡) | | | Description | | Value (†) | |
| | | | | | | | |
| | | | Chile — 0.1% | | | | |
| | 250,000,000 | | | Banco Santander Chile, 6.500%, 9/22/2020, 144A, (CLP) | | $ | 494,576 | |
| | 200,000 | | | Celulosa Arauco y Constitucion S.A., 4.750%, 1/11/2022, 144A | | | 204,731 | |
| | 250,000 | | | E.CL S.A., 5.625%, 1/15/2021, 144A | | | 267,985 | |
| | | | | | | | |
| | | | | | | 967,292 | |
| | | | | | | | |
| | | | China — 0.1% | | | | |
| | 400,000 | | | China Resources Gas Group Ltd., 4.500%, 4/05/2022, 144A | | | 393,112 | |
| | | | | | | | |
| | | | Colombia — 0.2% | | | | |
| | 450,000,000 | | | Emgesa S.A. E.S.P., 8.750%, 1/25/2021, 144A, (COP) | | | 273,163 | |
| | 1,430,000,000 | | | Empresas Publicas de Medellin E.S.P., 8.375%, 2/01/2021, 144A, (COP) | | | 850,045 | |
| | 200,000,000 | | | Republic of Colombia, 7.750%, 4/14/2021, (COP) | | | 133,371 | |
| | 40,000 | | | Republic of Colombia, 8.125%, 5/21/2024 | | | 56,700 | |
| | | | | | | | |
| | | | | | | 1,313,279 | |
| | | | | | | | |
| | | | Czech Republic — 0.1% | | | | |
| | 400,000 | | | CEZ AS, 4.250%, 4/03/2022, 144A | | | 397,896 | |
| | | | | | | | |
| | | | France — 0.1% | | | | |
| | 150,000 | | | Lafarge S.A., EMTN, 5.375%, 6/26/2017, (EUR) | | | 203,056 | |
| | 240,000 | | | Veolia Environnement S.A., EMTN, 4.000%, 2/12/2016, (EUR) | | | 342,737 | |
| | 25,000 | | | Veolia Environnement S.A., EMTN, 5.125%, 5/24/2022, (EUR) | | | 36,636 | |
| | 200,000 | | | Vivendi S.A., EMTN, 4.250%, 12/01/2016, (EUR) | | | 283,998 | |
| | | | | | | | |
| | | | | | | 866,427 | |
| | | | | | | | |
| | | | Germany — 0.5% | | | | |
| | 240,000 | | | Bundesrepublik Deutschland, 3.000%, 7/04/2020, (EUR) | | | 356,578 | |
| | 2,030,000 | | | Bundesrepublik Deutschland, 3.750%, 1/04/2017, (EUR) | | | 3,082,971 | |
| | | | | | | | |
| | | | | | | 3,439,549 | |
| | | | | | | | |
| | | | Hong Kong — 0.1% | | | | |
| | 400,000 | | | Hutchinson Whampoa International 11 Ltd., 3.500%, 1/13/2017, 144A | | | 404,871 | |
| | 100,000 | | | Noble Group Ltd., 6.750%, 1/29/2020, 144A | | | 98,500 | |
| | | | | | | | |
| | | | | | | 503,371 | |
| | | | | | | | |
| | | | Hungary — 0.0% | | | | |
| | 200,000 | | | Hungary Government International Bond, 6.375%, 3/29/2021 | | | 183,000 | |
| | | | | | | | |
| | | | India — 0.0% | | | | |
| | 200,000 | | | Canara Bank Ltd., (fixed rate to 11/28/2016, variable rate thereafter),
6.365%, 11/28/2021 | | | 194,443 | |
| | 100,000 | | | ICICI Bank Ltd., (fixed rate to 4/30/2017, variable rate thereafter),
6.375%, 4/30/2022, 144A | | | 94,000 | |
| | | | | | | | |
| | | | | | | 288,443 | |
| | | | | | | | |
| | | | Indonesia — 0.1% | | | | |
| | 200,000 | | | Adaro Indonesia PT, 7.625%, 10/22/2019, 144A | | | 217,000 | |
| | 3,500,000,000 | | | Indonesia Government International Bond, 9.500%, 7/15/2023, (IDR) | | | 481,276 | |
| | 781,000,000 | | | Indonesia Government International Bond, 11.500%, 9/15/2019, (IDR) | | | 114,069 | |
| | | | | | | | |
| | | | | | | 812,345 | |
| | | | | | | | |
See accompanying notes to financial statements.
| 24
Portfolio of Investments – as of March 31, 2012 (Unaudited)
Loomis Sayles Global Equity and Income Fund – (continued)
| | | | | | | | |
Principal
Amount (‡) | | | Description | | Value (†) | |
| | | | | | | | |
| | | | Ireland — 0.0% | | | | |
| | 100,000 | | | WPP 2008 Ltd., 6.000%, 4/04/2017, (GBP) | | $ | 178,778 | |
| | | | | | | | |
| | | | Italy — 0.1% | | | | |
| | 250,000 | | | Finmeccanica SpA, EMTN, 4.875%, 3/24/2025, (EUR) | | | 277,083 | |
| | 100,000 | | | Telecom Italia SpA, EMTN, 5.375%, 1/29/2019, (EUR) | | | 136,310 | |
| | 125,000 | | | Telecom Italia Capital S.A., 6.000%, 9/30/2034 | | | 110,000 | |
| | 10,000 | | | Telecom Italia Capital S.A., 6.375%, 11/15/2033 | | | 9,000 | |
| | | | | | | | |
| | | | | | | 532,393 | |
| | | | | | | | |
| | | | Korea — 0.6% | | | | |
| | 8,000,000 | | | Export-Import Bank of Korea, 4.000%, 11/26/2015, 144A, (PHP) | | | 183,627 | |
| | 400,000 | | | Hana Bank, 4.000%, 11/03/2016, 144A | | | 410,913 | |
| | 600,000 | | | Hyundai Capital Services, Inc., 3.500%, 9/13/2017, 144A | | | 601,408 | |
| | 600,000 | | | Hyundai Steel Co., 4.625%, 4/21/2016, 144A | | | 618,376 | |
| | 400,000 | | | Kia Motors Corp., 3.625%, 6/14/2016, 144A | | | 407,840 | |
| | 400,000 | | | Korea Finance Corp., 4.625%, 11/16/2021 | | | 407,984 | |
| | 400,000 | | | Korea National Oil Corp., 3.125%, 4/03/2017, 144A | | | 399,137 | |
| | 400,000,000 | | | Korea Treasury Bond, 5.000%, 9/10/2014, (KRW) | | | 364,463 | |
| | 400,000 | | | Shinhan Bank, 4.375%, 7/27/2017, 144A | | | 421,504 | |
| | 140,000 | | | SK Telecom Co. Ltd., 6.625%, 7/20/2027, 144A | | | 163,811 | |
| | 200,000 | | | Woori Bank, 5.875%, 4/13/2021, 144A | | | 213,062 | |
| | | | | | | | |
| | | | | | | 4,192,125 | |
| | | | | | | | |
| | | | Latvia — 0.1% | | | | |
| | 600,000 | | | Republic of Latvia, 5.250%, 2/22/2017, 144A | | | 618,000 | |
| | | | | | | | |
| | | | Luxembourg — 0.1% | | | | |
| | 400,000 | | | ArcelorMittal, 6.750%, 3/01/2041 | | | 374,847 | |
| | | | | | | | |
| | | | Malaysia — 0.1% | | | | |
| | 1,750,000 | | | Malaysia Government Bond, 3.434%, 8/15/2014, (MYR) | | | 574,833 | |
| | 1,000,000 | | | Malaysia Government Bond, 4.262%, 9/15/2016, (MYR) | | | 338,704 | |
| | | | | | | | |
| | | | | | | 913,537 | |
| | | | | | | | |
| | | | Mexico — 1.0% | | | | |
| | 7,000,000 | | | America Movil SAB de CV, 3.500%, 2/08/2015, (CNY) | | | 1,125,511 | |
| | 195,000 | | | Axtel SAB de CV, 7.625%, 2/01/2017, 144A | | | 157,950 | |
| | 145,000 | | | Axtel SAB de CV, 9.000%, 9/22/2019, 144A | | | 118,175 | |
| | 400,000 | | | Corporacion GEO SAB de CV, 9.250%, 6/30/2020, 144A | | | 423,000 | |
| | 300,000 | | | Desarrolladora Homex SAB de CV, 9.750%, 3/25/2020, 144A | | | 318,000 | |
| | 94,000(††††) | | | Mexican Fixed Rate Bonds, Series M, 6.500%, 6/10/2021, (MXN) | | | 749,390 | |
| | 74,000(††††) | | | Mexican Fixed Rate Bonds, Series M-10, 8.000%, 12/17/2015, (MXN) | | | 634,082 | |
| | 88,000(††††) | | | Mexican Fixed Rate Bonds, Series M-10, 8.500%, 12/13/2018, (MXN) | | | 798,211 | |
| | 65,000(††††) | | | Mexican Fixed Rate Bonds, Series M-20, 10.000%, 12/05/2024, (MXN) | | | 664,055 | |
| | 80,000(††††) | | | Mexican Fixed Rate Bonds, Series M-30, 8.500%, 11/18/2038, (MXN) | | | 697,626 | |
| | 100,000 | | | Mexichem SAB de CV, 8.750%, 11/06/2019, 144A | | | 119,500 | |
| | 330,000 | | | Petroleos Mexicanos, 8.000%, 5/03/2019 | | | 417,450 | |
| | 200,000 | | | Urbi Desarrollos Urbanos SAB de CV, 9.500%, 1/21/2020, 144A | | | 211,000 | |
| | 400,000 | | | Urbi Desarrollos Urbanos SAB de CV, 9.750%, 2/03/2022, 144A | | | 424,000 | |
| | | | | | | | |
| | | | | | | 6,857,950 | |
| | | | | | | | |
See accompanying notes to financial statements.
25 |
Portfolio of Investments – as of March 31, 2012 (Unaudited)
Loomis Sayles Global Equity and Income Fund – (continued)
| | | | | | | | |
Principal
Amount (‡) | | | Description | | Value (†) | |
| | | | | | | | |
| | | | Netherlands — 0.2% | | | | |
| | 200,000 | | | EADS Finance BV, EMTN, 4.625%, 8/12/2016, (EUR) | | $ | 296,455 | |
| | 200,000 | | | Indosat Palapa Co. BV, 7.375%, 7/29/2020, 144A | | | 220,000 | |
| | 400,000 | | | Listrindo Capital BV, 6.950%, 2/21/2019, 144A | | | 412,848 | |
| | 300,000 | | | Marfrig Holding Europe BV, 8.375%, 5/09/2018, 144A | | | 273,000 | |
| | 100,000 | | | Myriad International Holding BV, 6.375%, 7/28/2017, 144A | | | 109,500 | |
| | 50,000 | | | OI European Group BV, 6.875%, 3/31/2017, 144A, (EUR) | | | 68,519 | |
| | | | | | | | |
| | | | | | | 1,380,322 | |
| | | | | | | | |
| | | | New Zealand — 0.1% | | | | |
| | 1,000,000 | | | New Zealand Government Bond, 6.000%, 5/15/2021, (NZD) | | | 935,504 | |
| | | | | | | | |
| | | | Norway — 0.3% | | | | |
| | 125,000 | | | Eksportfinans ASA, 2.000%, 9/15/2015 | | | 110,905 | |
| | 3,335,000 | | | Norwegian Government, 4.250%, 5/19/2017, (NOK) | | | 649,671 | |
| | 6,360,000 | | | Norwegian Government, 4.500%, 5/22/2019, (NOK) | | | 1,277,305 | |
| | | | | | | | |
| | | | | | | 2,037,881 | |
| | | | | | | | |
| | | | Oman — 0.0% | | | | |
| | 200,000 | | | MBPS Finance Co., 11.250%, 11/15/2015, 144A | | | 156,000 | |
| | | | | | | | |
| | | | Panama — 0.0% | | | | |
| | 300,000 | | | Banco Latinoamericano de Comercio Exterior, S.A.,
3.750%, 4/04/2017, 144A | | | 299,625 | |
| | | | | | | | |
| | | | Peru — 0.1% | | | | |
| | 500,000 | | | Banco Continental S.A. Via Continental Senior Trustees II Cayman Ltd., 5.750%, 1/18/2017, 144A | | | 525,000 | |
| | | | | | | | |
| | | | Philippines — 0.1% | | | | |
| | 30,000,000 | | | Philippine Government International Bond, 6.250%, 1/14/2036, (PHP) | | | 746,314 | |
| | | | | | | | |
| | | | Poland — 0.1% | | | | |
| | 95,000 | | | Poland Government International Bond, 3.000%, 9/23/2014, (CHF) | | | 108,923 | |
| | 800,000 | | | Poland Government International Bond, 5.000%, 3/23/2022 | | | 843,216 | |
| | | | | | | | |
| | | | | | | 952,139 | |
| | | | | | | | |
| | | | Russia — 0.0% | | | | |
| | 200,000 | | | Gazprom OAO Via Gaz Capital S.A., 4.950%, 5/23/2016, 144A | | | 207,254 | |
| | | | | | | | |
| | | | Singapore — 0.5% | | | | |
| | 3,355,000 | | | Singapore Government Bond, 1.625%, 4/01/2013, (SGD) | | | 2,707,124 | |
| | 345,000 | | | Singapore Government Bond, 2.250%, 7/01/2013, (SGD) | | | 281,620 | |
| | 605,000 | | | Singapore Government Bond, 2.250%, 6/01/2021, (SGD) | | | 506,017 | |
| | 150,000 | | | STATS ChipPAC Ltd., 7.500%, 8/12/2015, 144A | | | 160,875 | |
| | | | | | | | |
| | | | | | | 3,655,636 | |
| | | | | | | | |
| | | | South Africa — 0.2% | | | | |
| | 450,000 | | | Edcon Proprietary Ltd., 4.126%, 6/15/2014, (EUR)(d) | | | 528,145 | |
| | 130,000 | | | Edcon Proprietary Ltd., 4.126%, 6/15/2014, 144A, (EUR)(d) | | | 152,575 | |
| | 285,000 | | | Republic of South Africa, EMTN, 4.500%, 4/05/2016, (EUR) | | | 404,336 | |
| | 400,000 | | | Transnet Ltd., 4.500%, 2/10/2016, 144A | | | 414,048 | |
| | | | | | | | |
| | | | | | | 1,499,104 | |
| | | | | | | | |
See accompanying notes to financial statements.
| 26
Portfolio of Investments – as of March 31, 2012 (Unaudited)
Loomis Sayles Global Equity and Income Fund – (continued)
| | | | | | | | |
Principal
Amount (‡) | | | Description | | Value (†) | |
| | | | | | | | |
| | | | Supranationals — 0.2% | | | | |
| | 840,000 | | | Central American Bank for Economic Integration, 3.875%, 2/09/2017, 144A | | $ | 866,923 | |
| | 305,000 | | | European Investment Bank, 2.375%, 7/10/2020, (CHF) | | | 365,225 | |
| | 400,000,000 | | | International Bank for Reconstruction & Development, GMTN,
2.300%, 2/26/2013, (KRW) | | | 350,700 | |
| | | | | | | | |
| | | | | | | 1,582,848 | |
| | | | | | | | |
| | | | Sweden — 0.1% | | | | |
| | 3,020,000 | | | Sweden Government Bond, 5.500%, 10/08/2012, (SEK) | | | 465,848 | |
| | | | | | | | |
| | | | Turkey — 0.1% | | | | |
| | 300,000 | | | Akbank TAS, 5.125%, 7/22/2015, 144A | | | 299,550 | |
| | 200,000 | | | Export Credit Bank of Turkey, 5.375%, 11/04/2016, 144A | | | 202,000 | |
| | 400,000 | | | Yapi ve Kredi Bankasi Via Unicredit Luxembourg S.A.,
5.188%, 10/13/2015, 144A | | | 396,000 | |
| | | | | | | | |
| | | | | | | 897,550 | |
| | | | | | | | |
| | | | United Arab Emirates — 0.1% | | | | |
| | 500,000 | | | DP World Ltd., 6.850%, 7/02/2037, 144A | | | 482,500 | |
| | 300,000 | | | Dubai Electricity & Water Authority, 6.375%, 10/21/2016, 144A | | | 319,500 | |
| | 200,000 | | | Dubai Electricity & Water Authority, 8.500%, 4/22/2015, 144A | | | 222,500 | |
| | | | | | | | |
| | | | | | | 1,024,500 | |
| | | | | | | | |
| | | | United Kingdom — 0.5% | | | | |
| | 410,000,000 | | | Barclays Bank PLC, EMTN, 3.680%, 8/20/2015, (KRW) | | | 364,833 | |
| | 150,000 | | | BAT International Finance PLC, 6.000%, 6/29/2022, (GBP) | | | 282,877 | |
| | 150,000 | | | British Telecommunications PLC, 5.750%, 12/07/2028, (GBP) | | | 261,140 | |
| | 60,000 | | | BSKYB Finance UK PLC, 5.750%, 10/20/2017, (GBP) | | | 110,195 | |
| | 150,000 | | | Imperial Tobacco Finance PLC, EMTN, 6.250%, 12/04/2018, (GBP) | | | 279,352 | |
| | 100,000 | | | Rexam PLC, EMTN, 4.375%, 3/15/2013, (EUR) | | | 136,204 | |
| | 250,000 | | | Standard Chartered Bank, Series 17, EMTN, 5.875%, 9/26/2017, (EUR) | | | 357,627 | |
| | 430,000 | | | United Kingdom Treasury, 1.750%, 1/22/2017, (GBP) | | | 711,273 | |
| | 250,000 | | | United Kingdom Treasury, 4.250%, 3/07/2036, (GBP) | | | 463,655 | |
| | 300,000 | | | United Kingdom Treasury, 5.250%, 6/07/2012, (GBP) | | | 484,025 | |
| | 200,000 | | | Vedanta Resources PLC, 8.250%, 6/07/2021, 144A | | | 185,500 | |
| | | | | | | | |
| | | | | | | 3,636,681 | |
| | | | | | | | |
| | | | United States — 16.0% | | | | |
| | 310,000 | | | Alcatel-Lucent USA, Inc., 6.450%, 3/15/2029 | | | 244,900 | |
| | 15,000 | | | Alcatel-Lucent USA, Inc., 6.500%, 1/15/2028 | | | 11,738 | |
| | 975,000 | | | Alcoa, Inc., 5.900%, 2/01/2027 | | | 980,849 | |
| | 1,325,000 | | | Ally Financial, Inc., 5.500%, 2/15/2017 | | | 1,326,575 | |
| | 60,000 | | | Ally Financial, Inc., 6.875%, 8/28/2012 | | | 61,050 | |
| | 55,000 | | | Ally Financial, Inc., 7.500%, 12/31/2013 | | | 58,438 | |
| | 129,000 | | | Ally Financial, Inc., 8.000%, 12/31/2018 | | | 137,062 | |
| | 1,946,000 | | | Ally Financial, Inc., 8.000%, 11/01/2031 | | | 2,145,465 | |
| | 257,000 | | | Ally Financial, Inc., 6.750%, 12/01/2014 | | | 269,207 | |
| | 720,000 | | | American International Group, Inc., (fixed rate to 5/15/2038, variable rate thereafter), 8.175%, 5/15/2068 | | | 762,120 | |
| | 60,000 | | | Arrow Electronics, Inc., 6.875%, 7/01/2013 | | | 64,045 | |
See accompanying notes to financial statements.
27 |
Portfolio of Investments – as of March 31, 2012 (Unaudited)
Loomis Sayles Global Equity and Income Fund – (continued)
| | | | | | | | |
Principal
Amount (‡) | | | Description | | Value (†) | |
| | | | | | | | |
| | | | United States — continued | | | | |
| $ | 21,325 | | | Atlas Air Pass Through Trust, Series 1998-1, Class B, 7.680%, 7/02/2015 | | $ | 20,259 | |
| | 905,000 | | | Aviation Capital Group Corp., 6.750%, 4/06/2021, 144A | | | 877,769 | |
| | 145,000 | | | Avnet, Inc., 6.000%, 9/01/2015 | | | 160,198 | |
| | 1,820,000 | | | Ball Corp., 5.000%, 3/15/2022 | | | 1,824,550 | |
| | 200,000 | | | Bank of America Corp., 5.490%, 3/15/2019 | | | 200,474 | |
| | 300,000 | | | Bank of America Corp., 6.500%, 9/15/2037 | | | 289,409 | |
| | 450,000 | | | Bank of America Corp., (fixed rate to 5/06/2014, variable rate thereafter),
4.750%, 5/06/2019, (EUR) | | | 523,044 | |
| | 115,000 | | | Bank of America Corp., MTN, 5.000%, 5/13/2021 | | | 115,177 | |
| | 15,000 | | | Boston Scientific Corp., 5.125%, 1/12/2017 | | | 16,518 | |
| | 5,000 | | | Boston Scientific Corp., 5.450%, 6/15/2014 | | | 5,406 | |
| | 15,000 | | | Boston Scientific Corp., 6.400%, 6/15/2016 | | | 17,270 | |
| | 60,000 | | | Boston Scientific Corp., 7.000%, 11/15/2035 | | | 71,877 | |
| | 1,520,000 | | | Cantor Fitzgerald LP, 6.375%, 6/26/2015, 144A | | | 1,538,278 | |
| | 1,995,000 | | | CenturyLink, Inc., 6.450%, 6/15/2021 | | | 2,047,885 | |
| | 55,000 | | | CenturyLink, Inc., Series G, 6.875%, 1/15/2028 | | | 51,395 | |
| | 605,000 | | | CenturyLink, Inc., Series P, 7.600%, 9/15/2039 | | | 572,279 | |
| | 75,000 | | | Chesapeake Energy Corp., 6.875%, 11/15/2020 | | | 77,437 | |
| | 2,300,000 | | | Chrysler Group LLC/CG Co-Issuer, Inc., 8.250%, 6/15/2021 | | | 2,323,000 | |
| | 300,000 | | | Comcast Corp., 5.650%, 6/15/2035 | | | 327,747 | |
| | 586,147 | | | Continental Airlines Pass Through Trust, Series 1999-1, Class B,
6.795%, 2/02/2020 | | | 574,425 | |
| | 190,000 | | | CSX Corp., 6.250%, 3/15/2018 | | | 228,307 | |
| | 265,000 | | | Cummins, Inc., 5.650%, 3/01/2098 | | | 252,004 | |
| | 258,167 | | | Delta Air Lines Pass Through Trust, Series 2007-1, Class B, 8.021%, 2/10/2024 | | | 262,995 | |
| | 250,321 | | | Delta Air Lines Pass Through Trust, Series 2007-1, Class C, 8.954%, 8/10/2014 | | | 249,996 | |
| | 42,000 | | | Dillard’s, Inc., 6.625%, 1/15/2018 | | | 42,945 | |
| | 50,000 | | | Dillard’s, Inc., 7.000%, 12/01/2028 | | | 46,750 | |
| | 8,000 | | | Dillard’s, Inc., 7.750%, 7/15/2026 | | | 7,880 | |
| | 250,000 | | | Exelon Corp., 4.900%, 6/15/2015 | | | 272,696 | |
| | 150,000 | | | Foot Locker, Inc., 8.500%, 1/15/2022 | | | 161,625 | |
| | 25,000 | | | Ford Motor Co., 6.375%, 2/01/2029 | | | 27,111 | |
| | 50,000 | | | Ford Motor Co., 6.625%, 2/15/2028 | | | 55,376 | |
| | 2,105,000 | | | Ford Motor Co., 6.625%, 10/01/2028 | | | 2,337,005 | |
| | 40,000 | | | Ford Motor Co., 7.125%, 11/15/2025 | | | 43,600 | |
| | 835,000 | | | Ford Motor Co., 7.450%, 7/16/2031 | | | 1,020,787 | |
| | 5,000 | | | Ford Motor Co., 7.500%, 8/01/2026 | | | 5,600 | |
| | 2,250,000 | | | Ford Motor Credit Co. LLC, 7.000%, 10/01/2013 | | | 2,399,119 | |
| | 845,000 | | | Ford Motor Credit Co. LLC, 7.000%, 4/15/2015 | | | 923,043 | |
| | 905,000 | | | Ford Motor Credit Co. LLC, 8.000%, 12/15/2016 | | | 1,049,261 | |
| | 905,000 | | | Forethought Financial Group, Inc., 8.625%, 4/15/2021, 144A | | | 893,679 | |
| | 28,000 | | | Freescale Semiconductor, Inc., 10.125%, 12/15/2016 | | | 29,890 | |
| | 45,000 | | | General Electric Capital Corp., 5.625%, 5/01/2018 | | | 52,159 | |
| | 205,000 | | | General Electric Capital Corp., MTN, 5.875%, 1/14/2038 | | | 225,343 | |
| | 900,000 | | | General Electric Capital Corp., Series A, GMTN, 7.625%, 12/10/2014, (NZD) | | | 794,237 | |
| | 750,000 | | | General Electric Capital Corp., Series A, MTN, 4.875%, 3/04/2015 | | | 824,086 | |
| | 3,435,000 | | | Georgia-Pacific LLC, 7.250%, 6/01/2028 | | | 4,043,029 | |
See accompanying notes to financial statements.
| 28
Portfolio of Investments – as of March 31, 2012 (Unaudited)
Loomis Sayles Global Equity and Income Fund – (continued)
| | | | | | | | |
Principal
Amount (‡) | | | Description | | Value (†) | |
| | | | | | | | |
| | | | United States — continued | | | | |
| $ | 105,000 | | | Georgia-Pacific LLC, 7.375%, 12/01/2025 | | $ | 128,074 | |
| | 180,000 | | | Georgia-Pacific LLC, 7.750%, 11/15/2029 | | | 224,294 | |
| | 405,000 | | | Georgia-Pacific LLC, 8.875%, 5/15/2031 | | | 546,362 | |
| | 200,000 | | | Gerdau Holdings, Inc., 7.000%, 1/20/2020, 144A | | | 230,440 | |
| | 2,035,000 | | | Goldman Sachs Group, Inc. (The), 6.750%, 10/01/2037 | | | 1,988,344 | |
| | 50,000 | | | Goldman Sachs Group, Inc. (The), 6.875%, 1/18/2038, (GBP) | | | 71,779 | |
| | 3,045,000 | | | Goodyear Tire & Rubber Co. (The), 7.000%, 5/15/2022 | | | 2,961,262 | |
| | 165,000 | | | Goodyear Tire & Rubber Co. (The), 7.000%, 3/15/2028 | | | 155,512 | |
| | 410,000 | | | Hanover Insurance Group, Inc. (The), 6.375%, 6/15/2021 | | | 432,315 | |
| | 20,000 | | | HCA, Inc., 5.750%, 3/15/2014 | | | 20,750 | |
| | 90,000 | | | HCA, Inc., 6.375%, 1/15/2015 | | | 94,950 | |
| | 225,000 | | | HCA, Inc., 7.050%, 12/01/2027 | | | 201,937 | |
| | 245,000 | | | HCA, Inc., 7.190%, 11/15/2015 | | | 259,700 | |
| | 90,000 | | | HCA, Inc., 7.500%, 12/15/2023 | | | 85,950 | |
| | 250,000 | | | HCA, Inc., 7.500%, 11/06/2033 | | | 234,375 | |
| | 1,500,000 | | | HCA, Inc., 7.690%, 6/15/2025 | | | 1,445,625 | |
| | 395,000 | | | HCA, Inc., 8.360%, 4/15/2024 | | | 402,900 | |
| | 195,000 | | | HCA, Inc., MTN, 7.580%, 9/15/2025 | | | 184,275 | |
| | 75,000 | | | HCA, Inc., MTN, 7.750%, 7/15/2036 | | | 69,375 | |
| | 585,000 | | | Hercules, Inc., 6.500%, 6/30/2029 | | | 465,075 | |
| | 470,000 | | | Highwoods Properties, Inc., 5.850%, 3/15/2017 | | | 499,518 | |
| | 110,000 | | | Incitec Pivot Finance LLC, 6.000%, 12/10/2019, 144A | | | 116,952 | |
| | 1,700,000 | | | International Lease Finance Corp., 6.250%, 5/15/2019 | | | 1,678,034 | |
| | 1,670,000 | | | International Lease Finance Corp., Series R, MTN, 5.625%, 9/20/2013 | | | 1,690,875 | |
| | 95,000 | | | iStar Financial, Inc., 5.500%, 6/15/2012 | | | 94,525 | |
| | 70,000 | | | iStar Financial, Inc., 5.850%, 3/15/2017 | | | 61,425 | |
| | 405,000 | | | iStar Financial, Inc., 5.875%, 3/15/2016 | | | 362,981 | |
| | 145,000 | | | iStar Financial, Inc., 6.050%, 4/15/2015 | | | 132,675 | |
| | 1,235,000 | | | iStar Financial, Inc., 8.625%, 6/01/2013 | | | 1,225,737 | |
| | 35,000 | | | iStar Financial, Inc., Series B, 5.700%, 3/01/2014 | | | 31,850 | |
| | 950,000 | | | iStar Financial, Inc., Series B, 5.950%, 10/15/2013 | | | 904,875 | |
| | 5,000 | | | J.C. Penney Corp., Inc., 5.750%, 2/15/2018 | | | 5,119 | |
| | 64,000 | | | J.C. Penney Corp., Inc., 6.375%, 10/15/2036 | | | 56,240 | |
| | 15,000 | | | J.C. Penney Corp., Inc., 7.125%, 11/15/2023 | | | 15,694 | |
| | 5,000 | | | J.C. Penney Corp., Inc., 7.625%, 3/01/2097 | | | 4,500 | |
| | 370,000 | | | Jefferies Group, Inc., 3.875%, 11/09/2015 | | | 365,375 | |
| | 665,000 | | | Jefferies Group, Inc., 5.125%, 4/13/2018 | | | 645,050 | |
| | 780,000 | | | Jefferies Group, Inc., 6.250%, 1/15/2036 | | | 703,950 | |
| | 625,000 | | | Jefferies Group, Inc., 6.450%, 6/08/2027 | | | 615,625 | |
| | 65,000 | | | Jefferies Group, Inc., 6.875%, 4/15/2021 | | | 66,138 | |
| | 405,000 | | | Jefferies Group, Inc., 8.500%, 7/15/2019 | | | 449,550 | |
| | 15,000 | | | K. Hovnanian Enterprises, Inc., 5.000%, 11/01/2021, 144A | | | 10,125 | |
| | 260,000 | | | K. Hovnanian Enterprises, Inc., 6.250%, 1/15/2016 | | | 151,450 | |
| | 1,665,000 | | | KB Home, 8.000%, 3/15/2020 | | | 1,648,350 | |
| | 375,000 | | | Kindred Healthcare, Inc., 8.250%, 6/01/2019 | | | 326,719 | |
| | 15,000 | | | Lennar Corp., Series B, 5.500%, 9/01/2014 | | | 15,600 | |
| | 1,090,000 | | | Lennar Corp., Series B, 5.600%, 5/31/2015 | | | 1,139,050 | |
| | 55,000 | | | Lennar Corp., Series B, 6.500%, 4/15/2016 | | | 57,819 | |
See accompanying notes to financial statements.
29 |
Portfolio of Investments – as of March 31, 2012 (Unaudited)
Loomis Sayles Global Equity and Income Fund – (continued)
| | | | | | | | |
Principal
Amount (‡) | | | Description | | Value (†) | |
| | | | | | | | |
| | | | United States — continued | | | | |
| $ | 1,435,000 | | | Level 3 Financing, Inc., 8.625%, 7/15/2020, 144A | | $ | 1,506,750 | |
| | 235,000 | | | Level 3 Financing, Inc., 8.750%, 2/15/2017 | | | 245,575 | |
| | 30,000 | | | Level 3 Financing, Inc., 9.375%, 4/01/2019 | | | 32,775 | |
| | 160,000 | | | Masco Corp., 6.500%, 8/15/2032 | | | 150,660 | |
| | 865,000 | | | Masco Corp., 7.750%, 8/01/2029 | | | 892,188 | |
| | 600,000 | | | Merrill Lynch & Co., Inc., 6.050%, 5/16/2016 | | | 631,750 | |
| | 2,700,000 | | | Merrill Lynch & Co., Inc., 6.110%, 1/29/2037 | | | 2,569,855 | |
| | 310,000 | | | MGM Resorts International, 8.625%, 2/01/2019, 144A | | | 332,475 | |
| | 310,000 | | | Momentive Specialty Chemicals, Inc., 7.875%, 2/15/2023(e) | | | 251,100 | |
| | 410,000 | | | Momentive Specialty Chemicals, Inc., 8.375%, 4/15/2016(e) | | | 364,900 | |
| | 230,000 | | | Morgan Stanley, 5.375%, 11/14/2013, (GBP) | | | 377,344 | |
| | 2,500,000 | | | Morgan Stanley, 5.750%, 1/25/2021 | | | 2,454,455 | |
| | 500,000 | | | Morgan Stanley, GMTN, 7.625%, 3/03/2016, (AUD) | | | 525,727 | |
| | 400,000 | | | Morgan Stanley, MTN, 6.250%, 8/09/2026 | | | 397,417 | |
| | 1,382,000 | | | New Albertson’s, Inc., 7.450%, 8/01/2029 | | | 1,057,230 | |
| | 100,000 | | | New Albertson’s, Inc., 7.750%, 6/15/2026 | | | 81,000 | |
| | 3,450,000 | | | New Albertson’s, Inc., 8.000%, 5/01/2031 | | | 2,613,375 | |
| | 1,965,000 | | | New Albertson’s, Inc., 8.700%, 5/01/2030 | | | 1,611,300 | |
| | 155,000 | | | New Albertson’s, Inc., Series C, MTN, 6.625%, 6/01/2028 | | | 109,275 | |
| | 15,000 | | | News America, Inc., 6.400%, 12/15/2035 | | | 17,006 | |
| | 935,000 | | | Nextel Communications, Inc., Series D, 7.375%, 8/01/2015 | | | 902,275 | |
| | 30,000 | | | Nextel Communications, Inc., Series E, 6.875%, 10/31/2013 | | | 30,000 | |
| | 250,000 | | | NGC Corp. Capital Trust I, Series B, 8.316%, 6/01/2027(e)(f) | | | 65,000 | |
| | 35,000 | | | Nortel Networks Capital Corp., 7.875%, 6/15/2026(f) | | | 38,063 | |
| | 50,000 | | | Ohio Edison Co., 6.875%, 7/15/2036 | | | 61,525 | |
| | 565,000 | | | Owens Corning, Inc., 6.500%, 12/01/2016 | | | 627,698 | |
| | 535,000 | | | Owens Corning, Inc., 7.000%, 12/01/2036 | | | 570,125 | |
| | 40,000 | | | Owens-Illinois, Inc., 7.800%, 5/15/2018 | | | 44,900 | |
| | 47,000 | | | Pulte Group, Inc., 5.200%, 2/15/2015 | | | 47,940 | |
| | 540,000 | | | Pulte Group, Inc., 6.000%, 2/15/2035 | | | 421,200 | |
| | 695,000 | | | Pulte Group, Inc., 6.375%, 5/15/2033 | | | 559,475 | |
| | 1,335,000 | | | Qwest Capital Funding, Inc., 6.500%, 11/15/2018 | | | 1,425,112 | |
| | 650,000 | | | Qwest Capital Funding, Inc., 6.875%, 7/15/2028 | | | 621,279 | |
| | 400,000 | | | Qwest Capital Funding, Inc., 7.625%, 8/03/2021 | | | 410,385 | |
| | 60,000 | | | Qwest Capital Funding, Inc., 7.750%, 2/15/2031 | | | 58,204 | |
| | 560,000 | | | Qwest Corp., 6.875%, 9/15/2033 | | | 554,400 | |
| | 115,000 | | | Qwest Corp., 7.250%, 9/15/2025 | | | 123,050 | |
| | 755,000 | | | R.R. Donnelley & Sons Co., 8.250%, 3/15/2019 | | | 751,225 | |
| | 500,000 | | | Range Resources Corp., 5.000%, 8/15/2022 | | | 493,750 | |
| | 750,000 | | | Reliance Holdings USA, Inc., 5.400%, 2/14/2022, 144A | | | 746,098 | |
| | 600,000 | | | Residential Capital LLC, 9.625%, 5/15/2015 | | | 510,000 | |
| | 80,000 | | | Reynolds American, Inc., 6.750%, 6/15/2017 | | | 95,301 | |
| | 20,000 | | | Reynolds American, Inc., 7.250%, 6/15/2037 | | | 23,332 | |
| | 400,000 | | | Reynolds Group Issuer, Inc./Reynolds Group Issuer LLC/Reynolds Group Issuer (Luxembourg) S.A., 9.875%, 8/15/2019, 144A | | | 409,000 | |
| | 1,600(†††††) | | | SLM Corp., 6.000%, 12/15/2043 | | | 35,004 | |
| | 120,000 | | | SLM Corp., MTN, 5.050%, 11/14/2014 | | | 122,973 | |
See accompanying notes to financial statements.
| 30
Portfolio of Investments – as of March 31, 2012 (Unaudited)
Loomis Sayles Global Equity and Income Fund – (continued)
| | | | | | | | |
Principal
Amount (‡) | | | Description | | Value (†) | |
| | | | | | | | |
| | | | United States — continued | | | | |
| $ | 35,000 | | | SLM Corp., MTN, 5.125%, 8/27/2012 | | $ | 35,262 | |
| | 10,000 | | | SLM Corp., Series A, MTN, 0.860%, 1/27/2014(d) | | | 9,551 | |
| | 228,000 | | | SLM Corp., Series A, MTN, 5.000%, 10/01/2013 | | | 233,130 | |
| | 10,000 | | | SLM Corp., Series A, MTN, 5.000%, 6/15/2018 | | | 9,598 | |
| | 115,000 | | | SLM Corp., Series A, MTN, 5.375%, 1/15/2013 | | | 117,303 | |
| | 65,000 | | | SLM Corp., Series A, MTN, 5.375%, 5/15/2014 | | | 67,119 | |
| | 265,000 | | | SLM Corp., Series A, MTN, 5.625%, 8/01/2033 | | | 226,244 | |
| | 625,000 | | | SLM Corp., Series A, MTN, 8.450%, 6/15/2018 | | | 696,875 | |
| | 400,000 | | | Springleaf Finance Corp., MTN, 5.750%, 9/15/2016 | | | 315,000 | |
| | 100,000 | | | Springleaf Finance Corp., Series H, MTN, 5.375%, 10/01/2012 | | | 96,000 | |
| | 300,000 | | | Springleaf Finance Corp., Series I, MTN, 5.400%, 12/01/2015 | | | 248,250 | |
| | 330,000 | | | Springleaf Finance Corp., Series I, MTN, 5.850%, 6/01/2013 | | | 304,425 | |
| | 200,000 | | | Springleaf Finance Corp., Series J, MTN, 5.900%, 9/15/2012 | | | 192,500 | |
| | 595,000 | | | Springleaf Finance Corp., Series J, MTN, 6.900%, 12/15/2017 | | | 464,100 | |
| | 294,000 | | | Sprint Capital Corp., 6.875%, 11/15/2028 | | | 224,910 | |
| | 420,000 | | | Sprint Capital Corp., 6.900%, 5/01/2019 | | | 363,300 | |
| | 110,000 | | | Sprint Capital Corp., 8.750%, 3/15/2032 | | | 94,325 | |
| | 26,000 | | | Sprint Nextel Corp., 6.000%, 12/01/2016 | | | 23,205 | |
| | 265,000 | | | Tenet Healthcare Corp., 6.875%, 11/15/2031 | | | 226,575 | |
| | 250,000 | | | Textron, Inc., 3.875%, 3/11/2013, (EUR) | | | 338,893 | |
| | 820,000 | | | Textron, Inc., 5.950%, 9/21/2021 | | | 896,384 | |
| | 1,431,000 | | | Toys R Us, Inc., 7.375%, 10/15/2018 | | | 1,284,322 | |
| | 3,150,000 | | | TXU Corp., Series P, 5.550%, 11/15/2014 | | | 2,307,375 | |
| | 2,570,000 | | | TXU Corp., Series Q, 6.500%, 11/15/2024 | | | 1,349,250 | |
| | 30,000 | | | TXU Corp., Series R, 6.550%, 11/15/2034 | | | 15,000 | |
| | 7,795,000 | | | U.S. Treasury Note, 0.250%, 2/15/2015 | | | 7,738,970 | |
| | 9,200,000 | | | U.S. Treasury Note, 0.375%, 6/30/2013 | | | 9,212,218 | |
| | 1,100,000 | | | U.S. Treasury Note, 0.750%, 3/31/2013 | | | 1,105,672 | |
| | 376,250 | | | UAL Pass Through Trust, Series 2009-1, 10.400%, 5/01/2018 | | | 428,925 | |
| | 770,000 | | | United States Steel Corp., 6.650%, 6/01/2037 | | | 646,800 | |
| | 770,000 | | | United States Steel Corp., 7.500%, 3/15/2022 | | | 770,000 | |
| | 295,000 | | | UR Financing Escrow Corp., 7.625%, 4/15/2022, 144A | | | 303,112 | |
| | 50,000 | | | USG Corp., 6.300%, 11/15/2016 | | | 46,750 | |
| | 230,000 | | | USG Corp., 9.750%, 1/15/2018 | | | 228,275 | |
| | 5,000 | | | Verizon Maryland, Inc., Series B, 5.125%, 6/15/2033 | | | 4,956 | |
| | 110,000 | | | Verizon Pennsylvania, Inc., 6.000%, 12/01/2028 | | | 113,593 | |
| | 85,000 | | | Wells Fargo & Co., 4.625%, 11/02/2035, (GBP) | | | 135,974 | |
| | 100,000 | | | Wells Fargo & Co., Series F, EMTN, 4.875%, 11/29/2035, (GBP) | | | 144,419 | |
| | 60,000 | | | Weyerhaeuser Co., 6.950%, 10/01/2027 | | | 62,983 | |
| | 315,000 | | | Weyerhaeuser Co., 7.375%, 3/15/2032 | | | 335,565 | |
| | 125,000 | | | Xerox Corp., 6.750%, 2/01/2017 | | | 144,675 | |
| | 20,000 | | | Xerox Corp., MTN, 7.200%, 4/01/2016 | | | 23,259 | |
| | 250,000 | | | Zurich Finance USA, Inc., EMTN, (fixed rate to 6/15/2015, variable rate thereafter),
4.500%, 6/15/2025, (EUR) | | | 335,969 | |
| | | | | | | | |
| | | | | | | 115,113,946 | |
| | | | | | | | |
See accompanying notes to financial statements.
31 |
Portfolio of Investments – as of March 31, 2012 (Unaudited)
Loomis Sayles Global Equity and Income Fund – (continued)
| | | | | | | | |
Principal
Amount (‡) | | | Description | | Value (†) | |
| | | | | | | | |
| | | | Uruguay — 0.1% | | | | |
| | 4,077,490 | | | Uruguay Government International Bond, 3.700%, 6/26/2037, (UYU) | | $ | 206,104 | |
| | 5,176,827 | | | Uruguay Government International Bond, 4.375%, 12/15/2028, (UYU) | | | 290,394 | |
| | | | | | | | |
| | | | | | | 496,498 | |
| | | | | | | | |
| | | | Venezuela — 0.1% | | | | |
| | 800,000 | | | Petroleos de Venezuela S.A., 5.375%, 4/12/2027 | | | 492,000 | |
| | | | | | | | |
| | | | Total Non-Convertible Bonds
(Identified Cost $164,562,502) | | | 172,469,035 | |
| | | | | | | | |
| | | | | | | | |
| | Convertible Bonds — 1.0% | |
| | | | United States — 1.0% | | | | |
| | 350,000 | | | ArvinMeritor, Inc., (Step to Zero Coupon on 2/15/2019), 4.000%, 2/15/2027(g) | | | 291,813 | |
| | 125,000 | | | Ford Motor Co., 4.250%, 11/15/2016 | | | 198,125 | |
| | 745,000 | | | Hologic, Inc., (accretes to principal after 12/15/2013), 2.000%, 12/15/2037(g) | | | 740,344 | |
| | 620,000 | | | Human Genome Sciences, Inc., 3.000%, 11/15/2018 | | | 611,475 | |
| | 1,125,000 | | | Intel Corp., 3.250%, 8/01/2039 | | | 1,582,031 | |
| | 365,000 | | | Kulicke & Soffa Industries, Inc., 0.875%, 6/01/2012 | | | 370,475 | |
| | 215,000 | | | Level 3 Communications, Inc., 7.000%, 3/15/2015, 144A(e) | | | 280,575 | |
| | 1,885,000 | | | Old Republic International Corp., 3.750%, 3/15/2018 | | | 1,859,081 | |
| | 375,000 | | | Omnicare, Inc., 3.750%, 12/15/2025 | | | 544,688 | |
| | 610,000 | | | Owens-Brockway Glass Container, Inc., 3.000%, 6/01/2015, 144A | | | 597,037 | |
| | 90,000 | | | Trinity Industries, Inc., 3.875%, 6/01/2036 | | | 98,100 | |
| | | | | | | | |
| | | | Total Convertible Bonds
(Identified Cost $6,334,087) | | | 7,173,744 | |
| | | | | | | | |
| | | | | | | | |
| | Municipals — 0.1% | |
| | | | United States — 0.1% | | | | |
| | 415,000 | | | State of Illinois, 5.100%, 6/01/2033 | | | 391,204 | |
| | 135,000 | | | Virginia Tobacco Settlement Financing Corp., Series A-1, 6.706%, 6/01/2046(e) | | | 86,096 | |
| | | | | | | | |
| | | | Total Municipals
(Identified Cost $449,466) | | | 477,300 | |
| | | | | | | | |
| | | | Total Bonds and Notes
(Identified Cost $171,346,055) | | | 180,120,079 | |
| | | | | | | | |
| | | | | | | | |
| | Senior Loans — 0.2% | |
| | | | United States — 0.2% | | | | |
| | 1,270,000 | | | Flying Fortress, Inc., 1st Lien Term Loan, 5.000%, 6/30/2017(d) | | | 1,274,763 | |
| | 51,604 | | | SuperMedia, Inc., Exit Term Loan, 11.000%, 12/31/2015(d) | | | 27,814 | |
| | | | | | | | |
| | | | Total Senior Loans
(Identified Cost $1,308,585) | | | 1,302,577 | |
| | | | | | | | |
See accompanying notes to financial statements.
| 32
Portfolio of Investments – as of March 31, 2012 (Unaudited)
Loomis Sayles Global Equity and Income Fund – (continued)
| | | | | | | | |
Shares | | | Description | | Value (†) | |
| | | | | | | | |
| | Preferred Stocks — 0.6% | |
| | Convertible Preferred Stocks — 0.5% | |
| | | | United States — 0.5% | | | | |
| | 71,820 | | | General Motors Co., Series B, 4.750% | | $ | 3,005,667 | |
| | 820 | | | Lucent Technologies Capital Trust I, 7.750% | | | 666,250 | |
| | | | | | | | |
| | | | Total Convertible Preferred Stocks
(Identified Cost $3,969,958) | | | 3,671,917 | |
| | | | | | | | |
| | | | | | | | |
| | Non-Convertible Preferred Stock — 0.1% | |
| | | | United States — 0.1% | | | | |
| | 682 | | | Ally Financial, Inc., Series G, 7.000%, 144A
(Identified Cost $145,366) | | | 568,170 | |
| | | | | | | | |
| | | | Total Preferred Stocks
(Identified Cost $4,115,324) | | | 4,240,087 | |
| | | | | | | | |
| | | | | | | | |
Principal
Amount (‡) | | | | | | |
| | Short-Term Investments — 8.5% | |
| $ | 2 | | | Repurchase Agreement with State Street Bank and Trust Company, dated 3/30/2012 at 0.000% to be repurchased at $2 on 4/02/2012 collateralized by $100 U.S. Treasury Note, 1.500% due 7/31/2016 valued at $103 including accrued interest (Note 2 of Notes to Financial Statements) | | | 2 | |
| | 61,129,123 | | | Tri-Party Repurchase Agreement with Fixed Income Clearing Corporation, dated 3/30/2012 at 0.000% to be repurchased at $61,129,123 on 4/02/2012 collateralized by $4,330,000 Federal Home Loan Bank, 2.750% due 6/08/2018 valued at $4,660,163; $54,565,000 U.S. Treasury Note, 2.375% due 2/28/2015 valued at $57,696,376 including accrued interest (Note 2 of Notes to Financial Statements) | | | 61,129,123 | |
| | | | | | | | |
| | | | Total Short-Term Investments
(Identified Cost $61,129,125) | | | 61,129,125 | |
| | | | | | | | |
| | | | | | | | |
| | | | Total Investments — 100.6%
(Identified Cost $654,536,352)(a) | | | 722,744,835 | |
| | | | Other assets less liabilities — (0.6)% | | | (4,212,322 | ) |
| | | | | | | | |
| | | | Net Assets — 100.0% | | $ | 718,532,513 | |
| | | | | | | | |
| | (‡) | | | Principal Amount stated in U.S. dollars unless otherwise noted. | |
| | (†) | | | See Note 2 of Notes to Financial Statements. | |
| | (††) | | | Security held in units. One unit represents a principal amount of 1,000. Amount shown represents principal amount including inflation adjustments. | |
| | (†††) | | | Amount shown represents units. One unit represents a principal amount of 1,000. | |
| | (††††) | | | Amount shown represents units. One unit represents a principal amount of 100. | |
| | (†††††) | | | Amount shown represents units. One unit represents a principal amount of 25. | |
See accompanying notes to financial statements.
33 |
Portfolio of Investments – as of March 31, 2012 (Unaudited)
Loomis Sayles Global Equity and Income Fund – (continued)
| | | | | | | | |
| | | | | | | | |
| | (a) | | | Federal Tax Information (Amounts exclude certain adjustments made at the end of the Fund’s fiscal year for tax purposes. Such adjustments are primarily due to wash sales. Amortization of premium on debt securities is excluded for tax purposes.): | |
| | | | At March 31, 2012, the net unrealized appreciation on investments based on a cost of $654,807,082 for federal income tax purposes was as follows: | |
| | | | Aggregate gross unrealized appreciation for all investments in which there is an excess of value over tax cost | | $ | 77,830,798 | |
| | | | Aggregate gross unrealized depreciation for all investments in which there is an excess of tax cost over value | | | (9,893,045 | ) |
| | | | | | | | |
| | | | Net unrealized appreciation | | $ | 67,937,753 | |
| | | | | | | | |
| | | | | | | | |
| | (b) | | | Non-income producing security. | |
| | (c) | | | All or a portion of this security has been designated to cover the Fund’s obligations under open forward foreign currency contracts. | |
| | (d) | | | Variable rate security. Rate as of March 31, 2012 is disclosed. | |
| | (e) | | | Illiquid security. At March 31, 2012, the value of these securities amounted to $1,047,671 or 0.1% of net assets. | |
| | (f) | | | The issuer is in default with respect to interest and/or principal payments. Income is not being accrued. | |
| | (g) | | | Coupon rate is a fixed rate for an initial period then resets at a specified date and rate. | |
| | | | | | | | |
| | 144A | | | All or a portion of these securities are exempt from registration under Rule 144A of the Securities Act of 1933. These securities may be resold in transactions exempt from registration, normally to qualified institutional buyers. At March 31, 2012, the value of Rule 144A holdings amounted to $35,833,479 or 5.0% of net assets. | |
| | ADR/GDR | | | An American Depositary Receipt or Global Depositary Receipt is a certificate issued by a custodian bank representing the right to receive securities of the foreign issuer described. The values of ADRs and GDRs may be significantly influenced by trading on exchanges not located in the United States. | |
| | EMTN | | | Euro Medium Term Note | |
| | GMTN | | | Global Medium Term Note | |
| | MTN | | | Medium Term Note | |
| | | | | | | | |
| | AUD | | | Australian Dollar | |
| | BRL | | | Brazilian Real | |
| | CAD | | | Canadian Dollar | |
| | CHF | | | Swiss Franc | |
| | CLP | | | Chilean Peso | |
| | CNY | | | Chinese Renminbi | |
| | COP | | | Colombian Peso | |
| | EUR | | | Euro | |
| | GBP | | | British Pound | |
| | IDR | | | Indonesian Rupiah | |
| | KRW | | | South Korean Won | |
| | MXN | | | Mexican Peso | |
| | MYR | | | Malaysian Ringgit | |
| | NOK | | | Norwegian Krone | |
| | NZD | | | New Zealand Dollar | | | | |
| | PHP | | | Philippine Peso | | | | |
See accompanying notes to financial statements.
| 34
Portfolio of Investments – as of March 31, 2012 (Unaudited)
Loomis Sayles Global Equity and Income Fund – (continued)
| | | | | | |
| | | | | | |
| | SEK | | | Swedish Krona |
| | SGD | | | Singapore Dollar |
| | UYU | | | Uruguayan Peso |
At March 31, 2012, the Fund had the following open forward foreign currency contracts:
| | | | | | | | | | | | | | | | | | |
Contract to Buy/Sell | | Delivery Date | | | Currency | | Units | | | Notional Value | | | Unrealized Appreciation (Depreciation) | |
| Sell1 | | | 6/20/2012 | | | Australian Dollar | | | 700,000 | | | $ | 718,877 | | | $ | 17,089 | |
| Sell1 | | | 6/04/2012 | | | Brazilian Real | | | 250,000 | | | | 135,190 | | | | 8,736 | |
| Buy2 | | | 8/22/2012 | | | Chinese Renminbi | | | 11,630,000 | | | | 1,843,912 | | | | (3,586 | ) |
| Sell2 | | | 8/22/2012 | | | Chinese Renminbi | | | 7,000,000 | | | | 1,109,835 | | | | 5,449 | |
| Buy4 | | | 6/21/2012 | | | Malaysian Ringgit | | | 1,250,000 | | | | 405,931 | | | | (441 | ) |
| Buy3 | | | 6/11/2012 | | | South Korean Won | | | 780,000,000 | | | | 684,950 | | | | (3,640 | ) |
| Buy1 | | | 6/11/2012 | | | South Korean Won | | | 1,488,000,000 | | | | 1,306,674 | | | | (6,421 | ) |
| | | | | | | | | | | | | | | | | | |
| Total | | | | | | | | | | | | | | | | $ | 17,186 | |
| | | | | | | | | | | | | | | | | | |
At March 31, 2012, the Fund had the following open forward cross currency contracts:
| | | | | | | | | | | | | | |
| Settlement Date | | Deliver/Units of Currency | | | Receive5/Units of Currency | | Unrealized
Appreciation
(Depreciation) | |
| 6/12/2012 | | Norwegian Krone | | | 5,600,000 | | | Euro | | 751,476 | | $ | 21,881 | |
| | | | | | | | | | | | | | |
1 Counterparty is Credit Suisse.
2 Counterparty is Morgan Stanley.
3 Counterparty is Barclays.
4 Counterparty is JPMorgan Chase.
5 Counterparty is Deutsche Bank AG.
See accompanying notes to financial statements.
35 |
Portfolio of Investments – as of March 31, 2012 (Unaudited)
Loomis Sayles Global Equity and Income Fund – (continued)
Industry Summary at March 31, 2012 (Unaudited)
| | | | |
Beverages | | | 5.6 | % |
Treasuries | | | 5.6 | |
Commercial Banks | | | 4.8 | |
Pharmaceuticals | | | 4.5 | |
Energy Equipment & Services | | | 4.4 | |
Internet Software & Services | | | 4.4 | |
Machinery | | | 4.1 | |
Software | | | 3.3 | |
Computers & Peripherals | | | 3.0 | |
Chemicals | | | 2.5 | |
Automotive | | | 2.4 | |
Banking | | | 2.3 | |
Wireless Telecommunication Services | | | 2.1 | |
Internet & Catalog Retail | | | 2.1 | |
Aerospace & Defense | | | 2.1 | |
Diversified Telecommunication Services | | | 2.1 | |
Other Investments, less than 2% each | | | 36.8 | |
Short-Term Investments | | | 8.5 | |
| | | | |
Total Investments | | | 100.6 | |
Other assets less liabilities (including open forward foreign currency contracts) | | | (0.6 | ) |
| | | | |
Net Assets | | | 100.0 | % |
| | | | |
Currency Exposure at March 31, 2012 (Unaudited)
| | | | |
United States Dollar | | | 70.8 | % |
British Pound | | | 8.3 | |
Euro | | | 5.3 | |
Brazilian Real | | | 3.6 | |
Swedish krona | | | 2.1 | |
Other, less than 2% each | | | 10.5 | |
| | | | |
Total Investments | | | 100.6 | |
Other assets less liabilities (including open forward foreign currency contracts) | | | (0.6 | ) |
| | | | |
Net Assets | | | 100.0 | % |
| | | | |
See accompanying notes to financial statements.
| 36
Portfolio of Investments – as of March 31, 2012 (Unaudited)
Loomis Sayles Growth Fund
| | | | | | | | |
Shares | | | Description | | Value (†) | |
| | | | | | | | |
| | Common Stocks — 98.8% of Net Assets | | | | |
| | | | Air Freight & Logistics — 6.8% | | | | |
| | 83,287 | | | Expeditors International of Washington, Inc. | | $ | 3,873,678 | |
| | 66,384 | | | United Parcel Service, Inc., Class B | | | 5,358,517 | |
| | | | | | | | |
| | | | | | | 9,232,195 | |
| | | | | | | | |
| | | | Beverages — 4.1% | | | | |
| | 46,020 | | | Coca-Cola Co. (The) | | | 3,405,940 | |
| | 22,599 | | | Diageo PLC, Sponsored ADR | | | 2,180,804 | |
| | | | | | | | |
| | | | | | | 5,586,744 | |
| | | | | | | | |
| | | | Biotechnology — 4.3% | | | | |
| | 85,183 | | | Amgen, Inc. | | | 5,791,592 | |
| | | | | | | | |
| | | | Capital Markets — 9.3% | | | | |
| | 16,476 | | | Franklin Resources, Inc. | | | 2,043,518 | |
| | 55,767 | | | Greenhill & Co., Inc. | | | 2,433,672 | |
| | 80,711 | | | Legg Mason, Inc. | | | 2,254,258 | |
| | 284,447 | | | SEI Investments Co. | | | 5,885,209 | |
| | | | | | | | |
| | | | | | | 12,616,657 | |
| | | | | | | | |
| | | | Communications Equipment — 11.5% | | | | |
| | 384,538 | | | Cisco Systems, Inc. | | | 8,132,979 | |
| | 108,460 | | | QUALCOMM, Inc. | | | 7,377,449 | |
| | | | | | | | |
| | | | | | | 15,510,428 | |
| | | | | | | | |
| | | | Consumer Finance — 3.9% | | | | |
| | 92,028 | | | American Express Co. | | | 5,324,740 | |
| | | | | | | | |
| | | | Energy Equipment & Services — 3.1% | | | | |
| | 58,867 | | | Schlumberger Ltd. | | | 4,116,569 | |
| | | | | | | | |
| | | | Food Products — 4.3% | | | | |
| | 419,209 | | | Danone S.A., Sponsored ADR | | | 5,818,621 | |
| | | | | | | | |
| | | | Health Care Equipment & Supplies — 5.5% | | | | |
| | 49,057 | | | Medtronic, Inc. | | | 1,922,544 | |
| | 85,678 | | | Zimmer Holdings, Inc. | | | 5,507,382 | |
| | | | | | | | |
| | | | | | | 7,429,926 | |
| | | | | | | | |
| | | | Household Products — 3.9% | | | | |
| | 26,843 | | | Clorox Co. (The) | | | 1,845,456 | |
| | 51,352 | | | Procter & Gamble Co. (The) | | | 3,451,368 | |
| | | | | | | | |
| | | | | | | 5,296,824 | |
| | | | | | | | |
| | | | Internet & Catalog Retail — 6.3% | | | | |
| | 35,239 | | | Amazon.com, Inc.(b) | | | 7,136,250 | |
| | 41,560 | | | Blue Nile, Inc.(b) | | | 1,370,649 | |
| | | | | | | | |
| | | | | | | 8,506,899 | |
| | | | | | | | |
| | | | Internet Software & Services — 5.8% | | | | |
| | 12,298 | | | Google, Inc., Class A(b) | | | 7,885,969 | |
| | | | | | | | |
See accompanying notes to financial statements.
37 |
Portfolio of Investments – as of March 31, 2012 (Unaudited)
Loomis Sayles Growth Fund – (continued)
| | | | | | | | |
Shares | | | Description | | Value (†) | |
| | | | | | | | |
| | | | IT Services — 7.3% | | | | |
| | 36,533 | | | Automatic Data Processing, Inc. | | $ | 2,016,256 | |
| | 66,407 | | | Visa, Inc., Class A | | | 7,836,026 | |
| | | | | | | | |
| | | | | | | 9,852,282 | |
| | | | | | | | |
| | | | Media — 2.1% | | | | |
| | 54,939 | | | Omnicom Group, Inc. | | | 2,782,660 | |
| | | | | | | | |
| | | | Multiline Retail — 0.3% | | | | |
| | 6,891 | | | Target Corp. | | | 401,539 | |
| | | | | | | | |
| | | | Pharmaceuticals — 5.1% | | | | |
| | 70,252 | | | Merck & Co., Inc. | | | 2,697,677 | |
| | 75,182 | | | Novartis AG, ADR | | | 4,165,834 | |
| | | | | | | | |
| | | | | | | 6,863,511 | |
| | | | | | | | |
| | | | Semiconductors & Semiconductor Equipment — 1.0% | | | | |
| | 14,639 | | | Altera Corp. | | | 582,925 | |
| | 17,520 | | | Analog Devices, Inc. | | | 707,808 | |
| | | | | | | | |
| | | | | | | 1,290,733 | |
| | | | | | | | |
| | | | Software — 10.7% | | | | |
| | 43,426 | | | FactSet Research Systems, Inc. | | | 4,300,911 | |
| | 117,313 | | | Microsoft Corp. | | | 3,783,344 | |
| | 219,492 | | | Oracle Corp. | | | 6,400,387 | |
| | | | | | | | |
| | | | | | | 14,484,642 | |
| | | | | | | | |
| | | | Specialty Retail — 3.5% | | | | |
| | 48,457 | | | Home Depot, Inc. (The) | | | 2,437,872 | |
| | 74,313 | | | Lowe’s Cos., Inc. | | | 2,331,942 | |
| | | | | | | | |
| | | | | | | 4,769,814 | |
| | | | | | | | |
| | | | Total Common Stocks
(Identified Cost $108,041,272) | | | 133,562,345 | |
| | | | | | | | |
| | | | | | | | |
Principal
Amount | | | | | | |
| | Short-Term Investments — 1.1% | | | | |
| $ | 1,529,691 | | | Tri-Party Repurchase Agreement with Fixed Income Clearing Corporation, dated 3/30/2012 at 0.000% to be repurchased at $1,529,691 on 4/02/2012 collateralized by $1,550,000 Federal Home Loan Mortgage Corp., 0.750% due 11/25/2014 valued at $1,561,625 including accrued interest (Note 2 of Notes to Financial Statements)
(Identified Cost $1,529,691) | | | 1,529,691 | |
| | | | | | | | |
| | | | | | | | |
| | | | Total Investments — 99.9%
(Identified Cost $109,570,963)(a) | | | 135,092,036 | |
| | | | Other assets less liabilities — 0.1% | | | 180,800 | |
| | | | | | | | |
| | | | Net Assets — 100.0% | | $ | 135,272,836 | |
| | | | | | | | |
| | | | | | | | |
See accompanying notes to financial statements.
| 38
Portfolio of Investments – as of March 31, 2012 (Unaudited)
Loomis Sayles Growth Fund – (continued)
| | | | | | | | |
| | | | | | | | |
| | (†) | | | See Note 2 of Notes to Financial Statements. | | | | |
| | (a) | | | Federal Tax Information (Amounts exclude certain adjustments made at the end of the Fund’s fiscal year for tax purposes. Such adjustments are primarily due to wash sales.): | |
| | | | At March 31, 2012, the net unrealized appreciation on investments based on a cost of $109,570,963 for federal income tax purposes was as follows: | |
| | | | Aggregate gross unrealized appreciation for all investments in which there is an excess of value over tax cost | | $ | 26,448,665 | |
| | | | Aggregate gross unrealized depreciation for all investments in which there is an excess of tax cost over value | | | (927,592 | ) |
| | | | | | | | |
| | | | Net unrealized appreciation | | $ | 25,521,073 | |
| | | | | | | | |
| | | | | | | | |
| | (b) | | | Non-income producing security. | | | | |
| | | | | | | | |
| | ADR | | | An American Depositary Receipt is a certificate issued by a custodian bank representing the right to receive securities of the foreign issuer described. The values of ADRs may be significantly influenced by trading on exchanges not located in the United States. | |
Industry Summary at March 31, 2012 (Unaudited)
| | | | |
Communications Equipment | | | 11.5 | % |
Software | | | 10.7 | |
Capital Markets | | | 9.3 | |
IT Services | | | 7.3 | |
Air Freight & Logistics | | | 6.8 | |
Internet & Catalog Retail | | | 6.3 | |
Internet Software & Services | | | 5.8 | |
Health Care Equipment & Supplies | | | 5.5 | |
Pharmaceuticals | | | 5.1 | |
Food Products | | | 4.3 | |
Biotechnology | | | 4.3 | |
Beverages | | | 4.1 | |
Consumer Finance | | | 3.9 | |
Household Products | | | 3.9 | |
Specialty Retail | | | 3.5 | |
Energy Equipment & Services | | | 3.1 | |
Media | | | 2.1 | |
Other Investments, less than 2% each | | | 1.3 | |
Short-Term Investments | | | 1.1 | |
| | | | |
Total Investments | | | 99.9 | |
Other assets less liabilities | | | 0.1 | |
| | | | |
Net Assets | | | 100.0 | % |
| | | | |
See accompanying notes to financial statements.
39 |
Portfolio of Investments – as of March 31, 2012 (Unaudited)
Loomis Sayles Mid Cap Growth Fund
| | | | | | | | |
Shares | | | Description | | Value (†) | |
| | | | | | | | |
| | Common Stocks — 96.8% of Net Assets | | | | |
| | | | Aerospace & Defense — 2.1% | | | | |
| | 20,337 | | | TransDigm Group, Inc.(b) | | $ | 2,354,211 | |
| | | | | | | | |
| | | | Beverages — 2.3% | | | | |
| | 40,971 | | | Monster Beverage Corp.(b) | | | 2,543,889 | |
| | | | | | | | |
| | | | Biotechnology — 8.0% | | | | |
| | 72,732 | | | Achillion Pharmaceuticals, Inc.(b) | | | 696,773 | |
| | 37,290 | | | Alexion Pharmaceuticals, Inc.(b) | | | 3,462,749 | |
| | 82,415 | | | ARIAD Pharmaceuticals, Inc.(b) | | | 1,314,519 | |
| | 75,194 | | | Idenix Pharmaceuticals, Inc.(b) | | | 736,149 | |
| | 19,750 | | | Medivation, Inc.(b) | | | 1,475,720 | |
| | 29,592 | | | Vertex Pharmaceuticals, Inc.(b) | | | 1,213,568 | |
| | | | | | | | |
| | | | | | | 8,899,478 | |
| | | | | | | | |
| | | | Capital Markets — 3.6% | | | | |
| | 25,446 | | | Affiliated Managers Group, Inc.(b) | | | 2,845,117 | |
| | 18,508 | | | T. Rowe Price Group, Inc. | | | 1,208,573 | |
| | | | | | | | |
| | | | | | | 4,053,690 | |
| | | | | | | | |
| | | | Chemicals — 1.4% | | | | |
| | 30,384 | | | Eastman Chemical Co. | | | 1,570,549 | |
| | | | | | | | |
| | | | Communications Equipment — 2.3% | | | | |
| | 19,311 | | | F5 Networks, Inc.(b) | | | 2,606,213 | |
| | | | | | | | |
| | | | Electrical Equipment — 1.5% | | | | |
| | 21,258 | | | Rockwell Automation, Inc. | | | 1,694,263 | |
| | | | | | | | |
| | | | Electronic Equipment, Instruments & Components — 1.5% | | | | |
| | 93,463 | | | InvenSense, Inc.(b) | | | 1,691,680 | |
| | | | | | | | |
| | | | Energy Equipment & Services — 3.0% | | | | |
| | 12,942 | | | Lufkin Industries, Inc. | | | 1,043,772 | |
| | 42,640 | | | Oceaneering International, Inc. | | | 2,297,870 | |
| | | | | | | | |
| | | | | | | 3,341,642 | |
| | | | | | | | |
| | | | Food & Staples Retailing — 2.2% | | | | |
| | 29,878 | | | Whole Foods Market, Inc. | | | 2,485,850 | |
| | | | | | | | |
| | | | Health Care Equipment & Supplies — 2.4% | | | | |
| | 4,892 | | | Intuitive Surgical, Inc.(b) | | | 2,650,241 | |
| | | | | | | | |
| | | | Health Care Technology — 2.6% | | | | |
| | 21,878 | | | athenahealth, Inc.(b) | | | 1,621,597 | |
| | 16,406 | | | SXC Health Solutions Corp.(b) | | | 1,229,794 | |
| | | | | | | | |
| | | | | | | 2,851,391 | |
| | | | | | | | |
| | | | Hotels, Restaurants & Leisure — 4.1% | | | | |
| | 6,162 | | | Chipotle Mexican Grill, Inc.(b) | | | 2,575,716 | |
| | 12,102 | | | Panera Bread Co., Class A(b) | | | 1,947,454 | |
| | | | | | | | |
| | | | | | | 4,523,170 | |
| | | | | | | | |
See accompanying notes to financial statements.
| 40
Portfolio of Investments – as of March 31, 2012 (Unaudited)
Loomis Sayles Mid Cap Growth Fund – (continued)
| | | | | | | | |
Shares | | | Description | | Value (†) | |
| | | | | | | | |
| | | | Internet Software & Services — 6.5% | | | | |
| | 18,088 | | | LinkedIn Corp., Class A(b) | | $ | 1,844,795 | |
| | 17,113 | | | MercadoLibre, Inc. | | | 1,673,480 | |
| | 65,653 | | | Rackspace Hosting, Inc.(b) | | | 3,794,087 | |
| | | | | | | | |
| | | | | | | 7,312,362 | |
| | | | | | | | |
| | | | Life Sciences Tools & Services — 2.0% | | | | |
| | 12,330 | | | Mettler-Toledo International, Inc.(b) | | | 2,277,967 | |
| | | | | | | | |
| | | | Machinery — 4.8% | | | | |
| | 13,882 | | | Cummins, Inc. | | | 1,666,396 | |
| | 38,403 | | | Timken Co. (The) | | | 1,948,568 | |
| | 42,322 | | | Westport Innovations, Inc.(b) | | | 1,731,816 | |
| | | | | | | | |
| | | | | | | 5,346,780 | |
| | | | | | | | |
| | | | Multiline Retail — 2.3% | | | | |
| | 26,649 | | | Dollar Tree, Inc.(b) | | | 2,518,064 | |
| | | | | | | | |
| | | | Oil, Gas & Consumable Fuels — 6.8% | | | | |
| | 45,265 | | | Approach Resources, Inc.(b) | | | 1,672,542 | |
| | 78,132 | | | Cobalt International Energy, Inc.(b) | | | 2,346,304 | |
| | 16,819 | | | Concho Resources, Inc.(b) | | | 1,716,883 | |
| | 38,009 | | | Rosetta Resources, Inc.(b) | | | 1,853,319 | |
| | | | | | | | |
| | | | | | | 7,589,048 | |
| | | | | | | | |
| | | | Pharmaceuticals — 1.6% | | | | |
| | 17,606 | | | Perrigo Co. | | | 1,818,876 | |
| | | | | | | | |
| | | | Professional Services — 2.3% | | | | |
| | 53,468 | | | Verisk Analytics, Inc., Class A(b) | | | 2,511,392 | |
| | | | | | | | |
| | | | Real Estate Management & Development — 2.2% | | | | |
| | 121,846 | | | CBRE Group, Inc., Class A(b) | | | 2,432,046 | |
| | | | | | | | |
| | | | Road & Rail — 2.1% | | | | |
| | 33,240 | | | Kansas City Southern(b) | | | 2,382,976 | |
| | | | | | | | |
| | | | Semiconductors & Semiconductor Equipment — 5.2% | | | | |
| | 86,464 | | | NXP Semiconductors NV(b) | | | 2,300,807 | |
| | 67,128 | | | Skyworks Solutions, Inc.(b) | | | 1,856,089 | |
| | 46,262 | | | Xilinx, Inc. | | | 1,685,325 | |
| | | | | | | | |
| | | | | | | 5,842,221 | |
| | | | | | | | |
| | | | Software — 10.2% | | | | |
| | 62,736 | | | Fortinet, Inc.(b) | | | 1,734,650 | |
| | 26,352 | | | Guidewire Software, Inc.(b) | | | 811,115 | |
| | 33,885 | | | Informatica Corp.(b) | | | 1,792,517 | |
| | 54,758 | | | Jive Software, Inc.(b) | | | 1,487,227 | |
| | 22,439 | | | NetSuite, Inc.(b) | | | 1,128,457 | |
| | 44,161 | | | Nuance Communications, Inc.(b) | | | 1,129,638 | |
| | 44,445 | | | SolarWinds, Inc.(b) | | | 1,717,799 | |
| | 33,766 | | | Sourcefire, Inc.(b) | | | 1,625,158 | |
| | | | | | | | |
| | | | | | | 11,426,561 | |
| | | | | | | | |
See accompanying notes to financial statements.
41 |
Portfolio of Investments – as of March 31, 2012 (Unaudited)
Loomis Sayles Mid Cap Growth Fund – (continued)
| | | | | | | | |
Shares | | | Description | | Value (†) | |
| | | | | | | | |
| | | | Specialty Retail — 9.3% | | | | |
| | 19,750 | | | O’Reilly Automotive, Inc.(b) | | $ | 1,804,163 | |
| | 40,051 | | | PetSmart, Inc. | | | 2,291,718 | |
| | 35,093 | | | Ross Stores, Inc. | | | 2,038,903 | |
| | 19,349 | | | Tractor Supply Co. | | | 1,752,245 | |
| | 26,894 | | | Ulta Salon, Cosmetics & Fragrance, Inc. | | | 2,498,184 | |
| | | | | | | | |
| | | | | | | 10,385,213 | |
| | | | | | | | |
| | | | Textiles, Apparel & Luxury Goods — 4.5% | | | | |
| | 22,904 | | | Lululemon Athletica, Inc.(b) | | | 1,710,471 | |
| | 36,012 | | | Michael Kors Holdings Ltd.(b) | | | 1,677,799 | |
| | 17,207 | | | Under Armour, Inc., Class A(b) | | | 1,617,458 | |
| | | | | | | | |
| | | | | | | 5,005,728 | |
| | | | | | | | |
| | | | Total Common Stocks
(Identified Cost $90,528,472) | | | 108,115,501 | |
| | | | | | | | |
| | | | | | | | |
| | Purchased Options — 0.0% | | | | |
| | 28,700 | | | Vertex Pharmaceuticals, Inc., Put expiring July 21, 2012 at 32
(Identified Cost $59,775) | | | 31,570 | |
| | | | | | | | |
| | | | | | | | |
Principal
Amount | | | | | | |
| | Short-Term Investments — 3.7% | |
| $ | 4,131,240 | | | Tri-Party Repurchase Agreement with Fixed Income Clearing Corporation, dated 3/30/2012 at 0.000% to be repurchased at $4,131,240 on 4/02/2012 collateralized by $4,200,000 U.S. Treasury Note, 0.500% due 10/15/2014 valued at $4,215,750, including accrued interest (Note 2 of Notes to Financial Statements)
(Identified Cost $4,131,240) | | | 4,131,240 | |
| | | | | | | | |
| | | | | | | | |
| | | | Total Investments — 100.5%
(Identified Cost $94,719,487)(a) | | | 112,278,311 | |
| | | | Other assets less liabilities — (0.5)% | | | (575,318 | ) |
| | | | | | | | |
| | | | Net Assets — 100.0% | | $ | 111,702,993 | |
| | | | | | | | |
| | | | | | | | |
| | (†) | | | See Note 2 of Notes to Financial Statements. | | | | |
| | (a) | | | Federal Tax Information (Amounts exclude certain adjustments made at the end of the Fund’s fiscal year for tax purposes. Such adjustments are primarily due to wash sales.): | |
| | | | At March 31, 2012, the net unrealized appreciation on investments based on a cost of $94,719,487 for federal income tax purposes was as follows: | |
| | | | Aggregate gross unrealized appreciation for all investments in which there is an excess of value over tax cost | | $ | 18,020,060 | |
| | | | Aggregate gross unrealized depreciation for all investments in which there is an excess of tax cost over value | | | (461,236 | ) |
| | | | | | | | |
| | | | Net unrealized appreciation | | $ | 17,558,824 | |
| | | | | | | | |
| | | | | | | | |
| | (b) | | | Non-income producing security. | | | | |
See accompanying notes to financial statements.
| 42
Portfolio of Investments – as of March 31, 2012 (Unaudited)
Loomis Sayles Mid Cap Growth Fund – (continued)
Industry Summary at March 31, 2012 (Unaudited)
| | | | |
Software | | | 10.2 | % |
Specialty Retail | | | 9.3 | |
Biotechnology | | | 8.0 | |
Oil, Gas & Consumable Fuels | | | 6.8 | |
Internet Software & Services | | | 6.5 | |
Semiconductors & Semiconductor Equipment | | | 5.2 | |
Machinery | | | 4.8 | |
Textiles, Apparel & Luxury Goods | | | 4.5 | |
Hotels, Restaurants & Leisure | | | 4.1 | |
Capital Markets | | | 3.6 | |
Energy Equipment & Services | | | 3.0 | |
Health Care Technology | | | 2.6 | |
Health Care Equipment & Supplies | | | 2.4 | |
Communications Equipment | | | 2.3 | |
Beverages | | | 2.3 | |
Multiline Retail | | | 2.3 | |
Professional Services | | | 2.3 | |
Food & Staples Retailing | | | 2.2 | |
Real Estate Management & Development | | | 2.2 | |
Road & Rail | | | 2.1 | |
Aerospace & Defense | | | 2.1 | |
Life Sciences Tools & Services | | | 2.0 | |
Other Investments, less than 2% each | | | 6.0 | |
Short-Term Investments | | | 3.7 | |
| | | | |
Total Investments | | | 100.5 | |
Other assets less liabilities | | | (0.5 | ) |
| | | | |
Net Assets | | | 100.0 | % |
| | | | |
See accompanying notes to financial statements.
43 |
Portfolio of Investments – as of March 31, 2012 (Unaudited)
Loomis Sayles Value Fund
| | | | | | | | |
Shares | | | Description | | Value (†) | |
| | | | | | | | |
| | Common Stocks — 98.4% of Net Assets | |
| | | | Aerospace & Defense — 2.8% | | | | |
| | 309,143 | | | Honeywell International, Inc. | | $ | 18,873,180 | |
| | 317,828 | | | Northrop Grumman Corp. | | | 19,412,934 | |
| | | | | | | | |
| | | | | | | 38,286,114 | |
| | | | | | | | |
| | | | Auto Components — 1.4% | | | | |
| | 697,131 | | | Goodyear Tire & Rubber Co. (The)(b) | | | 7,821,810 | |
| | 321,744 | | | Johnson Controls, Inc. | | | 10,450,245 | |
| | | | | | | | |
| | | | | | | 18,272,055 | |
| | | | | | | | |
| | | | Automobiles — 0.8% | | | | |
| | 409,915 | | | General Motors Co.(b) | | | 10,514,320 | |
| | | | | | | | |
| | | | Beverages — 3.0% | | | | |
| | 651,759 | | | Coca-Cola Enterprises, Inc. | | | 18,640,307 | |
| | 329,309 | | | PepsiCo, Inc. | | | 21,849,652 | |
| | | | | | | | |
| | | | | | | 40,489,959 | |
| | | | | | | | |
| | | | Biotechnology — 1.0% | | | | |
| | 191,051 | | | Amgen, Inc. | | | 12,989,557 | |
| | | | | | | | |
| | | | Capital Markets — 4.1% | | | | |
| | 320,300 | | | Ameriprise Financial, Inc. | | | 18,298,739 | |
| | 494,848 | | | Legg Mason, Inc. | | | 13,821,105 | |
| | 500,306 | | | State Street Corp. | | | 22,763,923 | |
| | | | | | | | |
| | | | | | | 54,883,767 | |
| | | | | | | | |
| | | | Chemicals — 1.0% | | | | |
| | 152,902 | | | Air Products & Chemicals, Inc. | | | 14,036,404 | |
| | | | | | | | |
| | | | Commercial Banks — 6.5% | | | | |
| | 1,379,621 | | | Fifth Third Bancorp | | | 19,383,675 | |
| | 369,794 | | | PNC Financial Services Group, Inc. | | | 23,848,015 | |
| | 462,311 | | | U.S. Bancorp | | | 14,646,012 | |
| | 886,299 | | | Wells Fargo & Co. | | | 30,258,248 | |
| | | | | | | | |
| | | | | | | 88,135,950 | |
| | | | | | | | |
| | | | Communications Equipment — 2.8% | | | | |
| | 854,019 | | | Cisco Systems, Inc. | | | 18,062,502 | |
| | 400,218 | | | Motorola Solutions, Inc. | | | 20,343,081 | |
| | | | | | | | |
| | | | | | | 38,405,583 | |
| | | | | | | | |
| | | | Computers & Peripherals — 1.2% | | | | |
| | 27,315 | | | Apple, Inc.(b) | | | 16,374,523 | |
| | | | | | | | |
| | | | Construction Materials — 0.7% | | | | |
| | 217,471 | | | Vulcan Materials Co. | | | 9,292,536 | |
| | | | | | | | |
| | | | Consumer Finance — 1.6% | | | | |
| | 647,252 | | | Discover Financial Services | | | 21,579,382 | |
| | | | | | | | |
See accompanying notes to financial statements.
| 44
Portfolio of Investments – as of March 31, 2012 (Unaudited)
Loomis Sayles Value Fund – (continued)
| | | | | | | | |
Shares | | | Description | | Value (†) | |
| | | | | | | | |
| | | | Diversified Financial Services — 5.4% | | | | |
| | 1,521,931 | | | Bank of America Corp. | | $ | 14,564,880 | |
| | 599,534 | | | Citigroup, Inc. | | | 21,912,968 | |
| | 786,121 | | | JPMorgan Chase & Co. | | | 36,145,843 | |
| | | | | | | | |
| | | | | | | 72,623,691 | |
| | | | | | | | |
| | | | Diversified Telecommunication Services — 3.1% | | | | |
| | 725,387 | | | AT&T, Inc. | | | 22,653,836 | |
| | 503,544 | | | CenturyLink, Inc. | | | 19,461,976 | |
| | | | | | | | |
| | | | | | | 42,115,812 | |
| | | | | | | | |
| | | | Electric Utilities — 3.6% | | | | |
| | 421,637 | | | Edison International | | | 17,923,789 | |
| | 405,683 | | | Exelon Corp. | | | 15,906,831 | |
| | 521,601 | | | PPL Corp. | | | 14,740,444 | |
| | | | | | | | |
| | | | | | | 48,571,064 | |
| | | | | | | | |
| | | | Electrical Equipment — 1.3% | | | | |
| | 268,972 | | | Cooper Industries PLC | | | 17,200,759 | |
| | | | | | | | |
| | | | Energy Equipment & Services — 2.7% | | | | |
| | 277,191 | | | Schlumberger Ltd. | | | 19,383,967 | |
| | 303,026 | | | Transocean Ltd. | | | 16,575,522 | |
| | | | | | | | |
| | | | | | | 35,959,489 | |
| | | | | | | | |
| | | | Food & Staples Retailing — 1.6% | | | | |
| | 470,754 | | | CVS Caremark Corp. | | | 21,089,779 | |
| | | | | | | | |
| | | | Food Products — 2.3% | | | | |
| | 859,441 | | | Sara Lee Corp. | | | 18,503,764 | |
| | 386,060 | | | Unilever NV | | | 13,137,622 | |
| | | | | | | | |
| | | | | | | 31,641,386 | |
| | | | | | | | |
| | | | Health Care Equipment & Supplies — 2.7% | | | | |
| | 249,558 | | | Baxter International, Inc. | | | 14,918,577 | |
| | 382,477 | | | Covidien PLC | | | 20,913,843 | |
| | | | | | | | |
| | | | | | | 35,832,420 | |
| | | | | | | | |
| | | | Health Care Providers & Services — 2.9% | | | | |
| | 465,541 | | | HCA Holdings, Inc. | | | 11,517,484 | |
| | 461,375 | | | UnitedHealth Group, Inc. | | | 27,193,443 | |
| | | | | | | | |
| | | | | | | 38,710,927 | |
| | | | | | | | |
| | | | Independent Power Producers & Energy Traders — 1.4% | | | | |
| | 1,090,242 | | | Calpine Corp.(b) | | | 18,763,065 | |
| | | | | | | | |
| | | | Industrial Conglomerates — 1.9% | | | | |
| | 1,266,233 | | | General Electric Co. | | | 25,413,296 | |
| | | | | | | | |
| | | | Insurance — 3.6% | | | | |
| | 496,168 | | | MetLife, Inc. | | | 18,531,875 | |
| | 255,127 | | | Travelers Cos., Inc. (The) | | | 15,103,518 | |
| | 611,309 | | | Unum Group | | | 14,964,844 | |
| | | | | | | | |
| | | | | | | 48,600,237 | |
| | | | | | | | |
See accompanying notes to financial statements.
45 |
Portfolio of Investments – as of March 31, 2012 (Unaudited)
Loomis Sayles Value Fund – (continued)
| | | | | | | | |
Shares | | | Description | | Value (†) | |
| | | | | | | | |
| | | | Internet & Catalog Retail — 1.3% | | | | |
| | 913,488 | | | Liberty Interactive Corp., Class A(b) | | $ | 17,438,486 | |
| | | | | | | | |
| | | | | | | | |
| | | | Internet Software & Services — 2.0% | | | | |
| | 482,041 | | | AOL, Inc.(b) | | | 9,144,318 | |
| | 482,290 | | | eBay, Inc.(b) | | | 17,791,678 | |
| | | | | | | | |
| | | | | | | 26,935,996 | |
| | | | | | | | |
| | | | Machinery — 3.4% | | | | |
| | 352,532 | | | Eaton Corp. | | | 17,566,670 | |
| | 290,390 | | | Harsco Corp. | | | 6,812,549 | |
| | 273,722 | | | Stanley Black & Decker, Inc. | | | 21,065,645 | |
| | | | | | | | |
| | | | | | | 45,444,864 | |
| | | | | | | | |
| | | | Media — 6.9% | | | | |
| | 392,725 | | | CBS Corp., Class B | | | 13,317,305 | |
| | 1,109,690 | | | Comcast Corp., Class A | | | 33,301,797 | |
| | 243,523 | | | DIRECTV, Class A(b) | | | 12,015,425 | |
| | 306,199 | | | Omnicom Group, Inc. | | | 15,508,979 | |
| | 382,480 | | | Viacom, Inc., Class B | | | 18,152,501 | |
| | | | | | | | |
| | | | | | | 92,296,007 | |
| | | | | | | | |
| | | | Multiline Retail — 1.0% | | | | |
| | 227,174 | | | Target Corp. | | | 13,237,429 | |
| | | | | | | | |
| | | | Oil, Gas & Consumable Fuels — 9.0% | | | | |
| | 258,007 | | | Chevron Corp. | | | 27,668,671 | |
| | 247,018 | | | CONSOL Energy, Inc. | | | 8,423,314 | |
| | 495,832 | | | El Paso Corp. | | | 14,651,835 | |
| | 397,171 | | | ExxonMobil Corp. | | | 34,446,641 | |
| | 357,356 | | | Hess Corp. | | | 21,066,136 | |
| | 64,665 | | | Noble Energy, Inc. | | | 6,322,944 | |
| | 120,889 | | | SM Energy Co. | | | 8,555,314 | |
| | | | | | | | |
| | | | | | | 121,134,855 | |
| | | | | | | | |
| | | | Pharmaceuticals — 6.4% | | | | |
| | 295,381 | | | Bristol-Myers Squibb Co. | | | 9,969,109 | |
| | 747,607 | | | Merck & Co., Inc. | | | 28,708,109 | |
| | 1,139,394 | | | Pfizer, Inc. | | | 25,818,668 | |
| | 542,951 | | | Sanofi, Sponsored ADR | | | 21,039,351 | |
| | | | | | | | |
| | | | | | | 85,535,237 | |
| | | | | | | | |
| | | | REITs — Diversified — 1.2% | | | | |
| | 765,649 | | | Weyerhaeuser Co. | | | 16,783,026 | |
| | | | | | | | |
| | | | Road & Rail — 1.3% | | | | |
| | 267,730 | | | Norfolk Southern Corp. | | | 17,624,666 | |
| | | | | | | | |
| | | | Semiconductors & Semiconductor Equipment — 2.3% | | | | |
| | 1,157,235 | | | Applied Materials, Inc. | | | 14,396,003 | |
| | 497,240 | | | Texas Instruments, Inc. | | | 16,712,237 | |
| | | | | | | | |
| | | | | | | 31,108,240 | |
| | | | | | | | |
See accompanying notes to financial statements.
| 46
Portfolio of Investments – as of March 31, 2012 (Unaudited)
Loomis Sayles Value Fund – (continued)
| | | | | | | | |
Shares | | | Description | | Value (†) | |
| | | | | | | | |
| | | | Software — 2.7% | | | | |
| | 512,099 | | | Microsoft Corp. | | $ | 16,515,193 | |
| | 688,618 | | | Oracle Corp. | | | 20,080,101 | |
| | | | | | | | |
| | | | | | | 36,595,294 | |
| | | | | | | | |
| | | | Wireless Telecommunication Services — 1.5% | | | | |
| | 735,456 | | | Vodafone Group PLC, Sponsored ADR | | | 20,350,067 | |
| | | | | | | | |
| | | | Total Common Stocks (Identified Cost $1,111,164,267) | | | 1,324,266,242 | |
| | | | | | | | |
| | | | | | | | |
Principal
Amount | | | | | | |
| | Short-Term Investments — 1.5% | |
| $ | 19,736,726 | | | Tri-Party Repurchase Agreement with Fixed Income Clearing Corporation, dated 3/30/2012 at 0.000% to be repurchased at $19,736,726 on 4/02/2012 collateralized by $20,035,000 Federal National Mortgage Association, 1.000% due 11/04/2014 valued at $20,135,175 including accrued interest (Note 2 of Notes to Financial Statements) (Identified Cost $19,736,726) | | | 19,736,726 | |
| | | | | | | | |
| | | | | | | | |
| | | | Total Investments — 99.9% (Identified Cost $1,130,900,993)(a) | | | 1,344,002,968 | |
| | | | Other assets less liabilities — 0.1% | | | 2,011,286 | |
| | | | | | | | |
| | | | Net Assets — 100.0% | | $ | 1,346,014,254 | |
| | | | | | | | |
| | | | | | | | |
| | (†) | | | See Note 2 of Notes to Financial Statements. | |
| | (a) | | | Federal Tax Information (Amounts exclude certain adjustments made at the end of the Fund’s fiscal year for tax purposes. Such adjustments are primarily due to wash sales.): | | | | |
| | | | At March 31, 2012, the net unrealized appreciation on investments based on a cost of $1,130,900,993 for federal income tax purposes was as follows: | | | | |
| | | | Aggregate gross unrealized appreciation for all investments in which there is an excess of value over tax cost | | $ | 241,535,669 | |
| | | | Aggregate gross unrealized depreciation for all investments in which there is an excess of tax cost over value | | | (28,433,694 | ) |
| | | | | | | | |
| | | | Net unrealized appreciation | | $ | 213,101,975 | |
| | | | | | | | |
| | | | | | | | |
| | (b) | | | Non-income producing security. | | | | |
| | | | | | | | |
| | ADR | | | An American Depositary Receipt is a certificate issued by a custodian bank representing the right to receive securities of the foreign issuer described. The values of ADRs may be significantly influenced by trading on exchanges not located in the United States. | | | | |
| | REITs | | | Real Estate Investment Trusts | | | | |
See accompanying notes to financial statements.
47 |
Portfolio of Investments – as of March 31, 2012 (Unaudited)
Loomis Sayles Value Fund – (continued)
Industry Summary at March 31, 2012 (Unaudited)
| | | | |
Oil, Gas & Consumable Fuels | | | 9.0 | % |
Media | | | 6.9 | |
Commercial Banks | | | 6.5 | |
Pharmaceuticals | | | 6.4 | |
Diversified Financial Services | | | 5.4 | |
Capital Markets | | | 4.1 | |
Insurance | | | 3.6 | |
Electric Utilities | | | 3.6 | |
Machinery | | | 3.4 | |
Diversified Telecommunication Services | | | 3.1 | |
Beverages | | | 3.0 | |
Health Care Providers & Services | | | 2.9 | |
Communications Equipment | | | 2.8 | |
Aerospace & Defense | | | 2.8 | |
Software | | | 2.7 | |
Energy Equipment & Services | | | 2.7 | |
Health Care Equipment & Supplies | | | 2.7 | |
Food Products | | | 2.3 | |
Semiconductors & Semiconductor Equipment | | | 2.3 | |
Internet Software & Services | | | 2.0 | |
Other Investments, less than 2% each | | | 20.2 | |
Short-Term Investments | | | 1.5 | |
| | | | |
Total Investments | | | 99.9 | |
Other assets less liabilities | | | 0.1 | |
| | | | |
Net Assets | | | 100.0 | % |
| | | | |
See accompanying notes to financial statements.
| 48
Statements of Assets & Liabilities
March 31, 2012 (Unaudited)
| | | | | | | | | | | | | | | | |
| | | Global Equity
and Income
Fund | | | Growth
Fund | | | Mid Cap
Growth
Fund | | �� | Value
Fund | |
ASSETS | | | | | | | | | | | | | | | | |
Investments at cost | | $ | 654,536,352 | | | $ | 109,570,963 | | | $ | 94,719,487 | | | $ | 1,130,900,993 | |
Net unrealized appreciation | | | 68,208,483 | | | | 25,521,073 | | | | 17,558,824 | | | | 213,101,975 | |
| | | | | | | | | | | | | | | | |
Investments at value | | | 722,744,835 | | | | 135,092,036 | | | | 112,278,311 | | | | 1,344,002,968 | |
Cash | | | 9,506 | | | | — | | | | — | | | | — | |
Foreign currency at value (identified cost $2,335,602, $0, $0 and $0) | | | 2,340,762 | | | | — | | | | — | | | | — | |
Receivable for Fund shares sold | | | 5,689,743 | | | | 157,194 | | | | 152,522 | | | | 1,648,484 | |
Receivable for securities sold | | | 8,850,687 | | | | — | | | | 983,225 | | | | — | |
Dividends and interest receivable | | | 3,932,256 | | | | 266,783 | | | | 36,659 | | | | 2,088,855 | |
Unrealized appreciation on forward foreign currency contracts (Note 2) | | | 53,155 | | | | — | | | | — | | | | — | |
Tax reclaims receivable | | | 94,216 | | | | 76,015 | | | | — | | | | 88,802 | |
| | | | | | | | | | | | | | | | |
TOTAL ASSETS | | | 743,715,160 | | | | 135,592,028 | | | | 113,450,717 | | | | 1,347,829,109 | |
| | | | | | | | | | | | | | | | |
LIABILITIES | | | | | | | | | | | | | | | | |
Payable for securities purchased | | | 23,838,592 | | | | — | | | | 698,369 | | | | — | |
Payable for Fund shares redeemed | | | 716,615 | | | | 69,768 | | | | 860,600 | | | | 814,870 | |
Unrealized depreciation on forward foreign currency contracts (Note 2) | | | 14,088 | | | | — | | | | — | | | | — | |
Management fees payable (Note 6) | | | 439,106 | | | | 55,853 | | | | 60,899 | | | | 563,003 | |
Deferred Trustees’ fees (Note 6) | | | 84,877 | | | | 118,662 | | | | 78,156 | | | | 300,854 | |
Administrative fees payable (Note 6) | | | 26,572 | | | | 5,070 | | | | 4,285 | | | | 51,105 | |
Payable to distributor (Note 6d) | | | 9,729 | | | | 691 | | | | 1,185 | | | | 27,979 | |
Other accounts payable and accrued expenses | | | 53,068 | | | | 69,148 | | | | 44,230 | | | | 57,044 | |
| | | | | | | | | | | | | | | | |
TOTAL LIABILITIES | | | 25,182,647 | | | | 319,192 | | | | 1,747,724 | | | | 1,814,855 | |
| | | | | | | | | | | | | | | | |
NET ASSETS | | $ | 718,532,513 | | | $ | 135,272,836 | | | $ | 111,702,993 | | | $ | 1,346,014,254 | |
| | | | | | | | | | | | | | | | |
NET ASSETS CONSIST OF: | | | | | | | | | | | | | | | | |
Paid-in capital | | $ | 691,290,881 | | | $ | 200,840,356 | | | $ | 138,872,282 | | | $ | 1,183,020,995 | |
Accumulated net investment (loss)/Undistributed net investment income | | | 2,400,323 | | | | 355,575 | | | | (320,883 | ) | | | 5,081,196 | |
Accumulated net realized loss on investments, options written and foreign currency transactions | | | (43,402,006 | ) | | | (91,444,168 | ) | | | (44,407,230 | ) | | | (55,189,912 | ) |
Net unrealized appreciation on investments and foreign currency translations | | | 68,243,315 | | | | 25,521,073 | | | | 17,558,824 | | | | 213,101,975 | |
| | | | | | | | | | | | | | | | |
NET ASSETS | | $ | 718,532,513 | | | $ | 135,272,836 | | | $ | 111,702,993 | | | $ | 1,346,014,254 | |
| | | | | | | | | | | | | | | | |
See accompanying notes to financial statements.
49 |
Statements of Assets & Liabilities (continued)
March 31, 2012 (Unaudited)
| | | | | | | | | | | | | | | | |
| | | Global Equity
and Income
Fund | | | Growth
Fund | | | Mid Cap
Growth
Fund | | | Value
Fund | |
COMPUTATION OF NET ASSET VALUE AND OFFERING PRICE: | | | | | | | | | | | | | | | | |
Class A shares: | | | | | | | | | | | | | | | | |
Net assets | | $ | 159,966,226 | | | $ | 29,749,932 | | | $ | 45,708,046 | | | $ | 136,304,947 | |
| | | | | | | | | | | | | | | | |
Shares of beneficial interest | | | 9,523,297 | | | | 4,702,137 | | | | 1,571,907 | | | | 6,833,774 | |
| | | | | | | | | | | | | | | | |
Net asset value and redemption price per share | | $ | 16.80 | | | $ | 6.33 | | | $ | 29.08 | | | $ | 19.95 | |
| | | | | | | | | | | | | | | | |
Offering price per share (100/94.25 of net asset value) (Note 1) | | $ | 17.82 | | | $ | 6.72 | | | $ | 30.85 | | | $ | 21.17 | |
| | | | | | | | | | | | | | | | |
Class B shares: (redemption price per share is equal to net asset value less any applicable contingent deferred sales charge) (Note 1) | | | | | | | | | | | | | | | | |
Net assets | | $ | — | | | $ | 2,420,522 | | | $ | — | | | $ | 2,009,262 | |
| | | | | | | | | | | | | | | | |
Shares of beneficial interest | | | — | | | | 407,237 | | | | — | | | | 99,956 | |
| | | | | | | | | | | | | | | | |
Net asset value and offering price per share | | $ | — | | | $ | 5.94 | | | $ | — | | | $ | 20.10 | |
| | | | | | | | | | | | | | | | |
Class C shares: (redemption price per share is equal to net asset value less any applicable contingent deferred sales charge) (Note 1) | | | | | | | | | | | | | | | | |
Net assets | | $ | 197,029,068 | | | $ | 11,009,276 | | | $ | 2,889,455 | | | $ | 9,919,902 | |
| | | | | | | | | | | | | | | | |
Shares of beneficial interest | | | 11,804,079 | | | | 1,851,538 | | | | 101,680 | | | | 500,571 | |
| | | | | | | | | | | | | | | | |
Net asset value and offering price per share | | $ | 16.69 | | | $ | 5.95 | | | $ | 28.42 | | | $ | 19.82 | |
| | | | | | | | | | | | | | | | |
Class Y shares: | | | | | | | | | | | | | | | | |
Net assets | | $ | 361,537,219 | | | $ | 92,093,106 | | | $ | 63,105,492 | | | $ | 1,197,778,034 | |
| | | | | | | | | | | | | | | | |
Shares of beneficial interest | | | 21,442,237 | | | | 13,736,106 | | | | 2,093,328 | | | | 59,982,591 | |
| | | | | | | | | | | | | | | | |
Net asset value, offering and redemption price per share | | $ | 16.86 | | | $ | 6.70 | | | $ | 30.15 | | | $ | 19.97 | |
| | | | | | | | | | | | | | | | |
Admin Class shares: | | | | | | | | | | | | | | | | |
Net assets | | $ | — | | | $ | — | | | $ | — | | | $ | 2,109 | |
| | | | | | | | | | | | | | | | |
Shares of beneficial interest | | | — | | | | — | | | | — | | | | 106 | |
| | | | | | | | | | | | | | | | |
Net asset value, offering and redemption price per share | | $ | — | | | $ | — | | | $ | — | | | $ | 19.90 | |
| | | | | | | | | | | | | | | | |
See accompanying notes to financial statements.
| 50
Statements of Operations
For the Six Months Ended March 31, 2012 (Unaudited)
| | | | | | | | | | | | | | | | |
| | | Global Equity
and Income
Fund | | | Growth
Fund | | | Mid Cap
Growth
Fund | | | Value
Fund | |
INVESTMENT INCOME | | | | | | | | | | | | | | | | |
Dividends | | $ | 3,681,595 | | | $ | 1,117,390 | | | $ | 365,007 | | | $ | 15,874,220 | |
Interest | | | 5,018,524 | | | | — | | | | — | | | | — | |
Less net foreign taxes withheld | | | (137,050 | ) | | | (27,479 | ) | | | — | | | | (17,168 | ) |
| | | | | | | | | | | | | | | | |
| | | 8,563,069 | | | | 1,089,911 | | | | 365,007 | | | | 15,857,052 | |
| | | | | | | | | | | | | | | | |
Expenses | | | | | | | | | | | | | | | | |
Management fees (Note 6) | | | 2,160,995 | | | | 304,573 | | | | 403,460 | | | | 3,103,499 | |
Service and distribution fees (Note 6) | | | 1,008,677 | | | | 101,613 | | | | 74,535 | | | | 226,403 | |
Administrative fees (Note 6) | | | 132,563 | | | | 28,035 | | | | 24,762 | | | | 285,690 | |
Trustees’ fees and expenses (Note 6) | | | 18,686 | | | | 18,041 | | | | 14,612 | | | | 42,283 | |
Transfer agent fees and expenses
(Note 6) | | | 246,519 | | | | 98,556 | | | | 71,874 | | | | 946,693 | |
Audit and tax services fees | | | 26,534 | | | | 20,818 | | | | 24,325 | | | | 17,421 | |
Custodian fees and expenses | | | 90,881 | | | | 8,917 | | | | 11,186 | | | | 27,167 | |
Legal fees | | | 3,931 | | | | 875 | | | | 786 | | | | 9,042 | |
Registration fees | | | 73,411 | | | | 28,578 | | | | 36,299 | | | | 55,280 | |
Shareholder reporting expenses | | | 18,473 | | | | 8,367 | | | | 5,893 | | | | 52,206 | |
Miscellaneous expenses | | | 13,564 | | | | 5,278 | | | | 8,555 | | | | 19,014 | |
| | | | | | | | | | | | | | | | |
Total expenses | | | 3,794,234 | | | | 623,651 | | | | 676,287 | | | | 4,784,698 | |
Less waiver and/or expense reimbursement (Note 6) | | | — | | | | — | | | | (61,863 | ) | | | — | |
| | | | | | | | | | | | | | | | |
Net expenses | | | 3,794,234 | | | | 623,651 | | | | 614,424 | | | | 4,784,698 | |
| | | | | | | | | | | | | | | | |
Net investment income (loss) | | | 4,768,835 | | | | 466,260 | | | | (249,417 | ) | | | 11,072,354 | |
| | | | | | | | | | | | | | | | |
NET REALIZED AND UNREALIZED GAIN (LOSS) ON INVESTMENTS, OPTIONS WRITTEN AND FOREIGN CURRENCY TRANSACTIONS | | | | | | | | | | | | | | | | |
Net realized gain (loss) on: | | | | | | | | | | | | | | | | |
Investments | | | 10,490,876 | | | | 1,182,603 | | | | 1,149,333 | | | | 5,460,688 | |
Options written | | | — | | | | — | | | | (43,815 | ) | | | — | |
Foreign currency transactions | | | (137,036 | ) | | | — | | | | — | | | | — | |
Net change in unrealized appreciation (depreciation) on: | | | | | | | | | | | | | | | | |
Investments | | | 86,234,957 | | | | 21,393,538 | | | | 18,129,109 | | | | 266,378,532 | |
Foreign currency translations | | | 320,589 | | | | — | | | | — | | | | — | |
| | | | | | | | | | | | | | | | |
Net realized and unrealized gain on investments, options written and foreign currency transactions | | | 96,909,386 | | | | 22,576,141 | | | | 19,234,627 | | | | 271,839,220 | |
| | | | | | | | | | | | | | | | |
NET INCREASE IN NET ASSETS RESULTING FROM OPERATIONS | | $ | 101,678,221 | | | $ | 23,042,401 | | | $ | 18,985,210 | | | $ | 282,911,574 | |
| | | | | | | | | | | | | | | | |
See accompanying notes to financial statements.
51 |
Statements of Changes in Net Assets
| | | | | | | | | | | | | | | | |
| | | Global Equity and Income Fund | | | Growth Fund | |
| | | Six Months Ended
March 31, 2012
(Unaudited) | | | Year Ended
September 30,
2011 | | | Six Months Ended
March 31, 2012
(Unaudited) | | | Year Ended
September 30,
2011 | |
FROM OPERATIONS: | | | | | | | | | | | | | | | | |
Net investment income | | $ | 4,768,835 | | | $ | 5,683,385 | | | $ | 466,260 | | | $ | 312,880 | |
Net realized gain on investments and foreign currency transactions | | | 10,353,840 | | | | 42,116,459 | | | | 1,182,603 | | | | 6,408,021 | |
Net change in unrealized appreciation (depreciation) on investments and foreign currency translations | | | 86,555,546 | | | | (73,870,933 | ) | | | 21,393,538 | | | | (5,147,611 | ) |
| | | | | | | | | | | | | | | | |
Net increase (decrease) in net assets resulting from operations | | | 101,678,221 | | | | (26,071,089 | ) | | | 23,042,401 | | | | 1,573,290 | |
| | | | | | | | | | | | | | | | |
FROM DISTRIBUTIONS TO SHAREHOLDERS: | | | | | | | | | | | | | | | | |
Net investment income | | | | | | | | | | | | | | | | |
Class A | | | (2,072,301 | ) | | | (1,363,693 | ) | | | (40,999 | ) | | | — | |
Class C | | | (1,277,382 | ) | | | (1,202,095 | ) | | | — | | | | — | |
Class Y | | | (4,073,326 | ) | | | (3,043,709 | ) | | | (290,007 | ) | | | — | |
| | | | | | | | | | | | | | | | |
Total distributions | | | (7,423,009 | ) | | | (5,609,497 | ) | | | (331,006 | ) | | | — | |
| | | | | | | | | | | | | | | | |
NET INCREASE IN NET ASSETS FROM CAPITAL SHARE TRANSACTIONS (NOTE 11) | | | 151,184,530 | | | | 186,170,302 | | | | 2,796,254 | | | | 8,413,669 | |
| | | | | | | | | | | | | | | | |
Net increase in net assets | | | 245,439,742 | | | | 154,489,716 | | | | 25,507,649 | | | | 9,986,959 | |
NET ASSETS | | | | | | | | | | | | | | | | |
Beginning of the period | | | 473,092,771 | | | | 318,603,055 | | | | 109,765,187 | | | | 99,778,228 | |
| | | | | | | | | | | | | | | | |
End of the period | | $ | 718,532,513 | | | $ | 473,092,771 | | | $ | 135,272,836 | | | $ | 109,765,187 | |
| | | | | | | | | | | | | | | | |
UNDISTRIBUTED NET INVESTMENT INCOME | | $ | 2,400,323 | | | $ | 5,054,497 | | | $ | 355,575 | | | $ | 220,321 | |
| | | | | | | | | | | | | | | | |
See accompanying notes to financial statements.
| 52
Statements of Changes in Net Assets (continued)
| | | | | | | | | | | | | | | | |
| | | Mid Cap Growth Fund | | | Value Fund | |
| | | Six Months Ended
March 31, 2012
(Unaudited) | | | Year Ended
September 30,
2011 | | | Six Months Ended
March 31, 2012
(Unaudited) | | | Year Ended
September 30,
2011 | |
FROM OPERATIONS: | | | | | | | | | | | | | | | | |
Net investment income (loss) | | $ | (249,417 | ) | | $ | (907,310 | ) | | $ | 11,072,354 | | | $ | 15,885,984 | |
Net realized gain on investments and options written | | | 1,105,518 | | | | 28,275,493 | | | | 5,460,688 | | | | 26,999,839 | |
Net change in unrealized appreciation (depreciation) on investments | | | 18,129,109 | | | | (23,131,410 | ) | | | 266,378,532 | | | | (91,039,296 | ) |
| | | | | | | | | | | | | | | | |
Net increase (decrease) in net assets resulting from operations | | | 18,985,210 | | | | 4,236,773 | | | | 282,911,574 | | | | (48,153,473 | ) |
| | | | | | | | | | | | | | | | |
FROM DISTRIBUTIONS TO SHAREHOLDERS: | | | | | | | | | | | | | | | | |
Net investment income | | | | | | | | | | | | | | | | |
Class A | | | — | | | | — | | | | (1,701,635 | ) | | | (1,714,073 | ) |
Class B | | | — | | | | — | | | | (4,098 | ) | | | (8,769 | ) |
Class C | | | — | | | | — | | | | (35,308 | ) | | | (44,845 | ) |
Class Y | | | — | | | | — | | | | (16,240,641 | ) | | | (14,549,558 | ) |
Admin Class | | | — | | | | — | | | | (19 | ) | | | (11 | ) |
| | | | | | | | | | | | | | | | |
Total distributions | | | — | | | | — | | | | (17,981,701 | ) | | | (16,317,256 | ) |
| | | | | | | | | | | | | | | | |
NET INCREASE (DECREASE) IN NET ASSETS FROM CAPITAL SHARE TRANSACTIONS (NOTE 11) | | | (9,046,874 | ) | | | (3,901,540 | ) | | | (14,323,167 | ) | | | 226,492,861 | |
| | | | | | | | | | | | | | | | |
Net increase in net assets | | | 9,938,336 | | | | 335,233 | | | | 250,606,706 | | | | 162,022,132 | |
NET ASSETS | | | | | | | | | | | | | | | | |
Beginning of the period | | | 101,764,657 | | | | 101,429,424 | | | | 1,095,407,548 | | | | 933,385,416 | |
| | | | | | | | | | | | | | | | |
End of the period | | $ | 111,702,993 | | | $ | 101,764,657 | | | $ | 1,346,014,254 | | | $ | 1,095,407,548 | |
| | | | | | | | | | | | | | | | |
ACCUMULATED NET INVESTMENT (LOSS)/UNDISTRIBUTED NET INVESTMENT INCOME | | $ | (320,883 | ) | | $ | (71,466 | ) | | $ | 5,081,196 | | | $ | 11,990,543 | |
| | | | | | | | | | | | | | | | |
See accompanying notes to financial statements.
53 |
This Page Intentionally Left Blank
| 54
Financial Highlights
For a share outstanding throughout each period.
| | | | | | | | | | | | | | | | | | | | | | | | | | | | |
| | | | | | Income (Loss) from Investment
Operations: | | | Less Distributions: | |
| | | Net asset
value,
beginning
of the
period | | | Net
investment
income (a) | | | Net realized
and
unrealized
gain (loss) | | | Total from
investment
operations | | | Dividends
from net
investment
income | | | Distributions
from net
realized
capital
gains (b) | | | Total
distributions | |
GLOBAL EQUITYAND INCOME FUND | | | | | | | | | | | | | | | | | | | | | |
Class A | | | | | | | | | | | | | | | | | | | | | | | | | | | | |
3/31/2012(h) | | $ | 14.24 | | | $ | 0.14 | | | $ | 2.65 | | | $ | 2.79 | | | $ | (0.23 | ) | | $ | — | | | $ | (0.23 | ) |
9/30/2011 | | | 14.72 | | | | 0.22 | | | | (0.45 | ) | | | (0.23 | ) | | | (0.25 | ) | | | — | | | | (0.25 | ) |
9/30/2010 | | | 12.50 | | | | 0.26 | | | | 2.26 | | | | 2.52 | | | | (0.30 | ) | | | — | | | | (0.30 | ) |
9/30/2009 | | | 11.65 | | | | 0.36 | | | | 0.74 | (j) | | | 1.10 | | | | (0.25 | ) | | | (0.00 | ) | | | (0.25 | ) |
9/30/2008 | | | 15.83 | | | | 0.25 | | | | (3.46 | ) | | | (3.21 | ) | | | (0.53 | ) | | | (0.44 | ) | | | (0.97 | ) |
9/30/2007 | | | 12.49 | | | | 0.20 | | | | 3.39 | | | | 3.59 | | | | (0.25 | ) | | | — | | | | (0.25 | ) |
Class C | | | | | | | | | | | | | | | | | | | | | | | | | | | | |
3/31/2012(h) | | | 14.10 | | | | 0.08 | | | | 2.63 | | | | 2.71 | | | | (0.12 | ) | | | — | | | | (0.12 | ) |
9/30/2011 | | | 14.59 | | | | 0.10 | | | | (0.44 | ) | | | (0.34 | ) | | | (0.15 | ) | | | — | | | | (0.15 | ) |
9/30/2010 | | | 12.39 | | | | 0.16 | | | | 2.26 | | | | 2.42 | | | | (0.22 | ) | | | — | | | | (0.22 | ) |
9/30/2009 | | | 11.51 | | | | 0.28 | | | | 0.75 | (j) | | | 1.03 | | | | (0.15 | ) | | | (0.00 | ) | | | (0.15 | ) |
9/30/2008 | | | 15.70 | | | | 0.15 | | | | (3.43 | ) | | | (3.28 | ) | | | (0.47 | ) | | | (0.44 | ) | | | (0.91 | ) |
9/30/2007 | | | 12.43 | | | | 0.10 | | | | 3.36 | | | | 3.46 | | | | (0.19 | ) | | | — | | | | (0.19 | ) |
Class Y | | | | | | | | | | | | | | | | | | | | | | | | | | | | |
3/31/2012(h) | | | 14.31 | | | | 0.16 | | | | 2.66 | | | | 2.82 | | | | (0.27 | ) | | | — | | | | (0.27 | ) |
9/30/2011 | | | 14.78 | | | | 0.26 | | | | (0.45 | ) | | | (0.19 | ) | | | (0.28 | ) | | | — | | | | (0.28 | ) |
9/30/2010 | | | 12.54 | | | | 0.29 | | | | 2.28 | | | | 2.57 | | | | (0.33 | ) | | | — | | | | (0.33 | ) |
9/30/2009 | | | 11.70 | | | | 0.38 | | | | 0.75 | (j) | | | 1.13 | | | | (0.29 | ) | | | (0.00 | ) | | | (0.29 | ) |
9/30/2008 | | | 15.87 | | | | 0.30 | | | | (3.48 | ) | | | (3.18 | ) | | | (0.55 | ) | | | (0.44 | ) | | | (0.99 | ) |
9/30/2007 | | | 12.51 | | | | 0.24 | | | | 3.39 | | | | 3.63 | | | | (0.27 | ) | | | — | | | | (0.27 | ) |
| (a) | Per share net investment income has been calculated using the average shares outstanding during the period. |
| (b) | Amount rounds to less than $0.01 per share, if applicable. |
| (c) | Effective June 2, 2008, redemption fees were eliminated. |
| (d) | Had certain expenses not been waived/reimbursed during the period, if applicable, total returns would have been lower. |
| (e) | A sales charge for Class A shares and a contingent deferred sales charge for Class C shares are not reflected in total return calculations. Periods less than one year, if applicable, are not annualized. |
| (f) | The investment adviser and/or administrator agreed to waive its fees and/or reimburse a portion of the Fund’s expenses during the period. Without this waiver/reimbursement, if applicable, expenses would have been higher. |
See accompanying notes to financial statements.
55 |
| | | | | | | | | | | | | | | | | | | | | | | | | | | | | | |
| | | | | |
| | | | | | | | | | | | | Ratios to Average Net Assets: | | | | |
Redemption
fees (b)(c) | | | Net asset
value,
end of
the period | | | Total
return
(%) (d)(e) | | | Net assets,
end of
the period
(000’s) | | | Net
expenses
(%) (f)(g) | | | Gross
expenses
(%) (g) | | | Net investment
income
(%) (g) | | | Portfolio
turnover
rate (%) | |
| | | | | | | | | | | | | | | | | | | | | | | | | | | | | | |
| | | | | | | | | | | | | | | | | | | | | | | | | | | | | | |
| | $ — | | | $ | 16.80 | | | | 19.75 | | | $ | 159,966 | | | | 1.22 | | | | 1.22 | | | | 1.76 | | | | 17 | |
| | — | | | | 14.24 | | | | (1.67 | ) | | | 111,589 | | | | 1.24 | (i) | | | 1.24 | (i) | | | 1.41 | | | | 65 | |
| | — | | | | 14.72 | | | | 20.61 | | | | 64,367 | | | | 1.25 | | | | 1.29 | | | | 1.96 | | | | 99 | |
| | — | | | | 12.50 | | | | 10.27 | | | | 44,669 | | | | 1.25 | | | | 1.34 | | | | 3.56 | | | | 114 | |
| | 0.00 | | | | 11.65 | | | | (21.87 | ) | | | 67,647 | | | | 1.25 | | | | 1.27 | | | | 1.74 | | | | 133 | |
| | 0.00 | | | | 15.83 | | | | 29.05 | | | | 28,927 | | | | 1.25 | | | | 1.37 | | | | 1.44 | | | | 78 | |
| | | | | | | | | | | | | | | | | | | | | | | | | | | | | | |
| | — | | | | 16.69 | | | | 19.33 | | | | 197,029 | | | | 1.97 | | | | 1.97 | | | | 1.00 | | | | 17 | |
| | — | | | | 14.10 | | | | (2.42 | ) | | | 145,369 | | | | 1.99 | (i) | | | 1.99 | (i) | | | 0.64 | | | | 65 | |
| | — | | | | 14.59 | | | | 19.79 | | | | 109,455 | | | | 2.00 | | | | 2.04 | | | | 1.21 | | | | 99 | |
| | — | | | | 12.39 | | | | 9.40 | | | | 96,208 | | | | 2.00 | | | | 2.09 | | | | 2.82 | | | | 114 | |
| | 0.00 | | | | 11.51 | | | | (22.42 | ) | | | 124,178 | | | | 2.00 | | | | 2.02 | | | | 1.04 | | | | 133 | |
| | 0.00 | | | | 15.70 | | | | 27.99 | | | | 60,179 | | | | 2.00 | | | | 2.11 | | | | 0.69 | | | | 78 | |
| | | | | | | | | | | | | | | | | | | | | | | | | | | | | | |
| | — | | | | 16.86 | | | | 19.90 | | | | 361,537 | | | | 0.97 | | | | 0.97 | | | | 2.01 | | | | 17 | |
| | — | | | | 14.31 | | | | (1.42 | ) | | | 216,136 | | | | 0.99 | (i) | | | 0.99 | (i) | | | 1.65 | | | | 65 | |
| | — | | | | 14.78 | | | | 21.02 | | | | 144,780 | | | | 1.00 | | | | 1.04 | | | | 2.20 | | | | 99 | |
| | — | | | | 12.54 | | | | 10.49 | | | | 108,728 | | | | 1.00 | | | | 1.01 | | | | 3.79 | | | | 114 | |
| | 0.00 | | | | 11.70 | | | | (21.66 | ) | | | 120,322 | | | | 0.99 | (k) | | | 0.99 | (k) | | | 2.06 | | | | 133 | |
| | 0.00 | | | | 15.87 | | | | 29.36 | | | | 80,824 | | | | 1.00 | | | | 1.02 | | | | 1.70 | | | | 78 | |
| (g) | Computed on an annualized basis for periods less than one year, if applicable. |
| (h) | For the six months ended March 31, 2012 (Unaudited). |
| (i) | Includes fee/expense recovery of 0.02%. |
| (j) | The amount shown for a share outstanding does not correspond with the aggregate realized and unrealized gain (loss) on investments for the period due to the timing of sales and redemptions of fund shares in relation to fluctuating market values of investments of the Fund. |
| (k) | Includes fee/expense recovery of less than 0.01%. |
See accompanying notes to financial statements.
| 56
Financial Highlights (continued)
For a share outstanding throughout each period.
| | | | | | | | | | | | | | | | | | | | | | | | | | | | |
| | | | | | Income (Loss) from Investment
Operations: | | | Less Distributions: | |
| | | Net asset
value,
beginning
of the
period | | | Net
investment
income
(loss) (a)(b) | | | Net realized
and
unrealized
gain (loss) | | | Total from
investment
operations | | | Dividends
from net
investment
income | | | Distributions
from net
realized
capital
gains | | | Total
distributions | |
GROWTH FUND | | | | | | | | | | | | | | | | | | | | | | | | | | | | |
Class A | | | | | | | | | | | | | | | | | | | | | | | | | | | | |
3/31/2012(g) | | $ | 5.24 | | | $ | 0.02 | | | $ | 1.08 | | | $ | 1.10 | | | $ | (0.01 | ) | | $ | — | | | $ | (0.01 | ) |
9/30/2011 | | | 5.14 | | | | 0.01 | | | | 0.09 | | | | 0.10 | | | | — | | | | — | | | | — | |
9/30/2010 | | | 4.48 | | | | (0.01 | ) | | | 0.67 | | | | 0.66 | | | | — | | | | — | | | | — | |
9/30/2009 | | | 4.99 | | | | (0.01 | ) | | | (0.50 | ) | | | (0.51 | ) | | | — | | | | — | | | | — | |
9/30/2008 | | | 7.01 | | | | (0.02 | ) | | | (2.00 | ) | | | (2.02 | ) | | | — | | | | — | | | | — | |
9/30/2007 | | | 5.84 | | | | (0.03 | ) | | | 1.20 | | | | 1.17 | | | | — | | | | — | | | | — | |
Class B | | | | | | | | | | | | | | | | | | | | | | | | | | | | |
3/31/2012(g) | | | 4.94 | | | | (0.00 | ) | | | 1.00 | | | | 1.00 | | | | — | | | | — | | | | — | |
9/30/2011 | | | 4.87 | | | | (0.03 | ) | | | 0.10 | | | | 0.07 | | | | — | | | | — | | | | — | |
9/30/2010 | | | 4.28 | | | | (0.05 | ) | | | 0.64 | | | | 0.59 | | | | — | | | | — | | | | — | |
9/30/2009 | | | 4.81 | | | | (0.04 | ) | | | (0.49 | ) | | | (0.53 | ) | | | — | | | | — | | | | — | |
9/30/2008 | | | 6.79 | | | | (0.07 | ) | | | (1.91 | ) | | | (1.98 | ) | | | — | | | | — | | | | — | |
9/30/2007 | | | 5.70 | | | | (0.07 | ) | | | 1.16 | | | | 1.09 | | | | — | | | | — | | | | — | |
Class C | | | | | | | | | | | | | | | | | | | | | | | | | | | | |
3/31/2012(g) | | | 4.94 | | | | (0.00 | ) | | | 1.01 | | | | 1.01 | | | | — | | | | — | | | | — | |
9/30/2011 | | | 4.87 | | | | (0.03 | ) | | | 0.10 | | | | 0.07 | | | | — | | | | — | | | | — | |
9/30/2010 | | | 4.28 | | | | (0.05 | ) | | | 0.64 | | | | 0.59 | | | | — | | | | — | | | | — | |
9/30/2009 | | | 4.81 | | | | (0.04 | ) | | | (0.49 | ) | | | (0.53 | ) | | | — | | | | — | | | | — | |
9/30/2008 | | | 6.80 | | | | (0.07 | ) | | | (1.92 | ) | | | (1.99 | ) | | | — | | | | — | | | | — | |
9/30/2007 | | | 5.71 | | | | (0.08 | ) | | | 1.17 | | | | 1.09 | | | | — | | | | — | | | | — | |
Class Y | | | | | | | | | | | | | | | | | | | | | | | | | | | | |
3/31/2012(g) | | | 5.56 | | | | 0.03 | | | | 1.13 | | | | 1.16 | | | | (0.02 | ) | | | — | | | | (0.02 | ) |
9/30/2011 | | | 5.43 | | | | 0.03 | | | | 0.10 | | | | 0.13 | | | | — | | | | — | | | | — | |
9/30/2010 | | | 4.73 | | | | (0.00 | ) | | | 0.70 | | | | 0.70 | | | | — | | | | — | | | | — | |
9/30/2009 | | | 5.24 | | | | 0.01 | | | | (0.52 | ) | | | (0.51 | ) | | | — | | | | — | | | | — | |
9/30/2008 | | | 7.32 | | | | 0.01 | | | | (2.09 | ) | | | (2.08 | ) | | | — | | | | — | | | | — | |
9/30/2007 | | | 6.08 | | | | (0.00 | ) | | | 1.24 | | | | 1.24 | | | | — | | | | — | | | | — | |
| (a) | Per share net investment income (loss) has been calculated using the average shares outstanding during the period. |
| (b) | Amount rounds to less than $0.01 per share, if applicable. |
| (c) | Had certain expenses not been waived/reimbursed during the period, if applicable, total returns would have been lower. |
| (d) | A sales charge for Class A shares and a contingent deferred sales charge for Class B and Class C shares are not reflected in total return calculations. Periods less than one year, if applicable, are not annualized. |
See accompanying notes to financial statements.
57 |
| | | | | | | | | | | | | | | | | | | | | | | | | | |
| | | | |
| | | | | | | | | | Ratios to Average Net Assets: | | | | |
| | | | | | |
Net asset
value,
end of
the period | | | Total
return
(%) (c)(d) | | | Net assets,
end of
the period
(000’s) | | | Net
expenses
(%) (e)(f) | | | Gross
expenses
(%) (f) | | | Net investment
income (loss)
(%) (f) | | | Portfolio
turnover
rate (%) | |
| | | | | | | | | | | | | | | | | | | | | | | | | | |
| | | | | | | | | | | | | | | | | | | | | | | | | | |
| | $6.33 | | | | 20.97 | | | $ | 29,750 | | | | 1.11 | | | | 1.11 | | | | 0.68 | | | | 7 | |
| | 5.24 | | | | 1.95 | | | | 26,716 | | | | 1.14 | | | | 1.14 | | | | 0.23 | | | | 16 | |
| | 5.14 | | | | 14.73 | | | | 29,901 | | | | 1.19 | | | | 1.20 | | | | (0.30 | ) | | | 163 | |
| | 4.48 | | | | (10.40 | ) | | | 33,207 | | | | 1.25 | | | | 1.31 | | | | (0.25 | ) | | | 191 | |
| | 4.99 | | | | (28.67 | ) | | | 156,841 | | | | 1.10 | | | | 1.10 | | | | (0.33 | ) | | | 179 | |
| | 7.01 | | | | 20.03 | | | | 228,629 | | | | 1.14 | (h) | | | 1.14 | (h) | | | (0.49 | ) | | | 134 | |
| | | | | | | | | | | | | | | | | | | | | | | | | | |
| | 5.94 | | | | 20.24 | | | | 2,421 | | | | 1.85 | | | | 1.85 | | | | (0.09 | ) | | | 7 | |
| | 4.94 | | | | 1.44 | | | | 2,609 | | | | 1.89 | | | | 1.89 | | | | (0.54 | ) | | | 16 | |
| | 4.87 | | | | 13.79 | | | | 4,086 | | | | 1.93 | | | | 1.95 | | | | (1.06 | ) | | | 163 | |
| | 4.28 | | | | (11.02 | ) | | | 5,397 | | | | 2.00 | | | | 2.12 | | | | (1.06 | ) | | | 191 | |
| | 4.81 | | | | (29.16 | ) | | | 9,553 | | | | 1.85 | | | | 1.85 | | | | (1.05 | ) | | | 179 | |
| | 6.79 | | | | 19.12 | | | | 28,258 | | | | 1.85 | (h) | | | 1.85 | (h) | | | (1.20 | ) | | | 134 | |
| | | | | | | | | | | | | | | | | | | | | | | | | | |
| | 5.95 | | | | 20.45 | | | | 11,009 | | | | 1.86 | | | | 1.86 | | | | (0.07 | ) | | | 7 | |
| | 4.94 | | | | 1.44 | | | | 10,262 | | | | 1.89 | | | | 1.89 | | | | (0.53 | ) | | | 16 | |
| | 4.87 | | | | 13.79 | | | | 12,493 | | | | 1.93 | | | | 1.95 | | | | (1.06 | ) | | | 163 | |
| | 4.28 | | | | (11.02 | ) | | | 16,336 | | | | 2.00 | | | | 2.12 | | | | (1.06 | ) | | | 191 | |
| | 4.81 | | | | (29.26 | ) | | | 27,743 | | | | 1.85 | | | | 1.85 | | | | (1.08 | ) | | | 179 | |
| | 6.80 | | | | 19.09 | | | | 39,157 | | | | 1.88 | | | | 1.88 | | | | (1.23 | ) | | | 134 | |
| | | | | | | | | | | | | | | | | | | | | | | | | | |
| | 6.70 | | | | 21.14 | | | | 92,093 | | | | 0.86 | | | | 0.86 | | | | 0.94 | | | | 7 | |
| | 5.56 | | | | 2.21 | | | | 70,177 | | | | 0.89 | | | | 0.89 | | | | 0.49 | | | | 16 | |
| | 5.43 | | | | 15.01 | | | | 53,299 | | | | 0.93 | (i) | | | 0.95 | | | | (0.05 | ) | | | 163 | |
| | 4.73 | | | | (9.73 | ) | | | 57,033 | | | | 0.75 | | | | 0.75 | | | | 0.18 | | | | 191 | |
| | 5.24 | | | | (28.42 | ) | | | 75,389 | | | | 0.66 | | | | 0.66 | | | | 0.11 | | | | 179 | |
| | 7.32 | | | | 20.39 | | | | 124,663 | | | | 0.67 | | | | 0.67 | | | | (0.02 | ) | | | 134 | |
| (e) | The investment adviser and/or administrator agreed to waive its fees and/or reimburse a portion of the Fund’s expenses during the period. Without this waiver/reimbursement, if applicable, expenses would have been higher. |
| (f) | Computed on an annualized basis for periods less than one year, if applicable. |
| (g) | For the six months ended March 31, 2012 (Unaudited). |
| (h) | Includes fee/expense recovery of less than 0.01% and 0.08% for Class A and Class B shares, respectively. |
| (i) | Effective February 1, 2010, the expense limit increased to 1.00% for Class Y shares. |
See accompanying notes to financial statements.
| 58
Financial Highlights (continued)
For a share outstanding throughout each period
| | | | | | | | | | | | | | | | | | | | | | | | | | | | |
| | | | | | Income (Loss) from Investment
Operations: | | | Less Distributions: | |
| | | Net asset
value,
beginning
of the
period | | | Net
investment
loss (a) | | | Net realized
and
unrealized
gain (loss) | | | Total from
investment
operations | | | Dividends
from net
investment
income | | | Distributions
from net
realized
capital
gains | | | Total
distributions | |
MID CAP GROWTH FUND | | | | | | | | | | | | | | | | | | | | | | | | | |
Class A* | | | | | | | | | | | | | | | | | | | | | | | | | | | | |
3/31/2012(f) | | $ | 24.40 | | | $ | (0.08 | ) | | $ | 4.76 | | | $ | 4.68 | | | $ | — | | | $ | — | | | $ | — | |
9/30/2011 | | | 23.76 | | | | (0.23 | )(g) | | | 0.87 | | | | 0.64 | | | | — | | | | — | | | | — | |
9/30/2010 | | | 18.29 | | | | (0.09 | )(i) | | | 5.56 | | | | 5.47 | | | | — | | | | — | | | | — | |
9/30/2009 | | | 21.12 | | | | (0.07 | )(j) | | | (2.76 | ) | | | (2.83 | ) | | | — | | | | — | | | | — | |
9/30/2008 | | | 26.84 | | | | (0.15 | ) | | | (5.57 | ) | | | (5.72 | ) | | | — | | | | — | | | | — | |
9/30/2007 | | | 19.69 | | | | (0.16 | )(k) | | | 7.31 | | | | 7.15 | | | | — | | | | — | | | | — | |
Class C | | | | | | | | | | | | | | | | | | | | | | | | | | | | |
3/31/2012(f) | | | 23.93 | | | | (0.17 | ) | | | 4.66 | | | | 4.49 | | | | — | | | | — | | | | — | |
9/30/2011 | | | 23.47 | | | | (0.45 | )(g) | | | 0.91 | | | | 0.46 | | | | — | | | | — | | | | — | |
9/30/2010 | | | 18.20 | | | | (0.18 | )(i) | | | 5.45 | | | | 5.27 | | | | — | | | | — | | | | — | |
9/30/2009** | | | 15.13 | | | | (0.16 | ) | | | 3.23 | | | | 3.07 | | | | — | | | | — | | | | — | |
Class Y* | | | | | | | | | | | | | | | | | | | | | | | | | | | | |
3/31/2012(f) | | | 25.27 | | | | (0.05 | ) | | | 4.93 | | | | 4.88 | | | | — | | | | — | | | | — | |
9/30/2011 | | | 24.53 | | | | (0.17 | )(g) | | | 0.91 | | | | 0.74 | | | | — | | | | — | | | | — | |
9/30/2010 | | | 18.84 | | | | (0.07 | )(i) | | | 5.76 | | | | 5.69 | | | | — | | | | — | | | | — | |
9/30/2009 | | | 21.70 | | | | (0.05 | )(j) | | | (2.81 | ) | | | (2.86 | ) | | | — | | | | — | | | | — | |
9/30/2008 | | | 27.51 | | | | (0.10 | ) | | | (5.71 | ) | | | (5.81 | ) | | | — | | | | — | | | | — | |
9/30/2007 | | | 20.13 | | | | (0.11 | )(k) | | | 7.49 | | | | 7.38 | | | | — | | | | — | | | | — | |
| * | Prior to the close of business on February 2, 2009, the Fund offered Retail and Institutional Class shares, which were redesignated as Class A and Class Y shares, respectively, on that date. |
| ** | From commencement of Class operations on February 2, 2009 through September 30, 2009. |
| (a) | Per share net investment loss has been calculated using the average shares outstanding during the period. |
| (b) | Had certain expenses not been waived/reimbursed during the period, if applicable, total returns would have been lower. |
| (c) | A sales charge for Class A shares and a contingent deferred sales charge for Class C shares are not reflected in total return calculations. Periods less than one year, if applicable, are not annualized. |
| (d) | The investment adviser and/or administrator agreed to waive its fees and/or reimburse a portion of the Fund’s expenses during the period. Without this waiver/reimbursement, if applicable, expenses would have been higher. |
| (e) | Computed on an annualized basis for periods less than one year, if applicable. |
| (f) | For the six months ended March 31, 2012 (Unaudited). |
| (g) | Includes a non-recurring dividend. Without this dividend, net investment loss per share would have been $(0.27), $(0.47) and $(0.20) for Class A, Class C and Class Y shares, respectively, total return would have been 2.53%, 1.79% and 2.81% for Class A, Class C and Class Y shares, respectively, and the ratio of net investment loss to average net assets would have been (0.96)%, (1.68)% and (0.70)% for Class A, Class C and Class Y shares, respectively. |
See accompanying notes to financial statements.
59 |
| | | | | | | | | | | | | | | | | | | | | | | | | | |
| | | | | | | | | |
Ratios to Average Net Assets: | | | | |
Net asset
value,
end of
the period | | | Total
return
(%) (b)(c) | | |
Net assets,
end of
the period
(000’s) | | | Net
expenses
(%) (d)(e) | | | Gross
expenses
(%) (e) | | | Net investment
loss
(%) (e) | | | Portfolio
turnover
rate (%) | |
| | | | | | | | | | | | | | | | | | | | | | | | | | |
| | | | | | | | | | | | | | | | | | | | | | | | | | |
| $ | 29.08 | | | | 19.23 | | | $ | 45,708 | | | | 1.25 | | | | 1.37 | | | | (0.57 | ) | | | 119 | |
| | 24.40 | | | | 2.65 | (g) | | | 49,177 | | | | 1.25 | (h) | | | 1.32 | | | | (0.81 | )(g) | | | 204 | |
| | 23.76 | | | | 29.91 | | | | 67,639 | | | | 1.25 | | | | 1.46 | | | | (0.45 | )(i) | | | 191 | |
| | 18.29 | | | | (13.44 | ) | | | 54,951 | | | | 1.25 | | | | 1.52 | | | | (0.45 | )(j) | | | 292 | |
| | 21.12 | | | | (21.27 | ) | | | 120,524 | | | | 1.25 | | | | 1.32 | | | | (0.58 | ) | | | 299 | |
| | 26.84 | | | | 36.31 | | | | 30,654 | | | | 1.25 | | | | 1.43 | | | | (0.71 | ) | | | 194 | |
| | | | | | | | | | | | | | | | | | | | | | | | | | |
| | 28.42 | | | | 18.76 | | | | 2,889 | | | | 2.00 | | | | 2.12 | | | | (1.29 | ) | | | 119 | |
| | 23.93 | | | | 1.96 | (g) | | | 2,182 | | | | 2.01 | (h) | | | 2.08 | | | | (1.63 | )(g) | | | 204 | |
| | 23.47 | | | | 28.96 | | | | 34 | | | | 2.00 | | | | 2.24 | | | | (0.89 | )(i) | | | 191 | |
| | 18.20 | | | | 20.29 | | | | 1 | | | | 2.00 | | | | 2.24 | | | | (1.54 | ) | | | 292 | |
| | | | | | | | | | | | | | | | | | | | | | | | | | |
| | 30.15 | | | | 19.36 | | | | 63,105 | | | | 1.00 | | | | 1.12 | | | | (0.33 | ) | | | 119 | |
| | 25.27 | | | | 2.98 | (g) | | | 50,406 | | | | 1.00 | (h) | | | 1.07 | | | | (0.58 | )(g) | | | 204 | |
| | 24.53 | | | | 30.20 | | | | 33,757 | | | | 1.00 | | | | 1.22 | | | | (0.34 | )(i) | | | 191 | |
| | 18.84 | | | | (13.18 | ) | | | 27,057 | | | | 1.00 | | | | 1.12 | | | | (0.27 | )(j) | | | 292 | |
| | 21.70 | | | | (21.12 | ) | | | 25,779 | | | | 1.00 | (l) | | | 1.00 | (l) | | | (0.36 | ) | | | 299 | |
| | 27.51 | | | | 36.66 | | | | 24,143 | | | | 1.00 | | | | 1.10 | | | | (0.47 | ) | | | 194 | |
| (h) | Includes interest expense from bank overdraft charges of 0.01% for Class C and less than 0.01% for Classes A and Y. Without this expense the ratio of net expenses for Class C would have been 2.00%. |
| (i) | Includes a non-recurring dividend. Without this dividend, net investment loss per share would have been $(0.21), $(0.36) and $(0.16) for Class A, Class C and Class Y shares, respectively, and the ratio of net investment loss to average net assets would have been (1.02)%, (1.74)% and (0.76)% for Class A, Class C and Class Y shares, respectively. |
| (j) | Includes a non-recurring dividend of $0.03 per share. Without this dividend, net investment loss per share would have been $(0.10) and $(0.08) for Class A and Class Y shares, respectively, and the ratio of net investment loss to average net assets would have been (0.63)% and (0.46)% for Class A and Class Y shares, respectively. |
| (k) | Includes a non-recurring dividend of $0.02 per share. |
| (l) | Includes fee/expense recovery of less than 0.01%. |
See accompanying notes to financial statements.
| 60
Financial Highlights (continued)
For a share outstanding throughout each period.
| | | | | | | | | | | | | | | | | | | | | | | | | | | | |
| | | | | | Income (Loss) from Investment
Operations: | | | Less Distributions: | |
| | | Net asset
value,
beginning
of the
period | | | Net
investment
income
(a)(b) | | | Net realized
and
unrealized
gain (loss) | | | Total from
investment
operations | | | Dividends
from net
investment
income | | | Distributions
from net
realized
capital
gains | | | Total
distributions | |
VALUE FUND | | | | | | | | | | | | | | | | | | | | | | | | | | | | |
Class A* | | | | | | | | | | | | | | | | | | | | | | | | | | | | |
3/31/2012(g) | | $ | 16.04 | | | $ | 0.14 | | | $ | 4.00 | | | $ | 4.14 | | | $ | (0.23 | ) | | $ | — | | | $ | (0.23 | ) |
9/30/2011 | | | 16.78 | | | | 0.20 | | | | (0.72 | ) | | | (0.52 | ) | | | (0.22 | ) | | | — | | | | (0.22 | ) |
9/30/2010 | | | 16.42 | | | | 0.27 | (h) | | | 0.23 | | | | 0.50 | | | | (0.14 | ) | | | — | | | | (0.14 | ) |
9/30/2009 | | | 17.93 | | | | 0.23 | | | | (1.53 | ) | | | (1.30 | ) | | | (0.21 | ) | | | — | | | | (0.21 | ) |
9/30/2008 | | | 23.46 | | | | 0.25 | | | | (4.45 | ) | | | (4.20 | ) | | | (0.18 | ) | | | (1.15 | ) | | | (1.33 | ) |
9/30/2007 | | | 21.04 | | | | 0.19 | | | | 3.27 | | | | 3.46 | | | | (0.13 | ) | | | (0.91 | ) | | | (1.04 | ) |
Class B | | | | | | | | | | | | | | | | | | | | | | | | | | | | |
3/31/2012(g) | | | 16.05 | | | | 0.08 | | | | 4.01 | | | | 4.09 | | | | (0.04 | ) | | | — | | | | (0.04 | ) |
9/30/2011 | | | 16.77 | | | | 0.06 | | | | (0.73 | ) | | | (0.67 | ) | | | (0.05 | ) | | | — | | | | (0.05 | ) |
9/30/2010 | | | 16.40 | | | | 0.12 | (h) | | | 0.25 | | | | 0.37 | | | | — | | | | — | | | | — | |
9/30/2009 | | | 17.80 | | | | 0.14 | | | | (1.51 | ) | | | (1.37 | ) | | | (0.03 | ) | | | — | | | | (0.03 | ) |
9/30/2008 | | | 23.46 | | | | 0.10 | | | | (4.45 | ) | | | (4.35 | ) | | | (0.16 | ) | | | (1.15 | ) | | | (1.31 | ) |
9/30/2007** | | | 24.00 | | | | 0.00 | | | | (0.54 | ) | | | (0.54 | ) | | | — | | | | — | | | | — | |
Class C | | | | | | | | | | | | | | | | | | | | | | | | | | | | |
3/31/2012(g) | | | 15.85 | | | | 0.07 | | | | 3.97 | | | | 4.04 | | | | (0.07 | ) | | | — | | | | (0.07 | ) |
9/30/2011 | | | 16.58 | | | | 0.06 | | | | (0.71 | ) | | | (0.65 | ) | | | (0.08 | ) | | | — | | | | (0.08 | ) |
9/30/2010 | | | 16.26 | | | | 0.14 | (h) | | | 0.22 | | | | 0.36 | | | | (0.04 | ) | | | — | | | | (0.04 | ) |
9/30/2009 | | | 17.79 | | | | 0.12 | | | | (1.51 | ) | | | (1.39 | ) | | | (0.14 | ) | | | — | | | | (0.14 | ) |
9/30/2008 | | | 23.46 | | | | 0.09 | | | | (4.43 | ) | | | (4.34 | ) | | | (0.18 | ) | | | (1.15 | ) | | | (1.33 | ) |
9/30/2007** | | | 24.00 | | | | 0.01 | | | | (0.55 | ) | | | (0.54 | ) | | | — | | | | — | | | | — | |
Class Y* | | | | | | | | | | | | | | | | | | | | | | | | | | | | |
3/31/2012(g) | | | 16.08 | | | | 0.17 | | | | 3.99 | | | | 4.16 | | | | (0.27 | ) | | | — | | | | (0.27 | ) |
9/30/2011 | | | 16.82 | | | | 0.25 | | | | (0.73 | ) | | | (0.48 | ) | | | (0.26 | ) | | | — | | | | (0.26 | ) |
9/30/2010 | | | 16.47 | | | | 0.31 | (h) | | | 0.23 | | | | 0.54 | | | | (0.19 | ) | | | — | | | | (0.19 | ) |
9/30/2009 | | | 18.01 | | | | 0.28 | | | | (1.54 | ) | | | (1.26 | ) | | | (0.28 | ) | | | — | | | | (0.28 | ) |
9/30/2008 | | | 23.54 | | | | 0.32 | | | | (4.45 | ) | | | (4.13 | ) | | | (0.25 | ) | | | (1.15 | ) | | | (1.40 | ) |
9/30/2007 | | | 21.05 | | | | 0.27 | | | | 3.27 | | | | 3.54 | | | | (0.14 | ) | | | (0.91 | ) | | | (1.05 | ) |
Admin Class | | | | | | | | | | | | | | | | | | | | | | | | | | | | |
3/31/2012(g) | | | 16.00 | | | | 0.12 | | | | 3.98 | | | | 4.10 | | | | (0.20 | ) | | | — | | | | (0.20 | ) |
9/30/2011 | | | 16.74 | | | | 0.17 | | | | (0.73 | ) | | | (0.56 | ) | | | (0.18 | ) | | | — | | | | (0.18 | ) |
9/30/2010*** | | | 16.72 | | | | 0.18 | (h) | | | (0.16 | ) | | | 0.02 | | | | — | | | | — | | | | — | |
| * | Prior to the close of business on June 1, 2007, the Fund offered Retail and Institutional Class shares, which were redesignated as Class A and Class Y shares, respectively, on that date. |
| ** | From commencement of Class operations on June 1, 2007, through September 30, 2007. |
| *** | From commencement of Class operations on February 1, 2010 through September 30, 2010. |
| (a) | Per share net investment income has been calculated using the average shares outstanding during the period. |
| (b) | Amount rounds to less than $0.01 per share, if applicable. |
| (c) | Had certain expenses not been waived/reimbursed during the period, if applicable, total returns would have been lower. |
| (d) | A sales charge for Class A shares and a contingent deferred sales charge for Class B and Class C shares are not reflected in total return calculations. Periods less than one year, if applicable, are not annualized. |
See accompanying notes to financial statements.
61 |
| | | | | | | | | | | | | | | | | | | | | | | | | | |
| | | | |
| | | | | | | | | | Ratios to Average Net Assets: | | | | |
Net asset
value,
end of
the period | | | Total
return
(%) (c)(d) | | | Net assets,
end of
the period
(000’s) | | | Net
expenses
(%) (e)(f) | | | Gross
expenses
(%) (f) | | | Net investment
income
(%) (f) | | | Portfolio
turnover
rate (%) | |
| | | | | | | | | | | | | | | | | | | | | | | | | | |
| | | | | | | | | | | | | | | | | | | | | | | | | | |
| $ | 19.95 | | | | 25.96 | | | $ | 136,305 | | | | 0.98 | | | | 0.98 | | | | 1.57 | | | | 10 | |
| | 16.04 | | | | (3.28 | ) | | | 126,789 | | | | 0.98 | | | | 0.98 | | | | 1.09 | | | | 29 | |
| | 16.78 | | | | 3.03 | | | | 130,922 | | | | 0.96 | | | | 0.96 | | | | 1.58 | (h) | | | 54 | |
| | 16.42 | | | | (6.97 | ) | | | 120,915 | | | | 1.06 | | | | 1.06 | | | | 1.67 | | | | 47 | |
| | 17.93 | | | | (19.01 | ) | | | 112,274 | | | | 1.05 | | | | 1.05 | | | | 1.24 | | | | 36 | (i) |
| | 23.46 | | | | 16.85 | | | | 17,500 | | | | 1.09 | (j) | | | 1.09 | (j) | | | 0.79 | | | | 41 | |
| | | | | | | | | | | | | | | | | | | | | | | | | | |
| | 20.10 | | | | 25.49 | | | | 2,009 | | | | 1.73 | | | | 1.73 | | | | 0.82 | | | | 10 | |
| | 16.05 | | | | (4.05 | ) | | | 2,037 | | | | 1.73 | | | | 1.73 | | | | 0.32 | | | | 29 | |
| | 16.77 | | | | 2.26 | | | | 3,299 | | | | 1.70 | | | | 1.70 | | | | 0.72 | (h) | | | 54 | |
| | 16.40 | | | | (7.62 | ) | | | 5,167 | | | | 1.81 | | | | 1.81 | | | | 1.03 | | | | 47 | |
| | 17.80 | | | | (19.65 | ) | | | 8,385 | | | | 1.80 | (k) | | | 1.80 | (k) | | | 0.51 | | | | 36 | (i) |
| | 23.46 | | | | (2.25 | ) | | | 108 | | | | 1.85 | | | | 1.89 | | | | 0.03 | | | | 41 | |
| | | | | | | | | | | | | | | | | | | | | | | | | | |
| | 19.82 | | | | 25.52 | | | | 9,920 | | | | 1.73 | | | | 1.73 | | | | 0.82 | | | | 10 | |
| | 15.85 | | | | (4.00 | ) | | | 8,996 | | | | 1.73 | | | | 1.73 | | | | 0.33 | | | | 29 | |
| | 16.58 | | | | 2.20 | | | | 10,226 | | | | 1.71 | | | | 1.71 | | | | 0.81 | (h) | | | 54 | |
| | 16.26 | | | | (7.60 | ) | | | 10,011 | | | | 1.81 | | | | 1.81 | | | | 0.89 | | | | 47 | |
| | 17.79 | | | | (19.62 | ) | | | 6,483 | | | | 1.80 | (k) | | | 1.80 | (k) | | | 0.46 | | | | 36 | (i) |
| | 23.46 | | | | (2.25 | ) | | | 1,390 | | | | 1.85 | | | | 1.94 | | | | 0.10 | | | | 41 | |
| | | | | | | | | | | | | | | | | | | | | | | | | | |
| | 19.97 | | | | 26.12 | | | | 1,197,778 | | | | 0.73 | | | | 0.73 | | | | 1.82 | | | | 10 | |
| | 16.08 | | | | (3.05 | ) | | | 957,584 | | | | 0.74 | | | | 0.74 | | | | 1.34 | | | | 29 | |
| | 16.82 | | | | 3.28 | | | | 788,937 | | | | 0.71 | | | | 0.71 | | | | 1.86 | (h) | | | 54 | |
| | 16.47 | | | | (6.66 | ) | | | 574,439 | | | | 0.66 | | | | 0.66 | | | | 1.97 | | | | 47 | |
| | 18.01 | | | | (18.67 | ) | | | 303,182 | | | | 0.65 | | | | 0.66 | | | | 1.58 | | | | 36 | (i) |
| | 23.54 | | | | 17.25 | | | | 182,002 | | | | 0.72 | (j) | | | 0.72 | (j) | | | 1.19 | | | | 41 | |
| | | | | | | | | | | | | | | | | | | | | | | | | | |
| | 19.90 | | | | 25.80 | | | | 2 | | | | 1.27 | | | | 1.27 | | | | 1.30 | | | | 10 | |
| | 16.00 | | | | (3.48 | ) | | | 1 | | | | 1.17 | | | | 1.17 | | | | 0.90 | | | | 29 | |
| | 16.74 | | | | 0.12 | | | | 1 | | | | 1.29 | | | | 1.29 | | | | 1.59 | (h) | | | 54 | |
| (e) | The investment adviser and/or administrator agreed to waive its fees and/or reimburse a portion of the Fund’s expenses during the period. Without this waiver/reimbursement, if applicable, expenses would have been higher. |
| (f) | Computed on an annualized basis for periods less than one year, if applicable. |
| (g) | For the six months ended March 31, 2012 (Unaudited). |
| (h) | Includes a non-recurring dividend. Without this dividend, net investment income per share would have been $0.14, $0.02, $0.01, $0.18 and $0.05 for Class A, Class B, Class C, Class Y and Admin Class shares, respectively, and the ratio of net investment income to average net assets would have been 0.84%, 0.10%, 0.09%, 1.08% and 0.50% for Class A, Class B, Class C, Class Y and Admin Class shares, respectively. |
| (i) | Portfolio turnover excludes the impact of assets resulting from a merger with another fund. |
| (j) | Includes fee/expense recovery of 0.02% and 0.01% for Class A and Class Y shares, respectively. |
| (k) | Includes fee/expense recovery of less than 0.01% for Class B and Class C shares. |
See accompanying notes to financial statements.
| 62
Notes to Financial Statements
March 31, 2012 (Unaudited)
1. Organization. Loomis Sayles Funds II (the “Trust”) is organized as a Massachusetts business trust. The Trust is registered under the Investment Company Act of 1940, as amended (the “1940 Act”), as an open-end management investment company. The Declaration of Trust permits the Board of Trustees to authorize the issuance of an unlimited number of shares of the Trust in multiple series. The financial statements for certain funds of the Trust are presented in separate reports. The following funds (individually, a “Fund” and collectively, the “Funds”) are included in this report:
Loomis Sayles Global Equity and Income Fund (the “Global Equity and Income Fund”)
Loomis Sayles Growth Fund (the “Growth Fund”)
Loomis Sayles Mid Cap Growth Fund (the “Mid Cap Growth Fund”)
Loomis Sayles Value Fund (the “Value Fund”)
Each Fund is a diversified investment company.
Effective January 1, 2012, the name of the Funds’ administrator changed from Natixis Asset Management Advisors, L.P. to NGAM Advisors, L.P. (“NGAM Advisors”) and the name of the Funds’ distributor changed from Natixis Distributors, L.P. to NGAM Distribution, L.P. (“NGAM Distribution”).
Each Fund offers Class A, Class C and Class Y shares. In addition, Value Fund offers Admin Class shares. Effective October 12, 2007, Class B shares are no longer offered. Existing Class B shareholders of Growth Fund and Value Fund may continue to reinvest dividends into Class B shares and exchange their Class B shares for Class B shares of other Natixis Funds subject to existing exchange privileges as described in the prospectus.
Class A shares are sold with a maximum front-end sales charge of 5.75%. Class B shares do not pay a front-end sales charge; however, they are charged higher Rule 12b-1 fees, and are subject to a contingent deferred sales charge (“CDSC”) if such shares are redeemed within six years of purchase. After eight years of ownership, Class B shares convert to Class A shares. Class C shares do not pay a front-end sales charge, do not convert to any other class of shares, pay higher Rule 12b-1 fees than Class A shares and may be subject to a CDSC of 1.00% if those shares are redeemed within one year of acquisition, except for reinvested distributions. Class Y shares do not pay a front-end sales charge, a CDSC or Rule 12b-1 fees. Class Y shares are generally intended for institutional investors with a minimum initial investment of $100,000, though some categories of investors are exempted from the minimum investment amount as outlined in the Funds’ prospectus. Admin Class shares do not pay a front-end sales charge or a CDSC, but do pay a Rule 12b-1 fee. Admin Class shares are offered exclusively through intermediaries.
Most expenses of the Trust can be directly attributed to a Fund. Expenses which can not be directly attributed to a Fund are generally apportioned based on the relative net assets of each of the funds in the Trust. Expenses of a Fund are borne pro rata by the
63 |
Notes to Financial Statements (continued)
March 31, 2012 (Unaudited)
holders of each class of shares, except that each class bears expenses unique to that class (including the Rule 12b-1 service and distribution fees). In addition, each class votes as a class only with respect to its own Rule 12b-1 Plan. Shares of each class would receive their pro rata share of the net assets of a Fund if the Fund were liquidated. The Trustees approve separate distributions from net investment income on each class of shares.
2. Significant Accounting Policies. The following is a summary of significant accounting policies consistently followed by each Fund in the preparation of its financial statements. The Funds’ financial statements are prepared in accordance with accounting principles generally accepted in the United States of America which require the use of management estimates that affect the reported amounts and disclosures in the financial statements. Actual results could differ from those estimates. Management has evaluated the events and transactions subsequent to period-end through the date the financial statements were issued and has determined that there were no material events that would require disclosure in the Funds’ financial statements.
a. Valuation. Equity securities, including shares of closed-end investment companies and exchange-traded funds, for which market quotations are readily available are valued at market value, as reported by independent pricing services recommended by the investment adviser and approved by the Board of Trustees. Such independent pricing services generally use the security’s last sale price on the exchange or market where the security is primarily traded or, if there is no reported sale during the day, the closing bid price. Securities traded on the NASDAQ Global Select Market, NASDAQ Global Market and NASDAQ Capital Market are valued at the NASDAQ Official Closing Price (“NOCP”), or if lacking a NOCP, at the most recent bid quotation on the applicable NASDAQ Market. Debt securities (other than short-term obligations purchased with an original or remaining maturity of sixty days or less) and unlisted equity securities are generally valued on the basis of evaluated bids furnished to the Fund by an independent pricing service recommended by the investment adviser and approved by the Board of Trustees, which service determines valuations for normal, institutional-size trading units of such securities using market information, transactions for comparable securities and various relationships between securities which are generally recognized by institutional traders. Senior loans are priced at bid prices supplied by an independent pricing service, if available. Broker-dealer bid quotations may also be used to value debt and equity securities and senior loans where an independent pricing service is unable to price a security or where an independent pricing service does not provide a reliable price for the security. Forward foreign currency contracts are valued utilizing interpolated prices determined from information provided by an independent pricing service. Domestic exchange-traded single equity option contracts are valued at the mean of the National Best Bid and Offer quotations. Investments in other open-end investment companies are valued at their net asset value each day. Short-term obligations purchased with an original or remaining maturity of sixty days or less are
| 64
Notes to Financial Statements (continued)
March 31, 2012 (Unaudited)
valued at amortized cost, which approximates market value. Securities for which market quotations are not readily available are valued at fair value as determined in good faith by the Funds’ investment adviser using consistently applied procedures under the general supervision of the Board of Trustees.
The Funds may hold securities traded in foreign markets. Foreign securities are valued at the market price in the foreign market. However, if events occurring after the close of the foreign market (but before the close of regular trading on the New York Stock Exchange) are believed to materially affect the value of those securities, such securities are fair valued pursuant to procedures approved by the Board of Trustees. When fair valuing securities, the Funds may, among other things, use modeling tools or other processes that may take into account factors such as securities market activity and/or significant events that occur after the close of the foreign market and before the Funds calculate their net asset values. As of March 31, 2012, approximately 19% of the market value of Global Equity and Income Fund’s investments was fair valued pursuant to procedures approved by the Board of Trustees.
b. Investment Transactions and Related Investment Income. Investment transactions are accounted for on a trade date plus one basis for daily net asset value calculation. However, for financial reporting purposes, investment transactions are reported on trade date. Dividend income is recorded on ex-dividend date, or in the case of certain foreign securities, as soon as a Fund is notified, and interest income is recorded on an accrual basis. Interest income is increased by the accretion of discount and decreased by the amortization of premium. Periodic principal adjustments for inflation-protected securities are recorded to interest income. Investment income is recorded net of foreign taxes withheld when applicable. In determining net gain or loss on securities sold, the cost of securities has been determined on an identified cost basis. Investment income, non-class specific expenses and realized and unrealized gains and losses are allocated on a pro rata basis to each class based on the relative net assets of each class to the total net assets of the Fund.
c. Foreign Currency Translation. The books and records of the Funds are maintained in U.S. dollars. The values of securities, currencies and other assets and liabilities denominated in currencies other than U.S. dollars are translated into U.S. dollars based upon foreign exchange rates prevailing at the end of the period. Purchases and sales of investment securities, income and expenses are translated on the respective dates of such transactions.
Since the values of investment securities are presented at the foreign exchange rates prevailing at the end of the period, it is not practical to isolate that portion of the results of operations arising from changes in exchange rates from fluctuations which arise due to changes in market prices of investment securities. Such changes are included with the net realized and unrealized gain or loss on investments.
65 |
Notes to Financial Statements (continued)
March 31, 2012 (Unaudited)
Net realized foreign exchange gains or losses arise from sales of foreign currency, currency gains or losses realized between the trade and settlement dates on securities transactions and the difference between the amounts of dividends, interest and foreign withholding taxes recorded on the Funds’ books and the U.S. dollar equivalent of the amounts actually received or paid. Net unrealized foreign exchange gains and losses arise from changes in the value of assets and liabilities, other than investment securities, at the end of the fiscal period, resulting from changes in exchange rates.
Each Fund may use foreign currency exchange contracts to facilitate transactions in foreign-denominated investments. Losses may arise from changes in the value of the foreign currency or if the counterparties do not perform under the contracts’ terms.
d. Forward Foreign Currency Contracts. The Funds may enter into forward foreign currency contracts, including forward foreign cross currency contracts to acquire exposure to foreign currencies or to hedge the Fund’s investments against currency fluctuation. A contract to buy or sell can offset a previous contract. These contracts involve market risk in excess of the unrealized gain or loss reflected in the Funds’ Statements of Assets and Liabilities. The U.S. dollar value of the currencies a Fund has committed to buy or sell represents the aggregate exposure to each currency the Fund has acquired or hedged through currency contracts outstanding at period end. Gains or losses are recorded for financial statement purposes as unrealized until settlement date. Risks may arise upon entering into these contracts from the potential inability of counterparties to meet the terms of their contracts and from unanticipated movements in the value of a foreign currency relative to the U.S. dollar. Certain contracts may require the movement of cash and/or securities as collateral for the Funds’ or counterparty’s net obligations under the contracts.
e. Option Contracts. The Funds may enter into option contracts. When a Fund purchases an option, it pays a premium and the option is subsequently marked to market to reflect current value. Premiums paid for purchasing options which expire are treated as realized losses. Premiums paid for purchasing options which are exercised or closed are added to the cost or deducted from the proceeds on the underlying instrument to determine the realized gain or loss. The risk associated with purchasing options is limited to the premium paid.
When a Fund writes an option, an amount equal to the net premium received (the premium less commission) is recorded as a liability and is subsequently adjusted to the current value. Net premiums received for written options which expire are treated as realized gains. Net premiums received for written options which are exercised or closed are deducted from the cost or added to the proceeds on the underlying instrument or closing purchase transaction to determine the realized gain or loss. The Fund, as writer of a written option, bears the risk of an unfavorable change in the market value of the instrument underlying the written option.
| 66
Notes to Financial Statements (continued)
March 31, 2012 (Unaudited)
Exchange-traded options are standardized contracts and are settled through a clearing house with fulfillment supported by the credit of the exchange. Therefore, counterparty credit risks to the Funds are reduced. Over-the-counter options are subject to the risk that the counterparty is unable or unwilling to meet its obligations under the option. For the six months ended March 31, 2012, the Funds were not party to any over-the-counter options.
f. Federal and Foreign Income Taxes. The Trust treats each Fund as a separate entity for federal income tax purposes. Each Fund intends to meet the requirements of the Internal Revenue Code of 1986, as amended, applicable to regulated investment companies, and to distribute to its shareholders substantially all of its net investment income and any net realized capital gains at least annually. Management has performed an analysis of each Fund’s tax positions for the open tax years as of March 31, 2012 and has concluded that no provisions for income tax are required. The Funds’ federal tax returns for the prior three fiscal years remain subject to examination by the Internal Revenue Service. Management is not aware of any events that are reasonably possible to occur in the next six months that would result in the amounts of any unrecognized tax benefits significantly increasing or decreasing for the Funds. However, management’s conclusions regarding tax positions taken may be subject to review and adjustment at a later date based on factors including, but not limited to, new tax laws and accounting regulations and interpretations thereof.
A Fund may be subject to foreign taxes on income and gains on investments that are accrued based upon the Fund’s understanding of the tax rules and regulations that exist in the countries in which the Fund invests. Foreign governments may also impose taxes or other payments on investments with respect to foreign securities. Such taxes are accrued as applicable, and are reflected as foreign taxes payable on the Statements of Assets and Liabilities. In the event that realized gains on investments are subsequently offset by realized losses, taxes paid on realized gains may be returned to a Fund. Such amounts, if applicable, are reflected as foreign tax rebates receivable on the Statements of Assets and Liabilities.
g. Dividends and Distributions to Shareholders. Dividends and distributions are recorded on ex-dividend date. The timing and characterization of certain income and capital gain distributions are determined annually in accordance with federal tax regulations, which may differ from accounting principles generally accepted in the United States of America. Permanent differences are primarily due to differing treatments for book and tax purposes of items such as net operating losses, paydown gains and losses, foreign currency transactions, gains realized from passive foreign investment companies (“PFICs”), defaulted bonds, premium amortization, deferred Trustees’ fees and expired capital loss carryforwards. Permanent book and tax basis differences relating to shareholder distributions will result in reclassifications to capital accounts. Temporary differences between book and tax distributable earnings are
67 |
Notes to Financial Statements (continued)
March 31, 2012 (Unaudited)
primarily due to deferred Trustees’ fees, forward foreign currency contract mark to market, wash sales, premium amortization, contingent payment debt instruments, basis adjustments for return of capital dividends received and defaulted bond interest. Distributions from net investment income and short-term capital gains are considered to be distributed from ordinary income for tax purposes.
The tax characterization of distributions is determined on an annual basis. The tax character of distributions paid to shareholders during the year ended September 30, 2011 was as follows:
| | | | | | | | | | | | |
| | | 2011 Distributions Paid From: | |
Fund | | Ordinary Income | | | Long-Term Capital Gains | | | Total | |
Global Equity and Income Fund | | $ | 5,609,497 | | | $ | — | | | $ | 5,609,497 | |
Value Fund | | | 16,317,256 | | | | — | | | | 16,317,256 | |
As of September 30, 2011, the capital loss carryforwards were as follows:
| | | | | | | | | | | | | | | | |
| | | Global
Equity and
Income Fund | | | Growth
Fund | | | Mid Cap
Growth
Fund | | | Value
Fund | |
Capital loss carryforward: | | | | | | | | | | | | | | | | |
Short-term: | | | | | | | | | | | | | | | | |
Expires September 30, 2016 | | $ | — | | | $ | (75,866 | ) | | $ | — | | | $ | — | |
Expires September 30, 2017 | | | (13,460,729 | ) | | | (57,062,095 | ) | | | (26,022,721 | ) | | | (1,676,396 | ) |
Expires September 30, 2018 | | | (38,448,993 | ) | | | (34,679,944 | ) | | | (18,569,793 | ) | | | (53,924,716 | ) |
| | | | | | | | | | | | | | | | |
Total capital loss carryforward | | $ | (51,909,722 | ) | | $ | (91,817,905 | ) | | $ | (44,592,514 | ) | | $ | (55,601,112 | ) |
| | | | | | | | | | | | | | | | |
On December 22, 2010, the Regulated Investment Company Modernization Act of 2010 (the “Act”) was enacted. The Act modernizes several of the federal income and excise tax provisions related to RICs, and, with certain exceptions, is effective for taxable years beginning after December 22, 2010. Among the changes made are changes to the capital loss carryforward rules allowing for capital losses to be carried forward indefinitely. Rules in effect previously limited the carryforward period to eight years. Capital loss carryforwards generated in taxable years beginning after the effective date of the Act must be fully used before capital loss carryforwards generated in taxable years prior to effective date of the Act; therefore, under certain circumstances, capital loss carryforwards available as of the report date, if any, may expire unused. Additionally, capital losses realized in taxable years beginning after the effective date of
| 68
Notes to Financial Statements (continued)
March 31, 2012 (Unaudited)
the Act are carried over in the character (short-term or long-term) realized. Rules in effect previously treated all capital loss carryforwards as short-term.
h. Repurchase Agreements. It is each Fund’s policy that the market value of the collateral for repurchase agreements be at least equal to 102% of the repurchase price, including interest. Certain repurchase agreements are tri-party arrangements whereby the collateral is held in a segregated account for the benefit of the Fund and on behalf of the counterparty. Repurchase agreements could involve certain risks in the event of default or insolvency of the counterparty, including possible delays or restrictions upon a Fund’s ability to dispose of the underlying securities.
i. Securities Lending. The Funds have entered into an agreement with State Street Bank and Trust Company (“State Street Bank”), as agent of the Funds, to lend securities to certain designated borrowers. The loans are collateralized with cash or securities in an amount equal to at least 105% or 102% of the market value (including accrued interest) of the loaned international or domestic securities, respectively, when the loan is initiated. Thereafter, the value of the collateral must remain at least 102% of the market value (including accrued interest) of loaned securities for U.S. equities and U.S. corporate debt; at least 105% of the market value (including accrued interest) of loaned securities for non-U.S. equities; and at least 100% of the market value (including accrued interest) of loaned securities for U.S. Government securities, sovereign debt issued by non-U.S. Governments and non-U.S. corporate debt. In the event that the market value of the collateral falls below the required percentages described above, the borrower will deliver additional collateral on the next business day. As with other extensions of credit, the Funds may bear the risk of loss with respect to the investment of the collateral. The Funds invest cash collateral in short-term investments, a portion of the income from which is remitted to the borrowers and the remainder allocated between the Funds and State Street Bank as lending agent.
For the six months ended March 31, 2012, none of the Funds had loaned securities under this agreement.
j. Indemnifications. Under the Trust’s organizational documents, its officers and Trustees are indemnified against certain liabilities arising out of the performance of their duties to the Funds. Additionally, in the normal course of business, the Funds enter into contracts with service providers that contain general indemnification clauses. The Funds’ maximum exposure under these arrangements is unknown as this would involve future claims that may be made against the Funds that have not yet occurred. However, based on experience, the Funds expect the risk of loss to be remote.
3. Fair Value Measurements. In accordance with accounting standards related to fair value measurements and disclosures, the Funds have categorized the inputs utilized in determining the value of each Fund’s assets or liabilities. These inputs are summarized in the three broad levels listed below:
69 |
Notes to Financial Statements (continued)
March 31, 2012 (Unaudited)
| | • | | Level 1 – quoted prices in active markets for identical assets or liabilities; |
| | • | | Level 2 – prices determined using other significant inputs that are observable either directly, or indirectly through corroboration with observable market data (which could include quoted prices for similar assets or liabilities, interest rates, credit risk, etc.); |
| | • | | Level 3 – prices determined using significant unobservable inputs when quoted prices or observable inputs are unavailable such as when there is little or no market activity for an asset or liability (unobservable inputs reflect each Fund’s own assumptions in determining the fair value of assets or liabilities and would be based on the best information available). |
The inputs or methodology used for valuing securities are not necessarily an indication of the risk associated with investing in those securities.
The following is a summary of the inputs used to value the Funds’ investments as of March 31, 2012, at value:
Global Equity and Income Fund
Asset Valuation Inputs
| | | | | | | | | | | | | | | | |
Description | | Level 1 | | | Level 2 | | | Level 3 | | | Total | |
Common Stocks | | | | | | | | | | | | | | | | |
Belgium | | $ | — | | | $ | 12,411,404 | | | $ | — | | | $ | 12,411,404 | |
China | | | 14,714,315 | | | | 5,131,393 | | | | — | | | | 19,845,708 | |
Denmark | | | — | | | | 12,958,103 | | | | — | | | | 12,958,103 | |
France | | | — | | | | 11,300,894 | | | | — | | | | 11,300,894 | |
Germany | | | — | | | | 6,340,163 | | | | — | | | | 6,340,163 | |
Hong Kong | | | — | | | | 3,843,703 | | | | — | | | | 3,843,703 | |
Japan | | | — | | | | 10,137,918 | | | | — | | | | 10,137,918 | |
Korea | | | — | | | | 5,477,870 | | | | — | | | | 5,477,870 | |
Russia | | | — | | | | 4,974,009 | | | | — | | | | 4,974,009 | |
Sweden | | | — | | | | 14,631,655 | | | | — | | | | 14,631,655 | |
United Kingdom | | | 8,866,325 | | | | 56,089,697 | | | | — | | | | 64,956,022 | |
All Other Common Stocks(a) | | | 309,075,518 | | | | — | | | | — | | | | 309,075,518 | |
| | | | | | | | | | | | | | | | |
Total Common Stocks | | | 332,656,158 | | | | 143,296,809 | | | | — | | | | 475,952,967 | |
| | | | | | | | | | | | | | | | |
| 70
Notes to Financial Statements (continued)
March 31, 2012 (Unaudited)
Global Equity and Income Fund (continued).
| | | | | | | | | | | | | | | | |
Description | | Level 1 | | | Level 2 | | | Level 3 | | | Total | |
Bonds and Notes | | | | | | | | | | | | | | | | |
Non-Convertible Bonds | | | | | | | | | | | | | | | | |
Korea | | $ | — | | | $ | 3,827,662 | | | $ | 364,463 | | | $ | 4,192,125 | |
Panama | | | — | | | | — | | | | 299,625 | | | | 299,625 | |
United States | | | 35,004 | | | | 115,078,942 | | | | — | | | | 115,113,946 | |
All Other Non-Convertible Bonds(a) | | | — | | | | 52,863,339 | | | | — | | | | 52,863,339 | |
| | | | | | | | | | | | | | | | |
Total Non-Convertible Bonds | | | 35,004 | | | | 171,769,943 | | | | 664,088 | | | | 172,469,035 | |
| | | | | | | | | | | | | | | | |
Convertible Bonds(a) | | | — | | | | 7,173,744 | | | | — | | | | 7,173,744 | |
Municipals(a) | | | — | | | | 477,300 | | | | — | | | | 477,300 | |
| | | | | | | | | | | | | | | | |
Total Bonds and Notes | | | 35,004 | | | | 179,420,987 | | | | 664,088 | | | | 180,120,079 | |
| | | | | | | | | | | | | | | | |
Senior Loans(a) | | | — | | | | 1,302,577 | | | | — | | | | 1,302,577 | |
Preferred Stocks | | | | | | | | | | | | | | | | |
Convertible Preferred Stocks(a) | | | 3,671,917 | | | | — | | | | — | | | | 3,671,917 | |
Non-Convertible Preferred Stock(a) | | | — | | | | 568,170 | | | | — | | | | 568,170 | |
| | | | | | | | | | | | | | | | |
Total Preferred Stocks | | | 3,671,917 | | | | 568,170 | | | | — | | | | 4,240,087 | |
| | | | | | | | | | | | | | | | |
Short-Term Investments | | | — | | | | 61,129,125 | | | | — | | | | 61,129,125 | |
| | | | | | | | | | | | | | | | |
Total Investments | | | 336,363,079 | | | | 385,717,668 | | | | 664,088 | | | | 722,744,835 | |
| | | | | | | | | | | | | | | | |
Forward Foreign Currency Contracts (unrealized appreciation) | | | — | | | | 53,155 | | | | — | | | | 53,155 | |
| | | | | | | | | | | | | | | | |
Total | | $ | 336,363,079 | | | $ | 385,770,823 | | | $ | 664,088 | | | $ | 722,797,990 | |
| | | | | | | | | | | | | | | | |
| | | | |
| Liability Valuation Inputs | | | | | | | | | | | | | | | | |
| | | | |
Description | | Level 1 | | | Level 2 | | | Level 3 | | | Total | |
Forward Foreign Currency Contracts (unrealized depreciation) | | $ | — | | | $ | (14,088 | ) | | $ | — | | | $ | (14,088 | ) |
| | | | | | | | | | | | | | | | |
| (a) | Details of the major categories of the Fund’s investments are reflected within the Portfolio of Investments. |
71 |
Notes to Financial Statements (continued)
March 31, 2012 (Unaudited)
Growth Fund
Asset Valuation Inputs
| | | | | | | | | | | | | | | | |
Description | | Level 1 | | | Level 2 | | | Level 3 | | | Total | |
Common Stocks(a) | | $ | 133,562,345 | | | $ | — | | | $ | — | | | $ | 133,562,345 | |
Short-Term Investments | | | — | | | | 1,529,691 | | | | — | | | | 1,529,691 | |
| | | | | | | | | | | | | | | | |
Total | | $ | 133,562,345 | | | $ | 1,529,691 | | | $ | — | | | $ | 135,092,036 | |
| | | | | | | | | | | | | | | | |
| (a) | Details of the major categories of the Fund’s investments are reflected within the Portfolio of Investments. |
For the six months ended March 31, 2012, there were no transfers between Levels 1, 2 and 3.
Mid Cap Growth Fund
Asset Valuation Inputs
| | | | | | | | | | | | | | | | |
Description | | Level 1 | | | Level 2 | | | Level 3 | | | Total | |
Common Stocks(a) | | $ | 108,115,501 | | | $ | — | | | $ | — | | | $ | 108,115,501 | |
Purchased Options | | | 31,570 | | | | — | | | | — | | | | 31,570 | |
Short-Term Investments | | | — | | | | 4,131,240 | | | | — | | | | 4,131,240 | |
| | | | | | | | | | | | | | | | |
Total | | $ | 108,147,071 | | | $ | 4,131,240 | | | $ | — | | | $ | 112,278,311 | |
| | | | | | | | | | | | | | | | |
| (a) | Details of the major categories of the Fund’s investments are reflected within the Portfolio of Investments. |
For the six months ended March 31, 2012, there were no transfers between Levels 1, 2 and 3.
Value Fund
Asset Valuation Inputs
| | | | | | | | | | | | | | | | |
Description | | Level 1 | | | Level 2 | | | Level 3 | | | Total | |
Common Stocks(a) | | $ | 1,324,266,242 | | | $ | — | | | $ | — | | | $ | 1,324,266,242 | |
Short-Term Investments | | | — | | | | 19,736,726 | | | | — | | | | 19,736,726 | |
| | | | | | | | | | | | | | | | |
Total | | $ | 1,324,266,242 | | | $ | 19,736,726 | | | $ | — | | | $ | 1,344,002,968 | |
| | | | | | | | | | | | | | | | |
| (a) | Details of the major categories of the Fund’s investments are reflected within the Portfolio of Investments. |
For the six months ended March 31, 2012, there were no transfers between Levels 1, 2 and 3.
| 72
Notes to Financial Statements (continued)
March 31, 2012 (Unaudited)
The following is a reconciliation of Level 3 investments for which significant unobservable inputs were used to determine fair values as of March 31, 2012:
Global Equity and Income Fund
Asset Valuation Inputs
| | | | | | | | | | | | | | | | | | | | |
Investments in Securities | | Balance as of
September 30,
2011 | | | Accrued
Discounts
(Premiums) | | | Realized
Gain
(Loss) | | | Change in
Unrealized
Appreciation
(Depreciation) | | | Purchases | |
Bonds and Notes | | | | | | | | | | | | | | | | | | | | |
Non-Convertible Bonds | | | | | | | | | | | | | | | | | | | | |
Korea | | $ | 351,758 | | | $ | (341 | ) | | $ | — | | | $ | 13,046 | | | $ | — | |
Panama | | | — | | | | — | | | | — | | | | 1,812 | | | | 297,813 | |
Supranationals | | | 983,784 | | | | 229 | | | | (168,909 | ) | | | 60,153 | | | | — | |
United States | | | 10,000 | | | | 688 | | | | (22,068 | ) | | | 24,480 | | | | — | |
Preferred Stocks | | | | | | | | | | | | | | | | | | | | |
Non-Convertible Preferred Stocks | | | | | | | | | | | | | | | | | | | | |
United States | | | 409,200 | | | | — | | | | — | | | | — | | | | — | |
| | | | | | | | | | | | | | | | | | | | |
Total | | $ | 1,754,742 | | | $ | 576 | | | $ | (190,977 | ) | | $ | 99,491 | | | $ | 297,813 | |
| | | | | | | | | | | | | | | | | | | | |
73 |
Notes to Financial Statements (continued)
March 31, 2012 (Unaudited)
| | | | | | | | | | | | | | | | | | | | |
Investments in Securities | | Sales | | | Transfers
into
Level 3 | | | Transfers
out of
Level 3 | | | Balance as of
March 31,
2012 | | | Change in
Unrealized
Appreciation
(Depreciation)
from
Investments
Still Held at
March 31,
2012 | |
Bonds and Notes | | | | | | | | | | | | | | | | | | | | |
Non-Convertible Bonds | | | | | | | | | | | | | | | | | | | | |
Korea | | $ | — | | | $ | — | | | $ | — | | | $ | 364,463 | | | $ | 13,046 | |
Panama | | | — | | | | — | | | | — | | | | 299,625 | | | | 1,812 | |
Supranationals | | | (875,257 | ) | | | — | | | | — | | | | — | | | | — | |
United States | | | (13,100 | ) | | | — | | | | — | | | | — | | | | — | |
Preferred Stocks | | | | | | | | | | | | | | | | | | | | |
Non-Convertible Preferred Stocks | | | | | | | | | | | | | | | | | | | | |
United States | | | — | | | | — | | | | (409,200 | ) | | | — | | | | — | |
| | | | | | | | | | | | | | | | | | | | |
Total | | $ | (888,357 | ) | | $ | — | | | $ | (409,200 | ) | | $ | 664,088 | | | $ | 14,858 | |
| | | | | | | | | | | | | | | | | | | | |
A preferred stock valued at $409,200 was transferred from Level 3 to Level 2 during the period ended March 31, 2012. At September 30, 2011, this security was valued using broker-dealer bid quotations based on inputs unobservable to the Fund as an independent pricing service either was unable to price the security or did not provide a reliable price for the security; at March 31, 2012, this security was valued on the basis of evaluated bids furnished to the Fund by an independent pricing service.
All transfers are recognized as of the beginning of the reporting period.
In May 2011, Accounting Standards Update (“ASU”) No. 2011-04, “Amendments to Achieve Common Fair Value Measurement and Disclosure Requirements” was issued and is effective for interim and annual periods beginning after December 15, 2011. The ASU requires reporting entities to disclose i) the amounts of any transfers between Level 1 and Level 2, and the reasons for the transfers; and ii) for Level 3 fair value measurements, a) quantitative information about significant unobservable inputs used, b) a description of the valuation processes used by the reporting entity, and c) a narrative description of the sensitivity of the fair value measurement to changes in unobservable inputs if a change in those inputs might result in a significantly higher or lower fair value measurement. Notwithstanding the projected regulatory implementation date of June 30, 2012 for the Fund, Management has already implemented disclosure of all transfers between Level 1 and Level 2, and the reasons
| 74
Notes to Financial Statements (continued)
March 31, 2012 (Unaudited)
for the transfers. Management is currently evaluating the impact, if any, the Level 3 disclosures may have on the Fund’s financial statements.
4. Derivatives. Derivative instruments are defined as financial instruments whose value and performance are based on the value and performance of another security or financial instrument. Derivative instruments that certain Funds used during the period include forward foreign currency contracts and option contracts.
The Funds are subject to the risk that changes in foreign currency exchange rates will have an unfavorable effect on the value of Fund assets denominated in foreign currencies. The Funds may enter into forward foreign currency contracts for hedging purposes to protect the value of the Funds’ holdings of foreign securities. The Funds may also use forward foreign currency contracts to gain exposure to foreign currencies, regardless of whether securities denominated in such currencies are held in the Funds. During the six months ended March 31, 2012, Global Equity and Income Fund engaged in forward foreign currency transactions for hedging purposes and to gain exposure to foreign currencies.
The Funds are subject to the risk of unpredictable declines in the value of individual equity securities and periods of below-average performance in individual securities or in the equity market as a whole. The Funds may use purchased put options and written call options to hedge against a decline in value of an equity security that it owns, and may use written put options to offset the cost of options used for hedging purposes. The Funds may also use purchased call options to gain exposure to an equity security without committing the capital required to buy it, while also limiting the downside risk associated with owning it. During the six months ended March 31, 2012, Mid Cap Growth Fund engaged in purchased put and written call options for hedging purposes, written put options to offset the cost of options used for hedging purposes, and in purchased call options to gain exposure to equity securities.
Global Equity and Income Fund is party to agreements with counterparties that govern transactions in forward foreign currency contracts. The agreements contain credit-risk-related contingent features that allow the counterparties to terminate open contracts early if the net asset value of a Fund declines beyond a certain threshold. If such features were to be triggered, the counterparties could request immediate settlement of open contracts at current fair value. As of March 31, 2012, the fair value of derivative positions (including open trades) subject to credit-risk-related contingent features that are in a net liability position by counterparty, and the value of collateral pledged to counterparties for such contracts is as follows:
| | | | | | | | | | |
Fund | | Counterparty | | Derivatives | | | Collateral
Pledged | |
| Global Equity and Income Fund | | Barclays | | $ | (3,640 | ) | | $ | — | |
| | JPMorgan Chase | | | (441 | ) | | | — | |
75 |
Notes to Financial Statements (continued)
March 31, 2012 (Unaudited)
Forward foreign currency contracts are subject to the risk that the counterparty will be unwilling or unable to meet its obligations under the contracts. Global Equity and Income Fund has mitigated this risk by entering into master netting agreements with counterparties that allow the Fund and the counterparty to offset amounts owed by each related to derivative contracts to one net amount payable by either the Fund or the counterparty. As of March 31, 2012, the maximum amount of loss that Global Equity and Income Fund would incur if counterparties failed to meet their obligations is $53,155 and the amount of loss that Global Equity and Income Fund would incur after taking into account master netting arrangements is $43,148.
Counterparty risk is managed through the posting of collateral and, as a result, the risk of loss to a Fund from counterparty default should be limited to the extent a Fund is undercollateralized. In addition to collateral requirements, the Funds also require counterparties to meet minimum credit quality requirements.
The following is a summary of derivative instruments for Global Equity and Income Fund as of March 31, 2012:
| | | | |
Statements of Assets and Liabilities Caption | | Foreign
Exchange
Contracts | |
Assets | | | | |
Unrealized appreciation on forward foreign currency contracts | | $ | 53,155 | |
Liabilities | | | | |
Unrealized depreciation on forward foreign currency contracts | | | (14,088 | ) |
Transactions in derivative instruments for Global Equity and Income Fund during the six months ended March 31, 2012, were as follows:
| | | | |
Statements of Operations Caption | | Foreign
Exchange
Contracts | |
Net Realized Gain (Loss) on: | | | | |
Foreign currency transactions* | | $ | (157,430 | ) |
Net Change in Unrealized Appreciation (Depreciation) on: | | | | |
Foreign currency translations* | | | 229,303 | |
| * | Represents realized gain (loss) and change in unrealized appreciation (depreciation), respectively, for forward foreign currency contracts during the period. |
| 76
Notes to Financial Statements (continued)
March 31, 2012 (Unaudited)
The following is a summary of derivative instruments for Mid Cap Growth Fund as of March 31, 2012:
| | | | |
Statements of Assets and Liabilities Caption | | Equity
Contracts | |
Assets | | | | |
Investments at value* | | $ | 31,570 | |
| * | Represents purchased options, at value. |
Transactions in derivative instruments for Mid Cap Growth Fund during the six months ended March 31, 2012 were as follows:
| | | | |
Statements of Operations Caption | | Equity
Contracts | |
Net Realized Loss on: | | | | |
Investments* | | $ | (831,342 | ) |
Options written | | | (43,815 | ) |
Net Change in Unrealized Appreciation (Depreciation) on: | | | | |
Investments* | | | (28,205 | ) |
| * | Represents realized gain (loss) and change in unrealized appreciation (depreciation), respectively, for purchased options during the period. |
As the Funds value their derivatives at fair value and recognize changes in fair value through the Statements of Operations, they do not qualify for hedge accounting under authoritative guidance for derivative instruments. The Funds’ investments in derivatives may represent an economic hedge; however, they are considered to be non-hedge transactions for the purpose of these disclosures.
The volume of forward foreign currency contract activity, as a percentage of net assets, for Global Equity and Income Fund, based on gross month-end notional amounts outstanding during the period, including long and short positions at absolute value, was as follows for the six months ended March 31, 2012:
| | | | |
Global Equity and Income Fund | | Forwards | |
Average Notional Amount Outstanding | | | 1.07 | % |
Highest Notional Amount Outstanding | | | 1.37 | % |
Lowest Notional Amount Outstanding | | | 0.80 | % |
Notional Amount Outstanding as of March 31, 2012 | | | 1.14 | % |
Notional amounts outstanding at the end of the prior period are included in the average notional amount outstanding.
The volume of option contract activity, as a percentage of net assets, for Mid Cap Growth Fund, based on month-end and/or daily market values of equity securities
77 |
Notes to Financial Statements (continued)
March 31, 2012 (Unaudited)
underlying purchased and written options, at absolute value, was as follows for the six months ended March 31, 2012:
| | | | | | | | | | | | | | | | |
Mid Cap Growth Fund* | | Call
Options
Written | | | Put
Options Written | | | Call
Options Purchased | | | Put
Options
Purchased | |
Average Market Value of Underlying Securities | | | 0.06 | % | | | 0.08 | % | | | 0.31 | % | | | 0.37 | % |
Highest Market Value of Underlying Securities | | | 0.88 | % | | | 2.64 | % | | | 4.11 | % | | | 2.68 | % |
Lowest Market Value of Underlying Securities | | | 0.00 | % | | | 0.00 | % | | | 0.00 | % | | | 0.00 | % |
Market Value of Underlying Securities as of March 31, 2012 | | | 0.00 | % | | | 0.00 | % | | | 0.00 | % | | | 1.05 | % |
| * | Market value of underlying securities is determined by multiplying option shares by the price of the option’s underlying security, as determined by the Fund’s Pricing Policies and Procedures. |
The following is a summary of Mid Cap Growth Fund’s written option activity:
| | | | | | | | |
| | | Number of Contracts | | | Premiums | |
Outstanding at 9/30/2011 | | | — | | | $ | — | |
Options written | | | 44,139 | | | | 964,918 | |
Options terminated in closing purchase transactions | | | (44,139 | ) | | | (964,918 | ) |
Options exercised | | | — | | | | — | |
Options expired | | | — | | | | — | |
| | | | | | | | |
Outstanding at 3/31/2012 | | | — | | | $ | — | |
| | | | | | | | |
5. Purchases and Sales of Securities. For the six months ended March 31, 2012, purchases and sales of securities (excluding short-term investments and U.S. Government/Agency securities and including paydowns) were as follows:
| | | | | | | | |
Fund | | Purchases | | | Sales | |
Global Equity and Income Fund | | $ | 196,212,187 | | | $ | 73,382,059 | |
Growth Fund | | | 10,017,144 | | | | 8,563,240 | |
Mid Cap Growth Fund | | | 121,854,102 | | | | 128,401,965 | |
Value Fund | | | 117,312,535 | | | | 122,929,880 | |
For the six months ended March 31, 2012, purchases and sales of U.S. Government/Agency securities by the Global Equity and Income Fund were $22,410,965 and $15,628,920, respectively.
| 78
Notes to Financial Statements (continued)
March 31, 2012 (Unaudited)
6. Management Fees and Other Transactions with Affiliates.
a. Management Fees. Loomis, Sayles & Company, L.P. (“Loomis Sayles”) serves as investment adviser to each Fund. Separate management agreements for each Fund in effect for the six months ended March 31, 2012, provided for fees at the following annual percentage rates of each Fund’s average daily net assets:
| | | | |
Fund | | Percentage of
Average
Daily Net Assets | |
Global Equity and Income Fund | | | 0.75 | % |
Growth Fund | | | 0.50 | % |
Mid Cap Growth Fund | | | 0.75 | % |
Value Fund | | | 0.50 | % |
Loomis Sayles has given binding undertakings to the Funds to waive management fees and/or reimburse certain expenses to limit the Funds’ operating expenses, exclusive of acquired fund fees and expenses, brokerage expenses, interest expense, taxes and extraordinary expenses. These undertakings are in effect until January 31, 2013 and are reevaluated on an annual basis. Management fees payable, as reflected on the Statements of Assets and Liabilities, is net of waivers and/or expense reimbursements, if any, pursuant to these undertakings.
For the six months ended March 31, 2012, the expense limits as a percentage of average daily net assets under the expense limitation agreements were as follows:
| | | | | | | | | | | | | | | | | | | | |
| | | Expense Limit as a Percentage of
Average Daily Net Assets | |
Fund | | Class A | | | Class B | | | Class C | | | Class Y | | | Admin
Class | |
Global Equity and Income Fund | | | 1.25 | % | | | — | | | | 2.00 | % | | | 1.00 | % | | | — | |
Growth Fund | | | 1.25 | % | | | 2.00 | % | | | 2.00 | % | | | 1.00 | % | | | — | |
Mid Cap Growth Fund | | | 1.25 | % | | | — | | | | 2.00 | % | | | 1.00 | % | | | — | |
Value Fund | | | 1.10 | % | | | 1.85 | % | | | 1.85 | % | | | 0.85 | % | | | 1.35 | % |
Loomis Sayles shall be permitted to recover expenses it has borne under the expense limitation agreements (whether through waiver of its management fees or otherwise) on a class by class basis in later periods to the extent the expenses of a class fall below a class’ expense limits, provided, however, that a class is not obligated to pay such waived/reimbursed fees or expenses more than one year after the end of the fiscal year in which the fees or expenses were waived/reimbursed.
For the six months ended March 31, 2012, the management fees and waivers of management fees for each Fund were as follows:
79 |
Notes to Financial Statements (continued)
March 31, 2012 (Unaudited)
| | | | | | | | | | | | | | | | | | | | |
| | | Gross
Management
Fees | | | Waivers of
Management
Fees1 | | | Net
Management
Fees | | | Percentage of
Average
Daily Net Assets | |
Fund | | | | | Gross | | | Net | |
Global Equity and Income Fund | | $ | 2,160,995 | | | $ | — | | | $ | 2,160,995 | | | | 0.75 | % | | | 0.75 | % |
Growth Fund | | | 304,573 | | | | — | | | | 304,573 | | | | 0.50 | % | | | 0.50 | % |
Mid Cap Growth Fund | | | 403,460 | | | | 61,863 | | | | 341,597 | | | | 0.75 | % | | | 0.64 | % |
Value Fund | | | 3,103,499 | | | | — | | | | 3,103,499 | | | | 0.50 | % | | | 0.50 | % |
| 1 | Management fee waivers are subject to possible recovery until September 30, 2013. |
No expenses were recovered for any of the Funds during the six months ended March 31, 2012 under the terms of the expense limitation agreements.
Certain officers and employees of Loomis Sayles are also officers or Trustees of the Trust. Loomis Sayles’ general partner is indirectly owned by Natixis Global Asset Management, L.P. (“Natixis US”), which is part of Natixis Global Asset Management, an international asset management group based in Paris, France.
b. Service and Distribution Fees. NGAM Distribution, which is a wholly-owned subsidiary of Natixis US, has entered into a distribution agreement with the Trust. Pursuant to this agreement, NGAM Distribution serves as principal underwriter of the Funds of the Trust.
Pursuant to Rule 12b-1 under the 1940 Act, the Trust has adopted a Service Plan relating to each Fund’s Class A shares (the “Class A Plans”), a Distribution and Service Plan relating to each Fund’s Class B (if applicable) and Class C shares (the “Class B and Class C Plans”), and Value Fund has adopted a Distribution Plan relating to its Admin Class shares (the “Admin Class Plan”).
Under the Class A Plans, each Fund pays NGAM Distribution a monthly service fee at an annual rate not to exceed 0.25% of the average daily net assets attributable to the Funds’ Class A shares, as reimbursement for expenses incurred by NGAM Distribution in providing personal services to investors in Class A shares and/or the maintenance of shareholder accounts.
Under the Class B (if applicable) and Class C Plans, each Fund pays NGAM Distribution a monthly service fee at an annual rate not to exceed 0.25% of the average daily net assets attributable to the Funds’ Class B (if applicable) and Class C shares, as compensation for services provided by NGAM Distribution in providing personal services to investors in Class B (if applicable) and Class C shares and/or the maintenance of shareholder accounts.
| 80
Notes to Financial Statements (continued)
March 31, 2012 (Unaudited)
Also under the Class B (if applicable) and Class C Plans, each Fund pays NGAM Distribution a monthly distribution fee at an annual rate of 0.75% of the average daily net assets attributable to the Funds’ Class B (if applicable) and Class C shares, as compensation for services provided by NGAM Distribution in connection with the marketing or sale of Class B (if applicable) and Class C shares.
Under the Admin Class Plan, Value Fund pays NGAM Distribution a monthly distribution fee at an annual rate not to exceed 0.25% of the average daily net assets attributable to the Fund’s Admin Class shares, as compensation for services provided by NGAM Distribution in connection with the marketing or sale of Admin Class shares or for payments made by NGAM Distribution to securities dealers or other financial intermediaries as commissions, asset-based sales charges or other compensation with respect to the sale of Admin Class shares, or for providing personal services to investors and/or the maintenance of shareholder accounts.
In addition, the Admin Class shares of Value Fund may pay NGAM Distribution an administrative service fee, at an annual rate not to exceed 0.25% of the average daily net assets attributable to Admin Class shares. These fees are subsequently paid to securities dealers or financial intermediaries for providing personal services and/or account maintenance for their customers who hold such shares.
For the six months ended March 31, 2012, the Funds paid the following service and distribution fees:
| | | | | | | | | | | | | | | | |
| | | Service Fees | |
Fund | | Class A | | | Class B | | | Class C | | | Admin Class | |
Global Equity and Income Fund | | $ | 175,768 | | | $ | — | | | $ | 208,227 | | | $ | — | |
Growth Fund | | | 35,672 | | | | 3,174 | | | | 13,312 | | | | — | |
Mid Cap Growth Fund | | | 60,149 | | | | — | | | | 3,596 | | | | — | |
Value Fund | | | 167,916 | | | | 2,603 | | | | 12,018 | | | | 1 | |
| | |
| | | | | | Distribution Fees | |
Fund | | | | | Class B | | | Class C | | | Admin Class | |
Global Equity and Income Fund | | | | | | $ | — | | | $ | 624,682 | | | $ | — | |
Growth Fund | | | | | | | 9,520 | | | | 39,935 | | | | — | |
Mid Cap Growth Fund | | | | | | | — | | | | 10,790 | | | | — | |
Value Fund | | | | | | | 7,810 | | | | 36,052 | | | | 3 | |
c. Administrative Fees. NGAM Advisors provides certain administrative services for the Funds and contracts with State Street Bank to serve as sub-administrator. NGAM Advisors is a wholly-owned subsidiary of Natixis US. Pursuant to an agreement among Natixis Funds Trust I, Natixis Funds Trust II, Natixis Funds Trust IV, Gateway Trust (“Natixis Funds Trusts”), Loomis Sayles Funds I, Loomis Sayles Funds II (“Loomis Sayles Funds Trusts”), Hansberger International Series and NGAM Advisors, each Fund pays NGAM Advisors monthly its pro rata portion of fees equal to an annual rate of 0.0575%
81 |
Notes to Financial Statements (continued)
March 31, 2012 (Unaudited)
of the first $15 billion of the average daily net assets of the Natixis Funds Trusts, Loomis Sayles Funds Trusts and Hansberger International Series, 0.0500% of the next $15 billion, 0.0400% of the next $30 billion and 0.0350% of such assets in excess of $60 billion, subject to an annual aggregate minimum fee for the Natixis Funds Trusts, Loomis Sayles Funds Trusts and Hansberger International Series of $10 million, which is reevaluated on an annual basis.
For the six months ended March 31, 2012, each Fund paid the following administrative fees to NGAM Advisors:
| | | | |
Fund | | Administrative
Fees | |
Global Equity and Income Fund | | $ | 132,563 | |
Growth Fund | | | 28,035 | |
Mid Cap Growth Fund | | | 24,762 | |
Value Fund | | | 285,690 | |
d. Sub-Transfer Agent Fees. NGAM Distribution has entered into agreements with financial intermediaries to provide certain recordkeeping, processing, shareholder communications and other services to customers of the intermediaries and has agreed to compensate the intermediaries for providing those services. Certain services would be provided by the Funds if the shares of those customers were registered directly with the Funds’ transfer agent. Accordingly, the Funds have agreed to reimburse NGAM Distribution for a portion of the intermediary fees attributable to shares of the Funds held by the intermediaries (which generally is a percentage of the value of shares held) not to exceed what the Funds would have paid its transfer agent had each customer’s shares been registered directly with the transfer agent instead of being held through the intermediaries.
For the six months ended March 31, 2012, the Funds paid the following sub-transfer agent fees, which are reflected in transfer agent fees and expenses in the Statements of Operations.
| | | | |
Fund | | Sub-Transfer
Agent Fees | |
Global Equity and Income Fund | | $ | 202,437 | |
Growth Fund | | | 31,668 | |
Mid Cap Growth Fund | | | 65,067 | |
Value Fund | | | 882,479 | |
| 82
Notes to Financial Statements (continued)
March 31, 2012 (Unaudited)
For the six months ended March 31, 2012, the Funds owe the following reimbursements for sub-transfer agent fees:
| | | | |
Fund | | Reimbursements
for Sub-Transfer
Agent Fees | |
Global Equity and Income Fund | | $ | 9,729 | |
Growth Fund | | | 691 | |
Mid Cap Growth Fund | | | 1,185 | |
Value Fund | | | 27,979 | |
e. Commissions. Commissions (including CDSCs) on Fund shares retained by NGAM Distribution during the six months ended March 31, 2012, were as follows:
| | | | |
Fund | | Commissions | |
Global Equity and Income Fund | | $ | 529,364 | |
Growth Fund | | | 50,658 | |
Mid Cap Growth Fund | | | 5,071 | |
Value Fund | | | 12,658 | |
f. Trustees Fees and Expenses. The Trust does not pay any compensation directly to its officers or Trustees who are directors, officers or employees of NGAM Advisors, NGAM Distribution, Natixis US or their affiliates. Effective January 1, 2012, the Chairperson of the Board receives a retainer fee at the annual rate of $265,000. The Chairperson does not receive any meeting attendance fees for Board of Trustees meetings or committee meetings that she attends. Each Independent Trustee (other than the Chairperson) receives, in the aggregate, a retainer fee at the annual rate of $95,000. Each Independent Trustee also receives a meeting attendance fee of $10,000 for each meeting of the Board of Trustees that he or she attends in person and $5,000 for each meeting of the Board of Trustees that he or she attends telephonically. In addition, each committee chairman receives an additional retainer fee at the annual rate of $15,000. Each Contract Review and Governance Committee member is compensated $6,000 for each Committee meeting that he or she attends in person and $3,000 for each meeting that he or she attends telephonically. Each Audit Committee member is compensated $7,500 for each Committee meeting that he or she attends in person and $3,750 for each meeting that he or she attends telephonically. These fees are allocated among the funds in the Natixis Funds Trusts, Loomis Sayles Funds Trusts and Hansberger International Series based on a formula that takes into account, among other factors, the relative net assets of each fund. Trustees are reimbursed for travel expenses in connection with attendance at meetings.
Prior to January 1, 2012, the Chairperson of the Board received a retainer fee at the annual rate of $250,000 and each Independent Trustee (other than the Chairperson) received, in aggregate, a retainer fee at the annual rate of $80,000. All other Trustee fees remain unchanged.
83 |
Notes to Financial Statements (continued)
March 31, 2012 (Unaudited)
A deferred compensation plan (the “Plan”) is available to the Trustees on a voluntary basis. Deferred amounts remain in the Funds until distributed in accordance with the provisions of the Plan. The value of a participating Trustee’s deferral account is based on theoretical investments of deferred amounts, on the normal payment dates, in certain funds of the Natixis Funds Trusts, Loomis Sayles Funds Trusts and Hansberger International Series as designated by the participating Trustees. Changes in the value of participants’ deferral accounts are allocated pro rata among the funds in the Natixis Funds Trusts, Loomis Sayles Funds Trusts, and Hansberger International Series, and are normally reflected as Trustees’ fees and expenses in the Statements of Operations. The portions of the accrued obligations allocated to the Funds under the Plan are reflected as Deferred Trustees’ fees on the Statements of Assets and Liabilities.
g. Affiliated Ownership. At March 31, 2012, Loomis Sayles Funded Pension Plan and Trust (“Pension Plan”) and Loomis Sayles Employees’ Profit Sharing Retirement Plan (“Retirement Plan”) held shares of beneficial interest in the Funds representing the following percentages of net assets:
| | | | | | | | |
Fund | | Pension Plan | | | Retirement Plan | |
Global Equity and Income Fund | | | 2.20 | % | | | 1.51 | % |
Growth Fund | | | 5.53 | % | | | 11.57 | % |
Mid Cap Growth Fund | | | 8.78 | % | | | 9.74 | % |
Value Fund | | | 0.67 | % | | | 1.20 | % |
7. Line of Credit. Each Fund, together with certain other funds of Natixis Funds Trusts, Loomis Sayles Funds Trusts and Hansberger International Series, participates in a $200,000,000 committed unsecured line of credit provided by State Street Bank, with an individual limit of $125,000,000 for each fund that participates in the line of credit. Interest is charged to each participating fund based on its borrowings at a rate per annum equal to the greater of the Federal Funds rate or overnight LIBOR, plus 1.25%. In addition, a commitment fee of 0.125% per annum, payable at the end of each calendar quarter, is accrued and apportioned among the participating funds based on their average daily unused portion of the line of credit. Effective April 19, 2012, the commitment fee will be 0.10% per annum.
For the six months ended March 31, 2012, none of the Funds had borrowings under these agreements.
8. Brokerage Commission Recapture. Each Fund has entered into agreements with certain brokers whereby the brokers will rebate a portion of brokerage commissions. All amounts rebated by the brokers are returned to the Funds under such agreements and are included in realized gains on investments on the Statements of Operations. For the
| 84
Notes to Financial Statements (continued)
March 31, 2012 (Unaudited)
six months ended March 31, 2012, amounts rebated under these agreements were as follows:
| | | | |
Fund | | Rebates | |
Global Equity and Income Fund | | $ | 8,504 | |
Growth Fund | | | 2,248 | |
Mid Cap Growth Fund | | | 14,859 | |
Value Fund | | | 45,745 | |
9. Concentration of Risk. Each Fund’s investments in foreign securities are subject to foreign currency fluctuations, higher volatility than U.S. securities, varying degrees of regulation and limited liquidity. Greater political, economic, credit and information risks are also associated with foreign securities.
10. Concentration of Ownership. From time to time, the Funds may have a concentration of one or more shareholders holding a significant percentage of shares outstanding. Investment activities of these shareholders could have material impacts on the Funds. As of March 31, 2012, Growth Fund had shareholders that owned more than 5% of the Fund’s total outstanding shares. The number of shareholders owning more than 5% of total outstanding shares of the Fund, including affiliated accounts, based on accounts that represent more than 5% of an individual class of shares, and the aggregate percentage of net assets represented by such holdings was as follows:
| | | | | | | | |
Fund | | Number of Greater
Than 5% Shareholders | | | Percentage of
Ownership | |
Growth Fund | | | 4 | | | | 33.57 | % |
Shares held in omnibus accounts may be beneficially held by one or more individuals or entities other than the owner of record. As of March 31, 2012, Mid Cap Growth Fund had omnibus accounts representing ownership of more than 25% of the Fund’s total outstanding shares. The number of omnibus accounts representing ownership of more than 25% of total outstanding shares of the Fund, based on accounts that represent more than 25% of an individual class of shares, and the aggregate percentage of net assets represented by such holdings was as follows:
| | | | | | | | |
Fund | | Number of 25% Omnibus Accounts | | | Percentage of
Ownership | |
Mid Cap Growth Fund | | | 1 | | | | 30.34 | % |
85 |
Notes to Financial Statements (continued)
March 31, 2012 (Unaudited)
11. Capital Shares. Each Fund may issue an unlimited number of shares of beneficial interest, without par value. Transactions in capital shares were as follows:
| | | | | | | | | | | | | | | | |
| |
| Six Months Ended
March 31, 2012 |
| |
| Year Ended
September 30, 2011 |
|
Global Equity and Income Fund | | | Shares | | | | Amount | | | | Shares | | | | Amount | |
| Class A | | | | | | | | | | | | | | | | |
Issued from the sale of shares | | | 4,353,462 | | | $ | 68,892,858 | | | | 5,840,219 | | | $ | 93,587,527 | |
Issued in connection with the reinvestment of distributions | | | 110,750 | | | | 1,656,822 | | | | 72,247 | | | | 1,114,772 | |
Redeemed | | | (2,776,184 | ) | | | (44,640,625 | ) | | | (2,449,449 | ) | | | (38,839,952 | ) |
| | | | | | | | | | | | | | | | |
Net change | | | 1,688,028 | | | $ | 25,909,055 | | | | 3,463,017 | | | $ | 55,862,347 | |
| | | | | | | | | | | | | | | | |
| Class C | | | | | | | | | | | | | | | | |
Issued from the sale of shares | | | 2,531,560 | | | $ | 40,099,404 | | | | 4,630,760 | | | $ | 73,457,166 | |
Issued in connection with the reinvestment of distributions | | | 37,940 | | | | 564,931 | | | | 29,527 | | | | 453,530 | |
Redeemed | | | (1,074,688 | ) | | | (16,518,282 | ) | | | (1,854,383 | ) | | | (29,059,321 | ) |
| | | | | | | | | | | | | | | | |
Net change | | | 1,494,812 | | | $ | 24,146,053 | | | | 2,805,904 | | | $ | 44,851,375 | |
| | | | | | | | | | | | | | | | |
| Class Y | | | | | | | | | | | | | | | | |
Issued from the sale of shares | | | 8,730,488 | | | $ | 138,981,712 | | | | 9,009,593 | | | $ | 143,819,801 | |
Issued in connection with the reinvestment of distributions | | | 185,653 | | | | 2,784,788 | | | | 117,939 | | | | 1,824,523 | |
Redeemed | | | (2,580,368 | ) | | | (40,637,078 | ) | | | (3,819,207 | ) | | | (60,187,744 | ) |
| | | | | | | | | | | | | | | | |
Net change | | | 6,335,773 | | | $ | 101,129,422 | | | | 5,308,325 | | | $ | 85,456,580 | |
| | | | | | | | | | | | | | | | |
Increase (decrease) from capital share transactions | | | 9,518,613 | | | $ | 151,184,530 | | | | 11,577,246 | | | $ | 186,170,302 | |
| | | | | | | | | | | | | | | | |
| 86
Notes to Financial Statements (continued)
March 31, 2012 (Unaudited)
11. Capital Shares (continued).
| | | | | | | | | | | | | | | | |
| |
| Six Months Ended
March 31, 2012 |
| |
| Year Ended
September 30, 2011 |
|
Growth Fund | | | Shares | | | | Amount | | | | Shares | | | | Amount | |
| Class A | | | | | | | | | | | | | | | | |
Issued from the sale of shares | | | 1,061,637 | | | $ | 5,992,620 | | | | 789,422 | | | $ | 4,312,824 | |
Issued in connection with the reinvestment of distributions | | | 6,836 | | | | 38,350 | | | | — | | | | — | |
Redeemed | | | (1,461,309 | ) | | | (8,379,247 | ) | | | (1,515,900 | ) | | | (8,531,709 | ) |
| | | | | | | | | | | | | | | | |
Net change | | | (392,836 | ) | | $ | (2,348,277 | ) | | | (726,478 | ) | | $ | (4,218,885 | ) |
| | | | | | | | | | | | | | | | |
| Class B | | | | | | | | | | | | | | | | |
Issued from the sale of shares | | | 9,916 | | | $ | 55,701 | | | | 12,241 | | | $ | 64,046 | |
Issued in connection with the reinvestment of distributions | | | — | | | | — | | | | — | | | | — | |
Redeemed | | | (131,170 | ) | | | (714,685 | ) | | | (322,361 | ) | | | (1,716,414 | ) |
| | | | | | | | | | | | | | | | |
Net change | | | (121,254 | ) | | $ | (658,984 | ) | | | (310,120 | ) | | $ | (1,652,368 | ) |
| | | | | | | | | | | | | | | | |
| Class C | | | | | | | | | | | | | | | | |
Issued from the sale of shares | | | 104,721 | | | $ | 585,482 | | | | 174,419 | | | $ | 922,261 | |
Issued in connection with the reinvestment of distributions | | | — | | | | — | | | | — | | | | — | |
Redeemed | | | (330,844 | ) | | | (1,804,940 | ) | | | (659,616 | ) | | | (3,529,748 | ) |
| | | | | | | | | | | | | | | | |
Net change | | | (226,123 | ) | | $ | (1,219,458 | ) | | | (485,197 | ) | | $ | (2,607,487 | ) |
| | | | | | | | | | | | | | | | |
| Class Y | | | | | | | | | | | | | | | | |
Issued from the sale of shares | | | 1,659,959 | | | $ | 10,407,609 | | | | 4,020,714 | | | $ | 24,184,766 | |
Issued in connection with the reinvestment of distributions | | | 46,359 | | | | 275,371 | | | | — | | | | — | |
Redeemed | | | (585,971 | ) | | | (3,660,007 | ) | | | (1,211,579 | ) | | | (7,292,357 | ) |
| | | | | | | | | | | | | | | | |
Net change | | | 1,120,347 | | | $ | 7,022,973 | | | | 2,809,135 | | | $ | 16,892,409 | |
| | | | | | | | | | | | | | | | |
Increase (decrease) from capital share transactions | | | 380,134 | | | $ | 2,796,254 | | | | 1,287,340 | | | $ | 8,413,669 | |
| | | | | | | | | | | | | | | | |
87 |
Notes to Financial Statements (continued)
March 31, 2012 (Unaudited)
11. Capital Shares (continued).
| | | | | | | | | | | | | | | | |
| |
| Six Months Ended
March 31, 2012 |
| |
| Year Ended
September 30, 2011 |
|
Mid Cap Growth Fund | | | Shares | | | | Amount | | | | Shares | | | | Amount | |
| Class A | | | | | | | | | | | | | | | | |
Issued from the sale of shares | | | 263,639 | | | $ | 6,989,869 | | | | 1,466,372 | | | $ | 40,418,776 | |
Issued in connection with the reinvestment of distributions | | | — | | | | — | | | | — | | | | — | |
Redeemed | | | (706,933 | ) | | | (18,695,649 | ) | | | (2,298,231 | ) | | | (65,461,720 | ) |
| | | | | | | | | | | | | | | | |
Net change | | | (443,294 | ) | | $ | (11,705,780 | ) | | | (831,859 | ) | | $ | (25,042,944 | ) |
| | | | | | | | | | | | | | | | |
| Class C | | | | | | | | | | | | | | | | |
Issued from the sale of shares | | | 36,281 | | | $ | 941,660 | | | | 98,542 | | | $ | 2,756,174 | |
Issued in connection with the reinvestment of distributions | | | — | | | | — | | | | — | | | | — | |
Redeemed | | | (25,760 | ) | | | (683,599 | ) | | | (8,837 | ) | | | (239,677 | ) |
| | | | | | | | | | | | | | | | |
Net change | | | 10,521 | | | $ | 258,061 | | | | 89,705 | | | $ | 2,516,497 | |
| | | | | | | | | | | | | | | | |
| Class Y | | | | | | | | | | | | | | | | |
Issued from the sale of shares | | | 424,654 | | | $ | 11,511,544 | | | | 1,071,985 | | | $ | 31,656,798 | |
Issued in connection with the reinvestment of distributions | | | — | | | | — | | | | — | | | | — | |
Redeemed | | | (326,252 | ) | | | (9,110,699 | ) | | | (453,103 | ) | | | (13,031,891 | ) |
| | | | | | | | | | | | | | | | |
Net change | | | 98,402 | | | $ | 2,400,845 | | | | 618,882 | | | $ | 18,624,907 | |
| | | | | | | | | | | | | | | | |
Increase (decrease) from capital share transactions | | | (334,371 | ) | | $ | (9,046,874 | ) | | | (123,272 | ) | | $ | (3,901,540 | ) |
| | | | | | | | | | | | | | | | |
| 88
Notes to Financial Statements (continued)
March 31, 2012 (Unaudited)
11. Capital Shares (continued).
| | | | | | | | | | | | | | | | |
| |
| Six Months Ended
March 31, 2012 |
| |
| Year Ended
September 30, 2011 |
|
Value Fund | | | Shares | | | | Amount | | | | Shares | | | | Amount | |
| Class A | | | | | | | | | | | | | | | | |
Issued from the sale of shares | | | 499,383 | | | $ | 9,122,796 | | | | 1,915,039 | | | $ | 35,613,722 | |
Issued in connection with the reinvestment of distributions | | | 87,182 | | | | 1,538,775 | | | | 88,461 | | | | 1,648,032 | |
Redeemed | | | (1,659,178 | ) | | | (29,959,581 | ) | | | (1,900,272 | ) | | | (35,517,239 | ) |
| | | | | | | | | | | | | | | | |
Net change | | | (1,072,613 | ) | | $ | (19,298,010 | ) | | | 103,228 | | | $ | 1,744,515 | |
| | | | | | | | | | | | | | | | |
| Class B | | | | | | | | | | | | | | | | |
Issued from the sale of shares | | | 1,050 | | | $ | 19,117 | | | | 11,718 | | | $ | 225,248 | |
Issued in connection with the reinvestment of distributions | | | 211 | | | | 3,758 | | | | 438 | | | | 8,207 | |
Redeemed | | | (28,200 | ) | | | (517,816 | ) | | | (81,989 | ) | | | (1,540,415 | ) |
| | | | | | | | | | | | | | | | |
Net change | | | (26,939 | ) | | $ | (494,941 | ) | | | (69,833 | ) | | $ | (1,306,960 | ) |
| | | | | | | | | | | | | | | | |
| Class C | | | | | | | | | | | | | | | | |
Issued from the sale of shares | | | 37,336 | | | $ | 675,235 | | | | 207,950 | | | $ | 3,898,637 | |
Issued in connection with the reinvestment of distributions | | | 1,337 | | | | 23,496 | | | | 1,601 | | | | 29,658 | |
Redeemed | | | (105,649 | ) | | | (1,894,894 | ) | | | (258,633 | ) | | | (4,682,108 | ) |
| | | | | | | | | | | | | | | | |
Net change | | | (66,976 | ) | | $ | (1,196,163 | ) | | | (49,082 | ) | | $ | (753,813 | ) |
| | | | | | | | | | | | | | | | |
| Class Y | | | | | | | | | | | | | | | | |
Issued from the sale of shares | | | 5,861,212 | | | $ | 106,745,289 | | | | 21,675,948 | | | $ | 394,526,208 | |
Issued in connection with the reinvestment of distributions | | | 871,612 | | | | 15,392,660 | | | | 734,748 | | | | 13,695,698 | |
Redeemed | | | (6,308,198 | ) | | | (115,472,369 | ) | | | (9,761,611 | ) | | | (181,413,250 | ) |
| | | | | | | | | | | | | | | | |
Net change | | | 424,626 | | | $ | 6,665,580 | | | | 12,649,085 | | | $ | 226,808,656 | |
| | | | | | | | | | | | | | | | |
| Admin Class | | | | | | | | | | | | | | | | |
Issued from the sale of shares | | | 25 | | | $ | 445 | | | | 27 | | | $ | 502 | |
Issued in connection with the reinvestment of distributions | | | 1 | | | | 12 | | | | 1 | | | | 11 | |
Redeemed | | | (5 | ) | | | (90 | ) | | | (3 | ) | | | (50 | ) |
| | | | | | | | | | | | | | | | |
Net change | | | 21 | | | $ | 367 | | | | 25 | | | $ | 463 | |
| | | | | | | | | | | | | | | | |
Increase (decrease) from capital share transactions | | | (741,881 | ) | | $ | (14,323,167 | ) | | | 12,633,423 | | | $ | 226,492,861 | |
| | | | | | | | | | | | | | | | |
89 |
SEMIANNUAL REPORT
March 31, 2012

Loomis Sayles Core Plus Bond Fund
Loomis Sayles High Income Fund
Loomis Sayles International Bond Fund
Loomis Sayles Limited Term Government
and Agency Fund
TABLE OF CONTENTS
Management Discussion and Investment Results page 1
Portfolio of Investments page 21
Financial Statements page 56
LOOMIS SAYLES CORE PLUS BOND FUND
Management Discussion
Managers:
Peter W. Palfrey, CFA
Richard G. Raczkowski
Loomis, Sayles & Company, L.P.
Objective:
Seeks high total investment return through a combination of current income and capital appreciation
Strategy:
Invests primarily in bonds
Fund Inception:
November 7, 1973
Symbols:
| | |
| Class A | | NEFRX |
| Class B | | NERBX |
| Class C | | NECRX |
| Class Y | | NERYX |
Market Conditions
The ongoing European sovereign debt crisis consistently moved markets higher or lower depending on headline news, causing investor preferences for risk to be intermittent. The European Central Bank’s decision to cut rates and provide liquidity through its long-term refinancing operations helped ease market fears. During the second half of the period, investor appetite for risk returned and pushed credit-sensitive markets higher and spreads (the yield difference between non-Treasury securities and comparable-maturity Treasuries) tighter. In the United States, strong corporate and bank balance sheets helped markets slowly recover. For the time being, positive U.S. labor and economic data have mitigated the need for another round of quantitative easing from the Federal Reserve Board. These data indicate that economic recovery is underway, albeit at a slower pace than initially expected.
Performance Results
For the six months ended March 31, 2012, Class A shares of Loomis Sayles Core Plus Bond Fund returned 5.05% at net asset value. The fund outperformed its benchmark, the Barclays Capital U.S. Aggregate Bond Index, which returned 1.43% for the period. It also outperformed the 2.96% average return of the Morningstar Intermediate-Term Bond category.
Explanation of Fund Performance
The fund’s out-of-benchmark exposure to the high-yield sector was a source of outperformance during the period. We maintained our exposure for much of the first half of the period, focusing on higher-quality securities within the high-yield market and lower-quality investment-grade credits. We began reducing those positions, based on valuations, during the second half of the period. However, we continued to maintain an overweight in investment-grade credit, adding exposure at more attractive valuations, particularly among lower-rated securities. The new-issue market provided some opportunities to add new positions. The fund’s exposure to this sector also aided returns during
1 |
the period. In terms of derivatives, we maintained a short position in the euro to reflect our bearish outlook for the euro zone and to hedge some of the fund’s overall risk. This position contributed positively to performance during the period.
We added exposure to the Mexican peso following the selloff last fall among higher-risk assets. This exposure significantly contributed to performance in the second half of the period, as the Mexican peso rallied. We sold the position late in the period to capture gains. The fund maintained its focus on older, higher-quality commercial mortgage-backed securities (CMBS). An overweight relative to the benchmark boosted overall returns, as the CMBS market recovered. We selectively reduced some positions late in the period in order to increase portfolio liquidity and we capitalized on the rally in this sector. In addition, an underweight allocation to U.S. Treasuries aided performance.
The fund’s longer-duration (price sensitivity to interest rate changes) and “barbelled” yield curve positioning (a focus on securities at the short and long end of the fund’s maturity spectrum) weighed on performance as rates increased. We added exposure to shorter-term U.S. Treasuries during the second half of the period to move closer to the benchmark’s duration. We also maintained a small overweight in asset-backed securities, which slightly detracted from relative performance. Within the mortgage-backed securities (MBS) sector, we had a modest skew toward higher-coupon issues to capture incremental yield. An underweight within 30-year MBS detracted modestly from relative performance.
Outlook
Late in the period, we began reducing the fund’s overweight in riskier positions in the investment-grade, high-yield and CMBS sectors, based on valuations and to position the fund closer to the benchmark’s allocation and duration profile. We may make additional reductions in our risk allocation as appropriate. We believe the fund is well positioned for a longer-term U.S. and global market recovery. Our goal is to maintain liquidity, allowing us the flexibility to move in and out of markets. We believe it is important to seek to maintain the fund’s yield advantage over competing funds and to continue to make tactical and opportunistic trades.
What You Should Know
Investments in the fund are subject to a number of risks. Please see the “Principal Risks” section of the fund’s prospectus. The purchase of fund shares should be seen as a long-term investment.
| 2
LOOMIS SAYLES CORE PLUS BOND FUND
Investment Results through March 31, 2012
The charts comparing the fund’s performance to an index provide you with a general sense of how it performed. The fund’s total return for the period shown below appears with and without sales charges and includes fund expenses and fees. An index measures the performance of a theoretical portfolio. Unlike a fund, an index is unmanaged and does not have expenses that affect the results. It is not possible to invest directly in an index. Investors would incur transaction costs and other expenses if they purchased the securities necessary to match the index.
Growth of $10,000 Investment in Class A Shares4
March 31, 2002 through March 31, 2012
Average Annual Total Returns — March 31, 20124
| | | | | | | | | | | | | | | | |
| | | | | |
| | | 6 Months | | | 1 Year | | | 5 Years | | | 10 Years | |
| | | | | |
| Class A (Inception 11/7/73) | | | | | | | | | | | | | | | | |
| NAV | | | 5.05 | % | | | 8.49 | % | | | 8.29 | % | | | 6.77 | % |
| With 4.50% Maximum Sales Charge | | | 0.31 | | | | 3.62 | | | | 7.29 | | | | 6.28 | |
| | | | | |
| Class B (Inception 9/13/93) | | | | | | | | | | | | | | | | |
| NAV | | | 4.73 | | | | 7.73 | | | | 7.50 | | | | 5.98 | |
| With CDSC1 | | | -0.27 | | | | 2.73 | | | | 7.20 | | | | 5.98 | |
| | | | | |
| Class C (Inception 12/30/94) | | | | | | | | | | | | | | | | |
| NAV | | | 4.68 | | | | 7.70 | | | | 7.49 | | | | 5.97 | |
| With CDSC1 | | | 3.68 | | | | 6.70 | | | | 7.49 | | | | 5.97 | |
| | | | | |
| Class Y (Inception 12/30/94) | | | | | | | | | | | | | | | | |
| NAV | | | 5.22 | | | | 8.78 | | | | 8.57 | | | | 7.10 | |
| | | | | |
| Comparative Performance | | | | | | | | | | | | | | | | |
| Barclays Capital U.S. Aggregate Bond Index2 | | | 1.43 | | | | 7.71 | | | | 6.25 | | | | 5.80 | |
| Morningstar Int.-Term Bond Fund Avg.3 | | | 2.96 | | | | 6.55 | | | | 5.67 | | | | 5.39 | |
Performance data quoted represents past performance and is no guarantee of future results. Total return and value will vary and you may have a gain or loss when shares are sold. Current performance may be lower or higher than quoted. For most recent month-end performance, visit ngam.natixis.com. Performance for other share classes will be greater or less than shown based on differences in fees and sales charges. Performance for periods less than one year is cumulative, not annualized. Returns reflect changes in share price and reinvestment of dividends and capital gains, if any. Class Y shares are not available for purchase by all investors. The table and graph do not reflect taxes shareholders might owe on any fund distributions or when they redeem their shares.
3 |
| | | | |
| Credit Quality | | % of Net
Assets as of
3/31/2012* | |
Aaa | | | 49.9 | |
Aa | | | 4.6 | |
A | | | 9.6 | |
Baaa | | | 19.3 | |
Ba | | | 9.6 | |
B | | | 3.2 | |
Caa & Lower | | | 0.1 | |
Not Rated | | | 0.2 | |
Short-term and other | | | 3.5 | |
| * | Credit quality at 3/31/12 reflects the highest credit rating assigned to individual holdings of the fund among Moody’s, S&P or Fitch; ratings are subject to change. The fund’s shares are not rated by any rating agency and no credit rating for fund shares is implied. The Moody’s equivalent of the assigned rating is presented in the table. |
| | | | |
| Effective Duration | | % of Net
Assets as of
3/31/2012 | |
1 year or less | | | 4.0 | |
1-5 years | | | 54.6 | |
5-10 years | | | 27.8 | |
10+ years | | | 13.6 | |
Average Effective Duration | | | 6.2 years | |
Portfolio characteristics will vary.
Expense Ratios
as stated in the most recent prospectus
| | | | | | | | |
| Share Class | | Gross Expense Ratio5 | | | Net Expense Ratio6 | |
| A | | | 0.87 | % | | | 0.87 | % |
| B | | | 1.62 | | | | 1.62 | |
| C | | | 1.62 | | | | 1.62 | |
| Y | | | 0.62 | | | | 0.62 | |
NOTES TO CHARTS
| 1 | Performance for Class B shares assumes a maximum 5% contingent deferred sales charge (“CDSC”) applied when you sell shares, which declines annually between years 1-6 according to the following schedule: 5, 4, 3, 3, 2, 1, 0%. Class C shares performance assumes a 1% CDSC applied when you sell shares within one year of purchase. |
| 2 | Barclays Capital U.S. Aggregate Bond Index is an unmanaged index that covers the U.S.-dollar denominated, investment-grade, fixed-rate, taxable bond market of SEC-registered securities. The index includes bonds from the Treasury, government-related, corporate, mortgage-backed securities, asset-backed securities, and collateralized mortgage-backed securities sectors. |
| 3 | Morningstar Int.-Term Bond Fund Average is the average performance without sales charges of funds with similar investment objectives, as calculated by Morningstar, Inc. |
| 4 | Fund performance has been increased by fee waivers and/or expense reimbursements, if any, without which performance would have been lower. |
| 5 | Before fee waivers and/or expense reimbursements. |
| 6 | After fee waivers and/or expense reimbursements. Waivers/reimbursements are contractual and are set to expire on 1/31/13. Contracts are reevaluated on an annual basis. |
| 4
LOOMIS SAYLES HIGH INCOME FUND
Management Discussion
Managers:
Matthew J. Eagan, CFA
Kathleen C. Gaffney, CFA
Elaine M. Stokes
Loomis, Sayles & Company, L.P.
Objective:
Seeks high current income plus the opportunity for capital appreciation to produce a high total return
Strategy:
Invests primarily in below investment-grade fixed-income securities
Fund Inception:
February 22, 1984
Symbols:
| | |
| Class A | | NEFHX |
| Class B | | NEHBX |
| Class C | | NEHCX |
| Class Y | | NEHYX |
Market Conditions
The momentum of the high-yield and equity market rallies from December continued into 2012. High-yield securities generated large returns in January before easing slightly in February and becoming flat in March. Actions by the European Central Bank calmed contagion fears, at least for the time being. In the United States, annualized fourth quarter gross domestic product growth of 3% pointed to a moderate but continued recovery and also helped subdue many investor fears.
Performance Results
For the six months ended March 31, 2012, Class A shares of Loomis Sayles High Income Fund returned 13.49% at net asset value. The fund outperformed its benchmark, the Barclays Capital U.S. Corporate High-Yield Bond Index, which returned 12.14% for the period. The fund also outperformed the 11.44% average return of the Morningstar High Yield Bond Fund category.
Explanation of Fund Performance
Out-of-benchmark allocations to convertible securities contributed significantly to the fund’s outperformance. In addition, an underweight position in below-investment-grade utilities had a positive effect on relative performance, as did an allocation to high-yield electric utilities. Investment-grade and high-yield consumer cyclicals were also among the top contributors. Similarly, investment-grade and high-yield financials also made a positive contribution to performance, with insurance and finance companies buoying the sector. Furthermore, a small, out-of-benchmark position in preferred securities contributed strongly to the fund’s absolute return, as equity-sensitive securities mirrored the upswing in the stock market.
In terms of lagging securities, the fund’s non-U.S.-dollar positions from Greece and Ireland underperformed. In addition, out-of-benchmark exposure to Treasuries detracted from relative return.
5 |
Outlook
As the second quarter begins, fixed-income investors continue to face an environment filled with opportunities and pitfalls. The sovereign debt situation in Europe is a chief ongoing concern, and the market is now focusing on Spain. Investors are taking solace in the improving U.S. economic situation, but Europe’s debt problems cast a large shadow over any sustainable recovery. So far this year, investors have generally sought out higher-risk securities for yield, but the progress (or lack thereof) in the euro zone could greatly influence their risk tolerance. In some respects, this is very similar to 2011, when cash rushed into credit, equity and other risky markets early in the year, only to reverse when political gyrations increased uncertainty. However, a resulting period of volatility can create buying opportunities for us. We continue to add credits that we believe have long-term potential for improving fundamentals.
In the first quarter of 2012, higher U.S. interest rates reinvigorated discussions surrounding the potential threat higher rates pose to fixed-income portfolios. We continue to believe that interest rates are in a period of transition and see rising rates as the next secular trend. However, given the Federal Reserve Board’s commitment to keep short-term rates low at least through the middle of 2014, the trading range in U.S. Treasuries should persist in the near term.
U.S. economic growth has been a bright spot thus far in 2012. We believe the overall health of corporate America remains intact, largely because corporate managements remain conservative. Reductions in the ranks of the unemployed, signs of potential recovery in the housing market and increased lending from financial institutions have highlighted the underlying fundamental health of the domestic economy. We anticipate a modest recovery in the United States and little to no growth in Europe and Japan. However, many developing countries show moderate to strong growth potential.
Above all else, our conviction in the merits of fundamental credit research has not changed. We remain steadfast in our opportunistic approach as well as our long-term outlook. Our focus continues to be on maintaining yield advantage, surveying the global marketplace for opportunities, and searching out specific risk that can lead to total return opportunities for the fund.
What You Should Know
Investments in the fund are subject to a number of risks. Please see the “Principal Risks” section of the fund’s prospectus. The purchase of fund shares should be seen as a long-term investment.
| 6
LOOMIS SAYLES HIGH INCOME FUND
Investment Results through March 31, 2012
The charts comparing the fund’s performance to an index provide you with a general sense of how it performed. The fund’s total return for the period shown below appears with and without sales charges and includes fund expenses and fees. An index measures the performance of a theoretical portfolio. Unlike a fund, the index is unmanaged and does not have expenses that affect the results. It is not possible to invest directly in an index. Investors would incur transaction costs and other expenses if they purchased the securities necessary to match the index.
Growth of a $10,000 Investment in Class A Shares4
March 31, 2002 through March 31, 2012

Average Annual Total Returns — March 31, 20124
| | | | | | | | | | | | | | | | | | | | |
| | | | | | |
| | | 6 Months | | | 1 Year | | | 5 Years | | | 10 Years | | | Since Class Y
Inception | |
| | | | | | |
| Class A (Inception 2/22/84) | | | | | | | | | | | | | | | | | | | | |
| NAV | | | 13.49 | % | | | 1.40 | % | | | 5.92 | % | | | 7.65 | % | | | — | |
| With 4.50% Maximum Sales Charge | | | 8.39 | | | | -3.14 | | | | 4.94 | | | | 7.15 | | | | — | |
| | | | | | |
| Class B (Inception 9/20/93) | | | | | | | | | | | | | | | | | | | | |
| NAV | | | 13.30 | | | | 0.86 | | | | 5.15 | | | | 6.86 | | | | — | |
| With CDSC1 | | | 8.32 | | | | -3.48 | | | | 4.87 | | | | 6.86 | | | | — | |
| | | | | | |
| Class C (Inception 3/2/98) | | | | | | | | | | | | | | | | | | | | |
| NAV | | | 13.06 | | | | 0.84 | | | | 5.13 | | | | 6.87 | | | | — | |
| With CDSC1 | | | 12.06 | | | | -0.03 | | | | 5.13 | | | | 6.87 | | | | — | |
| | | | | | |
| Class Y (Inception 2/29/08) | | | | | | | | | | | | | | | | | | | | |
| NAV | | | 13.63 | | | | 1.85 | | | | — | | | | — | | | | 7.94 | % |
| | | | | | |
| Comparative Performance | | | | | | | | | | | | | | | | | | | | |
| Barclays Capital U.S. Corporate High-Yield Bond Index2 | | | 12.14 | | | | 6.45 | | | | 8.10 | | | | 9.24 | | | | 10.95 | |
| Morningstar High Yield Bond Fund Avg.3 | | | 11.44 | | | | 4.62 | | | | 5.67 | | | | 7.42 | | | | 8.11 | |
Performance data quoted represents past performance and is no guarantee of future results. Total return and value will vary and you may have a gain or loss when shares are sold. Current performance may be lower or higher than quoted. For most recent month-end performance, visit ngam.natixis.com. Performance for other share classes will be greater or less than shown based on differences in fees and sales charges. Performance for periods less than one year is cumulative, not annualized. Returns reflect changes in share price and reinvestment of dividends and capital gains, if any. Class Y shares are not available for purchase by all investors. The table and graph do not reflect taxes shareholders might owe on any fund distributions or when they redeem their shares.
7 |
| | | | |
| Credit Quality | | % of Net
Assets as of
3/31/2012* | |
Aaa | | | 2.1 | |
Aa | | | 1.1 | |
A | | | 7.1 | |
Baaa | | | 9.2 | |
Ba | | | 22.8 | |
B | | | 28.8 | |
Caa and lower | | | 10.8 | |
Not Rated | | | 5.5 | |
Short-term and other | | | 12.6 | |
| * | Credit quality at 3/31/12 reflects the highest credit rating assigned to individual holdings of the fund among Moody’s, S&P or Fitch; ratings are subject to change. The fund’s shares are not rated by any rating agency and no credit rating for fund shares is implied. The Moody’s equivalent of the assigned rating is presented in the table. |
| | | | |
| Effective Maturity | | % of Net
Assets as of
3/31/2012 | |
1 year or less | | | 15.5 | |
1-5 years | | | 21.5 | |
5-10 years | | | 29.4 | |
10+ years | | | 33.6 | |
Average Effective Maturity | | | 10.4 years | |
Portfolio characteristics will vary.
Expense Ratios
as stated in the most recent prospectus
| | | | | | | | |
| Share Class | | Gross Expense Ratio5 | | | Net Expense Ratio6 | |
| A | | | 1.15 | % | | | 1.15 | % |
| B | | | 1.90 | | | | 1.90 | |
| C | | | 1.90 | | | | 1.90 | |
| Y | | | 0.90 | | | | 0.90 | |
NOTES TO CHARTS
| 1 | Performance for Class B shares assumes a maximum 5% contingent deferred sales charge (“CDSC”) applied when you sell shares, which declines annually between years 1-6 according to the following schedule: 5, 4, 3, 3, 2, 1, 0%. Class C shares performance assumes a 1% CDSC applied when you sell shares within one year of purchase. |
| 2 | Barclays Capital U.S. Corporate High-Yield Bond Index is an unmanaged index that covers the U.S. dollar-denominated, non-investment grade, fixed-rate, taxable corporate bond market. |
| 3 | Morningstar High Yield Bond Fund Average is the average performance without sales charges of funds with similar investment objectives, as calculated by Morningstar, Inc. |
| 4 | Fund performance has been increased by fee waivers and/or expense reimbursements, if any, without which performance would have been lower. |
| 5 | Before fee waivers and/or expense reimbursements. |
| 6 | After fee waivers and/or expense reimbursements. Waivers/reimbursements are contractual and are set to expire on 1/31/13. Contracts are reevaluated on an annual basis. |
| 8
LOOMIS SAYLES INTERNATIONAL BOND FUND
Management Discussion
Managers:
Kenneth M. Buntrock, CFA, CIC
David W. Rolley, CFA
Lynda L. Schweitzer, CFA
Loomis, Sayles & Company, L.P.
Objective:
Seeks high total return through a combination of high current income and capital appreciation
Strategy:
Invests primarily in fixed-income securities located outside the U.S.
Fund Inception:
February 1, 2008
Symbols:
| | |
| Class A | | LSIAX |
| Class C | | LSICX |
| Class Y | | LSIYX |
Market Conditions
Investor optimism led most markets higher during the six-month period. U.S. economic data appeared to strengthen, and the European Central Bank’s (ECB’s) long-term refinancing operations created ample liquidity; markets responded positively. The resulting quest for yield squeezed credit spreads (the yield difference between non-Treasury securities and comparable-maturity Treasuries) tighter.
Performance Results
For the six months ended March 31, 2012, Class A shares of Loomis Sayles International Bond Fund returned 3.77% at net asset value. The fund outperformed its benchmark, the Barclays Capital Global Aggregate, ex-USD Bond Index, which returned 0.80% for the period. The fund outperformed the 2.85% average return of funds in its peer group, the Morningstar World Bond category.
Explanation of Fund Performance
The fund’s overweight position in corporate bonds, and our security selection within this sector, drove the fund’s outperformance. In particular, our bias toward out-of-benchmark U.S.-dollar-pay corporates versus euro zone government bonds was additive to performance. Our selections in British-pound-denominated banking, communications and electric utilities issues were also favorable. From a currency perspective, an underweight position in yen and corresponding overweight positions in emerging market and peripheral currencies contributed to the fund’s outperformance. Specifically, holdings in the Colombian peso, Mexican peso, Singapore dollar and South Korean won aided results. Country allocation was another driver of outperformance, mainly due to an underweight position in Japan’s local markets and the fund’s overweight position in the out-of-benchmark U.S. local markets. Duration (price sensitivity to interest rate changes) and the fund’s positioning along the yield curve (a curve that shows the relationship among bond yields across the maturity spectrum) also added to performance. In addition, favorable positioning in U.S. Treasuries contributed to results.
9 |
The fund’s underweight position in the Australian dollar and overweight position in the Indonesian rupiah slightly detracted from relative performance during the period, as these currencies rallied with appreciation in commodity prices.
In terms of derivatives exposure, we traded foreign exchange forward contracts to acquire exposure to foreign currencies or to hedge the fund’s investments against currency fluctuations. We use foreign currency contracts as a part of our fixed-income currency strategy. During this period, the contracts had a positive impact on performance.
Outlook
We anticipate additional volatility in the coming months, which we plan to use to assess opportunities. Currently, growth challenges from a deteriorating outlook in Spain, higher oil prices and fears of a slowdown in China seem to be offsetting the positive effects of the ECB’s liquidity program for banks. In response, we have sought to reduce the fund’s risk exposure without reducing its yield, mostly by selective selling of higher-risk credits and replacing them with high-quality credits, such as U.S. Treasuries, reducing certain out-of-benchmark currency positions and maintaining the fund’s position in corporates.
Globally, investor sentiment remains challenged by the uncertain electoral and policy outcomes from the French elections, Spanish fiscal agony and doubts that the Bank of Japan is truly embracing a positive inflation target and quantitative easing. Domestically, we expect the U.S. recovery to be sustained, with gross domestic product growth of 2% or slightly higher in 2012. Economic data have been improving in recent months, and we believe there are more reasons to be positive than negative on the outlook. As the year progresses, we believe attention will shift from concerns in Europe to the U.S. political landscape and its fiscal ramifications. Ultimately, we expect a recovery in global growth, but currently too many policy risks loom for us to aggressively add growth-correlated positions.
What You Should Know
Investments in the fund are subject to a number of risks. Please see the “Principal Risks” section of the fund’s prospectus. The purchase of fund shares should be seen as a long-term investment.
| 10
LOOMIS SAYLES INTERNATIONAL BOND FUND
Investment Results through March 31, 2012
The charts comparing the fund’s performance to an index provide you with a general sense of how it performed. The fund’s total return for the period shown below appears with and without sales charges and includes fund expenses and fees. An index measures the performance of a theoretical portfolio. Unlike a fund, an index is unmanaged and does not have expenses that affect the results. It is not possible to invest directly in an index. Investors would incur transaction costs and other expenses if they purchased the securities necessary to match the index.
Growth of $10,000 Investment in Class A Shares4
February 1, 2008 (inception) through March 31, 2012
Average Annual Total Returns — March 31, 20124
| | | | | | | | | | | | |
| | | | |
| | | 6 Months | | | 1 Year | | | Since
Inception | |
| | | | |
| Class A (Inception 2/1/08) | | | | | | | | | | | | |
| NAV | | | 3.77 | % | | | 4.50 | % | | | 6.14 | % |
| With 4.50% Maximum Sales Charge | | | -0.86 | | | | -0.22 | | | | 4.98 | |
| | | | |
| Class C (Inception 2/1/08) | | | | | | | | | | | | |
| NAV | | | 3.41 | | | | 3.69 | | | | 5.32 | |
| With CDSC1 | | | 2.49 | | | | 2.77 | | | | 5.32 | |
| | | | |
| Class Y (Inception 2/1/08) | | | | | | | | | | | | |
| NAV | | | 3.89 | | | | 4.77 | | | | 6.39 | |
| | | | |
| Comparative Performance | | | | | | | | | | | | |
| Barclays Capital Global Aggregate ex-USD Bond Index2 | | | 0.80 | | | | 3.70 | | | | 4.53 | |
| Morningstar World Bond Fund Avg.3 | | | 2.85 | | | | 4.20 | | | | 5.02 | |
Performance data quoted represents past performance and is no guarantee of future results. Total return and value will vary and you may have a gain or loss when shares are sold. Current performance may be lower or higher than quoted. For most recent month-end performance, visit ngam.natixis.com. Performance for other share classes will be greater or less than shown based on differences in fees and sales charges. Performance for periods less than one year is cumulative, not annualized. Returns reflect changes in share price and reinvestment of dividends and capital gains, if any. Class Y shares are not available for purchase by all investors. The table and graph do not reflect taxes shareholders might owe on any fund distributions or when they redeem their shares.
11 |
| | | | |
| Credit Quality | | % of Net
Assets as of
3/31/2012* | |
Aaa | | | 37.3 | |
Aa | | | 30.7 | |
A | | | 9.9 | |
Baaa | | | 11.6 | |
Ba | | | 4.7 | |
B | | | 1.8 | |
Short-term and other | | | 4.0 | |
| * | Credit quality at 3/31/12 reflects the highest credit rating assigned to individual holdings of the fund among Moody’s, S&P or Fitch; ratings are subject to change. The fund’s shares are not rated by any rating agency and no credit rating for fund shares is implied. The Moody’s equivalent of the assigned rating is presented in the table. |
| | | | |
| Effective Maturity | | % of Net
Assets as of
3/31/2012 | |
1 year or less | | | 4.8 | |
1-5 years | | | 30.5 | |
5-10 years | | | 39.4 | |
10+ years | | | 25.3 | |
Average Effective Maturity | | | 8.2 years | |
Portfolio characteristics will vary.
Expense Ratios
as stated in the most recent prospectus
| | | | | | | | |
| Share Class | | Gross Expense Ratio5 | | | Net Expense Ratio6 | |
| A | | | 1.64 | % | | | 1.10 | % |
| C | | | 2.40 | | | | 1.85 | |
| Y | | | 1.36 | | | | 0.85 | |
NOTES TO CHARTS
| 1 | Class C shares performance assumes a 1% CDSC applied when you sell shares within one year of purchase. |
| 2 | Barclays Capital Global Aggregate ex-USD Bond Index is an unmanaged index that provides a broad-based measure of the international investment-grade fixed-rate debt markets. |
| 3 | Morningstar World Bond Fund Average is the average performance without sales charges of funds with similar investment objectives, as calculated by Morningstar, Inc. |
| 4 | Fund performance has been increased by fee waivers and/or expense reimbursements, if any, without which performance would have been lower. |
| 5 | Before fee waivers and/or expense reimbursements. |
| 6 | After fee waivers and/or expense reimbursements. Waivers/reimbursements are contractual and are set to expire on 1/31/13. Contracts are reevaluated on an annual basis. |
| 12
LOOMIS SAYLES LIMITED TERM GOVERNMENT AND AGENCY FUND
Management Discussion
Managers:*
John Hyll
Clifton V. Rowe, CFA
Loomis, Sayles & Company, L.P.
Objective:
Seeks a high current return consistent with preservation of capital
Strategy:
Invests primarily in securities issued or guaranteed by the U.S. government, its agencies or instrumentalities
Fund Inception:
January 3, 1989
Symbols:
| | |
| Class A | | NEFLX |
| Class B | | NELBX |
| Class C | | NECLX |
| Class Y | | NELYX |
| * | Please note that effective 4/23/2012 John Hyll is no longer a manager of the fund. Christopher T. Harms and Kurt Wagner have joined Mr. Rowe as co-managers of the fund. |
Market Conditions
Investors were generally upbeat during the six-month period, but markets experienced bouts of volatility stemming from events in Europe. During the first quarter of 2012, the negative news came less frequently, and Greek sovereign debt investors accepted a restructuring deal, which helped sustain the market rally. Domestic economic data generally improved, especially within the labor market and corporate sector. Late in the period, news that growth in China and other emerging market countries was slowing caused investors to be more cautious, and the market rally slowed.
Performance Results
For the six months ended March 31, 2012, Class A shares of Loomis Sayles Limited Term Government and Agency Fund returned 1.87% at net asset value. The fund outperformed its benchmark, the Barclays Capital U.S. 1-5 Year Government Bond Index, which returned 0.31% for the period. The fund also outperformed the 0.46% average return of the Morningstar Short Government category.
Explanation of Fund Performance
The commercial mortgage-backed securities sector generated strong returns during the period, and the fund’s large overweight in the sector, combined with prudent security selection, helped magnify the positive performance. Strong security selection in the fund’s out-of-benchmark allocation to mortgage-backed securities was another contributor to outperformance, as spreads (the yield difference between non-Treasury securities and comparable-maturity Treasuries) tightened due to diminishing risk concerns. In addition, a significant underweight in U.S. Treasuries contributed to the fund’s outperformance, as U.S. Treasury returns lagged during the period.
The fund’s underweight in agency securities detracted from performance, as the sector had strong returns. Security selection within the agency sector was also
13 |
lackluster during the period. Additionally, the fund’s shorter-than-benchmark duration (price sensitivity to interest rate changes) hampered relative performance as the longer end of the yield curve (a curve that shows the relationship among bond yields across the maturity spectrum) tightened relative to the rather compressed short end of the curve.
Outlook
We expect intermittent volatility to persist throughout the year. Domestically, we believe the economic environment should gradually improve, as American corporations continue to perform well. Investor focus should return to the United States later in the year as the election season progresses. China’s slowing economy may have a negative effect on global growth. China and other emerging nations are attempting to rein in inflation and steer their economies toward a soft landing. Finally, we believe the euro zone will likely create uncertainty due to the questionable fiscal health of weaker member nations. Europe seems likely to slip into recession. Ultimately, we expect a recovery in global growth but currently too many policy risks looms for us to aggressively add growth-correlated positions.
What You Should Know
Investments in the fund are subject to a number of risks. Please see the “Principal Risks” section of the fund’s prospectus. The purchase of fund shares should be seen as a long-term investment.
| 14
LOOMIS SAYLES LIMITED TERM GOVERNMENT AND AGENCY FUND
Investment Results through March 31, 2012
The charts comparing the fund’s performance to an index provide you with a general sense of how it performed. The fund’s total return for the period shown below appears with and without sales charges and includes fund expenses and fees. An index measures the performance of a theoretical portfolio. Unlike a fund, the index is unmanaged and does not have expenses that affect the results. It is not possible to invest directly in an index. Investors would incur transaction costs and other expenses if they purchased the securities necessary to match the index.
Growth of a $10,000 Investment in Class A Shares4
March 31, 2002 through March 31, 2012
Average Annual Total Returns — March 31, 20124
| | | | | | | | | | | | | | | | |
| | | | | |
| | | 6 Months | | | 1 Year | | | 5 Years | | | 10 Years | |
| | | | | |
| Class A (Inception 1/3/89) | | | | | | | | | | | | | | | | |
| NAV | | | 1.87 | % | | | 3.08 | % | | | 4.98 | % | | | 4.26 | % |
| With 3.00% Maximum Sales Charge | | | -1.21 | | | | -0.03 | | | | 4.34 | | | | 3.94 | |
| | | | | |
| Class B (Inception 9/27/93) | | | | | | | | | | | | | | | | |
| NAV | | | 1.40 | | | | 2.23 | | | | 4.18 | | | | 3.48 | |
| With CDSC1 | | | -3.60 | | | | -2.77 | | | | 3.84 | | | | 3.48 | |
| | | | | |
| Class C (Inception 12/30/94) | | | | | | | | | | | | | | | | |
| NAV | | | 1.49 | | | | 2.32 | | | | 4.20 | | | | 3.51 | |
| With CDSC1 | | | 0.49 | | | | 1.32 | | | | 4.20 | | | | 3.51 | |
| | | | | |
| Class Y (Inception 3/31/94) | | | | | | | | | | | | | | | | |
| NAV | | | 1.91 | | | | 3.25 | | | | 5.22 | | | | 4.52 | |
| | | | | |
| Comparative Performance | | | | | | | | | | | | | | | | |
| Barclays Capital U.S. 1-5 Year Government Bond Index2 | | | 0.31 | | | | 3.04 | | | | 4.43 | | | | 4.05 | |
| Morningstar Short Gov’t Fund Avg.3 | | | 0.46 | | | | 2.16 | | | | 3.54 | | | | 3.26 | |
Performance data quoted represents past performance and is no guarantee of future results. Total return and value will vary and you may have a gain or loss when shares are sold. Current performance may be lower or higher than quoted. For most recent month-end performance, visit ngam.natixis.com. Performance for other share classes will be greater or less than shown based on differences in fees and sales charges. Performance for periods less than one year is cumulative, not annualized. Returns reflect changes in share price and reinvestment of dividends and capital gains, if any. Class Y shares are not available for purchase by all investors. The table and graph do not reflect taxes shareholders might owe on any fund distributions or when they redeem their shares.
15 |
| | | | |
| Fund Composition | | % of Net
Assets as of
3/31/2012 | |
Hybrid ARMs | | | 23.3 | |
Mortgage Related | | | 20.6 | |
Collateralized Mortgage Obligations | | | 17.5 | |
Commercial Mortgage-Backed Securities | | | 14.3 | |
Treasuries | | | 14.2 | |
Government Owned - No Guarantee | | | 6.0 | |
ABS Car Loan | | | 0.7 | |
ABS Credit Card | | | 0.6 | |
Government Guaranteed | | | 0.4 | |
ABS Home Equity | | | 0.2 | |
Short-term and Other | | | 2.2 | |
| | | | |
| Effective Maturity | | % of Net
Assets as of
3/31/2012 | |
1 year or less | | | 12.0 | |
1-5 years | | | 73.3 | |
5-10 years | | | 14.7 | |
Average Effective Maturity | | | 3.1 years | |
Portfolio characteristics will vary.
Expense Ratios
as stated in the most recent prospectus
| | | | | | | | |
| Share Class | | Gross Expense Ratio5 | | | Net Expense Ratio6 | |
| A | | | 0.92 | % | | | 0.85 | % |
| B | | | 1.68 | | | | 1.60 | |
| C | | | 1.67 | | | | 1.60 | |
| Y | | | 0.67 | | | | 0.60 | |
NOTES TO CHARTS
| 1 | Performance for Class B shares assumes a maximum 5% contingent deferred sales charge (“CDSC”) applied when you sell shares, which declines annually between years 1-6 according to the following schedule: 5, 4, 3, 3, 2, 1, 0%. Class C shares performance assumes a 1% CDSC applied when you sell shares within one year of purchase. |
| 2 | Barclays Capital U.S. 1-5 Year Government Bond Index is an unmanaged index that includes U.S. Treasury and agency securities with remaining maturities of one to five years. |
| 3 | Morningstar Short Gov’t Fund Average is the average performance without sales charges of funds with similar investment objectives, as calculated by Morningstar, Inc. |
| 4 | Fund performance has been increased by fee waivers and/or expense reimbursements, if any, without which performance would have been lower. |
| 5 | Before fee waivers and/or expense reimbursements. |
| 6 | After fee waivers and/or expense reimbursements. Waivers/reimbursements are contractual and are set to expire on 1/31/13. Contracts are reevaluated on an annual basis. |
| 16
ADDITIONAL INFORMATION
The views expressed in this report reflect those of the portfolio managers as of the dates indicated. The managers’ views are subject to change at any time without notice based on changes in market or other conditions. References to specific securities or industries should not be regarded as investment advice. Because the funds are actively managed, there is no assurance that they will continue to invest in the securities or industries mentioned.
Before investing, consider the fund’s investment objectives, risks, charges and expenses. Visit ngam.natixis.com or call 800-225-5478 for a prospectus and/or a summary prospectus, both of which contain this and other information. Read it carefully.
PROXY VOTING INFORMATION
A description of the funds’ proxy voting policies and procedures is available without charge, upon request, by calling Natixis Funds at 800-225-5478; on the funds’ website at ngam.natixis.com; and on the Securities and Exchange Commission’s (SEC’s) website at www.sec.gov. Information regarding how the funds voted proxies relating to portfolio securities during the 12-month period ended June 30, 2011 is available from the funds’ website and the SEC’s website.
QUARTERLY PORTFOLIO SCHEDULES
The funds file a complete schedule of portfolio holdings with the SEC for the first and third quarters of each fiscal year on Form N-Q. The funds’ Forms N-Q are available on the SEC’s website at www.sec.gov and may be reviewed and copied at the SEC’s Public Reference Room in Washington, DC. Information on the operation of the Public Reference Room may be obtained by calling 800-SEC-0330.
17 |
UNDERSTANDING FUND EXPENSES
As a mutual fund shareholder, you incur different costs: transaction costs, including sales charges (loads) on purchases and contingent deferred sales charges on redemptions, and ongoing costs, including management fees, distribution and/or service fees (12b-1 fees), and other fund expenses. Certain exemptions may apply. These costs are described in more detail in the funds’ prospectuses. The examples below are intended to help you understand the ongoing costs of investing in the funds and help you compare these with the ongoing costs of investing in other mutual funds.
The first line in the table of each class of fund shares shows the actual account values and actual fund expenses you would have paid on a $1,000 investment in the fund from October 1, 2011 through March 31, 2012. To estimate the expenses you paid over the period, simply divide your account value by $1,000 (for example $8,600 account value divided by $1,000 = 8.60) and multiply the result by the number in the Expenses Paid During Period column as shown below for your class.
The second line in the table of each class of fund shares provides information about hypothetical account values and hypothetical expenses based on the fund’s actual expense ratios and an assumed rate of return of 5% per year before expenses, which is not the fund’s actual return. The hypothetical account values and expenses may not be used to estimate the actual ending account balance or expenses you paid on your investment for the period. You may use this information to compare the ongoing costs of investing in the fund and other funds. To do so, compare this 5% hypothetical example with the 5% hypothetical examples that appear in the shareholder reports of the other funds.
Please note that the expenses shown reflect ongoing costs only, and do not include any transaction costs such as sales charges. Therefore, the second line in the table of each fund is useful in comparing ongoing costs only, and will not help you determine the relative costs of owning different funds. If transaction costs were included, total costs would be higher.
| | | | | | | | | | | | |
| LOOMIS SAYLES CORE PLUS BOND FUND | | BEGINNING
ACCOUNT VALUE 10/1/2011 | | | ENDING
ACCOUNT VALUE 3/31/2012 | | | EXPENSES PAID
DURING PERIOD* 10/1/2011 – 3/31/2012 | |
Class A | | | | | | | | | | | | |
Actual | | | $1,000.00 | | | | $1,050.50 | | | | $4.15 | |
Hypothetical (5% return before expenses) | | | $1,000.00 | | | | $1,020.95 | | | | $4.09 | |
Class B | | | | | | | | | | | | |
Actual | | | $1,000.00 | | | | $1,047.30 | | | | $7.98 | |
Hypothetical (5% return before expenses) | | | $1,000.00 | | | | $1,017.20 | | | | $7.87 | |
Class C | | | | | | | | | | | | |
Actual | | | $1,000.00 | | | | $1,046.80 | | | | $7.98 | |
Hypothetical (5% return before expenses) | | | $1,000.00 | | | | $1,017.20 | | | | $7.87 | |
Class Y | | | | | | | | | | | | |
Actual | | | $1,000.00 | | | | $1,052.20 | | | | $2.92 | |
Hypothetical (5% return before expenses) | | | $1,000.00 | | | | $1,022.15 | | | | $2.88 | |
| * | Expenses are equal to the Fund’s annualized expense ratio: 0.81%, 1.56%, 1.56% and 0.57% for Class A, B, C and Y, respectively, multiplied by the average account value over the period, multiplied by the number of days in the most recent fiscal half-year, divided by 366 (to reflect the half-year period). |
| 18
| | | | | | | | | | | | |
| LOOMIS SAYLES HIGH INCOME FUND | | BEGINNING
ACCOUNT VALUE 10/1/2011 | | | ENDING
ACCOUNT VALUE 3/31/2012 | | | EXPENSES PAID
DURING PERIOD* 10/1/2011 – 3/31/2012 | |
Class A | | | | | | | | | | | | |
Actual | | | $1,000.00 | | | | $1,134.90 | | | | $6.14 | |
Hypothetical (5% return before expenses) | | | $1,000.00 | | | | $1,019.25 | | | | $5.81 | |
Class B | | | | | | | | | | | | |
Actual | | | $1,000.00 | | | | $1,133.00 | | | | $10.13 | |
Hypothetical (5% return before expenses) | | | $1,000.00 | | | | $1,015.50 | | | | $9.57 | |
Class C | | | | | | | | | | | | |
Actual | | | $1,000.00 | | | | $1,130.60 | | | | $10.12 | |
Hypothetical (5% return before expenses) | | | $1,000.00 | | | | $1,015.50 | | | | $9.57 | |
Class Y | | | | | | | | | | | | |
Actual | | | $1,000.00 | | | | $1,136.30 | | | | $4.81 | |
Hypothetical (5% return before expenses) | | | $1,000.00 | | | | $1,020.50 | | | | $4.55 | |
| * | Expenses are equal to the Fund’s annualized expense ratio (after waiver/reimbursement): 1.15%, 1.90%, 1.90% and 0.90% for Class A, B, C and Y, respectively, multiplied by the average account value over the period, multiplied by the number of days in the most recent fiscal half-year, divided by 366 (to reflect the half-year period). |
| | | | | | | | | | | | |
| LOOMIS SAYLES INTERNATIONAL BOND FUND | | BEGINNING
ACCOUNT VALUE 10/1/2011 | | | ENDING
ACCOUNT VALUE 3/31/2012 | | | EXPENSES PAID
DURING PERIOD* 10/1/2011 – 3/31/2012 | |
Class A | | | | | | | | | | | | |
Actual | | | $1,000.00 | | | | $1,037.70 | | | | $5.60 | |
Hypothetical (5% return before expenses) | | | $1,000.00 | | | | $1,019.50 | | | | $5.55 | |
Class C | | | | | | | | | | | | |
Actual | | | $1,000.00 | | | | $1,034.10 | | | | $9.41 | |
Hypothetical (5% return before expenses) | | | $1,000.00 | | | | $1,015.75 | | | | $9.32 | |
Class Y | | | | | | | | | | | | |
Actual | | | $1,000.00 | | | | $1,038.90 | | | | $4.33 | |
Hypothetical (5% return before expenses) | | | $1,000.00 | | | | $1,020.75 | | | | $4.29 | |
| * | Expenses are equal to the Fund’s annualized expense ratio (after waiver/reimbursement): 1.10%, 1.85% and 0.85% for Class A, C and Y, respectively, multiplied by the average account value over the period, multiplied by the number of days in the most recent fiscal half-year, divided by 366 (to reflect the half-year period). |
19 |
| | | | | | | | | | | | |
LOOMIS SAYLES LIMITED TERM
GOVERNMENT AND AGENCY FUND | | BEGINNING
ACCOUNT VALUE 10/1/2011 | | | ENDING
ACCOUNT VALUE 3/31/2012 | | | EXPENSES PAID
DURING PERIOD*
10/1/2011 – 3/31/2012 | |
Class A | | | | | | | | | | | | |
Actual | | | $1,000.00 | | | | $1,018.70 | | | | $4.29 | |
Hypothetical (5% return before expenses) | | | $1,000.00 | | | | $1,020.75 | | | | $4.29 | |
Class B | | | | | | | | | | | | |
Actual | | | $1,000.00 | | | | $1,014.00 | | | | $8.06 | |
Hypothetical (5% return before expenses) | | | $1,000.00 | | | | $1,017.00 | | | | $8.07 | |
Class C | | | | | | | | | | | | |
Actual | | | $1,000.00 | | | | $1,014.90 | | | | $8.06 | |
Hypothetical (5% return before expenses) | | | $1,000.00 | | | | $1,017.00 | | | | $8.07 | |
Class Y | | | | | | | | | | | | |
Actual | | | $1,000.00 | | | | $1,019.10 | | | | $3.03 | |
Hypothetical (5% return before expenses) | | | $1,000.00 | | | | $1,022.00 | | | | $3.03 | |
| * | Expenses are equal to the Fund’s annualized expense ratio (after waiver/reimbursement): 0.85%, 1.60%, 1.60% and 0.60% for Class A, B, C and Y, respectively, multiplied by the average account value over the period, multiplied by the number of days in the most recent fiscal half-year, divided by 366 (to reflect the half-year period). |
| 20
Portfolio of Investments – as of March 31, 2012 (Unaudited)
Loomis Sayles Core Plus Bond Fund
| | | | | | | | |
Principal
Amount | | | Description | | Value (†) | |
| | | | | | | | |
| | Bonds and Notes — 96.3% of Net Assets | | | | |
| | | | ABS Car Loan — 2.0% | | | | |
| $ | 2,290,000 | | | Ally Master Owner Trust, Series 2011-1, Class A2, 2.150%, 1/15/2016 | | $ | 2,338,709 | |
| | 570,000 | | | AmeriCredit Automobile Receivables Trust, Series 2011-2, Class A3, 1.610%, 10/08/2015 | | | 574,765 | |
| | 780,000 | | | AmeriCredit Automobile Receivables Trust, Series 2011-3, Class A3, 1.170%, 1/08/2016 | | | 781,717 | |
| | 2,410,000 | | | AmeriCredit Automobile Receivables Trust, Series 2011-4, Class A3, 1.170%, 5/09/2016 | | | 2,413,969 | |
| | 1,240,000 | | | Avis Budget Rental Car Funding AESOP LLC, Series 2010-2A, Class A, 3.630%, 8/20/2014, 144A | | | 1,268,773 | |
| | 1,300,000 | | | Avis Budget Rental Car Funding AESOP LLC, Series 2011-2A, Class A, 2.370%, 11/20/2014, 144A | | | 1,319,037 | |
| | 360,889 | | | Centre Point Funding LLC, Series 2010-1A, Class 1, 5.430%, 7/20/2016, 144A | | | 377,908 | |
| | 1,775,000 | | | DSC Floorplan Master Owner Trust, Series 2011-1, Class A, 3.910%, 3/15/2016, 144A | | | 1,800,173 | |
| | 790,000 | | | Hertz Vehicle Financing LLC, Series 2009-2A, Class A1, 4.260%, 3/25/2014, 144A | | | 809,230 | |
| | 7,130,000 | | | Santander Drive Auto Receivables Trust, Series 2012-1, Class 1A3, 1.490%, 10/15/2015 | | | 7,159,820 | |
| | | | | | | | |
| | | | | | | 18,844,101 | |
| | | | | | | | |
| | | | ABS Credit Card — 0.2% | | | | |
| | 1,580,000 | | | World Financial Network Credit Card Master Trust, Series 2009-D, Class A, 4.660%, 5/15/2017 | | | 1,655,518 | |
| | 500,000 | | | World Financial Network Credit Card Master Trust, Series 2010-A, Class A, 3.960%, 4/15/2019 | | | 539,678 | |
| | | | | | | | |
| | | | | | | 2,195,196 | |
| | | | | | | | |
| | | | ABS Home Equity — 0.3% | | | | |
| | 551,160 | | | Countrywide Asset-Backed Certificates, Series 2004-S1, Class A3, 4.615%, 2/25/2035 | | | 520,903 | |
| | 2,313,304 | | | Wells Fargo Mortgage Backed Securities Trust, Series 2005-11, Class 2A3, 5.500%, 11/25/2035 | | | 2,355,869 | |
| | | | | | | | |
| | | | | | | 2,876,772 | |
| | | | | | | | |
| | | | ABS Other — 0.2% | | | | |
| | 1,620,000 | | | Avis Budget Rental Car Funding AESOP LLC, Series 2011-1A, Class A, 1.850%, 11/20/2014, 144A | | | 1,624,406 | |
| | | | | | | | |
| | | | Aerospace & Defense — 0.4% | | | | |
| | 1,480,000 | | | Bombardier, Inc., 7.500%, 3/15/2018, 144A | | | 1,628,000 | |
| | 1,915,000 | | | Oshkosh Corp., 8.250%, 3/01/2017 | | | 2,077,775 | |
| | | | | | | | |
| | | | | | | 3,705,775 | |
| | | | | | | | |
| | | | Airlines — 0.1% | | | | |
| | 1,211,212 | | | Continental Airlines Pass Through Trust, Series 2010-1, Class A, 4.750%, 7/12/2022 | | | 1,259,661 | |
| | | | | | | | |
See accompanying notes to financial statements.
21 |
Portfolio of Investments – as of March 31, 2012 (Unaudited)
Loomis Sayles Core Plus Bond Fund – (continued)
| | | | | | | | |
Principal
Amount | | | Description | | Value (†) | |
| | | | | | | | |
| | | | Automotive — 2.3% | | | | |
| $ | 7,885,000 | | | Ford Motor Credit Co. LLC, 5.000%, 5/15/2018 | | $ | 8,167,725 | |
| | 510,000 | | | Ford Motor Credit Co. LLC, 5.625%, 9/15/2015 | | | 542,359 | |
| | 3,880,000 | | | Ford Motor Credit Co. LLC, 6.625%, 8/15/2017 | | | 4,299,556 | |
| | 880,000 | | | Ford Motor Credit Co. LLC, 7.000%, 10/01/2013 | | | 938,322 | |
| | 1,830,000 | | | Ford Motor Credit Co. LLC, 7.000%, 4/15/2015 | | | 1,999,017 | |
| | 660,000 | | | Ford Motor Credit Co. LLC, 8.000%, 12/15/2016 | | | 765,207 | |
| | 2,165,000 | | | General Motors Financial Co., Inc., 6.750%, 6/01/2018 | | | 2,312,352 | |
| | 2,205,000 | | | Kia Motors Corp., 3.625%, 6/14/2016, 144A | | | 2,248,216 | |
| | | | | | | | |
| | | | | | | 21,272,754 | |
| | | | | | | | |
| | | | Banking — 5.4% | | | | |
| | 4,900,000 | | | Banco Santander Brasil S.A., 4.625%, 2/13/2017, 144A | | | 4,912,250 | |
| | 5,925,000 | | | Bank of America Corp., MTN, 5.000%, 5/13/2021 | | | 5,934,142 | |
| | 1,365,000 | | | Bear Stearns Cos., Inc. (The), 6.400%, 10/02/2017 | | | 1,589,313 | |
| | 1,115,000 | | | Citigroup, Inc., 6.125%, 5/15/2018 | | | 1,249,899 | |
| | 4,880,000 | | | Citigroup, Inc., 6.500%, 8/19/2013 | | | 5,162,655 | |
| | 1,760,000 | | | Goldman Sachs Group, Inc. (The), 6.750%, 10/01/2037 | | | 1,719,649 | |
| | 4,305,000 | | | Goldman Sachs Group, Inc. (The), 7.500%, 2/15/2019 | | | 4,918,613 | |
| | 3,400,000 | | | Hana Bank, 4.250%, 6/14/2017, 144A | | | 3,516,416 | |
| | 4,785,000 | | | JPMorgan Chase & Co., 6.000%, 1/15/2018 | | | 5,535,336 | |
| | 3,650,000 | | | Merrill Lynch & Co., Inc., MTN, 6.875%, 4/25/2018 | | | 4,057,701 | |
| | 1,015,000 | | | Morgan Stanley, 5.375%, 10/15/2015 | | | 1,048,493 | |
| | 4,180,000 | | | Morgan Stanley, 5.750%, 1/25/2021 | | | 4,103,849 | |
| | 2,530,000 | | | Morgan Stanley, Series F, GMTN, 6.625%, 4/01/2018 | | | 2,664,125 | |
| | 3,735,000 | | | Royal Bank of Scotland PLC (The), 4.875%, 3/16/2015 | | | 3,882,368 | |
| | | | | | | | |
| | | | | | | 50,294,809 | |
| | | | | | | | |
| | | | Building Materials — 0.5% | | | | |
| | 2,420,000 | | | Owens Corning, Inc., 7.000%, 12/01/2036 | | | 2,578,885 | |
| | 1,845,000 | | | USG Corp., 6.300%, 11/15/2016 | | | 1,725,075 | |
| | | | | | | | |
| | | | | | | 4,303,960 | |
| | | | | | | | |
| | | | Chemicals — 1.2% | | | | |
| | 3,760,000 | | | Braskem America Finance Co., 7.125%, 7/22/2041, 144A | | | 3,773,160 | |
| | 2,270,000 | | | Chevron Phillips Chemical Co. LLC, 8.250%, 6/15/2019, 144A | | | 2,972,892 | |
| | 1,205,000 | | | Methanex Corp., 5.250%, 3/01/2022 | | | 1,226,548 | |
| | 2,755,000 | | | RPM International, Inc., 6.125%, 10/15/2019 | | | 3,016,507 | |
| | | | | | | | |
| | | | | | | 10,989,107 | |
| | | | | | | | |
| | | | Collateralized Mortgage Obligations — 0.6% | | | | |
| | 1,558,314 | | | Banc of America Funding Corp., Series 2005-B, Class 3A1, 0.472%, 4/20/2035(b) | | | 1,169,981 | |
| | 749,893 | | | Chase Mortgage Finance Corp., Series 2007-A1, Class 2A3, 2.750%, 2/25/2037(b) | | | 726,569 | |
| | 3,530,000 | | | FHLMC Multifamily Structured Pass Through Certificates,
Series K704, Class A2, 2.412%, 8/25/2018 | | | 3,587,271 | |
| | | | | | | | |
| | | | | | | 5,483,821 | |
| | | | | | | | |
See accompanying notes to financial statements.
| 22
Portfolio of Investments – as of March 31, 2012 (Unaudited)
Loomis Sayles Core Plus Bond Fund – (continued)
| | | | | | | | |
Principal
Amount | | | Description | | Value (†) | |
| | | | | | | | |
| | | | Commercial Mortgage-Backed Securities — 4.5% | | | | |
| $ | 501,352 | | | Banc of America Merrill Lynch Commercial Mortgage, Inc.,
Series 2007-2, Class A4, 5.634%, 4/10/2049(b) | | $ | 512,560 | |
| | 1,670,000 | | | Banc of America Merrill Lynch Commercial Mortgage, Inc.,
Series 2007-2, Class A4, 5.818%, 4/10/2049(b) | | | 1,837,618 | |
| | 2,680,000 | | | Banc of America Merrill Lynch Commercial Mortgage, Inc.,
Series 2007-5, Class A4, 5.492%, 2/10/2051 | | | 3,021,531 | |
| | 223,664 | | | Bear Stearns Commercial Mortgage Securities, Series 2005-PW10, Class A2, 5.270%, 12/11/2040 | | | 223,591 | |
| | 854,908 | | | Bear Stearns Commercial Mortgage Securities, Series 2007-PW16, Class A2, 5.853%, 6/11/2040(b) | | | 886,974 | |
| | 690,000 | | | Citigroup Commercial Mortgage Trust, Series 2007-C6, Class A4, 5.885%, 12/10/2049(b) | | | 786,911 | |
| | 1,000,000 | | | Citigroup Commercial Mortgage Trust, Series 2008-C7, Class A4, 6.276%, 12/10/2049(b) | | | 1,157,751 | |
| | 253,770 | | | Citigroup/Deutsche Bank Commercial Mortgage Trust,
Series 2006-CD2, Class A2, 5.408%, 1/15/2046 | | | 253,673 | |
| | 2,500,000 | | | Credit Suisse Mortgage Capital Certificates, Series 2007-C2, Class A3, 5.542%, 1/15/2049 | | | 2,705,057 | |
| | 3,500,000 | | | Credit Suisse Mortgage Capital Certificates, Series 2007-C4, Class A4, 5.967%, 9/15/2039(b) | | | 3,742,980 | |
| | 986,751 | | | Greenwich Capital Commercial Funding Corp., Series 2005-GG5, Class A2, 5.117%, 4/10/2037 | | | 990,561 | |
| | 425,000 | | | Greenwich Capital Commercial Funding Corp., Series 2006-GG7, Class A4, 6.081%, 7/10/2038(b) | | | 481,428 | |
| | 2,000,000 | | | Greenwich Capital Commercial Funding Corp., Series 2007-GG9, Class A4, 5.444%, 3/10/2039 | | | 2,200,840 | |
| | 890,000 | | | GS Mortgage Securities Corp. II, Series 2007-GG10, Class A4, 5.980%, 8/10/2045(b) | | | 987,630 | |
| | 3,000,000 | | | JPMorgan Chase Commercial Mortgage Securities Corp.,
Series 2006-LDP9, Class A3, 5.336%, 5/15/2047 | | | 3,285,843 | |
| | 2,650,000 | | | JPMorgan Chase Commercial Mortgage Securities Corp.,
Series 2007-CB18, Class A4, 5.440%, 6/12/2047 | | | 2,946,236 | |
| | 592,647 | | | LB-UBS Commercial Mortgage Trust, Series 2005-C3, Class A3, 4.647%, 7/15/2030 | | | 593,187 | |
| | 1,920,000 | | | LB-UBS Commercial Mortgage Trust, Series 2007-C2, Class A3, 5.430%, 2/15/2040 | | | 2,122,980 | |
| | 2,500,000 | | | Merrill Lynch/Countrywide Commercial Mortgage Trust,
Series 2007-5, Class A4, 5.378%, 8/12/2048 | | | 2,685,830 | |
| | 2,930,000 | | | Morgan Stanley Capital I, Series 2007-IQ14, Class A4, 5.692%, 4/15/2049 | | | 3,199,929 | |
| | 305,000 | | | Morgan Stanley Capital I, Series 2007-T27, Class A4, 5.817%, 6/11/2042(b) | | | 350,633 | |
See accompanying notes to financial statements.
23 |
Portfolio of Investments – as of March 31, 2012 (Unaudited)
Loomis Sayles Core Plus Bond Fund – (continued)
| | | | | | | | |
Principal
Amount | | | Description | | Value (†) | |
| | | | | | | | |
| | | | Commercial Mortgage-Backed Securities — continued | | | | |
| $ | 1,175,000 | | | Morgan Stanley Capital I, Series 2008-T29, Class A4, 6.455%, 1/11/2043(b) | | $ | 1,384,690 | |
| | 2,070,000 | | | Wachovia Bank Commercial Mortgage Trust, Series 2006-C29, Class A4, 5.308%, 11/15/2048 | | | 2,309,996 | |
| | 3,090,000 | | | Wachovia Bank Commercial Mortgage Trust, Series 2007-C30, Class A5, 5.342%, 12/15/2043 | | | 3,336,363 | |
| | | | | | | | |
| | | | | | | 42,004,792 | |
| | | | | | | | |
| | | | Construction Machinery — 0.1% | | | | |
| | 1,035,000 | | | Urbi Desarrollos Urbanos SAB de CV, 9.750%, 2/03/2022, 144A | | | 1,097,100 | |
| | | | | | | | |
| | | | Consumer Cyclical Services — 0.0% | | | | |
| | 360,000 | | | Service Corp. International, 7.000%, 5/15/2019 | | | 389,700 | |
| | | | | | | | |
| | | | Consumer Products — 0.5% | | | | |
| | 3,185,000 | | | Whirlpool Corp., MTN, 4.850%, 6/15/2021 | | | 3,239,655 | |
| | 1,546,000 | | | Whirlpool Corp., 6.500%, 6/15/2016 | | | 1,713,892 | |
| | | | | | | | |
| | | | | | | 4,953,547 | |
| | | | | | | | |
| | | | Diversified Manufacturing — 0.7% | | | | |
| | 1,200,000 | | | Crane Co., 6.550%, 11/15/2036 | | | 1,208,238 | |
| | 1,420,000 | | | Fibria Overseas Finance Ltd., 6.750%, 3/03/2021, 144A | | | 1,451,950 | |
| | 4,045,000 | | | Votorantim Cimentos S.A., 7.250%, 4/05/2041, 144A | | | 4,105,675 | |
| | | | | | | | |
| | | | | | | 6,765,863 | |
| | | | | | | | |
| | | | Electric — 1.1% | | | | |
| | 215,000 | | | Dubai Electricity & Water Authority, 6.375%, 10/21/2016, 144A | | | 228,975 | |
| | 1,440,000 | | | Dubai Electricity & Water Authority, 8.500%, 4/22/2015, 144A | | | 1,602,000 | |
| | 1,535,000 | | | Enersis S.A., 7.375%, 1/15/2014 | | | 1,665,060 | |
| | 2,370,000 | | | Florida Power & Light Co., 4.125%, 2/01/2042 | | | 2,322,638 | |
| | 1,010,000 | | | Ipalco Enterprises, Inc., 5.000%, 5/01/2018 | | | 1,004,950 | |
| | 2,945,000 | | | TransAlta Corp., 4.750%, 1/15/2015 | | | 3,141,782 | |
| | | | | | | | |
| | | | | | | 9,965,405 | |
| | | | | | | | |
| | | | Financial Other — 0.1% | | | | |
| | 1,100,000 | | | Hyundai Capital Services, Inc., 3.500%, 9/13/2017, 144A | | | 1,102,582 | |
| | | | | | | | |
| | | | Food & Beverage — 0.5% | | | | |
| | 1,445,000 | | | Bunge Ltd. Finance Corp., 4.100%, 3/15/2016 | | | 1,508,006 | |
| | 1,205,000 | | | Post Holdings, Inc., 7.375%, 2/15/2022, 144A | | | 1,262,238 | |
| | 1,675,000 | | | Sigma Alimentos S.A. de CV, 5.625%, 4/14/2018, 144A | | | 1,771,312 | |
| | | | | | | | |
| | | | | | | 4,541,556 | |
| | | | | | | | |
| | | | Government Owned — No Guarantee — 3.6% | | | | |
| | 5,700,000 | | | CEZ A.S., 5.625%, 4/03/2042, 144A | | | 5,744,175 | |
| | 2,620,000 | | | China Resources Gas Group Ltd., 4.500%, 4/05/2022, 144A | | | 2,574,881 | |
| | 3,450,000 | | | IPIC GMTN Ltd., 6.875%, 11/01/2041, 144A | | | 3,605,250 | |
| | 4,100,000 | | | Korea Development Bank, 4.000%, 9/09/2016 | | | 4,273,688 | |
| | 5,990,000 | | | Korea National Oil Corp., 3.125%, 4/03/2017, 144A | | | 5,977,080 | |
| | 3,060,000 | | | Petrobras International Finance Co., 6.750%, 1/27/2041 | | | 3,548,881 | |
| | 3,095,000 | | | Petrobras International Finance Co., 6.875%, 1/20/2040 | | | 3,636,226 | |
| | 1,000,000 | | | Qtel International Finance Ltd., 4.750%, 2/16/2021, 144A | | | 1,033,800 | |
| | 2,360,000 | | | Qtel International Finance Ltd., 7.875%, 6/10/2019, 144A | | | 2,896,900 | |
| | | | | | | | |
| | | | | | | 33,290,881 | |
| | | | | | | | |
See accompanying notes to financial statements.
| 24
Portfolio of Investments – as of March 31, 2012 (Unaudited)
Loomis Sayles Core Plus Bond Fund – (continued)
| | | | | | | | |
Principal
Amount | | | Description | | Value (†) | |
| | | | | | | | |
| | | | Healthcare — 1.1% | | | | |
| $ | 1,725,000 | | | Aristotle Holding, Inc., 4.750%, 11/15/2021, 144A | | $ | 1,846,126 | |
| | 3,865,000 | | | HCA, Inc., 7.500%, 2/15/2022 | | | 4,116,225 | |
| | 575,000 | | | HCA, Inc., 7.500%, 12/15/2023 | | | 549,125 | |
| | 1,785,000 | | | Medco Health Solutions, 7.250%, 8/15/2013 | | | 1,914,727 | |
| | 2,195,000 | | | PerkinElmer, Inc., 5.000%, 11/15/2021 | | | 2,292,067 | |
| | | | | | | | |
| | | | | | | 10,718,270 | |
| | | | | | | | |
| | | | Home Construction — 0.2% | | | | |
| | 2,230,000 | | | Desarrolladora Homex SAB de CV, 9.750%, 3/25/2020, 144A | | | 2,363,800 | |
| | | | | | | | |
| | | | Hybrid ARMs — 0.1% | | | | |
| | 365,458 | | | FHLMC, 6.006%, 11/01/2036(b) | | | 388,173 | |
| | 218,244 | | | FNMA, 2.250%, 2/01/2037(b) | | | 232,097 | |
| | | | | | | | |
| | | | | | | 620,270 | |
| | | | | | | | |
| | | | Independent Energy — 1.5% | | | | |
| | 1,560,000 | | | Anadarko Petroleum Corp., 5.950%, 9/15/2016 | | | 1,798,519 | |
| | 3,020,000 | | | Anadarko Petroleum Corp., 6.375%, 9/15/2017 | | | 3,588,415 | |
| | 1,835,000 | | | Denbury Resources, Inc., 6.375%, 8/15/2021 | | | 1,940,513 | |
| | 2,370,000 | | | Dolphin Energy Ltd., 5.500%, 12/15/2021, 144A | | | 2,497,388 | |
| | 2,715,000 | | | Newfield Exploration Co., 5.750%, 1/30/2022 | | | 2,843,962 | |
| | 1,670,000 | | | Range Resources Corp., 5.000%, 8/15/2022 | | | 1,649,125 | |
| | | | | | | | |
| | | | | | | 14,317,922 | |
| | | | | | | | |
| | | | Industrial Other — 1.2% | | | | |
| | 2,035,000 | | | Berau Coal Energy Tbk PT, 7.250%, 3/13/2017, 144A | | | 2,045,175 | |
| | 1,360,000 | | | Briggs & Stratton Corp., 6.875%, 12/15/2020 | | | 1,400,800 | |
| | 3,065,000 | | | Hutchison Whampoa International 11 Ltd., 4.625%, 1/13/2022, 144A | | | 3,078,452 | |
| | 2,650,000 | | | Hutchison Whampoa International Ltd., 5.750%, 9/11/2019, 144A | | | 2,915,620 | |
| | 1,570,000 | | | Timken Co. (The), 6.000%, 9/15/2014 | | | 1,712,225 | |
| | | | | | | | |
| | | | | | | 11,152,272 | |
| | | | | | | | |
| | | | Media Cable — 1.2% | | | | |
| | 1,175,000 | | | Cablevision Systems Corp., 7.750%, 4/15/2018 | | | 1,227,875 | |
| | 2,195,000 | | | Cablevision Systems Corp., 8.000%, 4/15/2020 | | | 2,321,212 | |
| | 1,070,000 | | | Cox Communications, Inc., 5.450%, 12/15/2014 | | | 1,189,471 | |
| | 4,515,000 | | | Time Warner Cable, Inc., 4.125%, 2/15/2021 | | | 4,690,575 | |
| | 1,330,000 | | | Time Warner Cable, Inc., 8.250%, 4/01/2019 | | | 1,700,940 | |
| | | | | | | | |
| | | | | | | 11,130,073 | |
| | | | | | | | |
| | | | Media Non-Cable — 0.4% | | | | |
| | 1,375,000 | | | Inmarsat Finance PLC, 7.375%, 12/01/2017, 144A | | | 1,467,813 | |
| | 1,065,000 | | | Myriad International Holding BV, 6.375%, 7/28/2017, 144A | | | 1,166,175 | |
| | 1,310,000 | | | R.R. Donnelley & Sons Co., 7.250%, 5/15/2018 | | | 1,270,700 | |
| | | | | | | | |
| | | | | | | 3,904,688 | |
| | | | | | | | |
| | | | Metals & Mining — 0.9% | | | | |
| | 2,090,000 | | | Alcoa, Inc., 6.150%, 8/15/2020 | | | 2,249,835 | |
| | 525,000 | | | APERAM, 7.375%, 4/01/2016, 144A | | | 511,949 | |
| | 3,465,000 | | | ArcelorMittal, 6.750%, 3/01/2041 | | | 3,247,114 | |
| | 485,000 | | | ArcelorMittal, 7.000%, 10/15/2039 | | | 463,241 | |
See accompanying notes to financial statements.
25 |
Portfolio of Investments – as of March 31, 2012 (Unaudited)
Loomis Sayles Core Plus Bond Fund – (continued)
| | | | | | | | |
Principal
Amount | | | Description | | Value (†) | |
| | | | | | | | |
| | | | Metals & Mining — continued | | | | |
| $ | 400,000 | | | United States Steel Corp., 6.650%, 6/01/2037 | | $ | 336,000 | |
| | 1,480,000 | | | United States Steel Corp., 7.375%, 4/01/2020 | | | 1,509,600 | |
| | | | | | | | |
| | | | | | | 8,317,739 | |
| | | | | | | | |
| | | | Mortgage Related — 16.2% | | | | |
| | 24,029,439 | | | FHLMC, 4.000%, with various maturities in 2041(c) | | | 25,174,159 | |
| | 13,099,045 | | | FHLMC, 4.500%, with various maturities from 2034 to 2039(c) | | | 13,898,992 | |
| | 917,774 | | | FHLMC, 5.000%, with various maturities from 2018 to 2038(c) | | | 988,949 | |
| | 13,054,031 | | | FHLMC, 5.500%, with various maturities from 2018 to 2040(c) | | | 14,208,073 | |
| | 71,956 | | | FHLMC, 6.000%, 6/01/2035 | | | 80,481 | |
| | 35,428,071 | | | FNMA, 4.000%, with various maturities from 2019 to 2041(c) | | | 37,212,320 | |
| | 16,456,675 | | | FNMA, 4.500%, with various maturities from 2039 to 2041(c) | | | 17,550,168 | |
| | 17,029,887 | | | FNMA, 5.000%, with various maturities from 2033 to 2037(c) | | | 18,436,007 | |
| | 14,001,340 | | | FNMA, 5.500%, with various maturities from 2018 to 2039(c) | | | 15,286,289 | |
| | 3,098,947 | | | FNMA, 6.000%, with various maturities from 2016 to 2039(c) | | | 3,433,672 | |
| | 163,722 | | | FNMA, 6.500%, with various maturities from 2029 to 2036(c) | | | 186,052 | |
| | 110,899 | �� | | FNMA, 7.000%, with various maturities in 2030(c) | | | 128,560 | |
| | 117,679 | | | FNMA, 7.500%, with various maturities from 2024 to 2032(c) | | | 140,563 | |
| | 632,633 | | | GNMA, 5.000%, 4/15/2038 | | | 699,467 | |
| | 2,606,071 | | | GNMA, 5.500%, with various maturities from 2038 to 2039(c) | | | 2,916,366 | |
| | 374,313 | | | GNMA, 6.000%, with various maturities from 2029 to 2038(c) | | | 423,430 | |
| | 259,631 | | | GNMA, 6.500%, with various maturities from 2028 to 2032(c) | | | 301,823 | |
| | 163,412 | | | GNMA, 7.000%, with various maturities from 2025 to 2029(c) | | | 189,939 | |
| | 57,275 | | | GNMA, 7.500%, with various maturities from 2025 to 2030(c) | | | 67,300 | |
| | 19,819 | | | GNMA, 8.000%, 11/15/2029 | | | 21,005 | |
| | 68,951 | | | GNMA, 8.500%, with various maturities from 2017 to 2023(c) | | | 70,500 | |
| | 10,903 | | | GNMA, 9.000%, with various maturities in 2016(c) | | | 11,751 | |
| | 16,842 | | | GNMA, 11.500%, with various maturities from 2013 to 2015(c) | | | 16,963 | |
| | | | | | | | |
| | | | | | | 151,442,829 | |
| | | | | | | | |
| | | | Non-Captive Consumer — 1.5% | | | | |
| | 1,825,000 | | | HSBC Finance Corp., 7.000%, 5/15/2012 | | | 1,838,182 | |
| | 325,000 | | | SLM Corp., MTN, 5.050%, 11/14/2014 | | | 333,052 | |
| | 9,280,000 | | | SLM Corp., MTN, 6.250%, 1/25/2016 | | | 9,651,200 | |
| | 350,000 | | | SLM Corp., Series A, MTN, 5.000%, 10/01/2013 | | | 357,875 | |
| | 30,000 | | | SLM Corp., Series A, MTN, 5.000%, 4/15/2015 | | | 30,531 | |
| | 120,000 | | | SLM Corp., Series A, MTN, 5.000%, 6/15/2018 | | | 115,172 | |
| | 55,000 | | | SLM Corp., Series A, MTN, 5.375%, 1/15/2013 | | | 56,101 | |
| | 35,000 | | | SLM Corp., Series A, MTN, 5.375%, 5/15/2014 | | | 36,141 | |
| | 1,135,000 | | | SLM Corp., Series A, MTN, 8.450%, 6/15/2018 | | | 1,265,525 | |
| | | | | | | | |
| | | | | | | 13,683,779 | |
| | | | | | | | |
| | | | Non-Captive Diversified — 3.6% | | | | |
| | 1,880,000 | | | Ally Financial, Inc., 5.500%, 2/15/2017 | | | 1,882,235 | |
| | 4,610,000 | | | Ally Financial, Inc., 6.250%, 12/01/2017 | | | 4,747,088 | |
| | 1,211,000 | | | Ally Financial, Inc., 8.000%, 11/01/2031 | | | 1,335,128 | |
| | 2,480,000 | | | Ally Financial, Inc., 8.300%, 2/12/2015 | | | 2,700,100 | |
| | 2,070,000 | | | GATX Corp., 4.750%, 5/15/2015 | | | 2,217,897 | |
| | 6,950,000 | | | General Electric Capital Corp., 2.250%, 11/09/2015 | | | 7,142,668 | |
See accompanying notes to financial statements.
| 26
Portfolio of Investments – as of March 31, 2012 (Unaudited)
Loomis Sayles Core Plus Bond Fund – (continued)
| | | | | | | | |
Principal
Amount | | | Description | | Value (†) | |
| | | | | | | | |
| | | | Non-Captive Diversified — continued | | | | |
| $ | 3,610,000 | | | General Electric Capital Corp., 5.300%, 2/11/2021 | | $ | 3,909,749 | |
| | 6,930,000 | | | International Lease Finance Corp., 5.750%, 5/15/2016 | | | 6,922,231 | |
| | 1,170,000 | | | International Lease Finance Corp., 6.250%, 5/15/2019 | | | 1,154,882 | |
| | 205,000 | | | International Lease Finance Corp., 6.375%, 3/25/2013 | | | 210,638 | |
| | 40,000 | | | International Lease Finance Corp., Series R, MTN, 5.550%, 9/05/2012 | | | 40,250 | |
| | 200,000 | | | International Lease Finance Corp., Series R, MTN, 5.625%, 9/20/2013 | | | 202,500 | |
| | 830,000 | | | International Lease Finance Corp., Series R, MTN, 5.650%, 6/01/2014 | | | 844,525 | |
| | | | | | | | |
| | | | | | | 33,309,891 | |
| | | | | | | | |
| | | | Oil Field Services — 2.6% | | | | |
| | 4,505,000 | | | Nabors Industries, Inc., 4.625%, 9/15/2021 | | | 4,700,098 | |
| | 4,285,000 | | | Pan American Energy LLC, 7.875%, 5/07/2021, 144A | | | 4,177,875 | |
| | 4,020,000 | | | Parker Drilling Co., 9.125%, 4/01/2018 | | | 4,261,200 | |
| | 2,540,000 | | | Rowan Cos., Inc., 5.000%, 9/01/2017 | | | 2,704,013 | |
| | 6,765,000 | | | Transocean, Inc., 4.950%, 11/15/2015 | | | 7,233,524 | |
| | 1,005,000 | | | Weatherford International Ltd., 5.950%, 4/15/2042 | | | 997,874 | �� |
| | | | | | | | |
| | | | | | | 24,074,584 | |
| | | | | | | | |
| | | | Paper — 1.2% | | | | |
| | 1,240,000 | | | Celulosa Arauco y Constitucion S.A., 4.750%, 1/11/2022, 144A | | | 1,269,331 | |
| | 1,850,000 | | | Celulosa Arauco y Constitucion S.A., 5.000%, 1/21/2021 | | | 1,927,661 | |
| | 2,005,000 | | | Georgia-Pacific LLC, 7.375%, 12/01/2025 | | | 2,445,605 | |
| | 3,305,000 | | | Georgia-Pacific LLC, 7.750%, 11/15/2029 | | | 4,118,291 | |
| | 735,000 | | | Georgia-Pacific LLC, 8.000%, 1/15/2024 | | | 935,648 | |
| | 365,000 | | | Georgia-Pacific LLC, 8.875%, 5/15/2031 | | | 492,401 | |
| | | | | | | | |
| | | | | | | 11,188,937 | |
| | | | | | | | |
| | | | Pharmaceuticals — 0.7% | | | | |
| | 600,000 | | | Valeant Pharmaceuticals International, 6.750%, 10/01/2017, 144A | | | 607,500 | |
| | 215,000 | | | Valeant Pharmaceuticals International, 6.750%, 8/15/2021, 144A | | | 209,088 | |
| | 4,130,000 | | | Valeant Pharmaceuticals International, 6.875%, 12/01/2018, 144A | | | 4,160,975 | |
| | 1,310,000 | | | Valeant Pharmaceuticals International, 7.250%, 7/15/2022, 144A | | | 1,296,900 | |
| | | | | | | | |
| | | | | | | 6,274,463 | |
| | | | | | | | |
| | | | Pipelines — 1.4% | | | | |
| | 6,970,000 | | | Energy Transfer Partners LP, 6.050%, 6/01/2041 | | | 7,033,385 | |
| | 2,050,000 | | | Kinder Morgan Finance Co. LLC, 5.700%, 1/05/2016 | | | 2,162,750 | |
| | 3,765,000 | | | Kinder Morgan Finance Co. LLC, 6.000%, 1/15/2018, 144A | | | 3,995,606 | |
| | | | | | | | |
| | | | | | | 13,191,741 | |
| | | | | | | | |
| | | | Property & Casualty Insurance — 1.3% | | | | |
| | 6,220,000 | | | Berkshire Hathaway, Inc., 1.900%, 1/31/2017 | | | 6,291,163 | |
| | 1,175,000 | | | Willis Group Holdings PLC, 4.125%, 3/15/2016 | | | 1,194,372 | |
| | 3,250,000 | | | Willis North America, Inc., 6.200%, 3/28/2017 | | | 3,636,721 | |
| | 555,000 | | | Willis North America, Inc., 7.000%, 9/29/2019 | | | 642,046 | |
| | | | | | | | |
| | | | | | | 11,764,302 | |
| | | | | | | | |
| | | | Railroads — 0.1% | | | | |
| | 1,325,000 | | | Burlington Northern Santa Fe LLC, 4.950%, 9/15/2041 | | | 1,351,072 | |
| | | | | | | | |
See accompanying notes to financial statements.
27 |
Portfolio of Investments – as of March 31, 2012 (Unaudited)
Loomis Sayles Core Plus Bond Fund – (continued)
| | | | | | | | |
Principal
Amount | | | Description | | Value (†) | |
| | | | | | | | |
| | | | Refining — 0.6% | | | | |
| $ | 5,480,000 | | | Phillips 66, 5.875%, 5/01/2042, 144A | | $ | 5,613,805 | |
| | | | | | | | |
| | | | Sovereigns — 0.4% | | | | |
| | 3,018,000 | | | Mexico Government International Bond, Series A, MTN, 6.050%, 1/11/2040 | | | 3,636,690 | |
| | | | | | | | |
| | | | Technology — 2.3% | | | | |
| | 250,000 | | | Amphenol Corp., 4.000%, 2/01/2022 | | | 251,619 | |
| | 3,745,000 | | | Amphenol Corp., 4.750%, 11/15/2014 | | | 4,068,066 | |
| | 2,635,000 | | | Brocade Communications Systems, Inc., 6.625%, 1/15/2018 | | | 2,766,750 | |
| | 495,000 | | | Brocade Communications Systems, Inc., 6.875%, 1/15/2020 | | | 545,737 | |
| | 2,461,000 | | | Equifax, Inc., 7.000%, 7/01/2037 | | | 2,868,714 | |
| | 4,140,000 | | | Fiserv, Inc., 3.125%, 10/01/2015 | | | 4,274,231 | |
| | 69,000 | | | Motorola Solutions, Inc., 6.625%, 11/15/2037 | | | 73,259 | |
| | 340,000 | | | Motorola Solutions, Inc., 7.500%, 5/15/2025 | | | 404,041 | |
| | 1,335,000 | | | National Semiconductor Corp., 3.950%, 4/15/2015 | | | 1,452,017 | |
| | 4,050,000 | | | Tencent Holdings Ltd., 4.625%, 12/12/2016, 144A | | | 4,075,677 | |
| | 279,000 | | | Xerox Corp., 5.500%, 5/15/2012 | | | 280,422 | |
| | | | | | | | |
| | | | | | | 21,060,533 | |
| | | | | | | | |
| | | | Tobacco — 0.6% | | | | |
| | 4,900,000 | | | Reynolds American, Inc., 7.250%, 6/15/2037 | | | 5,716,335 | |
| | | | | | | | |
| | | | Transportation Services — 0.1% | | | | |
| | 790,000 | | | Erac USA Finance Co., 5.250%, 10/01/2020, 144A | | | 856,480 | |
| | | | | | | | |
| | | | Treasuries — 27.4% | | | | |
| | 32,275,000 | | | U.S. Treasury Bond, 3.750%, 8/15/2041 | | | 34,892,309 | |
| | 3,875,000 | | | U.S. Treasury Bond, 3.875%, 8/15/2040 | | | 4,286,114 | |
| | 3,005,000 | | | U.S. Treasury Bond, 4.375%, 5/15/2040 | | | 3,611,166 | |
| | 570,000 | | | U.S. Treasury Bond, 4.375%, 5/15/2041 | | | 685,247 | |
| | 1,475,000 | | | U.S. Treasury Bond, 4.500%, 2/15/2036 | | | 1,795,352 | |
| | 1,665,000 | | | U.S. Treasury Bond, 4.750%, 2/15/2041 | | | 2,122,094 | |
| | 85,282,000 | | | U.S. Treasury Note, 0.875%, 2/28/2017 | | | 84,682,382 | |
| | 20,050,000 | | | U.S. Treasury Note, 1.250%, 2/15/2014 | | | 20,389,126 | |
| | 12,470,000 | | | U.S. Treasury Note, 1.875%, 8/31/2017 | | | 12,925,928 | |
| | 35,350,000 | | | U.S. Treasury Note, 2.000%, 2/15/2022 | | | 34,670,608 | |
| | 1,155,000 | | | U.S. Treasury Note, 2.125%, 8/15/2021 | | | 1,154,188 | |
| | 13,550,000 | | | U.S. Treasury Note, 2.625%, 11/15/2020(d) | | | 14,249,736 | |
| | 560,000 | | | U.S. Treasury Note, 2.750%, 10/31/2013 | | | 581,416 | |
| | 24,005,000 | | | U.S. Treasury Note, 3.125%, 5/15/2021 | | | 26,127,954 | |
| | 11,505,000 | | | U.S. Treasury Note, 3.625%, 2/15/2021(e) | | | 13,024,017 | |
| | | | | | | | |
| | | | | | | 255,197,637 | |
| | | | | | | | |
| | | | Wireless — 2.0% | | | | |
| | 1,915,000 | | | American Tower Corp., 4.625%, 4/01/2015 | | | 2,039,804 | |
| | 2,890,000 | | | CC Holdings GS V LLC/Crown Castle GS III Corp., 7.750%, 5/01/2017, 144A | | | 3,150,100 | |
| | 15,000 | | | Nextel Communications, Inc., Series C, 5.950%, 3/15/2014 | | | 15,000 | |
| | 10,000 | | | Nextel Communications, Inc., Series D, 7.375%, 8/01/2015 | | | 9,650 | |
| | 895,000 | | | NII Capital Corp., 7.625%, 4/01/2021 | | | 874,863 | |
| | 2,325,000 | | | SK Telecom Co. Ltd., 6.625%, 7/20/2027, 144A | | | 2,720,436 | |
| | 7,885,000 | | | Sprint Capital Corp., 6.875%, 11/15/2028 | | | 6,032,025 | |
| | 3,499,000 | | | Telemar Norte Leste S.A., 5.500%, 10/23/2020, 144A | | | 3,596,972 | |
| | | | | | | | |
| | | | | | | 18,438,850 | |
| | | | | | | | |
See accompanying notes to financial statements.
| 28
Portfolio of Investments – as of March 31, 2012 (Unaudited)
Loomis Sayles Core Plus Bond Fund – (continued)
| | | | | | | | |
Principal
Amount | | | Description | | Value (†) | |
| | | | | | | | |
| | | | Wirelines — 3.4% | | | | |
| $ | 6,440,000 | | | Axtel SAB de CV, 9.000%, 9/22/2019, 144A | | $ | 5,248,600 | |
| | 3,995,000 | | | eAccess Ltd., 8.250%, 4/01/2018, 144A | | | 3,825,213 | |
| | 6,553,000 | | | Embarq Corp., 7.995%, 6/01/2036 | | | 6,623,536 | |
| | 4,480,000 | | | Frontier Communications Corp., 7.875%, 4/15/2015 | | | 4,816,000 | |
| | 1,575,000 | | | Frontier Communications Corp., 7.875%, 1/15/2027 | | | 1,433,250 | |
| | 1,220,000 | | | Frontier Communications Corp., 8.250%, 4/15/2017 | | | 1,311,500 | |
| | 415,000 | | | Frontier Communications Corp., 9.000%, 8/15/2031 | | | 402,550 | |
| | 1,975,000 | | | Qwest Corp., 6.750%, 12/01/2021 | | | 2,204,594 | |
| | 6,045,000 | | | Windstream Corp., 7.500%, 4/01/2023 | | | 6,226,350 | |
| | | | | | | | |
| | | | | | | 32,091,593 | |
| | | | | | | | |
| | | | Total Bonds and Notes
(Identified Cost $875,459,536) | | | 898,380,343 | |
| | | | | | | | |
| | | | | | | | |
| Shares | | | | | | |
| | Preferred Stocks — 0.2% | | | | |
| | | | Non-Captive Consumer — 0.0% | | | | |
| | 5,510 | | | SLM Corp., Series A, 6.970% | | | 252,083 | |
| | | | | | | | |
| | | | Non-Captive Diversified — 0.2% | | | | |
| | 68,182 | | | Ally Financial, Inc., Series A, (fixed rate to 5/15/2016, variable rate thereafter), 8.500% | | | 1,479,549 | |
| | 532 | | | Ally Financial, Inc., Series G, 7.000%, 144A | | | 443,206 | |
| | | | | | | | |
| | | | | | | 1,922,755 | |
| | | | | | | | |
| | | | Total Preferred Stocks
(Identified Cost $2,068,801) | | | 2,174,838 | |
| | | | | | | | |
| | | | | | | | |
Principal
Amount | | | | | | |
| | Short-Term Investments — 4.1% | | | | |
| $ | 37,736,788 | | | Tri-Party Repurchase Agreement with Fixed Income Clearing Corporation, dated 3/30/2012 at 0.000% to be repurchased at $37,736,788 on 4/02/2012 collateralized by $38,205,000 Federal Home Loan Mortgage Corp., 0.750% due 11/25/2014 valued at $38,491,538 including accrued interest (Note 2 of Notes to Financial Statements)
(Identified Cost $37,736,788) | | | 37,736,788 | |
| | | | | | | | |
| | | | | | | | |
| | | | Total Investments — 100.6%
(Identified Cost $915,265,125)(a) | | | 938,291,969 | |
| | | | Other assets less liabilities — (0.6)% | | | (5,781,853 | ) |
| | | | | | | | |
| | | | Net Assets — 100.0% | | $ | 932,510,116 | |
| | | | | | | | |
See accompanying notes to financial statements.
29 |
Portfolio of Investments – as of March 31, 2012 (Unaudited)
Loomis Sayles Core Plus Bond Fund – (continued)
| | | | | | | | |
| | | | | | | | |
| | (†) | | | See Note 2 of Notes to Financial Statements. | | | | |
| | (a) | | | Federal Tax Information (Amounts exclude certain adjustments made at the end of the Fund’s fiscal year for tax purposes. Such adjustments are primarily due to wash sales. Amortization of premium on debt securities is excluded for tax purposes.): | | | | |
| | | | At March 31, 2012, the net unrealized appreciation on investments based on a cost of $916,203,861 for federal income tax purposes was as follows: | | | | |
| | | | Aggregate gross unrealized appreciation for all investments in which there is an excess of value over tax cost | | $ | 26,597,552 | |
| | | | Aggregate gross unrealized depreciation for all investments in which there is an excess of tax cost over value | | | (4,509,444 | ) |
| | | | | | | | |
| | | | Net unrealized appreciation | | $ | 22,088,108 | |
| | | | | | | | |
| | | | | | | | |
| | (b) | | | Variable rate security. Rate as of March 31, 2012 is disclosed. | | | | |
| | (c) | | | The Fund’s investment in mortgage related securities of Federal Home Loan Mortgage Corporation, Federal National Mortgage Association and Government National Mortgage Association are interests in separate pools of mortgages. All separate investments in securities of each issuer which have the same coupon rate have been aggregated for the purpose of presentation in the Portfolio of Investments. | |
| | (d) | | | All or a portion of this security has been pledged as collateral for open forward foreign currency contracts. | |
| | (e) | | | All or a portion of this security has been designated to cover the Fund’s obligations under open forward foreign currency contracts. | |
| | 144A | | | All or a portion of these securities are exempt from registration under Rule 144A of the Securities Act of 1933. These securities may be resold in transactions exempt from registration, normally to qualified institutional buyers. At March 31, 2012, the value of Rule 144A holdings amounted to $123,844,641 or 13.3% of net assets. | |
| | | | | | | | |
| | ABS | | | Asset-Backed Securities | | | | |
| | ARMs | | | Adjustable Rate Mortgages | | | | |
| | FHLMC | | | Federal Home Loan Mortgage Corp. | | | | |
| | FNMA | | | Federal National Mortgage Association | | | | |
| | GMTN | | | Global Medium Term Note | | | | |
| | GNMA | | | Government National Mortgage Association | | | | |
| | MTN | | | Medium Term Note | | | | |
At March 31, 2012, the Fund had the following open forward foreign currency contracts:
| | | | | | | | | | | | | | | | | | |
Contract to Buy/Sell1 | | Delivery
Date | | | Currency | | Units | | | Notional
Value | | | Unrealized
Appreciation
(Depreciation) | |
| Sell | | | 6/20/2012 | | | Euro | | | 20,385,000 | | | $ | 27,198,637 | | | $ | (442,955 | ) |
| | | | | | | | | | | | | | | | | | |
1 Counterparty is Credit Suisse.
See accompanying notes to financial statements.
| 30
Portfolio of Investments – as of March 31, 2012 (Unaudited)
Loomis Sayles Core Plus Bond Fund – (continued)
Industry Summary at March 31, 2012 (Unaudited)
| | | | |
Treasuries | | | 27.4 | % |
Mortgage Related | | | 16.2 | |
Banking | | | 5.4 | |
Commercial Mortgage-Backed Securities | | | 4.5 | |
Non-Captive Diversified | | | 3.8 | |
Government Owned — No Guarantee | | | 3.6 | |
Wirelines | | | 3.4 | |
Oil Field Services | | | 2.6 | |
Automotive | | | 2.3 | |
Technology | | | 2.3 | |
ABS Car Loan | | | 2.0 | |
Wireless | | | 2.0 | |
Other Investments, less than 2% each | | | 21.0 | |
Short-Term Investments | | | 4.1 | |
| | | | |
Total Investments | | | 100.6 | |
Other assets less liabilities (including open forward foreign currency contracts) | | | (0.6 | ) |
| | | | |
Net Assets | | | 100.0 | % |
| | | | |
See accompanying notes to financial statements.
31 |
Portfolio of Investments – as of March 31, 2012 (Unaudited)
Loomis Sayles High Income Fund
| | | | | | | | |
Principal
Amount (‡) | | | Description | | Value (†) | |
| | | | | | | | |
| | Bonds and Notes — 79.4% of Net Assets | | | | |
| |
| | Non-Convertible Bonds — 68.6% | | | | |
| | | | ABS Car Loan — 0.2% | | | | |
| $ | 350,000 | | | DSC Floorplan Master Owner Trust, Series 2011-1, Class B, 8.110%, 3/15/2016, 144A | | $ | 355,178 | |
| | | | | | | | |
| | | | ABS Home Equity — 2.0% | | | | |
| | 200,000 | | | Ameriquest Mortgage Securities, Inc., Series 2005-R11, Class M1, 0.692%, 1/25/2036(b) | | | 127,025 | |
| | 600,000 | | | Ameriquest Mortgage Securities, Inc., Series 2005-R7, Class M2, 0.742%, 9/25/2035(b) | | | 288,986 | |
| | 523,564 | | | Argent Securities, Inc., Series 2003-W3, Class M2, 2.942%, 9/25/2033(b) | | | 355,540 | |
| | 297,913 | | | Citigroup Mortgage Loan Trust, Inc., Series 2005-8, Class 1A1A, 2.814%, 10/25/2035(b) | | | 210,717 | |
| | 135,070 | | | Citimortgage Alternative Loan Trust, Series 2006-A3, Class 1A7, 6.000%, 7/25/2036 | | | 100,928 | |
| | 229,325 | | | Countrywide Home Loan Mortgage Pass Through Trust, Series 2005-11, Class 4A1, 0.512%, 4/25/2035(b) | | | 146,632 | |
| | 550,224 | | | GSAA Home Equity Trust, Series 2006-20, Class 1A1, 0.312%, 12/25/2046(b) | | | 250,992 | |
| | 105,033 | | | GSR Mortgage Loan Trust, Series 2004-14, Class 3A1, 2.901%, 12/25/2034(b) | | | 78,013 | |
| | 145,944 | | | JP Morgan Alternative Loan Trust, Series 2006-A1, Class 5A1, 5.297%, 3/25/2036(b) | | | 102,336 | |
| | 213,195 | | | Lehman Mortgage Trust, Series 2006-1, Class 3A5, 5.500%, 2/25/2036 | | | 188,860 | |
| | 447,458 | | | MASTR Asset Securitization Trust, Series 2007-1, Class 1A4, 6.500%, 11/25/2037 | | | 363,908 | |
| | 200,000 | | | New Century Home Equity Loan Trust, Series 2005-1, Class M3, 0.762%, 3/25/2035(b) | | | 142,845 | |
| | 300,000 | | | New Century Home Equity Loan Trust, Series 2005-2, Class M2, 0.692%, 6/25/2035(b) | | | 182,321 | |
| | 153,075 | | | New York Mortgage Trust, Series 2006-1, Class 2A2, 2.959%, 5/25/2036(b) | | | 123,933 | |
| | 575,000 | | | Park Place Securities, Inc., Series 2005-WCW2, Class M1, 0.742%, 7/25/2035(b) | | | 332,597 | |
| | 160,616 | | | Saxon Asset Securities Trust, Series 2004-3, Class M2, 0.892%, 12/26/2034(b) | | | 117,496 | |
| | 146,742 | | | WaMu Mortgage Pass Through Certificates, Series 2007-OA3, Class 2A1A, 0.919%, 4/25/2047(b) | | | 103,631 | |
| | | | | | | | |
| | | | | | | 3,216,760 | |
| | | | | | | | |
| | | | ABS Other — 0.3% | | | | |
| | 517,367 | | | Sierra Receivables Funding Co. LLC, Series 2011-3A, Class C, 9.310%, 7/20/2028, 144A | | | 517,275 | |
| | | | | | | | |
| | | | Airlines — 0.3% | | | | |
| | 105,000 | | | Air Canada, 9.250%, 8/01/2015, 144A | | | 102,375 | |
| | 30,000 | | | Air Canada, 12.000%, 2/01/2016, 144A | | | 26,550 | |
See accompanying notes to financial statements.
| 32
Portfolio of Investments – as of March 31, 2012 (Unaudited)
Loomis Sayles High Income Fund – (continued)
| | | | | | | | |
Principal
Amount (‡) | | | Description | | Value (†) | |
| | | | | | | | |
| | | | Airlines — continued | | | | |
| $ | 19,836 | | | Continental Airlines Pass Through Trust, Series 1997-4, Class B, 6.900%, 7/02/2018 | | $ | 19,836 | |
| | 198,446 | | | Continental Airlines Pass Through Trust, Series 2001-1, Class B, 7.373%, 6/15/2017 | | | 199,180 | |
| | 173,446 | | | Continental Airlines Pass Through Trust, Series 2007-1, Class B, 6.903%, 10/19/2023 | | | 176,355 | |
| | | | | | | | |
| | | | | | | 524,296 | |
| | | | | | | | |
| | | | Banking — 4.0% | | | | |
| | 2,210,000,000 | | | Barclays Bank PLC, EMTN, 3.680%, 8/20/2015, (KRW) | | | 1,966,540 | |
| | 11,260,000,000 | | | Barclays Financial LLC, EMTN, 8.250%, 10/27/2014, (IDR) | | | 1,266,688 | |
| | 820,000 | | | HBOS PLC, 6.000%, 11/01/2033, 144A | | | 623,169 | |
| | 1,100,000 | | | HBOS PLC, GMTN, 6.750%, 5/21/2018, 144A | | | 1,032,435 | |
| | 900,000 | | | Morgan Stanley, GMTN, 7.625%, 3/03/2016, (AUD) | | | 946,309 | |
| | 200,000 | | | Royal Bank of Scotland PLC (The), EMTN, 6.934%, 4/09/2018, (EUR) | | | 248,335 | |
| | 400,000 | | | Societe Generale S.A., MTN, 5.200%, 4/15/2021, 144A | | | 384,172 | |
| | | | | | | | |
| | | | | | | 6,467,648 | |
| | | | | | | | |
| | | | Building Materials — 3.0% | | | | |
| | 50,000 | | | Masco Corp., 6.500%, 8/15/2032 | | | 47,081 | |
| | 360,000 | | | Masco Corp., 7.125%, 3/15/2020 | | | 384,865 | |
| | 345,000 | | | Masco Corp., 7.750%, 8/01/2029 | | | 355,844 | |
| | 845,000 | | | Masonite International Corp., 8.250%, 4/15/2021, 144A | | | 878,800 | |
| | 265,000 | | | Ply Gem Industries, Inc., 8.250%, 2/15/2018 | | | 266,656 | |
| | 2,955,000 | | | USG Corp., 6.300%, 11/15/2016 | | | 2,762,925 | |
| | 100,000 | | | USG Corp., 8.375%, 10/15/2018, 144A | | | 102,500 | |
| | 75,000 | | | USG Corp., 9.750%, 1/15/2018 | | | 74,437 | |
| | | | | | | | |
| | | | | | | 4,873,108 | |
| | | | | | | | |
| | | | Chemicals — 1.6% | | | | |
| | 1,270,000 | | | Hercules, Inc., 6.500%, 6/30/2029 | | | 1,009,650 | |
| | 850,000 | | | Hexion US Finance Corp./Hexion Nova Scotia Finance ULC, 8.875%, 2/01/2018 | | | 879,750 | |
| | 420,000 | | | JM Huber Corp., 9.875%, 11/01/2019, 144A | | | 436,800 | |
| | 730,000 | | | Reichhold Industries, Inc., 9.000%, 8/15/2014, 144A(c)(d)(g) | | | 292,000 | |
| | | | | | | | |
| | | | | | | 2,618,200 | |
| | | | | | | | |
| | | | Collateralized Mortgage Obligations — 2.8% | | | | |
| | 346,623 | | | Adjustable Rate Mortgage Trust, Series 2005-10, Class 5A1, 0.502%, 1/25/2036(b) | | | 220,300 | |
| | 162,274 | | | American Home Mortgage Investment Trust, Series 2004-3, Class 3A, 2.563%, 10/25/2034(b) | | | 114,813 | |
| | 376,307 | | | American Home Mortgage Investment Trust, Series 2005-2, Class 4A1, 2.240%, 9/25/2045(b) | | | 295,747 | |
| | 381,155 | | | American Home Mortgage Investment Trust, Series 2006-1, Class 11A1, 0.382%, 3/25/2046(b) | | | 259,273 | |
| | 79,920 | | | Banc of America Mortgage Securities, Inc., Series 2005-A, Class 2A1, 3.002%, 2/25/2035(b) | | | 70,075 | |
See accompanying notes to financial statements.
33 |
Portfolio of Investments – as of March 31, 2012 (Unaudited)
Loomis Sayles High Income Fund – (continued)
| | | | | | | | |
Principal
Amount (‡) | | | Description | | Value (†) | |
| | | | | | | | |
| | | | Collateralized Mortgage Obligations — continued | | | | |
| $ | 305,987 | | | GSR Mortgage Loan Trust, Series 2005-AR7, Class 2A1, 2.661%, 11/25/2035(b) | | $ | 269,274 | |
| | 182,963 | | | Indymac Index Mortgage Loan Trust, Series 2005-AR3, Class 4A1, 2.916%, 4/25/2035(b) | | | 141,477 | |
| | 564,385 | | | Lehman Mortgage Trust, Series 2005-3, Class 1A6, 0.742%, 1/25/2036(b)(k) | | | 347,065 | |
| | 588,350 | | | Lehman XS Trust, Series 2007-10H, Class 1A11, 0.362%, 7/25/2037(b)(e) | | | 261,892 | |
| | 385,437 | | | MASTR Adjustable Rate Mortgages Trust, Series 2005-2, Class 3A1, 2.810%, 3/25/2035(b) | | | 269,052 | |
| | 260,698 | | | MASTR Adjustable Rate Mortgages Trust, Series 2005-2, Class 5A1, 2.725%, 3/25/2035(b) | | | 227,113 | |
| | 671,345 | | | MASTR Adjustable Rate Mortgages Trust, Series 2007-1, Class I2A1, 0.402%, 1/25/2047(b) | | | 360,798 | |
| | 640,499 | | | Merrill Lynch Alternative Note Asset, Series 2007-F1, Class 2A7, 6.000%, 3/25/2037 | | | 411,643 | |
| | 665,179 | | | Residential Accredit Loans, Inc., Series 2006-QO7, Class 1A1, 0.959%, 9/25/2046(b) | | | 298,280 | |
| | 589,601 | | | Residential Accredit Loans, Inc., Series 2006-QS6, Class 1A16, 6.000%, 6/25/2036 | | | 385,452 | |
| | 477,971 | | | Washington Mutual Alternative Mortgage Pass-Through Certificates, Series 2006-AR6, Class 2A,
1.119%, 8/25/2046(b) | | | 221,912 | |
| | 651,782 | | | Washington Mutual Alternative Mortgage Pass-Through Certificates, Series 2007-OC1, Class A1,
0.482%, 1/25/2047(b) | | | 266,961 | |
| | | | | | | | |
| | | | | | | 4,421,127 | |
| | | | | | | | |
| | | | Commercial Mortgage-Backed Securities — 1.2% | | | | |
| | 522,744 | | | GMAC Mortgage Corp. Loan Trust, Series 2005-AR3, Class 2A1, 2.947%, 6/19/2035(b) | | | 485,714 | |
| | 1,690,000 | | | GS Mortgage Securities Corp. II, Series 2007-GG10, Class AM, 5.980%, 8/10/2045(b) | | | 1,507,776 | |
| | | | | | | | |
| | | | | | | 1,993,490 | |
| | | | | | | | |
| | | | Construction Machinery — 0.3% | | | | |
| | 205,000 | | | UR Financing Escrow Corp., 7.625%, 4/15/2022, 144A | | | 210,638 | |
| | 300,000 | | | Urbi Desarrollos Urbanos SAB de CV, 9.750%, 2/03/2022, 144A | | | 318,000 | |
| | | | | | | | |
| | | | | | | 528,638 | |
| | | | | | | | |
| | | | Consumer Cyclical Services — 0.6% | | | | |
| | 1,035,000 | | | ServiceMaster Co. (The), 7.450%, 8/15/2027 | | | 882,338 | |
| | | | | | | | |
| | | | Consumer Products — 0.4% | | | | |
| | 740,000 | | | Visant Corp., 10.000%, 10/01/2017 | | | 690,975 | |
| | | | | | | | |
| | | | Diversified Manufacturing — 0.3% | | | | |
| | 400,000 | | | Votorantim Cimentos S.A., 7.250%, 4/05/2041, 144A | | | 406,000 | |
| | | | | | | | |
| | | | Electric — 2.5% | | | | |
| | 19,102 | | | AES Red Oak LLC, Series A, 8.540%, 11/30/2019 | | | 20,248 | |
| | 375,000 | | | Dynegy Holdings, Inc., 7.125%, 5/15/2018(f) | | | 245,625 | |
| | 180,000 | | | Dynegy Holdings, Inc., 7.625%, 10/15/2026(f) | | | 117,900 | |
| | 815,000 | | | Dynegy Holdings, Inc., 7.750%, 6/01/2019(f) | | | 535,863 | |
See accompanying notes to financial statements.
| 34
Portfolio of Investments – as of March 31, 2012 (Unaudited)
Loomis Sayles High Income Fund – (continued)
| | | | | | | | |
Principal
Amount (‡) | | | Description | | Value (†) | |
| | | | | | | | |
| | | | Electric — continued | | | | |
| $ | 1,055,000 | | | Edison Mission Energy, 7.625%, 5/15/2027 | | $ | 625,087 | |
| | 1,395,000 | | | EDP Finance BV, 4.900%, 10/01/2019, 144A | | | 1,133,995 | |
| | 200,000 | | | EDP Finance BV, 6.000%, 2/02/2018, 144A | | | 176,757 | |
| | 140,000 | | | NGC Corp. Capital Trust I, Series B, 8.316%, 6/01/2027(c)(f) | | | 36,400 | |
| | 515,000 | | | Texas Competitive Electric Holdings Co. LLC/TCEH Finance, Inc., 11.500%, 10/01/2020, 144A | | | 336,038 | |
| | 1,015,000 | | | TXU Corp., Series Q, 6.500%, 11/15/2024 | | | 532,875 | |
| | 370,000 | | | TXU Corp., Series R, 6.550%, 11/15/2034 | | | 185,000 | |
| | | | | | | | |
| | | | | | | 3,945,788 | |
| | | | | | | | |
| | | | Food & Beverage — 0.8% | | | | |
| | 475,000 | | | Del Monte Corp., 7.625%, 2/15/2019 | | | 472,625 | |
| | 400,000 | | | Marfrig Holding Europe BV, 8.375%, 5/09/2018, 144A | | | 364,000 | |
| | 500,000 | | | Marfrig Overseas Ltd., 9.500%, 5/04/2020, 144A | | | 457,900 | |
| | | | | | | | |
| | | | | | | 1,294,525 | |
| | | | | | | | |
| | | | Gaming — 2.7% | | | | |
| | 1,760,000 | | | Caesars Entertainment Operating Co., Inc., 10.000%, 12/15/2018 | | | 1,359,600 | |
| | 275,000 | | | MGM Resorts International, 6.625%, 7/15/2015 | | | 282,563 | |
| | 1,360,000 | | | MGM Resorts International, 7.500%, 6/01/2016 | | | 1,400,800 | |
| | 1,250,000 | | | MGM Resorts International, 7.625%, 1/15/2017 | | | 1,290,625 | |
| | | | | | | | |
| | | | | | | 4,333,588 | |
| | | | | | | | |
| | | | Government Owned — No Guarantee — 0.9% | | | | |
| | 900,000 | | | DP World Ltd., 6.850%, 7/02/2037, 144A | | | 868,500 | |
| | 4,800,000,000 | | | Export-Import Bank of Korea, 6.600%, 11/04/2013, 144A, (IDR) | | | 527,244 | |
| | | | | | | | |
| | | | | | | 1,395,744 | |
| | | | | | | | |
| | | | Healthcare — 2.0% | | | | |
| | 165,000 | | | HCA, Inc., 7.050%, 12/01/2027 | | | 148,088 | |
| | 640,000 | | | HCA, Inc., 7.500%, 12/15/2023 | | | 611,200 | |
| | 470,000 | | | HCA, Inc., 7.690%, 6/15/2025 | | | 452,962 | |
| | 480,000 | | | HCA, Inc., 8.360%, 4/15/2024 | | | 489,600 | |
| | 800,000 | | | HCA, Inc., MTN, 7.580%, 9/15/2025 | | | 756,000 | |
| | 515,000 | | | HCA, Inc., MTN, 7.750%, 7/15/2036 | | | 476,375 | |
| | 215,000 | | | Kindred Healthcare, Inc., 8.250%, 6/01/2019 | | | 187,319 | |
| | 90,000 | | | Tenet Healthcare Corp., 6.875%, 11/15/2031 | | | 76,950 | |
| | | | | | | | |
| | | | | | | 3,198,494 | |
| | | | | | | | |
| | | | Home Construction — 6.1% | | | | |
| | 40,000 | | | Beazer Homes USA, Inc., 9.125%, 6/15/2018 | | | 34,950 | |
| | 70,000 | | | Beazer Homes USA, Inc., 9.125%, 5/15/2019 | | | 60,200 | |
| | 600,000 | | | Corp GEO SAB de CV, 8.875%, 3/27/2022, 144A | | | 613,500 | |
| | 975,000 | | | Desarrolladora Homex SAB de CV, 9.750%, 3/25/2020, 144A | | | 1,033,500 | |
| | 305,000 | | | K. Hovnanian Enterprises, Inc., 10.625%, 10/15/2016 | | | 275,644 | |
| | 15,000 | | | KB Home, 5.875%, 1/15/2015 | | | 14,775 | |
| | 25,000 | | | KB Home, 6.250%, 6/15/2015 | | | 24,500 | |
| | 2,580,000 | | | KB Home, 7.250%, 6/15/2018 | | | 2,476,800 | |
| | 1,850,000 | | | Lennar Corp., 6.950%, 6/01/2018 | | | 1,961,000 | |
| | 3,135,000 | | | Pulte Group, Inc., 6.000%, 2/15/2035 | | | 2,445,300 | |
See accompanying notes to financial statements.
35 |
Portfolio of Investments – as of March 31, 2012 (Unaudited)
Loomis Sayles High Income Fund – (continued)
| | | | | | | | |
Principal
Amount (‡) | | | Description | | Value (†) | |
| | | | | | | | |
| | | | Home Construction — continued | | | | |
| $ | 495,000 | | | Pulte Group, Inc., 6.375%, 5/15/2033 | | $ | 398,475 | |
| | 380,000 | | | Pulte Group, Inc., 7.875%, 6/15/2032 | | | 352,450 | |
| | 70,000 | | | Standard Pacific Corp., 8.375%, 1/15/2021 | | | 73,500 | |
| | | | | | | | |
| | | | | | | 9,764,594 | |
| | | | | | | | |
| | | | Hybrid ARMs — 0.1% | | | | |
| | 387,281 | | | Countrywide Home Loan Mortgage Pass Through Trust,
Series 2005-11, Class 3A3,
2.925%, 4/25/2035(b) | | | 189,161 | |
| | | | | | | | |
| | | | Independent Energy — 0.7% | | | | |
| | 785,000 | | | Connacher Oil and Gas Ltd., 8.500%, 8/01/2019, 144A | | | 785,000 | |
| | 360,000 | | | SandRidge Energy, Inc., 7.500%, 3/15/2021 | | | 354,600 | |
| | | | | | | | |
| | | | | | | 1,139,600 | |
| | | | | | | | |
| | | | Life Insurance — 0.6% | | | | |
| | 860,000 | | | American International Group, Inc.,
(fixed rate to 5/15/2038, variable rate thereafter),
8.175%, 5/15/2068 | | | 910,310 | |
| | | | | | | | |
| | | | Lodging — 0.1% | | | | |
| | 180,000 | | | Royal Caribbean Cruises Ltd., 7.500%, 10/15/2027 | | | 180,900 | |
| | | | | | | | |
| | | | Media Non-Cable — 3.0% | | | | |
| | 1,060,000 | | | Clear Channel Communications, Inc., 5.500%, 9/15/2014 | | | 938,100 | |
| | 340,000 | | | Clear Channel Communications, Inc., 5.750%, 1/15/2013 | | | 337,450 | |
| | 2,275,000 | | | Intelsat Luxembourg S.A., 11.250%, 2/04/2017 | | | 2,366,000 | |
| | 1,100,000 | | | R.R. Donnelley & Sons Co., 7.250%, 5/15/2018 | | | 1,067,000 | |
| | 75,000 | | | R.R. Donnelley & Sons Co., 8.250%, 3/15/2019 | | | 74,625 | |
| | | | | | | | |
| | | | | | | 4,783,175 | |
| | | | | | | | |
| | | | Metals & Mining — 2.1% | | | | |
| | 780,000 | | | Algoma Acquisition Corp., 9.875%, 6/15/2015, 144A | | | 709,800 | |
| | 700,000 | | | ArcelorMittal, 6.750%, 3/01/2041 | | | 655,983 | |
| | 420,000 | | | Arch Coal, Inc., 7.250%, 6/15/2021, 144A | | | 387,450 | |
| | 35,000 | | | Essar Steel Algoma, Inc., 9.375%, 3/15/2015, 144A | | | 36,137 | |
| | 1,845,000 | | | United States Steel Corp., 6.650%, 6/01/2037 | | | 1,549,800 | |
| | | | | | | | |
| | | | | | | 3,339,170 | |
| | | | | | | | |
| | | | Non-Captive Consumer — 2.8% | | | | |
| | 1,605,000 | | | Residential Capital LLC, 9.625%, 5/15/2015 | | | 1,364,250 | |
| | 1,920,000 | | | Springleaf Finance Corp., MTN, 5.750%, 9/15/2016 | | | 1,512,000 | |
| | 2,000,000 | | | Springleaf Finance Corp., Series J, MTN, 6.900%, 12/15/2017 | | | 1,560,000 | |
| | | | | | | | |
| | | | | | | 4,436,250 | |
| | | | | | | | |
| | | | Non-Captive Diversified — 2.1% | | | | |
| | 240,000 | | | Aircastle Ltd., 7.625%, 4/15/2020, 144A | | | 240,000 | |
| | 1,620,000 | | | Ally Financial, Inc., 8.000%, 11/01/2031 | | | 1,786,050 | |
| | 1,045,000 | | | International Lease Finance Corp., 8.625%, 1/15/2022 | | | 1,161,693 | |
| | 100,000 | | | iStar Financial, Inc., 5.850%, 3/15/2017 | | | 87,750 | |
| | 135,000 | | | iStar Financial, Inc., 5.875%, 3/15/2016 | | | 120,994 | |
| | 15,000 | | | iStar Financial, Inc., Series B, 5.950%, 10/15/2013 | | | 14,287 | |
| | | | | | | | |
| | | | | | | 3,410,774 | |
| | | | | | | | |
See accompanying notes to financial statements.
| 36
Portfolio of Investments – as of March 31, 2012 (Unaudited)
Loomis Sayles High Income Fund – (continued)
| | | | | | | | |
Principal
Amount (‡) | | | Description | | Value (†) | |
| | | | | | | | |
| | | | Oil Field Services — 0.6% | | | | |
| $ | 800,000 | | | OGX Petroleo e Gas Participacoes S.A, 8.375%, 4/01/2022, 144A | | $ | 808,000 | |
| | 200,000 | | | OGX Petroleo e Gas Participacoes S.A, 8.500%, 6/01/2018, 144A | | | 207,800 | |
| | | | | | | | |
| | | | | | | 1,015,800 | |
| | | | | | | | |
| | | | Packaging — 1.1% | | | | |
| | 1,800,000 | | | Reynolds Group Issuer, Inc./Reynolds Group Issuer LLC/Reynolds Group Issuer (Luxembourg) S.A.,
8.500%, 2/15/2021, 144A | | | 1,692,000 | |
| | | | | | | | |
| | | | Pharmaceuticals — 0.4% | | | | |
| | 140,000 | | | Valeant Pharmaceuticals International, 6.750%, 8/15/2021, 144A | | | 136,150 | |
| | 530,000 | | | Valeant Pharmaceuticals International, 7.250%, 7/15/2022, 144A | | | 524,700 | |
| | | | | | | | |
| | | | | | | 660,850 | |
| | | | | | | | |
| | | | Pipelines — 0.6% | | | | |
| | 210,000 | | | NGPL PipeCo LLC, 6.514%, 12/15/2012, 144A | | | 202,647 | |
| | 105,000 | | | NGPL PipeCo LLC, 7.768%, 12/15/2037, 144A | | | 90,105 | |
| | 785,000 | | | Rockies Express Pipeline LLC, 6.875%, 4/15/2040, 144A | | | 626,038 | |
| | | | | | | | |
| | | | | | | 918,790 | |
| | | | | | | | |
| | | | Retailers — 1.4% | | | | |
| | 40,000 | | | Dillard’s, Inc., 7.000%, 12/01/2028 | | | 37,400 | |
| | 435,000 | | | Dillard’s, Inc., 7.750%, 7/15/2026 | | | 428,475 | |
| | 205,000 | | | Dillard’s, Inc., 7.750%, 5/15/2027 | | | 198,850 | |
| | 35,000 | | | Dillard’s, Inc., 7.875%, 1/01/2023 | | | 35,088 | |
| | 245,000 | | | J.C. Penney Corp., Inc., 7.400%, 4/01/2037 | | | 239,181 | |
| | 1,440,000 | | | Toys R Us, Inc., 7.375%, 10/15/2018 | | | 1,292,400 | |
| | | | | | | | |
| | | | | | | 2,231,394 | |
| | | | | | | | |
| | | | Sovereigns — 0.9% | | | | |
| | 2,250,000 | | | Republic of Brazil, 10.250%, 1/10/2028, (BRL) | | | 1,472,924 | |
| | | | | | | | |
| | | | Supermarkets — 1.0% | | | | |
| | 315,000 | | | American Stores Co., 8.000%, 6/01/2026 | | | 267,750 | |
| | 955,000 | | | New Albertson’s, Inc., 7.750%, 6/15/2026 | | | 773,550 | |
| | 735,000 | | | New Albertson’s, Inc., Series C, MTN, 6.625%, 6/01/2028 | | | 518,175 | |
| | | | | | | | |
| | | | | | | 1,559,475 | |
| | | | | | | | |
| | | | Supranational — 2.0% | | | | |
| | 2,000,000 | | | European Bank for Reconstruction & Development, GMTN, 9.250%, 9/10/2012, (BRL) | | | 1,099,564 | |
| | 180,450 | | | European Financial Stability Facility, 0.400%, 3/12/2013, (EUR) | | | 240,075 | |
| | 180,450 | | | European Financial Stability Facility, 1.000%, 3/12/2014, (EUR) | | | 240,171 | |
| | 11,160,000,000 | | | Inter-American Development Bank, EMTN, Zero Coupon, 8/20/2015, (IDR)(h) | | | 1,008,476 | |
| | 700,000,000 | | | International Bank for Reconstruction & Development, GMTN, 2.300%, 2/26/2013, (KRW) | | | 613,724 | |
| | | | | | | | |
| | | | | | | 3,202,010 | |
| | | | | | | | |
| | | | Technology — 2.4% | | | | |
| | 1,090,000 | | | Alcatel-Lucent USA, Inc., 6.450%, 3/15/2029 | | | 861,100 | |
| | 1,930,000 | | | Alcatel-Lucent USA, Inc., 6.500%, 1/15/2028 | | | 1,510,225 | |
| | 1,460,000 | | | First Data Corp., 8.250%, 1/15/2021, 144A | | | 1,427,150 | |
| | | | | | | | |
| | | | | | | 3,798,475 | |
| | | | | | | | |
See accompanying notes to financial statements.
37 |
Portfolio of Investments – as of March 31, 2012 (Unaudited)
Loomis Sayles High Income Fund – (continued)
| | | | | | | | |
Principal
Amount (‡) | | | Description | | Value (†) | |
| | | | | | | | |
| | | | Textile — 1.4% | | | | |
| $ | 2,605,000 | | | Jones Apparel Group, Inc., 6.125%, 11/15/2034 | | $ | 1,986,313 | |
| | 175,000 | | | Jones Group/Apparel Group Holdings/Apparel Group USA/Footwear Accessories Retail,
6.875%, 3/15/2019 | | | 171,281 | |
| | | | | | | | |
| | | | | | | 2,157,594 | |
| | | | | | | | |
| | | | Transportation Services — 0.4% | | | | |
| | 275,000 | | | APL Ltd., 8.000%, 1/15/2024(c) | | | 189,750 | |
| | 640,000 | | | Overseas Shipholding Group, 7.500%, 2/15/2024 | | | 424,800 | |
| | | | | | | | |
| | | | | | | 614,550 | |
| | | | | | | | |
| | | | Treasuries — 5.1% | | | | |
| | 150,000 | | | Ireland Government Bond, 4.500%, 10/18/2018, (EUR) | | | 180,436 | |
| | 375,000 | | | Ireland Government Bond, 4.500%, 4/18/2020, (EUR) | | | 430,137 | |
| | 930,000 | | | Ireland Government Bond, 5.400%, 3/13/2025, (EUR) | | | 1,070,786 | |
| | 65,000 | | | Italy Buoni Poliennali Del Tesoro, 5.000%, 8/01/2034, (EUR) | | | 78,067 | |
| | 60,000 | | | Italy Buoni Poliennali Del Tesoro, 5.250%, 11/01/2029, (EUR) | | | 76,925 | |
| | 55,000 | | | Italy Buoni Poliennali Del Tesoro, 5.750%, 2/01/2033, (EUR) | | | 72,637 | |
| | 301,500(††) | | | Mexican Fixed Rate Bonds, Series M-20, 8.000%, 12/07/2023, (MXN) | | | 2,669,307 | |
| | 10,000,000 | | | Philippine Government International Bond, 4.950%, 1/15/2021, (PHP) | | | 242,419 | |
| | 120,000,000 | | | Philippine Government International Bond, 6.250%, 1/14/2036, (PHP) | | | 2,985,257 | |
| | 50,000 | | | Portugal Obrigacoes do Tesouro OT, 3.850%, 4/15/2021, (EUR) | | | 38,190 | |
| | 400,000 | | | Portugal Obrigacoes do Tesouro OT, 4.950%, 10/25/2023, (EUR) | | | 308,618 | |
| | | | | | | | |
| | | | | | | 8,152,779 | |
| | | | | | | | |
| | | | Wireless — 3.6% | | | | |
| | 900,000 | | | Bakrie Telecom Pte Ltd., 11.500%, 5/07/2015, 144A | | | 670,500 | |
| | 1,595,000 | | | Clearwire Communications LLC/Clearwire Finance, Inc., 12.000%, 12/01/2015, 144A | | | 1,571,075 | |
| | 4,236,000 | | | Sprint Capital Corp., 6.875%, 11/15/2028 | | | 3,240,540 | |
| | 5,000 | | | Sprint Capital Corp., 6.900%, 5/01/2019 | | | 4,325 | |
| | 285,000 | | | Sprint Capital Corp., 8.750%, 3/15/2032 | | | 244,387 | |
| | | | | | | | |
| | | | | | | 5,730,827 | |
| | | | | | | | |
| | | | Wirelines — 4.2% | | | | |
| | 665,000 | | | Axtel SAB de CV, 9.000%, 9/22/2019, 144A | | | 541,975 | |
| | 130,000 | | | Cincinnati Bell Telephone Co. LLC, 6.300%, 12/01/2028 | | | 104,000 | |
| | 1,105,000 | | | Cincinnati Bell, Inc., 8.750%, 3/15/2018 | | | 1,031,794 | |
| | 1,070,000 | | | Frontier Communications Corp., 9.000%, 8/15/2031 | | | 1,037,900 | |
| | 940,000 | | | Level 3 Escrow, Inc., 8.125%, 7/01/2019, 144A | | | 970,550 | |
| | 1,910,000 | | | Level 3 Financing, Inc., 8.750%, 2/15/2017 | | | 1,995,950 | |
| | 350,000 | | | Portugal Telecom International Finance BV, EMTN, 4.500%, 6/16/2025, (EUR) | | | 325,590 | |
| | 250,000 | | | Portugal Telecom International Finance BV, EMTN, 5.000%, 11/04/2019, (EUR) | | | 267,597 | |
| | 300,000 | | | Portugal Telecom International Finance BV, EMTN, 5.625%, 2/08/2016, (EUR) | | | 369,036 | |
| | 25,000 | | | Telecom Italia Capital S.A., 6.000%, 9/30/2034 | | | 22,000 | |
| | 15,000 | | | Telecom Italia Capital S.A., 6.375%, 11/15/2033 | | | 13,500 | |
| | | | | | | | |
| | | | | | | 6,679,892 | |
| | | | | | | | |
| | | | Total Non-Convertible Bonds (Identified Cost $108,193,053) | | | 109,704,466 | |
| | | | | | | | |
See accompanying notes to financial statements.
| 38
Portfolio of Investments – as of March 31, 2012 (Unaudited)
Loomis Sayles High Income Fund – (continued)
| | | | | | | | |
Principal
Amount (‡) | | | Description | | Value (†) | |
| | | | | | | | |
| | Convertible Bonds — 10.8% | | | | |
| | | | Automotive — 2.5% | | | | |
| $ | 1,465,000 | | | ArvinMeritor, Inc., (Step to Zero Coupon on 2/15/2019), 4.000%, 2/15/2027(i) | | $ | 1,221,443 | |
| | 1,760,000 | | | Ford Motor Co., 4.250%, 11/15/2016 | | | 2,789,600 | |
| | | | | | | | |
| | | | | | | 4,011,043 | |
| | | | | | | | |
| | | | Diversified Manufacturing — 0.9% | | | | |
| | 1,325,000 | | | Trinity Industries, Inc., 3.875%, 6/01/2036 | | | 1,444,250 | |
| | | | | | | | |
| | | | Home Construction — 0.1% | | | | |
| | 70,000 | | | Lennar Corp., 2.000%, 12/01/2020, 144A | | | 81,900 | |
| | | | | | | | |
| | | | Metals & Mining — 0.2% | | | | |
| | 210,000 | | | Peabody Energy Corp., 4.750%, 12/15/2066 | | | 199,500 | |
| | 165,000 | | | Steel Dynamics, Inc., 5.125%, 6/15/2014 | | | 187,069 | |
| | | | | | | | |
| | | | | | | 386,569 | |
| | | | | | | | |
| | | | Pharmaceuticals — 1.8% | | | | |
| | 1,365,000 | | | Human Genome Sciences, Inc., 3.000%, 11/15/2018 | | | 1,346,231 | |
| | 1,370,000 | | | Vertex Pharmaceuticals, Inc., 3.350%, 10/01/2015 | | | 1,570,363 | |
| | | | | | | | |
| | | | | | | 2,916,594 | |
| | | | | | | | |
| | | | Technology — 5.0% | | | | |
| | 4,155,000 | | | Ciena Corp., 0.875%, 6/15/2017 | | | 3,651,206 | |
| | 145,000 | | | Ciena Corp., 3.750%, 10/15/2018, 144A | | | 163,669 | |
| | 40,000 | | | Ciena Corp., 4.000%, 3/15/2015, 144A | | | 45,150 | |
| | 2,930,000 | | | Intel Corp., 2.950%, 12/15/2035 | | | 3,369,500 | |
| | 620,000 | | | Micron Technology, Inc., Series B, 1.875%, 8/01/2031, 144A | | | 657,975 | |
| | 80,000 | | | SanDisk Corp., 1.500%, 8/15/2017 | | | 94,700 | |
| | | | | | | | |
| | | | | | | 7,982,200 | |
| | | | | | | | |
| | | | Textile — 0.3% | | | | |
| | 420,000 | | | Iconix Brand Group, Inc., 2.500%, 6/01/2016, 144A | | | 410,025 | |
| | | | | | | | |
| | | | Total Convertible Bonds (Identified Cost $15,203,050) | | | 17,232,581 | |
| | | | | | | | |
| | | | Total Bonds and Notes (Identified Cost $123,396,103) | | | 126,937,047 | |
| | | | | | | | |
| | | | | | | | |
| | Senior Loans — 0.4% | | | | |
| | | | Media Non-Cable — 0.2% | | | | |
| | 316,608 | | | SuperMedia, Inc., Exit Term Loan, 11.000%, 12/31/2015(b) | | | 170,652 | |
| | 224,012 | | | Tribune Company, Term Loan X, 5.000%, 6/04/2009(b)(f)(j) | | | 146,028 | |
| | | | | | | | |
| | | | | | | 316,680 | |
| | | | | | | | |
| | | | Wirelines — 0.2% | | | | |
| | 369,221 | | | FairPoint Communications, Inc., New Term Loan B, 6.500%, 1/22/2016(b) | | | 303,171 | |
| | | | | | | | |
| | | | Total Senior Loans (Identified Cost $1,007,580) | | | 619,851 | |
| | | | | | | | |
See accompanying notes to financial statements.
39 |
Portfolio of Investments – as of March 31, 2012 (Unaudited)
Loomis Sayles High Income Fund – (continued)
| | | | | | | | |
| Shares | | | Description | | Value (†) | |
| | | | | | | | |
| | Preferred Stocks — 5.0% | | | | |
| | Convertible Preferred Stocks — 3.4% | | | | |
| | | | Automotive — 1.1% | | | | |
| | 41,200 | | | General Motors Co., Series B, 4.750% | | $ | 1,724,220 | |
| | 2,500 | | | Goodyear Tire & Rubber Co. (The), 5.875% | | | 103,575 | |
| | | | | | | | |
| | | | | | | 1,827,795 | |
| | | | | | | | |
| | | | Banking — 0.0% | | | | |
| | 25 | | | Bank of America Corp., Series L, 7.250% | | | 24,472 | |
| | | | | | | | |
| | | | Construction Machinery — 0.1% | | | | |
| | 2,213 | | | United Rentals Trust I, 6.500% | | | 119,364 | |
| | | | | | | | |
| | | | Consumer Products — 1.6% | | | | |
| | 55,115 | | | Newell Financial Trust I, 5.250% | | | 2,604,184 | |
| | | | | | | | |
| | | | Pipelines — 0.6% | | | | |
| | 20,675 | | | El Paso Energy Capital Trust I, 4.750% | | | 953,117 | |
| | | | | | | | |
| | | | Total Convertible Preferred Stocks (Identified Cost $5,285,816) | | | 5,528,932 | |
| | | | | | | | |
| | | | | | | | |
| | Non-Convertible Preferred Stocks — 1.6% | | | | |
| | | | Non-Captive Diversified — 1.6% | | | | |
| | 940 | | | Ally Financial, Inc., Series G, 7.000%, 144A | | | 783,108 | |
| | 78,785 | | | Ally Financial, Inc., Series A, (fixed rate to 5/15/2016, variable rate thereafter), 8.500% | | | 1,709,635 | |
| | | | | | | | |
| | | | | | | 2,492,743 | |
| | | | | | | | |
| | | | Total Non-Convertible Preferred Stocks (Identified Cost $2,841,445) | | | 2,492,743 | |
| | | | | | | | |
| | | | Total Preferred Stocks (Identified Cost $8,127,261) | | | 8,021,675 | |
| | | | | | | | |
| | | | | | | | |
| | Common Stocks — 2.6% | | | | |
| | | | Automobiles — 0.4% | | | | |
| | 53,720 | | | Ford Motor Co. | | | 670,963 | |
| | | | | | | | |
| | | | Chemicals — 0.0% | | | | |
| | 1,087 | | | Ashland, Inc. | | | 66,372 | |
| | | | | | | | |
| | | | Diversified Telecommunication Services — 0.0% | | | | |
| | 593 | | | Hawaiian Telcom Holdco, Inc.(g) | | | 10,223 | |
| | | | | | | | |
| | | | Household Durables — 0.3% | | | | |
| | 46,500 | | | KB Home | | | 413,850 | |
| | | | | | | | |
| | | | Media — 0.0% | | | | |
| | 1,835 | | | SuperMedia, Inc.(g) | | | 4,386 | |
| | | | | | | | |
| | | | Oil, Gas & Consumable Fuels — 0.7% | | | | |
| | 35,176 | | | El Paso Corp. | | | 1,039,451 | |
| | | | | | | | |
See accompanying notes to financial statements.
| 40
Portfolio of Investments – as of March 31, 2012 (Unaudited)
Loomis Sayles High Income Fund – (continued)
| | | | | | | | |
| Shares | | | Description | | Value (†) | |
| | | | | | | | |
| | | | Pharmaceuticals — 1.2% | | | | |
| | 6,875 | | | Merck & Co., Inc. | | $ | 264,000 | |
| | 31,106 | | | Valeant Pharmaceuticals International, Inc.(g) | | | 1,670,081 | |
| | | | | | | | |
| | | | | | | 1,934,081 | |
| | | | | | | | |
| | | | Total Common Stocks (Identified Cost $2,254,651) | | | 4,139,326 | |
| | | | | | | | |
| | | | | | | | |
| | Warrants — 0.0% | | | | |
| | 10,023 | | | FairPoint Communications, Inc., Expiration on 1/24/2018(c)(d)(g) (Identified Cost $0) | | | — | |
| | | | | | | | |
| | | | | | | | |
Principal
Amount (‡) | | | | | | |
| | Short-Term Investments — 11.3% | | | | |
| | 101,349 | | | European Financial Stability Facility Treasury Bill, 0.000%, 9/12/2012, (EUR) | | | 134,922 | |
| $ | 17,978,729 | | | Tri-Party Repurchase Agreement with Fixed Income Clearing Corporation, dated 3/30/2012, at 0.000% to be repurchased at $17,978,729 on 4/02/2012 collateralized by $17,385,000 U.S. Treasury Note, 2.625% due 6/30/2014 valued at $18,341,175 including accrued interest (Note 2 of Notes to Financial Statements) | | | 17,978,729 | |
| | | | | | | | |
| | | | Total Short-Term Investments (Identified Cost $18,115,179) | | | 18,113,651 | |
| | | | | | | | |
| | | | Total Investments — 98.7% (Identified Cost $152,900,774)(a) | | | 157,831,550 | |
| | | | Other assets less liabilities — 1.3% | | | 2,103,615 | |
| | | | | | | | |
| | | | Net Assets — 100.0% | | $ | 159,935,165 | |
| | | | | | | | |
| | (‡) | | | Principal Amount stated in U.S. dollars unless otherwise noted. | | | | |
| | (†) | | | See Note 2 of Notes to Financial Statements. | | | | |
| | (††) | | | Amount shown represents units. One unit represents a principal amount of 100. | |
| | (a) | | | Federal Tax Information (Amounts exclude certain adjustments made at the end of the Fund’s fiscal year for tax purposes. Such adjustments are primarily due to wash sales. Amortization of premium on debt securities is excluded for tax purposes.): | |
| | | | At March 31, 2012, the net unrealized appreciation on investments based on a cost of $152,958,872 for federal income tax purposes was as follows: | |
| | | | Aggregate gross unrealized appreciation for all investments in which there is an excess of value over tax cost | | $ | 10,556,306 | |
| | | | Aggregate gross unrealized depreciation for all investments in which there is an excess of tax cost over value | | | (5,683,628 | ) |
| | | | | | | | |
| | | | Net unrealized appreciation | | $ | 4,872,678 | |
| | | | | | | | |
| (b) | | | Variable rate security. Rate as of March 31, 2012 is disclosed. | | | |
| | (c) | | | Illiquid security. At March 31, 2012, the value of these securities amounted to $518,150 or 0.3% of net assets. | |
| | (d) | | | Fair valued security by the Fund’s investment adviser. At March 31, 2012, the value of these securities amounted to $292,000 or 0.2% of net assets. | |
See accompanying notes to financial statements.
41 |
Portfolio of Investments – as of March 31, 2012 (Unaudited)
Loomis Sayles High Income Fund – (continued)
| | | | |
| | (e) | | | The issuer is making partial payments with respect to interest and/or principal. Income is not being accrued. |
| | (f) | | | The issuer is in default with respect to interest and/or principal payments. Income is not being accrued. |
| | (g) | | | Non-income producing security. |
| | (h) | | | All or a portion of this security has been designated to cover the Fund’s obligations under open forward foreign currency contracts. |
| | (i) | | | Coupon rate is a fixed rate for an initial period then resets at a specified date and rate. |
| | (j) | | | Issuer has filed for bankruptcy. |
| | (k) | | | The issuer is making partial payments with respect to principal. |
| | | | |
| | 144A | | | All or a portion of these securities are exempt from registration under Rule 144A of the Securities Act of 1933. These securities may be resold in transactions exempt from registration, normally to qualified institutional buyers. At March 31, 2012, the value of Rule 144A holdings amounted to $24,966,230 or 15.6% of net assets. |
| | | | |
| | ABS | | | Asset-Backed Securities |
| | ARMs | | | Adjustable Rate Mortgages |
| | EMTN | | | Euro Medium Term Note |
| | GMTN | | | Global Medium Term Note |
| | MTN | | | Medium Term Note |
| | | | |
| | AUD | | | Australian Dollar |
| | BRL | | | Brazilian Real |
| | EUR | | | Euro |
| | IDR | | | Indonesian Rupiah |
| | KRW | | | South Korean Won |
| | MXN | | | Mexican Peso |
| | PHP | | | Philippine Peso |
At March 31, 2012, the Fund had the following open forward foreign currency contracts:
| | | | | | | | | | | | | | | | | | |
Contract to Buy/Sell1 | | Delivery
Date | | | Currency | | Units | | | Notional
Value | | | Unrealized
Appreciation
(Depreciation) | |
| Buy | | | 4/30/2012 | | | Euro | | | 500,000 | | | $ | 666,926 | | | $ | 12,241 | |
| Sell | | | 4/30/2012 | | | Euro | | | 350,000 | | | | 466,848 | | | | 661 | |
| Sell | | | 4/30/2012 | | | Euro | | | 3,140,000 | | | | 4,188,297 | | | | (85,311 | ) |
| | | | | | | | | | | | | | | | | | |
| Total | | | | | | | | | | | | | | | | $ | (72,409 | ) |
| | | | | | | | | | | | | | | | | | |
1 Counterparty is Barclays.
See accompanying notes to financial statements.
| 42
Portfolio of Investments – as of March 31, 2012 (Unaudited)
Loomis Sayles High Income Fund – (continued)
Industry Summary at March 31, 2012 (Unaudited)
| | | | |
Technology | | | 7.4 | % |
Home Construction | | | 6.2 | |
Treasuries | | | 5.1 | |
Wirelines | | | 4.4 | |
Banking | | | 4.0 | |
Non-Captive Diversified | | | 3.7 | |
Automotive | | | 3.6 | |
Wireless | | | 3.6 | |
Pharmaceuticals | | | 3.4 | |
Media Non-Cable | | | 3.2 | |
Building Materials | | | 3.0 | |
Non-Captive Consumer | | | 2.8 | |
Collateralized Mortgage Obligations | | | 2.8 | |
Gaming | | | 2.7 | |
Electric | | | 2.5 | |
Metals & Mining | | | 2.3 | |
Consumer Products | | | 2.0 | |
ABS Home Equity | | | 2.0 | |
Supranational | | | 2.0 | |
Healthcare | | | 2.0 | |
Other Investments, less than 2% each | | | 18.7 | |
Short-Term Investments | | | 11.3 | |
| | | | |
Total Investments | | | 98.7 | |
Other assets less liabilities (including open forward foreign currency contracts) | | | 1.3 | |
| | | | |
Net Assets | | | 100.0 | % |
| | | | |
See accompanying notes to financial statements.
43 |
Portfolio of Investments – as of March 31, 2012 (Unaudited)
Loomis Sayles International Bond Fund
| | | | | | | | |
Principal
Amount (‡) | | | Description | | Value (†) | |
| | | | | | | | |
| | Bonds and Notes — 95.9% of Net Assets | | | | |
| | | | Brazil — 2.2% | | | | |
| $ | 119,000 | | | Fibria Overseas Finance Ltd., 7.500%, 5/04/2020, 144A | | $ | 125,700 | |
| | 100,000 | | | Telemar Norte Leste S.A., 5.125%, 12/15/2017, 144A, (EUR) | | | 138,547 | |
| | 200,000 | | | Votorantim Cimentos S.A., 7.250%, 4/05/2041, 144A | | | 203,000 | |
| | | | | | | | |
| | | | | | | 467,247 | |
| | | | | | | | |
| | | | Canada — 4.8% | | | | |
| | 95,000 | | | Bell Canada, Series M-17, 6.100%, 3/16/2035, (CAD) | | | 108,960 | |
| | 165,000 | | | Corus Entertainment, Inc., 7.250%, 2/10/2017, 144A, (CAD) | | | 175,347 | |
| | 85,000 | | | Methanex Corp., 5.250%, 3/01/2022 | | | 86,520 | |
| | 150,000 | | | Province of Quebec Canada, EMTN, 3.375%, 6/20/2016, (EUR) | | | 215,679 | |
| | 200,000 | | | Province of Quebec Canada, Series 169, EMTN, 3.625%, 2/10/2015, (EUR) | | | 285,274 | |
| | 95,000 | | | Shaw Communications, Inc., 5.650%, 10/01/2019, (CAD) | | | 106,842 | |
| | 60,000 | | | Videotron Ltee, 6.875%, 7/15/2021, 144A, (CAD) | | | 64,170 | |
| | | | | | | | |
| | | | | | | 1,042,792 | |
| | | | | | | | |
| | | | Colombia — 0.4% | | | | |
| | 160,000,000 | | | Empresas Publicas de Medellin E.S.P., 8.375%, 2/01/2021, 144A, (COP) | | | 95,110 | |
| | | | | | | | |
| | | | Denmark — 0.6% | | | | |
| | 645,000 | | | Kingdom of Denmark, 4.000%, 11/15/2015, (DKK) | | | 129,844 | |
| | | | | | | | |
| | | | Finland — 0.2% | | | | |
| | 35,000 | | | Finland Government Bond, 3.125%, 9/15/2014, (EUR) | | | 49,595 | |
| | | | | | | | |
| | | | France — 2.0% | | | | |
| | 50,000 | | | Alstom S.A., 4.125%, 2/01/2017, (EUR) | | | 70,116 | |
| | 150,000 | | | AXA S.A., EMTN, (fixed rate to 4/16/2020, variable rate thereafter), 5.250%, 4/16/2040, (EUR) | | | 171,168 | |
| | 100,000 | | | Klepierre, EMTN, 4.000%, 4/13/2017, (EUR) | | | 137,401 | |
| | 50,000 | | | Lafarge S.A., EMTN, 5.375%, 6/26/2017, (EUR) | | | 67,685 | |
| | | | | | | | |
| | | | | | | 446,370 | |
| | | | | | | | |
| | | | Germany — 19.3% | | | | |
| | 705,000 | | | Bundesobligation, 1.250%, 10/14/2016, (EUR) | | | 962,119 | |
| | 300,000 | | | Bundesobligation, 2.250%, 4/10/2015, (EUR) | | | 422,776 | |
| | 480,000 | | | Bundesrepublik Deutschland, 3.000%, 7/04/2020, (EUR) | | | 713,156 | |
| | 705,000 | | | Bundesrepublik Deutschland, 3.250%, 1/04/2020, (EUR) | | | 1,064,843 | |
| | 440,000 | | | Bundesrepublik Deutschland, 3.750%, 1/04/2017, (EUR) | | | 668,230 | |
| | 220,000 | | | Bundesrepublik Deutschland, 4.000%, 1/04/2037, (EUR) | | | 373,002 | |
| | | | | | | | |
| | | | | | | 4,204,126 | |
| | | | | | | | |
| | | | Ireland — 0.8% | | | | |
| | 100,000 | | | WPP 2008 Ltd., 6.000%, 4/04/2017, (GBP) | | | 178,778 | |
| | | | | | | | |
| | | | Italy — 1.7% | | | | |
| | 100,000 | | | Enel Finance International S.A., EMTN, 5.625%, 8/14/2024, (GBP) | | | 146,937 | |
| | 100,000 | | | Finmeccanica SpA, EMTN, 4.875%, 3/24/2025, (EUR) | | | 110,833 | |
| | 75,000 | | | Telecom Italia Finance S.A., EMTN, 7.750%, 1/24/2033, (EUR) | | | 104,986 | |
| | | | | | | | |
| | | | | | | 362,756 | |
| | | | | | | | |
See accompanying notes to financial statements.
| 44
Portfolio of Investments – as of March 31, 2012 (Unaudited)
Loomis Sayles International Bond Fund – (continued)
| | | | | | | | |
Principal
Amount (‡) | | | Description | | Value (†) | |
| | | | | | | | |
| | | | Japan — 26.2% | | | | |
| | 104,000,000 | | | Development Bank of Japan, 1.700%, 9/20/2022, (JPY) | | $ | 1,334,981 | |
| | 47,000,000 | | | Japan Finance Organization for Municipal Enterprises, 1.350%, 11/26/2013, (JPY) | | | 578,755 | |
| | 83,000,000 | | | Japan Government Five Year Bond, 0.700%, 6/20/2014, (JPY) | | | 1,015,596 | |
| | 80,000,000 | | | Japan Government Ten Year Bond, 1.300%, 3/20/2019, (JPY)(b) | | | 1,012,867 | |
| | 44,000,000 | | | Japan Government Ten Year Bond, 1.300%, 3/20/2021, (JPY) | | | 550,925 | |
| | 85,000,000 | | | Japan Government Ten Year Bond, 1.700%, 9/20/2017, (JPY) | | | 1,100,106 | |
| | 9,000,000 | | | Japan Government Twenty Year Bond, 2.100%, 12/20/2030, (JPY) | | | 115,409 | |
| | | | | | | | |
| | | | | | | 5,708,639 | |
| | | | | | | | |
| | | | Korea — 0.4% | | | | |
| | 3,600,000 | | | Export-Import Bank of Korea, 4.000%, 11/26/2015, 144A, (PHP) | | | 82,632 | |
| | | | | | | | |
| | | | Luxembourg — 0.3% | | | | |
| | 50,000 | | | FMC Finance VIII, S.A., 6.500%, 9/15/2018, 144A, (EUR) | | | 73,187 | |
| | | | | | | | |
| | | | Malaysia — 0.6% | | | | |
| | 370,000 | | | Malaysia Government Bond, 4.262%, 9/15/2016, (MYR) | | | 125,320 | |
| | | | | | | | |
| | | | Mexico — 3.3% | | | | |
| | 100,000 | | | America Movil SAB de CV, EMTN, 4.125%, 10/25/2019, (EUR) | | | 144,520 | |
| | 160,000 | | | Axtel SAB de CV, 9.000%, 9/22/2019, 144A | | | 130,400 | |
| | 15,000(††) | | | Mexican Fixed Rate Bonds, Series M, 6.500%, 6/10/2021, (MXN) | | | 119,583 | |
| | 37,500(††) | | | Mexican Fixed Rate Bonds, Series M-30, 8.500%, 11/18/2038, (MXN) | | | 327,012 | |
| | | | | | | | |
| | | | | | | 721,515 | |
| | | | | | | | |
| | | | Netherlands — 5.3% | | | | |
| | 50,000 | | | EDP Finance BV, EMTN, 4.750%, 9/26/2016, (EUR) | | | 58,223 | |
| | 30,000 | | | Fresenius Finance BV, 4.250%, 4/15/2019, 144A, (EUR) | | | 39,811 | |
| | 610,000 | | | Kingdom of Netherlands, 4.500%, 7/15/2017, (EUR) | | | 939,739 | |
| | 50,000 | | | Koninklijke KPN NV, GMTN, 5.625%, 9/30/2024, (EUR) | | | 75,507 | |
| | 50,000 | | | Portugal Telecom International Finance BV, EMTN, 5.000%, 11/04/2019, (EUR) | | | 53,519 | |
| | | | | | | | |
| | | | | | | 1,166,799 | |
| | | | | | | | |
| | | | Norway — 2.1% | | | | |
| | 30,000 | | | Eksportfinans ASA, 2.000%, 9/15/2015 | | | 26,617 | |
| | 2,205,000 | | | Norwegian Government, 4.250%, 5/19/2017, (NOK) | | | 429,543 | |
| | | | | | | | |
| | | | | | | 456,160 | |
| | | | | | | | |
| | | | Panama — 0.7% | | | | |
| | 150,000 | | | Banco Latinoamericano de Comercio Exterior, S.A., 3.750%, 4/04/2017, 144A | | | 149,813 | |
| | | | | | | | |
| | | | Philippines — 0.6% | | | | |
| | 5,000,000 | | | Philippine Government International Bond, 4.950%, 1/15/2021, (PHP) | | | 121,209 | |
| | | | | | | | |
| | | | Poland — 0.2% | | | | |
| | 50,000 | | | Poland Government International Bond, 5.000%, 3/23/2022 | | | 52,701 | |
| | | | | | | | |
| | | | Singapore — 2.0% | | | | |
| | 135,000 | | | Singapore Government Bond, 1.625%, 4/01/2013, (SGD) | | | 108,930 | |
| | 360,000 | | | Singapore Government Bond, 2.250%, 7/01/2013, (SGD) | | | 293,865 | |
| | 40,000 | | | Singapore Government Bond, 2.250%, 6/01/2021, (SGD) | | | 33,456 | |
| | | | | | | | |
| | | | | | | 436,251 | |
| | | | | | | | |
See accompanying notes to financial statements.
45 |
Portfolio of Investments – as of March 31, 2012 (Unaudited)
Loomis Sayles International Bond Fund – (continued)
| | | | | | | | |
Principal
Amount (‡) | | | Description | | Value (†) | |
| | | | | | | | |
| | | | South Africa — 0.8% | | | | |
| | 150,000 | | | Edcon Proprietary Ltd., 4.126%, 6/15/2014, 144A, (EUR)(c) | | $ | 176,048 | |
| | | | | | | | |
| | | | Supranationals — 2.5% | | | | |
| | 40,000,000 | | | Asian Development Bank, EMTN, 2.350%, 6/21/2027, (JPY) | | | 540,105 | |
| | | | | | | | |
| | | | United Arab Emirates — 0.4% | | | | |
| | 100,000 | | | DP World Ltd., 6.850%, 7/02/2037, 144A | | | 96,500 | |
| | | | | | | | |
| | | | United Kingdom — 8.1% | | | | |
| | 50,000 | | | British Sky Broadcasting Group PLC, EMTN, 6.000%, 5/21/2027, (GBP) | | | 90,636 | |
| | 105,000 | | | British Telecommunications PLC, 5.750%, 12/07/2028, (GBP) | | | 182,798 | |
| | 50,000 | | | BSKYB Finance UK PLC, 5.750%, 10/20/2017, (GBP) | | | 91,829 | |
| | 100,000 | | | Standard Chartered Bank, Series 17, EMTN, 5.875%, 9/26/2017, (EUR) | | | 143,051 | |
| | 330,000 | | | United Kingdom Treasury, 1.750%, 1/22/2017, (GBP) | | | 545,861 | |
| | 115,000 | | | United Kingdom Treasury, 4.750%, 12/07/2038, (GBP) | | | 231,069 | |
| | 240,000 | | | United Kingdom Treasury, 5.000%, 3/07/2025, (GBP) | | | 487,562 | |
| | | | | | | | |
| | | | | | | 1,772,806 | |
| | | | | | | | |
| | | | United States — 9.3% | | | | |
| | 85,000 | | | American Tower Corp., 4.700%, 3/15/2022 | | | 85,683 | |
| | 100,000 | | | BA Credit Card Trust, Series 04A1, 4.500%, 6/17/2016, (EUR) | | | 137,611 | |
| | 50,000 | | | Cargill, Inc., EMTN, 5.375%, 3/02/2037, (GBP) | | | 89,283 | |
| | 15,000,000 | | | Citigroup, Inc., 2.400%, 10/31/2025, (JPY) | | | 173,153 | |
| | 50,000 | | | Goldman Sachs Group, Inc. (The), 6.875%, 1/18/2038, (GBP) | | | 71,779 | |
| | 45,000 | | | HCA, Inc., 8.360%, 4/15/2024 | | | 45,900 | |
| | 150,000 | | | HSBC Finance Corp., EMTN, 4.500%, 6/14/2016, (EUR) | | | 213,663 | |
| | 100,000 | | | JPMorgan Chase & Co., EMTN, 4.375%, 1/30/2014, (EUR) | | | 139,758 | |
| | 150,000 | | | Merrill Lynch & Co., Inc., EMTN, 4.625%, 9/14/2018, (EUR) | | | 185,028 | |
| | 130,000 | | | Morgan Stanley, 5.375%, 11/14/2013, (GBP) | | | 213,281 | |
| | 100,000 | | | Newmont Mining Corp., 3.500%, 3/15/2022 | | | 96,341 | |
| | 40,000 | | | NII Capital Corp., 7.625%, 4/01/2021 | | | 39,100 | |
| | 75,000 | | | Valeant Pharmaceuticals International, 6.750%, 8/15/2021, 144A | | | 72,938 | |
| | 35,000 | | | Valeant Pharmaceuticals International, 7.250%, 7/15/2022, 144A | | | 34,650 | |
| | 100,000 | | | Wachovia Corp., EMTN, 4.375%, 11/27/2018, (EUR) | | | 133,689 | |
| | 100,000 | | | Wells Fargo & Co., 4.625%, 11/02/2035, (GBP) | | | 159,969 | |
| | 100,000 | | | Zurich Finance USA, Inc., EMTN, (fixed rate to 6/15/2015, variable rate thereafter),
4.500%, 6/15/2025, (EUR) | | | 134,388 | |
| | | | | | | | |
| | | | | | | 2,026,214 | |
| | | | | | | | |
| | | | Uruguay — 1.1% | | | | |
| | 4,018,221 | | | Uruguay Government International Bond, 4.375%, 12/15/2028, (UYU) | | | 230,910 | |
| | | | | | | | |
| | | | Total Bonds and Notes
(Identified Cost $20,796,361) | | | 20,913,427 | |
| | | | | | | | |
See accompanying notes to financial statements.
| 46
Portfolio of Investments – as of March 31, 2012 (Unaudited)
Loomis Sayles International Bond Fund – (continued)
| | | | | | | | |
Principal
Amount (‡) | | | Description | | Value (†) | |
| | | | | | | | |
| | Short-Term Investments — 0.7% | | | | |
| $ | 155,263 | | | Tri-Party Repurchase Agreement with Fixed Income Clearing Corporation, dated 3/30/2012 at 0.000% to be repurchased at $155,263 on 4/02/2011 collateralized by $160,000 Federal Home Loan Bank, 0.360% due 5/16/2013 valued at $160,400 including accrued interest (Note 2 of Notes to Financial Statements)
(Identified Cost $155,263) | | $ | 155,263 | |
| | | | | | | | |
| | | | Total Investments — 96.6%
(Identified Cost $20,951,624)(a) | | | 21,068,690 | |
| | | | Other assets less liabilities — 3.4% | | | 731,769 | |
| | | | | | | | |
| | | | Net Assets — 100.0% | | $ | 21,800,459 | |
| | | | | | | | |
| | (‡) | | | Principal Amount stated in U.S. dollars unless otherwise noted. | | | | |
| | (†) | | | See Note 2 of Notes to Financial Statements. | | | | |
| | (††) | | | Amount shown represents units. One unit represents a principal amount of 100. | | | | |
| | (a) | | | Federal Tax Information (Amounts exclude certain adjustments made at the end of the Fund’s fiscal year for tax purposes. Such adjustments are primarily due to wash sales. Amortization of premium on debt securities is excluded for tax purposes.): | |
| | | | At March 31, 2012, the net unrealized appreciation on investments based on a cost of $21,009,442 for federal income tax purposes was as follows: | |
| | | | Aggregate gross unrealized appreciation for all investments in which there is an excess of value over tax cost | | $ | 620,370 | |
| | | | Aggregate gross unrealized depreciation for all investments in which there is an excess of tax cost over value | | | (561,122 | ) |
| | | | | | | | |
| | | | Net unrealized appreciation | | $ | 59,248 | |
| | | | | | | | |
| | (b) | | | All or a portion of this security has been designated to cover the Fund’s obligations under open forward foreign currency contracts. | |
| | (c) | | | Variable rate security. Rate as of March 31, 2012 is disclosed. | | | | |
| | | | | | | | |
| | 144A | | | All or a portion of these securities are exempt from registration under Rule 144A of the Securities Act of 1933. These securities may be resold in transactions exempt from registration, normally to qualified institutional buyers. At March 31, 2012, the value of Rule 144A holdings amounted to $1,657,853 or 7.6% of net assets. | |
| | | | | | | | |
| | EMTN | | | Euro Medium Term Note | | | | |
| | GMTN | | | Global Medium Term Note | | | | |
| | | | | | | | |
| | CAD | | | Canadian Dollar | | | | |
| | COP | | | Colombian Peso | | | | |
| | DKK | | | Danish Krone | | | | |
| | EUR | | | Euro | | | | |
| | GBP | | | British Pound | | | | |
| | JPY | | | Japanese Yen | | | | |
| | MXN | | | Mexican Peso | | | | |
| | MYR | | | Malaysian Ringgit | | | | |
| | NOK | | | Norwegian Krone | | | | |
| | PHP | | | Philippine Peso | | | | |
| | SGD | | | Singapore Dollar | | | | |
| | UYU | | | Uruguayan Peso | | | | |
See accompanying notes to financial statements.
47 |
Portfolio of Investments – as of March 31, 2012 (Unaudited)
Loomis Sayles International Bond Fund – (continued)
At March 31, 2012, the Fund had the following open forward foreign currency contracts:
| | | | | | | | | | | | | | | | | | |
Contract to Buy/Sell | | Delivery
Date | | | Currency | | Units | | | Notional
Value | | | Unrealized
Appreciation
(Depreciation) | |
| Sell1 | | | 6/28/2012 | | | British Pound | | | 156,000 | | | $ | 249,378 | | | $ | (3,176 | ) |
| Buy2 | | | 6/20/2012 | | | Canadian Dollar | | | 720,000 | | | | 720,660 | | | | 1,681 | |
| Buy3 | | | 6/21/2012 | | | Malaysian Ringgit | | | 290,000 | | | | 94,176 | | | | (102 | ) |
| Buy1 | | | 6/11/2012 | | | South Korean Won | | | 130,000,000 | | | | 114,158 | | | | 64 | |
| Buy4 | | | 6/11/2012 | | | South Korean Won | | | 53,430,000 | | | | 46,919 | | | | (231 | ) |
| Buy1 | | | 6/11/2012 | | | South Korean Won | | | 500,000,000 | | | | 439,071 | | | | (2,333 | ) |
| Buy2 | | | 6/06/2012 | | | Swiss Franc | | | 171,000 | | | | 189,577 | | | | (1,497 | ) |
| | | | | | | | | | | | | | | | | | |
| Total | | | | | | | | | | | | | | | | $ | (5,594 | ) |
| | | | | | | | | | | | | | | | | | |
At March 31, 2012, the Fund had the following open forward cross currency contracts:
| | | | | | | | | | | | | | |
| Settlement Date | | Deliver/Units of Currency | | Receive5/Units of Currency | | | Unrealized
Appreciation
(Depreciation) | |
| 6/12/2012 | | Norwegian Krone | | 1,255,000 | | Euro | | | 168,411 | | | $ | 4,904 | |
| | | | | | | | | | | | | | |
1 Counterparty is Barclays.
2 Counterparty is UBS AG.
3 Counterparty is JPMorgan Chase.
4 Counterparty is Credit Suisse.
5 Counterparty is Deutche Bank.
Industry Summary at March 31, 2012 (Unaudited)
| | | | |
Treasuries | | | 54.8 | % |
Government Guaranteed | | | 8.8 | |
Banking | | | 6.3 | |
Wirelines | | | 2.9 | |
Supranational | | | 2.5 | |
Media Non-Cable | | | 2.4 | |
Local Authorities | | | 2.3 | |
Wireless | | | 2.0 | |
Other Investments, less than 2% each | | | 13.9 | |
Short-Term Investments | | | 0.7 | |
| | | | |
Total Investments | | | 96.6 | |
Other assets less liabilities (including open forward foreign currency contracts) | | | 3.4 | |
| | | | |
Net Assets | | | 100.0 | % |
| | | | |
See accompanying notes to financial statements.
| 48
Portfolio of Investments – as of March 31, 2012 (Unaudited)
Loomis Sayles International Bond Fund – (continued)
Currency Exposure at March 31, 2012 (Unaudited)
| | | | |
Euro | | | 37.6 | % |
Japanese Yen | | | 29.5 | |
British Pound | | | 11.3 | |
United States Dollar | | | 6.4 | |
Canadian Dollar | | | 2.1 | |
Mexican Peso | | | 2.0 | |
Singapore Dollar | | | 2.0 | |
Norwegian Krone | | | 2.0 | |
Other, less than 2% each | | | 3.7 | |
| | | | |
Total Investments | | | 96.6 | |
Other assets less liabilities (including open forward foreign currency contracts) | | | 3.4 | |
| | | | |
Net Assets | | | 100.0 | % |
| | | | |
See accompanying notes to financial statements.
49 |
Portfolio of Investments – as of March 31, 2012 (Unaudited)
Loomis Sayles Limited Term Government and Agency Fund
| | | | | | | | |
Principal
Amount | | | Description | | Value (†) | |
| | | | | | | | |
| | Bonds and Notes — 97.8% of Net Assets | | | | |
| | | | ABS Car Loan — 0.7% | | | | |
| $ | 1,380,000 | | | Ally Master Owner Trust, Series 2011-1, Class A2, 2.150%, 1/15/2016 | | $ | 1,409,353 | |
| | 298,978 | | | ARI Fleet Lease Trust, Series 2010-A, Class A, 1.692%, 8/15/2018, 144A(b) | | | 299,069 | |
| | 2,000,000 | | | World Omni Auto Receivables Trust, Series 2011-A, Class A3, 1.110%, 5/15/2015 | | | 2,009,234 | |
| | | | | | | | |
| | | | | | | 3,717,656 | |
| | | | | | | | |
| | | | ABS Credit Card — 0.6% | | | | |
| | 985,000 | | | American Express Credit Account Master, Series 2004-2, Class A, 0.412%, 12/15/2016(b) | | | 986,639 | |
| | 2,100,000 | | | World Financial Network Credit Card Master Trust, Series 2010-A, Class A, 3.960%, 4/15/2019 | | | 2,266,647 | |
| | | | | | | | |
| | | | | | | 3,253,286 | |
| | | | | | | | |
| | | | ABS Home Equity — 0.2% | | | | |
| | 520,960 | | | Countrywide Asset-Backed Certificates, Series 2004-S1, Class A3, 4.615%, 2/25/2035 | | | 492,360 | |
| | 368,035 | | | Residential Funding Mortgage Securities II, Series 2002-HI5, Class A7, 5.700%, 1/25/2028(b) | | | 351,222 | |
| | | | | | | | |
| | | | | | | 843,582 | |
| | | | | | | | |
| | | | Collateralized Mortgage Obligations — 17.5% | | | | |
| | 306,665 | | | Federal Home Loan Mortgage Corp., REMIC, Series 1500, Class FD, 1.180%, 5/15/2023(b) | | | 316,142 | |
| | 199,686 | | | Federal Home Loan Mortgage Corp., REMIC, Series 1552, Class I, 1.320%, 8/15/2023(b) | | | 204,353 | |
| | 1,554,553 | | | Federal Home Loan Mortgage Corp., REMIC, Series 2646, Class FM, 0.642%, 11/15/2032(b) | | | 1,553,970 | |
| | 3,825,000 | | | Federal Home Loan Mortgage Corp., REMIC, Series 2874, Class BC, 5.000%, 10/15/2019 | | | 4,248,301 | |
| | 130,598 | | | Federal Home Loan Mortgage Corp., REMIC, Series 2901, Class UA, 5.000%, 1/15/2030 | | | 131,611 | |
| | 6,280,000 | | | Federal Home Loan Mortgage Corp., REMIC, Series 2931, Class DE, 4.000%, 2/15/2020 | | | 6,795,625 | |
| | 6,746,070 | | | Federal Home Loan Mortgage Corp., REMIC, Series 3561, Class W, 5.208%, 6/15/2048(b) | | | 6,825,335 | |
| | 219,719 | | | Federal National Mortgage Association, REMIC, Series 1992-162, Class FB,
1.550%, 9/25/2022(b) | | | 226,353 | |
| | 192,605 | | | Federal National Mortgage Association, REMIC, Series 1994-42, Class FD, 1.510%, 4/25/2024(b) | | | 197,475 | |
| | 9,882,197 | | | Federal National Mortgage Association, REMIC, Series 2008-86, Class LA, 4.921%, 8/25/2038(b)(c) | | | 9,972,680 | |
| | 160,602 | | | Federal National Mortgage Association, REMIC, Series G93-19, Class FD, 1.560%, 4/25/2023(b) | | | 164,787 | |
| | 1,705,457 | | | FHLMC, 2.739%, 12/01/2034(b) | | | 1,825,964 | |
| | 2,688,258 | | | FHLMC, 5.001%, 3/01/2038(b) | | | 2,844,863 | |
| | 3,563,139 | | | FHLMC, 5.347%, 11/01/2038(b) | | | 3,832,145 | |
See accompanying notes to financial statements.
| 50
Portfolio of Investments – as of March 31, 2012 (Unaudited)
Loomis Sayles Limited Term Government and Agency Fund – (continued)
| | | | | | | | |
Principal
Amount | | | Description | | Value (†) | |
| | | | | | | | |
| | | | Collateralized Mortgage Obligations — continued | | | | |
| $ | 6,000,000 | | | FHLMC Multifamily Structured Pass Through Certificates,
Series K006, Class A2,
4.251%, 1/25/2020 | | $ | 6,643,902 | |
| | 4,305,000 | | | FHLMC Multifamily Structured Pass Through Certificates,
Series K014, Class A2,
3.871%, 4/25/2021 | | | 4,654,247 | |
| | 3,535,000 | | | FHLMC Multifamily Structured Pass Through Certificates,
Series K703, Class A2,
2.699%, 5/25/2018 | | | 3,656,268 | |
| | 700,000 | | | FHLMC Multifamily Structured Pass Through Certificates,
Series K704, Class A2,
2.412%, 8/25/2018 | | | 711,357 | |
| | 2,590,000 | | | FHLMC Multifamily Structured Pass Through Certificates,
Series K706, Class A2,
2.323%, 10/25/2018 | | | 2,615,758 | |
| | 7,809,669 | | | FNMA, 2.408%, 7/01/2035(b) | | | 8,318,435 | |
| | 9,403,150 | | | FNMA, 2.465%, 4/01/2037(b) | | | 10,013,815 | |
| | 7,240,106 | | | FNMA, 3.485%, 7/01/2037(b) | | | 7,675,722 | |
| | 2,204,873 | | | FNMA, 3.684%, 9/01/2036(b) | | | 2,330,157 | |
| | 1,113,639 | | | NCUA Guaranteed Notes, Series 2010-A1, Class A, 0.591%, 12/07/2020(b) | | | 1,117,737 | |
| | 1,280,000 | | | NCUA Guaranteed Notes, Series 2010-C1, Class A2, 2.900%, 10/29/2020 | | | 1,343,053 | |
| | 1,987,553 | | | NCUA Guaranteed Notes, Series 2010-R1, Class 1A, 0.691%, 10/07/2020(b) | | | 1,990,654 | |
| | 6,588,774 | | | NCUA Guaranteed Notes, Series 2010-R3, Class 1A, 0.801%, 12/08/2020(b) | | | 6,613,482 | |
| | | | | | | | |
| | | | | | | 96,824,191 | |
| | | | | | | | |
| | | | Commercial Mortgage-Backed Securities — 14.3% | | | | |
| | 1,780,000 | | | Banc of America Merrill Lynch Commercial Mortgage, Inc.,
Series 2007-2, Class A4,
5.818%, 4/10/2049(b) | | | 1,958,659 | |
| | 1,500,000 | | | Banc of America Merrill Lynch Commercial Mortgage, Inc.,
Series 2007-5, Class A4,
5.492%, 2/10/2051 | | | 1,691,156 | |
| | 4,645,000 | | | Bear Stearns Commercial Mortgage Securities,
Series 2007-PW15, Class A4,
5.331%, 2/11/2044 | | | 5,003,445 | |
| | 360,000 | | | Citigroup Commercial Mortgage Trust, Series 2006-C5, Class A4, 5.431%, 10/15/2049 | | | 407,492 | |
| | 1,500,000 | | | Citigroup Commercial Mortgage Trust, Series 2007-C6, Class A4, 5.885%, 12/10/2049(b) | | | 1,710,675 | |
| | 1,470,000 | | | Citigroup Commercial Mortgage Trust, Series 2008-C7, Class A4, 6.276%, 12/10/2049(b) | | | 1,701,894 | |
| | 3,200,500 | | | Citigroup/Deutsche Bank Commercial Mortgage Trust,
Series 2007-CD4, Class A4,
5.322%, 12/11/2049 | | | 3,500,829 | |
| | 2,625,000 | | | Credit Suisse Mortgage Capital Certificates, Series 2007-C2, Class A3, 5.542%, 1/15/2049 | | | 2,840,310 | |
| | 5,270,000 | | | Credit Suisse Mortgage Capital Certificates, Series 2007-C5, Class A4, 5.695%, 9/15/2040 | | | 5,736,843 | |
See accompanying notes to financial statements.
51 |
Portfolio of Investments – as of March 31, 2012 (Unaudited)
Loomis Sayles Limited Term Government and Agency Fund – (continued)
| | | | | | | | |
Principal
Amount | | | Description | | Value (†) | |
| | | | | | | | |
| | | | Commercial Mortgage-Backed Securities — continued | | | | |
| $ | 1,500,000 | | | Greenwich Capital Commercial Funding Corp., Series 2006-GG7, Class A4, 6.081%, 7/10/2038(b) | | $ | 1,699,156 | |
| | 7,778,000 | | | Greenwich Capital Commercial Funding Corp., Series 2007-GG11, Class A4, 5.736%, 12/10/2049 | | | 8,585,870 | |
| | 5,000,000 | | | Greenwich Capital Commercial Funding Corp., Series 2007-GG9, Class A4, 5.444%, 3/10/2039 | | | 5,502,100 | |
| | 1,140,000 | | | GS Mortgage Securities Corp. II, Series 2006-GG8, Class A4, 5.560%, 11/10/2039 | | | 1,284,341 | |
| | 6,075,000 | | | GS Mortgage Securities Corp. II, Series 2007-GG10, Class A4, 5.980%, 8/10/2045(b) | | | 6,741,409 | |
| | 295,000 | | | JPMorgan Chase Commercial Mortgage Securities Corp.,
Series 2006-CB15, Class A4,
5.814%, 6/12/2043 | | | 333,051 | |
| | 2,785,000 | | | JPMorgan Chase Commercial Mortgage Securities Corp.,
Series 2007-CB18, Class A4,
5.440%, 6/12/2047 | | | 3,096,327 | |
| | 5,000,000 | | | JPMorgan Chase Commercial Mortgage Securities Corp., Series 2007-LDPX, Class A3, 5.420%, 1/15/2049 | | | 5,540,950 | |
| | 2,000,000 | | | LB-UBS Commercial Mortgage Trust, Series 2007-C2, Class A3, 5.430%, 2/15/2040 | | | 2,211,438 | |
| | 1,173,000 | | | Merrill Lynch/Countrywide Commercial Mortgage Trust, Series 2007-5, Class A4, 5.378%, 8/12/2048 | | | 1,260,191 | |
| | 5,364,000 | | | Merrill Lynch/Countrywide Commercial Mortgage Trust, Series 2007-6, Class A4, 5.485%, 3/12/2051 | | | 5,775,692 | |
| | 5,000,000 | | | Merrill Lynch/Countrywide Commercial Mortgage Trust, Series 2007-9, Class A4, 5.700%, 9/12/2049 | | | 5,467,750 | |
| | 1,500,000 | | | Morgan Stanley Capital I, Series 2007-IQ15, Class A4, 6.076%, 6/11/2049(b) | | | 1,691,811 | |
| | 4,410,000 | | | Wachovia Bank Commercial Mortgage Trust, Series 2006-C28, Class A4, 5.572%, 10/15/2048 | | | 4,892,432 | |
| | 580,000 | | | Wachovia Bank Commercial Mortgage Trust, Series 2007-C30, Class A5, 5.342%, 12/15/2043 | | | 626,243 | |
| | | | | | | | |
| | | | | | | 79,260,064 | |
| | | | | | | | |
| | | | Government Guaranteed — 0.4% | | | | |
| | 2,340,000 | | | US Central Federal Credit Union, (FDIC insured), 1.900%, 10/19/2012 | | | 2,361,638 | |
| | | | | | | | |
| | | | Government Owned — No Guarantee — 6.0% | | | | |
| | 6,435,000 | | | Federal Home Loan Mortgage Corp., 1.750%, 6/15/2012 | | | 6,455,991 | |
| | 17,970,000 | | | Federal National Mortgage Association, 3.625%, 2/12/2013 | | | 18,492,154 | |
| | 8,265,000 | | | Federal National Mortgage Association, 4.750%, 11/19/2012 | | | 8,502,007 | |
| | | | | | | | |
| | | | | | | 33,450,152 | |
| | | | | | | | |
See accompanying notes to financial statements.
| 52
Portfolio of Investments – as of March 31, 2012 (Unaudited)
Loomis Sayles Limited Term Government and Agency Fund – (continued)
| | | | | | | | |
Principal
Amount | | | Description | | Value (†) | |
| | | | | | | | |
| | | | Hybrid ARMs — 23.3% | | | | |
| $ | 3,468,718 | | | FHLMC, 2.377%, 4/01/2036(b) | | $ | 3,624,711 | |
| | 3,687,412 | | | FHLMC, 2.420%, 2/01/2036(b) | | | 3,903,956 | |
| | 8,272,061 | | | FHLMC, 2.433%, 2/01/2036(b) | | | 8,748,572 | |
| | 2,801,721 | | | FHLMC, 2.461%, 4/01/2035(b) | | | 2,970,607 | |
| | 1,308,474 | | | FHLMC, 2.496%, 2/01/2035(b) | | | 1,373,446 | |
| | 8,004,368 | | | FHLMC, 2.502%, 5/01/2037(b) | | | 8,566,815 | |
| | 5,613,470 | | | FHLMC, 2.529%, 9/01/2035(b) | | | 5,996,186 | |
| | 4,877,270 | | | FHLMC, 3.224%, 11/01/2036(b) | | | 5,171,993 | |
| | 1,465,368 | | | FHLMC, 3.441%, 4/01/2037(b) | | | 1,559,993 | |
| | 1,127,802 | | | FHLMC, 5.251%, 12/01/2037(b) | | | 1,214,718 | |
| | 4,912,915 | | | FHLMC, 5.472%, 4/01/2037(b) | | | 5,221,099 | |
| | 1,437,760 | | | FHLMC, 5.675%, 9/01/2038(b) | | | 1,542,031 | |
| | 3,135,124 | | | FHLMC, 5.931%, 6/01/2037(b) | | | 3,325,938 | |
| | 4,173,621 | | | FNMA, 2.125%, 7/01/2035(b) | | | 4,416,438 | |
| | 497,848 | | | FNMA, 2.250%, 2/01/2037(b) | | | 529,449 | |
| | 1,587,771 | | | FNMA, 2.294%, 9/01/2034(b) | | | 1,669,338 | |
| | 898,137 | | | FNMA, 2.310%, 12/01/2034(b) | | | 948,139 | |
| | 2,477,014 | | | FNMA, 2.310%, 1/01/2036(b) | | | 2,605,863 | |
| | 5,208,062 | | | FNMA, 2.347%, 8/01/2035(b) | | | 5,502,698 | |
| | 12,797,889 | | | FNMA, 2.390%, 10/01/2034(b) | | | 13,533,087 | |
| | 3,808,845 | | | FNMA, 2.390%, 6/01/2036(b) | | | 4,019,861 | |
| | 2,101,399 | | | FNMA, 2.430%, 8/01/2034(b) | | | 2,239,994 | |
| | 5,017,654 | | | FNMA, 2.432%, 10/01/2033(b) | | | 5,318,537 | |
| | 1,016,120 | | | FNMA, 2.445%, 4/01/2033(b) | | | 1,075,247 | |
| | 3,327,852 | | | FNMA, 2.537%, 6/01/2033(b) | | | 3,504,560 | |
| | 880,730 | | | FNMA, 2.568%, 8/01/2033(b) | | | 931,743 | |
| | 2,759,858 | | | FNMA, 2.903%, 2/01/2047(b) | | | 2,938,909 | |
| | 868,725 | | | FNMA, 3.129%, 8/01/2036(b) | | | 925,148 | |
| | 5,271,090 | | | FNMA, 3.223%, 6/01/2035(b) | | | 5,559,083 | |
| | 6,673,828 | | | FNMA, 5.433%, 6/01/2037(b) | | | 7,059,918 | |
| | 12,316,310 | | | FNMA, 5.779%, 9/01/2037(b) | | | 13,312,486 | |
| | | | | | | | |
| | | | | | | 129,310,563 | |
| | | | | | | | |
| | | | Mortgage Related — 20.6% | | | | |
| | 12,974,069 | | | FHLMC, 2.434%, 3/01/2037(b) | | | 13,731,438 | |
| | 5,533,799 | | | FHLMC, 4.000%, with various maturities from 2024 to 2025(d) | | | 5,846,700 | |
| | 4,397,637 | | | FHLMC, 4.500%, with various maturities from 2025 to 2034(d) | | | 4,692,339 | |
| | 1,367,174 | | | FHLMC, 5.500%, 10/01/2023 | | | 1,479,312 | |
| | 1,750,622 | | | FHLMC, 6.000%, with various maturities from 2019 to 2021(d) | | | 1,898,566 | |
| | 3,244,329 | | | FHLMC, 6.500%, with various maturities from 2014 to 2034(d) | | | 3,640,835 | |
| | 98,289 | | | FHLMC, 7.000%, 2/01/2016 | | | 105,415 | |
| | 4,038 | | | FHLMC, 7.500%, with various maturities from 2012 to 2026(d) | | | 4,366 | |
| | 5,801 | | | FHLMC, 8.000%, 9/01/2015 | | | 6,271 | |
| | 3,139 | | | FHLMC, 10.000%, 7/01/2019 | | | 3,717 | |
| | 78,795 | | | FHLMC, 11.500%, with various maturities from 2015 to 2020(d) | | | 93,019 | |
| | 18,710,894 | | | FNMA, 3.000%, with various maturities from 2026 to 2027(c)(d) | | | 19,405,908 | |
| | 4,966,553 | | | FNMA, 4.000%, with various maturities from 2018 to 2019(d) | | | 5,303,731 | |
| | 6,169,957 | | | FNMA, 4.500%, with various maturities from 2019 to 2025(d) | | | 6,608,909 | |
See accompanying notes to financial statements.
53 |
Portfolio of Investments – as of March 31, 2012 (Unaudited)
Loomis Sayles Limited Term Government and Agency Fund – (continued)
| | | | | | | | |
Principal
Amount | | | Description | | Value (†) | |
| | | | | | | | |
| | | | Mortgage Related — continued | | | | |
| $ | 10,097,021 | | | FNMA, 5.000%, with various maturities from 2037 to 2038(d) | | $ | 10,932,468 | |
| | 2,403,653 | | | FNMA, 5.500%, with various maturities from 2018 to 2033(d) | | | 2,633,215 | |
| | 8,073,605 | | | FNMA, 6.000%, with various maturities from 2017 to 2022(d) | | | 8,751,837 | |
| | 2,228,759 | | | FNMA, 6.500%, with various maturities from 2017 to 2037(d) | | | 2,515,599 | |
| | 36,231 | | | FNMA, 7.000%, 12/01/2022 | | | 40,212 | |
| | 255,785 | | | FNMA, 7.500%, with various maturities from 2015 to 2032(d) | | | 302,069 | |
| | 24,637 | | | FNMA, 8.000%, with various maturities from 2015 to 2016(d) | | | 26,585 | |
| | 9,195,000 | | | FNMA (TBA), 3.000%, 4/01/2027(e) | | | 9,518,261 | |
| | 6,175,175 | | | GNMA, 2.071%, 2/20/2061(b) | | | 6,453,058 | |
| | 8,616,228 | | | GNMA, 4.659%, 2/20/2062 | | | 9,657,189 | |
| | 54,702 | | | GNMA, 6.000%, 12/15/2031 | | | 62,424 | |
| | 198,495 | | | GNMA, 6.500%, 5/15/2031 | | | 231,352 | |
| | 225,262 | | | GNMA, 7.000%, 10/15/2028 | | | 266,120 | |
| | 1,053 | | | GNMA, 12.500%, 6/15/2014 | | | 1,060 | |
| | | | | | | | |
| | | | | | | 114,211,975 | |
| | | | | | | | |
| | | | Treasuries — 14.2% | | | | |
| | 15,060,000 | | | U.S. Treasury Note, 0.625%, 7/15/2014 | | | 15,132,951 | |
| | 17,330,000 | | | U.S. Treasury Note, 1.375%, 9/15/2012 | | | 17,424,778 | |
| | 45,445,000 | | | U.S. Treasury Note, 1.750%, 4/15/2013 | | | 46,155,078 | |
| | | | | | | | |
| | | | | | | 78,712,807 | |
| | | | | | | | |
| | | | Total Bonds and Notes
(Identified Cost $529,045,260) | | | 541,945,914 | |
| | | | | | | | |
| | | | | | | | |
| | Short-Term Investments — 3.7% | | | | |
| | 20,397,124 | | | Tri-Party Repurchase Agreement with Fixed Income Clearing Corporation, dated 3/30/2012 at 0.000% to be repurchased at $20,397,124 on 4/02/2012 collateralized by $20,500,000 Federal Farm Credit Bank, 1.625% due 12/24/2012 valued at $20,807,500 including accrued interest (Note 2 of Notes to Financial Statements)
(Identified Cost $20,397,124) | | | 20,397,124 | |
| | | | | | | | |
| | | | | | | | |
| | | | Total Investments — 101.5%
(Identified Cost $549,442,384)(a) | | | 562,343,038 | |
| | | | Other assets less liabilities — (1.5)% | | | (8,480,522 | ) |
| | | | | | | | |
| | | | Net Assets — 100.0% | | $ | 553,862,516 | |
| | | | | | | | |
See accompanying notes to financial statements.
| 54
Portfolio of Investments – as of March 31, 2012 (Unaudited)
Loomis Sayles Limited Term Government and Agency Fund – (continued)
| | | | | | | | |
| | | | | | | | |
| | (†) | | | See Note 2 of Notes to Financial Statements. | | | | |
| | (a) | | | Federal Tax Information (Amounts exclude certain adjustments made at the end of the Fund’s fiscal year for tax purposes. Such adjustments are primarily due to wash sales. Amortization of premium on debt securities is excluded for tax purposes.): | | | | |
| | | | At March 31, 2012, the net unrealized appreciation on investments based on a cost of $551,150,060 for federal income tax purposes was as follows: | | | | |
| | | | Aggregate gross unrealized appreciation for all investments in which there is an excess of value over tax cost | | $ | 12,887,500 | |
| | | | Aggregate gross unrealized depreciation for all investments in which there is an excess of tax cost over value | | | (1,694,522 | ) |
| | | | | | | | |
| | | | Net unrealized appreciation | | $ | 11,192,978 | |
| | | | | | | | |
| | (b) | | | Variable rate security. Rate as of March 31, 2012 is disclosed. | |
| | (c) | | | All or a portion of this security has been designated to cover the Fund’s obligations under open TBA transactions. | |
| | (d) | | | The Fund’s investment in mortgage related securities of Federal Home Loan Mortgage Corporation and Federal National Mortgage Association are interests in separate pools of mortgages. All separate investments in securities of each issuer which have the same coupon rate have been aggregated for the purpose of presentation in the Portfolio of Investments. | |
| | (e) | | | Delayed delivery. See Note 2 of Notes to Financial Statements. | |
| | | | | | | | |
| | 144A | | | All or a portion of these securities are exempt from registration under Rule 144A of the Securities Act of 1933. These securities may be resold in transactions exempt from registration, normally to qualified institutional buyers. At March 31, 2012, the value of Rule 144A holdings amounted to $299,069 or 0.1% of net assets. | |
| | | | | | | | |
| | ABS | | | Asset-Backed Securities | | | | |
| | ARMs | | | Adjustable Rate Mortgages | | | | |
| | FDIC | | | Federal Deposit Insurance Corporation | | | | |
| | FHLMC | | | Federal Home Loan Mortgage Corp. | | | | |
| | FNMA | | | Federal National Mortgage Association | | | | |
| | GNMA | | | Government National Mortgage Association | | | | |
| | REMIC | | | Real Estate Mortgage Investment Conduit | | | | |
| | TBA | | | To Be Announced | | | | |
Industry Summary at March 31, 2012 (Unaudited)
| | | | |
Hybrid ARMs | | | 23.3 | % |
Mortgage Related | | | 20.6 | |
Collateralized Mortgage Obligations | | | 17.5 | |
Commercial Mortgage-Backed Securities | | | 14.3 | |
Treasuries | | | 14.2 | |
Government Owned — No Guarantee | | | 6.0 | |
Other Investments, less than 2% each | | | 1.9 | |
Short-Term Investments | | | 3.7 | |
| | | | |
Total Investments | | | 101.5 | |
Other assets less liabilities | | | (1.5 | ) |
| | | | |
Net Assets | | | 100.0 | % |
| | | | |
See accompanying notes to financial statements.
55 |
Statements of Assets and Liabilities
March 31, 2012 (Unaudited)
| | | | | | | | | | | | | | | | |
| | | Core Plus Bond
Fund | | | High Income
Fund | | | International Bond
Fund | | | Limited Term
Government
and Agency
Fund | |
ASSETS | | | | | | | | | | | | | | | | |
Investments at cost | | $ | 877,528,337 | | | $ | 134,922,045 | | | $ | 20,796,361 | | | $ | 529,045,260 | |
Repurchase agreement(s) at cost | | | 37,736,788 | | | | 17,978,729 | | | | 155,263 | | | | 20,397,124 | |
Net unrealized appreciation | | | 23,026,844 | | | | 4,930,776 | | | | 117,066 | | | | 12,900,654 | |
| | | | | | | | | | | | | | | | |
Investments at value | | | 938,291,969 | | | | 157,831,550 | | | | 21,068,690 | | | | 562,343,038 | |
Cash | | | — | | | | 20,637 | | | | — | | | | — | |
Foreign currency at value (identified cost $0, $0, $197,191 and $0) | | | — | | | | — | | | | 197,884 | | | | — | |
Receivable for Fund shares sold | | | 5,963,238 | | | | 1,549,943 | | | | 36,894 | | | | 2,163,674 | |
Receivable from investment adviser (Note 6) | | | — | | | | — | | | | 17,434 | | | | — | |
Receivable for securities sold | | | 5,644,530 | | | | 722,713 | | | | 552,614 | | | | — | |
Dividends and interest receivable | | | 8,278,910 | | | | 2,302,842 | | | | 242,637 | | | | 2,544,925 | |
Unrealized appreciation on forward foreign currency contracts (Note 2) | | | — | | | | 12,902 | | | | 6,649 | | | | — | |
Tax reclaims receivable | | | — | | | | 11,871 | | | | 1,736 | | | | — | |
| | | | | | | | | | | | | | | | |
TOTAL ASSETS | | | 958,178,647 | | | | 162,452,458 | | | | 22,124,538 | | | | 567,051,637 | |
| | | | | | | | | | | | | | | | |
LIABILITIES | | | | | | | | | | | | | | | | |
Payable for securities purchased | | | 23,212,311 | | | | 1,092,423 | | | | 148,907 | | | | 2,376,054 | |
Payable for delayed delivery securities purchased (Note 2) | | | — | | | | — | | | | — | | | | 9,553,166 | |
Payable for Fund shares redeemed | | | 1,411,396 | | | | 1,098,115 | | | | 92,678 | | | | 539,547 | |
Unrealized depreciation on forward foreign currency contracts (Note 2) | | | 442,955 | | | | 85,311 | | | | 7,339 | | | | — | |
Distributions payable | | | — | | | | — | | | | — | | | | 270,524 | |
Management fees payable (Note 6) | | | 295,419 | | | | 75,839 | | | | — | | | | 187,152 | |
Deferred Trustees’ fees (Note 6) | | | 241,549 | | | | 102,672 | | | | 37,275 | | | | 229,937 | |
Administrative fees payable (Note 6) | | | 34,774 | | | | 6,091 | | | | 865 | | | | 21,193 | |
Payable to distributor (Note 6d) | | | 5,539 | | | | 1,450 | | | | 143 | | | | 2,329 | |
Other accounts payable and accrued expenses | | | 24,588 | | | | 55,392 | | | | 36,872 | | | | 9,219 | |
| | | | | | | | | | | | | | | | |
TOTAL LIABILITIES | | | 25,668,531 | | | | 2,517,293 | | | | 324,079 | | | | 13,189,121 | |
| | | | | | | | | | | | | | | | |
NET ASSETS | | $ | 932,510,116 | | | $ | 159,935,165 | | | $ | 21,800,459 | | | $ | 553,862,516 | |
| | | | | | | | | | | | | | | | |
NET ASSETS CONSIST OF: | | | | | | | | | | | | | | | | |
Paid-in capital | | $ | 900,447,126 | | | $ | 157,226,117 | | | $ | 21,742,748 | | | $ | 543,702,546 | |
Distributions in excess of net investment income | | | (875,656 | ) | | | (691,665 | ) | | | (69,139 | ) | | | (2,955,811 | ) |
Accumulated net realized gain (loss) on investments and foreign currency transactions | | | 10,354,757 | | | | (1,454,387 | ) | | | 10,331 | | | | 215,127 | |
Net unrealized appreciation on investments and foreign currency translations | | | 22,583,889 | | | | 4,855,100 | | | | 116,519 | | | | 12,900,654 | |
| | | | | | | | | | | | | | | | |
NET ASSETS | | $ | 932,510,116 | | | $ | 159,935,165 | | | $ | 21,800,459 | | | $ | 553,862,516 | |
| | | | | | | | | | | | | | | | |
See accompanying notes to financial statements.
| 56
Statements of Assets and Liabilities (continued)
March 31, 2012 (Unaudited)
| | | | | | | | | | | | | | | | |
| | | Core Plus Bond
Fund | | | High Income
Fund | | | International Bond
Fund | | | Limited Term
Government
and Agency
Fund | |
COMPUTATION OF NET ASSET VALUE AND OFFERING PRICE: | | | | | | | | | | | | | | | | |
Class A shares: | | | | | | | | | | | | | | | | |
Net assets | | $ | 341,616,680 | | | $ | 72,075,877 | | | $ | 8,564,871 | | | $ | 298,602,152 | |
| | | | | | | | | | | | | | | | |
Shares of beneficial interest | | | 26,525,273 | | | | 16,258,034 | | | | 850,288 | | | | 25,037,040 | |
| | | | | | | | | | | | | | | | |
Net asset value and redemption price per share | | $ | 12.88 | | | $ | 4.43 | | | $ | 10.07 | | | $ | 11.93 | |
| | | | | | | | | | | | | | | | |
Offering price per share (100/[100-maximum sales charge] of net asset value) (Note 1) | | $ | 13.49 | | | $ | 4.64 | | | $ | 10.54 | | | $ | 12.30 | |
| | | | | | | | | | | | | | | | |
Class B shares: (redemption price per share is equal to net asset value less any applicable contingent deferred sales charge) (Note 1) | | | | | | | | | | | | | | | | |
Net assets | | $ | 2,699,965 | | | $ | 658,186 | | | $ | — | | | $ | 9,282,022 | |
| | | | | | | | | | | | | | | | |
Shares of beneficial interest | | | 208,854 | | | | 147,977 | | | | — | | | | 779,089 | |
| | | | | | | | | | | | | | | | |
Net asset value and offering price per share | | $ | 12.93 | | | $ | 4.45 | | | $ | — | | | $ | 11.91 | |
| | | | | | | | | | | | | | | | |
Class C shares: (redemption price per share is equal to net asset value less any applicable contingent deferred sales charge) (Note 1) | | | | | | | | | | | | | | | | |
Net assets | | $ | 205,649,913 | | | $ | 16,426,636 | | | | $6,296,379 | | | $ | 74,346,338 | |
| | | | | | | | | | | | | | | | |
Shares of beneficial interest | | | 15,961,571 | | | | 3,696,643 | | | | 629,494 | | | | 6,228,596 | |
| | | | | | | | | | | | | | | | |
Net asset value and offering price per share | | $ | 12.88 | | | $ | 4.44 | | | $ | 10.00 | | | $ | 11.94 | |
| | | | | | | | | | | | | | | | |
Class Y shares: | | | | | | | | | | | | | | | | |
Net assets | | $ | 382,543,558 | | | $ | 70,774,466 | | | $ | 6,939,209 | | | $ | 171,632,004 | |
| | | | | | | | | | | | | | | | |
Shares of beneficial interest | | | 29,515,526 | | | | 15,973,084 | | | | 689,079 | | | | 14,346,598 | |
| | | | | | | | | | | | | | | | |
Net asset value, offering and redemption price per share | | $ | 12.96 | | | $ | 4.43 | | | $ | 10.07 | | | $ | 11.96 | |
| | | | | | | | | | | | | | | | |
See accompanying notes to financial statements.
57 |
Statements of Operations
For the Six Months Ended March 31, 2012 (Unaudited)
| | | | | | | | | | | | | | | | |
| | | Core Plus Bond
Fund | | | High Income
Fund | | | International
Bond Fund | | | Limited Term
Government
and Agency
Fund | |
INVESTMENT INCOME | | | | | | | | | | | | | | | | |
Interest | | $ | 15,505,419 | | | $ | 4,674,927 | | | $ | 359,842 | | | $ | 6,402,667 | |
Dividends | | | 100,665 | | | | 254,021 | | | | — | | | | — | |
Less net foreign taxes withheld | | | (9,793 | ) | | | (1,083 | ) | | | (115 | ) | | | — | |
| | | | | | | | | | | | | | | | |
| | | 15,596,291 | | | | 4,927,865 | | | | 359,727 | | | | 6,402,667 | |
| | | | | | | | | | | | | | | | |
Expenses | | | | | | | | | | | | | | | | |
Management fees (Note 6) | | | 1,385,892 | | | | 422,418 | | | | 65,029 | | | | 1,147,948 | |
Service and distribution fees (Note 6) | | | 1,254,542 | | | | 164,338 | | | | 46,737 | | | | 779,398 | |
Administrative fees (Note 6) | | | 162,547 | | | | 32,455 | | | | 4,999 | | | | 117,929 | |
Trustees’ fees and expenses (Note 6) | | | 2,092 | | | | 4,465 | | | | 6,240 | | | | 1,943 | |
Transfer agent fees and expenses (Note 6) | | | 275,275 | | | | 97,097 | | | | 9,512 | | | | 224,534 | |
Audit and tax services fees | | | 23,923 | | | | 23,693 | | | | 24,045 | | | | 24,028 | |
Custodian fees and expenses | | | 19,688 | | | | 16,415 | | | | 23,206 | | | | 16,220 | |
Legal fees | | | 4,203 | | | | 987 | | | | 177 | | | | 3,632 | |
Registration fees | | | 82,899 | | | | 56,288 | | | | 43,280 | | | | 53,650 | |
Shareholder reporting expenses | | | 28,014 | | | | 14,046 | | | | 2,985 | | | | 25,624 | |
Miscellaneous expenses | | | 9,850 | | | | 4,864 | | | | 3,324 | | | | 9,446 | |
| | | | | | | | | | | | | | | | |
Total expenses | | | 3,248,925 | | | | 837,066 | | | | 229,534 | | | | 2,404,352 | |
Less waiver and/or expense reimbursement (Note 6) | | | — | | | | (39,101 | ) | | | (90,673 | ) | | | (90,533 | ) |
| | | | | | | | | | | | | | | | |
Net expenses | | | 3,248,925 | | | | 797,965 | | | | 138,861 | | | | 2,313,819 | |
| | | | | | | | | | | | | | | | |
Net investment income | | | 12,347,366 | | | | 4,129,900 | | | | 220,866 | | | | 4,088,848 | |
| | | | | | | | | | | | | | | | |
NET REALIZED AND UNREALIZED GAIN (LOSS) ON INVESTMENTS AND FOREIGN CURRENCY TRANSACTIONS | | | | | | | | | | | | | | | | |
Net realized gain (loss) on: | | | | | | | | | | | | | | | | |
Investments | | | 10,267,092 | | | | (1,722,920 | ) | | | 197,514 | | | | 1,683,241 | |
Foreign currency transactions | | | 1,580,921 | | | | 301,821 | | | | (95,925 | ) | | | — | |
Net change in unrealized appreciation (depreciation) on: | | | | | | | | | | | | | | | | |
Investments | | | 10,127,014 | | | | 14,606,720 | | | | 132,407 | | | | 3,054,248 | |
Foreign currency translations | | | (1,038,504 | ) | | | (278,463 | ) | | | 212,330 | | | | — | |
| | | | | | | | | | | | | | | | |
Net realized and unrealized gain on investments and foreign currency transactions | | | 20,936,523 | | | | 12,907,158 | | | | 446,326 | | | | 4,737,489 | |
| | | | | | | | | | | | | | | | |
NET INCREASE IN NET ASSETS RESULTING FROM OPERATIONS | | $ | 33,283,889 | | | $ | 17,037,058 | | | $ | 667,192 | | | $ | 8,826,337 | |
| | | | | | | | | | | | | | | | |
See accompanying notes to financial statements.
| 58
Statements of Changes in Net Assets
| | | | | | | | | | | | | | |
| | | Core Plus Bond Fund | | | High Income Fund |
| | | Six Months
Ended
March 31, 2012
(Unaudited) | | | Year Ended
September 30,
2011 | | | Six Months
Ended
March 31, 2012
(Unaudited) | | | Year Ended
September 30,
2011 |
FROM OPERATIONS: | | | | | | | | | | | | | | |
Net investment income | | $ | 12,347,366 | | | $ | 15,808,339 | | | $ | 4,129,900 | | | $ 9,114,367 |
Net realized gain (loss) on investments and foreign currency transactions | | | 11,848,013 | | | | 12,668,941 | | | | (1,421,099 | ) | | 13,134,551 |
Net change in unrealized appreciation (depreciation) on investments and foreign currency translations | | | 9,088,510 | | | | (13,172,679 | ) | | | 14,328,257 | | | (24,069,928) |
| | | | | | | | | | | | | | |
Net increase (decrease) in net assets resulting from operations | | | 33,283,889 | | | | 15,304,601 | | | | 17,037,058 | | | (1,821,010) |
| | | | | | | | | | | | | | |
FROM DISTRIBUTIONS TO SHAREHOLDERS: | | | | | | | | | | | | | | |
Net investment income | | | | | | | | | | | | | | |
Class A | | | (6,421,055 | ) | | | (9,722,337 | ) | | | (2,615,077 | ) | | (4,818,304) |
Class B | | | (50,423 | ) | | | (140,826 | ) | | | (25,252 | ) | | (55,282) |
Class C | | | (2,954,951 | ) | | | (4,743,579 | ) | | | (598,345 | ) | | (1,092,134) |
Class Y | | | (4,949,323 | ) | | | (3,422,261 | ) | | | (2,515,029 | ) | | (4,173,442) |
Net realized capital gains | | | | | | | | | | | | | | |
Class A | | | (4,420,850 | ) | | | — | | | | (5,086,896 | ) | | — |
Class B | | | (45,406 | ) | | | — | | | | (56,566 | ) | | — |
Class C | | | (2,475,931 | ) | | | — | | | | (1,334,655 | ) | | — |
Class Y | | | (2,888,998 | ) | | | — | | | | (4,826,965 | ) | | — |
| | | | | | | | | | | | | | |
Total distributions | | | (24,206,937 | ) | | | (18,029,003 | ) | | | (17,058,785 | ) | | (10,139,162) |
| | | | | | | | | | | | | | |
NET INCREASE (DECREASE) IN NET ASSETS FROM CAPITAL SHARE TRANSACTIONS (NOTE 9) | | | 401,530,548 | | | | 112,969,587 | | | | 45,511,583 | | | (32,012,862) |
| | | | | | | | | | | | | | |
Net increase (decrease) in net assets | | | 410,607,500 | | | | 110,245,185 | | | | 45,489,856 | | | (43,973,034) |
NET ASSETS | | | | | | | | | | | | | | |
Beginning of the period | | | 521,902,616 | | | | 411,657,431 | | | | 114,445,309 | | | 158,418,343 |
| | | | | | | | | | | | | | |
End of the period | | $ | 932,510,116 | | | $ | 521,902,616 | | | $ | 159,935,165 | | | $114,445,309 |
| | | | | | | | | | | | | | |
UNDISTRIBUTED (DISTRIBUTIONS IN EXCESS OF) NET INVESTMENT INCOME | | $ | (875,656 | ) | | $ | 1,152,730 | | | $ | (691,665 | ) | | $ 932,138 |
| | | | | | | | | | | | | | |
See accompanying notes to financial statements.
59 |
Statements of Changes in Net Assets (continued)
| | | | | | | | | | | | | | | | |
| | | International Bond Fund | | | Limited Term Government and
Agency Fund | |
| | | Six Months
Ended
March 31, 2012
(Unaudited) | | | Year Ended
September 30,
2011 | | | Six Months
Ended
March 31, 2012
(Unaudited) | | | Year Ended
September 30,
2011 | |
FROM OPERATIONS: | | | | | | | | | | | | | | | | |
Net investment income | | $ | 220,866 | | | $ | 554,267 | | | $ | 4,088,848 | | | $ | 5,442,750 | |
Net realized gain on investments and foreign currency transactions | | | 101,589 | | | | 2,521,734 | | | | 1,683,241 | | | | 3,687,939 | |
Net change in unrealized appreciation (depreciation) on investments and foreign currency translations | | | 344,737 | | | | (2,686,191 | ) | | | 3,054,248 | | | | (2,532,547 | ) |
| | | | | | | | | | | | | | | | |
Net increase in net assets resulting from operations | | | 667,192 | | | | 389,810 | | | | 8,826,337 | | | | 6,598,142 | |
| | | | | | | | | | | | | | | | |
FROM DISTRIBUTIONS TO SHAREHOLDERS: | | | | | | | | | | | | | | | | |
Net investment income | | | | | | | | | | | | | | | | |
Class A | | | (710,644 | ) | | | (571,142 | ) | | | (3,820,407 | ) | | | (5,000,378 | ) |
Class B | | | — | | | | — | | | | (96,521 | ) | | | (124,663 | ) |
Class C | | | (525,103 | ) | | | (182,583 | ) | | | (684,213 | ) | | | (990,378 | ) |
Class Y | | | (306,789 | ) | | | (143,686 | ) | | | (1,939,290 | ) | | | (2,328,759 | ) |
Net realized capital gains | | | | | | | | | | | | | | | | |
Class A | | | (306,969 | ) | | | (229,358 | ) | | | (98,584 | ) | | | (1,500,749 | ) |
Class B | | | — | | | | — | | | | (3,508 | ) | | | (29,955 | ) |
Class C | | | (237,383 | ) | | | (79,673 | ) | | | (24,502 | ) | | | (583,534 | ) |
Class Y | | | (116,763 | ) | | | (24,156 | ) | | | (43,423 | ) | | | (770,404 | ) |
| | | | | | | | | | | | | | | | |
Total distributions | | | (2,203,651 | ) | | | (1,230,598 | ) | | | (6,710,448 | ) | | | (11,328,820 | ) |
| | | | | | | | | | | | | | | | |
NET INCREASE (DECREASE) IN NET ASSETS FROM CAPITAL SHARE TRANSACTIONS (NOTE 9) | | | (945,619 | ) | | | (8,686,919 | ) | | | 47,447,096 | | | | 168,885,860 | |
| | | | | | | | | | | | | | | | |
Net increase (decrease) in net assets | | | (2,482,078 | ) | | | (9,527,707 | ) | | | 49,562,985 | | | | 164,155,182 | |
NET ASSETS | | | | | | | | | | | | | | | | |
Beginning of the period | | | 24,282,537 | | | | 33,810,244 | | | | 504,299,531 | | | | 340,144,349 | |
| | | | | | | | | | | | | | | | |
End of the period | | $ | 21,800,459 | | | $ | 24,282,537 | | | $ | 553,862,516 | | | $ | 504,299,531 | |
| | | | | | | | | | | | | | | | |
UNDISTRIBUTED (DISTRIBUTIONS IN EXCESS OF) NET INVESTMENT INCOME | | $ | (69,139 | ) | | $ | 1,252,531 | | | $ | (2,955,811 | ) | | $ | (504,228 | ) |
| | | | | | | | | | | | | | | | |
See accompanying notes to financial statements.
| 60
Financial Highlights
For a share outstanding throughout each period.
| | | | | | | | | | | | | | | | | | | | | | | | | | | | |
| | | | | | Income (Loss) from Investment
Operations: | | | Less Distributions: | |
| | | Net asset
value,
beginning
of the
period | | | Net
investment
income (a) | | | Net realized
and
unrealized
gain (loss) | | | Total from
investment
operations | | | Dividends
from net
investment
income | | | Distributions
from net
realized
capital
gains | | | Total
distributions | |
CORE PLUS BOND FUND | | | | | | | | | | | | | | | | | | | | | | | | | |
Class A | | | | | | | | | | | | | | | | | | | | | | | | | | | | |
3/31/2012(h) | | $ | 12.71 | | | $ | 0.23 | | | $ | 0.40 | | | $ | 0.63 | | | $ | (0.27 | ) | | $ | (0.19 | ) | | $ | (0.46 | ) |
9/30/2011 | | | 12.75 | | | | 0.52 | | | | 0.03 | (i) | | | 0.55 | | | | (0.59 | ) | | | — | | | | (0.59 | ) |
9/30/2010 | | | 11.91 | | | | 0.54 | | | | 0.91 | | | | 1.45 | | | | (0.61 | ) | | | — | | | | (0.61 | ) |
9/30/2009 | | | 10.54 | | | | 0.59 | | | | 1.44 | | | | 2.03 | | | | (0.66 | ) | | | — | | | | (0.66 | ) |
9/30/2008 | | | 11.31 | | | | 0.55 | | | | (0.71 | ) | | | (0.16 | ) | | | (0.61 | ) | | | — | | | | (0.61 | ) |
9/30/2007 | | | 11.23 | | | | 0.50 | | | | 0.14 | | | | 0.64 | | | | (0.56 | ) | | | — | | | | (0.56 | ) |
Class B | | | | | | | | | | | | | | | | | | | | | | | | | | | | |
3/31/2012(h) | | | 12.75 | | | | 0.18 | | | | 0.41 | | | | 0.59 | | | | (0.22 | ) | | | (0.19 | ) | | | (0.41 | ) |
9/30/2011 | | | 12.79 | | | | 0.42 | | | | 0.03 | (i) | | | 0.45 | | | | (0.49 | ) | | | — | | | | (0.49 | ) |
9/30/2010 | | | 11.95 | | | | 0.44 | | | | 0.92 | | | | 1.36 | | | | (0.52 | ) | | | — | | | | (0.52 | ) |
9/30/2009 | | | 10.57 | | | | 0.50 | | | | 1.45 | | | | 1.95 | | | | (0.57 | ) | | | — | | | | (0.57 | ) |
9/30/2008 | | | 11.31 | | | | 0.44 | | | | (0.67 | ) | | | (0.23 | ) | | | (0.51 | ) | | | — | | | | (0.51 | ) |
9/30/2007 | | | 11.24 | | | | 0.41 | | | | 0.13 | | | | 0.54 | | | | (0.47 | ) | | | — | | | | (0.47 | ) |
Class C | | | | | | | | | | | | | | | | | | | | | | | | | | | | |
3/31/2012(h) | | | 12.71 | | | | 0.18 | | | | 0.41 | | | | 0.59 | | | | (0.23 | ) | | | (0.19 | ) | | | (0.42 | ) |
9/30/2011 | | | 12.76 | | | | 0.42 | | | | 0.02 | (i) | | | 0.44 | | | | (0.49 | ) | | | — | | | | (0.49 | ) |
9/30/2010 | | | 11.92 | | | | 0.45 | | | | 0.91 | | | | 1.36 | | | | (0.52 | ) | | | — | | | | (0.52 | ) |
9/30/2009 | | | 10.55 | | | | 0.51 | | | | 1.44 | | | | 1.95 | | | | (0.58 | ) | | | — | | | | (0.58 | ) |
9/30/2008 | | | 11.32 | | | | 0.47 | | | | (0.71 | ) | | | (0.24 | ) | | | (0.53 | ) | | | — | | | | (0.53 | ) |
9/30/2007 | | | 11.25 | | | | 0.41 | | | | 0.13 | | | | 0.54 | | | | (0.47 | ) | | | — | | | | (0.47 | ) |
Class Y | | | | | | | | | | | | | | | | | | | | | | | | | | | | |
3/31/2012(h) | | | 12.78 | | | | 0.25 | | | | 0.41 | | | | 0.66 | | | | (0.29 | ) | | | (0.19 | ) | | | (0.48 | ) |
9/30/2011 | | | 12.82 | | | | 0.55 | | | | 0.03 | (i) | | | 0.58 | | | | (0.62 | ) | | | — | | | | (0.62 | ) |
9/30/2010 | | | 11.97 | | | | 0.57 | | | | 0.92 | | | | 1.49 | | | | (0.64 | ) | | | — | | | | (0.64 | ) |
9/30/2009 | | | 10.60 | | | | 0.62 | | | | 1.44 | | | | 2.06 | | | | (0.69 | ) | | | — | | | | (0.69 | ) |
9/30/2008 | | | 11.36 | | | | 0.58 | | | | (0.70 | ) | | | (0.12 | ) | | | (0.64 | ) | | | — | | | | (0.64 | ) |
9/30/2007 | | | 11.29 | | | | 0.54 | | | | 0.13 | | | | 0.67 | | | | (0.60 | ) | | | — | | | | (0.60 | ) |
| (a) | Per share net investment income has been calculated using the average shares outstanding during the period. |
| (b) | Amount rounds to less than $0.01 per share, if applicable. |
| (c) | Effective June 2, 2008, redemption fees were eliminated. |
| (d) | A sales charge for Class A shares and a contingent deferred sales charge for Class B and Class C shares are not reflected in total return calculations. Periods less than one year, if applicable, are not annualized. |
| (e) | Had certain expenses not been waived/reimbursed during the period, if applicable, total returns would have been lower. |
| (f) | The investment adviser and/or administrator agreed to waive its fees and/or reimburse a portion of the Fund’s expenses during the period. Without this waiver/reimbursement, if applicable, expenses would have been higher. |
See accompanying notes to financial statements.
61 |
| | | | | | | | | | | | | | | | | | | | | | | | | | | | | | |
| | | | | | | | | | | | | Ratios to Average Net Assets: | | | | |
Redemption
fees (b)(c) | | |
Net asset
value,
end of
the period | | | Total
return
(%) (d)(e) | | | Net assets,
end of
the period
(000’s) | | | Net
expenses
(%) (f)(g) | | | Gross
expenses
(%) (g) | | | Net investment
income
(%) (g) | | | Portfolio
turnover
rate (%) | |
| | | | | | | | | | | | | | | | | | | | | | | | | | | | | | |
| | | | | | | | | | | | | | | | | | | | | | | | | | | | | | |
| $ | — | | | $ | 12.88 | | | | 5.05 | | | $ | 341,617 | | | | 0.81 | | | | 0.81 | | | | 3.60 | | | | 39 | |
| | — | | | | 12.71 | | | | 4.42 | | | | 237,759 | | | | 0.87 | | | | 0.87 | | | | 4.07 | | | | 86 | |
| | — | | | | 12.75 | | | | 12.55 | | | | 214,723 | | | | 0.90 | | | | 0.90 | | | | 4.41 | | | | 87 | |
| | — | | | | 11.91 | | | | 20.07 | | | | 140,779 | | | | 0.90 | | | | 0.97 | | | | 5.43 | | | | 102 | |
| | 0.00 | | | | 10.54 | | | | (1.61 | ) | | | 115,873 | | | | 0.93 | | | | 1.04 | | | | 4.86 | | | | 82 | |
| | 0.00 | | | | 11.31 | | | | 5.70 | | | | 105,780 | | | | 1.04 | | | | 1.09 | | | | 4.41 | | | | 69 | |
| | | | | | | | | | | | | | | | | | | | | | | | | | | | | | |
| | — | | | | 12.93 | | | | 4.73 | | | | 2,700 | | | | 1.56 | | | | 1.56 | | | | 2.87 | | | | 39 | |
| | — | | | | 12.75 | | | | 3.60 | | | | 3,092 | | | | 1.62 | | | | 1.62 | | | | 3.32 | | | | 86 | |
| | — | | | | 12.79 | | | | 11.64 | | | | 4,490 | | | | 1.65 | | | | 1.65 | | | | 3.64 | | | | 87 | |
| | — | | | | 11.95 | | | | 19.19 | | | | 7,028 | | | | 1.65 | | | | 1.72 | | | | 4.66 | | | | 102 | |
| | 0.00 | | | | 10.57 | | | | (2.21 | ) | | | 10,481 | | | | 1.70 | | | | 1.80 | | | | 3.92 | | | | 82 | |
| | 0.00 | | | | 11.31 | | | | 4.90 | | | | 87,101 | | | | 1.79 | | | | 1.85 | | | | 3.64 | | | | 69 | |
| | | | | | | | | | | | | | | | | | | | | | | | | | | | | | |
| | — | | | | 12.88 | | | | 4.68 | | | | 205,650 | | | | 1.56 | | | | 1.56 | | | | 2.86 | | | | 39 | |
| | — | | | | 12.71 | | | | 3.56 | | | | 137,836 | | | | 1.62 | | | | 1.62 | | | | 3.32 | | | | 86 | |
| | — | | | | 12.76 | | | | 11.71 | | | | 123,123 | | | | 1.65 | | | | 1.65 | | | | 3.66 | | | | 87 | |
| | — | | | | 11.92 | | | | 19.20 | | | | 77,081 | | | | 1.65 | | | | 1.72 | | | | 4.69 | | | | 102 | |
| | 0.00 | | | | 10.55 | | | | (2.32 | ) | | | 26,698 | | | | 1.68 | | | | 1.79 | | | | 4.17 | | | | 82 | |
| | 0.00 | | | | 11.32 | | | | 4.91 | | | | 12,690 | | | | 1.78 | | | | 1.82 | | | | 3.66 | | | | 69 | |
| | | | | | | | | | | | | | | | | | | | | | | | | | | | | | |
| | — | | | | 12.96 | | | | 5.22 | | | | 382,544 | | | | 0.57 | | | | 0.57 | | | | 3.85 | | | | 39 | |
| | — | | | | 12.78 | | | | 4.65 | | | | 143,215 | | | | 0.62 | | | | 0.62 | | | | 4.31 | | | | 86 | |
| | — | | | | 12.82 | | | | 12.85 | | | | 69,322 | | | | 0.65 | | | | 0.65 | | | | 4.66 | | | | 87 | |
| | — | | | | 11.97 | | | | 20.37 | | | | 34,394 | | | | 0.65 | | | | 0.68 | | | | 5.67 | | | | 102 | |
| | 0.00 | | | | 10.60 | | | | (1.36 | ) | | | 20,407 | | | | 0.68 | | | | 0.75 | | | | 5.14 | | | | 82 | |
| | 0.00 | | | | 11.36 | | | | 6.06 | | | | 15,946 | | | | 0.70 | | | | 0.75 | | | | 4.75 | | | | 69 | |
| (g) | Computed on an annualized basis for periods less than one year, if applicable. |
| (h) | For the six months ended March 31, 2012 (Unaudited). |
| (i) | The amount shown for a share outstanding does not correspond with the aggregate realized and unrealized gain (loss) on investments for the period due to the timing of sales and redemptions of fund shares in relation to fluctuating market values of investments of the Fund. |
See accompanying notes to financial statements.
| 62
Financial Highlights (continued)
For a share outstanding throughout each period.
| | | | | | | | | | | | | | | | | | | | | | | | | | | | |
| | | | | | Income (Loss) from Investment
Operations: | | | Less Distributions: | |
| | | Net asset
value,
beginning
of the
period | | | Net
investment
income (a) | | | Net realized
and
unrealized
gain (loss) | | | Total from
investment
operations | | | Dividends
from net
investment
income | | | Distributions
from net
realized
capital
gains | | | Total
distributions | |
HIGH INCOME FUND | | | | | | | | | | | | | | | | | | | | | | | | | |
Class A | | | | | | | | | | | | | | | | | | | | | | | | | | | | |
3/31/2012(g) | | $ | 4.46 | | | $ | 0.13 | | | $ | 0.41 | | | $ | 0.54 | | | $ | (0.18 | ) | | $ | (0.39 | ) | | $ | (0.57 | ) |
9/30/2011 | | | 4.91 | | | | 0.28 | | | | (0.42 | ) | | | (0.14 | ) | | | (0.31 | ) | | | — | | | | (0.31 | ) |
9/30/2010 | | | 4.49 | | | | 0.32 | | | | 0.42 | | | | 0.74 | | | | (0.32 | ) | | | — | | | | (0.32 | ) |
9/30/2009 | | | 4.24 | | | | 0.34 | | | | 0.24 | | | | 0.58 | | | | (0.33 | ) | | | — | | | | (0.33 | ) |
9/30/2008 | | | 5.12 | | | | 0.34 | | | | (0.87 | ) | | | (0.53 | ) | | | (0.35 | ) | | | — | | | | (0.35 | ) |
9/30/2007 | | | 5.09 | | | | 0.33 | | | | 0.08 | | | | 0.41 | | | | (0.38 | ) | | | — | | | | (0.38 | ) |
Class B | | | | | | | | | | | | | | | | | | | | | | | | | | | | |
3/31/2012(g) | | | 4.47 | | | | 0.11 | | | | 0.43 | | | | 0.54 | | | | (0.17 | ) | | | (0.39 | ) | | | (0.56 | ) |
9/30/2011 | | | 4.92 | | | | 0.25 | | | | (0.43 | ) | | | (0.18 | ) | | | (0.27 | ) | | | — | | | | (0.27 | ) |
9/30/2010 | | | 4.50 | | | | 0.28 | | | | 0.42 | | | | 0.70 | | | | (0.28 | ) | | | — | | | | (0.28 | ) |
9/30/2009 | | | 4.25 | | | | 0.31 | | | | 0.25 | | | | 0.56 | | | | (0.31 | ) | | | — | | | | (0.31 | ) |
9/30/2008 | | | 5.13 | | | | 0.30 | | | | (0.87 | ) | | | (0.57 | ) | | | (0.31 | ) | | | — | | | | (0.31 | ) |
9/30/2007 | | | 5.10 | | | | 0.29 | | | | 0.07 | | | | 0.36 | | | | (0.33 | ) | | | — | | | | (0.33 | ) |
Class C | | | | | | | | | | | | | | | | | | | | | | | | | | | | |
3/31/2012(g) | | | 4.47 | | | | 0.11 | | | | 0.42 | | | | 0.53 | | | | (0.17 | ) | | | (0.39 | ) | | | (0.56 | ) |
9/30/2011 | | | 4.92 | | | | 0.25 | | | | (0.43 | ) | | | (0.18 | ) | | | (0.27 | ) | | | — | | | | (0.27 | ) |
9/30/2010 | | | 4.50 | | | | 0.28 | | | | 0.43 | | | | 0.71 | | | | (0.29 | ) | | | — | | | | (0.29 | ) |
9/30/2009 | | | 4.24 | | | | 0.31 | | | | 0.26 | | | | 0.57 | | | | (0.31 | ) | | | — | | | | (0.31 | ) |
9/30/2008 | | | 5.12 | | | | 0.31 | | | | (0.87 | ) | | | (0.56 | ) | | | (0.32 | ) | | | — | | | | (0.32 | ) |
9/30/2007 | | | 5.09 | | | | 0.29 | | | | 0.07 | | | | 0.36 | | | | (0.33 | ) | | | — | | | | (0.33 | ) |
Class Y | | | | | | | | | | | | | | | | | | | | | | | | | | | | |
3/31/2012(g) | | | 4.46 | | | | 0.13 | | | | 0.42 | | | | 0.55 | | | | (0.19 | ) | | | (0.39 | ) | | | (0.58 | ) |
9/30/2011 | | | 4.90 | | | | 0.29 | | | | (0.41 | ) | | | (0.12 | ) | | | (0.32 | ) | | | — | | | | (0.32 | ) |
9/30/2010 | | | 4.49 | | | | 0.33 | | | | 0.41 | | | | 0.74 | | | | (0.33 | ) | | | — | | | | (0.33 | ) |
9/30/2009 | | | 4.24 | | | | 0.34 | | | | 0.25 | | | | 0.59 | | | | (0.34 | ) | | | — | | | | (0.34 | ) |
9/30/2008* | | | 4.87 | | | | 0.22 | | | | (0.65 | ) | | | (0.43 | ) | | | (0.21 | ) | | | — | | | | (0.21 | ) |
| * | From commencement of Class operations on February 29, 2008 through September 30, 2008. |
| (a) | Per share net investment income has been calculated using the average shares outstanding during the period. |
| (b) | Amount rounds to less than $0.01 per share, if applicable. |
| (c) | Had certain expenses not been waived/reimbursed during the period, if applicable, total returns would have been lower. |
| (d) | A sales charge for Class A shares and a contingent deferred sales charge for Class B and Class C shares are not reflected in total return calculations. Periods less than one year, if applicable, are not annualized. |
| (e) | The investment adviser and/or administrator agreed to waive its fees and/or reimburse a portion of the Fund’s expenses during the period. Without this waiver/reimbursement, if applicable, expenses would have been higher. |
| (f) | Computed on an annualized basis for periods less than one year, if applicable. |
See accompanying notes to financial statements.
63 |
| | | | | | | | | | | | | | | | | | | | | | | | | | | | | | |
| | | | | | | | | | | | | Ratios to Average Net Assets: | | | | |
Redemption
fees (b) | | | Net asset
value,
end of
the period | | | Total
return
(%) (c)(d) | | | Net assets,
end of
the period
(000’s) | | | Net
expenses
(%) (e)(f) | | | Gross
expenses
(%) (f) | | | Net investment
income
(%) (f) | | | Portfolio
turnover
rate (%) | |
| | | | | | | | | | | | | | | | | | | | | | | | | | | | | | |
| | | | | | | | | | | | | | | | | | | | | | | | | | | | | | |
| $ | — | | | $ | 4.43 | | | | 13.49 | | | $ | 72,076 | | | | 1.15 | | | | 1.20 | | | | 5.82 | | | | 19 | |
| | — | | | | 4.46 | | | | (3.30 | ) | | | 59,907 | | | | 1.15 | (h) | | | 1.15 | (h) | | | 5.60 | | | | 67 | |
| | — | | | | 4.91 | | | | 17.05 | | | | 68,011 | | | | 1.15 | | | | 1.20 | | | | 6.72 | | | | 56 | |
| | 0.00 | (i) | | | 4.49 | | | | 15.97 | | | | 59,944 | | | | 1.15 | | | | 1.28 | | | | 8.82 | | | | 30 | |
| | 0.00 | | | | 4.24 | | | | (10.98 | ) | | | 38,577 | | | | 1.15 | | | | 1.40 | | | | 7.01 | | | | 27 | |
| | 0.00 | | | | 5.12 | | | | 8.10 | | | | 32,603 | | | | 1.18 | | | | 1.43 | | | | 6.40 | | | | 41 | |
| | | | | | | | | | | | | | | | | | | | | | | | | | | | | | |
| | — | | | | 4.45 | | | | 13.30 | | | | 658 | | | | 1.90 | | | | 1.95 | | | | 5.07 | | | | 19 | |
| | — | | | | 4.47 | | | | (4.04 | ) | | | 738 | | | | 1.90 | (h) | | | 1.90 | (h) | | | 4.90 | | | | 67 | |
| | — | | | | 4.92 | | | | 16.13 | | | | 1,209 | | | | 1.90 | | | | 1.94 | | | | 6.00 | | | | 56 | |
| | 0.00 | (i) | | | 4.50 | | | | 15.06 | | | | 1,569 | | | | 1.90 | | | | 2.06 | | | | 8.32 | | | | 30 | |
| | 0.00 | | | | 4.25 | | | | (11.64 | ) | | | 2,267 | | | | 1.90 | | | | 2.15 | | | | 6.15 | | | | 27 | |
| | 0.00 | | | | 5.13 | | | | 7.21 | | | | 4,201 | | | | 1.94 | | | | 2.18 | | | | 5.63 | | | | 41 | |
| | | | | | | | | | | | | | | | | | | | | | | | | | | | | | |
| | — | | | | 4.44 | | | | 13.06 | | | | 16,427 | | | | 1.90 | | | | 1.95 | | | | 5.08 | | | | 19 | |
| | — | | | | 4.47 | | | | (4.02 | ) | | | 15,790 | | | | 1.90 | (h) | | | 1.90 | (h) | | | 4.89 | | | | 67 | |
| | — | | | | 4.92 | | | | 16.15 | | | | 19,312 | | | | 1.90 | | | | 1.95 | | | | 5.97 | | | | 56 | |
| | 0.00 | (i) | | | 4.50 | | | | 15.37 | | | | 17,827 | | | | 1.90 | | | | 2.03 | | | | 8.09 | | | | 30 | |
| | 0.00 | | | | 4.24 | | | | (11.62 | ) | | | 9,945 | | | | 1.90 | | | | 2.15 | | | | 6.32 | | | | 27 | |
| | 0.00 | | | | 5.12 | | | | 7.22 | | | | 5,275 | | | | 1.93 | | | | 2.17 | | | | 5.63 | | | | 41 | |
| | | | | | | | | | | | | | | | | | | | | | | | | | | | | | |
| | — | | | | 4.43 | | | | 13.63 | | | | 70,774 | | | | 0.90 | | | | 0.96 | | | | 6.14 | | | | 19 | |
| | — | | | | 4.46 | | | | (2.86 | ) | | | 38,011 | | | | 0.90 | (h) | | | 0.90 | (h) | | | 5.86 | | | | 67 | |
| | — | | | | 4.90 | | | | 17.11 | | | | 69,887 | | | | 0.90 | | | | 0.93 | | | | 7.02 | | | | 56 | |
| | 0.00 | (i) | | | 4.49 | | | | 16.29 | | | | 105,713 | | | | 0.90 | | | | 0.92 | | | | 8.32 | | | | 30 | |
| | 0.01 | | | | 4.24 | | | | (9.10 | ) | | | 3,833 | | | | 0.90 | | | | 1.15 | | | | 8.03 | | | | 27 | |
| (g) | For the six months ended March 31, 2012 (Unaudited). |
| (h) | Includes fee/expense recovery of 0.01%. |
| (i) | Effective June 1, 2009, redemption fees were eliminated. |
See accompanying notes to financial statements.
| 64
Financial Highlights (continued)
For a share outstanding throughout each period.
| | | | | | | | | | | | | | | | | | | | | | | | | | | | |
| | | | | | Income (Loss) from Investment
Operations: | | | Less Distributions: | |
| | | Net asset
value,
beginning
of the
period | | | Net
investment
income (a) | | | Net realized
and
unrealized
gain (loss) | | | Total from
investment
operations | | | Dividends
from net
investment
income | | | Distributions
from net
realized
capital
gains | | | Total
distributions | |
INTERNATIONAL BOND FUND | | | | | | | | | | | | | | | | | | | | | |
Class A | | | | | | | | | | | | | | | | | | | | | | | | | | | | |
3/31/2012(g) | | $ | 10.94 | | | $ | 0.12 | | | $ | 0.24 | | | $ | 0.36 | | | $ | (0.86 | ) | | $ | (0.37 | ) | | $ | (1.23 | ) |
9/30/2011 | | | 11.17 | | | | 0.25 | | | | 0.06 | (h) | | | 0.31 | | | | (0.40 | ) | | | (0.14 | ) | | | (0.54 | ) |
9/30/2010 | | | 10.84 | | | | 0.22 | | | | 0.48 | | | | 0.70 | | | | (0.29 | ) | | | (0.08 | ) | | | (0.37 | ) |
9/30/2009 | | | 9.19 | | | | 0.32 | | | | 1.53 | | | | 1.85 | | | | (0.20 | ) | | | — | | | | (0.20 | ) |
9/30/2008(i) | | | 10.00 | | | | 0.17 | | | | (0.79 | ) | | | (0.62 | ) | | | (0.19 | ) | | | — | | | | (0.19 | ) |
Class C | | | | | | | | | | | | | | | | | | | | | | | | | | | | |
3/31/2012(g) | | | 10.87 | | | | 0.08 | | | | 0.24 | | | | 0.32 | | | | (0.82 | ) | | | (0.37 | ) | | | (1.19 | ) |
9/30/2011 | | | 11.11 | | | | 0.17 | | | | 0.05 | (h) | | | 0.22 | | | | (0.32 | ) | | | (0.14 | ) | | | (0.46 | ) |
9/30/2010 | | | 10.82 | | | | 0.15 | | | | 0.46 | | | | 0.61 | | | | (0.24 | ) | | | (0.08 | ) | | | (0.32 | ) |
9/30/2009 | | | 9.18 | | | | 0.24 | | | | 1.53 | | | | 1.77 | | | | (0.13 | ) | | | — | | | | (0.13 | ) |
9/30/2008(i) | | | 10.00 | | | | 0.13 | | | | (0.81 | ) | | | (0.68 | ) | | | (0.15 | ) | | | — | | | | (0.15 | ) |
Class Y | | | | | | | | | | | | | | | | | | | | | | | | | | | | |
3/31/2012(g) | | | 10.93 | | | | 0.13 | | | | 0.25 | | | | 0.38 | | | | (0.87 | ) | | | (0.37 | ) | | | (1.24 | ) |
9/30/2011 | | | 11.16 | | | | 0.28 | | | | 0.06 | (h) | | | 0.34 | | | | (0.43 | ) | | | (0.14 | ) | | | (0.57 | ) |
9/30/2010 | | | 10.82 | | | | 0.25 | | | | 0.47 | | | | 0.72 | | | | (0.30 | ) | | | (0.08 | ) | | | (0.38 | ) |
9/30/2009 | | | 9.18 | | | | 0.33 | | | | 1.53 | | | | 1.86 | | | | (0.22 | ) | | | — | | | | (0.22 | ) |
9/30/2008(i) | | | 10.00 | | | | 0.18 | | | | (0.81 | ) | | | (0.63 | ) | | | (0.20 | ) | | | — | | | | (0.20 | ) |
| (a) | Per share net investment income has been calculated using the average shares outstanding during the period. |
| (b) | Amount rounds to less than $0.01 per share, if applicable. |
| (c) | Had certain expenses not been waived/reimbursed during the period, if applicable, total returns would have been lower. |
| (d) | A sales charge for Class A shares and a contingent deferred sales charge for Class C shares are not reflected in total return calculations. Periods less than one year, if applicable, are not annualized. |
| (e) | The investment adviser and/or administrator agreed to waive its fees and/or reimburse a portion of the Fund’s expenses during the period. Without this waiver/reimbursement, if applicable, expenses would have been higher. |
| (f) | Computed on an annualized basis for periods less than one year, if applicable. |
| (g) | For the six months ended March 31, 2012 (Unaudited). |
| (h) | The amount shown for a share outstanding does not correspond with the aggregate realized and unrealized gain (loss) on investments for the period due to the timing of sales and redemptions of fund shares in relation to fluctuating market values of investments of the Fund. |
| (i) | From commencement of operations on February 1, 2008 through September 30, 2008. |
| (j) | Effective June 2, 2008, redemption fees were eliminated. |
See accompanying notes to financial statements.
65 |
| | | | | | | | | | | | | | | | | | | | | | | | | | | | | | |
| | | | | | | | | | | | |
Ratios to Average Net Assets: | | | | |
Redemption
fees (b) | | | Net asset
value,
end of
the period | | | Total
return
(%) (c)(d) | | |
Net assets,
end of
the period
(000’s) | | | Net
expenses
(%) (e)(f) | | | Gross
expenses
(%) (f) | | | Net investment
income
(%) (f) | | | Portfolio
turnover
rate (%) | |
| | | | | | | | | | | | | | | | | | | | | | | | | | | | | | |
| | | | | | | | | | | | | | | | | | | | | | | | | | | | | | |
| $ | — | | | $ | 10.07 | | | | 3.77 | | | $ | 8,565 | | | | 1.10 | | | | 1.93 | | | | 2.25 | | | | 69 | |
| | — | | | | 10.94 | | | | 2.70 | | | | 10,927 | | | | 1.10 | | | | 1.64 | | | | 2.26 | | | | 136 | |
| | — | | | | 11.17 | | | | 6.66 | | | | 18,758 | | | | 1.10 | | | | 1.49 | | | | 2.14 | | | | 128 | |
| | — | | | | 10.84 | | | | 20.41 | | | | 8,479 | | | | 1.10 | | | | 2.11 | | | | 3.29 | | | | 91 | |
| | 0.00 | (j) | | | 9.19 | | | | (6.37 | ) | | | 1,953 | | | | 1.10 | | | | 2.95 | | | | 2.66 | | | | 60 | |
| | | | | | | | | | | | | | | | | | | | | | | | | | | | | | |
| | — | | | | 10.00 | | | | 3.41 | | | | 6,296 | | | | 1.85 | | | | 2.68 | | | | 1.48 | | | | 69 | |
| | — | | | | 10.87 | | | | 1.87 | | | | 7,503 | | | | 1.85 | | | | 2.40 | | | | 1.52 | | | | 136 | |
| | — | | | | 11.11 | | | | 5.86 | | | | 6,145 | | | | 1.85 | | | | 2.24 | | | | 1.40 | | | | 128 | |
| | — | | | | 10.82 | | | | 19.58 | | | | 2,955 | | | | 1.85 | | | | 2.93 | | | | 2.56 | | | | 91 | |
| | 0.01 | (j) | | | 9.18 | | | | (6.95 | ) | | | 683 | | | | 1.85 | | | | 3.70 | | | | 1.92 | | | | 60 | |
| | | | | | | | | | | | | | | | | | | | | | | | | | | | | | |
| | — | | | | 10.07 | | | | 3.89 | | | | 6,939 | | | | 0.85 | | | | 1.71 | | | | 2.41 | | | | 69 | |
| | — | | | | 10.93 | | | | 3.06 | | | | 5,852 | | | | 0.85 | | | | 1.36 | | | | 2.47 | | | | 136 | |
| | — | | | | 11.16 | | | | 6.92 | | | | 8,908 | | | | 0.85 | | | | 1.23 | | | | 2.41 | | | | 128 | |
| | — | | | | 10.82 | | | | 20.73 | | | | 13,049 | | | | 0.85 | | | | 1.92 | | | | 3.53 | | | | 91 | |
| | 0.01 | (j) | | | 9.18 | | | | (6.39 | ) | | | 9,981 | | | | 0.85 | | | | 2.48 | | | | 2.74 | | | | 60 | |
See accompanying notes to financial statements.
| 66
Financial Highlights (continued)
For a share outstanding throughout each period.
| | | | | | | | | | | | | | | | | | | | | | | | | | | | |
| | | | | | Income (Loss) from Investment
Operations: | | | Less Distributions: | |
| | | Net asset
value,
beginning
of the
period | | | Net
investment
income (a) | | | Net realized
and
unrealized
gain (loss) | | | Total from
investment
operations | | | Dividends
from net
investment
income | | | Distributions
from net
realized
capital
gains (b) | | | Total
distributions | |
LIMITED TERM GOVERNMENTAND AGENCY FUND | |
Class A | | | | | | | | | | | | | | | | | | | | | | | | | | | | |
3/31/2012(g) | | $ | 11.87 | | | $ | 0.10 | | | $ | 0.12 | | | $ | 0.22 | | | $ | (0.16 | ) | | $ | (0.00 | ) | | $ | (0.16 | ) |
9/30/2011 | | | 12.02 | | | | 0.17 | | | | 0.03 | | | | 0.20 | | | | (0.26 | ) | | | (0.09 | ) | | | (0.35 | ) |
9/30/2010 | | | 11.60 | | | | 0.20 | | | | 0.49 | | | | 0.69 | | | | (0.27 | ) | | | — | | | | (0.27 | ) |
9/30/2009 | | | 10.98 | | | | 0.35 | | | | 0.63 | | | | 0.98 | | | | (0.36 | ) | | | — | | | | (0.36 | ) |
9/30/2008 | | | 11.00 | | | | 0.45 | | | | 0.02 | | | | 0.47 | | | | (0.49 | ) | | | — | | | | (0.49 | ) |
9/30/2007 | | | 11.00 | | | | 0.45 | | | | 0.03 | | | | 0.48 | | | | (0.48 | ) | | | — | | | | (0.48 | ) |
Class B | | | | | | | | | | | | | | | | | | | | | | | | | | | | |
3/31/2012(g) | | | 11.86 | | | | 0.05 | | | | 0.12 | | | | 0.17 | | | | (0.12 | ) | | | (0.00 | ) | | | (0.12 | ) |
9/30/2011 | | | 12.00 | | | | 0.09 | | | | 0.03 | | | | 0.12 | | | | (0.17 | ) | | | (0.09 | ) | | | (0.26 | ) |
9/30/2010 | | | 11.59 | | | | 0.12 | | | | 0.47 | | | | 0.59 | | | | (0.18 | ) | | | — | | | | (0.18 | ) |
9/30/2009 | | | 10.97 | | | | 0.26 | | | | 0.63 | | | | 0.89 | | | | (0.27 | ) | | | — | | | | (0.27 | ) |
9/30/2008 | | | 10.99 | | | | 0.36 | | | | 0.02 | | | | 0.38 | | | | (0.40 | ) | | | — | | | | (0.40 | ) |
9/30/2007 | | | 10.98 | | | | 0.37 | | | | 0.03 | | | | 0.40 | | | | (0.39 | ) | | | — | | | | (0.39 | ) |
Class C | | | | | | | | | | | | | | | | | | | | | | | | | | | | |
3/31/2012(g) | | | 11.88 | | | | 0.05 | | | | 0.13 | | | | 0.18 | | | | (0.12 | ) | | | (0.00 | ) | | | (0.12 | ) |
9/30/2011 | | | 12.03 | | | | 0.08 | | | | 0.03 | | | | 0.11 | | | | (0.17 | ) | | | (0.09 | ) | | | (0.26 | ) |
9/30/2010 | | | 11.61 | | | | 0.12 | | | | 0.48 | | | | 0.60 | | | | (0.18 | ) | | | — | | | | (0.18 | ) |
9/30/2009 | | | 10.99 | | | | 0.26 | | | | 0.63 | | | | 0.89 | | | | (0.27 | ) | | | — | | | | (0.27 | ) |
9/30/2008 | | | 11.00 | | | | 0.36 | | | | 0.03 | | | | 0.39 | | | | (0.40 | ) | | | — | | | | (0.40 | ) |
9/30/2007 | | | 10.99 | | | | 0.37 | | | | 0.03 | | | | 0.40 | | | | (0.39 | ) | | | — | | | | (0.39 | ) |
Class Y | | | | | | | | | | | | | | | | | | | | | | | | | | | | |
3/31/2012(g) | | | 11.91 | | | | 0.11 | | | | 0.12 | | | | 0.23 | | | | (0.18 | ) | | | (0.00 | ) | | | (0.18 | ) |
9/30/2011 | | | 12.05 | | | | 0.20 | | | | 0.04 | | | | 0.24 | | | | (0.29 | ) | | | (0.09 | ) | | | (0.38 | ) |
9/30/2010 | | | 11.64 | | | | 0.23 | | | | 0.48 | | | | 0.71 | | | | (0.30 | ) | | | — | | | | (0.30 | ) |
9/30/2009 | | | 11.01 | | | | 0.39 | | | | 0.63 | | | | 1.02 | | | | (0.39 | ) | | | — | | | | (0.39 | ) |
9/30/2008 | | | 11.03 | | | | 0.47 | | | | 0.02 | | | | 0.49 | | | | (0.51 | ) | | | — | | | | (0.51 | ) |
9/30/2007 | | | 11.03 | | | | 0.49 | | | | 0.03 | | | | 0.52 | | | | (0.52 | ) | | | — | | | | (0.52 | ) |
| (a) | Per share net investment income has been calculated using the average shares outstanding during the period. |
| (b) | Amount rounds to less than $0.01 per share, if applicable. |
| (c) | A sales charge for Class A shares and a contingent deferred sales charge for Class B and Class C shares are not reflected in total return calculations. Periods less than one year, if applicable, are not annualized. |
| (d) | Had certain expenses not been waived/reimbursed during the period, if applicable, total returns would have been lower. |
| (e) | The investment adviser and/or administrator agreed to waive its fees and/or reimburse a portion of the Fund’s expenses during the period. Without this waiver/reimbursement, if applicable, expenses would have been higher. |
| (f) | Computed on an annualized basis for periods less than one year, if applicable. |
| (g) | For the six months ended March 31, 2012 (Unaudited). |
See accompanying notes to financial statements.
67 |
| | | | | | | | | | | | | | | | | | | | | | | | | | |
| | | | | | | | | |
Ratios to Average Net Assets: | | | | |
Net asset
value,
end of
the period | | | Total
return
(%) (c)(d) | | | Net assets,
end of
the period
(000’s) | | | Net
expenses
(%) (e)(f) | | | Gross
expenses
(%) (f) | | | Net investment
income
(%) (f) | | | Portfolio
turnover
rate (%) | |
| | | | | | | | | | | | | | | | | | | | | | | | | | |
| | | | | | | | | | | | | | | | | | | | | | | | | | |
| $ | 11.93 | | | | 1.87 | | | $ | 298,602 | | | | 0.85 | | | | 0.89 | | | | 1.66 | | | | 34 | |
| | 11.87 | | | | 1.71 | | | | 293,675 | | | | 0.85 | | | | 0.92 | | | | 1.44 | | | | 66 | |
| | 12.02 | | | | 6.03 | | | | 164,265 | | | | 0.89 | | | | 0.97 | | | | 1.73 | | | | 89 | |
| | 11.60 | | | | 9.05 | | | | 118,619 | | | | 0.90 | | | | 0.99 | | | | 3.10 | | | | 77 | |
| | 10.98 | | | | 4.29 | | | | 105,047 | | | | 0.92 | | | | 1.07 | | | | 4.04 | | | | 52 | |
| | 11.00 | | | | 4.46 | | | | 108,536 | | | | 0.99 | | | | 1.10 | | | | 4.13 | | | | 45 | |
| | | | | | | | | | | | | | | | | | | | | | | | | | |
| | 11.91 | | | | 1.40 | | | | 9,282 | | | | 1.60 | | | | 1.64 | | | | 0.91 | | | | 34 | |
| | 11.86 | | | | 1.04 | | | | 10,976 | | | | 1.60 | | | | 1.68 | | | | 0.72 | | | | 66 | |
| | 12.00 | | | | 5.16 | | | | 4,049 | | | | 1.64 | | | | 1.72 | | | | 1.00 | | | | 89 | |
| | 11.59 | | | | 8.24 | | | | 4,442 | | | | 1.65 | | | | 1.74 | | | | 2.32 | | | | 77 | |
| | 10.97 | | | | 3.52 | | | | 4,532 | | | | 1.67 | | | | 1.82 | | | | 3.29 | | | | 52 | |
| | 10.99 | | | | 3.72 | | | | 6,787 | | | | 1.74 | | | | 1.85 | | | | 3.37 | | | | 45 | |
| | | | | | | | | | | | | | | | | | | | | | | | | | |
| | 11.94 | | | | 1.49 | | | | 74,346 | | | | 1.60 | | | | 1.64 | | | | 0.92 | | | | 34 | |
| | 11.88 | | | | 0.96 | | | | 68,776 | | | | 1.60 | | | | 1.67 | | | | 0.68 | | | | 66 | |
| | 12.03 | | | | 5.24 | | | | 75,984 | | | | 1.64 | | | | 1.72 | | | | 0.98 | | | | 89 | |
| | 11.61 | | | | 8.24 | | | | 50,973 | | | | 1.65 | | | | 1.74 | | | | 2.32 | | | | 77 | |
| | 10.99 | | | | 3.62 | | | | 22,711 | | | | 1.66 | | | | 1.83 | | | | 3.29 | | | | 52 | |
| | 11.00 | | | | 3.62 | | | | 5,261 | | | | 1.74 | | | | 1.85 | | | | 3.38 | | | | 45 | |
| | | | | | | | | | | | | | | | | | | | | | | | | | |
| | 11.96 | | | | 1.91 | | | | 171,632 | | | | 0.60 | | | | 0.63 | | | | 1.89 | | | | 34 | |
| | 11.91 | | | | 2.05 | | | | 130,874 | | | | 0.60 | | | | 0.67 | | | | 1.68 | | | | 66 | |
| | 12.05 | | | | 6.20 | | | | 95,847 | | | | 0.63 | | | | 0.71 | | | | 1.94 | | | | 89 | |
| | 11.64 | | | | 9.40 | | | | 28,004 | | | | 0.65 | | | | 0.72 | | | | 3.42 | | | | 77 | |
| | 11.01 | | | | 4.55 | | | | 6,577 | | | | 0.67 | | | | 0.72 | | | | 4.28 | | | | 52 | |
| | 11.03 | | | | 4.79 | | | | 4,201 | | | | 0.71 | | | | 0.75 | | | | 4.43 | | | | 45 | |
See accompanying notes to financial statements.
| 68
Notes to Financial Statements
March 31, 2012 (Unaudited)
1. Organization. Natixis Funds Trust I and Loomis Sayles Funds II (the “Trusts” and each a “Trust”) are each organized as a Massachusetts business trust. Each Trust is registered under the Investment Company Act of 1940, as amended (“1940 Act”), as an open-end management investment company. Each Declaration of Trust permits the Board of Trustees to authorize the issuance of an unlimited number of shares of the Trust in multiple series. The financial statements for certain funds of the Trusts are presented in separate reports. The following funds (individually, a “Fund” and collectively, the “Funds”) are included in this report:
Natixis Funds Trust I:
Loomis Sayles Core Plus Bond Fund (the “Core Plus Bond Fund”)
Loomis Sayles Funds II:
Loomis Sayles High Income Fund (the “High Income Fund”)
Loomis Sayles International Bond Fund (the “International Bond Fund”)
Loomis Sayles Limited Term Government and Agency Fund (the “Limited Term Government and Agency Fund”)
Each Fund is a diversified investment company, except for International Bond Fund, which is a non-diversified investment company.
Effective January 1, 2012, the name of the Funds’ administrator changed from Natixis Asset Management Advisors, L.P. to NGAM Advisors, L.P. (“NGAM Advisors”) and the name of the Funds’ distributor changed from Natixis Distributors, L.P. to NGAM Distribution, L.P. (“NGAM Distribution”).
The Funds each offer Class A, Class C and Class Y shares. Effective October 12, 2007, Class B shares are no longer offered. Existing Class B shareholders may continue to reinvest dividends into Class B shares and exchange their Class B shares for Class B shares of other Natixis Funds subject to existing exchange privileges as described in the prospectus.
Class A shares of all Funds except Limited Term Government and Agency Fund are sold with a maximum front-end sales charge of 4.50%. Class A shares of Limited Term Government and Agency Fund are sold with a maximum front-end sales charge of 3.00%. Class B shares do not pay a front-end sales charge; however, they are charged higher Rule 12b-1 fees, and are subject to a contingent deferred sales charge (“CDSC”) if such shares are redeemed within six years of purchase. After eight years of ownership, Class B shares convert to Class A shares. Class C shares do not pay a front-end sales charge, do not convert to any other class of shares, pay higher Rule 12b-1 fees than Class A shares and may be subject to a CDSC of 1.00% if those shares are redeemed within one year of acquisition, except for reinvested distributions. Class Y shares do not pay a front-end sales charge, a CDSC or Rule 12b-1 fees. Class Y shares are generally intended for institutional investors with a minimum initial investment of $100,000, though some categories of investors are exempted from the minimum investment amount as outlined in the Funds’ prospectus.
69 |
Notes to Financial Statements (continued)
March 31, 2012 (Unaudited)
Most expenses of the Trusts can be directly attributed to a Fund. Expenses which cannot be directly attributed to a Fund are generally apportioned based on the relative net assets of each of the funds in the Trusts. Expenses of a Fund are borne pro rata by the holders of each class of shares, except that each class bears expenses unique to that class (including the Rule 12b-1 service and distribution fees). In addition, each class votes as a class only with respect to its own Rule 12b-1 Plan. Shares of each class would receive their pro rata share of the net assets of a Fund if the Fund were liquidated. The Trustees approve separate distributions from net investment income on each class of shares.
2. Significant Accounting Policies. The following is a summary of significant accounting policies consistently followed by each Fund in the preparation of its financial statements. The Funds’ financial statements are prepared in accordance with accounting principles generally accepted in the United States of America which require the use of management estimates that affect the reported amounts and disclosures in the financial statements. Actual results could differ from those estimates. Management has evaluated the events and transactions subsequent to period-end through the date the financial statements were issued and has determined that there were no material events that would require disclosure in the Funds’ financial statements.
a. Valuation. Debt securities (other than short-term obligations purchased with an original or remaining maturity of sixty days or less) and unlisted equity securities are generally valued on the basis of evaluated bids furnished to the Funds by an independent pricing service recommended by the investment adviser and approved by the Board of Trustees, which service determines valuations for normal, institutional-size trading units of such securities using market information, transactions for comparable securities and various relationships between securities which are generally recognized by institutional traders. Senior loans are priced at bid prices supplied by an independent pricing service, if available. Equity securities, including shares of closed-end investment companies and exchange-traded funds, for which market quotations are readily available are valued at market value, as reported by independent pricing services recommended by the investment adviser and approved by the Board of Trustees. Such independent pricing services generally use the security’s last sale price on the exchange or market where the security is primarily traded or, if there is no reported sale during the day, the closing bid price. Securities traded on the NASDAQ Global Select Market, NASDAQ Global Market and NASDAQ Capital Market are valued at the NASDAQ Official Closing Price (“NOCP”), or if lacking a NOCP, at the most recent bid quotation on the applicable NASDAQ Market. Broker-dealer bid quotations may also be used to value debt and equity securities and senior loans where an independent pricing service does not price a security or where an independent pricing service is unable to provide a reliable price for the security. Forward foreign currency contracts are valued utilizing interpolated prices determined from information provided by an independent pricing service. Credit default swap agreements are valued based on mid
| 70
Notes to Financial Statements (continued)
March 31, 2012 (Unaudited)
prices supplied by an independent pricing service, if available, or quotations obtained from broker-dealers. Investments in other open-end investment companies are valued at their net asset value each day. Short-term obligations purchased with an original or remaining maturity of sixty days or less are valued at amortized cost, which approximates market value. Securities for which market quotations are not readily available are valued at fair value as determined in good faith by the Funds’ investment adviser using consistently applied procedures under the general supervision of the Board of Trustees.
Certain Funds may hold securities traded in foreign markets. Foreign securities are valued at the market price in the foreign market. However, if events occurring after the close of the foreign market (but before the close of regular trading on the New York Stock Exchange) are believed to materially affect the value of those securities, such securities are fair valued pursuant to procedures approved by the Board of Trustees. When fair valuing securities, the Funds may, among other things, use modeling tools or other processes that may take into account factors such as securities market activity and/or significant events that occur after the close of the foreign market and before the Funds calculate their net asset values.
b. Investment Transactions and Related Investment Income. Investment transactions are accounted for on a trade date plus one basis for daily net asset value calculation. However, for financial reporting purposes, investment transactions are reported on trade date. Dividend income is recorded on ex-dividend date, or in the case of certain foreign securities, as soon as a Fund is notified, and interest income is recorded on an accrual basis. Interest income is increased by the accretion of discount and decreased by the amortization of premium. Periodic principal adjustments for inflation-protected securities are recorded to interest income. Negative principal adjustments (in the event of deflation) are recorded as reductions of interest income to the extent of interest income earned, not to exceed the amount of positive principal adjustments on a cumulative basis. Investment income is recorded net of foreign taxes withheld when applicable. In determining net gain or loss on securities sold, the cost of securities has been determined on an identified cost basis. Investment income, non-class specific expenses and realized and unrealized gains and losses are allocated on a pro rata basis to each class based on the relative net assets of each class to the total net assets of the Fund.
c. Foreign Currency Translation. The books and records of the Funds are maintained in U.S. dollars. The values of securities, currencies and other assets and liabilities denominated in currencies other than U.S. dollars are translated into U.S. dollars based upon foreign exchange rates prevailing at the end of the period. Purchases and sales of investment securities, income and expenses are translated on the respective dates of such transactions.
Since the values of investment securities are presented at the foreign exchange rates prevailing at the end of the period, it is not practical to isolate that portion of the results
71 |
Notes to Financial Statements (continued)
March 31, 2012 (Unaudited)
of operations arising from changes in exchange rates from fluctuations which arise due to changes in market prices of investment securities. Such changes are included with the net realized and unrealized gain or loss on investments.
Net realized foreign exchange gains or losses arise from sales of foreign currency, currency gains or losses realized between the trade and settlement dates on securities transactions, and the difference between the amounts of dividends, interest and foreign withholding taxes recorded on the Funds’ books and the U.S. dollar equivalent of the amounts actually received or paid. Net unrealized foreign exchange gains and losses arise from changes in the value of assets and liabilities, other than investment securities, at the end of the fiscal period, resulting from changes in exchange rates.
Each Fund may use foreign currency exchange contracts to facilitate transactions in foreign-denominated investments. Losses may arise from changes in the value of the foreign currency or if the counterparties do not perform under the contracts’ terms.
d. Forward Foreign Currency Contracts. The Funds may enter into forward foreign currency contracts, including forward foreign cross currency contracts, to acquire exposure to foreign currencies or to hedge the Fund’s investments against currency fluctuations. A contract to buy or sell can offset a previous contract. These contracts involve market risk in excess of the unrealized gain or loss reflected in the Funds’ Statements of Assets and Liabilities. The U.S. dollar value of the currencies the Fund has committed to buy or sell represents the aggregate exposure to each currency a Fund has acquired or hedged through currency contracts outstanding at period end. Gains or losses are recorded for financial statement purposes as unrealized until settlement date. Risks may arise upon entering into these contracts from the potential inability of counterparties to meet the terms of their contracts and from unanticipated movements in the value of a foreign currency relative to the U.S. dollar. Certain contracts may require the movement of cash and/or securities as collateral for the Funds’ or counterparty’s net obligations under the contracts.
e. Swap Agreements. Each Fund may enter into credit default swaps. A credit default swap is an agreement between two parties (the “protection buyer” and “protection seller”) to exchange the credit risk of an issuer (“reference obligation”) for a specified time period. The reference obligation may be one or more debt securities or an index of such securities. The Funds may be either the protection buyer or the protection seller. As a protection buyer, the Funds have the ability to hedge the downside risk of an issuer or group of issuers. As a protection seller, the Funds have the ability to gain exposure to an issuer or group of issuers whose bonds are unavailable or in short supply in the cash bond market, as well as realize additional income in the form of fees paid by the protection buyer. The protection buyer is obligated to pay the protection seller a stream of payments (“fees”) over the term of the contract, provided that no credit event, such as a default or a downgrade in credit rating, occurs on the reference obligation. The Funds may also pay or receive upfront premiums. If a credit event occurs, the
| 72
Notes to Financial Statements (continued)
March 31, 2012 (Unaudited)
protection seller must pay the protection buyer the difference between the agreed upon notional value and market value of the reference obligation. Market value in this case is determined by a facilitated auction whereby a minimum number of allowable broker bids, together with a specified valuation method, are used to calculate the value. The maximum potential amount of undiscounted future payments that a Fund as the protection seller could be required to make under a credit default swap agreement would be an amount equal to the notional amount of the agreement.
The notional amounts of credit default swaps are not recorded in the financial statements. Credit default swaps are marked-to-market daily. Fluctuations in the value of credit default swaps are recorded in the Statements of Operations as change in unrealized appreciation (depreciation) on swap agreements. Fees are accrued in accordance with the terms of the agreement and are recorded in the Statements of Operations as realized gain or loss when received or paid. Upfront premiums paid or received by the Funds are recorded on the Statements of Assets and Liabilities as an asset or liability, respectively, and are amortized or accreted over the term of the agreement and recorded as realized gain or loss. Payments made or received by the Funds as a result of a credit event or termination of the agreement are recorded as realized gain or loss.
Credit default swaps are privately negotiated and traded between counterparties and, as such, are subject to the risk that a party to the agreement will not be able to meet its obligations. The Funds cover their net obligations under outstanding credit default swaps by segregating or earmarking liquid assets or cash.
There were no credit default swaps held by the Funds during the six months ended March 31, 2012.
f. Federal and Foreign Income Taxes. Each Trust treats each Fund as a separate entity for federal income tax purposes. Each Fund intends to meet the requirements of the Internal Revenue Code of 1986, as amended, applicable to regulated investment companies, and to distribute to its shareholders substantially all of its net investment income and any net realized capital gains at least annually. Management has performed an analysis of each Fund’s tax positions for the open tax years as of March 31, 2012 and has concluded that no provisions for income tax are required. The Funds’ federal tax returns for the prior three fiscal years remain subject to examination by the Internal Revenue Service. Management is not aware of any events that are reasonably possible to occur in the next six months that would result in the amounts of any unrecognized tax benefits significantly increasing or decreasing for the Funds. However, management’s conclusions regarding tax positions taken may be subject to review and adjustment at a later date based on factors including, but not limited to, new tax laws and accounting regulations and interpretations thereof.
A Fund may be subject to foreign taxes on income and gains on investments that are accrued based upon the Fund’s understanding of the tax rules and regulations that exist
73 |
Notes to Financial Statements (continued)
March 31, 2012 (Unaudited)
in the countries in which the Fund invests. Foreign governments may also impose taxes or other payments on investments with respect to foreign securities. Such taxes are accrued as applicable, and are reflected as foreign taxes payable on the Statements of Assets and Liabilities.
g. Dividends and Distributions to Shareholders. Dividends and distributions are recorded on ex-dividend date. The timing and characterization of certain income and capital gain distributions are determined annually in accordance with federal tax regulations, which may differ from accounting principles generally accepted in the United States of America. Permanent differences are primarily due to differing treatments for book and tax purposes of items such as foreign currency transactions, contingent payment debt instruments, preferred securities adjustments, premium amortization, defaulted bond adjustments, paydown gains and losses, deferred Trustees’ fees, return of capital dividend received and distribution redesignations. Permanent book and tax basis differences relating to shareholder distributions will result in reclassifications to capital accounts. Temporary differences between book and tax distributable earnings are primarily due to deferred Trustees’ fees, wash sales, premium amortization, forward foreign currency contract mark to market, dividends payable, return of capital dividend received, preferred securities adjustments, contingent payment debt instruments and defaulted bond interest. Distributions from net investment income and short-term capital gains are considered to be distributed from ordinary income for tax purposes.
The tax characterization of distributions is determined on an annual basis. The tax character of distributions paid to shareholders during the year ended September 30, 2011 was as follows:
| | | | | | | | | | | | |
| | | 2011 Distributions Paid From: | |
Fund | | Ordinary Income | | | Long-Term Capital Gains | | | Total | |
Core Plus Bond Fund | | $ | 18,029,003 | | | $ | — | | | $ | 18,029,003 | |
High Income Fund | | | 10,139,162 | | | | — | | | | 10,139,162 | |
International Bond Fund | | | 1,028,434 | | | | 202,164 | | | | 1,230,598 | |
Limited Term Government and Agency Fund | | | 10,215,010 | | | | 1,113,810 | | | | 11,328,820 | |
Differences between these amounts and those reported in the Statements of Changes in Net Assets are primarily attributable to different book and tax treatment for short-term capital gains.
On December 22, 2010, the Regulated Investment Company Modernization Act of 2010 (the “Act”) was enacted. The Act modernizes several of the federal income and excise tax provisions related to RICs, and, with certain exceptions, is effective for taxable years beginning after December 22, 2010. Among the changes made are changes to the capital loss carryforward rules allowing for capital losses to be carried forward indefinitely. Rules in effect previously limited the carryforward period to eight years.
| 74
Notes to Financial Statements (continued)
March 31, 2012 (Unaudited)
Additionally, capital losses realized in taxable years beginning after the effective date of the Act are carried over in the character (short-term or long-term) realized. Rules in effect previously treated all capital loss carryforwards as short-term.
h. Repurchase Agreements. It is each Fund’s policy that the market value of the collateral for repurchase agreements be at least equal to 102% of the repurchase price, including interest. Certain repurchase agreements are tri-party arrangements whereby the collateral is held in a segregated account for the benefit of the Fund and on behalf of the counterparty. Repurchase agreements could involve certain risks in the event of default or insolvency of the counterparty including possible delays or restrictions upon a Fund’s ability to dispose of the underlying securities.
i. Delayed Delivery Commitments. The Funds may purchase securities, including those designated as TBAs in the Portfolio of Investments, for which delivery or payment will occur at a later date, beyond the normal settlement period. The price of the security and the date when the security will be delivered and paid for are fixed at the time the transaction is negotiated. The security and the obligation to pay for it are recorded by the Funds at the time the commitment is entered into. The actual security that will be delivered to fulfill a TBA trade is not designated at the time of the trade. The security is “to be announced” 48 hours prior to the established trade settlement date. The value of the security may vary with market fluctuations during the time before the Funds take delivery of the security. When the Funds enter into such a transaction, collateral consisting of liquid securities or cash and cash equivalents is required to be segregated or earmarked at the custodian in an amount at least equal to the amount of the Funds’ commitment. No interest accrues to each Fund until the transaction settles.
Purchases of delayed delivery securities may have a similar effect on the Funds’ net asset value as if the Funds had created a degree of leverage in the portfolio. Risks may arise upon entering into such transactions from the potential inability of counterparties to meet their obligations under the transactions. Additionally, losses may arise due to changes in the value of the underlying securities.
j. Securities Lending. The Funds have entered into an agreement with State Street Bank and Trust Company (“State Street Bank”), as agent of the Funds, to lend securities to certain designated borrowers. The loans are collateralized with cash or securities in an amount equal to at least 105% or 102% of the market value (including accrued interest) of the loaned international or domestic securities, respectively, when the loan is initiated. Thereafter, the value of the collateral must remain at least 102% of the market value (including accrued interest) of loaned securities for U.S. equities and U.S. corporate debt; at least 105% of the market value (including accrued interest) of loaned securities for non-U.S. equities; and at least 100% of the market value (including accrued interest) of loaned securities for U.S. Government securities, sovereign debt issued by non-U.S. Governments and non-U.S. corporate debt. In the event that the market value of the collateral falls below the required percentages described above,
75 |
Notes to Financial Statements (continued)
March 31, 2012 (Unaudited)
the borrower will deliver additional collateral on the next business day. As with other extensions of credit, the Funds may bear the risk of loss with respect to the investment of the collateral. The Funds invest cash collateral in short-term investments, a portion of the income from which is remitted to the borrowers and the remainder allocated between the Funds and State Street Bank as lending agent.
For the six months ended March 31, 2012, none of the Funds had loaned securities under this agreement.
k. Indemnifications. Under the Trusts’ organizational documents, their officers and Trustees are indemnified against certain liabilities arising out of the performance of their duties to the Funds. Additionally, in the normal course of business, the Funds enter into contracts with service providers that contain general indemnification clauses. The Funds’ maximum exposure under these arrangements is unknown as this would involve future claims that may be made against the Funds that have not yet occurred. However, based on experience, the Funds expect the risk of loss to be remote.
3. Fair Value Measurements. In accordance with accounting standards related to fair value measurements and disclosures, the Funds have categorized the inputs utilized in determining the value of each Fund’s assets or liabilities. These inputs are summarized in the three broad levels listed below:
| | • | | Level 1 – quoted prices in active markets for identical assets or liabilities; |
| | • | | Level 2 – prices determined using other significant inputs that are observable either directly, or indirectly through corroboration with observable market data (which could include quoted prices for similar assets or liabilities, interest rates, credit risk, etc.); |
| | • | | Level 3 – prices determined using significant unobservable inputs when quoted prices or observable inputs are unavailable such as when there is little or no market activity for an asset or liability (unobservable inputs reflect each Fund’s own assumptions in determining the fair value of assets or liabilities and would be based on the best information available). |
The inputs or methodology used for valuing securities are not necessarily an indication of the risk associated with investing in those securities.
| 76
Notes to Financial Statements (continued)
March 31, 2012 (Unaudited)
The following is a summary of the inputs used to value the Funds’ investments as of March 31, 2012, at value:
Core Plus Bond Fund
Asset Valuation Inputs
| | | | | | | | | | | | | | | | |
Description | | Level 1 | | | Level 2 | | | Level 3 | | | Total | |
Bonds and Notes(a) | | $ | — | | | $ | 898,380,343 | | | $ | — | | | $ | 898,380,343 | |
Preferred Stocks | | | | | | | | | | | | | | | | |
Non-Captive Consumer | | | 252,083 | | | | — | | | | — | | | | 252,083 | |
Non-Captive Diversified | | | 1,479,549 | | | | 443,206 | | | | — | | | | 1,922,755 | |
| | | | | | | | | | | | | | | | |
Total Preferred Stocks | | | 1,731,632 | | | | 443,206 | | | | — | | | | 2,174,838 | |
| | | | | | | | | | | | | | | | |
Short-Term Investments | | | — | | | | 37,736,788 | | | | — | | | | 37,736,788 | |
| | | | | | | | | | | | | | | | |
Total | | $ | 1,731,632 | | | $ | 936,560,337 | | | $ | — | | | $ | 938,291,969 | |
| | | | | | | | | | | | | | | | |
Liability Valuation Inputs
| | | | | | | | | | | | | | | | |
Description | | Level 1 | | | Level 2 | | | Level 3 | | | Total | |
Forward Foreign Currency Contracts (unrealized depreciation) | | $ | — | | | | $ (442,955 | ) | | $ | — | | | | $ (442,955 | ) |
| | | | | | | | | | | | | | | | |
| (a) | Details of the major categories of the Fund’s investments are reflected within the Portfolio of Investments. |
77 |
Notes to Financial Statements (continued)
March 31, 2012 (Unaudited)
High Income Fund
Asset Valuation Inputs
| | | | | | | | | | | | | | | | |
Description | | Level 1 | | | Level 2 | | | Level 3 | | | Total | |
Bonds and Notes | | | | | | | | | | | | | | | | |
Non-Convertible Bonds | | | | | | | | | | | | | | | | |
Chemicals | | $ | — | | | $ | 2,326,200 | | | $ | 292,000 | | | $ | 2,618,200 | |
All Other Non-Convertible Bonds(a) | | | — | | | | 107,086,266 | | | | — | | | | 107,086,266 | |
| | | | | | | | | | | | | | | | |
Total Non-Convertible Bonds | | | — | | | | 109,412,466 | | | | 292,000 | | | | 109,704,466 | |
| | | | | | | | | | | | | | | | |
Convertible Bonds(a) | | | — | | | | 17,232,581 | | | | — | | | | 17,232,581 | |
| | | | | | | | | | | | | | | | |
Total Bonds and Notes | | | — | | | | 126,645,047 | | | | 292,000 | | | | 126,937,047 | |
| | | | | | | | | | | | | | | | |
Senior Loans(a) | | | — | | | | 619,851 | | | | — | | | | 619,851 | |
Preferred Stocks | | | | | | | | | | | | | | | | |
Convertible Preferred Stocks | | | | | | | | | | | | | | | | |
Construction Machinery | | | — | | | | 119,364 | | | | — | | | | 119,364 | |
Consumer Products | | | — | | | | 2,604,184 | | | | — | | | | 2,604,184 | |
All Other Convertible Preferred Stocks(a) | | | 2,805,384 | | | | — | | | | — | | | | 2,805,384 | |
| | | | | | | | | | | | | | | | |
Total Convertible Preferred Stocks | | | 2,805,384 | | | | 2,723,548 | | | | — | | | | 5,528,932 | |
| | | | | | | | | | | | | | | | |
Non-Convertible Preferred Stocks(a) | | | 1,709,635 | | | | 783,108 | | | | — | | | | 2,492,743 | |
| | | | | | | | | | | | | | | | |
Total Preferred Stocks | | | 4,515,019 | | | | 3,506,656 | | | | — | | | | 8,021,675 | |
| | | | | | | | | | | | | | | | |
Common Stocks(a) | | | 4,139,326 | | | | — | | | | — | | | | 4,139,326 | |
Warrants(b) | | | — | | | | — | | | | — | | | | — | |
Short-Term Investments | | | — | | | | 18,113,651 | | | | — | | | | 18,113,651 | |
| | | | | | | | | | | | | | | | |
Total Investments | | | 8,654,345 | | | | 148,885,205 | | | | 292,000 | | | | 157,831,550 | |
| | | | | | | | | | | | | | | | |
Forward Foreign Currency Contracts (unrealized appreciation) | | | — | | | | 12,902 | | | | — | | | | 12,902 | |
| | | | | | | | | | | | | | | | |
Total | | $ | 8,654,345 | | | $ | 148,898,107 | | | $ | 292,000 | | | $ | 157,844,452 | |
| | | | | | | | | | | | | | | | |
Liability Valuation Inputs
| | | | | | | | | | | | | | | | |
Description | | Level 1 | | | Level 2 | | | Level 3 | | | Total | |
Forward Foreign Currency Contracts (unrealized depreciation) | | $ | — | | | $ | (85,311 | ) | | $ | — | | | | $ (85,311 | ) |
| | | | | | | | | | | | | | | | |
| (a) | Details of the major categories of the Fund’s investments are reflected within the Portfolio of Investments. |
| (b) | Fair valued at zero using Level 2 inputs. |
| 78
Notes to Financial Statements (continued)
March 31, 2012 (Unaudited)
A preferred stock valued at $140,000 was transferred from Level 1 to Level 2 during the period ended March 31, 2012. At September 30, 2011, this security was valued at market price in accordance with the Fund’s valuation policy; at March 31, 2012, this security was valued on the basis of evaluated bids furnished to the Fund by an independent pricing service as a market price was not available.
All transfers are recognized as of the beginning of the reporting period.
International Bond Fund
Asset Valuation Inputs
| | | | | | | | | | | | | | | | |
Description | | Level 1 | | | Level 2 | | | Level 3 | | | Total | |
Bonds and Notes | | | | | | | | | | | | | | | | |
Panama | | $ | — | | | $ | — | | | $ | 149,813 | | | $ | 149,813 | |
All Other Bonds and Notes(a) | | | — | | | | 20,763,614 | | | | — | | | | 20,763,614 | |
| | | | | | | | | | | | | | | | |
Total Bonds and Notes | | | — | | | | 20,763,614 | | | | 149,813 | | | | 20,913,427 | |
| | | | | | | | | | | | | | | | |
Short-Term Investments | | | — | | | | 155,263 | | | | — | | | | 155,263 | |
| | | | | | | | | | | | | | | | |
Total Investments | | | — | | | | 20,918,877 | | | | 149,813 | | | | 21,068,690 | |
| | | | | | | | | | | | | | | | |
Forward Foreign Currency Contracts (unrealized appreciation) | | | — | | | | 6,649 | | | | — | | | | 6,649 | |
| | | | | | | | | | | | | | | | |
Total | | $ | — | | | $ | 20,925,526 | | | $ | 149,813 | | | $ | 21,075,339 | |
| | | | | | | | | | | | | | | | |
Liability Valuation Inputs
| | | | | | | | | | | | | | | | |
Description | | Level 1 | | | Level 2 | | | Level 3 | | | Total | |
Forward Foreign Currency Contracts (unrealized depreciation) | | $ | — | | | | $ (7,339 | ) | | $ | — | | | | $ (7,339 | ) |
| | | | | | | | | | | | | | | | |
| (a) | Details of the major categories of the Fund’s investments are reflected within the Portfolio of Investments. |
For the six months ended March 31, 2012, there were no transfers between Levels 1, 2 and 3.
Limited Term Government and Agency Fund
Asset Valuation Inputs
| | | | | | | | | | | | | | | | |
Description | | Level 1 | | | Level 2 | | | Level 3 | | | Total | |
Bonds and Notes(a) | | $ | — | | | $ | 541,945,914 | | | $ | — | | | $ | 541,945,914 | |
Short-Term Investments | | | — | | | | 20,397,124 | | | | — | | | | 20,397,124 | |
| | | | | | | | | | | | | | | | |
Total | | $ | — | | | $ | 562,343,038 | | | $ | — | | | $ | 562,343,038 | |
| | | | | | | | | | | | | | | | |
| (a) | Details of the major categories of the Fund’s investments are reflected within the Portfolio of Investments. |
79 |
Notes to Financial Statements (continued)
March 31, 2012 (Unaudited)
For the six months ended March 31, 2012, there were no transfers between Levels 1, 2 and 3.
The following is a reconciliation of Level 3 investments for which significant unobservable inputs were used to determine fair value as of March 31, 2012:
Core Plus Bond Fund
Asset Valuation Inputs
| | | | | | | | | | | | | | | | | | | | |
Investments in
Securities | | Balance as of September 30, 2011 | | | Accrued Discounts (Premiums) | | | Realized Gain (Loss) | | | Change in Unrealized Appreciation (Depreciation) | | | Purchases | |
Preferred Stocks | | | | | | | | | | | | | | | | | | | | |
Non-Captive Diversified | | $ | 319,200 | | | $ | — | | | $ | — | | | $ | — | | | $ | — | |
| | | | | | | | | | | | | | | | | | | | |
| | | | | |
Investments in
Securities | | Sales | | | Transfers into Level 3 | | | Transfers out of Level 3 | | | Balance as of March 31, 2012 | | | Change in Unrealized Appreciation (Depreciation) from Investments Still Held at March 31, 2012 | |
Preferred Stocks | | | | | | | | | | | | | | | | | | | | |
Non-Captive Diversified | | $ | — | | | $ | — | | | $ | (319,200 | ) | | $ | — | | | $ | — | |
| | | | | | | | | | | | | | | | | | | | |
A preferred stock valued at $319,200 was transferred from Level 3 to Level 2 during the period ended March 31, 2012. At September 30, 2011, this security was valued using broker-dealer bid quotations based on inputs unobservable to the Fund as an independent pricing service either was unable to price the security or did not provide a reliable price for the security; at March 31, 2012, this security was valued on the basis of evaluated bids furnished to the Fund by an independent pricing service.
All transfers are recognized as of the beginning of the reporting period.
| 80
Notes to Financial Statements (continued)
March 31, 2012 (Unaudited)
High Income Fund
Asset Valuation Inputs
| | | | | | | | | | | | | | | | | | | | |
Investments in Securities | | Balance as of
September 30, 2011 | | | Accrued Discounts (Premiums) | | | Realized Gain (Loss) | | | Change in Unrealized Appreciation (Depreciation) | | | Purchases | |
Bonds and Notes | | | | | | | | | | | | | | | | | | | | |
Non-Convertible Bonds | | | | | | | | | | | | | | | | | | | | |
Chemicals | | $ | — | | | $ | 3,955 | | | $ | — | | | $ | (208,355 | ) | | $ | — | |
Consumer Cyclical Services | | | 843,525 | | | | — | | | | — | | | | — | | | | — | |
Treasuries | | | 27,508 | | | | 715 | | | | (34,823 | ) | | | 22,081 | | | | — | |
| | | | | | | | | | | | | | | | | | | | |
Total | | $ | 871,033 | | | $ | 4,670 | | | $ | (34,823 | ) | | $ | (186,274 | ) | | $ | — | |
| | | | | | | | | | | | | | | | | | | | |
| | | | | |
Investments in Securities | | Sales | | | Transfers
into Level 3 | | | Transfers
out of
Level 3 | | | Balance as of
March 31,
2012 | | | Change in
Unrealized
Appreciation
(Depreciation)
from
Investments
Still Held at
March 31,
2012 | |
Bonds and Notes | | | | | | | | | | | | | | | | | | | | |
Non-Convertible Bonds | | | | | | | | | | | | | | | | | | | | |
Chemicals | | $ | — | | | $ | 496,400 | | | $ | — | | | $ | 292,000 | | | $ | (208,355 | ) |
Consumer Cyclical Services | | | — | | | | — | | | | (843,525 | ) | | | — | | | | — | |
Treasuries | | | (15,481 | ) | | | — | | | | — | | | | — | | | | — | |
| | | | | | | | | | | | | | | | | | | | |
Total | | $ | (15,481 | ) | | $ | 496,400 | | | $ | (843,525 | ) | | $ | 292,000 | | | $ | (208,355 | ) |
| | | | | | | | | | | | | | | | | | | | |
A debt security valued at $496,400 was transferred from Level 2 to Level 3 during the period ended March 31, 2012. At September 30, 2011, this security was valued on the basis of evaluated bids furnished to the Fund by an independent pricing service; at March 31, 2012, this security was valued at fair value as determined in good faith by the Fund’s investment adviser as an independent pricing service either was unable to price the security or did not provide a reliable price for the security and broker-dealer bid quotations could not be obtained due to the security being illiquid.
A debt security valued at $843,525 was transferred from Level 3 to Level 2 during the period ended March 31, 2012. At September 30, 2011, this security was valued using broker-dealer bid quotations based on inputs unobservable to the Fund as an
81 |
Notes to Financial Statements (continued)
March 31, 2012 (Unaudited)
independent pricing service either was unable to price the security or did not provide a reliable price for the security; at March 31, 2012, this security was valued on the basis of evaluated bids furnished to the Fund by an independent pricing service.
All transfers are recognized as of the beginning of the reporting period.
International Bond Fund
Asset Valuation Inputs
| | | | | | | | | | | | | | | | | | | | |
Investments in Securities | | Balance as of
September 30,
2011 | | | Accrued
Discounts
(Premiums) | | | Realized
Gain
(Loss) | | | Change in
Unrealized
Appreciation
(Depreciation) | | | Purchases | |
Bonds and Notes | | | | | | | | | | | | | | | | | | | | |
Non-Convertible Bonds | | | | | | | | | | | | | | | | | | | | |
Panama | | $ | — | | | $ | — | | | $ | — | | | $ | 906 | | | $ | 148,907 | |
Supranationals | | | 118,679 | | | | 67 | | | | (16,300 | ) | | | 7,247 | | | | — | |
| | | | | | | | | | | | | | | | | | | | |
Total | | $ | 118,679 | | | $ | 67 | | | $ | (16,300 | ) | | $ | 8,153 | | | $ | 148,907 | |
| | | | | | | | | | | | | | | | | | | | |
| | | | | |
Investments in Securities | | Sales | | | Transfers
into Level 3 | | | Transfers
out of
Level 3 | | | Balance as of March 31, 2012 | | | Change in
Unrealized
Appreciation
(Depreciation)
from
Investments
Still Held at
March 31,
2012 | |
Bonds and Notes | | | | | | | | | | | | | | | | | | | | |
Non-Convertible Bonds | | | | | | | | | | | | | | | | | | | | |
Panama | | $ | — | | | $ | — | | | $ | — | | | $ | 149,813 | | | $ | 906 | |
Supranationals | | | (109,693 | ) | | | — | | | | — | | | | — | | | | — | |
| | | | | | | | | | | | | | | | | | | | |
Total | | $ | (109,693 | ) | | $ | — | | | $ | — | | | $ | 149,813 | | | $ | 906 | |
| | | | | | | | | | | | | | | | | | | | |
In May 2011, Accounting Standards Update (“ASU”) No. 2011-04, “Amendments to Achieve Common Fair Value Measurement and Disclosure Requirements” was issued and is effective for interim and annual periods beginning after December 15, 2011. The ASU requires reporting entities to disclose i) the amounts of any transfers between Level 1 and Level 2, and the reasons for the transfers; and ii) for Level 3 fair value measurements, a) quantitative information about significant unobservable inputs used, b) a description of the valuation processes used by the reporting entity, and c) a narrative description of the sensitivity of the fair value measurement to changes in unobservable inputs if a change in those inputs might result in a significantly higher or lower fair value measurement.
| 82
Notes to Financial Statements (continued)
March 31, 2012 (Unaudited)
Notwithstanding the projected regulatory implementation date of June 30, 2012 for the Fund, Management has already implemented disclosure of all transfers between Level 1 and Level 2, and the reasons for the transfers. Management is currently evaluating the impact, if any, the Level 3 disclosures may have on the Fund’s financial statements.
4. Derivatives. Derivative instruments are defined as financial instruments whose value and performance are based on the value and performance of another security or financial instrument. Derivative instruments that certain Funds used during the period include forward foreign currency contracts.
The Funds are subject to the risk that changes in foreign currency exchange rates will have an unfavorable effect on the value of Fund assets denominated in foreign currencies. The Funds may enter into forward foreign currency contracts for hedging purposes to protect the value of the Funds’ holdings of foreign securities. The Funds may also use forward foreign currency contracts to gain exposure to foreign currencies, regardless of whether securities denominated in such currencies are held in the Funds. During the six months ended March 31, 2012, High Income Fund and Core Plus Bond Fund engaged in forward foreign currency transactions for hedging purposes. During the same period, International Bond Fund engaged in forward foreign currency transactions for hedging purposes and to gain exposure to foreign currencies.
Each Fund is party to agreements with counterparties that govern transactions in forward foreign currency contracts. These agreements contain credit-risk-related contingent features that allow the counterparties to terminate open contracts early if the net asset value of a Fund declines beyond a certain threshold. If such features were to be triggered, the counterparties could request immediate settlement of open contracts at current fair value. As of March 31, 2012, the fair value of derivative positions (including open trades) subject to credit-risk-related contingent features that are in a net liability position by counterparty, and the value of collateral pledged to counterparties for such contracts is as follows:
| | | | | | | | | | |
Fund | | Counterparty | | Derivatives | | | Collateral Pledged | |
Core Plus Bond Fund | | Credit Suisse | | $ | (442,955 | ) | | $ | 310,234 | |
High Income Fund | | Barclays | | | (72,409 | ) | | | — | |
International Bond Fund | | Barclays | | | (5,445 | ) | | | — | |
| | Credit Suisse | | | (231 | ) | | | — | |
| | JPMorgan Chase | | | (102 | ) | | | — | |
Forward foreign currency contracts are subject to the risk that the counterparty will be unwilling or unable to meet its obligations under the contracts. Certain Funds have mitigated this risk by entering into master netting agreements with counterparties that allow the Fund and the counterparty to offset amounts owed by each related to derivative contracts to one net amount payable by either the Fund or the counterparty. The maximum amount of loss that the Funds would incur if counterparties failed to meet
83 |
Notes to Financial Statements (continued)
March 31, 2012 (Unaudited)
their obligations and the amount of loss that the Funds would incur after taking into account master netting arrangements, are as follows as of March 31, 2012:
| | | | | | | | |
Fund | | Maximum Amount
of Loss - Gross | | | Maximum Amount
of Loss – Net | |
Core Plus Bond Fund | | $ | — | | | $ | — | |
High Income Fund | | | 12,902 | | | | — | |
International Bond Fund | | | 6,649 | | | | 5,088 | |
Counterparty risk is managed through the posting of collateral and, as a result, the risk of loss to a Fund from counterparty default should be limited to the extent a Fund is undercollateralized. In addition to collateral requirements, the Funds also require counterparties to meet minimum credit quality requirements.
The following is a summary of derivative instruments for Core Plus Bond Fund as of March 31, 2012:
| | | | |
Statements of Assets and Liabilities Caption | | Foreign
Exchange Contracts | |
Liabilities | | | | |
Unrealized depreciation on forward foreign currency contracts | | $ | (442,955 | ) |
Transactions in derivative instruments for Core Plus Bond Fund during the six months ended March 31, 2012, were as follows:
| | | | |
Statements of Operations Caption | | Foreign Exchange Contracts | |
Net Realized Gain (Loss) on: | | | | |
Foreign currency transactions* | | $ | 1,634,055 | |
Net Change in Unrealized Appreciation (Depreciation) on: | | | | |
Foreign currency translations* | | | (1,071,745 | ) |
| * | Represents realized gain (loss) and change in unrealized appreciation (depreciation), respectively, for forward foreign currency contracts during the period. |
The following is a summary of derivative instruments for High Income Fund as of March 31, 2012:
| | | | |
Statements of Assets and Liabilities Caption | | Foreign Exchange Contracts | |
Assets | | | | |
Unrealized appreciation on forward foreign currency contracts | | $ | 12,902 | |
Liabilities | | | | |
Unrealized depreciation on forward foreign currency contracts | | | (85,311 | ) |
| 84
Notes to Financial Statements (continued)
March 31, 2012 (Unaudited)
Transactions in derivative instruments for High Income Fund during the six months ended March 31, 2012, were as follows:
| | | | |
Statements of Operations Caption | | Foreign Exchange Contracts | |
Net Realized Gain (Loss) on: | | | | |
Foreign currency transactions* | | $ | 322,493 | |
Net Change in Unrealized Appreciation (Depreciation) on: | | | | |
Foreign currency translations* | | | (304,664 | ) |
| * | Represents realized gain and change in unrealized appreciation (depreciation), respectively, for forward foreign currency contracts during the period. |
The following is a summary of derivative instruments for International Bond Fund as of March 31, 2012:
| | | | |
Statements of Assets and Liabilities Caption | | Foreign Exchange Contracts | |
Assets | | | | |
Unrealized appreciation on forward foreign currency contracts | | $ | 6,649 | |
Liabilities | | | | |
Unrealized depreciation on forward foreign currency contracts | | | (7,339 | ) |
Transactions in derivative instruments for International Bond Fund during the six months ended March 31, 2012, were as follows:
| | | | |
Statements of Operations Caption | | Foreign Exchange
Contracts | |
Net Realized Gain (Loss) on: | | | | |
Foreign currency transactions* | | $ | (79,417 | ) |
Net Change in Unrealized Appreciation (Depreciation) on: | | | | |
Foreign currency translations* | | | 190,915 | |
| * | Represents realized gain (loss) and change in unrealized appreciation (depreciation), respectively, for forward foreign currency contracts during the period. |
As the Funds value their derivatives at fair value and recognize changes in fair value through the Statements of Operations, they do not qualify for hedge accounting under authoritative guidance for derivative instruments. The Funds’ investments in derivatives may represent an economic hedge; however, they are considered to be non-hedge transactions for the purpose of these disclosures.
85 |
Notes to Financial Statements (continued)
March 31, 2012 (Unaudited)
The volume of forwards activity, as a percentage of net assets, for Core Plus Bond Fund, High Income Fund and International Bond Fund, based on gross month-end notional amounts outstanding during the period, including long and short positions at absolute value, was as follows for the six months ended March 31, 2012:
| | |
Core Plus Bond Fund | | Forwards |
Average Notional Amount Outstanding | | 4.52% |
Highest Notional Amount Outstanding | | 5.78% |
Lowest Notional Amount Outstanding | | 2.92% |
Notional Amount Outstanding as of March 31, 2012 | | 2.92% |
| |
High Income Fund | | Forwards |
Average Notional Amount Outstanding | | 2.75% |
Highest Notional Amount Outstanding | | 3.34% |
Lowest Notional Amount Outstanding | | 2.29% |
Notional Amount Outstanding as of March 31, 2012 | | 3.34% |
| |
International Bond Fund | | Forwards |
Average Notional Amount Outstanding | | 24.15% |
Highest Notional Amount Outstanding | | 39.39% |
Lowest Notional Amount Outstanding | | 10.55% |
Notional Amount Outstanding as of March 31, 2012 | | 10.55% |
Notional amounts outstanding at the end of the prior period are included in the average notional amount outstanding.
5. Purchases and Sales of Securities. For the six months ended March 31, 2012, purchases and sales of securities (excluding short-term investments and including paydowns) were as follows:
| | | | | | | | | | | | | | | | |
| | | U.S. Government/
Agency Securities | | | Other Securities | |
Fund | | Purchases | | | Sales | | | Purchases | | | Sales | |
Core Plus Bond Fund | | $ | 353,792,297 | | | $ | 112,005,701 | | | $ | 288,875,587 | | | $ | 155,713,258 | |
High Income Fund | | | — | | | | — | | | | 43,576,227 | | | | 24,384,645 | |
International Bond Fund | | | 2,635,641 | | | | 2,634,708 | | | | 11,890,894 | | | | 14,862,506 | |
Limited Term Government and Agency Fund | | | 213,936,932 | | | | 141,834,081 | | | | 7,842,846 | | | | 32,428,792 | |
| 86
Notes to Financial Statements (continued)
March 31, 2012 (Unaudited)
6. Management Fees and Other Transactions with Affiliates.
a. Management Fees. Loomis, Sayles & Company, L.P. (“Loomis Sayles”) serves as investment adviser to each Fund. Under the terms of the management agreements, each Fund pays a management fee at the following annual rates, calculated daily and payable monthly, based on each Fund’s average daily net assets:
| | | | | | | | | | | | |
| | | Percentage of Average Daily Net Assets | |
Fund | | First $100 million | | | Next $150 million | | | Over $250 million | |
Core Plus Bond Fund | | | 0.2500 | % | | | 0.1875 | % | | | 0.1875 | % |
High Income Fund | | | 0.6000 | % | | | 0.6000 | % | | | 0.6000 | % |
International Bond Fund | | | 0.6000 | % | | | 0.6000 | % | | | 0.6000 | % |
Limited Term Government and Agency Fund | | | 0.5000 | % | | | 0.5000 | % | | | 0.4000 | % |
NGAM Advisors serves as the advisory administrator to Core Plus Bond Fund. Under the terms of the advisory administration agreement, the Fund pays an advisory administration fee at the following annual rates, calculated daily and payable monthly, based on its average daily net assets:
| | | | | | | | |
| | | Percentage of Average Daily Net Assets | |
Fund | | First $100 million | | | Over $100 million | |
Core Plus Bond Fund | | | 0.2500 | % | | | 0.1875 | % |
Management and advisory administration fees are presented in the Statements of Operations as management fees.
Loomis Sayles has given binding undertakings to the Funds to waive management fees and/or reimburse certain expenses to limit the Funds’ operating expenses, exclusive of acquired fund fees and expenses, brokerage expenses, interest expense, taxes and extraordinary expenses. These undertakings are in effect until January 31, 2013 and are reevaluated on an annual basis. Management fees payable, as reflected on the Statements of Assets and Liabilities, is net of waivers and/or expense reimbursements, if any, pursuant to these undertakings. Waivers/reimbursements that exceed management fees payable are reflected on the Statements of Assets and Liabilities as receivable from investment adviser.
87 |
Notes to Financial Statements (continued)
March 31, 2012 (Unaudited)
For the six months ended March 31, 2012, the expense limits as a percentage of average daily net assets under the expense limitation agreements were as follows:
| | | | | | | | | | | | | | | | |
| | | Expense Limit
as a Percentage of
Average Daily Net Assets | |
Fund | | Class A | | | Class B | | | Class C | | | Class Y | |
Core Plus Bond Fund | | | 0.90 | % | | | 1.65 | % | | | 1.65 | % | | | 0.65 | % |
High Income Fund | | | 1.15 | % | | | 1.90 | % | | | 1.90 | % | | | 0.90 | % |
International Bond Fund | | | 1.10 | % | | | — | | | | 1.85 | % | | | 0.85 | % |
Limited Term Government and Agency Fund | | | 0.85 | % | | | 1.60 | % | | | 1.60 | % | | | 0.60 | % |
Loomis Sayles and NGAM Advisors have agreed to equally bear the waivers and/or expense reimbursements for Core Plus Bond Fund.
Loomis Sayles (and NGAM Advisors for Core Plus Bond Fund) shall be permitted to recover expenses borne under the expense limitation agreements (whether through waiver of its management fees or otherwise) on a class by class basis in later periods to the extent the expenses of a class fall below a class’ expense limits, provided, however, that a class is not obligated to pay such waived/reimbursed fees or expenses more than one year after the end of the fiscal year in which the fees or expenses were waived/reimbursed.
For the six months ended March 31, 2012, the management fees and waivers of management fees for each Fund were as follows:
| | | | | | | | | | | | | | | | | | | | |
Fund | | Gross Management Fees | | | Waivers of Management Fees1 | | | Net Management Fees | | | Percentage of
Average
Daily Net Assets | |
| | | | | Gross | | | Net | |
Core Plus Bond Fund | | $ | 692,946 | | | $ | — | | | $ | 692,946 | | | | 0.196 | % | | | 0.196 | % |
High Income Fund | | | 422,418 | | | | 39,101 | | | | 383,317 | | | | 0.600 | % | | | 0.544 | % |
International Bond Fund | | | 65,029 | | | | 65,029 | | | | — | | | | 0.600 | % | | | — | |
Limited Term Government and Agency Fund | | | 1,147,948 | | | | 90,533 | | | | 1,057,415 | | | | 0.449 | % | | | 0.413 | % |
| 1 | Management fee waivers are subject to possible recovery until September 30, 2013. |
For the six months ended March 31, 2012, the advisory administration fees for Core Plus Bond Fund were as follows:
| | |
Advisory Administration
Fee | | Percentage of Average Daily Net Assets |
$692,946 | | 0.196% |
| 88
Notes to Financial Statements (continued)
March 31, 2012 (Unaudited)
For the six months ended March 31, 2012, expenses have been reimbursed as follows:
| | | | |
Fund | | Reimbursement 2 | |
International Bond Fund | | $ | 25,644 | |
| 2 | Expense reimbursements are subject to possible recovery until September 30, 2013. |
No expenses were recovered for any of the Funds during the six months ended March 31, 2012 under the terms of the expense agreements.
Certain officers and employees of Loomis Sayles are also officers or Trustees of the Trust. Loomis Sayles’ general partner is indirectly owned by Natixis Global Asset Management, L.P. (“Natixis US”), which is part of Natixis Global Asset Management, an international asset management group based in Paris, France.
b. Service and Distribution Fees. NGAM Distribution, which is a wholly-owned subsidiary of Natixis US, has entered into a distribution agreement with the Trusts. Pursuant to this agreement, NGAM Distribution serves as principal underwriter of the Funds of the Trusts.
Pursuant to Rule 12b-1 under the 1940 Act, the Trusts have adopted a Service Plan relating to each Fund’s Class A shares (the “Class A Plans”), and a Distribution and Service Plan relating to each Fund’s Class B (if applicable) and Class C shares (the “Class B and Class C Plans”).
Under the Class A Plans, each Fund pays NGAM Distribution a monthly service fee at an annual rate not to exceed 0.25% of the average daily net assets attributable to the Funds’ Class A shares, as reimbursement for expenses incurred by NGAM Distribution in providing personal services to investors in Class A shares and/or the maintenance of shareholder accounts.
Under the Class B (if applicable) and Class C Plans, each Fund pays NGAM Distribution a monthly service fee at an annual rate not to exceed 0.25% of the average daily net assets attributable to the Funds’ Class B (if applicable) and Class C shares, as compensation for services provided by NGAM Distribution in providing personal services to investors in Class B (if applicable) and Class C shares and/or the maintenance of shareholder accounts.
Also under the Class B (if applicable) and Class C Plans, each Fund pays NGAM Distribution a monthly distribution fee at the annual rate of 0.75% of the average daily net assets attributable to the Funds’ Class B (if applicable) and Class C shares, as compensation for services provided by NGAM Distribution in connection with the marketing or sale of Class B (if applicable) and Class C shares.
89 |
Notes to Financial Statements (continued)
March 31, 2012 (Unaudited)
For the six months ended March 31, 2012, the Funds paid the following service and distribution fees:
| | | | | | | | | | | | | | | | | | | | |
| | | Service Fees | | | Distribution Fees | |
Fund | | Class A | | | Class B | | | Class C | | | Class B | | | Class C | |
Core Plus Bond Fund | | $ | 387,234 | | | $ | 3,722 | | | $ | 213,105 | | | $ | 11,166 | | | $ | 639,315 | |
High Income Fund | | | 81,248 | | | | 854 | | | | 19,919 | | | | 2,560 | | | | 59,757 | |
International Bond Fund | | | 11,452 | | | | — | | | | 8,821 | | | | — | | | | 26,464 | |
Limited Term Government and Agency Fund | | | 365,255 | | | | 12,799 | | | | 90,736 | | | | 38,398 | | | | 272,210 | |
c. Administrative Fees. NGAM Advisors provides certain administrative services for the Funds and contracts with State Street Bank to serve as sub-administrator. NGAM Advisors is a wholly-owned subsidiary of Natixis US. Pursuant to an agreement among Natixis Funds Trust I, Natixis Funds Trust II, Natixis Funds Trust IV, Gateway Trust (“Natixis Funds Trusts”), Loomis Sayles Funds I, Loomis Sayles Funds II (“Loomis Sayles Funds Trusts”), Hansberger International Series and NGAM Advisors, each Fund pays NGAM Advisors monthly its pro rata portion of fees equal to an annual rate of 0.0575% of the first $15 billion of the average daily net assets of the Natixis Funds Trusts, Loomis Sayles Funds Trusts and Hansberger International Series, 0.0500% of the next $15 billion, 0.0400% of the next $30 billion and 0.0350% of such assets in excess of $60 billion, subject to an annual aggregate minimum fee for the Natixis Funds Trusts, Loomis Sayles Funds Trusts and Hansberger International Series of $10 million, which is reevaluated on an annual basis.
For the six months ended March 31, 2012, each Fund paid the following administrative fees to NGAM Advisors:
| | | | |
Fund | | Administrative
Fees | |
Core Plus Bond Fund | | $ | 162,547 | |
High Income Fund | | | 32,455 | |
International Bond Fund | | | 4,999 | |
Limited Term Government and Agency Fund | | | 117,929 | |
d. Sub-Transfer Agent Fees. NGAM Distribution has entered into agreements with financial intermediaries to provide certain recordkeeping, processing, shareholder communications and other services to customers of the intermediaries and has agreed to compensate the intermediaries for providing those services. Certain services would be provided by the Funds if the shares of those customers were registered directly with the Funds’ transfer agent. Accordingly, the Funds have agreed to reimburse NGAM Distribution for a portion of the intermediary fees attributable to shares of the Fund held by the intermediaries (which generally are a percentage of the value of shares held) not to exceed what the Funds would have paid their transfer agent had each customer’s shares been registered directly with the transfer agent instead of being held through the intermediaries.
| 90
Notes to Financial Statements (continued)
March 31, 2012 (Unaudited)
For the six months ended March 31, 2012, the Funds paid the following sub-transfer agent fees, which are reflected in transfer agent fees and expenses in the Statements of Operations:
| | | | |
Fund | | Sub-Transfer Agent Fees | |
Core Plus Bond Fund | | $ | 224,808 | |
High Income Fund | | | 61,491 | |
International Bond Fund | | | 6,215 | |
Limited Term Government and Agency Fund | | | 94,737 | |
As of March 31, 2012, the Funds owe NGAM Distribution the following reimbursements for sub-transfer agent fees:
| | | | |
Fund | | Reimbursements of Sub-Transfer
Agent Fees | |
Core Plus Bond Fund | | $ | 5,539 | |
High Income Fund | | | 1,450 | |
International Bond Fund | | | 143 | |
Limited Term Government and Agency Fund | | | 2,329 | |
e. Commissions. Commissions (including CDSCs) on Fund shares retained by NGAM Distribution during the six months ended March 31, 2012 were as follows:
| | | | |
Fund | | Commissions | |
Core Plus Bond Fund | | $ | 729,845 | |
High Income Fund | | | 39,789 | |
International Bond Fund | | | 14,821 | |
Limited Term Government and Agency Fund | | | 124,409 | |
f. Trustees Fees and Expenses. The Trusts do not pay any compensation directly to their officers or Trustees who are directors, officers or employees of NGAM Advisors, NGAM Distribution, Natixis US or their affiliates. Effective January 1, 2012, the Chairperson of the Board receives a retainer fee at the annual rate of $265,000. The Chairperson does not receive any meeting attendance fees for Board of Trustees meetings or committee meetings that she attends. Each Independent Trustee (other than the Chairperson) receives, in the aggregate, a retainer fee at the annual rate of $95,000. Each Independent Trustee also receives a meeting attendance fee of $10,000 for each meeting of the Board of Trustees that he or she attends in person and $5,000 for each meeting of the Board of Trustees that he or she attends telephonically. In addition, each committee chairman receives an additional retainer fee at an annual rate of $15,000. Each Contract Review and Governance Committee member is compensated $6,000 for each Committee meeting that he or she attends in person and $3,000 for each meeting that he or she attends telephonically. Each Audit Committee member is
91 |
Notes to Financial Statements (continued)
March 31, 2012 (Unaudited)
compensated $7,500 for each Committee meeting that he or she attends in person and $3,750 for each meeting that he or she attends telephonically. These fees are allocated among the funds in the Natixis Funds Trusts, Loomis Sayles Funds Trusts and Hansberger International Series based on a formula that takes into account, among other factors, the relative net assets of each fund. Trustees are reimbursed for travel expenses in connection with attendance at meetings.
Prior to January 1, 2012, the Chairperson of the Board received a retainer fee at the annual rate of $250,000 and each Independent Trustee (other than the Chairperson) received, in aggregate, a retainer fee at the annual rate of $80,000. All other Trustee fees remain unchanged.
A deferred compensation plan (the “Plan”) is available to the Trustees on a voluntary basis. Deferred amounts remain in the Funds until distributed in accordance with the provisions of the Plan. The value of a participating Trustee’s deferral account is based on theoretical investments of deferred amounts, on the normal payment dates, in certain funds of the Natixis Funds Trusts, Loomis Sayles Funds Trusts and Hansberger International Series as designated by the participating Trustees. Changes in the value of participants’ deferral accounts are allocated pro rata among the funds in the Natixis Funds Trusts, Loomis Sayles Funds Trusts, and Hansberger International Series, and are normally reflected as Trustees’ fees and expenses in the Statements of Operations. The portions of the accrued obligations allocated to the Funds under the Plan are reflected as Deferred Trustees’ fees in the Statements of Assets and Liabilities.
g. Affiliated Ownership. At March 31, 2012, the Loomis Sayles Employees’ Profit Sharing Retirement Plan, (“Retirement Plan”) held shares of beneficial interest in the Funds representing the following percentage of net assets:
| | | | |
Fund | | Retirement Plan | |
International Bond Fund | | | 0.63 | % |
Limited Term Government and Agency Fund | | | 0.07 | % |
7. Line of Credit. Each Fund, together with certain other funds of Natixis Funds Trusts, Loomis Sayles Funds Trusts and Hansberger International Series, participates in a $200,000,000 committed unsecured line of credit provided by State Street Bank, with an individual limit of $125,000,000 for each fund that participates in the line of credit. Interest is charged to each participating fund based on its borrowings at a rate per annum equal to the greater of the Federal Funds rate or overnight LIBOR, plus 1.25%. In addition, a commitment fee of 0.125% per annum, payable at the end of each calendar quarter, is accrued and apportioned among the participating funds based on their average daily unused portion of the line of credit. Effective April 19, 2012, the commitment fee will be 0.10% per annum.
For the six months ended March 31, 2012, none of the Funds had borrowings under these agreements.
| 92
Notes to Financial Statements (continued)
March 31, 2012 (Unaudited)
8. Concentration of Risk. International Bond Fund is a non-diversified fund. Compared with diversified mutual funds, International Bond Fund may invest a greater percentage of its assets in a particular country. Therefore, International Bond Fund’s returns could be significantly affected by the performance of any one of the small number of countries in its portfolio.
Each Fund’s investments in foreign securities are subject to foreign currency fluctuations, higher volatility than U.S. securities, varying degrees of regulation and limited liquidity. Greater political, economic, credit and information risks are also associated with foreign securities.
9. Capital Shares. Each Fund may issue an unlimited number of shares of beneficial interest, without par value. Transactions in capital shares were as follows:
| | | | | | | | | | | | | | | | |
| |
| Six Months Ended
March 31, 2012 |
| |
| Year Ended
September 30, 2011 |
|
Core Plus Bond Fund | | | Shares | | | | Amount | | | | Shares | | | | Amount | |
| Class A | | | | | | | | | | | | | | | | |
Issued from the sale of shares | | | 15,794,444 | | | $ | 202,317,791 | | | | 7,870,741 | | | $ | 100,254,532 | |
Issued in connection with the reinvestment of distributions | | | 666,545 | | | | 8,471,001 | | | | 562,968 | | | | 7,131,144 | |
Redeemed | | | (8,648,942 | ) | | | (111,059,722 | ) | | | (6,563,842 | ) | | | (83,095,094 | ) |
| | | | | | | | | | | | | | | | |
Net change | | | 7,812,047 | | | $ | 99,729,070 | | | | 1,869,867 | | | $ | 24,290,582 | |
| | | | | | | | | | | | | | | | |
| Class B | | | | | | | | | | | | | | | | |
Issued from the sale of shares | | | 15,535 | | | $ | 198,392 | | | | 26,416 | | | $ | 338,841 | |
Issued in connection with the reinvestment of distributions | | | 5,936 | | | | 75,623 | | | | 8,589 | | | | 109,089 | |
Redeemed | | | (55,096 | ) | | | (710,506 | ) | | | (143,488 | ) | | | (1,828,591 | ) |
| | | | | | | | | | | | | | | | |
Net change | | | (33,625 | ) | | $ | (436,491 | ) | | | (108,483 | ) | | $ | (1,380,661 | ) |
| | | | | | | | | | | | | | | | |
| Class C | | | | | | | | | | | | | | | | |
Issued from the sale of shares | | | 6,120,971 | | | $ | 78,524,283 | | | | 3,812,615 | | | $ | 48,580,295 | |
Issued in connection with the reinvestment of distributions | | | 203,162 | | | | 2,581,708 | | | | 149,316 | | | | 1,892,845 | |
Redeemed | | | (1,204,764 | ) | | | (15,477,919 | ) | | | (2,772,280 | ) | | | (35,095,298 | ) |
| | | | | | | | | | | | | | | | |
Net change | | | 5,119,369 | | | $ | 65,628,072 | | | | 1,189,651 | | | $ | 15,377,842 | |
| | | | | | | | | | | | | | | | |
| Class Y | | | | | | | | | | | | | | | | |
Issued from the sale of shares | | | 20,915,958 | | | $ | 270,306,600 | | | | 9,029,915 | | | $ | 116,089,119 | |
Issued in connection with the reinvestment of distributions | | | 399,662 | | | | 5,116,121 | | | | 140,385 | | | | 1,792,593 | |
Redeemed | | | (3,004,670 | ) | | | (38,812,824 | ) | | | (3,372,809 | ) | | | (43,199,888 | ) |
| | | | | | | | | | | | | | | | |
Net change | | | 18,310,950 | | | $ | 236,609,897 | | | | 5,797,491 | | | $ | 74,681,824 | |
| | | | | | | | | | | | | | | | |
Increase (decrease) from capital share transactions | | | 31,208,741 | | | $ | 401,530,548 | | | | 8,748,526 | | | $ | 112,969,587 | |
| | | | | | | | | | | | | | | | |
93 |
Notes to Financial Statements (continued)
March 31, 2012 (Unaudited)
9. Capital Shares (continued).
| | | | | | | | | | | | | | | | |
| |
| Six Months Ended
March 31, 2012 |
| |
| Year Ended
September 30, 2011 |
|
High Income Fund | | | Shares | | | | Amount | | | | Shares | | | | Amount | |
| Class A | | | | | | | | | | | | | | | | |
Issued from the sale of shares | | | 5,418,774 | | | $ | 23,593,079 | | | | 18,914,773 | | | $ | 95,991,464 | |
Issued in connection with the reinvestment of distributions | | | 1,708,188 | | | | 7,025,856 | | | | 752,698 | | | | 3,747,490 | |
Redeemed | | | (4,310,089 | ) | | | (18,908,838 | ) | | | (20,080,912 | ) | | | (101,121,007 | ) |
| | | | | | | | | | | | | | | | |
Net change | | | 2,816,873 | | | $ | 11,710,097 | | | | (413,441 | ) | | $ | (1,382,053 | ) |
| | | | | | | | | | | | | | | | |
| Class B | | | | | | | | | | | | | | | | |
Issued from the sale of shares | | | 1,287 | | | $ | 5,679 | | | | 7,798 | | | $ | 39,272 | |
Issued in connection with the reinvestment of distributions | | | 17,341 | | | | 71,321 | | | | 8,794 | | | | 43,828 | |
Redeemed | | | (35,716 | ) | | | (158,914 | ) | | | (97,228 | ) | | | (487,971 | ) |
| | | | | | | | | | | | | | | | |
Net change | | | (17,088 | ) | | $ | (81,914 | ) | | | (80,636 | ) | | $ | (404,871 | ) |
| | | | | | | | | | | | | | | | |
| Class C | | | | | | | | | | | | | | | | |
Issued from the sale of shares | | | 365,486 | | | $ | 1,573,855 | | | | 1,268,510 | | | $ | 6,372,692 | |
Issued in connection with the reinvestment of distributions | | | 360,050 | | | | 1,480,431 | | | | 130,779 | | | | 650,658 | |
Redeemed | | | (563,832 | ) | | | (2,445,033 | ) | | | (1,792,125 | ) | | | (8,989,058 | ) |
| | | | | | | | | | | | | | | | |
Net change | | | 161,704 | | | $ | 609,253 | | | | (392,836 | ) | | $ | (1,965,708 | ) |
| | | | | | | | | | | | | | | | |
| Class Y | | | | | | | | | | | | | | | | |
Issued from the sale of shares | | | 12,992,160 | | | $ | 58,311,318 | | | | 15,208,663 | | | $ | 76,115,275 | |
Issued in connection with the reinvestment of distributions | | | 1,106,030 | | | | 4,558,740 | | | | 718,068 | | | | 3,585,069 | |
Redeemed | | | (6,655,295 | ) | | | (29,595,911 | ) | | | (21,646,978 | ) | | | (107,960,574 | ) |
| | | | | | | | | | | | | | | | |
Net change | | | 7,442,895 | | | $ | 33,274,147 | | | | (5,720,247 | ) | | $ | (28,260,230 | ) |
| | | | | | | | | | | | | | | | |
Increase (decrease) from capital share transactions | | | 10,404,384 | | | $ | 45,511,583 | | | | (6,607,160 | ) | | $ | (32,012,862 | ) |
| | | | | | | | | | | | | | | | |
| 94
Notes to Financial Statements (continued)
March 31, 2012 (Unaudited)
9. Capital Shares (continued).
| | | | | | | | | | | | | | | | |
| |
| Six Months Ended
March 31, 2012 |
| |
| Year Ended
September 30, 2011 |
|
International Bond Fund | | | Shares | | | | Amount | | | | Shares | | | | Amount | |
| Class A | | | | | | | | | | | | | | | | |
Issued from the sale of shares | | | 118,273 | | | $ | 1,235,673 | | | | 1,211,150 | | | $ | 13,782,950 | |
Issued in connection with the reinvestment of distributions | | | 83,013 | | | | 821,454 | | | | 59,092 | | | | 637,499 | |
Redeemed | | | (350,113 | ) | | | (3,721,688 | ) | | | (1,950,042 | ) | | | (21,739,657 | ) |
| | | | | | | | | | | | | | | | |
Net change | | | (148,827 | ) | | $ | (1,664,561 | ) | | | (679,800 | ) | | $ | (7,319,208 | ) |
| | | | | | | | | | | | | | | | |
| Class C | | | | | | | | | | | | | | | | |
Issued from the sale of shares | | | 94,098 | | | $ | 957,803 | | | | 309,408 | | | $ | 3,486,185 | |
Issued in connection with the reinvestment of distributions | | | 44,914 | | | | 441,073 | | | | 9,437 | | | | 102,127 | |
Redeemed | | | (199,797 | ) | | | (2,071,217 | ) | | | (181,598 | ) | | | (1,994,024 | ) |
| | | | | | | | | | | | | | | | |
Net change | | | (60,785 | ) | | $ | (672,341 | ) | | | 137,247 | | | $ | 1,594,288 | |
| | | | | | | | | | | | | | | | |
| Class Y | | | | | | | | | | | | | | | | |
Issued from the sale of shares | | | 525,862 | | | $ | 5,329,298 | | | | 505,134 | | | $ | 5,693,161 | |
Issued in connection with the reinvestment of distributions | | | 18,714 | | | | 185,296 | | | | 8,923 | | | | 97,881 | |
Redeemed | | | (390,754 | ) | | | (4,123,311 | ) | | | (776,615 | ) | | | (8,753,041 | ) |
| | | | | | | | | | | | | | | | |
Net change | | | 153,822 | | | $ | 1,391,283 | | | | (262,558 | ) | | $ | (2,961,999 | ) |
| | | | | | | | | | | | | | | | |
Increase (decrease) from capital share transactions | | | (55,790 | ) | | $ | (945,619 | ) | | | (805,111 | ) | | $ | (8,686,919 | ) |
| | | | | | | | | | | | | | | | |
95 |
Notes to Financial Statements (continued)
March 31, 2012 (Unaudited)
9. Capital Shares (continued).
| | | | | | | | | | | | | | | | |
| |
| Six Months Ended
March 31, 2012 |
| |
| Year Ended
September 30, 2011 |
|
Limited Term Government and Agency Fund | | | Shares | | | | Amount | | | | Shares | | | | Amount | |
| Class A | | | | | | | | | | | | | | | | |
Issued from the sale of shares | | | 7,506,649 | | | $ | 89,306,255 | | | | 20,840,756 | | | $ | 248,142,366 | |
Issued in connection with the reinvestment of distributions | | | 277,326 | | | | 3,303,647 | | | | 438,301 | | | | 5,215,842 | |
Redeemed | | | (7,481,849 | ) | | | (88,898,298 | ) | | | (10,214,288 | ) | | | (121,563,216 | ) |
| | | | | | | | | | | | | | | | |
Net change | | | 302,126 | | | $ | 3,711,604 | | | | 11,064,769 | | | $ | 131,794,992 | |
| | | | | | | | | | | | | | | | |
| Class B | | | | | | | | | | | | | | | | |
Issued from the sale of shares | | | 43,322 | | | $ | 513,337 | | | | 912,056 | | | $ | 10,801,235 | |
Issued in connection with the reinvestment of distributions | | | 7,883 | | | | 93,788 | | | | 11,626 | | | | 138,181 | |
Redeemed | | | (197,503 | ) | | | (2,348,340 | ) | | | (335,640 | ) | | | (3,991,576 | ) |
| | | | | | | | | | | | | | | | |
Net change | | | (146,298 | ) | | $ | (1,741,215 | ) | | | 588,042 | | | $ | 6,947,840 | |
| | | | | | | | | | | | | | | | |
| Class C | | | | | | | | | | | | | | | | |
Issued from the sale of shares | | | 1,512,545 | | | $ | 17,994,332 | | | | 2,478,244 | | | $ | 29,568,408 | |
Issued in connection with the reinvestment of distributions | | | 33,764 | | | | 402,475 | | | | 74,077 | | | | 882,261 | |
Redeemed | | | (1,105,386 | ) | | | (13,166,805 | ) | | | (3,083,387 | ) | | | (36,752,240 | ) |
| | | | | | | | | | | | | | | | |
Net change | | | 440,923 | | | $ | 5,230,002 | | | | (531,066 | ) | | $ | (6,301,571 | ) |
| | | | | | | | | | | | | | | | |
| Class Y | | | | | | | | | | | | | | | | |
Issued from the sale of shares | | | 9,427,176 | | | $ | 112,637,231 | | | | 11,014,945 | | | $ | 131,705,304 | |
Issued in connection with the reinvestment of distributions | | | 78,413 | | | | 937,248 | | | | 100,885 | | | | 1,204,459 | |
Redeemed | | | (6,147,434 | ) | | | (73,327,774 | ) | | | (8,080,128 | ) | | | (96,465,164 | ) |
| | | | | | | | | | | | | | | | |
Net change | | | 3,358,155 | | | $ | 40,246,705 | | | | 3,035,702 | | | $ | 36,444,599 | |
| | | | | | | | | | | | | | | | |
Increase (decrease) from capital share transactions | | | 3,954,906 | | | $ | 47,447,096 | | | | 14,157,447 | | | $ | 168,885,860 | |
| | | | | | | | | | | | | | | | |
| 96
SEMIANNUAL REPORT
March 31, 2012

Loomis Sayles Investment Grade Bond Fund
TABLE OF CONTENTS
Management Discussion page 1
Investment Results page 3
Portfolio of Investments page 9
Financial Statements page 31
Loomis Sayles Investment Grade Bond Fund
Management Discussion
Managers:
Matthew J. Eagan, CFA
Daniel Fuss, CFA, CIC
Kathleen Gaffney, CFA
Elaine Stokes
Loomis, Sayles & Company, L.P.
Objective:
High total investment return through a combination of current income and capital appreciation
Strategy:
Invests primarily in investment-grade, fixed-income securities, although it may invest up to 10% of its assets in below investment-grade fixed-income securities and up to 10% of its assets in equity securities (including up to 5% in common stocks). The fund may invest any portion of its assets in securities of Canadian issuers and up to 20% in other foreign securities, including emerging markets.
Fund Inception:
December 31, 1996
Symbols:
| | |
| Class A | | LIGRX |
| Class B | | LGBBX |
| Class C | | LGBCX |
| Class Y | | LSIIX |
| Admin Class | | LIGAX |
Market Conditions
Throughout the period, the ongoing European sovereign debt crisis moved markets higher or lower depending on headline news, causing investor preferences for risk to be intermittent. The European Central Bank’s decision to cut rates and provide liquidity through long-term refinancing operations helped ease market fears during the second half of the period, pushing credit-sensitive markets higher and spreads (the difference in yield between non-Treasury securities and comparable-maturity Treasuries) tighter. In the United States, strong corporate and bank balance sheets helped riskier market sectors recover slowly. For the time being, positive U.S. labor and economic data have mitigated the need for another round of quantitative easing from the Federal Reserve Board (“the Fed”). These data indicate that economic recovery is underway, albeit at a slower pace than initially expected.
Performance Results
For the six months ended March 31, 2012, Class A shares of Loomis Sayles Investment Grade Bond Fund returned 6.19% at net asset value. The fund outperformed its benchmark, the Barclays Capital U.S. Government/Credit Bond Index, which returned 1.26% for the period. It also outperformed the 2.96% average return of the Morningstar Intermediate-Term Bond category.
Explanation of Fund Performance
An overweight position in the investment-grade corporate bond sector contributed to the fund’s outperformance during the period. In particular, selected issues in the banking, communications, transportation, basic industry and capital goods segments drove performance higher. In addition, significant exposure to non-U.S.-dollar-denominated holdings boosted returns. A preference for risk remained a dominant theme among investors, and currencies from economies that primarily are driven by commodity exports benefited from a rally in commodity prices and a corresponding increase in demand for these currencies. Specifically, holdings denominated in the Canadian
1 |
dollar, New Zealand dollar, Australian dollar, euro, Norwegian krone, Brazilian real and Mexican peso were strong performers. The fund’s underweight in U.S. Treasury and agency securities also contributed to relative returns, as investor risk preferences led them away from the perceived safe-haven of U.S. Treasuries. Additionally, out-of-benchmark allocations to high-yield corporate bonds in the financial and industrial sectors contributed positively to performance. Several specific finance, basic industry, transportation and capital goods companies aided returns. An allocation to equity-sensitive convertible holdings also aided the fund’s outperformance, as these securities tracked the rally in equity markets.
A small allocation to high-yield utility corporate bonds weighed on fund performance. In particular, several names from the natural gas and electric utility sectors generally underperformed. In addition, an underweight allocation to government-related securities detracted from performance.
As of the close of business on January 11, 2012, Class J shares were liquidated. This event had no impact on the performance of the fund.
Outlook
As the second quarter begins, fixed-income investors continue to face an environment filled with opportunities and pitfalls. The sovereign debt situation in Europe is a chief ongoing concern, and the market is now focusing on Spain. Investors are taking solace in the improving U.S. economic situation, but Europe’s debt problems cast a large shadow over any sustainable recovery. So far this year, investors have generally sought out higher-risk securities for yield, but the progress (or lack thereof) in the euro zone could greatly influence their risk tolerance. In some respects, this is very similar to 2011, when cash rushed into credit, equity and other risky markets early in the year, only to reverse when political gyrations increased uncertainty. However, a resulting period of volatility can create buying opportunities for us. We continue to add credits that we believe have long-term potential for improving fundamentals.
In the first quarter of 2012, higher U.S. interest rates reinvigorated discussions surrounding the potential threat higher rates pose to fixed-income portfolios. We continue to believe that interest rates are in a period of transition and see rising rates as the next secular trend. However, given the Fed’s continued commitment to keep short-term rates low at least through the middle of 2014, the trading range in U.S. Treasuries should persist in the near term.
U.S. economic growth has been a bright spot thus far in 2012. We believe the overall health of corporate America remains intact, largely because corporate managements remain conservative. Reductions in the ranks of the unemployed, signs of potential recovery in the housing market and increased lending from financial institutions have highlighted the underlying fundamental health of the domestic economy. We anticipate a modest recovery in the United States and little to no growth in Europe and Japan. However, many areas removed from the developed world show moderate to strong growth potential.
Above all else, our conviction in the merits of fundamental credit research has not changed. We remain steadfast in our opportunistic approach as well as our long-term outlook. Our focus continues to be on maintaining yield advantage, surveying the global marketplace for opportunities, and searching out specific risk that can lead to total return opportunities for the fund.
| 2
Loomis Sayles Investment Grade Bond Fund
Investment Results through March 31, 2012
The charts comparing the fund’s performance to an index provide you with a general sense of how it performed. The fund’s total return for the period shown below appears with and without sales charges and includes fund expenses and fees. An index measures the performance of a theoretical portfolio. Unlike a fund, the index is unmanaged and does not have expenses that affect the results. It is not possible to invest directly in an index. Investors would incur transaction costs and other expenses if they purchased the securities necessary to match the index.
Growth of a $10,000 Investment in Class A Shares1,5
March 31, 2002 through March 31, 2012
What You Should Know
Investments in the fund are subject to a number of risks. Please see the “Principal Risks” section of the fund’s prospectus. The purchase of fund shares should be seen as a long-term investment.
3 |
Average Annual Total Returns — March 31, 20125
| | | | | | | | | | | | | | | | |
| | | | | |
| | | 6 MONTHS | | | 1 YEAR | | | 5 YEARS | | | 10 YEARS | |
| | | | | |
| Class A (Inception 12/31/96)1 | | | | | | | | | | | | | | | | |
| NAV | | | 6.19 | % | | | 7.26 | % | | | 8.09 | % | | | 9.14 | % |
| With 4.50% Maximum Sales Charge | | | 1.42 | | | | 2.42 | | | | 7.09 | | | | 8.64 | |
| | | | | |
| Class B (Inception 9/12/03)1 | | | | | | | | | | | | | | | | |
| NAV | | | 5.82 | | | | 6.48 | | | | 7.20 | | | | 8.23 | |
| With CDSC2 | | | 0.82 | | | | 1.48 | | | | 6.89 | | | | 8.23 | |
| | | | | |
| Class C (Inception 9/12/03)1 | | | | | | | | | | | | | | | | |
| NAV | | | 5.76 | | | | 6.42 | | | | 7.28 | | | | 8.28 | |
| With CDSC2 | | | 4.76 | | | | 5.42 | | | | 7.28 | | | | 8.28 | |
| | | | | |
| Class Y (Inception 12/31/96) | | | | | | | | | | | | | | | | |
| NAV | | | 6.32 | | | | 7.52 | | | | 8.36 | | | | 9.45 | |
| | | | | |
| Admin Class (Inception 2/1/10)1 | | | | | | | | | | | | | | | | |
| NAV | | | 5.99 | | | | 6.94 | | | | 7.70 | | | | 8.63 | |
| | | | | |
| Comparative Performance | | | | | | | | | | | | | | | | |
| Barclays Capital U.S. Government/Credit Bond Index3 | | | 1.26 | | | | 8.53 | | | | 6.26 | | | | 5.91 | |
| Morningstar Intermediate-Term Bond Fund Avg.4 | | | 2.96 | | | | 6.55 | | | | 5.67 | | | | 5.39 | |
Performance data quoted represents past performance and is no guarantee of future results. Total return and value will vary and you may have a gain or loss when shares are sold. Current performance may be lower or higher than quoted. For most recent month-end performance, visit ngam.natixis.com. Performance for other share classes will be greater or less than shown based on differences in fees and sales charges. Performance for periods less than one year is cumulative, not annualized. Returns reflect changes in share price and reinvestment of dividends and capital gains, if any. Class Y shares are not available for purchase by all investors. The table and graph do not reflect taxes shareholders might owe on any fund distributions or when they redeem their shares.
NOTES TO CHARTS
| 1 | Prior to 9/15/03, performance of Class A shares is that of Retail Class shares, which were redesignated as Class A shares, restated to reflect the sales load of Class A shares. Prior to the inception of Class B and C shares (9/12/03), performance is that of Institutional Class shares, which were redesignated as Class Y shares, restated to reflect the higher net expenses and sales loads of Class B and C shares. Prior to the inception of Admin Class shares (2/1/10), performance is that of Class A shares, restated to reflect the higher net expenses of Admin Class shares. |
| 2 | Performance for Class B shares assumes a maximum 5% contingent deferred sales charge (“CDSC”) applied when you sell shares, which declines annually between years 1-6 according to the following schedule: 5, 4, 3, 3, 2, 1, 0%. Class C shares performance assumes a 1% CDSC applied when you sell shares within one year of purchase. |
| 3 | Barclays Capital U.S. Government/Credit Bond Index is an unmanaged index that includes U.S. Treasuries, government-related issues, and investment grade U.S. corporate securities. |
| 4 | Morningstar Intermediate – Term Bond Fund Average is the average performance without sales charges of Funds with similar investment objectives, as calculated by Morningstar, Inc. |
| 5 | Fund performance has been increased by fee waivers and/or expense reimbursements, if any, without which performance would have been lower. |
| 4
| | | | |
| Credit Quality | | % of Net Assets as of
3/31/2012 | |
Aaa | | | 21.3 | |
Aa | | | 5.2 | |
A | | | 19.9 | |
Baa | | | 38.2 | |
Ba | | | 3.6 | |
B | | | 1.6 | |
Caa & Lower | | | 0.0 | |
Not Rated | | | 0.0 | |
Short-term and other | | | 10.2 | |
Credit quality at 3/31/12 reflects the highest credit rating assigned to individual holdings of the fund among Moody’s, S&P or Fitch; ratings are subject to change. The fund’s shares are not rated by any rating agency and no credit rating for the fund’s shares is implied. The Moody’s equivalent of the assigned rating is presented in the table.
| | | | |
| Effective Maturity | | % of Net Assets as of
3/31/2012 | |
1 year or less | | | 16.8 | |
1-5 years | | | 26.3 | |
5-10 years | | | 39.7 | |
10+ years | | | 17.2 | |
Average Effective Maturity | | | 7.7 | years |
Portfolio characteristics will vary.
Expense Ratios
as stated in the most recent prospectus
| | | | | | | | |
| Share Class | | Gross Expense Ratio1 | | | Net Expense Ratio2 | |
| A | | | 0.81 | % | | | 0.81 | % |
| B | | | 1.56 | | | | 1.56 | |
| C | | | 1.56 | | | | 1.56 | |
| Y | | | 0.56 | | | | 0.56 | |
| Admin | | | 1.07 | | | | 1.07 | |
| 1 | Before fee waivers and/or expense reimbursements. |
| 2 | After fee waivers and/or expense reimbursements. Waivers/reimbursements are contractual and are set to expire on 1/31/13. Contracts are reevaluated on an annual basis. |
5 |
ADDITIONAL INFORMATION
The views expressed in this report reflect those of the portfolio managers as of the dates indicated. The managers’ views are subject to change at any time without notice based on changes in market or other conditions. References to specific securities or industries should not be regarded as investment advice. Because the fund is actively managed, there is no assurance that it will continue to invest in the securities, countries or industries mentioned.
Before investing, consider the fund’s investment objectives, risks, charges and other expenses. Visit ngam.natixis.com or call 800-225-5478 for a prospectus and/or a summary prospectus, both of which contain this and other information. Read it carefully.
PROXY VOTING INFORMATION
A description of the fund’s proxy voting policies and procedures is available without charge, upon request, by calling Natixis Funds at 800-225-5478; on the fund’s website at ngam.natixis.com; and on the Securities and Exchange Commission’s (SEC’s) website at www.sec.gov. Information regarding how the fund voted proxies relating to portfolio securities during the 12-month period ended June 30, 2011 is available from the fund’s website and the SEC’s website.
QUARTERLY PORTFOLIO SCHEDULES
The fund files a complete schedule of portfolio holdings with the SEC for the first and third quarters of each fiscal year on Form N-Q. The fund’s Forms N-Q are available on the SEC’s website at www.sec.gov and may be reviewed and copied at the SEC’s Public Reference Room in Washington, DC. Information on the operation of the Public Reference Room may be obtained by calling 800-SEC-0330.
| 6
UNDERSTANDING YOUR FUND’S EXPENSES
As a mutual fund shareholder, you incur different types of costs: transaction costs, including sales charges (loads) on purchases and contingent deferred sales charges on redemptions; and ongoing costs, including management fees, distribution fees (12b-1 fees) and/or service fees, and other fund expenses. These costs are described in more detail in the fund’s prospectus. The examples below are intended to help you understand the ongoing costs of investing in the fund and help you compare these with the ongoing costs of investing in other mutual funds.
The first line in the table for each class shows the actual amount of fund expenses you would have paid on a $1,000 investment in the fund from October 1, 2011 through March 31, 2012. It also shows how much a $1,000 investment would be worth at the close of the period, assuming actual fund returns and expenses. To estimate the expenses you paid over the period, simply divide your account value by $1,000 (for example $8,600 account value divided by $1,000 =8.60) and multiply the result by the number in the Expenses Paid During Period row as shown below for your class.
The second line in the table for each class provides information about hypothetical account values and hypothetical expenses based on the fund’s actual expense ratios and an assumed rate of return of 5% per year before expenses, which is not the fund’s actual return. The hypothetical account values and expenses may not be used to estimate the actual ending account balance or expenses you paid on your investment for the period. You may use this information to compare the ongoing costs of investing in the fund and other funds. To do so, compare this 5% hypothetical example with the 5% hypothetical examples that appear in the shareholder reports of the other funds.
Please note that the expenses shown reflect ongoing costs only, and do not include any transaction costs. Therefore, the second line in the table of the fund is useful in comparing ongoing costs only, and will not help you determine the relative costs of owning different funds. If transaction costs were included, total costs would be higher.
7 |
| | | | | | | | | | | | |
LOOMIS SAYLES INVESTMENT GRADE
BOND FUND | | BEGINNING
ACCOUNT VALUE 10/1/2011 | | | ENDING
ACCOUNT VALUE 3/31/2012 | | | EXPENSES PAID
DURING PERIOD* 10/1/2011 – 3/31/2012 | |
Class A | | | | | | | | | | | | |
Actual | | | $1,000.00 | | | | $1,061.90 | | | | $4.38 | |
Hypothetical (5% return before expenses) | | | $1,000.00 | | | | $1,020.75 | | | | $4.29 | |
Class B | | | | | | | | | | | | |
Actual | | | $1,000.00 | | | | $1,058.20 | | | | $8.18 | |
Hypothetical (5% return before expenses) | | | $1,000.00 | | | | $1,017.05 | | | | $8.02 | |
Class C | | | | | | | | | | | | |
Actual | | | $1,000.00 | | | | $1,057.60 | | | | $8.23 | |
Hypothetical (5% return before expenses) | | | $1,000.00 | | | | $1,017.00 | | | | $8.07 | |
Class Y | | | | | | | | | | | | |
Actual | | | $1,000.00 | | | | $1,063.20 | | | | $3.09 | |
Hypothetical (5% return before expenses) | | | $1,000.00 | | | | $1,022.00 | | | | $3.03 | |
Admin Class | | | | | | | | | | | | |
Actual | | | $1,000.00 | | | | $1,059.90 | | | | $5.66 | |
Hypothetical (5% return before expenses) | | | $1,000.00 | | | | $1,019.50 | | | | $5.55 | |
| * | Expenses are equal to the Fund’s annualized expense ratio: 0.85%, 1.59%, 1.60%, 0.60% and 1.10% for Class A, B, C, Y and Admin Class, respectively, multiplied by the average account value over the period, multiplied by the number of days in the most recent fiscal half-year, divided by 366 (to reflect the half-year period). |
| 8
Portfolio of Investments – as of March 31, 2012 (Unaudited)
Loomis Sayles Investment Grade Bond Fund
| | | | | | | | |
Principal
Amount (‡) | | | Description | | Value (†) | |
| | | | | | | | |
| | Bonds and Notes — 89.1% of Net Assets | | | | |
| | Non-Convertible Bonds — 84.8% | | | | |
| | | | ABS Car Loan — 0.7% | | | | |
| $ | 4,294,792 | | | Avis Budget Rental Car Funding AESOP LLC, Series 2007-2A, Class A, 0.382%, 8/20/2013, 144A(b) | | $ | 4,274,247 | |
| | 831,000 | | | Avis Budget Rental Car Funding AESOP LLC, Series 2010-2A, Class B, 5.740%, 8/20/2014, 144A | | | 856,592 | |
| | 4,590,000 | | | Avis Budget Rental Car Funding AESOP LLC, Series 2010-3A, Class B, 6.740%, 5/20/2016, 144A | | | 5,114,103 | |
| | 2,889,250 | | | Avis Budget Rental Car Funding AESOP LLC, Series 2010-5A, Class B, 5.110%, 3/20/2017, 144A | | | 3,079,709 | |
| | 18,620,000 | | | Chesapeake Funding LLC, Series 2009-2A, Class B, 1.992%, 9/15/2021, 144A(b) | | | 18,714,538 | |
| | 16,736,000 | | | Chesapeake Funding LLC, Series 2009-2A, Class C, 1.992%, 9/15/2021, 144A(b) | | | 16,768,408 | |
| | 19,574,000 | | | Ford Auto Securitization Trust, Series 2010-R3A, Class A3, 2.714%, 9/15/2015, 144A, (CAD) | | | 19,828,916 | |
| | 5,481,000 | | | Ford Auto Securitization Trust, Series 2010-R3A, Class D, 4.526%, 3/15/2017, 144A, (CAD) | | | 5,495,012 | |
| | 7,669,185 | | | Merrill Auto Trust Securitization Asset, Series 2008-1, Class B, 6.750%, 4/15/2015 | | | 7,720,761 | |
| | | | | | | | |
| | | | | | | 81,852,286 | |
| | | | | | | | |
| | | | ABS Credit Card — 0.6% | | | | |
| | 28,592,000 | | | Chase Issuance Trust, Series 2007-B1, Class B1, 0.492%, 4/15/2019(b) | | | 27,596,129 | |
| | 19,182,000 | | | GE Capital Credit Card Master Note Trust, Series 2009-4, Class B, 5.390%, 11/15/2017, 144A | | | 20,901,356 | |
| | 14,465,000 | | | MBNA Credit Card Master Note Trust, Series 2004-B1, Class B1, 4.450%, 8/15/2016 | | | 15,385,609 | |
| | 2,324,000 | | | World Financial Network Credit Card Master Trust, Series 2010-A, Class B, 6.750%, 4/15/2019 | | | 2,557,529 | |
| | | | | | | | |
| | | | | | | 66,440,623 | |
| | | | | | | | |
| | | | ABS Other — 1.5% | | | | |
| | 1,664,000 | | | Community Program Loan Trust, Series 1987-A, Class A5, 4.500%, 4/01/2029 | | | 1,683,647 | |
| | 7,882,184 | | | Diamond Resorts Owner Trust, Series 2011-1, Class A, 4.000%, 3/20/2023, 144A | | | 7,947,188 | |
| | 36,837,775 | | | Marriott Vacation Club Owner Trust, Series 2009-2A, Class A, 4.809%, 7/20/2031, 144A | | | 38,553,856 | |
| | 35,141,724 | | | SVO VOI Mortgage Corp., Series 2009-BA, Class NT, 5.810%, 12/20/2028, 144A | | | 36,304,978 | |
| | 40,965,588 | | | Trinity Rail Leasing LP, Series 2009-1A, Class A, 6.657%, 11/16/2039, 144A | | | 45,498,614 | |
| | 16,014,753 | | | Trinity Rail Leasing LP, Series 2010-1A, Class A, 5.194%, 10/16/2040, 144A | | | 15,421,884 | |
| | 16,764,270 | | | Trip Rail Master Funding LLC, Series 2011-1A, Class A1A, 4.370%, 7/15/2041, 144A | | | 16,878,349 | |
| | | | | | | | |
| | | | | | | 162,288,516 | |
| | | | | | | | |
See accompanying notes to financial statements.
9 |
Portfolio of Investments – as of March 31, 2012 (Unaudited)
Loomis Sayles Investment Grade Bond Fund – (continued)
| | | | | | | | |
Principal
Amount (‡) | | | Description | | Value (†) | |
| | | | | | | | |
| | | | Airlines — 2.6% | | | | |
| $ | 233,701 | | | Continental Airlines Pass Through Trust, Series 1997-1, Class A, 7.461%, 10/01/2016 | | $ | 233,701 | |
| | 769,912 | | | Continental Airlines Pass Through Trust, Series 1998-1, Class A, 6.648%, 3/15/2019 | | | 805,482 | |
| | 888,684 | | | Continental Airlines Pass Through Trust, Series 1999-1, Class A, 6.545%, 8/02/2020 | | | 956,401 | |
| | 8,816,189 | | | Continental Airlines Pass Through Trust, Series 2000-1, Class A-1, 8.048%, 5/01/2022 | | | 9,852,091 | |
| | 1,749,519 | | | Continental Airlines Pass Through Trust, Series 2000-2, Class A-1, 7.707%, 10/02/2022 | | | 1,891,579 | |
| | 3,122,083 | | | Continental Airlines Pass Through Trust, Series 2001-1, Class A-1, 6.703%, 12/15/2022 | | | 3,340,629 | |
| | 55,725,876 | | | Continental Airlines Pass Through Trust, Series 2007-1, Class A, 5.983%, 10/19/2023 | | | 60,423,568 | |
| | 11,512,983 | | | Continental Airlines Pass Through Trust, Series 2007-1, Class B, 6.903%, 10/19/2023 | | | 11,706,056 | |
| | 25,977,159 | | | Continental Airlines Pass Through Trust, Series 2009-1,
9.000%, 1/08/2018 | | | 29,613,961 | |
| | 20,051,663 | | | Continental Airlines Pass Through Trust, Series 2009-2, Class A, 7.250%, 5/10/2021 | | | 22,457,863 | |
| | 3,065,000 | | | Continental Airlines Pass Through Trust, Series 2012-1, Class B, 6.250%, 10/22/2021 | | | 3,118,637 | |
| | 1,848,459 | | | Delta Air Lines Pass Through Trust, Series 2007-1, Class A, 6.821%, 2/10/2024 | | | 2,024,063 | |
| | 13,580,966 | | | Delta Air Lines Pass Through Trust, Series 2007-1, Class B, 8.021%, 2/10/2024 | | | 13,834,930 | |
| | 35,655,632 | | | Delta Air Lines Pass Through Trust, Series 2009-1, Class A, 7.750%, 6/17/2021 | | | 40,647,421 | |
| | 2,707,898 | | | Delta Air Lines Pass Through Trust, Series 2009-1, Series B, 9.750%, 6/17/2018 | | | 2,883,912 | |
| | 20,198,823 | | | Delta Air Lines Pass Through Trust, Series 2010-1, Class A, 6.200%, 1/02/2020 | | | 21,865,226 | |
| | 6,717,300 | | | Northwest Airlines, Inc., Series 2007-1, Class B, 8.028%, 5/01/2019 | | | 6,851,646 | |
| | 7,277,000 | | | Qantas Airways Ltd., 6.050%, 4/15/2016, 144A | | | 7,485,333 | |
| | 24,068,327 | | | UAL Pass Through Trust, Series 2007-1, Class A, 6.636%, 1/02/2024 | | | 25,512,427 | |
| | 6,185,082 | | | UAL Pass Through Trust, Series 2009-1, 10.400%, 5/01/2018 | | | 7,050,993 | |
| | 17,386,000 | | | US Airways Pass Through Trust, Series 2011-1A, Class A, 7.125%, 4/22/2025 | | | 18,255,300 | |
| | | | | | | | |
| | | | | | | 290,811,219 | |
| | | | | | | | |
| | | | Automotive — 1.1% | | | | |
| | 40,992,000 | | | Cummins, Inc., 5.650%, 3/01/2098 | | | 38,981,711 | |
| | 5,274,000 | | | Cummins, Inc., 6.750%, 2/15/2027 | | | 6,268,682 | |
| | 1,948,000 | | | Ford Motor Co., 6.375%, 2/01/2029 | | | 2,112,505 | |
| | 125,000 | | | Ford Motor Co., 6.500%, 8/01/2018 | | | 135,625 | |
| | 255,000 | | | Ford Motor Co., 6.625%, 2/15/2028 | | | 282,416 | |
| | 5,074,000 | | | Ford Motor Co., 6.625%, 10/01/2028 | | | 5,633,236 | |
| | 8,544,000 | | | Ford Motor Co., 7.450%, 7/16/2031 | | | 10,445,040 | |
See accompanying notes to financial statements.
| 10
Portfolio of Investments – as of March 31, 2012 (Unaudited)
Loomis Sayles Investment Grade Bond Fund – (continued)
| | | | | | | | |
Principal
Amount (‡) | | | Description | | Value (†) | |
| | | | | | | | |
| | | | Automotive — continued | | | | |
| $ | 240,000 | | | Ford Motor Co., 7.500%, 8/01/2026 | | $ | 268,800 | |
| | 40,126,000 | | | Ford Motor Credit Co. LLC, 6.625%, 8/15/2017 | | | 44,464,945 | |
| | 338,000 | | | Ford Motor Credit Co. LLC, 7.000%, 10/01/2013 | | | 360,401 | |
| | 5,319,000 | | | Ford Motor Credit Co. LLC, 7.000%, 4/15/2015 | | | 5,810,257 | |
| | 4,540,000 | | | Ford Motor Credit Co. LLC, 8.000%, 12/15/2016 | | | 5,263,694 | |
| | | | | | | | |
| | | | | | | 120,027,312 | |
| | | | | | | | |
| | | | Banking — 10.6% | | | | |
| | 22,547,000 | | | AgriBank FCB, 9.125%, 7/15/2019, 144A | | | 28,607,002 | |
| | 7,200,000 | | | American Express Centurion Bank, Series BKN1, 6.000%, 9/13/2017 | | | 8,425,814 | |
| | 35,878,000 | | | Associates Corp. of North America, 6.950%, 11/01/2018 | | | 40,609,124 | |
| | 3,590,000 | | | Bank of America Corp., 5.420%, 3/15/2017 | | | 3,670,710 | |
| | 9,805,000 | | | Bank of America Corp., 6.000%, 9/01/2017 | | | 10,679,214 | |
| | 11,100,000 | | | Bank of America Corp., MTN, 5.000%, 5/13/2021 | | | 11,117,127 | |
| | 5,000,000 | | | Bank of America Corp., MTN, 6.750%, 9/09/2013, (AUD) | | | 5,238,613 | |
| | 2,393,000 | | | Bank of America Corp., Series L, MTN, 7.625%, 6/01/2019 | | | 2,759,407 | |
| | 17,249,000 | | | Bank of America NA, 5.300%, 3/15/2017 | | | 18,000,539 | |
| | 10,227,000 | | | Barclays Bank PLC, 6.050%, 12/04/2017, 144A | | | 10,515,780 | |
| | 7,110,000,000 | | | Barclays Bank PLC, EMTN, 3.680%, 8/20/2015, (KRW) | | | 6,326,742 | |
| | 337,230,000,000 | | | Barclays Financial LLC, EMTN, 8.250%, 10/27/2014, (IDR) | | | 37,936,531 | |
| | 2,173,000 | | | Bear Stearns Cos., Inc. (The), 4.650%, 7/02/2018 | | | 2,321,783 | |
| | 370,000 | | | BNP Paribas/Australia, 7.000%, 5/24/2016, (AUD) | | | 375,643 | |
| | 8,994,000 | | | Capital One Financial Corp., 6.150%, 9/01/2016 | | | 9,885,449 | |
| | 6,473,000 | | | Citigroup, Inc., 5.000%, 9/15/2014 | | | 6,703,627 | |
| | 2,700,000 | | | Citigroup, Inc., 5.365%, 3/06/2036, (CAD)(c) | | | 2,173,156 | |
| | 14,680,000 | | | Citigroup, Inc., 5.500%, 2/15/2017 | | | 15,397,646 | |
| | 1,297,000 | | | Citigroup, Inc., 5.850%, 12/11/2034 | | | 1,325,967 | |
| | 2,740,000 | | | Citigroup, Inc., 5.875%, 2/22/2033 | | | 2,571,424 | |
| | 19,875,000 | | | Citigroup, Inc., 6.125%, 5/15/2018 | | | 22,279,597 | |
| | 8,705,000 | | | Citigroup, Inc., 6.125%, 8/25/2036 | | | 8,366,132 | |
| | 72,682,000 | | | Citigroup, Inc., 6.375%, 8/12/2014 | | | 78,860,188 | |
| | 2,398,000 | | | Citigroup, Inc., EMTN, (fixed rate to 11/30/2012, variable rate thereafter), 3.625%, 11/30/2017, (EUR) | | | 2,780,845 | |
| | 63,845,000 | | | Citigroup, Inc., MTN, 5.500%, 10/15/2014 | | | 68,499,939 | |
| | 31,670,000 | | | Cooperatieve Centrale Raiffeisen-Boerenleenbank BA/Utrect,
3.375%, 1/19/2017 | | | 32,377,476 | |
| | 1,174,000 | | | Goldman Sachs Group, Inc. (The), 6.450%, 5/01/2036 | | | 1,135,951 | |
| | 111,655,000 | | | Goldman Sachs Group, Inc. (The), 6.750%, 10/01/2037 | | | 109,095,086 | |
| | 6,645,000 | | | Goldman Sachs Group, Inc. (The), GMTN, 5.375%, 3/15/2020 | | | 6,755,154 | |
| | 1,527,000 | | | HBOS PLC, 6.000%, 11/01/2033, 144A | | | 1,160,462 | |
| | 700,000 | | | ICICI Bank Ltd., (fixed rate to 4/30/2017, variable rate thereafter), 6.375%, 4/30/2022, 144A | | | 658,000 | |
| | 67,364,716,380 | | | JPMorgan Chase & Co., Zero Coupon, 4/12/2012, 144A, (IDR) | | | 7,303,001 | |
| | 12,000,000,000 | | | JPMorgan Chase & Co., EMTN, 7.070%, 3/22/2014, (IDR) | | | 1,301,837 | |
| | 16,000,000,000 | | | JPMorgan Chase Bank NA, 7.700%, 6/01/2016, 144A, (IDR) | | | 1,848,294 | |
| | 100,000 | | | Keybank NA, 6.950%, 2/01/2028 | | | 110,770 | |
| | 9,787,000 | | | Lloyds TSB Bank PLC, EMTN, 4.570%, 10/13/2015, (CAD) | | | 9,747,948 | |
| | 81,622,000 | | | Lloyds TSB Bank PLC, MTN, 6.500%, 9/14/2020, 144A | | | 80,743,094 | |
See accompanying notes to financial statements.
11 |
Portfolio of Investments – as of March 31, 2012 (Unaudited)
Loomis Sayles Investment Grade Bond Fund – (continued)
| | | | | | | | |
Principal
Amount (‡) | | | Description | | Value (†) | |
| | | | | | | | |
| | | | Banking — continued | | | | |
| $ | 6,479,000 | | | Merrill Lynch & Co., Inc., 5.700%, 5/02/2017 | | $ | 6,644,279 | |
| | 4,300,000 | | | Merrill Lynch & Co., Inc., 6.050%, 5/16/2016 | | | 4,527,539 | |
| | 103,309,000 | | | Merrill Lynch & Co., Inc., 6.110%, 1/29/2037 | | | 98,329,300 | |
| | 15,370,000 | | | Merrill Lynch & Co., Inc., 6.220%, 9/15/2026 | | | 15,666,195 | |
| | 9,780,000 | | | Merrill Lynch & Co., Inc., 10.710%, 3/08/2017, (BRL) | | | 5,478,129 | |
| | 3,132,000 | | | Merrill Lynch & Co., Inc., EMTN, 4.625%, 9/14/2018, (EUR) | | | 3,863,385 | |
| | 11,641,000 | | | Merrill Lynch & Co., Inc., MTN, 6.875%, 4/25/2018 | | | 12,941,288 | |
| | 40,126,000 | | | Merrill Lynch & Co., Inc., Series C, MTN, 6.050%, 6/01/2034 | | | 36,518,592 | |
| | 2,652,000 | | | Merrill Lynch & Co., Inc., Series C, MTN, 6.400%, 8/28/2017 | | | 2,892,099 | |
| | 18,273,000 | | | Morgan Stanley, 4.750%, 4/01/2014 | | | 18,572,019 | |
| | 110,093,000 | | | Morgan Stanley, 5.500%, 7/24/2020 | | | 107,449,117 | |
| | 5,900,000 | | | Morgan Stanley, 5.750%, 1/25/2021 | | | 5,792,514 | |
| | 550,000 | | | Morgan Stanley, EMTN, 5.750%, 2/14/2017, (GBP) | | | 900,459 | |
| | 5,400,000 | | | Morgan Stanley, GMTN, 5.500%, 1/26/2020 | | | 5,266,512 | |
| | 24,100,000 | | | Morgan Stanley, GMTN, 7.625%, 3/03/2016, (AUD) | | | 25,340,061 | |
| | 3,800,000 | | | Morgan Stanley, MTN, 7.250%, 5/26/2015, (AUD) | | | 3,892,261 | |
| | 38,206,000 | | | Morgan Stanley, Series F, GMTN, 5.625%, 9/23/2019 | | | 37,763,536 | |
| | 5,187,000 | | | Morgan Stanley, Series F, GMTN, 6.625%, 4/01/2018 | | | 5,461,984 | |
| | 9,699,000 | | | Morgan Stanley, Series F, MTN, 5.950%, 12/28/2017 | | | 9,986,003 | |
| | 2,239,000 | | | Morgan Stanley, Series G & H, GMTN, 5.125%, 11/30/2015, (GBP) | | | 3,658,058 | |
| | 2,875,000 | | | National City Bank of Indiana, 4.250%, 7/01/2018 | | | 3,017,948 | |
| | 8,638,000 | | | National City Corp., 6.875%, 5/15/2019 | | | 10,046,910 | |
| | 5,250,000 | | | Royal Bank of Scotland PLC (The), EMTN, 4.350%, 1/23/2017, (EUR) | | | 6,053,149 | |
| | 2,550,000 | | | Royal Bank of Scotland PLC (The), EMTN, 6.934%, 4/09/2018, (EUR) | | | 3,166,270 | |
| | 16,175,000 | | | Santander Holdings USA, Inc., 4.625%, 4/19/2016 | | | 16,390,597 | |
| | 30,886,000 | | | Societe Generale S.A., MTN, 5.200%, 4/15/2021, 144A | | | 29,663,841 | |
| | 3,300,000 | | | Standard Chartered Bank, 6.400%, 9/26/2017, 144A | | | 3,644,586 | |
| | 17,861,000 | | | Standard Chartered PLC, 5.500%, 11/18/2014, 144A | | | 19,202,361 | |
| | | | | | | | |
| | | | | | | 1,159,794,064 | |
| | | | | | | | |
| | | | Brokerage — 1.5% | | | | |
| | 59,450,000 | | | Cantor Fitzgerald LP, 6.375%, 6/26/2015, 144A | | | 60,164,886 | |
| | 44,990,000 | | | Cantor Fitzgerald LP, 7.875%, 10/15/2019, 144A(c) | | | 44,257,248 | |
| | 11,813,000 | | | Jefferies Group, Inc., 6.250%, 1/15/2036 | | | 10,661,233 | |
| | 44,188,000 | | | Jefferies Group, Inc., 8.500%, 7/15/2019 | | | 49,048,680 | |
| | | | | | | | |
| | | | | | | 164,132,047 | |
| | | | | | | | |
| | | | Building Materials — 1.3% | | | | |
| | 6,640,000 | | | Masco Corp., 4.800%, 6/15/2015 | | | 6,802,381 | |
| | 10,942,000 | | | Masco Corp., 5.850%, 3/15/2017 | | | 11,213,887 | |
| | 6,616,000 | | | Masco Corp., 6.125%, 10/03/2016 | | | 6,993,641 | |
| | 4,808,000 | | | Masco Corp., 6.500%, 8/15/2032 | | | 4,527,319 | |
| | 28,539,000 | | | Masco Corp., 7.125%, 3/15/2020 | | | 30,510,160 | |
| | 5,725,000 | | | Masco Corp., 7.750%, 8/01/2029 | | | 5,904,943 | |
| | 24,394,000 | | | Owens Corning, Inc., 6.500%, 12/01/2016 | | | 27,101,002 | |
| | 41,379,000 | | | Owens Corning, Inc., 7.000%, 12/01/2036 | | | 44,095,738 | |
| | 1,037,000 | | | USG Corp., 6.300%, 11/15/2016 | | | 969,595 | |
| | | | | | | | |
| | | | | | | 138,118,666 | |
| | | | | | | | |
See accompanying notes to financial statements.
| 12
Portfolio of Investments – as of March 31, 2012 (Unaudited)
Loomis Sayles Investment Grade Bond Fund – (continued)
| | | | | | | | |
Principal
Amount (‡) | | | Description | | Value (†) | |
| | | | | | | | |
| | | | Chemicals — 0.5% | | | | |
| $ | 34,763,000 | | | Chevron Phillips Chemical Co. LLC, 8.250%, 6/15/2019, 144A | | $ | 45,527,154 | |
| | 3,469,000 | | | Cytec Industries, Inc., 6.000%, 10/01/2015 | | | 3,828,996 | |
| | 1,700,000 | | | Methanex Corp., 5.250%, 3/01/2022 | | | 1,730,399 | |
| | 2,349,000 | | | Methanex Corp., Senior Note, 6.000%, 8/15/2015 | | | 2,442,392 | |
| | | | | | | | |
| | | | | | | 53,528,941 | |
| | | | | | | | |
| | | | Collateralized Mortgage Obligations — 0.0% | | | | |
| | 1,181,656 | | | GSR Mortgage Loan Trust, Series 2005-AR2, Class 2A1, 2.866%, 4/25/2035(b) | | | 1,024,709 | |
| | 2,433,993 | | | WaMu Mortgage Pass Through Certificates, Series 2007-OA6, Class 2A, 2.474%, 7/25/2047(b) | | | 1,468,806 | |
| | 80,113 | | | Wells Fargo Mortgage Backed Securities Trust, Series 2006-AR12, Class 1A1, 2.749%, 9/25/2036(b) | | | 58,899 | |
| | | | | | | | |
| | | | | | | 2,552,414 | |
| | | | | | | | |
| | | | Commercial Mortgage-Backed Securities — 3.3% | | | | |
| | 7,927,364 | | | Bear Stearns Commercial Mortgage Securities, Series 2007-PW15, Class A4, 5.331%, 2/11/2044 | | | 8,539,103 | |
| | 33,167,701 | | | Citigroup/Deutsche Bank Commercial Mortgage Trust, Series 2007-CD4, Class A4, 5.322%, 12/11/2049 | | | 36,280,092 | |
| | 12,000,000 | | | Credit Suisse Mortgage Capital Certificates, Series 2007-C2, Class A3, 5.542%, 1/15/2049 | | | 12,984,276 | |
| | 62,292,812 | | | Credit Suisse Mortgage Capital Certificates, Series 2007-C3, Class A4, 5.867%, 6/15/2039(b) | | | 67,237,616 | |
| | 34,381,273 | | | Credit Suisse Mortgage Capital Certificates, Series 2007-C4, Class A4, 5.967%, 9/15/2039(b) | | | 36,768,124 | |
| | 6,711,090 | | | Credit Suisse Mortgage Capital Certificates, Series 2007-C5, Class A4, 5.695%, 9/15/2040 | | | 7,305,592 | |
| | 57,694,000 | | | Crown Castle Towers LLC, 6.113%, 1/15/2040, 144A | | | 64,122,727 | |
| | 23,544,272 | | | Greenwich Capital Commercial Funding Corp., Series 2007-GG11, Class A4, 5.736%, 12/10/2049 | | | 25,989,721 | |
| | 15,789,051 | | | JPMorgan Chase Commercial Mortgage Securities Corp., Series 2006-LDP6, Class A4, 5.475%, 4/15/2043 | | | 17,666,653 | |
| | 28,718,413 | | | JPMorgan Chase Commercial Mortgage Securities Corp., Series 2007-LD11, Class A4, 6.003%, 6/15/2049(b) | | | 31,477,822 | |
| | 21,524,263 | | | JPMorgan Chase Commercial Mortgage Securities Corp., Series 2007-LDPX, Class A3, 5.420%, 1/15/2049 | | | 23,852,973 | |
| | 3,131,798 | | | LB-UBS Commercial Mortgage Trust, Series 2006-C4, Class A4, 6.067%, 6/15/2038(b) | �� | | 3,562,489 | |
| | 1,311,441 | | | Merrill Lynch/Countrywide Commercial Mortgage Trust, Series 2007-6, Class A4, 5.485%, 3/12/2051 | | | 1,412,095 | |
| | 9,786,870 | | | Morgan Stanley Re-REMIC Trust, Series 2009-GG10, Class A4B, 5.980%, 8/12/2045, 144A(b) | | | 10,088,981 | |
| | 6,851,000 | | | Vornado DP LLC, Series 2010-VNO, Class D, 6.356%, 9/13/2028, 144A | | | 7,435,637 | |
| | 3,621,142 | | | Wachovia Bank Commercial Mortgage Trust, Series 2006-C29, Class A4, 5.308%, 11/15/2048 | | | 4,040,977 | |
| | | | | | | | |
| | | | | | | 358,764,878 | |
| | | | | | | | |
See accompanying notes to financial statements.
13 |
Portfolio of Investments – as of March 31, 2012 (Unaudited)
Loomis Sayles Investment Grade Bond Fund – (continued)
| | | | | | | | |
Principal
Amount (‡) | | | Description | | Value (†) | |
| | | | | | | | |
| | | | Construction Machinery — 0.3% | | | | |
| $ | 23,638,000 | | | Case New Holland, Inc., 7.750%, 9/01/2013 | | $ | 25,174,470 | |
| | 6,787,000 | | | Toro Co., 6.625%, 5/01/2037(c) | | | 7,155,331 | |
| | | | | | | | |
| | | | | | | 32,329,801 | |
| | | | | | | | |
| | | | Consumer Cyclical Services — 0.0% | | | | |
| | 4,260,000 | | | Western Union Co. (The), 6.200%, 11/17/2036 | | | 4,468,335 | |
| | 196,000 | | | Western Union Co. (The), 6.200%, 6/21/2040 | | | 202,830 | |
| | | | | | | | |
| | | | | | | 4,671,165 | |
| | | | | | | | |
| | | | Consumer Products — 0.2% | | | | |
| | 7,458,000 | | | Hasbro, Inc., 6.600%, 7/15/2028 | | | 8,004,298 | |
| | 11,754,000 | | | Snap-on, Inc., 6.700%, 3/01/2019 | | | 14,263,503 | |
| | | | | | | | |
| | | | | | | 22,267,801 | |
| | | | | | | | |
| | | | Distributors — 0.1% | | | | |
| | 5,740,000 | | | ONEOK, Inc., 6.000%, 6/15/2035 | | | 6,118,513 | |
| | | | | | | | |
| | | | Diversified Manufacturing — 1.2% | | | | |
| | 1,395,000 | | | Ingersoll-Rand Global Holding Co. Ltd., 6.875%, 8/15/2018 | | | 1,703,991 | |
| | 2,814,000 | | | Textron Financial Corp., 5.400%, 4/28/2013 | | | 2,918,458 | |
| | 1,181,000 | | | Textron Financial Corp., Series E, MTN, 5.125%, 8/15/2014 | | | 1,230,366 | |
| | 18,800,000 | | | Textron, Inc., 3.875%, 3/11/2013, (EUR) | | | 25,484,760 | |
| | 78,795,000 | | | Textron, Inc., 5.950%, 9/21/2021 | | | 86,134,833 | |
| | 11,040,000 | | | Textron, Inc., EMTN, 6.625%, 4/07/2020, (GBP) | | | 19,733,010 | |
| | | | | | | | |
| | | | | | | 137,205,418 | |
| | | | | | | | |
| | | | Electric — 2.7% | | | | |
| | 35,959,293 | | | Alta Wind Holdings LLC, 7.000%, 6/30/2035, 144A | | | 38,727,439 | |
| | 46,556,000 | | | Ameren Illinois Co., 6.250%, 4/01/2018 | | | 54,596,640 | |
| | 30,257,000 | | | AmerenEnergy Generating Co., Series H, 7.000%, 4/15/2018 | | | 26,777,445 | |
| | 489,000 | | | Baltimore Gas & Electric Co., 5.200%, 6/15/2033 | | | 511,939 | |
| | 11,503,547 | | | Bruce Mansfield Unit, 6.850%, 6/01/2034 | | | 12,190,079 | |
| | 17,435,000 | | | Cleveland Electric Illuminating Co. (The), 5.700%, 4/01/2017 | | | 19,369,936 | |
| | 18,687,000 | | | Cleveland Electric Illuminating Co. (The), 5.950%, 12/15/2036 | | | 20,096,729 | |
| | 876,000 | | | Commonwealth Edison Co., 4.700%, 4/15/2015 | | | 962,685 | |
| | 12,185,000 | | | EDP Finance BV, 4.900%, 10/01/2019, 144A | | | 9,905,186 | |
| | 3,300,000 | | | EDP Finance BV, 6.000%, 2/02/2018, 144A | | | 2,916,491 | |
| | 1,000,000 | | | EDP Finance BV, EMTN, 4.625%, 6/13/2016, (EUR) | | | 1,166,987 | |
| | 900,000 | | | EDP Finance BV, EMTN, 5.875%, 2/01/2016, (EUR) | | | 1,102,431 | |
| | 979,000 | | | Empresa Nacional de Electricidad S.A. (Endesa-Chile), 8.350%, 8/01/2013 | | | 1,054,762 | |
| | 4,491,000 | | | Endesa S.A./Cayman Islands, 7.875%, 2/01/2027 | | | 5,374,779 | |
| | 19,600,000 | | | Enel Finance International NV, 6.000%, 10/07/2039, 144A | | | 17,788,568 | |
| | 7,800,000 | | | Enel Finance International NV, 6.800%, 9/15/2037, 144A | | | 7,594,657 | |
| | 3,603,000 | | | Exelon Corp., 4.900%, 6/15/2015 | | | 3,930,098 | |
| | 1,864,000 | | | ITC Holdings Corp., 5.875%, 9/30/2016, 144A | | | 2,127,683 | |
| | 7,932,880 | | | Mackinaw Power LLC, 6.296%, 10/31/2023, 144A(c) | | | 8,072,737 | |
| | 1,532,000 | | | Ohio Edison Co., 6.875%, 7/15/2036 | | | 1,885,137 | |
| | 50,026,000 | | | Southwestern Electric Power Co., 6.450%, 1/15/2019 | | | 59,133,483 | |
| | 1,075,000 | | | White Pine Hydro LLC, 6.310%, 7/10/2017(c) | | | 977,831 | |
See accompanying notes to financial statements.
| 14
Portfolio of Investments – as of March 31, 2012 (Unaudited)
Loomis Sayles Investment Grade Bond Fund – (continued)
| | | | | | | | |
Principal
Amount (‡) | | | Description | | Value (†) | |
| | | | | | | | |
| | | | Electric — continued | | | | |
| $ | 1,600,000 | | | White Pine Hydro LLC, 6.960%, 7/10/2037(c) | | $ | 1,346,656 | |
| | | | | | | | |
| | | | | | | 297,610,378 | |
| | | | | | | | |
| | | | Entertainment — 0.0% | | | | |
| | 494,000 | | | Time Warner, Inc., 7.625%, 4/15/2031 | | | 632,496 | |
| | 323,000 | | | Time Warner, Inc., 7.700%, 5/01/2032 | | | 421,270 | |
| | 3,616,000 | | | Viacom, Inc., 6.125%, 10/05/2017 | | | 4,318,408 | |
| | | | | | | | |
| | | | | | | 5,372,174 | |
| | | | | | | | |
| | | | Financial Other — 0.9% | | | | |
| | 61,860,000 | | | Aviation Capital Group Corp., 6.750%, 4/06/2021, 144A | | | 59,998,633 | |
| | 26,914,000 | | | National Life Insurance Co., 10.500%, 9/15/2039, 144A | | | 33,830,413 | |
| | | | | | | | |
| | | | | | | 93,829,046 | |
| | | | | | | | |
| | | | Food & Beverage — 0.1% | | | | |
| | 2,450,000 | | | Cargill, Inc., EMTN, 5.375%, 3/02/2037, (GBP) | | | 4,374,884 | |
| | 8,446,000 | | | Corn Products International, Inc., 6.625%, 4/15/2037 | | | 9,550,534 | |
| | | | | | | | |
| | | | | | | 13,925,418 | |
| | | | | | | | |
| | | | Government Guaranteed — 0.6% | | | | |
| | 12,910,000 | | | Instituto de Credito Oficial, EMTN, 4.530%, 3/17/2016, (CAD) | | | 12,017,580 | |
| | 13,005,000 | | | Instituto de Credito Oficial, MTN, 5.500%, 10/11/2012, (AUD) | | | 13,316,199 | |
| | 11,311,000 | | | Instituto de Credito Oficial, MTN, 6.125%, 2/27/2014, (AUD) | | | 11,122,880 | |
| | 31,142,000 | | | Queensland Treasury Corp., 7.125%, 9/18/2017, 144A, (NZD) | | | 28,560,396 | |
| | | | | | | | |
| | | | | | | 65,017,055 | |
| | | | | | | | |
| | | | Government Owned — No Guarantee — 1.4% | | | | |
| | 3,720,000 | | | Abu Dhabi National Energy Co., 6.500%, 10/27/2036, 144A | | | 3,864,150 | |
| | 36,975,000 | | | Abu Dhabi National Energy Co., 7.250%, 8/01/2018, 144A | | | 42,983,438 | |
| | 58,060,000 | | | DP World Ltd., 6.850%, 7/02/2037, 144A | | | 56,027,900 | |
| | 26,030,000,000 | | | Export-Import Bank of Korea, 6.600%, 11/04/2013, 144A, (IDR) | | | 2,859,201 | |
| | 27,800,000,000 | | | Export-Import Bank of Korea, 8.300%, 3/15/2014, 144A, (IDR) | | | 3,117,467 | |
| | 22,478,000 | | | Federal Home Loan Mortgage Corp., 1.625%, 4/15/2013 | | | 22,797,929 | |
| | 15,170,000 | | | Korea Gas Corp., 6.000%, 7/15/2014, 144A | | | 16,382,037 | |
| | 1,000,000 | | | Telekom Malaysia Berhad, 7.875%, 8/01/2025, 144A | | | 1,339,238 | |
| | | | | | | | |
| | | | | | | 149,371,360 | |
| | | | | | | | |
| | | | Government Sponsored — 0.6% | | | | |
| | 66,200,000 | | | Federal Home Loan Bank, 1.875%, 6/21/2013 | | | 67,488,252 | |
| | | | | | | | |
| | | | Health Insurance — 0.0% | | | | |
| | 1,569,000 | | | CIGNA Corp., 7.875%, 5/15/2027 | | | 1,957,621 | |
| | 1,174,000 | | | CIGNA Corp., (Step to 8.080% on 1/15/2023), 8.300%, 1/15/2033(d) | | | 1,441,260 | |
| | | | | | | | |
| | | | | | | 3,398,881 | |
| | | | | | | | |
| | | | Healthcare — 1.0% | | | | |
| | 20,100,000 | | | Aristotle Holding, Inc., 4.750%, 11/15/2021, 144A | | | 21,511,382 | |
| | 7,692,000 | | | Boston Scientific Corp., 6.000%, 1/15/2020 | | | 8,828,816 | |
| | 7,374,000 | | | Covidien International Finance S.A., 6.000%, 10/15/2017 | | | 8,845,998 | |
| | 17,416,000 | | | Express Scripts, Inc., 6.250%, 6/15/2014 | | | 19,146,001 | |
| | 9,459,000 | | | Express Scripts, Inc., 7.250%, 6/15/2019 | | | 11,685,677 | |
See accompanying notes to financial statements.
15 |
Portfolio of Investments – as of March 31, 2012 (Unaudited)
Loomis Sayles Investment Grade Bond Fund – (continued)
| | | | | | | | |
Principal
Amount (‡) | | | Description | | Value (†) | |
| | | | | | | | |
| | | | Healthcare — continued | | | | |
| $ | 9,278,000 | | | HCA, Inc., 5.750%, 3/15/2014 | | $ | 9,625,925 | |
| | 312,000 | | | HCA, Inc., 5.875%, 3/15/2022 | | | 312,390 | |
| | 1,908,000 | | | HCA, Inc., 6.250%, 2/15/2013 | | | 1,958,085 | |
| | 3,729,000 | | | HCA, Inc., 6.375%, 1/15/2015 | | | 3,934,095 | |
| | 3,617,000 | | | HCA, Inc., 6.500%, 2/15/2016 | | | 3,852,105 | |
| | 357,000 | | | HCA, Inc., 6.750%, 7/15/2013 | | | 371,280 | |
| | 2,936,000 | | | HCA, Inc., 7.050%, 12/01/2027 | | | 2,635,060 | |
| | 2,241,000 | | | HCA, Inc., 7.190%, 11/15/2015 | | | 2,375,460 | |
| | 2,109,000 | | | HCA, Inc., 7.500%, 12/15/2023 | | | 2,014,095 | |
| | 1,282,000 | | | HCA, Inc., 7.500%, 11/06/2033 | | | 1,201,875 | |
| | 3,807,000 | | | HCA, Inc., 7.690%, 6/15/2025 | | | 3,668,996 | |
| | 4,164,000 | | | HCA, Inc., 8.360%, 4/15/2024 | | | 4,247,280 | |
| | 1,199,000 | | | HCA, Inc., MTN, 7.580%, 9/15/2025 | | | 1,133,055 | |
| | 3,068,000 | | | HCA, Inc., MTN, 7.750%, 7/15/2036 | | | 2,837,900 | |
| | 2,256,000 | | | Owens & Minor, Inc., 6.350%, 4/15/2016(c) | | | 2,436,523 | |
| | | | | | | | |
| | | | | | | 112,621,998 | |
| | | | | | | | |
| | | | Home Construction — 0.1% | | | | |
| | 2,006,000 | | | Desarrolladora Homex SAB de CV, 7.500%, 9/28/2015 | | | 2,026,060 | |
| | 2,546,000 | | | Pulte Group, Inc., 5.200%, 2/15/2015 | | | 2,596,920 | |
| | 9,200,000 | | | Pulte Group, Inc., 6.000%, 2/15/2035 | | | 7,176,000 | |
| | 3,567,000 | | | Pulte Group, Inc., 6.375%, 5/15/2033 | | | 2,871,435 | |
| | | | | | | | |
| | | | | | | 14,670,415 | |
| | | | | | | | |
| | | | Independent Energy — 0.9% | | | | |
| | 11,930,000 | | | Anadarko Petroleum Corp., 6.375%, 9/15/2017 | | | 14,175,429 | |
| | 9,787,000 | | | EQT Corp., 8.125%, 6/01/2019 | | | 11,435,532 | |
| | 60,038,000 | | | Equitable Resources, Inc., 6.500%, 4/01/2018 | | | 68,403,094 | |
| | | | | | | | |
| | | | | | | 94,014,055 | |
| | | | | | | | |
| | | | Industrial Other — 0.0% | | | | |
| | 4,893,000 | | | Worthington Industries, Inc., 6.500%, 4/15/2020 | | | 5,266,913 | |
| | | | | | | | |
| | | | Life Insurance — 1.0% | | | | |
| | 7,100,000 | | | American International Group, Inc., EMTN, 5.000%, 4/26/2023, (GBP) | | | 10,460,819 | |
| | 6,910,000 | | | American International Group, Inc., Series G, MTN, 5.850%, 1/16/2018 | | | 7,514,667 | |
| | 2,036,000 | | | American International Group, Inc., Series MP, GMTN, 5.450%, 5/18/2017 | | | 2,188,781 | |
| | 9,777,000 | | | ASIF III Jersey Ltd., Series 2003-G, EMTN, 4.750%, 9/11/2013, (EUR) | | | 13,389,316 | |
| | 600,000 | | | AXA S.A., EMTN, (fixed rate to 10/16/2019, variable rate thereafter), 6.772%, 10/29/2049, (GBP) | | | 738,969 | |
| | 5,050,000 | | | AXA S.A., EMTN, (fixed rate to 4/16/2020, variable rate thereafter), 5.250%, 4/16/2040, (EUR) | | | 5,762,650 | |
| | 15,000,000 | | | Forethought Financial Group, Inc., 8.625%, 4/15/2021, 144A | | | 14,812,365 | |
| | 10,971,000 | | | MetLife, Inc., 6.400%, 12/15/2066 | | | 10,751,580 | |
| | 9,063,000 | | | Mutual of Omaha Insurance Co., 6.800%, 6/15/2036, 144A | | | 9,628,984 | |
| | 6,440,000 | | | NLV Financial Corp., 7.500%, 8/15/2033, 144A | | | 6,022,939 | |
| | 2,872,000 | | | Penn Mutual Life Insurance Co. (The), 6.650%, 6/15/2034, 144A | | | 3,029,268 | |
| | 14,489,000 | | | Penn Mutual Life Insurance Co. (The), 7.625%, 6/15/2040, 144A | | | 17,019,272 | |
See accompanying notes to financial statements.
| 16
Portfolio of Investments – as of March 31, 2012 (Unaudited)
Loomis Sayles Investment Grade Bond Fund – (continued)
| | | | | | | | |
Principal
Amount (‡) | | | Description | | Value (†) | |
| | | | | | | | |
| | | | Life Insurance — continued | | | | |
| $ | 4,732,000 | | | Unum Group, 7.125%, 9/30/2016 | | $ | 5,402,529 | |
| | | | | | | | |
| | | | | | | 106,722,139 | |
| | | | | | | | |
| | | | Local Authorities — 2.4% | | | | |
| | 7,448,000 | | | Manitoba (Province of), GMTN, 6.375%, 9/01/2015, (NZD) | | | 6,528,803 | |
| | 99,450,000 | | | New South Wales Treasury Corp., 5.500%, 8/01/2013, (AUD) | | | 105,054,957 | |
| | 47,456,000 | | | New South Wales Treasury Corp., 6.000%, 5/01/2012, (AUD) | | | 49,229,054 | |
| | 30,476,000 | | | New South Wales Treasury Corp., Series 12RG, 6.000%, 5/01/2012, (AUD) | | | 31,607,101 | |
| | 17,930,000 | | | New South Wales Treasury Corp., Series 17RG, 5.500%, 3/01/2017, (AUD) | | | 19,611,431 | |
| | 16,989 | | | Province of Alberta, 5.930%, 9/16/2016, (CAD) | | | 18,946 | |
| | 489,000 | | | Province of Nova Scotia, 6.600%, 6/01/2027, (CAD) | | | 674,001 | |
| | 29,791,000 | | | Province of Quebec, Canada, Series QC, 6.750%, 11/09/2015, (NZD) | | | 26,424,661 | |
| | 26,518,000 | | | Queensland Treasury Corp., Series 14, 5.750%, 11/21/2014, (AUD) | | | 28,458,908 | |
| | | | | | | | |
| | | | | | | 267,607,862 | |
| | | | | | | | |
| | | | Lodging — 0.8% | | | | |
| | 52,516,000 | | | Choice Hotels International, Inc., 5.700%, 8/28/2020 | | | 54,578,513 | |
| | 4,522,000 | | | Wyndham Worldwide Corp., 5.750%, 2/01/2018 | | | 5,035,573 | |
| | 100,000 | | | Wyndham Worldwide Corp., 6.000%, 12/01/2016 | | | 111,465 | |
| | 23,518,000 | | | Wyndham Worldwide Corp., 7.375%, 3/01/2020 | | | 28,290,084 | |
| | | | | | | | |
| | | | | | | 88,015,635 | |
| | | | | | | | |
| | | | Media Cable — 1.1% | | | | |
| | 2,923,000 | | | Comcast Corp., 6.950%, 8/15/2037 | | | 3,700,734 | |
| | 17,832,000 | | | Shaw Communications, Inc., 5.650%, 10/01/2019, (CAD) | | | 20,054,721 | |
| | 4,101,000 | | | Time Warner Cable, Inc., 5.850%, 5/01/2017 | | | 4,785,527 | |
| | 78,178,000 | | | Time Warner Cable, Inc., 6.750%, 7/01/2018 | | | 95,384,743 | |
| | | | | | | | |
| | | | | | | 123,925,725 | |
| | | | | | | | |
| | | | Media Non-Cable — 0.2% | | | | |
| | 7,536,000 | | | News America, Inc., 6.150%, 3/01/2037 | | | 8,423,598 | |
| | 4,482,000 | | | News America, Inc., 8.150%, 10/17/2036 | | | 5,450,596 | |
| | 10,870,000 | | | R.R. Donnelley & Sons Co., 8.250%, 3/15/2019 | | | 10,815,650 | |
| | | | | | | | |
| | | | | | | 24,689,844 | |
| | | | | | | | |
| | | | Metals & Mining — 1.8% | | | | |
| | 20,000,000 | | | Alcoa, Inc., 5.400%, 4/15/2021 | | | 20,666,320 | |
| | 15,060,000 | | | Alcoa, Inc., 5.870%, 2/23/2022 | | | 15,691,782 | |
| | 6,000,000 | | | Alcoa, Inc., 5.900%, 2/01/2027 | | | 6,035,994 | |
| | 5,505,000 | | | Alcoa, Inc., 5.950%, 2/01/2037 | | | 5,356,337 | |
| | 28,838,000 | | | Alcoa, Inc., 6.150%, 8/15/2020 | | | 31,043,415 | |
| | 5,804,000 | | | Alcoa, Inc., 6.750%, 1/15/2028 | | | 5,903,185 | |
| | 430,000 | | | ArcelorMittal, 5.500%, 3/01/2021 | | | 422,034 | |
| | 7,080,000 | | | ArcelorMittal, 6.125%, 6/01/2018 | | | 7,439,006 | |
| | 3,890,000 | | | ArcelorMittal, 6.250%, 2/25/2022 | | | 3,933,175 | |
| | 38,235,000 | | | ArcelorMittal, 6.750%, 3/01/2041 | | | 35,830,707 | |
| | 19,365,000 | | | ArcelorMittal, 7.000%, 10/15/2039 | | | 18,496,228 | |
See accompanying notes to financial statements.
17 |
Portfolio of Investments – as of March 31, 2012 (Unaudited)
Loomis Sayles Investment Grade Bond Fund – (continued)
| | | | | | | | |
Principal
Amount (‡) | | | Description | | Value (†) | |
| | | | | | | | |
| | | | Metals & Mining — continued | | | | |
| $ | 3,181,000 | | | Rio Tinto Alcan, Inc., 5.750%, 6/01/2035 | | $ | 3,628,058 | |
| | 1,943,000 | | | United States Steel Corp., 6.050%, 6/01/2017 | | | 1,981,860 | |
| | 4,612,000 | | | United States Steel Corp., 6.650%, 6/01/2037 | | | 3,874,080 | |
| | 31,210,000 | | | United States Steel Corp., 7.000%, 2/01/2018 | | | 32,068,275 | |
| | 3,655,000 | | | Vale Overseas Ltd., 6.875%, 11/21/2036 | | | 4,239,211 | |
| | | | | | | | |
| | | | | | | 196,609,667 | |
| | | | | | | | |
| | | | Mortgage Related — 0.0% | | | | |
| | 79,196 | | | FHLMC, 5.000%, 12/01/2031 | | | 85,547 | |
| | 13,036 | | | FNMA, 6.000%, 7/01/2029 | | | 14,564 | |
| | | | | | | | |
| | | | | | | 100,111 | |
| | | | | | | | |
| | | | Non-Captive Consumer — 1.6% | | | | |
| | 62,425(††) | | | SLM Corp., 6.000%, 12/15/2043 | | | 1,365,703 | |
| | 6,342,000 | | | SLM Corp., MTN, 5.050%, 11/14/2014 | | | 6,499,129 | |
| | 347,000 | | | SLM Corp., MTN, 5.125%, 8/27/2012 | | | 349,600 | |
| | 8,895,000 | | | SLM Corp., MTN, 7.250%, 1/25/2022 | | | 9,293,710 | |
| | 641,000 | | | SLM Corp., MTN, 8.000%, 3/25/2020 | | | 692,280 | |
| | 5,616,000 | | | SLM Corp., Series A, MTN, 0.860%, 1/27/2014(b) | | | 5,364,049 | |
| | 9,224,000 | | | SLM Corp., Series A, MTN, 5.000%, 10/01/2013 | | | 9,431,540 | |
| | 6,547,000 | | | SLM Corp., Series A, MTN, 5.000%, 4/15/2015 | | | 6,662,784 | |
| | 1,957,000 | | | SLM Corp., Series A, MTN, 5.000%, 6/15/2018 | | | 1,878,258 | |
| | 6,141,000 | | | SLM Corp., Series A, MTN, 5.375%, 1/15/2013 | | | 6,263,961 | |
| | 4,548,000 | | | SLM Corp., Series A, MTN, 5.375%, 5/15/2014 | | | 4,696,283 | |
| | 19,496,000 | | | SLM Corp., Series A, MTN, 5.625%, 8/01/2033 | | | 16,644,749 | |
| | 30,667,000 | | | SLM Corp., Series A, MTN, 8.450%, 6/15/2018 | | | 34,193,705 | |
| | 4,893,000 | | | Springleaf Finance Corp., Series I, MTN, 5.400%, 12/01/2015 | | | 4,048,958 | |
| | 87,676,000 | | | Springleaf Finance Corp., Series J, MTN, 6.900%, 12/15/2017 | | | 68,387,280 | |
| | | | | | | | |
| | | | | | | 175,771,989 | |
| | | | | | | | |
| | | | Non-Captive Diversified — 3.2% | | | | |
| | 1,282,000 | | | Ally Financial, Inc., 6.625%, 5/15/2012 | | | 1,286,333 | |
| | 1,634,000 | | | Ally Financial, Inc., 6.750%, 12/01/2014 | | | 1,700,615 | |
| | 391,000 | | | Ally Financial, Inc., 6.875%, 8/28/2012 | | | 396,999 | |
| | 3,075,000 | | | Ally Financial, Inc., 7.500%, 12/31/2013 | | | 3,267,187 | |
| | 5,543,000 | | | Ally Financial, Inc., 8.000%, 12/31/2018 | | | 5,889,437 | |
| | 2,285,000 | | | Ally Financial, Inc., 8.000%, 11/01/2031 | | | 2,436,777 | |
| | 15,688,000 | | | GATX Corp., 4.750%, 10/01/2012 | | | 15,938,741 | |
| | 3,500,000 | | | General Electric Capital Australia Funding Pty Ltd., 7.000%, 10/08/2015, (AUD) | | | 3,797,441 | |
| | 7,570,000 | | | General Electric Capital Australia Funding Pty Ltd., MTN, 6.000%, 5/15/2013, (AUD) | | | 7,948,127 | |
| | 3,100,000 | | | General Electric Capital Australia Funding Pty Ltd., MTN, 6.000%, 4/15/2015, (AUD) | | | 3,269,667 | |
| | 1,874,000 | | | General Electric Capital Australia Funding Pty Ltd., MTN, 6.000%, 3/15/2019, (AUD) | | | 1,918,802 | |
| | 969,000 | | | General Electric Capital Corp., 5.625%, 5/01/2018 | | | 1,123,155 | |
| | 4,673,000 | | | General Electric Capital Corp., MTN, 5.875%, 1/14/2038 | | | 5,136,725 | |
See accompanying notes to financial statements.
| 18
Portfolio of Investments – as of March 31, 2012 (Unaudited)
Loomis Sayles Investment Grade Bond Fund – (continued)
| | | | | | | | |
Principal
Amount (‡) | | | Description | | Value (†) | |
| | | | | | | | |
| | | | Non-Captive Diversified — continued | | | | |
| | 51,370,000 | | | General Electric Capital Corp., Series A, EMTN, 5.500%, 2/01/2017, (NZD) | | $ | 42,797,138 | |
| | 14,225,000 | | | General Electric Capital Corp., Series A, EMTN, 6.750%, 9/26/2016, (NZD) | | | 12,308,438 | |
| | 6,000,000 | | | General Electric Capital Corp., Series A, GMTN, 2.960%, 5/18/2012, (SGD) | | | 4,781,939 | |
| | 36,850,000 | | | General Electric Capital Corp., Series A, GMTN, 7.625%, 12/10/2014, (NZD) | | | 32,519,601 | |
| | 10,247,000 | | | General Electric Capital Corp., Series A, MTN, 0.867%, 5/13/2024(b) | | | 8,144,766 | |
| | 16,696,000 | | | General Electric Capital Corp., Series A, MTN, 4.875%, 3/04/2015 | | | 18,345,248 | |
| | 26,931,000 | | | General Electric Capital Corp., Series A, MTN, 6.500%, 9/28/2015, (NZD) | | | 23,031,504 | |
| | 73,590,000 | | | International Lease Finance Corp., 6.250%, 5/15/2019 | | | 72,639,144 | |
| | 13,899,000 | | | International Lease Finance Corp., 6.375%, 3/25/2013 | | | 14,281,222 | |
| | 60,419,000 | | | International Lease Finance Corp., 7.125%, 9/01/2018, 144A | | | 65,856,710 | |
| | 548,000 | | | International Lease Finance Corp., 8.625%, 9/15/2015 | | | 602,800 | |
| | 1,473,000 | | | International Lease Finance Corp., Series R, MTN, 5.625%, 9/20/2013 | | | 1,491,413 | |
| | 1,625,000 | | | International Lease Finance Corp., Series R, MTN, 5.650%, 6/01/2014 | | | 1,653,438 | |
| | | | | | | | |
| | | | | | | 352,563,367 | |
| | | | | | | | |
| | | | Oil Field Services — 0.6% | | | | |
| | 5,965,000 | | | Nabors Industries, Inc., 6.150%, 2/15/2018 | | | 6,960,523 | |
| | 22,583,000 | | | Nabors Industries, Inc., 9.250%, 1/15/2019 | | | 28,990,474 | |
| | 23,338,000 | | | Rowan Cos., Inc., 7.875%, 8/01/2019 | | | 27,854,230 | |
| | 587,000 | | | Transocean Ltd., 7.375%, 4/15/2018 | | | 674,990 | |
| | | | | | | | |
| | | | | | | 64,480,217 | |
| | | | | | | | |
| | | | Paper — 1.1% | | | | |
| | 4,365,000 | | | Celulosa Arauco y Constitucion S.A., 7.250%, 7/29/2019 | | | 5,175,546 | |
| | 23,225,000 | | | Georgia-Pacific LLC, 5.400%, 11/01/2020, 144A | | | 25,925,626 | |
| | 715,000 | | | Georgia-Pacific LLC, 7.250%, 6/01/2028 | | | 841,562 | |
| | 2,672,000 | | | Georgia-Pacific LLC, 7.375%, 12/01/2025 | | | 3,259,180 | |
| | 644,000 | | | Georgia-Pacific LLC, 7.750%, 11/15/2029 | | | 802,475 | |
| | 545,000 | | | Georgia-Pacific LLC, 8.000%, 1/15/2024 | | | 693,780 | |
| | 1,336,000 | | | Georgia-Pacific LLC, 8.875%, 5/15/2031 | | | 1,802,321 | |
| | 6,161,000 | | | International Paper Co., 5.250%, 4/01/2016 | | | 6,797,875 | |
| | 7,611,000 | | | International Paper Co., 8.700%, 6/15/2038 | | | 10,315,759 | |
| | 5,270,000 | | | Mead Corp. (The), 7.550%, 3/01/2047 | | | 4,800,706 | |
| | 5,764,000 | | | Westvaco Corp., 8.200%, 1/15/2030 | | | 6,383,422 | |
| | 24,007,000 | | | Weyerhaeuser Co., 6.875%, 12/15/2033 | | | 24,334,792 | |
| | 7,374,000 | | | Weyerhaeuser Co., 7.375%, 10/01/2019 | | | 8,463,096 | |
| | 20,254,000 | | | Weyerhaeuser Co., 7.375%, 3/15/2032 | | | 21,576,303 | |
| | | | | | | | |
| | | | | | | 121,172,443 | |
| | | | | | | | |
| | | | Pharmaceuticals — 0.6% | | | | |
| | 56,052,000 | | | Roche Holdings, Inc., 5.000%, 3/01/2014, 144A | | | 60,414,471 | |
| | 489,000 | | | Schering-Plough Corp., 5.300%, 12/01/2013 | | | 527,899 | |
| | | | | | | | |
| | | | | | | 60,942,370 | |
| | | | | | | | |
See accompanying notes to financial statements.
19 |
Portfolio of Investments – as of March 31, 2012 (Unaudited)
Loomis Sayles Investment Grade Bond Fund – (continued)
| | | | | | | | |
Principal
Amount (‡) | | | Description | | Value (†) | |
| | | | | | | | |
| | | | Pipelines — 3.6% | | | | |
| $ | 5,236,000 | | | CenterPoint Energy Resources Corp., 6.250%, 2/01/2037 | | $ | 6,002,791 | |
| | 1,967,000 | | | DCP Midstream LP, 6.450%, 11/03/2036, 144A | | | 2,190,607 | |
| | 528,000 | | | Energy Transfer Partners LP, 6.125%, 2/15/2017 | | | 589,918 | |
| | 1,571,000 | | | Energy Transfer Partners LP, 6.625%, 10/15/2036 | | | 1,629,692 | |
| | 9,257,000 | | | Enterprise Products Operating LLC, 4.050%, 2/15/2022 | | | 9,585,947 | |
| | 3,328,000 | | | Florida Gas Transmission Co., 7.900%, 5/15/2019, 144A | | | 4,028,571 | |
| | 14,300,000 | | | IFM US Colonial Pipeline 2 LLC, 6.450%, 5/01/2021, 144A | | | 15,346,217 | |
| | 14,675,000 | | | Kinder Morgan Energy Partners LP, 5.300%, 9/15/2020 | | | 16,121,251 | |
| | 66,165,000 | | | Kinder Morgan Energy Partners LP, 5.950%, 2/15/2018 | | | 77,275,493 | |
| | 303,000 | | | Kinder Morgan Finance Co. LLC, 5.700%, 1/05/2016 | | | 319,665 | |
| | 29,082,463 | | | Maritimes & Northeast Pipeline LLC, 7.500%, 5/31/2014, 144A(c) | | | 31,113,582 | |
| | 8,886,000 | | | NGPL PipeCo LLC, 6.514%, 12/15/2012, 144A | | | 8,574,874 | |
| | 30,760,000 | | | NGPL PipeCo LLC, 7.119%, 12/15/2017, 144A | | | 28,029,127 | |
| | 13,790,000 | | | NiSource Finance Corp., 6.125%, 3/01/2022 | | | 16,022,546 | |
| | 24,110,000 | | | NiSource Finance Corp., 6.400%, 3/15/2018 | | | 28,240,501 | |
| | 21,614,000 | | | NiSource Finance Corp., 6.800%, 1/15/2019 | | | 25,586,740 | |
| | 9,899,000 | | | Panhandle Eastern Pipeline Co., 6.200%, 11/01/2017 | | | 11,283,672 | |
| | 47,594,000 | | | Panhandle Eastern Pipeline Co., 7.000%, 6/15/2018 | | | 55,866,503 | |
| | 1,404,000 | | | Panhandle Eastern Pipeline Co., 8.125%, 6/01/2019 | | | 1,710,670 | |
| | 2,085,000 | | | Plains All American Pipeline LP, 6.125%, 1/15/2017 | | | 2,411,058 | |
| | 15,683,000 | | | Plains All American Pipeline LP, 6.500%, 5/01/2018 | | | 18,669,953 | |
| | 4,497,000 | | | Plains All American Pipeline LP, 6.650%, 1/15/2037 | | | 5,257,461 | |
| | 4,125,000 | | | Southern Natural Gas Co., 5.900%, 4/01/2017, 144A | | | 4,671,237 | |
| | 19,574,000 | | | Texas Eastern Transmission LP, 6.000%, 9/15/2017, 144A | | | 22,700,359 | |
| | | | | | | | |
| | | | | | | 393,228,435 | |
| | | | | | | | |
| | | | Property & Casualty Insurance — 0.8% | | | | |
| | 3,083,000 | | | Hanover Insurance Group, Inc. (The), 7.500%, 3/01/2020 | | | 3,489,111 | |
| | 9,038,000 | | | Liberty Mutual Group, Inc., 6.500%, 3/15/2035, 144A | | | 9,375,081 | |
| | 30,054,000 | | | Marsh & McLennan Cos., Inc., 5.875%, 8/01/2033 | | | 33,087,170 | |
| | 944,000 | | | MBIA Insurance Corp., (fixed rate to 1/15/2013, variable rate thereafter), 14.000%, 1/15/2033, 144A | | | 571,120 | |
| | 14,575,000 | | | Nationwide Mutual Insurance Co., 6.600%, 4/15/2034, 144A | | | 14,174,508 | |
| | 7,609,000 | | | White Mountains Re Group Ltd., 6.375%, 3/20/2017, 144A | | | 7,970,991 | |
| | 13,521,000 | | | Willis North America, Inc., 7.000%, 9/29/2019 | | | 15,641,620 | |
| | 2,212,000 | | | XL Group PLC, 6.250%, 5/15/2027 | | | 2,307,039 | |
| | 1,463,000 | | | XL Group PLC, 6.375%, 11/15/2024 | | | 1,617,898 | |
| | | | | | | | |
| | | | | | | 88,234,538 | |
| | | | | | | | |
| | | | Property Trust — 0.4% | | | | |
| | 36,192,000 | | | WEA Finance LLC/WT Finance Australia Property Ltd., 6.750%, 9/02/2019, 144A | | | 41,846,168 | |
| | | | | | | | |
| | | | Railroads — 0.1% | | | | |
| | 9,787,000 | | | Canadian Pacific Railway Co., 7.250%, 5/15/2019 | | | 11,807,507 | |
| | 238,000 | | | Missouri Pacific Railroad Co., 4.750%, 1/01/2030(c) | | | 202,300 | |
| | 1,701,000 | | | Missouri Pacific Railroad Co., 5.000%, 1/01/2045(c) | | | 1,360,800 | |
| | 191,000 | | | Missouri Pacific Railroad Co., Series A, 4.750%, 1/01/2020(c) | | | 168,080 | |
| | | | | | | | |
| | | | | | | 13,538,687 | |
| | | | | | | | |
See accompanying notes to financial statements.
| 20
Portfolio of Investments – as of March 31, 2012 (Unaudited)
Loomis Sayles Investment Grade Bond Fund – (continued)
| | | | | | | | |
Principal
Amount (‡) | | | Description | | Value (†) | |
| | | | | | | | |
| | | | Real Estate Operations/Development — 0.1% | | | | |
| $ | 10,276,000 | | | First Industrial LP, 5.950%, 5/15/2017 | | $ | 9,979,650 | |
| | | | | | | | |
| | | | Refining — 0.1% | | | | |
| | 7,700,000 | | | Reliance Holdings USA, Inc., 5.400%, 2/14/2022, 144A | | | 7,659,937 | |
| | | | | | | | |
| | | | REITs — Apartments — 0.3% | | | | |
| | 12,243,000 | | | Camden Property Trust, 5.000%, 6/15/2015 | | | 13,124,398 | |
| | 16,491,000 | | | Camden Property Trust, 5.700%, 5/15/2017 | | | 18,444,128 | |
| | 988,000 | | | ERP Operating LP, 5.125%, 3/15/2016 | | | 1,082,477 | |
| | 1,762,000 | | | ERP Operating LP, 5.375%, 8/01/2016 | | | 1,959,813 | |
| | 1,508,000 | | | ERP Operating LP, 5.750%, 6/15/2017 | | | 1,720,020 | |
| | | | | | | | |
| | | | | | | 36,330,836 | |
| | | | | | | | |
| | | | REITs — Diversified — 0.2% | | | | |
| | 4,140,000 | | | Duke Realty LP, 5.950%, 2/15/2017 | | | 4,626,715 | |
| | 19,574,000 | | | Duke Realty LP, 6.500%, 1/15/2018 | | | 22,421,156 | |
| | | | | | | | |
| | | | | | | 27,047,871 | |
| | | | | | | | |
| | | | REITs — Healthcare — 0.1% | | | | |
| | 5,972,000 | | | Health Care REIT, Inc., 6.500%, 3/15/2041 | | | 6,217,115 | |
| | | | | | | | |
| | | | REITs — Office Property — 0.3% | | | | |
| | 20,817,000 | | | Highwoods Properties, Inc., 5.850%, 3/15/2017 | | | 22,124,391 | |
| | 11,306,000 | | | Highwoods Properties, Inc., 7.500%, 4/15/2018 | | | 12,969,316 | |
| | | | | | | | |
| | | | | | | 35,093,707 | |
| | | | | | | | |
| | | | REITs — Regional Malls — 0.2% | | | | |
| | 2,427,000 | | | Simon Property Group LP, 5.250%, 12/01/2016 | | | 2,744,694 | |
| | 12,209,000 | | | Simon Property Group LP, 5.750%, 12/01/2015 | | | 13,767,186 | |
| | 1,889,000 | | | Simon Property Group LP, 5.875%, 3/01/2017 | | | 2,180,586 | |
| | 4,066,000 | | | Simon Property Group LP, 6.100%, 5/01/2016 | | | 4,676,986 | |
| | | | | | | | |
| | | | | | | 23,369,452 | |
| | | | | | | | |
| | | | REITs — Shopping Centers — 0.1% | | | | |
| | 4,893,000 | | | Equity One, Inc., 6.000%, 9/15/2017 | | | 5,275,275 | |
| | 1,918,000 | | | Federal Realty Investment Trust, 5.650%, 6/01/2016 | | | 2,113,494 | |
| | | | | | | | |
| | | | | | | 7,388,769 | |
| | | | | | | | |
| | | | REITs — Single Tenant — 0.3% | | | | |
| | 5,862,000 | | | Realty Income Corp., 5.750%, 1/15/2021 | | | 6,346,858 | |
| | 25,529,000 | | | Realty Income Corp., 6.750%, 8/15/2019 | | | 29,495,185 | |
| | | | | | | | |
| | | | | | | 35,842,043 | |
| | | | | | | | |
| | | | REITs — Warehouse/Industrials — 0.6% | | | | |
| | 3,873,000 | | | ProLogis LP, 5.625%, 11/15/2015 | | | 4,217,770 | |
| | 11,179,000 | | | ProLogis LP, 5.625%, 11/15/2016 | | | 11,829,741 | |
| | 10,889,000 | | | ProLogis LP, 5.750%, 4/01/2016 | | | 11,869,718 | |
| | 9,698,000 | | | ProLogis LP, 6.625%, 5/15/2018 | | | 11,039,641 | |
| | 18,869,000 | | | ProLogis LP, 7.375%, 10/30/2019 | | | 22,029,312 | |
| | | | | | | | |
| | | | | | | 60,986,182 | |
| | | | | | | | |
See accompanying notes to financial statements.
21 |
Portfolio of Investments – as of March 31, 2012 (Unaudited)
Loomis Sayles Investment Grade Bond Fund – (continued)
| | | | | | | | |
Principal
Amount (‡) | | | Description | | Value (†) | |
| | | | | | | | |
| | | | Restaurants — 0.1% | | | | |
| $ | 10,320,000 | | | Darden Restaurants, Inc., 6.000%, 8/15/2035 | | $ | 10,458,257 | |
| | | | | | | | |
| | | | Retailers — 0.6% | | | | |
| | 7,996,000 | | | J.C. Penney Corp., Inc., 5.750%, 2/15/2018 | | | 8,185,905 | |
| | 8,139,000 | | | J.C. Penney Corp., Inc., 6.375%, 10/15/2036 | | | 7,152,146 | |
| | 12,000 | | | J.C. Penney Corp., Inc., 7.125%, 11/15/2023 | | | 12,555 | |
| | 8,656,000 | | | J.C. Penney Corp., Inc., 7.625%, 3/01/2097 | | | 7,790,400 | |
| | 13,425,000 | | | Macy’s Retail Holdings, Inc., 6.375%, 3/15/2037 | | | 15,121,128 | |
| | 10,467,000 | | | Macy’s Retail Holdings, Inc., 6.790%, 7/15/2027 | | | 11,061,400 | |
| | 2,691,000 | | | Macy’s Retail Holdings, Inc., 6.900%, 4/01/2029 | | | 3,138,505 | |
| | 8,064,000 | | | Marks & Spencer PLC, 7.125%, 12/01/2037, 144A | | | 8,336,144 | |
| | | | | | | | |
| | | | | | | 60,798,183 | |
| | | | | | | | |
| | | | Sovereigns — 0.8% | | | | |
| | 24,178,000 | | | Republic of Brazil, 10.250%, 1/10/2028, (BRL) | | | 15,827,719 | |
| | 6,035,000 | | | Republic of Brazil, 12.500%, 1/05/2022, (BRL) | | | 4,390,414 | |
| | 52,555,000 | | | Republic of Croatia, 6.750%, 11/05/2019, 144A | | | 52,752,081 | |
| | 1,018,562,437 | | | Republic of Iceland, 4.250%, 8/24/2012, (ISK) | | | 5,306,498 | |
| | 776,294,507 | | | Republic of Iceland, 7.250%, 5/17/2013, (ISK) | | | 4,167,731 | |
| | | | | | | | |
| | | | | | | 82,444,443 | |
| | | | | | | | |
| | | | Supermarkets — 0.2% | | | | |
| | 4,130,000 | | | American Stores Co., Series B, MTN, 7.100%, 3/20/2028 | | | 3,066,525 | |
| | 3,269,000 | | | Kroger Co. (The), 6.400%, 8/15/2017 | | | 3,941,227 | |
| | 1,860,000 | | | New Albertson’s, Inc., 7.450%, 8/01/2029 | | | 1,422,900 | |
| | 979,000 | | | New Albertson’s, Inc., Series C, MTN, 6.625%, 6/01/2028 | | | 690,195 | |
| | 10,863,000 | | | Safeway, Inc., 6.350%, 8/15/2017 | | | 12,640,296 | |
| | | | | | | | |
| | | | | | | 21,761,143 | |
| | | | | | | | |
| | | | Supranational — 1.3% | | | | |
| | 11,745,000 | | | European Bank for Reconstruction & Development, GMTN, 9.250%, 9/10/2012, (BRL) | | | 6,457,192 | |
| | 3,933,310 | | | European Financial Stability Facility, 0.400%, 3/12/2013, (EUR) | | | 5,232,965 | |
| | 3,933,310 | | | European Financial Stability Facility, 1.000%, 3/12/2014, (EUR) | | | 5,235,058 | |
| | 192,350,850,000 | | | European Investment Bank, EMTN, Zero Coupon, 4/24/2013, 144A, (IDR) | | | 19,796,739 | |
| | 9,640,000 | | | European Investment Bank, MTN, 6.000%, 8/06/2020, (AUD) | | | 10,278,349 | |
| | 329,210,000,000 | | | Inter-American Development Bank, EMTN, Zero Coupon, 5/20/2013, (IDR) | | | 33,738,265 | |
| | 410,030,000,000 | | | Inter-American Development Bank, EMTN, Zero Coupon, 9/23/2013, (IDR) | | | 41,124,072 | |
| | 12,982,000 | | | Inter-American Development Bank, EMTN, 6.000%, 12/15/2017, (NZD) | | | 11,485,779 | |
| | 15,070,000 | | | International Bank for Reconstruction & Development, 1.430%, 3/05/2014, (SGD) | | | 12,105,992 | |
| | | | | | | | |
| | | | | | | 145,454,411 | |
| | | | | | | | |
| | | | Technology — 3.0% | | | | |
| | 8,705,000 | | | Agilent Technologies, Inc., 6.500%, 11/01/2017 | | | 10,470,139 | |
| | 4,600,000 | | | Alcatel-Lucent USA, Inc., 6.450%, 3/15/2029 | | | 3,634,000 | |
| | 1,028,000 | | | Arrow Electronics, Inc., 6.875%, 6/01/2018 | | | 1,186,509 | |
| | 3,059,000 | | | Avnet, Inc., 5.875%, 3/15/2014 | | | 3,243,296 | |
See accompanying notes to financial statements.
| 22
Portfolio of Investments – as of March 31, 2012 (Unaudited)
Loomis Sayles Investment Grade Bond Fund – (continued)
| | | | | | | | |
Principal
Amount (‡) | | | Description | | Value (†) | |
| | | | | | | | |
| | | | Technology — continued | | | | |
| $ | 6,097,000 | | | Avnet, Inc., 6.000%, 9/01/2015 | | $ | 6,736,051 | |
| | 1,507,000 | | | Avnet, Inc., 6.625%, 9/15/2016 | | | 1,707,852 | |
| | 12,444,000 | | | BMC Software, Inc., 7.250%, 6/01/2018(c) | | | 14,726,752 | |
| | 13,457,000 | | | Corning, Inc., 6.750%, 9/15/2013 | | | 14,448,808 | |
| | 1,448,000 | | | Corning, Inc., 6.850%, 3/01/2029 | | | 1,680,017 | |
| | 56,271,000 | | | Corning, Inc., 7.000%, 5/15/2024 | | | 70,387,481 | |
| | 7,487,000 | | | Corning, Inc., 7.250%, 8/15/2036 | | | 8,947,407 | |
| | 55,237,000 | | | Dun & Bradstreet Corp. (The), 6.000%, 4/01/2013 | | | 57,911,520 | |
| | 7,051,000 | | | Equifax, Inc., 7.000%, 7/01/2037 | | | 8,219,139 | |
| | 112,000 | | | Freescale Semiconductor, Inc., 10.125%, 12/15/2016 | | | 119,560 | |
| | 70,969,000 | | | Ingram Micro, Inc., 5.250%, 9/01/2017 | | | 74,811,758 | |
| | 7,795,000 | | | Intuit, Inc., 5.750%, 3/15/2017 | | | 8,938,768 | |
| | 19,078,000 | | | KLA-Tencor Corp., 6.900%, 5/01/2018 | | | 22,746,795 | |
| | 1,502,000 | | | Motorola Solutions, Inc., 6.625%, 11/15/2037 | | | 1,594,700 | |
| | 2,256,000 | | | Samsung Electronics Co. Ltd., 7.700%, 10/01/2027, 144A | | | 2,708,858 | |
| | 5,603,000 | | | Tyco Electronics Group S.A., 6.550%, 10/01/2017 | | | 6,633,706 | |
| | 561,000 | | | Xerox Corp., 6.350%, 5/15/2018 | | | 650,901 | |
| | 7,110,000 | | | Xerox Corp., 6.750%, 2/01/2017 | | | 8,229,107 | |
| | | | | | | | |
| | | | | | | 329,733,124 | |
| | | | | | | | |
| | | | Textile — 0.2% | | | | |
| | 3,755,000 | | | Phillips-Van Heusen Corp., 7.750%, 11/15/2023 | | | 4,280,700 | |
| | 14,903,000 | | | VF Corp., 6.450%, 11/01/2037 | | | 18,393,014 | |
| | | | | | | | |
| | | | | | | 22,673,714 | |
| | | | | | | | |
| | | | Tobacco — 0.1% | | | | |
| | 8,128,000 | | | Reynolds American, Inc., 6.750%, 6/15/2017 | | | 9,682,545 | |
| | 1,992,000 | | | Reynolds American, Inc., 7.250%, 6/15/2037 | | | 2,323,865 | |
| | | | | | | | |
| | | | | | | 12,006,410 | |
| | | | | | | | |
| | | | Transportation Services — 0.7% | | | | |
| | 8,436,000 | | | Erac USA Finance Co., 6.375%, 10/15/2017, 144A | | | 9,681,440 | |
| | 2,824,000 | | | Erac USA Finance Co., 6.700%, 6/01/2034, 144A | | | 3,074,130 | |
| | 51,504,000 | | | Erac USA Finance Co., 7.000%, 10/15/2037, 144A | | | 58,757,463 | |
| | | | | | | | |
| | | | | | | 71,513,033 | |
| | | | | | | | |
| | | | Treasuries — 17.2% | | | | |
| | 93,805,000 | | | Canadian Government, 1.750%, 3/01/2013, (CAD) | | | 94,611,905 | |
| | 360,010,000 | | | Canadian Government, 2.000%, 9/01/2012, (CAD) | | | 362,442,671 | |
| | 106,195,000 | | | Canadian Government, 3.500%, 6/01/2013, (CAD) | | | 109,409,223 | |
| | 194,485,000 | | | Canadian Government, 3.750%, 6/01/2019, (CAD) | | | 219,688,400 | |
| | 4,159,000 | | | Canadian Government, 4.000%, 6/01/2016, (CAD) | | | 4,587,930 | |
| | 183,949,000 | | | Canadian Government, 4.250%, 6/01/2018, (CAD) | | | 211,604,514 | |
| | 85,198,516 | | | Ireland Government Bond, 4.500%, 10/18/2018, (EUR) | | | 102,485,954 | |
| | 24,638,126 | | | Ireland Government Bond, 4.500%, 4/18/2020, (EUR) | | | 28,260,728 | |
| | 5,049,296 | | | Ireland Government Bond, 5.000%, 10/18/2020, (EUR) | | | 5,919,212 | |
| | 63,183,488 | | | Ireland Government Bond, 5.400%, 3/13/2025, (EUR) | | | 72,748,388 | |
| | 1,130,000 | | | Italy Buoni Poliennali Del Tesoro, 5.000%, 8/01/2034, (EUR) | | | 1,357,165 | |
| | 1,130,000 | | | Italy Buoni Poliennali Del Tesoro, 5.250%, 11/01/2029, (EUR) | | | 1,448,757 | |
See accompanying notes to financial statements.
23 |
Portfolio of Investments – as of March 31, 2012 (Unaudited)
Loomis Sayles Investment Grade Bond Fund – (continued)
| | | | | | | | |
Principal
Amount (‡) | | | Description | | Value (†) | |
| | | | | | | | |
| | | | Treasuries — continued | | | | |
| | 1,120,000 | | | Italy Buoni Poliennali Del Tesoro, 5.750%, 2/01/2033, (EUR) | | $ | 1,479,159 | |
| | 4,111,400(†††) | | | Mexican Fixed Rate Bonds, Series M-20, 8.000%, 12/07/2023, (MXN) | | | 36,399,956 | |
| | 12,263,000 | | | New Zealand Government Bond, 6.000%, 12/15/2017, (NZD) | | | 11,246,163 | |
| | 305,195,000 | | | New Zealand Government Bond, 6.500%, 4/15/2013, (NZD) | | | 259,652,112 | |
| | 726,401,000 | | | Norwegian Government, 4.250%, 5/19/2017, (NOK) | | | 141,505,810 | |
| | 118,387,000 | | | Norwegian Government, 5.000%, 5/15/2015, (NOK) | | | 22,869,963 | |
| | 994,369,000 | | | Norwegian Government, 6.500%, 5/15/2013, (NOK) | | | 183,946,260 | |
| | 18,301,446 | | | Portugal Obrigacoes do Tesouro OT, 3.850%, 4/15/2021, (EUR) | | | 13,978,580 | |
| | 4,599,829 | | | Portugal Obrigacoes do Tesouro OT, 4.800%, 6/15/2020, (EUR) | | | 3,673,997 | |
| | 927,108,000 | | | Republic of Iceland, 6.000%, 10/13/2016, (ISK) | | | 4,937,043 | |
| | | | | | | | |
| | | | | | | 1,894,253,890 | |
| | | | | | | | |
| | | | Wireless — 0.7% | | | | |
| | 31,416,000 | | | Cellco Partnership/Verizon Wireless Capital LLC, 8.500%, 11/15/2018 | | | 43,134,891 | |
| | 15,375,000 | | | Nextel Communications, Inc., Series C, 5.950%, 3/15/2014 | | | 15,375,000 | |
| | 8,549,000 | | | Nextel Communications, Inc., Series D, 7.375%, 8/01/2015 | | | 8,249,785 | |
| | 279,000 | | | Nextel Communications, Inc., Series E, 6.875%, 10/31/2013 | | | 279,000 | |
| | 6,373,000 | | | Sprint Capital Corp., 6.875%, 11/15/2028 | | | 4,875,345 | |
| | 2,594,000 | | | Sprint Capital Corp., 6.900%, 5/01/2019 | | | 2,243,810 | |
| | 612,000 | | | Sprint Capital Corp., 8.750%, 3/15/2032 | | | 524,790 | |
| | 91,000 | | | Sprint Nextel Corp., 6.000%, 12/01/2016 | | | 81,217 | |
| | 1,619,000 | | | Vodafone Group PLC, 5.000%, 9/15/2015 | | | 1,817,025 | |
| | | | | | | | |
| | | | | | | 76,580,863 | |
| | | | | | | | |
| | | | Wirelines — 4.5% | | | | |
| | 406,000 | | | Bell Canada, MTN, 7.300%, 2/23/2032, (CAD) | | | 510,739 | |
| | 1,874,000 | | | BellSouth Corp., 6.000%, 11/15/2034 | | | 2,029,201 | |
| | 2,936,000 | | | BellSouth Telecommunications, Inc., 5.850%, 11/15/2045 | | | 2,896,250 | |
| | 6,665,000 | | | BellSouth Telecommunications, Inc., 7.000%, 12/01/2095 | | | 7,750,575 | |
| | 62,040,000 | | | CenturyLink, Inc., 6.450%, 6/15/2021 | | | 63,684,618 | |
| | 4,990,000 | | | CenturyLink, Inc., Series G, 6.875%, 1/15/2028 | | | 4,662,926 | |
| | 2,708,000 | | | CenturyLink, Inc., Series P, 7.600%, 9/15/2039 | | | 2,561,538 | |
| | 121,506,000 | | | Deutsche Telekom International Finance BV, 6.000%, 7/08/2019 | | | 141,946,711 | |
| | 24,103,000 | | | Embarq Corp., 7.995%, 6/01/2036 | | | 24,362,445 | |
| | 3,279,000 | | | GTE Corp., 6.940%, 4/15/2028 | | | 3,977,588 | |
| | 1,440,000 | | | Level 3 Financing, Inc., 8.750%, 2/15/2017 | | | 1,504,800 | |
| | 200,000 | | | Level 3 Financing, Inc., 9.375%, 4/01/2019 | | | 218,500 | |
| | 5,200,000 | | | Oi S.A., 9.750%, 9/15/2016, 144A, (BRL) | | | 2,948,314 | |
| | 8,450,000 | | | Portugal Telecom International Finance BV, EMTN, 4.500%, 6/16/2025, (EUR) | | | 7,860,659 | |
| | 18,850,000 | | | Portugal Telecom International Finance BV, EMTN, 5.000%, 11/04/2019, (EUR) | | | 20,176,826 | |
| | 200,000 | | | Portugal Telecom International Finance BV, EMTN, 5.625%, 2/08/2016, (EUR) | | | 246,024 | |
| | 300,000 | | | Portugal Telecom International Finance BV, GMTN, 4.375%, 3/24/2017, (EUR) | �� | | 339,126 | |
| | 1,698,000 | | | Qwest Capital Funding, Inc., 6.500%, 11/15/2018 | | | 1,812,615 | |
| | 2,755,000 | | | Qwest Capital Funding, Inc., 6.875%, 7/15/2028 | | | 2,633,268 | |
See accompanying notes to financial statements.
| 24
Portfolio of Investments – as of March 31, 2012 (Unaudited)
Loomis Sayles Investment Grade Bond Fund – (continued)
| | | | | | | | |
Principal
Amount (‡) | | | Description | | Value (†) | |
| | | | | | | | |
| | | | Wirelines — continued | | | | |
| $ | 4,370,000 | | | Qwest Capital Funding, Inc., 7.625%, 8/03/2021 | | $ | 4,483,458 | |
| | 949,000 | | | Qwest Capital Funding, Inc., 7.750%, 2/15/2031 | | | 920,598 | |
| | 333,000 | | | Qwest Corp., 6.500%, 6/01/2017 | | | 376,382 | |
| | 14,480,000 | | | Qwest Corp., 6.875%, 9/15/2033 | | | 14,335,200 | |
| | 4,668,000 | | | Qwest Corp., 7.200%, 11/10/2026 | | | 4,703,010 | |
| | 9,077,000 | | | Qwest Corp., 7.250%, 9/15/2025 | | | 9,712,390 | |
| | 9,474,000 | | | Qwest Corp., 7.250%, 10/15/2035 | | | 9,663,480 | |
| | 1,566,000 | | | Qwest Corp., 7.500%, 6/15/2023 | | | 1,581,660 | |
| | 31,291,000 | | | Telecom Italia Capital S.A., 6.000%, 9/30/2034 | | | 27,536,080 | |
| | 12,595,000 | | | Telecom Italia Capital S.A., 6.375%, 11/15/2033 | | | 11,335,500 | |
| | 975,000 | | | Telefonica Emisiones SAU, 5.462%, 2/16/2021 | | | 947,861 | |
| | 8,375,000 | | | Telefonica Emisiones SAU, 7.045%, 6/20/2036 | | | 8,232,541 | |
| | 1,700,000 | | | Telefonica Emisiones SAU, EMTN, 5.289%, 12/09/2022, (GBP) | | | 2,512,135 | |
| | 2,700,000 | | | Telefonica Emisiones SAU, EMTN, 5.375%, 2/02/2026, (GBP) | | | 3,870,886 | |
| | 8,800,000 | | | Telefonica Emisiones SAU, EMTN, 5.597%, 3/12/2020, (GBP) | | | 13,774,193 | |
| | 14,137,000 | | | Telus Corp., 4.950%, 3/15/2017, (CAD) | | | 15,554,739 | |
| | 54,665,000 | | | Telus Corp., Series CG, 5.050%, 12/04/2019, (CAD) | | | 61,240,474 | |
| | 3,598,000 | | | Verizon Communications, Inc., 6.100%, 4/15/2018 | | | 4,331,845 | |
| | 4,163,000 | | | Verizon Maryland, Inc., Series B, 5.125%, 6/15/2033 | | | 4,126,549 | |
| | 2,642,000 | | | Verizon New England, Inc., 7.875%, 11/15/2029 | | | 3,227,372 | |
| | 5,260,000 | | | Verizon Pennsylvania, Inc., 6.000%, 12/01/2028 | | | 5,431,823 | |
| | | | | | | | |
| | | | | | | 500,020,899 | |
| | | | | | | | |
| | | | Total Non-Convertible Bonds
(Identified Cost $8,239,694,997) | | | 9,320,552,738 | |
| | | | | | | | |
| | Convertible Bonds — 3.7% | | | | |
| | | | Automotive — 0.5% | | | | |
| | 34,827,000 | | | Ford Motor Co., 4.250%, 11/15/2016 | | | 55,200,795 | |
| | | | | | | | |
| | | | Life Insurance — 0.7% | | | | |
| | 72,915,000 | | | Old Republic International Corp., 3.750%, 3/15/2018 | | | 71,912,419 | |
| | | | | | | | |
| | | | Media Non-Cable — 0.0% | | | | |
| | 512,983 | | | Liberty Media LLC, 3.500%, 1/15/2031 | | | 309,713 | |
| | | | | | | | |
| | | | REITs — Warehouse/Industrials — 0.3% | | | | |
| | 27,359,000 | | | ProLogis LP, 3.250%, 3/15/2015 | | | 30,949,869 | |
| | | | | | | | |
| | | | Technology — 2.2% | | | | |
| | 35,120,000 | | | Intel Corp., 2.950%, 12/15/2035 | | | 40,388,000 | |
| | 137,016,000 | | | Intel Corp., 3.250%, 8/01/2039 | | | 192,678,750 | |
| | 11,515,000 | | | Lam Research Corp., Series B, 1.250%, 5/15/2018, 144A | | | 12,090,750 | |
| | 880,000 | | | Micron Technology, Inc., 1.875%, 6/01/2014 | | | 894,300 | |
| | | | | | | | |
| | | | | | | 246,051,800 | |
| | | | | | | | |
| | | | Wirelines — 0.0% | | | | |
| | 2,926,000 | | | Level 3 Communications, Inc., 7.000%, 3/15/2015, 144A(c) | | | 3,818,430 | |
| | | | | | | | |
| | | | Total Convertible Bonds
(Identified Cost $321,793,747) | | | 408,243,026 | |
| | | | | | | | |
See accompanying notes to financial statements.
25 |
Portfolio of Investments – as of March 31, 2012 (Unaudited)
Loomis Sayles Investment Grade Bond Fund – (continued)
| | | | | | | | |
Principal
Amount (‡) | | | Description | | Value (†) | |
| | | | | | | | |
| | Municipals — 0.6% | | | | |
| | | | California — 0.1% | | | | |
| $ | 1,275,000 | | | San Jose California Redevelopment Agency Tax Allocation (Merged Area Redevelopment), Series C, (MBIA insured), 3.750%, 8/01/2028 | | $ | 1,028,224 | |
| | 470,000 | | | San Jose California Redevelopment Agency Tax Allocation (Merged Area Redevelopment), Series C, (Registered), (MBIA insured), 3.750%, 8/01/2028 | | | 422,460 | |
| | 1,585,000 | | | State of California, (AMBAC insured), 4.500%, 8/01/2027 | | | 1,628,492 | |
| | 1,285,000 | | | State of California, (AMBAC insured), 4.500%, 8/01/2030 | | | 1,313,437 | |
| | 1,450,000 | | | State of California, 4.500%, 8/01/2030 | | | 1,482,088 | |
| | 3,880,000 | | | State of California (Various Purpose), (AMBAC insured), 4.500%, 12/01/2033 | | | 3,897,615 | |
| | | | | | | | |
| | | | | | | 9,772,316 | |
| | | | | | | | |
| | | | District of Columbia — 0.2% | | | | |
| | 14,680,000 | | | Metropolitan Washington Airports Authority, 7.462%, 10/01/2046 | | | 16,178,241 | |
| | | | | | | | |
| | | | Illinois — 0.2% | | | | |
| | 530,000 | | | Chicago O’Hare International Airport, Series A, (AGMC insured), 4.500%, 1/01/2038 | | | 535,040 | |
| | 24,640,000 | | | State of Illinois, 5.100%, 6/01/2033 | | | 23,227,143 | |
| | | | | | | | |
| | | | | | | 23,762,183 | |
| | | | | | | | |
| | | | Michigan — 0.0% | | | | |
| | 2,490,000 | | | Michigan Tobacco Settlement Finance Authority Taxable Turbo, Series A, 7.309%, 6/01/2034(c) | | | 1,839,463 | |
| | | | | | | | |
| | | | Ohio — 0.0% | | | | |
| | 6,430,000 | | | Buckeye Tobacco Settlement Financing Authority, Series A-2, 5.875%, 6/01/2047(c) | | | 4,806,103 | |
| | | | | | | | |
| | | | Virginia — 0.1% | | | | |
| | 14,240,000 | | | Virginia Tobacco Settlement Financing Corp., Series A-1, 6.706%, 6/01/2046(c) | | | 9,081,560 | |
| | | | | | | | |
| | | | Total Municipals
(Identified Cost $65,435,177) | | | 65,439,866 | |
| | | | | | | | |
| | | | Total Bonds and Notes
(Identified Cost $8,626,923,921) | | | 9,794,235,630 | |
| | | | | | | | |
| | Senior Loans — 0.7% | | | | |
| | | | Non-Captive Diversified — 0.5% | | | | |
| | 55,685,000 | | | Flying Fortress, Inc., 1st Lien Term Loan, 5.000%, 6/30/2017(b) | | | 55,893,819 | |
| | | | | | | | |
| | | | Aerospace & Defense — 0.2% | | | | |
| | 15,840,000 | | | AWAS Finance Luxembourg S.A.R.L., Term Loan B, 5.250%, 6/10/2016(b) | | | 15,840,000 | |
| | | | | | | | |
| | | | Total Senior Loans
(Identified Cost $70,976,239) | | | 71,733,819 | |
| | | | | | | | |
See accompanying notes to financial statements.
| 26
Portfolio of Investments – as of March 31, 2012 (Unaudited)
Loomis Sayles Investment Grade Bond Fund – (continued)
| | | | | | | | |
Principal
Amount (‡) | | | Description | | Value (†) | |
| | | | | | | | |
| | Short-Term Investments — 5.9% | | | | |
| | 2,154,697 | | | European Financial Stability Facility Treasury Bill,
0.000%, 9/12/2012, (EUR) | | $ | 2,868,460 | |
| | 648,485,620 | | | Tri-Party Repurchase Agreement with Fixed Income Clearing Corporation, dated 3/30/2012 at 0.000% to be repurchased at $648,485,620 on 4/02/2012 collateralized by $82,655,000 Federal Home Loan Mortgage Corp., 0.500% due 2/24/2015 valued at $82,343,750; $50,000,000 Federal National Mortgage Association, 0.550% due 2/27/2015 valued at $49,875,000; $705,000 Federal Home Loan Mortgage Corp., 0.750% due 11/25/2014 valued at $710,288; $50,000,000 U.S. Treasury Note, 11.250% due 2/15/2015 valued at $65,937,500; $215,000,000 U.S. Treasury Note, 2.250% due 1/31/2015 valued at $226,287,500; $80,245,000 U.S. Treasury Note, 2.375% due 2/28/2015 valued at $84,850,100; $121,205,000 Federal National Mortgage Association, 1.000% due 11/04/2014 valued at $121,811,025; $26,615,000 U.S. Treasury Note, 4.250% due 11/15/2014 valued at $29,645,065 including accrued interest (Note 2 of Notes to Financial Statements) | | | 648,485,620 | |
| | | | | | | | |
| | | | Total Short-Term Investments
(Identified Cost $651,386,596) | | | 651,354,080 | |
| | | | | | | | |
| | | | | | | | |
| | | | Total Investments — 95.7%
(Identified Cost $9,349,286,756)(a) | | | 10,517,323,529 | |
| | | | Other assets less liabilities — 4.3% | | | 473,919,471 | |
| | | | | | | | |
| | | | Net Assets — 100.0% | | $ | 10,991,243,000 | |
| | | | | | | | |
| | | | | | | | |
| | (‡) | | | Principal Amount stated in U.S. dollars unless otherwise noted. | | | | |
| | (†) | | | See Note 2 of Notes to Financial Statements. | | | | |
| | (††) | | | Amount shown represents units. One unit represents a principal amount of 25. | |
| | (†††) | | | Amount shown represents units. One unit represents a principal amount of 100. | |
| | (a) | | | Federal Tax Information (Amounts exclude certain adjustments made at the end of the Fund’s fiscal year for tax purposes. Such adjustments are primarily due to wash sales. Amortization of premium on debt securities is excluded for tax purposes.): | |
| | | | At March 31, 2012, the net unrealized appreciation on investments based on a cost of $9,389,397,353 for federal income tax purposes was as follows: | |
| | | | Aggregate gross unrealized appreciation for all investments in which there is an excess of value over tax cost | | $ | 1,191,754,890 | |
| | | | Aggregate gross unrealized depreciation for all investments in which there is an excess of tax cost over value | | | (63,828,714 | ) |
| | | | | | | | |
| | | | Net unrealized appreciation | | $ | 1,127,926,176 | |
| | | | | | | | |
| | | | | | | | |
| | (b) | | | Variable rate security. Rate as of March 31, 2012 is disclosed. | | | | |
| | (c) | | | Illiquid security. At March 31, 2012, the value of these securities amounted to $133,536,552 or 1.2% of net assets. | | | | |
| | (d) | | | Coupon rate is a fixed rate for an initial period then resets at a specified date and rate. | |
| | | | | | | | |
See accompanying notes to financial statements.
27 |
Portfolio of Investments – as of March 31, 2012 (Unaudited)
Loomis Sayles Investment Grade Bond Fund – (continued)
| | | | | | |
| | | | | | |
| | 144A | | | All or a portion of these securities are exempt from registration under Rule 144A of the Securities Act of 1933. These securities may be resold in transactions exempt from registration, normally to qualified institutional buyers. At March 31, 2012, the value of Rule 144A holdings amounted to $1,610,599,516 or 14.7% of net assets. |
| | ABS | | | Asset-Backed Securities | | |
| | AGMC | | | Assured Guaranty Municipal Corp. | | |
| | AMBAC | | | American Municipal Bond Assurance Corp. | | |
| | EMTN | | | Euro Medium Term Note | | |
| | FHLMC | | | Federal Home Loan Mortgage Corp. | | |
| | FNMA | | | Federal National Mortgage Association | | |
| | GMTN | | | Global Medium Term Note | | |
| | MBIA | | | Municipal Bond Investors Assurance Corp. | | |
| | MTN | | | Medium Term Note | | |
| | REITs | | | Real Estate Investment Trusts | | |
| | REMIC | | | Real Estate Mortgage Investment Conduit | | |
| | | | | | |
| | AUD | | | Australian Dollar | | |
| | BRL | | | Brazilian Real | | |
| | CAD | | | Canadian Dollar | | |
| | EUR | | | Euro | | |
| | GBP | | | British Pound | | |
| | IDR | | | Indonesian Rupiah | | |
| | ISK | | | Icelandic Krona | | |
| | KRW | | | South Korean Won | | |
| | MXN | | | Mexican Peso | | |
| | NOK | | | Norwegian Krone | | |
| | NZD | | | New Zealand Dollar | | |
| | SGD | | | Singapore Dollar | | |
Industry Summary at March 31, 2012 (Unaudited)
| | | | |
Treasuries | | | 17.2 | % |
Banking | | | 10.6 | |
Technology | | | 5.2 | |
Wirelines | | | 4.5 | |
Non-Captive Diversified | | | 3.7 | |
Pipelines | | | 3.6 | |
Commercial Mortgage-Backed Securities | | | 3.3 | |
Electric | | | 2.7 | |
Airlines | | | 2.6 | |
Local Authorities | | | 2.4 | |
Other Investments, less than 2% each | | | 34.0 | |
Short-Term Investments | | | 5.9 | |
| | | | |
Total Investments | | | 95.7 | |
Other assets less liabilities | | | 4.3 | |
| | | | |
Net Assets | | | 100.0 | % |
| | | | |
See accompanying notes to financial statements.
| 28
Portfolio of Investments – as of March 31, 2012 (Unaudited)
Loomis Sayles Investment Grade Bond Fund – (continued)
Currency Exposure at March 31, 2012 (Unaudited)
| | | | |
United States Dollar | | | 69.1 | % |
Canadian Dollar | | | 10.5 | |
New Zealand Dollar | | | 4.1 | |
Norwegian Krone | | | 3.2 | |
Euro | | | 3.0 | |
Australian Dollar | | | 2.9 | |
Other, less than 2% each | | | 2.9 | |
| | | | |
Total Investments | | | 95.7 | |
Other assets less liabilities | | | 4.3 | |
| | | | |
Net Assets | | | 100.0 | % |
| | | | |
See accompanying notes to financial statements.
29 |
This Page Intentionally Left Blank
| 30
Statement of Assets and Liabilities
March 31, 2012 (Unaudited)
| | | | |
ASSETS | | | | |
Investments at cost | | $ | 9,349,286,756 | |
Net unrealized appreciation | | | 1,168,036,773 | |
| | | | |
Investments at value | | | 10,517,323,529 | |
Cash | | | 14,873 | |
Foreign currency at value (identified cost $1,001,821) | | | 808,317 | |
Receivable for Fund shares sold | | | 30,270,777 | |
Receivable for securities sold | | | 314,405,605 | |
Interest receivable | | | 148,216,302 | |
Tax reclaims receivable | | | 128,665 | |
| | | | |
TOTAL ASSETS | | | 11,011,168,068 | |
| | | | |
LIABILITIES | | | | |
Payable for securities purchased | | | 2,592,966 | |
Payable for Fund shares redeemed | | | 12,126,525 | |
Foreign taxes payable (Note 2) | | | 22,541 | |
Management fees payable (Note 5) | | | 3,726,804 | |
Deferred Trustees’ fees (Note 5) | | | 365,661 | |
Administrative fees payable (Note 5) | | | 419,808 | |
Payable to distributor (Note 5d) | | | 144,438 | |
Other accounts payable and accrued expenses | | | 526,325 | |
| | | | |
TOTAL LIABILITIES | | | 19,925,068 | |
| | | | |
NET ASSETS | | $ | 10,991,243,000 | |
| | | | |
NET ASSETS CONSIST OF: | | | | |
Paid-in capital | | $ | 9,811,927,959 | |
Undistributed net investment income | | | 7,034,175 | |
Accumulated net realized gain on investments and foreign currency transactions | | | 4,415,890 | |
Net unrealized appreciation on investments and foreign currency translations | | | 1,167,864,976 | |
| | | | |
NET ASSETS | | $ | 10,991,243,000 | |
| | | | |
See accompanying notes to financial statements.
31 |
| | | | |
COMPUTATION OF NET ASSET VALUE AND OFFERING PRICE: | | | | |
Class A shares: | | | | |
Net assets | | $ | 2,704,721,249 | |
| | | | |
Shares of beneficial interest | | | 218,205,102 | |
| | | | |
Net asset value and redemption price per share | | $ | 12.40 | |
| | | | |
Offering price per share (100/95.50 of net asset value) (Note 1) | | $ | 12.98 | |
| | | | |
Class B shares: (redemption price per share is equal to net asset value less any applicable contingent deferred sales charge) (Note 1) | | | | |
Net assets | | $ | 13,111,144 | |
| | | | |
Shares of beneficial interest | | | 1,063,067 | |
| | | | |
Net asset value and offering price per share | | $ | 12.33 | |
| | | | |
Class C shares: (redemption price per share is equal to net asset value less any applicable contingent deferred sales charge) (Note 1) | | | | |
Net assets | | $ | 2,209,875,599 | |
| | | | |
Shares of beneficial interest | | | 179,728,316 | |
| | | | |
Net asset value and offering price per share | | $ | 12.30 | |
| | | | |
Class Y shares: | | | | |
Net assets | | $ | 6,053,632,172 | |
| | | | |
Shares of beneficial interest | | | 488,034,494 | |
| | | | |
Net asset value, offering and redemption price per share | | $ | 12.40 | |
| | | | |
Admin Class shares: | | | | |
Net assets | | $ | 9,902,836 | |
| | | | |
Shares of beneficial interest | | | 800,083 | |
| | | | |
Net asset value, offering and redemption price per share | | $ | 12.38 | |
| | | | |
See accompanying notes to financial statements.
| 32
Statement of Operations
For the Six Months Ended March 31, 2012 (Unaudited)
| | | | |
INVESTMENT INCOME | | | | |
Interest | | $ | 265,405,744 | |
Less net foreign taxes withheld | | | (4,939 | ) |
| | | | |
| | | 265,400,805 | |
| | | | |
Expenses | | | | |
Management fees (Note 5) | | | 20,656,199 | |
Service and distribution fees (Note 5) | | | 14,586,350 | |
Administrative fees (Note 5) | | | 2,376,373 | |
Trustees’ fees and expenses (Note 5) | | | 121,417 | |
Transfer agent fees and expenses (Notes 5 and 6) | | | 6,098,925 | |
Audit and tax services fees | | | 30,086 | |
Custodian fees and expenses | | | 217,747 | |
Legal fees (Note 6) | | | 74,226 | |
Registration fees (Note 6) | | | 402,946 | |
Shareholder reporting expenses (Note 6) | | | 623,325 | |
Miscellaneous expenses | | | 132,672 | |
| | | | |
Total expenses | | | 45,320,266 | |
Fee/expense recovery (Note 5) | | | 26,917 | |
| | | | |
Net expenses | | | 45,347,183 | |
| | | | |
Net investment income | | | 220,053,622 | |
| | | | |
NET REALIZED AND UNREALIZED GAIN (LOSS) ON INVESTMENTS AND FOREIGN CURRENCY TRANSACTIONS | | | | |
Net realized gain (loss) on: | | | | |
Investments | | | 33,530,220 | |
Foreign currency transactions | | | (190,680 | ) |
Net change in unrealized appreciation (depreciation) on: | | | | |
Investments | | | 362,817,688 | |
Foreign currency translations | | | 2,803,437 | |
| | | | |
Net realized and unrealized gain on investments and foreign currency transactions | | | 398,960,665 | |
| | | | |
NET INCREASE IN NET ASSETS RESULTING FROM OPERATIONS | | $ | 619,014,287 | |
| | | | |
See accompanying notes to financial statements.
33 |
Statement of Changes in Net Assets
| | | | | | | | |
| | | Six Months
Ended
March 31, 2012
(Unaudited) | | | Year Ended
September 30,
2011 | |
FROM OPERATIONS: | | | | | | | | |
Net investment income | | $ | 220,053,622 | | | $ | 431,680,023 | |
Net realized gain on investments and foreign currency transactions | | | 33,339,540 | | | | 192,463,151 | |
Net change in unrealized appreciation (depreciation) on investments and foreign currency translations | | | 365,621,125 | | | | (325,162,613 | ) |
| | | | | | | | |
Net increase in net assets resulting from operations | | | 619,014,287 | | | | 298,980,561 | |
| | | | | | | | |
FROM DISTRIBUTIONS TO SHAREHOLDERS: | | | | | | | | |
Net investment income | | | | | | | | |
Class A | | | (80,698,201 | ) | | | (135,092,743 | ) |
Class B | | | (330,903 | ) | | | (629,400 | ) |
Class C | | | (53,298,864 | ) | | | (94,388,368 | ) |
Class Y | | | (153,040,149 | ) | | | (221,472,525 | ) |
Admin Class | | | (206,726 | ) | | | (116,800 | ) |
Class J | | | (1,366,652 | ) | | | (5,237,024 | ) |
Net realized capital gains | | | | | | | | |
Class A | | | (26,530,935 | ) | | | (60,444,223 | ) |
Class B | | | (123,858 | ) | | | (338,411 | ) |
Class C | | | (20,065,620 | ) | | | (51,169,312 | ) |
Class Y | | | (48,043,542 | ) | | | (92,540,414 | ) |
Admin Class | | | (72,361 | ) | | | (26,910 | ) |
Class J | | | (427,583 | ) | | | (2,664,737 | ) |
| | | | | | | | |
Total distributions | | | (384,205,394 | ) | | | (664,120,867 | ) |
| | | | | | | | |
NET INCREASE (DECREASE) IN NET ASSETS FROM CAPITAL SHARE TRANSACTIONS (NOTE 9) | | | 948,421,332 | | | | (137,153,662 | ) |
| | | | | | | | |
Net increase (decrease) in net assets | | | 1,183,230,225 | | | | (502,293,968 | ) |
NET ASSETS | | | | | | | | |
Beginning of the period | | | 9,808,012,775 | | | | 10,310,306,743 | |
| | | | | | | | |
End of the period | | $ | 10,991,243,000 | | | $ | 9,808,012,775 | |
| | | | | | | | |
UNDISTRIBUTED NET INVESTMENT INCOME | | $ | 7,034,175 | | | $ | 75,922,048 | |
| | | | | | | | |
See accompanying notes to financial statements.
| 34
Financial Highlights
For a share outstanding throughout each period.
| | | | | | | | | | | | | | | | | | | | | | | | | | | | |
| | | | | | Income (Loss) from Investment
Operations: | | | Less Distributions: | |
| | | Net asset
value,
beginning
of the
period | | | Net
investment
income(a) | | | Net realized
and
unrealized
gain (loss) | | | Total from
investment
operations | | | Dividends
from net
investment
income | | | Distributions
from net
realized
capital
gains | | | Total
distributions | |
INVESTMENT GRADE BOND FUND | | | | | | | | | | | | | | | | | | | | | |
Class A | | | | | | | | | | | | | | | | | | | | | | | | | | | | |
3/31/2012(f) | | $ | 12.12 | | | $ | 0.26 | | | $ | 0.48 | | | $ | 0.74 | | | $ | (0.35 | ) | | $ | (0.11 | ) | | $ | (0.46 | ) |
9/30/2011 | | | 12.56 | | | | 0.57 | | | | (0.15 | ) | | | 0.42 | | | | (0.60 | ) | | | (0.26 | ) | | | (0.86 | ) |
9/30/2010 | | | 11.64 | | | | 0.55 | | | | 0.96 | | | | 1.51 | | | | (0.56 | ) | | | (0.03 | ) | | | (0.59 | ) |
9/30/2009 | | | 10.54 | | | | 0.60 | | | | 1.22 | | | | 1.82 | | | | (0.59 | ) | | | (0.13 | ) | | | (0.72 | ) |
9/30/2008 | | | 11.73 | | | | 0.60 | | | | (1.15 | ) | | | (0.55 | ) | | | (0.64 | ) | | | — | | | | (0.64 | ) |
9/30/2007 | | | 11.35 | | | | 0.58 | | | | 0.42 | | | | 1.00 | | | | (0.62 | ) | | | — | | | | (0.62 | ) |
Class B | | | | | | | | | | | | | | | | | | | | | | | | | | | | |
3/31/2012(f) | | | 12.06 | | | | 0.22 | | | | 0.46 | | | | 0.68 | | | | (0.30 | ) | | | (0.11 | ) | | | (0.41 | ) |
9/30/2011 | | | 12.50 | | | | 0.47 | | | | (0.14 | ) | | | 0.33 | | | | (0.51 | ) | | | (0.26 | ) | | | (0.77 | ) |
9/30/2010 | | | 11.59 | | | | 0.45 | | | | 0.95 | | | | 1.40 | | | | (0.46 | ) | | | (0.03 | ) | | | (0.49 | ) |
9/30/2009 | | | 10.50 | | | | 0.51 | | | | 1.21 | | | | 1.72 | | | | (0.50 | ) | | | (0.13 | ) | | | (0.63 | ) |
9/30/2008 | | | 11.68 | | | | 0.50 | | | | (1.14 | ) | | | (0.64 | ) | | | (0.54 | ) | | | — | | | | (0.54 | ) |
9/30/2007 | | | 11.31 | | | | 0.47 | | | | 0.43 | | | | 0.90 | | | | (0.53 | ) | | | — | | | | (0.53 | ) |
Class C | | | | | | | | | | | | | | | | | | | | | | | | | | | | |
3/31/2012(f) | | | 12.03 | | | | 0.21 | | | | 0.48 | | | | 0.69 | | | | (0.31 | ) | | | (0.11 | ) | | | (0.42 | ) |
9/30/2011 | | | 12.47 | | | | 0.47 | | | | (0.14 | ) | | | 0.33 | | | | (0.51 | ) | | | (0.26 | ) | | | (0.77 | ) |
9/30/2010 | | | 11.56 | | | | 0.46 | | | | 0.96 | | | | 1.42 | | | | (0.48 | ) | | | (0.03 | ) | | | (0.51 | ) |
9/30/2009 | | | 10.47 | | | | 0.52 | | | | 1.22 | | | | 1.74 | | | | (0.52 | ) | | | (0.13 | ) | | | (0.65 | ) |
9/30/2008 | | | 11.66 | | | | 0.51 | | | | (1.15 | ) | | | (0.64 | ) | | | (0.55 | ) | | | — | | | | (0.55 | ) |
9/30/2007 | | | 11.30 | | | | 0.49 | | | | 0.42 | | | | 0.91 | | | | (0.55 | ) | | | — | | | | (0.55 | ) |
Class Y | | | | | | | | | | | | | | | | | | | | | | | | | | | | |
3/31/2012(f) | | | 12.13 | | | | 0.28 | | | | 0.47 | | | | 0.75 | | | | (0.37 | ) | | | (0.11 | ) | | | (0.48 | ) |
9/30/2011 | | | 12.56 | | | | 0.60 | | | | (0.14 | ) | | | 0.46 | | | | (0.63 | ) | | | (0.26 | ) | | | (0.89 | ) |
9/30/2010 | | | 11.65 | | | | 0.58 | | | | 0.95 | | | | 1.53 | | | | (0.59 | ) | | | (0.03 | ) | | | (0.62 | ) |
9/30/2009 | | | 10.55 | | | | 0.62 | | | | 1.23 | | | | 1.85 | | | | (0.62 | ) | | | (0.13 | ) | | | (0.75 | ) |
9/30/2008 | | | 11.73 | | | | 0.64 | | | | (1.15 | ) | | | (0.51 | ) | | | (0.67 | ) | | | — | | | | (0.67 | ) |
9/30/2007 | | | 11.36 | | | | 0.61 | | | | 0.41 | | | | 1.02 | | | | (0.65 | ) | | | — | | | | (0.65 | ) |
Admin Class | | | | | | | | | | | | | | | | | | | | | | | | | |
3/31/2012(f) | | | 12.11 | | | | 0.25 | | | | 0.47 | | | | 0.72 | | | | (0.34 | ) | | | (0.11 | ) | | | (0.45 | ) |
9/30/2011 | | | 12.55 | | | | 0.54 | | | | (0.15 | ) | | | 0.39 | | | | (0.57 | ) | | | (0.26 | ) | | | (0.83 | ) |
9/30/2010* | | | 11.80 | | | | 0.33 | | | | 0.73 | | | | 1.06 | | | | (0.31 | ) | | | — | | | | (0.31 | ) |
| * | From commencement of Class operations on February 1, 2010 through September 30, 2010. |
| (a) | Per share net investment income has been calculated using the average shares outstanding during the period. |
| (b) | Had certain expenses not been waived/reimbursed during the period, if applicable, total returns would have been lower. |
| (c) | A sales charge for Class A shares and a contingent deferred sales charge for Class B and Class C shares are not reflected in total return calculations. Periods less than one year, if applicable, are not annualized. |
See accompanying notes to financial statements.
35 |
| | | | | | | | | | | | | | | | | | | | | | | | | | |
| | | | | | | | | |
Ratios to Average Net Assets: | | | | |
Net asset
value,
end of
the period | | | Total
return
(%) (b)(c) | | | Net assets,
end of
the period
(000’s) | | | Net
expenses
(%) (d)(e) | | | Gross
expenses
(%) (e) | | | Net investment
income
(%) (e) | | | Portfolio
turnover
rate (%) | |
| | | | | | | | | | | | | | | | | | | | | | | | | | |
| | | | | | | | | | | | | | | | | | | | | | | | | | |
| | $12.40 | | | | 6.19 | | | $ | 2,704,721 | | | | 0.85 | | | | 0.85 | | | | 4.29 | | | | 8 | |
| | 12.12 | | | | 3.47 | | | | 2,705,810 | | | | 0.81 | | | | 0.81 | | | | 4.56 | | | | 19 | |
| | 12.56 | | | | 13.41 | | | | 3,092,956 | | | | 0.81 | | | | 0.81 | | | | 4.58 | | | | 25 | |
| | 11.64 | | | | 18.64 | | | | 2,946,489 | | | | 0.80 | | | | 0.80 | | | | 5.87 | | | | 30 | |
| | 10.54 | | | | (5.12 | ) | | | 1,867,335 | | | | 0.80 | | | | 0.80 | | | | 5.20 | | | | 35 | |
| | 11.73 | | | | 9.14 | | | | 834,736 | | | | 0.83 | | | | 0.83 | | | | 5.05 | | | | 35 | |
| | | | | | | | | | | | | | | | | | | | | | | | | | |
| | 12.33 | | | | 5.82 | | | | 13,111 | | | | 1.59 | | | | 1.59 | | | | 3.54 | | | | 8 | |
| | 12.06 | | | | 2.70 | | | | 13,549 | | | | 1.56 | | | | 1.56 | | | | 3.81 | | | | 19 | �� |
| | 12.50 | | | | 12.43 | | | | 17,113 | | | | 1.65 | | | | 1.65 | | | | 3.74 | | | | 25 | |
| | 11.59 | | | | 17.59 | | | | 17,489 | | | | 1.67 | | | | 1.67 | | | | 5.07 | | | | 30 | |
| | 10.50 | | | | (5.88 | ) | | | 16,009 | | | | 1.65 | (g) | | | 1.65 | (g) | | | 4.29 | | | | 35 | |
| | 11.68 | | | | 8.17 | | | | 17,082 | | | | 1.70 | | | | 1.71 | | | | 4.16 | | | | 35 | |
| | | | | | | | | | | | | | | | | | | | | | | | | | |
| | 12.30 | | | | 5.76 | | | | 2,209,876 | | | | 1.60 | | | | 1.60 | | | | 3.54 | | | | 8 | |
| | 12.03 | | | | 2.71 | | | | 2,091,834 | | | | 1.56 | | | | 1.56 | | | | 3.81 | | | | 19 | |
| | 12.47 | | | | 12.58 | | | | 2,593,324 | | | | 1.56 | | | | 1.56 | | | | 3.83 | | | | 25 | |
| | 11.56 | | | | 17.80 | | | | 2,495,305 | | | | 1.56 | | | | 1.56 | | | | 5.09 | | | | 30 | |
| | 10.47 | | | | (5.84 | ) | | | 1,333,421 | | | | 1.55 | | | | 1.55 | | | | 4.45 | | | | 35 | |
| | 11.66 | | | | 8.28 | | | | 605,934 | | | | 1.57 | | | | 1.57 | | | | 4.30 | | | | 35 | |
| | | | | | | | | | | | | | | | | | | | | | | | | | |
| | 12.40 | | | | 6.32 | | | | 6,053,632 | | | | 0.60 | | | | 0.60 | | | | 4.55 | | | | 8 | |
| | 12.13 | | | | 3.81 | | | | 4,887,742 | | | | 0.56 | | | | 0.56 | | | | 4.81 | | | | 19 | |
| | 12.56 | | | | 13.60 | | | | 4,473,001 | | | | 0.56 | | | | 0.56 | | | | 4.82 | | | | 25 | |
| | 11.65 | | | | 18.94 | | | | 3,531,187 | | | | 0.54 | | | | 0.54 | | | | 6.01 | | | | 30 | |
| | 10.55 | | | | (4.79 | ) | | | 1,044,046 | | | | 0.53 | | | | 0.53 | | | | 5.48 | | | | 35 | |
| | 11.73 | | | | 9.32 | | | | 448,873 | | | | 0.55 | (g) | | | 0.55 | (g) | | | 5.33 | | | | 35 | |
| | | | | | | | | | | | | | | | | | | | | | | | | | |
| | 12.38 | | | | 5.99 | | | | 9,903 | | | | 1.10 | | | | 1.10 | | | | 4.04 | | | | 8 | |
| | 12.11 | | | | 3.26 | | | | 5,967 | | | | 1.07 | | | | 1.07 | | | | 4.32 | | | | 19 | |
| | 12.55 | | | | 9.13 | | | | 879 | | | | 1.08 | | | | 7.68 | | | | 4.06 | | | | 25 | |
| (d) | The investment adviser and/or administrator agreed to waive its fees and/or reimburse a portion of the Fund’s expenses during the period. Without this waiver/reimbursement, if applicable, expenses would have been higher. |
| (e) | Computed on an annualized basis for periods less than one year, if applicable. |
| (f) | For the six months ended March 31, 2012 (Unaudited). |
| (g) | Includes fee/expense recovery of less than 0.01%. |
See accompanying notes to financial statements.
| 36
Notes to Financial Statements
March 31, 2012 (Unaudited)
1. Organization. Loomis Sayles Funds II (the “Trust”) is organized as a Massachusetts business trust. The Trust is registered under the Investment Company Act of 1940, as amended (the “1940 Act”), as an open-end management investment company. The Declaration of Trust permits the Board of Trustees to authorize the issuance of an unlimited number of shares of the Trust in multiple series. The financial statements for certain funds of the Trust are presented in separate reports. Information presented in these financial statements pertains to Loomis Sayles Investment Grade Bond Fund (the “Fund”).
The Fund is a diversified investment company.
Effective January 1, 2012, the name of the Fund’s administrator changed from Natixis Asset Management Advisors, L.P. to NGAM Advisors, L.P. (“NGAM Advisors”) and the name of the Fund’s distributor changed from Natixis Distributors, L.P. to NGAM Distribution, L.P. (“NGAM Distribution”).
The Fund offers Class A, Class C, Class Y and Admin Class shares. Class J shares ceased to be offered on October 17, 2011 and were liquidated after the close of business on January 11, 2012. Effective October 12, 2007, Class B shares are no longer offered. Existing Class B shareholders may continue to reinvest dividends into Class B shares and exchange their Class B shares for Class B shares of other Natixis Funds subject to existing exchange privileges as described in the prospectus.
Class A shares are sold with a maximum front-end sales charge of 4.50%. Class B shares do not pay a front-end sales charge; however, they are charged higher Rule 12b-1 fees, and are subject to a contingent deferred sales charge (“CDSC”) if such shares are redeemed within six years of purchase. After eight years of ownership, Class B shares convert to Class A shares. Class C shares do not pay a front-end sales charge, do not convert to any other class of shares, pay higher Rule 12b-1 fees than Class A shares and may be subject to a CDSC of 1.00% if those shares are redeemed within one year of acquisition, except for reinvested distributions. Class Y shares do not pay a front-end sales charge, a CDSC or Rule 12b-1 fees. Class Y shares are generally intended for institutional investors with a minimum initial investment of $100,000, though some categories of investors are exempted from the minimum investment amount as outlined in the Fund’s prospectus. Admin Class shares do not pay a front-end sales charge or a CDSC, but do pay a Rule 12b-1 fee. Admin Class shares are offered exclusively through intermediaries.
Most expenses of the Trust can be directly attributed to a Fund. Expenses which cannot be directly attributed to a Fund are generally apportioned based on the relative net assets of each of the funds in the Trust. Expenses of the Fund are borne pro rata by the holders of each class of shares, except that each class bears expenses unique to that class (Rule 12b-1 service and distribution fees for Class A, Class B, Class C and Admin Class). For the period from October 1, 2011 through January 11, 2012, Class J incurred
37 |
Notes to Financial Statements (continued)
March 31, 2012 (Unaudited)
class-specific expenses for Rule 12b-1 service and distribution, registration, legal, shareholder reporting and transfer agent fees. In addition, each class votes as a class only with respect to its own Rule 12b-1 Plan. Shares of each class would receive their pro rata share of the net assets of the Fund if the Fund were liquidated. The Trustees approve separate distributions from net investment income on each class of shares.
2. Significant Accounting Policies. The following is a summary of significant accounting policies consistently followed by the Fund in the preparation of its financial statements. The Fund’s financial statements are prepared in accordance with accounting principles generally accepted in the United States of America which require the use of management estimates that affect the reported amounts and disclosures in the financial statements. Actual results could differ from those estimates. Management has evaluated the events and transactions subsequent to period-end through the date the financial statements were issued and has determined that there were no material events that would require disclosure in the Fund’s financial statements.
a. Valuation. Debt securities (other than short-term obligations purchased with an original or remaining maturity of sixty days or less) are generally valued on the basis of evaluated bids furnished to the Fund by an independent pricing service recommended by the investment adviser and approved by the Board of Trustees, which service determines valuations for normal, institutional-size trading units of such securities using market information, transactions for comparable securities and various relationships between securities which are generally recognized by institutional traders. Senior loans are priced at bid prices supplied by an independent pricing service, if available. Broker-dealer bid quotations may also be used to value debt securities and senior loans where an independent pricing service is unable to price a security or where an independent pricing service does not provide a reliable price for the security. Forward foreign currency contracts are valued utilizing interpolated prices determined from information provided by an independent pricing service. Investments in other open-end investment companies are valued at their net asset value each day. Short-term obligations purchased with an original or remaining maturity of sixty days or less are valued at amortized cost, which approximates market value. Securities for which market quotations are not readily available are valued at fair value as determined in good faith by the Fund’s investment adviser using consistently applied procedures under the general supervision of the Board of Trustees.
The Fund may hold securities traded in foreign markets. Foreign securities are valued at the market price in the foreign market. However, if events occurring after the close of the foreign market (but before the close of regular trading on the New York Stock Exchange) are believed to materially affect the value of those securities, such securities are fair valued pursuant to procedures approved by the Board of Trustees. When fair valuing securities, the Fund may, among other things, use modeling tools or other processes that may take into account factors such as securities market activity
| 38
Notes to Financial Statements (continued)
March 31, 2012 (Unaudited)
and/or significant events that occur after the close of the foreign market and before the Fund calculates its net asset value.
b. Investment Transactions and Related Investment Income. Investment transactions are accounted for on a trade date plus one basis for daily net asset value calculation. However, for financial reporting purposes, investment transactions are reported on trade date. Interest income is recorded on an accrual basis. Interest income is increased by the accretion of discount and decreased by the amortization of premium. Investment income is recorded net of foreign taxes withheld when applicable. In determining net gain or loss on securities sold, the cost of securities has been determined on an identified cost basis. Investment income, non-class specific expenses and realized and unrealized gains and losses are allocated on a pro rata basis to each class based on the relative net assets of each class to the total net assets of the Fund.
c. Foreign Currency Translation. The books and records of the Fund are maintained in U.S. dollars. The values of securities, currencies and other assets and liabilities denominated in currencies other than U.S. dollars are translated into U.S. dollars based upon foreign exchange rates prevailing at the end of the period. Purchases and sales of investment securities, income and expenses are translated on the respective dates of such transactions.
Since the values of investment securities are presented at the foreign exchange rates prevailing at the end of the period, it is not practical to isolate that portion of the results of operations arising from changes in exchange rates from fluctuations which arise due to changes in market prices of investment securities. Such changes are included with the net realized and unrealized gain or loss on investments.
Net realized foreign exchange gains or losses arise from sales of foreign currency, currency gains or losses realized between the trade and settlement dates on securities transactions and the difference between the amounts of interest and foreign withholding taxes recorded on the Fund’s books and the U.S. dollar equivalent of the amounts actually received or paid. Net unrealized foreign exchange gains and losses arise from changes in the value of assets and liabilities, other than investment securities, at the end of the fiscal period, resulting from changes in exchange rates.
The Fund may use foreign currency exchange contracts to facilitate transactions in foreign-denominated investments. Losses may arise from changes in the value of the foreign currency or if the counterparties do not perform under the contracts’ terms.
d. Forward Foreign Currency Contracts. The Fund may enter into forward foreign currency contracts to hedge the Fund’s investments against currency fluctuation. A contract can also be used to offset a previous contract. These contracts involve market risk in excess of the unrealized gain or loss reflected in the Fund’s Statement of Assets and Liabilities. The U.S. dollar value of the currencies the Fund has committed to buy or sell represents the aggregate exposure to each currency the Fund has acquired or
39 |
Notes to Financial Statements (continued)
March 31, 2012 (Unaudited)
hedged through currency contracts outstanding at period end. Gains or losses are recorded for financial statement purposes as unrealized until settlement date. Risks may arise upon entering into these contracts from the potential inability of counterparties to meet the terms of their contracts and from unanticipated movements in the value of a foreign currency relative to the U.S. dollar. Certain contracts may require the movement of cash and/or securities as collateral for the Fund’s or counterparty’s net obligations under the contracts.
There were no forward foreign currency contracts held by the Fund during the six months ended March 31, 2012.
e. Federal and Foreign Income Taxes. The Trust treats each Fund as a separate entity for federal income tax purposes. The Fund intends to meet the requirements of the Internal Revenue Code of 1986, as amended, applicable to regulated investment companies, and to distribute to its shareholders substantially all of its net investment income and any net realized capital gains at least annually. Management has performed an analysis of the Fund’s tax positions for the open tax years as of March 31, 2012 and has concluded that no provisions for income tax are required. The Fund’s federal tax returns for the prior three fiscal years remain subject to examination by the Internal Revenue Service. Management is not aware of any events that are reasonably possible to occur in the next six months that would result in the amounts of any unrecognized tax benefits significantly increasing or decreasing for the Fund. However, management’s conclusions regarding tax positions taken may be subject to review and adjustment at a later date based on factors including, but not limited to, new tax laws and accounting regulations and interpretations thereof.
The Fund may be subject to foreign taxes on income and gains on investments that are accrued based upon the Fund’s understanding of the tax rules and regulations that exist in the countries in which the Fund invests. Foreign governments may also impose taxes or other payments on investments with respect to foreign securities. Such taxes are accrued as applicable, and are reflected as foreign taxes payable on the Statement of Assets and Liabilities.
f. Dividends and Distributions to Shareholders. Dividends and distributions are recorded on ex-dividend date. The timing and characterization of certain income and capital gain distributions are determined annually in accordance with federal tax regulations, which may differ from accounting principles generally accepted in the United States of America. Permanent differences are primarily due to differing treatments for book and tax purposes of items such as redemption in-kind gain/loss, deferred Trustees’ fees, capital gains tax paid in connection with redemptions in-kind, foreign currency transactions, paydown adjustments and premium amortization. Permanent book and tax basis differences relating to shareholder distributions will result in reclassifications to capital accounts. Temporary differences between book and tax distributable earnings are primarily due to premium amortization, deferred Trustees’
| 40
Notes to Financial Statements (continued)
March 31, 2012 (Unaudited)
fees, defaulted bond accruals, contingent payment debt instruments and wash sales. Distributions from net investment income and short-term capital gains are considered to be distributed from ordinary income for tax purposes.
The tax characterization of distributions is determined on an annual basis. The tax character of distributions paid to shareholders during the year ended September 30, 2011 was as follows:
| | | | | | | | |
2011 Distributions Paid From: | |
Ordinary Income | | Long-Term Capital Gains | | | Total | |
$554,809,060 | | | $109,311,807 | | | | $664,120,867 | |
Differences between these amounts and those reported in the Statement of Changes in Net Assets are primarily attributable to different book and tax treatment for short-term capital gains.
On December 22, 2010, the Regulated Investment Company Modernization Act of 2010 (the “Act”) was enacted. The Act modernizes several of the federal income and excise tax provisions related to RICs, and, with certain exceptions, is effective for taxable years beginning after December 22, 2010. Among the changes made are changes to the capital loss carryforward rules allowing for capital losses to be carried forward indefinitely. Rules in effect previously limited the carryforward period to eight years. Additionally, capital losses realized in taxable years beginning after the effective date of the Act are carried over in the character (short-term or long-term) realized. Rules in effect previously treated all capital loss carryforwards as short-term.
g. Repurchase Agreements. It is the Fund’s policy that the market value of the collateral for repurchase agreements be at least equal to 102% of the repurchase price, including interest. Certain repurchase agreements are tri-party arrangements whereby the collateral is held in a segregated account for the benefit of the Fund and on behalf of the counterparty. Repurchase agreements could involve certain risks in the event of default or insolvency of the counterparty including possible delays or restrictions upon the Fund’s ability to dispose of the underlying securities.
h. Securities Lending. The Fund has entered into an agreement with State Street Bank and Trust Company (“State Street Bank”), as agent of the Fund, to lend securities to certain designated borrowers. The loans are collateralized with cash or securities in an amount equal to at least 105% or 102% of the market value (including accrued interest) of the loaned international or domestic securities, respectively, when the loan is initiated. Thereafter, the value of the collateral must remain at least 102% of the market value (including accrued interest) of loaned securities for U.S. equities and U.S. corporate debt; at least 105% of the market value (including accrued interest) of loaned securities for non-U.S. equities; and at least 100% of the market value (including accrued interest) of loaned securities for U.S. Government securities, sovereign debt
41 |
Notes to Financial Statements (continued)
March 31, 2012 (Unaudited)
issued by non-U.S. Governments and non-U.S. corporate debt. In the event that the market value of the collateral falls below the required percentages described above, the borrower will deliver additional collateral on the next business day. As with other extensions of credit, the Fund may bear the risk of loss with respect to the investment of the collateral. The Fund invests cash collateral in short-term investments, a portion of the income from which is remitted to the borrowers and the remainder allocated between the Fund and State Street Bank as lending agent.
For the six months ended March 31, 2012, the Fund did not loan securities under this agreement.
i. Indemnifications. Under the Trust’s organizational documents, its officers and Trustees are indemnified against certain liabilities arising out of the performance of their duties to the Fund. Additionally, in the normal course of business, the Fund enters into contracts with service providers that contain general indemnification clauses. The Fund’s maximum exposure under these arrangements is unknown as this would involve future claims that may be made against the Fund that have not yet occurred. However, based on experience, the Fund expects the risk of loss to be remote.
3. Fair Value Measurements. In accordance with accounting standards related to fair value measurements and disclosures, the Fund has categorized the inputs utilized in determining the value of the Fund’s assets or liabilities. These inputs are summarized in the three broad levels listed below:
| | • | | Level 1 – quoted prices in active markets for identical assets or liabilities; |
| | • | | Level 2 – prices determined using other significant inputs that are observable either directly, or indirectly through corroboration with observable market data (which could include quoted prices for similar assets or liabilities, interest rates, credit risk, etc.); |
| | • | | Level 3 – prices determined using significant unobservable inputs when quoted prices or observable inputs are unavailable such as when there is little or no market activity for an asset or liability (unobservable inputs reflect the Fund’s own assumptions in determining the fair value of assets or liabilities and would be based on the best information available). |
The inputs or methodology used for valuing securities are not necessarily an indication of the risk associated with investing in those securities.
| 42
Notes to Financial Statements (continued)
March 31, 2012 (Unaudited)
The following is a summary of the inputs used to value the Fund’s investments as of March 31, 2012, at value:
Asset Valuation Inputs
| | | | | | | | | | | | | | | | |
Description | | Level 1 | | | Level 2 | | | Level 3 | | | Total | |
Bonds and Notes | | | | | | | | | | | | | | | | |
Non-Convertible Bonds | | | | | | | | | | | | | | | | |
ABS Car Loan | | $ | — | | | $ | 76,357,274 | | | $ | 5,495,012 | | | $ | 81,852,286 | |
Non-Captive Consumer | | | 1,365,703 | | | | 174,406,286 | | | | — | | | | 175,771,989 | |
Paper | | | — | | | | 116,371,737 | | | | 4,800,706 | | | | 121,172,443 | |
All Other Non-Convertible Bonds(a) | | | — | | | | 8,941,756,020 | | | | — | | | | 8,941,756,020 | |
| | | | | | | | | | | | | | | | |
Total Non-Convertible Bonds | | | 1,365,703 | | | | 9,308,891,317 | | | | 10,295,718 | | | | 9,320,552,738 | |
| | | | | | | | | | | | | | | | |
Convertible Bonds(a) | | | — | | | | 408,243,026 | | | | — | | | | 408,243,026 | |
| | | | | | | | | | | | | | | | |
Municipals(a) | | | — | | | | 65,439,866 | | | | — | | | | 65,439,866 | |
| | | | | | | | | | | | | | | | |
Total Bonds and Notes | | | 1,365,703 | | | | 9,782,574,209 | | | | 10,295,718 | | | | 9,794,235,630 | |
| | | | | | | | | | | | | | | | |
Senior Loans(a) | | | — | | | | 71,733,819 | | | | — | | | | 71,733,819 | |
Short-Term Investments | | | — | | | | 651,354,080 | | | | — | | | | 651,354,080 | |
| | | | | | | | | | | | | | | | |
Total | | $ | 1,365,703 | | | $ | 10,505,662,108 | | | $ | 10,295,718 | | | $ | 10,517,323,529 | |
| | | | | | | | | | | | | | | | |
| (a) | Details of the major categories of the Fund’s investments are reflected within the Portfolio of Investments. |
The following is a reconciliation of Level 3 investments for which significant unobservable inputs were used to determine fair value as of March 31, 2012:
Asset Valuation Inputs
| | | | | | | | | | | | | | | | | | | | |
Investments in Securities | | Balance as of
September 30,
2011 | | | Accrued
Discounts
(Premiums) | | | Realized
Gain
(Loss) | | | Change in
Unrealized
Appreciation
(Depreciation) | | | Purchases | |
Bonds and Notes | | | | | | | | | | | | | | | | | | | | |
Non-Convertible Bonds | | | | | | | | | | | | | | | | | | | | |
ABS Car Loan | | $ | 5,230,461 | | | $ | — | | | $ | — | | | $ | 264,551 | | | $ | — | |
Paper | | | — | | | | 684 | | | | — | | | | (1,034,527 | ) | | | — | |
Treasuries | | | 538,615 | | | | 14,570 | | | | (671,562 | ) | | | 421,513 | | | | — | |
| | | | | | | | | | | | | | | | | | | | |
Total | | $ | 5,769,076 | | | $ | 15,254 | | | $ | (671,562 | ) | | $ | (348,463 | ) | | $ | — | |
| | | | | | | | | | | | | | | | | | | | |
43 |
Notes to Financial Statements (continued)
March 31, 2012 (Unaudited)
| | | | | | | | | | | | | | | | | | | | |
Investments in Securities | | Sales | | | Transfers
into
Level 3 | | | Transfers
out of
Level 3 | | | Balance as of
March 31,
2012 | | | Change in
Unrealized
Appreciation
(Depreciation)
from
Investments
Still Held at
March 31,
2012 | |
Bonds and Notes | | | | | | | | | | | | | | | | | | | | |
Non-Convertible Bonds | | | | | | | | | | | | | | | | | | | | |
ABS Car Loan | | $ | — | | | $ | — | | | $ | — | | | $ | 5,495,012 | | | $ | 264,551 | |
Paper | | | — | | | | 5,834,549 | | | | — | | | | 4,800,706 | | | | (1,034,527 | ) |
Treasuries | | | (303,136 | ) | | | — | | | | — | | | | — | | | | — | |
| | | | | | | | | | | | | | | | | | | | |
Total | | $ | (303,136 | ) | | $ | 5,834,549 | | | $ | — | | | $ | 10,295,718 | | | $ | (769,976 | ) |
| | | | | | | | | | | | | | | | | | | | |
A debt security valued at $5,834,549 was transferred from Level 2 to Level 3 during the period ended March 31, 2012. At September 30, 2011, this security was valued on the basis of evaluated bids furnished to the Fund by an independent pricing service; at March 31, 2012, this security was valued using broker-dealer bid quotations based on inputs unobservable to the Fund as an independent pricing service either was unable to price the security or did not provide a reliable price for the security.
All transfers are recognized as of the beginning of the reporting period.
In May 2011, Accounting Standard Update (“ASU”) No. 2011-04, “Amendments to Achieve Common Fair Value Measurement and Disclosure Requirements” was issued and is effective for interim and annual periods beginning after December 15, 2011. The ASU requires reporting entities to disclose i) the amounts of any transfers between Level 1 and Level 2, and the reasons for the transfers; and ii) for Level 3 fair value measurements, a) quantitative information about significant unobservable inputs used, b) a description of the valuation processes used by the reporting entity, and c) a narrative description of the sensitivity of the fair value measurement to changes in unobservable inputs if a change in those inputs might result in a significantly higher or lower fair value measurement. Notwithstanding the projected regulatory implementation date of June 30, 2012 for the Fund, Management has already implemented disclosure of all transfers between Level 1 and Level 2, and the reasons for the transfers. Management is currently evaluating the impact, if any, the Level 3 disclosures may have on the Fund’s financial statements.
4. Purchases and Sales of Securities. For the six months ended March 31, 2012, purchases and sales of securities (excluding short-term investments and U.S. Government/Agency securities and including paydowns) were $751,267,701 and $416,663,867, respectively. Purchases and sales of U.S. Government/Agency securities
| 44
Notes to Financial Statements (continued)
March 31, 2012 (Unaudited)
(excluding short-term investments and including paydowns) were $303,441,395 and $311,877,284, respectively.
5. Management Fees and Other Transactions with Affiliates.
a. Management Fees. Loomis, Sayles & Company, L.P. (“Loomis Sayles”) serves as investment adviser to the Fund. Under the terms of the management agreement, the Fund pays a management fee at the annual rate of 0.40% of average daily net assets, calculated daily and payable monthly.
Loomis Sayles has given a binding undertaking to the Fund to waive management fees and/or reimburse certain expenses to limit the Fund’s operating expenses, exclusive of acquired fund fees and expenses, brokerage expenses, interest expense, taxes and extraordinary expenses. This undertaking is in effect until January 31, 2013 and is reevaluated on an annual basis. Management fees payable, as reflected on the Statement of Assets and Liabilities, is net of waivers and/or expense reimbursements, if any, pursuant to these undertakings.
For the six months ended March 31, 2012, the expense limits as a percentage of average daily net assets under the expense limitation agreement were as follows:
| | | | | | | | |
| Expense Limit as a Percentage of Average Daily Net Assets |
Class A | | Class B | | Class C | | Class Y | | Admin Class |
| 0.95% | | 1.70% | | 1.70% | | 0.70% | | 1.20% |
Loomis Sayles shall be permitted to recover expenses it has borne under the expense limitation agreement (whether through waiver of its management fees or otherwise) on a class by class basis in later periods to the extent the expenses of a class fall below a class’ expense limits, provided, however, that a class is not obligated to pay such waived/reimbursed fees or expenses more than one year after the end of the fiscal year in which the fees or expenses were waived/reimbursed.
For the six months ended March 31, 2012, the management fees for the Fund were $20,656,199 (0.40% of average daily net assets).
For the period from October 1, 2011 through January 11, 2012, $26,917 in expense reimbursements related to the prior fiscal year were recovered for Class J.
Certain officers and employees of Loomis Sayles are also officers or Trustees of the Trust. Loomis Sayles’ general partner is indirectly owned by Natixis Global Asset Management, L.P. (“Natixis US”), which is part of Natixis Global Asset Management, an international asset management group based in Paris, France.
b. Service and Distribution Fees. NGAM Distribution, which is a wholly-owned subsidiary of Natixis US, has entered into a distribution agreement with the Trust. Pursuant to this agreement, NGAM Distribution serves as principal underwriter of the Funds of the Trust.
45 |
Notes to Financial Statements (continued)
March 31, 2012 (Unaudited)
Pursuant to Rule 12b-1 under the 1940 Act, the Trust has adopted a Service Plan relating to the Fund’s Class A shares (the “Class A Plan”), a Distribution and Service Plan relating to the Fund’s Class B and Class C shares (the “Class B and Class C Plans”), and a Distribution Plan relating to its Admin Class shares (the “Admin Class Plan”).
Under the Class A Plan, the Fund pays NGAM Distribution a monthly service fee at an annual rate not to exceed 0.25% of the average daily net assets attributable to the Fund’s Class A shares, as reimbursement for expenses incurred by NGAM Distribution in providing personal services to investors in Class A shares and/or the maintenance of shareholder accounts.
Under the Class B and Class C Plans, the Fund pays NGAM Distribution a monthly service fee at an annual rate not to exceed 0.25% of the average daily net assets attributable to the Fund’s Class B and Class C shares, as compensation for services provided by NGAM Distribution in providing personal services to investors in Class B and Class C shares and/or the maintenance of shareholder accounts.
Also under the Class B and Class C Plans, the Fund pays NGAM Distribution a monthly distribution fee at an annual rate of 0.75% of the average daily net assets attributable to the Fund’s Class B and Class C shares, as compensation for services provided by NGAM Distribution in connection with the marketing or sale of Class B and Class C shares.
Under the Admin Class Plan, the Fund pays NGAM Distribution a monthly distribution fee at an annual rate not to exceed 0.25% of the average daily net assets attributable to the Fund’s Admin Class shares, as compensation for services provided by NGAM Distribution in connection with the marketing or sale of Admin Class shares or for payments made by NGAM Distribution to securities dealers or other financial intermediaries as commissions, asset-based sales charges or other compensation with respect to the sale of Admin Class shares, or for providing personal services to investors and/or the maintenance of shareholder accounts.
In addition, the Admin Class shares of the Fund may pay NGAM Distribution an administrative service fee, at an annual rate not to exceed 0.25% of the average daily net assets attributable to Admin Class shares. These fees are subsequently paid to securities dealers or financial intermediaries for providing personal services and/or account maintenance for their customers who hold such shares.
Class J shares, liquidated as of the close of business on January 11, 2012, were subject to a monthly shareholder service fee at an annual rate of 0.25% and a monthly distribution fee at an annual rate of 0.50% of the average daily net assets attributable to the Fund’s Class J shares, both payable to Loomis Sayles Distributors, pursuant to a shareholder service and distribution plan adopted under Rule 12b-1.
| 46
Notes to Financial Statements (continued)
March 31, 2012 (Unaudited)
For the six months ended March 31, 2012 the Fund paid the following service and distribution fees:
| | | | | | | | | | | | | | | | | | | | | | | | |
Service Fees | | | Distribution Fees | |
Class A | | Class B | | | Class C | | | Admin Class | | | Class B | | | Class C | | | Admin Class | |
| $3,573,344 | | $ | 16,709 | | | $ | 2,690,045 | | | $ | 9,998 | | | $ | 50,127 | | | $ | 8,070,136 | | | $ | 9,998 | |
For the period from October 1, 2011 through January 11, 2012, the Fund paid the following service and distribution fees for Class J:
| | |
Service Fees | | Distribution Fees |
$55,331 | | $110,662 |
c. Administrative Fees. NGAM Advisors provides certain administrative services for the Fund and contracts with State Street Bank to serve as sub-administrator. NGAM Advisors is a wholly-owned subsidiary of Natixis US. Pursuant to an agreement among Natixis Funds Trust I, Natixis Funds Trust II, Natixis Funds Trust IV, Gateway Trust (“Natixis Funds Trusts”), Loomis Sayles Funds I, Loomis Sayles Funds II (“Loomis Sayles Funds Trusts”), Hansberger International Series and NGAM Advisors, the Fund pays NGAM Advisors monthly its pro rata portion of fees equal to an annual rate of 0.0575% of the first $15 billion of the average daily net assets of the Natixis Funds Trusts, Loomis Sayles Funds Trusts and Hansberger International Series, 0.0500% of the next $15 billion, 0.0400% of the next $30 billion and 0.0350% of such assets in excess of $60 billion, subject to an annual aggregate minimum fee for the Natixis Funds Trusts, Loomis Sayles Funds Trusts and Hansberger International Series of $10 million, which is reevaluated on an annual basis.
For the six months ended March 31, 2012, the Fund paid $2,376,373 in administrative fees to NGAM Advisors.
d. Sub-Transfer Agent Fees. NGAM Distribution has entered into agreements with financial intermediaries to provide certain recordkeeping, processing, shareholder communications and other services to customers of the intermediaries and has agreed to compensate the intermediaries for providing those services. Certain services would be provided by the Fund if the shares of those customers were registered directly with the Fund’s transfer agent. Accordingly, the Fund has agreed to reimburse NGAM Distribution for a portion of the intermediary fees attributable to shares of the Fund held by the intermediaries (which generally are a percentage of the value of shares held) not to exceed what the Fund would have paid its transfer agent had each customer’s shares been registered directly with the transfer agent instead of being held through the intermediaries.
For the six months ended March 31, 2012, the Fund paid $5,460,661 in sub-transfer agent fees which are reflected in transfer agent fees and expenses in the Statement of Operations. As of March 31, 2012, the Fund owes NGAM Distribution $144,438 in reimbursement for sub-transfer agent fees.
47 |
Notes to Financial Statements (continued)
March 31, 2012 (Unaudited)
e. Commissions. Commissions (including CDSCs) on Fund shares retained by NGAM Distribution were $1,660,554 for the six months ended March 31, 2012.
f. Trustees Fees and Expenses. The Trust does not pay any compensation directly to its officers or Trustees who are directors, officers or employees of NGAM Advisors, NGAM Distribution, Natixis US or their affiliates. Effective January 1, 2012, the Chairperson of the Board receives a retainer fee at the annual rate of $265,000. The Chairperson does not receive any meeting attendance fees for Board of Trustees meetings or committee meetings that she attends. Each Independent Trustee (other than the Chairperson) receives, in the aggregate, a retainer fee at the annual rate of $95,000. Each Independent Trustee also receives a meeting attendance fee of $10,000 for each meeting of the Board of Trustees that he or she attends in person and $5,000 for each meeting of the Board of Trustees that he or she attends telephonically. In addition, each committee chairman receives an additional retainer fee at an annual rate of $15,000. Each Contract Review and Governance Committee member is compensated $6,000 for each Committee meeting that he or she attends in person and $3,000 for each meeting that he or she attends telephonically. Each Audit Committee member is compensated $7,500 for each Committee meeting that he or she attends in person and $3,750 for each meeting that he or she attends telephonically. These fees are allocated among the funds in the Natixis Funds Trusts, Loomis Sayles Funds Trusts and Hansberger International Series based on a formula that takes into account, among other factors, the relative net assets of each fund. Trustees are reimbursed for travel expenses in connection with attendance at meetings.
Prior to January 1, 2012, the Chairperson of the Board received a retainer fee at the annual rate of $250,000 and each Independent Trustee (other than the Chairperson) received, in aggregate, a retainer fee at the annual rate of $80,000. All other Trustee fees remain unchanged.
A deferred compensation plan (the “Plan”) is available to the Trustees on a voluntary basis. Deferred amounts remain in the Fund until distributed in accordance with the provisions of the Plan. The value of a participating Trustee’s deferral account is based on theoretical investments of deferred amounts, on the normal payment dates, in certain funds of the Natixis Funds Trusts, Loomis Sayles Funds Trusts and Hansberger International Series as designated by the participating Trustees. Changes in the value of participants’ deferral accounts are allocated pro rata among the funds in the Natixis Funds Trusts, Loomis Sayles Funds Trusts, and Hansberger International Series, and are normally reflected as Trustees’ fees and expenses in the Statement of Operations. The portions of the accrued obligations allocated to the Fund under the Plan are reflected as Deferred Trustees’ fees in the Statement of Assets and Liabilities.
g. Affiliated Ownership. At March 31, 2012, Loomis Sayles Employees’ Profit Sharing Retirement Plan held shares of beneficial interest in the Fund representing 0.06% of net assets.
| 48
Notes to Financial Statements (continued)
March 31, 2012 (Unaudited)
6. Class-Specific Expenses. For the period from October 1, 2011 through January 11, 2012, the Fund incurred the following class-specific expenses:
| | | | |
| | | Class J | |
Transfer Agent Fees and Expenses | | $ | 2,327 | |
Registration Fees | | | (1,250 | ) |
Legal Fees | | | (380 | ) |
Shareholder Reporting Expenses | | | (4,861 | ) |
Transfer agent, registration, legal, and shareholder reporting fees and expenses attributable to Class A, Class B, Class C, Class Y and Admin Class are allocated on a pro rata basis to each class based on the relative net assets of each class to the total net assets of those classes.
7. Line of Credit. The Fund, together with certain other funds of Natixis Funds Trusts, Loomis Sayles Funds Trusts and Hansberger International Series, participates in a $200,000,000 committed unsecured line of credit provided by State Street Bank, with an individual limit of $125,000,000 for each fund that participates in the line of credit. Interest is charged to each participating fund based on its borrowings at a rate per annum equal to the greater of the Federal Funds rate or overnight LIBOR, plus 1.25%. In addition, a commitment fee of 0.125% per annum, payable at the end of each calendar quarter, is accrued and apportioned among the participating funds based on their average daily unused portion of the line of credit. Effective April 19, 2012, the commitment fee will be 0.10% per annum.
For the six months ended March 31, 2012, the Fund had no borrowings under these agreements.
8. Concentration of Risk. The Fund’s investments in foreign securities are subject to foreign currency fluctuations, higher volatility than U.S. securities, varying degrees of regulation and limited liquidity. Greater political, economic, credit and information risks are also associated with foreign securities.
49 |
Notes to Financial Statements (continued)
March 31, 2012 (Unaudited)
9. Capital Shares. The Fund may issue an unlimited number of shares of beneficial interest, without par value. Transactions in capital shares were as follows:
| | | | | | | | | | | | | | | | |
| |
| Six Months Ended
March 31, 2012 |
| |
| Year Ended
September 30, 2011 |
|
| | | | Shares | | | | Amount | | | | Shares | | | | Amount | |
| Class A | | | | | | | | | | | | | | | | |
Issued from the sale of shares | | | 54,826,871 | | | $ | 669,696,872 | | | | 69,625,794 | | | $ | 863,861,783 | |
Issued in connection with the reinvestment of distributions | | | 7,727,369 | | | | 93,092,639 | | | | 13,344,354 | | | | 163,533,181 | |
Redeemed | | | (67,516,874 | ) | | | (827,350,019 | ) | | | (106,122,504 | ) | | | (1,311,579,537 | ) |
| | | | | | | | | | | | | | | | |
Net change | | | (4,962,634 | ) | | $ | (64,560,508 | ) | | | (23,152,356 | ) | | $ | (284,184,573 | ) |
| | | | | | | | | | | | | | | | |
| Class B | | | | | | | | | | | | | | | | |
Issued from the sale of shares | | | 49,625 | | | $ | 600,193 | | | | 61,769 | | | $ | 756,452 | |
Issued in connection with the reinvestment of distributions | | | 22,510 | | | | 269,690 | | | | 44,034 | | | | 536,387 | |
Redeemed | | | (132,071 | ) | | | (1,604,411 | ) | | | (352,124 | ) | | | (4,333,694 | ) |
| | | | | | | | | | | | | | | | |
Net change | | | (59,936 | ) | | $ | (734,528 | ) | | | (246,321 | ) | | $ | (3,040,855 | ) |
| | | | | | | | | | | | | | | | |
| Class C | | | | | | | | | | | | | | | | |
Issued from the sale of shares | | | 18,021,721 | | | $ | 218,027,625 | | | | 22,844,773 | | | $ | 280,915,141 | |
Issued in connection with the reinvestment of distributions | | | 3,463,025 | | | | 41,363,910 | | | | 6,164,352 | | | | 74,907,182 | |
Redeemed | | | (15,630,455 | ) | | | (189,616,157 | ) | | | (63,181,424 | ) | | | (774,669,875 | ) |
| | | | | | | | | | | | | | | | |
Net change | | | 5,854,291 | | | $ | 69,775,378 | | | | (34,172,299 | ) | | $ | (418,847,552 | ) |
| | | | | | | | | | | | | | | | |
| Class Y | | | | | | | | | | | | | | | | |
Issued from the sale of shares | | | 121,066,173 | | | $ | 1,482,721,303 | | | | 183,967,802 | | | $ | 2,281,887,609 | |
Issued in connection with the reinvestment of distributions | | | 13,544,283 | | | | 163,280,101 | | | | 19,605,289 | | | | 240,531,850 | |
Redeemed | | | (49,436,636 | ) | | | (603,358,197 | ) | | | (139,729,544 | ) | | | (1,726,639,001 | ) |
Redeemed in-kind (Note 10) | | | — | | | | — | | | | (16,974,699 | ) | | | (206,412,335 | ) |
| | | | | | | | | | | | | | | | |
Net change | | | 85,173,820 | | | $ | 1,042,643,207 | | | | 46,868,848 | | | $ | 589,368,123 | |
| | | | | | | | | | | | | | | | |
| Admin Class | | | | | | | | | | | | | | | | |
Issued from the sale of shares | | | 422,947 | | | $ | 5,117,296 | | | | 471,161 | | | $ | 5,852,745 | |
Issued in connection with the reinvestment of distributions | | | 13,930 | | | | 167,631 | | | | 7,731 | | | | 95,009 | |
Redeemed | | | (129,576 | ) | | | (1,568,292 | ) | | | (56,141 | ) | | | (693,953 | ) |
| | | | | | | | | | | | | | | | |
Net change | | | 307,301 | | | $ | 3,716,635 | | | | 422,751 | | | $ | 5,253,801 | |
| | | | | | | | | | | | | | | | |
| Class J | | | | | | | | | | | | | | | | |
Issued from the sale of shares | | | — | | | $ | — | | | | 712,300 | | | $ | 8,854,789 | |
Issued in connection with the reinvestment of distributions | | | — | | | | — | | | | — | | | | — | |
Redeemed* | | | (8,514,614 | ) | | | (102,418,852 | ) | | | (2,804,526 | ) | | | (34,557,395 | ) |
| | | | | | | | | | | | | | | | |
Net change | | | (8,514,614 | ) | | $ | (102,418,852 | ) | | | (2,092,226 | ) | | $ | (25,702,606 | ) |
| | | | | | | | | | | | | | | | |
Increase (decrease) from capital share transactions | | | 77,798,228 | | | $ | 948,421,332 | | | | (12,371,603 | ) | | $ | (137,153,662 | ) |
| | | | | | | | | | | | | | | | |
| *For | the period from October 1, 2011 through January 11, 2012. |
| 50
Notes to Financial Statements (continued)
March 31, 2012 (Unaudited)
10. Redemption In-Kind. In certain circumstances, a Fund may distribute portfolio securities rather than cash as payment for redemption of Fund shares (redemption in-kind). For financial reporting purposes, the Fund will recognize a gain on in-kind redemptions to the extent the value of the distributed securities on the date of redemption exceeds the cost of those securities; the Fund will recognize a loss if the cost exceeds value. Gains and losses realized on redemptions in-kind are not recognized for tax purposes, and are re-classified from realized gain (loss) to paid-in-capital.
51 |

Loomis Sayles Small Cap Growth Fund
Loomis Sayles Small Cap Value Fund
SEMI-ANNUAL REPORT
MARCH 31, 2012
LOOMIS SAYLES SMALL CAP GROWTH FUND
Fund and manager review
FUND FACTS
Managers:
Mark F. Burns, CFA
John Slavik, CFA
Symbols:
| | |
| Institutional Class | | LSSIX |
| Retail Class | | LCGRX |
Objective:
Long-term capital growth from investments in common stocks or other equity securities
Strategy:
Invests at least 80% of its net assets (plus any borrowings made for investment purposes) in equity securities of companies with market capitalizations that fall within the capitalization range of the Russell 2000 Index or is $3 billion or less at the time of investment. Unlike the Index, the Fund may invest in companies of any size.
The fund may invest any portion of its assets in Canadian securities and up to 20% of assets in other foreign securities, including emerging markets securities.
Fund Inception Date:
December 31, 1996
Net Assets:
$587.2 million
Market Conditions
Ongoing concerns related to the sovereign debt crisis in Europe contributed to market volatility during the second half of 2011. The European Central Bank’s December 2011 decision to open a low-interest financing program for banks helped calm the markets. Improved investor sentiment sparked a rally among stocks. The U.S. economy continued to show signs of improvement, with increased strength in consumer spending and job growth. Against this backdrop, small-cap stock performance was particularly strong during the first quarter of 2012, and it represented the best first quarter performance since 2006.
Performance Results
For the six months ended March 31, 2012, Institutional Class shares of Loomis Sayles Small Cap Growth Fund returned 26.63%. The fund underperformed its benchmark, the Russell 2000 Growth Index, which returned 30.26% for the period.
Explanation of Fund Performance
Despite its positive absolute return, the fund underperformed relative to the benchmark primarily due to stock selection in the healthcare and producer durables sectors. The largest positive contributions came from stock selection in the technology and energy sectors.
Technology companies DealerTrack Holdings, Allot Communications and Sourcefire were among the fund’s top individual contributors for the six-month period. Shares of DealerTrack Holdings, a provider of on-demand software and data solutions for the U.S. automotive industry, rallied due to better-than-expected growth in the company’s transaction revenue. This was a function of easing financing to consumers on new and used automobile purchases — a trend we expect will continue. Allot Communications, a leader in network traffic technology, benefited as wireless carriers across the board continued to adopt its must-have technology to monitor data traffic. Recent outperformance was due to favorable fourth-quarter results and strong guidance
1 |
for 2012. Sourcefire, a security software specialist, has been rapidly gaining market share. Recent outperformance was due to strong fourth-quarter results and attractive 2012 revenue guidance. The company is also in the initial stages of a new product launch that should help secure market share growth into the future.
The largest individual detractors from fund performance for the last six months included ZELTIQ Aesthetics, DexCom and Diamond Foods. ZELTIQ Aesthetics, a developer of a non-invasive fat-elimination procedure called CoolSculpting, had a disappointing launch. While the product is FDA-approved, unit placements have been slow, and potential competition is on the horizon. This led to weak results, and we exited the position. DexCom, a medical device company focused on glucose monitoring devices for Type 2 diabetes patients, was forced to push out its product launch due to another in a string of requests from the FDA for more data. DexCom’s next-generation product will be a significant move toward integrating glucose sensor and insulin pump devices, which are the two critical components of an artificial pancreas. We sold this position due to our stop-loss discipline. Diamond Foods, a snack and nut company, delivered strong and improving results during the two years we owned its stock. The combination of strong earnings and positive forecasts for its Pringles acquisition pushed the stock higher, and we trimmed our position size into that strength. In the fourth quarter of 2011, an Securities and Exchange Commission inquiry into timing problems related to payments between Diamond’s walnut co-op and walnut growers triggered a sharp decline in its stock price. Our stop-loss strategy triggered a sale, and the stock declined further after we exited the position.
Outlook
While volatility was markedly lower during the first quarter of 2012, rising volatility in the second quarter could have a positive effect on valuations among higher-quality stocks. Given the quality bias in the fund, we believe higher volatility may be beneficial to performance. In addition, because the first-quarter rally in small-cap stocks was led primarily by low-quality holdings, we believe valuations on quality businesses appear more attractive.
What You Should Know
Investments in the fund are subject to a number of risks. Please see the “Principal Risks” section of the fund’s prospectus. The purchase of fund shares should be seen as a long-term investment.
| 2
LOOMIS SAYLES SMALL CAP GROWTH FUND
Average Annual Total Returns
March 31, 2012
| | | | | | | | | | | | | | | | |
| | | | | |
| | | 6 months | | | 1 year | | | 5 years | | | 10 years | |
| | | | | |
| Institutional Class (Inception 12/31/96) | | | 26.63 | % | | | 2.64 | % | | | 7.12 | % | | | 6.94 | % |
| Retail Class (Inception 12/31/96) | | | 26.31 | | | | 2.29 | | | | 6.85 | | | | 6.67 | |
| | | | | |
| Comparative Performance | | | | | | | | | | | | | | | | |
| Russell 2000 Growth Index(c) | | | 30.26 | | | | 0.68 | | | | 4.15 | | | | 6.00 | |
| Russell 2000 Index(c) | | | 29.83 | | | | -0.18 | | | | 2.13 | | | | 6.45 | |
| Lipper Small-Cap Growth Funds Index(c) | | | 28.86 | | | | 1.35 | | | | 3.16 | | | | 5.19 | |
| Gross expense ratio (before fee waivers and/or expense reimbursements)* | |
| Institutional: 0.98% Retail: 1.27% | |
| |
| Net expense ratio (after fee waivers and/or expense reimbursements)* | |
| Institutional: 0.98% Retail: 1.25% | | | | | | | | | | | | | | | | |
| * | | As stated in the most recent prospectus. Waivers/reimbursements are contractual and are set to expire on 1/31/13. Contracts are reevaluated on an annual basis. |
Cumulative Performance
March 31, 2002 to March 31, 2012(a)(b)
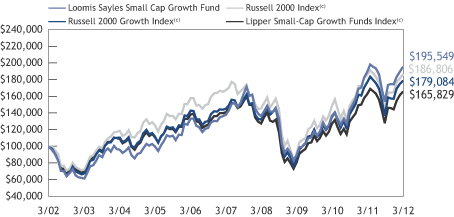
Performance data quoted represents past performance and is no guarantee of future results. Total return and value will vary and you may have a gain or loss when shares are sold. Current performance may be lower or higher than quoted. For most recent month-end performance, visit loomissayles.com. You may not invest directly in an index. Performance for periods less than one year is cumulative, not annualized. Returns reflect changes in share price and reinvestment of dividends and capital gains, if any. Performance data reflects certain fee waivers and/or expense reimbursements, if any, without which performance would be lower.
The table and graph do not reflect taxes shareholders might owe on any fund distributions or when they redeem their shares.
| (a) | | Cumulative performance is shown for the Institutional Class. Performance of the Retail Class would be lower due to higher fees and expenses. |
| (b) | | The mountain chart is based on the initial investment minimum of $100,000 for the Institutional Class. |
| (c) | | See page 7 for a description of the indices. |
3 |
LOOMIS SAYLES SMALL CAP VALUE FUND
Fund and manager review
FUND FACTS
Managers:
Joseph Gatz, CFA
Jeffrey Schwartz, CFA
Symbols:
| | |
| Institutional Class | | LSSCX |
| Retail Class | | LSCRX |
| Admin Class | | LSVAX |
Objective:
Long-term capital growth from investments in common stocks or other equity securities
Strategy:
Invests at least 80% of its net assets (plus any borrowings made for investment purposes) in equity securities of companies with market capitalizations that fall within the capitalization range of the Russell 2000 Index or is $3 billion or less at the time of investment. Unlike the Index, the Fund may invest in companies of any size.
The fund may invest up to 20% of its assets in securities of foreign issuers including emerging market securities.
Fund Inception Date:
May 13, 1991
Class Inception Date:
Institutional Class: May 13, 1991
Retail Class: December 31, 1996
Admin Class: January 2, 1998
Net Assets:
$1.0 billion
Market Conditions
Beginning in the fourth quarter of 2011, back-to-back quarters of strong equity returns were a welcome respite from the market volatility that has persisted largely since the 2008 financial crisis. Following a particularly tumultuous summer, investor sentiment began to improve at the end of 2011, helped along by the European Central Bank’s decision to extend low-cost financing to European banks. Additionally, improving business conditions and moderate but steady employment gains in the United States helped boost consumer confidence, further supporting the rally within the markets. Returns from small-cap value and small-cap growth stocks were similar, with both indexes returning nearly 30% for the six-month period. Leading sectors in the Russell 2000 Value index included economically sensitive consumer discretionary, materials and processing and producer durables, while less economically sensitive utilities and consumer staples lagged.
Performance Results
For the six months ended March 31, 2012, Institutional Class shares of Loomis Sayles Small Cap Value Fund returned 31.53%. The fund outperformed its benchmark, the Russell 2000 Value Index, which returned 29.41% for the period.
Explanation of Fund Performance
Stock selection was a significant positive influence on fund performance, with favorable trends in technology and energy offsetting negative selection in financial services. Sector allocation also contributed, with the favorable impact of an underweight in utilities offsetting the impact of maintaining a small cash balance during a strong market rally.
The fund’s top-performing stocks for the period included WellCare Health Plans, Wright Express and W.R. Grace. WellCare, a managed care provider for government-sponsored healthcare programs, reported strong earnings on favorable utilization trends and solid
| 4
cost controls during the final two quarters of 2011. Wright Express, a provider of payment processing and information services for commercial and government vehicle fleets, rallied sharply on strong earnings, which exceeded consensus forecasts and the company’s prior guidance. W. R. Grace, a manufacturer of specialty chemicals and construction products, also surpassed its prior earnings expectations, which drove shares higher.
Leading detractors for the six-month period included PHH, DFC Global and RadioShack. PHH, an outsource provider of mortgages and vehicle fleet services, sold off sharply late in 2011 on a debt-rating downgrade by Standard & Poor’s. While the downgrade may result in a higher cost of funding in the intermediate term, we eliminated our position on concerns about ongoing strategic issues. DFC Global, a provider of consumer loans, including pawn and payday lending services, was among the fund’s top performers during the first nine months of 2011. Profit-taking weighed on the stock in late 2011 and early 2012, and regulatory issues in the United Kingdom, a key growth market for the company, emerged during the period. We concluded the selloff in the stock is based on a scenario far worse than what we believe is likely to occur. We initiated a small position in RadioShack, a retailer of consumer electronics goods and services, in late 2011, following the appointment of new management and the implementation of new initiatives to turn around the business. Early results from the turnaround strategy fell short of our expectations, and we quickly eliminated the position.
Outlook
Stock market valuation indicators suggest equities are attractively valued relative to history, and we believe that stocks remain attractively valued relative to interest rates. Furthermore, investors appear less distracted than they have been by macroeconomic issues and more focused on the performance of individual companies. Another favorable factor for equities is dividend growth: we believe dividends are positioned to grow faster than earnings this year.
In the near term, we are most concerned about factors that could cause a spike in oil prices. Looking out further, Congress and the president will be required to act on a long list of expiring tax measures and the debt ceiling, while the November elections introduce another level of uncertainty. However, the market’s current attractive valuation may already reflect some of these risks. Elsewhere, a slowdown in China and a potential recession in the euro zone remain as risks. At the same time, there are reasons to be optimistic. The U.S. banking system is in substantially better shape than it was in recent years, and the euro zone banks have taken important steps to address their challenges. Considering the key positive and negative factors, we believe equities should remain attractive longer-term investment alternatives.
What You Should Know
Investments in the fund are subject to a number of risks. Please see the “Principal Risks” section of the fund’s prospectus. The purchase of fund shares should be seen as a long-term investment.
5 |
LOOMIS SAYLES SMALL CAP VALUE FUND
Average Annual Total Returns
March 31, 2012
| | | | | | | | | | | | | | | | |
| | | | | |
| | | 6 months | | | 1 year | | | 5 years | | | 10 years | |
| | | | | |
| Institutional Class (Inception 5/13/91) | | | 31.53 | % | | | 2.33 | % | | | 3.76 | % | | | 7.74 | % |
| | | | | |
| Retail Class (Inception 12/31/96) | | | 31.30 | | | | 2.04 | | | | 3.50 | | | | 7.47 | |
| Admin Class (Inception 1/2/98) | | | 31.17 | | | | 1.79 | | | | 3.24 | | | | 7.20 | |
| | | | | |
| Comparative Performance | | | | | | | | | | | | | | | | |
| Russell 2000 Value Index(c) | | | 29.41 | | | | -1.07 | | | | 0.01 | | | | 6.59 | |
| Russell 2000 Index(c) | | | 29.83 | | | | -0.18 | | | | 2.13 | | | | 6.45 | |
| Lipper Small-Cap Core Funds Index(c) | | | 27.47 | | | | 0.01 | | | | 2.99 | | | | 6.63 | |
| |
| Gross expense ratio (before fee waivers and/or expense reimbursements)* | |
| Institutional: 1.02% Retail: 1.31% Admin: 1.61% | |
| Net expense ratio (after fee waivers and/or expense reimbursements)* | |
| Institutional: 0.99% Retail: 1.24% Admin: 1.49% | |
| * | | As stated in the most recent prospectus. Waivers/reimbursements are contractual and are set to expire on 1/31/13. Contracts are reevaluated on an annual basis. |
Cumulative Performance
March 31, 2002 to March 31, 2012(a)(b)
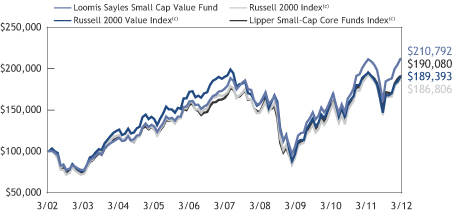
Performance data quoted represents past performance and is no guarantee of future results. Total return and value will vary and you may have a gain or loss when shares are sold. Current performance may be lower or higher than quoted. For most recent month-end performance, visit loomissayles.com. You may not invest directly in an index. Performance for periods less than one year is cumulative, not annualized. Returns reflect changes in share price and reinvestment of dividends and capital gains, if any. Performance data reflects certain fee waivers and/or expense reimbursements, if any, without which performance would be lower.
The table and graph do not reflect taxes shareholders might owe on any fund distributions or when they redeem their shares.
| (a) | | Cumulative performance is shown for the Institutional Class. Performance of the Retail and Admin Classes would be lower due to higher fees and expenses. |
| (b) | | The mountain chart is based on the initial investment minimum of $100,000 for the Institutional Class. |
| (c) | | See page 7 for a description of the indices. |
| 6
ADDITIONAL INFORMATION
The views expressed in this report reflect those of the portfolio managers as of the dates indicated. The managers’ views are subject to change at any time without notice based on changes in market or other conditions. References to specific securities or industries should not be regarded as investment advice. Because the funds are actively managed, there is no assurance that they will continue to invest in the securities or industries mentioned.
Index Definitions
Indices are unmanaged and do not have expenses that affect results, unlike mutual funds. Index returns are adjusted for the reinvestment of capital gain distributions and income dividends. It is not possible to invest directly in an index.
Lipper Small-Cap Core Funds Index is an unmanaged index that tracks the average performance of the 30 largest small-cap core funds according to Lipper Inc.
Lipper Small-Cap Growth Funds Index is an unmanaged index that tracks the average performance of the 30 largest small-cap growth funds according to Lipper Inc.
Source: Lipper, Inc.
Russell 2000 Index is an unmanaged index that measures the performance of the small-cap segment of the U.S. equity universe.
Russell 2000 Growth Index is an unmanaged index that measures the performance of the small-cap growth segment of the U.S. equity universe. It includes those Russell 2000 companies with higher price-to-book ratios and higher forecasted growth values.
Russell 2000 Value Index is an unmanaged index that measures the performance of the small-cap value segment of the U.S. equity universe. It includes those Russell 2000 companies with lower price-to-book ratios and lower forecasted growth values.
Proxy Voting Information
A description of the funds’ proxy voting policies and procedures is available without charge, upon request, (i) by calling Loomis Sayles at 800-633-3330; (ii) on the funds’ website, www.loomissayles.com, and (iii) on the SEC’s website, www.sec.gov. Information about how the funds voted proxies relating to portfolio securities during the 12 months ended June 30, 2011 is available on (i) the funds’ website and (ii) the SEC’s website.
Quarterly Portfolio Schedules
The funds file a complete schedule of portfolio holdings with the SEC for the first and third quarters of each fiscal year on Form N-Q. The funds’ Forms N-Q are available on the SEC’s website at www.sec.gov and may be reviewed and copied at the SEC’s Public Reference Room in Washington, DC. Information on the operation of the Public Reference Room may be obtained by calling 800-SEC-0330.
7 |
UNDERSTANDING YOUR FUND’S EXPENSES
As a mutual fund shareholder you incur two types of costs: (1) transaction costs and (2) ongoing costs, including management fees, distribution and/or service fees (12b-1 fees), and other fund expenses. These costs are described in more detail in the funds’ prospectus. The examples below are intended to help you understand the ongoing costs of investing in the funds and help you compare these with the ongoing costs of investing in other mutual funds.
The first line in the table of each fund shows the actual amount of fund expenses you would have paid on a $1,000 investment in the fund from October 1, 2011 through March 31, 2012. It also shows how much a $1,000 investment would be worth at the close of the period, assuming actual fund returns and expenses. To estimate the expenses you paid over the period, simply divide your account value by $1,000 (for example $8,600 account value divided by $1,000 = 8.6) and multiply the result by the number in the Expenses Paid During Period column as shown below for your class.
The second line in the table of each fund provides information about hypothetical account values and hypothetical expenses based on the fund’s actual expense ratios and an assumed rate of return of 5% per year before expenses, which is not the fund’s actual return. The hypothetical account values and expenses may not be used to estimate the actual ending account balance or expenses you paid on your investment for the period. You may use this information to compare the ongoing costs of investing in the funds and other funds. To do so, compare this 5% hypothetical example with the 5% hypothetical examples that appear in the shareholder reports of other funds.
Please note that the expenses shown reflect ongoing costs only, and do not include any transaction costs. Therefore, the second line in the table is useful in comparing ongoing costs only, and will not help you determine the relative costs of owning different funds. If transaction costs were included, total costs would be higher.
Loomis Sayles Small Cap Growth Fund
| | | | | | | | | | | | |
| Institutional Class | | Beginning
Account Value
10/1/2011 | | | Ending
Account Value
3/31/2012 | | | Expenses Paid
During Period*
10/1/2011 – 3/31/2012 | |
Actual | | | $1,000.00 | | | | $1,266.30 | | | | $5.38 | |
Hypothetical
(5% return before expenses) | | | $1,000.00 | | | | $1,020.25 | | | | $4.80 | |
| | | |
Retail Class | | | | | | | | | |
Actual | | | $1,000.00 | | | | $1,263.10 | | | | $7.07 | |
Hypothetical
(5% return before expenses) | | | $1,000.00 | | | | $1,018.75 | | | | $6.31 | |
| * | Expenses are equal to the Fund’s annualized expense ratio (after waiver/reimbursement): 0.95% and 1.25% for Institutional and Retail Class, respectively, multiplied by the average account value over the period, multiplied by the number of days in the most recent fiscal half-year, divided by 366 (to reflect the half-year period). |
| 8
Loomis Sayles Small Cap Value Fund
| | | | | | | | | | | | |
Institutional Class | | Beginning
Account Value
10/1/2011 | | | Ending
Account Value
3/31/2012 | | | Expenses Paid
During Period*
10/1/2011 – 3/31/2012 | |
Actual | | | $1,000.00 | | | | $1,315.30 | | | | $5.21 | |
Hypothetical
(5% return before expenses) | | | $1,000.00 | | | | $1,020.50 | | | | $4.55 | |
| | | |
Retail Class | | | | | | | | | |
Actual | | | $1,000.00 | | | | $1,313.00 | | | | $6.65 | |
Hypothetical
(5% return before expenses) | | | $1,000.00 | | | | $1,019.25 | | | | $5.81 | |
| | | |
Admin Class | | | | | | | | | |
Actual | | | $1,000.00 | | | | $1,311.70 | | | | $8.09 | |
Hypothetical
(5% return before expenses) | | | $1,000.00 | | | | $1,018.00 | | | | $7.06 | |
* Expenses are equal to the Fund’s annualized expense ratio (after waiver/reimbursement): 0.90%, 1.15% and 1.40% for Institutional, Retail and Admin Class, respectively, multiplied by the average account value over the period, multiplied by the number of days in the most recent fiscal half-year, divided by 366 (to reflect the half-year period). | |
9 |
Portfolio of Investments – as of March 31, 2012 (Unaudited)
Loomis Sayles Small Cap Growth Fund
| | | | | | | | |
| Shares | | | Description | | Value (†) | |
| | | | | | | | |
| |
| | Common Stocks – 96.8% of Net Assets | | | | |
| | |
| | | | Aerospace & Defense – 2.9% | | | | |
| | 88,786 | | | HEICO Corp. | | $ | 4,580,470 | |
| | 273,625 | | | Hexcel Corp.(b) | | | 6,569,736 | |
| | 95,591 | | | Triumph Group, Inc. | | | 5,989,732 | |
| | | | | | | | |
| | | | | | | 17,139,938 | |
| | | | | | | | |
| | | | Air Freight & Logistics – 0.9% | | | | |
| | 150,158 | | | HUB Group, Inc., Class A(b) | | | 5,410,193 | |
| | | | | | | | |
| | | | Auto Components – 2.2% | | | | |
| | 391,378 | | | Amerigon, Inc.(b) | | | 6,332,496 | |
| | 170,608 | | | Tenneco, Inc.(b) | | | 6,338,087 | |
| | | | | | | | |
| | | | | | | 12,670,583 | |
| | | | | | | | |
| | | | Biotechnology – 5.2% | | | | |
| | 171,121 | | | Aegerion Pharmaceuticals, Inc.(b) | | | 2,366,603 | |
| | 354,831 | | | Alkermes PLC(b) | | | 6,582,115 | |
| | 127,806 | | | Cepheid, Inc.(b) | | | 5,346,125 | |
| | 143,722 | | | Cubist Pharmaceuticals, Inc.(b) | | | 6,215,977 | |
| | 364,964 | | | Exact Sciences Corp.(b) | | | 4,072,998 | |
| | 282,753 | | | Idenix Pharmaceuticals, Inc.(b) | | | 2,768,152 | |
| | 399,167 | | | Neurocrine Biosciences, Inc.(b) | | | 3,181,361 | |
| | | | | | | | |
| | | | | | | 30,533,331 | |
| | | | | | | | |
| | | | Building Products – 0.7% | | | | |
| | 348,465 | | | NCI Building Systems, Inc.(b) | | | 4,010,832 | |
| | | | | | | | |
| | | | Capital Markets – 3.3% | | | | |
| | 228,158 | | | Evercore Partners, Inc., Class A | | | 6,632,553 | |
| | 303,394 | | | Financial Engines, Inc.(b) | | | 6,783,890 | |
| | 165,589 | | | Stifel Financial Corp.(b) | | | 6,265,888 | |
| | | | | | | | |
| | | | | | | 19,682,331 | |
| | | | | | | | |
| | | | Chemicals – 0.9% | | | | |
| | 438,343 | | | Flotek Industries, Inc.(b) | | | 5,268,883 | |
| | | | | | | | |
| | | | Commercial Banks – 3.1% | | | | |
| | 100,108 | | | Signature Bank(b) | | | 6,310,809 | |
| | 95,256 | | | SVB Financial Group(b) | | | 6,128,771 | |
| | 166,823 | | | Texas Capital Bancshares, Inc.(b) | | | 5,775,412 | |
| | | | | | | | |
| | | | | | | 18,214,992 | |
| | | | | | | | |
| | | | Commercial Services & Supplies – 1.7% | | | | |
| | 253,640 | | | Mobile Mini, Inc.(b) | | | 5,356,877 | |
| | 146,756 | | | Waste Connections, Inc. | | | 4,773,972 | |
| | | | | | | | |
| | | | | | | 10,130,849 | |
| | | | | | | | |
| | | | Communications Equipment – 1.0% | | | | |
| | 355,832 | | | Ciena Corp.(b) | | | 5,760,920 | |
| | | | | | | | |
See accompanying notes to financial statements.
| 10
Portfolio of Investments – as of March 31, 2012 (Unaudited)
Loomis Sayles Small Cap Growth Fund – continued
| | | | | | | | |
| Shares | | | Description | | Value (†) | |
| | | | | | | | |
| |
| | Common Stocks – continued | | | | |
| | |
| | | | Construction & Engineering – 0.7% | | | | |
| | 243,915 | | | MasTec, Inc.(b) | | $ | 4,412,422 | |
| | | | | | | | |
| | | | Consumer Finance – 0.8% | | | | |
| | 106,541 | | | First Cash Financial Services, Inc.(b) | | | 4,569,543 | |
| | | | | | | | |
| | | | Diversified Consumer Services – 0.9% | | | | |
| | 314,483 | | | Grand Canyon Education, Inc.(b) | | | 5,585,218 | |
| | | | | | | | |
| | | | Electrical Equipment – 0.3% | | | | |
| | 81,339 | | | Thermon Group Holdings, Inc.(b) | | | 1,663,383 | |
| | | | | | | | |
| | | | Electronic Equipment, Instruments & Components – 2.6% | | | | |
| | 98,410 | | | IPG Photonics Corp.(b) | | | 5,122,240 | |
| | 291,629 | | | Maxwell Technologies, Inc.(b) | | | 5,345,560 | |
| | 142,664 | | | Measurement Specialties, Inc.(b) | | | 4,807,777 | |
| | | | | | | | |
| | | | | | | 15,275,577 | |
| | | | | | | | |
| | | | Energy Equipment & Services – 3.9% | | | | |
| | 81,838 | | | Dril-Quip, Inc.(b) | | | 5,321,107 | |
| | 90,595 | | | Lufkin Industries, Inc. | | | 7,306,487 | |
| | 671,024 | | | Newpark Resources, Inc.(b) | | | 5,495,686 | |
| | 85,813 | | | Oceaneering International, Inc. | | | 4,624,463 | |
| | | | | | | | |
| | | | | | | 22,747,743 | |
| | | | | | | | |
| | | | Food & Staples Retailing – 1.0% | | | | |
| | 126,700 | | | Fresh Market, Inc. (The)(b) | | | 6,075,265 | |
| | | | | | | | |
| | | | Health Care Equipment & Supplies – 7.0% | | | | |
| | 184,060 | | | Abaxis, Inc.(b) | | | 5,361,668 | |
| | 192,468 | | | Align Technology, Inc.(b) | | | 5,302,494 | |
| | 113,209 | | | Cyberonics, Inc.(b) | | | 4,316,659 | |
| | 239,567 | | | Insulet Corp.(b) | | | 4,585,312 | |
| | 253,306 | | | NxStage Medical, Inc.(b) | | | 4,881,207 | |
| | 287,813 | | | Tornier NV(b) | | | 7,396,794 | |
| | 192,489 | | | Volcano Corp.(b) | | | 5,457,063 | |
| | 42,043 | | | Zoll Medical Corp.(b) | | | 3,894,443 | |
| | | | | | | | |
| | | | | | | 41,195,640 | |
| | | | | | | | |
| | | | Health Care Providers & Services – 4.0% | | | | |
| | 98,410 | | | Catalyst Health Solutions, Inc.(b) | | | 6,271,669 | |
| | 271,773 | | | Hanger Orthopedic Group, Inc.(b) | | | 5,940,958 | |
| | 162,160 | | | HMS Holdings Corp.(b) | | | 5,061,014 | |
| | 291,231 | | | Team Health Holdings, Inc.(b) | | | 5,987,709 | |
| | | | | | | | |
| | | | | | | 23,261,350 | |
| | | | | | | | |
| | | | Health Care Technology – 1.3% | | | | |
| | 98,517 | | | SXC Health Solutions Corp.(b) | | | 7,384,834 | |
| | | | | | | | |
See accompanying notes to financial statements.
11 |
Portfolio of Investments – as of March 31, 2012 (Unaudited)
Loomis Sayles Small Cap Growth Fund – continued
| | | | | | | | |
| Shares | | | Description | | Value (†) | |
| | | | | | | | |
| |
| | Common Stocks – continued | | | | |
| | |
| | | | Hotels, Restaurants & Leisure – 4.9% | | | | |
| | 243,047 | | | Bravo Brio Restaurant Group, Inc.(b) | | $ | 4,851,218 | |
| | 154,257 | | | Life Time Fitness, Inc.(b) | | | 7,800,777 | |
| | 27,183 | | | Panera Bread Co., Class A(b) | | | 4,374,288 | |
| | 29,247 | | | Peet’s Coffee & Tea, Inc.(b) | | | 2,155,504 | |
| | 221,779 | | | Shuffle Master, Inc.(b) | | | 3,903,310 | |
| | 341,405 | | | Texas Roadhouse, Inc. | | | 5,680,979 | |
| | | | | | | | |
| | | | | | | 28,766,076 | |
| | | | | | | | |
| | | | Internet Software & Services – 5.2% | | | | |
| | 246,986 | | | Angie’s List, Inc.(b) | | | 4,665,565 | |
| | 207,356 | | | Brightcove, Inc.(b) | | | 5,142,429 | |
| | 193,528 | | | Constant Contact, Inc.(b) | | | 5,765,199 | |
| | 300,399 | | | DealerTrack Holdings, Inc.(b) | | | 9,090,074 | |
| | 132,295 | | | Liquidity Services, Inc.(b) | | | 5,926,816 | |
| | | | | | | | |
| | | | | | | 30,590,083 | |
| | | | | | | | |
| | | | IT Services – 2.0% | | | | |
| | 363,170 | | | InterXion Holding NV(b) | | | 6,518,901 | |
| | 322,520 | | | ServiceSource International, Inc.(b) | | | 4,992,610 | |
| | | | | | | | |
| | | | | | | 11,511,511 | |
| | | | | | | | |
| | | | Life Sciences Tools & Services – 1.0% | | | | |
| | 243,431 | | | Luminex Corp.(b) | | | 5,684,114 | |
| | | | | | | | |
| | | | Machinery – 4.7% | | | | |
| | 115,746 | | | Chart Industries, Inc.(b) | | | 8,487,654 | |
| | 157,343 | | | RBC Bearings, Inc.(b) | | | 7,258,233 | |
| | 154,110 | | | Robbins & Myers, Inc. | | | 8,021,426 | |
| | 95,445 | | | Westport Innovations, Inc.(b) | | | 3,905,609 | |
| | | | | | | | |
| | | | | | | 27,672,922 | |
| | | | | | | | |
| | | | Media – 0.4% | | | | |
| | 219,129 | | | MDC Partners, Inc., Class A | | | 2,436,714 | |
| | | | | | | | |
| | | | Oil, Gas & Consumable Fuels – 5.1% | | | | |
| | 161,526 | | | Approach Resources, Inc.(b) | | | 5,968,386 | |
| | 282,140 | | | Halcon Resources Corp.(b) | | | 2,646,473 | |
| | 168,999 | | | Oasis Petroleum, Inc.(b) | | | 5,210,239 | |
| | 129,784 | | | Petroleum Development Corp.(b) | | | 4,813,689 | |
| | 113,775 | | | Rosetta Resources, Inc.(b) | | | 5,547,669 | |
| | 134,007 | | | World Fuel Services Corp. | | | 5,494,287 | |
| | | | | | | | |
| | | | | | | 29,680,743 | |
| | | | | | | | |
| | | | Pharmaceuticals – 1.6% | | | | |
| | 283,634 | | | Optimer Pharmaceuticals, Inc.(b) | | | 3,942,512 | |
| | 90,685 | | | Questcor Pharmaceuticals, Inc.(b) | | | 3,411,570 | |
| | 84,566 | | | Vivus, Inc.(b) | | | 1,890,896 | |
| | | | | | | | |
| | | | | | | 9,244,978 | |
| | | | | | | | |
See accompanying notes to financial statements.
| 12
Portfolio of Investments – as of March 31, 2012 (Unaudited)
Loomis Sayles Small Cap Growth Fund – continued
| | | | | | | | |
| Shares | | | Description | | Value (†) | |
| | | | | | | | |
| |
| | Common Stocks – continued | | | | |
| | |
| | | | Professional Services – 5.5% | | | | |
| | 78,318 | | | Advisory Board Co. (The)(b) | | $ | 6,940,541 | |
| | 208,920 | | | Corporate Executive Board Co. (The) | | | 8,985,649 | |
| | 92,810 | | | CoStar Group, Inc.(b) | | | 6,408,531 | |
| | 152,979 | | | FTI Consulting, Inc.(b) | | | 5,739,772 | |
| | 117,477 | | | Huron Consulting Group, Inc.(b) | | | 4,412,436 | |
| | | | | | | | |
| | | | | | | 32,486,929 | |
| | | | | | | | |
| | | | Road & Rail – 0.9% | | | | |
| | 97,652 | | | Genesee & Wyoming, Inc., Class A(b) | | | 5,329,846 | |
| | | | | | | | |
| | | | Semiconductors & Semiconductor Equipment – 6.3% | | | | |
| | 175,843 | | | Cavium, Inc.(b) | | | 5,440,582 | |
| | 222,222 | | | Ceva, Inc.(b) | | | 5,046,662 | |
| | 123,149 | | | Cymer, Inc.(b) | | | 6,157,450 | |
| | 132,007 | | | EZchip Semiconductor Ltd.(b) | | | 5,719,863 | |
| | 103,153 | | | Hittite Microwave Corp.(b) | | | 5,602,239 | |
| | 130,501 | | | Silicon Laboratories, Inc.(b) | | | 5,611,543 | |
| | 95,293 | | | Volterra Semiconductor Corp.(b) | | | 3,279,509 | |
| | | | | | | | |
| | | | | | | 36,857,848 | |
| | | | | | | | |
| | | | Software – 8.3% | | | | |
| | 326,710 | | | Allot Communications Ltd.(b) | | | 7,596,008 | |
| | 263,382 | | | Ariba, Inc.(b) | | | 8,615,225 | |
| | 103,157 | | | CommVault Systems, Inc.(b) | | | 5,120,713 | |
| | 126,252 | | | Guidewire Software, Inc.(b) | | | 3,886,037 | |
| | 88,646 | | | Imperva, Inc.(b) | | | 3,470,491 | |
| | 180,986 | | | QLIK Technologies, Inc.(b) | | | 5,791,552 | |
| | 154,177 | | | Sourcefire, Inc.(b) | | | 7,420,539 | |
| | 96,575 | | | Ultimate Software Group, Inc.(The)(b) | | | 7,077,016 | |
| | | | | | | | |
| | | | | | | 48,977,581 | |
| | | | | | | | |
| | | | Specialty Retail – 5.6% | | | | |
| | 310,619 | | | Asbury Automotive Group, Inc.(b) | | | 8,386,713 | |
| | 112,817 | | | Hibbett Sports, Inc.(b) | | | 6,154,167 | |
| | 269,145 | | | Lumber Liquidators Holdings, Inc.(b) | | | 6,758,231 | |
| | 58,811 | | | Ulta Salon, Cosmetics & Fragrance, Inc. | | | 5,462,954 | |
| | 133,640 | | | Vitamin Shoppe, Inc.(b) | | | 5,908,225 | |
| | | | | | | | |
| | | | | | | 32,670,290 | |
| | | | | | | | |
| | | | Textiles, Apparel & Luxury Goods – 0.9% | | | | |
| | 108,988 | | | Oxford Industries, Inc. | | | 5,538,770 | |
| | | | | | | | |
| | | | Total Common Stocks (Identified Cost $486,632,663) | | | 568,442,232 | |
| | | | | | | | |
See accompanying notes to financial statements.
13 |
Portfolio of Investments – as of March 31, 2012 (Unaudited)
Loomis Sayles Small Cap Growth Fund – continued
| | | | | | | | |
Principal
Amount | | | Description | | Value (†) | |
| | | | | | | | |
| |
| | Short-Term Investments – 4.8% | | | | |
| $ | 28,317,838 | | | Tri-Party Repurchase Agreement with Fixed Income Clearing Corporation, dated 3/30/2012 at 0.000% to be repurchased at $28,317,838 on 4/02/2012 collateralized by $27,380,000 U.S. Treasury Note, 2.625% due 6/30/2014 valued at $28,885,900 including accrued interest (Note 2 of Notes to Financial Statements) (Identified Cost $28,317,838) | | $ | 28,317,838 | |
| | | | | | | | |
| | |
| | | | Total Investments – 101.6% (Identified Cost $514,950,501)(a) | | | 596,760,070 | |
| | | | Other assets less liabilities—(1.6)% | | | (9,554,836 | ) |
| | | | | | | | |
| | | | Net Assets – 100.0% | | $ | 587,205,234 | |
| | | | | | | | |
| | |
| | (†) | | | See Note 2 of Notes to Financial Statements. | | | | |
| | (a) | | | Federal Tax Information (Amounts exclude certain adjustments made at the end of the Fund’s fiscal year for tax purposes. Such adjustments are primarily due to wash sales.): | | | | |
| | | | At March 31, 2012, the net unrealized appreciation on investments based on a cost of $514,950,511 for federal income tax purposes was as follows: | |
| | | | Aggregate gross unrealized appreciation for all investments in which there is an excess of value over tax cost | | $ | 86,280,536 | |
| | | | Aggregate gross unrealized depreciation for all investments in which there is an excess of tax cost over value | | | (4,470,977 | ) |
| | | | | | | | |
| | | | Net unrealized appreciation | | $ | 81,809,559 | |
| | | | | | | | |
| | (b) | | | Non-income producing security. | | | | |
Industry Summary at March 31, 2012 (Unaudited)
| | | | |
Software | | | 8.3 | % |
Health Care Equipment & Supplies | | | 7.0 | |
Semiconductors & Semiconductor Equipment | | | 6.3 | |
Specialty Retail | | | 5.6 | |
Professional Services | | | 5.5 | |
Internet Software & Services | | | 5.2 | |
Biotechnology | | | 5.2 | |
Oil, Gas & Consumable Fuels | | | 5.1 | |
Hotels, Restaurants & Leisure | | | 4.9 | |
Machinery | | | 4.7 | |
Health Care Providers & Services | | | 4.0 | |
Energy Equipment & Services | | | 3.9 | |
Capital Markets | | | 3.3 | |
Commercial Banks | | | 3.1 | |
Aerospace & Defense | | | 2.9 | |
Electronic Equipment, Instruments & Components | | | 2.6 | |
Auto Components | | | 2.2 | |
IT Services | | | 2.0 | |
Other Investments, less than 2% each | | | 15.0 | |
Short-Term Investments | | | 4.8 | |
| | | | |
Total Investments | | | 101.6 | |
Other assets less liabilities | | | (1.6 | ) |
| | | | |
Net Assets | | | 100.0 | % |
| | | | |
See accompanying notes to financial statements.
| 14
Portfolio of Investments – as of March 31, 2012 (Unaudited)
Loomis Sayles Small Cap Value Fund
| | | | | | | | |
| Shares | | | Description | | Value (†) | |
| | | | | | | | |
| |
| | Common Stocks – 97.3% of Net Assets | | | | |
| | |
| | | | Auto Components – 1.4% | | | | |
| | 534,579 | | | Dana Holding Corp. | | $ | 8,285,974 | |
| | 172,744 | | | Tenneco, Inc.(b) | | | 6,417,440 | |
| | | | | | | | |
| | | | | | | 14,703,414 | |
| | | | | | | | |
| | | | Building Products – 1.0% | | | | |
| | 136,504 | | | Armstrong World Industries, Inc. | | | 6,657,300 | |
| | 376,559 | | | Griffon Corp. | | | 4,029,181 | |
| | | | | | | | |
| | | | | | | 10,686,481 | |
| | | | | | | | |
| | | | Capital Markets – 1.7% | | | | |
| | 777,711 | | | Fifth Street Finance Corp. | | | 7,590,459 | |
| | 269,619 | | | Stifel Financial Corp.(b) | | | 10,202,383 | |
| | | | | | | | |
| | | | | | | 17,792,842 | |
| | | | | | | | |
| | | | Chemicals – 3.0% | | | | |
| | 112,430 | | | Koppers Holdings, Inc. | | | 4,335,301 | |
| | 97,033 | | | Minerals Technologies, Inc. | | | 6,346,929 | |
| | 282,814 | | | Olin Corp. | | | 6,151,205 | |
| | 203,318 | | | WR Grace & Co.(b) | | | 11,751,780 | |
| | 182,181 | | | Zep, Inc. | | | 2,623,406 | |
| | | | | | | | |
| | | | | | | 31,208,621 | |
| | | | | | | | |
| | | | Commercial Banks – 8.4% | | | | |
| | 587,102 | | | BancorpSouth, Inc. | | | 7,908,264 | |
| | 618,248 | | | Cathay General Bancorp | | | 10,942,990 | |
| | 159,134 | | | City National Corp. | | | 8,349,761 | |
| | 495,700 | | | CVB Financial Corp. | | | 5,819,518 | |
| | 482,130 | | | First Financial Bancorp | | | 8,340,849 | |
| | 160,056 | | | IBERIABANK Corp. | | | 8,558,194 | |
| | 246,925 | | | Pinnacle Financial Partners, Inc.(b) | | | 4,531,074 | |
| | 2,604,324 | | | Popular, Inc.(b) | | | 5,338,864 | |
| | 183,036 | | | Prosperity Bancshares, Inc. | | | 8,383,049 | |
| | 147,680 | | | Signature Bank(b) | | | 9,309,747 | |
| | 264,608 | | | Wintrust Financial Corp. | | | 9,470,320 | |
| | | | | | | | |
| | | | | | | 86,952,630 | |
| | | | | | | | |
| | | | Commercial Services & Supplies – 5.2% | | | | |
| | 382,556 | | | ACCO Brands Corp.(b) | | | 4,747,520 | |
| | 506,299 | | | KAR Auction Services, Inc.(b) | | | 8,207,107 | |
| | 336,098 | | | McGrath Rentcorp | | | 10,792,107 | |
| | 438,131 | | | Rollins, Inc. | | | 9,323,428 | |
| | 406,373 | | | Standard Parking Corp.(b) | | | 8,330,646 | |
| | 130,259 | | | Team, Inc.(b) | | | 4,031,516 | |
| | 247,808 | | | Waste Connections, Inc. | | | 8,061,194 | |
| | | | | | | | |
| | | | | | | 53,493,518 | |
| | | | | | | | |
See accompanying notes to financial statements.
15 |
Portfolio of Investments – as of March 31, 2012 (Unaudited)
Loomis Sayles Small Cap Value Fund – continued
| | | | | | | | |
| Shares | | | Description | | Value (†) | |
| | | | | | | | |
| |
| | Common Stocks – continued | | | | |
| | |
| | | | Communications Equipment – 1.9% | | | | |
| | 163,343 | | | ADTRAN, Inc. | | $ | 5,094,668 | |
| | 540,254 | | | Brocade Communications Systems, Inc.(b) | | | 3,106,460 | |
| | 662,976 | | | Harmonic, Inc.(b) | | | 3,626,479 | |
| | 205,280 | | | NETGEAR, Inc.(b) | | | 7,841,696 | |
| | | | | | | | |
| | | | | | | 19,669,303 | |
| | | | | | | | |
| | | | Computers & Peripherals – 0.4% | | | | |
| | 256,240 | | | QLogic Corp.(b) | | | 4,550,822 | |
| | | | | | | | |
| | | | Construction & Engineering – 0.4% | | | | |
| | 225,806 | | | MYR Group, Inc.(b) | | | 4,032,895 | |
| | | | | | | | |
| | | | Consumer Finance – 1.8% | | | | |
| | 182,778 | | | Cash America International, Inc. | | | 8,760,549 | |
| | 547,970 | | | DFC Global Corp.(b) | | | 10,340,194 | |
| | | | | | | | |
| | | | | | | 19,100,743 | |
| | | | | | | | |
| | | | Distributors – 0.4% | | | | |
| | 109,064 | | | Core-Mark Holding Co., Inc. | | | 4,465,080 | |
| | | | | | | | |
| | | | Diversified Financial Services – 0.8% | | | | |
| | 222,094 | | | MarketAxess Holdings, Inc. | | | 8,281,885 | |
| | | | | | | | |
| | | | Electric Utilities – 2.0% | | | | |
| | 220,623 | | | ALLETE, Inc. | | | 9,153,648 | |
| | 64,124 | | | ITC Holdings Corp. | | | 4,933,701 | |
| | 190,505 | | | UIL Holdings Corp. | | | 6,621,954 | |
| | | | | | | | |
| | | | | | | 20,709,303 | |
| | | | | | | | |
| | | | Electrical Equipment – 3.7% | | | | |
| | 151,992 | | | AZZ, Inc. | | | 7,848,867 | |
| | 77,673 | | | Belden, Inc. | | | 2,944,583 | |
| | 287,466 | | | EnerSys(b) | | | 9,960,697 | |
| | 169,323 | | | General Cable Corp.(b) | | | 4,923,913 | |
| | 148,139 | | | Global Power Equipment Group, Inc.(b) | | | 4,103,450 | |
| | 357,614 | | | II-VI, Inc.(b) | | | 8,457,571 | |
| | | | | | | | |
| | | | | | | 38,239,081 | |
| | | | | | | | |
| | | | Electronic Equipment, Instruments & Components – 3.8% | | | | |
| | 73,278 | | | Cognex Corp. | | | 3,104,056 | |
| | 359,931 | | | GSI Group, Inc.(b) | | | 4,340,768 | |
| | 168,298 | | | Littelfuse, Inc. | | | 10,552,285 | |
| | 337,014 | | | Methode Electronics, Inc. | | | 3,127,490 | |
| | 197,140 | | | Rofin-Sinar Technologies, Inc.(b) | | | 5,198,582 | |
| | 122,746 | | | Rogers Corp.(b) | | | 4,756,407 | |
| | 232,340 | | | ScanSource, Inc.(b) | | | 8,670,929 | |
| | | | | | | | |
| | | | | | | 39,750,517 | |
| | | | | | | | |
See accompanying notes to financial statements.
| 16
Portfolio of Investments – as of March 31, 2012 (Unaudited)
Loomis Sayles Small Cap Value Fund – continued
| | | | | | | | |
| Shares | | | Description | | Value (†) | |
| | | | | | | | |
| |
| | Common Stocks – continued | | | | |
| | |
| | | | Energy Equipment & Services – 2.2% | | | | |
| | 289,873 | | | Helix Energy Solutions Group, Inc.(b) | | $ | 5,159,739 | |
| | 120,001 | | | Lufkin Industries, Inc. | | | 9,678,081 | |
| | 148,637 | | | Oceaneering International, Inc. | | | 8,010,048 | |
| | | | | | | | |
| | | | | | | 22,847,868 | |
| | | | | | | | |
| | | | Food & Staples Retailing – 1.3% | | | | |
| | 106,486 | | | Casey’s General Stores, Inc. | | | 5,905,714 | |
| | 410,633 | | | Spartan Stores, Inc. | | | 7,440,670 | |
| | | | | | | | |
| | | | | | | 13,346,384 | |
| | | | | | | | |
| | | | Food Products – 2.2% | | | | |
| | 147,190 | | | Corn Products International, Inc. | | | 8,485,503 | |
| | 369,850 | | | Darling International, Inc.(b) | | | 6,442,787 | |
| | 145,012 | | | J & J Snack Foods Corp. | | | 7,607,330 | |
| | | | | | | | |
| | | | | | | 22,535,620 | |
| | | | | | | | |
| | | | Gas Utilities – 0.5% | | | | |
| | 209,629 | | | UGI Corp. | | | 5,712,390 | |
| | | | | | | | |
| | | | Health Care Equipment & Supplies – 0.9% | | | | |
| | 155,947 | | | SurModics, Inc.(b) | | | 2,396,906 | |
| | 112,062 | | | Teleflex, Inc. | | | 6,852,591 | |
| | | | | | | | |
| | | | | | | 9,249,497 | |
| | | | | | | | |
| | | | Health Care Providers & Services – 2.3% | | | | |
| | 193,953 | | | Hanger Orthopedic Group, Inc.(b) | | | 4,239,813 | |
| | 116,531 | | | MEDNAX, Inc.(b) | | | 8,666,410 | |
| | 150,714 | | | WellCare Health Plans, Inc.(b) | | | 10,833,322 | |
| | | | | | | | |
| | | | | | | 23,739,545 | |
| | | | | | | | |
| | | | Hotels, Restaurants & Leisure – 2.9% | | | | |
| | 107,958 | | | Churchill Downs, Inc. | | | 6,034,852 | |
| | 89,415 | | | Cracker Barrel Old Country Store, Inc. | | | 4,989,357 | |
| | 233,793 | | | Marriott Vacations Worldwide Corp.(b) | | | 6,665,438 | |
| | 113,080 | | | Six Flags Entertainment Corp. | | | 5,288,752 | |
| | 145,504 | | | Wyndham Worldwide Corp. | | | 6,767,391 | |
| | | | | | | | |
| | | | | | | 29,745,790 | |
| | | | | | | | |
| | | | Household Durables – 1.4% | | | | |
| | 163,170 | | | Jarden Corp. | | | 6,564,329 | |
| | 329,952 | | | La-Z-Boy, Inc.(b) | | | 4,936,082 | |
| | 117,495 | | | Leggett & Platt, Inc. | | | 2,703,560 | |
| | | | | | | | |
| | | | | | | 14,203,971 | |
| | | | | | | | |
| | | | Industrial Conglomerates – 0.7% | | | | |
| | 120,473 | | | Raven Industries, Inc. | | | 7,350,058 | |
| | | | | | | | |
See accompanying notes to financial statements.
17 |
Portfolio of Investments – as of March 31, 2012 (Unaudited)
Loomis Sayles Small Cap Value Fund – continued
| | | | | | | | |
| Shares | | | Description | | Value (†) | |
| | | | | | | | |
| |
| | Common Stocks – continued | | | | |
| | |
| | | | Insurance – 3.4% | | | | |
| | 446,540 | | | Employers Holdings, Inc. | | $ | 7,908,224 | |
| | 326,467 | | | HCC Insurance Holdings, Inc. | | | 10,175,976 | |
| | 108,309 | | | ProAssurance Corp. | | | 9,543,106 | |
| | 133,959 | | | Reinsurance Group of America, Inc., Class A | | | 7,966,542 | |
| | | | | | | | |
| | | | | | | 35,593,848 | |
| | | | | | | | |
| | | | Internet & Catalog Retail – 0.5% | | | | |
| | 127,655 | | | HSN, Inc. | | | 4,854,720 | |
| | | | | | | | |
| | | | Internet Software & Services – 0.9% | | | | |
| | 98,524 | | | IAC/InterActiveCorp | | | 4,836,543 | |
| | 341,227 | | | Perficient, Inc.(b) | | | 4,098,136 | |
| | | | | | | | |
| | | | | | | 8,934,679 | |
| | | | | | | | |
| | | | IT Services – 2.7% | | | | |
| | 627,651 | | | Convergys Corp.(b) | | | 8,379,141 | |
| | 300,794 | | | Euronet Worldwide, Inc.(b) | | | 6,283,587 | |
| | 215,207 | | | Wright Express Corp.(b) | | | 13,930,349 | |
| | | | | | | | |
| | | | | | | 28,593,077 | |
| | | | | | | | |
| | | | Leisure Equipment & Products – 0.4% | | | | |
| | 554,470 | | | Callaway Golf Co. | | | 3,748,217 | |
| | | | | | | | |
| | | | Machinery – 4.9% | | | | |
| | 172,663 | | | Actuant Corp., Class A | | | 5,005,500 | |
| | 146,584 | | | Alamo Group, Inc. | | | 4,406,315 | |
| | 404,916 | | | Albany International Corp., Class A | | | 9,292,822 | |
| | 443,446 | | | Altra Holdings, Inc.(b) | | | 8,514,163 | |
| | 308,158 | | | Commercial Vehicle Group, Inc.(b) | | | 3,762,609 | |
| | 185,466 | | | John Bean Technologies Corp. | | | 3,004,549 | |
| | 54,759 | | | Middleby Corp. (The)(b) | | | 5,540,516 | |
| | 170,275 | | | RBC Bearings, Inc.(b) | | | 7,854,786 | |
| | 49,107 | | | Wabtec Corp. | | | 3,701,195 | |
| | | | | | | | |
| | | | | | | 51,082,455 | |
| | | | | | | | |
| | | | Marine – 0.8% | | | | |
| | 121,016 | | | Kirby Corp.(b) | | | 7,961,643 | |
| | | | | | | | |
| | | | Media – 2.4% | | | | |
| | 178,757 | | | Arbitron, Inc. | | | 6,610,434 | |
| | 186,322 | | | John Wiley & Sons, Inc., Class A | | | 8,867,064 | |
| | 59,508 | | | Liberty Media Corp. - Liberty Capital, Class A(b) | | | 5,245,630 | |
| | 447,724 | | | Live Nation Entertainment, Inc.(b) | | | 4,208,606 | |
| | | | | | | | |
| | | | | | | 24,931,734 | |
| | | | | | | | |
| | | | Metals & Mining – 2.6% | | | | |
| | 102,828 | | | Haynes International, Inc. | | | 6,514,154 | |
| | 560,885 | | | Horsehead Holding Corp.(b) | | | 6,388,480 | |
See accompanying notes to financial statements.
| 18
Portfolio of Investments – as of March 31, 2012 (Unaudited)
Loomis Sayles Small Cap Value Fund – continued
| | | | | | | | |
| Shares | | | Description | | Value (†) | |
| | | | | | | | |
| |
| | Common Stocks – continued | | | | |
| | |
| | | | Metals & Mining – continued | | | | |
| | 154,083 | | | Reliance Steel & Aluminum Co. | | $ | 8,702,608 | |
| | 371,515 | | | SunCoke Energy, Inc.(b) | | | 5,279,228 | |
| | | | | | | | |
| | | | | | | 26,884,470 | |
| | | | | | | | |
| | | | Multi Utilities – 0.3% | | | | |
| | 96,223 | | | NorthWestern Corp. | | | 3,412,068 | |
| | | | | | | | |
| | | | Multiline Retail – 0.6% | | | | |
| | 398,351 | | | Fred’s, Inc. Class A | | | 5,819,908 | |
| | | | | | | | |
| | | | Oil, Gas & Consumable Fuels – 1.7% | | | | |
| | 109,369 | | | Berry Petroleum Co., Class A | | | 5,154,561 | |
| | 349,136 | | | Cloud Peak Energy, Inc.(b) | | | 5,561,736 | |
| | 441,718 | | | Energy Partners Ltd.(b) | | | 7,336,936 | |
| | | | | | | | |
| | | | | | | 18,053,233 | |
| | | | | | | | |
| | | | Pharmaceuticals – 0.7% | | | | |
| | 287,573 | | | Impax Laboratories, Inc.(b) | | | 7,068,544 | |
| | | | | | | | |
| | | | Professional Services – 0.3% | | | | |
| | 217,951 | | | Kelly Services, Inc., Class A | | | 3,485,037 | |
| | | | | | | | |
| | | | REITs – Apartments – 3.3% | | | | |
| | 233,803 | | | American Campus Communities, Inc. | | | 10,455,670 | |
| | 124,279 | | | Home Properties, Inc. | | | 7,582,262 | |
| | 133,984 | | | Mid-America Apartment Communities, Inc. | | | 8,980,948 | |
| | 258,603 | | | UDR, Inc. | | | 6,907,286 | |
| | | | | | | | |
| | | | | | | 33,926,166 | |
| | | | | | | | |
| | | | REITs – Diversified – 1.4% | | | | |
| | 364,429 | | | DuPont Fabros Technology, Inc. | | | 8,910,289 | |
| | 185,220 | | | Potlatch Corp. | | | 5,804,795 | |
| | | | | | | | |
| | | | | | | 14,715,084 | |
| | | | | | | | |
| | | | REITs – Healthcare – 0.9% | | | | |
| | 427,396 | | | Omega Healthcare Investors, Inc. | | | 9,086,439 | |
| | | | | | | | |
| | | | REITs – Hotels – 0.9% | | | | |
| | 1,629,443 | | | Hersha Hospitality Trust | | | 8,896,759 | |
| | | | | | | | |
| | | | REITs – Office Property – 1.0% | | | | |
| | 532,268 | | | BioMed Realty Trust, Inc. | | | 10,102,447 | |
| | | | | | | | |
| | | | REITs – Single Tenant – 0.8% | | | | |
| | 290,796 | | | National Retail Properties, Inc. | | | 7,906,743 | |
| | | | | | | | |
| | | | REITs – Storage – 1.8% | | | | |
| | 776,343 | | | CubeSmart | | | 9,238,481 | |
| | 180,366 | | | Sovran Self Storage, Inc. | | | 8,987,638 | |
| | | | | | | | |
| | | | | | | 18,226,119 | |
| | | | | | | | |
See accompanying notes to financial statements.
19 |
Portfolio of Investments – as of March 31, 2012 (Unaudited)
Loomis Sayles Small Cap Value Fund – continued
| | | | | | | | |
| Shares | | | Description | | Value (†) | |
| | | | | | | | |
| |
| | Common Stocks – continued | | | | |
| | |
| | | | Road & Rail – 2.4% | | | | |
| | 305,190 | | | Avis Budget Group, Inc.(b) | | $ | 4,318,438 | |
| | 121,198 | | | Genesee & Wyoming, Inc., Class A(b) | | | 6,614,987 | |
| | 195,914 | | | Old Dominion Freight Line, Inc.(b) | | | 9,339,220 | |
| | 207,617 | | | Werner Enterprises, Inc. | | | 5,161,359 | |
| | | | | | | | |
| | | | | | | 25,434,004 | |
| | | | | | | | |
| | | | Semiconductors & Semiconductor Equipment – 2.7% | | | | |
| | 965,558 | | | Lattice Semiconductor Corp.(b) | | | 6,208,538 | |
| | 278,294 | | | Semtech Corp.(b) | | | 7,920,247 | |
| | 199,069 | | | Skyworks Solutions, Inc.(b) | | | 5,504,258 | |
| | 476,419 | | | Teradyne, Inc.(b) | | | 8,046,717 | |
| | | | | | | | |
| | | | | | | 27,679,760 | |
| | | | | | | | |
| | | | Software – 1.7% | | | | |
| | 322,712 | | | Monotype Imaging Holdings, Inc.(b) | | | 4,808,409 | |
| | 150,161 | | | Progress Software Corp.(b) | | | 3,546,803 | |
| | 420,295 | | | SS&C Technologies Holdings, Inc.(b) | | | 9,805,482 | |
| | | | | | | | |
| | | | | | | 18,160,694 | |
| | | | | | | | |
| | | | Specialty Retail – 3.8% | | | | |
| | 131,282 | | | Genesco, Inc.(b) | | | 9,406,355 | |
| | 941,746 | | | Hot Topic, Inc. | | | 9,558,722 | |
| | 175,920 | | | Rent-A-Center, Inc. | | | 6,640,980 | |
| | 554,071 | | | Sally Beauty Holdings, Inc.(b) | | | 13,740,961 | |
| | | | | | | | |
| | | | | | | 39,347,018 | |
| | | | | | | | |
| | | | Textiles, Apparel & Luxury Goods – 0.8% | | | | |
| | 351,488 | | | Movado Group, Inc. | | | 8,629,030 | |
| | | | | | | | |
| | | | Thrifts & Mortgage Finance – 1.2% | | | | |
| | 216,184 | | | BankUnited, Inc. | | | 5,404,600 | |
| | 557,049 | | | Capitol Federal Financial, Inc. | | | 6,606,601 | |
| | | | | | | | |
| | | | | | | 12,011,201 | |
| | | | | | | | |
| | | | Trading Companies & Distributors – 1.4% | | | | |
| | 60,760 | | | DXP Enterprises, Inc.(b) | | | 2,642,452 | |
| | 248,018 | | | H&E Equipment Services, Inc.(b) | | | 4,692,501 | |
| | 341,141 | | | Rush Enterprises, Inc., Class A(b) | | | 7,239,012 | |
| | | | | | | | |
| | | | | | | 14,573,965 | |
| | | | | | | | |
| | | | Transportation Infrastructure – 0.3% | | | | |
| | 176,533 | | | Wesco Aircraft Holdings, Inc.(b) | | | 2,859,835 | |
| | | | | | | | |
| | | | Water Utilities – 0.4% | | | | |
| | 222,776 | | | Middlesex Water Co. | | | 4,208,239 | |
| | | | | | | | |
| | |
| | | | Total Common Stocks
(Identified Cost $750,098,939) | | | 1,008,555,394 | |
| | | | | | | | |
See accompanying notes to financial statements.
| 20
Portfolio of Investments – as of March 31, 2012 (Unaudited)
Loomis Sayles Small Cap Value Fund – continued
| | | | | | | | |
| Shares | | | Description | | Value (†) | |
| | | | | | | | |
| |
| | Closed End Investment Companies – 0.8% | | | | |
| | 527,881 | | | Ares Capital Corp. (Identified Cost $7,110,703) | | $ | 8,630,854 | |
| | | | | | | | |
| |
| | Warrants – 0.0% | | | | |
| | 67,892 | | | Magnum Hunter Resources Corp., Expiration on 10/14/2013(b)(c)(d) (Identified Cost $0) | |
| —
|
|
| | | | | | | | |
| | |
| Principal
Amount |
| | | | | | |
| |
| | Short-Term Investments – 1.8% | | | | |
| $ | 18,641,357 | | | Tri-Party Repurchase Agreement with Fixed Income Clearing Corporation, dated 3/30/2012 at 0.000% to be repurchased at $18,641,357 on 4/02/2012 collateralized by $18,945,000 U.S. Treasury Note, 0.500% due 10/15/2014 valued at $19,016,044 including accrued interest. (Note 2 of Notes to Financial Statements) (Identified Cost $18,641,357) | | | 18,641,357 | |
| | | | | | | | |
| | |
| | | | Total Investments – 99.9% (Identified Cost $775,850,999)(a) | | | 1,035,827,605 | |
| | | | Other assets less liabilities—0.1% | | | 1,402,845 | |
| | | | | | | | |
| | | | Net Assets – 100.0% | | $ | 1,037,230,450 | |
| | | | | | | | |
| | (†) | | | See Note 2 of Notes to Financial Statements. | | | | |
| | (a) | | | Federal Tax Information (Amounts exclude certain adjustments made at the end of the Fund’s fiscal year for tax purposes. Such adjustments are primarily due to wash sales.): | | | | |
| | | | At March 31, 2012, the net unrealized appreciation on investments based on a cost of $775,853,673 for federal income tax purposes was as follows: | | | | |
| | | | Aggregate gross unrealized appreciation for all investments in which there is an excess of value over tax cost | | $ | 271,278,812 | |
| | | | Aggregate gross unrealized depreciation for all investments in which there is an excess of tax cost over value | | | (11,304,880 | ) |
| | | | | | | | |
| | | | Net unrealized appreciation | | $ | 259,973,932 | |
| | | | | | | | |
| | (b) | | | Non-income producing security. | |
| | (c) | | | Fair valued security by the Fund’s investment adviser. | |
| | (d) | | | Illiquid security. | |
| | REITs | | | Real Estate Investment Trusts | |
See accompanying notes to financial statements.
21 |
Portfolio of Investments – as of March 31, 2012 (Unaudited)
Loomis Sayles Small Cap Value Fund – continued
Industry Summary at March 31, 2012 (Unaudited)
| | | | |
Commercial Banks | | | 8.4 | % |
Commercial Services & Supplies | | | 5.2 | |
Machinery | | | 4.9 | |
Electronic Equipment, Instruments & Components | | | 3.8 | |
Specialty Retail | | | 3.8 | |
Electrical Equipment | | | 3.7 | |
Insurance | | | 3.4 | |
REITs—Apartments | | | 3.3 | |
Chemicals | | | 3.0 | |
Hotels, Restaurants & Leisure | | | 2.9 | |
IT Services | | | 2.7 | |
Semiconductors & Semiconductor Equipment | | | 2.7 | |
Metals & Mining | | | 2.6 | |
Road & Rail | | | 2.4 | |
Media | | | 2.4 | |
Health Care Providers & Services | | | 2.3 | |
Energy Equipment & Services | | | 2.2 | |
Food Products | | | 2.2 | |
Electric Utilities | | | 2.0 | |
Other Investments, less than 2% each | | | 34.2 | |
Short-Term Investments | | | 1.8 | |
| | | | |
Total Investments | | | 99.9 | |
Other assets less liabilities | | | 0.1 | |
| | | | |
Net Assets | | | 100.0 | % |
| | | | |
See accompanying notes to financial statements.
| 22
Statements of Assets and Liabilities
March 31, 2012 (Unaudited)
| | | | | | | | |
| | | Small Cap
Growth Fund | | | Small Cap
Value Fund | |
ASSETS | | | | | | | | |
Investments at cost | | $ | 514,950,501 | | | $ | 775,850,999 | |
Net unrealized appreciation | | | 81,809,569 | | | | 259,976,606 | |
| | | | | | | | |
Investments at value | | | 596,760,070 | | | | 1,035,827,605 | |
Receivable for Fund shares sold | | | 7,919,432 | | | | 1,146,548 | |
Receivable for securities sold | | | 3,871,122 | | | | 4,321,914 | |
Dividends receivable | | | 62,385 | | | | 2,172,284 | |
| | | | | | | | |
TOTAL ASSETS | | | 608,613,009 | | | | 1,043,468,351 | |
| | | | | | | | |
LIABILITIES | | | | | | | | |
Payable for securities purchased | | | 18,316,352 | | | | 2,089,346 | |
Payable for Fund shares redeemed | | | 2,563,338 | | | | 3,204,454 | |
Management fees payable (Note 5) | | | 344,221 | | | | 656,421 | |
Deferred Trustees’ fees (Note 5) | | | 77,453 | | | | 149,707 | |
Administrative fees payable (Note 5) | | | 21,826 | | | | 40,228 | |
Payable to distributor (Note 5d) | | | 19,844 | | | | 12,726 | |
Other accounts payable and accrued expenses | | | 64,741 | | | | 85,019 | |
| | | | | | | | |
TOTAL LIABILITIES | | | 21,407,775 | | | | 6,237,901 | |
| | | | | | | | |
NET ASSETS | | $ | 587,205,234 | | | $ | 1,037,230,450 | |
| | | | | | | | |
NET ASSETS CONSIST OF: | | | | | | | | |
Paid-in capital | | $ | 524,117,452 | | | $ | 799,470,821 | |
Accumulated net investment (loss)/Undistributed net investment income | | | (2,041,131 | ) | | | 2,288,393 | |
Accumulated net realized loss on investments | | | (16,680,656 | ) | | | (24,505,370 | ) |
Net unrealized appreciation on investments | | | 81,809,569 | | | | 259,976,606 | |
| | | | | | | | |
NET ASSETS | | $ | 587,205,234 | | | $ | 1,037,230,450 | |
| | | | | | | | |
| | |
COMPUTATION OF NET ASSET VALUE AND OFFERING PRICE: | | | | | | | | |
Institutional Class: | | | | | | | | |
Net assets | | $ | 380,860,863 | | | $ | 591,632,711 | |
| | | | | | | | |
Shares of beneficial interest | | | 19,978,218 | | | | 20,159,719 | |
| | | | | | | | |
Net asset value, offering and redemption price per share | | $ | 19.06 | | | $ | 29.35 | |
| | | | | | | | |
Retail Class: | | | | | | | | |
Net assets | | $ | 206,344,371 | | | $ | 370,755,951 | |
| | | | | | | | |
Shares of beneficial interest | | | 11,249,562 | | | | 12,752,148 | |
| | | | | | | | |
Net asset value, offering and redemption price per share | | $ | 18.34 | | | $ | 29.07 | |
| | | | | | | | |
Admin Class: | | | | | | | | |
Net assets | | $ | — | | | $ | 74,841,788 | |
| | | | | | | | |
Shares of beneficial interest | | | — | | | | 2,626,941 | |
| | | | | | | | |
Net asset value, offering and redemption price per share | | $ | — | | | $ | 28.49 | |
| | | | | | | | |
See accompanying notes to financial statements.
23 |
Statements of Operations
For the Six Months Ended March 31, 2012 (Unaudited)
| | | | | | | | |
| | | Small Cap
Growth Fund | | | Small Cap
Value Fund | |
INVESTMENT INCOME | | | | | | | | |
Dividends | | $ | 364,858 | | | $ | 8,555,322 | |
Less net foreign taxes withheld | | | (8,759 | ) | | | — | |
| | | | | | | | |
| | | 356,099 | | | | 8,555,322 | |
| | | | | | | | |
Expenses | | | | | | | | |
Management fees (Note 5) | | | 1,638,354 | | | | 3,688,991 | |
Service and distribution fees (Note 5) | | | 206,781 | | | | 665,866 | |
Administrative fees (Note 5) | | | 100,424 | | | | 226,322 | |
Trustees’ fees and expenses (Note 5) | | | 16,502 | | | | 27,334 | |
Transfer agent fees and expenses (Notes 5 and 6) | | | 276,918 | | | | 482,122 | |
Audit and tax services fees | | | 18,631 | | | | 21,268 | |
Custodian fees and expenses | | | 17,447 | | | | 19,289 | |
Legal fees | | | 2,581 | | | | 7,199 | |
Registration fees | | | 60,551 | | | | 37,778 | |
Shareholder reporting expenses | | | 12,074 | | | | 59,806 | |
Miscellaneous expenses | | | 6,809 | | | | 15,575 | |
| | | | | | | | |
Total expenses | | | 2,357,072 | | | | 5,251,550 | |
Fee/expense recovery (Note 5) | | | — | | | | 12,239 | |
Less waiver and/or expense reimbursement (Note 5) | | | (29,825 | ) | | | (171,131 | ) |
| | | | | | | | |
Net expenses | | | 2,327,247 | | | | 5,092,658 | |
| | | | | | | | |
Net investment income (loss) | | | (1,971,148 | ) | | | 3,462,664 | |
| | | | | | | | |
| | |
NET REALIZED AND UNREALIZED GAIN ON INVESTMENTS | | | | | | | | |
Net realized gain on: | | | | | | | | |
Investments | | | 10,514,962 | | | | 32,046,228 | |
Net change in unrealized appreciation (depreciation) on: | | | | | | | | |
Investments | | | 84,530,352 | | | | 225,328,784 | |
| | | | | | | | |
Net realized and unrealized gain on investments | | | 95,045,314 | | | | 257,375,012 | |
| | | | | | | | |
NET INCREASE IN NET ASSETS RESULTING FROM OPERATIONS | | $ | 93,074,166 | | | $ | 260,837,676 | |
| | | | | | | | |
See accompanying notes to financial statements.
| 24
Statements of Changes in Net Assets
| | | | | | | | | | | | | | | | |
| | | Small Cap Growth Fund | | | Small Cap Value Fund | |
| | | Six Months Ended
March 31, 2012 (Unaudited) | | | Year Ended
September 30, 2011 | | | Six Months Ended
March 31, 2012 (Unaudited) | | | Year Ended
September 30, 2011 | |
FROM OPERATIONS: | | | | | | | | | | | | | | | | |
Net investment income (loss) | | $ | (1,971,148 | ) | | $ | (2,094,856 | ) | | $ | 3,462,664 | | | $ | 1,910,022 | |
Net realized gain on investments | | | 10,514,962 | | | | 24,546,166 | | | | 32,046,228 | | | | 92,685,709 | |
Net change in unrealized appreciation (depreciation) on investments | | | 84,530,352 | | | | (32,206,864 | ) | | | 225,328,784 | | | | (102,463,891 | ) |
| | | | | | | | | | | | | | | | |
Net increase (decrease) in net assets resulting from operations | | | 93,074,166 | | | | (9,755,554 | ) | | | 260,837,676 | | | | (7,868,160 | ) |
| | | | | | | | | | | | | | | | |
FROM DISTRIBUTIONS TO SHAREHOLDERS: | | | | | | | | | | | | | | | | |
Net investment income | | | | | | | | | | | | | | | | |
Institutional Class | | | — | | | | — | | | | (1,033,253 | ) | | | (3,276,433 | ) |
Retail Class | | | — | | | | — | | | | — | | | | (1,768,636 | ) |
Admin Class | | | — | | | | — | | | | — | | | | (178,569 | ) |
| | | | | | | | | | | | | | | | |
Total distributions | | | — | | | | — | | | | (1,033,253 | ) | | | (5,223,638 | ) |
| | | | | | | | | | | | | | | | |
NET INCREASE (DECREASE) IN NET ASSETS FROM CAPITAL SHARE TRANSACTIONS (NOTE 9) | | | 226,708,619 | | | | 149,332,650 | | | | (67,595,065 | ) | | | (54,117,495 | ) |
| | | | | | | | | | | | | | | | |
Net increase (decrease) in net assets | | | 319,782,785 | | | | 139,577,096 | | | | 192,209,358 | | | | (67,209,293 | ) |
NET ASSETS | | | | | | | | | | | | | | | | |
Beginning of the period | | | 267,422,449 | | | | 127,845,353 | | | | 845,021,092 | | | | 912,230,385 | |
| | | | | | | | | | | | | | | | |
End of the period | | $ | 587,205,234 | | | $ | 267,422,449 | | | $ | 1,037,230,450 | | | $ | 845,021,092 | |
| | | | | | | | | | | | | | | | |
UNDISTRIBUTED (DISTRIBUTIONS IN EXCESS OF) NET INVESTMENT INCOME/ACCUMULATED NET INVESTMENT (LOSS) | | $ | (2,041,131 | ) | | $ | (69,983 | ) | | $ | 2,288,393 | | | $ | (141,018 | ) |
| | | | | | | | | | | | | | | | |
See accompanying notes to financial statements.
25 |
This Page Intentionally Left Blank
| 26
Financial Highlights
For a share outstanding throughout each period.
| | | | | | | | | | | | | | | | | | | | | | | | | | | | | | |
| | | | | | Income (Loss) from
Investment Operations: | | | | | Less Distributions: | |
| | | Net asset
value,
beginning
of the
period | | | Net
investment
income
(loss) (a)(b) | | | Net
realized
and
unrealized
gain (loss) | | | Total
from
investment
operations | | | | | Dividends
from net
investment
income (b) | | | Distributions
from net
realized
capital
gains | | | Total
distributions | |
SMALL CAP GROWTH FUND | |
| | | | | | | |
| Institutional Class | | | | | | | | | | | | | | | | | | | | | | | | | | | |
3/31/2012(g) | | $ | 15.06 | | | $ | (0.07 | ) | | $ | 4.07 | | | $ | 4.00 | | | | | $ | — | | | $ | — | | | $ | — | |
9/30/2011 | | | 14.03 | | | | (0.13 | ) | | | 1.16 | (h) | | | 1.03 | | | | | | — | | | | — | | | | — | |
9/30/2010 | | | 11.58 | | | | (0.11 | )(j) | | | 2.56 | | | | 2.45 | | | | | | — | | | | — | | | | — | |
9/30/2009 | | | 13.07 | | | | (0.07 | ) | | | (1.42 | ) | | | (1.49 | ) | | | | | — | | | | — | | | | — | |
9/30/2008 | | | 15.87 | | | | (0.07 | ) | | | (2.73 | ) | | | (2.80 | ) | | | | | — | | | | — | | | | — | |
9/30/2007 | | | 12.00 | | | | (0.06 | )(k) | | | 3.93 | | | | 3.87 | | | | | | — | | | | — | | | | — | |
| | | | | | | | |
| Retail Class | | | | | | | | | | | | | | | | | | | | | | | | | | | | | | |
3/31/2012(g) | | | 14.52 | | | | (0.09 | ) | | | 3.91 | | | | 3.82 | | | | | | — | | | | — | | | | — | |
9/30/2011 | | | 13.55 | | | | (0.18 | ) | | | 1.15 | (h) | | | 0.97 | | | | | | — | | | | — | | | | — | |
9/30/2010 | | | 11.21 | | | | (0.13 | )(j) | | | 2.47 | | | | 2.34 | | | | | | — | | | | — | | | | — | |
9/30/2009 | | | 12.69 | | | | (0.09 | ) | | | (1.39 | ) | | | (1.48 | ) | | | | | — | | | | — | | | | — | |
9/30/2008 | | | 15.45 | | | | (0.10 | ) | | | (2.66 | ) | | | (2.76 | ) | | | | | — | | | | — | | | | — | |
9/30/2007 | | | 11.71 | | | | (0.09 | )(k) | | | 3.83 | | | | 3.74 | | | | | | — | | | | — | | | | — | |
SMALL CAP VALUE FUND | |
| | | | | | | |
| Institutional Class | | | | | | | | | | | | | | | | | | | | | | | | | | | |
3/31/2012(g) | | $ | 22.36 | | | $ | 0.11 | | | $ | 6.93 | | | $ | 7.04 | | | | | $ | (0.05 | ) | | $ | — | | | $ | (0.05 | ) |
9/30/2011 | | | 22.93 | | | | 0.09 | (m) | | | (0.50 | ) | | | (0.41 | ) | | | | | (0.16 | ) | | | — | | | | (0.16 | ) |
9/30/2010 | | | 20.66 | | | | 0.11 | | | | 2.23 | | | | 2.34 | | | | | | (0.07 | ) | | | — | | | | (0.07 | ) |
9/30/2009 | | | 22.01 | | | | 0.09 | | | | (1.32 | ) | | | (1.23 | ) | | | | | (0.11 | ) | | | (0.01 | ) | | | (0.12 | ) |
9/30/2008 | | | 28.77 | | | | 0.11 | (n) | | | (4.03 | ) | | | (3.92 | ) | | | | | (0.06 | ) | | | (2.78 | ) | | | (2.84 | ) |
9/30/2007 | | | 27.69 | | | | 0.12 | (k)(o) | | | 4.29 | | | | 4.41 | | | | | | (0.17 | ) | | | (3.16 | ) | | | (3.33 | ) |
| | | | | | | | |
| Retail Class | | | | | | | | | | | | | | | | | | | | | | | | | | | | | | |
3/31/2012(g) | | | 22.14 | | | | 0.08 | | | | 6.85 | | | | 6.93 | | | | | | — | | | | — | | | | — | |
9/30/2011 | | | 22.71 | | | | 0.02 | (m) | | | (0.48 | ) | | | (0.46 | ) | | | | | (0.11 | ) | | | — | | | | (0.11 | ) |
9/30/2010 | | | 20.47 | | | | 0.06 | | | | 2.21 | | | | 2.27 | | | | | | (0.03 | ) | | | — | | | | (0.03 | ) |
9/30/2009 | | | 21.79 | | | | 0.04 | | | | (1.30 | ) | | | (1.26 | ) | | | | | (0.05 | ) | | | (0.01 | ) | | | (0.06 | ) |
9/30/2008 | | | 28.52 | | | | 0.05 | (n) | | | (4.00 | ) | | | (3.95 | ) | | | | | — | | | | (2.78 | ) | | | (2.78 | ) |
9/30/2007 | | | 27.46 | | | | 0.04 | (k)(o) | | | 4.28 | | | | 4.32 | | | | | | (0.10 | ) | | | (3.16 | ) | | | (3.26 | ) |
| | | | | | | | |
| Admin Class | | | | | | | | | | | | | | | | | | | | | | | | | | | | | | |
3/31/2012(g) | | | 21.72 | | | | 0.04 | | | | 6.73 | | | | 6.77 | | | | | | — | | | | — | | | | — | |
9/30/2011 | | | 22.30 | | | | (0.04 | )(m) | | | (0.49 | ) | | | (0.53 | ) | | | | | (0.05 | ) | | | — | | | | (0.05 | ) |
9/30/2010 | | | 20.11 | | | | 0.00 | | | | 2.19 | | | | 2.19 | | | | | | — | | | | — | | | | — | |
9/30/2009 | | | 21.40 | | | | 0.00 | | | | (1.28 | ) | | | (1.28 | ) | | | | | (0.00 | ) | | | (0.01 | ) | | | (0.01 | ) |
9/30/2008 | | | 28.13 | | | | (0.01 | )(n) | | | (3.94 | ) | | | (3.95 | ) | | | | | — | | | | (2.78 | ) | | | (2.78 | ) |
9/30/2007 | | | 27.14 | | | | (0.03 | )(k)(o) | | | 4.22 | | | | 4.19 | | | | | | (0.04 | ) | | | (3.16 | ) | | | (3.20 | ) |
| (a) | Per share net investment income (loss) has been calculated using the average shares outstanding during the period. | |
| (b) | Amount rounds to less than $0.01 per share, if applicable. | |
| (c) | Effective June 1, 2009, redemption fees were eliminated. | |
| (d) | Had certain expenses not been waived/reimbursed during the period, if applicable, total returns would have been lower. Periods less than one year, if applicable, are not annualized. | |
| (e) | The investment adviser and/or administrator agreed to waive its fees and/or reimburse a portion of the Fund’s expenses during the period. Without this waiver/reimbursement, if applicable, expenses would have been higher. | |
| (f) | Computed on an annualized basis for periods less than one year, if applicable. | |
| (g) | For the six months ended March 31, 2012 (Unaudited). | |
| (h) | The amount shown for a share outstanding does not correspond with the aggregate realized and unrealized gain (loss) on investments for the period due to the timing of sales and redemptions of fund shares in relation to fluctuating market values of investments of the Fund. | |
| (i) | Includes fee/expense recovery of 0.03%. | |
See accompanying notes to financial statements.
27 |
| | | | | | | | | | | | | | | | | | | | | | | | | | | | | | |
| | | | | | | | | | | |
Ratios to Average Net Assets: | | | | |
Redemption
fees (b)(c) | | | Net asset
value,
end of
the
period | | | Total
return
(%) (d) | | | Net assets,
end of
the period
(000’s) | | | Net
expenses
(%) (e)(f) | | | Gross
expenses
(%) (f) | | | Net
investment
income (loss)
(%) (f) | | | Portfolio
turnover
rate (%) | |
| | | | | | | | | | | | | | | | | | | | | | | | | | | | | | |
| | | | | | | |
| | | | | | | | | | | | | | | | | | | | | | | | | | | | | | |
| $ | — | | | $ | 19.06 | | | | 26.63 | | | $ | 380,861 | | | | 0.95 | | | | 0.95 | | | | (0.79 | ) | | | 34 | |
| | — | | | | 15.06 | | | | 7.34 | | | | 154,313 | | | | 0.98 | (i) | | | 0.98 | (i) | | | (0.78 | ) | | | 76 | |
| | — | | | | 14.03 | | | | 21.16 | | | | 52,501 | | | | 1.00 | | | | 1.06 | | | | (0.85 | )(j) | | | 69 | |
| | — | | | | 11.58 | | | | (11.40 | ) | | | 45,557 | | | | 1.00 | | | | 1.01 | | | | (0.68 | ) | | | 107 | |
| | 0.00 | | | | 13.07 | | | | (17.64 | ) | | | 44,540 | | | | 1.00 | | | | 1.01 | | | | (0.47 | ) | | | 92 | |
| | 0.00 | | | | 15.87 | | | | 32.25 | | | | 28,088 | | | | 1.00 | | | | 1.23 | | | | (0.47 | ) | | | 83 | |
| | | | | | | |
| | | | | | | | | | | | | | | | | | | | | | | | | | | | | | |
| | — | | | | 18.34 | | | | 26.31 | | | | 206,344 | | | | 1.25 | | | | 1.29 | | | | (1.09 | ) | | | 34 | |
| | — | | | | 14.52 | | | | 7.16 | | | | 113,110 | | | | 1.25 | | | | 1.27 | | | | (1.07 | ) | | | 76 | |
| | — | | | | 13.55 | | | | 20.87 | | | | 75,344 | | | | 1.25 | | | | 1.39 | | | | (1.10 | )(j) | | | 69 | |
| | — | | | | 11.21 | | | | (11.66 | ) | | | 75,478 | | | | 1.25 | | | | 1.43 | | | | (0.93 | ) | | | 107 | |
| | 0.00 | | | | 12.69 | | | | (17.86 | ) | | | 79,897 | | | | 1.25 | | | | 1.42 | | | | (0.70 | ) | | | 92 | |
| | 0.00 | | | | 15.45 | | | | 31.94 | | | | 20,924 | | | | 1.25 | | | | 1.50 | | | | (0.66 | ) | | | 83 | |
| | | | | | | | | | | | | | | | | | | | | | | | | | | | | | |
| | | | | | | |
| | | | | | | | | | | | | | | | | | | | | | | | | | | | | | |
| $ | — | | | $ | 29.35 | | | | 31.53 | | | $ | 591,633 | | | | 0.90 | (l) | | | 0.90 | (l) | | | 0.85 | | | | 10 | |
| | — | | | | 22.36 | | | | (1.88 | )(m) | | | 431,761 | | | | 0.90 | | | | 0.93 | | | | 0.33 | (m) | | | 42 | |
| | — | | | | 22.93 | | | | 11.39 | | | | 454,853 | | | | 0.90 | | | | 0.94 | | | | 0.50 | | | | 52 | |
| | 0.00 | | | | 20.66 | | | | (5.42 | ) | | | 506,324 | | | | 0.90 | | | | 0.94 | | | | 0.52 | | | | 55 | |
| | 0.00 | | | | 22.01 | | | | (15.02 | ) | | | 553,268 | | | | 0.89 | | | | 0.89 | | | | 0.47 | | | | 61 | |
| | 0.00 | | | | 28.77 | | | | 17.02 | | | | 534,776 | | | | 0.89 | | | | 0.89 | | | | 0.43 | | | | 57 | |
| | | | | | | |
| | | | | | | | | | | | | | | | | | | | | | | | | | | | | | |
| | — | | | | 29.07 | | | | 31.30 | | | | 370,756 | | | | 1.15 | | | | 1.22 | | | | 0.57 | | | | 10 | |
| | — | | | | 22.14 | | | | (2.12 | )(m) | | | 347,759 | | | | 1.15 | | | | 1.22 | | | | 0.08 | (m) | | | 42 | |
| | — | | | | 22.71 | | | | 11.10 | | | | 383,934 | | | | 1.15 | | | | 1.24 | | | | 0.26 | | | | 52 | |
| | 0.00 | | | | 20.47 | | | | (5.66 | ) | | | 387,383 | | | | 1.15 | | | | 1.31 | | | | 0.26 | | | | 55 | |
| | 0.00 | | | | 21.79 | | | | (15.21 | ) | | | 464,525 | | | | 1.15 | | | | 1.27 | | | | 0.21 | | | | 61 | |
| | 0.00 | | | | 28.52 | | | | 16.74 | | | | 465,055 | | | | 1.15 | | | | 1.24 | | | | 0.15 | | | | 57 | |
| | | | | | | |
| | | | | | | | | | | | | | | | | | | | | | | | | | | | | | |
| | — | | | | 28.49 | | | | 31.17 | | | | 74,842 | | | | 1.40 | | | | 1.52 | | | | 0.33 | | | | 10 | |
| | — | | | | 21.72 | | | | (2.40 | )(m) | | | 65,500 | | | | 1.40 | | | | 1.52 | | | | (0.17 | )(m) | | | 42 | |
| | — | | | | 22.30 | | | | 10.89 | | | | 73,443 | | | | 1.40 | | | | 1.56 | | | | 0.02 | | | | 52 | |
| | 0.00 | | | | 20.11 | | | | (5.93 | ) | | | 74,195 | | | | 1.40 | | | | 1.77 | | | | 0.02 | | | | 55 | |
| | 0.00 | | | | 21.40 | | | | (15.44 | ) | | | 77,855 | | | | 1.40 | | | | 1.68 | | | | (0.04 | ) | | | 61 | |
| | 0.00 | | | | 28.13 | | | | 16.41 | | | | 76,783 | | | | 1.40 | | | | 1.56 | | | | (0.10 | ) | | | 57 | |
| | (j) | Includes a non-recurring dividend. Without this dividend, net investment loss per share would have been $(0.12) and $(0.14) for Institutional Class and Retail Class, respectively, and the ratio of net investment loss to average net assets would have been (0.92)% and (1.17)% for Institutional Class and Retail Class, respectively. |
| | (k) | Includes a non-recurring payment of $0.01 per share and $0.00 per share for Small Cap Growth Fund and Small Cap Value Fund, respectively. |
| | (l) | Includes fee/expense recovery of less than 0.01%. |
| | (m) | Includes a non-recurring dividend. Without this dividend, net investment income (loss) per share would have been $0.07, $0.01 and $(0.06) for Institutional Class, Retail Class and Admin Class, respectively, total return would have been (1.93)%, (2.16)% and (2.44)% for Institutional Class, Retail Class and Admin Class, respectively and the ratio of net investment income (loss) to average net assets would have been 0.28%, 0.03% and (0.22)% for Institutional Class, Retail Class and Admin Class, respectively. |
| | (n) | Includes a non-recurring dividend of $0.02 per share. |
| | (o) | Includes a non-recurring dividend of $0.05 per share. |
See accompanying notes to financial statements.
| 28
Notes to Financial Statements
March 31, 2012 (Unaudited)
1. Organization. Loomis Sayles Funds I and Loomis Sayles Funds II (the “Trusts” and each a “Trust”) are each organized as a Massachusetts business trust. Each Trust is registered under the Investment Company Act of 1940, as amended (the “1940 Act”), as an open-end management investment company. Each Declaration of Trust permits the Board of Trustees to authorize the issuance of an unlimited number of shares of the Trust in multiple series. The financial statements for certain funds of the Trusts are presented in separate reports. The following funds (individually, a “Fund” and collectively, the “Funds”) are included in this report:
Loomis Sayles Funds I:
Loomis Sayles Small Cap Value Fund (the “Small Cap Value Fund”)
Loomis Sayles Funds II:
Loomis Sayles Small Cap Growth Fund (the “Small Cap Growth Fund”)
Each Fund is a diversified investment company.
Effective January 1, 2012, the name of the Funds’ administrator changed from Natixis Asset Management Advisors, L.P. to NGAM Advisors, L.P. (“NGAM Advisors”) and the name of the Funds’ distributor changed from Natixis Distributors, L.P. to NGAM Distribution, L.P. (“NGAM Distribution”).
Each Fund offers Institutional Class shares and Retail Class shares. In addition, Small Cap Value Fund offers Admin Class shares.
Most expenses of the Trusts can be directly attributed to a Fund. Expenses which cannot be directly attributed to a Fund are generally apportioned based on the relative net assets of each of the funds in the Trusts. Expenses of a Fund are borne pro rata by the holders of each class of shares, except that each class bears expenses unique to that class (including the Rule 12b-1 service and distribution fees and transfer agent fees). In addition, each class votes as a class only with respect to its own Rule 12b-1 Plan. Shares of each class would receive their pro rata share of the net assets of a Fund if the Fund were liquidated. The Trustees approve separate distributions from net investment income on each class of shares.
2. Significant Accounting Policies. The following is a summary of significant accounting policies consistently followed by each Fund in the preparation of its financial statements. The Funds’ financial statements are prepared in accordance with accounting principles generally accepted in the United States of America which require the use of management estimates that affect the reported amounts and disclosures in the financial statements. Actual results could differ from those estimates. Management has evaluated the events and transactions subsequent to period-end through the date the financial statements were issued and has determined that there were no material events that would require disclosure in the Funds’ financial statements.
a. Valuation. Equity securities, including shares of closed-end investment companies and exchange-traded funds, for which market quotations are readily available are valued at market value, as reported by independent pricing services recommended by the investment
29 |
Notes to Financial Statements – continued
March 31, 2012 (Unaudited)
adviser and approved by the Board of Trustees. Such independent pricing services generally use the security’s last sale price on the exchange or market where the security is primarily traded or, if there is no reported sale during the day, the closing bid price. Securities traded on the NASDAQ Global Select Market, NASDAQ Global Market and NASDAQ Capital Market are valued at the NASDAQ Official Closing Price (“NOCP”), or if lacking a NOCP, at the most recent bid quotation on the applicable NASDAQ Market. Debt securities (other than short-term obligations purchased with an original or remaining maturity of sixty days or less) and unlisted equity securities are generally valued on the basis of evaluated bids furnished to the Funds by an independent pricing service recommended by the investment adviser and approved by the Board of Trustees, which service determines valuations for normal, institutional-size trading units of such securities using market information, transactions for comparable securities and various relationships between securities which are generally recognized by institutional traders. Broker-dealer bid quotations may also be used to value debt and equity securities where an independent pricing service is unable to price a security or where an independent pricing service does not provide a reliable price for the security. Investments in other open-end investment companies are valued at their net asset value each day. Short-term obligations purchased with an original or remaining maturity of sixty days or less are valued at amortized cost, which approximates market value. Securities for which market quotations are not readily available are valued at fair value as determined in good faith by the Funds’ investment adviser using consistently applied procedures under the general supervision of the Board of Trustees.
The Funds may hold securities traded in foreign markets. Foreign securities are valued at the market price in the foreign market. However, if events occurring after the close of the foreign market (but before the close of regular trading on the New York Stock Exchange) are believed to materially affect the value of those securities, such securities are fair valued pursuant to procedures approved by the Board of Trustees. When fair valuing securities, the Funds may, among other things, use modeling tools or other processes that may take into account factors such as securities market activity and/or significant events that occur after the close of the foreign market and before the Funds calculate their net asset values.
b. Investment Transactions and Related Investment Income. Investment transactions are accounted for on a trade date plus one basis for daily net asset value calculation. However, for financial reporting purposes, investment transactions are reported on trade date. Dividend income is recorded on ex-dividend date, or in the case of certain foreign securities, as soon as a Fund is notified, and interest income is recorded on an accrual basis. Interest income is increased by the accretion of discount and decreased by the amortization of premium. Distributions received from investments in securities that represent a return of capital or capital gain are recorded as a reduction of cost of the investments or as a realized gain, respectively. The calendar year-end amounts of ordinary income, capital gains, and return of capital included in distributions received from the Funds’ investments in real estate investment trusts (“REITs”) are reported to the Funds
| 30
Notes to Financial Statements – continued
March 31, 2012 (Unaudited)
after the end of the fiscal year; accordingly, the Funds estimate these amounts for accounting purposes until the characterization of REIT distributions is reported to the Funds after the end of the fiscal year. Estimates are based on the most recent REIT distribution information available. Investment income is recorded net of foreign taxes withheld when applicable. In determining net gain or loss on securities sold, the cost of securities has been determined on an identified cost basis. Investment income, non-class specific expenses and realized and unrealized gains and losses are allocated on a pro rata basis to each class based on the relative net assets of each class to the total net assets of the Fund.
c. Foreign Currency Translation. The books and records of the Funds are maintained in U.S. dollars. The values of securities, currencies and other assets and liabilities denominated in currencies other than U.S. dollars are translated into U.S. dollars based upon foreign exchange rates prevailing at the end of the period. Purchases and sales of investment securities, income and expenses are translated on the respective dates of such transactions.
Since the values of investment securities are presented at the foreign exchange rates prevailing at the end of the period, it is not practical to isolate that portion of the results of operations arising from changes in exchange rates from fluctuations which arise due to changes in market prices of investment securities. Such changes are included with the net realized and unrealized gain or loss on investments.
Net realized foreign exchange gains or losses arise from sales of foreign currency, currency gains or losses realized between the trade and settlement dates on securities transactions and the difference between the amounts of dividends, interest and foreign withholding taxes recorded on the Funds’ books and the U.S. dollar equivalent of the amounts actually received or paid. Net unrealized foreign exchange gains and losses arise from changes in the value of assets and liabilities, other than investment securities, at the end of the fiscal period, resulting from changes in exchange rates.
Each Fund may use foreign currency exchange contracts to facilitate transactions in foreign-denominated investments. Losses may arise from changes in the value of the foreign currency or if the counterparties do not perform under the contracts’ terms.
d. Federal and Foreign Income Taxes. Each Trust treats each Fund as a separate entity for federal income tax purposes. Each Fund intends to meet the requirements of the Internal Revenue Code of 1986, as amended, applicable to regulated investment companies, and to distribute to its shareholders substantially all of its net investment income and any net realized capital gains at least annually. Management has performed an analysis of each Fund’s tax positions for the open tax years as of March 31, 2012 and has concluded that no provisions for income tax are required. The Funds’ federal tax returns for the prior three fiscal years remain subject to examination by the Internal Revenue Service. Management is not aware of any events that are reasonably possible to occur in the next six months that would result in the amounts of any unrecognized tax benefits significantly increasing or
31 |
Notes to Financial Statements – continued
March 31, 2012 (Unaudited)
decreasing for the Funds. However, management’s conclusions regarding tax positions taken may be subject to review and adjustment at a later date based on factors including, but not limited to, new tax laws and accounting regulations and interpretations thereof.
A Fund may be subject to foreign taxes on income and gains on investments that are accrued based upon the Fund’s understanding of the tax rules and regulations that exist in the countries in which the Fund invests. Foreign governments may also impose taxes or other payments on investments with respect to foreign securities. Such taxes are accrued as applicable.
e. Dividends and Distributions to Shareholders. Dividends and distributions are recorded on ex-dividend date. The timing and characterization of certain income and capital gain distributions are determined annually in accordance with federal tax regulations, which may differ from accounting principles generally accepted in the United States of America. Permanent differences are primarily due to differing treatments for book and tax purposes of items such as expired capital loss carryforwards, distribution in excess of current earnings, net operating losses and deferred Trustees’ fees. Permanent book and tax basis differences relating to shareholder distributions will result in reclassifications to capital accounts. Temporary differences between book and tax distributable earnings are primarily due to deferred Trustees’ fees and wash sales. Distributions from net investment income and short-term capital gains are considered to be distributed from ordinary income for tax purposes.
The tax characterization of distributions is determined on an annual basis. The tax character of distributions paid to shareholders during the year ended September 30, 2011 was as follows:
| | | | | | | | | | | | |
| | | 2011 Distributions Paid From: | |
Fund | | Ordinary
Income | | | Long-Term
Capital Gains | | | Total | |
Small Cap Growth Fund | | $ | — | | | $ | — | | | $ | — | |
Small Cap Value Fund | | | 5,223,638 | | | | — | | | | 5,223,638 | |
As of September 30, 2011, the capital loss carryforwards were as follows:
| | | | | | | | |
| Capital loss carryforward: | | Small Cap
Growth Fund | | | Small Cap
Value Fund | |
Short-term: | | | | | | | | |
Expires September 30, 2017 | | $ | (14,995,800 | ) | | $ | — | |
Expires September 30, 2018 | | | (11,878,485 | ) | | | (55,289,597 | ) |
| | | | |
Total capital loss carryforward | | $ | (26,874,285 | ) | | $ | (55,289,597 | ) |
| | | | |
On December 22, 2010, the Regulated Investment Company Modernization Act of 2010 (the “Act”) was enacted. The Act modernizes several of the federal income and excise tax provisions related to RICs, and, with certain exceptions, is effective for taxable years beginning after December 22, 2010. Among the changes made are changes to the capital loss carryforward rules allowing for capital losses to be carried forward indefinitely. Rules
| 32
Notes to Financial Statements – continued
March 31, 2012 (Unaudited)
in effect previously limited the carryforward period to eight years. Capital loss carryforwards generated in taxable years beginning after the effective date of the Act must be fully used before capital loss carryforwards generated in taxable years prior to effective date of the Act; therefore, under certain circumstances, capital loss carryforwards available as of the report date, if any, may expire unused. Additionally, capital losses realized in taxable years beginning after the effective date of the Act are carried over in the character (short-term or long-term) realized. Rules in effect previously treated all capital loss carryforwards as short-term.
f. Repurchase Agreements. It is each Fund’s policy that the market value of the collateral for repurchase agreements be at least equal to 102% of the repurchase price, including interest. Certain repurchase agreements are tri-party arrangements whereby the collateral is held in a segregated account for the benefit of the Fund and on behalf of the counterparty. Repurchase agreements could involve certain risks in the event of default or insolvency of the counterparty, including possible delays or restrictions upon a Fund’s ability to dispose of the underlying securities.
g. Securities Lending. The Funds have entered into an agreement with State Street Bank and Trust Company (“State Street Bank”), as agent of the Funds, to lend securities to certain designated borrowers. The loans are collateralized with cash or securities in an amount equal to at least 105% or 102% of the market value (including accrued interest) of the loaned international or domestic securities, respectively, when the loan is initiated. Thereafter, the value of the collateral must remain at least 102% of the market value (including accrued interest) of loaned securities for U.S. equities and U.S. corporate debt; at least 105% of the market value (including accrued interest) of loaned securities for non-U.S. equities; and at least 100% of the market value (including accrued interest) of loaned securities for U.S. Government securities, sovereign debt issued by non-U.S. Governments and non-U.S. corporate debt. In the event that the market value of the collateral falls below the required percentages described above, the borrower will deliver additional collateral on the next business day. As with other extensions of credit, the Funds may bear the risk of loss with respect to the investment of the collateral. The Funds invest cash collateral in short-term investments, a portion of the income from which is remitted to the borrowers and the remainder allocated between the Funds and State Street Bank as lending agent.
For the six months ended March 31, 2012, neither Fund had loaned securities under this agreement.
h. Indemnifications. Under the Trusts’ organizational documents, their officers and Trustees are indemnified against certain liabilities arising out of the performance of their duties to the Funds. Additionally, in the normal course of business, the Funds enter into contracts with service providers that contain general indemnification clauses. The Funds’ maximum exposure under these arrangements is unknown as this would involve future claims that may be made against the Funds that have not yet occurred. However, based on experience, the Funds expect the risk of loss to be remote.
33 |
Notes to Financial Statements – continued
March 31, 2012 (Unaudited)
3. Fair Value Measurements. In accordance with accounting standards related to fair value measurements and disclosures, the Funds have categorized the inputs utilized in determining the value of each Fund’s assets or liabilities. These inputs are summarized in the three broad levels listed below:
| | • | | Level 1—quoted prices in active markets for identical assets or liabilities; |
| | • | | Level 2—prices determined using other significant inputs that are observable either directly, or indirectly through corroboration with observable market data (which could include quoted prices for similar assets or liabilities, interest rates, credit risk, etc.); |
| | • | | Level 3—prices determined using significant unobservable inputs when quoted prices or observable inputs are unavailable such as when there is little or no market activity for an asset or liability (unobservable inputs reflect each Fund’s own assumptions in determining the fair value of assets or liabilities and would be based on the best information available). |
The inputs or methodology used for valuing securities are not necessarily an indication of the risk associated with investing in those securities.
The following is a summary of the inputs used to value the Funds’ investments as of March 31, 2012, at value:
Small Cap Growth Fund
Asset Valuation Inputs
| | | | | | | | | | | | | | | | |
Description | | Level 1 | | | Level 2 | | | Level 3 | | | Total | |
Common Stocks(a) | | $ | 568,442,232 | | | $ | — | | | $ | — | | | $ | 568,442,232 | |
Short-Term Investments | | | — | | | | 28,317,838 | | | | — | | | | 28,317,838 | |
| | | | | | | | | | | | | | | | |
Total | | $ | 568,442,232 | | | $ | 28,317,838 | | | $ | — | | | $ | 596,760,070 | |
| | | | | | | | | | | | | | | | |
(a) Details of the major categories of the Fund’s investments are reflected within the Portfolio of Investments.
For the six months ended March 31, 2012, there were no transfers between Levels 1, 2 and 3.
Small Cap Value Fund
Asset Valuation Inputs
| | | | | | | | | | | | | | | | |
Description | | Level 1 | | | Level 2 | | | Level 3 | | | Total | |
Common Stocks(a) | | $ | 1,008,555,394 | | | $ | — | | | $ | — | | | $ | 1,008,555,394 | |
Closed End Investment Companies | | | 8,630,854 | | | | — | | | | — | | | | 8,630,854 | |
Warrants(b) | | | — | | | | — | | | | — | | | | — | |
Short-Term Investments | | | — | | | | 18,641,357 | | | | — | | | | 18,641,357 | |
| | | | | | | | | | | | | | | | |
Total | | $ | 1,017,186,248 | | | $ | 18,641,357 | | | $ | — | | | $ | 1,035,827,605 | |
| | | | | | | | | | | | | | | | |
(a) Details of the major categories of the Fund’s investments are reflected within the Portfolio of Investments.
(b) Fair valued at zero using level 2 inputs.
| 34
Notes to Financial Statements – continued
March 31, 2012 (Unaudited)
For the six months ended March 31, 2012, there were no transfers between Levels 1, 2 and 3.
In May, 2011, Accounting Standards Update (“ASU”) No. 2011-04, “Amendments to Achieve Common Fair Value Measurement and Disclosure Requirements” was issued and is effective for interim and annual periods beginning after December 15, 2011. The ASU requires reporting entities to disclose i) the amounts of any transfers between Level 1 and Level 2, and the reasons for the transfers; and ii) for Level 3 fair value measurements, a) quantitative information about significant unobservable inputs used, b) a description of the valuation processes used by the reporting entity, and c) a narrative description of the sensitivity of the fair value measurement to changes in unobservable inputs if a change in those inputs might result in a significantly higher or lower fair value measurement. Notwithstanding the projected regulatory implementation date of June 30, 2012 for the Fund, Management has already implemented disclosure of all transfers between Level 1 and Level 2, and the reasons for the transfers. Management is currently evaluating the impact, if any, the Level 3 disclosures may have on the Fund’s financial statements.
4. Purchases and Sales of Securities. For the six months ended March 31, 2012, purchases and sales of securities (excluding short-term investments) were as follows:
| | | | | | | | |
Fund | | Purchases | | | Sales | |
Small Cap Growth Fund | | $ | 357,361,196 | | | $ | 139,926,586 | |
Small Cap Value Fund | | | 94,626,038 | | | | 160,128,035 | |
5. Management Fees and Other Transactions with Affiliates.
a. Management Fees. Loomis, Sayles & Company, L.P. (“Loomis Sayles”) serves as investment adviser to each Fund. Under the terms of the management agreements, each Fund pays a management fee at the following annual rates, calculated daily and payable monthly, based on each Fund’s average daily net assets:
| | | | | |
Fund | | Percentage of
Average Daily
Net Assets |
Small Cap Growth Fund | | | | 0.75% | |
Small Cap Value Fund | | | | 0.75% | |
Loomis Sayles has given binding undertakings to the Funds to waive management fees and/or reimburse certain expenses to limit the Funds’ operating expenses, exclusive of acquired fund fees and expenses, brokerage expenses, interest expense, taxes and extraordinary expenses. These undertakings are in effect until January 31, 2013 and are reevaluated on an annual basis. Management fees payable, as reflected on the Statements of Assets and Liabilities, is net of waivers and/or expense reimbursements, if any, pursuant to these undertakings.
35 |
Notes to Financial Statements – continued
March 31, 2012 (Unaudited)
For the six months ended March 31, 2012, the expense limits as a percentage of average daily net assets under the expense limitation agreements were as follows:
| | | | | | | | | | | | | | | |
| | | Expense Limit as a Percentage of Average
Daily Net Assets |
Fund | | Institutional Class | | Retail Class | | Admin Class |
Small Cap Growth Fund | | | | 1.00% | | | | | 1.25% | | | | | — | |
Small Cap Value Fund | | | | 0.90% | | | | | 1.15% | | | | | 1.40% | |
Loomis Sayles shall be permitted to recover expenses it has borne under the expense limitation agreements (whether through waiver of its management fees or otherwise) on a class by class basis in later periods to the extent the expenses of a class fall below a class’ expense limits, provided, however, that a class is not obligated to pay such waived/reimbursed fees or expenses more than one year after the end of the fiscal year in which the fees or expenses were waived/reimbursed.
For the six months ended March 31, 2012, the management fees for each Fund were as follows:
| | | | | | | | | | |
Fund | | Management
Fees | | Percentage of
Average Daily Net Assets |
Small Cap Growth Fund | | | $ | 1,638,354 | | | | | 0.75 | % |
Small Cap Value Fund | | | | 3,688,991 | | | | | 0.75 | % |
For the six months ended March 31, 2012, class-specific expenses have been reimbursed as follows:
| | | | | | | | | | | | | | | | | | | | |
| | | Reimbursement1 |
Fund | | Institutional
Class | | Retail
Class | | Admin
Class | | Total |
Small Cap Growth Fund | | | $ | — | | | | $ | 29,825 | | | | $ | — | | | | $ | 29,825 | |
Small Cap Value Fund | | | | — | | | | | 126,344 | | | | | 44,787 | | | | | 171,131 | |
1 Expense reimbursements are subject to possible recovery until September 30, 2013.
For the six months ended March 31, 2012, expense reimbursements related to the prior fiscal year were recovered as follows:
| | | | | | | | | | | | | | | | |
| | | Recovered Expenses | |
Fund | | Institutional
Class | | | Retail
Class | | | Admin
Class | | | Total | |
Small Cap Value Fund | | $ | 12,239 | | | $ | — | | | $ | — | | | $ | 12,239 | |
Certain officers and employees of Loomis Sayles are also officers or Trustees of the Trust. Loomis Sayles’ general partner is indirectly owned by Natixis Global Asset Management, L.P. (“Natixis US”), which is part of Natixis Global Asset Management, an international asset management group based in Paris, France.
b. Service and Distribution Fees. NGAM Distribution, which is a wholly-owned subsidiary of Natixis US, has entered into a distribution agreement with the Trusts. Pursuant to this agreement, NGAM Distribution serves as principal underwriter of the Funds of the Trusts.
| 36
Notes to Financial Statements – continued
March 31, 2012 (Unaudited)
Pursuant to Rule 12b-1 under the 1940 Act, Small Cap Growth Fund and Small Cap Value Fund have adopted a Distribution Plan relating to each Fund’s Retail Class shares (the “Retail Class Plans”) and Small Cap Value Fund has adopted a Distribution Plan relating to its Admin Class shares (the “Admin Class Plan”).
Under the Retail Class Plans, each Fund pays NGAM Distribution a monthly distribution fee at an annual rate not to exceed 0.25% of the average daily net assets attributable to the Funds’ Retail Class shares, as compensation for services provided by NGAM Distribution in connection with the marketing or sale of Retail Class shares or for payments made by NGAM Distribution to securities dealers or other financial intermediaries as commissions, asset-based sales charges or other compensation with respect to the sale of Retail Class shares, or for providing personal services to investors and/or maintenance of shareholder accounts.
Under the Admin Class Plan, Small Cap Value Fund pays NGAM Distribution a monthly distribution fee at an annual rate not to exceed 0.25% of the average daily net assets attributable to the Fund’s Admin Class shares, as compensation for services provided by NGAM Distribution in connection with the marketing or sale of Admin Class shares or for payments made by NGAM Distribution to securities dealers or other financial intermediaries as commissions, asset-based sales charges or other compensation with respect to the sale of Admin Class shares, or for providing personal services to investors and/or the maintenance of shareholder accounts.
In addition, the Admin Class shares of Small Cap Value Fund may pay NGAM Distribution an administrative service fee, at an annual rate not to exceed 0.25% of the average daily net assets attributable to Admin Class shares. These fees are subsequently paid to securities dealers or financial intermediaries for providing personal services and/or account maintenance for their customers who hold such shares.
For the six months ended March 31, 2012, the Funds paid the following service and distribution fees:
| | | | | | | | | | | | |
| | | Service Fees | | | Distribution Fees | |
Fund | | Admin Class | | | Retail Class | | | Admin Class | |
Small Cap Growth Fund | | $ | — | | | $ | 206,781 | | | $ | — | |
Small Cap Value Fund | | | 91,974 | | | | 481,918 | | | | 91,974 | |
c. Administrative Fees. NGAM Advisors provides certain administrative services for the Funds and contracts with State Street Bank to serve as sub-administrator. NGAM Advisors is a wholly-owned subsidiary of Natixis US. Pursuant to an agreement among Natixis Funds Trust I, Natixis Funds Trust II, Natixis Funds Trust IV, Gateway Trust (“Natixis Funds Trusts”), Loomis Sayles Funds I, Loomis Sayles Funds II (“Loomis Sayles Funds Trusts”), Hansberger International Series and NGAM Advisors, each Fund pays NGAM Advisors monthly its pro rata portion of fees equal to an annual rate of 0.0575% of the first $15 billion of the average daily net assets of the Natixis Funds Trusts, Loomis Sayles Funds Trusts and Hansberger International Series, 0.0500% of the next $15 billion, 0.0400% of the next $30 billion and 0.0350% of such assets in excess of $60 billion,
37 |
Notes to Financial Statements – continued
March 31, 2012 (Unaudited)
subject to an annual aggregate minimum fee for the Natixis Funds Trusts, Loomis Sayles Funds Trusts and Hansberger International Series of $10 million, which is reevaluated on an annual basis.
For the six months ended March 31, 2012, each Fund paid the following administrative fees to NGAM Advisors:
| | | | |
Fund | | Administrative
Fees | |
Small Cap Growth Fund | | $ | 100,424 | |
Small Cap Value Fund | | | 226,322 | |
d. Sub-Transfer Agent Fees. NGAM Distribution has entered into agreements with financial intermediaries to provide certain recordkeeping, processing, shareholder communications and other services to customers of the intermediaries and has agreed to compensate the intermediaries for providing those services. Certain services would be provided by the Funds if the shares of those customers were registered directly with the Funds’ transfer agent. Accordingly, the Funds have agreed to reimburse NGAM Distribution for a portion of the intermediary fees attributable to shares of the Funds held by the intermediaries (which generally is a percentage of the value of shares held) not to exceed what the Funds would have paid their transfer agent had each customer’s shares been registered directly with the transfer agent instead of being held through the intermediaries.
For the six months ended March 31, 2012, the Funds paid the following sub-transfer agent fees, which are reflected in transfer agent fees and expenses in the Statements of Operations:
| | | | | | | | | | | | |
| | | Sub-Transfer Agent Fees | |
Fund | | Institutional
Class | | | Retail Class | | | Admin
Class | |
Small Cap Growth Fund | | $ | 118,141 | | | $ | 77,342 | | | $ | — | |
Small Cap Value Fund | | | 146,935 | | | | 254,610 | | | | 68,637 | |
As of March 31, 2012, the Funds owe NGAM Distribution the following reimbursements for sub-transfer agent fees:
| | | | | | | | | | | | |
| | | Reimbursements of Sub-Transfer
Agent Fees | |
Fund | | Institutional
Class | | | Retail
Class | | | Admin
Class | |
Small Cap Growth Fund | | $ | 12,868 | | | $ | 6,976 | | | $ | — | |
Small Cap Value Fund | | | 5,079 | | | | 6,033 | | | | 1,614 | |
e. Trustees Fees and Expenses. The Trusts do not pay any compensation directly to their officers or Trustees who are directors, officers or employees of NGAM Advisors, NGAM Distribution, Natixis US or their affiliates. Effective January 1, 2012, the Chairperson of the Board receives a retainer fee at the annual rate of $265,000. The Chairperson does not
| 38
Notes to Financial Statements – continued
March 31, 2012 (Unaudited)
receive any meeting attendance fees for Board of Trustees meetings or committee meetings that she attends. Each Independent Trustee (other than the Chairperson) receives, in the aggregate, a retainer fee at the annual rate of $95,000. Each Independent Trustee also receives a meeting attendance fee of $10,000 for each meeting of the Board of Trustees that he or she attends in person and $5,000 for each meeting of the Board of Trustees that he or she attends telephonically. In addition, each committee chairman receives an additional retainer fee at an annual rate of $15,000. Each Contract Review and Governance Committee member is compensated $6,000 for each Committee meeting that he or she attends in person and $3,000 for each meeting that he or she attends telephonically. Each Audit Committee member is compensated $7,500 for each Committee meeting that he or she attends in person and $3,750 for each meeting that he or she attends telephonically. These fees are allocated among the funds in the Natixis Funds Trusts, Loomis Sayles Funds Trusts and Hansberger International Series based on a formula that takes into account, among other factors, the relative net assets of each fund. Trustees are reimbursed for travel expenses in connection with attendance at meetings.
Prior to January 1, 2012, the Chairperson of the Board received a retainer fee at the annual rate of $250,000. Each Independent Trustee (other than the Chairperson) received, in aggregate, a retainer fee at the annual rate of $80,000. All other Trustee fees remain unchanged.
A deferred compensation plan (the “Plan”) is available to the Trustees on a voluntary basis. Deferred amounts remain in the Funds until distributed in accordance with the provisions of the Plan. The value of a participating Trustee’s deferral account is based on theoretical investments of deferred amounts, on the normal payment dates, in certain funds of the Natixis Funds Trusts, Loomis Sayles Funds Trusts and Hansberger International Series as designated by the participating Trustees. Changes in the value of participants’ deferral accounts are allocated pro rata among the funds in the Natixis Funds Trusts, Loomis Sayles Funds Trusts, and Hansberger International Series, and are normally reflected as Trustees’ fees and expenses in the Statements of Operations. The portions of the accrued obligations allocated to the Funds under the Plan are reflected as Deferred Trustees’ fees in the Statements of Assets and Liabilities.
f. Affiliated Ownership. At March 31, 2012, Loomis Sayles Funded Pension Plan and Trust (“Pension Plan”) and Loomis Sayles Employees’ Profit Sharing Retirement Plan (“Retirement Plan”) held shares of beneficial interest in the Funds representing the following percentages of net assets:
| | | | | | | | |
Fund | | Pension Plan | | | Retirement Plan | |
Small Cap Growth Fund | | | 1.13 | % | | | 1.51 | % |
Small Cap Value Fund | | | 1.09 | % | | | 2.00 | % |
39 |
Notes to Financial Statements – continued
March 31, 2012 (Unaudited)
6. Class-Specific Expenses. For the six months ended March 31, 2012, the Funds paid the following class-specific transfer agent fees and expenses (including sub-transfer agent fees):
| | | | | | | | | | | | |
| | | Transfer Agent Fees and Expenses | |
Fund | | Institutional
Class | | | Retail Class | | | Admin
Class | |
Small Cap Growth Fund | | $ | 128,210 | | | $ | 148,708 | | | $ | — | |
Small Cap Value Fund | | | 157,978 | | | | 254,872 | | | | 69,272 | |
7. Line of Credit. Each Fund, together with certain other funds of Natixis Funds Trusts, Loomis Sayles Funds Trusts and Hansberger International Series, participates in a $200,000,000 committed unsecured line of credit provided by State Street Bank, with an individual limit of $125,000,000 for each fund that participates in the line of credit. Interest is charged to each participating fund based on its borrowings at a rate per annum equal to the greater of the Federal Funds rate or overnight LIBOR, plus 1.25%. In addition, a commitment fee of 0.125% per annum, payable at the end of each calendar quarter, is accrued and apportioned among the participating funds based on their average daily unused portion of the line of credit. Effective April 19, 2012, the commitment fee will be 0.10% per annum.
For the six months ended March 31, 2012, neither Fund had borrowings under these agreements.
8. Brokerage Commission Recapture. Each Fund has entered into agreements with certain brokers whereby the brokers will rebate a portion of brokerage commissions. All amounts rebated by the brokers are returned to the Funds under such agreements and are included in realized gains on investments in the Statements of Operations. For the six months ended March 31, 2012, amounts rebated under these agreements were as follows:
| | | | |
Fund | | Rebates | |
Small Cap Growth Fund | | $ | 22,509 | |
Small Cap Value Fund | | | 25,578 | |
9. Capital Shares. Each Fund may issue an unlimited number of shares of beneficial interest, without par value. Transactions in capital shares were as follows:
| | | | | | | | | | | | | | | | |
| | | Small Cap Growth Fund | |
| | | Six Months Ended
March 31, 2012 | | | Year Ended
September 30, 2011 | |
| Institutional Class | | Shares | | | Amount | | | Shares | | | Amount | |
Issued from the sale of shares | | | 11,610,959 | | | $ | 202,735,243 | | | | 8,270,565 | | | $ | 142,244,743 | |
Issued in connection with the reinvestment of distributions | | | — | | | | — | | | | — | | | | — | |
Redeemed | | | (1,876,004 | ) | | | (33,165,238 | ) | | | (1,769,935 | ) | | | (30,230,462 | ) |
| | | | | | | | | | | | | | | | |
Net change | | | 9,734,955 | | | $ | 169,570,005 | | | | 6,500,630 | | | $ | 112,014,281 | |
| | | | | | | | | | | | | | | | |
| 40
Notes to Financial Statements – continued
March 31, 2012 (Unaudited)
9. Capital Shares – continued
| | | | | | | | | | | | | | | | |
| | | Small Cap Growth Fund – continued | |
| | | Six Months Ended
March 31, 2012 | | | Year Ended
September 30, 2011 | |
| Retail Class | | Shares | | | Amount | | | Shares | | | Amount | |
Issued from the sale of shares | | | 5,474,236 | | | $ | 91,409,514 | | | | 5,486,059 | | | $ | 91,670,428 | |
Issued in connection with the reinvestment of distributions | | | — | | | | — | | | | — | | | | — | |
Redeemed | | | (2,016,357 | ) | | | (34,270,900 | ) | | | (3,253,098 | ) | | | (54,352,059 | ) |
| | | | | | | | | | | | | | | | |
Net change | | | 3,457,879 | | | $ | 57,138,614 | | | | 2,232,961 | | | $ | 37,318,369 | |
| | | | | | | | | | | | | | | | |
Increase (decrease) from capital share transactions | | | 13,192,834 | | | $ | 226,708,619 | | | | 8,733,591 | | | $ | 149,332,650 | |
| | | | | | | | | | | | | | | | |
| | | | | | | | | | | | | | | | |
| | | Small Cap Value Fund | |
| | | Six Months Ended
March 31, 2012 | | | Year Ended
September 30, 2011 | |
| Institutional Class | | Shares | | | Amount | | | Shares | | | Amount | |
Issued from the sale of shares | | | 3,089,450 | | | $ | 82,159,404 | | | | 3,546,529 | | | $ | 95,137,414 | |
Issued in connection with the reinvestment of distributions | | | 37,002 | | | | 980,177 | | | | 114,244 | | | | 3,053,733 | |
Redeemed | | | (2,275,187 | ) | | | (60,539,247 | ) | | | (4,186,397 | ) | | | (112,560,971 | ) |
| | | | | | | | | | | | | | | | |
Net change | | | 851,265 | | | $ | 22,600,334 | | | | (525,624 | ) | | $ | (14,369,824 | ) |
| | | | | | | | | | | | | | | | |
| | | | |
| Retail Class | | | | | | | | | | | | |
Issued from the sale of shares | | | 725,944 | | | $ | 19,247,633 | | | | 2,574,140 | | | $ | 67,167,049 | |
Issued in connection with the reinvestment of distributions | | | — | | | | — | | | | 66,486 | | | | 1,762,558 | |
Redeemed | | | (3,684,181 | ) | | | (99,333,274 | ) | | | (3,836,066 | ) | | | (101,096,155 | ) |
| | | | | | | | | | | | | | | | |
Net change | | | (2,958,237 | ) | | $ | (80,085,641 | ) | | | (1,195,440 | ) | | $ | (32,166,548 | ) |
| | | | | | | | | | | | | | | | |
| | | | |
| Admin Class | | | | | | | | | | | | |
Issued from the sale of shares | | | 395,784 | | | $ | 10,229,300 | | | | 1,061,267 | | | $ | 27,365,871 | |
Issued in connection with the reinvestment of distributions | | | — | | | | — | | | | 5,109 | | | | 133,140 | |
Redeemed | | | (784,745 | ) | | | (20,339,058 | ) | | | (1,344,604 | ) | | | (35,080,134 | ) |
| | | | | | | | | | | | | | | | |
Net change | | | (388,961 | ) | | $ | (10,109,758 | ) | | | (278,228 | ) | | $ | (7,581,123 | ) |
| | | | | | | | | | | | | | | | |
Increase (decrease) from capital share transactions | | | (2,495,933 | ) | | $ | (67,595,065 | ) | | | (1,999,292 | ) | | $ | (54,117,495 | ) |
| | | | | | | | | | | | | | | | |
41 |
SEMIANNUAL REPORT
March 31, 2012

Loomis Sayles Strategic Income Fund
TABLE OF CONTENTS
Management Discussion page 1
Investment Results page 3
Portfolio of Investments page 9
Financial Statements page 32
LOOMIS SAYLES STRATEGIC INCOME FUND
Management Discussion
Managers:
Matthew J. Eagan, CFA
Daniel J. Fuss, CFA, CIC
Kathleen C. Gaffney, CFA
Elaine M. Stokes
Loomis, Sayles & Company, L.P.
Objective:
Seeks high current income with a secondary objective of capital growth
Strategy:
Invests primarily in income-producing securities in the U.S. and around the world
Fund Inception:
May 1, 1995
Symbols:
| | |
| Class A | | NEFZX |
| Class B | | NEZBX |
| Class C | | NECZX |
| Class Y | | NEZYX |
| Admin Class | | NEZAX |
Market Conditions
Market anxiety from the sovereign debt crisis in Europe eased markedly during the six-month period, as the European Central Bank took action to aid Greece and restore liquidity. Additionally, the release of successive months of positive domestic macroeconomic indicators and a prominent increase in liquidity encouraged greater risk-taking in the markets. Better-than-expected stress test results from U.S. banks helped bolster general investor optimism and lifted many corporate financial names.
Performance Results
For the six months ended March 31, 2012, Class A shares of Loomis Sayles Strategic Income Fund returned 10.37% at net asset value. The fund outperformed its benchmark, the Barclays Capital U.S. Aggregate Bond Index, which returned 1.43% for the period. The fund outperformed the 7.44% average return of the Morningstar Multisector Bond category.
Explanation of Fund Performance
A particularly strong showing in the second half of the period by non-U.S.-dollar-denominated holdings, coupled with robust security selection, resulted in a strong contribution to return. Winners within the allocation included investments denominated in the New Zealand dollar, Australian dollar, Brazilian real and Canadian dollar. A rally in commodity prices and a corresponding increase in demand buoyed these currencies. The fund’s allocation to convertible securities also bolstered returns, as convertibles tracked the equity markets, which surged forward throughout much of the six-month period. In addition, the high-yield market benefited from an increase in investor risk appetite, allowing for favorable performance from the sector. In particular, high-yield industrial names outpaced high-yield financials and utilities. High-yield industrials rebounded as subsectors that had previously lagged, such as homebuilders, telecommunications and retail, improved.
Specific holdings within traditionally defensive industries, such as natural gas, struggled as investors
1 |
favored more aggressive positions. In addition, investors trended toward commercial mortgage-backed securities (CMBS) during the second half of the period, and the fund’s underweight in this sector detracted from relative performance. An underweight in government-related securities also detracted from relative performance, as this sector generated solid results.
Outlook
As the second quarter begins, fixed-income investors continue to face an environment filled with opportunities and pitfalls. The sovereign debt situation in Europe is a chief ongoing concern, and the market is now focusing on Spain. Investors are taking solace in the improving U.S. economic situation, but Europe’s debt problems cast a large shadow over any sustainable recovery. So far this year, investors have generally sought out higher-risk securities for yield, but the progress (or lack thereof) in the euro zone could greatly influence their risk tolerance. In some respects, this is very similar to 2011, when cash rushed into credit, equity and other risky markets early in the year, only to reverse when political gyrations increased uncertainty. However, a resulting period of volatility can create buying opportunities for us. We continue to add credits that we believe have long-term potential for improving fundamentals.
In the first quarter of 2012, higher U.S. interest rates reinvigorated discussions surrounding the potential threat higher rates pose to fixed-income portfolios. We continue to believe that interest rates are in a period of transition and see rising rates as the next secular trend. However, given the Federal Reserve Board’s commitment to keep short-term rates low at least through the middle of 2014, the trading range in U.S. Treasuries should persist in the near term.
U.S. economic growth has been a bright spot thus far in 2012. We believe the overall health of corporate America remains intact, largely because corporate managements remain conservative. Reductions in the ranks of the unemployed, signs of potential recovery in the housing market and increased lending from financial institutions have highlighted the underlying fundamental health of the domestic economy. We anticipate a modest recovery in the United States and little to no growth in Europe and Japan. However, many areas removed from the developed world show moderate to strong growth potential.
Above all else, our conviction in the merits of fundamental credit research has not changed. We remain steadfast in our opportunistic approach as well as our long-term outlook. Our focus continues to be on maintaining yield advantage, surveying the global marketplace for opportunities, and searching out specific risk that can lead to total return opportunities for the fund.
What You Should Know:
Investments in the fund are subject to a number of risks. Please see the “Principal Risks” section of the fund’s prospectus. The purchase of fund shares should be seen as a long-term investment.
| 2
LOOMIS SAYLES STRATEGIC INCOME FUND
Investment Results through March 31, 2012
The charts comparing the fund’s performance to two indexes provide you with a general sense of how it performed. The fund’s total return for the period shown below appears with and without sales charges and includes fund expenses and fees. An index measures the performance of a theoretical portfolio. Unlike a fund, the index is unmanaged and does not have expenses that affect the results. It is not possible to invest directly in an index. Investors would incur transaction costs and other expenses if they purchased the securities necessary to match the index.
Growth of a $10,000 Investment in Class A Shares6
March 31, 2002 through March 31, 2012
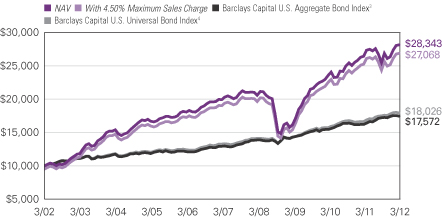
3 |
Average Annual Total Returns — March 31, 20126
| | | | | | | | | | | | | | | | |
| | | | | |
| | | 6 Months | | | 1 Year | | | 5 Years | | | 10 Years | |
| | | | | |
| Class A (Inception 5/1/95) | | | | | | | | | | | | | | | | |
| NAV | | | 10.37 | % | | | 6.47 | % | | | 7.19 | % | | | 10.98 | % |
| With 4.50% Maximum Sales Charge | | | 6.48 | | | | 2.73 | | | | 6.43 | | | | 10.59 | |
| | | | | |
| Class B (Inception 5/1/95) | | | | | | | | | | | | | | | | |
| NAV | | | 9.90 | | | | 5.70 | | | | 6.39 | | | | 10.16 | |
| With CDSC2 | | | 4.90 | | | | 0.70 | | | | 6.07 | | | | 10.16 | |
| | | | | |
| Class C (Inception 5/1/95) | | | | | | | | | | | | | | | | |
| NAV | | | 9.92 | | | | 5.65 | | | | 6.38 | | | | 10.16 | |
| With CDSC2 | | | 8.92 | | | | 4.65 | | | | 6.38 | | | | 10.16 | |
| | | | | |
| Class Y (Inception 12/1/99) | | | | | | | | | | | | | | | | |
| NAV | | | 10.51 | | | | 6.73 | | | | 7.46 | | | | 11.28 | |
| | | | | |
| Admin Class (Inception 2/1/10)1 | | | | | | | | | | | | | | | | |
| NAV | | | 10.20 | | | | 6.17 | | | | 6.87 | | | | 10.63 | |
| | | | | |
| Comparative Performance | | | | | | | | | | | | | | | | |
| Barclays Capital U.S. Aggregate Bond Index3 | | | 1.43 | | | | 7.71 | | | | 6.25 | | | | 5.80 | |
| Barclays Capital U.S. Universal Bond Index4 | | | 2.31 | | | | 7.59 | | | | 6.23 | | | | 6.07 | |
| Morningstar Multisector Bond Fund Avg.5 | | | 7.44 | | | | 5.19 | | | | 6.10 | | | | 7.46 | |
Performance data quoted represents past performance and is no guarantee of future results. Total return and value will vary and you may have a gain or loss when shares are sold. Current performance may be lower or higher than quoted. For most recent month-end performance, visit ngam.natixis.com. Performance for other share classes will be greater or less than shown based on differences in fees and sales charges. Performance for periods less than one year is cumulative, not annualized. Returns reflect changes in share price and reinvestment of dividends and capital gains, if any. Class Y shares are not available for purchase by all investors. The table and graph do not reflect taxes shareholders might owe on any fund distributions or when they redeem their shares.
| 1 | Prior to the inception of Admin Class shares (2/1/10), performance is that of Class A shares, restated to reflect the higher net expenses of Admin Class shares. |
| 2 | Performance for Class B shares assumes a maximum 5% contingent deferred sales charge (“CDSC”) applied when you sell shares, which declines annually between years 1-6 according to the following schedule: 5, 4, 3, 3, 2, 1, 0%. Class C share performance assumes a 1% CDSC applied when you sell shares within one year of purchase. |
| 3 | Barclays Capital U.S. Aggregate Bond Index is an unmanaged index that covers the U.S.-dollar denominated, investment-grade, fixed-rate, taxable bond market of SEC-registered securities. The index includes bonds from the Treasury, government-related, corporate, mortgage-backed securities, asset-backed securities, and collateralized mortgage-backed securities sectors. |
| 4 | Barclays Capital U.S. Universal Bond Index is an unmanaged index that covers U.S. dollar-denominated taxable bonds, including U.S. government and investment grade debt, non-investment grade debt, asset-backed and mortgage-backed securities, Eurobonds, 144A securities and emerging market debt. |
| 5 | Morningstar Multisector Bond Fund Average is the average performance without sales charges of funds with similar investment objectives, as calculated by Morningstar, Inc. |
| 6 | Fund performance has been increased by fee waivers and/or expense reimbursements, if any, without which performance would have been lower. |
| 4
| | | | |
| Credit Quality | | % of Net
Assets as of
3/31/2012 | |
Aaa | | | 11.3 | |
Aa | | | 4.7 | |
A | | | 8.5 | |
Baa | | | 22.1 | |
Ba | | | 10.9 | |
B | | | 13.5 | |
Caa & Lower | | | 3.5 | |
Not Rated | | | 18.4 | |
Short-Term and Other | | | 7.1 | |
| | Credit quality at 3/31/12 reflects the highest credit rating assigned to individual holdings of the fund among Moody’s, S&P or Fitch; ratings are subject to change. The fund’s shares are not rated by any rating agency and no credit rating for the fund’s shares is implied. The Moody’s equivalent of the assigned rating is presented in the table. |
| | |
| Effective Maturity | | % of Net
Assets as of
3/31/2012 |
1 year or less | | 13.1 |
1-5 years | | 28.4 |
5-10 years | | 22.0 |
10+ years | | 36.5 |
Average Effective Maturity | | 12.7 years |
Portfolio characteristics will vary.
Expense Ratios
as stated in the most recent prospectus
| | | | | | | | |
| Share Class | | Gross Expense Ratio1 | | | Net Expense Ratio2 | |
| A | | | 0.95 | % | | | 0.95 | % |
| B | | | 1.70 | | | | 1.70 | |
| C | | | 1.70 | | | | 1.70 | |
| Y | | | 0.70 | | | | 0.70 | |
| Admin | | | 1.21 | | | | 1.21 | |
NOTES TO CHARTS
| 1 | Before fee waivers and/or expense reimbursements. |
| 2 | After fee waivers and/or expense reimbursements. Waivers/reimbursements are contractual and are set to expire on 1/31/13. Contracts are reevaluated on an annual basis. |
5 |
ADDITIONAL INFORMATION
The views expressed in this report reflect those of the portfolio managers as of the dates indicated. The managers’ views are subject to change at any time without notice based on changes in market or other conditions. References to specific securities or industries should not be regarded as investment advice. Because the fund is actively managed, there is no assurance that it will continue to invest in the securities, countries or industries mentioned.
Before investing, consider the fund’s investment objectives, risks, charges and other expenses. Visit ngam.natixis.com or call 800-225-5478 for a prospectus and/or a summary prospectus, both of which contain this and other information. Read it carefully.
PROXY VOTING INFORMATION
A description of the fund’s proxy voting policies and procedures is available without charge, upon request, by calling Natixis Funds at 800-225-5478; on the fund’s website at ngam.natixis.com; and on the Securities and Exchange Commission’s (SEC’s) website at www.sec.gov. Information regarding how the fund voted proxies relating to portfolio securities during the 12-month period ended June 30, 2011 is available from the fund’s website and the SEC’s website.
QUARTERLY PORTFOLIO SCHEDULES
The fund files a complete schedule of portfolio holdings with the SEC for the first and third quarters of each fiscal year on Form N-Q. The fund’s Forms N-Q are available on the SEC’s website at www.sec.gov and may be reviewed and copied at the SEC’s Public Reference Room in Washington, DC. Information on the operation of the Public Reference Room may be obtained by calling 800-SEC-0330.
| 6
UNDERSTANDING YOUR FUND’S EXPENSES
As a mutual fund shareholder, you incur different types of costs: transaction costs, including sales charges (loads) on purchases and contingent deferred sales charges on redemptions; and ongoing costs, including management fees, distribution fees (12b-1 fees) and/or service fees, and other fund expenses. These costs are described in more detail in the fund’s prospectus. The examples below are intended to help you understand the ongoing costs of investing in the fund and help you compare these with the ongoing costs of investing in other mutual funds.
The first line in the table for each class shows the actual amount of fund expenses you would have paid on a $1,000 investment in the fund from October 1, 2011 through March 31, 2012. It also shows how much a $1,000 investment would be worth at the close of the period, assuming actual fund returns and expenses. To estimate the expenses you paid over the period, simply divide your account value by $1,000 (for example $8,600 account value divided by $1,000 =8.60) and multiply the result by the number in Expenses Paid During Period row as shown below for your class.
The second line in the table for each class provides information about hypothetical account values and hypothetical expenses based on the fund’s actual expense ratios and an assumed rate of return of 5% per year before expenses, which is not the fund’s actual return. The hypothetical account values and expenses may not be used to estimate the actual ending account balance or expenses you paid on your investment for the period. You may use this information to compare the ongoing costs of investing in the fund and other funds. To do so, compare this 5% hypothetical example with the 5% hypothetical examples that appear in the shareholder reports of the other funds.
Please note that the expenses shown reflect ongoing costs only, and do not include any transaction costs. Therefore, the second line in the table of the fund is useful in comparing ongoing costs only, and will not help you determine the relative costs of owning different funds. If transaction costs were included, total costs would be higher.
7 |
| | | | | | | | | | | | |
| LOOMIS SAYLES STRATEGIC INCOME FUND | | BEGINNING
ACCOUNT VALUE
10/1/2011 | | | ENDING
ACCOUNT VALUE
3/31/2012 | | | EXPENSES PAID
DURING PERIOD*
10/1/2011 – 3/31/2012 | |
Class A | | | | | | | | | | | | |
Actual | | | $1,000.00 | | | | $1,103.70 | | | | $5.00 | |
Hypothetical (5% return before expenses) | | | $1,000.00 | | | | $1,020.25 | | | | $4.80 | |
Class B | | | | | | | | | | | | |
Actual | | | $1,000.00 | | | | $1,099.00 | | | | $8.92 | |
Hypothetical (5% return before expenses) | | | $1,000.00 | | | | $1,016.50 | | | | $8.57 | |
Class C | | | | | | | | | | | | |
Actual | | | $1,000.00 | | | | $1,099.20 | | | | $8.92 | |
Hypothetical (5% return before expenses) | | | $1,000.00 | | | | $1,016.50 | | | | $8.57 | |
Class Y | | | | | | | | | | | | |
Actual | | | $1,000.00 | | | | $1,105.10 | | | | $3.74 | |
Hypothetical (5% return before expenses) | | | $1,000.00 | | | | $1,021.45 | | | | $3.59 | |
Admin Class | | | | | | | | | | | | |
Actual | | | $1,000.00 | | | | $1,102.00 | | | | $6.36 | |
Hypothetical (5% return before expenses) | | | $1,000.00 | | | | $1,018.95 | | | | $6.11 | |
| * | Expenses are equal to the Fund’s annualized expense ratio: 0.95%, 1.70%, 1.70%, 0.71% and 1.21% for Class A, B, C, Y and Admin Class, respectively, multiplied by the average account value over the period, multiplied by the number of days in the most recent fiscal half-year, divided by 366 (to reflect the half-year period). |
| 8
Portfolio of Investments – as of March 31, 2012 (Unaudited)
Loomis Sayles Strategic Income Fund
| | | | | | | | |
Principal
Amount (‡) | | | Description | | Value (†) | |
| | | | | | | | |
| | Bonds and Notes — 73.1% of Net Assets | | | | |
| | Non-Convertible Bonds — 63.3% | | | | |
| | | | ABS Car Loan — 0.1% | |
| $ | 6,009,375 | | | Avis Budget Rental Car Funding AESOP LLC, Series 2007-2A, Class A,
0.382%, 8/20/2013, 144A(b) | | $ | 5,980,629 | |
| | 4,093,750 | | | Avis Budget Rental Car Funding AESOP LLC, Series 2010-5A, Class B,
5.110%, 3/20/2017, 144A | | | 4,363,609 | |
| | | | | | | | |
| | | | | | | 10,344,238 | |
| | | | | | | | |
| | | | Aerospace & Defense — 0.3% | |
| | 620,000 | | | Bombardier, Inc., 7.350%, 12/22/2026, (CAD) | | | 642,837 | |
| | 11,800,000 | | | Bombardier, Inc., 7.450%, 5/01/2034, 144A | | | 12,095,000 | |
| | 2,425,000 | | | Ducommun, Inc., 9.750%, 7/15/2018 | | | 2,570,500 | |
| | 8,236,000 | | | Meccanica Holdings USA, Inc., 6.250%, 7/15/2019, 144A | | | 7,359,714 | |
| | 5,436,000 | | | Meccanica Holdings USA, Inc., 6.250%, 1/15/2040, 144A | | | 4,212,215 | |
| | 20,455,000 | | | Meccanica Holdings USA, Inc., 7.375%, 7/15/2039, 144A | | | 17,104,635 | |
| | | | | | | | |
| | | | | | | 43,984,901 | |
| | | | | | | | |
| | | | Airlines — 2.5% | |
| | 35,455,000 | | | Air Canada, 10.125%, 8/01/2015, 144A, (CAD) | | | 34,479,272 | |
| | 53,800 | | | Continental Airlines Pass Through Trust, Series 1996-1, Class A,
6.940%, 4/15/2015 | | | 54,677 | |
| | 2,594,581 | | | Continental Airlines Pass Through Trust, Series 1997-1, Class A,
7.461%, 10/01/2016 | | | 2,594,581 | |
| | 1,777,301 | | | Continental Airlines Pass Through Trust, Series 1997-4, Class B,
6.900%, 7/02/2018 | | | 1,777,301 | |
| | 1,992,873 | | | Continental Airlines Pass Through Trust, Series 1998-1, Class B,
6.748%, 9/15/2018 | | | 1,992,873 | |
| | 3,401,583 | | | Continental Airlines Pass Through Trust, Series 1999-1, Class B,
6.795%, 2/02/2020 | | | 3,333,552 | |
| | 2,268,645 | | | Continental Airlines Pass Through Trust, Series 1999-2, Class B,
7.566%, 9/15/2021 | | | 2,243,009 | |
| | 1,299,798 | | | Continental Airlines Pass Through Trust, Series 2000-1, Class A-1,
8.048%, 5/01/2022 | | | 1,452,524 | |
| | 1,480,648 | | | Continental Airlines Pass Through Trust, Series 2000-2, Class A-1,
7.707%, 10/02/2022 | | | 1,600,876 | |
| | 3,274,793 | | | Continental Airlines Pass Through Trust, Series 2000-2, Class B,
8.307%, 10/02/2019 | | | 3,245,974 | |
| | 1,860,333 | | | Continental Airlines Pass Through Trust, Series 2001-1, Class A-1,
6.703%, 12/15/2022 | | | 1,990,557 | |
| | 1,063,631 | | | Continental Airlines Pass Through Trust, Series 2001-1, Class B,
7.373%, 6/15/2017 | | | 1,067,567 | |
| | 11,074,721 | | | Continental Airlines Pass Through Trust, Series 2007-1, Class A,
5.983%, 10/19/2023 | | | 12,008,320 | |
| | 18,931,669 | | | Continental Airlines Pass Through Trust, Series 2007-1, Class B,
6.903%, 10/19/2023 | | | 19,249,153 | |
| | 17,695,010 | | | Continental Airlines Pass Through Trust, Series 2009-1, 9.000%, 1/08/2018 | | | 20,172,311 | |
| | 16,150,515 | | | Continental Airlines Pass Through Trust, Series 2009-2, Class A,
7.250%, 5/10/2021 | | | 18,088,576 | |
See accompanying notes to financial statements.
9 |
Portfolio of Investments – as of March 31, 2012 (Unaudited)
Loomis Sayles Strategic Income Fund – (continued)
| | | | | | | | |
Principal
Amount (‡) | | | Description | | Value (†) | |
| | | | | | | | |
| | | | Airlines — continued | | | | |
| $ | 3,980,000 | | | Continental Airlines Pass Through Trust, Series 2012-1, Class B,
6.250%, 10/22/2021 | | $ | 4,049,650 | |
| | 1,328,076 | | | Delta Air Lines Pass Through Trust, Series 2007-1, Class A,
6.821%, 2/10/2024 | | | 1,454,244 | |
| | 6,793,880 | | | Delta Air Lines Pass Through Trust, Series 2007-1, Class B,
8.021%, 2/10/2024 | | | 6,920,926 | |
| | 22,077,666 | | | Delta Air Lines Pass Through Trust, Series 2007-1, Class C,
8.954%, 8/10/2014 | | | 22,048,965 | |
| | 2,496,000 | | | Delta Air Lines, Inc., 9.500%, 9/15/2014, 144A | | | 2,658,240 | |
| | 2,010,779 | | | Northwest Airlines, Inc., Series 2002-1, Class G2, (MBIA insured),
6.264%, 5/20/2023 | | | 2,091,211 | |
| | 1,500,000 | | | Qantas Airways Ltd., 5.125%, 6/20/2013, 144A | | | 1,530,585 | |
| | 29,995,000 | | | Qantas Airways Ltd., 6.050%, 4/15/2016, 144A | | | 30,853,727 | |
| | 18,156,248 | | | UAL Pass Through Trust, Series 2007-1, Class A, 6.636%, 1/02/2024 | | | 19,245,622 | |
| | 8,695,972 | | | UAL Pass Through Trust, Series 2009-1, 10.400%, 5/01/2018 | | | 9,913,408 | |
| | 17,985,491 | | | US Airways Pass Through Trust, Series 2010-1B, Class B,
8.500%, 10/22/2018 | | | 17,985,491 | |
| | 43,228,000 | | | US Airways Pass Through Trust, Series 2010-1C, Class C,
11.000%, 10/22/2014, 144A | | | 43,011,860 | |
| | 52,073,000 | | | US Airways Pass Through Trust, Series 2011-1B, Class B,
9.750%, 4/22/2020 | | | 52,593,730 | |
| | 22,168,000 | | | US Airways Pass Through Trust, Series 2011-1C, Class C,
10.875%, 10/22/2014 | | | 22,611,360 | |
| | | | | | | | |
| | | | | | | 362,320,142 | |
| | | | | | | | |
| | | | Automotive — 1.0% | |
| | 265,000 | | | ArvinMeritor, Inc., 8.125%, 9/15/2015 | | | 279,575 | |
| | 3,800,000 | | | Chrysler Group LLC/CG Co-Issuer, Inc., 8.250%, 6/15/2021 | | | 3,838,000 | |
| | 4,500,000 | | | FCE Bank PLC, EMTN, 7.125%, 1/15/2013, (EUR) | | | 6,219,208 | |
| | 19,011,000 | | | Ford Motor Co., 6.375%, 2/01/2029 | | | 20,616,441 | |
| | 1,975,000 | | | Ford Motor Co., 6.500%, 8/01/2018 | | | 2,142,875 | |
| | 1,220,000 | | | Ford Motor Co., 6.625%, 2/15/2028 | | | 1,351,168 | |
| | 74,829,000 | | | Ford Motor Co., 6.625%, 10/01/2028 | | | 83,076,353 | |
| | 2,365,000 | | | Ford Motor Co., 7.125%, 11/15/2025 | | | 2,577,850 | |
| | 1,345,000 | | | Ford Motor Co., 7.500%, 8/01/2026 | | | 1,506,400 | |
| | 6,000,000 | | | Goodyear Tire & Rubber Co. (The), 7.000%, 5/15/2022 | | | 5,835,000 | |
| | 4,977,000 | | | Goodyear Tire & Rubber Co. (The), 7.000%, 3/15/2028 | | | 4,690,823 | |
| | 3,100,000 | | | TRW Automotive, Inc., 7.250%, 3/15/2017, 144A | | | 3,456,500 | |
| | 5,300,000 | | | TRW Automotive, Inc., 8.875%, 12/01/2017, 144A | | | 5,856,500 | |
| | | | | | | | |
| | | | | | | 141,446,693 | |
| | | | | | | | |
| | | | Banking — 4.2% | |
| | 1,175,000 | | | AgriBank FCB, 9.125%, 7/15/2019, 144A | | | 1,490,807 | |
| | 20,565,000 | | | Associates Corp. of North America, 6.950%, 11/01/2018 | | | 23,276,845 | |
| | 1,675,000 | | | Bank of America Corp., 5.420%, 3/15/2017 | | | 1,712,657 | |
| | 900,000 | | | Bank of America Corp., 5.490%, 3/15/2019 | | | 902,131 | |
| | 4,560,000 | | | Bank of America Corp., 6.000%, 9/01/2017 | | | 4,966,570 | |
| | 700,000 | | | Bank of America Corp., 6.500%, 9/15/2037 | | | 675,288 | |
See accompanying notes to financial statements.
| 10
Portfolio of Investments – as of March 31, 2012 (Unaudited)
Loomis Sayles Strategic Income Fund – (continued)
| | | | | | | | |
Principal
Amount (‡) | | | Description | | Value (†) | |
| | | | | | | | |
| | | | Banking — continued | | | | |
| $ | 265,000 | | | Bank of America Corp., MTN, 5.000%, 5/13/2021 | | $ | 265,409 | |
| | 1,000,000 | | | Bank of America Corp., MTN, 6.750%, 9/09/2013, (AUD) | | | 1,047,723 | |
| | 1,500,000 | | | Bank of America Corp., Series K, (fixed rate to 1/30/2018, variable rate thereafter), 8.000%, 12/29/2049 | | | 1,538,160 | |
| | 8,020,000 | | | Bank of America NA, 5.300%, 3/15/2017 | | | 8,369,431 | |
| | 39,890,000,000 | | | Barclays Bank PLC, EMTN, 3.680%, 8/20/2015, (KRW) | | | 35,495,605 | |
| | 2,190,000 | | | Barclays Bank PLC, EMTN, (fixed rate to 3/15/2020, variable rate thereafter), 4.750%, 3/29/2049, (EUR) | | | 1,623,499 | |
| | 57,792,000,000 | | | Barclays Financial LLC, EMTN, 3.500%, 11/29/2016, (KRW) | | | 50,572,144 | |
| | 3,336,000 | | | BNP Paribas S.A., (fixed rate to 6/29/2015, variable rate thereafter),
5.186%, 6/29/2049, 144A | | | 2,885,640 | |
| | 19,965,000 | | | Citigroup, Inc., 5.000%, 9/15/2014 | | | 20,676,333 | |
| | 4,000,000 | | | Citigroup, Inc., 5.365%, 3/06/2036, (CAD)(c) | | | 3,219,490 | |
| | 985,000 | | | Citigroup, Inc., 5.850%, 12/11/2034 | | | 1,006,999 | |
| | 24,610,000 | | | Citigroup, Inc., 5.875%, 2/22/2033 | | | 23,095,894 | |
| | 8,999,000 | | | Citigroup, Inc., 6.000%, 10/31/2033 | | | 8,618,018 | |
| | 6,060,000 | | | Citigroup, Inc., 6.125%, 8/25/2036 | | | 5,824,096 | |
| | 3,350,000 | | | Citigroup, Inc., EMTN, (fixed rate to 11/30/2012, variable rate thereafter), 3.625%, 11/30/2017, (EUR) | | | 3,884,834 | |
| | 20,765,000 | | | Cooperatieve Centrale Raiffeisen-Boerenleenbank BA/Utrect,
3.375%, 1/19/2017 | | | 21,228,869 | |
| | 400,000 | | | Goldman Sachs Group, Inc. (The), 6.450%, 5/01/2036 | | | 387,036 | |
| | 34,060,000 | | | Goldman Sachs Group, Inc. (The), 6.750%, 10/01/2037 | | | 33,279,106 | |
| | 6,120,000 | | | HBOS PLC, 6.000%, 11/01/2033, 144A | | | 4,650,967 | |
| | 15,304,000 | | | HBOS PLC, GMTN, 6.750%, 5/21/2018, 144A | | | 14,363,982 | |
| | 9,090,000 | | | ICICI Bank Ltd., (fixed rate to 4/30/2017, variable rate thereafter),
6.375%, 4/30/2022, 144A | | | 8,544,600 | |
| | 229,157,783,660 | | | JPMorgan Chase & Co., Zero Coupon, 4/12/2012, 144A, (IDR) | | | 24,842,969 | |
| | 260,000,000,000 | | | JPMorgan Chase & Co., EMTN, 7.070%, 3/22/2014, (IDR) | | | 28,206,474 | |
| | 227,000,000,000 | | | JPMorgan Chase Bank NA, 7.700%, 6/01/2016, 144A, (IDR) | | | 26,222,671 | |
| | 27,555,000 | | | Lloyds TSB Bank PLC, MTN, 6.500%, 9/14/2020, 144A | | | 27,258,288 | |
| | 3,010,000 | | | Merrill Lynch & Co., Inc., 5.700%, 5/02/2017 | | | 3,086,785 | |
| | 1,900,000 | | | Merrill Lynch & Co., Inc., 6.050%, 5/16/2016 | | | 2,000,540 | |
| | 6,700,000 | | | Merrill Lynch & Co., Inc., 6.110%, 1/29/2037 | | | 6,377,047 | |
| | 2,600,000 | | | Merrill Lynch & Co., Inc., 6.220%, 9/15/2026 | | | 2,650,105 | |
| | 51,500,000 | | | Merrill Lynch & Co., Inc., 10.710%, 3/08/2017, (BRL) | | | 28,846,997 | |
| | 3,450,000 | | | Merrill Lynch & Co., Inc., EMTN, 4.625%, 9/14/2018, (EUR) | | | 4,255,644 | |
| | 5,410,000 | | | Merrill Lynch & Co., Inc., MTN, 6.875%, 4/25/2018 | | | 6,014,292 | |
| | 800,000 | | | Merrill Lynch & Co., Inc., Series C, MTN, 6.050%, 6/01/2034 | | | 728,078 | |
| | 1,235,000 | | | Merrill Lynch & Co., Inc., Series C, MTN, 6.400%, 8/28/2017 | | | 1,346,811 | |
| | 13,400,000 | | | Morgan Stanley, 5.500%, 7/24/2020 | | | 13,078,199 | |
| | 3,300,000 | | | Morgan Stanley, 5.750%, 1/25/2021 | | | 3,239,881 | |
| | 950,000 | | | Morgan Stanley, EMTN, 5.750%, 2/14/2017, (GBP) | | | 1,555,338 | |
| | 1,000,000 | | | Morgan Stanley, GMTN, 4.500%, 2/23/2016, (EUR) | | | 1,352,956 | |
| | 79,700,000 | | | Morgan Stanley, GMTN, 7.625%, 3/03/2016, (AUD) | | | 83,800,947 | |
| | 7,300,000 | | | Morgan Stanley, MTN, 6.250%, 8/09/2026 | | | 7,252,864 | |
| | 6,600,000 | | | Morgan Stanley, Series F, GMTN, 5.625%, 9/23/2019 | | | 6,523,565 | |
| | 7,900,000 | | | Morgan Stanley, Series F, GMTN, 6.625%, 4/01/2018 | | | 8,318,811 | |
See accompanying notes to financial statements.
11 |
Portfolio of Investments – as of March 31, 2012 (Unaudited)
Loomis Sayles Strategic Income Fund – (continued)
| | | | | | | | |
Principal
Amount (‡) | | | Description | | Value (†) | |
| | | | | | | | |
| | | | Banking — continued | | | | |
| $ | 5,210,000 | | | Morgan Stanley, Series F, MTN, 5.950%, 12/28/2017 | | $ | 5,364,169 | |
| | 4,100,000 | | | Morgan Stanley, Series G & H, GMTN, 5.125%, 11/30/2015, (GBP) | | | 6,698,543 | |
| | 2,850,000 | | | RBS Capital Trust A, (fixed rate to 6/30/2012, variable rate thereafter),
6.467%, 12/29/2049, (EUR)(e) | | | 2,204,606 | |
| | 1,195,000 | | | RBS Capital Trust C, (fixed rate to 1/12/2016, variable rate thereafter),
4.243%, 12/29/2049, (EUR)(e) | | | 860,636 | |
| | 3,185,000 | | | RBS Capital Trust I, (fixed rate to 7/01/2013, variable rate thereafter),
4.709%, 12/29/2049(e) | | | 1,974,700 | |
| | 4,050,000 | | | RBS Capital Trust II, (fixed rate to 1/03/2034, variable rate thereafter),
6.425%, 12/29/2049(e) | | | 2,754,000 | |
| | 850,000 | | | Royal Bank of Scotland PLC (The), EMTN, 4.350%, 1/23/2017, (EUR) | | | 980,034 | |
| | 3,300,000 | | | Royal Bank of Scotland PLC (The), EMTN, 6.934%, 4/09/2018, (EUR) | | | 4,097,525 | |
| | 8,750,000 | | | Societe Generale S.A., (fixed rate to 5/22/2013, variable rate thereafter),
7.756%, 5/29/2049, (EUR) | | | 9,978,908 | |
| | | | | | | | |
| | | | | | | 605,474,516 | |
| | | | | | | | |
| | | | Brokerage — 0.4% | |
| | 2,850,000 | | | Cantor Fitzgerald LP, 6.375%, 6/26/2015, 144A | | | 2,884,271 | |
| | 8,935,000 | | | Jefferies Group, Inc., 3.875%, 11/09/2015 | | | 8,823,313 | |
| | 13,425,000 | | | Jefferies Group, Inc., 5.125%, 4/13/2018 | | | 13,022,250 | |
| | 14,865,000 | | | Jefferies Group, Inc., 6.250%, 1/15/2036 | | | 13,415,662 | |
| | 11,135,000 | | | Jefferies Group, Inc., 6.450%, 6/08/2027 | | | 10,967,975 | |
| | 1,160,000 | | | Jefferies Group, Inc., 6.875%, 4/15/2021 | | | 1,180,300 | |
| | 3,775,000 | | | Jefferies Group, Inc., 8.500%, 7/15/2019 | | | 4,190,250 | |
| | | | | | | | |
| | | | | | | 54,484,021 | |
| | | | | | | | |
| | | | Building Materials — 1.0% | |
| | 3,255,000 | | | Masco Corp., 4.800%, 6/15/2015 | | | 3,334,601 | |
| | 2,220,000 | | | Masco Corp., 5.850%, 3/15/2017 | | | 2,275,163 | |
| | 13,440,000 | | | Masco Corp., 6.125%, 10/03/2016 | | | 14,207,155 | |
| | 6,345,000 | | | Masco Corp., 6.500%, 8/15/2032 | | | 5,974,592 | |
| | 5,510,000 | | | Masco Corp., 7.125%, 3/15/2020 | | | 5,890,570 | |
| | 2,630,000 | | | Masco Corp., 7.750%, 8/01/2029 | | | 2,712,664 | |
| | 9,460,000 | | | Owens Corning, Inc., 6.500%, 12/01/2016 | | | 10,509,776 | |
| | 35,980,000 | | | Owens Corning, Inc., 7.000%, 12/01/2036 | | | 38,342,267 | |
| | 46,412,000 | | | USG Corp., 6.300%, 11/15/2016 | | | 43,395,220 | |
| | 14,155,000 | | | USG Corp., 9.750%, 1/15/2018 | | | 14,048,837 | |
| | | | | | | | |
| | | | | | | 140,690,845 | |
| | | | | | | | |
| | | | Chemicals — 0.8% | |
| | 36,355,000 | | | Chevron Phillips Chemical Co. LLC, 8.250%, 6/15/2019, 144A | | | 47,612,108 | |
| | 20,070,000 | | | Hercules, Inc., 6.500%, 6/30/2029 | | | 15,955,650 | |
| | 5,200,000 | | | Hexion US Finance Corp./Hexion Nova Scotia Finance ULC,
8.875%, 2/01/2018 | | | 5,382,000 | |
| | 4,250,000 | | | Methanex Corp., 5.250%, 3/01/2022 | | | 4,325,998 | |
| | 5,350,000 | | | Methanex Corp., Senior Note, 6.000%, 8/15/2015 | | | 5,562,705 | |
| | 23,584,000 | | | Momentive Specialty Chemicals, Inc., 7.875%, 2/15/2023(c) | | | 19,103,040 | |
| | 8,020,000 | | | Momentive Specialty Chemicals, Inc., 8.375%, 4/15/2016(c) | | | 7,137,800 | |
| | 8,757,000 | | | Momentive Specialty Chemicals, Inc., 9.200%, 3/15/2021(c) | | | 7,531,020 | |
| | | | | | | | |
| | | | | | | 112,610,321 | |
| | | | | | | | |
See accompanying notes to financial statements.
| 12
Portfolio of Investments – as of March 31, 2012 (Unaudited)
Loomis Sayles Strategic Income Fund – (continued)
| | | | | | | | |
Principal
Amount (‡) | | | Description | | Value (†) | |
| | | | | | | | |
| | | | Collateralized Mortgage Obligations — 0.1% | |
| $ | 5,061,230 | | | Banc of America Alternative Loan Trust, Series 2007-1, Class 2A1,
6.706%, 4/25/2037(b) | | $ | 3,580,096 | |
| | 4,421,270 | | | Banc of America Funding Corp., Series 2007-8, Class 4A1, 6.000%, 8/25/2037 | | | 3,934,829 | |
| | 3,068,402 | | | GSR Mortgage Loan Trust, Series 2005-AR2, Class 2A1, 2.866%, 4/25/2035(b) | | | 2,660,860 | |
| | 6,305,213 | | | WaMu Mortgage Pass Through Certificates, Series 2007-OA6, Class 2A,
2.474%, 7/25/2047(b) | | | 3,804,912 | |
| | 5,206,339 | | | Wells Fargo Mortgage Backed Securities Trust, Series 2005-AR4, Class 2A2, 2.689%, 4/25/2035(b) | | | 4,832,190 | |
| | | | | | | | |
| | | | | | | 18,812,887 | |
| | | | | | | | |
| | | | Construction Machinery — 0.4% | |
| | 1,425,000 | | | Joy Global, Inc., 6.625%, 11/15/2036 | | | 1,484,366 | |
| | 10,790,000 | | | Terex Corp., 8.000%, 11/15/2017 | | | 11,167,650 | |
| | 525,000 | | | United Rentals North America, Inc., 8.375%, 9/15/2020 | | | 543,375 | |
| | 26,935,000 | | | United Rentals North America, Inc., 10.875%, 6/15/2016 | | | 30,503,887 | |
| | 13,630,000 | | | UR Financing Escrow Corp., 7.625%, 4/15/2022, 144A | | | 14,004,825 | |
| | | | | | | | |
| | | | | | | 57,704,103 | |
| | | | | | | | |
| | | | Consumer Cyclical Services — 0.2% | |
| | 670,000 | | | ServiceMaster Co. (The), 7.100%, 3/01/2018 | | | 631,475 | |
| | 5,500,000 | | | ServiceMaster Co. (The), 7.450%, 8/15/2027 | | | 4,688,750 | |
| | 23,005,000 | | | Western Union Co. (The), 6.200%, 11/17/2036 | | | 24,130,059 | |
| | 1,048,000 | | | Western Union Co. (The), 6.200%, 6/21/2040 | | | 1,084,520 | |
| | | | | | | | |
| | | | | | | 30,534,804 | |
| | | | | | | | |
| | | | Diversified Manufacturing — 0.5% | |
| | 6,100,000 | | | Fibria Overseas Finance Ltd., 7.500%, 5/04/2020, 144A | | | 6,443,430 | |
| | 1,441,000 | | | Textron Financial Corp., 5.400%, 4/28/2013 | | | 1,494,491 | |
| | 5,310,000 | | | Textron Financial Corp., (fixed rate to 2/15/2017, variable rate thereafter),
6.000%, 2/15/2067, 144A | | | 4,035,600 | |
| | 550,000 | | | Textron Financial Corp., Series E, MTN, 5.125%, 8/15/2014 | | | 572,990 | |
| | 13,850,000 | | | Textron, Inc., 3.875%, 3/11/2013, (EUR) | | | 18,774,677 | |
| | 5,020,000 | | | Textron, Inc., 5.600%, 12/01/2017 | | | 5,443,457 | |
| | 16,040,000 | | | Textron, Inc., EMTN, 6.625%, 4/07/2020, (GBP) | | | 28,670,062 | |
| | | | | | | | |
| | | | | | | 65,434,707 | |
| | | | | | | | |
| | | | Electric — 3.0% | |
| | 7,802,187 | | | AES Ironwood LLC, 8.857%, 11/30/2025 | | | 8,738,450 | |
| | 904,172 | | | AES Red Oak LLC, Series A, 8.540%, 11/30/2019 | | | 958,423 | |
| | 49,210,138 | | | Alta Wind Holdings LLC, 7.000%, 6/30/2035, 144A | | | 52,998,334 | |
| | 69,236,555 | | | Bruce Mansfield Unit, 6.850%, 6/01/2034 | | | 73,368,593 | |
| | 2,912,256 | | | CE Generation LLC, 7.416%, 12/15/2018 | | | 3,036,027 | |
| | 11,275,000 | | | Dynegy Holdings, Inc., 7.125%, 5/15/2018(d) | | | 7,385,125 | |
| | 10,185,000 | | | Dynegy Holdings, Inc., 7.625%, 10/15/2026(d) | | | 6,671,175 | |
| | 8,955,000 | | | Dynegy Holdings, Inc., 7.750%, 6/01/2019(d) | | | 5,887,912 | |
| | 95,200,000 | | | Edison Mission Energy, 7.625%, 5/15/2027 | | | 56,406,000 | |
| | 34,100,000 | | | EDP Finance BV, 4.900%, 10/01/2019, 144A | | | 27,719,890 | |
| | 15,000,000 | | | EDP Finance BV, 5.375%, 11/02/2012, 144A | | | 15,007,500 | |
| | 7,800,000 | | | EDP Finance BV, 6.000%, 2/02/2018, 144A | | | 6,893,523 | |
See accompanying notes to financial statements.
13 |
Portfolio of Investments – as of March 31, 2012 (Unaudited)
Loomis Sayles Strategic Income Fund – (continued)
| | | | | | | | |
Principal
Amount (‡) | | | Description | | Value (†) | |
| | | | | | | | |
| | | | Electric — continued | | | | |
| | 2,800,000 | | | EDP Finance BV, EMTN, 4.625%, 6/13/2016, (EUR) | | $ | 3,267,564 | |
| | 500,000 | | | EDP Finance BV, EMTN, 4.750%, 9/26/2016, (EUR) | | | 582,227 | |
| | 100,000 | | | EDP Finance BV, EMTN, 5.875%, 2/01/2016, (EUR) | | | 122,492 | |
| | 250,000 | | | Empresa Nacional de Electricidad S.A. (Endesa-Chile), 8.350%, 8/01/2013 | | | 269,347 | |
| | 4,070,000 | | | Endesa S.A./Cayman Islands, 7.875%, 2/01/2027 | | | 4,870,931 | |
| | 5,940,000 | | | Energy Future Holdings Corp., 10.000%, 1/15/2020 | | | 6,444,900 | |
| | 555,000 | | | Enersis S.A., Cayman Islands, 7.400%, 12/01/2016 | | | 654,525 | |
| | 31,035,000 | | | NGC Corp. Capital Trust I, Series B, 8.316%, 6/01/2027(c)(d) | | | 8,069,100 | |
| | 25,230,000 | | | RRI Energy, Inc., 7.875%, 6/15/2017 | | | 22,013,175 | |
| | 16,670,000 | | | Texas Competitive Electric Holdings Co. LLC/TCEH Finance, Inc.,
11.500%, 10/01/2020, 144A | | | 10,877,175 | |
| | 50,270,000 | | | TXU Corp., Series P, 5.550%, 11/15/2014 | | | 36,822,775 | |
| | 101,735,000 | | | TXU Corp., Series Q, 6.500%, 11/15/2024 | | | 53,410,875 | |
| | 6,675,000 | | | TXU Corp., Series R, 6.550%, 11/15/2034 | | | 3,337,500 | |
| | 7,300,000 | | | White Pine Hydro LLC, 6.310%, 7/10/2017(c) | | | 6,640,153 | |
| | 10,935,000 | | | White Pine Hydro LLC, 6.960%, 7/10/2037(c) | | | 9,203,552 | |
| | 4,000,000 | | | White Pine Hydro Portfolio LLC, 7.260%, 7/20/2015(c) | | | 3,619,440 | |
| | | | | | | | |
| | | | | | | 435,276,683 | |
| | | | | | | | |
| | | | Financial Other — 0.3% | |
| | 19,005,000 | | | Aviation Capital Group Corp., 6.750%, 4/06/2021, 144A | | | 18,433,140 | |
| | 20,000,000 | | | National Life Insurance Co., 10.500%, 9/15/2039, 144A | | | 25,139,640 | |
| | | | | | | | |
| | | | | | | 43,572,780 | |
| | | | | | | | |
| | | | Food & Beverage — 0.1% | |
| | 2,085,000 | | | ARAMARK Corp., 5.000%, 6/01/2012 | | | 2,095,425 | |
| | 11,250,000 | | | Corn Products International, Inc., 6.625%, 4/15/2037 | | | 12,721,230 | |
| | 4,370,000 | | | Viterra, Inc., 6.406%, 2/16/2021, 144A, (CAD) | | | 4,858,150 | |
| | | | | | | | |
| | | | | | | 19,674,805 | |
| | | | | | | | |
| | | | Gaming — 0.3% | |
| | 810,000 | | | MGM Resorts International, 6.625%, 7/15/2015 | | | 832,275 | |
| | 865,000 | | | MGM Resorts International, 6.875%, 4/01/2016 | | | 873,650 | |
| | 710,000 | | | MGM Resorts International, 7.500%, 6/01/2016 | | | 731,300 | |
| | 1,770,000 | | | MGM Resorts International, 7.625%, 1/15/2017 | | | 1,827,525 | |
| | 37,005,000 | | | MGM Resorts International, 8.625%, 2/01/2019, 144A | | | 39,687,863 | |
| | | | | | | | |
| | | | | | | 43,952,613 | |
| | | | | | | | |
| | | | Government Guaranteed — 0.5% | |
| | 11,038,000 | | | Instituto de Credito Oficial, MTN, 5.500%, 10/11/2012, (AUD) | | | 11,302,130 | |
| | 72,695,000 | | | Queensland Treasury Corp., 7.125%, 9/18/2017, 144A, (NZD) | | | 66,668,745 | |
| | | | | | | | |
| | | | | | | 77,970,875 | |
| | | | | | | | |
| | | | Government Owned — No Guarantee — 0.8% | |
| | 26,435,000 | | | Abu Dhabi National Energy Co., 7.250%, 8/01/2018, 144A | | | 30,730,688 | |
| | 19,500,000 | | | DP World Ltd., 6.850%, 7/02/2037, 144A | | | 18,817,500 | |
| | 70,300,000,000 | | | Export-Import Bank of Korea, 6.600%, 11/04/2013, 144A, (IDR) | | | 7,721,929 | |
| | 499,300,000,000 | | | Export-Import Bank of Korea, 8.300%, 3/15/2014, 144A, (IDR) | | | 55,991,056 | |
| | 8,935,000 | | | Petroleos de Venezuela S.A., 5.375%, 4/12/2027 | | | 5,495,025 | |
| | | | | | | | |
| | | | | | | 118,756,198 | |
| | | | | | | | |
See accompanying notes to financial statements.
| 14
Portfolio of Investments – as of March 31, 2012 (Unaudited)
Loomis Sayles Strategic Income Fund – (continued)
| | | | | | | | |
Principal
Amount (‡) | | | Description | | Value (†) | |
| | | | | | | | |
| | | | Government Sponsored — 0.1% | |
| $ | 2,700,000 | | | Eksportfinans ASA, 2.000%, 9/15/2015 | | $ | 2,395,548 | |
| | 7,090,000 | | | Eksportfinans ASA, 2.375%, 5/25/2016 | | | 6,249,466 | |
| | 1,000,000 | | | Eksportfinans ASA, EMTN, 2.250%, 2/11/2021, (CHF) | | | 852,997 | |
| | | | | | | | |
| | | | | | | 9,498,011 | |
| | | | | | | | |
| | | | Healthcare — 2.3% | |
| | 4,075,000 | | | Boston Scientific Corp., 5.125%, 1/12/2017 | | | 4,487,268 | |
| | 2,765,000 | | | Boston Scientific Corp., 5.450%, 6/15/2014 | | | 2,989,615 | |
| | 4,155,000 | | | Boston Scientific Corp., 6.400%, 6/15/2016 | | | 4,783,784 | |
| | 16,510,000 | | | Boston Scientific Corp., 7.000%, 11/15/2035 | | | 19,778,270 | |
| | 17,785,000 | | | HCA, Inc., 5.750%, 3/15/2014 | | | 18,451,938 | |
| | 3,860,000 | | | HCA, Inc., 5.875%, 3/15/2022 | | | 3,864,825 | |
| | 3,800,000 | | | HCA, Inc., 6.250%, 2/15/2013 | | | 3,899,750 | |
| | 17,035,000 | | | HCA, Inc., 6.375%, 1/15/2015 | | | 17,971,925 | |
| | 45,490,000 | | | HCA, Inc., 6.500%, 2/15/2016 | | | 48,446,850 | |
| | 2,074,000 | | | HCA, Inc., 6.750%, 7/15/2013 | | | 2,156,960 | |
| | 14,620,000 | | | HCA, Inc., 7.050%, 12/01/2027 | | | 13,121,450 | |
| | 11,104,000 | | | HCA, Inc., 7.190%, 11/15/2015 | | | 11,770,240 | |
| | 20,447,000 | | | HCA, Inc., 7.500%, 12/15/2023 | | | 19,526,885 | |
| | 24,215,000 | | | HCA, Inc., 7.500%, 11/06/2033 | | | 22,701,562 | |
| | 46,148,000 | | | HCA, Inc., 7.690%, 6/15/2025 | | | 44,475,135 | |
| | 32,745,000 | | | HCA, Inc., 8.360%, 4/15/2024 | | | 33,399,900 | |
| | 15,815,000 | | | HCA, Inc., MTN, 7.580%, 9/15/2025 | | | 14,945,175 | |
| | 9,492,000 | | | HCA, Inc., MTN, 7.750%, 7/15/2036 | | | 8,780,100 | |
| | 2,620,000 | | | Kindred Healthcare, Inc., 8.250%, 6/01/2019 | | | 2,282,675 | |
| | 3,260,000 | | | Owens & Minor, Inc., 6.350%, 4/15/2016(c) | | | 3,520,862 | |
| | 32,559,000 | | | Tenet Healthcare Corp., 6.875%, 11/15/2031 | | | 27,837,945 | |
| | | | | | | | |
| | | | | | | 329,193,114 | |
| | | | | | | | |
| | | | Home Construction — 0.7% | |
| | 11,265,000 | | | Desarrolladora Homex SAB de CV, 7.500%, 9/28/2015 | | | 11,377,650 | |
| | 13,360,000 | | | K. Hovnanian Enterprises, Inc., 5.000%, 11/01/2021, 144A | | | 9,018,000 | |
| | 16,075,000 | | | K. Hovnanian Enterprises, Inc., 6.250%, 1/15/2016 | | | 9,363,687 | |
| | 6,290,000 | | | K. Hovnanian Enterprises, Inc., 7.500%, 5/15/2016 | | | 3,663,925 | |
| | 1,960,000 | | | KB Home, 5.875%, 1/15/2015 | | | 1,930,600 | |
| | 1,364,000 | | | KB Home, 6.250%, 6/15/2015 | | | 1,336,720 | |
| | 11,315,000 | | | KB Home, 7.250%, 6/15/2018 | | | 10,862,400 | |
| | 3,745,000 | | | Pulte Group, Inc., 5.200%, 2/15/2015 | | | 3,819,900 | |
| | 47,260,000 | | | Pulte Group, Inc., 6.000%, 2/15/2035 | | | 36,862,800 | |
| | 13,190,000 | | | Pulte Group, Inc., 6.375%, 5/15/2033 | | | 10,617,950 | |
| | | | | | | | |
| | | | | | | 98,853,632 | |
| | | | | | | | |
| | | | Independent Energy — 0.2% | |
| | 4,798,000 | | | Pioneer Natural Resources Co., 7.200%, 1/15/2028 | | | 5,796,987 | |
| | 12,635,000 | | | QEP Resources, Inc., 6.875%, 3/01/2021 | | | 13,961,675 | |
| | 2,499,000 | | | Swift Energy Co., 7.125%, 6/01/2017 | | | 2,592,712 | |
| | | | | | | | |
| | | | | | | 22,351,374 | |
| | | | | | | | |
See accompanying notes to financial statements.
15 |
Portfolio of Investments – as of March 31, 2012 (Unaudited)
Loomis Sayles Strategic Income Fund – (continued)
| | | | | | | | |
Principal
Amount (‡) | | | Description | | Value (†) | |
| | | | | | | | |
| | | | Industrial Other — 0.1% | |
| $ | 10,000,000 | | | Worthington Industries, Inc., 6.500%, 4/15/2020 | | $ | 10,764,180 | |
| | | | | | | | |
| | | | Life Insurance — 1.1% | |
| | 26,400,000 | | | American International Group, Inc., 6.250%, 3/15/2087 | | | 23,760,000 | |
| | 27,655,000 | | | American International Group, Inc., (fixed rate to 5/15/2038, variable rate thereafter), 8.175%, 5/15/2068 | | | 29,272,817 | |
| | 2,185,000 | | | American International Group, Inc., Series G, MTN, 5.600%, 10/18/2016 | | | 2,366,263 | |
| | 19,625,000 | | | American International Group, Inc., Series G, MTN, 5.850%, 1/16/2018 | | | 21,342,305 | |
| | 4,815,000 | | | American International Group, Inc., Series MP, GMTN, 5.450%, 5/18/2017 | | | 5,176,318 | |
| | 2,855,000 | | | American International Group, Inc., Series MPLE, 4.900%, 6/02/2014, (CAD) | | | 2,918,915 | |
| | 2,100,000 | | | AXA S.A., (fixed rate to 12/14/2036, variable rate thereafter),
6.379%, 12/29/2049, 144A | | | 1,727,250 | |
| | 1,000,000 | | | AXA S.A., EMTN, (fixed rate to 10/16/2019, variable rate thereafter),
6.772%, 10/29/2049, (GBP) | | | 1,231,616 | |
| | 15,000,000 | | | Forethought Financial Group, Inc., 8.625%, 4/15/2021, 144A | | | 14,812,365 | |
| | 1,475,000 | | | MetLife Capital Trust X, 9.250%, 4/08/2068, 144A | | | 1,777,375 | |
| | 15,930,000 | | | MetLife, Inc., 6.400%, 12/15/2066 | | | 15,611,400 | |
| | 8,145,000 | | | MetLife, Inc., 10.750%, 8/01/2069 | | | 11,179,012 | |
| | 8,920,000 | | | NLV Financial Corp., 7.500%, 8/15/2033, 144A | | | 8,342,332 | |
| | 3,910,000 | | | Penn Mutual Life Insurance Co. (The), 6.650%, 6/15/2034, 144A | | | 4,124,108 | |
| | 6,700,000 | | | Unum Group, 7.125%, 9/30/2016 | | | 7,649,397 | |
| | | | | | | | |
| | | | | | | 151,291,473 | |
| | | | | | | | |
| | | | Local Authorities — 1.4% | |
| | 3,905,000 | | | Manitoba (Province of), GMTN, 6.375%, 9/01/2015, (NZD) | | | 3,423,063 | |
| | 79,755,000 | | | New South Wales Treasury Corp., 6.000%, 5/01/2012, (AUD) | | | 82,734,811 | |
| | 10,530,000 | | | New South Wales Treasury Corp., Series 12RG, 6.000%, 5/01/2012, (AUD) | | | 10,920,816 | |
| | 66,305,000 | | | New South Wales Treasury Corp., Series 17RG, 5.500%, 3/01/2017, (AUD) | | | 72,522,920 | |
| | 26,730,000 | | | Queensland Treasury Corp., Series 14, 5.750%, 11/21/2014, (AUD) | | | 28,686,425 | |
| | | | | | | | |
| | | | | | | 198,288,035 | |
| | | | | | | | |
| | | | Media Cable — 0.2% | |
| | 25,270,000 | | | Shaw Communications, Inc., 5.650%, 10/01/2019, (CAD) | | | 28,419,851 | |
| | | | | | | | |
| | | | Media Non-Cable — 0.6% | |
| | 740,000 | | | Clear Channel Communications, Inc., 5.500%, 9/15/2014 | | | 654,900 | |
| | 3,045,000 | | | Clear Channel Communications, Inc., 5.750%, 1/15/2013 | | | 3,022,162 | |
| | 64,250,000 | | | Clear Channel Communications, Inc., 9.000%, 3/01/2021 | | | 57,825,000 | |
| | 28,455,000 | | | R.R. Donnelley & Sons Co., 8.250%, 3/15/2019 | | | 28,312,725 | |
| | | | | | | | |
| | | | | | | 89,814,787 | |
| | | | | | | | |
| | | | Metals & Mining — 0.4% | |
| | 3,949,000 | | | Alcoa, Inc., 5.870%, 2/23/2022 | | | 4,114,665 | |
| | 1,405,000 | | | Alcoa, Inc., 5.950%, 2/01/2037 | | | 1,367,058 | |
| | 4,330,000 | | | Alcoa, Inc., 6.750%, 1/15/2028 | | | 4,403,995 | |
| | 17,905,000 | | | Algoma Acquisition Corp., 9.875%, 6/15/2015, 144A | | | 16,293,550 | |
| | 7,000,000 | | | United States Steel Corp., 6.050%, 6/01/2017 | | | 7,140,000 | |
| | 6,779,000 | | | United States Steel Corp., 6.650%, 6/01/2037 | | | 5,694,360 | |
| | 16,435,000 | | | United States Steel Corp., 7.000%, 2/01/2018 | | | 16,886,962 | |
| | | | | | | | |
| | | | | | | 55,900,590 | |
| | | | | | | | |
See accompanying notes to financial statements.
| 16
Portfolio of Investments – as of March 31, 2012 (Unaudited)
Loomis Sayles Strategic Income Fund – (continued)
| | | | | | | | |
Principal
Amount (‡) | | | Description | | Value (†) | |
| | | | | | | | |
| | | | Non-Captive Consumer — 4.1% | |
| $ | 69,019,000 | | | Residential Capital LLC, 9.625%, 5/15/2015 | | $ | 58,666,150 | |
| | 995,000 | | | SLM Corp., 6.000%, 5/10/2012, (AUD) | | | 1,027,380 | |
| | 109,950(††) | | | SLM Corp., 6.000%, 12/15/2043 | | | 2,405,431 | |
| | 20,970,000 | | | SLM Corp., MTN, 5.050%, 11/14/2014 | | | 21,489,553 | |
| | 17,600,000 | | | SLM Corp., MTN, 7.250%, 1/25/2022 | | | 18,388,902 | |
| | 2,160,000 | | | SLM Corp., MTN, 8.000%, 3/25/2020 | | | 2,332,800 | |
| | 3,750,000 | | | SLM Corp., Series A, MTN, 0.860%, 1/27/2014(b) | | | 3,581,764 | |
| | 41,770,000 | | | SLM Corp., Series A, MTN, 5.000%, 4/15/2015 | | | 42,508,702 | |
| | 14,465,000 | | | SLM Corp., Series A, MTN, 5.000%, 6/15/2018 | | | 13,882,986 | |
| | 20,955,000 | | | SLM Corp., Series A, MTN, 5.375%, 5/15/2014 | | | 21,638,217 | |
| | 35,405,000 | | | SLM Corp., Series A, MTN, 5.625%, 8/01/2033 | | | 30,227,090 | |
| | 95,060,000 | | | SLM Corp., Series A, MTN, 8.450%, 6/15/2018 | | | 105,991,900 | |
| | 26,150,000 | | | Springleaf Finance Corp., 3.250%, 1/16/2013, (EUR) | | | 31,833,991 | |
| | 10,120,000 | | | Springleaf Finance Corp., MTN, 5.750%, 9/15/2016 | | | 7,969,500 | |
| | 6,900,000 | | | Springleaf Finance Corp., Series H, MTN, 5.375%, 10/01/2012 | | | 6,624,000 | |
| | 14,232,000 | | | Springleaf Finance Corp., Series I, MTN, 5.400%, 12/01/2015 | | | 11,776,980 | |
| | 14,430,000 | | | Springleaf Finance Corp., Series I, MTN, 5.850%, 6/01/2013 | | | 13,311,675 | |
| | 2,900,000 | | | Springleaf Finance Corp., Series J, MTN, 5.900%, 9/15/2012 | | | 2,791,250 | |
| | 800,000 | | | Springleaf Finance Corp., Series J, MTN, 6.500%, 9/15/2017 | | | 616,000 | |
| | 248,290,000 | | | Springleaf Finance Corp., Series J, MTN, 6.900%, 12/15/2017 | | | 193,666,200 | |
| | | | | | | | |
| | | | | | | 590,730,471 | |
| | | | | | | | |
| | | | Non-Captive Diversified — 5.9% | |
| | 7,855,000 | | | Aircastle Ltd., 7.625%, 4/15/2020, 144A | | | 7,855,000 | |
| | 22,211,000 | | | Ally Financial, Inc., 6.750%, 12/01/2014 | | | 23,266,022 | |
| | 2,947,000 | | | Ally Financial, Inc., 6.875%, 8/28/2012 | | | 2,998,573 | |
| | 17,038,000 | | | Ally Financial, Inc., 7.500%, 12/31/2013 | | | 18,102,875 | |
| | 35,400,000 | | | Ally Financial, Inc., 7.500%, 9/15/2020 | | | 38,232,000 | |
| | 32,711,000 | | | Ally Financial, Inc., 8.000%, 12/31/2018 | | | 34,755,437 | |
| | 33,040,000 | | | Ally Financial, Inc., 8.000%, 11/01/2031 | | | 36,426,600 | |
| | 42,715,000 | | | Ally Financial, Inc., 8.300%, 2/12/2015 | | | 46,505,956 | |
| | 3,100,000 | | | General Electric Capital Corp., EMTN, 6.125%, 5/17/2012, (GBP) | | | 4,986,191 | |
| | 25,320,000 | | | General Electric Capital Corp., Series A, EMTN, 5.500%, 2/01/2017, (NZD) | | | 21,094,482 | |
| | 79,035,000 | | | General Electric Capital Corp., Series A, EMTN, 6.750%, 9/26/2016, (NZD) | | | 68,386,460 | |
| | 65,300,000 | | | General Electric Capital Corp., Series A, GMTN, 2.960%, 5/18/2012, (SGD) | | | 52,043,432 | |
| | 58,490,000 | | | General Electric Capital Corp., Series A, GMTN, 7.625%, 12/10/2014, (NZD) | | | 51,616,593 | |
| | 15,305,000 | | | General Electric Capital Corp., Series A, MTN, 0.867%, 5/13/2024(b) | | | 12,165,087 | |
| | 245,797,000 | | | General Electric Capital Corp., Series A, MTN, 6.500%, 9/28/2015, (NZD) | | | 210,206,620 | |
| | 360,000 | | | International Lease Finance Corp., 5.875%, 5/01/2013 | | | 368,100 | |
| | 5,605,000 | | | International Lease Finance Corp., 6.250%, 5/15/2019 | | | 5,532,578 | |
| | 9,289,000 | | | International Lease Finance Corp., 6.375%, 3/25/2013 | | | 9,544,448 | |
| | 20,610,000 | | | International Lease Finance Corp., 7.125%, 9/01/2018, 144A | | | 22,464,900 | |
| | 10,245,000 | | | International Lease Finance Corp., 8.250%, 12/15/2020 | | | 11,271,651 | |
| | 24,750,000 | | | International Lease Finance Corp., 8.625%, 9/15/2015 | | | 27,225,000 | |
| | 2,620,000 | | | International Lease Finance Corp., Series R, MTN, 5.625%, 9/20/2013 | | | 2,652,750 | |
| | 2,547,000 | | | International Lease Finance Corp., Series R, MTN, 5.650%, 6/01/2014 | | | 2,591,573 | |
| | 3,010,000 | | | iStar Financial, Inc., 5.500%, 6/15/2012 | | | 2,994,950 | |
| | 23,175,000 | | | iStar Financial, Inc., 5.850%, 3/15/2017 | | | 20,336,062 | |
| | 20,478,000 | | | iStar Financial, Inc., 5.875%, 3/15/2016 | | | 18,353,408 | |
See accompanying notes to financial statements.
17 |
Portfolio of Investments – as of March 31, 2012 (Unaudited)
Loomis Sayles Strategic Income Fund – (continued)
| | | | | | | | |
Principal
Amount (‡) | | | Description | | Value (†) | |
| | | | | | | | |
| | | | Non-Captive Diversified — continued | | | | |
| $ | 8,300,000 | | | iStar Financial, Inc., 6.050%, 4/15/2015 | | $ | 7,594,500 | |
| | 35,130,000 | | | iStar Financial, Inc., 8.625%, 6/01/2013 | | | 34,866,525 | |
| | 2,920,000 | | | iStar Financial, Inc., Series B, 5.700%, 3/01/2014 | | | 2,657,200 | |
| | 44,610,000 | | | iStar Financial, Inc., Series B, 5.950%, 10/15/2013 | | | 42,491,025 | |
| | | | | | | | |
| | | | | | | 839,585,998 | |
| | | | | | | | |
| | | | Oil Field Services — 0.8% | |
| | 77,565,000 | | | Nabors Industries, Inc., 9.250%, 1/15/2019 | | | 99,572,518 | |
| | 3,095,000 | | | Parker Drilling Co., 9.125%, 4/01/2018 | | | 3,280,700 | |
| | 7,275,000 | | | Rowan Cos., Inc., 7.875%, 8/01/2019 | | | 8,682,814 | |
| | | | | | | | |
| | | | | | | 111,536,032 | |
| | | | | | | | |
| | | | Packaging — 0.3% | |
| | 2,450,000 | | | OI European Group BV, 6.875%, 3/31/2017, 144A, (EUR) | | | 3,357,422 | |
| | 33,261,000 | | | Owens-Illinois, Inc., 7.800%, 5/15/2018 | | | 37,335,473 | |
| | | | | | | | |
| | | | | | | 40,692,895 | |
| | | | | | | | |
| | | | Paper — 1.0% | |
| | 14,715,000 | | | Georgia-Pacific LLC, 7.250%, 6/01/2028 | | | 17,319,702 | |
| | 12,410,000 | | | Georgia-Pacific LLC, 7.375%, 12/01/2025 | | | 15,137,135 | |
| | 120,000 | | | Georgia-Pacific LLC, 7.700%, 6/15/2015 | | | 140,239 | |
| | 47,875,000 | | | Georgia-Pacific LLC, 7.750%, 11/15/2029 | | | 59,656,032 | |
| | 1,003,000 | | | Georgia-Pacific LLC, 8.875%, 5/15/2031 | | | 1,353,090 | |
| | 14,520,000 | | | Westvaco Corp., 7.950%, 2/15/2031 | | | 15,721,937 | |
| | 25,210,000 | | | Westvaco Corp., 8.200%, 1/15/2030 | | | 27,919,167 | |
| | 2,840,000 | | | Weyerhaeuser Co., 6.950%, 10/01/2027 | | | 2,981,205 | |
| | | | | | | | |
| | | | | | | 140,228,507 | |
| | | | | | | | |
| | | | Pipelines — 1.7% | |
| | 750,000 | | | El Paso Corp., GMTN, 7.800%, 8/01/2031 | | | 852,457 | |
| | 5,255,000 | | | Energy Transfer Partners LP, 6.125%, 2/15/2017 | | | 5,871,249 | |
| | 9,115,000 | | | Energy Transfer Partners LP, 6.625%, 10/15/2036 | | | 9,455,536 | |
| | 13,175,000 | | | Enterprise Products Operating LLC, 4.050%, 2/15/2022 | | | 13,643,174 | |
| | 5,100,000 | | | Florida Gas Transmission Co., 7.900%, 5/15/2019, 144A | | | 6,173,591 | |
| | 21,200,000 | | | IFM US Colonial Pipeline 2 LLC, 6.450%, 5/01/2021, 144A | | | 22,751,034 | |
| | 42,498,573 | | | Maritimes & Northeast Pipeline LLC, 7.500%, 5/31/2014, 144A(c) | | | 45,466,673 | |
| | 770,000 | | | NGPL PipeCo LLC, 6.514%, 12/15/2012, 144A | | | 743,040 | |
| | 81,710,000 | | | NGPL PipeCo LLC, 7.119%, 12/15/2017, 144A | | | 74,455,786 | |
| | 1,805,000 | | | NGPL PipeCo LLC, 7.768%, 12/15/2037, 144A | | | 1,548,945 | |
| | 43,450,000 | | | NiSource Finance Corp., 6.400%, 3/15/2018 | | | 50,893,811 | |
| | 1,315,000 | | | Rockies Express Pipeline LLC, 6.875%, 4/15/2040, 144A | | | 1,048,712 | |
| | 4,168,000 | | | Transportadora de Gas del Sur S.A., 7.875%, 5/14/2017, 144A | | | 3,688,680 | |
| | | | | | | | |
| | | | | | | 236,592,688 | |
| | | | | | | | |
| | | | Property & Casualty Insurance — 0.4% | |
| | 14,855,000 | | | Hanover Insurance Group, Inc. (The), 6.375%, 6/15/2021 | | | 15,663,498 | |
| | 3,405,000 | | | Hanover Insurance Group, Inc. (The), 7.500%, 3/01/2020 | | | 3,853,527 | |
| | 6,075,000 | | | Marsh & McLennan Cos., Inc., 5.875%, 8/01/2033 | | | 6,688,113 | |
| | 11,865,000 | | | MBIA Insurance Corp., (fixed rate to 1/15/2013, variable rate thereafter), 14.000%, 1/15/2033, 144A | | | 7,178,325 | |
See accompanying notes to financial statements.
| 18
Portfolio of Investments – as of March 31, 2012 (Unaudited)
Loomis Sayles Strategic Income Fund – (continued)
| | | | | | | | |
Principal
Amount (‡) | | | Description | | Value (†) | |
| | | | | | | | |
| | | | Property & Casualty Insurance — continued | | | | |
| $ | 2,275,000 | | | Nationwide Mutual Insurance Co., 6.600%, 4/15/2034, 144A | | $ | 2,212,488 | |
| | 11,200,000 | | | White Mountains Re Group Ltd., 6.375%, 3/20/2017, 144A | | | 11,732,829 | |
| | 3,000,000 | | | White Mountains Re Group Ltd., (fixed rate to 6/30/2017, variable rate thereafter), 7.506%, 5/29/2049, 144A | | | 2,881,500 | |
| | 1,425,000 | | | XL Group PLC, 6.375%, 11/15/2024 | | | 1,575,875 | |
| | | | | | | | |
| | | | | | | 51,786,155 | |
| | | | | | | | |
| | | | Property Trust — 0.4% | |
| | 46,015,000 | | | WEA Finance LLC/WT Finance Australia Property Ltd.,
6.750%, 9/02/2019, 144A | | | 53,203,785 | |
| | | | | | | | |
| | | | Railroads — 0.0% | |
| | 1,153,000 | | | Missouri Pacific Railroad Co., 5.000%, 1/01/2045(c) | | | 922,400 | |
| | | | | | | | |
| | | | REITs — Apartments — 0.2% | |
| | 2,025,000 | | | Camden Property Trust, 5.000%, 6/15/2015 | | | 2,170,784 | |
| | 27,950,000 | | | Camden Property Trust, 5.700%, 5/15/2017 | | | 31,260,286 | |
| | | | | | | | |
| | | | | | | 33,431,070 | |
| | | | | | | | |
| | | | REITs — Diversified — 0.0% | |
| | 4,030,000 | | | Duke Realty LP, 5.950%, 2/15/2017 | | | 4,503,783 | |
| | | | | | | | |
| | | | REITs — Office Property — 0.4% | |
| | 47,305,000 | | | Highwoods Properties, Inc., 5.850%, 3/15/2017 | | | 50,275,943 | |
| | | | | | | | |
| | | | REITs — Warehouse/Industrials — 0.1% | |
| | 4,180,000 | | | ProLogis LP, 5.625%, 11/15/2015 | | | 4,552,100 | |
| | 3,915,000 | | | ProLogis LP, 5.625%, 11/15/2016 | | | 4,142,896 | |
| | 4,635,000 | | | ProLogis LP, 5.750%, 4/01/2016 | | | 5,052,451 | |
| | 1,662,000 | | | ProLogis LP, 6.625%, 5/15/2018 | | | 1,891,925 | |
| | 1,100,000 | | | ProLogis LP, 6.875%, 3/15/2020 | | | 1,263,552 | |
| | 2,080,000 | | | ProLogis LP, 7.375%, 10/30/2019 | | | 2,428,373 | |
| | | | | | | | |
| | | | | | | 19,331,297 | |
| | | | | | | | |
| | | | Retailers — 1.0% | |
| | 5,743,000 | | | Dillard’s, Inc., 6.625%, 1/15/2018 | | | 5,872,217 | |
| | 3,325,000 | | | Dillard’s, Inc., 7.000%, 12/01/2028 | | | 3,108,875 | |
| | 4,187,000 | | | Dillard’s, Inc., 7.130%, 8/01/2018 | | | 4,406,817 | |
| | 1,500,000 | | | Dillard’s, Inc., 7.750%, 7/15/2026 | | | 1,477,500 | |
| | 425,000 | | | Dillard’s, Inc., 7.875%, 1/01/2023 | | | 426,063 | |
| | 10,270,000 | | | Foot Locker, Inc., 8.500%, 1/15/2022 | | | 11,065,925 | |
| | 3,685,000 | | | J.C. Penney Corp., Inc., 5.750%, 2/15/2018 | | | 3,772,519 | |
| | 37,064,000 | | | J.C. Penney Corp., Inc., 6.375%, 10/15/2036 | | | 32,569,990 | |
| | 635,000 | | | J.C. Penney Corp., Inc., 7.125%, 11/15/2023 | | | 664,369 | |
| | 3,985,000 | | | J.C. Penney Corp., Inc., 7.625%, 3/01/2097 | | | 3,586,500 | |
| | 15,907,000 | | | Macy’s Retail Holdings, Inc., 6.375%, 3/15/2037 | | | 17,916,706 | |
| | 12,275,000 | | | Macy’s Retail Holdings, Inc., 6.790%, 7/15/2027 | | | 12,972,073 | |
| | 2,365,000 | | | Macy’s Retail Holdings, Inc., 6.900%, 4/01/2029 | | | 2,758,292 | |
| | 6,365,000 | | | Marks & Spencer PLC, 7.125%, 12/01/2037, 144A | | | 6,579,806 | |
| | 37,646,000 | | | Toys R Us, Inc., 7.375%, 10/15/2018 | | | 33,787,285 | |
| | 8,355,000 | | | Toys R Us, Inc., 7.875%, 4/15/2013 | | | 8,647,425 | |
| | | | | | | | |
| | | | | | | 149,612,362 | |
| | | | | | | | |
See accompanying notes to financial statements.
19 |
Portfolio of Investments – as of March 31, 2012 (Unaudited)
Loomis Sayles Strategic Income Fund – (continued)
| | | | | | | | |
Principal
Amount (‡) | | | Description | | Value (†) | |
| | | | | | | | |
| | | | Sovereigns — 1.7% | |
| | 64,132,000,000 | | | Indonesia Treasury Bond, Series FR43, 10.250%, 7/15/2022, (IDR) | | $ | 9,195,143 | |
| | 10,000,000,000 | | | Indonesia Treasury Bond, Series FR47, 10.000%, 2/15/2028, (IDR) | | | 1,439,805 | |
| | 272,460,000,000 | | | Indonesia Treasury Bond, Series ZC3, Zero Coupon, 11/20/2012, (IDR) | | | 29,120,980 | |
| | 56,700,000 | | | Republic of Brazil, 10.250%, 1/10/2028, (BRL) | | | 37,117,697 | |
| | 49,120,000 | | | Republic of Brazil, 12.500%, 1/05/2016, (BRL) | | | 32,478,479 | |
| | 107,840,000 | | | Republic of Brazil, 12.500%, 1/05/2022, (BRL) | | | 78,452,721 | |
| | 18,400,000 | | | Republic of Croatia, 6.750%, 11/05/2019, 144A | | | 18,469,000 | |
| | 3,639,662,000 | | | Republic of Iceland, 4.250%, 8/24/2012, (ISK) | | | 18,961,881 | |
| | 3,178,700,000 | | | Republic of Iceland, 7.250%, 5/17/2013, (ISK) | | | 17,065,646 | |
| | | | | | | | |
| | | | | | | 242,301,352 | |
| | | | | | | | |
| | | | Supermarkets — 0.7% | |
| | 8,336,000 | | | American Stores Co., 7.900%, 5/01/2017 | | | 7,919,200 | |
| | 73,686,000 | | | New Albertson’s, Inc., 7.450%, 8/01/2029 | | | 56,369,790 | |
| | 20,250,000 | | | New Albertson’s, Inc., 7.750%, 6/15/2026 | | | 16,402,500 | |
| | 10,950,000 | | | New Albertson’s, Inc., 8.000%, 5/01/2031 | | | 8,294,625 | |
| | 3,425,000 | | | New Albertson’s, Inc., 8.700%, 5/01/2030 | | | 2,808,500 | |
| | 13,707,000 | | | New Albertson’s, Inc., Series C, MTN, 6.625%, 6/01/2028 | | | 9,663,435 | |
| | | | | | | | |
| | | | | | | 101,458,050 | |
| | | | | | | | |
| | | | Supranational — 1.8% | |
| | 108,310,000 | | | European Bank for Reconstruction & Development, GMTN,
9.000%, 4/28/2014, (BRL) | | | 61,173,834 | |
| | 20,250,000 | | | European Bank for Reconstruction & Development, GMTN,
9.250%, 9/10/2012, (BRL) | | | 11,133,090 | |
| | 5,804,390 | | | European Financial Stability Facility, 0.400%, 3/12/2013, (EUR) | | | 7,722,293 | |
| | 5,804,390 | | | European Financial Stability Facility, 1.000%, 3/12/2014, (EUR) | | | 7,725,381 | |
| | 16,375,000 | | | European Investment Bank, 11.250%, 2/14/2013, (BRL) | | | 9,249,370 | |
| | 460,500,000,000 | | | European Investment Bank, EMTN, Zero Coupon, 4/24/2013, 144A, (IDR) | | | 47,394,636 | |
| | 60,665,000 | | | European Investment Bank, MTN, 6.250%, 4/15/2015, (AUD) | | | 65,542,313 | |
| | 244,840,000,000 | | | Inter-American Development Bank, EMTN, Zero Coupon, 5/20/2013, (IDR) | | | 25,091,816 | |
| | 24,450,000 | | | Inter-American Development Bank, EMTN, 6.000%, 12/15/2017, (NZD) | | | 21,632,052 | |
| | 8,300,000 | | | International Bank for Reconstruction & Development,
1.430%, 3/05/2014, (SGD) | | | 6,667,534 | |
| | | | | | | | |
| | | | | | | 263,332,319 | |
| | | | | | | | |
| | | | Technology — 1.6% | |
| | 1,370,000 | | | Advanced Micro Devices, Inc., 7.750%, 8/01/2020 | | | 1,507,000 | |
| | 41,705,000 | | | Agilent Technologies, Inc., 6.500%, 11/01/2017 | | | 50,161,648 | |
| | 30,187,000 | | | Alcatel-Lucent, 8.500%, 1/15/2016, (EUR) | | | 41,588,984 | |
| | 832,000 | | | Alcatel-Lucent, EMTN, 6.375%, 4/07/2014, (EUR) | | | 1,134,605 | |
| | 65,200,000 | | | Alcatel-Lucent USA, Inc., 6.450%, 3/15/2029 | | | 51,508,000 | |
| | 5,845,000 | | | Alcatel-Lucent USA, Inc., 6.500%, 1/15/2028 | | | 4,573,713 | |
| | 2,435,000 | | | Arrow Electronics, Inc., 6.875%, 6/01/2018 | | | 2,810,458 | |
| | 10,600,000 | | | Avnet, Inc., 5.875%, 3/15/2014 | | | 11,238,618 | |
| | 35,630,000 | | | Avnet, Inc., 6.000%, 9/01/2015 | | | 39,364,523 | |
| | 11,345,000 | | | Avnet, Inc., 6.625%, 9/15/2016 | | | 12,857,050 | |
| | 2,520,000 | | | Corning, Inc., 6.850%, 3/01/2029 | | | 2,923,787 | |
| | 95,000 | | | Freescale Semiconductor, Inc., 8.875%, 12/15/2014 | | | 97,494 | |
See accompanying notes to financial statements.
| 20
Portfolio of Investments – as of March 31, 2012 (Unaudited)
Loomis Sayles Strategic Income Fund – (continued)
| | | | | | | | |
Principal
Amount (‡) | | | Description | | Value (†) | |
| | | | | | | | |
| | | | Technology — continued | | | | |
| $ | 2,175,000 | | | Freescale Semiconductor, Inc., 10.125%, 12/15/2016 | | $ | 2,321,813 | |
| | 475,000 | | | Motorola Solutions, Inc., 6.000%, 11/15/2017 | | | 547,841 | |
| | 2,562,000 | | | Motorola Solutions, Inc., 6.625%, 11/15/2037 | | | 2,720,122 | |
| | 4,345,000 | | | Nortel Networks Capital Corp., 7.875%, 6/15/2026(d) | | | 4,725,187 | |
| | 240,000 | | | Samsung Electronics Co. Ltd., 7.700%, 10/01/2027, 144A | | | 288,176 | |
| | 1,730,000 | | | Xerox Corp., MTN, 7.200%, 4/01/2016 | | | 2,011,893 | |
| | | | | | | | |
| | | | | | | 232,380,912 | |
| | | | | | | | |
| | | | Textile — 0.0% | |
| | 3,450,000 | | | Jones Group/Apparel Group Holdings/Apparel Group USA/Footwear Accessories Retail, 6.875%, 3/15/2019 | | | 3,376,688 | |
| | | | | | | | |
| | | | Tobacco — 0.1% | |
| | 5,805,000 | | | Reynolds American, Inc., 6.750%, 6/15/2017 | | | 6,915,253 | |
| | 6,175,000 | | | Reynolds American, Inc., 7.250%, 6/15/2037 | | | 7,203,749 | |
| | | | | | | | |
| | | | | | | 14,119,002 | |
| | | | | | | | |
| | | | Transportation Services — 0.3% | |
| | 10,503,000 | | | APL Ltd., 8.000%, 1/15/2024(c) | | | 7,247,070 | |
| | 8,743,174 | | | Atlas Air Pass Through Trust, Series 1998-1, Class B, 7.680%, 7/02/2015 | | | 8,306,015 | |
| | 6,862,758 | | | Atlas Air Pass Through Trust, Series 1998-1, Class C,
8.010%, 7/02/2011(e)(f) | | | 5,490,206 | |
| | 6,742,640 | | | Atlas Air Pass Through Trust, Series 1999-1, Class A-1, 7.200%, 7/02/2020 | | | 6,742,640 | |
| | 48,933 | | | Atlas Air Pass Through Trust, Series 1999-1, Class A-2, 6.880%, 4/02/2014 | | | 48,933 | |
| | 6,808,847 | | | Atlas Air Pass Through Trust, Series 1999-1, Class B, 7.630%, 7/02/2016 | | | 5,855,609 | |
| | 4,744,556 | | | Atlas Air Pass Through Trust, Series 1999-1, Class C,
8.770%, 7/02/2012(e) | | | 3,605,863 | |
| | 3,418,693 | | | Atlas Air Pass Through Trust, Series 2000-1, Class B, 9.057%, 7/02/2017 | | | 3,281,946 | |
| | 3,970,000 | | | Erac USA Finance Co., 7.000%, 10/15/2037, 144A | | | 4,529,107 | |
| | | | | | | | |
| | | | | | | 45,107,389 | |
| | | | | | | | |
| | | | Treasuries — 12.5% | |
| | 320,680,000 | | | Canadian Government, 2.000%, 9/01/2012, (CAD) | | | 322,846,909 | |
| | 80,216,000 | | | Canadian Government, 3.500%, 6/01/2013, (CAD) | | | 82,643,912 | |
| | 171,980,000 | | | Canadian Government, 3.750%, 6/01/2019, (CAD) | | | 194,266,967 | |
| | 25,445,000 | | | Canadian Government, 4.250%, 6/01/2018, (CAD) | | | 29,270,487 | |
| | 47,935,000 | | | Hellenic Republic Government International Bond,
2.125%, 7/05/2013, (CHF) | | | 20,444,195 | |
| | 118,375,000 | | | Ireland Government Bond, 4.500%, 10/18/2018, (EUR) | | | 142,394,203 | |
| | 52,325,000 | | | Ireland Government Bond, 4.500%, 4/18/2020, (EUR) | | | 60,018,470 | |
| | 7,325,000 | | | Ireland Government Bond, 5.000%, 10/18/2020, (EUR) | | | 8,586,985 | |
| | 121,560,000 | | | Ireland Government Bond, 5.400%, 3/13/2025, (EUR) | | | 139,962,107 | |
| | 1,440,000 | | | Italy Buoni Poliennali Del Tesoro, 5.000%, 8/01/2034, (EUR) | | | 1,729,485 | |
| | 1,440,000 | | | Italy Buoni Poliennali Del Tesoro, 5.250%, 11/01/2029, (EUR) | | | 1,846,203 | |
| | 1,435,000 | | | Italy Buoni Poliennali Del Tesoro, 5.750%, 2/01/2033, (EUR) | | | 1,895,172 | |
| | 18,686,981(†††) | | | Mexican Fixed Rate Bonds, Series M-20, 8.000%, 12/07/2023, (MXN) | | | 165,443,714 | |
| | 22,670,000 | | | New Zealand Government Bond, 6.000%, 12/15/2017, (NZD) | | | 20,790,224 | |
| | 150,113,000 | | | New Zealand Government Bond, 6.500%, 4/15/2013, (NZD) | | | 127,712,307 | |
| | 457,420,000 | | | Norwegian Government, 4.250%, 5/19/2017, (NOK) | | | 89,107,239 | |
| | 221,050,000 | | | Norwegian Government, 5.000%, 5/15/2015, (NOK) | | | 42,702,369 | |
See accompanying notes to financial statements.
21 |
Portfolio of Investments – as of March 31, 2012 (Unaudited)
Loomis Sayles Strategic Income Fund – (continued)
| | | | | | | | |
Principal
Amount (‡) | | | Description | | Value (†) | |
| | | | | | | | |
| | | | Treasuries — continued | | | | |
| | 1,520,540,000 | | | Norwegian Government, 6.500%, 5/15/2013, (NOK) | | $ | 281,281,543 | |
| | 27,700,000 | | | Portugal Obrigacoes do Tesouro OT, 3.850%, 4/15/2021, (EUR) | | | 21,157,162 | |
| | 1,995,000 | | | Portugal Obrigacoes do Tesouro OT, 4.100%, 4/15/2037, (EUR) | | | 1,225,267 | |
| | 6,225,000 | | | Portugal Obrigacoes do Tesouro OT, 4.800%, 6/15/2020, (EUR) | | | 4,972,061 | |
| | 14,475,000 | | | Portugal Obrigacoes do Tesouro OT, 4.950%, 10/25/2023, (EUR) | | | 11,168,117 | |
| | 3,481,377,000 | | | Republic of Iceland, 6.000%, 10/13/2016, (ISK) | | | 18,539,058 | |
| | | | | | | | |
| | | | | | | 1,790,004,156 | |
| | | | | | | | |
| | | | Wireless — 1.0% | |
| | 42,310,000 | | | Nextel Communications, Inc., Series C, 5.950%, 3/15/2014 | | | 42,310,000 | |
| | 30,755,000 | | | Nextel Communications, Inc., Series D, 7.375%, 8/01/2015 | | | 29,678,575 | |
| | 3,628,000 | | | Nextel Communications, Inc., Series E, 6.875%, 10/31/2013 | | | 3,628,000 | |
| | 31,041,000 | | | Sprint Capital Corp., 6.875%, 11/15/2028 | | | 23,746,365 | |
| | 29,252,000 | | | Sprint Capital Corp., 6.900%, 5/01/2019 | | | 25,302,980 | |
| | 6,260,000 | | | Sprint Capital Corp., 8.750%, 3/15/2032 | | | 5,367,950 | |
| | 11,309,000 | | | Sprint Nextel Corp., 6.000%, 12/01/2016 | | | 10,093,282 | |
| | | | | | | | |
| | | | | | | 140,127,152 | |
| | | | | | | | |
| | | | Wirelines — 3.7% | |
| | 5,650,000 | | | Axtel SAB de CV, 9.000%, 9/22/2019, 144A | | | 4,604,750 | |
| | 4,370,000 | | | Bell Canada, MTN, 6.550%, 5/01/2029, 144A, (CAD) | | | 5,166,760 | |
| | 21,480,000 | | | Bell Canada, Series M-17, 6.100%, 3/16/2035, (CAD) | | | 24,636,372 | |
| | 2,715,000 | | | BellSouth Telecommunications, Inc., 7.000%, 12/01/2095 | | | 3,157,211 | |
| | 72,320,000 | | | CenturyLink, Inc., 6.450%, 6/15/2021 | | | 74,237,131 | |
| | 7,410,000 | | | CenturyLink, Inc., Series G, 6.875%, 1/15/2028 | | | 6,924,304 | |
| | 2,965,000 | | | CenturyLink, Inc., Series P, 7.600%, 9/15/2039 | | | 2,804,638 | |
| | 350,000 | | | Cincinnati Bell Telephone Co. LLC, 6.300%, 12/01/2028 | | | 280,000 | |
| | 155,000 | | | Cincinnati Bell, Inc., 7.000%, 2/15/2015 | | | 156,550 | |
| | 5,330,000 | | | Embarq Corp., 7.995%, 6/01/2036 | | | 5,387,372 | |
| | 38,336,000 | | | Frontier Communications Corp., 7.875%, 1/15/2027 | | | 34,885,760 | |
| | 1,120,000 | | | Koninklijke (Royal) KPN NV, EMTN, 5.750%, 3/18/2016, (GBP) | | | 1,979,453 | |
| | 1,800,000 | | | Koninklijke (Royal) KPN NV, GMTN, 4.000%, 6/22/2015, (EUR) | | | 2,551,661 | |
| | 5,965,000 | | | Level 3 Financing, Inc., 8.625%, 7/15/2020, 144A | | | 6,263,250 | |
| | 50,080,000 | | | Level 3 Financing, Inc., 8.750%, 2/15/2017 | | | 52,333,600 | |
| | 2,555,000 | | | Level 3 Financing, Inc., 9.375%, 4/01/2019 | | | 2,791,338 | |
| | 500,000 | | | OTE PLC, GMTN, 4.625%, 5/20/2016, (EUR) | | | 479,132 | |
| | 16,550,000 | | | Portugal Telecom International Finance BV, EMTN,
4.500%, 6/16/2025, (EUR) | | | 15,395,729 | |
| | 29,750,000 | | | Portugal Telecom International Finance BV, EMTN,
5.000%, 11/04/2019, (EUR) | | | 31,844,063 | |
| | 750,000 | | | Portugal Telecom International Finance BV, EMTN,
5.625%, 2/08/2016, (EUR) | | | 922,590 | |
| | 800,000 | | | Portugal Telecom International Finance BV, GMTN,
4.375%, 3/24/2017, (EUR) | | | 904,337 | |
| | 16,335,000 | | | Qwest Capital Funding, Inc., 6.500%, 11/15/2018 | | | 17,437,612 | |
| | 42,460,000 | | | Qwest Capital Funding, Inc., 6.875%, 7/15/2028 | | | 40,583,862 | |
| | 12,463,000 | | | Qwest Capital Funding, Inc., 7.625%, 8/03/2021 | | | 12,786,577 | |
| | 32,395,000 | | | Qwest Capital Funding, Inc., 7.750%, 2/15/2031 | | | 31,425,482 | |
| | 31,060,000 | | | Qwest Corp., 6.875%, 9/15/2033 | | | 30,749,400 | |
See accompanying notes to financial statements.
| 22
Portfolio of Investments – as of March 31, 2012 (Unaudited)
Loomis Sayles Strategic Income Fund – (continued)
| | | | | | | | |
Principal
Amount (‡) | | | Description | | Value (†) | |
| | | | | | | | |
| | | | Wirelines — continued | | | | |
| $ | 3,075,000 | | | Qwest Corp., 7.200%, 11/10/2026 | | $ | 3,098,063 | |
| | 3,999,000 | | | Qwest Corp., 7.250%, 9/15/2025 | | | 4,278,930 | |
| | 2,288,000 | | | Qwest Corp., 7.500%, 6/15/2023 | | | 2,310,880 | |
| | 25,655,000 | | | Telecom Italia Capital S.A., 6.000%, 9/30/2034 | | | 22,576,400 | |
| | 20,965,000 | | | Telecom Italia Capital S.A., 6.375%, 11/15/2033 | | | 18,868,500 | |
| | 31,690,000 | | | Telus Corp., 4.950%, 3/15/2017, (CAD) | | | 34,868,055 | |
| | 18,600,000 | | | Telus Corp., Series CG, 5.050%, 12/04/2019, (CAD) | | | 20,837,333 | |
| | 9,835,000 | | | Verizon Maryland, Inc., Series B, 5.125%, 6/15/2033 | | | 9,748,885 | |
| | 3,346,000 | | | Verizon New England, Inc., 7.875%, 11/15/2029 | | | 4,087,353 | |
| | 5,215,000 | | | Verizon Pennsylvania, Inc., 6.000%, 12/01/2028 | | | 5,385,353 | |
| | | | | | | | |
| | | | | | | 536,748,686 | |
| | | | | | | | |
| | | | Total Non-Convertible Bonds
(Identified Cost $8,443,017,184) | | | 9,068,810,271 | |
| | | | | | | | |
| | | | | | | | |
| | Convertible Bonds — 8.6% | | | | |
| | | | Airlines — 0.0% | | | | |
| | 1,255,000 | | | United Continental Holdings, Inc., 4.500%, 6/30/2021 | | | 1,148,513 | |
| | | | | | | | |
| | | | Automotive — 1.5% | | | | |
| | 4,240,000 | | | ArvinMeritor, Inc., (Step to Zero Coupon on 2/15/2019), 4.000%, 2/15/2027(g) | | | 3,535,100 | |
| | 125,580,000 | | | Ford Motor Co., 4.250%, 11/15/2016 | | | 199,044,300 | |
| | 8,460,000 | | | Navistar International Corp., 3.000%, 10/15/2014 | | | 9,327,150 | |
| | | | | | | | |
| | | | | | | 211,906,550 | |
| | | | | | | | |
| | | | Brokerage — 0.0% | | | | |
| | 5,025,000 | | | Jefferies Group, Inc., 3.875%, 11/01/2029 | | | 4,773,750 | |
| | | | | | | | |
| | | | Diversified Manufacturing — 0.3% | | | | |
| | 30,570,000 | | | Owens-Brockway Glass Container, Inc., 3.000%, 6/01/2015, 144A | | | 29,920,387 | |
| | 16,727,000 | | | Trinity Industries, Inc., 3.875%, 6/01/2036 | | | 18,232,430 | |
| | | | | | | | |
| | | | | | | 48,152,817 | |
| | | | | | | | |
| | | | Electric — 0.0% | |
| | 1,800,000 | | | CMS Energy Corp., 5.500%, 6/15/2029 | | | 2,871,000 | |
| | | | | | | | |
| | | | Healthcare — 0.4% | | | | |
| | 19,215,000 | | | Hologic, Inc., (accretes to principal after 12/15/2013), 2.000%, 12/15/2037(g) | | | 19,094,906 | |
| | 1,810,000 | | | Illumina, Inc., 0.250%, 3/15/2016, 144A | | | 1,735,338 | |
| | 190,000 | | | LifePoint Hospitals, Inc., 3.250%, 8/15/2025 | | | 190,713 | |
| | 2,380,000 | | | LifePoint Hospitals, Inc., 3.500%, 5/15/2014 | | | 2,487,100 | |
| | 3,780,000 | | | Omnicare, Inc., 3.250%, 12/15/2035 | | | 3,633,525 | |
| | 20,495,000 | | | Omnicare, Inc., 3.750%, 12/15/2025 | | | 29,768,987 | |
| | | | | | | | |
| | | | | | | 56,910,569 | |
| | | | | | | | |
| | | | Home Construction — 0.5% | | | | |
| | 52,005,000 | | | Lennar Corp., 3.250%, 11/15/2021, 144A | | | 71,311,856 | |
| | | | | | | | |
| | | | Independent Energy — 0.2% | | | | |
| | 20,440,000 | | | Chesapeake Energy Corp., 2.250%, 12/15/2038 | | | 16,530,850 | |
| | 7,230,000 | | | Chesapeake Energy Corp., 2.500%, 5/15/2037 | | | 6,660,638 | |
| | | | | | | | |
| | | | | | | 23,191,488 | |
| | | | | | | | |
See accompanying notes to financial statements.
23 |
Portfolio of Investments – as of March 31, 2012 (Unaudited)
Loomis Sayles Strategic Income Fund – (continued)
| | | | | | | | |
Principal
Amount (‡) | | | Description | | Value (†) | |
| | | | | | | | |
| | | | Life Insurance — 0.5% | | | | |
| $ | 72,915,000 | | | Old Republic International Corp., 3.750%, 3/15/2018 | | $ | 71,912,419 | |
| | | | | | | | |
| | | | Media Non-Cable — 0.0% | | | | |
| | 7,610,056 | | | Liberty Media LLC, 3.500%, 1/15/2031 | | | 4,594,572 | |
| | | | | | | | |
| | | | Metals & Mining — 0.1% | | | | |
| | 1,000,000 | | | Steel Dynamics, Inc., 5.125%, 6/15/2014 | | | 1,133,750 | |
| | 11,270,000 | | | United States Steel Corp., 4.000%, 5/15/2014 | | | 13,326,775 | |
| | | | | | | | |
| | | | | | | 14,460,525 | |
| | | | | | | | |
| | | | Pharmaceuticals — 0.9% | | | | |
| | 41,680,000 | | | Human Genome Sciences, Inc., 2.250%, 8/15/2012 | | | 41,784,200 | |
| | 85,880,000 | | | Human Genome Sciences, Inc., 3.000%, 11/15/2018 | | | 84,699,150 | |
| | 3,065,000 | | | Vertex Pharmaceuticals, Inc., 3.350%, 10/01/2015 | | | 3,513,256 | |
| | | | | | | | |
| | | | | | | 129,996,606 | |
| | | | | | | | |
| | | | REITs — Warehouse/Industrials — 0.2% | | | | |
| | 19,445,000 | | | ProLogis LP, 3.250%, 3/15/2015 | | | 21,997,156 | |
| | | | | | | | |
| | | | Technology — 3.1% | | | | |
| | 4,320,000 | | | Alcatel-Lucent USA, Inc., Series B, 2.875%, 6/15/2025 | | | 4,244,400 | |
| | 49,215,000 | | | Ciena Corp., 0.875%, 6/15/2017 | | | 43,247,681 | |
| | 5,535,000 | | | Ciena Corp., 3.750%, 10/15/2018, 144A | | | 6,247,631 | |
| | 6,075,000 | | | Ciena Corp., 4.000%, 3/15/2015, 144A | | | 6,857,156 | |
| | 11,463,000 | | | Intel Corp., 2.950%, 12/15/2035 | | | 13,182,450 | |
| | 220,000,000 | | | Intel Corp., 3.250%, 8/01/2039 | | | 309,375,000 | |
| | 4,487,000 | | | Kulicke & Soffa Industries, Inc., 0.875%, 6/01/2012 | | | 4,554,305 | |
| | 1,055,000 | | | Lam Research Corp., Series B, 1.250%, 5/15/2018, 144A | | | 1,107,750 | |
| | 50,625,000 | | | Micron Technology, Inc., Series B, 1.875%, 8/01/2031, 144A | | | 53,725,782 | |
| | | | | | | | |
| | | | | | | 442,542,155 | |
| | | | | | | | |
| | | | Wirelines — 0.9% | | | | |
| | 6,000,000 | | | Level 3 Communications, Inc., 6.500%, 10/01/2016 | | | 9,600,000 | |
| | 54,075,000 | | | Level 3 Communications, Inc., 7.000%, 3/15/2015, 144A(c) | | | 70,567,875 | |
| | 32,895,000 | | | Level 3 Communications, Inc., Series B, 7.000%, 3/15/2015(c) | | | 42,927,975 | |
| | 900,000 | | | Portugal Telecom International Finance BV, Series PTC,
4.125%, 8/28/2014, (EUR) | | | 1,098,302 | |
| | | | | | | | |
| | | | | | | 124,194,152 | |
| | | | | | | | |
| | | | Total Convertible Bonds
(Identified Cost $985,656,865) | | | 1,229,964,128 | |
| | | | | | | | |
| | | | | | | | |
| | Municipals — 1.2% | | | | |
| | | | California — 0.2% | | | | |
| | 4,170,000 | | | San Jose California Redevelopment Agency Tax Allocation (Merged Area Redevelopment), Series C, (MBIA insured), 3.750%, 8/01/2028 | | | 3,362,896 | |
| | 1,530,000 | | | San Jose California Redevelopment Agency Tax Allocation (Merged Area Redevelopment), Series C, (Registered), (MBIA insured), 3.750%, 8/01/2028 | | | 1,375,241 | |
| | 5,175,000 | | | State of California, (AMBAC insured), 4.500%, 8/01/2027 | | | 5,317,002 | |
| | 4,190,000 | | | State of California, (AMBAC insured), 4.500%, 8/01/2030 | | | 4,282,725 | |
See accompanying notes to financial statements.
| 24
Portfolio of Investments – as of March 31, 2012 (Unaudited)
Loomis Sayles Strategic Income Fund – (continued)
| | | | | | | | |
Principal
Amount (‡) | | | Description | | Value (†) | |
| | | | | | | | |
| | | | California — (continued) | | | | |
| $ | 4,075,000 | | | State of California, 4.500%, 8/01/2030 | | $ | 4,165,180 | |
| | 12,645,000 | | | State of California (Various Purpose), (AMBAC insured), 4.500%, 12/01/2033 | | | 12,702,408 | |
| | | | | | | | |
| | | | | | | 31,205,452 | |
| | | | | | | | |
| | | | District of Columbia — 0.0% | |
| | 3,850,000 | | | Metropolitan Washington DC Airports Authority, Series D,
8.000%, 10/01/2047 | | | 4,360,394 | |
| | | | | | | | |
| | | | Illinois — 0.3% | | | | |
| | 1,725,000 | | | Chicago O’Hare International Airport, Series A, (AGMC insured),
4.500%, 1/01/2038 | | | 1,741,405 | |
| | 47,285,000 | | | State of Illinois, 5.100%, 6/01/2033 | | | 44,573,678 | |
| | | | | | | | |
| | | | | | | 46,315,083 | |
| | | | | | | | |
| | | | Michigan — 0.1% | | | | |
| | 12,500,000 | | | Michigan Tobacco Settlement Finance Authority Taxable Turbo, Series A, 7.309%, 6/01/2034(c) | | | 9,234,250 | |
| | | | | | | | |
| | | | Virginia — 0.6% | | | | |
| | 128,820,000 | | | Virginia Tobacco Settlement Financing Corp., Series A-1,
6.706%, 6/01/2046(c) | | | 82,154,955 | |
| | | | | | | | |
| | | | Total Municipals
(Identified Cost $210,908,949) | | | 173,270,134 | |
| | | | | | | | |
| | | | | | | | |
| | | | Total Bonds and Notes
(Identified Cost $9,639,582,998) | | | 10,472,044,533 | |
| | | | | | | | |
| | | | | | | | |
| | Senior Loans — 1.2% | | | | |
| | | | Automotive — 0.1% | | | | |
| | 18,000,000 | | | TI Automotive Limited, New Term Loan, 6.750%, 3/14/2018(b) | | | 18,033,840 | |
| | | | | | | | |
| | | | Electric — 0.0% | | | | |
| | 4,788,467 | | | Texas Competitive Electric Holdings Company, LLC, Non-Extended Term Loan, 3.743%, 10/10/2014(b) | | | 2,913,878 | |
| | | | | | | | |
| | | | Food & Beverage — 0.1% | | | | |
| | 13,770,830 | | | DS Waters Enterprises, L.P., 1st Lien Term Loan, 10.500%, 8/29/2017(b) | | | 13,550,497 | |
| | | | | | | | |
| | | | Media Non-Cable — 0.1% | | | | |
| | 2,694,722 | | | Dex Media West LLC, New Term Loan, 7.250%, 10/24/2014(b) | | | 1,715,649 | |
| | 23,322,309 | | | SuperMedia, Inc., Exit Term Loan, 11.000%, 12/31/2015(b) | | | 12,570,724 | |
| | | | | | | | |
| | | | | | | 14,286,373 | |
| | | | | | | | |
| | | | Non-Captive Diversified — 0.6% | | | | |
| | 84,000,000 | | | Istar Financial, Inc., Add on Term Loan A2, 7.000%, 3/17/2017(b) | | | 83,973,960 | |
| | | | | | | | |
| | | | Wireless — 0.1% | | | | |
| | 19,725,000 | | | Hawaiian Telcom Communications, Inc., Term Loan B, 7.000%, 2/28/2017(b) | | | 19,537,612 | |
| | | | | | | | |
| | | | Wirelines — 0.2% | | | | |
| | 25,152,059 | | | FairPoint Communications, Inc., New Term Loan B, 6.500%, 1/22/2016(b) | | | 20,652,607 | |
| | | | | | | | |
| | | | Total Senior Loans
(Identified Cost $189,265,302) | | | 172,948,767 | |
| | | | | | | | |
See accompanying notes to financial statements.
25 |
Portfolio of Investments – as of March 31, 2012 (Unaudited)
Loomis Sayles Strategic Income Fund – (continued)
| | | | | | | | |
Shares | | | Description | | Value (†) | |
| | | | | | | | |
| | | | | | | | |
| | Common Stocks — 15.8% | | | | |
| | | | Biotechnology — 0.2% | |
| | 867,059 | | | Vertex Pharmaceuticals, Inc.(e) | | $ | 35,558,090 | |
| | | | | | | | |
| | | | | | | | |
| | | | Chemicals — 1.7% | | | | |
| | 1,364,851 | | | Dow Chemical Co. (The) | | | 47,278,439 | |
| | 2,000,000 | | | PPG Industries, Inc. | | | 191,600,000 | |
| | | | | | | | |
| | | | | | | 238,878,439 | |
| | | | | | | | |
| | | | Containers & Packaging — 0.1% | |
| | 460,656 | | | Owens-Illinois, Inc.(e) | | | 10,751,711 | |
| | 1,675 | | | Rock-Tenn Co., Class A | | | 113,163 | |
| | | | | | | | |
| | | | | | | 10,864,874 | |
| | | | | | | | |
| | | | Diversified Financial Services — 0.3% | |
| | 3,979,932 | | | Bank of America Corp. | | | 38,087,949 | |
| | | | | | | | |
| | | | Diversified Telecommunication Services — 2.6% | | | | |
| | 183,181 | | | FairPoint Communications, Inc.(e) | | | 688,761 | |
| | 283,397 | | | Hawaiian Telcom Holdco, Inc.(e) | | | 4,885,764 | |
| | 200,000 | | | Telecom Italia SpA, Sponsored ADR | | | 2,374,000 | |
| | 3,871,339 | | | Telecom Italia SpA, Sponsored ADR | | | 37,668,128 | |
| | 19,550,590 | | | Telefonica S.A., Sponsored ADR | | | 320,825,182 | |
| | | | | | | | |
| | | | | | | 366,441,835 | |
| | | | | | | | |
| | | | Electric Utilities — 0.0% | | | | |
| | 282,500 | | | Duke Energy Corp. | | | 5,935,325 | |
| | | | | | | | |
| | | | Electronic Equipment, Instruments & Components — 0.7% | |
| | 7,297,204 | | | Corning, Inc. | | | 102,744,632 | |
| | | | | | | | |
| | | | Food Products — 0.4% | |
| | 2,309,175 | | | ConAgra Foods, Inc. | | | 60,638,935 | |
| | | | | | | | |
| | | | Household Durables — 0.1% | |
| | 477,725 | | | KB Home | | | 4,251,752 | |
| | 549,450 | | | Lennar Corp., Class A | | | 14,934,051 | |
| | | | | | | | |
| | | | | | | 19,185,803 | |
| | | | | | | | |
| | | | Media — 0.0% | | | | |
| | 4,701 | | | Dex One Corp.(e) | | | 6,675 | |
| | 56,625 | | | SuperMedia, Inc.(e) | | | 135,334 | |
| | | | | | | | |
| | | | | | | 142,009 | |
| | | | | | | | |
| | | | Oil, Gas & Consumable Fuels — 2.1% | | | | |
| | 846,398 | | | Chesapeake Energy Corp. | | | 19,611,042 | |
| | 5,119,117 | | | Repsol YPF S.A., Sponsored ADR | | | 127,875,543 | |
| | 2,134,173 | | | Royal Dutch Shell PLC, ADR | | | 149,669,552 | |
| | 141,249 | | | Spectra Energy Corp. | | | 4,456,406 | |
| | | | | | | | |
| | | | | | | 301,612,543 | |
| | | | | | | | |
| | | | Pharmaceuticals — 3.0% | | | | |
| | 8,514,190 | | | Bristol-Myers Squibb Co. | | | 287,353,913 | |
| | 2,288 | | | Teva Pharmaceutical Industries, Ltd., Sponsored ADR | | | 103,097 | |
| | 2,691,177 | | | Valeant Pharmaceuticals International, Inc.(e) | | | 144,489,293 | |
| | | | | | | | |
| | | | | | | 431,946,303 | |
| | | | | | | | |
See accompanying notes to financial statements.
| 26
Portfolio of Investments – as of March 31, 2012 (Unaudited)
Loomis Sayles Strategic Income Fund – (continued)
| | | | | | | | |
Shares | | | Description | | Value (†) | |
| | | | | | | | |
| | | | REITs — Apartments — 0.4% | | | | |
| | 290,904 | | | Apartment Investment & Management Co., Class A | | $ | 7,682,775 | |
| | 889,730 | | | Associated Estates Realty Corp. | | | 14,538,188 | |
| | 460,000 | | | Equity Residential | | | 28,805,200 | |
| | | | | | | | |
| | | | | | | 51,026,163 | |
| | | | | | | | |
| | | | REITs — Regional Malls — 0.1% | | | | |
| | 123,159 | | | Simon Property Group, Inc. | | | 17,941,803 | |
| | | | | | | | |
| | | | REITs — Shopping Centers — 0.0% | | | | |
| | 201,557 | | | DDR Corp. | | | 2,942,732 | |
| | | | | | | | |
| | | | Semiconductors & Semiconductor Equipment — 2.6% | | | | |
| | 13,359,360 | | | Intel Corp. | | | 375,531,610 | |
| | | | | | | | |
| | | | Software — 1.5% | | | | |
| | 6,568,091 | | | Microsoft Corp. | | | 211,820,935 | |
| | | | | | | | |
| | | | Total Common Stocks
(Identified Cost $1,897,289,616) | | | 2,271,299,980 | |
| | | | | | | | |
| | | | | | | | |
| | Preferred Stocks — 2.8% | | | | |
| | Convertible Preferred Stocks — 2.0% | | | | |
| | | | Automotive — 1.0% | | | | |
| | 2,776,055 | | | General Motors Co., Series B, 4.750% | | | 116,177,902 | |
| | 657,940 | | | Goodyear Tire & Rubber Co. (The), 5.875% | | | 27,258,454 | |
| | | | | | | | |
| | | | | | | 143,436,356 | |
| | | | | | | | |
| | | | Banking — 0.3% | | | | |
| | 19,062 | | | Bank of America Corp., Series L, 7.250% | | | 18,659,792 | |
| | 203,658 | | | Sovereign Capital Trust IV, 4.375% | | | 9,750,127 | |
| | 8,533 | | | Wells Fargo & Co., Series L, Class A, 7.500% | | | 9,528,801 | |
| | | | | | | | |
| | | | | | | 37,938,720 | |
| | | | | | | | |
| | | | Construction Machinery — 0.1% | | | | |
| | 145,110 | | | United Rentals Trust I, 6.500% | | | 7,826,871 | |
| | | | | | | | |
| | | | Consumer Products — 0.1% | | | | |
| | 208,218 | | | Newell Financial Trust I, 5.250% | | | 9,838,300 | |
| | | | | | | | |
| | | | Electric — 0.1% | | | | |
| | 380,577 | | | AES Trust III, 6.750% | | | 18,986,986 | |
| | | | | | | | |
| | | | Home Construction — 0.0% | | | | |
| | 355,000 | | | Hovnanian Enterprises, Inc., 7.250% | | | 4,757,000 | |
| | | | | | | | |
| | | | Independent Energy — 0.1% | | | | |
| | 52,020 | | | Chesapeake Energy Corp., 4.500% | | | 4,767,633 | |
| | 99,800 | | | SandRidge Energy, Inc., 8.500% | | | 12,260,430 | |
| | | | | | | | |
| | | | | | | 17,028,063 | |
| | | | | | | | |
| | | | Pipelines — 0.1% | | | | |
| | 242,297 | | | El Paso Energy Capital Trust I, 4.750% | | | 11,169,892 | |
| | | | | | | | |
| | | | REITs — Healthcare — 0.0% | | | | |
| | 116,700 | | | Health Care REIT, Inc., Series I, 6.500% | | | 6,101,076 | |
| | | | | | | | |
See accompanying notes to financial statements.
27 |
Portfolio of Investments – as of March 31, 2012 (Unaudited)
Loomis Sayles Strategic Income Fund – (continued)
| | | | | | | | |
Shares | | | Description | | Value (†) | |
| | | | | | | | |
| | | | Technology — 0.2% | | | | |
| | 39,920 | | | Lucent Technologies Capital Trust I, 7.750% | | $ | 32,435,000 | |
| | | | | | | | |
| | | | Total Convertible Preferred Stocks
(Identified Cost $299,879,183) | | | 289,518,264 | |
| | | | | | | | |
| | | | | | | | |
| | Non-Convertible Preferred Stocks — 0.8% | | | | |
| | | | Banking — 0.2% | | | | |
| | 35,000 | | | Bank of America Corp., 6.375% | | | 821,450 | |
| | 847,800 | | | Citigroup Capital XIII, (fixed rate to 10/30/2015, variable rate thereafter), 7.875% | | | 23,060,160 | |
| | 389,800 | | | Countrywide Capital IV, 6.750% | | | 9,171,994 | |
| | | | | | | | |
| | | | | | | 33,053,604 | |
| | | | | | | | |
| | | | Electric — 0.0% | | | | |
| | 393 | | | Entergy New Orleans, Inc., 4.750% | | | 35,002 | |
| | | | | | | | |
| | | | Government Sponsored — 0.2% | | | | |
| | 26,000 | | | Falcons Funding Trust I, (Step to 10.875% on 3/15/2015, variable rate after 3/15/2020), 8.875%, 144A(g) | | | 27,210,625 | |
| | | | | | | | |
| | | | Home Construction — 0.0% | | | | |
| | 208,246 | | | Hovnanian Enterprises, Inc., 7.625%(e) | | | 816,324 | |
| | | | | | | | |
| | | | Non-Captive Consumer — 0.0% | | | | |
| | 101,175 | | | SLM Corp., Series A, 6.970% | | | 4,628,756 | |
| | | | | | | | |
| | | | Non-Captive Diversified — 0.3% | | | | |
| | 41,336 | | | Ally Financial, Inc., Series G, 7.000%, 144A | | | 34,436,766 | |
| | | | | | | | |
| | | | REITs — Office Property — 0.0% | | | | |
| | 1,596 | | | Highwoods Properties, Inc., Series A, 8.625% | | | 1,820,936 | |
| | | | | | | | |
| | | | REITs — Warehouse/Industrials — 0.1% | | | | |
| | 116,192 | | | ProLogis, Inc., Series Q, 8.540% | | | 6,274,368 | |
| | | | | | | | |
| | | | Total Non-Convertible Preferred Stocks
(Identified Cost $79,160,259) | | | 108,276,381 | |
| | | | | | | | |
| | | | | | | | |
| | | | Total Preferred Stocks
(Identified Cost $379,039,442) | | | 397,794,645 | |
| | | | | | | | |
| | | | | | | | |
| | Closed End Investment Companies — 0.0% | | | | |
| | 104,115 | | | Morgan Stanley Emerging Markets Debt Fund, Inc. | | | 1,129,648 | |
| | 681,131 | | | Pyxis Credit Strategies Fund, Inc. | | | 4,318,370 | |
| | | | | | | | |
| | | | Total Closed End Investment Companies
(Identified Cost $11,168,862) | | | 5,448,018 | |
| | | | | | | | |
| | | | | | | | |
Principal
Amount (‡) | | | | | | |
| | Short-Term Investments — 2.8% | | | | |
| | 3,176,593 | | | European Financial Stability Facility Treasury Bill, 0.000%, 9/12/2012, (EUR) | | | 4,228,869 | |
See accompanying notes to financial statements.
| 28
Portfolio of Investments – as of March 31, 2012 (Unaudited)
Loomis Sayles Strategic Income Fund – (continued)
| | | | | | | | |
Principal
Amount (‡) | | | Description | | Value (†) | |
| | | | | | | | |
| | Short-Term Investments — (continued) | | | | |
| $ | 40,495 | | | Repurchase Agreement with State Street Bank and Trust Company, dated 3/30/2012 at 0.000% to be repurchased at $40,495 on 4/02/2012 collateralized by $40,200 U.S. Treasury Note, 1.500% due 7/31/2016 valued at $41,344 including accrued interest (Note 2 of Notes to Financial Statements) | | $ | 40,495 | |
| | 395,133,793 | | | Tri-Party Repurchase Agreement with Fixed Income Clearing Corporation, dated 3/30/2012 at 0.000% to be repurchased at $395,133,793 on 4/02/2012 collateralized by $108,760,000 Federal National Mortgage Association, 1.000% due 11/04/2014 valued at $109,303,800; $4,910,000 Federal Home Loan Mortgage Corp., 0.750% due 11/25/2014 valued at $4,946,825; $91,030,000 Federal National Mortgage Association, 2.625% due 11/20/2014 valued at $96,833,163; $73,385,000 U.S. Treasury Note, 4.250% due 11/15/2014 valued at $81,739,735; $102,850,000 U.S. Treasury Note, 2.375% due 10/31/2014 valued at $108,892,438; $1,250,000 U.S. Treasury Note, 2.375% due 2/28/2015 valued at $1,321,735 including accrued interest (Note 2 of Notes to Financial Statements) | | | 395,133,793 | |
| | | | | | | | |
| | | | Total Short-Term Investments
(Identified Cost $399,451,093) | | | 399,403,157 | |
| | | | | | | | |
| | | | | | | | |
| | | | Total Investments — 95.7%
(Identified Cost $12,515,797,313)(a) | | | 13,718,939,100 | |
| | | | Other assets less liabilities — 4.3% | | | 612,543,441 | |
| | | | | | | | |
| | | | Net Assets — 100.0% | | $ | 14,331,482,541 | |
| | | | | | | | |
| | | | | | | | |
| | (‡) | | | Principal Amount stated in U.S. dollars unless otherwise noted. | | | | |
| | (†) | | | See Note 2 of Notes to Financial Statements. | | | | |
| | (††) | | | Amount shown represents units. One unit represents a principal amount of 25. | |
| | (†††) | | | Amount shown represents units. One unit represents a principal amount of 100. | |
| | (a) | | | Federal Tax Information (Amounts exclude certain adjustments made at the end of the Fund’s fiscal year for tax purposes. Such adjustments are primarily due to wash sales. Amortization of premium on debt securities is excluded for tax purposes.): | | | | |
| | | | At March 31, 2012, the net unrealized appreciation on investments based on a cost of $12,556,958,960 for federal income tax purposes was as follows: | |
| | | | Aggregate gross unrealized appreciation for all investments in which there is an excess of value over tax cost | | $ | 1,762,164,661 | |
| | | | Aggregate gross unrealized depreciation for all investments in which there is an excess of tax cost over value | | | (600,184,521 | ) |
| | | | | | | | |
| | | | Net unrealized appreciation | | $ | 1,161,980,140 | |
| | | | | | | | |
| | | | | | | | |
| | (b | ) | | Variable rate security. Rate as of March 31, 2012 is disclosed. | | | | |
| | (c | ) | | Illiquid security. At March 31, 2012, the value of these securities amounted to
$326,565,655 or 2.3% of net assets. | |
| | (d | ) | | The issuer is in default with respect to interest and/or principal payments. Income is not being accrued. | | | | |
| | (e | ) | | Non-income producing security. | | | | |
See accompanying notes to financial statements.
29 |
Portfolio of Investments – as of March 31, 2012 (Unaudited)
Loomis Sayles Strategic Income Fund – (continued)
| | | | | | |
| | | | | | |
| | (f | ) | | Maturity has been extended under the terms of a plan of reorganization. | | |
| | (g | ) | | Coupon rate is a fixed rate for an initial period then resets at a specified date and rate. | | |
| | | | | | |
| | 144A | | | All or a portion of these securities are exempt from registration under Rule 144A of the Securities Act of 1933. These securities may be resold in transactions exempt from registration, normally to qualified institutional buyers. At March 31, 2012, the value of Rule 144A holdings amounted to $1,459,022,118 or 10.2% of net assets. |
| | ADR | | | An American Depositary Receipt is a certificate issued by a custodian bank representing the right to receive securities of the foreign issuer described. The values of ADRs may be significantly influenced by trading on exchanges not located in the United States. |
| | ABS | | | Asset-Backed Securities | | |
| | AGMC | | | Assured Guaranty Municipal Corp. | | |
| | AMBAC | | | American Municipal Bond Assurance Corp. | | |
| | EMTN | | | Euro Medium Term Note | | |
| | GMTN | | | Global Medium Term Note | | |
| | MBIA | | | Municipal Bond Investors Assurance Corp. | | |
| | MTN | | | Medium Term Note | | |
| | REITs | | | Real Estate Investment Trusts | | |
| | | | | | |
| | AUD | | | Australian Dollar | | |
| | BRL | | | Brazilian Real | | |
| | CAD | | | Canadian Dollar | | |
| | CHF | | | Swiss Franc | | |
| | EUR | | | Euro | | |
| | GBP | | | British Pound | | |
| | IDR | | | Indonesian Rupiah | | |
| | ISK | | | Icelandic Krona | | |
| | KRW | | | South Korean Won | | |
| | MXN | | | Mexican Peso | | |
| | NOK | | | Norwegian Krone | | |
| | NZD | | | New Zealand Dollar | | |
| | SGD | | | Singapore Dollar | | |
See accompanying notes to financial statements.
| 30
Portfolio of Investments – as of March 31, 2012 (Unaudited)
Loomis Sayles Strategic Income Fund – (continued)
Industry Summary at March 31, 2012 (Unaudited)
| | | | |
Treasuries | | | 12.5 | % |
Non-Captive Diversified | | | 6.8 | |
Technology | | | 4.9 | |
Wirelines | | | 4.8 | |
Banking | | | 4.7 | |
Non-Captive Consumer | | | 4.1 | |
Pharmaceuticals | | | 3.9 | |
Automotive | | | 3.6 | |
Electric | | | 3.1 | |
Healthcare | | | 2.7 | |
Semiconductors & Semiconductor Equipment | | | 2.6 | |
Diversified Telecommunication Services | | | 2.6 | |
Airlines | | | 2.5 | |
Chemicals | | | 2.5 | |
Oil, Gas & Consumable Fuels | | | 2.1 | |
Other Investments, less than 2% each | | | 29.5 | |
Short-Term Investments | | | 2.8 | |
| | | | |
Total Investments | | | 95.7 | |
Other assets less liabilities | | | 4.3 | |
| | | | |
Net Assets | | | 100.0 | % |
| | | | |
Currency Exposure at March 31, 2012 (Unaudited)
| | | | |
United States Dollar | | | 69.9 | % |
Canadian Dollar | | | 5.5 | |
Euro | | | 4.2 | |
New Zealand Dollar | | | 4.1 | |
Norwegian Krone | | | 2.9 | |
Australian Dollar | | | 2.5 | |
Other, less than 2% each | | | 6.6 | |
| | | | |
Total Investments | | | 95.7 | |
Other assets less liabilities | | | 4.3 | |
| | | | |
Net Assets | | | 100.0 | % |
| | | | |
See accompanying notes to financial statements.
31 |
Statement of Assets and Liabilities
March 31, 2012 (Unaudited)
| | | | |
ASSETS | | | | |
Investments at cost | | $ | 12,515,797,313 | |
Net unrealized appreciation | | | 1,203,141,787 | |
| | | | |
Investments at value | | | 13,718,939,100 | |
Cash | | | 1,068,136 | |
Due from custodian (Note 2) | | | 2,955,244 | |
Foreign currency at value (identified cost $3,960,411) | | | 3,093,875 | |
Receivable for Fund shares sold | | | 35,646,851 | |
Receivable for securities sold | | | 426,198,322 | |
Dividends and interest receivable | | | 190,362,971 | |
Tax reclaims receivable | | | 599,975 | |
| | | | |
TOTAL ASSETS | | | 14,378,864,474 | |
| | | | |
LIABILITIES | | | | |
Payable for securities purchased | | | 16,979,549 | |
Payable for Fund shares redeemed | | | 18,674,560 | |
Foreign taxes payable (Note 2) | | | 89,730 | |
Due to brokers (Note 2) | | | 2,955,244 | |
Management fees payable (Note 5) | | | 6,729,425 | |
Deferred Trustees’ fees (Note 5) | | | 696,849 | |
Administrative fees payable (Note 5) | | | 552,633 | |
Payable to distributor (Note 5d) | | | 113,743 | |
Other accounts payable and accrued expenses | | | 590,200 | |
| | | | |
TOTAL LIABILITIES | | | 47,381,933 | |
| | | | |
NET ASSETS | | $ | 14,331,482,541 | |
| | | | |
NET ASSETS CONSIST OF: | | | | |
Paid-in capital | | $ | 13,644,627,088 | |
Distributions in excess of net investment income | | | (41,489,743 | ) |
Accumulated net realized loss on investments and foreign currency transactions | | | (473,019,358 | ) |
Net unrealized appreciation on investments and foreign currency translations | | | 1,201,364,554 | |
| | | | |
NET ASSETS | | $ | 14,331,482,541 | |
| | | | |
See accompanying notes to financial statements.
| 32
Statement of Assets and Liabilities (continued)
March 31, 2012 (Unaudited)
| | | | |
COMPUTATION OF NET ASSET VALUE AND OFFERING PRICE: | | | | |
Class A shares: | | | | |
Net assets | | $ | 5,074,229,542 | |
| | | | |
Shares of beneficial interest | | | 334,378,181 | |
| | | | |
Net asset value and redemption price per share | | $ | 15.18 | |
| | | | |
Offering price per share (100/95.50 of net asset value) (Note 1) | | $ | 15.90 | |
| | | | |
Class B shares: (redemption price per share is equal to net asset value less any applicable contingent deferred sales charge) (Note 1) | | | | |
Net assets | | $ | 102,320,482 | |
| | | | |
Shares of beneficial interest | | | 6,698,752 | |
| | | | |
Net asset value and offering price per share | | $ | 15.27 | |
| | | | |
Class C shares: (redemption price per share is equal to net asset value less any applicable contingent deferred sales charge) (Note 1) | | | | |
Net assets | | $ | 5,055,599,852 | |
| | | | |
Shares of beneficial interest | | | 331,303,579 | |
| | | | |
Net asset value and offering price per share | | $ | 15.26 | |
| | | | |
Class Y shares: | | | | |
Net assets | | $ | 4,060,406,216 | |
| | | | |
Shares of beneficial interest | | | 267,760,313 | |
| | | | |
Net asset value, offering and redemption price per share | | $ | 15.16 | |
| | | | |
Admin Class shares: | | | | |
Net assets | | $ | 38,926,449 | |
| | | | |
Shares of beneficial interest | | | 2,571,210 | |
| | | | |
Net asset value, offering and redemption price per share | | $ | 15.14 | |
| | | | |
See accompanying notes to financial statements.
33 |
Statement of Operations
For the Six Months Ended March 31, 2012 (Unaudited)
| | | | |
INVESTMENT INCOME | | | | |
Interest | | $ | 349,518,509 | |
Dividends | | | 61,516,427 | |
Less net foreign taxes withheld | | | (4,433,157 | ) |
| | | | |
| | | 406,601,779 | |
| | | | |
Expenses | | | | |
Management fees (Note 5) | | | 37,742,040 | |
Service and distribution fees (Note 5) | | | 31,757,107 | |
Administrative fees (Note 5) | | | 3,118,499 | |
Trustees’ fees and expenses (Note 5) | | | 90,027 | |
Transfer agent fees and expenses (Note 5) | | | 5,514,746 | |
Audit and tax services fees | | | 26,697 | |
Custodian fees and expenses | | | 317,371 | |
Legal fees | | | 101,750 | |
Registration fees | | | 175,498 | |
Shareholder reporting expenses | | | 407,688 | |
Miscellaneous expenses | | | 176,784 | |
| | | | |
Total expenses | | | 79,428,207 | |
| | | | |
Net investment income | | | 327,173,572 | |
| | | | |
NET REALIZED AND UNREALIZED GAIN (LOSS) ON INVESTMENTS AND
FOREIGN CURRENCY TRANSACTIONS | | | | |
Net realized gain (loss) on: | | | | |
Investments | | | 14,969,306 | |
Foreign currency transactions | | | (1,508,470 | ) |
Net change in unrealized appreciation (depreciation) on: | | | | |
Investments | | | 967,517,679 | |
Foreign currency translations | | | 5,172,050 | |
| | | | |
Net realized and unrealized gain on investments and foreign currency transactions | | | 986,150,565 | |
| | | | |
NET INCREASE IN NET ASSETS RESULTING FROM OPERATIONS | | $ | 1,313,324,137 | |
| | | | |
See accompanying notes to financial statements.
| 34
Statement of Changes in Net Assets
| | | | | | | | |
| | | Six Months
Ended
March 31, 2012
(Unaudited) | | | Year Ended
September 30,
2011 | |
FROM OPERATIONS: | | | | | | | | |
Net investment income | | $ | 327,173,572 | | | $ | 662,753,316 | |
Net realized gain on investments and foreign currency transactions | | | 13,460,836 | | | | 365,118,083 | |
Net change in unrealized appreciation (depreciation) on investments and foreign currency translations | | | 972,689,729 | | | | (756,514,895 | ) |
| | | | | | | | |
Net increase in net assets resulting from operations | | | 1,313,324,137 | | | | 271,356,504 | |
| | | | | | | | |
FROM DISTRIBUTIONS TO SHAREHOLDERS: | | | | | | | | |
Net investment income | | | | | | | | |
Class A | | | (179,997,963 | ) | | | (312,937,228 | ) |
Class B | | | (3,065,935 | ) | | | (5,960,721 | ) |
Class C | | | (142,222,085 | ) | | | (237,583,471 | ) |
Class Y | | | (104,576,373 | ) | | | (155,221,506 | ) |
Admin Class | | | (998,859 | ) | | | (816,337 | ) |
| | | | | | | | |
Total distributions | | | (430,861,215 | ) | | | (712,519,263 | ) |
| | | | | | | | |
NET INCREASE (DECREASE) IN NET ASSETS FROM CAPITAL SHARE TRANSACTIONS (NOTE 8) | | | 579,577,418 | | | | (256,613,434 | ) |
| | | | | | | | |
Net increase (decrease) in net assets | | | 1,462,040,340 | | | | (697,776,193 | ) |
NET ASSETS | | | | | | | | |
Beginning of the period | | | 12,869,442,201 | | | | 13,567,218,394 | |
| | | | | | | | |
End of the period | | $ | 14,331,482,541 | | | $ | 12,869,442,201 | |
| | | | | | | | |
UNDISTRIBUTED (DISTRIBUTIONS IN EXCESS OF) NET
INVESTMENT INCOME | | $ | (41,489,743 | ) | | $ | 62,197,900 | |
| | | | | | | | |
See accompanying notes to financial statements.
35 |
This Page Intentionally Left Blank
| 36
Financial Highlights
For a share outstanding throughout each period.
| | | | | | | | | | | | | | | | | | | | | | | | | | | | |
| | | | | | Income (Loss) from Investment
Operations: | | | Less Distributions: | |
| | | Net asset
value,
beginning
of the
period | | | Net
investment
income (a) | | | Net realized
and
unrealized
gain (loss) | | | Total from
investment
operations | | | Dividends
from net
investment
income | | | Distributions
from net
realized
capital
gains | | | Total
distributions | |
STRATEGIC INCOME FUND | | | | | | | | | | | | | | | | | | | | | | | | | |
Class A | | | | | | | | | | | | | | | | | | | | | | | | | | | | |
3/31/2012(h) | | $ | 14.21 | | | $ | 0.37 | | | $ | 1.09 | | | $ | 1.46 | | | $ | (0.49 | ) | | $ | — | | | $ | (0.49 | ) |
9/30/2011 | | | 14.69 | | | | 0.77 | | | | (0.42 | ) | | | 0.35 | | | | (0.83 | ) | | | — | | | | (0.83 | ) |
9/30/2010 | | | 13.39 | | | | 0.80 | | | | 1.31 | | | | 2.11 | | | | (0.81 | ) | | | — | | | | (0.81 | ) |
9/30/2009 | | | 12.10 | | | | 0.87 | | | | 1.36 | | | | 2.23 | | | | (0.86 | ) | | | (0.08 | ) | | | (0.94 | ) |
9/30/2008 | | | 15.18 | | | | 0.96 | | | | (3.02 | ) | | | (2.06 | ) | | | (1.01 | ) | | | (0.01 | ) | | | (1.02 | ) |
9/30/2007 | | | 14.60 | | | | 0.80 | | | | 0.60 | | | | 1.40 | | | | (0.82 | ) | | | — | | | | (0.82 | ) |
Class B | | | | | | | | | | | | | | | | | | | | | | | | | | | | |
3/31/2012(h) | | | 14.30 | | | | 0.32 | | | | 1.08 | | | | 1.40 | | | | (0.43 | ) | | | — | | | | (0.43 | ) |
9/30/2011 | | | 14.78 | | | | 0.66 | | | | (0.43 | ) | | | 0.23 | | | | (0.71 | ) | | | — | | | | (0.71 | ) |
9/30/2010 | | | 13.46 | | | | 0.69 | | | | 1.33 | | | | 2.02 | | | | (0.70 | ) | | | — | | | | (0.70 | ) |
9/30/2009 | | | 12.16 | | | | 0.79 | | | | 1.36 | | | | 2.15 | | | | (0.77 | ) | | | (0.08 | ) | | | (0.85 | ) |
9/30/2008 | | | 15.25 | | | | 0.85 | | | | (3.04 | ) | | | (2.19 | ) | | | (0.89 | ) | | | (0.01 | ) | | | (0.90 | ) |
9/30/2007 | | | 14.66 | | | | 0.69 | | | | 0.60 | | | | 1.29 | | | | (0.70 | ) | | | — | | | | (0.70 | ) |
Class C | | | | | | | | | | | | | | | | | | | | | | | | | | | | |
3/31/2012(h) | | | 14.29 | | | | 0.32 | | | | 1.08 | | | | 1.40 | | | | (0.43 | ) | | | — | | | | (0.43 | ) |
9/30/2011 | | | 14.77 | | | | 0.66 | | | | (0.43 | ) | | | 0.23 | | | | (0.71 | ) | | | — | | | | (0.71 | ) |
9/30/2010 | | | 13.45 | | | | 0.69 | | | | 1.33 | | | | 2.02 | | | | (0.70 | ) | | | — | | | | (0.70 | ) |
9/30/2009 | | | 12.15 | | | | 0.79 | | | | 1.37 | | | | 2.16 | | | | (0.78 | ) | | | (0.08 | ) | | | (0.86 | ) |
9/30/2008 | | | 15.24 | | | | 0.85 | | | | (3.03 | ) | | | (2.18 | ) | | | (0.90 | ) | | | (0.01 | ) | | | (0.91 | ) |
9/30/2007 | | | 14.65 | | | | 0.69 | | | | 0.60 | | | | 1.29 | | | | (0.70 | ) | | | — | | | | (0.70 | ) |
Class Y | | | | | | | | | | | | | | | | | | | | | | | | | | | | |
3/31/2012(h) | | | 14.20 | | | | 0.39 | | | | 1.07 | | | | 1.46 | | | | (0.50 | ) | | | — | | | | (0.50 | ) |
9/30/2011 | | | 14.68 | | | | 0.81 | | | | (0.43 | ) | | | 0.38 | | | | (0.86 | ) | | | — | | | | (0.86 | ) |
9/30/2010 | | | 13.38 | | | | 0.83 | | | | 1.31 | | | | 2.14 | | | | (0.84 | ) | | | — | | | | (0.84 | ) |
9/30/2009 | | | 12.09 | | | | 0.90 | | | | 1.36 | | | | 2.26 | | | | (0.89 | ) | | | (0.08 | ) | | | (0.97 | ) |
9/30/2008 | | | 15.17 | | | | 1.00 | | | | (3.03 | ) | | | (2.03 | ) | | | (1.04 | ) | | | (0.01 | ) | | | (1.05 | ) |
9/30/2007 | | | 14.59 | | | | 0.85 | | | | 0.59 | | | | 1.44 | | | | (0.86 | ) | | | — | | | | (0.86 | ) |
Admin Class | | | | | | | | | | | | | | | | | | | | | | | | | | | | |
3/31/2012(h) | | | 14.18 | | | | 0.35 | | | | 1.08 | | | | 1.43 | | | | (0.47 | ) | | | — | | | | (0.47 | ) |
9/30/2011 | | | 14.66 | | | | 0.73 | | | | (0.42 | ) | | | 0.31 | | | | (0.79 | ) | | | — | | | | (0.79 | ) |
9/30/2010* | | | 13.87 | | | | 0.52 | | | | 0.79 | | | | 1.31 | | | | (0.52 | ) | | | — | | | | (0.52 | ) |
| * | From commencement of Class operations on February 1, 2010 through September 30, 2010. |
| (a) | Per share net investment income has been calculated using the average shares outstanding during the period. |
| (b) | Amount rounds to less than $0.01 per share, if applicable. |
| (c) | Effective June 2, 2008, redemption fees were eliminated. |
| (d) | A sales charge for Class A shares and a contingent deferred sales charge for Class B and Class C shares are not reflected in total return calculations. Periods less than one year, if applicable, are not annualized. |
See accompanying notes to financial statements.
37 |
| | | | | | | | | | | | | | | | | | | | | | | | | | | | | | |
| | | | | | | | | | | | | Ratios to Average Net Assets: | | | | |
Redemption
fees (b)(c) | | | Net asset
value,
end of
the period | | | Total
return
(%) (d)(e) | | | Net assets,
end of
the period
(000’s) | | | Net
expenses
(%) (f)(g) | | | Gross
expenses
(%) (f) | | | Net
investment
income
(%) (f) | | | Portfolio
turnover
rate (%) | |
| | | | | | | | | | | | | | | | | | | | | | | | | | | | | | |
| | | | | | | | | | | | | | | | | | | | | | | | | | | | | | |
| $ | — | | | $ | 15.18 | | | | 10.37 | | | $ | 5,074,230 | | | | 0.95 | | | | 0.95 | | | | 5.06 | | | | 12 | |
| | — | | | | 14.21 | | | | 2.20 | | | | 5,262,765 | | | | 0.95 | | | | 0.95 | | | | 5.10 | | | | 25 | |
| | — | | | | 14.69 | | | | 16.20 | | | | 5,758,070 | | | | 0.96 | | | | 0.96 | | | | 5.67 | | | | 27 | |
| | — | | | | 13.39 | | | | 20.56 | | | | 5,544,029 | | | | 0.99 | | | | 0.99 | | | | 7.74 | | | | 39 | |
| | 0.00 | | | | 12.10 | | | | (14.54 | ) | | | 5,551,066 | | | | 0.97 | | | | 0.98 | | | | 6.59 | | | | 24 | |
| | 0.00 | | | | 15.18 | | | | 9.90 | | | | 5,749,315 | | | | 1.00 | | | | 1.00 | | | | 5.39 | | | | 22 | |
| | | | | | | | | | | | | | | | | | | | | | | | | | | | | | |
| | — | | | | 15.27 | | | | 9.90 | | | | 102,320 | | | | 1.70 | | | | 1.70 | | | | 4.32 | | | | 12 | |
| | — | | | | 14.30 | | | | 1.48 | | | | 107,400 | | | | 1.70 | | | | 1.70 | | | | 4.35 | | | | 25 | |
| | — | | | | 14.78 | | | | 15.39 | | | | 137,268 | | | | 1.71 | | | | 1.71 | | | | 4.92 | | | | 27 | |
| | — | | | | 13.46 | | | | 19.62 | | | | 148,887 | | | | 1.74 | | | | 1.74 | | | | 7.02 | | | | 39 | |
| | 0.00 | | | | 12.16 | | | | (15.19 | ) | | | 161,751 | | | | 1.72 | | | | 1.73 | | | | 5.78 | | | | 24 | |
| | 0.00 | | | | 15.25 | | | | 9.08 | | | | 233,418 | | | | 1.76 | | | | 1.76 | | | | 4.61 | | | | 22 | |
| | | | | | | | | | | | | | | | | | | | | | | | | | | | | | |
| | — | | | | 15.26 | | | | 9.92 | | | | 5,055,600 | | | | 1.70 | | | | 1.70 | | | | 4.31 | | | | 12 | |
| | — | | | | 14.29 | | | | 1.42 | | | | 4,666,077 | | | | 1.70 | | | | 1.70 | | | | 4.35 | | | | 25 | |
| | — | | | | 14.77 | | | | 15.40 | | | | 5,146,164 | | | | 1.71 | | | | 1.71 | | | | 4.92 | | | | 27 | |
| | — | | | | 13.45 | | | | 19.66 | | | | 4,894,546 | | | | 1.74 | | | | 1.74 | | | | 6.95 | | | | 39 | |
| | 0.00 | | | | 12.15 | | | | (15.19 | ) | | | 3,984,204 | | | | 1.72 | | | | 1.73 | | | | 5.85 | | | | 24 | |
| | 0.00 | | | | 15.24 | | | | 9.08 | | | | 3,843,823 | | | | 1.75 | | | | 1.75 | | | | 4.63 | | | | 22 | |
| | | | | | | | | | | | | | | | | | | | | | | | | | | | | | |
| | — | | | | 15.16 | | | | 10.51 | | | | 4,060,406 | | | | 0.71 | | | | 0.71 | | | | 5.31 | | | | 12 | |
| | — | | | | 14.20 | | | | 2.46 | | | | 2,807,777 | | | | 0.70 | | | | 0.70 | | | | 5.35 | | | | 25 | |
| | — | | | | 14.68 | | | | 16.50 | | | | 2,521,337 | | | | 0.71 | | | | 0.71 | | | | 5.92 | | | | 27 | |
| | — | | | | 13.38 | | | | 20.91 | | | | 2,057,888 | | | | 0.72 | | | | 0.72 | | | | 7.76 | | | | 39 | |
| | 0.00 | | | | 12.09 | | | | (14.34 | ) | | | 783,058 | | | | 0.72 | | | | 0.72 | | | | 6.88 | | | | 24 | |
| | 0.00 | | | | 15.17 | | | | 10.22 | | | | 638,868 | | | | 0.74 | | | | 0.74 | | | | 5.67 | | | | 22 | |
| | | | | | | | | | | | | | | | | | | | | | | | | | | | | | |
| | — | | | | 15.14 | | | | 10.20 | | | | 38,926 | | | | 1.21 | | | | 1.21 | | | | 4.78 | | | | 12 | |
| | — | | | | 14.18 | | | | 1.98 | | | | 25,424 | | | | 1.21 | | | | 1.21 | | | | 4.87 | | | | 25 | |
| | — | | | | 14.66 | | | | 9.61 | | | | 4,379 | | | | 1.24 | | | | 1.24 | | | | 5.52 | | | | 27 | |
| (e) | Had certain expenses not been waived/reimbursed during the period, if applicable, total returns would have been lower. |
| (f) | Computed on an annualized basis for periods less than one year, if applicable. |
| (g) | The investment adviser and/or administrator agreed to waive its fees and/or reimburse a portion of the Fund’s expenses during the period. Without this waiver/reimbursement, if applicable, expenses would have been higher. |
| (h) | For the six months ended March 31, 2012 (Unaudited). |
See accompanying notes to financial statements.
| 38
Notes to Financial Statements
March 31, 2012 (Unaudited)
1. Organization. Loomis Sayles Funds II (the “Trust”) is organized as a Massachusetts business trust. The Trust is registered under the Investment Company Act of 1940, as amended (the “1940 Act”), as an open-end management investment company. The Declaration of Trust permits the Board of Trustees to authorize the issuance of an unlimited number of shares of the Trust in multiple series. The financial statements for certain funds of the Trust are presented in separate reports. Information presented in these financial statements pertains to Loomis Sayles Strategic Income Fund (the “Fund”).
The Fund is a diversified investment company.
Effective January 1, 2012, the name of the Fund’s administrator changed from Natixis Asset Management Advisors, L.P. to NGAM Advisors, L.P. (“NGAM Advisors”) and the name of the Fund’s distributor changed from Natixis Distributors, L.P. to NGAM Distribution, L.P. (“NGAM Distribution”).
The Fund offers Class A, Class C, Class Y and Admin Class shares. Effective October 12, 2007, Class B shares are no longer offered. Existing Class B shareholders may continue to reinvest dividends into Class B shares and exchange their Class B shares for Class B shares of other Natixis Funds subject to existing exchange privileges as described in the prospectus.
Class A shares are sold with a maximum front-end sales charge of 4.50%. Class B shares do not pay a front-end sales charge; however, they are charged higher Rule 12b-1 fees, and are subject to a contingent deferred sales charge (“CDSC”) if such shares are redeemed within six years of purchase. After eight years of ownership, Class B shares convert to Class A shares. Class C shares do not pay a front-end sales charge, do not convert to any other class of shares, pay higher Rule 12b-1 fees than Class A shares and may be subject to a CDSC of 1.00% if those shares are redeemed within one year of acquisition, except for reinvested distributions. Class Y shares do not pay a front-end sales charge, a CDSC or Rule 12b-1 fees. Class Y shares are generally intended for institutional investors with a minimum initial investment of $100,000, though some categories of investors are exempted from the minimum investment amount as outlined in the Fund’s prospectus. Admin Class shares do not pay a front-end sales charge or a CDSC, but do pay a Rule 12b-1 fee. Admin Class shares are offered exclusively through intermediaries.
Most expenses of the Trust can be directly attributed to a Fund. Expenses which cannot be directly attributed to a Fund are generally apportioned based on the relative net assets of each of the funds in the Trust. Expenses of the Fund are borne pro rata by the holders of each class of shares, except that each class bears expenses unique to that class (including the Rule 12b-1 service and distribution fees). In addition, each class votes as a class only with respect to its own Rule 12b-1 Plan. Shares of each class would receive their pro rata share of the net assets of the Fund if the Fund were liquidated. The Trustees approve separate distributions from net investment income on each class of shares.
39 |
Notes to Financial Statements (continued)
March 31, 2012 (Unaudited)
2. Significant Accounting Policies. The following is a summary of significant accounting policies consistently followed by the Fund in the preparation of its financial statements. The Fund’s financial statements are prepared in accordance with accounting principles generally accepted in the United States of America which require the use of management estimates that affect the reported amounts and disclosures in the financial statements. Actual results could differ from those estimates. Management has evaluated the events and transactions subsequent to period-end through the date the financial statements were issued and has determined that there were no material events that would require disclosure in the Fund’s financial statements.
a. Valuation. Debt securities (other than short-term obligations purchased with an original or remaining maturity of sixty days or less) and unlisted equity securities are generally valued on the basis of evaluated bids furnished to the Fund by an independent pricing service recommended by the investment adviser and approved by the Board of Trustees, which service determines valuations for normal, institutional-size trading units of such securities using market information, transactions for comparable securities and various relationships between securities which are generally recognized by institutional traders. Senior loans are priced at bid prices supplied by an independent pricing service, if available. Equity securities, including shares of closed-end investment companies and exchange-traded funds, for which market quotations are readily available are valued at market value, as reported by independent pricing services recommended by the investment adviser and approved by the Board of Trustees. Such independent pricing services generally use the security’s last sale price on the exchange or market where the security is primarily traded or, if there is no reported sale during the day, the closing bid price. Securities traded on the NASDAQ Global Select Market, NASDAQ Global Market and NASDAQ Capital Market are valued at the NASDAQ Official Closing Price (“NOCP”), or if lacking a NOCP, at the most recent bid quotation on the applicable NASDAQ Market. Broker-dealer bid quotations may also be used to value debt and equity securities and senior loans where an independent pricing service is unable to price a security or where an independent pricing service does not provide a reliable price for the security. Investments in other open-end investment companies are valued at their net asset value each day. Short-term obligations purchased with an original or remaining maturity of sixty days or less are valued at amortized cost, which approximates market value. Securities for which market quotations are not readily available are valued at fair value as determined in good faith by the Fund’s investment adviser using consistently applied procedures under the general supervision of the Board of Trustees.
The Fund may hold securities traded in foreign markets. Foreign securities are valued at the market price in the foreign market. However, if events occurring after the close of the foreign market (but before the close of regular trading on the New York Stock Exchange) are believed to materially affect the value of those securities, such securities are fair valued pursuant to procedures approved by the Board of Trustees.
| 40
Notes to Financial Statements (continued)
March 31, 2012 (Unaudited)
When fair valuing securities, the Fund may, among other things, use modeling tools or other processes that may take into account factors such as securities market activity and/or significant events that occur after the close of the foreign market and before the Fund calculates its net asset value.
b. Investment Transactions and Related Investment Income. Investment transactions are accounted for on a trade date plus one basis for daily net asset value calculation. However, for financial reporting purposes, investment transactions are reported on trade date. Dividend income is recorded on ex-dividend date, or in the case of certain foreign securities, as soon as the Fund is notified, and interest income is recorded on an accrual basis. Interest income is increased by the accretion of discount and decreased by the amortization of premium. Distributions received from investments in securities that represent a return of capital or capital gain are recorded as a reduction of the cost of investments or as a realized gain, respectively. Investment income is recorded net of foreign taxes withheld when applicable. In determining net gain or loss on securities sold, the cost of securities has been determined on an identified cost basis. Investment income, non-class specific expenses and realized and unrealized gains and losses are allocated on a pro rata basis to each class based on the relative net assets of each class to the total net assets of the Fund.
c. Foreign Currency Translation. The books and records of the Fund are maintained in U.S. dollars. The values of securities, currencies and other assets and liabilities denominated in currencies other than U.S. dollars are translated into U.S. dollars based upon foreign exchange rates prevailing at the end of the period. Purchases and sales of investment securities, income and expenses are translated on the respective dates of such transactions.
Since the values of investment securities are presented at the foreign exchange rates prevailing at the end of the period, it is not practical to isolate that portion of the results of operations arising from changes in exchange rates from fluctuations which arise due to changes in market prices of investment securities. Such changes are included with the net realized and unrealized gain or loss on investments.
Net realized foreign exchange gains or losses arise from sales of foreign currency, currency gains or losses realized between the trade and settlement dates on securities transactions, and the difference between the amounts of dividends, interest and foreign withholding taxes recorded on the Fund’s books and the U.S. dollar equivalent of the amounts actually received or paid. Net unrealized foreign exchange gains and losses arise from changes in the value of assets and liabilities, other than investment securities, at the end of the fiscal period, resulting from changes in exchange rates.
The Fund may use foreign currency exchange contracts to facilitate transactions in foreign-denominated investments. Losses may arise from changes in the value of the foreign currency or if the counterparties do not perform under the contracts’ terms.
41 |
Notes to Financial Statements (continued)
March 31, 2012 (Unaudited)
d. Federal and Foreign Income Taxes. The Trust treats each Fund as a separate entity for federal income tax purposes. The Fund intends to meet the requirements of the Internal Revenue Code of 1986, as amended, applicable to regulated investment companies, and to distribute to its shareholders substantially all of its net investment income and any net realized capital gains at least annually. Management has performed an analysis of the Fund’s tax positions for the open tax years as of March 31, 2012 and has concluded that no provisions for income tax are required. The Fund’s federal tax returns for the prior three fiscal years remain subject to examination by the Internal Revenue Service. Management is not aware of any events that are reasonably possible to occur in the next six months that would result in the amounts of any unrecognized tax benefits significantly increasing or decreasing for the Fund. However, management’s conclusions regarding tax positions taken may be subject to review and adjustment at a later date based on factors including, but not limited to, new tax laws and accounting regulations and interpretations thereof.
The Fund may be subject to foreign taxes on income and gains on investments that are accrued based upon the Fund’s understanding of the tax rules and regulations that exist in the countries in which the Fund invests. Foreign governments may also impose taxes or other payments on investments with respect to foreign securities. Such taxes are accrued as applicable, and are reflected as foreign taxes payable on the Statement of Assets and Liabilities.
e. Dividends and Distributions to Shareholders. Dividends and distributions are recorded on ex-dividend date. The timing and characterization of certain income and capital gain distributions are determined annually in accordance with federal tax regulations, which may differ from accounting principles generally accepted in the United States of America. Permanent differences are primarily due to differing treatments for book and tax purposes of items such as foreign currency transactions, deferred Trustees’ fees, return of capital dividend received, premium amortization, defaulted bond adjustments, paydown gains and losses, trust preferred securities and return of capital and capital gains distributions from real estate investment trusts (“REITs”). Permanent book and tax basis differences relating to shareholder distributions will result in reclassifications to capital accounts. Temporary differences between book and tax distributable earnings are primarily due to deferred Trustees’ fees, wash sales, premium amortization, REIT basis adjustments, trust preferred securities, contingent payment debt instruments and defaulted bond interest. Distributions from net investment income and short-term capital gains are considered to be distributed from ordinary income for tax purposes.
| 42
Notes to Financial Statements (continued)
March 31, 2012 (Unaudited)
The tax characterization of distributions is determined on an annual basis. The tax character of distributions paid to shareholders during the year ended September 30, 2011 was as follows:
| | | | | | | | |
2011 Distributions Paid From: | |
Ordinary Income | | Long-Term Capital Gains | | | Total | |
$712,519,263 | | $ | — | | | $ | 712,519,263 | |
As of September 30, 2011, the capital loss carryforwards were as follows:
| | | | |
Capital loss carryforward: | | | | |
Short-term: Expires September 30, 2018 | | $ | (440,508,454 | ) |
| | | | |
On December 22, 2010, the Regulated Investment Company Modernization Act of 2010 (the “Act”) was enacted. The Act modernizes several of the federal income and excise tax provisions related to RICs, and, with certain exceptions, is effective for taxable years beginning after December 22, 2010. Among the changes made are changes to the capital loss carryforward rules allowing for capital losses to be carried forward indefinitely. Rules in effect previously limited the carryforward period to eight years. Capital loss carryforwards generated in taxable years beginning after the effective date of the Act must be fully used before capital loss carryforwards generated in taxable years prior to effective date of the Act; therefore, under certain circumstances, capital loss carryforwards available as of the report date, if any, may expire unused. Additionally, capital losses realized in taxable years beginning after the effective date of the Act are carried over in the character (short-term or long-term) realized. Rules in effect previously treated all capital loss carryforwards as short-term.
f. Repurchase Agreements. It is the Fund’s policy that the market value of the collateral for repurchase agreements be at least equal to 102% of the repurchase price, including interest. Certain repurchase agreements are tri-party arrangements whereby the collateral is held in a segregated account for the benefit of the Fund and on behalf of the counterparty. Repurchase agreements could involve certain risks in the event of default or insolvency of the counterparty including possible delays or restrictions upon the Fund’s ability to dispose of the underlying securities.
g. Securities Lending. The Fund has entered into an agreement with State Street Bank and Trust Company (“State Street Bank”), as agent of the Fund, to lend securities to certain designated borrowers. The loans are collateralized with cash or securities in an amount equal to at least 105% or 102% of the market value (including accrued interest) of the loaned international or domestic securities, respectively, when the loan is initiated. Thereafter, the value of the collateral must remain at least 102% of the market value (including accrued interest) of loaned securities for U.S. equities and U.S. corporate debt;
43 |
Notes to Financial Statements (continued)
March 31, 2012 (Unaudited)
at least 105% of the market value (including accrued interest) of loaned securities for non-U.S. equities; and at least 100% of the market value (including accrued interest) of loaned securities for U.S. Government securities, sovereign debt issued by non-U.S. Governments and non-U.S. corporate debt. In the event that the market value of the collateral falls below the required percentages described above, the borrower will deliver additional collateral on the next business day. As with other extensions of credit, the Fund may bear the risk of loss with respect to the investment of the collateral. The Fund invests cash collateral in short-term investments, a portion of the income from which is remitted to the borrowers and the remainder allocated between the Fund and State Street Bank as lending agent. Excess collateral in the amount of $2,955,244 related to terminated loans with a bankrupt borrower is held by State Street Bank on behalf of the Fund.
For the six months ended March 31, 2012, the Fund did not loan securities under this agreement.
h. Indemnifications. Under the Trust’s organizational documents, its officers and Trustees are indemnified against certain liabilities arising out of the performance of their duties to the Fund. Additionally, in the normal course of business, the Fund enters into contracts with service providers that contain general indemnification clauses. The Fund’s maximum exposure under these arrangements is unknown as this would involve future claims that may be made against the Fund that have not yet occurred. However, based on experience, the Fund expects the risk of loss to be remote.
3. Fair Value Measurements. In accordance with accounting standards related to fair value measurements and disclosures, the Fund has categorized the inputs utilized in determining the value of the Fund’s assets or liabilities. These inputs are summarized in the three broad levels listed below:
| | • | | Level 1 – quoted prices in active markets for identical assets or liabilities; |
| | • | | Level 2 – prices determined using other significant inputs that are observable either directly, or indirectly through corroboration with observable market data (which could include quoted prices for similar assets or liabilities, interest rates, credit risk, etc.); |
| | • | | Level 3 – prices determined using significant unobservable inputs when quoted prices or observable inputs are unavailable such as when there is little or no market activity for an asset or liability (unobservable inputs reflect the Fund’s own assumptions in determining the fair value of assets or liabilities and would be based on the best information available). |
The inputs or methodology used for valuing securities are not necessarily an indication of the risk associated with investing in those securities.
| 44
Notes to Financial Statements (continued)
March 31, 2012 (Unaudited)
The following is a summary of the inputs used to value the Fund’s investments as of March 31, 2012, at value:
Asset Valuation Inputs
| | | | | | | | | | | | | | | | |
Description | | Level 1 | | | Level 2 | | | Level 3 | | | Total | |
Bonds and Notes | | | | | | | | | | | | | | | | |
Non-Convertible Bonds | | | | | | | | | | | | | | | | |
Non-Captive Consumer | | $ | 2,405,431 | | | $ | 588,325,040 | | | $ | — | | | $ | 590,730,471 | |
All Other Non-Convertible Bonds(a) | | | — | | | | 8,478,079,800 | | | | — | | | | 8,478,079,800 | |
| | | | | | | | | | | | | | | | |
Total Non-Convertible Bonds | | | 2,405,431 | | | | 9,066,404,840 | | | | — | | | | 9,068,810,271 | |
| | | | | | | | | | | | | | | | |
Convertible Bonds(a) | | | — | | | | 1,229,964,128 | | | | — | | | | 1,229,964,128 | |
Municipals(a) | | | — | | | | 173,270,134 | | | | — | | | | 173,270,134 | |
| | | | | | | | | | | | | | | | |
Total Bonds and Notes | | | 2,405,431 | | | | 10,469,639,102 | | | | — | | | | 10,472,044,533 | |
| | | | | | | | | | | | | | | | |
Senior Loans(a) | | | — | | | | 172,948,767 | | | | — | | | | 172,948,767 | |
Common Stocks(a) | | | 2,271,299,980 | | | | — | | | | — | | | | 2,271,299,980 | |
Preferred Stocks | | | | | | | | | | | | | | | | |
Convertible Preferred Stocks | | | | | | | | | | | | | | | | |
Banking | | | 28,188,593 | | | | 9,750,127 | | | | — | | | | 37,938,720 | |
Construction Machinery | | | — | | | | 7,826,871 | | | | — | | | | 7,826,871 | |
Consumer Products | | | — | | | | 9,838,300 | | | | — | | | | 9,838,300 | |
Independent Energy | | | 4,767,633 | | | | 12,260,430 | | | | — | | | | 17,028,063 | |
All Other Convertible Preferred Stocks(a) | | | 216,886,310 | | | | — | | | | — | | | | 216,886,310 | |
| | | | | | | | | | | | | | | | |
Total Convertible Preferred Stocks | | | 249,842,536 | | | | 39,675,728 | | | | — | | | | 289,518,264 | |
| | | | | | | | | | | | | | | | |
Non-Convertible Preferred Stocks | | | | | | | | | | | | | | | | |
Electric | | | — | | | | 35,002 | | | | — | | | | 35,002 | |
Government Sponsored | | | — | | | | 27,210,625 | | | | — | | | | 27,210,625 | |
Non-Captive Diversified | | | — | | | | 34,436,766 | | | | — | | | | 34,436,766 | |
REITs - Office Property | | | — | | | | 1,820,936 | | | | — | | | | 1,820,936 | |
All Other Non-Convertible Preferred Stocks(a) | | | 44,773,052 | | | | — | | | | — | | | | 44,773,052 | |
| | | | | | | | | | | | | | | | |
Total Non-Convertible Preferred Stocks | | | 44,773,052 | | | | 63,503,329 | | | | — | | | | 108,276,381 | |
| | | | | | | | | | | | | | | | |
Total Preferred Stocks | | | 294,615,588 | | | | 103,179,057 | | | | — | | | | 397,794,645 | |
| | | | | | | | | | | | | | | | |
Closed End Investment Companies | | | 5,448,018 | | | | — | | | | — | | | | 5,448,018 | |
Short-Term Investments | | | — | | | | 399,403,157 | | | | — | | | | 399,403,157 | |
| | | | | | | | | | | | | | | | |
Total | | $ | 2,573,769,017 | | | $ | 11,145,170,083 | | | $ | — | | | $ | 13,718,939,100 | |
| | | | | | | | | | | | | | | | |
| (a) | Details of the major categories of the Fund’s investments are reflected within the Portfolio of Investments. |
45 |
Notes to Financial Statements (continued)
March 31, 2012 (Unaudited)
A preferred stock valued at $9,179,640 was transferred from Level 1 to Level 2 during the period ended March 31, 2012. At September 30, 2011, this security was valued at market price in accordance with the Fund’s valuation policy; at March 31, 2012, this security was valued on the basis of evaluated bids furnished to the Fund by an independent pricing service as a market price was not available.
All transfers are recognized as of the beginning of the reporting period.
The following is a reconciliation of Level 3 investments for which significant unobservable inputs were used to determine fair value as of March 31, 2012:
Asset Valuation Inputs
| | | | | | | | | | | | | | | | | | | | |
Investments in Securities | | Balance as of
September 30,
2011 | | | Accrued
Discounts
(Premiums) | | | Realized
Gain (Loss) | | | Change in
Unrealized
Appreciation
(Depreciation) | | | Purchases | |
Bonds and Notes | | | | | | | | | | | | | | | | | | | | |
Non-Convertible Bonds | | | | | | | | | | | | | | | | | | | | |
Consumer Cyclical Services | | $ | 4,482,500 | | | $ | — | | | $ | — | | | $ | — | | | $ | — | |
Technology | | | 1,740,000 | | | | 106,837 | | | | (3,925,024 | ) | | | 4,358,575 | | | | — | |
Treasuries | | | 742,727 | | | | 20,092 | | | | (926,055 | ) | | | 581,249 | | | | — | |
Preferred Stocks | | | | | | | | | | | | | | | | | | | | |
Convertible Preferred Stocks | | | | | | | | | | | | | | | | | | | | |
Electric | | | 4,847,625 | | | | — | | | | 105,583 | | | | 433,042 | | | | — | |
Independent Energy | | | 9,980,000 | | | | — | | | | — | | | | — | | | | — | |
Non-Convertible Preferred Stocks | | | | | | | | | | | | | | | | | | | | |
Non-Captive Diversified | | | 22,149,600 | | | | — | | | | — | | | | — | | | | — | |
| | | | | | | | | | | | | | | | | | | | |
Total | | $ | 43,942,452 | | | $ | 126,929 | | | $ | (4,745,496 | ) | | $ | 5,372,866 | | | $ | — | |
| | | | | | | | | | | | | | | | | | | | |
| 46
Notes to Financial Statements (continued)
March 31, 2012 (Unaudited)
Asset Valuation Inputs (continued)
| | | | | | | | | | | | | | | | | | | | |
Investments in Securities | | Sales | | | Transfers
into
Level 3 | | | Transfers
out of
Level 3 | | | Balance as of
March 31,
2012 | | | Change in
Unrealized
Appreciation
(Depreciation)
from
Investments
Still Held at
March 31,
2012 | |
Bonds and Notes | | | | | | | | | | | | | | | | | | | | |
Non-Convertible Bonds | | | | | | | | | | | | | | | | | | | | |
Consumer Cyclical Services | | $ | — | | | $ | — | | | $ | (4,482,500 | ) | | $ | — | | | $ | — | |
Technology | | | (2,280,388 | ) | | | — | | | | — | | | | — | | | | — | |
Treasuries | | | (418,013 | ) | | | — | | | | — | | | | — | | | | — | |
Preferred Stocks | | | | | | | | | | | | | | | | | | | | |
Convertible Preferred Stocks | | | | | | | | | | | | | | | | | | | | |
Electric | | | (5,386,250 | ) | | | — | | | | — | | | | — | | | | — | |
Independent Energy | | | — | | | | — | | | | (9,980,000 | ) | | | — | | | | — | |
Non-Convertible Preferred Stocks | | | | | | | | | | | | | | | | | | | | |
Non-Captive Diversified | | | — | | | | — | | | | (22,149,600 | ) | | | — | | | | — | |
| | | | | | | | | | | | | | | | | | | | |
Total | | $ | (8,084,651 | ) | | $ | — | | | $ | (36,612,100 | ) | | $ | — | | | $ | — | |
| | | | | | | | | | | | | | | | | | | | |
A debt security ($4,482,500) and preferred stocks ($32,129,600) valued at $36,612,100 were transferred from Level 3 to Level 2 during the period ended March 31, 2012. At September 30, 2011, these securities were valued using broker-dealer bid quotations based on inputs unobservable to the Fund as an independent pricing service either was unable to price the security or did not provide a reliable price for the security; at March 31, 2012, these securities were valued on the basis of evaluated bids furnished to the Fund by an independent pricing service.
All transfers are recognized as of the beginning of the reporting period.
In May 2011, Accounting Standard Update (“ASU”) No. 2011-04, “Amendments to Achieve Common Fair Value Measurement and Disclosure Requirements” was issued and is effective for interim and annual periods beginning after December 15, 2011. The ASU requires reporting entities to disclose i) the amounts of any transfers between Level 1 and Level 2, and the reasons for the transfers; and ii) for Level 3 fair value measurements, a) quantitative information about significant unobservable inputs used, b) a description of the valuation processes used by the reporting entity, and c) a
47 |
Notes to Financial Statements (continued)
March 31, 2012 (Unaudited)
narrative description of the sensitivity of the fair value measurement to changes in unobservable inputs if a change in those inputs might result in a significantly higher or lower fair value measurement. Notwithstanding the projected regulatory implementation date of June 30, 2012 for the Fund, Management has already implemented disclosure of all transfers between Level 1 and Level 2, and the reasons for the transfers. Management is currently evaluating the impact, if any, the Level 3 disclosures may have on the Fund’s financial statements.
4. Purchases and Sales of Securities. For the six months ended March 31, 2012, purchases and sales of securities (excluding short-term investments and U.S. Government/Agency securities and including paydowns) were $1,083,592,146 and $1,145,006,433, respectively. Purchases and sales of U.S. Government/Agency securities (excluding short-term investments and including paydowns) were $407,609,116 and $418,916,792, respectively.
5. Management Fees and Other Transactions with Affiliates.
a. Management Fees. Loomis, Sayles & Company, L.P. (“Loomis Sayles”) serves as investment adviser to the Fund. Under the terms of the management agreement, the Fund pays a management fee at the following annual rates, calculated daily and payable monthly, based on the Fund’s average daily net assets:
| | | | | | |
Percentage of Average Daily Net Assets |
First $200 million | | Next $1.8 billion | | Next
$13 billion | | Over
$15 billion |
0.65% | | 0.60% | | 0.55% | | 0.54% |
Loomis Sayles has given a binding undertaking to the Fund to waive management fees and/or reimburse certain expenses to limit the Fund’s operating expenses, exclusive of acquired fund fees and expenses, brokerage expenses, interest expense, taxes and extraordinary expenses. This undertaking is in effect until January 31, 2013 and is reevaluated on an annual basis. Management fees payable, as reflected on the Statement of Assets and Liabilities, is net of waivers and/or expense reimbursements, if any, pursuant to this undertaking.
For the six months ended March 31, 2012, the expense limits as a percentage of average daily net assets under the expense limitation agreement were as follows:
| | | | | | | | | | | | | | | | |
Expense Limit
as a Percentage of
Average Daily Net Assets | |
Class A | | Class B | | | Class C | | | Class Y | | | Admin
Class | |
| 1.25% | | | 2.00 | % | | | 2.00 | % | | | 1.00 | % | | | 1.50 | % |
Loomis Sayles shall be permitted to recover expenses it has borne under the expense limitation agreement (whether through waiver of its management fees or otherwise) on
| 48
Notes to Financial Statements (continued)
March 31, 2012 (Unaudited)
a class by class basis in later periods to the extent the expenses of a class fall below a class’ expense limits, provided, however, that a class is not obligated to pay such waived/reimbursed fees or expenses more than one year after the end of the fiscal year in which the fees or expenses were waived/reimbursed.
For the six months ended March 31, 2012, the management fees for the Fund were $37,742,040 (effective rate of 0.56% of average daily net assets).
No expenses were recovered during the six months ended March 31, 2012 under the terms of the expense limitation agreement.
Certain officers and employees of Loomis Sayles are also officers or Trustees of the Trust. Loomis Sayles’ general partner is indirectly owned by Natixis Global Asset Management, L.P. (“Natixis US”), which is part of Natixis Global Asset Management, an international asset management group based in Paris, France.
b. Service and Distribution Fees. NGAM Distribution, which is a wholly-owned subsidiary of Natixis US, has entered into a distribution agreement with the Trust. Pursuant to this agreement, NGAM Distribution serves as principal underwriter of the Funds of the Trust.
Pursuant to Rule 12b-1 under the 1940 Act, the Trust has adopted a Service Plan relating to the Fund’s Class A shares (the “Class A Plan”), a Distribution and Service Plan relating to the Fund’s Class B and Class C shares (the “Class B and Class C Plans”), and a Distribution Plan relating to its Admin Class shares (the “Admin Class Plan”).
Under the Class A Plan, the Fund pays NGAM Distribution a monthly service fee at an annual rate not to exceed 0.25% of the average daily net assets attributable to the Fund’s Class A shares, as reimbursement for expenses incurred by NGAM Distribution in providing personal services to investors in Class A shares and/or the maintenance of shareholder accounts.
Under the Class B and Class C Plans, the Fund pays NGAM Distribution a monthly service fee at an annual rate not to exceed 0.25% of the average daily net assets attributable to the Fund’s Class B and Class C shares, as compensation for services provided by NGAM Distribution in providing personal services to investors in Class B and Class C shares and/or the maintenance of shareholder accounts.
Also under the Class B and Class C Plans, the Fund pays NGAM Distribution a monthly distribution fee at an annual rate of 0.75% of the average daily net assets attributable to the Fund’s Class B and Class C shares, as compensation for services provided by NGAM Distribution in connection with the marketing or sale of Class B and Class C shares.
Under the Admin Class Plan, the Fund pays NGAM Distribution a monthly distribution fee at an annual rate not to exceed 0.25% of the average daily net assets attributable to the Fund’s Admin Class shares, as compensation for services provided by NGAM
49 |
Notes to Financial Statements (continued)
March 31, 2012 (Unaudited)
Distribution in connection with the marketing or sale of Admin Class shares or for payments made by NGAM Distribution to securities dealers or other financial intermediaries as commissions, asset-based sales charges or other compensation with respect to the sale of Admin Class shares, or for providing personal services to investors and/or the maintenance of shareholder accounts.
In addition, the Admin Class shares of the Fund may pay NGAM Distribution an administrative service fee, at an annual rate not to exceed 0.25% of the average daily net assets attributable to Admin Class shares. These fees are subsequently paid to securities dealers or financial intermediaries for providing personal services and/or account maintenance for their customers who hold such shares.
For the six months ended March 31, 2012, the Fund paid the following service and distribution fees:
| | | | | | | | | | | | |
Service Fees | | Distribution Fees |
Class A | | Class B | | Class C | | Admin Class | | Class B | | Class C | | Admin Class |
$6,839,175 | | $131,457 | | $6,078,480 | | $39,092 | | $394,372 | | $18,235,439 | | $39,092 |
c. Administrative Fees. NGAM Advisors provides certain administrative services for the Fund and contracts with State Street Bank to serve as sub-administrator. NGAM Advisors is a wholly-owned subsidiary of Natixis US. Pursuant to an agreement among Natixis Funds Trust I, Natixis Funds Trust II, Natixis Funds Trust IV, Gateway Trust (“Natixis Funds Trusts”), Loomis Sayles Funds I, Loomis Sayles Funds II (“Loomis Sayles Funds Trusts”), Hansberger International Series and NGAM Advisors, the Fund pays NGAM Advisors monthly its pro rata portion of fees equal to an annual rate of 0.0575% of the first $15 billion of the average daily net assets of the Natixis Funds Trusts, Loomis Sayles Funds Trusts and Hansberger International Series, 0.0500% of the next $15 billion, 0.0400% of the next $30 billion and 0.0350% of such assets in excess of $60 billion, subject to an annual aggregate minimum fee for the Natixis Funds Trusts, Loomis Sayles Funds Trusts and Hansberger International Series of $10 million, which is reevaluated on an annual basis.
For the six months ended March 31, 2012, the Fund paid $3,118,499 in administrative fees to NGAM Advisors.
d. Sub-Transfer Agent Fees. NGAM Distribution has entered into agreements with financial intermediaries to provide certain recordkeeping, processing, shareholder communications and other services to customers of the intermediaries and has agreed to compensate the intermediaries for providing those services. Certain services would be provided by the Fund if the shares of those customers were registered directly with the Fund’s transfer agent. Accordingly, the Fund has agreed to reimburse NGAM Distribution for a portion of the intermediary fees attributable to shares of the Fund held
| 50
Notes to Financial Statements (continued)
March 31, 2012 (Unaudited)
by intermediaries (which generally are a percentage of the value of shares held) not to exceed what the Fund would have paid its transfer agent had each customer’s shares been registered directly with the transfer agent instead of being held through the intermediaries.
For the six months ended March 31, 2012, the Fund paid $4,785,549 in sub-transfer agent fees, which are reflected in transfer agent fees and expenses in the Statement of Operations. As of March 31, 2012, the Fund owes NGAM Distribution $113,743 in reimbursement for sub-transfer agent fees.
e. Commissions. Commissions (including CDSCs) on Fund shares retained by NGAM Distribution during the six months ended March 31, 2012 amounted to $2,805,538.
f. Trustees Fees and Expenses. The Trust does not pay any compensation directly to its officers or Trustees who are directors, officers or employees of NGAM Advisors, NGAM Distribution, Natixis US or their affiliates. Effective January 1, 2012, the Chairperson of the Board receives a retainer fee at the annual rate of $265,000. The Chairperson does not receive any meeting attendance fees for Board of Trustees meetings or committee meetings that she attends. Each Independent Trustee (other than the Chairperson) receives, in the aggregate, a retainer fee at the annual rate of $95,000. Each Independent Trustee also receives a meeting attendance fee of $10,000 for each meeting of the Board of Trustees that he or she attends in person and $5,000 for each meeting of the Board of Trustees that he or she attends telephonically. In addition, each committee chairman receives an additional retainer fee at an annual rate of $15,000. Each Contract Review and Governance Committee member is compensated $6,000 for each Committee meeting that he or she attends in person and $3,000 for each meeting that he or she attends telephonically. Each Audit Committee member is compensated $7,500 for each Committee meeting that he or she attends in person and $3,750 for each meeting that he or she attends telephonically. These fees are allocated among the funds in the Natixis Funds Trusts, Loomis Sayles Funds Trusts and Hansberger International Series based on a formula that takes into account, among other factors, the relative net assets of each fund. Trustees are reimbursed for travel expenses in connection with attendance at meetings.
Prior to January 1, 2012, the Chairperson of the Board received a retainer fee at the annual rate of $250,000 and each Independent Trustee (other than the Chairperson) received, in aggregate, a retainer fee at the annual rate of $80,000. All other Trustee fees remain unchanged.
A deferred compensation plan (the “Plan”) is available to the Trustees on a voluntary basis. Deferred amounts remain in the Fund until distributed in accordance with the provisions of the Plan. The value of a participating Trustee’s deferral account is based on theoretical investments of deferred amounts, on the normal payment dates, in certain funds of the Natixis Funds Trusts, Loomis Sayles Funds Trusts and Hansberger International Series as designated by the participating Trustees. Changes in the value
51 |
Notes to Financial Statements (continued)
March 31, 2012 (Unaudited)
of participants’ deferral accounts are allocated pro rata among the funds in the Natixis Funds Trusts, Loomis Sayles Funds Trusts, and Hansberger International Series, and are normally reflected as Trustees’ fees and expenses in the Statement of Operations. The portions of the accrued obligations allocated to the Fund under the Plan are reflected as Deferred Trustees’ fees in the Statement of Assets and Liabilities.
6. Line of Credit. The Fund, together with certain other funds of Natixis Funds Trusts, Loomis Sayles Funds Trusts and Hansberger International Series, participates in a $200,000,000 committed unsecured line of credit provided by State Street Bank, with an individual limit of $125,000,000 for each fund that participates in the line of credit. Interest is charged to each participating fund based on its borrowings at a rate per annum equal to the greater of the Federal Funds rate or overnight LIBOR, plus 1.25%. In addition, a commitment fee of 0.125% per annum, payable at the end of each calendar quarter, is accrued and apportioned among the participating funds based on their average daily unused portion of the line of credit. Effective April 19, 2012, the commitment fee will be 0.10% per annum.
For the six months ended March 31, 2012, the Fund had no borrowings under these agreements.
7. Concentration of Risk. The Fund’s investments in foreign securities are subject to foreign currency fluctuations, higher volatility than U.S. securities, varying degrees of regulation and limited liquidity. Greater political, economic, credit and information risks are also associated with foreign securities.
8. Capital Shares. The Fund may issue an unlimited number of shares of beneficial interest, without par value. Transactions in capital shares were as follows:
| | | | | | | | | | | | | | | | |
| |
| Six Months Ended
March 31, 2012 |
| |
| Year Ended
September 30, 2011 |
|
| | | Shares | | | | Amount | | | | Shares | | | | Amount | |
Class A | | | | | | | | | | | | | | | | |
Issued from the sale of shares | | | 51,618,534 | | | $ | 761,065,525 | | | | 100,728,799 | | | $ | 1,519,559,694 | |
Issued in connection with the reinvestment of distributions | | | 10,433,379 | | | | 151,930,102 | | | | 16,985,705 | | | | 254,980,186 | |
Redeemed | | | (97,947,288 | ) | | | (1,459,308,663 | ) | | | (139,402,301 | ) | | | (2,096,241,991 | ) |
| | | | | | | | | | | | | | | | |
Net change | | | (35,895,375 | ) | | $ | (546,313,036 | ) | | | (21,687,797 | ) | | $ | (321,702,111 | ) |
| | | | | | | | | | | | | | | | |
Class B | | | | | | | | | | | | | | | | |
Issued from the sale of shares | | | 100,202 | | | $ | 1,487,860 | | | | 192,090 | | | $ | 2,919,791 | |
Issued in connection with the reinvestment of distributions | | | 115,485 | | | | 1,690,667 | | | | 201,211 | | | | 3,037,937 | |
Redeemed | | | (1,024,811 | ) | | | (15,195,493 | ) | | | (2,173,334 | ) | | | (32,992,197 | ) |
| | | | | | | | | | | | | | | | |
Net change | | | (809,124 | ) | | $ | (12,016,966 | ) | | | (1,780,033 | ) | | $ | (27,034,469 | ) |
| | | | | | | | | | | | | | | | |
| 52
Notes to Financial Statements (continued)
March 31, 2012 (Unaudited)
8. Capital Shares (continued).
| | | | | | | | | | | | | | | | |
| |
| Six Months Ended
March 31, 2012 |
| |
| Year Ended
September 30, 2011 |
|
| | | Shares | | | | Amount | | | | Shares | | | | Amount | |
Class C | | | | | | | | | | | | | | | | |
Issued from the sale of shares | | | 26,956,955 | | | $ | 399,648,558 | | | | 43,771,397 | | | $ | 662,887,999 | |
Issued in connection with the reinvestment of distributions | | | 5,139,178 | | | | 75,229,491 | | | | 7,721,378 | | | | 116,516,115 | |
Redeemed | | | (27,269,291 | ) | | | (403,682,911 | ) | | | (73,499,317 | ) | | | (1,110,786,820 | ) |
| | | | | | | | | | | | | | | | |
Net change | | | 4,826,842 | | | $ | 71,195,138 | | | | (22,006,542 | ) | | $ | (331,382,706 | ) |
| | | | | | | | | | | | | | | | |
Class Y | | | | | | | | | | | | | | | | |
Issued from the sale of shares | | | 101,586,251 | | | $ | 1,517,369,169 | | | | 98,118,850 | | | $ | 1,481,121,222 | |
Issued in connection with the reinvestment of distributions | | | 3,397,471 | | | | 49,531,768 | | | | 4,346,254 | | | | 65,258,226 | |
Redeemed | | | (34,911,423 | ) | | | (511,683,629 | ) | | | (76,525,358 | ) | | | (1,145,382,580 | ) |
| | | | | | | | | | | | | | | | |
Net change | | | 70,072,299 | | | $ | 1,055,217,308 | | | | 25,939,746 | | | $ | 400,996,868 | |
| | | | | | | | | | | | | | | | |
Admin Class | | | | | | | | | | | | | | | | |
Issued from the sale of shares | | | 840,929 | | | $ | 12,418,524 | | | | 1,568,042 | | | $ | 23,628,559 | |
Issued in connection with the reinvestment of distributions | | | 54,217 | | | | 789,018 | | | | 41,605 | | | | 625,462 | |
Redeemed | | | (116,570 | ) | | | (1,712,568 | ) | | | (115,648 | ) | | | (1,745,037 | ) |
| | | | | | | | | | | | | | | | |
Net change | | | 778,576 | | | $ | 11,494,974 | | | | 1,493,999 | | | $ | 22,508,984 | |
| | | | | | | | | | | | | | | | |
Increase (decrease) from capital share transactions | | | 38,973,218 | | | $ | 579,577,418 | | | | (18,040,627 | ) | | $ | (256,613,434 | ) |
| | | | | | | | | | | | | | | | |
53 |
Not applicable.
| Item 3. | Audit Committee Financial Expert. |
Not applicable.
| Item 4. | Principal Accountant Fees and Services. |
Not applicable.
| Item 5. | Audit Committee of Listed Registrants. |
Not applicable.
| Item 6. | Schedule of Investments. |
Included as part of the Report to Shareholders filed as Item 1 herewith.
| Item 7. | Disclosure of Proxy Voting Policies and Procedures for Closed-End Management Investment Companies. |
Not applicable.
| Item 8. | Portfolio Managers of Closed-End Management Investment Companies. |
Not applicable.
| Item 9. | Purchases of Equity Securities by Closed-End Management Investment Companies and Affiliated Purchasers. |
Not applicable.
| Item 10. | Submission of Matters to a Vote of Securities Holders. |
There were no material changes to the procedures by which shareholders may recommend nominees to the Trust’s Board of Trustees.
| Item 11. | Controls and Procedures. |
The Registrant’s principal executive officer and principal financial officer have concluded that the Registrant’s disclosure controls and procedures are sufficient to ensure that information required to be disclosed by the Registrant in this Form N-CSR was recorded, processed, summarized and reported within the time periods specified in the Securities and Exchange Commission’s rules and forms, based upon such officers’ evaluation of these controls and procedures as of a date within 90 days of the filing date of the report.
There was no change in the Registrant’s internal control over financial reporting that occurred during the Registrant’s last fiscal quarter of the period covered by the report that has materially affected, or is reasonably likely to materially affect, the Registrant’s internal control over financial reporting.
| | | | |
| | |
| (a) | | (1) | | Not applicable. |
| | |
| (a) | | (2) | | Certifications of Principal Executive Officer and Principal Financial Officer pursuant to Rule 30a-2(a) under the Investment Company Act of 1940 (17 CFR 270.30a-2(a)), filed herewith as Exhibits (a)(2)(1) and a(2)(2), respectively. |
| | |
| (a) | | (3) | | Not applicable. |
| | |
| (b) | | | | Certifications of Principal Executive Officer and Principal Financial Officer pursuant to Section 906 of Sarbanes-Oxley Act of 2002 are filed herewith as Exhibit (b). |
SIGNATURES
Pursuant to the requirements of the Securities Exchange Act of 1934 and the Investment Company Act of 1940, the Registrant has duly caused this report to be signed on its behalf by the undersigned, thereunto duly authorized.
| | |
| Loomis Sayles Funds II |
| |
| By: | | /s/ Robert J. Blanding |
| |
| Name: | | Robert J. Blanding |
| Title: | | Chief Executive Officer |
| Date: | | May 18, 2012 |
Pursuant to the requirements of the Securities Exchange Act of 1934 and the Investment Company Act of 1940, this report has been signed by the following persons on behalf of the Registrant and in the capacities and on the dates indicated.
| | |
| |
| By: | | /s/ Robert J. Blanding |
| |
| Name: | | Robert J. Blanding |
| Title: | | Chief Executive Officer |
| Date: | | May 18, 2012 |
| |
| By: | | /s/ Michael C. Kardok |
| |
| Name: | | Michael C. Kardok |
| Title: | | Treasurer |
| Date: | | May 18, 2012 |