UNITED STATES
SECURITIES AND EXCHANGE COMMISSION
Washington, D.C. 20549
FORM N-CSR
CERTIFIED SHAREHOLDER REPORT OF REGISTERED
MANAGEMENT INVESTMENT COMPANIES
Investment Company Act file number: 811-06241
Loomis Sayles Funds II
(Exact name of Registrant as specified in charter)
399 Boylston Street, Boston, Massachusetts 02116
(Address of principal executive offices) (Zip code)
Coleen Downs Dinneen, Esq.
Natixis Distributors, L.P.
399 Boylston Street
Boston, Massachusetts 02116
(Name and address of agent for service)
Registrant’s telephone number, including area code: (617) 449-2810
Date of fiscal year end: September 30
Date of reporting period: March 31, 2010
| Item 1. | Reports to Stockholders. |
The Registrant’s semi-annual report transmitted to shareholders pursuant to Rule 30e-1 under the Investment Company Act of 1940 is as follows:

INCOME FUNDS
SEMIANNUAL REPORT
March 31, 2010
Loomis Sayles Core Plus Bond Fund
Loomis Sayles High Income Fund
Loomis Sayles International Bond Fund
Loomis Sayles Limited Term Government and Agency Fund
Loomis Sayles Strategic Income Fund


TABLE OF CONTENTS
Management Discussion and Performancepage 1
Portfolio of Investmentspage 15
Financial Statementspage 51
LOOMIS SAYLES CORE PLUS BOND FUND
PORTFOLIO PROFILE
Objective:
Seeks high total investment return through a combination of current income and capital appreciation
Strategy:
Invests primarily in U.S. corporate and U.S. government bonds
Fund Inception:
November 7, 1973
Managers:
Peter W. Palfrey, CFA
Richard G. Raczkowski
Loomis, Sayles & Company, L.P.
Symbols:
| | |
| Class A | | NEFRX |
| Class B | | NERBX |
| Class C | | NECRX |
| Class Y | | NERYX |
What You Should Know:
Fixed-income securities are subject to credit risk and interest rate risk; their value generally rises when prevailing interest rates fall and falls when rates rise.
The fund can invest a significant percentage of assets in debt securities that are rated below investment grade and the value of fund shares can be adversely affected by changes in economic conditions or other circumstances. Lower rated debt securities have speculative characteristics and may be subject to greater price volatility than higher rated investments. In addition, the secondary market for these securities may lack liquidity. The fund can also invest a significant percentage of assets in foreign securities and the value of the fund shares can be adversely affected by changes in currency exchange rates, political, and economic developments. In emerging markets, these risks can be significant. Fund shares should be viewed as a long-term investment.
Management Discussion
Investors’ willingness to accept risk continued to increase over the six-month period ended March 31, 2010, and this was reflected in the solid performance of a wide range of non-Treasury sectors in the bond market. At the same time, both the U.S. and global economies showed sustained signs of improvement. In this environment, Loomis Sayles Core Plus Bond Fund benefited because it was well positioned to take advantage of global economic recovery.
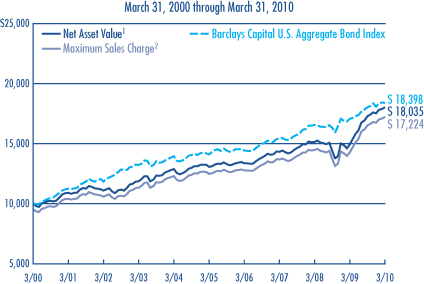
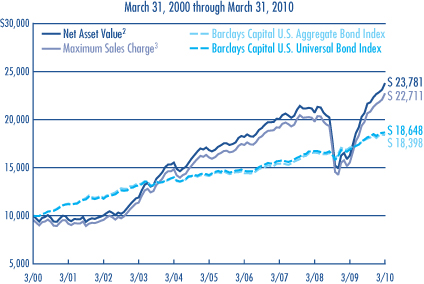
For the six months ended March 31, 2010, Class A shares of Loomis Sayles Core Plus Bond Fund returned 4.31%. By comparison, the fund’s benchmark, the Barclays Capital U.S. Aggregate Bond Index, returned 1.99% for the six-month period, while Morningstar’s Intermediate-Term Bond category returned 3.70%.
WHAT WAS THE PRIMARY REASON FOR THE FUND’S OUTPERFORMANCE?
Strong sector allocation and security selection were the principal contributors to returns, especially in investment-grade and high-yield debt. The lower quality and cyclical biases within these sectors significantly benefited the fund over the period. The fund benefited from its underweight in U.S. government securities, which lagged during the period, and from having a slightly longer maturity than the benchmark.
WHICH FACTORS POSITIVELY CONTRIBUTED TO THE FUND’S PERFORMANCE?
The fund’s overweight position in investment-grade bonds was especially beneficial. Within the sector, we favored bonds rated between A and Baa by Moody’s Investors Service. Longer-duration issues and the industrial sector were also key contributors within investment-grade. (Duration is a measure of interest rate sensitivity.) In our high-yield holdings, we focused on bonds issued by companies with proven access to capital markets and solid balance sheets. While we maintained an overweight position in high-yield, we trimmed some positions as they reached what we believed to be fair market value. Within the commercial mortgage-backed securities (CMBS) area, the fund’s focus is on older, high-quality issues that offer a combination of value, attractive income and some protection from the currently adverse commercial real estate environment.
Early in 2010 we added to positions in intermediate-term Mexican and Japanese bonds. We believe the Mexican peso will help increase yield in the fund and the currency is attractive given the moderate recovery conditions we anticipate in the United States. The Japanese yen remains fundamentally undervalued. We believe the yen has the potential to appreciate modestly from current levels and help serve as a partial hedge and offset adverse effects in the event risk goes out of favor and volatility increases.
Throughout the period, we underweighted U.S. Treasuries and avoided Agencies — a positive for the fund. Our security selection among asset-backed securities (ABS) was another positive.
WHICH FACTORS DETRACTED FROM THE FUND’S RESULTS?
The fund remained significantly underweight in mortgage-backed securities (MBS) relative to the benchmark. We believe there is limited upside potential in the MBS market; and although performance was slightly punished, our underweight in these securities allowed us to emphasize other sectors that did well.
While our sector allocation to CMBS contributed to return over the past six months, certain security-specific issues weighed modestly on overall outperformance. We remain confident that the issues we selected have the potential to benefit the fund over the long term.
WHAT IS YOUR OUTLOOK?
In general, we have structured the portfolio to benefit from a continuing market recovery, although we have been careful to maintain significant reserves in U.S. Treasuries to provide flexibility if the market gives back some of its recent gains. We remain focused on generating income and plan to selectively add more issue-specific risk into the portfolio. We will look for opportunities to moderately increase high-yield, CMBS and ABS allocations, as well as to shorten duration in anticipation of higher Treasury yields.
1
LOOMIS SAYLES CORE PLUS BOND FUND
Investment Results through March 31, 2010
PERFORMANCE IN PERSPECTIVE
The charts comparing the fund’s performance to an index provide you with a general sense of how it performed. The fund’s total return for the period shown below appears with and without sales charges and includes fund expenses and fees. An index measures the performance of a theoretical portfolio. Unlike a fund, an index is unmanaged and does not have expenses that affect the results. It is not possible to invest directly in an index. Investors would incur transaction costs and other expenses if they purchased the securities necessary to match the index.
Growth of a $10,000 Investment in Class A Shares 4
Average Annual Returns — March 31, 20104
| | | | | | | | | | | | |
| | | | | |
| | | 6 MONTHS | | | 1 YEAR | | | 5 YEARS | | | 10 YEARS | |
Class A (Inception 11/7/73) | | | | | | | | | | | | |
Net Asset Value1 | | 4.31 | % | | 20.66 | % | | 6.64 | % | | 6.08 | % |
With Maximum Sales Charge2 | | -0.37 | | | 15.21 | | | 5.66 | | | 5.59 | |
| | | | | |
Class B (Inception 9/13/93) | | | | | | | | | | | | |
Net Asset Value1 | | 3.90 | | | 19.77 | | | 5.86 | | | 5.31 | |
With CDSC3 | | -1.10 | | | 14.77 | | | 5.54 | | | 5.31 | |
| | | | | |
Class C (Inception 12/30/94) | | | | | | | | | | | | |
Net Asset Value1 | | 3.93 | | | 19.76 | | | 5.85 | | | 5.30 | |
With CDSC3 | | 2.93 | | | 18.76 | | | 5.85 | | | 5.30 | |
| | | | | |
Class Y (Inception 12/30/94) | | | | | | | | | | | | |
Net Asset Value1 | | 4.42 | | | 20.96 | | | 6.92 | | | 6.44 | |
| | | | | |
| COMPARATIVE PERFORMANCE | | 6 MONTHS | | | 1 YEAR | | | 5 YEARS | | | 10 YEARS | |
Barclays Capital U.S. Aggregate Bond Index | | 1.99 | % | | 7.69 | % | | 5.44 | % | | 6.29 | % |
Morningstar Int.-Term Bond Fund Avg. | | 3.70 | | | 16.76 | | | 4.48 | | | 5.60 | |
See page 11 for a description of the indices.
All returns represent past performance and do not guarantee future results. Periods of less than one year are not annualized. Share price and return will vary and you may have a gain or loss when you sell your shares. All results include reinvestment of any dividends and capital gains. Current returns may be higher or lower than those shown. For performance current to the most recent month-end, visit www.funds.natixis.com. Class Y shares are available to certain investors, as described in the prospectus.
The table and graph do not reflect taxes shareholders might owe on any fund distributions or when they redeem their shares.
PORTFOLIO FACTS
| | | | |
| |
| | | % of Net Assets as of |
| CREDIT QUALITY | | 3/31/10* | | 9/30/09** |
Aaa | | 39.4 | | 51.5 |
Aa | | 6.5 | | 4.7 |
A | | 11.8 | | 9.0 |
Baa | | 24.5 | | 19.6 |
Ba | | 10.8 | | 5.9 |
B | | 5.1 | | 3.3 |
Caa and lower | | 0.2 | | 1.3 |
Not Rated | | — | | 1.9 |
Short-term and other | | 1.7 | | 1.8 |
* Credit quality at 3/31/2010 reflects the highest rating assigned to a security among Moody’s, S&P, or Fitch. The Moody’s equivalent of the assigned rating is presented in the table.
** Credit quality at 9/30/2009 was based on ratings from Moody’s. Securities that were not rated by Moody’s may have been rated by another rating agency or by Loomis Sayles.
| | | | | | |
| |
| | | % of Net Assets as of | |
| EFFECTIVE DURATION | | 3/31/10 | | | 9/30/09 | |
1 year or less | | 6.0 | | | 6.7 | |
1-5 years | | 31.3 | | | 36.6 | |
5-10 years | | 43.8 | | | 43.9 | |
10+ years | | 18.9 | | | 12.8 | |
Average Effective Duration | | 9.0 | years | | 5.9 | years |
Portfolio characteristics will vary.
EXPENSE RATIOS AS STATED IN THE MOST RECENT PROSPECTUS
| | | | | | |
| Share Class | | Gross Expense Ratio5 | | | Net Expense Ratio6 | |
A | | 0.97 | % | | 0.90 | % |
B | | 1.72 | | | 1.65 | |
C | | 1.72 | | | 1.65 | |
Y | | 0.68 | | | 0.65 | |
NOTES TO CHARTS
| 1 | Does not include a sales charge. |
| 2 | Includes maximum sales charge of 4.50%. |
| 3 | Performance for Class B shares assumes a maximum 5% contingent deferred sales charge (“CDSC”) applied when you sell shares, which declines annually between years 1-6 according to the following schedule: 5, 4, 3, 3, 2, 1, 0%. Class C shares performance assumes a 1% CDSC applied when you sell shares within one year of purchase. |
| 4 | Fund performance has been increased by expense reductions and reimbursements, if any, without which performance would have been lower. |
| 5 | Before reductions and reimbursements. |
| 6 | After reductions and reimbursements. Expense reductions are contractual and are set to expire on 1/31/11. |
2
LOOMIS SAYLES HIGH INCOME FUND
PORTFOLIO PROFILE
Objective:
Seeks high current income plus the opportunity for capital appreciation to produce a high total return
Strategy:
Invests primarily in lower-quality fixed-income securities
Fund Inception:
February 22, 1984
Managers:
Matthew J. Eagan, CFA
Kathleen C. Gaffney, CFA
Elaine M. Stokes
Loomis, Sayles & Company, L.P.
Symbols:
| | |
| Class A | | NEFHX |
| Class B | | NEHBX |
| Class C | | NEHCX |
| Class Y | | NEHYX |
What You Should Know:
Fixed-income securities are subject to credit risk and interest rate risk; their value generally rises when prevailing interest rates fall and falls when rates rise.
The fund can invest a significant percentage of assets in debt securities that are rated below investment grade and the value of fund shares can be adversely affected by changes in economic conditions or other circumstances. Lower rated debt securities have speculative characteristics and may be subject to greater price volatility than higher rated investments. In addition, the secondary market for these securities may lack liquidity. The fund can also invest a significant percentage of assets in foreign securities and the value of the fund shares can be adversely affected by changes in currency exchange rates, political, and economic developments. In emerging markets, these risks can be significant. Fund shares should be viewed as a long-term investment.
Management Discussion
Investors responded to improving economic conditions by continuing to invest in lower-quality debt securities. Growing confidence in the recovery’s sustainability made risk more acceptable. The resulting strong flow of money into corporate and high-yield issues caused spreads to narrow from the exceptionally wide levels seen during the depths of the recession; by period’s end, spreads had approached 15-year historical averages. Fears over a looming debt crisis in Greece and other peripheral eurozone markets and concerns about China’s lending restrictions percolated through the global credit markets. In the United States, conflicting economic data and an uncertain outlook for financial regulation drove some market participants back into defensive mode for a time. Still, the overall tone in the high-yield market was optimistic, thanks to shrinking default rates and brighter economic trends.
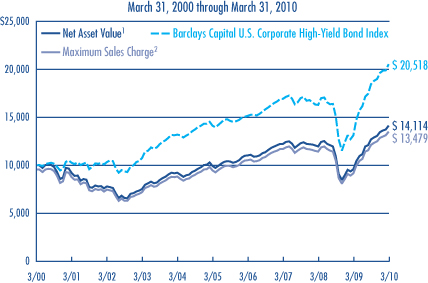
For the six months ended March 31, 2010, Class A shares of Loomis Sayles High Income Fund returned 11.26%. The fund performed in line with its benchmark, Barclays Capital U.S. Corporate High-Yield Bond Index, which returned 11.10% over the period, and ahead of Morningstar’s High Yield Bond category, which had an average return of 10.15%.
WHICH FACTORS CONTRIBUTED POSITIVELY TO THE FUND’S PERFORMANCE?
Convertible securities in the health care and automotive sectors led fund performance over this period, rising along with climbing equity prices. High-yield industrial issues also rose amid indications of increased business activity. Prices for consumer cyclical, non-cyclical and communications credits appreciated as companies cut overhead and posted positive earnings early in the period. Projections of continued economic strengthening also helped buoy holdings in these industries. Bonds rated Baa and B had the greatest positive impact on performance, as investors continued to seek yield throughout the period. Commodity prices pushed higher in anticipation of continued global recovery, benefiting fund holdings based in commodity-rich countries. Bonds denominated in the Mexican peso, Indonesian rupiah and Uruguayan peso were among the top-performing currency exposures.
WHICH FACTORS DETRACTED FROM THE FUND’S RESULTS?
While security selection was positive, underweights in strong sectors held back results. Among the below-benchmark exposures that detracted over the period were high-yield financials, including banks and insurance companies. Underweights among C- and Ca-rated issues also penalized returns, as lower-rated issues outperformed those in higher rating categories. Bonds sponsored by government agencies, a minor position in the portfolio, were the sole area of absolute negative returns for the period.
WHAT IS YOUR OUTLOOK?
The fund is positioned to take advantage of a gradual economic recovery and positive fundamental trends. We believe short-term interest rates in the United States will remain low for the foreseeable future, but acknowledge the continuing pressures that the ever-increasing U.S. Treasury issuance will place on longer-term rates. In our opinion, there remains ample opportunity for corporate bond yield spreads to tighten further. Within corporate credit, we are advocating a strategy of specific (fundamental credit) risk instead of market (interest rate) risk. We continue to see opportunity in the convertible market and have focused on increasing our exposure. We continue to add opportunistically to non-U.S. dollar denominated securities, with a focus on credits and countries in which we anticipate fundamental improvements will continue to emerge. We believe that in a rising-rate environment, research and security selection will continue to prove key to successful portfolio management.
3
LOOMIS SAYLES HIGH INCOME FUND
Investment Results through March 31, 2010
PERFORMANCE IN PERSPECTIVE
The charts comparing the fund’s performance to an index provide you with a general sense of how it performed. The fund’s total return for the period shown below appears with and without sales charges and includes fund expenses and fees. An index measures the performance of a theoretical portfolio. Unlike a fund, the index is unmanaged and does not have expenses that affect the results. It is not possible to invest directly in an index. Investors would incur transaction costs and other expenses if they purchased the securities necessary to match the index.
Growth of a $10,000 Investment in Class A Shares 4
Average Annual Returns — March 31, 20104
| | | | | | | | | | | | | | | |
| | | | | | |
| | | 6 MONTHS | | | 1 YEAR | | | 5 YEARS | | | 10 YEARS | | | SINCE
INCEPTION | |
Class A (Inception 2/22/84) | | | | | | | | | | | | | | | |
Net Asset Value1 | | 11.26 | % | | 47.06 | % | | 7.33 | % | | 3.51 | % | | — | |
With Maximum Sales Charge2 | | 6.29 | | | 40.28 | | | 6.35 | | | 3.03 | | | — | |
| | | | | | |
Class B (Inception 9/20/93) | | | | | | | | | | | | | | | |
Net Asset Value1 | | 10.82 | | | 46.23 | | | 6.54 | | | 2.74 | | | — | |
With CDSC3 | | 5.82 | | | 41.23 | | | 6.23 | | | 2.74 | | | — | |
| | | | | | |
Class C (Inception 3/2/98) | | | | | | | | | | | | | | | |
Net Asset Value1 | | 10.59 | | | 45.97 | | | 6.51 | | | 2.73 | | | — | |
With CDSC3 | | 9.59 | | | 44.97 | | | 6.51 | | | 2.73 | | | — | |
| | | | | | |
| Class Y (Inception 2/29/08) | | | | | | | | | | | | | | | |
Net Asset Value1 | | 11.17 | | | 47.15 | | | — | | | — | | | 8.05 | |
| | | | | | |
| COMPARATIVE PERFORMANCE | | 6 MONTHS | | | 1 YEAR | | | 5 YEARS | | | 10 YEARS | | | SINCE
CLASS Y
INCEPTION7 | |
Barclays Capital U.S. Corporate High-Yield Bond Index | | 11.10 | % | | 56.18 | % | | 7.78 | % | | 7.45 | % | | 11.56 | % |
Morningstar High Yield Bond Fund Avg. | | 10.15 | | | 47.60 | | | 5.52 | | | 5.32 | | | 7.44 | |
See page 11 for a description of the indices.
All returns represent past performance and do not guarantee future results. Periods of less than one year are not annualized. Share price and return will vary and you may have a gain or loss when you sell your shares. All results include reinvestment of dividends and capital gains. Current returns may be higher or lower than those shown. For performance current to the most recent month-end, visit www.funds.natixis.com. Performance history includes periods from a predecessor fund. Class Y shares are available to certain investors, as described in the prospectus.
The table and graph do not reflect taxes shareholders might owe on any fund distributions or when they redeem their shares.
PORTFOLIO FACTS
| | | | |
| |
| | | % of Net Assets as of |
| CREDIT QUALITY | | 3/31/10* | | 9/30/09** |
Aaa | | 3.2 | | 10.0 |
Aa | | 2.1 | | 0.5 |
A | | 4.1 | | 0.2 |
Baa | | 7.2 | | 5.3 |
Ba | | 34.8 | | 28.5 |
B | | 24.1 | | 28.2 |
Caa and lower | | 6.8 | | 14.8 |
Not Rated | | 6.1 | | 5.6 |
Short-term and other | | 11.6 | | 6.9 |
* Credit quality at 3/31/2010 reflects the highest rating assigned to a security among Moody’s, S&P, or Fitch. The Moody’s equivalent of the assigned rating is presented in the table.
** Credit quality at 9/30/2009 was based on ratings from Moody’s. Securities that were not rated by Moody’s may have been rated by another rating agency or by Loomis Sayles.
| | | | | | |
| |
| | | % of Net Assets as of | |
| EFFECTIVE MATURITY | | 3/31/10 | | | 9/30/09 | |
1 year or less | | 13.2 | | | 6.8 | |
1-5 years | | 27.3 | | | 32.1 | |
5-10 years | | 24.7 | | | 34.2 | |
10+ years | | 34.8 | | | 26.9 | |
Average Effective Maturity | | 9.3 | years | | 8.6 | years |
Portfolio characteristics will vary.
EXPENSE RATIOS AS STATED IN THE MOST RECENT PROSPECTUS
| | | | | | |
| Share Class | | Gross Expense Ratio5 | | | Net Expense Ratio6 | |
A | | 1.28 | % | | 1.15 | % |
B | | 2.06 | | | 1.90 | |
C | | 2.03 | | | 1.90 | |
Y | | 0.92 | | | 0.90 | |
NOTES TO CHARTS
| 1 | Does not include a sales charge. |
| 2 | Includes maximum sales charge of 4.50%. |
| 3 | Performance for Class B shares assumes a maximum 5% contingent deferred sales charge (“CDSC”) applied when you sell shares, which declines annually between years 1-6 according to the following schedule: 5, 4, 3, 3, 2, 1, 0%. Class C shares performance assumes a 1% CDSC applied when you sell shares within one year of purchase. |
| 4 | Fund performance has been increased by expense reductions and reimbursements, if any, without which performance would have been lower. |
| 5 | Before reductions and reimbursements. |
| 6 | After reductions and reimbursements. Expense reductions are contractual and are set to expire on 1/31/11. |
| 7 | The since-inception comparative performance figures shown for Class Y shares are calculated from 3/1/08. |
4
LOOMIS SAYLES INTERNATIONAL BOND FUND
PORTFOLIO PROFILE
Objective:
Seeks high total return through a combination of high current income and capital appreciation
Strategy:
Invests primarily in fixed-income securities located outside the U.S.
Fund Inception:
February 1, 2008
Managers:
Lynda L. Schweitzer, CFA
Kenneth M. Buntrock, CFA, CIC
David W. Rolley, CFA
Loomis, Sayles & Company, L.P.
Symbols:
| | |
| Class A | | LSIAX |
| Class C | | LSICX |
| Class Y | | LSIYX |
What You Should Know:
Fixed-income securities are subject to credit risk and interest rate risk; their value generally rises when prevailing interest rates fall and falls when rates rise. The fund may also invest in public or private debt obligations issued or guaranteed by U.S. or non-U.S. issuers. The fund can invest a significant percentage of assets in foreign securities and the value of the fund shares can be adversely affected by changes in currency exchange rates, political, and economic developments. In emerging markets these risks can be significant. The fund can invest a significant percentage of assets in debt securities that are rated below investment grade. Lower-rated debt securities have speculative characteristics and may be subject to greater price volatility than higher-rated investments. In addition, the secondary market for these securities may lack liquidity. Fund shares should be viewed as a long-term investment.
Management Discussion
Global bond markets produced uneven results during the six months ended March 31, 2010. A continuing rebound in world economic growth led to solid gains in sectors exposed to credit risk. However, longer-maturity sovereign debt of developed nations, most notably in Europe and Japan, lost ground. The currencies of some developed economies, including the euro and the Japanese yen, also declined. At the same time, the currencies of many commodity-linked national economies in the emerging markets gained as investors grew more confident.
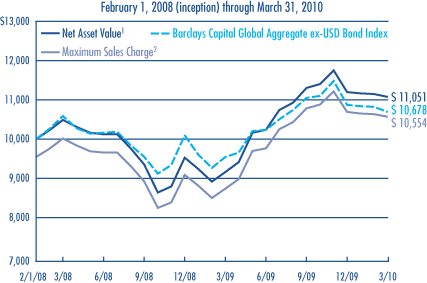
For the six months ended March 31, 2010, Class A shares of Loomis Sayles International Bond Fund returned -1.98%. During the same period, the fund’s benchmark, the Barclays Capital Global Aggregate ex-USD Bond Index, returned -3.18%, while funds in Morningstar’s World Bond category returned an average of 1.35%.
WHAT WAS THE PRIMARY REASON THE FUND’S OUTPERFORMANCE?
The fund’s overall performance reflected the diverse factors affecting bond markets throughout the world during the past six months. Good sector positioning – notably the overweight allocations to corporate bonds – and effective currency strategies helped support results. However, the strength of the U.S. dollar and weak performance by major foreign currencies, including the euro and the British pound, resulted in negative absolute returns both for the fund and the benchmark.
WHICH FACTORS POSITIVELY CONTRIBUTED TO THE FUND’S PERFORMANCE?
The fund’s overweight in corporate bonds and its de-emphasis of government bonds and securitized assets proved helpful during a period when corporate securities produced solid gains. In addition, our decisions to underweight the euro and the Japanese yen provided further support as those currencies lost value on world markets. Conversely, the allocations to emerging market investments supported results, with positions in Korea, Indonesia, Malaysia, Brazil and Mexico all producing positive performance for the fund.
WHICH FACTORS DETRACTED FROM THE FUND’S RESULTS?
The fund’s positions in longer-maturity U.S. government and domestic corporate bonds lagged shorter-maturity securities, as longer-term interest rates rose more than short-term rates. While overall currency positioning was helpful, exposure to the currencies of Norway and Sweden detracted from results. The euro saw even lower returns due to the impact of government deficit problems in Greece. Overall, investments in government bonds denominated in the home currencies of developed markets such as France, Japan, the Netherlands and Germany were the greatest drags on results.
WHAT IS YOUR OUTLOOK?
We think the global economy will continue to recover during 2010, but we are concerned about 2011 as fiscal problems of many governments threaten to limit the pace of the expansion. Against this backdrop, we continue to favor selected emerging market corporate securities, such as corporate bonds in Indonesia and South Korea. We also may consider adding exposure to the currencies of Malaysia and India. Overall, we favor holding short-maturity high-yield corporate bonds to keep yield in the portfolio until such time as longer-maturity securities offer better value.
5
LOOMIS SAYLES INTERNATIONAL BOND FUND
Investment Results through March 31, 2010
PERFORMANCE IN PERSPECTIVE
The charts comparing the fund’s performance to an index provide you with a general sense of how it performed. The fund’s total return for the period shown below appears with and without sales charges and includes fund expenses and fees. An index measures the performance of a theoretical portfolio. Unlike a fund, an index is unmanaged and does not have expenses that affect the results. It is not possible to invest directly in an index. Investors would incur transaction costs and other expenses if they purchased the securities necessary to match the index.
Growth of $10,000 Investment in Class A Shares 4
Average Annual Returns — March 31, 20104
| | | | | | | | | |
| | | | |
| | | 6 MONTHS | | | 1 YEAR | | | SINCE
INCEPTION | |
Class A (Inception 2/1/08) | | | | | | | | | |
Net Asset Value1 | | -1.98 | % | | 20.49 | % | | 4.73 | % |
With Maximum Sales Charge2 | | -6.38 | | | 15.06 | | | 2.53 | |
| | | | |
Class C (Inception 2/1/08) | | | | | | | | | |
Net Asset Value1 | | -2.32 | | | 19.69 | | | 3.93 | |
With CDSC3 | | -3.27 | | | 18.69 | | | 3.93 | |
| | | | |
Class Y (Inception 2/1/08) | | | | | | | | | |
Net Asset Value1 | | -1.87 | | | 20.68 | | | 4.91 | |
| | | | |
| COMPARATIVE PERFORMANCE | | 6 MONTHS | | | 1 YEAR | | | SINCE
INCEPTION | |
Barclays Capital Global Aggregate ex-USD Bond Index | | -3.18 | % | | 11.83 | % | | 3.07 | % |
Morningstar World Bond Fund Avg. | | 1.35 | | | 17.63 | | | 4.46 | |
See page 11 for a description of the indices.
All returns represent past performance and do not guarantee future results. Periods of less than one year are not annualized. Share price and return will vary and you may have a gain or loss when you sell your shares. All results include reinvestment of dividends and capital gains. Current returns may be higher or lower than those shown. For performance current to the most recent month-end, visit www.funds.natixis.com. Class Y shares are available to certain investors, as described in the prospectus.
The table does not reflect taxes shareholders might owe on any fund distributions or when they redeem their shares.
PORTFOLIO FACTS
| | | | |
| |
| | | % of Net Assets as of |
| CREDIT QUALITY | �� | 3/31/10* | | 9/30/09** |
Aaa | | 48.7 | | 52.5 |
Aa | | 21.9 | | 19.1 |
A | | 7.3 | | 7.0 |
Baa | | 11.7 | | 10.7 |
Ba | | 5.5 | | 2.7 |
B | | 1.3 | | 1.2 |
Caa and lower | | — | | 0.4 |
Not Rated | | — | | 3.3 |
Short-term and other | | 3.6 | | 3.1 |
* Credit quality at 3/31/2010 reflects the highest rating assigned to a security among Moody’s, S&P, or Fitch. The Moody’s equivalent of the assigned rating is presented in the table.
** Credit quality at 9/30/2009 was based on ratings from Moody’s. Securities that were not rated by Moody’s may have been rated by another rating agency or by Loomis Sayles.
| | | | | | |
| |
| | | % of Net Assets as of | |
| EFFECTIVE MATURITY | | 3/31/10 | | | 9/30/09 | |
1 year or less | | 4.5 | | | 17.3 | |
1-5 years | | 34.3 | | | 35.9 | |
5-10 years | | 47.9 | | | 29.2 | |
10+ years | | 13.3 | | | 17.6 | |
Average Effective Maturity | | 7.0 | years | | 6.7 | years |
Portfolio characteristics will vary.
EXPENSE RATIOS AS STATED IN THE MOST RECENT PROSPECTUS
| | | | | | |
| Share Class | | Gross Expense Ratio5 | | | Net Expense Ratio6 | |
A | | 2.11 | % | | 1.10 | % |
C | | 2.93 | | | 1.85 | |
Y | | 1.92 | | | 0.85 | |
NOTES TO CHARTS
| 1 | Does not include a sales charge. |
| 2 | Includes maximum sales charge of 4.50%. |
| 3 | Class C shares performance assumes a 1% CDSC applied when you sell shares within one year of purchase. |
| 4 | Fund performance has been increased by expense reductions and reimbursements, if any, without which performance would have been lower. |
| 5 | Before reductions and reimbursements. |
| 6 | After reductions and reimbursements. Expense reductions are contractual and are set to expire on 1/31/11. |
6
LOOMIS SAYLES LIMITED TERM GOVERNMENTAND AGENCY FUND
PORTFOLIO PROFILE
Objective:
Seeks a high current return consistent with preservation of capital
Strategy:
Invests primarily in securities issued or guaranteed by the U.S. government, its agencies or instrumentalities
Fund Inception:
January 3, 1989
Managers:
John Hyll
Clifton V. Rowe, CFA
Loomis, Sayles & Company, L.P.
Symbols:
| | |
| Class A | | NEFLX |
| Class B | | NELBX |
| Class C | | NECLX |
| Class Y | | NELYX |
What You Should Know:
Fixed-income securities are subject to credit risk and interest rate risk; their value generally rises when prevailing interest rates fall and falls when rates rise. Securities issued by the U.S. government are guaranteed by the U.S. government if held to maturity; mutual funds that invest in these securities are not guaranteed. Securities issued by U.S. government agencies may not be government guaranteed.
Management Discussion
Mortgage- and asset-backed securities posted robust returns during the period. These sectors became significantly undervalued during the financial crisis of 2008. However, investors began to recognize the compelling values they offered early last year. An attractive combination of rising prices and higher yields led to strong performance. Treasuries lagged throughout the period.
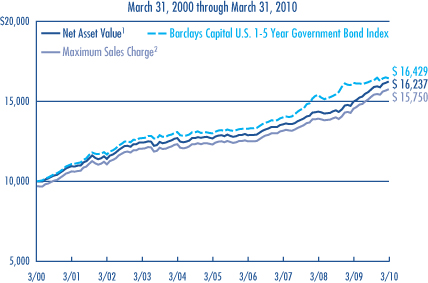
For the six months ended March 31, 2010, Class A shares of Loomis Sayles Limited Term Government and Agency Fund returned 3.18%. based on the net asset value of Class A shares. For the same period, the fund’s benchmark, the Barclays Capital U.S. 1-5 Year Government Bond Index, returned 0.92%, while Morningstar’s Short Government category returned 1.15%.
WHAT WAS THE PRIMARY REASON FOR THE FUND’S OUTPERFORMANCE?
The fund’s holdings in sectors that offered a yield advantage relative to Treasuries, such as mortgage- and asset-backed securities (MBS) and (ABS), were the principal drivers of performance. These sectors had been significantly undervalued due to concerns about real estate and mortgages. However, in the second quarter of 2009, investors began to recognize the compelling value of these securities. Risk preference shifted away from safety, leading to relative price appreciation in securitized assets. Overall, the combination of rising prices and significant yield advantage led to strong performance in these sectors. In order of their impact on the fund’s return, securities backed by commercial mortgages (CMBS) were the largest contributors to return, followed by ABS and then MBS related to government-sponsored entities (GSEs).
WHICH FACTORS POSITIVELY CONTRIBUTED TO THE FUND’S PERFORMANCE?
As the sectors that had provided the most support for the fund during the financial crisis became underperformers, we gradually positioned the fund more aggressively. We modestly increased holdings in CMBS, which continue to see good demand coupled with low supply. These factors bolstered price movement, leading to significant gains throughout the period. We also maintained an overweight in ABS because of their attractive yields and further appreciation potential.
The fund’s holdings in Treasury Inflation-Protected Securities (TIPS) also performed well. With the continued improvement in the economic outlook late in 2009 and early 2010, concerns about deflation began to ease, resulting in higher valuations for TIPS. We sold the fund’s TIPS holdings on strength during the fourth quarter of 2009.
WHICH FACTORS DETRACTED FROM THE FUND’S RESULTS?
Treasuries were underperformers for the fund during the period, as investors grew more comfortable with risk and shifted into higher-yielding issues. Though a significant portfolio underweight relative to the benchmark allowed for a positive contribution from Treasuries, results were weak compared to other portfolio holdings. In addition, longer-maturity securities lagged shorter-maturity securities, as longer-term interest rates rose more than short-term rates.
WHAT IS YOUR OUTLOOK?
Although we expect the Federal Reserve Board to raise short-term interest rates, we believe the first rate increase will occur later than the market thinks it will. We expect our GSE mortgage positions to benefit from a stable interest-rate environment. As a result, we modestly increased CMBS holdings and plan to maintain an overweight in both CMBS and ABS until market conditions warrant a change. We continue to favor ABS and MBS because they are protected through credit enhancements intended to absorb losses and protect senior securities. We believe this protection is strong. Within the fund’s investment parameters, we will continue to look for opportunities to take advantage of a steep yield curve and will focus on income over price appreciation.
Given our expectations of a gradual rise in yields and slow economic growth, we believe our strategy, coupled with careful security selection, has the potential to provide attractive returns for shareholders. As always, we are watching incoming data for signs that market conditions have changed.
7
LOOMIS SAYLES LIMITED TERM GOVERNMENTAND AGENCY FUND
Investment Results through March 31, 2010
PERFORMANCE IN PERSPECTIVE
The charts comparing the fund’s performance to an index provide you with a general sense of how it performed. The fund’s total return for the period shown below appears with and without sales charges and includes fund expenses and fees. An index measures the performance of a theoretical portfolio. Unlike a fund, the index is unmanaged and does not have expenses that affect the results. It is not possible to invest directly in an index. Investors would incur transaction costs and other expenses if they purchased the securities necessary to match the index.
Growth of a $10,000 Investment in Class A Shares 4
Average Annual Returns — March 31, 20104
| | | | | | | | | | | | |
| | | | | |
| | | 6 MONTHS | | | 1 YEAR | | | 5 YEARS | | | 10 YEARS | |
| | | | | |
Class A (Inception 1/3/89) | | | | | | | | | | | | |
Net Asset Value1 | | 3.18 | % | | 8.40 | % | | 5.07 | % | | 4.96 | % |
With Maximum Sales Charge2 | | 0.07 | | | 5.13 | | | 4.43 | | | 4.65 | |
| | | | | |
Class B (Inception 9/27/93) | | | | | | | | | | | | |
Net Asset Value1 | | 2.80 | | | 7.70 | | | 4.28 | | | 4.22 | |
With CDSC3 | | -2.20 | | | 2.70 | | | 3.94 | | | 4.22 | |
| | | | | |
Class C (Inception 12/30/94) | | | | | | | | | | | | |
Net Asset Value1 | | 2.79 | | | 7.69 | | | 4.30 | | | 4.23 | |
With CDSC3 | | 1.79 | | | 6.69 | | | 4.30 | | | 4.23 | |
| | | | | |
Class Y (Inception 3/31/94) | | | | | | | | | | | | |
Net Asset Value1 | | 3.30 | | | 8.75 | | | 5.36 | | | 5.29 | |
| | | | | |
| COMPARATIVE PERFORMANCE | | 6 MONTHS | | | 1 YEAR | | | 5 YEARS | | | 10 YEARS | |
Barclays Capital U.S. 1-5 Year Government Bond Index | | 0.92 | % | | 1.67 | % | | 4.81 | % | | 5.09 | % |
Morningstar Short Gov’t Fund Avg. | | 1.15 | | | 3.24 | | | 4.05 | | | 4.40 | |
| | | | | | | | | | | | | |
See page 11 for a description of the indices.
All returns represent past performance and do not guarantee future results. Periods of less than one year are not annualized. Share price and return will vary and you may have a gain or loss when you sell your shares. All results include reinvestment of dividends and capital gains. Current returns may be higher or lower than those shown. For performance current to the most recent month-end, visit www.funds.natixis.com. Performance history includes periods from a predecessor fund. Class Y shares are available to certain investors, as described in the prospectus.
The table and graph do not reflect taxes shareholders might owe on any fund distributions or when they redeem their shares.
PORTFOLIO FACTS
| | | | |
| |
| | | % of Net Assets as of |
| FUND COMPOSITION | | 3/31/10 | | 9/30/09 |
Treasuries | | 25.3 | | 14.6 |
Mortgage Related | | 23.2 | | 42.4 |
Commercial Mortgage-Backed Securities | | 12.8 | | 10.9 |
Government Guaranteed | | 12.0 | | 3.5 |
Government Owned - No Guarantee | | 9.9 | | 10.0 |
Government Sponsored | | 6.9 | | 8.3 |
ABS Car Loan | | 3.1 | | 2.1 |
ABS Credit Card | | 1.0 | | 3.4 |
Hybrid ARMs | | 0.9 | | 2.0 |
ABS Home Equity | | 0.8 | | 1.2 |
Collateralized Mortgage Obligations | | 0.3 | | 0.4 |
ABS Other | | — | | 0.3 |
Short-Term Investments & Other | | 3.8 | | 0.9 |
| | | | | | |
| |
| | | % of Net Assets as of | |
| EFFECTIVE MATURITY | | 3/31/10 | | | 9/30/09 | |
1 year or less | | 9.1 | | | 1.9 | |
1-5 years | | 77.2 | | | 83.5 | |
5-10 years | | 13.7 | | | 14.6 | |
10+ years | | — | | | — | |
Average Effective Maturity | | 2.8 | years | | 3.5 | years |
Portfolio characteristics will vary.
EXPENSE RATIOS AS STATED IN THE MOST RECENT PROSPECTUS
| | | | | | |
| Share Class | | Gross Expense Ratio5 | | | Net Expense Ratio6 | |
A | | 0.99 | % | | 0.90 | % |
B | | 1.74 | | | 1.65 | |
C | | 1.74 | | | 1.65 | |
Y | | 0.72 | | | 0.65 | |
NOTES TO CHARTS
| 1 | Does not include a sales charge. |
| 2 | Includes maximum sales charge of 3.00%. |
| 3 | Performance for Class B shares assumes a maximum 5% contingent deferred sales charge (“CDSC”) applied when you sell shares, which declines annually between years 1-6 according to the following schedule: 5, 4, 3, 3, 2, 1, 0%. Class C shares performance assumes a 1% CDSC applied when you sell shares within one year of purchase. |
| 4 | Fund performance has been increased by expense reductions and reimbursements, if any, without which performance would have been lower. |
| 5 | Before reductions and reimbursements. |
| 6 | After reductions and reimbursements. Expense reductions are contractual and are set to expire on 1/31/11. |
8
LOOMIS SAYLES STRATEGIC INCOME FUND
PORTFOLIO PROFILE
Objective:
Seeks high current income, with a secondary objective of capital growth
Strategy:
Invests primarily in income-producing securities in the U.S. and around the world
Fund Inception:
May 1, 1995
Managers:
Daniel J. Fuss, CFA, CIC
Kathleen C. Gaffney, CFA
Associate Managers:
Matthew J. Eagan, CFA
Elaine M. Stokes
Loomis, Sayles & Company, L.P.
Symbols:
| | |
| Class A | | NEFZX |
| Class B | | NEZBX |
| Class C | | NECZX |
| Class Y | | NEZYX |
| Admin Class | | NEZAX |
What You Should Know:
Fixed-income securities are subject to credit risk and interest rate risk; their value generally rises when prevailing interest rates fall and falls when rates rise.
The fund can invest a significant percentage of assets in debt securities that are rated below investment grade and the value of fund shares can be adversely affected by changes in economic conditions or other circumstances. Lower rated debt securities have speculative characteristics and may be subject to greater price volatility than higher rated investments. In addition, the secondary market for these securities may lack liquidity. The fund can also invest a significant percentage of assets in foreign securities and the value of the fund shares can be adversely affected by changes in currency exchange rates, political, and economic developments. In emerging markets, these risks can be significant. Fund shares should be viewed as a long-term investment.
Management Discussion
As the world economy continues to recover slowly, investors replaced lingering pessimism with optimism. Still fears about government debt in Europe and China’s tight lending practices percolated through the global credit markets, tempering investor enthusiasm for overseas obligations. In the United States, wavering economic data and an uncertain outlook for financial regulation drove some market participants back into defensive mode. Despite these challenges, improved access to capital, declining corporate default rates and brighter economic trends fed an appetite for risk, and corporate bond spreads narrowed during the period.
For the six month period ended March 31, 2010, Class A shares of Loomis Sayles Strategic Income Fund returned 9.86%. The fund significantly outperformed its benchmark, the Barclays Capital U.S. Aggregate Bond Index, which returned 1.99% over the period. It also outperformed the average fund in Morningstar’s Multisector Bond category, which returned 6.82%.
WHAT WAS THE PRIMARY REASON FOR THE FUND’S OUTPERFORMANCE?
Successful security selection was the key to the period’s impressive results, with investment-grade and high-yield corporate issues, convertible bonds and non-U.S dollar obligations all contributing to the fund’s strong performance relative to its benchmark.
WHICH FACTORS POSITIVELY CONTRIBUTED TO THE FUND’S PERFORMANCE?
Strong corporate earnings and better-than-expected fourth quarter gross domestic product (GDP) growth buoyed results among investment-grade corporate issues. Notable returns came from industrial issues in technology, transportation and capital goods. Certain investment-grade financial and electric utility names also lifted performance. Despite a few periods of muted performance, high yield garnered the most gains for the fund, as investors were willing to accept greater risk in pursuit of higher yields. Within high yield, financial (consumer finance, diversified finance) and industrial (technology, communications, retail, automotive) names drove outperformance.
The fund’s non-U.S dollar allocation was among the top contributors of excess return. Investments denominated in the Canadian dollar, Indonesian rupiah and Mexican peso benefited from both asset and currency appreciation. The fund’s Australian dollar, Brazilian real, British pound and New Zealand dollar holdings also contributed.
The equity market rally that started in 2009 extended into 2010, lending support for convertible bonds. Our increased allocation to convertibles generated some of the best returns for the period, led by selected names in automotive, pharmaceuticals and technology. Modest exposure to preferred and equity securities also benefited from the performance surge.
WHICH FACTORS DETRACTED FROM THE FUND’S RESULTS?
There were few areas of weakness that existed in the fund amid the widespread bullish sentiment that swept fixed-income markets over the last several months. Our bias away from commercial mortgage-backed securities (CMBS) detracted from performance as the sector rallied. Currency weakness was a performance drag for holdings denominated in the Icelandic krona and Norwegian krone.
WHAT IS YOUR OUTLOOK?
The fund is positioned to take advantage of a gradual economic recovery and positive fundamental trends. We believe short-term interest rates in the United States will remain low for the foreseeable future, but acknowledge the continuing pressures that the ever-increasing U.S. Treasury issuance will place on longer-term rates. In our opinion, there remains ample opportunity for corporate bond yield spreads to tighten further. Within corporate credit, we are advocating a strategy of specific (fundamental credit) risk instead of market (interest rate) risk. We continue to see opportunity in the convertible market and have focused on increasing our exposure. We continue to add opportunistically to non-U.S. dollar-denominated securities, with a focus on credits and countries in which we anticipate fundamental improvements will continue to emerge. We believe that in a rising-rate environment, research and security selection will continue to prove key to successful portfolio management.
9
LOOMIS SAYLES STRATEGIC INCOME FUND
Investment Results through March 31, 2010
PERFORMANCE IN PERSPECTIVE
The charts comparing the fund’s performance to two indexes provide you with a general sense of how it performed. The fund’s total return for the period shown below appears with and without sales charges and includes fund expenses and fees. An index measures the performance of a theoretical portfolio. Unlike a fund, the index is unmanaged and does not have expenses that affect the results. It is not possible to invest directly in an index. Investors would incur transaction costs and other expenses if they purchased the securities necessary to match the index.
Growth of a $10,000 Investment in Class A Shares 5
Average Annual Returns — March 31, 2010 5
| | | | | | | | | | | | |
| | | | | |
| | | 6 MONTHS | | | 1 YEAR | | | 5 YEARS | | | 10 YEARS | |
Class A (Inception 5/1/95) | | | | | | | | | | | | |
Net Asset Value2 | | 9.86 | % | | 46.29 | % | | 7.17 | % | | 9.05 | % |
With Maximum Sales Charge3 | | 4.92 | | | 39.69 | | | 6.19 | | | 8.55 | |
| | | | | |
Class B (Inception 5/1/95) | | | | | | | | | | | | |
Net Asset Value2 | | 9.54 | | | 45.36 | | | 6.40 | | | 8.23 | |
With CDSC4 | | 4.54 | | | 40.36 | | | 6.08 | | | 8.23 | |
| | | | | |
Class C (Inception 5/1/95) | | | | | | | | | | | | |
Net Asset Value2 | | 9.55 | | | 45.28 | | | 6.39 | | | 8.24 | |
With CDSC4 | | 8.55 | | | 44.28 | | | 6.39 | | | 8.24 | |
| | | | | |
Class Y (Inception 12/1/99) | | | | | | | | | | | | |
Net Asset Value2 | | 10.00 | | | 46.73 | | | 7.47 | | | 9.37 | |
| | | | | |
Admin Class (Inception 2/1/10)1 | | | | | | | | | | | | |
Net Asset Value2 | | 9.60 | | | 45.88 | | | 6.86 | | | 8.66 | |
| COMPARATIVE PERFORMANCE | | 6 MONTHS | | | 1 YEAR | | | 5 YEARS | | | 10 YEARS | |
Barclays Capital U.S. Aggregate Bond Index | | 1.99 | % | | 7.69 | % | | 5.44 | % | | 6.29 | % |
Barclays Capital U.S. Universal Bond Index | | 2.63 | | | 10.39 | | | 5.55 | | | 6.43 | |
Morningstar Multisector Bond Fund Avg. | | 6.82 | | | 31.84 | | | 5.59 | | | 6.56 | |
See page 11 for a description of the indices.
All returns represent past performance and do not guarantee future results. Periods of less than one year are not annualized. Share price and return will vary and you may have a gain or loss when you sell your shares. All results include reinvestment of dividends and capital gains. Current returns may be higher or lower than those shown. Performance history includes periods from a predecessor fund. For performance current to the most recent month-end, visit www.funds.natixis.com. Class Y shares are available to certain investors, as described in the prospectus.
The table and graph do not reflect taxes shareholders might owe on any fund distributions or when they redeem their shares.
PORTFOLIO FACTS
| | | | |
| |
| | | % of Net Assets as of |
| CREDIT QUALITY | | 3/31/10* | | 9/30/09** |
Aaa | | 16.2 | | 15.6 |
Aa | | 6.6 | | 6.1 |
A | | 10.6 | | 7.4 |
Baa | | 27.0 | | 30.8 |
Ba | | 10.8 | | 10.5 |
B | | 13.2 | | 6.9 |
Caa and lower | | 5.7 | | 8.1 |
Not Rated | | 7.2 | | 6.7 |
Short-term and other | | 2.7 | | 4.0 |
* Credit quality at 3/31/2010 reflects the highest rating assigned to a security among Moody’s, S&P, or Fitch. The Moody’s equivalent of the assigned rating is presented in the table.
** Credit quality at 9/30/2009 was based on ratings from Moody’s. Securities that were not rated by Moody’s may have been rated by another rating agency or by Loomis Sayles.
| | | | | | |
| |
| | | % of Net Assets as of | |
| EFFECTIVE MATURITY | | 3/31/10 | | | 9/30/09 | |
1 year or less | | 4.5 | | | 5.7 | |
1-5 years | | 31.5 | | | 25.8 | |
5-10 years | | 30.5 | | | 33.1 | |
10+ years | | 33.5 | | | 35.4 | |
Average Effective Maturity | | 11.5 | years | | 12.3 | years |
Portfolio characteristics will vary.
EXPENSE RATIOS AS STATED IN THE MOST RECENT PROSPECTUS
| | | | | | |
| Share Class | | Gross Expense Ratio6 | | | Net Expense Ratio7 | |
A | | 0.99 | % | | 0.99 | % |
B | | 1.75 | | | 1.75 | |
C | | 1.74 | | | 1.74 | |
Y | | 0.73 | | | 0.73 | |
Admin | | 1.24 | | | 1.24 | |
NOTES TO CHARTS
| 1 | Prior to the inception of Admin Class shares (2/1/10), performance is that of Class A shares, restated to reflect the higher net expenses of Admin Class shares. |
| 2 | Does not include a sales charge. |
| 3 | Includes maximum sales charge of 4.50%. |
| 4 | Performance for Class B shares assumes a maximum 5% contingent deferred sales charge (“CDSC”) applied when you sell shares, which declines annually between years 1-6 according to the following schedule: 5, 4, 3, 3, 2, 1, 0%. Class C share performance assumes a 1.00% CDSC applied when you sell shares within one year of purchase. |
| 5 | Fund performance has been increased by expense reductions and reimbursements, if any, without which performance would have been lower. |
| 6 | Before reductions and reimbursements. |
| 7 | After reductions and reimbursements. Expense reductions are contractual and are set to expire on 1/31/11. |
10
ADDITIONAL INFORMATION
The views expressed in this report reflect those of the portfolio managers as of the dates indicated. The managers’ views are subject to change at any time without notice based on changes in market or other conditions. References to specific securities or industries should not be regarded as investment advice. Because the funds are actively managed, there is no assurance that they will continue to invest in the securities or industries mentioned.
Before investing, consider the Fund’s investment objectives, risks, charges and expenses. Visit www.funds.natixis.com or call 1-800-225-5478 for a prospectus and/or a summary prospectus, both of which contain this and other information. Read it carefully.
INDEX/AVERAGE DESCRIPTIONS
Barclays Capital Global Aggregate ex-USD Bond Index is an unmanaged index that provides a broad-based measure of the international investment-grade fixed-rate debt markets.
Barclays Capital U.S. 1-5 Year Government Bond Index is an unmanaged index that includes U.S. Treasury and agency securities with remaining maturities of one to five years.
Barclays Capital U.S. Aggregate Bond Index is an unmanaged index that covers the U.S.-dollar denominated, investment-grade, fixed-rate, taxable bond market of SEC-registered securities. The index includes bonds from the Treasury, government-related, corporate, mortgage-backed securities, asset-backed securities, and collateralized mortgage-backed securities sectors.
Barclays Capital U.S. Corporate High-Yield Bond Index is an unmanaged index that covers the U.S. dollar-denominated, non-investment grade, fixed-rate, taxable corporate bond market.
Barclays Capital U.S. Universal Bond Index is an unmanaged index that covers U.S. dollar-denominated taxable bonds, including U.S. government and investment grade debt, non-investment grade debt, asset-backed and mortgage-backed securities, Eurobonds, 144A securities and emerging market debt.
Morningstar Fund Averages are the average performance without sales charges of funds with similar investment objectives, as calculated by Morningstar, Inc.
PROXY VOTING INFORMATION
A description of the funds’ proxy voting policies and procedures is available without charge, upon request, by calling Natixis Funds at 800-225-5478; on the funds’ website at www.funds.natixis.com; and on the Securities and Exchange Commission’s (SEC’s) website at www.sec.gov. Information regarding how the funds voted proxies relating to portfolio securities during the 12-month period ended June 30, 2009 is available from the funds’ website and the SEC’s website.
QUARTERLY PORTFOLIO SCHEDULES
The funds file a complete schedule of portfolio holdings with the SEC for the first and third quarters of each fiscal year on Form N-Q. The funds’ Forms N-Q are available on the SEC’s website at www.sec.gov and may be reviewed and copied at the SEC’s Public Reference Room in Washington, DC. Information on the operation of the Public Reference Room may be obtained by calling
1-800-SEC-0330.
| | | | |
| NOT FDIC INSURED | | MAY LOSE VALUE | | NO BANK GUARANTEE |
11
UNDERSTANDING FUND EXPENSES
As a mutual fund shareholder, you incur different costs: transaction costs, including sales charges (loads) on purchases, contingent deferred sales charges on redemptions; certain exchange fees; and ongoing costs, including management fees, distribution and/or service fees (12b-1 fees), and other fund expenses. In addition, each fund may assess a minimum balance fee of $20 on an annual basis for accounts that fall below the required minimum to establish an account. Certain exemptions may apply. These costs are described in more detail in the funds’ prospectuses. The examples below are intended to help you understand the ongoing costs of investing in the funds and help you compare these with the ongoing costs of investing in other mutual funds.
The first line in the table of each class of fund shares shows the actual account values and actual fund expenses you would have paid on a $1,000 investment in the fund from October 1, 2009 through March 31, 2010. To estimate the expenses you paid over the period, simply divide your account value by $1,000 (for example $8,600 account value divided by $1,000 = 8.60) and multiply the result by the number in the Expenses Paid During Period column as shown below for your class.
The second line in the table of each class of fund shares provides information about hypothetical account values and hypothetical expenses based on the fund’s actual expense ratios and an assumed rate of return of 5% per year before expenses, which is not the fund’s actual return. The hypothetical account values and expenses may not be used to estimate the actual ending account balance or expenses you paid on your investment for the period. You may use this information to compare the ongoing costs of investing in the fund and other funds. To do so, compare this 5% hypothetical example with the 5% hypothetical examples that appear in the shareholder reports of the other funds.
Please note that the expenses shown reflect ongoing costs only, and do not include any transaction costs such as sales charges redemption fees, or exchange fees. Therefore, the second line in the table of each fund is useful in comparing ongoing costs only, and will not help you determine the relative costs of owning different funds. If transaction costs were included, total costs would be higher.
| | | | | | |
| LOOMIS SAYLES CORE PLUS BOND FUND | | BEGINNING ACCOUNT VALUE
10/1/2009 | | ENDING ACCOUNT VALUE
3/31/2010 | | EXPENSES PAID DURING PERIOD*
10/1/2009 – 3/31/2010 |
Class A | | | | | | |
Actual | | $1,000.00 | | $1,043.10 | | $4.58 |
Hypothetical (5% return before expenses) | | $1,000.00 | | $1,020.44 | | $4.53 |
Class B | | | | | | |
Actual | | $1,000.00 | | $1,039.00 | | $8.39 |
Hypothetical (5% return before expenses) | | $1,000.00 | | $1,016.70 | | $8.30 |
Class C | | | | | | |
Actual | | $1,000.00 | | $1,039.30 | | $8.39 |
Hypothetical (5% return before expenses) | | $1,000.00 | | $1,016.70 | | $8.30 |
Class Y | | | | | | |
Actual | | $1,000.00 | | $1,044.20 | | $3.31 |
Hypothetical (5% return before expenses) | | $1,000.00 | | $1,021.69 | | $3.28 |
| * | Expenses are equal to the Fund’s annualized expense ratio: 0.90%, 1.65%, 1.65% and 0.65% for Class A, B, C and Y, respectively, multiplied by the average account value over the period, multiplied by the number of days in the most recent fiscal half-year, divided by 365 (to reflect the half-year period). |
12
UNDERSTANDING FUND EXPENSES
| | | | | | |
| LOOMIS SAYLES HIGH INCOME FUND | | BEGINNING ACCOUNT VALUE
10/1/2009 | | ENDING ACCOUNT VALUE 3/31/2010 | | EXPENSES PAID DURING PERIOD* 10/1/2009 – 3/31/2010 |
Class A | | | | | | |
Actual | | $1,000.00 | | $1,112.60 | | $6.06 |
Hypothetical (5% return before expenses) | | $1,000.00 | | $1,019.20 | | $5.79 |
Class B | | | | | | |
Actual | | $1,000.00 | | $1,108.20 | | $9.99 |
Hypothetical (5% return before expenses) | | $1,000.00 | | $1,015.46 | | $9.55 |
Class C | | | | | | |
Actual | | $1,000.00 | | $1,105.90 | | $9.98 |
Hypothetical (5% return before expenses) | | $1,000.00 | | $1,015.46 | | $9.55 |
Class Y | | | | | | |
Actual | | $1,000.00 | | $1,111.70 | | $4.74 |
Hypothetical (5% return before expenses) | | $1,000.00 | | $1,020.44 | | $4.53 |
| * | Expenses are equal to the Fund’s annualized expense ratio (after fee reduction/reimbursement): 1.15%, 1.90%, 1.90% and 0.90% for Class A, B, C and Y, respectively, multiplied by the average account value over the period, multiplied by the number of days in the most recent fiscal half-year, divided by 365 (to reflect the half-year period). |
| | | | | | |
| LOOMIS SAYLES INTERNATIONAL BOND FUND | | BEGINNING ACCOUNT VALUE 10/1/2009 | | ENDING ACCOUNT VALUE 3/31/2010 | | EXPENSES PAID DURING PERIOD* 10/1/2009 – 3/31/2010 |
Class A | | | | | | |
Actual | | $1,000.00 | | $980.20 | | $5.43 |
Hypothetical (5% return before expenses) | | $1,000.00 | | $1,019.45 | | $5.54 |
Class C | | | | | | |
Actual | | $1,000.00 | | $976.80 | | $9.12 |
Hypothetical (5% return before expenses) | | $1,000.00 | | $1,015.71 | | $9.30 |
Class Y | | | | | | |
Actual | | $1,000.00 | | $981.30 | | $4.20 |
Hypothetical (5% return before expenses) | | $1,000.00 | | $1,020.69 | | $4.28 |
| * | Expenses are equal to the Fund’s annualized expense ratio (after fee reduction/reimbursement): 1.10%, 1.85% and 0.85%, for Class A, C and Y, respectively, multiplied by the average account value over the period, multiplied by the number of days in the most recent fiscal half-year, divided by 365 (to reflect the half-year period). |
13
UNDERSTANDING FUND EXPENSES
| | | | | | |
LOOMIS SAYLES LIMITED TERM GOVERNMENT AND
AGENCY FUND | | BEGINNING ACCOUNT VALUE
10/1/2009 | | ENDING ACCOUNT VALUE
3/31/2010 | | EXPENSES PAID DURING PERIOD*
10/1/2010 – 3/31/2010 |
Class A | | | | | | |
Actual | | $1,000.00 | | $1,031.80 | | $4.56 |
Hypothetical (5% return before expenses) | | $1,000.00 | | $1,020.44 | | $4.53 |
Class B | | | | | | |
Actual | | $1,000.00 | | $1,028.00 | | $8.34 |
Hypothetical (5% return before expenses) | | $1,000.00 | | $1,016.70 | | $8.30 |
Class C | | | | | | |
Actual | | $1,000.00 | | $1,027.90 | | $8.34 |
Hypothetical (5% return before expenses) | | $1,000.00 | | $1,016.70 | | $8.30 |
Class Y | | | | | | |
Actual | | $1,000.00 | | $1,033.00 | | $3.29 |
Hypothetical (5% return before expenses) | | $1,000.00 | | $1,021.69 | | $3.28 |
| * | Expenses are equal to the Fund’s annualized expense ratio (after fee reduction/reimbursment): 0.90%, 1.65%, 1.65% and 0.65%, for Class A, B, C and Y, respectively, multiplied by the average account value over the period multiplied by the number of days in the most recent fiscal half-year, divided by 365 (to reflect the half-year period). |
| | | | | | | | |
| LOOMIS SAYLES STRATEGIC INCOME FUND | | BEGINNING ACCOUNT VALUE
10/1/2009 | | ENDING ACCOUNT VALUE
3/31/2010 | | | EXPENSES PAID DURING PERIOD*
10/1/2009 – 3/31/2010 | |
Class A | | | | | | | | |
Actual | | $1,000.00 | | $1,098.60 | | | $5.02 | 1 |
Hypothetical (5% return before expenses) | | $1,000.00 | | $1,020.14 | | | $4.84 | * |
Class B | | | | | | | | |
Actual | | $1,000.00 | | $1,095.40 | | | $8.93 | 1 |
Hypothetical (5% return before expenses) | | $1,000.00 | | $1,016.40 | | | $8.60 | * |
Class C | | | | | | | | |
Actual | | $1,000.00 | | $1,095.50 | | | $8.93 | 1 |
Hypothetical (5% return before expenses) | | $1,000.00 | | $1,016.40 | | | $8.60 | * |
Class Y | | | | | | | | |
Actual | | $1,000.00 | | $1,100.00 | | | $3.72 | 1 |
Hypothetical (5% return before expenses) | | $1,000.00 | | $1,021.39 | | | $3.58 | * |
Admin Class | | | | | | | | |
Actual | | $1,000.00 | | $1,038.30 | 2 | | $1.98 | 2 |
Hypothetical (5% return before expenses) | | $1,000.00 | | $1,001.86 | * | | $6.09 | * |
| * | Hypothetical expenses are equal to the Fund’s annualized expense ratio: 0.96%, 1.71%, 1.71%, 0.71% and 1.22% for Class A, B, C, Y and Admin Class, respectively, multiplied by the average account value over the period, multiplied by the number of days in the most recent fiscal half-year (182), divided by 365 (to reflect the half-year period). |
| 1 | Actual expenses for Class A, B, C and Y are equal to the Fund’s annualized expense ratio: 0.96%, 1.71%, 1.71% and 0.71%, respectively, multiplied by the average account value over the period, multiplied by the number of days in the most recent fiscal half-year (182), divided by 365 (to reflect the half-year period). |
| 2 | Admin Class commenced operations on February 1, 2010. Actual expenses are equal to Fund’s annualized expense ratio: 1.22% for the Admin Class, multiplied by the average account value over the period, multiplied by the number of days in the most recent fiscal period (58), divided by 365 (to reflect the partial period). |
14
LOOMIS SAYLES CORE PLUS BOND FUND — PORTFOLIOOF INVESTMENTS
Investments as of March 31, 2010 (Unaudited)
| | | | | | |
Principal
Amount (‡) | | Description | | Value (†) |
| | | | | | |
| | Bonds and Notes — 98.1% of Net Assets |
| | | ABS Car Loan — 2.0% | | | |
| $ | 1,140,000 | | AESOP Funding II LLC, Series 2010-2A, Class A, 144A,
3.630%, 8/20/2014 | | $ | 1,139,886 |
| | 570,000 | | Centre Point Funding LLC, Series 2010-1A, Class 1, 144A,
5.430%, 7/20/2016 | | | 570,112 |
| | 3,865,000 | | Chrysler Financial Lease Trust, Series 2010-A, Class B, 144A,
3.460%, 9/16/2013 | | | 3,862,059 |
| | 790,000 | | Hertz Vehicle Financing LLC, Series 2009-2A, Class A1, 144A,
4.260%, 3/25/2014 | | | 813,166 |
| | | | | | |
| | | | | | 6,385,223 |
| | | | | | |
| | | ABS Home Equity — 0.2% | | | |
| | 885,399 | | Countrywide Asset-Backed Certificates, Series 2004-S1, Class A3,
4.615%, 2/25/2035 | | | 713,642 |
| | | | | | |
| | | Aerospace & Defense — 0.8% | | | |
| | 2,495,000 | | Bombardier, Inc., 144A,
7.500%, 3/15/2018 | | | 2,601,037 |
| | | | | | |
| | | Automotive — 1.2% | | | |
| | 1,990,000 | | Ford Motor Credit Co. LLC,
7.000%, 10/01/2013 | | | 2,059,125 |
| | 975,000 | | Ford Motor Credit Co. LLC,
8.000%, 12/15/2016 | | | 1,027,282 |
| | 830,000 | | Lear Corp.,
7.875%, 3/15/2018 | | | 839,338 |
| | | | | | |
| | | | | | 3,925,745 |
| | | | | | |
| | | Banking — 5.8% | | | |
| | 1,365,000 | | Bear Stearns Cos., Inc. (The),
6.400%, 10/02/2017 | | | 1,507,937 |
| | 605,000 | | Citigroup, Inc.,
6.125%, 5/15/2018 | | | 618,182 |
| | 2,135,000 | | Citigroup, Inc.,
6.500%, 8/19/2013 | | | 2,301,556 |
| | 1,380,000 | | Citigroup, Inc.,
8.125%, 7/15/2039 | | | 1,593,076 |
| | 625,000 | | Goldman Sachs Group, Inc. (The),
5.300%, 2/14/2012 | | | 665,257 |
| | 790,000 | | JPMorgan Chase & Co.,
6.000%, 1/15/2018 | | | 857,705 |
| | 2,530,000 | | Merrill Lynch & Co., Inc., MTN,
6.875%, 4/25/2018 | | | 2,726,503 |
| | 960,000 | | Morgan Stanley,
4.750%, 4/01/2014 | | | 980,234 |
| | 615,000 | | Morgan Stanley,
5.375%, 10/15/2015 | | | 638,767 |
| | 100,000 | | Morgan Stanley,
6.750%, 4/15/2011 | | | 105,565 |
| | 1,620,000 | | Morgan Stanley, Series F, GMTN,
6.625%, 4/01/2018 | | | 1,727,858 |
| | 835,000 | | Morgan Stanley, Series F, MTN,
5.550%, 4/27/2017 | | | 853,987 |
| | 920,000 | | Nomura Holdings, Inc.,
5.000%, 3/04/2015 | | | 940,438 |
| | 3,155,000 | | Royal Bank of Scotland PLC (The),
4.875%, 3/16/2015 | | | 3,154,224 |
| | | | | | |
| | | | | | 18,671,289 |
| | | | | | |
| | | Building Materials — 1.3% | | | |
| | 2,520,000 | | Holcim Capital Corp. Ltd., 144A,
6.875%, 9/29/2039 | | | 2,654,586 |
| | | | | | |
Principal
Amount (‡) | | Description | | Value (†) |
| | | | | | |
| | | Building Materials — continued | | | |
| $ | 815,000 | | Owens Corning, Inc.,
7.000%, 12/01/2036 | | $ | 798,525 |
| | 795,000 | | USG Corp.,
6.300%, 11/15/2016 | | | 711,525 |
| | | | | | |
| | | | | | 4,164,636 |
| | | | | | |
| | | Chemicals — 1.2% | | | |
| | 1,305,000 | | Chevron Phillips Chemical Co. LLC, 144A,
8.250%, 6/15/2019 | | | 1,557,931 |
| | 740,000 | | LBI Escrow Corp., 144A,
8.000%, 11/01/2017 | | | 767,750 |
| | 1,330,000 | | RPM International, Inc.,
6.125%, 10/15/2019 | | | 1,382,969 |
| | | | | | |
| | | | | | 3,708,650 |
| | | | | | |
| | | Commercial Mortgage-Backed Securities — 8.0% | | | |
| | 795,000 | | Banc of America Commercial Mortgage, Inc., Series 2005-6,
Class A2,
5.165%, 9/10/2047 | | | 807,517 |
| | 850,000 | | Banc of America Commercial Mortgage, Inc., Series 2006-1,
Class A2,
5.334%, 9/10/2045 | | | 866,507 |
| | 1,305,000 | | Banc of America Commercial Mortgage, Inc., Series 2007-2,
Class A2,
5.634%, 4/10/2049 | | | 1,338,686 |
| | 2,680,000 | | Banc of America Commercial Mortgage, Inc., Series 2007-5,
Class A4,
5.492%, 2/10/2051 | | | 2,544,450 |
| | 1,245,000 | | Bear Stearns Commercial Mortgage Securities, Inc., Series 2005-PW10, Class A2,
5.270%, 12/11/2040 | | | 1,263,234 |
| | 1,200,000 | | Bear Stearns Commercial Mortgage Securities, Inc., Series 2007-PW16, Class A2,
5.856%, 6/11/2040(c) | | | 1,244,520 |
| | 145,000 | | Bear Stearns Commercial Mortgage Securities, Series 2007-PW15, Class A4,
5.331%, 2/11/2044 | | | 139,706 |
| | 690,000 | | Citigroup Commercial Mortgage Trust, Series 2007-C6, Class A4,
5.888%, 12/10/2049(c) | | | 687,127 |
| | 1,000,000 | | Citigroup Commercial Mortgage Trust, Series 2008-C7, Class A4,
6.298%, 12/10/2049(c) | | | 1,007,673 |
| | 710,000 | | Citigroup/Deutsche Bank Commercial Mortgage Trust, Series 2006-CD2, Class A2,
5.408%, 1/15/2046 | | | 723,170 |
| | 1,793,914 | | Greenwich Capital Commercial Funding Corp., Series 2005-GG5, Class A2,
5.117%, 4/10/2037 | | | 1,825,193 |
| | 960,000 | | Greenwich Capital Commercial Funding Corp., Series 2006-GG7, Class A4,
6.085%, 7/10/2038(c) | | | 978,640 |
| | 2,839,000 | | GS Mortgage Securities Corp. II, Series 2006-GG6, Class A4,
5.553%, 4/10/2038 | | | 2,853,286 |
| | 1,140,000 | | GS Mortgage Securities Corp. II, Series 2006-GG8, Class A4,
5.560%, 11/10/2039 | | | 1,128,582 |
| | 1,375,000 | | JPMorgan Chase Commercial Mortgage Securities Corp., Series 2006-LDP7, Class A4,
6.064%, 4/15/2045(c) | | | 1,419,518 |
| | 850,000 | | JPMorgan Chase Commercial Mortgage Securities Corp., Series 2007-CB18, Class A4,
5.440%, 6/12/2047 | | | 830,785 |
See accompanying notes to financial statements.
15
LOOMIS SAYLES CORE PLUS BOND FUND — PORTFOLIOOF INVESTMENTS (continued)
Investments as of March 31, 2010 (Unaudited)
| | | | | | |
Principal
Amount (‡) | | Description | | Value (†) |
| | | | | | |
| | | Commercial Mortgage-Backed Securities — continued | | | |
| $ | 1,710,000 | | LB-UBS Commercial Mortgage Trust, Series 2005-C3, Class A3,
4.647%, 7/15/2030 | | $ | 1,745,728 |
| | 900,000 | | Morgan Stanley Capital I, Series 2007-T27, Class A4,
5.802%, 6/11/2042(c) | | | 930,678 |
| | 1,175,000 | | Morgan Stanley Capital I, Series 2008-T29, Class A4,
6.458%, 1/11/2043(c) | | | 1,237,698 |
| | 2,070,000 | | Wachovia Bank Commercial Mortgage Trust, Series 2006-C29, Class A4,
5.308%, 11/15/2048 | | | 2,055,156 |
| | | | | | |
| | | | | | 25,627,854 |
| | | | | | |
| | | Construction Machinery — 0.1% | | | |
| | 470,000 | | Oshkosh Corp., 144A,
8.250%, 3/01/2017 | | | 485,275 |
| | | | | | |
| | | Consumer Products — 0.2% | | | |
| | 255,000 | | Whirlpool Corp.,
8.000%, 5/01/2012 | | | 280,261 |
| | 250,000 | | Whirlpool Corp., MTN,
8.600%, 5/01/2014 | | | 290,134 |
| | | | | | |
| | | | | | 570,395 |
| | | | | | |
| | | Distributors — 0.3% | | | |
| | 714,000 | | EQT Corp.,
8.125%, 6/01/2019 | | | 848,260 |
| | | | | | |
| | | Diversified Manufacturing — 0.9% | | | |
| | 1,200,000 | | Crane Co.,
6.550%, 11/15/2036(d) | | | 1,174,762 |
| | 1,580,000 | | Hutchison Whampoa International Ltd., 144A,
5.750%, 9/11/2019 | | | 1,640,125 |
| | | | | | |
| | | | | | 2,814,887 |
| | | | | | |
| | | Electric — 2.0% | | | |
| | 290,000 | | AES Corp. (The),
7.750%, 10/15/2015 | | | 295,075 |
| | 570,000 | | AES Corp. (The),
8.000%, 10/15/2017 | | | 578,550 |
| | 1,765,000 | | AES Corp. (The),
8.000%, 6/01/2020 | | | 1,758,381 |
| | 110,000 | | CMS Energy Corp.,
8.750%, 6/15/2019 | | | 124,200 |
| | 630,000 | | Exelon Generation Co. LLC,
5.200%, 10/01/2019 | | | 636,433 |
| | 690,000 | | IPALCO Enterprises, Inc., 144A,
7.250%, 4/01/2016 | | | 715,875 |
| | 1,270,000 | | TransAlta Corp.,
4.750%, 1/15/2015 | | | 1,311,515 |
| | 1,100,000 | | TransAlta Corp.,
6.500%, 3/15/2040 | | | 1,087,499 |
| | | | | | |
| | | | | | 6,507,528 |
| | | | | | |
| | | Food & Beverage — 2.8% | | | |
| | 560,000 | | Anheuser-Busch Cos., Inc.,
4.500%, 4/01/2018 | | | 555,182 |
| | 2,235,000 | | Del Monte Corp., 144A,
7.500%, 10/15/2019 | | | 2,343,956 |
| | 1,420,000 | | Dr Pepper Snapple Group, Inc.,
6.820%, 5/01/2018 | | | 1,622,221 |
| | 915,000 | | Kraft Foods, Inc.,
6.125%, 8/23/2018 | | | 997,129 |
| | 1,510,000 | | Kraft Foods, Inc.,
6.500%, 2/09/2040 | | | 1,564,784 |
| | | | | | |
Principal
Amount (‡) | | Description | | Value (†) |
| | | | | | |
| | | Food & Beverage — continued | | | |
| $ | 1,410,000 | | Smithfield Foods, Inc., 144A,
10.000%, 7/15/2014 | | $ | 1,572,150 |
| | 255,000 | | TreeHouse Foods, Inc.,
7.750%, 3/01/2018 | | | 264,563 |
| | | | | | |
| | | | | | 8,919,985 |
| | | | | | |
| | | Government Guaranteed — 1.3% | | | |
| | 95,000,000 | | Japan Finance Organization for Municipal Enterprises,
1.350%, 11/26/2013 (JPY) | | | 1,050,020 |
| | 296,000,000 | | Japan Finance Organization for Municipal Enterprises,
1.550%, 2/21/2012 (JPY) | | | 3,235,268 |
| | | | | | |
| | | | | | 4,285,288 |
| | | | | | |
| | | Government Owned - No Guarantee — 1.4% | | | |
| | 2,360,000 | | Petrobras International Finance Co.,
6.875%, 1/20/2040 | | | 2,435,957 |
| | 1,375,000 | | Qtel International Finance Ltd., 144A,
7.875%, 6/10/2019 | | | 1,589,137 |
| | 545,000 | | Taqa Abu Dhabi National Energy, 144A,
6.250%, 9/16/2019 | | | 547,944 |
| | | | | | |
| | | | | | 4,573,038 |
| | | | | | |
| | | Health Insurance — 0.7% | | | |
| | 2,005,000 | | WellPoint, Inc.,
7.000%, 2/15/2019 | | | 2,273,642 |
| | | | | | |
| | | Healthcare — 1.6% | | | |
| | 190,000 | | Express Scripts, Inc.,
7.250%, 6/15/2019 | | | 219,961 |
| | 575,000 | | HCA, Inc.,
7.500%, 12/15/2023 | | | 526,125 |
| | 935,000 | | HCA, Inc.,
9.125%, 11/15/2014 | | | 987,594 |
| | 485,000 | | Hospira, Inc.,
6.050%, 3/30/2017 | | | 520,925 |
| | 2,050,000 | | Life Technologies Corp.,
6.000%, 3/01/2020 | | | 2,098,942 |
| | 670,000 | | Medco Health Solutions,
7.250%, 8/15/2013 | | | 757,531 |
| | | | | | |
| | | | | | 5,111,078 |
| | | | | | |
| | | Hybrid ARMs — 0.6% | | | |
| | 882,747 | | FHLMC,
5.937%, 11/01/2036(c) | | | 922,673 |
| | 863,352 | | FNMA,
6.015%, 2/01/2037(c) | | | 911,034 |
| | | | | | |
| | | | | | 1,833,707 |
| | | | | | |
| | | Independent Energy — 0.8% | | | |
| | 2,400,000 | | XTO Energy, Inc.,
6.375%, 6/15/2038 | | | 2,687,690 |
| | | | | | |
| | | Industrial Other — 0.3% | | | |
| | 760,000 | | Timken Co. (The),
6.000%, 9/15/2014 | | | 808,238 |
| | | | | | |
| | | Life Insurance — 0.5% | | | |
| | 1,575,000 | | Aflac, Inc.,
6.900%, 12/17/2039 | | | 1,623,140 |
| | | | | | |
| | | Lodging — 0.3% | | | |
| | 500,000 | | Royal Caribbean Cruises Ltd.,
7.250%, 6/15/2016 | | | 493,750 |
See accompanying notes to financial statements.
16
LOOMIS SAYLES CORE PLUS BOND FUND — PORTFOLIOOF INVESTMENTS (continued)
Investments as of March 31, 2010 (Unaudited)
| | | | | | |
Principal
Amount (‡) | | Description | | Value (†) |
| | | | | | |
| | | Lodging — continued | | | |
| $ | 510,000 | | Royal Caribbean Cruises Ltd.,
11.875%, 7/15/2015 | | $ | 600,525 |
| | | | | | |
| | | | | | 1,094,275 |
| | | | | | |
| | | Media Cable — 2.0% | | | |
| | 995,000 | | Comcast Corp.,
6.450%, 3/15/2037 | | | 1,013,274 |
| | 1,770,000 | | Comcast Corp.,
6.950%, 8/15/2037 | | | 1,914,818 |
| | 410,000 | | Cox Communications, Inc.,
5.450%, 12/15/2014 | | | 443,188 |
| | 755,000 | | Cox Communications, Inc.,
6.750%, 3/15/2011 | | | 790,476 |
| | 1,760,000 | | Time Warner Cable, Inc.,
8.250%, 4/01/2019 | | | 2,129,755 |
| | | | | | |
| | | | | | 6,291,511 |
| | | | | | |
| | | Media Non-Cable — 0.6% | | | |
| | 1,900,000 | | Inmarsat Finance PLC, 144A,
7.375%, 12/01/2017 | | | 1,976,000 |
| | | | | | |
| | | Metals & Mining — 1.4% | | | |
| | 1,275,000 | | ArcelorMittal,
7.000%, 10/15/2039 | | | 1,309,402 |
| | 1,510,000 | | ArcelorMittal,
9.850%, 6/01/2019 | | | 1,919,205 |
| | 710,000 | | United States Steel Corp.,
6.650%, 6/01/2037 | | | 610,600 |
| | 640,000 | | United States Steel Corp.,
7.375%, 4/01/2020 | | | 641,600 |
| | | | | | |
| | | | | | 4,480,807 |
| | | | | | |
| | | Mortgage Related — 13.5% | | | |
| | 642,213 | | FHLMC,
4.000%, 7/01/2019 | | | 665,510 |
| | 1,423,840 | | FHLMC,
4.500%, 12/01/2034 | | | 1,438,480 |
| | 310,961 | | FHLMC,
5.000%, 11/01/2018 | | | 330,503 |
| | 858,808 | | FHLMC
5.500%, with various maturities in 2018(e) | | | 927,621 |
| | 123,299 | | FHLMC,
6.000%, 6/01/2035 | | | 133,897 |
| | 538,187 | | FNMA,
4.000%, 6/01/2019 | | | 557,627 |
| | 5,211,366 | | FNMA
4.500%, with various maturities from 2019 to 2035(e) | | | 5,357,299 |
| | 5,748,951 | | FNMA,
5.500%, with various maturities from 2018 to 2036(e)(f) | | | 6,115,945 |
| | 5,229,512 | | FNMA
6.000%, with various maturities from 2016 to 2039(e) | | | 5,586,491 |
| | 1,130,922 | | FNMA
6.500%, with various maturities from 2029 to 2036(e) | | | 1,234,993 |
| | 145,745 | | FNMA
7.000%, with various maturities in 2030(e) | | | 163,660 |
| | 165,198 | | FNMA
7.500%, with various maturities from 2024 to 2032(e) | | | 186,994 |
| | 1,280,000 | | FNMA (TBA),
6.000%, 1/01/2036(b) | | | 1,359,601 |
| | 1,735,000 | | FNMA (TBA),
6.500%, 4/01/2035(b) | | | 1,880,306 |
| | | | | | |
Principal
Amount (‡) | | Description | | Value (†) |
| | | | | | |
| | | Mortgage Related — continued | | | |
| $ | 4,089,553 | | GNMA
5.000%, with various maturities from 2035 to 2038(e) | | $ | 4,264,648 |
| | 9,603,804 | | GNMA
5.500%, with various maturities from 2034 to 2039(e) | | | 10,183,218 |
| | 1,738,448 | | GNMA
6.000%, with various maturities from 2029 to 2037(e) | | | 1,863,783 |
| | 376,811 | | GNMA
6.500%, with various maturities from 2028 to 2032(e) | | | 413,457 |
| | 269,105 | | GNMA
7.000%, with various maturities from 2025 to 2029(e) | | | 301,478 |
| | 102,918 | | GNMA
7.500%, with various maturities from 2025 to 2030(e) | | | 116,242 |
| | 58,202 | | GNMA,
8.000%, 11/15/2029 | | | 67,036 |
| | 90,576 | | GNMA
8.500%, with various maturities from 2017 to 2023(e) | | | 103,596 |
| | 15,872 | | GNMA
9.000%, with various maturities in 2016(e) | | | 17,727 |
| | 32,030 | | GNMA
11.500%, with various maturities from 2013 to 2015(e) | | | 35,861 |
| | | | | | |
| | | | | | 43,305,973 |
| | | | | | |
| | | Non-Captive Consumer — 1.0% | | | |
| | 735,000 | | HSBC Finance Corp.,
7.000%, 5/15/2012 | | | 801,539 |
| | 325,000 | | SLM Corp., MTN,
5.050%, 11/14/2014 | | | 300,750 |
| | 350,000 | | SLM Corp., Series A, MTN,
5.000%, 10/01/2013 | | | 334,376 |
| | 30,000 | | SLM Corp., Series A, MTN,
5.000%, 4/15/2015 | | | 27,316 |
| | 120,000 | | SLM Corp., Series A, MTN,
5.000%, 6/15/2018 | | | 99,014 |
| | 55,000 | | SLM Corp., Series A, MTN,
5.375%, 1/15/2013 | | | 54,321 |
| | 35,000 | | SLM Corp., Series A, MTN,
5.375%, 5/15/2014 | | | 33,152 |
| | 420,000 | | SLM Corp., Series A, MTN,
5.625%, 8/01/2033 | | | 324,082 |
| | 1,135,000 | | SLM Corp., Series A, MTN,
8.450%, 6/15/2018 | | | 1,147,895 |
| | | | | | |
| | | | | | 3,122,445 |
| | | | | | |
| | | Non-Captive Diversified — 3.8% | | | |
| | 1,275,000 | | GATX Corp.,
4.750%, 5/15/2015 | | | 1,265,477 |
| | 745,000 | | General Electric Capital Corp.,
5.875%, 1/14/2038 | | | 708,308 |
| | 4,120,000 | | General Electric Capital Corp., Series A, GMTN,
6.150%, 8/07/2037 | | | 4,028,973 |
| | 2,472,000 | | GMAC, Inc.,
6.625%, 5/15/2012 | | | 2,496,720 |
| | 1,211,000 | | GMAC, Inc.,
8.000%, 11/01/2031 | | | 1,156,505 |
| | 1,105,000 | | GMAC, Inc., 144A,
8.300%, 2/12/2015 | | | 1,160,250 |
| | 465,000 | | International Lease Finance Corp.,
5.000%, 4/15/2010 | | | 465,042 |
| | 205,000 | | International Lease Finance Corp.,
6.375%, 3/25/2013 | | | 200,338 |
See accompanying notes to financial statements.
17
LOOMIS SAYLES CORE PLUS BOND FUND — PORTFOLIOOF INVESTMENTS (CONTINUED)
Investments as of March 31, 2010 (Unaudited)
| | | | | | |
Principal
Amount (‡) | | Description | | Value (†) |
| | | | | | |
| | | Non-Captive Diversified — continued | | | |
| $ | 120,000 | | International Lease Finance Corp., Series R, MTN,
5.300%, 5/01/2012 | | $ | 116,552 |
| | 40,000 | | International Lease Finance Corp., Series R, MTN,
5.550%, 9/05/2012 | | | 38,956 |
| | 200,000 | | International Lease Finance Corp., Series R, MTN,
5.625%, 9/20/2013 | | | 188,655 |
| | 285,000 | | International Lease Finance Corp., Series R, MTN,
5.650%, 6/01/2014 | | | 264,140 |
| | | | | | |
| | | | | | 12,089,916 |
| | | | | | |
| | | Oil Field Services — 0.9% | | | |
| | 190,000 | | Nabors Industries, Inc.,
6.150%, 2/15/2018 | | | 202,408 |
| | 730,000 | | Nabors Industries, Inc.,
9.250%, 1/15/2019 | | | 908,032 |
| | 1,605,000 | | Parker Drilling Co., 144A,
9.125%, 4/01/2018 | | | 1,643,119 |
| | | | | | |
| | | | | | 2,753,559 |
| | | | | | |
| | | Packaging — 0.3% | | | |
| | 1,105,000 | | Ball Corp.,
6.750%, 9/15/2020 | | | 1,124,337 |
| | | | | | |
| | | Paper — 1.8% | | | |
| | 565,000 | | Georgia-Pacific Corp.,
7.375%, 12/01/2025 | | | 562,175 |
| | 1,470,000 | | Georgia-Pacific Corp.,
7.750%, 11/15/2029 | | | 1,470,000 |
| | 735,000 | | Georgia-Pacific Corp.,
8.000%, 1/15/2024 | | | 779,100 |
| | 365,000 | | Georgia-Pacific Corp.,
8.875%, 5/15/2031 | | | 396,025 |
| | 1,945,000 | | International Paper Co.,
9.375%, 5/15/2019 | | | 2,431,439 |
| | | | | | |
| | | | | | 5,638,739 |
| | | | | | |
| | | Pipelines — 0.6% | | | |
| | 830,000 | | Enterprise Products Operating LLC,
7.550%, 4/15/2038 | | | 954,799 |
| | 705,000 | | ONEOK Partners LP,
8.625%, 3/01/2019 | | | 870,566 |
| | | | | | |
| | | | | | 1,825,365 |
| | | | | | |
| | | Property & Casualty Insurance — 0.2% | | | |
| | 475,000 | | Willis North America, Inc.,
6.200%, 3/28/2017 | | | 481,219 |
| | 245,000 | | Willis North America, Inc.,
7.000%, 9/29/2019 | | | 256,560 |
| | | | | | |
| | | | | | 737,779 |
| | | | | | |
| | | Refining — 2.4% | | | |
| | 1,895,000 | | Coffeyville Resources, 144A,
10.875%, 4/01/2017 | | | 1,880,788 |
| | 2,720,000 | | Motiva Enterprises LLC, 144A,
6.850%, 1/15/2040 | | | 2,931,189 |
| | 1,570,000 | | Valero Energy Corp.,
6.125%, 2/01/2020 | | | 1,570,397 |
| | 965,000 | | Valero Energy Corp.,
9.375%, 3/15/2019 | | | 1,148,867 |
| | | | | | |
| | | | | | 7,531,241 |
| | | | | | |
| | | | | |
Principal
Amount (‡) | | Description | | Value (†) |
| | | | | |
| | Sovereigns — 3.2% | | | |
| 1,230,000(††) | | Mexican Fixed Rate Bonds, Series M-10,
7.750%, 12/14/2017 (MXN) | | $ | 10,132,484 |
| | | | | |
| | Supranational — 1.5% | | | |
| 439,000,000 | | European Investment Bank,
1.250%, 9/20/2012 (JPY) | | | 4,803,296 |
| | | | | |
| | Technology — 4.2% | | | |
| 1,895,000 | | Amphenol Corp.,
4.750%, 11/15/2014 | | | 1,949,366 |
| 830,000 | | Brocade Communications Systems, Inc., 144A,
6.625%, 1/15/2018 | | | 844,525 |
| 290,000 | | Brocade Communications Systems, Inc., 144A,
6.875%, 1/15/2020 | | | 295,800 |
| 745,000 | | Corning, Inc.,
7.250%, 8/15/2036 | | | 798,201 |
| 440,000 | | Equifax, Inc.,
7.000%, 7/01/2037 | | | 469,911 |
| 2,760,000 | | Equinix, Inc.,
8.125%, 3/01/2018 | | | 2,856,600 |
| 1,180,000 | | Fiserv, Inc.,
6.125%, 11/20/2012 | | | 1,284,260 |
| 215,000 | | Jabil Circuit, Inc.,
7.750%, 7/15/2016 | | | 226,287 |
| 85,000 | | Motorola, Inc.,
6.500%, 9/01/2025 | | | 82,542 |
| 485,000 | | Motorola, Inc.,
6.500%, 11/15/2028 | | | 455,299 |
| 185,000 | | Motorola, Inc.,
6.625%, 11/15/2037 | | | 173,625 |
| 1,775,000 | | National Semiconductor Corp.,
3.950%, 4/15/2015 | | | 1,755,067 |
| 279,000 | | Xerox Corp.,
5.500%, 5/15/2012 | | | 295,936 |
| 1,435,000 | | Xerox Corp.,
6.350%, 5/15/2018 | | | 1,554,498 |
| 316,000 | | Xerox Corp.,
6.400%, 3/15/2016 | | | 346,816 |
| | | | | |
| | | | | 13,388,733 |
| | | | | |
| | Textile — 0.5% | | | |
| 1,515,000 | | Hanesbrands, Inc.,
8.000%, 12/15/2016 | | | 1,568,025 |
| | | | | |
| | Tobacco — 0.6% | | | |
| 1,995,000 | | Reynolds American, Inc.,
7.250%, 6/15/2037 | | | 2,030,527 |
| | | | | |
| | Treasuries — 14.9% | | | |
| 4,425,000 | | Republic of Germany,
4.000%, 4/13/2012 (EUR) | | | 6,339,170 |
| 8,162,000 | | U.S. Treasury Note
0.875%, 12/31/2010 | | | 8,193,881 |
| 955,000 | | U.S. Treasury Note,
0.875%, 5/31/2011 | | | 959,104 |
| 910,000 | | U.S. Treasury Note,
1.875%, 6/15/2012 | | | 924,858 |
| 1,000,000 | | U.S. Treasury Note,
2.625%, 6/30/2014 | | | 1,014,766 |
| 17,855,000 | | U.S. Treasury Note,
3.125%, 5/15/2019 | | | 17,005,495 |
See accompanying notes to financial statements.
18
LOOMIS SAYLES CORE PLUS BOND FUND — PORTFOLIOOF INVESTMENTS (CONTINUED)
Investments as of March 31, 2010 (Unaudited)
| | | | | | |
Principal
Amount (‡) | | Description | | Value (†) |
| | | | | | |
| | | Treasuries — continued | | | |
| $ | 3,545,000 | | U.S. Treasury Note,
3.250%, 7/31/2016 | | $ | 3,581,836 |
| | 1,345,000 | | U.S. Treasury Note,
3.625%, 8/15/2019 | | | 1,328,607 |
| | 1,555,000 | | U.S. Treasury Note,
3.625%, 2/15/2020 | | | 1,528,517 |
| | 1,060,000 | | U.S. Treasury Note,
3.750%, 11/15/2018 | | | 1,068,033 |
| | 2,160,000 | | U.S. Treasury Note
4.375%, 12/15/2010 | | | 2,221,679 |
| | 3,005,000 | | U.S. Treasury Note,
4.625%, 2/15/2017 | | | 3,274,275 |
| | | | | | |
| | | | | | 47,440,221 |
| | | | | | |
| | | Wireless — 3.9% | | | |
| | 2,185,000 | | America Movil Sab De CV, 144A,
6.125%, 3/30/2040 | | | 2,135,160 |
| | 1,070,000 | | American Tower Corp.,
4.625%, 4/01/2015 | | | 1,100,403 |
| | 2,615,000 | | CC Holdings GS V LLC/Crown Castle GS III Corp., 144A,
7.750%, 5/01/2017 | | | 2,850,350 |
| | 10,000 | | Nextel Communications, Inc., Series D,
7.375%, 8/01/2015 | | | 9,500 |
| | 15,000 | | Nextel Communications, Inc., Series F,
5.950%, 3/15/2014 | | | 13,988 |
| | 1,385,000 | | SK Telecom Co., Ltd., 144A,
6.625%, 7/20/2027 | | | 1,459,266 |
| | 3,945,000 | | Sprint Capital Corp.,
6.875%, 11/15/2028 | | | 3,175,725 |
| | 100,000 | | True Move Co. Ltd., 144A,
10.375%, 8/01/2014 | | | 103,500 |
| | 1,520,000 | | True Move Co. Ltd., 144A,
10.750%, 12/16/2013 | | | 1,586,500 |
| | | | | | |
| | | | | | 12,434,392 |
| | | | | | |
| | | Wirelines — 6.5% | | | |
| | 2,795,000 | | Axtel SAB de CV, 144A,
9.000%, 9/22/2019 | | | 2,850,900 |
| | 4,033,000 | | Embarq Corp.,
7.995%, 6/01/2036 | | | 4,089,236 |
| | 1,575,000 | | Frontier Communications Corp.,
7.875%, 1/15/2027 | | | 1,417,500 |
| | 1,325,000 | | New Communications Holdings, Inc., 144A,
7.875%, 4/15/2015 | | | 1,361,437 |
| | 450,000 | | New Communications Holdings, Inc., 144A,
8.250%, 4/15/2017 | | | 457,875 |
| | 210,000 | | Qwest Capital Funding, Inc.,
6.500%, 11/15/2018 | | | 196,350 |
| | 1,350,000 | | Qwest Corp.,
6.875%, 9/15/2033 | | | 1,302,750 |
| | 1,545,000 | | Qwest Corp.,
7.250%, 9/15/2025 | | | 1,560,450 |
| | 255,000 | | Qwest Corp.,
7.250%, 10/15/2035 | | | 246,075 |
| | 2,020,000 | | Qwest Corp.,
7.500%, 6/15/2023 | | | 2,020,000 |
| | 775,000 | | Qwest Corp.,
8.875%, 3/15/2012 | | | 848,625 |
| | 590,000 | | Telecom Italia Capital SA,
6.000%, 9/30/2034 | | | 523,413 |
| | | | | | | |
Principal
Amount (‡) | | Description | | Value (†) | |
| | | | | | | |
| $ | 2,435,000 | | Telecom Italia Capital SA,
7.200%, 7/18/2036 | | $ | 2,458,503 | |
| | 1,100,000 | | Telemar Norte Leste SA, 144A,
9.500%, 4/23/2019 | | | 1,306,250 | |
| | | | | | | |
| | | | | | 20,639,364 | |
| | | | | | | |
| | | Total Bonds and Notes (Identified Cost $297,826,205) | | | 313,549,216 | |
| | | | | | | |
Shares | | | | | |
| | Preferred Stocks — 0.2% | |
| | | Banking — 0.1% | | | | |
| | 532 | | GMAC, Inc., Series G, 144A,
7.000% | | | 405,517 | |
| | | | | | | |
| | | Thrifts & Mortgage Finance — 0.1% | | | | |
| | 256,000 | | Federal National Mortgage Association,
6.750%(g)(h) | | | 238,080 | |
| | 4,200 | | Federal National Mortgage Association, (fixed rate to 12/13/2010, variable rate thereafter),
8.250%(g)(h) | | | 5,334 | |
| | | | | | | |
| | | | | | 243,414 | |
| | | | | | | |
| | | Total Preferred Stocks (Identified Cost $1,717,443) | | | 648,931 | |
| | | | | | | |
Principal
Amount (‡) | | | | | |
| | Short-Term Investments — 3.0% | |
| $ | 8,079,061 | | Tri-Party Repurchase Agreement with Fixed Income Clearing Corporation, dated 3/31/2010 at 0.000% to be repurchased at $8,079,061 on 4/01/2010, collateralized by $7,700,000 Federal National Mortgage Association, 5.125% due 4/15/2011 valued at $8,242,850, including accrued interest (Note 2 of Notes to Financial Statements) | | | 8,079,061 | |
| | 1,590,000 | | U.S. Treasury Bill,
0.101%, 6/17/2010(i) | | | 1,589,507 | |
| | | | | | | |
| | | Total Short-Term Investments (Identified Cost $9,668,502) | | | 9,668,568 | |
| | | | | | | |
| | | | | | | |
| | | Total Investments — 101.3%
(Identified Cost $309,212,150)(a) | | | 323,866,715 | |
| | | Other assets less liabilities—(1.3)% | | | (4,269,157 | ) |
| | | | | | | |
| | | Net Assets — 100.0% | | $ | 319,597,558 | |
| | | | | | | |
| | | | | | | |
| | (‡) | | Principal amount stated in U.S. dollars unless otherwise noted. | | | | |
| | (†) | | See Note 2 of Notes to Financial Statements. | | | | |
| | (††) | | Amount shown represents units. One unit represents a principal amount of 100. | |
| | (a) | | Federal Tax Information (Amounts exclude certain adjustments made at the end of the Fund’s fiscal year for tax purposes. Such adjustments are primarily due to wash sales. Amortization of premium on debt securities is excluded for tax purposes.): At March 31, 2010, the net unrealized appreciation on investments based on a cost of $309,445,799 for federal income tax purposes was as follows: | |
| | | Aggregate gross unrealized appreciation for all investments in which there is an excess of value over tax cost | | $ | 16,968,289 | |
| | | Aggregate gross unrealized depreciation for all investments in which there is an excess of tax cost over value | | | (2,547,373 | ) |
| | | | | | | |
| | | Net unrealized appreciation | | $ | 14,420,916 | |
| | | | | | | |
| | (b) | | Delayed delivery. See Note 2 of Notes to Financial Statements. | | | | |
| | (c) | | Variable rate security. Rate as of March 31, 2010 is disclosed. | | | | |
| | (d) | | Illiquid security. At March 31, 2010, the value of this security amounted to $1,174,762 or 0.4% of net assets. | |
See accompanying notes to financial statements.
19
LOOMIS SAYLES CORE PLUS BOND FUND — PORTFOLIOOF INVESTMENTS (CONTINUED)
Investments as of March 31, 2010 (Unaudited)
| | | | |
| | | | |
| (e) | | The Fund’s investment in mortgage related securities of the Federal Home Loan Mortgage Corporation, Federal National Mortgage Association and Government National Mortgage Association are interests in separate pools of mortgages. All separate investments in securities of each issuer which have the same coupon rate have been aggregated for the purpose of presentation in the Portfolio of Investments. |
| (f) | | All or a portion of this security has been segregated to cover collateral requirements on TBA obligations. |
| (g) | | Non-income producing security. | | |
| (h) | | Future dividend payments have been eliminated as the issuer has been placed in conservatorship. |
| (i) | | Interest rate represents discount rate at time of purchase; not a coupon rate. |
| | |
| 144A | | Securities exempt from registration under Rule 144A of the Securities Act of 1933. These securities may be resold in transactions exempt from registration, normally to qualified institutional buyers. At March 31, 2010, the value of these securities amounted to $48,109,415 or 15.1% of net assets. |
| | |
| ABS | | Asset-Backed Securities | | |
| ARMs | | Adjustable Rate Mortgages | | |
| FHLMC | | Federal Home Loan Mortgage Corporation | | |
| FNMA | | Federal National Mortgage Association | | |
| GMTN | | Global Medium Term Note | | |
| GNMA | | Government National Mortgage Association | | |
| MTN | | Medium Term Note | | |
| TBA | | To Be Announced | | |
| | | | |
| EUR | | Euro | | |
| JPY | | Japanese Yen | | |
| MXN | | Mexican Peso | | |
Industry Summary at March 31, 2010 (Unaudited)
| | | |
| Treasuries | | 14.9 | % |
| Mortgage Related | | 13.5 | |
| Commercial Mortgage-Backed Securities | | 8.0 | |
| Wirelines | | 6.5 | |
| Banking | | 5.9 | |
| Technology | | 4.2 | |
| Wireless | | 3.9 | |
| Non-Captive Diversified | | 3.8 | |
| Sovereigns | | 3.2 | |
| Food & Beverage | | 2.8 | |
| Refining | | 2.4 | |
| Electric | | 2.0 | |
| ABS Car Loan | | 2.0 | |
| Media Cable | | 2.0 | |
| Other Investments, less than 2% each | | 23.2 | |
| Short-Term Investments | | 3.0 | |
| | | |
| Total Investments | | 101.3 | |
| Other assets less liabilities | | (1.3 | ) |
| | | |
| Net Assets | | 100.0 | % |
| | | |
See accompanying notes to financial statements.
20
LOOMIS SAYLES HIGH INCOME FUND — PORTFOLIOOF INVESTMENTS
Investments as of March 31, 2010 (Unaudited)
| | | | | | |
Principal
Amount (‡) | | Description | | Value (†) |
| | | | | | |
| | Bonds and Notes — 84.4% of Net Assets |
| | Non-Convertible Bonds — 66.2% |
| | | ABS Car Loan — 0.3% | | | |
| $ | 105,000 | | Avis Budget Car Rental LLC/Avis Budget Finance, Inc.,
7.750%, 5/15/2016 | | $ | 102,900 |
| | 315,000 | | Avis Budget Car Rental LLC/Avis Budget Finance, Inc., 144A,
9.625%, 3/15/2018 | | | 329,175 |
| | | | | | |
| | | | | | 432,075 |
| | | | | | |
| | | ABS Home Equity — 1.6% | | | |
| | 700,000 | | Asset Backed Funding Certificates, Series 2006-HE1, Class A2B,
0.356%, 1/25/2037(b) | | | 340,296 |
| | 225,000 | | Bear Stearns Asset Backed Securities Trust, Series 2004-HE7, Class M2,
1.396%, 8/25/2034(b) | | | 137,685 |
| | 247,416 | | Countrywide Asset-Backed Certificates, Series 2004-6,
Class M1,
0.846%, 10/25/2034(b) | | | 155,131 |
| | 650,000 | | Fremont Home Loan Trust, Series 2004-D, Class M2,
0.846%, 11/25/2034(b) | | | 397,464 |
| | 725,000 | | GSAMP Trust, Series 2006-HE5, Class A2C,
0.396%, 8/25/2036(b) | | | 283,091 |
| | 150,000 | | Park Place Securities, Inc., Series 2004-WCW2, Class M2,
0.896%, 10/25/2034(b) | | | 84,204 |
| | 1,000,000 | | Residential Asset Mortgage Products, Inc., Series 2006-RZ5, Class A2,
0.426%, 8/25/2046(b) | | | 827,211 |
| | | | | | |
| | | | | | 2,225,082 |
| | | | | | |
| | | Airlines — 1.3% | | | |
| | 37,277 | | Continental Airlines Pass Through Trust, Series 1997-4,
Class 4B,
6.900%, 7/02/2018 | | | 35,972 |
| | 302,009 | | Continental Airlines Pass Through Trust, Series 2000-2,
Class A-1,
7.707%, 10/02/2022 | | | 302,009 |
| | 514,974 | | Continental Airlines Pass Through Trust, Series 2001-1, Class B,
7.373%, 6/15/2017 | | | 486,651 |
| | 180,000 | | Continental Airlines Pass Through Trust, Series 2007-1, Class B,
6.903%, 4/19/2022 | | | 163,800 |
| | 745,000 | | UAL Pass Through Trust, Series 2009-1,
10.400%, 5/01/2018 | | | 800,875 |
| | | | | | |
| | | | | | 1,789,307 |
| | | | | | |
| | | Automotive — 2.1% | | | |
| | 450,000 | | FCE Bank PLC, EMTN,
7.875%, 2/15/2011, (GBP) | | | 697,352 |
| | 420,000 | | Ford Motor Co.,
6.375%, 2/01/2029 | | | 341,250 |
| | 1,220,000 | | Ford Motor Co.,
6.625%, 10/01/2028 | | | 1,024,800 |
| | 65,000 | | Ford Motor Co.,
6.625%, 2/15/2028 | | | 54,600 |
| | 40,000 | | Ford Motor Co.,
7.500%, 8/01/2026 | | | 35,500 |
| | 150,000 | | Ford Motor Credit Co. LLC,
8.000%, 12/15/2016 | | | 158,043 |
| | 635,000 | | Goodyear Tire & Rubber Co. (The),
7.000%, 3/15/2028 | | | 547,687 |
| | | | | | |
| | | | | | 2,859,232 |
| | | | | | |
| | | | | |
Principal
Amount (‡) | | Description | | Value (†) |
| | | | | |
| | Banking — 0.9% | | | |
| 12,176,250,000 | | JPMorgan Chase Bank NA, EMTN, 144A,
Zero Coupon, 10/17/2011, (IDR) | | $ | 1,212,072 |
| | | | | |
| | Building Materials — 0.9% | | | |
| 50,000 | | Masco Corp.,
6.500%, 8/15/2032 | | | 42,915 |
| 345,000 | | Masco Corp.,
7.750%, 8/01/2029 | | | 329,476 |
| 785,000 | | USG Corp.,
6.300%, 11/15/2016 | | | 702,575 |
| 75,000 | | USG Corp.,
9.500%, 1/15/2018 | | | 75,844 |
| 65,000 | | USG Corp., 144A,
9.750%, 8/01/2014 | | | 68,900 |
| | | | | |
| | | | | 1,219,710 |
| | | | | |
| | Chemicals — 1.3% | | | |
| 855,000 | | Hercules, Inc., Subordinated Note,
6.500%, 6/30/2029 | | | 684,000 |
| 450,000 | | LBI Escrow Corp., 144A,
8.000%, 11/01/2017 | | | 466,875 |
| 680,000 | | Reichhold Industries, Inc., 144A,
9.000%, 8/15/2014 | | | 644,300 |
| | | | | |
| | | | | 1,795,175 |
| | | | | |
| | Collateralized Mortgage Obligations — 1.9% | | | |
| 450,005 | | Adjustable Rate Mortgage Trust, Series 2005-10, Class 5A1,
0.506%, 1/25/2036(b) | | | 262,076 |
| 335,247 | | GSR Mortgage Loan Trust, Series 2005-AR7, Class 2A1,
3.399%, 11/25/2035(b) | | | 285,094 |
| 553,112 | | Impac CMB Trust, Series 2005-3, Class A1,
0.486%, 8/25/2035(b) | | | 362,609 |
| 714,179 | | Lehman Mortgage Trust, Series 2005-3, Class 1A6,
0.746%, 1/25/2036(b) | | | 449,828 |
| 588,266 | | Lehman Mortgage Trust, Series 2006-6, Class 5A1,
0.746%, 12/25/2036(b) | | | 425,234 |
| 715,484 | | Lehman XS Trust, Series 2007-10H, Class 1A11,
0.366%, 7/25/2037(b)(k) | | | 347,276 |
| 347,029 | | Master Adjustable Rate Mortgages Trust, Series 2005-2,
Class 5A1,
3.004%, 3/25/2035(b) | | | 290,766 |
| 507,192 | | Residential Accredit Loans, Inc., Series 2005-QA13, Class 2A1,
5.794%, 12/25/2035(b) | | | 268,504 |
| | | | | |
| | | | | 2,691,387 |
| | | | | |
| | Commercial Mortgage-Backed Securities — 0.6% | | | |
| 100,000 | | Bear Stearns Commercial Mortgage Securities, Series 2007-PW15, Class A4,
5.331%, 2/11/2044 | | | 96,349 |
| 100,000 | | Credit Suisse Mortgage Capital Certificates, Series 2007-C4, Class A4,
5.998%, 9/15/2039(b) | | | 90,955 |
| 520,000 | | JPMorgan Chase Commercial Mortgage Securities Corp., Series 2007-LD11, Class A4,
6.006%, 6/15/2049(b) | | | 498,627 |
| 100,000 | | JPMorgan Chase Commercial Mortgage Securities Corp., Series 2007-LDPX, Class A3,
5.420%, 1/15/2049 | | | 96,335 |
| | | | | |
| | | | | 782,266 |
| | | | | |
| | Construction Machinery — 0.9% | | | |
| 100,000 | | Oshkosh Corp., 144A,
8.250%, 3/01/2017 | | | 103,250 |
See accompanying notes to financial statements.
21
LOOMIS SAYLES HIGH INCOME FUND — PORTFOLIOOF INVESTMENTS (continued)
Investments as of March 31, 2010 (Unaudited)
| | | | | | |
Principal
Amount (‡) | | Description | | Value (†) |
| | | | | | |
| | | Construction Machinery — continued | | | |
| $ | 985,000 | | RSC Equipment Rental, Inc.,
9.500%, 12/01/2014 | | $ | 975,150 |
| | 15,000 | | United Rentals North America, Inc.,
7.750%, 11/15/2013 | | | 14,400 |
| | 170,000 | | Urbi Desarrollos Urbanos SAB de CV, 144A,
9.500%, 1/21/2020 | | | 184,025 |
| | | | | | |
| | | | | | 1,276,825 |
| | | | | | |
| | | Consumer Products — 0.7% | | | |
| | 1,085,000 | | Acco Brands Corp.,
7.625%, 8/15/2015 | | | 1,015,831 |
| | | | | | |
| | | Electric — 2.6% | | | |
| | 35,000 | | AES Corp. (The),
8.000%, 10/15/2017 | | | 35,525 |
| | 209,522 | | AES Ironwood LLC,
8.857%, 11/30/2025 | | | 205,331 |
| | 22,648 | | AES Red Oak LLC, Series A,
8.540%, 11/30/2019 | | | 23,158 |
| | 375,000 | | Dynegy Holdings, Inc.,
7.125%, 5/15/2018 | | | 266,250 |
| | 180,000 | | Dynegy Holdings, Inc.,
7.625%, 10/15/2026 | | | 115,200 |
| | 815,000 | | Dynegy Holdings, Inc.,
7.750%, 6/01/2019 | | | 615,325 |
| | 2,230,000 | | Edison Mission Energy,
7.625%, 5/15/2027 | | | 1,427,200 |
| | 140,000 | | NGC Corp. Capital Trust I, Series B,
8.316%, 6/01/2027 | | | 72,800 |
| | 195,000 | | TXU Corp., Series P,
5.550%, 11/15/2014 | | | 142,350 |
| | 1,015,000 | | TXU Corp., Series Q,
6.500%, 11/15/2024 | | | 527,800 |
| | 370,000 | | TXU Corp., Series R,
6.550%, 11/15/2034 | | | 190,550 |
| | | | | | |
| | | | | | 3,621,489 |
| | | | | | |
| | | Gaming — 0.1% | | | |
| | 185,000 | | MGM MIRAGE, 144A,
9.000%, 3/15/2020 | | | 190,550 |
| | | | | | |
| | | Government Owned - No Guarantee — 0.1% | | | |
| | 200,000 | | DP World Ltd., 144A,
6.850%, 7/02/2037 | | | 171,743 |
| | | | | | |
| | | Healthcare — 3.3% | | | |
| | 30,000 | | Boston Scientific Corp.,
7.000%, 11/15/2035 | | | 26,989 |
| | 165,000 | | Boston Scientific Corp.,
7.375%, 1/15/2040 | | | 155,793 |
| | 35,000 | | HCA, Inc.,
7.050%, 12/01/2027 | | | 29,925 |
| | 630,000 | | HCA, Inc.,
7.500%, 12/15/2023 | | | 576,450 |
| | 700,000 | | HCA, Inc.,
7.500%, 11/06/2033 | | | 609,000 |
| | 40,000 | | HCA, Inc.,
7.690%, 6/15/2025 | | | 37,000 |
| | 480,000 | | HCA, Inc.,
8.360%, 4/15/2024 | | | 454,800 |
| | 670,000 | | HCA, Inc., MTN,
7.580%, 9/15/2025 | | | 606,350 |
| | | | | | |
Principal
Amount (‡) | | Description | | Value (†) |
| | | | | | |
| | | Healthcare — continued | | | |
| $ | 1,685,000 | | HCA, Inc., MTN,
7.750%, 7/15/2036 | | $ | 1,482,800 |
| | 380,000 | | Psychiatric Solutions, Inc., 144A,
7.750%, 7/15/2015 | | | 387,125 |
| | 255,000 | | Tenet Healthcare Corp.,
6.875%, 11/15/2031 | | | 207,825 |
| | | | | | |
| | | | | | 4,574,057 |
| | | | | | |
| | | Home Construction — 3.6% | | | |
| | 410,000 | | Desarrolladora Homex SAB de CV,
7.500%, 9/28/2015 | | | 416,150 |
| | 360,000 | | KB Home, Guaranteed Note,
5.875%, 1/15/2015 | | | 341,100 |
| | 1,790,000 | | KB Home, Guaranteed Note,
7.250%, 6/15/2018 | | | 1,713,925 |
| | 830,000 | | Lennar Corp., Series B,
6.500%, 4/15/2016 | | | 799,912 |
| | 1,325,000 | | Pulte Group, Inc.,
6.000%, 2/15/2035 | | | 1,026,875 |
| | 495,000 | | Pulte Group, Inc.,
6.375%, 5/15/2033 | | | 396,000 |
| | 380,000 | | Pulte Group, Inc.,
7.875%, 6/15/2032 | | | 347,700 |
| | | | | | |
| | | | | | 5,041,662 |
| | | | | | |
| | | Independent Energy — 6.4% | | | |
| | 3,295,000 | | Chesapeake Energy Corp.,
6.500%, 8/15/2017 | | | 3,187,913 |
| | 790,000 | | Chesapeake Energy Corp.,
6.875%, 11/15/2020 | | | 768,275 |
| | 620,000 | | Connacher Oil and Gas Ltd., 144A,
10.250%, 12/15/2015 | | | 630,850 |
| | 3,127,000 | | Pioneer Natural Resources Co.,
7.200%, 1/15/2028 | | | 2,957,110 |
| | 340,000 | | SandRidge Energy, Inc., 144A,
8.000%, 6/01/2018 | | | 323,000 |
| | 1,065,000 | | Swift Energy Co.,
7.125%, 6/01/2017 | | | 1,011,750 |
| | | | | | |
| | | | | | 8,878,898 |
| | | | | | |
| | | Industrial Other — 0.5% | | | |
| | 530,000 | | Corp. Pesquera Inca SAC, 144A,
9.000%, 2/10/2017 | | | 535,300 |
| | 140,000 | | Ranhill Labuan Ltd., 144A,
12.500%, 10/26/2011 | | | 129,500 |
| | | | | | |
| | | | | | 664,800 |
| | | | | | |
| | | Lodging — 1.9% | | | |
| | 2,000,000 | | Royal Caribbean Cruises Ltd.,
7.000%, 6/15/2013 | | | 2,025,000 |
| | 670,000 | | Royal Caribbean Cruises Ltd.,
7.250%, 6/15/2016 | | | 661,625 |
| | | | | | |
| | | | | | 2,686,625 |
| | | | | | |
| | | Media Non-Cable — 1.0% | | | |
| | 240,000 | | Clear Channel Communications, Inc.,
4.400%, 5/15/2011 | | | 226,200 |
| | 415,000 | | Clear Channel Communications, Inc.,
5.000%, 3/15/2012 | | | 367,275 |
| | 595,000 | | Clear Channel Communications, Inc.,
6.250%, 3/15/2011 | | | 575,663 |
See accompanying notes to financial statements.
22
LOOMIS SAYLES HIGH INCOME FUND — PORTFOLIOOF INVESTMENTS (continued)
Investments as of March 31, 2010 (Unaudited)
| | | | | | |
Principal
Amount (‡) | | Description | | Value (†) |
| | | | | | |
| | | Media Non-Cable — continued | | | |
| $ | 20,000 | | Clear Channel Communications, Inc.,
7.650%, 9/15/2010 | | $ | 19,925 |
| | 175,000 | | Intelsat Corp.,
6.875%, 1/15/2028 | | | 150,500 |
| | | | | | |
| | | | | | 1,339,563 |
| | | | | | |
| | | Metals & Mining — 0.4% | | | |
| | 80,000 | | Algoma Acquisition Corp., 144A,
9.875%, 6/15/2015 | | | 73,600 |
| | 125,000 | | United States Steel Corp.,
7.000%, 2/01/2018 | | | 123,125 |
| | 315,000 | | United States Steel Corp.,
7.375%, 4/01/2020 | | | 315,788 |
| | | | | | |
| | | | | | 512,513 |
| | | | | | |
| | | Non-Captive Consumer — 0.6% | | | |
| | 10,000 | | SLM Corp., Series A, MTN,
5.000%, 6/15/2018 | | | 8,251 |
| | 5,000 | | SLM Corp., Series A, MTN,
5.625%, 8/01/2033 | | | 3,858 |
| | 735,000 | | SLM Corp., Series A, MTN,
6.500%, 6/15/2010, (NZD)(c) | | | 522,208 |
| | 245,000 | | SLM Corp., Series A, MTN,
8.450%, 6/15/2018 | | | 247,784 |
| | | | | | |
| | | | | | 782,101 |
| | | | | | |
| | | Non-Captive Diversified — 2.1% | | | |
| | 30,000 | | CIT Group, Inc.,
7.000%, 5/01/2017 | | | 27,675 |
| | 1,300,000 | | General Electric Capital Corp., Series A, GMTN,
2.960%, 5/18/2012, (SGD) | | | 931,464 |
| | 660,000 | | General Motors Acceptance Corp. of Canada Ltd., EMTN,
7.125%, 9/13/2011, (AUD) | | | 595,391 |
| | 139,000 | | GMAC, Inc.,
8.000%, 11/01/2031 | | | 132,745 |
| | 1,105,000 | | International Lease Finance Corp., 144A,
8.750%, 3/15/2017 | | | 1,130,451 |
| | 80,000 | | iStar Financial, Inc.,
5.850%, 3/15/2017 | | | 59,200 |
| | 10,000 | | iStar Financial, Inc.,
5.875%, 3/15/2016 | | | 7,500 |
| | 15,000 | | iStar Financial, Inc., Series B,
5.950%, 10/15/2013 | | | 12,000 |
| | | | | | |
| | | | | | 2,896,426 |
| | | | | | |
| | | Oil Field Services — 1.7% | | | |
| | 490,000 | | Basic Energy Services, Inc.,
7.125%, 4/15/2016 | | | 426,300 |
| | 380,000 | | Basic Energy Services, Inc.,
11.625%, 8/01/2014 | | | 418,000 |
| | 350,000 | | Compagnie Generale de Geophysique-Veritas,
9.500%, 5/15/2016 | | | 374,500 |
| | 305,000 | | Complete Production Services, Inc.,
8.000%, 12/15/2016 | | | 301,950 |
| | 30,000 | | Key Energy Services, Inc.,
8.375%, 12/01/2014 | | | 30,337 |
| | 296,000 | | North American Energy Partners, Inc.,
8.750%, 12/01/2011 | | | 296,000 |
| | 120,000 | | Parker Drilling Co., 144A,
9.125%, 4/01/2018 | | | 122,850 |
| | | | | | |
Principal
Amount (‡) | | Description | | Value (†) |
| | | | | | |
| | | Oil Field Services — continued | | | |
| $ | 385,000 | | Pioneer Drilling Co., 144A,
9.875%, 3/15/2018 | | $ | 381,150 |
| | | | | | |
| | | | | | 2,351,087 |
| | | | | | |
| | | Paper — 1.1% | | | |
| | 340,000 | | Georgia-Pacific Corp.,
7.250%, 6/01/2028 | | | 336,600 |
| | 160,000 | | Georgia-Pacific Corp.,
7.375%, 12/01/2025 | | | 159,200 |
| | 1,071,000 | | Georgia-Pacific Corp.,
7.750%, 11/15/2029 | | | 1,071,000 |
| | | | | | |
| | | | | | 1,566,800 |
| | | | | | |
| | | Pipelines — 2.0% | | | |
| | 2,285,000 | | El Paso Corp.,
6.950%, 6/01/2028 | | | 2,063,620 |
| | 405,000 | | El Paso Corp.,
7.420%, 2/15/2037 | | | 357,927 |
| | 110,000 | | El Paso Corp., GMTN,
7.800%, 8/01/2031 | | | 108,111 |
| | 235,000 | | El Paso Corp., GMTN,
8.050%, 10/15/2030 | | | 234,593 |
| | | | | | |
| | | | | | 2,764,251 |
| | | | | | |
| | | Refining — 0.6% | | | |
| | 150,000 | | Petroplus Finance Ltd., 144A,
6.750%, 5/01/2014 | | | 135,000 |
| | 745,000 | | Petroplus Finance Ltd., 144A,
7.000%, 5/01/2017 | | | 640,700 |
| | | | | | |
| | | | | | 775,700 |
| | | | | | |
| | | REITs — 0.1% | | | |
| | 170,000 | | Felcor Lodging LP,
10.000%, 10/01/2014 | | | 175,100 |
| | | | | | |
| | | Retailers — 2.2% | | | |
| | 250,000 | | Dillard’s, Inc.,
6.625%, 1/15/2018 | | | 231,250 |
| | 105,000 | | Dillard’s, Inc.,
7.130%, 8/01/2018 | | | 98,700 |
| | 545,000 | | J.C. Penney Corp., Inc., Senior Note,
6.375%, 10/15/2036 | | | 507,531 |
| | 510,000 | | Macy’s Retail Holdings, Inc.,
6.375%, 3/15/2037 | | | 469,200 |
| | 30,000 | | Macy’s Retail Holdings, Inc.,
6.790%, 7/15/2027 | | | 27,000 |
| | 210,000 | | Macy’s Retail Holdings, Inc.,
6.900%, 4/01/2029 | | | 199,500 |
| | 1,600,000 | | Toys R Us, Inc.,
7.375%, 10/15/2018 | | | 1,536,000 |
| | | | | | |
| | | | | | 3,069,181 |
| | | | | | |
| | | Sovereigns — 4.6% | | | |
| | 502,000(††) | | Mexican Fixed Rate Bonds, Series M-20,
8.000%, 12/07/2023, (MXN) | | | 4,066,347 |
| | 350,000 | | New South Wales Treasury Corp., Series 10RG,
7.000%, 12/01/2010, (AUD) | | | 326,782 |
| | 3,000,000 | | Republic of Brazil,
10.250%, 1/10/2028, (BRL) | | | 1,703,827 |
| | 4,611,430 | | Republic of Uruguay,
4.250%, 4/05/2027, (UYU) | | | 236,536 |
| | | | | | |
| | | | | | 6,333,492 |
| | | | | | |
See accompanying notes to financial statements.
23
LOOMIS SAYLES HIGH INCOME FUND — PORTFOLIOOF INVESTMENTS (continued)
Investments as of March 31, 2010 (Unaudited)
| | | | | | |
Principal
Amount (‡) | | Description | | Value (†) |
| | | | | | |
| | | Supermarkets — 1.3% | | | |
| $ | 300,000 | | American Stores Co.,
8.000%, 6/01/2026 | | $ | 263,250 |
| | 750,000 | | New Albertson’s, Inc.,
7.450%, 8/01/2029 | | | 633,750 |
| | 190,000 | | New Albertson’s, Inc.,
7.750%, 6/15/2026 | | | 161,500 |
| | 130,000 | | New Albertson’s, Inc.,
8.000%, 5/01/2031 | | | 111,800 |
| | 735,000 | | New Albertson’s, Inc., Series C, MTN,
6.625%, 6/01/2028 | | | 556,762 |
| | | | | | |
| | | | | | 1,727,062 |
| | | | | | |
| | | Supranational — 2.1% | | | |
| | 17,499,000,000 | | European Investment Bank, EMTN, 144A,
Zero Coupon, 4/24/2013, (IDR) | | | 1,570,766 |
| | 1,500,000,000 | | International Bank for Reconstruction & Development, EMTN,
2.300%, 2/26/2013, (KRW) | | | 1,304,388 |
| | 13,400,000 | | International Bank for Reconstruction & Development,
9.500%, 5/27/2010, (ISK) | | | 58,600 |
| | | | | | |
| | | | | | 2,933,754 |
| | | | | | |
| | | Technology — 4.2% | | | |
| | 1,090,000 | | Alcatel-Lucent USA, Inc.,
6.450%, 3/15/2029 | | | 768,450 |
| | 1,930,000 | | Alcatel-Lucent USA, Inc.,
6.500%, 1/15/2028 | | | 1,355,825 |
| | 290,000 | | Amkor Technology, Inc.,
9.250%, 6/01/2016 | | | 305,950 |
| | 1,110,000 | | First Data Corp.,
9.875%, 9/24/2015 | | | 957,375 |
| | 25,000 | | Freescale Semiconductor, Inc.,
8.875%, 12/15/2014 | | | 23,875 |
| | 580,000 | | Motorola, Inc.,
6.500%, 9/01/2025 | | | 563,227 |
| | 1,000,000 | | Motorola, Inc.,
7.500%, 5/15/2025 | | | 1,030,502 |
| | 340,000 | | Nortel Networks Capital Corp.,
7.875%, 6/15/2026(d) | | | 244,800 |
| | 560,000 | | Nortel Networks Ltd.,
6.875%, 9/01/2023(d) | | | 173,600 |
| | 355,000 | | Xerox Capital Trust I,
8.000%, 2/01/2027 | | | 348,295 |
| | | | | | |
| | | | | | 5,771,899 |
| | | | | | |
| | | Textile — 0.2% | | | |
| | 375,000 | | Jones Apparel Group, Inc.,
6.125%, 11/15/2034 | | | 305,625 |
| | | | | | |
| | | Transportation Services — 0.6% | | | |
| | 275,000 | | APL Ltd., Senior Note,
8.000%, 1/15/2024(c) | | | 205,563 |
| | 640,000 | | Overseas Shipholding Group, Senior Note,
7.500%, 2/15/2024 | | | 556,800 |
| | | | | | |
| | | | | | 762,363 |
| | | | | | |
| | | Wireless — 3.6% | | | |
| | 1,443,000 | | Nextel Communications, Inc., Series D,
7.375%, 8/01/2015 | | | 1,370,850 |
| | 944,000 | | Nextel Communications, Inc., Series E,
6.875%, 10/31/2013 | | | 920,400 |
| | 1,080,000 | | Nextel Communications, Inc., Series F,
5.950%, 3/15/2014 | | | 1,007,100 |
| | | | | | |
Principal
Amount (‡) | | Description | | Value (†) |
| | | | | | |
| | | Wireless — continued | | | |
| $ | 2,061,000 | | Sprint Capital Corp.,
6.875%, 11/15/2028 | | $ | 1,659,105 |
| | 55,000 | | Sprint Capital Corp.,
6.900%, 5/01/2019 | | | 50,325 |
| | 20,000 | | Sprint Capital Corp.,
8.750%, 3/15/2032 | | | 18,550 |
| | | | | | |
| | | | | | 5,026,330 |
| | | | | | |
| | | Wirelines — 6.8% | | | |
| | 65,000 | | Cincinnati Bell Telephone Co.,
6.300%, 12/01/2028 | | | 50,050 |
| | 530,000 | | Cincinnati Bell, Inc.,
7.000%, 2/15/2015 | | | 515,425 |
| | 1,611,153 | | FairPoint Communications, Inc.,
13.125%, 4/02/2018(d) | | | 261,812 |
| | 95,000 | | Frontier Communications Corp.,
7.000%, 11/01/2025 | | | 79,088 |
| | 30,000 | | Frontier Communications Corp.,
7.125%, 3/15/2019 | | | 28,500 |
| | 1,245,000 | | Frontier Communications Corp.,
7.875%, 1/15/2027 | | | 1,120,500 |
| | 605,000 | | Frontier Communications Corp.,
9.000%, 8/15/2031 | | | 589,875 |
| | 80,000 | | Hawaiian Telcom Communications, Inc., Series B,
12.500%, 5/01/2015(d) | | | 8 |
| | 770,000 | | Level 3 Financing, Inc.,
8.750%, 2/15/2017 | | | 704,550 |
| | 495,000 | | Level 3 Financing, Inc.,
9.250%, 11/01/2014 | | | 482,625 |
| | 2,860,000 | | Qwest Capital Funding, Inc.,
7.750%, 2/15/2031 | | | 2,717,000 |
| | 425,000 | | Qwest Capital Funding, Inc.,
6.500%, 11/15/2018 | | | 397,375 |
| | 1,445,000 | | Qwest Capital Funding, Inc., Guaranteed Note,
6.875%, 7/15/2028 | | | 1,293,275 |
| | 275,000 | | Qwest Capital Funding, Inc., Guaranteed Note,
7.625%, 8/03/2021 | | | 269,500 |
| | 10,000 | | Qwest Corp.,
6.875%, 9/15/2033 | | | 9,650 |
| | 975,000 | | Windstream Corp.,
7.875%, 11/01/2017 | | | 960,375 |
| | | | | | |
| | | | | | 9,479,608 |
| | | | | | |
| | | Total Non-Convertible Bonds (Identified Cost $82,713,129) | | | 91,701,641 |
| | | | | | |
| | Convertible Bonds — 18.2% |
| | | Automotive — 1.9% | | | |
| | 55,000 | | ArvinMeritor, Inc., (Step to Zero Coupon on 2/15/2019), 4.000%, 2/15/2027(e) | | | 46,406 |
| | 1,720,000 | | Ford Motor Co.,
4.250%, 11/15/2016 | | | 2,573,550 |
| | | | | | |
| | | | | | 2,619,956 |
| | | | | | |
| | | Diversified Manufacturing — 0.3% | | | |
| | 600,000 | | Trinity Industries, Inc.,
3.875%, 6/01/2036 | | | 470,250 |
| | | | | | |
| | | Electric — 0.5% | | | |
| | 555,000 | | CMS Energy Corp.,
5.500%, 6/15/2029 | | | 662,531 |
| | | | | | |
See accompanying notes to financial statements.
24
LOOMIS SAYLES HIGH INCOME FUND — PORTFOLIOOF INVESTMENTS (continued)
Investments as of March 31, 2010 (Unaudited)
| | | | | | |
Principal
Amount (‡) | | Description | | Value (†) |
| | | | | | |
| | | Healthcare — 2.0% | | | |
| $ | 1,555,000 | | Hologic, Inc., (Step to Zero Coupon on 12/15/2013),
2.000%, 12/15/2037(e) | | $ | 1,391,725 |
| | 40,000 | | Life Technologies Corp.,
1.500%, 2/15/2024 | | | 46,900 |
| | 1,488,000 | | Omnicare, Inc.,
3.250%, 12/15/2035 | | | 1,259,220 |
| | | | | | |
| | | | | | 2,697,845 |
| | | | | | |
| | | Independent Energy — 0.5% | | | |
| | 475,000 | | Chesapeake Energy Corp.,
2.250%, 12/15/2038 | | | 345,563 |
| | 435,000 | | Penn Virginia Corp.,
4.500%, 11/15/2012 | | | 408,900 |
| | | | | | |
| | | | | | 754,463 |
| | | | | | |
| | | Metals & Mining — 0.6% | | | |
| | 470,000 | | Peabody Energy Corp.,
4.750%, 12/15/2066 | | | 508,775 |
| | 245,000 | | Steel Dynamics, Inc.,
5.125%, 6/15/2014 | | | 301,350 |
| | | | | | |
| | | | | | 810,125 |
| | | | | | |
| | | Pharmaceuticals — 3.5% | | | |
| | 950,000 | | Human Genome Sciences, Inc.,
2.250%, 10/15/2011 | | | 1,900,000 |
| | 840,000 | | Human Genome Sciences, Inc.,
2.250%, 8/15/2012 | | | 1,510,950 |
| | 785,000 | | Kendle International, Inc.,
3.375%, 7/15/2012 | | | 741,825 |
| | 505,000 | | Valeant Pharmaceuticals International, Subordinated Note,
4.000%, 11/15/2013 | | | 703,212 |
| | | | | | |
| | | | | | 4,855,987 |
| | | | | | |
| | | REITs — 0.3% | | | |
| | 195,000 | | ProLogis,
1.875%, 11/15/2037 | | | 183,788 |
| | 170,000 | | ProLogis,
2.250%, 4/01/2037 | | | 165,325 |
| | | | | | |
| | | | | | 349,113 |
| | | | | | |
| | | Technology — 4.7% | | | |
| | 1,130,000 | | Advanced Micro Devices, Inc.,
5.750%, 8/15/2012 | | | 1,125,762 |
| | 95,000 | | Advanced Micro Devices, Inc.,
6.000%, 5/01/2015 | | | 91,081 |
| | 1,580,000 | | Alcatel-Lucent USA, Inc., Series B,
2.875%, 6/15/2025 | | | 1,368,675 |
| | 15,000 | | Ciena Corp.,
0.250%, 5/01/2013 | | | 12,450 |
| | 970,000 | | Ciena Corp.,
0.875%, 6/15/2017 | | | 654,750 |
| | 40,000 | | Ciena Corp.,
4.000%, 3/15/2015 | | | 41,400 |
| | 1,015,000 | | Intel Corp.,
2.950%, 12/15/2035 | | | 995,969 |
| | 345,000 | | JDS Uniphase Corp.,
1.000%, 5/15/2026 | | | 311,794 |
| | 1,330,000 | | Kulicke & Soffa Industries, Inc.,
0.875%, 6/01/2012 | | | 1,226,925 |
| | 285,000 | | Kulicke & Soffa Industries, Inc.,
1.000%, 6/30/2010 | | | 276,450 |
| | | | | | |
Principal
Amount (‡) | | Description | | Value (†) |
| | | | | | |
| | | Technology — continued | | | |
| $ | 188,000 | | Maxtor Corp., Subordinated Note,
5.750%, 3/01/2012(c) | | $ | 182,360 |
| | 280,000 | | Nortel Networks Corp.,
2.125%, 4/15/2014(d) | | | 210,700 |
| | | | | | |
| | | | | | 6,498,316 |
| | | | | | |
| | | Textile — 0.1% | | | |
| | 115,000 | | Iconix Brand Group, Inc.,
1.875%, 6/30/2012 | | | 107,094 |
| | | | | | |
| | | Wireless — 1.0% | | | |
| | 80,000 | | NII Holdings, Inc.,
2.750%, 8/15/2025 | | | 81,200 |
| | 1,435,000 | | NII Holdings, Inc.,
3.125%, 6/15/2012 | | | 1,354,281 |
| | | | | | |
| | | | | | 1,435,481 |
| | | | | | |
| | | Wirelines — 2.8% | | | |
| | 2,235,000 | | Level 3 Communications, Inc.,
3.500%, 6/15/2012 | | | 2,058,994 |
| | 459,000 | | Level 3 Communications, Inc.,
5.250%, 12/15/2011 | | | 446,951 |
| | 400,000 | | Level 3 Communications, Inc.,
10.000%, 5/01/2011 | | | 411,000 |
| | 815,000 | | Level 3 Communications, Inc., 144A,
7.000%, 3/15/2015(c) | | | 973,925 |
| | | | | | |
| | | | | | 3,890,870 |
| | | | | | |
| | | Total Convertible Bonds (Identified Cost $19,143,441) | | | 25,152,031 |
| | | | | | |
| | | Total Bonds and Notes (Identified Cost $101,856,570) | | | 116,853,672 |
| | | | | | |
| | Bank Loans — 1.1% |
| | | Media Non-Cable — 0.1% | | | |
| | 224,012 | | Tribune Company, Term Loan X,
5.000%, 6/04/2009(d)(f)(g) | | | 139,447 |
| | | | | | |
| | | Printing & Publishing — 0.3% | | | |
| | 395,696 | | SuperMedia, Inc., Exit Term Loan,
11.000%, 12/31/2015(g) | | | 372,338 |
| | | | | | |
| | | Technology — 0.0% | | | |
| | 2,407 | | Sungard Data Systems, Inc., Tranche A,
1.979%, 2/28/2014(g) | | | 2,324 |
| | | | | | |
| | | Wirelines — 0.7% | | | |
| | 763,371 | | FairPoint Communications, Inc., Initial Term Loan B,
5.000%, 3/31/2015(d)(g) | | | 627,445 |
| | 35,904 | | Hawaiian Telcom Communications, Inc., Tranche C Term Loan,
4.750%, 6/01/2014(g)(h) | | | 25,492 |
| | 250,000 | | Level 3 Financing, Inc., Add on Term Loan,
11.500%, 3/13/2014(g) | | | 272,500 |
| | 25,000 | | Level 3 Financing, Inc., Tranche A Term Loan,
2.501%, 3/13/2014(g) | | | 23,211 |
| | | | | | |
| | | | | | 948,648 |
| | | | | | |
| | | Total Bank Loans (Identified Cost $1,341,194) | | | 1,462,757 |
| | | | | | |
Shares | | | | |
| | Preferred Stocks — 2.1% |
| | Convertible Preferred Stocks — 1.9% |
| | | Automotive — 0.0% | | | |
| | 450 | | Ford Motor Co. Capital Trust II,
6.500%(i) | | | 20,880 |
| | | | | | |
See accompanying notes to financial statements.
25
LOOMIS SAYLES HIGH INCOME FUND — PORTFOLIOOF INVESTMENTS (continued)
Investments as of March 31, 2010 (Unaudited)
| | | | | |
| | |
| Shares | | Description | | Value (†) |
| | | | | |
| | Capital Markets — 0.8% | | | |
| 26,890 | | Newell Financial Trust I,
5.250% | | $ | 1,082,322 |
| | | | | |
| | Diversified Financial Services — 0.1% | | | |
| 3,732 | | Sovereign Capital Trust IV,
4.375% | | | 119,424 |
| | | | | |
| | Electric Utilities — 0.2% | | | |
| 6,475 | | AES Trust III,
6.750% | | | 292,589 |
| | | | | |
| | Machinery — 0.1% | | | |
| 2,550 | | United Rentals Trust I,
6.500% | | | 76,819 |
| | | | | |
| | Oil, Gas & Consumable Fuels — 0.2% | | | |
| 9,500 | | El Paso Energy Capital Trust I,
4.750% | | | 355,063 |
| | | | | |
| | Semiconductors & Semiconductor Equipment — 0.5% | | | |
| 799 | | Lucent Technologies Capital Trust I,
7.750% | | | 636,004 |
| | | | | |
| | Total Convertible Preferred Stocks (Identified Cost $2,195,580) | | | 2,583,101 |
| | | | | |
| Non-Convertible Preferred Stocks — 0.2% |
| | Banking — 0.2% | | | |
| 274 | | GMAC, Inc., Series G, 144A,
7.000% | | | 208,857 |
| | | | | |
| | Thrifts & Mortgage Finance — 0.0% | | | |
| 300 | | Federal Home Loan Mortgage Corp.,
5.000%(i)(j) | | | 465 |
| 7,900 | | Federal Home Loan Mortgage Corp.,
5.570%(i)(j) | | | 6,715 |
| 2,850 | | Federal Home Loan Mortgage Corp.,
5.660%(i)(j) | | | 2,391 |
| 1,000 | | Federal Home Loan Mortgage Corp.,
5.700%(i)(j) | | | 1,740 |
| 1,800 | | Federal Home Loan Mortgage Corp.,
5.790%(i)(j) | | | 2,916 |
| 650 | | Federal Home Loan Mortgage Corp.,
5.810%(i)(j) | | | 1,059 |
| 1,400 | | Federal Home Loan Mortgage Corp.,
5.900%(i)(j) | | | 1,259 |
| 350 | | Federal Home Loan Mortgage Corp.,
6.000%(i)(j) | | | 648 |
| 600 | | Federal Home Loan Mortgage Corp.,
6.420%(i)(j) | | | 1,146 |
| 1,350 | | Federal Home Loan Mortgage Corp.,
6.550%(i)(j) | | | 1,336 |
| 7,400 | | Federal Home Loan Mortgage Corp., (fixed rate to 12/31/2012, variable rate thereafter),
8.375%(i)(j) | | | 9,398 |
| 1,200 | | Federal National Mortgage Association,
4.750%(i)(j) | | | 1,620 |
| 200 | | Federal National Mortgage Association,
5.125%(i)(j) | | | 302 |
| 400 | | Federal National Mortgage Association,
5.375%(i)(j) | | | 684 |
| 350 | | Federal National Mortgage Association,
5.810%(i)(j) | | | 595 |
| 550 | | Federal National Mortgage Association,
6.750%(i)(j) | | | 512 |
| | | | | | |
| | |
| Shares | | Description | | Value (†) |
| | | | | | |
| | 10,250 | | Federal National Mortgage Association, (fixed rate to 12/13/2010, variable rate thereafter),
8.250%(i)(j) | | $ | 13,017 |
| | | | | | |
| | | | | | 45,803 |
| | | | | | |
| | | Total Non-Convertible Preferred Stocks
(Identified Cost $634,132) | | | 254,660 |
| | | | | | |
| | | Total Preferred Stocks (Identified Cost $2,829,712) | | | 2,837,761 |
| | | | | | |
| | Common Stocks — 0.8% |
| | | Biotechnology — 0.2% | | | |
| | 8,147 | | Vertex Pharmaceuticals, Inc.(i) | | | 332,968 |
| | | | | | |
| | | Chemicals — 0.0% | | | |
| | 1,087 | | Ashland, Inc. | | | 57,361 |
| | | | | | |
| | | Household Durables — 0.0% | | | |
| | 1,775 | | KB Home | | | 29,731 |
| | | | | | |
| | | Media — 0.1% | | | |
| | 3,338 | | Dex One Corp.(i) | | | 93,197 |
| | | | | | |
| | | Oil, Gas & Consumable Fuels — 0.3% | | | |
| | 35,176 | | El Paso Corp. | | | 381,308 |
| | | | | | |
| | | Pharmaceuticals — 0.2% | | | |
| | 6,875 | | Merck & Co., Inc. | | | 256,781 |
| | | | | | |
| | | Thrifts & Mortgage Finance — 0.0% | | | |
| | 5,500 | | Federal Home Loan Mortgage Corp.(i)(j) | | | 6,985 |
| | | | | | |
| | | Total Common Stocks (Identified Cost $1,642,171) | | | 1,158,331 |
| | | | | | |
| | Closed-End Investment Companies — 0.0% |
| | 2,535 | | Morgan Stanley Emerging Markets Debt Fund, Inc. | | | 26,466 |
| | 2,175 | | Western Asset High Income Opportunity Fund, Inc. | | | 13,833 |
| | | | | | |
| | | Total Closed-End Investment Companies
(Identified Cost $34,947) | | | 40,299 |
| | | | | | |
Principal
Amount (‡) | | | | |
| | Short-Term Investments — 10.3% |
| $ | 13,307 | | Repurchase Agreement with State Street Corporation, dated 3/31/2010 at 0.000% to be repurchased at $13,307 on 4/01/2010, collateralized by $15,000 U.S. Treasury Bill, due 7/08/2010 valued at $14,994 including accrued interest (Note 2 of Notes to Financial Statements) | | | 13,307 |
| | 14,311,357 | | Tri-Party Repurchase Agreement with Fixed Income Clearing Corporation, dated 3/31/2010 at 0.000% to be repurchased at $14,311,357 on 4/01/2010, collateralized by $14,600,000 Federal Home Loan Mortgage Corp., 2.125% due 6/18/2013 valued at $14,600,000 including accrued interest (Note 2 of Notes to Financial Statements) | | | 14,311,357 |
| | | | | | |
| | | Total Short-Term Investments (Identified Cost $14,324,664) | | | 14,324,664 |
| | | | | | |
| | | Total Investments — 98.7%
(Identified Cost $122,029,258)(a) | | | 136,677,484 |
| | | Other assets less liabilities—1.3% | | | 1,861,578 |
| | | | | | |
| | | Net Assets — 100.0% | | $ | 138,539,062 |
| | | | | | |
| | | | | | |
| | (‡) | | Principal amount stated in U.S. dollars unless otherwise noted. | | | |
| | (†) | | See Note 2 of Notes to Financial Statements. | | | |
| | (††) | | Amount shown represents units. One unit represents a principal amount of 100. |
See accompanying notes to financial statements.
26
LOOMIS SAYLES HIGH INCOME FUND — PORTFOLIOOF INVESTMENTS (continued)
Investments as of March 31, 2010 (Unaudited)
| | | | | | |
| | | | | | |
| (a) | | Federal Tax Information (Amounts exclude certain adjustments made at the end of the Fund’s fiscal year for tax purposes. Such adjustments are primarily due to wash sales. Amortization of premium on debt securities is excluded for tax purposes.): At March 31, 2010, the net unrealized appreciation on investments based on a cost of $122,051,259 for federal income tax purposes was as follows: | |
| | Aggregate gross unrealized appreciation for all investments in which there is an excess of value over tax cost | | $ | 18,094,699 | |
| | Aggregate gross unrealized depreciation for all investments in which there is an excess of tax cost over value | | | (3,468,474 | ) |
| | | | | | |
| | Net unrealized appreciation | | $ | 14,626,225 | |
| | | | | | |
| | | | | | |
| (b) | | Variable rate security. Rate as of March 31, 2010 is disclosed. | |
| (c) | | Illiquid security. At March 31, 2010, the value of these securities amounted to $1,884,056 or 1.4% of net assets. | |
| (d) | | The issuer is in default with respect to interest and/or principal payments. Income is not being accrued. | |
| (e) | | Coupon rate is a fixed rate for an initial period then resets at a specified date and rate. | |
| (f) | | Issuer has filed for bankruptcy. | | | | |
| (g) | | Variable rate security. Rate shown represents the weighted average rate at March 31, 2010. | |
| (h) | | All or a portion of interest payment is paid-in-kind. | | | | |
| (i) | | Non-income producing security. | | | | |
| (j) | | Future dividend payments have been eliminated as the issuer has been placed in conservatorship. | |
| (k) | | The issuer has made partial payments with respect to interest and/or principal. Income is not being accrued. | |
| | | |
| 144A | | Securities exempt from registration under Rule 144A of the Securities Act of 1933. These securities may be resold in transactions exempt from registration, normally to qualified institutional buyers. At March 31, 2010, the value of these securities amounted to $10,613,964 or 7.7% of net assets. | |
| | | |
| ABS | | Asset-Backed Securities | | | | |
| EMTN | | Euro Medium Term Note | | | | |
| GMTN | | Global Medium Term Note | | | | |
| MTN | | Medium Term Note | | | | |
| REITs | | Real Estate Investment Trusts | | | | |
| | | | | | |
| AUD | | Australian Dollar | | | | |
| BRL | | Brazilian Real | | | | |
| GBP | | British Pound | | | | |
| IDR | | Indonesian Rupiah | | | | |
| ISK | | Icelandic Krona | | | | |
| KRW | | South Korean Won | | | | |
| MXN | | Mexican Peso | | | | |
| NZD | | New Zealand Dollar | | | | |
| SGD | | Singapore Dollar | | | | |
| UYU | | Uruguayan Peso | | | | |
Industry Summary at March 31, 2010 (Unaudited)
| | | |
| Wirelines | | 10.3 | % |
| Technology | | 8.9 | |
| Independent Energy | | 6.9 | |
| Healthcare | | 5.3 | |
| Wireless | | 4.6 | |
| Sovereigns | | 4.6 | |
| Automotive | | 4.0 | |
| Pharmaceuticals | | 3.7 | |
| Home Construction | | 3.6 | |
| Electric | | 3.1 | |
| Retailers | | 2.2 | |
| Supranational | | 2.1 | |
| Non-Captive Diversified | | 2.1 | |
| Pipelines | | 2.0 | |
| Other Investments, less than 2% each | | 25.0 | |
| Short-Term Investments | | 10.3 | |
| | | |
| Total Investments | | 98.7 | |
| Other assets less liabilities | | 1.3 | |
| | | |
| Net Assets | | 100.0 | % |
| | | |
See accompanying notes to financial statements.
27
LOOMIS SAYLES INTERNATIONAL BOND FUND — PORTFOLIOOF INVESTMENTS
Investments as of March 31, 2010 (Unaudited)
| | | | | |
Principal
Amount (‡) | | Description | | Value (†) |
| | | | | |
| Bonds and Notes — 96.4% of Net Assets |
| Non-Convertible Bonds — 95.7% | | | |
| | Australia — 3.1% | | | |
| 200,000 | | Australia & New Zealand Banking Group Ltd., EMTN,
2.625%, 11/16/2012, (EUR) | | $ | 273,070 |
| 200,000 | | National Australia Bank Ltd., EMTN,
3.500%, 1/23/2015, (EUR) | | | 275,928 |
| 505,000 | | New South Wales Treasury Corp., Series 10RG,
7.000%, 12/01/2010, (AUD) | | | 471,500 |
| | | | | |
| | | | | 1,020,498 |
| | | | | |
| | Belgium — 3.7% | | | |
| 100,000 | | Anheuser-Busch InBev NV, EMTN,
6.500%, 6/23/2017, (GBP) | | | 169,462 |
| 720,000 | | Kingdom of Belgium, Series 50,
4.000%, 3/28/2013, (EUR) | | | 1,042,690 |
| | | | | |
| | | | | 1,212,152 |
| | | | | |
| | Brazil — 1.1% | | | |
| 190,279(††) | | Brazil Notas do Tesouro Nacional, Series B,
6.000%, 5/15/2015, (BRL) | | | 105,488 |
| 100,000 | | NET Servicos de Comunicacao SA, 144A,
7.500%, 1/27/2020 | | | 105,500 |
| 250,000 | | Republic of Brazil,
10.250%, 1/10/2028, (BRL) | | | 141,986 |
| | | | | |
| | | | | 352,974 |
| | | | | |
| | Canada — 6.3% | | | |
| 225,000 | | Bell Canada, Series M-17,
6.100%, 3/16/2035, (CAD) | | | 222,147 |
| 170,000 | | Canadian Government,
2.000%, 9/01/2012, (CAD) | | | 167,251 |
| 805,000 | | Canadian Government,
4.500%, 6/01/2015, (CAD)(b) | | | 853,293 |
| 165,000 | | Corus Entertainment, Inc., 144A,
7.250%, 2/10/2017, (CAD) | | | 165,429 |
| 200,000 | | Province of Ontario, EMTN,
4.000%, 12/03/2019, (EUR) | | | 278,011 |
| 150,000 | | Province of Quebec Canada, EMTN,
3.375%, 6/20/2016, (EUR) | | | 205,909 |
| 200,000 | | Shaw Communications, Inc.,
5.650%, 10/01/2019, (CAD) | | | 202,713 |
| | | | | |
| | | | | 2,094,753 |
| | | | | |
| | Cayman Islands — 1.7% | | | |
| 60,000 | | DASA Finance Corp., 144A,
8.750%, 5/29/2018 | | | 64,200 |
| 100,000 | | Fibria Overseas Finance Ltd., 144A,
9.250%, 10/30/2019 | | | 114,000 |
| 200,000 | | Hutchison Whampoa Finance Ltd.,
4.625%, 9/21/2016, (EUR) | | | 278,210 |
| 100,000 | | Odebrecht Finance Ltd., 144A,
7.000%, 4/21/2020 | | | 104,125 |
| | | | | |
| | | | | 560,535 |
| | | | | |
| | Denmark — 1.9% | | | |
| 3,250,000 | | Denmark Government Bond,
4.000%, 11/15/2015, (DKK) | | | 631,571 |
| | | | | |
| | France — 6.3% | | | |
| 100,000 | | Cie Financiere et Industrielle des Autoroutes,
5.250%, 4/30/2018, (EUR) | | | 147,848 |
| | | | | |
Principal
Amount (‡) | | Description | | Value (†) |
| | | | | |
| | France — continued | | | |
| 375,000 | | Government of France,
4.000%, 4/25/2013, (EUR) | | $ | 544,126 |
| 305,000 | | Government of France,
4.250%, 10/25/2017, (EUR) | | | 447,283 |
| 315,000 | | Government of France,
5.000%, 10/25/2016, (EUR) | | | 482,274 |
| 140,000 | | Lafarge SA, EMTN,
4.750%, 3/23/2020, (EUR) | | | 181,282 |
| 50,000 | | Lafarge SA, EMTN,
5.375%, 6/26/2017, (EUR) | | | 68,857 |
| 70,000 | | Veolia Environnement, EMTN,
6.125%, 11/25/2033, (EUR) | | | 107,226 |
| 100,000 | | Wendel,
4.875%, 5/26/2016, (EUR) | | | 119,546 |
| | | | | |
| | | | | 2,098,442 |
| | | | | |
| | Germany — 19.3% | | | |
| 100,000 | | Bertelsmann AG, EMTN,
3.625%, 10/06/2015, (EUR) | | | 132,785 |
| 185,000 | | Kreditanstalt fuer Wiederaufbau,
2.500%, 10/11/2010, (EUR) | | | 252,290 |
| 110,000 | | Landesbank Baden-Wuerttemberg,
3.750%, 2/12/2014, (EUR) | | | 157,451 |
| 105,000 | | Muenchener Hypothekenbank eG,
5.000%, 1/16/2012, (EUR) | | | 150,872 |
| 735,000 | | Republic of Germany,
3.250%, 1/04/2020, (EUR) | | | 1,005,366 |
| 315,000 | | Republic of Germany,
3.750%, 7/04/2013, (EUR) | | | 455,730 |
| 1,005,000 | | Republic of Germany,
3.750%, 1/04/2017, (EUR)(b) | | | 1,451,757 |
| 395,000 | | Republic of Germany,
4.000%, 4/13/2012, (EUR) | | | 565,870 |
| 285,000 | | Republic of Germany,
4.000%, 1/04/2037, (EUR) | | | 393,673 |
| 490,000 | | Republic of Germany,
4.250%, 7/04/2017, (EUR) | | | 727,795 |
| 380,000 | | Republic of Germany,
4.500%, 1/04/2013, (EUR) | | | 557,448 |
| 295,000 | | Republic of Germany,
6.500%, 7/04/2027, (EUR) | | | 539,335 |
| | | | | |
| | | | | 6,390,372 |
| | | | | |
| | India — 0.6% | | | |
| 100,000 | | Canara Bank Ltd., (fixed rate to 11/28/2016, variable rate thereafter),
6.365%, 11/28/2021 | | | 99,542 |
| 100,000 | | ICICI Bank Ltd., (fixed rate to 4/30/2017, variable rate thereafter), 144A,
6.375%, 4/30/2022 | | | 94,153 |
| | | | | |
| | | | | 193,695 |
| | | | | |
| | Indonesia — 0.3% | | | |
| 100,000 | | Adaro Indonesia PT, 144A,
7.625%, 10/22/2019 | | | 103,880 |
| | | | | |
| | Ireland — 0.8% | | | |
| 30,000,000 | | Depfa ACS Bank, Series 686, EMTN,
1.650%, 12/20/2016, (JPY) | | | 272,960 |
| | | | | |
See accompanying notes to financial statements.
28
LOOMIS SAYLES INTERNATIONAL BOND FUND — PORTFOLIOOF INVESTMENTS (continued)
Investments as of March 31, 2010 (Unaudited)
| | | | | |
Principal
Amount (‡) | | Description | | Value (†) |
| | | | | |
| | Italy — 1.1% | | | |
| 100,000 | | Atlantia SpA, Series 5, EMTN,
5.625%, 5/06/2016, (EUR) | | $ | 149,223 |
| 150,000 | | Finmeccanica SpA, EMTN,
4.875%, 3/24/2025, (EUR) | | | 203,361 |
| | | | | |
| | | | | 352,584 |
| | | | | |
| | Japan — 13.6% | | | |
| 83,000,000 | | Japan Finance Organization for Municipal Enterprises,
1.350%, 11/26/2013, (JPY) | | | 917,386 |
| 123,000,000 | | Japan Government,
0.700%, 6/20/2014, (JPY) | | | 1,328,886 |
| 160,000,000 | | Japan Government,
1.300%, 3/20/2019, (JPY) | | | 1,722,150 |
| 35,000,000 | | Japan Government,
1.400%, 6/20/2011, (JPY) | | | 379,997 |
| 160,000 | | Nomura Holdings, Inc.,
6.700%, 3/04/2020 | | | 166,050 |
| | | | | |
| | | | | 4,514,469 |
| | | | | |
| | Jersey — 0.2% | | | |
| 50,000 | | WPP PLC,
6.000%, 4/04/2017, (GBP) | | | 79,535 |
| | | | | |
| | Luxembourg — 0.8% | | | |
| 150,000 | | Enel Finance International SA, EMTN,
5.625%, 8/14/2024, (GBP) | | | 227,971 |
| 25,000 | | Telecom Italia Finance SA, EMTN,
7.750%, 1/24/2033, (EUR) | | | 39,915 |
| | | | | |
| | | | | 267,886 |
| | | | | |
| | Mexico — 2.7% | | | |
| 160,000 | | Axtel SAB de CV, 144A,
9.000%, 9/22/2019 | | | 163,200 |
| 85,000 | | Desarrolladora Homex SAB de CV,
7.500%, 9/28/2015 | | | 86,275 |
| 10,000(†††) | | Mexican Fixed Rate Bonds, Series M-10,
8.000%, 12/17/2015, (MXN) | | | 84,465 |
| 41,000(†††) | | Mexican Fixed Rate Bonds, Series M-10,
8.500%, 12/13/2018, (MXN) | | | 352,009 |
| 10,000(†††) | | Mexican Fixed Rate Bonds, Series M-20,
8.000%, 12/07/2023, (MXN) | | | 81,003 |
| 100,000 | | Mexichem SAB de CV, 144A,
8.750%, 11/06/2019 | | | 108,500 |
| | | | | |
| | | | | 875,452 |
| | | | | |
| | Netherlands — 1.7% | | | |
| 150,000 | | Kingdom of Netherlands,
5.000%, 7/15/2011, (EUR) | | | 213,586 |
| 100,000 | | Majapahit Holding BV, 144A,
7.750%, 1/20/2020 | | | 108,500 |
| 150,000 | | RWE Finance BV, EMTN,
5.500%, 7/06/2022, (GBP) | | | 232,913 |
| | | | | |
| | | | | 554,999 |
| | | | | |
| | Norway — 2.9% | | | |
| 275,000 | | Norwegian Government,
4.250%, 5/19/2017, (NOK) | | | 48,455 |
| 2,625,000 | | Norwegian Government,
5.000%, 5/15/2015, (NOK) | | | 479,592 |
| 2,075,000 | | Norwegian Government,
6.000%, 5/16/2011, (NOK) | | | 363,237 |
| | | | | |
Principal
Amount (‡) | | Description | | Value (†) |
| | | | | |
| | Norway — continued | | | |
| 310,000 | | Norwegian Government,
6.500%, 5/15/2013, (NOK) | | $ | 57,972 |
| | | | | |
| | | | | 949,256 |
| | | | | |
| | Poland — 0.2% | | | |
| 80,000 | | Poland Government International Bond,
3.000%, 9/23/2014, (CHF) | | | 77,883 |
| | | | | |
| | Russia — 0.3% | | | |
| 100,000 | | Lithuania Government International Bond, 144A,
7.375%, 2/11/2020 | | | 109,455 |
| | | | | |
| | Singapore — 2.1% | | | |
| 130,000 | | Republic of Singapore,
1.625%, 4/01/2013, (SGD) | | | 95,137 |
| 810,000 | | Republic of Singapore,
2.250%, 7/01/2013, (SGD) | | | 603,938 |
| | | | | |
| | | | | 699,075 |
| | | | | |
| | South Africa — 0.5% | | | |
| 150,000 | | Edcon Proprietary Ltd., 144A,
3.900%, 6/15/2014, (EUR)(c) | | | 154,481 |
| | | | | |
| | Supranational — 4.9% | | | |
| 40,000,000 | | Asian Development Bank, EMTN,
2.350%, 6/21/2027, (JPY) | | | 442,542 |
| 25,000,000 | | European Investment Bank,
1.250%, 9/20/2012, (JPY) | | | 273,536 |
| 44,000,000 | | European Investment Bank,
1.400%, 6/20/2017, (JPY) | | | 482,503 |
| 921,000,000 | | European Investment Bank, EMTN, 144A,
Zero Coupon, 4/24/2013, (IDR) | | | 82,672 |
| 30,000,000 | | Nordic Investment Bank, Series C, GMTN,
1.700%, 4/27/2017, (JPY) | | | 336,075 |
| | | | | |
| | | | | 1,617,328 |
| | | | | |
| | Sweden — 4.8% | | | |
| 2,700,000 | | Sweden Government Bond,
4.500%, 8/12/2015, (SEK) | | | 411,181 |
| 5,100,000 | | Sweden Government Bond,
5.500%, 10/08/2012, (SEK) | | | 774,429 |
| 100,000 | | Telefonaktiebolaget LM Ericsson, EMTN,
5.375%, 6/27/2017, (EUR) | | | 144,444 |
| 200,000 | | Volvo Treasury AB, Series 225, EMTN,
5.000%, 5/31/2017, (EUR) | | | 266,635 |
| | | | | |
| | | | | 1,596,689 |
| | | | | |
| | Switzerland — 0.4% | | | |
| 100,000 | | Credit Suisse London, EMTN,
5.125%, 9/18/2017, (EUR) | | | 146,473 |
| | | | | |
| | United Arab Emirates — 0.3% | | | |
| 100,000 | | DP World Ltd., 144A,
6.850%, 7/02/2037 | | | 85,871 |
| | | | | |
| | United Kingdom — 6.1% | | | |
| 50,000 | | BAT International Finance PLC, EMTN,
5.375%, 6/29/2017, (EUR) | | | 74,381 |
| 100,000 | | British Sky Broadcasting Group PLC, EMTN,
6.000%, 5/21/2027, (GBP) | | | 155,189 |
| 50,000 | | BSKYB Finance UK PLC,
5.750%, 10/20/2017, (GBP) | | | 80,561 |
| 25,000 | | National Grid PLC, EMTN,
4.375%, 3/10/2020, (EUR) | | | 34,336 |
See accompanying notes to financial statements.
29
LOOMIS SAYLES INTERNATIONAL BOND FUND — PORTFOLIOOF INVESTMENTS (continued)
Investments as of March 31, 2010 (Unaudited)
| | | | | |
Principal
Amount (‡) | | Description | | Value (†) |
| | | | | |
| | United Kingdom — continued | | | |
| 75,000 | | National Grid PLC, EMTN,
5.000%, 7/02/2018, (EUR) | | $ | 109,002 |
| 100,000 | | Rexam PLC, EMTN,
4.375%, 3/15/2013, (EUR) | | | 139,292 |
| 50,000 | | Standard Chartered Bank, Series 17, EMTN,
5.875%, 9/26/2017, (EUR) | | | 73,128 |
| 155,000 | | United Kingdom Treasury,
4.000%, 9/07/2016, (GBP) | | | 246,413 |
| 105,000 | | United Kingdom Treasury,
4.750%, 3/07/2020, (GBP) | | | 169,177 |
| 285,000 | | United Kingdom Treasury,
5.000%, 3/07/2025, (GBP) | | | 462,718 |
| 105,000 | | United Kingdom Treasury,
5.250%, 6/07/2012, (GBP) | | | 172,715 |
| 100,000 | | Virgin Media Secured Finance PLC, 144A,
7.000%, 1/15/2018, (GBP) | | | 154,975 |
| 100,000 | | Vodafone Group PLC, Series 25, EMTN,
5.375%, 6/06/2022, (EUR) | | | 145,292 |
| | | | | |
| | | | | 2,017,179 |
| | | | | |
| | United States — 8.0% | | | |
| 80,000 | | Ahold Finance USA, Inc., EMTN,
6.500%, 3/14/2017, (GBP) | | | 132,251 |
| 50,000 | | Alcoa, Inc.,
6.750%, 1/15/2028 | | | 46,251 |
| 100,000 | | BA Credit Card Trust, Series 04A1,
4.500%, 6/17/2016, (EUR) | | | 139,529 |
| 165,000 | | Ball Corp.,
6.750%, 9/15/2020 | | | 167,888 |
| 50,000 | | Cargill, Inc., EMTN,
5.375%, 3/02/2037, (GBP) | | | 67,807 |
| 100,000 | | Citibank Credit Card Issuance Trust, Series 2001-A4, Class A4,
5.375%, 4/10/2013, (EUR) | | | 137,972 |
| 15,000,000 | | Citigroup, Inc.,
2.400%, 10/31/2025, (JPY) | | | 125,785 |
| 100,000 | | Goldman Sachs Group, Inc. (The),
6.875%, 1/18/2038, (GBP) | | | 161,040 |
| 55,000 | | HCA, Inc.,
5.750%, 3/15/2014 | | | 51,906 |
| 45,000 | | HCA, Inc.,
8.360%, 4/15/2024 | | | 42,638 |
| 200,000 | | HSBC Finance Corp., EMTN,
4.500%, 6/14/2016, (EUR) | | | 280,362 |
| 70,000 | | IPALCO Enterprises, Inc., 144A,
7.250%, 4/01/2016 | | | 72,625 |
| 955,000,000 | | JPMorgan Chase Bank NA, EMTN, 144A,
Zero Coupon, 10/17/2011, (IDR) | | | 95,064 |
| 150,000 | | Kraft Foods, Inc.,
6.250%, 3/20/2015, (EUR) | | | 229,057 |
| 100,000 | | Merrill Lynch & Co., Inc., EMTN,
4.625%, 9/14/2018, (EUR) | | | 128,601 |
| 95,000 | | Morgan Stanley,
5.375%, 11/14/2013, (GBP) | | | 152,236 |
| 75,000 | | Motorola, Inc.,
6.625%, 11/15/2037 | | | 70,388 |
| 50,000 | | Owens Brockway Glass Container, Inc.,
6.750%, 12/01/2014, (EUR) | | | 68,883 |
| 100,000 | | SLM Corp., Series 7, EMTN,
4.750%, 3/17/2014, (EUR) | | | 125,273 |
| | | | | | | |
Principal
Amount (‡) | | Description | | Value (†) | |
| | | | | | | |
| | | United States — continued | | | | |
| $ | 70,000 | | SLM Corp., Series A, MTN,
4.500%, 7/26/2010 | | $ | 70,322 | |
| | 84,000 | | Sprint Capital Corp.,
8.375%, 3/15/2012 | | | 87,360 | |
| | 100,000 | | Textron, Inc.,
3.875%, 3/11/2013, (EUR) | | | 133,235 | |
| | 50,000 | | Wells Fargo & Co.,
4.625%, 11/02/2035, (GBP) | | | 66,899 | |
| | | | | | | |
| | | | | | 2,653,372 | |
| | | | | | | |
| | | Total Non-Convertible Bonds (Identified Cost $31,968,799) | | | 31,683,819 | |
| | | | | | | |
| | Convertible Bonds — 0.7% | |
| | | United States — 0.7% | | | | |
| | 190,000 | | Advanced Micro Devices, Inc.,
6.000%, 5/01/2015 | | | 182,162 | |
| | 50,000 | | Hologic, Inc., (Step to Zero Coupon on 12/15/2013),
2.000%, 12/15/2037(d) | | | 44,750 | |
| | | | | | | |
| | | Total Convertible Bonds (Identified Cost $214,779) | | | 226,912 | |
| | | | | | | |
| | | Total Bonds and Notes (Identified Cost $32,183,578) | | | 31,910,731 | |
| | | | | | | |
| | Short-Term Investments — 1.2% | |
| | 391,292 | | Tri-Party Repurchase Agreement with Fixed Income Clearing Corporation, dated 3/31/2010 at 0.000% to be repurchased at $391,292 on 4/01/2010, collateralized by $400,000 Federal Home Loan Mortgage Corp., 2.000% due 3/29/2013 valued at $400,500 including accrued interest (Note 2 of Notes to Financial Statements) (Identified Cost $391,292) | | | 391,292 | |
| | | | | | | |
| | | | | | | |
| | | Total Investments — 97.6%
(Identified Cost $32,574,870)(a) | | | 32,302,023 | |
| | | Other assets less liabilities—2.4% | | | 808,300 | |
| | | | | | | |
| | | Net Assets — 100.0% | | $ | 33,110,323 | |
| | | | | | | |
| | | | | | | |
| | (‡) | | Principal amount stated in U.S. dollars unless otherwise noted. | | | | |
| | (†) | | See Note 2 of Notes to Financial Statements. | | | | |
| | (††) | | Security held in units. One unit represents a principal amount of 1,000. Amount shown represents principal amount including inflation adjustments. | | | | |
| | (†††) | | Amount shown represents units. One unit represents a principal amount of 100. | | | | |
| | (a) | | Federal Tax Information (Amounts exclude certain adjustments made at the end of the Fund’s fiscal year for tax purposes. Such adjustments are primarily due to wash sales. Amortization of premium on debt securities is excluded for tax purposes.): | | | | |
| | | At March 31, 2010, the net unrealized depreciation on investments based on a cost of $32,657,582 for federal income tax purposes was as follows: | | | | |
| | | Aggregate gross unrealized appreciation for all investments in which there is an excess of value over tax cost | | $ | 712,182 | |
| | | Aggregate gross unrealized depreciation for all investments in which there is an excess of tax cost over value | | | (1,067,741 | ) |
| | | | | | | |
| | | Net unrealized depreciation | | $ | (355,559 | ) |
| | | | | | | |
| | | | | | | |
| | (b) | | All or a portion of this security is held as collateral for open forward foreign currency contracts. | | | | |
| | (c) | | Variable rate security. Rate as of March 31, 2010 is disclosed. | | | | |
See accompanying notes to financial statements.
30
LOOMIS SAYLES INTERNATIONAL BOND FUND — PORTFOLIOOF INVESTMENTS (continued)
Investments as of March 31, 2010 (Unaudited)
| | | | |
| | | | |
| (d) | | Coupon rate is a fixed rate for an initial period then resets at a specified date and rate. | | |
| | | | |
| 144A | | Securities exempt from registration under Rule 144A of the Securities Act of 1933. These securities may be resold in transactions exempt from registration, normally to qualified institutional buyers. At March 31, 2010, the value of these securities amounted to $1,886,630 or 5.7% of net assets. | | |
| | | | |
| EMTN | | Euro Medium Term Note | | |
| GMTN | | Global Medium Term Note | | |
| MTN | | Medium Term Note | | |
| | | | |
| AUD | | Australian Dollar | | |
| BRL | | Brazilian Real | | |
| CAD | | Canadian Dollar | | |
| CHF | | Swiss Franc | | |
| DKK | | Danish Krone | | |
| EUR | | Euro | | |
| GBP | | British Pound | | |
| IDR | | Indonesian Rupiah | | |
| JPY | | Japanese Yen | | |
| MXN | | Mexican Peso | | |
| NOK | | Norwegian Krone | | |
| SEK | | Swedish Krona | | |
| SGD | | Singapore Dollar | | |
At March 31, 2010, the Fund had the following open forward foreign currency contracts:
| | | | | | | | | | | | | |
Contract to Buy/Sell | | Delivery Date | | Currency | | Units | | Notional Value | | Unrealized Appreciation (Depreciation) | |
| Buy1 | | 11/16/2010 | | Chinese Renminbi | | 2,350,000 | | $ | 345,444 | | $ | (10,122 | ) |
| Buy2 | | 6/16/2010 | | Euro | | 507,000 | | | 684,810 | | | (3,645 | ) |
| Sell2 | | 6/16/2010 | | Euro | | 383,000 | | | 517,322 | | | 10,084 | |
| Buy3 | | 9/23/2010 | | Indian Rupee | | 15,000,000 | | | 329,165 | | | 1,940 | |
| Buy4 | | 6/16/2010 | | Japanese Yen | | 100,300,000 | | | 1,073,258 | | | (35,770 | ) |
| Buy4 | | 9/22/2010 | | Malaysian Ringgit | | 1,100,000 | | | 334,022 | | | 2,596 | |
| Buy3 | | 6/14/2010 | | South Korean Won | | 355,000,000 | | | 312,930 | | | 938 | |
| Buy5 | | 6/14/2010 | | South Korean Won | | 720,000,000 | | | 634,675 | | | 1,819 | |
| Buy2 | | 6/14/2010 | | South Korean Won | | 770,000,000 | | | 678,749 | | | 1,945 | |
| | | | | | | | | | | | | |
| Total | | | | | | | | | | | $ | (30,215 | ) |
| | | | | | | | | | | | | |
1 Counterparty is Morgan Stanley.
2 Counterparty is Credit Suisse.
3 Counterparty is UBS.
4 Counterparty is JPMorgan Chase.
5 Counterparty is Barclays Bank PLC.
Industry Summary at March 31, 2010 (Unaudited)
| | | |
| Treasuries | | 52.5 | % |
| Banking | | 7.4 | |
| Supranational | | 4.9 | |
| Sovereigns | | 4.3 | |
| Government Guaranteed | | 3.5 | |
| Media Cable | | 2.1 | |
| Other Investments, less than 2% each | | 21.7 | |
| Short-Term Investments | | 1.2 | |
| | | |
| Total Investments | | 97.6 | |
| Other assets less liabilities (including open forward foreign currency contracts) | | 2.4 | |
| | | |
| Net Assets | | 100.0 | % |
| | | |
Currency Exposure at March 31, 2010 as a Percentage of Net Assets (Unaudited)
| | | |
| Euro | | 42.2 | % |
| Japanese Yen | | 19.0 | |
| United States Dollar | | 8.3 | |
| British Pound | | 8.3 | |
| Canadian Dollar | | 4.9 | |
| Swedish Krona | | 3.6 | |
| Norwegian Krone | | 2.9 | |
| Singapore Dollar | | 2.1 | |
| Other, less than 2% each | | 6.3 | |
| | | |
| Total Investments | | 97.6 | |
| Other assets less liabilities (including open forward foreign currency contracts) | | 2.4 | |
| | | |
| Net Assets | | 100.0 | % |
| | | |
See accompanying notes to financial statements.
31
LOOMIS SAYLES LIMITED TERM GOVERNMENTAND AGENCY FUND —
PORTFOLIOOF INVESTMENTS
Investments as of March 31, 2010 (Unaudited)
| | | | | | |
Principal
Amount | | Description | | Value (†) |
| | | | | | |
| | Bonds and Notes — 96.2% of Net Assets |
| | | ABS Car Loan — 3.1% | | | |
| $ | 1,593,178 | | ARI Fleet Lease Trust, Series 2010-A, Class A, 144A,
1.680%, 8/15/2018(b) | | $ | 1,593,165 |
| | 510,746 | | Merrill Auto Trust Securitization, Series 2008-1, Class 3A3,
5.500%, 3/15/2012 | | | 523,605 |
| | 3,245,000 | | Navistar Financial Dealer Note Master Trust, Series 2010-1, Class A, 144A,
1.896%, 1/26/2015(b) | | | 3,244,992 |
| | 1,810,000 | | Nissan Master Owner Trust Receivables, Series 2010-AA, Class A,
144A,
1.380%, 1/15/2015(b) | | | 1,815,022 |
| | 363,635 | | USAA Auto Owner Trust, Series 2008-3, Class A3,
4.280%, 10/15/2012 | | | 372,055 |
| | | | | | |
| | | | | | 7,548,839 |
| | | | | | |
| | | ABS Credit Card — 1.0% | | | |
| | 985,000 | | American Express Credit Account Master, Series 2004-2 Class A,
0.400%, 12/15/2016(b) | | | 978,125 |
| | 1,500,000 | | Citibank Credit Card Issuance Trust, Series 2006-A8, Class A8,
0.291%, 12/17/2018(b) | | | 1,444,662 |
| | | | | | |
| | | | | | 2,422,787 |
| | | | | | |
| | | ABS Home Equity — 0.8% | | | |
| | 836,884 | | Countrywide Asset-Backed Certificates, Series 2004-S1, Class A3,
4.615%, 2/25/2035 | | | 674,539 |
| | 597,632 | | Residential Funding Mortgage Securities II, Series 2002-HI5, Class A7,
5.700%, 1/25/2028 | | | 557,682 |
| | 660,000 | | Residential Funding Mortgage Securities II, Series 2005-HI3, Class A4,
5.490%, 9/25/2035 | | | 618,078 |
| | | | | | |
| | | | | | 1,850,299 |
| | | | | | |
| | | Collateralized Mortgage Obligations — 0.3% | | | |
| | 668,548 | | Federal Home Loan Mortgage Corp., Series 2901, Class UA,
5.000%, 1/15/2030 | | | 704,916 |
| | 60,821 | | Federal Home Loan Mortgage Corp., Series 3145, Class KA,
5.000%, 8/15/2024 | | | 62,320 |
| | | | | | |
| | | | | | 767,236 |
| | | | | | |
| | | Commercial Mortgage-Backed Securities — 12.8% | | | |
| | 1,500,000 | | Banc of America Commercial Mortgage, Inc., Series 2007-5, Class A4,
5.492%, 2/10/2051 | | | 1,424,132 |
| | 2,000,000 | | Bear Stearns Commercial Mortgage Securities, Series 2007-PW15, Class A4,
5.331%, 2/11/2044 | | | 1,926,976 |
| | 360,000 | | Citigroup Commercial Mortgage Trust, Series 2006-C5, Class A4,
5.431%, 10/15/2049 | | | 361,606 |
| | 1,400,000 | | Citigroup Commercial Mortgage Trust, Series 2008-C7, Class A4,
6.298%, 12/10/2049(b) | | | 1,410,743 |
| | 2,200,500 | | Citigroup/Deutsche Bank Commercial Mortgage Trust, Series 2007-CD4, Class A4,
5.322%, 12/11/2049 | | | 2,130,094 |
| | 1,400,000 | | Commercial Mortgage Pass Through Certificates, Series 2006-C7, Class A4,
5.960%, 6/10/2046(b) | | | 1,445,197 |
| | 2,670,000 | | Credit Suisse Mortgage Capital Certificates, Series 2006-C3, Class A3,
6.019%, 6/15/2038(b) | | | 2,694,935 |
| | | | | | |
Principal
Amount | | Description | | Value (†) |
| | | | | | |
| | | Commercial Mortgage-Backed Securities — continued | | | |
| $ | 825,000 | | Credit Suisse Mortgage Capital Certificates, Series 2007-C2, Class A3,
5.542%, 1/15/2049 | | $ | 736,672 |
| | 1,610,000 | | Credit Suisse Mortgage Capital Certificates, Series 2007-C3, Class A4,
5.912%, 6/15/2039(b) | | | 1,450,278 |
| | 2,000,000 | | Credit Suisse Mortgage Capital Certificates, Series 2007-C4, Class A4,
5.998%, 9/15/2039(b) | | | 1,819,108 |
| | 3,000,000 | | Credit Suisse Mortgage Capital Certificates, Series 2007-C5, Class A4,
5.695%, 9/15/2040 | | | 2,688,325 |
| | 1,500,000 | | Greenwich Capital Commercial Funding Corp., Series 2006-GG7, Class A4,
6.085%, 7/10/2038(b) | | | 1,529,124 |
| | 1,860,000 | | GS Mortgage Securities Corp. II, Series 2006-GG6, Class A4,
5.553%, 4/10/2038 | | | 1,869,359 |
| | 1,140,000 | | GS Mortgage Securities Corp. II, Series 2006-GG8, Class A4,
5.560%, 11/10/2039 | | | 1,128,582 |
| | 1,685,000 | | JPMorgan Chase Commercial Mortgage Securities Corp., Series 2007-CB18, Class A4,
5.440%, 6/12/2047 | | | 1,646,910 |
| | 3,014,000 | | Merrill Lynch/Countrywide Commercial Mortgage Trust, Series 2007-6, Class A4,
5.485%, 3/12/2051 | | | 2,763,231 |
| | 1,720,000 | | Morgan Stanley Capital I, Series 2007-IQ14, Class A4,
5.692%, 4/15/2049 | | | 1,577,412 |
| | 815,000 | | Wachovia Bank Commercial Mortgage Trust, Series 2006-C23, Class A4,
5.418%, 1/15/2045 | | | 826,160 |
| | 1,410,000 | | Wachovia Bank Commercial Mortgage Trust, Series 2006-C28, Class A4,
5.572%, 10/15/2048 | | | 1,386,561 |
| | | | | | |
| | | | | | 30,815,405 |
| | | | | | |
| | | Government Guaranteed — 12.0% | | | |
| | 7,000,000 | | Citigroup Funding, Inc.,
0.301%, 7/12/2012 (FDIC insured)(b) | | | 7,006,755 |
| | 3,000,000 | | Citigroup Funding, Inc., Series D, MTN,
0.579%, 4/30/2012 (FDIC insured)(b) | | | 3,020,829 |
| | 9,240,000 | | General Electric Capital Corp.,
0.271%, 12/21/2012 (FDIC insured)(b) | | | 9,239,982 |
| | 1,400,000 | | General Electric Capital Corp., Series G, MTN,
2.625%, 12/28/2012 (FDIC insured) | | | 1,437,671 |
| | 4,175,000 | | GMAC, Inc.,
1.750%, 10/30/2012 (FDIC insured) | | | 4,199,152 |
| | 2,340,000 | | US Central Federal Credit Union,
1.900%, 10/19/2012 (FDIC insured) | | | 2,361,563 |
| | 1,800,000 | | West Corp. Federal Credit Union,
1.750%, 11/02/2012 (FDIC insured) | | | 1,805,190 |
| | | | | | |
| | | | | | 29,071,142 |
| | | | | | |
| | | Government Owned - No Guarantee — 9.9% | | | |
| | 7,600,000 | | Federal Home Loan Mortgage Corp.,
1.125%, 12/15/2011 | | | 7,617,358 |
| | 6,000,000 | | Federal Home Loan Mortgage Corp.,
2.125%, 3/23/2012 | | | 6,108,468 |
| | 1,600,000 | | Federal Home Loan Mortgage Corp.,
4.125%, 10/18/2010 | | | 1,631,858 |
See accompanying notes to financial statements.
32
LOOMIS SAYLES LIMITED TERM GOVERNMENTAND AGENCY FUND —
PORTFOLIOOF INVESTMENTS (continued)
Investments as of March 31, 2010 (Unaudited)
| | | | | | |
Principal
Amount | | Description | | Value (†) |
| | | | | | |
| | | Government Owned - No Guarantee — continued | | | |
| $ | 5,000,000 | | Federal National Mortgage Association,
1.750%, 3/23/2011 | | $ | 5,056,955 |
| | 3,420,000 | | Federal National Mortgage Association,
2.000%, 1/09/2012 | | | 3,473,687 |
| | | | | | |
| | | | | | 23,888,326 |
| | | | | | |
| | | Government Sponsored — 6.9% | | | |
| | 6,800,000 | | Federal Home Loan Bank,
1.125%, 6/03/2011 | | | 6,835,435 |
| | 5,000,000 | | Federal Home Loan Bank,
1.625%, 7/27/2011 | | | 5,055,415 |
| | 3,000,000 | | Federal Home Loan Bank,
3.375%, 10/20/2010 | | | 3,047,646 |
| | 1,700,000 | | Federal Home Loan Bank,
3.625%, 9/16/2011 | | | 1,770,783 |
| | | | | | |
| | | | | | 16,709,279 |
| | | | | | |
| | | Hybrid ARMs — 0.9% | | | |
| | 1,969,436 | | FNMA,
6.015%, 2/01/2037(b) | | | 2,078,204 |
| | | | | | |
| | | Mortgage Related — 23.2% | | | |
| | 5,100,000 | | Federal Home Loan Mortgage Corp.,
0.149%, 2/02/2012(b) | | | 5,090,029 |
| | 645,878 | | FHLMC,
4.500%, 5/01/2034 | | | 652,519 |
| | 2,963,251 | | FHLMC,
5.500%, 10/01/2023 | | | 3,174,597 |
| | 3,858,501 | | FHLMC
6.000%, with various maturities from 2019 to 2021(c) | | | 4,172,282 |
| | 5,774,100 | | FHLMC
6.500%, with various maturities from 2014 to 2034(c) | | | 6,310,083 |
| | 154,250 | | FHLMC,
7.000%, 2/01/2016 | | | 167,519 |
| | 15,148 | | FHLMC
7.500%, with various maturities from 2012 to 2026(c) | | | 16,303 |
| | 10,825 | | FHLMC,
8.000%, 9/01/2015 | | | 11,862 |
| | 4,266 | | FHLMC,
10.000%, 7/01/2019 | | | 4,804 |
| | 121,881 | | FHLMC
11.500%, with various maturities from 2015 to 2020(c) | | | 130,731 |
| | 8,741,027 | | FNMA
4.000%, with various maturities from 2018 to 2019(c) | | | 9,062,645 |
| | 759,312 | | FNMA,
4.500%, 9/01/2019 | | | 798,234 |
| | 1,519,352 | | FNMA
5.500%, with various maturities from 2017 to 2033(c) | | | 1,619,942 |
| | 16,808,078 | | FNMA
6.000%, with various maturities from 2017 to 2022(c) | | | 18,167,284 |
| | 4,695,111 | | FNMA
6.500%, with various maturities from 2017 to 2037(c) | | | 5,117,303 |
| | 183,910 | | FNMA,
7.000%, 12/01/2022 | | | 201,701 |
| | 356,482 | | FNMA
7.500%, with various maturities from 2015 to 2032(c) | | | 400,611 |
| | 53,335 | | FNMA
8.000%, with various maturities from 2015 to 2016(c) | | | 58,473 |
| | 85,808 | | GNMA,
6.000%, 12/15/2031 | | | 93,081 |
| | | | | | | |
Principal
Amount | | Description | | Value (†) | |
| | | | | | | |
| | | Mortgage Related — continued | | | | |
| $ | 298,722 | | GNMA,
6.500%, 5/15/2031 | | $ | 328,596 | |
| | 285,946 | | GNMA,
7.000%, 10/15/2028 | | | 320,886 | |
| | 2,151 | | GNMA,
12.500%, 6/15/2014 | | | 2,439 | |
| | 32,519 | | GNMA
16.000%, with various maturities from 2011 to 2012(c) | | | 35,778 | |
| | 9,927 | | GNMA
17.000%, with various maturities in 2011(c) | | | 10,706 | |
| | | | | | | |
| | | | | | 55,948,408 | |
| | | | | | | |
| | | Treasuries — 25.3% | | | | |
| | 15,100,000 | | U.S. Treasury Note,
0.875%, 5/31/2011 | | | 15,164,885 | |
| | 24,625,000 | | U.S. Treasury Note,
1.000%, 9/30/2011 | | | 24,724,066 | |
| | 4,800,000 | | U.S. Treasury Note,
1.000%, 3/31/2012 | | | 4,797,744 | |
| | 3,415,000 | | U.S. Treasury Note,
1.500%, 10/31/2010 | | | 3,438,744 | |
| | 4,785,000 | | U.S. Treasury Note,
2.375%, 2/28/2015 | | | 4,752,127 | |
| | 8,050,000 | | U.S. Treasury Note,
2.625%, 7/31/2014 | | | 8,160,060 | |
| | | | | | | |
| | | | | | 61,037,626 | |
| | | | | | | |
| | | Total Bonds and Notes (Identified Cost $224,625,739) | | | 232,137,551 | |
| | | | | | | |
| | Short-Term Investments — 5.1% | |
| | 4,000,000 | | Federal Home Loan Mortgage Corp. Discount Note,
0.135%, 5/03/2010(d) | | | 3,999,716 | |
| | 8,283,850 | | Tri-Party Repurchase Agreement with Fixed Income Clearing Corporation, dated 3/31/2010 at 0.000% to be repurchased at $8,283,850 on 4/01/2010, collateralized by $8,420,000 Federal National Mortgage Association, 3.000% due 1/29/2015 valued at $8,451,575 including accrued interest (Note 2 of Notes to Financial Statements) | | | 8,283,850 | |
| | | | | | | |
| | | Total Short-Term Investments (Identified Cost $12,283,370) | | | 12,283,566 | |
| | | | | | | |
| | | | | | | |
| | | Total Investments — 101.3%
(Identified Cost $236,909,109)(a) | | | 244,421,117 | |
| | | Other assets less liabilities—(1.3)% | | | (3,146,090 | ) |
| | | | | | | |
| | | Net Assets — 100.0% | | $ | 241,275,027 | |
| | | | | | | |
| | | | | | | |
| | (†) | | See Note 2 of Notes to Financial Statements. | | | | |
| | (a) | | Federal Tax Information (Amounts exclude certain adjustments made at the end of the Fund’s fiscal year for tax purposes. Such adjustments are primarily due to wash sales. Amortization of premium on debt securities is excluded for tax purposes.): | | | | |
| | | At March 31, 2010, the net unrealized appreciation on investments based on a cost of $237,040,343 for federal income tax purposes was as follows: | | | | |
| | | Aggregate gross unrealized appreciation for all investments in which there is an excess of value over tax cost | | $ | 7,830,294 | |
| | | Aggregate gross unrealized depreciation for all investments in which there is an excess of tax cost over value | | | (449,520 | ) |
| | | | | | | |
| | | Net unrealized appreciation | | $ | 7,380,774 | |
| | | | | | | |
See accompanying notes to financial statements.
33
LOOMIS SAYLES LIMITED TERM GOVERNMENTAND AGENCY FUND — PORTFOLIOOF INVESTMENTS (continued)
Investments as of March 31, 2010 (Unaudited)
| | | | |
| | | | |
| (b) | | Variable rate security. Rate as of March 31, 2010 is disclosed. | | |
| (c) | | The Fund’s investment in mortgage related securities of the Federal Home Loan Mortgage Corporation, Federal National Mortgage Association and Government National Mortgage Association are interests in separate pools of mortgages. All separate investments in securities of each issuer which have the same coupon rate have been aggregated for the purpose of presentation in the Portfolio of Investments. | | |
| (d) | | Interest rate represents discount rate at time of purchase; not a coupon rate. | | |
| | | | |
| 144A | | Securities exempt from registration under Rule 144A of the Securities Act of 1933. These securities may be resold in transactions exempt from registration, normally to qualified institutional buyers. At March 31, 2010, the total value of these securities amounted to $6,653,179 or 2.8% of net assets. | | |
| | | | |
| ABS | | Asset-Backed Securities | | |
| ARMs | | Adjustable Rate Mortgages | | |
| FDIC | | Federal Deposit Insurance Corporation | | |
| FHLMC | | Federal Home Loan Mortgage Corporation | | |
| FNMA | | Federal National Mortgage Association | | |
| GNMA | | Government National Mortgage Association | | |
| MTN | | Medium Term Note | | |
Industry Summary at March 31, 2010 (Unaudited)
| | | |
| Treasuries | | 25.3 | % |
| Mortgage Related | | 23.2 | |
| Commercial Mortgage-Backed Securities | | 12.8 | |
| Government Guaranteed | | 12.0 | |
| Government Owned—No Guarantee | | 9.9 | |
| Government Sponsored | | 6.9 | |
| ABS Car Loan | | 3.1 | |
| Other Investments, less than 2% each | | 3.0 | |
| Short-Term Investments | | 5.1 | |
| | | |
| Total Investments | | 101.3 | |
| Other assets less liabilities | | (1.3 | ) |
| | | |
| Net Assets | | 100.0 | % |
| | | |
See accompanying notes to financial statements.
34
LOOMIS SAYLES STRATEGIC INCOME FUND — PORTFOLIOOF INVESTMENTS
Investments as of March 31, 2010 (Unaudited)
| | | | | | |
Principal
Amount (‡) | | Description | | Value (†) |
| | | | | | |
| | Bonds and Notes — 91.4% of Net Assets |
| | Non-Convertible Bonds — 82.4% |
| | | ABS Car Loan — 0.1% | | | |
| $ | 11,305,000 | | Avis Budget Rental Car Funding AESOP LLC, Series 2007-2A, Class A, 144A,
0.380%, 8/20/2013(b) | | $ | 10,659,962 |
| | | | | | |
| | | ABS Credit Card — 0.6% | | | |
| | 80,700,000 | | Citibank Credit Card Issuance Trust, Series 2008-C6, Class C6,
6.300%, 6/20/2014 | | | 85,382,359 |
| | | | | | |
| | | Aerospace & Defense — 0.1% | | | |
| | 1,380,000 | | Bombardier, Inc., 144A,
6.300%, 5/01/2014 | | | 1,431,750 |
| | 870,000 | | Bombardier, Inc.,
7.350%, 12/22/2026, (CAD) | | | 837,955 |
| | 11,800,000 | | Bombardier, Inc., 144A,
7.450%, 5/01/2034 | | | 10,856,000 |
| | | | | | |
| | | | | | 13,125,705 |
| | | | | | |
| | | Airlines — 1.9% | | | |
| | 3,222,650 | | American Airlines Pass Through Trust, Series 2009-1A,
10.375%, 7/02/2019 | | | 3,730,218 |
| | 432,651 | | American Airlines Pass Through Trust, Series 93A6,
8.040%, 9/16/2011 | | | 411,019 |
| | 145,287 | | Continental Airlines Pass Through Trust, Series 1996-1, Class A,
6.940%, 4/15/2015 | | | 148,920 |
| | 7,169,663 | | Continental Airlines Pass Through Trust, Series 1997-1, Class A,
7.461%, 10/01/2016 | | | 7,080,043 |
| | 3,339,995 | | Continental Airlines Pass Through Trust, Series 1997-4, Class 4B,
6.900%, 7/02/2018 | | | 3,223,095 |
| | 3,046,379 | | Continental Airlines Pass Through Trust, Series 1998-1, Class B,
6.748%, 9/15/2018 | | | 2,939,755 |
| | 5,801,291 | | Continental Airlines Pass Through Trust, Series 1999-1, Class B,
6.795%, 2/02/2020 | | | 5,409,704 |
| | 5,029,719 | | Continental Airlines Pass Through Trust, Series 1999-2, Class B,
7.566%, 9/15/2021 | | | 4,778,233 |
| | 1,542,353 | | Continental Airlines Pass Through Trust, Series 2000-1, Class A-1,
8.048%, 5/01/2022 | | | 1,565,488 |
| | 1,535,749 | | Continental Airlines Pass Through Trust, Series 2000-2, Class A-1,
7.707%, 10/02/2022 | | | 1,535,749 |
| | 7,707,691 | | Continental Airlines Pass Through Trust, Series 2000-2, Class B,
8.307%, 10/02/2019 | | | 7,322,307 |
| | 2,067,163 | | Continental Airlines Pass Through Trust, Series 2001-1, Class A-1,
6.703%, 12/15/2022 | | | 1,922,462 |
| | 2,760,159 | | Continental Airlines Pass Through Trust, Series 2001-1, Class B,
7.373%, 6/15/2017 | | | 2,608,350 |
| | 11,915,000 | | Continental Airlines Pass Through Trust, Series 2007-1, Class A,
5.983%, 10/19/2023 | | | 11,706,487 |
| | | | | | |
Principal
Amount (‡) | | Description | | Value (†) |
| | | | | | |
| | | Airlines — continued | | | |
| $ | 19,647,000 | | Continental Airlines Pass Through Trust, Series 2007-1, Class B,
6.903%, 4/19/2022 | | $ | 17,878,770 |
| | 19,595,724 | | Continental Airlines Pass Through Trust, Series 2009-1, Class A,
9.000%, 7/08/2016 | | | 21,163,382 |
| | 17,425,000 | | Continental Airlines Pass Through Trust, Series 2009-2, Class A,
7.250%, 11/10/2019 | | | 18,644,750 |
| | 3,145,000 | | Delta Air Lines, Inc., 144A,
9.500%, 9/15/2014 | | | 3,306,181 |
| | 2,450,000 | | Delta Air Lines, Inc., Series 2001-1, Class A-2,
7.111%, 3/18/2013 | | | 2,560,250 |
| | 1,526,968 | | Delta Air Lines, Inc., Series 2007-1, Class A,
6.821%, 2/10/2024 | | | 1,526,968 |
| | 8,464,020 | | Delta Air Lines, Inc., Series 2007-1, Class B,
8.021%, 2/10/2024 | | | 7,786,898 |
| | 27,413,153 | | Delta Air Lines, Inc., Series 2007-1, Class C,
8.954%, 8/10/2014 | | | 25,652,954 |
| | 7,500,000 | | Delta Air Lines, Inc., Series B,
9.750%, 12/17/2016 | | | 7,725,000 |
| | 2,201,154 | | Northwest Airlines, Inc., Series 2002-1, Class G2, (MBIA insured),
6.264%, 5/20/2023 | | | 2,091,096 |
| | 24,085,629 | | Northwest Airlines, Inc., Series 2007-1, Class B,
8.028%, 11/01/2017 | | | 22,032,811 |
| | 1,500,000 | | Qantas Airways Ltd., 144A,
5.125%, 6/20/2013 | | | 1,531,428 |
| | 32,710,000 | | Qantas Airways Ltd., 144A,
6.050%, 4/15/2016 | | | 33,800,748 |
| | 17,870,524 | | UAL Pass through Trust, Series 2007-1, Class A,
6.636%, 1/02/2024 | | | 16,530,234 |
| | 11,325,000 | | UAL Pass through Trust, Series 2009-1,
10.400%, 5/01/2018 | | | 12,174,375 |
| | | | | | |
| | | | | | 248,787,675 |
| | | | | | |
| | | Automotive — 3.0% | | | |
| | 265,000 | | ArvinMeritor, Inc.,
8.125%, 9/15/2015 | | | 255,725 |
| | 1,853,000 | | Cummins, Inc.,
6.750%, 2/15/2027 | | | 1,768,639 |
| | 2,145,000 | | Cummins, Inc.,
7.125%, 3/01/2028 | | | 2,120,253 |
| | 3,100,000 | | FCE Bank PLC, EMTN,
4.625%, 10/25/2010, (NOK) | | | 511,172 |
| | 6,500,000 | | FCE Bank PLC, EMTN,
7.125%, 1/16/2012, (EUR) | | | 8,976,761 |
| | 4,500,000 | | FCE Bank PLC, EMTN,
7.125%, 1/15/2013, (EUR) | | | 6,229,875 |
| | 5,700,000 | | FCE Bank PLC, EMTN,
7.875%, 2/15/2011, (GBP) | | | 8,833,119 |
| | 18,566,000 | | Ford Motor Co.,
6.375%, 2/01/2029 | | | 15,084,875 |
| | 1,975,000 | | Ford Motor Co.,
6.500%, 8/01/2018 | | | 1,876,250 |
| | 500,000 | | Ford Motor Co.,
6.625%, 2/15/2028 | | | 420,000 |
| | 73,314,000 | | Ford Motor Co.,
6.625%, 10/01/2028 | | | 61,583,760 |
See accompanying notes to financial statements.
35
LOOMIS SAYLES STRATEGIC INCOME FUND — PORTFOLIOOF INVESTMENTS (continued)
Investments as of March 31, 2010 (Unaudited)
| | | | | | |
Principal
Amount (‡) | | Description | | Value (†) |
| | | | | | |
| | | Automotive — continued | | | |
| $ | 1,940,000 | | Ford Motor Co.,
7.125%, 11/15/2025 | | $ | 1,653,850 |
| | 88,470,000 | | Ford Motor Co.,
7.450%, 7/16/2031 | | | 83,604,150 |
| | 1,250,000 | | Ford Motor Co.,
7.500%, 8/01/2026 | | | 1,109,375 |
| | 10,685,000 | | Ford Motor Credit Co. LLC,
7.000%, 10/01/2013 | | | 11,056,154 |
| | 24,235,000 | | Ford Motor Credit Co. LLC,
7.250%, 10/25/2011 | | | 25,056,348 |
| | 5,940,000 | | Ford Motor Credit Co. LLC,
7.500%, 8/01/2012 | | | 6,150,757 |
| | 1,030,000 | | Ford Motor Credit Co. LLC,
7.875%, 6/15/2010 | | | 1,039,579 |
| | 47,810,000 | | Ford Motor Credit Co. LLC,
8.000%, 6/01/2014 | | | 50,332,264 |
| | 14,595,000 | | Ford Motor Credit Co. LLC,
8.000%, 12/15/2016 | | | 15,377,628 |
| | 10,625,000 | | Ford Motor Credit Co. LLC,
8.625%, 11/01/2010 | | | 10,882,858 |
| | 50,000,000 | | Ford Motor Credit Co. LLC,
8.700%, 10/01/2014 | | | 54,215,500 |
| | 1,645,000 | | Ford Motor Credit Co. LLC,
9.750%, 9/15/2010 | | | 1,684,441 |
| | 4,977,000 | | Goodyear Tire & Rubber Co. (The),
7.000%, 3/15/2028 | | | 4,292,663 |
| | 9,635,000 | | Goodyear Tire & Rubber Co. (The),
10.500%, 5/15/2016 | | | 10,405,800 |
| | 1,300,000 | | TRW Automotive, Inc., 144A,
7.000%, 3/15/2014 | | | 1,280,500 |
| | 3,100,000 | | TRW Automotive, Inc., 144A,
7.250%, 3/15/2017 | | | 2,991,500 |
| | 5,300,000 | | TRW Automotive, Inc., 144A,
8.875%, 12/01/2017 | | | 5,492,125 |
| | | | | | |
| | | | | | 394,285,921 |
| | | | | | |
| | | Banking — 6.5% | | | |
| | 67,925,000 | | AgriBank FCB, 144A,
9.125%, 7/15/2019(c) | | | 77,275,556 |
| | 20,565,000 | | Associates Corp. of North America,
6.950%, 11/01/2018 | | | 21,672,343 |
| | 22,125,000 | | BAC Capital Trust VI,
5.625%, 3/08/2035 | | | 18,268,104 |
| | 1,675,000 | | Bank of America Corp.,
5.420%, 3/15/2017 | | | 1,655,312 |
| | 4,560,000 | | Bank of America Corp.,
6.000%, 9/01/2017 | | | 4,742,519 |
| | 8,020,000 | | Bank of America NA,
5.300%, 3/15/2017 | | | 7,939,006 |
| | 56,650,000,000 | | Barclays Financial LLC, 144A,
4.470%, 12/04/2011, (KRW) | | | 50,164,277 |
| | 17,310,000,000 | | Barclays Financial LLC, EMTN, 144A,
4.060%, 9/16/2010, (KRW) | | | 15,328,969 |
| | 21,340,000,000 | | Barclays Financial LLC, EMTN, 144A,
4.460%, 9/23/2010, (KRW) | | | 18,933,236 |
| | 224,520,000,000 | | BNP Paribas SA, EMTN, 144A,
Zero Coupon, 6/13/2011, (IDR) | | | 22,450,766 |
| | 2,165,000 | | Capital One Financial Corp.,
6.150%, 9/01/2016 | | | 2,246,131 |
| | | | | |
Principal
Amount (‡) | | Description | | Value (†) |
| | | | | |
| | Banking — continued | | | |
| 18,650,000 | | Citibank NA, 144A,
15.000%, 7/02/2010, (BRL) | | $ | 10,628,408 |
| 47,120,000 | | Citigroup, Inc.,
5.000%, 9/15/2014 | | | 47,053,608 |
| 985,000 | | Citigroup, Inc.,
5.850%, 12/11/2034 | | | 894,390 |
| 22,790,000 | | Citigroup, Inc.,
5.875%, 2/22/2033 | | | 19,664,260 |
| 10,819,000 | | Citigroup, Inc.,
6.000%, 10/31/2033 | | | 9,486,294 |
| 6,060,000 | | Citigroup, Inc.,
6.125%, 8/25/2036 | | | 5,288,180 |
| 45,862,000 | | Citigroup, Inc.,
6.375%, 8/12/2014 | | | 48,994,512 |
| 3,350,000 | | Citigroup, Inc., EMTN, (fixed rate to 11/30/2012, variable rate thereafter),
3.625%, 11/30/2017, (EUR) | | | 4,167,429 |
| 64,000,000 | | Citigroup, Inc., MTN,
5.500%, 10/15/2014 | | | 66,233,984 |
| 9,905,000 | | First Niagara Financial Group, Inc.,
6.750%, 3/19/2020 | | | 10,009,537 |
| 400,000 | | Goldman Sachs Group, Inc. (The),
6.450%, 5/01/2036 | | | 386,772 |
| 30,375,000 | | Goldman Sachs Group, Inc. (The),
6.750%, 10/01/2037 | | | 30,336,849 |
| 1,285,000 | | Goldman Sachs Group, Inc. (The), MTN,
5.375%, 3/15/2020 | | | 1,273,115 |
| 119,806,078 | | HSBC Bank USA, 144A,
Zero Coupon, 11/28/2011 | | | 105,597,077 |
| 9,090,000 | | ICICI Bank Ltd., (fixed rate to 4/30/2017, variable rate thereafter), 144A,
6.375%, 4/30/2022 | | | 8,558,535 |
| 109,312,000,000 | | JPMorgan Chase & Co., 144A,
Zero Coupon, 3/28/2011, (IDR) | | | 11,211,703 |
| 229,157,783,660 | | JPMorgan Chase & Co., 144A,
Zero Coupon, 4/12/2012, (IDR) | | | 21,763,631 |
| 599,726,100,000 | | JPMorgan Chase & Co., EMTN, 144A,
Zero Coupon, 3/28/2011, (IDR) | | | 61,511,552 |
| 92,000,000 | | JPMorgan Chase Bank, 144A,
Zero Coupon, 5/17/2010, (BRL) | | | 50,465,881 |
| 76,496,404,750 | | JPMorgan Chase Bank, EMTN, 144A,
Zero Coupon, 10/21/2010, (IDR) | | | 8,104,020 |
| 3,010,000 | | Merrill Lynch & Co., Inc.,
5.700%, 5/02/2017 | | | 2,991,925 |
| 1,400,000 | | Merrill Lynch & Co., Inc.,
6.110%, 1/29/2037 | | | 1,288,129 |
| 51,500,000 | | Merrill Lynch & Co., Inc.,
10.710%, 3/08/2017, (BRL) | | | 28,235,443 |
| 3,450,000 | | Merrill Lynch & Co., Inc., EMTN,
4.625%, 9/14/2018, (EUR) | | | 4,436,729 |
| 5,410,000 | | Merrill Lynch & Co., Inc., MTN,
6.875%, 4/25/2018 | | | 5,830,189 |
| 800,000 | | Merrill Lynch & Co., Inc., Series C, MTN,
6.050%, 6/01/2034 | | | 687,833 |
| 1,235,000 | | Merrill Lynch & Co., Inc., Series C, MTN,
6.400%, 8/28/2017 | | | 1,301,599 |
| 26,665,000 | | Morgan Stanley,
4.750%, 4/01/2014 | | | 27,227,018 |
| 5,050,000 | | Morgan Stanley,
5.125%, 11/30/2015, (GBP) | | | 7,852,563 |
See accompanying notes to financial statements.
36
LOOMIS SAYLES STRATEGIC INCOME FUND — PORTFOLIOOF INVESTMENTS (continued)
Investments as of March 31, 2010 (Unaudited)
| | | | | | |
Principal
Amount (‡) | | Description | | Value (†) |
| | | | | | |
| | | Banking — continued | | | |
| $ | 7,900,000 | | Morgan Stanley, Series F, GMTN,
6.625%, 4/01/2018 | | $ | 8,425,974 |
| | 2,900,000 | | Morgan Stanley, Series F, MTN,
5.550%, 4/27/2017 | | | 2,965,943 |
| | 6,600,000 | | Morgan Stanley, Series F, MTN,
5.625%, 9/23/2019 | | | 6,576,728 |
| | 5,210,000 | | Morgan Stanley, Series F, MTN,
5.950%, 12/28/2017 | | | 5,352,598 |
| | | | | | |
| | | | | | 865,478,627 |
| | | | | | |
| | | Brokerage — 0.0% | | | |
| | 4,000,000 | | Jefferies Group, Inc.,
8.500%, 7/15/2019 | | | 4,437,372 |
| | | | | | |
| | | Building Materials — 1.0% | | | |
| | 3,255,000 | | Masco Corp.,
4.800%, 6/15/2015 | | | 3,140,255 |
| | 2,220,000 | | Masco Corp.,
5.850%, 3/15/2017 | | | 2,163,716 |
| | 13,440,000 | | Masco Corp.,
6.125%, 10/03/2016 | | | 13,401,924 |
| | 2,045,000 | | Masco Corp.,
6.500%, 8/15/2032 | | | 1,755,213 |
| | 18,935,000 | | Owens Corning, Inc.,
6.500%, 12/01/2016 | | | 20,039,195 |
| | 35,980,000 | | Owens Corning, Inc.,
7.000%, 12/01/2036 | | | 35,252,700 |
| | 44,212,000 | | USG Corp.,
6.300%, 11/15/2016 | | | 39,569,740 |
| | 14,155,000 | | USG Corp.,
9.500%, 1/15/2018 | | | 14,314,244 |
| | | | | | |
| | | | | | 129,636,987 |
| | | | | | |
| | | Chemicals — 1.0% | | | |
| | 23,584,000 | | Borden, Inc.,
7.875%, 2/15/2023 | | | 16,744,640 |
| | 6,920,000 | | Borden, Inc.,
8.375%, 4/15/2016 | | | 5,743,600 |
| | 8,757,000 | | Borden, Inc.,
9.200%, 3/15/2021 | | | 7,049,385 |
| | 38,140,000 | | Chevron Phillips Chemical Co. LLC, 144A,
8.250%, 6/15/2019 | | | 45,532,180 |
| | 14,550,000 | | Hercules, Inc., Subordinated Note,
6.500%, 6/30/2029 | | | 11,640,000 |
| | 24,086,000 | | Hexion US Finance Corp./Hexion Nova Scotia Finance ULC,
9.750%, 11/15/2014 | | | 24,567,720 |
| | 5,350,000 | | Methanex Corp., Senior Note,
6.000%, 8/15/2015 | | | 4,834,239 |
| | 6,465,000 | | Mosaic Global Holdings, Inc.,
7.300%, 1/15/2028 | | | 6,922,974 |
| | 2,730,000 | | Mosaic Global Holdings, Inc.,
7.375%, 8/01/2018 | | | 3,055,580 |
| | | | | | |
| | | | | | 126,090,318 |
| | | | | | |
| | | Construction Machinery — 0.9% | | | |
| | 48,305,000 | | Case New Holland, Inc., 144A,
7.750%, 9/01/2013 | | | 50,116,437 |
| | 1,425,000 | | Joy Global, Inc.,
6.625%, 11/15/2036 | | | 1,357,013 |
| | 1,645,000 | | RSC Equipment Rental, Inc.,
9.500%, 12/01/2014 | | | 1,628,550 |
| | | | | | |
Principal
Amount (‡) | | Description | | Value (†) |
| | | | | | |
| | | Construction Machinery — continued | | | |
| $ | 10,790,000 | | Terex Corp.,
8.000%, 11/15/2017 | | $ | 10,493,275 |
| | 18,703,000 | | United Rentals North America, Inc.,
7.000%, 2/15/2014 | | | 17,300,275 |
| | 14,955,000 | | United Rentals North America, Inc.,
7.750%, 11/15/2013 | | | 14,356,800 |
| | 26,935,000 | | United Rentals North America, Inc.,
10.875%, 6/15/2016 | | | 29,291,813 |
| | | | | | |
| | | | | | 124,544,163 |
| | | | | | |
| | | Consumer Cyclical Services — 0.8% | | | |
| | 670,000 | | ServiceMaster Co. (The),
7.100%, 3/01/2018 | | | 569,500 |
| | 4,675,000 | | ServiceMaster Co. (The),
7.450%, 8/15/2027 | | | 3,564,688 |
| | 101,985,000 | | Western Union Co. (The),
6.200%, 11/17/2036 | | | 103,716,093 |
| | | | | | |
| | | | | | 107,850,281 |
| | | | | | |
| | | Consumer Products — 0.1% | | | |
| | 9,860,000 | | Whirlpool Corp.,
8.000%, 5/01/2012 | | | 10,836,732 |
| | 5,915,000 | | Whirlpool Corp., MTN,
8.600%, 5/01/2014 | | | 6,864,576 |
| | | | | | |
| | | | | | 17,701,308 |
| | | | | | |
| | | Distributors — 0.0% | | | |
| | 1,500,000 | | EQT Corp.,
8.125%, 6/01/2019 | | | 1,782,058 |
| | | | | | |
| | | Diversified Manufacturing — 0.7% | | | |
| | 1,441,000 | | Textron Financial Corp.,
5.400%, 4/28/2013 | | | 1,480,600 |
| | 550,000 | | Textron Financial Corp., Series E, MTN,
5.125%, 8/15/2014 | | | 523,447 |
| | 9,950,000 | | Textron, Inc.,
3.875%, 3/11/2013, (EUR) | | | 13,256,874 |
| | 5,020,000 | | Textron, Inc.,
5.600%, 12/01/2017 | | | 5,056,209 |
| | 26,000,000 | | Textron, Inc.,
6.200%, 3/15/2015 | | | 27,538,290 |
| | 18,635,000 | | Textron, Inc.,
7.250%, 10/01/2019 | | | 20,133,068 |
| | 16,040,000 | | Textron, Inc., EMTN,
6.625%, 4/07/2020, (GBP) | | | 22,515,134 |
| | | | | | |
| | | | | | 90,503,622 |
| | | | | | |
| | | Electric — 3.4% | | | |
| | 4,020,000 | | AES Corp. (The),
7.750%, 3/01/2014 | | | 4,110,450 |
| | 5,565,000 | | AES Corp. (The),
8.375%, 3/01/2011, (GBP)(c) | | | 8,613,780 |
| | 8,582,347 | | AES Ironwood LLC,
8.857%, 11/30/2025 | | | 8,410,700 |
| | 1,072,018 | | AES Red Oak LLC, Series A,
8.540%, 11/30/2019 | | | 1,096,138 |
| | 70,811,970 | | Bruce Mansfield Unit,
6.850%, 6/01/2034(c) | | | 71,834,495 |
| | 3,710,000 | | Calpine Corp., 144A,
7.250%, 10/15/2017 | | | 3,645,075 |
| | 3,363,840 | | CE Generation LLC,
7.416%, 12/15/2018 | | | 3,402,046 |
See accompanying notes to financial statements.
37
LOOMIS SAYLES STRATEGIC INCOME FUND — PORTFOLIOOF INVESTMENTS (continued)
Investments as of March 31, 2010 (Unaudited)
| | | | | | |
Principal
Amount (‡) | | Description | | Value (†) |
| | | | | | |
| | | Electric — continued | | | |
| $ | 32,125,000 | | Cleveland Electric Illuminating Co.,
5.950%, 12/15/2036 | | $ | 30,809,546 |
| | 11,275,000 | | Dynegy Holdings, Inc.,
7.125%, 5/15/2018 | | | 8,005,250 |
| | 1,000,000 | | Dynegy Holdings, Inc.,
7.500%, 6/01/2015 | | | 830,000 |
| | 10,185,000 | | Dynegy Holdings, Inc.,
7.625%, 10/15/2026 | | | 6,518,400 |
| | 500,000 | | Dynegy Holdings, Inc.,
7.750%, 6/01/2019 | | | 377,500 |
| | 7,455,000 | | Dynegy Holdings, Inc.,
8.375%, 5/01/2016 | | | 6,187,650 |
| | 1,132,099 | | Dynegy Roseton/Danskammer Pass Through Trust, Series A,
7.270%, 11/08/2010 | | | 1,137,760 |
| | 95,200,000 | | Edison Mission Energy,
7.625%, 5/15/2027 | | | 60,928,000 |
| | 250,000 | | Empresa Nacional de Electricidad SA, (Endesa-Chile),
8.350%, 8/01/2013 | | | 285,022 |
| | 4,875,000 | | Empresa-Chile Overseas Co.,
7.875%, 2/01/2027 | | | 5,344,550 |
| | 5,940,000 | | Energy Future Holdings Corp., 144A,
10.000%, 1/15/2020 | | | 6,229,575 |
| | 555,000 | | Enersis SA, Cayman Islands,
7.400%, 12/01/2016 | | | 607,861 |
| | 5,310,000 | | ITC Holdings Corp., 144A,
6.375%, 9/30/2036 | | | 5,315,321 |
| | 31,735,000 | | NGC Corp. Capital Trust I, Series B,
8.316%, 6/01/2027 | | | 16,502,200 |
| | 43,450,000 | | NiSource Finance Corp.,
6.400%, 3/15/2018 | | | 46,587,568 |
| | 2,500,000 | | NRG Energy, Inc.,
7.250%, 2/01/2014 | | | 2,518,750 |
| | 5,000,000 | | NRG Energy, Inc.,
7.375%, 2/01/2016 | | | 4,962,500 |
| | 1,379,875 | | Quezon Power (Philippines) Ltd., Senior Secured Note,
8.860%, 6/15/2017 | | | 1,400,573 |
| | 25,230,000 | | RRI Energy, Inc.,
7.875%, 6/15/2017 | | | 22,643,925 |
| | 1,050,000 | | SP PowerAssets Ltd., EMTN,
3.730%, 10/22/2010, (SGD) | | | 761,554 |
| | 655,000 | | Texas Competitive Electric Holdings Co. LLC, Series A,
10.250%, 11/01/2015 | | | 455,225 |
| | 7,165,000 | | Toledo Edison Co.,
6.150%, 5/15/2037 | | | 7,223,997 |
| | 50,270,000 | | TXU Corp., Series P,
5.550%, 11/15/2014 | | | 36,697,100 |
| | 101,735,000 | | TXU Corp., Series Q,
6.500%, 11/15/2024 | | | 52,902,200 |
| | 6,675,000 | | TXU Corp., Series R,
6.550%, 11/15/2034 | | | 3,437,625 |
| | 7,300,000 | | White Pine Hydro LLC,
6.310%, 7/10/2017(c) | | | 7,125,165 |
| | 10,935,000 | | White Pine Hydro LLC,
6.960%, 7/10/2037(c) | | | 9,811,757 |
| | 4,000,000 | | White Pine Hydro LLC,
7.260%, 7/20/2015(c) | | | 3,416,680 |
| | | | | | |
| | | | | | 450,135,938 |
| | | | | | |
| | | | | | |
Principal
Amount (‡) | | Description | | Value (†) |
| | | | | | |
| | | Entertainment — 0.1% | | | |
| $ | 12,679,000 | | Viacom, Inc.,
6.875%, 4/30/2036 | | $ | 13,442,086 |
| | | | | | |
| | | Financial Other — 0.2% | | | |
| | 20,000,000 | | National Life Insurance Co., 144A,
10.500%, 9/15/2039 | | | 21,407,820 |
| | | | | | |
| | | Food & Beverage — 0.3% | | | |
| | 2,085,000 | | Aramark Services, Inc.,
5.000%, 6/01/2012 | | | 2,053,725 |
| | 23,710,000 | | Corn Products International, Inc.,
6.625%, 4/15/2037 | | | 22,527,132 |
| | 14,120,000 | | Sara Lee Corp.,
6.125%, 11/01/2032 | | | 13,873,719 |
| | 965,000 | | Smithfield Foods, Inc.,
7.750%, 7/01/2017 | | | 948,112 |
| | | | | | |
| | | | | | 39,402,688 |
| | | | | | |
| | | Government Owned - No Guarantee — 0.3% | | | |
| | 26,435,000 | | Abu Dhabi National Energy Co., 144A,
7.250%, 8/01/2018 | | | 28,494,128 |
| | 13,600,000 | | DP World Ltd., 144A,
6.850%, 7/02/2037 | | | 11,678,497 |
| | | | | | |
| | | | | | 40,172,625 |
| | | | | | |
| | | Government Sponsored — 0.4% | | | |
| | 66,595,000 | | Queensland Treasury Corp., 144A,
7.125%, 9/18/2017, (NZD) | | | 49,994,656 |
| | | | | | |
| | | Health Insurance — 0.5% | | | |
| | 15,325,000 | | CIGNA Corp.,
6.150%, 11/15/2036 | | | 14,939,668 |
| | 2,000,000 | | CIGNA Corp.,
6.350%, 3/15/2018 | | | 2,154,480 |
| | 50,000,000 | | WellPoint, Inc.,
6.375%, 6/15/2037 | | | 51,337,250 |
| | | | | | |
| | | | | | 68,431,398 |
| | | | | | |
| | | Healthcare — 3.2% | | | |
| | 4,075,000 | | Boston Scientific Corp.,
5.125%, 1/12/2017 | | | 3,824,815 |
| | 2,765,000 | | Boston Scientific Corp.,
5.450%, 6/15/2014 | | | 2,784,302 |
| | 10,230,000 | | Boston Scientific Corp.,
6.000%, 1/15/2020 | | | 9,664,189 |
| | 4,155,000 | | Boston Scientific Corp.,
6.400%, 6/15/2016 | | | 4,237,481 |
| | 16,510,000 | | Boston Scientific Corp.,
7.000%, 11/15/2035 | | | 14,852,660 |
| | 17,785,000 | | HCA, Inc.,
5.750%, 3/15/2014 | | | 16,784,594 |
| | 3,800,000 | | HCA, Inc.,
6.250%, 2/15/2013 | | | 3,771,500 |
| | 17,035,000 | | HCA, Inc.,
6.375%, 1/15/2015 | | | 16,183,250 |
| | 49,350,000 | | HCA, Inc.,
6.500%, 2/15/2016 | | | 46,820,812 |
| | 2,074,000 | | HCA, Inc.,
6.750%, 7/15/2013 | | | 2,074,000 |
| | 14,620,000 | | HCA, Inc.,
7.050%, 12/01/2027 | | | 12,500,100 |
| | 11,104,000 | | HCA, Inc.,
7.190%, 11/15/2015 | | | 10,493,280 |
See accompanying notes to financial statements.
38
LOOMIS SAYLES STRATEGIC INCOME FUND — PORTFOLIOOF INVESTMENTS (continued)
Investments as of March 31, 2010 (Unaudited)
| | | | | | |
Principal
Amount (‡) | | Description | | Value (†) |
| | | | | | |
| | | Healthcare — continued | | | |
| $ | 20,392,000 | | HCA, Inc.,
7.500%, 12/15/2023 | | $ | 18,658,680 |
| | 18,780,000 | | HCA, Inc.,
7.500%, 11/06/2033 | | | 16,338,600 |
| | 44,258,000 | | HCA, Inc.,
7.690%, 6/15/2025 | | | 40,938,650 |
| | 31,650,000 | | HCA, Inc.,
8.360%, 4/15/2024 | | | 29,988,375 |
| | 15,815,000 | | HCA, Inc., MTN,
7.580%, 9/15/2025 | | | 14,312,575 |
| | 9,492,000 | | HCA, Inc., MTN,
7.750%, 7/15/2036 | | | 8,352,960 |
| | 11,370,000 | | Hospira, Inc.,
6.050%, 3/30/2017 | | | 12,212,199 |
| | 92,120,000 | | Medco Health Solutions, Inc.,
7.125%, 3/15/2018 | | | 105,027,117 |
| | 3,260,000 | | Owens & Minor, Inc.,
6.350%, 4/15/2016(c) | | | 3,131,889 |
| | 31,009,000 | | Tenet Healthcare Corp.,
6.875%, 11/15/2031 | | | 25,272,335 |
| | 1,570,000 | | Tenet Healthcare Corp.,
7.375%, 2/01/2013 | | | 1,585,700 |
| | 4,765,000 | | Tenet Healthcare Corp.,
9.250%, 2/01/2015 | | | 4,997,294 |
| | | | | | |
| | | | | | 424,807,357 |
| | | | | | |
| | | Home Construction — 1.0% | | | |
| | 1,625,000 | | D.R. Horton, Inc.,
6.500%, 4/15/2016 | | | 1,629,062 |
| | 11,265,000 | | Desarrolladora Homex SAB de CV,
7.500%, 9/28/2015 | | | 11,433,975 |
| | 6,290,000 | | K. Hovnanian Enterprises, Inc.,
7.500%, 5/15/2016 | | | 4,937,650 |
| | 1,935,000 | | K. Hovnanian Enterprises, Inc.,
7.750%, 5/15/2013 | | | 1,673,775 |
| | 1,235,000 | | K. Hovnanian Enterprises, Inc.,
8.875%, 4/01/2012 | | | 1,139,288 |
| | 4,830,000 | | K. Hovnanian Enterprises, Inc., Guaranteed Note,
6.250%, 1/15/2015 | | | 3,815,700 |
| | 16,075,000 | | K. Hovnanian Enterprises, Inc., Guaranteed Note,
6.250%, 1/15/2016 | | | 12,377,750 |
| | 6,040,000 | | K. Hovnanian Enterprises, Inc., Guaranteed Note,
6.375%, 12/15/2014 | | | 4,847,100 |
| | 2,490,000 | | K. Hovnanian Enterprises, Inc., Guaranteed Note,
6.500%, 1/15/2014 | | | 2,091,600 |
| | 1,685,000 | | KB Home,
5.750%, 2/01/2014 | | | 1,634,450 |
| | 8,340,000 | | KB Home, Guaranteed Note,
5.875%, 1/15/2015 | | | 7,902,150 |
| | 5,805,000 | | KB Home, Guaranteed Note,
6.250%, 6/15/2015 | | | 5,572,800 |
| | 11,315,000 | | KB Home, Guaranteed Note,
7.250%, 6/15/2018 | | | 10,834,112 |
| | 2,720,000 | | Lennar Corp., Series B,
5.125%, 10/01/2010 | | | 2,737,000 |
| | 3,745,000 | | Pulte Group, Inc.,
5.200%, 2/15/2015 | | | 3,590,519 |
| | 46,260,000 | | Pulte Group, Inc.,
6.000%, 2/15/2035 | | | 35,851,500 |
| | | | | | |
Principal
Amount (‡) | | Description | | Value (†) |
| | | | | | |
| | | Home Construction — continued | | | |
| $ | 13,190,000 | | Pulte Group, Inc.,
6.375%, 5/15/2033 | | $ | 10,552,000 |
| | 4,245,000 | | Toll Brothers Financial Corp.,
5.150%, 5/15/2015 | | | 4,235,992 |
| | | | | | |
| | | | | | 126,856,423 |
| | | | | | |
| | | Independent Energy — 1.3% | | | |
| | 48,410,000 | | Anadarko Petroleum Corp.,
6.450%, 9/15/2036 | | | 49,336,567 |
| | 4,185,000 | | Chesapeake Energy Corp.,
6.250%, 1/15/2017, (EUR) | | | 5,482,898 |
| | 14,650,000 | | Chesapeake Energy Corp.,
6.500%, 8/15/2017 | | | 14,173,875 |
| | 22,690,000 | | Chesapeake Energy Corp.,
6.875%, 11/15/2020 | | | 22,066,025 |
| | 15,054,000 | | Connacher Oil and Gas Ltd., 144A,
10.250%, 12/15/2015 | | | 15,317,445 |
| | 3,000,000 | | Connacher Oil and Gas Ltd., 144A,
11.750%, 7/15/2014 | | | 3,315,000 |
| | 6,495,000 | | Hilcorp Energy I LP, 144A,
7.750%, 11/01/2015 | | | 6,413,813 |
| | 1,805,000 | | Penn Virginia Corp.,
10.375%, 6/15/2016 | | | 1,958,425 |
| | 7,175,000 | | Pioneer Natural Resources Co.,
5.875%, 7/15/2016 | | | 7,060,702 |
| | 1,760,000 | | Pioneer Natural Resources Co.,
6.875%, 5/01/2018 | | | 1,759,016 |
| | 4,798,000 | | Pioneer Natural Resources Co.,
7.200%, 1/15/2028 | | | 4,537,325 |
| | 2,499,000 | | Swift Energy Co.,
7.125%, 6/01/2017 | | | 2,374,050 |
| | 9,170,000 | | Talisman Energy, Inc.,
5.850%, 2/01/2037 | | | 8,790,151 |
| | 24,260,000 | | Talisman Energy, Inc.,
6.250%, 2/01/2038 | | | 24,686,176 |
| | | | | | |
| | | | | | 167,271,468 |
| | | | | | |
| | | Industrial Other — 0.1% | | | |
| | 545,000 | | Great Lakes Dredge & Dock Corp., Senior Subordinated Note,
7.750%, 12/15/2013 | | | 549,769 |
| | 20,000,000 | | Ranhill Labuan Ltd., 144A,
12.500%, 10/26/2011 | | | 18,500,000 |
| | | | | | |
| | | | | | 19,049,769 |
| | | | | | |
| | | Life Insurance — 0.4% | | | |
| | 2,855,000 | | American International Group, Inc.,
4.900%, 6/02/2014, (CAD) | | | 2,586,127 |
| | 4,815,000 | | American International Group, Inc., MTN,
5.450%, 5/18/2017 | | | 4,429,530 |
| | 2,185,000 | | American International Group, Inc., Series G, MTN,
5.600%, 10/18/2016 | | | 2,033,733 |
| | 23,190,000 | | American International Group, Inc., Series G, MTN,
5.850%, 1/16/2018 | | | 21,547,360 |
| | 1,500,000 | | MetLife, Inc.,
6.400%, 12/15/2066 | | | 1,342,500 |
| | 9,620,000 | | MetLife, Inc.,
10.750%, 8/01/2069 | | | 12,399,718 |
| | 6,700,000 | | Unum Group,
7.125%, 9/30/2016 | | | 7,283,141 |
| | | | | | |
| | | | | | 51,622,109 |
| | | | | | |
See accompanying notes to financial statements.
39
LOOMIS SAYLES STRATEGIC INCOME FUND — PORTFOLIOOF INVESTMENTS (continued)
Investments as of March 31, 2010 (Unaudited)
| | | | | | |
Principal
Amount (‡) | | Description | | Value (†) |
| | | | | | |
| | | Media Cable — 2.0% | | | |
| $ | 31,795,000 | | Comcast Corp.,
5.650%, 6/15/2035 | | $ | 29,436,224 |
| | 8,810,000 | | Comcast Corp.,
6.500%, 11/15/2035 | | | 9,023,872 |
| | 161,264,000 | | Comcast Corp.,
6.950%, 8/15/2037 | | | 174,458,298 |
| | 400,000 | | CSC Holdings LLC,
7.875%, 2/15/2018 | | | 420,000 |
| | 2,540,000 | | CSC Holdings LLC, 144A,
8.500%, 4/15/2014 | | | 2,705,100 |
| | 25,270,000 | | Shaw Communications, Inc.,
5.650%, 10/01/2019, (CAD) | | | 25,612,855 |
| | 17,959,000 | | Time Warner Cable, Inc.,
6.750%, 7/01/2018 | | | 20,066,686 |
| | 2,720,000 | | Virgin Media Finance PLC,
9.125%, 8/15/2016 | | | 2,890,000 |
| | 1,065,573 | | Virgin Media Finance PLC,
9.750%, 4/15/2014, (GBP) | | | 1,669,558 |
| | | | | | |
| | | | | | 266,282,593 |
| | | | | | |
| | | Media Non-Cable — 0.6% | | | |
| | 1,140,000 | | Clear Channel Communications, Inc.,
4.400%, 5/15/2011 | | | 1,074,450 |
| | 3,370,000 | | Clear Channel Communications, Inc.,
5.000%, 3/15/2012 | | | 2,982,450 |
| | 4,740,000 | | Clear Channel Communications, Inc.,
6.250%, 3/15/2011 | | | 4,585,950 |
| | 145,000 | | Clear Channel Communications, Inc.,
7.650%, 9/15/2010 | | | 144,456 |
| | 225,000 | | Intelsat Corp.,
6.875%, 1/15/2028 | | | 193,500 |
| | 46,000,000 | | News America, Inc.,
6.150%, 3/01/2037 | | | 45,342,246 |
| | 11,140,000 | | News America, Inc.,
6.200%, 12/15/2034 | | | 11,110,824 |
| | 13,075,000 | | News America, Inc.,
6.400%, 12/15/2035 | | | 13,351,563 |
| | | | | | |
| | | | | | 78,785,439 |
| | | | | | |
| | | Metals & Mining — 0.5% | | | |
| | 10,000,000 | | Alcoa, Inc.,
5.720%, 2/23/2019 | | | 9,721,620 |
| | 3,949,000 | | Alcoa, Inc.,
5.870%, 2/23/2022 | | | 3,628,464 |
| | 1,405,000 | | Alcoa, Inc.,
5.950%, 2/01/2037 | | | 1,151,997 |
| | 4,330,000 | | Alcoa, Inc.,
6.750%, 1/15/2028 | | | 4,005,337 |
| | 9,785,000 | | Algoma Acquisition Corp., 144A,
9.875%, 6/15/2015 | | | 9,002,200 |
| | 1,840,000 | | Rio Tinto Alcan, Inc.,
5.750%, 6/01/2035 | | | 1,801,533 |
| | 1,730,000 | | Teck Resources Ltd.,
10.250%, 5/15/2016 | | | 2,058,700 |
| | 1,000,000 | | Teck Resources Ltd.,
10.750%, 5/15/2019 | | | 1,225,000 |
| | 7,000,000 | | United States Steel Corp.,
6.050%, 6/01/2017 | | | 6,737,500 |
| | 6,779,000 | | United States Steel Corp.,
6.650%, 6/01/2037 | | | 5,829,940 |
| | | | | | |
Principal
Amount (‡) | | Description | | Value (†) |
| | | | | | |
| | | Metals & Mining — continued | | | |
| $ | 16,435,000 | | United States Steel Corp.,
7.000%, 2/01/2018 | | $ | 16,188,475 |
| | | | | | |
| | | | | | 61,350,766 |
| | | | | | |
| | | Non-Captive Consumer — 4.1% | | | |
| | 4,900,000 | | American General Finance Corp., MTN,
5.750%, 9/15/2016 | | | 4,199,177 |
| | 229,690,000 | | American General Finance Corp., Series J, MTN,
6.900%, 12/15/2017 | | | 201,187,538 |
| | 37,749,000 | | Residential Capital LLC,
9.625%, 5/15/2015 | | | 37,182,765 |
| | 995,000 | | SLM Corp.,
6.000%, 5/10/2012, (AUD) | | | 829,015 |
| | 109,950(††) | | SLM Corp.,
6.000%, 12/15/2043 | | | 1,956,835 |
| | 20,590,000 | | SLM Corp., MTN,
5.050%, 11/14/2014 | | | 19,053,677 |
| | 3,695,000 | | SLM Corp., MTN,
5.125%, 8/27/2012 | | | 3,671,537 |
| | 1,665,000 | | SLM Corp., MTN,
8.000%, 3/25/2020 | | | 1,621,309 |
| | 4,700,000 | | SLM Corp., Series 7, EMTN,
4.750%, 3/17/2014, (EUR) | | | 5,887,823 |
| | 5,625,000 | | SLM Corp., Series A, MTN,
4.500%, 7/26/2010 | | | 5,650,892 |
| | 54,478,000 | | SLM Corp., Series A, MTN,
5.000%, 10/01/2013 | | | 52,046,048 |
| | 41,770,000 | | SLM Corp., Series A, MTN,
5.000%, 4/15/2015 | | | 38,033,298 |
| | 14,465,000 | | SLM Corp., Series A, MTN,
5.000%, 6/15/2018 | | | 11,935,303 |
| | 19,605,000 | | SLM Corp., Series A, MTN,
5.375%, 1/15/2013 | | | 19,362,819 |
| | 24,705,000 | | SLM Corp., Series A, MTN,
5.375%, 5/15/2014 | | | 23,400,304 |
| | 1,390,000 | | SLM Corp., Series A, MTN,
5.400%, 10/25/2011 | | | 1,403,041 |
| | 28,150,000 | | SLM Corp., Series A, MTN,
5.625%, 8/01/2033 | | | 21,721,244 |
| | 6,100,000 | | SLM Corp., Series A, MTN,
6.500%, 6/15/2010, (NZD)(c) | | | 4,333,970 |
| | 95,060,000 | | SLM Corp., Series A, MTN,
8.450%, 6/15/2018 | | | 96,139,977 |
| | | | | | |
| | | | | | 549,616,572 |
| | | | | | |
| | | Non-Captive Diversified — 8.0% | | | |
| | 18,096,402 | | CIT Group, Inc.,
7.000%, 5/01/2013 | | | 17,598,751 |
| | 27,144,615 | | CIT Group, Inc.,
7.000%, 5/01/2014 | | | 25,651,661 |
| | 27,144,615 | | CIT Group, Inc.,
7.000%, 5/01/2015 | | | 25,312,353 |
| | 66,996,037 | | CIT Group, Inc.,
7.000%, 5/01/2016 | | | 61,803,844 |
| | 70,052,457 | | CIT Group, Inc.,
7.000%, 5/01/2017 | | | 64,623,392 |
| | 3,100,000 | | General Electric Capital Corp., EMTN,
6.125%, 5/17/2012, (GBP) | | | 5,048,607 |
| | 6,610,000 | | General Electric Capital Corp., EMTN,
9.000%, 1/04/2011, (NZD) | | | 4,856,118 |
See accompanying notes to financial statements.
40
LOOMIS SAYLES STRATEGIC INCOME FUND — PORTFOLIOOF INVESTMENTS (continued)
Investments as of March 31, 2010 (Unaudited)
| | | | | |
Principal
Amount (‡) | | Description | | Value (†) |
| | | | | |
| | Non-Captive Diversified — continued | | | |
| 79,035,000 | | General Electric Capital Corp., Series A, EMTN,
6.750%, 9/26/2016, (NZD) | | $ | 56,305,203 |
| 65,300,000 | | General Electric Capital Corp., Series A, GMTN,
2.960%, 5/18/2012, (SGD) | | | 46,788,165 |
| 43,080,000 | | General Electric Capital Corp., Series A, GMTN,
7.625%, 12/10/2014, (NZD) | | | 32,329,868 |
| 15,305,000 | | General Electric Capital Corp., Series A, MTN,
0.551%, 5/13/2024(b) | | | 12,933,903 |
| 115,000,000 | | General Electric Capital Corp., Series A, MTN,
3.485%, 3/08/2012, (SGD) | | | 83,229,601 |
| 243,057,000 | | General Electric Capital Corp., Series A, MTN,
6.500%, 9/28/2015, (NZD) | | | 172,894,809 |
| 5,760,000 | | General Motors Acceptance Corp. of Canada Ltd., EMTN,
7.125%, 9/13/2011, (AUD) | | | 5,196,136 |
| 43,074,000 | | GMAC, Inc.,
5.375%, 6/06/2011 | | | 42,912,472 |
| 3,390,000 | | GMAC, Inc.,
5.750%, 9/27/2010 | | | 3,403,560 |
| 905,000 | | GMAC, Inc.,
6.000%, 4/01/2011 | | | 903,869 |
| 36,075,000 | | GMAC, Inc.,
6.000%, 12/15/2011 | | | 36,165,188 |
| 311,000 | | GMAC, Inc., 144A,
6.625%, 12/17/2010 | | | 312,944 |
| 15,426,000 | | GMAC, Inc.,
6.625%, 5/15/2012 | | | 15,580,260 |
| 22,211,000 | | GMAC, Inc.,
6.750%, 12/01/2014 | | | 22,099,945 |
| 6,829,000 | | GMAC, Inc.,
6.875%, 9/15/2011 | | | 6,939,971 |
| 2,947,000 | | GMAC, Inc.,
6.875%, 8/28/2012 | | | 2,987,521 |
| 7,702,000 | | GMAC, Inc.,
7.000%, 2/01/2012 | | | 7,836,785 |
| 17,038,000 | | GMAC, Inc.,
7.500%, 12/31/2013 | | | 17,336,165 |
| 32,711,000 | | GMAC, Inc.,
8.000%, 12/31/2018 | | | 32,220,335 |
| 25,955,000 | | GMAC, Inc.,
8.000%, 11/01/2031 | | | 24,787,025 |
| 49,800,000 | | GMAC, Inc., 144A,
8.300%, 2/12/2015 | | | 52,290,000 |
| 10,985,000 | | International Lease Finance Corp.,
6.375%, 3/25/2013 | | | 10,735,168 |
| 23,370,000 | | International Lease Finance Corp., 144A,
8.625%, 9/15/2015 | | | 23,890,146 |
| 2,330,000 | | International Lease Finance Corp., Series R, MTN,
5.625%, 9/20/2013 | | | 2,197,826 |
| 2,547,000 | | International Lease Finance Corp., Series R, MTN,
5.650%, 6/01/2014 | | | 2,360,580 |
| 34,782,000 | | iStar Financial, Inc.,
5.150%, 3/01/2012 | | | 30,434,250 |
| 5,255,000 | | iStar Financial, Inc.,
5.375%, 4/15/2010 | | | 5,241,863 |
| 3,010,000 | | iStar Financial, Inc.,
5.500%, 6/15/2012 | | | 2,607,413 |
| 19,110,000 | | iStar Financial, Inc.,
5.650%, 9/15/2011 | | | 17,437,875 |
| 1,530,000 | | iStar Financial, Inc.,
5.700%, 3/01/2014 | | | 1,216,350 |
| | | | | | |
Principal
Amount (‡) | | Description | | Value (†) |
| | | | | | |
| | | Non-Captive Diversified — continued | | | |
| $ | 4,040,000 | | iStar Financial, Inc.,
5.800%, 3/15/2011 | | $ | 3,832,950 |
| | 4,815,000 | | iStar Financial, Inc.,
5.850%, 3/15/2017 | | | 3,563,100 |
| | 8,815,000 | | iStar Financial, Inc.,
5.875%, 3/15/2016 | | | 6,611,250 |
| | 4,300,000 | | iStar Financial, Inc.,
6.050%, 4/15/2015 | | | 3,160,500 |
| | 35,130,000 | | iStar Financial, Inc.,
8.625%, 6/01/2013 | | | 30,036,150 |
| | 1,780,000 | | iStar Financial, Inc., Series B,
5.125%, 4/01/2011 | | | 1,604,225 |
| | 44,610,000 | | iStar Financial, Inc., Series B,
5.950%, 10/15/2013 | | | 35,688,000 |
| | | | | | |
| | | | | | 1,060,966,097 |
| | | | | | |
| | | Oil Field Services — 1.6% | | | |
| | 7,015,000 | | Allis-Chalmers Energy, Inc.,
8.500%, 3/01/2017 | | | 6,208,275 |
| | 8,060,000 | | Allis-Chalmers Energy, Inc.,
9.000%, 1/15/2014 | | | 7,737,600 |
| | 10,860,000 | | Nabors Industries, Inc.,
6.150%, 2/15/2018 | | | 11,569,234 |
| | 107,054,000 | | Nabors Industries, Inc.,
9.250%, 1/15/2019 | | | 133,162,223 |
| | 3,973,000 | | North American Energy Partners, Inc.,
8.750%, 12/01/2011 | | | 3,973,000 |
| | 16,035,000 | | Rowan Cos., Inc.,
7.875%, 8/01/2019 | | | 18,365,190 |
| | 15,520,000 | | Weatherford International Ltd.,
6.500%, 8/01/2036 | | | 15,421,370 |
| | 2,975,000 | | Weatherford International Ltd.,
6.800%, 6/15/2037 | | | 3,053,153 |
| | 9,580,000 | | Weatherford International Ltd.,
7.000%, 3/15/2038 | | | 10,128,915 |
| | | | | | |
| | | | | | 209,618,960 |
| | | | | | |
| | | Packaging — 0.3% | | | |
| | 2,450,000 | | OI European Group BV, 144A,
6.875%, 3/31/2017, (EUR) | | | 3,342,185 |
| | 1,750,000 | | Owens Brockway Glass Container, Inc.,
6.750%, 12/01/2014, (EUR) | | | 2,410,911 |
| | 33,261,000 | | Owens-Illinois, Inc., Senior Note,
7.800%, 5/15/2018 | | | 34,341,982 |
| | | | | | |
| | | | | | 40,095,078 |
| | | | | | |
| | | Packaging & Containers — 0.0% | | | |
| | 4,445,000 | | XL Capital Ltd.,
6.250%, 5/15/2027 | | | 4,191,044 |
| | 1,425,000 | | XL Capital Ltd.,
6.375%, 11/15/2024 | | | 1,356,694 |
| | | | | | |
| | | | | | 5,547,738 |
| | | | | | |
| | | Paper — 2.6% | | | |
| | 22,285,000 | | Fibria Overseas Finance Ltd., 144A,
9.250%, 10/30/2019 | | | 25,404,900 |
| | 12,430,000 | | Georgia-Pacific Corp.,
7.250%, 6/01/2028 | | | 12,305,700 |
| | 11,605,000 | | Georgia-Pacific Corp.,
7.375%, 12/01/2025 | | | 11,546,975 |
See accompanying notes to financial statements.
41
LOOMIS SAYLES STRATEGIC INCOME FUND — PORTFOLIOOF INVESTMENTS (continued)
Investments as of March 31, 2010 (Unaudited)
| | | | | | |
Principal
Amount (‡) | | Description | | Value (†) |
| | | | | | |
| | | Paper — continued | | | |
| $ | 120,000 | | Georgia-Pacific Corp.,
7.700%, 6/15/2015 | | $ | 127,200 |
| | 42,425,000 | | Georgia-Pacific Corp.,
7.750%, 11/15/2029 | | | 42,425,000 |
| | 16,475,000 | | Georgia-Pacific Corp.,
8.000%, 1/15/2024 | | | 17,463,500 |
| | 18,378,000 | | Georgia-Pacific Corp.,
8.875%, 5/15/2031 | | | 19,940,130 |
| | 154,533,000 | | International Paper Co.,
7.950%, 6/15/2018 | | | 180,547,240 |
| | 3,995,000 | | Jefferson Smurfit Corp.,
7.500%, 6/01/2013(d) | | | 3,515,600 |
| | 100,000 | | Smurfit-Stone Container Enterprises, Inc.,
8.000%, 3/15/2017(d) | | | 89,250 |
| | 14,520,000 | | Westvaco Corp.,
7.950%, 2/15/2031 | | | 15,688,540 |
| | 17,355,000 | | Westvaco Corp.,
8.200%, 1/15/2030 | | | 19,077,796 |
| | | | | | |
| | | | | | 348,131,831 |
| | | | | | |
| | | Pharmaceuticals — 0.3% | | | |
| | 41,300,000 | | Elan Finance PLC/ Elan Finance Corp.,
8.875%, 12/01/2013 | | | 42,539,000 |
| | | | | | |
| | | Pipelines — 2.2% | | | |
| | 19,745,000 | | DCP Midstream LP, 144A,
6.450%, 11/03/2036 | | | 19,577,622 |
| | 15,685,000 | | El Paso Corp.,
6.950%, 6/01/2028 | | | 14,165,374 |
| | 1,500,000 | | El Paso Corp.,
7.420%, 2/15/2037 | | | 1,325,655 |
| | 750,000 | | El Paso Corp., GMTN,
7.800%, 8/01/2031 | | | 737,120 |
| | 1,000,000 | | El Paso Energy Corp., GMTN,
7.750%, 1/15/2032 | | | 982,610 |
| | 5,255,000 | | Energy Transfer Partners LP,
6.125%, 2/15/2017 | | | 5,647,764 |
| | 9,115,000 | | Energy Transfer Partners LP,
6.625%, 10/15/2036 | | | 9,177,338 |
| | 13,175,000 | | Enterprise Products Operating LLP,
6.300%, 9/15/2017 | | | 14,472,487 |
| | 5,100,000 | | Florida Gas Transmission Co., 144A,
7.900%, 5/15/2019 | | | 6,076,308 |
| | 500,000 | | Kinder Morgan Energy Partners LP,
5.800%, 3/15/2035 | | | 469,935 |
| | 46,406,379 | | Maritimes & Northeast Pipeline LLC, 144A,
7.500%, 5/31/2014(c) | | | 50,764,866 |
| | 81,710,000 | | NGPL Pipeco LLC, 144A,
7.119%, 12/15/2017 | | | 91,631,637 |
| | 3,425,000 | | ONEOK Partners LP,
6.650%, 10/01/2036 | | | 3,570,730 |
| | 20,770,000 | | Plains All American Pipeline LP,
6.125%, 1/15/2017 | | | 22,303,574 |
| | 44,730,000 | | Plains All American Pipeline LP,
6.650%, 1/15/2037 | | | 46,382,326 |
| | 4,168,000 | | Transportadora de Gas del Sur SA, 144A,
7.875%, 5/14/2017 | | | 3,954,390 |
| | 444,000 | | Williams Cos., Inc. (The),
7.875%, 9/01/2021 | | | 522,774 |
| | 715,000 | | Williams Cos., Inc. (The), Senior Note,
7.750%, 6/15/2031 | | | 802,104 |
| | | | | | |
Principal
Amount (‡) | | Description | | Value (†) |
| | | | | | |
| | | Pipelines — continued | | | |
| $ | 2,984,000 | | Williams Cos., Inc. (The), Series A,
7.500%, 1/15/2031 | | $ | 3,278,769 |
| | | | | | |
| | | | | | 295,843,383 |
| | | | | | |
| | | Property & Casualty Insurance — 0.3% | | | |
| | 3,405,000 | | Hanover Insurance Group, Inc. (The),
7.500%, 3/01/2020 | | | 3,492,338 |
| | 2,660,000 | | Marsh & McLennan Cos., Inc.,
5.375%, 7/15/2014 | | | 2,751,499 |
| | 11,710,000 | | Marsh & McLennan Cos., Inc.,
5.750%, 9/15/2015 | | | 12,400,784 |
| | 11,075,000 | | Marsh & McLennan Cos., Inc.,
5.875%, 8/01/2033 | | | 9,755,148 |
| | 6,080,000 | | MBIA Insurance Corp., (fixed rate to 1/15/2013, variable rate thereafter), 144A,
14.000%, 1/15/2033 | | | 4,134,400 |
| | 11,205,000 | | Willis North America, Inc.,
6.200%, 3/28/2017 | | | 11,351,696 |
| | | | | | |
| | | | | | 43,885,865 |
| | | | | | |
| | | Railroads — 0.2% | | | |
| | 1,200,000 | | Canadian Pacific Railway Co.,
5.750%, 3/15/2033 | | | 1,131,932 |
| | 10,370,000 | | Canadian Pacific Railway Co.,
5.950%, 5/15/2037 | | | 10,021,713 |
| | 18,450,000 | | CSX Corp., MTN,
6.000%, 10/01/2036 | | | 18,328,747 |
| | 1,153,000 | | Missouri Pacific Railroad Co.,
5.000%, 1/01/2045(c) | | | 691,800 |
| | | | | | |
| | | | | | 30,174,192 |
| | | | | | |
| | | Refining — 0.0% | | | |
| | 1,335,000 | | Valero Energy Corp.,
6.625%, 6/15/2037 | | | 1,269,660 |
| | | | | | |
| | | REITs — 1.2% | | | |
| | 2,025,000 | | Camden Property Trust,
5.000%, 6/15/2015 | | | 2,017,200 |
| | 27,950,000 | | Camden Property Trust,
5.700%, 5/15/2017 | | | 27,485,192 |
| | 4,030,000 | | Duke Realty LP,
5.950%, 2/15/2017 | | | 3,962,115 |
| | 3,300,000 | | ERP Operating LP,
5.125%, 3/15/2016 | | | 3,393,671 |
| | 47,305,000 | | Highwoods Properties, Inc.,
5.850%, 3/15/2017 | | | 45,215,349 |
| | 4,180,000 | | ProLogis,
5.625%, 11/15/2015 | | | 4,144,240 |
| | 3,915,000 | | ProLogis,
5.625%, 11/15/2016 | | | 3,787,030 |
| | 4,635,000 | | ProLogis,
5.750%, 4/01/2016 | | | 4,540,381 |
| | 1,002,000 | | ProLogis,
6.625%, 5/15/2018 | | | 995,734 |
| | 2,080,000 | | ProLogis,
7.375%, 10/30/2019 | | | 2,135,166 |
| | 1,500,000 | | Simon Property Group LP,
5.250%, 12/01/2016 | | | 1,486,479 |
| | 4,900,000 | | Simon Property Group LP,
5.750%, 12/01/2015 | | | 5,183,695 |
| | 550,000 | | Simon Property Group LP,
5.875%, 3/01/2017 | | | 568,272 |
See accompanying notes to financial statements.
42
LOOMIS SAYLES STRATEGIC INCOME FUND — PORTFOLIOOF INVESTMENTS (continued)
Investments as of March 31, 2010 (Unaudited)
| | | | | | |
Principal
Amount (‡) | | Description | | Value (†) |
| | | | | | |
| | | REITs — continued | | | |
| $ | 1,890,000 | | Simon Property Group LP,
6.100%, 5/01/2016 | | $ | 1,989,681 |
| | 450,000 | | Simon Property Group LP,
6.125%, 5/30/2018 | | | 465,548 |
| | 46,015,000 | | WEA Finance LLC/WT Finance Australia Property Ltd., 144A,
6.750%, 9/02/2019 | | | 49,101,870 |
| | | | | | |
| | | | | | 156,471,623 |
| | | | | | |
| | | Restaurants — 0.0% | | | |
| | 1,250,000 | | McDonald’s Corp., EMTN,
3.628%, 10/10/2010, (SGD) | | | 905,124 |
| | | | | | |
| | | Retailers — 2.2% | | | |
| | 8,758,000 | | Dillard’s, Inc.,
6.625%, 1/15/2018 | | | 8,101,150 |
| | 4,187,000 | | Dillard’s, Inc.,
7.130%, 8/01/2018 | | | 3,935,780 |
| | 1,500,000 | | Dillard’s, Inc.,
7.750%, 7/15/2026 | | | 1,275,000 |
| | 425,000 | | Dillard’s, Inc.,
7.875%, 1/01/2023 | | | 377,188 |
| | 3,325,000 | | Dillard’s, Inc., Class A,
7.000%, 12/01/2028 | | | 2,660,000 |
| | 123,940,000 | | Home Depot, Inc.,
5.875%, 12/16/2036 | | | 120,274,722 |
| | 3,685,000 | | J.C. Penney Corp., Inc.,
5.750%, 2/15/2018 | | | 3,689,606 |
| | 635,000 | | J.C. Penney Corp., Inc.,
7.125%, 11/15/2023 | | | 640,556 |
| | 3,985,000 | | J.C. Penney Corp., Inc.,
7.625%, 3/01/2097 | | | 3,606,425 |
| | 72,470,000 | | J.C. Penney Corp., Inc., Senior Note,
6.375%, 10/15/2036 | | | 67,487,688 |
| | 16,627,000 | | Macy’s Retail Holdings, Inc.,
6.375%, 3/15/2037 | | | 15,296,840 |
| | 12,275,000 | | Macy’s Retail Holdings, Inc.,
6.790%, 7/15/2027 | | | 11,047,500 |
| | 2,365,000 | | Macy’s Retail Holdings, Inc.,
6.900%, 4/01/2029 | | | 2,246,750 |
| | 6,365,000 | | Marks & Spencer PLC, 144A,
7.125%, 12/01/2037 | | | 6,447,586 |
| | 32,675,000 | | Toys R Us, Inc.,
7.375%, 10/15/2018 | | | 31,368,000 |
| | 8,355,000 | | Toys R Us, Inc.,
7.875%, 4/15/2013 | | | 8,563,875 |
| | 10,270,000 | | Woolworth Corp.,
8.500%, 1/15/2022 | | | 9,499,750 |
| | | | | | |
| | | | | | 296,518,416 |
| | | | | | |
| | | Sovereigns — 4.7% | | | |
| | 104,626,000,000 | | Indonesia Treasury Bond, Series FR43,
10.250%, 7/15/2022, (IDR) | | | 12,185,942 |
| | 10,000,000,000 | | Indonesia Treasury Bond, Series FR47,
10.000%, 2/15/2028, (IDR) | | | 1,086,521 |
| | 272,460,000,000 | | Indonesia Treasury Bond, Series ZC3,
Zero Coupon, 11/20/2012, (IDR) | | | 24,654,793 |
| | 2,350,305(†††) | | Mexican Fixed Rate Bonds, Series M-10,
7.250%, 12/15/2016, (MXN) | | | 19,005,843 |
| | 2,037,000(†††) | | Mexican Fixed Rate Bonds, Series M-10,
9.000%, 12/20/2012, (MXN) | | | 17,729,376 |
| | | | | |
Principal
Amount (‡) | | Description | | Value (†) |
| | | | | |
| | Sovereigns — continued | | | |
| 18,686,981(†††) | | Mexican Fixed Rate Bonds, Series M-20,
8.000%, 12/07/2023, (MXN) | | $ | 151,370,025 |
| 79,755,000 | | New South Wales Treasury Corp., Series 10RG,
7.000%, 12/01/2010, (AUD) | | | 74,464,372 |
| 10,530,000 | | New South Wales Treasury Corp., Series 12RG,
6.000%, 5/01/2012, (AUD) | | | 9,791,710 |
| 66,305,000 | | New South Wales Treasury Corp., Series 17RG,
5.500%, 3/01/2017, (AUD) | | | 59,281,078 |
| 56,700,000 | | Republic of Brazil,
10.250%, 1/10/2028, (BRL) | | | 32,202,322 |
| 140,235,000 | | Republic of Brazil,
12.500%, 1/05/2016, (BRL) | | | 89,699,616 |
| 107,840,000 | | Republic of Brazil,
12.500%, 1/05/2022, (BRL) | | | 70,797,762 |
| 18,400,000 | | Republic of Croatia, 144A,
6.750%, 11/05/2019 | | | 20,248,078 |
| 3,178,700,000 | | Republic of Iceland,
7.250%, 5/17/2013, (ISK) | | | 14,096,843 |
| 1,700,700,000 | | Republic of Iceland,
8.000%, 7/22/2011, (ISK) | | | 7,569,372 |
| 4,844,663,000 | | Republic of Iceland,
13.750%, 12/10/2010, (ISK) | | | 22,113,570 |
| 4,020,000 | | Republic of Venezuela,
7.000%, 3/16/2015, (EUR) | | | 4,845,931 |
| | | | | |
| | | | | 631,143,154 |
| | | | | |
| | Supermarkets — 0.7% | | | |
| 2,000,000 | | American Stores Co.,
7.900%, 5/01/2017 | | | 1,861,460 |
| 72,681,000 | | New Albertson’s, Inc.,
7.450%, 8/01/2029 | | | 61,415,445 |
| 19,060,000 | | New Albertson’s, Inc.,
7.750%, 6/15/2026 | | | 16,201,000 |
| 4,895,000 | | New Albertson’s, Inc.,
8.000%, 5/01/2031 | | | 4,209,700 |
| 1,510,000 | | New Albertson’s, Inc.,
8.700%, 5/01/2030 | | | 1,404,300 |
| 13,242,000 | | New Albertson’s, Inc., Series C, MTN,
6.625%, 6/01/2028 | | | 10,030,815 |
| | | | | |
| | | | | 95,122,720 |
| | | | | |
| | Supranational — 1.3% | | | |
| 128,250,000 | | European Investment Bank,
Zero Coupon, 3/10/2021, (AUD) | | | 54,701,201 |
| 16,375,000 | | European Investment Bank,
11.250%, 2/14/2013, (BRL) | | | 9,784,853 |
| 460,500,000,000 | | European Investment Bank, EMTN, 144A,
Zero Coupon, 4/24/2013, (IDR) | | | 41,335,942 |
| 24,398,000 | | European Investment Bank, EMTN,
7.000%, 1/18/2012, (NZD) | | | 18,141,623 |
| 244,840,000,000 | | Inter-American Development Bank, EMTN,
Zero Coupon, 5/20/2013, (IDR) | | | 21,033,181 |
| 24,450,000 | | Inter-American Development Bank, EMTN,
6.000%, 12/15/2017, (NZD) | | | 17,442,546 |
| 8,300,000 | | International Bank for Reconstruction & Development,
1.430%, 3/05/2014, (SGD) | | | 5,770,344 |
| 1,385,900,000 | | International Bank for Reconstruction & Development,
9.500%, 5/27/2010, (ISK) | | | 6,060,721 |
| | | | | |
| | | | | 174,270,411 |
| | | | | |
See accompanying notes to financial statements.
43
LOOMIS SAYLES STRATEGIC INCOME FUND — PORTFOLIOOF INVESTMENTS (continued)
Investments as of March 31, 2010 (Unaudited)
| | | | | | |
Principal
Amount (‡) | | Description | | Value (†) |
| | | | | | |
| | | Technology — 2.4% | | | |
| $ | 41,705,000 | | Agilent Technologies, Inc.,
6.500%, 11/01/2017 | | $ | 45,058,457 |
| | 41,104,000 | | Alcatel-Lucent USA, Inc.,
6.450%, 3/15/2029 | | | 28,978,320 |
| | 5,065,000 | | Alcatel-Lucent USA, Inc.,
6.500%, 1/15/2028 | | | 3,558,163 |
| | 832,000 | | Alcatel-Lucent, EMTN,
6.375%, 4/07/2014, (EUR) | | | 1,137,788 |
| | 10,725,000 | | Amkor Technology, Inc.,
7.750%, 5/15/2013 | | | 10,805,437 |
| | 1,225,000 | | Amkor Technology, Inc.,
9.250%, 6/01/2016 | | | 1,292,375 |
| | 2,435,000 | | Arrow Electronics, Inc.,
6.875%, 6/01/2018 | | | 2,602,896 |
| | 30,125,000 | | Avnet, Inc.,
5.875%, 3/15/2014 | | | 32,114,997 |
| | 35,630,000 | | Avnet, Inc.,
6.000%, 9/01/2015 | | | 37,520,635 |
| | 11,345,000 | | Avnet, Inc.,
6.625%, 9/15/2016 | | | 12,128,917 |
| | 6,225,000 | | Corning, Inc.,
5.900%, 3/15/2014 | | | 6,771,829 |
| | 6,220,000 | | Corning, Inc.,
6.200%, 3/15/2016 | | | 6,791,500 |
| | 6,150,000 | | Corning, Inc.,
6.850%, 3/01/2029 | | | 6,402,279 |
| | 4,725,000 | | Corning, Inc.,
7.250%, 8/15/2036 | | | 5,062,417 |
| | 3,640,000 | | Eastman Kodak Co.,
7.250%, 11/15/2013 | | | 3,467,100 |
| | 11,626,000 | | Equifax, Inc.,
7.000%, 7/01/2037 | | | 12,416,335 |
| | 285,000 | | Freescale Semiconductor, Inc.,
8.875%, 12/15/2014 | | | 272,175 |
| | 6,290,000 | | Freescale Semiconductor, Inc.,
10.125%, 12/15/2016 | | | 5,566,650 |
| | 9,739,000 | | Motorola, Inc.,
5.220%, 10/01/2097 | | | 6,678,529 |
| | 475,000 | | Motorola, Inc.,
6.000%, 11/15/2017 | | | 491,568 |
| | 10,830,000 | | Motorola, Inc.,
6.500%, 9/01/2025 | | | 10,516,796 |
| | 22,424,000 | | Motorola, Inc.,
6.500%, 11/15/2028 | | | 21,050,777 |
| | 22,385,000 | | Motorola, Inc.,
6.625%, 11/15/2037 | | | 21,008,591 |
| | 250,000 | | Motorola, Inc.,
7.500%, 5/15/2025 | | | 257,626 |
| | 9,350,000 | | Nortel Networks Capital Corp.,
7.875%, 6/15/2026(d) | | | 6,732,000 |
| | 11,770,000 | | Nortel Networks Ltd.,
6.875%, 9/01/2023(d) | | | 3,648,700 |
| | 270,000 | | Samsung Electronics Co. Ltd., 144A,
7.700%, 10/01/2027 | | | 295,595 |
| | 21,822,000 | | Xerox Capital Trust I,
8.000%, 2/01/2027 | | | 21,409,848 |
| | 4,795,000 | | Xerox Corp.,
5.500%, 5/15/2012 | | | 5,086,066 |
| | 1,730,000 | | Xerox Corp., MTN,
7.200%, 4/01/2016 | | | 1,933,318 |
| | | | | | |
| | | | | | 321,057,684 |
| | | | | | |
| | | | | | |
Principal
Amount (‡) | | Description | | Value (†) |
| | | | | | |
| | | Tobacco — 0.5% | | | |
| $ | 1,375,000 | | Altria Group, Inc.,
9.700%, 11/10/2018 | | $ | 1,690,740 |
| | 52,930,000 | | Reynolds American, Inc.,
6.750%, 6/15/2017 | | | 56,692,476 |
| | 13,400,000 | | Reynolds American, Inc.,
7.250%, 6/15/2037 | | | 13,638,627 |
| | | | | | |
| | | | | | 72,021,843 |
| | | | | | |
| | | Transportation Services — 0.4% | | | |
| | 10,503,000 | | APL Ltd., Senior Note,
8.000%, 1/15/2024(c) | | | 7,850,992 |
| | 14,891,493 | | Atlas Air, Inc., Series 1998-1, Class 1B,
7.680%, 7/02/2015 | | | 14,072,461 |
| | 8,356,817 | | Atlas Air, Inc., Series 1999-1, Class A1,
7.200%, 7/02/2020 | | | 7,938,976 |
| | 226,930 | | Atlas Air, Inc., Series 1999-1, Class A2,
6.880%, 1/02/2011 | | | 216,718 |
| | 10,885,664 | | Atlas Air, Inc., Series 1999-1, Class B,
7.630%, 7/02/2016 | | | 9,307,243 |
| | 4,744,556 | | Atlas Air, Inc., Series 1999-1, Class C,
8.770%, 7/02/2012(e) | | | 3,700,754 |
| | 4,917,945 | | Atlas Air, Inc., Series 2000-1, Class B,
9.057%, 7/02/2017 | | | 4,819,586 |
| | 6,862,758 | | Atlas Air, Inc., Series C,
8.010%, 7/02/2011(e) | | | 5,627,462 |
| | 3,970,000 | | Erac USA Finance Co., 144A,
7.000%, 10/15/2037 | | | 4,092,844 |
| | | | | | |
| | | | | | 57,627,036 |
| | | | | | |
| | | Treasuries — 13.8% | | | |
| | 393,245,000 | | Canadian Government,
1.000%, 9/01/2011, (CAD) | | | 385,268,978 |
| | 11,035,000 | | Canadian Government,
1.250%, 12/01/2011, (CAD) | | | 10,809,552 |
| | 320,680,000 | | Canadian Government,
2.000%, 9/01/2012, (CAD) | | | 315,495,571 |
| | 130,000,000 | | Canadian Government,
2.750%, 12/01/2010, (CAD) | | | 129,763,206 |
| | 130,216,000 | | Canadian Government,
3.500%, 6/01/2013, (CAD) | | | 132,571,209 |
| | 101,755,000 | | Canadian Government,
3.750%, 6/01/2012, (CAD) | | | 104,124,424 |
| | 171,980,000 | | Canadian Government,
3.750%, 6/01/2019, (CAD) | | | 171,592,234 |
| | 25,445,000 | | Canadian Government,
4.250%, 6/01/2018, (CAD) | | | 26,430,331 |
| | 75,385,000 | | Canadian Government,
5.250%, 6/01/2012, (CAD) | | | 79,494,008 |
| | 22,670,000 | | New Zealand Government Bond,
6.000%, 12/15/2017, (NZD) | | | 16,384,962 |
| | 68,665,000 | | New Zealand Government Bond,
6.500%, 4/15/2013, (NZD) | | | 51,419,842 |
| | 457,420,000 | | Norwegian Government,
4.250%, 5/19/2017, (NOK) | | | 80,597,186 |
| | 221,050,000 | | Norwegian Government,
5.000%, 5/15/2015, (NOK) | | | 40,386,220 |
| | 366,200,000 | | Norwegian Government,
6.000%, 5/16/2011, (NOK) | | | 64,104,717 |
| | 262,545,000 | | Norwegian Government,
6.500%, 5/15/2013, (NOK) | | | 49,098,018 |
See accompanying notes to financial statements.
44
LOOMIS SAYLES STRATEGIC INCOME FUND — PORTFOLIOOF INVESTMENTS (continued)
Investments as of March 31, 2010 (Unaudited)
| | | | | | |
Principal
Amount (‡) | | Description | | Value (†) |
| | | | | | |
| | | Treasuries — continued | | | |
| $ | 102,640,000 | | U.S. Treasury Bond,
4.375%, 11/15/2039 | | $ | 97,058,950 |
| | 65,745,000 | | U.S. Treasury Bond,
4.625%, 2/15/2040 | | | 64,799,916 |
| | 25,000,000 | | U.S. Treasury Note,
3.125%, 5/15/2019 | | | 23,810,550 |
| | | | | | |
| | | | | | 1,843,209,874 |
| | | | | | |
| | | Utility Other — 0.0% | | | |
| | 3,300,000 | | Listrindo Capital BV, 144A,
9.250%, 1/29/2015 | | | 3,576,078 |
| | | | | | |
| | | Wireless — 1.2% | | | |
| | 29,635,000 | | Nextel Communications, Inc., Series D,
7.375%, 8/01/2015 | | | 28,153,250 |
| | 15,931,000 | | Nextel Communications, Inc., Series E,
6.875%, 10/31/2013 | | | 15,532,725 |
| | 42,310,000 | | Nextel Communications, Inc., Series F,
5.950%, 3/15/2014 | | | 39,454,075 |
| | 2,525,000 | | Rogers Wireless, Inc., Senior Secured Note,
6.375%, 3/01/2014 | | | 2,802,162 |
| | 21,186,000 | | Sprint Capital Corp.,
6.875%, 11/15/2028 | | | 17,054,730 |
| | 18,070,000 | | Sprint Capital Corp.,
6.900%, 5/01/2019 | | | 16,534,050 |
| | 6,260,000 | | Sprint Capital Corp.,
8.750%, 3/15/2032 | | | 5,806,150 |
| | 11,309,000 | | Sprint Nextel Corp.,
6.000%, 12/01/2016 | | | 10,206,372 |
| | 20,600,000 | | True Move Co. Ltd., 144A,
10.750%, 12/16/2013 | | | 21,501,250 |
| | | | | | |
| | | | | | 157,044,764 |
| | | | | | |
| | | Wirelines — 3.4% | | | |
| | 10,245,000 | | AT&T Corp.,
6.500%, 3/15/2029 | | | 10,415,815 |
| | 16,000,000 | | AT&T, Inc.,
6.500%, 9/01/2037 | | | 16,591,024 |
| | 5,650,000 | | Axtel SAB de CV, 144A,
9.000%, 9/22/2019 | | | 5,763,000 |
| | 4,370,000 | | Bell Canada, MTN, 144A,
6.550%, 5/01/2029, (CAD) | | | 4,455,795 |
| | 8,445,000 | | Bell Canada, MTN,
7.300%, 2/23/2032, (CAD) | | | 9,371,360 |
| | 33,640,000 | | Bell Canada, Series M-17,
6.100%, 3/16/2035, (CAD) | | | 33,213,393 |
| | 2,715,000 | | BellSouth Telecommunications, Inc.,
7.000%, 12/01/2095 | | | 2,708,093 |
| | 155,000 | | Cincinnati Bell, Inc.,
7.000%, 2/15/2015 | | | 150,737 |
| | 270,000 | | Cincinnati Bell, Inc.,
8.375%, 1/15/2014 | | | 277,762 |
| | 5,330,000 | | Embarq Corp.,
7.995%, 6/01/2036 | | | 5,404,322 |
| | 35,260,000 | | Frontier Communications Corp.,
7.875%, 1/15/2027 | | | 31,734,000 |
| | 10,555,000 | | GTE Corp.,
6.940%, 4/15/2028 | | | 11,081,600 |
| | 525,000 | | Hawaiian Telcom Communications, Inc., Series B,
12.500%, 5/01/2015(d) | | | 53 |
| | | | | |
Principal
Amount (‡) | | Description | | Value (†) |
| | | | | |
| | Wirelines — continued | | | |
| 1,120,000 | | Koninklijke (Royal) KPN NV, EMTN,
5.750%, 3/18/2016, (GBP) | | $ | 1,816,072 |
| 1,800,000 | | Koninklijke (Royal) KPN NV, GMTN,
4.000%, 6/22/2015, (EUR) | | | 2,519,447 |
| 32,435,000 | | Level 3 Financing, Inc.,
8.750%, 2/15/2017 | | | 29,678,025 |
| 13,010,000 | | Level 3 Financing, Inc.,
9.250%, 11/01/2014 | | | 12,684,750 |
| 3,346,000 | | New England Telephone & Telegraph Co.,
7.875%, 11/15/2029 | | | 3,667,835 |
| 16,335,000 | | Qwest Capital Funding, Inc.,
6.500%, 11/15/2018 | | | 15,273,225 |
| 32,395,000 | | Qwest Capital Funding, Inc.,
7.750%, 2/15/2031 | | | 30,775,250 |
| 42,460,000 | | Qwest Capital Funding, Inc., Guaranteed Note,
6.875%, 7/15/2028 | | | 38,001,700 |
| 12,463,000 | | Qwest Capital Funding, Inc., Guaranteed Note,
7.625%, 8/03/2021 | | | 12,213,740 |
| 33,130,000 | | Qwest Corp.,
6.875%, 9/15/2033 | | | 31,970,450 |
| 3,075,000 | | Qwest Corp.,
7.200%, 11/10/2026 | | | 2,959,687 |
| 3,999,000 | | Qwest Corp.,
7.250%, 9/15/2025 | | | 4,038,990 |
| 2,288,000 | | Qwest Corp.,
7.500%, 6/15/2023 | | | 2,288,000 |
| 5,470,000 | | SK Broadband Co. Ltd., 144A,
7.000%, 2/01/2012 | | | 5,764,286 |
| 23,000,000 | | Telecom Italia Capital SA,
6.000%, 9/30/2034 | | | 20,404,220 |
| 19,635,000 | | Telecom Italia Capital SA,
6.375%, 11/15/2033 | | | 18,189,334 |
| 31,690,000 | | Telus Corp.,
4.950%, 3/15/2017, (CAD) | | | 32,140,552 |
| 18,600,000 | | Telus Corp., Series CG,
5.050%, 12/04/2019, (CAD) | | | 18,346,909 |
| 18,022,000 | | Verizon Global Funding Corp., Senior Note,
5.850%, 9/15/2035 | | | 17,540,236 |
| 6,230,000 | | Verizon Maryland, Inc., Series B,
5.125%, 6/15/2033 | | | 5,071,831 |
| 6,835,000 | | Verizon New York, Inc., Series A,
7.375%, 4/01/2032 | | | 7,347,789 |
| 5,215,000 | | Verizon Pennsylvania, Inc.,
6.000%, 12/01/2028 | | | 4,667,399 |
| | | | | |
| | | | | 448,526,681 |
| | | | | |
| | Total Non-Convertible Bonds
(Identified Cost $10,429,064,653) | | | 10,984,463,277 |
| | | | | |
| Convertible Bonds — 7.9% |
| | Airlines — 0.1% | | | |
| 7,730,000 | | AMR Corp.,
6.250%, 10/15/2014 | | | 8,937,812 |
| 755,000 | | UAL Corp.,
4.500%, 6/30/2021 | | | 744,808 |
| | | | | |
| | | | | 9,682,620 |
| | | | | |
| | Automotive — 1.4% | | | |
| 1,070,000 | | ArvinMeritor, Inc., (Step to Zero Coupon on 2/15/2019),
4.000%, 2/15/2027(f) | | | 902,813 |
See accompanying notes to financial statements.
45
LOOMIS SAYLES STRATEGIC INCOME FUND — PORTFOLIOOF INVESTMENTS (continued)
Investments as of March 31, 2010 (Unaudited)
| | | | | | |
Principal
Amount (‡) | | Description | | Value (†) |
| | | | | | |
| | | Automotive — continued | | | |
| $ | 121,370,000 | | Ford Motor Co.,
4.250%, 11/15/2016 | | $ | 181,599,862 |
| | 8,460,000 | | Navistar International Corp.,
3.000%, 10/15/2014 | | | 9,432,900 |
| | | | | | |
| | | | | | 191,935,575 |
| | | | | | |
| | | Diversified Manufacturing — 0.1% | | | |
| | 16,517,000 | | Trinity Industries, Inc.,
3.875%, 6/01/2036 | | | 12,945,199 |
| | | | | | |
| | | Electric — 0.0% | | | |
| | 1,800,000 | | CMS Energy Corp.,
5.500%, 6/15/2029 | | | 2,148,750 |
| | | | | | |
| | | Healthcare — 0.4% | | | |
| | 26,280,000 | | Affymetrix, Inc.,
3.500%, 1/15/2038 | | | 23,586,300 |
| | 6,855,000 | | Hologic, Inc., (Step to Zero Coupon on 12/15/2013), 2.000%, 12/15/2037(f) | | | 6,135,225 |
| | 12,005,000 | | Life Technologies Corp.,
1.500%, 2/15/2024 | | | 14,075,862 |
| | 190,000 | | LifePoint Hospitals, Inc.,
3.250%, 8/15/2025 | | | 185,013 |
| | 2,380,000 | | LifePoint Hospitals, Inc.,
3.500%, 5/15/2014 | | | 2,374,050 |
| | 5,445,000 | | Omnicare, Inc.,
3.250%, 12/15/2035 | | | 4,607,831 |
| | | | | | |
| | | | | | 50,964,281 |
| | | | | | |
| | | Independent Energy — 0.0% | | | |
| | 860,000 | | Chesapeake Energy Corp.,
2.250%, 12/15/2038 | | | 625,650 |
| | 3,795,000 | | Penn Virginia Corp.,
4.500%, 11/15/2012 | | | 3,567,300 |
| | | | | | |
| | | | | | 4,192,950 |
| | | | | | |
| | | Lodging — 0.2% | | | |
| | 30,418,000 | | Host Hotels & Resorts, Inc., 144A,
2.625%, 4/15/2027 | | | 29,125,235 |
| | | | | | |
| | | Media Non-Cable — 0.0% | | | |
| | 7,732,404 | | Liberty Media LLC,
3.500%, 1/15/2031 | | | 4,620,111 |
| | | | | | |
| | | Metals & Mining — 0.2% | | | |
| | 1,000,000 | | Steel Dynamics, Inc.,
5.125%, 6/15/2014 | | | 1,230,000 |
| | 11,270,000 | | United States Steel Corp.,
4.000%, 5/15/2014 | | | 23,681,088 |
| | | | | | |
| | | | | | 24,911,088 |
| | | | | | |
| | | Non-Captive Diversified — 0.3% | | | |
| | 44,035,000 | | iStar Financial, Inc.,
0.751%, 10/01/2012(b) | | | 33,488,617 |
| | | | | | |
| | | Oil Field Services — 0.0% | | | |
| | 1,300,000 | | Transocean, Inc., Series B,
1.500%, 12/15/2037 | | | 1,269,125 |
| | 535,000 | | Transocean, Inc., Series C,
1.500%, 12/15/2037 | | | 512,263 |
| | | | | | |
| | | | | | 1,781,388 |
| | | | | | |
| | | Pharmaceuticals — 1.1% | | | |
| | 635,000 | | Human Genome Sciences, Inc.,
2.250%, 10/15/2011 | | | 1,270,000 |
| | | | | | |
Principal
Amount (‡) | | Description | | Value (†) |
| | | | | | |
| | | Pharmaceuticals — continued | | | |
| $ | 41,680,000 | | Human Genome Sciences, Inc.,
2.250%, 8/15/2012 | | $ | 74,971,900 |
| | 2,240,000 | | Kendle International, Inc.,
3.375%, 7/15/2012 | | | 2,116,800 |
| | 24,461,000 | | Nektar Therapeutics,
3.250%, 9/28/2012 | | | 24,308,119 |
| | 28,222,000 | | Valeant Pharmaceuticals International, Subordinated Note,
4.000%, 11/15/2013 | | | 39,299,135 |
| | | | | | |
| | | | | | 141,965,954 |
| | | | | | |
| | | REITs — 0.2% | | | |
| | 6,469,000 | | ProLogis,
1.875%, 11/15/2037 | | | 6,097,032 |
| | 5,920,000 | | ProLogis,
2.250%, 4/01/2037 | | | 5,757,200 |
| | 19,445,000 | | ProLogis,
3.250%, 3/15/2015 | | | 19,542,225 |
| | | | | | |
| | | | | | 31,396,457 |
| | | | | | |
| | | Technology — 2.6% | | | |
| | 6,512,000 | | Advanced Micro Devices, Inc.,
5.750%, 8/15/2012 | | | 6,487,580 |
| | 4,005,000 | | Advanced Micro Devices, Inc.,
6.000%, 5/01/2015 | | | 3,839,794 |
| | 2,560,000 | | Alcatel-Lucent USA, Inc., Series B,
2.875%, 6/15/2025 | | | 2,217,600 |
| | 220,000 | | Ciena Corp.,
0.250%, 5/01/2013 | | | 182,600 |
| | 30,160,000 | | Ciena Corp.,
0.875%, 6/15/2017 | | | 20,358,000 |
| | 6,075,000 | | Ciena Corp.,
4.000%, 3/15/2015 | | | 6,287,625 |
| | 9,863,000 | | Intel Corp.,
2.950%, 12/15/2035 | | | 9,678,069 |
| | 220,000,000 | | Intel Corp., 144A,
3.250%, 8/01/2039 | | | 263,725,000 |
| | 9,197,000 | | Kulicke & Soffa Industries, Inc.,
0.875%, 6/01/2012 | | | 8,484,232 |
| | 3,880,000 | | Kulicke & Soffa Industries, Inc.,
1.000%, 6/30/2010 | | | 3,763,600 |
| | 3,241,000 | | Maxtor Corp., Subordinated Note,
5.750%, 3/01/2012(c) | | | 3,143,770 |
| | 745,000 | | Nortel Networks Corp.,
1.750%, 4/15/2012(d) | | | 560,613 |
| | 30,767,000 | | Nortel Networks Corp.,
2.125%, 4/15/2014(d) | | | 23,152,167 |
| | 257,000 | | Richardson Electronics Ltd.,
7.750%, 12/15/2011 | | | 257,000 |
| | | | | | |
| | | | | | 352,137,650 |
| | | | | | |
| | | Textile — 0.0% | | | |
| | 103,000 | | Dixie Group, Inc., Subordinated Note,
7.000%, 5/15/2012 | | | 89,224 |
| | | | | | |
| | | Wireless — 0.1% | | | |
| | 16,157,000 | | NII Holdings, Inc.,
3.125%, 6/15/2012 | | | 15,248,169 |
| | | | | | |
| | | Wirelines — 1.2% | | | |
| | 34,645,000 | | Level 3 Communications, Inc.,
3.500%, 6/15/2012 | | | 31,916,706 |
See accompanying notes to financial statements.
46
LOOMIS SAYLES STRATEGIC INCOME FUND — PORTFOLIOOF INVESTMENTS (continued)
Investments as of March 31, 2010 (Unaudited)
| | | | | | |
Principal
Amount (‡) | | Description | | Value (†) |
| | | | | | |
| | | Wirelines — continued | | | |
| $ | 13,484,000 | | Level 3 Communications, Inc.,
5.250%, 12/15/2011 | | $ | 13,130,045 |
| | 54,075,000 | | Level 3 Communications, Inc., 144A,
7.000%, 3/15/2015(c) | | | 64,619,625 |
| | 32,895,000 | | Level 3 Communications, Inc.,
7.000%, 3/15/2015(c) | | | 39,309,525 |
| | 2,470,000 | | Level 3 Communications, Inc.,
10.000%, 5/01/2011 | | | 2,537,925 |
| | 1,000,000 | | Qwest Communications International, Inc.,
3.500%, 11/15/2025 | | | 1,125,000 |
| | | | | | |
| | | | | | 152,638,826 |
| | | | | | |
| | | Total Convertible Bonds (Identified Cost $866,011,724) | | | 1,059,272,094 |
| | | | | | |
| | Municipals — 1.1% |
| | | California — 0.3% | | | |
| | 4,170,000 | | San Jose California Redevelopment Agency Tax Allocation (Merged Area Redevelopment), Series C, (MBIA insured)
3.750%, 8/01/2028 | | | 3,271,031 |
| | 1,530,000 | | San Jose California Redevelopment Agency Tax Allocation (Merged Area), Series C, (Registered), (MBIA insured),
3.750%, 8/01/2028 | | | 1,283,808 |
| | 5,175,000 | | State of California, (AMBAC insured),
4.500%, 8/01/2027 | | | 4,670,800 |
| | 14,415,000 | | State of California,
4.500%, 10/01/2029 | | | 12,627,828 |
| | 4,190,000 | | State of California, (AMBAC insured),
4.500%, 8/01/2030 | | | 3,646,138 |
| | 3,620,000 | | State of California,
4.500%, 8/01/2030 | | | 3,150,124 |
| | 2,680,000 | | State of California (Various Purpose), (MBIA insured),
3.250%, 12/01/2027 | | | 2,015,199 |
| | 12,645,000 | | State of California (Various Purpose), (AMBAC insured),
4.500%, 12/01/2033 | | | 10,716,132 |
| | | | | | |
| | | | | | 41,381,060 |
| | | | | | |
| | | Illinois — 0.0% | | | |
| | 1,725,000 | | Chicago O’Hare International Airport, Series A, (AGMC insured),
4.500%, 1/01/2038 | | | 1,633,351 |
| | | | | | |
| | | Michigan — 0.1% | | | |
| | 12,850,000 | | Michigan Tobacco Settlement Finance Authority, Taxable Turbo Series A,
7.309%, 6/01/2034(c) | | | 10,320,606 |
| | | | | | |
| | | Virginia — 0.7% | | | |
| | 128,820,000 | | Virginia Tobacco Settlement Financing Corp., Series A-1,
6.706%, 6/01/2046(c) | | | 93,809,300 |
| | | | | | |
| | | Total Municipals (Identified Cost $186,180,181) | | | 147,144,317 |
| | | | | | |
| | | Total Bonds and Notes (Identified Cost $11,481,256,558) | | | 12,190,879,688 |
| | | | | | |
| | Bank Loans — 0.6% |
| | | Chemicals — 0.1% | | | |
| | 3,757,630 | | Hexion Specialty Chemicals, Inc., Extended Term Loan C1,
4.063%, 5/05/2015(g) | | | 3,538,635 |
| | 813,594 | | Hexion Specialty Chemicals, Inc., Extended Term Loan C2,
4.063%, 5/05/2015(g) | | | 766,178 |
| | | | | | |
| | | | | | 4,304,813 |
| | | | | | |
| | | | | | |
Principal
Amount (‡) | | Description | | Value (†) |
| | | | | | |
| | | Energy — 0.1% | | | |
| $ | 12,774,619 | | ATP Oil & Gas Corp., Tranche B-1 Term Loan,
11.250%, 7/15/2014(g) | | $ | 12,910,413 |
| | 1,808,458 | | ATP Oil & Gas Corp., Tranche B2 Term Loan,
12.250%, 1/15/2011(g) | | | 1,827,682 |
| | | | | | |
| | | | | | 14,738,095 |
| | | | | | |
| | | Media Non-Cable — 0.0% | | | |
| | 2,797,946 | | Tribune Company, Term Loan X,
5.000%, 6/04/2009(d)(g)(h) | | | 1,741,721 |
| | | | | | |
| | | Oil Field Services — 0.0% | | | |
| | 2,485,000 | | Dresser, Inc., 2nd Lien Term Loan,
6.000%, 5/04/2015(g) | | | 2,357,023 |
| | 1,230,373 | | Dresser, Inc., Term Loan,
2.500%, 5/04/2014(g) | | | 1,180,715 |
| | | | | | |
| | | | | | 3,537,738 |
| | | | | | |
| | | Printing & Publishing — 0.2% | | | |
| | 22,293,180 | | SuperMedia, Inc., Exit Term Loan,
11.000%, 12/31/2015(g) | | | 20,977,213 |
| | 6,855,000 | | SuperMedia, Inc., Exit Term Loan,
12/31/2015(i) | | | 6,450,349 |
| | | | | | |
| | | | | | 27,427,562 |
| | | | | | |
| | | Wirelines — 0.2% | | | |
| | 3,975,879 | | FairPoint Communications, Inc., Initial Term Loan A,
4.750%, 3/31/2014(d)(g) | | | 3,268,212 |
| | 12,057,742 | | FairPoint Communications, Inc., Initial Term Loan B,
5.000%, 3/31/2015(d)(g) | | | 9,910,740 |
| | 17,154,004 | | Hawaiian Telcom Communications, Inc., Tranche C Term Loan,
4.750%, 6/01/2014(g)(j) | | | 12,179,343 |
| | 5,395,000 | | Level 3 Financing, Inc., Tranche A Term Loan,
2.501%, 3/13/2014(g) | | | 5,008,934 |
| | | | | | |
| | | | | | 30,367,229 |
| | | | | | |
| | | Total Bank Loans (Identified Cost $78,348,894) | | | 82,117,158 |
| | | | | | |
Shares | | | | |
| | Common Stocks — 3.0% |
| | | Biotechnology — 0.3% | | | |
| | 867,059 | | Vertex Pharmaceuticals, Inc.(e) | | | 35,436,702 |
| | | | | | |
| | | Containers & Packaging — 0.1% | | | |
| | 460,656 | | Owens-Illinois, Inc.(e) | | | 16,371,714 |
| | | | | | |
| | | Electric Utilities — 0.0% | | | |
| | 282,500 | | Duke Energy Corp. | | | 4,610,400 |
| | | | | | |
| | | Electronic Equipment, Instruments &
Components — 0.0% | | | |
| | 41,343 | | Corning, Inc. | | | 835,542 |
| | | | | | |
| | | Food Products — 0.4% | | | |
| | 2,309,175 | | ConAgra Foods, Inc. | | | 57,891,017 |
| | | | | | |
| | | Household Durables — 0.1% | | | |
| | 477,725 | | KB Home | | | 8,001,894 |
| | 549,450 | | Lennar Corp., Class A | | | 9,456,034 |
| | | | | | |
| | | | | | 17,457,928 |
| | | | | | |
| | | Media — 0.0% | | | |
| | 37,276 | | Dex One Corp.(e) | | | 1,040,746 |
| | | | | | |
| | | Oil, Gas & Consumable Fuels — 0.2% | | | |
| | 846,398 | | Chesapeake Energy Corp. | | | 20,008,849 |
| | 141,249 | | Spectra Energy Corp. | | | 3,182,340 |
| | | | | | |
| | | | | | 23,191,189 |
| | | | | | |
See accompanying notes to financial statements.
47
LOOMIS SAYLES STRATEGIC INCOME FUND — PORTFOLIOOF INVESTMENTS (continued)
Investments as of March 31, 2010 (Unaudited)
| | | | | |
| | |
| Shares | | Description | | Value (†) |
| | | | | |
| | Pharmaceuticals — 1.5% | | | |
| 7,238,800 | | Bristol-Myers Squibb Co. | | $ | 193,275,960 |
| 2,288 | | Teva Pharmaceutical Industries Ltd., Sponsored ADR | | | 144,327 |
| | | | | |
| | | | | 193,420,287 |
| | | | | |
| | REITs — 0.4% | | | |
| 290,904 | | Apartment Investment & Management Co., Class A | | | 5,355,542 |
| 889,730 | | Associated Estates Realty Corp. | | | 12,269,377 |
| 201,557 | | Developers Diversified Realty Corp. | | | 2,452,949 |
| 460,000 | | Equity Residential | | | 18,009,000 |
| 123,159 | | Simon Property Group, Inc. | | | 10,333,040 |
| | | | | |
| | | | | 48,419,908 |
| | | | | |
| | Thrifts & Mortgage Finance — 0.0% | | | |
| 4,794,025 | | Federal Home Loan Mortgage Corp.(e)(k) | | | 6,088,412 |
| | | | | |
| | Total Common Stocks (Identified Cost $455,138,392) | | | 404,763,845 |
| | | | | |
| Preferred Stocks — 1.9% |
| Convertible Preferred Stocks — 1.2% |
| | Automotive — 0.5% | | | |
| 1,476,621 | | Ford Motor Co. Capital Trust II,
6.500%(e) | | | 68,515,214 |
| | | | | |
| | Capital Markets — 0.1% | | | |
| 183,851 | | Newell Financial Trust I,
5.250% | | | 7,400,003 |
| | | | | |
| | Commercial Banks — 0.0% | | | |
| 5,933 | | Wells Fargo & Co., Series L, Class A,
7.500% | | | 5,796,541 |
| | | | | |
| | Diversified Consumer Services — 0.0% | | | |
| 6 | | Six Flags, Inc.,
7.250%(e) | | | 3 |
| | | | | |
| | Diversified Financial Services — 0.2% | | | |
| 16,622 | | Bank of America Corp., Series L,
7.250% | | | 16,248,005 |
| 203,258 | | Sovereign Capital Trust IV,
4.375% | | | 6,504,256 |
| | | | | |
| | | | | 22,752,261 |
| | | | | |
| | Electric Utilities — 0.1% | | | |
| 380,577 | | AES Trust III,
6.750% | | | 17,197,323 |
| 107,725 | | CMS Energy Trust I,
7.750%(c)(l) | | | 3,770,375 |
| | | | | |
| | | | | 20,967,698 |
| | | | | |
| | Machinery — 0.0% | | | |
| 184,491 | | United Rentals Trust I,
6.500% | | | 5,557,791 |
| | | | | |
| | Oil, Gas & Consumable Fuels — 0.1% | | | |
| 52,020 | | Chesapeake Energy Corp.,
4.500% | | | 4,349,912 |
| 159,477 | | El Paso Energy Capital Trust I,
4.750% | | | 5,960,453 |
| | | | | |
| | | | | 10,310,365 |
| | | | | |
| | REITs — 0.0% | | | |
| 42,700 | | FelCor Lodging Trust, Inc., Series A,
7.800%(e) | | | 772,870 |
| | | | | |
| | Semiconductors & Semiconductor Equipment — 0.2% |
| 32,320 | | Lucent Technologies Capital Trust I,
7.750% | | | 25,726,720 |
| | | | | |
| | Total Convertible Preferred Stocks
(Identified Cost $152,365,283) | | | 167,799,466 |
| | | | | |
| | | | | |
| | |
| Shares | | Description | | Value (†) |
| | | | | |
| Non-Convertible Preferred Stocks — 0.7% |
| | Banking — 0.2% | | | |
| 36,916 | | GMAC, Inc., Series G, 144A,
7.000% | | $ | 28,139,221 |
| | | | | |
| | Diversified Financial Services — 0.0% | | | |
| 35,000 | | Bank of America Corp.,
6.375% | | | 727,300 |
| | | | | |
| | Electric Utilities — 0.0% | | | |
| 393 | | Entergy New Orleans, Inc.,
4.750% | | | 29,033 |
| | | | | |
| | REITs — 0.1% | | | |
| 1,596 | | Highwoods Properties, Inc., Series A,
8.625% | | | 1,688,269 |
| 116,192 | | ProLogis, Series C,
8.540% | | | 5,613,235 |
| | | | | |
| | | | | 7,301,504 |
| | | | | |
| | Software — 0.2% | | | |
| 26,000 | | Falcons Funding Trust I, (Step to 10.875% on 3/15/2015, variable rate after 3/15/2020), 144A,
8.875%(f) | | | 26,154,375 |
| | | | | |
| | Thrifts & Mortgage Finance — 0.2% | | | |
| 389,800 | | Countrywide Capital IV,
6.750% | | | 8,369,006 |
| 75,100 | | Federal Home Loan Mortgage Corp.,
5.000%(e)(k) | | | 116,405 |
| 1,741,500 | | Federal Home Loan Mortgage Corp.,
5.570%(e)(k) | | | 1,480,275 |
| 444,350 | | Federal Home Loan Mortgage Corp.,
5.660%(e)(k) | | | 372,810 |
| 120,695 | | Federal Home Loan Mortgage Corp.,
5.700%(e)(k) | | | 210,009 |
| 283,000 | | Federal Home Loan Mortgage Corp.,
5.790%(e)(k) | | | 458,460 |
| 81,450 | | Federal Home Loan Mortgage Corp.,
5.810%(e)(k) | | | 132,764 |
| 219,750 | | Federal Home Loan Mortgage Corp.,
5.900%(e)(k) | | | 197,555 |
| 96,600 | | Federal Home Loan Mortgage Corp.,
6.000%(e)(k) | | | 178,710 |
| 89,300 | | Federal Home Loan Mortgage Corp.,
6.420%(e)(k) | | | 170,563 |
| 392,116 | | Federal Home Loan Mortgage Corp.,
6.550%(e)(k) | | | 388,195 |
| 3,856,103 | | Federal Home Loan Mortgage Corp., (fixed rate to 12/31/2012, variable rate thereafter),
8.375%(e)(k) | | | 4,897,251 |
| 192,100 | | Federal National Mortgage Association,
4.750%(e)(k) | | | 259,335 |
| 144,900 | | Federal National Mortgage Association,
5.125%(e)(k) | | | 218,799 |
| 104,850 | | Federal National Mortgage Association,
5.375%(e)(k) | | | 179,293 |
| 56,600 | | Federal National Mortgage Association,
5.810%(e)(k) | | | 96,220 |
| 87,300 | | Federal National Mortgage Association,
6.750%(e)(k) | | | 81,189 |
| 250,000 | | Federal National Mortgage Association,
8.250%(e)(k) | | | 300,000 |
See accompanying notes to financial statements.
48
LOOMIS SAYLES STRATEGIC INCOME FUND — PORTFOLIOOF INVESTMENTS (continued)
Investments as of March 31, 2010 (Unaudited)
| | | | | | |
| | |
| Shares | | Description | | Value (†) |
| | | | | | |
| | | Thrifts & Mortgage Finance — continued | | | |
| | 6,747,525 | | Federal National Mortgage Association, (fixed rate to 12/13/2010, variable rate thereafter),
8.250%(e)(k) | | $ | 8,569,357 |
| | | | | | |
| | | | | | 26,676,196 |
| | | | | | |
| | | Total Non-Convertible Preferred Stocks
(Identified Cost $334,190,469) | | | 89,027,629 |
| | | | | | |
| | | Total Preferred Stocks (Identified Cost $486,555,752) | | | 256,827,095 |
| | | | | | |
| | Closed-End Investment Companies — 0.3% |
| | 1,033,275 | | Dreyfus High Yield Strategies | | | 4,484,413 |
| | 88,955 | | DWS High Income Trust | | | 810,380 |
| | 860,000 | | Highland Credit Strategies Fund | | | 6,794,000 |
| | 110,211 | | Morgan Stanley Emerging Markets Debt Fund, Inc. | | | 1,150,603 |
| | 2,055,800 | | Western Asset High Income Opportunity Fund, Inc. | | | 13,074,888 |
| | 1,217,820 | | Western Asset Managed High Income Fund, Inc. | | | 7,611,375 |
| | | | | | |
| | | Total Closed-End Investment Companies
(Identified Cost $38,848,137) | | | 33,925,659 |
| | | | | | |
| | Warrants — 0.1% |
| | | Pharmaceuticals — 0.1% | | | |
| | 574,624 | | Valeant Pharmaceuticals International(c)(e)(l)
(Identified Cost $0) | | | 6,493,251 |
| | | | | | |
Principal Amount (‡) | | | | |
| | Short-Term Investments — 1.0% |
| $ | 387,537 | | Repurchase Agreement with State Street Corporation, dated 3/31/2010 at 0.000% to be repurchased at $387,537 on 4/01/2010, collateralized by $400,000 U.S. Treasury Bill, due 7/08/2010 valued at $399,848 including accrued interest (Note 2 of Notes to Financial Statements) | | | 387,537 |
| | 134,087,725 | | Tri-Party Repurchase Agreement with Fixed Income Clearing Corporation, dated 3/31/2010 at 0.000% to be repurchased at $134,087,725 on 4/01/2010, collateralized by $134,955,000 Federal National Mortgage Association, 1.750% due 3/23/2011 valued at $136,641,938; $130,000 Federal Home Loan Mortgage Corp., 3.000% due 1/21/2014 valued at $130,975 including accrued interest (Note 2 of Notes to Financial Statements) | | | 134,087,725 |
| | | | | | |
| | | Total Short-Term Investments (Identified Cost $134,475,262) | | | 134,475,262 |
| | | | | | |
| | | | | | |
| | | Total Investments — 98.3%
(Identified Cost $12,674,622,995)(a) | | | 13,109,481,958 |
| | | Other assets less liabilities—1.7% | | | 224,971,207 |
| | | | | | |
| | | Net Assets — 100.0% | | $ | 13,334,453,165 |
| | | | | | |
| | | | | | |
| | (‡) | | Principal amount stated in U.S. dollars unless otherwise noted. | | | |
| | (†) | | See Note 2 of Notes to Financial Statements. | | | |
| | (††) | | Amount shown represents units. One unit represents a principal amount of 25. | | | |
| | (†††) | | Amount shown represents units. One unit represents a principal amount of 100. | | | |
| | | | | | |
| | | | | | |
| (a) | | Federal Tax Information (Amounts exclude certain adjustments made at the end of the Fund’s fiscal year for tax purposes. Such adjustments are primarily due to wash sales. Amortization of premium on debt securities is excluded for tax purposes.): | | | | |
| | At March 31, 2010, the net unrealized appreciation on investments based on a cost of $12,692,583,748 for federal income tax purposes was as follows: | | | | |
| | Aggregate gross unrealized appreciation for all investments in which there is an excess of value over tax cost | | $ | 1,162,045,540 | |
| | Aggregate gross unrealized depreciation for all investments in which there is an excess of tax cost over value | | | (745,147,330 | ) |
| | | | | | |
| | Net unrealized appreciation | | $ | 416,898,210 | |
| | | | | | |
| | | | | | |
| (b) | | Variable rate security. Rate as of March 31, 2010 is disclosed. | |
| (c) | | Illiquid security. At March 31, 2010, the value of these securities amounted to $466,317,402 or 3.5% of net assets. | |
| (d) | | The issuer is in default with respect to interest and/or principal payments. Income is not being accrued. | |
| (e) | | Non-income producing security. | |
| (f) | | Coupon rate is a fixed rate for an initial period then resets at a specified date and rate. | |
| (g) | | Variable rate security. Rate shown represents the weighted average rate at March 31, 2010. | |
| (h) | | Issuer has filed for bankruptcy. | |
| (i) | | All or a portion of this security has not settled. Contract rates are not determined and do not take effect until settlement date. | |
| (j) | | All or a portion of interest payment is paid-in-kind. | |
| (k) | | Future dividend payments have been eliminated as the issuer has been placed in conservatorship. | |
| (l) | | Fair valued security by the Fund’s investment adviser. At March 31, 2010 the value of these securities amounted to $10,263,626 or 0.1% of net assets. | |
| | | | | | |
| 144A | | Securities exempt from registration under Rule 144A of the Securities Act of 1933. These securities may be resold in transactions exempt from registration, normally to qualified institutional buyers. At March 31, 2010, the value of these securities amounted to $1,666,736,230 or 12.5% of net assets. | |
| | | | | | |
| ABS | | Asset-Backed Securities | |
| ADR | | An American Depositary Receipt is a certificate issued by a custodian bank representing the right to receive securities of the foreign issuer described. The values of ADRs are significantly influenced by trading on exchanges not located in the United States. | |
| AGMC | | Assured Guaranty Municipal Corp. | |
| AMBAC | | American Municipal Bond Assurance Corp. | |
| EMTN | | Euro Medium Term Note | |
| GMTN | | Global Medium Term Note | |
| MBIA | | Municipal Bond Investors Assurance Corp. | |
| MTN | | Medium Term Note | |
| REITs | | Real Estate Investment Trusts | |
| | | | | | |
| AUD | | Australian Dollar | |
| BRL | | Brazilian Real | |
| CAD | | Canadian Dollar | |
| EUR | | Euro | |
| GBP | | British Pound | |
| IDR | | Indonesian Rupiah | |
| ISK | | Icelandic Krona | |
| KRW | | South Korean Won | |
| MXN | | Mexican Peso | |
| NOK | | Norwegian Krone | |
| NZD | | New Zealand Dollar | |
| SGD | | Singapore Dollar | |
See accompanying notes to financial statements.
49
LOOMIS SAYLES STRATEGIC INCOME FUND — PORTFOLIOOF INVESTMENTS (continued)
Investments as of March 31, 2010 (Unaudited)
Industry Summary at March 31, 2010 (Unaudited)
| | | |
| Treasuries | | 13.8 | % |
| Non-Captive Diversified | | 8.3 | |
| Banking | | 6.7 | |
| Technology | | 5.0 | |
| Automotive | | 4.9 | |
| Wirelines | | 4.8 | |
| Sovereigns | | 4.7 | |
| Non-Captive Consumer | | 4.1 | |
| Healthcare | | 3.6 | |
| Electric | | 3.4 | |
| Pharmaceuticals | | 3.0 | |
| Paper | | 2.6 | |
| Retailers | | 2.2 | |
| Pipelines | | 2.2 | |
| Media Cable | | 2.0 | |
| Airlines | | 2.0 | |
| Other Investments, less than 2% each | | 24.0 | |
| Short-Term Investments | | 1.0 | |
| | | |
| Total Investments | | 98.3 | |
| Other assets less liabilities | | 1.7 | |
| | | |
| Net Assets | | 100.0 | % |
| | | |
Currency Exposure at March 31, 2010 as a Percentage of Net Assets (Unaudited)
| | | |
| United States Dollar | | 72.5 | % |
| Canadian Dollar | | 11.1 | |
| New Zealand Dollar | | 3.2 | |
| Brazilian Real | | 2.2 | |
| Other, less than 2% each | | 9.3 | |
| | | |
| Total Investments | | 98.3 | |
| Other assets less liabilities | | 1.7 | |
| | | |
| Net Assets | | 100.0 | % |
| | | |
See accompanying notes to financial statements.
50
STATEMENTSOF ASSETSAND LIABILITIES
March 31, 2010 (Unaudited)
| | | | | | | | | | | | |
| | | Core Plus Bond Fund | | | High Income Fund | | | International
Bond Fund | |
| | | | | | | | | | | | |
ASSETS | | | | | | | | | | | | |
Investments at cost | | $ | 301,133,089 | | | $ | 107,704,594 | | | $ | 32,183,578 | |
Repurchase agreement(s) at cost | | | 8,079,061 | | | | 14,324,664 | | | | 391,292 | |
Net unrealized appreciation (depreciation) | | | 14,654,565 | | | | 14,648,226 | | | | (272,847 | ) |
| | | | | | | | | | | | |
Investments at value | | | 323,866,715 | | | | 136,677,484 | | | | 32,302,023 | |
Cash | | | — | | | | 12,654 | | | | — | |
Due from custodian (Note 2) | | | — | | | | — | | | | — | |
Foreign currency at value (identified cost $0, $0, $269,805, $0 and $9,100,628) | | | — | | | | — | | | | 272,009 | |
Receivable for Fund shares sold | | | 802,916 | | | | 533,007 | | | | 154,699 | |
Receivable for securities sold | | | 1,624,856 | | | | 780,507 | | | | — | |
Unrealized appreciation on forward foreign currency contracts (Note 2) | | | — | | | | — | | | | 19,322 | |
Dividend and interest receivable | | | 3,939,246 | | | | 1,925,541 | | | | 502,304 | |
Tax reclaims receivable | | | 11,107 | | | | — | | | | 2,015 | |
| | | | | | | | | | | | |
TOTAL ASSETS | | | 330,244,840 | | | | 139,929,193 | | | | 33,252,372 | |
| | | | | | | | | | | | |
LIABILITIES | | | | | | | | | | | | |
Payable for securities purchased | | | 6,258,265 | | | | 542,868 | | | | — | |
Payable for delayed delivery securities purchased (Note 2) | | | 3,219,285 | | | | — | | | | — | |
Payable for Fund shares redeemed | | | 783,683 | | | | 686,619 | | | | 47,624 | |
Unrealized depreciation on forward foreign currency contracts (Note 2) | | | — | | | | — | | | | 49,537 | |
Due to broker (Note 2) | | | — | | | | — | | | | — | |
Dividends payable | | | — | | | | — | | | | — | |
Management fees payable (Note 6) | | | 116,684 | | | | 59,503 | | | | 5,715 | |
Administrative fees payable (Note 6) | | | 13,377 | | | | 5,663 | | | | 1,390 | |
Deferred Trustees’ fees (Note 6) | | | 203,875 | | | | 77,974 | | | | 19,011 | |
Foreign taxes payable (Note 2) | | | — | | | | 81 | | | | — | |
Other accounts payable and accrued expenses | | | 52,113 | | | | 17,423 | | | | 18,772 | |
| | | | | | | | | | | | |
TOTAL LIABILITIES | | | 10,647,282 | | | | 1,390,131 | | | | 142,049 | |
| | | | | | | | | | | | |
NET ASSETS | | $ | 319,597,558 | | | $ | 138,539,062 | | | $ | 33,110,323 | |
| | | | | | | | | | | | |
NET ASSETS CONSIST OF: | | | | | | | | | | | | |
Paid-in capital | | $ | 322,291,666 | | | $ | 141,913,428 | | | $ | 33,242,316 | |
Distributions in excess of net investment income | | | (584,654 | ) | | | (352,714 | ) | | | (258,190 | ) |
Accumulated net realized gain (loss) on investments and foreign currency transactions | | | (16,768,458 | ) | | | (17,672,050 | ) | | | 442,857 | |
Net unrealized appreciation (depreciation) on investments and foreign currency translations | | | 14,659,004 | | | | 14,650,398 | | | | (316,660 | ) |
| | | | | | | | | | | | |
NET ASSETS | | $ | 319,597,558 | | | $ | 138,539,062 | | | $ | 33,110,323 | |
| | | | | | | | | | | | |
COMPUTATION OF NET ASSET VALUE AND OFFERING PRICE: | | | | | | | | | | | | |
Class A shares: | | | | | | | | | | | | |
Net assets | | $ | 159,931,944 | | | $ | 69,903,532 | | | $ | 17,659,312 | |
| | | | | | | | | | | | |
Shares of beneficial interest | | | 13,230,609 | | | | 14,540,220 | | | | 1,715,792 | |
| | | | | | | | | | | | |
Net asset value and redemption price per share | | $ | 12.09 | | | $ | 4.81 | | | $ | 10.29 | |
| | | | | | | | | | | | |
Offering price per share (100/[100-maximum sales charge] of net asset value) (Note 1) | | $ | 12.66 | | | $ | 5.04 | | | $ | 10.77 | |
| | | | | | | | | | | | |
Class B shares: (redemption price per share is equal to net asset value less any applicable contingent deferred sales charge) (Note 1) | | | | | | | | | | | | |
Net assets | | $ | 5,476,760 | | | $ | 1,442,847 | | | $ | — | |
| | | | | | | | | | | | |
Shares of beneficial interest | | | 451,586 | | | | 299,580 | | | | — | |
| | | | | | | | | | | | |
Net asset value and offering price per share | | $ | 12.13 | | | $ | 4.82 | | | $ | — | |
| | | | | | | | | | | | |
Class C shares: (redemption price per share is equal to net asset value less any applicable contingent deferred sales charge) (Note 1) | | | | | | | | | | | | |
Net assets | | $ | 101,735,792 | | | $ | 19,597,092 | | | $ | 6,869,418 | |
| | | | | | | | | | | | |
Shares of beneficial interest | | | 8,411,369 | | | | 4,070,250 | | | | 668,995 | |
| | | | | | | | | | | | |
Net asset value and offering price per share | | $ | 12.10 | | | $ | 4.81 | | | $ | 10.27 | |
| | | | | | | | | | | | |
Class Y shares: | | | | | | | | | | | | |
Net assets | | $ | 52,453,062 | | | $ | 47,595,591 | | | $ | 8,581,593 | |
| | | | | | | | | | | | |
Shares of beneficial interest | | | 4,315,534 | | | | 9,909,405 | | | | 835,233 | |
| | | | | | | | | | | | |
Net asset value, offering and redemption price per share | | $ | 12.15 | | | $ | 4.80 | | | $ | 10.27 | |
| | | | | | | | | | | | |
Admin Class shares: | | | | | | | | | | | | |
Net assets | | $ | — | | | $ | — | | | $ | — | |
| | | | | | | | | | | | |
Shares of beneficial interest | | | — | | | | — | | | | — | |
| | | | | | | | | | | | |
Net asset value, offering and redemption price per share | | $ | — | | | $ | — | | | $ | — | |
| | | | | | | | | | | | |
See accompanying notes to financial statements.
51
| | | | | | |
Limited Term Government
and Agency Fund | | | Strategic
Income Fund | |
| | | | | | |
| | | | | | |
| $ | 228,625,259 | | | $ | 12,540,147,733 | |
| | 8,283,850 | | | | 134,475,262 | |
| | 7,512,008 | | | | 434,858,963 | |
| | | | | | | |
| | 244,421,117 | | | | 13,109,481,958 | |
| | — | | | | 652,960 | |
| | — | | | | 2,993,578 | |
| | — | | | | 8,617,625 | |
| | 2,006,737 | | | | 38,537,318 | |
| | — | | | | 26,202,129 | |
| | — | | | | — | |
| | 776,955 | | | | 199,835,733 | |
| | — | | | | 258,837 | |
| | | | | | | |
| | 247,204,809 | | | | 13,386,580,138 | |
| | | | | | | |
| | | | | | |
| | 4,796,454 | | | | 10,168,227 | |
| | — | | | | — | |
| | 631,127 | | | | 31,013,370 | |
| | — | | | | — | |
| | — | | | | 2,993,578 | |
| | 136,366 | | | | 13 | |
| | 93,007 | | | | 6,272,185 | |
| | 9,949 | | | | 546,718 | |
| | 192,597 | | | | 482,850 | |
| | — | | | | 103,764 | |
| | 70,282 | | | | 546,268 | |
| | | | | | | |
| | 5,929,782 | | | | 52,126,973 | |
| | | | | | | |
| $ | 241,275,027 | | | $ | 13,334,453,165 | |
| | | | | | | |
| | | | | | |
| $ | 236,061,420 | | | $ | 13,461,880,017 | |
| | (495,323 | ) | | | (14,888,682 | ) |
| | (1,803,078 | ) | | | (546,384,342 | ) |
| | 7,512,008 | | | | 433,846,172 | |
| | | | | | | |
| $ | 241,275,027 | | | $ | 13,334,453,165 | |
| | | | | | | |
| | | | | | |
| | | | | | |
| $ | 130,210,505 | | | $ | 5,806,911,701 | |
| | | | | | | |
| | 11,014,234 | | | | 406,552,034 | |
| | | | | | | |
| $ | 11.82 | | | $ | 14.28 | |
| | | | | | | |
| $ | 12.19 | | | $ | 14.95 | |
| | | | | | | |
| |
| | | | | | |
| $ | 4,118,204 | | | $ | 145,441,904 | |
| | | | | | | |
| | 348,706 | | | | 10,123,378 | |
| | | | | | | |
| $ | 11.81 | | | $ | 14.37 | |
| | | | | | | |
| |
| | | | | | |
| $ | 61,745,933 | | | $ | 5,111,328,617 | |
| | | | | | | |
| | 5,218,994 | | | | 356,043,181 | |
| | | | | | | |
| $ | 11.83 | | | $ | 14.36 | |
| | | | | | | |
| | | | | | |
| $ | 45,200,385 | | | $ | 2,270,769,901 | |
| | | | | | | |
| | 3,812,043 | | | | 159,087,774 | |
| | | | | | | |
| $ | 11.86 | | | $ | 14.27 | |
| | | | | | | |
| | | | | | |
| $ | — | | | $ | 1,042 | |
| | | | | | | |
| | — | | | | 73 | |
| | | | | | | |
| $ | — | | | $ | 14.27 | |
| | | | | | | |
52
STATEMENTSOF OPERATIONS
For the Six Months Ended March 31, 2010 (Unaudited)
| | | | | | | | | | | | |
| | | Core Plus Bond Fund | | | High Income Fund | | | International Bond
Fund | |
| | | | | | | | | | | | |
INVESTMENT INCOME | | | | | | | | | | | | |
Interest | | $ | 7,913,551 | | | $ | 6,912,354 | | | $ | 494,824 | |
Dividends | | | 18,445 | | | | 114,266 | | | | — | |
Less net foreign taxes withheld | | | — | | | | — | | | | (1,722 | ) |
| | | | | | | | | | | | |
| | | 7,931,996 | | | | 7,026,620 | | | | 493,102 | |
| | | | | | | | | | | | |
Expenses | | | | | | | | | | | | |
Management fees (Note 6) | | | 626,152 | | | | 509,792 | | | | 91,121 | |
Service and distribution fees (Note 6) | | | 689,767 | | | | 183,655 | | | | 46,769 | |
Trustees’ fees and expenses (Note 6) | | | 10,277 | | | | 7,958 | | | | 5,865 | |
Administrative fees (Note 6) | | | 72,863 | | | | 41,184 | | | | 7,360 | |
Custodian fees and expenses | | | 13,845 | | | | 37,323 | | | | 22,319 | |
Transfer agent fees and expenses (Note 6) | | | 160,588 | | | | 96,346 | | | | 3,866 | |
Audit and tax services fees | | | 23,219 | | | | 22,955 | | | | 23,279 | |
Legal fees | | | 2,819 | | | | 1,961 | | | | 255 | |
Shareholder reporting expenses | | | 24,155 | | | | 12,859 | | | | 1,819 | |
Registration fees | | | 33,479 | | | | 40,244 | | | | 25,251 | |
Fee/expense recovery (Note 6) | | | 2,915 | | | | — | | | | — | |
Miscellaneous expenses | | | 6,981 | | | | 5,703 | | | | 3,174 | |
| | | | | | | | | | | | |
Total expenses | | | 1,667,060 | | | | 959,980 | | | | 231,078 | |
Less fee reduction and/or expense reimbursement (Note 6) | | | — | | | | (12,142 | ) | | | (55,220 | ) |
| | | | | | | | | | | | |
Net expenses | | | 1,667,060 | | | | 947,838 | | | | 175,858 | |
| | | | | | | | | | | | |
Net investment income | | | 6,264,936 | | | | 6,078,782 | | | | 317,244 | |
| | | | | | | | | | | | |
NET REALIZED AND UNREALIZED GAIN (LOSS) ON INVESTMENTS
AND FOREIGN CURRENCY TRANSACTIONS | | | | | | | | | | | | |
Net realized gain (loss) on: | | | | | | | | | | | | |
Investments | | | 4,299,842 | | | | 11,984,297 | | | | 479,129 | |
Foreign currency transactions | | | (924 | ) | | | (11,211 | ) | | | 60,466 | |
Net change in unrealized appreciation (depreciation) on: | | | | | | | | | | | | |
Investments | | | 1,887,367 | | | | 30,093 | | | | (1,536,741 | ) |
Foreign currency translations | | | 4,439 | | | | 11,605 | | | | (123,445 | ) |
| | | | | | | | | | | | |
Net realized and unrealized gain (loss) on investments and foreign currency transactions | | | 6,190,724 | | | | 12,014,784 | | | | (1,120,591 | ) |
| | | | | | | | | | | | |
NET INCREASE (DECREASE) IN NET ASSETS RESULTING FROM OPERATIONS | | $ | 12,455,660 | | | $ | 18,093,566 | | | $ | (803,347 | ) |
| | | | | | | | | | | | |
See accompanying notes to financial statements.
53
| | | | | | |
Limited Term Government
and Agency Fund | | | Strategic
Income Fund | |
| | | | | | |
| | | | | | |
| $ | 3,246,814 | | | $ | 418,301,975 | |
| | — | | | | 15,771,000 | |
| | — | | | | — | |
| | | | | | | |
| | 3,246,814 | | | | 434,072,975 | |
| | | | | | | |
| | | | | | |
| | 560,201 | | | | 36,112,550 | |
| | 459,794 | | | | 32,757,641 | |
| | 9,644 | | | | 102,803 | |
| | 54,298 | | | | 3,133,800 | |
| | 13,133 | | | | 311,435 | |
| | 113,742 | | | | 4,979,087 | |
| | 23,303 | | | | 29,197 | |
| | 2,190 | | | | 132,282 | |
| | 10,690 | | | | 592,310 | |
| | 34,030 | | | | 123,397 | |
| | — | | | | — | |
| | 6,205 | | | | 198,624 | |
| | | | | | | |
| | 1,287,230 | | | | 78,473,126 | |
| | (99,174 | ) | | | — | |
| | | | | | | |
| | 1,188,056 | | | | 78,473,126 | |
| | | | | | | |
| | 2,058,758 | | | | 355,599,849 | |
| | | | | | | |
| |
| | | | | | |
| | | | | | |
| | 4,334,222 | | | | 105,813,570 | |
| | — | | | | 1,364,628 | |
| | | | | | |
| | 401,050 | | | | 748,614,760 | |
| | — | | | | (2,864,688 | ) |
| | | | | | | |
| | 4,735,272 | | | | 852,928,270 | |
| | | | | | | |
| $ | 6,794,030 | | | $ | 1,208,528,119 | |
| | | | | | | |
54
STATEMENTSOF CHANGESIN NET ASSETS
| | | | | | | | | | | | | | | | | | | | | | | | |
| | | Core Plus Bond Fund | | | High Income Fund | | | International Bond Fund | |
| | | Six Months Ended
March 31, 2010
(Unaudited) | | | Year Ended
September 30,
2009 | | | Six Months Ended
March 31, 2010
(Unaudited) | | | Year Ended
September 30,
2009 | | | Six Months Ended
March 31, 2010
(Unaudited) | | | Year Ended
September 30,
2009 | |
| | | | | | | | | | | | | | | | | | | | | | | | |
FROM OPERATIONS: | | | | | | | | | | | | | | | | | | | | | | | | |
Net investment income | | $ | 6,264,936 | | | $ | 10,726,024 | | | $ | 6,078,782 | | | $ | 7,929,754 | | | $ | 317,244 | | | $ | 501,191 | |
Net realized gain (loss) on investments and
foreign currency transactions | | | 4,298,918 | | | | 1,047,585 | | | | 11,973,086 | | | | (2,943,074 | ) | | | 539,595 | | | | 246,125 | |
Net change in unrealized appreciation (depreciation)
on investments and foreign currency translations | | | 1,891,806 | | | | 27,447,211 | | | | 41,698 | | | | 23,846,800 | | | | (1,660,186 | ) | | | 2,396,258 | |
| | | | | | | | | | | | | | | | | | | | | | | | |
Net increase (decrease) in net assets resulting
from operations | | | 12,455,660 | | | | 39,220,820 | | | | 18,093,566 | | | | 28,833,480 | | | | (803,347 | ) | | | 3,143,574 | |
| | | | | | | | | | | | | | | | | | | | | | | | |
FROM DISTRIBUTIONS TO
SHAREHOLDERS: | | | | | | | | | | | | | | | | | | | | | | | | |
Net investment income | | | | | | | | | | | | | | | | | | | | | | | | |
Class A | | | (4,270,353 | ) | | | (7,509,410 | ) | | | (2,532,888 | ) | | | (3,638,806 | ) | | | (312,837 | ) | | | (80,043 | ) |
Class B | | | (143,617 | ) | | | (436,844 | ) | | | (51,162 | ) | | | (124,178 | ) | | | — | | | | — | |
Class C | | | (2,238,071 | ) | | | (2,761,267 | ) | | | (640,109 | ) | | | (969,430 | ) | | | (135,971 | ) | | | (13,441 | ) |
Class Y | | | (1,360,265 | ) | | | (1,308,176 | ) | | | (3,215,877 | ) | | | (3,008,116 | ) | | | (307,238 | ) | | | (240,546 | ) |
Admin Class | | | — | | | | — | | | | — | | | | — | | | | — | | | | — | |
Net realized capital gains | | | | | | | | | | | | | | | | | | | | | | | | |
Class A | | | — | | | | — | | | | — | | | | — | | | | (81,934 | ) | | | — | |
Class B | | | — | | | | — | | | | — | | | | — | | | | — | | | | — | |
Class C | | | — | | | | — | | | | — | | | | — | | | | (46,824 | ) | | | — | |
Class Y | | | — | | | | — | | | | — | | | | — | | | | (94,216 | ) | | | — | |
| | | | | | | | | | | | | | | | | | | | | | | | |
Total distributions | | | (8,012,306 | ) | | | (12,015,697 | ) | | | (6,440,036 | ) | | | (7,740,530 | ) | | | (979,020 | ) | | | (334,030 | ) |
| | | | | | | | | | | | | | | | | | | | | | | | |
NET INCREASE (DECREASE) IN NET ASSETS
FROM CAPITAL SHARE
TRANSACTIONS (NOTE 10) | | | 55,872,502 | | | | 58,618,493 | | | | (58,167,092 | ) | | | 109,311,312 | | | | 10,409,757 | | | | 9,056,042 | |
| | | | | | | | | | | | | | | | | | | | | | | | |
Redemption fees | | | | | | | | | | | | | | | | | | | | | | | | |
Class A | | | — | | | | — | | | | — | | | | 17,604 | | | | — | | | | — | |
Class B | | | — | | | | — | | | | — | | | | 697 | | | | — | | | | — | |
Class C | | | — | | | | — | | | | — | | | | 4,945 | | | | — | | | | — | |
Class Y | | | — | | | | — | | | | — | | | | 3,996 | | | | — | | | | — | |
| | | | | | | | | | | | | | | | | | | | | | | | |
Total redemption fees | | | — | | | | — | | | | — | | | | 27,242 | | | | — | | | | — | |
| | | | | | | | | | | | | | | | | | | | | | | | |
Net increase (decrease) in net assets | | | 60,315,856 | | | | 85,823,616 | | | | (46,513,562 | ) | | | 130,431,504 | | | | 8,627,390 | | | | 11,865,586 | |
NET ASSETS | | | | | | | | | | | | | | | | | | | | | | | | |
Beginning of the period | | | 259,281,702 | | | | 173,458,086 | | | | 185,052,624 | | | | 54,621,120 | | | | 24,482,933 | | | | 12,617,347 | |
| | | | | | | | | | | | | | | | | | | | | | | | |
End of the period | | $ | 319,597,558 | | | $ | 259,281,702 | | | $ | 138,539,062 | | | $ | 185,052,624 | | | $ | 33,110,323 | | | $ | 24,482,933 | |
| | | | | | | | | | | | | | | | | | | | | | | | |
UNDISTRIBUTED NET INVESTMENT INCOME/(DISTRIBUTIONS IN EXCESS OF NET INVESTMENT INCOME) | | $ | (584,654 | ) | | $ | 1,162,716 | | | $ | (352,714 | ) | | $ | 8,540 | | | $ | (258,190 | ) | | $ | 180,612 | |
| | | | | | | | | | | | | | | | | | | | | | | | |
See accompanying notes to financial statements.
55
| | | | | | | | | | | | | | |
Limited Term Government and
Agency Fund | | | Strategic Income Fund | |
Six Months Ended
March 31, 2010
(Unaudited) | | | Year Ended
September 30,
2009 | | | Six Months Ended
March 31, 2010
(Unaudited) | | | Year Ended
September 30,
2009 | |
| | | | | | | | | | | | | | |
| | | | | | | | | | | | | | |
| $ | 2,058,758 | | | $ | 5,607,171 | | | $ | 355,599,849 | | | $ | 729,275,012 | |
| | | |
| | 4,334,222 | | | | 2,955,994 | | | | 107,178,198 | | | | (765,289,471 | ) |
| | | |
| | 401,050 | | | | 8,456,894 | | | | 745,750,072 | | | | 2,056,646,082 | |
| | | | | | | | | | | | | | | |
| | | |
| | 6,794,030 | | | | 17,020,059 | | | | 1,208,528,119 | | | | 2,020,631,623 | |
| | | | | | | | | | | | | | | |
| | | |
| | | | | | | | | | | | | | |
| | | | | | | | | | | | | | |
| | (1,569,225 | ) | | | (3,913,002 | ) | | | (168,103,267 | ) | | | (356,540,265 | ) |
| | (37,484 | ) | | | (112,841 | ) | | | (3,765,021 | ) | | | (9,240,752 | ) |
| | (487,918 | ) | | | (1,292,557 | ) | | | (128,831,535 | ) | | | (258,397,380 | ) |
| | (500,354 | ) | | | (471,487 | ) | | | (66,454,735 | ) | | | (89,955,755 | ) |
| | — | | | | — | | | | (9 | ) | | | — | |
| | | | | | | | | | | | | | |
| | — | | | | — | | | | — | | | | (33,148,981 | ) |
| | — | | | | — | | | | — | | | | (1,003,570 | ) |
| | — | | | | — | | | | — | | | | (25,254,965 | ) |
| | — | | | | — | | | | — | | | | (5,262,204 | ) |
| | | | | | | | | | | | | | | |
| | (2,594,981 | ) | | | (5,789,887 | ) | | | (367,154,567 | ) | | | (778,803,872 | ) |
| | | | | | | | | | | | | | | |
| | | |
| | 35,038,039 | | | | 51,940,484 | | | | (152,270,337 | ) | | | 923,443,021 | |
| | | | | | | | | | | | | | | |
| | | | | | | | | | | | | | |
| | — | | | | — | | | | — | | | | — | |
| | — | | | | — | | | | — | | | | — | |
| | — | | | | — | | | | — | | | | — | |
| | — | | | | — | | | | — | | | | — | |
| | | | | | | | | | | | | | | |
| | — | | | | — | | | | — | | | | — | |
| | | | | | | | | | | | | | | |
| | 39,237,088 | | | | 63,170,656 | | | | 689,103,215 | | | | 2,165,270,772 | |
| | | | | | | | | | | | | | |
| | 202,037,939 | | | | 138,867,283 | | | | 12,645,349,950 | | | | 10,480,079,178 | |
| | | | | | | | | | | | | | | |
| $ | 241,275,027 | | | $ | 202,037,939 | | | $ | 13,334,453,165 | | | $ | 12,645,349,950 | |
| | | | | | | | | | | | | | | |
| | | |
| $ | (495,323 | ) | | $ | 40,900 | | | $ | (14,888,682 | ) | | $ | (3,333,964 | ) |
| | | | | | | | | | | | | | | |
56
FINANCIAL HIGHLIGHTS
For a share outstanding throughout each period.
| | | | | | | | | | | | | | | | | | | | | | | | | | | |
| | | | | | | Income (Loss) from Investment Operations: | | | Less Distributions: | | | |
| | | | | | | | |
| | | | | Net asset
value,
beginning
of
the period | | Net
investment
income (a) | | Net realized
and unrealized
gain (loss) | | | Total from
investment
operations | | | Dividends
from
net investment
income | | | Total
distributions | | | Redemption
fees (b)(c) |
| | | | | | | | | | | | | | | | | | | | | | | | | | | |
CORE PLUS BOND FUND | | | | | | | | | | | | | | | | | | | | | | | | | | | |
Class A | | | | | | | | | | | | | | | | | | | | | | | | | | | |
3/31/2010(h) | | | | $ | 11.91 | | $ | 0.26 | | $ | 0.25 | | | $ | 0.51 | | | $ | (0.33 | ) | | $ | (0.33 | ) | | $ | — |
9/30/2009 | | | | | 10.54 | | | 0.59 | | | 1.44 | | | | 2.03 | | | | (0.66 | ) | | | (0.66 | ) | | | — |
9/30/2008 | | | | | 11.31 | | | 0.55 | | | (0.71 | ) | | | (0.16 | ) | | | (0.61 | ) | | | (0.61 | ) | | | 0.00 |
9/30/2007 | | | | | 11.23 | | | 0.50 | | | 0.14 | | | | 0.64 | | | | (0.56 | ) | | | (0.56 | ) | | | 0.00 |
9/30/2006 | | | | | 11.41 | | | 0.50 | | | (0.07 | ) | | | 0.43 | | | | (0.61 | ) | | | (0.61 | ) | | | 0.00 |
9/30/2005 | | | | | 11.69 | | | 0.46 | | | (0.18 | ) | | | 0.28 | | | | (0.56 | ) | | | (0.56 | ) | | | 0.00 |
Class B | | | | | | | | | | | | | | | | | | | | | | | | | | | |
3/31/2010(h) | | | | | 11.95 | | | 0.22 | | | 0.24 | | | | 0.46 | | | | (0.28 | ) | | | (0.28 | ) | | | — |
9/30/2009 | | | | | 10.57 | | | 0.50 | | | 1.45 | | | | 1.95 | | | | (0.57 | ) | | | (0.57 | ) | | | — |
9/30/2008 | | | | | 11.31 | | | 0.44 | | | (0.67 | ) | | | (0.23 | ) | | | (0.51 | ) | | | (0.51 | ) | | | 0.00 |
9/30/2007 | | | | | 11.24 | | | 0.41 | | | 0.13 | | | | 0.54 | | | | (0.47 | ) | | | (0.47 | ) | | | 0.00 |
9/30/2006 | | | | | 11.41 | | | 0.41 | | | (0.05 | ) | | | 0.36 | | | | (0.53 | ) | | | (0.53 | ) | | | 0.00 |
9/30/2005 | | | | | 11.70 | | | 0.37 | | | (0.18 | ) | | | 0.19 | | | | (0.48 | ) | | | (0.48 | ) | | | 0.00 |
Class C | | | | | | | | | | | | | | | | | | | | | | | | | | | |
3/31/2010(h) | | | | | 11.92 | | | 0.22 | | | 0.24 | | | | 0.46 | | | | (0.28 | ) | | | (0.28 | ) | | | — |
9/30/2009 | | | | | 10.55 | | | 0.51 | | | 1.44 | | | | 1.95 | | | | (0.58 | ) | | | (0.58 | ) | | | — |
9/30/2008 | | | | | 11.32 | | | 0.47 | | | (0.71 | ) | | | (0.24 | ) | | | (0.53 | ) | | | (0.53 | ) | | | 0.00 |
9/30/2007 | | | | | 11.25 | | | 0.41 | | | 0.13 | | | | 0.54 | | | | (0.47 | ) | | | (0.47 | ) | | | 0.00 |
9/30/2006 | | | | | 11.42 | | | 0.41 | | | (0.05 | ) | | | 0.36 | | | | (0.53 | ) | | | (0.53 | ) | | | 0.00 |
9/30/2005 | | | | | 11.71 | | | 0.37 | | | (0.18 | ) | | | 0.19 | | | | (0.48 | ) | | | (0.48 | ) | | | 0.00 |
Class Y | | | | | | | | | | | | | | | | | | | | | | | | | | | |
3/31/2010(h) | | | | | 11.97 | | | 0.28 | | | 0.24 | | | | 0.52 | | | | (0.34 | ) | | | (0.34 | ) | | | — |
9/30/2009 | | | | | 10.60 | | | 0.62 | | | 1.44 | | | | 2.06 | | | | (0.69 | ) | | | (0.69 | ) | | | — |
9/30/2008 | | | | | 11.36 | | | 0.58 | | | (0.70 | ) | | | (0.12 | ) | | | (0.64 | ) | | | (0.64 | ) | | | 0.00 |
9/30/2007 | | | | | 11.29 | | | 0.54 | | | 0.13 | | | | 0.67 | | | | (0.60 | ) | | | (0.60 | ) | | | 0.00 |
9/30/2006 | | | | | 11.46 | | | 0.51 | | | (0.04 | ) | | | 0.47 | | | | (0.64 | ) | | | (0.64 | ) | | | 0.00 |
9/30/2005 | | | | | 11.74 | | | 0.49 | | | (0.18 | ) | | | 0.31 | | | | (0.59 | ) | | | (0.59 | ) | | | 0.00 |
| (a) | Per share net investment income has been calculated using the average shares outstanding during the period. |
| (b) | Amount rounds to less than $0.01 per share, if applicable. |
| (c) | Effective June 2, 2008, redemption fees were eliminated. |
| (d) | A sales charge for Class A shares and a contingent deferred sales charge for Class B and Class C shares are not reflected in total return calculations. Periods less than one year, if applicable, are not annualized. |
| (e) | Had certain expenses not been reduced during the period, if applicable, total returns would have been lower. |
See accompanying notes to financial statements.
57
| | | | | | | | | | | | | | | | | |
| | | | | | | | Ratios to Average Net Assets: | | |
| | | | | | |
Net asset
value,
end of
the period | | Total
return
(%) (d)(e) | | | Net assets,
end of the
period
(000’s) | | Net
expenses
(%) (f)(g) | | | Gross
expenses
(%) (g) | | | Net investment
income
(%) (g) | | Portfolio
turnover
rate (%) |
| | | | | | | | | | | | | | | | | |
| | | | | | | | | | | | | | | | | |
| | | | | | | | | | | | | | | | | |
| $ | 12.09 | | 4.31 | | | $ | 159,932 | | 0.90 | (i) | | 0.90 | (i) | | 4.37 | | 44 |
| | 11.91 | | 20.07 | | | | 140,779 | | 0.90 | | | 0.97 | | | 5.43 | | 102 |
| | 10.54 | | (1.61 | ) | | | 115,873 | | 0.93 | | | 1.04 | | | 4.86 | | 82 |
| | 11.31 | | 5.70 | | | | 105,780 | | 1.04 | | | 1.09 | | | 4.41 | | 69 |
| | 11.23 | | 4.03 | | | | 91,464 | | 1.05 | | | 1.08 | | | 4.46 | | 91 |
| | 11.41 | | 2.43 | | | | 105,111 | | 1.13 | | | 1.18 | | | 3.93 | | 64 |
| | | | | | | | | | | | | | | | | |
| | 12.13 | | 3.90 | | | | 5,477 | | 1.65 | (i) | | 1.65 | (i) | | 3.59 | | 44 |
| | 11.95 | | 19.19 | | | | 7,028 | | 1.65 | | | 1.72 | | | 4.66 | | 102 |
| | 10.57 | | (2.21 | ) | | | 10,481 | | 1.70 | | | 1.80 | | | 3.92 | | 82 |
| | 11.31 | | 4.90 | | | | 87,101 | | 1.79 | | | 1.85 | | | 3.64 | | 69 |
| | 11.24 | | 3.26 | | | | 109,782 | | 1.80 | | | 1.83 | | | 3.72 | | 91 |
| | 11.41 | | 1.58 | | | | 132,221 | | 1.88 | | | 1.93 | | | 3.18 | | 64 |
| | | | | | | | | | | | | | | | | |
| | 12.10 | | 3.93 | | | | 101,736 | | 1.65 | (i) | | 1.65 | (i) | | 3.63 | | 44 |
| | 11.92 | | 19.20 | | | | 77,081 | | 1.65 | | | 1.72 | | | 4.69 | | 102 |
| | 10.55 | | (2.32 | ) | | | 26,698 | | 1.68 | | | 1.79 | | | 4.17 | | 82 |
| | 11.32 | | 4.91 | | | | 12,690 | | 1.78 | | | 1.82 | | | 3.66 | | 69 |
| | 11.25 | | 3.26 | | | | 6,983 | | 1.80 | | | 1.82 | | | 3.63 | | 91 |
| | 11.42 | | 1.59 | | | | 6,065 | | 1.88 | | | 1.93 | | | 3.17 | | 64 |
| | | | | | | | | | | | | | | | | |
| | 12.15 | | 4.42 | | | | 52,453 | | 0.65 | (i) | | 0.65 | (i) | | 4.63 | | 44 |
| | 11.97 | | 20.37 | | | | 34,394 | | 0.65 | | | 0.68 | | | 5.67 | | 102 |
| | 10.60 | | (1.36 | ) | | | 20,407 | | 0.68 | | | 0.75 | | | 5.14 | | 82 |
| | 11.36 | | 6.06 | | | | 15,946 | | 0.70 | | | 0.75 | | | 4.75 | | 69 |
| | 11.29 | | 4.28 | | | | 11,986 | | 0.80 | (j) | | 0.80 | (j) | | 4.58 | | 91 |
| | 11.46 | | 2.68 | | | | 9,060 | | 0.88 | | | 0.99 | | | 4.18 | | 64 |
| (f) | The investment adviser and/or administrator agreed to reimburse a portion of the Fund’s expenses and/or reduce its fees during the period. Without this reimbursement/fee reduction, if applicable, expenses would have been higher. |
| (g) | Computed on an annualized basis for periods less than one year, if applicable. |
| (h) | For the six months ended March 31, 2010 (Unaudited). |
| (i) | Includes fee/expense recovery of less than 0.01%. |
| (j) | Includes fee/expense recovery of 0.06%. |
58
FINANCIAL HIGHLIGHTS (continued)
For a share outstanding throughout each period.
| | | | | | | | | | | | | | | | | | | | | | | | | | | | | | |
| | | | | Income (Loss) from Investment Operations: | | | Less Distributions: | | | | |
| | | | | | | | |
| | | Net asset
value,
beginning
of
the period | | Net
investment
income (a) | | Net realized
and unrealized
gain (loss) | | | Total from
investment
operations | | | Dividends
from net
investment
income | | | Distributions
from net
realized
capital gains | | | Total
distributions | | | Redemption
fees (b) | |
| | | | | | | | | | | | | | | | | | | | | | | | | | | | | | |
HIGH INCOME FUND | | | | | | | | | | | | | | | | | | | | | | | | | | | | | | |
Class A | | | | | | | | | | | | | | | | | | | | | | | | | | | | | | |
3/31/2010(g) | | $ | 4.49 | | $ | 0.17 | | $ | 0.33 | | | $ | 0.50 | | | $ | (0.18 | ) | | $ | — | | | $ | (0.18 | ) | | $ | — | |
9/30/2009 | | | 4.24 | | | 0.34 | | | 0.24 | | | | 0.58 | | | | (0.33 | ) | | | — | | | | (0.33 | ) | | | 0.00 | (h) |
9/30/2008 | | | 5.12 | | | 0.34 | | | (0.87 | ) | | | (0.53 | ) | | | (0.35 | ) | | | — | | | | (0.35 | ) | | | 0.00 | |
9/30/2007 | | | 5.09 | | | 0.33 | | | 0.08 | | | | 0.41 | | | | (0.38 | ) | | | — | | | | (0.38 | ) | | | 0.00 | |
9/30/2006 | | | 4.98 | | | 0.34 | | | 0.11 | | | | 0.45 | | | | (0.34 | ) | | | — | | | | (0.34 | ) | | | 0.00 | |
9/30/2005 | | | 4.82 | | | 0.33 | | | 0.16 | | | | 0.49 | | | | (0.33 | ) | | | — | | | | (0.33 | ) | | | 0.00 | |
Class B | | | | | | | | | | | | | | | | | | | | | | | | | | | | | | |
3/31/2010(g) | | | 4.50 | | | 0.15 | | | 0.33 | | | | 0.48 | | | | (0.16 | ) | | | — | | | | (0.16 | ) | | | — | |
9/30/2009 | | | 4.25 | | | 0.31 | | | 0.25 | | | | 0.56 | | | | (0.31 | ) | | | — | | | | (0.31 | ) | | | 0.00 | (h) |
9/30/2008 | | | 5.13 | | | 0.30 | | | (0.87 | ) | | | (0.57 | ) | | | (0.31 | ) | | | — | | | | (0.31 | ) | | | 0.00 | |
9/30/2007 | | | 5.10 | | | 0.29 | | | 0.07 | | | | 0.36 | | | | (0.33 | ) | | | — | | | | (0.33 | ) | | | 0.00 | |
9/30/2006 | | | 4.98 | | | 0.30 | | | 0.12 | | | | 0.42 | | | | (0.30 | ) | | | — | | | | (0.30 | ) | | | 0.00 | |
9/30/2005 | | | 4.83 | | | 0.29 | | | 0.15 | | | | 0.44 | | | | (0.29 | ) | | | — | | | | (0.29 | ) | | | 0.00 | |
Class C | | | | | | | | | | | | | | | | | | | | | | | | | | | | | | |
3/31/2010(g) | | | 4.50 | | | 0.15 | | | 0.32 | | | | 0.47 | | | | (0.16 | ) | | | — | | | | (0.16 | ) | | | — | |
9/30/2009 | | | 4.24 | | | 0.31 | | | 0.26 | | | | 0.57 | | | | (0.31 | ) | | | — | | | | (0.31 | ) | | | 0.00 | (h) |
9/30/2008 | | | 5.12 | | | 0.31 | | | (0.87 | ) | | | (0.56 | ) | | | (0.32 | ) | | | — | | | | (0.32 | ) | | | 0.00 | |
9/30/2007 | | | 5.09 | | | 0.29 | | | 0.07 | | | | 0.36 | | | | (0.33 | ) | | | — | | | | (0.33 | ) | | | 0.00 | |
9/30/2006 | | | 4.98 | | | 0.30 | | | 0.11 | | | | 0.41 | | | | (0.30 | ) | | | — | | | | (0.30 | ) | | | 0.00 | |
9/30/2005 | | | 4.83 | | | 0.29 | | | 0.15 | | | | 0.44 | | | | (0.29 | ) | | | — | | | | (0.29 | ) | | | 0.00 | |
Class Y | | | | | | | | | | | | | | | | | | | | | | | | | | | | | | |
3/31/2010(g) | | | 4.49 | | | 0.17 | | | 0.32 | | | | 0.49 | | | | (0.18 | ) | | | — | | | | (0.18 | ) | | | — | |
9/30/2009 | | | 4.24 | | | 0.34 | | | 0.25 | | | | 0.59 | | | | (0.34 | ) | | | — | | | | (0.34 | ) | | | 0.00 | (h) |
9/30/2008(i) | | | 4.87 | | | 0.22 | | | (0.65 | ) | | | (0.43 | ) | | | (0.21 | ) | | | — | | | | (0.21 | ) | | | 0.01 | |
INTERNATIONAL BOND FUND | | | | | | | | | | | | | | | | | | | | | | | | | | | | | | |
Class A | | | | | | | | | | | | | | | | | | | | | | | | | | | | | | |
3/31/2010(g) | | $ | 10.84 | | $ | 0.11 | | $ | (0.32 | ) | | $ | (0.21 | ) | | $ | (0.26 | ) | | $ | (0.08 | ) | | $ | (0.34 | ) | | $ | — | |
9/30/2009 | | | 9.19 | | | 0.32 | | | 1.53 | | | | 1.85 | | | | (0.20 | ) | | | — | | | | (0.20 | ) | | | — | |
9/30/2008(j) | | | 10.00 | | | 0.17 | | | (0.79 | ) | | | (0.62 | ) | | | (0.19 | ) | | | — | | | | (0.19 | ) | | | 0.00 | (k) |
Class C | | | | | | | | | | | | | | | | | | | | | | | | | | | | | | |
3/31/2010(g) | | | 10.82 | | | 0.07 | | | (0.32 | ) | | | (0.25 | ) | | | (0.22 | ) | | | (0.08 | ) | | | (0.30 | ) | | | — | |
9/30/2009 | | | 9.18 | | | 0.24 | | | 1.53 | | | | 1.77 | | | | (0.13 | ) | | | — | | | | (0.13 | ) | | | — | |
9/30/2008(j) | | | 10.00 | | | 0.13 | | | (0.81 | ) | | | (0.68 | ) | | | (0.15 | ) | | | — | | | | (0.15 | ) | | | 0.01 | (k) |
Class Y | | | | | | | | | | | | | | | | | | | | | | | | | | | | | | |
3/31/2010(g) | | | 10.82 | | | 0.13 | | | (0.33 | ) | | | (0.20 | ) | | | (0.27 | ) | | | (0.08 | ) | | | (0.35 | ) | | | — | |
9/30/2009 | | | 9.18 | | | 0.33 | | | 1.53 | | | | 1.86 | | | | (0.22 | ) | | | — | | | | (0.22 | ) | | | — | |
9/30/2008(j) | | | 10.00 | | | 0.18 | | | (0.81 | ) | | | (0.63 | ) | | | (0.20 | ) | | | — | | | | (0.20 | ) | | | 0.01 | (k) |
| (a) | Per share net investment income has been calculated using the average shares outstanding during the period. |
| (b) | Amount rounds to less than $0.01 per share, if applicable. |
| (c) | A sales charge for Class A shares and a contingent deferred sales charge for Class B and Class C shares are not reflected in total return calculations. Periods less than one year, if applicable, are not annualized. |
| (d) | Had certain expenses not been reduced during the period, if applicable, total returns would have been lower. |
| (e) | The investment adviser and/or administrator agreed to reimburse a portion of the Fund’s expenses and/or reduce its fees during the period. Without this reimbursement/fee reduction, if applicable, expenses would have been higher. |
See accompanying notes to financial statements.
59
| | | | | | | | | | | | | | | |
| | | | | | | | Ratios to Average Net Assets: | | |
| | | | | | |
Net asset
value, end
of
the period | | Total
return
(%) (c)(d) | | | Net assets,
end of
the period
(000’s) | | Net
expenses
(%) (e)(f) | | Gross
expenses
(%) (f) | | Net investment
income
(%) (f) | | Portfolio
turnover
rate (%) |
| | | | | | | | | | | | | | | |
| | | | | | | | | | | | | | | |
| | | | | | | | | | | | | | | |
| $ | 4.81 | | 11.26 | | | $ | 69,904 | | 1.15 | | 1.18 | | 7.17 | | 20 |
| | 4.49 | | 15.97 | | | | 59,944 | | 1.15 | | 1.28 | | 8.82 | | 30 |
| | 4.24 | | (10.98 | ) | | | 38,577 | | 1.15 | | 1.40 | | 7.01 | | 27 |
| | 5.12 | | 8.10 | | | | 32,603 | | 1.18 | | 1.43 | | 6.40 | | 41 |
| | 5.09 | | 9.39 | | | | 29,069 | | 1.31 | | 1.48 | | 6.70 | | 41 |
| | 4.98 | | 10.34 | | | | 25,817 | | 1.58 | | 1.72 | | 6.60 | | 42 |
| | | | | | | | | | | | | | | |
| | 4.82 | | 10.82 | | | | 1,443 | | 1.90 | | 1.92 | | 6.38 | | 20 |
| | 4.50 | | 15.06 | | | | 1,569 | | 1.90 | | 2.06 | | 8.32 | | 30 |
| | 4.25 | | (11.64 | ) | | | 2,267 | | 1.90 | | 2.15 | | 6.15 | | 27 |
| | 5.13 | | 7.21 | | | | 4,201 | | 1.94 | | 2.18 | | 5.63 | | 41 |
| | 5.10 | | 8.79 | | | | 7,283 | | 2.08 | | 2.25 | | 6.00 | | 41 |
| | 4.98 | | 9.29 | | | | 12,034 | | 2.33 | | 2.47 | | 5.85 | | 42 |
| | | | | | | | | | | | | | | |
| | 4.81 | | 10.59 | | | | 19,597 | | 1.90 | | 1.93 | | 6.40 | | 20 |
| | 4.50 | | 15.37 | | | | 17,827 | | 1.90 | | 2.03 | | 8.09 | | 30 |
| | 4.24 | | (11.62 | ) | | | 9,945 | | 1.90 | | 2.15 | | 6.32 | | 27 |
| | 5.12 | | 7.22 | | | | 5,275 | | 1.93 | | 2.17 | | 5.63 | | 41 |
| | 5.09 | | 8.58 | | | | 3,457 | | 2.07 | | 2.23 | | 5.96 | | 41 |
| | 4.98 | | 9.29 | | | | 3,554 | | 2.33 | | 2.47 | | 5.82 | | 42 |
| | | | | | | | | | | | | | | |
| | 4.80 | | 11.17 | | | | 47,596 | | 0.90 | | 0.90 | | 7.33 | | 20 |
| | 4.49 | | 16.29 | | | | 105,713 | | 0.90 | | 0.92 | | 8.32 | | 30 |
| | 4.24 | | (9.10 | ) | | | 3,833 | | 0.90 | | 1.15 | | 8.03 | | 27 |
| | | | | | | | | | | | | | | |
| | | | | | | | | | | | | | | |
| $ | 10.29 | | (1.98 | ) | | $ | 17,659 | | 1.10 | | 1.47 | | 2.14 | | 67 |
| | 10.84 | | 20.41 | | | | 8,479 | | 1.10 | | 2.11 | | 3.29 | | 91 |
| | 9.19 | | (6.37 | ) | | | 1,953 | | 1.10 | | 2.95 | | 2.66 | | 60 |
| | | | | | | | | | | | | | | |
| | 10.27 | | (2.32 | ) | | | 6,869 | | 1.85 | | 2.22 | | 1.40 | | 67 |
| | 10.82 | | 19.58 | | | | 2,955 | | 1.85 | | 2.93 | | 2.56 | | 91 |
| | 9.18 | | (6.95 | ) | | | 683 | | 1.85 | | 3.70 | | 1.92 | | 60 |
| | | | | | | | | | | | | | | |
| | 10.27 | | (1.87 | ) | | | 8,582 | | 0.85 | | 1.21 | | 2.41 | | 67 |
| | 10.82 | | 20.73 | | | | 13,049 | | 0.85 | | 1.92 | | 3.53 | | 91 |
| | 9.18 | | (6.39 | ) | | | 9,981 | | 0.85 | | 2.48 | | 2.74 | | 60 |
| (f) | Computed on an annualized basis for periods less than one year, if applicable. |
| (g) | For the six months ended March 31, 2010 (Unaudited). |
| (h) | Effective June 1, 2009, redemption fees were eliminated. |
| (i) | From commencement of class operations on February 29, 2008 through September 30, 2008. |
| (j) | For the period February 1, 2008 (inception) through September 30, 2008. |
| (k) | Effective June 2, 2008, redemption fees were eliminated. |
60
FINANCIAL HIGHLIGHTS (continued)
For a share outstanding throughout each period.
| | | | | | | | | | | | | | | | | | | | | | | | | |
| | | | | | | | | Income (Loss) from Investment Operations: | | Less Distributions: | |
| | | | | | | | |
| | | | | | | Net asset
value,
beginning
of
the period | | Net
investment
income (a) | | Net realized
and unrealized
gain (loss) | | | Total from
investment
operations | | Dividends
from net
investment
income | | | Total
distributions | |
| | | | | | | | | | | | | | | | | | | | | | | | | |
LIMITED TERM GOVERNMENT AND AGENCY FUND | | | | | | | | | | | | | | | | | | | | | | | | | |
Class A | | | | | | | | | | | | | | | | | | | | | | | | | |
3/31/2010(f) | | | | | | $ | 11.60 | | $ | 0.12 | | $ | 0.25 | | | $ | 0.37 | | $ | (0.15 | ) | | $ | (0.15 | ) |
9/30/2009 | | | | | | | 10.98 | | | 0.35 | | | 0.63 | | | | 0.98 | | | (0.36 | ) | | | (0.36 | ) |
9/30/2008 | | | | | | | 11.00 | | | 0.45 | | | 0.02 | | | | 0.47 | | | (0.49 | ) | | | (0.49 | ) |
9/30/2007 | | | | | | | 11.00 | | | 0.45 | | | 0.03 | | | | 0.48 | | | (0.48 | ) | | | (0.48 | ) |
9/30/2006 | | | | | | | 11.09 | | | 0.39 | | | (0.05 | ) | | | 0.34 | | | (0.43 | ) | | | (0.43 | ) |
9/30/2005 | | | | | | | 11.30 | | | 0.28 | | | (0.16 | ) | | | 0.12 | | | (0.33 | ) | | | (0.33 | ) |
Class B | | | | | | | | | | | | | | | | | | | | | | | | | |
3/31/2010(f) | | | | | | | 11.59 | | | 0.07 | | | 0.25 | | | | 0.32 | | | (0.10 | ) | | | (0.10 | ) |
9/30/2009 | | | | | | | 10.97 | | | 0.26 | | | 0.63 | | | | 0.89 | | | (0.27 | ) | | | (0.27 | ) |
9/30/2008 | | | | | | | 10.99 | | | 0.36 | | | 0.02 | | | | 0.38 | | | (0.40 | ) | | | (0.40 | ) |
9/30/2007 | | | | | | | 10.98 | | | 0.37 | | | 0.03 | | | | 0.40 | | | (0.39 | ) | | | (0.39 | ) |
9/30/2006 | | | | | | | 11.07 | | | 0.31 | | | (0.05 | ) | | | 0.26 | | | (0.35 | ) | | | (0.35 | ) |
9/30/2005 | | | | | | | 11.28 | | | 0.20 | | | (0.17 | ) | | | 0.03 | | | (0.24 | ) | | | (0.24 | ) |
Class C | | | | | | | | | | | | | | | | | | | | | | | | | |
3/31/2010(f) | | | | | | | 11.61 | | | 0.07 | | | 0.25 | | | | 0.32 | | | (0.10 | ) | | | (0.10 | ) |
9/30/2009 | | | | | | | 10.99 | | | 0.26 | | | 0.63 | | | | 0.89 | | | (0.27 | ) | | | (0.27 | ) |
9/30/2008 | | | | | | | 11.00 | | | 0.36 | | | 0.03 | | | | 0.39 | | | (0.40 | ) | | | (0.40 | ) |
9/30/2007 | | | | | | | 10.99 | | | 0.37 | | | 0.03 | | | | 0.40 | | | (0.39 | ) | | | (0.39 | ) |
9/30/2006 | | | | | | | 11.08 | | | 0.31 | | | (0.05 | ) | | | 0.26 | | | (0.35 | ) | | | (0.35 | ) |
9/30/2005 | | | | | | | 11.30 | | | 0.20 | | | (0.18 | ) | | | 0.02 | | | (0.24 | ) | | | (0.24 | ) |
Class Y | | | | | | | | | | | | | | | | | | | | | | | | | |
3/31/2010(f) | | | | | | | 11.64 | | | 0.13 | | | 0.25 | | | | 0.38 | | | (0.16 | ) | | | (0.16 | ) |
9/30/2009 | | | | | | | 11.01 | | | 0.39 | | | 0.63 | | | | 1.02 | | | (0.39 | ) | | | (0.39 | ) |
9/30/2008 | | | | | | | 11.03 | | | 0.47 | | | 0.02 | | | | 0.49 | | | (0.51 | ) | | | (0.51 | ) |
9/30/2007 | | | | | | | 11.03 | | | 0.49 | | | 0.03 | | | | 0.52 | | | (0.52 | ) | | | (0.52 | ) |
9/30/2006 | | | | | | | 11.13 | | | 0.43 | | | (0.06 | ) | | | 0.37 | | | (0.47 | ) | | | (0.47 | ) |
9/30/2005 | | | | | | | 11.34 | | | 0.31 | | | (0.17 | ) | | | 0.14 | | | (0.35 | ) | | | (0.35 | ) |
| (a) | Per share net investment income has been calculated using the average shares outstanding during the period. |
| (b) | A sales charge for Class A shares and a contingent deferred sales charge for Class B and Class C shares are not reflected in total return calculations. Periods less than one year, if applicable, are not annualized. |
| (c) | Had certain expenses not been reduced during the period, if applicable, total returns would have been lower. |
| (d) | Computed on an annualized basis for periods less than one year, if applicable. |
See accompanying notes to financial statements.
61
| | | | | | | | | | | | | | | |
| | | | | | | Ratios to Average Net Assets: | | |
| | | | | | |
Net asset
value,
end of
the period | | Total
return
(%) (b)(c) | | Net assets,
end of
the period
(000’s) | | Net
expenses
(%) (d)(e) | | Gross
expenses
(%) (d) | | | Net investment
income
(%) (d) | | Portfolio
turnover
rate (%) |
| | | | | | | | | | | | | | | |
| | | | | | | | | | | | | | | |
| | | | | | | | | | | | | | | |
| $ | 11.82 | | 3.18 | | $ | 130,211 | | 0.90 | | 0.99 | | | 2.00 | | 50 |
| | 11.60 | | 9.05 | | | 118,619 | | 0.90 | | 0.99 | | | 3.10 | | 77 |
| | 10.98 | | 4.29 | | | 105,047 | | 0.92 | | 1.07 | | | 4.04 | | 52 |
| | 11.00 | | 4.46 | | | 108,536 | | 0.99 | | 1.10 | | | 4.13 | | 45 |
| | 11.00 | | 3.20 | | | 114,180 | | 1.04 | | 1.09 | | | 3.57 | | 50 |
| | 11.09 | | 1.05 | | | 141,417 | | 1.24 | | 1.24 | | | 2.50 | | 93 |
| | | | | | | | | | | | | | | |
| | 11.81 | | 2.80 | | | 4,118 | | 1.65 | | 1.74 | | | 1.28 | | 50 |
| | 11.59 | | 8.24 | | | 4,442 | | 1.65 | | 1.74 | | | 2.32 | | 77 |
| | 10.97 | | 3.52 | | | 4,532 | | 1.67 | | 1.82 | | | 3.29 | | 52 |
| | 10.99 | | 3.72 | | | 6,787 | | 1.74 | | 1.85 | | | 3.37 | | 45 |
| | 10.98 | | 2.36 | | | 9,952 | | 1.79 | | 1.84 | | | 2.79 | | 50 |
| | 11.07 | | 0.29 | | | 15,114 | | 1.99 | | 1.99 | | | 1.75 | | 93 |
| | | | | | | | | | | | | | | |
| | 11.83 | | 2.79 | | | 61,746 | | 1.65 | | 1.74 | | | 1.26 | | 50 |
| | 11.61 | | 8.24 | | | 50,973 | | 1.65 | | 1.74 | | | 2.32 | | 77 |
| | 10.99 | | 3.62 | | | 22,711 | | 1.66 | | 1.83 | | | 3.29 | | 52 |
| | 11.00 | | 3.62 | | | 5,261 | | 1.74 | | 1.85 | | | 3.38 | | 45 |
| | 10.99 | | 2.46 | | | 4,230 | | 1.79 | | 1.84 | | | 2.81 | | 50 |
| | 11.08 | | 0.21 | | | 5,715 | | 1.99 | | 1.99 | | | 1.75 | | 93 |
| | | | | | | | | | | | | | | |
| | 11.86 | | 3.30 | | | 45,200 | | 0.65 | | 0.74 | | | 2.22 | | 50 |
| | 11.64 | | 9.40 | | | 28,004 | | 0.65 | | 0.72 | | | 3.42 | | 77 |
| | 11.01 | | 4.55 | | | 6,577 | | 0.67 | | 0.72 | | | 4.28 | | 52 |
| | 11.03 | | 4.79 | | | 4,201 | | 0.71 | | 0.75 | | | 4.43 | | 45 |
| | 11.03 | | 3.43 | | | 2,461 | | 0.74 | | 0.74 | | | 3.89 | | 50 |
| | 11.13 | | 1.24 | | | 2,533 | | 1.02 | | 1.59 | (g) | | 2.77 | | 93 |
| (e) | The investment adviser and/or administrator agreed to reimburse a portion of the Fund’s expenses and/or reduce its fees during the period. Without this reimbursement/fee reduction, if applicable, expenses would have been higher. |
| (f) | For the six months ended March 31, 2010 (Unaudited). |
| (g) | Represents the total expenses prior to reduction of a portion of the class’s transfer agent expenses. |
62
FINANCIAL HIGHLIGHTS (continued)
For a share outstanding throughout each period.
| | | | | | | | | | | | | | | | | | | | | | | | | | | | | |
| | | | | Income (Loss) from Investment Operations: | | | Less Distributions: | | | |
| | | | | | | | |
| | | Net asset
value,
beginning
of
the period | | Net
investment
income (a) | | Net realized
and unrealized
gain (loss) | | | Total from
investment
operations | | | Dividends
from
net investment
income | | | Distributions
from net
realized
capital gains | | | Total
distributions | | | Redemption
fees (b)(c) |
| | | | | | | | | | | | | | | | | | | | | | | | | | | | | |
STRATEGIC INCOME FUND | | | | | | | | | | | | | | | | | | | | | | | | | | | | | |
Class A | | | | | | | | | | | | | | | | | | | | | | | | | | | | | |
3/31/2010(h) | | $ | 13.39 | | $ | 0.40 | | $ | 0.90 | | | $ | 1.30 | | | $ | (0.41 | ) | | $ | — | | | $ | (0.41 | ) | | $ | — |
9/30/2009 | | | 12.10 | | | 0.87 | | | 1.36 | | | | 2.23 | | | | (0.86 | ) | | | (0.08 | ) | | | (0.94 | ) | | | — |
9/30/2008 | | | 15.18 | | | 0.96 | | | (3.02 | ) | | | (2.06 | ) | | | (1.01 | ) | | | (0.01 | ) | | | (1.02 | ) | | | 0.00 |
9/30/2007 | | | 14.60 | | | 0.80 | | | 0.60 | | | | 1.40 | | | | (0.82 | ) | | | — | | | | (0.82 | ) | | | 0.00 |
9/30/2006 | | | 14.17 | | | 0.71 | | | 0.53 | | | | 1.24 | | | | (0.81 | ) | | | — | | | | (0.81 | ) | | | 0.00 |
9/30/2005 | | | 13.57 | | | 0.66 | | | 0.70 | | | | 1.36 | | | | (0.76 | ) | | | — | | | | (0.76 | ) | | | 0.00 |
Class B | | | | | | | | | | | | | | | | | | | | | | | | | | | | | |
3/31/2010(h) | | | 13.46 | | | 0.35 | | | 0.92 | | | | 1.27 | | | | (0.36 | ) | | | — | | | | (0.36 | ) | | | — |
9/30/2009 | | | 12.16 | | | 0.79 | | | 1.36 | | | | 2.15 | | | | (0.77 | ) | | | (0.08 | ) | | | (0.85 | ) | | | — |
9/30/2008 | | | 15.25 | | | 0.85 | | | (3.04 | ) | | | (2.19 | ) | | | (0.89 | ) | | | (0.01 | ) | | | (0.90 | ) | | | 0.00 |
9/30/2007 | | | 14.66 | | | 0.69 | | | 0.60 | | | | 1.29 | | | | (0.70 | ) | | | — | | | | (0.70 | ) | | | 0.00 |
9/30/2006 | | | 14.22 | | | 0.61 | | | 0.52 | | | | 1.13 | | | | (0.69 | ) | | | — | | | | (0.69 | ) | | | 0.00 |
9/30/2005 | | | 13.60 | | | 0.56 | | | 0.71 | | | | 1.27 | | | | (0.65 | ) | | | — | | | | (0.65 | ) | | | 0.00 |
Class C | | | | | | | | | | | | | | | | | | | | | | | | | | | | | |
3/31/2010(h) | | | 13.45 | | | 0.35 | | | 0.92 | | | | 1.27 | | | | (0.36 | ) | | | — | | | | (0.36 | ) | | | — |
9/30/2009 | | | 12.15 | | | 0.79 | | | 1.37 | | | | 2.16 | | | | (0.78 | ) | | | (0.08 | ) | | | (0.86 | ) | | | — |
9/30/2008 | | | 15.24 | | | 0.85 | | | (3.03 | ) | | | (2.18 | ) | | | (0.90 | ) | | | (0.01 | ) | | | (0.91 | ) | | | 0.00 |
9/30/2007 | | | 14.65 | | | 0.69 | | | 0.60 | | | | 1.29 | | | | (0.70 | ) | | | — | | | | (0.70 | ) | | | 0.00 |
9/30/2006 | | | 14.22 | | | 0.61 | | | 0.51 | | | | 1.12 | | | | (0.69 | ) | | | — | | | | (0.69 | ) | | | 0.00 |
9/30/2005 | | | 13.60 | | | 0.55 | | | 0.72 | | | | 1.27 | | | | (0.65 | ) | | | — | | | | (0.65 | ) | | | 0.00 |
Class Y | | | | | | | | | | | | | | | | | | | | | | | | | | | | | |
3/31/2010(h) | | | 13.38 | | | 0.41 | | | 0.91 | | | | 1.32 | | | | (0.43 | ) | | | — | | | | (0.43 | ) | | | — |
9/30/2009 | | | 12.09 | | | 0.90 | | | 1.36 | | | | 2.26 | | | | (0.89 | ) | | | (0.08 | ) | | | (0.97 | ) | | | — |
9/30/2008 | | | 15.17 | | | 1.00 | | | (3.03 | ) | | | (2.03 | ) | | | (1.04 | ) | | | (0.01 | ) | | | (1.05 | ) | | | 0.00 |
9/30/2007 | | | 14.59 | | | 0.85 | | | 0.59 | | | | 1.44 | | | | (0.86 | ) | | | — | | | | (0.86 | ) | | | 0.00 |
9/30/2006 | | | 14.17 | | | 0.76 | | | 0.51 | | | | 1.27 | | | | (0.85 | ) | | | — | | | | (0.85 | ) | | | 0.00 |
9/30/2005 | | | 13.57 | | | 0.70 | | | 0.70 | | | | 1.40 | | | | (0.80 | ) | | | — | | | | (0.80 | ) | | | 0.00 |
Admin Class | | | | | | | | | | | | | | | | | | | | | | | | | | | | | |
3/31/2010* | | | 13.87 | | | 0.11 | | | 0.42 | | | | 0.53 | | | | (0.13 | ) | | | — | | | | (0.13 | ) | | | — |
| * | From commencement of Class operations on February 1, 2010 through March 31, 2010. |
| (a) | Per share net investment income has been calculated using the average shares outstanding during the period. |
| (b) | Amount rounds to less than $0.01 per share, if applicable. |
| (c) | Effective June 2, 2008, redemption fees were eliminated. |
| (d) | A sales charge for Class A shares and a contingent deferred sales charge for Class B and Class C shares are not reflected in total return calculations. Periods less than one year, if applicable, are not annualized. |
See accompanying notes to financial statements.
63
| | | | | | | | | | | | | | | |
| | | | | | | | Ratios to Average Net Assets: | | |
| | | | | | |
Net asset
value,
end of
the period | | Total
return
(%) (d)(e) | | | Net
assets,
end of
the period
(000’s) | | Net
expenses
(%) (f)(g) | | Gross
expenses
(%) (f) | | Net investment
income
(%) (f) | | Portfolio
turnover
rate (%) |
| | | | | | | | | | | | | | | |
| | | | | | | | | | | | | | | |
| | | | | | | | | | | | | | | |
| $ | 14.28 | | 9.86 | | | $ | 5,806,912 | | 0.96 | | 0.96 | | 5.75 | | 14 |
| | 13.39 | | 20.56 | | | | 5,544,029 | | 0.99 | | 0.99 | | 7.74 | | 39 |
| | 12.10 | | (14.54 | ) | | | 5,551,066 | | 0.97 | | 0.98 | | 6.59 | | 24 |
| | 15.18 | | 9.90 | | | | 5,749,315 | | 1.00 | | 1.00 | | 5.39 | | 22 |
| | 14.60 | | 9.04 | | | | 2,782,887 | | 1.05 | | 1.05 | | 5.01 | | 21 |
| | 14.17 | | 10.20 | | | | 977,198 | | 1.18 | | 1.18 | | 4.71 | | 14 |
| | | | | | | | | | | | | | | |
| | 14.37 | | 9.54 | | | | 145,442 | | 1.71 | | 1.71 | | 5.00 | | 14 |
| | 13.46 | | 19.62 | | | | 148,887 | | 1.74 | | 1.74 | | 7.02 | | 39 |
| | 12.16 | | (15.19 | ) | | | 161,751 | | 1.72 | | 1.73 | | 5.78 | | 24 |
| | 15.25 | | 9.08 | | | | 233,418 | | 1.76 | | 1.76 | | 4.61 | | 22 |
| | 14.66 | | 8.22 | | | | 179,927 | | 1.79 | | 1.79 | | 4.26 | | 21 |
| | 14.22 | | 9.46 | | | | 144,081 | | 1.93 | | 1.93 | | 3.98 | | 14 |
| | | | | | | | | | | | | | | |
| | 14.36 | | 9.55 | | | | 5,111,329 | | 1.71 | | 1.71 | | 5.00 | | 14 |
| | 13.45 | | 19.66 | | | | 4,894,546 | | 1.74 | | 1.74 | | 6.95 | | 39 |
| | 12.15 | | (15.19 | ) | | | 3,984,204 | | 1.72 | | 1.73 | | 5.85 | | 24 |
| | 15.24 | | 9.08 | | | | 3,843,823 | | 1.75 | | 1.75 | | 4.63 | | 22 |
| | 14.65 | | 8.14 | | | | 1,812,278 | | 1.79 | | 1.79 | | 4.24 | | 21 |
| | 14.22 | | 9.45 | | | | 765,200 | | 1.93 | | 1.93 | | 3.93 | | 14 |
| | | | | | | | | | | | | | | |
| | 14.27 | | 10.00 | | | | 2,270,770 | | 0.71 | | 0.71 | | 6.01 | | 14 |
| | 13.38 | | 20.91 | | | | 2,057,888 | | 0.72 | | 0.72 | | 7.76 | | 39 |
| | 12.09 | | (14.34 | ) | | | 783,058 | | 0.72 | | 0.72 | | 6.88 | | 24 |
| | 15.17 | | 10.22 | | | | 638,868 | | 0.74 | | 0.74 | | 5.67 | | 22 |
| | 14.59 | | 9.28 | | | | 271,065 | | 0.78 | | 0.78 | | 5.30 | | 21 |
| | 14.17 | | 10.51 | | | | 50,369 | | 0.91 | | 0.91 | | 4.98 | | 14 |
| | | | | | | | | | | | | | | |
| | 14.27 | | 3.83 | | | | 1 | | 1.22 | | 1.22 | | 4.97 | | 14 |
| (e) | Had certain expenses not been reduced during the period, if applicable, total returns would have been lower. |
| (f) | Computed on an annualized basis for periods less than one year, if applicable. |
| (g) | The investment adviser and/or administrator agreed to reimburse a portion of the Fund’s expenses and/or reduce its fees during the period. Without this reimbursement/fee reduction, if applicable, expenses would have been higher. |
| (h) | For the six months ended March 31, 2010 (Unaudited). |
64
NOTESTO FINANCIAL STATEMENTS
March 31, 2010 (Unaudited)
1. Organization. Natixis Funds Trust I and Loomis Sayles Funds II (the “Trusts” and each a “Trust”) are each organized as a Massachusetts business trust. Each Trust is registered under the Investment Company Act of 1940, as amended (“1940 Act”), as an open-end management investment company. Each Declaration of Trust permits the Board of Trustees to authorize the issuance of an unlimited number of shares of the Trust in multiple series. The financial statements for certain funds of the Trusts are presented in separate reports. The following funds (individually, a “Fund” and collectively, the “Funds”) are included in this report:
Natixis Funds Trust I:
Loomis Sayles Core Plus Bond Fund (the “Core Plus Bond Fund”)
Loomis Sayles Funds II:
Loomis Sayles High Income Fund (the “High Income Fund”)
Loomis Sayles International Bond Fund (the “International Bond Fund”)
Loomis Sayles Limited Term Government and Agency Fund (the “Limited Term Government and Agency Fund”)
Loomis Sayles Strategic Income Fund (the “Strategic Income Fund”)
The Funds each offer Class A, Class C and Class Y shares. Effective February 1, 2010, Strategic Income Fund began offering Admin Class shares. Effective October 12, 2007, Class B shares are no longer offered. Existing Class B shareholders may continue to reinvest dividends into Class B shares and exchange their Class B shares for Class B shares of other Natixis Funds subject to existing exchange privileges as described in the Prospectus.
Class A shares of all Funds except Limited Term Government and Agency Fund are sold with a maximum front-end sales charge of 4.50%. Class A shares of Limited Term Government and Agency Fund are sold with a maximum front-end sales charge of 3.00%. Class B shares do not pay a front-end sales charge, but pay higher Rule 12b-1 fees than Class A shares for eight years (at which point they automatically convert to Class A shares), and are subject to a contingent deferred sales charge (“CDSC”) if those shares are redeemed within six years of purchase. Class C shares do not pay a front-end sales charge, do not convert to any other Class of shares and pay higher Rule 12b-1 fees than Class A shares and may be subject to a CDSC of 1.00% if those shares are redeemed within one year of acquisition except for reinvested distributions. Class Y shares do not pay a front-end sales charge, a CDSC or Rule 12b-1 fees. Class Y shares are generally intended for institutional investors with a minimum initial investment of $100,000, though some categories of investors are exempted from the minimum investment amount as outlined in the Fund’s Prospectus. Admin Class shares do not pay a front-end sales charge or a CDSC, but do pay a Rule 12b-1 fee. Admin Class shares are offered exclusively through intermediaries.
Most expenses of the Trusts can be directly attributed to a fund. Expenses which cannot be directly attributed to a fund are generally apportioned based on the relative net assets of each of the funds in the Trusts. Expenses of a Fund are borne pro rata by the holders of each class of shares, except that each class bears expenses unique to that class (including the Rule 12b-1 service and distribution fees). In addition, each class votes as a class only with respect to its own Rule 12b-1 Plan. Shares of each class would receive their pro rata share of the net assets of a Fund if the Fund were liquidated. The Trustees approve separate dividends from net investment income on each class of shares.
2. Significant Accounting Policies. The following is a summary of significant accounting policies consistently followed by each Fund in the preparation of its financial statements. The Funds’ financial statements are prepared in accordance with accounting principles generally accepted in the United States of America which require the use of management estimates that affect the reported amounts and disclosures in the financial statements. Actual results could differ from those estimates. Management has evaluated the events and transactions that have occurred through the date the financial statements were issued, and noted no items requiring recognition in the financial statements or additional disclosure in the Notes to Financial Statements.
a. Valuation. Debt securities (other than short-term obligations purchased with an original or remaining maturity of sixty days or less) are generally valued on the basis of evaluated bids furnished to the Funds by a pricing service recommended by the investment adviser and approved by the Board of Trustees, which service determines valuations for normal, institutional-size trading units of such securities using market information, transactions for comparable securities and various relationships between securities which are generally recognized by institutional traders. Equity securities, including shares of closed-end investment companies and exchange-traded funds, for which market quotations are readily available are valued at market value, as reported by pricing services recommended by the investment adviser and approved by the Board of Trustees. Such pricing services generally use the security’s last sale price on the exchange or market where the security is primarily traded or, if there is no reported sale during the day, the closing bid price. Securities traded on the NASDAQ Global Select Market, NASDAQ Global Market and NASDAQ Capital Market are valued at the NASDAQ Official Closing Price (“NOCP”), or if lacking a NOCP, at the most recent bid quotation on the applicable NASDAQ market. Broker-dealer bid quotations may also be used to value debt and equity securities where a pricing service does not price a security or where a pricing service does not provide a reliable price for the security. In instances where broker-dealer bid quotations are not available, certain securities held by the Funds may be valued on the basis of a price provided by a principal market maker. Forward foreign currency contracts are valued utilizing interpolated prices determined from information provided by an independent pricing service. Short-term obligations purchased with an original or remaining maturity of sixty days or less are valued at amortized cost, which approximates market value. Securities for which market quotations are not readily available are valued at fair value as determined in good faith by the Funds’ investment adviser using consistently applied procedures under the general supervision of the Board of Trustees. Investments in other open-end investment companies are valued at their net asset value each day.
Certain Funds may hold securities traded in foreign markets. Foreign securities are valued at the market price in the foreign market. However, if events occurring after the close of the foreign market (but before the close of regular trading on the New York Stock Exchange) are believed to materially affect the value of those securities, such securities
65
NOTESTO FINANCIAL STATEMENTS (continued)
March 31, 2010 (Unaudited)
are fair valued pursuant to procedures approved by the Board of Trustees. When fair valuing securities, the Funds may, among other things, use modeling tools or other processes that may take into account factors such as securities market activity and/or significant events that occur after the close of the foreign market and before the Funds calculate their net asset values.
b. Security Transactions and Related Investment Income. Security transactions are accounted for on trade date. Dividend income is recorded on ex-dividend date, or in the case of certain foreign securities, as soon as a Fund is notified, and interest income is recorded on an accrual basis. Interest income is increased by the accretion of discount and decreased by the amortization of premium. Periodic principal adjustments for inflation-protected securities are recorded to interest income. Negative principal adjustments (in the event of deflation) are recorded as reductions of interest income to the extent of interest income earned, not to exceed the amount of positive principal adjustments on a cumulative basis. Distributions received from investments in securities that represent a return of capital or capital gain are recorded as a reduction of cost of investments or as a realized gain, respectively. The calendar year-end amounts of ordinary income, capital gains, and return of capital included in distributions received from the Funds’ investments in real estate investment trusts (“REITs”) are reported to the Funds after the end of the fiscal year; accordingly, the Funds estimate these amounts for accounting purposes until the characterization of REIT distributions is reported to the Funds after the end of the fiscal year. Estimates are based on the most recent REIT distribution information available. Investment income is recorded net of foreign taxes withheld when applicable. In determining net gain or loss on securities sold, the cost of securities has been determined on an identified cost basis. Investment income, non-class specific expenses and realized and unrealized gains and losses are allocated on a pro rata basis to each class based on the relative net assets of each class to the total net assets of the Fund.
c. Foreign Currency Translation. The books and records of the Funds are maintained in U.S. dollars. The value of securities, currencies and other assets and liabilities denominated in currencies other than U.S. dollars are translated into U.S. dollars based upon foreign exchange rates prevailing at the end of the period. Purchases and sales of investment securities, income and expenses are translated on the respective dates of such transactions.
Since the values of investment securities are presented at the foreign exchange rates prevailing at the end of the period, it is not practical to isolate that portion of the results of operations arising from changes in exchange rates from fluctuations which arise due to changes in market prices of investment securities. Such changes are included with the net realized and unrealized gain or loss on investments.
Net realized foreign exchange gains or losses arise from sales of foreign currency, currency gains or losses realized between the trade and settlement dates on securities transactions, and the difference between the amounts of dividends, interest and foreign withholding taxes recorded on the Funds’ books and the U.S. dollar equivalent of the amounts actually received or paid. Net unrealized foreign exchange gains and losses arise from changes in the value of assets and liabilities, other than investment securities, at the end of the fiscal period, resulting from changes in exchange rates.
Each Fund may use foreign currency exchange contracts to facilitate transactions in foreign-denominated investments. Losses may arise from changes in the value of the foreign currency or if the counterparties do not perform under the contracts’ terms.
d. Forward Foreign Currency Contracts. Each Fund may enter into forward foreign currency contracts. Contracts to buy generally are used to acquire exposure to foreign currencies, while contracts to sell generally are used to hedge a Fund’s investments against currency fluctuation. Also, a contract to buy or sell can offset a previous contract. These contracts involve market risk in excess of the unrealized gain or loss reflected in the Funds’ Statements of Assets and Liabilities. The U.S. dollar value of the currencies a Fund has committed to buy or sell represents the aggregate exposure to each currency the Fund has acquired or hedged through currency contracts outstanding at period end. Gains or losses are recorded for financial statement purposes as unrealized until settlement date. Risks may arise upon entering into these contracts from the potential inability of counterparties to meet the terms of their contracts and from unanticipated movements in the value of a foreign currency relative to the U.S. dollar. Certain contracts may require the movement of cash or securities to or from the counterparty as collateral for the Funds’ or counterparty’s net obligations under the contracts.
e. Federal and Foreign Income Taxes. Each Trust treats each fund as a separate entity for federal income tax purposes. Each Fund intends to meet the requirements of the Internal Revenue Code of 1986, as amended, applicable to regulated investment companies, and to distribute to its shareholders substantially all of its net investment income and any net realized capital gains at least annually. Management has performed an analysis of each Fund’s tax positions for the open tax years as of March 31, 2010 and has concluded that no provisions for income tax are required. The Funds’ federal tax returns for the prior three fiscal years, where applicable, remain subject to examination by the Internal Revenue Service. Management is not aware of any events that are reasonably possible to occur in the next six months that would result in the amounts of any unrecognized tax benefits significantly increasing or decreasing for the Funds. However, management’s conclusions regarding tax positions taken may be subject to review and adjustment at a later date based on factors including, but not limited to, new tax laws and accounting regulations and interpretations thereof.
A Fund may be subject to foreign taxes on income and gains on investments that are accrued based upon the Fund’s understanding of the tax rules and regulations that exist in the countries in which the Fund invests. Foreign governments may also impose taxes or other payments on investments with respect to foreign securities. Such taxes are accrued as applicable, and are reflected as foreign taxes payable on the Statements of Assets and Liabilities.
f. Dividends and Distributions to Shareholders. Dividends and distributions are recorded on ex-dividend date. The timing and characterization of certain income and capital gain distributions are determined annually in accordance with federal tax regulations, which may differ from accounting principles generally accepted in the United States of America. Permanent differences are primarily due to differing treatments for book and tax purposes for items such as foreign currency transactions, treasury inflation
66
NOTESTO FINANCIAL STATEMENTS (continued)
March 31, 2010 (Unaudited)
protected bond adjustments, premium amortization, defaulted bond adjustments, paydown gains and losses, distribution redesignations, expired capital loss carryforwards and return of capital and capital gains distributions from REITS. Permanent book and tax basis differences relating to shareholder distributions will result in reclassifications to capital accounts. Temporary differences between book and tax distributable earnings are primarily due to deferred Trustees’ fees, wash sales, premium amortization accruals, forward contracts mark to market, dividends payable, securities lending collateral gain/loss adjustment, REIT basis adjustments, discount accretion on inflation-protected securities and defaulted bond interest. Distributions from net investment income and short-term capital gains are considered to be distributed from ordinary income for tax purposes.
The tax characterization of distributions is determined on an annual basis. The tax character of distributions paid to shareholders during the year ended September 30, 2009 was as follows:
| | | | | | | | | |
| | | 2009 Distributions Paid From: |
Fund | | Ordinary Income | | Long-Term Capital Gains | | Total |
Core Plus Bond Fund | | $ | 12,015,697 | | $ | — | | $ | 12,015,697 |
High Income Fund | | | 7,740,530 | | | — | | | 7,740,530 |
International Bond Fund | | | 334,030 | | | — | | | 334,030 |
Limited Term Government and Agency Fund | | | 5,789,887 | | | — | | | 5,789,887 |
Strategic Income Fund | | | 725,851,869 | | | 52,952,003 | | | 778,803,872 |
Differences between these amounts and those reported in the Statements of Changes in Net Assets, if any, are primarily attributable to different book and tax treatment for short-term capital gains.
As of September 30, 2009, the capital loss carryforwards and post-October losses were as follows:
| | | | | | | | | | | | | | | | | | | | |
| | | Core Plus Bond
Fund | | | High Income
Fund | | | International
Bond Fund | | | Limited Term
Government
and Agency
Fund | | | Strategic Income
Fund | |
Capital loss carryforward: | | | | | | | | | | | | | | | | | | | | |
Expires September 30, 2010 | | $ | (19,393,733 | ) | | $ | (26,826,634 | ) | | $ | — | | | $ | — | | | $ | — | |
Expires September 30, 2014 | | | (181,728 | ) | | | — | | | | — | | | | (1,425,832 | ) | | | — | |
Expires September 30, 2015 | | | — | | | | — | | | | — | | | | (4,336,746 | ) | | | — | |
Expires September 30, 2016 | | | — | | | | — | | | | — | | | | (100,316 | ) | | | — | |
Expires September 30, 2017 | | | — | | | | (33,112 | ) | | | — | | | | — | | | | (45,672,245 | ) |
| | | | | | | | | | | | | | | | | | | | |
Total capital loss carryforward | | $ | (19,575,461 | ) | | $ | (26,859,746 | ) | | $ | — | | | $ | (5,862,894 | ) | | $ | (45,672,245 | ) |
| | | | | | | | | | | | | | | | | | | | |
Deferred net capital losses (post-October 2008) | | $ | (129,243 | ) | | $ | (2,276,152 | ) | | $ | (45,041 | ) | | $ | (83,587 | ) | | $ | (552,853,501 | ) |
| | | | | | | | | | | | | | | | | | | | |
g. Repurchase Agreements. It is each Fund’s policy that the market value of the collateral for repurchase agreements be at least equal to 102% of the repurchase price, including interest. Certain repurchase agreements are tri-party arrangements whereby the collateral is held in a segregated account for the benefit of the Fund and on behalf of the counterparty. Repurchase agreements could involve certain risks in the event of default or insolvency of the counterparty including possible delays or restrictions upon a Fund’s ability to dispose of the underlying securities.
h. Securities Lending. The Funds have entered into an agreement with State Street Bank and Trust Company (“State Street Bank”), as agent of the Funds, to lend securities to certain designated borrowers. The loans are collateralized with cash or securities in an amount equal to at least 105% or 102% of the market value (including accrued interest) of the loaned international or domestic securities, respectively, when the loan is initiated. Thereafter, the value of the collateral must remain at least 102% of the market value (including accrued interest) of loaned securities for U.S. equities and U.S. corporate debt; at least 105% of the market value (including accrued interest) of loaned securities for non-U.S. equities; and at least 100% of the market value (including accrued interest) of loaned securities for U.S. Government securities, sovereign debt issued by non-U.S. Governments and non-U.S. corporate debt. In the event that the market value of the collateral falls below the required percentages described above, the borrower will deliver additional collateral on the next business day. As with other extensions of credit, the Funds bear the risk of loss with respect to the investment of the collateral. The Funds invest cash collateral in short-term investments, a portion of the income from which is remitted to the borrowers and the remainder allocated between the Funds and State Street Bank as lending agent.
As of March 31, 2010, there were no securities on loan. Excess collateral in the amount of $2,993,578 related to terminated loans with a bankrupt borrower, is held by State Street Bank on behalf of Strategic Income Fund. This amount is expected to be returned to the bankruptcy administrator before the end of the Fund’s fiscal year at September 30, 2010.
67
NOTESTO FINANCIAL STATEMENTS (continued)
March 31, 2010 (Unaudited)
i. Delayed Delivery Commitments. Purchases of delayed delivery instruments may have a similar effect on a Fund’s net asset value as if the Fund had created a degree of leverage in its portfolio. The price of the underlying instruments and the date when they will be paid for are fixed at the time the transaction is negotiated. If a Fund enters into such a transaction, collateral consisting of liquid securities or cash and cash equivalents will be maintained in an amount at least equal to the commitment with the custodian and/or broker. Losses may arise due to changes in the market value of the underlying instruments or if the counterparty does not perform under the contract.
j. Indemnifications. Under the Trusts’ organizational documents, their officers and Trustees are indemnified against certain liabilities arising out of the performance of their duties to the Funds. Additionally, in the normal course of business, the Funds enter into contracts with service providers that contain general indemnification clauses. The Funds’ maximum exposure under these arrangements is unknown as this would involve future claims that may be made against the Funds that have not yet occurred. However, based on experience, the Funds expect the risk of loss to be remote.
3. Fair Value Measurements. In accordance with accounting standards related to fair value measurements and disclosures, the Funds have categorized the inputs utilized in determining the value of each Fund’s assets or liabilities. These inputs are summarized in the three broad levels listed below:
| | • | | Level 1 – quoted prices in active markets for identical assets or liabilities; |
| | • | | Level 2 – prices determined using other significant inputs that are observable either directly, or indirectly through corroboration with observable market data (which could include quoted prices for similar assets or liabilities, interest rates, credit risk, etc.); |
| | • | | Level 3 – prices determined using significant unobservable inputs for situations where quoted prices or observable inputs are unavailable such as when there is little or no market activity for an asset or liability (unobservable inputs reflect each Fund’s own assumptions in determining the fair value of assets or liabilities and would be based on the best information available). |
The inputs or methodology used for valuing securities are not necessarily an indication of the risk associated with investing in those securities.
The following is a summary of the inputs used to value the Funds’ investments as of March 31, 2010, at value:
Core Plus Bond Fund
Asset Valuation Inputs
| | | | | | | | | | | | |
Description | | Level 1 | | Level 2 | | Level 3 | | Total |
Bonds and Notes | | | | | | | | | | | | |
ABS Car Loan | | $ | — | | $ | 5,245,337 | | $ | 1,139,886 | | $ | 6,385,223 |
All Other Bonds and Notes(a) | | | — | | | 307,163,993 | | | — | | | 307,163,993 |
| | | | | | | | | | | | |
Total Bonds and Notes | | | — | | | 312,409,330 | | | 1,139,886 | | | 313,549,216 |
| | | | | | | | | | | | |
Preferred Stocks | | | | | | | | | | | | |
Banking | | | — | | | 405,517 | | | — | | | 405,517 |
Thrift & Mortgage Finance | | | 238,080 | | | 5,334 | | | — | | | 243,414 |
| | | | | | | | | | | | |
Total Preferred Stocks | | | 238,080 | | | 410,851 | | | — | | | 648,931 |
| | | | | | | | | | | | |
Short-Term Investments | | | — | | | 9,668,568 | | | — | | | 9,668,568 |
| | | | | | | | | | | | |
Total | | $ | 238,080 | | $ | 322,488,749 | | $ | 1,139,886 | | $ | 323,866,715 |
| | | | | | | | | | | | |
| (a) | Major categories of the Fund’s investments are included in the Portfolio of Investments. |
68
NOTESTO FINANCIAL STATEMENTS (continued)
March 31, 2010 (Unaudited)
High Income Fund
Asset Valuation Inputs
| | | | | | | | | | | | |
Description | | Level 1 | | Level 2 | | Level 3 | | Total |
Bonds and Notes | | | | | | | | | | | | |
Non-Convertible Bonds | | | | | | | | | | | | |
Wirelines | | $ | — | | $ | 9,217,796 | | $ | 261,812 | | $ | 9,479,608 |
All Other Non-Convertible Bonds(a) | | | — | | | 82,222,033 | | | — | | | 82,222,033 |
| | | | | | | | | | | | |
Total Non-Convertible Bonds | | | — | | | 91,439,829 | | | 261,812 | | | 91,701,641 |
| | | | | | | | | | | | |
Convertible Bonds(a) | | | — | | | 25,152,031 | | | — | | | 25,152,031 |
| | | | | | | | | | | | |
Total Bonds and Notes | | | — | | | 116,591,860 | | | 261,812 | | | 116,853,672 |
| | | | | | | | | | | | |
Bank Loans(a) | | | — | | | 1,462,757 | | | — | | | 1,462,757 |
| | | | | | | | | | | | |
Preferred Stocks | | | | | | | | | | | | |
Convertible Preferred Stocks | | | | | | | | | | | | |
Automotive | | | 20,880 | | | — | | | — | | | 20,880 |
All Other Convertible Preferred Stocks(a) | | | — | | | 2,562,221 | | | — | | | 2,562,221 |
| | | | | | | | | | | | |
Total Convertible Preferred Stocks | | | 20,880 | | | 2,562,221 | | | — | | | 2,583,101 |
| | | | | | | | | | | | |
Non-Convertible Preferred Stocks | | | | | | | | | | | | |
Banking | | | — | | | 208,857 | | | — | | | 208,857 |
Thrifts & Mortgage Finance | | | 21,085 | | | 24,718 | | | — | | | 45,803 |
| | | | | | | | | | | | |
Total Non-Convertible Preferred Stocks | | | 21,085 | | | 233,575 | | | — | | | 254,660 |
| | | | | | | | | | | | |
Total Preferred Stocks | | | 41,965 | | | 2,795,796 | | | — | | | 2,837,761 |
| | | | | | | | | | | | |
Common Stocks(a) | | | 1,158,331 | | | — | | | — | | | 1,158,331 |
Closed-End Investment Companies | | | 40,299 | | | — | | | — | | | 40,299 |
Short-Term Investments | | | — | | | 14,324,664 | | | — | | | 14,324,664 |
| | | | | | | | | | | | |
Total | | $ | 1,240,595 | | $ | 135,175,077 | | $ | 261,812 | | $ | 136,677,484 |
| | | | | | | | | | | | |
| (a) | Major categories of the Fund’s investments are included in the Portfolio of Investments. |
International Bond Fund
Asset Valuation Inputs
| | | | | | | | | | | | |
Description(a) | | Level 1 | | Level 2 | | Level 3 | | Total |
Bonds and Notes | | | | | | | | | | | | |
Non-Convertible Bonds | | $ | — | | $ | 31,683,819 | | $ | — | | $ | 31,683,819 |
Convertible Bonds | | | — | | | 226,912 | | | — | | | 226,912 |
| | | | | | | | | | | | |
Total Bonds and Notes | | | — | | | 31,910,731 | | | — | | | 31,910,731 |
| | | | | | | | | | | | |
Short-Term Investments | | | — | | | 391,292 | | | — | | | 391,292 |
| | | | | | | | | | | | |
Total Investments | | | — | | | 32,302,023 | | | — | | | 32,302,023 |
| | | | | | | | | | | | |
Forward Foreign Currency Contracts (unrealized appreciation) | | | — | | | 19,322 | | | — | | | 19,322 |
| | | | | | | | | | | | |
Total | | $ | — | | $ | 32,321,345 | | $ | — | | $ | 32,321,345 |
| | | | | | | | | | | | |
Liability Valuation Inputs
| | | | | | | | | | | | |
Description(a) | | Level 1 | | Level 2 | | | Level 3 | | Total | |
Forward Foreign Currency Contracts (unrealized depreciation) | | $ | — | | $ (49,537 | ) | | $ | — | | $ (49,537 | ) |
| | | | | | | | | | | | |
| (a) | Major categories of the Fund’s investments and forward foreign currency contracts are included in the Portfolio of Investments. |
69
NOTESTO FINANCIAL STATEMENTS (continued)
March 31, 2010 (Unaudited)
Limited Term Government and Agency Fund
Asset Valuation Inputs
| | | | | | | | | | | | |
Description(a) | | Level 1 | | Level 2 | | Level 3 | | Total |
Bonds and Notes | | $ | — | | $ | 232,137,551 | | $ | — | | $ | 232,137,551 |
Short-Term Investments | | | — | | | 12,283,566 | | | — | | | 12,283,566 |
| | | | | | | | | | | | |
Total | | $ | — | | $ | 244,421,117 | | $ | — | | $ | 244,421,117 |
| | | | | | | | | | | | |
| (a) | Major categories of the Fund’s investments are included in the Portfolio of Investments. |
Strategic Income Fund
Asset Valuation Inputs
| | | | | | | | | | | | |
Description | | Level 1 | | Level 2 | | Level 3 | | Total |
Bonds and Notes | | | | | | | | | | | | |
Non-Convertible Bonds | | | | | | | | | | | | |
Chemicals | | $ | — | | $ | 109,345,678 | | $ | 16,744,640 | | $ | 126,090,318 |
Non-Captive Diversified | | | — | | | 1,057,805,597 | | | 3,160,500 | | | 1,060,966,097 |
Property & Casualty Insurance | | | — | | | 39,751,465 | | | 4,134,400 | | | 43,885,865 |
All Other Non-Convertible Bonds(a) | | | — | | | 9,753,520,997 | | | — | | | 9,753,520,997 |
| | | | | | | | | | | | |
Total Non-Convertible Bonds | | | — | | | 10,960,423,737 | | | 24,039,540 | | | 10,984,463,277 |
| | | | | | | | | | | | |
Convertible Bonds(a) | | | — | | | 1,059,272,094 | | | — | | | 1,059,272,094 |
Municipals(a) | | | — | | | 147,144,317 | | | — | | | 147,144,317 |
| | | | | | | | | | | | |
Total Bonds and Notes | | | — | | | 12,166,840,148 | | | 24,039,540 | | | 12,190,879,688 |
| | | | | | | | | | | | |
Bank Loans(a) | | | — | | | 82,117,158 | | | — | | | 82,117,158 |
Common Stocks(a) | | | 404,763,845 | | | — | | | — | | | 404,763,845 |
| | | | | | | | | | | | |
Preferred Stocks | | | | | | | | | | | | |
Convertible Preferred Stocks | | | | | | | | | | | | |
Automotive | | | 68,515,214 | | | — | | | — | | | 68,515,214 |
Capital Markets | | | — | | | 7,400,003 | | | — | | | 7,400,003 |
Commercial Banks | | | 5,796,541 | | | — | | | — | | | 5,796,541 |
Diversified Consumer Services | | | 3 | | | — | | | — | | | 3 |
Diversified Financial Services | | | — | | | 22,752,261 | | | — | | | 22,752,261 |
Electric Utilities | | | — | | | 17,197,323 | | | 3,770,375 | | | 20,967,698 |
Machinery | | | — | | | 5,557,791 | | | — | | | 5,557,791 |
Oil, Gas & Consumable Fuels | | | 4,349,912 | | | 5,960,453 | | | — | | | 10,310,365 |
REITs | | | — | | | 772,870 | | | — | | | 772,870 |
Semiconductors & Semiconductor Equipment | | | — | | | 25,726,720 | | | — | | | 25,726,720 |
| | | | | | | | | | | | |
Total Convertible Preferred Stocks | | | 78,661,670 | | | 85,367,421 | | | 3,770,375 | | | 167,799,466 |
| | | | | | | | | | | | |
Non-Convertible Preferred Stocks | | | | | | | | | | | | |
Banking | | | — | | | 28,139,221 | | | — | | | 28,139,221 |
Diversified Financial Services | | | 727,300 | | | — | | | — | | | 727,300 |
Electric Utilities | | | — | | | 29,033 | | | — | | | 29,033 |
REITs | | | 5,613,235 | | | 1,688,269 | | | — | | | 7,301,504 |
Software | | | — | | | 26,154,375 | | | — | | | 26,154,375 |
Thrifts & Mortgage Finance | | | 15,368,004 | | | 11,308,192 | | | — | | | 26,676,196 |
| | | | | | | | | | | | |
Total Non-Convertible Preferred Stocks | | | 21,708,539 | | | 67,319,090 | | | — | | | 89,027,629 |
| | | | | | | | | | | | |
Total Preferred Stocks | | | 100,370,209 | | | 152,686,511 | | | 3,770,375 | | | 256,827,095 |
| | | | | | | | | | | | |
70
NOTESTO FINANCIAL STATEMENTS (continued)
March 31, 2010 (Unaudited)
Strategic Income Fund
Asset Valuation Inputs (continued)
| | | | | | | | | | | | |
Description | | Level 1 | | Level 2 | | Level 3 | | Total |
Closed-End Investment Companies | | $ | 33,925,659 | | $ | — | | $ | — | | $ | 33,925,659 |
Warrants(a) | | | — | | | — | | | 6,493,251 | | | 6,493,251 |
Short-Term Investments | | | — | | | 134,475,262 | | | — | | | 134,475,262 |
| | | | | | | | | | | | |
Total | | $ | 539,059,713 | | $ | 12,536,119,079 | | $ | 34,303,166 | | $ | 13,109,481,958 |
| | | | | | | | | | | | |
| (a) | Major categories of the Fund’s investments are included in the Portfolio of Investments. |
The following is a reconciliation of Level 3 investments for which significant unobservable inputs were used to determine fair value as of March 31, 2010:
Core Plus Bond Fund
Asset Valuation Inputs
| | | | | | | | | | | | | | | | | | | | | | | |
Investments in Securities | | Balance as of
September 30,
2009 | | Accrued
Discounts
(Premiums) | | Realized
Gain
(Loss) | | Change in
Unrealized
Appreciation
(Depreciation) | | Net Purchases
(Sales) | | | Net Transfers
into/(out of)
Level 3 | | | Balance as of
March 31,
2010 |
Bonds and Notes | | | | | | | | | | | | | | | | | | | | | | | |
ABS Car Loan | | $ | — | | $ | — | | $ | — | | $ | 2 | | $ | 1,139,884 | | | $ | — | | | $ | 1,139,886 |
| | | | | | | | | | | | | | | | | | | | | | | |
Total | | $ | — | | $ | — | | $ | — | | $ | 2 | | $ | 1,139,884 | | | $ | — | | | $ | 1,139,886 |
| | | | | | | | | | | | | | | | | | | | | | | |
High Income Fund Asset Valuation Inputs | | | | | | | | | | | | | | | | | | | | | | | |
Investments in Securities | | Balance as of
September 30,
2009 | | Accrued
Discounts
(Premiums) | | Realized
Gain
(Loss) | | Change in
Unrealized
Appreciation
(Depreciation) | | Net Purchases
(Sales) | | | Net Transfers
into/(out of)
Level 3 | | | Balance as of
March 31,
2010 |
Bonds and Notes | | | | | | | | | | | | | | | | | | | | | | | |
Non-Convertible Bonds | | | | | | | | | | | | | | | | | | | | | | | |
Collateralized Mortgage Obligations | | $ | 389,767 | | $ | — | | $ | 22,453 | | $ | 21,542 | | $ | (86,486 | ) | | $ | (347,276 | ) | | $ | — |
Non-Captive Consumer | | | 497,545 | | | 6,240 | | | — | | | 18,423 | | | — | | | | (522,208 | ) | | | — |
Non-Captive Diversified | | | 478,858 | | | 10,328 | | | — | | | 43,686 | | | 62,519 | | | | (595,391 | ) | | | — |
Supranational | | | 678,290 | | | 52,237 | | | — | | | 162,683 | | | 677,555 | | | | (1,570,765 | ) | | | — |
Technology | | | 900,000 | | | 3,158 | | | — | | | 127,344 | | | — | | | | (1,030,502 | ) | | | — |
Wirelines | | | 970,125 | | | 4,195 | | | — | | | 51,307 | | | (961,181 | ) | | | 197,366 | | | | 261,812 |
Convertible Bonds | | | | | | | | | | | | | | | | | | | | | | | |
Technology | | | 196,560 | | | 3,054 | | | 2,771 | | | 7,975 | | | (28,000 | ) | | | (182,360 | ) | | | — |
Wirelines | | | 863,900 | | | 1,197 | | | — | | | 108,828 | | | — | | | | (973,925 | ) | | | — |
| | | | | | | | | | | | | | | | | | | | | | | |
Total | | $ | 4,975,045 | | $ | 80,409 | | $ | 25,224 | | $ | 541,788 | | $ | (335,593 | ) | | $ | (5,025,061 | ) | | $ | 261,812 |
| | | | | | | | | | | | | | | | | | | | | | | |
71
NOTESTO FINANCIAL STATEMENTS (continued)
March 31, 2010 (Unaudited)
International Bond Fund
Asset Valuation Inputs
| | | | | | | | | | | | | | | | | | | | | | | | | | |
Investments in Securities | | Balance as of
September 30,
2009 | | Accrued
Discounts
(Premiums) | | | Realized
Gain
(Loss) | | | Change in
Unrealized
Appreciation
(Depreciation) | | | Net Purchases
(Sales) | | | Net Transfers
into/(out of)
Level 3 | | | Balance as of
March 31,
2010 |
Bonds and Notes | | | | | | | | | | | | | | | | | | | | | | | | | | |
Non-Convertible Bonds | | | | | | | | | | | | | | | | | | | | | | | | | | |
Ireland | | $ | 98,563 | | $ | 57 | | | $ | (1,861 | ) | | $ | 147 | | | $ | (96,906 | ) | | $ | — | | | $ | — |
Supranational | | | 67,829 | | | 3,052 | | | | — | | | | 11,791 | | | | — | | | | (82,672 | ) | | | — |
| | | | | | | | | | | | | | | | | | | | | | | | | | |
Total | | $ | 166,392 | | $ | 3,109 | | | $ | (1,861 | ) | | $ | 11,938 | | | $ | (96,906 | ) | | $ | (82,672 | ) | | $ | — |
| | | | | | | | | | | | | | | | | | | | | | | | | | |
Limited Term Government and Agency Fund Asset Valuation Inputs | | | | | | | | | | | | | | | | | | | | | | | | | | |
Investments in Securities | | Balance as of
September 30,
2009 | | Accrued
Discounts
(Premiums) | | | Realized
Gain
(Loss) | | | Change in
Unrealized
Appreciation
(Depreciation) | | | Net Purchases
(Sales) | | | Net Transfers
into/(out of)
Level 3 | | | Balance as of
March 31,
2010 |
Bonds and Notes | | | | | | | | | | | | | | | | | | | | | | | | | | |
ABS Home Equity | | $ | 538,786 | | $ | — | | | $ | (141,942 | ) | | $ | 457,162 | | | $ | (854,006 | ) | | $ | — | | | $ | — |
| | | | | | | | | | | | | | | | | | | | | | | | | | |
Total | | $ | 538,786 | | $ | — | | | $ | (141,942 | ) | | $ | 457,162 | | | $ | (854,006 | ) | | $ | — | | | $ | — |
| | | | | | | | | | | | | | | | | | | | | | | | | | |
Strategic Income Fund Asset Valuation Inputs | | | | | | | | | | | | | | | | | | | | | | | | | | |
Investments in Securities | | Balance as of
September 30,
2009 | | Accrued
Discounts
(Premiums) | | | Realized
Gain
(Loss) | | | Change in
Unrealized
Appreciation
(Depreciation) | | | Net Purchases
(Sales) | | | Net Transfers
into/(out of)
Level 3 | | | Balance as of
March 31,
2010 |
Bonds and Notes | | | | | | | | | | | | | | | | | | | | | | | | | | |
Non-Convertible Bonds | | | | | | | | | | | | | | | | | | | | | | | | | | |
Airlines | | $ | 6,940,852 | | $ | — | | | $ | 51,499 | | | $ | 1,116,416 | | | $ | (321,869 | ) | | $ | (7,786,898 | ) | | $ | — |
Automotive | | | 2,526,146 | | | 17,881 | | | | — | | | | 87,398 | | | | — | | | | (2,631,425 | ) | | | — |
Chemicals | | | 23,203,580 | | | 91,767 | | | | — | | | | 6,242,278 | | | | — | | | | (12,792,985 | ) | | | 16,744,640 |
Diversified Manufacturing | | | 20,732,656 | | | 167,154 | | | | — | | | | 1,008,952 | | | | 606,371 | | | | (22,515,133 | ) | | | — |
Electric | | | 4,708,532 | | | (38,289 | ) | | | 100,503 | | | | (20,972 | ) | | | (3,612,014 | ) | | | (1,137,760 | ) | | | — |
Non-Captive Consumer | | | 4,129,285 | | | 2,274 | | | | — | | | | 202,411 | | | | — | | | | (4,333,970 | ) | | | — |
Non-Captive Diversified | | | 4,017,538 | | | 129,079 | | | | — | | | | 1,239,834 | | | | 723,435 | | | | (2,949,386 | ) | | | 3,160,500 |
Property & Casualty Insurance | | | — | | | 1,678 | | | | — | | | | 1,457,522 | | | | — | | | | 2,675,200 | | | | 4,134,400 |
Supranational | | | 30,455,245 | | | — | | | | — | | | | 7,041,221 | | | | 3,839,476 | | | | (41,335,942 | ) | | | — |
Technology | | | 225,000 | | | 790 | | | | — | | | | 31,836 | | | | — | | | | (257,626 | ) | | | — |
Convertible Bonds | | | | | | | | | | | | | | | | | | | | | | | | | | |
Technology | | | 3,394,300 | | | 35,254 | | | | 28,704 | | | | 174,512 | | | | (489,000 | ) | | | (3,143,770 | ) | | | — |
Wirelines | | | 57,319,500 | | | 79,390 | | | | — | | | | 7,220,735 | | | | — | | | | (64,619,625 | ) | | | — |
Preferred Stocks | | | | | | | | | | | | | | | | | | | | | | | | | | |
Convertible Preferred Stocks | | | | | | | | | | | | | | | | | | | | | | | | | | |
Electric Utilities | | | 3,770,375 | | | — | | | | — | | | | — | | | | — | | | | — | | | | 3,770,375 |
REITs | | | 491,050 | | | — | | | | — | | | | 281,820 | | | | — | | | | (772,870 | ) | | | — |
Warrants | | | | | | | | | | | | | | | | | | | | | | | | | | |
Pharmaceuticals | | | — | | | — | | | | — | | | | 6,493,251 | | | | — | | | | — | | | | 6,493,251 |
| | | | | | | | | | | | | | | | | | | | | | | | | | |
Total | | $ | 161,914,059 | | $ | 486,978 | | | $ | 180,706 | | | $ | 32,577,214 | | | $ | 746,399 | | | $ | (161,602,190 | ) | | $ | 34,303,166 |
| | | | | | | | | | | | | | | | | | | | | | | | | | |
72
NOTESTO FINANCIAL STATEMENTS (continued)
March 31, 2010 (Unaudited)
4. Derivatives. Derivative instruments are defined as financial instruments whose value and performance are based on the value and performance of another security or financial instrument. Derivative instruments that the Funds currently use include forward foreign currency contracts.
The Funds are subject to the risk that changes in foreign currency exchange rates will have an unfavorable effect on the value of Fund assets denominated in foreign currencies. The Funds may enter into forward foreign currency contracts for hedging purposes to protect the value of the Funds’ holdings of foreign securities. The Funds may also use forward foreign currency contracts to gain exposure to foreign currencies, regardless of whether securities denominated in such currencies are held in the Funds. During the six months ended March 31, 2010, High Income Fund engaged in forward foreign currency contract transactions for hedging purposes. During this same period, International Bond Fund engaged in forward foreign currency contract transactions for hedging purposes and to gain exposure to foreign currencies.
Each Fund is party to agreements with counterparties that govern transactions in forward foreign currency contracts. These agreements contain contingent features that allow the counterparties to terminate open contracts early if the net asset value of a Fund declines beyond a certain threshold. If such contingent features were to be triggered, the counterparties could request immediate settlement of open contracts at current fair value.
Transactions in derivative instruments for High Income Fund during the six months ended March 31, 2010, were as follows:
| | | | |
Realized Gain (Loss) | | Forwards | |
Foreign exchange contracts | | $ | (12,761 | ) |
| | | | |
Statements of Operations Location | | Included in Net realized gain (loss) on foreign currency transactions |
| | | |
Change in Unrealized Appreciation (Depreciation) | | Forwards |
Foreign exchange contracts | | $ | 12,761 |
| | |
Statements of Operations Location | | Included in Net change in unrealized appreciation (depreciation) on foreign currency translations |
The following is a summary of derivative instruments for International Bond Fund, as of March 31, 2010:
| | | |
Asset Derivatives | | Forwards |
Foreign exchange contracts | | $ | 19,322 |
| | |
Statements of Assets and Liabilities Location | | Unrealized appreciation on forward foreign currency contracts |
| | | | |
Liability Derivatives | | Forwards | |
Foreign exchange contracts | | $ | (49,537 | ) |
| | |
Statements of Assets and Liabilities Location | | Unrealized depreciation on forward foreign currency contracts |
Transactions in derivative instruments for International Bond Fund during the six months ended March 31, 2010, were as follows:
| | | |
Realized Gain (Loss) | | Forwards |
Foreign exchange contracts | | $ | 66,102 |
| | |
Statements of Operations Location | | Included in Net realized gain (loss) on foreign currency transactions |
| | | | |
Change in Unrealized Appreciation (Depreciation) | | Forwards | |
Foreign exchange contracts | | $ | (95,421 | ) |
| | |
Statements of Operations Location | | Included in Net change in unrealized appreciation (depreciation) on foreign currency translations |
73
NOTESTO FINANCIAL STATEMENTS (continued)
March 31, 2010 (Unaudited)
Volume of derivative activity for High Income Fund and International Bond Fund, based on month-end notional amounts outstanding during the period, at absolute value, was as follows for the six months ended March 31, 2010:
| | |
| | | Percentage of Net Assets |
High Income Fund | | Forwards* |
Average Notional Amount Outstanding | | 0.14% |
Highest Notional Amount Outstanding | | 0.00% |
Lowest Notional Amount Outstanding | | 0.00% |
Notional Amount Outstanding as of March 31, 2010 | | 0.00% |
| |
International Bond Fund | | Forwards |
Average Notional Amount Outstanding | | 14.91% |
Highest Notional Amount Outstanding | | 18.18% |
Lowest Notional Amount Outstanding | | 10.04% |
Notional Amount Outstanding as of March 31, 2010 | | 14.83% |
* Forward foreign currency contracts outstanding at September 30, 2009 were closed during the first month of the period and are included in average notional amount outstanding.
5. Purchases and Sales of Securities. For the six months ended March 31, 2010, purchases and sales of securities (excluding short-term investments and including paydowns) were as follows:
| | | | | | | | | | | | |
| | | U.S. Government and
Agency Securities | | Other Securities |
Fund | | Purchases | | Sales | | Purchases | | Sales |
Core Plus Bond Fund | | $ | 50,136,655 | | $ | 76,361,036 | | $ | 136,911,663 | | $ | 52,916,062 |
High Income Fund | | | — | | | 173,431 | | | 30,848,390 | | | 94,075,955 |
International Bond Fund | | | 4,307,843 | | | 4,313,610 | | | 27,049,378 | | | 14,774,910 |
Limited Term Government and Agency Fund | | | 91,313,702 | | | 86,654,519 | | | 45,474,297 | | | 22,783,942 |
Strategic Income Fund | | | 162,676,309 | | | — | | | 1,611,826,374 | | | 1,703,346,108 |
6. Management Fees and Other Transactions with Affiliates.
a. Management Fees. Loomis, Sayles & Company, L.P. (“Loomis Sayles”) serves as investment adviser to each Fund. Under the terms of the management agreements, each Fund pays a management fee at the following annual rates, calculated daily and payable monthly, based on each Fund’s average daily net assets:
| | | | | | | | | | |
| | | Percentage of Average Daily Net Assets |
Fund | | First $100 million | | Next $100 million | | Next $1.8 billion | | Next $13 billion | | Over $15 billion |
Core Plus Bond Fund | | 0.2500% | | 0.1875% | | 0.1875% | | 0.1875% | | 0.1875% |
High Income Fund | | 0.6000% | | 0.6000% | | 0.6000% | | 0.6000% | | 0.6000% |
International Bond Fund | | 0.6000% | | 0.6000% | | 0.6000% | | 0.6000% | | 0.6000% |
Limited Term Government and Agency Fund | | 0.5000% | | 0.5000% | | 0.5000% | | 0.5000% | | 0.5000% |
Strategic Income Fund | | 0.6500% | | 0.6500% | | 0.6000% | | 0.5500% | | 0.5400% |
Natixis Asset Management Advisors, L.P. (“Natixis Advisors”), serves as the advisory administrator to Core Plus Bond Fund. Under the terms of the advisory administration agreement, the Fund pays an advisory administration fee at the following annual rates, calculated daily and payable monthly, based on its average daily net assets:
| | | | |
| | | Percentage of Average
Daily Net Assets |
Fund | | First $100 million | | Over $100 million |
Core Plus Bond Fund | | 0.2500% | | 0.1875% |
74
NOTESTO FINANCIAL STATEMENTS (continued)
March 31, 2010 (Unaudited)
Management and advisory administration fees are presented in the Statements of Operations as management fees.
Loomis Sayles has given binding undertakings to the Funds to reduce management fees and/or reimburse certain expenses to limit the Funds’ operating expenses, exclusive of acquired fund fees and expenses, brokerage expenses, interest expense, taxes and extraordinary expenses. These undertakings are in effect until January 31, 2011 and will be reevaluated on an annual basis. Management fee payables, as reflected on the Statements of Assets and Liabilities, are net of fee reductions and/or expense reimbursements, if any, pursuant to these undertakings.
For the six months ended March 31, 2010, the expense limits as a percentage of average daily net assets under the expense limitation agreements were as follows:
| | | | | | | | | | |
| | | Expense Limit as a Percentage of
Average Daily Net Assets |
Fund | | Class A | | Class B | | Class C | | Class Y | | Admin Class |
| | | | | | | | | | |
Core Plus Bond Fund | | 0.90% | | 1.65% | | 1.65% | | 0.65% | | — |
High Income Fund | | 1.15% | | 1.90% | | 1.90% | | 0.90% | | — |
International Bond Fund | | 1.10% | | — | | 1.85% | | 0.85% | | — |
Limited Term Government and Agency Fund | | 0.90% | | 1.65% | | 1.65% | | 0.65% | | — |
Strategic Income Fund | | 1.25% | | 2.00% | | 2.00% | | 1.00% | | 1.50% |
Loomis Sayles and Natixis Advisors have agreed to equally bear the fee reductions and/or expense reimbursements for the Core Plus Bond Fund.
Loomis Sayles (and Natixis Advisors for Core Plus Bond Fund) shall be permitted to recover expenses borne under the expense limitation agreements (whether through reduction of its management fees or otherwise) on a class by class basis in later periods to the extent the expenses of a class fall below a class’ expense limits, provided, however, that a class is not obligated to pay such reduced fees/expenses more than one year after the end of the fiscal year in which the fees/expenses were reduced.
For the six months ended March 31, 2010, the management fees and reductions of management fees for each Fund were as follows:
| | | | | | | | | | | | | |
Fund | | Gross
Management
Fees | | Reductions of
Management
Fees1 | | Net
Management
Fees | | Percentage of Average
Daily Net Assets |
| | | | | Gross | | Net |
| | | | | | | | | | | | | |
Core Plus Bond Fund | | $ | 313,076 | | $ | — | | $ | 313,076 | | 0.208% | | 0.208% |
High Income Fund | | | 509,792 | | | 12,142 | | | 497,650 | | 0.600% | | 0.586% |
International Bond Fund | | | 91,121 | | | 55,220 | | | 35,901 | | 0.600% | | 0.236% |
Limited Term Government and Agency Fund | | | 560,201 | | | 99,174 | | | 461,027 | | 0.500% | | 0.411% |
Strategic Income Fund | | | 36,112,550 | | | — | | | 36,112,550 | | 0.560% | | 0.560% |
| 1 | Management fee reductions are subject to possible recovery until September 30, 2011. |
For the six months ended March 31, 2010, the advisory administration fees for Core Plus Bond Fund were as follows:
| | | | |
| | | Advisory
Administration
Fee | | Percentage of
Average
Daily Net Assets |
| | $ 313,076 | | 0.208% |
For the six months ended March 31, 2010, expense reimbursements related to the prior fiscal year were recovered as follows:
| | | | | | | | | | | | | | | |
| | | Recovered Expenses |
Fund | | Class A | | Class B | | Class C | | Class Y | | Total |
| | | | | | | | | | | | | | | |
Core Plus Bond Fund | | $ | 1,597 | | $ | 82 | | $ | 827 | | $ | 409 | | $ | 2,915 |
Certain officers and directors of Loomis Sayles and Natixis Advisors are also Trustees of the Funds. Loomis Sayles and Natixis Advisors are both limited partnerships indirectly owned by Natixis Global Asset Management, L.P. (“Natixis US”), which is part of Natixis Global Asset Management, an international asset management group based in Paris, France.
b. Administrative Fees. Natixis Advisors provides certain administrative services for the Funds and contracts with State Street Bank to serve as sub-administrator. Natixis Advisors is a wholly-owned subsidiary of Natixis US. Pursuant to an agreement among Natixis Funds Trust I, Natixis Funds Trust II, Natixis Funds Trust IV, Natixis Cash Management Trust, Gateway Trust (“Natixis Funds Trusts”), Loomis Sayles Funds I, Loomis Sayles Funds II (“Loomis Sayles Funds Trusts”), Hansberger International Series and Natixis
75
NOTESTO FINANCIAL STATEMENTS (continued)
March 31, 2010 (Unaudited)
Advisors, each Fund pays Natixis Advisors monthly its pro rata portion of fees equal to an annual rate of 0.0575% of the first $15 billion of the average daily net assets of the Natixis Funds Trusts, Loomis Sayles Funds Trusts and the Hansberger International Series, 0.0500% of the next $15 billion, 0.0425% of the next $30 billion and 0.0375% of such assets in excess of $60 billion, subject to an annual aggregate minimum fee for the Natixis Funds Trusts, Loomis Sayles Funds Trusts and the Hansberger International Series of $10 million, which is reevaluated on an annual basis. New funds are subject to a fee for the first twelve months of operations of $75,000 plus $12,500 per additional class and an additional $75,000 if managed by multiple subadvisers.
For the six months ended March 31, 2010, each Fund paid the following for administrative fees to Natixis Advisors:
| | | |
Fund | | Administrative
Fees |
Core Plus Bond Fund | | $ | 72,863 |
High Income Fund | | | 41,184 |
International Bond Fund | | | 7,360 |
Limited Term Government and Agency Fund | | | 54,298 |
Strategic Income Fund | | | 3,133,800 |
c. Service and Distribution Fees. Natixis Distributors, L.P. (“Natixis Distributors”), a wholly-owned subsidiary of Natixis US, has entered into a distribution agreement with the Trusts. Pursuant to this agreement, Natixis Distributors serves as principal underwriter of the Funds of the Trusts.
Pursuant to Rule 12b-1 under the 1940 Act, the Trusts have adopted a Service Plan relating to each Fund’s Class A shares (the “Class A Plans”), a Distribution and Service Plan relating to each Fund’s Class B (if applicable) and Class C shares (the “Class B and Class C Plans”), and the Strategic Income Fund has adopted a Distribution Plan relating to its Admin Class shares (the “Admin Class Plan”).
Under the Class A Plans, each Fund pays Natixis Distributors a monthly service fee at an annual rate not to exceed 0.25% of the average daily net assets attributable to the Fund’s Class A shares, as reimbursement for expenses incurred by Natixis Distributors in providing personal services to investors in Class A shares and/or the maintenance of shareholder accounts.
Under the respective Class B (if applicable) and Class C Plans, each Fund pays Natixis Distributors a monthly service fee at an annual rate not to exceed 0.25% of the average daily net assets attributable to the Fund’s Class B (if applicable) and Class C shares, as compensation for services provided by Natixis Distributors in providing personal services to investors in Class B (if applicable) and Class C shares and/or the maintenance of shareholder accounts.
Also under the respective Class B (if applicable) and Class C Plans, each Fund pays Natixis Distributors a monthly distribution fee at the annual rate of 0.75% of the average daily net assets attributable to the Fund’s Class B (if applicable) and Class C shares, as compensation for services provided by Natixis Distributors in connection with the marketing or sale of Class B (if applicable) and Class C shares.
Under the Admin Class Plan, the Strategic Income Fund pays Natixis Distributors a monthly distribution fee at an annual rate not to exceed 0.25% of the average daily net assets attributable to the Fund’s Admin Class shares, as compensation for services provided by Natixis Distributors in connection with the marketing or sale of Admin Class shares or for payments made by Natixis Distributors to securities dealers or other financial intermediaries as commissions, asset-based sales charges or other compensation with respect to the sale of Admin Class shares, or for providing personal services to Investors and/or the maintenance of shareholder accounts.
In addition, the Admin Class shares of the Strategic Income Fund may pay Natixis Distributors an administrative service fee, at an annual rate not to exceed 0.25% of the average daily net assets attributable to Admin Class shares. These fees are subsequently paid to securities dealers or financial intermediaries for providing personal services and/or account maintenance for their customers who hold such shares.
For the six months ended March 31, 2010 the Funds paid the following service and distribution fees:
| | | | | | | | | | | | | | | | | | | | | | | |
| | | Service Fees | | | Distribution Fees | |
| | | Class A | | Class B | | Class C | | Admin Class | | | Class B | | Class C | | Admin Class | |
Core Plus Bond Fund | | $ | 193,475 | | $ | 7,780 | | $ | 116,293 | | $ | — | | | $ | 23,339 | | $ | 348,880 | | $ | — | |
High Income Fund | | | 82,471 | | | 1,893 | | | 23,404 | | | — | | | | 5,677 | | | 70,210 | | | — | |
International Bond Fund | | | 16,636 | | | — | | | 7,533 | | | — | | | | — | | | 22,600 | | | — | |
Limited Term Government and Agency Fund | | | 158,362 | | | 5,294 | | | 70,064 | | | — | | | | 15,883 | | | 210,191 | | | — | |
Strategic Income Fund | | | 7,068,933 | | | 183,195 | | | 6,238,982 | | | — | (a) | | | 549,583 | | | 18,716,948 | | | — | (a) |
| (a) | Amount is less than $1. |
76
NOTESTO FINANCIAL STATEMENTS (continued)
March 31, 2010 (Unaudited)
d. Sub-Transfer Agent Fees. Natixis Distributors has entered into agreements with financial intermediaries to provide certain recordkeeping, processing, shareholder communications and other services to customers of the intermediaries and has agreed to compensate the intermediaries for providing those services. Certain services would be provided by the Funds if the shares of those customers were registered directly with the Funds’ transfer agent. Accordingly, the Funds agreed to pay a portion of the intermediary fees attributable to shares of the Fund held by the intermediaries (which generally are a percentage of the value of shares held) not exceeding what the Funds would have paid its transfer agent had each customer’s shares been registered directly with the transfer agent instead of held through the intermediaries. Natixis Distributors pays the remainder of the fees.
For the six months ended March 31, 2010, the Funds paid the following sub-transfer agent fees, which are reflected in transfer agent fees and expenses in the Statements of Operations.
| | | |
Fund | | Sub-Transfer
Agent Fees |
Core Plus Bond Fund | | $ | 104,138 |
High Income Fund | | | 78,391 |
International Bond Fund | | | 2,845 |
Limited Term Government and Agency Fund | | | 46,545 |
Strategic Income Fund | | | 4,015,021 |
e. Commissions. The Funds have been informed that commissions (including CDSCs) on Fund shares retained by Natixis Distributors during the six months ended March 31, 2010 were as follows:
| | | |
Fund | | Commissions |
Core Plus Bond Fund | | $ | 186,018 |
High Income Fund | | | 28,518 |
International Bond Fund | | | 47,660 |
Limited Term Government and Agency Fund | | | 108,321 |
Strategic Income Fund | | | 3,768,767 |
f. Trustees Fees and Expenses. The Funds do not pay any compensation directly to its officers or Trustees who are directors, officers or employees of Natixis Advisors, Natixis Distributors, Natixis US or their affiliates. Effective January 1, 2010, the Chairperson of the Board receives a retainer fee at the annual rate of $250,000. The Chairperson does not receive any meeting attendance fees for Board of Trustees meetings or committee meetings that she attends. Each Independent Trustee (other than the Chairperson) receives, in the aggregate, a retainer fee at the annual rate of $80,000. Each Independent Trustee also receives a meeting attendance fee of $10,000 for each meeting of the Board of Trustees that he or she attends in person and $5,000 for each meeting of the Board of Trustees that he or she attends telephonically. In addition, each committee chairman receives an additional retainer fee at an annual rate of $15,000. Each Contract Review and Governance Committee member is compensated $6,000 for each Committee meeting that he or she attends in person and $3,000 for each meeting that he or she attends telephonically. Each Audit Committee member is compensated $7,500 for each Committee meeting that he or she attends in person and $3,750 for each meeting that he or she attends telephonically. Each member of the ad hoc Committee on Alternative Investments received a one-time fee of $10,000. The ad hoc Committee on Alternative Investments is not a standing committee. These fees are allocated among the funds in the Natixis Funds Trusts, Loomis Sayles Funds Trusts and Hansberger International Series based on a formula that takes into account, among other factors, the relative net assets of each fund. Trustees are reimbursed for travel expenses in connection with attendance at meetings.
Prior to January 1, 2010, the Chairperson of the Board received a retainer fee at the annual rate of $200,000. The Chairperson did not receive any meeting attendance fees for Board of Trustees meetings or committee meetings that she attended. Each Independent Trustee (other than the Chairperson) received, in the aggregate, a retainer fee at the annual rate of $65,000. Each Independent Trustee also received a meeting attendance fee of $7,500 for each meeting of the Board of Trustees that he or she attended in person and $3,750 for each meeting of the Board of Trustees that he or she attended telephonically. In addition, each committee chairman received an additional retainer fee at an annual rate of $10,000. Each Contract Review and Governance Committee member was compensated $5,000 for each Committee meeting that he or she attended in person and $2,500 for each meeting that he or she attended telephonically. Each Audit Committee member was compensated $6,250 for each Committee meeting that he or she attended in person and $3,125 for each meeting that he or she attended telephonically.
A deferred compensation plan (the “Plan”) is available to the Trustees on a voluntary basis. Deferred amounts remain in the Funds until distributed in accordance with the provisions of the Plan. The value of a participating Trustee’s deferral account is based on theoretical investments of deferred amounts, on the normal payment dates, in certain funds of the Natixis Funds Trusts, Loomis Sayles Funds Trusts and Hansberger International Series as designated by the participating Trustees. Changes in the value of participants’ deferral accounts are allocated pro rata among the funds in the Natixis Funds Trusts, Loomis Sayles Funds Trusts, and Hansberger International Series, and are normally reflected as Trustees’ fees and expenses in the Statements of Operations. The portions of the accrued obligations allocated to the Funds under the Plan are reflected as Deferred Trustees’ fees in the Statements of Assets and Liabilities.
77
NOTESTO FINANCIAL STATEMENTS (continued)
March 31, 2010 (Unaudited)
g. Payments by Affiliates. For the six months ended March 31, 2010, Loomis Sayles reimbursed the Strategic Income Fund $76,238 for losses incurred in connection with a trading error.
7. Line of Credit. Each Fund, together with certain other funds of Natixis Funds Trusts, Loomis Sayles Funds Trusts and the Hansberger International Series, participates in a $200,000,000 committed unsecured line of credit provided by State Street Bank, with an individual limit of $125,000,000 for each Fund that participates in the line of credit. Interest is charged to each participating fund based on its borrowings at a rate per annum equal to the greater of the Federal Funds rate or overnight LIBOR, plus 1.25%. In addition, a commitment fee of 0.15% per annum, payable at the end of each calendar quarter, is accrued and apportioned among the participating funds based on their average daily unused portion of the line of credit.
Prior to March 10, 2010, each Fund, together with certain other funds of Natixis Funds Trusts, Loomis Sayles Funds Trusts and the Hansberger International Series, participated in a $200,000,000 committed unsecured line of credit provided by State Street Bank, with an individual limit of $125,000,000 for each Fund that participated in the line of credit. Interest was charged to each participating fund based on its borrowings at a rate per annum equal to the greater of the Federal Funds rate or overnight LIBOR, plus 0.75%. In addition, a commitment fee of 0.125% per annum, payable at the end of each calendar quarter, was accrued and apportioned among the participating funds based on their average daily unused portion of the line of credit.
For the six months ended March 31, 2010, the Funds had no borrowings under these agreements.
8. Concentration of Risk. International Bond Fund is a non-diversified fund. Compared with diversified mutual funds, the International Bond Fund may invest a greater percentage of its assets in a particular country. Therefore, the International Bond Fund’s returns could be significantly affected by the performance of any one of the small number of countries in its portfolio.
Each Fund may purchase investments of foreign issuers. Investing in securities of foreign issuers involves special risks and considerations not typically associated with investing in U.S. companies and securities of the U.S. Government. These risks include revaluation of currencies and the risk of expropriation. Moreover, the markets for securities of many foreign issuers may be less liquid and the prices of such securities may be more volatile than those of comparable U.S. companies and the U.S. Government.
9. Concentration of Ownership. At March 31, 2010, the Loomis Sayles Employees’ Profit Sharing Retirement Plan held 23,063 shares of beneficial interest of Limited Term Government and Agency Fund and Natixis US owned shares equating to 18.75% of International Bond Fund’s net assets.
10. Capital Shares. Each Fund may issue an unlimited number of shares of beneficial interest, without par value. Transactions in capital shares were as follows:
| | | | | | | | | | | | | | |
| | Six Months Ended
March 31, 2010 | | | Year Ended
September 30, 2009 | |
Core Plus Bond Fund | | Shares | | | | Amount | | | Shares | | | | Amount | |
| | | | | | | | | | | | | | |
| Class A | | | | | | | | | | | | | | |
Issued from the sale of shares | | 3,067,695 | | | $ | 36,793,975 | | | 5,053,473 | | | $ | 54,649,921 | |
Issued in connection with the reinvestment of distributions | | 263,518 | | | | 3,154,462 | | | 515,393 | | | | 5,579,642 | |
Redeemed | | (1,920,885 | ) | | | (23,079,926 | ) | | (4,737,622 | ) | | | (51,103,206 | ) |
| | | | | | | | | | | | | | |
Net change | | 1,410,328 | | | $ | 16,868,511 | | | 831,244 | | | $ | 9,126,357 | |
| | | | | | | | | | | | | | |
| Class B | | | | | | | | | | | | | | |
Issued from the sale of shares | | 36,046 | | | $ | 432,842 | | | 72,713 | | | $ | 778,608 | |
Issued in connection with the reinvestment of distributions | | 9,146 | | | | 109,781 | | | 28,331 | | | | 305,872 | |
Redeemed | | (181,845 | ) | | | (2,184,667 | ) | | (504,102 | ) | | | (5,425,057 | ) |
| | | | | | | | | | | | | | |
Net change | | (136,653 | ) | | $ | (1,642,044 | ) | | (403,058 | ) | | $ | (4,340,577 | ) |
| | | | | | | | | | | | | | |
| Class C | | | | | | | | | | | | | | |
Issued from the sale of shares | | 2,956,291 | | | $ | 35,465,305 | | | 5,539,383 | | | $ | 59,909,721 | |
Issued in connection with the reinvestment of distributions | | 75,920 | | | | 909,491 | | | 82,284 | | | | 901,682 | |
Redeemed | | (1,088,541 | ) | | | (13,084,582 | ) | | (1,683,762 | ) | | | (18,156,728 | ) |
| | | | | | | | | | | | | | |
Net change | | 1,943,670 | | | $ | 23,290,214 | | | 3,937,905 | | | $ | 42,654,675 | |
| | | | | | | | | | | | | | |
| Class Y | | | | | | | | | | | | | | |
Issued from the sale of shares | | 2,393,755 | | | $ | 28,833,350 | | | 2,459,788 | | | $ | 27,430,717 | |
Issued in connection with the reinvestment of distributions | | 44,900 | | | | 540,633 | | | 63,520 | | | | 692,382 | |
Redeemed | | (995,437 | ) | | | (12,018,162 | ) | | (1,576,971 | ) | | | (16,945,061 | ) |
| | | | | | | | | | | | | | |
Net change | | 1,443,218 | | | $ | 17,355,821 | | | 946,337 | | | $ | 11,178,038 | |
| | | | | | | | | | | | | | |
Increase (decrease) from capital share transactions | | 4,660,563 | | | $ | 55,872,502 | | | 5,312,428 | | | $ | 58,618,493 | |
| | | | | | | | | | | | | | |
78
NOTESTO FINANCIAL STATEMENTS (continued)
March 31, 2010 (Unaudited)
10. Capital Shares (continued).
| | | | | | | | | | | | | | |
| | Six Months Ended
March 31, 2010 | | | Year Ended
September 30, 2009 | |
High Income Fund | | Shares | | | | Amount | | | Shares | | | | Amount | |
| | | | | | | | | | | | | | |
| Class A | | | | | | | | | | | | | | |
Issued from the sale of shares | | 4,281,291 | | | $ | 20,088,342 | | | 9,902,651 | | | $ | 37,553,280 | |
Issued in connection with the reinvestment of distributions | | 409,977 | | | | 1,909,509 | | | 702,667 | | | | 2,621,142 | |
Redeemed | | (3,489,077 | ) | | | (16,356,008 | ) | | (6,362,694 | ) | | | (24,378,951 | ) |
| | | | | | | | | | | | | | |
Net change | | 1,202,191 | | | $ | 5,641,843 | | | 4,242,624 | | | $ | 15,795,471 | |
| | | | | | | | | | | | | | |
| Class B | | | | | | | | | | | | | | |
Issued from the sale of shares | | 17,982 | | | $ | 83,679 | | | 22,526 | | | $ | 84,592 | |
Issued in connection with the reinvestment of distributions | | 7,737 | | | | 36,046 | | | 21,555 | | | | 78,355 | |
Redeemed | | (74,608 | ) | | | (347,970 | ) | | (229,184 | ) | | | (845,267 | ) |
| | | | | | | | | | | | | | |
Net change | | (48,889 | ) | | $ | (228,245 | ) | | (185,103 | ) | | $ | (682,320 | ) |
| | | | | | | | | | | | | | |
| Class C | | | | | | | | | | | | | | |
Issued from the sale of shares | | 862,143 | | | $ | 4,027,332 | | | 2,411,038 | | | $ | 9,092,790 | |
Issued in connection with the reinvestment of distributions | | 78,136 | | | | 364,286 | | | 155,802 | | | | 577,576 | |
Redeemed | | (830,627 | ) | | | (3,874,502 | ) | | (949,303 | ) | | | (3,508,124 | ) |
| | | | | | | | | | | | | | |
Net change | | 109,652 | | | $ | 517,116 | | | 1,617,537 | | | $ | 6,162,242 | |
| | | | | | | | | | | | | | |
| Class Y | | | | | | | | | | | | | | |
Issued from the sale of shares | | 4,273,201 | | | $ | 19,873,256 | | | 22,731,680 | | | $ | 88,407,570 | |
Issued in connection with the reinvestment of distributions | | 619,703 | | | | 2,865,579 | | | 650,415 | | | | 2,696,934 | |
Redeemed | | (18,529,000 | ) | | | (86,836,641 | ) | | (740,730 | ) | | | (3,068,585 | ) |
| | | | | | | | | | | | | | |
Net change | | (13,636,096 | ) | | $ | (64,097,806 | ) | | 22,641,365 | | | $ | 88,035,919 | |
| | | | | | | | | | | | | | |
Increase (decrease) from capital share transactions | | (12,373,142 | ) | | $ | (58,167,092 | ) | | 28,316,423 | | | $ | 109,311,312 | |
| | | | | | | | | | | | | | |
| | | | | | | | | | | | | | |
| | Six Months Ended
March 31, 2010 | | | Year Ended
September 30, 2009 | |
International Bond Fund | | Shares | | | | Amount | | | Shares | | | | Amount | |
| | | | | | | | | | | | | | |
| Class A | | | | | | | | | | | | | | |
Issued from the sale of shares | | 1,173,859 | | | $ | 12,549,232 | | | 672,013 | | | $ | 6,666,998 | |
Issued in connection with the reinvestment of distributions | | 22,686 | | | | 238,157 | | | 5,103 | | | | 49,865 | |
Redeemed | | (262,835 | ) | | | (2,830,351 | ) | | (107,505 | ) | | | (999,973 | ) |
| | | | | | | | | | | | | | |
Net change | | 933,710 | | | $ | 9,957,038 | | | 569,611 | | | $ | 5,716,890 | |
| | | | | | | | | | | | | | |
| Class C | | | | | | | | | | | | | | |
Issued from the sale of shares | | 455,725 | | | $ | 4,956,671 | | | 238,418 | | | $ | 2,461,614 | |
Issued in connection with the reinvestment of distributions | | 4,370 | | | | 45,831 | | | 670 | | | | 6,563 | |
Redeemed | | (64,199 | ) | | | (672,311 | ) | | (40,421 | ) | | | (390,729 | ) |
| | | | | | | | | | | | | | |
Net change | | 395,896 | | | $ | 4,330,191 | | | 198,667 | | | $ | 2,077,448 | |
| | | | | | | | | | | | | | |
| Class Y | | | | | | | | | | | | | | |
Issued from the sale of shares | | 321,631 | | | $ | 3,471,886 | | | 148,246 | | | $ | 1,536,076 | |
Issued in connection with the reinvestment of distributions | | 31,997 | | | | 336,749 | | | 24,645 | | | | 234,656 | |
Redeemed | | (724,001 | ) | | | (7,686,107 | ) | | (54,815 | ) | | | (509,028 | ) |
| | | | | | | | | | | | | | |
Net change | | (370,373 | ) | | $ | (3,877,472 | ) | | 118,076 | | | $ | 1,261,704 | |
| | | | | | | | | | | | | | |
Increase (decrease) from capital share transactions | | 959,233 | | | $ | 10,409,757 | | | 886,354 | | | $ | 9,056,042 | |
| | | | | | | | | | | | | | |
79
NOTESTO FINANCIAL STATEMENTS (continued)
March 31, 2010 (Unaudited)
10. Capital Shares (continued).
| | | | | | | | | | | | | | |
| | Six Months Ended
March 31, 2010 | | | Year Ended
September 30, 2009 | |
Limited Term Government and Agency Fund | | Shares | | | | Amount | | | Shares | | | | Amount | |
| | | | | | | | | | | | | | |
| Class A | | | | | | | | | | | | | | |
Issued from the sale of shares | | 4,708,910 | | | $ | 55,242,284 | | | 8,687,955 | | | $ | 97,183,574 | |
Issued in connection with the reinvestment of distributions | | 97,005 | | | | 1,136,421 | | | 242,614 | | | | 2,733,365 | |
Redeemed | | (4,016,538 | ) | | | (47,152,830 | ) | | (8,273,983 | ) | | | (93,400,549 | ) |
| | | | | | | | | | | | | | |
Net change | | 789,377 | | | $ | 9,225,875 | | | 656,586 | | | $ | 6,516,390 | |
| | | | | | | | | | | | | | |
| Class B | | | | | | | | | | | | | | |
Issued from the sale of shares | | 33,730 | | | $ | 394,746 | | | 130,399 | | | $ | 1,438,679 | |
Issued in connection with the reinvestment of distributions | | 2,462 | | | | 28,800 | | | 7,515 | | | | 84,528 | |
Redeemed | | (70,755 | ) | | | (827,220 | ) | | (167,898 | ) | | | (1,871,502 | ) |
| | | | | | | | | | | | | | |
Net change | | (34,563 | ) | | $ | (403,674 | ) | | (29,984 | ) | | $ | (348,295 | ) |
| | | | | | | | | | | | | | |
| Class C | | | | | | | | | | | | | | |
Issued from the sale of shares | | 1,972,537 | | | $ | 23,120,590 | | | 6,162,236 | | | $ | 68,267,485 | |
Issued in connection with the reinvestment of distributions | | 19,247 | | | | 225,584 | | | 42,444 | | | | 479,083 | |
Redeemed | | (1,163,354 | ) | | | (13,639,930 | ) | | (3,881,272 | ) | | | (43,578,196 | ) |
| | | | | | | | | | | | | | |
Net change | | 828,430 | | | $ | 9,706,244 | | | 2,323,408 | | | $ | 25,168,372 | |
| | | | | | | | | | | | | | |
| Class Y | | | | | | | | | | | | | | |
Issued from the sale of shares | | 2,748,448 | | | $ | 32,332,750 | | | 2,463,987 | | | $ | 28,003,881 | |
Issued in connection with the reinvestment of distributions | | 13,227 | | | | 155,624 | | | 14,127 | | | | 160,181 | |
Redeemed | | (1,356,477 | ) | | | (15,978,780 | ) | | (668,533 | ) | | | (7,560,045 | ) |
| | | | | | | | | | | | | | |
Net change | | 1,405,198 | | | $ | 16,509,594 | | | 1,809,581 | | | $ | 20,604,017 | |
| | | | | | | | | | | | | | |
Increase (decrease) from capital share transactions | | 2,988,442 | | | $ | 35,038,039 | | | 4,759,591 | | | $ | 51,940,484 | |
| | | | | | | | | | | | | | |
80
NOTESTO FINANCIAL STATEMENTS (continued)
March 31, 2010 (Unaudited)
10. Capital Shares (continued).
| | | | | | | | | | | | | | |
| | Six Months Ended March 31, 2010 | | | Year Ended September 30, 2009 | |
Strategic Income Fund | | Shares | | | | Amount | | | Shares | | | | Amount | |
| | | | | | | | | | | | | | |
| Class A | | | | | | | | | | | | | | |
Issued from the sale of shares | | 56,218,087 | | | $ | 778,170,863 | | | 197,022,094 | | | $ | 2,182,492,582 | |
Issued in connection with the reinvestment of distributions | | 10,162,335 | | | | 140,306,622 | | | 27,449,011 | | | | 301,119,073 | |
Redeemed | | (73,970,828 | ) | | | (1,023,343,406 | ) | | (269,140,105 | ) | | | (2,956,389,363 | ) |
| | | | | | | | | | | | | | |
Net change | | (7,590,406 | ) | | $ | (104,865,921 | ) | | (44,669,000 | ) | | $ | (472,777,708 | ) |
| | | | | | | | | | | | | | |
| Class B | | | | | | | | | | | | | | |
Issued from the sale of shares | | 106,779 | | | $ | 1,482,515 | | | 498,498 | | | $ | 5,392,143 | |
Issued in connection with the reinvestment of distributions | | 134,127 | | | | 1,861,856 | | | 443,741 | | | | 4,856,521 | |
Redeemed | | (1,177,001 | ) | | | (16,353,800 | ) | | (3,184,682 | ) | | | (35,016,126 | ) |
| | | | | | | | | | | | | | |
Net change | | (936,095 | ) | | $ | (13,009,429 | ) | | (2,242,443 | ) | | $ | (24,767,462 | ) |
| | | | | | | | | | | | | | |
| Class C | | | | | | | | | | | | | | |
Issued from the sale of shares | | 31,487,862 | | | $ | 437,439,812 | | | 123,246,746 | | | $ | 1,377,861,744 | |
Issued in connection with the reinvestment of distributions | | 4,341,729 | | | | 60,244,405 | | | 11,167,692 | | | | 123,558,637 | |
Redeemed | | (43,619,682 | ) | | | (606,102,482 | ) | | (98,406,847 | ) | | | (1,085,168,243 | ) |
| | | | | | | | | | | | | | |
Net change | | (7,790,091 | ) | | $ | (108,418,265 | ) | | 36,007,591 | | | $ | 416,252,138 | |
| | | | | | | | | | | | | | |
| Class Y | | | | | | | | | | | | | | |
Issued from the sale of shares | | 34,386,943 | | | $ | 476,337,708 | | | 132,053,741 | | | $ | 1,485,053,461 | |
Issued in connection with the reinvestment of distributions | | 1,670,606 | | | | 23,062,883 | | | 2,940,277 | | | | 33,107,757 | |
Redeemed | | (30,793,045 | ) | | | (425,378,324 | ) | | (45,930,609 | ) | | | (513,425,165 | ) |
| | | | | | | | | | | | | | |
Net change | | 5,264,504 | | | $ | 74,022,267 | | | 89,063,409 | | | $ | 1,004,736,053 | |
| | | | | | | | | | | | | | |
| Admin Class* | | | | | | | | | | | | | | |
Issued from the sale of shares | | 72 | | | $ | 1,002 | | | — | | | $ | — | |
Issued in connection with the reinvestment of distributions | | 1 | | | | 9 | | | — | | | | — | |
Redeemed | | — | | | | — | | | — | | | | — | |
| | | | | | | | | | | | | | |
Net change | | 73 | | | $ | 1,011 | | | — | | | $ | — | |
| | | | | | | | | | | | | | |
Increase (decrease) from capital share transactions | | (11,052,015 | ) | | $ | (152,270,337 | ) | | 78,159,557 | | | $ | 923,443,021 | |
| | | | | | | | | | | | | | |
| * | From commencement of Class operations on February 1, 2010 through March 31, 2010. |
81

EQUITY FUNDS
SEMIANNUAL
March 31, 2010
Loomis Sayles Disciplined Equity Fund
Loomis Sayles Global Markets Fund
Loomis Sayles Growth Fund
Loomis Sayles Mid Cap Growth Fund
Loomis Sayles Value Fund


TABLE OF CONTENTS
Management Discussion and Performance page 1
Portfolio of Investments page 15
Financial Statements page 33
LOOMIS SAYLES DISCIPLINED EQUITY FUND
PORTFOLIO PROFILE
Objective:
Long-term growth of capital
Strategy:
Invests primarily in equity securities, including common stocks, convertible securities, and warrants; focuses on stocks of large-capitalization companies, but may invest in companies of any size
Fund Inception:
July 31, 2000
Managers:
Maureen G. Depp, CFA
Brian James, CFA
Loomis, Sayles & Company, L.P.
Symbols:
| | |
| Class A | | LSRRX |
| Class B | | LSCBX |
| Class C | | LSCCX |
| Class Y | | LISRX |
What You Should Know:
Growth stocks are generally more sensitive to market movements than value stocks. The fund can invest a significant percentage of assets in foreign securities and the value of the fund shares can be adversely affected by changes in currency exchange rates, political, and economic developments. In emerging markets these risks can be significant. Fund shares should be viewed as a long-term investment.
Management Discussion
Equities generally marched ahead during the six months ended March 31, 2010, sustaining a rally that began in early 2009. The period began with the stock market producing solid gains in the final three months of 2009. While the rally paused during the first two months of 2010, signs of an improving economy increased investors’ appetite for risk in March and the rally returned. Gains in equity prices tended to be broad-based, with economically-sensitive sectors producing the best relative returns while defensive areas lagged.
For the six months ended March 31, 2010, Class A shares of Loomis Sayles Disciplined Equity Fund returned 9.57%. During the same period, the fund’s benchmark, the S&P 500 Index, returned 11.75%, while funds in Morningstar’s Large Growth category returned an average 11.38%.
WHAT WAS THE PRIMARY REASON FOR THE FUND’S UNDERPERFORMANCE?
The fund essentially matched the S&P 500 Index during the final three months of 2009, but lost ground during the first quarter of 2010. The primary reason for this underperformance was our emphasis on valuation and company quality – as reflected by factors such as balance sheet strength – during a period in which higher-risk, “momentum” stocks tended to turn in the strongest relative performance. In addition, individual stock selection, particularly in the energy and consumer staples sectors, held back overall results. During the period, we introduced the use of trading in call options – a form of equity derivatives – to manage risk and generate yield. The performance of these trades was in line with the fund’s overall results.
WHICH FACTORS CONTRIBUTED POSITIVELY TO FUND PERFORMANCE?
Holdings in the information technology, utilities and industrials sectors all helped support performance. Aided by a global economic expansion, technology companies experienced rebounding sales and increasing merger-and-acquisition activity. The sector’s solid balance sheets also attracted investors. Within the information technology group, Oracle, Apple and Hewlett-Packard did especially well. Software company Oracle successfully completed its acquisition of Sun Microsystems, while Apple enjoyed strong sales of its iPhone and personal computer products. Hewlett-Packard, meanwhile, saw steady gains in personal computers and corporate enterprise spending. Our success in utilities came from a decision to protect the fund against the threat of declining power prices. The top individual utility investment was Constellation Energy, which traded at a discounted price at the start of the period and outperformed the overall utilities sector due to specific business catalysts.
WHICH FACTORS DETRACTED FROM THE FUND’S RESULTS?
Our investments in the energy and consumer staples sectors did not help performance. In energy, we did not invest early enough in two of the better-performing stocks, Anadarko Petroleum (sold from the portfolio), an independent exploration and production company, and Williams Companies, a natural gas corporation. In the same sector, positions in Marathon Oil, Pride International and Transocean also lagged. Pride was sold. Poor performance among the fund’s consumer staples holdings in the fourth quarter of 2009 held back results for the entire period. Disappointing staples positions included Whole Foods Market, Dr. Pepper Snapple, Avon Products and SUPERVALU. For the fund as a whole, the most notable individual detractors included QUALCOMM, a technology company whose share price fell after reporting disappointing quarterly results, and Owens-Illinois, a glass manufacturer affected by slumping sales. All of these poor performers were sold.
WHAT IS YOUR OUTLOOK?
We believe the stock market has the potential to produce positive returns over the next 12 months, although overall gains may be modest and interrupted by periodic reversals. Corporate cost-cutting programs have been responsible for most of the earnings growth that has occurred up until now. We believe the economy has stabilized, setting the stage for revenue improvements that can drive future profit growth. However, improved earnings also can trigger talk of higher interest rates, which, in turn, could restrain overall market performance.
1
LOOMIS SAYLES DISCIPLINED EQUITY FUND
Investment Results through March 31, 2010
PERFORMANCE IN PERSPECTIVE
The charts comparing the fund’s performance to an index provide you with a general sense of how it performed. The fund’s total return for the period shown below appears with and without sales charges and includes fund expenses and fees. An index measures the performance of a theoretical portfolio. Unlike a fund, the index is unmanaged and does not have expenses that affect the results. It is not possible to invest directly in an index. Investors would incur transaction costs and other expenses if they purchased the securities necessary to match the index.
Growth of a $10,000 Investment in Class A Shares1,6
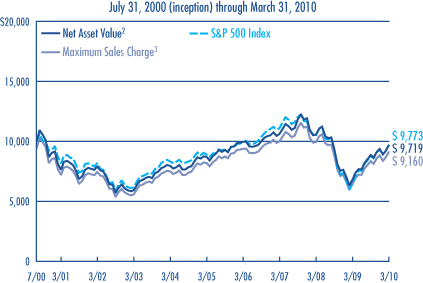
Average Annual Total Returns — March 31, 20106
| | | | | | | | | | | | |
| | | | | |
| | | 6 MONTHS | | | 1 YEAR | | | 5 YEARS | | | SINCE FUND
INCEPTION | |
CLASS A (Inception 11/30/01)1 | | | | | | | | | | | | |
Net Asset Value2 | | 9.57 | % | | 42.53 | % | | 2.26 | % | | -0.30 | % |
With Maximum Sales Charge3 | | 3.25 | | | 34.24 | | | 1.05 | | | -0.90 | |
| | | | | |
CLASS B (Inception 9/12/03)1 | | | | | | | | | | | | |
Net Asset Value2 | | 9.12 | | | 41.34 | | | 1.46 | | | -1.11 | |
With CDSC4 | | 4.12 | | | 36.34 | | | 1.16 | | | -1.11 | |
| | | | | |
CLASS C (Inception 9/12/03)1 | | | | | | | | | | | | |
Net Asset Value2 | | 9.05 | | | 41.36 | | | 1.43 | | | -1.15 | |
With CDSC4 | | 8.05 | | | 40.36 | | | 1.43 | | | -1.15 | |
| | | | | |
CLASS Y (Inception 7/31/00) | | | | | | | | | | | | |
Net Asset Value2 | | 9.82 | | | 42.81 | | | 2.61 | | | 0.03 | |
| | | | | |
| COMPARATIVE PERFORMANCE | | 6 MONTHS | | | 1 YEAR | | | 5 YEARS | | | SINCE FUND
INCEPTION5 | |
S&P 500 Index | | 11.75 | % | | 49.77 | % | | 1.92 | % | | -0.24 | % |
Morningstar Large Growth Fund Avg. | | 11.38 | | | 48.34 | | | 2.93 | | | -1.94 | |
All returns represent past performance and do not guarantee future results. Periods of less than one year are not annualized. Share price and return will vary and you may have a gain or loss when you sell your shares. All results include reinvestment of dividends and capital gains. Current returns may be higher or lower than those shown. For performance current to the most recent month-end, visit www.funds.natixis.com.
Class Y shares are available to certain investors, as described in the prospectus.
The table and graph do not reflect taxes shareholders might owe on any fund distributions or when they redeem their shares.
PORTFOLIO FACTS
| | | | |
| |
| | | % of Net Assets as of |
| FUND COMPOSITION | | 3/31/10 | | 9/30/09 |
Common Stocks | | 96.3 | | 97.4 |
Short-Term Investments and Other | | 3.7 | | 2.6 |
| |
| | | % of Net Assets as of |
| TEN LARGEST HOLDINGS | | 3/31/10 | | 9/30/09 |
Oracle Corp. | | 4.8 | | 2.5 |
Hewlett-Packard Co. | | 4.0 | | 2.2 |
Microsoft Corp. | | 3.8 | | — |
Google, Inc., Class A | | 3.3 | | 1.7 |
Apple, Inc. | | 3.3 | | 3.2 |
Merck & Co., Inc. | | 3.0 | | 1.2 |
WellPoint, Inc. | | 2.9 | | — |
Transocean Ltd. | | 2.8 | | — |
Whirlpool Corp. | | 2.8 | | — |
Pfizer, Inc. | | 2.8 | | 2.4 |
| |
| | | % of Net Assets as of |
| FIVE LARGEST INDUSTRIES | | 3/31/10 | | 9/30/09 |
Computers & Peripherals | | 9.7 | | 7.1 |
Software | | 8.6 | | 3.5 |
Pharmaceuticals | | 7.3 | | 5.7 |
Health Care Providers & Services | | 6.5 | | 3.2 |
Oil, Gas & Consumable Fuels | | 6.2 | | 10.1 |
Portfolio holdings and asset allocations will vary.
EXPENSE RATIOS AS STATED IN THE MOST RECENT PROSPECTUS
| | | | |
| Share Class | | Gross Expense Ratio7 | | Net Expense Ratio8 |
A | | 1.78% | | 1.25% |
B | | 2.49 | | 2.00 |
C | | 2.51 | | 2.00 |
Y | | 1.38 | | 1.00 |
NOTES TO CHARTS
See page 11 for a description of the indices.
| 1 | Prior to 9/15/03, performance of Class A shares is that of Retail Class shares, which were redesignated as Class A shares, restated to reflect the sales load of Class A shares. Prior to the inception of Retail Class shares (11/30/01) performance is that of Institutional Class shares, restated to reflect the higher net expenses and sales loads of Class A shares. Prior to the inception of Class B and C shares (9/12/03), performance is that of Institutional Class shares, restated to reflect the higher net expenses and sales loads of Class B and C shares. The fund revised its investment strategies on 10/1/09; performance may have been different had the current investment strategies been in place for all periods shown. |
| 2 | Does not include a sales charge. |
| 3 | Includes maximum sales charge of 5.75%. |
| 4 | Performance for Class B shares assumes a maximum of 5% contingent deferred sales charge (“CDSC”) applied when you sell shares, which declines annually between years 1-6 according to the following schedule: 5, 4, 3, 3, 2, 1, 0%. Class C shares performance assumes a 1% CDSC applied when you sell shares within one year of purchase. |
| 5 | The since-inception performance comparisons shown are calculated from 8/1/00. |
| 6 | Fund performance has been increased by expense reductions and reimbursements, if any, without which performance would have been lower. |
| 7 | Before reductions and reimbursements. |
| 8 | After reductions and reimbursements. Expense reductions are contractual and are set to expire 1/31/11. |
2
LOOMIS SAYLES GLOBAL MARKETS FUND
PORTFOLIO PROFILE
Objective:
Seeks high total return through a combination of capital appreciation and current income
Strategy:
Invests primarily in equity and fixed-income securities of U.S. and foreign issuers, including securities of issuers located in emerging markets
Fund Inception:
May 1, 1996
Managers:
Mark Baribeau, CFA
Dan Fuss, CFA, CIC
Warren Koontz, CFA, CIC
David Rolley, CFA
Loomis, Sayles & Company, L.P.
Symbols:
| | |
| Class A | | LGMAX |
| Class C | | LGMCX |
| Class Y | | LSWWX |
What You Should Know:
The fund can invest a significant percentage of assets in foreign securities and the value of the fund shares can be adversely affected by changes in currency exchange rates, political, and economic developments. In emerging markets these risks can be significant. The fund can invest a significant percentage of assets in debt securities that are rated below investment grade and the value of fund shares can be adversely affected by changes in economic conditions or other circumstances. In addition, the secondary market for these securities may lack liquidity. Fund shares should be viewed as a long-term investment.
Management Discussion
Equity markets around the world delivered solid returns during the six months ended March 31, 2010, as a global economic recovery continued to gain traction. Global bond markets produced uneven results. Sectors exposed to credit risk benefited from improved economic conditions. However, the longer-maturity sovereign debt of eurozone countries lost ground under a cloud of debt problems, and Japan’s bond market also suffered.
In this environment, Class A shares of Loomis Sayles Global Markets Fund returned 10.28%, for the six months ended March 31, 2010. For the same period, the fund’s primary benchmark, the MSCI World Index (common stocks from developed countries around the world) returned 7.67% while its secondary benchmark, Citigroup World Government Bond Index (government bonds issued in the United States and other developed countries) returned -3.23%. The average return on the funds in Morningstar’s World Allocation category was 5.38%. Both the equity and bond portions of the fund performed well for the period, reflecting strong markets for U.S. dollar-denominated bonds and vigorous gains in the stock market.
WHAT WAS THE PRIMARY REASON FOR THE FUND’S OUTPERFORMANCE?
Security selection on both the bond and stock sides generally accounted for the fund’s performance advantage over the index and peer group average. Sector and currency allocations in fixed-income gave the fund a comfortable edge over these comparative measures during the period.
WHICH FACTORS POSITIVELY CONTRIBUTED TO THE FUND’S PERFORMANCE?
Within the equity portion of the portfolio, consumer discretionary and information technology stocks performed particularly well during the period. Priceline.com and Amazon.com were among the fund’s top performers. Amazon benefited from expanded product offerings, including the Kindle digital reader. Priceline was up after the company beat its own earnings estimates. Apple was another solid performer as the company recently reported its best quarter ever.
During the period, we continued to focus on strong, fundamentally-driven opportunities around the world. We added to positions in companies with improving earnings outlooks as we trimmed or eliminated holdings showing signs of weakness. The most notable change in our sector weights was a reduction in financial stocks.
Within the bond portion of the portfolio, security selection and country allocations were positives. High-yield corporate issues denominated in U.S. dollars were among the best performers, and an overweight in this area helped. We kept our focus on shorter-maturity, high-yield corporate bonds to keep yield in the higher ranges until securities with longer maturities offer better value. Emerging markets also benefited returns.
WHICH FACTORS DETRACTED FROM THE FUND’S RESULTS?
Some disappointing industrial stocks detracted from performance. Highly regarded Spanish wind turbine manufacturer Gamesa fell on weakness in the turbine market. Volvo shares declined when the company reported a drop in sales late in 2009 and an anticipated improvement in volume appeared to stall out. Piraeus Bank, QUALCOMM and Southwestern Energy also detracted from performance. The Greek debt crisis hurt Piraeus. We sold Gamesa, Volvo and Piraeus and trimmed our position in Southwestern Energy as its price fell amid pricing concerns for natural gas. Wireless chipmaker QUALCOMM reported disappointing earnings and also was sold from the portfolio.
Corporate bonds with longer maturities were weak. However, the fund’s duration – a measure of interest-rate sensitivity – was shorter than the duration of its benchmark, which aided relative performance. The fund’s exposure to weaker currencies – namely the Norwegian krone and the Polish zloty – also detracted from returns. The weakest performers on the bond side were lower-yielding government bonds denominated in the euro, the Japanese yen and the British pound.
WHAT IS YOUR OUTLOOK?
We believe the stock market has the potential to produce positive returns over the next 12 months, although overall gains may be modest and interrupted by periodic reversals. Corporate cost-cutting programs have been responsible for most of the earnings growth that has occurred up until now. We believe the economy has stabilized, setting the stage for revenue improvements that can drive future profit growth. However, improved earnings also can trigger talk of higher interest rates, which, in turn, could restrain overall market performance.
3
LOOMIS SAYLES GLOBAL MARKETS FUND
Investment Results through March 31, 2010
PERFORMANCE IN PERSPECTIVE
The charts comparing the fund’s performance to two indexes provide you with a general sense of how it performed. The fund’s total return for the period shown below appears with and without sales charges and includes fund expenses and fees. An index measures the performance of a theoretical portfolio. Unlike a fund, the index is unmanaged and does not have expenses that affect the results. It is not possible to invest directly in an index. Investors would incur transaction costs and other expenses if they purchased the securities necessary to match the index.
Growth of a $10,000 Investment in Class A Shares1,5
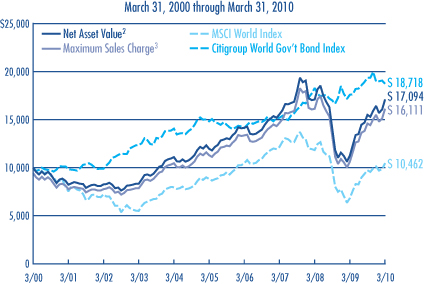
Average Annual Total Returns — March 31, 20105
| | | | | | | | | | | | |
| | | | | |
| | | 6 MONTHS | | | 1 YEAR | | | 5 YEARS | | | 10 YEARS | |
CLASS A (Inception 2/1/06)1 | | | | | | | | | | | | |
Net Asset Value2 | | 10.28 | % | | 51.82 | % | | 7.38 | % | | 5.51 | % |
With Maximum Sales Charge3 | | 3.96 | | | 43.15 | | | 6.12 | | | 4.89 | |
| | | | | |
CLASS C (Inception 2/1/06)1 | | | | | | | | | | | | |
Net Asset Value2 | | 9.94 | | | 50.68 | | | 6.59 | | | 4.73 | |
With CDSC4 | | 8.94 | | | 49.68 | | | 6.59 | | | 4.73 | |
| | | | | |
CLASS Y (Inception 5/1/96) | | | | | | | | | | | | |
Net Asset Value2 | | 10.46 | | | 52.26 | | | 7.64 | | | 5.77 | |
| | | | | |
| COMPARATIVE PERFORMANCE | | 6 MONTHS | | | 1 YEAR | | | 5 YEARS | | | 10 YEARS | |
MSCI World Index | | 7.67 | % | | 53.23 | % | | 3.45 | % | | 0.45 | % |
Citigroup World Government Bond Index | | -3.23 | | | 6.31 | | | 4.78 | | | 6.47 | |
Morningstar World Allocation Fund Avg. | | 5.38 | | | 36.39 | | | 5.17 | | | 5.63 | |
All returns represent past performance and do not guarantee future results. Periods of less than one year are not annualized. Share price and return will vary and you may have a gain or loss when you sell your shares. All results include reinvestment of dividends and capital gains. Current returns may be higher or lower than those shown. For performance current to the most recent month-end, visit www.funds.natixis.com.
Class Y shares are available to certain investors, as described in the prospectus.
The table and graph do not reflect taxes shareholders might owe on any fund distributions or when they redeem their shares.
PORTFOLIO FACTS
| | | | |
| |
| | | % of Net Assets as of |
| FUND COMPOSITION | | 3/31/10 | | 9/30/09 |
Common Stocks and Warrants | | 63.7 | | 60.6 |
Bonds and Notes | | 32.6 | | 37.0 |
Preferred Stock | | 0.4 | | 0.4 |
Bank Loans | | 0.1 | | 0.1 |
Short-Term Investments and Other | | 3.2 | | 1.9 |
| |
| | | % of Net Assets as of |
| TEN LARGEST HOLDINGS | | 3/31/10 | | 9/30/09 |
Apple, Inc. | | 4.0 | | 3.4 |
Standard Chartered PLC | | 2.7 | | 2.7 |
Amazon.com, Inc. | | 2.2 | | 1.4 |
Anadarko Petroleum Corp. | | 2.0 | | — |
Google, Inc., Class A | | 1.8 | | 1.5 |
Baidu, Inc., Sponsored ADR | | 1.7 | | 1.2 |
Tencent Holdings Ltd. | | 1.7 | | 1.3 |
Vale SA, Sponsored ADR | | 1.7 | | 0.8 |
Priceline.com, Inc. | | 1.6 | | 1.6 |
FMC Technologies, Inc. | | 1.5 | | 1.1 |
| |
| | | % of Net Assets as of |
| FIVE LARGEST INDUSTRIES | | 3/31/10 | | 9/30/09 |
Commercial Banks | | 5.9 | | 5.4 |
Computers & Peripherals | | 5.4 | | 3.4 |
Internet Software & Services | | 5.2 | | 5.1 |
Metals & Mining | | 4.6 | | 3.2 |
Semiconductors & Semiconductor Equipment | | 4.6 | | 3.9 |
Portfolio holdings and asset allocations will vary.
EXPENSE RATIOS AS STATED IN THE MOST RECENT PROSPECTUS
| | | | |
| Share Class | | Gross Expense Ratio6 | | Net Expense Ratio7 |
A | | 1.34% | | 1.25% |
C | | 2.09 | | 2.00 |
Y | | 1.01 | | 1.00 |
NOTES TO CHARTS
See page 11 for a description of the indices.
| 1 | Prior to the inception of Class A and C shares (2/1/06), performance is that of Institutional Class shares, restated to reflect the higher net expenses and sales loads of Class A and C shares. |
| 2 | Does not include a sales charge. |
| 3 | Includes the maximum sales charge of 5.75%. |
| 4 | Performance for Class C shares assumes a 1% contingent deferred sales charge (“CDSC”) applied when you sell shares within one year of purchase. |
| 5 | Fund performance has been increased by expense reductions and reimbursements, if any, without which performance would have been lower. |
| 6 | Before reductions and reimbursements. |
| 7 | After reductions and reimbursements. Expense reductions are contractual and are set to expire 1/31/11. |
4
LOOMIS SAYLES GROWTH FUND
PORTFOLIO PROFILE
Objective:
Long-term growth of capital
Strategy:
Invests primarily in equity securities, including common stocks, convertible securities, and warrants; focuses on stocks of large-capitalization companies, but may invest in companies of any size
Fund Inception:
May 16, 1991
Managers:
Mark Baribeau, CFA
Pamela Czekanski, CFA
Richard Skaggs, CFA
Loomis, Sayles &
Company, L.P.
Symbols:
| | |
| Class A | | LGRRX |
| Class B | | LGRBX |
| Class C | | LGRCX |
| Class Y | | LSGRX |
What You Should Know:
Growth stocks are generally more sensitive to market movements because their stock prices are based on future expectations. Frequent portfolio turnover may result in increased tax liabilities that will reduce the fund’s overall return. The fund can invest a significant percentage of assets in foreign securities and the value of the fund shares can be adversely affected by changes in currency exchange rates, political, and economic developments. In emerging markets these risks can be significant. Fund shares should be viewed as a long-term investment.
Management Discussion
Equity investments produced generally solid returns during the six months ended March 31, 2010, although the recovery in stock prices was interrupted in January 2010 as investors absorbed the gains produced in 2009. However, new evidence indicating an improving economy increased investors’ confidence as well as their appetite for risk and the rally reignited in March. Stocks in economically sensitive groups generally produced the best relative returns, while stocks in defensive areas tended to lag.
For the six months ended March 31, 2010, Class A shares of Loomis Sayles Growth Fund returned 14.51%. During the same period, the fund’s benchmark, the Russell 1000 Growth Index, returned 12.96%, while funds in Morningstar’s Large Growth category returned an average 11.38%.
WHAT WAS THE PRIMARY REASON FOR THE FUND’S OUTPERFORMANCE?
Stock selection drove the fund’s solid relative results, especially in the consumer discretionary, materials and health care sectors. The strong performance came despite disappointing returns from financials holdings. Over the period, we continued to follow our longer-term strategy, seeking select large-cap growth companies with solid fundamentals and leading products in their competitive markets. The primary changes we made during the six months were to increase an overweight in consumer discretionary stocks, while reducing our emphasis on financial companies. We maintained an overweight in information technology.
WHICH FACTORS POSITIVELY CONTRIBUTED TO THE FUND’S PERFORMANCE?
Among consumer discretionary holdings, performance was particularly favorable for on-line travel company Priceline.com and on-line retailer Amazon.com, both of which reported healthy earnings improvements. The expansion of Priceline.com’s travel business was particularly noteworthy in Europe, while Amazon.com succeeded by expanding its product offerings. In the materials sector, the standout performer was Cliffs Natural Resources, an international mining corporation that reaped solid gains as global demand for iron ore improved. Apple was the best-performing information technology holding, as it reported its best-ever quarter after setting sales records for both personal computers and smart phones.
WHICH FACTORS DETRACTED FROM THE FUND’S RESULTS?
Our holdings in the financial services and producer durable industries generated disappointing returns. Among financials, banks Goldman Sachs and JPMorgan Chase performed poorly as investors pulled back and took gains from the stocks’ earlier rallies. Market concerns also arose over the potential effects of proposed new financial regulations on companies such as Goldman Sachs. In the producer durables group, valve manufacturer Flowserve encountered stiff pricing pressure, causing a slight decline in the company’s share price. We sold the stock. Other poor performers included two information technology companies: QUALCOMM, which produces operating systems for wireless communications, and Brocade, which develops and markets hardware and software products for data networks. We sold both QUALCOMM and Brocade before the end of the period.
WHAT IS YOUR OUTLOOK?
We believe the stock market has the potential to produce positive returns over the next 12 months, although overall gains may be modest and interrupted by periodic reversals. Corporate cost-cutting programs have been responsible for most of the earnings growth that has occurred up until now. We believe the economy has stabilized, setting the stage for revenue improvements that can drive future profit growth. However, improved earnings also can trigger talk of higher interest rates, which, in turn, could restrain overall market performance.
5
LOOMIS SAYLES GROWTH FUND
Investment Results through March 31, 2010
PERFORMANCE IN PERSPECTIVE
The charts comparing the fund’s performance to an index provide you with a general sense of how it performed. The fund’s total return for the period shown below appears with and without sales charges and includes fund expenses and fees. An index measures the performance of a theoretical portfolio. Unlike a fund, the index is unmanaged and does not have expenses that affect the results. It is not possible to invest directly in an index. Investors would incur transaction costs and other expenses if they purchased the securities necessary to match the index.
Growth of a $10,000 Investment in Class A Shares1,5
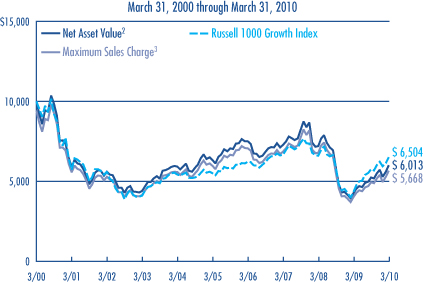
Average Annual Total Returns — March 31, 20105
| | | | | | | | | | | | |
| | | | | |
| | | 6 MONTHS | | | 1 YEAR | | | 5 YEARS | | | 10 YEARS | |
CLASS A (Inception 12/31/96)1 | | | | | | | | | | | | |
Net Asset Value2 | | 14.51 | % | | 40.93 | % | | -0.98 | % | | -4.96 | % |
With Maximum Sales Charge3 | | 8.00 | | | 32.90 | | | -2.15 | | | -5.52 | |
| | | | | |
CLASS B (Inception 9/12/03)1 | | | | | | | | | | | | |
Net Asset Value2 | | 14.02 | | | 39.83 | | | -1.75 | | | -5.68 | |
With CDSC4 | | 9.02 | | | 34.83 | | | -2.14 | | | -5.68 | |
| | | | | |
CLASS C (Inception 9/12/03)1 | | | | | | | | | | | | |
Net Asset Value2 | | 14.25 | | | 40.11 | | | -1.71 | | | -5.66 | |
With CDSC4 | | 13.25 | | | 39.11 | | | -1.71 | | | -5.66 | |
| | | | | |
CLASS Y (Inception 5/16/91) | | | | | | | | | | | | |
Net Asset Value2 | | 14.59 | | | 41.51 | | | -0.58 | | | -4.66 | |
| | | | | |
| COMPARATIVE PERFORMANCE | | 6 MONTHS | | | 1 YEAR | | | 5 YEARS | | | 10 YEARS | |
Russell 1000 Growth Index | | 12.96 | % | | 49.75 | % | | 3.42 | % | | -4.21 | % |
Morningstar Large Growth Fund Avg. | | 11.38 | | | 48.34 | | | 2.93 | | | -2.46 | |
All returns represent past performance and do not guarantee future results. Periods of less than one year are not annualized. Share price and return will vary and you may have a gain or loss when you sell your shares. All results include reinvestment of dividends and capital gains. Current returns may be higher or lower than those shown. For performance current to the most recent month-end, visit www.funds.natixis.com.
Class Y shares are available to certain investors, as described in the prospectus.
The table and graph do not reflect taxes shareholders might owe on any fund distributions or when they redeem their shares.
PORTFOLIO FACTS
| | | | |
| |
| | | % of Net Assets as of |
| FUND COMPOSITION | | 3/31/10 | | 9/30/09 |
Common Stocks | | 99.1 | | 99.2 |
Short-Term Investments and Other | | 0.9 | | 0.8 |
| |
| | | % of Net Assets as of |
| TEN LARGEST HOLDINGS | | 3/31/10 | | 9/30/09 |
Apple, Inc. | | 5.0 | | 4.9 |
Priceline.com, Inc. | | 4.2 | | 3.2 |
Microsoft Corp. | | 4.0 | | — |
Amazon.com, Inc. | | 4.0 | | 3.0 |
Cisco Systems, Inc. | | 3.7 | | 2.9 |
Google, Inc., Class A | | 3.6 | | 4.5 |
Visa, Inc., Class A | | 3.3 | | 2.0 |
Broadcom Corp., Class A | | 2.7 | | 2.9 |
Mylan, Inc. | | 2.5 | | 2.0 |
Starbucks Corp. | | 2.4 | | 2.5 |
| |
| | | % of Net Assets as of |
| FIVE LARGEST INDUSTRIES | | 3/31/10 | | 9/30/09 |
Computers & Peripherals | | 8.6 | | 10.5 |
Internet & Catalog Retail | | 8.2 | | 6.2 |
Semiconductors & Semiconductor Equipment | | 7.7 | | 5.5 |
Software | | 7.6 | | 4.4 |
IT Services | | 5.7 | | 4.1 |
Portfolio holdings and asset allocations will vary.
EXPENSE RATIOS AS STATED IN THE MOST RECENT PROSPECTUS
| | | | |
| Share Class | | Gross Expense Ratio6 | | Net Expense Ratio7 |
A | | 1.22% | | 1.22% |
B | | 1.98 | | 1.98 |
C | | 1.98 | | 1.98 |
Y | | 0.99 | | 0.99 |
NOTES TO CHARTS
See page 11 for a description of the indices.
| 1 | Prior to 9/15/03, performance of Class A shares is that of Retail Class shares, which were redesignated as Class A shares, restated to reflect the sales load of Class A shares. Prior to the inception of Class B and C shares (9/12/03), performance is that of Institutional Class shares, restated to reflect the higher net expenses and sales loads of Class B and C shares. |
| 2 | Does not include a sales charge. |
| 3 | Includes maximum sales charge of 5.75%. |
| 4 | Performance for Class B shares assumes a maximum of 5% contingent deferred sales charge (“CDSC”) applied when you sell shares, which declines annually between years 1-6 according to the following schedule: 5, 4, 3, 3, 2, 1, 0%. Class C shares performance assumes a 1% CDSC applied when you sell shares within one year of purchase. |
| 5 | Fund performance has been increased by expense reductions and reimbursements, if any, without which performance would have been lower. |
| 6 | Before reductions and reimbursements. |
| 7 | After reductions and reimbursements. Expense reductions are contractual and are set to expire 1/31/11. |
6
LOOMIS SAYLES MID CAP GROWTH FUND
PORTFOLIO PROFILE
Objective:
Long-term growth of capital
Strategy:
Invests primarily in common stocks or other equity securities; focuses on stocks of companies that fall within the capitalization range of the companies included in the Russell Midcap Growth Index.
Fund Inception:
December 31, 1996
Manager:
Philip C. Fine, CFA
Symbols:
| | |
| Class A | | LAGRX |
| Class C | | LSACX |
| Class Y | | LSAIX |
What You Should Know
Small- and mid-cap stocks may be more volatile than larger, more established companies. The secondary market for these stocks may be less liquid, which could adversely impact the fund’s value. Growth funds involve increased risks, in part, because the value of the underlying securities is based on future expectations that may or may not be met. The fund can invest a significant percentage of assets in foreign securities and the value of the fund shares can be adversely affected by changes in currency exchange rates, political, and economic developments. In emerging markets these risks can be significant. The fund is subject to currency decline. Fund shares should be viewed as a long-term investment.
Management Discussion
The stock market generated broad-based positive returns for the period, even though it pulled back early in 2010 before regaining its footing in March. Economic data improved, and confident investors drove returns higher across most sectors of the market.
For the six months ended March 31, 2010, Class A shares of Loomis Sayles Mid Cap Growth Fund returned 17.88%. The fund outperformed its benchmark, the Russell Midcap Growth Index, which returned 14.88%, and the 12.89% average return of funds in its peer group, the Morningstar Mid-Cap Growth category. Gains made early in the period helped the fund hold onto its lead even during a period of market weakness, as the fund’s ratio of winners to losers was substantial. The stop-loss discipline we had in place prompted us to sell underperformers and redirect assets to winners.
WHAT WAS THE PRIMARY REASON FOR THE FUND’S OUTPERFORMANCE?
Strong stock selection across most sectors aided returns. From a sector standpoint, producer durables had the most positive impact on the fund’s returns, followed by technology. Some of our biggest winners in durables were companies exposed to natural resources. Leading this group was Bucyrus International, which provides mining equipment and services to customers worldwide. Bucyrus’ rapid growth also reflects its participation in emerging markets.
Winners in technology included communications equipment businesses, such as F5 Networks, which offers cost-saving internet traffic management solutions, and electronics companies such as Cree, a leading manufacturer of light-emitting diode (LED) chips and components. Sales of Cree’s product lines reflected growing demand for energy-saving lighting equipment.
WHICH FACTORS POSITIVELY CONTRIBUTED TO THE FUND’S PERFORMANCE?
In addition to technology, e-commerce stocks were winning themes among the fund’s consumer discretionary holdings. Specialty retail and apparel stocks such as Lululemon Athletica and Guess?, both of which continue to show strong earnings momentum, also helped results. Other top-performing individual stocks included Priceline.com, a leading online travel company. Despite a global recession, Priceline.com continues to enjoy vigorous growth, driven by its European travel bookings.
WHICH FACTORS DETRACTED FROM THE FUND’S RESULTS?
Financial services was one of the fund’s only groups with negative performance for the six-month period. Ill-timed stock selections included investment managers Janus Capital Group and SVB Financial. Both positions were closed during the period. The stocks we picked in the materials sector were positive, but we were underweight in the sector, which generated solid performance. Our healthcare selections provided positive absolute returns, but they lagged the benchmark’s healthcare holdings in the first quarter of 2010. Almost half the fund’s shortfall in healthcare came from biotech companies, where several of our stocks experienced corrections.
Among individual stock holdings, our greatest disappointments included biotechnology company Illumina. It was one of our big winners early in 2009, but the company’s subsequent earnings were disappointing. The stock was sold during the period. Fibria Celulose, a Brazilian producer of pulp and paper products, declined sharply on balance-sheet concerns. This caused our stop-loss program to kick in and the position was eliminated. Fuqi International, a leading Chinese jewelry manufacturer, exemplifies one of our favorite macro themes: rising middle-class consumption in emerging markets. However, the company reported a disappointing quarter, and the stock was sold when it reached our stop-loss price.
WHAT IS YOUR OUTLOOK?
We believe the stock market has the potential to produce positive returns over the next 12 months, although overall gains may be modest and interrupted by periodic reversals. Corporate cost-cutting programs have been responsible for most of the earnings growth that has occurred up until now. We believe the economy has stabilized, setting the stage for revenue improvements that can drive future profit growth. However, improved earnings also can trigger talk of higher interest rates, which, in turn, could restrain overall market performance.
7
LOOMIS SAYLES MID CAP GROWTH FUND
Investment Results through March 31, 2010
PERFORMANCE IN PERSPECTIVE
The charts comparing the fund’s performance to an index provide you with a general sense of how it performed. The fund’s total return for the period shown below appears with and without sales charges and includes fund expenses and fees. An index measures the performance of a theoretical portfolio. Unlike a fund, the index is unmanaged and does not have expenses that affect the results. It is not possible to invest directly in an index. Investors would incur transaction costs and other expenses if they purchased the securities necessary to match the index.
Growth of a $10,000 Investment in Class A Shares1,5

Average Annual Total Returns — March 31, 20105
| | | | | | | | | | | | |
| | | | | |
| | | 6 MONTHS | | | 1 YEAR | | | 5 YEARS | | | 10 YEARS | |
CLASS A (Inception 12/31/96)1 | | | | | | | | | | | | |
Net Asset Value2 | | 17.88 | % | | 44.12 | % | | 5.44 | % | | -6.78 | % |
With Maximum Sales Charge3 | | 11.08 | | | 35.85 | | | 4.20 | | | -7.33 | |
| | | | | |
CLASS C (Inception 2/2/09)1 | | | | | | | | | | | | |
Net Asset Value2 | | 17.47 | | | 43.11 | | | 4.62 | | | -7.52 | |
With CDSC4 | | 16.47 | | | 42.11 | | | 4.62 | | | -7.52 | |
| | | | | |
CLASS Y (Inception 12/31/96) | | | | | | | | | | | | |
Net Asset Value2 | | 18.05 | | | 44.51 | | | 5.72 | | | -6.53 | |
| | | | | |
| COMPARATIVE PERFORMANCE | | 6 MONTHS | | | 1 YEAR | | | 5 YEARS | | | 10 YEARS | |
Russell Midcap Growth Index | | 14.88 | % | | 63.00 | % | | 4.27 | % | | -1.69 | % |
Morningstar Mid-Cap Growth Avg. | | 12.89 | | | 55.35 | | | 3.86 | | | -0.50 | |
All returns represent past performance and do not guarantee future results. Periods of less than one year are not annualized. Share price and return will vary and you may have a gain or loss when you sell your shares. All results include reinvestment of dividends and capital gains. Current returns may be higher or lower than those shown. For performance current to the most recent month-end, visit www.funds.natixis.com.
Class Y shares are available to certain investors, as described in the prospectus.
The table and graph do not reflect taxes shareholders might owe on any fund distributions or when they redeem their shares.
PORTFOLIO FACTS
| | | | |
| |
| | | % of Net Assets as of |
| FUND COMPOSITION | | 3/31/10 | | 9/30/09 |
Common Stocks | | 97.8 | | 98.5 |
Short-Term Investments and Other | | 2.2 | | 1.5 |
| |
| | | % of Net Assets as of |
| TEN LARGEST HOLDINGS | | 3/31/10 | | 9/30/09 |
F5 Networks, Inc. | | 2.7 | | 1.6 |
Green Mountain Coffee Roasters, Inc. | | 2.6 | | 1.9 |
Walter Energy, Inc. | | 2.5 | | 2.4 |
Massey Energy Co. | | 2.5 | | — |
Cree, Inc. | | 2.4 | | — |
Priceline.com, Inc. | | 2.4 | | 2.7 |
Cummins, Inc. | | 2.4 | | 1.5 |
Baidu, Inc., Sponsored ADR | | 2.3 | | — |
Salesforce.com, Inc. | | 2.3 | | 2.0 |
Concho Resources, Inc. | | 2.3 | | 1.9 |
| |
| | | % of Net Assets as of |
| FIVE LARGEST INDUSTRIES | | 3/31/10 | | 9/30/09 |
Internet Software & Services | | 9.0 | | 2.7 |
Oil, Gas & Consumable Fuels | | 5.9 | | 3.7 |
Semiconductors & Semiconductor Equipment | | 5.4 | | 9.5 |
Textiles, Apparel & Luxury Goods | | 5.0 | | 2.6 |
Specialty Retail | | 4.7 | | 5.6 |
Portfolio holdings and asset allocations will vary.
EXPENSE RATIOS AS STATED IN THE MOST RECENT PROSPECTUS
| | | | |
| Share Class | | Gross Expense Ratio6 | | Net Expense Ratio7 |
A | | 1.49% | | 1.25% |
C | | 2.31 | | 2.00 |
Y | | 1.24 | | 1.00 |
NOTES TO CHARTS
See page 11 for a description of the indices.
| 1 | Prior to 2/1/09, performance of Class A shares is that of Retail Class shares, which were redesignated as Class A shares, restated to reflect the sales load of Class A shares. Prior to the inception of Class C shares (2/2/09), performance is that of Retail Class shares, restated to reflect the higher net expenses and sales loads of Class C shares. The fund revised its investment strategies on 2/1/07; performance may have been different had the current strategies been in place for all periods shown. |
| 2 | Does not include a sales charge. |
| 3 | Includes maximum sales charge of 5.75%. |
| 4 | Class C shares performance assumes a 1% CDSC applied when you sell shares within one year of purchase. |
| 5 | Fund performance has been increased by expense reductions and reimbursements, if any, without which performance would have been lower. |
| 6 | Before reductions and reimbursements. |
| 7 | After reductions and reimbursements. Expense reductions are contractual and are set to expire 1/31/11. |
8
LOOMIS SAYLES VALUE FUND
PORTFOLIO PROFILE
Objective:
Long-term growth of capital and income
Strategy:
Invests primarily in equity securities, including common stocks, convertible securities, and warrants.
Fund Inception:
May 13, 1991
Managers:
Arthur Barry, CFA
James L. Carroll, CFA
Warren N. Koontz, CFA, CIC
Loomis, Sayles & Company, L.P.
Symbols:
| | |
| Class A | | LSVRX |
| Class B | | LSVBX |
| Class C | | LSCVX |
| Class Y | | LSGIX |
| Admin Class | | LSAVX |
What You Should Know:
While the fund offers potential for long-term capital growth, it invests in value stocks, which can fall out of favor with investors and may underperform growth stocks during certain market conditions. The fund can invest a significant percentage of assets in foreign securities and the value of the fund shares can be adversely affected by changes in currency exchange rates, political, and economic developments. In emerging markets these risks can be significant. Fund shares should be viewed as a long-term investment.
Management Discussion
The stock market rally continued into the fourth quarter of 2009, then paused briefly early this year as investors sought further indications that the economic recovery might be sustainable. In March, improving housing, employment and manufacturing data fed renewed bullishness and an increasing appetite for risk that drove up stocks, especially in economically-sensitive sectors.
Loomis Sayles Value Fund trailed both its benchmark and Morningstar peer group. For the six months ended March 31, 2010, Class A shares provided a total return of 9.42%. The fund’s benchmark, the Russell 1000 Value Index, returned 11.28%, while the average return on the funds in Morningstar’s Large Value category was 10.75%.
WHAT WAS THE PRIMARY REASON FOR THE FUND’S UNDERPERFORMANCE?
Stock selection within the producer durables and healthcare sectors generally accounted for the shortfall relative to the index.
WHICH FACTORS POSITIVELY CONTRIBUTED TO THE FUND’S PERFORMANCE?
As investors spurned more defensive market segments in pursuit of greater gains, an underweight in utilities contributed to relative results. It also helped the fund to have less exposure than the index to AT&T, a laggard stock and a large holding in the fund’s benchmark. AT&T was sold during the period. In utilities, American Electric Power performed well, thanks to its attractive valuation as well as favorable regulatory environments in its service areas. Below-benchmark stakes in energy and financials also were beneficial. Among individual holdings, Smith International, an oil field service company, rose sharply on news of its pending acquisition by industry leader Schlumberger; the combined company is well-positioned to benefit from the growing complexity of global oil and gas production. Smith reported strong fourth-quarter revenue gains in all of its operating segments, highlighting the breadth of the recovery and possibly auguring well for 2010. Financial planning specialist Ameriprise and PNC Financial, a diversified financial company, both delivered strong returns. Estee Lauder continued to surprise skeptics with very good earnings reports. Shares of Northrop Grumman rebounded from depressed levels as it rebuilt its Louisiana shipyard following hurricane damage. Moreover, most defense contractors have performed well, based on appealing valuations and budgets that remain robust in the face of world tensions.
WHICH FACTORS DETRACTED FROM THE FUND’S RESULTS?
Several individual stocks held back performance in the producer durables, health care and materials sectors. Medical device maker Boston Scientific suffered an important product recall and also tempered its growth projections. We think the market has taken an overly negative view of Boston Scientific’s new management team. Foster Wheeler, an engineering and construction firm, also reduced its earnings forecast. In addition, investors reacted negatively when new contract awards failed to reach anticipated levels. We sold long-term holding, beer-maker Molson Coors, due to concerns about a resumption of price wars with its competitors.
WHAT IS YOUR OUTLOOK?
We believe the stock market has the potential to produce positive returns over the next 12 months, although overall gains may be modest and interrupted by periodic reversals. Corporate cost-cutting programs have been responsible for most of the earnings growth that has occurred up until now. We believe the economy has stabilized, setting the stage for revenue improvements that can drive future profit growth. However, improved earnings also can trigger talk of higher interest rates, which, in turn, could restrain overall market performance.
9
LOOMIS SAYLES VALUE FUND
Investment Results through March 31, 2010
PERFORMANCE IN PERSPECTIVE
The charts comparing the fund’s performance to an index provide you with a general sense of how it performed. The fund’s total return for the period shown below appears with and without sales charges and includes fund expenses and fees. An index measures the performance of a theoretical portfolio. Unlike a fund, the index is unmanaged and does not have expenses that affect the results. It is not possible to invest directly in an index. Investors would incur transaction costs and other expenses if they purchased the securities necessary to match the index.
Growth of a $10,000 Investment in Class A Shares1,5
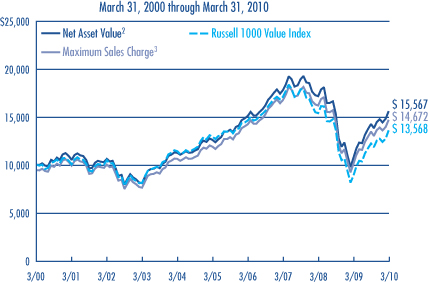
Average Annual Total Returns — March 31, 20105
| | | | | | | | | | | | |
| | | | | |
| | | 6 MONTHS | | | 1 YEAR | | | 5 YEARS | | | 10 YEARS | |
CLASS A (Inception 6/30/06)1 | | | | | | | | | | | | |
Net Asset Value2 | | 9.42 | % | | 45.71 | % | | 4.38 | % | | 4.53 | % |
With Maximum Sales Charge3 | | 3.14 | | | 37.36 | | | 3.15 | | | 3.91 | |
| | | | | |
CLASS B (Inception 6/1/07)1 | | | | | | | | | | | | |
Net Asset Value2 | | 9.02 | | | 44.66 | | | 3.53 | | | 3.62 | |
With CDSC4 | | 4.02 | | | 39.66 | | | 3.18 | | | 3.62 | |
| | | | | |
CLASS C (Inception 6/1/07)1 | | | | | | | | | | | | |
Net Asset Value2 | | 8.98 | | | 44.66 | | | 3.53 | | | 3.62 | |
With CDSC4 | | 7.98 | | | 43.66 | | | 3.53 | | | 3.62 | |
| | | | | |
CLASS Y (Inception 5/13/91) | | | | | | | | | | | | |
Net Asset Value2 | | 9.54 | | | 46.21 | | | 4.70 | | | 4.83 | |
| | | | | |
Admin Class (Inception 2/1/10)1 | | | | | | | | | | | | |
Net Asset Value2 | | 9.29 | | | 45.28 | | | 4.08 | | | 4.23 | |
| | | | | |
| COMPARATIVE PERFORMANCE | | 6 MONTHS | | | 1 YEAR | | | 5 YEARS | | | 10 YEARS | |
Russell 1000 Value Index | | 11.28 | % | | 53.55 | % | | 1.05 | % | | 3.10 | % |
Morningstar Large Value Fund Avg. | | 10.75 | | | 50.25 | | | 1.21 | | | 3.12 | |
All returns represent past performance and do not guarantee future results. Periods of less than one year are not annualized. Share price and return will vary and you may have a gain or loss when you sell your shares. All results include reinvestment of dividends and capital gains. Current returns may be higher or lower than those shown. For performance current to the most recent month-end, visit www.funds.natixis.com.
Class Y shares are available to certain investors, as described in the prospectus.
The table and graph do not reflect taxes shareholders might owe on any fund distributions or when they redeem their shares.
PORTFOLIO FACTS
| | | | |
| |
| | | % of Net Assets as of |
| FUND COMPOSITION | | 3/31/10 | | 9/30/09 |
Common Stocks | | 96.0 | | 88.2 |
Short-Term Investments and Other | | 4.0 | | 11.8 |
| |
| | | % of Net Assets as of |
| TEN LARGEST HOLDINGS | | 3/31/10 | | 9/30/09 |
JPMorgan Chase & Co. | | 3.0 | | 2.8 |
Bank of America Corp. | | 2.2 | | 1.9 |
Hewlett-Packard Co. | | 2.2 | | 1.9 |
Wells Fargo & Co. | | 2.1 | | 1.3 |
General Electric Co. | | 2.1 | | 1.3 |
Ameriprise Financial, Inc. | | 2.1 | | 1.6 |
Comcast Corp., Class A | | 2.0 | | — |
ExxonMobil Corp. | | 2.0 | | 1.8 |
Northrop Grumman Corp. | | 1.9 | | 1.9 |
PepsiCo, Inc. | | 1.8 | | 1.0 |
| |
| | | % of Net Assets as of |
| FIVE LARGEST INDUSTRIES | | 3/31/10 | | 9/30/09 |
Oil, Gas & Consumable Fuels | | 11.5 | | 11.3 |
Pharmaceuticals | | 6.6 | | 6.9 |
Capital Markets | | 6.4 | | 5.2 |
Commercial Banks | | 6.0 | | 3.5 |
Diversified Financial Services | | 5.2 | | 4.6 |
Portfolio holdings and asset allocations will vary.
EXPENSE RATIOS AS STATED IN THE MOST RECENT PROSPECTUS
| | | | |
| Share Class | | Gross Expense Ratio6 | | Net Expense Ratio7 |
A | | 1.06% | | 1.06% |
B | | 1.81 | | 1.81 |
C | | 1.81 | | 1.81 |
Y | | 0.66 | | 0.66 |
Admin | | 1.22 | | 1.22 |
NOTES TO CHARTS
See page 11 for a description of the indices.
| 1 | Prior to 6/1/07, performance of Class A shares is that of Retail Class shares, which were redesignated as Class A shares, restated to reflect the sales load of Class A shares. Prior to the inception of Retail Class shares (6/30/06), performance is that of Institutional Class shares, restated to reflect the higher net expenses and sales loads of Class A shares. Prior to the inception of Class B and C shares (6/1/07), performance is that of Institutional Class shares, restated to reflect the higher net expenses and sales loads of Class B and C shares. Prior to the inception of Admin Class shares (2/1/10), performance is that of Class A shares, restated to reflect the higher net expenses of Admin Class shares. |
| 2 | Does not include a sales charge. |
| 3 | Includes maximum sales charge of 5.75%. |
| 4 | Performance for Class B shares assumes a maximum of 5% contingent deferred sales charge (“CDSC”) applied when you sell shares, which declines annually between years 1-6 according to the following schedule: 5, 4, 3, 3, 2, 1, 0%. Class C shares performance assumes a 1% CDSC applied when you sell shares within one year of purchase. |
| 5 | Fund performance has been increased by expense reductions and reimbursements, if any, without which performance would have been lower. |
| 6 | Before reductions and reimbursements. |
| 7 | After reductions and reimbursements. Expense reductions are contractual and are set to expire 1/31/11. |
10
ADDITIONAL INFORMATION
The views expressed in this report reflect those of the portfolio managers as of the dates indicated. The managers’ views are subject to change at any time without notice based on changes in market or other conditions. References to specific securities or industries should not be regarded as investment advice. Because these funds are actively managed, there is no assurance that they will continue to invest in the securities or industries mentioned.
Before investing, consider the fund’s investment objectives, risks, charges and expenses. Visit www.funds.natixis.com or call 1-800-225-5478 for a prospectus and/or a summary prospectus, both of which contain this and other information. Read it carefully.
INDEX/AVERAGE DESCRIPTIONS:
Citigroup World Government Bond Index is an unmanaged index that includes the most significant and liquid government bond markets globally that carry at least an investment-grade rating.
MSCI World Index is an unmanaged index that is designed to measure the equity market performance of developed markets.
Russell 1000 Growth Index is an unmanaged index that measures the performance of the large-cap growth segment of the U.S. equity universe. It includes those Russell 1000 companies with higher price-to-book ratios and higher forecasted growth values.
Russell 1000 Value Index is an unmanaged index that measures the performance of the large-cap value segment of the U.S. equity universe. It includes those Russell 1000 companies with lower price-to-book ratios and lower expected growth values.
Russell Midcap Growth Index is an unmanaged index that measures the performance of the mid-cap growth segment of the U.S. equity universe. It includes those Russell Midcap Index companies with higher price-to-book ratios and higher forecasted growth values.
Standard & Poor’s 500 Index (“S&P 500”) is a widely recognized measure of U.S. stock market performance. It is an unmanaged index of 500 common stocks chosen for market size, liquidity, and industry group representation, among other factors.
Morningstar Fund Averages are the average performance without sales charges of funds with similar investment objectives, as calculated by Morningstar, Inc.
PROXY VOTING INFORMATION
A description of the funds’ proxy voting policies and procedures is available without charge, upon request, by calling Natixis Funds at 800-225-5478; on the funds’ website at www.funds.natixis.com; and on the Securities and Exchange Commission’s website at www.sec.gov. Information regarding how the funds voted proxies relating to portfolio securities during the 12-month period ended June 30, 2009 is available from the funds’ website and the SEC’s website.
QUARTERLY PORTFOLIO SCHEDULES
The funds will file a complete schedule of portfolio holdings with the SEC for the first and third quarters of each fiscal year on Form N-Q. The funds’ Forms N-Q are available on the SEC’s website at www.sec.gov and may be reviewed and copied at the SEC’s Public Reference Room in Washington, DC. Information on the operation of the Public Reference Room may be obtained by calling
1-800-SEC-0330.
| | | | |
| NOT FDIC INSURED | | MAY LOSE VALUE | | NO BANK GUARANTEE |
11
UNDERSTANDING FUND EXPENSES
As a mutual fund shareholder, you incur different types of costs: transaction costs, including sales charges (loads) on purchases and contingent deferred sales charges on redemptions, certain exchange fees and ongoing costs, including management fees, distribution and/or service fees (12b-1 fees), and other fund expenses. In addition, each fund may assess a minimum balance fee of $20 on an annual basis for accounts that fall below the required minimum to establish an account (certain exceptions may apply). These costs are described in more detail in the funds’ prospectus. The examples below are intended to help you understand the ongoing costs of investing in the funds and help you compare these with the ongoing costs of investing in other mutual funds.
The first line in the table for each class shows the actual amount of fund expenses you would have paid on a $1,000 investment in the fund from October 1, 2009 through March 31, 2010. It also shows how much a $1,000 investment would be worth at the close of the period, assuming actual fund returns and expenses. To estimate the expenses you paid over the period, simply divide your account value by $1,000 (for example, $8,600 account value divided by $1,000 = 8.6) and multiply the result by the number in the Expenses Paid During the Period row as shown below for your class.
The second line in the table for each class provides information about hypothetical account values and hypothetical expenses based on the fund’s actual expense ratios and an assumed rate of return of 5% per year before expenses, which is not the fund’s actual return. The hypothetical account values and expenses may not be used to estimate the actual ending account balance or expenses you paid on your investment for the period. You may use this information to compare the ongoing costs of investing in the fund and other funds. To do so, compare this 5% hypothetical example with the 5% hypothetical examples that appear in the shareholder reports of the other funds.
Please note that the expenses shown reflect ongoing costs only, and do not include any transaction costs. Therefore, the second line in the table of each fund is useful in comparing ongoing costs only, and will not help you determine the relative costs of owning different funds. If transaction costs were included, total costs would be higher.
| | | | | | |
| LOOMIS SAYLES DISCIPLINED EQUITY FUND | | BEGINNING ACCOUNT VALUE
10/1/2009 | | ENDING ACCOUNT VALUE
3/31/2010 | | EXPENSES PAID DURING PERIOD*
10/1/2009 – 3/31/2010 |
Class A | | | | | | |
Actual | | $1,000.00 | | $1,095.70 | | $6.01 |
Hypothetical (5% return before expenses) | | $1,000.00 | | $1,019.20 | | $5.79 |
Class B | | | | | | |
Actual | | $1,000.00 | | $1,091.20 | | $9.85 |
Hypothetical (5% return before expenses) | | $1,000.00 | | $1,015.51 | | $9.50 |
Class C | | | | | | |
Actual | | $1,000.00 | | $1,090.50 | | $9.85 |
Hypothetical (5% return before expenses) | | $1,000.00 | | $1,015.51 | | $9.50 |
Class Y | | | | | | |
Actual | | $1,000.00 | | $1,098.20 | | $4.71 |
Hypothetical (5% return before expenses) | | $1,000.00 | | $1,020.44 | | $4.53 |
| * | Expenses are equal to the Fund’s annualized expense ratio (after fee reduction/reimbursement): 1.15%, 1.89%, 1.89% and 0.90%, for Class A, B, C and Y, respectively, multiplied by the average account value over the period, multiplied by the number of days in the most recent fiscal half-year, divided by 365 (to reflect the half-year period). |
12
UNDERSTANDING FUND EXPENSES
| | | | | | |
| LOOMIS SAYLES GLOBAL MARKETS FUND | | BEGINNING ACCOUNT VALUE
10/1/2009 | | ENDING ACCOUNT VALUE
3/31/2010 | | EXPENSES PAID DURING PERIOD*
10/1/2009 – 3/31/2010 |
Class A | | | | | | |
Actual | | $1,000.00 | | $1,102.80 | | $6.55 |
Hypothetical (5% return before expenses) | | $1,000.00 | | $1,018.70 | | $6.29 |
Class C | | | | | | |
Actual | | $1,000.00 | | $1,099.40 | | $10.47 |
Hypothetical (5% return before expenses) | | $1,000.00 | | $1,014.96 | | $10.05 |
Class Y | | | | | | |
Actual | | $1,000.00 | | $1,104.60 | | $5.25 |
Hypothetical (5% return before expenses) | | $1,000.00 | | $1,019.95 | | $5.04 |
| * | Expenses are equal to the Fund’s annualized expense ratio (after fee reduction/reimbursement): 1.25%, 2.00% and 1.00%, for Class A, C and Y, respectively, multiplied by the average account value over the period multiplied by the number of days in the most recent fiscal half-year, divided by 365 (to reflect the half-year period). |
| | | | | | |
| LOOMIS SAYLES GROWTH FUND | | BEGINNING ACCOUNT VALUE
10/1/2009 | | ENDING ACCOUNT VALUE
3/31/2010 | | EXPENSES PAID DURING PERIOD*
10/1/2009 – 3/31/2010 |
Class A | | | | | | |
Actual | | $1,000.00 | | $1,145.10 | | $6.15 |
Hypothetical (5% return before expenses) | | $1,000.00 | | $1,019.20 | | $5.79 |
Class B | | | | | | |
Actual | | $1,000.00 | | $1,140.20 | | $10.14 |
Hypothetical (5% return before expenses) | | $1,000.00 | | $1,015.46 | | $9.55 |
Class C | | | | | | |
Actual | | $1,000.00 | | $1,142.50 | | $10.15 |
Hypothetical (5% return before expenses) | | $1,000.00 | | $1,015.46 | | $9.55 |
Class Y | | | | | | |
Actual | | $1,000.00 | | $1,145.90 | | $4.76 |
Hypothetical (5% return before expenses) | | $1,000.00 | | $1,020.49 | | $4.48 |
| * | Expenses are equal to the Fund’s annualized expense ratio (after fee reduction/reimbursement): 1.15%, 1.90%, 1.90% and 0.89% for Class A, B, C and Y, respectively, multiplied by the average account value over the period, multiplied by the number of days in the most recent fiscal half-year, divided by 365 (to reflect the half-year period). |
13
UNDERSTANDING FUND EXPENSES
| | | | | | |
| LOOMIS SAYLES MID CAP GROWTH FUND | | BEGINNING ACCOUNT VALUE
10/1/2009 | | ENDING ACCOUNT VALUE
3/31/2010 | | EXPENSES PAID DURING PERIOD*
10/1/2009 – 3/31/2010 |
CLASS A | | | | | | |
Actual | | $1,000.00 | | $1,178.80 | | $6.79 |
Hypothetical (5% return before expenses) | | $1,000.00 | | $1,018.70 | | $6.29 |
CLASS C | | | | | | |
Actual | | $1,000.00 | | $1,174.70 | | $10.84 |
Hypothetical (5% return before expenses) | | $1,000.00 | | $1,014.96 | | $10.05 |
CLASS Y | | | | | | |
Actual | | $1,000.00 | | $1,180.50 | | $5.44 |
Hypothetical (5% return before expenses) | | $1,000.00 | | $1,019.95 | | $5.04 |
| * | Expenses are equal to the Fund’s annualized expense ratio (after fee reduction/reimbursement): 1.25%, 2.00% and 1.00%, for Class A, C and Y, respectively, multiplied by the average account value over the period, multiplied by the number of days in the most recent fiscal half-year, divided by 365 (to reflect the half-year period). |
| | | | | | | | |
| LOOMIS SAYLES VALUE FUND | | BEGINNING ACCOUNT VALUE
10/1/2009 | | ENDING ACCOUNT VALUE
3/31/2010 | | | EXPENSES PAID DURING PERIOD
10/1/2009 – 3/31/2010 | |
CLASS A | | | | | | | | |
Actual | | $1,000.00 | | $1,094.20 | | | $4.86 | 1 |
Hypothetical (5% return before expenses) | | $1,000.00 | | $1,020.29 | | | $4.68 | * |
CLASS B | | | | | | | | |
Actual | | $1,000.00 | | $1,090.20 | | | $8.75 | 1 |
Hypothetical (5% return before expenses) | | $1,000.00 | | $1,016.55 | | | $8.45 | * |
CLASS C | | | | | | | | |
Actual | | $1,000.00 | | $1,089.80 | | | $8.75 | 1 |
Hypothetical (5% return before expenses) | | $1,000.00 | | $1,016.55 | | | $8.45 | * |
CLASS Y | | | | | | | | |
Actual | | $1,000.00 | | $1,095.40 | | | $3.60 | 1 |
Hypothetical (5% return before expenses) | | $1,000.00 | | $1,021.49 | | | $3.48 | * |
Admin Class | | | | | | | | |
Actual | | $1,000.00 | | $1,065.20 | 2 | | $2.20 | 2 |
Hypothetical (5% return before expenses) | | $1,000.00 | | $1,001.26 | * | | $6.69 | * |
| * | Hypothetical expenses are equal to the Fund’s annualized expense ratio: 0.93%, 1.68%, 1.68%, 0.69% and 1.34%, for Class A, B, C, Y and Admin Class, respectively, multiplied by the average account value over the period, multiplied by the number of days in the most recent fiscal half-year (182), divided by 365 (to reflect the half-year period). |
| 1 | Actual expenses for Class A, B, C and Y are equal to the Fund’s annualized expense ratio: 0.93%, 1.68%, 1.68% and 0.69% , respectively, multiplied by the average account value over the period, multiplied by the number of days in the most recent fiscal half-year (182), divided by 365 (to reflect the half-year period). |
| 2 | Admin Class commenced operations on February 1, 2010. Actual expenses are equal to the Fund’s annualized expense ratio of 1.34% multiplied by the average account value over the period, multiplied by the number of days in the most recent fiscal period (58), divided by 365 (to reflect the partial period). |
14
LOOMIS SAYLES DISCIPLINED EQUITY FUND — PORTFOLIOOF INVESTMENTS
Investments as of March 31, 2010 (Unaudited)
| | | | | |
| Shares | | Description | | Value (†) |
| | | | | |
| Common Stocks — 96.3% of Net Assets |
| | Aerospace & Defense — 2.4% | | | |
| 10,857 | | General Dynamics Corp.(b) | | $ | 838,161 |
| | | | | |
| | Automobiles — 2.5% | | | |
| 68,071 | | Ford Motor Co.(c) | | | 855,653 |
| | | | | |
| | Beverages — 3.9% | | | |
| 9,150 | | Brown-Forman Corp., Class B | | | 543,967 |
| 12,343 | | PepsiCo, Inc. | | | 816,613 |
| | | | | |
| | | | | 1,360,580 |
| | | | | |
| | Biotechnology — 2.3% | | | |
| 13,262 | | Amgen, Inc.(c) | | | 792,537 |
| | | | | |
| | Capital Markets — 4.2% | | | |
| 3,431 | | BlackRock, Inc.(b) | | | 747,135 |
| 4,259 | | Goldman Sachs Group, Inc. (The)(b) | | | 726,713 |
| | | | | |
| | | | | 1,473,848 |
| | | | | |
| | Communications Equipment — 3.4% | | | |
| 10,888 | | F5 Networks, Inc.(c) | | | 669,721 |
| 10,464 | | Harris Corp.(b) | | | 496,935 |
| | | | | |
| | | | | 1,166,656 |
| | | | | |
| | Computers & Peripherals — 9.7% | | | |
| 4,868 | | Apple, Inc.(c) | | | 1,143,639 |
| 45,826 | | EMC Corp.(c) | | | 826,701 |
| 25,979 | | Hewlett-Packard Co.(b) | | | 1,380,784 |
| | | | | |
| | | | | 3,351,124 |
| | | | | |
| | Diversified Financial Services — 3.3% | | | |
| 32,465 | | Bank of America Corp. | | | 579,500 |
| 12,344 | | JPMorgan Chase & Co.(b) | | | 552,394 |
| | | | | |
| | | | | 1,131,894 |
| | | | | |
| | Electrical Equipment — 1.4% | | | |
| 9,857 | | Emerson Electric Co.(b) | | | 496,201 |
| | | | | |
| | Energy Equipment & Services — 2.8% | | | |
| 11,276 | | Transocean Ltd.(c) | | | 974,021 |
| | | | | |
| | Food & Staples Retailing — 0.9% | | | |
| 5,777 | | Wal-Mart Stores, Inc. | | | 321,201 |
| | | | | |
| | Health Care Equipment & Supplies — 1.5% | | | |
| 19,305 | | CareFusion Corp.(c) | | | 510,231 |
| | | | | |
| | Health Care Providers & Services — 6.5% | | | |
| 15,201 | | Aetna, Inc. | | | 533,707 |
| 24,529 | | AmerisourceBergen Corp.(b) | | | 709,379 |
| 15,832 | | WellPoint, Inc.(b)(c) | | | 1,019,264 |
| | | | | |
| | | | | 2,262,350 |
| | | | | |
| | Household Durables — 2.8% | | | |
| 11,092 | | Whirlpool Corp. | | | 967,777 |
| | | | | |
| | Household Products — 2.6% | | | |
| 14,040 | | Procter & Gamble Co. (The) | | | 888,311 |
| | | | | |
| | Independent Power Producers & Energy Traders — 2.1% |
| 20,905 | | Constellation Energy Group, Inc. | | | 733,975 |
| | | | | |
| | Industrial Conglomerates — 3.4% | | | |
| 5,086 | | 3M Co.(b) | | | 425,037 |
| 41,621 | | General Electric Co. | | | 757,502 |
| | | | | |
| | | | | 1,182,539 |
| | | | | |
| | | | | | | |
| Shares | | Description | | Value (†) | |
| | | | | | | |
| | | Insurance — 3.9% | | | | |
| | 12,049 | | Travelers Cos., Inc. (The)(b) | | $ | 649,923 | |
| | 27,744 | | Unum Group | | | 687,219 | |
| | | | | | | |
| | | | | | 1,337,142 | |
| | | | | | | |
| | | Internet & Catalog Retail — 2.5% | | | | |
| | 3,449 | | Priceline.com, Inc.(b)(c) | | | 879,495 | |
| | | | | | | |
| | | Internet Software & Services — 3.3% | | | | |
| | 2,048 | | Google, Inc., Class A(b)(c) | | | 1,161,237 | |
| | | | | | | |
| | | Life Sciences Tools & Services — 0.9% | | | | |
| | 6,407 | | Thermo Fisher Scientific, Inc.(c) | | | 329,576 | |
| | | | | | | |
| | | Media — 1.4% | | | | |
| | 14,132 | | Discovery Communications, Inc., Class A(c) | | | 477,520 | |
| | | | | | | |
| | | Metals & Mining — 2.0% | | | | |
| | 3,998 | | Walter Energy, Inc. | | | 368,896 | |
| | 17,395 | | Xstrata PLC(c) | | | 329,565 | |
| | | | | | | |
| | | | | | 698,461 | |
| | | | | | | |
| | | Multiline Retail — 1.5% | | | | |
| | 8,756 | | Dollar Tree, Inc.(c) | | | 518,530 | |
| | | | | | | |
| | | Oil, Gas & Consumable Fuels — 6.2% | | | | |
| | 70,870 | | El Paso Corp. | | | 768,231 | |
| | 27,959 | | Marathon Oil Corp. | | | 884,623 | |
| | 21,309 | | Williams Cos., Inc. (The) | | | 492,238 | |
| | | | | | | |
| | | | | | 2,145,092 | |
| | | | | | | |
| | | Paper & Forest Products — 1.6% | | | | |
| | 23,179 | | International Paper Co.(b) | | | 570,435 | |
| | | | | | | |
| | | Personal Products — 1.4% | | | | |
| | 7,486 | | Estee Lauder Cos., Inc., (The) Class A | | | 485,617 | |
| | | | | | | |
| | | Pharmaceuticals — 7.3% | | | | |
| | 27,541 | | Merck & Co., Inc. | | | 1,028,656 | |
| | 24,691 | | Mylan, Inc.(c) | | | 560,733 | |
| | 55,802 | | Pfizer, Inc. | | | 957,004 | |
| | | | | | | |
| | | | | | 2,546,393 | |
| | | | | | | |
| | | Software — 8.6% | | | | |
| | 45,193 | | Microsoft Corp. | | | 1,322,799 | |
| | 65,303 | | Oracle Corp.(b) | | | 1,677,634 | |
| | | | | | | |
| | | | | | 3,000,433 | |
| | | | | | | |
| | | Total Common Stocks (Identified Cost $30,038,940) | | | 33,456,990 | |
| | | | | | | |
Principal
Amount | | | | | |
| | Short-Term Investments — 4.3% | |
| $ | 1,481,511 | | Tri-Party Repurchase Agreement with Fixed Income Clearing Corporation, dated 3/31/2010 at 0.000% to be repurchased at $1,481,511 on 4/01/2010 collateralized by $1,510,000 Federal National Mortgage Association, 3.000% due 1/29/2015 valued at $1,515,663 including accrued interest (Note 2 of Notes to Financial Statements)
(Identified Cost $1,481,511) | | | 1,481,511 | |
| | | | | | | |
| | | Total Investments — 100.6%
(Identified Cost $31,520,451)(a) | | | 34,938,501 | |
| | | Other assets less liabilities — (0.6)% | | | (216,646 | ) |
| | | | | | | |
| | | Net Assets — 100.0% | | $ | 34,721,855 | |
| | | | | | | |
See accompanying notes to financial statements.
15
LOOMIS SAYLES DISCIPLINED EQUITY FUND — PORTFOLIOOF INVESTMENTS (continued)
Investments as of March 31, 2010 (Unaudited)
| | | | | | |
| Contracts | | Description | | Value (†) | |
| | | | | | |
| | Call Options Written — (0.2%) | | | | |
| 25 | | 3M Co. expiring May 22, 2010 at 85 | | $ | (4,125 | ) |
| 244 | | AmerisourceBergen Corp. expiring May 22, 2010 at 30 | | | (13,420 | ) |
| 10 | | BlackRock, Inc. expiring May 22, 2010 at 240 | | | (2,200 | ) |
| 32 | | Emerson Electric Co. expiring April 17, 2010 at 50 | | | (3,040 | ) |
| 72 | | General Dynamics Corp. expiring May 22, 2010 at 80 | | | (9,360 | ) |
| 11 | | Goldman Sachs Group, Inc. (The) expiring May 22, 2010 at 190 | | | (1,254 | ) |
| 6 | | Google, Inc., Class A expiring May 22, 2010 at 600 | | | (6,090 | ) |
| 22 | | Harris Corp. expiring May 22, 2010 at 50 | | | (2,255 | ) |
| 86 | | Hewlett-Packard Co. expiring May 22, 2010 at 55 | | | (7,009 | ) |
| 67 | | International Paper Co. expiring May 22, 2010 at 30 | | | (838 | ) |
| 42 | | JPMorgan Chase & Co. expiring May 22, 2010 at 48 | | | (2,415 | ) |
| 206 | | Oracle Corp. expiring April 17, 2010 at 26 | | | (5,356 | ) |
| 20 | | Priceline.com, Inc. expiring April 17, 2010 at 260 | | | (9,000 | ) |
| 120 | | Travelers Cos., Inc. (The) expiring April 17, 2010 at 55 | | | (3,900 | ) |
| 48 | | WellPoint, Inc. expiring April 17, 2010 at 65 | | | (4,224 | ) |
| 48 | | WellPoint, Inc. expiring May 22, 2010 at 67.50 | | | (6,456 | ) |
| | | | | | |
| | Total Call Options Written (Premiums Received $83,766) | | $ | (80,942 | ) |
| | | | | | |
| | | |
| (†) | | See Note 2 of Notes to Financial Statements. | |
| (a) | | Federal Tax Information (Amounts exclude certain adjustments made at the end of the Fund’s fiscal year for tax purposes. Such adjustments are primarily due to wash sales.): At March 31, 2010, the net unrealized appreciation on investments based on a cost of $31,520,451 for federal income tax purposes was as follows: | |
| | Aggregate gross unrealized appreciation for all investments in which there is an excess of value over tax cost | | $ | 3,475,816 | |
| | Aggregate gross unrealized depreciation for all investments in which there is an excess of tax cost over value | | | (57,766 | ) |
| | | | | | |
| | Net unrealized appreciation | | $ | 3,418,050 | |
| | | | | | |
| | | | | | |
| (b) | | All or a portion of this security is held as collateral for outstanding call options. | |
| (c) | | Non-income producing security. | | | | |
Industry Summary at March 31, 2010 (Unaudited)
| | | |
| Computers & Peripherals | | 9.7 | % |
| Software | | 8.6 | |
| Pharmaceuticals | | 7.3 | |
| Health Care Providers & Services | | 6.5 | |
| Oil, Gas & Consumable Fuels | | 6.2 | |
| Capital Markets | | 4.2 | |
| Beverages | | 3.9 | |
| Insurance | | 3.9 | |
| Industrial Conglomerates | | 3.4 | |
| Communications Equipment | | 3.4 | |
| Internet Software & Services | | 3.3 | |
| Diversified Financial Services | | 3.3 | |
| Energy Equipment & Services | | 2.8 | |
| Household Durables | | 2.8 | |
| Household Products | | 2.6 | |
| Internet & Catalog Retail | | 2.5 | |
| Automobiles | | 2.5 | |
| Aerospace & Defense | | 2.4 | |
| Biotechnology | | 2.3 | |
| Independent Power Producers & Energy Traders | | 2.1 | |
| Metals & Mining | | 2.0 | |
| Other Investments, less than 2% each | | 10.6 | |
| Short-Term Investments | | 4.3 | |
| | | |
| Total Investments | | 100.6 | |
Other assets less liabilities
(including call options written) | | (0.6 | ) |
| | | |
| Net Assets | | 100.0 | % |
| | | |
See accompanying notes to financial statements.
16
LOOMIS SAYLES GLOBAL MARKETS FUND — PORTFOLIOOF INVESTMENTS
Investments as of March 31, 2010 (Unaudited)
| | | | | |
| Shares | | Description | | Value (†) |
| | | | | |
| Common Stocks — 63.6% of Net Assets | | | |
| | Belgium — 0.9% | | | |
| 51,509 | | Anheuser-Busch InBev NV | | $ | 2,590,782 |
| | | | | |
| | Brazil — 6.0% | | | |
| 144,700 | | Hypermarcas SA(b) | | | 1,769,744 |
| 166,400 | | Lojas Renner SA | | | 3,817,651 |
| 209,700 | | Natura Cosmeticos SA | | | 4,256,851 |
| 254,600 | | OGX Petroleo e Gas Participacoes SA | | | 2,383,721 |
| 147,184 | | Vale SA, Sponsored ADR | | | 4,737,853 |
| | | | | |
| | | | | 16,965,820 |
| | | | | |
| | Cayman Islands — 2.8% | | | |
| 8,200 | | Baidu, Inc., Sponsored ADR(b) | | | 4,895,400 |
| 79,162 | | Ctrip.com International Ltd., ADR(b) | | | 3,103,150 |
| | | | | |
| | | | | 7,998,550 |
| | | | | |
| | Chile — 0.9% | | | |
| 38,800 | | Banco Santander Chile, ADR | | | 2,646,936 |
| | | | | |
| | China — 1.7% | | | |
| 242,400 | | Tencent Holdings Ltd. | | | 4,853,874 |
| | | | | |
| | France — 0.8% | | | |
| 48,363 | | ArcelorMittal, (NY Registered) | | | 2,123,619 |
| | | | | |
| | Germany — 1.2% | | | |
| 34,706 | | Siemens AG, (Registered) | | | 3,467,719 |
| | | | | |
| | Hong Kong — 1.6% | | | |
| 1,114,000 | | Cathay Pacific Airways Ltd.(b) | | | 2,340,405 |
| 474,000 | | Li & Fung Ltd. | | | 2,328,059 |
| | | | | |
| | | | | 4,668,464 |
| | | | | |
| | Japan — 1.8% | | | |
| 85,400 | | Honda Motor Co. Ltd. | | | 3,010,238 |
| 146,000 | | Nippon Electric Glass Co. Ltd. | | | 2,060,780 |
| | | | | |
| | | | | 5,071,018 |
| | | | | |
| | Korea — 1.8% | | | |
| 31,304 | | Hyundai Motor Co. | | | 3,192,159 |
| 19,621 | | Samsung Electro-Mechanics Co. Ltd. | | | 1,992,611 |
| | | | | |
| | | | | 5,184,770 |
| | | | | |
| | Netherlands Antilles — 0.6% | | | |
| 26,349 | | Schlumberger Ltd. | | | 1,672,108 |
| | | | | |
| | Russia — 1.0% | | | |
| 1,011,769 | | Sberbank | | | 2,953,985 |
| | | | | |
| | Switzerland — 3.5% | | | |
| 191,070 | | ABB Ltd., (Registered)(b) | | | 4,174,961 |
| 36,470 | | Credit Suisse Group AG | | | 1,877,198 |
| 30,955 | | Sonova Holding AG, (Registered) | | | 3,842,151 |
| | | | | |
| | | | | 9,894,310 |
| | | | | |
| | United Kingdom — 5.9% | | | |
| 904,280 | | ARM Holdings PLC | | | 3,241,299 |
| 253,562 | | Experian PLC | | | 2,493,390 |
| 276,831 | | Standard Chartered PLC | | | 7,545,665 |
| 69,318 | | Vodafone Group PLC, Sponsored ADR | | | 1,614,416 |
| 94,186 | | Xstrata PLC(b) | | | 1,782,593 |
| | | | | |
| | | | | 16,677,363 |
| | | | | |
| | United States — 33.1% | | | |
| 46,340 | | Amazon.com, Inc.(b) | | | 6,289,728 |
| 76,273 | | Anadarko Petroleum Corp. | | | 5,554,963 |
| 47,812 | | Apple, Inc.(b) | | | 11,232,473 |
| 180,211 | | Bank of America Corp. | | | 3,216,766 |
| | | | | | |
| Shares | | Description | | Value (†) |
| | | | | | |
| | | United States — continued | | | |
| | 84,834 | | Broadcom Corp., Class A | | $ | 2,814,792 |
| | 31,440 | | Caterpillar, Inc. | | | 1,976,004 |
| | 103,190 | | Cisco Systems, Inc.(b) | | | 2,686,036 |
| | 51,011 | | Cree, Inc.(b) | | | 3,581,992 |
| | 12,529 | | Dex One Corp.(b) | | | 349,810 |
| | 122,847 | | EMC Corp.(b) | | | 2,216,160 |
| | 53,050 | | Emerson Electric Co. | | | 2,670,537 |
| | 56,988 | | Estee Lauder Cos., Inc. (The), Class A | | | 3,696,811 |
| | 67,627 | | FMC Technologies, Inc.(b) | | | 4,370,733 |
| | 16,420 | | Franklin Resources, Inc. | | | 1,820,978 |
| | 16,082 | | Goldman Sachs Group, Inc. (The) | | | 2,744,072 |
| | 9,083 | | Google, Inc., Class A(b) | | | 5,150,152 |
| | 63,993 | | Guess?, Inc. | | | 3,006,391 |
| | 33,211 | | Hewlett-Packard Co. | | | 1,765,165 |
| | 132,801 | | Marvell Technology Group Ltd.(b) | | | 2,706,484 |
| | 85,906 | | Microsoft Corp. | | | 2,514,469 |
| | 29,235 | | Precision Castparts Corp. | | | 3,704,367 |
| | 18,213 | | Priceline.com, Inc.(b) | | | 4,644,315 |
| | 72,183 | | Southwestern Energy Co.(b) | | | 2,939,292 |
| | 96,129 | | Starbucks Corp.(b) | | | 2,333,051 |
| | 26,818 | | Vertex Pharmaceuticals, Inc.(b) | | | 1,096,052 |
| | 28,973 | | Visa, Inc., Class A | | | 2,637,412 |
| | 28,041 | | Walter Energy, Inc. | | | 2,587,343 |
| | 117,420 | | Wells Fargo & Co. | | | 3,654,110 |
| | | | | | |
| | | | | | 93,960,458 |
| | | | | | |
| | | Total Common Stocks (Identified Cost $147,972,698) | | | 180,729,776 |
| | | | | | |
Principal
Amount (‡) | | | | |
| | Bonds and Notes — 32.6% | | | |
| | Non-Convertible Bonds — 31.4% | | | |
| | | Argentina — 0.2% | | | |
| $ | 570,000 | | Transportadora de Gas del Sur SA, | | | |
| | | 7.875%, 5/14/2017, 144A | | | 540,788 |
| | | | | | |
| | | Australia — 0.1% | | | |
| | 230,000 | | New South Wales Treasury Corp., Series 10RG, | | | |
| | | 7.000%, 12/01/2010, (AUD) | | | 214,743 |
| | | | | | |
| | | Bermuda — 0.2% | | | |
| | 100,000 | | Noble Group Ltd., | | | |
| | | 6.750%, 1/29/2020, 144A | | | 103,375 |
| | 100,000 | | Noble Group Ltd., | | | |
| | | 8.500%, 5/30/2013, 144A | | | 112,375 |
| | 200,000 | | Qtel International Finance Ltd., | | | |
| | | 7.875%, 6/10/2019, 144A | | | 231,147 |
| | | | | | |
| | | | | | 446,897 |
| | | | | | |
| | | Brazil — 0.9% | | | |
| | 200,000 | | Banco Nacional de Desenvolvimento Economico e Social, | | | |
| | | 6.500%, 6/10/2019, 144A | | | 213,500 |
| | 400,000 | | Banco Santander Brasil, | | | |
| | | 4.500%, 4/06/2015, 144A | | | 399,080 |
| | 1,522,229(††) | | Brazil Notas do Tesouro Nacional, Series B, | | | |
| | | 6.000%, 8/15/2010, (BRL) | | | 861,654 |
| | 456,669(††) | | Brazil Notas do Tesouro Nacional, Series B, | | | |
| | | 6.000%, 5/15/2015, (BRL) | | | 253,171 |
| | 200,000 | | Gerdau Holdings, Inc., | | | |
| | | 7.000%, 1/20/2020, 144A | | | 211,000 |
| | 100,000 | | NET Servicos de Comunicacao SA, | | | |
| | | 7.500%, 1/27/2020, 144A | | | 105,500 |
See accompanying notes to financial statements.
17
LOOMIS SAYLES GLOBAL MARKETS FUND — PORTFOLIOOF INVESTMENTS (continued)
Investments as of March 31, 2010 (Unaudited)
| | | | | |
Principal
Amount (‡) | | Description | | Value (†) |
| | | | | |
| | Brazil — continued | | | |
| 650,000 | | Republic of Brazil, | | | |
| | 10.250%, 1/10/2028, (BRL) | | $ | 369,163 |
| 100,000 | | Telemar Norte Leste SA, | | | |
| | 9.500%, 4/23/2019, 144A | | | 118,750 |
| | | | | |
| | | | | 2,531,818 |
| | | | | |
| | Canada — 0.4% | | | |
| 680,000 | | Canadian Government, | | | |
| | 4.500%, 6/01/2015, (CAD)(c) | | | 720,794 |
| 25,000 | | Canadian Pacific Railway Ltd., MTN, | | | |
| | 4.900%, 6/15/2010, (CAD), 144A | | | 24,798 |
| 180,000 | | Corus Entertainment, Inc., | | | |
| | 7.250%, 2/10/2017, (CAD), 144A | | | 180,468 |
| 50,000 | | Nortel Networks Ltd., | | | |
| | 6.875%, 9/01/2023(d) | | | 15,500 |
| 100,000 | | Pacific Rubiales Energy Corp., | | | |
| | 8.750%, 11/10/2016, 144A | | | 108,500 |
| 100,000 | | Shaw Communications, Inc., | | | |
| | 5.650%, 10/01/2019, (CAD) | | | 101,357 |
| | | | | |
| | | | | 1,151,417 |
| | | | | |
| | Cayman Islands — 0.9% | | | |
| 360,000 | | DASA Finance Corp., | | | |
| | 8.750%, 5/29/2018, 144A | | | 385,200 |
| 200,000 | | Embraer Overseas Ltd., | | | |
| | 6.375%, 1/24/2017 | | | 206,500 |
| 100,000 | | Fibria Overseas Finance Ltd., | | | |
| | 9.250%, 10/30/2019, 144A | | | 114,000 |
| 100,000 | | Hutchison Whampoa International 09 Ltd., | | | |
| | 7.625%, 4/09/2019, 144A | | | 116,616 |
| 100,000 | | LPG International, Inc., | | | |
| | 7.250%, 12/20/2015 | | | 109,750 |
| 170,000 | | Marfrig Overseas Ltd., | | | |
| | 9.625%, 11/16/2016, 144A | | | 179,350 |
| 200,000 | | Odebrecht Finance Ltd., | | | |
| | 7.000%, 4/21/2020, 144A | | | 208,250 |
| 320,000 | | Petrobras International Finance Co., | | | |
| | 5.875%, 3/01/2018 | | | 334,192 |
| 300,000 | | Petrobras International Finance Co., | | | |
| | 6.875%, 1/20/2040 | | | 309,655 |
| 536,000 | | Vale Overseas Ltd., | | | |
| | 6.875%, 11/21/2036 | | | 554,519 |
| 200,000 | | Voto-Votorantim Ltd., | | | |
| | 6.750%, 4/05/2021, 144A | | | 197,500 |
| | | | | |
| | | | | 2,715,532 |
| | | | | |
| | Chile — 0.0% | | | |
| 100,000 | | Celulosa Arauco y Constitucion SA, | | | |
| | 7.250%, 7/29/2019 | | | 107,457 |
| | | | | |
| | Colombia — 0.1% | | | |
| 200,000 | | Ecopetrol SA, | | | |
| | 7.625%, 7/23/2019 | | | 222,000 |
| 100,000 | | Empresas Publicas de Medellin ESP, | | | |
| | 7.625%, 7/29/2019, 144A | | | 110,500 |
| 40,000 | | Republic of Colombia, | | | |
| | 8.125%, 5/21/2024 | | | 48,000 |
| | | | | |
| | | | | 380,500 |
| | | | | |
| | Denmark — 0.2% | | | |
| 3,650,000 | | Denmark Government Bond, | | | |
| | 4.000%, 11/15/2015, (DKK) | | | 709,303 |
| | | | | |
| | | | | |
Principal
Amount (‡) | | Description | | Value (†) |
| | | | | |
| | France — 0.4% | | | |
| 35,000 | | Lafarge SA, EMTN, | | | |
| | 4.750%, 3/23/2020, (EUR) | | $ | 45,320 |
| 250,000 | | Lafarge SA, EMTN, | | | |
| | 5.375%, 6/26/2017, (EUR) | | | 344,283 |
| 240,000 | | Veolia Environnement, EMTN, | | | |
| | 4.000%, 2/12/2016, (EUR) | | | 333,964 |
| 25,000 | | Veolia Environnement, EMTN, | | | |
| | 5.125%, 5/24/2022, (EUR) | | | 35,858 |
| 100,000 | | Wendel, | | | |
| | 4.375%, 8/09/2017, (EUR) | | | 110,753 |
| 200,000 | | Wendel, | | | |
| | 4.875%, 5/26/2016, (EUR) | | | 239,092 |
| | | | | |
| | | | | 1,109,270 |
| | | | | |
| | Germany — 0.4% | | | |
| 200,000 | | Bertelsmann AG, | | | |
| | 4.750%, 9/26/2016, (EUR) | | | 276,881 |
| 300,000 | | Bundesrepublik Deutschland, Series 03, | | | |
| | 4.500%, 1/04/2013, (EUR) | | | 440,090 |
| 110,000 | | Bundesrepublik Deutschland, Series 06, | | | |
| | 3.750%, 1/04/2017, (EUR) | | | 158,899 |
| 140,000 | | Republic of Germany, | | | |
| | 3.750%, 7/04/2013, (EUR) | | | 202,547 |
| | | | | |
| | | | | 1,078,417 |
| | | | | |
| | Hungary — 0.1% | | | |
| 350,000 | | Republic of Hungary, | | | |
| | 6.250%, 1/29/2020 | | | 372,318 |
| | | | | |
| | India — 0.2% | | | |
| 500,000 | | Canara Bank Ltd., (fixed rate to 11/28/2016, variable
rate thereafter), | | | |
| | 6.365%, 11/28/2021 | | | 497,707 |
| 100,000 | | ICICI Bank Ltd., (fixed rate to 4/30/2017, variable
rate thereafter), | | | |
| | 6.375%, 4/30/2022, 144A | | | 94,153 |
| | | | | |
| | | | | 591,860 |
| | | | | |
| | Indonesia — 0.6% | | | |
| 200,000 | | Adaro Indonesia PT, | | | |
| | 7.625%, 10/22/2019, 144A | | | 207,760 |
| 400,000 | | Indonesia Government International Bond, | | | |
| | 6.875%, 1/17/2018 | | | 445,000 |
| 700,000 | | Indonesia Government International Bond, | | | |
| | 7.750%, 1/17/2038, 144A | | | 812,000 |
| 1,500,000,000 | | Indonesia Government International Bond, | | | |
| | 11.500%, 9/15/2019, (IDR) | | | 190,205 |
| 100,000 | | Indonesia Government International Bond, | | | |
| | 11.625%, 3/04/2019, 144A | | | 143,750 |
| | | | | |
| | | | | 1,798,715 |
| | | | | |
| | Italy — 0.2% | | | |
| 100,000 | | Atlantia SpA, EMTN, | | | |
| | 5.625%, 5/06/2016, (EUR) | | | 149,224 |
| 250,000 | | Finmeccanica SpA, EMTN, | | | |
| | 4.875%, 3/24/2025, (EUR) | | | 338,934 |
| 100,000 | | Telecom Italia SpA, EMTN, | | | |
| | 5.375%, 1/29/2019, (EUR) | | | 139,506 |
| | | | | |
| | | | | 627,664 |
| | | | | |
See accompanying notes to financial statements.
18
LOOMIS SAYLES GLOBAL MARKETS FUND — PORTFOLIOOF INVESTMENTS (continued)
Investments as of March 31, 2010 (Unaudited)
| | | | | |
Principal
Amount (‡) | | Description | | Value (†) |
| | | | | |
| | Japan — 0.6% | | | |
| 10,000,000 | | Japan Finance Corp. for Small and Medium Enterprises, | | | |
| | 1.100%, 9/20/2011, (JPY) | | $ | 107,843 |
| 120,000,000 | | Japan Government, | | | |
| | 1.400%, 6/20/2011, (JPY) | | | 1,302,848 |
| 180,000 | | Nomura Holdings, Inc., | | | |
| | 6.700%, 3/04/2020 | | | 186,806 |
| | | | | |
| | | | | 1,597,497 |
| | | | | |
| | Jersey — 0.1% | | | |
| 100,000 | | WPP PLC, | | | |
| | 6.000%, 4/04/2017, (GBP) | | | 159,070 |
| | | | | |
| | Korea — 0.7% | | | |
| 400,000 | | Export-Import Bank of Korea, | | | |
| | 8.125%, 1/21/2014 | | | 464,045 |
| 200,000 | | Korea Gas Corp., | | | |
| | 6.000%, 7/15/2014, 144A | | | 217,527 |
| 300,000 | | Korea Hydro & Nuclear Power Co. Ltd., | | | |
| | 6.250%, 6/17/2014, 144A | | | 328,735 |
| 400,000,000 | | Korea Treasury Bond, | | | |
| | 5.000%, 9/10/2014, (KRW) | | | 362,262 |
| 460,000 | | SK Broadband Co. Ltd., | | | |
| | 7.000%, 2/01/2012, 144A | | | 484,748 |
| 140,000 | | SK Telecom Co. Ltd., | | | |
| | 6.625%, 7/20/2027, 144A | | | 147,507 |
| | | | | |
| | | | | 2,004,824 |
| | | | | |
| | Lithuania — 0.1% | | | |
| 350,000 | | Lithuania Government International Bond, | | | |
| | 7.375%, 2/11/2020, 144A | | | 383,093 |
| | | | | |
| | Luxembourg — 0.0% | | | |
| 125,000 | | Telecom Italia Capital SA, | | | |
| | 6.000%, 9/30/2034 | | | 110,892 |
| 10,000 | | Telecom Italia Capital SA, | | | |
| | 6.375%, 11/15/2033 | | | 9,264 |
| | | | | |
| | | | | 120,156 |
| | | | | |
| | Malaysia — 0.1% | | | |
| 200,000 | | Ranhill Labuan Ltd., | | | |
| | 12.500%, 10/26/2011, 144A | | | 185,000 |
| | | | | |
| | Mexico — 0.9% | | | |
| 200,000 | | America Movil SAB de CV, | | | |
| | 3.625%, 3/30/2015, 144A | | | 200,679 |
| 195,000 | | Axtel SAB de CV, | | | |
| | 7.625%, 2/01/2017, 144A | | | 195,000 |
| 145,000 | | Axtel SAB de CV, | | | |
| | 9.000%, 9/22/2019, 144A | | | 147,900 |
| 160,000 | | Corporacion GEO SAB de CV, | | | |
| | 8.875%, 9/25/2014, 144A | | | 171,600 |
| 295,000 | | Desarrolladora Homex SAB de CV, | | | |
| | 7.500%, 9/28/2015 | | | 299,425 |
| 42,000(†††) | | Mexican Fixed Rate Bonds, Series M-10, | | | |
| | 8.000%, 12/17/2015, (MXN) | | | 354,751 |
| 44,000(†††) | | Mexican Fixed Rate Bonds, Series M-10, | | | |
| | 8.500%, 12/13/2018, (MXN) | | | 377,766 |
| 100,000 | | Mexichem SAB de CV, | | | |
| | 8.750%, 11/06/2019, 144A | | | 108,500 |
| 330,000 | | Petroleos Mexicanos, | | | |
| | 8.000%, 5/03/2019 | | | 386,925 |
| 200,000 | | Urbi Desarrollos Urbanos SAB de CV, | | | |
| | 9.500%, 1/21/2020, 144A | | | 216,500 |
| | | | | |
| | | | | 2,459,046 |
| | | | | |
| | | | | | |
Principal
Amount (‡) | | Description | | Value (†) |
| | | | | | |
| | | Netherlands — 0.2% | | | |
| $ | 200,000 | | Listrindo Capital BV, | | | |
| | | 9.250%, 1/29/2015, 144A | | $ | 216,732 |
| | 100,000 | | Majapahit Holding BV, | | | |
| | | 7.250%, 6/28/2017, 144A | | | 106,500 |
| | 100,000 | | Majapahit Holding BV, | | | |
| | | 7.750%, 1/20/2020, 144A | | | 108,500 |
| | 100,000 | | Majapahit Holding BV, | | | |
| | | 8.000%, 8/07/2019, 144A | | | 109,875 |
| | 50,000 | | OI European Group BV, | | | |
| | | 6.875%, 3/31/2017, (EUR), 144A | | | 68,208 |
| | | | | | |
| | | | | | 609,815 |
| | | | | | |
| | | New Zealand — 0.1% | | | |
| | 500,000 | | New Zealand Government, | | | |
| | | 6.500%, 4/15/2013, (NZD) | | | 374,425 |
| | | | | | |
| | | Norway — 0.5% | | | |
| | 635,000 | | Norwegian Government, | | | |
| | | 4.250%, 5/19/2017, (NOK) | | | 111,887 |
| | 1,765,000 | | Norwegian Government, | | | |
| | | 5.000%, 5/15/2015, (NOK) | | | 322,469 |
| | 1,885,000 | | Norwegian Government, | | | |
| | | 6.000%, 5/16/2011, (NOK) | | | 329,976 |
| | 2,860,000 | | Norwegian Government, | | | |
| | | 6.500%, 5/15/2013, (NOK)(c) | | | 534,843 |
| | | | | | |
| | | | | | 1,299,175 |
| | | | | | |
| | | Poland — 0.1% | | | |
| | 95,000 | | Poland Government Bond, | | | |
| | | 3.000%, 9/23/2014, (CHF) | | | 92,486 |
| | 500,000 | | Poland Government Bond, | | | |
| | | 5.000%, 10/24/2013, (PLN) | | | 176,267 |
| | | | | | |
| | | | | | 268,753 |
| | | | | | |
| | | Qatar — 0.1% | | | |
| | 100,000 | | Qatar Government International Bond, | | | |
| | | 4.000%, 1/20/2015, 144A | | | 101,850 |
| | 250,000 | | Ras Laffan Liquefied Natural Gas Co. Ltd. III, | | | |
| | | 5.500%, 9/30/2014, 144A | | | 268,325 |
| | | | | | |
| | | | | | 370,175 |
| | | | | | |
| | | Singapore — 0.2% | | | |
| | 200,000 | | Prime Dig Pte Ltd., | | | |
| | | 11.750%, 11/03/2014, 144A | | | 216,500 |
| | 435,000 | | Singapore Government, | | | |
| | | 2.250%, 7/01/2013, (SGD) | | | 324,337 |
| | | | | | |
| | | | | | 540,837 |
| | | | | | |
| | | South Africa — 0.5% | | | |
| | 130,000 | | Edcon Proprietary Ltd., | | | |
| | | 3.900%, 6/15/2014, (EUR), 144A(e) | | | 133,883 |
| | 450,000 | | Edcon Proprietary Ltd., | | | |
| | | 3.900%, 6/15/2014, (EUR)(e) | | | 463,442 |
| | 400,000 | | Republic of South Africa, | | | |
| | | 5.500%, 3/09/2020 | | | 405,000 |
| | 285,000 | | Republic of South Africa, EMTN, | | | |
| | | 4.500%, 4/05/2016, (EUR) | | | 392,634 |
| | | | | | |
| | | | | | 1,394,959 |
| | | | | | |
| | | Spain — 0.2% | | | |
| | 500,000 | | Instituto de Credito Oficial, MTN, | | | |
| | | 6.125%, 2/27/2014, (AUD) | | | 446,676 |
| | | | | | |
See accompanying notes to financial statements.
19
LOOMIS SAYLES GLOBAL MARKETS FUND — PORTFOLIOOF INVESTMENTS (continued)
Investments as of March 31, 2010 (Unaudited)
| | | | | |
Principal
Amount (‡) | | Description | | Value (†) |
| | | | | |
| | Supranational — 0.1% | | | |
| 14,000,000 | | European Investment Bank, | | | |
| | 1.250%, 9/20/2012, (JPY) | | $ | 153,180 |
| | | | | |
| | Sweden — 0.3% | | | |
| 2,300,000 | | Sweden Government Bond, | | | |
| | 4.500%, 8/12/2015, (SEK) | | | 350,265 |
| 3,020,000 | | Sweden Government Bond, | | | |
| | 5.500%, 10/08/2012, (SEK) | | | 458,584 |
| | | | | |
| | | | | 808,849 |
| | | | | |
| | Thailand — 0.2% | | | |
| 330,000 | | True Move Co. Ltd., | | | |
| | 10.375%, 8/01/2014 | | | 341,550 |
| 100,000 | | True Move Co. Ltd., | | | |
| | 10.375%, 8/01/2014, 144A | | | 103,500 |
| | | | | |
| | | | | 445,050 |
| | | | | |
| | Turkey — 0.1% | | | |
| 400,000 | | Republic of Turkey, | | | |
| | 5.625%, 3/30/2021 | | | 393,000 |
| | | | | |
| | United Arab Emirates — 0.6% | | | |
| 400,000 | | Abu Dhabi National Energy Co., | | | |
| | 6.500%, 10/27/2036, 144A | | | 373,862 |
| 400,000 | | Abu Dhabi National Energy Co., | | | |
| | 7.250%, 8/01/2018, 144A | | | 431,158 |
| 500,000 | | DP World Ltd., | | | |
| | 6.850%, 7/02/2037, 144A | | | 429,357 |
| 150,000 | | Emirate of Abu Dhabi, | | | |
| | 5.500%, 4/08/2014, 144A | | | 163,050 |
| 250,000 | | Mubadala Development Co., GMTN, | | | |
| | 7.625%, 5/06/2019, 144A | | | 282,733 |
| | | | | |
| | | | | 1,680,160 |
| | | | | |
| | United Kingdom — 0.4% | | | |
| 100,000 | | BAT International Finance PLC, | | | |
| | 5.875%, 3/12/2015, (EUR) | | | 151,570 |
| 60,000 | | BSKYB Finance UK PLC, | | | |
| | 5.750%, 10/20/2017, (GBP) | | | 96,673 |
| 200,000 | | Imperial Tobacco Finance PLC, EMTN, | | | |
| | 4.375%, 11/22/2013, (EUR) | | | 282,669 |
| 100,000 | | Rexam PLC, EMTN, | | | |
| | 4.375%, 3/15/2013, (EUR) | | | 139,292 |
| 250,000 | | Standard Chartered Bank, EMTN, | | | |
| | 5.875%, 9/26/2017, (EUR) | | | 365,642 |
| 100,000 | | Virgin Media Secured Finance PLC, | | | |
| | 7.000%, 1/15/2018, (GBP), 144A | | | 154,974 |
| | | | | |
| | | | | 1,190,820 |
| | | | | |
| | United States — 20.4% | | | |
| 155,000 | | Alcatel-Lucent USA, Inc., | | | |
| | 6.450%, 3/15/2029 | | | 109,275 |
| 15,000 | | Amkor Technology, Inc., | | | |
| | 7.750%, 5/15/2013 | | | 15,113 |
| 35,000 | | Anheuser-Busch Cos., Inc., | | | |
| | 6.500%, 5/01/2042 | | | 36,806 |
| 250,000 | | Anheuser-Busch InBev Worldwide, Inc., | | | |
| | 7.750%, 1/15/2019, 144A | | | 297,345 |
| 60,000 | | Arrow Electronics, Inc., | | | |
| | 6.875%, 7/01/2013 | | | 66,293 |
| 35,000 | | AT&T, Inc., | | | |
| | 6.500%, 9/01/2037 | | | 36,293 |
| | | | | | |
Principal
Amount (‡) | | Description | | Value (†) |
| | | | | | |
| | | United States — continued | | | |
| $ | 36,321 | | Atlas Air, Inc., Series B, | | | |
| | | 7.680%, 1/02/2014 | | $ | 34,323 |
| | 145,000 | | Avnet, Inc., | | | |
| | | 6.000%, 9/01/2015 | | | 152,694 |
| | 200,000 | | Bank of America Corp., (fixed rate to 5/06/2014, variable rate thereafter), | | | |
| | | 4.750%, 5/06/2019, (EUR) | | | 261,961 |
| | 400,000,000 | | Barclays Financial LLC, | | | |
| | | 4.060%, 9/16/2010, (KRW), 144A | | | 354,222 |
| | 310,000 | | Borden, Inc., | | | |
| | | 7.875%, 2/15/2023 | | | 220,100 |
| | 410,000 | | Borden, Inc., | | | |
| | | 8.375%, 4/15/2016 | | | 340,300 |
| | 15,000 | | Boston Scientific Corp., | | | |
| | | 5.125%, 1/12/2017 | | | 14,079 |
| | 5,000 | | Boston Scientific Corp., | | | |
| | | 5.450%, 6/15/2014 | | | 5,035 |
| | 15,000 | | Boston Scientific Corp., | | | |
| | | 6.400%, 6/15/2016 | | | 15,298 |
| | 60,000 | | Boston Scientific Corp., | | | |
| | | 7.000%, 11/15/2035 | | | 53,977 |
| | 50,000 | | Bristol-Myers Squibb Co., | | | |
| | | 4.625%, 11/15/2021, (EUR) | | | 71,313 |
| | 700,000 | | Capital One Multi-Asset Execution Trust, Series 2005-A10, Class A, | | | |
| | | 0.310%, 9/15/2015(e) | | | 692,740 |
| | 2,335,000 | | Capital One Multi-Asset Execution Trust, Series 2006-A5, Class A5, | | | |
| | | 0.290%, 1/15/2016(e) | | | 2,305,947 |
| | 15,000 | | Chesapeake Energy Corp., | | | |
| | | 6.500%, 8/15/2017 | | | 14,513 |
| | 70,000 | | Chesapeake Energy Corp., | | | |
| | | 6.875%, 1/15/2016 | | | 69,125 |
| | 75,000 | | Chesapeake Energy Corp., | | | |
| | | 6.875%, 11/15/2020 | | | 72,937 |
| | 79,617 | | CIT Group, Inc., | | | |
| | | 7.000%, 5/01/2013 | | | 77,428 |
| | 119,429 | | CIT Group, Inc., | | | |
| | | 7.000%, 5/01/2014 | | | 112,860 |
| | 119,429 | | CIT Group, Inc., | | | |
| | | 7.000%, 5/01/2015 | | | 111,368 |
| | 199,049 | | CIT Group, Inc., | | | |
| | | 7.000%, 5/01/2016 | | | 183,623 |
| | 278,673 | | CIT Group, Inc., | | | |
| | | 7.000%, 5/01/2017 | | | 257,076 |
| | 120,000 | | Citi Credit Card Issuance Trust, Series 2001-A4, Class A4, | | | |
| | | 5.375%, 4/10/2013, (EUR) | | | 165,566 |
| | 680,000 | | Comcast Corp., | | | |
| | | 5.650%, 6/15/2035 | | | 629,553 |
| | 999,656 | | Continental Airlines Pass Through Trust, Series 1999-1, Class B, | | | |
| | | 6.795%, 8/02/2018 | | | 932,180 |
| | 190,000 | | CSX Corp., | | | |
| | | 6.250%, 3/15/2018 | | | 205,304 |
| | 265,000 | | Cummins, Inc., | | | |
| | | 5.650%, 3/01/2098 | | | 163,826 |
| | 160,000 | | Cummins, Inc., | | | |
| | | 7.125%, 3/01/2028 | | | 158,154 |
| | 10,000 | | D.R. Horton, Inc., | | | |
| | | 5.250%, 2/15/2015 | | | 9,650 |
| | 321,633 | | Delta Air Lines, Inc., Series 2007-1, Class B, | | | |
| | | 8.021%, 8/10/2022 | | | 295,902 |
See accompanying notes to financial statements.
20
LOOMIS SAYLES GLOBAL MARKETS FUND — PORTFOLIOOF INVESTMENTS (continued)
Investments as of March 31, 2010 (Unaudited)
| | | | | | |
Principal
Amount (‡) | | Description | | Value (†) |
| | | | | | |
| | | United States — continued | | | |
| $ | 310,816 | | Delta Air Lines, Inc., Series 2007-1, Class C, | | | |
| | | 8.954%, 8/10/2014 | | $ | 290,859 |
| | 42,000 | | Dillard’s, Inc., | | | |
| | | 6.625%, 1/15/2018 | | | 38,850 |
| | 50,000 | | Dillard’s, Inc., | | | |
| | | 7.000%, 12/01/2028 | | | 40,000 |
| | 8,000 | | Dillard’s, Inc., | | | |
| | | 7.750%, 7/15/2026 | | | 6,800 |
| | 11,000 | | ESI Tractebel Acquisition Corp., Series B, | | | |
| | | 7.990%, 12/30/2011 | | | 10,997 |
| | 250,000 | | Exelon Corp., | | | |
| | | 4.900%, 6/15/2015 | | | 260,559 |
| | 150,000 | | Foot Locker, Inc., | | | |
| | | 8.500%, 1/15/2022 | | | 138,750 |
| | 10,000 | | Ford Motor Co., | | | |
| | | 6.625%, 2/15/2028 | | | 8,400 |
| | 1,750,000 | | Ford Motor Co., | | | |
| | | 6.625%, 10/01/2028 | | | 1,470,000 |
| | 15,000 | | Ford Motor Co., | | | |
| | | 7.125%, 11/15/2025 | | | 12,788 |
| | 595,000 | | Ford Motor Co., | | | |
| | | 7.450%, 7/16/2031 | | | 562,275 |
| | 2,250,000 | | Ford Motor Credit Co. LLC, | | | |
| | | 7.000%, 10/01/2013 | | | 2,328,156 |
| | 260,000 | | Ford Motor Credit Co. LLC, | | | |
| | | 7.250%, 10/25/2011 | | | 268,812 |
| | 345,000 | | Ford Motor Credit Co. LLC, | | | |
| | | 7.500%, 8/01/2012 | | | 357,241 |
| | 905,000 | | Ford Motor Credit Co. LLC, | | | |
| | | 8.000%, 12/15/2016 | | | 953,529 |
| | 170,000 | | Ford Motor Credit Co. LLC, | | | |
| | | 8.625%, 11/01/2010 | | | 174,126 |
| | 390,000 | | Ford Motor Credit Co. LLC, | | | |
| | | 9.750%, 9/15/2010 | | | 399,351 |
| | 80,000 | | Freescale Semiconductor, Inc., | | | |
| | | 10.125%, 12/15/2016 | | | 70,800 |
| | 45,000 | | General Electric Capital Corp., | | | |
| | | 5.625%, 5/01/2018 | | | 47,026 |
| | 205,000 | | General Electric Capital Corp., MTN, | | | |
| | | 5.875%, 1/14/2038 | | | 194,904 |
| | 750,000 | | General Electric Capital Corp., Series A, MTN, | | | |
| | | 4.875%, 3/04/2015 | | | 788,116 |
| | 3,375,000 | | Georgia-Pacific LLC, | | | |
| | | 7.250%, 6/01/2028 | | | 3,341,250 |
| | 35,000 | | Georgia-Pacific LLC, | | | |
| | | 7.750%, 11/15/2029 | | | 35,000 |
| | 525,000 | | Georgia-Pacific LLC, | | | |
| | | 8.000%, 1/15/2024 | | | 556,500 |
| | 405,000 | | Georgia-Pacific LLC, | | | |
| | | 8.875%, 5/15/2031 | | | 439,425 |
| | 288,000 | | GMAC, Inc., | | | |
| | | 6.000%, 12/15/2011 | | | 288,720 |
| | 129,000 | | GMAC, Inc., | | | |
| | | 6.625%, 5/15/2012 | | | 130,290 |
| | 257,000 | | GMAC, Inc., | | | |
| | | 6.750%, 12/01/2014 | | | 255,715 |
| | 28,000 | | GMAC, Inc., | | | |
| | | 6.875%, 9/15/2011 | | | 28,455 |
| | | | | | |
Principal
Amount (‡) | | Description | | Value (†) |
| | | | | | |
| | | United States — continued | | | |
| $ | 60,000 | | GMAC, Inc., | | | |
| | | 6.875%, 8/28/2012 | | $ | 60,825 |
| | 63,000 | | GMAC, Inc., | | | |
| | | 7.000%, 2/01/2012 | | | 64,102 |
| | 63,000 | | GMAC, Inc., | | | |
| | | 7.250%, 3/02/2011 | | | 64,102 |
| | 55,000 | | GMAC, Inc., | | | |
| | | 7.500%, 12/31/2013 | | | 55,963 |
| | 129,000 | | GMAC, Inc., | | | |
| | | 8.000%, 12/31/2018 | | | 127,065 |
| | 1,946,000 | | GMAC, Inc., | | | |
| | | 8.000%, 11/01/2031 | | | 1,858,430 |
| | 150,000 | | Goldman Sachs Group, Inc. (The), | | | |
| | | 1.011%, 5/23/2016, (EUR)(e) | | | 186,016 |
| | 455,000 | | Goldman Sachs Group, Inc. (The), | | | |
| | | 6.750%, 10/01/2037 | | | 454,429 |
| | 400,000 | | Goldman Sachs Group, Inc. (The), | | | |
| | | 6.875%, 1/18/2038, (GBP) | | | 644,161 |
| | 165,000 | | Goodyear Tire & Rubber Co. (The), | | | |
| | | 7.000%, 3/15/2028 | | | 142,312 |
| | 25,000 | | GTE Corp., | | | |
| | | 6.940%, 4/15/2028 | | | 26,247 |
| | 20,000 | | HCA, Inc., | | | |
| | | 5.750%, 3/15/2014 | | | 18,875 |
| | 55,000 | | HCA, Inc., | | | |
| | | 6.250%, 2/15/2013 | | | 54,588 |
| | 90,000 | | HCA, Inc., | | | |
| | | 6.375%, 1/15/2015 | | | 85,500 |
| | 15,000 | | HCA, Inc., | | | |
| | | 6.500%, 2/15/2016 | | | 14,231 |
| | 40,000 | | HCA, Inc., | | | |
| | | 6.750%, 7/15/2013 | | | 40,000 |
| | 225,000 | | HCA, Inc., | | | |
| | | 7.050%, 12/01/2027 | | | 192,375 |
| | 245,000 | | HCA, Inc., | | | |
| | | 7.190%, 11/15/2015 | | | 231,525 |
| | 90,000 | | HCA, Inc., | | | |
| | | 7.500%, 12/15/2023 | | | 82,350 |
| | 250,000 | | HCA, Inc., | | | |
| | | 7.500%, 11/06/2033 | | | 217,500 |
| | 1,295,000 | | HCA, Inc., | | | |
| | | 7.690%, 6/15/2025 | | | 1,197,875 |
| | 395,000 | | HCA, Inc., | | | |
| | | 8.360%, 4/15/2024 | | | 374,262 |
| | 125,000 | | HCA, Inc., | | | |
| | | 8.750%, 11/01/2010, (GBP) | | | 193,955 |
| | 110,000 | | HCA, Inc., MTN, | | | |
| | | 7.580%, 9/15/2025 | | | 99,550 |
| | 75,000 | | HCA, Inc., MTN, | | | |
| | | 7.750%, 7/15/2036 | | | 66,000 |
| | 75,000 | | Hexion US Finance Corp./Hexion Nova Scotia Finance ULC, | | | |
| | | 9.750%, 11/15/2014 | | | 76,500 |
| | 470,000 | | Highwoods Properties, Inc., | | | |
| | | 5.850%, 3/15/2017 | | | 449,238 |
| | 260,000 | | Hilcorp Energy I LP, | | | |
| | | 7.750%, 11/01/2015, 144A | | | 256,750 |
| | 110,000 | | Incitec Pivot Finance LLC, | | | |
| | | 6.000%, 12/10/2019, 144A | | | 111,171 |
See accompanying notes to financial statements.
21
LOOMIS SAYLES GLOBAL MARKETS FUND — PORTFOLIOOF INVESTMENTS (continued)
Investments as of March 31, 2010 (Unaudited)
| | | | | | |
Principal
Amount (‡) | | Description | | Value (†) |
| | | | | | |
| | | United States — continued | | | |
| $ | 250,000 | | iStar Financial, Inc., | | | |
| | | 5.150%, 3/01/2012 | | $ | 218,750 |
| | 95,000 | | iStar Financial, Inc., | | | |
| | | 5.500%, 6/15/2012 | | | 82,294 |
| | 105,000 | | iStar Financial, Inc., | | | |
| | | 5.650%, 9/15/2011 | | | 95,812 |
| | 70,000 | | iStar Financial, Inc., | | | |
| | | 5.850%, 3/15/2017 | | | 51,800 |
| | 300,000 | | iStar Financial, Inc., | | | |
| | | 5.875%, 3/15/2016 | | | 225,000 |
| | 145,000 | | iStar Financial, Inc., | | | |
| | | 6.050%, 4/15/2015 | | | 106,575 |
| | 985,000 | | iStar Financial, Inc., | | | |
| | | 8.625%, 6/01/2013 | | | 842,175 |
| | 35,000 | | iStar Financial, Inc., Series B, | | | |
| | | 5.700%, 3/01/2014 | | | 27,825 |
| | 950,000 | | iStar Financial, Inc., Series B, | | | |
| | | 5.950%, 10/15/2013 | | | 760,000 |
| | 5,000 | | J.C. Penney Corp., Inc., | | | |
| | | 5.750%, 2/15/2018 | | | 5,006 |
| | 125,000 | | J.C. Penney Corp., Inc., | | | |
| | | 6.375%, 10/15/2036 | | | 116,406 |
| | 15,000 | | J.C. Penney Corp., Inc., | | | |
| | | 7.125%, 11/15/2023 | | | 15,131 |
| | 5,000 | | J.C. Penney Corp., Inc., | | | |
| | | 7.625%, 3/01/2097 | | | 4,525 |
| | 450,000 | | Jefferies Group, Inc., | | | |
| | | 8.500%, 7/15/2019 | | | 499,204 |
| | 260,000 | | K. Hovnanian Enterprises, Inc., | | | |
| | | 6.250%, 1/15/2016 | | | 200,200 |
| | 15,000 | | K. Hovnanian Enterprises, Inc., | | | |
| | | 6.375%, 12/15/2014 | | | 12,038 |
| | 150,000 | | Kraft Foods, Inc., | | | |
| | | 6.250%, 3/20/2015, (EUR) | | | 229,057 |
| | 15,000 | | Lennar Corp., Series B, | | | |
| | | 5.500%, 9/01/2014 | | | 14,475 |
| | 1,090,000 | | Lennar Corp., Series B, | | | |
| | | 5.600%, 5/31/2015 | | | 1,035,500 |
| | 55,000 | | Lennar Corp., Series B, | | | |
| | | 6.500%, 4/15/2016 | | | 53,006 |
| | 15,000 | | Level 3 Financing, Inc., | | | |
| | | 8.750%, 2/15/2017 | | | 13,725 |
| | 10,000 | | Level 3 Financing, Inc., | | | |
| | | 9.250%, 11/01/2014 | | | 9,750 |
| | 130,000 | | MBNA Credit Card Master Note Trust, Series 03A5, | | | |
| | | 4.150%, 9/19/2012, (EUR) | | | 175,777 |
| | 150,000 | | Merrill Lynch & Co., Inc., EMTN, | | | |
| | | 4.625%, 9/14/2018, (EUR) | | | 192,901 |
| | 230,000 | | Morgan Stanley, | | | |
| | | 5.375%, 11/14/2013, (GBP) | | | 368,571 |
| | 500,000 | | New Albertson’s, Inc., | | | |
| | | 7.450%, 8/01/2029 | | | 422,500 |
| | 50,000 | | New Albertson’s, Inc., Series C, MTN, | | | |
| | | 6.625%, 6/01/2028 | | | 37,875 |
| | 80,000 | | News America, Inc., | | | |
| | | 6.150%, 3/01/2037 | | | 78,856 |
| | 25,000 | | News America, Inc., | | | |
| | | 6.400%, 12/15/2035 | | | 25,529 |
| | | | | | |
Principal
Amount (‡) | | Description | | Value (†) |
| | | | | | |
| | | United States — continued | | | |
| $ | 925,000 | | Nextel Communications, Inc., Series D, | | | |
| | | 7.375%, 8/01/2015 | | $ | 878,750 |
| | 140,000 | | Nextel Communications, Inc., Series E, | | | |
| | | 6.875%, 10/31/2013 | | | 136,500 |
| | 230,000 | | Nextel Communications, Inc., Series F, | | | |
| | | 5.950%, 3/15/2014 | | | 214,475 |
| | 250,000 | | NGC Corp. Capital Trust I, Series B, | | | |
| | | 8.316%, 6/01/2027 | | | 130,000 |
| | 35,000 | | Nortel Networks Capital Corp., | | | |
| | | 7.875%, 6/15/2026(d) | | | 25,200 |
| | 1,000,000 | | NRG Energy, Inc., | | | |
| | | 7.375%, 2/01/2016 | | | 992,500 |
| | 50,000 | | Ohio Edison Co., | | | |
| | | 6.875%, 7/15/2036 | | | 53,886 |
| | 150,000 | | Owens Brockway Glass Container, Inc., | | | |
| | | 6.750%, 12/01/2014, (EUR) | | | 206,650 |
| | 565,000 | | Owens Corning, Inc., | | | |
| | | 6.500%, 12/01/2016 | | | 597,948 |
| | 535,000 | | Owens Corning, Inc., | | | |
| | | 7.000%, 12/01/2036 | | | 524,186 |
| | 40,000 | | Owens-Illinois, Inc., | | | |
| | | 7.800%, 5/15/2018 | | | 41,300 |
| | 47,000 | | Pulte Group, Inc., | | | |
| | | 5.200%, 2/15/2015 | | | 45,061 |
| | 540,000 | | Pulte Group, Inc., | | | |
| | | 6.000%, 2/15/2035 | | | 418,500 |
| | 695,000 | | Pulte Group, Inc., | | | |
| | | 6.375%, 5/15/2033 | | | 556,000 |
| | 1,335,000 | | Qwest Capital Funding, Inc., | | | |
| | | 6.500%, 11/15/2018 | | | 1,248,225 |
| | 650,000 | | Qwest Capital Funding, Inc., | | | |
| | | 6.875%, 7/15/2028 | | | 581,750 |
| | 400,000 | | Qwest Capital Funding, Inc., | | | |
| | | 7.625%, 8/03/2021 | | | 392,000 |
| | 60,000 | | Qwest Capital Funding, Inc., | | | |
| | | 7.750%, 2/15/2031 | | | 57,000 |
| | 560,000 | | Qwest Corp., | | | |
| | | 6.875%, 9/15/2033 | | | 540,400 |
| | 115,000 | | Qwest Corp., | | | |
| | | 7.250%, 9/15/2025 | | | 116,150 |
| | 80,000 | | Reynolds American, Inc., | | | |
| | | 6.750%, 6/15/2017 | | | 85,687 |
| | 20,000 | | Reynolds American, Inc., | | | |
| | | 7.250%, 6/15/2037 | | | 20,356 |
| | 1,600(††††) | | SLM Corp., | | | |
| | | 6.000%, 12/15/2043 | | | 28,476 |
| | 120,000 | | SLM Corp., MTN, | | | |
| | | 5.050%, 11/14/2014 | | | 111,046 |
| | 35,000 | | SLM Corp., MTN, | | | |
| | | 5.125%, 8/27/2012 | | | 34,778 |
| | 15,000 | | SLM Corp., Series A, MTN, | | | |
| | | 4.500%, 7/26/2010 | | | 15,069 |
| | 228,000 | | SLM Corp., Series A, MTN, | | | |
| | | 5.000%, 10/01/2013 | | | 217,822 |
| | 10,000 | | SLM Corp., Series A, MTN, | | | |
| | | 5.000%, 6/15/2018 | | | 8,251 |
| | 115,000 | | SLM Corp., Series A, MTN, | | | |
| | | 5.375%, 1/15/2013 | | | 113,579 |
See accompanying notes to financial statements.
22
LOOMIS SAYLES GLOBAL MARKETS FUND — PORTFOLIOOF INVESTMENTS (continued)
Investments as of March 31, 2010 (Unaudited)
| | | | | | |
Principal
Amount (‡) | | Description | | Value (†) |
| | | | | | |
| | | United States — continued | | | |
| $ | 75,000 | | SLM Corp., Series A, MTN, | | | |
| | | 5.375%, 5/15/2014 | | $ | 71,039 |
| | 30,000 | | SLM Corp., Series A, MTN, | | | |
| | | 5.400%, 10/25/2011 | | | 30,281 |
| | 20,000 | | SLM Corp., Series A, MTN, | | | |
| | | 5.625%, 8/01/2033 | | | 15,433 |
| | 625,000 | | SLM Corp., Series A, MTN, | | | |
| | | 8.450%, 6/15/2018 | | | 632,101 |
| | 294,000 | | Sprint Capital Corp., | | | |
| | | 6.875%, 11/15/2028 | | | 236,670 |
| | 320,000 | | Sprint Capital Corp., | | | |
| | | 6.900%, 5/01/2019 | | | 292,800 |
| | 110,000 | | Sprint Capital Corp., | | | |
| | | 8.750%, 3/15/2032 | | | 102,025 |
| | 26,000 | | Sprint Nextel Corp., | | | |
| | | 6.000%, 12/01/2016 | | | 23,465 |
| | 265,000 | | Tenet Healthcare Corp., | | | |
| | | 6.875%, 11/15/2031 | | | 215,975 |
| | 23,000 | | Tenet Healthcare Corp., | | | |
| | | 7.375%, 2/01/2013 | | | 23,230 |
| | 250,000 | | Textron, Inc., | | | |
| | | 3.875%, 3/11/2013, (EUR) | | | 333,087 |
| | 395,000 | | Time Warner, Inc., | | | |
| | | 6.625%, 5/15/2029 | | | 416,480 |
| | 105,000 | | Toll Brothers Finance Corp., | | | |
| | | 5.150%, 5/15/2015 | | | 104,777 |
| | 375,000 | | Toys R Us, Inc., | | | |
| | | 7.375%, 10/15/2018 | | | 360,000 |
| | 3,150,000 | | TXU Corp., Series P, | | | |
| | | 5.550%, 11/15/2014 | | | 2,299,500 |
| | 2,570,000 | | TXU Corp., Series Q, | | | |
| | | 6.500%, 11/15/2024 | | | 1,336,400 |
| | 30,000 | | TXU Corp., Series R, | | | |
| | | 6.550%, 11/15/2034 | | | 15,450 |
| | 1,775,000 | | U.S. Treasury Note, | | | |
| | | 1.000%, 12/31/2011 | | | 1,778,536 |
| | 400,000 | | U.S. Treasury Note, | | | |
| | | 3.625%, 2/15/2020 | | | 393,188 |
| | 490,000 | | UAL Pass Through Trust, Series 2009-1, | | | |
| | | 10.400%, 11/01/2016 | | | 526,750 |
| | 2,320,000 | | United Rentals North America, Inc., | | | |
| | | 7.000%, 2/15/2014 | | | 2,146,000 |
| | 840,000 | | United Rentals North America, Inc., | | | |
| | | 7.750%, 11/15/2013 | | | 806,400 |
| | 770,000 | | United States Steel Corp., | | | |
| | | 6.650%, 6/01/2037 | | | 662,200 |
| | 50,000 | | USG Corp., | | | |
| | | 6.300%, 11/15/2016 | | | 44,750 |
| | 230,000 | | USG Corp., | | | |
| | | 9.500%, 1/15/2018 | | | 232,587 |
| | 106,000 | | Verizon Communications, Inc., | | | |
| | | 5.850%, 9/15/2035 | | | 103,166 |
| | 5,000 | | Verizon Maryland, Inc., | | | |
| | | 5.125%, 6/15/2033 | | | 4,070 |
| | 140,000 | | Verizon New York, Inc., Series B, | | | |
| | | 7.375%, 4/01/2032 | | | 150,503 |
| | 110,000 | | Verizon Pennsylvania, Inc., | | | |
| | | 6.000%, 12/01/2028 | | | 98,449 |
| | 185,000 | | Wells Fargo & Co., | | | |
| | | 4.625%, 11/02/2035, (GBP) | | | 247,528 |
| | | | | | |
Principal
Amount (‡) | | Description | | Value (†) |
| | | | | | |
| | | United States — continued | | | |
| $ | 230,000 | | Williams Cos., Inc. (The), | | | |
| | | 7.875%, 9/01/2021 | | $ | 270,806 |
| | 74,000 | | Williams Cos., Inc. (The), Series A, | | | |
| | | 7.500%, 1/15/2031 | | | 81,310 |
| | 24,000 | | Xerox Capital Trust I, | | | |
| | | 8.000%, 2/01/2027 | | | 23,547 |
| | 125,000 | | Xerox Corp., | | | |
| | | 6.750%, 2/01/2017 | | | 138,006 |
| | 20,000 | | Xerox Corp., MTN, | | | |
| | | 7.200%, 4/01/2016 | | | 22,351 |
| | | | | | |
| | | | | | 58,036,438 |
| | | | | | |
| | | Total Non-Convertible Bonds (Identified Cost $83,994,246) | | | 89,297,697 |
| | | | | | |
| | Convertible Bonds — 1.2% | | | |
| | | United States — 1.2% | | | |
| | 125,000 | | Ford Motor Co., | | | |
| | | 4.250%, 11/15/2016 | | | 187,031 |
| | 1,125,000 | | Intel Corp., | | | |
| | | 3.250%, 8/01/2039, 144A | | | 1,348,594 |
| | 430,000 | | iStar Financial, Inc., | | | |
| | | 0.751%, 10/01/2012(e) | | | 327,015 |
| | 365,000 | | Kulicke & Soffa Industries, Inc., | | | |
| | | 0.875%, 6/01/2012 | | | 336,712 |
| | 440,000 | | Level 3 Communications, Inc., | | | |
| | | 3.500%, 6/15/2012 | | | 405,350 |
| | 185,000 | | Level 3 Communications, Inc., | | | |
| | | 5.250%, 12/15/2011 | | | 180,144 |
| | 215,000 | | Level 3 Communications, Inc., | | | |
| | | 7.000%, 3/15/2015, 144A(f) | | | 256,925 |
| | 200,000 | | NII Holdings, Inc., | | | |
| | | 3.125%, 6/15/2012 | | | 188,750 |
| | 80,000 | | Valeant Pharmaceuticals International, | | | |
| | | 4.000%, 11/15/2013 | | | 111,400 |
| | | | | | |
| | | Total Convertible Bonds (Identified Cost $3,015,595) | | | 3,341,921 |
| | | | | | |
| | Municipals — 0.0% | | | |
| | | United States — 0.0% | | | |
| | 135,000 | | Virginia Tobacco Settlement Financing Corp., Series A-1, | | | |
| | | 6.706%, 6/01/2046(f) (Identified Cost $134,987) | | | 98,310 |
| | | | | | |
| | | Total Bonds and Notes (Identified Cost $87,144,828) | | | 92,737,928 |
| | | | | | |
| | Bank Loans — 0.1% | | | |
| | | United States — 0.1% | | | |
| | 1,958 | | Dole Food Co., Inc., Credit Link Deposit, | | | |
| | | 7.887%, 4/12/2013(g) | | | 1,958 |
| | 57,836 | | Hawaiian Telcom Communications, Inc., Tranche C Term Loan, | | | |
| | | 4.750%, 6/01/2014(g)(h) | | | 41,063 |
| | 40,000 | | Level 3 Financing, Inc., Tranche A Term Loan, | | | |
| | | 2.501%, 3/13/2014(g) | | | 37,138 |
| | 2,751 | | Sungard Data Systems, Inc., Tranche A, | | | |
| | | 1.979%, 2/28/2014(g) | | | 2,656 |
| | 64,494 | | SuperMedia, Inc., Exit Term Loan, | | | |
| | | 11.000%, 12/31/2015(g) | | | 60,687 |
| | 7,314 | | Tribune Company, Term Loan X, | | | |
| | | 5.000%, 6/04/2009(d)(g)(i) | | | 4,553 |
| | | | | | |
| | | Total Bank Loans (Identified Cost $153,541) | | | 148,055 |
| | | | | | |
See accompanying notes to financial statements.
23
LOOMIS SAYLES GLOBAL MARKETS FUND — PORTFOLIOOF INVESTMENTS (continued)
Investments as of March 31, 2010 (Unaudited)
| | | | | | | |
| Shares | | Description | | Value (†) | |
| | | | | | | |
| | Preferred Stocks — 0.4% | | | | |
| | | United States — 0.4% | | | | |
| | 12,940 | | Federal Home Loan Mortgage Corp., (fixed rate to 12/31/2012, variable rate thereafter), 8.375%(b)(j) | | $ | 16,434 | |
| | 17,500 | | Federal National Mortgage Association, (fixed rate to 12/13/2010, variable rate thereafter), 8.250%(b)(j) | | | 22,225 | |
| | 682 | | GMAC, Inc., Series G, 7.000%, 144A | | | 519,854 | |
| | 820 | | Lucent Technologies Capital Trust, 7.750% | | | 652,720 | |
| | | | | | | |
| | | Total Preferred Stocks (Identified Cost $1,389,780) | | | 1,211,233 | |
| | | | | | | |
| | Warrants — 0.1% | | | | |
| | | United States — 0.1% | | | | |
| | 12,495 | | Valeant Pharmaceuticals International,
Expiration 8/16/2010(b)(f)(k) (Identified Cost $0) | | | 141,194 | |
| | | | | | | |
Principal
Amount (‡) | | | | | |
| | Short-Term Investments — 1.3% | | | | |
| $ | 1,871 | | Repurchase Agreement with State Street Corp., dated 3/31/2010 at 0.000%, to be repurchased at $1,871 on 4/01/2010 collateralized by $5,000 U.S. Treasury Bill, due 7/08/2010 valued at $4,998 including accrued interest (Note 2 of Notes to Financial Statemets) | | | 1,871 | |
| | 3,792,336 | | Tri-Party Repurchase Agreement with Fixed Income Clearing Corp., dated 3/31/2010 at 0.000% to be repurchased at $3,792,336 on 4/01/2010 collateralized by $3,855,000 Federal National Mortgage Association, 3.000% due 1/29/2015 valued at $3,869,456 including accrued interest (Note 2 of Notes to Financial Statements) | | | 3,792,336 | |
| | | | | | | |
| | | Total Short-Term Investments (Identified Cost $3,794,207) | | | 3,794,207 | |
| | | | | | | |
| | | Total Investments — 98.1% | | | | |
| | | (Identified Cost $240,455,054)(a) | | | 278,762,393 | |
| | | Other assets less liabilities — 1.9% | | | 5,423,783 | |
| | | | | | | |
| | | Net Assets — 100.0% | | $ | 284,186,176 | |
| | | | | | | |
| | | | | | | |
| | (‡) | | Principal amount stated in U.S. dollars unless otherwise noted. | |
| | (†) | | See Note 2 of Notes to Financial Statements. | |
| | (††) | | Security held in units. One unit represents a principal amount of 1,000. Amount shown represents principal amount including inflation adjustments. | |
| | (†††) | | Amount shown represents units. One unit represents a principal amount of 100. | |
| | (††††) | | Amount shown represents units. One unit represents a principal amount of 25. | |
| | (a) | | Federal Tax Information (Amounts exclude certain adjustments made at the end of the Fund’s fiscal year for tax purposes. Such adjustments are primarily due to wash sales. Amortization of premium on debt securities is excluded for tax purposes.):
At March 31, 2010, the net unrealized appreciation on investments based on a cost of $240,555,531 for federal income tax purposes was as follows: | |
| | | Aggregate gross unrealized appreciation for all investments in which there is an excess of value over tax cost | | $ | 44,018,436 | |
| | | Aggregate gross unrealized depreciation for all investments in which there is an excess of tax cost over value | | | (5,811,574 | ) |
| | | | | | | |
| | | Net unrealized appreciation | | $ | 38,206,862 | |
| | | | | | | |
| | (b) | | Non-income producing security. | |
| | (c) | | All or a portion of this security is held as collateral for open forward contracts. | |
| | (d) | | The issuer is in default with respect to interest and/or principal payments. Income is not being accrued. | |
| | (e) | | Variable rate security. Rate as of March 31, 2010 is disclosed. | |
| | (f) | | Illiquid security. At March 31, 2010, the value of these securities amounted to $496,429 or 0.2% of net assets. | |
| | (g) | | Variable rate security. Rate shown represents the weighted average rate at March 31, 2010. | |
| | | | |
| (h) | | All or a portion of interest payment is paid-in-kind. |
| (i) | | Issuer has filed for bankruptcy. |
| (j) | | Future dividend payments have been eliminated as the issuer has been placed in conservatorship. |
| (k) | | Fair valued security by the Fund’s investment adviser. At March 31, 2010 the value of this security amounted to $141,194 or 0.0% of net assets. |
| | | | |
| 144A | | Securities exempt from registration under Rule 144A of the Securities Act of 1933. These securities may be resold in transactions exempt from registration, normally to qualified institutional buyers. At March 31, 2010, the total value of these securities amounted to $14,119,017 or 5.0% of net assets. |
| | | | |
| ADR | | An American Depositary Receipt is a certificate issued by a custodian bank representing the right to receive securities of the foreign issuer described. The values of ADRs are significantly influenced by trading on exchanges not located in the United States. |
| | | | |
| EMTN | | Euro Medium Term Note | | |
| GMTN | | Global Medium Term Note | | |
| MTN | | Medium Term Note | | |
| | | | |
| AUD | | Australian Dollar | | |
| BRL | | Brazilian Real | | |
| CAD | | Canadian Dollar | | |
| CHF | | Swiss Franc | | |
| DKK | | Danish Krone | | |
| EUR | | Euro | | |
| GBP | | British Pound | | |
| IDR | | Indonesian Rupiah | | |
| JPY | | Japanese Yen | | |
| KRW | | South Korean Won | | |
| MXN | | Mexican Peso | | |
| NOK | | Norwegian Krone | | |
| NZD | | New Zealand Dollar | | |
| PLN | | Polish Zloty | | |
| SEK | | Swedish Krona | | |
| SGD | | Singapore Dollar | | |
See accompanying notes to financial statements.
24
LOOMIS SAYLES GLOBAL MARKETS FUND — PORTFOLIOOF INVESTMENTS (continued)
Investments as of March 31, 2010 (Unaudited)
At March 31, 2010, the Fund had the following open forward foreign currency contracts:
| | | | | | | | | | | | |
Contract
to Buy | | Delivery
Date | | Currency | | Units | | Notional
Value | | Unrealized
Appreciation |
Buy1 | | 09/23/2010 | | Indian Rupee | | 17,250,000 | | $ | 378,540 | | $ | 2,231 |
Buy2 | | 09/22/2010 | | Malaysian Ringgit | | 1,250,000 | | | 379,570 | | | 2,951 |
Buy3 | | 06/14/2010 | | South Korean Won | | 780,000,000 | | | 687,564 | | | 1,970 |
Buy4 | | 06/14/2010 | | South Korean Won | | 870,000,000 | | | 766,898 | | | 2,198 |
| | | | | | | | | | | | |
| | | | | | | | | | | $ | 9,350 |
| | | | | | | | | | | | |
| 2 | Counterparty is JP Morgan Chase Bank. |
| 3 | Counterparty is Barclays Bank PLC. |
| 4 | Counterparty is Credit Suisse. |
Industry Summary at March 31, 2010 (Unaudited)
| | | |
| Commercial Banks | | 5.9 | % |
| Computers & Peripherals | | 5.4 | |
| Internet Software & Services | | 5.2 | |
| Metals & Mining | | 4.6 | |
| Semiconductors & Semiconductor Equipment | | 4.6 | |
| Internet & Catalog Retail | | 3.9 | |
| Oil, Gas & Consumable Fuels | | 3.8 | |
| Personal Products | | 3.4 | |
| Treasuries | | 3.2 | |
| Non-Captive Diversified | | 2.6 | |
| Automotive | | 2.5 | |
| Electrical Equipment | | 2.4 | |
| Sovereigns | | 2.3 | |
| Capital Markets | | 2.3 | |
| Automobiles | | 2.2 | |
| Energy Equipment & Services | | 2.1 | |
| Electric | | 2.0 | |
| Other Investments, less than 2% each | | 38.4 | |
| Short-Term Investments | | 1.3 | |
| | | |
| Total Investments | | 98.1 | |
| Other assets less liabilities (including open forward foreign currency contracts) | | 1.9 | |
| | | |
| Net Assets | | 100.0 | % |
| | | |
Currency Exposure at March 31, 2010 as a Percentage of Net Assets (Unaudited)
| | | |
| United States Dollar | | 69.3 | % |
| British Pound | | 6.0 | |
| Brazilian Real | | 4.8 | |
| Euro | | 4.5 | |
| Hong Kong Dollar | | 3.4 | |
| Japanese Yen | | 2.3 | |
| South Korean Won | | 2.1 | |
| Swiss Franc | | 2.0 | |
| Other, less than 2% each | | 3.7 | |
| | | |
| Total Investments | | 98.1 | |
| Other assets less liabilities (including open forward foreign currency contracts) | | 1.9 | |
| | | |
| Net Assets | | 100.0 | % |
| | | |
See accompanying notes to financial statements.
25
LOOMIS SAYLES GROWTH FUND — PORTFOLIOOF INVESTMENTS
Investments as of March 31, 2010 (Unaudited)
| | | | | |
| Shares | | Description | | Value (†) |
| | | | | |
| Common Stocks — 99.1% of Net Assets | | | |
| | Aerospace & Defense — 1.1% | | | |
| 9,674 | | Precision Castparts Corp. | | $ | 1,225,793 |
| | | | | |
| | Air Freight & Logistics — 2.2% | | | |
| 37,769 | | United Parcel Service, Inc., Class B | | | 2,432,701 |
| | | | | |
| | Auto Components — 1.8% | | | |
| 60,387 | | Johnson Controls, Inc. | | | 1,992,167 |
| | | | | |
| | Automobiles — 1.9% | | | |
| 170,014 | | Ford Motor Co.(b) | | | 2,137,076 |
| | | | | |
| | Biotechnology — 1.7% | | | |
| 42,115 | | Gilead Sciences, Inc.(b) | | | 1,915,390 |
| | | | | |
| | Capital Markets — 3.5% | | | |
| 20,661 | | Franklin Resources, Inc. | | | 2,291,305 |
| 9,776 | | Goldman Sachs Group, Inc. (The) | | | 1,668,079 |
| | | | | |
| | | | | 3,959,384 |
| | | | | |
| | Communications Equipment — 5.1% | | | |
| 157,724 | | Cisco Systems, Inc.(b) | | | 4,105,556 |
| 25,856 | | F5 Networks, Inc.(b) | | | 1,590,402 |
| | | | | |
| | | | | 5,695,958 |
| | | | | |
| | Computers & Peripherals — 8.6% | | | |
| 23,729 | | Apple, Inc.(b) | | | 5,574,654 |
| 42,368 | | Hewlett-Packard Co. | | | 2,251,859 |
| 53,320 | | NetApp, Inc.(b) | | | 1,736,099 |
| | | | | |
| | | | | 9,562,612 |
| | | | | |
| | Consumer Finance — 1.6% | | | |
| 42,800 | | American Express Co. | | | 1,765,928 |
| | | | | |
| | Diversified Financial Services — 1.5% | | | |
| 38,133 | | JPMorgan Chase & Co. | | | 1,706,452 |
| | | | | |
| | Electrical Equipment — 1.2% | | | |
| 25,878 | | Emerson Electric Co. | | | 1,302,698 |
| | | | | |
| | Energy Equipment & Services — 1.6% | | | |
| 27,919 | | FMC Technologies, Inc.(b) | | | 1,804,405 |
| | | | | |
| | Health Care Equipment & Supplies — 2.4% | | | |
| 51,947 | | CareFusion Corp.(b) | | | 1,372,959 |
| 3,806 | | Intuitive Surgical, Inc.(b) | | | 1,324,983 |
| | | | | |
| | | | | 2,697,942 |
| | | | | |
| | Health Care Providers & Services — 3.5% | | | |
| 23,393 | | Express Scripts, Inc.(b) | | | 2,380,472 |
| 24,411 | | Medco Health Solutions, Inc.(b) | | | 1,575,974 |
| | | | | |
| | | | | 3,956,446 |
| | | | | |
| | Hotels, Restaurants & Leisure — 2.4% | | | |
| 111,997 | | Starbucks Corp.(b) | | | 2,718,167 |
| | | | | |
| | Industrial Conglomerates — 2.2% | | | |
| 29,880 | | 3M Co. | | | 2,497,072 |
| | | | | |
| | Internet & Catalog Retail — 8.2% | | | |
| 32,898 | | Amazon.com, Inc.(b) | | | 4,465,245 |
| 18,519 | | Priceline.com, Inc.(b) | | | 4,722,345 |
| | | | | |
| | | | | 9,187,590 |
| | | | | |
| | Internet Software & Services — 3.6% | | | |
| 7,182 | | Google, Inc., Class A(b) | | | 4,072,266 |
| | | | | |
| | | | | |
| Shares | | Description | | Value (†) |
| | | | | |
| | IT Services — 5.7% | | | |
| 53,073 | | Cognizant Technology Solutions Corp., Class A(b) | | $ | 2,705,662 |
| 40,418 | | Visa, Inc., Class A | | | 3,679,250 |
| | | | | |
| | | | | 6,384,912 |
| | | | | |
| | Machinery — 4.4% | | | |
| 16,217 | | Bucyrus International, Inc. | | | 1,070,160 |
| 20,415 | | Danaher Corp. | | | 1,631,363 |
| 38,090 | | Deere & Co. | | | 2,264,831 |
| | | | | |
| | | | | 4,966,354 |
| | | | | |
| | Media — 1.2% | | | |
| 40,877 | | Discovery Communications, Inc., Class A(b) | | | 1,381,234 |
| | | | | |
| | Metals & Mining — 3.2% | | | |
| 31,109 | | Cliffs Natural Resources, Inc. | | | 2,207,184 |
| 14,875 | | Walter Energy, Inc. | | | 1,372,516 |
| | | | | |
| | | | | 3,579,700 |
| | | | | |
| | Multiline Retail — 2.0% | | | |
| 54,238 | | Nordstrom, Inc. | | | 2,215,622 |
| | | | | |
| | Oil, Gas & Consumable Fuels — 4.8% | | | |
| 34,589 | | Anadarko Petroleum Corp. | | | 2,519,117 |
| 30,930 | | Range Resources Corp. | | | 1,449,689 |
| 32,861 | | Southwestern Energy Co.(b) | | | 1,338,100 |
| | | | | |
| | | | | 5,306,906 |
| | | | | |
| | Personal Products — 1.4% | | | |
| 23,379 | | Estee Lauder Cos., Inc., (The) Class A | | | 1,516,596 |
| | | | | |
| | Pharmaceuticals — 3.3% | | | |
| 122,873 | | Mylan, Inc.(b) | | | 2,790,446 |
| 14,752 | | Perrigo Co. | | | 866,237 |
| | | | | |
| | | | | 3,656,683 |
| | | | | |
| | Semiconductors & Semiconductor Equipment — 7.7% | | | |
| 92,409 | | Broadcom Corp., Class A | | | 3,066,130 |
| 32,950 | | Cree, Inc.(b) | | | 2,313,749 |
| 79,172 | | Intel Corp. | | | 1,762,369 |
| 71,868 | | Marvell Technology Group Ltd.(b) | | | 1,464,670 |
| | | | | |
| | | | | 8,606,918 |
| | | | | |
| | Software — 7.6% | | | |
| 154,391 | | Microsoft Corp. | | | 4,519,025 |
| 89,355 | | Oracle Corp. | | | 2,295,530 |
| 22,783 | | Salesforce.com, Inc.(b) | | | 1,696,194 |
| | | | | |
| | | | | 8,510,749 |
| | | | | |
| | Specialty Retail — 3.7% | | | |
| 38,843 | | Guess?, Inc. | | | 1,824,844 |
| 49,232 | | Tiffany & Co. | | | 2,338,028 |
| | | | | |
| | | | | 4,162,872 |
| | | | | |
| | Total Common Stocks (Identified Cost $86,323,496) | | | 110,918,593 |
| | | | | |
| | | | | |
| | Total Investments — 99.1%
(Identified Cost $86,323,496)(a) | | | 110,918,593 |
| | Other assets less liabilities — 0.9% | | | 951,939 |
| | | | | |
| | Net Assets — 100.0% | | $ | 111,870,532 |
| | | | | |
See accompanying notes to financial statements.
26
LOOMIS SAYLES GROWTH FUND — PORTFOLIOOF INVESTMENTS (continued)
Investments as of March 31, 2010 (Unaudited)
| | | | | | |
| (†) | | See Note 2 of Notes to Financial Statements. | | | | |
| (a) | | Federal Tax Information (Amounts exclude certain adjustments made at the end of the Fund’s fiscal year for tax purposes. Such adjustments are primarily due to wash sales.): | | | | |
| | At March 31, 2010, the net unrealized appreciation on investments based on a cost of $86,323,496 for federal income tax purposes was as follows: | | | | |
| | Aggregate gross unrealized appreciation for all investments in which there is an excess of value over tax cost | | $ | 25,078,116 | |
| | Aggregate gross unrealized depreciation for all investments in which there is an excess of tax cost over value | | | (483,019 | ) |
| | | | | | |
| | Net unrealized appreciation | | $ | 24,595,097 | |
| | | | | | |
| | | | | | |
| (b) | | Non-income producing security. | | | | |
Industry Summary at March 31, 2010 (Unaudited)
| | | |
| Computers & Peripherals | | 8.6 | % |
| Internet & Catalog Retail | | 8.2 | |
| Semiconductors & Semiconductor Equipment | | 7.7 | |
| Software | | 7.6 | |
| IT Services | | 5.7 | |
| Communications Equipment | | 5.1 | |
| Oil, Gas & Consumable Fuels | | 4.8 | |
| Machinery | | 4.4 | |
| Specialty Retail | | 3.7 | |
| Internet Software & Services | | 3.6 | |
| Capital Markets | | 3.5 | |
| Health Care Providers & Services | | 3.5 | |
| Pharmaceuticals | | 3.3 | |
| Metals & Mining | | 3.2 | |
| Hotels, Restaurants & Leisure | | 2.4 | |
| Health Care Equipment & Supplies | | 2.4 | |
| Industrial Conglomerates | | 2.2 | |
| Air Freight & Logistics | | 2.2 | |
| Multiline Retail | | 2.0 | |
| Other Investments, less than 2% each | | 15.0 | |
| | | |
| Total Investments | | 99.1 | |
| Other assets less liabilities | | 0.9 | |
| | | |
| Net Assets | | 100.0 | % |
| | | |
See accompanying notes to financial statements.
27
LOOMIS SAYLES MID CAP GROWTH FUND — PORTFOLIOOF INVESTMENTS
Investments as of March 31, 2010 (Unaudited)
| | | | | |
| Shares | | Description | | Value (†) |
| | | | | |
| Common Stocks — 97.8% of Net Assets |
| | Aerospace & Defense — 2.1% | | | |
| 12,746 | | Precision Castparts Corp. | | $ | 1,615,046 |
| | | | | |
| | Biotechnology — 4.2% | | | |
| 16,384 | | Alexion Pharmaceuticals, Inc.(b) | | | 890,798 |
| 38,519 | | Amylin Pharmaceuticals, Inc.(b) | | | 866,292 |
| 24,842 | | Human Genome Sciences, Inc.(b) | | | 750,228 |
| 18,542 | | Vertex Pharmaceuticals, Inc.(b) | | | 757,812 |
| | | | | |
| | | | | 3,265,130 |
| | | | | |
| | Capital Markets — 4.5% | | | |
| 24,953 | | Evercore Partners, Inc., Class A | | | 748,590 |
| 13,869 | | Greenhill & Co., Inc. | | | 1,138,506 |
| 29,343 | | T. Rowe Price Group, Inc. | | | 1,611,811 |
| | | | | |
| | | | | 3,498,907 |
| | | | | |
| | Commercial Banks — 1.6% | | | |
| 32,297 | | Comerica, Inc. | | | 1,228,578 |
| | | | | |
| | Communications Equipment — 2.7% | | | |
| 34,181 | | F5 Networks, Inc.(b) | | | 2,102,473 |
| | | | | |
| | Computers & Peripherals — 1.4% | | | |
| 33,348 | | NetApp, Inc.(b) | | | 1,085,811 |
| | | | | |
| | Electrical Equipment — 1.7% | | | |
| 23,659 | | Rockwell Automation, Inc. | | | 1,333,421 |
| | | | | |
| | Electronic Equipment Instruments & Components — 2.1% | | | |
| 27,373 | | Dolby Laboratories, Inc., Class A(b) | | | 1,605,974 |
| | | | | |
| | Energy Equipment & Services — 1.7% | | | |
| 21,373 | | Dril-Quip, Inc.(b) | | | 1,300,333 |
| | | | | |
| | Food Products — 4.7% | | | |
| 20,907 | | Green Mountain Coffee Roasters, Inc.(b) | | | 2,024,216 |
| 31,321 | | Mead Johnson Nutrition Co., Class A | | | 1,629,631 |
| | | | | |
| | | | | 3,653,847 |
| | | | | |
| | Health Care Equipment & Supplies — 3.4% | | | |
| 11,668 | | Edwards Lifesciences Corp.(b) | | | 1,153,732 |
| 4,337 | | Intuitive Surgical, Inc.(b) | | | 1,509,840 |
| | | | | |
| | | | | 2,663,572 |
| | | | | |
| | Health Care Providers & Services — 2.8% | | | |
| 31,713 | | Catalyst Health Solutions, Inc.(b) | | | 1,312,284 |
| 16,863 | | HMS Holdings Corp.(b) | | | 859,844 |
| | | | | |
| | | | | 2,172,128 |
| | | | | |
| | Health Care Technology — 1.5% | | | |
| 13,980 | | Cerner Corp.(b) | | | 1,189,139 |
| | | | | |
| | Hotels, Restaurants & Leisure — 3.8% | | | |
| 37,745 | | Ctrip.com International Ltd., ADR(b) | | | 1,479,604 |
| 19,774 | | Panera Bread Co., Class A(b) | | | 1,512,513 |
| | | | | |
| | | | | 2,992,117 |
| | | | | |
| | Internet & Catalog Retail — 4.1% | | | |
| 17,933 | | Netflix, Inc.(b) | | | 1,322,380 |
| 7,269 | | Priceline.com, Inc.(b) | | | 1,853,595 |
| | | | | |
| | | | | 3,175,975 |
| | | | | |
| | Internet Software & Services — 9.0% | | | |
| 47,524 | | Akamai Technologies, Inc.(b) | | | 1,492,729 |
| 3,018 | | Baidu, Inc., Sponsored ADR(b) | | | 1,801,746 |
| 43,234 | | GSI Commerce, Inc.(b) | | | 1,196,285 |
| 25,940 | | MercadoLibre, Inc.(b) | | | 1,250,567 |
| | | | | |
| Shares | | Description | | Value (†) |
| | | | | |
| | Internet Software & Services — continued | | | |
| 22,711 | | VistaPrint NV(b) | | $ | 1,300,205 |
| | | | | |
| | | | | 7,041,532 |
| | | | | |
| | IT Services — 2.1% | | | |
| 32,045 | | Cognizant Technology Solutions Corp., Class A(b) | | | 1,633,654 |
| | | | | |
| | Life Sciences Tools & Services — 4.0% | | | |
| 31,422 | | Life Technologies Corp.(b) | | | 1,642,428 |
| 13,740 | | Mettler-Toledo International, Inc.(b) | | | 1,500,408 |
| | | | | |
| | | | | 3,142,836 |
| | | | | |
| | Machinery — 4.4% | | | |
| 23,859 | | Bucyrus International, Inc. | | | 1,574,455 |
| 29,564 | | Cummins, Inc. | | | 1,831,490 |
| | | | | |
| | | | | 3,405,945 |
| | | | | |
| | Metals & Mining — 2.5% | | | |
| 21,017 | | Walter Energy, Inc. | | | 1,939,239 |
| | | | | |
| | Oil, Gas & Consumable Fuels — 5.9% | | | |
| 35,253 | | Concho Resources, Inc.(b) | | | 1,775,341 |
| 36,682 | | Massey Energy Co. | | | 1,918,102 |
| 40,365 | | Rosetta Resources, Inc.(b) | | | 950,596 |
| | | | | |
| | | | | 4,644,039 |
| | | | | |
| | Personal Products — 3.0% | | | |
| 18,295 | | Estee Lauder Cos., Inc., (The) Class A | | | 1,186,797 |
| 23,870 | | NBTY, Inc.(b) | | | 1,145,282 |
| | | | | |
| | | | | 2,332,079 |
| | | | | |
| | Pharmaceuticals — 2.0% | | | |
| 26,645 | | Perrigo Co. | | | 1,564,594 |
| | | | | |
| | Professional Services — 1.5% | | | |
| 37,946 | | Robert Half International, Inc. | | | 1,154,697 |
| | | | | |
| | Real Estate Management & Development — 1.6% | | | |
| 78,806 | | CB Richard Ellis Group, Inc., Class A(b) | | | 1,249,075 |
| | | | | |
| | Semiconductors & Semiconductor Equipment — 5.4% | | | |
| 115,805 | | ARM Holdings PLC, Sponsored ADR | | | 1,237,956 |
| 26,911 | | Cree, Inc.(b) | | | 1,889,690 |
| 92,196 | | Cypress Semiconductor Corp.(b) | | | 1,060,254 |
| | | | | |
| | | | | 4,187,900 |
| | | | | |
| | Software — 4.4% | | | |
| 19,145 | | Concur Technologies, Inc.(b) | | | 785,136 |
| 23,941 | | Salesforce.com, Inc.(b) | | | 1,782,408 |
| 47,724 | | SuccessFactors, Inc.(b) | | | 908,665 |
| | | | | |
| | | | | 3,476,209 |
| | | | | |
| | Specialty Retail — 4.7% | | | |
| 20,944 | | Abercrombie & Fitch Co., Class A | | | 955,884 |
| 33,106 | | Guess?, Inc. | | | 1,555,320 |
| 26,107 | | J. Crew Group, Inc.(b) | | | 1,198,311 |
| | | | | |
| | | | | 3,709,515 |
| | | | | |
| | Textiles, Apparel & Luxury Goods — 5.0% | | | |
| 30,856 | | Fossil, Inc.(b) | | | 1,164,505 |
| 32,639 | | Lululemon Athletica, Inc.(b) | | | 1,354,519 |
| 24,661 | | Phillips-Van Heusen Corp. | | | 1,414,555 |
| | | | | |
| | | | | 3,933,579 |
| | | | | |
| | Total Common Stocks (Identified Cost $58,794,281) | | | 76,297,344 |
| | | | | |
See accompanying notes to financial statements.
28
LOOMIS SAYLES MID CAP GROWTH FUND — PORTFOLIOOF INVESTMENTS (continued)
Investments as of March 31, 2010 (Unaudited)
| | | | | | | |
Principal
Amount | | Description | | Value (†) | |
| | | | | | | |
| | Short-Term Investments — 2.3% | |
| $ | 1,773,973 | | Tri-Party Repurchase Agreement with Fixed Income Clearing Corporation, dated 3/31/2010 at 0.000% to be repurchased at $1,773,973 on 4/01/2010 collateralized by $1,810,000 Federal Home Loan Mortgage Corp., 2.000% due 3/29/2013 valued at $1,812,263, including accrued interest (Note 2 of Notes to Financial Statements) (Identified Cost $1,773,973) | | $ | 1,773,973 | |
| | | | | | | |
| | | | | | | |
| | | Total Investments — 100.1%
(Identified Cost $60,568,254)(a) | | | 78,071,317 | |
| | | Other assets less liabilities — (0.1)% | | | (71,563 | ) |
| | | | | | | |
| | | Net Assets — 100.0% | | $ | 77,999,754 | |
| | | | | | | |
| | | | | | | |
| | (†) | | See Note 2 of Notes to Financial Statements. | | | | |
| | (a) | | Federal Tax Information (Amounts exclude certain adjustments made at the end of the Fund’s fiscal year for tax purposes. Such adjustments are primarily due to wash sales.): At March 31, 2010, the net unrealized appreciation on investments based on a cost of $60,568,254 for federal income tax purposes was as follows: | |
| | | Aggregate gross unrealized appreciation for all investments in which there is an excess of value over tax cost | | $ | 17,778,840 | |
| | | Aggregate gross unrealized depreciation for all investments in which there is an excess of tax cost over value | | | (275,777 | ) |
| | | | | | | |
| | | Net unrealized appreciation | | $ | 17,503,063 | |
| | | | | | | |
| | (b) | | Non-income producing security. | | | | |
| | | | | | | |
| | ADR | | An American Depositary Receipt is a certificate issued by a custodian bank representing the right to receive securities of the foreign issuer described. The values of ADRs are significantly influenced by trading on exchanges not located in the United States. | |
Industry Summary at March 31, 2010 (Unaudited)
| | | |
| Internet Software & Services | | 9.0 | % |
| Oil, Gas & Consumable Fuels | | 5.9 | |
| Semiconductors & Semiconductor Equipment | | 5.4 | |
| Textiles, Apparel & Luxury Goods | | 5.0 | |
| Specialty Retail | | 4.7 | |
| Food Products | | 4.7 | |
| Capital Markets | | 4.5 | |
| Software | | 4.4 | |
| Machinery | | 4.4 | |
| Biotechnology | | 4.2 | |
| Internet & Catalog Retail | | 4.1 | |
| Life Sciences Tools & Services | | 4.0 | |
| Hotels, Restaurants & Leisure | | 3.8 | |
| Health Care Equipment & Supplies | | 3.4 | |
| Personal Products | | 3.0 | |
| Health Care Providers & Services | | 2.8 | |
| Communications Equipment | | 2.7 | |
| Metals & Mining | | 2.5 | |
| IT Services | | 2.1 | |
| Aerospace & Defense | | 2.1 | |
| Electronic Equipment Instruments & Components | | 2.1 | |
| Pharmaceuticals | | 2.0 | |
| Other Investments, less than 2% each | | 11.0 | |
| Short-Term Investments | | 2.3 | |
| | | |
| Total Investments | | 100.1 | |
| Other assets less liabilities | | (0.1 | ) |
| | | |
| Net Assets | | 100.0 | % |
| | | |
See accompanying notes to financial statements.
29
LOOMIS SAYLES VALUE FUND — PORTFOLIOOF INVESTMENTS
Investments as of March 31, 2010 (Unaudited)
| | | | | |
| Shares | | Description | | Value (†) |
| | | | | |
| Common Stocks — 96.0% of Net Assets | | | |
| | Aerospace & Defense — 3.2% | | | |
| 271,238 | | Honeywell International, Inc. | | $ | 12,278,944 |
| 276,484 | | Northrop Grumman Corp. | | | 18,129,056 |
| | | | | |
| | | | | 30,408,000 |
| | | | | |
| | Auto Components — 1.9% | | | |
| 601,483 | | Goodyear Tire & Rubber Co. (The)(b) | | | 7,602,745 |
| 303,057 | | Johnson Controls, Inc. | | | 9,997,851 |
| | | | | |
| | | | | 17,600,596 |
| | | | | |
| | Beverages — 2.5% | | | |
| 190,639 | | Dr Pepper Snapple Group, Inc. | | | 6,704,774 |
| 257,963 | | PepsiCo, Inc. | | | 17,066,832 |
| | | | | |
| | | | | 23,771,606 |
| | | | | |
| | Biotechnology — 1.1% | | | |
| 179,104 | | Amgen, Inc.(b) | | | 10,703,255 |
| | | | | |
| | Capital Markets — 6.4% | | | |
| 428,586 | | Ameriprise Financial, Inc. | | | 19,440,661 |
| 451,737 | | Bank of New York Mellon Corp. | | | 13,949,638 |
| 394,740 | | Legg Mason, Inc. | | | 11,317,196 |
| 348,662 | | State Street Corp. | | | 15,738,603 |
| | | | | |
| | | | | 60,446,098 |
| | | | | |
| | Chemicals — 0.7% | | | |
| 94,510 | | Air Products & Chemicals, Inc. | | | 6,989,014 |
| | | | | |
| | Commercial Banks — 6.0% | | | |
| 647,581 | | Fifth Third Bancorp | | | 8,800,626 |
| 274,333 | | PNC Financial Services Group, Inc. | | | 16,377,680 |
| 449,176 | | U.S. Bancorp | | | 11,624,675 |
| 640,615 | | Wells Fargo & Co. | | | 19,935,939 |
| | | | | |
| | | | | 56,738,920 |
| | | | | |
| | Computers & Peripherals — 3.1% | | | |
| 384,209 | | Hewlett-Packard Co. | | | 20,420,709 |
| 72,097 | | International Business Machines Corp. | | | 9,246,440 |
| | | | | |
| | | | | 29,667,149 |
| | | | | |
| | Construction & Engineering — 1.0% | | | |
| 362,615 | | Foster Wheeler AG(b) | | | 9,841,371 |
| | | | | |
| | Consumer Finance — 1.0% | | | |
| 633,915 | | Discover Financial Services | | | 9,445,333 |
| | | | | |
| | Containers & Packaging — 1.5% | | | |
| 395,600 | | Owens-Illinois, Inc.(b) | | | 14,059,624 |
| | | | | |
| | Diversified Financial Services — 5.2% | | | |
| 1,168,608 | | Bank of America Corp. | | | 20,859,653 |
| 626,908 | | JPMorgan Chase & Co. | | | 28,054,133 |
| | | | | |
| | | | | 48,913,786 |
| | | | | |
| | Diversified Telecommunication Services — 1.0% | | | |
| 277,549 | | CenturyTel, Inc. | | | 9,841,888 |
| | | | | |
| | Electric Utilities — 2.4% | | | |
| 520,249 | | Allegheny Energy, Inc. | | | 11,965,727 |
| 313,935 | | American Electric Power Co., Inc. | | | 10,730,298 |
| | | | | |
| | | | | 22,696,025 |
| | | | | |
| | Electrical Equipment — 1.1% | | | |
| 481,977 | | ABB Ltd., Sponsored ADR(b) | | | 10,526,378 |
| | | | | |
| | Energy Equipment & Services — 2.5% | | | |
| 41,857 | | Schlumberger Ltd. | | | 2,656,245 |
| 266,301 | | Smith International, Inc. | | | 11,403,009 |
| | | | | |
| Shares | | Description | | Value (†) |
| | | | | |
| | Energy Equipment & Services — continued | | | |
| 196,520 | | Tidewater, Inc. | | $ | 9,289,500 |
| | | | | |
| | | | | 23,348,754 |
| | | | | |
| | Food & Staples Retailing — 2.5% | | | |
| 337,947 | | CVS Caremark Corp. | | | 12,355,342 |
| 207,235 | | Wal-Mart Stores, Inc. | | | 11,522,266 |
| | | | | |
| | | | | 23,877,608 |
| | | | | |
| | Food Products — 1.2% | | | |
| 466,297 | | ConAgra Foods, Inc. | | | 11,690,066 |
| | | | | |
| | Gas Utilities — 1.1% | | | |
| 248,989 | | EQT Corp. | | | 10,208,549 |
| | | | | |
| | Health Care Equipment & Supplies — 3.2% | | | |
| 1,191,227 | | Boston Scientific Corp.(b) | | | 8,600,659 |
| 222,621 | | Covidien PLC | | | 11,193,384 |
| 237,751 | | Medtronic, Inc. | | | 10,705,927 |
| | | | | |
| | | | | 30,499,970 |
| | | | | |
| | Health Care Providers & Services — 1.5% | | | |
| 435,326 | | UnitedHealth Group, Inc. | | | 14,222,100 |
| | | | | |
| | Household Durables — 1.7% | | | |
| 208,812 | | Harman International Industries, Inc.(b) | | | 9,768,225 |
| 570,362 | | Pulte Group, Inc.(b) | | | 6,416,573 |
| | | | | |
| | | | | 16,184,798 |
| | | | | |
| | Industrial Conglomerates — 3.4% | | | |
| 1,082,068 | | General Electric Co. | | | 19,693,637 |
| 121,404 | | Siemens AG, Sponsored ADR | | | 12,136,758 |
| | | | | |
| | | | | 31,830,395 |
| | | | | |
| | Insurance — 3.9% | | | |
| 146,733 | | Berkshire Hathaway, Inc., Class B(b) | | | 11,924,991 |
| 288,838 | | Travelers Cos., Inc. (The) | | | 15,579,922 |
| 389,681 | | Unum Group | | | 9,652,398 |
| | | | | |
| | | | | 37,157,311 |
| | | | | |
| | Internet Software & Services — 1.6% | | | |
| 213,811 | | AOL, Inc.(b) | | | 5,405,142 |
| 358,026 | | eBay, Inc.(b) | | | 9,648,801 |
| | | | | |
| | | | | 15,053,943 |
| | | | | |
| | Media — 4.7% | | | |
| 1,018,822 | | Comcast Corp., Class A | | | 19,174,230 |
| 451,635 | | DIRECTV, Class A(b) | | | 15,269,779 |
| 301,500 | | Time Warner, Inc. | | | 9,427,905 |
| | | | | |
| | | | | 43,871,914 |
| | | | | |
| | Metals & Mining — 1.0% | | | |
| 215,962 | | ArcelorMittal, (NY Registered) | | | 9,482,891 |
| | | | | |
| | Multi-Utilities & Unregulated Power — 1.1% | | | |
| 338,828 | | Public Service Enterprise Group, Inc. | | | 10,002,203 |
| | | | | |
| | Oil, Gas & Consumable Fuels — 11.5% | | | |
| 159,498 | | Anadarko Petroleum Corp. | | | 11,616,240 |
| 212,705 | | CONSOL Energy, Inc. | | | 9,073,995 |
| 1,069,488 | | El Paso Corp. | | | 11,593,250 |
| 130,631 | | EOG Resources, Inc. | | | 12,140,845 |
| 275,869 | | ExxonMobil Corp. | | | 18,477,706 |
| 269,866 | | Hess Corp. | | | 16,880,118 |
| 290,948 | | Total SA, Sponsored ADR | | | 16,880,803 |
| 607,200 | | Valero Energy Corp. | | | 11,961,840 |
| | | | | |
| | | | | 108,624,797 |
| | | | | |
See accompanying notes to financial statements.
30
LOOMIS SAYLES VALUE FUND — PORTFOLIOOF INVESTMENTS (continued)
Investments as of March 31, 2010 (Unaudited)
| | | | | | | |
| Shares | | Description | | Value (†) | |
| | | | | | | |
| | | Paper & Forest Products — 1.2% | | | | |
| | 242,453 | | Weyerhaeuser Co. | | $ | 10,975,847 | |
| | | | | | | |
| | | Personal Products — 1.0% | | | | |
| | 148,291 | | Estee Lauder Cos., Inc., (The) Class A | | | 9,619,637 | |
| | | | | | | |
| | | Pharmaceuticals — 6.6% | | | | |
| | 326,188 | | Bristol-Myers Squibb Co. | | | 8,709,220 | |
| | 156,732 | | Johnson & Johnson | | | 10,218,927 | |
| | 454,892 | | Merck & Co., Inc. | | | 16,990,216 | |
| | 914,702 | | Pfizer, Inc. | | | 15,687,139 | |
| | 279,803 | | Sanofi-Aventis SA, Sponsored ADR | | | 10,453,440 | |
| | | | | | | |
| | | | | | 62,058,942 | |
| | | | | | | |
| | | Road & Rail — 1.1% | | | | |
| | 178,900 | | Norfolk Southern Corp. | | | 9,998,721 | |
| | | | | | | |
| | | Semiconductors & Semiconductor Equipment — 0.7% | | | | |
| | 511,173 | | Applied Materials, Inc. | | | 6,890,612 | |
| | | | | | | |
| | | Software — 2.8% | | | | |
| | 331,903 | | Microsoft Corp. | | | 9,714,801 | |
| | 646,065 | | Oracle Corp. | | | 16,597,410 | |
| | | | | | | |
| | | | | | 26,312,211 | |
| | | | | | | |
| | | Specialty Retail — 2.3% | | | | |
| | 431,803 | | Gap, Inc. (The) | | | 9,978,967 | |
| | 491,320 | | Lowe’s Cos., Inc. | | | 11,909,597 | |
| | | | | | | |
| | | | | | 21,888,564 | |
| | | | | | | |
| | | Wireless Telecommunication Services — 1.3% | | | | |
| | 522,134 | | Vodafone Group PLC, Sponsored ADR | | | 12,160,501 | |
| | | | | | | |
| | | Total Common Stocks (Identified Cost $807,788,206) | | | 907,609,377 | |
| | | | | | | |
Principal
Amount | | | | | |
| | Short-Term Investments — 3.5% | | | | |
| $ | 32,720,374 | | Tri-Party Repurchase Agreement with Fixed Income Clearing Corporation, dated 3/31/2010 at 0.000% to be repurchased at $32,720,374 on 4/01/2010 collateralized by $33,375,000 Federal Home Mortgage Corp., 2.125% due 6/18/2013 valued at $33,375,000, including accrued interest (Note 2 of Notes to Financial Statements)
(Identified Cost $32,720,374) | | | 32,720,374 | |
| | | | | | | |
| | | Total Investments — 99.5%
(Identified Cost $840,508,580)(a) | | | 940,329,751 | |
| | | Other assets less liabilities — 0.5% | | | 4,821,626 | |
| | | | | | | |
| | | Net Assets — 100.0% | | $ | 945,151,377 | |
| | | | | | | |
| | | | | | | |
| | (†) | | See Note 2 of Notes to Financial Statements. | | | | |
| | (a) | | Federal Tax Information (Amounts exclude certain adjustments made at the end of the Fund’s fiscal year for tax purposes. Such adjustments are primarily due to wash sales.): At March 31, 2010, the net unrealized appreciation on investments based on a cost of $840,508,580 for federal income tax purposes was as follows: | |
| | | Aggregate gross unrealized appreciation for all investments in which there is an excess of value over tax cost | | $ | 109,427,839 | |
| | | Aggregate gross unrealized depreciation for all investments in which there is an excess of tax cost over value | | | (9,606,668 | ) |
| | | | | | | |
| | | Net unrealized appreciation | | $ | 99,821,171 | |
| | | | | | | |
| | (b) | | Non-income producing security. | | | | |
| | | | | | | |
| | ADR | | An American Depositary Receipt is a certificate issued by a custodian bank representing the right to receive securities of the foreign issuer described. The values of ADRs are significantly influenced by trading on exchanges not located in the United States. | |
Industry Summary at March 31, 2010 (Unaudited)
| | | |
| Oil, Gas & Consumable Fuels | | 11.5 | % |
| Pharmaceuticals | | 6.6 | |
| Capital Markets | | 6.4 | |
| Commercial Banks | | 6.0 | |
| Diversified Financial Services | | 5.2 | |
| Media | | 4.7 | |
| Insurance | | 3.9 | |
| Industrial Conglomerates | | 3.4 | |
| Health Care Equipment & Supplies | | 3.2 | |
| Aerospace & Defense | | 3.2 | |
| Computers & Peripherals | | 3.1 | |
| Software | | 2.8 | |
| Food & Staples Retailing | | 2.5 | |
| Beverages | | 2.5 | |
| Energy Equipment & Services | | 2.5 | |
| Electric Utilities | | 2.4 | |
| Specialty Retail | | 2.3 | |
| Other Investments, less than 2% each | | 23.8 | |
| Short-Term Investments | | 3.5 | |
| | | |
| Total Investments | | 99.5 | |
| Other assets less liabilities | | 0.5 | |
| | | |
| Net Assets | | 100.0 | % |
| | | |
See accompanying notes to financial statements.
31
This Page Intentionally Left Blank
32
STATEMENTSOF ASSETSAND LIABILITIES
March 31, 2010 (Unaudited)
| | | | | | | | |
| | | Disciplined
Equity Fund | | | Global Markets Fund | |
| | | | | | | | |
ASSETS | | | | | | | | |
Investments at cost | | $ | 31,520,451 | | | $ | 240,455,054 | |
Net unrealized appreciation | | | 3,418,050 | | | | 38,307,339 | |
| | | | | | | | |
Investments at value | | | 34,938,501 | | | | 278,762,393 | |
Foreign currency at value (identified cost $0, $867,484, $0, $0 and $0) | | | — | | | | 879,207 | |
Restricted foreign currency at value (identified cost $0, $1,905,601, $0, $0 and $0) (Note 8) | | | — | | | | 1,904,731 | |
Receivable for Fund shares sold | | | 9,387 | | | | 938,723 | |
Receivable for securities sold | | | 701,128 | | | | 1,463,661 | |
Unrealized appreciation on forward foreign currency contracts (Note 2) | | | — | | | | 9,350 | |
Dividends and interest receivable | | | 29,195 | | | | 2,091,772 | |
Tax reclaims receivable | | | — | | | | 17,829 | |
Foreign tax rebates receivable (Note 2) | | | — | | | | 3,248 | |
| | | | | | | | |
TOTAL ASSETS | | | 35,678,211 | | | | 286,070,914 | |
| | | | | | | | |
LIABILITIES | | | | | | | | |
Options written, at value (premiums received $83,766, $0, $0, $0 and $0) (Note 2) | | | 80,942 | | | | — | |
Payable for securities purchased | | | 785,714 | | | | 1,388,435 | |
Payable for Fund shares redeemed | | | 5,557 | | | | 221,804 | |
Payable to custodian bank | | | — | | | | 115 | |
Management fees payable (Note 6) | | | 8,413 | | | | 168,068 | |
Administrative fees payable (Note 6) | | | 1,364 | | | | 11,388 | |
Deferred Trustees’ fees (Note 6) | | | 44,103 | | | | 49,758 | |
Other accounts payable and accrued expenses | | | 30,263 | | | | 45,170 | |
| | | | | | | | |
TOTAL LIABILITIES | | | 956,356 | | | | 1,884,738 | |
| | | | | | | | |
NET ASSETS | | $ | 34,721,855 | | | $ | 284,186,176 | |
| | | | | | | | |
NET ASSETS CONSIST OF: | | | | | | | | |
Paid-in capital | | $ | 36,020,293 | | | $ | 345,727,731 | |
Undistributed (Distributions in excess of) net investment income/Accumulated net investment (loss) | | | (5,501 | ) | | | 1,047,380 | |
Accumulated net realized loss on investments, options written and foreign currency transactions | | | (4,713,811 | ) | | | (100,913,684 | ) |
Net unrealized appreciation on investments, options written and foreign currency translations | | | 3,420,874 | | | | 38,324,749 | |
| | | | | | | | |
NET ASSETS | | $ | 34,721,855 | | | $ | 284,186,176 | |
| | | | | | | | |
COMPUTATION OF NET ASSET VALUE AND OFFERING PRICE: | | | | | | | | |
Class A shares: | | | | | | | | |
Net assets | | $ | 1,982,531 | | | $ | 53,613,066 | |
| | | | | | | | |
Shares of beneficial interest | | | 278,183 | | | | 3,983,269 | |
| | | | | | | | |
Net asset value and redemption price per share | | $ | 7.13 | | | $ | 13.46 | |
| | | | | | | | |
Offering price per share (100/94.25 of net asset value) (Note 1) | | $ | 7.56 | | | $ | 14.28 | |
| | | | | | | | |
Class B shares: (redemption price per share is equal to net asset value less any applicable contingent deferred sales charge) (Note 1) | | | | | | | | |
Net assets | | $ | 150,170 | | | $ | — | |
| | | | | | | | |
Shares of beneficial interest | | | 21,625 | | | | — | |
| | | | | | | | |
Net asset value and offering price per share | | $ | 6.94 | | | $ | — | |
| | | | | | | | |
Class C shares: (redemption price per share is equal to net asset value less any applicable contingent deferred sales charge) (Note 1) | | | | | | | | |
Net assets | | $ | 1,334,797 | | | $ | 107,117,499 | |
| | | | | | | | |
Shares of beneficial interest | | | 194,157 | | | | 8,001,969 | |
| | | | | | | | |
Net asset value and offering price per share | | $ | 6.87 | | | $ | 13.39 | |
| | | | | | | | |
Class Y shares: | | | | | | | | |
Net assets | | $ | 31,254,357 | | | $ | 123,455,611 | |
| | | | | | | | |
Shares of beneficial interest | | | 4,354,609 | | | | 9,150,391 | |
| | | | | | | | |
Net asset value, offering and redemption price per share | | $ | 7.18 | | | $ | 13.49 | |
| | | | | | | | |
Admin Class shares: | | | | | | | | |
Net assets | | $ | — | | | $ | — | |
| | | | | | | | |
Shares of beneficial interest | | | — | | | | — | |
| | | | | | | | |
Net asset value, offering and redemption price per share | | $ | — | | | $ | — | |
| | | | | | | | |
See accompanying notes to financial statements.
33
| | | | | | | | | | |
| Growth Fund | | | Mid Cap
Growth Fund | | | Value Fund | |
| | | | | | | | | | |
| | | | | | | | | | |
| $ | 86,323,496 | | | $ | 60,568,254 | | | $ | 840,508,580 | |
| | 24,595,097 | | | | 17,503,063 | | | | 99,821,171 | |
| | | | | | | | | | | |
| | 110,918,593 | | | | 78,071,317 | | | | 940,329,751 | |
| | — | | | | — | | | | — | |
| | — | | | | — | | | | — | |
| | 54,515 | | | | 85,682 | | | | 5,088,573 | |
| | 3,392,526 | | | | 473,869 | | | | — | |
| | — | | | | — | | | | — | |
| | 50,723 | | | | 13,959 | | | | 686,337 | |
| | — | | | | — | | | | 116,965 | |
| | — | | | | — | | | | — | |
| | | | | | | | | | | |
| | 114,416,357 | | | | 78,644,827 | | | | 946,221,626 | |
| | | | | | | | | | | |
| | | | | | | | | | |
| | — | | | | — | | | | — | |
| | 1,956,269 | | | | 407,358 | | | | — | |
| | 141,303 | | | | 117,587 | | | | 376,535 | |
| | 228,682 | | | | — | | | | — | |
| | 48,617 | | | | 34,586 | | | | 392,712 | |
| | 4,566 | | | | 3,190 | | | | 38,073 | |
| | 80,308 | | | | 47,568 | | | | 217,426 | |
| | 86,080 | | | | 34,784 | | | | 45,503 | |
| | | | | | | | | | | |
| | 2,545,825 | | | | 645,073 | | | | 1,070,249 | |
| | | | | | | | | | | |
| $ | 111,870,532 | | | $ | 77,999,754 | | | $ | 945,151,377 | |
| | | | | | | | | | | |
| | | | | | | | | | |
| $ | 211,283,424 | | | $ | 203,357,315 | | | $ | 926,131,162 | |
| | (333,814 | ) | | | (423,045 | ) | | | 1,396,470 | |
| | (123,674,175 | ) | | | (142,437,579 | ) | | | (82,197,426 | ) |
| | 24,595,097 | | | | 17,503,063 | | | | 99,821,171 | |
| | | | | | | | | | | |
| $ | 111,870,532 | | | $ | 77,999,754 | | | $ | 945,151,377 | |
| | | | | | | | | | | |
| | | | | | | | | | |
| | | | | | | | | | |
| $ | 34,024,298 | | | $ | 46,369,556 | | | $ | 135,132,875 | |
| | | | | | | | | | | |
| | 6,631,996 | | | | 2,150,672 | | | | 7,582,148 | |
| | | | | | | | | | | |
| $ | 5.13 | | | $ | 21.56 | | | $ | 17.82 | |
| | | | | | | | | | | |
| $ | 5.44 | | | $ | 22.88 | | | $ | 18.91 | |
| | | | | | | | | | | |
| | | | | | | | | | |
| $ | 5,002,671 | | | $ | — | | | $ | 4,646,719 | |
| | | | | | | | | | | |
| | 1,024,160 | | | | — | | | | 259,918 | |
| | | | | | | | | | | |
| $ | 4.88 | | | $ | — | | | $ | 17.88 | |
| | | | | | | | | | | |
| | | | | | | | | | |
| $ | 14,572,797 | | | $ | 21,716 | | | $ | 10,974,324 | |
| | | | | | | | | | | |
| | 2,981,229 | | | | 1,016 | | | | 620,663 | |
| | | | | | | | | | | |
| $ | 4.89 | | | $ | 21.38 | | | $ | 17.68 | |
| | | | | | | | | | | |
| | | | | | | | | | |
| $ | 58,270,766 | | | $ | 31,608,482 | | | $ | 794,396,390 | |
| | | | | | | | | | | |
| | 10,745,263 | | | | 1,421,533 | | | | 44,523,621 | |
| | | | | | | | | | | |
| $ | 5.42 | | | $ | 22.24 | | | $ | 17.84 | |
| | | | | | | | | | | |
| | | | | | | | | | |
| $ | — | | | $ | — | | | $ | 1,069 | |
| | | | | | | | | | | |
| | — | | | | — | | | | 60 | |
| | | | | | | | | | | |
| $ | — | | | $ | — | | | $ | 17.81 | |
| | | | | | | | | | | |
34
STATEMENTSOF OPERATIONS
For the Six Months Ended March 31, 2010 (Unaudited)
| | | | | | | | |
| | | Disciplined
Equity Fund | | | Global
Markets Fund | |
| | | | | | | | |
INVESTMENT INCOME | | | | | | | | |
Dividends | | $ | 231,829 | | | $ | 909,582 | |
Interest | | | — | | | | 3,349,241 | |
Less net foreign taxes withheld | | | — | | | | (57,994 | ) |
| | | | | | | | |
| | | 231,829 | | | | 4,200,829 | |
| | | | | | | | |
Expenses | | | | | | | | |
Management fees (Note 6) | | | 78,867 | | | | 982,567 | |
Service and distribution fees (Note 6) | | | 10,333 | | | | 564,654 | |
Trustees’ fees and expenses (Note 6) | | | 6,357 | | | | 8,065 | |
Administrative fees (Note 6) | | | 7,634 | | | | 63,405 | |
Custodian fees and expenses | | | 14,638 | | | | 84,128 | |
Transfer agent fees and expenses (Note 6) | | | 14,405 | | | | 112,876 | |
Audit and tax services fees | | | 22,727 | | | | 26,327 | |
Legal fees | | | 310 | | | | 2,551 | |
Shareholder reporting expenses | | | 2,984 | | | | 19,319 | |
Registration fees | | | 33,605 | | | | 32,801 | |
Fee/expense recovery (Note 6) | | | — | | | | — | |
Miscellaneous expenses | | | 5,860 | | | | 15,092 | |
| | | | | | | | |
Total expenses | | | 197,720 | | | | 1,911,785 | |
Less fee reduction and/or expense reimbursement (Note 6) | | | (45,498 | ) | | | (37,043 | ) |
| | | | | | | | |
Net expenses | | | 152,222 | | | | 1,874,742 | |
| | | | | | | | |
Net investment income (loss) | | | 79,607 | | | | 2,326,087 | |
| | | | | | | | |
NET REALIZED AND UNREALIZED GAIN (LOSS) ON INVESTMENTS,
OPTIONS WRITTEN AND FOREIGN CURRENCY TRANSACTIONS | | | | | | | | |
Net realized gain (loss) on: | | | | | | | | |
Investments | | | 3,066,972 | | | | 11,511,770 | |
Options written | | | 139,491 | | | | — | |
Foreign currency transactions | | | (1,650 | ) | | | 88,963 | |
Net change in unrealized appreciation (depreciation) on: | | | | | | | | |
Investments | | | (344,662 | ) | | | 11,705,106 | |
Options written | | | 2,824 | | | | — | |
Foreign currency translations | | | — | | | | (30,317 | ) |
| | | | | | | | |
Net realized and unrealized gain on investments, options written and foreign currency transactions | | | 2,862,975 | | | | 23,275,522 | |
| | | | | | | | |
NET INCREASE IN NET ASSETS RESULTING FROM OPERATIONS | | $ | 2,942,582 | | | $ | 25,601,609 | |
| | | | | | | | |
See accompanying notes to financial statements.
35
| | | | | | | | | | |
| Growth Fund | | | Mid Cap
Growth Fund | | | Value Fund | |
| | | | | | | | | | |
| | | | | | | | | | |
| $ | 393,506 | | | $ | 88,229 | | | $ | 7,387,358 | |
| | — | | | | — | | | | — | |
| | — | | | | — | | | | (122,161 | ) |
| | | | | | | | | | | |
| | 393,506 | | | | 88,229 | | | | 7,265,197 | |
| | | | | | | | | | | |
| | | | | | | | | | |
| | 278,395 | | | | 299,194 | | | | 2,029,139 | |
| | 143,527 | | | | 63,157 | | | | 235,433 | |
| | 7,514 | | | | 6,797 | | | | 13,788 | |
| | 26,943 | | | | 19,303 | | | | 196,437 | |
| | 13,704 | | | | 10,561 | | | | 17,700 | |
| | 101,396 | | | | 78,518 | | | | 416,843 | |
| | 20,756 | | | | 21,662 | | | | 17,342 | |
| | 1,163 | | | | 845 | | | | 7,237 | |
| | 24,436 | | | | 12,923 | | | | 25,592 | |
| | 31,567 | | | | 25,370 | | | | 49,822 | |
| | 1,517 | | | | — | | | | — | |
| | 6,556 | | | | 6,439 | | | | 13,460 | |
| | | | | | | | | | | |
| | 657,474 | | | | 544,769 | | | | 3,022,793 | |
| | (15,201 | ) | | | (82,683 | ) | | | — | |
| | | | | | | | | | | |
| | 642,273 | | | | 462,086 | | | | 3,022,793 | |
| | | | | | | | | | | |
| | (248,767 | ) | | | (373,857 | ) | | | 4,242,404 | |
| | | | | | | | | | | |
| | | | | | | | | | |
| | | | | | | | | | |
| | | | | | | | | | |
| | 9,299,166 | | | | 11,503,117 | | | | 16,538,931 | |
| | — | | | | (17,532 | ) | | | — | |
| | — | | | | — | | | | — | |
| | | | | | | | | | |
| | 5,785,194 | | | | 2,108,746 | | | | 55,321,675 | |
| | — | | | | — | | | | — | |
| | — | | | | — | | | | — | |
| | | | | | | | | | | |
| | 15,084,360 | | | | 13,594,331 | | | | 71,860,606 | |
| | | | | | | | | | | |
| $ | 14,835,593 | | | $ | 13,220,474 | | | $ | 76,103,010 | |
| | | | | | | | | | | |
36
STATEMENTSOF CHANGESIN NET ASSETS
| | | | | | | | | | | | | | | | |
| | | Disciplined Equity Fund | | | Global Markets Fund | |
| | | Six Months Ended
March 31, 2010
(Unaudited) | | | Year Ended
September 30, 2009 | | | Six Months Ended
March 31, 2010
(Unaudited) | | | Year Ended
September 30, 2009 | |
| | | | | | | | | | | | | | | | |
FROM OPERATIONS: | | | | | | | | | | | | | | | | |
Net investment income (loss) | | $ | 79,607 | | | $ | 227,891 | | | $ | 2,326,087 | | | $ | 6,881,001 | |
Net realized gain (loss) on investments, options written and foreign currency transactions | | | 3,204,813 | | | | (6,612,204 | ) | | | 11,600,733 | | | | (80,934,410 | ) |
Net change in unrealized appreciation (depreciation) on investments, options written and foreign currency translations | | | (341,838 | ) | | | 5,341,200 | | | | 11,674,789 | | | | 77,383,636 | |
| | | | | | | | | | | | | | | | |
Net increase (decrease) in net assets resulting from operations | | | 2,942,582 | | | | (1,043,113 | ) | | | 25,601,609 | | | | 3,330,227 | |
| | | | | | | | | | | | | | | | |
FROM DISTRIBUTIONS TO SHAREHOLDERS: | | | | | | | | | | | | | | | | |
Net investment income | | | | | | | | | | | | | | | | |
Class A | | | (6,227 | ) | | | (16,599 | ) | | | (1,152,276 | ) | | | (1,215,467 | ) |
Class B | | | — | | | | — | | | | — | | | | — | |
Class C | | | — | | | | (6,028 | ) | | | (1,701,697 | ) | | | (1,365,584 | ) |
Class Y | | | (178,902 | ) | | | (193,935 | ) | | | (2,794,707 | ) | | | (2,348,859 | ) |
Admin Class | | | — | | | | — | | | | — | | | | — | |
Net realized capital gains | | | | | | | | | | | | | | | | |
Class A | | | — | | | | — | | | | — | | | | (14,673 | ) |
Class C | | | — | | | | — | | | | — | | | | (28,430 | ) |
Class Y | | | — | | | | — | | | | — | | | | (24,786 | ) |
| | | | | | | | | | | | | | | | |
Total distributions | | | (185,129 | ) | | | (216,562 | ) | | | (5,648,680 | ) | | | (4,997,799 | ) |
| | | | | | | | | | | | | | | | |
NET INCREASE (DECREASE) IN NET ASSETS FROM CAPITAL SHARE TRANSACTIONS (NOTE 11) | | | 1,880,885 | | | | 5,893,459 | | | | 14,627,910 | | | | (60,874,359 | ) |
| | | | | | | | | | | | | | | | |
Net increase (decrease) in net assets | | | 4,638,338 | | | | 4,633,784 | | | | 34,580,839 | | | | (62,541,931 | ) |
NET ASSETS | | | | | | | | | | | | | | | | |
Beginning of the period | | | 30,083,517 | | | | 25,449,733 | | | | 249,605,337 | | | | 312,147,268 | |
| | | | | | | | | | | | | | | | |
End of the period | | $ | 34,721,855 | | | $ | 30,083,517 | | | $ | 284,186,176 | | | $ | 249,605,337 | |
| | | | | | | | | | | | | | | | |
UNDISTRIBUTED (DISTRIBUTIONS IN EXCESS OF) NET INVESTMENT INCOME/ACCUMULATED NET INVESTMENT (LOSS) | | $ | (5,501 | ) | | $ | 100,021 | | | $ | 1,047,380 | | | $ | 4,369,973 | |
| | | | | | | | | | | | | | | | |
See accompanying notes to financial statements.
37
| | | | | | | | | | | | | | | | | | | | | | |
| Growth Fund | | | Mid Cap Growth Fund | | | Value Fund | |
Six Months Ended
March 31, 2010
(Unaudited) | | | Year Ended
September 30, 2009 | | | Six Months Ended
March 31, 2010
(Unaudited) | | | Year Ended
September 30, 2009 | | | Six Months Ended
March 31, 2010
(Unaudited) | | | Year Ended
September 30, 2009 | |
| | | | | | | | | | | | | | | | | | | | | | |
| | | | | | | | | | | | | | | | | | | | | | |
| $ | (248,767 | ) | | $ | (300,880 | ) | | $ | (373,857 | ) | | $ | (350,178 | ) | | $ | 4,242,404 | | | $ | 7,832,048 | |
| | 9,299,166 | | | | (84,916,365 | ) | | | 11,485,585 | | | | (49,001,103 | ) | | | 16,538,931 | | | | (86,224,117 | ) |
| | | | | | | | | | | | | | | | | | | | | | |
| | 5,785,194 | | | | 36,216,597 | | | | 2,108,746 | | | | 26,716,743 | | | | 55,321,675 | | | | 84,560,021 | |
| | | | | | | | | | | | | | | | | | | | | | | |
| | 14,835,593 | | | | (49,000,648 | ) | | | 13,220,474 | | | | (22,634,538 | ) | | | 76,103,010 | | | | 6,167,952 | |
| | | | | | | | | | | | | | | | | | | | | | | |
| | | | | | | | | | | | | | | | | | | | | | |
| | | | | | | | | | | | | | | | | | | | | | |
| | — | | | | — | | | | — | | | | — | | | | (1,044,591 | ) | | | (1,386,477 | ) |
| | — | | | | — | | | | — | | | | — | | | | — | | | | (12,760 | ) |
| | — | | | | — | | | | — | | | | — | | | | (22,715 | ) | | | (69,049 | ) |
| | — | | | | — | | | | — | | | | — | | | | (6,810,650 | ) | | | (4,718,484 | ) |
| | — | | | | — | | | | — | | | | — | | | | — | | | | — | |
| | | | | | | | | | | | | | | | | | | | | | |
| | — | | | | — | | | | — | | | | — | | | | — | | | | — | |
| | — | | | | — | | | | — | | | | — | | | | — | | | | — | |
| | — | | | | — | | | | — | | | | — | | | | — | | | | — | |
| | | | | | | | | | | | | | | | | | | | | | | |
| | — | | | | — | | | | — | | | | — | | | | (7,877,956 | ) | | | (6,186,770 | ) |
| | | | | | | | | | | | | | | | | | | | | | | |
| | | | | | | | | | | | | | | | | | | | | | |
| | (14,938,091 | ) | | | (108,551,663 | ) | | | (17,229,665 | ) | | | (41,659,860 | ) | | | 166,393,808 | | | | 280,227,901 | |
| | | | | | | | | | | | | | | | | | | | | | | |
| | (102,498 | ) | | | (157,552,311 | ) | | | (4,009,191 | ) | | | (64,294,398 | ) | | | 234,618,862 | | | | 280,209,083 | |
| | | | | | | | | | | | | | | | | | | | | | |
| | 111,973,030 | | | | 269,525,341 | | | | 82,008,945 | | | | 146,303,343 | | | | 710,532,515 | | | | 430,323,432 | |
| | | | | | | | | | | | | | | | | | | | | | | |
| $ | 111,870,532 | | | $ | 111,973,030 | | | $ | 77,999,754 | | | $ | 82,008,945 | | | $ | 945,151,377 | | | $ | 710,532,515 | |
| | | | | | | | | | | | | | | | | | | | | | | |
| | | | | | | | | | | | | | | | | | | | | | |
| $ | (333,814 | ) | | $ | (85,047 | ) | | $ | (423,045 | ) | | $ | (49,188 | ) | | $ | 1,396,470 | | | $ | 5,032,022 | |
| | | | | | | | | | | | | | | | | | | | | | | |
38
FINANCIAL HIGHLIGHTS
For a share outstanding throughout each period.
| | | | | | | | | | | | | | | | | | | | | | | | | | | |
| | | | | Income (Loss) from Investment Operations: | | | Less Distributions: | |
| | | | | | | |
| | | Net asset
value,
beginning
of
the period | | Net
investment
income
(loss) (a)(b) | | | Net realized
and unrealized
gain (loss) | | | Total from
investment
operations | | | Dividends
from
net investment
income (b) | | | Distributions
from net
realized
capital gains | | | Total
distributions (b) | |
| | | | | | | | | | | | | | | | | | | | | | | | | | | |
DISCIPLINED EQUITY FUND | | | | | | | | | | | | | | | | | | | | | | | | | | | |
Class A | | | | | | | | | | | | | | | | | | | | | | | | | | | |
3/31/2010(g) | | $ | 6.53 | | $ | 0.01 | | | $ | 0.61 | | | $ | 0.62 | | | $ | (0.02 | ) | | $ | — | | | $ | (0.02 | ) |
9/30/2009 | | | 6.98 | | | 0.04 | | | | (0.44 | ) | | | (0.40 | ) | | | (0.05 | ) | | | — | | | | (0.05 | ) |
9/30/2008 | | | 9.77 | | | 0.03 | | | | (1.80 | ) | | | (1.77 | ) | | | (0.05 | ) | | | (0.97 | ) | | | (1.02 | ) |
9/30/2007 | | | 9.42 | | | 0.02 | | | | 1.53 | | | | 1.55 | | | | (0.07 | ) | | | (1.13 | ) | | | (1.20 | ) |
9/30/2006 | | | 9.22 | | | 0.05 | | | | 0.64 | | | | 0.69 | | | | (0.03 | ) | | | (0.46 | ) | | | (0.49 | ) |
9/30/2005 | | | 7.79 | | | 0.00 | | | | 1.43 | | | | 1.43 | | | | (0.00 | ) | | | — | | | | (0.00 | ) |
Class B | | | | | | | | | | | | | | | | | | | | | | | | | | | |
3/31/2010(g) | | | 6.36 | | | (0.01 | ) | | | 0.59 | | | | 0.58 | | | | — | | | | — | | | | — | |
9/30/2009 | | | 6.80 | | | (0.00 | ) | | | (0.44 | ) | | | (0.44 | ) | | | — | | | | — | | | | — | |
9/30/2008 | | | 9.56 | | | (0.03 | ) | | | (1.76 | ) | | | (1.79 | ) | | | — | | | | (0.97 | ) | | | (0.97 | ) |
9/30/2007 | | | 9.25 | | | (0.05 | ) | | | 1.50 | | | | 1.45 | | | | (0.01 | ) | | | (1.13 | ) | | | (1.14 | ) |
9/30/2006 | | | 9.10 | | | (0.02 | ) | | | 0.63 | | | | 0.61 | | | | — | | | | (0.46 | ) | | | (0.46 | ) |
9/30/2005 | | | 7.73 | | | (0.06 | ) | | | 1.43 | | | | 1.37 | | | | (0.00 | ) | | | — | | | | (0.00 | ) |
Class C | | | | | | | | | | | | | | | | | | | | | | | | | | | |
3/31/2010(g) | | | 6.30 | | | (0.01 | ) | | | 0.58 | | | | 0.57 | | | | — | | | | — | | | | — | |
9/30/2009 | | | 6.76 | | | (0.00 | ) | | | (0.44 | ) | | | (0.44 | ) | | | (0.02 | ) | | | — | | | | (0.02 | ) |
9/30/2008 | | | 9.52 | | | (0.03 | ) | | | (1.76 | ) | | | (1.79 | ) | | | — | | | | (0.97 | ) | | | (0.97 | ) |
9/30/2007 | | | 9.22 | | | (0.05 | ) | | | 1.50 | | | | 1.45 | | | | (0.02 | ) | | | (1.13 | ) | | | (1.15 | ) |
9/30/2006 | | | 9.08 | | | (0.02 | ) | | | 0.63 | | | | 0.61 | | | | (0.01 | ) | | | (0.46 | ) | | | (0.47 | ) |
9/30/2005 | | | 7.73 | | | (0.07 | ) | | | 1.42 | | | | 1.35 | | | | (0.00 | ) | | | — | | | | (0.00 | ) |
Class Y | | | | | | | | | | | | | | | | | | | | | | | | | | | |
3/31/2010(g) | | | 6.58 | | | 0.02 | | | | 0.62 | | | | 0.64 | | | | (0.04 | ) | | | — | | | | (0.04 | ) |
9/30/2009 | | | 7.03 | | | 0.06 | | | | (0.45 | ) | | | (0.39 | ) | | | (0.06 | ) | | | — | | | | (0.06 | ) |
9/30/2008 | | | 9.85 | | | 0.07 | | | | (1.82 | ) | | | (1.75 | ) | | | (0.10 | ) | | | (0.97 | ) | | | (1.07 | ) |
9/30/2007 | | | 9.49 | | | 0.06 | | | | 1.53 | | | | 1.59 | | | | (0.10 | ) | | | (1.13 | ) | | | (1.23 | ) |
9/30/2006 | | | 9.27 | | | 0.09 | | | | 0.64 | | | | 0.73 | | | | (0.05 | ) | | | (0.46 | ) | | | (0.51 | ) |
9/30/2005 | | | 7.82 | | | 0.04 | | | | 1.44 | | | | 1.48 | | | | (0.03 | ) | | | — | | | | (0.03 | ) |
| (a) | Per share net investment income (loss) has been calculated using the average shares outstanding during the period. |
| (b) | Amount rounds to less than $0.01 per share, if applicable. |
| (c) | Had certain expenses not been reduced during the period, if applicable, total returns would have been lower. |
| (d) | A sales charge for Class A shares and a contingent deferred sales charge for Class B and Class C shares are not reflected in total return calculations. Periods less than one year, if applicable, are not annualized. |
See accompanying notes to financial statements.
39
| | | | | | | | | | | | | | | | |
| | | | | | | | Ratios to Average Net Assets: | | | |
| | | | | | |
Net asset
value,
end of
the period | | Total
return
(%) (c)(d) | | | Net assets,
end of
the period
(000’s) | | Net
expenses
(%) (e)(f) | | Gross
expenses
(%) (f) | | Net investment
income (loss)
(%) (f) | | | Portfolio
turnover
rate (%) |
| | | | | | | | | | | | | | | | |
| | | | | | | | | | | | | | | | |
| | | | | | | | | | | | | | | | |
| $ | 7.13 | | 9.57 | | | $ | 1,983 | | 1.15 | | 1.44 | | 0.33 | | | 132 |
| | 6.53 | | (5.64 | ) | | | 1,599 | | 1.25 | | 1.78 | | 0.78 | | | 180 |
| | 6.98 | | (20.40 | ) | | | 736 | | 1.25 | | 1.55 | | 0.38 | | | 149 |
| | 9.77 | | 17.98 | | | | 1,198 | | 1.25 | | 1.50 | | 0.22 | | | 148 |
| | 9.42 | | 7.69 | | | | 1,331 | | 1.25 | | 1.68 | | 0.56 | | | 143 |
| | 9.22 | | 18.42 | | | | 344 | | 1.25 | | 34.73 | | 0.03 | | | 133 |
| | | | | | | | | | | | | | | | |
| | 6.94 | | 9.12 | | | | 150 | | 1.89 | | 2.18 | | (0.42 | ) | | 132 |
| | 6.36 | | (6.47 | ) | | | 168 | | 2.00 | | 2.49 | | (0.03 | ) | | 180 |
| | 6.80 | | (21.01 | ) | | | 227 | | 2.00 | | 2.30 | | (0.37 | ) | | 149 |
| | 9.56 | | 17.11 | | | | 356 | | 2.00 | | 2.31 | | (0.51 | ) | | 148 |
| | 9.25 | | 6.90 | | | | 331 | | 2.00 | | 2.33 | | (0.19 | ) | | 143 |
| | 9.10 | | 17.77 | | | | 210 | | 2.00 | | 41.40 | | (0.71 | ) | | 133 |
| | | | | | | | | | | | | | | | |
| | 6.87 | | 9.05 | | | | 1,335 | | 1.89 | | 2.18 | | (0.42 | ) | | 132 |
| | 6.30 | | (6.41 | ) | | | 1,460 | | 2.00 | | 2.51 | | (0.06 | ) | | 180 |
| | 6.76 | | (21.10 | ) | | | 949 | | 2.00 | | 2.30 | | (0.39 | ) | | 149 |
| | 9.52 | | 17.17 | | | | 1,164 | | 2.00 | | 2.29 | | (0.54 | ) | | 148 |
| | 9.22 | | 6.92 | | | | 1,198 | | 2.00 | | 2.37 | | (0.18 | ) | | 143 |
| | 9.08 | | 17.51 | | | | 140 | | 2.00 | | 37.60 | | (0.76 | ) | | 133 |
| | | | | | | | | | | | | | | | |
| | 7.18 | | 9.82 | | | | 31,254 | | 0.90 | | 1.19 | | 0.57 | | | 132 |
| | 6.58 | | (5.42 | ) | | | 26,857 | | 0.85 | | 1.38 | | 1.09 | | | 180 |
| | 7.03 | | (20.17 | ) | | | 23,538 | | 0.85 | | 1.15 | | 0.78 | | | 149 |
| | 9.85 | | 18.39 | | | | 27,400 | | 0.85 | | 1.11 | | 0.62 | | | 148 |
| | 9.49 | | 8.13 | | | | 23,096 | | 0.85 | | 1.26 | | 0.98 | | | 143 |
| | 9.27 | | 18.99 | | | | 24,651 | | 0.85 | | 1.31 | | 0.43 | | | 133 |
| (e) | The investment adviser and/or administrator agreed to reimburse a portion of the Fund’s expenses and/or reduce its fees during the period. Without this reimbursement/fee reduction (including the voluntary reimbursement/fee reduction), if applicable, expenses would have been higher. |
| (f) | Computed on an annualized basis for periods less than one year, if applicable. |
| (g) | For the six months ended March 31, 2010 (Unaudited). |
40
FINANCIAL HIGHLIGHTS (continued)
For a share outstanding throughout each period.
| | | | | | | | | | | | | | | | | | | | | | | | | | | | | |
| | | | | Income (Loss) from Investment Operations: | | | Less Distributions: | | | |
| | | | | | | | |
| | | Net asset
value,
beginning
of
the period | | Net
investment
income (a) | | Net realized
and unrealized
gain (loss) | | | Total from
investment
operations | | | Dividends
from
net investment
income | | | Distributions
from net
realized
capital gains (b) | | | Total
distributions | | | Redemption
fees (b)(c) |
| | | | | | | | | | | | | | | | | | | | | | | | | | | | | |
GLOBAL MARKETS FUND | | | | | | | | | | | | | | | | | | | | | | | | | | | | | |
Class A | | | | | | | | | | | | | | | | | | | | | | | | | | | | | |
3/31/2010(h) | | $ | 12.50 | | $ | 0.13 | | $ | 1.13 | | | $ | 1.26 | | | $ | (0.30 | ) | | $ | — | | | $ | (0.30 | ) | | $ | — |
9/30/2009 | | | 11.65 | | | 0.36 | | | 0.74 | (i) | | | 1.10 | | | | (0.25 | ) | | | (0.00 | ) | | | (0.25 | ) | | | — |
9/30/2008 | | | 15.83 | | | 0.25 | | | (3.46 | ) | | | (3.21 | ) | | | (0.53 | ) | | | (0.44 | ) | | | (0.97 | ) | | | 0.00 |
9/30/2007 | | | 12.49 | | | 0.20 | | | 3.39 | | | | 3.59 | | | | (0.25 | ) | | | — | | | | (0.25 | ) | | | 0.00 |
9/30/2006* | | | 12.71 | | | 0.12 | | | (0.34 | ) | | | (0.22 | ) | | | — | | | | — | | | | — | | | | — |
Class C | | | | | | | | | | | | | | | | | | | | | | | | | | | | | |
3/31/2010(h) | | | 12.39 | | | 0.08 | | | 1.14 | | | | 1.22 | | | | (0.22 | ) | | | — | | | | (0.22 | ) | | | — |
9/30/2009 | | | 11.51 | | | 0.28 | | | 0.75 | (i) | | | 1.03 | | | | (0.15 | ) | | | (0.00 | ) | | | (0.15 | ) | | | — |
9/30/2008 | | | 15.70 | | | 0.15 | | | (3.43 | ) | | | (3.28 | ) | | | (0.47 | ) | | | (0.44 | ) | | | (0.91 | ) | | | 0.00 |
9/30/2007 | | | 12.43 | | | 0.10 | | | 3.36 | | | | 3.46 | | | | (0.19 | ) | | | — | | | | (0.19 | ) | | | 0.00 |
9/30/2006* | | | 12.71 | | | 0.06 | | | (0.34 | ) | | | (0.28 | ) | | | — | | | | — | | | | — | | | | — |
Class Y | | | | | | | | | | | | | | | | | | | | | | | | | | | | | |
3/31/2010(h) | | | 12.54 | | | 0.14 | | | 1.14 | | | | 1.28 | | | | (0.33 | ) | | | — | | | | (0.33 | ) | | | — |
9/30/2009 | | | 11.70 | | | 0.38 | | | 0.75 | (i) | | | 1.13 | | | | (0.29 | ) | | | (0.00 | ) | | | (0.29 | ) | | | — |
9/30/2008 | | | 15.87 | | | 0.30 | | | (3.48 | ) | | | (3.18 | ) | | | (0.55 | ) | | | (0.44 | ) | | | (0.99 | ) | | | 0.00 |
9/30/2007 | | | 12.51 | | | 0.24 | | | 3.39 | | | | 3.63 | | | | (0.27 | ) | | | — | | | | (0.27 | ) | | | 0.00 |
9/30/2006** | | | 11.84 | | | 0.19 | | | 0.64 | | | | 0.83 | | | | (0.16 | ) | | | — | | | | (0.16 | ) | | | 0.00 |
9/30/2005 | | | 10.19 | | | 0.19 | | | 1.73 | | | | 1.92 | | | | (0.27 | ) | | | — | | | | (0.27 | ) | | | — |
| * | From commencement of Class operations on February 1, 2006 through September 30, 2006. |
| ** | Prior to the close of business on February 1, 2006, the Fund offered Institutional Class shares, which were redesignated as Class Y shares on that date. |
| (a) | Per share net investment income has been calculated using the average shares outstanding during the period. |
| (b) | Amount rounds to less than $0.01 per share, if applicable. |
| (c) | Effective June 2, 2008, redemption fees were eliminated. |
| (d) | A sales charge for Class A shares and a contingent deferred sales charge for Class C shares are not reflected in total return calculations. Periods less than one year, if applicable, are not annualized. |
| (e) | Had certain expenses not been reduced during the period, if applicable, total returns would have been lower. |
See accompanying notes to financial statements.
41
| | | | | | | | | | | | | | | | | |
| | | | | | | | Ratios to Average Net Assets: | | |
| | | | | | |
Net asset
value,
end of
the period | | Total
return
(%) (d)(e) | | | Net assets,
end of
the period
(000’s) | | Net
expenses
(%) (f)(g) | | | Gross
expenses
(%) (f) | | | Net investment
income
(%) (f) | | Portfolio
turnover
rate (%) |
| | | | | | | | | | | | | | | | | |
| | | | | | | | | | | | | | | | | |
| | | | | | | | | | | | | | | | | |
| $ | 13.46 | | 10.28 | | | $ | 53,613 | | 1.25 | | | 1.28 | | | 1.96 | | 49 |
| | 12.50 | | 10.27 | | | | 44,669 | | 1.25 | | | 1.34 | | | 3.56 | | 114 |
| | 11.65 | | (21.87 | ) | | | 67,647 | | 1.25 | | | 1.27 | | | 1.74 | | 133 |
| | 15.83 | | 29.05 | | | | 28,927 | | 1.25 | | | 1.37 | | | 1.44 | | 78 |
| | 12.49 | | (1.73 | ) | | | 10,438 | | 1.25 | | | 1.56 | | | 1.52 | | 103 |
| | | | | | | | | | | | | | | | | |
| | 13.39 | | 9.94 | | | | 107,117 | | 2.00 | | | 2.03 | | | 1.21 | | 49 |
| | 12.39 | | 9.40 | | | | 96,208 | | 2.00 | | | 2.09 | | | 2.82 | | 114 |
| | 11.51 | | (22.42 | ) | | | 124,178 | | 2.00 | | | 2.02 | | | 1.04 | | 133 |
| | 15.70 | | 27.99 | | | | 60,179 | | 2.00 | | | 2.11 | | | 0.69 | | 78 |
| | 12.43 | | (2.12 | ) | | | 20,228 | | 2.00 | | | 2.32 | | | 0.78 | | 103 |
| | | | | | | | | | | | | | | | | |
| | 13.49 | | 10.46 | | | | 123,456 | | 1.00 | | | 1.03 | | | 2.20 | | 49 |
| | 12.54 | | 10.49 | | | | 108,728 | | 1.00 | | | 1.01 | | | 3.79 | | 114 |
| | 11.70 | | (21.66 | ) | | | 120,322 | | 0.99 | (j) | | 0.99 | (j) | | 2.06 | | 133 |
| | 15.87 | | 29.36 | | | | 80,824 | | 1.00 | | | 1.02 | | | 1.70 | | 78 |
| | 12.51 | | 7.07 | | | | 58,650 | | 1.00 | | | 1.19 | | | 1.58 | | 103 |
| | 11.84 | | 19.11 | | | | 47,712 | | 1.00 | | | 1.46 | | | 1.72 | | 78 |
| (f) | Computed on an annualized basis for periods less than one year, if applicable. |
| (g) | The investment adviser and/or administrator agreed to reimburse a portion of the Fund’s expenses and/or reduce its fees during the period. Without this reimbursement/fee reduction, if applicable, expenses would have been higher. |
| (h) | For the six months ended March 31, 2010 (Unaudited). |
| (i) | The amount shown for a share outstanding does not correspond with the aggregate realized and unrealized gain (loss) on investments for the period due to the timing of sales and redemptions of fund shares in relation to fluctuating market values of investments of the Fund. |
| (j) | Includes fee/expense recovery of 0.01%. |
42
FINANCIAL HIGHLIGHTS (continued)
For a share outstanding throughout each period.
| | | | | | | | | | | | | | | | | | | | | | | | |
| | | | | Income (Loss) from Investment Operations: | | | Less Distributions: |
| | | | | | | |
| | | Net asset
value,
beginning
of
the period | | Net
investment
income
(loss) (a)(b) | | | Net realized
and unrealized
gain (loss) | | | Total from
investment
operations | | | Dividends
from
net investment
income | | Distributions
from net
realized
capital gains | | Total
distributions |
| | | | | | | | | | | | | | | | | | | | | | | | |
GROWTH FUND | | | | | | | | | | | | | | | | | | | | | | | | |
Class A | | | | | | | | | | | | | | | | | | | | | | | | |
3/31/2010(g) | | $ | 4.48 | | $ | (0.01 | ) | | $ | 0.66 | | | $ | 0.65 | | | $ | — | | $ | — | | $ | — |
9/30/2009 | | | 4.99 | | | (0.01 | ) | | | (0.50 | ) | | | (0.51 | ) | | | — | | | — | | | — |
9/30/2008 | | | 7.01 | | | (0.02 | ) | | | (2.00 | ) | | | (2.02 | ) | | | — | | | — | | | — |
9/30/2007 | | | 5.84 | | | (0.03 | ) | | | 1.20 | | | | 1.17 | | | | — | | | — | | | — |
9/30/2006 | | | 6.03 | | | (0.00 | ) | | | (0.19 | ) | | | (0.19 | ) | | | — | | | — | | | — |
9/30/2005 | | | 4.98 | | | (0.02 | ) | | | 1.07 | | | | 1.05 | | | | — | | | — | | | — |
Class B | | | | | | | | | | | | | | | | | | | | | | | | |
3/31/2010(g) | | | 4.28 | | | (0.03 | ) | | | 0.63 | | | | 0.60 | | | | — | | | — | | | — |
9/30/2009 | | | 4.81 | | | (0.04 | ) | | | (0.49 | ) | | | (0.53 | ) | | | — | | | — | | | — |
9/30/2008 | | | 6.79 | | | (0.07 | ) | | | (1.91 | ) | | | (1.98 | ) | | | — | | | — | | | — |
9/30/2007 | | | 5.70 | | | (0.07 | ) | | | 1.16 | | | | 1.09 | | | | — | | | — | | | — |
9/30/2006 | | | 5.94 | | | (0.05 | ) | | | (0.19 | ) | | | (0.24 | ) | | | — | | | — | | | — |
9/30/2005 | | | 4.94 | | | (0.06 | ) | | | 1.06 | | | | 1.00 | | | | — | | | — | | | — |
Class C | | | | | | | | | | | | | | | | | | | | | | | | |
3/31/2010(g) | | | 4.28 | | | (0.03 | ) | | | 0.64 | | | | 0.61 | | | | — | | | — | | | — |
9/30/2009 | | | 4.81 | | | (0.04 | ) | | | (0.49 | ) | | | (0.53 | ) | | | — | | | — | | | — |
9/30/2008 | | | 6.80 | | | (0.07 | ) | | | (1.92 | ) | | | (1.99 | ) | | | — | | | — | | | — |
9/30/2007 | | | 5.71 | | | (0.08 | ) | | | 1.17 | | | | 1.09 | | | | — | | | — | | | — |
9/30/2006 | | | 5.94 | | | (0.04 | ) | | | (0.19 | ) | | | (0.23 | ) | | | — | | | — | | | — |
9/30/2005 | | | 4.94 | | | (0.06 | ) | | | 1.06 | | | | 1.00 | | | | — | | | — | | | — |
Class Y | | | | | | | | | | | | | | | | | | | | | | | | |
3/31/2010(g) | | | 4.73 | | | (0.00 | ) | | | 0.69 | | | | 0.69 | | | | — | | | — | | | — |
9/30/2009 | | | 5.24 | | | 0.01 | | | | (0.52 | ) | | | (0.51 | ) | | | — | | | — | | | — |
9/30/2008 | | | 7.32 | | | 0.01 | | | | (2.09 | ) | | | (2.08 | ) | | | — | | | — | | | — |
9/30/2007 | | | 6.08 | | | (0.00 | ) | | | 1.24 | | | | 1.24 | | | | — | | | — | | | — |
9/30/2006 | | | 6.26 | | | 0.02 | | | | (0.20 | ) | | | (0.18 | ) | | | — | | | — | | | — |
9/30/2005 | | | 5.15 | | | (0.00 | ) | | | 1.11 | | | | 1.11 | | | | — | | | — | | | — |
| (a) | Per share net investment income (loss) has been calculated using the average shares outstanding during the period. |
| (b) | Amount rounds to less than $0.01 per share, if applicable. |
| (c) | Had certain expenses not been reduced during the period, if applicable, total returns would have been lower. |
| (d) | A sales charge for Class A shares and a contingent deferred sales charge for Class B and Class C shares are not reflected in total return calculations. Periods less than one year, if applicable, are not annualized. |
| (e) | Computed on an annualized basis for periods less than one year, if applicable. |
| (f) | The investment adviser and/or administrator agreed to reimburse a portion of the Fund’s expenses and/or reduce its fees during the period. Without this reimbursement/fee reduction (including the voluntary reimbursement/fee reduction), if applicable, expenses would have been higher. |
See accompanying notes to financial statements.
43
| | | | | | | | | | | | | | | | | | |
| | | | | | | | Ratios to Average Net Assets: | | | |
| | | | | | |
Net asset
value,
end of
the period | | Total
return
(%) (c)(d) | | | Net assets,
end of
the period
(000’s) | | Net
expenses
(%) (e)(f) | | | Gross
expenses
(%) (e) | | | Net investment
income
(loss) (%) (e) | | | Portfolio
turnover
rate (%) |
| | | | | | | | | | | | | | | | | | |
| | | | | | | | | | | | | | | | | | |
| | | | | | | | | | | | | | | | | | |
| $ | 5.13 | | 14.51 | | | $ | 34,024 | | 1.15 | (h) | | 1.18 | (h) | | (0.44 | ) | | 59 |
| | 4.48 | | (10.40 | ) | | | 33,207 | | 1.25 | | | 1.31 | | | (0.25 | ) | | 191 |
| | 4.99 | | (28.67 | ) | | | 156,841 | | 1.10 | | | 1.10 | | | (0.33 | ) | | 179 |
| | 7.01 | | 20.03 | | | | 228,629 | | 1.14 | (i) | | 1.14 | (i) | | (0.49 | ) | | 134 |
| | 5.84 | | (3.15 | ) | | | 225,729 | | 1.10 | | | 1.17 | | | (0.03 | ) | | 174 |
| | 6.03 | | 21.08 | | | | 51,248 | | 1.10 | | | 1.60 | | | (0.38 | ) | | 164 |
| | | | | | | | | | | | | | | | | | |
| | 4.88 | | 14.02 | | | | 5,003 | | 1.90 | (h) | | 1.92 | (h) | | (1.19 | ) | | 59 |
| | 4.28 | | (11.02 | ) | | | 5,397 | | 2.00 | | | 2.12 | | | (1.06 | ) | | 191 |
| | 4.81 | | (29.16 | ) | | | 9,553 | | 1.85 | | | 1.85 | | | (1.05 | ) | | 179 |
| | 6.79 | | 19.12 | | | | 28,258 | | 1.85 | (i) | | 1.85 | (i) | | (1.20 | ) | | 134 |
| | 5.70 | | (4.04 | ) | | | 32,160 | | 1.95 | | | 2.11 | | | (0.85 | ) | | 174 |
| | 5.94 | | 20.24 | | | | 38,538 | | 1.85 | | | 2.33 | | | (1.14 | ) | | 164 |
| | | | | | | | | | | | | | | | | | |
| | 4.89 | | 14.25 | | | | 14,573 | | 1.90 | (h) | | 1.93 | (h) | | (1.20 | ) | | 59 |
| | 4.28 | | (11.02 | ) | | | 16,336 | | 2.00 | | | 2.12 | | | (1.06 | ) | | 191 |
| | 4.81 | | (29.26 | ) | | | 27,743 | | 1.85 | | | 1.85 | | | (1.08 | ) | | 179 |
| | 6.80 | | 19.09 | | | | 39,157 | | 1.88 | | | 1.88 | | | (1.23 | ) | | 134 |
| | 5.71 | | (3.87 | ) | | | 43,415 | | 1.85 | | | 1.95 | | | (0.76 | ) | | 174 |
| | 5.94 | | 20.24 | | | | 25,734 | | 1.85 | | | 2.35 | | | (1.10 | ) | | 164 |
| | | | | | | | | | | | | | | | | | |
| | 5.42 | | 14.59 | | | | 58,271 | | 0.89 | | | 0.92 | | | (0.19 | ) | | 59 |
| | 4.73 | | (9.73 | ) | | | 57,033 | | 0.75 | | | 0.75 | | | 0.18 | | | 191 |
| | 5.24 | | (28.42 | ) | | | 75,389 | | 0.66 | | | 0.66 | | | 0.11 | | | 179 |
| | 7.32 | | 20.39 | | | | 124,663 | | 0.67 | | | 0.67 | | | (0.02 | ) | | 134 |
| | 6.08 | | (2.88 | ) | | | 121,478 | | 0.80 | (j) | | 0.80 | (j) | | 0.31 | | | 174 |
| | 6.26 | | 21.55 | | | | 95,534 | | 0.85 | | | 0.97 | | | (0.05 | ) | | 164 |
| (g) | For the six months ended March 31, 2010 (Unaudited). |
| (h) | Includes fee/expense recovery of 0.01% for Class A, Class B and Class C shares, respectively. |
| (i) | Includes fee/expense recovery of less than 0.01% and 0.08% for Class A and Class B shares, respectively. |
| (j) | Includes fee/expense recovery of 0.07%. |
44
FINANCIAL HIGHLIGHTS (continued)
For a share outstanding throughout each period.
| | | | | | | | | | | | | | | | | | | | | | | |
| | | | | Income (Loss) from Investment Operations: | | | Less Distributions: | |
| | | | | | |
| | | Net asset
value,
beginning
of
the period | | Net
investment
loss (a) | | | Net realized
and unrealized
gain (loss) | | | Total from
investment
operations | | | Dividends
from
net investment
income | | | Total
distributions | |
| | | | | | | | | | | | | | | | | | | | | | | |
MID CAP GROWTH FUND | | | | | | | | | | | | | | | | | | | | | | | |
Class A* | | | | | | | | | | | | | | | | | | | | | | | |
3/31/2010(f) | | $ | 18.29 | | $ | (0.10 | ) | | $ | 3.37 | | | $ | 3.27 | | | $ | — | | | $ | — | |
9/30/2009 | | | 21.12 | | | (0.07 | )(g) | | | (2.76 | ) | | | (2.83 | ) | | | — | | | | — | |
9/30/2008 | | | 26.84 | | | (0.15 | ) | | | (5.57 | ) | | | (5.72 | ) | | | — | | | | — | |
9/30/2007 | | | 19.69 | | | (0.16 | )(h) | | | 7.31 | | | | 7.15 | | | | — | | | | — | |
9/30/2006 | | | 18.63 | | | (0.15 | ) | | | 1.21 | | | | 1.06 | | | | — | | | | — | |
9/30/2005 | | | 15.20 | | | (0.14 | ) | | | 3.70 | | | | 3.56 | | | | (0.13 | ) | | | (0.13 | ) |
Class C | | | | | | | | | | | | | | | | | | | | | | | |
3/31/2010(f) | | | 18.20 | | | (0.17 | ) | | | 3.35 | | | | 3.18 | | | | — | | | | | |
9/30/2009** | | | 15.13 | | | (0.16 | ) | | | 3.23 | | | | 3.07 | | | | — | | | | — | |
Class Y* | | | | | | | | | | | | | | | | | | | | | | | |
3/31/2010(f) | | | 18.84 | | | (0.08 | ) | | | 3.48 | | | | 3.40 | | | | — | | | | — | |
9/30/2009 | | | 21.70 | | | (0.05 | )(g) | | | (2.81 | ) | | | (2.86 | ) | | | — | | | | — | |
9/30/2008 | | | 27.51 | | | (0.10 | ) | | | (5.71 | ) | | | (5.81 | ) | | | — | | | | — | |
9/30/2007 | | | 20.13 | | | (0.11 | )(h) | | | 7.49 | | | | 7.38 | | | | — | | | | — | |
9/30/2006 | | | 19.00 | | | (0.10 | ) | | | 1.23 | | | | 1.13 | | | | — | | | | — | |
9/30/2005 | | | 15.50 | | | (0.10 | ) | | | 3.78 | | | | 3.68 | | | | (0.18 | ) | | | (0.18 | ) |
| * | Prior to the close of business on February 2, 2009, the Fund offered Retail and Institutional Class shares, which were redesignated as Class A and Class Y shares, respectively on that date. |
| ** | From commencement of Class operations on February 2, 2009 through September 30, 2009. |
| (a) | Per share net investment loss has been calculated using the average shares outstanding during the period. |
| (b) | Had certain expenses not been reduced during the period, if applicable, total returns would have been lower. |
| (c) | A sales charge for Class A shares and a contingent deferred sales charge for Class C shares are not reflected in total return calculations. Periods less than one year, if applicable, are not annualized. |
| (d) | The investment adviser and/or administrator agreed to reimburse a portion of the Fund’s expenses and/or reduce its fees during the period. Without this reimbursement/fee reduction, if applicable, expenses would have been higher. |
See accompanying notes to financial statements.
45
| | | | | | | | | | | | | | | | | | |
| | | | | | | | Ratios to Average Net Assets: | | | |
| | | | | | |
Net asset
value,
end of
the period | | Total
return
(%) (b)(c) | | | Net assets,
end of
the period
(000’s) | | Net
expenses
(%) (d)(e) | | | Gross
expenses
(%) (e) | | | Net investment
loss (%) (e) | | | Portfolio
turnover
rate (%) |
| | | | | | | | | | | | | | | | | | |
| | | | | | | | | | | | | | | | | | |
| | | | | | | | | | | | | | | | | | |
| $ | 21.56 | | 17.88 | | | $ | 46,370 | | 1.25 | | | 1.45 | | | (1.03 | ) | | 81 |
| | 18.29 | | (13.44 | ) | | | 54,951 | | 1.25 | | | 1.52 | | | (0.45 | )(g) | | 292 |
| | 21.12 | | (21.27 | ) | | | 120,524 | | 1.25 | | | 1.32 | | | (0.58 | ) | | 299 |
| | 26.84 | | 36.31 | | | | 30,654 | | 1.25 | | | 1.43 | | | (0.71 | ) | | 194 |
| | 19.69 | | 5.69 | | | | 26,668 | | 1.25 | �� | | 1.52 | | | (0.72 | ) | | 211 |
| | 18.63 | | 23.55 | | | | 25,802 | | 1.25 | | | 1.50 | | | (0.85 | ) | | 280 |
| | | | | | | | | | | | | | | | | | |
| | 21.38 | | 17.47 | | | | 22 | | 2.00 | | | 2.24 | | | (1.72 | ) | | 81 |
| | 18.20 | | 20.29 | | | | 1 | | 2.00 | | | 2.24 | | | (1.54 | ) | | 292 |
| | | | | | | | | | | | | | | | | | |
| | 22.24 | | 18.05 | | | | 31,608 | | 1.00 | | | 1.21 | | | (0.77 | ) | | 81 |
| | 18.84 | | (13.18 | ) | | | 27,057 | | 1.00 | | | 1.12 | | | (0.27 | )(g) | | 292 |
| | 21.70 | | (21.12 | ) | | | 25,779 | | 1.00 | (i) | | 1.00 | (i) | | (0.36 | ) | | 299 |
| | 27.51 | | 36.66 | | | | 24,143 | | 1.00 | | | 1.10 | | | (0.47 | ) | | 194 |
| | 20.13 | | 5.95 | | | | 17,467 | | 1.00 | | | 1.12 | | | (0.49 | ) | | 211 |
| | 19.00 | | 23.85 | | | | 26,159 | | 1.00 | | | 1.21 | | | (0.60 | ) | | 280 |
| (e) | Computed on an annualized basis for periods less than one year, if applicable. |
| (f) | For the six months ended March 31, 2010 (Unaudited). |
| (g) | Includes a non-recurring dividend of $0.03 per share. Without this dividend, net investment loss per share would have been $(0.10) and $(0.08) for Class A and Class Y shares, respectively, and the ratio of net investment loss to average net assets would have been (0.63)% and (0.46)% for Class A and Class Y shares, respectively. |
| (h) | Includes a non-recurring dividend of $0.02 per share. |
| (i) | Includes fee/expense recovery of less than 0.01% |
46
FINANCIAL HIGHLIGHTS (continued)
For a share outstanding throughout each period.
| | | | | | | | | | | | | | | | | | | | | | | | | | |
| | | | | Income (Loss) from Investment Operations: | | | Less Distributions: | |
| | | | | | | |
| | | Net asset
value,
beginning
of
the period | | Net
investment
income (a)(b) | | Net realized
and unrealized
gain (loss) | | | Total from
investment
operations | | | Dividends
from
net investment
income | | | Distributions
from net
realized
capital gains | | | Total
distributions | |
| | | | | | | | | | | | | | | | | | | | | | | | | | |
VALUE FUND | | | | | | | | | | | | | | | | | | | | | | | | | | |
Class A* | | | | | | | | | | | | | | | | | | | | | | | | | | |
3/31/2010(g) | | $ | 16.42 | | $ | 0.07 | | $ | 1.47 | | | $ | 1.54 | | | $ | (0.14 | ) | | $ | — | | | $ | (0.14 | ) |
9/30/2009 | | | 17.93 | | | 0.23 | | | (1.53 | ) | | | (1.30 | ) | | | (0.21 | ) | | | — | | | | (0.21 | ) |
9/30/2008 | | | 23.46 | | | 0.25 | | | (4.45 | ) | | | (4.20 | ) | | | (0.18 | ) | | | (1.15 | ) | | | (1.33 | ) |
9/30/2007 | | | 21.04 | | | 0.19 | | | 3.27 | | | | 3.46 | | | | (0.13 | ) | | | (0.91 | ) | | | (1.04 | ) |
9/30/2006** | | | 19.69 | | | 0.02 | | | 1.33 | | | | 1.35 | | | | — | | | | — | | | | — | |
Class B | | | | | | | | | | | | | | | | | | | | | | | | | | |
3/31/2010(g) | | | 16.40 | | | 0.01 | | | 1.47 | | | | 1.48 | | | | — | | | | — | | | | — | |
9/30/2009 | | | 17.80 | | | 0.14 | | | (1.51 | ) | | | (1.37 | ) | | | (0.03 | ) | | | — | | | | (0.03 | ) |
9/30/2008 | | | 23.46 | | | 0.10 | | | (4.45 | ) | | | (4.35 | ) | | | (0.16 | ) | | | (1.15 | ) | | | (1.31 | ) |
9/30/2007*** | | | 24.00 | | | 0.00 | | | (0.54 | ) | | | (0.54 | ) | | | — | | | | — | | | | — | |
Class C | | | | | | | | | | | | | | | | | | | | | | | | | | |
3/31/2010(g) | | | 16.26 | | | 0.01 | | | 1.45 | | | | 1.46 | | | | (0.04 | ) | | | — | | | | (0.04 | ) |
9/30/2009 | | | 17.79 | | | 0.12 | | | (1.51 | ) | | | (1.39 | ) | | | (0.14 | ) | | | — | | | | (0.14 | ) |
9/30/2008 | | | 23.46 | | | 0.09 | | | (4.43 | ) | | | (4.34 | ) | | | (0.18 | ) | | | (1.15 | ) | | | (1.33 | ) |
9/30/2007*** | | | 24.00 | | | 0.01 | | | (0.55 | ) | | | (0.54 | ) | | | — | | | | — | | | | — | |
Class Y* | | | | | | | | | | | | | | | | | | | | | | | | | | |
3/31/2010(g) | | | 16.47 | | | 0.09 | | | 1.47 | | | | 1.56 | | | | (0.19 | ) | | | — | | | | (0.19 | ) |
9/30/2009 | | | 18.01 | | | 0.28 | | | (1.54 | ) | | | (1.26 | ) | | | (0.28 | ) | | | — | | | | (0.28 | ) |
9/30/2008 | | | 23.54 | | | 0.32 | | | (4.45 | ) | | | (4.13 | ) | | | (0.25 | ) | | | (1.15 | ) | | | (1.40 | ) |
9/30/2007 | | | 21.05 | | | 0.27 | | | 3.27 | | | | 3.54 | | | | (0.14 | ) | | | (0.91 | ) | | | (1.05 | ) |
9/30/2006 | | | 18.72 | | | 0.22 | | | 3.17 | | | | 3.39 | | | | (0.27 | ) | | | (0.79 | ) | | | (1.06 | ) |
9/30/2005 | | | 15.95 | | | 0.20 | | | 2.83 | | | | 3.03 | | | | (0.26 | ) | | | — | | | | (0.26 | ) |
Admin Class | | | | | | | | | | | | | | | | | | | | | | | | | | |
3/31/2010**** | | | 16.72 | | | 0.01 | | | 1.08 | | | | 1.09 | | | | — | | | | — | | | | — | |
| * | Prior to the close of business on June 1, 2007, the Fund offered Retail and Institutional Class shares, which were redesignated as Class A and Class Y shares, respectively, on that date. |
| ** | From commencement of Class operations on June 30, 2006, through September 30, 2006. |
| *** | From commencement of Class operations on June 1, 2007, through September 30, 2007. |
| **** | From commencement of Class operations on February 1, 2010, through March 31, 2010. |
| (a) | Amount rounds to less than $0.01 per share, if applicable. |
| (b) | Per share net investment income has been calculated using the average shares outstanding during the period. |
| (c) | A sales charge for Class A shares and a contingent deferred sales charge for Class B and Class C shares are not reflected in total return calculations. Periods less than one year, if applicable, are not annualized. |
| (d) | Had certain expenses not been reduced during the period, if applicable, total returns would have been lower. |
See accompanying notes to financial statements.
47
| | | | | | | | | | | | | | | | | | |
| | | | | | | | Ratios to Average Net Assets: | | | |
| | | | | | |
Net asset
value,
end of
the period | | Total
return
(%) (c)(d) | | | Net assets,
end of
the period
(000’s) | | Net
expenses
(%) (e)(f) | | | Gross
expenses
(%) (f) | | | Net investment
income
(%) (f) | | Portfolio
turnover
rate (%) | |
| | | | | | | | | | | | | | | | | | |
| | | | | | | | | | | | | | | | | | |
| | | | | | | | | | | | | | | | | | |
| $ | 17.82 | | 9.42 | | | $ | 135,133 | | 0.93 | | | 0.93 | | | 0.87 | | 28 | |
| | 16.42 | | (6.97 | ) | | | 120,915 | | 1.06 | | | 1.06 | | | 1.67 | | 47 | |
| | 17.93 | | (19.01 | ) | | | 112,274 | | 1.05 | | | 1.05 | | | 1.24 | | 36 | (h) |
| | 23.46 | | 16.85 | | | | 17,500 | | 1.09 | (i) | | 1.09 | (i) | | 0.79 | | 41 | |
| | 21.04 | | 6.86 | | | | 466 | | 1.10 | | | 8.65 | | | 0.42 | | 36 | |
| | | | | | | | | | | | | | | | | | |
| | 17.88 | | 9.02 | | | | 4,647 | | 1.68 | | | 1.68 | | | 0.14 | | 28 | |
| | 16.40 | | (7.62 | ) | | | 5,167 | | 1.81 | | | 1.81 | | | 1.03 | | 47 | |
| | 17.80 | | (19.65 | ) | | | 8,385 | | 1.80 | (j) | | 1.80 | (j) | | 0.51 | | 36 | (h) |
| | 23.46 | | (2.25 | ) | | | 108 | | 1.85 | | | 1.89 | | | 0.03 | | 41 | |
| | | | | | | | | | | | | | | | | | |
| | 17.68 | | 8.98 | | | | 10,974 | | 1.68 | | | 1.68 | | | 0.12 | | 28 | |
| | 16.26 | | (7.60 | ) | | | 10,011 | | 1.81 | | | 1.81 | | | 0.89 | | 47 | |
| | 17.79 | | (19.62 | ) | | | 6,483 | | 1.80 | (j) | | 1.80 | (j) | | 0.46 | | 36 | (h) |
| | 23.46 | | (2.25 | ) | | | 1,390 | | 1.85 | | | 1.94 | | | 0.10 | | 41 | |
| | | | | | | | | | | | | | | | | | |
| | 17.84 | | 9.54 | | | | 794,396 | | 0.69 | | | 0.69 | | | 1.10 | | 28 | |
| | 16.47 | | (6.66 | ) | | | 574,439 | | 0.66 | | | 0.66 | | | 1.97 | | 47 | |
| | 18.01 | | (18.67 | ) | | | 303,182 | | 0.65 | | | 0.66 | | | 1.58 | | 36 | (h) |
| | 23.54 | | 17.25 | | | | 182,002 | | 0.72 | (i) | | 0.72 | (i) | | 1.19 | | 41 | |
| | 21.05 | | 18.92 | | | | 71,147 | | 0.85 | | | 0.91 | | | 1.13 | | 36 | |
| | 18.72 | | 19.19 | | | | 37,255 | | 0.85 | | | 0.92 | | | 1.13 | | 34 | |
| | | | | | | | | | | | | | | | | | |
| | 17.81 | | 6.52 | | | | 1 | | 1.34 | | | 1.34 | | | 0.44 | | 28 | |
| (e) | The investment adviser and/or administrator agreed to reimburse a portion of the Fund’s expenses and/or reduce its fees during the period. Without this reimbursement/fee reduction, if applicable, expenses would have been higher. |
| (f) | Computed on an annualized basis for periods less than one year, if applicable. |
| (g) | For the six months ended March 31, 2010 (Unaudited). |
| (h) | Portfolio turnover excludes the impact of assets resulting from a merger with another fund. |
| (i) | Includes fee/expense recovery of 0.02% and 0.01% for Class A and Class Y shares, respectively. |
| (j) | Includes fee/expense recovery of less than 0.01% for Class B and Class C shares, respectively. |
48
NOTESTO FINANCIAL STATEMENTS
March 31, 2010 (Unaudited)
1. Organization. Loomis Sayles Funds II (the “Trust”) is organized as a Massachusetts business trust. The Trust is registered under the Investment Company Act of 1940, as amended (the “1940 Act”), as an open-end management investment company. The Declaration of Trust permits the Board of Trustees to authorize the issuance of an unlimited number of shares of the Trust in multiple series. The financial statements for certain funds of the Trust are presented in separate reports. The following funds (individually, a “Fund” and collectively, the “Funds”) are included in this report:
Loomis Sayles Disciplined Equity Fund (the “Disciplined Equity Fund”)
Loomis Sayles Global Markets Fund (the “Global Markets Fund”)
Loomis Sayles Growth Fund (the “Growth Fund”)
Loomis Sayles Mid Cap Growth Fund (the “Mid Cap Growth Fund”)
Loomis Sayles Value Fund (the “Value Fund”)
Each Fund offers Class A, Class C and Class Y shares. Effective February 1, 2010, the Value Fund began offering Admin Class shares. Effective October 12, 2007, Class B shares are no longer offered. Existing Class B shareholders may continue to reinvest dividends into Class B shares and exchange their Class B shares for Class B shares of other Natixis Funds subject to existing exchange privileges as described in the Prospectus.
Class A shares are sold with a maximum front-end sales charge of 5.75%. Class B shares do not pay a front-end sales charge, but pay higher Rule 12b-1 fees than Class A shares for eight years (at which point they automatically convert to Class A shares), and are subject to a contingent deferred sales charge (��CDSC”) if those shares are redeemed within six years of purchase. Class C shares do not pay a front-end sales charge, do not convert to any other class of shares and pay higher Rule 12b-1 fees than Class A shares and may be subject to a CDSC of 1.00% if those shares are redeemed within one year of acquisition, except for reinvested distributions. Class Y shares do not pay a front-end sales charge, a CDSC or Rule 12b-1 fees. Class Y shares are generally intended for institutional investors with a minimum initial investment of $100,000, though some categories of investors are exempted from the minimum investment amount as outlined in the Funds’ Prospectus. Admin Class shares do not pay a front-end sales charge or a CDSC, but do pay a Rule 12b-1 fee. Admin Class shares are offered exclusively through intermediaries.
Most expenses of the Trust can be directly attributed to a fund. Expenses which can not be directly attributed to a fund are generally apportioned based on the relative net assets of each of the funds in the Trust. Expenses of a Fund are borne pro rata by the holders of each class of shares, except that each class bears expenses unique to that class (including the Rule 12b-1 service and distribution fees). In addition, each class votes as a class only with respect to its own Rule 12b-1 Plan. Shares of each class would receive their pro rata share of the net assets of a Fund if the Fund were liquidated. The Trustees approve separate dividends from net investment income on each class of shares.
2. Significant Accounting Policies. The following is a summary of significant accounting policies consistently followed by each Fund in the preparation of its financial statements. The Funds’ financial statements are prepared in accordance with accounting principles generally accepted in the United States of America which require the use of management estimates that affect the reported amounts and disclosures in the financial statements. Actual results could differ from those estimates. Management has evaluated the events and transactions that have occurred through the date the financial statements were issued, and noted no items requiring recognition in the financial statements or additional disclosures in the Notes to Financial Statements.
a. Valuation. Equity securities, including shares of closed-end investment companies and exchange-traded funds, for which market quotations are readily available are valued at market value, as reported by pricing services recommended by the investment adviser and approved by the Board of Trustees. Such pricing services generally use the security’s last sale price on the exchange or market where the security is primarily traded or, if there is no reported sale during the day, the closing bid price. Securities traded on the NASDAQ Global Select Market, NASDAQ Global Market and NASDAQ Capital Market are valued at the NASDAQ Official Closing Price (“NOCP”), or if lacking a NOCP, at the most recent bid quotation on the applicable NASDAQ Market. Debt securities (other than short-term obligations purchased with an original or remaining maturity of sixty days or less) are generally valued on the basis of evaluated bids furnished to the Funds by a pricing service recommended by the investment adviser and approved by the Board of Trustees, which service determines valuations for normal, institutional-size trading units of such securities using market information, transactions for comparable securities and various relationships between securities which are generally recognized by institutional traders. Broker-dealer bid quotations may also be used to value debt and equity securities where a pricing service does not price a security or where a pricing service does not provide a reliable price for the security. In instances where broker-dealer bid quotations are not available, certain securities held by the Funds may be valued on the basis of a price provided by a principal market maker. Forward foreign currency contracts are valued utilizing interpolated prices determined from information provided by an independent pricing service. Domestic exchange-traded single equity option contracts are valued at the mean of the National Best Bid and offer quotations. Short-term obligations purchased with an original or remaining maturity of sixty days or less are valued at amortized cost, which approximates market value. Securities for which market quotations are not readily available are valued at fair value as determined in good faith by the Funds’ investment adviser using consistently applied procedures under the general supervision of the Board of Trustees. Investments in other open-end investment companies are valued at their net asset value each day.
The Funds may hold securities traded in foreign markets. Foreign securities are valued at the market price in the foreign market. However, if events occurring after the close of the foreign market (but before the close of regular trading on the New York Stock Exchange) are believed to materially affect the value of those securities, such securities are fair valued pursuant to procedures approved by the Board of Trustees. When fair valuing securities, the Funds may, among other things, use modeling tools or other processes that may take into account factors such as securities market activity and/or significant events that occur after the close of the foreign market and before the Funds calculate their net asset values. As of March 31, 2010, approximately 19% of the market value of the Global Markets Fund’s investments was fair valued pursuant to procedures approved by the Board of Trustees.
49
NOTESTO FINANCIAL STATEMENTS (continued)
March 31, 2010 (Unaudited)
b. Security Transactions and Related Investment Income. Security transactions are accounted for on trade date. Dividend income is recorded on ex-dividend date, or in the case of certain foreign securities, as soon as a Fund is notified, and interest income is recorded on an accrual basis. Interest income is increased by the accretion of discount and decreased by the amortization of premium. Periodic principal adjustments for inflation-protected securities are recorded to interest income. Investment income is recorded net of foreign taxes withheld when applicable. In determining net gain or loss on securities sold, the cost of securities has been determined on an identified cost basis. Investment income, non-class specific expenses and realized and unrealized gains and losses are allocated on a pro rata basis to each class based on the relative net assets of each class to the total net assets of the Fund.
c. Foreign Currency Translation. The books and records of the Funds are maintained in U.S. dollars. The value of securities, currencies and other assets and liabilities denominated in currencies other than U.S. dollars are translated into U.S. dollars based upon foreign exchange rates prevailing at the end of the period. Purchases and sales of investment securities, income and expenses are translated on the respective dates of such transactions.
Since the values of investment securities are presented at the foreign exchange rates prevailing at the end of the period, it is not practical to isolate that portion of the results of operations arising from changes in exchange rates from fluctuations which arise due to changes in market prices of investment securities. Such changes are included with the net realized and unrealized gain or loss on investments.
Net realized foreign exchange gains or losses arise from sales of foreign currency, currency gains or losses realized between the trade and settlement dates on securities transactions and the difference between the amounts of dividends, interest and foreign withholding taxes recorded on the Funds’ books and the U.S. dollar equivalent of the amounts actually received or paid. Net unrealized foreign exchange gains and losses arise from changes in the value of assets and liabilities, other than investment securities, at the end of the fiscal period, resulting from changes in exchange rates.
Each Fund may use foreign currency exchange contracts to facilitate transactions in foreign-denominated investments. Losses may arise from changes in the value of the foreign currency or if the counterparties do not perform under the contracts’ terms.
d. Forward Foreign Currency Contracts. Each Fund may enter into forward foreign currency contracts. Contracts to buy generally are used to acquire exposure to foreign currencies, while contracts to sell generally are used to hedge a Fund’s investments against currency fluctuation. Also, a contract to buy or sell can offset a previous contract. These contracts involve market risk in excess of the unrealized gain or loss reflected in the Funds’ Statements of Assets and Liabilities. The U.S. dollar value of the currencies a Fund has committed to buy or sell represents the aggregate exposure to each currency the Fund has acquired or hedged through currency contracts outstanding at period end. Gains or losses are recorded for financial statement purposes as unrealized until settlement date. Risks may arise upon entering into these contracts from the potential inability of counterparties to meet the terms of their contracts and from unanticipated movements in the value of a foreign currency relative to the U.S. dollar. Certain contracts may require the movement of cash or securities to or from the counterparty as collateral for the Funds’ or counterparty’s net obligations under the contracts.
e. Option Contracts. The Funds may enter into option contracts. When a Fund purchases an option, it pays a premium and the option is subsequently marked to market to reflect current value. Premiums paid for purchasing options which expire are treated as realized losses. Premiums paid for purchasing options which are exercised or closed are added to the cost or deducted from the proceeds on the underlying instrument to determine the realized gain or loss. The risk associated with purchasing options is limited to the premium paid.
When a Fund writes an option, an amount equal to the net premium received (the premium less commission) is recorded as a liability and is subsequently adjusted to the current value until the option expires or the Fund enters into a closing purchase transaction. When a written option expires on its stipulated expiration date or the Fund enters into a closing purchase transaction, the difference between the net premium received and any amount paid at expiration or on effecting a closing purchase transaction, including commission, is treated as a realized gain or, if the net premium received is less than the amount paid, as a realized loss. The Fund, as writer of a written option, bears the risk of an unfavorable change in the market value of the equity underlying the written option.
Exchange-traded options have standardized contracts and are settled through a clearing house with fulfillment guaranteed by the credit of the exchange. Therefore, counterparty credit risks to the Funds are limited. Over-the-counter options are subject to the risk that the counterparty is unable or unwilling to meet its obligations under the option. The Funds are not party to any over-the-counter options at March 31, 2010.
f. Federal and Foreign Income Taxes. The Trust treats each fund as a separate entity for federal income tax purposes. Each Fund intends to meet the requirements of the Internal Revenue Code of 1986, as amended, applicable to regulated investment companies, and to distribute to its shareholders substantially all of its net investment income and any net realized capital gains at least annually. Management has performed an analysis of each Fund’s tax positions for the open tax years as of March 31, 2010 and has concluded that no provisions for income tax are required. The Funds’ federal tax returns for the prior three fiscal years remain subject to examination by the Internal Revenue Service. Management is not aware of any events that are reasonably possible to occur in the next six months that would result in the amounts of any unrecognized tax benefits significantly increasing or decreasing for the Funds. However, management’s conclusions regarding tax positions taken may be subject to review and adjustment at a later date based on factors including, but not limited to, new tax laws and accounting regulations and interpretations thereof.
50
NOTESTO FINANCIAL STATEMENTS (continued)
March 31, 2010 (Unaudited)
A Fund may be subject to foreign taxes on income and gains on investments that are accrued based upon the Fund’s understanding of the tax rules and regulations that exist in the countries in which the Fund invests. Foreign governments may also impose taxes or other payments on investments with respect to foreign securities. Such taxes are accrued as applicable, and are reflected as foreign taxes payable on the Statements of Assets and Liabilities. In the event that realized gains on investments are subsequently offset by realized losses, taxes paid on realized gains may be returned to a Fund. Such amounts, if applicable, are reflected as foreign tax rebates receivable on the Statements of Assets and Liabilities.
g. Dividends and Distributions to Shareholders. Dividends and distributions are recorded on ex-dividend date. The timing and characterization of certain income and capital gain distributions are determined annually in accordance with federal tax regulations, which may differ from accounting principles generally accepted in the United States of America. Permanent differences are primarily due to differing treatments for book and tax purposes for items such as net operating losses, distribution redesignations, paydown adjustments, foreign currency transactions, gains realized from passive foreign investment companies (“PFICs”), defaulted bonds and premium amortization accruals. Permanent book and tax basis differences relating to shareholder distributions will result in reclassifications to capital accounts. Temporary differences between book and tax distributable earnings are primarily due to deferred Trustees’ fees, forward contracts mark to market, securities lending collateral gain/loss adjustment, straddle loss deferrals, wash sales, premium amortization accruals and defaulted bond interest. Distributions from net investment income and short-term capital gains are considered to be distributed from ordinary income for tax purposes.
The tax characterization of distributions is determined on an annual basis. The tax character of distributions paid to shareholders during the year ended September 30, 2009:
| | | | | | | | |
| | | 2009 Distributions Paid From: |
Fund | | Ordinary Income | | Long-Term Capital Gains | | Total |
| | | | | | | | |
Disciplined Equity Fund | | $ | 216,562 | | — | | $ | 216,562 |
Global Markets Fund | | | 4,997,799 | | — | | | 4,997,799 |
Growth Fund | | | — | | — | | | — |
Mid Cap Growth Fund | | | — | | — | | | — |
Value Fund | | | 6,186,770 | | — | | | 6,186,770 |
Differences between these amounts and those reported in the Statements of Changes in Net Assets, if any, are primarily attributable to different book and tax treatment for short-term capital gains.
As of September 30, 2009, the capital loss carryforwards and post-October losses were as follows:
| | | | | | | | | | | | | | | | | | | | |
| | | Disciplined Equity Fund | | | Global Markets Fund | | | Growth Fund | | | Mid Cap Growth Fund | | | Value Fund | |
| | | | | | | | | | | | | | | | | | | | |
Capital loss carryforward: | | | | | | | | | | | | | | | | | | | | |
Expires September 30, 2010 | | $ | — | | | $ | — | | | $ | (9,606,459 | )* | | $ | (65,130,772 | ) | | $ | — | |
Expires September 30, 2011 | | | — | | | | — | | | | (6,192,314 | )* | | | (21,142,388 | ) | | | — | |
Expires September 30, 2016 | | | — | | | | — | | | | (75,866 | ) | | | — | | | | — | |
Expires September 30, 2017 | | | (2,229,424 | ) | | | (54,290,711 | ) | | | (57,062,095 | ) | | | (33,667,761 | ) | | | (26,840,015 | ) |
| | | | | | | | | | | | | | | | | | | | |
Total capital loss carryforward | | $ | (2,229,424 | ) | | $ | (54,290,711 | ) | | $ | (72,936,734 | ) | | $ | (119,940,921 | ) | | $ | (26,840,015 | ) |
| | | | | | | | | | | | | | | | | | | | |
Deferred net capital losses (post-October 2008) | | $ | (4,813,445 | ) | | $ | (56,215,833 | ) | | $ | (57,669,601 | ) | | $ | (32,805,392 | ) | | $ | (66,497,637 | ) |
| | | | | | | | | | | | | | | | | | | | |
* A significant portion of the Loomis Sayles Growth Fund’s carryforward losses are a result of prior year mergers; therefore, utilization of these losses has been limited under section 382 of the Internal Revenue Code.
h. Repurchase Agreements. It is each Fund’s policy that the market value of the collateral for repurchase agreements be at least equal to 102% of the repurchase price, including interest. Certain repurchase agreements are tri-party arrangements whereby the collateral is held in a segregated account for the benefit of the Fund and on behalf of the counterparty. Repurchase agreements could involve certain risks in the event of default or insolvency of the counterparty including possible delays or restrictions upon a Fund’s ability to dispose of the underlying securities.
i. Securities Lending. The Funds have entered into an agreement with State Street Bank and Trust Company (“State Street Bank”), as agent of the Funds, to lend securities to certain designated borrowers. The loans are collateralized with cash or securities in an amount equal to at least 105% or 102% of the market value (including accrued interest) of the loaned international or domestic securities, respectively, when the loan is initiated. Thereafter, the value of the collateral must remain at least 102% of the market value (including accrued interest) of loaned securities for U.S. equities and U.S. corporate debt; at least 105% of the market value (including accrued interest) of loaned
51
NOTESTO FINANCIAL STATEMENTS (continued)
March 31, 2010 (Unaudited)
securities for non-U.S. equities; and at least 100% of the market value (including accrued interest) of loaned securities for U.S. Government securities, sovereign debt issued by non-U.S. Governments and non-U.S. corporate debt. In the event that the market value of the collateral falls below the required percentages described above, the borrower will deliver additional collateral on the next business day. As with other extensions of credit, the Funds bear the risk of loss with respect to the investment of the collateral. The Funds invest cash collateral in short-term investments, a portion of the income from which is remitted to the borrowers and the remainder allocated between the Funds and State Street Bank as lending agent.
As of March 31, 2010, there were no securities on loan.
j. Indemnifications. Under the Trust’s organizational documents, its officers and Trustees are indemnified against certain liabilities arising out of the performance of their duties to the Funds. Additionally, in the normal course of business, the Funds enter into contracts with service providers that contain general indemnification clauses. The Funds’ maximum exposure under these arrangements is unknown as this would involve future claims that may be made against the Funds that have not yet occurred. However, based on experience, the Funds expect the risk of loss to be remote.
3. Fair Value Measurements. In accordance with accounting standards related to fair value measurements and disclosures, the Funds have categorized the inputs utilized in determining the value of each Fund’s assets or liabilities. These inputs are summarized in the three broad levels listed below:
| | • | | Level 1 — quoted prices in active markets for identical assets or liabilities; |
| | • | | Level 2 — prices determined using other significant inputs that are observable either directly, or indirectly through corroboration with observable market data (which could include quoted prices for similar assets or liabilities, interest rates, credit risk, etc.); |
| | • | | Level 3 — prices determined using significant unobservable inputs for situations where quoted prices or observable inputs are unavailable such as when there is little or no market activity for an asset or liability (unobservable inputs reflect each Fund’s own assumptions in determining the fair value of assets or liabilities and would be based on the best information available). |
The inputs or methodology used for valuing securities are not necessarily an indication of the risk associated with investing in those securities.
The following is a summary of the inputs used to value the Funds’ investments as of March 31, 2010, at value:
Disciplined Equity Fund
Asset Valuation Inputs
| | | | | | | | | | | | |
Description(a) | | Level 1 | | Level 2 | | Level 3 | | Total |
| | | | | | | | | | | | |
Common Stocks | | $ | 33,456,990 | | $ | — | | $ | — | | $ | 33,456,990 |
Short-Term Investments | | | — | | | 1,481,511 | | | — | | | 1,481,511 |
| | | | | | | | | | | | |
Total | | $ | 33,456,990 | | $ | 1,481,511 | | $ | — | | $ | 34,938,501 |
| | | | | | | | | | | | |
Liability Valuation Inputs
| | | | | | | | | | | | | | |
Description(a) | | Level 1 | | | Level 2 | | Level 3 | | Total | |
| | | | | | | | | | | | | | |
Call Options Written | | $ | (80,942 | ) | | $ | — | | $ | — | | $ | (80,942 | ) |
| | | | | | | | | | | | | | |
(a) Major categories of the Fund’s investments and option contracts are included in the Portfolio of Investments.
52
NOTESTO FINANCIAL STATEMENTS (continued)
March 31, 2010 (Unaudited)
Global Markets Fund
Asset Valuation Inputs
| | | | | | | | | | | | |
Description | | Level 1 | | Level 2 | | Level 3 | | Total |
| | | | | | | | | | | | |
Common Stocks | | | | | | | | | | | | |
Belgium | | $ | — | | $ | 2,590,782 | | $ | — | | $ | 2,590,782 |
Brazil | | | 16,965,820 | | | — | | | — | | | 16,965,820 |
Cayman Islands | | | 7,998,550 | | | — | | | — | | | 7,998,550 |
Chile | | | 2,646,936 | | | — | | | — | | | 2,646,936 |
China | | | — | | | 4,853,874 | | | — | | | 4,853,874 |
France | | | 2,123,619 | | | — | | | — | | | 2,123,619 |
Germany | | | — | | | 3,467,719 | | | — | | | 3,467,719 |
Hong Kong | | | — | | | 4,668,464 | | | — | | | 4,668,464 |
Japan | | | — | | | 5,071,018 | | | — | | | 5,071,018 |
Korea | | | — | | | 5,184,770 | | | — | | | 5,184,770 |
Netherlands Antilles | | | 1,672,108 | | | — | | | — | | | 1,672,108 |
Russia | | | — | | | 2,953,985 | | | — | | | 2,953,985 |
Switzerland | | | — | | | 9,894,310 | | | — | | | 9,894,310 |
United Kingdom | | | 1,614,416 | | | 15,062,947 | | | — | | | 16,677,363 |
United States | | | 93,960,458 | | | — | | | — | | | 93,960,458 |
| | | | | | | | | | | | |
Total Common Stocks | | | 126,981,907 | | | 53,747,869 | | | — | | | 180,729,776 |
| | | | | | | | | | | | |
Bonds and Notes | | | | | | | | | | | | |
Non-Convertible Bonds | | | | | | | | | | | | |
Korea | | | — | | | 1,642,562 | | | 362,262 | | | 2,004,824 |
United States | | | — | | | 57,709,763 | | | 326,675 | | | 58,036,438 |
All Other Non-Convertible Bonds(a) | | | — | | | 29,256,435 | | | — | | | 29,256,435 |
| | | | | | | | | | | | |
Total Non-Convertible Bonds | | | — | | | 88,608,760 | | | 688,937 | | | 89,297,697 |
| | | | | | | | | | | | |
Convertible Bonds(a) | | | — | | | 3,341,921 | | | — | | | 3,341,921 |
Municipals(a) | | | — | | | 98,310 | | | — | | | 98,310 |
| | | | | | | | | | | | |
Total Bonds and Notes | | | — | | | 92,048,991 | | | 688,937 | | | 92,737,928 |
| | | | | | | | | | | | |
Bank Loans(a) | | | — | | | 148,055 | | | — | | | 148,055 |
Preferred Stocks(a) | | | 16,434 | | | 1,194,799 | | | — | | | 1,211,233 |
Warrants(a) | | | — | | | — | | | 141,194 | | | 141,194 |
Short-Term Investments | | | — | | | 3,794,207 | | | — | | | 3,794,207 |
| | | | | | | | | | | | |
Total Investments | | | 126,998,341 | | | 150,933,921 | | | 830,131 | | | 278,762,393 |
| | | | | | | | | | | | |
Forward Foreign Currency Contracts (unrealized appreciation)(a) | | | — | | | 9,350 | | | — | | | 9,350 |
| | | | | | | | | | | | |
Total | | $ | 126,998,341 | | $ | 150,943,271 | | $ | 830,131 | | $ | 278,771,743 |
| | | | | | | | | | | | |
(a) Major categories of the Fund’s investments and forward foreign currency contracts are included in the Portfolio of Investments.
Growth Fund
Asset Valuation Inputs
| | | | | | | | | | | | |
Description(a) | | Level 1 | | Level 2 | | Level 3 | | Total |
| | | | | | | | | | | | |
Common Stocks | | $ | 110,918,93 | | $ | — | | $ | — | | $ | 110,918,593 |
| | | | | | | | | | | | |
(a) Major categories of the Fund’s investments are included in the Portfolio of Investments.
53
NOTESTO FINANCIAL STATEMENTS (continued)
March 31, 2010 (Unaudited)
Mid Cap Growth Fund
Asset Valuation Inputs
| | | | | | | | | | | | |
Description(a) | | Level 1 | | Level 2 | | Level 3 | | Total |
Common Stocks | | $ | 76,297,344 | | $ | — | | $ | — | | $ | 76,297,344 |
Short-Term Investments | | | — | | | 1,773,973 | | | — | | | 1,773,973 |
| | | | | | | | | | | | |
Total | | $ | 76,297,344 | | $ | 1,773,973 | | $ | — | | $ | 78,071,317 |
| | | | | | | | | | | | |
(a) Major categories of the Fund’s investments are included in the Portfolio of Investments.
Value Fund
Asset Valuation Inputs
| | | | | | | | | | | | |
Description(a) | | Level 1 | | Level 2 | | Level 3 | | Total |
Common Stocks | | $ | 907,609,377 | | $ | — | | $ | — | | $ | 907,609,377 |
Short-Term Investments | | | — | | | 32,720,374 | | | — | | | 32,720,374 |
| | | | | | | | | | | | |
Total | | $ | 907,609,377 | | $ | 32,720,374 | | $ | — | | $ | 940,329,751 |
| | | | | | | | | | | | |
(a) Major categories of the Fund’s investments are included in the Portfolio of Investments.
The following is a reconciliation of Level 3 investments for which significant unobservable inputs were used to determine fair values as of March 31, 2010:
Global Markets Fund
Asset Valuation Inputs
| | | | | | | | | | | | | | | | | | | | | | | | |
Investments in Securities | | Balance as of September 30, 2009 | | Accrued Discounts (Premiums) | | Realized Gain (Loss) | | | Change in Unrealized Appreciation (Depreciation) | | Net Purchases (Sales) | | | Net Transfers into/(out of) Level 3 | | | Balance as of March 31, 2010 |
Bonds and Notes | | | | | | | | | | | | | | | | | | | | | | | | |
Non-Convertible Bonds | | | | | | | | | | | | | | | | | | | | | | | | |
Korea | | $ | — | | $ | — | | $ | — | | | $ | 8,120 | | $ | 354,142 | | | $ | — | | | $ | 362,262 |
United States | | | 859,552 | | | 4,131 | | | (76 | ) | | | 193,892 | | | (12,231 | ) | | | (718,593 | ) | | | 326,675 |
Convertible Bonds | | | | | | | | | | | | | | | | | | | | | | | | |
United States | | | 227,900 | | | 316 | | | — | | | | 28,709 | | | — | | | | (256,925 | ) | | | — |
Warrants | | | | | | | | | | | | | | | | | | | | | | | | |
United States | | | — | | | — | | | — | | | | 141,194 | | | — | | | | — | | | | 141,194 |
| | | | | | | | | | | | | | | | | | | | | | | | |
Total | | $ | 1,087,452 | | $ | 4,447 | | $ | (76 | ) | | $ | 371,915 | | $ | 341,911 | | | $ | (975,518 | ) | | $ | 830,131 |
| | | | | | | | | | | | | | | | | | | | | | | | |
4. Derivatives. Derivative instruments are defined as financial instruments whose value and performance are based on the value and performance of another security or financial instrument. Derivative instruments that the Funds currently use are forward foreign currency contracts and option contracts.
The Funds are subject to the risk that changes in foreign currency exchange rates will have an unfavorable effect on the value of Fund assets denominated in foreign currencies. The Funds may enter into forward foreign currency contracts for hedging purposes to protect the value of the Funds’ holdings of foreign securities. The Funds may also use forward foreign currency contracts to gain exposure to foreign currencies, regardless of whether securities denominated in such currencies are held in the Funds. During the six months ended March 31, 2010, Global Markets Fund engaged in forward foreign currency transactions to gain exposure to foreign currencies.
Disciplined Equity Fund, Global Markets Fund and Mid Cap Growth Fund are parties to agreements with counterparties that govern transactions in forward foreign currency contracts. These agreements contain contingent features that allow the counterparties to terminate open contracts early if the net asset value of a Fund declines beyond a certain threshold. If such contingent features were to be triggered, the counterparties could request immediate settlement of open contracts at current fair value.
54
NOTESTO FINANCIAL STATEMENTS (continued)
March 31, 2010 (Unaudited)
The Funds are subject to the risk of unpredictable declines in the value of individual equity securities and periods of below-average performance in individual securities or in the equity market as a whole. Certain Funds may use purchased put options and written call options to hedge against a decline in value of an equity security that it owns. Certain Funds may also write put options to offset the cost of options used for hedging purposes. During the six months ended March 31, 2010, Disciplined Equity Fund and Mid Cap Growth Fund engaged in written call option transactions. During this same period, Mid Cap Growth Fund also engaged in purchased and written put option transactions.
The following is a summary of derivative instruments for Disciplined Equity Fund as of March 31, 2010:
| | |
Liability Derivatives | | Options Written |
Equity contracts | | $(80,942) |
| | |
| |
Statements of Assets and Liabilities Location | | Options written, at value |
Transactions in derivative instruments during the six months ended March 31, 2010 were as follows:
| | |
Realized Gain (Loss) | | Options Written |
Equity contracts | | $139,491 |
| | |
| |
Statements of Operations Location | | Net realized gain (loss) on options written |
| | |
Change in Unrealized Appreciation (Depreciation) | | Options Written |
Equity contracts | | $2,824 |
| | |
| |
Statements of Operations Location | | Net change in unrealized appreciation (depreciation) on options written |
The following is a summary of derivative instruments for Global Markets Fund as of March 31, 2010:
| | |
Asset Derivatives | | Forwards |
Foreign exchange contracts | | $9,350 |
| | |
| |
Statements of Assets and Liabilities Location | | Unrealized appreciation on forward foreign currency contracts |
Transactions in derivative instruments during the six months ended March 31, 2010 were as follows:
| | |
Realized Gain (Loss) | | Forwards |
Foreign exchange contracts | | $72,268 |
| | |
| |
Statements of Operations Location | | Included in Net realized gain (loss) on foreign currency transactions |
| | |
Change in Unrealized Appreciation (Depreciation) | | Forwards |
Foreign exchange contracts | | $(12,959) |
| | |
| |
Statements of Operations Location | | Included in Net change in unrealized appreciation (depreciation) on foreign currency translations |
Transactions in derivative instruments for Mid Cap Growth Fund during the six months ended March 31, 2010 were as follows:
| | | | |
Realized Gain (Loss) | | Purchased Options | | Options Written |
Equity contracts | | $(215,385) | | $(17,532) |
| | |
Statements of Operations Location | | Included in Net realized gain (loss) on investments | | Net realized gain (loss) on options written |
55
NOTESTO FINANCIAL STATEMENTS (continued)
March 31, 2010 (Unaudited)
The following is a summary of Disciplined Equity Fund’s written option activity:
| | | | | | | |
| | | Number of Contracts | | | Premiums | |
| | | | | | | |
Outstanding at 9/30/2009 | | — | | | $ | — | |
Options written | | 11,617 | | | | 826,289 | |
Options terminated in closing purchase transactions | | (9,649 | ) | | | (701,072 | ) |
Options exercised | | (42 | ) | | | (2,058 | ) |
Options expired | | (867 | ) | | | (39,393 | ) |
| | | | | | | |
Outstanding at 3/31/2010 | | 1,059 | | | $ | 83,766 | |
| | | | | | | |
The following is a summary of Mid Cap Growth Fund’s purchased option activity:
| | | | | | | |
| | | Number of Contracts | | | Premiums | |
| | | | | | | |
Outstanding at 9/30/2009 | | — | | | $ | — | |
Options purchased | | 840 | | | | 349,785 | |
Options terminated in closing sale transactions | | (840 | ) | | | (349,785 | ) |
Options expired | | — | | | | — | |
| | | | | | | |
Outstanding at 3/31/2010 | | — | | | $ | — | |
| | | | | | | |
The following is a summary of Mid Cap Growth Fund’s written option activity:
| | | | | | | |
| | | Number of Contracts | | | Premiums | |
| | | | | | | |
Outstanding at 9/30/2009 | | — | | | $ | — | |
Options written | | 1,042 | | | | 125,130 | |
Options terminated in closing purchase transactions | | (1,042 | ) | | | (125,130 | ) |
Options expired | | — | | | | — | |
| | | | | | | |
Outstanding at 3/31/2010 | | — | | | $ | — | |
| | | | | | | |
Volume of derivative activity for Global Markets Fund, based on month-end notional amounts outstanding during the period, at absolute value, was as follows for the six months ended March 31, 2010:
| | |
| | | Percentage of
Net Assets
Forwards |
Average Notional Amount Outstanding | | 0.40% |
Highest Notional Amount Outstanding | | 0.78% |
Lowest Notional Amount Outstanding | | 0.25% |
Notional Amount Outstanding as of March 31, 2010 | | 0.78% |
5. Purchases and Sales of Securities. For the six months ended March 31, 2010, purchases and sales of securities (excluding short-term investments and U.S. Government/agency securities and including paydowns) were as follows:
| | | | | | |
Fund | | Purchases | | Sales |
| | | | | | |
Disciplined Equity Fund | | $ | 41,994,159 | | $ | 40,520,596 |
Global Markets Fund | | | 125,909,232 | | | 121,580,512 |
Growth Fund | | | 64,269,398 | | | 79,518,872 |
Mid Cap Growth Fund | | | 62,074,740 | | | 80,346,528 |
Value Fund | | | 426,299,336 | | | 216,978,403 |
56
NOTESTO FINANCIAL STATEMENTS (continued)
March 31, 2010 (Unaudited)
For the six months ended March 31, 2010, purchases and sales of U.S. Government/agency securities by the Global Markets Fund were $4,415,265 and $2,240,499, respectively.
6. Management Fees and Other Transactions with Affiliates.
a. Management Fees. Loomis, Sayles & Company, L.P. (“Loomis Sayles”) serves as investment adviser to each Fund. Separate management agreements for each Fund in effect for the six months ended March 31, 2010, provided for fees at the following annual percentage rates of each Fund’s average daily net assets:
| | |
Fund | | Percentage of Average Daily Net Assets |
Disciplined Equity Fund | | 0.50% |
Global Markets Fund | | 0.75% |
Growth Fund | | 0.50% |
Mid Cap Growth Fund | | 0.75% |
Value Fund | | 0.50% |
Loomis Sayles has given binding undertakings to the Funds to reduce management fees and/or reimburse certain expenses to limit the Funds’ operating expenses, exclusive of acquired fund fees and expenses, brokerage expenses, interest expense, taxes and extraordinary expenses. These undertakings are in effect until January 31, 2011 and will be reevaluated on an annual basis. Management fee payables, as reflected on the Statement of Assets and Liabilities, are net of fee reductions and/or expense reimbursements, if any, pursuant to these undertakings.
For the period from February 1, 2010 to March 31, 2010, the expense limits as a percentage of average daily net assets under the expense limitation agreements were as follows:
| | | | | | | | | | | | | | | |
| | | Expense Limit as a Percentage of Average
Daily Net Assets | |
Fund | | Class A | | | Class B | | | Class C | | | Class Y | | | Admin Class | |
Disciplined Equity Fund | | 1.25 | % | | 2.00 | % | | 2.00 | % | | 1.00 | % | | N/A | |
Global Markets Fund | | 1.25 | % | | N/A | | | 2.00 | % | | 1.00 | % | | N/A | |
Growth Fund | | 1.25 | % | | 2.00 | % | | 2.00 | % | | 1.00 | % | | N/A | |
Mid Cap Growth Fund | | 1.25 | % | | N/A | | | 2.00 | % | | 1.00 | % | | N/A | |
Value Fund | | 1.10 | % | | 1.85 | % | | 1.85 | % | | 0.85 | % | | 1.35 | % |
Prior to February 1, 2010, the expense limits as a percentage of average daily net assets were as follows:
| | | | | | | | | | | | |
| | | Expense Limit as a Percentage of Average
Daily Net Assets | |
Fund | | Class A | | | Class B | | | Class C | | | Class Y | |
Disciplined Equity Fund | | 1.25 | % | | 2.00 | % | | 2.00 | % | | 0.85 | % |
Global Markets Fund | | 1.25 | % | | N/A | | | 2.00 | % | | 1.00 | % |
Growth Fund | | 1.25 | % | | 2.00 | % | | 2.00 | % | | 0.85 | % |
Mid Cap Growth Fund | | 1.25 | % | | N/A | | | 2.00 | % | | 1.00 | % |
Value Fund | | 1.10 | % | | 1.85 | % | | 1.85 | % | | 0.85 | % |
For the period from October 1, 2009 to January 31, 2010, Loomis Sayles voluntarily agreed to further limit the operating expenses for Classes A, B and C of the Disciplined Equity Fund and the Growth Fund as follows:
| | | | | | |
| | | Expense Limit as a Percentage of
Average Daily Net Assets |
Fund | | Class A | | Class B | | Class C |
Disciplined Equity Fund | | 1.10% | | 1.85% | | 1.85% |
Growth Fund | | 1.10% | | 1.85% | | 1.85% |
57
NOTESTO FINANCIAL STATEMENTS (continued)
March 31, 2010 (Unaudited)
Loomis Sayles shall be permitted to recover expenses it has borne under the expense limitation agreements (whether through reduction of its management fees or otherwise) on a class by class basis in later periods to the extent a class’ expenses fall below a class’ expense limits, provided, however, that a class is not obligated to pay such reduced fees/expenses more than one year after the end of the fiscal year in which the fees/expenses were reduced. Fees waived and/or expenses reimbursed pursuant to the voluntary agreement cannot be recovered by Loomis Sayles in later periods.
For the six months ended March 31, 2010, the management fees and reductions of management fees for each Fund were as follows:
| | | | | | | | | | | | | | | | |
| | | Gross
Management
Fees | | Contractual
Reductions of
Management
Fees1 | | Voluntary
Reductions of
Management
Fees | | Net
Management
Fees | | Percentage of
Average
Daily Net Assets |
| | | | | | | | |
Fund | | | | | | Gross | | Net |
Disciplined Equity Fund | | $ | 78,867 | | $ | 43,762 | | $ | 1,736 | | $ | 33,369 | | 0.50% | | 0.21% |
Global Markets Fund | | | 982,567 | | | 37,043 | | | — | | | 945,524 | | 0.75% | | 0.72% |
Growth Fund | | | 278,395 | | | 7,904 | | | 7,297 | | | 263,194 | | 0.50% | | 0.47% |
Mid Cap Growth Fund | | | 299,194 | | | 82,683 | | | — | | | 216,511 | | 0.75% | | 0.54% |
Value Fund | | | 2,029,139 | | | — | | | — | | | 2,029,139 | | 0.50% | | 0.50% |
1 Management fee reductions are subject to possible recovery until September 30, 2011.
For the six months ended March 31, 2010, expense reimbursements related to the prior fiscal year were recovered as follows:
| | | | | | | | | | | | | | | |
| | | Recovered Expenses |
Fund | | Class A | | Class B | | Class C | | Class Y | | Total |
Growth Fund | | $ | 944 | | $ | 145 | | $ | 428 | | $ | — | | $ | 1,517 |
Certain officers and employees of Loomis Sayles are also officers or Trustees of the Trust. Loomis Sayles’ general partner is indirectly owned by Natixis Global Asset Management, L.P. (“Natixis US”), which is part of Natixis Global Asset Management, an international asset management group based in Paris, France.
b. Administrative Fees. Natixis Asset Management Advisors, L.P. (“Natixis Advisors”) provides certain administrative services for the Funds and contracts with State Street Bank to serve as sub-administrator. Natixis Advisors is a wholly-owned subsidiary of Natixis US. Pursuant to an agreement among Natixis Funds Trust I, Natixis Funds Trust II, Natixis Funds Trust IV, Natixis Cash Management Trust, Gateway Trust (“Natixis Funds Trusts”), Loomis Sayles Funds I, Loomis Sayles Funds II (“Loomis Sayles Funds Trusts”), Hansberger International Series and Natixis Advisors, each Fund pays Natixis Advisors monthly its pro rata portion of fees equal to an annual rate of 0.0575% of the first $15 billion of the average daily net assets of the Natixis Funds Trusts, Loomis Sayles Funds Trusts and the Hansberger International Series, 0.0500% of the next $15 billion, 0.0425% of the next $30 billion and 0.0375% of such assets in excess of $60 billion, subject to an annual aggregate minimum fee for the Natixis Funds Trusts, Loomis Sayles Funds Trusts and the Hansberger International Series of $10 million, which is reevaluated on an annual basis. New funds are subject to a fee for the first twelve months of operations of $75,000 plus $12,500 per additional class and an additional $75,000 if managed by multiple subadvisers.
For the six months ended March 31, 2010, each Fund paid the following for administrative fees to Natixis Advisors:
| | | |
Fund | | Administrative Fees |
Disciplined Equity Fund | | $ | 7,634 |
Global Markets Fund | | | 63,405 |
Growth Fund | | | 26,943 |
Mid Cap Growth Fund | | | 19,303 |
Value Fund | | | 196,437 |
c. Service and Distribution Fees. Natixis Distributors, L.P. (“Natixis Distributors”), a wholly-owned subsidiary of Natixis US, has entered into a distribution agreement with the Trust. Pursuant to this agreement, Natixis Distributors serves as principal underwriter of the funds of the Trust.
Pursuant to Rule 12b-1 under the 1940 Act, the Trusts have adopted a Service Plan relating to each Fund’s Class A shares (the “Class A Plans”), a Distribution and Service Plan relating to each Fund’s Class B (if applicable) and Class C shares (the “Class B and Class C Plans”), and Value Fund has adopted a Distribution Plan relating to its Admin Class shares (the “Admin Class Plan”).
58
NOTESTO FINANCIAL STATEMENTS (continued)
March 31, 2010 (Unaudited)
Under the Class A Plans, each Fund pays Natixis Distributors a monthly service fee at an annual rate not to exceed 0.25% of the average daily net assets attributable to the Fund’s Class A shares, as reimbursement for expenses incurred by Natixis Distributors in providing personal services to investors in Class A shares and/or the maintenance of shareholder accounts.
Under the respective Class B (if applicable) and Class C Plans, each Fund pays Natixis Distributors a monthly service fee at an annual rate not to exceed 0.25% of the average daily net assets attributable to the Fund’s Class B (if applicable) and Class C shares, as compensation for services provided by Natixis Distributors in providing personal services to investors in Class B (if applicable) and Class C shares and/or the maintenance of shareholder accounts.
Also under the respective Class B (if applicable) and Class C Plans, each Fund pays Natixis Distributors a monthly distribution fee at the annual rate of 0.75% of the average daily net assets attributable to the Fund’s Class B (if applicable) and Class C shares, as compensation for services provided by Natixis Distributors in connection with the marketing or sale of Class B (if applicable) and Class C shares.
Under the Admin Class Plan, the Value Fund pays Natixis Distributors a monthly distribution fee at an annual rate not to exceed 0.25% of the average daily net assets attributable to the Fund’s Admin Class shares, as compensation for services provided by Natixis Distributors in connection with the marketing or sale of Admin Class shares or for payments made by Natixis Distributors to securities dealers or other financial intermediaries as commissions, asset-based sales charges or other compensation with respect to the sale of Admin Class shares, or for providing personal services to investors and/or the maintenance of shareholder accounts.
In addition, the Admin Class shares of the Value Fund may pay Natixis Distributors an administrative service fee, at an annual rate not to exceed 0.25% of the average daily net assets attributable to Admin Class shares. These fees are subsequently paid to securities dealers or financial intermediaries for providing personal services and/or account maintenance for their customers who hold such shares.
For the six months ended March 31, 2010 the Fund paid the following service and distribution fees:
| | | | | | | | | | | | | | | | | | | | | | | |
| | | Service Fees | | | Distribution Fees | |
| | | Class A | | Class B | | Class C | | Admin Class | | | Class B | | Class C | | Admin Class | |
| | | | | | | | | | | | | | | | | | | | | | | |
| | | | | | | | | | | | | | | | | | | | | | | |
Disciplined Equity Fund | | $ | 2,190 | | $ | 202 | | $ | 1,834 | | $ | — | | | $ | 605 | | $ | 5,502 | | $ | — | |
Global Markets Fund | | | 61,140 | | | — | | | 125,879 | | | — | | | | — | | | 377,635 | | | — | |
Growth Fund | | | 41,865 | | | 6,481 | | | 18,935 | | | — | | | | 19,442 | | | 56,804 | | | — | |
Mid Cap Growth Fund | | | 63,086 | | | — | | | 18 | | | — | | | | — | | | 53 | | | — | |
Value Fund | | | 159,497 | | | 6,047 | | | 12,937 | | | — | (a) | | | 18,140 | | | 38,812 | | | — | (a) |
(a) Amount is less than $1.
d. Sub-Transfer Agent Fees. Natixis Distributors has entered into agreements with financial intermediaries to provide certain recordkeeping, processing, shareholder communications and other services to customers of the intermediaries and has agreed to compensate the intermediaries for providing those services. Certain services would be provided by the Funds if the shares of those customers were registered directly with the Funds’ transfer agent. Accordingly, the Funds agreed to pay a portion of the intermediary fees attributable to shares of the Fund held by the intermediaries (which generally is a percentage of the value of shares held) not exceeding what the Funds would have paid its transfer agent had each customer’s shares been registered directly with the transfer agent instead of held through the intermediaries. Natixis Distributors pays the remainder of the fees.
For the six months ended March 31, 2010, the Funds paid the following sub-transfer agent fees, which are reflected in transfer agent fees and expenses in the Statements of Operations.
| | | |
Fund | | Sub-Transfer Agent Fees |
Disciplined Equity Fund | | $ | 10,043 |
Global Markets Fund | | | 98,519 |
Growth Fund | | | 39,348 |
Mid Cap Growth Fund | | | 59,101 |
Value Fund | | | 288,877 |
59
NOTESTO FINANCIAL STATEMENTS (continued)
March 31, 2010 (Unaudited)
e. Commissions. The Funds have been informed that commissions (including CDSCs) on Fund shares retained by Natixis Distributors during the six months ended March 31, 2010, were as follows:
| | | |
Fund | | Commissions |
Disciplined Equity Fund | | $ | 2,460 |
Global Markets Fund | | | 117,446 |
Growth Fund | | | 19,274 |
Mid Cap Growth Fund | | | 1,846 |
Value Fund | | | 24,328 |
f. Trustees Fees and Expenses. The Funds do not pay any compensation directly to its officers or Trustees who are directors, officers or employees of Natixis Advisors, Natixis Distributors, Natixis US, or their affiliates. Effective January 1, 2010, the Chairperson of the Board receives a retainer fee at the annual rate of $250,000. The Chairperson does not receive any meeting attendance fees for Board of Trustees meetings or committee meetings that she attends. Each Independent Trustee (other than the Chairperson) receives, in the aggregate, a retainer fee at the annual rate of $80,000. Each Independent Trustee also receives a meeting attendance fee of $10,000 for each meeting of the Board of Trustees that he or she attends in person and $5,000 for each meeting of the Board of Trustees that he or she attends telephonically. In addition, each committee chairman receives an additional retainer fee at the annual rate of $15,000. Each Contract Review and Governance Committee member is compensated $6,000 for each Committee meeting that he or she attends in person and $3,000 for each meeting that he or she attends telephonically. Each Audit Committee member is compensated $7,500 for each Committee meeting that he or she attends in person and $3,750 for each meeting that he or she attends telephonically. Each member of the ad hoc Committee on Alternative Investments received a one-time fee of $10,000. The ad hoc Committee on Alternative Investments is not a standing committee. These fees are allocated among the funds in the Natixis Funds Trusts, Loomis Sayles Funds Trusts and the Hansberger International Series based on a formula that takes into account, among other factors, the relative net assets of each fund. Trustees are reimbursed for travel expenses in connection with attendance at meetings.
Prior to January 1, 2010, the Chairperson of the Board received a retainer fee at the annual rate of $200,000. The Chairperson did not receive any meeting attendance fees for Board of Trustees meetings or committee meetings that she attended. Each Independent Trustee (other than the Chairperson) received, in the aggregate, a retainer fee at the annual rate of $65,000. Each Independent Trustee also received a meeting attendance fee of $7,500 for each meeting of the Board of Trustees that he or she attended in person and $3,750 for each meeting of the Board of Trustees that he or she attended telephonically. In addition, each committee chairman received an additional retainer fee at an annual rate of $10,000. Each Contract Review and Governance Committee member was compensated $5,000 for each Committee meeting that he or she attended in person and $2,500 for each meeting that he or she attended telephonically. Each Audit Committee member was compensated $6,250 for each Committee meeting that he or she attended in person and $3,125 for each meeting that he or she attended telephonically.
A deferred compensation plan (the “Plan”) is available to the Trustees on a voluntary basis. Deferred amounts remain in the Funds until distributed in accordance with the provisions of the Plan. The value of a participating Trustee’s deferral account is based on theoretical investments of deferred amounts, on the normal payment dates, in certain funds of the Natixis Funds Trusts, Loomis Sayles Funds Trusts and Hansberger International Series as designated by the participating Trustees. Changes in the value of participants’ deferral accounts are allocated pro rata among the funds in the Natixis Funds Trusts, Loomis Sayles Funds Trusts, and Hansberger International Series, and are normally reflected as Trustees’ fees and expenses in the Statements of Operations. The portions of the accrued obligations allocated to the Funds under the Plan are reflected as Deferred Trustees’ fees on the Statements of Assets and Liabilities.
7. Line of Credit. Each Fund, together with certain other funds of Natixis Funds Trusts, Loomis Sayles Funds Trusts and the Hansberger International Series, participates in a $200,000,000 committed unsecured line of credit provided by State Street Bank, with an individual limit of $125,000,000 for each fund that participates in the line of credit. Interest is charged to each participating fund based on its borrowings at a rate per annum equal to the greater of the Federal Funds rate or overnight LIBOR, plus 1.25%. In addition, a commitment fee of 0.15% per annum, payable at the end of each calendar quarter, is accrued and apportioned among the participating funds based on their average daily unused portion of the line of credit.
Prior to March 10, 2010, each Fund, together with certain other funds of Natixis Funds Trusts, Loomis Sayles Funds Trusts and the Hansberger International Series, participated in a $200,000,000 committed unsecured line of credit provided by State Street Bank, with an individual limit of $125,000,000 for each Fund that participated in the line of credit. Interest was charged to each participating fund based on its borrowings at a rate per annum equal to the greater of the Federal Funds rate or overnight LIBOR, plus 0.75%. In addition, a commitment fee of 0.125% per annum, payable at the end of each calendar quarter, was accrued and apportioned among the participating funds based on their average daily unused portion of the line of credit.
For the six months ended March 31, 2010, the Funds had no borrowings under these agreements.
8. Concentration of Risk. Each Fund may purchase investments of foreign issuers. Investing in securities of foreign issuers involves special risks and considerations not typically associated with investing in U.S. companies and securities of the U.S. Government. These risks include revaluation of currencies and the risk of expropriation. Moreover, the markets for securities of many foreign issuers may be less liquid and the prices of such securities may be more volatile than those of comparable U.S. companies and the U.S. Government.
60
NOTESTO FINANCIAL STATEMENTS (continued)
March 31, 2010 (Unaudited)
At March 31, 2010, Global Markets Fund held Taiwan dollars, valued at $1,904,731, that were restricted as to withdrawal or usage. This amount represents the proceeds from sales of securities in Taiwan. These proceeds cannot be repatriated until the Fund engages a tax agent in Taiwan for the purpose of performing certain duties for compliance with Taiwan’s tax laws. Subsequent to March 31, 2010, a tax agent was engaged and proceeds were repatriated.
9. Brokerage Commission Recapture. Each Fund has entered into agreements with certain brokers whereby the brokers will rebate a portion of brokerage commissions. All amounts rebated by the brokers are returned to the Funds under such agreements and are included in realized gains on the Statements of Operations. For the six months ended March 31, 2010, amounts rebated under these agreements were as follows:
| | | |
Fund | | Rebates |
Disciplined Equity Fund | | $ | 8,960 |
Global Markets Fund | | | 21,034 |
Growth Fund | | | 21,807 |
Mid Cap Growth Fund | | | 14,688 |
Value Fund | | | 77,273 |
10. Concentration of Ownership. At March 31, 2010, Loomis Sayles Funded Pension Plan and Loomis Sayles Employees’ Profit Sharing Retirement Plan held shares of beneficial interest in the Funds as follows:
| | | | |
Fund | | Pension Plan | | Profit Sharing Retirement Plan |
Disciplined Equity Fund | | 1,065,345 | | 891,301 |
Global Markets Fund | | 981,661 | | 549,554 |
Growth Fund | | 1,268,615 | | 1,839,688 |
Mid Cap Growth Fund | | 302,417 | | 351,205 |
Value Fund | | 487,579 | | 732,046 |
From time to time, the Funds may have a concentration of several shareholders having a significant percentage of shares outstanding. Investment activities of these shareholders could have material impacts on the Funds. As of March 31, 2010, certain Funds had shareholders that held greater than 5% of the fund’s outstanding shares. Such ownership may be beneficially held by individuals or entities other than the owner of record. The number of greater than 5% shareholders and the aggregate percentage of net assets represented by such ownership was as follows:
| | | | | |
Fund | | Number of Greater Than 5% Shareholders | | Percentage of Ownership | |
Disciplined Equity Fund | | 1 | | 16.48 | % |
Global Markets Fund | | 1 | | 9.37 | % |
Growth Fund | | 1 | | 6.33 | % |
Mid Cap Growth Fund | | 1 | | 7.46 | % |
Value Fund | | 1 | | 6.09 | % |
61
NOTESTO FINANCIAL STATEMENTS (continued)
March 31, 2010 (Unaudited)
11. Capital Shares. Each Fund may issue an unlimited number of shares of beneficial interest, without par value. Transactions in capital shares were as follows:
| | | | | | | | | | | | | | |
| | Six Months Ended
March 31, 2010 |
| | Year Ended
September 30, 2009 |
|
Disciplined Equity Fund | | Shares | | | | Amount | | | Shares | | | | Amount | |
| | | | | | | | | | | | | | |
| Class A | | | | | | | | | | | | | | |
Issued from the sale of shares | | 67,127 | | | $ | 456,853 | | | 503,388 | | | $ | 2,877,536 | |
Issued in connection with the reinvestment of distributions | | 878 | | | | 5,881 | | | 2,476 | | | | 13,914 | |
Redeemed | | (34,872 | ) | | | (236,136 | ) | | (366,248 | ) | | | (1,808,856 | ) |
| | | | | | | | | | | | | | |
Net change | | 33,133 | | | $ | 226,598 | | | 139,616 | | | $ | 1,082,594 | |
| | | | | | | | | | | | | | |
| Class B | | | | | | | | | | | | | | |
Issued from the sale of shares | | 306 | | | $ | 2,000 | | | 12,584 | | | $ | 70,815 | |
Issued in connection with the reinvestment of distributions | | — | | | | — | | | — | | | | — | |
Redeemed | | (5,097 | ) | | | (33,457 | ) | | (19,550 | ) | | | (106,750 | ) |
| | | | | | | | | | | | | | |
Net change | | (4,791 | ) | | $ | (31,457 | ) | | (6,966 | ) | | $ | (35,935 | ) |
| | | | | | | | | | | | | | |
| Class C | | | | | | | | | | | | | | |
Issued from the sale of shares | | 23,906 | | | $ | 157,512 | | | 392,349 | | | $ | 2,090,452 | |
Issued in connection with the reinvestment of distributions | | — | | | | — | | | 300 | | | | 1,642 | |
Redeemed | | (61,637 | ) | | | (402,360 | ) | | (301,104 | ) | | | (1,542,203 | ) |
| | | | | | | | | | | | | | |
Net change | | (37,731 | ) | | $ | (244,848 | ) | | 91,545 | | | $ | 549,891 | |
| | | | | | | | | | | | | | |
| Class Y | | | | | | | | | | | | | | |
Issued from the sale of shares | | 574,854 | | | $ | 4,009,444 | | | 1,188,390 | | | $ | 6,823,853 | |
Issued in connection with the reinvestment of distributions | | 25,762 | | | | 173,639 | | | 34,089 | | | | 192,942 | |
Redeemed | | (326,208 | ) | | | (2,252,491 | ) | | (488,997 | ) | | | (2,719,886 | ) |
| | | | | | | | | | | | | | |
Net change | | 274,408 | | | $ | 1,930,592 | | | 733,482 | | | $ | 4,296,909 | |
| | | | | | | | | | | | | | |
Increase (decrease) from capital share transactions | | 265,019 | | | $ | 1,880,885 | | | 957,677 | | | $ | 5,893,459 | |
| | | | | | | | | | | | | | |
| | |
| | Six Months Ended
March 31, 2010 |
| | Year Ended
September 30, 2009 |
|
Global Markets Fund | | Shares | | | | Amount | | | Shares | | | | Amount | |
| | | | | | | | | | | | | | |
| Class A | | | | | | | | | | | | | | |
Issued from the sale of shares | | 928,741 | | | $ | 11,923,858 | | | 1,705,833 | | | $ | 19,017,067 | |
Issued in connection with the reinvestment of distributions | | 73,498 | | | | 923,132 | | | 101,851 | | | | 922,775 | |
Redeemed | | (592,920 | ) | | | (7,563,442 | ) | | (4,038,918 | ) | | | (39,038,267 | ) |
| | | | | | | | | | | | | | |
Net change | | 409,319 | | | $ | 5,283,548 | | | (2,231,234 | ) | | $ | (19,098,425 | ) |
| | | | | | | | | | | | | | |
| Class C | | | | | | | | | | | | | | |
Issued from the sale of shares | | 1,179,251 | | | $ | 15,057,338 | | | 1,738,010 | | | $ | 17,537,139 | |
Issued in connection with the reinvestment of distributions | | 53,353 | | | | 667,977 | | | 53,943 | | | | 487,650 | |
Redeemed | | (993,713 | ) | | | (12,711,100 | ) | | (4,818,214 | ) | | | (46,175,227 | ) |
| | | | | | | | | | | | | | |
Net change | | 238,891 | | | $ | 3,014,215 | | | (3,026,261 | ) | | $ | (28,150,438 | ) |
| | | | | | | | | | | | | | |
| Class Y | | | | | | | | | | | | | | |
Issued from the sale of shares | | 1,806,248 | | | $ | 23,360,952 | | | 2,798,814 | | | $ | 29,261,743 | |
Issued in connection with the reinvestment of distributions | | 145,986 | | | | 1,836,503 | | | 162,878 | | | | 1,477,305 | |
Redeemed | | (1,475,258 | ) | | | (18,867,308 | ) | | (4,571,286 | ) | | | (44,364,544 | ) |
| | | | | | | | | | | | | | |
Net change | | 476,976 | | | $ | 6,330,147 | | | (1,609,594 | ) | | $ | (13,625,496 | ) |
| | | | | | | | | | | | | | |
Increase (decrease) from capital share transactions | | 1,125,186 | | | $ | 14,627,910 | | | (6,867,089 | ) | | $ | (60,874,359 | ) |
| | | | | | | | | | | | | | |
62
NOTESTO FINANCIAL STATEMENTS (continued)
March 31, 2010 (Unaudited)
11. Capital Shares (continued).
| | | | | | | | | | | | | | |
| | Six Months Ended
March 31, 2010 |
| | Year Ended
September 30, 2009 |
|
Growth Fund | | Shares | | | | Amount | | | Shares | | | | Amount | |
| | | | | | | | | | | | | | |
| Class A | | | | | | | | | | | | | | |
Issued from the sale of shares | | 496,024 | | | $ | 2,363,535 | | | 3,453,752 | | | $ | 13,194,701 | |
Issued in connection with the reinvestment of distributions | | — | | | | — | | | — | | | | — | |
Redeemed | | (1,277,530 | ) | | | (6,064,444 | ) | | (27,441,954 | ) | | | (101,923,299 | ) |
| | | | | | | | | | | | | | |
Net change | | (781,506 | ) | | $ | (3,700,909 | ) | | (23,988,202 | ) | | $ | (88,728,598 | ) |
| | | | | | | | | | | | | | |
| Class B | | | | | | | | | | | | | | |
Issued from the sale of shares | | 11,856 | | | $ | 54,645 | | | 41,478 | | | $ | 155,665 | |
Issued in connection with the reinvestment of distributions | | — | | | | — | | | — | | | | — | |
Redeemed | | (248,690 | ) | | | (1,127,365 | ) | | (768,098 | ) | | | (2,804,977 | ) |
| | | | | | | | | | | | | | |
Net change | | (236,834 | ) | | $ | (1,072,720 | ) | | (726,620 | ) | | $ | (2,649,312 | ) |
| | | | | | | | | | | | | | |
| Class C | | | | | | | | | | | | | | |
Issued from the sale of shares | | 82,107 | �� | | $ | 370,139 | | | 669,485 | | | $ | 2,490,747 | |
Issued in connection with the reinvestment of distributions | | — | | | | — | | | — | | | | — | |
Redeemed | | (914,330 | ) | | | (4,087,264 | ) | | (2,624,342 | ) | | | (9,647,623 | ) |
| | | | | | | | | | | | | | |
Net change | | (832,223 | ) | | $ | (3,717,125 | ) | | (1,954,857 | ) | | $ | (7,156,876 | ) |
| | | | | | | | | | | | | | |
| Class Y | | | | | | | | | | | | | | |
Issued from the sale of shares | | 603,811 | | | $ | 3,113,495 | | | 2,676,025 | | | $ | 11,399,448 | |
Issued in connection with the reinvestment of distributions | | — | | | | — | | | — | | | | — | |
Redeemed | | (1,920,451 | ) | | | (9,560,832 | ) | | (4,993,469 | ) | | | (21,416,325 | ) |
| | | | | | | | | | | | | | |
Net change | | (1,316,640 | ) | | $ | (6,447,337 | ) | | (2,317,444 | ) | | $ | (10,016,877 | ) |
| | | | | | | | | | | | | | |
Increase (decrease) from capital share transactions | | (3,167,203 | ) | | $ | (14,938,091 | ) | | (28,987,123 | ) | | $ | (108,551,663 | ) |
| | | | | | | | | | | | | | |
| | |
| | Six Months Ended
March 31, 2010 |
| | Year Ended
September 30, 2009 |
|
Mid Cap Growth Fund | | Shares | | | | Amount | | | Shares | | | | Amount | |
| | | | | | | | | | | | | | |
| Class A** | | | | | | | | | | | | | | |
Issued from the sale of shares | | 193,756 | | | $ | 3,828,763 | | | 5,551,566 | | | $ | 85,146,527 | |
Issued in connection with the reinvestment of distributions | | — | | | | — | | | — | | | | — | |
Redeemed | | (1,047,613 | ) | | | (20,813,275 | ) | | (8,253,762 | ) | | | (130,696,008 | ) |
| | | | | | | | | | | | | | |
Net change | | (853,857 | ) | | $ | (16,984,512 | ) | | (2,702,196 | ) | | $ | (45,549,481 | ) |
| | | | | | | | | | | | | | |
| Class C* | | | | | | | | | | | | | | |
Issued from the sale of shares | | 1,186 | | | $ | 23,000 | | | 66 | | | $ | 1,000 | |
Issued in connection with the reinvestment of distributions | | — | | | | — | | | — | | | | — | |
Redeemed | | (236 | ) | | | (5,000 | ) | | — | | | | — | |
| | | | | | | | | | | | | | |
Net change | | 950 | | | $ | 18,000 | | | 66 | | | $ | 1,000 | |
| | | | | | | | | | | | | | |
| Class Y** | | | | | | | | | | | | | | |
Issued from the sale of shares | | 163,195 | | | $ | 3,340,264 | | | 2,017,424 | | | $ | 31,974,020 | |
Issued in connection with the reinvestment of distributions | | — | | | | — | | | — | | | | — | |
Redeemed | | (177,963 | ) | | | (3,603,417 | ) | | (1,769,294 | ) | | | (28,085,399 | ) |
| | | | | | | | | | | | | | |
Net change | | (14,768 | ) | | $ | (263,153 | ) | | 248,130 | | | $ | 3,888,621 | |
| | | | | | | | | | | | | | |
Increase (decrease) from capital share transactions | | (867,675 | ) | | $ | (17,229,665 | ) | | (2,454,000 | ) | | $ | (41,659,860 | ) |
| | | | | | | | | | | | | | |
| * | From commencement of Class operations on February 2, 2009 through September 30, 2009. |
| ** | Prior to the close of business on February 2, 2009 the Fund offered Retail and Institutional Class shares, which were redesignated as Class A and Class Y shares, respectively on that date. |
63
NOTESTO FINANCIAL STATEMENTS (continued)
March 31, 2010 (Unaudited)
11. Capital Shares (continued).
| | | | | | | | | | | | | | |
| | Six Months Ended
March 31, 2010 |
| | Year Ended
September 30, 2009 |
|
Value Fund | | Shares | | | | Amount | | | Shares | | | | Amount | |
| | | | | | | | | | | | | | |
| Class A | | | | | | | | | | | | | | |
Issued from the sale of shares | | 1,363,864 | | | $ | 22,838,803 | | | 3,255,896 | | | $ | 44,814,805 | |
Issued in connection with the reinvestment of distributions | | 60,746 | | | | 1,001,697 | | | 94,079 | | | | 1,308,638 | |
Redeemed | | (1,205,126 | ) | | | (20,127,532 | ) | | (2,248,215 | ) | | | (30,522,329 | ) |
| | | | | | | | | | | | | | |
Net change | | 219,484 | | | $ | 3,712,968 | | | 1,101,760 | | | $ | 15,601,114 | |
| | | | | | | | | | | | | | |
| Class B | | | | | | | | | | | | | | |
Issued from the sale of shares | | 14,537 | | | $ | 244,520 | | | 22,368 | | | $ | 308,302 | |
Issued in connection with the reinvestment of distributions | | — | | | | — | | | 888 | | | | 12,403 | |
Redeemed | | (69,721 | ) | | | (1,180,148 | ) | | (179,186 | ) | | | (2,417,234 | ) |
| | | | | | | | | | | | | | |
Net change | | (55,184 | ) | | $ | (935,628 | ) | | (155,930 | ) | | $ | (2,096,529 | ) |
| | | | | | | | | | | | | | |
| Class C | | | | | | | | | | | | | | |
Issued from the sale of shares | | 116,845 | | | $ | 1,952,429 | | | 382,900 | | | $ | 5,369,989 | |
Issued in connection with the reinvestment of distributions | | 939 | | | | 15,401 | | | 3,005 | | | | 41,620 | |
Redeemed | | (112,910 | ) | | | (1,892,746 | ) | | (134,455 | ) | | | (1,783,797 | ) |
| | | | | | | | | | | | | | |
Net change | | 4,874 | | | $ | 75,084 | | | 251,450 | | | $ | 3,627,812 | |
| | | | | | | | | | | | | | |
| Class Y | | | | | | | | | | | | | | |
Issued from the sale of shares | | 16,660,547 | | | $ | 280,457,831 | | | 26,551,540 | | | $ | 378,808,598 | |
Issued in connection with the reinvestment of distributions | | 379,395 | | | | 6,260,027 | | | 306,125 | | | | 4,258,197 | |
Redeemed | | (7,393,091 | ) | | | (123,177,476 | ) | | (8,813,838 | ) | | | (119,971,291 | ) |
| | | | | | | | | | | | | | |
Net change | | 9,646,851 | | | $ | 163,540,382 | | | 18,043,827 | | | $ | 263,095,504 | |
| | | | | | | | | | | | | | |
| Admin Class* | | | | | | | | | | | | | | |
Issued from the sale of shares | | 60 | | | $ | 1,002 | | | — | | | $ | — | |
Issued in connection with the reinvestment of distributions | | — | | | | — | | | — | | | | — | |
Redeemed | | — | | | | — | | | — | | | | — | |
| | | | | | | | | | | | | | |
Net change | | 60 | | | $ | 1,002 | | | — | | | | — | |
| | | | | | | | | | | | | | |
Increase (decrease) from capital share transactions | | 9,816,085 | | | $ | 166,393,808 | | | 19,241,107 | | | $ | 280,227,901 | |
| | | | | | | | | | | | | | |
* From commencement of Class operations on February 1, 2010 through March 31, 2010.
64

Loomis Sayles Small Cap Growth Fund
Loomis Sayles Small Cap Value Fund
SEMI-ANNUAL REPORT
MARCH 31, 2010 (Unaudited)
FUND AND MANAGER REVIEW
Loomis Sayles Small Cap Growth Fund

Mark F. Burns, CFA
Manager since January 2005

John Slavik, CFA
Manager since April 2005
PORTFOLIO REVIEW
After finishing 2009 on a strong note, the stock market started off slowly in 2010, with investors digesting the extraordinary gains of the previous year while wondering whether signs of improved economic activity were sustainable. March data revealed a brighter employment picture, increased manufacturing activity and greater stability in housing—and the market responded accordingly. Strong fourth-quarter returns, combined with solid gains in March, led to solid six-month returns for all segments of the stock market.
For the six months ended March 31, 2010, Institutional Class shares of Loomis Sayles Small Cap Growth Fund returned 15.37%. The fund outperformed its benchmark, the Russell 2000 Growth Index, which returned 12.07% for the period.
WHAT WAS THE PRIMARY REASON FOR THE FUND’S OUTPERFORMANCE?
The fund’s outperformance was due primarily to a shift in investor focus to the type of companies we favor, particularly during the fourth quarter of 2009: companies with strong competitive positions that can sustain growth well into the future. Additionally, the fund’s performance benefited from strong stock selection across a diverse group of sectors, including healthcare, consumer discretionary, producer durables and energy.
WHICH FACTORS POSITIVELY CONTRIBUTED TO THE FUND’S PERFORMANCE?
Our healthcare holdings were the greatest contributors to performance. Leading stocks included Incyte, a biotechnology company, which signed large partnerships for two of its drugs, and SXC Health Solutions, a pharmacy benefit management services and healthcare IT company, which reported strong fourth-quarter results. Our position in IMAX, the leader in 3-D movies, led performance in the consumer discretionary sector, while Bucyrus International, an industrial, construction and mining company, reported better-than-expected earnings and drove results in producer durables.
WHICH FACTORS DETRACTED FROM THE FUND’S RESULTS?
Stock selection in the technology, materials and utilities sectors had a negative impact on the fund’s relative performance. Brocade, a provider of switching solutions for storage area networks, was among the largest detractors, after missing earnings estimates and issuing lower-than-expected guidance. We reduced the fund’s technology weight, primarily due to weak prospects for growth among specific communication equipment and software companies. Nevertheless, technology remains the fund’s largest sector weight.
WHAT IS YOUR OUTLOOK?
We believe the stock market has the potential to produce positive returns over the next 12 months, although overall gains may be modest and interrupted by periodic reversals. Corporate cost-cutting programs have been responsible for most of the earnings growth that has occurred up until now. We believe the economy has stabilized, setting the stage for revenue improvements that can drive future profit growth. However, improved earnings also can trigger talk of higher interest rates, which, in turn, could restrain overall market performance.
FUND FACTS
Symbol | Institutional: LSSIX;
Retail: LCGRX
Objective | Long-term capital growth from investments in common stocks or other equity securities
Strategy | Invests at least 80% of its net assets (plus any borrowings made for investment purposes) in equity securities of companies with market capitalizations that fall within the capitalization range of the Russell 2000 Index or is $3 billion or less at the time of investment. Unlike the Index, the Fund may invest in companies of any size.
Fund Inception Date | 12/31/96
Total Net Assets | $124.7 million
1
AVERAGE ANNUAL TOTAL RETURNS
Periods Ended March 31, 2010
| | | | | | | | | | | | | |
| 6 Months | | | 1 Year | | | 5 Years | | | 10 Years | | | Since
Inception | |
Loomis Sayles Small Cap Growth: Institutional | |
| 15.37 | % | | 52.69 | % | | 6.35 | % | | -7.16 | % | | 3.11 | % |
Loomis Sayles Small Cap Growth: Retail | |
| 15.34 | | | 52.48 | | | 6.09 | | | -7.39 | | | 2.86 | |
Russell 2000 Growth Index(c) | |
| 12.07 | | | 60.32 | | | 3.82 | | | -1.53 | | | 3.28 | |
Russell 2000 Index(c) | |
| 13.07 | | | 62.76 | | | 3.36 | | | 3.68 | | | 6.22 | |
Lipper Small-Cap Growth Funds Index(c) | |
| 12.68 | | | 57.45 | | | 2.71 | | | -1.59 | | | 4.61 | |
| | | | | | | | |
Gross expense ratio (before reductions and reimbursements)* |
| Institutional: 1.01% | | Retail: 1.43% |
Net expense ratio (after reductions and reimbursements)* |
| Institutional: 1.00% | | Retail: 1.25% |
* As stated in the most recent prospectus. Expense reductions are contractual and are set to expire on 1/31/11.
CUMULATIVE PERFORMANCE
Inception to March 31, 2010(a)(b)
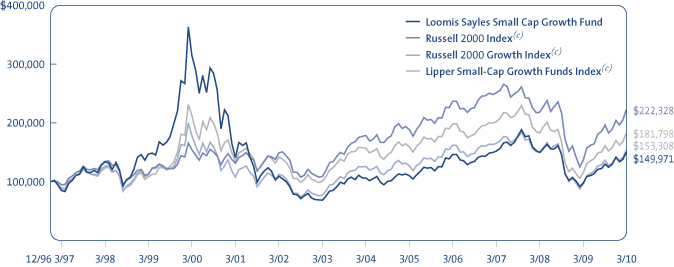
Data quoted reflects past performance and cannot guarantee future results. Average annual total returns assume reinvestment of dividends and capital gains distributions. Investment return and principal value will fluctuate so that shares, when redeemed, may be worth more or less than their original cost. For performance current to the most recent month end, please visit www.loomissayles.com. Current performance may be higher or lower than quoted.
Returns do not reflect the taxes that a shareholder would pay on fund distributions or the redemption of shares. Periods of less than one year are not annualized. Performance data reflects certain fee reductions and reimbursements, if any, without which performance would be lower.
(a) Cumulative performance is shown for the institutional class of shares. Performance of the retail class would be lower due to higher fees. (b) The mountain chart is based on the initial investment minimum of $100,000 for the institutional class. (c) See page 5 for a description of the indices.
WHAT YOU SHOULD KNOW
Small- and mid-cap stocks may be more volatile than larger, more established companies. The secondary market for these stocks may be less liquid, which could adversely impact the fund’s value. Growth funds involve increased risks, in part, because the value of the underlying securities is based on future expectations that may or may not be met.
The fund can invest a significant percentage of assets in foreign securities and the value of the fund shares can be adversely affected by changes in currency exchange rates, political, and economic developments. In emerging markets these risks can be significant. The fund is subject to currency risk, which is the risk that fluctuations in exchange rates between the U.S. dollar and foreign currencies may cause the value of a fund’s investments to decline. Fund shares should be viewed as a long-term investment.
2
FUND AND MANAGER REVIEW
Loomis Sayles Small Cap Value Fund

Joseph Gatz, CFA
Manager since January 2000

Daniel Thelen, CFA
Manager since April 2000
PORTFOLIO REVIEW
After finishing 2009 on a strong note, the stock market started off slowly in 2010, as investors digested the extraordinary gains of the previous year while wondering whether improved economic activity was sustainable. March data revealed a brighter employment picture, increased manufacturing activity and greater stability in housing—and the market responded accordingly. Strong fourth-quarter returns, combined with solid gains in March, led to solid six-month returns for all segments of the stock market.
For the six months ended March 31, 2010, Institutional Class shares of Loomis Sayles Small Cap Value Fund returned 9.74%. The fund underperformed its benchmark, the Russell 2000 Value Index, which returned 14.01% for the period.
WHAT WAS THE PRIMARY REASON FOR THE FUND’S UNDERPERFORMANCE?
The fund underperformed its benchmark because of its focus on higher-quality stocks, which underperformed lower-quality stocks during the first quarter of 2010. In general, the small-cap market was led by low-priced stocks, the smallest market caps and low-quality companies.
WHICH FACTORS POSITIVELY CONTRIBUTED TO THE FUND’S PERFORMANCE?
In 2009, we made several additions to the portfolio early in the market recovery, emphasizing smaller-cap and more cyclical stocks poised for a recovery. These changes helped limit the negative impact of the low-quality rally in 2009. However, we backed off the strategy late last year and early in 2010, as better fundamentals emerged. Hence, we were surprised that low-quality stocks, a segment of the market that typically does not match up well with our strategy, continued to lead the market in 2010. Stock selection in the healthcare sector contributed positively. Perrigo, a store-brand over-the-counter pharmaceutical provider, was one of the fund’s top performers.
WHICH FACTORS DETRACTED FROM THE FUND’S RESULTS?
Stock selection was negative during the period, with the financial services, materials and processing and technology sectors detracting the most. In particular, our holdings among high-quality banks and non-credit-sensitive transaction processors did not keep pace with the index return of the financial services sector overall.
WHAT IS YOUR OUTLOOK?
We believe the stock market has the potential to produce positive returns over the next 12 months, although overall gains may be modest and interrupted by periodic reversals. Corporate cost-cutting programs have been responsible for most of the earnings growth that has occurred up until now. We believe the economy has stabilized, setting the stage for revenue improvements that can drive future profit growth. However, improved earnings also can trigger talk of higher interest rates, which, in turn, could restrain overall market performance.
FUND FACTS
Symbol | Institutional: LSSCX;
Retail: LSCRX; Admin: LSVAX
Objective | Long-term capital growth from investments in common stocks or other equity securities
Strategy | Invests at least 80% of its net assets (plus any borrowings made for investment purposes) in equity securities of companies with market capitalizations that fall within the capitalization range of the Russell 2000 Index or is $3 billion or less at the time of investment. Unlike the Index, the Fund may invest in companies of any size.
Fund Inception Date | 5/13/91
Class Inception Date | Institutional: 5/13/91
Retail: 12/31/96
Admin: 1/2/98
Total Net Assets | $986.1 million
3
AVERAGE ANNUAL TOTAL RETURNS
Periods Ended March 31, 2010
| | | | | | | | | | | | | |
| 6 Months | | | 1 Year | | | 5 Years | | | 10 Years | | | Since Fund
Inception(a)(b) | |
Loomis Sayles Small Cap Value: Institutional | |
| 9.74 | % | | 53.29 | % | | 4.38 | % | | 8.24 | % | | 12.17 | % |
Loomis Sayles Small Cap Value: Retail(a) | |
| 9.53 | | | 52.84 | | | 4.11 | | | 7.97 | | | 11.97 | |
Loomis Sayles Small Cap Value: Admin(a) | |
| 9.45 | | | 52.42 | | | 3.84 | | | 7.70 | | | 11.62 | |
Russell 2000 Value Index(c) | |
| 14.01 | | | 65.07 | | | 2.75 | | | 8.90 | | | 11.43 | |
Russell 2000 Index(c) | |
| 13.07 | | | 62.76 | | | 3.36 | | | 3.68 | | | 9.09 | |
Lipper Small-Cap Core Funds Index(b)(c) | |
| 12.46 | | | 63.48 | | | 3.71 | | | 4.98 | | | N/A | |
| | | | | | | | |
Gross expense ratio (before reductions and reimbursements)* |
| Institutional: 0.94% | | Retail: 1.31% | | Admin: 1.77% |
Net expense ratio (after reductions and reimbursements)* |
| Institutional: 0.90% | | Retail: 1.15% | | Admin: 1.40% |
* As stated in the most recent prospectus. Expense reductions are contractual and are set to expire on 1/31/11.
CUMULATIVE PERFORMANCE
Inception to March 31, 2010(d)(e)
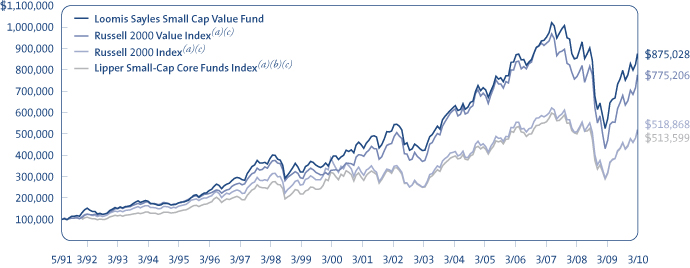
Data quoted reflects past performance and cannot guarantee future results. Average annual total returns assume reinvestment of dividends and capital gains distributions. Investment return and principal value will fluctuate so that shares, when redeemed, may be worth more or less than their original cost. For performance current to the most recent month end, please visit www.loomissayles.com. Current performance may be higher or lower than quoted.
Returns do not reflect the taxes that a shareholder would pay on fund distributions or the redemption of shares. Periods of less than one year are not annualized. Performance data reflects certain fee reductions and reimbursements, if any, without which performance would be lower.
(a) Prior to the inception of retail class shares (12/31/96) and admin class shares (1/2/98), performance is that of institutional class shares, restated to reflect the higher net expenses of the retail class shares and admin class shares, respectively. Since index performance data is not available coincident with the fund’s inception date, the beginning value of the index is the value as of the month end closest to the Fund’s inception date. (b) The Lipper Small-Cap Core Funds Index performance data is not available prior to January 1, 1992. (c) See page 5 for a description of the Indices. (d) Cumulative performance is shown for the institutional class of shares. Performance of the retail and admin classes would be lower due to higher fees and expenses. (e) The mountain chart is based on the initial investment minimum of $100,000 for the institutional class.
WHAT YOU SHOULD KNOW
Value stocks may fall out of favor with investors and underperform the overall equity market during any given period. Small- and mid-cap stocks may be more volatile than larger, more established companies. The secondary market for these stocks may be less liquid, which could adversely impact the Fund’s value.
The fund can invest a significant percentage of assets in foreign securities and the value of the fund shares can be adversely affected by changes in currency exchange rates, political, and economic developments. In emerging markets these risks can be significant. The fund is subject to currency risk, which is the risk that fluctuations in exchange rates between the U.S. dollar and foreign currencies may cause the value of a fund’s investments to decline. Fund shares should be viewed as a long-term investment.
4
ADDITIONAL INFORMATION
Index Definitions
Indices are unmanaged and do not have expenses that affect results, unlike mutual funds. Index returns are adjusted for the reinvestment of capital gain distributions and income dividends. It is not possible to invest directly in an index.
Lipper Small-Cap Core Funds Index is an unmanaged index which tracks the average performance of the 30 largest small-cap core funds according to Lipper Inc.
Lipper Small-Cap Growth Funds Index is an unmanaged index which tracks the average performance of the 30 largest small-cap growth funds according to Lipper Inc.
Source: Lipper, Inc.
Russell 2000 Index is an unmanaged index that measures the performance of the small-cap segment of the U.S. equity universe.
Russell 2000 Growth Index is an unmanaged index that measures the performance of the small-cap growth segment of the U.S. equity universe. It includes those Russell 2000 companies with higher price-to-book ratios and higher forecasted growth values.
Russell 2000 Value Index is an unmanaged index that measures the performance of the small-cap value segment of the U.S. equity universe. It includes those Russell 2000 companies with lower price-to-book ratios and lower forecasted growth values.
Proxy Voting Information
A description of the funds’ proxy voting policies and procedures is available without charge, upon request, (i) by calling Loomis Sayles at 800-633-3330; (ii) on the funds’ website, www.loomissayles.com, and (iii) on the SEC’s website, www.sec.gov. Information about how the Funds voted proxies relating to portfolio securities during the 12 months ended June 30, 2009 is available on (i) the funds’ website and (ii) the SEC’s website.
Quarterly Portfolio Schedules
The funds file a complete schedule of portfolio holdings with the SEC for the first and third quarters of each fiscal year on Form N-Q. The funds’ Forms N-Q are available on the SEC’s website at www.sec.gov and may be reviewed and copied at the SEC’s Public Reference Room in Washington, DC. Information on the operation of the Public Reference Room may be obtained by calling 800-SEC-0330.
UNDERSTANDING YOUR FUND’S EXPENSES
As a mutual fund shareholder you incur two types of costs: (1) transaction costs, including redemption fees and certain exchange fees; and (2) ongoing costs, including management fees, distribution and/or service fees (12b-1 fees), and other fund expenses. These costs are described in more detail in the funds’ prospectus. The examples below are intended to help you understand the ongoing costs of investing in the Funds and help you compare these with the ongoing costs of investing in other mutual funds.
The first line in the table of each fund shows the actual amount of fund expenses you would have paid on a $1,000 investment in the fund from October 1, 2009 through March 31, 2010. It also shows how much a $1,000 investment would be worth at the close of the period, assuming actual fund returns and expenses. To estimate the expenses you paid over the period, simply divide your account value by $1,000 (for example $8,600 account value divided by $1,000 = 8.6) and multiply the result by the number in the Expenses Paid During the Period column as shown below for your class.
The second line in the table of each fund provides information about hypothetical account values and hypothetical expenses based on the fund’s actual expense ratios and an assumed rate of return of 5% per year before expenses, which is not the fund’s actual return. The hypothetical account values and expenses may not be used to estimate the actual ending account balance or expenses you paid on your investment for the period. You may use this information to compare the ongoing costs of investing in the funds and other funds. To do so, compare this 5% hypothetical example with the 5% hypothetical examples that appear in the shareholder reports of other funds.
5
Please note that the expenses shown reflect ongoing costs only, and do not include any transaction costs. Therefore, the second line in the table is useful in comparing ongoing costs only, and will not help you determine the relative costs of owning different funds. If transaction costs were included, total costs would be higher.
Loomis Sayles Small Cap Growth Fund
| | | | | | |
Institutional Class | | Beginning
Account Value
10/1/2009 | | Ending
Account Value
3/31/2010 | | Expenses Paid
During Period*
10/1/2009 – 3/31/2010 |
Actual | | $1,000.00 | | $1,153.70 | | $5.37 |
Hypothetical (5% return before expenses) | | $1,000.00 | | $1,019.95 | | $5.04 |
| | | |
Retail Class | | | | | | |
Actual | | $1,000.00 | | $1,153.40 | | $6.71 |
Hypothetical (5% return before expenses) | | $1,000.00 | | $1,018.70 | | $6.29 |
* Expenses are equal to the Fund's annualized expense ratio (after fee reduction/reimbursement): 1.00%, and 1.25% for Institutional and Retail Class, respectively, multiplied by the average account value over the period multiplied by the number of days in the most recent fiscal half-year, divided by 365 (to reflect the half-year period). |
Loomis Sayles Small Cap Value Fund
| | | | | | |
Institutional Class | | Beginning
Account Value
10/1/2009 | | Ending
Account Value
3/31/2010 | | Expenses Paid
During Period*
10/1/2009 – 3/31/2010 |
Actual | | $1,000.00 | | $1,097.40 | | $4.71 |
Hypothetical (5% return before expenses) | | $1,000.00 | | $1,020.44 | | $4.53 |
| | | |
Retail Class | | | | | | |
Actual | | $1,000.00 | | $1,095.30 | | $6.01 |
Hypothetical (5% return before expenses) | | $1,000.00 | | $1,019.20 | | $5.79 |
| | | |
Admin Class | | | | | | |
Actual | | $1,000.00 | | $1,094.50 | | $7.31 |
Hypothetical (5% return before expenses) | | $1,000.00 | | $1,017.95 | | $7.04 |
* Expenses are equal to the Fund's annualized expense ratio (after fee reduction/reimbursement): 0.90%, 1.15% and 1.40%, for Institutional, Retail and Admin Class, respectively, multiplied by the average account value over the period, multiplied by the number of days in the most recent fiscal half-year, divided by 365 (to reflect the half-year period). |
6
PORTFOLIO OF INVESTMENTS – as of March 31, 2010 (Unaudited)
Loomis Sayles Small Cap Growth Fund
| | | | | | | |
| | | | | Shares | | Value (†) |
| | | | | | | |
| | | |
| COMMON STOCKS – 98.4% of Net Assets | | | | | | | |
| | | |
| Aerospace & Defense – 1.1% | | | | | | | |
Hexcel Corp.(b) | | | | 98,695 | | $ | 1,425,156 |
| | | | | | | |
| Air Freight & Logistics – 1.3% | | | | | | | |
Atlas Air Worldwide Holdings, Inc.(b) | | | | 30,970 | | | 1,642,958 |
| | | | | | | |
| Auto Components – 0.8% | | | | | | | |
Amerigon, Inc.(b) | | | | 103,402 | | | 1,045,394 |
| | | | | | | |
| Biotechnology – 4.8% | | | | | | | |
Alexion Pharmaceuticals, Inc.(b) | | | | 20,875 | | | 1,134,974 |
Alkermes, Inc.(b) | | | | 63,045 | | | 817,693 |
Cepheid, Inc.(b) | | | | 74,574 | | | 1,303,553 |
Clinical Data, Inc.(b) | | | | 44,662 | | | 866,443 |
Incyte Corp. Ltd.(b) | | | | 63,105 | | | 880,946 |
Regeneron Pharmaceuticals, Inc.(b) | | | | 35,363 | | | 936,766 |
| | | | | | | |
| | | | | | | 5,940,375 |
| | | | | | | |
| Building Products – 1.0% | | | | | | | |
Trex Company, Inc.(b) | | | | 60,972 | | | 1,298,094 |
| | | | | | | |
| Capital Markets – 3.5% | | | | | | | |
Evercore Partners, Inc., Class A | | | | 37,942 | | | 1,138,260 |
Greenhill & Co., Inc. | | | | 14,012 | | | 1,150,245 |
Harris & Harris Group, Inc.(b) | | | | 146,816 | | | 676,822 |
Stifel Financial Corp.(b) | | | | 27,137 | | | 1,458,614 |
| | | | | | | |
| | | | | | | 4,423,941 |
| | | | | | | |
| Commercial Banks – 1.1% | | | | | | | |
Signature Bank(b) | | | | 36,482 | | | 1,351,658 |
| | | | | | | |
| Commercial Services & Supplies – 1.9% | | | | | | | |
EnerNOC, Inc.(b) | | | | 35,814 | | | 1,062,960 |
Waste Connections, Inc.(b) | | | | 38,719 | | | 1,314,897 |
| | | | | | | |
| | | | | | | 2,377,857 |
| | | | | | | |
| Communications Equipment – 3.9% | | | | | | | |
Brocade Communications Systems, Inc.(b) | | | | 129,107 | | | 737,201 |
Ciena Corp.(b) | | | | 71,586 | | | 1,090,971 |
DG FastChannel, Inc.(b) | | | | 36,824 | | | 1,176,527 |
F5 Networks, Inc.(b) | | | | 20,451 | | | 1,257,941 |
Meru Networks, Inc.(b) | | | | 32,443 | | | 621,932 |
| | | | | | | |
| | | | | | | 4,884,572 |
| | | | | | | |
| Computers & Peripherals – 1.0% | | | | | | | |
Netezza Corp.(b) | | | | 96,525 | | | 1,234,555 |
| | | | | | | |
| Construction & Engineering – 1.6% | | | | | | | |
MasTec, Inc.(b) | | | | 82,678 | | | 1,042,570 |
Orion Marine Group, Inc.(b) | | | | 50,944 | | | 919,539 |
| | | | | | | |
| | | | | | | 1,962,109 |
| | | | | | | |
| Diversified Consumer Services – 1.9% | | | | | | | |
Grand Canyon Education, Inc.(b) | | | | 49,279 | | | 1,288,153 |
Lincoln Educational Services Corp.(b) | | | | 44,355 | | | 1,122,182 |
| | | | | | | |
| | | | | | | 2,410,335 |
| | | | | | | |
| Diversified Financial Services – 1.2% | | | | | | | |
MSCI, Inc.(b) | | | | 41,107 | | | 1,483,963 |
| | | | | | | |
See accompanying notes to financial statements.
7
| | | | | | | |
| | | | | Shares | | Value (†) |
| | | | | | | |
| | | |
| COMMON STOCKS – continued | | | | | | | |
| | | |
| Electrical Equipment – 0.7% | | | | | | | |
Polypore International, Inc.(b) | | | | 48,328 | | $ | 843,807 |
| | | | | | | |
| Electronic Equipment Instruments & Components – 1.0% | | | | | | | |
IPG Photonics Corp.(b) | | | | 79,935 | | | 1,183,038 |
| | | | | | | |
| Energy Equipment & Services – 2.1% | | | | | | | |
Oceaneering International, Inc.(b) | | | | 21,284 | | | 1,351,321 |
Tesco Corp.(b) | | | | 109,132 | | | 1,273,571 |
| | | | | | | |
| | | | | | | 2,624,892 |
| | | | | | | |
| Food Products – 0.8% | | | | | | | |
Diamond Foods, Inc. | | | | 22,716 | | | 954,981 |
| | | | | | | |
| Health Care Equipment & Supplies – 8.6% | | | | | | | |
AGA Medical Holdings, Inc.(b) | | | | 77,807 | | | 1,264,364 |
Align Technology, Inc.(b) | | | | 67,002 | | | 1,295,819 |
DexCom, Inc.(b) | | | | 95,692 | | | 931,083 |
Electro-Optical Sciences, Inc.(b) | | | | 89,923 | | | 667,229 |
ev3, Inc.(b) | | | | 108,641 | | | 1,723,046 |
Insulet Corp.(b) | | | | 81,805 | | | 1,234,437 |
Masimo Corp. | | | | 40,848 | | | 1,084,514 |
ResMed, Inc.(b) | | | | 20,192 | | | 1,285,221 |
Volcano Corp.(b) | | | | 52,499 | | | 1,268,376 |
| | | | | | | |
| | | | | | | 10,754,089 |
| | | | | | | |
| Health Care Providers & Services – 3.8% | | | | | | | |
Bio-Reference Labs, Inc.(b) | | | | 28,706 | | | 1,262,203 |
Catalyst Health Solutions, Inc.(b) | | | | 30,466 | | | 1,260,683 |
Hanger Orthopedic Group, Inc.(b) | | | | 52,472 | | | 953,941 |
IPC The Hospitalist Co.(b) | | | | 35,350 | | | 1,241,138 |
| | | | | | | |
| | | | | | | 4,717,965 |
| | | | | | | |
| Health Care Technology – 3.0% | | | | | | | |
athenahealth, Inc.(b) | | | | 20,167 | | | 737,306 |
MedAssets, Inc.(b) | | | | 70,781 | | | 1,486,401 |
SXC Health Solutions Corp.(b) | | | | 22,366 | | | 1,504,784 |
| | | | | | | |
| | | | | | | 3,728,491 |
| | | | | | | |
| Hotels, Restaurants & Leisure – 3.2% | | | | | | | |
Bally Technologies, Inc.(b) | | | | 25,049 | | | 1,015,487 |
Buffalo Wild Wings, Inc.(b) | | | | 25,185 | | | 1,211,650 |
Life Time Fitness, Inc.(b) | | | | 21,218 | | | 596,226 |
Panera Bread Co., Class A(b) | | | | 15,062 | | | 1,152,092 |
| | | | | | | |
| | | | | | | 3,975,455 |
| | | | | | | |
| Household Durables – 1.2% | | | | | | | |
Tempur-Pedic International, Inc.(b) | | | | 50,944 | | | 1,536,471 |
| | | | | | | |
| Internet Software & Services – 6.3% | | | | | | | |
Constant Contact, Inc.(b) | | | | 43,221 | | | 1,003,592 |
DealerTrack Holdings, Inc.(b) | | | | 64,341 | | | 1,098,944 |
GSI Commerce, Inc.(b) | | | | 80,864 | | | 2,237,507 |
MercadoLibre, Inc.(b) | | | | 24,419 | | | 1,177,240 |
Monster Worldwide, Inc.(b) | | | | 73,769 | | | 1,225,303 |
WebMD Health Corp.(b) | | | | 24,175 | | | 1,121,236 |
| | | | | | | |
| | | | | | | 7,863,822 |
| | | | | | | |
See accompanying notes to financial statements.
8
PORTFOLIO OF INVESTMENTS – as of March 31, 2010 (Unaudited)
Loomis Sayles Small Cap Growth Fund – continued
| | | | | | | |
| | | | | Shares | | Value (†) |
| | | | | | | |
| | | |
| COMMON STOCKS – continued | | | | | | | |
| | | |
| IT Services – 1.0% | | | | | | | |
CyberSource Corp.(b) | | | | 67,248 | | $ | 1,186,255 |
| | | | | | | |
| Machinery – 1.6% | | | | | | | |
Bucyrus International, Inc. | | | | 19,497 | | | 1,286,607 |
Energy Recovery, Inc.(b) | | | | 118,792 | | | 748,390 |
| | | | | | | |
| | | | | | | 2,034,997 |
| | | | | | | |
| Media – 1.0% | | | | | | | |
Imax Corp.(b) | | | | 70,645 | | | 1,270,904 |
| | | | | | | |
| Oil, Gas & Consumable Fuels – 3.9% | | | | | | | |
Brigham Exploration Co.(b) | | | | 66,566 | | | 1,061,728 |
Comstock Resources, Inc.(b) | | | | 35,998 | | | 1,144,736 |
Concho Resources, Inc.(b) | | | | 30,588 | | | 1,540,412 |
Rosetta Resources, Inc.(b) | | | | 46,797 | | | 1,102,069 |
| | | | | | | |
| | | | | | | 4,848,945 |
| | | | | | | |
| Pharmaceuticals – 2.5% | | | | | | | |
Eurand NV(b) | | | | 60,767 | | | 685,451 |
Inspire Pharmaceuticals, Inc.(b) | | | | 126,979 | | | 792,349 |
Nektar Therapeutics(b) | | | | 62,704 | | | 953,728 |
Somaxon Pharmaceuticals, Inc.(b) | | | | 72,623 | | | 628,189 |
| | | | | | | |
| | | | | | | 3,059,717 |
| | | | | | | |
| Professional Services – 2.8% | | | | | | | |
ICF International, Inc.(b) | | | | 45,951 | | | 1,141,423 |
IHS, Inc., Class A(b) | | | | 25,377 | | | 1,356,908 |
On Assignment, Inc.(b) | | | | 146,065 | | | 1,041,443 |
| | | | | | | |
| | | | | | | 3,539,774 |
| | | | | | | |
| Semiconductors & Semiconductor Equipment – 8.6% | | | | | | | |
Advanced Energy Industries, Inc.(b) | | | | 63,782 | | | 1,056,230 |
Cavium Network, Inc.(b) | | | | 38,857 | | | 965,985 |
Cymer, Inc.(b) | | | | 30,111 | | | 1,123,140 |
EZchip Semiconductor Ltd.(b) | | | | 33,071 | | | 651,168 |
Hittite Microwave Corp.(b) | | | | 27,778 | | | 1,221,399 |
Lam Research Corp.(b) | | | | 25,936 | | | 967,932 |
Netlogic Microsystems, Inc.(b) | | | | 37,519 | | | 1,104,184 |
Power Integrations, Inc. | | | | 22,697 | | | 935,116 |
Silicon Laboratories, Inc.(b) | | | | 28,733 | | | 1,369,702 |
Varian Semiconductor Equipment Associates, Inc.(b) | | | | 40,262 | | | 1,333,477 |
| | | | | | | |
| | | | | | | 10,728,333 |
| | | | | | | |
| Software – 10.1% | | | | | | | |
ArcSight, Inc.(b) | | | | 47,574 | | | 1,339,208 |
Ariba, Inc.(b) | | | | 113,825 | | | 1,462,651 |
Blackboard, Inc.(b) | | | | 35,419 | | | 1,475,556 |
Concur Technologies, Inc.(b) | | | | 32,457 | | | 1,331,062 |
Informatica Corp.(b) | | | | 66,675 | | | 1,790,891 |
Sourcefire, Inc.(b) | | | | 48,311 | | | 1,108,737 |
SuccessFactors, Inc.(b) | | | | 48,311 | | | 919,841 |
Tyler Technologies, Inc.(b) | | | | 33,004 | | | 618,495 |
Ultimate Software Group, Inc.(The)(b) | | | | 41,216 | | | 1,358,067 |
VanceInfo Technologies, Inc., ADR(b) | | | | 54,314 | | | 1,210,659 |
| | | | | | | |
| | | | | | | 12,615,167 |
| | | | | | | |
See accompanying notes to financial statements.
9
| | | | | | | | | |
| | | | | Shares | | Value (†) | |
| | | | | | | | | |
| | | |
| COMMON STOCKS – continued | | | | | | | | | |
| | | |
| Specialty Retail – 6.7% | | | | | | | | | |
DSW, Inc., Class A(b) | | | | | 46,742 | | $ | 1,193,323 | |
hhgregg, Inc.(b) | | | | | 47,807 | | | 1,206,649 | |
Hibbett Sports, Inc.(b) | | | | | 45,651 | | | 1,167,753 | |
Lumber Liquidators Holdings, Inc.(b) | | | | | 42,881 | | | 1,143,636 | |
Monro Muffler Brake, Inc. | | | | | 35,978 | | | 1,286,573 | |
Rue21, Inc.(b) | | | | | 26,864 | | | 931,375 | |
Ulta Salon, Cosmetics & Fragrance, Inc.(b) | | | | | 61,026 | | | 1,380,408 | |
| | | | | | | | | |
| | | | | | | | 8,309,717 | |
| | | | | | | | | |
| Textiles, Apparel & Luxury Goods – 3.4% | | | | | | | | | |
Lululemon Athletica, Inc.(b) | | | | | 30,162 | | | 1,251,723 | |
Phillips-Van Heusen Corp. | | | | | 28,961 | | | 1,661,203 | |
Volcom, Inc.(b) | | | | | 65,310 | | | 1,274,851 | |
| | | | | | | | | |
| | | | | | | | 4,187,777 | |
| | | | | | | | | |
| Transportation Infrastructure – 1.0% | | | | | | | | | |
Aegean Marine Petroleum Network, Inc. | | | | | 44,019 | | | 1,249,259 | |
| | | | | | | | | |
| | | |
| TOTAL COMMON STOCKS | | | | | | | | | |
(Identified Cost $91,389,144) | | | | | | | | 122,694,823 | |
| | | | | | | | | |
| | | |
| | | | | Principal
Amount | | | |
| SHORT-TERM INVESTMENTS – 2.9% | | | | | | | | | |
| Tri-Party Repurchase Agreement with Fixed Income Clearing Corporation, dated 3/31/10 at 0.000% to be repurchased at $3,674,633 on 4/01/10 collateralized by $3,745,000 Federal Home Loan Mortgage Corp., 2.000% due 3/29/13 valued at $3,749,681 including accrued interest (Note 2 of Notes to Financial Statements) (Identified Cost $3,674,633) | | | | $ | 3,674,633 | | | 3,674,633 | |
| | | | | | | | | |
| | | |
| TOTAL INVESTMENTS – 101.3% | | | | | | | | | |
| | | | | | | | | |
(Identified Cost $95,063,777)(a) | | | | | | | | 126,369,456 | |
Other assets less liabilities—(1.3)% | | | | | | | | (1,645,854 | ) |
| | | | | | | | | |
| | | |
| NET ASSETS – 100.0% | | | | | | | $ | 124,723,602 | |
| | | | | | | | | |
|
(†) See Note 2 of Notes to Financial Statements. | |
(a) Federal Tax Information (Amounts exclude certain adjustments made at the end of the Fund’s fiscal year for tax purposes. Such adjustments are primarily due to wash sales.): | | | | |
At March 31, 2010, the net unrealized appreciation on investments based on a cost of $95,063,349 for federal income tax purposes was as follows: | |
Aggregate gross unrealized appreciation for all investments in which there is an excess of value over tax cost | | $ | 32,331,929 | |
Aggregate gross unrealized depreciation for all investments in which there is an excess of tax cost over value | | | (1,025,822 | ) |
| | | | | | | | | |
Net unrealized appreciation | | $ | 31,306,107 | |
| | | | | | | | | |
| (b) | Non-income producing security. |
| ADR | An American Depositary Receipt is a certificate issued by a custodian bank representing the right to receive securities of the foreign issuer described. The values of ADRs are significantly influenced by trading on exchanges not located in the United States. |
See accompanying notes to financial statements.
10
PORTFOLIO OF INVESTMENTS – as of March 31, 2010 (Unaudited)
Loomis Sayles Small Cap Growth Fund – continued
INDUSTRY SUMMARY AT MARCH 31, 2010 (Unaudited)
| | | |
Software | | 10.1 | % |
Health Care Equipment & Supplies | | 8.6 | |
Semiconductors & Semiconductor Equipment | | 8.6 | |
Specialty Retail | | 6.7 | |
Internet Software & Services | | 6.3 | |
Biotechnology | | 4.8 | |
Communications Equipment | | 3.9 | |
Oil, Gas & Consumable Fuels | | 3.9 | |
Health Care Providers & Services | | 3.8 | |
Capital Markets | | 3.5 | |
Textiles, Apparel & Luxury Goods | | 3.4 | |
Hotels, Restaurants & Leisure | | 3.2 | |
Health Care Technology | | 3.0 | |
Professional Services | | 2.8 | |
Pharmaceuticals | | 2.5 | |
Energy Equipment & Services | | 2.1 | |
Other Investments, less than 2% each | | 21.2 | |
Short-Term Investments | | 2.9 | |
| | | |
Total Investments | | 101.3 | |
Other assets less liabilities | | (1.3 | ) |
| | | |
Net Assets | | 100.0 | % |
| | | |
See accompanying notes to financial statements.
11
PORTFOLIO OF INVESTMENTS – as of March 31, 2010 (Unaudited)
Loomis Sayles Small Cap Value Fund
| | | | | | | |
| | | | | Shares | | Value (†) |
| | | | | | | |
| | | |
| COMMON STOCKS – 97.8% of Net Assets | | | | | | | |
| | | |
| Air Freight & Logistics – 1.2% | | | | | | | |
Atlas Air Worldwide Holdings, Inc.(b) | | | | 215,956 | | $ | 11,456,466 |
| | | | | | | |
| Auto Components – 1.3% | | | | | | | |
Goodyear Tire & Rubber Co. (The)(b) | | | | 445,746 | | | 5,634,229 |
Tenneco, Inc.(b) | | | | 284,295 | | | 6,723,577 |
| | | | | | | |
| | | | | | | 12,357,806 |
| | | | | | | |
| Building Products – 1.2% | | | | | | | |
Armstrong World Industries, Inc.(b) | | | | 197,748 | | | 7,180,230 |
Griffon Corp.(b) | | | | 348,440 | | | 4,341,562 |
| | | | | | | |
| | | | | | | 11,521,792 |
| | | | | | | |
| Capital Markets – 3.5% | | | | | | | |
Ares Capital Corp. | | | | 555,653 | | | 8,245,891 |
Fifth Street Finance Corp. | | | | 647,491 | | | 7,517,371 |
JMP Group, Inc. | | | | 161,713 | | | 1,374,560 |
Legg Mason, Inc. | | | | 85,230 | | | 2,443,544 |
Stifel Financial Corp.(b) | | | | 186,950 | | | 10,048,562 |
SWS Group, Inc. | | | | 432,968 | | | 4,992,121 |
| | | | | | | |
| | | | | | | 34,622,049 |
| | | | | | | |
| Chemicals – 3.6% | | | | | | | |
Calgon Carbon Corp.(b) | | | | 270,934 | | | 4,638,390 |
Ferro Corp.(b) | | | | 613,965 | | | 5,396,752 |
Koppers Holdings, Inc. | | | | 200,009 | | | 5,664,255 |
Minerals Technologies, Inc. | | | | 80,553 | | | 4,175,868 |
Olin Corp. | | | | 244,931 | | | 4,805,546 |
RPM International, Inc. | | | | 295,732 | | | 6,310,921 |
WR Grace & Co.(b) | | | | 154,875 | | | 4,299,330 |
| | | | | | | |
| | | | | | | 35,291,062 |
| | | | | | | |
| Commercial Banks – 6.7% | | | | | | | |
Cathay General Bancorp | | | | 308,253 | | | 3,591,147 |
First Financial Bancorp | | | | 482,716 | | | 8,587,518 |
First Horizon National Corp.(b) | | | | 536,247 | | | 7,534,270 |
First Midwest Bancorp, Inc. | | | | 355,187 | | | 4,812,784 |
Hancock Holding Co. | | | | 166,074 | | | 6,943,554 |
IBERIABANK Corp. | | | | 188,834 | | | 11,331,928 |
Prosperity Bancshares, Inc. | | | | 228,423 | | | 9,365,343 |
Signature Bank(b) | | | | 228,219 | | | 8,455,514 |
Sterling Bancshares, Inc. | | | | 941,772 | | | 5,255,088 |
| | | | | | | |
| | | | | | | 65,877,146 |
| | | | | | | |
| Commercial Services & Supplies – 4.2% | | | | | | | |
Brink’s Co. (The) | | | | 58,466 | | | 1,650,495 |
McGrath Rentcorp | | | | 147,833 | | | 3,581,994 |
Rollins, Inc. | | | | 665,046 | | | 14,418,197 |
Standard Parking Corp.(b) | | | | 497,373 | | | 8,166,865 |
Team, Inc.(b) | | | | 174,849 | | | 2,900,745 |
US Ecology, Inc. | | | | 150,555 | | | 2,423,935 |
Waste Connections, Inc.(b) | | | | 248,909 | | | 8,452,950 |
| | | | | | | |
| | | | | | | 41,595,181 |
| | | | | | | |
See accompanying notes to financial statements.
12
PORTFOLIO OF INVESTMENTS – as of March 31, 2010 (Unaudited)
Loomis Sayles Small Cap Value Fund – continued
| | | | | | | |
| | | | | Shares | | Value (†) |
| | | | | | | |
| | | |
| COMMON STOCKS – continued | | | | | | | |
| | | |
| Communications Equipment – 1.4% | | | | | | | |
ADTRAN, Inc. | | | | 295,065 | | $ | 7,774,963 |
Tekelec(b) | | | | 343,013 | | | 6,229,116 |
| | | | | | | |
| | | | | | | 14,004,079 |
| | | | | | | |
| Computers & Peripherals – 0.3% | | | | | | | |
Intevac, Inc.(b) | | | | 197,385 | | | 2,727,861 |
| | | | | | | |
| Construction & Engineering – 0.3% | | | | | | | |
MYR Group, Inc.(b) | | | | 195,627 | | | 3,190,676 |
| | | | | | | |
| Consumer Finance – 1.5% | | | | | | | |
Cash America International, Inc. | | | | 134,704 | | | 5,318,114 |
Dollar Financial Corp.(b) | | | | 392,286 | | | 9,438,401 |
| | | | | | | |
| | | | | | | 14,756,515 |
| | | | | | | |
| Containers & Packaging – 0.4% | | | | | | | |
Myers Industries, Inc. | | | | 336,928 | | | 3,531,005 |
| | | | | | | |
| Distributors – 0.4% | | | | | | | |
Core-Mark Holding Co., Inc.(b) | | | | 134,464 | | | 4,115,943 |
| | | | | | | |
| Diversified Financial Services – 1.4% | | | | | | | |
MarketAxess Holdings, Inc. | | | | 165,315 | | | 2,600,405 |
PHH Corp.(b) | | | | 459,820 | | | 10,837,957 |
| | | | | | | |
| | | | | | | 13,438,362 |
| | | | | | | |
| Electric Utilities – 2.2% | | | | | | | |
ALLETE, Inc. | | | | 203,571 | | | 6,815,557 |
ITC Holdings Corp. | | | | 147,590 | | | 8,117,450 |
UIL Holdings Corp. | | | | 257,628 | | | 7,084,770 |
| | | | | | | |
| | | | | | | 22,017,777 |
| | | | | | | |
| Electrical Equipment – 3.7% | | | | | | | |
Baldor Electric Co. | | | | 260,504 | | | 9,742,850 |
Encore Wire Corp. | | | | 163,553 | | | 3,401,902 |
General Cable Corp.(b) | | | | 152,990 | | | 4,130,730 |
GrafTech International Ltd.(b) | | | | 343,908 | | | 4,701,222 |
II-VI, Inc.(b) | | | | 282,201 | | | 9,549,682 |
Thomas & Betts Corp.(b) | | | | 123,425 | | | 4,843,197 |
| | | | | | | |
| | | | | | | 36,369,583 |
| | | | | | | |
| Electronic Equipment Instruments & Components – 1.7% | | | | | | | |
Littelfuse, Inc.(b) | | | | 37,667 | | | 1,431,723 |
Methode Electronics, Inc. | | | | 471,204 | | | 4,664,919 |
ScanSource, Inc.(b) | | | | 205,397 | | | 5,911,326 |
TTM Technologies, Inc.(b) | | | | 491,001 | | | 4,360,089 |
| | | | | | | |
| | | | | | | 16,368,057 |
| | | | | | | |
| Energy Equipment & Services – 2.2% | | | | | | | |
Dresser-Rand Group, Inc.(b) | | | | 238,477 | | | 7,492,947 |
Lufkin Industries, Inc. | | | | 78,784 | | | 6,235,754 |
Oceaneering International, Inc.(b) | | | | 127,450 | | | 8,091,800 |
| | | | | | | |
| | | | | | | 21,820,501 |
| | | | | | | |
| Food & Staples Retailing – 0.7% | | | | | | | |
BJ’s Wholesale Club, Inc.(b) | | | | 82,885 | | | 3,065,916 |
Spartan Stores, Inc. | | | | 282,047 | | | 4,067,118 |
| | | | | | | |
| | | | | | | 7,133,034 |
| | | | | | | |
See accompanying notes to financial statements.
13
| | | | | | | |
| | | | | Shares | | Value (†) |
| | | | | | | |
| | | |
| COMMON STOCKS – continued | | | | | | | |
| | | |
| Food Products – 2.8% | | | | | | | |
Corn Products International, Inc. | | | | 128,224 | | $ | 4,444,244 |
Darling International, Inc.(b) | | | | 645,479 | | | 5,783,492 |
Fresh Del Monte Produce, Inc.(b) | | | | 186,239 | | | 3,771,340 |
Imperial Sugar Co. | | | | 147,879 | | | 2,293,603 |
J & J Snack Foods Corp. | | | | 190,066 | | | 8,262,169 |
Ralcorp Holdings, Inc.(b) | | | | 44,053 | | | 2,985,912 |
| | | | | | | |
| | | | | | | 27,540,760 |
| | | | | | | |
| Gas Utilities – 1.7% | | | | | | | |
UGI Corp. | | | | 644,457 | | | 17,103,889 |
| | | | | | | |
| Health Care Equipment & Supplies – 2.6% | | | | | | | |
Haemonetics Corp.(b) | | | | 126,173 | | | 7,210,787 |
Medical Action Industries, Inc.(b) | | | | 262,583 | | | 3,221,893 |
Teleflex, Inc. | | | | 146,254 | | | 9,370,494 |
West Pharmaceutical Services, Inc. | | | | 144,562 | | | 6,064,376 |
| | | | | | | |
| | | | | | | 25,867,550 |
| | | | | | | |
| Health Care Providers & Services – 1.6% | | | | | | | |
Almost Family, Inc.(b) | | | | 67,401 | | | 2,540,344 |
CorVel Corp.(b) | | | | 82,524 | | | 2,950,233 |
MEDNAX, Inc.(b) | | | | 119,792 | | | 6,970,696 |
MWI Veterinary Supply, Inc.(b) | | | | 79,972 | | | 3,230,869 |
| | | | | | | |
| | | | | | | 15,692,142 |
| | | | | | | |
| Hotels, Restaurants & Leisure – 2.1% | | | | | | | |
Bob Evans Farms, Inc. | | | | 181,897 | | | 5,622,436 |
California Pizza Kitchen, Inc.(b) | | | | 202,715 | | | 3,403,585 |
Dover Downs Gaming & Entertainment, Inc. | | | | 301,983 | | | 1,195,853 |
Isle of Capri Casinos, Inc.(b) | | | | 430,695 | | | 3,350,807 |
Wyndham Worldwide Corp. | | | | 286,963 | | | 7,383,558 |
| | | | | | | |
| | | | | | | 20,956,239 |
| | | | | | | |
| Household Durables – 1.4% | | | | | | | |
Jarden Corp. | | | | 197,326 | | | 6,568,982 |
Leggett & Platt, Inc. | | | | 349,731 | | | 7,568,179 |
| | | | | | | |
| | | | | | | 14,137,161 |
| | | | | | | |
| Industrial Conglomerates – 0.4% | | | | | | | |
Raven Industries, Inc. | | | | 123,702 | | | 3,647,972 |
| | | | | | | |
| Insurance – 5.2% | | | | | | | |
Aspen Insurance Holdings Ltd. | | | | 256,449 | | | 7,395,989 |
Assured Guaranty Ltd. | | | | 184,155 | | | 4,045,885 |
Hanover Insurance Group, Inc. (The) | | | | 134,037 | | | 5,845,354 |
HCC Insurance Holdings, Inc. | | | | 334,373 | | | 9,228,695 |
Primerica, Inc.(b) | | | | 53,340 | | | 800,100 |
ProAssurance Corp.(b) | | | | 123,616 | | | 7,236,481 |
Reinsurance Group of America, Inc. | | | | 139,456 | | | 7,324,229 |
RLI Corp. | | | | 113,569 | | | 6,475,704 |
Zenith National Insurance Corp. | | | | 78,015 | | | 2,989,535 |
| | | | | | | |
| | | | | | | 51,341,972 |
| | | | | | | |
| Internet & Catalog Retail – 0.5% | | | | | | | |
HSN, Inc.(b) | | | | 176,776 | | | 5,204,285 |
| | | | | | | |
See accompanying notes to financial statements.
14
PORTFOLIO OF INVESTMENTS – as of March 31, 2010 (Unaudited)
Loomis Sayles Small Cap Value Fund – continued
| | | | | | | |
| | | | | Shares | | Value (†) |
| | | | | | | |
| | | |
| COMMON STOCKS – continued | | | | | | | |
| | | |
| Internet Software & Services – 0.7% | | | | | | | |
AOL, Inc.(b) | | | | 127,486 | | $ | 3,222,846 |
IAC/InterActiveCorp(b) | | | | 172,647 | | | 3,925,993 |
| | | | | | | |
| | | | | | | 7,148,839 |
| | | | | | | |
| IT Services – 4.0% | | | | | | | |
Alliance Data Systems Corp.(b) | | | | 111,455 | | | 7,132,005 |
Broadridge Financial Solutions, Inc. | | | | 419,303 | | | 8,964,698 |
iGATE Corp. | | | | 456,216 | | | 4,438,982 |
Lender Processing Services, Inc. | | | | 217,332 | | | 8,204,283 |
NCI, Inc., Class A(b) | | | | 139,200 | | | 4,208,016 |
Wright Express Corp.(b) | | | | 214,667 | | | 6,465,770 |
| | | | | | | |
| | | | | | | 39,413,754 |
| | | | | | | |
| Life Sciences Tools & Services – 1.2% | | | | | | | |
Mettler-Toledo International, Inc.(b) | | | | 63,086 | | | 6,888,991 |
Pharmaceutical Product Development, Inc. | | | | 200,248 | | | 4,755,890 |
| | | | | | | |
| | | | | | | 11,644,881 |
| | | | | | | |
| Machinery – 4.9% | | | | | | | |
Actuant Corp., Class A | | | | 476,590 | | | 9,317,334 |
Albany International Corp., Class A | | | | 486,785 | | | 10,480,481 |
Altra Holdings, Inc.(b) | | | | 345,727 | | | 4,746,832 |
Harsco Corp. | | | | 90,868 | | | 2,902,324 |
John Bean Technologies Corp. | | | | 370,402 | | | 6,496,851 |
Middleby Corp. (The)(b) | | | | 42,038 | | | 2,420,968 |
RBC Bearings, Inc.(b) | | | | 146,570 | | | 4,671,186 |
Wabtec Corp. | | | | 169,822 | | | 7,152,903 |
| | | | | | | |
| | | | | | | 48,188,879 |
| | | | | | | |
| Marine – 0.6% | | | | | | | |
Kirby Corp.(b) | | | | 156,357 | | | 5,965,020 |
| | | | | | | |
| Media – 4.3% | | | | | | | |
Alloy, Inc.(b) | | | | 244,628 | | | 2,005,950 |
Arbitron, Inc. | | | | 163,892 | | | 4,369,361 |
John Wiley & Sons, Inc. Class A | | | | 231,322 | | | 10,011,616 |
Liberty Media–Starz, Series A(b) | | | | 135,351 | | | 7,400,993 |
Live Nation Entertainment, Inc.(b) | | | | 621,015 | | | 9,004,717 |
Madison Square Garden, Inc. Class A(b) | | | | 78,782 | | | 1,711,933 |
Scholastic Corp. | | | | 264,343 | | | 7,401,604 |
| | | | | | | |
| | | | | | | 41,906,174 |
| | | | | | | |
| Metals & Mining – 1.5% | | | | | | | |
Horsehead Holding Corp.(b) | | | | 429,497 | | | 5,085,245 |
Reliance Steel & Aluminum Co. | | | | 190,083 | | | 9,357,786 |
| | | | | | | |
| | | | | | | 14,443,031 |
| | | | | | | |
| Multi-Utilities & Unregulated Power – 0.5% | | | | | | | |
NorthWestern Corp. | | | | 193,268 | | | 5,181,515 |
| | | | | | | |
| Multiline Retail – 0.3% | | | | | | | |
Fred’s, Inc. Class A | | | | 213,784 | | | 2,561,132 |
| | | | | | | |
| Oil, Gas & Consumable Fuels – 3.8% | | | | | | | |
Arena Resources, Inc.(b) | | | | 169,513 | | | 5,661,734 |
Berry Petroleum Co., Class A | | | | 187,881 | | | 5,290,729 |
Cloud Peak Energy, Inc.(b) | | | | 219,099 | | | 3,645,807 |
See accompanying notes to financial statements.
15
| | | | | | | |
| | | | | Shares | | Value (†) |
| | | | | | | |
| COMMON STOCKS – continued | | | | | | | |
| | | |
| Oil, Gas & Consumable Fuels – continued | | | | | | | |
Comstock Resources, Inc.(b) | | | | 196,822 | | $ | 6,258,940 |
Mariner Energy, Inc.(b) | | | | 360,308 | | | 5,393,811 |
Penn Virginia Corp. | | | | 459,007 | | | 11,245,671 |
| | | | | | | |
| | | | | | | 37,496,692 |
| | | | | | | |
| Paper & Forest Products – 0.6% | | | | | | | |
Clearwater Paper Corp.(b) | | | | 33,143 | | | 1,632,293 |
Deltic Timber Corp. | | | | 94,118 | | | 4,145,898 |
| | | | | | | |
| | | | | | | 5,778,191 |
| | | | | | | |
| Pharmaceuticals – 1.8% | | | | | | | |
Endo Pharmaceuticals Holdings, Inc.(b) | | | | 297,263 | | | 7,042,160 |
Obagi Medical Products, Inc.(b) | | | | 371,504 | | | 4,524,919 |
Perrigo Co. | | | | 109,497 | | | 6,429,664 |
| | | | | | | |
| | | | | | | 17,996,743 |
| | | | | | | |
| Professional Services – 0.2% | | | | | | | |
Navigant Consulting, Inc.(b) | | | | 159,540 | | | 1,935,220 |
| | | | | | | |
| Real Estate Management & Development – 0.6% | | | | | | | |
Forestar Group, Inc.(b) | | | | 332,824 | | | 6,283,717 |
| | | | | | | |
| REITs – 4.4% | | | | | | | |
American Campus Communities, Inc. | | | | 332,085 | | | 9,185,471 |
Capstead Mortgage Corp. | | | | 581,120 | | | 6,950,195 |
Chimera Investment Corp. | | | | 1,535,216 | | | 5,971,990 |
Digital Realty Trust, Inc. | | | | 133,573 | | | 7,239,656 |
National Retail Properties, Inc. | | | | 219,320 | | | 5,007,076 |
Potlatch Corp. | | | | 268,691 | | | 9,414,933 |
| | | | | | | |
| | | | | | | 43,769,321 |
| | | | | | | |
| Road & Rail – 1.0% | | | | | | | |
Con-way, Inc. | | | | 112,329 | | | 3,944,995 |
Genesee & Wyoming, Inc., Class A(b) | | | | 187,345 | | | 6,392,211 |
| | | | | | | |
| | | | | | | 10,337,206 |
| | | | | | | |
| Semiconductors & Semiconductor Equipment – 3.7% | | | | | | | |
Applied Micro Circuits Corp.(b) | | | | 339,295 | | | 2,928,116 |
Atmel Corp.(b) | | | | 1,369,402 | | | 6,888,092 |
Cohu, Inc. | | | | 251,428 | | | 3,462,164 |
LSI Corp.(b) | | | | 1,032,647 | | | 6,319,800 |
ON Semiconductor Corp.(b) | | | | 740,740 | | | 5,925,920 |
Teradyne, Inc.(b) | | | | 665,150 | | | 7,429,725 |
TriQuint Semiconductor, Inc.(b) | | | | 518,512 | | | 3,629,584 |
| | | | | | | |
| | | | | | | 36,583,401 |
| | | | | | | |
| Software – 2.2% | | | | | | | |
Progress Software Corp.(b) | | | | 156,761 | | | 4,926,998 |
Quest Software, Inc.(b) | | | | 272,667 | | | 4,850,746 |
Radiant Systems, Inc.(b) | | | | 209,408 | | | 2,988,252 |
Sybase, Inc.(b) | | | | 197,444 | | | 9,204,840 |
| | | | | | | |
| | | | | | | 21,970,836 |
| | | | | | | |
| Specialty Retail – 2.7% | | | | | | | |
Genesco, Inc.(b) | | | | 194,583 | | | 6,034,019 |
Jo-Ann Stores, Inc.(b) | | | | 183,120 | | | 7,687,378 |
Sally Beauty Holdings, Inc.(b) | | | | 1,014,346 | | | 9,047,966 |
Sonic Automotive, Inc., Class A(b) | | | | 382,036 | | | 4,202,396 |
| | | | | | | |
| | | | | | | 26,971,759 |
| | | | | | | |
See accompanying notes to financial statements.
16
PORTFOLIO OF INVESTMENTS – as of March 31, 2010 (Unaudited)
Loomis Sayles Small Cap Value Fund – continued
| | | | | | | | | |
| | | | | Shares | | Value (†) | |
| | | | | | | | | |
| | | |
| COMMON STOCKS – continued | | | | | | | | | |
| | | |
| Textiles, Apparel & Luxury Goods – 1.2% | | | | | | | | | |
Fossil, Inc.(b) | | | �� | | 248,694 | | $ | 9,385,712 | |
Movado Group, Inc.(b) | | | | | 208,947 | | | 2,356,922 | |
| | | | | | | | | |
| | | | | | | | 11,742,634 | |
| | | | | | | | | |
| Thrifts & Mortgage Finance – 0.9% | | | | | | | | | |
Washington Federal, Inc. | | | | | 412,680 | | | 8,385,658 | |
| | | | | | | | | |
| Water Utilities – 0.5% | | | | | | | | | |
Middlesex Water Co. | | | | | 272,189 | | | 4,640,823 | |
| | | | | | | | | |
| | | |
| TOTAL COMMON STOCKS | | | | | | | | | |
(Identified Cost $799,503,423) | | | | | | | | 964,032,291 | |
| | | | | | | | | |
| | | |
| | | | | Principal Amount | | | |
| | | |
| SHORT-TERM INVESTMENTS – 2.2% | | | | | | | | | |
| Tri-Party Repurchase Agreement with Fixed Income Clearing Corporation, dated 3/31/2010 at 0.000% to be repurchased at $21,709,598 on 4/01/2010 collateralized by $22,145,000 Federal Home Loan Mortgage Corp., 2.125% due 6/18/2013 valued at $22,145,000 including accrued interest (Note 2 of Notes to Financial Statements) (Identified Cost $21,709,598) | | | | $ | 21,709,598 | | | 21,709,598 | |
| | | | | | | | | |
| | | |
| TOTAL INVESTMENTS – 100.0% | | | | | | | | | |
(Identified Cost $821,213,021)(a) | | | | | | | | 985,741,889 | |
Other assets less liabilities—0.0% | | | | | | | | 336,164 | |
| | | | | | | | | |
| | | |
| NET ASSETS – 100.0% | | | | | | | $ | 986,078,053 | |
| | | | | | | | | |
| |
(†) See Note 2 of Notes to Financial Statements. | | | | |
(a) Federal Tax Information (Amounts exclude certain adjustments made at the end of the Fund’s fiscal year for tax purposes. Such adjustments are primarily due to wash sales.): At March 31, 2010, the net unrealized appreciation on investments based on a cost of $821,070,333 for federal income tax purposes was as follows: | | | | |
Aggregate gross unrealized appreciation for all investments in which there is an excess of value over tax cost | | $ | 184,249,202 | |
Aggregate gross unrealized depreciation for all investments in which there is an excess of tax cost over value | | | (19,577,646 | ) |
| | | | | | | | | |
Net unrealized appreciation | | $ | 164,671,556 | |
| | | | | | | | | |
(b) Non-income producing security. | | | | |
REITs Real Estate Investment Trusts
See accompanying notes to financial statements.
17
INDUSTRY SUMMARY AT MARCH 31, 2010 (Unaudited)
| | | |
Commercial Banks | | 6.7 | % |
Insurance | | 5.2 | |
Machinery | | 4.9 | |
REITs | | 4.4 | |
Media | | 4.3 | |
Commercial Services & Supplies | | 4.2 | |
IT Services | | 4.0 | |
Oil, Gas & Consumable Fuels | | 3.8 | |
Semiconductors & Semiconductor Equipment | | 3.7 | |
Electrical Equipment | | 3.7 | |
Chemicals | | 3.6 | |
Capital Markets | | 3.5 | |
Food Products | | 2.8 | |
Specialty Retail | | 2.7 | |
Health Care Equipment & Supplies | | 2.6 | |
Electric Utilities | | 2.2 | |
Software | | 2.2 | |
Energy Equipment & Services | | 2.2 | |
Hotels, Restaurants & Leisure | | 2.1 | |
Other Investments, less than 2% each | | 29.0 | |
Short-Term Investments | | 2.2 | |
| | | |
Total Investments | | 100.0 | |
Other assets less liabilities | | 0.0 | |
| | | |
Net Assets | | 100.0 | % |
| | | |
See accompanying notes to financial statements.
18
STATEMENTS OF ASSETS AND LIABILITIES
March 31, 2010 (Unaudited)
| | | | | | | | |
| | | Small Cap
Growth Fund | | | Small Cap
Value Fund | |
Assets | | | | | | | | |
Investments at cost | | $ | 95,063,777 | | | $ | 821,213,021 | |
Net unrealized appreciation | | | 31,305,679 | | | | 164,528,868 | |
| | | | | | | | |
Investments at value | | | 126,369,456 | | | | 985,741,889 | |
Receivable for Fund shares sold | | | 202,400 | | | | 833,331 | |
Receivable for securities sold | | | 444,190 | | | | 3,596,919 | |
Dividends receivable | | | — | | | | 1,546,152 | |
| | | | | | | | |
Total Assets | | | 127,016,046 | | | | 991,718,291 | |
| | | | | | | | |
| | |
| Liabilities | | | | | | | | |
Payable for securities purchased | | | 1,741,869 | | | | 2,134,561 | |
Payable for Fund shares redeemed | | | 378,753 | | | | 2,727,065 | |
Management fees payable (Note 5) | | | 79,109 | | | | 569,757 | |
Administrative fees payable (Note 5) | | | 5,476 | | | | 40,428 | |
Deferred Trustees’ fees (Note 5) | | | 45,702 | | | | 104,756 | |
Other accounts payable and accrued expenses | | | 41,535 | | | | 63,671 | |
| | | | | | | | |
Total Liabilities | | | 2,292,444 | | | | 5,640,238 | |
| | | | | | | | |
Net Assets | | $ | 124,723,602 | | | $ | 986,078,053 | |
| | | | | | | | |
Net Assets consist of: | | | | | | | | |
Paid-in capital | | $ | 327,268,014 | | | $ | 1,005,282,238 | |
Accumulated net investment (loss)/Undistributed net investment income | | | (640,180 | ) | | | 1,199,281 | |
Accumulated net realized loss on investments | | | (233,209,911 | ) | | | (184,932,334 | ) |
Net unrealized appreciation on investments | | | 31,305,679 | | | | 164,528,868 | |
| | | | | | | | |
Net Assets | | $ | 124,723,602 | | | $ | 986,078,053 | |
| | | | | | | | |
| | |
| Computation of Net Asset Value and Offering Price: | | | | | | | | |
Institutional Class: | | | | | | | | |
Net assets | | $ | 49,361,390 | | | $ | 507,433,350 | |
| | | | | | | | |
Shares of beneficial interest | | | 3,693,875 | | | | 22,467,275 | |
| | | | | | | | |
Net asset value, offering and redemption price per share | | $ | 13.36 | | | $ | 22.59 | |
| | | | | | | | |
Retail Class: | | | | | | | | |
Net assets | | $ | 75,362,212 | | | $ | 405,023,043 | |
| | | | | | | | |
Shares of beneficial interest | | | 5,830,029 | | | | 18,086,325 | |
| | | | | | | | |
Net asset value, offering and redemption price per share | | $ | 12.93 | | | $ | 22.39 | |
| | | | | | | | |
Admin Class: | | | | | | | | |
Net assets | | $ | — | | | $ | 73,621,660 | |
| | | | | | | | |
Shares of beneficial interest | | | — | | | | 3,344,579 | |
| | | | | | | | |
Net asset value, offering and redemption price per share | | $ | — | | | $ | 22.01 | |
| | | | | | | | |
See accompanying notes to financial statements.
19
STATEMENTS OF OPERATIONS
For the Six Months Ended March 31, 2010 (Unaudited)
| | | | | | | | |
| | | Small Cap
Growth Fund | | | Small Cap
Value Fund | |
Investment Income | | | | | | | | |
Dividends | | $ | 130,936 | | | $ | 7,321,848 | |
| | | | | | | | |
| | |
| Expenses | | | | | | | | |
Management fees (Note 5) | | | 468,302 | | | | 3,597,932 | |
Service and distribution fees (Note 5) | | | 99,753 | | | | 661,073 | |
Trustees’ fees and expenses (Note 5) | | | 7,034 | | | | 14,110 | |
Administrative fees (Note 5) | | | 30,217 | | | | 232,150 | |
Custodian fees and expenses | | | 11,317 | | | | 20,504 | |
Transfer agent fees and expenses (Notes 5 and 6) | | | 89,267 | | | | 567,945 | |
Audit and tax services fees | | | 18,555 | | | | 21,199 | |
Legal fees | | | 1,234 | | | | 9,730 | |
Shareholder reporting expenses | | | 12,220 | | | | 77,999 | |
Registration fees | | | 19,314 | | | | 42,780 | |
Fee/expense recovery (Note 5) | | | 838 | | | | — | |
Miscellaneous expenses | | | 4,968 | | | | 18,307 | |
| | | | | | | | |
Total expenses | | | 763,019 | | | | 5,263,729 | |
Less fee reduction and/or expense reimbursement (Note 5) | | | (38,864 | ) | | | (285,128 | ) |
| | | | | | | | |
Net expenses | | | 724,155 | | | | 4,978,601 | |
| | | | | | | | |
Net investment income (loss) | | | (593,219 | ) | | | 2,343,247 | |
| | | | | | | | |
| | |
| Net Realized and Unrealized Gain (Loss) on Investments | | | | | | | | |
Net realized gain on: | | | | | | | | |
Investments | | | 6,741,771 | | | | 22,924,510 | |
| | |
| Net change in unrealized appreciation (depreciation) on: | | | | | | | | |
Investments | | | 11,955,656 | | | | 62,191,872 | |
| | | | | | | | |
Net realized and unrealized gain on investments | | | 18,697,427 | | | | 85,116,382 | |
| | | | | | | | |
| | |
| Net Increase in Net Assets Resulting from Operations | | $ | 18,104,208 | | | $ | 87,459,629 | |
| | | | | | | | |
See accompanying notes to financial statements.
20
STATEMENTS OF CHANGES IN NET ASSETS
Small Cap Growth Fund
| | | | | | | | |
| | | Six Months
Ended
March 31, 2010
(Unaudited) | | | Year Ended
September 30, 2009 | |
From Operations: | | | | | | | | |
Net investment loss | | $ | (593,219 | ) | | $ | (794,013 | ) |
Net realized gain (loss) on investments | | | 6,741,771 | | | | (34,962,361 | ) |
Net change in unrealized appreciation (depreciation) on investments | | | 11,955,656 | | | | 21,890,105 | |
| | | | | | | | |
Net increase (decrease) in net assets resulting from operations | | | 18,104,208 | | | | (13,866,269 | ) |
| | | | | | | | |
From Distributions to Shareholders: | | | | | | | | |
Net Investment Income | | | | | | | | |
Institutional Class | | | — | | | | — | |
Retail Class | | | — | | | | — | |
Net Realized Capital gains | | | | | | | | |
Institutional Class | | | — | | | | — | |
Retail Class | | | — | | | | — | |
| | | | | | | | |
Net Increase (Decrease) in Net Assets from Capital Share Transactions (Note 10) | | | (14,415,537 | ) | | | 10,464,100 | |
| | | | | | | | |
Net Increase (Decrease) in Net Assets | | | 3,688,671 | | | | (3,402,169 | ) |
Net Assets | | | | | | | | |
Beginning of the period | | | 121,034,931 | | | | 124,437,100 | |
| | | | | | | | |
End of the period | | $ | 124,723,602 | | | $ | 121,034,931 | |
| | | | | | | | |
Accumulated Net Investment (Loss) | | $ | (640,180 | ) | | $ | (46,961 | ) |
| | | | | | | | |
Small Cap Value Fund
| | | | | | | | |
| | | Six Months
Ended
March 31, 2010
(Unaudited) | | | Year Ended
September 30, 2009 | |
FROM OPERATIONS: | | | | | | | | |
Net investment income | | $ | 2,343,247 | | | $ | 3,004,380 | |
Net realized gain (loss) on investments | | | 22,924,510 | | | | (157,922,333 | ) |
Net change in unrealized appreciation (depreciation) on investments | | | 62,191,872 | | | | 76,497,968 | |
| | | | | | | | |
Net increase (decrease) in net assets resulting from operations | | | 87,459,629 | | | | (78,419,985 | ) |
| | | | | | | | |
From Distributions to Shareholders: | | | | | | | | |
Net Investment Income | | | | | | | | |
Institutional Class | | | (1,798,397 | ) | | | (2,585,541 | ) |
Retail Class | | | (522,660 | ) | | | (1,071,277 | ) |
Admin Class | | | — | | | | (9,660 | ) |
Net Realized Capital Gain | | | | | | | | |
Institutional Class | | | — | | | | (167,987 | ) |
Retail Class | | | — | | | | (141,335 | ) |
Admin Class | | | — | | | | (24,687 | ) |
| | | | | | | | |
Total distributions | | | (2,321,057 | ) | | | (4,000,487 | ) |
| | | | | | | | |
Net Decrease in Net Assets from Capital Share Transactions (Note 10) | | | (66,962,560 | ) | | | (45,368,424 | ) |
| | | | | | | | |
Redemption fees | | | | | | | | |
Institutional Class | | | — | | | | 21,500 | |
Retail Class | | | — | | | | 17,487 | |
Admin Class | | | — | | | | 3,123 | |
| | | | | | | | |
Total redemption fees | | | — | | | | 42,110 | |
| | | | | | | | |
Net increase (decrease) in net assets | | | 18,176,012 | | | | (127,746,786 | ) |
Net Assets | | | | | | | | |
Beginning of the period | | | 967,902,041 | | | | 1,095,648,827 | |
| | | | | | | | |
End of the period | | $ | 986,078,053 | | | $ | 967,902,041 | |
| | | | | | | | |
Undistributed Net Investment Income | | $ | 1,199,281 | | | $ | 1,177,091 | |
| | | | | | | | |
See accompanying notes to financial statements.
21
THIS PAGE INTENTIONALLY LEFT BLANK
22
FINANCIAL HIGHLIGHTS
For a share outstanding throughout each period.
| | | | | | | | | | | | | | | | | | | | | | | | | | | | | |
| | | | | Income (Loss) from Investment Operations: | | | | | Less Distributions: | |
| | | Net asset
value,
beginning
of
the period | | Net
investment
income
(loss)(a)(b) | | | Net realized
and unrealized
gain (loss) | | | Total from
investment
operations | | | | | Dividends
from
net investment
income(b) | | | Distributions
from
net realized
capital gains | | | Total
distributions | |
| Small Cap Growth Fund | | | | | | | | | | | | | | | | | | | | | | | |
| | | | | | |
| Institutional Class | | | | | | | | | | | | | | | | | | | | | | | |
3/31/2010(g) | | $ | 11.58 | | $ | (0.05 | ) | | $ | 1.83 | | | $ | 1.78 | | | | | $ | — | | | $ | — | | | $ | — | |
9/30/2009 | | | 13.07 | | | (0.07 | ) | | | (1.42 | ) | | | (1.49 | ) | | | | | — | | | | — | | | | — | |
9/30/2008 | | | 15.87 | | | (0.07 | ) | | | (2.73 | ) | | | (2.80 | ) | | | | | — | | | | — | | | | — | |
9/30/2007 | | | 12.00 | | | (0.06 | )(i) | | | 3.93 | | | | 3.87 | | | | | | — | | | | — | | | | — | |
9/30/2006 | | | 11.08 | | | (0.08 | ) | | | 0.99 | | | | 0.91 | | | | | | — | | | | — | | | | — | |
9/30/2005 | | | 8.96 | | | (0.08 | ) | | | 2.20 | | | | 2.12 | | | | | | — | | | | — | | | | — | |
| | | | | | | | |
| Retail Class | | | | | | | | | | | | | | | | | | | | | | | | | | | | | |
3/31/2010(g) | | | 11.21 | | | (0.06 | ) | | | 1.78 | | | | 1.72 | | | | | | — | | | | — | | | | — | |
9/30/2009 | | | 12.69 | | | (0.09 | ) | | | (1.39 | ) | | | (1.48 | ) | | | | | — | | | | — | | | | — | |
9/30/2008 | | | 15.45 | | | (0.10 | ) | | | (2.66 | ) | | | (2.76 | ) | | | | | — | | | | — | | | | — | |
9/30/2007 | | | 11.71 | | | (0.09 | )(i) | | | 3.83 | | | | 3.74 | | | | | | — | | | | — | | | | — | |
9/30/2006 | | | 10.84 | | | (0.11 | ) | | | 0.97 | | | | 0.86 | | | | | | — | | | | — | | | | — | |
9/30/2005 | | | 8.78 | | | (0.11 | ) | | | 2.17 | | | | 2.06 | | | | | | — | | | | — | | | | — | |
| | | | | | |
| Small Cap Value Fund | | | | | | | | | | | | | | | | | | | | | | | |
| | | | | | |
| Institutional Class | | | | | | | | | | | | | | | | | | | | | | | |
3/31/2010(g) | | $ | 20.66 | | $ | 0.07 | | | $ | 1.93 | | | $ | 2.00 | | | | | $ | (0.07 | ) | | $ | — | | | $ | (0.07 | ) |
9/30/2009 | | | 22.01 | | | 0.09 | | | | (1.32 | ) | | | (1.23 | ) | | | | | (0.11 | ) | | | (0.01 | ) | | | (0.12 | ) |
9/30/2008 | | | 28.77 | | | 0.11 | (j) | | | (4.03 | ) | | | (3.92 | ) | | | | | (0.06 | ) | | | (2.78 | ) | | | (2.84 | ) |
9/30/2007 | | | 27.69 | | | 0.12 | (i)(k) | | | 4.29 | | | | 4.41 | | | | | | (0.17 | ) | | | (3.16 | ) | | | (3.33 | ) |
9/30/2006 | | | 27.43 | | | 0.13 | | | | 2.70 | | | | 2.83 | | | | | | (0.15 | ) | | | (2.42 | ) | | | (2.57 | ) |
9/30/2005 | | | 25.75 | | | 0.13 | | | | 4.22 | | | | 4.35 | | | | | | (0.02 | ) | | | (2.65 | ) | | | (2.67 | ) |
| | | | | | | |
| Retail Class | | | | | | | | | | | | | | | | | | | | | | | | | | |
3/31/2010(g) | | | 20.47 | | | 0.04 | | | | 1.91 | | | | 1.95 | | | | | | (0.03 | ) | | | — | | | | (0.03 | ) |
9/30/2009 | | | 21.79 | | | 0.04 | | | | (1.30 | ) | | | (1.26 | ) | | | | | (0.05 | ) | | | (0.01 | ) | | | (0.06 | ) |
9/30/2008 | | | 28.52 | | | 0.05 | (j) | | | (4.00 | ) | | | (3.95 | ) | | | | | — | | | | (2.78 | ) | | | (2.78 | ) |
9/30/2007 | | | 27.46 | | | 0.04 | (i)(k) | | | 4.28 | | | | 4.32 | | | | | | (0.10 | ) | | | (3.16 | ) | | | (3.26 | ) |
9/30/2006 | | | 27.23 | | | 0.06 | | | | 2.67 | | | | 2.73 | | | | | | (0.08 | ) | | | (2.42 | ) | | | (2.50 | ) |
9/30/2005 | | | 25.62 | | | 0.06 | | | | 4.20 | | | | 4.26 | | | | | | — | | | | (2.65 | ) | | | (2.65 | ) |
| | | | | | | |
| Admin Class | | | | | | | | | | | | | | | | | | | | | | | | | | |
3/31/2010(g) | | | 20.11 | | | 0.01 | | | | 1.89 | | | | 1.90 | | | | | | — | | | | — | | | | — | |
9/30/2009 | | | 21.40 | | | 0.00 | | | | (1.28 | ) | | | (1.28 | ) | | | | | (0.00 | ) | | | (0.01 | ) | | | (0.01 | ) |
9/30/2008 | | | 28.13 | | | (0.01 | )(j) | | | (3.94 | ) | | | (3.95 | ) | | | | | — | | | | (2.78 | ) | | | (2.78 | ) |
9/30/2007 | | | 27.14 | | | (0.03 | )(i)(k) | | | 4.22 | | | | 4.19 | | | | | | (0.04 | ) | | | (3.16 | ) | | | (3.20 | ) |
9/30/2006 | | | 26.94 | | | (0.01 | ) | | | 2.65 | | | | 2.64 | | | | | | (0.02 | ) | | | (2.42 | ) | | | (2.44 | ) |
9/30/2005 | | | 25.43 | | | (0.00 | ) | | | 4.16 | | | | 4.16 | | | | | | — | | | | (2.65 | ) | | | (2.65 | ) |
(a) Per share net investment income (loss) has been calculated using the average shares outstanding during the period.
(b) Amount rounds to less than $0.01 per share, if applicable.
(c) Effective June 1, 2009, redemption fees were eliminated.
(d) Had certain expenses not been reduced during the period, if applicable, total returns would have been lower. Periods less than one year, if applicable, are not annualized.
(e) Computed on an annualized basis for periods less than one year, if applicable.
(f) The investment adviser and/or administrator agreed to reimburse a portion of the Fund’s expenses and/or reduce its fees during the period. Without this reimbursement/fee reduction, if applicable, expenses would have been higher.
See accompanying notes to financial statements.
23
| | | | | | | | | | | | | | | | | | | | | |
| | | | | | | | | | Ratios to Average Net Assets: | | | |
| | | | | | | |
Redemption
fees(b)(c) | | Net asset
value,
end of
the period | | Total
return (%)(d) | | | Net assets,
end of the
period
(000’s) | | Net
expenses (%)(e)(f) | | | Gross
expenses (%)(e) | | | Net investment
income (loss) (%)(e) | | | Portfolio
turnover
rate (%) |
| | | | | | | | | | | | | | | | | | | | | |
| | | | | | | |
| | | | | | | | | | | | | | | | | | | | | |
| $ | — | | $ | 13.36 | | 15.37 | | | $ | 49,361 | | 1.00 | (h) | | 1.00 | (h) | | (0.79 | ) | | 33 |
| | — | | | 11.58 | | (11.40 | ) | | | 45,557 | | 1.00 | | | 1.01 | | | (0.68 | ) | | 107 |
| | 0.00 | | | 13.07 | | (17.64 | ) | | | 44,540 | | 1.00 | | | 1.01 | | | (0.47 | ) | | 92 |
| | 0.00 | | | 15.87 | | 32.25 | | | | 28,088 | | 1.00 | | | 1.23 | | | (0.47 | ) | | 83 |
| | 0.01 | | | 12.00 | | 8.30 | | | | 20,414 | | 1.00 | | | 1.38 | | | (0.69 | ) | | 100 |
| | 0.00 | | | 11.08 | | 23.66 | | | | 15,785 | | 1.00 | | | 1.70 | | | (0.85 | ) | | 227 |
| | | | | | | |
| | | | | | | | | | | | | | | | | | | | | |
| | — | | | 12.93 | | 15.34 | | | | 75,362 | | 1.25 | | | 1.35 | | | (1.04 | ) | | 33 |
| | — | | | 11.21 | | (11.66 | ) | | | 75,478 | | 1.25 | | | 1.43 | | | (0.93 | ) | | 107 |
| | 0.00 | | | 12.69 | | (17.86 | ) | | | 79,897 | | 1.25 | | | 1.42 | | | (0.70 | ) | | 92 |
| | 0.00 | | | 15.45 | | 31.94 | | | | 20,924 | | 1.25 | | | 1.50 | | | (0.66 | ) | | 83 |
| | 0.01 | | | 11.71 | | 8.03 | | | | 2,981 | | 1.25 | | | 1.92 | | | (0.94 | ) | | 100 |
| | 0.00 | | | 10.84 | | 23.46 | | | | 3,592 | | 1.25 | | | 1.87 | | | (1.14 | ) | | 227 |
| | | | | | | |
| | | | | | | | | | | | | | | | | | | | | |
| | | | | | | |
| | | | | | | | | | | | | | | | | | | | | |
| $ | — | | $ | 22.59 | | 9.74 | | | $ | 507,433 | | 0.90 | | | 0.92 | | | 0.62 | | | 25 |
| | 0.00 | | | 20.66 | | (5.42 | ) | | | 506,324 | | 0.90 | | | 0.94 | | | 0.52 | | | 55 |
| | 0.00 | | | 22.01 | | (15.02 | ) | | | 553,268 | | 0.89 | | | 0.89 | | | 0.47 | | | 61 |
| | 0.00 | | | 28.77 | | 17.02 | | | | 534,776 | | 0.89 | | | 0.89 | | | 0.43 | | | 57 |
| | 0.00 | | | 27.69 | | 11.17 | | | | 442,714 | | 0.89 | (l) | | 0.89 | (l) | | 0.47 | | | 62 |
| | 0.00 | | | 27.43 | | 17.99 | | | | 403,110 | | 0.90 | | | 0.93 | | | 0.48 | | | 59 |
| | | | | | | |
| | | | | | | | | | | | | | | | | | | | | |
| | — | | | 22.39 | | 9.53 | | | | 405,023 | | 1.15 | | | 1.23 | | | 0.38 | | | 25 |
| | 0.00 | | | 20.47 | | (5.66 | ) | | | 387,383 | | 1.15 | | | 1.31 | | | 0.26 | | | 55 |
| | 0.00 | | | 21.79 | | (15.21 | ) | | | 464,525 | | 1.15 | | | 1.27 | | | 0.21 | | | 61 |
| | 0.00 | | | 28.52 | | 16.74 | | | | 465,055 | | 1.15 | | | 1.24 | | | 0.15 | | | 57 |
| | 0.00 | | | 27.46 | | 10.87 | | | | 291,690 | | 1.15 | | | 1.20 | | | 0.21 | | | 62 |
| | 0.00 | | | 27.23 | | 17.69 | | | | 235,948 | | 1.15 | | | 1.20 | | | 0.24 | | | 59 |
| | | | | | | |
| | | | | | | | | | | | | | | | | | | | | |
| | — | | | 22.01 | | 9.45 | | | | 73,622 | | 1.40 | | | 1.63 | | | 0.14 | | | 25 |
| | 0.00 | | | 20.11 | | (5.93 | ) | | | 74,195 | | 1.40 | | | 1.77 | | | 0.02 | | | 55 |
| | 0.00 | | | 21.40 | | (15.44 | ) | | | 77,855 | | 1.40 | | | 1.68 | | | (0.04 | ) | | 61 |
| | 0.00 | | | 28.13 | | 16.41 | | | | 76,783 | | 1.40 | | | 1.56 | | | (0.10 | ) | | 57 |
| | 0.00 | | | 27.14 | | 10.59 | | | | 64,367 | | 1.40 | | | 1.46 | | | (0.04 | ) | | 62 |
| | 0.00 | | | 26.94 | | 17.40 | | | | 67,505 | | 1.40 | | | 1.43 | | | (0.01 | ) | | 59 |
(g) For the six months ended March 31, 2010 (Unaudited).
(h) Includes fee/expense recovery of less than 0.01%.
(i) Includes a non-recurring payment of $0.01 per share and $0.00 per share for Small Cap Growth Fund and Small Cap Value Fund, respectively.
(j) Includes a non-recurring dividend of $0.02 per share.
(k) Includes a non-recurring dividend of $0.05 per share.
(l) Includes fee/expense recovery of 0.02%.
See accompanying notes to financial statements.
24
NOTES TO FINANCIAL STATEMENTS
March 31, 2010 (Unaudited)
1. Organization. Loomis Sayles Funds I and Loomis Sayles Funds II (the “Trusts” and each a “Trust”) are each organized as a Massachusetts business trust. Each Trust is registered under the Investment Company Act of 1940, as amended (the “1940 Act”), as an open-end management investment company. Each Declaration of Trust permits the Board of Trustees to authorize the issuance of an unlimited number of shares of the Trusts in multiple series. The financial statements for certain funds of the Trusts are presented in separate reports. The following funds (individually, a “Fund” and collectively, the “Funds”) are included in this report:
Loomis Sayles Funds I:
Loomis Sayles Small Cap Value Fund (the “Small Cap Value Fund”)
Loomis Sayles Funds II:
Loomis Sayles Small Cap Growth Fund (the “Small Cap Growth Fund”)
Each Fund offers Institutional Class Shares and Retail Class Shares. In addition, Small Cap Value Fund offers Admin Class Shares.
Most expenses of the Trusts can be directly attributed to a fund. Expenses which cannot be directly attributed to a fund are generally apportioned based on the relative net assets of each of the funds in the Trusts. Expenses of a Fund are borne pro rata by the holders of each class of shares, except that each class bears expenses unique to that class (including the Rule 12b-1 service and distribution fees and transfer agent fees). In addition, each class votes as a class only with respect to its own Rule 12b-1 Plan. Shares of each class would receive their pro rata share of the net assets of a Fund if the Fund were liquidated. The Trustees approve separate dividends from net investment income on each class of shares.
2. Significant Accounting Policies. The following is a summary of significant accounting policies consistently followed by each Fund in the preparation of its financial statements. The Funds’ financial statements are prepared in accordance with accounting principles generally accepted in the United States of America which require the use of management estimates that affect the reported amounts and disclosures in the financial statements. Actual results could differ from those estimates. Management has evaluated the events and transactions that have occurred through the date the financial statements were issued, and noted no items requiring recognition in the financial statements or additional disclosure in the Notes to Financial Statements.
a. Valuation. Equity securities, including shares of closed-end investment companies and exchange-traded funds, for which market quotations are readily available are valued at market value, as reported by pricing services recommended by the investment adviser and approved by the Board of Trustees. Such pricing services generally use the security’s last sale price on the exchange or market where the security is primarily traded or, if there is no reported sale during the day, the closing bid price. Securities traded on the NASDAQ Global Select Market, NASDAQ Global Market and NASDAQ Capital Market are valued at the NASDAQ Official Closing Price (“NOCP”), or if lacking a NOCP, at the most recent bid quotation on the applicable NASDAQ Market. Debt securities (other than short-term obligations purchased with an original or remaining maturity of sixty days or less) are generally valued on the basis of evaluated bids furnished to the Funds by a pricing service recommended by the investment adviser and approved by the Board of Trustees, which service determines valuations for normal, institutional-size trading units of such securities using market information, transactions for comparable securities and various relationships between securities which are generally recognized by institutional traders. Broker-dealer bid quotations may also be used to value debt and equity securities where a pricing service does not price a security or where a pricing service does not provide a reliable price for the security. In instances where broker-dealer bid quotations are not available, certain securities held by the Funds may be valued on the basis of a price provided by a principal market maker. Forward foreign currency contracts are valued utilizing interpolated prices determined from information provided by an independent pricing service. Short-term obligations purchased with an original or remaining maturity of sixty days or less are valued at amortized cost, which approximates market value. Securities for which market quotations are not readily available are valued at fair value as determined in good faith by the Funds’ investment adviser using consistently applied procedures under the general supervision of the Board of Trustees. Investments in other open-end investment companies are valued at their net asset value each day.
The Funds may hold securities traded in foreign markets. Foreign securities are valued at the market price in the foreign market. However, if events occurring after the close of the foreign market (but before the close of regular trading on the New York Stock Exchange) are believed to materially affect the value of those securities, such securities are fair valued pursuant to procedures approved by the Board of Trustees. When fair valuing securities, the Funds may, among other things, use modeling tools or other processes that may take into account factors such as securities market activity and/or significant events that occur after the close of the foreign market and before the Funds calculate their net asset values.
25
b. Security Transactions and Related Investment Income. Security transactions are accounted for on trade date. Dividend income is recorded on ex-dividend date, or in the case of certain foreign securities, as soon as a Fund is notified, and interest income is recorded on an accrual basis. Interest income is increased by the accretion of discount and decreased by the amortization of premium. Distributions received from investments in securities that represent a return of capital or capital gain are recorded as a reduction of cost of investments or as a realized gain, respectively. The calendar year-end amounts of ordinary income, capital gains, and return of capital included in distributions received from the Funds’ investments in real estate investment trusts (“REITs”) are reported to the Funds after the end of the fiscal year; accordingly, the Funds estimate these amounts for accounting purposes until the characterization of REIT distributions is reported to the Funds after the end of the fiscal year. Estimates are based on the most recent REIT distribution information available. Investment income is recorded net of foreign taxes withheld when applicable. In determining net gain or loss on securities sold, the cost of securities has been determined on an identified cost basis. Investment income, non-class specific expenses and realized and unrealized gains and losses are allocated on a pro rata basis to each class based on the relative net assets of each class to the total net assets of the Fund.
c. Foreign Currency Translation. The books and records of the Funds are maintained in U.S. dollars. The value of securities, currencies and other assets and liabilities denominated in currencies other than U.S. dollars are translated into U.S. dollars based upon foreign exchange rates prevailing at the end of the period. Purchases and sales of investment securities, income and expenses are translated on the respective dates of such transactions.
Since the values of investment securities are presented at the foreign exchange rates prevailing at the end of the period, it is not practical to isolate that portion of the results of operations arising from changes in exchange rates from fluctuations which arise due to changes in market prices of investment securities. Such changes are included with the net realized and unrealized gain or loss on investments.
Net realized foreign exchange gains or losses arise from sales of foreign currency, currency gains or losses realized between the trade and settlement dates on securities transactions and the difference between the amounts of dividends, interest and foreign withholding taxes recorded on the Funds’ books and the U.S. dollar equivalent of the amounts actually received or paid. Net unrealized foreign exchange gains and losses arise from changes in the value of assets and liabilities, other than investment securities, at the end of the fiscal period, resulting from changes in exchange rates.
Each Fund may use foreign currency exchange contracts to facilitate transactions in foreign-denominated investments. Losses may arise from changes in the value of the foreign currency or if the counterparties do not perform under the contracts’ terms.
d. Federal and Foreign Income Taxes. Each Trust treats each fund as a separate entity for federal income tax purposes. Each Fund intends to meet the requirements of the Internal Revenue Code of 1986, as amended, applicable to regulated investment companies, and to distribute to its shareholders substantially all of its net investment income and any net realized capital gains at least annually. Management has performed an analysis of each Fund’s tax positions for the open tax years as of March 31, 2010 and has concluded that no provisions for income tax are required. The Funds’ federal tax returns for the prior three fiscal years remain subject to examination by the Internal Revenue Service. Management is not aware of any events that are reasonably possible to occur in the next six months that would result in the amounts of any unrecognized tax benefits significantly increasing or decreasing for the Funds. However, management’s conclusions regarding tax positions taken may be subject to review and adjustment at a later date based on factors including, but not limited to, new tax laws and accounting regulations and interpretations thereof.
A Fund may be subject to foreign taxes on income and gains on investments that are accrued based upon the Fund’s understanding of the tax rules and regulations that exist in the countries in which the Fund invests. Foreign governments may also impose taxes or other payments on investments with respect to foreign securities. Such taxes are accrued as applicable.
e. Dividends and Distributions to Shareholders. Dividends and distributions are recorded on ex-dividend date. The timing and characterization of certain income and capital gain distributions are determined annually in accordance with federal tax regulations, which may differ from accounting principles generally accepted in the United States of America. Permanent differences are primarily due to differing treatments for book and tax purposes for items such as distribution redesignation and net operating losses. Permanent book and tax basis differences relating to shareholder distributions will result in reclassifications to capital accounts. Temporary differences between book and tax distributable earnings are primarily due to securities lending collateral gain/loss adjustment, deferred Trustees’ fees and wash sales. Distributions from net investment income and short-term capital gains are considered to be distributed from ordinary income for tax purposes.
26
NOTES TO FINANCIAL STATEMENTS – continued
March 31, 2010 (Unaudited)
The tax characterization of distributions is determined on an annual basis. The tax character of distributions paid to shareholders during the year ended September 30, 2009 was as follows:
| | | | | | | | | |
| | | 2009 Distributions Paid From: |
Fund | | Ordinary
Income | | Long-Term
Capital Gains | | Total |
Small Cap Growth Fund | | $ | — | | $ | — | | $ | — |
Small Cap Value Fund | | | 3,669,309 | | | 331,178 | | | 4,000,487 |
Differences between these amounts and those reported in the Statements of Changes in Net Assets, if any, are primarily attributable to different book and tax treatment for short-term capital gains.
As of September 30, 2009, the capital loss carryforwards and post-October losses were as follows:
| | | | | | | | |
| | | Small Cap
Growth Fund | | | Small Cap
Value Fund | |
Capital loss carryforward: | | | | | | | | |
Expires September 30, 2010 | | $ | (138,314,515 | ) | | $ | — | |
Expires September 30, 2011 | | | (59,283,040 | ) | | | — | |
Expires September 30, 2017 | | | (14,995,800 | ) | | | (88,137,321 | ) |
| | | | | | | | |
Total capital loss carryforward | | $ | (212,593,355 | ) | | $ | (88,137,321 | ) |
| | | | | | | | |
Deferred net capital losses (post-October 2008) | | $ | (26,616,006 | ) | | $ | (110,445,559 | ) |
| | | | | | | | |
f. Repurchase Agreements. It is each Fund’s policy that the market value of the collateral for repurchase agreements be at least equal to 102% of the repurchase price, including interest. Certain repurchase agreements are tri-party arrangements whereby the collateral is held in a segregated account for the benefit of the Fund and on behalf of the counterparty. Repurchase agreements could involve certain risks in the event of default or insolvency of the counterparty including possible delays or restrictions upon a Fund’s ability to dispose of the underlying securities.
g. Securities Lending. The Funds have entered into an agreement with State Street Bank and Trust Company (“State Street Bank”), as agent of the Funds, to lend securities to certain designated borrowers. The loans are collateralized with cash or securities in an amount equal to at least 105% or 102% of the market value (including accrued interest) of the loaned international or domestic securities, respectively, when the loan is initiated. Thereafter, the value of the collateral must remain at least 102% of the market value (including accrued interest) of loaned securities for U.S. equities and U.S. corporate debt; at least 105% of the market value (including accrued interest) of loaned securities for non-U.S. equities; and at least 100% of the market value (including accrued interest) of loaned securities for U.S. Government securities, sovereign debt issued by non-U.S. Governments and non-U.S. corporate debt. In the event that the market value of the collateral falls below the required percentages described above, the borrower will deliver additional collateral on the next business day. As with other extensions of credit, the Funds bear the risk of loss with respect to the investment of the collateral. The Funds invest cash collateral in short-term investments, a portion of the income from which is remitted to the borrowers and the remainder allocated between the Funds and State Street Bank as lending agent.
As of March 31, 2010, there were no securities on loan.
h. Indemnifications. Under the Trusts’ organizational documents, their officers and Trustees are indemnified against certain liabilities arising out of the performance of their duties to the Funds. Additionally, in the normal course of business, the Funds enter into contracts with service providers that contain general indemnification clauses. The Funds’ maximum exposure under these arrangements is unknown as this would involve future claims that may be made against the Funds that have not yet occurred. However, based on experience, the Funds expect the risk of loss to be remote.
3. Fair Value Measurements. In accordance with accounting standards related to fair value measurements and disclosures, the Funds have categorized the inputs utilized in determining the value of each Fund’s assets or liabilities. These inputs are summarized in the three broad levels listed below:
| • | | Level 1—quoted prices in active markets for identical assets or liabilities; |
| • | | Level 2—prices determined using other significant inputs that are observable either directly, or indirectly through corroboration with observable market data (which could include quoted prices for similar assets or liabilities, interest rates, credit risk, etc.); |
27
| • | | Level 3—prices determined using significant unobservable inputs for situations where quoted prices or observable inputs are unavailable such as when there is little or no market activity for an asset or liability (unobservable inputs reflect each Fund’s own assumptions in determining the fair value of assets or liabilities and would be based on the best information available). |
The inputs or methodology used for valuing securities are not necessarily an indication of the risk associated with investing in those securities.
The following is a summary of the inputs used to value the Funds’ investments as of March 31, 2010, at value:
Small Cap Growth Fund
Asset Valuation Inputs
| | | | | | | | | | | | |
Description(a) | | Level 1 | | Level 2 | | Level 3 | | Total |
Common Stocks | | $ | 122,694,823 | | $ | — | | $ | — | | $ | 122,694,823 |
Short-Term Investments | | | — | | | 3,674,633 | | | — | | | 3,674,633 |
| | | | | | | | | | | | |
Total | | $ | 122,694,823 | | $ | 3,674,633 | | $ | — | | $ | 126,369,456 |
| | | | | | | | | | | | |
(a)Major categories of the Fund’s investments are included in the Portfolio of Investments. |
Small Cap Value Fund
Asset Valuation Inputs
| | | | | | | | | | | | |
Description(a) | | Level 1 | | Level 2 | | Level 3 | | Total |
Common Stocks | | $ | 964,032,291 | | $ | — | | $ | — | | $ | 964,032,291 |
Short-Term Investments | | | — | | | 21,709,598 | | | — | | | 21,709,598 |
| | | | | | | | | | | | |
Total | | $ | 964,032,291 | | $ | 21,709,598 | | $ | — | | $ | 985,741,889 |
| | | | | | | | | | | | |
(a)Major categories of the Fund’s investments are included in the Portfolio of Investments. |
4. Purchases and Sales of Securities. For the six months ended March 31, 2010, purchases and sales of securities (excluding short-term investments) were as follows:
| | | | | | |
Fund | | Purchases | | Sales |
Small Cap Growth Fund | | $ | 39,503,483 | | $ | 53,318,877 |
Small Cap Value Fund | | | 232,048,082 | | | 276,558,127 |
5. Management Fees and Other Transactions with Affiliates.
a. Management Fees. Loomis, Sayles & Company, L.P. (“Loomis Sayles”) serves as investment adviser to each Fund. Under the terms of the management agreements, each Fund pays a management fee at the following annual rates, calculated daily and payable monthly, based on each Fund’s average daily net assets:
| | |
Fund | | Percentage of
Average Daily
Net Assets |
Small Cap Growth Fund | | 0.75% |
Small Cap Value Fund | | 0.75% |
Loomis Sayles has given binding undertakings to the Funds to reduce management fees and/or reimburse certain expenses to limit the Funds’ operating expenses, exclusive of acquired fund fees and expenses, brokerage expenses, interest expense, taxes and extraordinary expenses. These undertakings are in effect until January 31, 2011 and will be reevaluated on an annual basis. Management fees payable, as reflected on the Statements of Assets and Liabilities, are net of fee reductions and/or expense reimbursements, if any, pursuant to these undertakings.
For the six months ended March 31, 2010, the expense limits as a percentage of average daily net assets under the expense limitation agreements were as follows:
| | | | | | | | | |
| | | Expense Limit as a Percentage of
Average Daily Net Assets | |
Fund | | Institutional Class | | | Retail Class | | | Admin Class | |
Small Cap Growth Fund | | 1.00 | % | | 1.25 | % | | — | |
Small Cap Value Fund | | 0.90 | % | | 1.15 | % | | 1.40 | % |
28
NOTES TO FINANCIAL STATEMENTS – continued
March 31, 2010 (Unaudited)
Loomis Sayles shall be permitted to recover expenses it has borne under the expense limitation agreements (whether through reduction of its management fees or otherwise) on a class by class basis in later periods to the extent the expenses of a class fall below a class’ expense limits, provided, however, that a class is not obligated to pay such reduced fees/expenses more than one year after the end of the fiscal year in which the fees/expenses were reduced.
For the six months ended March 31, 2010, the management fees for each Fund were as follows:
| | | | | |
Fund | | Management
Fees | | Percentage of
Average Daily
Net Assets |
Small Cap Growth Fund | | $ | 468,302 | | 0.75% |
Small Cap Value Fund | | | 3,597,932 | | 0.75% |
For the six months ended March 31, 2010, class-specific expenses have been reimbursed as follows:
| | | | | | | | | | | | |
| | | Reimbursement1 |
Fund | | Institutional
Class | | Retail
Class | | Admin
Class | | Total |
Small Cap Growth Fund | | $ | — | | $ | 38,864 | | $ | — | | $ | 38,864 |
Small Cap Value Fund | | | 46,436 | | | 154,439 | | | 84,253 | | | 285,128 |
1 Expense reimbursements are subject to possible recovery until September 30, 2011. |
For the six months ended March 31, 2010, expense reimbursements related to prior fiscal year were recovered as follows:
| | | | | | | | | |
| | | Recovered Expenses |
Fund | | Institutional
Class | | Retail
Class | | Total |
Small Cap Growth Fund | | $ | 838 | | $ | — | | $ | 838 |
Certain officers and employees of Loomis Sayles are also officers or Trustees of the Trust. Loomis Sayles’ general partner is indirectly owned by Natixis Global Asset Management, L.P. (“Natixis US”), which is part of Natixis Global Asset Management, an international asset management group based in Paris, France.
b. Administrative Fees. Natixis Asset Management Advisors, L.P. (“Natixis Advisors”) provides certain administrative services for the Funds and contracts with State Street Bank to serve as sub-administrator. Natixis Advisors is a wholly-owned subsidiary of Natixis US. Pursuant to an agreement among Natixis Funds Trust I, Natixis Funds Trust II, Natixis Funds Trust IV, Natixis Cash Management Trust, Gateway Trust (“Natixis Funds Trusts”), Loomis Sayles Funds I, Loomis Sayles Funds II (“Loomis Sayles Funds Trusts”), Hansberger International Series and Natixis Advisors, each Fund pays Natixis Advisors monthly its pro rata portion of fees equal to an annual rate of 0.0575% of the first $15 billion of the average daily net assets of the Natixis Funds Trusts, Loomis Sayles Funds Trusts and the Hansberger International Series, 0.0500% of the next $15 billion, 0.0425% of the next $30 billion and 0.0375% of such assets in excess of $60 billion, subject to an annual aggregate minimum fee for the Natixis Funds Trusts, Loomis Sayles Funds Trusts and the Hansberger International Series of $10 million, which is reevaluated on an annual basis. New funds are subject to a fee for the first twelve months of operations of $75,000 plus $12,500 per additional class and an additional $75,000 if managed by multiple subadvisers.
For the six months ended March 31, 2010, each Fund paid the following for administrative fees to Natixis Advisors:
| | | |
Fund | | Administrative
Fees |
Small Cap Growth Fund | | $ | 30,217 |
Small Cap Value Fund | | | 232,150 |
c. Service and Distribution Fees. Natixis Distributors, L.P. (“Natixis Distributors”), a wholly-owned subsidiary of Natixis US, has entered into a distribution agreement with the Trusts. Pursuant to this agreement, Natixis Distributors serves as principal underwriter of the Funds of the Trusts.
Pursuant to Rule 12b-1 under the 1940 Act, the Small Cap Growth Fund and Small Cap Value Fund have adopted a Distribution Plan relating to each Fund’s Retail Class shares (the “Retail Class Plan”), and the Small Cap Value Fund has adopted a Distribution Plan relating to its Admin Class shares (the “Admin Class Plan”).
29
Under the respective Retail Class Plan, each Fund pays Natixis Distributors a monthly distribution fee at an annual rate not to exceed 0.25% of the average daily net assets attributable to the Funds’ Retail Class shares, as compensation for services provided by Natixis Distributors in connection with the marketing or sale of Retail Class shares or for payments made by Natixis Distributors to securities dealers or other financial intermediaries as commissions, asset-based sales charges or other compensation with respect to the sale of Retail Class shares, or for providing personal services to investors and/or the maintenance of shareholder accounts.
Under the Admin Class Plan, the Small Cap Value Fund pays Natixis Distributors a monthly distribution fee at an annual rate not to exceed 0.25% of the average daily net assets attributable to the Fund’s Admin Class shares, as compensation for services provided by Natixis Distributors in connection with the marketing or sale of Admin Class shares or for payments made by Natixis Distributors to securities dealers or other financial intermediaries as commissions, asset-based sales charges or other compensation with respect to the sale of Admin Class shares, or for providing personal services to investors and/or the maintenance of shareholder accounts.
In addition, the Admin Class shares of the Small Cap Value may pay Natixis Distributors an administrative service fee, at an annual rate not to exceed 0.25% of the average daily net assets attributable to Admin Class shares. These fees are subsequently paid to securities dealers or financial intermediaries for providing personal services and/or account maintenance for their customers who hold such shares.
For the six months ended March 31, 2010 the Fund paid the following service and distribution fees:
| | | | | | | | | |
| | | Service Fees | | Distribution Fees |
| | | Admin
Class | | Retail
Class | | Admin
Class |
Small Cap Growth Fund | | $ | — | | $ | 99,753 | | $ | — |
Small Cap Value Fund | | | 90,357 | | | 480,359 | | | 90,357 |
d. Sub-Transfer Agent Fees. Natixis Distributors has entered into agreements with financial intermediaries to provide certain recordkeeping, processing, shareholder communications and other services to customers of the intermediaries and has agreed to compensate the intermediaries for providing those services. Certain services would be provided by the Funds if the shares of those customers were registered directly with the Funds’ transfer agent. Accordingly, the Funds agreed to pay a portion of the intermediary fees attributable to shares of the Fund held by the intermediaries (which generally is a percentage of the value of shares held) not exceeding what the Funds would have paid its transfer agent had each customer’s shares been registered directly with the transfer agent instead of held through the intermediaries. Natixis Distributors pays the remainder of the fees.
For the six months ended March 31, 2010, the Funds paid the following sub-transfer agent fees, which are reflected in transfer agent fees and expenses in the Statements of Operations:
| | | | | | | | | |
| | | Sub-Transfer Agent Fees |
Fund | | Institutional
Class | | Retail
Class | | Admin
Class |
Small Cap Growth Fund | | $ | 16,330 | | $ | 21,614 | | $ | — |
Small Cap Value Fund | | | 183,310 | | | 259,468 | | | 83,929 |
e. Trustees Fees and Expenses. The Funds do not pay any compensation directly to their officers or Trustees who are directors, officers or employees of Natixis Advisors, Natixis Distributors, Natixis US or their affiliates. Effective January 1, 2010, the Chairperson of the Board receives a retainer fee at the annual rate of $250,000. The Chairperson does not receive any meeting attendance fees for Board of Trustees meetings or committee meetings that she attends. Each Independent Trustee (other than the Chairperson) receives, in the aggregate, a retainer fee at the annual rate of $80,000. Each Independent Trustee also receives a meeting attendance fee of $10,000 for each meeting of the Board of Trustees that he or she attends in person and $5,000 for each meeting of the Board of Trustees that he or she attends telephonically. In addition, each committee chairman receives an additional retainer fee at an annual rate of $15,000. Each Contract Review and Governance Committee member is compensated $6,000 for each Committee meeting that he or she attends in person and $3,000 for each meeting that he or she attends telephonically. Each Audit Committee member is compensated $7,500 for each Committee meeting that he or she attends in person and $3,750 for each meeting that he or she attends telephonically. Each member of the ad hoc Committee on Alternative Investments received a one-time fee of $10,000. The ad hoc Committee on Alternative Investments is not a standing committee. These fees are allocated among the funds in the Natixis Funds Trusts, Loomis Sayles Funds Trusts and Hansberger International
30
NOTES TO FINANCIAL STATEMENTS – continued
March 31, 2010 (Unaudited)
Series based on a formula that takes into account, among other factors, the relative net assets of each fund. Trustees are reimbursed for travel expenses in connection with attendance at meetings.
Prior to January 1, 2010, the Chairperson of the Board received a retainer fee at the annual rate of $200,000. The Chairperson did not receive any meeting attendance fees for Board of Trustees meetings or committee meetings that she attended. Each Independent Trustee (other than the Chairperson) received, in the aggregate, a retainer fee at the annual rate of $65,000. Each Independent Trustee also received a meeting attendance fee of $7,500 for each meeting of the Board of Trustees that he or she attended in person and $3,750 for each meeting of the Board of Trustees that he or she attended telephonically. In addition, each committee chairman received an additional retainer fee at the annual rate of $10,000. Each Contract Review and Governance Committee member was compensated $5,000 for each Committee meeting that he or she attended in person and $2,500 for each meeting that he or she attended telephonically. Each Audit Committee member was compensated $6,250 for each Committee meeting that he or she attended in person and $3,125 for each meeting that he or she attended telephonically.
A deferred compensation plan (the “Plan”) is available to the Trustees on a voluntary basis. Deferred amounts remain in the Funds until distributed in accordance with the provisions of the Plan. The value of a participating Trustee’s deferral account is based on theoretical investments of deferred amounts, on the normal payment dates, in certain funds of the Natixis Funds Trusts, Loomis Sayles Funds Trusts and Hansberger International Series as designated by the participating Trustees. Changes in the value of participants’ deferral accounts are allocated pro rata among the funds in the Natixis Funds Trusts, Loomis Sayles Funds Trusts, and Hansberger International Series, and are normally reflected as Trustees’ fees and expenses in the Statements of Operations. The portions of the accrued obligations allocated to the Funds under the Plan are reflected as Deferred Trustees’ fees in the Statements of Assets and Liabilities.
6. Class-Specific Expenses. For the six months ended March 31, 2010, the Funds paid the following class-specific transfer agent fees and expenses (including sub-transfer agent fees):
| | | | | | | | | |
| | | Transfer Agent Fees
and Expenses |
Fund | | Institutional
Class | | Retail
Class | | Admin
Class |
Small Cap Growth Fund | | $ | 17,579 | | $ | 71,688 | | $ | — |
Small Cap Value Fund | | | 195,118 | | | 267,120 | | | 105,707 |
7. Line of Credit. Each Fund, together with certain other funds of Natixis Funds Trusts, Loomis Sayles Funds Trusts and the Hansberger International Series, participates in a $200,000,000 committed unsecured line of credit provided by State Street Bank, with an individual limit of $125,000,000 for each Fund that participates in the line of credit. Interest is charged to each participating fund based on its borrowings at a rate per annum equal to the greater of the Federal Funds rate or overnight LIBOR, plus 1.25%. In addition, a commitment fee of 0.15% per annum, payable at the end of each calendar quarter, is accrued and apportioned among the participating funds based on their average daily unused portion of the line of credit.
Prior to March 10, 2010, each Fund, together with certain other funds of Natixis Funds Trusts, Loomis Sayles Funds Trusts and the Hansberger International Series, participated in a $200,000,000 committed unsecured line of credit provided by State Street Bank, with an individual limit of $125,000,000 for each Fund that participated in the line of credit. Interest was charged to each participating fund based on its borrowings at a rate per annum equal to the greater of the Federal Funds rate or overnight LIBOR, plus 0.75%. In addition, a commitment fee of 0.125% per annum, payable at the end of each calendar quarter, was accrued and apportioned among the participating funds based on their average daily unused portion of the line of credit.
For the six months ended March 31, 2010, the Funds had no borrowings under these agreements.
8. Brokerage Commission Recapture. Each Fund has entered into agreements with certain brokers whereby the brokers will rebate a portion of brokerage commissions. All amounts rebated by the brokers are returned to the Funds under such agreements and are included in realized gains in the Statements of Operations. For the six months ended March 31, 2010, amounts rebated under these agreements were as follows:
| | | |
Fund | | Rebates |
Small Cap Growth Fund | | $ | 6,525 |
Small Cap Value Fund | | | 53,322 |
31
9. Concentration of Ownership. At March 31, 2010, the Loomis Sayles Funded Pension Plan and the Loomis Sayles Employees’ Profit Sharing Retirement Plan held shares of beneficial interest in the Funds as follows:
| | | | |
Fund | | Pension Plan | | Profit Sharing
Retirement Plan |
Small Cap Growth Fund | | 365,070 | | 397,390 |
Small Cap Value Fund | | 360,114 | | 784,294 |
From time to time, the Funds may have a concentration of several shareholders having a significant percentage of shares outstanding. Investment activities of these shareholders could have material impacts on the Funds. As of March 31, 2010, Small Cap Growth Fund had shareholders that held greater than 5% of the fund’s outstanding shares. Such ownership may be beneficially held by individuals or entities other than the owner of record. The number of greater than 5% shareholders and the aggregate percentage of net assets represented by such ownership was as follows:
| | | | |
Fund | | Number of Greater
Than 5% Shareholders | | Percentage of
Ownership |
Small Cap Growth Fund | | 1 | | 7.77% |
10. Capital Shares. Each Fund may issue an unlimited number of shares of beneficial interest, without par value. Transactions in capital shares were as follows:
| | | | | | | | | | | | | | |
| | | Small Cap Growth Fund | |
| | |
| | | Six Months Ended March 31, 2010 | | | Year Ended September 30, 2009 | |
| | | | |
| Institutional Class | | Shares | | | Amount | | | Shares | | | Amount | |
Issued from the sale of shares | | 438,005 | | | $ | 5,443,350 | | | 1,974,319 | | | $ | 19,253,187 | |
Issued in connection with the
reinvestment of distributions | | — | | | | — | | | — | | | | — | |
Redeemed | | (679,124 | ) | | | (8,083,408 | ) | | (1,447,130 | ) | | | (13,740,063 | ) |
| | | | | | | | | | | | | | |
Net change | | (241,119 | ) | | $ | (2,640,058 | ) | | 527,189 | | | $ | 5,513,124 | |
| | | | | | | | | | | | | | |
| | | | |
| Retail Class | | Shares | | | Amount | | | Shares | | | Amount | |
Issued from the sale of shares | | 988,405 | | | $ | 11,767,651 | | | 3,127,117 | | | $ | 30,016,606 | |
Issued in connection with the
reinvestment of distributions | | — | | | | — | | | — | | | | — | |
Redeemed | | (1,889,534 | ) | | | (23,543,130 | ) | | (2,692,237 | ) | | | (25,065,630 | ) |
| | | | | | | | | | | | | | |
Net change | | (901,129 | ) | | $ | (11,775,479 | ) | | 434,880 | | | $ | 4,950,976 | |
| | | | | | | | | | | | | | |
Increase (decrease) from capital share transactions | | (1,142,248 | ) | | $ | (14,415,537 | ) | | 962,069 | | | $ | 10,464,100 | |
| | | | | | | | | | | | | | |
| |
| | | Small Cap Value Fund | |
| | |
| | | Six Months Ended March 31, 2010 | | | Year Ended September 30, 2009 | |
| | | | |
| Institutional Class | | Shares | | | Amount | | | Shares | | | Amount | |
Issued from the sale of shares | | 1,429,802 | | | $ | 30,263,216 | | | 5,487,523 | | | $ | 94,433,600 | |
Issued in connection with the reinvestment of distributions | | 80,409 | | | | 1,643,559 | | | 156,833 | | | | 2,488,947 | |
Redeemed | | (3,549,030 | ) | | | (74,103,038 | ) | | (6,270,554 | ) | | | (105,527,302 | ) |
| | | | | | | | | | | | | | |
Net change | | (2,038,819 | ) | | $ | (42,196,263 | ) | | (626,198 | ) | | $ | (8,604,755 | ) |
| | | | | | | | | | | | | | |
32
NOTES TO FINANCIAL STATEMENTS – continued
March 31, 2010 (Unaudited)
10. Capital Shares – continued
| | | | | | | | | | | | | | |
| | | Small Cap Value Fund—continued | |
| | |
| | | Six Months Ended March 31, 2010 | | | Year Ended September 30, 2009 | |
| | | | |
| Retail Class | | Shares | | | Amount | | | Shares | | | Amount | |
Issued from the sale of shares | | 1,012,390 | | | $ | 21,392,927 | | | 4,033,997 | | | $ | 70,124,577 | |
Issued in connection with the reinvestment of distributions | | 25,691 | | | | 521,021 | | | 76,628 | | | | 1,206,896 | |
Redeemed | | (1,879,123 | ) | | | (39,444,773 | ) | | (6,502,104 | ) | | | (108,566,266 | ) |
| | | | | | | | | | | | | | |
Net change | | (841,042 | ) | | $ | (17,530,825 | ) | | (2,391,479 | ) | | $ | (37,234,793 | ) |
| | | | | | | | | | | | | | |
| | | | |
| Admin Class | | Shares | | | Amount | | | Shares | | | Amount | |
Issued from the sale of shares | | 493,279 | | | $ | 10,172,635 | | | 1,211,062 | | | $ | 19,455,331 | |
Issued in connection with the reinvestment of distributions | | — | | | | — | | | 1,691 | | | | 26,231 | |
Redeemed | | (837,460 | ) | | | (17,408,107 | ) | | (1,162,021 | ) | | | (19,010,438 | ) |
| | | | | | | | | | | | | | |
Net change | | (344,181 | ) | | $ | (7,235,472 | ) | | 50,732 | | | $ | 471,124 | |
| | | | | | | | | | | | | | |
Increase (decrease) from capital share transactions | | (3,224,042 | ) | | $ | (66,962,560 | ) | | (2,966,945 | ) | | $ | (45,368,424 | ) |
| | | | | | | | | | | | | | |
33

SEMIANNUAL REPORT
March 31, 2010
Loomis Sayles Investment Grade Bond Fund


TABLE OF CONTENTS
Management Discussion and Performance page 1
Portfolio of Investments page 5
Financial Statements page 18
LOOMIS SAYLES INVESTMENT GRADE BOND FUND
PORTFOLIO PROFILE
Objective:
High total investment return through a combination of current income and capital appreciation
Strategy:
Invests primarily in investment-grade, fixed-income securities, although it may invest up to 10% of its assets in lower quality fixed-income securities. The fund may invest any portion of its assets in securities of Canadian issuers and up to 20% in other foreign securities, including emerging markets.
Fund Inception:
December 31, 1996
Managers:
Daniel Fuss, CFA, CIC
Associate Managers:
Matthew J. Eagan, CFA
Kathleen Gaffney, CFA
Elaine Stokes
Loomis, Sayles & Company, L.P.
Symbols:
| | |
| Class A | | LIGRX |
| Class B | | LGBBX |
| Class C | �� | LGBCX |
| Class Y | | LSIIX |
| Admin Class | | LIGAX |
| Class J | | LIGJX |
What You Should Know:
This fund invests in fixed-income securities that are subject to credit risk, interest rate risk and liquidity risk. It may also invest in mortgage-related securities that are subject to prepayment risk. The fund can invest a significant percentage of assets in foreign securities and the value of fund shares can be adversely affected by changes in currency exchange rates, political, and economic developments. In emerging markets these risks can be significant. The fund is subject to currency risk, which is the risk that fluctuations in exchange rates between the U.S. dollar and foreign currencies may cause the value of a fund’s investments to decline. Lower rated debt securities have speculative characteristics and may be subject to greater price volatility than higher rated investments. In addition, the secondary market for these securities may lack liquidity. Fund shares should be viewed as a long-term investment.
Management Discussion
Corporate debt and other fixed-income securities offering yield advantages over low-risk bonds continued to perform well during the six months ended March 31, 2010. Amid growing market expectations of a sustained global economic recovery, investors became more willing to accept credit risk in return for the high yields offered by corporate bonds and securitized debt. In line with the increasing appetite for risk, currencies of countries with commodity-based economies gained against other countries.
For the six months ended March 31, 2010, Class A shares of Loomis Sayles Investment Grade Bond Fund returned 6.24%. During the same period, the fund’s benchmark, the Barclays Capital U.S. Government/Credit Bond Index, rose 1.34%, while funds in Morningstar’s Intermediate-Term Bond category returned an average of 3.70%.
WHAT WAS THE PRIMARY REASON FOR THE FUND’S OUTPERFORMANCE?
As investors grew more confident about an economic recovery, securities with credit risk tended to rally in price. The fund’s emphasis on investment-grade corporate bonds, as well as its exposure to high-yield bonds and select non-agency securitized assets, helped propel strong results relative to the Barclays index. Moreover, as commodities gained in price in global markets, the fund’s exposure to commodity-linked currencies also helped support performance. The fund’s investments in securities denominated in the currencies of Canada, Indonesia, Australia, New Zealand and Mexico all contributed positive returns. Convertible bonds were also a performance driver.
WHAT FACTORS POSITIVELY CONTRIBUTED TO THE FUND’S PERFORMANCE?
Investment-grade industrial bonds were among the strongest performers, particularly holdings in the transportation, technology, capital goods and telecommunication services industries. In addition, investments in higher-yielding, below investment-grade corporate bonds also aided results, as demand for high-yield securities increased and expected default rates fell. In particular, positions in high-yield bonds of companies in the transportation, technology, retail and financial industries contributed positively to results. Investments in non-government agency securitized debt, including commercial mortgage-backed debt, provided further support. Finally, the dramatic performance of equity markets during the six months covered by this report also aided the fund, as convertible bonds rallied in industries such as autos, technology and financials.
WHICH FACTORS DETRACTED FROM THE FUND’S RESULTS?
Holdings in securities denominated in Icelandic krona underperformed when the currency depreciated relative to the U.S. dollar. In addition, the fund’s longer-than-benchmark duration – a measure of sensitivity to changes in interest rates – was a performance detractor as interest-rate sensitive longer-maturity bonds lagged.
WHAT IS YOUR CURRENT OUTLOOK?
The fund is positioned to take advantage of a gradual economic recovery and positive fundamental trends. We believe short-term interest rates in the United States will remain low for the foreseeable future, but acknowledge the continuing pressures that the ever-increasing U.S. Treasury issuance will place on longer-term rates. In our opinion, there remains ample opportunity for corporate bond yield spreads to tighten further. Within corporate credit, we are advocating a strategy of specific (fundamental credit) risk instead of market (interest rate) risk. We continue to see opportunity in the convertible market and have focused on increasing our exposure. We continue to add opportunistically to non-U.S. dollar-denominated securities, with a focus on credits and countries in which we anticipate fundamental improvements will continue to emerge. We believe that in a rising-rate environment, research and security selection will continue to prove key to successful portfolio management.
1
LOOMIS SAYLES INVESTMENT GRADE BOND FUND
Investment Results through March 31, 2010
PERFORMANCE IN PERSPECTIVE
The charts comparing the fund’s performance to an index provide you with a general sense of how it performed. The fund’s total return for the period shown below appears with and without sales charges and includes fund expenses and fees. An index measures the performance of a theoretical portfolio. Unlike a fund, the index is unmanaged and does not have expenses that affect the results. It is not possible to invest directly in an index. Investors would incur transaction costs and other expenses if they purchased the securities necessary to match the index.
Growth of a $10,000 Investment in Class A Shares1,4
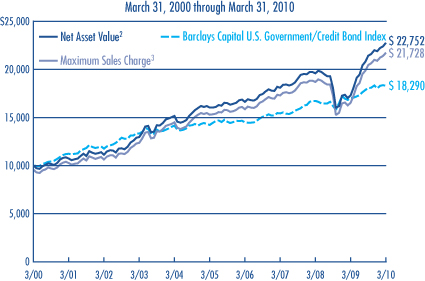
Average Annual Total Returns — March 31, 20104
| | | | | | | | | | | | |
| | | | | |
| | | 6 MONTHS | | | 1 YEAR | | | 5 YEARS | | | 10 YEARS | |
Class A (Inception 12/31/96)1 | | | | | | | | | | | | |
Net Asset Value2 | | 6.24 | % | | 31.52 | % | | 7.28 | % | | 8.57 | % |
With Maximum Sales Charge3 | | 1.45 | | | 25.54 | | | 6.29 | | | 8.07 | |
| | | | | |
Class B (Inception 9/12/03)1 | | | | | | | | | | | | |
Net Asset Value2 | | 5.74 | | | 30.33 | | | 6.39 | | | 7.61 | |
With CDSC5 | | 0.74 | | | 25.33 | | | 6.07 | | | 7.61 | |
| | | | | |
Class C (Inception 9/12/03)1 | | | | | | | | | | | | |
Net Asset Value2 | | 5.90 | | | 30.55 | | | 6.48 | | | 7.67 | |
With CDSC5 | | 4.90 | | | 29.55 | | | 6.48 | | | 7.67 | |
| | | | | |
Class Y (Inception 12/31/96) | | | | | | | | | | | | |
Net Asset Value2 | | 6.37 | | | 31.97 | | | 7.61 | | | 8.86 | |
| | | | | |
Admin Class (Inception 2/1/10)1 | | | | | | | | | | | | |
Net Asset Value2 | | 6.04 | | | 30.94 | | | 6.77 | | | 7.98 | |
| | | | | |
Class J (Inception 5/24/99) | | | | | | | | | | | | |
Net Asset Value2 | | 5.98 | | | 30.89 | | �� | 6.80 | | | 8.06 | |
With Sales Charge5 | | 2.29 | | | 26.31 | | | 6.05 | | | 7.67 | |
| | | | | |
| COMPARATIVE PERFORMANCE | | 6 MONTHS | | | 1 YEAR | | | 5 YEARS | | | 10 YEARS | |
Barclays Capital U.S. Government/Credit Bond Index | | 1.34 | % | | 7.51 | % | | 5.17 | % | | 6.22 | % |
Morningstar Intermediate-Term Bond Fund Avg. | | 3.70 | | | 16.76 | | | 4.48 | | | 5.60 | |
See page 3 for a description of the index/average.
All returns represent past performance and do not guarantee future results. Share price and return will vary and you may have a gain or loss when you sell your shares. All results include reinvestment of any dividends and capital gains. Current returns may be higher or lower than those shown. For performance current to the most recent month-end, visit www.funds.natixis.com. Class Y is only available to certain investors as described in the prospectus. Class J shares are not offered for sale in the United States and are not eligible for sale to U.S. investors.
PORTFOLIO FACTS
| | | | |
| |
| | | % of Net Assets as of |
| CREDIT QUALITY | | 3/31/2010* | | 9/30/2009** |
Aaa | | 31.1 | | 31.8 |
Aa | | 5.6 | | 2.9 |
A | | 21.4 | | 16.0 |
Baa | | 33.9 | | 37.8 |
Ba | | 3.9 | | 4.6 |
B | | 1.7 | | 0.4 |
Caa and lower | | 0.3 | | 1.6 |
Not Rated | | 0.5 | | 1.2 |
Short-term and other | | 1.6 | | 3.7 |
| | * | Credit quality at 3/31/2010 reflects the highest rating assigned to a security among Moody’s, S&P, or Fitch. The Moody’s equivalent of the assigned rating is presented in the table. | |
| | ** | Credit quality at 9/30/2009 was based on ratings from Moody’s. Securities that were not rated by Moody’s may have been rated by another rating agency or by Loomis Sayles. | |
| | | | | | |
| |
| | | % of Net Assets as of | |
| EFFECTIVE MATURITY | | 3/31/2010 | | | 9/30/2009 | |
1 year or less | | 1.7 | | | 6.0 | |
1-5 years | | 36.0 | | | 31.3 | |
5-10 years | | 45.0 | | | 43.5 | |
10+ years | | 17.3 | | | 19.2 | |
Average Effective Maturity | | 9.0 | years | | 9.7 | years |
Portfolio characteristics will vary.
EXPENSE RATIOS AS STATED IN THE MOST RECENT PROSPECTUS
| | | | | | |
| Share Class | | Gross Expense Ratio6 | | | Net Expense Ratio7 | |
A | | 0.80 | % | | 0.80 | % |
B | | 1.67 | | | 1.67 | |
C | | 1.56 | | | 1.56 | |
Y | | 0.54 | | | 0.54 | |
Admin | | 1.33 | | | 1.20 | |
J | | 1.31 | | | 1.30 | |
NOTES TO CHARTS
The table and graph do not reflect taxes shareholders might owe on any fund distributions or when they redeem their shares.
| 1 | Prior to 9/15/03, performance of Class A shares is that of Retail Class shares, which were redesignated as Class A shares, restated to reflect the sales load of Class A shares. From 12/18/00 to 1/31/02, during which time Retail Class shares were not outstanding, performance is that of Institutional Class shares, restated to reflect the higher net expenses and sales loads of Class A shares. Prior to the inception of Class B and C shares (9/12/03), performance is that of Institutional Class shares, restated to reflect the higher net expenses and sales loads of Class B and C shares. Prior to the inception of Admin Class shares (2/1/10), performance is that of Class A shares, restated to reflect the higher net expenses of Admin Class shares. |
| 2 | Does not include a sales charge. |
| 3 | Includes maximum sales charge of 4.50%. |
| 4 | Fund performance has been increased by expense reductions and reimbursements, if any, without which performance would have been lower. |
| 5 | Performance for Class B shares assumes a maximum 5% contingent deferred sales charge (“CDSC”) applied when you sell shares, which declines annually between years 1-6 according to the following schedule: 5, 4, 3, 3, 2, 1, 0%. Class C shares performance assumes a 1% CDSC applied when you sell shares within one year of purchase. Performance for Class J assumes a 3.50% sales charge. |
| 6 | Before reductions and reimbursements. |
| 7 | After reductions and reimbursements. Expense reductions are contractual and are set to expire on 1/31/11. |
2
ADDITIONAL INFORMATION
The views expressed in this report reflect those of the portfolio managers as of the dates indicated. The managers’ views are subject to change at any time without notice based on changes in market or other conditions. References to specific securities or industries should not be regarded as investment advice. Because the fund is actively managed, there is no assurance that it will continue to invest in the securities, countries or industries mentioned.
Before investing, consider the fund’s investment objectives, risks, charges and other expenses. Visit www.funds.natixis.com or call 1-800-225-5478 for a prospectus and/or a summary prospectus, both of which contain this and other information. Read it carefully.
INDEX/AVERAGE DESCRIPTIONS:
Barclays Capital U.S. Government/Credit Bond Index is an unmanaged index that includes U.S. Treasuries, government-related issues, and investment grade U.S. corporate securities.
Morningstar Intermediate-Term Bond Fund Average is the average performance without sales charges of funds with similar investment objectives, as calculated by Morningstar, Inc.
PROXY VOTING INFORMATION
A description of the fund’s proxy voting policies and procedures is available without charge, upon request, by calling Natixis Funds at 800-225-5478; on the fund’s website at www.funds.natixis.com; and on the Securities and Exchange Commission’s (SEC’s) website at www.sec.gov. Information regarding how the fund voted proxies relating to portfolio securities during the 12-month period ended June 30, 2009 is available from the fund’s website and the SEC’s website.
QUARTERLY PORTFOLIO SCHEDULES
The fund files a complete schedule of portfolio holdings with the SEC for the first and third quarters of each fiscal year on Form N-Q. The fund’s Forms N-Q are available on the SEC’s website at www.sec.gov and may be reviewed and copied at the SEC’s Public Reference Room in Washington, DC. Information on the operation of the Public Reference Room may be obtained by calling 1-800-SEC-0330.
| | | | |
| NOT FDIC INSURED | | MAY LOSE VALUE | | NO BANK GUARANTEE |
3
UNDERSTANDING YOUR FUND’S EXPENSES
As a mutual fund shareholder, you incur different types of costs: transaction costs, including sales charges (loads) on purchases and contingent deferred sales charges on redemptions; certain exchange fees; and ongoing costs, including management fees, distribution fees (12b-1 fees) and/or service fees, and other fund expenses. In addition, the fund may assess a minimum balance fee of $20 on an annual basis for accounts that fall below the required minimum to establish an account (certain exceptions may apply). These costs are described in more detail in the fund’s prospectus. The examples below are intended to help you understand the ongoing costs of investing in the fund and help you compare these with the ongoing costs of investing in other mutual funds.
The first line in the table for each Class shows the actual amount of fund expenses you would have paid on a $1,000 investment in the fund from October 1, 2009 through March 31, 2010. It also shows how much a $1,000 investment would be worth at the close of the period, assuming actual fund returns and expenses. To estimate the expenses you paid over the period, simply divide your account value by $1,000 (for example $8,600 account value divided by $1,000 =8.6) and multiply the result by the number in the Expenses Paid During the Period row as shown below for your class.
The second line in the table for each Class provides information about hypothetical account values and hypothetical expenses based on the fund’s actual expense ratios and an assumed rate of return of 5% per year before expenses, which is not the fund’s actual return. The hypothetical account values and expenses may not be used to estimate the actual ending account balance or expenses you paid on your investment for the period. You may use this information to compare the ongoing costs of investing in the fund and other funds. To do so, compare this 5% hypothetical example with the 5% hypothetical examples that appear in the shareholder reports of the other funds.
Please note that the expenses shown reflect ongoing costs only, and do not include any transaction costs. Therefore, the second line in the table of the fund is useful in comparing ongoing costs only, and will not help you determine the relative costs of owning different funds. If transaction costs were included, total costs would be higher.
| | | | | | | | |
| LOOMIS SAYLES INVESTMENT GRADE BOND FUND | | BEGINNING ACCOUNT VALUE
10/1/2009 | | ENDING ACCOUNT VALUE
3/31/2010 | | | EXPENSES PAID DURING PERIOD
10/1/2009 – 3/31/2010 | |
Class A | | | | | | | | |
Actual | | $1,000.00 | | $1,062.40 | | | $4.11 | 1 |
Hypothetical (5% return before expenses) | | $1,000.00 | | $1,020.94 | | | $4.03 | * |
Class B | | | | | | | | |
Actual | | $1,000.00 | | $1,057.40 | | | $8.46 | 1 |
Hypothetical (5% return before expenses) | | $1,000.00 | | $1,016.70 | | | $8.30 | * |
Class C | | | | | | | | |
Actual | | $1,000.00 | | $1,059.00 | | | $7.96 | 1 |
Hypothetical (5% return before expenses) | | $1,000.00 | | $1,017.20 | | | $7.80 | * |
Class Y | | | | | | | | |
Actual | | $1,000.00 | | $1,063.70 | | | $2.83 | 1 |
Hypothetical (5% return before expenses) | | $1,000.00 | | $1,022.19 | | | $2.77 | * |
Admin Class | | | | | | | | |
Actual | | $1,000.00 | | $1,024.20 | 2 | | $1.93 | 2 |
Hypothetical (5% return before expenses) | | $1,000.00 | | $1,001.96 | * | | $5.99 | * |
Class J | | | | | | | | |
Actual | | $1,000.00 | | $1,059.80 | | | $6.68 | 1 |
Hypothetical (5% return before expenses) | | $1,000.00 | | $1,018.45 | | | $6.54 | * |
| * | Hypothetical expenses are equal to the Fund's annualized expense ratio (after fee reduction/reimbursement): 0.80%, 1.65%, 1.55%, 0.55%, 1.20% and 1.30%, for Class A, B, C, Y, Admin Class and Class J, respectively, multiplied by the average account value over the period, multiplied by the number of days in the most recent fiscal half-year (182), divided by 365 (to reflect the half-year period). |
| 1 | Actual expenses for Class A, B, C, Y and J are equal to the Fund's annualized expense ratio (after fee reduction/reimbursement): 0.80%, 1.65%, 1.55%, 0.55% and 1.30%, respectively, multiplied by the average account value over the period, multiplied by the number of days in the most recent fiscal half-year (182), divided by 365 (to reflect the half-year period). |
| 2 | Admin Class commenced operations on February 1, 2010. Actual expenses are equal to the Fund's annualized expense ratio (after fee reduction/reimbursement) of 1.20%, multiplied by the average account value over the period, multiplied by the number of days in the most recent fiscal period (58), divided by 365 (to reflect the partial period). |
4
LOOMIS SAYLES INVESTMENT GRADE BOND FUND — PORTFOLIOOF INVESTMENTS
Investments as of March 31, 2010 (Unaudited)
| | | | | | |
Principal
Amount (‡) | | Description | | Value (†) |
| | | | | | |
| | Bonds and Notes — 98.4% of Net Assets | | | |
| | Non-Convertible Bonds — 94.8% | | | |
| | | ABS Car Loan — 1.0% | | | |
| $ | 8,255,000 | | Avis Budget Rental Car Funding AESOP LLC, Series 2007-2A, Class A, 0.380%, 8/20/2013, 144A(b) | | $ | 7,783,988 |
| | 831,000 | | Avis Budget Rental Car Funding AESOP LLC, Series 2010-2A, Class B, 5.740%, 8/20/2014, 144A | | | 830,917 |
| | 4,690,000 | | Avis Budget Rental Car Funding AESOP LLC, Series 2010-3A, Class B, 6.740%, 5/20/2016, 144A | | | 4,689,531 |
| | 19,025,000 | | Chesapeake Funding LLC, Series 2009-2A, Class B, 1.980%, 9/15/2021, 144A(b) | | | 17,230,290 |
| | 17,100,000 | | Chesapeake Funding LLC, Series 2009-2A, Class C, 1.980%, 9/15/2021, 144A(b) | | | 14,927,777 |
| | 43,060,000 | | Chrysler Financial Lease Trust, Series 2010-A, Class B, 3.460%, 9/16/2013, 144A | | | 43,027,240 |
| | 7,199,000 | | Merrill Auto Trust Securitization Asset, Series 2008-1, Class B, 6.750%, 4/15/2015 | | | 7,453,984 |
| | | | | | |
| | | | | | 95,943,727 |
| | | | | | |
| | | ABS Credit Card — 1.5% | | | |
| | 9,995,000 | | American Express Issuance Trust, Series 2005-2, Class A, 0.300%, 8/15/2013(b) | | | 9,945,404 |
| | 24,955,000 | | Capital One Multi-Asset Execution Trust, Series 2005-A10, Class A, 0.310%, 9/15/2015(b) | | | 24,696,181 |
| | 2,550,000 | | Capital One Multi-Asset Execution Trust, Series 2006-C2, Class C, 0.530%, 6/16/2014(b) | | | 2,482,335 |
| | 29,215,000 | | Chase Issuance Trust, Series 2007-B1, Class B1, 0.480%, 4/15/2019(b) | | | 26,730,726 |
| | 4,000,000 | | Citibank Credit Card Issuance Trust, Series 2008-A1, Class A1, 5.350%, 2/07/2020 | | | 4,367,546 |
| | 29,395,000 | | Citibank Credit Card Issuance Trust, Series 2008-C6, Class C6, 6.300%, 6/20/2014 | | | 31,100,551 |
| | 19,600,000 | | GE Capital Credit Card Master Note Trust, Series 2009-4, Class B, 5.390%, 11/15/2017, 144A | | | 19,623,573 |
| | 10,000,000 | | MBNA Credit Card Master Note Trust, Series 2002-C1, Class C1, 6.800%, 7/15/2014 | | | 10,623,847 |
| | 14,780,000 | | MBNA Credit Card Master Note Trust, Series 2004-B1, Class B1, 4.450%, 8/15/2016 | | | 15,133,867 |
| | | | | | |
| | | | | | 144,704,030 |
| | | | | | |
| | | ABS Other — 2.4% | | | |
| | 15,998,819 | | CIT Equipment Collateral, Series 2008-VT1, Class A3, 6.590%, 12/22/2014 | | | 16,406,912 |
| | 1,700,000 | | Community Program Loan Trust, Series 1987-A, Class A5, 4.500%, 4/01/2029 | | | 1,539,581 |
| | 69,893,722 | | Marriott Vacation Club Owner Trust, Series 2009-2A, Class A, 4.809%, 7/20/2031, 144A | | | 70,032,056 |
| | 27,329,233 | | Sierra Receivables Funding Co., Series 2009-3A, Class A1, 7.620%, 7/20/2026, 144A | | | 27,648,135 |
| | 65,832,508 | | SVO VOI Mortgage Corp., Series 2009-BA, Class NT, 5.810%, 12/20/2028, 144A | | | 66,377,305 |
| | 45,620,871 | | Trinity Rail Leasing LP, Series 2009-1A, Class A, 6.657%, 11/16/2039, 144A | | | 44,697,673 |
| | | | | | |
| | | | | | 226,701,662 |
| | | | | | |
| | | | | | |
Principal
Amount (‡) | | Description | | Value (†) |
| | | | | | |
| | | Airlines — 3.0% | | | |
| $ | 17,225,538 | | American Airlines Pass Through Trust, Series 2009-1A, 10.375%, 7/02/2019 | | $ | 19,938,560 |
| | 659,643 | | Continental Airlines Pass Through Trust, Series 1997-1, Class A, 7.461%, 10/01/2016 | | | 651,398 |
| | 990,361 | | Continental Airlines Pass Through Trust, Series 1998-1, Class A, 6.648%, 3/15/2019 | | | 992,341 |
| | 1,006,573 | | Continental Airlines Pass Through Trust, Series 1999-1, Class A, 6.545%, 8/02/2020 | | | 1,026,705 |
| | 10,689,316 | | Continental Airlines Pass Through Trust, Series 2000-1, Class A-1, 8.048%, 5/01/2022 | | | 10,849,656 |
| | 1,853,823 | | Continental Airlines Pass Through Trust, Series 2000-2, Class A-1, 7.707%, 10/02/2022 | | | 1,853,823 |
| | 2,661,607 | | Continental Airlines Pass Through Trust, Series 2001-1, Class A-1, 6.703%, 12/15/2022 | | | 2,475,294 |
| | 61,260,000 | | Continental Airlines Pass Through Trust, Series 2007-1, Class A, 5.983%, 10/19/2023 | | | 60,187,950 |
| | 12,208,000 | | Continental Airlines Pass Through Trust, Series 2007-1, Class B, 6.903%, 4/19/2022 | | | 11,109,280 |
| | 29,393,585 | | Continental Airlines Pass Through Trust, Series 2009-1, Class A, 9.000%, 7/08/2016 | | | 31,745,072 |
| | 22,105,000 | | Continental Airlines Pass Through Trust, Series 2009-2, Class A, 7.250%, 11/10/2019 | | | 23,652,350 |
| | 4,300,000 | | Delta Air Lines, Inc., Series 2001-1, Class A-2, 7.111%, 3/18/2013 | | | 4,493,500 |
| | 2,171,631 | | Delta Air Lines, Inc., Series 2007-1, Class A, 6.821%, 2/10/2024 | | | 2,171,631 |
| | 17,287,761 | | Delta Air Lines, Inc., Series 2007-1, Class B, 8.021%, 2/10/2024 | | | 15,904,740 |
| | 41,530,000 | | Delta Air Lines, Inc., Series A, 7.750%, 12/17/2019 | | | 43,606,500 |
| | 5,000,000 | | Delta Air Lines, Inc., Series B, 9.750%, 12/17/2016 | | | 5,150,000 |
| | 10,186,641 | | Northwest Airlines, Inc., Series 2007-1, Class B, 8.028%, 11/01/2017 | | | 9,318,434 |
| | 8,115,000 | | Qantas Airways Ltd., 6.050%, 4/15/2016, 144A | | | 8,385,603 |
| | 28,073,356 | | UAL Pass Through Trust, Series 2007-1, Class A, 6.636%, 1/02/2024 | | | 25,967,854 |
| | 8,230,000 | | UAL Pass Through Trust, Series 2009-1, 10.400%, 5/01/2018 | | | 8,847,250 |
| | | | | | |
| | | | | | 288,327,941 |
| | | | | | |
| | | Automotive — 0.6% | | | |
| | 33,885,000 | | Cummins, Inc., 5.650%, 3/01/2098 | | | 20,948,080 |
| | 5,389,000 | | Cummins, Inc., 6.750%, 2/15/2027 | | | 5,143,655 |
| | 665,000 | | Cummins, Inc., 7.125%, 3/01/2028 | | | 657,328 |
| | 1,990,000 | | Ford Motor Co., 6.375%, 2/01/2029 | | | 1,616,875 |
| | 130,000 | | Ford Motor Co., 6.500%, 8/01/2018 | | | 123,500 |
| | 260,000 | | Ford Motor Co., 6.625%, 2/15/2028 | | | 218,400 |
| | 5,185,000 | | Ford Motor Co., 6.625%, 10/01/2028 | | | 4,355,400 |
| | 8,730,000 | | Ford Motor Co., 7.450%, 7/16/2031 | | | 8,249,850 |
See accompanying notes to financial statements.
5
LOOMIS SAYLES INVESTMENT GRADE BOND FUND — PORTFOLIOOF INVESTMENTS (continued)
Investments as of March 31, 2010 (Unaudited)
| | | | | | |
Principal
Amount (‡) | | Description | | Value (†) |
| | | | | | |
| | | Automotive — continued | | | |
| $ | 245,000 | | Ford Motor Co., 7.500%, 8/01/2026 | | $ | 217,437 |
| | 345,000 | | Ford Motor Credit Co. LLC, 7.000%, 10/01/2013 | | | 356,984 |
| | 2,215,000 | | Ford Motor Credit Co. LLC, 7.250%, 10/25/2011 | | | 2,290,069 |
| | 4,640,000 | | Ford Motor Credit Co. LLC, 8.000%, 12/15/2016 | | | 4,888,811 |
| | 935,000 | | Ford Motor Credit Co. LLC, 8.625%, 11/01/2010 | | | 957,691 |
| | 2,135,000 | | Ford Motor Credit Co. LLC, 9.750%, 9/15/2010 | | | 2,186,189 |
| | | | | | |
| | | | | | 52,210,269 |
| | | | | | |
| | | Banking — 8.8% | | | |
| | 47,100,000 | | AgriBank FCB, 9.125%, 7/15/2019, 144A(c) | | | 53,583,786 |
| | 7,450,000 | | American Express Centurion Bank, Series BKN1, 6.000%, 9/13/2017 | | | 7,995,720 |
| | 36,659,000 | | Associates Corp. of North America, 6.950%, 11/01/2018 | | | 38,632,940 |
| | 2,595,000 | | BAC Capital Trust VI, 5.625%, 3/08/2035 | | | 2,142,632 |
| | 3,690,000 | | Bank of America Corp., 5.420%, 3/15/2017 | | | 3,646,628 |
| | 10,020,000 | | Bank of America Corp., 6.000%, 9/01/2017 | | | 10,421,061 |
| | 17,625,000 | | Bank of America NA, 5.300%, 3/15/2017 | | | 17,447,005 |
| | 3,120,000,000 | | Barclays Financial LLC, 4.060%, 9/16/2010, (KRW), 144A | | | 2,762,934 |
| | 3,500,000,000 | | Barclays Financial LLC, 4.460%, 9/23/2010, (KRW), 144A | | | 3,105,264 |
| | 2,220,000 | | Bear Stearns Cos., Inc. (The), 4.650%, 7/02/2018 | | | 2,164,968 |
| | 975,000 | | Bear Stearns Cos., Inc. (The), 5.300%, 10/30/2015 | | | 1,037,973 |
| | 2,150,000 | | Bear Stearns Cos., Inc. (The), 6.400%, 10/02/2017 | | | 2,375,139 |
| | 12,745,000 | | Bear Stearns Cos., Inc. (The), 7.250%, 2/01/2018 | | | 14,729,269 |
| | 16,371,250,000 | | BNP Paribas SA, EMTN, Zero Coupon, 6/13/2011, (IDR), 144A | | | 1,637,035 |
| | 19,200,000 | | Capital One Financial Corp., 6.150%, 9/01/2016 | | | 19,919,501 |
| | 9,860,000 | | Citibank NA, 15.000%, 7/02/2010, (BRL), 144A | | | 5,619,094 |
| | 10,400,000 | | Citigroup, Inc., 5.000%, 9/15/2014 | | | 10,385,346 |
| | 1,325,000 | | Citigroup, Inc., 5.850%, 12/11/2034 | | | 1,203,113 |
| | 2,800,000 | | Citigroup, Inc., 5.875%, 2/22/2033 | | | 2,415,969 |
| | 20,308,000 | | Citigroup, Inc., 6.125%, 5/15/2018 | | | 20,750,491 |
| | 8,895,000 | | Citigroup, Inc., 6.125%, 8/25/2036 | | | 7,762,106 |
| | 74,265,000 | | Citigroup, Inc., 6.375%, 8/12/2014 | | | 79,337,522 |
| | | | | |
Principal
Amount (‡) | | Description | | Value (†) |
| | | | | |
| | Banking — continued | | | |
| 2,450,000 | | Citigroup, Inc., EMTN, (fixed rate to 11/30/2012, variable rate thereafter), 3.625%, 11/30/2017, (EUR) | | $ | 3,047,821 |
| 80,235,000 | | Citigroup, Inc., MTN, 5.500%, 10/15/2014 | | | 83,035,683 |
| 7,110,000 | | First Niagara Finance Group, Inc., 6.750%, 3/19/2020 | | | 7,185,039 |
| 1,200,000 | | Goldman Sachs Group, Inc. (The), 6.450%, 5/01/2036 | | | 1,160,316 |
| 99,020,000 | | Goldman Sachs Group, Inc. (The), 6.750%, 10/01/2037 | | | 98,895,631 |
| 6,790,000 | | Goldman Sachs Group, Inc. (The), GMTN, 5.375%, 3/15/2020 | | | 6,727,199 |
| 700,000 | | ICICI Bank Ltd., (fixed rate to 4/30/2017, variable rate thereafter), 6.375%, 4/30/2022, 144A | | | 659,073 |
| 18,000,000 | | JPMorgan Chase & Co., Zero Coupon, 5/17/2010, (BRL), 144A | | | 9,873,759 |
| 17,920,000,000 | | JPMorgan Chase & Co., Zero Coupon, 3/28/2011, (IDR), 144A | | | 1,837,984 |
| 68,827,366,920 | | JPMorgan Chase & Co., Zero Coupon, 4/12/2012, (IDR), 144A | | | 6,536,690 |
| 22,683,264,000 | | JPMorgan Chase & Co., EMTN, Zero Coupon, 3/28/2011, (IDR), 144A | | | 2,326,533 |
| 344,497,150,000 | | JPMorgan Chase Bank NA, EMTN, Zero Coupon, 10/17/2011, (IDR), 144A | | | 34,292,601 |
| 24,124,936,500 | | JPMorgan Chase London, EMTN, Zero Coupon, 10/21/2010, (IDR), 144A | | | 2,555,793 |
| 100,000 | | Keybank NA, 6.950%, 2/01/2028 | | | 90,056 |
| 6,620,000 | | Merrill Lynch & Co., Inc., 5.700%, 5/02/2017 | | | 6,580,247 |
| 70,800,000 | | Merrill Lynch & Co., Inc., 6.110%, 1/29/2037 | | | 65,142,514 |
| 10,000,000 | | Merrill Lynch & Co., Inc., 10.710%, 3/08/2017, (BRL) | | | 5,482,610 |
| 3,200,000 | | Merrill Lynch & Co., Inc., EMTN, 4.625%, 9/14/2018, (EUR) | | | 4,115,227 |
| 11,895,000 | | Merrill Lynch & Co., Inc., MTN, 6.875%, 4/25/2018 | | | 12,818,873 |
| 41,000,000 | | Merrill Lynch & Co., Inc., Series C, MTN, 6.050%, 6/01/2034 | | | 35,251,431 |
| 2,710,000 | | Merrill Lynch & Co., Inc., Series C, MTN, 6.400%, 8/28/2017 | | | 2,856,139 |
| 51,525,000 | | Morgan Stanley, 4.750%, 4/01/2014 | | | 52,610,992 |
| 1,510,000 | | Morgan Stanley, EMTN, 5.450%, 1/09/2017 | | | 1,530,998 |
| 2,850,000 | | Morgan Stanley, GMTN, 5.125%, 11/30/2015, (GBP) | | | 4,431,645 |
| 5,300,000 | | Morgan Stanley, Series F, GMTN, 6.625%, 4/01/2018 | | | 5,652,869 |
| 17,500,000 | | Morgan Stanley, Series F, MTN, 5.550%, 4/27/2017 | | | 17,897,932 |
| 4,400,000 | | Morgan Stanley, Series F, MTN, 5.625%, 9/23/2019 | | | 4,384,486 |
| 9,910,000 | | Morgan Stanley, Series F, MTN, 5.950%, 12/28/2017 | | | 10,181,237 |
| 2,875,000 | | National City Bank of Indiana, 4.250%, 7/01/2018 | | | 2,706,669 |
See accompanying notes to financial statements.
6
LOOMIS SAYLES INVESTMENT GRADE BOND FUND — PORTFOLIOOF INVESTMENTS (continued)
Investments as of March 31, 2010 (Unaudited)
| | | | | | |
Principal
Amount (‡) | | Description | | Value (†) |
| | | | | | |
| | | Banking — continued | | | |
| $ | 1,325,000 | | National City Bank, MTN, 5.800%, 6/07/2017 | | $ | 1,378,374 |
| | 9,826,000 | | National City Corp., 6.875%, 5/15/2019 | | | 10,918,052 |
| | 3,400,000 | | Standard Chartered Bank, 6.400%, 9/26/2017, 144A | | | 3,599,655 |
| | 18,250,000 | | Standard Chartered PLC, 5.500%, 11/18/2014, 144A | | | 19,623,586 |
| | | | | | |
| | | | | | 834,463,210 |
| | | | | | |
| | | Brokerage — 0.6% | | | |
| | 54,955,000 | | Jefferies Group, Inc., 8.500%, 7/15/2019 | | | 60,963,945 |
| | | | | | |
| | | Building Materials — 1.0% | | | |
| | 6,785,000 | | Masco Corp., 4.800%, 6/15/2015 | | | 6,545,815 |
| | 11,180,000 | | Masco Corp., 5.850%, 3/15/2017 | | | 10,896,553 |
| | 6,760,000 | | Masco Corp., 6.125%, 10/03/2016 | | | 6,740,849 |
| | 2,260,000 | | Masco Corp., 6.500%, 8/15/2032 | | | 1,939,747 |
| | 1,925,000 | | Masco Corp., 7.750%, 8/01/2029 | | | 1,838,383 |
| | 24,925,000 | | Owens Corning, Inc., 6.500%, 12/01/2016 | | | 26,378,501 |
| | 41,680,000 | | Owens Corning, Inc., 7.000%, 12/01/2036 | | | 40,837,481 |
| | 1,060,000 | | USG Corp., 6.300%, 11/15/2016 | | | 948,700 |
| | | | | | |
| | | | | | 96,126,029 |
| | | | | | |
| | | Chemicals — 1.3% | | | |
| | 35,520,000 | | Chevron Phillips Chemical Co. LLC, 8.250%, 6/15/2019, 144A | | | 42,404,380 |
| | 3,545,000 | | Cytec Industries, Inc., 6.000%, 10/01/2015 | | | 3,813,208 |
| | 2,400,000 | | Methanex Corp., 6.000%, 8/15/2015 | | | 2,168,630 |
| | 68,560,000 | | PPG Industries, Inc., 6.650%, 3/15/2018 | | | 76,319,209 |
| | | | | | |
| | | | | | 124,705,427 |
| | | | | | |
| | | Collateralized Mortgage Obligations — 0.0% | | | |
| | 115,908 | | Wells Fargo Mortgage Backed Securities Trust, Series 2006-AR12, Class 1A1, 5.886%, 9/25/2036(b) | | | 84,707 |
| | | | | | |
| | | Commercial Mortgage-Backed Securities — 3.5% | | | |
| | 2,970,353 | | Bank of America-First Union NB Commercial Mortgage, Series 2001-3, Class A2, 5.464%, 4/11/2037 | | | 3,082,050 |
| | 8,100,000 | | Bear Stearns Commercial Mortgage Securities, Series 2007-PW15, Class A4, 5.331%, 2/11/2044 | | | 7,804,252 |
| | 62,975,000 | | Credit Suisse Mortgage Capital Certificates, Series 2007-C3, Class A4, 5.912%, 6/15/2039(b) | | | 56,727,483 |
| | 35,130,000 | | Credit Suisse Mortgage Capital Certificates, Series 2007-C4, Class A4, 5.998%, 9/15/2039(b) | | | 31,952,625 |
| | | | | | |
Principal
Amount (‡) | | Description | | Value (†) |
| | | | | | |
| | | Commercial Mortgage-Backed Securities — continued | | | |
| $ | 5,110,000 | | Credit Suisse Mortgage Capital Certificates, Series 2007-C5, Class A4, 5.695%, 9/15/2040 | | $ | 4,579,114 |
| | 58,950,000 | | Crown Castle Towers LLC, 6.113%, 1/15/2040 | | | 61,664,058 |
| | 24,057,000 | | Greenwich Capital Commercial Funding Corp., Series 2007-GG11, Class A4, 5.736%, 12/10/2049 | | | 23,384,657 |
| | 15,360,000 | | Greenwich Capital Commercial Funding Corp., Series 2007-GG9, Class A4, 5.444%, 3/10/2039 | | | 14,937,576 |
| | 20,220,000 | | JPMorgan Chase Commercial Mortgage Securities Corp., Series 2006-LDP6, Class A4, 5.475%, 4/15/2043 | | | 20,754,200 |
| | 8,930,000 | | JPMorgan Chase Commercial Mortgage Securities Corp., Series 2006-LDP7, Class A4, 6.064%, 4/15/2045(b) | | | 9,219,126 |
| | 60,634,099 | | JPMorgan Chase Commercial Mortgage Securities Corp., Series 2007-LD11, Class A4, 6.006%, 6/15/2049(b) | | | 58,141,898 |
| | 21,993,000 | | JPMorgan Chase Commercial Mortgage Securities Corp., Series 2007-LDPX, Class A3, 5.420%, 1/15/2049 | | | 21,187,014 |
| | 3,200,000 | | LB-UBS Commercial Mortgage Trust, Series 2006-C4, Class A4, 6.080%, 6/15/2038(b) | | | 3,362,148 |
| | 1,340,000 | | Merrill Lynch/Countrywide Commercial Mortgage Trust, Series 2007-6, Class A4, 5.485%, 3/12/2051 | | | 1,228,510 |
| | 12,700,000 | | Morgan Stanley Capital I, Series 2008-T29, Class A4, 6.458%, 1/11/2043(b) | | | 13,377,668 |
| | 3,700,000 | | Wachovia Bank Commercial Mortgage Trust, Series 2006-C29, Class A4, 5.308%, 11/15/2048 | | | 3,673,467 |
| | | | | | |
| | | | | | 335,075,846 |
| | | | | | |
| | | Construction Machinery — 0.3% | | | |
| | 24,153,000 | | Case New Holland, Inc., 7.750%, 9/01/2013, 144A | | | 25,058,737 |
| | 6,935,000 | | Toro Co., 6.625%, 5/01/2037(c) | | | 6,119,923 |
| | | | | | |
| | | | | | 31,178,660 |
| | | | | | |
| | | Consumer Cyclical Services — 0.9% | | | |
| | 15,350,000 | | Western Union Co. (The), 5.930%, 10/01/2016 | | | 16,975,412 |
| | 40,000,000 | | Western Union Co. (The), 6.500%, 2/26/2014 | | | 45,109,840 |
| | 19,330,000 | | Western Union. (The), 6.200%, 11/17/2036 | | | 19,658,107 |
| | | | | | |
| | | | | | 81,743,359 |
| | | | | | |
| | | Consumer Products — 0.2% | | | |
| | 7,620,000 | | Hasbro, Inc., 6.600%, 7/15/2028 | | | 7,748,877 |
| | 12,010,000 | | Snap-on, Inc., 6.700%, 3/01/2019 | | | 12,743,955 |
| | 1,335,000 | | Whirlpool Corp., MTN, 8.000%, 5/01/2012 | | | 1,467,245 |
| | 800,000 | | Whirlpool Corp., MTN, 8.600%, 5/01/2014 | | | 928,430 |
| | | | | | |
| | | | | | 22,888,507 |
| | | | | | |
See accompanying notes to financial statements.
7
LOOMIS SAYLES INVESTMENT GRADE BOND FUND — PORTFOLIOOF INVESTMENTS (continued)
Investments as of March 31, 2010 (Unaudited)
| | | | | | |
Principal
Amount (‡) | | Description | | Value (†) |
| | | | | | |
| | | Distributors — 0.9% | | | |
| $ | 10,000,000 | | EQT Corp., 8.125%, 6/01/2019 | | $ | 11,880,390 |
| | 61,345,000 | | Equitable Resources, Inc., 6.500%, 4/01/2018 | | | 66,157,577 |
| | 5,865,000 | | ONEOK, Inc., 6.000%, 6/15/2035 | | | 5,595,990 |
| | | | | | |
| | | | | | 83,633,957 |
| | | | | | |
| | | Diversified Manufacturing — 0.9% | | | |
| | 1,425,000 | | Ingersoll-Rand Global Holding Co. Ltd., 6.875%, 8/15/2018 | | | 1,602,491 |
| | 2,875,000 | | Textron Financial Corp., 5.400%, 4/28/2013 | | | 2,954,008 |
| | 1,207,000 | | Textron Financial Corp., Series E, MTN, 5.125%, 8/15/2014 | | | 1,148,728 |
| | 19,200,000 | | Textron, Inc., 3.875%, 3/11/2013, (EUR) | | | 25,581,104 |
| | 18,895,000 | | Textron, Inc., 6.200%, 3/15/2015 | | | 20,012,923 |
| | 13,540,000 | | Textron, Inc., 7.250%, 10/01/2019 | | | 14,628,480 |
| | 11,280,000 | | Textron, Inc., EMTN, 6.625%, 4/07/2020, (GBP) | | | 15,833,585 |
| | | | | | |
| | | | | | 81,761,319 |
| | | | | | |
| | | Electric — 3.2% | | | |
| | 40,400,000 | | AmerenEnergy Generating Co., Series H, 7.000%, 4/15/2018 | | | 43,119,970 |
| | 500,000 | | Baltimore Gas & Electric Co., 5.200%, 6/15/2033 | | | 440,719 |
| | 12,021,175 | | Bruce Mansfield Unit, 6.850%, 6/01/2034(c) | | | 12,194,761 |
| | 17,815,000 | | Cleveland Electric Illuminating Co. (The), 5.700%, 4/01/2017 | | | 18,614,092 |
| | 26,290,000 | | Cleveland Electric Illuminating Co. (The), 5.950%, 12/15/2036 | | | 25,213,477 |
| | 895,000 | | Commonwealth Edison Co., 4.700%, 4/15/2015 | | | 941,560 |
| | 5,500,000 | | Empresa Nacional de Electricidad SA (Endesa-Chile), 7.875%, 2/01/2027 | | | 6,029,749 |
| | 1,000,000 | | Empresa Nacional de Electricidad SA (Endesa-Chile), 8.350%, 8/01/2013 | | | 1,140,088 |
| | 3,681,000 | | Exelon Corp., 4.900%, 6/15/2015 | | | 3,836,471 |
| | 47,570,000 | | Illinois Power Co., 6.250%, 4/01/2018 | | | 50,694,588 |
| | 1,905,000 | | ITC Holdings Corp., 5.875%, 9/30/2016, 144A | | | 1,987,429 |
| | 2,830,000 | | ITC Holdings Corp., 6.375%, 9/30/2036, 144A | | | 2,832,836 |
| | 9,305,213 | | Mackinaw Power LLC, 6.296%, 10/31/2023, 144A | | | 9,299,164 |
| | 14,090,000 | | NiSource Finance Corp., 6.125%, 3/01/2022 | | | 14,700,590 |
| | 24,635,000 | | NiSource Finance Corp., 6.400%, 3/15/2018 | | | 26,413,918 |
| | 22,085,000 | | NiSource Finance Corp., 6.800%, 1/15/2019 | | | 24,009,001 |
| | 1,565,000 | | Ohio Edison Co., 6.875%, 7/15/2036 | | | 1,686,619 |
| | | | | | |
Principal
Amount (‡) | | Description | | Value (†) |
| | | | | | |
| | | Electric — continued | | | |
| $ | 33,250 | | Quezon Power Philippines Co., 8.860%, 6/15/2017 | | $ | 33,749 |
| | 51,115,000 | | Southwestern Electric Power Co., 6.450%, 1/15/2019 | | | 55,069,563 |
| | 500,000 | | SP Powerassets Ltd., EMTN, 3.730%, 10/22/2010, (SGD) | | | 362,645 |
| | 7,165,000 | | Toledo Edison Co., 6.150%, 5/15/2037 | | | 7,223,996 |
| | 1,075,000 | | White Pine Hydro LLC, 6.310%, 7/10/2017(c) | | | 1,049,254 |
| | 1,600,000 | | White Pine Hydro LLC, 6.960%, 7/10/2037(c) | | | 1,435,648 |
| | | | | | |
| | | | | | 308,329,887 |
| | | | | | |
| | | Entertainment — 0.1% | | | |
| | 4,300,000 | | Time Warner, Inc., 6.625%, 5/15/2029 | | | 4,533,838 |
| | 505,000 | | Time Warner, Inc., 7.625%, 4/15/2031 | | | 576,771 |
| | 330,000 | | Time Warner, Inc., 7.700%, 5/01/2032 | | | 380,877 |
| | 3,695,000 | | Viacom, Inc., 6.125%, 10/05/2017 | | | 3,994,675 |
| | 2,655,000 | | Viacom, Inc., 6.250%, 4/30/2016 | | | 2,933,263 |
| | | | | | |
| | | | | | 12,419,424 |
| | | | | | |
| | | Financial Other — 0.8% | | | |
| | 45,970,000 | | Cantor Fitzgerald LP, 7.875%, 10/15/2019, 144A(c) | | | 46,068,744 |
| | 27,500,000 | | National Life Insurance Co., 10.500%, 9/15/2039, 144A | | | 29,435,752 |
| | | | | | |
| | | | | | 75,504,496 |
| | | | | | |
| | | Food & Beverage — 0.2% | | | |
| | 6,845,000 | | Anheuser-Busch Cos., Inc., 5.950%, 1/15/2033 | | | 6,802,055 |
| | 2,500,000 | | Cargill, Inc., EMTN, 5.375%, 3/02/2037, (GBP) | | | 3,390,366 |
| | 1,525,000 | | Cia Brasileira de Bebidas, 8.750%, 9/15/2013 | | | 1,801,406 |
| | 8,630,000 | | Corn Products International, Inc., 6.625%, 4/15/2037 | | | 8,199,458 |
| | | | | | |
| | | | | | 20,193,285 |
| | | | | | |
| | | Government Guaranteed — 0.1% | | | |
| | 13,500,000 | | Instituto de Credito Oficial, MTN, 6.125%, 2/27/2014, (AUD) | | | 12,060,259 |
| | | | | | |
| | | Government Owned - No Guarantee — 4.3% | | | |
| | 3,820,000 | | Abu Dhabi National Energy Co., 6.500%, 10/27/2036, 144A | | | 3,570,386 |
| | 37,780,000 | | Abu Dhabi National Energy Co., 7.250%, 8/01/2018, 144A | | | 40,722,835 |
| | 56,020,000 | | DP World Ltd., 6.850%, 7/02/2037, 144A | | | 48,105,102 |
| | 101,460,000 | | Federal Home Loan Mortgage Corp., 2.125%, 9/21/2012 | | | 103,053,125 |
| | 132,280,000 | | Federal National Mortgage Association, 1.375%, 4/28/2011 | | | 133,342,473 |
| | 67,635,000 | | Federal National Mortgage Association, 1.625%, 4/15/2013 | | | 67,242,379 |
See accompanying notes to financial statements.
8
LOOMIS SAYLES INVESTMENT GRADE BOND FUND — PORTFOLIOOF INVESTMENTS (continued)
Investments as of March 31, 2010 (Unaudited)
| | | | | | |
Principal
Amount (‡) | | Description | | Value (†) |
| | | | | | |
| | | Government Owned - No Guarantee — continued | | | |
| $ | 15,500,000 | | Korea Gas Corp., 6.000%, 7/15/2014, 144A | | $ | 16,858,312 |
| | 1,000,000 | | Telekom Malaysia Berhad, 7.875%, 8/01/2025, 144A | | | 1,216,326 |
| | | | | | |
| | | | | | 414,110,938 |
| | | | | | |
| | | Government Sponsored — 0.9% | | | |
| | 67,635,000 | | Federal Home Loan Bank, 1.625%, 9/26/2012 | | | 67,849,809 |
| | 24,230,000 | | Queensland Treasury Corp., 7.125%, 9/18/2017, (NZD), 144A | | | 18,190,112 |
| | | | | | |
| | | | | | 86,039,921 |
| | | | | | |
| | | Health Insurance — 0.8% | | | |
| | 5,455,000 | | CIGNA Corp., 6.150%, 11/15/2036 | | | 5,317,839 |
| | 1,355,000 | | CIGNA Corp., 6.350%, 3/15/2018 | | | 1,459,660 |
| | 1,603,000 | | CIGNA Corp., 7.875%, 5/15/2027 | | | 1,785,707 |
| | 3,650,000 | | CIGNA Corp., 8.500%, 5/01/2019 | | | 4,424,709 |
| | 1,200,000 | | CIGNA Corp., (Step to 8.080% on 1/15/2023), 8.300%, 1/15/2033(d) | | | 1,345,069 |
| | 24,830,000 | | UnitedHealth Group, Inc., 5.800%, 3/15/2036 | | | 23,252,476 |
| | 565,000 | | UnitedHealth Group, Inc., 6.500%, 6/15/2037 | | | 574,367 |
| | 4,556,000 | | UnitedHealth Group, Inc., 6.625%, 11/15/2037 | | | 4,736,017 |
| | 2,567,000 | | UnitedHealth Group, Inc., 6.875%, 2/15/2038 | | | 2,736,165 |
| | 27,070,000 | | WellPoint, Inc., 6.375%, 6/15/2037 | | | 27,793,987 |
| | | | | | |
| | | | | | 73,425,996 |
| | | | | | |
| | | Healthcare — 1.4% | | | |
| | 7,860,000 | | Boston Scientific Corp., 6.000%, 1/15/2020 | | | 7,425,271 |
| | 7,535,000 | | Covidien International Finance SA, 6.000%, 10/15/2017 | | | 8,263,220 |
| | 17,795,000 | | Express Scripts, Inc., 6.250%, 6/15/2014 | | | 19,715,668 |
| | 10,730,000 | | Express Scripts, Inc., 7.250%, 6/15/2019 | | | 12,422,046 |
| | 9,480,000 | | HCA, Inc., 5.750%, 3/15/2014 | | | 8,946,750 |
| | 1,950,000 | | HCA, Inc., 6.250%, 2/15/2013 | | | 1,935,375 |
| | 3,930,000 | | HCA, Inc., 6.300%, 10/01/2012 | | | 3,925,088 |
| | 3,810,000 | | HCA, Inc., 6.375%, 1/15/2015 | | | 3,619,500 |
| | 4,015,000 | | HCA, Inc., 6.500%, 2/15/2016 | | | 3,809,231 |
| | 365,000 | | HCA, Inc., 6.750%, 7/15/2013 | | | 365,000 |
| | 3,000,000 | | HCA, Inc., 7.050%, 12/01/2027 | | | 2,565,000 |
| | 2,290,000 | | HCA, Inc., 7.190%, 11/15/2015 | | | 2,164,050 |
| | | | | | |
Principal
Amount (‡) | | Description | | Value (†) |
| | | | | | |
| | | Healthcare — continued | | | |
| $ | 2,155,000 | | HCA, Inc., 7.500%, 12/15/2023 | | $ | 1,971,825 |
| | 1,310,000 | | HCA, Inc., 7.500%, 11/06/2033 | | | 1,139,700 |
| | 3,890,000 | | HCA, Inc., 7.690%, 6/15/2025 | | | 3,598,250 |
| | 4,255,000 | | HCA, Inc., 8.360%, 4/15/2024 | | | 4,031,613 |
| | 1,225,000 | | HCA, Inc., MTN, 7.580%, 9/15/2025 | | | 1,108,625 |
| | 3,135,000 | | HCA, Inc., MTN, 7.750%, 7/15/2036 | | | 2,758,800 |
| | 2,865,000 | | Hospira, Inc., 6.050%, 3/30/2017 | | | 3,077,216 |
| | 29,930,000 | | Medco Health Solutions, Inc., 7.125%, 3/15/2018 | | | 34,123,552 |
| | 2,305,000 | | Owens & Minor, Inc., 6.350%, 4/15/2016(c) | | | 2,214,418 |
| | | | | | |
| | | | | | 129,180,198 |
| | | | | | |
| | | Home Construction — 0.4% | | | |
| | 3,685,000 | | D.R. Horton, Inc., 5.250%, 2/15/2015 | | | 3,556,025 |
| | 2,050,000 | | Desarrolladora Homex SAB de CV, 7.500%, 9/28/2015 | | | 2,080,750 |
| | 20,035,000 | | Masco Corp., 7.125%, 3/15/2020 | | | 20,238,936 |
| | 2,601,000 | | Pulte Group, Inc., 5.200%, 2/15/2015 | | | 2,493,709 |
| | 9,400,000 | | Pulte Group, Inc., 6.000%, 2/15/2035 | | | 7,285,000 |
| | 3,645,000 | | Pulte Group, Inc., 6.375%, 5/15/2033 | | | 2,916,000 |
| | 3,605,000 | | Toll Brothers Finance Corp., 5.150%, 5/15/2015 | | | 3,597,350 |
| | | | | | |
| | | | | | 42,167,770 |
| | | | | | |
| | | Independent Energy — 0.9% | | | |
| | 15,680,000 | | Anadarko Petroleum Corp., 6.450%, 9/15/2036 | | | 15,980,115 |
| | 1,940,000 | | Chesapeake Energy Corp., 6.250%, 1/15/2017, (EUR) | | | 2,541,654 |
| | 600,000 | | Questar Market Resources, Inc., 6.050%, 9/01/2016 | | | 641,928 |
| | 48,640,000 | | Questar Market Resources, Inc., 6.800%, 4/01/2018 | | | 53,239,982 |
| | 3,585,000 | | Talisman Energy, Inc., 5.850%, 2/01/2037 | | | 3,436,499 |
| | 10,865,000 | | Talisman Energy, Inc., 6.250%, 2/01/2038 | | | 11,055,865 |
| | | | | | |
| | | | | | 86,896,043 |
| | | | | | |
| | | Integrated Energy — 0.3% | | | |
| | 21,450,000 | | Marathon Oil Corp., 7.500%, 2/15/2019 | | | 24,758,019 |
| | 1,186,207 | | PF Export Receivables Master Trust, Series A, 6.436%, 6/01/2015, 144A | | | 1,209,931 |
| | | | | | |
| | | | | | 25,967,950 |
| | | | | | |
See accompanying notes to financial statements.
9
LOOMIS SAYLES INVESTMENT GRADE BOND FUND — PORTFOLIOOF INVESTMENTS (continued)
Investments as of March 31, 2010 (Unaudited)
| | | | | | |
Principal
Amount (‡) | | Description | | Value (†) |
| | | | | | |
| | | Life Insurance — 0.4% | | | |
| $ | 8,315,000 | | American International Group, Inc., Series G, MTN, 5.850%, 1/16/2018 | | $ | 7,726,015 |
| | 2,080,000 | | American International Group, Inc., Series MP, GMTN, 5.450%, 5/18/2017 | | | 1,913,484 |
| | 9,990,000 | | ASIF III Jersey Ltd., Series 2003-G, EMTN, 4.750%, 9/11/2013, (EUR) | | | 13,267,476 |
| | 9,260,000 | | Mutual of Omaha Insurance Co., 6.800%, 6/15/2036, 144A | | | 8,029,522 |
| | 4,835,000 | | Unum Group, 7.125%, 9/30/2016 | | | 5,255,819 |
| | | | | | |
| | | | | | 36,192,316 |
| | | | | | |
| | | Local Authorities — 0.5% | | | |
| | 220,000 | | Alberta Municipal Funding Corp., 5.700%, 9/01/2011, (CAD) | | | 229,422 |
| | 7,070,000 | | Manitoba (Province of), GMTN, 6.375%, 9/01/2015, (NZD) | | | 5,155,171 |
| | 23,219 | | Province of Alberta, 5.930%, 9/16/2016, (CAD) | | | 25,441 |
| | 500,000 | | Province of Nova Scotia, 6.600%, 6/01/2027, (CAD) | | | 594,585 |
| | 30,440,000 | | Quebec Province, Series QC, 6.750%, 11/09/2015, (NZD) | | | 22,517,942 |
| | 19,325,000 | | Queensland Treasury Corp., Series 11G, 6.000%, 6/14/2011, (AUD) | | | 17,966,997 |
| | | | | | |
| | | | | | 46,489,558 |
| | | | | | |
| | | Lodging — 0.4% | | | |
| | 10,690,000 | | Wyndham Worldwide Corp., 6.000%, 12/01/2016 | | | 10,589,984 |
| | 22,590,000 | | Wyndham Worldwide Corp., 7.375%, 3/01/2020 | | | 22,895,349 |
| | | | | | |
| | | | | | 33,485,333 |
| | | | | | |
| | | Media Cable — 1.7% | | | |
| | 10,978,000 | | Comcast Corp., 5.650%, 6/15/2035 | | | 10,163,575 |
| | 420,000 | | Comcast Corp., 6.450%, 3/15/2037 | | | 427,714 |
| | 3,235,000 | | Comcast Corp., 6.500%, 11/15/2035 | | | 3,313,533 |
| | 32,715,000 | | Comcast Corp., 6.950%, 8/15/2037 | | | 35,391,676 |
| | 4,100,000 | | Cox Communications, Inc., Class A, 6.250%, 6/01/2018, 144A | | | 4,360,374 |
| | 18,220,000 | | Shaw Communications, Inc., 5.650%, 10/01/2019, (CAD) | | | 18,467,203 |
| | 4,190,000 | | Time Warner Cable, Inc., 5.850%, 5/01/2017 | | | 4,486,447 |
| | 79,880,000 | | Time Warner Cable, Inc., 6.750%, 7/01/2018 | | | 89,254,797 |
| | 73,560 | | Virgin Media Finance PLC, 9.750%, 4/15/2014, (GBP) | | | 115,255 |
| | | | | | |
| | | | | | 165,980,574 |
| | | | | | |
| | | Media Non-Cable — 0.3% | | | |
| | 4,580,000 | | News America Holdings, 8.150%, 10/17/2036 | | | 5,334,839 |
| | 7,700,000 | | News America, Inc., 6.150%, 3/01/2037 | | | 7,589,898 |
| | | | | | |
Principal
Amount (‡) | | Description | | Value (†) |
| | | | | | |
| | | Media Non-Cable — continued | | | |
| $ | 4,095,000 | | News America, Inc., 6.200%, 12/15/2034 | | $ | 4,084,275 |
| | 8,890,000 | | News America, Inc., 6.400%, 12/15/2035 | | | 9,078,041 |
| | | | | | |
| | | | | | 26,087,053 |
| | | | | | |
| | | Metals & Mining — 0.6% | | | |
| | 5,170,000 | | Alcoa, Inc., 5.870%, 2/23/2022 | | | 4,750,356 |
| | 5,625,000 | | Alcoa, Inc., 5.950%, 2/01/2037 | | | 4,612,089 |
| | 5,930,000 | | Alcoa, Inc., 6.750%, 1/15/2028 | | | 5,485,369 |
| | 3,250,000 | | Rio Tinto Alcan, Inc., 5.750%, 6/01/2035 | | | 3,182,056 |
| | 1,500,000 | | Teck Cominco Ltd., 7.000%, 9/15/2012 | | | 1,614,375 |
| | 1,985,000 | | United States Steel Corp., 6.050%, 6/01/2017 | | | 1,910,563 |
| | 4,712,000 | | United States Steel Corp., 6.650%, 6/01/2037 | | | 4,052,320 |
| | 31,890,000 | | United States Steel Corp., 7.000%, 2/01/2018 | | | 31,411,650 |
| | 3,735,000 | | Vale Overseas Ltd., 6.875%, 11/21/2036 | | | 3,864,044 |
| | | | | | |
| | | | | | 60,882,822 |
| | | | | | |
| | | Mortgage Related — 0.0% | | | |
| | 139,523 | | FHLMC, 5.000%, 12/01/2031 | | | 145,180 |
| | 23,793 | | FNMA, 6.000%, 7/01/2029 | | | 25,894 |
| | | | | | |
| | | | | | 171,074 |
| | | | | | |
| | | Non-Captive Consumer — 2.1% | | | |
| | 5,000,000 | | American General Finance Corp., Series I, MTN, 5.400%, 12/01/2015 | | | 4,310,600 |
| | 88,895,000 | | American General Finance Corp., Series J, MTN, 6.900%, 12/15/2017 | | | 77,863,931 |
| | 25,000,000 | | HSBC Finance Corp., 6.375%, 11/27/2012 | | | 27,262,250 |
| | 63,775(†††) | | SLM Corp., 6.000%, 12/15/2043 | | | 1,135,035 |
| | 6,200,000 | | SLM Corp., EMTN, 4.750%, 3/17/2014, (EUR) | | | 7,766,915 |
| | 6,480,000 | | SLM Corp., MTN, 5.050%, 11/14/2014 | | | 5,996,495 |
| | 355,000 | | SLM Corp., MTN, 5.125%, 8/27/2012 | | | 352,746 |
| | 655,000 | | SLM Corp., MTN, 8.000%, 3/25/2020 | | | 637,812 |
| | 4,900,000 | | SLM Corp., Series A, MTN, 0.549%, 1/27/2014(b) | | | 4,239,318 |
| | 155,000 | | SLM Corp., Series A, MTN, 4.500%, 7/26/2010 | | | 155,713 |
| | 9,425,000 | | SLM Corp., Series A, MTN, 5.000%, 10/01/2013 | | | 9,004,259 |
| | 6,690,000 | | SLM Corp., Series A, MTN, 5.000%, 4/15/2015 | | | 6,091,519 |
| | 2,000,000 | | SLM Corp., Series A, MTN, 5.000%, 6/15/2018 | | | 1,650,232 |
See accompanying notes to financial statements.
10
LOOMIS SAYLES INVESTMENT GRADE BOND FUND — PORTFOLIOOF INVESTMENTS (continued)
Investments as of March 31, 2010 (Unaudited)
| | | | | | |
Principal
Amount (‡) | | Description | | Value (†) |
| | | | | | |
| | | Non-Captive Consumer — continued | | | |
| $ | 6,275,000 | | SLM Corp., Series A, MTN, 5.375%, 1/15/2013 | | $ | 6,197,485 |
| | 5,485,000 | | SLM Corp., Series A, MTN, 5.375%, 5/15/2014 | | | 5,195,332 |
| | 300,000 | | SLM Corp., Series A, MTN, 5.400%, 10/25/2011 | | | 302,815 |
| | 690,000 | | SLM Corp., Series A, MTN, 5.625%, 8/01/2033 | | | 532,421 |
| | 7,590,000 | | SLM Corp., Series A, MTN, 6.500%, 6/15/2010, (NZD)(c) | | | 5,392,596 |
| | 31,335,000 | | SLM Corp., Series A, MTN, 8.450%, 6/15/2018 | | | 31,690,997 |
| | | | | | |
| | | | | | 195,778,471 |
| | | | | | |
| | | Non-Captive Diversified — 2.9% | | | |
| | 4,602,472 | | CIT Group, Inc., 7.000%, 5/01/2013 | | | 4,475,904 |
| | 6,903,711 | | CIT Group, Inc., 7.000%, 5/01/2014 | | | 6,524,007 |
| | 6,903,710 | | CIT Group, Inc., 7.000%, 5/01/2015 | | | 6,437,710 |
| | 11,506,193 | | CIT Group, Inc., 7.000%, 5/01/2016 | | | 10,614,463 |
| | 16,108,672 | | CIT Group, Inc., 7.000%, 5/01/2017 | | | 14,860,250 |
| | 36,465,000 | | GATX Corp., 4.750%, 10/01/2012 | | | 38,062,349 |
| | 7,515,000 | | General Electric Capital Australia Funding Pty Ltd., EMTN, 8.000%, 2/13/2012, (AUD) | | | 7,133,968 |
| | 7,730,000 | | General Electric Capital Australia Funding Pty, MTN, 6.000%, 5/15/2013, (AUD) | | | 6,861,033 |
| | 1,915,000 | | General Electric Capital Australia Funding Pty, MTN, 6.000%, 3/15/2019, (AUD) | | | 1,518,708 |
| | 990,000 | | General Electric Capital Corp., 5.625%, 5/01/2018 | | | 1,034,562 |
| | 915,000 | | General Electric Capital Corp., EMTN, 9.000%, 1/04/2011, (NZD) | | | 672,216 |
| | 4,775,000 | | General Electric Capital Corp., MTN, 5.875%, 1/14/2038 | | | 4,539,826 |
| | 14,535,000 | | General Electric Capital Corp., Series A, EMTN, 6.750%, 9/26/2016, (NZD) | | | 10,354,857 |
| | 6,200,000 | | General Electric Capital Corp., Series A, GMTN, 2.960%, 5/18/2012, (SGD) | | | 4,442,368 |
| | 13,400,000 | | General Electric Capital Corp., Series A, GMTN, 3.485%, 3/08/2012, (SGD) | | | 9,698,058 |
| | 37,650,000 | | General Electric Capital Corp., Series A, GMTN, 7.625%, 12/10/2014, (NZD) | | | 28,254,864 |
| | 10,470,000 | | General Electric Capital Corp., Series A, MTN, 0.551%, 5/13/2024(b) | | | 8,847,956 |
| | 17,060,000 | | General Electric Capital Corp., Series A, MTN, 4.875%, 3/04/2015 | | | 17,927,023 |
| | 27,137,000 | | General Electric Capital Corp., Series A, MTN, 6.500%, 9/28/2015, (NZD) | | | 19,303,482 |
| | 1,345,000 | | GMAC, Inc., 6.000%, 12/15/2011 | | | 1,345,161 |
| | 1,310,000 | | GMAC, Inc., 6.625%, 5/15/2012 | | | 1,317,722 |
| | 1,670,000 | | GMAC, Inc., 6.750%, 12/01/2014 | | | 1,659,484 |
| | | | | | |
Principal
Amount (‡) | | Description | | Value (†) |
| | | | | | |
| | | Non-Captive Diversified — continued | | | |
| $ | 1,500,000 | | GMAC, Inc., 6.875%, 9/15/2011 | | $ | 1,520,859 |
| | 400,000 | | GMAC, Inc., 6.875%, 8/28/2012 | | | 404,520 |
| | 1,210,000 | | GMAC, Inc., 7.000%, 2/01/2012 | | | 1,229,107 |
| | 3,142,000 | | GMAC, Inc., 7.500%, 12/31/2013 | | | 3,196,985 |
| | 5,664,000 | | GMAC, Inc., 8.000%, 12/31/2018 | | | 5,579,040 |
| | 2,335,000 | | GMAC, Inc., 8.000%, 11/01/2031 | | | 2,220,221 |
| | 5,045,000 | | GMAC, Inc., EMTN, 5.375%, 6/06/2011, (EUR) | | | 6,779,961 |
| | 380,000 | | GMAC, Inc., EMTN, 5.750%, 9/27/2010, (EUR) | | | 513,247 |
| | 2,930,000 | | International Lease Finance Corp., 5.000%, 4/15/2010 | | | 2,930,267 |
| | 2,285,000 | | International Lease Finance Corp., 5.000%, 9/15/2012 | | | 2,195,810 |
| | 6,660,000 | | International Lease Finance Corp., 5.125%, 11/01/2010 | | | 6,667,879 |
| | 16,795,000 | | International Lease Finance Corp., 6.375%, 3/25/2013 | | | 16,413,031 |
| | 655,000 | | International Lease Finance Corp., Series R, MTN, 5.550%, 9/05/2012 | | | 637,897 |
| | 2,755,000 | | International Lease Finance Corp., Series R, MTN, 5.625%, 9/15/2010 | | | 2,774,437 |
| | 1,505,000 | | International Lease Finance Corp., Series R, MTN, 5.625%, 9/20/2013 | | | 1,419,626 |
| | 1,660,000 | | International Lease Finance Corp., Series R, MTN, 5.650%, 6/01/2014 | | | 1,538,501 |
| | 5,225,000 | | iStar Financial, Inc., 5.150%, 3/01/2012 | | | 4,571,875 |
| | 1,000,000 | | iStar Financial, Inc., 5.375%, 4/15/2010 | | | 997,500 |
| | 330,000 | | iStar Financial, Inc., 5.500%, 6/15/2012 | | | 285,862 |
| | 3,700,000 | | iStar Financial, Inc., 5.650%, 9/15/2011 | | | 3,376,250 |
| | 765,000 | | iStar Financial, Inc., 5.800%, 3/15/2011 | | | 725,794 |
| | 385,000 | | iStar Financial, Inc., 5.850%, 3/15/2017 | | | 284,900 |
| | 1,605,000 | | iStar Financial, Inc., 5.875%, 3/15/2016 | | | 1,203,750 |
| | 745,000 | | iStar Financial, Inc., 6.050%, 4/15/2015 | | | 547,575 |
| | 535,000 | | iStar Financial, Inc., 8.625%, 6/01/2013 | | | 457,425 |
| | 335,000 | | iStar Financial, Inc., Series B, 5.125%, 4/01/2011 | | | 301,919 |
| | 254,000 | | iStar Financial, Inc., Series B, 5.700%, 3/01/2014 | | | 201,930 |
| | 5,680,000 | | iStar Financial, Inc., Series B, 5.950%, 10/15/2013 | | | 4,544,000 |
| | | | | | |
| | | | | | 279,406,139 |
| | | | | | |
See accompanying notes to financial statements.
11
LOOMIS SAYLES INVESTMENT GRADE BOND FUND — PORTFOLIOOF INVESTMENTS (continued)
Investments as of March 31, 2010 (Unaudited)
| | | | | | |
Principal
Amount (‡) | | Description | | Value (†) |
| | | | | | |
| | | Oil Field Services — 1.2% | | | |
| $ | 6,095,000 | | Nabors Industries, Inc., 6.150%, 2/15/2018 | | $ | 6,493,046 |
| | 52,565,000 | | Nabors Industries, Inc., 9.250%, 1/15/2019 | | | 65,384,500 |
| | 23,846,000 | | Rowan Cos., Inc., 7.875%, 8/01/2019 | | | 27,311,277 |
| | 600,000 | | Transocean Ltd., 7.375%, 4/15/2018 | | | 702,652 |
| | 5,905,000 | | Weatherford International Ltd., 6.500%, 8/01/2036 | | | 5,867,474 |
| | 1,680,000 | | Weatherford International Ltd., 6.800%, 6/15/2037 | | | 1,724,133 |
| | 5,405,000 | | Weatherford International Ltd., 7.000%, 3/15/2038 | | | 5,714,696 |
| | | | | | |
| | | | | | 113,197,778 |
| | | | | | |
| | | Paper — 1.7% | | | |
| | 4,460,000 | | Celulosa Arauco y Constitucion SA, 7.250%, 7/29/2019 | | | 4,792,582 |
| | 575,000 | | Georgia-Pacific LLC, 7.250%, 6/01/2028 | | | 569,250 |
| | 2,460,000 | | Georgia-Pacific LLC, 7.375%, 12/01/2025 | | | 2,447,700 |
| | 285,000 | | Georgia-Pacific LLC, 7.750%, 11/15/2029 | | | 285,000 |
| | 1,340,000 | | Georgia-Pacific LLC, 8.000%, 1/15/2024 | | | 1,420,400 |
| | 2,280,000 | | Georgia-Pacific LLC, 8.875%, 5/15/2031 | | | 2,473,800 |
| | 6,295,000 | | International Paper Co., 5.250%, 4/01/2016 | | | 6,336,245 |
| | 92,495,000 | | International Paper Co., 7.950%, 6/15/2018 | | | 108,065,701 |
| | 7,777,000 | | International Paper Co., 8.700%, 6/15/2038 | | | 9,607,278 |
| | 5,385,000 | | Mead Corp. (The), 7.550%, 3/01/2047 | | | 5,116,461 |
| | 22,860,000 | | Weyerhaeuser Co., 6.875%, 12/15/2033 | | | 20,325,512 |
| | | | | | |
| | | | | | 161,439,929 |
| | | | | | |
| | | Pharmaceuticals — 1.1% | | | |
| | 2,280,000 | | Elan Finance PLC/Elan Finance Corp., 8.875%, 12/01/2013 | | | 2,348,400 |
| | 90,000,000 | | Roche Holdings, Inc., 5.000%, 3/01/2014, 144A | | | 97,211,610 |
| | 500,000 | | Schering-Plough Corp., 5.300%, 12/01/2013 | | | 555,422 |
| | | | | | |
| | | | | | 100,115,432 |
| | | | | | |
| | | Pipelines — 3.4% | | | |
| | 5,350,000 | | CenterPoint Energy Resources Corp., 6.250%, 2/01/2037 | | | 5,202,436 |
| | 2,010,000 | | DCP Midstream LP, 6.450%, 11/03/2036, 144A | | | 1,992,961 |
| | 2,470,000 | | El Paso Corp., 6.950%, 6/01/2028 | | | 2,230,697 |
| | 1,000,000 | | El Paso Corp., 12.000%, 12/12/2013 | | | 1,170,000 |
| | 540,000 | | Energy Transfer Partners LP, 6.125%, 2/15/2017 | | | 580,360 |
| | | | | | |
Principal
Amount (‡) | | Description | | Value (†) |
| | | | | | |
| | | Pipelines — continued | | | |
| $ | 1,605,000 | | Energy Transfer Partners LP, 6.625%, 10/15/2036 | | $ | 1,615,977 |
| | 9,455,000 | | Enterprise Products Operating LLP, 6.300%, 9/15/2017 | | | 10,386,138 |
| | 3,400,000 | | Florida Gas Transmission Co., 7.900%, 5/15/2019, 144A | | | 4,050,872 |
| | 4,390,000 | | Kinder Morgan Energy Partners LP, 5.800%, 3/15/2035 | | | 4,126,029 |
| | 82,600,000 | | Kinder Morgan Energy Partners LP, 5.950%, 2/15/2018 | | | 88,592,217 |
| | 310,000 | | Kinder Morgan Finance Co., 5.700%, 1/05/2016 | | | 303,800 |
| | 32,448,172 | | Maritimes & Northeast Pipeline LLC, 7.500%, 5/31/2014, 144A(c) | | | 35,495,704 |
| | 9,080,000 | | NGPL PipeCo LLC, 6.514%, 12/15/2012, 144A | | | 9,961,904 |
| | 31,430,000 | | NGPL PipeCo LLC, 7.119%, 12/15/2017, 144A | | | 35,246,388 |
| | 4,665,000 | | ONEOK Partners LP, 6.650%, 10/01/2036 | | | 4,863,491 |
| | 10,115,000 | | Panhandle Eastern Pipeline Co., 6.200%, 11/01/2017 | | | 10,738,883 |
| | 48,630,000 | | Panhandle Eastern Pipeline Co., 7.000%, 6/15/2018 | | | 53,948,517 |
| | 1,435,000 | | Panhandle Eastern Pipeline Co., 8.125%, 6/01/2019 | | | 1,671,086 |
| | 2,130,000 | | Plains All American Pipeline LP, 6.125%, 1/15/2017 | | | 2,287,271 |
| | 16,025,000 | | Plains All American Pipeline LP, 6.500%, 5/01/2018 | | | 17,460,071 |
| | 4,595,000 | | Plains All American Pipeline LP, 6.650%, 1/15/2037 | | | 4,764,739 |
| | 4,215,000 | | Southern Natural Gas Co., 5.900%, 4/01/2017, 144A | | | 4,390,214 |
| | 20,000,000 | | Texas Eastern Transmission LP, 6.000%, 9/15/2017, 144A | | | 21,636,800 |
| | | | | | |
| | | | | | 322,716,555 |
| | | | | | |
| | | Property & Casualty Insurance — 0.8% | | | |
| | 3,150,000 | | Hanover Insurance Group, Inc., 7.500%, 3/01/2020 | | | 3,230,798 |
| | 3,460,000 | | Marsh & McLennan Cos., Inc., 5.375%, 7/15/2014 | | | 3,579,017 |
| | 12,652,000 | | Marsh & McLennan Cos., Inc., 5.750%, 9/15/2015 | | | 13,398,354 |
| | 31,010,000 | | Marsh & McLennan Cos., Inc., 5.875%, 8/01/2033 | | | 27,314,414 |
| | 965,000 | | MBIA Insurance Corp., (fixed rate to 1/15/2013, variable rate thereafter), 14.000%, 1/15/2033, 144A | | | 656,200 |
| | 2,950,000 | | White Mountains RE Group, 6.375%, 3/20/2017, 144A | | | 2,876,052 |
| | 4,830,000 | | Willis North America, Inc., 6.200%, 3/28/2017 | | | 4,893,234 |
| | 13,815,000 | | Willis North America, Inc., 7.000%, 9/29/2019 | | | 14,466,875 |
| | 2,260,000 | | XL Capital Ltd., 6.250%, 5/15/2027 | | | 2,130,879 |
| | 1,495,000 | | XL Capital Ltd., 6.375%, 11/15/2024 | | | 1,423,339 |
| | | | | | |
| | | | | | 73,969,162 |
| | | | | | |
See accompanying notes to financial statements.
12
LOOMIS SAYLES INVESTMENT GRADE BOND FUND — PORTFOLIOOF INVESTMENTS (continued)
Investments as of March 31, 2010 (Unaudited)
| | | | | | |
Principal
Amount (‡) | | Description | | Value (†) |
| | | | | | |
| | | Railroads — 0.4% | | | |
| $ | 2,390,000 | | Canadian Pacific Railway Co., 5.750%, 3/15/2033 | | $ | 2,254,432 |
| | 10,003,000 | | Canadian Pacific Railway Co., 5.950%, 5/15/2037 | | | 9,667,039 |
| | 10,000,000 | | Canadian Pacific Railway Co., 7.250%, 5/15/2019 | | | 11,360,410 |
| | 5,000,000 | | Canadian Pacific Railway Ltd., MTN, 4.900%, 6/15/2010, (CAD), 144A | | | 4,959,681 |
| | 5,670,000 | | CSX Corp., MTN, 6.000%, 10/01/2036 | | | 5,632,737 |
| | 243,000 | | Missouri Pacific Railroad Co., 4.750%, 1/01/2030(c) | | | 194,400 |
| | 1,738,000 | | Missouri Pacific Railroad Co., 5.000%, 1/01/2045(c) | | | 1,042,800 |
| | 195,000 | | Missouri Pacific Railroad Co., Series A, 4.750%, 1/01/2020(c) | | | 183,105 |
| | | | | | |
| | | | | | 35,294,604 |
| | | | | | |
| | | Refining — 0.0% | | | |
| | 3,740,000 | | Valero Energy Corp., 6.625%, 6/15/2037 | | | 3,556,949 |
| | | | | | |
| | | REITs — 2.7% | | | |
| | 12,510,000 | | Camden Property Trust, 5.000%, 6/15/2015 | | | 12,461,811 |
| | 16,850,000 | | Camden Property Trust, 5.700%, 5/15/2017 | | | 16,569,785 |
| | 1,153,000 | | Colonial Realty LP, 4.800%, 4/01/2011 | | | 1,135,521 |
| | 4,230,000 | | Duke Realty LP, 5.950%, 2/15/2017 | | | 4,158,746 |
| | 20,000,000 | | Duke Realty LP, 6.500%, 1/15/2018 | | | 19,999,040 |
| | 5,000,000 | | Equity One, Inc., 6.000%, 9/15/2017 | | | 4,839,965 |
| | 1,010,000 | | ERP Operating LP, 5.125%, 3/15/2016 | | | 1,038,669 |
| | 1,800,000 | | ERP Operating LP, 5.375%, 8/01/2016 | | | 1,862,411 |
| | 2,420,000 | | ERP Operating LP, 5.750%, 6/15/2017 | | | 2,501,235 |
| | 1,960,000 | | Federal Realty Investment Trust, 5.650%, 6/01/2016 | | | 1,958,667 |
| | 10,500,000 | | First Industrial LP, 5.950%, 5/15/2017 | | | 8,441,097 |
| | 21,270,000 | | Highwoods Properties, Inc., 5.850%, 3/15/2017 | | | 20,330,419 |
| | 11,552,000 | | Highwoods Properties, Inc., 7.500%, 4/15/2018 | | | 11,723,894 |
| | 3,957,000 | | ProLogis, 5.625%, 11/15/2015 | | | 3,923,148 |
| | 11,422,000 | | ProLogis, 5.625%, 11/15/2016 | | | 11,048,649 |
| | 11,126,000 | | ProLogis, 5.750%, 4/01/2016 | | | 10,898,874 |
| | 9,909,000 | | ProLogis, 6.625%, 5/15/2018 | | | 9,847,039 |
| | 19,280,000 | | ProLogis, 7.375%, 10/30/2019 | | | 19,791,344 |
| | 32,075,000 | | Realty Income Corp., 6.750%, 8/15/2019 | | | 33,472,091 |
| | | | | | |
Principal
Amount (‡) | | Description | | Value (†) |
| | | | | | |
| | | REITs — continued | | | |
| $ | 2,480,000 | | Simon Property Group LP, 5.250%, 12/01/2016 | | $ | 2,457,645 |
| | 2,040,000 | | Simon Property Group LP, 5.300%, 5/30/2013 | | | 2,158,565 |
| | 12,475,000 | | Simon Property Group LP, 5.750%, 12/01/2015 | | | 13,197,265 |
| | 1,930,000 | | Simon Property Group LP, 5.875%, 3/01/2017 | | | 1,994,118 |
| | 4,155,000 | | Simon Property Group LP, 6.100%, 5/01/2016 | | | 4,374,139 |
| | 36,980,000 | | WEA Finance LLC/WT Finance Australia Property Ltd., 6.750%, 9/02/2019, 144A | | | 39,460,766 |
| | | | | | |
| | | | | | 259,644,903 |
| | | | | | |
| | | Restaurants — 0.1% | | | |
| | 10,545,000 | | Darden Restaurants, Inc., 6.000%, 8/15/2035 | | | 9,930,364 |
| | 1,000,000 | | McDonald’s Corp., EMTN, 3.628%, 10/10/2010, (SGD) | | | 724,099 |
| | | | | | |
| | | | | | 10,654,463 |
| | | | | | |
| | | Retailers — 0.7% | | | |
| | 3,765,000 | | Home Depot, Inc. (The), 5.875%, 12/16/2036 | | | 3,653,658 |
| | 8,170,000 | | J.C. Penney Corp., Inc., 5.750%, 2/15/2018 | | | 8,180,212 |
| | 16,260,000 | | J.C. Penney Corp., Inc., 6.375%, 10/15/2036 | | | 15,142,125 |
| | 12,000 | | J.C. Penney Corp., Inc., 7.125%, 11/15/2023 | | | 12,105 |
| | 8,845,000 | | J.C. Penney Corp., Inc., 7.625%, 3/01/2097 | | | 8,004,725 |
| | 14,338,000 | | Macy’s Retail Holdings, Inc., 6.375%, 3/15/2037 | | | 13,190,960 |
| | 10,695,000 | | Macy’s Retail Holdings, Inc., 6.790%, 7/15/2027 | | | 9,625,500 |
| | 2,750,000 | | Macy’s Retail Holdings, Inc., 6.900%, 4/01/2029 | | | 2,612,500 |
| | 8,240,000 | | Marks & Spencer PLC, 7.125%, 12/01/2037, 144A | | | 8,346,914 |
| | | | | | |
| | | | | | 68,768,699 |
| | | | | | |
| | | Sovereigns — 2.1% | | | |
| | 438,500(††) | | Mexican Fixed Rate Bonds, Series M-10, 7.250%, 12/15/2016, (MXN) | | | 3,545,949 |
| | 4,200,900(††) | | Mexican Fixed Rate Bonds, Series M-20, 8.000%, 12/07/2023, (MXN) | | | 34,028,522 |
| | 380,000(††) | | Mexican Fixed Rate Bonds, Series MI-10, 9.000%, 12/20/2012, (MXN) | | | 3,307,395 |
| | 29,165,000 | | New South Wales Treasury Corp., Series 10RG, 7.000%, 12/01/2010, (AUD) | | | 27,230,310 |
| | 31,140,000 | | New South Wales Treasury Corp., Series 12RG, 6.000%, 5/01/2012, (AUD) | | | 28,956,679 |
| | 18,320,000 | | New South Wales Treasury Corp., Series 17RG, 5.500%, 3/01/2017, (AUD) | | | 16,379,298 |
| | 24,705,000 | | Republic of Brazil, 10.250%, 1/10/2028, (BRL) | | | 14,031,012 |
| | 6,285,000 | | Republic of Brazil, 12.500%, 1/05/2022, (BRL) | | | 4,126,149 |
| | 53,700,000 | | Republic of Croatia, 6.750%, 11/05/2019, 144A | | | 59,093,574 |
See accompanying notes to financial statements.
13
LOOMIS SAYLES INVESTMENT GRADE BOND FUND — PORTFOLIOOF INVESTMENTS (continued)
Investments as of March 31, 2010 (Unaudited)
| | | | | |
Principal
Amount (‡) | | Description | | Value (†) |
| | | | | |
| | Sovereigns — continued | | | |
| 793,200,000 | | Republic of Iceland, 7.250%, 5/17/2013, (ISK) | | $ | 3,517,670 |
| 424,400,000 | | Republic of Iceland, 8.000%, 7/22/2011, (ISK) | | | 1,888,894 |
| 1,344,917,000 | | Republic of Iceland, 13.750%, 12/10/2010, (ISK) | | | 6,138,903 |
| | | | | |
| | | | | 202,244,355 |
| | | | | |
| | Supermarkets — 0.2% | | | |
| 4,220,000 | | American Stores Co., Series B, MTN, 7.100%, 3/20/2028 | | | 3,397,100 |
| 3,340,000 | | Kroger Co., 6.400%, 8/15/2017 | | | 3,713,305 |
| 1,900,000 | | New Albertson’s, Inc., 7.450%, 8/01/2029 | | | 1,605,500 |
| 1,000,000 | | New Albertson’s, Inc., Series C, MTN, 6.625%, 6/01/2028 | | | 757,500 |
| 11,100,000 | | Safeway, Inc., 6.350%, 8/15/2017 | | | 12,294,094 |
| | | | | |
| | | | | 21,767,499 |
| | | | | |
| | Supranational — 1.3% | | | |
| 196,541,400,000 | | European Investment Bank, EMTN, Zero Coupon, 4/24/2013, (IDR), 144A | | | 17,642,180 |
| 28,694,000 | | European Investment Bank, EMTN, 7.000%, 1/18/2012, (NZD) | | | 21,336,000 |
| 336,380,000,000 | | Inter-American Development Bank, EMTN, Zero Coupon, 5/20/2013, (IDR) | | | 28,896,999 |
| 418,960,000,000 | | Inter-American Development Bank, EMTN, Zero Coupon, 9/23/2013, (IDR) | | | 34,922,926 |
| 13,265,000 | | Inter-American Development Bank, EMTN, 6.000%, 12/15/2017, (NZD) | | | 9,463,205 |
| 15,400,000 | | International Bank for Reconstruction & Development, 1.430%, 3/05/2014, (SGD) | | | 10,706,421 |
| 429,100,000 | | International Bank for Reconstruction & Development, 9.500%, 5/27/2010, (ISK) | | | 1,876,510 |
| | | | | |
| | | | | 124,844,241 |
| | | | | |
| | Technology — 3.4% | | | |
| 8,895,000 | | Agilent Technologies, Inc., 6.500%, 11/01/2017 | | | 9,610,238 |
| 4,700,000 | | Alcatel-Lucent USA, Inc., 6.450%, 3/15/2029 | | | 3,313,500 |
| 2,035,000 | | Arrow Electronics, Inc., 6.875%, 7/01/2013 | | | 2,248,425 |
| 1,050,000 | | Arrow Electronics, Inc., 6.875%, 6/01/2018 | | | 1,122,398 |
| 9,000,000 | | Avnet, Inc., 5.875%, 3/15/2014 | | | 9,594,522 |
| 6,230,000 | | Avnet, Inc., 6.000%, 9/01/2015 | | | 6,560,582 |
| 1,540,000 | | Avnet, Inc., 6.625%, 9/15/2016 | | | 1,646,411 |
| 12,715,000 | | BMC Software, Inc., 7.250%, 6/01/2018(c) | | | 13,958,514 |
| 13,750,000 | | Corning, Inc., 6.750%, 9/15/2013 | | | 15,261,235 |
| 1,480,000 | | Corning, Inc., 6.850%, 3/01/2029 | | | 1,540,711 |
| 58,825,000 | | Corning, Inc., 7.000%, 5/15/2024 | | | 63,030,517 |
| | | | | | |
Principal
Amount (‡) | | Description | | Value (†) |
| | | | | | |
| | | Technology — continued | | | |
| $ | 7,650,000 | | Corning, Inc., 7.250%, 8/15/2036 | | $ | 8,196,294 |
| | 56,440,000 | | Dun & Bradstreet Corp. (The), 6.000%, 4/01/2013 | | | 60,969,931 |
| | 7,205,000 | | Equifax, Inc., 7.000%, 7/01/2037 | | | 7,694,796 |
| | 330,000 | | Freescale Semiconductor, Inc., 10.125%, 12/15/2016 | | | 292,050 |
| | 7,965,000 | | Intuit, Inc., 5.750%, 3/15/2017 | | | 8,418,639 |
| | 45,430,000 | | KLA-Tencor Corp., 6.900%, 5/01/2018 | | | 49,281,283 |
| | 4,680,000 | | Motorola, Inc., 5.220%, 10/01/2097 | | | 3,209,315 |
| | 7,559,000 | | Motorola, Inc., 6.500%, 9/01/2025 | | | 7,340,394 |
| | 6,150,000 | | Motorola, Inc., 6.500%, 11/15/2028 | | | 5,773,380 |
| | 10,100,000 | | Motorola, Inc., 6.625%, 11/15/2037 | | | 9,478,971 |
| | 1,625,000 | | Motorola, Inc., 8.000%, 11/01/2011 | | | 1,755,798 |
| | 2,628,000 | | Samsung Electronics Co. Ltd., 7.700%, 10/01/2027, 144A | | | 2,877,124 |
| | 5,725,000 | | Tyco Electronics Group SA, 6.550%, 10/01/2017 | | | 6,298,565 |
| | 11,189,000 | | Xerox Capital Trust I, 8.000%, 2/01/2027 | | | 10,977,673 |
| | 782,000 | | Xerox Corp., 5.500%, 5/15/2012 | | | 829,469 |
| | 573,000 | | Xerox Corp., 6.350%, 5/15/2018 | | | 620,716 |
| | 7,265,000 | | Xerox Corp., 6.750%, 2/01/2017 | | | 8,020,923 |
| | | | | | |
| | | | | | 319,922,374 |
| | | | | | |
| | | Textile — 0.2% | | | |
| | 3,837,000 | | Phillips-Van Heusen Corp., 7.750%, 11/15/2023 | | | 3,826,958 |
| | 15,228,000 | | VF Corp., 6.450%, 11/01/2037 | | | 15,934,153 |
| | | | | | |
| | | | | | 19,761,111 |
| | | | | | |
| | | Tobacco — 0.1% | | | |
| | 2,175,000 | | Altria Group, Inc., 9.700%, 11/10/2018 | | | 2,674,443 |
| | 8,305,000 | | Reynolds American, Inc., 6.750%, 6/15/2017 | | | 8,895,353 |
| | 2,035,000 | | Reynolds American, Inc., 7.250%, 6/15/2037 | | | 2,071,239 |
| | | | | | |
| | | | | | 13,641,035 |
| | | | | | |
| | | Transportation Services — 0.7% | | | |
| | 8,620,000 | | Erac USA Finance Co., 6.375%, 10/15/2017, 144A | | | 9,326,435 |
| | 2,885,000 | | Erac USA Finance Co., 6.700%, 6/01/2034, 144A | | | 2,789,879 |
| | 52,626,000 | | Erac USA Finance Co., 7.000%, 10/15/2037, 144A | | | 54,254,406 |
| | | | | | |
| | | | | | 66,370,720 |
| | | | | | |
See accompanying notes to financial statements.
14
LOOMIS SAYLES INVESTMENT GRADE BOND FUND — PORTFOLIOOF INVESTMENTS (continued)
Investments as of March 31, 2010 (Unaudited)
| | | | | |
Principal
Amount (‡) | | Description | | Value (†) |
| | | | | |
| | Treasuries — 20.9% | | | |
| 154,833,000 | | Canadian Government, 1.000%, 9/01/2011, (CAD) | | $ | 151,692,588 |
| 1,265,000 | | Canadian Government, 1.250%, 12/01/2011, (CAD) | | | 1,239,156 |
| 367,850,000 | | Canadian Government, 2.000%, 9/01/2012, (CAD) | | | 361,902,974 |
| 26,235,000 | | Canadian Government, 2.750%, 12/01/2010, (CAD) | | | 26,187,213 |
| 39,109,000 | | Canadian Government, 3.500%, 6/01/2013, (CAD) | | | 39,816,362 |
| 229,170,000 | | Canadian Government, 3.750%, 6/01/2012, (CAD) | | | 234,506,356 |
| 198,720,000 | | Canadian Government, 3.750%, 6/01/2019, (CAD) | | | 198,271,943 |
| 4,250,000 | | Canadian Government, 4.000%, 6/01/2016, (CAD) | | | 4,391,102 |
| 187,955,000 | | Canadian Government, 4.250%, 6/01/2018, (CAD) | | | 195,233,364 |
| 310,490,000 | | Canadian Government, 5.250%, 6/01/2012, (CAD) | | | 327,413,868 |
| 9,600,000 | | Canadian Government, 5.500%, 6/01/2010, (CAD) | | | 9,529,488 |
| 12,530,000 | | New Zealand Government, 6.000%, 12/15/2017, (NZD) | | | 9,056,179 |
| 191,570,000 | | New Zealand Government, 6.500%, 4/15/2013, (NZD) | | | 143,457,354 |
| 742,220,000 | | Norwegian Government, 4.250%, 5/19/2017, (NOK) | | | 130,778,809 |
| 120,965,000 | | Norwegian Government, 5.000%, 5/15/2015, (NOK) | | | 22,100,516 |
| 199,940,000 | | Norwegian Government, 6.000%, 5/16/2011, (NOK) | | | 35,000,265 |
| 142,485,000 | | Norwegian Government, 6.500%, 5/15/2013, (NOK) | | | 26,645,836 |
| 80,000,000 | | U.S. Treasury Note, 3.125%, 5/15/2019 | | | 76,193,760 |
| | | | | |
| | | | | 1,993,417,133 |
| | | | | |
| | Wireless — 0.8% | | | |
| 32,100,000 | | Cellco Partnership/Verizon Wireless Capital LLC, 8.500%, 11/15/2018 | | | 40,049,854 |
| 8,650,000 | | Nextel Communications, Inc., Series D, 7.375%, 8/01/2015 | | | 8,217,500 |
| 1,220,000 | | Nextel Communications, Inc., Series E, 6.875%, 10/31/2013 | | | 1,189,500 |
| 15,710,000 | | Nextel Communications, Inc., Series F, 5.950%, 3/15/2014 | | | 14,649,575 |
| 6,512,000 | | Sprint Capital Corp., 6.875%, 11/15/2028 | | | 5,242,160 |
| 1,800,000 | | Sprint Capital Corp., 6.900%, 5/01/2019 | | | 1,647,000 |
| 625,000 | | Sprint Capital Corp., 8.750%, 3/15/2032 | | | 579,687 |
| 93,000 | | Sprint Nextel Corp., 6.000%, 12/01/2016 | | | 83,933 |
| 600,000 | | True Move Co. Ltd., 10.750%, 12/16/2013, 144A | | | 626,250 |
| 1,654,000 | | Vodafone Group PLC, 5.000%, 9/15/2015 | | | 1,749,872 |
| | | | | |
| | | | | 74,035,331 |
| | | | | |
| | | | | | |
Principal
Amount (‡) | | Description | | Value (†) |
| | | | | | |
| | | Wirelines — 3.8% | | | |
| $ | 19,610,000 | | AT&T Corp., 6.500%, 3/15/2029 | | $ | 19,936,958 |
| | 1,895,000 | | AT&T, Inc., 6.500%, 9/01/2037 | | | 1,964,999 |
| | 415,000 | | Bell Canada, MTN, 7.300%, 2/23/2032, (CAD) | | | 460,523 |
| | 3,250,000 | | Bell Canada, Series M-17, 6.100%, 3/16/2035, (CAD) | | | 3,208,785 |
| | 1,915,000 | | BellSouth Corp., 6.000%, 11/15/2034 | | | 1,848,806 |
| | 3,000,000 | | BellSouth Telecommunications, Inc., 5.850%, 11/15/2045 | | | 2,613,309 |
| | 6,810,000 | | BellSouth Telecommunications, Inc., 7.000%, 12/01/2095 | | | 6,792,675 |
| | 134,165,000 | | Deutsche Telekom International Finance BV, 6.000%, 7/08/2019 | | | 143,760,749 |
| | 3,350,000 | | GTE Corp., 6.940%, 4/15/2028 | | | 3,517,135 |
| | 65,000 | | Level 3 Financing, Inc., 8.750%, 2/15/2017 | | | 59,475 |
| | 560,000 | | Level 3 Financing, Inc., 9.250%, 11/01/2014 | | | 546,000 |
| | 2,700,000 | | New England Telephone & Telegraph, 7.875%, 11/15/2029 | | | 2,959,700 |
| | 1,735,000 | | Qwest Capital Funding, Inc., 6.500%, 11/15/2018 | | | 1,622,225 |
| | 2,815,000 | | Qwest Capital Funding, Inc., 6.875%, 7/15/2028 | | | 2,519,425 |
| | 4,465,000 | | Qwest Capital Funding, Inc., 7.625%, 8/03/2021 | | | 4,375,700 |
| | 970,000 | | Qwest Capital Funding, Inc., 7.750%, 2/15/2031 | | | 921,500 |
| | 340,000 | | Qwest Corp., 6.500%, 6/01/2017 | | | 354,025 |
| | 14,795,000 | | Qwest Corp., 6.875%, 9/15/2033 | | | 14,277,175 |
| | 890,000 | | Qwest Corp., 7.200%, 11/10/2026 | | | 856,625 |
| | 1,265,000 | | Qwest Corp., 7.250%, 9/15/2025 | | | 1,277,650 |
| | 4,295,000 | | Qwest Corp., 7.250%, 10/15/2035 | | | 4,144,675 |
| | 1,600,000 | | Qwest Corp., 7.500%, 6/15/2023 | | | 1,600,000 |
| | 17,170,000 | | Telecom Italia Capital SA, 4.875%, 10/01/2010 | | | 17,469,651 |
| | 11,215,000 | | Telecom Italia Capital SA, 6.000%, 9/30/2034 | | | 9,949,275 |
| | 4,180,000 | | Telecom Italia Capital SA, 6.375%, 11/15/2033 | | | 3,872,239 |
| | 14,445,000 | | Telus Corp., 4.950%, 3/15/2017, (CAD) | | | 14,650,372 |
| | 55,855,000 | | Telus Corp., Series CG, 5.050%, 12/04/2019, (CAD) | | | 55,094,978 |
| | 4,068,000 | | Verizon Communications, Inc., 5.850%, 9/15/2035 | | | 3,959,254 |
| | 3,676,000 | | Verizon Communications, Inc., 6.100%, 4/15/2018 | | | 4,021,070 |
| | 5,674,000 | | Verizon Maryland, Inc., 5.125%, 6/15/2033 | | | 4,619,192 |
See accompanying notes to financial statements.
15
LOOMIS SAYLES INVESTMENT GRADE BOND FUND — PORTFOLIOOF INVESTMENTS (continued)
Investments as of March 31, 2010 (Unaudited)
| | | | | | |
Principal
Amount (‡) | | Description | | Value (†) |
| | | | | | |
| | | Wirelines — continued | | | |
| $ | 14,540,000 | | Verizon New England, Inc., 6.500%, 9/15/2011 | | $ | 15,459,873 |
| | 7,047,000 | | Verizon New York, Inc., Series B, 7.375%, 4/01/2032 | | | 7,575,694 |
| | 5,375,000 | | Verizon Pennsylvania, Inc., 6.000%, 12/01/2028 | | | 4,810,599 |
| | | | | | |
| | | | | | 361,100,311 |
| | | | | | |
| | | Total Non-Convertible Bonds (Identified Cost $8,268,588,244) | | | 9,037,744,686 |
| | | | | | |
| | Convertible Bonds — 3.1% | | | |
| | | Automotive — 0.5% | | | |
| | 35,585,000 | | Ford Motor Co. 4.250%, 11/15/2016 | | | 53,244,056 |
| | | | | | |
| | | Media Non-Cable — 0.0% | | | |
| | 532,704 | | Liberty Media LLC, 3.500%, 1/15/2031 | | | 318,291 |
| | | | | | |
| | | Non-Captive Diversified — 0.1% | | | |
| | 9,920,000 | | iStar Financial, Inc., 0.751%, 10/01/2012(b) | | | 7,544,160 |
| | | | | | |
| | | Oil Field Services — 0.1% | | | |
| | 505,000 | | Transocean, Inc., Series B, 1.500%, 12/15/2037 | | | 493,006 |
| | 7,050,000 | | Transocean, Inc., Series C, 1.500%, 12/15/2037 | | | 6,750,375 |
| | | | | | |
| | | | | | 7,243,381 |
| | | | | | |
| | | REITs — 0.4% | | | |
| | 1,400,000 | | ERP Operating LP, 3.850%, 8/15/2026 | | | 1,407,000 |
| | 10,673,000 | | ProLogis, 1.875%, 11/15/2037 | | | 10,059,303 |
| | 4,070,000 | | ProLogis, 2.250%, 4/01/2037 | | | 3,958,075 |
| | 27,955,000 | | ProLogis, 3.250%, 3/15/2015 | | | 28,094,775 |
| | | | | | |
| | | | | | 43,519,153 |
| | | | | | |
| | | Technology — 1.8% | | | |
| | 1,405,000 | | Intel Corp., 2.950%, 12/15/2035 | | | 1,378,656 |
| | 140,000,000 | | Intel Corp., 3.250%, 8/01/2039, 144A | | | 167,825,000 |
| | | | | | |
| | | | | | 169,203,656 |
| | | | | | |
| | | Wireless — 0.1% | | | |
| | 5,200,000 | | NII Holdings, Inc., 3.125%, 6/15/2012 | | | 4,907,500 |
| | | | | | |
| | | Wirelines — 0.1% | | | |
| | 2,735,000 | | Level 3 Communications, Inc., 3.500%, 6/15/2012 | | | 2,519,619 |
| | 230,000 | | Level 3 Communications, Inc., 5.250%, 12/15/2011 | | | 223,962 |
| | 2,990,000 | | Level 3 Communications, Inc., 7.000%, 3/15/2015, 144A(c) | | | 3,573,050 |
| | | | | | |
| | | | | | 6,316,631 |
| | | | | | |
| | | Total Convertible Bonds (Identified Cost $244,916,195) | | | 292,296,828 |
| | | | | | |
| | | | | | |
Principal
Amount (‡) | | Description | | Value (†) |
| | | | | | |
| | Municipals — 0.5% | | | |
| | | California — 0.1% | | | |
| $ | 1,305,000 | | San Jose California Redevelopment Agency Tax Allocation (Merged Area Redevelopment), Series C, (MBIA insured), 3.750%, 8/01/2028 | | $ | 1,023,668 |
| | 480,000 | | San Jose California Redevelopment Agency Tax Allocation (Merged Area), Series C, (Registered), (MBIA insured), 3.750%, 8/01/2028 | | | 402,763 |
| | 1,620,000 | | State of California, (AMBAC insured), 4.500%, 8/01/2027 | | | 1,462,163 |
| | 4,515,000 | | State of California, 4.500%, 10/01/2029 | | | 3,955,230 |
| | 1,315,000 | | State of California, (AMBAC insured), 4.500%, 8/01/2030 | | | 1,144,313 |
| | 1,135,000 | | State of California, 4.500%, 8/01/2030 | | | 987,677 |
| | 840,000 | | State of California (Various Purpose), (MBIA insured), 3.250%, 12/01/2027 | | | 631,630 |
| | 3,965,000 | | State of California (Various Purpose), (AMBAC insured), 4.500%, 12/01/2033 | | | 3,360,179 |
| | | | | | |
| | | | | | 12,967,623 |
| | | | | | |
| | | District Of Columbia — 0.2% | | | |
| | 15,000,000 | | Metropolitan Washington Airports Authority, 7.462%, 10/01/2046 | | | 15,430,050 |
| | | | | | |
| | | Illinois — 0.0% | | | |
| | 540,000 | | Chicago O’Hare International Airport, Series A, (AGMC insured), 4.500%, 1/01/2038 | | | 511,310 |
| | | | | | |
| | | Michigan — 0.0% | | | |
| | 2,615,000 | | Michigan Tobacco Settlement Finance Authority, 7.309%, 6/01/2034(c) | | | 2,100,263 |
| | | | | | |
| | | Ohio — 0.1% | | | |
| | 6,570,000 | | Buckeye Tobacco Settlement Financing Authority, Series A-2, 5.875%, 6/01/2047(c) | | | 4,767,652 |
| | | | | | |
| | | Virginia — 0.1% | | | |
| | 14,550,000 | | Virginia Tobacco Settlement Financing Corp., Series A-1, 6.706%, 6/01/2046(c) | | | 10,595,601 |
| | | | | | |
| | | Total Municipals (Identified Cost $52,284,651) | | | 46,372,499 |
| | | | | | |
| | | Total Bonds and Notes (Identified Cost $8,565,789,090) | | | 9,376,414,013 |
| | | | | | |
| | | | | | |
| | | Total Investments - 98.4%
(Identified Cost $8,565,789,090)(a) | | | 9,376,414,013 |
| | | Other assets less liabilities — 1.6% | | | 150,544,320 |
| | | | | | |
| | | Net Assets — 100.0% | | $ | 9,526,958,333 |
| | | | | | |
| | | | | | |
| | (‡) | | Principal amount stated in U.S. dollars unless otherwise noted. | | | |
| | (†) | | See Note 2 of Notes to Financial Statements. | | | |
| | (††) | | Amount shown represents units. One unit represents a principal amount of 100. | | | |
| | (†††) | | Amount shown represents units. One unit represents a principal amount of 25. | | | |
See accompanying notes to financial statements.
16
LOOMIS SAYLES INVESTMENT GRADE BOND FUND — PORTFOLIOOF INVESTMENTS (continued)
Investments as of March 31, 2010 (Unaudited)
| | | | | | |
| | | | | | |
| (a) | | Federal Tax Information (Amounts exclude certain adjustments made at the end of the Fund’s fiscal year for tax purposes. Such adjustments are primarily due to wash sales. Amortization of premium on debt securities is excluded for tax purposes.): At March 31, 2010, the net unrealized appreciation on investments based on a cost of $8,589,392,324 for federal income tax purposes was as follows: | | | | |
| | Aggregate gross unrealized appreciation for all investments in which there is an excess of value over tax cost | | $ | 847,382,421 | |
| | Aggregate gross unrealized depreciation for all investments in which there is an excess of tax cost over value | | | (60,360,732 | ) |
| | | | | | |
| | Net unrealized appreciation | | $ | 787,021,689 | |
| | | | | | |
| | | | | | |
| (b) | | Variable rate security. Rate as of March 31, 2010 is disclosed. | |
| (c) | | Illiquid security. At March 31, 2010, the value of these securities amounted to $199,970,219 or 2.1% of net assets. | |
| (d) | | Coupon rate is a fixed rate for an initial period then resets at a specified date and rate. | |
| 144A | | Securities exempt from registration under Rule 144A of the Securities Act of 1933. These securities may be resold in transactions exempt from registration, normally to qualified institutional buyers. At March 31, 2010, the total value of these securities amounted to $1,356,911,781 or 14.2% of net assets. | |
| | | |
| ABS | | Asset-Backed Securities | |
| AGMC | | Assured Guaranty Municipal Corp. | |
| AMBAC | | American Municipal Bond Assurance Corp. | |
| EMTN | | Euro Medium Term Note | |
| FHLMC | | Federal Home Loan Mortgage Corp. | |
| FNMA | | Federal National Mortgage Association | |
| GMTN | | Global Medium Term Note | |
| MBIA | | Municipal Bond Investor Assurance Corp. | |
| MTN | | Medium Term Note | |
| REITs | | Real Estate Investment Trusts | |
| | | | | | |
| AUD | | Australian Dollar | |
| BRL | | Brazilian Real | |
| CAD | | Canadian Dollar | |
| EUR | | Euro | |
| GBP | | British Pound | |
| IDR | | Indonesian Rupiah | |
| ISK | | Icelandic Krona | |
| KRW | | South Korean Won | |
| MXN | | Mexican Peso | |
| NOK | | Norwegian Krone | |
| NZD | | New Zealand Dollar | |
| SGD | | Singapore Dollar | |
Industry Summary at March 31, 2010 (Unaudited)
| | | |
| Treasuries | | 20.9 | % |
| Banking | | 8.8 | |
| Technology | | 5.2 | |
| Government Owned—No Guarantee | | 4.3 | |
| Wirelines | | 3.9 | |
| Commercial Mortgage-Backed Securities | | 3.5 | |
| Pipelines | | 3.4 | |
| Electric | | 3.2 | |
| REITs | | 3.1 | |
| Airlines | | 3.0 | |
| Non-Captive Diversified | | 3.0 | |
| ABS Other | | 2.4 | |
| Sovereigns | | 2.1 | |
| Non-Captive Consumer | | 2.1 | |
| Other Investments, less than 2% each | | 29.5 | |
| | | |
| Total Investments | | 98.4 | |
| Other assets less liabilities | | 1.6 | |
| | | |
| Net Assets | | 100.0 | % |
| | | |
Currency Exposure at March 31, 2010 as Percentage of Net Assets (Unaudited)
| | | |
| United States Dollar | | 71.0 | % |
| Canadian Dollar | | 17.3 | |
| New Zealand Dollar | | 3.1 | |
| Norwegian Krone | | 2.3 | |
| Other, less than 2% each | | 4.7 | |
| | | |
| Total Investments | | 98.4 | |
| Other assets less liabilities | | 1.6 | |
| | | |
| Net Assets | | 100.0 | % |
| | | |
See accompanying notes to financial statements.
17
STATEMENTOF ASSETSAND LIABILITIES
March 31, 2010 (Unaudited)
| | | |
ASSETS | | | |
| | | |
Investments at cost | | $ | 8,565,789,090 |
Net unrealized appreciation | | | 810,624,923 |
| | | |
Investments at value | | | 9,376,414,013 |
Foreign currency at value (identified cost $1,713,003) | | | 1,421,633 |
Receivable for Fund shares sold | | | 41,532,547 |
Receivable for securities sold | | | 5,287,314 |
Interest receivable | | | 134,072,848 |
Tax reclaims receivable | | | 154,405 |
| | | |
TOTAL ASSETS | | | 9,558,882,760 |
| | | |
LIABILITIES | | | |
Payable for securities purchased | | | 520,786 |
Payable for Fund shares redeemed | | | 25,684,425 |
Payable to custodian bank | | | 1,780,211 |
Management fees payable (Note 5) | | | 3,222,173 |
Administrative fees payable (Note 5) | | | 390,901 |
Deferred Trustees’ fees (Note 5) | | | 179,521 |
Foreign taxes payable (Note 2) | | | 24,800 |
Other accounts payable and accrued expenses | | | 121,610 |
| | | |
TOTAL LIABILITIES | | | 31,924,427 |
| | | |
NET ASSETS | | $ | 9,526,958,333 |
| | | |
NET ASSETS CONSIST OF: | | | |
Paid-in capital | | $ | 8,615,397,189 |
Undistributed net investment income | | | 27,107,762 |
Accumulated net realized gain on investments and foreign currency transactions | | | 73,891,544 |
Net unrealized appreciation on investments and foreign currency translations | | | 810,561,838 |
| | | |
NET ASSETS | | $ | 9,526,958,333 |
| | | |
COMPUTATION OF NET ASSET VALUE AND OFFERING PRICE: | | | |
Class A shares: | | | |
Net assets | | $ | 3,022,747,636 |
| | | |
Shares of beneficial interest | | | 251,013,477 |
| | | |
Net asset value and redemption price per share | | $ | 12.04 |
| | | |
Offering price per share (100/95.50 of net asset value) (Note 1) | | $ | 12.61 |
| | | |
Class B shares: (redemption price per share is equal to net asset value less any applicable contingent deferred sales charge) (Note 1) | | | |
Net assets | | $ | 17,247,429 |
| | | |
Shares of beneficial interest | | | 1,439,081 |
| | | |
Net asset value and offering price per share | | $ | 11.99 |
| | | |
Class C shares: (redemption price per share is equal to net asset value less any applicable contingent deferred sales charge) (Note 1) | | | |
Net assets | | $ | 2,549,002,324 |
| | | |
Shares of beneficial interest | | | 213,198,083 |
| | | |
Net asset value and offering price per share | | $ | 11.96 |
| | | |
Class Y shares: | | | |
Net assets | | $ | 3,800,953,967 |
| | | |
Shares of beneficial interest | | | 315,436,633 |
| | | |
Net asset value, offering and redemption price per share | | $ | 12.05 |
| | | |
Admin Class shares: | | | |
Net assets | | $ | 1,023 |
| | | |
Shares of beneficial interest | | | 85 |
| | | |
Net asset value, offering and redemption price per share | | $ | 12.04 |
| | | |
Class J shares: | | | |
Net assets | | $ | 137,005,954 |
| | | |
Shares of beneficial interest | | | 11,390,620 |
| | | |
Net asset value and redemption price per share | | $ | 12.03 |
| | | |
Offering price per share (100/96.50 of net asset value) (Note 1) | | $ | 12.47 |
| | | |
See accompanying notes to financial statements.
18
STATEMENTOF OPERATIONS
For the Six Months Ended March 31, 2010 (Unaudited)
| | | | |
| | | | |
INVESTMENT INCOME | | | | |
Interest | | $ | 258,595,511 | |
| | | | |
Expenses | | | | |
Management fees (Note 5) | | | 18,751,238 | |
Service and distribution fees (Note 5) | | | 17,012,685 | |
Trustees’ fees and expenses (Note 5) | | | 78,694 | |
Administrative fees (Note 5) | | | 2,268,682 | |
Custodian fees and expenses | | | 220,617 | |
Transfer agent fees and expenses (Notes 5 and 6) | | | 3,658,985 | |
Audit and tax services fees | | | 28,071 | |
Legal fees (Note 6) | | | 104,459 | |
Shareholder reporting expenses (Note 6) | | | 347,641 | |
Registration fees (Note 6) | | | 208,124 | |
Miscellaneous expenses | | | 139,990 | |
| | | | |
Total expenses | | | 42,819,186 | |
Less fee reduction and/or expense reimbursement (Note 5) | | | (35,825 | ) |
| | | | |
Net expenses | | | 42,783,361 | |
| | | | |
Net investment income | | | 215,812,150 | |
| | | | |
NET REALIZED AND UNREALIZED GAIN (LOSS) ON INVESTMENTS AND FOREIGN CURRENCY TRANSACTIONS | | | | |
Net realized gain on: | | | | |
Investments | | | 113,917,711 | |
Foreign currency transactions | | | 1,045,345 | |
Net change in unrealized appreciation (depreciation) on: | | | | |
Investments | | | 233,843,552 | |
Foreign currency translations | | | (1,541,089 | ) |
| | | | |
Net realized and unrealized gain on investments and foreign currency transactions | | | 347,265,519 | |
| | | | |
NET INCREASE IN NET ASSETS RESULTING FROM OPERATIONS | | $ | 563,077,669 | |
| | | | |
See accompanying notes to financial statements.
19
STATEMENTOF CHANGESIN NET ASSETS
| | | | | | | | |
| | | Six Months Ended
March 31,
2010
(Unaudited) | | | Year Ended
September 30,
2009 | |
| | | | | | | | |
FROM OPERATIONS: | | | | | | | | |
Net investment income | | $ | 215,812,150 | | | $ | 350,121,874 | |
Net realized gain (loss) on investments and foreign currency transactions | | | 114,963,056 | | | | (23,240,057 | ) |
Net change in unrealized appreciation (depreciation) on investments and foreign currency translations | | | 232,302,463 | | | | 1,086,052,060 | |
| | | | | | | | |
Net increase in net assets resulting from operations | | | 563,077,669 | | | | 1,412,933,877 | |
| | | | | | | | |
FROM DISTRIBUTIONS TO SHAREHOLDERS: | | | | | | | | |
Net investment income | | | | | | | | |
Class A | | | (72,852,306 | ) | | | (126,482,744 | ) |
Class B | | | (356,044 | ) | | | (778,099 | ) |
Class C | | | (53,100,636 | ) | | | (86,396,910 | ) |
Class Y | | | (94,986,865 | ) | | | (111,617,170 | ) |
Admin Class | | | (4 | ) | | | — | |
Class J | | | (3,158,970 | ) | | | (8,135,019 | ) |
Net realized capital gains | | | | | | | | |
Class A | | | (6,651,489 | ) | | | (24,679,708 | ) |
Class B | | | (39,640 | ) | | | (203,042 | ) |
Class C | | | (5,758,632 | ) | | | (18,444,267 | ) |
Class Y | | | (8,463,329 | ) | | | (16,568,771 | ) |
Admin Class | | | — | | | | — | |
Class J | | | (320,597 | ) | | | (2,097,657 | ) |
| | | | | | | | |
Total distributions | | | (245,688,512 | ) | | | (395,403,387 | ) |
| | | | | | | | |
NET INCREASE IN NET ASSETS FROM CAPITAL SHARE TRANSACTIONS (NOTE 10) | | | 67,481,912 | | | | 3,695,970,881 | |
| | | | | | | | |
Net increase in net assets | | | 384,871,069 | | | | 4,713,501,371 | |
NET ASSETS | | | | | | | | |
Beginning of the period | | | 9,142,087,264 | | | | 4,428,585,893 | |
| | | | | | | | |
End of the period | | $ | 9,526,958,333 | | | $ | 9,142,087,264 | |
| | | | | | | | |
UNDISTRIBUTED NET INVESTMENT INCOME | | $ | 27,107,762 | | | $ | 35,750,437 | |
| | | | | | | | |
See accompanying notes to financial statements.
20
FINANCIAL HIGHLIGHTS
For a share outstanding throughout each period.
| | | | | | | | | | | | | | | | | | | | | | | | | | |
| | | | | Income (Loss) from Investment Operations: | | | Less Distributions: | |
| | | Net asset
value,
beginning
of
the period | | Net
investment
income (a) | | Net realized
and unrealized
gain (loss) | | | Total from
investment
operations | | | Dividends
from net
investment
income | | | Distributions
from net
realized
capital gains | | | Total
distributions | |
| | | | | | | | | | | | | | | | | | | | | | | | | | |
INVESTMENT GRADE BOND FUND | | | | | | | | | | | | | | | | | | | | | | | | | | |
Class A | | | | | | | | | | | | | | | | | | | | | | | | | | |
3/31/2010(f) | | $ | 11.64 | | $ | 0.28 | | $ | 0.43 | | | $ | 0.71 | | | $ | (0.28 | ) | | $ | (0.03 | ) | | $ | (0.31 | ) |
9/30/2009 | | | 10.54 | | | 0.60 | | | 1.22 | | | | 1.82 | | | | (0.59 | ) | | | (0.13 | ) | | | (0.72 | ) |
9/30/2008 | | | 11.73 | | | 0.60 | | | (1.15 | ) | | | (0.55 | ) | | | (0.64 | ) | | | — | | | | (0.64 | ) |
9/30/2007 | | | 11.35 | | | 0.58 | | | 0.42 | | | | 1.00 | | | | (0.62 | ) | | | — | | | | (0.62 | ) |
9/30/2006 | | | 11.71 | | | 0.51 | | | 0.10 | | | | 0.61 | | | | (0.75 | ) | | | (0.22 | ) | | | (0.97 | ) |
9/30/2005 | | | 11.84 | | | 0.49 | | | 0.29 | | | | 0.78 | | | | (0.74 | ) | | | (0.17 | ) | | | (0.91 | ) |
Class B | | | | | | | | | | | | | | | | | | | | | | | | | | |
3/31/2010(f) | | | 11.59 | | | 0.23 | | | 0.44 | | | | 0.67 | | | | (0.24 | ) | | | (0.03 | ) | | | (0.27 | ) |
9/30/2009 | | | 10.50 | | | 0.51 | | | 1.21 | | | | 1.72 | | | | (0.50 | ) | | | (0.13 | ) | | | (0.63 | ) |
9/30/2008 | | | 11.68 | | | 0.50 | | | (1.14 | ) | | | (0.64 | ) | | | (0.54 | ) | | | — | | | | (0.54 | ) |
9/30/2007 | | | 11.31 | | | 0.47 | | | 0.43 | | | | 0.90 | | | | (0.53 | ) | | | — | | | | (0.53 | ) |
9/30/2006 | | | 11.67 | | | 0.42 | | | 0.10 | | | | 0.52 | | | | (0.66 | ) | | | (0.22 | ) | | | (0.88 | ) |
9/30/2005 | | | 11.82 | | | 0.41 | | | 0.27 | | | | 0.68 | | | | (0.66 | ) | | | (0.17 | ) | | | (0.83 | ) |
Class C | | | | | | | | | | | | | | | | | | | | | | | | | | |
3/31/2010(f) | | | 11.56 | | | 0.23 | | | 0.44 | | | | 0.67 | | | | (0.24 | ) | | | (0.03 | ) | | | (0.27 | ) |
9/30/2009 | | | 10.47 | | | 0.52 | | | 1.22 | | | | 1.74 | | | | (0.52 | ) | | | (0.13 | ) | | | (0.65 | ) |
9/30/2008 | | | 11.66 | | | 0.51 | | | (1.15 | ) | | | (0.64 | ) | | | (0.55 | ) | | | — | | | | (0.55 | ) |
9/30/2007 | | | 11.30 | | | 0.49 | | | 0.42 | | | | 0.91 | | | | (0.55 | ) | | | — | | | | (0.55 | ) |
9/30/2006 | | | 11.66 | | | 0.42 | | | 0.11 | | | | 0.53 | | | | (0.67 | ) | | | (0.22 | ) | | | (0.89 | ) |
9/30/2005 | | | 11.81 | | | 0.40 | | | 0.28 | | | | 0.68 | | | | (0.66 | ) | | | (0.17 | ) | | | (0.83 | ) |
Class Y | | | | | | | | | | | | | | | | | | | | | | | | | | |
3/31/2010(f) | | | 11.65 | | | 0.29 | | | 0.44 | | | | 0.73 | | | | (0.30 | ) | | | (0.03 | ) | | | (0.33 | ) |
9/30/2009 | | | 10.55 | | | 0.62 | | | 1.23 | | | | 1.85 | | | | (0.62 | ) | | | (0.13 | ) | | | (0.75 | ) |
9/30/2008 | | | 11.73 | | | 0.64 | | | (1.15 | ) | | | (0.51 | ) | | | (0.67 | ) | | | — | | | | (0.67 | ) |
9/30/2007 | | | 11.36 | | | 0.61 | | | 0.41 | | | | 1.02 | | | | (0.65 | ) | | | — | | | | (0.65 | ) |
9/30/2006 | | | 11.71 | | | 0.55 | | | 0.11 | | | | 0.66 | | | | (0.79 | ) | | | (0.22 | ) | | | (1.01 | ) |
9/30/2005 | | | 11.85 | | | 0.54 | | | 0.28 | | | | 0.82 | | | | (0.79 | ) | | | (0.17 | ) | | | (0.96 | ) |
Admin Class | | | | | | | | | | | | | | | | | | | | | | | | | | |
3/31/2010* | | | 11.80 | | | 0.09 | | | 0.19 | | | | 0.28 | | | | (0.04 | ) | | | — | | | | (0.04 | ) |
Class J | | | | | | | | | | | | | | | | | | | | | | | | | | |
3/31/2010(f) | | | 11.63 | | | 0.25 | | | 0.44 | | | | 0.69 | | | | (0.26 | ) | | | (0.03 | ) | | | (0.29 | ) |
9/30/2009 | | | 10.53 | | | 0.55 | | | 1.22 | | | | 1.77 | | | | (0.54 | ) | | | (0.13 | ) | | | (0.67 | ) |
9/30/2008 | | | 11.71 | | | 0.54 | | | (1.14 | ) | | | (0.60 | ) | | | (0.58 | ) | | | — | | | | (0.58 | ) |
9/30/2007 | | | 11.34 | | | 0.52 | | | 0.42 | | | | 0.94 | | | | (0.57 | ) | | | — | | | | (0.57 | ) |
9/30/2006 | | | 11.69 | | | 0.46 | | | 0.11 | | | | 0.57 | | | | (0.70 | ) | | | (0.22 | ) | | | (0.92 | ) |
9/30/2005 | | | 11.83 | | | 0.46 | | | 0.27 | | | | 0.73 | | | | (0.70 | ) | | | (0.17 | ) | | | (0.87 | ) |
| * | From commencement of Class operations on February 1, 2010 through March 31, 2010. |
| (a) | Per share net investment income has been calculated using the average shares outstanding during the period. |
| (b) | Had certain expenses not been reduced during the period, if applicable, total returns would have been lower. |
| (c) | A sales charge for Class A and Class J shares and a contingent deferred sales charge for Class B and Class C shares are not reflected in total return calculations. Periods less than one year, if applicable, are not annualized. |
| (d) | The investment adviser and/or administrator agreed to reimburse a portion of the Fund’s expenses and/or reduce its fees during the period. Without this reimbursement/fee reduction, if applicable, expenses would have been higher. |
See accompanying notes to financial statements.
21
| | | | | | | | | | | | | | | | | |
| | | | | | | | Ratios to Average Net Assets: | | |
Net asset
value,
end of
the period | | Total
return
(%) (b)(c) | | | Net assets,
end of
the period
(000’s) | | Net
expenses
(%) (d)(e) | | | Gross
expenses
(%) (e) | | | Net investment
income
(%) (e) | | Portfolio
turnover
rate (%) |
| | | | | | | | | | | | | | | | | |
| | | | | | | | | | | | | | | | | |
| | | | | | | | | | | | | | | | | |
| $ | 12.04 | | 6.24 | | | $ | 3,022,748 | | 0.80 | | | 0.80 | | | 4.72 | | 14 |
| | 11.64 | | 18.64 | | | | 2,946,489 | | 0.80 | | | 0.80 | | | 5.87 | | 30 |
| | 10.54 | | (5.12 | ) | | | 1,867,335 | | 0.80 | | | 0.80 | | | 5.20 | | 35 |
| | 11.73 | | 9.14 | | | | 834,736 | | 0.83 | | | 0.83 | | | 5.05 | | 35 |
| | 11.35 | | 5.63 | | | | 152,054 | | 0.92 | (g) | | 0.92 | (g) | | 4.59 | | 35 |
| | 11.71 | | 6.83 | | | | 39,168 | | 0.95 | | | 1.14 | | | 4.21 | | 28 |
| | | | | | | | | | | | | | | | | |
| | 11.99 | | 5.74 | | | | 17,247 | | 1.65 | | | 1.65 | | | 3.86 | | 14 |
| | 11.59 | | 17.59 | | | | 17,489 | | 1.67 | | | 1.67 | | | 5.07 | | 30 |
| | 10.50 | | (5.88 | ) | | | 16,009 | | 1.65 | (h) | | 1.65 | (h) | | 4.29 | | 35 |
| | 11.68 | | 8.17 | | | | 17,082 | | 1.70 | | | 1.71 | | | 4.16 | | 35 |
| | 11.31 | | 4.83 | | | | 5,525 | | 1.70 | | | 1.89 | | | 3.75 | | 35 |
| | 11.67 | | 5.89 | | | | 3,443 | | 1.70 | | | 2.18 | | | 3.47 | | 28 |
| | | | | | | | | | | | | | | | | |
| | 11.96 | | 5.90 | | | | 2,549,002 | | 1.55 | | | 1.55 | | | 3.97 | | 14 |
| | 11.56 | | 17.80 | | | | 2,495,305 | | 1.56 | | | 1.56 | | | 5.09 | | 30 |
| | 10.47 | | (5.84 | ) | | | 1,333,421 | | 1.55 | | | 1.55 | | | 4.45 | | 35 |
| | 11.66 | | 8.28 | | | | 605,934 | | 1.57 | | | 1.57 | | | 4.30 | | 35 |
| | 11.30 | | 4.87 | | | | 82,863 | | 1.70 | (g) | | 1.70 | (g) | | 3.79 | | 35 |
| | 11.66 | | 5.91 | | | | 27,992 | | 1.70 | | | 1.97 | | | 3.45 | | 28 |
| | | | | | | | | | | | | | | | | |
| | 12.05 | | 6.37 | | | | 3,800,954 | | 0.55 | | | 0.55 | | | 4.97 | | 14 |
| | 11.65 | | 18.94 | | | | 3,531,187 | | 0.54 | | | 0.54 | | | 6.01 | | 30 |
| | 10.55 | | (4.79 | ) | | | 1,044,046 | | 0.53 | | | 0.53 | | | 5.48 | | 35 |
| | 11.73 | | 9.32 | | | | 448,873 | | 0.55 | (h) | | 0.55 | (h) | | 5.33 | | 35 |
| | 11.36 | | 6.09 | | | | 76,548 | | 0.55 | | | 0.63 | | | 4.94 | | 35 |
| | 11.71 | | 7.13 | | | | 26,012 | | 0.55 | | | 0.82 | | | 4.61 | | 28 |
| | | | | | | | | | | | | | | | | |
| | 12.04 | | 2.42 | | | | 1 | | 1.20 | | | 3,185.50 | | | 4.54 | | 14 |
| | | | | | | | | | | | | | | | | |
| | 12.03 | | 5.98 | | | | 137,006 | | 1.30 | | | 1.31 | | | 4.21 | | 14 |
| | 11.63 | | 18.05 | | | | 151,617 | | 1.30 | | | 1.31 | | | 5.48 | | 30 |
| | 10.53 | | (5.50 | ) | | | 167,775 | | 1.28 | | | 1.28 | | | 4.66 | | 35 |
| | 11.71 | | 8.52 | | | | 180,453 | | 1.28 | | | 1.28 | | | 4.57 | | 35 |
| | 11.34 | | 5.29 | | | | 214,894 | | 1.30 | (g) | | 1.30 | (g) | | 4.09 | | 35 |
| | 11.69 | | 6.36 | | | | 314,418 | | 1.30 | | | 1.35 | | | 3.89 | | 28 |
| (e) | Computed on an annualized basis for periods less than one year, if applicable. |
| (f) | For the six months ended March 31, 2010 (Unaudited). |
| (g) | Includes fee/expense recovery of 0.06%, 0.09% and 0.03% for Class A, Class C and Class J shares, respectively. |
| (h) | Includes fee/expense recovery of less than 0.01% for Class B and Class Y shares, respectively. |
22
NOTESTO FINANCIAL STATEMENTS
March 31, 2010 (Unaudited)
1. Organization. Loomis Sayles Funds II (the “Trust”) is organized as a Massachusetts business trust. The Trust is registered under the Investment Company Act of 1940, as amended (the “1940 Act”), as an open-end management investment company. The Declaration of Trust permits the Board of Trustees to authorize the issuance of an unlimited number of shares of the Trust in multiple series. The financial statements for certain funds of the Trust are presented in separate reports. Information presented in these financial statements pertains to Loomis Sayles Investment Grade Bond Fund (the “Fund” or the “Investment Grade Bond Fund”).
The Fund offers Class A, Class C, Class Y, Admin Class and Class J. Effective February 1, 2010, the Fund began offering Admin Class shares. Effective October 12, 2007, Class B shares are no longer offered. Existing Class B shareholders may continue to reinvest dividends into Class B shares and exchange their Class B shares for Class B shares of other Natixis Funds subject to existing exchange privileges as described in the Fund’s Prospectus.
Class A shares are sold with a maximum front-end sales charge of 4.50%. Class B shares do not pay a front-end sales charge, but pay higher Rule 12b-1 fees than Class A shares for eight years (at which point they automatically convert to Class A shares) and are subject to a contingent deferred sales charge (“CDSC”) if those shares are redeemed within six years of purchase. Class C shares do not pay a front-end sales charge, do not convert to any other class of shares, pay higher Rule 12b-1 fees than Class A shares and may be subject to a CDSC of 1.00% if those shares are redeemed within one year of acquisition except for reinvested distributions. Class Y shares do not pay a front-end sales charge, a CDSC or Rule 12b-1 fees. Class Y shares are generally intended for institutional investors with a minimum initial investment of $100,000, though some categories of investors are exempted from the minimum investment amount as outlined in the Fund’s Prospectus. Admin Class shares do not pay a front-end sales charge or a CDSC, but do pay a Rule 12b-1 fee. Admin Class shares are offered exclusively through intermediaries. Class J shares are only offered to non-U.S. investors and are sold with a maximum front-end sales charge of 3.50%.
Most expenses of the Trust can be directly attributed to a fund. Expenses which can not be directly attributed to a fund are generally apportioned based on the relative net assets of each of the funds in the Trust. Expenses of the Fund are borne pro rata by the holders of each class of shares, except that each class bears expenses unique to that class (including the Rule 12b-1 service and distribution fees, registration, legal, shareholder reporting and Class J transfer agent fees). In addition, each class votes as a class only with respect to its own Rule 12b-1 Plan. Shares of each class would receive their pro rata share of the net assets of the Fund if the Fund were liquidated. The Trustees approve separate dividends from net investment income on each class of shares.
2. Significant Accounting Policies. The following is a summary of significant accounting policies consistently followed by the Fund in the preparation of its financial statements. The Fund’s financial statements are prepared in accordance with accounting principles generally accepted in the United States of America which require the use of management estimates that affect the reported amounts and disclosures in the financial statements. Actual results could differ from those estimates. Management has evaluated the events and transactions that have occurred through the date the financial statements were issued, and noted no items requiring recognition in the financial statements or additional disclosure in the Notes to Financial Statements.
a. Valuation. Debt securities (other than short-term obligations purchased with an original or remaining maturity of sixty days or less) are generally valued on the basis of evaluated bids furnished to the Fund by a pricing service recommended by the investment adviser and approved by the Board of Trustees, which service determines valuations for normal, institutional-size trading units of such securities using market information, transactions for comparable securities and various relationships between securities which are generally recognized by institutional traders. Broker-dealer bid quotations may also be used to value debt securities where a pricing service does not price a security or where a pricing service does not provide a reliable price for the security. In instances where broker-dealer bid quotations are not available, certain securities held by the Fund may be valued on the basis of a price provided by a principal market maker. Forward foreign currency contracts are valued utilizing interpolated prices determined from information provided by an independent pricing service. Short-term obligations purchased with an original or remaining maturity of sixty days or less are valued at amortized cost, which approximates market value. Securities for which market quotations are not readily available are valued at fair value as determined in good faith by the Fund’s investment adviser using consistently applied procedures under the general supervision of the Board of Trustees. Investments in other open-end investment companies are valued at their net asset value each day.
The Fund may hold securities traded in foreign markets. Foreign securities are valued at the market price in the foreign market. However, if events occurring after the close of the foreign market (but before the close of regular trading on the New York Stock Exchange) are believed to materially affect the value of those securities, such securities are fair valued pursuant to procedures approved by the Board of Trustees. When fair valuing securities, the Fund may, among other things, use modeling tools or other processes that may take into account factors such as securities market activity and/or significant events that occur after the close of the foreign market and before the Fund calculates its net asset value.
b. Security Transactions and Related Investment Income. Security transactions are accounted for on trade date. Interest income is recorded on an accrual basis. Interest income is increased by the accretion of discount and decreased by the amortization of premium. Investment income is recorded net of foreign taxes withheld when applicable. In determining net gain or loss on securities sold, the cost of securities has been determined on an identified cost basis. Investment income, non-class specific expenses and realized and unrealized gains and losses are allocated on a pro rata basis to each class based on the relative net assets of each class to the total net assets of the Fund.
c. Foreign Currency Translation. The books and records of the Fund are maintained in U.S. dollars. The value of securities, currencies and other assets and liabilities denominated in currencies other than U.S. dollars are translated into U.S. dollars based upon foreign exchange rates prevailing at the end of the period. Purchases and sales of investment securities, income and expenses are translated on the respective dates of such transactions.
23
NOTESTO FINANCIAL STATEMENTS (continued)
March 31, 2010 (Unaudited)
Since the values of investment securities are presented at the foreign exchange rates prevailing at the end of the period, it is not practical to isolate that portion of the results of operations arising from changes in exchange rates from fluctuations which arise due to changes in market prices of investment securities. Such changes are included with the net realized and unrealized gain or loss on investments.
Net realized foreign exchange gains or losses arise from sales of foreign currency, currency gains or losses realized between the trade and settlement dates on securities transactions and the difference between the amounts of interest and foreign withholding taxes recorded on the Fund’s books and the U.S. dollar equivalent of the amounts actually received or paid. Net unrealized foreign exchange gains and losses arise from changes in the value of assets and liabilities, other than investment securities, at the end of the fiscal period, resulting from changes in exchange rates.
The Fund may use foreign currency exchange contracts to facilitate transactions in foreign-denominated investments. Losses may arise from changes in the value of the foreign currency or if the counterparties do not perform under the contracts’ terms.
d. Forward Foreign Currency Contracts. The Fund may enter into forward foreign currency contracts. Contracts to buy generally are used to acquire exposure to foreign currencies, while contracts to sell generally are used to hedge the Fund’s investments against currency fluctuation. Also, a contract to buy or sell can offset a previous contract. These contracts involve market risk in excess of the unrealized gain or loss reflected in the Fund’s Statement of Assets and Liabilities. The U.S. dollar value of the currencies the Fund has committed to buy or sell represents the aggregate exposure to each currency the Fund has acquired or hedged through currency contracts outstanding at period end. Gains or losses are recorded for financial statement purposes as unrealized until settlement date. Risks may arise upon entering into these contracts from the potential inability of counterparties to meet the terms of their contracts and from unanticipated movements in the value of a foreign currency relative to the U.S. dollar. Certain contracts may require the movement of cash or securities to or from the counterparty as collateral for the Fund’s or counterparty’s net obligations under the contracts.
At March 31, 2010, there were no open forward foreign currency contracts.
e. Federal and Foreign Income Taxes. The Trust treats each fund as a separate entity for federal income tax purposes. The Fund intends to meet the requirements of the Internal Revenue Code of 1986, as amended, applicable to regulated investment companies, and to distribute to its shareholders substantially all of its net investment income and any net realized capital gains at least annually. Management has performed an analysis of the Fund’s tax positions for the open tax years as of March 31, 2010 and has concluded that no provisions for income tax are required. The Fund’s federal tax returns for the prior three fiscal years remain subject to examination by the Internal Revenue Service. Management is not aware of any events that are reasonably possible to occur in the next six months that would result in the amounts of any unrecognized tax benefits significantly increasing or decreasing for the Fund. However, management’s conclusions regarding tax positions taken may be subject to review and adjustment at a later date based on factors including, but not limited to, new tax laws and accounting regulations and interpretations thereof.
The Fund may be subject to foreign taxes on income and gains on investments that are accrued based upon the Fund’s understanding of the tax rules and regulations that exist in the countries in which the Fund invests. Foreign governments may also impose taxes or other payments on investments with respect to foreign securities. Such taxes are accrued as applicable, and are reflected as foreign taxes payable on the Statement of Assets and Liabilities.
f. Dividends and Distributions to Shareholders. Dividends and distributions are recorded on ex-dividend date. The timing and characterization of certain income and capital gain distributions are determined annually in accordance with federal tax regulations, which may differ from accounting principles generally accepted in the United States of America. Permanent differences are primarily due to differing treatments for book and tax purposes for items such as defaulted bonds, distribution redesignations, foreign currency transactions, paydown adjustments and premium amortization accruals. Permanent book and tax basis differences relating to shareholder distributions will result in reclassifications to capital accounts. Temporary differences between book and tax distributable earnings are primarily due to premium amortization accruals, deferred Trustees’ fees, defaulted bond accruals, securities lending collateral gain/loss adjustments and wash sales. Distributions from net investment income and short-term capital gains are considered to be distributed from ordinary income for tax purposes.
The tax characterization of distributions is determined on an annual basis. The tax character of distributions paid to shareholders during the year ended September 30, 2009 was as follows:
| | | | | | |
2009 Distributions Paid From: |
Ordinary
Income | | Long-Term Capital Gains | | Total |
$386,232,314 | | $ | 9,171,073 | | $ | 395,403,387 |
Differences between these amounts and those reported in the Statement of Changes in Net Assets, if any, are primarily attributable to different book and tax treatment for short-term capital gains.
24
NOTESTO FINANCIAL STATEMENTS (continued)
March 31, 2010 (Unaudited)
As of September 30, 2009, the capital loss carryforwards and post-October losses were as follows:
| | | | |
Capital loss carryforward: | | | | |
Expires September 30, 2017 | | $ | (1,891,321 | ) |
| | | | |
Deferred net capital losses (post- October 2008) | | $ | (3,774,568 | ) |
| | | | |
g. Repurchase Agreements. It is the Fund’s policy that the market value of the collateral for repurchase agreements be at least equal to 102% of the repurchase price, including interest. Certain repurchase agreements are tri-party arrangements whereby the collateral is held in a segregated account for the benefit of the Fund and on behalf of the counterparty. Repurchase agreements could involve certain risks in the event of default or insolvency of the counterparty including possible delays or restrictions upon a Fund’s ability to dispose of the underlying securities.
h. Securities Lending. The Fund has entered into an agreement with State Street Bank and Trust Company (“State Street Bank”), as agent of the Fund, to lend securities to certain designated borrowers. The loans are collateralized with cash or securities in an amount equal to at least 105% or 102% of the market value (including accrued interest) of the loaned international or domestic securities, respectively, when the loan is initiated. Thereafter, the value of the collateral must remain at least 102% of the market value (including accrued interest) of loaned securities for U.S. equities and U.S. corporate debt; at least 105% of the market value (including accrued interest) of loaned securities for non-U.S. equities; and at least 100% of the market value (including accrued interest) of loaned securities for U.S. Government securities, sovereign debt issued by non-U.S. Governments and non-U.S. corporate debt. In the event that the market value of the collateral falls below the required percentages described above, the borrower will deliver additional collateral on the next business day. As with other extensions of credit, the Fund bears the risk of loss with respect to the investment of the collateral. The Fund invests cash collateral in short-term investments, a portion of the income from which is remitted to the borrowers and the remainder allocated between the Fund and State Street Bank as lending agent.
As of March 31, 2010 there were no securities on loan.
i. Indemnifications. Under the Trust’s organizational documents, its officers and Trustees are indemnified against certain liabilities arising out of the performance of their duties to the Fund. Additionally, in the normal course of business, the Fund enters into contracts with service providers that contain general indemnification clauses. The Fund’s maximum exposure under these arrangements is unknown as this would involve future claims that may be made against the Fund that have not yet occurred. However, based on experience, the Fund expects the risk of loss to be remote.
3. Fair Value Measurements. In accordance with accounting standards related to fair value measurements and disclosures, the Fund has categorized the inputs utilized in determining the value of the Fund’s assets or liabilities. These inputs are summarized in the three broad levels listed below:
| | • | | Level 1 – quoted prices in active markets for identical assets or liabilities; |
| | • | | Level 2 – prices determined using other significant inputs that are observable either directly, or indirectly through corroboration with observable market data (which could include quoted prices for similar assets or liabilities, interest rates, credit risk, etc.); |
| | • | | Level 3 – prices determined using significant unobservable inputs for situations where quoted prices or observable inputs are unavailable such as when there is little or no market activity for an asset or liability (unobservable inputs reflect the Fund’s own assumptions in determining the fair value of assets or liabilities and would be based on the best information available). |
The inputs or methodology used for valuing securities are not necessarily an indication of the risk associated with investing in those securities.
25
NOTESTO FINANCIAL STATEMENTS (continued)
March 31, 2010 (Unaudited)
The following is a summary of the inputs used to value the Fund’s investments as of March 31, 2010, at value:
Asset Valuation Inputs
| | | | | | | | | | | | |
Description | | Level 1 | | Level 2 | | Level 3 | | Total |
Bonds and Notes | | | | | | | | | | | | |
Non-Convertible Bonds | | | | | | | | | | | | |
ABS Car Loan | | $ | — | | $ | 90,423,279 | | $ | 5,520,448 | | $ | 95,943,727 |
Integrated Energy | | | — | | | 24,758,019 | | | 1,209,931 | | | 25,967,950 |
Non-Captive Diversified | | | — | | | 278,858,564 | | | 547,575 | | | 279,406,139 |
Property & Casualty Insurance | | | — | | | 73,312,962 | | | 656,200 | | | 73,969,162 |
All Other Non-Convertible Bonds(a) | | | — | | | 8,562,457,708 | | | — | | | 8,562,457,708 |
| | | | | | | | | | | | |
Total Non-Convertible Bonds | | | — | | | 9,029,810,532 | | | 7,934,154 | | | 9,037,744,686 |
| | | | | | | | | | | | |
Convertible Bonds(a) | | | — | | | 292,296,828 | | | — | | | 292,296,828 |
Municipals(a) | | | — | | | 46,372,499 | | | — | | | 46,372,499 |
| | | | | | | | | | | | |
Total | | $ | — | | $ | 9,368,479,859 | | $ | 7,934,154 | | $ | 9,376,414,013 |
| | | | | | | | | | | | |
| (a) | Major categories of the Fund’s investments are included in the Portfolio of Investments. |
The following is a reconciliation of Level 3 investments for which significant unobservable inputs were used to determine fair value as of March 31, 2010:
Asset Valuation Inputs
| | | | | | | | | | | | | | | | | | | | | | | | |
Investments in Securities | | Balance as of
September 30,
2009 | | Accrued
Discounts
(Premiums) | | Realized
Gain
(Loss) | | Change in
Unrealized
Appreciation
(Depreciation) | | | Net Purchases
(Sales) | | | Net Transfers
into/(out of)
Level 3 | | | Balance as of
March 31, 2010 |
Bonds and Notes | | | | | | | | | | | | | | | | | | | | | | | | |
Non-Convertible Bonds | | | | | | | | | | | | | | | | | | | | | | | | |
ABS Car Loan | | $ | — | | $ | — | | $ | — | | $ | (7 | ) | | $ | 5,520,455 | | | $ | — | | | $ | 5,520,448 |
ABS Other | | | 39,800,000 | | | — | | | 1,601 | | | 317,301 | | | | (12,470,767 | ) | | | (27,648,135 | ) | | | — |
Airlines | | | 14,176,691 | | | — | | | — | | | 2,385,467 | | | | (657,418 | ) | | | (15,904,740 | ) | | | — |
Automotive | | | 630,087 | | | 607 | | | — | | | 26,634 | | | | — | | | | (657,328 | ) | | | — |
Diversified Manufacturing | | | 14,557,959 | | | 116,253 | | | — | | | 708,291 | | | | 451,081 | | | | (15,833,584 | ) | | | — |
Integrated Energy | | | 1,351,142 | | | — | | | — | | | (28,243 | ) | | | (112,968 | ) | | | — | | | | 1,209,931 |
Non-Captive Consumer | | | 5,137,913 | | | 67,421 | | | — | | | 187,262 | | | | — | | | | (5,392,596 | ) | | | — |
Non-Captive Diversified | | | — | | | 7,438 | | | — | | | 150,874 | | | | — | | | | 389,263 | | | | 547,575 |
Property & Casualty Insurance | | | — | | | 290 | | | — | | | 231,310 | | | | — | | | | 424,600 | | | | 656,200 |
Supranational | | | 8,370,105 | | | 43,676 | | | — | | | 2,452,852 | | | | 6,775,547 | | | | (17,642,180 | ) | | | — |
Convertible Bonds | | | | | | | | | | | | | | | | | | | | | | | | |
Wirelines | | | 3,169,400 | | | 4,390 | | | — | | | 399,260 | | | | — | | | | (3,573,050 | ) | | | — |
| | | | | | | | | | | | | | | | | | | | | | | | |
Total | | $ | 87,193,297 | | $ | 240,075 | | $ | 1,601 | | $ | 6,831,001 | | | $ | (494,070 | ) | | $ | (85,837,750 | ) | | $ | 7,934,154 |
| | | | | | | | | | | | | | | | | | | | | | | | |
4. Purchases and Sales of Securities. For the six months ended March 31, 2010, purchases and sales of securities (excluding short-term investments and U.S. Government/agency securities and including paydowns) were $1,500,679,842 and $1,035,041,174, respectively. Purchases and sales of U.S. Government/agency securities (excluding short-term investments and including paydowns) were $91,234,632 and $238,966,372, respectively.
5. Management Fees and Other Transactions with Affiliates.
a. Management Fees. Loomis, Sayles & Company, L.P. (“Loomis Sayles”) serves as investment adviser to the Fund. Under the terms of the management agreement, the Fund pays a management fee at the annual rate of 0.40% of average daily net assets, calculated daily and payable monthly.
26
NOTESTO FINANCIAL STATEMENTS (continued)
March 31, 2010 (Unaudited)
Loomis Sayles has given a binding undertaking to the Fund to reduce management fees and/or reimburse certain expenses to limit the Fund’s operating expenses, exclusive of acquired fund fees and expenses, brokerage expenses, interest expense, taxes and extraordinary expenses. This undertaking is in effect until January 31, 2011 and will be reevaluated on an annual basis. Management fee payable, as reflected on the Statement of Assets and Liabilities, is net of fee reductions and/or expense reimbursements, if any, pursuant to these undertakings.
For the period from February 1, 2010 to March 31, 2010, the expense limits as a percentage of average daily net assets under the expense limitation agreement were as follows:
| | | | | | | | | | |
Expense Limit as a Percentage of Average Daily Net Assets |
Class A | | Class B | | Class C | | Class Y | | Admin Class | | Class J |
0.95% | | 1.70% | | 1.70% | | 0.70% | | 1.20% | | 1.30% |
Prior to February 1, 2010, the expense limit as a percentage of average daily net assets for Class Y was 0.55%.
Loomis Sayles shall be permitted to recover expenses it has borne under the expense limitation agreement (whether through reduction of its management fees or otherwise) on a class by class basis in later periods to the extent the expenses of a class fall below a class’ expense limits, provided, however, that a class is not obligated to pay such reduced fees/expenses more than one year after the end of the fiscal year in which the fees/expenses were reduced.
For the six months ended March 31, 2010, the management fees for the Fund were $18,751,238 (0.40% of average daily net assets).
For the six months ended March 31, 2010, class-specific expenses have been reimbursed as follows:
| | | | | | | | | | | | | | | |
Reimbursement1 |
Class A | | Class B | | Class C | | Class Y | | Admin Class | | Class J |
$— | | $ | — | | $ | — | | $ | 26,680 | | $ | 5,110 | | $ | 4,035 |
| 1 | Expense reimbursements are subject to possible recovery until September 30, 2011. |
No expenses were recovered during the six months ended March 31, 2010 under the terms of the expense limitation agreement.
Certain officers and employees of Loomis Sayles are also officers or Trustees of the Trust. Loomis Sayles’ general partner is indirectly owned by Natixis Global Asset Management, L.P. (“Natixis US”), which is part of Natixis Global Asset Management, an international asset management group based in Paris, France.
b. Administrative Fees. Natixis Asset Management Advisors, L.P. (“Natixis Advisors”) provides certain administrative services for the Fund and contracts with State Street Bank to serve as sub-administrator. Natixis Advisors is a wholly-owned subsidiary of Natixis US. Pursuant to an agreement among Natixis Funds Trust I, Natixis Funds Trust II, Natixis Funds Trust IV, Natixis Cash Management Trust, Gateway Trust (“Natixis Funds Trusts”), Loomis Sayles Funds I, Loomis Sayles Funds II (“Loomis Sayles Funds Trusts”), Hansberger International Series and Natixis Advisors, the Fund pays Natixis Advisors monthly its pro rata portion of fees equal to an annual rate of 0.0575% of the first $15 billion of the average daily net assets of the Natixis Funds Trusts, Loomis Sayles Funds Trusts and the Hansberger International Series, 0.0500% of the next $15 billion, 0.0425% of the next $30 billion and 0.0375% of such assets in excess of $60 billion, subject to an annual aggregate minimum fee for the Natixis Funds Trusts, Loomis Sayles Funds Trusts and the Hansberger International Series of $10 million, which is reevaluated on an annual basis. New funds are subject to a fee for the first twelve months of operations of $75,000 plus $12,500 per additional class and an additional $75,000 if managed by multiple subadvisers.
For the six months ended March 31, 2010, the Fund paid $2,268,682 in administrative fees to Natixis Advisors.
c. Service and Distribution Fees. Natixis Distributors, L.P. (“Natixis Distributors”), a wholly-owned subsidiary of Natixis US, has entered into a distribution agreement with the Trust. Pursuant to this agreement, Natixis Distributors serves as principal underwriter of the funds of the Trust, except Class J shares of the Fund. The Fund has entered into a distribution agreement relating to Class J shares with Loomis Sayles Distributors, L.P. (“Loomis Sayles Distributors”), a wholly-owned subsidiary of Natixis US.
Pursuant to Rule 12b-1 under the 1940 Act, the Trust has adopted a Service Plan relating to the Fund’s Class A shares (the “Class A Plans”), a Distribution and Service Plan relating to the Fund’s Class B and Class C shares (the “Class B and Class C Plans”), and a Distribution Plan relating to its Admin Class shares (the “Admin Class Plan”).
Under the Class A Plan, the Fund pays Natixis Distributors a monthly service fee at an annual rate not to exceed 0.25% of the average daily net assets attributable to the Fund’s Class A shares, as reimbursement for expenses incurred by Natixis Distributors in providing personal services to investors in Class A shares and/or the maintenance of shareholder accounts.
27
NOTESTO FINANCIAL STATEMENTS (continued)
March 31, 2010 (Unaudited)
Under the respective Class B and Class C Plans, the Fund pays Natixis Distributors a monthly service fee at an annual rate not to exceed 0.25% of the average daily net assets attributable to the Fund’s Class B and Class C shares, as compensation for services provided by Natixis Distributors in providing personal services to investors in Class B and Class C shares and/or the maintenance of shareholder accounts.
Also under the respective Class B and Class C Plans, the Fund pays Natixis Distributors a monthly distribution fee at the annual rate of 0.75% of the average daily net assets attributable to the Fund’s Class B and Class C shares, as compensation for services provided by Natixis Distributors in connection with the marketing or sale of Class B and Class C shares.
Under the Admin Class Plan, the Fund pays Natixis Distributors a monthly distribution fee at an annual rate not to exceed 0.25% of the average daily net assets attributable to the Fund’s Admin Class shares, as compensation for services provided by Natixis Distributors in connection with the marketing or sale of Admin Class shares or for payments made by Natixis Distributors to securities dealers or other financial intermediaries as commissions, asset-based sales charges or other compensation with respect to the sale of Admin Class shares, or for providing personal services to investors and/or the maintenance of shareholder accounts.
In addition, the Admin Class shares of the Fund may pay Natixis Distributors an administrative service fee, at an annual rate not to exceed 0.25% of the average daily net assets attributable to Admin Class shares. These fees are subsequently paid to securities dealers or financial intermediaries for providing personal services and/or account maintenance for their customers who hold such shares.
Class J shares are subject to a monthly shareholder service fee at an annual rate of 0.25% and a monthly distribution fee, at an annual rate of 0.50% of the average daily net assets attributable to the Fund’s Class J shares, both payable to Loomis Sayles Distributors, pursuant to a shareholder service and distribution plan adopted under Rule 12b-1.
For the six months ended March 31, 2010 the Fund paid the following service and distribution fees:
| | | | | | | | | | | | | | | | | | | | | | | | | | |
Service Fees | | Distribution Fees |
Class A | | Class B | | Class C | | Admin Class | | | Class J | | Class B | | Class C | | Admin Class | | | Class J |
$3,728,615 | | $ | 21,751 | | $ | 3,166,135 | | $ | — | (a) | | $ | 177,509 | | $ | 65,253 | | $ | 9,498,405 | | $ | — | (a) | | $ | 355,017 |
| (a) | Amount is less than $1. |
d. Sub-Transfer Agent Fees. Natixis Distributors has entered into agreements with financial intermediaries to provide certain recordkeeping, processing, shareholder communications and other services to customers of the intermediaries and has agreed to compensate the intermediaries for providing those services. Certain services would be provided by the Fund if the shares of those customers were registered directly with the Fund’s transfer agent. Accordingly, the Fund agreed to pay a portion of the intermediary fees attributable to shares of the Fund held by intermediaries (which generally are a percentage of the value of shares held) not exceeding what the Fund would have paid its transfer agent had each customer’s shares been registered directly with the transfer agent instead of held through the intermediaries. Natixis Distributors pays the remainder of the fees.
For the six months ended March 31, 2010, the Fund paid the following sub-transfer agent fees which are reflected in transfer agent fees and expenses in the Statement of Operations.
| | | | | | | | | | | | | | | |
Sub Transfer Agent Fees |
Class A | | Class B | | Class C | | Class Y | | Admin Class | | Class J |
$1,033,487 | | $ | 6,069 | | $ | 877,915 | | $ | 1,272,797 | | $ | — | | $ | — |
e. Commissions. The Fund has been informed that commissions (including CDSCs) on Fund shares retained by Natixis Distributors were $2,930,362 and commissions on Fund shares retained by Loomis Sayles Distributors by investors in Class J shares of the Fund were $28,796 for the six months ended March 31, 2010.
f. Trustees Fees and Expenses. The Funds do not pay any compensation directly to its officers or Trustees who are directors, officers or employees of Natixis Advisors, Natixis Distributors, Natixis US or their affiliates. Effective January 1, 2010, the Chairperson of the Board receives a retainer fee at the annual rate of $250,000. The Chairperson does not receive any meeting attendance fees for Board of Trustees meetings or committee meetings that she attends. Each Independent Trustee (other than the Chairperson) receives, in the aggregate, a retainer fee at the annual rate of $80,000. Each Independent Trustee also receives a meeting attendance fee of $10,000 for each meeting of the Board of Trustees that he or she attends in person and $5,000 for each meeting of the Board of Trustees that he or she attends telephonically. In addition, each committee chairman receives an additional retainer fee at an annual rate of $15,000. Each Contract Review and Governance Committee member is compensated $6,000 for each Committee meeting that he or she attends in person and $3,000 for each meeting that he or she attends telephonically. Each Audit Committee member is compensated $7,500 for each Committee meeting that he or she attends in person and $3,750 for each meeting that he or she attends telephonically. Each member of the ad hoc Committee on Alternative Investments received a one-time fee of $10,000. The ad hoc Committee on Alternative Investments is not a standing committee. These fees are allocated among the
28
NOTESTO FINANCIAL STATEMENTS (continued)
March 31, 2010 (Unaudited)
funds in the Natixis Funds Trusts, Loomis Sayles Funds Trusts and Hansberger International Series based on a formula that takes into account, among other factors, the relative net assets of each fund. Trustees are reimbursed for travel expenses in connection with attendance at meetings.
Prior to January 1, 2010, the Chairperson of the Board received a retainer fee at the annual rate of $200,000. The Chairperson did not receive any meeting attendance fees for Board of Trustees meetings or committee meetings that she attended. Each Independent Trustee (other than the Chairperson) received, in the aggregate, a retainer fee at the annual rate of $65,000. Each Independent Trustee also received a meeting attendance fee of $7,500 for each meeting of the Board of Trustees that he or she attended in person and $3,750 for each meeting of the Board of Trustees that he or she attended telephonically. In addition, each committee chairman received an additional retainer fee at an annual rate of $10,000. Each Contract Review and Governance Committee member was compensated $5,000 for each Committee meeting that he or she attended in person and $2,500 for each meeting that he or she attended telephonically. Each Audit Committee member was compensated $6,250 for each Committee meeting that he or she attended in person and $3,125 for each meeting that he or she attended telephonically.
A deferred compensation plan (the “Plan”) is available to the Trustees on a voluntary basis. Deferred amounts remain in the Funds until distributed in accordance with the provisions of the Plan. The value of a participating Trustee’s deferral account is based on theoretical investments of deferred amounts, on the normal payment dates, in certain funds of the Natixis Funds Trusts, Loomis Sayles Funds Trusts and Hansberger International Series as designated by the participating Trustees. Changes in the value of participants’ deferral accounts are allocated pro rata among the funds in the Natixis Funds Trusts, Loomis Sayles Funds Trusts, and Hansberger International Series, and are normally reflected as Trustees’ fees and expenses in the Statement of Operations. The portions of the accrued obligations allocated to the Fund under the Plan are reflected as Deferred Trustees’ fees on the Statement of Assets and Liabilities.
6. Class-Specific Expenses. For the six months ended March 31, 2010, the Fund paid the following class-specific expenses:
| | | | | | | | | | | | | | | | | | |
| | | Class A | | Class B | | Class C | | Class Y | | Admin Class | | Class J |
Transfer Agent Fees and Expenses | | $ | 1,180,701 | | $ | 6,890 | | $ | 1,002,771 | | $ | 1,464,116 | | $ | — | | $ | 4,507 |
Registration Fees | | | 36,494 | | | 8,659 | | | 32,721 | | | 123,763 | | | 5,106 | | | 1,381 |
Legal Fees | | | 30,315 | | | 179 | | | 25,879 | | | 36,595 | | | — | | | 11,491 |
Shareholding Reporting Expenses | | | 106,410 | | | 1,325 | | | 90,870 | | | 96,918 | | | 6 | | | 52,112 |
7. Line of Credit. The Fund, together with certain other funds of Natixis Funds Trusts, Loomis Sayles Funds Trusts and the Hansberger International Series, participates in a $200,000,000 committed unsecured line of credit provided by State Street Bank, with an individual limit of $125,000,000 for each fund that participates in the line of credit. Interest is charged to each participating fund based on its borrowings at a rate per annum equal to the greater of the Federal Funds rate or overnight LIBOR, plus 1.25%. In addition, a commitment fee of 0.15% per annum, payable at the end of each calendar quarter, is accrued and apportioned among the participating funds based on their average daily unused portion of the line of credit.
Prior to March 10, 2010, the Fund, together with certain other funds of Natixis Funds Trusts, Loomis Sayles Funds Trusts and the Hansberger International Series, participated in a $200,000,000 committed unsecured line of credit provided by State Street Bank, with an individual limit of $125,000,000 for each Fund that participated in the line of credit. Interest was charged to each participating fund based on its borrowings at a rate per annum equal to the greater of the Federal Funds rate or overnight LIBOR, plus 0.75%. In addition, a commitment fee of 0.125% per annum, payable at the end of each calendar quarter was accrued and apportioned among the participating funds based on their average daily unused portion of the line of credit.
For the six months ended March 31, 2010, the Fund had no borrowings under these agreements.
8. Concentration of Risk. The Fund may purchase investments of foreign issuers. Investing in securities of foreign issuers involves special risks and considerations not typically associated with investing in U.S. companies and securities of the U.S. Government. These risks include revaluation of currencies and the risk of expropriation. Moreover, the markets for securities of many foreign issuers may be less liquid and the prices of such securities may be more volatile than those of comparable U.S. companies and the U.S. Government.
9. Concentration of Ownership. At March 31, 2010, the Loomis Sayles Employees’ Profit Sharing Retirement Plan held 475,869 shares of beneficial interest of Class Y shares.
29
NOTESTO FINANCIAL STATEMENTS (continued)
March 31, 2010 (Unaudited)
10. Capital Shares. The Fund may issue an unlimited number of shares of beneficial interest, without par value. Transactions in capital shares were as follows:
| | | | | | | | | | | | | | |
| | | Six Months Ended
March 31, 2010 | | | Year Ended
September 30, 2009 | |
| | | Shares | | | Amount | | | Shares | | | Amount | |
| | | | | | | | | | | | | | |
| Class A | | | | | | | | | | | | | | |
Issued from the sale of shares | | 53,211,394 | | | $ | 627,549,848 | | | 200,269,071 | | | $ | 2,017,489,461 | |
Issued in connection with the reinvestment of distributions | | 5,538,773 | | | | 64,956,085 | | | 11,250,899 | | | | 113,354,829 | |
Redeemed | | (60,822,598 | ) | | | (717,556,016 | ) | | (135,581,311 | ) | | | (1,374,597,415 | ) |
| | | | | | | | | | | | | | |
Net change | | (2,072,431 | ) | | $ | (25,050,083 | ) | | 75,938,659 | | | $ | 756,246,875 | |
| | | | | | | | | | | | | | |
| Class B | | | | | | | | | | | | | | |
Issued from the sale of shares | | 48,340 | | | $ | 565,709 | | | 342,411 | | | $ | 3,353,183 | |
Issued in connection with the reinvestment of distributions | | 16,859 | | | | 196,840 | | | 47,761 | | | | 475,214 | |
Redeemed | | (135,224 | ) | | | (1,589,435 | ) | | (406,153 | ) | | | (4,093,030 | ) |
| | | | | | | | | | | | | | |
Net change | | (70,025 | ) | | $ | (826,886 | ) | | (15,981 | ) | | $ | (264,633 | ) |
| | | | | | | | | | | | | | |
| Class C | | | | | | | | | | | | | | |
Issued from the sale of shares | | 25,426,201 | | | $ | 297,709,116 | | | 125,777,319 | | | $ | 1,258,454,707 | |
Issued in connection with the reinvestment of distributions | | 2,426,537 | | | | 28,263,501 | | | 4,814,937 | | | | 48,253,057 | |
Redeemed | | (30,478,991 | ) | | | (357,603,278 | ) | | (42,064,857 | ) | | | (423,168,232 | ) |
| | | | | | | | | | | | | | |
Net change | | (2,626,253 | ) | | $ | (31,630,661 | ) | | 88,527,399 | | | $ | 883,539,532 | |
| | | | | | | | | | | | | | |
| Class Y | | | | | | | | | | | | | | |
Issued from the sale of shares | | 84,088,448 | | | $ | 992,316,180 | | | 271,785,951 | | | $ | 2,773,164,198 | |
Issued in connection with the reinvestment of distributions | | 6,030,512 | | | | 70,731,240 | | | 8,469,829 | | | | 85,983,440 | |
Redeemed | | (77,792,522 | ) | | | (918,692,920 | ) | | (76,132,184 | ) | | | (772,285,683 | ) |
| | | | | | | | | | | | | | |
Net change | | 12,326,438 | | | $ | 144,354,500 | | | 204,123,596 | | | $ | 2,086,861,955 | |
| | | | | | | | | | | | | | |
| Admin Class * | | | | | | | | | | | | | | |
Issued from the sale of shares | | 85 | | | $ | 1,002 | | | — | | | $ | — | |
Issued in connection with the reinvestment of distributions | | — | (a) | | | 4 | | | — | | | | — | |
Redeemed | | — | | | | — | | | — | | | | — | |
| | | | | | | | | | | | | | |
Net change | | 85 | | | $ | 1,006 | | | — | | | $ | — | |
| | | | | | | | | | | | | | |
| Class J | | | | | | | | | | | | | | |
Issued from the sale of shares | | 484,500 | | | $ | 5,724,595 | | | 1,250,300 | | | $ | 12,326,154 | |
Issued in connection with the reinvestment of distributions | | — | | | | — | | | — | | | | — | |
Redeemed | | (2,131,790 | ) | | | (25,090,559 | ) | | (4,148,420 | ) | | | (42,739,002 | ) |
| | | | | | | | | | | | | | |
Net change | | (1,647,290 | ) | | $ | (19,365,964 | ) | | (2,898,120 | ) | | $ | (30,412,848 | ) |
| | | | | | | | | | | | | | |
Increase (decrease) from capital share transactions | | 5,910,524 | | | $ | 67,481,912 | | | 365,675,553 | | | $ | 3,695,970,881 | |
| | | | | | | | | | | | | | |
| * | From commencement of Class operations on February 1, 2010 through March 31, 2010. |
| (a) | Amount rounds to less than one share. |
30
Not applicable.
| Item 3. | Audit Committee Financial Expert. |
Not applicable.
| Item 4. | Principal Accountant Fees and Services. |
Not applicable.
| Item 5. | Audit Committee of Listed Registrants. |
Not applicable.
| Item 6. | Schedule of Investments. |
Included as part of the Report to Shareholders filed as Item 1 herewith.
| Item 7. | Disclosure of Proxy Voting Policies and Procedures for Closed-End Management Investment Companies. |
Not applicable.
| Item 8. | Portfolio Managers of Closed-End Management Investment Companies. |
Not applicable.
| Item 9. | Purchases of Equity Securities by Closed-End Management Investment Companies and Affiliated Purchasers. |
Not applicable.
| Item 10. | Submission of Matters to a Vote of Securities Holders. |
There were no material changes to the procedures by which shareholders may recommend nominees to the Trust’s Board of Trustees.
| Item 11. | Controls and Procedures. |
The Registrant’s principal executive officer and principal financial officer have concluded that the Registrant’s disclosure controls and procedures are sufficient to ensure that information required to be disclosed by the Registrant in this Form N-CSR was recorded, processed, summarized and reported within the time periods specified in the Securities and Exchange Commission’s rules and forms, based upon such officers’ evaluation of these controls and procedures as of a date within 90 days of the filing date of the report.
There was no change in the Registrant’s internal control over financial reporting that occurred during the Registrant’s last fiscal quarter of the period covered by the report that has materially affected, or is reasonably likely to materially affect, the Registrant’s internal control over financial reporting.
| | | | |
| | |
| (a) | | (1) | | Not applicable. |
| | |
| (a) | | (2) | | Certifications of Principal Executive Officer and Principal Financial Officer pursuant to Rule 30a-2(a) under the Investment Company Act of 1940 (17 CFR 270.30a-2(a)), filed herewith as Exhibits (a)(2)(1) and a(2)(2), respectively. |
| | |
| (a) | | (3) | | Not applicable. |
| | |
| (b) | | | | Certifications of Principal Executive Officer and Principal Financial Officer pursuant to Section 906 of Sarbanes-Oxley Act of 2002 are filed herewith as Exhibit (b). |
SIGNATURES
Pursuant to the requirements of the Securities Exchange Act of 1934 and the Investment Company Act of 1940, the Registrant has duly caused this report to be signed on its behalf by the undersigned, thereunto duly authorized.
| | |
| LOOMIS SAYLES FUNDS II |
| |
| By: | | /S/ ROBERT J. BLANDING |
| Name: | | Robert J. Blanding |
| Title: | | Chief Executive Officer |
| Date: | | May 20, 2010 |
Pursuant to the requirements of the Securities Exchange Act of 1934 and the Investment Company Act of 1940, this report has been signed by the following persons on behalf of the Registrant and in the capacities and on the dates indicated.
| | |
| |
| By: | | /S/ ROBERT J. BLANDING |
| Name: | | Robert J. Blanding |
| Title: | | Chief Executive Officer |
| Date: | | May 20, 2010 |
| |
| By: | | /S/ MICHAEL C. KARDOK |
| Name: | | Michael C. Kardok |
| Title: | | Treasurer |
| Date: | | May 20, 2010 |