UNITED STATES
SECURITIES AND EXCHANGE COMMISSION
Washington, D.C. 20549
FORM N-CSR
CERTIFIED SHAREHOLDER REPORT OF REGISTERED
MANAGEMENT INVESTMENT COMPANIES
Investment Company Act file number: 811-06241
Loomis Sayles Funds II
(Exact name of Registrant as specified in charter)
399 Boylston Street, Boston, Massachusetts 02116
(Address of principal executive offices) (Zip code)
Coleen Downs Dinneen, Esq.
Natixis Distributors, L.P.
399 Boylston Street
Boston, Massachusetts 02116
(Name and address of agent for service)
Registrant’s telephone number, including area code: (617) 449-2810
Date of fiscal year end: September 30
Date of reporting period: March 31, 2011
Item 1. Reports to Stockholders.
The Registrant’s semi-annual report transmitted to shareholders pursuant to Rule 30e-1 under the Investment Company Act of 1940 is as follows:
SEMIANNUAL REPORT
March 31, 2011

Loomis Sayles Core Plus Bond Fund
Loomis Sayles High Income Fund
Loomis Sayles International Bond Fund
Loomis Sayles Limited Term Government and Agency Fund
Loomis Sayles Strategic Income Fund
Loomis, Sayles & Company, L.P.
TABLE OF CONTENTS
Management Discussion and Investment Results page 1
Portfolio of Investments page 15
Financial Statements page 48
LOOMIS SAYLES CORE PLUS BOND FUND
Management Discussion
Managers:
Peter W. Palfrey, CFA
Richard G. Raczkowski
Loomis, Sayles & Company, L.P.
Objective:
Seeks high total investment return through a combination of current income and capital appreciation
Strategy:
Invests primarily in fixed income securities
Fund Inception:
November 7, 1973
Symbols:
| | |
| Class A | | NEFRX |
| Class B | | NERBX |
| Class C | | NECRX |
| Class Y | | NERYX |
What You Should Know:
Investments in the Fund are subject to a number of risks. Please see the “Principal Risks” section of the Fund’s prospectus. The purchase of Fund shares should be seen as a long-term investment.
Market Conditions
Sentiment in the domestic fixed-income markets remained healthy despite disruptions abroad – including financial disturbances in Europe, civil unrest in the Middle East and the massive earthquake and nuclear crisis in Japan. Improving economic growth prospects in the United States encouraged the Federal Reserve Board (the Fed) to maintain its commitment to a low-interest-rate policy. The resulting environment sent investors in search of higher yields, causing interest rates in the United States to rise, on average. As investors intensified their search for income, sectors that offered a yield advantage over Treasuries benefited from steady demand. The best performers were higher-yielding issues, including investment-grade bonds and mortgage-backed securities (MBS).
Performance Results
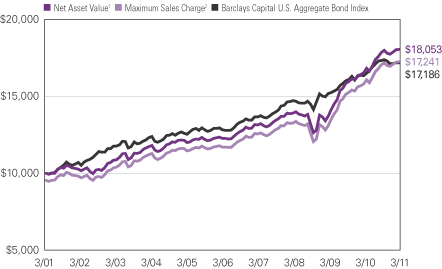
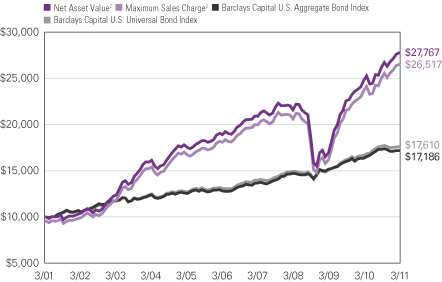
For the six months ended March 31, 2011, Class A shares of Loomis Sayles Core Plus Bond Fund returned 1.11% at net asset value. For the same period, the fund’s benchmark, Barclays Capital U.S. Aggregate Bond Index, returned -0.88%, while the average return of funds in Morningstar’s Intermediate-Term Bond category was 0.12%.
Explanation of Fund Performance
An emphasis on corporate bonds and an underweight relative to the benchmark in U.S. Treasuries aided the fund’s performance. These positions more than offset the impact of the fund’s longer duration (a measure of interest rate sensitivity), which detracted from performance as interest rates rose, and its below-benchmark exposure to MBS, which outperformed during the period.
Strong security selection and sector allocation among corporate bonds were the primary drivers of the fund’s standout performance relative to its benchmark. Exposure to high-yield securities, which are not part of the benchmark, was especially positive. In particular, the fund’s holdings of cyclical industrial high-yield bonds, which were positioned to benefit from global economic recovery, did well. We trimmed securities that had outperformed and added to well-financed issuers with solid balance sheets and leading market positions. In February, we reduced the fund’s near maximum allocation to high yield and swapped the proceeds into Treasuries. However, we moved back into the sector in March after riskier assets sold off in response to problems in Japan’s markets. In addition, we favored investment-grade bonds rated A and BBB, focusing on securities that we believed offered the best value. Here too, we harvested gains when we thought the securities had fully recovered in price.
Throughout the six-month period, the fund maintained its focus on higher- quality commercial mortgage-backed securities (CMBS). We added to holdings, taking advantage of a brief sell-off that made the sector even more attractive. The fund also had more exposure than the benchmark to asset-backed securities (ABS), which aided performance. During the period, we added to higher-quality, shorter-term loans. And, we raised exposure to MBS after the Fed announced that it would unwind its MBS portfolio over time.
To position the fund more defensively, we sold the remainder of the fund’s exposure to foreign currencies, swapping proceeds into higher-coupon MBS. Late in March, 2011, we also initiated a short position in the euro, to express our bearish view of the currency (and a more constructive view on the dollar) and to hedge the overall risk in the portfolio.
Outlook
We believe the portfolio is well positioned for a longer-term recovery in the U.S. and global markets. Our goal is to maintain sufficient flexibility to move in and out of markets to maintain the fund’s yield advantage and to execute tactical and opportunistic trades. In this regard, we plan to maintain the fund’s underweight relative to the benchmark in government securities and overweight in the investment-grade, high-yield and CMBS markets. We also plan to maintain the fund’s “barbell” configuration, emphasizing both longer- and shorter-term securities. Given current market conditions and increasing volatility, we may take steps to become more defensive by shortening the fund’s duration later in the year.
1 |
LOOMIS SAYLES CORE PLUS BOND FUND
Investment Results through March 31, 2011
The charts comparing the fund’s performance to an index provide you with a general sense of how it performed. The fund’s total return for the period shown below appears with and without sales charges and includes fund expenses and fees. An index measures the performance of a theoretical portfolio. Unlike a fund, an index is unmanaged and does not have expenses that affect the results. It is not possible to invest directly in an index. Investors would incur transaction costs and other expenses if they purchased the securities necessary to match the index.
Growth of a $10,000 Investment in Class A Shares4
March 31, 2001 through March 31, 2011
Average Annual Returns — March 31, 20114
| | | | | | | | | | | | | | | | |
| | | | | |
| | | 6 Months | | | 1 Year | | | 5 Years | | | 10 Years | |
| | | | | |
| Class A (Inception 11/7/73) | | | | | | | | | | | | | | | | |
| Net Asset Value1 | | | 1.11 | % | | | 9.09 | % | | | 8.04 | % | | | 6.08 | % |
| With Maximum Sales Charge2 | | | -3.44 | | | | 4.18 | | | | 7.05 | | | | 5.60 | |
| | | | | |
| Class B (Inception 9/13/93) | | | | | | | | | | | | | | | | |
| Net Asset Value1 | | | 0.72 | | | | 8.22 | | | | 7.24 | | | | 5.31 | |
| With CDSC3 | | | -4.21 | | | | 3.22 | | | | 6.93 | | | | 5.31 | |
| | | | | |
| Class C (Inception 12/30/94) | | | | | | | | | | | | | | | | |
| Net Asset Value1 | | | 0.65 | | | | 8.19 | | | | 7.23 | | | | 5.30 | |
| With CDSC3 | | | -0.34 | | | | 7.19 | | | | 7.23 | | | | 5.30 | |
| | | | | |
| Class Y (Inception 12/30/94) | | | | | | | | | | | | | | | | |
| Net Asset Value1 | | | 1.23 | | | | 9.40 | | | | 8.33 | | | | 6.43 | |
| | | | | |
| Comparative Performance | | | | | | | | | | | | | | | | |
| Barclays Capital U.S. Aggregate Bond Index | | | -0.88 | | | | 5.12 | | | | 6.03 | | | | 5.56 | |
| Morningstar Int.-Term Bond Fund Avg. | | | 0.12 | | | | 6.16 | | | | 5.50 | | | | 5.15 | |
All returns represent past performance and do not guarantee future results. Periods of less than one year are not annualized. Share price and return will vary and you may have a gain or loss when you sell your shares. All results include reinvestment of dividends and capital gains. Current returns may be higher or lower than those shown. For performance current to the most recent month-end, visit ga.natixis.com. Class Y shares are not available for purchase by all investors. The table and graph do not reflect taxes shareholders might owe on any fund distributions or when they redeem their shares.
| | | | |
| Credit Quality | | % of Net
Assets as of
3/31/11* | |
| Aaa | | | 43.1 | |
| Aa | | | 6.2 | |
| A | | | 6.2 | |
| Baa | | | 24.4 | |
| Ba | | | 14.7 | |
| B | | | 3.2 | |
| Not Rated | | | 0.5 | |
| Short-term and other | | | 1.7 | |
| * | Credit quality at 3/31/2011 reflects the highest credit rating assigned to individual holdings of the fund among Moody’s, S&P or Fitch; ratings are subject to change. The fund’s share are not rated by any rating agency and no credit rating for fund shares is implied. The Moody’s equivalent of the assigned rating is presented in the table. |
| | | | |
| Effective Duration | | % of Net
Assets as of
3/31/11 | |
| 1 year or less | | | 5.3 | |
| 1-5 years | | | 44.4 | |
| 5-10 years | | | 36.3 | |
| 10+ years | | | 14.0 | |
| Average Effective Duration | | | 6.1 | years |
Portfolio characteristics will vary.
Expense Ratios
as stated in the most recent prospectus
| | | | | | | | |
| Share Class | | Gross Expense Ratio5 | | | Net Expense Ratio6 | |
| A | | | 0.90 | % | | | 0.90 | % |
| B | | | 1.65 | | | | 1.65 | |
| C | | | 1.65 | | | | 1.65 | |
| Y | | | 0.65 | | | | 0.65 | |
NOTES TO CHARTS
See page 11 for a description of the indices.
| 1 | At Net Asset Value (NAV) - does not reflect payment of sales charge at time of purchase. |
| 2 | With Maximum Sales Charge (MSC) - reflects maximum sales charge of 4.50% at time of purchase. |
| 3 | Performance for Class B shares assumes a maximum 5% contingent deferred sales charge (“CDSC”) applied when you sell shares, which declines annually between years 1-6 according to the following schedule: 5, 4, 3, 3, 2, 1, 0%. Class C shares performance assumes a 1% CDSC applied when you sell shares within one year of purchase. |
| 4 | Fund performance has been increased by fee waivers and/or expense reimbursements, if any, without which performance would have been lower. |
| 5 | Before fee waivers and/or expense reimbursements. |
| 6 | After fee waivers and/or expense reimbursements. Waivers/reimbursements are contractual and are set to expire on 1/31/12. Contracts are reevaluated on an annual basis. |
| 2
LOOMIS SAYLES HIGH INCOME FUND
Management Discussion
Managers:
Matthew J. Eagan, CFA
Kathleen C. Gaffney, CFA
Associate Manager:
Elaine M. Stokes
Loomis, Sayles & Company, L.P.
Objective:
Seeks high current income plus the opportunity for capital appreciation to produce a high total return
Strategy:
Invests primarily in below investment-grade fixed-income securities
Fund Inception:
February 22, 1984
Symbols:
| | |
| Class A | | NEFHX |
| Class B | | NEHBX |
| Class C | | NEHCX |
| Class Y | | NEHYX |
What You Should Know:
Investments in the Fund are subject to a number of risks. Please see the “Principal Risks” section of the Fund’s prospectus. The purchase of Fund shares should be seen as a long-term investment.
Market Conditions
A gradual improvement in the global economy, stronger corporate balance sheets and improvements in the U.S. labor market boosted investor confidence during the six months ended March 31, 2011. The positive environment helped stimulate optimism in both the fixed-income and equity markets. As money flowed freely, debt issuers continued to refinance old lines of credit at increasingly beneficial terms, while investors reached for yield in a continuing environment of low interest rates. However, political upheavals in the Middle East and Northern Africa and banking sector troubles in Europe unsettled foreign debt markets, adding to volatility. At the same time, a massive earthquake and tsunami in Japan caused damage to that country’s infrastructure bringing concerns that Japan, one of the largest holders of U.S. Treasury securities, might liquidate positions to fund reconstruction and short-term operations. In this environment, high-yield bonds generally outperformed investment-grade bonds.
Performance Results
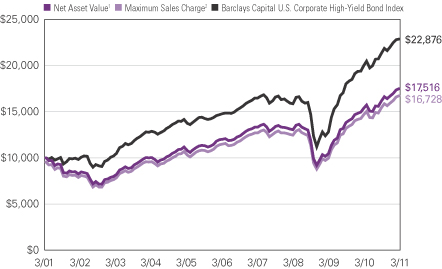
For the six months ended March 31, 2011, Class A shares of Loomis Sayles High Income Fund returned 8.23% at net asset value. The fund outperformed its benchmark, the Barclays Capital U.S. Corporate High-Yield Bond Index, which returned 7.23%. The fund also outperformed the 7.34% average return of funds in its peer group, the Morningstar High Yield Bond category.
Explanation of Fund Performance
Strong security selection and allocations to some issues not in the benchmark helped the fund outperform. Although quality-based returns were mixed, high-yield credits tended to outperform their investment-grade counterparts. High-yield industrials, utilities and financials continued to provide attractive returns as the economy strengthened and investors grew more comfortable with taking greater risk in pursuit of higher yields. Investments in convertibles and a small position in equities, neither of which is included in the benchmark, also helped boost fund returns higher than the benchmark. These holdings benefited from an equity market rally during the period. In addition, the fund’s exposure to the Australian dollar, as well as the Colombian and Uruguayan pesos, made a positive contribution to performance.
Although investment-grade securities and securities denominated in foreign currencies provided positive returns, the returns they generated were not as strong as the return of the benchmark. The only negative returns came from a small position in U.S. government securities, which lagged as investors embraced risk.
Outlook
Strong liquidity, markets in transition, geopolitical turmoil, continued economic recovery and tragic natural disasters garnered significant attention from market participants during the first quarter of 2011. Many of these themes will continue to dominate investor consciousness going forward. We believe markets remain in transition regarding interest rates, with pressures building both globally and domestically. Globally, growth in many areas of the world remains robust; however, inflation concerns have begun to attract attention. Central banks will likely continue to shift toward less accommodative policy as 2011 progresses. We anticipate the Fed’s program of Treasury purchases in the United States, which is referred to as “QE2” (short for quantitative easing), will end during the second quarter and believe the U.S. economic recovery has sufficient momentum to continue expanding without outsized government stimulus.
Our assessment of the fundamental underpinnings of the corporate sector remains positive. In general, corporations are proceeding conservatively with regard to hiring and capital expenditures. Merger and acquisition activity has increased recently, and we believe there is room for more growth in that space. Valuations in the corporate bond space are generally fair, with investor demand for yield providing support and liquidity to the high-yield, investment-grade and convertible sectors. We continue to position the fund for global economic recovery, as well as a gradual upward bias in interest rates. We continue to emphasize yield advantage, global diversification and specific bond picking within the fund.
3 |
LOOMIS SAYLES HIGH INCOME FUND
Investment Results through March 31, 2011
The charts comparing the fund’s performance to an index provide you with a general sense of how it performed. The fund’s total return for the period shown below appears with and without sales charges and includes fund expenses and fees. An index measures the performance of a theoretical portfolio. Unlike a fund, the index is unmanaged and does not have expenses that affect the results. It is not possible to invest directly in an index. Investors would incur transaction costs and other expenses if they purchased the securities necessary to match the index.
Growth of a $10,000 Investment in Class A Shares4
March 31, 2001 through March 31, 2011
Average Annual Returns — March 31, 20114
| | | | | | | | | | | | | | | | | | | | |
| | | | | | |
| | | 6 Months | | | 1 Year | | | 5 Years | | | 10 Years | | | Since
Class Y
Inception7 | |
| | | | | | |
| Class A (Inception 2/22/84) | | | | | | | | | | | | | | | | | | | | |
| Net Asset Value1 | | | 8.23 | % | | | 13.86 | % | | | 7.81 | % | | | 5.76 | % | | | — | |
| With Maximum Sales Charge2 | | | 3.38 | | | | 8.67 | | | | 6.82 | | | | 5.28 | | | | — | |
| | | | | | |
| Class B (Inception 9/20/93) | | | | | | | | | | | | | | | | | | | | |
| Net Asset Value1 | | | 7.80 | | | | 12.97 | | | | 7.01 | | | | 4.96 | | | | — | |
| With CDSC3 | | | 2.80 | | | | 7.97 | | | | 6.70 | | | | 4.96 | | | | — | |
| | | | | | |
| Class C (Inception 3/2/98) | | | | | | | | | | | | | | | | | | | | |
| Net Asset Value1 | | | 7.61 | | | | 13.01 | | | | 6.99 | | | | 4.95 | | | | — | |
| With CDSC3 | | | 6.61 | | | | 12.01 | | | | 6.99 | | | | 4.95 | | | | — | |
| | | | | | |
| Class Y (Inception 2/29/08) | | | | | | | | | | | | | | | | | | | | |
| Net Asset Value1 | | | 8.38 | | | | 14.17 | | | | — | | | | — | | | | 10.00 | |
| | | | | | |
| Comparative Performance | | | | | | | | | | | | | | | | | | | | |
| Barclays Capital U.S. Corporate High-Yield Bond Index | | | 7.23 | | | | 14.31 | | | | 9.12 | | | | 8.63 | | | | 12.44 | |
| Morningstar High Yield Bond Fund Avg. | | | 7.34 | | | | 13.58 | | | | 6.86 | | | | 6.85 | | | | 9.45 | |
All returns represent past performance and do not guarantee future results. Periods of less than one year are not annualized. Share price and return will vary and you may have a gain or loss when you sell your shares. All results include reinvestment of dividends and capital gains. Current returns may be higher or lower than those shown. For performance current to the most recent month-end, visit ga.natixis.com. Performance history includes periods from a predecessor fund. Class Y shares are not available for purchase by all investors. The table and graph do not reflect taxes shareholders might owe on any fund distributions or when they redeem their shares.
| | | | |
| Credit Quality | | % of Net
Assets as of
3/31/11* | |
| Aaa | | | 5.2 | |
| Aa | | | 3.4 | |
| A | | | 7.1 | |
| Baa | | | 4.9 | |
| Ba | | | 26.0 | |
| B | | | 28.3 | |
| Caa and lower | | | 6.3 | |
| Not Rated | | | 6.4 | |
| Short-term and other | | | 12.4 | |
| * | Credit quality at 3/31/2011 reflects the highest credit rating assigned to individual holdings of the fund among Moody’s, S&P or Fitch; ratings are subject to change. The fund’s share are not rated by any rating agency and no credit rating for fund shares is implied. The Moody’s equivalent of the assigned rating is presented in the table. |
| | | | |
| Effective Maturity | | % of Net
Assets as of
3/31/11 | |
| 1 year or less | | | 15.2 | |
| 1-5 years | | | 26.4 | |
| 5-10 years | | | 24.1 | |
| 10+ years | | | 34.3 | |
| Average Effective Maturity | | | 9.4 | years |
Portfolio characteristics will vary.
Expense Ratios
as stated in the most recent prospectus
| | | | | | | | |
| Share Class | | Gross Expense Ratio5 | | | Net Expense Ratio6 | |
| A | | | 1.20 | % | | | 1.15 | % |
| B | | | 1.94 | | | | 1.90 | |
| C | | | 1.95 | | | | 1.90 | |
| Y | | | 0.93 | | | | 0.90 | |
NOTES TO CHARTS
| See | page 11 for a description of the indices. |
| 1 | At Net Asset Value (NAV) - does not reflect payment of sales charge at time of purchase. |
| 2 | With Maximum Sales Charge (MSC) - reflects maximum sales charge of 4.50% at time of purchase. |
| 3 | Performance for Class B shares assumes a maximum 5% contingent deferred sales charge (“CDSC”) applied when you sell shares, which declines annually between years 1-6 according to the following schedule: 5, 4, 3, 3, 2, 1, 0%. Class C shares performance assumes a 1% CDSC applied when you sell shares within one year of purchase. |
| 4 | Fund performance has been increased by fee waivers and/or expense reimbursements, if any, without which performance would have been lower. |
| 5 | Before fee waivers and/or expense reimbursements. |
| 6 | After fee waivers and/or expense reimbursements. Waivers/reimbursements are contractual and are set to expire on 1/31/12. Contracts are reevaluated on an annual basis. |
| 7 | The since-inception comparative performance figures shown for Class Y shares are calculated from 3/1/08. |
| 4
LOOMIS SAYLES INTERNATIONAL BOND FUND
Management Discussion
Managers:
David W. Rolley, CFA
Kenneth M. Buntrock, CFA, CIC
Lynda L. Schweitzer, CFA
Loomis, Sayles & Company, L.P.
Objective:
Seeks high total return through a combination of high current income and capital appreciation
Strategy:
Invests primarily in fixed-income securities located outside the U.S.
Fund Inception:
February 1, 2008
Symbols:
| | |
| Class A | | LSIAX |
| Class C | | LSICX |
| Class Y | | LSIYX |
What You Should Know:
Investments in the Fund are subject to a number of risks. Please see the “Principal Risks” section of the Fund’s prospectus. The purchase of Fund shares should be seen as a long-term investment.
Market Conditions
Riskier sectors produced the best performance in global fixed-income markets for the six months ended March 31, 2011, despite increasing uncertainty created by higher oil prices, turmoil in the Middle East, a major disaster in Japan and growing doubts about some European sovereign debt. Against a backdrop of rising interest rates and strengthening economies, credit-sensitive securities outperformed comparable-duration government securities. (Duration is a measure of interest rate risk.) The returns from lower-quality bonds outpaced results from investments in higher-quality securities. Meanwhile, the U.S. dollar declined relative to major foreign currencies.
Performance Results
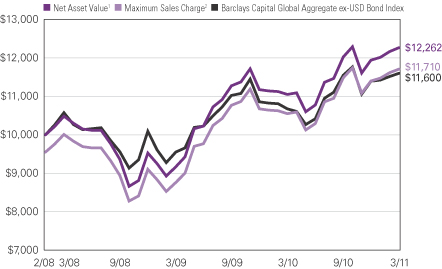
For the six months ended March 31, 2011, Class A shares of Loomis Sayles International Bond Fund returned 1.98% at net asset value. The fund outperformed its benchmark, the Barclays Capital Global Aggregate ex-USD Bond Index, which returned 0.44%. The fund also outperformed the 0.25% average return of funds in its peer group, the Morningstar World Bond category.
Explanation of Fund Performance
Good security selection, which resulted in an emphasis on corporate bonds and a de-emphasis on government securities, was generally responsible for the fund’s strong performance relative to its benchmark. Within the corporate bond sector, we focused on companies that were positioned to benefit from a growing economy, such as the technology, communications and banking industries, which helped performance. In addition, the fund had more exposure than the benchmark to lower-tier investment-grade securities, and in higher-yielding, below-investment-grade debt, which also helped support results. As the U.S. dollar drifted lower, an emphasis on developing and non-core currencies (non-U.S. dollar, Japanese yen and euro) gave a further boost to the fund’s relative results. In particular, investments denominated in the currencies of Indonesia, Malaysia, Mexico and Singapore helped, as did positions in the currencies of Norway and Sweden, where the fund’s exposure was greater than the index.
Overall, the fund’s defensive interest-rate positioning aided performance as yields rose. However, the fund’s euro positioning slightly dampened results because its duration was longer, on average, than the benchmark. And because the euro appreciated relative to the U.S. dollar, the fund lost some additional ground because it had less exposure to the euro than the benchmark. An emphasis on bonds issued in the United States also hurt the fund’s performance versus the benchmark. As part of our strategy, we traded currency contracts to align the currency exposure of foreign holdings. The trade in these currency-related derivatives had a positive effect on results.
Outlook
While we recognize that there are risks to growth going forward, we remain optimistic that the global economy will continue to expand. As a result, we have favored corporate bonds, although we have reduced exposure to higher interest rates by becoming more defensive with investments in developed markets. In addition, we believe it still makes sense to maintain positions in emerging markets, commodity-linked currencies and in Asian markets other than Japan. We have positioned the portfolio with a focus on Asian currencies, other than the Japanese yen, as we expect central banks in Asia to tighten monetary policy, which should be positive for their currencies. In Europe, we think it is becoming more likely that the European Central Bank will raise short-term interest rates to respond to rising inflationary pressures fueled by higher oil prices. As a consequence, the yield difference between short-term rates in the United States and in Europe should widen, giving support to the value of the euro.
One note of caution, however, is that we expect an increase in volatility in equity markets when the U.S. Federal Reserve Board ends its second round of quantitative easing (QE2), which involves the large-scale purchase of Treasury securities. This could have an impact on credit-sensitive securities in the fixed-income market as well. However, we believe the impact would be relatively minor as long as global growth prospects remain firm.
5 |
LOOMIS SAYLES INTERNATIONAL BOND FUND
Investment Results through March 31, 2011
The charts comparing the fund’s performance to an index provide you with a general sense of how it performed. The fund’s total return for the period shown below appears with and without sales charges and includes fund expenses and fees. An index measures the performance of a theoretical portfolio. Unlike a fund, an index is unmanaged and does not have expenses that affect the results. It is not possible to invest directly in an index. Investors would incur transaction costs and other expenses if they purchased the securities necessary to match the index.
Growth of $10,000 Investment in Class A Shares4
February 1, 2008 (inception) through March 31, 2011
Average Annual Returns — March 31, 20114
| | | | | | | | | | | | |
| | | | |
| | | 6 Months | | | 1 Year | | | Since
Inception | |
| | | | |
| Class A (Inception 2/1/08) | | | | | | | | | | | | |
| Net Asset Value1 | | | 1.98 | % | | | 10.97 | % | | | 6.66 | % |
| With Maximum Sales Charge2 | | | -2.64 | | | | 6.02 | | | | 5.13 | |
| | | | |
| Class C (Inception 2/1/08) | | | | | | | | | | | | |
| Net Asset Value1 | | | 1.61 | | | | 10.12 | | | | 5.85 | |
| With CDSC3 | | | 0.62 | | | | 9.12 | | | | 5.85 | |
| | | | |
| Class Y (Inception 2/1/08) | | | | | | | | | | | | |
| Net Asset Value1 | | | 2.20 | | | | 11.35 | | | | 6.90 | |
| | | | |
| Comparative Performance | | | | | | | | | | | | |
| Barclays Capital Global Aggregate ex-USD Bond Index | | | 0.44 | | | | 8.63 | | | | 4.80 | |
| Morningstar World Bond Fund Avg. | | | 0.25 | | | | 7.25 | | | | 5.44 | |
All returns represent past performance and do not guarantee future results. Periods of less than one year are not annualized. Share price and return will vary and you may have a gain or loss when you sell your shares. All results include reinvestment of dividends and capital gains. Current returns may be higher or lower than those shown. For performance current to the most recent month-end, visit ga.natixis.com. Class Y shares are not available for purchase by all investors. The table and graph do not reflect taxes shareholders might owe on any fund distributions or when they redeem their shares.
| | | | |
| Credit Quality | | % of Net
Assets as of
3/31/11* | |
| Aaa | | | 41.3 | |
| Aa | | | 27.4 | |
| A | | | 10.1 | |
| Baa | | | 9.8 | |
| Ba | | | 8.1 | |
| B | | | 1.6 | |
| Short-term and other | | | 1.7 | |
| * | Credit quality at 3/31/2011 reflects the highest credit rating assigned to individual holdings of the fund among Moody’s, S&P or Fitch; ratings are subject to change. The fund’s share are not rated by any rating agency and no credit rating for fund shares is implied. The Moody’s equivalent of the assigned rating is presented in the table. |
| | | | |
| Effective Maturity | | % of Net
Assets as of
3/31/11 | |
| 1 year or less | | | 3.9 | |
| 1-5 years | | | 37.2 | |
| 5-10 years | | | 43.6 | |
| 10+ years | | | 15.3 | |
| Average Effective Maturity | | | 7.2 | years |
Portfolio characteristics will vary.
Expense Ratios
as stated in the most recent prospectus
| | | | | | | | |
| Share Class | | Gross Expense Ratio5 | | | Net Expense Ratio6 | |
| A | | | 1.49 | % | | | 1.10 | % |
| C | | | 2.24 | | | | 1.85 | |
| Y | | | 1.23 | | | | 0.85 | |
NOTES TO CHARTS
See page 11 for a description of the indices.
| 1 | At Net Asset Value (NAV) - does not reflect payment of sales charge at time of purchase. |
| 2 | With Maximum Sales Charge (MSC) - reflects maximum sales charge of 4.50% at time of purchase. |
| 3 | Class C shares performance assumes a 1% CDSC applied when you sell shares within one year of purchase. |
| 4 | Fund performance has been increased by fee waivers and/or expense reimbursements, if any, without which performance would have been lower. |
| 5 | Before fee waivers and/or expense reimbursements. |
| 6 | After fee waivers and/or expense reimbursements. Waivers/reimbursements are contractual and are set to expire on 1/31/12. Contracts are reevaluated on an annual basis. |
| 6
LOOMIS SAYLES LIMITED TERM GOVERNMENT AND AGENCY FUND
Management Discussion
Managers:
John Hyll
Clifton V. Rowe, CFA
Loomis, Sayles & Company, L.P.
Objective:
Seeks a high current return consistent with preservation of capital
Strategy:
Invests primarily in securities issued or guaranteed by the U.S. government, its agencies or instrumentalities
Fund Inception:
January 3, 1989
Symbols:
| | |
| Class A | | NEFLX |
| Class B | | NELBX |
| Class C | | NECLX |
| Class Y | | NELYX |
What You Should Know:
Investments in the Fund are subject to a number of risks. Please see the “Principal Risks” section of the Fund’s prospectus. The purchase of Fund shares should be seen as a long-term investment.
Market Conditions
During the six months ended March 31, 2011, sentiment in the domestic bond markets remained relatively healthy, despite many disruptions from overseas – including financial market disturbances in Europe, civil disruption in the Middle East and an earthquake and nuclear crisis in Japan. Even though the Federal Reserve Board (the Fed) maintained its commitment to a low-interest-rate policy, improved domestic economic growth prospects nudged U.S. interest rates higher. As yield-hungry investors intensified their search for income, securities that offered a yield advantage over Treasuries benefited from steady demand. The high-yield and investment-grade sectors were the most rewarding segments of the bond market during the period.
Performance Results
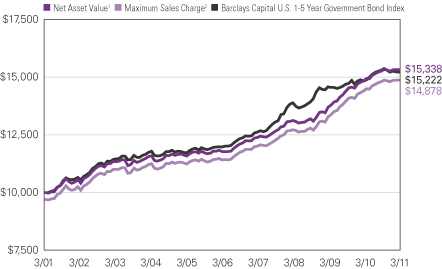
For the six months ended March 31, 2011, Class A shares of Loomis Sayles Limited Term Government and Agency Fund returned 0.51% at net asset value. The fund outperformed its benchmark, the Barclays Capital U.S. 1-5 Year Government Bond Index, which returned -0.56%, and the -0.21% average return of the funds in its peer group, the Morningstar Short Government category.
Explanation of Fund Performance
A combination of favorable security selection and sector allocation drove the fund’s performance advantage over its benchmark. The fund’s emphasis on commercial mortgage-backed securities (CMBS) and allocations to agency mortgage-backed securities (MBS) and asset-backed securities (ABS) drove excess returns for the fund. The fund had more exposure than the benchmark to CMBS, which were solid performers for the period. Most of the fund’s CMBS holdings were senior securities acquired in 2008 and 2009 when bond prices were severely depressed. Investor demand for yield in the intervening months has driven up the prices of these bonds, and the fund has profited. The fund’s allocations to 15- and 30-year agency MBS outperformed the benchmark by a significant margin. Within ABS, we focused on high-quality loans backed by auto equipment. We believed these bonds offered a yield advantage. This decision was rewarded as investor demand for high-quality bonds at the short end of the yield curve was strong.
Overall, the fund’s interest-rate positioning was neutral for performance. The benefit of the fund’s modestly shorter duration (a measure of interest rate sensitivity) was largely offset by the negative impact of its “barbelled” configuration: We emphasized longer- and shorter-term issues rather than distributing assets in a more balanced fashion across the yield curve. This positioning detracted from performance as long-term yields increased more than short-term yields.
The fund’s emphasis on higher-quality securities hampered performance, as lower-quality securities outperformed. Agency debentures in the fund underperformed those in the benchmark, which also detracted from returns.
Late in the period we added some adjustable-rate securities of government sponsored enterprises (GSEs) to the portfolio, because we expect them to perform well in a stable-to-rising interest-rate environment. GSEs are a group of financial services corporations that were created by Congress to enhance the flow of credit to certain sectors of the market, such as agriculture, home finance and education, and to make these segments more efficient and transparent.
Outlook
We believe that the Fed will continue its current interest-rate policy well into 2011. In the intermediate term, we expect interest rates to rise gradually if modest U.S. economic growth persists. While we believe the mortgage and consumer loan markets will continue to struggle, we think the fund’s holdings offer the potential for attractive risk-adjusted returns. The portfolio remains overweight in CMBS and ABS, and we look for further strength from its GSE holdings. Our strategy will be to continue to emphasize opportunities for income over potential price appreciation.
7 |
LOOMIS SAYLES LIMITED TERM GOVERNMENT AND AGENCY FUND
Investment Results through March 31, 2011
The charts comparing the fund’s performance to an index provide you with a general sense of how it performed. The fund’s total return for the period shown below appears with and without sales charges and includes fund expenses and fees. An index measures the performance of a theoretical portfolio. Unlike a fund, the index is unmanaged and does not have expenses that affect the results. It is not possible to invest directly in an index. Investors would incur transaction costs and other expenses if they purchased the securities necessary to match the index.
Growth of a $10,000 Investment in Class A Shares4
March 31, 2001 through March 31, 2011
Average Annual Returns — March 31, 20114
| | | | | | | | | | | | | | | | |
| | | | | |
| | | 6 Months | | | 1 Year | | | 5 Years | | | 10 Years | |
| | | | | |
| Class A (Inception 1/3/89) | | | | | | | | | | | | | | | | |
| Net Asset Value1 | | | 0.51 | % | | | 3.30 | % | | | 5.41 | % | | | 4.37 | % |
| With Maximum Sales Charge2 | | | -2.49 | | | | 0.16 | | | | 4.77 | | | | 4.05 | |
| | | | | |
| Class B (Inception 9/27/93) | | | | | | | | | | | | | | | | |
| Net Asset Value1 | | | 0.22 | | | | 2.53 | | | | 4.64 | | | | 3.62 | |
| With CDSC3 | | | -4.71 | | | | -2.47 | | | | 4.30 | | | | 3.62 | |
| | | | | |
| Class C (Inception 12/30/94) | | | | | | | | | | | | | | | | |
| Net Asset Value1 | | | 0.14 | | | | 2.53 | | | | 4.63 | | | | 3.63 | |
| With CDSC3 | | | -0.85 | | | | 1.53 | | | | 4.63 | | | | 3.63 | |
| | | | | |
| Class Y (Inception 3/31/94) | | | | | | | | | | | | | | | | |
| Net Asset Value1 | | | 0.72 | | | | 3.55 | | | | 5.68 | | | | 4.66 | |
| | | | | |
| Comparative Performance | | | | | | | | | | | | | | | | |
| Barclays Capital U.S. 1-5 Year Government Bond Index | | | -0.56 | | | | 2.67 | | | | 4.90 | | | | 4.29 | |
| Morningstar Short Gov’t Fund Avg. | | | -0.21 | | | | 2.23 | | | | 4.08 | | | | 3.52 | |
All returns represent past performance and do not guarantee future results. Periods of less than one year are not annualized. Share price and return will vary and you may have a gain or loss when you sell your shares. All results include reinvestment of dividends and capital gains. Current returns may be higher or lower than those shown. For performance current to the most recent month-end, visit ga.natixis.com. Performance history includes periods from a predecessor fund. Class Y shares are not available for purchase by all investors. The table and graph do not reflect taxes shareholders might owe on any fund distributions or when they redeem their shares.
| | | | |
| Fund Composition | | % of Net
Assets as of
3/31/11 | |
| Treasuries | | | 23.3 | |
| Mortgage Related | | | 19.0 | |
| Government Owned - No Guarantee | | | 17.4 | |
Commercial Mortgage-Backed Securities | | | 15.0 | |
| Hybrid ARMs | | | 12.9 | |
| Government Sponsored | | | 3.6 | |
| Collateralized Mortgage Obligations | | | 2.7 | |
| ABS Car Loan | | | 2.3 | |
| Government Guaranteed | | | 1.0 | |
| ABS Credit Card | | | 0.8 | |
| ABS Student Loan | | | 0.3 | |
| ABS Home Equity | | | 0.3 | |
| Short-term and Other | | | 1.4 | |
| |
| Effective Maturity | | % of Net
Assets as of
3/31/11 | |
| 1 year or less | | | 14.2 | |
| 1-5 years | | | 69.3 | |
| 5-10 years | | | 16.5 | |
| Average Effective Maturity | | | 2.8 | years |
Portfolio characteristics will vary.
Expense Ratios
as stated in the most recent prospectus
| | | | | | | | |
| Share Class | | Gross Expense Ratio5 | | | Net Expense Ratio6 | |
| A | | | 0.97 | % | | | 0.85 | % |
| B | | | 1.72 | | | | 1.60 | |
| C | | | 1.72 | | | | 1.60 | |
| Y | | | 0.71 | | | | 0.60 | |
NOTES TO CHARTS
See page 11 for a description of the indices.
| 1 | At Net Asset Value (NAV) - does not reflect payment of sales charge at time of purchase. |
| 2 | With Maximum Sales Charge (MSC) - reflects maximum sales charge of 3.00% at time of purchase. |
| 3 | Performance for Class B shares assumes a maximum 5% contingent deferred sales charge (“CDSC”) applied when you sell shares, which declines annually between years 1-6 according to the following schedule: 5, 4, 3, 3, 2, 1, 0%. Class C shares performance assumes a 1% CDSC applied when you sell shares within one year of purchase. |
| 4 | Fund performance has been increased by fee waivers and/or expense reimbursements, if any, without which performance would have been lower. |
| 5 | Before fee waivers and/or expense reimbursements. |
| 6 | After fee waivers and/or expense reimbursements. Waivers/reimbursements are contractual and are set to expire on 1/31/12. Contacts are reevaluated on an annual basis. |
| 8
LOOMIS SAYLES STRATEGIC INCOME FUND
Management Discussion
Managers:
Daniel J. Fuss, CFA, CIC
Kathleen C. Gaffney, CFA
Associate Managers:
Matthew J. Eagan, CFA
Elaine M. Stokes
Loomis, Sayles & Company, L.P.
Objective:
Seeks high current income, with a secondary objective of capital growth
Strategy:
Invests primarily in income-producing securities in the U.S. and around the world
Fund Inception:
May 1, 1995
Symbols:
| | |
| Class A | | NEFZX |
| Class B | | NEZBX |
| Class C | | NECZX |
| Class Y | | NEZYX |
| Admin Class | | NEZAX |
What You Should Know:
Investments in the Fund are subject to a number of risks. Please see the “Principal Risks” section of the Fund’s prospectus. The purchase of Fund shares should be seen as a long-term investment.
Market Conditions
As a fragile economic recovery evolved into steadier growth, investors adopted a more optimistic view of the economy. This optimism prevailed for most of the past six months. Credit markets enjoyed a new wave of liquidity, chiefly by way of new issues. Companies sought to replace older, higher-interest debt, benefiting both high-yield and investment-grade markets.
However, the transition was not without problems. Europe faced renewed sovereign debt concerns. Widespread violence in North Africa and the Middle East brought new bouts of anxiety. In addition, earthquakes in Japan and New Zealand, coming atop China’s efforts to cool its economy, periodically rattled global credit markets, as bond investors grew wary of taking on added risk. The Federal Reserve Board’s (the Fed’s) second round of quantitative easing, known as “QE2,” which involves large-scale purchases of Treasury securities, helped moderate concerns.
Performance Results
For the six months ended March 31, 2011, Class A shares of Loomis Sayles Strategic Income Fund returned 5.95% at net asset value. The fund outperformed its benchmark, the Barclays Capital U.S. Aggregate Bond Index, which returned -0.88% over the same period. The fund also outdistanced the 3.30% average return of funds in its peer group, the Morningstar Multisector Bond category.
Explanation of Fund Performance
Security selection, holdings of convertible bonds and preferred securities, non-U.S. dollar-denominated investments and high-yield credit were key contributors to the period’s impressive returns.
The stock market’s vigor meant increased prices for the fund’s equity-sensitive convertible bonds and preferred securities. In Europe, major currencies strengthened in response to favorable euro zone bank stress tests. A weaker U.S. dollar fed strong results for the fund’s holdings denominated in several currencies, notably the Canadian, Australian and New Zealand dollars, as well as the Norwegian krone. Returns were modestly positive for holdings in Asian currencies, including the Indonesian rupiah, the Singapore dollar and South Korean won.
The industrials sector led the way among the fund’s high-yield holdings. The strongest returns came from individual issues in the information technology, communications and consumer non-cyclical industries. The fund also benefited from its exposure to high-yield financials. A below-benchmark commitment to U.S. Treasury obligations added to results, as fixed-income investors sold Treasuries and accepted some risk in pursuit of more satisfactory yields.
By contrast, relative underweights among securities backed by commercial or residential mortgages held back comparative returns as prices rose. Small positions in government-owned securities, where the fund’s long average duration left prices vulnerable to rising rates, also hampered return.
Outlook
Strong liquidity, markets in transition, geopolitical turmoil, continued economic recovery and tragic natural disasters garnered significant attention from market participants during the first quarter of 2011. Many of these themes will continue to dominate investor consciousness going forward. We believe markets remain in transition regarding interest rates, with pressures building both globally and domestically. Globally, growth in many areas of the world remains robust; however, inflation concerns have begun to attract attention. Central banks will likely continue to shift toward less accommodative policy as 2011 progresses. We anticipate the Fed’s program of Treasury purchases in the United States will end during the second quarter and believe the U.S. economic recovery has sufficient momentum to continue expanding without outsized government stimulus.
Our assessment of the fundamental underpinnings of the corporate sector remains positive. In general, corporations are proceeding conservatively with regard to hiring and capital expenditures. Merger and acquisition activity has increased recently, and we believe there is room for more growth in that space. Valuations in the corporate bond space are generally fair, with investor demand for yield providing support and liquidity to the high-yield, investment-grade and convertible sectors. We continue to position the fund for global economic recovery, as well as a gradual upward bias in interest rates. We continue to emphasize yield advantage, global diversification and specific bond picking within the fund.
9 |
LOOMIS SAYLES STRATEGIC INCOME FUND
Investment Results through March 31, 2011
The charts comparing the fund’s performance to two indexes provide you with a general sense of how it performed. The fund’s total return for the period shown below appears with and without sales charges and includes fund expenses and fees. An index measures the performance of a theoretical portfolio. Unlike a fund, the index is unmanaged and does not have expenses that affect the results. It is not possible to invest directly in an index. Investors would incur transaction costs and other expenses if they purchased the securities necessary to match the index.
Growth of a $10,000 Investment in Class A Shares5
March 31, 2001 through March 31, 2011
Average Annual Returns — March 31, 20115
| | | | | | | | | | | | | | | | |
| | | | | |
| | | 6 Months | | | 1 Year | | | 5 Years | | | 10 Years | |
| | | | | |
| Class A (Inception 5/1/95) | | | | | | | | | | | | | | | | |
| Net Asset Value2 | | | 5.95 | % | | | 12.06 | % | | | 7.95 | % | | | 10.75 | % |
| With Maximum Sales Charge3 | | | 1.19 | | | | 7.04 | | | | 6.97 | | | | 10.25 | |
| | | | | |
| Class B (Inception 5/1/95) | | | | | | | | | | | | | | | | |
| Net Asset Value2 | | | 5.51 | | | | 11.14 | | | | 7.14 | | | | 9.92 | |
| With CDSC4 | | | 0.51 | | | | 6.14 | | | | 6.83 | | | | 9.92 | |
| | | | | |
| Class C (Inception 5/1/95) | | | | | | | | | | | | | | | | |
| Net Asset Value2 | | | 5.52 | | | | 11.15 | | | | 7.15 | | | | 9.92 | |
| With CDSC4 | | | 4.52 | | | | 10.15 | | | | 7.15 | | | | 9.92 | |
| | | | | |
| Class Y (Inception 12/1/99) | | | | | | | | | | | | | | | | |
| Net Asset Value2 | | | 6.08 | | | | 12.35 | | | | 8.23 | | | | 11.04 | |
| | | | | |
| Admin Class (Inception 2/1/10)1 | | | | | | | | | | | | | | | | |
| Net Asset Value2 | | | 5.85 | | | | 11.75 | | | | 7.64 | | | | 10.38 | |
| | | | | |
| Comparative Performance | | | | | | | | | | | | | | | | |
| Barclays Capital U.S. Aggregate Bond Index | | | -0.88 | | | | 5.12 | | | | 6.03 | | | | 5.56 | |
| Barclays Capital U.S. Universal Bond Index | | | -0.37 | | | | 5.73 | | | | 6.12 | | | | 5.82 | |
| Morningstar Multisector Bond Fund Avg. | | | 3.30 | | | | 9.36 | | | | 6.49 | | | | 7.45 | |
All returns represent past performance and do not guarantee future results. Periods of less than one year are not annualized. Share price and return will vary and you may have a gain or loss when you sell your shares. All results include reinvestment of dividends and capital gains. Current returns may be higher or lower than those shown. Performance history includes periods from a predecessor fund. For performance current to the most recent month-end, visit ga.natixis.com. Class Y shares are not available for purchase by all investors. The table and graph do not reflect taxes shareholders might owe on any fund distributions or when they redeem their shares.
| | | | |
| Credit Quality | | % of Net
Assets as of
3/31/11* | |
| Aaa | | | 15.1 | |
| Aa | | | 6.3 | |
| A | | | 12.9 | |
| Baa | | | 23.4 | |
| Ba | | | 13.6 | |
| B | | | 14.8 | |
| Caa and Lower | | | 3.4 | |
| Not Rated | | | 7.7 | |
| Short-term and Other | | | 2.8 | |
| * | Credit quality at 3/31/2011 reflects the highest credit rating assigned to individual holdings of the fund among Moody’s, S&P or Fitch; ratings are subject to change. The fund’s share are not rated by any rating agency and no credit rating for fund shares is implied. The Moody’s equivalent of the assigned rating is presented in the table. |
| | | | |
| Effective Maturity | | % of Net
Assets as of
3/31/11 | |
| 1 year or less | | | 9.5 | |
| 1-5 years | | | 31.6 | |
| 5-10 years | | | 24.7 | |
| 10+ years | | | 34.2 | |
| Average Effective Maturity | | | 11.2 | years |
Portfolio characteristics will vary.
Expense Ratios
as stated in the most recent prospectus
| | | | | | | | |
| Share Class | | Gross Expense Ratio6 | | | Net Expense Ratio7 | |
| A | | | 0.97 | % | | | 0.97 | % |
| B | | | 1.72 | | | | 1.72 | |
| C | | | 1.72 | | | | 1.72 | |
| Y | | | 0.72 | | | | 0.72 | |
| Admin | | | 1.24 | | | | 1.24 | |
NOTES TO CHARTS
See page 11 for a description of the indices.
| 1 | Prior to the inception of Admin Class shares (2/1/10), performance is that of Class A shares, restated to reflect the higher net expenses of Admin Class shares. |
| 2 | At Net Asset Value (NAV) - does not reflect payment of sales charge at time of purchase. |
| 3 | With Maximum Sales Charge (MSC) - reflects maximum sales charge of 4.50% at time of purchase. |
| 4 | Performance for Class B shares assumes a maximum 5% contingent deferred sales charge (“CDSC”) applied when you sell shares, which declines annually between years 1-6 according to the following schedule: 5, 4, 3, 3, 2, 1, 0%. Class C share performance assumes a 1% CDSC applied when you sell shares within one year of purchase. |
| 5 | Fund performance has been increased by fee waivers and/or expense reimbursements, if any, without which performance would have been lower. |
| 6 | Before fee waivers and/or expense reimbursements. |
| 7 | After fee waivers and/or expense reimbursements. Waivers/reimbursements are contractual and are set to expire on 1/31/12. Contracts are reevaluated on an annual basis. |
| 10
ADDITIONAL INFORMATION
The views expressed in this report reflect those of the portfolio managers as of the dates indicated. The managers’ views are subject to change at any time without notice based on changes in market or other conditions. References to specific securities or industries should not be regarded as investment advice. Because the funds are actively managed, there is no assurance that they will continue to invest in the securities or industries mentioned.
Before investing, consider the fund’s investment objectives, risks, charges and expenses. Visit ga.natixis.com or call 800-225-5478 for a prospectus and/or a summary prospectus, both of which contain this and other information. Read it carefully.
INDEX/AVERAGE DESCRIPTIONS
Barclays Capital Global Aggregate ex-USD Bond Index is an unmanaged index that provides a broad-based measure of the international investment-grade fixed-rate debt markets.
Barclays Capital U.S. 1-5 Year Government Bond Index is an unmanaged index that includes U.S. Treasury and agency securities with remaining maturities of one to five years.
Barclays Capital U.S. Aggregate Bond Index is an unmanaged index that covers the U.S.-dollar denominated, investment-grade, fixed-rate, taxable bond market of SEC-registered securities. The index includes bonds from the Treasury, government-related, corporate, mortgage-backed securities, asset-backed securities, and collateralized mortgage-backed securities sectors.
Barclays Capital U.S. Corporate High-Yield Bond Index is an unmanaged index that covers the U.S. dollar-denominated, non-investment grade, fixed-rate, taxable corporate bond market.
Barclays Capital U.S. Universal Bond Index is an unmanaged index that covers U.S. dollar-denominated taxable bonds, including U.S. government and investment grade debt, non-investment grade debt, asset-backed and mortgage-backed securities, Eurobonds, 144A securities and emerging market debt.
Morningstar Fund Averages are the average performance without sales charges of funds with similar investment objectives, as calculated by Morningstar, Inc.
PROXY VOTING INFORMATION
A description of the funds’ proxy voting policies and procedures is available without charge, upon request, by calling Natixis Funds at 800-225-5478; on the funds’ website at ga.natixis.com; and on the Securities and Exchange Commission’s (SEC’s) website at www.sec.gov. Information regarding how the funds voted proxies relating to portfolio securities during the 12-month period ended June 30, 2010 is available from the funds’ website and the SEC’s website.
QUARTERLY PORTFOLIO SCHEDULES
The funds file a complete schedule of portfolio holdings with the SEC for the first and third quarters of each fiscal year on Form N-Q. The funds’ Forms N-Q are available on the SEC’s website at www.sec.gov and may be reviewed and copied at the SEC’s Public Reference Room in Washington, DC. Information on the operation of the Public Reference Room may be obtained by calling
1-800-SEC-0330.
11 |
UNDERSTANDING FUND EXPENSES
As a mutual fund shareholder, you incur different costs: transaction costs, including sales charges (loads) on purchases and contingent deferred sales charges on redemptions, and ongoing costs, including management fees, distribution and/or service fees (12b-1 fees), and other fund expenses. Certain exemptions may apply. These costs are described in more detail in the funds’ prospectuses. The examples below are intended to help you understand the ongoing costs of investing in the funds and help you compare these with the ongoing costs of investing in other mutual funds.
The first line in the table of each class of fund shares shows the actual account values and actual fund expenses you would have paid on a $1,000 investment in the fund from October 1, 2010 through March 31, 2011. To estimate the expenses you paid over the period, simply divide your account value by $1,000 (for example $8,600 account value divided by $1,000 = 8.60) and multiply the result by the number in the Expenses Paid During Period column as shown below for your class.
The second line in the table of each class of fund shares provides information about hypothetical account values and hypothetical expenses based on the fund’s actual expense ratios and an assumed rate of return of 5% per year before expenses, which is not the fund’s actual return. The hypothetical account values and expenses may not be used to estimate the actual ending account balance or expenses you paid on your investment for the period. You may use this information to compare the ongoing costs of investing in the fund and other funds. To do so, compare this 5% hypothetical example with the 5% hypothetical examples that appear in the shareholder reports of the other funds.
Please note that the expenses shown reflect ongoing costs only, and do not include any transaction costs such as sales charges redemption fees, or exchange fees. Therefore, the second line in the table of each fund is useful in comparing ongoing costs only, and will not help you determine the relative costs of owning different funds. If transaction costs were included, total costs would be higher.
| | | | | | | | | | | | |
| LOOMIS SAYLES CORE PLUS BOND FUND | | BEGINNING ACCOUNT VALUE
10/1/2010 | | | ENDING ACCOUNT VALUE
3/31/2011 | | | EXPENSES PAID DURING PERIOD*
10/1/2010 – 3/31/2011 | |
Class A | | | | | | | | | | | | |
Actual | | | $1,000.00 | | | | $1,011.10 | | | | $4.36 | |
Hypothetical (5% return before expenses) | | | $1,000.00 | | | | $1,020.59 | | | | $4.38 | |
Class B | | | | | | | | | | | | |
Actual | | | $1,000.00 | | | | $1,007.20 | | | | $8.11 | |
Hypothetical (5% return before expenses) | | | $1,000.00 | | | | $1,016.85 | | | | $8.15 | |
Class C | | | | | | | | | | | | |
Actual | | | $1,000.00 | | | | $1,006.50 | | | | $8.10 | |
Hypothetical (5% return before expenses) | | | $1,000.00 | | | | $1,016.85 | | | | $8.15 | |
Class Y | | | | | | | | | | | | |
Actual | | | $1,000.00 | | | | $1,012.30 | | | | $3.11 | |
Hypothetical (5% return before expenses) | | | $1,000.00 | | | | $1,021.84 | | | | $3.13 | |
| * | Expenses are equal to the Fund’s annualized expense ratio: 0.87%, 1.62%, 1.62% and 0.62% for Class A, B, C and Y, respectively, multiplied by the average account value over the period, multiplied by the number of days in the most recent fiscal half-year, divided by 365 (to reflect the half-year period). |
| 12
UNDERSTANDING FUND EXPENSES
| | | | | | | | | | | | |
| LOOMIS SAYLES HIGH INCOME FUND | | BEGINNING ACCOUNT VALUE
10/1/2010 | | | ENDING ACCOUNT VALUE
3/31/2011 | | | EXPENSES PAID DURING PERIOD*
10/1/2010 – 3/31/2011 | |
Class A | | | | | | | | | | | | |
Actual | | | $1,000.00 | | | | $1,082.30 | | | | $5.97 | |
Hypothetical (5% return before expenses) | | | $1,000.00 | | | | $1,019.20 | | | | $5.79 | |
Class B | | | | | | | | | | | | |
Actual | | | $1,000.00 | | | | $1,078.00 | | | | $9.84 | |
Hypothetical (5% return before expenses) | | | $1,000.00 | | | | $1,015.46 | | | | $9.55 | |
Class C | | | | | | | | | | | | |
Actual | | | $1,000.00 | | | | $1,076.10 | | | | $9.83 | |
Hypothetical (5% return before expenses) | | | $1,000.00 | | | | $1,015.46 | | | | $9.55 | |
Class Y | | | | | | | | | | | | |
Actual | | | $1,000.00 | | | | $1,083.80 | | | | $4.68 | |
Hypothetical (5% return before expenses) | | | $1,000.00 | | | | $1,020.44 | | | | $4.53 | |
| * | Expenses are equal to the Fund’s annualized expense ratio: 1.15%, 1.90%, 1.90% and 0.90% for Class A, B, C and Y, respectively, multiplied by the average account value over the period, multiplied by the number of days in the most recent fiscal half-year, divided by 365 (to reflect the half-year period). |
| | | | | | | | | | | | |
| LOOMIS SAYLES INTERNATIONAL BOND FUND | | BEGINNING ACCOUNT VALUE
10/1/2010 | | | ENDING ACCOUNT VALUE
3/31/2011 | | | EXPENSES PAID DURING PERIOD*
10/1/2010 – 3/31/2011 | |
Class A | | | | | | | | | | | | |
Actual | | | $1,000.00 | | | | $1,019.80 | | | | $5.54 | |
Hypothetical (5% return before expenses) | | | $1,000.00 | | | | $1,019.45 | | | | $5.54 | |
Class C | | | | | | | | | | | | |
Actual | | | $1,000.00 | | | | $1,016.10 | | | | $9.30 | |
Hypothetical (5% return before expenses) | | | $1,000.00 | | | | $1,015.71 | | | | $9.30 | |
Class Y | | | | | | | | | | | | |
Actual | | | $1,000.00 | | | | $1,022.00 | | | | $4.28 | |
Hypothetical (5% return before expenses) | | | $1,000.00 | | | | $1,020.69 | | | | $4.28 | |
| * | Expenses are equal to the Fund’s annualized expense ratio (after waiver/reimbursement): 1.10%, 1.85% and 0.85% for Class A, C and Y, respectively, multiplied by the average account value over the period, multiplied by the number of days in the most recent fiscal half-year, divided by 365 (to reflect the half-year period). |
13 |
UNDERSTANDING FUND EXPENSES
| | | | | | | | | | | | |
LOOMIS SAYLES LIMITED TERM
GOVERNMENT AND AGENCY FUND | | BEGINNING ACCOUNT VALUE
10/1/2010 | | | ENDING ACCOUNT VALUE
3/31/2011 | | | EXPENSES PAID DURING PERIOD*
10/1/2010 – 3/31/2011 | |
Class A | | | | | | | | | | | | |
Actual | | | $1,000.00 | | | | $1,005.10 | | | | $4.25 | |
Hypothetical (5% return before expenses) | | | $1,000.00 | | | | $1,020.69 | | | | $4.28 | |
Class B | | | | | | | | | | | | |
Actual | | | $1,000.00 | | | | $1,002.20 | | | | $7.99 | |
Hypothetical (5% return before expenses) | | | $1,000.00 | | | | $1,016.95 | | | | $8.05 | |
Class C | | | | | | | | | | | | |
Actual | | | $1,000.00 | | | | $1,001.40 | | | | $7.98 | |
Hypothetical (5% return before expenses) | | | $1,000.00 | | | | $1,016.95 | | | | $8.05 | |
Class Y | | | | | | | | | | | | |
Actual | | | $1,000.00 | | | | $1,007.20 | | | | $3.00 | |
Hypothetical (5% return before expenses) | | | $1,000.00 | | | | $1,021.94 | | | | $3.02 | |
| * | Expenses are equal to the Fund’s annualized expense ratio (after waiver/reimbursement): 0.85%, 1.60%, 1.60% and 0.60% for Class A, B, C and Y, respectively, multiplied by the average account value over the period, multiplied by the number of days in the most recent fiscal half-year, divided by 365 (to reflect the half-year period). |
| | | | | | | | | | | | |
| LOOMIS SAYLES STRATEGIC INCOME FUND | | BEGINNING ACCOUNT VALUE
10/1/2010 | | | ENDING ACCOUNT VALUE
3/31/2011 | | | EXPENSES PAID DURING PERIOD*
10/1/2010 – 3/31/2011 | |
Class A | | | | | | | | | | | | |
Actual | | | $1,000.00 | | | | $1,059.50 | | | | $4.88 | |
Hypothetical (5% return before expenses) | | | $1,000.00 | | | | $1,020.19 | | | | $4.78 | |
Class B | | | | | | | | | | | | |
Actual | | | $1,000.00 | | | | $1,055.10 | | | | $8.71 | |
Hypothetical (5% return before expenses) | | | $1,000.00 | | | | $1,016.45 | | | | $8.55 | |
Class C | | | | | | | | | | | | |
Actual | | | $1,000.00 | | | | $1,055.20 | | | | $8.71 | |
Hypothetical (5% return before expenses) | | | $1,000.00 | | | | $1,016.45 | | | | $8.55 | |
Class Y | | | | | | | | | | | | |
Actual | | | $1,000.00 | | | | $1,060.80 | | | | $3.60 | |
Hypothetical (5% return before expenses) | | | $1,000.00 | | | | $1,021.44 | | | | $3.53 | |
Admin Class | | | | | | | | | | | | |
Actual | | | $1,000.00 | | | | $1,058.50 | | | | $6.21 | |
Hypothetical (5% return before expenses) | | | $1,000.00 | | | | $1,018.90 | | | | $6.09 | |
| * | Expenses are equal to the Fund’s annualized expense ratio: 0.95%, 1.70%, 1.70%, 0.70% and 1.21% for Class A, B, C, Y and Admin Class, respectively, multiplied by the average account value over the period, multiplied by the number of days in the most recent fiscal half-year, divided by 365 (to reflect the half-year period). |
| 14
Portfolio of Investments – as of March 31, 2011 (Unaudited)
Loomis Sayles Core Plus Bond Fund
| | | | | | | | |
Principal
Amount | | | Description | | Value (†) | |
| | | | | | | | |
| | Bonds and Notes — 97.0% of Net Assets | | | | |
| | | | ABS Car Loan — 2.6% | | | | |
| $ | 1,140,000 | | | AESOP Funding II LLC, Series 2010-2A, Class A, 3.630%, 8/20/2014, 144A | | $ | 1,172,091 | |
| | 2,815,000 | | | Ally Master Owner Trust, Series 2011-1, Class A2, 2.150%, 1/15/2016 | | | 2,815,248 | |
| | 474,747 | | | Centre Point Funding LLC, Series 2010-1A, Class 1, 5.430%, 7/20/2016, 144A | | | 501,807 | |
| | 2,902,112 | | | Chrysler Financial Lease Trust,
Series 2010-A, Class B, 3.460%, 9/16/2013, 144A | | | 2,904,975 | |
| | 1,775,000 | | | DSC Floorplan Master Owner Trust,
Series 2011-1, Class A, 3.910%, 3/15/2016, 144A | | | 1,775,000 | |
| | 790,000 | | | Hertz Vehicle Financing LLC,
Series 2009-2A, Class A1, 4.260%, 3/25/2014, 144A | | | 827,694 | |
| | | | | | | | |
| | | | | | | 9,996,815 | |
| | | | | | | | |
| | | | ABS Credit Card — 0.9% | | | | |
| | 1,700,000 | | | GE Capital Credit Card Master Note Trust,
Series 2010-3, Class A, 2.210%, 6/15/2016 | | | 1,727,126 | |
| | 1,580,000 | | | World Financial Network Credit Card Master Trust, Series 2009-D, Class A, 4.660%, 5/15/2017 | | | 1,679,829 | |
| | | | | | | | |
| | | | | | | 3,406,955 | |
| | | | | | | | |
| | | | ABS Home Equity — 0.2% | | | | |
| | 678,676 | | | Countrywide Asset-Backed Certificates,
Series 2004-S1, Class A3, 4.615%, 2/25/2035 | | | 638,528 | |
| | | | | | | | |
| | | | Aerospace & Defense — 0.7% | | | | |
| | 1,140,000 | | | Bombardier, Inc., 7.500%, 3/15/2018, 144A | | | 1,231,200 | |
| | 1,415,000 | | | Oshkosh Corp., 8.250%, 3/01/2017 | | | 1,556,500 | |
| | | | | | | | |
| | | | | | | 2,787,700 | |
| | | | | | | | |
| | | | Airlines — 0.2% | | | | |
| | 890,000 | | | Continental Airlines Pass Through Trust,
Series 2010-1, Class A, 4.750%, 1/12/2021 | | | 872,200 | |
| | | | | | | | |
| | | | Automotive — 1.5% | | | | |
| | 510,000 | | | Ford Motor Credit Co. LLC, 5.625%, 9/15/2015 | | | 534,061 | |
| | 285,000 | | | Ford Motor Credit Co. LLC, 6.625%, 8/15/2017 | | | 304,166 | |
| | 880,000 | | | Ford Motor Credit Co. LLC, 7.000%, 10/01/2013 | | | 949,932 | |
| | 1,830,000 | | | Ford Motor Credit Co. LLC, 7.000%, 4/15/2015 | | | 1,980,840 | |
| | 660,000 | | | Ford Motor Credit Co. LLC, 8.000%, 12/15/2016 | | | 749,220 | |
| | 1,155,000 | | | Lear Corp., 7.875%, 3/15/2018 | | | 1,256,062 | |
| | | | | | | | |
| | | | | | | 5,774,281 | |
| | | | | | | | |
| | | | Banking — 7.7% | | | | |
| | 760,000 | | | Bank of America Corp., 5.625%, 7/01/2020 | | | 780,274 | |
| | 1,365,000 | | | Bear Stearns Cos., Inc. (The), 6.400%, 10/02/2017 | | | 1,533,416 | |
| | 605,000 | | | Citigroup, Inc., 6.125%, 5/15/2018 | | | 659,880 | |
| | | | | | | | |
Principal
Amount | | | Description | | Value (†) | |
| | | | | | | | |
| | | | Banking — continued | | | | |
| $ | 2,135,000 | | | Citigroup, Inc., 6.500%, 8/19/2013 | | $ | 2,334,313 | |
| | 795,000 | | | Citigroup, Inc., 8.125%, 7/15/2039 | | | 996,544 | |
| | 625,000 | | | Goldman Sachs Group, Inc. (The), 5.300%, 2/14/2012 | | | 649,356 | |
| | 1,815,000 | | | Goldman Sachs Group, Inc. (The), 6.750%, 10/01/2037 | | | 1,830,662 | |
| | 1,090,000 | | | JPMorgan Chase & Co., 6.000%, 1/15/2018 | | | 1,195,168 | |
| | 3,860,000 | | | Lloyds TSB Bank PLC, 6.375%, 1/21/2021 | | | 4,022,490 | |
| | 2,530,000 | | | Merrill Lynch & Co., Inc., MTN, 6.875%, 4/25/2018 | | | 2,810,051 | |
| | 960,000 | | | Morgan Stanley, 4.750%, 4/01/2014 | | | 1,000,335 | |
| | 615,000 | | | Morgan Stanley, 5.375%, 10/15/2015 | | | 653,325 | |
| | 2,470,000 | | | Morgan Stanley, 5.750%, 1/25/2021 | | | 2,492,961 | |
| | 100,000 | | | Morgan Stanley, 6.750%, 4/15/2011 | | | 100,166 | |
| | 1,900,000 | | | Royal Bank of Scotland PLC (The), 4.875%, 3/16/2015 | | | 1,974,811 | |
| | 3,955,000 | | | Societe Generale, 2.500%, 1/15/2014, 144A | | | 3,924,357 | |
| | 2,265,000 | | | SunTrust Banks, Inc., 3.600%, 4/15/2016 | | | 2,251,491 | |
| | | | | | | | |
| | | | | | | 29,209,600 | |
| | | | | | | | |
| | | | Building Materials — 1.0% | | | | |
| | 975,000 | | | Holcim Capital Corp. Ltd., 6.875%, 9/29/2039, 144A | | | 988,082 | |
| | 1,915,000 | | | Owens Corning, Inc., 7.000%, 12/01/2036 | | | 1,921,574 | |
| | 795,000 | | | USG Corp., 6.300%, 11/15/2016 | | | 747,300 | |
| | | | | | | | |
| | | | | | | 3,656,956 | |
| | | | | | | | |
| | | | Chemicals — 0.8% | | | | |
| | 1,305,000 | | | Chevron Phillips Chemical Co. LLC, 8.250%, 6/15/2019, 144A | | | 1,558,054 | |
| | 1,330,000 | | | RPM International, Inc., 6.125%, 10/15/2019 | | | 1,395,178 | |
| | | | | | | | |
| | | | | | | 2,953,232 | |
| | | | | | | | |
| | | | Collateralized Mortgage Obligations — 0.6% | | | | |
| | 1,710,869 | | | Banc of America Funding Corp.,
Series 2005-B, Class 3A1, 0.484%, 4/20/2035(b) | | | 1,324,803 | |
| | 853,869 | | | Chase Mortgage Finance Corp.,
Series 2007-A1, Class 2A3, 2.887%, 2/25/2037(b) | | | 815,421 | |
| | | | | | | | |
| | | | | | | 2,140,224 | |
| | | | | | | | |
| | | | Commercial Mortgage-Backed Securities — 9.6% | |
| | 74,901 | | | Banc of America Commercial Mortgage, Inc.,
Series 2005-6, Class A2,
5.165%, 9/10/2047 | | | 74,863 | |
| | 923,370 | | | Banc of America Commercial Mortgage, Inc.,
Series 2007-2, Class A2,
5.634%, 4/10/2049 | | | 937,125 | |
| | 2,680,000 | | | Banc of America Commercial Mortgage, Inc.,
Series 2007-5, Class A4,
5.492%, 2/10/2051 | | | 2,814,135 | |
See accompanying notes to financial statements.
15 |
Portfolio of Investments – as of March 31, 2011 (Unaudited)
Loomis Sayles Core Plus Bond Fund – (continued)
| | | | | | | | |
Principal
Amount | | | Description | | Value (†) | |
| | | | | | | | |
| | | | Commercial Mortgage-Backed Securities — continued | |
| $ | 446,106 | | | Bear Stearns Commercial Mortgage Securities,
Series 2005-PW10, Class A2,
5.270%, 12/11/2040 | | $ | 445,556 | |
| | 2,970,000 | | | Bear Stearns Commercial Mortgage Securities,
Series 2007-PW15, Class A4,
5.331%, 2/11/2044 | | | 3,111,336 | |
| | 1,106,835 | | | Bear Stearns Commercial Mortgage Securities,
Series 2007-PW16, Class A2,
5.854%, 6/11/2040(b) | | | 1,132,450 | |
| | 690,000 | | | Citigroup Commercial Mortgage Trust,
Series 2007-C6, Class A4,
5.886%, 12/10/2049(b) | | | 746,566 | |
| | 1,000,000 | | | Citigroup Commercial Mortgage Trust,
Series 2008-C7, Class A4,
6.294%, 12/10/2049(b) | | | 1,097,263 | |
| | 267,581 | | | Citigroup/Deutsche Bank Commercial Mortgage Trust, Series 2006-CD2, Class A2,
5.408%, 1/15/2046 | | | 267,446 | |
| | 1,840,000 | | | Credit Suisse Mortgage Capital Certificates,
Series 2007-C3, Class A4,
5.905%, 6/15/2039(b) | | | 1,948,465 | |
| | 2,310,000 | | | Credit Suisse Mortgage Capital Certificates,
Series 2007-C5, Class A4,
5.695%, 9/15/2040 | | | 2,400,446 | |
| | 1,345,767 | | | Greenwich Capital Commercial Funding Corp.,
Series 2005-GG5, Class A2,
5.117%, 4/10/2037 | | | 1,359,367 | |
| | 425,000 | | | Greenwich Capital Commercial Funding Corp.,
Series 2006-GG7, Class A4,
6.078%, 7/10/2038(b) | | | 464,948 | |
| | 2,839,000 | | | GS Mortgage Securities Corp. II,
Series 2006-GG6, Class A4,
5.553%, 4/10/2038 | | | 3,044,658 | |
| | 1,140,000 | | | GS Mortgage Securities Corp. II,
Series 2006-GG8, Class A4,
5.560%, 11/10/2039 | | | 1,226,118 | |
| | 1,570,000 | | | GS Mortgage Securities Trust,
Series 2007-GG10, Class A4,
6.002%, 8/10/2045(b) | | | 1,666,925 | |
| | 1,375,000 | | | JPMorgan Chase Commercial Mortgage Securities Corp., Series 2006-LDP7, Class A4,
6.061%, 4/15/2045(b) | | | 1,510,888 | |
| | 2,650,000 | | | JPMorgan Chase Commercial Mortgage Securities Corp., Series 2007-CB18, Class A4,
5.440%, 6/12/2047 | | | 2,794,383 | |
| | 1,710,000 | | | LB-UBS Commercial Mortgage Trust,
Series 2005-C3, Class A3,
4.647%, 7/15/2030 | | | 1,734,170 | |
| | 540,000 | | | Merrill Lynch/Countrywide Commercial Mortgage Trust, Series 2007-6, Class A4,
5.485%, 3/12/2051 | | | 565,570 | |
| | 1,080,000 | | | Morgan Stanley Capital I,
Series 2007-IQ14, Class A4,
5.692%, 4/15/2049 | | | 1,137,875 | |
| | 305,000 | | | Morgan Stanley Capital I,
Series 2007-T27, Class A4,
5.795%, 6/11/2042(b) | | | 334,955 | |
| | 1,175,000 | | | Morgan Stanley Capital I,
Series 2008-T29, Class A4,
6.458%, 1/11/2043(b) | | | 1,316,240 | |
| | 2,070,000 | | | Wachovia Bank Commercial Mortgage Trust,
Series 2006-C29, Class A4,
5.308%, 11/15/2048 | | | 2,217,545 | |
| | | | | | | | |
Principal
Amount | | | Description | | Value (†) | |
| | | | | | | | |
| | | | Commercial Mortgage-Backed Securities — continued | |
| $ | 1,890,000 | | | Wachovia Bank Commercial Mortgage Trust,
Series 2007-C30, Class A5,
5.342%, 12/15/2043 | | $ | 1,957,125 | |
| | | | | | | | |
| | | | | | | 36,306,418 | |
| | | | | | | | |
| | | | Consumer Cyclical Services — 0.8% | | | | |
| | 1,800,000 | | | Expedia, Inc.,
5.950%, 8/15/2020 | | | 1,815,750 | |
| | 1,150,000 | | | Service Corp. International,
7.000%, 5/15/2019 | | | 1,207,500 | |
| | | | | | | | |
| | | | | | | 3,023,250 | |
| | | | | | | | |
| | | | Diversified Manufacturing — 0.9% | | | | |
| | 1,200,000 | | | Crane Co.,
6.550%, 11/15/2036(c) | | | 1,204,344 | |
| | 580,000 | | | Fibria Overseas Finance Ltd.,
6.750%, 3/03/2021, 144A | | | 598,850 | |
| | 675,000 | | | Snap-On, Inc.,
4.250%, 1/15/2018 | | | 690,482 | |
| | 1,110,000 | | | Votorantim Cimentos SA,
7.250%, 4/05/2041, 144A | | | 1,103,284 | |
| | | | | | | | |
| | | | | | | 3,596,960 | |
| | | | | | | | |
| | | | Electric — 0.9% | | | | |
| | 915,000 | | | Dubai Electricity & Water Authority,
8.500%, 4/22/2015, 144A | | | 992,775 | |
| | 1,120,000 | | | TransAlta Corp.,
4.750%, 1/15/2015 | | | 1,190,245 | |
| | 1,100,000 | | | TransAlta Corp.,
6.500%, 3/15/2040 | | | 1,124,919 | |
| | | | | | | | |
| | | | | | | 3,307,939 | |
| | | | | | | | |
| | | | Food & Beverage — 1.2% | | | | |
| | 760,000 | | | Anheuser-Busch Cos., Inc.,
4.500%, 4/01/2018 | | | 787,572 | |
| | 1,130,000 | | | Bunge Ltd. Finance Corp.,
4.100%, 3/15/2016 | | | 1,132,813 | |
| | 1,660,000 | | | Corn Products International, Inc.,
4.625%, 11/01/2020 | | | 1,631,577 | |
| | 753,000 | | | Smithfield Foods, Inc.,
10.000%, 7/15/2014 | | | 886,658 | |
| | | | | | | | |
| | | | | | | 4,438,620 | |
| | | | | | | | |
| | | | Government Owned - No Guarantee — 1.8% | | | | |
| | 1,960,000 | | | Korea Development Bank,
4.000%, 9/09/2016 | | | 1,980,841 | |
| | 665,000 | | | Petrobras International Finance Co.,
6.750%, 1/27/2041 | | | 685,088 | |
| | 2,535,000 | | | Petrobras International Finance Co.,
6.875%, 1/20/2040 | | | 2,654,659 | |
| | 1,375,000 | | | Qtel International Finance Ltd.,
7.875%, 6/10/2019, 144A | | | 1,608,750 | |
| | | | | | | | |
| | | | | | | 6,929,338 | |
| | | | | | | | |
| | | | Healthcare — 0.8% | | | | |
| | 575,000 | | | HCA, Inc.,
7.500%, 12/15/2023 | | | 543,375 | |
| | 935,000 | | | HCA, Inc.,
9.125%, 11/15/2014 | | | 980,581 | |
| | 670,000 | | | Medco Health Solutions,
7.250%, 8/15/2013 | | | 750,364 | |
| | 590,000 | | | Omnicare, Inc.,
7.750%, 6/01/2020 | | | 625,400 | |
| | | | | | | | |
| | | | | | | 2,899,720 | |
| | | | | | | | |
See accompanying notes to financial statements.
| 16
Portfolio of Investments – as of March 31, 2011 (Unaudited)
Loomis Sayles Core Plus Bond Fund – (continued)
| | | | | | | | |
Principal
Amount | | | Description | | Value (†) | |
| | | | | | | | |
| | | | Hybrid ARMs — 0.2% | | | | |
| $ | 551,054 | | | FHLMC,
6.004%, 11/01/2036(b) | | $ | 589,190 | |
| | 281,790 | | | FNMA,
5.983%, 2/01/2037(b) | | | 299,694 | |
| | | | | | | | |
| | | | | | | 888,884 | |
| | | | | | | | |
| | | | Independent Energy — 1.4% | | | | |
| | 2,520,000 | | | Anadarko Petroleum Corp.,
6.375%, 9/15/2017 | | | 2,773,751 | |
| | 1,165,000 | | | Denbury Resources, Inc.,
6.375%, 8/15/2021 | | | 1,194,125 | |
| | 415,000 | | | SM Energy Co.,
6.625%, 2/15/2019, 144A | | | 425,894 | |
| | 280,000 | | | Williams Cos., Inc. (The),
7.750%, 6/15/2031 | | | 332,535 | |
| | 485,000 | | | Williams Cos., Inc. (The), Series A,
7.500%, 1/15/2031 | | | 567,400 | |
| | | | | | | | |
| | | | | | | 5,293,705 | |
| | | | | | | | |
| | | | Industrial Other — 1.2% | | | | |
| | 1,360,000 | | | Briggs & Stratton Corp.,
6.875%, 12/15/2020 | | | 1,424,600 | |
| | 1,580,000 | | | Hutchison Whampoa International Ltd.,
5.750%, 9/11/2019, 144A | | | 1,699,595 | |
| | 1,205,000 | | | Timken Co. (The),
6.000%, 9/15/2014 | | | 1,329,169 | |
| | | | | | | | |
| | | | | | | 4,453,364 | |
| | | | | | | | |
| | | | Media Cable — 0.9% | | | | |
| | 900,000 | | | Cablevision Systems Corp.,
7.750%, 4/15/2018 | | | 972,000 | |
| | 610,000 | | | Cablevision Systems Corp.,
8.000%, 4/15/2020 | | | 664,900 | |
| | 410,000 | | | Cox Communications, Inc.,
5.450%, 12/15/2014 | | | 452,510 | |
| | 1,050,000 | | | Time Warner Cable, Inc.,
8.250%, 4/01/2019 | | | 1,279,140 | |
| | | | | | | | |
| | | | | | | 3,368,550 | |
| | | | | | | | |
| | | | Media Non-Cable — 0.5% | | | | |
| | 1,375,000 | | | Inmarsat Finance PLC,
7.375%, 12/01/2017, 144A | | | 1,450,625 | |
| | 600,000 | | | Myriad International Holding BV,
6.375%, 7/28/2017, 144A | | | 633,720 | |
| | | | | | | | |
| | | | | | | 2,084,345 | |
| | | | | | | | |
| | | | Metals & Mining — 1.8% | | | | |
| | 955,000 | | | Alcoa, Inc.,
6.150%, 8/15/2020 | | | 1,009,170 | |
| | 460,000 | | | Allegheny Technologies, Inc.,
5.950%, 1/15/2021 | | | 484,329 | |
| | 525,000 | | | APERAM,
7.375%, 4/01/2016, 144A | | | 534,188 | |
| | 2,845,000 | | | ArcelorMittal,
6.750%, 3/01/2041 | | | 2,788,217 | |
| | 765,000 | | | ArcelorMittal,
9.850%, 6/01/2019 | | | 970,595 | |
| | 400,000 | | | United States Steel Corp.,
6.650%, 6/01/2037 | | | 368,000 | |
| | 640,000 | | | United States Steel Corp.,
7.375%, 4/01/2020 | | | 670,400 | |
| | | | | | | | |
| | | | | | | 6,824,899 | |
| | | | | | | | |
| | | | Mortgage Related — 18.8% | | | | |
| | 469,702 | | | FHLMC,
4.000%, 7/01/2019 | | | 491,352 | |
| | | | | | | | |
Principal
Amount | | | Description | | Value (†) | |
| | | | | | | | |
| | | | Mortgage Related — continued | | | | |
| $ | 1,131,549 | | | FHLMC,
4.500%, 12/01/2034 | | $ | 1,159,692 | |
| | 8,550,140 | | | FHLMC,
5.000%, with various maturities from
2018 to 2040(d) | | | 8,940,904 | |
| | 14,142,970 | | | FHLMC,
5.500%, with various maturities from
2018 to 2040(d) | | | 15,127,666 | |
| | 93,889 | | | FHLMC,
6.000%, 6/01/2035 | | | 103,291 | |
| | 3,450,000 | | | FHLMC (TBA),
5.000%, 4/01/2041(e) | | | 3,600,399 | |
| | 378,289 | | | FNMA,
4.000%, 6/01/2019 | | | 395,785 | |
| | 5,990,216 | | | FNMA,
4.500%, with various maturities from
2039 to 2040(d) | | | 6,106,859 | |
| | 19,090,069 | | | FNMA,
5.500%, with various maturities from
2018 to 2039(d) | | | 20,469,064 | |
| | 3,864,083 | | | FNMA,
6.000%, with various maturities from
2016 to 2039(d) | | | 4,229,126 | |
| | 220,602 | | | FNMA,
6.500%, with various maturities from
2029 to 2036(d) | | | 249,102 | |
| | 127,157 | | | FNMA,
7.000%, with various maturities in 2030(d) | | | 147,070 | |
| | 138,524 | | | FNMA,
7.500%, with various maturities from
2024 to 2032(d) | | | 160,780 | |
| | 3,246,286 | | | GNMA,
5.000%, with various maturities from
2035 to 2038(d) | | | 3,454,758 | |
| | 4,949,495 | | | GNMA,
5.500%, with various maturities from
2034 to 2039(d) | | | 5,370,733 | |
| | 492,227 | | | GNMA,
6.000%, with various maturities from
2029 to 2037(d) | | | 543,150 | |
| | 298,795 | | | GNMA,
6.500%, with various maturities from
2028 to 2032(d) | | | 338,386 | |
| | 194,910 | | | GNMA,
7.000%, with various maturities from
2025 to 2029(d) | | | 224,767 | |
| | 70,956 | | | GNMA,
7.500%, with various maturities from
2025 to 2030(d) | | | 82,375 | |
| | 42,513 | | | GNMA,
8.000%, 11/15/2029 | | | 50,054 | |
| | 80,751 | | | GNMA,
8.500%, with various maturities from
2017 to 2023(d) | | | 93,612 | |
| | 13,514 | | | GNMA,
9.000%, with various maturities in 2016(d) | | | 15,076 | |
| | 25,139 | | | GNMA,
11.500%, with various maturities from
2013 to 2015(d) | | | 25,357 | |
| | | | | | | | |
| | | | | | | 71,379,358 | |
| | | | | | | | |
| | | | Non-Captive Consumer — 1.7% | | | | |
| | 735,000 | | | HSBC Finance Corp.,
7.000%, 5/15/2012 | | | 781,730 | |
See accompanying notes to financial statements.
17 |
Portfolio of Investments – as of March 31, 2011 (Unaudited)
Loomis Sayles Core Plus Bond Fund – (continued)
| | | | | | | | |
Principal
Amount | | | Description | | Value (†) | |
| | | | | | | | |
| | | | Non-Captive Consumer — continued | | | | |
| $ | 325,000 | | | SLM Corp., MTN,
5.050%, 11/14/2014 | | $ | 328,064 | |
| | 2,835,000 | | | SLM Corp., MTN,
6.250%, 1/25/2016 | | | 2,955,487 | |
| | 350,000 | | | SLM Corp., Series A, MTN,
5.000%, 10/01/2013 | | | 362,282 | |
| | 30,000 | | | SLM Corp., Series A, MTN,
5.000%, 4/15/2015 | | | 30,205 | |
| | 120,000 | | | SLM Corp., Series A, MTN,
5.000%, 6/15/2018 | | | 112,767 | |
| | 55,000 | | | SLM Corp., Series A, MTN,
5.375%, 1/15/2013 | | | 57,208 | |
| | 35,000 | | | SLM Corp., Series A, MTN,
5.375%, 5/15/2014 | | | 36,295 | |
| | 420,000 | | | SLM Corp., Series A, MTN,
5.625%, 8/01/2033 | | | 359,078 | |
| | 1,135,000 | | | SLM Corp., Series A, MTN,
8.450%, 6/15/2018 | | | 1,271,200 | |
| | | | | | | | |
| | | | | | | 6,294,316 | |
| | | | | | | | |
| | | | Non-Captive Diversified — 3.1% | | | | |
| | 1,211,000 | | | Ally Financial, Inc.,
8.000%, 11/01/2031 | | | 1,319,990 | |
| | 1,555,000 | | | Ally Financial, Inc.,
8.300%, 2/12/2015 | | | 1,704,669 | |
| | 1,680,000 | | | GATX Corp.,
4.750%, 5/15/2015 | | | 1,753,811 | |
| | 4,000,000 | | | General Electric Capital Corp.,
2.250%, 11/09/2015 | | | 3,842,668 | |
| | 1,595,000 | | | General Electric Capital Corp.,
5.300%, 2/11/2021 | | | 1,619,992 | |
| | 205,000 | | | International Lease Finance Corp.,
6.375%, 3/25/2013 | | | 212,175 | |
| | 120,000 | | | International Lease Finance Corp., Series R, MTN,
5.300%, 5/01/2012 | | | 122,100 | |
| | 40,000 | | | International Lease Finance Corp., Series R, MTN,
5.550%, 9/05/2012 | | | 40,800 | |
| | 200,000 | | | International Lease Finance Corp., Series R, MTN,
5.625%, 9/20/2013 | | | 203,250 | |
| | 830,000 | | | International Lease Finance Corp., Series R, MTN,
5.650%, 6/01/2014 | | | 834,150 | |
| | | | | | | | |
| | | | | | | 11,653,605 | |
| | | | | | | | |
| | | | Oil Field Services — 2.6% | | | | |
| | 2,270,000 | | | Pan American Energy LLC,
7.875%, 5/07/2021, 144A | | | 2,443,201 | |
| | 1,875,000 | | | Parker Drilling Co.,
9.125%, 4/01/2018 | | | 2,015,625 | |
| | 1,420,000 | | | Rowan Cos., Inc.,
5.000%, 9/01/2017 | | | 1,469,243 | |
| | 3,845,000 | | | Transocean, Inc.,
4.950%, 11/15/2015 | | | 4,063,423 | |
| | | | | | | | |
| | | | | | | 9,991,492 | |
| | | | | | | | |
| | | | Paper — 1.2% | | | | |
| | 1,215,000 | | | Celulosa Arauco y Constitucion SA,
5.000%, 1/21/2021, 144A | | | 1,198,821 | |
| | 565,000 | | | Georgia-Pacific LLC,
7.375%, 12/01/2025 | | | 596,075 | |
| | 1,470,000 | | | Georgia-Pacific LLC,
7.750%, 11/15/2029 | | | 1,615,162 | |
| | 735,000 | | | Georgia-Pacific LLC,
8.000%, 1/15/2024 | | | 839,738 | |
| | 365,000 | | | Georgia-Pacific LLC,
8.875%, 5/15/2031 | | | 440,738 | |
| | | | | | | | |
| | | | | | | 4,690,534 | |
| | | | | | | | |
| | | | | | | | |
Principal
Amount | | | Description | | Value (†) | |
| | | | | | | | |
| | | | Pharmaceuticals — 0.9% | | | | |
| $ | 600,000 | | | Valeant Pharmaceuticals International,
6.750%, 10/01/2017, 144A | | $ | 591,000 | |
| | 2,810,000 | | | Valeant Pharmaceuticals International,
6.875%, 12/01/2018, 144A | | | 2,753,800 | |
| | | | | | | | |
| | | | | | | 3,344,800 | |
| | | | | | | | |
| | | | Pipelines — 1.8% | | | | |
| | 285,000 | | | Energy Transfer Partners LP,
6.625%, 10/15/2036 | | | 297,792 | |
| | 500,000 | | | Energy Transfer Partners LP,
7.500%, 7/01/2038 | | | 578,309 | |
| | 2,775,000 | | | Kinder Morgan Finance Co. LLC,
6.000%, 1/15/2018, 144A | | | 2,865,187 | |
| | 570,000 | | | Nisource Finance Corp.,
6.250%, 12/15/2040 | | | 581,942 | |
| | 1,255,000 | | | ONEOK Partners LP,
8.625%, 3/01/2019 | | | 1,578,562 | |
| | 725,000 | | | Southern Natural Gas Co.,
7.350%, 2/15/2031 | | | 822,280 | |
| | | | | | | | |
| | | | | | | 6,724,072 | |
| | | | | | | | |
| | | | Property & Casualty Insurance — 0.7% | | | | |
| | 1,175,000 | | | Willis Group Holdings PLC,
4.125%, 3/15/2016 | | | 1,168,952 | |
| | 1,005,000 | | | Willis North America, Inc.,
6.200%, 3/28/2017 | | | 1,071,071 | |
| | 555,000 | | | Willis North America, Inc.,
7.000%, 9/29/2019 | | | 601,048 | |
| | | | | | | | |
| | | | | | | 2,841,071 | |
| | | | | | | | |
| | | | Refining — 0.6% | | | | |
| | 1,895,000 | | | Coffeyville Resources LLC/Coffeyville
Finance, Inc.,
10.875%, 4/01/2017, 144A | | | 2,155,562 | |
| | | | | | | | |
| | | | Technology — 3.8% | | | | |
| | 1,895,000 | | | Amphenol Corp.,
4.750%, 11/15/2014 | | | 2,033,250 | |
| | 1,405,000 | | | Brocade Communications Systems, Inc.,
6.625%, 1/15/2018 | | | 1,487,544 | |
| | 495,000 | | | Brocade Communications Systems, Inc.,
6.875%, 1/15/2020 | | | 534,600 | |
| | 1,420,000 | | | Corning, Inc.,
7.250%, 8/15/2036 | | | 1,621,175 | |
| | 1,425,000 | | | Equifax, Inc.,
7.000%, 7/01/2037 | | | 1,519,100 | |
| | 2,615,000 | | | Fiserv, Inc.,
3.125%, 10/01/2015 | | | 2,602,524 | |
| | 1,180,000 | | | Fiserv, Inc.,
6.125%, 11/20/2012 | | | 1,266,926 | |
| | 85,000 | | | Motorola Solutions, Inc.,
6.500%, 9/01/2025 | | | 89,441 | |
| | 535,000 | | | Motorola Solutions, Inc.,
6.500%, 11/15/2028 | | | 549,807 | |
| | 410,000 | | | Motorola Solutions, Inc.,
6.625%, 11/15/2037 | | | 439,931 | |
| | 340,000 | | | Motorola Solutions, Inc.,
7.500%, 5/15/2025 | | | 385,131 | |
| | 1,775,000 | | | National Semiconductor Corp.,
3.950%, 4/15/2015 | | | 1,808,093 | |
| | 279,000 | | | Xerox Corp.,
5.500%, 5/15/2012 | | | 291,865 | |
| | | | | | | | |
| | | | | | | 14,629,387 | |
| | | | | | | | |
| | | | Textile — 1.0% | | | | |
| | 2,045,000 | | | Hanesbrands, Inc.,
6.375%, 12/15/2020 | | | 1,993,875 | |
See accompanying notes to financial statements.
| 18
Portfolio of Investments – as of March 31, 2011 (Unaudited)
Loomis Sayles Core Plus Bond Fund – (continued)
| | | | | | | | |
Principal
Amount | | | Description | | Value (†) | |
| | | | | | | | |
| | | | Textile — continued | | | | |
| $ | 1,515,000 | | | Hanesbrands, Inc.,
8.000%, 12/15/2016 | | $ | 1,641,881 | |
| | | | | | | | |
| | | | | | | 3,635,756 | |
| | | | | | | | |
| | | | Tobacco — 0.8% | | | | |
| | 2,835,000 | | | Reynolds American, Inc.,
7.250%, 6/15/2037 | | | 3,000,459 | |
| | | | | | | | |
| | | | Transportation Services — 0.7% | | | | |
| | 2,470,000 | | | Erac USA Finance Co.,
5.250%, 10/01/2020, 144A | | | 2,543,280 | |
| | | | | | | | |
| | | | Treasuries — 11.9% | | | | |
| | 3,875,000 | | | U.S. Treasury Bond,
3.875%, 8/15/2040 | | | 3,467,520 | |
| | 10,115,000 | | | U.S. Treasury Bond,
4.375%, 5/15/2040 | | | 9,889,031 | |
| | 325,000 | | | U.S. Treasury Note,
2.625%, 8/15/2020 | | | 304,891 | |
| | 8,550,000 | | | U.S. Treasury Note,
2.625%, 11/15/2020 | | | 7,978,219 | |
| | 15,420,000 | | | U.S. Treasury Note,
3.625%, 8/15/2019 | | | 15,940,425 | |
| | 7,555,000 | | | U.S. Treasury Note,
3.625%, 2/15/2021(f) | | | 7,662,424 | |
| | | | | | | | |
| | | | | | | 45,242,510 | |
| | | | | | | | |
| | | | Wireless — 4.0% | | | | |
| | 1,070,000 | | | American Tower Corp.,
4.625%, 4/01/2015 | | | 1,110,813 | |
| | 2,615,000 | | | CC Holdings GS V LLC/Crown Castle GS III Corp.,
7.750%, 5/01/2017, 144A | | | 2,850,350 | |
| | 1,980,000 | | | eAccess Ltd.,
8.250%, 4/01/2018, 144A | | | 2,012,274 | |
| | 15,000 | | | Nextel Communications, Inc., Series C,
5.950%, 3/15/2014 | | | 15,038 | |
| | 10,000 | | | Nextel Communications, Inc., Series D,
7.375%, 8/01/2015 | | | 10,038 | |
| | 585,000 | | | NII Capital Corp.,
7.625%, 4/01/2021 | | | 598,162 | |
| | 1,495,000 | | | SK Telecom Co. Ltd.,
6.625%, 7/20/2027, 144A | | | 1,657,536 | |
| | 3,945,000 | | | Sprint Capital Corp.,
6.875%, 11/15/2028 | | | 3,639,262 | |
| | 1,624,000 | | | Telemar Norte Leste SA,
5.500%, 10/23/2020, 144A | | | 1,595,580 | |
| | 100,000 | | | True Move Co. Ltd.,
10.375%, 8/01/2014, 144A | | | 108,000 | |
| | 1,520,000 | | | True Move Co. Ltd.,
10.750%, 12/16/2013, 144A | | | 1,645,400 | |
| | | | | | | | |
| | | | | | | 15,242,453 | |
| | | | | | | | |
| | | | Wirelines — 5.2% | | | | |
| | 2,795,000 | | | Axtel SAB de CV,
9.000%, 9/22/2019, 144A | | | 2,683,200 | |
| | 4,653,000 | | | Embarq Corp.,
7.995%, 6/01/2036 | | | 5,245,797 | |
| | 1,325,000 | | | Frontier Communications Corp.,
7.875%, 4/15/2015 | | | 1,427,687 | |
| | 1,575,000 | | | Frontier Communications Corp.,
7.875%, 1/15/2027 | | | 1,504,125 | |
| | 450,000 | | | Frontier Communications Corp.,
8.250%, 4/15/2017 | | | 486,000 | |
| | | | | | | | |
Principal
Amount | | | Description | | Value (†) | |
| | | | | | | | |
| | | | Wirelines — continued | | | | |
| $ | 415,000 | | | Frontier Communications Corp.,
9.000%, 8/15/2031 | | $ | 424,338 | |
| | 775,000 | | | Qwest Corp.,
8.875%, 3/15/2012 | | | 829,250 | |
| | 590,000 | | | Telecom Italia Capital SA,
6.000%, 9/30/2034 | | | 533,865 | |
| | 2,435,000 | | | Telecom Italia Capital SA, 7.200%, 7/18/2036 | | | 2,443,661 | |
| | 3,790,000 | | | Windstream Corp., 7.500%, 4/01/2023, 144A | | | 3,733,150 | |
| | 515,000 | | | Windstream Corp., 8.125%, 9/01/2018 | | | 549,763 | |
| | | | | | | | |
| | | | | | | 19,860,836 | |
| | | | | | | | |
| | | | Total Bonds and Notes
(Identified Cost $353,478,493) | | | 368,081,974 | |
| | | | | | | | |
| | Bank Loans — 0.7% | | | | |
| | | | Non-Captive Consumer — 0.7% | | | | |
| | 2,700,000 | | | Springleaf Finance Corp., Term Loan B, 7.250%, 4/21/2015(g)
(Identified Cost $2,667,021) | | | 2,701,701 | |
| | | | | | | | |
| | | | | | | | |
| Shares | | | | | | |
| | Preferred Stocks — 0.6% | | | | |
| | | | Banking — 0.6% | | | | |
| | 68,182 | | | Ally Financial, Inc., Series A, (fixed rate to 5/15/2016, variable rate thereafter),
8.500% | | | 1,697,664 | |
| | 532 | | | Ally Financial, Inc., Series G, 7.000%, 144A | | | 495,026 | |
| | | | | | | | |
| | | | Total Preferred Stocks
(Identified Cost $1,830,494) | | | 2,192,690 | |
| | | | | | | | |
| | | | | | | | |
Principal
Amount | | | | | | |
| | Short-Term Investments — 3.6% | | | | |
| $ | 13,602,620 | | | Tri-Party Repurchase Agreement with Fixed Income Clearing Corporation, dated 3/31/2011 at 0.000% to be repurchased at $13,602,620 on 4/01/2011 collateralized by $14,590,000 Federal Home Loan Mortgage Corp., 3.310% due 11/10/2020 valued at $13,878,738 including accrued interest (Note 2 of Notes to Financial Statements)
(Identified Cost $13,602,620) | | | 13,602,620 | |
| | | | | | | | |
| | | | | | | | |
| | | | Total Investments — 101.9% | | | | |
| | | | (Identified Cost $371,578,628)(a) | | | 386,578,985 | |
| | | | Other assets less liabilities — (1.9)% | | | (7,371,165 | ) |
| | | | | | | | |
| | | | Net Assets — 100.0% | | $ | 379,207,820 | |
| | | | | | | | |
| (†) | | | See Note 2 of Notes to Financial Statements. | | | | |
| | (a) | | | Federal Tax Information (Amounts exclude certain adjustments made at the end of the Fund’s fiscal year for tax purposes. Such adjustments are primarily due to wash sales. Amortization of premium on debt securities is excluded for tax purposes.): | |
See accompanying notes to financial statements.
19 |
Portfolio of Investments – as of March 31, 2011 (Unaudited)
Loomis Sayles Core Plus Bond Fund – (continued)
| | | | | | | | |
| | | | At March 31, 2011, the net unrealized appreciation on investments based on a cost of $371,919,597 for federal income tax purposes was as follows: | |
| | | | Aggregate gross unrealized appreciation for all investments in which there is an excess of value over tax cost | | $ | 17,545,931 | |
| | | | Aggregate gross unrealized depreciation for all investments in which there is an excess of tax cost over value | | | (2,886,543 | ) |
| | | | | | | | |
| | | | Net unrealized appreciation | | $ | 14,659,388 | |
| | | | | | | | |
| | | | | | | | |
| | | | | | | | |
| | (b) | | | Variable rate security. Rate as of March 31, 2011 is disclosed. | |
| | (c) | | | Illiquid security. At March 31, 2011, the value of this security amounted to $1,204,344 or 0.3% of net assets. | |
| | (d) | | | The Fund’s investment in mortgage related securities of Federal Home Loan Mortgage Corporation, Federal National Mortgage Association and Government National Mortgage Association are interests in separate pools of mortgages. All separate investments in securities of each issuer which have the same coupon rate have been aggregated for the purpose of presentation in the Portfolio of Investments. | |
| | (e) | | | Delayed delivery. See Note 2 of Notes to Financial Statements. | |
| | (f) | | | All or a portion of this security has been designated to cover the Fund’s obligations under open forward foreign currency contracts or TBA transactions. | |
| | (g) | | | Variable rate security. Rate shown represents the weighted average rate at March 31, 2011. | |
| | | | | |
| | 144A | | | All or a portion of these securities are exempt from registration under Rule 144A of the Securities Act of 1933. These securities may be resold in transactions exempt from registration, normally to qualified institutional buyers. At March 31, 2011, the value of Rule 144A holdings amounted to $55,262,308 or 14.6% of net assets. | |
| | ABS | | | Asset-Backed Securities | |
| | ARMs | | | Adjustable Rate Mortgages | |
| | FHLMC | | | Federal Home Loan Mortgage Corp. | |
| | FNMA | | | Federal National Mortgage Association | |
| | GNMA | | | Government National Mortgage Association | |
| | MTN | | | Medium Term Note | |
| | TBA | | | To Be Announced | |
At March 31, 2011, the Fund had the following open forward foreign currency contracts:
| | | | | | | | | | | | | | | | | | |
Contract
to
Buy/Sell | | Delivery
Date | | | Currency | | Units | | | Notional
Value | | | Unrealized
Depreciation | |
| Sell1 | | | 06/15/2011 | | | Euro | | | 8,050,000 | | | $ | 11,392,551 | | | $ | (23,536 | ) |
| | | | | | | | | | | | | | | | | | |
1 Counterparty is Credit Suisse.
Industry Summary at March 31, 2011 (Unaudited)
| | | | |
| Mortgage Related | | | 18.8 | % |
| Treasuries | | | 11.9 | |
Commercial Mortgage-Backed Securities | | | 9.6 | |
| Banking | | | 8.3 | |
| Wirelines | | | 5.2 | |
| Wireless | | | 4.0 | |
| Technology | | | 3.8 | |
| Non-Captive Diversified | | | 3.1 | |
| ABS Car Loan | | | 2.6 | |
| Oil Field Services | | | 2.6 | |
| Non-Captive Consumer | | | 2.4 | |
Other Investments, less than 2% each | | | 26.0 | |
| Short-Term Investments | | | 3.6 | |
| | | | |
| Total Investments | | | 101.9 | |
| Other assets less liabilities (including open forward foreign currency contracts) | | | (1.9 | ) |
| | | | |
| Net Assets | | | 100.0 | % |
| | | | |
See accompanying notes to financial statements.
| 20
Portfolio of Investments – as of March 31, 2011 (Unaudited)
Loomis Sayles High Income Fund
| | | | | | | | |
Principal
Amount (‡) | | | Description | | Value (†) | |
| | | | | | | | |
| | Bonds and Notes — 80.0% of Net Assets | | | | |
| | Non-Convertible Bonds — 60.9% | | | | |
| | | | ABS Car Loan — 0.2% | | | | |
| $ | 350,000 | | | DSC Floorplan Master Owner Trust,
Series 2011-1, Class B,
8.110%, 3/15/2016, 144A | | $ | 350,000 | |
| | | | | | | | |
| | | | ABS Home Equity — 1.2% | | | | |
| | 200,000 | | | Ameriquest Mortgage Securities, Inc.,
Series 2005-R11, Class M1,
0.700%, 1/25/2036(b) | | | 135,714 | |
| | 600,000 | | | Ameriquest Mortgage Securities, Inc.,
Series 2005-R7, Class M2,
0.750%, 9/25/2035(b) | | | 382,685 | |
| | 523,564 | | | Argent Securities, Inc.,
Series 2003-W3, Class M2,
2.950%, 9/25/2033(b) | | | 350,246 | |
| | 200,000 | | | New Century Home Equity Loan Trust,
Series 2005-1, Class M3,
0.770%, 3/25/2035(b) | | | 127,753 | |
| | 300,000 | | | New Century Home Equity Loan Trust,
Series 2005-2, Class M2,
0.700%, 6/25/2035(b) | | | 230,889 | |
| | 275,000 | | | Park Place Securities, Inc.,
Series 2004-WCW2, Class M2,
0.900%, 10/25/2034(b) | | | 214,383 | |
| | 575,000 | | | Park Place Securities, Inc.,
Series 2005-WCW2, Class M1,
0.750%, 7/25/2035(b) | | | 423,178 | |
| | 241,687 | | | Saxon Asset Securities Trust,
Series 2004-3, Class M2,
0.900%, 12/26/2034(b) | | | 202,358 | |
| | | | | | | | |
| | | | | | | 2,067,206 | |
| | | | | | | | |
| | | | Airlines — 1.1% | | | | |
| | 28,291 | | | Continental Airlines Pass Through Trust,
Series 1997-4, Class B,
6.900%, 7/02/2018 | | | 28,220 | |
| | 291,619 | | | Continental Airlines Pass Through Trust,
Series 2000-2, Class A-1,
7.707%, 10/02/2022 | | | 315,678 | |
| | 484,465 | | | Continental Airlines Pass Through Trust,
Series 2001-1, Class B,
7.373%, 6/15/2017 | | | 485,677 | |
| | 176,811 | | | Continental Airlines Pass Through Trust,
Series 2007-1, Class B,
6.903%, 4/19/2022 | | | 178,137 | |
| | 703,508 | | | UAL Pass Through Trust, Series 2009-1,
10.400%, 5/01/2018 | | | 805,517 | |
| | | | | | | | |
| | | | | | | 1,813,229 | |
| | | | | | | | |
| | | | Automotive — 1.3% | | | | |
| | 420,000 | | | Ford Motor Co.,
6.375%, 2/01/2029 | | | 396,792 | |
| | 65,000 | | | Ford Motor Co.,
6.625%, 2/15/2028 | | | 63,114 | |
| | 1,220,000 | | | Ford Motor Co.,
6.625%, 10/01/2028 | | | 1,184,043 | |
| | 40,000 | | | Ford Motor Co.,
7.500%, 8/01/2026 | | | 40,160 | |
| | 635,000 | | | Goodyear Tire & Rubber Co. (The),
7.000%, 3/15/2028 | | | 596,900 | |
| | | | | | | | |
| | | | | | | 2,281,009 | |
| | | | | | | | |
| | | | | | | | |
Principal
Amount (‡) | | | Description | | Value (†) | |
| | | | | | | | |
| | | | Banking — 2.6% | | | | |
| | 2,210,000,000 | | | Barclays Bank PLC, EMTN,
3.680%, 8/20/2015, (KRW) | | $ | 1,967,014 | |
| | 12,176,250,000 | | | JPMorgan Chase Bank NA, EMTN,
Zero Coupon, 10/17/2011, 144A, (IDR) | | | 1,356,692 | |
| | 900,000 | | | Morgan Stanley, GMTN,
7.625%, 3/03/2016, (AUD) | | | 937,786 | |
| | 80,000 | | | National Australia Bank Ltd.,
6.500%, 11/05/2015, (AUD) | | | 82,265 | |
| | | | | | | | |
| | | | | | | 4,343,757 | |
| | | | | | | | |
| | | | Building Materials — 1.7% | | | | |
| | 50,000 | | | Masco Corp.,
6.500%, 8/15/2032 | | | 45,114 | |
| | 345,000 | | | Masco Corp.,
7.750%, 8/01/2029 | | | 350,928 | |
| | 2,440,000 | | | USG Corp.,
6.300%, 11/15/2016 | | | 2,293,600 | |
| | 100,000 | | | USG Corp.,
8.375%, 10/15/2018, 144A | | | 104,500 | |
| | 65,000 | | | USG Corp.,
9.750%, 8/01/2014, 144A | | | 71,175 | |
| | 75,000 | | | USG Corp.,
9.750%, 1/15/2018 | | | 78,563 | |
| | | | | | | | |
| | | | | | | 2,943,880 | |
| | | | | | | | |
| | | | Chemicals — 1.1% | | | | |
| | 855,000 | | | Hercules, Inc.,
6.500%, 6/30/2029 | | | 719,269 | |
| | 400,000 | | | Hexion US Finance Corp./Hexion Nova Scotia Finance ULC,
8.875%, 2/01/2018 | | | 423,000 | |
| | 730,000 | | | Reichhold Industries, Inc.,
9.000%, 8/15/2014, 144A(c) | | | 643,312 | |
| | | | | | | | |
| | | | | | | 1,785,581 | |
| | | | | | | | |
| | | | Collateralized Mortgage Obligations — 2.2% | | | | |
| | 382,599 | | | Adjustable Rate Mortgage Trust,
Series 2005-10, Class 5A1,
0.510%, 1/25/2036(b) | | | 219,203 | |
| | 93,569 | | | American Home Mortgage Investment Trust,
Series 2004-3, Class 3A,
2.292%, 10/25/2034(b) | | | 76,582 | |
| | 234,677 | | | Countrywide Alternative Loan Trust,
Series 2005-38, Class A3,
0.600%, 9/25/2035(b) | | | 149,112 | |
| | 347,489 | | | GSR Mortgage Loan Trust,
Series 2005-AR7, Class 2A1,
2.788%, 11/25/2035(b) | | | 311,507 | |
| | 490,385 | | | Impac CMB Trust, Series 2005-3, Class A1,
0.730%, 8/25/2035(b) | | | 360,259 | |
| | 631,047 | | | Lehman Mortgage Trust,
Series 2005-3, Class 1A6,
0.750%, 1/25/2036(b) | | | 438,003 | |
| | 684,339 | | | Lehman XS Trust, Series 2007-10H, Class 1A11,
0.370%, 7/25/2037(b)(d) | | | 303,518 | |
| | 530,377 | | | Luminent Mortgage Pass Through Trust,
Series 2006-6, Class A1,
0.450%, 10/25/2046(b) | | | 363,267 | |
| | 421,060 | | | Master Adjustable Rate Mortgages Trust,
Series 2005-2, Class 3A1,
2.649%, 3/25/2035(b) | | | 295,589 | |
| | 300,837 | | | Master Adjustable Rate Mortgages Trust,
Series 2005-2, Class 5A1,
2.637%, 3/25/2035(b) | | | 269,203 | |
See accompanying notes to financial statements.
21 |
Portfolio of Investments – as of March 31, 2011 (Unaudited)
Loomis Sayles High Income Fund – (continued)
| | | | | | | | |
Principal
Amount (‡) | | | Description | | Value (†) | |
| | | | | | | | |
| | | | Collateralized Mortgage Obligations — continued | |
| $ | 746,150 | | | Master Adjustable Rate Mortgages Trust,
Series 2007-1, Class I2A1,
0.410%, 1/25/2047(b) | | $ | 439,654 | |
| | 182,787 | | | Sequoia Mortgage Trust,
Series 2007-2, Class 1A1,
0.464%, 6/20/2036(b) | | | 137,983 | |
| | 758,982 | | | Washington Mutual Alternative Mortgage Pass-Through Certificates,
Series 2007-OC1, Class A1,
0.490%, 1/25/2047(b) | | | 336,519 | |
| | | | | | | | |
| | | | | | | 3,700,399 | |
| | | | | | | | |
| | | | Consumer Cyclical Services — 0.8% | | | | |
| | 1,035,000 | | | ServiceMaster Co. (The),
7.450%, 8/15/2027 | | | 835,762 | |
| | 475,000 | | | West Corp.,
8.625%, 10/01/2018, 144A | | | 499,938 | |
| | | | | | | | |
| | | | | | | 1,335,700 | |
| | | | | | | | |
| | | | Consumer Products — 0.3% | | | | |
| | 145,000 | | | NBTY, Inc.,
9.000%, 10/01/2018, 144A | | | 157,325 | |
| | 275,000 | | | Visant Corp.,
10.000%, 10/01/2017 | | | 297,000 | |
| | | | | | | | |
| | | | | | | 454,325 | |
| | | | | | | | |
| | | | Electric — 1.8% | | | | |
| | 20,962 | | | AES Red Oak LLC, Series A,
8.540%, 11/30/2019 | | | 21,276 | |
| | 375,000 | | | Dynegy Holdings, Inc.,
7.125%, 5/15/2018 | | | 275,625 | |
| | 180,000 | | | Dynegy Holdings, Inc.,
7.625%, 10/15/2026 | | | 125,100 | |
| | 815,000 | | | Dynegy Holdings, Inc.,
7.750%, 6/01/2019 | | | 632,644 | |
| | 1,055,000 | | | Edison Mission Energy,
7.625%, 5/15/2027 | | | 785,975 | |
| | 720,000,000 | | | Emgesa SA ESP,
8.750%, 1/25/2021, 144A, (COP) | | | 405,454 | |
| | 140,000 | | | NGC Corp. Capital Trust I, Series B,
8.316%, 6/01/2027(c) | | | 71,400 | |
| | 195,000 | | | TXU Corp., Series P,
5.550%, 11/15/2014 | | | 127,725 | |
| | 1,015,000 | | | TXU Corp., Series Q,
6.500%, 11/15/2024 | | | 474,513 | |
| | 370,000 | | | TXU Corp., Series R,
6.550%, 11/15/2034 | | | 170,200 | |
| | | | | | | | |
| | | | | | | 3,089,912 | |
| | | | | | | | |
| | | | Food & Beverage — 1.1% | | | | |
| | 385,000 | | | Blue Merger Sub, Inc.,
7.625%, 2/15/2019, 144A | | | 390,294 | |
| | 105,000 | | | Dean Foods Co.,
6.900%, 10/15/2017 | | | 97,388 | |
| | 750,000 | | | Dean Foods Co.,
7.000%, 6/01/2016 | | | 715,312 | |
| | 700,000 | | | Marfrig Overseas Ltd.,
9.500%, 5/04/2020, 144A | | | 729,750 | |
| | | | | | | | |
| | | | | | | 1,932,744 | |
| | | | | | | | |
| | | | Gaming — 2.8% | | | | |
| | 2,005,000 | | | Caesars Entertainment Operating Co., Inc.,
10.000%, 12/15/2018 | | | 1,829,562 | |
| | 470,000 | | | MGM Resorts International,
5.875%, 2/27/2014 | | | 448,850 | |
| | | | | | | | |
Principal
Amount (‡) | | | Description | | Value (†) | |
| | | | | | | | |
| | | | Gaming — continued | | | | |
| $ | 155,000 | | | MGM Resorts International,
6.625%, 7/15/2015 | | $ | 146,863 | |
| | 90,000 | | | MGM Resorts International,
6.875%, 4/01/2016 | | | 83,700 | |
| | 1,870,000 | | | MGM Resorts International,
7.500%, 6/01/2016 | | | 1,767,150 | |
| | 555,000 | | | MGM Resorts International,
7.625%, 1/15/2017 | | | 523,781 | |
| | | | | | | | |
| | | | | | | 4,799,906 | |
| | | | | | | | |
| | | | Government Owned - No Guarantee — 0.8% | | | | |
| | 900,000 | | | DP World Ltd.,
6.850%, 7/02/2037, 144A | | | 828,000 | |
| | 4,800,000,000 | | | Export-Import Bank of Korea,
6.600%, 11/04/2013, 144A, (IDR) | | | 532,617 | |
| | | | | | | | |
| | | | | | | 1,360,617 | |
| | | | | | | | |
| | | | Healthcare — 3.4% | | | | |
| | 35,000 | | | HCA, Inc.,
7.050%, 12/01/2027 | | | 31,150 | |
| | 630,000 | | | HCA, Inc.,
7.500%, 12/15/2023 | | | 595,350 | |
| | 1,620,000 | | | HCA, Inc.,
7.500%, 11/06/2033 | | | 1,486,350 | |
| | 75,000 | | | HCA, Inc.,
7.690%, 6/15/2025 | | | 71,437 | |
| | 480,000 | | | HCA, Inc.,
8.360%, 4/15/2024 | | | 480,000 | |
| | 680,000 | | | HCA, Inc., MTN,
7.580%, 9/15/2025 | | | 640,900 | |
| | 1,700,000 | | | HCA, Inc., MTN,
7.750%, 7/15/2036 | | | 1,589,500 | |
| | 1,080,000 | | | Tenet Healthcare Corp.,
6.875%, 11/15/2031 | | | 895,050 | |
| | | | | | | | |
| | | | | | | 5,789,737 | |
| | | | | | | | |
| | | | Home Construction — 3.2% | | | | |
| | 1,790,000 | | | KB Home,
7.250%, 6/15/2018 | | | 1,754,200 | |
| | 515,000 | | | Lennar Corp.,
6.950%, 6/01/2018 | | | 509,850 | |
| | 3,135,000 | | | Pulte Group, Inc.,
6.000%, 2/15/2035 | | | 2,453,137 | |
| | 495,000 | | | Pulte Group, Inc.,
6.375%, 5/15/2033 | | | 402,188 | |
| | 380,000 | | | Pulte Group, Inc.,
7.875%, 6/15/2032 | | | 350,550 | |
| | | | | | | | |
| | | | | | | 5,469,925 | |
| | | | | | | | |
| | | | Hybrid ARMs — 0.1% | | | | |
| | 431,177 | | | Countrywide Home Loan Mortgage Pass Through Trust, Series 2005-11, Class 3A3,
3.262%, 4/25/2035(b) | | | 220,251 | |
| | | | | | | | |
| | | | Independent Energy — 0.4% | | | | |
| | 620,000 | | | Connacher Oil and Gas Ltd.,
10.250%, 12/15/2015, 144A | | | 657,200 | |
| | | | | | | | |
| | | | Industrial Other — 0.2% | | | | |
| | 215,000 | | | Atkore International, Inc.,
9.875%, 1/01/2018, 144A | | | 229,513 | |
| | 140,000 | | | Ranhill Labuan Ltd.,
12.500%, 10/26/2011, 144A | | | 123,200 | |
| | | | | | | | |
| | | | | | | 352,713 | |
| | | | | | | | |
See accompanying notes to financial statements.
| 22
Portfolio of Investments – as of March 31, 2011 (Unaudited)
Loomis Sayles High Income Fund – (continued)
| | | | | | | | |
Principal
Amount (‡) | | | Description | | Value (†) | |
| | | | | | | | |
| | | | Life Insurance — 0.5% | | | | |
| $ | 860,000 | | | American International Group, Inc., (fixed rate to 5/15/2038, variable rate thereafter),
8.175%, 5/15/2068 | | $ | 925,575 | |
| | | | | | | | |
| | | | Local Authorities — 0.1% | | | | |
| | 85,000 | | | New South Wales Treasury Corp.,
5.500%, 8/01/2013, (AUD) | | | 88,468 | |
| | | | | | | | |
| | | | Media Non-Cable — 0.2% | | | | |
| | 320,000 | | | Intelsat SA,
11.250%, 2/04/2017 | | | 349,600 | |
| | | | | | | | |
| | | | Metals & Mining — 0.3% | | | | |
| | 360,000 | | | Algoma Acquisition Corp.,
9.875%, 6/15/2015, 144A | | | 331,200 | |
| | 35,000 | | | Essar Steel Algoma, Inc.,
9.375%, 3/15/2015, 144A | | | 35,000 | |
| | 190,000 | | | United States Steel Corp.,
6.650%, 6/01/2037 | | | 174,800 | |
| | | | | | | | |
| | | | | | | 541,000 | |
| | | | | | | | |
| | | | Non-Captive Consumer — 3.5% | | | | |
| | 1,040,000 | | | Residential Capital LLC,
9.625%, 5/15/2015 | | | 1,049,100 | |
| | 10,000 | | | SLM Corp., Series A, MTN,
5.000%, 6/15/2018 | | | 9,397 | |
| | 715,000 | | | SLM Corp., Series A, MTN,
5.625%, 8/01/2033 | | | 611,288 | |
| | 245,000 | | | SLM Corp., Series A, MTN,
8.450%, 6/15/2018 | | | 274,400 | |
| | 400,000 | | | Springleaf Finance Corp.,
3.250%, 1/16/2013, (EUR) | | | 528,611 | |
| | 220,000 | | | Springleaf Finance Corp., MTN,
5.750%, 9/15/2016 | | | 198,000 | |
| | 600,000 | | | Springleaf Finance Corp., Series H, MTN,
5.375%, 10/01/2012 | | | 590,250 | |
| | 800,000 | | | Springleaf Finance Corp., Series I, MTN,
4.875%, 7/15/2012 | | | 786,000 | |
| | 600,000 | | | Springleaf Finance Corp., Series I, MTN,
5.850%, 6/01/2013 | | | 586,500 | |
| | 100,000 | | | Springleaf Finance Corp., Series J, MTN,
5.900%, 9/15/2012 | | | 99,000 | |
| | 1,400,000 | | | Springleaf Finance Corp., Series J, MTN,
6.900%, 12/15/2017 | | | 1,279,250 | |
| | | | | | | | |
| | | | | | | 6,011,796 | |
| | | | | | | | |
| | | | Non-Captive Diversified — 1.3% | | | | |
| | 1,300,000 | | | General Electric Capital Corp.,
Series A, GMTN,
2.960%, 5/18/2012, (SGD) | | | 1,047,801 | |
| | 660,000 | | | General Motors Acceptance Corp. of Canada Ltd., EMTN,
7.125%, 9/13/2011, (AUD)(e) | | | 676,756 | |
| | 295,000 | | | International Lease Finance Corp.,
8.250%, 12/15/2020 | | | 323,394 | |
| | 80,000 | | | iStar Financial, Inc.,
5.850%, 3/15/2017 | | | 69,800 | |
| | 10,000 | | | iStar Financial, Inc.,
5.875%, 3/15/2016 | | | 8,900 | |
| | 15,000 | | | iStar Financial, Inc., Series B,
5.950%, 10/15/2013 | | | 14,212 | |
| | | | | | | | |
| | | | | | | 2,140,863 | |
| | | | | | | | |
| | | | Oil Field Services — 0.9% | | | | |
| | 490,000 | | | Basic Energy Services, Inc.,
7.125%, 4/15/2016 | | | 497,350 | |
| | | | | | | | |
Principal
Amount (‡) | | | Description | | Value (†) | |
| | | | | | | | |
| | | | Oil Field Services — continued | | | | |
| $ | 350,000 | | | Cie Generale de Geophysique - Veritas,
9.500%, 5/15/2016 | | $ | 390,250 | |
| | 265,000 | | | Parker Drilling Co.,
9.125%, 4/01/2018 | | | 284,875 | |
| | 385,000 | | | Pioneer Drilling Co.,
9.875%, 3/15/2018 | | | 413,875 | |
| | | | | | | | |
| | | | | | | 1,586,350 | |
| | | | | | | | |
| | | | Packaging — 0.2% | | | | |
| | 300,000 | | | Reynolds Group Holdings Ltd.,
8.250%, 2/15/2021, 144A | | | 297,000 | |
| | | | | | | | |
| | | | Pharmaceuticals — 0.3% | | | | |
| | 185,000 | | | Valeant Pharmaceuticals International,
6.750%, 8/15/2021, 144A | | | 175,519 | |
| | 290,000 | | | Valeant Pharmaceuticals International,
7.250%, 7/15/2022, 144A | | | 280,575 | |
| | | | | | | | |
| | | | | | | 456,094 | |
| | | | | | | | |
| | | | Refining — 0.5% | | | | |
| | 150,000 | | | Petroplus Finance Ltd.,
6.750%, 5/01/2014, 144A | | | 147,000 | |
| | 745,000 | | | Petroplus Finance Ltd.,
7.000%, 5/01/2017, 144A | | | 707,750 | |
| | | | | | | | |
| | | | | | | 854,750 | |
| | | | | | | | |
| | | | Retailers — 1.3% | | | | |
| | 250,000 | | | Dillard’s, Inc.,
6.625%, 1/15/2018 | | | 246,250 | |
| | 105,000 | | | Dillard’s, Inc.,
7.130%, 8/01/2018 | | | 105,788 | |
| | 285,000 | | | Dillard’s, Inc., 7.750%, 7/15/2026 | | | 273,600 | |
| | 105,000 | | | Dillard’s, Inc.,
7.750%, 5/15/2027 | | | 99,225 | |
| | 145,000 | | | Dillard’s, Inc.,
7.875%, 1/01/2023 | | | 141,375 | |
| | 1,285,000 | | | Toys R Us, Inc.,
7.375%, 10/15/2018 | | | 1,288,212 | |
| | | | | | | | |
| | | | | | | 2,154,450 | |
| | | | | | | | |
| | | | Sovereigns — 4.7% | | | | |
| | 502,000(††) | | | Mexican Fixed Rate Bonds, Series M-20,
8.000%, 12/07/2023, (MXN) | | | 4,284,185 | |
| | 4,750,000 | | | Republic of Brazil,
10.250%, 1/10/2028, (BRL) | | | 2,894,834 | |
| | 7,970,000 | | | Republic of Iceland,
8.000%, 7/22/2011, (ISK) | | | 41,790 | |
| | 10,822,830 | | | Uruguay Government International Bond,
3.700%, 6/26/2037, (UYU) | | | 572,628 | |
| | 4,962,953 | | | Uruguay Government International Bond,
4.250%, 4/05/2027, (UYU) | | | 276,903 | |
| | | | | | | | |
| | | | | | | 8,070,340 | |
| | | | | | | | |
| | | | Supermarkets — 1.4% | | | | |
| | 315,000 | | | American Stores Co.,
8.000%, 6/01/2026 | | | 285,075 | |
| | 750,000 | | | New Albertson’s, Inc.,
7.450%, 8/01/2029 | | | 592,500 | |
| | 955,000 | | | New Albertson’s, Inc.,
7.750%, 6/15/2026 | | | 795,037 | |
| | 130,000 | | | New Albertson’s, Inc.,
8.000%, 5/01/2031 | | | 106,600 | |
| | 15,000 | | | New Albertson’s, Inc.,
8.700%, 5/01/2030 | | | 12,863 | |
See accompanying notes to financial statements.
23 |
Portfolio of Investments – as of March 31, 2011 (Unaudited)
Loomis Sayles High Income Fund – (continued)
| | | | | | | | |
Principal
Amount (‡) | | | Description | | Value (†) | |
| | | | | | | | |
| | | | Supermarkets — continued | | | | |
| $ | 735,000 | | | New Albertson’s, Inc., Series C, MTN,
6.625%, 6/01/2028 | | $ | 532,875 | |
| | | | | | | | |
| | | | | | | 2,324,950 | |
| | | | | | | | |
| | | | Supranational — 5.1% | | | | |
| | 2,000,000 | | | European Bank for Reconstruction & Development, GMTN,
9.250%, 9/10/2012, (BRL) | | | 1,224,488 | |
| | 17,499,000,000 | | | European Investment Bank, EMTN,
Zero Coupon, 4/24/2013, 144A, (IDR) | | | 1,754,221 | |
| | 35,340,000,000 | | | Inter-American Development Bank, EMTN,
Zero Coupon, 8/20/2015, (IDR) | | | 2,806,096 | |
| | 72,300,000 | | | Inter-American Development Bank, EMTN,
4.750%, 1/10/2014, (INR) | | | 1,576,511 | |
| | 1,500,000,000 | | | International Bank for Reconstruction & Development, EMTN,
2.300%, 2/26/2013, (KRW) | | | 1,363,462 | |
| | | | | | | | |
| | | | | | | 8,724,778 | |
| | | | | | | | |
| | | | Technology — 2.6% | | | | |
| | 1,090,000 | | | Alcatel-Lucent USA, Inc.,
6.450%, 3/15/2029 | | | 937,400 | |
| | 1,930,000 | | | Alcatel-Lucent USA, Inc.,
6.500%, 1/15/2028 | | | 1,659,800 | |
| | 225,000 | | | Buccaneer Merger Sub, Inc.,
9.125%, 1/15/2019, 144A | | | 238,500 | |
| | 365,000 | | | CommScope, Inc.,
8.250%, 1/15/2019, 144A | | | 381,425 | |
| | 840,000 | | | First Data Corp.,
8.250%, 1/15/2021, 144A | | | 837,900 | |
| | 340,000 | | | Nortel Networks Capital Corp.,
7.875%, 6/15/2026(f) | | | 249,900 | |
| | 560,000 | | | Nortel Networks Ltd.,
6.875%, 9/01/2023(f) | | | 145,600 | |
| | | | | | | | |
| | | | | | | 4,450,525 | |
| | | | | | | | |
| | | | Textile — 0.2% | | | | |
| | 375,000 | | | Jones Apparel Group, Inc.,
6.125%, 11/15/2034 | | | 299,063 | |
| | | | | | | | |
| | | | Transportation Services — 0.4% | | | | |
| | 275,000 | | | APL Ltd.,
8.000%, 1/15/2024(c) | | | 188,375 | |
| | 640,000 | | | Overseas Shipholding Group,
7.500%, 2/15/2024 | | | 548,800 | |
| | | | | | | | |
| | | | | | | 737,175 | |
| | | | | | | | |
| | | | Treasuries — 2.4% | | | | |
| | 59,169 | | | Hellenic Republic Government Bond,
2.300%, 7/25/2030, (EUR) | | | 42,001 | |
| | 50,000 | | | Hellenic Republic Government Bond,
4.600%, 7/20/2018, (EUR) | | | 43,657 | |
| | 175,000 | | | Hellenic Republic Government Bond,
4.700%, 3/20/2024, (EUR) | | | 147,095 | |
| | 150,000 | | | Ireland Government Bond,
4.500%, 10/18/2018, (EUR) | | | 150,103 | |
| | 275,000 | | | Ireland Government Bond,
4.500%, 4/18/2020, (EUR) | | | 264,042 | |
| | 600,000 | | | Ireland Government Bond,
5.400%, 3/13/2025, (EUR) | | | 566,287 | |
| | 10,000,000 | | | Philippine Government International Bond,
4.950%, 1/15/2021, (PHP) | | | 225,876 | |
| | 120,000,000 | | | Philippine Government International Bond,
6.250%, 1/14/2036, (PHP) | | | 2,611,659 | |
| | 50,000 | | | Portugal Obrigacoes do Tesouro OT,
3.850%, 4/15/2021, (EUR) | | | 49,729 | |
| | | | | | | | |
| | | | | | | 4,100,449 | |
| | | | | | | | |
| | | | | | | | |
Principal
Amount (‡) | | | Description | | Value (†) | |
| | | | | | | | |
| | | | Water Sewer — 0.2% | | | | |
| | 540,000,000 | | | Empresas Publicas de Medellin ESP,
8.375%, 1/31/2021, 144A, (COP) | | $ | 298,118 | |
| | | | | | | | |
| | | | Wireless — 1.7% | | | | |
| | 600,000 | | | eAccess Ltd.,
8.250%, 4/01/2018, 144A | | | 609,780 | |
| | 280,000 | | | NII Capital Corp.,
7.625%, 4/01/2021 | | | 286,300 | |
| | 2,061,000 | | | Sprint Capital Corp.,
6.875%, 11/15/2028 | | | 1,901,272 | |
| | 20,000 | | | Sprint Capital Corp.,
8.750%, 3/15/2032 | | | 21,275 | |
| | | | | | | | |
| | | | | | | 2,818,627 | |
| | | | | | | | |
| | | | Wirelines — 6.8% | | | | |
| | 120,000 | | | Axtel SAB de CV,
9.000%, 9/22/2019, 144A | | | 115,200 | |
| | 900,000 | | | Bakrie Telecom Pte Ltd.,
11.500%, 5/07/2015, 144A | | | 960,750 | |
| | 130,000 | | | Cincinnati Bell Telephone Co. LLC,
6.300%, 12/01/2028 | | | 104,000 | |
| | 530,000 | | | Cincinnati Bell, Inc.,
7.000%, 2/15/2015 | | | 536,625 | |
| | 370,000 | | | Cincinnati Bell, Inc.,
8.750%, 3/15/2018 | | | 349,188 | |
| | 95,000 | | | Frontier Communications Corp.,
7.000%, 11/01/2025 | | | 85,614 | |
| | 1,245,000 | | | Frontier Communications Corp.,
7.875%, 1/15/2027 | | | 1,188,975 | |
| | 605,000 | | | Frontier Communications Corp.,
9.000%, 8/15/2031 | | | 618,612 | |
| | 1,910,000 | | | Level 3 Financing, Inc.,
8.750%, 2/15/2017 | | | 1,895,675 | |
| | 495,000 | | | Level 3 Financing, Inc.,
9.250%, 11/01/2014 | | | 506,137 | |
| | 425,000 | | | Qwest Capital Funding, Inc.,
6.500%, 11/15/2018 | | | 433,500 | |
| | 1,445,000 | | | Qwest Capital Funding, Inc.,
6.875%, 7/15/2028 | | | 1,434,162 | |
| | 275,000 | | | Qwest Capital Funding, Inc.,
7.625%, 8/03/2021 | | | 286,000 | |
| | 2,860,000 | | | Qwest Capital Funding, Inc.,
7.750%, 2/15/2031 | | | 3,045,900 | |
| | 10,000 | | | Qwest Corp.,
6.875%, 9/15/2033 | | | 10,013 | |
| | | | | | | | |
| | | | | | | 11,570,351 | |
| | | | | | | | |
| | | | Total Non-Convertible Bonds
(Identified Cost $95,199,378) | | | 103,548,413 | |
| | | | | | | | |
| | | | | | | | |
| | Convertible Bonds — 19.1% | | | | |
| | | | Automotive — 2.1% | | | | |
| | 410,000 | | | ArvinMeritor, Inc., (Step to Zero Coupon on 2/15/2019),
4.000%, 2/15/2027(g) | | | 404,363 | |
| | 1,720,000 | | | Ford Motor Co.,
4.250%, 11/15/2016 | | | 3,117,500 | |
| | | | | | | | |
| | | | | | | 3,521,863 | |
| | | | | | | | |
| | | | Diversified Manufacturing — 2.3% | | | | |
| | 1,150,000 | | | Owens-Brockway Glass Container, Inc.,
3.000%, 6/01/2015, 144A | | | 1,165,812 | |
| | 2,515,000 | | | Trinity Industries, Inc.,
3.875%, 6/01/2036 | | | 2,741,350 | |
| | | | | | | | |
| | | | | | | 3,907,162 | |
| | | | | | | | |
See accompanying notes to financial statements.
| 24
Portfolio of Investments – as of March 31, 2011 (Unaudited)
Loomis Sayles High Income Fund – (continued)
| | | | | | | | |
Principal
Amount (‡) | | | Description | | Value (†) | |
| | | | | | | | |
| | | | Healthcare — 1.3% | | | | |
| $ | 35,000 | | | Hologic, Inc., (Step to Zero Coupon on 12/15/2016),
2.000%, 12/15/2037(g) | | $ | 42,569 | |
| | 1,560,000 | | | Hologic, Inc., (Step to Zero Coupon on 12/15/2013),
2.000%, 12/15/2037(g) | | | 1,505,400 | |
| | 515,000 | | | Omnicare, Inc.,
3.750%, 12/15/2025 | | | 663,706 | |
| | | | | | | | |
| | | | | | | 2,211,675 | |
| | | | | | | | |
| | | | Home Construction — 0.0% | | | | |
| | 70,000 | | | Lennar Corp.,
2.000%, 12/01/2020, 144A | | | 70,438 | |
| | | | | | | | |
| | | | Independent Energy — 2.4% | | | | |
| | 1,975,000 | | | Chesapeake Energy Corp.,
2.250%, 12/15/2038 | | | 1,814,531 | |
| | 1,300,000 | | | Chesapeake Energy Corp.,
2.500%, 5/15/2037 | | | 1,412,125 | |
| | 785,000 | | | Penn Virginia Corp.,
4.500%, 11/15/2012 | | | 810,513 | |
| | | | | | | | |
| | | | | | | 4,037,169 | |
| | | | | | | | |
| | | | Metals & Mining — 0.4% | | | | |
| | 555,000 | | | Peabody Energy Corp.,
4.750%, 12/15/2066 | | | 735,375 | |
| | | | | | | | |
| | | | Pharmaceuticals — 4.6% | | | | |
| | 845,000 | | | Amylin Pharmaceuticals, Inc.,
3.000%, 6/15/2014 | | | 726,700 | |
| | 475,000 | | | Human Genome Sciences, Inc.,
2.250%, 10/15/2011 | | | 841,937 | |
| | 840,000 | | | Human Genome Sciences, Inc.,
2.250%, 8/15/2012 | | | 1,360,800 | |
| | 785,000 | | | Kendle International, Inc.,
3.375%, 7/15/2012 | | | 743,788 | |
| | 505,000 | | | Valeant Pharmaceuticals International,
4.000%, 11/15/2013 | | | 1,994,750 | |
| | 1,755,000 | | | Vertex Pharmaceuticals, Inc.,
3.350%, 10/01/2015 | | | 2,132,325 | |
| | | | | | | | |
| | | | | | | 7,800,300 | |
| | | | | | | | |
| | | | Technology — 6.0% | | | | |
| | 775,000 | | | Alcatel-Lucent USA, Inc., Series B,
2.875%, 6/15/2025 | | | 749,812 | |
| | 15,000 | | | Ciena Corp.,
0.250%, 5/01/2013 | | | 15,300 | |
| | 2,845,000 | | | Ciena Corp.,
0.875%, 6/15/2017 | | | 2,777,431 | |
| | 145,000 | | | Ciena Corp.,
3.750%, 10/15/2018, 144A | | | 217,138 | |
| | 40,000 | | | Ciena Corp.,
4.000%, 3/15/2015, 144A | | | 58,600 | |
| | 3,925,000 | | | Intel Corp.,
2.950%, 12/15/2035 | | | 4,037,844 | |
| | 1,330,000 | | | Kulicke & Soffa Industries, Inc.,
0.875%, 6/01/2012 | | | 1,328,337 | |
| | 820,000 | | | Micron Technology, Inc.,
1.875%, 6/01/2014 | | | 891,750 | |
| | 280,000 | | | Nortel Networks Corp.,
2.125%, 4/15/2014(f) | | | 241,150 | |
| | | | | | | | |
| | | | | | | 10,317,362 | |
| | | | | | | | |
| | | | Total Convertible Bonds
(Identified Cost $24,876,937) | | | 32,601,344 | |
| | | | | | | | |
| | | | Total Bonds and Notes
(Identified Cost $120,076,315) | | | 136,149,757 | |
| | | | | | | | |
| | | | | | | | |
Principal
Amount (‡) | | | Description | | Value (†) | |
| | | | | | | | |
| | Bank Loans — 0.6% | | | | |
| | | | Media Non-Cable — 0.2% | | | | |
| $ | 349,332 | | | SuperMedia, Inc., Exit Term Loan,
11.000%, 12/31/2015(h) | | $ | 230,797 | |
| | 224,012 | | | Tribune Company, Term Loan X,
5.000%, 6/04/2009(f)(h)(i) | | | 153,237 | |
| | | | | | | | |
| | | | | | | 384,034 | |
| | | | | | | | |
| | | | Technology — 0.0% | | | | |
| | 2,342 | | | Sungard Data Systems, Inc., Tranche A,
2.008%, 2/28/2014(h) | | | 2,301 | |
| | | | | | | | |
| | | | Wireless — 0.0% | | | | |
| | 17,815 | | | Hawaiian Telcom Communications, Inc., Exit Term Loan,
9.000%, 11/01/2015(h)(j) | | | 18,144 | |
| | | | | | | | |
| | | | Wirelines — 0.4% | | | | |
| | 370,146 | | | FairPoint Communications, Inc., New Term Loan B,
6.500%, 1/24/2016(h) | | | 356,766 | |
| | 250,000 | | | Level 3 Financing, Inc., Add on Term Loan,
11.500%, 3/13/2014(h) | | | 266,875 | |
| | | | | | | | |
| | | | | | | 623,641 | |
| | | | | | | | |
| | | | Total Bank Loans
(Identified Cost $1,321,823) | | | 1,028,120 | |
| | | | | | | | |
| | | | | | | | |
| Shares | | | | | | |
| | Preferred Stocks — 5.6% | | | | |
| | Convertible Preferred Stocks — 5.0% | | | | |
| | | | Automotive — 2.4% | | | | |
| | 68,550 | | | General Motors Co., Series B,
4.750% | | | 3,304,110 | |
| | 15,725 | | | Goodyear Tire & Rubber Co. (The),
5.875% | | | 803,233 | |
| | | | | | | | |
| | | | | | | 4,107,343 | |
| | | | | | | | |
| | | | Capital Markets — 1.5% | | | | |
| | 55,115 | | | Newell Financial Trust I,
5.250% | | | 2,638,630 | |
| | | | | | | | |
| | | | Diversified Financial Services — 0.1% | | | | |
| | 3,732 | | | Sovereign Capital Trust IV,
4.375% | | | 166,074 | |
| | | | | | | | |
| | | | Electric Utilities — 0.2% | | | | |
| | 6,475 | | | AES Trust III,
6.750% | | | 315,980 | |
| | | | | | | | |
| | | | Machinery — 0.1% | | | | |
| | 2,550 | | | United Rentals Trust I,
6.500% | | | 119,850 | |
| | | | | | | | |
| | | | Oil, Gas & Consumable Fuels — 0.2% | | | | |
| | 9,500 | | | El Paso Energy Capital Trust I,
4.750% | | | 420,375 | |
| | | | | | | | |
| | | | Semiconductors & Semiconductor Equipment — 0.5% | |
| | 799 | | | Lucent Technologies Capital Trust I,
7.750% | | | 783,020 | |
| | | | | | | | |
| | | | Total Convertible Preferred Stocks
(Identified Cost $7,826,938) | | | 8,551,272 | |
| | | | | | | | |
| | Non-Convertible Preferred Stocks — 0.6% | | | | |
| | | | Banking — 0.6% | | | | |
| | 26,825 | | | Ally Financial, Inc., Series A, (fixed rate to 5/15/2016, variable rate thereafter),
8.500% | | | 667,916 | |
See accompanying notes to financial statements.
25 |
Portfolio of Investments – as of March 31, 2011 (Unaudited)
Loomis Sayles High Income Fund – (continued)
| | | | | | | | |
| Shares | | | Description | | Value (†) | |
| | | | | | | | |
| | | | Banking — continued | | | | |
| | 274 | | | Ally Financial, Inc., Series G,
7.000%, 144A | | $ | 254,957 | |
| | | | | | | | |
| | | | Total Non-Convertible Preferred Stocks
(Identified Cost $738,910) | | | 922,873 | |
| | | | | | | | |
| | | | Total Preferred Stocks
(Identified Cost $8,565,848) | | | 9,474,145 | |
| | | | | | | | |
| | Common Stocks — 1.4% | | | | |
| | | | Automobiles — 0.5% | | | | |
| | 53,720 | | | Ford Motor Co.(k) | | | 800,965 | |
| | | | | | | | |
| | | | Biotechnology — 0.2% | | | | |
| | 8,147 | | | Vertex Pharmaceuticals, Inc.(k) | | | 390,486 | |
| | | | | | | | |
| | | | Chemicals — 0.0% | | | | |
| | 1,087 | | | Ashland, Inc. | | | 62,785 | |
| | | | | | | | |
| | | | Diversified Telecommunication Services — 0.2% | |
| | 14,623 | | | FairPoint Communications, Inc.(k) | | | 246,690 | |
| | 593 | | | Hawaiian Telcom Holdco, Inc.(k) | | | 15,566 | |
| | | | | | | | |
| | | | | | | 262,256 | |
| | | | | | | | |
| | | | Household Durables — 0.0% | | | | |
| | 1,775 | | | KB Home | | | 22,081 | |
| | | | | | | | |
| | | | Media — 0.0% | | | | |
| | 388 | | | Dex One Corp.(k) | | | 1,878 | |
| | 1,835 | | | SuperMedia, Inc.(k) | | | 11,451 | |
| | | | | | | | |
| | | | | | | 13,329 | |
| | | | | | | | |
| | | | Oil, Gas & Consumable Fuels — 0.4% | | | | |
| | 35,176 | | | El Paso Corp. | | | 633,168 | |
| | | | | | | | |
| | | | Pharmaceuticals — 0.1% | | | | |
| | 6,875 | | | Merck & Co., Inc. | | | 226,944 | |
| | | | | | | | |
| | | | Total Common Stocks
(Identified Cost $2,484,531) | | | 2,412,014 | |
| | | | | | | | |
| | Closed End Investment Companies — 0.0% | | | | |
| | 1,772 | | | Western Asset High Income Opportunity Fund, Inc.
(Identified Cost $11,277) | | | 11,270 | |
| | | | | | | | |
| | Warrants — 0.0% | | | | |
| | 10,023 | | | FairPoint Communications, Inc., Expiration on 1/24/2018(c)(k)(l)
(Identified Cost $0) | | | — | |
| | | | | | | | |
Principal
Amount (‡) | | | | | | |
| | Short-Term Investments — 9.8% | | | | |
| $ | 16,610,830 | | | Tri-Party Repurchase Agreement with Fixed Income Clearing Corporation, dated 3/31/2011, at 0.000% to be repurchased at $16,610,830 on 4/01/2011 collateralized by $16,760,000 U.S. Treasury Note, 1.000% due 4/30/2012 valued at $16,947,100 including accrued interest (Note 2 to Financial Statements)
(Identified Cost $16,610,830) | | | 16,610,830 | |
| | | | | | | | |
| | | | | | | | |
| | | | Total Investments — 97.4% | | | | |
| | | | (Identified Cost $149,070,624)(a) | | | 165,686,136 | |
| | | | Other assets less liabilities — 2.6% | | | 4,380,600 | |
| | | | | | | | |
| | | | Net Assets — 100.0% | | $ | 170,066,736 | |
| | | | | | | | |
| | | | | | | | |
| | | | | | | | |
| | | | | | | | |
| | (‡) | | | Principal amount stated in U.S. dollars unless otherwise noted. | |
| | (†) | | | See Note 2 of Notes to Financial Statements. | |
| | (††) | | | Amount shown represents units. One unit represents a principal amount of 100. | |
| | (a) | | | Federal Tax Information (Amounts exclude certain adjustments made at the end of the Fund’s fiscal year for tax purposes. Such adjustments are primarily due to wash sales. Amortization of premium on debt securities is excluded for tax purposes.): | |
| | | | At March 31, 2011, the net unrealized appreciation on investments based on a cost of $149,083,822 for federal income tax purposes was as follows: | |
| | | | Aggregate gross unrealized appreciation for all investments in which there is an excess of value over tax cost | | $ | 20,044,527 | |
| | | | Aggregate gross unrealized depreciation for all investments in which there is an excess of tax cost over value | | | (3,442,213 | ) |
| | | | | | | | |
| | | | Net unrealized appreciation | | $ | 16,602,314 | |
| | | | | | | | |
| | | | | | | | |
| | (b) | | | Variable rate security. Rate as of March 31, 2011 is disclosed. | |
| | (c) | | | Illiquid security. At March 31, 2011, the value of these securities amounted to $903,087 or 0.5% of net assets. | |
| | (d) | | | The issuer has made partial payment with respect to interest and/or principal. Income is not being accrued. | |
| | (e) | | | All or a portion of this security has been designated to cover the Fund’s obligations under open forward foreign currency contracts. | |
| | (f) | | | The issuer is in default with respect to interest and/or principal payments. Income is not being accrued. | |
| | (g) | | | Coupon rate is a fixed rate for an initial period then resets at a specified date and rate. | |
| | (h) | | | Variable rate security. Rate shown represents the weighted average rate at March 31, 2011. | |
| | (i) | | | Issuer has filed for bankruptcy. | |
| | (j) | | | All or a portion of interest payment is paid-in-kind. | |
| | (k) | | | Non-income producing security. | |
| | (l) | | | Fair valued security by the Fund’s investment adviser. At March 31, 2011 the value of this security amounted to $0. | |
| | | | | | | | |
| | 144A | | | All or a portion of these securities are exempt from registration under Rule 144A of the Securities Act of 1933. These securities may be resold in transactions exempt from registration, normally to qualified institutional buyers. At March 31, 2011, the value of Rule 144A holdings amounted to $16,015,853 or 9.4% of net assets. | |
| | ABS | | | Asset-Backed Securities | | | | |
| | ARMs | | | Adjustable Rate Mortgages | | | | |
| | EMTN | | | Euro Medium Term Note | | | | |
| | GMTN | | | Global Medium Term Note | | | | |
| | MTN | | | Medium Term Note | | | | |
| | | | | | | | |
| | AUD | | | Australian Dollar | | | | |
| | BRL | | | Brazilian Real | | | | |
| | COP | | | Colombian Peso | | | | |
| | EUR | | | Euro | | | | |
| | IDR | | | Indonesian Rupiah | | | | |
| | INR | | | Indian Rupee | | | | |
| | ISK | | | Icelandic Krona | | | | |
| | KRW | | | South Korean Won | | | | |
| | MXN | | | Mexican Peso | | | | |
| | PHP | | | Philippine Peso | | | | |
| | SGD | | | Singapore Dollar | | | | |
| | UYU | | | Uruguayan Peso | | | | |
See accompanying notes to financial statements.
| 26
Portfolio of Investments – as of March 31, 2011 (Unaudited)
Loomis Sayles High Income Fund – (continued)
At March 31, 2011, the Fund had the following open forward foreign currency contracts:
| | | | | | | | | | | | | | | | | | |
Contract to Buy/Sell | | Delivery
Date | | | Currency | | Units | | | Notional
Value | | | Unrealized
Depreciation | |
| Sell1 | | | 04/29/2011 | | | Euro | | | 1,100,000 | | | $ | 1,558,195 | | | $ | (46,043 | ) |
| | | | | | | | | | | | | | | | | | |
1 Counterparty is Barclays.
Industry Summary at March 31, 2011 (Unaudited)
| | | | |
| Technology | | | 8.6 | % |
| Wirelines | | | 7.2 | |
| Automotive | | | 5.8 | |
| Supranational | | | 5.1 | |
| Pharmaceuticals | | | 5.0 | |
| Sovereigns | | | 4.7 | |
| Healthcare | | | 4.7 | |
| Non-Captive Consumer | | | 3.5 | |
| Home Construction | | | 3.2 | |
| Banking | | | 3.2 | |
| Gaming | | | 2.8 | |
| Independent Energy | | | 2.8 | |
| Treasuries | | | 2.4 | |
| Diversified Manufacturing | | | 2.3 | |
| Collateralized Mortgage Obligations | | | 2.2 | |
Other Investments, less than 2% each | | | 24.1 | |
| Short-Term Investments | | | 9.8 | |
| | | | |
| Total Investments | | | 97.4 | |
| Other assets less liabilities (including open forward foreign currency contracts) | | | 2.6 | |
| | | | |
| Net Assets | | | 100.0 | % |
| | | | |
See accompanying notes to financial statements.
27 |
Portfolio of Investments – as of March 31, 2011 (Unaudited)
Loomis Sayles International Bond Fund
| | | | | | | | |
Principal
Amount (‡) | | | Description | | Value (†) | |
| | | | | | | | |
| | Bonds and Notes — 98.0% of Net Assets | | | | |
| | Non-Convertible Bonds — 97.8% | | | | |
| | | | Argentina — 0.5% | | | | |
| $ | 136,600 | | | Argentina Government International Bond,
8.280%, 12/31/2033 | | $ | 121,778 | |
| | | | | | | | |
| | | | Belgium — 0.8% | | | | |
| | 100,000 | | | Anheuser-Busch InBev NV, EMTN,
6.500%, 6/23/2017, (GBP) | | | 179,640 | |
| | | | | | | | |
| | | | Brazil — 0.6% | | | | |
| | 100,000 | | | Telemar Norte Leste SA,
5.125%, 12/15/2017, 144A, (EUR) | | | 138,106 | |
| | | | | | | | |
| | | | Canada — 7.6% | | | | |
| | 225,000 | | | Bell Canada, Series M-17,
6.100%, 3/16/2035, (CAD) | | | 230,368 | |
| | 165,000 | | | Corus Entertainment, Inc.,
7.250%, 2/10/2017, 144A, (CAD) | | | 181,679 | |
| | 200,000 | | | Province of Ontario, EMTN,
4.000%, 12/03/2019, (EUR) | | | 285,970 | |
| | 25,000,000 | | | Province of Quebec Canada,
1.600%, 5/09/2013, (JPY) | | | 305,921 | |
| | 150,000 | | | Province of Quebec Canada, EMTN,
3.375%, 6/20/2016, (EUR) | | | 213,174 | |
| | 200,000 | | | Province of Quebec Canada, Series 169, EMTN,
3.625%, 2/10/2015, (EUR) | | | 289,174 | |
| | 200,000 | | | Shaw Communications, Inc.,
5.650%, 10/01/2019, (CAD) | | | 211,218 | |
| | | | | | | | |
| | | | | | | 1,717,504 | |
| | | | | | | | |
| | | | Cayman Islands — 0.6% | | | | |
| | 119,000 | | | Fibria Overseas Finance Ltd.,
7.500%, 5/04/2020, 144A | | | 129,115 | |
| | | | | | | | |
| | | | Colombia — 0.6% | | | | |
| | 105,000,000 | | | Emgesa SA ESP,
8.750%, 1/25/2021, 144A, (COP) | | | 59,129 | |
| | 160,000,000 | | | Empresas Publicas de Medellin ESP,
8.375%, 2/01/2021, 144A, (COP) | | | 88,331 | |
| | | | | | | | |
| | | | | | | 147,460 | |
| | | | | | | | |
| | | | Denmark — 0.3% | | | | |
| | 50,000 | | | Kingdom of Denmark, EMTN,
1.750%, 10/05/2015, (EUR) | | | 67,969 | |
| | | | | | | | |
| | | | Finland — 4.4% | | | | |
| | 680,000 | | | Finland Government Bond,
3.125%, 9/15/2014, (EUR) | | | 987,981 | |
| | | | | | | | |
| | | | France — 0.3% | | | | |
| | 50,000 | | | Lafarge SA, EMTN,
5.375%, 6/26/2017, (EUR) | | | 69,919 | |
| | | | | | | | |
| | | | Germany — 11.0% | | | | |
| | 240,000 | | | Bundesobligation, 2.250%, 4/10/2015, (EUR) | | | 337,985 | |
| | 670,000 | | | Bundesrepublik Deutschland, 3.000%, 7/04/2020, (EUR)(b) | | | 925,045 | |
| | 175,000 | | | Bundesrepublik Deutschland, 3.250%, 1/04/2020, (EUR) | | | 247,489 | |
| | 165,000 | | | Bundesrepublik Deutschland, 3.750%, 7/04/2013, (EUR) | | | 243,486 | |
| | 235,000 | | | Bundesrepublik Deutschland, Series 6, 3.750%, 1/04/2017, (EUR) | | | 348,798 | |
| | 255,000 | | | Republic of Germany, 1.250%, 9/16/2011, (EUR) | | | 361,852 | |
| | | | | | | | |
| | | | | | | 2,464,655 | |
| | | | | | | | |
| | | | | | | | |
Principal
Amount (‡) | | | Description | | Value (†) | |
| | | | | | | | |
| | | | Hungary — 0.3% | | | | |
| $ | 60,000 | | | Hungary Government International Bond,
6.375%, 3/29/2021 | | $ | 60,060 | |
| | | | | | | | |
| | | | India — 0.4% | | | | |
| | 100,000 | | | Canara Bank Ltd., (fixed rate to 11/28/2016, variable rate thereafter),
6.365%, 11/28/2021 | | | 99,621 | |
| | | | | | | | |
| | | | Italy — 3.7% | | | | |
| | 150,000 | | | Finmeccanica SpA, EMTN,
4.875%, 3/24/2025, (EUR) | | | 200,852 | |
| | 470,000 | | | Italy Buoni Poliennali Del Tesoro,
4.000%, 9/01/2020, (EUR) | | | 631,454 | |
| | | | | | | | |
| | | | | | | 832,306 | |
| | | | | | | | |
| | | | Japan — 16.5% | | | | |
| | 65,000,000 | | | Japan Finance Organization for Municipal Enterprises,
1.350%, 11/26/2013, (JPY) | | | 801,442 | |
| | 94,000,000 | | | Japan Government Five Year Bond,
0.700%, 6/20/2014, (JPY) | | | 1,143,880 | |
| | 70,200,000 | | | Japan Government Ten Year Bond,
1.300%, 3/20/2019, (JPY)(b) | | | 867,844 | |
| | 50,000,000 | | | Japan Government Ten Year Bond,
1.700%, 9/20/2017, (JPY) | | | 638,668 | |
| | 13,000,000 | | | Japan Government Twenty Year Bond,
2.000%, 9/20/2025, (JPY) | | | 162,083 | |
| | 9,000,000 | | | Japan Government Twenty Year Bond, Series 123,
2.100%, 12/20/2030, (JPY) | | | 108,881 | |
| | | | | | | | |
| | | | | | | 3,722,798 | |
| | | | | | | | |
| | | | Jersey — 0.8% | | | | |
| | 100,000 | | | WPP PLC,
6.000%, 4/04/2017, (GBP) | | | 170,948 | |
| | | | | | | | |
| | | | Korea — 0.6% | | | | |
| | 6,000,000 | | | Export-Import Bank of Korea,
4.000%, 11/26/2015, 144A, (PHP) | | | 132,581 | |
| | | | | | | | |
| | | | Lithuania — 0.4% | | | | |
| | 100,000 | | | Lithuania Government International Bond,
6.125%, 3/09/2021, 144A | | | 102,100 | |
| | | | | | | | |
| | | | Luxembourg — 1.2% | | | | |
| | 150,000 | | | Enel Finance International SA, EMTN,
5.625%, 8/14/2024, (GBP) | | | 234,641 | |
| | 25,000 | | | Telecom Italia Finance SA, EMTN,
7.750%, 1/24/2033, (EUR) | | | 37,912 | |
| | | | | | | | |
| | | | | | | 272,553 | |
| | | | | | | | |
| | | | Mexico — 3.4% | | | | |
| | 160,000 | | | Axtel SAB de CV,
9.000%, 9/22/2019, 144A | | | 153,600 | |
| | 20,500(†††) | | | Mexican Fixed Rate Bonds, Series M-10,
8.000%, 12/17/2015, (MXN) | | | 179,786 | |
| | 48,000(†††) | | | Mexican Fixed Rate Bonds, Series M-10,
8.500%, 12/13/2018, (MXN) | | | 432,161 | |
| | | | | | | | |
| | | | | | | 765,547 | |
| | | | | | | | |
| | | | Netherlands — 3.2% | | | | |
| | 260,000 | | | Kingdom of Netherlands,
4.500%, 7/15/2017, (EUR)(b) | | | 396,420 | |
| | 45,000 | | | Kingdom of Netherlands,
5.500%, 1/15/2028, (EUR) | | | 76,153 | |
| | 150,000 | | | RWE Finance BV, EMTN,
5.500%, 7/06/2022, (GBP) | | | 244,800 | |
| | | | | | | | |
| | | | | | | 717,373 | |
| | | | | | | | |
See accompanying notes to financial statements.
| 28
Portfolio of Investments – as of March 31, 2011 (Unaudited)
Loomis Sayles International Bond Fund – (continued)
| | | | | | | | |
Principal
Amount (‡) | | | Description | | Value (†) | |
| | | | | | | | |
| | | | New Zealand — 1.1% | | | | |
| | 300,000 | | | New Zealand Government Bond,
6.500%, 4/15/2013, (NZD) | | $ | 242,490 | |
| | | | | | | | |
| | | | Norway — 4.2% | | | | |
| | 2,500,000 | | | Norwegian Government,
4.250%, 5/19/2017, (NOK) | | | 470,293 | |
| | 2,525,000 | | | Norwegian Government,
4.500%, 5/22/2019, (NOK) | | | 480,805 | |
| | | | | | | | |
| | | | | | | 951,098 | |
| | | | | | | | |
| | | | Peru — 0.4% | | | | |
| | 240,000 | | | Republic of Peru,
7.840%, 8/12/2020, 144A, (PEN) | | | 91,774 | |
| | | | | | | | |
| | | | Philippines — 0.5% | | | | |
| | 5,000,000 | | | Philippine Government International Bond,
4.950%, 1/15/2021, (PHP) | | | 112,938 | |
| | | | | | | | |
| | | | Poland — 1.1% | | | | |
| | 700,000 | | | Poland Government International Bond,
5.000%, 10/24/2013, (PLN) | | | 245,651 | |
| | | | | | | | |
| | | | Singapore — 3.2% | | | | |
| | 175,000 | | | Singapore Government Bond,
1.625%, 4/01/2013, (SGD) | | | 142,120 | |
| | 690,000 | | | Singapore Government Bond,
2.250%, 7/01/2013, (SGD) | | | 570,098 | |
| | | | | | | | |
| | | | | | | 712,218 | |
| | | | | | | | |
| | | | South Africa — 0.8% | | | | |
| | 150,000 | | | Edcon Proprietary Ltd.,
4.423%, 6/15/2014, 144A, (EUR)(c) | | | 181,756 | |
| | | | | | | | |
| | | | Supranationals — 8.2% | | | | |
| | 40,000,000 | | | Asian Development Bank, EMTN,
2.350%, 6/21/2027, (JPY) | | | 516,580 | |
| | 921,000,000 | | | European Investment Bank, EMTN,
Zero Coupon, 4/24/2013, 144A, (IDR) | | �� | 92,328 | |
| | 260,000 | | | European Investment Bank,
2.375%, 7/10/2020, (CHF) | | | 288,472 | |
| | 5,560,000,000 | | | Inter-American Development Bank, EMTN,
Zero Coupon, 8/20/2015, (IDR) | | | 441,480 | |
| | 5,700,000 | | | Inter-American Development Bank, EMTN,
4.750%, 1/10/2014, (INR) | | | 124,289 | |
| | 30,000,000 | | | Nordic Investment Bank, Series C, GMTN,
1.700%, 4/27/2017, (JPY) | | | 379,958 | |
| | | | | | | | |
| | | | | | | 1,843,107 | |
| | | | | | | | |
| | | | Sweden — 3.4% | | | | |
| | 1,940,000 | | | Sweden Government Bond,
5.000%, 12/01/2020, (SEK) | | | 348,419 | |
| | 2,500,000 | | | Sweden Government Bond,
5.500%, 10/08/2012, (SEK) | | | 414,534 | |
| | | | | | | | |
| | | | | | | 762,953 | |
| | | | | | | | |
| | | | Switzerland — 0.7% | | | | |
| | 100,000 | | | Credit Suisse London, EMTN,
5.125%, 9/18/2017, (EUR) | | | 148,310 | |
| | | | | | | | |
| | | | United Arab Emirates — 0.4% | | | | |
| | 100,000 | | | DP World Ltd.,
6.850%, 7/02/2037, 144A | | | 92,000 | |
| | | | | | | | |
| | | | United Kingdom — 4.5% | | | | |
| | 100,000 | | | British Sky Broadcasting Group PLC, EMTN,
6.000%, 5/21/2027, (GBP) | | | 165,338 | |
| | 150,000 | | | British Telecommunications PLC,
5.750%, 12/07/2028, (GBP) | | | 231,077 | |
| | 50,000 | | | BSKYB Finance UK PLC,
5.750%, 10/20/2017, (GBP) | | | 85,697 | |
| | | | | | | | |
Principal
Amount (‡) | | | Description | | Value (†) | |
| | | | | | | | |
| | | | United Kingdom — continued | | | | |
| | 50,000 | | | Standard Chartered Bank, Series 17, EMTN,
5.875%, 9/26/2017, (EUR) | | $ | 73,316 | |
| | 50,000 | | | United Kingdom Treasury,
4.000%, 9/07/2016, (GBP) | | | 85,191 | |
| | 65,000 | | | United Kingdom Treasury,
4.000%, 3/07/2022, (GBP) | | | 105,521 | |
| | 60,000 | | | United Kingdom Treasury,
4.750%, 12/07/2038, (GBP) | | | 102,587 | |
| | 95,000 | | | United Kingdom Treasury,
5.250%, 6/07/2012, (GBP) | | | 159,940 | |
| | | | | | | | |
| | | | | | | 1,008,667 | |
| | | | | | | | |
| | | | United States — 10.7% | | | | |
| | 130,000 | | | Ally Financial, Inc.,
6.750%, 12/01/2014 | | | 136,988 | |
| | 100,000 | | | BA Credit Card Trust, Series 04A1,
4.500%, 6/17/2016, (EUR) | | | 144,052 | |
| | 50,000 | | | Cargill, Inc., EMTN,
5.375%, 3/02/2037, (GBP) | | | 78,008 | |
| | 100,000 | | | Citibank Credit Card Issuance Trust,
Series 2001-A4, Class A4,
5.375%, 4/10/2013, (EUR) | | | 141,786 | |
| | 15,000,000 | | | Citigroup, Inc.,
2.400%, 10/31/2025, (JPY) | | | 162,999 | |
| | 150,000 | | | Ford Motor Credit Co. LLC,
6.625%, 8/15/2017 | | | 160,088 | |
| | 150,000 | | | Frontier Communications Corp.,
9.000%, 8/15/2031 | | | 153,375 | |
| | 50,000 | | | Goldman Sachs Group, Inc. (The),
6.875%, 1/18/2038, (GBP) | | | 80,002 | |
| | 45,000 | | | HCA, Inc.,
8.360%, 4/15/2024 | | | 45,000 | |
| | 200,000 | | | HSBC Finance Corp., EMTN,
4.500%, 6/14/2016, (EUR) | | | 287,377 | |
| | 70,000 | | | IPALCO Enterprises, Inc.,
7.250%, 4/01/2016, 144A | | | 75,775 | |
| | 100,000 | | | Merrill Lynch & Co., Inc., EMTN,
4.625%, 9/14/2018, (EUR) | | | 130,471 | |
| | 95,000 | | | Morgan Stanley,
5.375%, 11/14/2013, (GBP) | | | 159,348 | |
| | 55,000 | | | NRG Energy, Inc.,
8.250%, 9/01/2020, 144A | | | 57,200 | |
| | 100,000 | | | Owens-Brockway Glass Container, Inc.,
6.750%, 12/01/2014, (EUR) | | | 143,846 | |
| | 40,000 | | | SLM Corp., Series A, MTN,
5.000%, 10/01/2013 | | | 41,404 | |
| | 100,000 | | | Textron, Inc.,
3.875%, 3/11/2013, (EUR) | | | 140,938 | |
| | 55,000 | | | Valeant Pharmaceuticals International,
6.750%, 8/15/2021, 144A | | | 52,181 | |
| | 50,000 | | | Wells Fargo & Co.,
4.625%, 11/02/2035, (GBP) | | | 69,856 | |
| | 100,000 | | | Zurich Finance USA, Inc., EMTN, (fixed rate to 6/15/2015, variable rate thereafter),
4.500%, 6/15/2025, (EUR) | | | 141,201 | |
| | | | | | | | |
| | | | | | | 2,401,895 | |
| | | | | | | | |
| | | | Uruguay — 1.4% | | | | |
| | 2,865,250 | | | Uruguay Government International Bond,
3.700%, 6/26/2037, (UYU) | | | 151,598 | |
| | 2,496,807 | | | Uruguay Government International Bond,
5.000%, 9/14/2018, (UYU) | | | 153,873 | |
| | | | | | | | |
| | | | | | | 305,471 | |
| | | | | | | | |
| | | | Total Non-Convertible Bonds
(Identified Cost $20,803,605) | | | 22,000,342 | |
| | | | | | | | |
See accompanying notes to financial statements.
29 |
Portfolio of Investments – as of March 31, 2011 (Unaudited)
Loomis Sayles International Bond Fund – (continued)
| | | | | | | | |
Principal
Amount (‡) | | | Description | | Value (†) | |
| | | | | | | | |
| | Convertible Bonds — 0.2% | | | | |
| | | | United States — 0.2% | | | | |
| $ | 50,000 | | | Hologic, Inc., (Step to Zero Coupon on 12/15/2013),
2.000%, 12/15/2037(d)
(Identified Cost $35,248) | | $ | 48,250 | |
| | | | | | | | |
| | | | Total Bonds and Notes
(Identified Cost $20,838,853) | | | 22,048,592 | |
| | | | | | | | |
| | | | | | | | |
| | | | Total Investments — 98.0% | | | | |
| | | | (Identified Cost $20,838,853)(a) | | | 22,048,592 | |
| | | | Other assets less liabilities — 2.0% | | | 447,640 | |
| | | | | | | | |
| | | | Net Assets — 100.0% | | $ | 22,496,232 | |
| | | | | | | | |
| | | | | | | | |
| | (‡) | | | Principal amount stated in U.S. dollars unless otherwise noted. | |
| | (†) | | | See Note 2 of Notes to Financial Statements. | |
| | (†††) | | | Amount shown represents units. One unit represents a principal amount of 100. | |
| | (a) | | | Federal Tax Information (Amounts exclude certain adjustments made at the end of the Fund’s fiscal year for tax purposes. Such adjustments are primarily due to wash sales. Amortization of premium on debt securities is excluded for tax purposes.): | |
| | | | At March 31, 2011, the net unrealized appreciation on investments based on a cost of $20,926,389 for federal income tax purposes was as follows: | |
| | | | Aggregate gross unrealized appreciation for all investments in which there is an excess of value over tax cost | | $ | 1,305,283 | |
| | | | Aggregate gross unrealized depreciation for all investments in which there is an excess of tax cost over value | | | (183,080 | ) |
| | | | | | | | |
| | | | Net unrealized appreciation | | $ | 1,122,203 | |
| | | | | | | | |
| | (b) | | | All or a portion of this security has been designated to cover the Fund’s obligations under open forward foreign currency contracts. | |
| | (c) | | | Variable rate security. Rate as of March 31, 2011 is disclosed. | |
| | (d) | | | Coupon rate is a fixed rate for an initial period then resets at a specified date and rate. | |
| | | | | | | | |
| | 144A | | | All or a portion of these securities are exempt from registration under Rule 144A of the Securities Act of 1933. These securities may be resold in transactions exempt from registration, normally to qualified institutional buyers. At March 31, 2011, the value of Rule 144A holdings amounted to $1,627,655 or 7.2% of net assets. | |
| | EMTN | | | Euro Medium Term Note | | | | |
| | GMTN | | | Global Medium Term Note | | | | |
| | MTN | | | Medium Term Note | | | | |
| | | | | | | | |
| | CAD | | | Canadian Dollar | | | | |
| | CHF | | | Swiss Franc | | | | |
| | COP | | | Colombian Peso | | | | |
| | EUR | | | Euro | | | | |
| | GBP | | | British Pound | | | | |
| | IDR | | | Indonesian Rupiah | | | | |
| | INR | | | Indian Rupee | | | | |
| | JPY | | | Japanese Yen | | | | |
| | MXN | | | Mexican Peso | | | | |
| | NOK | | | Norwegian Krone | | | | |
| | NZD | | | New Zealand Dollar | | | | |
| | PEN | | | Peruvian Nuevo Sol | | | | |
| | PHP | | | Philippine Peso | | | | |
| | PLN | | | Polish Zloty | | | | |
| | SEK | | | Swedish Krona | | | | |
| | SGD | | | Singapore Dollar | | | | |
| | UYU | | | Uruguayan Peso | | | | |
At March 31, 2011, the Fund had the following open forward foreign currency contracts:
| | | | | | | | | | | | | | | | | | | | |
Contract
to
Buy/Sell | | Delivery
Date | | | Currency | | | Units | | | Notional
Value | | | Unrealized
Appreciation
(Depreciation) | |
| Buy1 | | | 06/15/2011 | | | | Australian Dollar | | | | 420,000 | | | $ | 430,572 | | | $ | 11,627 | |
| Buy2 | | | 06/15/2011 | | | | Canadian Dollar | | | | 700,000 | | | | 720,833 | | | | 1,615 | |
| Buy1 | | | 06/15/2011 | | | | Euro | | | | 310,000 | | | | 438,719 | | | | 8,492 | |
| Sell1 | | | 06/15/2011 | | | | Euro | | | | 90,000 | | | | 127,370 | | | | 412 | |
| Buy3 | | | 06/15/2011 | | | | Japanese Yen | | | | 95,500,000 | | | | 1,148,622 | | | | (11,315 | ) |
| Buy3 | | | 06/20/2011 | | | | Malaysian Ringgit | | | | 700,000 | | | | 229,908 | | | | 1,865 | |
| Buy4 | | | 06/02/2011 | | | | Polish Zloty | | | | 670,000 | | | | 234,776 | | | | 4,772 | |
| Sell4 | | | 06/02/2011 | | | | Polish Zloty | | | | 670,000 | | | | 234,776 | | | | (4,476 | ) |
| Buy5 | | | 06/13/2011 | | | | South Korean Won | | | | 720,000,000 | | | | 653,483 | | | | 11,199 | |
| Buy1 | | | 06/13/2011 | | | | South Korean Won | | | | 470,000,000 | | | | 426,579 | | | | 7,011 | |
| | | | | | | | | | | | | | | | | | | | |
| Total | | | | | | | | | | | | | | | | | | $ | 31,202 | |
| | | | | | | | | | | | | | | | | | | | |
At March 31, 2011, the Fund had the following open forward cross currency contracts:
| | | | | | | | | | | | | | | | | | | | |
| Settlement Date | | Deliver2/Units of
Currency | | | Receive/In
Exchange For | | | Unrealized
Appreciation | |
| 06/16/2011 | | | British Pound | | | | 146,159 | | | | Euro | | | | 170,000 | | | $ | 6,342 | |
| | | | | | | | | | | | | | | | | | | | |
1 Counterparty is Credit Suisse.
2 Counterparty is UBS.
3 Counterparty is JPMorgan Chase.
4 Counterparty is Morgan Stanley.
5 Counterparty is Barclays.
Industry Summary at March 31, 2011 (Unaudited)
| | | | |
| Treasuries | | | 51.0 | % |
| Supranationals | | | 8.2 | |
| Local Authorities | | | 4.9 | |
| Banking | | | 4.1 | |
| Sovereigns | | | 3.8 | |
| Wirelines | | | 3.6 | |
| Government Guaranteed | | | 3.6 | |
| Electric | | | 2.9 | |
| Media Non-Cable | | | 2.7 | |
Other Investments, less than 2% each | | | 13.2 | |
| | | | |
| Total Investments | | | 98.0 | |
| Other assets less liabilities (including open forward foreign currency contracts) | | | 2.0 | |
| | | | |
| Net Assets | | | 100.0 | % |
| | | | |
Currency Exposure at March 31, 2011 (Unaudited)
| | | | |
| Euro | | | 32.9 | % |
| Japanese Yen | | | 22.6 | |
| British Pound | | | 9.7 | |
| U.S. Dollar | | | 6.7 | |
| Norwegian Krone | | | 4.2 | |
| Swedish Krona | | | 3.4 | |
| Singapore Dollar | | | 3.2 | |
| Canadian Dollar | | | 2.7 | |
| Mexican Peso | | | 2.7 | |
| Indonesian Rupiah | | | 2.4 | |
| Other, less than 2% each | | | 7.5 | |
| | | | |
| Total Investments | | | 98.0 | |
| Other assets less liabilities (including open forward foreign currency contracts) | | | 2.0 | |
| | | | |
| Net Assets | | | 100.0 | % |
| | | | |
See accompanying notes to financial statements.
| 30
Portfolio of Investments – as of March 31, 2011 (Unaudited)
Loomis Sayles Limited Term Government and Agency Fund
| | | | | | | | |
Principal
Amount | | | Description | | Value (†) | |
| | | | | | | | |
| | Bonds and Notes — 98.6% of Net Assets | | | | |
| | | | ABS Car Loan — 2.3% | | | | |
| $ | 1,380,000 | | | Ally Master Owner Trust, Series 2011-1, Class A2,
2.150%, 1/15/2016 | | $ | 1,380,122 | |
| | 831,014 | | | ARI Fleet Lease Trust, Series 2010-A, Class A,
1.705%, 8/15/2018, 144A(b) | | | 837,158 | |
| | 3,245,000 | | | Navistar Financial Dealer Note Master Trust, Series 2010-1, Class A,
1.900%, 1/26/2015, 144A(b) | | | 3,266,547 | |
| | 1,810,000 | | | Nissan Master Owner Trust Receivables, Series 2010-AA, Class A,
1.405%, 1/15/2015, 144A(b) | | | 1,829,660 | |
| | 35,916 | | | USAA Auto Owner Trust, Series 2008-3, Class A3,
4.280%, 10/15/2012 | | | 36,022 | |
| | 2,000,000 | | | World Omni Auto Receivables Trust, Series 2011-A, Class A3,
1.110%, 5/15/2015 | | | 1,997,605 | |
| | | | | | | | |
| | | | | | | 9,347,114 | |
| | | | | | | | |
| | | | ABS Credit Card — 0.8% | | | | |
| | 985,000 | | | American Express Credit Account Master, Series 2004-2, Class A,
0.425%, 12/15/2016(b) | | | 983,389 | |
| | 2,100,000 | | | World Financial Network Credit Card Master Trust, Series 2010-A, Class A,
3.960%, 4/15/2019 | | | 2,173,197 | |
| | | | | | | | |
| | | | | | | 3,156,586 | |
| | | | | | | | |
| | | | ABS Home Equity — 0.3% | | | | |
| | 641,489 | | | Countrywide Asset-Backed Certificates, Series 2004-S1, Class A3,
4.615%, 2/25/2035 | | | 603,540 | |
| | 476,590 | | | Residential Funding Mortgage Securities II, Series 2002-HI5, Class A7,
5.700%, 1/25/2028 | | | 460,584 | |
| | 231,509 | | | Residential Funding Mortgage Securities II, Series 2005-HI3, Class A4,
5.490%, 9/25/2035 | | | 228,592 | |
| | | | | | | | |
| | | | | | | 1,292,716 | |
| | | | | | | | |
| | | | ABS Student Loan — 0.3% | | | | |
| | 1,336,986 | | | NCUA Guaranteed Notes,
Series 2010-A1, Class A,
0.586%, 12/07/2020(b) | | | 1,338,390 | |
| | | | | | | | |
| | | | Collateralized Mortgage Obligations — 2.7% | | | | |
| | 454,670 | | | Federal Home Loan Mortgage Corp., Series 2901, Class UA,
5.000%, 1/15/2030 | | | 469,124 | |
| | 5,263 | | | Federal Home Loan Mortgage Corp., Series 3145, Class KA,
5.000%, 8/15/2024 | | | 5,262 | |
| | 1,280,000 | | | NCUA Guaranteed Notes,
Series 2010-C1, Class A2,
2.900%, 10/29/2020 | | | 1,246,157 | |
| | 2,392,048 | | | NCUA Guaranteed Notes,
Series 2010-R1, Class 1A,
0.690%, 10/07/2020(b) | | | 2,395,038 | |
| | 7,070,229 | | | NCUA Guaranteed Notes,
Series 2010-R3, Class 1A,
0.800%, 12/08/2020(b) | | | 7,103,388 | |
| | | | | | | | |
| | | | | | | 11,218,969 | |
| | | | | | | | |
| | | | Commercial Mortgage-Backed Securities — 15.0% | |
| | 1,780,000 | | | Banc of America Commercial Mortgage, Inc., Series 2007-2, Class A4,
5.826%, 4/10/2049(b) | | | 1,889,276 | |
| | | | | | | | |
Principal
Amount | | | Description | | Value (†) | |
| | | | | | | | |
| | | | Commercial Mortgage-Backed Securities — continued | |
| $ | 1,500,000 | | | Banc of America Commercial Mortgage, Inc., Series 2007-5, Class A4,
5.492%, 2/10/2051 | | $ | 1,575,075 | |
| | 2,000,000 | | | Bear Stearns Commercial Mortgage Securities, Series 2007-PW15, Class A4,
5.331%, 2/11/2044 | | | 2,095,175 | |
| | 360,000 | | | Citigroup Commercial Mortgage Trust,
Series 2006-C5, Class A4,
5.431%, 10/15/2049 | | | 384,545 | |
| | 1,500,000 | | | Citigroup Commercial Mortgage Trust,
Series 2007-C6, Class A4,
5.886%, 12/10/2049(b) | | | 1,622,971 | |
| | 1,470,000 | | | Citigroup Commercial Mortgage Trust,
Series 2008-C7, Class A4,
6.294%, 12/10/2049(b) | | | 1,612,976 | |
| | 3,200,500 | | | Citigroup/Deutsche Bank Commercial Mortgage Trust, Series 2007-CD4, Class A4,
5.322%, 12/11/2049 | | | 3,363,984 | |
| | 1,400,000 | | | Commercial Mortgage Pass Through Certificates, Series 2006-C7, Class A4,
5.951%, 6/10/2046(b) | | | 1,528,469 | |
| | 2,670,000 | | | Credit Suisse Mortgage Capital Certificates, Series 2006-C3, Class A3,
6.018%, 6/15/2038(b) | | | 2,889,338 | |
| | 2,525,000 | | | Credit Suisse Mortgage Capital Certificates, Series 2007-C2, Class A3,
5.542%, 1/15/2049 | | | 2,619,146 | |
| | 4,640,000 | | | Credit Suisse Mortgage Capital Certificates, Series 2007-C5, Class A4,
5.695%, 9/15/2040 | | | 4,821,674 | |
| | 1,500,000 | | | Greenwich Capital Commercial Funding Corp., Series 2006-GG7, Class A4,
6.078%, 7/10/2038(b) | | | 1,640,994 | |
| | 5,000,000 | | | Greenwich Capital Commercial Funding Corp., Series 2007-GG9, Class A4,
5.444%, 3/10/2039 | | | 5,292,317 | |
| | 1,860,000 | | | GS Mortgage Securities Corp. II,
Series 2006-GG6, Class A4,
5.553%, 4/10/2038 | | | 1,994,739 | |
| | 1,140,000 | | | GS Mortgage Securities Corp. II,
Series 2006-GG8, Class A4,
5.560%, 11/10/2039 | | | 1,226,118 | |
| | 5,000,000 | | | GS Mortgage Securities Trust,
Series 2007-GG10, Class A4,
6.002%, 8/10/2045(b) | | | 5,308,677 | |
| | 2,785,000 | | | JPMorgan Chase Commercial Mortgage Securities Corp., Series 2007-CB18, Class A4,
5.440%, 6/12/2047 | | | 2,936,739 | |
| | 5,000,000 | | | JPMorgan Chase Commercial Mortgage Securities Corp., Series 2007-LDPX, Class A3,
5.420%, 1/15/2049 | | | 5,273,191 | |
| | 1,173,000 | | | Merrill Lynch/Countrywide Commercial Mortgage Trust, Series 2007-5, Class A4,
5.378%, 8/12/2048 | | | 1,215,336 | |
| | 3,914,000 | | | Merrill Lynch/Countrywide Commercial Mortgage Trust, Series 2007-6, Class A4,
5.485%, 3/12/2051 | | | 4,099,338 | |
| | 1,500,000 | | | Morgan Stanley Capital I,
Series 2007-IQ15, Class A4,
6.071%, 6/11/2049(b) | | | 1,597,906 | |
| | 815,000 | | | Wachovia Bank Commercial Mortgage Trust, Series 2006-C23, Class A4,
5.418%, 1/15/2045 | | | 875,119 | |
See accompanying notes to financial statements.
31 |
Portfolio of Investments – as of March 31, 2011 (Unaudited)
Loomis Sayles Limited Term Government and Agency Fund – (continued)
| | | | | | | | |
Principal
Amount | | | Description | | Value (†) | |
| | | | | | | | |
| | | | Commercial Mortgage-Backed Securities — continued | |
| $ | 4,410,000 | | | Wachovia Bank Commercial Mortgage Trust, Series 2006-C28, Class A4,
5.572%, 10/15/2048 | | $ | 4,664,728 | |
| | 580,000 | | | Wachovia Bank Commercial Mortgage Trust, Series 2007-C30, Class A5,
5.342%, 12/15/2043 | | | 600,599 | |
| | | | | | | | |
| | | | | | | 61,128,430 | |
| | | | | | | | |
| | | | Government Guaranteed — 1.0% | | | | |
| | 1,800,000 | | | General Electric Capital Corp., MTN, (FDIC insured),
2.125%, 12/21/2012 | | | 1,842,523 | |
| | 2,340,000 | | | US Central Federal Credit Union, (FDIC insured),
1.900%, 10/19/2012 | | | 2,384,360 | |
| | | | | | | | |
| | | | | | | 4,226,883 | |
| | | | | | | | |
| | | | Government Owned – No Guarantee — 17.4% | | | | |
| | 16,000,000 | | | Federal Home Loan Mortgage Corp.,
1.625%, 4/26/2011 | | | 16,017,040 | |
| | 6,435,000 | | | Federal Home Loan Mortgage Corp.,
1.750%, 6/15/2012 | | | 6,534,723 | |
| | 11,920,000 | | | Federal Home Loan Mortgage Corp.,
2.125%, 3/23/2012 | | | 12,122,187 | |
| | 5,400,000 | | | Federal Home Loan Mortgage Corp., MTN,
0.181%, 2/02/2012(b) | | | 5,398,499 | |
| | 3,100,000 | | | Federal Home Loan Mortgage Corp., MTN,
0.241%, 8/05/2011(b) | | | 3,100,564 | |
| | 17,970,000 | | | Federal National Mortgage Association,
3.625%, 2/12/2013 | | | 18,881,852 | |
| | 8,265,000 | | | Federal National Mortgage Association,
4.750%, 11/19/2012 | | | 8,807,382 | |
| | | | | | | | |
| | | | | | | 70,862,247 | |
| | | | | | | | |
| | | | Government Sponsored — 3.6% | | | | |
| | 1,070,000 | | | Federal Home Loan Bank,
0.243%, 10/06/2011(b) | | | 1,070,105 | |
| | 6,800,000 | | | Federal Home Loan Bank,
1.125%, 6/03/2011 | | | 6,811,995 | |
| | 5,000,000 | | | Federal Home Loan Bank,
1.625%, 7/27/2011 | | | 5,024,555 | |
| | 1,700,000 | | | Federal Home Loan Bank,
3.625%, 9/16/2011 | | | 1,727,815 | |
| | | | | | | | |
| | | | | | | 14,634,470 | |
| | | | | | | | |
| | | | Hybrid ARMs — 12.9% | | | | |
| | 6,220,393 | | | FHLMC,
5.518%, 4/01/2037(b) | | | 6,587,158 | |
| | 1,845,669 | | | FHLMC,
5.692%, 4/01/2037(b) | | | 1,955,016 | |
| | 3,731,868 | | | FHLMC,
5.944%, 6/01/2037(b) | | | 3,961,136 | |
| | 4,494,697 | | | FNMA,
2.055%, 7/01/2035(b) | | | 4,683,241 | |
| | 5,866,500 | | | FNMA,
2.597%, 8/01/2035(b) | | | 6,179,863 | |
| | 2,490,723 | | | FNMA,
2.796%, 8/01/2034(b) | | | 2,614,721 | |
| | 5,674,373 | | | FNMA,
3.400%, 6/01/2035(b) | | | 5,930,915 | |
| | 4,566,852 | | | FNMA,
3.549%, 6/01/2036(b) | | | 4,808,977 | |
| | 1,006,756 | | | FNMA,
4.340%, 8/01/2036(b) | | | 1,062,232 | |
| | 9,371,893 | | | FNMA,
5.437%, 6/01/2037(b) | | | 9,979,305 | |
| | | | | | | | |
Principal
Amount | | | Description | | Value (†) | |
| | | | | | | | |
| | | | Hybrid ARMs — continued | | | | |
| $ | 3,804,115 | | | FNMA,
5.596%, 2/01/2047(b) | | $ | 4,020,161 | |
| | 642,805 | | | FNMA,
5.983%, 2/01/2037(b) | | | 683,648 | |
| | | | | | | | |
| | | | | | | 52,466,373 | |
| | | | | | | | |
| | | | Mortgage Related — 19.0% | | | | |
| | 8,120,539 | | | FHLMC,
4.000%, with various maturities from
2024 to 2025(c) | | | 8,360,348 | |
| | 13,554,463 | | | FHLMC,
4.500%, with various maturities from
2025 to 2034(c) | | | 14,221,824 | |
| | 1,942,199 | | | FHLMC,
5.500%, 10/01/2023 | | | 2,098,678 | |
| | 2,694,386 | | | FHLMC,
6.000%, with various maturities from
2019 to 2021(c) | | | 2,935,464 | |
| | 4,240,885 | | | FHLMC,
6.500%, with various maturities from
2014 to 2034(c) | | | 4,734,397 | |
| | 121,271 | | | FHLMC,
7.000%, 2/01/2016 | | | 131,612 | |
| | 8,323 | | | FHLMC,
7.500%, with various maturities from
2012 to 2026(c) | | | 8,970 | |
| | 8,009 | | | FHLMC, 8.000%, 9/01/2015 | | | 8,825 | |
| | 3,629 | | | FHLMC, 10.000%, 7/01/2019 | | | 4,119 | |
| | 100,003 | | | FHLMC, 11.500%, with various maturities from
2015 to 2020(c) | | | 103,018 | |
| | 6,495,312 | | | FNMA, 4.000%, with various maturities from
2018 to 2019(c) | | | 6,798,016 | |
| | 8,045,887 | | | FNMA, 4.500%, with various maturities from
2019 to 2025(c) | | | 8,452,659 | |
| | 5,703,611 | | | FNMA, 5.000%, 4/01/2040 | | | 5,977,573 | |
| | 6,089,740 | | | FNMA, 5.500%, with various maturities from
2017 to 2033(c) | | | 6,589,364 | |
| | 11,176,021 | | | FNMA, 6.000%, with various maturities from
2017 to 2022(c) | | | 12,211,676 | |
| | 2,991,314 | | | FNMA, 6.500%, with various maturities from
2017 to 2037(c) | | | 3,367,500 | |
| | 171,732 | | | FNMA, 7.000%, 12/01/2022 | | | 189,192 | |
| | 297,346 | | | FNMA, 7.500%, with various maturities from
2015 to 2032(c) | | | 342,455 | |
| | 39,841 | | | FNMA, 8.000%, with various maturities from
2015 to 2016(c) | | | 44,034 | |
| | 71,465 | | | GNMA, 6.000%, 12/15/2031 | | | 79,073 | |
| | 242,924 | | | GNMA, 6.500%, 5/15/2031 | | | 275,111 | |
| | 257,654 | | | GNMA, 7.000%, 10/15/2028 | | | 297,749 | |
See accompanying notes to financial statements.
| 32
Portfolio of Investments – as of March 31, 2011 (Unaudited)
Loomis Sayles Limited Term Government and Agency Fund – (continued)
| | | | | | | | |
Principal
Amount | | | Description | | Value (†) | |
| | | | | | | | |
| | | | Mortgage Related — continued | | | | |
| $ | 1,638 | | | GNMA, 12.500%, 6/15/2014 | | $ | 1,650 | |
| | 9,196 | | | GNMA, 16.000%, with various maturities from
2011 to 2012(c) | | | 9,263 | |
| | 635 | | | GNMA, 17.000%, 11/15/2011 | | | 635 | |
| | | | | | | | |
| | | | | | | 77,243,205 | |
| | | | | | | | |
| | | | Treasuries — 23.3% | | | | |
| | 35,970,000 | | | U.S. Treasury Note, 1.375%, 9/15/2012 | | | 36,409,805 | |
| | 57,335,000 | | | U.S. Treasury Note, 1.750%, 4/15/2013 | | | 58,419,205 | |
| | | | | | | | |
| | | | | | | 94,829,010 | |
| | | | | | | | |
| | | | Total Bonds and Notes
(Identified Cost $392,409,609) | | | 401,744,393 | |
| | | | | | | | |
| | Short-Term Investments — 0.4% | | | | |
| | 1,839,203 | | | Tri-Party Repurchase Agreement with Fixed Income Clearing Corporation, dated 3/31/2011 at 0.000% to be repurchased at $1,839,203 on 4/01/2011 collateralized by $1,975,000 Federal National Mortgage Association, 3.420% due 11/24/2020 valued at $1,878,719 including accrued interest (Note 2 of Notes to Financial Statements)
(Identified Cost $1,839,203) | | | 1,839,203 | |
| | | | | | | | |
| | | | | | | | |
| | | | Total Investments — 99.0% | | | | |
| | | | (Identified Cost $394,248,812)(a) | | | 403,583,596 | |
| | | | Other assets less liabilities — 1.0% | | | 3,954,433 | |
| | | | | | | | |
| | | | Net Assets — 100.0% | | $ | 407,538,029 | |
| | | | | | | | |
| | | | | | | | |
| | (†) | | | See Note 2 of Notes to Financial Statements. | | | | |
| | (a) | | | Federal Tax Information (Amounts exclude certain adjustments made at the end of the Fund’s fiscal year for tax purposes. Such adjustments are primarily due to wash sales. Amortization of premium on debt securities is excluded for tax purposes.): | |
| | | | At March 31, 2011, the net unrealized appreciation on investments based on a cost of $395,039,199 for federal income tax purposes was as follows: | |
| | | | Aggregate gross unrealized appreciation for all investments in which there is an excess of value over tax cost | | $ | 9,539,471 | |
| | | | Aggregate gross unrealized depreciation for all investments in which there is an excess of tax cost over value | | | (995,074 | ) |
| | | | | | | | |
| | | | Net unrealized appreciation | | $ | 8,544,397 | |
| | | | | | | | |
| | | | | | | | |
| | (b) | | | Variable rate security. Rate as of March 31, 2011 is disclosed. | |
| | (c) | | | The Fund’s investment in mortgage related securities of Federal Home Loan Mortgage Corporation, Federal National Mortgage Association and Government National Mortgage Association are interests in separate pools of mortgages. All separate investments in securities of each issuer which have the same coupon rate have been aggregated for the purpose of presentation in the Portfolio of Investments. | |
| | | | | | | | |
| | | | | | | | |
| | | | | | | | |
| | 144A | | | All or a portion of these securities are exempt from registration under Rule 144A of the Securities Act of 1933. These securities may be resold in transactions exempt from registration, normally to qualified institutional buyers. At March 31, 2011, the value of Rule 144A holdings amounted to $5,933,365 or 1.5% of net assets. | |
| | ABS | | | Asset-Backed Securities | |
| | ARMs | | | Adjustable Rate Mortgages | |
| | FDIC | | | Federal Deposit Insurance Corporation | |
| | FHLMC | | | Federal Home Loan Mortgage Corp. | |
| | FNMA | | | Federal National Mortgage Association | |
| | GNMA | | | Government National Mortgage Association | |
| | MTN | | | Medium Term Note | |
Industry Summary at March 31, 2011 (Unaudited)
| | | | |
| Treasuries | | | 23.3 | % |
| Mortgage Related | | | 19.0 | |
| Government Owned - No Guarantee | | | 17.4 | |
Commercial Mortgage-Backed Securities | | | 15.0 | |
| Hybrid ARMs | | | 12.9 | |
| Government Sponsored | | | 3.6 | |
| Collateralized Mortgage Obligations | | | 2.7 | |
| ABS Car Loan | | | 2.3 | |
Other Investments, less than 2% each | | | 2.4 | |
| Short-Term Investments | | | 0.4 | |
| | | | |
| Total Investments | | | 99.0 | |
| Other assets less liabilities | | | 1.0 | |
| | | | |
| Net Assets | | | 100.0 | % |
| | | | |
See accompanying notes to financial statements.
33 |
Portfolio of Investments – as of March 31, 2011 (Unaudited)
Loomis Sayles Strategic Income Fund
| | | | | | | | |
Principal
Amount (‡) | | | Description | | Value (†) | |
| | | | | | | | |
| | Bonds and Notes — 88.5% of Net Assets | |
| | Non-Convertible Bonds — 77.8% | | | | |
| | | | ABS Car Loan — 0.1% | | | | |
| $ | 7,211,250 | | | Avis Budget Rental Car Funding AESOP LLC, Series 2007-2A, Class A, 0.394%, 8/20/2013, 144A(b) | | $ | 7,057,019 | |
| | 4,093,750 | | | Avis Budget Rental Car Funding AESOP LLC, Series 2010-5A, Class B, 5.110%, 3/20/2017, 144A | | | 4,291,296 | |
| | | | | | | | |
| | | | | | | 11,348,315 | |
| | | | | | | | |
| | | | Aerospace & Defense — 0.1% | | | | |
| | 620,000 | | | Bombardier, Inc., 7.350%, 12/22/2026, (CAD) | | | 654,399 | |
| | 11,800,000 | | | Bombardier, Inc., 7.450%, 5/01/2034, 144A | | | 11,328,000 | |
| | | | | | | | |
| | | | | | | 11,982,399 | |
| | | | | | | | |
| | | | Airlines — 2.2% | | | | |
| | 35,455,000 | | | Air Canada, 10.125%, 8/01/2015, 144A, (CAD) | | | 38,947,473 | |
| | 179,522 | | | American Airlines Pass Through Trust,
Series 1993-A6, 8.040%, 9/16/2011 | | | 179,522 | |
| | 1,567,240 | | | American Airlines Pass Through Trust,
Series 2009-1A, 10.375%, 1/02/2021 | | | 1,841,507 | |
| | 102,607 | | | Continental Airlines Pass Through Trust,
Series 1996-1, Class A, 6.940%, 4/15/2015 | | | 104,403 | |
| | 5,048,174 | | | Continental Airlines Pass Through Trust,
Series 1997-1, Class A, 7.461%, 10/01/2016 | | | 5,104,966 | |
| | 2,534,842 | | | Continental Airlines Pass Through Trust,
Series 1997-4, Class B, 6.900%, 7/02/2018 | | | 2,528,505 | |
| | 2,181,612 | | | Continental Airlines Pass Through Trust,
Series 1998-1, Class B, 6.748%, 9/15/2018 | | | 2,197,974 | |
| | 4,506,400 | | | Continental Airlines Pass Through Trust,
Series 1999-1, Class B, 6.795%, 2/02/2020 | | | 4,416,272 | |
| | 3,296,771 | | | Continental Airlines Pass Through Trust,
Series 1999-2, Class B, 7.566%, 9/15/2021 | | | 3,263,803 | |
| | 1,314,717 | | | Continental Airlines Pass Through Trust,
Series 2000-1, Class A-1, 8.048%, 5/01/2022 | | | 1,433,042 | |
| | 1,482,915 | | | Continental Airlines Pass Through Trust,
Series 2000-2, Class A-1, 7.707%, 10/02/2022 | | | 1,605,256 | |
| | 3,409,712 | | | Continental Airlines Pass Through Trust,
Series 2000-2, Class B, 8.307%, 10/02/2019 | | | 3,443,809 | |
| | 1,861,429 | | | Continental Airlines Pass Through Trust,
Series 2001-1, Class A-1, 6.703%, 12/15/2022 | | | 1,945,193 | |
| | 2,596,637 | | | Continental Airlines Pass Through Trust,
Series 2001-1, Class B, 7.373%, 6/15/2017 | | | 2,603,128 | |
| | 11,493,463 | | | Continental Airlines Pass Through Trust,
Series 2007-1, Class A, 5.983%, 10/19/2023 | | | 11,780,799 | |
| | 19,298,951 | | | Continental Airlines Pass Through Trust,
Series 2007-1, Class B, 6.903%, 4/19/2022 | | | 19,443,693 | |
| | | | | | | | |
Principal
Amount (‡) | | | Description | | Value (†) | |
| | | | | | | | |
| | | | Airlines — continued | | | | |
| $ | 18,787,410 | | | Continental Airlines Pass Through Trust,
Series 2009-1, 9.000%, 7/08/2016 | | $ | 21,323,711 | |
| | 16,943,625 | | | Continental Airlines Pass Through Trust,
Series 2009-2, Class A, 7.250%, 5/10/2021 | | | 18,299,115 | |
| | 2,825,000 | | | Delta Air Lines, Inc.,
9.500%, 9/15/2014, 144A | | | 3,001,562 | |
| | 2,450,000 | | | Delta Air Lines Pass Through Trust,
Series 2001-1, Class A-2,
7.111%, 3/18/2013 | | | 2,523,500 | |
| | 1,422,234 | | | Delta Air Lines Pass Through Trust,
Series 2007-1, Class A, 6.821%, 2/10/2024 | | | 1,468,456 | |
| | 7,656,297 | | | Delta Air Lines Pass Through Trust,
Series 2007-1, Class B, 8.021%, 2/10/2024 | | | 7,905,127 | |
| | 24,656,615 | | | Delta Air Lines Pass Through Trust,
Series 2007-1, Class C, 8.954%, 8/10/2014 | | | 25,581,238 | |
| | 6,763,459 | | | Delta Air Lines Pass Through Trust,
Series 2009-1, Series B, 9.750%, 12/17/2016 | | | 7,169,267 | |
| | 2,107,285 | | | Northwest Airlines, Inc.,
Series 2002-1, Class G2, (MBIA insured), 6.264%, 5/20/2023 | | | 2,170,503 | |
| | 19,092,799 | | | Northwest Airlines, Inc.,
Series 2007-1, Class B, 8.028%, 11/01/2017 | | | 19,474,655 | |
| | 1,500,000 | | | Qantas Airways Ltd., 5.125%, 6/20/2013, 144A | | | 1,578,426 | |
| | 32,710,000 | | | Qantas Airways Ltd., 6.050%, 4/15/2016, 144A | | | 34,836,804 | |
| | 19,762,558 | | | UAL Pass Through Trust,
Series 2007-1, Class A, 6.636%, 1/02/2024 | | | 19,960,184 | |
| | 10,694,272 | | | UAL Pass Through Trust, Series 2009-1, 10.400%, 5/01/2018 | | | 12,244,941 | |
| | 19,140,000 | | | US Airways Pass Through Trust,
Series 2010-1, Class B, 8.500%, 10/22/2018 | | | 19,235,700 | |
| | | | | | | | |
| | | | | | | 297,612,534 | |
| | | | | | | | |
| | | | Automotive — 1.9% | | | | |
| | 265,000 | | | ArvinMeritor, Inc., 8.125%, 9/15/2015 | | | 275,600 | |
| | 1,853,000 | | | Cummins, Inc., 6.750%, 2/15/2027 | | | 1,944,686 | |
| | 6,500,000 | | | FCE Bank PLC, EMTN, 7.125%, 1/16/2012, (EUR) | | | 9,488,150 | |
| | 4,500,000 | | | FCE Bank PLC, EMTN, 7.125%, 1/15/2013, (EUR) | | | 6,696,267 | |
| | 19,011,000 | | | Ford Motor Co., 6.375%, 2/01/2029 | | | 17,960,490 | |
| | 1,975,000 | | | Ford Motor Co., 6.500%, 8/01/2018 | | | 2,067,827 | |
| | 1,220,000 | | | Ford Motor Co., 6.625%, 2/15/2028 | | | 1,184,607 | |
| | 74,829,000 | | | Ford Motor Co., 6.625%, 10/01/2028 | | | 72,623,565 | |
| | 2,365,000 | | | Ford Motor Co., 7.125%, 11/15/2025 | | | 2,296,179 | |
| | 90,200,000 | | | Ford Motor Co., 7.450%, 7/16/2031 | | | 97,651,422 | |
See accompanying notes to financial statements.
| 34
Portfolio of Investments – as of March 31, 2011 (Unaudited)
Loomis Sayles Strategic Income Fund – (continued)
| | | | | | | | |
Principal
Amount (‡) | | | Description | | Value (†) | |
| | | | | | | | |
| | | | Automotive — continued | | | | |
| $ | 1,345,000 | | | Ford Motor Co., 7.500%, 8/01/2026 | | $ | 1,350,384 | |
| | 22,410,000 | | | Ford Motor Credit Co. LLC, 7.000%, 4/15/2015 | | | 24,257,167 | |
| | 4,977,000 | | | Goodyear Tire & Rubber Co. (The), 7.000%, 3/15/2028 | | | 4,678,380 | |
| | 9,635,000 | | | Goodyear Tire & Rubber Co. (The), 10.500%, 5/15/2016 | | | 10,791,200 | |
| | 3,100,000 | | | TRW Automotive, Inc., 7.250%, 3/15/2017, 144A | | | 3,410,000 | |
| | 5,300,000 | | | TRW Automotive, Inc., 8.875%, 12/01/2017, 144A | | | 5,936,000 | |
| | | | | | | | |
| | | | | | | 262,611,924 | |
| | | | | | | | |
| | | | Banking — 6.2% | | | | |
| | 16,175,000 | | | AgriBank FCB,
9.125%, 7/15/2019, 144A | | | 19,311,025 | |
| | 20,565,000 | | | Associates Corp. of North America,
6.950%, 11/01/2018 | | | 22,983,033 | |
| | 22,125,000 | | | BAC Capital Trust VI,
5.625%, 3/08/2035 | | | 19,307,403 | |
| | 1,675,000 | | | Bank of America Corp.,
5.420%, 3/15/2017 | | | 1,709,981 | |
| | 4,560,000 | | | Bank of America Corp.,
6.000%, 9/01/2017 | | | 4,887,399 | |
| | 8,020,000 | | | Bank of America NA,
5.300%, 3/15/2017 | | | 8,233,861 | |
| | 39,890,000,000 | | | Barclays Bank PLC, EMTN,
3.680%, 8/20/2015, (KRW) | | | 35,504,155 | |
| | 56,650,000,000 | | | Barclays Financial LLC,
4.470%, 12/04/2011, 144A, (KRW) | | | 51,781,958 | |
| | 224,520,000,000 | | | BNP Paribas SA, EMTN,
Zero Coupon, 6/13/2011, 144A, (IDR) | | | 25,452,046 | |
| | 47,120,000 | | | Citigroup, Inc.,
5.000%, 9/15/2014 | | | 49,202,845 | |
| | 985,000 | | | Citigroup, Inc.,
5.850%, 12/11/2034 | | | 965,862 | |
| | 22,790,000 | | | Citigroup, Inc.,
5.875%, 2/22/2033 | | | 21,425,335 | |
| | 10,819,000 | | | Citigroup, Inc.,
6.000%, 10/31/2033 | | | 10,330,944 | |
| | 6,060,000 | | | Citigroup, Inc.,
6.125%, 8/25/2036 | | | 5,778,786 | |
| | 45,862,000 | | | Citigroup, Inc.,
6.375%, 8/12/2014 | | | 50,697,598 | |
| | 3,350,000 | | | Citigroup, Inc., EMTN, (fixed rate to 11/30/2012, variable rate thereafter),
3.625%, 11/30/2017, (EUR) | | | 4,462,016 | |
| | 64,000,000 | | | Citigroup, Inc., MTN,
5.500%, 10/15/2014 | | | 69,030,400 | |
| | 9,905,000 | | | First Niagara Finance Group, Inc.,
6.750%, 3/19/2020 | | | 10,804,651 | |
| | 400,000 | | | Goldman Sachs Group, Inc. (The),
6.450%, 5/01/2036 | | | 391,189 | |
| | 30,375,000 | | | Goldman Sachs Group, Inc. (The),
6.750%, 10/01/2037 | | | 30,637,106 | |
| | 1,285,000 | | | Goldman Sachs Group, Inc. (The), GMTN,
5.375%, 3/15/2020 | | | 1,304,705 | |
| | 3,120,000 | | | HBOS PLC,
6.000%, 11/01/2033, 144A | | | 2,347,784 | |
| | 119,806,078 | | | HSBC Bank USA,
Zero Coupon, 11/28/2011, 144A | | | 117,038,558 | |
| | 9,090,000 | | | ICICI Bank Ltd., (fixed rate to 4/30/2017, variable rate thereafter),
6.375%, 4/30/2022, 144A | | | 9,044,550 | |
| | | | | | | | |
Principal
Amount (‡) | | | Description | | Value (†) | |
| | | | | | | | |
| | | | Banking — continued | | | | |
| | 229,157,783,660 | | | JPMorgan Chase & Co.,
Zero Coupon, 4/12/2012, 144A, (IDR) | | $ | 24,727,724 | |
| | 260,000,000,000 | | | JPMorgan Chase & Co., EMTN,
7.070%, 3/22/2014, (IDR) | | | 29,644,330 | |
| | 27,555,000 | | | Lloyds TSB Bank PLC, MTN,
6.500%, 9/14/2020, 144A | | | 27,089,486 | |
| | 3,010,000 | | | Merrill Lynch & Co., Inc.,
5.700%, 5/02/2017 | | | 3,099,337 | |
| | 1,400,000 | | | Merrill Lynch & Co., Inc.,
6.110%, 1/29/2037 | | | 1,327,784 | |
| | 51,500,000 | | | Merrill Lynch & Co., Inc.,
10.710%, 3/08/2017, (BRL) | | | 31,859,247 | |
| | 3,450,000 | | | Merrill Lynch & Co., Inc., EMTN,
4.625%, 9/14/2018, (EUR) | | | 4,501,237 | |
| | 5,410,000 | | | Merrill Lynch & Co., Inc., MTN,
6.875%, 4/25/2018 | | | 6,008,844 | |
| | 800,000 | | | Merrill Lynch & Co., Inc., Series C, MTN,
6.050%, 6/01/2034 | | | 735,512 | |
| | 1,235,000 | | | Merrill Lynch & Co., Inc., Series C, MTN,
6.400%, 8/28/2017 | | | 1,346,246 | |
| | 8,835,000 | | | Morgan Stanley,
4.750%, 4/01/2014 | | | 9,206,211 | |
| | 13,400,000 | | | Morgan Stanley,
5.500%, 7/24/2020 | | | 13,390,580 | |
| | 3,300,000 | | | Morgan Stanley,
5.750%, 1/25/2021 | | | 3,330,677 | |
| | 79,700,000 | | | Morgan Stanley, GMTN,
7.625%, 3/03/2016, (AUD) | | | 83,046,145 | |
| | 6,600,000 | | | Morgan Stanley, Series F, GMTN,
5.625%, 9/23/2019 | | | 6,740,811 | |
| | 7,900,000 | | | Morgan Stanley, Series F, GMTN,
6.625%, 4/01/2018 | | | 8,683,016 | |
| | 5,210,000 | | | Morgan Stanley, Series F, MTN,
5.950%, 12/28/2017 | | | 5,596,259 | |
| | 5,050,000 | | | Morgan Stanley, Series G & H, GMTN,
5.125%, 11/30/2015, (GBP) | | | 8,334,658 | |
| | | | | | | | |
| | | | | | | 841,301,294 | |
| | | | | | | | |
| | | | Brokerage — 0.0% | | | | |
| | 880,000 | | | Jefferies Group, Inc.,
6.250%, 1/15/2036 | | | 813,402 | |
| | 3,285,000 | | | Jefferies Group, Inc.,
8.500%, 7/15/2019 | | | 3,875,311 | |
| | | | | | | | |
| | | | | | | 4,688,713 | |
| | | | | | | | |
| | | | Building Materials — 1.0% | | | | |
| | 3,255,000 | | | Masco Corp.,
4.800%, 6/15/2015 | | | 3,234,510 | |
| | 2,220,000 | | | Masco Corp.,
5.850%, 3/15/2017 | | | 2,176,683 | |
| | 13,440,000 | | | Masco Corp.,
6.125%, 10/03/2016 | | | 13,784,978 | |
| | 2,045,000 | | | Masco Corp.,
6.500%, 8/15/2032 | | | 1,845,175 | |
| | 18,935,000 | | | Owens Corning, Inc.,
6.500%, 12/01/2016 | | | 20,616,447 | |
| | 35,980,000 | | | Owens Corning, Inc.,
7.000%, 12/01/2036 | | | 36,103,519 | |
| | 46,412,000 | | | USG Corp.,
6.300%, 11/15/2016 | | | 43,627,280 | |
| | 14,155,000 | | | USG Corp.,
9.750%, 1/15/2018 | | | 14,827,363 | |
| | | | | | | | |
| | | | | | | 136,215,955 | |
| | | | | | | | |
See accompanying notes to financial statements.
35 |
Portfolio of Investments – as of March 31, 2011 (Unaudited)
Loomis Sayles Strategic Income Fund – (continued)
| | | | | | | | |
Principal
Amount (‡) | | | Description | | Value (†) | |
| | | | | | | | |
| | | | Chemicals — 0.8% | | | | |
| $ | 36,355,000 | | | Chevron Phillips Chemical Co. LLC,
8.250%, 6/15/2019, 144A | | $ | 43,404,634 | |
| | 14,550,000 | | | Hercules, Inc.,
6.500%, 6/30/2029 | | | 12,240,187 | |
| | 5,200,000 | | | Hexion US Finance Corp./Hexion Nova Scotia Finance ULC,
8.875%, 2/01/2018 | | | 5,499,000 | |
| | 5,350,000 | | | Methanex Corp., Senior Note,
6.000%, 8/15/2015 | | | 5,361,503 | |
| | 23,584,000 | | | Momentive Specialty Chemicals, Inc.,
7.875%, 2/15/2023 | | | 19,338,880 | |
| | 7,420,000 | | | Momentive Specialty Chemicals, Inc.,
8.375%, 4/15/2016 | | | 6,900,600 | |
| | 8,757,000 | | | Momentive Specialty Chemicals, Inc.,
9.200%, 3/15/2021 | | | 8,144,010 | |
| | 700,000 | | | Mosaic Global Holdings, Inc.,
7.375%, 8/01/2018 | | | 796,043 | |
| | | | | | | | |
| | | | | | | 101,684,857 | |
| | | | | | | | |
| | | | Collateralized Mortgage Obligations — 0.1% | | | | |
| | 5,340,261 | | | Banc of America Alternative Loan Trust, Series 2007-1, Class 2A1,
5.763%, 4/25/2037(b) | | | 4,228,584 | |
| | 4,998,745 | | | Banc of America Funding Corp.,
Series 2007-8, Class 4A1,
6.000%, 8/25/2037 | | | 4,470,613 | |
| | 6,934,447 | | | WaMu Mortgage Pass Through Certificates, Series 2007-OA6, Class 2A,
2.734%, 7/25/2047(b) | | | 4,358,307 | |
| | 6,027,486 | | | Wells Fargo Mortgage Backed Securities Trust, Series 2005-AR4, Class 2A2,
2.753%, 4/25/2035(b) | | | 5,810,093 | |
| | | | | | | | |
| | | | | | | 18,867,597 | |
| | | | | | | | |
| | | | Commercial Mortgage-Backed Securities — 0.0% | |
| | 3,438,699 | | | GSR Mortgage Loan Trust,
Series 2005-AR2, Class 2A1,
2.745%, 4/25/2035(b) | | | 3,101,115 | |
| | | | | | | | |
| | | | Construction Machinery — 0.7% | | | | |
| | 48,305,000 | | | Case New Holland, Inc.,
7.750%, 9/01/2013 | | | 52,592,069 | |
| | 1,425,000 | | | Joy Global, Inc.,
6.625%, 11/15/2036 | | | 1,443,380 | |
| | 1,335,000 | | | RSC Equipment Rental, Inc./RSC Holdings III LLC,
9.500%, 12/01/2014 | | | 1,398,412 | |
| | 10,790,000 | | | Terex Corp.,
8.000%, 11/15/2017 | | | 11,369,962 | |
| | 26,935,000 | | | United Rentals North America, Inc.,
10.875%, 6/15/2016 | | | 31,109,925 | |
| | | | | | | | |
| | | | | | | 97,913,748 | |
| | | | | | | | |
| | | | Consumer Cyclical Services — 0.6% | | | | |
| | 670,000 | | | ServiceMaster Co. (The),
7.100%, 3/01/2018 | | | 629,800 | |
| | 5,500,000 | | | ServiceMaster Co. (The),
7.450%, 8/15/2027 | | | 4,441,250 | |
| | 70,369,000 | | | Western Union Co. (The),
6.200%, 11/17/2036 | | | 68,861,626 | |
| | 1,048,000 | | | Western Union Co. (The),
6.200%, 6/21/2040 | | | 1,028,471 | |
| | | | | | | | |
| | | | | | | 74,961,147 | |
| | | | | | | | |
| | | | | | | | |
Principal
Amount (‡) | | | Description | | Value (†) | |
| | | | | | | | |
| | | | Distributors — 0.0% | | | | |
| $ | 1,500,000 | | | EQT Corp.,
8.125%, 6/01/2019 | | $ | 1,788,021 | |
| | | | | | | | |
| | | | Diversified Manufacturing — 0.4% | | | | |
| | 6,100,000 | | | Fibria Overseas Finance Ltd.,
7.500%, 5/04/2020, 144A | | | 6,618,500 | |
| | 1,441,000 | | | Textron Financial Corp.,
5.400%, 4/28/2013 | | | 1,515,271 | |
| | 550,000 | | | Textron Financial Corp., Series E, MTN,
5.125%, 8/15/2014 | | | 564,623 | |
| | 13,850,000 | | | Textron, Inc.,
3.875%, 3/11/2013, (EUR) | | | 19,519,923 | |
| | 5,020,000 | | | Textron, Inc.,
5.600%, 12/01/2017 | | | 5,245,378 | |
| | 16,040,000 | | | Textron, Inc., EMTN,
6.625%, 4/07/2020, (GBP) | | | 25,441,825 | |
| | | | | | | | |
| | | | | | | 58,905,520 | |
| | | | | | | | |
| | | | Electric — 3.3% | | | | |
| | 8,212,273 | | | AES Ironwood LLC,
8.857%, 11/30/2025 | | | 8,150,681 | |
| | 992,181 | | | AES Red Oak LLC, Series A,
8.540%, 11/30/2019 | | | 1,007,063 | |
| | 52,100,000 | | | Alta Wind Holdings LLC,
7.000%, 6/30/2035, 144A | | | 54,872,241 | |
| | 70,050,991 | | | Bruce Mansfield Unit,
6.850%, 6/01/2034(c) | | | 73,508,042 | |
| | 3,145,728 | | | CE Generation LLC,
7.416%, 12/15/2018 | | | 3,228,247 | |
| | 31,115,000 | | | Cleveland Electric Illuminating Co. (The),
5.950%, 12/15/2036 | | | 29,105,095 | |
| | 11,275,000 | | | Dynegy Holdings, Inc.,
7.125%, 5/15/2018 | | | 8,287,125 | |
| | 10,185,000 | | | Dynegy Holdings, Inc.,
7.625%, 10/15/2026 | | | 7,078,575 | |
| | 8,955,000 | | | Dynegy Holdings, Inc.,
7.750%, 6/01/2019 | | | 6,951,319 | |
| | 95,200,000 | | | Edison Mission Energy,
7.625%, 5/15/2027 | | | 70,924,000 | |
| | 13,200,000 | | | EDP Finance BV,
4.900%, 10/01/2019, 144A | | | 11,521,831 | |
| | 250,000 | | | Empresa Nacional de Electricidad SA (Endesa-Chile),
8.350%, 8/01/2013 | | | 280,159 | |
| | 4,875,000 | | | Endesa SA/Cayman Islands,
7.875%, 2/01/2027 | | | 5,444,137 | |
| | 5,940,000 | | | Energy Future Holdings Corp.,
10.000%, 1/15/2020 | | | 6,294,470 | |
| | 555,000 | | | Enersis SA, Cayman Islands,
7.400%, 12/01/2016 | | | 640,489 | |
| | 5,310,000 | | | ITC Holdings Corp.,
6.375%, 9/30/2036, 144A | | | 5,555,423 | |
| | 31,735,000 | | | NGC Corp. Capital Trust I, Series B,
8.316%, 6/01/2027(c) | | | 16,184,850 | |
| | 1,255,375 | | | Quezon Power Philippines LC,
8.860%, 6/15/2017 | | | 1,368,359 | |
| | 25,230,000 | | | RRI Energy, Inc.,
7.875%, 6/15/2017 | | | 25,040,775 | |
| | 655,000 | | | Texas Competitive Electric Holdings Co. LLC, Series A,
10.250%, 11/01/2015 | | | 383,175 | |
| | 50,270,000 | | | TXU Corp., Series P,
5.550%, 11/15/2014 | | | 32,926,850 | |
| | 101,735,000 | | | TXU Corp., Series Q,
6.500%, 11/15/2024 | | | 47,561,112 | |
See accompanying notes to financial statements.
| 36
Portfolio of Investments – as of March 31, 2011 (Unaudited)
Loomis Sayles Strategic Income Fund – (continued)
| | | | | | | | |
Principal
Amount (‡) | | | Description | | Value (†) | |
| | | | | | | | |
| | | | Electric — continued | | | | |
| $ | 6,675,000 | | | TXU Corp., Series R,
6.550%, 11/15/2034 | | $ | 3,070,500 | |
| | 7,300,000 | | | White Pine Hydro LLC,
6.310%, 7/10/2017(c) | | | 7,577,619 | |
| | 10,935,000 | | | White Pine Hydro LLC,
6.960%, 7/10/2037(c) | | | 10,355,445 | |
| | 4,000,000 | | | White Pine Hydro Portfolio LLC,
7.260%, 7/20/2015(c) | | | 3,792,600 | |
| | | | | | | | |
| | | | | | | 441,110,182 | |
| | | | | | | | |
| | | | Financial Other — 0.2% | | | | |
| | 20,000,000 | | | National Life Insurance Co.,
10.500%, 9/15/2039, 144A | | | 25,122,300 | |
| | | | | | | | |
| | | | Food & Beverage — 0.2% | | | | |
| | 2,085,000 | | | ARAMARK Corp.,
5.000%, 6/01/2012 | | | 2,126,700 | |
| | 23,710,000 | | | Corn Products International, Inc.,
6.625%, 4/15/2037 | | | 24,782,617 | |
| | 965,000 | | | Smithfield Foods, Inc.,
7.750%, 7/01/2017 | | | 1,037,375 | |
| | 4,370,000 | | | Viterra, Inc.,
6.406%, 2/16/2021, 144A, (CAD) | | | 4,670,739 | |
| | | | | | | | |
| | | | | | | 32,617,431 | |
| | | | | | | | |
| | | | Government Owned – No Guarantee — 0.8% | | | | |
| | 26,435,000 | | | Abu Dhabi National Energy Co.,
7.250%, 8/01/2018, 144A | | | 29,111,544 | |
| | 19,500,000 | | | DP World Ltd.,
6.850%, 7/02/2037, 144A | | | 17,940,000 | |
| | 70,300,000,000 | | | Export-Import Bank of Korea,
6.600%, 11/04/2013, 144A, (IDR) | | | 7,800,615 | |
| | 499,300,000,000 | | | Export-Import Bank of Korea,
8.300%, 3/15/2014, 144A, (IDR) | | | 57,943,457 | |
| | | | | | | | |
| | | | | | | 112,795,616 | |
| | | | | | | | |
| | | | Health Insurance — 0.1% | | | | |
| | 7,885,000 | | | CIGNA Corp.,
6.150%, 11/15/2036 | | | 8,041,990 | |
| | | | | | | | |
| | | | Healthcare — 2.5% | | | | |
| | 4,075,000 | | | Boston Scientific Corp.,
5.125%, 1/12/2017 | | | 4,168,102 | |
| | 2,765,000 | | | Boston Scientific Corp.,
5.450%, 6/15/2014 | | | 2,950,960 | |
| | 10,230,000 | | | Boston Scientific Corp.,
6.000%, 1/15/2020 | | | 10,719,168 | |
| | 4,155,000 | | | Boston Scientific Corp.,
6.400%, 6/15/2016 | | | 4,530,379 | |
| | 16,510,000 | | | Boston Scientific Corp.,
7.000%, 11/15/2035 | | | 16,860,425 | |
| | 17,785,000 | | | HCA, Inc.,
5.750%, 3/15/2014 | | | 18,118,469 | |
| | 3,800,000 | | | HCA, Inc.,
6.250%, 2/15/2013 | | | 3,942,500 | |
| | 17,035,000 | | | HCA, Inc.,
6.375%, 1/15/2015 | | | 17,375,700 | |
| | 49,350,000 | | | HCA, Inc.,
6.500%, 2/15/2016 | | | 50,213,625 | |
| | 2,074,000 | | | HCA, Inc.,
6.750%, 7/15/2013 | | | 2,180,293 | |
| | 14,620,000 | | | HCA, Inc.,
7.050%, 12/01/2027 | | | 13,011,800 | |
| | 11,104,000 | | | HCA, Inc.,
7.190%, 11/15/2015 | | | 11,159,520 | |
| | 20,447,000 | | | HCA, Inc.,
7.500%, 12/15/2023 | | | 19,322,415 | |
| | | | | | | | |
Principal
Amount (‡) | | | Description | | Value (†) | |
| | | | | | | | |
| | | | Healthcare — continued | | | | |
| $ | 24,215,000 | | | HCA, Inc.,
7.500%, 11/06/2033 | | $ | 22,217,262 | |
| | 46,148,000 | | | HCA, Inc.,
7.690%, 6/15/2025 | | | 43,955,970 | |
| | 32,745,000 | | | HCA, Inc.,
8.360%, 4/15/2024 | | | 32,745,000 | |
| | 15,815,000 | | | HCA, Inc., MTN,
7.580%, 9/15/2025 | | | 14,905,638 | |
| | 9,492,000 | | | HCA, Inc., MTN,
7.750%, 7/15/2036 | | | 8,875,020 | |
| | 3,260,000 | | | Owens & Minor, Inc.,
6.350%, 4/15/2016(c) | | | 3,344,740 | |
| | 32,559,000 | | | Tenet Healthcare Corp.,
6.875%, 11/15/2031 | | | 26,983,271 | |
| | 4,765,000 | | | Tenet Healthcare Corp.,
9.250%, 2/01/2015 | | | 5,247,456 | |
| | | | | | | | |
| | | | | | | 332,827,713 | |
| | | | | | | | |
| | | | Home Construction — 0.9% | | | | |
| | 11,265,000 | | | Desarrolladora Homex SAB de CV,
7.500%, 9/28/2015 | | | 11,602,950 | |
| | 4,830,000 | | | K. Hovnanian Enterprises, Inc.,
6.250%, 1/15/2015 | | | 4,008,900 | |
| | 16,075,000 | | | K. Hovnanian Enterprises, Inc.,
6.250%, 1/15/2016 | | | 11,975,875 | |
| | 6,040,000 | | | K. Hovnanian Enterprises, Inc.,
6.375%, 12/15/2014 | | | 5,481,300 | |
| | 2,490,000 | | | K. Hovnanian Enterprises, Inc.,
6.500%, 1/15/2014 | | | 2,259,675 | |
| | 6,290,000 | | | K. Hovnanian Enterprises, Inc.,
7.500%, 5/15/2016 | | | 4,780,400 | |
| | 1,685,000 | | | KB Home,
5.750%, 2/01/2014 | | | 1,701,850 | |
| | 8,340,000 | | | KB Home,
5.875%, 1/15/2015 | | | 8,235,750 | |
| | 5,805,000 | | | KB Home,
6.250%, 6/15/2015 | | | 5,746,950 | |
| | 11,315,000 | | | KB Home,
7.250%, 6/15/2018 | | | 11,088,700 | |
| | 3,745,000 | | | Pulte Group, Inc.,
5.200%, 2/15/2015 | | | 3,716,912 | |
| | 47,260,000 | | | Pulte Group, Inc.,
6.000%, 2/15/2035 | | | 36,980,950 | |
| | 13,190,000 | | | Pulte Group, Inc.,
6.375%, 5/15/2033 | | | 10,716,875 | |
| | 2,060,000 | | | Toll Brothers Finance Corp.,
5.150%, 5/15/2015 | | | 2,102,671 | |
| | | | | | | | |
| | | | | | | 120,399,758 | |
| | | | | | | | |
| | | | Independent Energy — 1.1% | | | | |
| | 5,990,000 | | | Anadarko Petroleum Corp.,
6.375%, 9/15/2017 | | | 6,593,163 | |
| | 48,410,000 | | | Anadarko Petroleum Corp.,
6.450%, 9/15/2036 | | | 48,347,503 | |
| | 4,185,000 | | | Chesapeake Energy Corp.,
6.250%, 1/15/2017, (EUR) | | | 6,160,805 | |
| | 14,650,000 | | | Chesapeake Energy Corp.,
6.500%, 8/15/2017 | | | 15,840,312 | |
| | 22,690,000 | | | Chesapeake Energy Corp.,
6.875%, 11/15/2020 | | | 24,505,200 | |
| | 15,054,000 | | | Connacher Oil and Gas Ltd.,
10.250%, 12/15/2015, 144A | | | 15,957,240 | |
| | 3,000,000 | | | Connacher Oil and Gas Ltd.,
11.750%, 7/15/2014, 144A | | | 3,225,000 | |
See accompanying notes to financial statements.
37 |
Portfolio of Investments – as of March 31, 2011 (Unaudited)
Loomis Sayles Strategic Income Fund – (continued)
| | | | | | | | |
Principal
Amount (‡) | | | Description | | Value (†) | |
| | | | | | | | |
| | | | Independent Energy — continued | | | | |
| $ | 6,495,000 | | | Hilcorp Energy I LP,
7.750%, 11/01/2015, 144A | | $ | 6,722,325 | |
| | 4,798,000 | | | Pioneer Natural Resources Co.,
7.200%, 1/15/2028 | | | 5,003,292 | |
| | 13,570,000 | | | QEP Resources, Inc.,
6.875%, 3/01/2021 | | | 14,248,500 | |
| | 2,499,000 | | | Swift Energy Co.,
7.125%, 6/01/2017 | | | 2,555,228 | |
| | | | | | | | |
| | | | | | | 149,158,568 | |
| | | | | | | | |
| | | | Industrial Other — 0.2% | | | | |
| | 20,000,000 | | | Ranhill Labuan Ltd.,
12.500%, 10/26/2011, 144A | | | 17,600,000 | |
| | 10,000,000 | | | Worthington Industries, Inc.,
6.500%, 4/15/2020 | | | 10,696,550 | |
| | | | | | | | |
| | | | | | | 28,296,550 | |
| | | | | | | | |
| | | | Life Insurance — 0.6% | | | | |
| | 2,185,000 | | | American International Group, Inc.,
Series G, MTN,
5.600%, 10/18/2016 | | | 2,266,798 | |
| | 19,625,000 | | | American International Group, Inc.,
Series G, MTN,
5.850%, 1/16/2018 | | | 20,442,107 | |
| | 4,815,000 | | | American International Group, Inc.,
Series MP, GMTN,
5.450%, 5/18/2017 | | | 4,942,785 | |
| | 2,855,000 | | | American International Group, Inc.,
Series MPLE,
4.900%, 6/02/2014, (CAD) | | | 2,974,265 | |
| | 15,930,000 | | | MetLife, Inc.,
6.400%, 12/15/2066 | | | 15,342,183 | |
| | 9,620,000 | | | MetLife, Inc.,
10.750%, 8/01/2069 | | | 13,275,600 | |
| | 8,920,000 | | | NLV Financial Corp.,
7.500%, 8/15/2033, 144A | | | 8,575,795 | |
| | 3,910,000 | | | Penn Mutual Life Insurance Co. (The),
6.650%, 6/15/2034, 144A | | | 3,788,993 | |
| | 6,700,000 | | | Unum Group,
7.125%, 9/30/2016 | | | 7,553,138 | |
| | | | | | | | |
| | | | | | | 79,161,664 | |
| | | | | | | | |
| | | | Local Authorities — 1.9% | | | | |
| | 3,905,000 | | | Manitoba (Province of), GMTN,
6.375%, 9/01/2015, (NZD) | | | 3,154,416 | |
| | 79,755,000 | | | New South Wales Treasury Corp.,
6.000%, 5/01/2012, (AUD) | | | 83,399,527 | |
| | 10,530,000 | | | New South Wales Treasury Corp.,
Series 12RG,
6.000%, 5/01/2012, (AUD) | | | 11,009,573 | |
| | 66,305,000 | | | New South Wales Treasury Corp.,
Series 17RG,
5.500%, 3/01/2017, (AUD) | | | 68,236,696 | |
| | 72,695,000 | | | Queensland Treasury Corp.,
7.125%, 9/18/2017, 144A, (NZD) | | | 60,105,706 | |
| | 26,730,000 | | | Queensland Treasury Corp., Series 14,
5.750%, 11/21/2014, (AUD) | | | 27,848,617 | |
| | | | | | | | |
| | | | | | | 253,754,535 | |
| | | | | | | | |
| | | | Lodging — 0.0% | | | | |
| | 5,850,000 | | | Wyndham Worldwide Corp.,
5.750%, 2/01/2018 | | | 6,061,489 | |
| | | | | | | | |
| | | | Media Cable — 1.4% | | | | |
| | 145,710,000 | | | Comcast Corp.,
6.950%, 8/15/2037 | | | 158,632,145 | |
| | | | | | | | |
Principal
Amount (‡) | | | Description | | Value (†) | |
| | | | | | | | |
| | | | Media Cable — continued | | | | |
| $ | 400,000 | | | CSC Holdings LLC,
7.875%, 2/15/2018 | | $ | 444,000 | |
| | 25,270,000 | | | Shaw Communications, Inc.,
5.650%, 10/01/2019, (CAD) | | | 26,687,414 | |
| | | | | | | | |
| | | | | | | 185,763,559 | |
| | | | | | | | |
| | | | Media Non-Cable — 0.3% | | | | |
| | 5,200,000 | | | Clear Channel Communications, Inc.,
5.000%, 3/15/2012 | | | 5,161,000 | |
| | 3,785,000 | | | Clear Channel Communications, Inc.,
5.750%, 1/15/2013 | | | 3,747,150 | |
| | 37,790,000 | | | News America, Inc.,
6.150%, 3/01/2037 | | | 37,445,128 | |
| | | | | | | | |
| | | | | | | 46,353,278 | |
| | | | | | | | |
| | | | Metals & Mining — 0.5% | | | | |
| | 10,000,000 | | | Alcoa, Inc.,
5.720%, 2/23/2019 | | | 10,399,180 | |
| | 3,949,000 | | | Alcoa, Inc.,
5.870%, 2/23/2022 | | | 4,041,197 | |
| | 1,405,000 | | | Alcoa, Inc.,
5.950%, 2/01/2037 | | | 1,325,480 | |
| | 4,330,000 | | | Alcoa, Inc.,
6.750%, 1/15/2028 | | | 4,529,483 | |
| | 12,745,000 | | | Algoma Acquisition Corp.,
9.875%, 6/15/2015, 144A | | | 11,725,400 | |
| | 7,000,000 | | | United States Steel Corp.,
6.050%, 6/01/2017 | | | 7,218,750 | |
| | 6,779,000 | | | United States Steel Corp.,
6.650%, 6/01/2037 | | | 6,236,680 | |
| | 16,435,000 | | | United States Steel Corp.,
7.000%, 2/01/2018 | | | 17,071,856 | |
| | | | | | | | |
| | | | | | | 62,548,026 | |
| | | | | | | | |
| | | | Non-Captive Consumer — 5.1% | | | | |
| | 69,019,000 | | | Residential Capital LLC,
9.625%, 5/15/2015 | | | 69,622,916 | |
| | 995,000 | | | SLM Corp.,
6.000%, 5/10/2012, (AUD) | | | 1,001,606 | |
| | 109,950(††) | | | SLM Corp.,
6.000%, 12/15/2043 | | | 2,310,874 | |
| | 20,970,000 | | | SLM Corp., MTN,
5.050%, 11/14/2014 | | | 21,167,705 | |
| | 3,695,000 | | | SLM Corp., MTN,
5.125%, 8/27/2012 | | | 3,813,373 | |
| | 2,160,000 | | | SLM Corp., MTN,
8.000%, 3/25/2020 | | | 2,354,400 | |
| | 54,478,000 | | | SLM Corp., Series A, MTN,
5.000%, 10/01/2013 | | | 56,389,633 | |
| | 41,770,000 | | | SLM Corp., Series A, MTN,
5.000%, 4/15/2015 | | | 42,055,289 | |
| | 14,465,000 | | | SLM Corp., Series A, MTN,
5.000%, 6/15/2018 | | | 13,593,108 | |
| | 19,605,000 | | | SLM Corp., Series A, MTN,
5.375%, 1/15/2013 | | | 20,392,180 | |
| | 24,705,000 | | | SLM Corp., Series A, MTN,
5.375%, 5/15/2014 | | | 25,618,789 | |
| | 35,405,000 | | | SLM Corp., Series A, MTN,
5.625%, 8/01/2033 | | | 30,269,434 | |
| | 95,060,000 | | | SLM Corp., Series A, MTN,
8.450%, 6/15/2018 | | | 106,467,200 | |
| | 25,600,000 | | | Springleaf Finance Corp.,
3.250%, 1/16/2013, (EUR) | | | 33,831,131 | |
| | 7,920,000 | | | Springleaf Finance Corp., MTN,
5.750%, 9/15/2016 | | | 7,128,000 | |
See accompanying notes to financial statements.
| 38
Portfolio of Investments – as of March 31, 2011 (Unaudited)
Loomis Sayles Strategic Income Fund – (continued)
| | | | | | | | |
Principal
Amount (‡) | | | Description | | Value (†) | |
| | | | | | | | |
| | | | Non-Captive Consumer — continued | | | | |
| $ | 6,900,000 | | | Springleaf Finance Corp., Series H, MTN,
5.375%, 10/01/2012 | | $ | 6,787,875 | |
| | 10,700,000 | | | Springleaf Finance Corp., Series I, MTN,
4.875%, 7/15/2012 | | | 10,512,750 | |
| | 17,610,000 | | | Springleaf Finance Corp., Series I, MTN,
5.850%, 6/01/2013 | | | 17,213,775 | |
| | 600,000 | | | Springleaf Finance Corp., Series J, MTN,
5.200%, 12/15/2011 | | | 598,500 | |
| | 300,000 | | | Springleaf Finance Corp., Series J, MTN,
5.625%, 8/17/2011 | | | 300,375 | |
| | 2,900,000 | | | Springleaf Finance Corp., Series J, MTN,
5.900%, 9/15/2012 | | | 2,871,000 | |
| | 800,000 | | | Springleaf Finance Corp., Series J, MTN,
6.500%, 9/15/2017 | | | 712,000 | |
| | 240,295,000 | | | Springleaf Finance Corp., Series J, MTN,
6.900%, 12/15/2017 | | | 219,569,556 | |
| | | | | | | | |
| | | | | | | 694,581,469 | |
| | | | | | | | |
| | | | Non-Captive Diversified — 8.4% | | | | |
| | 22,211,000 | | | Ally Financial, Inc.,
6.750%, 12/01/2014 | | | 23,404,841 | |
| | 2,947,000 | | | Ally Financial, Inc.,
6.875%, 8/28/2012 | | | 3,094,350 | |
| | 17,038,000 | | | Ally Financial, Inc.,
7.500%, 12/31/2013 | | | 18,337,147 | |
| | 35,400,000 | | | Ally Financial, Inc.,
7.500%, 9/15/2020, 144A | | | 37,745,250 | |
| | 32,711,000 | | | Ally Financial, Inc.,
8.000%, 12/31/2018 | | | 35,123,436 | |
| | 25,955,000 | | | Ally Financial, Inc.,
8.000%, 11/01/2031 | | | 28,290,950 | |
| | 49,800,000 | | | Ally Financial, Inc.,
8.300%, 2/12/2015 | | | 54,593,250 | |
| | 19,005,000 | | | Aviation Capital Group Corp.,
6.750%, 4/06/2021, 144A | | | 19,052,512 | |
| | 9,495,481 | | | CIT Group, Inc.,
7.000%, 5/01/2013 | | | 9,673,521 | |
| | 27,144,615 | | | CIT Group, Inc.,
7.000%, 5/01/2014 | | | 27,653,577 | |
| | 27,144,615 | | | CIT Group, Inc.,
7.000%, 5/01/2015 | | | 27,382,130 | |
| | 61,650,794 | | | CIT Group, Inc.,
7.000%, 5/01/2016 | | | 61,727,857 | |
| | 70,757,457 | | | CIT Group, Inc.,
7.000%, 5/01/2017 | | | 70,845,904 | |
| | 3,100,000 | | | General Electric Capital Corp., EMTN,
6.125%, 5/17/2012, (GBP) | | | 5,189,498 | |
| | 79,035,000 | | | General Electric Capital Corp.,
Series A, EMTN,
6.750%, 9/26/2016, (NZD) | | | 62,674,665 | |
| | 65,300,000 | | | General Electric Capital Corp.,
Series A, GMTN,
2.960%, 5/18/2012, (SGD) | | | 52,631,852 | |
| | 115,000,000 | | | General Electric Capital Corp.,
Series A, GMTN,
3.485%, 3/08/2012, (SGD) | | | 92,707,608 | |
| | 58,490,000 | | | General Electric Capital Corp.,
Series A, GMTN,
7.625%, 12/10/2014, (NZD) | | | 48,194,931 | |
| | 15,305,000 | | | General Electric Capital Corp., Series A, MTN,
0.603%, 5/13/2024(b) | | | 13,399,114 | |
| | 245,797,000 | | | General Electric Capital Corp., Series A, MTN,
6.500%, 9/28/2015, (NZD) | | | 195,206,684 | |
| | | | | | | | |
Principal
Amount (‡) | | | Description | | Value (†) | |
| | | | | | | | |
| | | | Non-Captive Diversified — continued | | | | |
| | 5,760,000 | | | General Motors Acceptance Corp. of Canada Ltd., EMTN,
7.125%, 9/13/2011, (AUD) | | $ | 5,906,236 | |
| | 360,000 | | | International Lease Finance Corp.,
5.875%, 5/01/2013 | | | 369,000 | |
| | 10,985,000 | | | International Lease Finance Corp.,
6.375%, 3/25/2013 | | | 11,369,475 | |
| | 20,610,000 | | | International Lease Finance Corp.,
7.125%, 9/01/2018, 144A | | | 22,145,445 | |
| | 16,430,000 | | | International Lease Finance Corp.,
8.250%, 12/15/2020 | | | 18,011,388 | |
| | 24,750,000 | | | International Lease Finance Corp.,
8.875%, 9/15/2015, 144A | | | 27,225,000 | |
| | 415,000 | | | International Lease Finance Corp.,
Series Q, MTN,
5.250%, 1/10/2013 | | | 420,188 | |
| | 2,620,000 | | | International Lease Finance Corp.,
Series R, MTN,
5.625%, 9/20/2013 | | | 2,662,575 | |
| | 2,547,000 | | | International Lease Finance Corp.,
Series R, MTN,
5.650%, 6/01/2014 | | | 2,559,735 | |
| | 34,782,000 | | | iStar Financial, Inc.,
5.150%, 3/01/2012 | | | 34,521,135 | |
| | 3,010,000 | | | iStar Financial, Inc.,
5.500%, 6/15/2012 | | | 2,979,900 | |
| | 16,160,000 | | | iStar Financial, Inc.,
5.650%, 9/15/2011 | | | 16,200,400 | |
| | 11,800,000 | | | iStar Financial, Inc.,
5.850%, 3/15/2017 | | | 10,295,500 | |
| | 20,478,000 | | | iStar Financial, Inc.,
5.875%, 3/15/2016 | | | 18,225,420 | |
| | 4,300,000 | | | iStar Financial, Inc.,
6.050%, 4/15/2015 | | | 3,934,500 | |
| | 35,130,000 | | | iStar Financial, Inc.,
8.625%, 6/01/2013 | | | 35,656,950 | |
| | 2,920,000 | | | iStar Financial, Inc., Series B,
5.700%, 3/01/2014 | | | 2,730,200 | |
| | 44,610,000 | | | iStar Financial, Inc., Series B,
5.950%, 10/15/2013 | | | 42,267,975 | |
| | | | | | | | |
| | | | | | | 1,144,410,099 | |
| | | | | | | | |
| | | | Oil Field Services — 1.3% | | | | |
| | 7,015,000 | | | Allis-Chalmers Energy, Inc.,
8.500%, 3/01/2017 | | | 7,523,588 | |
| | 7,160,000 | | | Allis-Chalmers Energy, Inc.,
9.000%, 1/15/2014 | | | 7,312,150 | |
| | 10,860,000 | | | Nabors Industries, Inc.,
6.150%, 2/15/2018 | | | 11,890,049 | |
| | 77,565,000 | | | Nabors Industries, Inc.,
9.250%, 1/15/2019 | | | 97,774,638 | |
| | 3,095,000 | | | Parker Drilling Co.,
9.125%, 4/01/2018 | | | 3,327,125 | |
| | 16,035,000 | | | Rowan Cos., Inc.,
7.875%, 8/01/2019 | | | 19,020,332 | |
| | 15,520,000 | | | Weatherford International Ltd.,
6.500%, 8/01/2036 | | | 15,518,153 | |
| | 2,975,000 | | | Weatherford International Ltd.,
6.800%, 6/15/2037 | | | 3,093,887 | |
| | 9,580,000 | | | Weatherford International Ltd.,
7.000%, 3/15/2038 | | | 10,146,916 | |
| | | | | | | | |
| | | | | | | 175,606,838 | |
| | | | | | | | |
See accompanying notes to financial statements.
39 |
Portfolio of Investments – as of March 31, 2011 (Unaudited)
Loomis Sayles Strategic Income Fund – (continued)
| | | | | | | | |
Principal
Amount (‡) | | | Description | | Value (†) | |
| | | | | | | | |
| | | | Packaging — 0.3% | | | | |
| | 2,450,000 | | | OI European Group BV,
6.875%, 3/31/2017, 144A, (EUR) | | $ | 3,550,262 | |
| | 1,750,000 | | | Owens-Brockway Glass Container, Inc.,
6.750%, 12/01/2014, (EUR) | | | 2,517,300 | |
| | 33,261,000 | | | Owens-Illinois, Inc.,
7.800%, 5/15/2018 | | | 36,296,066 | |
| | | | | | | | |
| | | | | | | 42,363,628 | |
| | | | | | | | |
| | | | Paper — 1.1% | | | | |
| | 12,430,000 | | | Georgia-Pacific LLC,
7.250%, 6/01/2028 | | | 12,989,350 | |
| | 11,605,000 | | | Georgia-Pacific LLC,
7.375%, 12/01/2025 | | | 12,243,275 | |
| | 120,000 | | | Georgia-Pacific LLC,
7.700%, 6/15/2015 | | | 135,900 | |
| | 42,425,000 | | | Georgia-Pacific LLC,
7.750%, 11/15/2029 | | | 46,614,469 | |
| | 16,475,000 | | | Georgia-Pacific LLC,
8.000%, 1/15/2024 | | | 18,822,687 | |
| | 11,003,000 | | | Georgia-Pacific LLC,
8.875%, 5/15/2031 | | | 13,286,122 | |
| | 14,520,000 | | | Westvaco Corp.,
7.950%, 2/15/2031 | | | 15,190,926 | |
| | 25,210,000 | | | Westvaco Corp.,
8.200%, 1/15/2030 | | | 26,904,767 | |
| | 2,840,000 | | | Weyerhaeuser Co.,
6.950%, 10/01/2027 | | | 2,826,263 | |
| | 5,490,000 | | | Weyerhaeuser Co.,
7.375%, 3/15/2032 | | | 5,789,134 | |
| | | | | | | | |
| | | | | | | 154,802,893 | |
| | | | | | | | |
| | | | Pharmaceuticals — 0.1% | | | | |
| | 11,957,000 | | | Elan Finance PLC/Elan Finance Corp.,
8.875%, 12/01/2013 | | | 12,360,549 | |
| | | | | | | | |
| | | | Pipelines — 2.5% | | | | |
| | 19,745,000 | | | DCP Midstream LP,
6.450%, 11/03/2036, 144A | | | 20,072,175 | |
| | 15,685,000 | | | El Paso Corp.,
6.950%, 6/01/2028 | | | 15,890,568 | |
| | 1,500,000 | | | El Paso Corp.,
7.420%, 2/15/2037 | | | 1,535,073 | |
| | 1,000,000 | | | El Paso Corp., GMTN,
7.750%, 1/15/2032 | | | 1,120,582 | |
| | 750,000 | | | El Paso Corp., GMTN,
7.800%, 8/01/2031 | | | 832,021 | |
| | 5,255,000 | | | Energy Transfer Partners LP,
6.125%, 2/15/2017 | | | 5,866,850 | |
| | 9,115,000 | | | Energy Transfer Partners LP,
6.625%, 10/15/2036 | | | 9,524,108 | |
| | 13,175,000 | | | Enterprise Products Operating LLP,
6.300%, 9/15/2017 | | | 14,854,193 | |
| | 5,100,000 | | | Florida Gas Transmission Co.,
7.900%, 5/15/2019, 144A | | | 6,151,508 | |
| | 44,419,359 | | | Maritimes & Northeast Pipeline LLC,
7.500%, 5/31/2014, 144A(c) | | | 48,045,755 | |
| | 81,710,000 | | | NGPL PipeCo LLC,
7.119%, 12/15/2017, 144A | | | 91,297,279 | |
| | 43,450,000 | | | NiSource Finance Corp.,
6.400%, 3/15/2018 | | | 48,610,383 | |
| | 20,770,000 | | | Plains All American Pipeline LP,
6.125%, 1/15/2017 | | | 23,002,235 | |
| | 44,730,000 | | | Plains All American Pipeline LP,
6.650%, 1/15/2037 | | | 47,298,173 | |
| | | | | | | | |
Principal
Amount (‡) | | | Description | | Value (†) | |
| | | | | | | | |
| | | | Pipelines — continued | | | | |
| $ | 4,168,000 | | | Transportadora de Gas del Sur SA,
7.875%, 5/14/2017, 144A | | $ | 4,115,900 | |
| | | | | | | | |
| | | | | | | 338,216,803 | |
| | | | | | | | |
| | | | Property & Casualty Insurance — 0.3% | | | | |
| | 3,405,000 | | | Hanover Insurance Group, Inc. (The),
7.500%, 3/01/2020 | | | 3,619,416 | |
| | 11,075,000 | | | Marsh & McLennan Cos., Inc.,
5.875%, 8/01/2033 | | | 10,425,496 | |
| | 6,080,000 | | | MBIA Insurance Corp., (fixed rate to 1/15/2013, variable rate thereafter),
14.000%, 1/15/2033, 144A | | | 3,344,000 | |
| | 11,200,000 | | | White Mountains Re Group Ltd.,
6.375%, 3/20/2017, 144A | | | 11,461,374 | |
| | 4,445,000 | | | XL Group PLC,
6.250%, 5/15/2027 | | | 4,413,458 | |
| | 1,425,000 | | | XL Group PLC,
6.375%, 11/15/2024 | | | 1,482,197 | |
| | | | | | | | |
| | | | | | | 34,745,941 | |
| | | | | | | | |
| | | | Property Trust — 0.4% | | | | |
| | 46,015,000 | | | WEA Finance LLC/WT Finance Australia Property Ltd.,
6.750%, 9/02/2019, 144A | | | 52,798,439 | |
| | | | | | | | |
| | | | Railroads — 0.0% | | | | |
| | 1,153,000 | | | Missouri Pacific Railroad Co.,
5.000%, 1/01/2045(c) | | | 786,923 | |
| | | | | | | | |
| | | | Refining — 0.0% | | | | |
| | 1,335,000 | | | Valero Energy Corp.,
6.625%, 6/15/2037 | | | 1,345,619 | |
| | | | | | | | |
| | | | REITs – Apartments — 0.3% | | | | |
| | 2,025,000 | | | Camden Property Trust,
5.000%, 6/15/2015 | | | 2,165,588 | |
| | 27,950,000 | | | Camden Property Trust,
5.700%, 5/15/2017 | | | 30,595,551 | |
| | 3,300,000 | | | ERP Operating LP,
5.125%, 3/15/2016 | | | 3,543,731 | |
| | | | | | | | |
| | | | | | | 36,304,870 | |
| | | | | | | | |
| | | | REITs – Diversified — 0.0% | | | | |
| | 4,030,000 | | | Duke Realty LP,
5.950%, 2/15/2017 | | | 4,347,230 | |
| | | | | | | | |
| | | | REITs – Office Property — 0.4% | | | | |
| | 47,305,000 | | | Highwoods Properties, Inc.,
5.850%, 3/15/2017 | | | 50,345,150 | |
| | | | | | | | |
| | | | REITs – Regional Malls — 0.0% | | | | |
| | 4,900,000 | | | Simon Property Group LP,
5.750%, 12/01/2015 | | | 5,449,692 | |
| | 450,000 | | | Simon Property Group LP,
6.125%, 5/30/2018 | | | 504,321 | |
| | | | | | | | |
| | | | | | | 5,954,013 | |
| | | | | | | | |
| | | | REITs – Warehouse/Industrials — 0.1% | | | | |
| | 4,180,000 | | | ProLogis,
5.625%, 11/15/2015 | | | 4,436,079 | |
| | 3,915,000 | | | ProLogis,
5.625%, 11/15/2016 | | | 4,100,966 | |
| | 4,635,000 | | | ProLogis,
5.750%, 4/01/2016 | | | 4,978,453 | |
| | 1,662,000 | | | ProLogis,
6.625%, 5/15/2018 | | | 1,800,229 | |
| | 1,100,000 | | | ProLogis,
6.875%, 3/15/2020 | | | 1,203,652 | |
See accompanying notes to financial statements.
| 40
Portfolio of Investments – as of March 31, 2011 (Unaudited)
Loomis Sayles Strategic Income Fund – (continued)
| | | | | | | | |
Principal
Amount (‡) | | | Description | | Value (†) | |
| | | | | | | | |
| | | | REITs – Warehouse/Industrials — continued | | | | |
| $ | 2,080,000 | | | ProLogis,
7.375%, 10/30/2019 | | $ | 2,355,698 | |
| | | | | | | | |
| | | | | | | 18,875,077 | |
| | | | | | | | |
| | | | Retailers — 1.1% | | | | |
| | 8,758,000 | | | Dillard’s, Inc.,
6.625%, 1/15/2018 | | | 8,626,630 | |
| | 3,325,000 | | | Dillard’s, Inc.,
7.000%, 12/01/2028 | | | 2,959,250 | |
| | 4,187,000 | | | Dillard’s, Inc.,
7.130%, 8/01/2018 | | | 4,218,402 | |
| | 1,500,000 | | | Dillard’s, Inc.,
7.750%, 7/15/2026 | | | 1,440,000 | |
| | 425,000 | | | Dillard’s, Inc.,
7.875%, 1/01/2023 | | | 414,375 | |
| | 10,270,000 | | | Foot Locker, Inc.,
8.500%, 1/15/2022 | | | 10,372,700 | |
| | 3,685,000 | | | J.C. Penney Corp., Inc.,
5.750%, 2/15/2018 | | | 3,712,638 | |
| | 37,064,000 | | | J.C. Penney Corp., Inc.,
6.375%, 10/15/2036 | | | 33,403,930 | |
| | 635,000 | | | J.C. Penney Corp., Inc.,
7.125%, 11/15/2023 | | | 657,225 | |
| | 3,985,000 | | | J.C. Penney Corp., Inc.,
7.625%, 3/01/2097 | | | 3,566,575 | |
| | 15,907,000 | | | Macy’s Retail Holdings, Inc.,
6.375%, 3/15/2037 | | | 15,907,000 | |
| | 12,275,000 | | | Macy’s Retail Holdings, Inc.,
6.790%, 7/15/2027 | | | 11,876,062 | |
| | 2,365,000 | | | Macy’s Retail Holdings, Inc.,
6.900%, 4/01/2029 | | | 2,394,563 | |
| | 6,365,000 | | | Marks & Spencer PLC,
7.125%, 12/01/2037, 144A | | | 6,077,907 | |
| | 32,675,000 | | | Toys R Us, Inc.,
7.375%, 10/15/2018 | | | 32,756,687 | |
| | 8,355,000 | | | Toys R Us, Inc.,
7.875%, 4/15/2013 | | | 8,981,625 | |
| | | | | | | | |
| | | | | | | 147,365,569 | |
| | | | | | | | |
| | | | Sovereigns — 3.9% | | | | |
| | 104,626,000,000 | | | Indonesia Treasury Bond, Series FR43,
10.250%, 7/15/2022, (IDR) | | | 13,640,407 | |
| | 10,000,000,000 | | | Indonesia Treasury Bond, Series FR47,
10.000%, 2/15/2028, (IDR) | | | 1,227,580 | |
| | 272,460,000,000 | | | Indonesia Treasury Bond, Series ZC3,
Zero Coupon, 11/20/2012, (IDR) | | | 28,338,531 | |
| | 2,350,305(†††) | | | Mexican Fixed Rate Bonds, Series M-10,
7.250%, 12/15/2016, (MXN) | | | 19,979,109 | |
| | 18,686,981(†††) | | | Mexican Fixed Rate Bonds, Series M-20,
8.000%, 12/07/2023, (MXN) | | | 159,479,038 | |
| | 2,037,000(†††) | | | Mexican Fixed Rate Bonds, Series MI-10,
9.000%, 12/20/2012, (MXN) | | | 18,106,933 | |
| | 56,700,000 | | | Republic of Brazil,
10.250%, 1/10/2028, (BRL) | | | 34,555,171 | |
| | 140,235,000 | | | Republic of Brazil,
12.500%, 1/05/2016, (BRL) | | | 97,489,802 | |
| | 107,840,000 | | | Republic of Brazil,
12.500%, 1/05/2022, (BRL) | | | 76,620,463 | |
| | 18,400,000 | | | Republic of Croatia,
6.750%, 11/05/2019, 144A | | | 19,274,000 | |
| | 3,401,600,000 | | | Republic of Iceland,
4.250%, 8/24/2012, (ISK) | | | 17,843,066 | |
| | 3,178,700,000 | | | Republic of Iceland,
7.250%, 5/17/2013, (ISK) | | | 17,836,954 | |
| | | | | | | | |
Principal
Amount (‡) | | | Description | | Value (†) | |
| | | | | | | | |
| | | | Sovereigns — continued | | | | |
| | 3,722,839,000 | | | Republic of Iceland,
8.000%, 7/22/2011, (ISK) | | $ | 19,520,600 | |
| | | | | | | | |
| | | | | | | 523,911,654 | |
| | | | | | | | |
| | | | Supermarkets — 0.7% | | | | |
| | 2,000,000 | | | American Stores Co.,
7.900%, 5/01/2017 | | | 1,925,000 | |
| | 72,681,000 | | | New Albertson’s, Inc.,
7.450%, 8/01/2029 | | | 57,417,990 | |
| | 19,060,000 | | | New Albertson’s, Inc.,
7.750%, 6/15/2026 | | | 15,867,450 | |
| | 4,895,000 | | | New Albertson’s, Inc.,
8.000%, 5/01/2031 | | | 4,013,900 | |
| | 1,510,000 | | | New Albertson’s, Inc.,
8.700%, 5/01/2030 | | | 1,294,825 | |
| | 13,242,000 | | | New Albertson’s, Inc., Series C, MTN,
6.625%, 6/01/2028 | | | 9,600,450 | |
| | | | | | | | |
| | | | | | | 90,119,615 | |
| | | | | | | | |
| | | | Supranational — 1.5% | | | | |
| | 20,250,000 | | | European Bank for Reconstruction & Development, GMTN,
9.250%, 9/10/2012, (BRL) | | | 12,397,939 | |
| | 16,375,000 | | | European Investment Bank,
11.250%, 2/14/2013, (BRL) | | | 10,304,922 | |
| | 460,500,000,000 | | | European Investment Bank, EMTN,
Zero Coupon, 4/24/2013, 144A, (IDR) | | | 46,163,704 | |
| | 24,398,000 | | | European Investment Bank, EMTN,
7.000%, 1/18/2012, (NZD) | | | 19,172,115 | |
| | 60,665,000 | | | European Investment Bank, MTN,
6.250%, 4/15/2015, (AUD) | | | 63,781,671 | |
| | 244,840,000,000 | | | Inter-American Development Bank, EMTN,
Zero Coupon, 5/20/2013, (IDR) | | | 23,953,970 | |
| | 24,450,000 | | | Inter-American Development Bank, EMTN,
6.000%, 12/15/2017, (NZD) | | | 19,513,813 | |
| | 8,300,000 | | | International Bank for Reconstruction & Development,
1.430%, 3/05/2014, (SGD) | | | 6,611,679 | |
| | | | | | | | |
| | | | | | | 201,899,813 | |
| | | | | | | | |
| | | | Technology — 2.2% | | | | |
| | 1,370,000 | | | Advanced Micro Devices, Inc.,
7.750%, 8/01/2020 | | | 1,407,675 | |
| | 41,705,000 | | | Agilent Technologies, Inc.,
6.500%, 11/01/2017 | | | 46,526,181 | |
| | 832,000 | | | Alcatel-Lucent, EMTN,
6.375%, 4/07/2014, (EUR) | | | 1,220,379 | |
| | 52,300,000 | | | Alcatel-Lucent USA, Inc.,
6.450%, 3/15/2029 | | | 44,978,000 | |
| | 5,065,000 | | | Alcatel-Lucent USA, Inc.,
6.500%, 1/15/2028 | | | 4,355,900 | |
| | 2,435,000 | | | Arrow Electronics, Inc.,
6.875%, 6/01/2018 | | | 2,654,600 | |
| | 10,600,000 | | | Avnet, Inc.,
5.875%, 3/15/2014 | | | 11,395,413 | |
| | 35,630,000 | | | Avnet, Inc.,
6.000%, 9/01/2015 | | | 38,272,321 | |
| | 11,345,000 | | | Avnet, Inc.,
6.625%, 9/15/2016 | | | 12,417,046 | |
| | 6,150,000 | | | Corning, Inc.,
6.850%, 3/01/2029 | | | 6,921,905 | |
| | 4,725,000 | | | Corning, Inc.,
7.250%, 8/15/2036 | | | 5,394,405 | |
| | 3,640,000 | | | Eastman Kodak Co.,
7.250%, 11/15/2013 | | | 3,621,800 | |
See accompanying notes to financial statements.
41 |
Portfolio of Investments – as of March 31, 2011 (Unaudited)
Loomis Sayles Strategic Income Fund – (continued)
| | | | | | | | |
Principal
Amount (‡) | | | Description | | Value (†) | |
| | | | | | | | |
| | | | Technology — continued | | | | |
| $ | 11,626,000 | | | Equifax, Inc.,
7.000%, 7/01/2037 | | $ | 12,393,723 | |
| | 285,000 | | | Freescale Semiconductor, Inc.,
8.875%, 12/15/2014 | | | 295,331 | |
| | 6,290,000 | | | Freescale Semiconductor, Inc.,
10.125%, 12/15/2016 | | | 6,683,125 | |
| | 475,000 | | | Motorola Solutions, Inc.,
6.000%, 11/15/2017 | | | 519,843 | |
| | 10,830,000 | | | Motorola Solutions, Inc.,
6.500%, 9/01/2025 | | | 11,395,824 | |
| | 22,539,000 | | | Motorola Solutions, Inc.,
6.500%, 11/15/2028 | | | 23,162,812 | |
| | 23,255,000 | | | Motorola Solutions, Inc.,
6.625%, 11/15/2037 | | | 24,952,662 | |
| | 9,350,000 | | | Nortel Networks Capital Corp.,
7.875%, 6/15/2026(d) | | | 6,872,250 | |
| | 11,770,000 | | | Nortel Networks Ltd.,
6.875%, 9/01/2023(d) | | | 3,060,200 | |
| | 255,000 | | | Samsung Electronics Co. Ltd.,
7.700%, 10/01/2027, 144A | | | 299,457 | |
| | 21,822,000 | | | Xerox Capital Trust I,
8.000%, 2/01/2027 | | | 22,203,885 | |
| | 1,730,000 | | | Xerox Corp., MTN,
7.200%, 4/01/2016 | | | 1,987,310 | |
| | | | | | | | |
| | | | | | | 292,992,047 | |
| | | | | | | | |
| | | | Tobacco — 0.6% | | | | |
| | 52,930,000 | | | Reynolds American, Inc.,
6.750%, 6/15/2017 | | | 60,528,208 | |
| | 13,400,000 | | | Reynolds American, Inc.,
7.250%, 6/15/2037 | | | 14,182,064 | |
| | | | | | | | |
| | | | | | | 74,710,272 | |
| | | | | | | | |
| | | | Transportation Services — 0.4% | | | | |
| | 10,503,000 | | | APL Ltd.,
8.000%, 1/15/2024(c) | | | 7,194,555 | |
| | 12,832,050 | | | Atlas Air Pass Through Trust,
Series 1998-1, Class B,
7.680%, 7/02/2015 | | | 12,703,730 | |
| | 6,862,758 | | | Atlas Air Pass Through Trust,
Series 1998-1, Class C,
8.010%, 7/02/2011(e) | | | 5,764,717 | |
| | 7,354,307 | | | Atlas Air Pass Through Trust,
Series 1999-1, Class A-1,
7.200%, 7/02/2020 | | | 7,207,221 | |
| | 144,698 | | | Atlas Air Pass Through Trust,
Series 1999-1, Class A-2,
6.880%, 7/02/2011 | | | 141,804 | |
| | 9,382,134 | | | Atlas Air Pass Through Trust,
Series 1999-1, Class B,
7.630%, 7/02/2016 | | | 8,350,099 | |
| | 4,744,556 | | | Atlas Air Pass Through Trust,
Series 1999-1, Class C,
8.770%, 7/02/2012(e) | | | 3,795,645 | |
| | 4,424,401 | | | Atlas Air Pass Through Trust,
Series 2000-1, Class B,
10.128%, 7/02/2017(e) | | | 4,468,645 | |
| | 3,970,000 | | | Erac USA Finance Co.,
7.000%, 10/15/2037, 144A | | | 4,325,426 | |
| | | | | | | | |
| | | | | | | 53,951,842 | |
| | | | | | | | |
| | | | Treasuries — 14.3% | | | | |
| | 26,685,000 | | | Canadian Government,
1.000%, 9/01/2011, (CAD) | | | 27,521,745 | |
| | | | | | | | |
Principal
Amount (‡) | | | Description | | Value (†) | |
| | | | | | | | |
| | | | Treasuries — continued | | | | |
| | 43,965,000 | | | Canadian Government,
1.250%, 12/01/2011, (CAD) | | $ | 45,372,606 | |
| | 320,680,000 | | | Canadian Government,
2.000%, 9/01/2012, (CAD) | | | 332,624,048 | |
| | 130,216,000 | | | Canadian Government,
3.500%, 6/01/2013, (CAD) | | | 138,868,413 | |
| | 171,980,000 | | | Canadian Government,
3.750%, 6/01/2019, (CAD) | | | 183,980,461 | |
| | 25,445,000 | | | Canadian Government,
4.250%, 6/01/2018, (CAD) | | | 28,206,288 | |
| | 4,104,177 | | | Hellenic Republic Government Bond,
2.300%, 7/25/2030, (EUR) | | | 2,913,334 | |
| | 1,350,000 | | | Hellenic Republic Government Bond,
4.600%, 7/20/2018, (EUR) | | | 1,178,734 | |
| | 26,550,000 | | | Hellenic Republic Government Bond,
4.700%, 3/20/2024, (EUR) | | | 22,316,363 | |
| | 112,100,000 | | | Ireland Government Bond,
4.500%, 10/18/2018, (EUR) | | | 112,176,733 | |
| | 37,675,000 | | | Ireland Government Bond,
4.500%, 4/18/2020, (EUR) | | | 36,173,749 | |
| | 6,250,000 | | | Ireland Government Bond,
5.000%, 10/18/2020, (EUR) | | | 6,106,447 | |
| | 78,825,000 | | | Ireland Government Bond,
5.400%, 3/13/2025, (EUR) | | | 74,396,004 | |
| | 22,670,000 | | | New Zealand Government Bond,
6.000%, 12/15/2017, (NZD) | | | 18,096,168 | |
| | 151,035,000 | | | New Zealand Government Bond,
6.500%, 4/15/2013, (NZD) | | | 122,081,485 | |
| | 457,420,000 | | | Norwegian Government,
4.250%, 5/19/2017, (NOK) | | | 86,048,558 | |
| | 221,050,000 | | | Norwegian Government,
5.000%, 5/15/2015, (NOK) | | | 42,530,416 | |
| | 366,200,000 | | | Norwegian Government,
6.000%, 5/16/2011, (NOK) | | | 66,492,424 | |
| | 1,180,775,000 | | | Norwegian Government,
6.500%, 5/15/2013, (NOK) | | | 229,341,190 | |
| | 24,800,000 | | | Portugal Obrigacoes do Tesouro OT,
3.850%, 4/15/2021, (EUR) | | | 24,665,846 | |
| | 6,225,000 | | | Portugal Obrigacoes do Tesouro OT,
4.800%, 6/15/2020, (EUR) | | | 6,845,659 | |
| | 337,510,000 | | | U.S. Treasury Bond,
4.250%, 11/15/2040 | | | 322,796,589 | |
| | | | | | | | |
| | | | | | | 1,930,733,260 | |
| | | | | | | | |
| | | | Utility Other — 0.0% | | | | |
| | 3,300,000 | | | Listrindo Capital BV,
9.250%, 1/29/2015, 144A | | | 3,650,823 | |
| | | | | | | | |
| | | | Wireless — 1.2% | | | | |
| | 42,310,000 | | | Nextel Communications, Inc., Series C,
5.950%, 3/15/2014 | | | 42,415,775 | |
| | 30,755,000 | | | Nextel Communications, Inc., Series D,
7.375%, 8/01/2015 | | | 30,870,331 | |
| | 3,628,000 | | | Nextel Communications, Inc., Series E,
6.875%, 10/31/2013 | | | 3,655,210 | |
| | 24,636,000 | | | Sprint Capital Corp.,
6.875%, 11/15/2028 | | | 22,726,710 | |
| | 29,252,000 | | | Sprint Capital Corp.,
6.900%, 5/01/2019 | | | 30,202,690 | |
| | 6,260,000 | | | Sprint Capital Corp.,
8.750%, 3/15/2032 | | | 6,659,075 | |
| | 11,309,000 | | | Sprint Nextel Corp.,
6.000%, 12/01/2016 | | | 11,351,409 | |
| | 13,320,000 | | | True Move Co. Ltd.,
10.750%, 12/16/2013, 144A | | | 14,418,900 | |
| | | | | | | | |
| | | | | | | 162,300,100 | |
| | | | | | | | |
See accompanying notes to financial statements.
| 42
Portfolio of Investments – as of March 31, 2011 (Unaudited)
Loomis Sayles Strategic Income Fund – (continued)
| | | | | | | | |
Principal
Amount (‡) | | | Description | | Value (†) | |
| | | | | | | | |
| | | | Wirelines — 3.5% | | | | |
| $ | 6,265,000 | | | AT&T Corp.,
6.500%, 3/15/2029 | | $ | 6,628,771 | |
| | 5,650,000 | | | Axtel SAB de CV,
9.000%, 9/22/2019, 144A | | | 5,424,000 | |
| | 4,370,000 | | | Bell Canada, MTN,
6.550%, 5/01/2029, 144A, (CAD) | | | 4,774,907 | |
| | 8,445,000 | | | Bell Canada, MTN,
7.300%, 2/23/2032, (CAD) | | | 9,846,896 | |
| | 25,560,000 | | | Bell Canada, Series M-17,
6.100%, 3/16/2035, (CAD) | | | 26,169,802 | |
| | 2,715,000 | | | BellSouth Telecommunications, Inc.,
7.000%, 12/01/2095 | | | 2,766,664 | |
| | 350,000 | | | Cincinnati Bell Telephone Co. LLC,
6.300%, 12/01/2028 | | | 280,000 | |
| | 155,000 | | | Cincinnati Bell, Inc.,
7.000%, 2/15/2015 | | | 156,938 | |
| | 5,330,000 | | | Embarq Corp.,
7.995%, 6/01/2036 | | | 6,009,047 | |
| | 38,336,000 | | | Frontier Communications Corp.,
7.875%, 1/15/2027 | | | 36,610,880 | |
| | 10,555,000 | | | GTE Corp.,
6.940%, 4/15/2028 | | | 11,702,276 | |
| | 1,120,000 | | | Koninklijke (Royal) KPN NV, EMTN,
5.750%, 3/18/2016, (GBP) | | | 1,923,317 | |
| | 1,800,000 | | | Koninklijke (Royal) KPN NV, GMTN,
4.000%, 6/22/2015, (EUR) | | | 2,592,616 | |
| | 50,080,000 | | | Level 3 Financing, Inc.,
8.750%, 2/15/2017 | | | 49,704,400 | |
| | 13,010,000 | | | Level 3 Financing, Inc.,
9.250%, 11/01/2014 | | | 13,302,725 | |
| | 2,555,000 | | | Level 3 Financing, Inc.,
9.375%, 4/01/2019, 144A | | | 2,471,962 | |
| | 7,000,000 | | | Portugal Telecom International Finance BV, EMTN,
4.500%, 6/16/2025, (EUR) | | | 7,590,690 | |
| | 13,700,000 | | | Portugal Telecom International Finance BV, EMTN,
5.000%, 11/04/2019, (EUR) | | | 16,672,592 | |
| | 16,335,000 | | | Qwest Capital Funding, Inc.,
6.500%, 11/15/2018 | | | 16,661,700 | |
| | 42,460,000 | | | Qwest Capital Funding, Inc.,
6.875%, 7/15/2028 | | | 42,141,550 | |
| | 12,463,000 | | | Qwest Capital Funding, Inc.,
7.625%, 8/03/2021 | | | 12,961,520 | |
| | 32,395,000 | | | Qwest Capital Funding, Inc.,
7.750%, 2/15/2031 | | | 34,500,675 | |
| | 31,060,000 | | | Qwest Corp.,
6.875%, 9/15/2033 | | | 31,098,825 | |
| | 3,075,000 | | | Qwest Corp.,
7.200%, 11/10/2026 | | | 3,090,375 | |
| | 3,999,000 | | | Qwest Corp.,
7.250%, 9/15/2025 | | | 4,258,935 | |
| | 2,288,000 | | | Qwest Corp.,
7.500%, 6/15/2023 | | | 2,293,720 | |
| | 5,470,000 | | | SK Broadband Co. Ltd.,
7.000%, 2/01/2012, 144A | | | 5,688,800 | |
| | 23,000,000 | | | Telecom Italia Capital SA,
6.000%, 9/30/2034 | | | 20,811,688 | |
| | 19,635,000 | | | Telecom Italia Capital SA,
6.375%, 11/15/2033 | | | 18,529,883 | |
| | 31,690,000 | | | Telus Corp.,
4.950%, 3/15/2017, (CAD) | | | 33,855,837 | |
| | 18,600,000 | | | Telus Corp., Series CG,
5.050%, 12/04/2019, (CAD) | | | 19,266,684 | |
| | | | | | | | |
Principal
Amount (‡) | | | Description | | Value (†) | |
| | | | | | | | |
| | | | Wirelines — continued | | | | |
| $ | 11,680,000 | | | Verizon Maryland, Inc., Series B,
5.125%, 6/15/2033 | | $ | 10,542,800 | |
| | 3,346,000 | | | Verizon New England, Inc.,
7.875%, 11/15/2029 | | | 3,870,823 | |
| | 6,835,000 | | | Verizon New York, Inc., Series B,
7.375%, 4/01/2032 | | | 7,668,501 | |
| | 5,215,000 | | | Verizon Pennsylvania, Inc.,
6.000%, 12/01/2028 | | | 4,856,104 | |
| | | | | | | | |
| | | | | | | 476,726,903 | |
| | | | | | | | |
| | | | Total Non-Convertible Bonds
(Identified Cost $9,671,016,051) | | | 10,533,203,237 | |
| | | | | | | | |
| | Convertible Bonds — 9.4% | | | | |
| | | | Airlines — 0.1% | | | | |
| | 10,950,000 | | | AMR Corp.,
6.250%, 10/15/2014 | | | 11,524,875 | |
| | 1,255,000 | | | UAL Corp.,
4.500%, 6/30/2021 | | | 1,272,319 | |
| | | | | | | | |
| | | | | | | 12,797,194 | |
| | | | | | | | |
| | | | Automotive — 1.7% | | | | |
| | 2,020,000 | | | ArvinMeritor, Inc., (Step to Zero Coupon on 2/15/2019),
4.000%, 2/15/2027(f) | | | 1,992,225 | |
| | 121,370,000 | | | Ford Motor Co.,
4.250%, 11/15/2016 | | | 219,983,125 | |
| | 8,460,000 | | | Navistar International Corp.,
3.000%, 10/15/2014 | | | 12,774,600 | |
| | | | | | | | |
| | | | | | | 234,749,950 | |
| | | | | | | | |
| | | | Diversified Manufacturing — 0.4% | | | | |
| | 30,570,000 | | | Owens-Brockway Glass Container, Inc.,
3.000%, 6/01/2015, 144A | | | 30,990,337 | |
| | 16,727,000 | | | Trinity Industries, Inc.,
3.875%, 6/01/2036 | | | 18,232,430 | |
| | | | | | | | |
| | | | | | | 49,222,767 | |
| | | | | | | | |
| | | | Electric — 0.0% | | | | |
| | 1,800,000 | | | CMS Energy Corp.,
5.500%, 6/15/2029 | | | 2,616,750 | |
| | | | | | | | |
| | | | Healthcare — 0.5% | | | | |
| | 19,215,000 | | | Hologic, Inc., (Step to Zero Coupon on 12/15/2013),
2.000%, 12/15/2037(f) | | | 18,542,475 | |
| | 12,005,000 | | | Life Technologies Corp.,
1.500%, 2/15/2024 | | | 13,925,800 | |
| | 190,000 | | | LifePoint Hospitals, Inc.,
3.250%, 8/15/2025 | | | 196,413 | |
| | 2,380,000 | | | LifePoint Hospitals, Inc.,
3.500%, 5/15/2014 | | | 2,534,700 | |
| | 5,445,000 | | | Omnicare, Inc.,
3.250%, 12/15/2035 | | | 5,050,237 | |
| | 20,495,000 | | | Omnicare, Inc.,
3.750%, 12/15/2025 | | | 26,412,931 | |
| | | | | | | | |
| | | | | | | 66,662,556 | |
| | | | | | | | |
| | | | Independent Energy — 0.1% | | | | |
| | 7,395,000 | | | Chesapeake Energy Corp.,
2.250%, 12/15/2038 | | | 6,794,156 | |
| | 7,230,000 | | | Chesapeake Energy Corp.,
2.500%, 5/15/2037 | | | 7,853,588 | |
| | | | | | | | |
| | | | | | | 14,647,744 | |
| | | | | | | | |
See accompanying notes to financial statements.
43 |
Portfolio of Investments – as of March 31, 2011 (Unaudited)
Loomis Sayles Strategic Income Fund – (continued)
| | | | | | | | |
Principal
Amount (‡) | | | Description | | Value (†) | |
| | | | | | | | |
| | | | Life Insurance — 0.5% | | | | |
| $ | 72,915,000 | | | Old Republic International Corp.,
3.750%, 3/15/2018 | | $ | 73,188,431 | |
| | | | | | | | |
| | | | Lodging — 0.2% | | | | |
| | 26,513,000 | | | Host Hotels & Resorts, Inc.,
2.625%, 4/15/2027, 144A | | | 26,546,141 | |
| | | | | | | | |
| | | | Media Non-Cable — 0.0% | | | | |
| | 7,672,291 | | | Liberty Media LLC,
3.500%, 1/15/2031 | | | 4,296,483 | |
| | | | | | | | |
| | | | Metals & Mining — 0.2% | | | | |
| | 1,000,000 | | | Steel Dynamics, Inc.,
5.125%, 6/15/2014 | | | 1,280,000 | |
| | 11,270,000 | | | United States Steel Corp.,
4.000%, 5/15/2014 | | | 20,553,663 | |
| | | | | | | | |
| | | | | | | 21,833,663 | |
| | | | | | | | |
| | | | Non-Captive Diversified — 0.3% | | | | |
| | 44,035,000 | | | iStar Financial, Inc.,
0.803%, 10/01/2012(b) | | | 40,181,938 | |
| | | | | | | | |
| | | | Pharmaceuticals — 1.5% | | | | |
| | 635,000 | | | Human Genome Sciences, Inc.,
2.250%, 10/15/2011 | | | 1,125,538 | |
| | 41,680,000 | | | Human Genome Sciences, Inc.,
2.250%, 8/15/2012 | | | 67,521,600 | |
| | 2,240,000 | | | Kendle International, Inc.,
3.375%, 7/15/2012 | | | 2,122,400 | |
| | 24,461,000 | | | Nektar Therapeutics,
3.250%, 9/28/2012 | | | 24,644,457 | |
| | 28,222,000 | | | Valeant Pharmaceuticals International,
4.000%, 11/15/2013 | | | 111,476,900 | |
| | | | | | | | |
| | | | | | | 206,890,895 | |
| | | | | | | | |
| | | | REITs – Warehouse/Industrials — 0.2% | | | | |
| | 19,445,000 | | | ProLogis,
3.250%, 3/15/2015 | | | 22,823,569 | |
| | | | | | | | |
| | | | Technology — 2.8% | | | | |
| | 220,000 | | | Ciena Corp.,
0.250%, 5/01/2013 | | | 224,400 | |
| | 33,805,000 | | | Ciena Corp.,
0.875%, 6/15/2017 | | | 33,002,131 | |
| | 5,535,000 | | | Ciena Corp.,
3.750%, 10/15/2018, 144A | | | 8,288,663 | |
| | 6,075,000 | | | Ciena Corp.,
4.000%, 3/15/2015, 144A | | | 8,899,875 | |
| | 11,463,000 | | | Intel Corp.,
2.950%, 12/15/2035 | | | 11,792,561 | |
| | 220,000,000 | | | Intel Corp.,
3.250%, 8/01/2039 | | | 258,775,000 | |
| | 9,197,000 | | | Kulicke & Soffa Industries, Inc.,
0.875%, 6/01/2012 | | | 9,185,504 | |
| | 15,555,000 | | | Micron Technology, Inc.,
1.875%, 6/01/2014 | | | 16,916,062 | |
| | 745,000 | | | Nortel Networks Corp.,
1.750%, 4/15/2012(d) | | | 641,631 | |
| | 30,767,000 | | | Nortel Networks Corp.,
2.125%, 4/15/2014(d) | | | 26,498,079 | |
| | | | | | | | |
| | | | | | | 374,223,906 | |
| | | | | | | | |
| | | | Textile — 0.0% | | | | |
| | 85,000 | | | Dixie Yarns, Inc.,
7.000%, 5/15/2012 | | | 82,450 | |
| | | | | | | | |
| | | | Wirelines — 0.9% | | | | |
| | 14,735,000 | | | Level 3 Communications, Inc.,
3.500%, 6/15/2012 | | | 14,532,394 | |
| | | | | | | | |
Principal
Amount (‡) | | | Description | | Value (†) | |
| | | | | | | | |
| | | | Wirelines — continued | | | | |
| $ | 6,000,000 | | | Level 3 Communications, Inc.,
6.500%, 10/01/2016 | | $ | 8,782,500 | |
| | 54,075,000 | | | Level 3 Communications, Inc.,
7.000%, 3/15/2015, 144A(c) | | | 62,929,781 | |
| | 32,895,000 | | | Level 3 Communications, Inc., Series B,
7.000%, 3/15/2015(c) | | | 38,281,556 | |
| | | | | | | | |
| | | | | | | 124,526,231 | |
| | | | | | | | |
| | | | Total Convertible Bonds
(Identified Cost $949,413,275) | | | 1,275,290,668 | |
| | | | | | | | |
| | Municipals — 1.3% | | | | |
| | | | California — 0.3% | | | | |
| | 4,170,000 | | | San Jose California Redevelopment Agency Tax Allocation (Merged Area Redevelopment), Series C, (MBIA insured),
3.750%, 8/01/2028 | | | 2,883,347 | |
| | 1,530,000 | | | San Jose California Redevelopment Agency Tax Allocation (Merged Area Redevelopment), Series C, (Registered), (MBIA insured),
3.750%, 8/01/2028 | | | 1,139,100 | |
| | 5,175,000 | | | State of California, (AMBAC insured),
4.500%, 8/01/2027 | | | 4,660,709 | |
| | 14,415,000 | | | State of California,
4.500%, 10/01/2029 | | | 12,529,950 | |
| | 4,190,000 | | | State of California, (AMBAC insured),
4.500%, 8/01/2030 | | | 3,607,129 | |
| | 4,075,000 | | | State of California,
4.500%, 8/01/2030 | | | 3,508,127 | |
| | 2,680,000 | | | State of California (Various Purpose), (MBIA insured),
3.250%, 12/01/2027 | | | 1,996,573 | |
| | 12,645,000 | | | State of California (Various Purpose), (AMBAC insured),
4.500%, 12/01/2033 | | | 10,656,194 | |
| | | | | | | | |
| | | | | | | 40,981,129 | |
| | | | | | | | |
| | | | District of Columbia — 0.0% | | | | |
| | 3,850,000 | | | Metropolitan Washington DC Airports Authority, Series D,
8.000%, 10/01/2047 | | | 3,745,011 | |
| | | | | | | | |
| | | | Illinois — 0.3% | | | | |
| | 1,725,000 | | | Chicago O’Hare International Airport, Series A, (AGMC insured),
4.500%, 1/01/2038 | | | 1,342,705 | |
| | 47,285,000 | | | State of Illinois,
5.100%, 6/01/2033 | | | 38,341,988 | |
| | | | | | | | |
| | | | | | | 39,684,693 | |
| | | | | | | | |
| | | | Michigan — 0.1% | | | | |
| | 12,700,000 | | | Michigan Tobacco Settlement Finance Authority Taxable Turbo, Series A,
7.309%, 6/01/2034(c) | | | 9,008,237 | |
| | | | | | | | |
| | | | Virginia — 0.6% | | | | |
| | 128,820,000 | | | Virginia Tobacco Settlement Financing Corp., Series A-1,
6.706%, 6/01/2046(c) | | | 81,021,339 | |
| | | | | | | | |
| | | | Total Municipals (Identified Cost $226,163,474) | | | 174,440,409 | |
| | | | | | | | |
| | | | Total Bonds and Notes | | | | |
| | | | (Identified Cost $10,846,592,800) | | | 11,982,934,314 | |
| | | | | | | | |
See accompanying notes to financial statements.
| 44
Portfolio of Investments – as of March 31, 2011 (Unaudited)
Loomis Sayles Strategic Income Fund – (continued)
| | | | | | | | |
Principal
Amount (‡) | | | Description | | Value (†) | |
| | | | | | | | |
| | Bank Loans — 0.3% | | | | |
| | | | Electric — 0.0% | | | | |
| $ | 4,967,910 | | | Texas Competitive Electric Holdings Company, LLC, Term Loan B2,
3.783%, 10/10/2014(g) | | $ | 4,181,639 | |
| | | | | | | | |
| | | | Media Non-Cable — 0.1% | | | | |
| | 3,007,479 | | | Dex Media West, LLC, New Term Loan,
7.000%, 10/24/2014(g) | | | 2,662,251 | |
| | 25,732,821 | | | SuperMedia, Inc., Exit Term Loan,
11.000%, 12/31/2015(g) | | | 17,001,160 | |
| | | | | | | | |
| | | | | | | 19,663,411 | |
| | | | | | | | |
| | | | Wireless — 0.1% | | | | |
| | 8,511,351 | | | Hawaiian Telcom Communications, Inc., Exit Term Loan,
9.000%, 11/01/2015(g)(h) | | | 8,668,811 | |
| | | | | | | | |
| | | | Wirelines — 0.1% | | | | |
| | 7,755,097 | | | FairPoint Communications, Inc., New Term Loan B,
6.500%, 1/24/2016(g) | | | 7,474,750 | |
| | 2,335,000 | | | Level 3 Financing, Inc., Tranche A Term Loan,
2.553%, 3/13/2014(g) | | | 2,263,619 | |
| | | | | | | | |
| | | | | | | 9,738,369 | |
| | | | | | | | |
| | | | Total Bank Loans
(Identified Cost $59,426,104) | | | 42,252,230 | |
| | | | | | | | |
| | | | | | | | |
| Shares | | | | | | |
| | Common Stocks — 5.3% | | | | |
| | | | Biotechnology — 0.3% | | | | |
| | 867,059 | | | Vertex Pharmaceuticals, Inc.(e) | | | 41,558,138 | |
| | | | | | | | |
| | | | Containers & Packaging — 0.1% | | | | |
| | 460,656 | | | Owens-Illinois, Inc.(e) | | | 13,907,205 | |
| | 5,474 | | | Smurfit-Stone Container Corp.(e) | | | 211,570 | |
| | | | | | | | |
| | | | | | | 14,118,775 | |
| | | | | | | | |
| | | | Diversified Telecommunication Services — 0.1% | |
| | 183,181 | | | FairPoint Communications, Inc.(e) | | | 3,090,264 | |
| | 283,397 | | | Hawaiian Telcom Holdco, Inc.(e) | | | 7,439,171 | |
| | | | | | | | |
| | | | | | | 10,529,435 | |
| | | | | | | | |
| | | | Electric Utilities — 0.0% | | | | |
| | 282,500 | | | Duke Energy Corp. | | | 5,127,375 | |
| | | | | | | | |
| | | | Electronic Equipment, Instruments & Components — 0.0% | |
| | 41,343 | | | Corning, Inc. | | | 852,906 | |
| | | | | | | | |
| | | | Food Products — 0.4% | | | | |
| | 2,309,175 | | | ConAgra Foods, Inc. | | | 54,842,906 | |
| | | | | | | | |
| | | | Household Durables — 0.1% | | | | |
| | 477,725 | | | KB Home | | | 5,942,899 | |
| | 549,450 | | | Lennar Corp., Class A | | | 9,956,034 | |
| | | | | | | | |
| | | | | | | 15,898,933 | |
| | | | | | | | |
| | | | Media — 0.0% | | | | |
| | 4,701 | | | Dex One Corp.(e) | | | 22,753 | |
| | 56,625 | | | SuperMedia, Inc.(e) | | | 353,340 | |
| | | | | | | | |
| | | | | | | 376,093 | |
| | | | | | | | |
| | | | Oil, Gas & Consumable Fuels — 0.3% | | | | |
| | 846,398 | | | Chesapeake Energy Corp. | | | 28,371,261 | |
| | 216,429 | | | Repsol YPF SA, Sponsored ADR | | | 7,455,979 | |
| | 141,249 | | | Spectra Energy Corp. | | | 3,839,148 | |
| | | | | | | | |
| | | | | | | 39,666,388 | |
| | | | | | | | |
| | | | Pharmaceuticals — 1.7% | | | | |
| | 7,978,200 | | | Bristol-Myers Squibb Co. | | | 210,863,826 | |
| | | | | | | | |
Shares | | | Description | | Value (†) | |
| | | | | | | | |
| | | | Pharmaceuticals — continued | | | | |
| | 2,288 | | | Teva Pharmaceutical Industries, Ltd., Sponsored ADR | | $ | 114,789 | |
| | 459,757 | | | Valeant Pharmaceuticals International, Inc. | | | 22,900,496 | |
| | | | | | | | |
| | | | | | | 233,879,111 | |
| | | | | | | | |
| | | | REITs – Apartments — 0.4% | | | | |
| | 290,904 | | | Apartment Investment & Management Co., Class A | | | 7,409,325 | |
| | 889,730 | | | Associated Estates Realty Corp. | | | 14,128,912 | |
| | 460,000 | | | Equity Residential | | | 25,948,600 | |
| | | | | | | | |
| | | | | | | 47,486,837 | |
| | | | | | | | |
| | | | REITs – Regional Malls — 0.1% | | | | |
| | 123,159 | | | Simon Property Group, Inc. | | | 13,197,719 | |
| | | | | | | | |
| | | | REITs – Shopping Centers — 0.0% | | | | |
| | 201,557 | | | Developers Diversified Realty Corp. | | | 2,821,798 | |
| | | | | | | | |
| | | | Semiconductors & Semiconductor Equipment — 1.8% | |
| | 11,932,326 | | | Intel Corp. | | | 240,675,015 | |
| | | | | | | | |
| | | | Total Common Stocks
(Identified Cost $643,543,343) | | | 721,031,429 | |
| | | | | | | | |
| | Preferred Stocks — 2.9% | | | | |
| | Convertible Preferred Stocks — 2.1% | | | | |
| | | | Automotive — 0.9% | | | | |
| | 1,971,675 | | | General Motors Co., Series B,
4.750% | | | 95,034,735 | |
| | 642,890 | | | Goodyear Tire & Rubber Co. (The),
5.875% | | | 32,838,821 | |
| | | | | | | | |
| | | | | | | 127,873,556 | |
| | | | | | | | |
| | | | Capital Markets — 0.1% | | | | |
| | 186,526 | | | Newell Financial Trust I,
5.250% | | | 8,929,932 | |
| | | | | | | | |
| | | | Commercial Banks — 0.1% | | | | |
| | 8,533 | | | Wells Fargo & Co., Series L, Class A,
7.500% | | | 8,833,362 | |
| | | | | | | | |
| | | | Diversified Financial Services — 0.2% | | | | |
| | 19,062 | | | Bank of America Corp., Series L,
7.250% | | | 19,271,491 | |
| | 203,258 | | | Sovereign Capital Trust IV,
4.375% | | | 9,044,981 | |
| | | | | | | | |
| | | | | | | 28,316,472 | |
| | | | | | | | |
| | | | Electric Utilities — 0.1% | | | | |
| | 380,577 | | | AES Trust III,
6.750% | | | 18,572,158 | |
| | 107,725 | | | CMS Energy Trust I,
7.750%(c)(i) | | | 4,847,625 | |
| | | | | | | | |
| | | | | | | 23,419,783 | |
| | | | | | | | |
| | | | Household Durables — 0.1% | | | | |
| | 355,000 | | | Hovnanian Enterprises, Inc.,
7.250% | | | 7,526,000 | |
| | | | | | | | |
| | | | Machinery — 0.1% | | | | |
| | 229,491 | | | United Rentals Trust I,
6.500% | | | 10,786,077 | |
| | | | | | | | |
| | | | Oil, Gas & Consumable Fuels — 0.2% | | | | |
| | 52,020 | | | Chesapeake Energy Corp.,
4.500% | | | 5,045,940 | |
| | 218,997 | | | El Paso Energy Capital Trust I,
4.750% | | | 9,690,617 | |
| | 99,800 | | | SandRidge Energy, Inc.,
8.500% | | | 18,045,836 | |
| | | | | | | | |
| | | | | | | 32,782,393 | |
| | | | | | | | |
See accompanying notes to financial statements.
45 |
Portfolio of Investments – as of March 31, 2011 (Unaudited)
Loomis Sayles Strategic Income Fund – (continued)
| | | | | | | | |
Shares | | | Description | | Value (†) | |
| | | | | | | | |
| | | | REITs – Healthcare — 0.0% | | | | |
| | 116,700 | | | Health Care REIT, Inc., Series I,
6.500% | | $ | 6,080,070 | |
| | | | | | | | |
| | | | Semiconductors & Semiconductor Equipment — 0.3% | |
| | 39,920 | | | Lucent Technologies Capital Trust I,
7.750% | | | 39,121,600 | |
| | | | | | | | |
| | | | Total Convertible Preferred Stocks
(Identified Cost $266,120,110) | | | 293,669,245 | |
| | | | | | | | |
| | Non-Convertible Preferred Stocks — 0.8% | | | | |
| | | | Banking — 0.3% | | | | |
| | 36,916 | | | Ally Financial, Inc., Series G,
7.000%, 144A | | | 34,350,338 | |
| | | | | | | | |
| | | | Diversified Financial Services — 0.2% | | | | |
| | 35,000 | | | Bank of America Corp.,
6.375% | | | 783,650 | |
| | 847,800 | | | Citigroup Capital XIII, (fixed rate to 10/30/2015, variable rate thereafter),
7.875% | | | 23,229,720 | |
| | | | | | | | |
| | | | | | | 24,013,370 | |
| | | | | | | | |
| | | | Electric Utilities — 0.0% | | | | |
| | 393 | | | Entergy New Orleans, Inc.,
4.750% | | | 31,882 | |
| | | | | | | | |
| | | | Household Durables — 0.0% | | | | |
| | 116,411 | | | Hovnanian Enterprises, Inc.,
7.625%(e) | | | 785,774 | |
| | | | | | | | |
| | | | REITs – Office Property — 0.0% | | | | |
| | 1,596 | | | Highwoods Properties, Inc., Series A,
8.625% | | | 1,700,738 | |
| | | | | | | | |
| | | | REITs – Warehouse/Industrials — 0.0% | | | | |
| | 116,192 | | | ProLogis, Series C,
8.540% | | | 6,274,368 | |
| | | | | | | | |
| | | | Software — 0.2% | | | | |
| | 26,000 | | | Falcons Funding Trust I, (Step to 10.875% on 3/15/2015, variable rate after 3/15/2020),
8.875%, 144A(f) | | | 28,088,125 | |
| | | | | | | | |
| | | | Thrifts & Mortgage Finance — 0.1% | | | | |
| | 389,800 | | | Countrywide Capital IV,
6.750% | | | 9,655,346 | |
| | | | | | | | |
| | | | Total Non-Convertible Preferred Stocks
(Identified Cost $70,811,537) | | | 104,899,941 | |
| | | | | | | | |
| | | | Total Preferred Stocks
(Identified Cost $336,931,647) | | | 398,569,186 | |
| | | | | | | | |
| | Closed End Investment Companies — 0.2% | | | | |
| | 147,147 | | | Dreyfus High Yield Strategies Fund | | | 687,176 | |
| | 60,769 | | | DWS High Income Trust | | | 616,198 | |
| | 860,000 | | | Highland Credit Strategies Fund | | | 6,458,600 | |
| | 104,115 | | | Morgan Stanley Emerging Markets Debt Fund, Inc. | | | 1,058,850 | |
| | 2,042,648 | | | Western Asset High Income Opportunity Fund, Inc. | | | 12,991,241 | |
| | 1,076,501 | | | Western Asset Managed High Income Fund, Inc. | | | 6,868,076 | |
| | | | | | | | |
| | | | Total Closed End Investment Companies
(Identified Cost $34,288,753) | | | 28,680,141 | |
| | | | | | | | |
| | | | | | | | |
Principal
Amount (‡) | | | Description | | Value (†) | |
| | | | | | | | |
| | Short-Term Investments — 1.4% | | | | |
| $ | 187,522,869 | | | Tri-Party Repurchase Agreement with Fixed Income Clearing Corporation, dated 3/31/2011 at 0.000% to be repurchased at $187,522,869 on 4/01/2011 collateralized by $193,180,000 Federal Home Loan Mortgage Corp., 3.500% due 8/18/2020 valued at $187,143,125; $4,060,000 Federal Home Loan Mortgage Corp., 3.310% due 11/10/2020 valued at $3,862,075; $265,000 Federal National Mortgage Association, 2.000% due 1/09/2012 valued at $269,638 including accrued interest (Note 2 of Notes to Financial Statements) (Identified Cost $187,522,869) | | $ | 187,522,869 | |
| | | | | | | | |
| | | | | | | | |
| | | | Total Investments — 98.6%
(Identified Cost $12,108,305,516)(a) | | | 13,360,990,169 | |
| | | | Other assets less liabilities — 1.4% | | | 185,283,593 | |
| | | | | | | | |
| | | | Net Assets — 100.0% | | $ | 13,546,273,762 | |
| | | | | | | | |
| | | | | | | | |
| | (‡) | | | Principal amount stated in U.S. dollars unless otherwise noted. | |
| | (†) | | | See Note 2 of Notes to Financial Statements. | |
| | (††) | | | Amount shown represents units. One unit represents a principal amount of 25. | |
| | (†††) | | | Amount shown represents units. One unit represents a principal amount of 100. | |
| | (a) | | | Federal Tax Information (Amounts exclude certain adjustments made at the end of the Fund’s fiscal year for tax purposes. Such adjustments are primarily due to wash sales. Amortization of premium on debt securities is excluded for tax purposes.): | |
| | | | At March 31, 2011, the net unrealized appreciation on investments based on a cost of $12,143,596,981 for federal income tax purposes was as follows: | |
| | | | Aggregate gross unrealized appreciation for all investments in which there is an excess of value over tax cost | | $ | 1,586,620,448 | |
| | | | Aggregate gross unrealized depreciation for all investments in which there is an excess of tax cost over value | | | (369,227,260 | ) |
| | | | | | | | |
| | | | Net unrealized appreciation | | $ | 1,217,393,188 | |
| | | | | | | | |
| | | | | | | | |
| | (b) | | | Variable rate security. Rate as of March 31, 2011 is disclosed. | |
| | (c) | | | Illiquid security. At March 31, 2011, the value of these securities amounted to $366,879,067 or 2.7% of net assets. | |
| | (d) | | | The issuer is in default with respect to interest and/or principal payments. Income is not being accrued. | |
| | (e) | | | Non-income producing security. | |
| | (f) | | | Coupon rate is a fixed rate for an initial period then resets at a specified date and rate. | |
| | (g) | | | Variable rate security. Rate shown represents the weighted average rate at March 31, 2011. | |
| | (h) | | | All or a portion of interest payment is paid-in-kind. | |
| | (i) | | | Fair valued security by the Fund’s investment adviser. At March 31, 2011 the value of this security amounted to $4,847,625 or less than 0.1% of net assets. | |
| | | | | | | | |
| | 144A | | | All or a portion of these securities are exempt from registration under Rule 144A of the Securities Act of 1933. These securities may be resold in transactions exempt from registration, normally to qualified institutional buyers. At March 31, 2011, the value of Rule 144A holdings amounted to $1,439,109,499 or 10.6% of net assets. | |
See accompanying notes to financial statements.
| 46
Portfolio of Investments – as of March 31, 2011 (Unaudited)
Loomis Sayles Strategic Income Fund – (continued)
| | | | | | | | |
| | | | | | | | |
| | ADR | | | An American Depositary Receipt is a certificate issued by a custodian bank representing the right to receive securities of the foreign issuer described. The values of ADRs may be significantly influenced by trading on exchanges not located in the United States. | |
| | | | | | | | |
| | ABS | | | Asset-Backed Securities | | | | |
| | AGMC | | | Assured Guaranty Municipal Corp. | | | | |
| | AMBAC | | | American Municipal Bond Assurance Corp. | | | | |
| | EMTN | | | Euro Medium Term Note | | | | |
| | GMTN | | | Global Medium Term Note | | | | |
| | MBIA | | | Municipal Bond Investors Assurance Corp. | | | | |
| | MTN | | | Medium Term Note | | | | |
| | REITs | | | Real Estate Investment Trusts | | | | |
| | | | | | | | |
| | AUD | | | Australian Dollar | | | | |
| | BRL | | | Brazilian Real | | | | |
| | CAD | | | Canadian Dollar | | | | |
| | EUR | | | Euro | | | | |
| | GBP | | | British Pound | | | | |
| | IDR | | | Indonesian Rupiah | | | | |
| | ISK | | | Icelandic Krona | | | | |
| | KRW | | | South Korean Won | | | | |
| | MXN | | | Mexican Peso | | | | |
| | NOK | | | Norwegian Krone | | | | |
| | NZD | | | New Zealand Dollar | | | | |
| | SGD | | | Singapore Dollar | | | | |
Industry Summary at March 31, 2011 (Unaudited)
| | | | |
| Treasuries | | | 14.3 | % |
| Non-Captive Diversified | | | 8.7 | |
| Banking | | | 6.5 | |
| Non-Captive Consumer | | | 5.1 | |
| Technology | | | 5.0 | |
| Automotive | | | 4.5 | |
| Wirelines | | | 4.5 | |
| Sovereigns | | | 3.9 | |
| Pharmaceuticals | | | 3.3 | |
| Electric | | | 3.3 | |
| Healthcare | | | 3.0 | |
| Pipelines | | | 2.5 | |
| Airlines | | | 2.3 | |
Semiconductors & Semiconductor Equipment | | | 2.1 | |
Other Investments, less than 2% each | | | 28.2 | |
| Short-Term Investments | | | 1.4 | |
| | | | |
| Total Investments | | | 98.6 | |
| Other assets less liabilities | | | 1.4 | |
| | | | |
| Net Assets | | | 100.0 | % |
| | | | |
Currency Exposure at March 31, 2011 (Unaudited)
| | | | |
| United States Dollar | | | 71.3 | % |
| Canadian Dollar | | | 6.8 | |
| New Zealand Dollar | | | 4.0 | |
| Norwegian Krone | | | 3.1 | |
| Euro | | | 3.0 | |
| Australian Dollar | | | 2.5 | |
| Other, less than 2% each | | | 7.9 | |
| | | | |
| Total Investments | | | 98.6 | |
| Other assets less liabilities | | | 1.4 | |
| | | | |
| Net Assets | | | 100.0 | % |
| | | | |
See accompanying notes to financial statements.
47 |
Statements of Assets and Liabilities
March 31, 2011 (Unaudited)
| | | | | | | | | | | | | | | | | | | | |
| | | Core Plus
Bond Fund | | | High
Income Fund | | | International
Bond Fund | | | Limited Term
Government
and Agency
Fund | | | Strategic
Income Fund | |
ASSETS | | | | | | | | | | | | | | | | | | | | |
Investments at cost | | $ | 371,578,628 | | | $ | 149,070,624 | | | $ | 20,838,853 | | | $ | 394,248,812 | | | $ | 12,108,305,516 | |
Net unrealized appreciation | | | 15,000,357 | | | | 16,615,512 | | | | 1,209,739 | | | | 9,334,784 | | | | 1,252,684,653 | |
| | | | | | | | | | | | | | | | | | | | |
Investments at value | | | 386,578,985 | | | | 165,686,136 | | | | 22,048,592 | | | | 403,583,596 | | | | 13,360,990,169 | |
Cash | | | — | | | | — | | | | — | | | | — | | | | 5,104,220 | |
Due from custodian (Note 2) | | | — | | | | — | | | | — | | | | — | | | | 3,175,275 | |
Foreign currency at value (identified cost $0, $6,566, $289,957, $0 and $14,847,640) | | | — | | | | 5,184 | | | | 297,383 | | | | — | | | | 14,611,313 | |
Receivable for Fund shares sold | | | 2,153,115 | | | | 4,140,879 | | | | 8,384 | | | | 3,336,219 | | | | 30,909,051 | |
Receivable from investment adviser (Note 6) | | | — | | | | — | | | | 1,825 | | | | — | | | | — | |
Receivable for securities sold | | | 1,446,689 | | | | 130,611 | | | | 247,338 | | | | — | | | | 6,446,644 | |
Dividends and interest receivable | | | 4,060,574 | | | | 2,147,093 | | | | 333,409 | | | | 2,184,781 | | | | 200,270,912 | |
Unrealized appreciation on forward foreign currency contracts (Note 2) | | | — | | | | — | | | | 53,335 | | | | — | | | | — | |
Tax reclaims receivable | | | 7,909 | | | | 26,428 | | | | 4,688 | | | | — | | | | 1,305,090 | |
| | | | | | | | | | | | | | | | | | | | |
TOTAL ASSETS | | | 394,247,272 | | | | 172,136,331 | | | | 22,994,954 | | | | 409,104,596 | | | | 13,622,812,674 | |
| | | | | | | | | | | | | | | | | | | | |
LIABILITIES | | | | | | | | | | | | | | | | | | | | |
Payable for securities purchased | | | 10,005,905 | | | | 1,619,097 | | | | — | | | | — | | | | 38,309,756 | |
Payable for delayed delivery securities purchased (Note 2) | | | 3,600,399 | | | | — | | | | — | | | | — | | | | — | |
Payable for Fund shares redeemed | | | 977,283 | | | | 136,439 | | | | 259,120 | | | | 864,441 | | | | 26,030,350 | |
Payable to custodian bank | | | — | | | | — | | | | 163,544 | | | | — | | | | — | |
Unrealized depreciation on forward foreign currency contracts (Note 2) | | | 23,536 | | | | 46,043 | | | | 15,791 | | | | — | | | | — | |
Foreign taxes payable (Note 2) | | | — | | | | — | | | | — | | | | — | | | | 242,694 | |
Due to broker (Note 2) | | | — | | | | — | | | | — | | | | — | | | | 3,175,275 | |
Dividends payable | | | — | | | | — | | | | — | | | | 240,999 | | | | — | |
Management fees payable (Note 6) | | | 131,151 | | | | 101,587 | | | | — | | | | 149,317 | | | | 6,381,663 | |
Deferred Trustees’ fees (Note 6) | | | 240,739 | | | | 99,217 | | | | 33,335 | | | | 227,001 | | | | 643,381 | |
Administrative fees payable (Note 6) | | | 15,163 | | | | 6,773 | | | | 938 | | | | 17,211 | | | | 539,048 | |
Other accounts payable and accrued expenses | | | 45,276 | | | | 60,439 | | | | 25,994 | | | | 67,598 | | | | 1,216,745 | |
| | | | | | | | | | | | | | | | | | | | |
TOTAL LIABILITIES | | | 15,039,452 | | | | 2,069,595 | | | | 498,722 | | | | 1,566,567 | | | | 76,538,912 | |
| | | | | | | | | | | | | | | | | | | | |
NET ASSETS | | $ | 379,207,820 | | | $ | 170,066,736 | | | $ | 22,496,232 | | | $ | 407,538,029 | | | $ | 13,546,273,762 | |
| | | | | | | | | | | | | | | | | | | | |
NET ASSETS CONSIST OF: | | | | | | | | | | | | | | | | | | | | |
Paid-in capital | | $ | 359,250,665 | | | $ | 148,810,161 | | | $ | 20,541,948 | | | $ | 401,601,282 | | | $ | 12,914,822,258 | |
Distributions in excess of net investment income | | | (1,490,132 | ) | | | (1,015,214 | ) | | | (442,061 | ) | | | (1,628,933 | ) | | | (32,849,653 | ) |
Accumulated net realized gain (loss) on investments, swap agreements and foreign currency transactions | | | 6,470,466 | | | | 5,694,097 | | | | 1,129,365 | | | | (1,769,104 | ) | | | (590,304,438 | ) |
Net unrealized appreciation on investments and foreign currency translations | | | 14,976,821 | | | | 16,577,692 | | | | 1,266,980 | | | | 9,334,784 | | | | 1,254,605,595 | |
| | | | | | | | | | | | | | | | | | | | |
NET ASSETS | | $ | 379,207,820 | | | $ | 170,066,736 | | | $ | 22,496,232 | | | $ | 407,538,029 | | | $ | 13,546,273,762 | |
| | | | | | | | | | | | | | | | | | | | |
COMPUTATION OF NET ASSET VALUE AND OFFERING PRICE: | | | | | | | | | | | | | | | | | | | | |
Class A shares: | | | | | | | | | | | | | | | | | | | | |
Net assets | | $ | 200,477,747 | | | $ | 75,740,222 | | | $ | 14,791,776 | | | $ | 242,981,202 | | | $ | 5,705,330,438 | |
| | | | | | | | | | | | | | | | | | | | |
Shares of beneficial interest | | | 15,953,782 | | | | 14,807,449 | | | | 1,346,127 | | | | 20,489,469 | | | | 377,418,914 | |
| | | | | | | | | | | | | | | | | | | | |
Net asset value and redemption price per share | | $ | 12.57 | | | $ | 5.12 | | | $ | 10.99 | | | $ | 11.86 | | | $ | 15.12 | |
| | | | | | | | | | | | | | | | | | | | |
Offering price per share (100/[100 – maximum sales charge of net asset value) (Note 1) | | $ | 13.16 | | | $ | 5.36 | | | $ | 11.51 | | | $ | 12.23 | | | $ | 15.83 | |
| | | | | | | | | | | | | | | | | | | | |
Class B shares: (redemption price per share is equal to net asset value less any applicable contingent deferred sales charge) (Note 1) | | | | | | | | | | | | | | | | | | | | |
Net assets | | $ | 3,531,789 | | | $ | 1,028,457 | | | $ | — | | | $ | 12,079,142 | | | $ | 128,349,613 | |
| | | | | | | | | | | | | | | | | | | | |
Shares of beneficial interest | | | 280,073 | | | | 200,606 | | | | — | | | | 1,019,688 | | | | 8,437,774 | |
| | | | | | | | | | | | | | | | | | | | |
Net asset value and offering price per share | | $ | 12.61 | | | $ | 5.13 | | | $ | — | | | $ | 11.85 | | | $ | 15.21 | |
| | | | | | | | | | | | | | | | | | | | |
Class C shares: (redemption price per share is equal to net asset value less any applicable contingent deferred sales charge) (Note 1) | | | | | | | | | | | | | | | | | | | | |
Net assets | | $ | 117,637,305 | | | $ | 19,976,155 | | | $ | 5,810,336 | | | $ | 66,163,372 | | | $ | 5,037,580,759 | |
| | | | | | | | | | | | | | | | | | | | |
Shares of beneficial interest | | | 9,355,834 | | | | 3,899,075 | | | | 531,782 | | | | 5,574,390 | | | | 331,452,451 | |
| | | | | | | | | | | | | | | | | | | | |
Net asset value and offering price per share | | $ | 12.57 | | | $ | 5.12 | | | $ | 10.93 | | | $ | 11.87 | | | $ | 15.20 | |
| | | | | | | | | | | | | | | | | | | | |
Class Y shares: | | | | | | | | | | | | | | | | | | | | |
Net assets | | $ | 57,560,979 | | | $ | 73,321,902 | | | $ | 1,894,120 | | | $ | 86,314,313 | | | $ | 2,659,601,209 | |
| | | | | | | | | | | | | | | | | | | | |
Shares of beneficial interest | | | 4,553,931 | | | | 14,348,200 | | | | 172,427 | | | | 7,255,754 | | | | 176,063,241 | |
| | | | | | | | | | | | | | | | | | | | |
Net asset value, offering and redemption price per share | | $ | 12.64 | | | $ | 5.11 | | | $ | 10.99 | | | $ | 11.90 | | | $ | 15.11 | |
| | | | | | | | | | | | | | | | | | | | |
Admin Class shares: | | | | | | | | | | | | | | | | | | | | |
Net assets | | $ | — | | | $ | — | | | $ | — | | | $ | — | | | $ | 15,411,743 | |
| | | | | | | | | | | | | | | | | | | | |
Shares of beneficial interest | | | — | | | | — | | | | — | | | | — | | | | 1,021,570 | |
| | | | | | | | | | | | | | | | | | | | |
Net asset value, offering and redemption price per share | | $ | — | | | $ | — | | | $ | — | | | $ | — | | | $ | 15.09 | |
| | | | | | | | | | | | | | | | | | | | |
See accompanying notes to financial statements.
| 48
Statements of Operations
For the Six Months Ended March 31, 2011 (Unaudited)
| | | | | | | | | | | | | | | | | | | | |
| | | Core Plus
Bond Fund | | | High
Income Fund | | | International
Bond Fund | | | Limited Term
Government
and Agency
Fund | | | Strategic
Income Fund | |
INVESTMENT INCOME | | | | | | | | | | | | | | | | | | | | |
Interest | | $ | 9,716,424 | | | $ | 5,644,111 | | | $ | 464,668 | | | $ | 4,163,078 | | | $ | 385,292,961 | |
Dividends | | | 19,855 | | | | 181,346 | | | | — | | | | — | | | | 28,086,015 | |
Less net foreign taxes withheld | | | (5,360 | ) | | | (10,159 | ) | | | — | | | | — | | | | (251,701 | ) |
| | | | | | | | | | | | | | | | | | | | |
| | | 9,730,919 | | | | 5,815,298 | | | | 464,668 | | | | 4,163,078 | | | | 413,127,275 | |
| | | | | | | | | | | | | | | | | | | | |
Expenses | | | | | | | | | | | | | | | | | | | | |
Management fees (Note 6) | | �� | 792,886 | | | | 490,547 | | | | 81,464 | | | | 877,271 | | | | 37,538,551 | |
Service and distribution fees (Note 6) | | | 876,798 | | | | 202,996 | | | | 52,539 | | | | 643,982 | | | | 33,197,892 | |
Administrative fees (Note 6) | | | 91,030 | | | | 38,198 | | | | 6,345 | | | | 87,898 | | | | 3,142,417 | |
Trustees’ fees and expenses (Note 6) | | | 21,236 | | | | 14,052 | | | | 10,617 | | | | 20,288 | | | | 140,725 | |
Transfer agent fees and expenses (Note 6) | | | 175,883 | | | | 80,274 | | | | 7,700 | | | | 132,118 | | | | 4,816,054 | |
Audit and tax services fees | | | 24,095 | | | | 23,810 | | | | 24,094 | | | | 24,158 | | | | 32,474 | |
Custodian fees and expenses | | | 16,294 | | | | 16,767 | | | | 21,561 | | | | 14,149 | | | | 350,910 | |
Legal fees | | | 11,813 | | | | 1,876 | | | | 356 | | | | 4,187 | | | | 159,529 | |
Registration fees | | | 39,871 | | | | 37,237 | | | | 26,542 | | | | 52,265 | | | | 195,407 | |
Shareholder reporting expenses | | | 30,933 | | | | 12,149 | | | | 2,182 | | | | 12,123 | | | | 510,124 | |
Miscellaneous expenses | | | 8,862 | | | | 5,583 | | | | 3,639 | | | | 8,126 | | | | 198,544 | |
| | | | | | | | | | | | | | | | | | | | |
Total expenses | | | 2,089,701 | | | | 923,489 | | | | 237,039 | | | | 1,876,565 | | | | 80,282,627 | |
| | | | | | | | | | | | | | | | | | | | |
Fee/expense recovery (Note 6) | | | — | | | | 15,327 | | | | — | | | | — | | | | — | |
Less waiver and/or expense reimbursement (Note 6) | | | — | | | | — | | | | (69,093 | ) | | | (103,662 | ) | | | — | |
| | | | | | | | | | | | | | | | | | | | |
Net expenses | | | 2,089,701 | | | | 938,816 | | | | 167,946 | | | | 1,772,903 | | | | 80,282,627 | |
| | | | | | | | | | | | | | | | | | | | |
Net investment income | | | 7,641,218 | | | | 4,876,482 | | | | 296,722 | | | | 2,390,175 | | | | 332,844,648 | |
| | | | | | | | | | | | | | | | | | | | |
NET REALIZED AND UNREALIZED GAIN (LOSS) ON INVESTMENTS AND FOREIGN CURRENCY TRANSACTIONS | | | | | | | | | | | | | | | | | | | | |
Net realized gain (loss) on: | | | | | | | | | | | | | | | | | | | | |
Investments | | | 7,688,526 | | | | 5,792,531 | | | | 1,098,082 | | | | 2,558,256 | | | | 150,989,677 | |
Foreign currency transactions | | | (11,073 | ) | | | (41,721 | ) | | | 222,938 | | | | — | | | | 3,160,026 | |
Net change in unrealized appreciation (depreciation) on: | | | | | | | | | | | | | | | | | | | | |
Investments | | | (11,654,794 | ) | | | 2,023,764 | | | | (1,082,117 | ) | | | (3,044,169 | ) | | | 268,899,833 | |
Foreign currency translations | | | (36,443 | ) | | | (42,843 | ) | | | (108,876 | ) | | | — | | | | 516,042 | |
| | | | | | | | | | | | | | | | | | | | |
Net realized and unrealized gain (loss) on investments and foreign currency transactions | | | (4,013,784 | ) | | | 7,731,731 | | | | 130,027 | | | | (485,913 | ) | | | 423,565,578 | |
| | | | | | | | | | | | | | | | | | | | |
NET INCREASE IN NET ASSETS RESULTING FROM OPERATIONS | | $ | 3,627,434 | | | $ | 12,608,213 | | | $ | 426,749 | | | $ | 1,904,262 | | | $ | 756,410,226 | |
| | | | | | | | | | | | | | | | | | | | |
See accompanying notes to financial statements.
49 |
Statements of Changes in Net Assets
| | | | | | | | | | | | | | | | | | | | | | | | |
| | | Core Plus Bond Fund | | | High Income Fund | | | International Bond Fund | |
| | | Six Months
Ended
March 31,
2011
(Unaudited) | | | Year Ended
September 30,
2010 | | | Six Months
Ended
March 31,
2011
(Unaudited) | | | Year Ended
September 30,
2010 | | | Six Months
Ended
March 31,
2011
(Unaudited) | | | Year Ended
September 30,
2010 | |
FROM OPERATIONS: | | | | | | | | | | | | | | | | | | | | | | | | |
Net investment income | | $ | 7,641,218 | | | $ | 13,660,599 | | | $ | 4,876,482 | | | $ | 10,726,616 | | | $ | 296,722 | | | $ | 647,223 | |
Net realized gain on investments, swap agreements and foreign currency transactions | | | 7,677,453 | | | | 11,688,056 | | | | 5,750,810 | | | | 15,069,056 | | | | 1,321,020 | | | | 81,150 | |
Net change in unrealized appreciation (depreciation) on investments and foreign currency translations | | | (11,691,237 | ) | | | 13,900,860 | | | | 1,980,921 | | | | (11,929 | ) | | | (1,190,993 | ) | | | 1,114,447 | |
| | | | | | | | | | | | | | | | | | | | | | | | |
Net increase in net assets resulting from operations | | | 3,627,434 | | | | 39,249,515 | | | | 12,608,213 | | | | 25,783,743 | | | | 426,749 | | | | 1,842,820 | |
| | | | | | | | | | | | | | | | | | | | | | | | |
FROM DISTRIBUTIONS TO SHAREHOLDERS: | | | | | | | | | | | | | | | | | | | | | | | | |
Net investment income | | | | | | | | | | | | | | | | | | | | | | | | |
Class A | | | (5,212,653 | ) | | | (8,308,883 | ) | | | (2,798,103 | ) | | | (4,606,994 | ) | | | (395,800 | ) | | | (356,057 | ) |
Class B | | | (83,338 | ) | | | (232,826 | ) | | | (36,284 | ) | | | (84,337 | ) | | | — | | | | — | |
Class C | | | (2,564,810 | ) | | | (4,369,129 | ) | | | (693,198 | ) | | | (1,149,766 | ) | | | (116,316 | ) | | | (148,175 | ) |
Class Y | | | (1,519,918 | ) | | | (2,762,927 | ) | | | (2,542,151 | ) | | | (5,066,381 | ) | | | (63,287 | ) | | | (329,863 | ) |
Admin Class | | | — | | | | — | | | | — | | | | — | | | | — | | | | — | |
Net realized capital gains | | | | | | | | | | | | | | | | | | | | | | | | |
Class A | | | — | | | | — | | | | — | | | | — | | | | (229,358 | ) | | | (81,934 | ) |
Class B | | | — | | | | — | | | | — | | | | — | | | | — | | | | — | |
Class C | | | — | | | | — | | | | — | | | | — | | | | (79,673 | ) | | | (46,824 | ) |
Class Y | | | — | | | | — | | | | — | | | | — | | | | (24,156 | ) | | | (94,216 | ) |
| | | | | | | | | | | | | | | | | | | | | | | | |
Total distributions | | | (9,380,719 | ) | | | (15,673,765 | ) | | | (6,069,736 | ) | | | (10,907,478 | ) | | | (908,590 | ) | | | (1,057,069 | ) |
| | | | | | | | | | | | | | | | | | | | | | | | |
NET INCREASE (DECREASE) IN NET ASSETS FROM CAPITAL SHARE TRANSACTIONS (NOTE 10) | | | (26,696,326 | ) | | | 128,799,979 | | | | 5,109,916 | | | | (41,510,546 | ) | | | (10,832,171 | ) | | | 8,541,560 | |
| | | | | | | | | | | | | | | | | | | | | | | | |
Net increase (decrease) in net assets | | | (32,449,611 | ) | | | 152,375,729 | | | | 11,648,393 | | | | (26,634,281 | ) | | | (11,314,012 | ) | | | 9,327,311 | |
NET ASSETS | | | | | | | | | | | | | | | | | | | | | | | | |
Beginning of the period | | | 411,657,431 | | | | 259,281,702 | | | | 158,418,343 | | | | 185,052,624 | | | | 33,810,244 | | | | 24,482,933 | |
| | | | | | | | | | | | | | | | | | | | | | | | |
End of the period | | $ | 379,207,820 | | | $ | 411,657,431 | | | $ | 170,066,736 | | | $ | 158,418,343 | | | $ | 22,496,232 | | | $ | 33,810,244 | |
| | | | | | | | | | | | | | | | | | | | | | | | |
UNDISTRIBUTED NET INVESTMENT INCOME (DISTRIBUTIONS IN EXCESS OF NET INVESTMENT INCOME) | | $ | (1,490,132 | ) | | $ | 249,369 | | | $ | (1,015,214 | ) | | $ | 178,040 | | | $ | (442,061 | ) | | $ | (163,380 | ) |
| | | | | | | | | | | | | | | | | | | | | | | | |
See accompanying notes to financial statements.
| 50
Statements of Changes in Net Assets (continued)
| | | | | | | | | | | | | | | | |
| | | Limited Term Government
and Agency Fund | | | Strategic Income Fund | |
| | | Six Months
Ended
March 31,
2011
(Unaudited) | | | Year Ended
September 30,
2010 | | | Six Months
Ended
March 31,
2011
(Unaudited) | | | Year Ended
September 30,
2010 | |
FROM OPERATIONS: | | | | | | | | | | | | | | | | |
Net investment income | | $ | 2,390,175 | | | $ | 4,207,760 | | | $ | 332,844,648 | | | $ | 708,256,908 | |
Net realized gain (loss) on investments and foreign currency transactions | | | 2,558,256 | | | | 5,299,478 | | | | 154,149,703 | | | | (74,940,768 | ) |
Net change in unrealized appreciation (depreciation) on investments and foreign currency translations | | | (3,044,169 | ) | | | 5,267,995 | | | | 269,415,875 | | | | 1,297,093,620 | |
| | | | | | | | | | | | | | | | |
Net increase in net assets resulting from operations | | | 1,904,262 | | | | 14,775,233 | | | | 756,410,226 | | | | 1,930,409,760 | |
| | | | | | | | | | | | | | | | |
FROM DISTRIBUTIONS TO SHAREHOLDERS: | | | | | | | | | | | | | | | | |
Net investment income | | | | | | | | | | | | | | | | |
Class A | | | (2,169,101 | ) | | | (3,182,978 | ) | | | (164,140,619 | ) | | | (325,626,381 | ) |
Class B | | | (41,801 | ) | | | (65,117 | ) | | | (3,292,160 | ) | | | (7,060,015 | ) |
Class C | | | (514,659 | ) | | | (971,553 | ) | | | (126,576,599 | ) | | | (249,098,299 | ) |
Class Y | | | (1,166,200 | ) | | | (1,424,364 | ) | | | (76,269,086 | ) | | | (134,204,230 | ) |
Admin Class | | | — | | | | — | | | | (258,924 | ) | | | (41,765 | ) |
Net realized capital gains | | | | | | | | | | | | | | | | |
Class A | | | (1,500,749 | ) | | | — | | | | — | | | | — | |
Class B | | | (29,955 | ) | | | — | | | | — | | | | — | |
Class C | | | (583,534 | ) | | | — | | | | — | | | | — | |
Class Y | | | (770,404 | ) | | | — | | | | — | | | | — | |
| | | | | | | | | | | | | | | | |
Total distributions | | | (6,776,403 | ) | | | (5,644,012 | ) | | | (370,537,388 | ) | | | (716,030,690 | ) |
| | | | | | | | | | | | | | | | |
NET INCREASE (DECREASE) IN NET ASSETS FROM CAPITAL SHARE TRANSACTIONS (NOTE 10) | | | 72,265,821 | | | | 128,975,189 | | | | (406,817,470 | ) | | | (292,510,626 | ) |
| | | | | | | | | | | | | | | | |
Net increase (decrease) in net assets | | | 67,393,680 | | | | 138,106,410 | | | | (20,944,632 | ) | | | 921,868,444 | |
NET ASSETS | | | | | | | | | | | | | | | | |
Beginning of the period | | | 340,144,349 | | | | 202,037,939 | | | | 13,567,218,394 | | | | 12,645,349,950 | |
| | | | | | | | | | | | | | | | |
End of the period | | $ | 407,538,029 | | | $ | 340,144,349 | | | $ | 13,546,273,762 | | | $ | 13,567,218,394 | |
| | | | | | | | | | | | | | | | |
UNDISTRIBUTED NET INVESTMENT INCOME (DISTRIBUTIONS IN EXCESS OF NET INVESTMENT INCOME) | | $ | (1,628,933 | ) | | $ | (127,347 | ) | | $ | (32,849,653 | ) | | $ | 4,843,087 | |
| | | | | | | | | | | | | | | | |
See accompanying notes to financial statements.
51 |
This Page Intentionally Left Blank
| 52
Financial Highlights
For a share outstanding throughout each period.
| | | | | | | | | | | | | | | | | | | | | | | | | | | | | | | | |
| | | | | | Income (Loss) from Investment
Operations: | | | Less Distributions: | | | | |
| | | Net asset
value,
beginning
of
the period | | | Net
investment
income (a) | | | Net realized
and unrealized
gain (loss) | | | Total from
investment
operations | | | Dividends
from
net investment
income | | | Distributions
from net
realized
capital gains | | | Total
distributions | | | Redemption
fees (b)(c) | |
| | | | | | | | | | | | | | | | | | | | | | | | | | | | | | | | |
CORE PLUS BOND FUND | | | | | | | | | | | | | | | | | | | | | | | | | | | | | | | | |
Class A | | | | | | | | | | | | | | | | | | | | | | | | | | | | | | | | |
3/31/2011(h) | | $ | 12.75 | | | $ | 0.26 | | | $ | (0.12 | ) | | $ | 0.14 | | | $ | (0.32 | ) | | $ | — | | | $ | (0.32 | ) | | $ | — | |
9/30/2010 | | | 11.91 | | | | 0.54 | | | | 0.91 | | | | 1.45 | | | | (0.61 | ) | | | — | | | | (0.61 | ) | | | — | |
9/30/2009 | | | 10.54 | | | | 0.59 | | | | 1.44 | | | | 2.03 | | | | (0.66 | ) | | | — | | | | (0.66 | ) | | | — | |
9/30/2008 | | | 11.31 | | | | 0.55 | | | | (0.71 | ) | | | (0.16 | ) | | | (0.61 | ) | | | — | | | | (0.61 | ) | | | 0.00 | |
9/30/2007 | | | 11.23 | | | | 0.50 | | | | 0.14 | | | | 0.64 | | | | (0.56 | ) | | | — | | | | (0.56 | ) | | | 0.00 | |
9/30/2006 | | | 11.41 | | | | 0.50 | | | | (0.07 | ) | | | 0.43 | | | | (0.61 | ) | | | — | | | | (0.61 | ) | | | 0.00 | |
Class B | | | | | | | | | | | | | | | | | | | | | | | | | | | | | | | | |
3/31/2011(h) | | | 12.79 | | | | 0.21 | | | | (0.12 | ) | | | 0.09 | | | | (0.27 | ) | | | — | | | | (0.27 | ) | | | — | |
9/30/2010 | | | 11.95 | | | | 0.44 | | | | 0.92 | | | | 1.36 | | | | (0.52 | ) | | | — | | | | (0.52 | ) | | | — | |
9/30/2009 | | | 10.57 | | | | 0.50 | | | | 1.45 | | | | 1.95 | | | | (0.57 | ) | | | — | | | | (0.57 | ) | | | — | |
9/30/2008 | | | 11.31 | | | | 0.44 | | | | (0.67 | ) | | | (0.23 | ) | | | (0.51 | ) | | | — | | | | (0.51 | ) | | | 0.00 | |
9/30/2007 | | | 11.24 | | | | 0.41 | | | | 0.13 | | | | 0.54 | | | | (0.47 | ) | | | — | | | | (0.47 | ) | | | 0.00 | |
9/30/2006 | | | 11.41 | | | | 0.41 | | | | (0.05 | ) | | | 0.36 | | | | (0.53 | ) | | | — | | | | (0.53 | ) | | | 0.00 | |
Class C | | | | | | | | | | | | | | | | | | | | | | | | | | | | | | | | |
3/31/2011(h) | | | 12.76 | | | | 0.21 | | | | (0.13 | ) | | | 0.08 | | | | (0.27 | ) | | | — | | | | (0.27 | ) | | | — | |
9/30/2010 | | | 11.92 | | | | 0.45 | | | | 0.91 | | | | 1.36 | | | | (0.52 | ) | | | — | | | | (0.52 | ) | | | — | |
9/30/2009 | | | 10.55 | | | | 0.51 | | | | 1.44 | | | | 1.95 | | | | (0.58 | ) | | | — | | | | (0.58 | ) | | | — | |
9/30/2008 | | | 11.32 | | | | 0.47 | | | | (0.71 | ) | | | (0.24 | ) | | | (0.53 | ) | | | — | | | | (0.53 | ) | | | 0.00 | |
9/30/2007 | | | 11.25 | | | | 0.41 | | | | 0.13 | | | | 0.54 | | | | (0.47 | ) | | | — | | | | (0.47 | ) | | | 0.00 | |
9/30/2006 | | | 11.42 | | | | 0.41 | | | | (0.05 | ) | | | 0.36 | | | | (0.53 | ) | | | — | | | | (0.53 | ) | | | 0.00 | |
Class Y | | | | | | | | | | | | | | | | | | | | | | | | | | | | | | | | |
3/31/2011(h) | | | 12.82 | | | | 0.28 | | | | (0.13 | ) | | | 0.15 | | | | (0.33 | ) | | | — | | | | (0.33 | ) | | | — | |
9/30/2010 | | | 11.97 | | | | 0.57 | | | | 0.92 | | | | 1.49 | | | | (0.64 | ) | | | — | | | | (0.64 | ) | | | — | |
9/30/2009 | | | 10.60 | | | | 0.62 | | | | 1.44 | | | | 2.06 | | | | (0.69 | ) | | | — | | | | (0.69 | ) | | | — | |
9/30/2008 | | | 11.36 | | | | 0.58 | | | | (0.70 | ) | | | (0.12 | ) | | | (0.64 | ) | | | — | | | | (0.64 | ) | | | 0.00 | |
9/30/2007 | | | 11.29 | | | | 0.54 | | | | 0.13 | | | | 0.67 | | | | (0.60 | ) | | | — | | | | (0.60 | ) | | | 0.00 | |
9/30/2006 | | | 11.46 | | | | 0.51 | | | | (0.04 | ) | | | 0.47 | | | | (0.64 | ) | | | — | | | | (0.64 | ) | | | 0.00 | |
| (a) | Per share net investment income has been calculated using the average shares outstanding during the period. |
| (b) | Amount rounds to less than $0.01 per share, if applicable. |
| (c) | Effective June 2, 2008, redemption fees were eliminated. |
| (d) | A sales charge for Class A shares and a contingent deferred sales charge for Class B and Class C shares are not reflected in total return calculations. Periods less than one year, if applicable, are not annualized. |
| (e) | Had certain expenses not been waived/reimbursed during the period, if applicable, total returns would have been lower. |
See accompanying notes to financial statements.
53 |
| | | | | | | | | | | | | | | | | | | | | | | | | | |
| | | | |
| | | | | | | | | | Ratios to Average Net Assets: | | | | |
Net asset
value,
end of
the period | | | Total
return
(%) (d)(e) | | | Net assets,
end of
the period
(000’s) | | | Net
expenses
(%) (f)(g) | | | Gross
expenses
(%) (f) | | | Net investment
income
(%) (f) | | | Portfolio
turnover
rate (%) | |
| | | | | | | | | | | | | | | | | | | | | | | | | | |
| | | | | | | | | | | | | | | | | | | | | | | | | | |
| | | | | | | | | | | | | | | | | | | | | | | | | | |
| $ | 12.57 | | | | 1.11 | | | $ | 200,478 | | | | 0.87 | | | | 0.87 | | | | 4.12 | | | | 62 | |
| | 12.75 | | | | 12.55 | | | | 214,723 | | | | 0.90 | | | | 0.90 | | | | 4.41 | | | | 87 | |
| | 11.91 | | | | 20.07 | | | | 140,779 | | | | 0.90 | | | | 0.97 | | | | 5.43 | | | | 102 | |
| | 10.54 | | | | (1.61 | ) | | | 115,873 | | | | 0.93 | | | | 1.04 | | | | 4.86 | | | | 82 | |
| | 11.31 | | | | 5.70 | | | | 105,780 | | | | 1.04 | | | | 1.09 | | | | 4.41 | | | | 69 | |
| | 11.23 | | | | 4.03 | | | | 91,464 | | | | 1.05 | | | | 1.08 | | | | 4.46 | | | | 91 | |
| | | | | | | | | | | | | | | | | | | | | | | | | | |
| | 12.61 | | | | 0.72 | | | | 3,532 | | | | 1.62 | | | | 1.62 | | | | 3.36 | | | | 62 | |
| | 12.79 | | | | 11.64 | | | | 4,490 | | | | 1.65 | | | | 1.65 | | | | 3.64 | | | | 87 | |
| | 11.95 | | | | 19.19 | | | | 7,028 | | | | 1.65 | | | | 1.72 | | | | 4.66 | | | | 102 | |
| | 10.57 | | | | (2.21 | ) | | | 10,481 | | | | 1.70 | | | | 1.80 | | | | 3.92 | | | | 82 | |
| | 11.31 | | | | 4.90 | | | | 87,101 | | | | 1.79 | | | | 1.85 | | | | 3.64 | | | | 69 | |
| | 11.24 | | | | 3.26 | | | | 109,782 | | | | 1.80 | | | | 1.83 | | | | 3.72 | | | | 91 | |
| | | | | | | | | | | | | | | | | | | | | | | | | | |
| | 12.57 | | | | 0.65 | | | | 117,637 | | | | 1.62 | | | | 1.62 | | | | 3.38 | | | | 62 | |
| | 12.76 | | | | 11.71 | | | | 123,123 | | | | 1.65 | | | | 1.65 | | | | 3.66 | | | | 87 | |
| | 11.92 | | | | 19.20 | | | | 77,081 | | | | 1.65 | | | | 1.72 | | | | 4.69 | | | | 102 | |
| | 10.55 | | | | (2.32 | ) | | | 26,698 | | | | 1.68 | | | | 1.79 | | | | 4.17 | | | | 82 | |
| | 11.32 | | | | 4.91 | | | | 12,690 | | | | 1.78 | | | | 1.82 | | | | 3.66 | | | | 69 | |
| | 11.25 | | | | 3.26 | | | | 6,983 | | | | 1.80 | | | | 1.82 | | | | 3.63 | | | | 91 | |
| | | | | | | | | | | | | | | | | | | | | | | | | | |
| | 12.64 | | | | 1.23 | | | | 57,561 | | | | 0.62 | | | | 0.62 | | | | 4.37 | | | | 62 | |
| | 12.82 | | | | 12.85 | | | | 69,322 | | | | 0.65 | | | | 0.65 | | | | 4.66 | | | | 87 | |
| | 11.97 | | | | 20.37 | | | | 34,394 | | | | 0.65 | | | | 0.68 | | | | 5.67 | | | | 102 | |
| | 10.60 | | | | (1.36 | ) | | | 20,407 | | | | 0.68 | | | | 0.75 | | | | 5.14 | | | | 82 | |
| | 11.36 | | | | 6.06 | | | | 15,946 | | | | 0.70 | | | | 0.75 | | | | 4.75 | | | | 69 | |
| | 11.29 | | | | 4.28 | | | | 11,986 | | | | 0.80 | (i) | | | 0.80 | (i) | | | 4.58 | | | | 91 | |
| (f) | Computed on an annualized basis for periods less than one year, if applicable. |
| (g) | The investment adviser and/or administrator agreed to waive its fees and/or reimburse a portion of the Fund’s expenses during the period. Without this waiver/reimbursement, if applicable, expenses would have been higher. |
| (h) | For the six months ended March 31, 2011 (Unaudited). |
| (i) | Includes fee/expense recovery of 0.06%. |
| 54
Financial Highlights (continued)
For a share outstanding throughout each period.
| | | | | | | | | | | | | | | | | | | | | | | | | | | | | | | | |
| | | | | | Income (Loss) from Investment
Operations: | | | Less Distributions: | | | | |
| | | Net asset
value,
beginning
of
the period | | | Net
investment
income (a) | | | Net realized
and unrealized
gain (loss) | | | Total from
investment
operations | | | Dividends
from
net investment
income | | | Distributions
from net
realized
capital gains | | | Total
distributions | | | Redemption
fees (b) | |
| | | | | | | | | | | | | | | | | | | | | | | | | | | | | | | | |
HIGH INCOME FUND | | | | | | | | | | | | | | | | | | | | | | | | | | | | | | | | |
Class A | | | | | | | | | | | | | | | | | | | | | | | | | | | | | | | | |
3/31/2011(g) | | $ | 4.91 | | | $ | 0.15 | | | $ | 0.25 | | | $ | 0.40 | | | $ | (0.19 | ) | | $ | — | | | $ | (0.19 | ) | | $ | — | |
9/30/2010 | | | 4.49 | | | | 0.32 | | | | 0.42 | | | | 0.74 | | | | (0.32 | ) | | | — | | | | (0.32 | ) | | | — | |
9/30/2009 | | | 4.24 | | | | 0.34 | | | | 0.24 | | | | 0.58 | | | | (0.33 | ) | | | — | | | | (0.33 | ) | | | 0.00 | (i) |
9/30/2008 | | | 5.12 | | | | 0.34 | | | | (0.87 | ) | | | (0.53 | ) | | | (0.35 | ) | | | — | | | | (0.35 | ) | | | 0.00 | |
9/30/2007 | | | 5.09 | | | | 0.33 | | | | 0.08 | | | | 0.41 | | | | (0.38 | ) | | | — | | | | (0.38 | ) | | | 0.00 | |
9/30/2006 | | | 4.98 | | | | 0.34 | | | | 0.11 | | | | 0.45 | | | | (0.34 | ) | | | — | | | | (0.34 | ) | | | 0.00 | |
Class B | | | | | | | | | | | | | | | | | | | | | | | | | | | | | | | | |
3/31/2011(g) | | | 4.92 | | | | 0.13 | | | | 0.25 | | | | 0.38 | | | | (0.17 | ) | | | — | | | | (0.17 | ) | | | — | |
9/30/2010 | | | 4.50 | | | | 0.28 | | | | 0.42 | | | | 0.70 | | | | (0.28 | ) | | | — | | | | (0.28 | ) | | | — | |
9/30/2009 | | | 4.25 | | | | 0.31 | | | | 0.25 | | | | 0.56 | | | | (0.31 | ) | | | — | | | | (0.31 | ) | | | 0.00 | (i) |
9/30/2008 | | | 5.13 | | | | 0.30 | | | | (0.87 | ) | | | (0.57 | ) | | | (0.31 | ) | | | — | | | | (0.31 | ) | | | 0.00 | |
9/30/2007 | | | 5.10 | | | | 0.29 | | | | 0.07 | | | | 0.36 | | | | (0.33 | ) | | | — | | | | (0.33 | ) | | | 0.00 | |
9/30/2006 | | | 4.98 | | | | 0.30 | | | | 0.12 | | | | 0.42 | | | | (0.30 | ) | | | — | | | | (0.30 | ) | | | 0.00 | |
Class C | | | | | | | | | | | | | | | | | | | | | | | | | | | | | | | | |
3/31/2011(g) | | | 4.92 | | | | 0.13 | | | | 0.24 | | | | 0.37 | | | | (0.17 | ) | | | — | | | | (0.17 | ) | | | — | |
9/30/2010 | | | 4.50 | | | | 0.28 | | | | 0.43 | | | | 0.71 | | | | (0.29 | ) | | | — | | | | (0.29 | ) | | | — | |
9/30/2009 | | | 4.24 | | | | 0.31 | | | | 0.26 | | | | 0.57 | | | | (0.31 | ) | | | — | | | | (0.31 | ) | | | 0.00 | (i) |
9/30/2008 | | | 5.12 | | | | 0.31 | | | | (0.87 | ) | | | (0.56 | ) | | | (0.32 | ) | | | — | | | | (0.32 | ) | | | 0.00 | |
9/30/2007 | | | 5.09 | | | | 0.29 | | | | 0.07 | | | | 0.36 | | | | (0.33 | ) | | | — | | | | (0.33 | ) | | | 0.00 | |
9/30/2006 | | | 4.98 | | | | 0.30 | | | | 0.11 | | | | 0.41 | | | | (0.30 | ) | | | — | | | | (0.30 | ) | | | 0.00 | |
Class Y | | | | | | | | | | | | | | | | | | | | | | | | | | | | | | | | |
3/31/2011(g) | | | 4.90 | | | | 0.16 | | | | 0.24 | | | | 0.40 | | | | (0.19 | ) | | | — | | | | (0.19 | ) | | | — | |
9/30/2010 | | | 4.49 | | | | 0.33 | | | | 0.41 | | | | 0.74 | | | | (0.33 | ) | | | — | | | | (0.33 | ) | | | — | |
9/30/2009 | | | 4.24 | | | | 0.34 | | | | 0.25 | | | | 0.59 | | | | (0.34 | ) | | | — | | | | (0.34 | ) | | | 0.00 | (i) |
9/30/2008(j) | | | 4.87 | | | | 0.22 | | | | (0.65 | ) | | | (0.43 | ) | | | (0.21 | ) | | | — | | | | (0.21 | ) | | | 0.01 | |
INTERNATIONAL BOND FUND | | | | | | | | | | | | | | | | | | | | | | | | | | | | | |
Class A | | | | | | | | | | | | | | | | | | | | | | | | | | | | | | | | |
3/31/2011(g) | | $ | 11.17 | | | $ | 0.13 | | | $ | 0.08 | | | $ | 0.21 | | | $ | (0.25 | ) | | $ | (0.14 | ) | | $ | (0.39 | ) | | $ | — | |
9/30/2010 | | | 10.84 | | | | 0.22 | | | | 0.48 | | | | 0.70 | | | | (0.29 | ) | | | (0.08 | ) | | | (0.37 | ) | | | — | |
9/30/2009 | | | 9.19 | | | | 0.32 | | | | 1.53 | | | | 1.85 | | | | (0.20 | ) | | | — | | | | (0.20 | ) | | | — | |
9/30/2008(k) | | | 10.00 | | | | 0.17 | | | | (0.79 | ) | | | (0.62 | ) | | | (0.19 | ) | | | — | | | | (0.19 | ) | | | 0.00 | (l) |
Class C | | | | | | | | | | | | | | | | | | | | | | | | | | | | | | | | |
3/31/2011(g) | | | 11.11 | | | | 0.09 | | | | 0.07 | | | | 0.16 | | | | (0.20 | ) | | | (0.14 | ) | | | (0.34 | ) | | | — | |
9/30/2010 | | | 10.82 | | | | 0.15 | | | | 0.46 | | | | 0.61 | | | | (0.24 | ) | | | (0.08 | ) | | | (0.32 | ) | | | — | |
9/30/2009 | | | 9.18 | | | | 0.24 | | | | 1.53 | | | | 1.77 | | | | (0.13 | ) | | | — | | | | (0.13 | ) | | | — | |
9/30/2008(k) | | | 10.00 | | | | 0.13 | | | | (0.81 | ) | | | (0.68 | ) | | | (0.15 | ) | | | — | | | | (0.15 | ) | | | 0.01 | (l) |
Class Y | | | | | | | | | | | | | | | | | | | | | | | | | | | | | | | | |
3/31/2011(g) | | | 11.16 | | | | 0.14 | | | | 0.09 | | | | 0.23 | | | | (0.26 | ) | | | (0.14 | ) | | | (0.40 | ) | | | — | |
9/30/2010 | | | 10.82 | | | | 0.25 | | | | 0.47 | | | | 0.72 | | | | (0.30 | ) | | | (0.08 | ) | | | (0.38 | ) | | | — | |
9/30/2009 | | | 9.18 | | | | 0.33 | | | | 1.53 | | | | 1.86 | | | | (0.22 | ) | | | — | | | | (0.22 | ) | | | — | |
9/30/2008(k) | | | 10.00 | | | | 0.18 | | | | (0.81 | ) | | | (0.63 | ) | | | (0.20 | ) | | | — | | | | (0.20 | ) | | | 0.01 | (l) |
| (a) | Per share net investment income has been calculated using the average shares outstanding during the period. |
| (b) | Amount rounds to less than $0.01 per share, if applicable. |
| (c) | Had certain expenses not been waived/reimbursed during the period, if applicable, total returns would have been lower. |
| (d) | A sales charge for Class A shares and a contingent deferred sales charge for Class B and Class C shares are not reflected in total return calculations. Periods less than one year, if applicable, are not annualized. |
| (e) | Computed on an annualized basis for periods less than one year, if applicable. |
| (f) | The investment adviser and/or administrator agreed to waive its fees and/or reimburse a portion of the Fund’s expenses during the period. Without this waiver/reimbursement, if applicable, expenses would have been higher. |
See accompanying notes to financial statements.
55 |
| | | | | | | | | | | | | | | | | | | | | | | | | | |
| | | | |
| | | | | | | | | | Ratios to Average Net Assets: | | | | |
| | | | | | |
Net asset
value, end
of the period | | | Total
return
(%)(c)(d) | | | Net assets,
end of
the period
(000’s) | | | Net
expenses
(%)(e)(f) | | | Gross
expenses
(%)(e) | | | Net investment
income
(%)(e) | | | Portfolio
turnover
rate (%) | |
| | | | | | | | | | | | | | | | | | | | | | | | | | |
| | | | | | | | | | | | | | | | | | | | | | | | | | |
| | | | | | | | | | | | | | | | | | | | | | | | | | |
| $ | 5.12 | | | | 8.23 | | | $ | 75,740 | | | | 1.15 | (h) | | | 1.15 | (h) | | | 5.96 | | | | 31 | |
| | 4.91 | | | | 17.05 | | | | 68,011 | | | | 1.15 | | | | 1.20 | | | | 6.72 | | | | 56 | |
| | 4.49 | | | | 15.97 | | | | 59,944 | | | | 1.15 | | | | 1.28 | | | | 8.82 | | | | 30 | |
| | 4.24 | | | | (10.98 | ) | | | 38,577 | | | | 1.15 | | | | 1.40 | | | | 7.01 | | | | 27 | |
| | 5.12 | | | | 8.10 | | | | 32,603 | | | | 1.18 | | | | 1.43 | | | | 6.40 | | | | 41 | |
| | 5.09 | | | | 9.39 | | | | 29,069 | | | | 1.31 | | | | 1.48 | | | | 6.70 | | | | 41 | |
| | | | | | | | | | | | | | | | | | | | | | | | | | |
| | 5.13 | | | | 7.80 | | | | 1,028 | | | | 1.90 | (h) | | | 1.90 | (h) | | | 5.21 | | | | 31 | |
| | 4.92 | | | | 16.13 | | | | 1,209 | | | | 1.90 | | | | 1.94 | | | | 6.00 | | | | 56 | |
| | 4.50 | | | | 15.06 | | | | 1,569 | | | | 1.90 | | | | 2.06 | | | | 8.32 | | | | 30 | |
| | 4.25 | | | | (11.64 | ) | | | 2,267 | | | | 1.90 | | | | 2.15 | | | | 6.15 | | | | 27 | |
| | 5.13 | | | | 7.21 | | | | 4,201 | | | | 1.94 | | | | 2.18 | | | | 5.63 | | | | 41 | |
| | 5.10 | | | | 8.79 | | | | 7,283 | | | | 2.08 | | | | 2.25 | | | | 6.00 | | | | 41 | |
| | | | | | | | | | | | | | | | | | | | | | | | | | |
| | 5.12 | | | | 7.61 | | | | 19,976 | | | | 1.90 | (h) | | | 1.90 | (h) | | | 5.21 | | | | 31 | |
| | 4.92 | | | | 16.15 | | | | 19,312 | | | | 1.90 | | | | 1.95 | | | | 5.97 | | | | 56 | |
| | 4.50 | | | | 15.37 | | | | 17,827 | | | | 1.90 | | | | 2.03 | | | | 8.09 | | | | 30 | |
| | 4.24 | | | | (11.62 | ) | | | 9,945 | | | | 1.90 | | | | 2.15 | | | | 6.32 | | | | 27 | |
| | 5.12 | | | | 7.22 | | | | 5,275 | | | | 1.93 | | | | 2.17 | | | | 5.63 | | | | 41 | |
| | 5.09 | | | | 8.58 | | | | 3,457 | | | | 2.07 | | | | 2.23 | | | | 5.96 | | | | 41 | |
| | | | | | | | | | | | | | | | | | | | | | | | | | |
| | 5.11 | | | | 8.38 | | | | 73,322 | | | | 0.90 | (h) | | | 0.90 | (h) | | | 6.21 | | | | 31 | |
| | 4.90 | | | | 17.11 | | | | 69,887 | | | | 0.90 | | | | 0.93 | | | | 7.02 | | | | 56 | |
| | 4.49 | | | | 16.29 | | | | 105,713 | | | | 0.90 | | | | 0.92 | | | | 8.32 | | | | 30 | |
| | 4.24 | | | | (9.10 | ) | | | 3,833 | | | | 0.90 | | | | 1.15 | | | | 8.03 | | | | 27 | |
| | | | | | | | | | | | | | | | | | | | | | | | | | |
| | | | | | | | | | | | | | | | | | | | | | | | | | |
| $ | 10.99 | | | | 1.98 | | | $ | 14,792 | | | | 1.10 | | | | 1.62 | | | | 2.33 | | | | 48 | |
| | 11.17 | | | | 6.66 | | | | 18,758 | | | | 1.10 | | | | 1.49 | | | | 2.14 | | | | 128 | |
| | 10.84 | | | | 20.41 | | | | 8,479 | | | | 1.10 | | | | 2.11 | | | | 3.29 | | | | 91 | |
| | 9.19 | | | | (6.37 | ) | | | 1,953 | | | | 1.10 | | | | 2.95 | | | | 2.66 | | | | 60 | |
| | | | | | | | | | | | | | | | | | | | | | | | | | |
| | 10.93 | | | | 1.61 | | | | 5,810 | | | | 1.85 | | | | 2.38 | | | | 1.59 | | | | 48 | |
| | 11.11 | | | | 5.86 | | | | 6,145 | | | | 1.85 | | | | 2.24 | | | | 1.40 | | | | 128 | |
| | 10.82 | | | | 19.58 | | | | 2,955 | | | | 1.85 | | | | 2.93 | | | | 2.56 | | | | 91 | |
| | 9.18 | | | | (6.95 | ) | | | 683 | | | | 1.85 | | | | 3.70 | | | | 1.92 | | | | 60 | |
| | | | | | | | | | | | | | | | | | | | | | | | | | |
| | 10.99 | | | | 2.20 | | | | 1,894 | | | | 0.85 | | | | 1.26 | | | | 2.51 | | | | 48 | |
| | 11.16 | | | | 6.92 | | | | 8,908 | | | | 0.85 | | | | 1.23 | | | | 2.41 | | | | 128 | |
| | 10.82 | | | | 20.73 | | | | 13,049 | | | | 0.85 | | | | 1.92 | | | | 3.53 | | | | 91 | |
| | 9.18 | | | | (6.39 | ) | | | 9,981 | | | | 0.85 | | | | 2.48 | | | | 2.74 | | | | 60 | |
| (g) | For the six months ended March 31, 2011 (Unaudited). |
| (h) | Includes fee/expense recovery of 0.02%. |
| (i) | Effective June 1, 2009, redemption fees were eliminated. |
| (j) | From commencement of Class operations on February 29, 2008 through September 30, 2008. |
| (k) | For the period February 1, 2008 (inception) through September 30, 2008. |
| (l) | Effective June 2, 2008, redemption fees were eliminated. |
| 56
Financial Highlights (continued)
For a share outstanding throughout each period.
| | | | | | | | | | | | | | | | | | | | | | | | | | | | |
| | | | | | Income (Loss) from Investment
Operations: | | | Less Distributions: | |
| | | Net asset
value,
beginning
of
the period | | | Net
investment
income (a) | | | Net realized
and unrealized
gain (loss) | | | Total from
investment
operations | | | Dividends
from
net investment
income | | | Distributions
from net
realized
capital gains | | | Total
distributions | |
| | | | | | | | | | | | | | | | | | | | | | | | | | | | |
LIMITED TERM GOVERNMENTAND AGENCY FUND | | | | | | | | | | | | | | | | | | | | | |
Class A | | | | | | | | | | | | | | | | | | | | | | | | | | | | |
3/31/2011(f) | | $ | 12.02 | | | $ | 0.08 | | | $ | (0.02 | ) | | $ | 0.06 | | | $ | (0.13 | ) | | $ | (0.09 | ) | | $ | (0.22 | ) |
9/30/2010 | | | 11.60 | | | | 0.20 | | | | 0.49 | | | | 0.69 | | | | (0.27 | ) | | | — | | | | (0.27 | ) |
9/30/2009 | | | 10.98 | | | | 0.35 | | | | 0.63 | | | | 0.98 | | | | (0.36 | ) | | | — | | | | (0.36 | ) |
9/30/2008 | | | 11.00 | | | | 0.45 | | | | 0.02 | | | | 0.47 | | | | (0.49 | ) | | | — | | | | (0.49 | ) |
9/30/2007 | | | 11.00 | | | | 0.45 | | | | 0.03 | | | | 0.48 | | | | (0.48 | ) | | | — | | | | (0.48 | ) |
9/30/2006 | | | 11.09 | | | | 0.39 | | | | (0.05 | ) | | | 0.34 | | | | (0.43 | ) | | | — | | | | (0.43 | ) |
Class B | | | | | | | | | | | | | | | | | | | | | | | | | | | | |
3/31/2011(f) | | | 12.00 | | | | 0.04 | | | | (0.01 | ) | | | 0.03 | | | | (0.09 | ) | | | (0.09 | ) | | | (0.18 | ) |
9/30/2010 | | | 11.59 | | | | 0.12 | | | | 0.47 | | | | 0.59 | | | | (0.18 | ) | | | — | | | | (0.18 | ) |
9/30/2009 | | | 10.97 | | | | 0.26 | | | | 0.63 | | | | 0.89 | | | | (0.27 | ) | | | — | | | | (0.27 | ) |
9/30/2008 | | | 10.99 | | | | 0.36 | | | | 0.02 | | | | 0.38 | | | | (0.40 | ) | | | — | | | | (0.40 | ) |
9/30/2007 | | | 10.98 | | | | 0.37 | | | | 0.03 | | | | 0.40 | | | | (0.39 | ) | | | — | | | | (0.39 | ) |
9/30/2006 | | | 11.07 | | | | 0.31 | | | | (0.05 | ) | | | 0.26 | | | | (0.35 | ) | | | — | | | | (0.35 | ) |
Class C | | | | | | | | | | | | | | | | | | | | | | | | | | | | |
3/31/2011(f) | | | 12.03 | | | | 0.04 | | | | (0.02 | ) | | | 0.02 | | | | (0.09 | ) | | | (0.09 | ) | | | (0.18 | ) |
9/30/2010 | | | 11.61 | | | | 0.12 | | | | 0.48 | | | | 0.60 | | | | (0.18 | ) | | | — | | | | (0.18 | ) |
9/30/2009 | | | 10.99 | | | | 0.26 | | | | 0.63 | | | | 0.89 | | | | (0.27 | ) | | | — | | | | (0.27 | ) |
9/30/2008 | | | 11.00 | | | | 0.36 | | | | 0.03 | | | | 0.39 | | | | (0.40 | ) | | | — | | | | (0.40 | ) |
9/30/2007 | | | 10.99 | | | | 0.37 | | | | 0.03 | | | | 0.40 | | | | (0.39 | ) | | | — | | | | (0.39 | ) |
9/30/2006 | | | 11.08 | | | | 0.31 | | | | (0.05 | ) | | | 0.26 | | | | (0.35 | ) | | | — | | | | (0.35 | ) |
Class Y | | | | | | | | | | | | | | | | | | | | | | | | | | | | |
3/31/2011(f) | | | 12.05 | | | | 0.10 | | | | (0.01 | ) | | | 0.09 | | | | (0.15 | ) | | | (0.09 | ) | | | (0.24 | ) |
9/30/2010 | | | 11.64 | | | | 0.23 | | | | 0.48 | | | | 0.71 | | | | (0.30 | ) | | | — | | | | (0.30 | ) |
9/30/2009 | | | 11.01 | | | | 0.39 | | | | 0.63 | | | | 1.02 | | | | (0.39 | ) | | | — | | | | (0.39 | ) |
9/30/2008 | | | 11.03 | | | | 0.47 | | | | 0.02 | | | | 0.49 | | | | (0.51 | ) | | | — | | | | (0.51 | ) |
9/30/2007 | | | 11.03 | | | | 0.49 | | | | 0.03 | | | | 0.52 | | | | (0.52 | ) | | | — | | | | (0.52 | ) |
9/30/2006 | | | 11.13 | | | | 0.43 | | | | (0.06 | ) | | | 0.37 | | | | (0.47 | ) | | | — | | | | (0.47 | ) |
| (a) | Per share net investment income has been calculated using the average shares outstanding during the period. |
| (b) | A sales charge for Class A shares and a contingent deferred sales charge for Class B and Class C shares are not reflected in total return calculations. Periods less than one year, if applicable, are not annualized. |
| (c) | Had certain expenses not been waived/reimbursed during the period, if applicable, total returns would have been lower. |
See accompanying notes to financial statements.
57 |
| | | | | | | | | | | | | | | | | | | | | | | | | | |
| | | | |
| | | | | | | | | | Ratios to Average Net Assets: | | | | |
| | | | | | |
Net asset
value,
end of
the period | | | Total
return
(%) (b)(c) | | | Net assets,
end of
the period
(000’s) | | | Net
expenses
(%) (d)(e) | | | Gross
expenses
(%) (d) | | | Net investment
income
(%) (d) | | | Portfolio
turnover
rate (%) | |
| | | | | | | | | | | | | | | | | | | | | | | | | | |
| | | | | | | | | | | | | | | | | | | | | | | | | | |
| | | | | | | | | | | | | | | | | | | | | | | | | | |
| $ | 11.86 | | | | 0.51 | | | $ | 242,981 | | | | 0.85 | | | | 0.90 | | | | 1.37 | | | | 45 | |
| | 12.02 | | | | 6.03 | | | | 164,265 | | | | 0.89 | | | | 0.97 | | | | 1.73 | | | | 89 | |
| | 11.60 | | | | 9.05 | | | | 118,619 | | | | 0.90 | | | | 0.99 | | | | 3.10 | | | | 77 | |
| | 10.98 | | | | 4.29 | | | | 105,047 | | | | 0.92 | | | | 1.07 | | | | 4.04 | | | | 52 | |
| | 11.00 | | | | 4.46 | | | | 108,536 | | | | 0.99 | | | | 1.10 | | | | 4.13 | | | | 45 | |
| | 11.00 | | | | 3.20 | | | | 114,180 | | | | 1.04 | | | | 1.09 | | | | 3.57 | | | | 50 | |
| | | | | | | | | | | | | | | | | | | | | | | | | | |
| | 11.85 | | | | 0.22 | | | | 12,079 | | | | 1.60 | | | | 1.66 | | | | 0.66 | | | | 45 | |
| | 12.00 | | | | 5.16 | | | | 4,049 | | | | 1.64 | | | | 1.72 | | | | 1.00 | | | | 89 | |
| | 11.59 | | | | 8.24 | | | | 4,442 | | | | 1.65 | | | | 1.74 | | | | 2.32 | | | | 77 | |
| | 10.97 | | | | 3.52 | | | | 4,532 | | | | 1.67 | | | | 1.82 | | | | 3.29 | | | | 52 | |
| | 10.99 | | | | 3.72 | | | | 6,787 | | | | 1.74 | | | | 1.85 | | | | 3.37 | | | | 45 | |
| | 10.98 | | | | 2.36 | | | | 9,952 | | | | 1.79 | | | | 1.84 | | | | 2.79 | | | | 50 | |
| | | | | | | | | | | | | | | | | | | | | | | | | | |
| | 11.87 | | | | 0.14 | | | | 66,163 | | | | 1.60 | | | | 1.66 | | | | 0.61 | | | | 45 | |
| | 12.03 | | | | 5.24 | | | | 75,984 | | �� | | 1.64 | | | | 1.72 | | | | 0.98 | | | | 89 | |
| | 11.61 | | | | 8.24 | | | | 50,973 | | | | 1.65 | | | | 1.74 | | | | 2.32 | | | | 77 | |
| | 10.99 | | | | 3.62 | | | | 22,711 | | | | 1.66 | | | | 1.83 | | | | 3.29 | | | | 52 | |
| | 11.00 | | | | 3.62 | | | | 5,261 | | | | 1.74 | | | | 1.85 | | | | 3.38 | | | | 45 | |
| | 10.99 | | | | 2.46 | | | | 4,230 | | | | 1.79 | | | | 1.84 | | | | 2.81 | | | | 50 | |
| | | | | | | | | | | | | | | | | | | | | | | | | | |
| | 11.90 | | | | 0.72 | | | | 86,314 | | | | 0.60 | | | | 0.65 | | | | 1.60 | | | | 45 | |
| | 12.05 | | | | 6.20 | | | | 95,847 | | | | 0.63 | | | | 0.71 | | | | 1.94 | | | | 89 | |
| | 11.64 | | | | 9.40 | | | | 28,004 | | | | 0.65 | | | | 0.72 | | | | 3.42 | | | | 77 | |
| | 11.01 | | | | 4.55 | | | | 6,577 | | | | 0.67 | | | | 0.72 | | | | 4.28 | | | | 52 | |
| | 11.03 | | | | 4.79 | | | | 4,201 | | | | 0.71 | | | | 0.75 | | | | 4.43 | | | | 45 | |
| | 11.03 | | | | 3.43 | | | | 2,461 | | | | 0.74 | | | | 0.74 | | | | 3.89 | | | | 50 | |
| (d) | Computed on an annualized basis for periods less than one year, if applicable. |
| (e) | The investment adviser and/or administrator agreed to waive its fees and/or reimburse a portion of the Fund’s expenses during the period. Without this waiver/reimbursement, if applicable, expenses would have been higher. |
| (f) | For the six months ended March 31, 2011 (Unaudited). |
| 58
Financial Highlights (continued)
For a share outstanding throughout each period.
| | | | | | | | | | | | | | | | | | | | | | | | | | | | | | | | |
| | | | | | Income (Loss) from Investment
Operations: | | | Less Distributions: | | | | |
| | | Net asset
value,
beginning
of
the period | | | Net
investment
income (a) | | | Net realized
and unrealized
gain (loss) | | | Total from
investment
operations | | | Dividends
from
net investment
income | | | Distributions
from net
realized
capital gains | | | Total
distributions | | | Redemption
fees (b)(c) | |
STRATEGIC INCOME FUND | | | | | | | | | | | | | | | | | | | | | | | | | | | | | | | | |
Class A | | | | | | | | | | | | | | | | | | | | | | | | | | | | | | | | |
3/31/2011(h) | | $ | 14.69 | | | $ | 0.39 | | | $ | 0.47 | | | $ | 0.86 | | | $ | (0.43 | ) | | $ | — | | | $ | (0.43 | ) | | $ | — | |
9/30/2010 | | | 13.39 | | | | 0.80 | | | | 1.31 | | | | 2.11 | | | | (0.81 | ) | | | — | | | | (0.81 | ) | | | — | |
9/30/2009 | | | 12.10 | | | | 0.87 | | | | 1.36 | | | | 2.23 | | | | (0.86 | ) | | | (0.08 | ) | | | (0.94 | ) | | | — | |
9/30/2008 | | | 15.18 | | | | 0.96 | | | | (3.02 | ) | | | (2.06 | ) | | | (1.01 | ) | | | (0.01 | ) | | | (1.02 | ) | | | 0.00 | |
9/30/2007 | | | 14.60 | | | | 0.80 | | | | 0.60 | | | | 1.40 | | | | (0.82 | ) | | | — | | | | (0.82 | ) | | | 0.00 | |
9/30/2006 | | | 14.17 | | | | 0.71 | | | | 0.53 | | | | 1.24 | | | | (0.81 | ) | | | — | | | | (0.81 | ) | | | 0.00 | |
Class B | | | | | | | | | | | | | | | | | | | | | | | | | | | | | | | | |
3/31/2011(h) | | | 14.78 | | | | 0.33 | | | | 0.47 | | | | 0.80 | | | | (0.37 | ) | | | — | | | | (0.37 | ) | | | — | |
9/30/2010 | | | 13.46 | | | | 0.69 | | | | 1.33 | | | | 2.02 | | | | (0.70 | ) | | | — | | | | (0.70 | ) | | | — | |
9/30/2009 | | | 12.16 | | | | 0.79 | | | | 1.36 | | | | 2.15 | | | | (0.77 | ) | | | (0.08 | ) | | | (0.85 | ) | | | — | |
9/30/2008 | | | 15.25 | | | | 0.85 | | | | (3.04 | ) | | | (2.19 | ) | | | (0.89 | ) | | | (0.01 | ) | | | (0.90 | ) | | | 0.00 | |
9/30/2007 | | | 14.66 | | | | 0.69 | | | | 0.60 | | | | 1.29 | | | | (0.70 | ) | | | — | | | | (0.70 | ) | | | 0.00 | |
9/30/2006 | | | 14.22 | | | | 0.61 | | | | 0.52 | | | | 1.13 | | | | (0.69 | ) | | | — | | | | (0.69 | ) | | | 0.00 | |
Class C | | | | | | | | | | | | | | | | | | | | | | | | | | | | | | | | |
3/31/2011(h) | | | 14.77 | | | | 0.33 | | | | 0.47 | | | | 0.80 | | | | (0.37 | ) | | | — | | | | (0.37 | ) | | | — | |
9/30/2010 | | | 13.45 | | | | 0.69 | | | | 1.33 | | | | 2.02 | | | | (0.70 | ) | | | — | | | | (0.70 | ) | | | — | |
9/30/2009 | | | 12.15 | | | | 0.79 | | | | 1.37 | | | | 2.16 | | | | (0.78 | ) | | | (0.08 | ) | | | (0.86 | ) | | | — | |
9/30/2008 | | | 15.24 | | | | 0.85 | | | | (3.03 | ) | | | (2.18 | ) | | | (0.90 | ) | | | (0.01 | ) | | | (0.91 | ) | | | 0.00 | |
9/30/2007 | | | 14.65 | | | | 0.69 | | | | 0.60 | | | | 1.29 | | | | (0.70 | ) | | | — | | | | (0.70 | ) | | | 0.00 | |
9/30/2006 | | | 14.22 | | | | 0.61 | | | | 0.51 | | | | 1.12 | | | | (0.69 | ) | | | — | | | | (0.69 | ) | | | 0.00 | |
Class Y | | | | | | | | | | | | | | | | | | | | | | | | | | | | | | | | |
3/31/2011(h) | | | 14.68 | | | | 0.40 | | | | 0.48 | | | | 0.88 | | | | (0.45 | ) | | | — | | | | (0.45 | ) | | | — | |
9/30/2010 | | | 13.38 | | | | 0.83 | | | | 1.31 | | | | 2.14 | | | | (0.84 | ) | | | — | | | | (0.84 | ) | | | — | |
9/30/2009 | | | 12.09 | | | | 0.90 | | | | 1.36 | | | | 2.26 | | | | (0.89 | ) | | | (0.08 | ) | | | (0.97 | ) | | | — | |
9/30/2008 | | | 15.17 | | | | 1.00 | | | | (3.03 | ) | | | (2.03 | ) | | | (1.04 | ) | | | (0.01 | ) | | | (1.05 | ) | | | 0.00 | |
9/30/2007 | | | 14.59 | | | | 0.85 | | | | 0.59 | | | | 1.44 | | | | (0.86 | ) | | | — | | | | (0.86 | ) | | | 0.00 | |
9/30/2006 | | | 14.17 | | | | 0.76 | | | | 0.51 | | | | 1.27 | | | | (0.85 | ) | | | — | | | | (0.85 | ) | | | 0.00 | |
Admin Class | | | | | | | | | | | | | | | | | | | | | | | | | | | | | | | | |
3/31/2011(h) | | | 14.66 | | | | 0.38 | | | | 0.47 | | | | 0.85 | | | | (0.42 | ) | | | — | | | | (0.42 | ) | | | — | |
9/30/2010* | | | 13.87 | | | | 0.52 | | | | 0.79 | | | | 1.31 | | | | (0.52 | ) | | | — | | | | (0.52 | ) | | | — | |
| * | From commencement of Class operations on February 1, 2010 through September 30, 2010. |
| (a) | Per share net investment income has been calculated using the average shares outstanding during the period. |
| (b) | Amount rounds to less than $0.01 per share, if applicable. |
| (c) | Effective June 2, 2008, redemption fees were eliminated. |
| (d) | A sales charge for Class A shares and a contingent deferred sales charge for Class B and Class C shares are not reflected in total return calculations. Periods less than one year, if applicable, are not annualized. |
| (e) | Had certain expenses not been waived/reimbursed during the period, if applicable, total returns would have been lower. |
59 |
| | | | | | | | | | | | | | | | | | | | | | | | | | |
| | | | |
| | | | | | | | | | Ratios to Average Net Assets: | | | | |
| | | | | | |
Net asset
value,
end of
the period | | | Total
return
(%) (d)(e) | | | Net assets,
end of
the period
(000’s) | | | Net
expenses
(%) (f)(g) | | | Gross
expenses
(%) (f) | | | Net investment
income
(%) (f) | | | Portfolio
turnover
rate (%) | |
| | | | | | | | | | | | | | | | | | | | | | | | | | |
| | | | | | | | | | | | | | | | | | | | | | | | | | |
| | | | | | | | | | | | | | | | | | | | | | | | | | |
| $ | 15.12 | | | | 5.95 | | | $ | 5,705,330 | | | | 0.95 | | | | 0.95 | | | | 5.19 | | | | 10 | |
| | 14.69 | | | | 16.20 | | | | 5,758,070 | | | | 0.96 | | | | 0.96 | | | | 5.67 | | | | 27 | |
| | 13.39 | | | | 20.56 | | | | 5,544,029 | | | | 0.99 | | | | 0.99 | | | | 7.74 | | | | 39 | |
| | 12.10 | | | | (14.54 | ) | | | 5,551,066 | | | | 0.97 | | | | 0.98 | | | | 6.59 | | | | 24 | |
| | 15.18 | | | | 9.90 | | | | 5,749,315 | | | | 1.00 | | | | 1.00 | | | | 5.39 | | | | 22 | |
| | 14.60 | | | | 9.04 | | | | 2,782,887 | | | | 1.05 | | | | 1.05 | | | | 5.01 | | | | 21 | |
| | | | | | | | | | | | | | | | | | | | | | | | | | |
| | 15.21 | | | | 5.51 | | | | 128,350 | | | | 1.70 | | | | 1.70 | | | | 4.44 | | | | 10 | |
| | 14.78 | | | | 15.39 | | | | 137,268 | | | | 1.71 | | | | 1.71 | | | | 4.92 | | | | 27 | |
| | 13.46 | | | | 19.62 | | | | 148,887 | | | | 1.74 | | | | 1.74 | | | | 7.02 | | | | 39 | |
| | 12.16 | | | | (15.19 | ) | | | 161,751 | | | | 1.72 | | | | 1.73 | | | | 5.78 | | | | 24 | |
| | 15.25 | | | | 9.08 | | | | 233,418 | | | | 1.76 | | | | 1.76 | | | | 4.61 | | | | 22 | |
| | 14.66 | | | | 8.22 | | | | 179,927 | | | | 1.79 | | | | 1.79 | | | | 4.26 | | | | 21 | |
| | | | | | | | | | | | | | | | | | | | | | | | | | |
| | 15.20 | | | | 5.52 | | | | 5,037,581 | | | | 1.70 | | | | 1.70 | | | | 4.44 | | | | 10 | |
| | 14.77 | | | | 15.40 | | | | 5,146,164 | | | | 1.71 | | | | 1.71 | | | | 4.92 | | | | 27 | |
| | 13.45 | | | | 19.66 | | | | 4,894,546 | | | | 1.74 | | | | 1.74 | | | | 6.95 | | | | 39 | |
| | 12.15 | | | | (15.19 | ) | | | 3,984,204 | | | | 1.72 | | | | 1.73 | | | | 5.85 | | | | 24 | |
| | 15.24 | | | | 9.08 | | | | 3,843,823 | | | | 1.75 | | | | 1.75 | | | | 4.63 | | | | 22 | |
| | 14.65 | | | | 8.14 | | | | 1,812,278 | | | | 1.79 | | | | 1.79 | | | | 4.24 | | | | 21 | |
| | | | | | | | | | | | | | | | | | | | | | | | | | |
| | 15.11 | | | | 6.08 | | | | 2,659,601 | | | | 0.70 | | | | 0.70 | | | | 5.45 | | | | 10 | |
| | 14.68 | | | | 16.50 | | | | 2,521,337 | | | | 0.71 | | | | 0.71 | | | | 5.92 | | | | 27 | |
| | 13.38 | | | | 20.91 | | | | 2,057,888 | | | | 0.72 | | | | 0.72 | | | | 7.76 | | | | 39 | |
| | 12.09 | | | | (14.34 | ) | | | 783,058 | | | | 0.72 | | | | 0.72 | | | | 6.88 | | | | 24 | |
| | 15.17 | | | | 10.22 | | | | 638,868 | | | | 0.74 | | | | 0.74 | | | | 5.67 | | | | 22 | |
| | 14.59 | | | | 9.28 | | | | 271,065 | | | | 0.78 | | | | 0.78 | | | | 5.30 | | | | 21 | |
| | | | | | | | | | | | | | | | | | | | | | | | | | |
| | 15.09 | | | | 5.85 | | | | 15,412 | | | | 1.21 | | | | 1.21 | | | | 5.08 | | | | 10 | |
| | 14.66 | | | | 9.61 | | | | 4,379 | | | | 1.24 | | | | 1.24 | | | | 5.52 | | | | 27 | |
| (f) | Computed on an annualized basis for periods less than one year, if applicable. |
| (g) | The investment adviser and/or administrator agreed to waive its fees and/or reimburse a portion of the Fund’s expenses during the period. Without this waiver/reimbursement, if applicable, expenses would have been higher. |
| (h) | For the six months ended March 31, 2011 (Unaudited). |
| 60
Notes to Financial Statements
March 31, 2011 (Unaudited)
1. Organization. Natixis Funds Trust I and Loomis Sayles Funds II (the “Trusts” and each a “Trust”) are each organized as a Massachusetts business trust. Each Trust is registered under the Investment Company Act of 1940, as amended (“1940 Act”), as an open-end management investment company. Each Declaration of Trust permits the Board of Trustees to authorize the issuance of an unlimited number of shares of the Trust in multiple series. The financial statements for certain funds of the Trusts are presented in separate reports. The following funds (individually, a “Fund” and collectively, the “Funds”) are included in this report:
Natixis Funds Trust I:
Loomis Sayles Core Plus Bond Fund (the “Core Plus Bond Fund”)
Loomis Sayles Funds II:
Loomis Sayles High Income Fund (the “High Income Fund”)
Loomis Sayles International Bond Fund (the “International Bond Fund”)
Loomis Sayles Limited Term Government and Agency Fund (the “Limited Term Government and Agency Fund”)
Loomis Sayles Strategic Income Fund (the “Strategic Income Fund”)
The Funds each offer Class A, Class C and Class Y shares. Strategic Income Fund also offers Admin Class shares. Effective October 12, 2007, Class B shares are no longer offered. Existing Class B shareholders may continue to reinvest dividends into Class B shares and exchange their Class B shares for Class B shares of other Natixis Funds subject to existing exchange privileges as described in the prospectus.
Class A shares of all Funds except Limited Term Government and Agency Fund are sold with a maximum front-end sales charge of 4.50%. Class A shares of Limited Term Government and Agency Fund are sold with a maximum front-end sales charge of 3.00%. Class C shares do not pay a front-end sales charge, do not convert to any other class of shares, pay higher Rule 12b-1 fees than Class A shares and may be subject to a CDSC of 1.00% if those shares are redeemed within one year of acquisition, except for reinvested distributions. Class Y shares do not pay a front-end sales charge, a CDSC or Rule 12b-1 fees. Class Y shares are generally intended for institutional investors with a minimum initial investment of $100,000, though some categories of investors are exempted from the minimum investment amount as outlined in the Fund’s prospectus. Admin Class shares do not pay a front-end sales charge or a CDSC, but do pay a Rule 12b-1 fee. Admin Class shares are offered exclusively through intermediaries.
Most expenses of the Trusts can be directly attributed to a Fund. Expenses which cannot be directly attributed to a Fund are generally apportioned based on the relative net assets of each of the Funds in the Trusts. Expenses of a Fund are borne pro rata by the holders of each class of shares, except that each class bears expenses unique to that class (including the Rule 12b-1 service and distribution fees). In addition, each class votes as a class only with respect to its own Rule 12b-1 Plan. Shares of each class would receive their pro rata share of the net assets of a Fund if the Fund were liquidated. The Trustees approve separate distributions from net investment income on each class of shares.
2. Significant Accounting Policies. The following is a summary of significant accounting policies consistently followed by each Fund in the preparation of its financial statements. The Funds’ financial statements are prepared in accordance with accounting principles generally accepted in the United States of America which require the use of management estimates that affect the reported amounts and disclosures in the financial statements. Actual results could differ from those estimates. Management has evaluated the events and transactions subsequent to period-end through the date the financial statements were issued and has determined that there were no material events that would require disclosure in the Funds’ financial statements.
a. Valuation. Debt securities (other than short-term obligations purchased with an original or remaining maturity of sixty days or less) are generally valued on the basis of evaluated bids furnished to the Funds by a pricing service recommended by the investment adviser and approved by the Board of Trustees, which service determines valuations for normal, institutional-size trading units of such securities using market information, transactions for comparable securities and various relationships between securities which are generally recognized by institutional traders. Equity securities, including shares of closed-end investment companies and exchange-traded funds, for which market quotations are readily available are valued at market value, as reported by pricing services recommended by the investment adviser and approved by the Board of Trustees. Such pricing services generally use the security’s last sale price on the exchange or market where the security is primarily traded or, if there is no reported sale during the day, the closing bid price. Securities traded on the NASDAQ Global Select Market, NASDAQ Global Market and NASDAQ Capital Market are valued at the NASDAQ Official Closing Price (“NOCP”), or if lacking a NOCP, at the most recent bid quotation on the applicable NASDAQ Market. Broker-dealer bid quotations may also be used to value debt and equity securities where a pricing service does not price a security or where a pricing service does not provide a reliable price for the security. In instances where broker-dealer bid quotations are not
61 |
Notes to Financial Statements (continued)
March 31, 2011 (Unaudited)
available, certain securities held by the Funds may be valued on the basis of a price provided by a principal market maker. Forward foreign currency contracts are valued utilizing interpolated prices determined from information provided by an independent pricing service. Swap agreements are valued based on prices supplied by a pricing service, if available, or quotations obtained from broker-dealers. Short-term obligations purchased with an original or remaining maturity of sixty days or less are valued at amortized cost, which approximates market value. Investments in other open-end investment companies are valued at their net asset value each day. Securities for which market quotations are not readily available are valued at fair value as determined in good faith by the Funds’ investment adviser using consistently applied procedures under the general supervision of the Board of Trustees.
Certain Funds may hold securities traded in foreign markets. Foreign securities are valued at the market price in the foreign market. However, if events occurring after the close of the foreign market (but before the close of regular trading on the New York Stock Exchange) are believed to materially affect the value of those securities, such securities are fair valued pursuant to procedures approved by the Board of Trustees. When fair valuing securities, the Funds may, among other things, use modeling tools or other processes that may take into account factors such as securities market activity and/or significant events that occur after the close of the foreign market and before the Funds calculate their net asset values.
b. Investment Transactions and Related Investment Income. Investment transactions are accounted for on a trade date plus one basis for daily net asset value calculation. However, for financial reporting purposes, investment transactions are reported on trade date. Dividend income is recorded on ex-dividend date, or in the case of certain foreign securities, as soon as a Fund is notified, and interest income is recorded on an accrual basis. Interest income is increased by the accretion of discount and decreased by the amortization of premium. Periodic principal adjustments for inflation-protected securities are recorded to interest income. Negative principal adjustments (in the event of deflation) are recorded as reductions of interest income to the extent of interest income earned, not to exceed the amount of positive principal adjustments on a cumulative basis. Distributions received from investments in securities that represent a return of capital or capital gain are recorded as a reduction of cost of investments or as a realized gain, respectively. The calendar year-end amounts of ordinary income, capital gains, and return of capital included in distributions received from the Funds’ investments in real estate investment trusts (“REITs”) are reported to the Funds after the end of the fiscal year; accordingly, the Funds estimate these amounts for accounting purposes until the characterization of REIT distributions is reported to the Funds after the end of the fiscal year. Estimates are based on the most recent REIT distribution information available. Investment income is recorded net of foreign taxes withheld when applicable. In determining net gain or loss on securities sold, the cost of securities has been determined on an identified cost basis. Investment income, non-class specific expenses and realized and unrealized gains and losses are allocated on a pro rata basis to each class based on the relative net assets of each class to the total net assets of the Fund.
c. Foreign Currency Translation. The books and records of the Funds are maintained in U.S. dollars. The values of securities, currencies and other assets and liabilities denominated in currencies other than U.S. dollars are translated into U.S. dollars based upon foreign exchange rates prevailing at the end of the period. Purchases and sales of investment securities, income and expenses are translated on the respective dates of such transactions.
Since the values of investment securities are presented at the foreign exchange rates prevailing at the end of the period, it is not practical to isolate that portion of the results of operations arising from changes in exchange rates from fluctuations which arise due to changes in market prices of investment securities. Such changes are included with the net realized and unrealized gain or loss on investments.
Net realized foreign exchange gains or losses arise from sales of foreign currency, currency gains or losses realized between the trade and settlement dates on securities transactions, and the difference between the amounts of dividends, interest and foreign withholding taxes recorded on the Funds’ books and the U.S. dollar equivalent of the amounts actually received or paid. Net unrealized foreign exchange gains and losses arise from changes in the value of assets and liabilities, other than investment securities, at the end of the fiscal period, resulting from changes in exchange rates.
Each Fund may use foreign currency exchange contracts to facilitate transactions in foreign-denominated investments. Losses may arise from changes in the value of the foreign currency or if the counterparties do not perform under the contracts’ terms.
d. Forward Foreign Currency Contracts. The Funds may enter into forward foreign currency contracts, including forward foreign cross currency contracts. Contracts to buy generally are used to acquire exposure to foreign currencies, while contracts to sell generally are used to hedge a Fund’s investments against currency fluctuation. Also, a contract to buy or sell can offset a previous contract. These contracts involve market risk in excess of the unrealized gain or loss reflected in the Funds’ Statements of Assets and Liabilities. The U.S. dollar value of the currencies a Fund has committed to buy or sell represents the aggregate exposure to each currency the Fund
| 62
Notes to Financial Statements (continued)
March 31, 2011 (Unaudited)
has acquired or hedged through currency contracts outstanding at period end. Gains or losses are recorded for financial statement purposes as unrealized until settlement date. Risks may arise upon entering into these contracts from the potential inability of counterparties to meet the terms of their contracts and from unanticipated movements in the value of a foreign currency relative to the U.S. dollar. Certain contracts may require the movement of cash or securities as collateral for the Funds’ or counterparty’s net obligations under the contracts.
e. Swap Agreements. Each Fund may enter into credit default swaps. A credit default swap is an agreement between two parties (the “protection buyer” and “protection seller”) to exchange the credit risk of an issuer (“reference obligation”) for a specified time period. The reference obligation may be one or more debt securities or an index of such securities. The Funds may be either the protection buyer or the protection seller. The protection buyer is obligated to pay the protection seller a stream of payments (“fees”) over the term of the contract, provided that no credit event, such as a default or a downgrade in credit rating, occurs on the reference obligation. The Funds may also make or receive upfront payments. If a credit event occurs, the protection seller must pay the protection buyer the difference between the agreed upon notional value and market value of the reference obligation. Market value in this case is determined by a facilitated auction whereby a minimum number of allowable broker bids, together with a specified valuation method, are used to calculate the value. The maximum potential amount of undiscounted future payments that a Fund as the protection seller could be required to make under a credit default swap agreement would be an amount equal to the notional amount of the agreement.
The notional amounts of credit default swaps are not recorded in the financial statements. Credit default swaps are marked-to-market daily. Fluctuations in the value of credit default swaps are recorded in the Statements of Operations as change in unrealized appreciation (depreciation) on swap agreements. Fees are accrued in accordance with the terms of the agreement and are recorded in the Statements of Operations as realized gain or loss when received or paid. Upfront fees paid or received by the Funds are recorded on the Statements of Assets and Liabilities as an asset or liability, respectively, and are amortized or accreted over the term of the agreement and recorded as realized gain or loss. Payments made or received by the Funds as a result of a credit event or termination of the agreement are recorded as realized gain or loss.
Credit default swaps are privately negotiated and traded between counterparties and, as such, are subject to the risk that a party to the agreement will not be able to meet its obligations. The Funds cover their net obligations under outstanding credit default swaps by segregating or earmarking liquid assets or cash.
There were no credit default swaps held by the Funds during the six months ended March 31, 2011.
f. Federal and Foreign Income Taxes. Each Trust treats each Fund as a separate entity for federal income tax purposes. Each Fund intends to meet the requirements of the Internal Revenue Code of 1986, as amended, applicable to regulated investment companies, and to distribute to its shareholders substantially all of its net investment income and any net realized capital gains at least annually. Management has performed an analysis of each Fund’s tax positions for the open tax years as of March 31, 2011 and has concluded that no provisions for income tax are required. The Funds’ federal tax returns for the prior three fiscal years remain subject to examination by the Internal Revenue Service. Management is not aware of any events that are reasonably possible to occur in the next six months that would result in the amounts of any unrecognized tax benefits significantly increasing or decreasing for the Funds. However, management’s conclusions regarding tax positions taken may be subject to review and adjustment at a later date based on factors including, but not limited to, new tax laws and accounting regulations and interpretations thereof.
A Fund may be subject to foreign taxes on income and gains on investments that are accrued based upon the Fund’s understanding of the tax rules and regulations that exist in the countries in which the Fund invests. Foreign governments may also impose taxes or other payments on investments with respect to foreign securities. Such taxes are accrued as applicable, and are reflected as foreign taxes payable on the Statements of Assets and Liabilities.
g. Dividends and Distributions to Shareholders. Dividends and distributions are recorded on ex-dividend date. The timing and characterization of certain income and capital gain distributions are determined annually in accordance with federal tax regulations, which may differ from accounting principles generally accepted in the United States of America. Permanent differences are primarily due to differing treatments for book and tax purposes of items such as foreign currency transactions, premium amortization, defaulted bond adjustments, paydown gains and losses, distribution redesignations, expired capital loss carryforwards and return of capital and capital gain distributions from REITs. Permanent book and tax basis differences relating to shareholder distributions will result in reclassifications to capital accounts. Temporary differences between book and tax distributable earnings are primarily due to deferred Trustees’ fees, wash sales, premium amortization, forward contract mark to market, dividends payable, securities lending collateral gain/loss adjustment, REIT basis adjustments, contingent payment debt instruments and defaulted bond interest. Distributions from net investment income and short-term capital gains are considered to be distributed from ordinary income for tax purposes.
63 |
Notes to Financial Statements (continued)
March 31, 2011 (Unaudited)
The tax characterization of distributions is determined on an annual basis. The tax character of distributions paid to shareholders during the year ended September 30, 2010 was as follows:
| | | | | | | | | | | | |
| | | 2010 Distributions Paid From: | |
Fund | | Ordinary
Income | | | Long-Term
Capital Gains | | | Total | |
Core Plus Bond Fund | | $ | 15,673,765 | | | $ | — | | | $ | 15,673,765 | |
High Income Fund | | | 10,907,478 | | | | — | | | | 10,907,478 | |
International Bond Fund | | | 1,057,069 | | | | — | | | | 1,057,069 | |
Limited Term Government and Agency Fund | | | 5,644,012 | | | | — | | | | 5,644,012 | |
Strategic Income Fund | | | 716,030,690 | | | | — | | | | 716,030,690 | |
Differences between these amounts and those reported in the Statements of Changes in Net Assets are primarily attributable to different book and tax treatment for short-term capital gains.
As of September 30, 2010, the capital loss carryforwards and post-October losses were as follows:
| | | | | | | | | | | | | | | | | | | | |
| | | Core Plus
Bond Fund | | | High Income
Fund | | | International
Bond Fund | | | Limited Term
Government
and Agency
Fund | | | Strategic Income
Fund | |
Capital loss carryforward: | | | | | | | | | | | | | | | | | | | | |
Expires September 30, 2014 | | $ | (181,728 | ) | | $ | — | | | $ | — | | | $ | — | | | $ | — | |
Expires September 30, 2015 | | | — | | | | — | | | | — | | | | (715,432 | ) | | | — | |
Expires September 30, 2016 | | | — | | | | — | | | | — | | | | (100,316 | ) | | | — | |
Expires September 30, 2017 | | | — | | | | (33,112 | ) | | | — | | | | — | | | | (45,672,245 | ) |
Expires September 30, 2018 | | | — | | | | — | | | | — | | | | — | | | | (529,941,082 | ) |
| | | | | | | | | | | | | | | | | | | | |
Total capital loss carryforward | | $ | (181,728 | ) | | $ | (33,112 | ) | | $ | — | | | $ | (815,748 | ) | | $ | (575,613,327 | ) |
| | | | | | | | | | | | | | | | | | | | |
Deferred net capital losses (post-October 2009) | | $ | — | | | $ | — | | | $ | — | | | $ | — | | | $ | (126,545,807 | ) |
| | | | | | | | | | | | | | | | | | | | |
On December 22, 2010, the Regulated Investment Company Modernization Act of 2010 (the “Act”) was enacted. The Act modernizes several of the federal income and excise tax provisions related to RICs, and, with certain exceptions, is effective for taxable years beginning after December 22, 2010. Among the changes made are changes to the capital loss carryforward rules allowing for capital losses to be carried forward indefinitely. Rules in effect as of the report date limit the carryforward period to eight years. Capital loss carryforwards generated in taxable years beginning after effective date of the Act must be fully used before capital loss carryforwards generated in taxable years prior to effective date of the Act; therefore, under certain circumstances, capital loss carryforwards available as of the report date, if any, may expire unused.
h. Repurchase Agreements. It is each Fund’s policy that the market value of the collateral for repurchase agreements be at least equal to 102% of the repurchase price, including interest. Certain repurchase agreements are tri-party arrangements whereby the collateral is held in a segregated account for the benefit of the Fund and on behalf of the counterparty. Repurchase agreements could involve certain risks in the event of default or insolvency of the counterparty including possible delays or restrictions upon a Fund’s ability to dispose of the underlying securities.
i. Delayed Delivery Commitments. The Funds may purchase securities, including those designated as TBAs in the Portfolio of Investments, for which delivery or payment will occur at a later date, beyond the normal settlement period. The price of the security and the date when the security will be delivered and paid for are fixed at the time the transaction is negotiated. The security and the obligation to pay for it are recorded by the Funds at the time the commitment is entered into. The actual security that will be delivered to fulfill a TBA trade is not designated at the time of the trade. The security is “to be announced” 48 hours prior to the established trade settlement date. The value of the security may vary with market fluctuations during the time before the Funds take delivery of the security. No interest accrues to the Funds until the transaction settles. When the Funds enter into such a transaction, collateral consisting of liquid securities or cash and cash equivalents is required to be segregated or earmarked at the custodian in an amount at least equal to the amount of the Funds’ commitment.
| 64
Notes to Financial Statements (continued)
March 31, 2011 (Unaudited)
Purchases of delayed delivery securities may have a similar effect on the Funds’ net asset value as if the Funds had created a degree of leverage in its portfolio. Risks may arise upon entering into such transactions from the potential inability of counterparties to meet their obligations under the transactions. Additionally, losses may arise due to changes in the value of the underlying securities.
j. Securities Lending. The Funds have entered into an agreement with State Street Bank and Trust Company (“State Street Bank”), as agent of the Funds, to lend securities to certain designated borrowers. The loans are collateralized with cash or securities in an amount equal to at least 105% or 102% of the market value (including accrued interest) of the loaned international or domestic securities, respectively, when the loan is initiated. Thereafter, the value of the collateral must remain at least 102% of the market value (including accrued interest) of loaned securities for U.S. equities and U.S. corporate debt; at least 105% of the market value (including accrued interest) of loaned securities for non-U.S. equities; and at least 100% of the market value (including accrued interest) of loaned securities for U.S. Government securities, sovereign debt issued by non-U.S. Governments and non-U.S. corporate debt. In the event that the market value of the collateral falls below the required percentages described above, the borrower will deliver additional collateral on the next business day. As with other extensions of credit, the Funds may bear the risk of loss with respect to the investment of the collateral. The Funds invest cash collateral in short-term investments, a portion of the income from which is remitted to the borrowers and the remainder allocated between the Funds and State Street Bank as lending agent. For the six months ended March 31, 2011, none of the Funds had loaned securities under this agreement. Excess collateral in the amount of $3,175,275 related to terminated loans with a bankrupt borrower is held by State Street Bank on behalf of Strategic Income Fund.
k. Indemnifications. Under the Trusts’ organizational documents, their officers and Trustees are indemnified against certain liabilities arising out of the performance of their duties to the Funds. Additionally, in the normal course of business, the Funds enter into contracts with service providers that contain general indemnification clauses. The Funds’ maximum exposure under these arrangements is unknown as this would involve future claims that may be made against the Funds that have not yet occurred. However, based on experience, the Funds expect the risk of loss to be remote.
3. Fair Value Measurements. In accordance with accounting standards related to fair value measurements and disclosures, the Funds have categorized the inputs utilized in determining the value of each Fund’s assets or liabilities. These inputs are summarized in the three broad levels listed below:
| | • | | Level 1 – quoted prices in active markets for identical assets or liabilities; |
| | • | | Level 2 – prices determined using other significant inputs that are observable either directly, or indirectly through corroboration with observable market data (which could include quoted prices for similar assets or liabilities, interest rates, credit risk, etc.); |
| | • | | Level 3 – prices determined using significant unobservable inputs when quoted prices or observable inputs are unavailable such as when there is little or no market activity for an asset or liability (unobservable inputs reflect each Fund’s own assumptions in determining the fair value of assets or liabilities and would be based on the best information available). |
The inputs or methodology used for valuing securities are not necessarily an indication of the risk associated with investing in those securities.
The following is a summary of the inputs used to value the Funds’ investments as of March 31, 2011, at value:
Core Plus Bond Fund
Asset Valuation Inputs
| | | | | | | | | | | | | | | | |
Description | | Level 1 | | | Level 2 | | | Level 3 | | | Total | |
| | | | | | | | | | | | | | | | |
Bonds and Notes | | | | | | | | | | | | | | | | |
ABS Car Loan | | $ | — | | | $ | 8,221,815 | | | $ | 1,775,000 | | | $ | 9,996,815 | |
Wireless | | | — | | | | 13,230,179 | | | | 2,012,274 | | | | 15,242,453 | |
All Other Bonds and Notes(a) | | | — | | | | 342,842,706 | | | | — | | | | 342,842,706 | |
| | | | | | | | | | | | | | | | |
Total Bonds and Notes | | | — | | | | 364,294,700 | | | | 3,787,274 | | | | 368,081,974 | |
| | | | | | | | | | | | | | | | |
Bank Loans(a) | | | — | | | | 2,701,701 | | | | — | | | | 2,701,701 | |
Preferred Stocks(a) | | | — | | | | 2,192,690 | | | | — | | | | 2,192,690 | |
Short-Term Investments | | | — | | | | 13,602,620 | | | | — | | | | 13,602,620 | |
| | | | | | | | | | | | | | | | |
Total | | $ | — | | | $ | 382,791,711 | | | $ | 3,787,274 | | | $ | 386,578,985 | |
| | | | | | | | | | | | | | | | |
65 |
Notes to Financial Statements (continued)
March 31, 2011 (Unaudited)
Liability Valuation Inputs
| | | | | | | | | | | | | | | | |
Description(a) | | Level 1 | | | Level 2 | | | Level 3 | | | Total | |
| | | | | | | | | | | | | | | | |
Forward Foreign Currency Contracts (unrealized depreciation) | | $ | — | | | $ | (23,536 | ) | | $ | — | | | $ | (23,536 | ) |
| | | | | | | | | | | | | | | | |
| (a) | Major categories of the Fund’s investments are included in the Portfolio of Investments. |
High Income Fund
Asset Valuation Inputs
| | | | | | | | | | | | | | | | |
Description | | Level 1 | | | Level 2 | | | Level 3 | | | Total | |
| | | | | | | | | | | | | | | | |
Bonds and Notes | | | | | | | | | | | | | | | | |
Non-Convertible Bonds | | | | | | | | | | | | | | | | |
ABS Car Loan | | $ | — | | | $ | — | | | $ | 350,000 | | | $ | 350,000 | |
Supranational | | | — | | | | 7,148,267 | | | | 1,576,511 | | | | 8,724,778 | |
Wireless | | | — | | | | 2,208,847 | | | | 609,780 | | | | 2,818,627 | |
All Other Non-Convertible Bonds(a) | | | — | | | | 91,655,008 | | | | — | | | | 91,655,008 | |
| | | | | | | | | | | | | | | | |
Total Non-Convertible Bonds | | | — | | | | 101,012,122 | | | | 2,536,291 | | | | 103,548,413 | |
| | | | | | | | | | | | | | | | |
Convertible Bonds(a) | | | — | | | | 32,601,344 | | | | — | | | | 32,601,344 | |
| | | | | | | | | | | | | | | | |
Total Bonds and Notes | | | — | | | | 133,613,466 | | | | 2,536,291 | | | | 136,149,757 | |
| | | | | | | | | | | | | | | | |
Bank Loans(a) | | | — | | | | 1,028,120 | | | | — | | | | 1,028,120 | |
Preferred Stocks | | | | | | | | | | | | | | | | |
Convertible Preferred Stocks | | | | | | | | | | | | | | | | |
Automotive | | | 3,304,110 | | | | 803,233 | | | | — | | | | 4,107,343 | |
Capital Markets | | | — | | | | 2,638,630 | | | | — | | | | 2,638,630 | |
Diversified Financial Services | | | — | | | | 166,074 | | | | — | | | | 166,074 | |
Electric Utilities | | | 315,980 | | | | — | | | | — | | | | 315,980 | |
Machinery | | | — | | | | — | | | | 119,850 | | | | 119,850 | |
Oil, Gas & Consumable Fuels | | | 420,375 | | | | — | | | | — | | | | 420,375 | |
Semiconductors & Semiconductor Equipment | | | 783,020 | | | | — | | | | — | | | | 783,020 | |
| | | | | | | | | | | | | | | | |
Total Convertible Preferred Stocks | | | 4,823,485 | | | | 3,607,937 | | | | 119,850 | | | | 8,551,272 | |
| | | | | | | | | | | | | | | | |
Non-Convertible Preferred Stocks(a) | | | — | | | | 922,873 | | | | — | | | | 922,873 | |
| | | | | | | | | | | | | | | | |
Total Preferred Stocks | | | 4,823,485 | | | | 4,530,810 | | | | 119,850 | | | | 9,474,145 | |
| | | | | | | | | | | | | | | | |
Common Stocks(a) | | | 2,412,014 | | | | — | | | | — | | | | 2,412,014 | |
Closed End Investment Companies | | | 11,270 | | | | — | | | | — | | | | 11,270 | |
Warrants | | | — | | | | — | | | | — | | | | — | |
Short-Term Investments | | | — | | | | 16,610,830 | | | | — | | | | 16,610,830 | |
| | | | | | | | | | | | | | | | |
Total | | $ | 7,246,769 | | | $ | 155,783,226 | | | $ | 2,656,141 | | | $ | 165,686,136 | |
| | | | | | | | | | | | | | | | |
Liability Valuation Inputs
| | | | | | | | | | | | | | | | |
Description(a) | | Level 1 | | | Level 2 | | | Level 3 | | | Total | |
| | | | | | | | | | | | | | | | |
Forward Foreign Currency Contracts (unrealized depreciation) | | $ | — | | | $ | (46,043) | | | $ | — | | | $ | (46,043) | |
| | | | | | | | | | | | | | | | |
| (a) | Major categories of the Fund’s investments are included in the Portfolio of Investments. |
| 66
Notes to Financial Statements (continued)
March 31, 2011 (Unaudited)
International Bond Fund
Asset Valuation Inputs
| | | | | | | | | | | | | | | | |
Description | | Level 1 | | | Level 2 | | | Level 3 | | | Total | |
| | | | | | | | | | | | | | | | |
Bonds and Notes | | | | | | | | | | | | | | | | |
Non-Convertible Bonds | | | | | | | | | | | | | | | | |
Supranationals | | $ | — | | | $ | 1,718,818 | | | $ | 124,289 | | | $ | 1,843,107 | |
All Other Non-Convertible Bonds(a) | | | — | | | | 20,157,235 | | | | — | | | | 20,157,235 | |
| | | | | | | | | | | | | | | | |
Total Non-Convertible Bonds | | | — | | | | 21,876,053 | | | | 124,289 | | | | 22,000,342 | |
| | | | | | | | | | | | | | | | |
Convertible Bonds(a) | | | — | | | | 48,250 | | | | — | | | | 48,250 | |
| | | | | | | | | | | | | | | | |
Total Bonds and Notes | | | — | | | | 21,924,303 | | | | 124,289 | | | | 22,048,592 | |
| | | | | | | | | | | | | | | | |
Forward Foreign Currency Contracts (unrealized appreciation)(a) | | | — | | | | 53,335 | | | | — | | | | 53,335 | |
| | | | | | | | | | | | | | | | |
Total | | $ | — | | | $ | 21,977,638 | | | $ | 124,289 | | | $ | 22,101,927 | |
| | | | | | | | | | | | | | | | |
Liability Valuation Inputs
| | | | | | | | | | | | | | | | |
Description(a) | | Level 1 | | | Level 2 | | | Level 3 | | | Total | |
| | | | | | | | | | | | | | | | |
Forward Foreign Currency Contracts (unrealized depreciation) | | $ | — | | | $ | (15,791 | ) | | $ | — | | | $ | (15,791 | ) |
| | | | | | | | | | | | | | | | |
| (a) | Major categories of the Fund’s investments are included in the Portfolio of Investments. |
Limited Term Government and Agency Fund
Asset Valuation Inputs
| | | | | | | | | | | | | | | | |
Description(a) | | Level 1 | | | Level 2 | | | Level 3 | | | Total | |
| | | | | | | | | | | | | | | | |
Bonds and Notes | | $ | — | | | $ | 401,744,393 | | | $ | — | | | $ | 401,744,393 | |
Short-Term Investments | | | — | | | | 1,839,203 | | | | — | | | | 1,839,203 | |
| | | | | | | | | | | | | | | | |
Total | | $ | — | | | $ | 403,583,596 | | | $ | — | | | $ | 403,583,596 | |
| | | | | | | | | | | | | | | | |
| (a) | Major categories of the Fund’s investments are included in the Portfolio of Investments. |
Strategic Income Fund
Asset Valuation Inputs
| | | | | | | | | | | | | | | | |
Description | | Level 1 | | | Level 2 | | | Level 3 | | | Total | |
| | | | | | | | | | | | | | | | |
Bonds and Notes | | | | | | | | | | | | | | | | |
Non-Convertible Bonds | | | | | | | | | | | | | | | | |
Non-Captive Consumer | | $ | 2,310,874 | | | $ | 692,270,595 | | | $ | — | | | $ | 694,581,469 | |
Non-Captive Diversified | | | — | | | | 1,125,357,587 | | | | 19,052,512 | | | | 1,144,410,099 | |
All Other Non-Convertible Bonds(a) | | | — | | | | 8,694,211,669 | | | | — | | | | 8,694,211,669 | |
| | | | | | | | | | | | | | | | |
Total Non-Convertible Bonds | | | 2,310,874 | | | | 10,511,839,851 | | | | 19,052,512 | | | | 10,533,203,237 | |
| | | | | | | | | | | | | | | | |
Convertible Bonds(a) | | | — | | | | 1,275,290,668 | | | | — | | | | 1,275,290,668 | |
Municipals(a) | | | — | | | | 174,440,409 | | | | — | | | | 174,440,409 | |
| | | | | | | | | | | | | | | | |
Total Bonds and Notes | | | 2,310,874 | | | | 11,961,570,928 | | | | 19,052,512 | | | | 11,982,934,314 | |
| | | | | | | | | | | | | | | | |
Bank Loans(a) | | | — | | | | 42,252,230 | | | | — | | | | 42,252,230 | |
Common Stocks(a) | | | 721,031,429 | | | | — | | | | — | | | | 721,031,429 | |
67 |
Notes to Financial Statements (continued)
March 31, 2011 (Unaudited)
Asset Valuation Inputs (continued)
| | | | | | | | | | | | | | | | |
Description | | Level 1 | | | Level 2 | | | Level 3 | | | Total | |
| | | | | | | | | | | | | | | | |
Preferred Stocks | | | | | | | | | | | | | | | | |
Convertible Preferred Stocks | | | | | | | | | | | | | | | | |
Automotive | | $ | 95,034,735 | | | $ | 32,838,821 | | | $ | — | | | $ | 127,873,556 | |
Capital Markets | | | — | | | | 8,929,932 | | | | — | | | | 8,929,932 | |
Commercial Banks | | | 8,833,362 | | | | — | | | | — | | | | 8,833,362 | |
Diversified Financial Services | | | 19,271,491 | | | | 9,044,981 | | | | — | | | | 28,316,472 | |
Electric Utilities | | | 18,572,158 | | | | — | | | | 4,847,625 | | | | 23,419,783 | |
Household Durables | | | 7,526,000 | | | | — | | | | — | | | | 7,526,000 | |
Machinery | | | — | | | | — | | | | 10,786,077 | | | | 10,786,077 | |
Oil, Gas & Consumable Fuels | | | 32,782,393 | | | | — | | | | — | | | | 32,782,393 | |
REITs – Healthcare | | | 6,080,070 | | | | — | | | | — | | | | 6,080,070 | |
Semiconductors & Semiconductor Equipment | | | 39,121,600 | | | | — | | | | — | | | | 39,121,600 | |
| | | | | | | | | | | | | | | | |
Total Convertible Preferred Stocks | | | 227,221,809 | | | | 50,813,734 | | | | 15,633,702 | | | | 293,669,245 | |
| | | | | | | | | | | | | | | | |
Non-Convertible Preferred Stocks | | | | | | | | | | | | | | | | |
Banking | | | — | | | | 34,350,338 | | | | — | | | | 34,350,338 | |
Diversified Financial Services | | | 24,013,370 | | | | — | | | | — | | | | 24,013,370 | |
Electric Utilities | | | — | | | | 31,882 | | | | — | | | | 31,882 | |
Household Durables | | | 785,774 | | | | — | | | | — | | | | 785,774 | |
REITs – Office Property | | | — | | | | 1,700,738 | | | | — | | | | 1,700,738 | |
REITs – Warehouse/Industrials | | | 6,274,368 | | | | — | | | | — | | | | 6,274,368 | |
Software | | | — | | | | 28,088,125 | | | | — | | | | 28,088,125 | |
Thrifts & Mortgage Finance | | | 9,655,346 | | | | — | | | | — | | | | 9,655,346 | |
| | | | | | | | | | | | | | | | |
Total Non-Convertible Preferred Stocks | | | 40,728,858 | | | | 64,171,083 | | | | — | | | | 104,899,941 | |
| | | | | | | | | | | | | | | | |
Total Preferred Stocks | | | 267,950,667 | | | | 114,984,817 | | | | 15,633,702 | | | | 398,569,186 | |
| | | | | | | | | | | | | | | | |
Closed End Investment Companies | | | 28,680,141 | | | | — | | | | — | | | | 28,680,141 | |
Short-Term Investments | | | — | | | | 187,522,869 | | | | — | | | | 187,522,869 | |
| | | | | | | | | | | | | | | | |
Total Investments | | $ | 1,019,973,111 | | | $ | 12,306,330,844 | | | $ | 34,686,214 | | | $ | 13,360,990,169 | |
| | | | | | | | | | | | | | | | |
| (a) | Major categories of the Fund’s investments are included in the Portfolio of Investments. |
Preferred stocks valued at $21,195,000 were transferred from Level 2 to Level 1 during the six months ended March 31, 2011. At September 30, 2010, this security was valued at the original purchase price; at March 31, 2011, this security was valued at the market price in accordance with the Fund’s valuation policies. All transfers are recognized as of the beginning of the reporting period.
| 68
Notes to Financial Statements (continued)
March 31, 2011 (Unaudited)
The following is a reconciliation of Level 3 investments for which significant unobservable inputs were used to determine fair value as of March 31, 2011:
Core Plus Bond Fund
Asset Valuation Inputs
| | | | | | | | | | | | | | | | | | | | | | | | | | | | | | | | | | | | | | | | |
Investments in
Securities | | Balance as of
September 30,
2010 | | | Accrued
Discounts
(Premiums) | | | Realized
Gain
(Loss) | | | Change in
Unrealized
Appreciation
(Depreciation) | | | Purchases | | | Sales | | | Transfers
into
Level 3 | | | Transfers
out of
Level 3 | | | Balance as of
March 31,
2011 | | | Change in
Unrealized
Appreciation
(Depreciation)
from
Investments
Still Held at
March 31,
2011 | |
Bonds and Notes ABS Car Loan | | $ | — | | | $ | — | | | $ | — | | | $ | 49 | | | $ | 1,774,951 | | | $ | — | | | $ | — | | | $ | — | | | $ | 1,775,000 | | | $ | 49 | |
Wireless | | | — | | | | — | | | | — | | | | 32,274 | | | | 1,980,000 | | | | — | | | | — | | | | — | | | | 2,012,274 | | | | 32,274 | |
| | | | | | | | | | | | | | | | | | | | | | | | | | | | | | | | | | | | | | | | |
Total | | $ | — | | | $ | — | | | $ | — | | | $ | 32,323 | | | $ | 3,754,951 | | | $ | — | | | $ | — | | | $ | — | | | $ | 3,787,274 | | | $ | 32,323 | |
| | | | | | | | | | | | | | | | | | | | | | | | | | | | | | | | | | | | | | | | |
High Income Fund
Asset Valuation Inputs
| | | | | | | | | | | | | | | | | | | | | | | | | | | | | | | | | | | | | | | | |
Investments in
Securities | | Balance as of
September 30,
2010 | | | Accrued
Discounts
(Premiums) | | | Realized
Gain
(Loss) | | | Change in
Unrealized
Appreciation
(Depreciation) | | | Purchases | | | Sales | | | Transfers
into Level 3 | | | Transfers
out of
Level 3 | | | Balance as of
March 31,
2011 | | | Change in
Unrealized
Appreciation
(Depreciation)
from
Investments
Still Held at
March 31,
2011 | |
Bonds and Notes | | | | | | | | | | | | | | | | | | | | | | | | | | | | | | | | | | | | | | | | |
Non-Convertible Bonds | | | | | | | | | | | | | | | | | | | | | | | | | | | | | | | | | | | | | | | | |
ABS Car Loan | | $ | — | | | $ | — | | | $ | — | | | $ | 15 | | | $ | 349,985 | | | $ | — | | | $ | — | | | $ | — | | | $ | 350,000 | | | $ | 15 | |
Supranational | | | — | | | | 282 | | | | — | | | | (20,456 | ) | | | 1,596,685 | | | | — | | | | — | | | | — | | | | 1,576,511 | | | | (20,456 | ) |
Wireless | | | — | | | | — | | | | — | | | | 9,780 | | | | 600,000 | | | | — | | | | — | | | | — | | | | 609,780 | | | | 9,780 | |
Preferred Stocks | | | | | | | | | | | | | | | | | | | | | | | | | | | | | | | | | | | | | | | | |
Convertible Preferred Stocks | | | | | | | | | | | | | | | | | | | | | | | | | | | | | | | | | | | | | | | | |
Machinery | | | — | | | | — | | | | — | | | | 34,425 | | | | — | | | | — | | | | 85,425 | | | | — | | | | 119,850 | | | | 34,425 | |
| | | | | | | | | | | | | | | | | | | | | | | | | | | | | | | | | | | | | | | | |
Total | | $ | — | | | $ | 282 | | | $ | — | | | $ | 23,764 | | | $ | 2,546,670 | | | $ | — | | | $ | 85,425 | | | $ | — | | | $ | 2,656,141 | | | $ | 23,764 | |
| | | | | | | | | | | | | | | | | | | | | | | | | | | | | | | | | | | | | | | | |
Preferred stocks valued at $85,425 were transferred from Level 2 to Level 3 during the six months ended March 31, 2011. At September 30, 2010, these securities were valued using evaluated bids furnished to the Fund by a pricing service; at March 31, 2011, these securities were valued using broker-dealer bid quotations based on inputs unobservable to the Fund.
All transfers are recognized as of the beginning of the reporting period.
69 |
Notes to Financial Statements (continued)
March 31, 2011 (Unaudited)
International Bond Fund
Asset Valuation Inputs
| | | | | | | | | | | | | | | | | | | | | | | | | | | | | | | | | | | | | | | | |
Investments in
Securities | | Balance as of
September 30,
2010 | | | Accrued
Discounts
(Premiums) | | | Realized
Gain
(Loss) | | | Change in
Unrealized
Appreciation
(Depreciation) | | | Purchases | | | Sales | | | Transfers
into Level 3 | | | Transfers
out of
Level 3 | | | Balance as of
March 31,
2011 | | | Change in
Unrealized
Appreciation
(Depreciation)
from
Investments
Still Held at
March 31,
2011 | |
Bonds and Notes | | | | | | | | | | | | | | | | | | | | | | | | | | | | | | | | | | | | | | | | |
Non-Convertible Bonds Supranationals | | $ | — | | | $ | 34 | | | $ | — | | | $ | (1,559) | | | $ | 125,814 | | | $ | — | | | $ | — | | | $ | — | | | $ | 124,289 | | | $ | (1,559) | |
| | | | | | | | | | | | | | | | | | | | | | | | | | | | | | | | | | | | | | | | |
Strategic Income Fund
Asset Valuation Inputs
| | | | | | | | | | | | | | | | | | | | | | | | | | | | | | | | | | | | | | | | |
Investments in
Securities | | Balance as of
September 30,
2010 | | | Accrued
Discounts
(Premiums) | | | Realized
Gain
(Loss) | | | Change in
Unrealized
Appreciation
(Depreciation) | | | Purchases | | | Sales | | | Transfers Into Level 3 | | | Transfers out of Level 3 | | | Balance as of
March 31,
2011 | | | Change in
Unrealized
Appreciation
(Depreciation)
from
Investments
Still Held at
March 31,
2011 | |
Bonds and Notes | | | | | | | | | | | | | | | | | | | | | | | | | | | | | | | | | | | | | | | | |
Non-Convertible Bonds
Airlines | | $ | 34,976,018 | | | $ | — | | | $ | — | | | $ | — | | | $ | — | | | $ | — | | | $ | — | | | $ | (34,976,018 | ) | | $ | — | | | $ | — | |
Non-Captive Diversified | | | — | | | | — | | | | — | | | | 47,512 | | | | 19,005,000 | | | | — | | | | — | | | | — | | | | 19,052,512 | | | | 47,512 | |
Preferred Stocks | | | | | | | | | | | | | | | | | | | | | | | | | | | | | | | | | | | | | | | | |
Convertible Preferred Stocks | | | | | | | | | | | | | | | | | | | | | | | | | | | | | | | | | | | | | | | | |
Electric Utilities | | | 3,770,375 | | | | — | | | | — | | | | 1,077,250 | | | | — | | | | — | | | | — | | | | — | | | | 4,847,625 | | | | 1,077,250 | |
Machinery | | | — | | | | — | | | | — | | | | 3,098,129 | | | | — | | | | — | | | | 7,687,948 | | | | — | | | | 10,786,077 | | | | 3,098,129 | |
| | | | | | | | | | | | | | | | | | | | | | | | | | | | | | | | | | | | | | | | |
Total | | $ | 38,746,393 | | | $ | — | | | $ | — | | | $ | 4,222,891 | | | $ | 19,005,000 | | | $ | — | | | $ | 7,687,948 | | | $ | (34,976,018) | | | $ | 34,686,214 | | | $ | 4,222,891 | |
| | | | | | | | | | | | | | | | | | | | | | | | | | | | | | | | | | | | | | | | |
Debt securities valued at $34,976,018 were transferred from Level 3 to Level 2 during the six months ended March 31, 2011. At September 30, 2010, these securities were valued using broker-dealer bid quotations based on inputs unobservable to the Fund; at March 31, 2011, these securities were valued on the basis of evaluated bids furnished to the Fund by a pricing service.
Preferred stocks valued at $7,687,948 were transferred from Level 2 to Level 3 during the six months ended March 31, 2011. At September 30, 2010, these securities were valued using evaluated bids furnished to the Fund by a pricing service; at March 31, 2011, these securities were valued using broker-dealer bid quotations based on inputs unobservable to the Fund.
All transfers are recognized as of the beginning of the reporting period.
4. Derivatives. Derivative instruments are defined as financial instruments whose value and performance are based on the value and performance of another security or financial instrument. Derivative instruments that the Funds used during the period include forward foreign currency contracts.
The Funds are subject to the risk that changes in foreign currency exchange rates will have an unfavorable effect on the value of Fund assets denominated in foreign currencies. The Funds may enter into forward foreign currency contracts for hedging purposes to protect the value of the Funds’ holdings of foreign securities. The Funds may also use forward foreign currency contracts to gain exposure to foreign currencies, regardless of whether securities denominated in such currencies are held in the Funds. During the six months ended March 31, 2011, Core Plus Bond Fund and High Income Fund engaged in forward foreign currency transactions for hedging purposes. During the same period, International Bond Fund engaged in forward foreign currency transactions for hedging purposes and to gain exposure to foreign currencies.
| 70
Notes to Financial Statements (continued)
March 31, 2011 (Unaudited)
Each Fund is party to agreements with counterparties that govern transactions in forward foreign currency contracts. These agreements contain credit-risk-related contingent features that allow the counterparties to terminate open contracts early if the net asset value of a Fund declines beyond a certain threshold. If such features were to be triggered, the counterparties could request immediate settlement of open contracts at current fair value. As of March 31, 2011, the fair value of derivative positions subject to credit-risk-related contingent features that are in a net liability position (unrealized depreciation) by counterparty, and the value of collateral pledged to counterparties for such contracts is as follows:
| | | | | | | | | | |
Fund | | Counterparty | | Derivatives | | | Collateral Pledged | |
Core Plus Bond Fund | | Credit Suisse | | $ | (23,536 | ) | | $ | — | |
High Income Fund | | Barclays | | | (46,043 | ) | | | — | |
International Bond Fund | | JPMorgan Chase | | | (9,450 | ) | | | — | |
Forward foreign currency contracts are subject to the risk that the counterparty will be unwilling or unable to meet its obligations under the contracts. The Funds have mitigated this risk by entering into master netting agreements with counterparties that allow the Fund and the counterparty to net amounts owed by each related to derivative contracts to one net amount payable by either the Fund or the counterparty. The maximum amount of loss that the Funds would incur if counterparties failed to meet their obligations, based on the value of derivative positions in an unrealized gain position as of period end, and the amount of loss that the Funds would incur after taking into account master netting arrangements, are as follows as of March 31, 2011:
| | | | | | | | |
Fund | | Maximum Amount
of Loss - Gross | | | Maximum Amount
of Loss - Net | |
Core Plus Bond Fund | | $ | — | | | $ | — | |
High Income Fund | | | — | | | | — | |
International Bond Fund | | | 53,335 | | | | 46,994 | |
Counterparty risk is managed through the posting of collateral and, as a result, the risk of loss to a Fund from counterparty default should be limited to the extent a Fund is undercollateralized. In addition to collateral requirements, the Funds also require counterparties to meet minimum credit quality requirements.
The following is a summary of derivative instruments for Core Plus Bond Fund as of March 31, 2011:
| | | | |
Statements of Assets and Liabilities Caption | | Foreign
Exchange
Contracts | |
Liabilities | | | | |
Unrealized depreciation on forward foreign currency contracts | | $ | (23,536 | ) |
Transactions in derivative instruments for Core Plus Bond Fund during the six months ended March 31, 2011, were as follows:
| | | | |
Statements of Operations Caption | | Foreign
Exchange
Contracts | |
Net Change in Unrealized Appreciation (Depreciation) on: | | | | |
Foreign currency translations* | | $ | (23,536 | ) |
| * | Represents change in unrealized appreciation (depreciation) for forward foreign currency contracts during the period. |
The following is a summary of derivative instruments for High Income Fund as of March 31, 2011:
| | | | |
Statements of Assets and Liabilities Caption | | Foreign
Exchange
Contracts | |
Liabilities | | | | |
Unrealized depreciation on forward foreign currency contracts | | $ | (46,043 | ) |
71 |
Notes to Financial Statements (continued)
March 31, 2011 (Unaudited)
Transactions in derivative instruments for High Income Fund during the six months ended March 31, 2011, were as follows:
| | | | |
Statements of Operations Caption | | Foreign
Exchange
Contracts | |
Net Realized Gain (Loss) on: | | | | |
Foreign currency transactions* | | $ | (57,807 | ) |
Net Change in Unrealized Appreciation (Depreciation) on: | | | | |
Foreign currency translations* | | | (46,043 | ) |
| * | Represents realized loss and change in unrealized appreciation (depreciation), respectively, for forward foreign currency contracts during the period. |
The following is a summary of derivative instruments for International Bond Fund as of March 31, 2011:
| | | | |
Statements of Assets and Liabilities Caption | | Foreign
Exchange
Contracts | |
Assets | | | | |
Unrealized appreciation on forward foreign currency contracts | | $ | 53,335 | |
Liabilities | | | | |
Unrealized depreciation on forward foreign currency contracts | | | (15,791 | ) |
Transactions in derivative instruments for International Bond Fund during the six months ended March 31, 2011, were as follows:
| | | | |
Statements of Operations Caption | | Foreign
Exchange
Contracts | |
Net Realized Gain (Loss) on: | | | | |
Foreign currency transactions* | | $ | 190,919 | |
Net Change in Unrealized Appreciation (Depreciation) on: | | | | |
Foreign currency translations* | | | (97,047 | ) |
| * | Represents realized gain and change in unrealized appreciation (depreciation), respectively, for forward foreign currency contracts during the period. |
As the Funds value their derivatives at fair value and recognize changes in fair value through the Statements of Operations, they do not qualify for hedge accounting under authoritative guidance for derivative instruments. The Funds’ investments in derivatives may represent an economic hedge; however, they are considered to be non-hedge transactions for the purpose of these disclosures.
| 72
Notes to Financial Statements (continued)
March 31, 2011 (Unaudited)
Volume of forwards activity, as a percentage of net assets, for Core Plus Bond Fund, High Income Fund and International Bond Fund, based on month-end notional amounts outstanding during the period, at absolute value, was as follows for the six months ended March 31, 2011:
| | | | |
Core Plus Bond Fund | | Forwards | |
Average Notional Amount Outstanding | | | 0.42 | % |
Highest Notional Amount Outstanding | | | 3.00 | % |
Lowest Notional Amount Outstanding | | | 0.00 | % |
Notional Amount Outstanding as of March 31, 2011 | | | 3.00 | % |
| |
High Income Fund | | Forwards | |
Average Notional Amount Outstanding | | | 0.56 | % |
Highest Notional Amount Outstanding | | | 0.92 | % |
Lowest Notional Amount Outstanding | | | 0.00 | % |
Notional Amount Outstanding as of March 31, 2011 | | | 0.92 | % |
| |
International Bond Fund | | Forwards | |
Average Notional Amount Outstanding | | | 27.62 | % |
Highest Notional Amount Outstanding | | | 42.00 | % |
Lowest Notional Amount Outstanding | | | 21.89 | % |
Notional Amount Outstanding as of March 31, 2011 | | | 22.76 | % |
Notional amounts outstanding at the end of the prior period are included in the average notional amount outstanding.
5. Purchases and Sales of Securities. For the six months ended March 31, 2011, purchases and sales of securities (excluding short-term investments and including paydowns) were as follows:
| | | | | | | | | | | | | | | | |
| | | U.S. Government/Agency
Securities | | | Other Securities | |
Fund | | Purchases | | | Sales | | | Purchases | | | Sales | |
Core Plus Bond Fund | | $ | 141,954,589 | | | $ | 158,792,311 | | | $ | 96,124,107 | | | $ | 85,785,522 | |
High Income Fund | | | — | | | | — | | | | 46,349,043 | | | | 50,745,786 | |
International Bond Fund | | | 2,014,304 | | | | 2,008,748 | | | | 10,616,247 | | | | 21,271,683 | |
Limited Term Government and Agency Fund | | | 196,544,188 | | | | 156,560,836 | | | | 35,349,571 | | | | 9,978,541 | |
Strategic Income Fund | | | 318,107,642 | | | | — | | | | 992,476,833 | | | | 1,937,577,878 | |
6. Management Fees and Other Transactions with Affiliates.
a. Management Fees. Loomis, Sayles & Company, L.P. (“Loomis Sayles”) serves as investment adviser to each Fund. Under the terms of the management agreements, each Fund pays a management fee at the following annual rates, calculated daily and payable monthly, based on each Fund’s average daily net assets:
| | | | | | | | | | | | | | | | | | | | | | | | |
| | | Percentage of Average Daily Net Assets | |
Fund | | First
$100 million | | | Next
$100 million | | | Next
$50 million | | | Next
$1.75 billion | | | Next
$13 billion | | | Over
$15 billion | |
Core Plus Bond Fund | | | 0.2500 | % | | | 0.1875 | % | | | 0.1875 | % | | | 0.1875 | % | | | 0.1875 | % | | | 0.1875 | % |
High Income Fund | | | 0.6000 | % | | | 0.6000 | % | | | 0.6000 | % | | | 0.6000 | % | | | 0.6000 | % | | | 0.6000 | % |
International Bond Fund | | | 0.6000 | % | | | 0.6000 | % | | | 0.6000 | % | | | 0.6000 | % | | | 0.6000 | % | | | 0.6000 | % |
Limited Term Government and Agency Fund | | | 0.5000 | % | | | 0.5000 | % | | | 0.5000 | % | | | 0.4000 | % | | | 0.4000 | % | | | 0.4000 | % |
Strategic Income Fund | | | 0.6500 | % | | | 0.6500 | % | | | 0.6000 | % | | | 0.6000 | % | | | 0.5500 | % | | | 0.5400 | % |
73 |
Notes to Financial Statements (continued)
March 31, 2011 (Unaudited)
Natixis Asset Management Advisors, L.P. (“Natixis Advisors”) serves as the advisory administrator to Core Plus Bond Fund. Under the terms of the advisory administration agreement, the Fund pays an advisory administration fee at the following annual rates, calculated daily and payable monthly, based on its average daily net assets:
| | | | | | | | |
| | | Percentage of Average Daily Net Assets | |
Fund | | First $100 million | | | Over $100 million | |
Core Plus Bond Fund | | | 0.2500% | | | | 0.1875% | |
Management and advisory administration fees are presented in the Statements of Operations as management fees.
Loomis Sayles has given binding undertakings to the Funds to waive management fees and/or reimburse certain expenses to limit the Funds’ operating expenses, exclusive of acquired fund fees and expenses, brokerage expenses, interest expense, taxes and extraordinary expenses. These undertakings are in effect until January 31, 2012 and are reevaluated on an annual basis. Management fees payable, as reflected on the Statements of Assets and Liabilities, is net of waivers and/or expense reimbursements, if any, pursuant to these undertakings. Waivers/reimbursements that exceed management fees payable are reflected on the Statements of Assets and Liabilities as receivable from investment adviser.
For the six months ended March 31, 2011, the expense limits as a percentage of average daily net assets under the expense limitation agreements were as follows:
| | | | | | | | | | |
| | | Expense Limit as a Percentage of Average
Daily Net Assets |
Fund | | Class A | | Class B | | Class C | | Class Y | | Admin Class |
Core Plus Bond Fund | | 0.90% | | 1.65% | | 1.65% | | 0.65% | | — |
High Income Fund | | 1.15% | | 1.90% | | 1.90% | | 0.90% | | — |
International Bond Fund | | 1.10% | | — | | 1.85% | | 0.85% | | — |
Limited Term Government and Agency Fund | | 0.85% | | 1.60% | | 1.60% | | 0.60% | | — |
Strategic Income Fund | | 1.25% | | 2.00% | | 2.00% | | 1.00% | | 1.50% |
Loomis Sayles and Natixis Advisors have agreed to equally bear the waivers and/or expense reimbursements for Core Plus Bond Fund.
Loomis Sayles (and Natixis Advisors for Core Plus Bond Fund) shall be permitted to recover expenses borne under the expense limitation agreements (whether through waiver of its management fees or otherwise) on a class by class basis in later periods to the extent the expenses of a class fall below a class’ expense limits, provided, however, that a class is not obligated to pay such waived/reimbursed fees or expenses more than one year after the end of the fiscal year in which the fees or expenses were waived/reimbursed.
For the six months ended March 31, 2011, the management fees and waivers of management fees for each Fund were as follows:
| | | | | | | | | | | | | | | | | | | | |
Fund | | Gross
Management
Fees | | | Waivers of
Management
Fees1 | | | Net
Management
Fees | | | Percentage of
Average
Daily Net Assets | |
| | | | | Gross | | | Net | |
Core Plus Bond Fund | | $ | 396,443 | | | $ | — | | | $ | 396,443 | | | | 0.203 | % | | | 0.203 | % |
High Income Fund | | | 490,547 | | | | — | | | | 490,547 | | | | 0.600 | % | | | 0.600 | % |
International Bond Fund | | | 81,464 | | | | 69,093 | | | | 12,371 | | | | 0.600 | % | | | 0.091 | % |
Limited Term Government and Agency Fund | | | 877,271 | | | | 103,662 | | | | 773,609 | | | | 0.466 | % | | | 0.411 | % |
Strategic Income Fund | | | 37,538,551 | | | | — | | | | 37,538,551 | | | | 0.558 | % | | | 0.558 | % |
| 1 | Management fee waivers are subject to possible recovery until September 30, 2012. |
| 74
Notes to Financial Statements (continued)
March 31, 2011 (Unaudited)
For the six months ended March 31, 2011, the advisory administration fees for Core Plus Bond Fund were as follows:
| | | | |
Advisory
Administration
Fee | | Percentage of
Average
Daily Net Assets | |
$396,443 | | | 0.203% | |
For the six months ended March 31, 2011, expense reimbursements related to the prior fiscal year were recovered as follows:
| | | | | | | | | | | | | | | | | | | | |
| | | Recovered Expenses | |
Fund | | Class A | | | Class B | | | Class C | | | Class Y | | | Total | |
High Income Fund | | $ | 7,237 | | | $ | 110 | | | $ | 1,971 | | | $ | 6,009 | | | $ | 15,327 | |
Certain officers and directors of Loomis Sayles and Natixis Advisors and its affiliates are also Trustees of the Funds. Loomis Sayles and Natixis Advisors are both limited partnerships indirectly owned by Natixis Global Asset Management, L.P. (“Natixis US”), which is part of Natixis Global Asset Management, an international asset management group based in Paris, France.
b. Service and Distribution Fees. Natixis Distributors, L.P. (“Natixis Distributors”), a wholly-owned subsidiary of Natixis US, has entered into a distribution agreement with the Trusts. Pursuant to this agreement, Natixis Distributors serves as principal underwriter of the Funds of the Trusts.
Pursuant to Rule 12b-1 under the 1940 Act, the Trusts have adopted a Service Plan relating to each Fund’s Class A shares (the “Class A Plans”), a Distribution and Service Plan relating to each Fund’s Class B (if applicable) and Class C shares (the “Class B and Class C Plans”), and Strategic Income Fund has adopted a Distribution Plan relating to its Admin Class shares (the “Admin Class Plan”).
Under the Class A Plans, each Fund pays Natixis Distributors a monthly service fee at an annual rate not to exceed 0.25% of the average daily net assets attributable to the Fund’s Class A shares, as reimbursement for expenses incurred by Natixis Distributors in providing personal services to investors in Class A shares and/or the maintenance of shareholder accounts.
Under the Class B (if applicable) and Class C Plans, each Fund pays Natixis Distributors a monthly service fee at an annual rate not to exceed 0.25% of the average daily net assets attributable to the Fund’s Class B (if applicable) and Class C shares, as compensation for services provided by Natixis Distributors in providing personal services to investors in Class B (if applicable) and Class C shares and/or the maintenance of shareholder accounts.
Also under the Class B (if applicable) and Class C Plans, each Fund pays Natixis Distributors a monthly distribution fee at the annual rate of 0.75% of the average daily net assets attributable to the Fund’s Class B (if applicable) and Class C shares, as compensation for services provided by Natixis Distributors in connection with the marketing or sale of Class B (if applicable) and Class C shares.
Under the Admin Class Plan, Strategic Income Fund pays Natixis Distributors a monthly distribution fee at an annual rate not to exceed 0.25% of the average daily net assets attributable to the Fund’s Admin Class shares, as compensation for services provided by Natixis Distributors in connection with the marketing or sale of Admin Class shares or for payments made by Natixis Distributors to securities dealers or other financial intermediaries as commissions, asset-based sales charges or other compensation with respect to the sale of Admin Class shares, or for providing personal services to investors and/or the maintenance of shareholder accounts.
In addition, the Admin Class shares of Strategic Income Fund may pay Natixis Distributors an administrative service fee, at an annual rate not to exceed 0.25% of the average daily net assets attributable to Admin Class shares. These fees are subsequently paid to securities dealers or financial intermediaries for providing personal services and/or account maintenance for their customers who hold such shares.
75 |
Notes to Financial Statements (continued)
March 31, 2011 (Unaudited)
For the six months ended March 31, 2011, the Funds paid the following service and distribution fees:
| | | | | | | | | | | | | | | | | | | | | | | | | | | | |
| | | Service Fees | | | Distribution Fees | |
Fund | | Class A | | | Class B | | | Class C | | | Admin Class | | | Class B | | | Class C | | | Admin Class | |
Core Plus Bond Fund | | $ | 259,298 | | | $ | 4,952 | | | $ | 149,423 | | | $ | — | | | $ | 14,856 | | | $ | 448,269 | | | $ | — | |
High Income Fund | | | 93,918 | | | | 1,383 | | | | 25,887 | | | | — | | | | 4,148 | | | | 77,660 | | | | — | |
International Bond Fund | | | 21,921 | | | | — | | | | 7,654 | | | | — | | | | — | | | | 22,964 | | | | — | |
Limited Term Government and Agency Fund | | | 250,810 | | | | 7,285 | | | | 91,007 | | | | — | | | | 21,857 | | | | 273,023 | | | | — | |
Strategic Income Fund | | | 7,119,810 | | | | 165,733 | | | | 6,348,308 | | | | 10,959 | | | | 497,199 | | | | 19,044,924 | | | | 10,959 | |
c. Administrative Fees. Natixis Advisors provides certain administrative services for the Funds and contracts with State Street Bank to serve as sub-administrator. Natixis Advisors is a wholly-owned subsidiary of Natixis US. Pursuant to an agreement among Natixis Funds Trust I, Natixis Funds Trust II, Natixis Funds Trust IV, Natixis Cash Management Trust, Gateway Trust (“Natixis Funds Trusts”), Loomis Sayles Funds I, Loomis Sayles Funds II (“Loomis Sayles Funds Trusts”), Hansberger International Series and Natixis Advisors, each Fund pays Natixis Advisors monthly its pro rata portion of fees equal to an annual rate of 0.0575% of the first $15 billion of the average daily net assets of the Natixis Funds Trusts, Loomis Sayles Funds Trusts and Hansberger International Series, 0.0500% of the next $15 billion, 0.0400% of the next $30 billion and 0.0350% of such assets in excess of $60 billion, subject to an annual aggregate minimum fee for the Natixis Funds Trusts, Loomis Sayles Funds Trusts and Hansberger International Series of $10 million, which is reevaluated on an annual basis. New funds are subject to a fee for the first twelve months of operations of $75,000 plus $12,500 per additional class and an additional $75,000 if managed by multiple subadvisers.
For the six months ended March 31, 2011, each Fund paid the following administrative fees to Natixis Advisors:
| | | | |
Fund | | Administrative
Fees | |
Core Plus Bond Fund | | $ | 91,030 | |
High Income Fund | | | 38,198 | |
International Bond Fund | | | 6,345 | |
Limited Term Government and Agency Fund | | | 87,898 | |
Strategic Income Fund | | | 3,142,417 | |
d. Sub-Transfer Agent Fees. Natixis Distributors has entered into agreements with financial intermediaries to provide certain recordkeeping, processing, shareholder communications and other services to customers of the intermediaries and has agreed to compensate the intermediaries for providing those services. Certain services would be provided by the Funds if the shares of those customers were registered directly with the Funds’ transfer agent. Accordingly, the Funds agreed to pay a portion of the intermediary fees attributable to shares of the Fund held by the intermediaries (which generally are a percentage of the value of shares held) not to exceed what the Funds would have paid their transfer agent had each customer’s shares been registered directly with the transfer agent instead of held through the intermediaries. Natixis Distributors pays the remainder of the fees.
For the six months ended March 31, 2011, the Funds paid the following sub-transfer agent fees, which are reflected in transfer agent fees and expenses in the Statements of Operations.
| | | | |
Fund | | Sub-Transfer Agent
Fees | |
Core Plus Bond Fund | | $ | 125,239 | |
High Income Fund | | | 51,140 | |
International Bond Fund | | | 5,765 | |
Limited Term Government and Agency Fund | | | 70,247 | |
Strategic Income Fund | | | 3,950,368 | |
| 76
Notes to Financial Statements (continued)
March 31, 2011 (Unaudited)
e. Commissions. Commissions (including CDSCs) on Fund shares retained by Natixis Distributors during the six months ended March 31, 2011 were as follows:
| | | | |
Fund | | Commissions | |
Core Plus Bond Fund | | $ | 212,453 | |
High Income Fund | | | 49,292 | |
International Bond Fund | | | 4,656 | |
Limited Term Government and Agency Fund | | | 107,676 | |
Strategic Income Fund | | | 2,519,255 | |
f. Trustees Fees and Expenses. The Trusts do not pay any compensation directly to their officers or Trustees who are directors, officers or employees of Natixis Advisors, Natixis Distributors, Natixis US or their affiliates. The Chairperson of the Board receives a retainer fee at the annual rate of $250,000. The Chairperson does not receive any meeting attendance fees for Board of Trustees meetings or committee meetings that she attends. Each Independent Trustee (other than the Chairperson) receives, in the aggregate, a retainer fee at the annual rate of $80,000. Each Independent Trustee also receives a meeting attendance fee of $10,000 for each meeting of the Board of Trustees that he or she attends in person and $5,000 for each meeting of the Board of Trustees that he or she attends telephonically. In addition, each committee chairman receives an additional retainer fee at an annual rate of $15,000. Each Contract Review and Governance Committee member is compensated $6,000 for each Committee meeting that he or she attends in person and $3,000 for each meeting that he or she attends telephonically. Each Audit Committee member is compensated $7,500 for each Committee meeting that he or she attends in person and $3,750 for each meeting that he or she attends telephonically. These fees are allocated among the funds in the Natixis Funds Trusts, Loomis Sayles Funds Trusts and Hansberger International Series based on a formula that takes into account, among other factors, the relative net assets of each fund. Trustees are reimbursed for travel expenses in connection with attendance at meetings.
A deferred compensation plan (the “Plan”) is available to the Trustees on a voluntary basis. Deferred amounts remain in the Funds until distributed in accordance with the provisions of the Plan. The value of a participating Trustee’s deferral account is based on theoretical investments of deferred amounts, on the normal payment dates, in certain funds of the Natixis Funds Trusts, Loomis Sayles Funds Trusts and Hansberger International Series as designated by the participating Trustees. Changes in the value of participants’ deferral accounts are allocated pro rata among the funds in the Natixis Funds Trusts, Loomis Sayles Funds Trusts, and Hansberger International Series, and are normally reflected as Trustees’ fees and expenses in the Statements of Operations. The portions of the accrued obligations allocated to the Funds under the Plan are reflected as Deferred Trustees’ fees in the Statements of Assets and Liabilities.
7. Line of Credit. Each Fund, together with certain other funds of Natixis Funds Trusts, Loomis Sayles Funds Trusts and Hansberger International Series, participates in a $200,000,000 committed unsecured line of credit provided by State Street Bank, with an individual limit of $125,000,000 for each fund that participates in the line of credit. Interest is charged to each participating fund based on its borrowings at a rate per annum equal to the greater of the Federal Funds rate or overnight LIBOR, plus 1.25%. In addition, a commitment fee of 0.15% per annum, payable at the end of each calendar quarter, is accrued and apportioned among the participating funds based on their average daily unused portion of the line of credit.
Effective April 21, 2011, each Fund, together with certain other funds of Natixis Funds Trusts, Loomis Sayles Funds Trusts and Hansberger International Series, will participate in a $200,000,000 committed unsecured line of credit provided by State Street Bank, with an individual limit of $125,000,000 for each fund that will participate in the line of credit. Interest will be charged to each participating fund based on its borrowings at a rate per annum equal to the greater of the Federal Funds rate or overnight LIBOR, plus 1.25%. In addition, a commitment fee of 0.125% per annum, payable at the end of each calendar quarter, will be accrued and apportioned among the participating funds based on their average daily unused portion of the line of credit.
For the six months ended March 31, 2011, none of the Funds had borrowings under these agreements.
8. Concentration of Risk. International Bond Fund is a non-diversified fund. Compared with diversified mutual funds, International Bond Fund may invest a greater percentage of its assets in a particular country. Therefore, International Bond Fund’s returns could be significantly affected by the performance of any one of the small number of countries in its portfolio.
Each Fund’s investments in foreign securities are subject to foreign currency fluctuations, higher volatility than U.S. securities, varying degrees of regulation and limited liquidity. Greater political, economic, credit and information risks are also associated with foreign securities.
9. Concentration of Ownership. At March 31, 2011, the Loomis Sayles Employees’ Profit Sharing Retirement Plan held 27,912 shares of beneficial interest of Limited Term Government and Agency Fund.
77 |
Notes to Financial Statements (continued)
March 31, 2011 (Unaudited)
From time to time, the Funds may have a concentration of several shareholders having a significant percentage of shares outstanding. Investment activities of these shareholders could have material impacts on the Funds. As of March 31, 2011, one shareholder individually owned more than 5% of Limited Term Government and Agency Fund’s total outstanding shares, representing 5.84% of the Fund’s net assets. Such ownership may be beneficially held by individuals or entities other than the owner of record.
10. Capital Shares. Each Fund may issue an unlimited number of shares of beneficial interest, without par value. Transactions in capital shares were as follows:
| | | | | | | | | | | | | | | | |
| |
| Six Months Ended
March 31, 2011 |
| |
| Year Ended
September 30, 2010 |
|
Core Plus Bond Fund | | | Shares | | | | Amount | | | | Shares | | | | Amount | |
| | | | | | | | | | | | | | | | |
| Class A | | | | | | | | | | | | | | | | |
Issued from the sale of shares | | | 3,032,407 | | | $ | 38,246,183 | | | | 8,076,791 | | | $ | 99,281,285 | |
Issued in connection with the reinvestment of distributions | | | 305,573 | | | | 3,842,934 | | | | 503,145 | | | | 6,118,146 | |
Redeemed | | | (4,227,557 | ) | | | (53,230,022 | ) | | | (3,556,858 | ) | | | (43,324,928 | ) |
| | | | | | | | | | | | | | | | |
Net change | | | (889,577 | ) | | $ | (11,140,905 | ) | | | 5,023,078 | | | $ | 62,074,503 | |
| | | | | | | | | | | | | | | | |
| Class B | | | | | | | | | | | | | | | | |
Issued from the sale of shares | | | 14,270 | | | $ | 182,537 | | | | 46,593 | | | $ | 562,160 | |
Issued in connection with the reinvestment of distributions | | | 5,067 | | | | 63,936 | | | | 14,472 | | | | 175,787 | |
Redeemed | | | (90,226 | ) | | | (1,145,001 | ) | | | (298,342 | ) | | | (3,615,617 | ) |
| | | | | | | | | | | | | | | | |
Net change | | | (70,889 | ) | | $ | (898,528 | ) | | | (237,277 | ) | | $ | (2,877,670 | ) |
| | | | | | | | | | | | | | | | |
| Class C | | | | | | | | | | | | | | | | |
Issued from the sale of shares | | | 1,357,749 | | | $ | 17,140,317 | | | | 4,971,733 | | | $ | 60,338,041 | |
Issued in connection with the reinvestment of distributions | | | 79,585 | | | | 1,001,303 | | | | 143,826 | | | | 1,750,082 | |
Redeemed | | | (1,734,051 | ) | | | (21,836,494 | ) | | | (1,930,707 | ) | | | (23,457,007 | ) |
| | | | | | | | | | | | | | | | |
Net change | | | (296,717 | ) | | $ | (3,694,874 | ) | | | 3,184,852 | | | $ | 38,631,116 | |
| | | | | | | | | | | | | | | | |
| Class Y | | | | | | | | | | | | | | | | |
Issued from the sale of shares | | | 1,188,549 | | | $ | 15,087,610 | | | | 4,875,867 | | | $ | 59,587,010 | |
Issued in connection with the reinvestment of distributions | | | 60,378 | | | | 763,931 | | | | 102,891 | | | | 1,263,048 | |
Redeemed | | | (2,102,081 | ) | | | (26,813,560 | ) | | | (2,443,989 | ) | | | (29,878,028 | ) |
| | | | | | | | | | | | | | | | |
Net change | | | (853,154 | ) | | $ | (10,962,019 | ) | | | 2,534,769 | | | $ | 30,972,030 | |
| | | | | | | | | | | | | | | | |
Increase (decrease) from capital share transactions | | | (2,110,337 | ) | | $ | (26,696,326 | ) | | | 10,505,422 | | | $ | 128,799,979 | |
| | | | | | | | | | | | | | | | |
| | |
| |
| Six Months Ended
March 31, 2011 |
| |
| Year Ended
September 30, 2010 |
|
High Income Fund | | | Shares | | | | Amount | | | | Shares | | | | Amount | |
| | | | | | | | | | | | | | | | |
| Class A | | | | | | | | | | | | | | | | |
Issued from the sale of shares | | | 6,406,995 | | | $ | 32,219,556 | | | | 7,886,065 | | | $ | 37,432,096 | |
Issued in connection with the reinvestment of distributions | | | 414,136 | | | | 2,063,913 | | | | 740,661 | | | | 3,486,120 | |
Redeemed | | | (5,868,284 | ) | | | (29,489,780 | ) | | | (8,110,153 | ) | | | (38,368,078 | ) |
| | | | | | | | | | | | | | | | |
Net change | | | 952,847 | | | $ | 4,793,689 | | | | 516,573 | | | $ | 2,550,138 | |
| | | | | | | | | | | | | | | | |
| Class B | | | | | | | | | | | | | | | | |
Issued from the sale of shares | | | 7,725 | | | $ | 38,906 | | | | 27,891 | | | $ | 131,139 | |
Issued in connection with the reinvestment of distributions | | | 5,683 | | | | 28,373 | | | | 13,045 | | | | 61,362 | |
Redeemed | | | (58,503 | ) | | | (293,024 | ) | | | (143,704 | ) | | | (680,984 | ) |
| | | | | | | | | | | | | | | | |
Net change | | | (45,095 | ) | | $ | (225,745 | ) | | | (102,768 | ) | | $ | (488,483 | ) |
| | | | | | | | | | | | | | | | |
| Class C | | | | | | | | | | | | | | | | |
Issued from the sale of shares | | | 906,852 | | | $ | 4,550,450 | | | | 1,272,869 | | | $ | 6,002,594 | |
Issued in connection with the reinvestment of distributions | | | 81,744 | | | | 408,112 | | | | 138,274 | | | | 650,996 | |
Redeemed | | | (1,017,296 | ) | | | (5,134,472 | ) | | | (1,443,966 | ) | | | (6,801,815 | ) |
| | | | | | | | | | | | | | | | |
Net change | | | (28,700 | ) | | $ | (175,910 | ) | | | (32,823 | ) | | $ | (148,225 | ) |
| | | | | | | | | | | | | | | | |
| Class Y | | | | | | | | | | | | | | | | |
Issued from the sale of shares | | | 5,230,705 | | | $ | 26,362,690 | | | | 10,174,824 | | | $ | 47,942,376 | |
Issued in connection with the reinvestment of distributions | | | 444,780 | | | | 2,215,625 | | | | 940,961 | | | | 4,395,066 | |
Redeemed | | | (5,577,721 | ) | | | (27,860,433 | ) | | | (20,410,850 | ) | | | (95,761,418 | ) |
| | | | | | | | | | | | | | | | |
Net change | | | 97,764 | | | $ | 717,882 | | | | (9,295,065 | ) | | $ | (43,423,976 | ) |
| | | | | | | | | | | | | | | | |
Increase (decrease) from capital share transactions | | | 976,816 | | | $ | 5,109,916 | | | | (8,914,083 | ) | | $ | (41,510,546 | ) |
| | | | | | | | | | | | | | | | |
| 78
Notes to Financial Statements (continued)
March 31, 2011 (Unaudited)
| | | | | | | | | | | | | | | | |
| |
| Six Months Ended
March 31, 2011 |
| |
| Year Ended
September 30, 2010 |
|
International Bond Fund | | | Shares | | | | Amount | | | | Shares | | | | Amount | |
| | | | | | | | | | | | | | | | |
| Class A | | | | | | | | | | | | | | | | |
Issued from the sale of shares | | | 310,157 | | | $ | 3,443,838 | | | | 1,454,026 | | | $ | 15,450,317 | |
Issued in connection with the reinvestment of distributions | | | 48,847 | | | | 520,362 | | | | 25,628 | | | | 268,292 | |
Redeemed | | | (691,792 | ) | | | (7,492,108 | ) | | | (582,821 | ) | | | (6,085,212 | ) |
| | | | | | | | | | | | | | | | |
Net change | | | (332,788 | ) | | $ | (3,527,908 | ) | | | 896,833 | | | $ | 9,633,397 | |
| | | | | | | | | | | | | | | | |
| Class C | | | | | | | | | | | | | | | | |
Issued from the sale of shares | | | 76,500 | | | $ | 830,178 | | | | 488,076 | | | $ | 5,290,541 | |
Issued in connection with the reinvestment of distributions | | | 6,600 | | | | 69,857 | | | | 4,722 | | | | 49,432 | |
Redeemed | | | (104,350 | ) | | | (1,125,861 | ) | | | (212,865 | ) | | | (2,176,537 | ) |
| | | | | | | | | | | | | | | | |
Net change | | | (21,250 | ) | | $ | (225,826 | ) | | | 279,933 | | | $ | 3,163,436 | |
| | | | | | | | | | | | | | | | |
| Class Y | | | | | | | | | | | | | | | | |
Issued from the sale of shares | | | 66,794 | | | $ | 737,139 | | | | 363,950 | | | $ | 3,901,435 | |
Issued in connection with the reinvestment of distributions | | | 6,729 | | | | 72,798 | | | | 34,152 | | | | 358,772 | |
Redeemed | | | (698,911 | ) | | | (7,888,374 | ) | | | (805,893 | ) | | | (8,515,480 | ) |
| | | | | | | | | | | | | | | | |
Net change | | | (625,388 | ) | | $ | (7,078,437 | ) | | | (407,791 | ) | | $ | (4,255,273 | ) |
| | | | | | | | | | | | | | | | |
Increase (decrease) from capital share transactions | | | (979,426 | ) | | $ | (10,832,171 | ) | | | 768,975 | | | $ | 8,541,560 | |
| | | | | | | | | | | | | | | | |
| | |
| |
| Six Months Ended
March 31, 2011 |
| |
| Year Ended
September 30, 2010 |
|
Limited Term Government and Agency Fund | | | Shares | | | | Amount | | | | Shares | | | | Amount | |
| | | | | | | | | | | | | | | | |
| Class A | | | | | | | | | | | | | | | | |
Issued from the sale of shares | | | 12,933,441 | | | $ | 153,984,071 | | | | 11,266,230 | | | $ | 133,267,058 | |
Issued in connection with the reinvestment of distributions | | | 243,436 | | | | 2,896,407 | | | | 199,254 | | | | 2,358,259 | |
Redeemed | | | (6,357,553 | ) | | | (75,647,525 | ) | | | (8,020,196 | ) | | | (94,867,976 | ) |
| | | | | | | | | | | | | | | | |
Net change | | | 6,819,324 | | | $ | 81,232,953 | | | | 3,445,288 | | | $ | 40,757,341 | |
| | | | | | | | | | | | | | | | |
| Class B | | | | | | | | | | | | | | | | |
Issued from the sale of shares | | | 777,069 | | | $ | 9,196,264 | | | | 74,327 | | | $ | 877,417 | |
Issued in connection with the reinvestment of distributions | | | 5,237 | | | | 62,223 | | | | 4,282 | | | | 50,516 | |
Redeemed | | | (99,963 | ) | | | (1,189,894 | ) | | | (124,533 | ) | | | (1,466,258 | ) |
| | | | | | | | | | | | | | | | |
Net change | | | 682,343 | | | $ | 8,068,593 | | | | (45,924 | ) | | $ | (538,325 | ) |
| | | | | | | | | | | | | | | | |
| Class C | | | | | | | | | | | | | | | | |
Issued from the sale of shares | | | 1,300,166 | | | $ | 15,535,752 | | | | 4,108,090 | | | $ | 48,568,618 | |
Issued in connection with the reinvestment of distributions | | | 51,870 | | | | 617,715 | | | | 41,123 | | | | 487,281 | |
Redeemed | | | (2,096,385 | ) | | | (24,997,335 | ) | | | (2,221,038 | ) | | | (26,267,537 | ) |
| | | | | | | | | | | | | | | | |
Net change | | | (744,349 | ) | | $ | (8,843,868 | ) | | | 1,928,175 | | | $ | 22,788,362 | |
| | | | | | | | | | | | | | | | |
| Class Y | | | | | | | | | | | | | | | | |
Issued from the sale of shares | | | 2,917,144 | | | $ | 34,958,835 | | | | 10,058,653 | | | $ | 119,749,282 | |
Issued in connection with the reinvestment of distributions | | | 62,913 | | | | 751,193 | | | | 40,673 | | | | 484,828 | |
Redeemed | | | (3,677,044 | ) | | | (43,901,885 | ) | | | (4,553,430 | ) | | | (54,266,299 | ) |
| | | | | | | | | | | | | | | | |
Net change | | | (696,987 | ) | | $ | (8,191,857 | ) | | | 5,545,896 | | | $ | 65,967,811 | |
| | | | | | | | | | | | | | | | |
Increase (decrease) from capital share transactions | | | 6,060,331 | | | $ | 72,265,821 | | | | 10,873,435 | | | $ | 128,975,189 | |
| | | | | | | | | | | | | | | | |
79 |
Notes to Financial Statements (continued)
March 31, 2011 (Unaudited)
| | | | | | | | | | | | | | | | |
| |
| Six Months Ended
March 31, 2011 |
| |
| Year Ended
September 30, 2010* |
|
Strategic Income Fund | | | Shares | | | | Amount | | | | Shares | | | | Amount | |
| | | | | | | | | | | | | | | | |
| Class A | | | | | | | | | | | | | | | | |
Issued from the sale of shares | | | 47,706,228 | | | $ | 711,712,948 | | | | 102,095,738 | | | $ | 1,433,327,434 | |
Issued in connection with the reinvestment of distributions | | | 8,958,378 | | | | 132,962,547 | | | | 19,067,875 | | | | 267,178,534 | |
Redeemed | | | (71,207,045 | ) | | | (1,060,425,268 | ) | | | (143,344,700 | ) | | | (2,011,259,494 | ) |
| | | | | | | | | | | | | | | | |
Net change | | | (14,542,439 | ) | | $ | (215,749,773 | ) | | | (22,181,087 | ) | | $ | (310,753,526 | ) |
| | | | | | | | | | | | | | | | |
| Class B | | | | | | | | | | | | | | | | |
Issued from the sale of shares | | | 88,076 | | | $ | 1,317,878 | | | | 186,206 | | | $ | 2,622,085 | |
Issued in connection with the reinvestment of distributions | | | 111,282 | | | | 1,661,923 | | | | 248,193 | | | | 3,496,666 | |
Redeemed | | | (1,049,493 | ) | | | (15,751,816 | ) | | | (2,205,963 | ) | | | (31,123,182 | ) |
| | | | | | | | | | | | | | | | |
Net change | | | (850,135 | ) | | $ | (12,772,015 | ) | | | (1,771,564 | ) | | $ | (25,004,431 | ) |
| | | | | | | | | | | | | | | | |
| Class C | | | | | | | | | | | | | | | | |
Issued from the sale of shares | | | 22,491,707 | | | $ | 337,144,423 | | | | 56,633,554 | | | $ | 798,369,591 | |
Issued in connection with the reinvestment of distributions | | | 4,088,802 | | | | 61,020,245 | | | | 8,306,362 | | | | 117,036,115 | |
Redeemed | | | (43,611,337 | ) | | | (653,065,844 | ) | | | (80,289,909 | ) | | | (1,131,902,366 | ) |
| | | | | | | | | | | | | | | | |
Net change | | | (17,030,828 | ) | | $ | (254,901,176 | ) | | | (15,349,993 | ) | | $ | (216,496,660 | ) |
| | | | | | | | | | | | | | | | |
| Class Y | | | | | | | | | | | | | | | | |
Issued from the sale of shares | | | 45,120,463 | | | $ | 673,015,337 | | | | 71,382,373 | | | $ | 1,004,096,644 | |
Issued in connection with the reinvestment of distributions | | | 2,049,416 | | | | 30,408,557 | | | | 3,481,005 | | | | 48,849,457 | |
Redeemed | | | (42,854,906 | ) | | | (637,587,343 | ) | | | (56,938,380 | ) | | | (797,459,413 | ) |
| | | | | | | | | | | | | | | | |
Net change | | | 4,314,973 | | | $ | 65,836,551 | | | | 17,924,998 | | | $ | 255,486,688 | |
| | | | | | | | | | | | | | | | |
| Admin Class | | | | | | | | | | | | | | | | |
Issued from the sale of shares | | | 733,916 | | | $ | 10,934,371 | | | | 309,466 | | | $ | 4,414,761 | |
Issued in connection with the reinvestment of distributions | | | 13,940 | | | | 206,993 | | | | 2,485 | | | | 35,684 | |
Redeemed | | | (24,921 | ) | | | (372,421 | ) | | | (13,316 | ) | | | (193,142 | ) |
| | | | | | | | | | | | | | | | |
Net change | | | 722,935 | | | $ | 10,768,943 | | | | 298,635 | | | $ | 4,257,303 | |
| | | | | | | | | | | | | | | | |
Increase (decrease) from capital share transactions | | | (27,385,494 | ) | | $ | (406,817,470 | ) | | | (21,079,011 | ) | | $ | (292,510,626 | ) |
| | | | | | | | | | | | | | | | |
| * | From commencement of operations on February 1, 2010 through September 30, 2010 for Admin Class shares. |
| 80
SEMIANNUAL REPORT
March 31, 2011

Loomis Sayles Global Equity and Income Fund
(Formerly Loomis Sayles Global Markets Fund)
Loomis Sayles Growth Fund
Loomis Sayles Mid Cap Growth Fund
Loomis Sayles Value Fund
Loomis, Sayles & Company, L.P.
TABLE OF CONTENTS
Management Discussion and Performance page 1
Portfolio of Investments page 21
Financial Statements page 48
LOOMIS SAYLES GLOBAL EQUITY AND INCOME FUND*
Management Discussion
Managers:
Mark Baribeau, CFA**
Dan Fuss, CFA, CIC
Warren Koontz, CFA, CIC
David Rolley, CFA
Loomis, Sayles & Company, L.P.
Objective:
Seeks high total return through a combination of capital appreciation and current income
Strategy:
Invests primarily in equity and fixed-income securities of U.S. and foreign issuers, including securities of issuers located in emerging markets
Fund Inception:
May 1, 1996
Symbols:
| | |
| Class A | | LGMAX |
| Class C | | LGMCX |
| Class Y | | LSWWX |
| * | Formerly Loomis Sayles Global Markets Fund |
| ** | Effective May 2, 2011, Mark Baribeau no longer serves as a portfolio manager of the fund. |
Effective March 31, 2011, Loomis Sayles Global Markets Fund changed its name to Loomis Sayles Global Equity and Income Fund.
Market Conditions
Last year��s stock market rally carried over into 2011 until Mideast turmoil, Japan’s devastating earthquake and rising energy prices stymied the rally. Those concerns, as well as Europe’s ongoing sovereign debt crisis, led fixed-income investors to reconsider the riskier positions taken in response to improving economic trends. The dollar weakened against major currencies and interest rates were broadly on the rise. Given the magnitude of these concerns, corporate issues held up well compared to government obligations, and lower-quality bonds outperformed higher-rated issues.
Performance Results
For the six months ended March 31, 2011, Class A shares of Loomis Sayles Global Equity and Income Fund returned 12.14% at net asset value. The fund trailed its primary benchmark, the Morgan Stanley Capital International (MSCI) World Index, which returned 14.42%. The fund outperformed its secondary benchmark, the Citigroup World Government Bond Index, which returned -1.11%. The fund also outperformed the 8.57% average return of funds in Morningstar’s World Allocation category.
Explanation of Fund Performance
The fund pursues its objective by investing in equity and fixed-income securities. The fund’s primary benchmark measures equity market performance and its secondary benchmark measures government bond market performance.
On the equity side of the portfolio, strong stock selection within the information technology and industrial sectors enhanced returns. Companies tied to the global demand for smart phones and Internet access led in technology. British chip maker ARM Holdings turned in strong results, thanks to increased sales and licensing agreements. Apple continued to move higher, due to vigorous sales of its iPad tablet computer. In addition, Verizon’s adoption of iPhones boosted sales. Nvidia, which supplies semiconductors for non-Apple devices, declined. Within industrials, robust orders and
1 |
a sizeable backlog boosted FMC Technologies, makers and providers of offshore oil and gas systems and service. We increased energy exposure in response to growing global demand for oil service. In Brazil, shares of OGX Petroleo e Gas retreated following a disappointing earnings report, while Hypermarcas, a large conglomerate, fell when news of its intention to acquire a large drug chain was poorly received by the market. Stock selection among financials hurt returns as market participants shifted from the developing markets we emphasized to troubled financial institutions in developed countries.
On the bond side of the portfolio, results benefited from corporate bond exposure and an underweight in government bonds. Cyclical holdings stood out, including Lucent in technology, iStar in financials and Hovnanian Enterprises in manufacturing. The fund’s high-yield, emerging market and convertible securities also aided returns. The fund had less exposure than the index to Japanese securities, which benefited performance relative to that measure. Despite the fund’s short duration, or sensitivity to interest rate changes, long duration in U.S. dollar-denominated bonds proved disadvantageous when rates rose. A rally in the euro hurt returns compared to the index, because the fund was underweight in the euro.
Outlook
The Federal Reserve Board’s (the Fed) Treasury purchase program designed to inject money into the economy, which is referred to as “QE2” (short for quantitative easing), is about to end. A new wave of purchases is not expected unless the economy deteriorates; and that prospect is unlikely, given recent strong employment data. Rising energy prices notwithstanding, we anticipate 2011 earnings growth of 15% for the S&P 500 Index, decelerating to 10% or so next year. The Fed may have to snug up interest rates at some point if inflation expands.
In Asia outside of Japan, we believe strong currency moves versus the dollar will offset the effects of weak local equity markets. Overall, we are retaining corporate exposures because we believe that further global expansion is likely and that rising commodity prices will help sustain growth in emerging markets.
What You Should Know:
Investments in the Fund are subject to a number of risks. Please see the “Principal Risks” section of the Funds prospectus. The purchase of Fund shares should be seen as a long-term investment.
| 2
LOOMIS SAYLES GLOBAL EQUITY AND INCOME FUND*
Investment Results through March 31, 2011
The charts comparing the fund’s performance to two indexes provide you with a general sense of how it performed. The fund’s total return for the period shown below appears with and without sales charges and includes fund expenses and fees. An index measures the performance of a theoretical portfolio. Unlike a fund, the index is unmanaged and does not have expenses that affect the results. It is not possible to invest directly in an index. Investors would incur transaction costs and other expenses if they purchased the securities necessary to match the index.
Growth of a $10,000 Investment in Class A Shares1,5
March 31, 2001 through March 31, 2011
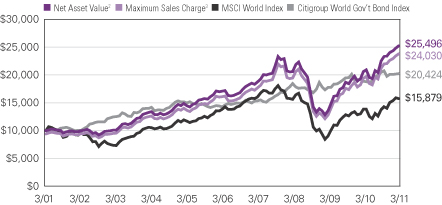
Average Annual Returns — March 31, 20115
| | | | | | | | | | | | | | | | |
| | | | | |
| | | 6 Months | | | 1 Year | | | 5 Years | | | 10 Years | |
| | | | | |
| Class A (Inception 2/1/06)1 | | | | | | | | | | | | | | | | |
| Net Asset Value2 | | | 12.14 | % | | | 22.64 | % | | | 8.17 | % | | | 9.81 | % |
| With Maximum Sales Charge3 | | | 5.68 | | | | 15.60 | | | | 6.91 | | | | 9.16 | |
| | | | | |
| Class C (Inception 2/1/06)1 | | | | | | | | | | | | | | | | |
| Net Asset Value2 | | | 11.70 | | | | 21.71 | | | | 7.37 | | | | 9.00 | |
| With CDSC4 | | | 10.70 | | | | 20.71 | | | | 7.37 | | | | 9.00 | |
| | | | | |
| Class Y (Inception 5/1/96) | | | | | | | | | | | | | | | | |
| Net Asset Value2 | | | 12.22 | | | | 22.95 | | | | 8.45 | | | | 10.09 | |
| | | | | |
| Comparative Performance | | | | | | | | | | | | | | | | |
| MSCI World Index | | | 14.42 | | | | 14.03 | | | | 2.64 | | | | 4.73 | |
| Citigroup World Government Bond Index | | | -1.11 | | | | 7.29 | | | | 7.31 | | | | 7.40 | |
| Morningstar World Allocation Fund Avg. | | | 8.57 | | | | 11.84 | | | | 4.51 | | | | 6.82 | |
* Formerly Loomis Sayles Global Markets Fund.
All returns represent past performance and do not guarantee future results. Periods of less than one year are not annualized. Share price and return will vary and you may have a gain or loss when you sell your shares. All results include reinvestment of dividends and capital gains. Current returns may be higher or lower than those shown. For performance current to the most recent month-end, visit ga.natixis.com.
Class Y shares are not available for purchase by all investors.
The table and graph do not reflect taxes shareholders might owe on any fund distributions or when they redeem their shares.
3 |
| | | | |
| Fund Composition | | % of Net
Assets as of
3/31/11 | |
Common Stocks | | | 67.7 | |
Bonds and Notes | | | 25.2 | |
Preferred Stock | | | 0.3 | |
Bank Loans | | | 0.0 | |
Short-Term Investments and Other | | | 6.8 | |
| |
| Ten Largest Holdings | | % of Net
Assets as of
3/31/11 | |
Apple, Inc. | | | 4.1 | |
Novo Nordisk A/S, Class B | | | 2.6 | |
ARM Holdings PLC | | | 2.5 | |
Siemens AG, (Registered) | | | 2.4 | |
Deere & Co. | | | 2.1 | |
Oracle Corp. | | | 2.0 | |
Baidu, Inc., Sponsored ADR | | | 2.0 | |
Estee Lauder Cos., Inc. (The), Class A | | | 2.0 | |
FMC Technologies, Inc. | | | 1.8 | |
Caterpillar, Inc. | | | 1.7 | |
| | | | |
| Five Largest Industries | | % of Net
Assets as of
3/31/11 | |
Machinery | | | 8.0 | |
Energy Equipment & Services | | | 6.0 | |
Treasuries | | | 5.7 | |
Internet Software & Services | | | 5.1 | |
Computers & Peripherals | | | 4.1 | |
Portfolio holdings and asset allocations will vary.
Expense Ratios
as stated in the most recent prospectus
| | | | | | | | |
| Share Class | | Gross Expense Ratio6 | | | Net Expense Ratio7 | |
| A | | | 1.29 | % | | | 1.25 | % |
| C | | | 2.04 | | | | 2.00 | |
| Y | | | 1.04 | | | | 1.00 | |
NOTES TO CHARTS
| See | page 17 for a description of the indices. |
| 1 | Prior to the inception of Class A and C shares (2/1/06), performance is that of Institutional Class shares, restated to reflect the higher net expenses and sales loads of Class A and C shares. |
| 2 | At Net Asset Value (NAV) — does not reflect payment of sales charge at time of purchase. |
| 3 | With Maximum Sales Charge (MSC) — reflects maximum sales charge of 5.75% at time of purchase. |
| 4 | Performance for Class C shares assumes a 1% contingent deferred sales charge (“CDSC”) applied when you sell shares within one year of purchase. |
| 5 | Fund performance has been increased by fee waivers and/or expense reimbursements, if any, without which performance would have been lower. |
| 6 | Before fee waivers and/or expense reimbursements. |
| 7 | After fee waivers and/or expense reimbursements. Waivers/reimbursements are contractual and are set to expire 1/31/12. Contracts are reevaluated on an annual basis. |
| 4
LOOMIS SAYLES GROWTH FUND
Management Discussion
Manager:
Aziz Hamzaogullari, CFA
Loomis, Sayles & Company, L.P.
Objective:
Long-term growth of capital
Strategy:
Invests primarily in equity securities, including common stocks, convertible securities, and warrants; focuses on stocks of large-capitalization companies, but may invest in companies of any size
Fund Inception:
May 16, 1991
Symbols:
| | |
| Class A | | LGRRX |
| Class B | | LGRBX |
| Class C | | LGRCX |
| Class Y | | LSGRX |
Market Conditions
Stocks staged an impressive rally over the six months ended March 31, 2011. Rising corporate profits and increasing evidence of a strengthening economy bolstered investor confidence, and the positive environment was favorable for companies across all capitalization ranges. Among large-cap stocks, growth shares outpaced value shares by a small margin.
Performance Results
For the six months ended March 31, 2011, Class A shares of Loomis Sayles Growth Fund returned 11.87% at net asset value. For the same period, the fund’s benchmark, the Russell 1000 Growth Index, rose 18.57%, while the average return of funds in the Morningstar Large Growth category was 17.88%.
Explanation of Fund Performance
The fund delivered solid double-digit gains for the period but lagged its benchmark. The fund had less exposure to energy stocks during a period in which oil prices shot up, in large part due to growing political unrest in the Middle East and North Africa. In addition, the fund’s focus on attractively priced, higher-quality companies was out of step during the period, as investors were attracted to more volatile, lower-quality companies that led the market rally. Stock selection in the healthcare and producer durables sectors also detracted from results, offsetting the positive impact of the fund’s stock selection in the consumer discretionary sector.
Relative to the benchmark, consumer discretionary was the only positively contributing sector for the time period. This strong performance was due primarily to advertising company Omnicom, the best performer for the period. We believe that an increasingly complex and changing landscape in the advertising market may create opportunities for Omnicom, including migration to digital marketing and improving measurement techniques. Other holdings that performed well included: oil service company Schlumberger, which benefited from the economic recovery and the rise in oil prices; software company Oracle, whose revenues were driven by database sales and an expansion in computer hardware; semiconductor manufacturer Altera; and biotechnology company Biogen Idec, which reported strong sales of its multiple sclerosis drug.
5 |
Despite the success in Biogen Idec, the fund’s overall healthcare results lagged. Pharmaceuticals companies Amgen, Novartis and Merck were notable detractors from the fund’s return. Amgen, a biotechnology company, came under pressure from concern about the durability of its Anemia Franchise and slower than expected uptake of new products. Switzerland-based Novartis underperformed because of worries about the effects of pending patent expirations of several products. Merck’s shares declined after the company stopped drug trials for one potential product and narrowed the scope of trials for a second product. In the producer durables area, the most notable laggard was global logistics company Expeditors International of Washington. Its share price declined after the company reported disappointing profit margins. An investment in technology giant Cisco Systems, which reported disappointing earnings margins because of increased spending in product research and development, also held back performance.
Outlook
At the end of the period, the fund had more exposure than the benchmark to the healthcare, financials and consumer staples sectors and less exposure to the energy, industrials and technology groups. These sector weights are the result of the stock selection process.
It is important to note that we do not manage the fund based on projections of macroeconomic trends. Our disciplined investment approach relies on fundamental and bottom-up research. Regardless of the current market environment, we search for what we believe are high-quality businesses with sustainable competitive advantages and profitable growth characteristics whose shares are trading at significant discounts to intrinsic values. We believe this discipline can limit the downside risks of losing capital and result in a diversified portfolio of companies with different fundamental drivers of return. Our approach may not produce the highest results in any one period, but we are confident that it is a prudent strategy for the long term. Because we take a long-term view on the fund’s investments, portfolio turnover tends to be relatively low.
What You Should Know:
Investments in the Fund are subject to a number of risks. Please see the “Principal Risks” section of the Funds prospectus. The purchase of Fund shares should be seen as a long-term investment.
| 6
LOOMIS SAYLES GROWTH FUND
Investment Results through March 31, 2011
The charts comparing the fund’s performance to an index provide you with a general sense of how it performed. The fund’s total return for the period shown below appears with and without sales charges and includes fund expenses and fees. An index measures the performance of a theoretical portfolio. Unlike a fund, the index is unmanaged and does not have expenses that affect the results. It is not possible to invest directly in an index. Investors would incur transaction costs and other expenses if they purchased the securities necessary to match the index.
Growth of a $10,000 Investment in Class A Shares1,5
March 31, 2001 through March 31, 2011
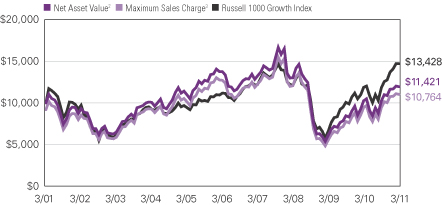
Average Annual Returns — March 31, 20115
| | | | | | | | | | | | | | | | |
| | | | | |
| | | 6 Months | | | 1 Year | | | 5 Years | | | 10 Years | |
| | | | | |
| Class A (Inception 12/31/96)1 | | | | | | | | | | | | | | | | |
| Net Asset Value2 | | | 11.87 | % | | | 12.09 | % | | | -2.12 | % | | | 1.34 | % |
| With Maximum Sales Charge3 | | | 5.50 | | | | 5.70 | | | | -3.27 | | | | 0.74 | |
| | | | | |
| Class B (Inception 9/12/03)1 | | | | | | | | | | | | | | | | |
| Net Asset Value2 | | | 11.70 | | | | 11.48 | | | | -2.83 | | | | 0.59 | |
| With CDSC4 | | | 6.70 | | | | 6.48 | | | | -3.22 | | | | 0.59 | |
| | | | | |
| Class C (Inception 9/12/03)1 | | | | | | | | | | | | | | | | |
| Net Asset Value2 | | | 11.70 | | | | 11.25 | | | | -2.83 | | | | 0.59 | |
| With CDSC4 | | | 10.70 | | | | 10.25 | | | | -2.83 | | | | 0.59 | |
| | | | | |
| Class Y (Inception 5/16/91) | | | | | | | | | | | | | | | | |
| Net Asset Value2 | | | 11.95 | | | | 12.36 | | | | -1.71 | | | | 1.67 | |
| | | | | |
| Comparative Performance | | | | | | | | | | | | | | | | |
| Russell 1000 Growth Index | | | 18.57 | | | | 18.26 | | | | 4.34 | | | | 2.99 | |
| Morningstar Large Growth Fund Avg. | | | 17.88 | | | | 16.77 | | | | 3.08 | | | | 2.91 | |
All returns represent past performance and do not guarantee future results. Periods of less than one year are not annualized. Share price and return will vary and you may have a gain or loss when you sell your shares. All results include reinvestment of dividends and capital gains. Current returns may be higher or lower than those shown. For performance current to the most recent month-end, visit ga.natixis.com.
Class Y shares are not available for purchase by all investors.
The table and graph do not reflect taxes shareholders might owe on any fund distributions or when they redeem their shares.
7 |
| | | | |
| Fund Composition | | % of Net
Assets as of
3/31/11 | |
Common Stocks | | | 98.8 | |
Short-Term Investments and Other | | | 1.2 | |
| |
| Ten Largest Holdings | | % of Net
Assets as of
3/31/11 | |
Google, Inc., Class A | | | 6.1 | |
Amazon.com, Inc. | | | 5.7 | |
Oracle Corp. | | | 5.3 | |
Visa, Inc., Class A | | | 5.3 | |
QUALCOMM, Inc. | | | 4.9 | |
Cisco Systems, Inc. | | | 4.5 | |
United Parcel Service, Inc., Class B | | | 4.2 | |
SEI Investments Co. | | | 4.1 | |
American Express Co. | | | 4.0 | |
Amgen, Inc. | | | 3.8 | |
| | | | |
| Five Largest Industries | | % of Net
Assets as of
3/31/11 | |
Software | | | 11.0 | |
Communications Equipment | | | 9.4 | |
Capital Markets | | | 8.3 | |
Air Freight & Logistics | | | 7.7 | |
Internet & Catalog Retail | | | 7.4 | |
Portfolio holdings and asset allocations will vary.
Expense Ratios
as stated in the most recent prospectus
| | | | | | | | |
| Share Class | | Gross Expense Ratio6 | | | Net Expense Ratio7 | |
| A | | | 1.20 | % | | | 1.20 | % |
| B | | | 1.95 | | | | 1.95 | |
| C | | | 1.95 | | | | 1.95 | |
| Y | | | 0.95 | | | | 0.95 | |
NOTES TO CHARTS
| See | page 17 for a description of the indices. |
| 1 | Prior to 9/15/03, performance of Class A shares is that of Retail Class shares, which were redesignated as Class A shares, restated to reflect the sales load of Class A shares. Prior to the inception of Class B and C shares (9/12/03), performance is that of Institutional Class shares, restated to reflect the higher net expenses and sales loads of Class B and C shares. |
| 2 | At Net Asset Value (NAV) — does not reflect payment of sales charge at time of purchase. |
| 3 | With Maximum Sales Charge (MSC) — reflects maximum sales charge of 5.75% at time of purchase. |
| 4 | Performance for Class B shares assumes a maximum of 5% contingent deferred sales charge (“CDSC”) applied when you sell shares, which declines annually between years 1-6 according to the following schedule: 5, 4, 3, 3, 2, 1, 0%. Class C shares performance assumes a 1% CDSC applied when you sell shares within one year of purchase. |
| 5 | Fund performance has been increased by fee waivers and/or expense reimbursements, if any, without which performance would have been lower. |
| 6 | Before fee waivers and/or expense reimbursements. |
| 7 | After fee waivers and/or expense reimbursements. Waivers/reimbursements are contractual and are set to expire 1/31/12. Contracts are reevaluated on an annual basis. |
| 8
LOOMIS SAYLES MID CAP GROWTH FUND
Management Discussion
Manager:
Philip C. Fine, CFA
Loomis, Sayles & Company, L.P.
Objective:
Long-term growth of capital
Strategy:
Invests primarily in common stocks or other equity securities; focuses on stocks of companies that fall within the capitalization range of the companies included in the Russell Midcap Growth Index.
Fund Inception:
December 31, 1996
Symbols:
| | |
| Class A | | LAGRX |
| Class C | | LSACX |
| Class Y | | LSAIX |
Market Conditions
Despite upheavals in the Middle East, sharply rising oil prices and a series of disasters in Japan, gains in manufacturing, exports and retail sales helped dissipate fears of a double-dip recession during the six-month period ended March 31, 2011. The financial markets were shaken by rate hikes in key emerging markets, economic uncertainty in China and credit downgrades in several European countries. Through all this, the U.S. stock market shook off a brief correction and advanced strongly for the period.
Performance Results
For the six months ended March 31, 2011, Class A shares of Loomis Sayles Mid Cap Growth Fund returned 28.03% at net asset value. The fund outperformed its benchmark, the Russell Midcap Growth Index, which returned 22.97%. It also outdistanced the 22.60% average return of the funds in its peer group, the Morningstar Mid-Cap Growth category.
Explanation of Fund Performance
During a period that was generally strong for the U.S. stock market, the fund outperformed its benchmark by a significant margin. Investments in the technology, healthcare, consumer discretionary and energy sectors generally accounted for the fund’s solid gains. Within the technology sector, where the fund had an overweight position relative to its benchmark, Riverbed Technology, Acme Packet and Aruba Networks made significant contributions to return. In the consumer discretionary sector, lululemon athletica, a designer and retailer of women’s athletic apparel; Fossil, which designs and manufactures watches and accessories; and Netflix, the leader in providing movies and other entertainment content online and by mail, were outstanding performers. Lululemon was an out-of-index selection that generated outsized returns. The fund’s energy holdings were also strong contributors to return. A decision to own more shares of Concho Resources and Walter Energy paid off handsomely, as both stocks
generated returns that were substantially higher than the benchmark average.
9 |
The most disappointing stocks in the portfolio were Finisar, which designs and manufactures optical components for communications networks; Citrix Systems, an enterprise software company; and Eldorado Gold, an international mining company. All three stocks were sold. The only two sectors to lag the benchmark were consumer staples and materials. Even so, both sectors made a positive contribution to total return for the period. Within consumer staples, Green Mountain Coffee drove underperformance for the sector. The fund held the stock in late 2010 when it declined after the company issued disappointing earnings guidance. It rebounded early in 2011 when it announced a partnership with Starbucks, but we had sold most of our position and did not reap the benefits. The underperformance in materials can be attributed to several gold mining, copper and fertilizer stocks.
During the period, the fund employed derivatives to hedge several stocks that represented large positions in the portfolio or that were exposed to significant “event” risk — healthcare stocks, for example, where clinical trials were essential to performance. In most of these instances the underlying stocks continued to appreciate, so the hedges were a drag on performance. Nevertheless, we viewed them as valuable defensive measures for the overall portfolio.
Outlook
We believe that business leaders are becoming more convinced of the sustainability of this expansion and are planning accordingly. Profit margins are currently healthy as companies are operating with lean staffing, although employment growth has clearly turned up. Equity price-to-earnings multiples are lower, on average, than they have been in the past 25 years. Yet earnings growth is likely to continue to be strong for the next few quarters, even as comparisons become more difficult. While there will be no shortage of hurdles for investors in the coming months, we continue to believe that stocks can represent an attractive and timely opportunity for long-term investors.
What You Should Know
Investments in the Fund are subject to a number of risks. Please see the “Principal Risks” section of the Funds prospectus. The purchase of Fund shares should be seen as a long-term investment.
| 10
LOOMIS SAYLES MID CAP GROWTH FUND
Investment Results through March 31, 2011
The charts comparing the fund’s performance to an index provide you with a general sense of how it performed. The fund’s total return for the period shown below appears with and without sales charges and includes fund expenses and fees. An index measures the performance of a theoretical portfolio. Unlike a fund, the index is unmanaged and does not have expenses that affect the results. It is not possible to invest directly in an index. Investors would incur transaction costs and other expenses if they purchased the securities necessary to match the index.
Growth of a $10,000 Investment in Class A Shares1,5
March 31, 2001 through March 31, 2011
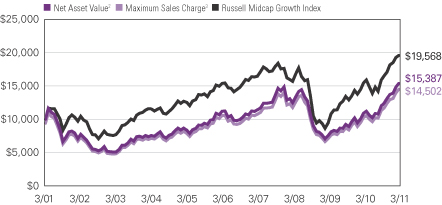
Average Annual Returns — March 31, 20115
| | | | | | | | | | | | | | | | |
| | | | | |
| | | 6 Months | | | 1 Year | | | 5 Years | | | 10 Years | |
| | | | | |
| Class A (Inception 12/31/96)1 | | | | | | | | | | | | | | | | |
| Net Asset Value2 | | | 28.03 | % | | | 41.09 | % | | | 6.49 | % | | | 4.40 | % |
| With Maximum Sales Charge3 | | | 20.67 | | | | 32.95 | | | | 5.24 | | | | 3.78 | |
| | | | | |
| Class C (Inception 2/2/09)1 | | | | | | | | | | | | | | | | |
| Net Asset Value2 | | | 27.57 | | | | 40.04 | | | | 5.66 | | | | 3.59 | |
| With CDSC4 | | | 26.57 | | | | 39.04 | | | | 5.66 | | | | 3.59 | |
| | | | | |
| Class Y (Inception 12/31/96) | | | | | | | | | | | | | | | | |
| Net Asset Value2 | | | 28.21 | | | | 41.41 | | | | 6.76 | | | | 4.67 | |
| | | | | |
| Comparative Performance | | | | | | | | | | | | | | | | |
| Russell Midcap Growth Index | | | 22.97 | | | | 26.60 | | | | 4.93 | | | | 6.94 | |
| Morningstar Mid-Cap Growth Avg. | | | 22.60 | | | | 25.86 | | | | 4.31 | | | | 5.90 | |
All returns represent past performance and do not guarantee future results. Periods of less than one year are not annualized. Share price and return will vary and you may have a gain or loss when you sell your shares. All results include reinvestment of dividends and capital gains. Current returns may be higher or lower than those shown. For performance current to the most recent month-end, visit ga.natixis.com.
Class Y shares are not available for purchase by all investors.
The table and graph do not reflect taxes shareholders might owe on any fund distributions or when they redeem their shares.
11 |
| | | | |
| Fund Composition | | % of Net
Assets as of
3/31/11 | |
Common Stocks | | | 97.2 | |
Put Options | | | 0.1 | |
Short-Term Investments and Other | | | 2.7 | |
| Ten Largest Holdings | | % of Net
Assets as of
3/31/11 | |
Concho Resources, Inc. | | | 3.1 | |
Joy Global, Inc. | | | 2.9 | |
Fossil, Inc. | | | 2.5 | |
Priceline.com, Inc. | | | 2.3 | |
OpenTable, Inc. | | | 2.3 | |
Aruba Networks, Inc. | | | 2.2 | |
SINA Corp. | | | 2.2 | |
VeriFone Systems, Inc. | | | 2.2 | |
Alexion Pharmaceuticals, Inc. | | | 2.1 | |
Valeant Pharmaceuticals International, Inc. | | | 2.1 | |
| | | | |
| Five Largest Industries | | % of Net
Assets as of
3/31/11 | |
Internet Software & Services | | | 9.2 | |
Machinery | | | 7.4 | |
Oil, Gas & Consumable Fuels | | | 6.2 | |
Software | | | 5.8 | |
Textiles, Apparel & Luxury Goods | | | 5.6 | |
Portfolio holdings and asset allocations will vary.
Expense Ratios
as stated in the most recent prospectus
| | | | | | | | |
| Share Class | | Gross Expense Ratio6 | | | Net Expense Ratio7 | |
| A | | | 1.46 | % | | | 1.25 | % |
| C | | | 2.24 | | | | 2.00 | |
| Y | | | 1.22 | | | | 1.00 | |
NOTES TO CHARTS
| See | page 17 for a description of the indices. |
| 1 | Prior to 2/1/09, performance of Class A shares is that of Retail Class shares, which were redesignated as Class A shares, restated to reflect the sales load of Class A shares. Prior to the inception of Class C shares (2/2/09), performance is that of Retail Class shares, restated to reflect the higher net expenses and sales loads of Class C shares. The fund revised its investment strategies on 2/1/07; performance may have been different had the current strategies been in place for all periods shown. |
| 2 | At Net Asset Value (NAV) — does not reflect payment of sales charge at time of purchase. |
| 3 | With Maximum Sales Charge (MSC) — reflects maximum sales charge of 5.75% at time of purchase. |
| 4 | Class C shares performance assumes a 1% CDSC applied when you sell shares within one year of purchase. |
| 5 | Fund performance has been increased by fee waivers and/or expense reimbursements, if any, without which performance would have been lower. |
| 6 | Before fee waivers and/or expense reimbursements. |
| 7 | After fee waivers and/or expense reimbursements. Waivers/reimbursements are contractual and are set to expire 1/31/12. Contracts are reevaluated on an annual basis. |
| 12
LOOMIS SAYLES VALUE FUND
Management Discussion
Managers:
Arthur Barry, CFA
James L. Carroll, CFA
Warren N. Koontz, CFA, CIC
Loomis, Sayles & Company, L.P.
Objective:
Long-term growth of capital and income
Strategy:
Invests primarily in equity securities, including common stocks, convertible securities, and warrants.
Fund Inception:
May 13, 1991
Symbols:
| | |
| Class A | | LSVRX |
| Class B | | LSVBX |
| Class C | | LSCVX |
| Class Y | | LSGIX |
| Admin Class | | LSAVX |
Market Conditions
A recovering economy brought improved financial results for corporations over the past six months, with expanding cash flows and revenues brightening the outlook for future growth. Stock prices fed on this good news, moving higher over the period. Market participants were also encouraged by a more business-friendly tone in Washington.
Performance Results
For the six months ended March 31, 2011, Class A shares of Loomis Sayles Value Fund returned 19.87% at net asset value. The fund outperformed its benchmark, the Russell 1000 Value Index, which returned 17.68%. It also outperformed the 16.88% average return of the funds in its peer group, the Morningstar Large Value category.
Explanation of Fund Performance
Strong security selection, notably in the financial services and consumer discretionary sectors, accounted for the bulk of the fund’s performance advantage against its benchmark, with the balance coming as a result of sector allocation. The fund’s sector allocations are the result of its stock selection process.
In financial services, as Discover Financial emerged from recession-related credit difficulties, investors came to recognize its growth potential. A dividend increase further boosted Discover Financial’s performance. The fund reduced its underweight in financials by adding to Citigroup and Fifth Third Bancorp. In the consumer discretionary sector, the fund benefited from an overweight in the sector as well as from strong stock selection in automotive and media companies.
Although the fund’s energy holdings slightly underperformed the benchmark’s 43% energy sector return, the fund benefited from strong performances by Schlumberger, Hess, and ExxonMobil as oil and gas prices rose. Natural gas pipeline operator El Paso moved higher over the period thanks to rising prices and its strong exploration and production profile. El Paso is potentially well-positioned to expand volumes over the next several years.
13 |
Additionally, the sale of Owens Illinois shares shifted the portfolio from overweight to underweight in the materials and processing sector.
Results in technology and pharmaceuticals were disappointing. AOL’s shares moved higher on expectations of a merger with Yahoo, then fell when the rumors proved false. Shares have partly rebounded since. The management team believes AOL’s current strategy of focusing on premium content and high quality advertising could drive better results in the second half of this year. Shares of Cisco Systems, which sells Internet-related networking and other communications products, fell despite improving sales and revenue trends. Pharmaceutical giant Merck reported strong revenues and better-than-expected earnings early in the period. However, shares retreated when management backed off its long-range earnings forecasts. Behind management’s caution were industry pressures and a setback in trials for Vorapaxar, a clot-fighting drug that had been expected to yield large sales.
Outlook
The Federal Reserve Board’s (the Fed’s) Treasury purchase program designed to inject money into the economy, which is known as “QE2” (quantitative easing), is about to end. A new wave of purchases is not expected unless the economy takes an unexpected turn to the downside. That prospect is unlikely, given recent strong employment data. In fact, the employment figures for February and March were some of the best we have seen in several years. Our working assumption is that investors and corporate executives need to plan for somewhat higher energy and other commodity input costs in the months ahead. However, we anticipate 15% earnings growth for the S&P 500 Index in 2011, decelerating to 10% or so next year.
What You Should Know:
Investments in the Fund are subject to a number of risks. Please see the “Principal Risks” section of the Funds prospectus. The purchase of Fund shares should be seen as a long-term investment.
| 14
LOOMIS SAYLES VALUE FUND
Investment Results through March 31, 2011
The charts comparing the fund’s performance to an index provide you with a general sense of how it performed. The fund’s total return for the period shown below appears with and without sales charges and includes fund expenses and fees. An index measures the performance of a theoretical portfolio. Unlike a fund, the index is unmanaged and does not have expenses that affect the results. It is not possible to invest directly in an index. Investors would incur transaction costs and other expenses if they purchased the securities necessary to match the index.
Growth of a $10,000 Investment in Class A Shares1,5
March 31, 2001 through March 31, 2011
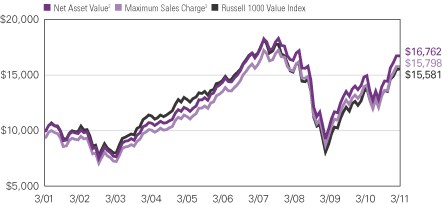
Average Annual Returns — March 31, 20115
| | | | | | | | | | | | | | | | |
| | | | | |
| | | 6 Months | | | 1 Year | | | 5 Years | | | 10 Years | |
| | | | | |
| Class A (Inception 6/30/06)1 | | | | | | | | | | | | | | | | |
| Net Asset Value2 | | | 19.87 | % | | | 12.88 | % | | | 3.13 | % | | | 5.30 | % |
| With Maximum Sales Charge3 | | | 13.00 | | | | 6.37 | | | | 1.91 | | | | 4.68 | |
| | | | | |
| Class B (Inception 6/1/07)1 | | | | | | | | | | | | | | | | |
| Net Asset Value2 | | | 19.39 | | | | 11.98 | | | | 2.33 | | | | 4.40 | |
| With CDSC4 | | | 14.39 | | | | 6.98 | | | | 1.96 | | | | 4.40 | |
| | | | | |
| Class C (Inception 6/1/07)1 | | | | | | | | | | | | | | | | |
| Net Asset Value2 | | | 19.44 | | | | 12.01 | | | | 2.34 | | | | 4.40 | |
| With CDSC4 | | | 18.44 | | | | 11.01 | | | | 2.34 | | | | 4.40 | |
| | | | | |
| Class Y (Inception 5/13/91) | | | | | | | | | | | | | | | | |
| Net Asset Value2 | | | 19.98 | | | | 13.12 | | | | 3.44 | | | | 5.60 | |
| | | | | |
| Admin Class (Inception 2/1/10)1 | | | | | | | | | | | | | | | | |
| Net Asset Value2 | | | 19.75 | | | | 12.55 | | | | 2.84 | | | | 5.00 | |
| | | | | |
| Comparative Performance | | | | | | | | | | | | | | | | |
| Russell 1000 Value Index | | | 17.68 | | | | 15.15 | | | | 1.38 | | | | 4.53 | |
| Morningstar Large Value Fund Avg. | | | 16.88 | | | | 14.16 | | | | 1.65 | | | | 4.13 | |
All returns represent past performance and do not guarantee future results. Periods of less than one year are not annualized. Share price and return will vary and you may have a gain or loss when you sell your shares. All results include reinvestment of dividends and capital gains. Current returns may be higher or lower than those shown. For performance current to the most recent month-end, visit ga.natixis.com.
Class Y shares are not available for purchase by all investors.
The table and graph do not reflect taxes shareholders might owe on any fund distributions or when they redeem their shares.
15 |
| | | | |
| Fund Composition | | % of Net
Assets as of
3/31/11 | |
Common Stocks | | | 97.7 | |
Short-Term Investments and Other | | | 2.3 | |
| |
| Ten Largest Holdings | | % of Net
Assets as of
3/31/11 | |
General Electric Co. | | | 2.7 | |
JPMorgan Chase & Co. | | | 2.7 | |
ExxonMobil Corp. | | | 2.7 | |
Schlumberger Ltd. | | | 2.3 | |
El Paso Corp. | | | 2.1 | |
Oracle Corp. | | | 2.1 | |
Comcast Corp., Class A | | | 2.0 | |
Total SA, Sponsored ADR | | | 2.0 | |
Hess Corp. | | | 1.9 | |
Wells Fargo & Co. | | | 1.9 | |
| | | | |
| Five Largest Industries | | % of Net
Assets as of
3/31/11 | |
Oil, Gas & Consumable Fuels | | | 11.1 | |
Media | | | 6.3 | |
Commercial Banks | | | 5.8 | |
Diversified Financial Services | | | 5.8 | |
Pharmaceuticals | | | 5.6 | |
Portfolio holdings and asset allocations will vary.
Expense Ratios
as stated in the most recent prospectus
| | | | | | | | |
| Share Class | | Gross Expense Ratio6 | | | Net Expense Ratio7 | |
| A | | | 0.96 | % | | | 0.96 | % |
| B | | | 1.70 | | | | 1.70 | |
| C | | | 1.71 | | | | 1.71 | |
| Y | | | 0.71 | | | | 0.71 | |
| Admin | | | 1.29 | | | | 1.29 | |
NOTES TO CHARTS
| See | page 17 for a description of the indices. |
| 1 | Prior to 6/1/07, performance of Class A shares is that of Retail Class shares, which were redesignated as Class A shares, restated to reflect the sales load of Class A shares. Prior to the inception of Retail Class shares (6/30/06), performance is that of Institutional Class shares, restated to reflect the higher net expenses and sales loads of Class A shares. Prior to the inception of Class B and C shares (6/1/07), performance is that of Institutional Class shares, restated to reflect the higher net expenses and sales loads of Class B and C shares. Prior to the inception of Admin Class shares (2/1/10), performance is that of Class A shares, restated to reflect the higher net expenses of Admin Class shares. |
| 2 | At Net Asset Value (NAV) — does not reflect payment of sales charge at time of purchase. |
| 3 | With Maximum Sales Charge (MSC) — reflects maximum sales charge of 5.75% at time of purchase. |
| 4 | Performance for Class B shares assumes a maximum of 5% contingent deferred sales charge (“CDSC”) applied when you sell shares, which declines annually between years 1-6 according to the following schedule: 5, 4, 3, 3, 2, 1, 0%. Class C shares performance assumes a 1% CDSC applied when you sell shares within one year of purchase. |
| 5 | Fund performance has been increased by fee waivers and/or expense reimbursements, if any, without which performance would have been lower. |
| 6 | Before fee waivers and/or expense reimbursements. |
| 7 | After fee waivers and/or expense reimbursements. Waivers/reimbursements are contractual and are set to expire 1/31/12. Contracts are reevaluated on an annual basis. |
| 16
ADDITIONAL INFORMATION
The views expressed in this report reflect those of the portfolio managers as of the dates indicated. The managers’ views are subject to change at any time without notice based on changes in market or other conditions. References to specific securities or industries should not be regarded as investment advice. Because these funds are actively managed, there is no assurance that they will continue to invest in the securities or industries mentioned.
Before investing, consider the fund’s investment objectives, risks, charges and expenses. Visit ga.natixis.com or call 800-225-5478 for a prospectus and/or a summary prospectus, both of which contain this and other information. Read it carefully.
INDEX/AVERAGE DESCRIPTIONS:
Citigroup World Government Bond Index is an unmanaged index that includes the most significant and liquid government bond markets globally that carry at least an investment-grade rating.
MSCI World Index is an unmanaged index that is designed to measure the equity market performance of developed markets.
Russell 1000 Growth Index is an unmanaged index that measures the performance of the large-cap growth segment of the U.S. equity universe. It includes those Russell 1000 companies with higher price-to-book ratios and higher forecasted growth values.
Russell 1000 Value Index is an unmanaged index that measures the performance of the large-cap value segment of the U.S. equity universe. It includes those Russell 1000 companies with lower price-to-book ratios and lower expected growth values.
Russell Midcap Growth Index is an unmanaged index that measures the performance of the mid-cap growth segment of the U.S. equity universe. It includes those Russell Midcap Index companies with higher price-to-book ratios and higher forecasted growth values.
Morningstar Fund Averages are the average performance without sales charges of funds with similar investment objectives, as calculated by Morningstar, Inc.
PROXY VOTING INFORMATION
A description of the funds’ proxy voting policies and procedures is available without charge, upon request, by calling Natixis Funds at 800-225-5478; on the funds’ website at ga.natixis.com; and on the Securities and Exchange Commission’s website at www.sec.gov. Information regarding how the funds voted proxies relating to portfolio securities during the 12-month period ended June 30, 2010 is available from the funds’ website and the SEC’s website.
QUARTERLY PORTFOLIO SCHEDULES
The funds will file a complete schedule of portfolio holdings with the SEC for the first and third quarters of each fiscal year on Form N-Q. The funds’ Forms N-Q are available on the SEC’s website at www.sec.gov and may be reviewed and copied at the SEC’s Public Reference Room in Washington, DC. Information on the operation of the Public Reference Room may be obtained by calling
1-800-SEC-0330.
17 |
UNDERSTANDING FUND EXPENSES
As a mutual fund shareholder, you incur different types of costs: transaction costs, including sales charges (loads) on purchases and contingent deferred sales charges on redemptions, and ongoing costs, including management fees, distribution and/or service fees (12b-1 fees), and other fund expenses. These costs are described in more detail in the funds’ prospectus. The examples below are intended to help you understand the ongoing costs of investing in the funds and help you compare these with the ongoing costs of investing in other mutual funds.
The first line in the table for each class shows the actual amount of fund expenses you would have paid on a $1,000 investment in the fund from October 1, 2010 through March 31, 2011. It also shows how much a $1,000 investment would be worth at the close of the period, assuming actual fund returns and expenses. To estimate the expenses you paid over the period, simply divide your account value by $1,000 (for example, $8,600 account value divided by $1,000 = 8.6) and multiply the result by the number in the Expenses Paid During the Period row as shown below for your class.
The second line in the table for each class provides information about hypothetical account values and hypothetical expenses based on the fund’s actual expense ratios and an assumed rate of return of 5% per year before expenses, which is not the fund’s actual return. The hypothetical account values and expenses may not be used to estimate the actual ending account balance or expenses you paid on your investment for the period. You may use this information to compare the ongoing costs of investing in the fund and other funds. To do so, compare this 5% hypothetical example with the 5% hypothetical examples that appear in the shareholder reports of the other funds.
Please note that the expenses shown reflect ongoing costs only, and do not include any transaction costs. Therefore, the second line in the table of each fund is useful in comparing ongoing costs only, and will not help you determine the relative costs of owning different funds. If transaction costs were included, total costs would be higher.
| | | | | | | | | | | | |
LOOMIS SAYLES GLOBAL EQUITY AND
INCOME FUND** | | BEGINNING
ACCOUNT VALUE
10/1/2010 | | | ENDING
ACCOUNT VALUE
3/31/2011 | | | EXPENSES PAID
DURING PERIOD*
10/1/2010 – 3/31/2011 | |
Class A | | | | | | | | | | | | |
Actual | | | $1,000.00 | | | | $1,121.40 | | | | $6.61 | |
Hypothetical (5% return before expenses) | | | $1,000.00 | | | | $1,018.70 | | | | $6.29 | |
Class C | | | | | | | | | | | | |
Actual | | | $1,000.00 | | | | $1,117.00 | | | | $10.56 | |
Hypothetical (5% return before expenses) | | | $1,000.00 | | | | $1,014.96 | | | | $10.05 | |
Class Y | | | | | | | | | | | | |
Actual | | | $1,000.00 | | | | $1,122.20 | | | | $5.29 | |
Hypothetical (5% return before expenses) | | | $1,000.00 | | | | $1,019.95 | | | | $5.04 | |
| * | Expenses are equal to the Fund’s annualized expense ratio: 1.25%, 2.00% and 1.00% for Class A, C and Y, respectively, multiplied by the average account value over the period, multiplied by the number of days in the most recent fiscal half-year, divided by 365 (to reflect the half-year period). |
| ** | Formerly Loomis Sayles Global Markets Fund. |
| 18
| | | | | | | | | | | | |
| LOOMIS SAYLES GROWTH FUND | | BEGINNING
ACCOUNT VALUE
10/1/2010 | | | ENDING
ACCOUNT VALUE
3/31/2011 | | | EXPENSES PAID
DURING PERIOD*
10/1/2010 – 3/31/2011 | |
Class A | | | | | | | | | | | | |
Actual | | | $1,000.00 | | | | $1,118.70 | | | | $6.23 | |
Hypothetical (5% return before expenses) | | | $1,000.00 | | | | $1,019.05 | | | | $5.94 | |
Class B | | | | | | | | | | | | |
Actual | | | $1,000.00 | | | | $1,117.00 | | | | $10.19 | |
Hypothetical (5% return before expenses) | | | $1,000.00 | | | | $1,015.31 | | | | $9.70 | |
Class C | | | | | | | | | | | | |
Actual | | | $1,000.00 | | | | $1,117.00 | | | | $10.19 | |
Hypothetical (5% return before expenses) | | | $1,000.00 | | | | $1,015.31 | | | | $9.70 | |
Class Y | | | | | | | | | | | | |
Actual | | | $1,000.00 | | | | $1,119.50 | | | | $4.91 | |
Hypothetical (5% return before expenses) | | | $1,000.00 | | | | $1,020.29 | | | | $4.68 | |
| * | Expenses are equal to the Fund’s annualized expense ratio: 1.18%, 1.93%, 1.93% and 0.93% for Class A, B, C and Y, respectively, multiplied by the average account value over the period, multiplied by the number of days in the most recent fiscal half-year, divided by 365 (to reflect the half-year period). |
| | | | | | | | | | | | |
| LOOMIS SAYLES MID CAP GROWTH FUND | | BEGINNING
ACCOUNT VALUE
10/1/2010 | | | ENDING
ACCOUNT VALUE
3/31/2011 | | | EXPENSES PAID
DURING PERIOD*
10/1/2010 – 3/31/2011 | |
Class A | | | | | | | | | | | | |
Actual | | | $1,000.00 | | | | $1,280.30 | | | | $7.11 | |
Hypothetical (5% return before expenses) | | | $1,000.00 | | | | $1,018.70 | | | | $6.29 | |
Class C | | | | | | | | | | | | |
Actual | | | $1,000.00 | | | | $1,275.70 | | | | $11.35 | |
Hypothetical (5% return before expenses) | | | $1,000.00 | | | | $1,014.96 | | | | $10.05 | |
Class Y | | | | | | | | | | | | |
Actual | | | $1,000.00 | | | | $1,282.10 | | | | $5.69 | |
Hypothetical (5% return before expenses) | | | $1,000.00 | | | | $1,019.95 | | | | $5.04 | |
| * | Expenses are equal to the Fund’s annualized expense ratio (after waiver/reimbursement): 1.25%, 2.00% and 1.00% for Class A, C and Y, respectively, multiplied by the average account value over the period, multiplied by the number of days in the most recent fiscal half-year, divided by 365 (to reflect the half-year period). |
19 |
| | | | | | | | | | | | |
| LOOMIS SAYLES VALUE FUND | | BEGINNING
ACCOUNT VALUE
10/1/2010 | | | ENDING
ACCOUNT VALUE
3/31/2011 | | | EXPENSES PAID
DURING PERIOD*
10/1/2010 – 3/31/2011 | |
Class A | | | | | | | | | | | | |
Actual | | $ | 1,000.00 | | | $ | 1,198.70 | | | $ | 5.21 | |
Hypothetical (5% return before expenses) | | $ | 1,000.00 | | | $ | 1,020.19 | | | $ | 4.78 | |
Class B | | | | | | | | | | | | |
Actual | | $ | 1,000.00 | | | $ | 1,193.90 | | | $ | 9.30 | |
Hypothetical (5% return before expenses) | | $ | 1,000.00 | | | $ | 1,016.45 | | | $ | 8.55 | |
Class C | | | | | | | | | | | | |
Actual | | $ | 1,000.00 | | | $ | 1,194.40 | | | $ | 9.30 | |
Hypothetical (5% return before expenses) | | $ | 1,000.00 | | | $ | 1,016.45 | | | $ | 8.55 | |
Class Y | | | | | | | | | | | | |
Actual | | $ | 1,000.00 | | | $ | 1,199.80 | | | $ | 3.84 | |
Hypothetical (5% return before expenses) | | $ | 1,000.00 | | | $ | 1,021.44 | | | $ | 3.53 | |
Admin Class | | | | | | | | | | | | |
Actual | | $ | 1,000.00 | | | $ | 1,197.50 | | | $ | 6.25 | |
Hypothetical (5% return before expenses) | | $ | 1,000.00 | | | $ | 1,019.25 | | | $ | 5.74 | |
| * | Expenses are equal to the Fund’s annualized expense ratio: 0.95%, 1.70%, 1.70%, 0.70% and 1.14% for Class A, B, C, Y and Admin Class, respectively, multiplied by the average account value over the period, multiplied by the number of days in the most recent fiscal half-year, divided by 365 (to reflect the half-year period). |
| 20
Portfolio of Investments – as of March 31, 2011 (Unaudited)
Loomis Sayles Global Equity and Income Fund*
| | | | | | | | |
| Shares | | | Description | | Value (†) | |
| | | | | | | | |
| | Common Stocks — 67.7% of Net Assets | | | | |
| | | | Belgium — 1.0% | | | | |
| | 80,420 | | | Anheuser-Busch InBev NV | | $ | 4,584,887 | |
| | | | | | | | |
| | | | Brazil — 3.9% | | | | |
| | 172,800 | | | Cia Hering | | | 3,175,206 | |
| | 168,622 | | | Embraer SA, ADR | | | 5,597,407 | |
| | 305,500 | | | Mills Estruturas e Servicos de Engenharia SA | | | 3,358,788 | |
| | 209,900 | | | Natura Cosmeticos SA | | | 5,913,944 | |
| | | | | | | | |
| | | | | | | 18,045,345 | |
| | | | | | | | |
| | | | British Virgin Islands — 0.6% | | | | |
| | 87,403 | | | Mail.ru Group Ltd., GDR, 144A(b) | | | 2,621,216 | |
| | | | | | | | |
| | | | Canada — 0.1% | | | | |
| | 9,996 | | | Valeant Pharmaceuticals International, Inc. | | | 497,901 | |
| | | | | | | | |
| | | | Cayman Islands — 4.9% | | | | |
| | 68,734 | | | Baidu, Inc., Sponsored ADR(b) | | | 9,472,233 | |
| | 66,012 | | | SINA Corp.(b) | | | 7,065,924 | |
| | 2,304,000 | | | Wynn Macau Ltd. | | | 6,443,833 | |
| | | | | | | | |
| | | | | | | 22,981,990 | |
| | | | | | | | |
| | | | Chile — 2.2% | | | | |
| | 71,368 | | | Banco Santander Chile, ADR | | | 6,191,174 | |
| | 390,962 | | | S.A.C.I. Falabella | | | 3,982,058 | |
| | | | | | | | |
| | | | | | | 10,173,232 | |
| | | | | | | | |
| | | | Denmark — 2.6% | | | | |
| | 96,211 | | | Novo Nordisk A/S, Class B | | | 12,082,426 | |
| | | | | | | | |
| | | | Germany — 5.0% | | | | |
| | 85,364 | | | Bayerische Motoren Werke AG | | | 7,087,240 | |
| | 68,424 | | | Daimler AG, (Registered)(b) | | | 4,821,322 | |
| | 82,592 | | | Siemens AG, (Registered) | | | 11,297,631 | |
| | | | | | | | |
| | | | | | | 23,206,193 | |
| | | | | | | | |
| | | | Hong Kong — 0.7% | | | | |
| | 717,000 | | | Hang Lung Properties Ltd. | | | 3,135,506 | |
| | | | | | | | |
| | | | Italy — 1.4% | | | | |
| | 126,103 | | | Saipem SpA | | | 6,699,111 | |
| | | | | | | | |
| | | | Japan — 3.7% | | | | |
| | 39,000 | | | FANUC Ltd. | | | 5,895,119 | |
| | 388,000 | | | Mitsubishi Electric Corp. | | | 4,566,205 | |
| | 166,900 | | | Softbank Corp. | | | 6,650,015 | |
| | | | | | | | |
| | | | | | | 17,111,339 | |
| | | | | | | | |
| | | | Korea — 2.6% | | | | |
| | 15,888 | | | Hyundai Heavy Industries Co. Ltd. | | | 7,492,290 | |
| | 11,373 | | | LG Chem Ltd. | | | 4,758,585 | |
| | | | | | | | |
| | | | | | | 12,250,875 | |
| | | | | | | | |
See accompanying notes to financial statements.
21 |
Portfolio of Investments – as of March 31, 2011 (Unaudited)
Loomis Sayles Global Equity and Income Fund* – (continued)
| | | | | | | | |
| Shares | | | Description | | Value (†) | |
| | | | | | | | |
| | | | Mexico — 0.8% | | | | |
| | 1,767,300 | | | Genomma Lab Internacional SA de CV, Class B(b) | | $ | 3,996,853 | |
| | | | | | | | |
| | | | Netherlands Antilles — 1.0% | | | | |
| | 51,393 | | | Schlumberger Ltd. | | | 4,792,911 | |
| | | | | | | | |
| | | | Sweden — 1.3% | | | | |
| | 230,490 | | | Atlas Copco AB, Class A | | | 6,121,032 | |
| | | | | | | | |
| | | | Switzerland — 0.8% | | | | |
| | 8,632 | | | Swatch Group AG (The) | | | 3,808,947 | |
| | | | | | | | |
| | | | United Kingdom — 6.8% | | | | |
| | 210,253 | | | Antofagasta PLC | | | 4,583,282 | |
| | 1,252,184 | | | ARM Holdings PLC | | | 11,619,386 | |
| | 411,255 | | | Burberry Group PLC | | | 7,745,977 | |
| | 308,057 | | | Standard Chartered PLC | | | 7,990,648 | |
| | | | | | | | |
| | | | | | | 31,939,293 | |
| | | | | | | | |
| | | | United States — 28.3% | | | | |
| | 90,404 | | | Acme Packet, Inc.(b) | | | 6,415,068 | |
| | 131,932 | | | American Express Co. | | | 5,963,326 | |
| | 54,395 | | | Apple, Inc.(b) | | | 18,953,938 | |
| | 71,797 | | | Caterpillar, Inc. | | | 7,994,596 | |
| | 101,774 | | | Deere & Co. | | | 9,860,883 | |
| | 1,679 | | | Dex One Corp.(b) | | | 8,126 | |
| | 96,007 | | | Estee Lauder Cos., Inc. (The), Class A | | | 9,251,235 | |
| | 88,952 | | | FMC Technologies, Inc.(b) | | | 8,404,185 | |
| | 8,183 | | | Google, Inc., Class A(b) | | | 4,796,956 | |
| | 955 | | | Hawaiian Telcom Holdco, Inc.(b) | | | 25,069 | |
| | 61,708 | | | Jones Lang LaSalle, Inc. | | | 6,154,756 | |
| | 53,714 | | | Lululemon Athletica, Inc.(b) | | | 4,783,232 | |
| | 100,632 | | | National Oilwell Varco, Inc. | | | 7,977,099 | |
| | 26,433 | | | NetFlix, Inc.(b) | | | 6,273,344 | |
| | 286,906 | | | Oracle Corp. | | | 9,574,053 | |
| | 30,975 | | | Precision Castparts Corp. | | | 4,558,900 | |
| | 14,422 | | | Priceline.com, Inc.(b) | | | 7,303,878 | |
| | 95,846 | | | QUALCOMM, Inc. | | | 5,255,236 | |
| | 57,306 | | | Salesforce.com, Inc.(b) | | | 7,654,935 | |
| | 299 | | | SuperMedia, Inc.(b) | | | 1,866 | |
| | 26,818 | | | Vertex Pharmaceuticals, Inc.(b) | | | 1,285,387 | |
| | | | | | | | |
| | | | | | | 132,496,068 | |
| | | | | | | | |
| | | | Total Common Stocks
(Identified Cost $250,917,619) | | | 316,545,125 | |
| | | | | | | | |
See accompanying notes to financial statements.
| 22
Portfolio of Investments – as of March 31, 2011 (Unaudited)
Loomis Sayles Global Equity and Income Fund* – (continued)
| | | | | | | | |
Principal
Amount (‡) | | | Description | | Value (†) | |
| | | | | | | | |
| | Bonds and Notes — 25.2% | | | | |
| | Non-Convertible Bonds — 23.7% | | | | |
| | | | Argentina — 0.3% | | | | |
| $ | 611,447 | | | Argentina Government International Bond, 8.280%, 12/31/2033 | | $ | 545,105 | |
| | 190,000 | | | Pan American Energy LLC, 7.875%, 5/07/2021, 144A | | | 204,497 | |
| | 570,000 | | | Transportadora de Gas del Sur SA, 7.875%, 5/14/2017, 144A | | | 562,875 | |
| | | | | | | | |
| | | | | | | 1,312,477 | |
| | | | | | | | |
| | | | Australia — 0.2% | | | | |
| | 500,000 | | | Macquarie Bank Ltd., 6.625%, 4/07/2021, 144A | | | 499,025 | |
| | 250,000 | | | New South Wales Treasury Corp., 6.000%, 5/01/2012, (AUD) | | | 261,424 | |
| | 155,000 | | | Sydney Airport Finance Co., 5.125%, 2/22/2021, 144A | | | 151,713 | |
| | | | | | | | |
| | | | | | | 912,162 | |
| | | | | | | | |
| | | | Bermuda — 0.0% | | | | |
| | 100,000 | | | Noble Group Ltd., 6.750%, 1/29/2020, 144A | | | 107,000 | |
| | | | | | | | |
| | | | Brazil — 0.7% | | | | |
| | 200,000 | | | Banco Nacional de Desenvolvimento Economico e Social,
6.500%, 6/10/2019, 144A | | | 218,000 | |
| | 400,000 | | | Banco Santander Brasil, 4.500%, 4/06/2015, 144A | | | 406,871 | |
| | 1,615,178(††) | | | Brazil Notas do Tesouro Nacional, Series B, 6.000%, 8/15/2014, (BRL) | | | 975,234 | |
| | 484,554(††) | | | Brazil Notas do Tesouro Nacional, Series B, 6.000%, 5/15/2015, (BRL) | | | 291,574 | |
| | 1,800,000 | | | Republic of Brazil, 10.250%, 1/10/2028, (BRL) | | | 1,096,990 | |
| | 129,000 | | | Telemar Norte Leste SA, 5.500%, 10/23/2020, 144A | | | 126,743 | |
| | | | | | | | |
| | | | | | | 3,115,412 | |
| | | | | | | | |
| | | | Canada — 0.6% | | | | |
| | 2,265,000 | | | Canadian Government, 3.000%, 12/01/2015, (CAD) | | | 2,370,973 | |
| | 180,000 | | | Corus Entertainment, Inc., 7.250%, 2/10/2017, 144A, (CAD) | | | 198,195 | |
| | 50,000 | | | Nortel Networks Ltd., 6.875%, 9/01/2023(c) | | | 13,000 | |
| | 100,000 | | | Pacific Rubiales Energy Corp., 8.750%, 11/10/2016, 144A | | | 114,250 | |
| | 100,000 | | | Shaw Communications, Inc., 5.650%, 10/01/2019, (CAD) | | | 105,609 | |
| | | | | | | | |
| | | | | | | 2,802,027 | |
| | | | | | | | |
| | | | Cayman Islands — 0.9% | | | | |
| | 200,000 | | | Embraer Overseas Ltd., 6.375%, 1/24/2017 | | | 215,500 | |
| | 300,000 | | | Fibria Overseas Finance Ltd., 6.750%, 3/03/2021, 144A | | | 309,750 | |
| | 119,000 | | | Fibria Overseas Finance Ltd., 7.500%, 5/04/2020, 144A | | | 129,115 | |
| | 100,000 | | | Hutchison Whampoa International Ltd., 7.625%, 4/09/2019, 144A | | | 119,679 | |
| | 100,000 | | | LPG International, Inc., 7.250%, 12/20/2015 | | | 110,000 | |
| | 700,000 | | | Marfrig Overseas Ltd., 9.500%, 5/04/2020, 144A | | | 729,750 | |
| | 170,000 | | | Marfrig Overseas Ltd., 9.625%, 11/16/2016, 144A | | | 180,200 | |
| | 200,000 | | | MBPS Finance Co., 11.250%, 11/15/2015, 144A | | | 197,000 | |
| | 200,000 | | | Odebrecht Drilling Norbe VIII/IX Ltd., 6.350%, 6/30/2021, 144A | | | 210,750 | |
| | 300,000 | | | Odebrecht Finance Ltd., 6.000%, 4/05/2023, 144A | | | 297,000 | |
| | 200,000 | | | Odebrecht Finance Ltd., 7.000%, 4/21/2020, 144A | | | 218,700 | |
| | 320,000 | | | Petrobras International Finance Co., 5.875%, 3/01/2018 | | | 338,960 | |
| | 300,000 | | | Petrobras International Finance Co., 6.875%, 1/20/2040 | | | 314,161 | |
| | 536,000 | | | Vale Overseas Ltd., 6.875%, 11/21/2036 | | | 570,765 | |
See accompanying notes to financial statements.
23 |
Portfolio of Investments – as of March 31, 2011 (Unaudited)
Loomis Sayles Global Equity and Income Fund* – (continued)
| | | | | | | | |
Principal
Amount (‡) | | | Description | | Value (†) | |
| | | | | | | | |
| | | | Cayman Islands — continued | | | | |
| $ | 200,000 | | | Voto-Votorantim Ltd., 6.750%, 4/05/2021, 144A | | $ | 212,000 | |
| | | | | | | | |
| | | | | | | 4,153,330 | |
| | | | | | | | |
| | | | Chile — 0.2% | | | | |
| | 250,000,000 | | | Banco Santander Chile, 6.500%, 9/22/2020, 144A, (CLP) | | | 481,524 | |
| | 185,000 | | | Celulosa Arauco y Constitucion SA, 5.000%, 1/21/2021, 144A | | | 182,537 | |
| | 250,000 | | | E.CL SA, 5.625%, 1/15/2021, 144A | | | 250,367 | |
| | | | | | | | |
| | | | | | | 914,428 | |
| | | | | | | | |
| | | | Colombia — 0.3% | | | | |
| | 450,000,000 | | | Emgesa SA ESP, 8.750%, 1/25/2021, 144A, (COP) | | | 253,409 | |
| | 1,430,000,000 | | | Empresas Publicas de Medellin ESP, 8.375%, 2/01/2021, 144A, (COP) | | | 789,461 | |
| | 200,000,000 | | | Republic of Colombia, 7.750%, 4/14/2021, (COP) | | | 115,266 | |
| | 40,000 | | | Republic of Colombia, 8.125%, 5/21/2024 | | | 50,660 | |
| | | | | | | | |
| | | | | | | 1,208,796 | |
| | | | | | | | |
| | | | Croatia — 0.1% | | | | |
| | 300,000 | | | Croatia Government International Bond, 6.375%, 3/24/2021, 144A | | | 300,375 | |
| | | | | | | | |
| | | | France — 0.1% | | | | |
| | 150,000 | | | Lafarge SA, EMTN, 5.375%, 6/26/2017, (EUR) | | | 209,757 | |
| | 240,000 | | | Veolia Environnement, EMTN, 4.000%, 2/12/2016, (EUR) | | | 345,588 | |
| | 25,000 | | | Veolia Environnement, EMTN, 5.125%, 5/24/2022, (EUR) | | | 36,496 | |
| | | | | | | | |
| | | | | | | 591,841 | |
| | | | | | | | |
| | | | Germany — 0.4% | | | | |
| | 975,000 | | | Bundesrepublik Deutschland, 3.000%, 7/04/2020, (EUR)(d) | | | 1,346,147 | |
| | 400,000 | | | Republic of Germany, 4.000%, 4/13/2012, (EUR) | | | 581,874 | |
| | | | | | | | |
| | | | | | | 1,928,021 | |
| | | | | | | | |
| | | | Hungary — 0.1% | | | | |
| | 400,000 | | | Hungary Government International Bond, 6.375%, 3/29/2021 | | | 400,400 | |
| | | | | | | | |
| | | | India — 0.1% | | | | |
| | 200,000 | | | Canara Bank Ltd., (fixed rate to 11/28/2016, variable rate thereafter),
6.365%, 11/28/2021 | | | 199,241 | |
| | 100,000 | | | ICICI Bank Ltd., (fixed rate to 4/30/2017, variable rate thereafter),
6.375%, 4/30/2022, 144A | | | 99,500 | |
| | | | | | | | |
| | | | | | | 298,741 | |
| | | | | | | | |
| | | | Indonesia — 0.2% | | | | |
| | 200,000 | | | Adaro Indonesia PT, 7.625%, 10/22/2019, 144A | | | 221,000 | |
| | 3,500,000,000 | | | Indonesia Government International Bond, 9.500%, 7/15/2023, (IDR) | | | 429,051 | |
| | 1,500,000,000 | | | Indonesia Government International Bond, 11.500%, 9/15/2019, (IDR) | | | 209,130 | |
| | | | | | | | |
| | | | | | | 859,181 | |
| | | | | | | | |
| | | | Italy — 0.1% | | | | |
| | 250,000 | | | Finmeccanica SpA, EMTN, 4.875%, 3/24/2025, (EUR) | | | 334,753 | |
| | 100,000 | | | Telecom Italia SpA, EMTN, 5.375%, 1/29/2019, (EUR) | | | 142,287 | |
| | | | | | | | |
| | | | | | | 477,040 | |
| | | | | | | | |
See accompanying notes to financial statements.
| 24
Portfolio of Investments – as of March 31, 2011 (Unaudited)
Loomis Sayles Global Equity and Income Fund* – (continued)
| | | | | | | | |
Principal
Amount (‡) | | | Description | | Value (†) | |
| | | | | | | | |
| | | | Jersey — 0.0% | | | | |
| | 100,000 | | | WPP PLC, 6.000%, 4/04/2017, (GBP) | | $ | 170,948 | |
| | | | | | | | |
| | | | Korea — 0.2% | | | | |
| | 8,000,000 | | | Export-Import Bank of Korea, 4.000%, 11/26/2015, 144A, (PHP) | | | 176,774 | |
| | 400,000,000 | | | Korea Treasury Bond, 5.000%, 9/10/2014, (KRW) | | | 375,819 | |
| | 260,000 | | | SK Broadband Co. Ltd., 7.000%, 2/01/2012, 144A | | | 270,400 | |
| | 140,000 | | | SK Telecom Co. Ltd., 6.625%, 7/20/2027, 144A | | | 155,221 | |
| | | | | | | | |
| | | | | | | 978,214 | |
| | | | | | | | |
| | | | Luxembourg — 0.1% | | | | |
| | 100,000 | | | CSN Resources SA, 6.500%, 7/21/2020, 144A | | | 106,500 | |
| | 200,000 | | | Gazprom Via Gaz Capital SA, 5.092%, 11/29/2015, 144A | | | 208,740 | |
| | 125,000 | | | Telecom Italia Capital SA, 6.000%, 9/30/2034 | | | 113,107 | |
| | 10,000 | | | Telecom Italia Capital SA, 6.375%, 11/15/2033 | | | 9,437 | |
| | | | | | | | |
| | | | | | | 437,784 | |
| | | | | | | | |
| | | | Mexico — 0.7% | | | | |
| | 195,000 | | | Axtel SAB de CV, 7.625%, 2/01/2017, 144A | | | 183,300 | |
| | 145,000 | | | Axtel SAB de CV, 9.000%, 9/22/2019, 144A | | | 139,200 | |
| | 200,000 | | | BBVA Bancomer SA, 6.500%, 3/10/2021, 144A | | | 197,632 | |
| | 200,000 | | | Corporacion GEO SAB de CV, 9.250%, 6/30/2020, 144A | | | 222,500 | |
| | 295,000 | | | Desarrolladora Homex SAB de CV, 7.500%, 9/28/2015 | | | 303,850 | |
| | 74,000(†††) | | | Mexican Fixed Rate Bonds, Series M-10, 8.000%, 12/17/2015, (MXN) | | | 648,984 | |
| | 116,000(†††) | | | Mexican Fixed Rate Bonds, Series M-10, 8.500%, 12/13/2018, (MXN) | | | 1,044,390 | |
| | 100,000 | | | Mexichem SAB de CV, 8.750%, 11/06/2019, 144A | | | 114,750 | |
| | 330,000 | | | Petroleos Mexicanos, 8.000%, 5/03/2019 | | | 396,330 | |
| | 200,000 | | | Urbi Desarrollos Urbanos SAB de CV, 9.500%, 1/21/2020, 144A | | | 224,000 | |
| | | | | | | | |
| | | | | | | 3,474,936 | |
| | | | | | | | |
| | | | Netherlands — 0.1% | | | | |
| | 50,000 | | | British American Tobacco Holdings BV, 4.000%, 7/07/2020, (EUR) | | | 68,360 | |
| | 200,000 | | | Indosat Palapa Co. BV, 7.375%, 7/29/2020, 144A | | | 219,760 | |
| | 200,000 | | | Listrindo Capital BV, 9.250%, 1/29/2015, 144A | | | 221,262 | |
| | 100,000 | | | Myriad International Holding BV, 6.375%, 7/28/2017, 144A | | | 105,620 | |
| | 50,000 | | | OI European Group BV, 6.875%, 3/31/2017, 144A, (EUR) | | | 72,454 | |
| | | | | | | | |
| | | | | | | 687,456 | |
| | | | | | | | |
| | | | New Zealand — 0.3% | | | | |
| | 1,300,000 | | | New Zealand Government Bond, 6.000%, 12/15/2017, (NZD) | | | 1,037,716 | |
| | 700,000 | | | New Zealand Government Bond, 6.500%, 4/15/2013, (NZD) | | | 565,809 | |
| | | | | | | | |
| | | | | | | 1,603,525 | |
| | | | | | | | |
| | | | Norway — 0.4% | | | | |
| | 3,335,000 | | | Norwegian Government, 4.250%, 5/19/2017, (NOK) | | | 627,371 | |
| | 6,360,000 | | | Norwegian Government, 4.500%, 5/22/2019, (NOK) | | | 1,211,058 | |
| | | | | | | | |
| | | | | | | 1,838,429 | |
| | | | | | | | |
| | | | Peru — 0.0% | | | | |
| | 450,000 | | | Republic of Peru, 7.840%, 8/12/2020, 144A, (PEN) | | | 172,076 | |
| | | | | | | | |
See accompanying notes to financial statements.
25 |
Portfolio of Investments – as of March 31, 2011 (Unaudited)
Loomis Sayles Global Equity and Income Fund* – (continued)
| | | | | | | | |
Principal
Amount (‡) | | | Description | | Value (†) | |
| | | | | | | | |
| | | | Philippines — 0.1% | | | | |
| | 30,000,000 | | | Philippine Government International Bond, 6.250%, 1/14/2036, (PHP) | | $ | 652,915 | |
| | | | | | | | |
| | | | Poland — 0.0% | | | | |
| | 95,000 | | | Poland Government International Bond, 3.000%, 9/23/2014, (CHF) | | | 104,671 | |
| | | | | | | | |
| | | | Qatar — 0.1% | | | | |
| | 100,000 | | | Qatar Government International Bond, 4.000%, 1/20/2015, 144A | | | 103,250 | |
| | 250,000 | | | Ras Laffan Liquefied Natural Gas Co. Ltd. III, 5.500%, 9/30/2014, 144A | | | 268,303 | |
| | | | | | | | |
| | | | | | | 371,553 | |
| | | | | | | | |
| | | | Singapore — 0.6% | | | | |
| | 1,400,000 | | | Singapore Government Bond, 1.625%, 4/01/2013, (SGD) | | | 1,136,961 | |
| | 1,555,000 | | | Singapore Government Bond, 2.250%, 7/01/2013, (SGD) | | | 1,284,787 | |
| | 150,000 | | | STATS ChipPAC Ltd., 7.500%, 8/12/2015, 144A | | | 163,500 | |
| | | | | | | | |
| | | | | | | 2,585,248 | |
| | | | | | | | |
| | | | South Africa — 0.3% | | | | |
| | 450,000 | | | Edcon Proprietary Ltd., 4.423%, 6/15/2014, (EUR)(e) | | | 545,268 | |
| | 130,000 | | | Edcon Proprietary Ltd., 4.423%, 6/15/2014, 144A, (EUR)(e) | | | 157,522 | |
| | 285,000 | | | Republic of South Africa, EMTN, 4.500%, 4/05/2016, (EUR) | | | 409,455 | |
| | 400,000 | | | Transnet Ltd., 4.500%, 2/10/2016, 144A | | | 408,343 | |
| | | | | | | | |
| | | | | | | 1,520,588 | |
| | | | | | | | |
| | | | Supranationals — 0.3% | | | | |
| | 305,000 | | | European Investment Bank, 2.375%, 7/10/2020, (CHF) | | | 338,400 | |
| | 47,250,000 | | | Inter-American Development Bank, EMTN, 4.750%, 1/10/2014, (INR) | | | 1,030,293 | |
| | | | | | | | |
| | | | | | | 1,368,693 | |
| | | | | | | | |
| | | | Sweden — 0.2% | | | | |
| | 2,210,000 | | | Sweden Government Bond, 5.000%, 12/01/2020, (SEK) | | | 396,910 | |
| | 3,020,000 | | | Sweden Government Bond, 5.500%, 10/08/2012, (SEK)(d) | | | 500,758 | |
| | | | | | | | |
| | | | | | | 897,668 | |
| | | | | | | | |
| | | | Thailand — 0.1% | | | | |
| | 330,000 | | | True Move Co. Ltd., 10.375%, 8/01/2014 | | | 356,400 | |
| | 100,000 | | | True Move Co. Ltd., 10.375%, 8/01/2014, 144A | | | 108,000 | |
| | | | | | | | |
| | | | | | | 464,400 | |
| | | | | | | | |
| | | | Turkey — 0.1% | | | | |
| | 200,000 | | | Akbank TAS, 5.125%, 7/22/2015, 144A | | | 200,760 | |
| | 619,871 | | | Republic of Turkey, 4.000%, 4/29/2015, (TRY) | | | 431,485 | |
| | | | | | | | |
| | | | | | | 632,245 | |
| | | | | | | | |
| | | | United Arab Emirates — 0.5% | | | | |
| | 400,000 | | | Abu Dhabi National Energy Co., 6.500%, 10/27/2036, 144A | | | 382,000 | |
| | 400,000 | | | Abu Dhabi National Energy Co., 7.250%, 8/01/2018, 144A | | | 440,500 | |
| | 500,000 | | | DP World Ltd., 6.850%, 7/02/2037, 144A | | | 460,000 | |
| | 300,000 | | | Dubai Electricity & Water Authority, 6.375%, 10/21/2016, 144A | | | 302,250 | |
| | 200,000 | | | Dubai Electricity & Water Authority, 8.500%, 4/22/2015, 144A | | | 217,000 | |
| | 250,000 | | | Mubadala Development Co., GMTN, 7.625%, 5/06/2019, 144A | | | 290,414 | |
| | | | | | | | |
| | | | | | | 2,092,164 | |
| | | | | | | | |
See accompanying notes to financial statements.
| 26
Portfolio of Investments – as of March 31, 2011 (Unaudited)
Loomis Sayles Global Equity and Income Fund* – (continued)
| | | | | | | | |
Principal
Amount (‡) | | | Description | | Value (†) | |
| | | | | | | | |
| | | | United Kingdom — 0.5% | | | | |
| | 410,000,000 | | | Barclays Bank PLC, EMTN, 3.680%, 8/20/2015, (KRW) | | $ | 364,921 | |
| | 100,000 | | | BAT International Finance PLC, EMTN, 5.375%, 6/29/2017, (EUR) | | | 151,519 | |
| | 150,000 | | | British Telecommunications PLC, 5.750%, 12/07/2028, (GBP) | | | 231,077 | |
| | 60,000 | | | BSKYB Finance UK PLC, 5.750%, 10/20/2017, (GBP) | | | 102,837 | |
| | 150,000 | | | Imperial Tobacco Finance PLC, EMTN, 6.250%, 12/04/2018, (GBP) | | | 260,407 | |
| | 100,000 | | | Rexam PLC, EMTN, 4.375%, 3/15/2013, (EUR) | | | 144,458 | |
| | 250,000 | | | Standard Chartered Bank, Series 17, EMTN, 5.875%, 9/26/2017, (EUR) | | | 366,580 | |
| | 300,000 | | | United Kingdom Treasury, 5.250%, 6/07/2012, (GBP) | | | 505,073 | |
| | | | | | | | |
| | | | | | | 2,126,872 | |
| | | | | | | | |
| | | | United States — 14.7% | | | | |
| | 155,000 | | | Alcatel-Lucent USA, Inc., 6.450%, 3/15/2029 | | | 133,300 | |
| | 975,000 | | | Alcoa, Inc., 5.900%, 2/01/2027 | | | 959,268 | |
| | 257,000 | | | Ally Financial, Inc., 6.750%, 12/01/2014 | | | 270,814 | |
| | 60,000 | | | Ally Financial, Inc., 6.875%, 8/28/2012 | | | 63,000 | |
| | 63,000 | | | Ally Financial, Inc., 7.000%, 2/01/2012 | | | 64,969 | |
| | 55,000 | | | Ally Financial, Inc., 7.500%, 12/31/2013 | | | 59,194 | |
| | 129,000 | | | Ally Financial, Inc., 8.000%, 12/31/2018 | | | 138,514 | |
| | 1,946,000 | | | Ally Financial, Inc., 8.000%, 11/01/2031 | | | 2,121,140 | |
| | 60,000 | | | Arrow Electronics, Inc., 6.875%, 7/01/2013 | | | 65,484 | |
| | 31,298 | | | Atlas Air Pass Through Trust, Series 1998-1, Class B, 7.680%, 7/02/2015 | | | 30,985 | |
| | 145,000 | | | Avnet, Inc., 6.000%, 9/01/2015 | | | 155,753 | |
| | 200,000 | | | Bank of America Corp., (fixed rate to 5/06/2014, variable rate thereafter),
4.750%, 5/06/2019, (EUR) | | | 266,982 | |
| | 15,000 | | | Boston Scientific Corp., 5.125%, 1/12/2017 | | | 15,343 | |
| | 5,000 | | | Boston Scientific Corp., 5.450%, 6/15/2014 | | | 5,336 | |
| | 15,000 | | | Boston Scientific Corp., 6.400%, 6/15/2016 | | | 16,355 | |
| | 60,000 | | | Boston Scientific Corp., 7.000%, 11/15/2035 | | | 61,274 | |
| | 700,000 | | | Capital One Multi-Asset Execution Trust, Series 2005-A10, Class A,
0.335%, 9/15/2015(e) | | | 696,670 | |
| | 2,335,000 | | | Capital One Multi-Asset Execution Trust, Series 2006-A5, Class A5,
0.315%, 1/15/2016(e) | | | 2,326,260 | |
| | 15,000 | | | Chesapeake Energy Corp., 6.500%, 8/15/2017 | | | 16,219 | |
| | 75,000 | | | Chesapeake Energy Corp., 6.875%, 11/15/2020 | | | 81,000 | |
| | 41,776 | | | CIT Group, Inc., 7.000%, 5/01/2013 | | | 42,560 | |
| | 119,429 | | | CIT Group, Inc., 7.000%, 5/01/2014 | | | 121,668 | |
| | 119,429 | | | CIT Group, Inc., 7.000%, 5/01/2015 | | | 120,474 | |
| | 199,049 | | | CIT Group, Inc., 7.000%, 5/01/2016 | | | 199,298 | |
| | 278,673 | | | CIT Group, Inc., 7.000%, 5/01/2017 | | | 279,021 | |
| | 120,000 | | | Citibank Credit Card Issuance Trust, Series 2001-A4, Class A4,
5.375%, 4/10/2013, (EUR) | | | 170,144 | |
| | 300,000 | | | Comcast Corp., 5.650%, 6/15/2035 | | | 282,001 | |
| | 776,526 | | | Continental Airlines Pass Through Trust, Series 1999-1, Class B,
6.795%, 2/02/2020 | | | 760,995 | |
| | 190,000 | | | CSX Corp., 6.250%, 3/15/2018 | | | 216,712 | |
| | 265,000 | | | Cummins, Inc., 5.650%, 3/01/2098 | | | 214,309 | |
| | 160,000 | | | Cummins, Inc., 7.125%, 3/01/2028 | | | 177,316 | |
| | 290,939 | | | Delta Air Lines Pass Through Trust, Series 2007-1, Class B, 8.021%, 2/10/2024 | | | 300,395 | |
See accompanying notes to financial statements.
27 |
Portfolio of Investments – as of March 31, 2011 (Unaudited)
Loomis Sayles Global Equity and Income Fund* – (continued)
| | | | | | | | |
Principal
Amount (‡) | | | Description | | Value (†) | |
| | | | | | | | |
| | | | United States — continued | | | | |
| $ | 279,562 | | | Delta Air Lines Pass Through Trust, Series 2007-1, Class C, 8.954%, 8/10/2014 | | $ | 290,045 | |
| | 42,000 | | | Dillard’s, Inc., 6.625%, 1/15/2018 | | | 41,370 | |
| | 50,000 | | | Dillard’s, Inc., 7.000%, 12/01/2028 | | | 44,500 | |
| | 8,000 | | | Dillard’s, Inc., 7.750%, 7/15/2026 | | | 7,680 | |
| | 250,000 | | | Exelon Corp., 4.900%, 6/15/2015 | | | 262,724 | |
| | 150,000 | | | Foot Locker, Inc., 8.500%, 1/15/2022 | | | 151,500 | |
| | 25,000 | | | Ford Motor Co., 6.375%, 2/01/2029 | | | 23,619 | |
| | 50,000 | | | Ford Motor Co., 6.625%, 2/15/2028 | | | 48,549 | |
| | 2,105,000 | | | Ford Motor Co., 6.625%, 10/01/2028 | | | 2,042,959 | |
| | 40,000 | | | Ford Motor Co., 7.125%, 11/15/2025 | | | 38,836 | |
| | 835,000 | | | Ford Motor Co., 7.450%, 7/16/2031 | | | 903,979 | |
| | 5,000 | | | Ford Motor Co., 7.500%, 8/01/2026 | | | 5,020 | |
| | 2,250,000 | | | Ford Motor Credit Co. LLC, 7.000%, 10/01/2013 | | | 2,428,803 | |
| | 845,000 | | | Ford Motor Credit Co. LLC, 7.000%, 4/15/2015 | | | 914,650 | |
| | 905,000 | | | Ford Motor Credit Co. LLC, 8.000%, 12/15/2016 | | | 1,027,340 | |
| | 80,000 | | | Freescale Semiconductor, Inc., 10.125%, 12/15/2016 | | | 85,000 | |
| | 45,000 | | | General Electric Capital Corp., 5.625%, 5/01/2018 | | | 48,650 | |
| | 205,000 | | | General Electric Capital Corp., MTN, 5.875%, 1/14/2038 | | | 202,391 | |
| | 900,000 | | | General Electric Capital Corp., Series A, GMTN, 7.625%, 12/10/2014, (NZD) | | | 741,587 | |
| | 750,000 | | | General Electric Capital Corp., Series A, MTN, 4.875%, 3/04/2015 | | | 808,658 | |
| | 3,375,000 | | | Georgia-Pacific LLC, 7.250%, 6/01/2028 | | | 3,526,875 | |
| | 35,000 | | | Georgia-Pacific LLC, 7.750%, 11/15/2029 | | | 38,456 | |
| | 525,000 | | | Georgia-Pacific LLC, 8.000%, 1/15/2024 | | | 599,812 | |
| | 405,000 | | | Georgia-Pacific LLC, 8.875%, 5/15/2031 | | | 489,038 | |
| | 200,000 | | | Gerdau Holdings, Inc., 7.000%, 1/20/2020, 144A | | | 221,500 | |
| | 455,000 | | | Goldman Sachs Group, Inc. (The), 6.750%, 10/01/2037 | | | 458,926 | |
| | 50,000 | | | Goldman Sachs Group, Inc. (The), 6.875%, 1/18/2038, (GBP) | | | 80,002 | |
| | 165,000 | | | Goodyear Tire & Rubber Co. (The), 7.000%, 3/15/2028 | | | 155,100 | |
| | 20,000 | | | HCA, Inc., 5.750%, 3/15/2014 | | | 20,375 | |
| | 90,000 | | | HCA, Inc., 6.375%, 1/15/2015 | | | 91,800 | |
| | 225,000 | | | HCA, Inc., 7.050%, 12/01/2027 | | | 200,250 | |
| | 245,000 | | | HCA, Inc., 7.190%, 11/15/2015 | | | 246,225 | |
| | 90,000 | | | HCA, Inc., 7.500%, 12/15/2023 | | | 85,050 | |
| | 250,000 | | | HCA, Inc., 7.500%, 11/06/2033 | | | 229,375 | |
| | 1,295,000 | | | HCA, Inc., 7.690%, 6/15/2025 | | | 1,233,487 | |
| | 395,000 | | | HCA, Inc., 8.360%, 4/15/2024 | | | 395,000 | |
| | 195,000 | | | HCA, Inc., MTN, 7.580%, 9/15/2025 | | | 183,788 | |
| | 75,000 | | | HCA, Inc., MTN, 7.750%, 7/15/2036 | | | 70,125 | |
| | 470,000 | | | Highwoods Properties, Inc., 5.850%, 3/15/2017 | | | 500,205 | |
| | 110,000 | | | Incitec Pivot Finance LLC, 6.000%, 12/10/2019, 144A | | | 115,261 | |
| | 80,000 | | | International Lease Finance Corp., 8.250%, 12/15/2020 | | | 87,700 | |
| | 250,000 | | | iStar Financial, Inc., 5.150%, 3/01/2012 | | | 248,125 | |
| | 95,000 | | | iStar Financial, Inc., 5.500%, 6/15/2012 | | | 94,050 | |
| | 70,000 | | | iStar Financial, Inc., 5.850%, 3/15/2017 | | | 61,075 | |
| | 405,000 | | | iStar Financial, Inc., 5.875%, 3/15/2016 | | | 360,450 | |
| | 145,000 | | | iStar Financial, Inc., 6.050%, 4/15/2015 | | | 132,675 | |
| | 985,000 | | | iStar Financial, Inc., 8.625%, 6/01/2013 | | | 999,775 | |
See accompanying notes to financial statements.
| 28
Portfolio of Investments – as of March 31, 2011 (Unaudited)
Loomis Sayles Global Equity and Income Fund* – (continued)
| | | | | | | | |
Principal
Amount (‡) | | | Description | | Value (†) | |
| | | | | | | | |
| | | | United States — continued | | | | |
| $ | 35,000 | | | iStar Financial, Inc., Series B, 5.700%, 3/01/2014 | | $ | 32,725 | |
| | 950,000 | | | iStar Financial, Inc., Series B, 5.950%, 10/15/2013 | | | 900,125 | |
| | 5,000 | | | J.C. Penney Corp., Inc., 5.750%, 2/15/2018 | | | 5,038 | |
| | 64,000 | | | J.C. Penney Corp., Inc., 6.375%, 10/15/2036 | | | 57,680 | |
| | 15,000 | | | J.C. Penney Corp., Inc., 7.125%, 11/15/2023 | | | 15,525 | |
| | 5,000 | | | J.C. Penney Corp., Inc., 7.625%, 3/01/2097 | | | 4,475 | |
| | 95,000 | | | Jefferies Group, Inc., 6.250%, 1/15/2036 | | | 87,810 | |
| | 375,000 | | | Jefferies Group, Inc., 8.500%, 7/15/2019 | | | 442,387 | |
| | 260,000 | | | K. Hovnanian Enterprises, Inc., 6.250%, 1/15/2016 | | | 193,700 | |
| | 15,000 | | | K. Hovnanian Enterprises, Inc., 6.375%, 12/15/2014 | | | 13,613 | |
| | 15,000 | | | Lennar Corp., Series B, 5.500%, 9/01/2014 | | | 15,000 | |
| | 1,090,000 | | | Lennar Corp., Series B, 5.600%, 5/31/2015 | | | 1,073,650 | |
| | 55,000 | | | Lennar Corp., Series B, 6.500%, 4/15/2016 | | | 55,000 | |
| | 235,000 | | | Level 3 Financing, Inc., 8.750%, 2/15/2017 | | | 233,238 | |
| | 10,000 | | | Level 3 Financing, Inc., 9.250%, 11/01/2014 | | | 10,225 | |
| | 30,000 | | | Level 3 Financing, Inc., 9.375%, 4/01/2019, 144A | | | 29,025 | |
| | 310,000 | | | Momentive Specialty Chemicals, Inc., 7.875%, 2/15/2023 | | | 254,200 | |
| | 410,000 | | | Momentive Specialty Chemicals, Inc., 8.375%, 4/15/2016 | | | 381,300 | |
| | 230,000 | | | Morgan Stanley, 5.375%, 11/14/2013, (GBP) | | | 385,789 | |
| | 2,500,000 | | | Morgan Stanley, 5.750%, 1/25/2021 | | | 2,523,240 | |
| | 500,000 | | | Morgan Stanley, GMTN, 7.625%, 3/03/2016, (AUD) | | | 520,992 | |
| | 500,000 | | | New Albertson’s, Inc., 7.450%, 8/01/2029 | | | 395,000 | |
| | 50,000 | | | New Albertson’s, Inc., Series C, MTN, 6.625%, 6/01/2028 | | | 36,250 | |
| | 15,000 | | | News America, Inc., 6.400%, 12/15/2035 | | | 15,433 | |
| | 935,000 | | | Nextel Communications, Inc., Series D, 7.375%, 8/01/2015 | | | 938,506 | |
| | 30,000 | | | Nextel Communications, Inc., Series E, 6.875%, 10/31/2013 | | | 30,225 | |
| | 250,000 | | | NGC Corp. Capital Trust I, Series B, 8.316%, 6/01/2027(f) | | | 127,500 | |
| | 35,000 | | | Nortel Networks Capital Corp., 7.875%, 6/15/2026(c) | | | 25,725 | |
| | 50,000 | | | Ohio Edison Co., 6.875%, 7/15/2036 | | | 54,153 | |
| | 565,000 | | | Owens Corning, Inc., 6.500%, 12/01/2016 | | | 615,173 | |
| | 535,000 | | | Owens Corning, Inc., 7.000%, 12/01/2036 | | | 536,837 | |
| | 150,000 | | | Owens-Brockway Glass Container, Inc., 6.750%, 12/01/2014, (EUR) | | | 215,769 | |
| | 40,000 | | | Owens-Illinois, Inc., 7.800%, 5/15/2018 | | | 43,650 | |
| | 47,000 | | | Pulte Group, Inc., 5.200%, 2/15/2015 | | | 46,648 | |
| | 540,000 | | | Pulte Group, Inc., 6.000%, 2/15/2035 | | | 422,550 | |
| | 695,000 | | | Pulte Group, Inc., 6.375%, 5/15/2033 | | | 564,688 | |
| | 1,335,000 | | | Qwest Capital Funding, Inc., 6.500%, 11/15/2018 | | | 1,361,700 | |
| | 650,000 | | | Qwest Capital Funding, Inc., 6.875%, 7/15/2028 | | | 645,125 | |
| | 400,000 | | | Qwest Capital Funding, Inc., 7.625%, 8/03/2021 | | | 416,000 | |
| | 60,000 | | | Qwest Capital Funding, Inc., 7.750%, 2/15/2031 | | | 63,900 | |
| | 560,000 | | | Qwest Corp., 6.875%, 9/15/2033 | | | 560,700 | |
| | 115,000 | | | Qwest Corp., 7.250%, 9/15/2025 | | | 122,475 | |
| | 80,000 | | | Reynolds American, Inc., 6.750%, 6/15/2017 | | | 91,484 | |
| | 20,000 | | | Reynolds American, Inc., 7.250%, 6/15/2037 | | | 21,167 | |
| | 1,600(††††) | | | SLM Corp., 6.000%, 12/15/2043 | | | 33,628 | |
| | 120,000 | | | SLM Corp., MTN, 5.050%, 11/14/2014 | | | 121,131 | |
| | 35,000 | | | SLM Corp., MTN, 5.125%, 8/27/2012 | | | 36,121 | |
See accompanying notes to financial statements.
29 |
Portfolio of Investments – as of March 31, 2011 (Unaudited)
Loomis Sayles Global Equity and Income Fund* – (continued)
| | | | | | | | |
Principal
Amount (‡) | | | Description | | Value (†) | |
| | | | | | | | |
| | | | United States — continued | | | | |
| $ | 228,000 | | | SLM Corp., Series A, MTN, 5.000%, 10/01/2013 | | $ | 236,001 | |
| | 10,000 | | | SLM Corp., Series A, MTN, 5.000%, 6/15/2018 | | | 9,397 | |
| | 115,000 | | | SLM Corp., Series A, MTN, 5.375%, 1/15/2013 | | | 119,617 | |
| | 75,000 | | | SLM Corp., Series A, MTN, 5.375%, 5/15/2014 | | | 77,774 | |
| | 265,000 | | | SLM Corp., Series A, MTN, 5.625%, 8/01/2033 | | | 226,561 | |
| | 625,000 | | | SLM Corp., Series A, MTN, 8.450%, 6/15/2018 | | | 700,000 | |
| | 100,000 | | | Springleaf Finance Corp., MTN, 5.750%, 9/15/2016 | | | 90,000 | |
| | 100,000 | | | Springleaf Finance Corp., Series H, MTN, 5.375%, 10/01/2012 | | | 98,375 | |
| | 300,000 | | | Springleaf Finance Corp., Series I, MTN, 4.875%, 7/15/2012 | | | 294,750 | |
| | 400,000 | | | Springleaf Finance Corp., Series I, MTN, 5.850%, 6/01/2013 | | | 391,000 | |
| | 200,000 | | | Springleaf Finance Corp., Series J, MTN, 5.900%, 9/15/2012 | | | 198,000 | |
| | 400,000 | | | Springleaf Finance Corp., Series J, MTN, 6.900%, 12/15/2017 | | | 365,500 | |
| | 294,000 | | | Sprint Capital Corp., 6.875%, 11/15/2028 | | | 271,215 | |
| | 420,000 | | | Sprint Capital Corp., 6.900%, 5/01/2019 | | | 433,650 | |
| | 110,000 | | | Sprint Capital Corp., 8.750%, 3/15/2032 | | | 117,013 | |
| | 26,000 | | | Sprint Nextel Corp., 6.000%, 12/01/2016 | | | 26,098 | |
| | 265,000 | | | Tenet Healthcare Corp., 6.875%, 11/15/2031 | | | 219,619 | |
| | 250,000 | | | Textron, Inc., 3.875%, 3/11/2013, (EUR) | | | 352,345 | |
| | 50,000 | | | Toll Brothers Finance Corp., 5.150%, 5/15/2015 | | | 51,036 | |
| | 375,000 | | | Toys R Us, Inc., 7.375%, 10/15/2018 | | | 375,938 | |
| | 3,150,000 | | | TXU Corp., Series P, 5.550%, 11/15/2014 | | | 2,063,250 | |
| | 2,570,000 | | | TXU Corp., Series Q, 6.500%, 11/15/2024 | | | 1,201,475 | |
| | 30,000 | | | TXU Corp., Series R, 6.550%, 11/15/2034 | | | 13,800 | |
| | 3,440,000 | | | U.S. Treasury Bond, 4.250%, 11/15/2040 | | | 3,290,037 | |
| | 1,100,000 | | | U.S. Treasury Note, 0.750%, 3/31/2013 | | | 1,099,142 | |
| | 7,250,000 | | | U.S. Treasury Note, 0.875%, 1/31/2012 | | | 7,285,967 | |
| | 462,710 | | | UAL Pass Through Trust, Series 2009-1, 10.400%, 5/01/2018 | | | 529,803 | |
| | 770,000 | | | United States Steel Corp., 6.650%, 6/01/2037 | | | 708,400 | |
| | 50,000 | | | USG Corp., 6.300%, 11/15/2016 | | | 47,000 | |
| | 230,000 | | | USG Corp., 9.750%, 1/15/2018 | | | 240,925 | |
| | 5,000 | | | Verizon Maryland, Inc., Series B, 5.125%, 6/15/2033 | | | 4,513 | |
| | 140,000 | | | Verizon New York, Inc., Series B, 7.375%, 4/01/2032 | | | 157,072 | |
| | 110,000 | | | Verizon Pennsylvania, Inc., 6.000%, 12/01/2028 | | | 102,430 | |
| | 85,000 | | | Wells Fargo & Co., 4.625%, 11/02/2035, (GBP) | | | 118,755 | |
| | 100,000 | | | Wells Fargo & Co., Series F, EMTN, 4.875%, 11/29/2035, (GBP) | | | 132,643 | |
| | 60,000 | | | Weyerhaeuser Co., 6.950%, 10/01/2027 | | | 59,710 | |
| | 315,000 | | | Weyerhaeuser Co., 7.375%, 3/15/2032 | | | 332,163 | |
| | 24,000 | | | Xerox Capital Trust I, 8.000%, 2/01/2027 | | | 24,420 | |
| | 125,000 | | | Xerox Corp., 6.750%, 2/01/2017 | | | 143,520 | |
| | 20,000 | | | Xerox Corp., MTN, 7.200%, 4/01/2016 | | | 22,975 | |
| | | | | | | | |
| | | | | | | 68,483,277 | |
| | | | | | | | |
| | | | Uruguay — 0.1% | | | | |
| | 3,776,920 | | | Uruguay Government International Bond, 3.700%, 6/26/2037, (UYU) | | | 199,834 | |
| | 4,300,057 | | | Uruguay Government International Bond, 5.000%, 9/14/2018, (UYU) | | | 265,003 | |
| | | | | | | | |
| | | | | | | 464,837 | |
| | | | | | | | |
| | | | Total Non-Convertible Bonds
(Identified Cost $102,675,822) | | | 110,509,730 | |
| | | | | | | | |
See accompanying notes to financial statements.
| 30
Portfolio of Investments – as of March 31, 2011 (Unaudited)
Loomis Sayles Global Equity and Income Fund* – (continued)
| | | | | | | | |
Principal
Amount (‡) | | | Description | | Value (†) | |
| | | | | | | | |
| | Convertible Bonds — 1.4% | | | | |
| | | | United States — 1.4% | | | | |
| $ | 125,000 | | | Ford Motor Co., 4.250%, 11/15/2016 | | $ | 226,563 | |
| | 745,000 | | | Hologic, Inc., (Step to Zero Coupon on 12/15/2013), 2.000%, 12/15/2037(g) | | | 718,925 | |
| | 1,125,000 | | | Intel Corp., 3.250%, 8/01/2039 | | | 1,323,281 | |
| | 430,000 | | | iStar Financial, Inc., 0.803%, 10/01/2012(e) | | | 392,375 | |
| | 365,000 | | | Kulicke & Soffa Industries, Inc., 0.875%, 6/01/2012 | | | 364,544 | |
| | 195,000 | | | Level 3 Communications, Inc., 3.500%, 6/15/2012 | | | 192,319 | |
| | 215,000 | | | Level 3 Communications, Inc., 7.000%, 3/15/2015, 144A(f) | | | 250,206 | |
| | 200,000 | | | NII Holdings, Inc., 3.125%, 6/15/2012 | | | 201,000 | |
| | 1,545,000 | | | Old Republic International Corp., 3.750%, 3/15/2018 | | | 1,550,794 | |
| | 375,000 | | | Omnicare, Inc., 3.750%, 12/15/2025 | | | 483,281 | |
| | 610,000 | | | Owens-Brockway Glass Container, Inc., 3.000%, 6/01/2015, 144A | | | 618,387 | |
| | 90,000 | | | Trinity Industries, Inc., 3.875%, 6/01/2036 | | | 98,100 | |
| | 80,000 | | | Valeant Pharmaceuticals International, 4.000%, 11/15/2013 | | | 316,000 | |
| | | | | | | | |
| | | | Total Convertible Bonds
(Identified Cost $5,964,712) | | | 6,735,775 | |
| | | | | | | | |
| | | | | | | | |
| | Municipals — 0.1% | | | | |
| | | | United States — 0.1% | | | | |
| | 415,000 | | | State of Illinois, 5.100%, 6/01/2033 | | | 336,511 | |
| | 135,000 | | | Virginia Tobacco Settlement Financing Corp., Series A-1, 6.706%, 6/01/2046(f) | | | 84,908 | |
| | | | | | | | |
| | | | Total Municipals
(Identified Cost $447,528) | | | 421,419 | |
| | | | | | | | |
| | | | Total Bonds and Notes
(Identified Cost $109,088,062) | | | 117,666,924 | |
| | | | | | | | |
| | | | | | | | |
| | Bank Loans — 0.0% | | | | |
| | | | United States — 0.0% | | | | |
| | 28,697 | | | Hawaiian Telcom Communications, Inc., Exit Term Loan,
9.000%, 11/01/2015(h)(i) | | | 29,228 | |
| | 2,676 | | | Sungard Data Systems, Inc., Tranche A, 2.008%, 2/28/2014(h) | | | 2,630 | |
| | 56,937 | | | SuperMedia, Inc., Exit Term Loan, 11.000%, 12/31/2015(h) | | | 37,617 | |
| | | | | | | | |
| | | | Total Bank Loans
(Identified Cost $108,416) | | | 69,475 | |
| | | | | | | | |
| | | | | | | | |
| Shares | | | | | | |
| | Preferred Stocks — 0.3% | | | | |
| | Convertible Preferred Stock — 0.2% | | | | |
| | | | United States — 0.2% | | | | |
| | 820 | | | Lucent Technologies Capital Trust I, 7.750%
(Identified Cost $590,508) | | | 803,600 | |
| | | | | | | | |
| | | | | | | | |
See accompanying notes to financial statements.
31 |
Portfolio of Investments – as of March 31, 2011 (Unaudited)
Loomis Sayles Global Equity and Income Fund* – (continued)
| | | | | | | | |
| Shares | | | Description | | Value (†) | |
| | | | | | | | |
| | Non-Convertible Preferred Stock — 0.1% | | | | |
| | | | United States — 0.1% | | | | |
| | 682 | | | Ally Financial, Inc., Series G, 7.000% 144A
(Identified Cost $145,366) | | $ | 634,601 | |
| | | | | | | | |
| | | | Total Preferred Stocks
(Identified Cost $735,874) | | | 1,438,201 | |
| | | | | | | | |
| | | | | | | | |
Principal Amount (‡) | | | | | | |
| | Short-Term Investments — 5.8% | | | | |
| $ | 26,922,241 | | | Tri-Party Repurchase Agreement with Fixed Income Clearing Corporation, dated 3/31/2011 at 0.000% to be repurchased at $26,922,241 on 4/01/2011 collateralized by $26,785,000 U.S. Treasury Bill, due 9/22/2011 valued at $26,758,215; $700,000 U.S. Treasury Note, 1.000% due 4/30/12 valued at $707,814 including accrued interest (Note 2 of Notes to Financial Statements) (Identified Cost $26,922,241) | | | 26,922,241 | |
| | | | | | | | |
| | | | | | | | |
| | | | Total Investments — 99.0%
(Identified Cost $387,772,212)(a) | | | 462,641,966 | |
| | | | Other assets less liabilities — 1.0% | | | 4,678,344 | |
| | | | | | | | |
| | | | Net Assets — 100.0% | | $ | 467,320,310 | |
| | | | | | | | |
| | | | | | | | |
| | * | | | Formerly Loomis Sayles Global Markets Fund. | |
| | (‡) | | | Principal amount stated in U.S. dollars unless otherwise noted. | |
| | (†) | | | See Note 2 of Notes to Financial Statements. | |
| | (††) | | | Security held in units. One unit represents a principal amount of 1,000. Amount shown represents principal amount including inflation adjustments. | |
| | (†††) | | | Amount shown represents units. One unit represents a principal amount of 100. | |
| | (††††) | | | Amount shown represents units. One unit represents a principal amount of 25. | |
| | (a) | | | Federal Tax Information (Amounts exclude certain adjustments made at the end of the Fund’s fiscal year for tax purposes. Such adjustments are primarily due to wash sales. Amortization of premium on debt securities is excluded for tax purposes.): | |
| | | | At March 31, 2011, the net unrealized appreciation on investments based on a cost of $387,911,956 for federal income tax purposes was as follows: | |
| | | | Aggregate gross unrealized appreciation for all investments in which there is an excess of value over tax cost | | $ | 79,086,346 | |
| | | | Aggregate gross unrealized depreciation for all investments in which there is an excess of tax cost over value | | | (4,356,336 | ) |
| | | | | | | | |
| | | | Net unrealized appreciation | | $ | 74,730,010 | |
| | | | | | | | |
| | | | | | | | |
| | (b) | | | Non-income producing security. | |
| | (c) | | | The issuer is in default with respect to interest and/or principal payments. Income is not being accrued. | |
| | (d) | | | All or a portion of this security has been designated to cover the Fund’s obligations under open forward foreign currency contracts. | |
| | (e) | | | Variable rate security. Rate as of March 31, 2011 is disclosed. | |
See accompanying notes to financial statements.
| 32
Portfolio of Investments – as of March 31, 2011 (Unaudited)
Loomis Sayles Global Equity and Income Fund* – (continued)
| | | | | | | | |
| | (f) | | | Illiquid security. At March 31, 2011, the value of these securities amounted to $462,614 or 0.1% of net assets. | |
| | (g) | | | Coupon rate is a fixed rate for an initial period then resets at a specified date and rate. | |
| | (h) | | | Variable rate security. Rate shown represents the weighted average rate at March 31, 2011. | |
| | (i) | | | All or a portion of interest payment is paid-in-kind. | |
| | | | | | | | |
| | 144A | | | All or a portion of these securities are exempt from registration under Rule 144A of the Securities Act of 1933. These securities may be resold in transactions exempt from registration, normally to qualified institutional buyers. At March 31, 2011, the value of Rule 144A holdings amounted to $18,553,513 or 4.0% of net assets. | |
| | ADR/GDR | | | An American Depositary Receipt or Global Depositary Receipt is a certificate issued by a custodian bank representing the right to receive securities of the foreign issuer described. The values of ADRs and GDRs may be significantly influenced by trading on exchanges not located in the United States. | |
| | EMTN | | | Euro Medium Term Note | |
| | GMTN | | | Global Medium Term Note | |
| | MTN | | | Medium Term Note | |
| | | | | | | | |
| | AUD | | | Australian Dollar | |
| | BRL | | | Brazilian Real | |
| | CAD | | | Canadian Dollar | |
| | CHF | | | Swiss Franc | |
| | CLP | | | Chilean Peso | |
| | COP | | | Colombian Peso | |
| | EUR | | | Euro | |
| | GBP | | | British Pound | |
| | IDR | | | Indonesian Rupiah | |
| | INR | | | Indian Rupee | |
| | KRW | | | South Korean Won | |
| | MXN | | | Mexican Peso | |
| | NOK | | | Norwegian Krone | |
| | NZD | | | New Zealand Dollar | |
| | PEN | | | Peruvian Nuevo Sol | |
| | PHP | | | Philippine Peso | |
| | SEK | | | Swedish Krona | |
| | SGD | | | Singapore Dollar | |
| | TRY | | | Turkish Lira | |
| | UYU | | | Uruguayan Peso | |
See accompanying notes to financial statements.
33 |
Portfolio of Investments – as of March 31, 2011 (Unaudited)
Loomis Sayles Global Equity and Income Fund* – (continued)
At March 31, 2011, the Fund had the following open forward foreign currency contracts:
| | | | | | | | | | | | | | | | | | |
Contract
to
Buy/Sell | | Delivery
Date | | | Currency | | Units | | | Notional
Value | | | Unrealized
Appreciation
(Depreciation) | |
| Sell1 | | | 06/15/2011 | | | Australian Dollar | | | 500,000 | | | $ | 512,586 | | | $ | (11,686) | |
| Buy2 | | | 08/23/2011 | | | Chinese Renminbi | | | 11,630,000 | | | | 1,788,699 | | | | 26,331 | |
| Buy3 | | | 06/20/2011 | | | Malaysian Ringgit | | | 1,250,000 | | | | 410,550 | | | | 3,330 | |
| Buy2 | | | 06/02/2011 | | | Polish Zloty | | | 1,200,000 | | | | 420,494 | | | | 8,548 | |
| Sell2 | | | 06/02/2011 | | | Polish Zloty | | | 1,200,000 | | | | 420,494 | | | | (8,017) | |
| Buy1 | | | 06/13/2011 | | | South Korean Won | | | 870,000,000 | | | | 789,625 | | | | 12,978 | |
| Buy4 | | | 06/13/2011 | | | South Korean Won | | | 780,000,000 | | | | 707,939 | | | | 12,132 | |
| | | | | | | | | | | | | | | | | | |
| Total | | | | | | | | | | | | | | | | $ | 43,616 | |
| | | | | | | | | | | | | | | | | | |
1 Counterparty is Credit Suisse.
2 Counterparty is Morgan Stanley.
3 Counterparty is JPMorgan Chase.
4 Counterparty is Barclays.
Industry Summary at March 31, 2011 (Unaudited)
| | | | |
Machinery | | | 8.0 | % |
Energy Equipment & Services | | | 6.0 | |
Treasuries | | | 5.7 | |
Internet Software & Services | | | 5.1 | |
Computers & Peripherals | | | 4.1 | |
Software | | | 3.7 | |
Pharmaceuticals | | | 3.6 | |
Textiles, Apparel & Luxury Goods | | | 3.5 | |
Personal Products | | | 3.2 | |
Commercial Banks | | | 3.0 | |
Internet & Catalog Retail | | | 2.9 | |
Semiconductors & Semiconductor Equipment | | | 2.7 | |
Automobiles | | | 2.5 | |
Communications Equipment | | | 2.5 | |
Industrial Conglomerates | | | 2.4 | |
Aerospace & Defense | | | 2.3 | |
Other Investments, less than 2% each | | | 32.0 | |
Short-Term Investments | | | 5.8 | |
| | | | |
Total Investments | | | 99.0 | |
Other assets less liabilities (including open forward foreign currency contracts) | | | 1.0 | |
| | | | |
Net Assets | | | 100.0 | % |
| | | | |
See accompanying notes to financial statements.
| 34
Portfolio of Investments – as of March 31, 2011 (Unaudited)
Loomis Sayles Global Equity and Income Fund* – (continued)
Currency Exposure at March 31, 2011 (Unaudited)
| | | | |
United States Dollar | | | 61.1 | % |
Euro | | | 8.6 | |
British Pound | | | 7.3 | |
Japanese Yen | | | 3.7 | |
Brazilian Real | | | 3.2 | |
South Korean Won | | | 2.8 | |
Danish Krone | | | 2.6 | |
Hong Kong Dollar | | | 2.0 | |
Other, less than 2% each | | | 7.7 | |
| | | | |
Total Investments | | | 99.0 | |
Other assets less liabilities (including open forward foreign currency contracts) | | | 1.0 | |
| | | | |
Net Assets | | | 100.0 | % |
| | | | |
See accompanying notes to financial statements.
35 |
Portfolio of Investments – as of March 31, 2011 (Unaudited)
Loomis Sayles Growth Fund
| | | | | | | | |
| Shares | | | Description | | Value (†) | |
| | | | | | | | |
| | Common Stocks — 98.8% of Net Assets | |
| | | | Air Freight & Logistics — 7.7% | | | | |
| | 83,027 | | | Expeditors International of Washington, Inc. | | $ | 4,162,974 | |
| | 68,026 | | | United Parcel Service, Inc., Class B | | | 5,055,692 | |
| | | | | | | | |
| | | | | | | 9,218,666 | |
| | | | | | | | |
| | | | Beverages — 4.0% | | | | |
| | 45,889 | | | Coca-Cola Co. (The) | | | 3,044,735 | |
| | 22,532 | | | Diageo PLC, Sponsored ADR | | | 1,717,389 | |
| | | | | | | | |
| | | | | | | 4,762,124 | |
| | | | | | | | |
| | | | Biotechnology — 6.5% | | | | |
| | 84,942 | | | Amgen, Inc.(b) | | | 4,540,150 | |
| | 44,659 | | | Biogen Idec, Inc.(b) | | | 3,277,524 | |
| | | | | | | | |
| | | | | | | 7,817,674 | |
| | | | | | | | |
| | | | Capital Markets — 8.3% | | | | |
| | 16,428 | | | Franklin Resources, Inc. | | | 2,054,815 | |
| | 80,480 | | | Legg Mason, Inc. | | | 2,904,523 | |
| | 207,849 | | | SEI Investments Co. | | | 4,963,434 | |
| | | | | | | | |
| | | | | | | 9,922,772 | |
| | | | | | | | |
| | | | Communications Equipment — 9.4% | | | | |
| | 313,336 | | | Cisco Systems, Inc. | | | 5,373,713 | |
| | 107,292 | | | QUALCOMM, Inc. | | | 5,882,820 | |
| | | | | | | | |
| | | | | | | 11,256,533 | |
| | | | | | | | |
| | | | Consumer Finance — 4.0% | | | | |
| | 106,425 | | | American Express Co. | | | 4,810,410 | |
| | | | | | | | |
| | | | Energy Equipment & Services — 3.4% | | | | |
| | 43,908 | | | Schlumberger Ltd. | | | 4,094,860 | |
| | | | | | | | |
| | | | Food Products — 2.0% | | | | |
| | 180,619 | | | Danone SA, Sponsored ADR | | | 2,371,527 | |
| | | | | | | | |
| | | | Health Care Equipment & Supplies — 4.7% | | | | |
| | 48,914 | | | Medtronic, Inc. | | | 1,924,766 | |
| | 61,551 | | | Zimmer Holdings, Inc.(b) | | | 3,725,682 | |
| | | | | | | | |
| | | | | | | 5,650,448 | |
| | | | | | | | |
| | | | Household Products — 4.2% | | | | |
| | 26,768 | | | Clorox Co. (The) | | | 1,875,634 | |
| | 51,204 | | | Procter & Gamble Co. (The) | | | 3,154,166 | |
| | | | | | | | |
| | | | | | | 5,029,800 | |
| | | | | | | | |
| | | | Internet & Catalog Retail — 7.4% | | | | |
| | 37,721 | | | Amazon.com, Inc.(b) | | | 6,794,683 | |
| | 37,520 | | | Blue Nile, Inc.(b) | | | 2,025,705 | |
| | | | | | | | |
| | | | | | | 8,820,388 | |
| | | | | | | | |
| | | | Internet Software & Services — 6.1% | | | | |
| | 12,434 | | | Google, Inc., Class A(b) | | | 7,288,935 | |
| | | | | | | | |
See accompanying notes to financial statements.
| 36
Portfolio of Investments – as of March 31, 2011 (Unaudited)
Loomis Sayles Growth Fund – (continued)
| | | | | | | | |
| Shares | | | Description | | Value (†) | |
| | | | | | | | |
| | | | IT Services — 6.8% | | | | |
| | 36,427 | | | Automatic Data Processing, Inc. | | $ | 1,869,069 | |
| | 85,530 | | | Visa, Inc., Class A | | | 6,296,719 | |
| | | | | | | | |
| | | | | | | 8,165,788 | |
| | | | | | | | |
| | | | Media — 2.5% | | | | |
| | 60,953 | | | Omnicom Group, Inc. | | | 2,990,354 | |
| | | | | | | | |
| | | | Multiline Retail — 0.3% | | | | |
| | 6,883 | | | Target Corp. | | | 344,219 | |
| | | | | | | | |
| | | | Pharmaceuticals — 5.2% | | | | |
| | 70,048 | | | Merck & Co., Inc. | | | 2,312,285 | |
| | 70,487 | | | Novartis AG, ADR | | | 3,830,968 | |
| | | | | | | | |
| | | | | | | 6,143,253 | |
| | | | | | | | |
| | | | Semiconductors & Semiconductor Equipment — 3.1% | | | | |
| | 52,336 | | | Altera Corp. | | | 2,303,831 | |
| | 33,779 | | | Analog Devices, Inc. | | | 1,330,217 | |
| | | | | | | | |
| | | | | | | 3,634,048 | |
| | | | | | | | |
| | | | Software — 11.0% | | | | |
| | 43,301 | | | FactSet Research Systems, Inc. | | | 4,534,914 | |
| | 89,672 | | | Microsoft Corp. | | | 2,274,082 | |
| | 190,838 | | | Oracle Corp. | | | 6,368,264 | |
| | | | | | | | |
| | | | | | | 13,177,260 | |
| | | | | | | | |
| | | | Specialty Retail — 2.2% | | | | |
| | 48,320 | | | Home Depot, Inc. (The) | | | 1,790,739 | |
| | 33,027 | | | Lowe’s Cos., Inc. | | | 872,904 | |
| | | | | | | | |
| | | | | | | 2,663,643 | |
| | | | | | | | |
| | | | Total Common Stocks
(Identified Cost $99,756,842) | | | 118,162,702 | |
| | | | | | | | |
| | | | | | | | |
Principal
Amount | | | | | | |
| | Short-Term Investments — 7.3% | |
| $ | 8,715,666 | | | Tri-Party Repurchase Agreement with Fixed Income Clearing Corporation, dated 3/31/2011 at 0.000% to be repurchased at $8,715,666 on 4/01/2011 collateralized by $8,970,000 Federal Home Loan Mortgage Corp., 2.950% due 12/08/2017 valued at $8,891,513 including accrued interest (Note 2 of Notes to Financial Statements)
(Identified Cost $8,715,666) | | | 8,715,666 | |
| | | | | | | | |
| | | | | | | | |
| | | | Total Investments — 106.1%
(Identified Cost $108,472,508)(a) | | | 126,878,368 | |
| | | | Other assets less liabilities — (6.1)% | | | (7,258,840 | ) |
| | | | | | | | |
| | | | Net Assets — 100.0% | | $ | 119,619,528 | |
| | | | | | | | |
See accompanying notes to financial statements.
37 |
Portfolio of Investments – as of March 31, 2011 (Unaudited)
Loomis Sayles Growth Fund – (continued)
| | | | | | | | |
| | (†) | | | See Note 2 of Notes to Financial Statements. | | | | |
| | (a) | | | Federal Tax Information (Amounts exclude certain adjustments made at the end of the Fund’s fiscal year for tax purposes. Such adjustments are primarily due to wash sales.): | |
| | | | At March 31, 2011, the net unrealized appreciation on investments based on a cost of $108,472,508 for federal income tax purposes was as follows: | |
| | | | Aggregate gross unrealized appreciation for all investments in which there is an excess of value over tax cost | | $ | 19,992,141 | |
| | | | Aggregate gross unrealized depreciation for all investments in which there is an excess of tax cost over value | | | (1,586,281 | ) |
| | | | | | | | |
| | | | Net unrealized appreciation | | $ | 18,405,860 | |
| | | | | | | | |
| | | | | | | | |
| | (b) | | | Non-income producing security. | |
| | | | | | | | |
| | ADR | | | An American Depositary Receipt is a certificate issued by a custodian bank representing the right to receive securities of the foreign issuer described. The values of ADRs may be significantly influenced by trading on exchanges not located in the United States. | |
Industry Summary at March 31, 2011 (Unaudited)
| | | | |
Software | | | 11.0 | % |
Communications Equipment | | | 9.4 | |
Capital Markets | | | 8.3 | |
Air Freight & Logistics | | | 7.7 | |
Internet & Catalog Retail | | | 7.4 | |
IT Services | | | 6.8 | |
Biotechnology | | | 6.5 | |
Internet Software & Services | | | 6.1 | |
Pharmaceuticals | | | 5.2 | |
Health Care Equipment & Supplies | | | 4.7 | |
Household Products | | | 4.2 | |
Consumer Finance | | | 4.0 | |
Beverages | | | 4.0 | |
Energy Equipment & Services | | | 3.4 | |
Semiconductors & Semiconductor Equipment | | | 3.1 | |
Media | | | 2.5 | |
Specialty Retail | | | 2.2 | |
Food Products | | | 2.0 | |
Multiline Retail | | | 0.3 | |
Short-Term Investments | | | 7.3 | |
| | | | |
Total Investments | | | 106.1 | |
Other assets less liabilities | | | (6.1 | ) |
| | | | |
Net Assets | | | 100.0 | % |
| | | | |
See accompanying notes to financial statements.
| 38
Portfolio of Investments – as of March 31, 2011 (Unaudited)
Loomis Sayles Mid Cap Growth Fund
| | | | | | | | |
| Shares | | | Description | | Value (†) | |
| | | | | | | | |
| | Common Stocks — 97.2% of Net Assets | |
| | | | Auto Components — 1.7% | | | | |
| | 30,394 | | | BorgWarner, Inc.(b) | | $ | 2,422,098 | |
| | | | | | | | |
| | | | Automobiles — 1.4% | | | | |
| | 47,400 | | | Harley-Davidson, Inc. | | | 2,014,026 | |
| | | | | | | | |
| | | | Biotechnology — 3.1% | | | | |
| | 30,959 | | | Alexion Pharmaceuticals, Inc.(b) | | | 3,055,034 | |
| | 28,679 | | | Vertex Pharmaceuticals, Inc.(b) | | | 1,374,585 | |
| | | | | | | | |
| | | | | | | 4,429,619 | |
| | | | | | | | |
| | | | Capital Markets — 1.8% | | | | |
| | 39,094 | | | T. Rowe Price Group, Inc. | | | 2,596,623 | |
| | | | | | | | |
| | | | Chemicals — 1.0% | | | | |
| | 23,239 | | | Kronos Worldwide, Inc. | | | 1,358,320 | |
| | | | | | | | |
| | | | Commercial Services & Supplies — 1.9% | | | | |
| | 30,688 | | | Stericycle, Inc.(b) | | | 2,721,105 | |
| | | | | | | | |
| | | | Communications Equipment — 3.8% | | | | |
| | 30,931 | | | Acme Packet, Inc.(b) | | | 2,194,864 | |
| | 95,066 | | | Aruba Networks, Inc.(b) | | | 3,217,033 | |
| | | | | | | | |
| | | | | | | 5,411,897 | |
| | | | | | | | |
| | | | Containers & Packaging — 1.6% | | | | |
| | 59,396 | | | Crown Holdings, Inc.(b) | | | 2,291,498 | |
| | | | | | | | |
| | | | Diversified Financial Services — 1.3% | | | | |
| | 15,604 | | | IntercontinentalExchange, Inc.(b) | | | 1,927,718 | |
| | | | | | | | |
| | | | Electrical Equipment — 3.6% | | | | |
| | 39,426 | | | Polypore International, Inc.(b) | | | 2,270,149 | |
| | 29,872 | | | Rockwell Automation, Inc. | | | 2,827,385 | |
| | | | | | | | |
| | | | | | | 5,097,534 | |
| | | | | | | | |
| | | | Energy Equipment & Services — 2.8% | | | | |
| | 25,466 | | | Lufkin Industries, Inc. | | | 2,380,307 | |
| | 38,566 | | | Superior Energy Services, Inc.(b) | | | 1,581,206 | |
| | | | | | | | |
| | | | | | | 3,961,513 | |
| | | | | | | | |
| | | | Food Products — 1.4% | | | | |
| | 34,985 | | | Diamond Foods, Inc. | | | 1,952,163 | |
| | | | | | | | |
| | | | Health Care Equipment & Supplies — 1.8% | | | | |
| | 30,200 | | | Edwards Lifesciences Corp.(b) | | | 2,627,400 | |
| | | | | | | | |
| | | �� | Health Care Providers & Services — 1.4% | | | | |
| | 25,260 | | | HMS Holdings Corp.(b) | | | 2,067,531 | |
| | | | | | | | |
| | | | Health Care Technology — 1.7% | | | | |
| | 44,353 | | | SXC Health Solutions Corp.(b) | | | 2,430,544 | |
| | | | | | | | |
| | | | Hotels, Restaurants & Leisure — 2.7% | | | | |
| | 41,076 | | | Ctrip.com International Ltd., ADR(b) | | | 1,704,243 | |
| | 16,807 | | | Wynn Resorts Ltd. | | | 2,138,691 | |
| | | | | | | | |
| | | | | | | 3,842,934 | |
| | | | | | | | |
See accompanying notes to financial statements.
39 |
Portfolio of Investments – as of March 31, 2011 (Unaudited)
Loomis Sayles Mid Cap Growth Fund – (continued)
| | | | | | | | |
| Shares | | | Description | | Value (†) | |
| | | | | | | | |
| | | | Household Products — 1.4% | | | | |
| | 26,045 | | | Church & Dwight Co., Inc. | | $ | 2,066,410 | |
| | | | | | | | |
| | | | Internet & Catalog Retail — 4.3% | | | | |
| | 12,101 | | | NetFlix, Inc.(b) | | | 2,871,930 | |
| | 6,400 | | | Priceline.com, Inc.(b) | | | 3,241,216 | |
| | | | | | | | |
| | | | | | | 6,113,146 | |
| | | | | | | | |
| | | | Internet Software & Services — 9.2% | | | | |
| | 28,232 | | | MercadoLibre, Inc. | | | 2,304,578 | |
| | 30,367 | | | OpenTable, Inc.(b) | | | 3,229,530 | |
| | 23,024 | | | Qihoo 360 Technology Co. Ltd., ADR(b) | | | 681,280 | |
| | 56,047 | | | Rackspace Hosting, Inc.(b) | | | 2,401,614 | |
| | 29,722 | | | SINA Corp.(b) | | | 3,181,443 | |
| | 29,778 | | | Youku.com, Inc., Sponsored ADR(b) | | | 1,414,753 | |
| | | | | | | | |
| | | | | | | 13,213,198 | |
| | | | | | | | |
| | | | IT Services — 3.8% | | | | |
| | 53,820 | | | Gartner, Inc.(b) | | | 2,242,680 | |
| | 57,433 | | | VeriFone Systems, Inc.(b) | | | 3,155,943 | |
| | | | | | | | |
| | | | | | | 5,398,623 | |
| | | | | | | | |
| | | | Life Sciences Tools & Services — 2.0% | | | | |
| | 16,657 | | | Mettler-Toledo International, Inc.(b) | | | 2,865,004 | |
| | | | | | | | |
| | | | Machinery — 7.4% | | | | |
| | 19,867 | | | Cummins, Inc. | | | 2,177,820 | |
| | 41,708 | | | Joy Global, Inc. | | | 4,121,167 | |
| | 21,807 | | | Parker Hannifin Corp. | | | 2,064,687 | |
| | 36,973 | | | WABCO Holdings, Inc.(b) | | | 2,279,016 | |
| | | | | | | | |
| | | | | | | 10,642,690 | |
| | | | | | | | |
| | | | Metals & Mining — 3.6% | | | | |
| | 26,584 | | | Cliffs Natural Resources, Inc. | | | 2,612,675 | |
| | 19,192 | | | Walter Energy, Inc. | | | 2,599,173 | |
| | | | | | | | |
| | | | | | | 5,211,848 | |
| | | | | | | | |
| | | | Multiline Retail — 1.7% | | | | |
| | 43,700 | | | Dollar Tree, Inc.(b) | | | 2,426,224 | |
| | | | | | | | |
| | | | Oil, Gas & Consumable Fuels — 6.2% | | | | |
| | 62,111 | | | Brigham Exploration Co.(b) | | | 2,309,287 | |
| | 41,820 | | | Concho Resources, Inc.(b) | | | 4,487,286 | |
| | 27,605 | | | SM Energy Co. | | | 2,048,015 | |
| | | | | | | | |
| | | | | | | 8,844,588 | |
| | | | | | | | |
| | | | Personal Products — 1.5% | | | | |
| | 21,505 | | | Estee Lauder Cos., Inc. (The), Class A | | | 2,072,222 | |
| | | | | | | | |
| | | | Pharmaceuticals — 4.1% | | | | |
| | 36,044 | | | Perrigo Co. | | | 2,866,219 | |
| | 59,032 | | | Valeant Pharmaceuticals International, Inc. | | | 2,940,384 | |
| | | | | | | | |
| | | | | | | 5,806,603 | |
| | | | | | | | |
See accompanying notes to financial statements.
| 40
Portfolio of Investments – as of March 31, 2011 (Unaudited)
Loomis Sayles Mid Cap Growth Fund – (continued)
| | | | | | | | |
| Shares | | | Description | | Value (†) | |
| | | | | | | | |
| | | | Real Estate Management & Development — 3.3% | | | | |
| | 100,797 | | | CB Richard Ellis Group, Inc., Class A(b) | | $ | 2,691,280 | |
| | 20,486 | | | Jones Lang LaSalle, Inc. | | | 2,043,274 | |
| | | | | | | | |
| | | | | | | 4,734,554 | |
| | | | | | | | |
| | | | Semiconductors & Semiconductor Equipment — 4.3% | | | | |
| | 79,655 | | | ARM Holdings PLC, Sponsored ADR | | | 2,243,881 | |
| | 69,537 | | | NXP Semiconductors NV(b) | | | 2,086,110 | |
| | 57,762 | | | Skyworks Solutions, Inc.(b) | | | 1,872,644 | |
| | | | | | | | |
| | | | | | | 6,202,635 | |
| | | | | | | | |
| | | | Software — 5.8% | | | | |
| | 47,650 | | | Autodesk, Inc.(b) | | | 2,101,841 | |
| | 31,274 | | | Fortinet, Inc.(b) | | | 1,376,056 | |
| | 55,385 | | | Informatica Corp.(b) | | | 2,892,759 | |
| | 14,700 | | | Salesforce.com, Inc.(b) | | | 1,963,626 | |
| | | | | | | | |
| | | | | | | 8,334,282 | |
| | | | | | | | |
| | | | Textiles, Apparel & Luxury Goods — 5.6% | | | | |
| | 25,170 | | | Deckers Outdoor Corp.(b) | | | 2,168,396 | |
| | 37,766 | | | Fossil, Inc.(b) | | | 3,536,786 | |
| | 26,248 | | | Lululemon Athletica, Inc.(b) | | | 2,337,384 | |
| | | | | | | | |
| | | | | | | 8,042,566 | |
| | | | | | | | |
| | | | Total Common Stocks
(Identified Cost $105,494,055) | | | 139,127,116 | |
| | | | | | | | |
| | | | | | | | |
| | Purchased Options — 0.1% | |
| | | | Options on Securities — 0.1% | | | | |
| | 30,100 | | | Edwards Lifesciences Corp., Put expiring April 16, 2011 at 85
(Identified Cost $76,157) | | | 77,508 | |
| | | | | | | | |
| | | | | | | | |
Principal
Amount | | | | | | |
| | Short-Term Investments — 3.1% | |
| $ | 4,484,321 | | | Tri-Party Repurchase Agreement with Fixed Income Clearing Corporation, dated 3/31/2011 at 0.000% to be repurchased at $4,484,321 on 4/01/2011 collateralized by $4,810,000 Federal Home Loan Mortgage Corp., 3.310% due 11/10/2020 valued at $4,575,513, including accrued interest (Note 2 of Notes to Financial Statements)
(Identified Cost $4,484,321) | | | 4,484,321 | |
| | | | | | | | |
| | | | | | | | |
| | | | Total Investments — 100.4%
(Identified Cost $110,054,533)(a) | | | 143,688,945 | |
| | | | Other assets less liabilities — (0.4)% | | | (610,542 | ) |
| | | | | | | | |
| | | | Net Assets — 100.0% | | $ | 143,078,403 | |
| | | | | | | | |
See accompanying notes to financial statements.
41 |
Portfolio of Investments – as of March 31, 2011 (Unaudited)
Loomis Sayles Mid Cap Growth Fund – (continued)
| | | | | | | | |
| | (†) | | | See Note 2 of Notes to Financial Statements. | | | | |
| | (a) | | | Federal Tax Information (Amounts exclude certain adjustments made at the end of the Fund’s fiscal year for tax purposes. Such adjustments are primarily due to wash sales.): | |
| | | | At March 31, 2011, the net unrealized appreciation on investments based on a cost of $110,054,533 for federal income tax purposes was as follows: | |
| | | | Aggregate gross unrealized appreciation for all investments in which there is an excess of value over tax cost | | $ | 33,942,593 | |
| | | | Aggregate gross unrealized depreciation for all investments in which there is an excess of tax cost over value | | | (308,181 | ) |
| | | | | | | | |
| | | | Net unrealized appreciation | | $ | 33,634,412 | |
| | | | | | | | |
| | | | | | | | |
| | (b) | | | Non-income producing security. | | | | |
| | | | | | | | |
| | ADR | | | An American Depositary Receipt is a certificate issued by a custodian bank representing the right to receive securities of the foreign issuer described. The values of ADRs may be significantly influenced by trading on exchanges not located in the United States. | |
Industry Summary at March 31, 2011 (Unaudited)
| | | | |
Internet Software & Services | | | 9.2 | % |
Machinery | | | 7.4 | |
Oil, Gas & Consumable Fuels | | | 6.2 | |
Software | | | 5.8 | |
Textiles, Apparel & Luxury Goods | | | 5.6 | |
Semiconductors & Semiconductor Equipment | | | 4.3 | |
Internet & Catalog Retail | | | 4.3 | |
Pharmaceuticals | | | 4.1 | |
Communications Equipment | | | 3.8 | |
IT Services | | | 3.8 | |
Metals & Mining | | | 3.6 | |
Electrical Equipment | | | 3.6 | |
Real Estate Management & Development | | | 3.3 | |
Biotechnology | | | 3.1 | |
Energy Equipment & Services | | | 2.8 | |
Hotels, Restaurants & Leisure | | | 2.7 | |
Life Sciences Tools & Services | | | 2.0 | |
Other Investments, less than 2% each | | | 21.7 | |
Short-Term Investments | | | 3.1 | |
| | | | |
Total Investments | | | 100.4 | |
Other assets less liabilities | | | (0.4 | ) |
| | | | |
Net Assets | | | 100.0 | % |
| | | | |
See accompanying notes to financial statements.
| 42
Portfolio of Investments – as of March 31, 2011 (Unaudited)
Loomis Sayles Value Fund
| | | | | | | | |
| Shares | | | Description | | Value (†) | |
| | | | | | | | |
| | Common Stocks — 97.7% of Net Assets | | | | |
| | | | Aerospace & Defense — 3.0% | | | | |
| | 303,229 | | | Honeywell International, Inc. | | $ | 18,105,804 | |
| | 51,957 | | | Huntington Ingalls Industries, Inc.(b) | | | 2,156,215 | |
| | 311,747 | | | Northrop Grumman Corp. | | | 19,549,654 | |
| | | | | | | | |
| | | | | | | 39,811,673 | |
| | | | | | | | |
| | | | Auto Components — 1.6% | | | | |
| | 567,735 | | | Goodyear Tire & Rubber Co. (The)(b) | | | 8,504,670 | |
| | 315,588 | | | Johnson Controls, Inc. | | | 13,118,993 | |
| | | | | | | | |
| | | | | | | 21,623,663 | |
| | | | | | | | |
| | | | Automobiles — 0.8% | | | | |
| | 336,870 | | | General Motors Co.(b) | | | 10,453,076 | |
| | | | | | | | |
| | | | Beverages — 2.9% | | | | |
| | 639,290 | | | Coca-Cola Enterprises, Inc. | | | 17,452,617 | |
| | 323,349 | | | PepsiCo, Inc. | | | 20,826,909 | |
| | | | | | | | |
| | | | | | | 38,279,526 | |
| | | | | | | | |
| | | | Biotechnology — 0.9% | | | | |
| | 220,296 | | | Amgen, Inc.(b) | | | 11,774,821 | |
| | | | | | | | |
| | | | Capital Markets — 5.3% | | | | |
| | 314,173 | | | Ameriprise Financial, Inc. | | | 19,189,687 | |
| | 486,044 | | | Bank of New York Mellon Corp. | | | 14,518,134 | |
| | 485,380 | | | Legg Mason, Inc. | | | 17,517,364 | |
| | 428,811 | | | State Street Corp. | | | 19,270,767 | |
| | | | | | | | |
| | | | | | | 70,495,952 | |
| | | | | | | | |
| | | | Chemicals — 1.2% | | | | |
| | 169,243 | | | Air Products & Chemicals, Inc. | | | 15,262,334 | |
| | | | | | | | |
| | | | Commercial Banks — 5.8% | | | | |
| | 1,167,696 | | | Fifth Third Bancorp | | | 16,207,620 | |
| | 337,418 | | | PNC Financial Services Group, Inc. | | | 21,253,960 | |
| | 552,459 | | | U.S. Bancorp | | | 14,601,491 | |
| | 787,945 | | | Wells Fargo & Co. | | | 24,977,857 | |
| | | | | | | | |
| | | | | | | 77,040,928 | |
| | | | | | | | |
| | | | Communications Equipment — 1.0% | | | | |
| | 771,803 | | | Cisco Systems, Inc. | | | 13,236,421 | |
| | | | | | | | |
| | | | Computers & Peripherals — 0.7% | | | | |
| | 209,237 | | | Hewlett-Packard Co. | | | 8,572,440 | |
| | | | | | | | |
| | | | Construction & Engineering — 0.9% | | | | |
| | 316,323 | | | Foster Wheeler AG(b) | | | 11,900,071 | |
| | | | | | | | |
| | | | Construction Materials — 0.9% | | | | |
| | 271,696 | | | Vulcan Materials Co. | | | 12,389,338 | |
| | | | | | | | |
| | | | Consumer Finance — 1.5% | | | | |
| | 840,702 | | | Discover Financial Services | | | 20,277,732 | |
| | | | | | | | |
| | | | Diversified Financial Services — 5.8% | | | | |
| | 1,492,813 | | | Bank of America Corp. | | | 19,899,198 | |
See accompanying notes to financial statements.
43 |
Portfolio of Investments – as of March 31, 2011 (Unaudited)
Loomis Sayles Value Fund – (continued)
| | | | | | | | |
| Shares | | | Description | | Value (†) | |
| | | | | | | | |
| | | | Diversified Financial Services — continued | | | | |
| | 4,672,779 | | | Citigroup, Inc.(b) | | $ | 20,653,683 | |
| | 771,081 | | | JPMorgan Chase & Co. | | | 35,546,834 | |
| | | | | | | | |
| | | | | | | 76,099,715 | |
| | | | | | | | |
| | | | Diversified Telecommunication Services — 2.9% | | | | |
| | 711,509 | | | AT&T, Inc. | | | 21,772,176 | |
| | 392,893 | | | CenturyLink, Inc. | | | 16,324,704 | |
| | | | | | | | |
| | | | | | | 38,096,880 | |
| | | | | | | | |
| | | | Electric Utilities — 1.2% | | | | |
| | 623,008 | | | PPL Corp. | | | 15,762,102 | |
| | | | | | | | |
| | | | Electrical Equipment — 1.0% | | | | |
| | 554,712 | | | ABB Ltd., Sponsored ADR(b) | | | 13,418,483 | |
| | | | | | | | |
| | | | Energy Equipment & Services — 2.3% | | | | |
| | 323,644 | | | Schlumberger Ltd. | | | 30,183,039 | |
| | | | | | | | |
| | | | Food & Staples Retailing — 1.3% | | | | |
| | 492,989 | | | CVS Caremark Corp. | | | 16,919,382 | |
| | | | | | | | |
| | | | Food Products — 1.7% | | | | |
| | 280,879 | | | ConAgra Foods, Inc. | | | 6,670,876 | |
| | 302,134 | | | Kellogg Co. | | | 16,309,194 | |
| | | | | | | | |
| | | | | | | 22,980,070 | |
| | | | | | | | |
| | | | Health Care Equipment & Supplies — 3.7% | | | | |
| | 262,253 | | | Alere, Inc.(b) | | | 10,264,582 | |
| | 375,159 | | | Covidien PLC | | | 19,485,759 | |
| | 467,621 | | | Medtronic, Inc. | | | 18,400,886 | |
| | | | | | | | |
| | | | | | | 48,151,227 | |
| | | | | | | | |
| | | | Health Care Providers & Services — 2.4% | | | | |
| | 299,252 | | | HCA Holdings, Inc.(b) | | | 10,135,665 | |
| | 487,141 | | | UnitedHealth Group, Inc. | | | 22,018,773 | |
| | | | | | | | |
| | | | | | | 32,154,438 | |
| | | | | | | | |
| | | | Household Durables — 2.0% | | | | |
| | 679,862 | | | Newell Rubbermaid, Inc. | | | 13,005,760 | |
| | 178,454 | | | Stanley Black & Decker, Inc. | | | 13,669,576 | |
| | | | | | | | |
| | | | | | | 26,675,336 | |
| | | | | | | | |
| | | | Household Products — 1.3% | | | | |
| | 271,379 | | | Procter & Gamble Co. (The) | | | 16,716,946 | |
| | | | | | | | |
| | | | Independent Power Producers & Energy Traders — 1.2% | | | | |
| | 1,014,565 | | | Calpine Corp.(b) | | | 16,101,147 | |
| | | | | | | | |
| | | | Industrial Conglomerates — 3.9% | | | | |
| | 1,801,818 | | | General Electric Co. | | | 36,126,451 | |
| | 110,982 | | | Siemens AG, Sponsored ADR | | | 15,242,268 | |
| | | | | | | | |
| | | | | | | 51,368,719 | |
| | | | | | | | |
| | | | Insurance — 3.8% | | | | |
| | 444,487 | | | MetLife, Inc. | | | 19,881,904 | |
See accompanying notes to financial statements.
| 44
Portfolio of Investments – as of March 31, 2011 (Unaudited)
Loomis Sayles Value Fund – (continued)
| | | | | | | | |
| Shares | | | Description | | Value (†) | |
| | | | | | | | |
| | | | Insurance — continued | | | | |
| | 269,357 | | | Travelers Cos., Inc. (The) | | $ | 16,021,354 | |
| | 556,704 | | | Unum Group | | | 14,613,480 | |
| | | | | | | | |
| | | | | | | 50,516,738 | |
| | | | | | | | |
| | | | Internet Software & Services — 1.8% | | | | |
| | 405,653 | | | AOL, Inc.(b) | | | 7,922,403 | |
| | 527,886 | | | eBay, Inc.(b) | | | 16,385,582 | |
| | | | | | | | |
| | | | | | | 24,307,985 | |
| | | | | | | | |
| | | | Machinery — 0.8% | | | | |
| | 284,834 | | | Harsco Corp. | | | 10,051,792 | |
| | | | | | | | |
| | | | Media — 6.3% | | | | |
| | 657,685 | | | CBS Corp., Class B | | | 16,468,433 | |
| | 1,088,460 | | | Comcast Corp., Class A | | | 26,906,731 | |
| | 238,863 | | | DIRECTV, Class A(b) | | | 11,178,788 | |
| | 300,341 | | | Omnicom Group, Inc. | | | 14,734,730 | |
| | 302,160 | | | Viacom, Inc., Class B | | | 14,056,483 | |
| | | | | | | | |
| | | | | | | 83,345,165 | |
| | | | | | | | |
| | | | Multi Utilities — 1.0% | | | | |
| | 416,770 | | | Public Service Enterprise Group, Inc. | | | 13,132,423 | |
| | | | | | | | |
| | | | Oil, Gas & Consumable Fuels — 11.1% | | | | |
| | 202,826 | | | Chevron Corp. | | | 21,789,597 | |
| | 190,641 | | | CONSOL Energy, Inc. | | | 10,224,077 | |
| | 1,538,756 | | | El Paso Corp. | | | 27,697,608 | |
| | 419,889 | | | ExxonMobil Corp. | | | 35,325,261 | |
| | 294,075 | | | Hess Corp. | | | 25,058,131 | |
| | 425,664 | | | Total SA, Sponsored ADR | | | 25,952,734 | |
| | | | | | | | |
| | | | | | | 146,047,408 | |
| | | | | | | | |
| | | | Paper & Forest Products — 0.6% | | | | |
| | 274,699 | | | AbitibiBowater, Inc.(b) | | | 7,381,162 | |
| | | | | | | | |
| | | | Pharmaceuticals — 5.6% | | | | |
| | 553,181 | | | Bristol-Myers Squibb Co. | | | 14,620,574 | |
| | 594,445 | | | Merck & Co., Inc. | | | 19,622,629 | |
| | 1,059,209 | | | Pfizer, Inc. | | | 21,512,535 | |
| | 532,563 | | | Sanofi-Aventis SA, Sponsored ADR | | | 18,756,869 | |
| | | | | | | | |
| | | | | | | 74,512,607 | |
| | | | | | | | |
| | | | REITs - Diversified — 1.3% | | | | |
| | 684,164 | | | Weyerhaeuser Co. | | | 16,830,434 | |
| | | | | | | | |
| | | | Road & Rail — 1.2% | | | | |
| | 220,065 | | | Norfolk Southern Corp. | | | 15,243,903 | |
| | | | | | | | |
| | | | Semiconductors & Semiconductor Equipment — 1.3% | | | | |
| | 1,135,095 | | | Applied Materials, Inc. | | | 17,730,184 | |
| | | | | | | | |
| | | | Software — 2.1% | | | | |
| | 818,669 | | | Oracle Corp. | | | 27,318,985 | |
| | | | | | | | |
| | | | Specialty Retail — 2.0% | | | | |
| | 531,120 | | | Gap, Inc. (The) | | | 12,035,179 | |
See accompanying notes to financial statements.
45 |
Portfolio of Investments – as of March 31, 2011 (Unaudited)
Loomis Sayles Value Fund – (continued)
| | | | | | | | |
| Shares | | | Description | | Value (†) | |
| | | | | | | | |
| | | | Specialty Retail — continued | | | | |
| | 539,638 | | | Lowe’s Cos., Inc. | | $ | 14,262,633 | |
| | | | | | | | |
| | | | | | | 26,297,812 | |
| | | | | | | | |
| | | | Wireless Telecommunication Services — 1.6% | | | | |
| | 721,386 | | | Vodafone Group PLC, Sponsored ADR | | | 20,739,848 | |
| | | | | | | | |
| | | | Total Common Stocks
(Identified Cost $1,069,874,649) | | | 1,289,201,905 | |
| | | | | | | | |
| | | | | | | | |
Principal
Amount | | | | | | |
| | Short-Term Investments — 2.5% | | | | |
| $ | 33,202,923 | | | Tri-Party Repurchase Agreement with Fixed Income Clearing Corporation, dated 3/31/2011 at 0.000% to be repurchased at $33,202,923 on 4/01/2011 collateralized by $35,605,000 Federal Home Loan Mortgage Corp., 3.310% due 11/10/2020 valued at $33,869,256 including accrued interest (Note 2 of Notes to Financial Statements)
(Identified Cost $33,202,923) | | | 33,202,923 | |
| | | | | | | | |
| | | | | | | | |
| | | | Total Investments — 100.2%
(Identified Cost $1,103,077,572)(a) | | | 1,322,404,828 | |
| | | | Other assets less liabilities — (0.2)% | | | (2,070,629 | ) |
| | | | | | | | |
| | | | Net Assets — 100.0% | | $ | 1,320,334,199 | |
| | | | | | | | |
| | | | | | | | |
| | (†) | | | See Note 2 of Notes to Financial Statements. | | | | |
| | (a) | | | Federal Tax Information (Amounts exclude certain adjustments made at the end of the Fund’s fiscal year for tax purposes. Such adjustments are primarily due to wash sales.): | |
| | | | At March 31, 2011, the net unrealized appreciation on investments based on a cost of $1,103,077,572 for federal income tax purposes was as follows: | |
| | | | Aggregate gross unrealized appreciation for all investments in which there is an excess of value over tax cost | | $ | 228,695,005 | |
| | | | Aggregate gross unrealized depreciation for all investments in which there is an excess of tax cost over value | | | (9,367,749 | ) |
| | | | | | | | |
| | | | Net unrealized appreciation | | $ | 219,327,256 | |
| | | | | | | | |
| | | | | | | | |
| | (b) | | | Non-income producing security. | | | | |
| | | | | | | | |
| | ADR | | | An American Depositary Receipt is a certificate issued by a custodian bank representing the right to receive securities of the foreign issuer described. The values of ADRs may be significantly influenced by trading on exchanges not located in the United States. | |
| | REITs | | | Real Estate Investment Trusts | | | | |
See accompanying notes to financial statements.
| 46
Portfolio of Investments – as of March 31, 2011 (Unaudited)
Loomis Sayles Value Fund – (continued)
Industry Summary at March 31, 2011 (Unaudited)
| | | | |
| Oil, Gas & Consumable Fuels | | | 11.1 | % |
| Media | | | 6.3 | |
| Commercial Banks | | | 5.8 | |
| Diversified Financial Services | | | 5.8 | |
| Pharmaceuticals | | | 5.6 | |
| Capital Markets | | | 5.3 | |
| Industrial Conglomerates | | | 3.9 | |
| Insurance | | | 3.8 | |
| Health Care Equipment & Supplies | | | 3.7 | |
| Aerospace & Defense | | | 3.0 | |
| Beverages | | | 2.9 | |
| Diversified Telecommunication Services | | | 2.9 | |
| Health Care Providers & Services | | | 2.4 | |
| Energy Equipment & Services | | | 2.3 | |
| Software | | | 2.1 | |
| Household Durables | | | 2.0 | |
| Specialty Retail | | | 2.0 | |
| Other Investments, less than 2% each | | | 26.8 | |
| Short-Term Investments | | | 2.5 | |
| | | | |
| Total Investments | | | 100.2 | |
| Other assets less liabilities | | | (0.2 | ) |
| | | | |
| Net Assets | | | 100.0 | % |
| | | | |
See accompanying notes to financial statements.
47 |
Statements of Assets and Liabilities
March 31, 2011 (Unaudited)
| | | | | | | | | | | | | | | | |
| | | Global Equity
and Income
Fund* | | | Growth
Fund | | | Mid Cap
Growth
Fund | | | Value
Fund | |
ASSETS | | | | | | | | | | | | | | | | |
Investments at cost | | $ | 387,772,212 | | | $ | 108,472,508 | | | $ | 110,054,533 | | | $ | 1,103,077,572 | |
Net unrealized appreciation | | | 74,869,754 | | | | 18,405,860 | | | | 33,634,412 | | | | 219,327,256 | |
| | | | | | | | | | | | | | | | |
Investments at value | | | 462,641,966 | | | | 126,878,368 | | | | 143,688,945 | | | | 1,322,404,828 | |
Cash | | | 14,187 | | | | — | | | | — | | | | — | |
Foreign currency at value (identified cost $4,350,506, $0, $0 and $0) | | | 4,334,115 | | | | — | | | | — | | | | — | |
Receivable for Fund shares sold | | | 3,017,286 | | | | 43,383 | | | | 434,236 | | | | 1,900,021 | |
Receivable for securities sold | | | 341,351 | | | | — | | | | — | | | | — | |
Dividends and interest receivable | | | 2,496,765 | | | | 227,856 | | | | 15,286 | | | | 1,559,709 | |
Unrealized appreciation on forward foreign currency contracts (Note 2) | | | 63,319 | | | | — | | | | — | | | | — | |
Tax reclaims receivable | | | 63,092 | | | | 30,942 | | | | — | | | | 139,637 | |
| | | | | | | | | | | | | | | | |
TOTAL ASSETS | | | 472,972,081 | | | | 127,180,549 | | | | 144,138,467 | | | | 1,326,004,195 | |
| | | | | | | | | | | | | | | | |
LIABILITIES | | | | | | | | | | | | | | | | |
Payable for securities purchased | | | 4,742,020 | | | | 7,060,250 | | | | 679,549 | | | | — | |
Payable for Fund shares redeemed | | | 399,059 | | | | 267,827 | | | | 186,876 | | | | 4,756,980 | |
Unrealized depreciation on forward foreign currency contracts (Note 2) | | | 19,703 | | | | — | | | | — | | | | — | |
Management fees payable (Note 6) | | | 356,024 | | | | 47,009 | | | | 74,329 | | | | 550,333 | |
Deferred Trustees’ fees (Note 6) | | | 67,273 | | | | 98,386 | | | | 70,305 | | | | 251,059 | |
Administrative fees payable (Note 6) | | | 17,518 | | | | 4,429 | | | | 5,424 | | | | 51,772 | |
Other accounts payable and accrued expenses | | | 50,174 | | | | 83,120 | | | | 43,581 | | | | 59,852 | |
| | | | | | | | | | | | | | | | |
TOTAL LIABILITIES | | | 5,651,771 | | | | 7,561,021 | | | | 1,060,064 | | | | 5,669,996 | |
| | | | | | | | | | | | | | | | |
NET ASSETS | | $ | 467,320,310 | | | $ | 119,619,528 | | | $ | 143,078,403 | | | $ | 1,320,334,199 | |
| | | | | | | | | | | | | | | | |
NET ASSETS CONSIST OF: | | | | | | | | | | | | | | | | |
Paid-in capital | | $ | 465,424,123 | | | $ | 197,603,129 | | | $ | 164,588,863 | | | $ | 1,163,398,067 | |
Accumulated net investment (loss)/Undistributed net investment income | | | 113,569 | | | | 23,583 | | | | (432,727 | ) | | | 3,095,919 | |
Accumulated net realized loss on investments, options written and foreign currency transactions | | | (73,138,189 | ) | | | (96,413,044 | ) | | | (54,712,145 | ) | | | (65,487,043 | ) |
Net unrealized appreciation on investments and foreign currency translations | | | 74,920,807 | | | | 18,405,860 | | | | 33,634,412 | | | | 219,327,256 | |
| | | | | | | | | | | | | | | | |
NET ASSETS | | $ | 467,320,310 | | | $ | 119,619,528 | | | $ | 143,078,403 | | | $ | 1,320,334,199 | |
| | | | | | | | | | | | | | | | |
| * | Formerly Global Markets Fund. |
See accompanying notes to financial statements.
| 48
Statements of Assets and Liabilities (continued)
March 31, 2011 (Unaudited)
| | | | | | | | | | | | | | | | |
| | | Global Equity
and Income
Fund* | | | Growth
Fund | | | Mid Cap
Growth
Fund | | | Value
Fund | |
COMPUTATION OF NET ASSET VALUE AND OFFERING PRICE: | | | | | | | | | | | | | | | | |
Class A shares: | | | | | | | | | | | | | | | | |
Net assets | | $ | 98,952,101 | | | $ | 30,943,191 | | | $ | 91,950,427 | | | $ | 158,436,984 | |
| | | | | | | | | | | | | | | | |
Shares of beneficial interest | | | 6,093,684 | | | | 5,379,127 | | | | 3,022,873 | | | | 7,970,470 | |
| | | | | | | | | | | | | | | | |
Net asset value and redemption price per share | | $ | 16.24 | | | $ | 5.75 | | | $ | 30.42 | | | $ | 19.88 | |
| | | | | | | | | | | | | | | | |
Offering price per share (100/94.25 of net asset value) (Note 1) | | $ | 17.23 | | | $ | 6.10 | | | $ | 32.28 | | | $ | 21.09 | |
| | | | | | | | | | | | | | | | |
Class B shares: (redemption price per share is equal to net asset value less any applicable contingent deferred sales charge) (Note 1) | | | | | | | | | | | | | | | | |
Net assets | | $ | — | | | $ | 3,506,389 | | | $ | — | | | $ | 3,242,658 | |
| | | | | | | | | | | | | | | | |
Shares of beneficial interest | | | — | | | | 644,941 | | | | — | | | | 162,369 | |
| | | | | | | | | | | | | | | | |
Net asset value and offering price per share | | $ | — | | | $ | 5.44 | | | $ | — | | | $ | 19.97 | |
| | | | | | | | | | | | | | | | |
Class C shares: (redemption price per share is equal to net asset value less any applicable contingent deferred sales charge) (Note 1) | | | | | | | | | | | | | | | | |
Net assets | | $ | 145,799,605 | | | $ | 12,837,667 | | | $ | 1,084,927 | | | $ | 12,711,878 | |
| | | | | | | | | | | | | | | | |
Shares of beneficial interest | | | 9,034,811 | | | | 2,360,194 | | | | 36,231 | | | | 644,568 | |
| | | | | | | | | | | | | | | | |
Net asset value and offering price per share | | $ | 16.14 | | | $ | 5.44 | | | $ | 29.94 | | | $ | 19.72 | |
| | | | | | | | | | | | | | | | |
Class Y shares: | | | | | | | | | | | | | | | | |
Net assets | | $ | 222,568,604 | | | $ | 72,332,281 | | | $ | 50,043,049 | | | $ | 1,145,941,478 | |
| | | | | | | | | | | | | | | | |
Shares of beneficial interest | | | 13,661,419 | | | | 11,868,122 | | | | 1,590,994 | | | | 57,571,114 | |
| | | | | | | | | | | | | | | | |
Net asset value, offering and redemption price per share | | $ | 16.29 | | | $ | 6.09 | | | $ | 31.45 | | | $ | 19.90 | |
| | | | | | | | | | | | | | | | |
Admin Class shares: | | | | | | | | | | | | | | | | |
Net assets | | $ | — | | | $ | — | | | $ | — | | | $ | 1,201 | |
| | | | | | | | | | | | | | | | |
Shares of beneficial interest | | | — | | | | — | | | | — | | | | 61 | |
| | | | | | | | | | | | | | | | |
Net asset value, offering and redemption price per share | | $ | — | | | $ | — | | | $ | — | | | $ | 19.85 | |
| | | | | | | | | | | | | | | | |
| * | Formerly Global Markets Fund. |
See accompanying notes to financial statements.
49 |
Statements of Operations
For the Six Months Ended March 31, 2011 (Unaudited)
| | | | | | | | | | | | | | | | |
| | | Global Equity
and Income
Fund* | | | Growth
Fund | | | Mid Cap
Growth
Fund | | | Value
Fund | |
INVESTMENT INCOME | | | | | | | | | | | | | | | | |
Dividends | | $ | 1,277,329 | | | $ | 760,070 | | | $ | 342,629 | (a) | | $ | 11,268,873 | |
Interest | | | 3,419,706 | | | | — | | | | — | | | | — | |
Less net foreign taxes withheld | | | (108,153 | ) | | | (23,206 | ) | | | (1,674 | ) | | | (177,336 | ) |
| | | | | | | | | | | | | | | | |
| | | 4,588,882 | | | | 736,864 | | | | 340,955 | | | | 11,091,537 | |
| | | | | | | | | | | | | | | | |
Expenses | | | | | | | | | | | | | | | | |
Management fees (Note 6) | | | 1,434,635 | | | | 270,136 | | | | 460,970 | | | | 2,961,907 | |
Service and distribution fees (Note 6) | | | 733,021 | | | | 123,582 | | | | 103,632 | | | | 255,265 | |
Administrative fees (Note 6) | | | 89,357 | | | | 25,242 | | | | 28,713 | | | | 276,739 | |
Trustees’ fees and expenses (Note 6) | | | 15,689 | | | | 15,823 | | | | 20,598 | | | | 32,857 | |
Transfer agent fees and expenses (Note 6) | | | 109,589 | | | | 96,475 | | | | 66,323 | | | | 718,131 | |
Audit and tax services fees | | | 26,215 | | | | 20,939 | | | | 26,207 | | | | 17,416 | |
Custodian fees and expenses | | | 95,799 | | | | 8,961 | | | | 12,590 | | | | 18,373 | |
Legal fees | | | 3,957 | | | | 1,209 | | | | 1,229 | | | | 12,597 | |
Registration fees | | | 30,504 | | | | 41,651 | | | | 32,107 | | | | 58,194 | |
Shareholder reporting expenses | | | 14,819 | | | | 14,999 | | | | 6,894 | | | | 50,142 | |
Miscellaneous expenses | | | 15,733 | | | | 5,390 | | | | 7,173 | | | | 17,878 | |
| | | | | | | | | | | | | | | | |
Total expenses | | | 2,569,318 | | | | 624,407 | | | | 766,436 | | | | 4,419,499 | |
| | | | | | | | | | | | | | | | |
Fee/expense recovery (Note 6) | | | 76,550 | | | | — | | | | — | | | | — | |
Less waiver and/or expense reimbursement (Note 6) | | | — | | | | — | | | | (47,918 | ) | | | — | |
| | | | | | | | | | | | | | | | |
Net expenses | | | 2,645,868 | | | | 624,407 | | | | 718,518 | | | | 4,419,499 | |
| | | | | | | | | | | | | | | | |
Net investment income (loss) | | | 1,943,014 | | | | 112,457 | | | | (377,563 | ) | | | 6,672,038 | |
| | | | | | | | | | | | | | | | |
NET REALIZED AND UNREALIZED GAIN (LOSS) ON INVESTMENTS, OPTIONS WRITTEN AND FOREIGN CURRENCY TRANSACTIONS | | | | | | | | | | | | | | | | |
Net realized gain on: | | | | | | | | | | | | | | | | |
Investments | | | 21,514,113 | | | | 2,752,664 | | | | 19,146,488 | | | | 22,473,214 | |
Options written | | | — | | | | — | | | | 333,238 | | | | — | |
Foreign currency transactions | | | 35,269 | | | | — | | | | 6,858 | | | | — | |
Net change in unrealized appreciation (depreciation) on: | | | | | | | | | | | | | | | | |
Investments | | | 19,438,710 | | | | 9,130,714 | | | | 11,184,515 | | | | 181,564,517 | |
Options written | | | — | | | | — | | | | (111,228 | ) | | | — | |
Foreign currency translations | | | (76,605 | ) | | | — | | | | — | | | | — | |
| | | | | | | | | | | | | | | | |
Net realized and unrealized gain on investments, options written and foreign currency transactions | | | 40,911,487 | | | | 11,883,378 | | | | 30,559,871 | | | | 204,037,731 | |
| | | | | | | | | | | | | | | | |
NET INCREASE IN NET ASSETS RESULTING FROM OPERATIONS | | $ | 42,854,501 | | | $ | 11,995,835 | | | $ | 30,182,308 | | | $ | 210,709,769 | |
| | | | | | | | | | | | | | | | |
| * | Formerly Global Markets Fund. |
| (a) | Includes a non-recurring dividend of $165,704. |
See accompanying notes to financial statements.
| 50
Statements of Changes in Net Assets
| | | | | | | | | | | | | | | | |
| | | Global Equity and Income Fund* | | | Growth Fund | |
| | | Six Months
Ended
March 31, 2011
(Unaudited) | | | Year Ended
September 30,
2010 | | | Six Months
Ended
March 31, 2011
(Unaudited) | | | Year Ended
September 30,
2010 | |
FROM OPERATIONS: | | | | | | | | | | | | | | | | |
Net investment income (loss) | | $ | 1,943,014 | | | $ | 4,895,993 | | | $ | 112,457 | | | $ | (323,963 | ) |
Net realized gain on investments and foreign currency transactions | | | 21,549,382 | | | | 18,063,372 | | | | 2,752,664 | | | | 24,201,174 | |
Net change in unrealized appreciation (depreciation) on investments and foreign currency translations | | | 19,362,105 | | | | 28,908,742 | | | | 9,130,714 | | | | (9,534,757 | ) |
| | | | | | | | | | | | | | | | |
Net increase in net assets resulting from operations | | | 42,854,501 | | | | 51,868,107 | | | | 11,995,835 | | | | 14,342,454 | |
| | | | | | | | | | | | | | | | |
FROM DISTRIBUTIONS TO SHAREHOLDERS: | | | | | | | | | | | | | | | | |
Net investment income | | | | | | | | | | | | | | | | |
Class A | | | (1,363,693 | ) | | | (1,152,275 | ) | | | — | | | | — | |
Class B | | | — | | | | — | | | | — | | | | — | |
Class C | | | (1,202,095 | ) | | | (1,701,697 | ) | | | — | | | | — | |
Class Y | | | (3,043,709 | ) | | | (2,794,707 | ) | | | — | | | | — | |
| | | | | | | | | | | | | | | | |
Total distributions | | | (5,609,497 | ) | | | (5,648,679 | ) | | | — | | | | — | |
| | | | | | | | | | | | | | | | |
NET INCREASE (DECREASE) IN NET ASSETS FROM CAPITAL SHARE TRANSACTIONS (NOTE 11) | | | 111,472,251 | | | | 22,778,290 | | | | 7,845,465 | | | | (26,537,256 | ) |
| | | | | | | | | | | | | | | | |
Net increase (decrease) in net assets | | | 148,717,255 | | | | 68,997,718 | | | | 19,841,300 | | | | (12,194,802 | ) |
NET ASSETS | | | | | | | | | | | | | | | | |
Beginning of the period | | | 318,603,055 | | | | 249,605,337 | | | | 99,778,228 | | | | 111,973,030 | |
| | | | | | | | | | | | | | | | |
End of the period | | $ | 467,320,310 | | | $ | 318,603,055 | | | $ | 119,619,528 | | | $ | 99,778,228 | |
| | | | | | | | | | | | | | | | |
ACCUMULATED NET INVESTMENT (LOSS)/UNDISTRIBUTED NET INVESTMENT INCOME | | $ | 113,569 | | | $ | 3,780,052 | | | $ | 23,583 | | | $ | (88,874 | ) |
| | | | | | | | | | | | | | | | |
| * | Formerly Global Markets Fund. |
See accompanying notes to financial statements.
51 |
Statements of Changes in Net Assets (continued)
| | | | | | | | | | | | | | | | |
| | | Mid Cap Growth Fund | | | Value Fund | |
| | | Six Months
Ended
March 31, 2011
(Unaudited) | | | Year Ended
September 30,
2010 | | | Six Months
Ended
March 31, 2011
(Unaudited) | | | Year Ended
September 30,
2010 | |
FROM OPERATIONS: | | | | | | | | | | | | | | | | |
Net investment income (loss) | | $ | (377,563 | ) | | $ | (328,650 | ) | | $ | 6,672,038 | | | $ | 15,587,073 | |
Net realized gain on investments, options written and foreign currency transactions | | | 19,486,584 | | | | 14,593,740 | | | | 22,473,214 | | | | 10,776,100 | |
Net change in unrealized appreciation (depreciation) on investments, options written and foreign currency translations | | | 11,073,287 | | | | 7,166,808 | | | | 181,564,517 | | | | (6,736,757 | ) |
| | | | | | | | | | | | | | | | |
Net increase in net assets resulting from operations | | | 30,182,308 | | | | 21,431,898 | | | | 210,709,769 | | | | 19,626,416 | |
| | | | | | | | | | | | | | | | |
FROM DISTRIBUTIONS TO SHAREHOLDERS: | | | | | | | | | | | | | | | | |
Net investment income | | | | | | | | | | | | | | | | |
Class A | | | — | | | | — | | | | (1,714,074 | ) | | | (1,044,591 | ) |
Class B | | | — | | | | — | | | | (8,769 | ) | | | — | |
Class C | | | — | | | | — | | | | (44,845 | ) | | | (22,715 | ) |
Class Y | | | — | | | | — | | | | (14,549,558 | ) | | | (6,810,651 | ) |
Admin Class | | | — | | | | — | | | | (11 | ) | | | — | |
| | | | | | | | | | | | | | | | |
Total distributions | | | — | | | | — | | | | (16,317,257 | ) | | | (7,877,957 | ) |
| | | | | | | | | | | | | | | | |
NET INCREASE (DECREASE) IN NET ASSETS FROM CAPITAL SHARE TRANSACTIONS (NOTE 11) | | | 11,466,671 | | | | (2,011,419 | ) | | | 192,556,271 | | | | 211,104,442 | |
| | | | | | | | | | | | | | | | |
Net increase in net assets | | | 41,648,979 | | | | 19,420,479 | | | | 386,948,783 | | | | 222,852,901 | |
NET ASSETS | | | | | | | | | | | | | | | | |
Beginning of the period | | | 101,429,424 | | | | 82,008,945 | | | | 933,385,416 | | | | 710,532,515 | |
| | | | | | | | | | | | | | | | |
End of the period | | $ | 143,078,403 | | | $ | 101,429,424 | | | $ | 1,320,334,199 | | | $ | 933,385,416 | |
| | | | | | | | | | | | | | | | |
ACCUMULATED NET INVESTMENT (LOSS)/UNDISTRIBUTED NET INVESTMENT INCOME | | $ | (432,727 | ) | | $ | (55,164 | ) | | $ | 3,095,919 | | | $ | 12,741,138 | |
| | | | | | | | | | | | | | | | |
See accompanying notes to financial statements.
| 52
Financial Highlights
For a share outstanding throughout each period.
| | | | | | | | | | | | | | | | | | | | | | | | | | | | |
| | | | | | Income (Loss) From Investment
Operations: | | | Less Distributions: | |
| | | Net asset
value,
beginning
of the
period | | | Net
investment
income (a) | | | Net realized
and
unrealized
gain (loss) | | | Total from
investment
operations | | | Dividends
from net
investment
income | | | Distributions
from net
realized
capital
gains (b) | | | Total
distributions | |
GLOBAL EQUITYAND INCOME FUND* | | | | | | | | | | | | | | | | | | | | | |
Class A | | | | | | | | | | | | | | | | | | | | | | | | | | | | |
3/31/2011(h) | | $ | 14.72 | | | $ | 0.09 | | | $ | 1.68 | | | $ | 1.77 | | | $ | (0.25 | ) | | $ | — | | | $ | (0.25 | ) |
9/30/2010 | | | 12.50 | | | | 0.26 | | | | 2.26 | | | | 2.52 | | | | (0.30 | ) | | | — | | | | (0.30 | ) |
9/30/2009 | | | 11.65 | | | | 0.36 | | | | 0.74 | (j) | | | 1.10 | | | | (0.25 | ) | | | (0.00 | ) | | | (0.25 | ) |
9/30/2008 | | | 15.83 | | | | 0.25 | | | | (3.46 | ) | | | (3.21 | ) | | | (0.53 | ) | | | (0.44 | ) | | | (0.97 | ) |
9/30/2007 | | | 12.49 | | | | 0.20 | | | | 3.39 | | | | 3.59 | | | | (0.25 | ) | | | — | | | | (0.25 | ) |
9/30/2006** | | | 12.71 | | | | 0.12 | | | | (0.34 | ) | | | (0.22 | ) | | | — | | | | — | | | | — | |
Class C | | | | | | | | | | | | | | | | | | | | | | | | | | | | |
3/31/2011(h) | | | 14.59 | | | | 0.03 | | | | 1.67 | | | | 1.70 | | | | (0.15 | ) | | | — | | | | (0.15 | ) |
9/30/2010 | | | 12.39 | | | | 0.16 | | | | 2.26 | | | | 2.42 | | | | (0.22 | ) | | | — | | | | (0.22 | ) |
9/30/2009 | | | 11.51 | | | | 0.28 | | | | 0.75 | (j) | | | 1.03 | | | | (0.15 | ) | | | (0.00 | ) | | | (0.15 | ) |
9/30/2008 | | | 15.70 | | | | 0.15 | | | | (3.43 | ) | | | (3.28 | ) | | | (0.47 | ) | | | (0.44 | ) | | | (0.91 | ) |
9/30/2007 | | | 12.43 | | | | 0.10 | | | | 3.36 | | | | 3.46 | | | | (0.19 | ) | | | — | | | | (0.19 | ) |
9/30/2006** | | | 12.71 | | | | 0.06 | | | | (0.34 | ) | | | (0.28 | ) | | | — | | | | — | | | | — | |
Class Y*** | | | | | | | | | | | | | | | | | | | | | | | | | | | | |
3/31/2011(h) | | | 14.78 | | | | 0.11 | | | | 1.68 | | | | 1.79 | | | | (0.28 | ) | | | — | | | | (0.28 | ) |
9/30/2010 | | | 12.54 | | | | 0.29 | | | | 2.28 | | | | 2.57 | | | | (0.33 | ) | | | — | | | | (0.33 | ) |
9/30/2009 | | | 11.70 | | | | 0.38 | | | | 0.75 | (j) | | | 1.13 | | | | (0.29 | ) | | | (0.00 | ) | | | (0.29 | ) |
9/30/2008 | | | 15.87 | | | | 0.30 | | | | (3.48 | ) | | | (3.18 | ) | | | (0.55 | ) | | | (0.44 | ) | | | (0.99 | ) |
9/30/2007 | | | 12.51 | | | | 0.24 | | | | 3.39 | | | | 3.63 | | | | (0.27 | ) | | | — | | | | (0.27 | ) |
9/30/2006 | | | 11.84 | | | | 0.19 | | | | 0.64 | | | | 0.83 | | | | (0.16 | ) | | | — | | | | (0.16 | ) |
| * | Formerly Global Markets Fund. |
| ** | From commencement of Class operations on February 1, 2006 through September 30, 2006. |
| *** | Prior to the close of business on February 1, 2006, the Fund offered Institutional Class shares, which were redesignated as Class Y shares on that date. |
| (a) | Per share net investment income has been calculated using the average shares outstanding during the period. |
| (b) | Amount rounds to less than $0.01 per share, if applicable. |
| (c) | Effective June 2, 2008, redemption fees were eliminated. |
| (d) | Had certain expenses not been waived/reimbursed during the period, if applicable, total returns would have been lower. |
| (e) | A sales charge for Class A shares and a contingent deferred sales charge for Class C shares are not reflected in total return calculations. Periods less than one year, if applicable, are not annualized. |
See accompanying notes to financial statements.
53 |
| | | | | | | | | | | | | | | | | | | | | | | | | | | | | | |
| | | | | | | | | | | | | Ratios to Average Net Assets: | | | | |
Redemption
fees (b)(c) | | | Net asset
value,
end of
the period | | | Total
return
(%) (d)(e) | | | Net assets,
end of
the period
(000’s) | | | Net
expenses
(%) (f)(g) | | | Gross
expenses
(%) (g) | | | Net investment
income
(%) (g) | | | Portfolio
turnover
rate (%) | |
| | | | | | | | | | | | | | | | | | | | | | | | | | | | | | |
| | | | | | | | | | | | | | | | | | | | | | | | | | | | | | |
| $ | — | | | $ | 16.24 | | | | 12.14 | | | $ | 98,952 | | | | 1.25 | (i) | | | 1.25 | (i) | | | 1.15 | | | | 39 | |
| | — | | | | 14.72 | | | | 20.61 | | | | 64,367 | | | | 1.25 | | | | 1.29 | | | | 1.96 | | | | 99 | |
| | — | | | | 12.50 | | | | 10.27 | | | | 44,669 | | | | 1.25 | | | | 1.34 | | | | 3.56 | | | | 114 | |
| | 0.00 | | | | 11.65 | | | | (21.87 | ) | | | 67,647 | | | | 1.25 | | | | 1.27 | | | | 1.74 | | | | 133 | |
| | 0.00 | | | | 15.83 | | | | 29.05 | | | | 28,927 | | | | 1.25 | | | | 1.37 | | | | 1.44 | | | | 78 | |
| | — | | | | 12.49 | | | | (1.73 | ) | | | 10,438 | | | | 1.25 | | | | 1.56 | | | | 1.52 | | | | 103 | |
| | | | | | | | | | | | | | | | | | | | | | | | | | | | | | |
| | — | | | | 16.14 | | | | 11.70 | | | | 145,800 | | | | 2.00 | (i) | | | 2.00 | (i) | | | 0.39 | | | | 39 | |
| | — | | | | 14.59 | | | | 19.79 | | | | 109,455 | | | | 2.00 | | | | 2.04 | | | | 1.21 | | | | 99 | |
| | — | | | | 12.39 | | | | 9.40 | | | | 96,208 | | | | 2.00 | | | | 2.09 | | | | 2.82 | | | | 114 | |
| | 0.00 | | | | 11.51 | | | | (22.42 | ) | | | 124,178 | | | | 2.00 | | | | 2.02 | | | | 1.04 | | | | 133 | |
| | 0.00 | | | | 15.70 | | | | 27.99 | | | | 60,179 | | | | 2.00 | | | | 2.11 | | | | 0.69 | | | | 78 | |
| | — | | | | 12.43 | | | | (2.12 | ) | | | 20,228 | | | | 2.00 | | | | 2.32 | | | | 0.78 | | | | 103 | |
| | | | | | | | | | | | | | | | | | | | | | | | | | | | | | |
| | — | | | | 16.29 | | | | 12.22 | | | | 222,569 | | | | 1.00 | (i) | | | 1.00 | (i) | | | 1.40 | | | | 39 | |
| | — | | | | 14.78 | | | | 21.02 | | | | 144,780 | | | | 1.00 | | | | 1.04 | | | | 2.20 | | | | 99 | |
| | — | | | | 12.54 | | | | 10.49 | | | | 108,728 | | | | 1.00 | | | | 1.01 | | | | 3.79 | | | | 114 | |
| | 0.00 | | | | 11.70 | | | | (21.66 | ) | | | 120,322 | | | | 0.99 | (k) | | | 0.99 | (k) | | | 2.06 | | | | 133 | |
| | 0.00 | | | | 15.87 | | | | 29.36 | | | | 80,824 | | | | 1.00 | | | | 1.02 | | | | 1.70 | | | | 78 | |
| | 0.00 | | | | 12.51 | | | | 7.07 | | | | 58,650 | | | | 1.00 | | | | 1.19 | | | | 1.58 | | | | 103 | |
| (f) | The investment adviser and/or administrator agreed to waive its fees and/or reimburse a portion of the Fund’s expenses during the period. Without this waiver/reimbursement, if applicable, expenses would have been higher. |
| (g) | Computed on an annualized basis for periods less than one year, if applicable. |
| (h) | For the six months ended March 31, 2011 (Unaudited). |
| (i) | Includes fee/expense recovery of 0.04%. |
| (j) | The amount shown for a share outstanding does not correspond with the aggregate realized and unrealized gain (loss) on investments for the period due to the timing of sales and redemptions of fund shares in relation to fluctuating market values of investments of the Fund. |
| (k) | Includes fee/expense recovery of less than 0.01%. |
See accompanying notes to financial statements.
| 54
Financial Highlights (continued)
For a share outstanding throughout each period.
| | | | | | | | | | | | | | | | | | | | | | | | | | | | |
| | | | | | Income (Loss) From Investment
Operations: | | | Less Distributions: | |
| | | Net asset
value,
beginning
of the
period | | | Net
investment
income
(loss) (a)(b) | | | Net realized
and
unrealized
gain (loss) | | | Total from
investment
operations | | | Dividends
from net
investment
income | | | Distributions
from net
realized
capital
gains | | | Total
distributions | |
GROWTH FUND | | | | | | | | | | | | | | | | | | | | | | | | | |
Class A | | | | | | | | | | | | | | | | | | | | | | | | | |
3/31/2011(g) | | $ | 5.14 | | | $ | 0.00 | | | $ | 0.61 | | | $ | 0.61 | | | $ | — | | | $ | — | | | $ | — | |
9/30/2010 | | | 4.48 | | | | (0.01 | ) | | | 0.67 | | | | 0.66 | | | | — | | | | — | | | | — | |
9/30/2009 | | | 4.99 | | | | (0.01 | ) | | | (0.50 | ) | | | (0.51 | ) | | | — | | | | — | | | | — | |
9/30/2008 | | | 7.01 | | | | (0.02 | ) | | | (2.00 | ) | | | (2.02 | ) | | | — | | | | — | | | | — | |
9/30/2007 | | | 5.84 | | | | (0.03 | ) | | | 1.20 | | | | 1.17 | | | | — | | | | — | | | | — | |
9/30/2006 | | | 6.03 | | | | (0.00 | ) | | | (0.19 | ) | | | (0.19 | ) | | | — | | | | — | | | | — | |
Class B | | | | | | | | | | | | | | | | | | | | | | | | | |
3/31/2011(g) | | | 4.87 | | | | (0.02 | ) | | | 0.59 | | | | 0.57 | | | | — | | | | — | | | | — | |
9/30/2010 | | | 4.28 | | | | (0.05 | ) | | | 0.64 | | | | 0.59 | | | | — | | | | — | | | | — | |
9/30/2009 | | | 4.81 | | | | (0.04 | ) | | | (0.49 | ) | | | (0.53 | ) | | | — | | | | — | | | | — | |
9/30/2008 | | | 6.79 | | | | (0.07 | ) | | | (1.91 | ) | | | (1.98 | ) | | | — | | | | — | | | | — | |
9/30/2007 | | | 5.70 | | | | (0.07 | ) | | | 1.16 | | | | 1.09 | | | | — | | | | — | | | | — | |
9/30/2006 | | | 5.94 | | | | (0.05 | ) | | | (0.19 | ) | | | (0.24 | ) | | | — | | | | — | | | | — | |
Class C | | | | | | | | | | | | | | | | | | | | | | | | | |
3/31/2011(g) | | | 4.87 | | | | (0.02 | ) | | | 0.59 | | | | 0.57 | | | | — | | | | — | | | | — | |
9/30/2010 | | | 4.28 | | | | (0.05 | ) | | | 0.64 | | | | 0.59 | | | | — | | | | — | | | | — | |
9/30/2009 | | | 4.81 | | | | (0.04 | ) | | | (0.49 | ) | | | (0.53 | ) | | | — | | | | — | | | | — | |
9/30/2008 | | | 6.80 | | | | (0.07 | ) | | | (1.92 | ) | | | (1.99 | ) | | | — | | | | — | | | | — | |
9/30/2007 | | | 5.71 | | | | (0.08 | ) | | | 1.17 | | | | 1.09 | | | | — | | | | — | | | | — | |
9/30/2006 | | | 5.94 | | | | (0.04 | ) | | | (0.19 | ) | | | (0.23 | ) | | | — | | | | — | | | | — | |
Class Y | | | | | | | | | | | | | | | | | | | | | | | | | |
3/31/2011(g) | | | 5.43 | | | | 0.01 | | | | 0.65 | | | | 0.66 | | | | — | | | | — | | | | — | |
9/30/2010 | | | 4.73 | | | | (0.00 | ) | | | 0.70 | | | | 0.70 | | | | — | | | | — | | | | — | |
9/30/2009 | | | 5.24 | | | | 0.01 | | | | (0.52 | ) | | | (0.51 | ) | | | — | | | | — | | | | — | |
9/30/2008 | | | 7.32 | | | | 0.01 | | | | (2.09 | ) | | | (2.08 | ) | | | — | | | | — | | | | — | |
9/30/2007 | | | 6.08 | | | | (0.00 | ) | | | 1.24 | | | | 1.24 | | | | — | | | | — | | | | — | |
9/30/2006 | | | 6.26 | | | | 0.02 | | | | (0.20 | ) | | | (0.18 | ) | | | — | | | | — | | | | — | |
| (a) | Per share net investment income (loss) has been calculated using the average shares outstanding during the period. |
| (b) | Amount rounds to less than $0.01 per share, if applicable. |
| (c) | Had certain expenses not been waived/reimbursed during the period, if applicable, total returns would have been lower. |
| (d) | A sales charge for Class A shares and a contingent deferred sales charge for Class B and Class C shares are not reflected in total return calculations. Periods less than one year, if applicable, are not annualized. |
| (e) | The investment adviser and/or administrator agreed to waive its fees and/or reimburse a portion of the Fund’s expenses during the period. Without this waiver/reimbursement, if applicable, expenses would have been higher. |
See accompanying notes to financial statements.
55 |
| | | | | | | | | | | | | | | | | | | | | | | | | | |
| | | | | | | | | | Ratios to Average Net Assets: | | | | |
Net asset
value,
end of
the period | | | Total
return
(%) (c)(d) | | | Net assets,
end of
the period
(000’s) | | | Net
expenses
(%) (e)(f) | | | Gross
expenses
(%) (f) | | | Net investment
income (loss)
(%) (f) | | | Portfolio
turnover
rate (%) | |
| | | | | | | | | | | | | | | | | | | | | | | | | | |
| | | | | | | | | | | | | | | | | | | | | | | | | | |
| $ | 5.75 | | | | 11.87 | | | $ | 30,943 | | | | 1.18 | | | | 1.18 | | | | 0.18 | | | | 8 | |
| | 5.14 | | | | 14.73 | | | | 29,901 | | | | 1.19 | | | | 1.20 | | | | (0.30 | ) | | | 163 | |
| | 4.48 | | | | (10.40 | ) | | | 33,207 | | | | 1.25 | | | | 1.31 | | | | (0.25 | ) | | | 191 | |
| | 4.99 | | | | (28.67 | ) | | | 156,841 | | | | 1.10 | | | | 1.10 | | | | (0.33 | ) | | | 179 | |
| | 7.01 | | | | 20.03 | | | | 228,629 | | | | 1.14 | (h) | | | 1.14 | (h) | | | (0.49 | ) | | | 134 | |
| | 5.84 | | | | (3.15 | ) | | | 225,729 | | | | 1.10 | | | | 1.17 | | | | (0.03 | ) | | | 174 | |
| | | | | | | | | | | | | | | | | | | | | | | | | | |
| | 5.44 | | | | 11.70 | | | | 3,506 | | | | 1.93 | | | | 1.93 | | | | (0.59 | ) | | | 8 | |
| | 4.87 | | | | 13.79 | | | | 4,086 | | | | 1.93 | | | | 1.95 | | | | (1.06 | ) | | | 163 | |
| | 4.28 | | | | (11.02 | ) | | | 5,397 | | | | 2.00 | | | | 2.12 | | | | (1.06 | ) | | | 191 | |
| | 4.81 | | | | (29.16 | ) | | | 9,553 | | | | 1.85 | | | | 1.85 | | | | (1.05 | ) | | | 179 | |
| | 6.79 | | | | 19.12 | | | | 28,258 | | | | 1.85 | (h) | | | 1.85 | (h) | | | (1.20 | ) | | | 134 | |
| | 5.70 | | | | (4.04 | ) | | | 32,160 | | | | 1.95 | | | | 2.11 | | | | (0.85 | ) | | | 174 | |
| | | | | | | | | | | | | | | | | | | | | | | | | | |
| | 5.44 | | | | 11.70 | | | | 12,838 | | | | 1.93 | | | | 1.93 | | | | (0.58 | ) | | | 8 | |
| | 4.87 | | | | 13.79 | | | | 12,493 | | | | 1.93 | | | | 1.95 | | | | (1.06 | ) | | | 163 | |
| | 4.28 | | | | (11.02 | ) | | | 16,336 | | | | 2.00 | | | | 2.12 | | | | (1.06 | ) | | | 191 | |
| | 4.81 | | | | (29.26 | ) | | | 27,743 | | | | 1.85 | | | | 1.85 | | | | (1.08 | ) | | | 179 | |
| | 6.80 | | | | 19.09 | | | | 39,157 | | | | 1.88 | | | | 1.88 | | | | (1.23 | ) | | | 134 | |
| | 5.71 | | | | (3.87 | ) | | | 43,415 | | | | 1.85 | | | | 1.95 | | | | (0.76 | ) | | | 174 | |
| | | | | | | | | | | | | | | | | | | | | | | | | | |
| | 6.09 | | | | 11.95 | | | | 72,332 | | | | 0.93 | | | | 0.93 | | | | 0.45 | | | | 8 | |
| | 5.43 | | | | 15.01 | | | | 53,299 | | | | 0.93 | (i) | | | 0.95 | | | | (0.05 | ) | | | 163 | |
| | 4.73 | | | | (9.73 | ) | | | 57,033 | | | | 0.75 | | | | 0.75 | | | | 0.18 | | | | 191 | |
| | 5.24 | | | | (28.42 | ) | | | 75,389 | | | | 0.66 | | | | 0.66 | | | | 0.11 | | | | 179 | |
| | 7.32 | | | | 20.39 | | | | 124,663 | | | | 0.67 | | | | 0.67 | | | | (0.02 | ) | | | 134 | |
| | 6.08 | | | | (2.88 | ) | | | 121,478 | | | | 0.80 | (j) | | | 0.80 | (j) | | | 0.31 | | | | 174 | |
| (f) | Computed on an annualized basis for periods less than one year, if applicable. |
| (g) | For the six months ended March 31, 2011 (Unaudited). |
| (h) | Includes fee/expense recovery of less than 0.01% and 0.08% for Class A and Class B shares, respectively. |
| (i) | Effective February 1, 2010, the expense limit increased to 1.00% for Class Y shares. |
| (j) | Includes fee/expense recovery of 0.07%. |
See accompanying notes to financial statements.
| 56
Financial Highlights (continued)
For a share outstanding throughout each period.
| | | | | | | | | | | | | | | | | | | | | | | | | | | | |
| | | | | | Income (Loss) From Investment
Operations: | | | Less Distributions: | |
| | | Net asset
value,
beginning
of the
period | | | Net
investment
loss(a) | | | Net realized
and
unrealized
gain (loss) | | | Total from
investment
operations | | | Dividends
from net
investment
income | | | Distributions
from net
realized
capital
gains | | | Total
distributions | |
MID CAP GROWTH FUND | | | | | | | | | | | | | | | | | | | | | | | | | |
Class A* | | | | | | | | | | | | | | | | | | | | | | | | | | | | |
3/31/2011(f) | | $ | 23.76 | | | $ | (0.09 | )(g) | | $ | 6.75 | | | $ | 6.66 | | | $ | — | | | $ | — | | | $ | — | |
9/30/2010 | | | 18.29 | | | | (0.09 | )(h) | | | 5.56 | | | | 5.47 | | | | — | | | | — | | | | — | |
9/30/2009 | | | 21.12 | | | | (0.07 | )(i) | | | (2.76 | ) | | | (2.83 | ) | | | — | | | | — | | | | — | |
9/30/2008 | | | 26.84 | | | | (0.15 | ) | | | (5.57 | ) | | | (5.72 | ) | | | — | | | | — | | | | — | |
9/30/2007 | | | 19.69 | | | | (0.16 | )(j) | | | 7.31 | | | | 7.15 | | | | — | | | | — | | | | — | |
9/30/2006 | | | 18.63 | | | | (0.15 | ) | | | 1.21 | | | | 1.06 | | | | — | | | | — | | | | — | |
Class C | | | | | | | | | | | | | | | | | | | | | | | | | | | | |
3/31/2011(f) | | | 23.47 | | | | (0.20 | )(g) | | | 6.67 | | | | 6.47 | | | | — | | | | — | | | | — | |
9/30/2010 | | | 18.20 | | | | (0.18 | )(h) | | | 5.45 | | | | 5.27 | | | | — | | | | — | | | | — | |
9/30/2009** | | | 15.13 | | | | (0.16 | ) | | | 3.23 | | | | 3.07 | | | | — | | | | — | | | | — | |
Class Y* | | | | | | | | | | | | | | | | | | | | | | | | | | | | |
3/31/2011(f) | | | 24.53 | | | | (0.06 | )(g) | | | 6.98 | | | | 6.92 | | | | — | | | | — | | | | — | |
9/30/2010 | | | 18.84 | | | | (0.07 | )(h) | | | 5.76 | | | | 5.69 | | | | — | | | | — | | | | — | |
9/30/2009 | | | 21.70 | | | | (0.05 | )(i) | | | (2.81 | ) | | | (2.86 | ) | | | — | | | | — | | | | — | |
9/30/2008 | | | 27.51 | | | | (0.10 | ) | | | (5.71 | ) | | | (5.81 | ) | | | — | | | | — | | | | — | |
9/30/2007 | | | 20.13 | | | | (0.11 | )(j) | | | 7.49 | | | | 7.38 | | | | — | | | | — | | | | — | |
9/30/2006 | | | 19.00 | | | | (0.10 | ) | | | 1.23 | | | | 1.13 | | | | — | | | | — | | | | — | |
| * | Prior to the close of business on February 2, 2009, the Fund offered Retail and Institutional Class shares, which were redesignated as Class A and Class Y shares, respectively, on that date. |
| ** | From commencement of Class operations on February 2, 2009 through September 30, 2009. |
| (a) | Per share net investment loss has been calculated using the average shares outstanding during the period. |
| (b) | Had certain expenses not been waived/reimbursed during the period, if applicable, total returns would have been lower. |
| (c) | A sales charge for Class A shares and a contingent deferred sales charge for Class C shares are not reflected in total return calculations. Periods less than one year, if applicable, are not annualized. |
| (d) | The investment adviser and/or administrator agreed to waive its fees and/or reimburse a portion of the Fund’s expenses during the period. Without this waiver/reimbursement, if applicable, expenses would have been higher. |
| (e) | Computed on an annualized basis for periods less than one year, if applicable. |
See accompanying notes to financial statements.
57 |
| | | | | | | | | | | | | | | | | | | | | | | | | | |
| | | | | | | | | | Ratios to Average Net Assets: | | | | |
Net asset
value,
end of
the period | | | Total
return
(%) (b)(c) | | | Net assets,
end of
the period
(000’s) | | | Net
expenses
(%) (d)(e) | | | Gross
expenses
(%) (e) | | | Net investment
loss
(%) (e) | | | Portfolio
turnover
rate (%) | |
| | | | | | | | | | | | | | | | | | | | | | | | | | |
| | | | | | | | | | | | | | | | | | | | | | | | | | |
| $ | 30.42 | | | | 28.03 | | | $ | 91,950 | | | | 1.25 | | | | 1.33 | | | | (0.69 | )(g) | | | 91 | |
| | 23.76 | | | | 29.91 | | | | 67,639 | | | | 1.25 | | | | 1.46 | | | | (0.45 | )(h) | | | 191 | |
| | 18.29 | | | | (13.44 | ) | | | 54,951 | | | | 1.25 | | | | 1.52 | | | | (0.45 | )(i) | | | 292 | |
| | 21.12 | | | | (21.27 | ) | | | 120,524 | | | | 1.25 | | | | 1.32 | | | | (0.58 | ) | | | 299 | |
| | 26.84 | | | | 36.31 | | | | 30,654 | | | | 1.25 | | | | 1.43 | | | | (0.71 | ) | | | 194 | |
| | 19.69 | | | | 5.69 | | | | 26,668 | | | | 1.25 | | | | 1.52 | | | | (0.72 | ) | | | 211 | |
| | | | | | | | | | | | | | | | | | | | | | | | | | |
| | 29.94 | | | | 27.57 | | | | 1,085 | | | | 2.00 | | | | 2.09 | | | | (1.51 | )(g) | | | 91 | |
| | 23.47 | | | | 28.96 | | | | 34 | | | | 2.00 | | | | 2.24 | | | | (0.89 | )(h) | | | 191 | |
| | 18.20 | | | | 20.29 | | | | 1 | | | | 2.00 | | | | 2.24 | | | | (1.54 | ) | | | 292 | |
| | | | | | | | | | | | | | | | | | | | | | | | | | |
| | 31.45 | | | | 28.21 | | | | 50,043 | | | | 1.00 | | | | 1.08 | | | | (0.45 | )(g) | | | 91 | |
| | 24.53 | | | | 30.20 | | | | 33,757 | | | | 1.00 | | | | 1.22 | | | | (0.34 | )(h) | | | 191 | |
| | 18.84 | | | | (13.18 | ) | | | 27,057 | | | | 1.00 | | | | 1.12 | | | | (0.27 | )(i) | | | 292 | |
| | 21.70 | | | | (21.12 | ) | | | 25,779 | | | | 1.00 | (k) | | | 1.00 | (k) | | | (0.36 | ) | | | 299 | |
| | 27.51 | | | | 36.66 | | | | 24,143 | | | | 1.00 | | | | 1.10 | | | | (0.47 | ) | | | 194 | |
| | 20.13 | | | | 5.95 | | | | 17,467 | | | | 1.00 | | | | 1.12 | | | | (0.49 | ) | | | 211 | |
| (f) | For the six months ended March 31, 2011 (Unaudited). |
| (g) | Includes a non-recurring dividend. Without this dividend, net investment loss per share would have been $(0.13), $(0.23) and $(0.10) for Class A, Class C and Class Y shares, respectively, and the ratio of net investment loss to average net assets would have been (0.96)%, (1.71)% and (0.72)% for Class A, Class C and Class Y shares, respectively. |
| (h) | Includes a non-recurring dividend. Without this dividend, net investment loss per share would have been $(0.21), $(0.36) and $(0.16) for Class A, Class C and Class Y shares, respectively, and the ratio of net investment loss to average net assets would have been (1.02)%, (1.74)% and (0.76)% for Class A, Class C and Class Y shares, respectively. |
| (i) | Includes a non-recurring dividend of $0.03 per share. Without this dividend, net investment loss per share would have been $(0.10) and $(0.08) for Class A and Class Y shares, respectively, and the ratio of net investment loss to average net assets would have been (0.63)% and (0.46)% for Class A and Class Y shares, respectively. |
| (j) | Includes a non-recurring dividend of $0.02 per share. |
| (k) | Includes fee/expense recovery of less than 0.01%. |
See accompanying notes to financial statements.
| 58
Financial Highlights (continued)
For a share outstanding throughout each period.
| | | | | | | | | | | | | | | | | | | | | | | | | | | | |
| | | | | | Income (Loss) From Investment
Operations: | | | Less Distributions: | |
| | | Net asset
value,
beginning
of the
period | | | Net
investment
income
(a)(b) | | | Net realized
and
unrealized
gain (loss) | | | Total from
investment
operations | | | Dividends
from net
investment
income | | | Distributions
from net
realized
capital
gains | | | Total
distributions | |
VALUE FUND | | | | | | | | | | | | | | | | | | | | | | | | | | | | |
Class A* | | | | | | | | | | | | | | | | | | | | | | | | | | | | |
3/31/2011(g) | | $ | 16.78 | | | $ | 0.08 | | | $ | 3.24 | | | $ | 3.32 | | | $ | (0.22 | ) | | $ | — | | | $ | (0.22 | ) |
9/30/2010 | | | 16.42 | | | | 0.27 | (h) | | | 0.23 | | | | 0.50 | | | | (0.14 | ) | | | — | | | | (0.14 | ) |
9/30/2009 | | | 17.93 | | | | 0.23 | | | | (1.53 | ) | | | (1.30 | ) | | | (0.21 | ) | | | — | | | | (0.21 | ) |
9/30/2008 | | | 23.46 | | | | 0.25 | | | | (4.45 | ) | | | (4.20 | ) | | | (0.18 | ) | | | (1.15 | ) | | | (1.33 | ) |
9/30/2007 | | | 21.04 | | | | 0.19 | | | | 3.27 | | | | 3.46 | | | | (0.13 | ) | | | (0.91 | ) | | | (1.04 | ) |
9/30/2006** | | | 19.69 | | | | 0.02 | | | | 1.33 | | | | 1.35 | | | | — | | | | — | | | | — | |
Class B | | | | | | | | | | | | | | | | | | | | | | | | | | | | |
3/31/2011(g) | | | 16.77 | | | | 0.02 | | | | 3.23 | | | | 3.25 | | | | (0.05 | ) | | | — | | | | (0.05 | ) |
9/30/2010 | | | 16.40 | | | | 0.12 | (h) | | | 0.25 | | | | 0.37 | | | | — | | | | — | | | | — | |
9/30/2009 | | | 17.80 | | | | 0.14 | | | | (1.51 | ) | | | (1.37 | ) | | | (0.03 | ) | | | — | | | | (0.03 | ) |
9/30/2008 | | | 23.46 | | | | 0.10 | | | | (4.45 | ) | | | (4.35 | ) | | | (0.16 | ) | | | (1.15 | ) | | | (1.31 | ) |
9/30/2007*** | | | 24.00 | | | | 0.00 | | | | (0.54 | ) | | | (0.54 | ) | | | — | | | | — | | | | — | |
Class C | | | | | | | | | | | | | | | | | | | | | | | | | | | | |
3/31/2011(g) | | | 16.58 | | | | 0.01 | | | | 3.21 | | | | 3.22 | | | | (0.08 | ) | | | — | | | | (0.08 | ) |
9/30/2010 | | | 16.26 | | | | 0.14 | (h) | | | 0.22 | | | | 0.36 | | | | (0.04 | ) | | | — | | | | (0.04 | ) |
9/30/2009 | | | 17.79 | | | | 0.12 | | | | (1.51 | ) | | | (1.39 | ) | | | (0.14 | ) | | | — | | | | (0.14 | ) |
9/30/2008 | | | 23.46 | | | | 0.09 | | | | (4.43 | ) | | | (4.34 | ) | | | (0.18 | ) | | | (1.15 | ) | | | (1.33 | ) |
9/30/2007*** | | | 24.00 | | | | 0.01 | | | | (0.55 | ) | | | (0.54 | ) | | | — | | | | — | | | | — | |
Class Y* | | | | | | | | | | | | | | | | | | | | | | | | | | | | |
3/31/2011(g) | | | 16.82 | | | | 0.11 | | | | 3.23 | | | | 3.34 | | | | (0.26 | ) | | | — | | | | (0.26 | ) |
9/30/2010 | | | 16.47 | | | | 0.31 | (h) | | | 0.23 | | | | 0.54 | | | | (0.19 | ) | | | — | | | | (0.19 | ) |
9/30/2009 | | | 18.01 | | | | 0.28 | | | | (1.54 | ) | | | (1.26 | ) | | | (0.28 | ) | | | — | | | | (0.28 | ) |
9/30/2008 | | | 23.54 | | | | 0.32 | | | | (4.45 | ) | | | (4.13 | ) | | | (0.25 | ) | | | (1.15 | ) | | | (1.40 | ) |
9/30/2007 | | | 21.05 | | | | 0.27 | | | | 3.27 | | | | 3.54 | | | | (0.14 | ) | | | (0.91 | ) | | | (1.05 | ) |
9/30/2006 | | | 18.72 | | | | 0.22 | | | | 3.17 | | | | 3.39 | | | | (0.27 | ) | | | (0.79 | ) | | | (1.06 | ) |
Admin Class | | | | | | | | | | | | | | | | | | | | | | | | | | | | |
3/31/2011(g) | | | 16.74 | | | | 0.05 | | | | 3.24 | | | | 3.29 | | | | (0.18 | ) | | | — | | | | (0.18 | ) |
9/30/2010**** | | | 16.72 | | | | 0.18 | (h) | | | (0.16 | ) | | | 0.02 | | | | — | | | | — | | | | — | |
| * | Prior to the close of business on June 1, 2007, the Fund offered Retail and Institutional Class shares, which were redesignated as Class A and Class Y shares, respectively, on that date. |
| ** | From commencement of Class operations on June 30, 2006, through September 30, 2006. |
| *** | From commencement of Class operations on June 1, 2007, through September 30, 2007. |
| **** | From commencement of Class operations on February 1, 2010 through September 30, 2010. |
| (a) | Per share net investment income has been calculated using the average shares outstanding during the period. |
| (b) | Amount rounds to less than $0.01 per share, if applicable. |
| (c) | A sales charge for Class A shares and a contingent deferred sales charge for Class B and Class C shares are not reflected in total return calculations. Periods less than one year, if applicable, are not annualized. |
| (d) | Had certain expenses not been waived/reimbursed during the period, if applicable, total returns would have been lower. |
See accompanying notes to financial statements.
59 |
| | | | | | | | | | | | | | | | | | | | | | | | | | |
| | | | | | | | | | Ratios to Average Net Assets: | | | | |
Net asset
value,
end of
the period | | | Total
return
(%) (c)(d) | | | Net assets,
end of
the period
(000’s) | | | Net
expenses
(%) (e)(f) | | | Gross
expenses
(%) (f) | | | Net investment
income
(%) (f) | | | Portfolio
turnover
rate (%) | |
| | | | | | | | | | | | | | | | | | | | | | | | | | |
| | | | | | | | | | | | | | | | | | | | | | | | | | |
| $ | 19.88 | | | | 19.87 | | | $ | 158,437 | | | | 0.95 | | | | 0.95 | | | | 0.91 | | | | 15 | |
| | 16.78 | | | | 3.03 | | | | 130,922 | | | | 0.96 | | | | 0.96 | | | | 1.58 | (h) | | | 54 | |
| | 16.42 | | | | (6.97 | ) | | | 120,915 | | | | 1.06 | | | | 1.06 | | | | 1.67 | | | | 47 | |
| | 17.93 | | | | (19.01 | ) | | | 112,274 | | | | 1.05 | | | | 1.05 | | | | 1.24 | | | | 36 | (i) |
| | 23.46 | | | | 16.85 | | | | 17,500 | | | | 1.09 | (j) | | | 1.09 | (j) | | | 0.79 | | | | 41 | |
| | 21.04 | | | | 6.86 | | | | 466 | | | | 1.10 | | | | 8.65 | | | | 0.42 | | | | 36 | |
| | | | | | | | | | | | | | | | | | | | | | | | | | |
| | 19.97 | | | | 19.39 | | | | 3,243 | | | | 1.70 | | | | 1.70 | | | | 0.17 | | | | 15 | |
| | 16.77 | | | | 2.26 | | | | 3,299 | | | | 1.70 | | | | 1.70 | | | | 0.72 | (h) | | | 54 | |
| | 16.40 | | | | (7.62 | ) | | | 5,167 | | | | 1.81 | | | | 1.81 | | | | 1.03 | | | | 47 | |
| | 17.80 | | | | (19.65 | ) | | | 8,385 | | | | 1.80 | (k) | | | 1.80 | (k) | | | 0.51 | | | | 36 | (i) |
| | 23.46 | | | | (2.25 | ) | | | 108 | | | | 1.85 | | | | 1.89 | | | | 0.03 | | | | 41 | |
| | | | | | | | | | | | | | | | | | | | | | | | | | |
| | 19.72 | | | | 19.44 | | | | 12,712 | | | | 1.70 | | | | 1.70 | | | | 0.16 | | | | 15 | |
| | 16.58 | | | | 2.20 | | | | 10,226 | | | | 1.71 | | | | 1.71 | | | | 0.81 | (h) | | | 54 | |
| | 16.26 | | | | (7.60 | ) | | | 10,011 | | | | 1.81 | | | | 1.81 | | | | 0.89 | | | | 47 | |
| | 17.79 | | | | (19.62 | ) | | | 6,483 | | | | 1.80 | (k) | | | 1.80 | (k) | | | 0.46 | | | | 36 | (i) |
| | 23.46 | | | | (2.25 | ) | | | 1,390 | | | | 1.85 | | | | 1.94 | | | | 0.10 | | | | 41 | |
| | | | | | | | | | | | | | | | | | | | | | | | | | |
| | 19.90 | | | | 19.98 | | | | 1,145,941 | | | | 0.70 | | | | 0.70 | | | | 1.17 | | | | 15 | |
| | 16.82 | | | | 3.28 | | | | 788,937 | | | | 0.71 | | | | 0.71 | | | | 1.86 | (h) | | | 54 | |
| | 16.47 | | | | (6.66 | ) | | | 574,439 | | | | 0.66 | | | | 0.66 | | | | 1.97 | | | | 47 | |
| | 18.01 | | | | (18.67 | ) | | | 303,182 | | | | 0.65 | | | | 0.66 | | | | 1.58 | | | | 36 | (i) |
| | 23.54 | | | | 17.25 | | | | 182,002 | | | | 0.72 | (j) | | | 0.72 | (j) | | | 1.19 | | | | 41 | |
| | 21.05 | | | | 18.92 | | | | 71,147 | | | | 0.85 | | | | 0.91 | | | | 1.13 | | | | 36 | |
| | | | | | | | | | | | | | | | | | | | | | | | | | |
| | 19.85 | | | | 19.75 | | | | 1 | | | | 1.14 | | | | 1.14 | | | | 0.54 | | | | 15 | |
| | 16.74 | | | | 0.12 | | | | 1 | | | | 1.29 | | | | 1.29 | | | | 1.59 | (h) | | | 54 | |
| (e) | The investment adviser and/or administrator agreed to waive its fees and/or reimburse a portion of the Fund’s expenses during the period. Without this waiver/reimbursement, if applicable, expenses would have been higher. |
| (f) | Computed on an annualized basis for periods less than one year, if applicable. |
| (g) | For the six months ended March 31, 2011 (Unaudited). |
| (h) | Includes a non-recurring dividend. Without this dividend, net investment income per share would have been $0.14, $0.02, $0.01, $0.18 and $0.05 for Class A, Class B, Class C, Class Y and Admin Class shares, respectively, and the ratio of net investment income to average net assets would have been 0.84%, 0.10%, 0.09%, 1.08% and 0.50% for Class A, Class B, Class C, Class Y and Admin Class shares, respectively. |
| (i) | Portfolio turnover excludes the impact of assets resulting from a merger with another fund. |
| (j) | Includes fee/expense recovery of 0.02% and 0.01% for Class A and Class Y shares, respectively. |
| (k) | Includes fee/expense recovery of less than 0.01% for Class B and Class C shares. |
See accompanying notes to financial statements.
| 60
Notes to Financial Statements
March 31, 2011 (Unaudited)
1. Organization. Loomis Sayles Funds II (the “Trust”) is organized as a Massachusetts business trust. The Trust is registered under the Investment Company Act of 1940, as amended (the “1940 Act”), as an open-end management investment company. The Declaration of Trust permits the Board of Trustees to authorize the issuance of an unlimited number of shares of the Trust in multiple series. The financial statements for certain funds of the Trust are presented in separate reports. The following funds (individually, a “Fund” and collectively, the “Funds”) are included in this report:
Loomis Sayles Global Equity and Income Fund (formerly Loomis Sayles Global Markets Fund) (the “Global Equity and Income Fund”)
Loomis Sayles Growth Fund (the “Growth Fund”)
Loomis Sayles Mid Cap Growth Fund (the “Mid Cap Growth Fund”)
Loomis Sayles Value Fund (the “Value Fund”)
Each Fund offers Class A, Class C and Class Y shares. In addition, Value Fund offers Admin Class shares. Effective October 12, 2007, Class B shares are no longer offered. Existing Class B shareholders of Growth Fund and Value Fund may continue to reinvest dividends into Class B shares and exchange their Class B shares for Class B shares of other Natixis Funds subject to existing exchange privileges as described in the prospectus.
Class A shares are sold with a maximum front-end sales charge of 5.75%. Class B shares do not pay a front-end sales charge; however, they are charged higher Rule 12b-1 fees, and are subject to a contingent deferred sales charge (“CDSC”) if such shares are redeemed within six years of purchase. After eight years of ownership, Class B shares convert to Class A shares. Class C shares do not pay a front-end sales charge, do not convert to any other class of shares, pay higher Rule 12b-1 fees than Class A shares and may be subject to a CDSC of 1.00% if those shares are redeemed within one year of acquisition, except for reinvested distributions. Class Y shares do not pay a front-end sales charge, a CDSC or Rule 12b-1 fees. Class Y shares are generally intended for institutional investors with a minimum initial investment of $100,000, though some categories of investors are exempted from the minimum investment amount as outlined in the Funds’ prospectus. Admin Class shares do not pay a front-end sales charge or a CDSC, but do pay a Rule 12b-1 fee. Admin Class shares are offered exclusively through intermediaries.
Most expenses of the Trust can be directly attributed to a Fund. Expenses which can not be directly attributed to a Fund are generally apportioned based on the relative net assets of each of the Funds in the Trust. Expenses of a Fund are borne pro rata by the holders of each class of shares, except that each class bears expenses unique to that class (including the Rule 12b-1 service and distribution fees). In addition, each class votes as a class only with respect to its own Rule 12b-1 Plan. Shares of each class would receive their pro rata share of the net assets of a Fund if the Fund were liquidated. The Trustees approve separate distributions from net investment income on each class of shares.
61 |
Notes to Financial Statements (continued)
March 31, 2011 (Unaudited)
2. Significant Accounting Policies. The following is a summary of significant accounting policies consistently followed by each Fund in the preparation of its financial statements. The Funds’ financial statements are prepared in accordance with accounting principles generally accepted in the United States of America which require the use of management estimates that affect the reported amounts and disclosures in the financial statements. Actual results could differ from those estimates. Management has evaluated the events and transactions subsequent to period-end through the date the financial statements were issued and has determined that there were no material events that would require disclosure in the Funds’ financial statements.
a. Valuation. Equity securities, including shares of closed-end investment companies and exchange-traded funds, for which market quotations are readily available are valued at market value, as reported by pricing services recommended by the investment adviser and approved by the Board of Trustees. Such pricing services generally use the security’s last sale price on the exchange or market where the security is primarily traded or, if there is no reported sale during the day, the closing bid price. Securities traded on the NASDAQ Global Select Market, NASDAQ Global Market and NASDAQ Capital Market are valued at the NASDAQ Official Closing Price (“NOCP”), or if lacking a NOCP, at the most recent bid quotation on the applicable NASDAQ Market. Debt securities (other than short-term obligations purchased with an original or remaining maturity of sixty days or less) are generally valued on the basis of evaluated bids furnished to the Funds by a pricing service recommended by the investment adviser and approved by the Board of Trustees, which service determines valuations for normal, institutional-size trading units of such securities using market information, transactions for comparable securities and various relationships between securities which are generally recognized by institutional traders. Broker-dealer bid quotations may also be used to value debt and equity securities where a pricing service does not price a security or where a pricing service does not provide a reliable price for the security. In instances where broker-dealer bid quotations are not available, certain securities held by the Funds may be valued on the basis of a price provided by a principal market maker. Forward foreign currency contracts are valued utilizing interpolated prices determined from information provided by an independent pricing service. Domestic exchange-traded single equity option contracts are valued at the mean of the National Best Bid and Offer quotations. Short-term obligations purchased with an original or remaining maturity of sixty days or less are valued at amortized cost, which approximates market value. Investments in other open-end investment companies are valued at their net asset value each day. Securities for which market quotations are not readily available are valued at fair value as determined in good faith by the Funds’ investment adviser using consistently applied procedures under the general supervision of the Board of Trustees.
The Funds may hold securities traded in foreign markets. Foreign securities are valued at the market price in the foreign market. However, if events occurring after the close of
| 62
Notes to Financial Statements (continued)
March 31, 2011 (Unaudited)
the foreign market (but before the close of regular trading on the New York Stock Exchange) are believed to materially affect the value of those securities, such securities are fair valued pursuant to procedures approved by the Board of Trustees. When fair valuing securities, the Funds may, among other things, use modeling tools or other processes that may take into account factors such as securities market activity and/or significant events that occur after the close of the foreign market and before the Funds calculate their net asset values. As of March 31, 2011, approximately 28% of the market value of Global Equity and Income Fund’s investments was fair valued pursuant to procedures approved by the Board of Trustees.
b. Investment Transactions and Related Investment Income. Investment transactions are accounted for on a trade date plus one basis for daily net asset value calculation. However, for financial reporting purposes, investment transactions are reported on trade date. Dividend income is recorded on ex-dividend date, or in the case of certain foreign securities, as soon as a Fund is notified, and interest income is recorded on an accrual basis. Interest income is increased by the accretion of discount and decreased by the amortization of premium. Periodic principal adjustments for inflation-protected securities are recorded to interest income. Investment income is recorded net of foreign taxes withheld when applicable. In determining net gain or loss on securities sold, the cost of securities has been determined on an identified cost basis. Investment income, non-class specific expenses and realized and unrealized gains and losses are allocated on a pro rata basis to each class based on the relative net assets of each class to the total net assets of the Fund.
c. Foreign Currency Translation. The books and records of the Funds are maintained in U.S. dollars. The values of securities, currencies and other assets and liabilities denominated in currencies other than U.S. dollars are translated into U.S. dollars based upon foreign exchange rates prevailing at the end of the period. Purchases and sales of investment securities, income and expenses are translated on the respective dates of such transactions.
Since the values of investment securities are presented at the foreign exchange rates prevailing at the end of the period, it is not practical to isolate that portion of the results of operations arising from changes in exchange rates from fluctuations which arise due to changes in market prices of investment securities. Such changes are included with the net realized and unrealized gain or loss on investments.
Net realized foreign exchange gains or losses arise from sales of foreign currency, currency gains or losses realized between the trade and settlement dates on securities transactions and the difference between the amounts of dividends, interest and foreign withholding taxes recorded on the Funds’ books and the U.S. dollar equivalent of the amounts actually received or paid. Net unrealized foreign exchange gains and losses arise from changes in the value of assets and liabilities, other than investment securities, at the end of the fiscal period, resulting from changes in exchange rates.
63 |
Notes to Financial Statements (continued)
March 31, 2011 (Unaudited)
Each Fund may use foreign currency exchange contracts to facilitate transactions in foreign-denominated investments. Losses may arise from changes in the value of the foreign currency or if the counterparties do not perform under the contracts’ terms.
d. Forward Foreign Currency Contracts. Each Fund may enter into forward foreign currency contracts, including forward foreign cross currency contracts. Contracts to buy generally are used to acquire exposure to foreign currencies, while contracts to sell generally are used to hedge a Fund’s investments against currency fluctuation. Also, a contract to buy or sell can offset a previous contract. These contracts involve market risk in excess of the unrealized gain or loss reflected in the Funds’ Statements of Assets and Liabilities. The U.S. dollar value of the currencies a Fund has committed to buy or sell represents the aggregate exposure to each currency the Fund has acquired or hedged through currency contracts outstanding at period end. Gains or losses are recorded for financial statement purposes as unrealized until settlement date. Risks may arise upon entering into these contracts from the potential inability of counterparties to meet the terms of their contracts and from unanticipated movements in the value of a foreign currency relative to the U.S. dollar. Certain contracts may require the movement of cash or securities as collateral for the Funds’ or counterparty’s net obligations under the contracts.
e. Option Contracts. The Funds may enter into option contracts. When a Fund purchases an option, it pays a premium and the option is subsequently marked to market to reflect current value. Premiums paid for purchasing options which expire are treated as realized losses. Premiums paid for purchasing options which are exercised or closed are added to the cost or deducted from the proceeds on the underlying instrument to determine the realized gain or loss. The risk associated with purchasing options is limited to the premium paid.
When a Fund writes an option, an amount equal to the net premium received (the premium less commission) is recorded as a liability and is subsequently adjusted to the current value. Net premiums received for written options which expire are treated as realized gains. Net premiums received for written options which are exercised or closed are deducted from the cost or added to the proceeds on the underlying instrument or closing purchase transaction to determine the realized gain or loss. The Fund, as writer of a written option, bears the risk of an unfavorable change in the market value of the instrument underlying the written option.
Exchange-traded options have standardized contracts and are settled through a clearing house with fulfillment guaranteed by the credit of the exchange. Therefore, counterparty credit risks to the Funds are limited. Over-the-counter options are subject to the risk that the counterparty is unable or unwilling to meet its obligations under the option. For the six months ended March 31, 2011, the Funds were not party to any over-the-counter options.
| 64
Notes to Financial Statements (continued)
March 31, 2011 (Unaudited)
f. Federal and Foreign Income Taxes. The Trust treats each Fund as a separate entity for federal income tax purposes. Each Fund intends to meet the requirements of the Internal Revenue Code of 1986, as amended, applicable to regulated investment companies, and to distribute to its shareholders substantially all of its net investment income and any net realized capital gains at least annually. Management has performed an analysis of each Fund’s tax positions for the open tax years as of March 31, 2011 and has concluded that no provisions for income tax are required. The Funds’ federal tax returns for the prior three fiscal years remain subject to examination by the Internal Revenue Service. Management is not aware of any events that are reasonably possible to occur in the next six months that would result in the amounts of any unrecognized tax benefits significantly increasing or decreasing for the Funds. However, management’s conclusions regarding tax positions taken may be subject to review and adjustment at a later date based on factors including, but not limited to, new tax laws and accounting regulations and interpretations thereof.
A Fund may be subject to foreign taxes on income and gains on investments that are accrued based upon the Fund’s understanding of the tax rules and regulations that exist in the countries in which the Fund invests. Foreign governments may also impose taxes or other payments on investments with respect to foreign securities. Such taxes are accrued as applicable, and are reflected as foreign taxes payable on the Statements of Assets and Liabilities. In the event that realized gains on investments are subsequently offset by realized losses, taxes paid on realized gains may be returned to a Fund. Such amounts, if applicable, are reflected as foreign tax rebates receivable on the Statements of Assets and Liabilities.
g. Dividends and Distributions to Shareholders. Dividends and distributions are recorded on ex-dividend date. The timing and characterization of certain income and capital gain distributions are determined annually in accordance with federal tax regulations, which may differ from accounting principles generally accepted in the United States of America. Permanent differences are primarily due to differing treatments for book and tax purposes of items such as net operating losses, paydown gains and losses, foreign currency transactions, gains realized from passive foreign investment companies (“PFICs”), defaulted bonds, premium amortization and expired capital loss carryforwards. Permanent book and tax basis differences relating to shareholder distributions will result in reclassifications to capital accounts. Temporary differences between book and tax distributable earnings are primarily due to deferred Trustees’ fees, forward contract mark to market, securities lending collateral gain/loss adjustment, straddle loss deferrals, wash sales, premium amortization, contingent payment debt instruments, PFIC un-reversed inclusions and defaulted bond interest. Distributions from net investment income and short-term capital gains are considered to be distributed from ordinary income for tax purposes.
65 |
Notes to Financial Statements (continued)
March 31, 2011 (Unaudited)
The tax characterization of distributions is determined on an annual basis. The tax character of distributions paid to shareholders during the year ended September 30, 2010 was as follows:
| | | | | | | | | | | | |
| | | 2010 Distributions Paid From: | |
Fund | | Ordinary Income | | | Long-Term Capital Gains | | | Total | |
Global Equity and Income Fund | | $ | 5,648,679 | | | $ | — | | | $ | 5,648,679 | |
Growth Fund | | | — | | | | — | | | | — | |
Mid Cap Growth Fund | | | — | | | | — | | | | — | |
Value Fund | | | 7,877,957 | | | | — | | | | 7,877,957 | |
As of September 30, 2010, the capital loss carryforwards were as follows:
| | | | | | | | | | | | | | | | |
| | | Global
Equity and
Income Fund | | | Growth
Fund | | | Mid Cap
Growth Fund | | | Value
Fund | |
Capital loss carryforward: | | | | | | | | | | | | | | | | |
Expires September 30, 2011 | | $ | — | | | $ | (6,192,314 | ) | | $ | (21,142,388 | ) | | $ | — | |
Expires September 30, 2016 | | | — | | | | (75,866 | ) | | | — | | | | — | |
Expires September 30, 2017 | | | (54,290,711 | ) | | | (57,062,095 | ) | | | (33,667,761 | ) | | | (26,840,015 | ) |
Expires September 30, 2018 | | | (38,601,700 | ) | | | (34,687,546 | ) | | | (18,653,312 | ) | | | (54,112,420 | ) |
| | | | | | | | | | | | | | | | |
Total capital loss carryforward | | $ | (92,892,411 | ) | | $ | (98,017,821 | ) | | $ | (73,463,461 | ) | | $ | (80,952,435 | ) |
| | | | | | | | | | | | | | | | |
On December 22, 2010, the Regulated Investment Company Modernization Act of 2010 (the “Act”) was enacted. The Act modernizes several of the federal income and excise tax provisions related to RICs, and, with certain exceptions, is effective for taxable years beginning after December 22, 2010. Among the changes made are changes to the capital loss carryforward rules allowing for capital losses to be carried forward indefinitely. Rules in effect as of the report date limit the carryforward period to eight years. Capital loss carryforwards generated in taxable years beginning after effective date of the Act must be fully used before capital loss carryforwards generated in taxable years prior to effective date of the Act; therefore, under certain circumstances, capital loss carryforwards available as of the report date, if any, may expire unused.
h. Repurchase Agreements. It is each Fund’s policy that the market value of the collateral for repurchase agreements be at least equal to 102% of the repurchase price, including interest. Certain repurchase agreements are tri-party arrangements whereby the collateral is held in a segregated account for the benefit of the Fund and on behalf of the counterparty. Repurchase agreements could involve certain risks in the event of default or insolvency of the counterparty including possible delays or restrictions upon a Fund’s ability to dispose of the underlying securities.
| 66
Notes to Financial Statements (continued)
March 31, 2011 (Unaudited)
i. Securities Lending. The Funds have entered into an agreement with State Street Bank and Trust Company (“State Street Bank”), as agent of the Funds, to lend securities to certain designated borrowers. The loans are collateralized with cash or securities in an amount equal to at least 105% or 102% of the market value (including accrued interest) of the loaned international or domestic securities, respectively, when the loan is initiated. Thereafter, the value of the collateral must remain at least 102% of the market value (including accrued interest) of loaned securities for U.S. equities and U.S. corporate debt; at least 105% of the market value (including accrued interest) of loaned securities for non-U.S. equities; and at least 100% of the market value (including accrued interest) of loaned securities for U.S. Government securities, sovereign debt issued by non-U.S. Governments and non-U.S. corporate debt. In the event that the market value of the collateral falls below the required percentages described above, the borrower will deliver additional collateral on the next business day. As with other extensions of credit, the Funds may bear the risk of loss with respect to the investment of the collateral. The Funds invest cash collateral in short-term investments, a portion of the income from which is remitted to the borrowers and the remainder allocated between the Funds and State Street Bank as lending agent.
For the six months ended March 31, 2011, none of the Funds had loaned securities under this agreement.
j. Indemnifications. Under the Trust’s organizational documents, its officers and Trustees are indemnified against certain liabilities arising out of the performance of their duties to the Funds. Additionally, in the normal course of business, the Funds enter into contracts with service providers that contain general indemnification clauses. The Funds’ maximum exposure under these arrangements is unknown as this would involve future claims that may be made against the Funds that have not yet occurred. However, based on experience, the Funds expect the risk of loss to be remote.
3. Fair Value Measurements. In accordance with accounting standards related to fair value measurements and disclosures, the Funds have categorized the inputs utilized in determining the value of each Fund’s assets or liabilities. These inputs are summarized in the three broad levels listed below:
| | • | | Level 1 – quoted prices in active markets for identical assets or liabilities; |
| | • | | Level 2 – prices determined using other significant inputs that are observable either directly, or indirectly through corroboration with observable market data (which could include quoted prices for similar assets or liabilities, interest rates, credit risk, etc.); |
| | • | | Level 3 – prices determined using significant unobservable inputs when quoted prices or observable inputs are unavailable such as when there is little or no market activity for an asset or liability (unobservable inputs reflect each Fund’s own assumptions in determining the fair value of assets or liabilities and would be based on the best information available). |
67 |
Notes to Financial Statements (continued)
March 31, 2011 (Unaudited)
The inputs or methodology used for valuing securities are not necessarily an indication of the risk associated with investing in those securities.
The following is a summary of the inputs used to value the Funds’ investments as of March 31, 2011, at value:
Global Equity and Income Fund
Asset Valuation Inputs
| | | | | | | | | | | | | | | | |
Description | | Level 1 | | | Level 2 | | | Level 3 | | | Total | |
Common Stocks | | | | | | | | | | | | | | | | |
Belgium | | $ | — | | | $ | 4,584,887 | | | $ | — | | | $ | 4,584,887 | |
Brazil | | | 12,447,938 | | | | 5,597,407 | | | | — | | | | 18,045,345 | |
British Virgin Islands | | | — | | | | 2,621,216 | | | | — | | | | 2,621,216 | |
Canada | | | 497,901 | | | | — | | | | — | | | | 497,901 | |
Cayman Islands | | | 16,538,157 | | | | 6,443,833 | | | | — | | | | 22,981,990 | |
Chile | | | 10,173,232 | | | | — | | | | — | | | | 10,173,232 | |
Denmark | | | — | | | | 12,082,426 | | | | — | | | | 12,082,426 | |
Germany | | | — | | | | 23,206,193 | | | | — | | | | 23,206,193 | |
Hong Kong | | | — | | | | 3,135,506 | | | | — | | | | 3,135,506 | |
Italy | | | — | | | | 6,699,111 | | | | — | | | | 6,699,111 | |
Japan | | | — | | | | 17,111,339 | | | | — | | | | 17,111,339 | |
Korea | | | — | | | | 12,250,875 | | | | — | | | | 12,250,875 | |
Mexico | | | 3,996,853 | | | | — | | | | — | | | | 3,996,853 | |
Netherlands Antilles | | | 4,792,911 | | | | — | | | | — | | | | 4,792,911 | |
Sweden | | | — | | | | 6,121,032 | | | | — | | | | 6,121,032 | |
Switzerland | | | — | | | | 3,808,947 | | | | — | | | | 3,808,947 | |
United Kingdom | | | — | | | | 31,939,293 | | | | — | | | | 31,939,293 | |
United States | | | 132,496,068 | | | | — | | | | — | | | | 132,496,068 | |
| | | | | | | | | | | | | | | | |
Total Common Stocks | | | 180,943,060 | | | | 135,602,065 | | | | — | | | | 316,545,125 | |
| | | | | | | | | | | | | | | | |
Bonds and Notes | | | | | | | | | | | | | | | | |
Non-Convertible Bonds | | | | | | | | | | | | | | | | |
Korea | | | — | | | | 602,395 | | | | 375,819 | | | | 978,214 | |
Supranationals | | | — | | | | 338,400 | | | | 1,030,293 | | | | 1,368,693 | |
United States | | | 33,628 | | | | 68,449,649 | | | | — | | | | 68,483,277 | |
All Other Non-convertible Bonds(a) | | | — | | | | 39,679,546 | | | | — | | | | 39,679,546 | |
| | | | | | | | | | | | | | | | |
Total Non-Convertible Bonds | | | 33,628 | | | | 109,069,990 | | | | 1,406,112 | | | | 110,509,730 | |
| | | | | | | | | | | | | | | | |
Convertible Bonds(a) | | | — | | | | 6,735,775 | | | | — | | | | 6,735,775 | |
Municipals(a) | | | — | | | | 421,419 | | | | — | | | | 421,419 | |
| | | | | | | | | | | | | | | | |
Total Bonds and Notes | | | 33,628 | | | | 116,227,184 | | | | 1,406,112 | | | | 117,666,924 | |
| | | | | | | | | | | | | | | | |
| 68
Notes to Financial Statements (continued)
March 31, 2011 (Unaudited)
Global Equity and Income Fund
Asset Valuation Inputs (continued)
| | | | | | | | | | | | | | | | |
Description | | Level 1 | | | Level 2 | | | Level 3 | | | Total | |
Bank Loans(a) | | $ | — | | | $ | 69,475 | | | $ | — | | | $ | 69,475 | |
Preferred Stocks(a) | | | 803,600 | | | | 634,601 | | | | — | | | | 1,438,201 | |
Short-Term Investments | | | — | | | | 26,922,241 | | | | — | | | | 26,922,241 | |
| | | | | | | | | | | | | | | | |
Total Investments | | | 181,780,288 | | | | 279,455,566 | | | | 1,406,112 | | | | 462,641,966 | |
| | | | | | | | | | | | | | | | |
Forward Foreign Currency Contracts (unrealized appreciation) | | | — | | | | 63,319 | | | | — | | | | 63,319 | |
| | | | | | | | | | | | | | | | |
Total | | $ | 181,780,288 | | | $ | 279,518,885 | | | $ | 1,406,112 | | | $ | 462,705,285 | |
| | | | | | | | | | | | | | | | |
| | | | |
| Liability Valuation Inputs | | | | | | | | | | | | | | | | |
| | | | |
Description | | Level 1 | | | Level 2 | | | Level 3 | | | Total | |
Forward Foreign Currency Contracts (unrealized depreciation) | | $ | — | | | $ | (19,703 | ) | | $ | — | | | $ | (19,703 | ) |
| | | | | | | | | | | | | | | | |
| (a) | Major categories of the Fund’s investments are included in the Portfolio of Investments. |
Growth Fund
Asset Valuation Inputs
| | | | | | | | | | | | | | | | |
Description(a) | | Level 1 | | | Level 2 | | | Level 3 | | | Total | |
Common Stocks | | $ | 118,162,702 | | | $ | — | | | $ | — | | | $ | 118,162,702 | |
Short-Term Investments | | | — | | | | 8,715,666 | | | | — | | | | 8,715,666 | |
| | | | | | | | | | | | | | | | |
Total | | $ | 118,162,702 | | | $ | 8,715,666 | | | $ | — | | | $ | 126,878,368 | |
| | | | | | | | | | | | | | | | |
| (a) | Major categories of the Fund’s investments are included in the Portfolio of Investments. |
69 |
Notes to Financial Statements (continued)
March 31, 2011 (Unaudited)
Mid Cap Growth Fund
Asset Valuation Inputs
| | | | | | | | | | | | | | | | |
Description(a) | | Level 1 | | | Level 2 | | | Level 3 | | | Total | |
Common Stocks | | $ | 139,127,116 | | | $ | — | | | $ | — | | | $ | 139,127,116 | |
Purchased Options | | | 77,508 | | | | — | | | | — | | | | 77,508 | |
Short-Term Investments | | | — | | | | 4,484,321 | | | | — | | | | 4,484,321 | |
| | | | | | | | | | | | | | | | |
Total | | $ | 139,204,624 | | | $ | 4,484,321 | | | $ | — | | | $ | 143,688,945 | |
| | | | | | | | | | | | | | | | |
| (a) | Major categories of the Fund’s investments are included in the Portfolio of Investments. |
Value Fund
Asset Valuation Inputs
| | | | | | | | | | | | | | | | |
Description(a) | | Level 1 | | | Level 2 | | | Level 3 | | | Total | |
Common Stocks | | $ | 1,289,201,905 | | | $ | — | | | $ | — | | | $ | 1,289,201,905 | |
Short-Term Investments | | | — | | | | 33,202,923 | | | | — | | | | 33,202,923 | |
| | | | | | | | | | | | | | | | |
Total | | $ | 1,289,201,905 | | | $ | 33,202,923 | | | $ | — | | | $ | 1,322,404,828 | |
| | | | | | | | | | | | | | | | |
| (a) | Major categories of the Fund’s investments are included in the Portfolio of Investments. |
The following is a reconciliation of Level 3 investments for which significant unobservable inputs were used to determine fair values as of March 31, 2011:
Global Equity and Income Fund
Asset Valuation Inputs
| | | | | | | | | | | | | | | | | | | | |
Investments in
Securities | | Balance as of
September 30,
2010 | | | Accrued
Discounts
(Premiums) | | | Realized
Gain
(Loss) | | | Change in
Unrealized
Appreciation
(Depreciation) | | | Purchases | |
Bonds and Notes | | | | | | | | | | | | | | | | | | | | |
Non-Convertible Bonds | | | | | | | | | | | | | | | | | | | | |
Korea | | $ | 368,686 | | | $ | (339 | ) | | $ | — | | | $ | 7,472 | | | $ | — | |
Supranationals | | | — | | | | 248 | | | | — | | | | (13,082 | ) | | | 1,043,127 | |
| | | | | | | | | | | | | | | | | | | | |
Total | | $ | 368,686 | | | $ | (91 | ) | | $ | — | | | $ | (5,610 | ) | | $ | 1,043,127 | |
| | | | | | | | | | | | | | | | | | | | |
| 70
Notes to Financial Statements (continued)
March 31, 2011 (Unaudited)
Asset Valuation Inputs (continued)
| | | | | | | | | | | | | | | | | | | | |
Investments in
Securities | | Sales | | | Transfers
into Level 3 | | | Transfers
out of
Level 3 | | | Balance
as of
March 31,
2011 | | | Change in
Unrealized
Appreciation
(Depreciation)
from
Investments
Still Held at
March 31,
2011 | |
Bonds and Notes | | | | | | | | | | | | | | | | | | | | |
Non-Convertible Bonds | | | | | | | | | | | | | | | | | | | | |
Korea | | $ | — | | | $ | — | | | $ | — | | | $ | 375,819 | | | $ | 7,472 | |
Supranationals | | | — | | | | — | | | | — | | | | 1,030,293 | | | | (13,082 | ) |
| | | | | | | | | | | | | | | | | | | | |
Total | | $ | — | | | $ | — | | | $ | — | | | $ | 1,406,112 | | | $ | (5,610 | ) |
| | | | | | | | | | | | | | | | | | | | |
4. Derivatives. Derivative instruments are defined as financial instruments whose value and performance are based on the value and performance of another security or financial instrument. Derivative instruments that the Funds currently use are forward foreign currency contracts and option contracts.
The Funds are subject to the risk that changes in foreign currency exchange rates will have an unfavorable effect on the value of Fund assets denominated in foreign currencies. The Funds may enter into forward foreign currency contracts for hedging purposes to protect the value of the Funds’ holdings of foreign securities. The Funds may also use forward foreign currency contracts to gain exposure to foreign currencies, regardless of whether securities denominated in such currencies are held in the Funds. During the six months ended March 31, 2011, Global Equity and Income Fund engaged in forward foreign currency transactions for hedging purposes and to gain exposure to foreign currencies.
The Funds are subject to the risk of unpredictable declines in the value of individual equity securities and periods of below-average performance in individual securities or in the equity market as a whole. The Funds may use purchased put options and written call options to hedge against a decline in value of an equity security that it owns, and may use written put options to offset the cost of options used for hedging purposes. The Funds may also use purchased call options to gain exposure to an equity security without committing the capital required to buy it, while also limiting the downside risk associated with owning it. During the six months ended March 31, 2011, Mid Cap Growth Fund engaged in purchased put and written call options for hedging purposes, and in written put options to offset the cost of options used for hedging purposes.
Global Equity and Income Fund and Mid Cap Growth Fund are parties to agreements with counterparties that govern transactions in forward foreign currency contracts and over-the-counter options. The agreements contain credit-risk-related contingent fea-
71 |
Notes to Financial Statements (continued)
March 31, 2011 (Unaudited)
tures that allow the counterparties to terminate open contracts early if the net asset value of a Fund declines beyond a certain threshold. If such features were to be triggered, the counterparties could request immediate settlement of open contracts at current fair value. As of March 31, 2011, there were no Funds that held derivative positions subject to credit-risk related contingent features that were in a net liability position (unrealized depreciation) by counterparty.
Forward foreign currency contracts and over-the-counter options are subject to the risk that the counterparty will be unwilling or unable to meet its obligations under the contracts. Global Equity and Income Fund and Mid Cap Growth Fund have mitigated this risk by entering into master netting agreements with counterparties that allow the Fund and the counterparty to net amounts owed by each related to derivative contracts to one net amount payable by either the Fund or the counterparty. As of March 31, 2011, the maximum amount of loss that Global Equity and Income Fund would incur if counterparties failed to meet their obligations, based on the value of derivative positions in an unrealized gain position as of period end, is $63,319 and the amount of loss that Global Equity and Income Fund would incur after taking into account master netting arrangements is $43,616.
Counterparty risk is managed through the posting of collateral and, as a result, the risk of loss to a Fund from counterparty default should be limited to the extent a Fund is undercollateralized. In addition to collateral requirements, the Funds also require counterparties to meet minimum credit quality requirements.
The following is a summary of derivative instruments for Global Equity and Income Fund as of March 31, 2011:
| | | | |
Statements of Assets and Liabilities Caption | | Foreign
Exchange
Contracts | |
Assets | | | | |
Unrealized appreciation on forward foreign currency contracts | | $ | 63,319 | |
Liabilities | | | | |
Unrealized depreciation on forward foreign currency contracts | | | (19,703 | ) |
Transactions in derivative instruments for Global Equity and Income Fund during the six months ended March 31, 2011, were as follows:
| | | | |
Statements of Operations Caption | | Foreign
Exchange
Contracts | |
Net Realized Gain on: | | | | |
Foreign currency transactions* | | $ | 98,101 | |
Net Change in Unrealized Appreciation (Depreciation) on: | | | | |
Foreign currency translations* | | | (15,621 | ) |
| * | Represents realized gain and change in unrealized appreciation (depreciation), respectively, for forward foreign currency contracts during the period. |
| 72
Notes to Financial Statements (continued)
March 31, 2011 (Unaudited)
The following is a summary of derivative instruments for Mid Cap Growth Fund as of March 31, 2011:
| | | | |
Statements of Assets and Liabilities Caption | | Equity
Contracts | |
Assets | | | | |
Investments at value* | | $ | 77,508 | |
| * | Represents purchased options, at value. |
Transactions in derivative instruments for Mid Cap Growth Fund during the six months ended March 31, 2011 were as follows:
| | | | |
Statements of Operations Caption | | Equity
Contracts | |
Net Realized Gain on: | | | | |
Investments* | | $ | (1,239,458 | ) |
Options written | | | 333,238 | |
Net Change in Unrealized Appreciation (Depreciation) on: | | | | |
Investments* | | | 359,854 | |
Options written | | | (111,228 | ) |
| * | Represents realized gain (loss) and change in unrealized appreciation (depreciation), respectively, for purchased options during the period. |
As the Funds value their derivatives at fair value and recognize changes in fair value through the Statements of Operations, they do not qualify for hedge accounting under authoritative guidance for derivative instruments. The Funds’ investments in derivatives may represent an economic hedge; however, they are considered to be non-hedge transactions for the purpose of these disclosures.
Volume of forwards activity, as a percentage of net assets, for Global Equity and Income Fund, based on month-end notional amounts outstanding during the period, at absolute value, was as follows for the six months ended March 31, 2011:
| | | | |
Global Equity and Income Fund | | Forwards | |
Average Notional Amount Outstanding | | | 1.07 | % |
Highest Notional Amount Outstanding | | | 1.25 | % |
Lowest Notional Amount Outstanding | | | 1.00 | % |
Notional Amount Outstanding as of March 31, 2011 | | | 1.08 | % |
Notional amounts outstanding at the end of the prior period are included in the averages above.
73 |
Notes to Financial Statements (continued)
March 31, 2011 (Unaudited)
Volume of option activity, as a percentage of net assets, for Mid Cap Growth Fund, based on month-end market values of equity securities underlying purchased and written options, at absolute value, was as follows for the six months ended March 31, 2011:
| | | | | | | | | | | | |
Mid Cap Growth Fund* | | Call Options
Written | | | Put Options Written | | | Put Options
Purchased | |
Average Market Value of Underlying Securities | | | 1.28 | % | | | 2.26 | % | | | 3.43 | % |
Highest Market Value of Underlying Securities | | | 8.07 | % | | | 8.07 | % | | | 10.19 | % |
Lowest Market Value of Underlying Securities | | | 0.00 | % | | | 0.00 | % | | | 0.00 | % |
Market Value of Underlying Securities as of March 31, 2011 | | | 0.00 | % | | | 0.00 | % | | | 1.83 | % |
| * | Market value of underlying securities is determined by multiplying option shares by the price of the option’s underlying security, as determined by the Fund’s Pricing Policies and Procedures. |
The following is a summary of Mid Cap Growth Fund’s written option activity:
| | | | | | | | |
| | | Number of Contracts | | | Premiums | |
Outstanding at 9/30/2010 | | | 1,126 | | | $ | 335,823 | |
Options written | | | 1,688 | | | | 531,933 | |
Options terminated in closing purchase transactions | | | (2,814 | ) | | | (867,756 | ) |
Options exercised | | | — | | | | — | |
Options expired | | | — | | | | — | |
| | | | | | | | |
Outstanding at 3/31/2011 | | | — | | | $ | — | |
| | | | | | | | |
5. Purchases and Sales of Securities. For the six months ended March 31, 2011, purchases and sales of securities (excluding short-term investments and U.S. Government/agency securities and including paydowns) were as follows:
| | | | | | | | |
Fund | | Purchases | | | Sales | |
Global Equity and Income Fund | | $ | 215,910,265 | | | $ | 140,151,388 | |
Growth Fund | | | 16,009,757 | | | | 8,941,779 | |
Mid Cap Growth Fund | | | 112,687,412 | | | | 108,439,497 | |
Value Fund | | | 345,823,658 | | | | 169,892,658 | |
For the six months ended March 31, 2011, purchases and sales of U.S. Government/agency securities by Global Equity and Income Fund were $13,488,306 and $2,542,114, respectively.
| 74
Notes to Financial Statements (continued)
March 31, 2011 (Unaudited)
6. Management Fees and Other Transactions with Affiliates.
a. Management Fees. Loomis, Sayles & Company, L.P. (“Loomis Sayles”) serves as investment adviser to each Fund. Separate management agreements for each Fund in effect for the six months ended March 31, 2011, provided for fees at the following annual percentage rates of each Fund’s average daily net assets:
| | | | |
Fund | | Percentage of
Average
Daily Net Assets | |
Global Equity and Income Fund | | | 0.75 | % |
Growth Fund | | | 0.50 | % |
Mid Cap Growth Fund | | | 0.75 | % |
Value Fund | | | 0.50 | % |
Loomis Sayles has given binding undertakings to the Funds to waive management fees and/or reimburse certain expenses to limit the Funds’ operating expenses, exclusive of acquired fund fees and expenses, brokerage expenses, interest expense, taxes and extraordinary expenses. These undertakings are in effect until January 31, 2012 and are reevaluated on an annual basis. Management fees payable, as reflected on the Statements of Assets and Liabilities, is net of waivers and/or expense reimbursements, if any, pursuant to these undertakings.
For the six months ended March 31, 2011, the expense limits as a percentage of average daily net assets under the expense limitation agreements were as follows:
| | | | | | | | | | | | | | | | | | | | |
| | | Expense Limit as a Percentage of Average Daily
Net Assets | |
Fund | | Class A | | | Class B | | | Class C | | | Class Y | | | Admin Class | |
Global Equity and Income Fund | | | 1.25 | % | | | — | | | | 2.00 | % | | | 1.00 | % | | | — | |
Growth Fund | | | 1.25 | % | | | 2.00 | % | | | 2.00 | % | | | 1.00 | % | | | — | |
Mid Cap Growth Fund | | | 1.25 | % | | | — | | | | 2.00 | % | | | 1.00 | % | | | — | |
Value Fund | | | 1.10 | % | | | 1.85 | % | | | 1.85 | % | | | 0.85 | % | | | 1.35 | % |
Loomis Sayles shall be permitted to recover expenses it has borne under the expense limitation agreements (whether through waiver of its management fees or otherwise) on a class by class basis in later periods to the extent the expenses of a class fall below a class’ expense limits, provided, however, that a class is not obligated to pay such waived/reimbursed fees or expenses more than one year after the end of the fiscal year in which the fees or expenses were waived/reimbursed.
75 |
Notes to Financial Statements (continued)
March 31, 2011 (Unaudited)
For the six months ended March 31, 2011, the management fees and waivers of management fees for each Fund were as follows:
| | | | | | | | | | | | | | | | | | | | |
| | | Gross
Management
Fees | | | Waivers of
Management
Fees1 | | | Net
Management
Fees | | | Percentage of
Average
Daily Net Assets | |
Fund | | | | | Gross | | | Net | |
Global Equity and Income Fund | | $ | 1,434,635 | | | $ | — | | | $ | 1,434,635 | | | | 0.75 | % | | | 0.75 | % |
Growth Fund | | | 270,136 | | | | — | | | | 270,136 | | | | 0.50 | % | | | 0.50 | % |
Mid Cap Growth Fund | | | 460,970 | | | | 47,918 | | | | 413,052 | | | | 0.75 | % | | | 0.67 | % |
Value Fund | | | 2,961,907 | | | | — | | | | 2,961,907 | | | | 0.50 | % | | | 0.50 | % |
| 1 | Management fee waivers are subject to possible recovery until September 30, 2012. |
For the six months ended March 31, 2011, expense reimbursements related to the prior fiscal year were recovered as follows:
| | | | | | | | | | | | | | | | |
| | | Recovered Expenses | |
Fund | | Class A | | | Class C | | | Class Y | | | Total | |
Global Equity and Income Fund | | $ | 16,286 | | | $ | 25,497 | | | $ | 34,767 | | | $ | 76,550 | |
Certain officers and employees of Loomis Sayles are also officers or Trustees of the Trust. Loomis Sayles’ general partner is indirectly owned by Natixis Global Asset Management, L.P. (“Natixis US”), which is part of Natixis Global Asset Management, an international asset management group based in Paris, France.
b. Service and Distribution Fees. Natixis Distributors, L.P. (“Natixis Distributors”), a wholly owned subsidiary of Natixis US, has entered into a distribution agreement with the Trust. Pursuant to this agreement, Natixis Distributors serves as principal underwriter of the Funds of the Trust.
Pursuant to Rule 12b-1 under the 1940 Act, the Trust has adopted a Service Plan relating to the Fund’s Class A shares (the “Class A Plans”), a Distribution and Service Plan relating to each Fund’s Class B (if applicable) and Class C shares (the “Class B and Class C Plans”), and Value Fund has adopted a Distribution Plan relating to its Admin Class shares (the “Admin Class Plan”).
Under the Class A Plans, each Fund pays Natixis Distributors a monthly service fee at an annual rate not to exceed 0.25% of the average daily net assets attributable to the Fund’s Class A shares, as reimbursement for expenses incurred by Natixis Distributors in providing personal services to investors in Class A shares and/or the maintenance of shareholder accounts.
| 76
Notes to Financial Statements (continued)
March 31, 2011 (Unaudited)
Under the Class B (if applicable) and Class C Plans, each Fund pays Natixis Distributors a monthly service fee at an annual rate not to exceed 0.25% of the average daily net assets attributable to the Fund’s Class B (if applicable) and Class C shares, as compensation for services provided by Natixis Distributors in providing personal services to investors in Class B (if applicable) and Class C shares and/or the maintenance of shareholder accounts.
Also under the Class B (if applicable) and Class C Plans, each Fund pays Natixis Distributors a monthly distribution fee at an annual rate of 0.75% of the average daily net assets attributable to the Fund’s Class B (if applicable) and Class C shares, as compensation for services provided by Natixis Distributors in connection with the marketing or sale of Class B (if applicable) and Class C shares.
Under the Admin Class Plan, Value Fund pays Natixis Distributors a monthly distribution fee at an annual rate not to exceed 0.25% of the average daily net assets attributable to the Fund’s Admin Class shares, as compensation for services provided by Natixis Distributors in connection with the marketing or sale of Admin Class shares or for payments made by Natixis Distributors to securities dealers or other financial intermediaries as commissions, asset-based sales charges or other compensation with respect to the sale of Admin Class shares, or for providing personal services to investors and/or the maintenance of shareholder accounts.
In addition, the Admin Class shares of Value Fund may pay Natixis Distributors an administrative service fee, at an annual rate not to exceed 0.25% of the average daily net assets attributable to Admin Class shares. These fees are subsequently paid to securities dealers or financial intermediaries for providing personal services and/or account maintenance for their customers who hold such shares.
For the six months ended March 31, 2011, the Funds paid the following service and distribution fees:
| | | | | | | | | | | | | | | | | | | | | | | | | | | | |
| | | Service Fees | | | Distribution Fees | |
Fund | | Class A | | | Class B | | | Class C | | | Admin Class | | | Class B | | | Class C | | | Admin Class | |
Global Equity and Income Fund | | $ | 102,397 | | | $ | — | | | $ | 157,656 | | | $ | — | | | $ | — | | | $ | 472,968 | | | $ | — | |
Growth Fund | | | 38,698 | | | | 4,862 | | | | 16,359 | | | | — | | | | 14,587 | | | | 49,076 | | | | — | |
Mid Cap Growth Fund | | | 100,408 | | | | — | | | | 806 | | | | — | | | | — | | | | 2,418 | | | | — | |
Value Fund | | | 182,979 | | | | 4,179 | | | | 13,891 | | | | 2 | | | | 12,538 | | | | 41,674 | | | | 2 | |
c. Administrative Fees. Natixis Asset Management Advisors, L.P. (“Natixis Advisors”) provides certain administrative services for the Funds and contracts with State Street Bank to serve as sub-administrator. Natixis Advisors is a wholly-owned subsidiary of Natixis US. Pursuant to an agreement among Natixis Funds Trust I, Natixis Funds Trust II, Natixis Funds Trust IV, Natixis Cash Management Trust, Gateway Trust (“Natixis Funds Trusts”), Loomis Sayles Funds I, Loomis Sayles Funds II (“Loomis Sayles Funds
77 |
Notes to Financial Statements (continued)
March 31, 2011 (Unaudited)
Trusts”), Hansberger International Series and Natixis Advisors, each Fund pays Natixis Advisors monthly its pro rata portion of fees equal to an annual rate of 0.0575% of the first $15 billion of the average daily net assets of the Natixis Funds Trusts, Loomis Sayles Funds Trusts and Hansberger International Series, 0.0500% of the next $15 billion, 0.0400% of the next $30 billion and 0.0350% of such assets in excess of $60 billion, subject to an annual aggregate minimum fee for the Natixis Funds Trusts, Loomis Sayles Funds Trusts and Hansberger International Series of $10 million, which is reevaluated on an annual basis. New funds are subject to a fee for the first twelve months of operations of $75,000 plus $12,500 per additional class and an additional $75,000 if managed by multiple subadvisers.
For the six months ended March 31, 2011, each Fund paid the following administrative fees to Natixis Advisors:
| | | | |
Fund | | Administrative
Fees | |
Global Equity and Income Fund | | $ | 89,357 | |
Growth Fund | | | 25,242 | |
Mid Cap Growth Fund | | | 28,713 | |
Value Fund | | | 276,739 | |
d. Sub-Transfer Agent Fees. Natixis Distributors has entered into agreements with financial intermediaries to provide certain recordkeeping, processing, shareholder communications and other services to customers of the intermediaries and has agreed to compensate the intermediaries for providing those services. Certain services would be provided by the Funds if the shares of those customers were registered directly with the Funds’ transfer agent. Accordingly, the Funds agreed to pay a portion of the intermediary fees attributable to shares of the Fund held by the intermediaries (which generally is a percentage of the value of shares held) not to exceed what the Funds would have paid its transfer agent had each customer’s shares been registered directly with the transfer agent instead of held through the intermediaries. Natixis Distributors pays the remainder of the fees.
For the six months ended March 31, 2011, the Funds paid the following sub-transfer agent fees, which are reflected in transfer agent fees and expenses in the Statements of Operations.
| | | | |
Fund | | Sub-Transfer
Agent Fees | |
Global Equity and Income Fund | | $ | 90,671 | |
Growth Fund | | | 29,444 | |
Mid Cap Growth Fund | | | 56,163 | |
Value Fund | | | 637,762 | |
| 78
Notes to Financial Statements (continued)
March 31, 2011 (Unaudited)
e. Commissions. Commissions (including CDSCs) on Fund shares retained by Natixis Distributors during the six months ended March 31, 2011, were as follows:
| | | | |
Fund | | Commissions | |
Global Equity and Income Fund | | $ | 311,993 | |
Growth Fund | | | 15,965 | |
Mid Cap Growth Fund | | | 8,658 | |
Value Fund | | | 25,765 | |
f. Trustees Fees and Expenses. The Trust does not pay any compensation directly to its officers or Trustees who are directors, officers or employees of Natixis Advisors, Natixis Distributors, Natixis US, or their affiliates. The Chairperson of the Board receives a retainer fee at the annual rate of $250,000. The Chairperson does not receive any meeting attendance fees for Board of Trustees meetings or committee meetings that she attends. Each Independent Trustee (other than the Chairperson) receives, in the aggregate, a retainer fee at the annual rate of $80,000. Each Independent Trustee also receives a meeting attendance fee of $10,000 for each meeting of the Board of Trustees that he or she attends in person and $5,000 for each meeting of the Board of Trustees that he or she attends telephonically. In addition, each committee chairman receives an additional retainer fee at the annual rate of $15,000. Each Contract Review and Governance Committee member is compensated $6,000 for each Committee meeting that he or she attends in person and $3,000 for each meeting that he or she attends telephonically. Each Audit Committee member is compensated $7,500 for each Committee meeting that he or she attends in person and $3,750 for each meeting that he or she attends telephonically. These fees are allocated among the funds in the Natixis Funds Trusts, Loomis Sayles Funds Trusts and Hansberger International Series based on a formula that takes into account, among other factors, the relative net assets of each fund. Trustees are reimbursed for travel expenses in connection with attendance at meetings.
A deferred compensation plan (the “Plan”) is available to the Trustees on a voluntary basis. Deferred amounts remain in the funds until distributed in accordance with the provisions of the Plan. The value of a participating Trustee’s deferral account is based on theoretical investments of deferred amounts, on the normal payment dates, in certain funds of the Natixis Funds Trusts, Loomis Sayles Funds Trusts and Hansberger International Series as designated by the participating Trustees. Changes in the value of participants’ deferral accounts are allocated pro rata among the funds in the Natixis Funds Trusts, Loomis Sayles Funds Trusts, and Hansberger International Series, and are normally reflected as Trustees’ fees and expenses in the Statements of Operations. The portions of the accrued obligations allocated to the Funds under the Plan are reflected as Deferred Trustees’ fees on the Statements of Assets and Liabilities.
g. Payments by Affiliates. For the six months ended March 31, 2011, Loomis Sayles reimbursed Global Equity and Income Fund $332 for losses incurred in connection with a trading error.
79 |
Notes to Financial Statements (continued)
March 31, 2011 (Unaudited)
7. Line of Credit. Each Fund, together with certain other funds of Natixis Funds Trusts, Loomis Sayles Funds Trusts and Hansberger International Series, participates in a $200,000,000 committed unsecured line of credit provided by State Street Bank, with an individual limit of $125,000,000 for each fund that participates in the line of credit. Interest is charged to each participating fund based on its borrowings at a rate per annum equal to the greater of the Federal Funds rate or overnight LIBOR, plus 1.25%. In addition, a commitment fee of 0.15% per annum, payable at the end of each calendar quarter, is accrued and apportioned among the participating funds based on their average daily unused portion of the line of credit.
Effective April 21, 2011, each Fund, together with certain other funds of Natixis Funds Trusts, Loomis Sayles Funds Trusts and Hansberger International Series, will participate in a $200,000,000 committed unsecured line of credit provided by State Street Bank, with an individual limit of $125,000,000 for each fund that will participate in the line of credit. Interest will be charged to each participating fund based on its borrowings at a rate per annum equal to the greater of the Federal Funds rate or overnight LIBOR, plus 1.25%. In addition, a commitment fee of 0.125% per annum, payable at the end of each calendar quarter, will be accrued and apportioned among the participating funds based on their average daily unused portion of the line of credit.
For the six months ended March 31, 2011, none of the Funds had borrowings under these agreements.
8. Brokerage Commission Recapture. Each Fund has entered into agreements with certain brokers whereby the brokers will rebate a portion of brokerage commissions. All amounts rebated by the brokers are returned to the Funds under such agreements and are included in realized gains on investments on the Statements of Operations. For the six months ended March 31, 2011, amounts rebated under these agreements were as follows:
| | | | |
Fund | | Rebates | |
Global Equity and Income Fund | | $ | 9,184 | |
Growth Fund | | | 711 | |
Mid Cap Growth Fund | | | 14,337 | |
Value Fund | | | 27,765 | |
9. Concentration of Risk. Each Fund’s investments in foreign securities are subject to foreign currency fluctuations, higher volatility than U.S. securities, varying degrees of regulation and limited liquidity. Greater political, economic, credit and information risks are also associated with foreign securities.
At March 31, 2011, Global Equity and Income Fund held Taiwan dollars, valued at $2,267,842, that were restricted as to withdrawal or usage. This amount represents the proceeds from sales of securities in Taiwan. These proceeds cannot be repatriated until the Fund engages a tax agent in Taiwan for the purpose of performing certain duties for compliance with Taiwan’s tax laws.
| 80
Notes to Financial Statements (continued)
March 31, 2011 (Unaudited)
10. Concentration of Ownership. At March 31, 2011, Loomis Sayles Funded Pension Plan and Trust (“Pension Plan”) and the Loomis Sayles Employees’ Profit Sharing Retirement Plan (“Retirement Plan”) held shares of beneficial interest in the Funds as follows:
| | | | | | | | |
Fund | | Pension Plan | | | Retirement Plan | |
Global Equity and Income Fund | | | 975,173 | | | | 634,052 | |
Growth Fund | | | 1,236,821 | | | | 1,833,895 | |
Mid Cap Growth Fund | | | 332,294 | | | | 369,741 | |
Value Fund | | | 454,056 | | | | 732,306 | |
From time to time, the Funds may have a concentration of several shareholders having a significant percentage of shares outstanding. Investment activities of these shareholders could have material impacts on the Funds. As of March 31, 2011, certain Funds had shareholders that held greater than 5% of the fund’s outstanding shares. Such ownership may be beneficially held by multiple individuals or entities other than the owner of record. The number of greater than 5% shareholders and the aggregate percentage of net assets represented by such ownership was as follows:
| | | | | | | | |
Fund | | Number of Greater
Than 5% Shareholders | | | Percentage of
Ownership | |
Global Equity and Income Fund | | | 1 | | | | 7.01 | % |
Growth Fund | | | 2 | | | | 13.46 | % |
81 |
Notes to Financial Statements (continued)
March 31, 2011 (Unaudited)
11. Capital Shares. Each Fund may issue an unlimited number of shares of beneficial interest, without par value. Transactions in capital shares were as follows:
| | | | | | | | | | | | | | | | |
| |
| Six Months Ended
March 31, 2011 |
| |
| Year Ended
September 30, 2010 |
|
Global Equity and Income Fund | | | Shares | | | | Amount | | | | Shares | | | | Amount | |
| Class A | | | | | | | | | | | | | | | | |
Issued from the sale of shares | | | 2,379,521 | | | $ | 37,312,683 | | | | 2,185,512 | | | $ | 29,116,463 | |
Issued in connection with the reinvestment of distributions | | | 72,247 | | | | 1,114,772 | | | | 73,498 | | | | 923,132 | |
Redeemed | | | (730,336 | ) | | | (11,460,639 | ) | | | (1,460,708 | ) | | | (18,916,251 | ) |
| | | | | | | | | | | | | | | | |
Net change | | | 1,721,432 | | | $ | 26,966,816 | | | | 798,302 | | | $ | 11,123,344 | |
| | | | | | | | | | | | | | | | |
| Class C | | | | | | | | | | | | | | | | |
Issued from the sale of shares | | | 2,209,691 | | | $ | 34,385,819 | | | | 1,778,019 | | | $ | 23,110,162 | |
Issued in connection with the reinvestment of distributions | | | 29,527 | | | | 453,530 | | | | 53,353 | | | | 667,977 | |
Redeemed | | | (707,770 | ) | | | (10,963,089 | ) | | | (2,091,087 | ) | | | (27,231,329 | ) |
| | | | | | | | | | | | | | | | |
Net change | | | 1,531,448 | | | $ | 23,876,260 | | | | (259,715 | ) | | $ | (3,453,190 | ) |
| | | | | | | | | | | | | | | | |
| Class Y | | | | | | | | | | | | | | | | |
Issued from the sale of shares | | | 4,669,125 | | | $ | 73,356,581 | | | | 3,286,223 | | | $ | 43,183,799 | |
Issued in connection with the reinvestment of distributions | | | 117,939 | | | | 1,824,523 | | | | 145,986 | | | | 1,836,503 | |
Redeemed | | | (923,784 | ) | | | (14,551,929 | ) | | | (2,307,485 | ) | | | (29,912,166 | ) |
| | | | | | | | | | | | | | | | |
Net change | | | 3,863,280 | | | $ | 60,629,175 | | | | 1,124,724 | | | $ | 15,108,136 | |
| | | | | | | | | | | | | | | | |
Increase (decrease) from capital share transactions | | | 7,116,160 | | | $ | 111,472,251 | | | | 1,663,311 | | | $ | 22,778,290 | |
| | | | | | | | | | | | | | | | |
| 82
Notes to Financial Statements (continued)
March 31, 2011 (Unaudited)
11. Capital Shares (continued).
| | | | | | | | | | | | | | | | |
| |
| Six Months Ended
March 31, 2011 |
| |
| Year Ended
September 30, 2010 |
|
Growth Fund | | | Shares | | | | Amount | | | | Shares | | | | Amount | |
| Class A | | | | | | | | | | | | | | | | |
Issued from the sale of shares | | | 301,778 | | | $ | 1,692,320 | | | | 843,820 | | | $ | 4,085,570 | |
Issued in connection with the reinvestment of distributions | | | — | | | | — | | | | — | | | | — | |
Redeemed | | | (744,102 | ) | | | (4,116,588 | ) | | | (2,435,871 | ) | | | (11,723,591 | ) |
| | | | | | | | | | | | | | | | |
Net change | | | (442,324 | ) | | $ | (2,424,268 | ) | | | (1,592,051 | ) | | $ | (7,638,021 | ) |
| | | | | | | | | | | | | | | | |
| Class B | | | | | | | | | | | | | | | | |
Issued from the sale of shares | | | 10,896 | | | $ | 56,719 | | | | 26,879 | | | $ | 126,650 | |
Issued in connection with the reinvestment of distributions | | | — | | | | — | | | | — | | | | — | |
Redeemed | | | (204,566 | ) | | | (1,079,579 | ) | | | (449,262 | ) | | | (2,069,094 | ) |
| | | | | | | | | | | | | | | | |
Net change | | | (193,670 | ) | | $ | (1,022,860 | ) | | | (422,383 | ) | | $ | (1,942,444 | ) |
| | | | | | | | | | | | | | | | |
| Class C | | | | | | | | | | | | | | | | |
Issued from the sale of shares | | | 93,563 | | | $ | 491,289 | | | | 131,088 | | | $ | 596,834 | |
Issued in connection with the reinvestment of distributions | | | — | | | | — | | | | — | | | | — | |
Redeemed | | | (296,227 | ) | | | (1,570,718 | ) | | | (1,381,682 | ) | | | (6,253,716 | ) |
| | | | | | | | | | | | | | | | |
Net change | | | (202,664 | ) | | $ | (1,079,429 | ) | | | (1,250,594 | ) | | $ | (5,656,882 | ) |
| | | | | | | | | | | | | | | | |
| Class Y | | | | | | | | | | | | | | | | |
Issued from the sale of shares | | | 2,640,814 | | | $ | 15,816,957 | | | | 1,951,737 | | | $ | 9,949,238 | |
Issued in connection with the reinvestment of distributions | | | — | | | | — | | | | — | | | | — | |
Redeemed | | | (579,316 | ) | | | (3,444,935 | ) | | | (4,207,016 | ) | | | (21,249,147 | ) |
| | | | | | | | | | | | | | | | |
Net change | | | 2,061,498 | | | $ | 12,372,022 | | | | (2,255,279 | ) | | $ | (11,299,909 | ) |
| | | | | | | | | | | | | | | | |
Increase (decrease) from capital share transactions | | | 1,222,840 | | | $ | 7,845,465 | | | | (5,520,307 | ) | | $ | (26,537,256 | ) |
| | | | | | | | | | | | | | | | |
83 |
Notes to Financial Statements (continued)
March 31, 2011 (Unaudited)
11. Capital Shares (continued).
| | | | | | | | | | | | | | | | |
| |
| Six Months Ended
March 31, 2011 |
| |
| Year Ended
September 30, 2010 |
|
Mid Cap Growth Fund | | | Shares | | | | Amount | | | | Shares | | | | Amount | |
| Class A | | | | | | | | | | | | | | | | |
Issued from the sale of shares | | | 719,262 | | | $ | 19,502,978 | | | | 1,543,225 | | | $ | 34,666,538 | |
Issued in connection with the reinvestment of distributions | | | — | | | | — | | | | — | | | | — | |
Redeemed | | | (543,449 | ) | | | (14,874,691 | ) | | | (1,700,694 | ) | | | (35,573,122 | ) |
| | | | | | | | | | | | | | | | |
Net change | | | 175,813 | | | $ | 4,628,287 | | | | (157,469 | ) | | $ | (906,584 | ) |
| | | | | | | | | | | | | | | | |
| Class C | | | | | | | | | | | | | | | | |
Issued from the sale of shares | | | 35,912 | | | $ | 925,542 | | | | 2,038 | | | $ | 43,089 | |
Issued in connection with the reinvestment of distributions | | | — | | | | — | | | | — | | | | — | |
Redeemed | | | (1,135 | ) | | | (32,499 | ) | | | (650 | ) | | | (13,453 | ) |
| | | | | | | | | | | | | | | | |
Net change | | | 34,777 | | | $ | 893,043 | | | | 1,388 | | | $ | 29,636 | |
| | | | | | | | | | | | | | | | |
| Class Y | | | | | | | | | | | | | | | | |
Issued from the sale of shares | | | 439,619 | | | $ | 12,266,013 | | | | 303,029 | | | $ | 6,515,222 | |
Issued in connection with the reinvestment of distributions | | | — | | | | — | | | | — | | | | — | |
Redeemed | | | (224,669 | ) | | | (6,320,672 | ) | | | (363,286 | ) | | | (7,649,693 | ) |
| | | | | | | | | | | | | | | | |
Net change | | | 214,950 | | | $ | 5,945,341 | | | | (60,257 | ) | | $ | (1,134,471 | ) |
| | | | | | | | | | | | | | | | |
Increase (decrease) from capital share transactions | | | 425,540 | | | $ | 11,466,671 | | | | (216,338 | ) | | $ | (2,011,419 | ) |
| | | | | | | | | | | | | | | | |
| 84
Notes to Financial Statements (continued)
March 31, 2011 (Unaudited)
11. Capital Shares (continued).
| | | | | | | | | | | | | | | | |
| |
| Six Months Ended
March 31, 2011 |
| |
| Year Ended
September 30, 2010* |
|
Value Fund | | | Shares | | | | Amount | | | | Shares | | | | Amount | |
| Class A | | | | | | | | | | | | | | | | |
Issued from the sale of shares | | | 1,060,944 | | | $ | 19,919,404 | | | | 2,979,169 | | | $ | 49,942,924 | |
Issued in connection with the reinvestment of distributions | | | 88,461 | | | | 1,648,031 | | | | 60,746 | | | | 1,001,699 | |
Redeemed | | | (982,094 | ) | | | (18,335,349 | ) | | | (2,599,420 | ) | | | (43,052,197 | ) |
| | | | | | | | | | | | | | | | |
Net change | | | 167,311 | | | $ | 3,232,086 | | | | 440,495 | | | $ | 7,892,426 | |
| | | | | | | | | | | | | | | | |
| Class B | | | | | | | | | | | | | | | | |
Issued from the sale of shares | | | 10,905 | | | $ | 210,614 | | | | 19,365 | | | $ | 325,859 | |
Issued in connection with the reinvestment of distributions | | | 438 | | | | 8,207 | | | | — | | | | — | |
Redeemed | | | (45,702 | ) | | | (860,707 | ) | | | (137,739 | ) | | | (2,333,285 | ) |
| | | | | | | | | | | | | | | | |
Net change | | | (34,359 | ) | | $ | (641,886 | ) | | | (118,374 | ) | | $ | (2,007,426 | ) |
| | | | | | | | | | | | | | | | |
| Class C | | | | | | | | | | | | | | | | |
Issued from the sale of shares | | | 148,380 | | | $ | 2,829,927 | | | | 202,556 | | | $ | 3,401,414 | |
Issued in connection with the reinvestment of distributions | | | 1,601 | | | | 29,658 | | | | 939 | | | | 15,401 | |
Redeemed | | | (122,042 | ) | | | (2,226,119 | ) | | | (202,655 | ) | | | (3,347,711 | ) |
| | | | | | | | | | | | | | | | |
Net change | | | 27,939 | | | $ | 633,466 | | | | 840 | | | $ | 69,104 | |
| | | | | | | | | | | | | | | | |
| Class Y | | | | | | | | | | | | | | | | |
Issued from the sale of shares | | | 15,189,477 | | | $ | 274,042,686 | | | | 24,167,438 | | | $ | 406,626,788 | |
Issued in connection with the reinvestment of distributions | | | 734,748 | | | | 13,695,698 | | | | 379,395 | | | | 6,260,027 | |
Redeemed | | | (5,261,991 | ) | | | (98,405,790 | ) | | | (12,514,723 | ) | | | (207,737,479 | ) |
| | | | | | | | | | | | | | | | |
Net change | | | 10,662,234 | | | $ | 189,332,594 | | | | 12,032,110 | | | $ | 205,149,336 | |
| | | | | | | | | | | | | | | | |
| Admin Class | | | | | | | | | | | | | | | | |
Issued from the sale of shares | | | — | | | $ | — | | | | 60 | | | $ | 1,002 | |
Issued in connection with the reinvestment of distributions | | | 1 | | | | 11 | | | | — | | | | — | |
Redeemed | | | — | | | | — | | | | — | | | | — | |
| | | | | | | | | | | | | | | | |
Net change | | | 1 | | | $ | 11 | | | | 60 | | | $ | 1,002 | |
| | | | | | | | | | | | | | | | |
Increase (decrease) from capital share transactions | | | 10,823,126 | | | $ | 192,556,271 | | | | 12,355,131 | | | $ | 211,104,442 | |
| | | | | | | | | | | | | | | | |
| * | From commencement of operations on February 1, 2010 through September 30, 2010 for Admin Class shares. |
85 |

Loomis Sayles Small Cap Growth Fund
Loomis Sayles Small Cap Value Fund
SEMI-ANNUAL REPORT
MARCH 31, 2011
LOOMIS SAYLES SMALL CAP GROWTH FUND
Fund and manager review
FUND FACTS
Managers:
Mark F. Burns, CFA
John Slavik, CFA
Symbols:
| | |
| Institutional Class | | LSSIX |
| Retail Class | | LCGRX |
Objective:
Long-term capital growth from investments in common stocks or other equity securities
Strategy:
Invests at least 80% of its net assets (plus any borrowings made for investment purposes) in equity securities of companies with market capitalizations that fall within the capitalization range of the Russell 2000 Index or is $3 billion or less at the time of investment. Unlike the Index, the Fund may invest in companies of any size.
The fund may invest any portion of its assets in Canadian securities and up to 20% of assets in other foreign securities, including emerging markets securities.
Fund Inception Date:
December 31, 1996
Net Assets:
$249.5 million
Market Conditions
Stocks rallied sharply during the six-month period, fueled by a modest improvement in U.S. business conditions and renewed investor optimism stemming from continued accommodation from the Federal Reserve Board (the Fed). These factors, combined with better-than-expected corporate profits, drove share prices higher despite political turmoil in North Africa and the Middle East and the earthquake, tsunami and nuclear crisis in Japan. Risk appetites stayed fairly high, and equities remained the vehicle of choice for investors. Overall, small-cap stocks led the market higher, and growth stocks outperformed value stocks.
Performance Results
For the six months ended March 31, 2011, Institutional Class shares of Loomis Sayles Small Cap Growth Fund returned 32.43%. The fund outperformed its benchmark, the Russell 2000 Growth Index, which returned 27.93% for the period.
Explanation of Fund Performance
Strong stock selection primarily drove the fund’s relative outperformance. Our choices were particularly strong in the consumer discretionary sector, where IMAX and Tempur-Pedic International drove results. Shares of IMAX, the operator of large screen movie theaters, rose sharply after beating earnings and raising estimates for new theater installations. Tempur-Pedic shares rose sharply after reporting better-than-expected earnings due to market share gains for the company’s Cloud Collection mattresses, which appeal to the higher end of the market. Stock selection and an overweight position led to favorable relative results in the energy sector with Rosetta Resources Inc. and T-3 Energy Services as the top performers. Rosetta Resources, an oil and gas exploration and production company, rose sharply in the fourth quarter after reporting strong earnings. T-3 Energy Services, an oilfield products and service company, saw shares spike after the company announced it was being acquired by Robbins and Myers in the fourth quarter. Stock selection also contributed favorably in the producer durables sector. Shares of Ladish, a metal processing and fabrication company,
1 |
spiked after Allegheny Technologies agreed to acquire the company at a nearly 60% premium. MasTec, a building and construction company focusing on utilities and communications infrastructure, advanced on solid earnings and revenue growth.
Stock selection was weakest in the financial services sector, the only sector to materially detract from relative performance. Shares of NetSpend Holding Inc., a provider of pre-paid debit cards, declined due to poor business fundamentals, while investment-banking firm Greenhill tumbled on a weak fourth quarter and uneven mergers and acquisitions activity.
The largest change in sector weights during the period was a reduction in the healthcare sector. We sold specific companies within the medical device, healthcare services and pharmaceutical/biotechnology industries. We also reduced the fund’s weight in the consumer discretionary sector, albeit to a lesser extent, primarily by selling holdings in the retail industry. The biggest beneficiaries of the sales proceeds were the producer durables, technology and materials and processing sectors.
Outlook
Core inflation statistics have remained well within the Fed’s informal target range, but many commentators believe that the Fed may need to snug things up somewhat in the next few months. The Fed’s second round of large-scale Treasury purchases, which is referred to as “QE2”, is scheduled to end on June 30, 2011. At this point we do not expect an extension of asset purchases in the form of a “QE3” unless the economy takes an unexpected turn to the downside. Employment conditions have improved substantially over the past several months, and the employment reports for the months of February and March, 2011, made for some of the best reading we have seen in several years. Our working assumption is that investors and corporate executives need to plan for somewhat higher energy and other commodity input costs in the months ahead. This may be a factor in an eventual plateauing of corporate margins. However, this is built into our outlook in that we are anticipating about 15% earnings growth for the S&P 500 this year, decelerating to 10% or so next year.
What You Should Know:
Investments in the fund are subject to a number of risks. Please see the “Principal Risks” section of the fund’s prospectus. The purchase of fund shares should be seen as a long-term investment.
| 2
LOOMIS SAYLES SMALL CAP GROWTH FUND
Average Annual Returns
March 31, 2011
| | | | | | | | | | | | | | | | | | | | |
| | | | | | |
| | | | | | 6 months | | | 1 year | | | 5 years | | | 10 years | |
| | | | | | |
| Institutional Class (Inception 12/31/96) | | | | | | | 32.43 | % | | | 39.07 | % | | | 7.29 | % | | | 4.00 | % |
| Retail Class (Inception 12/31/96) | | | | | | | 32.32 | | | | 38.67 | | | | 7.04 | | | | 3.75 | |
| | | | | | |
| Comparative Performance | | | | | | | | | | | | | | | | | | | | |
| Russell 2000 Growth Index(c)(d) | | | | | | | 27.93 | | | | 31.04 | | | | 4.34 | | | | 6.44 | |
| Russell 2000 Index(c) | | | | | | | 25.48 | | | | 25.79 | | | | 3.35 | | | | 7.87 | |
| Lipper Small-Cap Growth Funds Index(c) | | | | | | | 25.75 | | | | 28.19 | | | | 3.28 | | | | 5.63 | |
| | |
| Gross expense ratio (before fee waivers and/or expense reimbursements)* | | | | | |
| Institutional: 1.09% Retail: 1.42% | | | | | | | | | | | | | | | | | | | | |
| | |
| Net expense ratio (after fee waivers and/or expense reimbursements)* | | | | | |
| Institutional: 1.03% Retail: 1.28% | | | | | | | | | | | | | | | | | | | | |
| * | | As stated in the most recent prospectus. Waivers/reimbursements are contractual and are set to expire on 1/31/12. Contracts are reevaluated on an annual basis. |
Cumulative Performance
March 31, 2001 to March 31, 2011(a)(b)
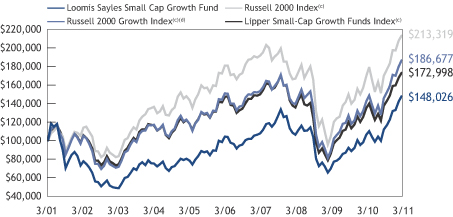
Data quoted reflects past performance and cannot guarantee future results. Average annual total returns assume reinvestment of dividends and capital gains distributions. Investment return and principal value will fluctuate so that shares, when redeemed, may be worth more or less than their original cost. For performance current to the most recent month end, please visit www.loomissayles.com. Current performance may be higher or lower than quoted.
Returns do not reflect the taxes that a shareholder would pay on fund distributions or the redemption of shares. Periods of less than one year are not annualized. Performance data reflects certain fee waivers and/or expense reimbursements, if any, without which performance would be lower.
| (a) | | Cumulative performance is shown for the Institutional Class. Performance of the Retail Class would be lower due to higher fees and expenses. |
| (b) | | The mountain chart is based on the initial investment minimum of $100,000 for the Institutional Class. |
| (c) | | See page 7 for a description of the indices. |
| (d) | | Effective August 20, 2010, the Russell 2000 Growth Index replaced the Russell 2000 Index as the fund’s primary benchmark. |
3 |
LOOMIS SAYLES SMALL CAP VALUE FUND
Fund and manager review
FUND FACTS
Managers:
Joseph Gatz, CFA
Daniel Thelen, CFA*
Symbols:
| | |
| Institutional Class | | LSSCX |
| Retail Class | | LSCRX |
| Admin Class | | LSVAX |
Objective:
Long-term capital growth from investments in common stocks or other equity securities
Strategy:
Invests at least 80% of its net assets (plus any borrowings made for investment purposes) in equity securities of companies with market capitalizations that fall within the capitalization range of the Russell 2000 Index or is $3 billion or less at the time of investment. Unlike the Index, the Fund may invest in companies of any size.
The fund may invest up to 20% of its assets in securities of foreign issuers including emerging market securities.
Fund Inception Date:
May 13, 1991
Class Inception Date:
Institutional Class: May 13, 1991
Retail Class: December 31, 1996
Admin Class: January 2, 1998
Net Assets:
$1,146.4 million
| * | | Effective June 1, 2011, Daniel Thelen will no longer serve as a portfolio manager of the fund. |
Market Conditions
Stocks rallied sharply during the six-month period, fueled by a modest improvement in U.S. business conditions and renewed investor optimism stemming from continued accommodation from the Federal Reserve Board. These factors, combined with better-than-expected corporate profits, drove share prices higher despite a host of challenges: political turmoil in North Africa and the Middle East and an earthquake, tsunami and nuclear crisis in Japan. Risk appetites stayed fairly high, and equities remained the vehicle of choice for investors. Overall, small-cap stocks led the market higher, and growth stocks outperformed value stocks.
Performance Results
For the six months ended March 31, 2011, Institutional Class shares of Loomis Sayles Small Cap Value Fund returned 26.11%. The fund outperformed its benchmark, the Russell 2000 Value Index, which returned 22.97% for the period.
Explanation of Fund Performance
All sectors of the portfolio delivered double-digit returns for the period. Stock selection, particularly in the producer durables and financial services sectors, drove the fund’s outperformance relative to the benchmark. Within producer durables, the fund’s position in Baldor Electric, a manufacturer of industrial electric motors, was its top contributor. The company agreed to be acquired by Switzerland-based power and automation engineering company ABB Ltd. for a 41% premium to prior trading levels. In the financial services sector, our stock selections in the brokerage, transaction processing and consumer lending industries contributed positively to performance. In addition, an underweight in the financial services sector helped, as the group trailed the small cap value index. Overall, the fund’s sector weights contributed positively to relative performance, with overweight positions in outperforming sectors, including producer durables and materials and processing, offsetting a slight underweight in energy stocks.
| 4
What You Should Know:
Investments in the fund are subject to a number of risks. Please see the “Principal Risks” section of the fund’s prospectus. The purchase of fund shares should be seen as a long-term investment.
On a relative basis, an underweight in the energy sector, which was the market’s top-performing sector, and weak stock selection in the real estate investment trust (REIT) segment of the financials sector detracted from results. REIT stocks lagged during the six-month period. While the fund benefited from having a relatively small weight in the sector, stock selection lagged due to weaker performance in certain data center and health-care facility REITs.
Changes to the portfolio during the six months were largely driven by company-specific factors, with the net result showing an increase in technology holdings and a reduction in consumer durables. The technology weight increased with the addition of several communications-related stocks positioned to benefit from increasing demands on enterprise and carrier-based networks.
Outlook
Core inflation statistics have remained well within the Fed’s informal target range, but many commentators believe that the Fed may need to snug things up somewhat in the next few months. The Fed’s second round of large-scale Treasury purchases, which is referred to as “QE2”, is scheduled to end on June 30, 2011. At this point we do not expect an extension of asset purchases in the form of a “QE3” unless the economy takes an unexpected turn to the downside. Employment conditions have improved substantially over the past several months, and the employment reports for the months of February and March, 2011, made for some of the best reading we have seen in several years. Our working assumption is that investors and corporate executives need to plan for somewhat higher energy and other commodity input costs in the months ahead. This may be a factor in an eventual plateauing of corporate margins. However, this is built into our outlook in that we are anticipating about 15% earnings growth for the S&P 500 this year, decelerating to 10% or so next year.
5 |
LOOMIS SAYLES SMALL CAP VALUE FUND
Average Annual Returns
March 31, 2011
| | | | | | | | | | | | | | | | | | | | |
| | | | | | |
| | | | | | 6 months | | | 1 year | | | 5 years | | | 10 years | |
| | | | | | |
| Institutional Class (Inception 5/13/91) | | | | | | | 26.11 | % | | | 28.01 | % | | | 5.18 | % | | | 9.98 | % |
| Retail Class (Inception 12/31/96) | | | | | | | 25.96 | | | | 27.76 | | | | 4.92 | | | | 9.71 | |
| Admin Class (Inception 1/2/98) | | | | | | | 25.78 | | | | 27.43 | | | | 4.65 | | | | 9.43 | |
| | | | | | |
| Comparative Performance | | | | | | | | | | | | | | | | | | | | |
| Russell 2000 Value Index(c) | | | | | | | 22.97 | | | | 20.63 | | | | 2.23 | | | | 9.01 | |
| Russell 2000 Index(c) | | | | | | | 25.48 | | | | 25.79 | | | | 3.35 | | | | 7.87 | |
| Lipper Small-Cap Core Funds Index(c) | | | | | | | 24.22 | | | | 25.72 | | | | 4.01 | | | | 8.60 | |
| |
| Gross expense ratio (before fee waivers and/or expense reimbursements)* | |
| Institutional: 1.00% Retail: 1.30% Admin: 1.62% | | | | | |
| | |
| Net expense ratio (after fee waivers and/or expense reimbursements)* | | | | | |
| Institutional: 0.96% Retail: 1.21% Admin: 1.46% | | | | | |
| * | | As stated in the most recent prospectus. Waivers/reimbursements are contractual and are set to expire on 1/31/12. Contracts are reevaluated on an annual basis. |
Cumulative Performance
March 31, 2001 to March 31, 2011(a)(b)
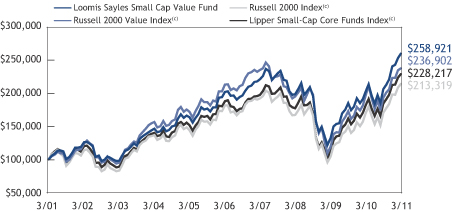
Data quoted reflects past performance and cannot guarantee future results. Average annual total returns assume reinvestment of dividends and capital gains distributions. Investment return and principal value will fluctuate so that shares, when redeemed, may be worth more or less than their original cost. For performance current to the most recent month end, please visit www.loomissayles.com. Current performance may be higher or lower than quoted.
Returns do not reflect the taxes that a shareholder would pay on fund distributions or the redemption of shares. Periods of less than one year are not annualized. Performance data reflects certain fee waivers and/or expense reimbursements, if any, without which performance would be lower.
| (a) | | Cumulative performance is shown for the Institutional Class. Performance of the Retail and Admin Classes would be lower due to higher fees and expenses. |
| (b) | | The mountain chart is based on the initial investment minimum of $100,000 for the Institutional Class. |
| (c) | | See page 7 for a description of the indices. |
| 6
ADDITIONAL INFORMATION
The views expressed in this report reflect those of the portfolio managers as of the dates indicated. The managers’ views are subject to change at any time without notice based on changes in market or other conditions. References to specific securities or industries should not be regarded as investment advice. Because the funds are actively managed, there is no assurance that they will continue to invest in the securities or industries mentioned.
Index Definitions
Indices are unmanaged and do not have expenses that affect results, unlike mutual funds. Index returns are adjusted for the reinvestment of capital gain distributions and income dividends. It is not possible to invest directly in an index.
Lipper Small-Cap Core Funds Index is an unmanaged index that tracks the average performance of the 30 largest small-cap core funds according to Lipper Inc.
Lipper Small-Cap Growth Funds Index is an unmanaged index that tracks the average performance of the 30 largest small-cap growth funds according to Lipper Inc.
Source: Lipper, Inc.
Russell 2000 Index is an unmanaged index that measures the performance of the small-cap segment of the U.S. equity universe.
Russell 2000 Growth Index is an unmanaged index that measures the performance of the small-cap growth segment of the U.S. equity universe. It includes those Russell 2000 companies with higher price-to-book ratios and higher forecasted growth values.
Russell 2000 Value Index is an unmanaged index that measures the performance of the small-cap value segment of the U.S. equity universe. It includes those Russell 2000 companies with lower price-to-book ratios and lower forecasted growth values.
Proxy Voting Information
A description of the funds’ proxy voting policies and procedures is available without charge, upon request, (i) by calling Loomis Sayles at 800-633-3330; (ii) on the funds’ website, www.loomissayles.com, and (iii) on the SEC’s website, www.sec.gov. Information about how the funds voted proxies relating to portfolio securities during the 12 months ended June 30, 2010 is available on (i) the funds’ website and (ii) the SEC’s website.
Quarterly Portfolio Schedules
The funds file a complete schedule of portfolio holdings with the SEC for the first and third quarters of each fiscal year on Form N-Q. The funds’ Forms N-Q are available on the SEC’s website at www.sec.gov and may be reviewed and copied at the SEC’s Public Reference Room in Washington, DC. Information on the operation of the Public Reference Room may be obtained by calling 800-SEC-0330.
UNDERSTANDING YOUR FUND’S EXPENSES
As a mutual fund shareholder you incur two types of costs: (1) transaction costs and (2) ongoing costs, including management fees, distribution and/or service fees (12b-1 fees), and other fund expenses. These costs are described in more detail in the funds’ prospectus. The examples below are intended to help you understand the ongoing costs of investing in the funds and help you compare these with the ongoing costs of investing in other mutual funds.
7 |
The first line in the table of each fund shows the actual amount of fund expenses you would have paid on a $1,000 investment in the fund from October 1, 2010 through March 31, 2011. It also shows how much a $1,000 investment would be worth at the close of the period, assuming actual fund returns and expenses. To estimate the expenses you paid over the period, simply divide your account value by $1,000 (for example $8,600 account value divided by $1,000 = 8.6) and multiply the result by the number in the Expenses Paid During the Period column as shown below for your class.
The second line in the table of each fund provides information about hypothetical account values and hypothetical expenses based on the fund’s actual expense ratios and an assumed rate of return of 5% per year before expenses, which is not the fund’s actual return. The hypothetical account values and expenses may not be used to estimate the actual ending account balance or expenses you paid on your investment for the period. You may use this information to compare the ongoing costs of investing in the funds and other funds. To do so, compare this 5% hypothetical example with the 5% hypothetical examples that appear in the shareholder reports of other funds.
Please note that the expenses shown reflect ongoing costs only, and do not include any transaction costs. Therefore, the second line in the table is useful in comparing ongoing costs only, and will not help you determine the relative costs of owning different funds. If transaction costs were included, total costs would be higher.
Loomis Sayles Small Cap Growth Fund
| | | | | | | | | | | | |
Institutional Class | | Beginning
Account Value
10/1/2010 | | | Ending
Account Value
3/31/2011 | | | Expenses Paid
During Period*
10/1/2010 – 3/31/2011 | |
Actual | | | $1,000.00 | | | | $1,324.30 | | | | $5.79 | |
Hypothetical
(5% return before expenses) | | | $1,000.00 | | | | $1,019.95 | | | | $5.04 | |
| | | |
Retail Class | | | | | | | | | |
Actual | | | $1,000.00 | | | | $1,323.20 | | | | $7.24 | |
Hypothetical
(5% return before expenses) | | | $1,000.00 | | | | $1,018.70 | | | | $6.29 | |
|
* Expenses are equal to the Fund’s annualized expense ratio (after waiver/reimbursement): 1.00% and 1.25% for Institutional and Retail Class, respectively, multiplied by the average account value over the period multiplied by the number of days in the most recent fiscal half-year, divided by 365 (to reflect the half-year period). | |
| 8
Loomis Sayles Small Cap Value Fund
| | | | | | | | | | | | |
Institutional Class | | Beginning
Account Value
10/1/2010 | | | Ending
Account Value
3/31/2011 | | | Expenses Paid
During Period*
10/1/2010 – 3/31/2011 | |
Actual | | | $1,000.00 | | | | $1,261.10 | | | | $5.07 | |
Hypothetical
(5% return before expenses) | | | $1,000.00 | | | | $1,020.44 | | | | $4.53 | |
| | | |
Retail Class | | | | | | | | | |
Actual | | | $1,000.00 | | | | $1,259.60 | | | | $6.48 | |
Hypothetical
(5% return before expenses) | | | $1,000.00 | | | | $1,019.20 | | | | $5.79 | |
| | | |
Admin Class | | | | | | | | | |
Actual | | | $1,000.00 | | | | $1,257.80 | | | | $7.88 | |
Hypothetical
(5% return before expenses) | | | $1,000.00 | | | | $1,017.95 | | | | $7.04 | |
|
* Expenses are equal to the Fund’s annualized expense ratio (after waiver/reimbursement): 0.90%, 1.15% and 1.40% for Institutional, Retail and Admin Class, respectively, multiplied by the average account value over the period, multiplied by the number of days in the most recent fiscal half-year, divided by 365 (to reflect the half-year period). | |
9 |
Portfolio of Investments – as of March 31, 2011 (Unaudited)
Loomis Sayles Small Cap Growth Fund
| | | | | | | | |
| Shares | | | Description | | Value (†) | |
| | | | | | | | |
| |
| | Common Stocks – 95.5% of Net Assets | | | | |
| | |
| | | | Aerospace & Defense – 2.1% | | | | |
| | 39,011 | | | HEICO Corp. | | $ | 2,438,968 | |
| | 142,718 | | | Hexcel Corp.(b) | | | 2,810,117 | |
| | | | | | | | |
| | | | | | | 5,249,085 | |
| | | | | | | | |
| | | | Air Freight & Logistics – 2.3% | | | | |
| | 43,812 | | | Atlas Air Worldwide Holdings, Inc.(b) | | | 3,054,573 | |
| | 71,258 | | | HUB Group, Inc., Class A(b) | | | 2,578,827 | |
| | | | | | | | |
| | | | | | | 5,633,400 | |
| | | | | | | | |
| | | | Auto Components – 2.1% | | | | |
| | 197,069 | | | Amerigon, Inc.(b) | | | 3,009,244 | |
| | 55,214 | | | Tenneco, Inc.(b) | | | 2,343,834 | |
| | | | | �� | | | |
| | | | | | | 5,353,078 | |
| | | | | | | | |
| | | | Biotechnology – 3.3% | | | | |
| | 103,488 | | | Cepheid, Inc.(b) | | | 2,899,734 | |
| | 65,349 | | | Genomic Health, Inc.(b) | | | 1,607,585 | |
| | 89,404 | | | Incyte Corp. Ltd.(b) | | | 1,417,053 | |
| | 28,201 | | | Pharmasset, Inc.(b) | | | 2,219,701 | |
| | | | | | | | |
| | | | | | | 8,144,073 | |
| | | | | | | | |
| | | | Building Products – 1.7% | | | | |
| | 122,454 | | | NCI Building Systems, Inc.(b) | | | 1,551,492 | |
| | 83,370 | | | Trex Company, Inc.(b) | | | 2,719,530 | |
| | | | | | | | |
| | | | | | | 4,271,022 | |
| | | | | | | | |
| | | | Capital Markets – 2.7% | | | | |
| | 70,922 | | | Evercore Partners, Inc., Class A | | | 2,431,915 | |
| | 24,794 | | | Greenhill & Co., Inc. | | | 1,631,197 | |
| | 37,402 | | | Stifel Financial Corp.(b) | | | 2,685,090 | |
| | | | | | | | |
| | | | | | | 6,748,202 | |
| | | | | | | | |
| | | | Commercial Banks – 2.1% | | | | |
| | 45,759 | | | Signature Bank(b) | | | 2,580,807 | |
| | 45,105 | | | SVB Financial Group(b) | | | 2,567,828 | |
| | | | | | | | |
| | | | | | | 5,148,635 | |
| | | | | | | | |
| | | | Commercial Services & Supplies – 1.1% | | | | |
| | 93,651 | | | Waste Connections, Inc. | | | 2,696,212 | |
| | | | | | | | |
| | | | Communications Equipment – 1.8% | | | | |
| | 66,552 | | | Aruba Networks, Inc.(b) | | | 2,252,119 | |
| | 89,655 | | | Ciena Corp.(b) | | | 2,327,444 | |
| | | | | | | | |
| | | | | | | 4,579,563 | |
| | | | | | | | |
| | | | Construction & Engineering – 0.9% | | | | |
| | 101,658 | | | MasTec, Inc.(b) | | | 2,114,486 | |
| | | | | | | | |
See accompanying notes to financial statements.
| 10
Portfolio of Investments – as of March 31, 2011 (Unaudited)
Loomis Sayles Small Cap Growth Fund – continued
| | | | | | | | |
| Shares | | | Description | | Value (†) | |
| | | | | | | | |
| |
| | Common Stocks – continued | | | | |
| | |
| | | | Diversified Consumer Services – 1.1% | | | | |
| | 77,636 | | | K12, Inc.(b) | | $ | 2,616,333 | |
| | | | | | | | |
| | | | Diversified Financial Services – 0.9% | | | | |
| | 64,040 | | | MSCI, Inc., Class A(b) | | | 2,357,953 | |
| | | | | | | | |
| | | | Electrical Equipment – 1.7% | | | | |
| | 115,709 | | | GrafTech International Ltd.(b) | | | 2,387,077 | |
| | 32,649 | | | Polypore International, Inc.(b) | | | 1,879,929 | |
| | | | | | | | |
| | | | | | | 4,267,006 | |
| | | | | | | | |
| | | | Electronic Equipment, Instruments & Components – 1.8% | | | | |
| | 44,820 | | | IPG Photonics Corp.(b) | | | 2,585,218 | |
| | 113,207 | | | Maxwell Technologies, Inc.(b) | | | 1,955,085 | |
| | | | | | | | |
| | | | | | | 4,540,303 | |
| | | | | | | | |
| | | | Energy Equipment & Services – 1.9% | | | | |
| | 23,120 | | | Lufkin Industries, Inc. | | | 2,161,026 | |
| | 29,528 | | | Oceaneering International, Inc.(b) | | | 2,641,280 | |
| | | | | | | | |
| | | | | | | 4,802,306 | |
| | | | | | | | |
| | | | Food & Staples Retailing – 0.6% | | | | |
| | 38,072 | | | Fresh Market, Inc. (The)(b) | | | 1,436,837 | |
| | | | | | | | |
| | | | Food Products – 1.1% | | | | |
| | 50,006 | | | Diamond Foods, Inc. | | | 2,790,335 | |
| | | | | | | | |
| | | | Health Care Equipment & Supplies – 5.8% | | | | |
| | 173,477 | | | Accuray, Inc.(b) | | | 1,566,497 | |
| | 13,022 | | | HeartWare International, Inc.(b) | | | 1,113,772 | |
| | 144,144 | | | Insulet Corp.(b) | | | 2,972,249 | |
| | 139,502 | | | Natus Medical, Inc.(b) | | | 2,343,633 | |
| | 77,016 | | | NxStage Medical, Inc.(b) | | | 1,692,812 | |
| | 85,725 | | | Volcano Corp.(b) | | | 2,194,560 | |
| | 57,023 | | | Zoll Medical Corp.(b) | | | 2,555,201 | |
| | | | | | | | |
| | | | | | | 14,438,724 | |
| | | | | | | | |
| | | | Health Care Providers & Services – 5.6% | | | | |
| | 103,354 | | | ExamWorks Group, Inc.(b) | | | 2,297,559 | |
| | 85,609 | | | Hanger Orthopedic Group, Inc.(b) | | | 2,228,402 | |
| | 29,949 | | | HMS Holdings Corp.(b) | | | 2,451,326 | |
| | 29,175 | | | MWI Veterinary Supply, Inc.(b) | | | 2,353,839 | |
| | 96,724 | | | PSS World Medical, Inc.(b) | | | 2,626,057 | |
| | 118,477 | | | Team Health Holdings, Inc.(b) | | | 2,070,978 | |
| | | | | | | | |
| | | | | | | 14,028,161 | |
| | | | | | | | |
| | | | Health Care Technology – 1.3% | | | | |
| | 56,972 | | | SXC Health Solutions Corp.(b) | | | 3,122,066 | |
| | | | | | | | |
See accompanying notes to financial statements.
11 |
Portfolio of Investments – as of March 31, 2011 (Unaudited)
Loomis Sayles Small Cap Growth Fund – continued
| | | | | | | | |
| Shares | | | Description | | Value (†) | |
| | | | | | | | |
| |
| | Common Stocks – continued | | | | |
| | |
| | | | Hotels, Restaurants & Leisure – 3.6% | | | | |
| | 60,195 | | | Life Time Fitness, Inc.(b) | | $ | 2,245,875 | |
| | 18,969 | | | Panera Bread Co., Class A(b) | | | 2,409,063 | |
| | 169,970 | | | Shuffle Master, Inc.(b) | | | 1,815,280 | |
| | 141,553 | | | Texas Roadhouse, Inc. | | | 2,404,986 | |
| | | | | | | | |
| | | | | | | 8,875,204 | |
| | | | | | | | |
| | | | Household Durables – 1.4% | | | | |
| | 67,666 | | | Tempur-Pedic International, Inc.(b) | | | 3,427,960 | |
| | | | | | | | |
| | | | Internet Software & Services – 7.2% | | | | |
| | 49,906 | | | Ancestry.com, Inc.(b) | | | 1,769,168 | |
| | 53,580 | | | comScore, Inc.(b) | | | 1,581,146 | |
| | 69,646 | | | Constant Contact, Inc.(b) | | | 2,430,645 | |
| | 84,430 | | | DealerTrack Holdings, Inc.(b) | | | 1,938,513 | |
| | 126,118 | | | Dice Holdings, Inc.(b) | | | 1,905,643 | |
| | 55,307 | | | IntraLinks Holdings, Inc.(b) | | | 1,478,909 | |
| | 47,605 | | | SAVVIS, Inc.(b) | | | 1,765,670 | |
| | 91,654 | | | Vocus, Inc.(b) | | | 2,370,172 | |
| | 52,508 | | | WebMD Health Corp.(b) | | | 2,804,977 | |
| | | | | | | | |
| | | | | | | 18,044,843 | |
| | | | | | | | |
| | | | IT Services – 0.7% | | | | |
| | 125,241 | | | InterXion Holding NV(b) | | | 1,628,133 | |
| | | | | | | | |
| | | | Machinery – 2.5% | | | | |
| | 33,338 | | | Chart Industries, Inc.(b) | | | 1,834,923 | |
| | 45,306 | | | Robbins & Myers, Inc. | | | 2,083,623 | |
| | 108,171 | | | Westport Innovations, Inc.(b) | | | 2,377,599 | |
| | | | | | | | |
| | | | | | | 6,296,145 | |
| | | | | | | | |
| | | | Media – 1.1% | | | | |
| | 84,301 | | | Imax Corp.(b) | | | 2,695,946 | |
| | | | | | | | |
| | | | Metals & Mining – 0.7% | | | | |
| | 28,436 | | | Schnitzer Steel Industries, Inc., Class A | | | 1,848,624 | |
| | | | | | | | |
| | | | Oil, Gas & Consumable Fuels – 5.6% | | | | |
| | 50,695 | | | Approach Resources, Inc.(b) | | | 1,703,352 | |
| | 63,418 | | | Brigham Exploration Co.(b) | | | 2,357,881 | |
| | 83,134 | | | Comstock Resources, Inc.(b) | | | 2,572,166 | |
| | 56,990 | | | Oasis Petroleum, Inc.(b) | | | 1,802,024 | |
| | 56,520 | | | Rosetta Resources, Inc.(b) | | | 2,686,961 | |
| | 67,313 | | | World Fuel Services Corp. | | | 2,733,581 | |
| | | | | | | | |
| | | | | | | 13,855,965 | |
| | | | | | | | |
| | | | Pharmaceuticals – 2.0% | | | | |
| | 70,821 | | | Auxilium Pharmaceuticals, Inc.(b) | | | 1,520,527 | |
| | 160,727 | | | Nektar Therapeutics(b) | | | 1,522,084 | |
See accompanying notes to financial statements.
| 12
Portfolio of Investments – as of March 31, 2011 (Unaudited)
Loomis Sayles Small Cap Growth Fund – continued
| | | | | | | | |
| Shares | | | Description | | Value (†) | |
| | | | | | | | |
| |
| | Common Stocks – continued | | | | |
| | |
| | | | Pharmaceuticals – continued | | | | |
| | 137,624 | | | Questcor Pharmaceuticals, Inc.(b) | | $ | 1,983,162 | |
| | | | | | | | |
| | | | | | | 5,025,773 | |
| | | | | | | | |
| | |
| | | | Professional Services – 3.2% | | | | |
| | 59,612 | | | Advisory Board Co. (The)(b) | | | 3,070,018 | |
| | 55,070 | | | Corporate Executive Board Co. (The) | | | 2,223,176 | |
| | 31,661 | | | IHS, Inc., Class A(b) | | | 2,809,914 | |
| | | | | | | | |
| | | | | | | 8,103,108 | |
| | | | | | | | |
| | | | Road & Rail – 1.0% | | | | |
| | 43,493 | | | Genesee & Wyoming, Inc., Class A(b) | | | 2,531,293 | |
| | | | | | | | |
| | | | Semiconductors & Semiconductor Equipment – 8.9% | | | | |
| | 130,665 | | | Advanced Energy Industries, Inc.(b) | | | 2,136,373 | |
| | 53,632 | | | Cavium Network, Inc.(b) | | | 2,409,686 | |
| | 52,742 | | | Cymer, Inc.(b) | | | 2,984,142 | |
| | 171,155 | | | GT Solar International, Inc.(b) | | | 1,824,512 | |
| | 37,467 | | | Hittite Microwave Corp.(b) | | | 2,389,271 | |
| | 97,199 | | | Inphi Corp.(b) | | | 2,042,151 | |
| | 57,929 | | | Netlogic Microsystems, Inc.(b) | | | 2,434,176 | |
| | 41,378 | | | Power Integrations, Inc. | | | 1,586,019 | |
| | 36,880 | | | Silicon Laboratories, Inc.(b) | | | 1,593,585 | |
| | 57,627 | | | Varian Semiconductor Equipment Associates, Inc.(b) | | | 2,804,706 | |
| | | | | | | | |
| | | | | | | 22,204,621 | |
| | | | | | | | |
| | | | Software – 7.9% | | | | |
| | 112,619 | | | Ariba, Inc.(b) | | | 3,844,813 | |
| | 45,021 | | | Concur Technologies, Inc.(b) | | | 2,496,414 | |
| | 76,024 | | | Informatica Corp.(b) | | | 3,970,734 | |
| | 70,201 | | | QLIK Technologies, Inc.(b) | | | 1,825,226 | |
| | 72,365 | | | SuccessFactors, Inc.(b) | | | 2,828,748 | |
| | 48,462 | | | Ultimate Software Group, Inc.(The)(b) | | | 2,847,142 | |
| | 62,864 | | | VanceInfo Technologies, Inc., ADR(b) | | | 1,974,558 | |
| | | | | | | | |
| | | | | | | 19,787,635 | |
| | | | | | | | |
| | | | Specialty Retail – 4.6% | | | | |
| | 93,711 | | | Asbury Automotive Group, Inc.(b) | | | 1,732,716 | |
| | 62,075 | | | DSW, Inc., Class A(b) | | | 2,480,517 | |
| | 68,824 | | | Hibbett Sports, Inc.(b) | | | 2,464,587 | |
| | 49,959 | | | Ulta Salon, Cosmetics & Fragrance, Inc.(b) | | | 2,404,527 | |
| | 72,365 | | | Vitamin Shoppe, Inc.(b) | | | 2,448,108 | |
| | | | | | | | |
| | | | | | | 11,530,455 | |
| | | | | | | | |
| | | | Textiles, Apparel & Luxury Goods – 2.7% | | | | |
| | 24,343 | | | Deckers Outdoor Corp.(b) | | | 2,097,149 | |
| | 62,241 | | | G-III Apparel Group Ltd.(b) | | | 2,339,017 | |
See accompanying notes to financial statements.
13 |
Portfolio of Investments – as of March 31, 2011 (Unaudited)
Loomis Sayles Small Cap Growth Fund – continued
| | | | | | | | |
| Shares | | | Description | | Value (†) | |
| | | | | | | | |
| |
| | Common Stocks – continued | | | | |
| | |
| | | | Textiles, Apparel & Luxury Goods – continued | | | | |
| | 35,520 | | | Phillips-Van Heusen Corp. | | $ | 2,309,866 | |
| | | | | | | | |
| | | | | | | 6,746,032 | |
| | | | | | | | |
| | | | Trading Companies & Distributors – 0.5% | | | | |
| | 53,717 | | | Titan Machinery, Inc.(b) | | | 1,356,354 | |
| | | | | | | | |
| | |
| | | | Total Common Stocks (Identified Cost $174,761,736) | | | 238,295,871 | |
| | | | | | | | |
| | |
| Principal
Amount |
| | | | | | |
| |
| | Short-Term Investments – 6.4% | | | | |
| $ | 16,104,356 | | | Tri-Party Repurchase Agreement with Fixed Income Clearing Corporation, dated 3/31/2011 at 0.000% to be repurchased at $16,104,356 on 4/01/2011 collateralized by $17,270,000 Federal Home Loan Mortgage Corp., 3.310% due 11/10/2020 valued at $16,428,088 including accrued interest (Note 2 of Notes to Financial Statements) (Identified Cost $16,104,356) | | | 16,104,356 | |
| | | | | | | | |
| | |
| | | | Total Investments – 101.9% (Identified Cost $190,866,092)(a) | | | 254,400,227 | |
| | | | Other assets less liabilities—(1.9)% | | | (4,863,744 | ) |
| | | | | | | | |
| | | | Net Assets – 100.0% | | $ | 249,536,483 | |
| | | | | | | | |
| | |
| | (†) | | | See Note 2 of Notes to Financial Statements. | | | | |
| | (a) | | | Federal Tax Information (Amounts exclude certain adjustments made at the end of the Fund’s fiscal year for tax purposes. Such adjustments are primarily due to wash sales.): | | | | |
| | | | At March 31, 2011, the net unrealized appreciation on investments based on a cost of $190,865,183 for federal income tax purposes was as follows: | | | | |
| | | | Aggregate gross unrealized appreciation for all investments in which there is an excess of value over tax cost | | $ | 64,102,669 | |
| | | | Aggregate gross unrealized depreciation for all investments in which there is an excess of tax cost over value | | | (567,625 | ) |
| | | | | | | | |
| | | | Net unrealized appreciation | | $ | 63,535,044 | |
| | | | | | | | |
| | (b) | | | Non-income producing security. | | | | |
| | |
| | ADR | | | An American Depositary Receipt is a certificate issued by a custodian bank representing the right to receive securities of the foreign issuer described. The values of ADRs may be significantly influenced by trading on exchanges not located in the United States. | | | | |
See accompanying notes to financial statements.
| 14
Portfolio of Investments – as of March 31, 2011 (Unaudited)
Loomis Sayles Small Cap Growth Fund – continued
Industry Summary at March 31, 2011 (Unaudited)
| | | | |
Semiconductors & Semiconductor Equipment | | | 8.9 | % |
Software | | | 7.9 | |
Internet Software & Services | | | 7.2 | |
Health Care Equipment & Supplies | | | 5.8 | |
Health Care Providers & Services | | | 5.6 | |
Oil, Gas & Consumable Fuels | | | 5.6 | |
Specialty Retail | | | 4.6 | |
Hotels, Restaurants & Leisure | | | 3.6 | |
Biotechnology | | | 3.3 | |
Professional Services | | | 3.2 | |
Capital Markets | | | 2.7 | |
Textiles, Apparel & Luxury Goods | | | 2.7 | |
Machinery | | | 2.5 | |
Air Freight & Logistics | | | 2.3 | |
Auto Components | | | 2.1 | |
Aerospace & Defense | | | 2.1 | |
Commercial Banks | | | 2.1 | |
Pharmaceuticals | | | 2.0 | |
Other Investments, less than 2% each | | | 21.3 | |
Short-Term Investments | | | 6.4 | |
| | | | |
Total Investments | | | 101.9 | |
Other assets less liabilities | | | (1.9 | ) |
| | | | |
Net Assets | | | 100.0 | % |
| | | | |
See accompanying notes to financial statements.
15 |
Portfolio of Investments – as of March 31, 2011 (Unaudited)
Loomis Sayles Small Cap Value Fund
| | | | | | | | |
| Shares | | | Description | | Value (†) | |
| | | | | | | | |
| |
| | Common Stocks – 96.8% of Net Assets | | | | |
| | |
| | | | Air Freight & Logistics – 1.1% | | | | |
| | 187,245 | | | Atlas Air Worldwide Holdings, Inc.(b) | | $ | 13,054,721 | |
| | | | | | | | |
| | | | Auto Components – 1.4% | | | | |
| | 483,703 | | | Dana Holding Corp.(b) | | | 8,411,595 | |
| | 172,744 | | | Tenneco, Inc.(b) | | | 7,332,983 | |
| | | | | | | | |
| | | | | | | 15,744,578 | |
| | | | | | | | |
| | | | Building Products – 0.8% | | | | |
| | 102,030 | | | Armstrong World Industries, Inc. | | | 4,720,928 | |
| | 376,559 | | | Griffon Corp.(b) | | | 4,944,220 | |
| | | | | | | | |
| | | | | | | 9,665,148 | |
| | | | | | | | |
| | | | Capital Markets – 2.6% | | | | |
| | 555,653 | | | Ares Capital Corp. | | | 9,390,536 | |
| | 698,225 | | | Fifth Street Finance Corp. | | | 9,321,304 | |
| | 162,890 | | | Stifel Financial Corp.(b) | | | 11,693,873 | |
| | | | | | | | |
| | | | | | | 30,405,713 | |
| | | | | | | | |
| | | | Chemicals – 4.9% | | | | |
| | 473,609 | | | Chemtura Corp.(b) | | | 8,146,075 | |
| | 541,390 | | | Ferro Corp.(b) | | | 8,981,660 | |
| | 230,016 | | | Koppers Holdings, Inc. | | | 9,821,683 | |
| | 80,553 | | | Minerals Technologies, Inc. | | | 5,519,492 | |
| | 244,931 | | | Olin Corp. | | | 5,613,818 | |
| | 421,127 | | | Omnova Solutions, Inc.(b) | | | 3,314,269 | |
| | 263,186 | | | WR Grace & Co.(b) | | | 10,077,392 | |
| | 285,865 | | | Zep, Inc. | | | 4,976,910 | |
| | | | | | | | |
| | | | | | | 56,451,299 | |
| | | | | | | | |
| | | | Commercial Banks – 7.3% | | | | |
| | 618,248 | | | Cathay General Bancorp | | | 10,541,128 | |
| | 158,997 | | | City National Corp. | | | 9,070,779 | |
| | 495,700 | | | CVB Financial Corp. | | | 4,614,967 | |
| | 424,006 | | | First Financial Bancorp | | | 7,076,660 | |
| | 500,904 | | | First Horizon National Corp. | | | 5,615,134 | |
| | 147,328 | | | IBERIABANK Corp. | | | 8,858,833 | |
| | 266,529 | | | Pinnacle Financial Partners, Inc.(b) | | | 4,408,390 | |
| | 2,273,275 | | | Popular, Inc.(b) | | | 6,615,230 | |
| | 183,036 | | | Prosperity Bancshares, Inc. | | | 7,828,450 | |
| | 180,927 | | | Signature Bank(b) | | | 10,204,283 | |
| | 244,462 | | | Wintrust Financial Corp. | | | 8,983,978 | |
| | | | | | | | |
| | | | | | | 83,817,832 | |
| | | | | | | | |
| | | | Commercial Services & Supplies – 3.2% | | | | |
| | 195,496 | | | KAR Auction Services, Inc.(b) | | | 2,998,909 | |
| | 221,440 | | | McGrath Rentcorp | | | 6,038,669 | |
See accompanying notes to financial statements.
| 16
Portfolio of Investments – as of March 31, 2011 (Unaudited)
Loomis Sayles Small Cap Value Fund – continued
| | | | | | | | |
| Shares | | | Description | | Value (†) | |
| | | | | | | | |
| |
| | Common Stocks – continued | | | | |
| | |
| | | | Commercial Services & Supplies – continued | | | | |
| | 567,866 | | | Rollins, Inc. | | $ | 11,527,680 | |
| | 444,373 | | | Standard Parking Corp.(b) | | | 7,892,064 | |
| | 113,083 | | | Team, Inc.(b) | | | 2,969,560 | |
| | 187,550 | | | Waste Connections, Inc. | | | 5,399,564 | |
| | | | | | | | |
| | | | | | | 36,826,446 | |
| | | | | | | | |
| | | | Communications Equipment – 2.2% | | | | |
| | 135,839 | | | ADTRAN, Inc. | | | 5,767,724 | |
| | 1,387,561 | | | Brocade Communications Systems, Inc.(b) | | | 8,533,500 | |
| | 395,609 | | | Harmonic, Inc.(b) | | | 3,710,812 | |
| | 227,170 | | | NETGEAR, Inc.(b) | | | 7,369,395 | |
| | | | | | | | |
| | | | | | | 25,381,431 | |
| | | | | | | | |
| | | | Construction & Engineering – 0.7% | | | | |
| | 223,305 | | | MYR Group, Inc.(b) | | | 5,341,455 | |
| | 60,077 | | | URS Corp.(b) | | | 2,766,546 | |
| | | | | | | | |
| | | | | | | 8,108,001 | |
| | | | | | | | |
| | | | Consumer Finance – 1.8% | | | | |
| | 200,778 | | | Cash America International, Inc. | | | 9,245,827 | |
| | 545,544 | | | Dollar Financial Corp.(b) | | | 11,320,038 | |
| | | | | | | | |
| | | | | | | 20,565,865 | |
| | | | | | | | |
| | | | Containers & Packaging – 0.8% | | | | |
| | 400,477 | | | Temple-Inland, Inc. | | | 9,371,162 | |
| | | | | | | | |
| | | | Distributors – 0.3% | | | | |
| | 109,064 | | | Core-Mark Holding Co., Inc.(b) | | | 3,604,565 | |
| | | | | | | | |
| | | | Diversified Financial Services – 1.3% | | | | |
| | 322,962 | | | MarketAxess Holdings, Inc. | | | 7,815,680 | |
| | 311,941 | | | PHH Corp.(b) | | | 6,790,956 | |
| | | | | | | | |
| | | | | | | 14,606,636 | |
| | | | | | | | |
| | | | Diversified Telecommunication Services – 0.1% | | | | |
| | 55,583 | | | Neutral Tandem, Inc.(b) | | | 819,849 | |
| | | | | | | | |
| | | | Electric Utilities – 2.0% | | | | |
| | 178,898 | | | ALLETE, Inc. | | | 6,971,655 | |
| | 131,699 | | | ITC Holdings Corp. | | | 9,205,760 | |
| | 224,693 | | | UIL Holdings Corp. | | | 6,857,631 | |
| | | | | | | | |
| | | | | | | 23,035,046 | |
| | | | | | | | |
| | | | Electrical Equipment – 2.5% | | | | |
| | 189,632 | | | AZZ, Inc. | | | 8,647,219 | |
| | 178,305 | | | II-VI, Inc.(b) | | | 8,870,674 | |
| | 92,247 | | | LaBarge, Inc.(b) | | | 1,632,772 | |
See accompanying notes to financial statements.
17 |
Portfolio of Investments – as of March 31, 2011 (Unaudited)
Loomis Sayles Small Cap Value Fund – continued
| | | | | | | | |
| Shares | | | Description | | Value (†) | |
| | | | | | | | |
| |
| | Common Stocks – continued | | | | |
| | |
| | | | Electrical Equipment – continued | | | | |
| | 152,523 | | | Thomas & Betts Corp.(b) | | $ | 9,070,543 | |
| | | | | | | | |
| | | | | | | 28,221,208 | |
| | | | | | | | |
| | | | Electronic Equipment, Instruments & Components – 5.1% | | | | |
| | 440,208 | | | Brightpoint, Inc.(b) | | | 4,771,855 | |
| | 231,931 | | | Cognex Corp. | | | 6,552,051 | |
| | 359,931 | | | GSI Group, Inc.(b) | | | 3,707,289 | |
| | 131,288 | | | Littelfuse, Inc. | | | 7,496,545 | |
| | 537,821 | | | Methode Electronics, Inc. | | | 6,496,877 | |
| | 152,792 | | | Rofin-Sinar Technologies, Inc.(b) | | | 6,035,284 | |
| | 122,746 | | | Rogers Corp.(b) | | | 5,530,935 | |
| | 278,194 | | | ScanSource, Inc.(b) | | | 10,568,590 | |
| | 407,515 | | | TTM Technologies, Inc.(b) | | | 7,400,472 | |
| | | | | | | | |
| | | | | | | 58,559,898 | |
| | | | | | | | |
| | | | Energy Equipment & Services – 3.0% | | | | |
| | 191,015 | | | Dresser-Rand Group, Inc.(b) | | | 10,242,224 | |
| | 289,873 | | | Helix Energy Solutions Group, Inc.(b) | | | 4,985,816 | |
| | 78,328 | | | Lufkin Industries, Inc. | | | 7,321,318 | |
| | 133,752 | | | Oceaneering International, Inc.(b) | | | 11,964,116 | |
| | | | | | | | |
| | | | | | | 34,513,474 | |
| | | | | | | | |
| | | | Food & Staples Retailing – 0.5% | | | | |
| | 410,633 | | | Spartan Stores, Inc. | | | 6,073,262 | |
| | | | | | | | |
| | | | Food Products – 3.5% | | | | |
| | 167,748 | | | Corn Products International, Inc. | | | 8,692,701 | |
| | 634,943 | | | Darling International, Inc.(b) | | | 9,759,074 | |
| | 186,239 | | | Fresh Del Monte Produce, Inc. | | | 4,862,700 | |
| | 168,066 | | | J & J Snack Foods Corp. | | | 7,910,867 | |
| | 1,098,796 | | | Pilgrim’s Pride Corp.(b) | | | 8,471,717 | |
| | | | | | | | |
| | | | | | | 39,697,059 | |
| | | | | | | | |
| | | | Gas Utilities – 1.1% | | | | |
| | 401,155 | | | UGI Corp. | | | 13,198,000 | |
| | | | | | | | |
| | | | Health Care Equipment & Supplies – 1.6% | | | | |
| | 150,493 | | | Alere, Inc.(b) | | | 5,890,296 | |
| | 112,062 | | | Teleflex, Inc. | | | 6,497,355 | |
| | 124,562 | | | West Pharmaceutical Services, Inc. | | | 5,576,641 | |
| | | | | | | | |
| | | | | | | 17,964,292 | |
| | | | | | | | |
| | | | Health Care Providers & Services – 1.6% | | | | |
| | 103,792 | | | MEDNAX, Inc.(b) | | | 6,913,585 | |
| | 274,348 | | | WellCare Health Plans, Inc.(b) | | | 11,508,899 | |
| | | | | | | | |
| | | | | | | 18,422,484 | |
| | | | | | | | |
See accompanying notes to financial statements.
| 18
Portfolio of Investments – as of March 31, 2011 (Unaudited)
Loomis Sayles Small Cap Value Fund – continued
| | | | | | | | |
| Shares | | | Description | | Value (†) | |
| | | | | | | | |
| |
| | Common Stocks – continued | | | | |
| | |
| | | | Hotels, Restaurants & Leisure – 2.0% | | | | |
| | 149,999 | | | Bob Evans Farms, Inc. | | $ | 4,889,968 | |
| | 205,689 | | | California Pizza Kitchen, Inc.(b) | | | 3,472,030 | |
| | 473,802 | | | Isle of Capri Casinos, Inc.(b) | | | 4,501,119 | |
| | 47,861 | | | Six Flags Entertainment Corp. | | | 3,445,992 | |
| | 222,622 | | | Wyndham Worldwide Corp. | | | 7,081,606 | |
| | | | | | | | |
| | | | | | | 23,390,715 | |
| | | | | | | | |
| | | | Household Durables – 0.9% | | | | |
| | 197,326 | | | Jarden Corp. | | | 7,018,886 | |
| | 117,495 | | | Leggett & Platt, Inc. | | | 2,878,627 | |
| | | | | | | | |
| | | | | | | 9,897,513 | |
| | | | | | | | |
| | | | Industrial Conglomerates – 0.9% | | | | |
| | 162,146 | | | Raven Industries, Inc. | | | 9,959,007 | |
| | | | | | | | |
| | | | Insurance – 3.9% | | | | |
| | 446,540 | | | Employers Holdings, Inc. | | | 9,225,516 | |
| | 58,490 | | | Hanover Insurance Group, Inc. (The) | | | 2,646,673 | |
| | 299,373 | | | HCC Insurance Holdings, Inc. | | | 9,373,369 | |
| | 496,165 | | | Old Republic International Corp. | | | 6,296,334 | |
| | 123,616 | | | ProAssurance Corp.(b) | | | 7,833,546 | |
| | 156,558 | | | Reinsurance Group of America, Inc., Class A | | | 9,828,711 | |
| | | | | | | | |
| | | | | | | 45,204,149 | |
| | | | | | | | |
| | | | Internet & Catalog Retail – 0.4% | | | | |
| | 127,655 | | | HSN, Inc.(b) | | | 4,088,790 | |
| | | | | | | | |
| | | | Internet Software & Services – 0.6% | | | | |
| | 193,225 | | | IAC/InterActiveCorp(b) | | | 5,968,720 | |
| | 124,392 | | | Perficient, Inc.(b) | | | 1,493,948 | |
| | | | | | | | |
| | | | | | | 7,462,668 | |
| | | | | | | | |
| | | | IT Services – 1.3% | | | | |
| | 39,664 | | | Alliance Data Systems Corp.(b) | | | 3,406,741 | |
| | 234,247 | | | Wright Express Corp.(b) | | | 12,143,364 | |
| | | | | | | | |
| | | | | | | 15,550,105 | |
| | | | | | | | |
| | | | Life Sciences Tools & Services – 0.4% | | | | |
| | 155,622 | | | Pharmaceutical Product Development, Inc. | | | 4,312,286 | |
| | | | | | | | |
| | | | Machinery – 5.5% | | | | |
| | 334,348 | | | Actuant Corp., Class A | | | 9,696,092 | |
| | 439,916 | | | Albany International Corp., Class A | | | 10,953,908 | |
| | 402,453 | | | Altra Holdings, Inc.(b) | | | 9,505,940 | |
| | 308,158 | | | Commercial Vehicle Group, Inc.(b) | | | 5,497,539 | |
| | 283,740 | | | John Bean Technologies Corp. | | | 5,456,320 | |
| | 200,062 | | | Meritor, Inc.(b) | | | 3,395,052 | |
| | 42,038 | | | Middleby Corp. (The)(b) | | | 3,918,782 | |
See accompanying notes to financial statements.
19 |
Portfolio of Investments – as of March 31, 2011 (Unaudited)
Loomis Sayles Small Cap Value Fund – continued
| | | | | | | | |
| Shares | | | Description | | Value (†) | |
| | | | | | | | |
| |
| | Common Stocks – continued | | | | |
| | |
| | | | Machinery – continued | | | | |
| | 114,839 | | | RBC Bearings, Inc.(b) | | $ | 4,390,295 | |
| | 564,738 | | | Wabash National Corp.(b) | | | 6,539,666 | |
| | 49,107 | | | Wabtec Corp. | | | 3,330,928 | |
| | | | | | | | |
| | | | | | | 62,684,522 | |
| | | | | | | | |
| | | | Marine – 0.6% | | | | |
| | 113,347 | | | Kirby Corp.(b) | | | 6,493,650 | |
| | | | | | | | |
| | | | Media – 3.4% | | | | |
| | 163,892 | | | Arbitron, Inc. | | | 6,560,597 | |
| | 168,118 | | | Harte-Hanks, Inc. | | | 2,000,604 | |
| | 211,322 | | | John Wiley & Sons, Inc., Class A | | | 10,743,611 | |
| | 176,394 | | | Liberty Media-Starz, Series A(b) | | | 13,688,174 | |
| | 168,066 | | | Live Nation Entertainment, Inc.(b) | | | 1,680,660 | |
| | 145,558 | | | Madison Square Garden, Inc., Class A(b) | | | 3,928,610 | |
| | | | | | | | |
| | | | | | | 38,602,256 | |
| | | | | | | | |
| | | | Metals & Mining – 2.2% | | | | |
| | 102,828 | | | Haynes International, Inc. | | | 5,701,813 | |
| | 560,885 | | | Horsehead Holding Corp.(b) | | | 9,563,089 | |
| | 166,083 | | | Reliance Steel & Aluminum Co. | | | 9,596,276 | |
| | | | | | | | |
| | | | | | | 24,861,178 | |
| | | | | | | | |
| | | | Multiline Retail – 0.6% | | | | |
| | 486,031 | | | Fred’s, Inc. Class A | | | 6,473,933 | |
| | | | | | | | |
| | | | Oil, Gas & Consumable Fuels – 3.7% | | | | |
| | 172,522 | | | Berry Petroleum Co., Class A | | | 8,703,735 | |
| | 271,798 | | | Cloud Peak Energy, Inc.(b) | | | 5,868,119 | |
| | 140,906 | | | Comstock Resources, Inc.(b) | | | 4,359,632 | |
| | 506,035 | | | Energy Partners Ltd.(b) | | | 9,108,630 | |
| | 105,638 | | | Petroleum Development Corp.(b) | | | 5,071,680 | |
| | 140,096 | | | Rosetta Resources, Inc.(b) | | | 6,660,164 | |
| | 87,847 | | | SemGroup Corp., Class A(b) | | | 2,473,771 | |
| | | | | | | | |
| | | | | | | 42,245,731 | |
| | | | | | | | |
| | | | Paper & Forest Products – 0.5% | | | | |
| | 89,855 | | | Deltic Timber Corp. | | | 6,005,908 | |
| | | | | | | | |
| | | | Pharmaceuticals – 0.3% | | | | |
| | 296,279 | | | Obagi Medical Products, Inc.(b) | | | 3,744,967 | |
| | | | | | | | |
| | | | REITs – Apartments – 2.4% | | | | |
| | 332,085 | | | American Campus Communities, Inc. | | | 10,958,805 | |
| | 133,984 | | | Mid-America Apartment Communities, Inc. | | | 8,601,773 | |
| | 309,208 | | | UDR, Inc. | | | 7,535,399 | |
| | | | | | | | |
| | | | | | | 27,095,977 | |
| | | | | | | | |
See accompanying notes to financial statements.
| 20
Portfolio of Investments – as of March 31, 2011 (Unaudited)
Loomis Sayles Small Cap Value Fund – continued
| | | | | | | | |
| Shares | | | Description | | Value (†) | |
| | | | | | | | |
| |
| | Common Stocks – continued | | | | |
| | |
| | | | REITs – Diversified – 1.5% | | | | |
| | 364,429 | | | DuPont Fabros Technology, Inc. | | $ | 8,837,403 | |
| | 205,021 | | | Potlatch Corp. | | | 8,241,844 | |
| | | | | | | | |
| | | | | | | 17,079,247 | |
| | | | | | | | |
| | | | REITs – Healthcare – 0.7% | | | | |
| | 382,192 | | | Omega Healthcare Investors, Inc. | | | 8,538,169 | |
| | | | | | | | |
| | | | REITs – Hotels – 0.6% | | | | |
| | 1,093,626 | | | Hersha Hospitality Trust | | | 6,496,138 | |
| | | | | | | | |
| | | | REITs – Office Property – 0.8% | | | | |
| | 463,665 | | | BioMed Realty Trust, Inc. | | | 8,818,908 | |
| | | | | | | | |
| | | | REITs – Single Tenant – 0.6% | | | | |
| | 268,632 | | | National Retail Properties, Inc. | | | 7,019,354 | |
| | | | | | | | |
| | | | REITs – Storage – 1.1% | | | | |
| | 132,469 | | | Sovran Self Storage, Inc. | | | 5,239,149 | |
| | 707,732 | | | U-Store-It Trust | | | 7,445,341 | |
| | | | | | | | |
| | | | | | | 12,684,490 | |
| | | | | | | | |
| | | | Road & Rail – 1.7% | | | | |
| | 123,490 | | | Genesee & Wyoming, Inc., Class A(b) | | | 7,187,118 | |
| | 218,510 | | | Old Dominion Freight Line, Inc.(b) | | | 7,667,516 | |
| | 306,604 | | | Vitran Corp., Inc.(b) | | | 4,320,050 | |
| | | | | | | | |
| | | | | | | 19,174,684 | |
| | | | | | | | |
| | | | Semiconductors & Semiconductor Equipment – 2.4% | | | | |
| | 151,607 | | | Cohu, Inc. | | | 2,328,684 | |
| | 167,103 | | | Diodes, Inc.(b) | | | 5,691,528 | |
| | 575,368 | | | PMC-Sierra, Inc.(b) | | | 4,315,260 | |
| | 558,088 | | | Teradyne, Inc.(b) | | | 9,939,547 | |
| | 380,746 | | | TriQuint Semiconductor, Inc.(b) | | | 4,915,431 | |
| | | | | | | | |
| | | | | | | 27,190,450 | |
| | | | | | | | |
| | | | Software – 1.9% | | | | |
| | 197,611 | | | Monotype Imaging Holdings, Inc.(b) | | | 2,865,360 | |
| | 280,515 | | | Progress Software Corp.(b) | | | 8,160,181 | |
| | 342,563 | | | Radiant Systems, Inc.(b) | | | 6,063,365 | |
| | 240,438 | | | SS&C Technologies Holdings, Inc.(b) | | | 4,909,744 | |
| | | | | | | | |
| | | | | | | 21,998,650 | |
| | | | | | | | |
| | | | Specialty Retail – 2.7% | | | | |
| | 169,583 | | | Genesco, Inc.(b) | | | 6,817,237 | |
| | 1,077,563 | | | Hot Topic, Inc. | | | 6,142,109 | |
| | 202,455 | | | OfficeMax, Inc.(b) | | | 2,619,768 | |
| | 680,131 | | | PEP Boys-Manny Moe & Jack | | | 8,644,465 | |
| | 515,951 | | | Sally Beauty Holdings, Inc.(b) | | | 7,228,473 | |
| | | | | | | | |
| | | | | | | 31,452,052 | |
| | | | | | | | |
See accompanying notes to financial statements.
21 |
Portfolio of Investments – as of March 31, 2011 (Unaudited)
Loomis Sayles Small Cap Value Fund – continued
| | | | | | | | |
| Shares | | | Description | | Value (†) | |
| | | | | | | | |
| |
| | Common Stocks – continued | | | | |
| | |
| | | | Textiles, Apparel & Luxury Goods – 0.9% | | | | |
| | 160,273 | | | Kenneth Cole Productions, Inc., Class A(b) | | $ | 2,078,741 | |
| | 418,305 | | | Movado Group, Inc.(b) | | | 6,140,717 | |
| | 41,046 | | | Vera Bradley, Inc.(b) | | | 1,732,552 | |
| | | | | | | | |
| | | | | | | 9,952,010 | |
| | | | | | | | |
| | | | Thrifts & Mortgage Finance – 1.5% | | | | |
| | 216,184 | | | BankUnited, Inc. | | | 6,206,642 | |
| | 503,218 | | | Capitol Federal Financial, Inc. | | | 5,671,267 | |
| | 358,162 | | | First Niagara Financial Group, Inc. | | | 4,863,840 | |
| | | | | | | | |
| | | | | | | 16,741,749 | |
| | | | | | | | |
| | | | Trading Companies & Distributors – 1.0% | | | | |
| | 288,240 | | | H&E Equipment Services, Inc.(b) | | | 5,623,562 | |
| | 299,808 | | | Rush Enterprises, Inc., Class A(b) | | | 5,936,199 | |
| | | | | | | | |
| | | | | | | 11,559,761 | |
| | | | | | | | |
| | | | Water Utilities – 0.4% | | | | |
| | 272,189 | | | Middlesex Water Co. | | | 4,951,118 | |
| | | | | | | | |
| | |
| | | | Total Common Stocks (Identified Cost $811,005,423) | | | 1,109,838,104 | |
| | | | | | | | |
| | |
| Principal
Amount |
| | | | | | |
| |
| | Short-Term Investments – 3.1% | | | | |
| $ | 35,067,817 | | | Tri-Party Repurchase Agreement with Fixed Income Clearing Corporation, dated 3/31/2011 at 0.000% to be repurchased at $35,067,817 on 4/01/2011 collateralized by $36,085,000 Federal Home Loan Mortgage Corp., 4.125% due 5/12/2025 valued at $35,769,256 including accrued interest (Note 2 of Notes to Financial Statements) (Identified Cost $35,067,817) | | | 35,067,817 | |
| | | | | | | | |
| | |
| | | | Total Investments – 99.9% (Identified Cost $846,073,240)(a) | | | 1,144,905,921 | |
| | | | Other assets less liabilities—0.1% | | | 1,447,067 | |
| | | | | | | | |
| | | | Net Assets – 100.0% | | $ | 1,146,352,988 | |
| | | | | | | | |
| | |
| | (†) | | | See Note 2 of Notes to Financial Statements. | | | | |
| | (a) | | | Federal Tax Information (Amounts exclude certain adjustments made at the end of the Fund’s fiscal year for tax purposes. Such adjustments are primarily due to wash sales.): | | | | |
| | | | At March 31, 2011, the net unrealized appreciation on investments based on a cost of $846,075,914 for federal income tax purposes was as follows: | | | | |
| | | | Aggregate gross unrealized appreciation for all investments in which there is an excess of value over tax cost | | $ | 306,575,976 | |
| | | | Aggregate gross unrealized depreciation for all investments in which there is an excess of tax cost over value | | | (7,745,969 | ) |
| | | | | | | | |
| | | | Net unrealized appreciation | | $ | 298,830,007 | |
| | | | | | | | |
| | (b) | | | Non-income producing security. | | | | |
| | |
| | REITs | | | Real Estate Investment Trusts | | | | |
See accompanying notes to financial statements.
| 22
Portfolio of Investments – as of March 31, 2011 (Unaudited)
Loomis Sayles Small Cap Value Fund – continued
Industry Summary at March 31, 2011 (Unaudited)
| | | | |
Commercial Banks | | | 7.3 | % |
Machinery | | | 5.5 | |
Electronic Equipment, Instruments & Components | | | 5.1 | |
Chemicals | | | 4.9 | |
Insurance | | | 3.9 | |
Oil, Gas & Consumable Fuels | | | 3.7 | |
Food Products | | | 3.5 | |
Media | | | 3.4 | |
Commercial Services & Supplies | | | 3.2 | |
Energy Equipment & Services | | | 3.0 | |
Specialty Retail | | | 2.7 | |
Capital Markets | | | 2.6 | |
Electrical Equipment | | | 2.5 | |
Semiconductors & Semiconductor Equipment | | | 2.4 | |
REITs – Apartments | | | 2.4 | |
Communications Equipment | | | 2.2 | |
Metals & Mining | | | 2.2 | |
Hotels, Restaurants & Leisure | | | 2.0 | |
Electric Utilities | | | 2.0 | |
Other Investments, less than 2% each | | | 32.3 | |
Short-Term Investments | | | 3.1 | |
| | | | |
Total Investments | | | 99.9 | |
Other assets less liabilities | | | 0.1 | |
| | | | |
Net Assets | | | 100.0 | % |
| | | | |
See accompanying notes to financial statements.
23 |
Statements of Assets And Liabilities
March 31, 2011 (Unaudited)
| | | | | | | | |
| | | Small Cap
Growth Fund | | | Small Cap
Value Fund | |
ASSETS | | | | | | | | |
Investments at cost | | $ | 190,866,092 | | | $ | 846,073,240 | |
Net unrealized appreciation | | | 63,534,135 | | | | 298,832,681 | |
| | | | | | | | |
Investments at value | | | 254,400,227 | | | | 1,144,905,921 | |
Receivable for Fund shares sold | | | 2,759,371 | | | | 1,189,404 | |
Receivable for securities sold | | | 2,493,718 | | | | 3,596,864 | |
Dividends receivable | | | 11,807 | | | | 1,023,887 | |
| | | | | | | | |
TOTAL ASSETS | | | 259,665,123 | | | | 1,150,716,076 | |
| | | | | | | | |
LIABILITIES | | | | | | | | |
Payable for securities purchased | | | 9,412,848 | | | | 2,599,458 | |
Payable for Fund shares redeemed | | | 419,498 | | | | 822,884 | |
Management fees payable (Note 5) | | | 165,921 | | | | 625,040 | |
Deferred Trustees’ fees (Note 5) | | | 61,666 | | | | 128,955 | |
Administrative fees payable (Note 5) | | | 9,006 | | | | 44,333 | |
Other accounts payable and accrued expenses | | | 59,701 | | | | 142,418 | |
| | | | | | | | |
TOTAL LIABILITIES | | | 10,128,640 | | | | 4,363,088 | |
| | | | | | | | |
NET ASSETS | | $ | 249,536,483 | | | $ | 1,146,352,988 | |
| | | | | | | | |
NET ASSETS CONSIST OF: | | | | | | | | |
Paid-in capital | | $ | 256,543,687 | | | $ | 925,364,035 | |
Distributions in excess of net investment income/Accumulated net investment (loss) | | | (979,364 | ) | | | (570,274 | ) |
Accumulated net realized loss on investments | | | (69,561,975 | ) | | | (77,273,454 | ) |
Net unrealized appreciation on investments | | | 63,534,135 | | | | 298,832,681 | |
| | | | | | | | |
NET ASSETS | | $ | 249,536,483 | | | $ | 1,146,352,988 | |
| | | | | | | | |
| | |
COMPUTATION OF NET ASSET VALUE AND OFFERING PRICE: | | | | | | | | |
Institutional Class: | | | | | | | | |
Net assets | | $ | 120,790,368 | | | $ | 582,154,282 | |
| | | | | | | | |
Shares of beneficial interest | | | 6,500,074 | | | | 20,253,147 | |
| | | | | | | | |
Net asset value, offering and redemption price per share | | $ | 18.58 | | | $ | 28.74 | |
| | | | | | | | |
Retail Class: | | | | | | | | |
Net assets | | $ | 128,746,115 | | | $ | 473,307,134 | |
| | | | | | | | |
Shares of beneficial interest | | | 7,179,209 | | | | 16,613,259 | |
| | | | | | | | |
Net asset value, offering and redemption price per share | | $ | 17.93 | | | $ | 28.49 | |
| | | | | | | | |
Admin Class: | | | | | | | | |
Net assets | | $ | — | | | $ | 90,891,572 | |
| | | | | | | | |
Shares of beneficial interest | | | — | | | | 3,247,518 | |
| | | | | | | | |
Net asset value, offering and redemption price per share | | $ | — | | | $ | 27.99 | |
| | | | | | | | |
See accompanying notes to financial statements.
| 24
Statements of Operations
For the Six Months Ended March 31, 2011 (Unaudited)
| | | | | | | | |
| | | Small Cap
Growth Fund | | | Small Cap
Value Fund | |
INVESTMENT INCOME | | | | | | | | |
Dividends | | $ | 103,003 | | | $ | 7,729,887 | |
| | | | | | | | |
Expenses | | | | | | | | |
Management fees (Note 5) | | | 678,739 | | | | 3,876,424 | |
Service and distribution fees (Note 5) | | | 123,948 | | | | 744,175 | |
Administrative fees (Note 5) | | | 42,270 | | | | 241,468 | |
Trustees’ fees and expenses (Note 5) | | | 13,834 | | | | 24,363 | |
Transfer agent fees and expenses (Notes 5 and 6) | | | 95,109 | | | | 631,451 | |
Audit and tax services fees | | | 18,507 | | | | 21,221 | |
Custodian fees and expenses | | | 12,298 | | | | 19,242 | |
Legal fees | | | 1,772 | | | | 11,302 | |
Registration fees | | | 22,072 | | | | 32,931 | |
Shareholder reporting expenses | | | 14,740 | | | | 70,671 | |
Miscellaneous expenses | | | 5,390 | | | | 17,116 | |
| | | | | | | | |
Total expenses | | | 1,028,679 | | | | 5,690,364 | |
Fee/expense recovery (Note 5) | | | 20,355 | | | | — | |
Less waiver and/or expense reimbursement (Note 5) | | | (20,098 | ) | | | (294,480 | ) |
| | | | | | | | |
Net expenses | | | 1,028,936 | | | | 5,395,884 | |
| | | | | | | | |
Net investment income (loss) | | | (925,933 | ) | | | 2,334,003 | |
| | | | | | | | |
| | |
NET REALIZED AND UNREALIZED GAIN ON INVESTMENTS | | | | | | | | |
Net realized gain on: | | | | | | | | |
Investments | | | 17,120,406 | | | | 71,963,853 | |
Net change in unrealized appreciation (depreciation) on: | | | | | | | | |
Investments | | | 34,048,054 | | | | 161,720,968 | |
| | | | | | | | |
Net realized and unrealized gain on investments | | | 51,168,460 | | | | 233,684,821 | |
| | | | | | | | |
| | |
NET INCREASE IN NET ASSETS RESULTING FROM OPERATIONS | | $ | 50,242,527 | | | $ | 236,018,824 | |
| | | | | | | | |
See accompanying notes to financial statements.
25 |
Statements of Changes in Net Assets
| | | | | | | | |
| Small Cap Growth Fund | | Six Months Ended
March 31, 2011
(Unaudited) | | | Year Ended
September 30, 2010 | |
FROM OPERATIONS: | | | | | | | | |
Net investment income (loss) | | $ | (925,933 | ) | | $ | (1,245,082 | ) |
Net realized gain on investments | | | 17,120,406 | | | | 14,954,786 | |
Net change in unrealized appreciation (depreciation) on investments | | | 34,048,054 | | | | 10,136,058 | |
| | | | | | | | |
Net increase in net assets resulting from operations | | | 50,242,527 | | | | 23,845,762 | |
| | | | | | | | |
FROM DISTRIBUTIONS TO SHAREHOLDERS: | | | | | | | | |
Net investment income | | | | | | | | |
Institutional Class | | | — | | | | — | |
Retail Class | | | — | | | | — | |
Admin Class | | | — | | | | — | |
| | | | | | | | |
Total distributions | | | — | | | | — | |
| | | | | | | | |
NET INCREASE (DECREASE) IN NET ASSETS FROM CAPITAL SHARE TRANSACTIONS (NOTE 10) | | | 71,448,603 | | | | (17,035,340 | ) |
| | | | | | | | |
Net increase (decrease) in net assets | | | 121,691,130 | | | | 6,810,422 | |
NET ASSETS | | | | | | | | |
Beginning of the period | | | 127,845,353 | | | | 121,034,931 | |
| | | | | | | | |
End of the period | | $ | 249,536,483 | | | $ | 127,845,353 | |
| | | | | | | | |
UNDISTRIBUTED (DISTRIBUTIONS IN EXCESS OF) NET INVESTMENT INCOME/ACCUMULATED NET INVESTMENT (LOSS) | | $ | (979,364 | ) | | $ | (53,431 | ) |
| | | | | | | | |
| | | | | | | | |
| Small Cap Value Fund | | Six Months Ended
March 31, 2011
(Unaudited) | | | Year Ended
September 30, 2010 | |
FROM OPERATIONS: | | | | | | | | |
Net investment income (loss) | | $ | 2,334,003 | | | $ | 3,463,326 | |
Net realized gain on investments | | | 71,963,853 | | | | 58,619,537 | |
Net change in unrealized appreciation (depreciation) on investments | | | 161,720,968 | | | | 34,774,717 | |
| | | | | | | | |
Net increase in net assets resulting from operations | | | 236,018,824 | | | | 96,857,580 | |
| | | | | | | | |
FROM DISTRIBUTIONS TO SHAREHOLDERS: | | | | | | | | |
Net investment income | | | | | | | | |
Institutional Class | | | (3,276,432 | ) | | | (1,798,397 | ) |
Retail Class | | | (1,768,636 | ) | | | (522,660 | ) |
Admin Class | | | (178,569 | ) | | | — | |
| | | | | | | | |
Total distributions | | | (5,223,637 | ) | | | (2,321,057 | ) |
| | | | | | | | |
NET INCREASE (DECREASE) IN NET ASSETS FROM CAPITAL SHARE TRANSACTIONS (NOTE 10) | | | 3,327,416 | | | | (150,208,179 | ) |
| | | | | | | | |
Net increase (decrease) in net assets | | | 234,122,603 | | | | (55,671,656 | ) |
NET ASSETS | | | | | | | | |
Beginning of the period | | | 912,230,385 | | | | 967,902,041 | |
| | | | | | | | |
End of the period | | $ | 1,146,352,988 | | | $ | 912,230,385 | |
| | | | | | | | |
UNDISTRIBUTED (DISTRIBUTIONS IN EXCESS OF) NET INVESTMENT INCOME/ACCUMULATED NET INVESTMENT (LOSS) | | $ | (570,274 | ) | | $ | 2,319,360 | |
| | | | | | | | |
See accompanying notes to financial statements.
| 26
Financial Highlights
For a share outstanding throughout each period.
| | | | | | | | | | | | | | | | | | | | | | | | | | | | | | | | |
| | | | | | Income (Loss) from
Investment Operations: | | | | | | Less Distributions: | |
| | | Net asset
value,
beginning
of the
period | | | Net
investment
income
(loss) (a)(b) | | | Net
realized
and
unrealized
gain (loss) | | | Total
from
investment
operations | | | | | | Dividends
from net
investment
income (b) | | | Distributions
from net
realized
capital
gains | | | Total
distributions | |
SMALL CAP GROWTH FUND | | | | | | | | | | | | | | | | | | | | | | | | | |
| | | | | | | |
| Institutional Class | | | | | | | | | | | | | | | | | | | | | | | | | | | | | |
3/31/2011(g) | | $ | 14.03 | | | $ | (0.07 | ) | | $ | 4.62 | | | $ | 4.55 | | | | | | | $ | — | | | $ | — | | | $ | — | |
9/30/2010 | | | 11.58 | | | | (0.11 | )(i) | | | 2.56 | | | | 2.45 | | | | | | | | — | | | | — | | | | — | |
9/30/2009 | | | 13.07 | | | | (0.07 | ) | | | (1.42 | ) | | | (1.49 | ) | | | | | | | — | | | | — | | | | — | |
9/30/2008 | | | 15.87 | | | | (0.07 | ) | | | (2.73 | ) | | | (2.80 | ) | | | | | | | — | | | | — | | | | — | |
9/30/2007 | | | 12.00 | | | | (0.06 | )(j) | | | 3.93 | | | | 3.87 | | | | | | | | — | | | | — | | | | — | |
9/30/2006 | | | 11.08 | | | | (0.08 | ) | | | 0.99 | | | | 0.91 | | | | | | | | — | | | | — | | | | — | |
| | | | | | | |
| Retail Class | | | | | | | | | | | | | | | | | | | | | | | | | | | | | |
3/31/2011(g) | | | 13.55 | | | | (0.09 | ) | | | 4.47 | | | | 4.38 | | | | | | | | — | | | | — | | | | — | |
9/30/2010 | | | 11.21 | | | | (0.13 | )(i) | | | 2.47 | | | | 2.34 | | | | | | | | — | | | | — | | | | — | |
9/30/2009 | | | 12.69 | | | | (0.09 | ) | | | (1.39 | ) | | | (1.48 | ) | | | | | | | — | | | | — | | | | — | |
9/30/2008 | | | 15.45 | | | | (0.10 | ) | | | (2.66 | ) | | | (2.76 | ) | | | | | | | — | | | | — | | | | — | |
9/30/2007 | | | 11.71 | | | | (0.09 | )(j) | | | 3.83 | | | | 3.74 | | | | | | | | — | | | | — | | | | — | |
9/30/2006 | | | 10.84 | | | | (0.11 | ) | | | 0.97 | | | | 0.86 | | | | | | | | — | | | | — | | | | — | |
| SMALL CAP VALUE FUND | | | | | | | | | | | | | | | | | | | | | | | | | |
| | | | | | | |
| Institutional Class | | | | | | | | | | | | | | | | | | | | | | | | | | | | | |
3/31/2011(g) | | $ | 22.93 | | | $ | 0.08 | | | $ | 5.89 | | | $ | 5.97 | | | | | | | $ | (0.16 | ) | | $ | — | | | $ | (0.16 | ) |
9/30/2010 | | | 20.66 | | | | 0.11 | | | | 2.23 | | | | 2.34 | | | | | | | | (0.07 | ) | | | — | | | | (0.07 | ) |
9/30/2009 | | | 22.01 | | | | 0.09 | | | | (1.32 | ) | | | (1.23 | ) | | | | | | | (0.11 | ) | | | (0.01 | ) | | | (0.12 | ) |
9/30/2008 | | | 28.77 | | | | 0.11 | (k) | | | (4.03 | ) | | | (3.92 | ) | | | | | | | (0.06 | ) | | | (2.78 | ) | | | (2.84 | ) |
9/30/2007 | | | 27.69 | | | | 0.12 | (j)(l) | | | 4.29 | | | | 4.41 | | | | | | | | (0.17 | ) | | | (3.16 | ) | | | (3.33 | ) |
9/30/2006 | | | 27.43 | | | | 0.13 | | | | 2.70 | | | | 2.83 | | | | | | | | (0.15 | ) | | | (2.42 | ) | | | (2.57 | ) |
| | | | | | | |
| Retail Class | | | | | | | | | | | | | | | | | | | | | | | | | | | | | |
3/31/2011(g) | | | 22.71 | | | | 0.04 | | | | 5.85 | | | | 5.89 | | | | | | | | (0.11 | ) | | | — | | | | (0.11 | ) |
9/30/2010 | | | 20.47 | | | | 0.06 | | | | 2.21 | | | | 2.27 | | | | | | | | (0.03 | ) | | | — | | | | (0.03 | ) |
9/30/2009 | | | 21.79 | | | | 0.04 | | | | (1.30 | ) | | | (1.26 | ) | | | | | | | (0.05 | ) | | | (0.01 | ) | | | (0.06 | ) |
9/30/2008 | | | 28.52 | | | | 0.05 | (k) | | | (4.00 | ) | | | (3.95 | ) | | | | | | | — | | | | (2.78 | ) | | | (2.78 | ) |
9/30/2007 | | | 27.46 | | | | 0.04 | (j)(l) | | | 4.28 | | | | 4.32 | | | | | | | | (0.10 | ) | | | (3.16 | ) | | | (3.26 | ) |
9/30/2006 | | | 27.23 | | | | 0.06 | | | | 2.67 | | | | 2.73 | | | | | | | | (0.08 | ) | | | (2.42 | ) | | | (2.50 | ) |
| | | | | | | |
| Admin Class | | | | | | | | | | | | | | | | | | | | | | | | | | | | | |
3/31/2011(g) | | | 22.30 | | | | 0.01 | | | | 5.73 | | | | 5.74 | | | | | | | | (0.05 | ) | | | — | | | | (0.05 | ) |
9/30/2010 | | | 20.11 | | | | 0.00 | | | | 2.19 | | | | 2.19 | | | | | | | | — | | | | — | | | | — | |
9/30/2009 | | | 21.40 | | | | 0.00 | | | | (1.28 | ) | | | (1.28 | ) | | | | | | | (0.00 | ) | | | (0.01 | ) | | | (0.01 | ) |
9/30/2008 | | | 28.13 | | | | (0.01 | )(k) | | | (3.94 | ) | | | (3.95 | ) | | | | | | | — | | | | (2.78 | ) | | | (2.78 | ) |
9/30/2007 | | | 27.14 | | | | (0.03 | )(j)(l) | | | 4.22 | | | | 4.19 | | | | | | | | (0.04 | ) | | | (3.16 | ) | | | (3.20 | ) |
9/30/2006 | | | 26.94 | | | | (0.01 | ) | | | 2.65 | | | | 2.64 | | | | | | | | (0.02 | ) | | | (2.42 | ) | | | (2.44 | ) |
| (a) | Per share net investment income (loss) has been calculated using the average shares outstanding during the period. | |
| (b) | Amount rounds to less than $0.01 per share, if applicable. | |
| (c) | Effective June 1, 2009, redemption fees were eliminated. | |
| (d) | Had certain expenses not been waived/reimbursed during the period, if applicable, total returns would have been lower. Periods less than one year, if applicable, are not annualized. | |
| (e) | Computed on an annualized basis for periods less than one year, if applicable. | |
| (f) | The investment adviser and/or administrator agreed to waive its fees and/or reimburse a portion of the Fund’s expenses during the period. Without this waiver/reimbursement, if applicable, expenses would have been higher. | |
| (g) | For the six months ended March 31, 2011 (Unaudited). | |
| (h) | Includes fee/expense recovery of 0.05%. | |
See accompanying notes to financial statements.
27 |
| | | | | | | | | | | | | | | | | | | | | | | | | | | | | | |
| | | | | | | | | | | | |
Ratios to Average Net Assets: | | | | |
Redemption
fees (b)(c) | | | Net asset
value,
end of
the
period | | | Total
return
(%) (d) | | | Net assets,
end of
the period
(000’s) | | | Net
expenses
(%) (e)(f) | | | Gross
expenses
(%) (e) | | | Net
investment
income (loss)
(%) (e) | | | Portfolio
turnover
rate (%) | |
| | | | | | | | | | | | | | | | | | | | | | | | | | | | | | |
| | | | | | | |
| | | | | | | | | | | | | | | | | | | | | | | | | | | | | | |
| $ | — | | | $ | 18.58 | | | | 32.43 | | | $ | 120,790 | | | | 1.00 | (h) | | | 1.00 | (h) | | | (0.89 | ) | | | 39 | |
| | — | | | | 14.03 | | | | 21.16 | | | | 52,501 | | | | 1.00 | | | | 1.06 | | | | (0.85 | )(i) | | | 69 | |
| | — | | | | 11.58 | | | | (11.40 | ) | | | 45,557 | | | | 1.00 | | | | 1.01 | | | | (0.68 | ) | | | 107 | |
| | 0.00 | | | | 13.07 | | | | (17.64 | ) | | | 44,540 | | | | 1.00 | | | | 1.01 | | | | (0.47 | ) | | | 92 | |
| | 0.00 | | | | 15.87 | | | | 32.25 | | | | 28,088 | | | | 1.00 | | | | 1.23 | | | | (0.47 | ) | | | 83 | |
| | 0.01 | | | | 12.00 | | | | 8.30 | | | | 20,414 | | | | 1.00 | | | | 1.38 | | | | (0.69 | ) | | | 100 | |
| | | | | | | |
| | | | | | | | | | | | | | | | | | | | | | | | | | | | | | |
| | — | | | | 17.93 | | | | 32.32 | | | | 128,746 | | | | 1.25 | | | | 1.29 | | | | (1.14 | ) | | | 39 | |
| | — | | | | 13.55 | | | | 20.87 | | | | 75,344 | | | | 1.25 | | | | 1.39 | | | | (1.10 | )(i) | | | 69 | |
| | — | | | | 11.21 | | | | (11.66 | ) | | | 75,478 | | | | 1.25 | | | | 1.43 | | | | (0.93 | ) | | | 107 | |
| | 0.00 | | | | 12.69 | | | | (17.86 | ) | | | 79,897 | | | | 1.25 | | | | 1.42 | | | | (0.70 | ) | | | 92 | |
| | 0.00 | | | | 15.45 | | | | 31.94 | | | | 20,924 | | | | 1.25 | | | | 1.50 | | | | (0.66 | ) | | | 83 | |
| | 0.01 | | | | 11.71 | | | | 8.03 | | | | 2,981 | | | | 1.25 | | | | 1.92 | | | | (0.94 | ) | | | 100 | |
| | | | | | | | | | | | | | | | | | | | | | | | | | | | | | |
| | | | | | | |
| | | | | | | | | | | | | | | | | | | | | | | | | | | | | | |
| $ | — | | | $ | 28.74 | | | | 26.11 | | | $ | 582,154 | | | | 0.90 | | | | 0.93 | | | | 0.60 | | | | 25 | |
| | — | | | | 22.93 | | | | 11.39 | | | | 454,853 | | | | 0.90 | | | | 0.94 | | | | 0.50 | | | | 52 | |
| | 0.00 | | | | 20.66 | | | | (5.42 | ) | | | 506,324 | | | | 0.90 | | | | 0.94 | | | | 0.52 | | | | 55 | |
| | 0.00 | | | | 22.01 | | | | (15.02 | ) | | | 553,268 | | | | 0.89 | | | | 0.89 | | | | 0.47 | | | | 61 | |
| | 0.00 | | | | 28.77 | | | | 17.02 | | | | 534,776 | | | | 0.89 | | | | 0.89 | | | | 0.43 | | | | 57 | |
| | 0.00 | | | | 27.69 | | | | 11.17 | | | | 442,714 | | | | 0.89 | (m) | | | 0.89 | (m) | | | 0.47 | | | | 62 | |
| | | | | | | |
| | | | | | | | | | | | | | | | | | | | | | | | | | | | | | |
| | — | | | | 28.49 | | | | 25.96 | | | | 473,307 | | | | 1.15 | | | | 1.22 | | | | 0.34 | | | | 25 | |
| | — | | | | 22.71 | | | | 11.10 | | | | 383,934 | | | | 1.15 | | | | 1.24 | | | | 0.26 | | | | 52 | |
| | 0.00 | | | | 20.47 | | | | (5.66 | ) | | | 387,383 | | | | 1.15 | | | | 1.31 | | | | 0.26 | | | | 55 | |
| | 0.00 | | | | 21.79 | | | | (15.21 | ) | | | 464,525 | | | | 1.15 | | | | 1.27 | | | | 0.21 | | | | 61 | |
| | 0.00 | | | | 28.52 | | | | 16.74 | | | | 465,055 | | | | 1.15 | | | | 1.24 | | | | 0.15 | | | | 57 | |
| | 0.00 | | | | 27.46 | | | | 10.87 | | | | 291,690 | | | | 1.15 | | | | 1.20 | | | | 0.21 | | | | 62 | |
| | | | | | | |
| | | | | | | | | | | | | | | | | | | | | | | | | | | | | | |
| | — | | | | 27.99 | | | | 25.78 | | | | 90,892 | | | | 1.40 | | | | 1.52 | | | | 0.10 | | | | 25 | |
| | — | | | | 22.30 | | | | 10.89 | | | | 73,443 | | | | 1.40 | | | | 1.56 | | | | 0.02 | | | | 52 | |
| | 0.00 | | | | 20.11 | | | | (5.93 | ) | | | 74,195 | | | | 1.40 | | | | 1.77 | | | | 0.02 | | | | 55 | |
| | 0.00 | | | | 21.40 | | | | (15.44 | ) | | | 77,855 | | | | 1.40 | | | | 1.68 | | | | (0.04 | ) | | | 61 | |
| | 0.00 | | | | 28.13 | | | | 16.41 | | | | 76,783 | | | | 1.40 | | | | 1.56 | | | | (0.10 | ) | | | 57 | |
| | 0.00 | | | | 27.14 | | | | 10.59 | | | | 64,367 | | | | 1.40 | | | | 1.46 | | | | (0.04 | ) | | | 62 | |
| | (i) | Includes a non-recurring dividend. Without this dividend, net investment loss per share would have been $(0.12) and $(0.14) for Institutional Class and Retail Class, respectively, and the ratio of net investment loss to average net assets would have been (0.92)% and (1.17)% for Institutional Class and Retail Class, respectively. | |
| | (j) | Includes a non-recurring payment of $0.01 per share and $0.00 per share for Small Cap Growth Fund and Small Cap Value Fund, respectively. | |
| | (k) | Includes a non-recurring dividend of $0.02 per share. | |
| | (l) | Includes a non-recurring dividend of $0.05 per share. | |
| | (m) | Includes fee/expense recovery of 0.02%. | |
See accompanying notes to financial statements.
| 28
Notes to Financial Statements
March 31, 2011 (Unaudited)
1. Organization. Loomis Sayles Funds I and Loomis Sayles Funds II (the “Trusts” and each a “Trust”) are each organized as a Massachusetts business trust. Each Trust is registered under the Investment Company Act of 1940, as amended (the “1940 Act”), as an open-end management investment company. Each Declaration of Trust permits the Board of Trustees to authorize the issuance of an unlimited number of shares of the Trust in multiple series. The financial statements for certain funds of the Trusts are presented in separate reports. The following funds (individually, a “Fund” and collectively, the “Funds”) are included in this report:
Loomis Sayles Funds I:
Loomis Sayles Small Cap Value Fund (the “Small Cap Value Fund”)
Loomis Sayles Funds II:
Loomis Sayles Small Cap Growth Fund (the “Small Cap Growth Fund”)
Each Fund offers Institutional Class Shares and Retail Class Shares. In addition, Small Cap Value Fund offers Admin Class Shares.
Most expenses of the Trusts can be directly attributed to a Fund. Expenses which cannot be directly attributed to a Fund are generally apportioned based on the relative net assets of each of the Funds in the Trusts. Expenses of a Fund are borne pro rata by the holders of each class of shares, except that each class bears expenses unique to that class (including the Rule 12b-1 service and distribution fees and transfer agent fees). In addition, each class votes as a class only with respect to its own Rule 12b-1 Plan. Shares of each class would receive their pro rata share of the net assets of a Fund if the Fund were liquidated. The Trustees approve separate distributions from net investment income on each class of shares.
2. Significant Accounting Policies. The following is a summary of significant accounting policies consistently followed by each Fund in the preparation of its financial statements. The Funds’ financial statements are prepared in accordance with accounting principles generally accepted in the United States of America which require the use of management estimates that affect the reported amounts and disclosures in the financial statements. Actual results could differ from those estimates. Management has evaluated the events and transactions subsequent to period-end through the date the financial statements were issued and has determined that there were no material events that would require disclosure in the Funds’ financial statements.
a. Valuation. Equity securities, including shares of closed-end investment companies and exchange-traded funds, for which market quotations are readily available are valued at market value, as reported by pricing services recommended by the investment adviser and approved by the Board of Trustees. Such pricing services generally use the security’s last sale price on the exchange or market where the security is primarily traded or, if there is no reported sale during the day, the closing bid price. Securities traded on the NASDAQ Global Select Market, NASDAQ Global Market and NASDAQ Capital Market are valued at the NASDAQ Official Closing Price (“NOCP”), or if lacking a NOCP, at the most
29 |
Notes to Financial Statements – continued
March 31, 2011 (Unaudited)
recent bid quotation on the applicable NASDAQ Market. Debt securities (other than short-term obligations purchased with an original or remaining maturity of sixty days or less) are generally valued on the basis of evaluated bids furnished to the Funds by a pricing service recommended by the investment adviser and approved by the Board of Trustees, which service determines valuations for normal, institutional-size trading units of such securities using market information, transactions for comparable securities and various relationships between securities which are generally recognized by institutional traders. Broker-dealer bid quotations may also be used to value debt and equity securities where a pricing service does not price a security or where a pricing service does not provide a reliable price for the security. In instances where broker-dealer bid quotations are not available, certain securities held by the Funds may be valued on the basis of a price provided by a principal market maker. Forward foreign currency contracts are valued utilizing interpolated prices determined from information provided by an independent pricing service. Short-term obligations purchased with an original or remaining maturity of sixty days or less are valued at amortized cost, which approximates market value. Investments in other open-end investment companies are valued at their net asset value each day. Securities for which market quotations are not readily available are valued at fair value as determined in good faith by the Funds’ investment adviser using consistently applied procedures under the general supervision of the Board of Trustees.
The Funds may hold securities traded in foreign markets. Foreign securities are valued at the market price in the foreign market. However, if events occurring after the close of the foreign market (but before the close of regular trading on the New York Stock Exchange) are believed to materially affect the value of those securities, such securities are fair valued pursuant to procedures approved by the Board of Trustees. When fair valuing securities, the Funds may, among other things, use modeling tools or other processes that may take into account factors such as securities market activity and/or significant events that occur after the close of the foreign market and before the Funds calculate their net asset values.
b. Investment Transactions and Related Investment Income. Investment transactions are accounted for on a trade date plus one basis for daily net asset value calculation. However, for financial reporting purposes, investment transactions are reported on trade date. Dividend income is recorded on ex-dividend date, or in the case of certain foreign securities, as soon as a Fund is notified, and interest income is recorded on an accrual basis. Interest income is increased by the accretion of discount and decreased by the amortization of premium. Distributions received from investments in securities that represent a return of capital or capital gain are recorded as a reduction of cost of investments or as a realized gain, respectively. The calendar year-end amounts of ordinary income, capital gains, and return of capital included in distributions received from the Funds’ investments in real estate investment trusts (“REITs”) are reported to the Funds after the end of the fiscal year; accordingly, the Funds estimate these amounts for accounting purposes until the characterization of REIT distributions is reported to the Funds after the end of the fiscal year. Estimates are based on the most recent REIT
| 30
Notes to Financial Statements – continued
March 31, 2011 (Unaudited)
distribution information available. Investment income is recorded net of foreign taxes withheld when applicable. In determining net gain or loss on securities sold, the cost of securities has been determined on an identified cost basis. Investment income, non-class specific expenses and realized and unrealized gains and losses are allocated on a pro rata basis to each class based on the relative net assets of each class to the total net assets of the Fund.
c. Foreign Currency Translation. The books and records of the Funds are maintained in U.S. dollars. The values of securities, currencies and other assets and liabilities denominated in currencies other than U.S. dollars are translated into U.S. dollars based upon foreign exchange rates prevailing at the end of the period. Purchases and sales of investment securities, income and expenses are translated on the respective dates of such transactions.
Since the values of investment securities are presented at the foreign exchange rates prevailing at the end of the period, it is not practical to isolate that portion of the results of operations arising from changes in exchange rates from fluctuations which arise due to changes in market prices of investment securities. Such changes are included with the net realized and unrealized gain or loss on investments.
Net realized foreign exchange gains or losses arise from sales of foreign currency, currency gains or losses realized between the trade and settlement dates on securities transactions and the difference between the amounts of dividends, interest and foreign withholding taxes recorded on the Funds’ books and the U.S. dollar equivalent of the amounts actually received or paid. Net unrealized foreign exchange gains and losses arise from changes in the value of assets and liabilities, other than investment securities, at the end of the fiscal period, resulting from changes in exchange rates.
Each Fund may use foreign currency exchange contracts to facilitate transactions in foreign-denominated investments. Losses may arise from changes in the value of the foreign currency or if the counterparties do not perform under the contracts’ terms.
d. Federal and Foreign Income Taxes. Each Trust treats each Fund as a separate entity for federal income tax purposes. Each Fund intends to meet the requirements of the Internal Revenue Code of 1986, as amended, applicable to regulated investment companies, and to distribute to its shareholders substantially all of its net investment income and any net realized capital gains at least annually. Management has performed an analysis of each Fund’s tax positions for the open tax years as of March 31, 2011 and has concluded that no provisions for income tax are required. The Funds’ federal tax returns for the prior three fiscal years remain subject to examination by the Internal Revenue Service. Management is not aware of any events that are reasonably possible to occur in the next six months that would result in the amounts of any unrecognized tax benefits significantly increasing or decreasing for the Funds. However, management’s conclusions regarding tax positions taken may be subject to review and adjustment at a later date based on factors including, but not limited to, new tax laws and accounting regulations and interpretations thereof.
31 |
Notes to Financial Statements – continued
March 31, 2011 (Unaudited)
A Fund may be subject to foreign taxes on income and gains on investments that are accrued based upon the Fund’s understanding of the tax rules and regulations that exist in the countries in which the Fund invests. Foreign governments may also impose taxes or other payments on investments with respect to foreign securities. Such taxes are accrued as applicable.
e. Dividends and Distributions to Shareholders. Dividends and distributions are recorded on ex-dividend date. The timing and characterization of certain income and capital gain distributions are determined annually in accordance with federal tax regulations, which may differ from accounting principles generally accepted in the United States of America. Permanent differences are primarily due to differing treatments for book and tax purposes of items such as expired capital loss carryforwards, distribution redesignations and net operating losses. Permanent book and tax basis differences relating to shareholder distributions will result in reclassifications to capital accounts. Temporary differences between book and tax distributable earnings are primarily due to securities lending collateral gain/loss adjustment, deferred Trustees’ fees and wash sales. Distributions from net investment income and short-term capital gains are considered to be distributed from ordinary income for tax purposes.
The tax characterization of distributions is determined on an annual basis. The tax character of distributions paid to shareholders during the year ended September 30, 2010 was as follows:
| | | | | | | | | | | | |
| | | 2010 Distributions Paid From: | |
Fund | | Ordinary
Income | | | Long-Term
Capital Gains | | | Total | |
Small Cap Growth Fund | | $ | — | | | $ | — | | | $ | — | |
Small Cap Value Fund | | | 2,321,057 | | | | — | | | | 2,321,057 | |
As of September 30, 2010, the capital loss carryforwards were as follows:
| | | | | | | | |
| Capital loss carryforward: | | Small Cap
Growth Fund | | | Small Cap
Value Fund | |
Expires September 30, 2011 | | $ | (59,283,040 | ) | | $ | — | |
Expires September 30, 2017 | | | (14,995,800 | ) | | | (88,137,321 | ) |
Expires September 30, 2018 | | | (11,885,718 | ) | | | (58,500,125 | ) |
| | | | | | | | |
Total capital loss carryforward | | $ | (86,164,558 | ) | | $ | (146,637,446 | ) |
| | | | | | | | |
On December 22, 2010, the Regulated Investment Company Modernization Act of 2010 (the “Act”) was enacted. The Act modernizes several of the federal income and excise tax provisions related to RICs, and, with certain exceptions, is effective for taxable years beginning after December 22, 2010. Among the changes made are changes to the capital loss carryforward rules allowing for capital losses to be carried forward indefinitely. Rules in effect as of the report date limit the carryforward period to eight years. Capital loss carryforwards generated in taxable years beginning after effective date of the Act must be
| 32
Notes to Financial Statements – continued
March 31, 2011 (Unaudited)
fully used before capital loss carryforwards generated in taxable years prior to effective date of the Act; therefore, under certain circumstances, capital loss carryforwards available as of the report date, if any, may expire unused.
f. Repurchase Agreements. It is each Fund’s policy that the market value of the collateral for repurchase agreements be at least equal to 102% of the repurchase price, including interest. Certain repurchase agreements are tri-party arrangements whereby the collateral is held in a segregated account for the benefit of the Fund and on behalf of the counterparty. Repurchase agreements could involve certain risks in the event of default or insolvency of the counterparty, including possible delays or restrictions upon a Fund’s ability to dispose of the underlying securities.
g. Securities Lending. The Funds have entered into an agreement with State Street Bank and Trust Company (“State Street Bank”), as agent of the Funds, to lend securities to certain designated borrowers. The loans are collateralized with cash or securities in an amount equal to at least 105% or 102% of the market value (including accrued interest) of the loaned international or domestic securities, respectively, when the loan is initiated. Thereafter, the value of the collateral must remain at least 102% of the market value (including accrued interest) of loaned securities for U.S. equities and U.S. corporate debt; at least 105% of the market value (including accrued interest) of loaned securities for non-U.S. equities; and at least 100% of the market value (including accrued interest) of loaned securities for U.S. Government securities, sovereign debt issued by non-U.S. Governments and non-U.S. corporate debt. In the event that the market value of the collateral falls below the required percentages described above, the borrower will deliver additional collateral on the next business day. As with other extensions of credit, the Funds may bear the risk of loss with respect to the investment of the collateral. The Funds invest cash collateral in short-term investments, a portion of the income from which is remitted to the borrowers and the remainder allocated between the Funds and State Street Bank as lending agent.
For the six months ended March 31, 2011, none of the Funds had loaned securities under this agreement.
h. Indemnifications. Under the Trusts’ organizational documents, their officers and Trustees are indemnified against certain liabilities arising out of the performance of their duties to the Funds. Additionally, in the normal course of business, the Funds enter into contracts with service providers that contain general indemnification clauses. The Funds’ maximum exposure under these arrangements is unknown as this would involve future claims that may be made against the Funds that have not yet occurred. However, based on experience, the Funds expect the risk of loss to be remote.
3. Fair Value Measurements. In accordance with accounting standards related to fair value measurements and disclosures, the Funds have categorized the inputs utilized in
33 |
Notes to Financial Statements – continued
March 31, 2011 (Unaudited)
determining the value of each Fund’s assets or liabilities. These inputs are summarized in the three broad levels listed below:
| | • | | Level 1—quoted prices in active markets for identical assets or liabilities; |
| | • | | Level 2—prices determined using other significant inputs that are observable either directly, or indirectly through corroboration with observable market data (which could include quoted prices for similar assets or liabilities, interest rates, credit risk, etc.); |
| | • | | Level 3—prices determined using significant unobservable inputs when quoted prices or observable inputs are unavailable such as when there is little or no market activity for an asset or liability (unobservable inputs reflect each Fund’s own assumptions in determining the fair value of assets or liabilities and would be based on the best information available). |
The inputs or methodology used for valuing securities are not necessarily an indication of the risk associated with investing in those securities.
The following is a summary of the inputs used to value the Funds’ investments as of March 31, 2011, at value:
Small Cap Growth Fund
Asset Valuation Inputs
| | | | | | | | | | | | | | | | |
Description(a) | | Level 1 | | | Level 2 | | | Level 3 | | | Total | |
Common Stocks | | $ | 238,295,871 | | | $ | — | | | $ | — | | | $ | 238,295,871 | |
Short-Term Investments | | | — | | | | 16,104,356 | | | | — | | | | 16,104,356 | |
| | | | | | | | | | | | | | | | |
Total | | $ | 238,295,871 | | | $ | 16,104,356 | | | $ | — | | | $ | 254,400,227 | |
| | | | | | | | | | | | | | | | |
(a) Major categories of the Fund’s investments are included in the Portfolio of Investments.
Small Cap Value Fund
Asset Valuation Inputs
| | | | | | | | | | | | | | | | |
Description(a) | | Level 1 | | | Level 2 | | | Level 3 | | | Total | |
Common Stocks | | $ | 1,109,838,104 | | | $ | — | | | $ | — | | | $ | 1,109,838,104 | |
Short-Term Investments | | | — | | | | 35,067,817 | | | | — | | | | 35,067,817 | |
| | | | | | | | | | | | | | | | |
Total | | $ | 1,109,838,104 | | | $ | 35,067,817 | | | $ | — | | | $ | 1,144,905,921 | |
| | | | | | | | | | | | | | | | |
| (a) | Major categories of the Fund’s investments are included in the Portfolio of Investments. | |
4. Purchases and Sales of Securities. For the six months ended March 31, 2011, purchases and sales of securities (excluding short-term investments) were as follows:
| | | | | | | | |
Fund | | Purchases | | | Sales | |
Small Cap Growth Fund | | $ | 132,000,138 | | | $ | 68,953,957 | |
Small Cap Value Fund | | | 247,614,342 | | | | 273,055,808 | |
| 34
Notes to Financial Statements – continued
March 31, 2011 (Unaudited)
5. Management Fees and Other Transactions with Affiliates.
a. Management Fees. Loomis, Sayles & Company, L.P. (“Loomis Sayles”) serves as investment adviser to each Fund. Under the terms of the management agreements, each Fund pays a management fee at the following annual rates, calculated daily and payable monthly, based on each Fund’s average daily net assets:
| | |
Fund | | Percentage of
Average Daily Net Assets |
Small Cap Growth Fund | | 0.75% |
Small Cap Value Fund | | 0.75% |
Loomis Sayles has given binding undertakings to the Funds to waive management fees and/or reimburse certain expenses to limit the Funds’ operating expenses, exclusive of acquired fund fees and expenses, brokerage expenses, interest expense, taxes and extraordinary expenses. These undertakings are in effect until January 31, 2012 and are reevaluated on an annual basis. Management fees payable, as reflected on the Statements of Assets and Liabilities, is net of waivers and/or expense reimbursements, if any, pursuant to these undertakings.
For the six months ended March 31, 2011, the expense limits as a percentage of average daily net assets under the expense limitation agreements were as follows:
| | | | | | |
| | | Expense Limit as a Percentage of
Average Daily Net Assets |
Fund | | Institutional Class | | Retail Class | | Admin Class |
Small Cap Growth Fund | | 1.00% | | 1.25% | | — |
Small Cap Value Fund | | 0.90% | | 1.15% | | 1.40% |
Loomis Sayles shall be permitted to recover expenses it has borne under the expense limitation agreements (whether through waiver of its management fees or otherwise) on a class by class basis in later periods to the extent the expenses of a class fall below a class’ expense limits, provided, however, that a class is not obligated to pay such waived/reimbursed fees or expenses more than one year after the end of the fiscal year in which the fees or expenses were waived/reimbursed.
For the six months ended March 31, 2011, the management fees for each Fund were as follows:
| | | | | | |
Fund | | Management
Fees | | | Percentage of
Average Daily Net Assets |
Small Cap Growth Fund | | $ | 678,739 | | | 0.75% |
Small Cap Value Fund | | | 3,876,424 | | | 0.75% |
For the six months ended March 31, 2011, class-specific expenses have been reimbursed as follows:
| | | | | | | | | | | | | | | | |
| | | Reimbursement1 | |
Fund | | Institutional
Class | | | Retail
Class | | | Admin
Class | | | Total | |
Small Cap Growth Fund | | $ | — | | | $ | 20,098 | | | $ | — | | | $ | 20,098 | |
Small Cap Value Fund | | | 83,694 | | | | 160,951 | | | | 49,835 | | | | 294,480 | |
1Expense reimbursements are subject to possible recovery until September 30, 2012.
35 |
Notes to Financial Statements – continued
March 31, 2011 (Unaudited)
For the six months ended March 31, 2011, expense reimbursements related to the prior fiscal year were recovered as follows:
| | | | | | | | | | | | |
| | | Recovered Expenses | |
Fund | | Institutional
Class | | | Retail Class | | | Total | |
Small Cap Growth Fund | | $ | 20,355 | | | $ | — | | | $ | 20,355 | |
Certain officers and employees of Loomis Sayles are also officers or Trustees of the Trust. Loomis Sayles’ general partner is indirectly owned by Natixis Global Asset Management, L.P. (“Natixis US”), which is part of Natixis Global Asset Management, an international asset management group based in Paris, France.
b. Service and Distribution Fees. Natixis Distributors, L.P. (“Natixis Distributors”), a wholly-owned subsidiary of Natixis US, has entered into a distribution agreement with the Trusts. Pursuant to this agreement, Natixis Distributors serves as principal underwriter of the Funds of the Trusts.
Pursuant to Rule 12b-1 under the 1940 Act, Small Cap Growth Fund and Small Cap Value Fund have adopted a Distribution Plan relating to each Fund’s Retail Class shares (the “Retail Class Plans”) and Small Cap Value Fund has adopted a Distribution Plan relating to its Admin Class shares (the “Admin Class Plan”).
Under the Retail Class Plans, each Fund pays Natixis Distributors a monthly distribution fee at an annual rate not to exceed 0.25% of the average daily net assets attributable to the Funds’ Retail Class shares, as compensation for services provided by Natixis Distributors in connection with the marketing or sale of Retail Class shares or for payments made by Natixis Distributors to securities dealers or other financial intermediaries as commissions, asset-based sales charges or other compensation with respect to the sale of Retail Class shares, or for providing personal services to investors and/or maintenance of shareholder accounts.
Under the Admin Class Plan, Small Cap Value Fund pays Natixis Distributors a monthly distribution fee at an annual rate not to exceed 0.25% of the average daily net assets attributable to the Fund’s Admin Class shares, as compensation for services provided by Natixis Distributors in connection with the marketing or sale of Admin Class shares or for payments made by Natixis Distributors to securities dealers or other financial intermediaries as commissions, asset-based sales charges or other compensation with respect to the sale of Admin Class shares, or for providing personal services to investors and/or the maintenance of shareholder accounts.
In addition, the Admin Class shares of Small Cap Value Fund may pay Natixis Distributors an administrative service fee, at an annual rate not to exceed 0.25% of the average daily net assets attributable to Admin Class shares. These fees are subsequently paid to securities dealers or financial intermediaries for providing personal services and/or account maintenance for their customers who hold such shares.
| 36
Notes to Financial Statements – continued
March 31, 2011 (Unaudited)
For the six months ended March 31, 2011, the Funds paid the following service and distribution fees:
| | | | | | | | | | | | |
| | | Service Fees | | | Distribution Fees | |
Fund | | Admin Class | | | Retail Class | | | Admin Class | |
Small Cap Growth Fund | | $ | — | | | $ | 123,948 | | | $ | — | |
Small Cap Value Fund | | | 103,146 | | | | 537,883 | | | | 103,146 | |
c. Administrative Fees. Natixis Asset Management Advisors, L.P. (“Natixis Advisors”) provides certain administrative services for the Funds and contracts with State Street Bank to serve as sub-administrator. Natixis Advisors is a wholly-owned subsidiary of Natixis US. Pursuant to an agreement among Natixis Funds Trust I, Natixis Funds Trust II, Natixis Funds Trust IV, Natixis Cash Management Trust, Gateway Trust (“Natixis Funds Trusts”), Loomis Sayles Funds I, Loomis Sayles Funds II (“Loomis Sayles Funds Trusts”), Hansberger International Series and Natixis Advisors, each Fund pays Natixis Advisors monthly its pro rata portion of fees equal to an annual rate of 0.0575% of the first $15 billion of the average daily net assets of the Natixis Funds Trusts, Loomis Sayles Funds Trusts and Hansberger International Series, 0.0500% of the next $15 billion, 0.0400% of the next $30 billion and 0.0350% of such assets in excess of $60 billion, subject to an annual aggregate minimum fee for the Natixis Funds Trusts, Loomis Sayles Funds Trusts and Hansberger International Series of $10 million, which is reevaluated on an annual basis. New funds are subject to a fee for the first twelve months of operations of $75,000 plus $12,500 per additional class and an additional $75,000 if managed by multiple subadvisers.
For the six months ended March 31, 2011, each Fund paid the following administrative fees to Natixis Advisors:
| | | | |
Fund | | Administrative
Fees | |
Small Cap Growth Fund | | $ | 42,270 | |
Small Cap Value Fund | | | 241,468 | |
d. Sub-Transfer Agent Fees. Natixis Distributors has entered into agreements with financial intermediaries to provide certain recordkeeping, processing, shareholder communications and other services to customers of the intermediaries and has agreed to compensate the intermediaries for providing those services. Certain services would be provided by the Funds if the shares of those customers were registered directly with the Funds’ transfer agent. Accordingly, the Funds agreed to pay a portion of the intermediary fees attributable to shares of the Fund held by the intermediaries (which generally is a percentage of the value of shares held) not to exceed what the Funds would have paid its transfer agent had each customer’s shares been registered directly with the transfer agent instead of held through the intermediaries. Natixis Distributors pays the remainder of the fees.
37 |
Notes to Financial Statements – continued
March 31, 2011 (Unaudited)
For the six months ended March 31, 2011, the Funds paid the following sub-transfer agent fees, which are reflected in transfer agent fees and expenses in the Statements of Operations:
| | | | | | | | | | | | |
| | | Sub-Transfer Agent Fees | |
Fund | | Institutional
Class | | | Retail Class | | | Admin
Class | |
Small Cap Growth Fund | | $ | 21,215 | | | $ | 29,301 | | | $ | — | |
Small Cap Value Fund | | | 209,839 | | | | 274,357 | | | | 74,719 | |
e. Trustees Fees and Expenses. The Trusts do not pay any compensation directly to their officers or Trustees who are directors, officers or employees of Natixis Advisors, Natixis Distributors, Natixis US or their affiliates. The Chairperson of the Board receives a retainer fee at the annual rate of $250,000. The Chairperson does not receive any meeting attendance fees for Board of Trustees meetings or committee meetings that she attends. Each Independent Trustee (other than the Chairperson) receives, in the aggregate, a retainer fee at the annual rate of $80,000. Each Independent Trustee also receives a meeting attendance fee of $10,000 for each meeting of the Board of Trustees that he or she attends in person and $5,000 for each meeting of the Board of Trustees that he or she attends telephonically. In addition, each committee chairman receives an additional retainer fee at an annual rate of $15,000. Each Contract Review and Governance Committee member is compensated $6,000 for each Committee meeting that he or she attends in person and $3,000 for each meeting that he or she attends telephonically. Each Audit Committee member is compensated $7,500 for each Committee meeting that he or she attends in person and $3,750 for each meeting that he or she attends telephonically. These fees are allocated among the funds in the Natixis Funds Trusts, Loomis Sayles Funds Trusts and Hansberger International Series based on a formula that takes into account, among other factors, the relative net assets of each fund. Trustees are reimbursed for travel expenses in connection with attendance at meetings.
A deferred compensation plan (the “Plan”) is available to the Trustees on a voluntary basis. Deferred amounts remain in the Funds until distributed in accordance with the provisions of the Plan. The value of a participating Trustee’s deferral account is based on theoretical investments of deferred amounts, on the normal payment dates, in certain funds of the Natixis Funds Trusts, Loomis Sayles Funds Trusts and Hansberger International Series as designated by the participating Trustees. Changes in the value of participants’ deferral accounts are allocated pro rata among the funds in the Natixis Funds Trusts, Loomis Sayles Funds Trusts, and Hansberger International Series, and are normally reflected as Trustees’ fees and expenses in the Statements of Operations. The portions of the accrued obligations allocated to the Funds under the Plan are reflected as Deferred Trustees’ fees in the Statements of Assets and Liabilities.
f. Payments by Affiliates. For the six months ended March 31, 2011, Loomis Sayles reimbursed Small Cap Growth Fund $36 for losses incurred in connection with a trading error.
| 38
Notes to Financial Statements – continued
March 31, 2011 (Unaudited)
6. Class Specific Expenses. For the six months ended March 31, 2011, the Funds paid the following class-specific transfer agent fees and expenses (including sub-transfer agent fees):
| | | | | | | | | | | | |
| | | Transfer Agent Fees and Expenses | |
Fund | | Institutional
Class | | | Retail Class | | | Admin
Class | |
Small Cap Growth Fund | | $ | 22,608 | | | $ | 72,501 | | | $ | — | |
Small Cap Value Fund | | | 253,033 | | | | 301,579 | | | | 76,839 | |
7. Line of Credit. Each Fund, together with certain other funds of Natixis Funds Trusts, Loomis Sayles Funds Trusts and Hansberger International Series, participates in a $200,000,000 committed unsecured line of credit provided by State Street Bank, with an individual limit of $125,000,000 for each fund that participates in the line of credit. Interest is charged to each participating fund based on its borrowings at a rate per annum equal to the greater of the Federal Funds rate or overnight LIBOR, plus 1.25%. In addition, a commitment fee of 0.15% per annum, payable at the end of each calendar quarter, is accrued and apportioned among the participating funds based on their average daily unused portion of the line of credit.
Effective April 21, 2011, each Fund, together with certain other funds of Natixis Funds Trusts, Loomis Sayles Funds Trusts and Hansberger International Series, will participate in a $200,000,000 committed unsecured line of credit provided by State Street Bank, with an individual limit of $125,000,000 for each fund that will participate in the line of credit. Interest will be charged to each participating fund based on its borrowings at a rate per annum equal to the greater of the Federal Funds rate or overnight LIBOR, plus 1.25%. In addition, a commitment fee of 0.125% per annum, payable at the end of each calendar quarter, will be accrued and apportioned among the participating funds based on their average daily unused portion of the line of credit.
For the six months ended March 31, 2011, none of the Funds had borrowings under these agreements.
8. Brokerage Commission Recapture. Each Fund has entered into agreements with certain brokers whereby the brokers will rebate a portion of brokerage commissions. All amounts rebated by the brokers are returned to the Funds under such agreements and are included in realized gains on investments in the Statements of Operations. For the six months ended March 31, 2011, amounts rebated under these agreements were as follows:
| | | | |
Fund | | Rebates | |
Small Cap Growth Fund | | $ | 10,256 | |
Small Cap Value Fund | | | 67,389 | |
9. Concentration of Ownership. At March 31, 2011, Loomis Sayles Funded Pension Plan and Trust (“Pension Plan”) and the Loomis Sayles Employees’ Profit Sharing Retirement Plan (“Retirement Plan”) held shares of beneficial interest in the Funds as follows:
| | | | | | | | |
Fund | | Pension Plan | | | Retirement Plan | |
Small Cap Growth Fund | | | 356,240 | | | | 420,374 | |
Small Cap Value Fund | | | 394,254 | | | | 730,654 | |
39 |
Notes to Financial Statements – continued
March 31, 2011 (Unaudited)
From time to time, the Funds may have a concentration of several shareholders having a significant percentage of shares outstanding. Investment activities of these shareholders could have material impacts on the Funds. As of March 31, 2011, one shareholder account owned more than 5% of Small Cap Growth Fund’s total outstanding shares, representing 5.30% of the Fund’s net assets. Such ownership may be beneficially held by individuals or entities other than the owner of record.
10. Capital Shares. Each Fund may issue an unlimited number of shares of beneficial interest, without par value. Transactions in capital shares were as follows:
| | | | | | | | | | | | | | | | |
| | | Small Cap Growth Fund | |
| | | Six Months Ended
March 31, 2011 | | | Year Ended
September 30, 2010 | |
| Institutional Class | | Shares | | | Amount | | | Shares | | | Amount | |
Issued from the sale of shares | | | 3,332,975 | | | $ | 55,477,806 | | | | 942,038 | | | $ | 12,157,438 | |
Issued in connection with the reinvestment of distributions | | | — | | | | — | | | | — | | | | — | |
Redeemed | | | (575,534 | ) | | | (9,643,306 | ) | | | (1,134,399 | ) | | | (14,055,822 | ) |
| | | | | | | | | | | | | | | | |
Net change | | | 2,757,441 | | | $ | 45,834,500 | | | | (192,361 | ) | | $ | (1,898,384 | ) |
| | | | | | | | | | | | | | | | |
| Retail Class | | | | | | | | | | | | |
Issued from the sale of shares | | | 2,572,111 | | | $ | 40,906,269 | | | | 1,649,726 | | | $ | 20,206,682 | |
Issued in connection with the reinvestment of distributions | | | — | | | | — | | | | — | | | | — | |
Redeemed | | | (951,624 | ) | | | (15,292,166 | ) | | | (2,822,162 | ) | | | (35,343,638 | ) |
| | | | | | | | | | | | | | | | |
Net change | | | 1,620,487 | | | $ | 25,614,103 | | | | (1,172,436 | ) | | $ | (15,136,956 | ) |
| | | | | | | | | | | | | | | | |
Increase (decrease) from capital share transactions | | | 4,377,928 | | | $ | 71,448,603 | | | | (1,364,797 | ) | | $ | (17,035,340 | ) |
| | | | | | | | | | | | | | | | |
| 40
Notes to Financial Statements – continued
March 31, 2011 (Unaudited)
10. Capital Shares (continued)
| | | | | | | | | | | | | | | | |
| | | Small Cap Value Fund | |
| | | Six Months Ended
March 31, 2011 | | | Year Ended
September 30, 2010 | |
| Institutional Class | | Shares | | | Amount | | | Shares | | | Amount | |
Issued from the sale of shares | | | 1,940,008 | | | $ | 51,491,304 | | | | 2,602,888 | | | $ | 56,206,503 | |
Issued in connection with the reinvestment of distributions | | | 114,244 | | | | 3,053,734 | | | | 80,409 | | | | 1,643,559 | |
Redeemed | | | (1,635,183 | ) | | | (43,226,771 | ) | | | (7,355,313 | ) | | | (156,910,081 | ) |
| | | | | | | | | | | | | | | | |
Net change | | | 419,069 | | | $ | 11,318,267 | | | | (4,672,016 | ) | | $ | (99,060,019 | ) |
| | | | | | | | | | | | | | | | |
| Retail Class | | | | | | | | | | | | |
Issued from the sale of shares | | | 1,288,707 | | | $ | 33,912,104 | | | | 1,882,548 | | | $ | 40,646,183 | |
Issued in connection with the reinvestment of distributions | | | 66,486 | | | | 1,762,558 | | | | 25,691 | | | | 521,021 | |
Redeemed | | | (1,647,759 | ) | | | (42,551,105 | ) | | | (3,929,781 | ) | | | (84,156,249 | ) |
| | | | | | | | | | | | | | | | |
Net change | | | (292,566 | ) | | $ | (6,876,443 | ) | | | (2,021,542 | ) | | $ | (42,989,045 | ) |
| | | | | | | | | | | | | | | | |
| Admin Class | | | | | | | | | | | | |
Issued from the sale of shares | | | 630,020 | | | $ | 16,316,416 | | | | 995,292 | | | $ | 21,022,763 | |
Issued in connection with the reinvestment of distributions | | | 5,109 | | | | 133,140 | | | | — | | | | — | |
Redeemed | | | (681,741 | ) | | | (17,563,964 | ) | | | (1,389,922 | ) | | | (29,181,878 | ) |
| | | | | | | | | | | | | | | | |
Net change | | | (46,612 | ) | | $ | (1,114,408 | ) | | | (394,630 | ) | | $ | (8,159,115 | ) |
| | | | | | | | | | | | | | | | |
Increase (decrease) from capital share transactions | | | 79,891 | | | $ | 3,327,416 | | | | (7,088,188 | ) | | $ | (150,208,179 | ) |
| | | | | | | | | | | | | | | | |
41 |
SEMIANNUAL REPORT
March 31, 2011

Loomis Sayles Investment Grade Bond Fund
Loomis, Sayles & Company, L.P.
TABLE OF CONTENTS
Management Discussion page 1
Investment Results page 3
Portfolio of Investments page 9
Financial Statements page 28
Loomis Sayles Investment Grade Bond Fund
Management Discussion
Managers:
Daniel Fuss, CFA, CIC
Associate Managers:
Matthew J. Eagan, CFA
Kathleen Gaffney, CFA
Elaine Stokes
Loomis, Sayles & Company, L.P.
Objective:
High total investment return through a combination of current income and capital appreciation
Strategy:
Invests primarily in investment-grade, fixed-income securities, although it may invest up to 10% of its assets in below investment-grade fixed-income securities. The fund may invest any portion of its assets in securities of Canadian issuers and up to 20% in other foreign securities, including emerging markets.
Fund Inception:
December 31, 1996
Symbols:
| | |
| Class A | | LIGRX |
| Class B | | LGBBX |
| Class C | | LGBCX |
| Class Y | | LSIIX |
| Admin Class | | LIGAX |
| Class J | | LIGJX |
Market Conditions
Corporate bonds and credit-sensitive securities outperformed Treasuries and other high quality fixed-income investments during the six months ended March 31, 2011. The Federal Reserve Board’s (the Fed’s) accommodative policies combined with an expanding global economy, solid corporate earnings gains and rising consumer confidence to create a favorable backdrop for riskier sectors. However, the fixed-income market became more volatile toward the end of the first quarter of 2011 as a result of political unrest in the Middle East, a devastating earthquake in Japan and rising commodity prices, particularly for oil. Meanwhile, the U.S. dollar declined relative to major currencies over the period.
Performance Results
For the six months ended March 31, 2011, Class A shares of Loomis Sayles Investment Grade Bond Fund returned 2.44% at net asset value. The fund outperformed its benchmark, the Barclays Capital U.S. Government/Credit Bond Index, which returned -1.90%. It also outperformed the 0.12% average return of funds in its peer group, the Morningstar Intermediate-Term Bond category.
Explanation of Fund Performance
The fund’s outperformance was primarily due to strong security selection and sector positioning within non-U.S. dollar holdings, investment grade and high yield corporate credit and convertible bonds. A decision to underweight U.S. Treasuries also proved helpful in a market that rewarded risk.
The fund’s substantial out-of-benchmark exposure to outperforming, higher-yielding currencies was a major factor in its outperformance, as the U.S. dollar fell in relative value against many foreign currencies. Exposure to the Canadian dollar, Australian dollar, Norwegian krone and New Zealand dollar provided the greatest boost to returns. At the same time, security selection within the investment-grade corporate sector also helped, led by holdings in the finance, banking, capital goods and transportation industries. In addition, the fund gained from modest positions in the higher-yielding, below-investment-grade corporate market, which is not part of the benchmark. Within the high-yield sector, we concentrated on industrials, where we received particularly
1 |
good results in the consumer cyclicals, transportation and basic and capital goods industries. Exposure to commercial mortgage- and asset-backed securities also helped performance, as did positions in convertible bonds.
While the fund’s exposure to credit risk had a positive effect on returns, exposure to interest-rate risk had a somewhat negative effect, as yields moved higher during the six months. We maintained a slightly longer-than-benchmark duration—a measure of price sensitivity to changes in yields—and this positioning tended to hold back results when yields rose. The fund’s small position in municipal bonds also modestly detracted from relative performance.
Outlook
Strong liquidity, markets in transition, geopolitical turmoil, continued economic recovery and tragic natural disasters garnered significant attention from market participants during the first quarter of 2011. Many of these themes will continue to dominate investor consciousness going forward. We believe markets remain in transition regarding interest rates, with pressures building both globally and domestically. Globally, growth in many areas of the world remains robust; however, inflation concerns have begun to attract attention. Central banks will likely continue to shift toward less accommodative policy as 2011 progresses. We anticipate the Fed’s program of Treasury purchases in the United States, which is referred to as “QE2” (short for quantitative easing), will end during the second quarter and believe the U.S. economic recovery has sufficient momentum to continue expanding without outsized government stimulus.
Our assessment of the fundamental underpinnings of the corporate sector remains positive. In general, corporations are proceeding conservatively with regard to hiring and capital expenditures. Merger and acquisition activity has increased recently, and we believe there is room for more growth in that space. Valuations in the corporate bond space are generally fair, with investor demand for yield providing support and liquidity to the high-yield, investment-grade and convertible sectors. We continue to position the fund for global economic recovery, as well as a gradual upward bias in interest rates. We continue to emphasize yield advantage, global diversification and specific bond picking within the fund.
What You Should Know:
Investments in the Fund are subject to a number of risks. Please see the “Principal Risks” section of the Fund’s prospectus. The purchase of Fund shares should be seen as a long-term investment.
| 2
Loomis Sayles Investment Grade Bond Fund
Investment Results through March 31, 2011
The charts comparing the fund’s performance to an index provide you with a general sense of how it performed. The fund’s total return for the period shown below appears with and without sales charges and includes fund expenses and fees. An index measures the performance of a theoretical portfolio. Unlike a fund, the index is unmanaged and does not have expenses that affect the results. It is not possible to invest directly in an index. Investors would incur transaction costs and other expenses if they purchased the securities necessary to match the index.
Growth of a $10,000 Investment in Class A Shares1,4
March 31, 2001 through March 31, 2011
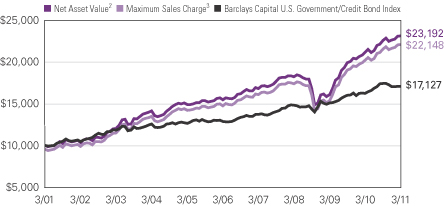
3 |
Average Annual Total Returns — March 31, 20114
| | | | | | | | | | | | | | | | |
| | | | | |
| | | 6 Months | | | 1 Year | | | 5 Years | | | 10 Years | |
| | | | | |
| Class A (Inception 12/31/96)1 | | | | | | | | | | | | | | | | |
| Net Asset Value2 | | | 2.44 | % | | | 9.35 | % | | | 8.41 | % | | | 8.78 | % |
| With Maximum Sales Charge3 | | | -2.16 | | | | 4.40 | | | | 7.43 | | | | 8.27 | |
| | | | | |
| Class B (Inception 9/12/03)1 | | | | | | | | | | | | | | | | |
| Net Asset Value2 | | | 2.06 | | | | 8.52 | | | | 7.51 | | | | 7.85 | |
| With CDSC5 | | | -2.83 | | | | 3.52 | | | | 7.21 | | | | 7.85 | |
| | | | | |
| Class C (Inception 9/12/03)1 | | | | | | | | | | | | | | | | |
| Net Asset Value2 | | | 2.07 | | | | 8.51 | | | | 7.61 | | | | 7.90 | |
| With CDSC5 | | | 1.09 | | | | 7.51 | | | | 7.61 | | | | 7.90 | |
| | | | | |
| Class Y (Inception 12/31/96) | | | | | | | | | | | | | | | | |
| Net Asset Value2 | | | 2.65 | | | | 9.62 | | | | 8.72 | | | | 9.08 | |
| | | | | |
| Admin Class (Inception 2/1/10)1 | | | | | | | | | | | | | | | | |
| Net Asset Value2 | | | 2.33 | | | | 9.04 | | | | 7.96 | | | | 8.23 | |
| | | | | |
| Class J (Inception 5/24/99) | | | | | | | | | | | | | | | | |
| Net Asset Value2 | | | 2.19 | | | | 8.73 | | | | 7.90 | | | | 8.26 | |
| With Sales Charge5 | | | -1.35 | | | | 4.90 | | | | 7.13 | | | | 7.87 | |
| | | | | |
| COMPARATIVE PERFORMANCE | | | | | | | | | | | | | | | | |
| Barclays Capital U.S. Government/Credit Bond Index | | | -1.90 | | | | 5.26 | | | | 5.83 | | | | 5.53 | |
| Morningstar Intermediate-Term Bond Fund Avg. | | | 0.12 | | | | 6.16 | | | | 5.50 | | | | 5.15 | |
All returns represent past performance and do not guarantee future results. Share price and return will vary and you may have a gain or loss when you sell your shares. All results include reinvestment of any dividends and capital gains. Current returns may be higher or lower than those shown. For performance current to the most recent month-end, visit ga.natixis.com. Class Y shares are not available for purchase by all investors. Class J shares are not offered for sale in the United States and are not eligible for sale to U.S. investors. The table and graph do not reflect taxes shareholders might owe on any fund distributions or when they redeem their shares.
NOTES TO CHARTS
See page 6 for a description of the index/average.
| 1 | Prior to 9/15/03, performance of Class A shares is that of Retail Class shares, which were redesignated as Class A shares, restated to reflect the sales load of Class A shares. From 12/18/00 to 1/31/02, during which time Retail Class shares were not outstanding, performance is that of Institutional Class shares, restated to reflect the higher net expenses and sales loads of Class A shares. Prior to the inception of Class B and C shares (9/12/03), performance is that of Institutional Class shares, which were redesignated as Class Y shares, restated to reflect the higher net expenses and sales loads of Class B and C shares. Prior to the inception of Admin Class shares (2/1/10), performance is that of Class A shares, restated to reflect the higher net expenses of Admin Class shares. |
| 2 | At Net Asset Value (NAV) - does not reflect payment of sales charge at time of purchase. |
| 3 | With Maximum Sales Charge (MSC) - reflects maximum sales charge of 4.50% at time of purchase. |
| 4 | Fund performance has been increased by fee waivers and/or expense reimbursements, if any, without which performance would have been lower. |
| 5 | Performance for Class B shares assumes a maximum 5% contingent deferred sales charge (“CDSC”) applied when you sell shares, which declines annually between years 1-6 according to the following schedule: 5, 4, 3, 3, 2, 1, 0%. Class C shares performance assumes a 1% CDSC applied when you sell shares within one year of purchase. Performance for Class J assumes a 3.50% sales charge. |
| 4
| | | | |
| | | % of Net Assets as of | |
| CREDIT QUALITY | | 3/31/11 | |
Aaa | | | 23.2 | |
Aa | | | 6.4 | |
A | | | 24.4 | |
Baa | | | 37.1 | |
Ba | | | 4.7 | |
B | | | 2.0 | |
Caa & Lower | | | 0.1 | |
Not Rated | | | 0.0 | |
Short-term and other | | | 2.1 | |
Credit quality at 3/31/11 reflects the highest credit rating assigned to individual holdings of the fund among Moody’s, S&P or Fitch; ratings are subject to change. The fund’s shares are not rated by any rating agency and no credit rating for the fund’s shares is implied. The Moody’s equivalent of the assigned rating is presented in the table.
| | | | |
| | | % of Net Assets as of | |
| EFFECTIVE MATURITY | | 3/31/11 | |
1 year or less | | | 5.7 | |
1-5 years | | | 26.3 | |
5-10 years | | | 46.3 | |
10+ years | | | 21.7 | |
Average Effective Maturity | | | 9.6 | years |
Portfolio characteristics will vary.
Expense Ratios
as stated in the most recent prospectus
| | | | | | | | |
| Share Class | | Gross Expense Ratio1 | | | Net Expense Ratio2 | |
| A | | | 0.81 | % | | | 0.81 | % |
| B | | | 1.56 | | | | 1.56 | |
| C | | | 1.56 | | | | 1.56 | |
| Y | | | 0.56 | | | | 0.56 | |
| Admin | | | 1.06 | | | | 1.06 | |
| J | | | 1.30 | | | | 1.30 | |
| 1 | Before fee waivers and/or expense reimbursements. |
| 2 | After fee waivers and/or expense reimbursements. Waivers/reimbursements are contractual and are set to expire on 1/31/12. Contracts are reevaluated on an annual basis. |
5 |
ADDITIONAL INFORMATION
The views expressed in this report reflect those of the portfolio managers as of the dates indicated. The managers’ views are subject to change at any time without notice based on changes in market or other conditions. References to specific securities or industries should not be regarded as investment advice. Because the fund is actively managed, there is no assurance that it will continue to invest in the securities, countries or industries mentioned.
Before investing, consider the fund’s investment objectives, risks, charges and other expenses. Visit ga.natixis.com or call 800-225-5478 for a prospectus and/or a summary prospectus, both of which contain this and other information. Read it carefully.
INDEX/AVERAGE DESCRIPTIONS:
Barclays Capital U.S. Government/Credit Bond Index is an unmanaged index that includes U.S. Treasuries, government-related issues, and investment grade U.S. corporate securities.
Morningstar Intermediate-Term Bond Fund Average is the average performance without sales charges of funds with similar investment objectives, as calculated by Morningstar, Inc.
PROXY VOTING INFORMATION
A description of the fund’s proxy voting policies and procedures is available without charge, upon request, by calling Natixis Funds at 800-225-5478; on the fund’s website at ga.natixis.com; and on the Securities and Exchange Commission’s (SEC’s) website at www.sec.gov. Information regarding how the fund voted proxies relating to portfolio securities during the 12-month period ended June 30, 2010 is available from the fund’s website and the SEC’s website.
QUARTERLY PORTFOLIO SCHEDULES
The fund files a complete schedule of portfolio holdings with the SEC for the first and third quarters of each fiscal year on Form N-Q. The fund’s Forms N-Q are available on the SEC’s website at www.sec.gov and may be reviewed and copied at the SEC’s Public Reference Room in Washington, DC. Information on the operation of the Public Reference Room may be obtained by calling 1-800-SEC-0330.
| 6
UNDERSTANDING YOUR FUND’S EXPENSES
As a mutual fund shareholder, you incur different types of costs: transaction costs, including sales charges (loads) on purchases and contingent deferred sales charges on redemptions; and ongoing costs, including management fees, distribution fees (12b-1 fees) and/or service fees, and other fund expenses. These costs are described in more detail in the fund’s prospectus. The examples below are intended to help you understand the ongoing costs of investing in the fund and help you compare these with the ongoing costs of investing in other mutual funds.
The first line in the table for each class shows the actual amount of fund expenses you would have paid on a $1,000 investment in the fund from October 1, 2010 through March 31, 2011. It also shows how much a $1,000 investment would be worth at the close of the period, assuming actual fund returns and expenses. To estimate the expenses you paid over the period, simply divide your account value by $1,000 (for example $8,600 account value divided by $1,000 =8.6) and multiply the result by the number in the Expenses Paid During the Period row as shown below for your class.
The second line in the table for each class provides information about hypothetical account values and hypothetical expenses based on the fund’s actual expense ratios and an assumed rate of return of 5% per year before expenses, which is not the fund’s actual return. The hypothetical account values and expenses may not be used to estimate the actual ending account balance or expenses you paid on your investment for the period. You may use this information to compare the ongoing costs of investing in the fund and other funds. To do so, compare this 5% hypothetical example with the 5% hypothetical examples that appear in the shareholder reports of the other funds.
Please note that the expenses shown reflect ongoing costs only, and do not include any transaction costs. Therefore, the second line in the table of the fund is useful in comparing ongoing costs only, and will not help you determine the relative costs of owning different funds. If transaction costs were included, total costs would be higher.
7 |
| | | | | | | | | | | | |
LOOMIS SAYLES INVESTMENT GRADE
BOND FUND | | BEGINNING
ACCOUNT VALUE
10/1/2010 | | | ENDING
ACCOUNT VALUE
3/31/2011 | | | EXPENSES PAID
DURING PERIOD*
10/1/2010 – 3/31/2011 | |
Class A | | | | | | | | | | | | |
Actual | | | $1,000.00 | | | | $1,024.40 | | | | $4.04 | |
Hypothetical (5% return before expenses) | | | $1,000.00 | | | | $1,020.94 | | | | $4.03 | |
Class B | | | | | | | | | | | | |
Actual | | | $1,000.00 | | | | $1,020.60 | | | | $7.81 | |
Hypothetical (5% return before expenses) | | | $1,000.00 | | | | $1,017.20 | | | | $7.80 | |
Class C | | | | | | | | | | | | |
Actual | | | $1,000.00 | | | | $1,020.70 | | | | $7.81 | |
Hypothetical (5% return before expenses) | | | $1,000.00 | | | | $1,017.20 | | | | $7.80 | |
Class Y | | | | | | | | | | | | |
Actual | | | $1,000.00 | | | | $1,026.50 | | | | $2.78 | |
Hypothetical (5% return before expenses) | | | $1,000.00 | | | | $1,022.19 | | | | $2.77 | |
Admin Class | | | | | | | | | | | | |
Actual | | | $1,000.00 | | | | $1,023.30 | | | | $5.35 | |
Hypothetical (5% return before expenses) | | | $1,000.00 | | | | $1,024.93 | | | | $5.35 | |
Class J | | | | | | | | | | | | |
Actual | | | $1,000.00 | | | | $1,021.90 | | | | $6.55 | |
Hypothetical (5% return before expenses) | | | $1,000.00 | | | | $1,018.45 | | | | $6.54 | |
| * | Expenses are equal to the Fund's annualized expense ratio: 0.80%, 1.55%, 1.55%, 0.55%, 1.06% and 1.30% for Class A, B, C, Y, Admin Class and Class J, respectively, multiplied by the average account value over the period, multiplied by the number of days in the most recent fiscal half-year, divided by 365 (to reflect the half-year period). |
| 8
Portfolio of Investments – as of March 31, 2011 (Unaudited)
Loomis Sayles Investment Grade Bond Fund
| | | | | | | | |
Principal
Amount (‡) | | | Description | | Value (†) | |
| | | | | | | | |
| | Bonds and Notes — 97.7% of Net Assets | | | | |
| | Non-Convertible Bonds — 92.9% | | | | |
| | | | ABS Car Loan — 1.3% | | | | |
| $ | 5,153,750 | | | Avis Budget Rental Car Funding AESOP LLC, Series 2007-2A, Class A,
0.394%, 8/20/2013, 144A(b) | | $ | 5,043,524 | |
| | 831,000 | | | Avis Budget Rental Car Funding AESOP LLC, Series 2010-2A, Class B,
5.740%, 8/20/2014, 144A | | | 882,752 | |
| | 4,590,000 | | | Avis Budget Rental Car Funding AESOP LLC, Series 2010-3A, Class B,
6.740%, 5/20/2016, 144A | | | 5,087,753 | |
| | 2,889,250 | | | Avis Budget Rental Car Funding AESOP LLC, Series 2010-5A, Class B,
5.110%, 3/20/2017, 144A | | | 3,028,672 | |
| | 18,620,000 | | | Chesapeake Funding LLC, Series 2009-2A, Class B,
2.005%, 9/15/2021, 144A(b) | | | 18,827,971 | |
| | 16,736,000 | | | Chesapeake Funding LLC, Series 2009-2A, Class C,
2.005%, 9/15/2021, 144A(b) | | | 16,800,772 | |
| | 31,643,159 | | | Chrysler Financial Lease Trust, Series 2010-A, Class B,
3.460%, 9/16/2013, 144A | | | 31,674,378 | |
| | 19,574,000 | | | Ford Auto Securitization Trust, Series 2010-R3A, Class A3,
2.714%, 9/15/2015, 144A, (CAD) | | | 20,099,540 | |
| | 5,481,000 | | | Ford Auto Securitization Trust, Series 2010-R3A, Class D,
4.526%, 3/15/2017, 144A, (CAD) | | | 5,636,469 | |
| | 8,333,000 | | | Merrill Auto Trust Securitization Asset, Series 2008-1, Class B,
6.750%, 4/15/2015 | | | 8,772,957 | |
| | | | | | | | |
| | | | | | | 115,854,788 | |
| | | | | | | | |
| | | | ABS Credit Card — 0.9% | | | | |
| | 2,450,000 | | | Capital One Multi-Asset Execution Trust, Series 2006-C2, Class C,
0.555%, 6/16/2014(b) | | | 2,443,507 | |
| | 28,592,000 | | | Chase Issuance Trust, Series 2007-B1, Class B1, 0.505%, 4/15/2019(b) | | | 27,521,284 | |
| | 19,182,000 | | | GE Capital Credit Card Master Note Trust, Series 2009-4, Class B,
5.390%, 11/15/2017, 144A | | | 20,446,138 | |
| | 9,787,000 | | | MBNA Credit Card Master Note Trust, Series 2002-C1, Class C1,
6.800%, 7/15/2014 | | | 10,244,717 | |
| | 14,465,000 | | | MBNA Credit Card Master Note Trust, Series 2004-B1, Class B1,
4.450%, 8/15/2016 | | | 15,423,915 | |
| | 2,324,000 | | | World Financial Network Credit Card Master Trust, Series 2010-A, Class B, 6.750%, 4/15/2019 | | | 2,519,081 | |
| | | | | | | | |
| | | | | | | 78,598,642 | |
| | | | | | | | |
| | | | ABS Other — 2.0% | | | | |
| | 6,279,977 | | | CIT Equipment Collateral, Series 2008-VT1, Class A3, 6.590%, 12/22/2014 | | | 6,387,368 | |
| | 1,664,000 | | | Community Program Loan Trust, Series 1987-A, Class A5, 4.500%, 4/01/2029 | | | 1,573,545 | |
| | 50,424,891 | | | Marriott Vacation Club Owner Trust, Series 2009-2A, Class A,
4.809%, 7/20/2031, 144A | | | 51,715,884 | |
| | 12,079,480 | | | Sierra Receivables Funding Co., Series 2009-3A, Class A1,
7.620%, 7/20/2026, 144A | | | 12,355,989 | |
| | 49,406,254 | | | SVO VOI Mortgage Corp., Series 2009-BA, Class NT,
5.810%, 12/20/2028, 144A | | | 51,007,495 | |
See accompanying notes to financial statements.
9 |
Portfolio of Investments – as of March 31, 2011 (Unaudited)
Loomis Sayles Investment Grade Bond Fund – (continued)
| | | | | | | | |
Principal
Amount (‡) | | | Description | | Value (†) | |
| | | | | | | | |
| | | | ABS Other — continued | | | | |
| $ | 42,878,359 | | | Trinity Rail Leasing LP, Series 2009-1A, Class A, 6.657%, 11/16/2039, 144A | | $ | 45,542,533 | |
| | 16,593,488 | | | Trinity Rail Leasing LP, Series 2010-1A, Class A, 5.194%, 10/16/2040, 144A | | | 16,591,754 | |
| | | | | | | | |
| | | | | | | 185,174,568 | |
| | | | | | | | |
| | | | Airlines — 3.2% | | | | |
| | 8,210,380 | | | American Airlines Pass Through Trust, Series 2009-1A, 10.375%, 1/02/2021 | | | 9,647,197 | |
| | 454,703 | | | Continental Airlines Pass Through Trust, Series 1997-1, Class A,
7.461%, 10/01/2016 | | | 459,818 | |
| | 895,042 | | | Continental Airlines Pass Through Trust, Series 1998-1, Class A,
6.648%, 3/15/2019 | | | 942,032 | |
| | 942,784 | | | Continental Airlines Pass Through Trust, Series 1999-1, Class A,
6.545%, 8/02/2020 | | | 999,351 | |
| | 8,917,382 | | | Continental Airlines Pass Through Trust, Series 2000-1, Class A-1,
8.048%, 5/01/2022 | | | 9,719,947 | |
| | 1,752,198 | | | Continental Airlines Pass Through Trust, Series 2000-2, Class A-1,
7.707%, 10/02/2022 | | | 1,896,754 | |
| | 3,123,921 | | | Continental Airlines Pass Through Trust, Series 2001-1, Class A-1,
6.703%, 12/15/2022 | | | 3,264,498 | |
| | 57,832,905 | | | Continental Airlines Pass Through Trust, Series 2007-1, Class A,
5.983%, 10/19/2023 | | | 59,278,727 | |
| | 11,736,340 | | | Continental Airlines Pass Through Trust, Series 2007-1, Class B,
6.903%, 4/19/2022 | | | 11,824,362 | |
| | 27,580,858 | | | Continental Airlines Pass Through Trust, Series 2009-1, 9.000%, 7/08/2016 | | | 31,304,274 | |
| | 21,036,349 | | | Continental Airlines Pass Through Trust, Series 2009-2, Class A,
7.250%, 5/10/2021 | | | 22,719,256 | |
| | 4,208,000 | | | Delta Air Lines Pass Through Trust, Series 2001-1, Class A-2,
7.111%, 3/18/2013 | | | 4,334,240 | |
| | 1,979,511 | | | Delta Air Lines Pass Through Trust, Series 2007-1, Class A, 6.821%, 2/10/2024 | | | 2,043,844 | |
| | 15,304,937 | | | Delta Air Lines Pass Through Trust, Series 2007-1, Class B, 8.021%, 2/10/2024 | | | 15,802,348 | |
| | 39,677,913 | | | Delta Air Lines Pass Through Trust, Series 2009-1, Class A, 7.750%, 6/17/2021 | | | 43,447,315 | |
| | 4,412,481 | | | Delta Air Lines Pass Through Trust, Series 2009-1, Series B,
9.750%, 12/17/2016 | | | 4,677,229 | |
| | 22,198,030 | | | Delta Air Lines Pass Through Trust, Series 2010-1, Class A, 6.200%, 7/02/2018 | | | 23,030,456 | |
| | 7,903,103 | | | Northwest Airlines, Inc., Series 2007-1, Class B, 8.028%, 11/01/2017 | | | 8,061,165 | |
| | 7,942,000 | | | Qantas Airways Ltd., 6.050%, 4/15/2016, 144A | | | 8,458,389 | |
| | 26,197,688 | | | UAL Pass Through Trust, Series 2007-1, Class A, 6.636%, 1/02/2024 | | | 26,459,665 | |
| | 7,606,389 | | | UAL Pass Through Trust, Series 2009-1, 10.400%, 5/01/2018 | | | 8,709,316 | |
| | | | | | | | |
| | | | | | | 297,080,183 | |
| | | | | | | | |
| | | | Automotive — 1.2% | | | | |
| | 40,992,000 | | | Cummins, Inc., 5.650%, 3/01/2098 | | | 33,150,763 | |
| | 5,274,000 | | | Cummins, Inc., 6.750%, 2/15/2027 | | | 5,534,958 | |
| | 1,948,000 | | | Ford Motor Co., 6.375%, 2/01/2029 | | | 1,840,357 | |
| | 125,000 | | | Ford Motor Co., 6.500%, 8/01/2018 | | | 130,875 | |
See accompanying notes to financial statements.
| 10
Portfolio of Investments – as of March 31, 2011 (Unaudited)
Loomis Sayles Investment Grade Bond Fund – (continued)
| | | | | | | | |
Principal
Amount (‡) | | | Description | | Value (†) | |
| | | | | | | | |
| | | | Automotive — continued | | | | |
| $ | 255,000 | | | Ford Motor Co., 6.625%, 2/15/2028 | | $ | 247,602 | |
| | 5,074,000 | | | Ford Motor Co., 6.625%, 10/01/2028 | | | 4,924,454 | |
| | 8,544,000 | | | Ford Motor Co., 7.450%, 7/16/2031 | | | 9,249,820 | |
| | 240,000 | | | Ford Motor Co., 7.500%, 8/01/2026 | | | 240,961 | |
| | 40,126,000 | | | Ford Motor Credit Co. LLC, 6.625%, 8/15/2017 | | | 42,824,514 | |
| | 338,000 | | | Ford Motor Credit Co. LLC, 7.000%, 10/01/2013 | | | 364,860 | |
| | 5,319,000 | | | Ford Motor Credit Co. LLC, 7.000%, 4/15/2015 | | | 5,757,424 | |
| | 4,540,000 | | | Ford Motor Credit Co. LLC, 8.000%, 12/15/2016 | | | 5,153,726 | |
| | | | | | | | |
| | | | | | | 109,420,314 | |
| | | | | | | | |
| | | | Banking — 10.5% | | | | |
| | 22,547,000 | | | AgriBank FCB, 9.125%, 7/15/2019, 144A | | | 26,918,435 | |
| | 7,200,000 | | | American Express Centurion Bank, Series BKN1, 6.000%, 9/13/2017 | | | 8,020,915 | |
| | 35,878,000 | | | Associates Corp. of North America, 6.950%, 11/01/2018 | | | 40,096,535 | |
| | 2,540,000 | | | BAC Capital Trust VI, 5.625%, 3/08/2035 | | | 2,216,534 | |
| | 3,590,000 | | | Bank of America Corp., 5.420%, 3/15/2017 | | | 3,664,974 | |
| | 9,805,000 | | | Bank of America Corp., 6.000%, 9/01/2017 | | | 10,508,979 | |
| | 17,249,000 | | | Bank of America NA, 5.300%, 3/15/2017 | | | 17,708,962 | |
| | 7,110,000,000 | | | Barclays Bank PLC, EMTN, 3.680%, 8/20/2015, (KRW) | | | 6,328,266 | |
| | 2,173,000 | | | Bear Stearns Cos., Inc. (The), 4.650%, 7/02/2018 | | | 2,194,467 | |
| | 16,371,250,000 | | | BNP Paribas SA, EMTN, Zero Coupon, 6/13/2011, 144A, (IDR) | | | 1,855,878 | |
| | 8,994,000 | | | Capital One Financial Corp., 6.150%, 9/01/2016 | | | 9,848,979 | |
| | 10,178,000 | | | Citigroup, Inc., 5.000%, 9/15/2014 | | | 10,627,898 | |
| | 14,680,000 | | | Citigroup, Inc., 5.500%, 2/15/2017 | | | 15,250,010 | |
| | 1,297,000 | | | Citigroup, Inc., 5.850%, 12/11/2034 | | | 1,271,801 | |
| | 2,740,000 | | | Citigroup, Inc., 5.875%, 2/22/2033 | | | 2,575,929 | |
| | 19,875,000 | | | Citigroup, Inc., 6.125%, 5/15/2018 | | | 21,677,881 | |
| | 8,705,000 | | | Citigroup, Inc., 6.125%, 8/25/2036 | | | 8,301,044 | |
| | 72,682,000 | | | Citigroup, Inc., 6.375%, 8/12/2014 | | | 80,345,445 | |
| | 2,398,000 | | | Citigroup, Inc., EMTN, (fixed rate to 11/30/2012, variable rate thereafter), 3.625%, 11/30/2017, (EUR) | | | 3,194,004 | |
| | 63,845,000 | | | Citigroup, Inc., MTN, 5.500%, 10/15/2014 | | | 68,863,217 | |
| | 6,958,000 | | | First Niagara Finance Group, Inc., 6.750%, 3/19/2020 | | | 7,589,981 | |
| | 1,174,000 | | | Goldman Sachs Group, Inc. (The), 6.450%, 5/01/2036 | | | 1,148,140 | |
| | 96,910,000 | | | Goldman Sachs Group, Inc. (The), 6.750%, 10/01/2037 | | | 97,746,236 | |
| | 6,645,000 | | | Goldman Sachs Group, Inc. (The), GMTN, 5.375%, 3/15/2020 | | | 6,746,901 | |
| | 1,527,000 | | | HBOS PLC, 6.000%, 11/01/2033, 144A | | | 1,149,060 | |
| | 700,000 | | | ICICI Bank Ltd., (fixed rate to 4/30/2017, variable rate thereafter), 6.375%, 4/30/2022, 144A | | | 696,500 | |
| | 67,364,716,380 | | | JPMorgan Chase & Co., Zero Coupon, 4/12/2012, 144A, (IDR) | | | 7,269,123 | |
| | 12,000,000,000 | | | JPMorgan Chase & Co., EMTN, 7.070%, 3/22/2014, (IDR) | | | 1,368,200 | |
| | 337,000,000,000 | | | JPMorgan Chase Bank NA, EMTN, Zero Coupon, 10/17/2011, 144A, (IDR) | | | 37,566,010 | |
| | 100,000 | | | Keybank NA, 6.950%, 2/01/2028 | | | 108,208 | |
| | 9,787,000 | | | Lloyds TSB Bank PLC, EMTN, 4.570%, 10/13/2015, (CAD) | | | 9,839,292 | |
See accompanying notes to financial statements.
11 |
Portfolio of Investments – as of March 31, 2011 (Unaudited)
Loomis Sayles Investment Grade Bond Fund – (continued)
| | | | | | | | |
Principal
Amount (‡) | | | Description | | Value (†) | |
| | | | | | | | |
| | | | Banking — continued | | | | |
| $ | 81,622,000 | | | Lloyds TSB Bank PLC, MTN, 6.500%, 9/14/2020, 144A | | $ | 80,243,078 | |
| | 6,479,000 | | | Merrill Lynch & Co., Inc., 5.700%, 5/02/2017 | | | 6,671,297 | |
| | 69,291,000 | | | Merrill Lynch & Co., Inc., 6.110%, 1/29/2037 | | | 65,716,762 | |
| | 9,780,000 | | | Merrill Lynch & Co., Inc., 10.710%, 3/08/2017, (BRL) | | | 6,050,164 | |
| | 3,132,000 | | | Merrill Lynch & Co., Inc., EMTN, 4.625%, 9/14/2018, (EUR) | | | 4,086,340 | |
| | 11,641,000 | | | Merrill Lynch & Co., Inc., MTN, 6.875%, 4/25/2018 | | | 12,929,566 | |
| | 40,126,000 | | | Merrill Lynch & Co., Inc., Series C, MTN, 6.050%, 6/01/2034 | | | 36,891,443 | |
| | 2,652,000 | | | Merrill Lynch & Co., Inc., Series C, MTN, 6.400%, 8/28/2017 | | | 2,890,887 | |
| | 29,308,000 | | | Morgan Stanley, 4.750%, 4/01/2014 | | | 30,539,405 | |
| | 93,758,000 | | | Morgan Stanley, 5.500%, 7/24/2020 | | | 93,692,088 | |
| | 1,510,000 | | | Morgan Stanley, EMTN, 5.450%, 1/09/2017 | | | 1,591,845 | |
| | 24,100,000 | | | Morgan Stanley, GMTN, 7.625%, 3/03/2016, (AUD) | | | 25,111,821 | |
| | 29,556,000 | | | Morgan Stanley, Series F, GMTN, 5.625%, 9/23/2019 | | | 30,186,577 | |
| | 5,187,000 | | | Morgan Stanley, Series F, GMTN, 6.625%, 4/01/2018 | | | 5,701,115 | |
| | 9,699,000 | | | Morgan Stanley, Series F, MTN, 5.950%, 12/28/2017 | | | 10,418,064 | |
| | 2,789,000 | | | Morgan Stanley, Series G & H, GMTN, 5.125%, 11/30/2015, (GBP) | | | 4,603,042 | |
| | 2,875,000 | | | National City Bank of Indiana, 4.250%, 7/01/2018 | | | 2,835,037 | |
| | 8,638,000 | | | National City Corp., 6.875%, 5/15/2019 | | | 9,861,115 | |
| | 3,300,000 | | | Standard Chartered Bank, 6.400%, 9/26/2017, 144A | | | 3,564,531 | |
| | 17,861,000 | | | Standard Chartered PLC, 5.500%, 11/18/2014, 144A | | | 19,276,520 | |
| | | | | | | | |
| | | | | | | 965,558,501 | |
| | | | | | | | |
| | | | Brokerage — 1.9% | | | | |
| | 59,450,000 | | | Cantor Fitzgerald LP, 6.375%, 6/26/2015, 144A | | | 59,839,992 | |
| | 44,990,000 | | | Cantor Fitzgerald LP, 7.875%, 10/15/2019, 144A(c) | | | 46,747,534 | |
| | 11,813,000 | | | Jefferies Group, Inc., 6.250%, 1/15/2036 | | | 10,918,992 | |
| | 44,188,000 | | | Jefferies Group, Inc., 8.500%, 7/15/2019 | | | 52,128,540 | |
| | | | | | | | |
| | | | | | | 169,635,058 | |
| | | | | | | | |
| | | | Building Materials — 1.5% | | | | |
| | 6,640,000 | | | Masco Corp., 4.800%, 6/15/2015 | | | 6,598,201 | |
| | 10,942,000 | | | Masco Corp., 5.850%, 3/15/2017 | | | 10,728,500 | |
| | 6,616,000 | | | Masco Corp., 6.125%, 10/03/2016 | | | 6,785,819 | |
| | 4,808,000 | | | Masco Corp., 6.500%, 8/15/2032 | | | 4,338,191 | |
| | 29,341,000 | | | Masco Corp., 7.125%, 3/15/2020 | | | 30,364,209 | |
| | 4,923,000 | | | Masco Corp., 7.750%, 8/01/2029 | | | 5,007,592 | |
| | 24,394,000 | | | Owens Corning, Inc., 6.500%, 12/01/2016 | | | 26,560,212 | |
| | 41,379,000 | | | Owens Corning, Inc., 7.000%, 12/01/2036 | | | 41,521,054 | |
| | 1,037,000 | | | USG Corp., 6.300%, 11/15/2016 | | | 974,780 | |
| | | | | | | | |
| | | | | | | 132,878,558 | |
| | | | | | | | |
| | | | Chemicals — 0.5% | | | | |
| | 34,763,000 | | | Chevron Phillips Chemical Co. LLC, 8.250%, 6/15/2019, 144A | | | 41,503,928 | |
| | 3,469,000 | | | Cytec Industries, Inc., 6.000%, 10/01/2015 | | | 3,797,698 | |
| | 2,349,000 | | | Methanex Corp., Senior Note, 6.000%, 8/15/2015 | | | 2,354,051 | |
| | | | | | | | |
| | | | | | | 47,655,677 | |
| | | | | | | | |
See accompanying notes to financial statements.
| 12
Portfolio of Investments – as of March 31, 2011 (Unaudited)
Loomis Sayles Investment Grade Bond Fund – (continued)
| | | | | | | | |
Principal
Amount (‡) | | | Description | | Value (†) | |
| | | | | | | | |
| | | | Collateralized Mortgage Obligations — 0.0% | | | | |
| $ | 2,676,895 | | | WaMu Mortgage Pass Through Certificates, Series 2007-OA6,
Class 2A, 2.734%, 7/25/2047(b) | | $ | 1,682,431 | |
| | 95,361 | | | Wells Fargo Mortgage Backed Securities Trust, Series 2006-AR12, Class 1A1, 5.821%, 9/25/2036(b) | | | 79,262 | |
| | | | | | | | |
| | | | | | | 1,761,693 | |
| | | | | | | | |
| | | | Commercial Mortgage-Backed Securities — 4.2% | | | | |
| | 1,779,931 | | | Bank of America-First Union NB Commercial Mortgage, Series 2001-3, Class A2, 5.464%, 4/11/2037 | | | 1,791,603 | |
| | 7,927,364 | | | Bear Stearns Commercial Mortgage Securities, Series 2007-PW15, Class A4, 5.331%, 2/11/2044 | | | 8,304,609 | |
| | 33,167,701 | | | Citigroup/Deutsche Bank Commercial Mortgage Trust, Series 2007-CD4, Class A4, 5.322%, 12/11/2049 | | | 34,861,927 | |
| | 61,632,812 | | | Credit Suisse Mortgage Capital Certificates, Series 2007-C3, Class A4, 5.905%, 6/15/2039(b) | | | 65,265,962 | |
| | 34,381,273 | | | Credit Suisse Mortgage Capital Certificates, Series 2007-C4, Class A4, 5.995%, 9/15/2039(b) | | | 36,516,917 | |
| | 5,001,090 | | | Credit Suisse Mortgage Capital Certificates, Series 2007-C5, Class A4, 5.695%, 9/15/2040 | | | 5,196,902 | |
| | 57,694,000 | | | Crown Castle Towers LLC, 6.113%, 1/15/2040, 144A | | | 62,531,815 | |
| | 23,544,272 | | | Greenwich Capital Commercial Funding Corp., Series 2007-GG11, Class A4, 5.736%, 12/10/2049 | | | 24,902,866 | |
| | 1,324,259 | | | GSR Mortgage Loan Trust, Series 2005-AR2, Class 2A1,
2.745%, 4/25/2035(b) | | | 1,194,254 | |
| | 19,789,051 | | | JPMorgan Chase Commercial Mortgage Securities Corp., Series 2006-LDP6, Class A4, 5.475%, 4/15/2043 | | | 21,319,487 | |
| | 8,739,675 | | | JPMorgan Chase Commercial Mortgage Securities Corp., Series 2006-LDP7, Class A4, 6.061%, 4/15/2045(b) | | | 9,603,396 | |
| | 59,341,803 | | | JPMorgan Chase Commercial Mortgage Securities Corp., Series 2007-LD11, Class A4, 6.005%, 6/15/2049(b) | | | 63,556,003 | |
| | 21,524,263 | | | JPMorgan Chase Commercial Mortgage Securities Corp., Series 2007-LDPX, Class A3, 5.420%, 1/15/2049 | | | 22,700,310 | |
| | 3,131,798 | | | LB-UBS Commercial Mortgage Trust, Series 2006-C4, Class A4,
6.078%, 6/15/2038(b) | | | 3,444,213 | |
| | 1,311,441 | | | Merrill Lynch/Countrywide Commercial Mortgage Trust, Series 2007-6, Class A4, 5.485%, 3/12/2051 | | | 1,373,541 | |
| | 9,786,870 | | | Morgan Stanley Re-REMIC Trust, Series 2009-GG10, Class A4B,
6.002%, 8/12/2045, 144A(b) | | | 10,024,043 | |
| | 6,851,000 | | | Vornado DP LLC, Series 2010-VNO, Class D, 6.356%, 9/13/2028, 144A | | | 6,873,848 | |
| | 3,621,142 | | | Wachovia Bank Commercial Mortgage Trust, Series 2006-C29,
Class A4, 5.308%, 11/15/2048 | | | 3,879,249 | |
| | | | | | | | |
| | | | | | | 383,340,945 | |
| | | | | | | | |
| | | | Construction Machinery — 0.3% | | | | |
| | 23,638,000 | | | Case New Holland, Inc., 7.750%, 9/01/2013 | | | 25,735,873 | |
| | 6,787,000 | | | Toro Co., 6.625%, 5/01/2037(c) | | | 6,096,592 | |
| | | | | | | | |
| | | | | | | 31,832,465 | |
| | | | | | | | |
See accompanying notes to financial statements.
13 |
Portfolio of Investments – as of March 31, 2011 (Unaudited)
Loomis Sayles Investment Grade Bond Fund – (continued)
| | | | | | | | |
Principal
Amount (‡) | | | Description | | Value (†) | |
| | | | | | | | |
| | | | Consumer Cyclical Services — 0.1% | | | | |
| $ | 13,049,000 | | | Western Union Co. (The), 6.200%, 11/17/2036 | | $ | 12,769,477 | |
| | 196,000 | | | Western Union Co. (The), 6.200%, 6/21/2040 | | | 192,348 | |
| | | | | | | | |
| | | | | | | 12,961,825 | |
| | | | | | | | |
| | | | Consumer Products — 0.2% | | | | |
| | 7,458,000 | | | Hasbro, Inc., 6.600%, 7/15/2028 | | | 7,778,754 | |
| | 11,754,000 | | | Snap-on, Inc., 6.700%, 3/01/2019 | | | 13,285,323 | |
| | | | | | | | |
| | | | | | | 21,064,077 | |
| | | | | | | | |
| | | | Distributors — 0.9% | | | | |
| | 9,787,000 | | | EQT Corp., 8.125%, 6/01/2019 | | | 11,666,241 | |
| | 60,038,000 | | | Equitable Resources, Inc., 6.500%, 4/01/2018 | | | 65,279,978 | |
| | 5,740,000 | | | ONEOK, Inc., 6.000%, 6/15/2035 | | | 5,583,872 | |
| | | | | | | | |
| | | | | | | 82,530,091 | |
| | | | | | | | |
| | | | Diversified Manufacturing — 0.5% | | | | |
| | 1,395,000 | | | Ingersoll-Rand Global Holding Co. Ltd., 6.875%, 8/15/2018 | | | 1,619,592 | |
| | 2,814,000 | | | Textron Financial Corp., 5.400%, 4/28/2013 | | | 2,959,036 | |
| | 1,181,000 | | | Textron Financial Corp., Series E, MTN, 5.125%, 8/15/2014 | | | 1,212,399 | |
| | 18,800,000 | | | Textron, Inc., 3.875%, 3/11/2013, (EUR) | | | 26,496,358 | |
| | 11,040,000 | | | Textron, Inc., EMTN, 6.625%, 4/07/2020, (GBP) | | | 17,511,082 | |
| | | | | | | | |
| | | | | | | 49,798,467 | |
| | | | | | | | |
| | | | Electric — 3.1% | | | | |
| | 38,071,000 | | | Alta Wind Holdings LLC, 7.000%, 6/30/2035, 144A | | | 40,096,758 | |
| | 46,556,000 | | | Ameren Illinois Co., 6.250%, 4/01/2018 | | | 50,945,579 | |
| | 39,539,000 | | | AmerenEnergy Generating Co., Series H, 7.000%, 4/15/2018 | | | 40,074,951 | |
| | 489,000 | | | Baltimore Gas & Electric Co., 5.200%, 6/15/2033 | | | 454,434 | |
| | 11,638,864 | | | Bruce Mansfield Unit, 6.850%, 6/01/2034(c) | | | 12,213,248 | |
| | 17,435,000 | | | Cleveland Electric Illuminating Co. (The), 5.700%, 4/01/2017 | | | 18,540,466 | |
| | 24,922,000 | | | Cleveland Electric Illuminating Co. (The), 5.950%, 12/15/2036 | | | 23,312,138 | |
| | 876,000 | | | Commonwealth Edison Co., 4.700%, 4/15/2015 | | | 939,630 | |
| | 9,000,000 | | | EDP Finance BV, 4.900%, 10/01/2019, 144A | | | 7,855,794 | |
| | 979,000 | | | Empresa Nacional de Electricidad SA (Endesa-Chile), 8.350%, 8/01/2013 | | | 1,097,102 | |
| | 5,383,000 | | | Endesa SA/Cayman Islands, 7.875%, 2/01/2027 | | | 6,011,444 | |
| | 3,603,000 | | | Exelon Corp., 4.900%, 6/15/2015 | | | 3,786,382 | |
| | 1,864,000 | | | ITC Holdings Corp., 5.875%, 9/30/2016, 144A | | | 2,055,746 | |
| | 2,770,000 | | | ITC Holdings Corp., 6.375%, 9/30/2036, 144A | | | 2,898,027 | |
| | 8,569,598 | | | Mackinaw Power LLC, 6.296%, 10/31/2023, 144A | | | 9,044,011 | |
| | 1,532,000 | | | Ohio Edison Co., 6.875%, 7/15/2036 | | | 1,659,242 | |
| | 30,250 | | | Quezon Power Philippines LC, 8.860%, 6/15/2017 | | | 32,972 | |
| | 50,026,000 | | | Southwestern Electric Power Co., 6.450%, 1/15/2019 | | | 55,828,616 | |
| | 1,075,000 | | | White Pine Hydro LLC, 6.310%, 7/10/2017(c) | | | 1,115,882 | |
| | 1,600,000 | | | White Pine Hydro LLC, 6.960%, 7/10/2037(c) | | | 1,515,200 | |
| | | | | | | | |
| | | | | | | 279,477,622 | |
| | | | | | | | |
| | | | Entertainment — 0.1% | | | | |
| | 494,000 | | | Time Warner, Inc., 7.625%, 4/15/2031 | | | 569,863 | |
| | 323,000 | | | Time Warner, Inc., 7.700%, 5/01/2032 | | | 376,669 | |
| | 3,616,000 | | | Viacom, Inc., 6.125%, 10/05/2017 | | | 4,071,601 | |
| | | | | | | | |
| | | | | | | 5,018,133 | |
| | | | | | | | |
See accompanying notes to financial statements.
| 14
Portfolio of Investments – as of March 31, 2011 (Unaudited)
Loomis Sayles Investment Grade Bond Fund – (continued)
| | | | | | | | |
Principal
Amount (‡) | | | Description | | Value (†) | |
| | | | | | | | |
| | | | Financial Other — 0.4% | | | | |
| $ | 26,914,000 | | | National Life Insurance Co., 10.500%, 9/15/2039, 144A | | $ | 33,807,079 | |
| | | | | | | | |
| | | | Food & Beverage — 0.1% | | | | |
| | 2,450,000 | | | Cargill, Inc., EMTN, 5.375%, 3/02/2037, (GBP) | | | 3,822,409 | |
| | 8,446,000 | | | Corn Products International, Inc., 6.625%, 4/15/2037 | | | 8,828,089 | |
| | | | | | | | |
| | | | | | | 12,650,498 | |
| | | | | | | | |
| | | | Government Guaranteed — 0.1% | | | | |
| | 10,276,000 | | | Instituto de Credito Oficial, MTN, 6.125%, 2/27/2014, (AUD) | | | 10,114,131 | |
| | | | | | | | |
| | | | Government Owned — No Guarantee — 1.6% | | | | |
| | 3,720,000 | | | Abu Dhabi National Energy Co., 6.500%, 10/27/2036, 144A | | | 3,552,600 | |
| | 36,975,000 | | | Abu Dhabi National Energy Co., 7.250%, 8/01/2018, 144A | | | 40,718,719 | |
| | 58,060,000 | | | DP World Ltd., 6.850%, 7/02/2037, 144A | | | 53,415,200 | |
| | 26,030,000,000 | | | Export-Import Bank of Korea, 6.600%, 11/04/2013, 144A, (IDR) | | | 2,888,336 | |
| | 27,800,000,000 | | | Export-Import Bank of Korea, 8.300%, 3/15/2014, 144A, (IDR) | | | 3,226,173 | |
| | 22,478,000 | | | Federal National Mortgage Association, 1.625%, 4/15/2013 | | | 22,821,509 | |
| | 15,170,000 | | | Korea Gas Corp., 6.000%, 7/15/2014, 144A | | | 16,552,563 | |
| | 1,000,000 | | | Telekom Malaysia Berhad, 7.875%, 8/01/2025, 144A | | | 1,267,229 | |
| | | | | | | | |
| | | | | | | 144,442,329 | |
| | | | | | | | |
| | | | Government Sponsored — 0.7% | | | | |
| | 66,200,000 | | | Federal Home Loan Bank, 1.875%, 6/21/2013 | | | 67,464,221 | |
| | | | | | | | |
| | | | Health Insurance — 0.1% | | | | |
| | 2,744,000 | | | CIGNA Corp., 6.150%, 11/15/2036 | | | 2,798,633 | |
| | 1,569,000 | | | CIGNA Corp., 7.875%, 5/15/2027 | | | 1,835,771 | |
| | 1,174,000 | | | CIGNA Corp., (Step to 8.080% on 1/15/2023), 8.300%, 1/15/2033(d) | | | 1,406,567 | |
| | | | | | | | |
| | | | | | | 6,040,971 | |
| | | | | | | | |
| | | | Healthcare — 1.0% | | | | |
| | 7,692,000 | | | Boston Scientific Corp., 6.000%, 1/15/2020 | | | 8,059,808 | |
| | 7,374,000 | | | Covidien International Finance SA, 6.000%, 10/15/2017 | | | 8,404,059 | |
| | 17,416,000 | | | Express Scripts, Inc., 6.250%, 6/15/2014 | | | 19,348,323 | |
| | 9,459,000 | | | Express Scripts, Inc., 7.250%, 6/15/2019 | | | 11,296,051 | |
| | 9,278,000 | | | HCA, Inc., 5.750%, 3/15/2014 | | | 9,451,962 | |
| | 1,908,000 | | | HCA, Inc., 6.250%, 2/15/2013 | | | 1,979,550 | |
| | 3,729,000 | | | HCA, Inc., 6.375%, 1/15/2015 | | | 3,803,580 | |
| | 3,929,000 | | | HCA, Inc., 6.500%, 2/15/2016 | | | 3,997,758 | |
| | 357,000 | | | HCA, Inc., 6.750%, 7/15/2013 | | | 375,296 | |
| | 2,936,000 | | | HCA, Inc., 7.050%, 12/01/2027 | | | 2,613,040 | |
| | 2,241,000 | | | HCA, Inc., 7.190%, 11/15/2015 | | | 2,252,205 | |
| | 2,109,000 | | | HCA, Inc., 7.500%, 12/15/2023 | | | 1,993,005 | |
| | 1,282,000 | | | HCA, Inc., 7.500%, 11/06/2033 | | | 1,176,235 | |
| | 3,807,000 | | | HCA, Inc., 7.690%, 6/15/2025 | | | 3,626,168 | |
| | 4,164,000 | | | HCA, Inc., 8.360%, 4/15/2024 | | | 4,164,000 | |
| | 1,199,000 | | | HCA, Inc., MTN, 7.580%, 9/15/2025 | | | 1,130,058 | |
| | 3,068,000 | | | HCA, Inc., MTN, 7.750%, 7/15/2036 | | | 2,868,580 | |
| | 2,256,000 | | | Owens & Minor, Inc., 6.350%, 4/15/2016(c) | | | 2,314,642 | |
| | | | | | | | |
| | | | | | | 88,854,320 | |
| | | | | | | | |
See accompanying notes to financial statements.
15 |
Portfolio of Investments – as of March 31, 2011 (Unaudited)
Loomis Sayles Investment Grade Bond Fund – (continued)
| | | | | | | | |
Principal
Amount (‡) | | | Description | | Value (†) | |
| | | | | | | | |
| | | | Home Construction — 0.2% | | | | |
| $ | 2,006,000 | | | Desarrolladora Homex SAB de CV, 7.500%, 9/28/2015 | | $ | 2,066,180 | |
| | 2,546,000 | | | Pulte Group, Inc., 5.200%, 2/15/2015 | | | 2,526,905 | |
| | 9,200,000 | | | Pulte Group, Inc., 6.000%, 2/15/2035 | | | 7,199,000 | |
| | 3,567,000 | | | Pulte Group, Inc., 6.375%, 5/15/2033 | | | 2,898,187 | |
| | 1,711,000 | | | Toll Brothers Finance Corp., 5.150%, 5/15/2015 | | | 1,746,442 | |
| | | | | | | | |
| | | | | | | 16,436,714 | |
| | | | | | | | |
| | | | Independent Energy — 0.3% | | | | |
| | 11,930,000 | | | Anadarko Petroleum Corp., 6.375%, 9/15/2017 | | | 13,131,292 | |
| | 15,346,000 | | | Anadarko Petroleum Corp., 6.450%, 9/15/2036 | | | 15,326,188 | |
| | 1,890,000 | | | Chesapeake Energy Corp., 6.250%, 1/15/2017, (EUR) | | | 2,782,299 | |
| | | | | | | | |
| | | | | | | 31,239,779 | |
| | | | | | | | |
| | | | Industrial Other — 0.1% | | | | |
| | 4,893,000 | | | Worthington Industries, Inc., 6.500%, 4/15/2020 | | | 5,233,822 | |
| | | | | | | | |
| | | | Integrated Energy — 0.0% | | | | |
| | 939,695 | | | PF Export Receivables Master Trust, Series A, 6.436%, 6/01/2015, 144A | | | 1,000,776 | |
| | | | | | | | |
| | | | Life Insurance — 0.9% | | | | |
| | 4,400,000 | | | American International Group, Inc., EMTN, 5.000%, 4/26/2023, (GBP) | | | 6,065,208 | |
| | 6,910,000 | | | American International Group, Inc., Series G, MTN, 5.850%, 1/16/2018 | | | 7,197,705 | |
| | 2,036,000 | | | American International Group, Inc., Series MP, GMTN, 5.450%, 5/18/2017 | | | 2,090,033 | |
| | 9,777,000 | | | ASIF III Jersey Ltd., Series 2003-G, EMTN, 4.750%, 9/11/2013, (EUR) | | | 14,142,417 | |
| | 10,971,000 | | | MetLife, Inc., 6.400%, 12/15/2066 | | | 10,566,170 | |
| | 9,063,000 | | | Mutual of Omaha Insurance Co., 6.800%, 6/15/2036, 144A | | | 9,171,348 | |
| | 6,440,000 | | | NLV Financial Corp., 7.500%, 8/15/2033, 144A | | | 6,191,493 | |
| | 2,872,000 | | | Penn Mutual Life Insurance Co. (The), 6.650%, 6/15/2034, 144A | | | 2,783,117 | |
| | 14,489,000 | | | Penn Mutual Life Insurance Co. (The), 7.625%, 6/15/2040, 144A | | | 15,664,101 | |
| | 4,732,000 | | | Unum Group, 7.125%, 9/30/2016 | | | 5,334,545 | |
| | | | | | | | |
| | | | | | | 79,206,137 | |
| | | | | | | | |
| | | | Local Authorities — 1.9% | | | | |
| | 215,000 | | | Alberta Municipal Funding Corp., 5.700%, 9/01/2011, (CAD) | | | 225,824 | |
| | 7,448,000 | | | Manitoba (Province of), GMTN, 6.375%, 9/01/2015, (NZD) | | | 6,016,411 | |
| | 28,543,000 | | | New South Wales Treasury Corp., 6.000%, 5/01/2012, (AUD) | | | 29,847,316 | |
| | 30,476,000 | | | New South Wales Treasury Corp., Series 12RG, 6.000%, 5/01/2012, (AUD) | | | 31,863,982 | |
| | 17,930,000 | | | New South Wales Treasury Corp., Series 17RG, 5.500%, 3/01/2017, (AUD) | | | 18,452,364 | |
| | 20,195 | | | Province of Alberta, 5.930%, 9/16/2016, (CAD) | | | 23,131 | |
| | 489,000 | | | Province of Nova Scotia, 6.600%, 6/01/2027, (CAD) | | | 628,225 | |
| | 29,791,000 | | | Province of Quebec, Canada, Series QC, 6.750%, 11/09/2015, (NZD) | | | 24,360,107 | |
| | 31,142,000 | | | Queensland Treasury Corp., 7.125%, 9/18/2017, 144A, (NZD) | | | 25,748,840 | |
| | 18,913,000 | | | Queensland Treasury Corp., Series 11G, 6.000%, 6/14/2011, (AUD) | | | 19,604,716 | |
| | 19,163,000 | | | Queensland Treasury Corp., Series 14, 5.750%, 11/21/2014, (AUD) | | | 19,964,948 | |
| | | | | | | | |
| | | | | | | 176,735,864 | |
| | | | | | | | |
| | | | Lodging — 1.1% | | | | |
| | 52,516,000 | | | Choice Hotels International, Inc., 5.700%, 8/28/2020 | | | 51,949,668 | |
| | 4,522,000 | | | Wyndham Worldwide Corp., 5.750%, 2/01/2018 | | | 4,685,479 | |
| | 13,286,000 | | | Wyndham Worldwide Corp., 6.000%, 12/01/2016 | | | 14,078,377 | |
| | 23,518,000 | | | Wyndham Worldwide Corp., 7.375%, 3/01/2020 | | | 25,943,882 | |
| | | | | | | | |
| | | | | | | 96,657,406 | |
| | | | | | | | |
See accompanying notes to financial statements.
| 16
Portfolio of Investments – as of March 31, 2011 (Unaudited)
Loomis Sayles Investment Grade Bond Fund – (continued)
| | | | | | | | |
Principal
Amount (‡) | | | Description | | Value (†) | |
| | | | | | | | |
| | | | Media Cable — 1.5% | | | | |
| $ | 24,518,000 | | | Comcast Corp., 6.950%, 8/15/2037 | | $ | 26,692,354 | |
| | 17,832,000 | | | Shaw Communications, Inc., 5.650%, 10/01/2019, (CAD) | | | 18,832,210 | |
| | 4,101,000 | | | Time Warner Cable, Inc., 5.850%, 5/01/2017 | | | 4,485,260 | |
| | 78,178,000 | | | Time Warner Cable, Inc., 6.750%, 7/01/2018 | | | 88,811,850 | |
| | | | | | | | |
| | | | | | | 138,821,674 | |
| | | | | | | | |
| | | | Media Non-Cable — 0.1% | | | | |
| | 7,536,000 | | | News America, Inc., 6.150%, 3/01/2037 | | | 7,467,226 | |
| | 4,482,000 | | | News America, Inc., 8.150%, 10/17/2036 | | | 5,433,112 | |
| | | | | | | | |
| | | | | | | 12,900,338 | |
| | | | | | | | |
| | | | Metals & Mining — 1.4% | | | | |
| | 15,060,000 | | | Alcoa, Inc., 5.870%, 2/23/2022 | | | 15,411,606 | |
| | 5,505,000 | | | Alcoa, Inc., 5.950%, 2/01/2037 | | | 5,193,428 | |
| | 54,838,000 | | | Alcoa, Inc., 6.150%, 8/15/2020 | | | 57,948,576 | |
| | 5,804,000 | | | Alcoa, Inc., 6.750%, 1/15/2028 | | | 6,071,390 | |
| | 3,181,000 | | | Rio Tinto Alcan, Inc., 5.750%, 6/01/2035 | | | 3,176,601 | |
| | 1,943,000 | | | United States Steel Corp., 6.050%, 6/01/2017 | | | 2,003,719 | |
| | 4,612,000 | | | United States Steel Corp., 6.650%, 6/01/2037 | | | 4,243,040 | |
| | 31,210,000 | | | United States Steel Corp., 7.000%, 2/01/2018 | | | 32,419,387 | |
| | 3,655,000 | | | Vale Overseas Ltd., 6.875%, 11/21/2036 | | | 3,892,067 | |
| | | | | | | | |
| | | | | | | 130,359,814 | |
| | | | | | | | |
| | | | Mortgage Related — 0.0% | | | | |
| | 109,424 | | | FHLMC, 5.000%, 12/01/2031 | | | 115,315 | |
| | 17,436 | | | FNMA, 6.000%, 7/01/2029 | | | 19,198 | |
| | | | | | | | |
| | | | | | | 134,513 | |
| | | | | | | | |
| | | | Non-Captive Consumer — 2.0% | | | | |
| | 62,425(††) | | | SLM Corp., 6.000%, 12/15/2043 | | | 1,312,017 | |
| | 6,342,000 | | | SLM Corp., MTN, 5.050%, 11/14/2014 | | | 6,401,792 | |
| | 347,000 | | | SLM Corp., MTN, 5.125%, 8/27/2012 | | | 358,117 | |
| | 641,000 | | | SLM Corp., MTN, 8.000%, 3/25/2020 | | | 698,690 | |
| | 4,796,000 | | | SLM Corp., Series A, MTN, 0.603%, 1/27/2014(b) | | | 4,548,651 | |
| | 9,224,000 | | | SLM Corp., Series A, MTN, 5.000%, 10/01/2013 | | | 9,547,670 | |
| | 6,547,000 | | | SLM Corp., Series A, MTN, 5.000%, 4/15/2015 | | | 6,591,716 | |
| | 1,957,000 | | | SLM Corp., Series A, MTN, 5.000%, 6/15/2018 | | | 1,839,040 | |
| | 6,141,000 | | | SLM Corp., Series A, MTN, 5.375%, 1/15/2013 | | | 6,387,573 | |
| | 5,368,000 | | | SLM Corp., Series A, MTN, 5.375%, 5/15/2014 | | | 5,566,552 | |
| | 19,496,000 | | | SLM Corp., Series A, MTN, 5.625%, 8/01/2033 | | | 16,668,066 | |
| | 30,667,000 | | | SLM Corp., Series A, MTN, 8.450%, 6/15/2018 | | | 34,347,040 | |
| | 4,893,000 | | | Springleaf Finance Corp., Series I, MTN, 5.400%, 12/01/2015 | | | 4,464,863 | |
| | 87,676,000 | | | Springleaf Finance Corp., Series J, MTN, 6.900%, 12/15/2017 | | | 80,113,945 | |
| | | | | | | | |
| | | | | | | 178,845,732 | |
| | | | | | | | |
| | | | Non-Captive Diversified — 4.0% | | | | |
| | 1,316,000 | | | Ally Financial, Inc., 6.000%, 12/15/2011 | | | 1,348,880 | |
| | 1,282,000 | | | Ally Financial, Inc., 6.625%, 5/15/2012 | | | 1,321,186 | |
| | 1,634,000 | | | Ally Financial, Inc., 6.750%, 12/01/2014 | | | 1,716,043 | |
| | 1,468,000 | | | Ally Financial, Inc., 6.875%, 9/15/2011 | | | 1,495,631 | |
See accompanying notes to financial statements.
17 |
Portfolio of Investments – as of March 31, 2011 (Unaudited)
Loomis Sayles Investment Grade Bond Fund – (continued)
| | | | | | | | |
Principal
Amount (‡) | | | Description | | Value (†) | |
| | | | | | | | |
| | | | Non-Captive Diversified — continued | | | | |
| $ | 391,000 | | | Ally Financial, Inc., 6.875%, 8/28/2012 | | $ | 410,697 | |
| | 1,184,000 | | | Ally Financial, Inc., 7.000%, 2/01/2012 | | | 1,221,435 | |
| | 3,075,000 | | | Ally Financial, Inc., 7.500%, 12/31/2013 | | | 3,309,469 | |
| | 5,543,000 | | | Ally Financial, Inc., 8.000%, 12/31/2018 | | | 5,951,796 | |
| | 2,285,000 | | | Ally Financial, Inc., 8.000%, 11/01/2031 | | | 2,537,312 | |
| | 4,937,000 | | | Ally Financial, Inc., EMTN, 5.375%, 6/06/2011, (EUR) | | | 7,017,704 | |
| | 42,755,000 | | | Aviation Capital Group, 6.750%, 4/06/2021, 144A | | | 42,861,887 | |
| | 2,414,993 | | | CIT Group, Inc., 7.000%, 5/01/2013 | | | 2,460,274 | |
| | 6,756,572 | | | CIT Group, Inc., 7.000%, 5/01/2014 | | | 6,883,258 | |
| | 6,756,571 | | | CIT Group, Inc., 7.000%, 5/01/2015 | | | 6,815,691 | |
| | 10,302,540 | | | CIT Group, Inc., 7.000%, 5/01/2016 | | | 10,315,418 | |
| | 15,765,347 | | | CIT Group, Inc., 7.000%, 5/01/2017 | | | 15,785,054 | |
| | 35,688,000 | | | GATX Corp., 4.750%, 10/01/2012 | | | 37,306,772 | |
| | 7,355,000 | | | General Electric Capital Australia Funding Pty Ltd., EMTN,
8.000%, 2/13/2012, (AUD) | | | 7,761,142 | |
| | 7,570,000 | | | General Electric Capital Australia Funding Pty Ltd., MTN,
6.000%, 5/15/2013, (AUD) | | | 7,802,254 | |
| | 3,100,000 | | | General Electric Capital Australia Funding Pty Ltd., MTN,
6.000%, 4/15/2015, (AUD) | | | 3,149,793 | |
| | 1,874,000 | | | General Electric Capital Australia Funding Pty Ltd., MTN,
6.000%, 3/15/2019, (AUD) | | | 1,805,190 | |
| | 969,000 | | | General Electric Capital Corp., 5.625%, 5/01/2018 | | | 1,047,604 | |
| | 4,673,000 | | | General Electric Capital Corp., MTN, 5.875%, 1/14/2038 | | | 4,613,531 | |
| | 14,225,000 | | | General Electric Capital Corp., Series A, EMTN, 6.750%, 9/26/2016, (NZD) | | | 11,280,409 | |
| | 6,000,000 | | | General Electric Capital Corp., Series A, GMTN, 2.960%, 5/18/2012, (SGD) | | | 4,836,005 | |
| | 13,100,000 | | | General Electric Capital Corp., Series A, GMTN, 3.485%, 3/08/2012, (SGD) | | | 10,560,606 | |
| | 36,850,000 | | | General Electric Capital Corp., Series A, GMTN,
7.625%, 12/10/2014, (NZD) | | | 30,363,877 | |
| | 10,247,000 | | | General Electric Capital Corp., Series A, MTN, 0.603%, 5/13/2024(b) | | | 8,970,972 | |
| | 16,696,000 | | | General Electric Capital Corp., Series A, MTN, 4.875%, 3/04/2015 | | | 18,001,811 | |
| | 26,931,000 | | | General Electric Capital Corp., Series A, MTN, 6.500%, 9/28/2015, (NZD) | | | 21,388,020 | |
| | 2,236,000 | | | International Lease Finance Corp., 5.000%, 9/15/2012 | | | 2,270,658 | |
| | 16,437,000 | | | International Lease Finance Corp., 6.375%, 3/25/2013 | | | 17,012,295 | |
| | 60,419,000 | | | International Lease Finance Corp., 7.125%, 9/01/2018, 144A | | | 64,920,215 | |
| | 548,000 | | | International Lease Finance Corp., 8.875%, 9/15/2015, 144A | | | 602,800 | |
| | 641,000 | | | International Lease Finance Corp., Series R, MTN, 5.550%, 9/05/2012 | | | 653,820 | |
| | 1,473,000 | | | International Lease Finance Corp., Series R, MTN, 5.625%, 9/20/2013 | | | 1,496,936 | |
| | 1,625,000 | | | International Lease Finance Corp., Series R, MTN, 5.650%, 6/01/2014 | | | 1,633,125 | |
| | | | | | | | |
| | | | | | | 368,929,570 | |
| | | | | | | | |
| | | | Oil Field Services — 0.8% | | | | |
| | 5,965,000 | | | Nabors Industries, Inc., 6.150%, 2/15/2018 | | | 6,530,768 | |
| | 22,583,000 | | | Nabors Industries, Inc., 9.250%, 1/15/2019 | | | 28,467,023 | |
| | 23,338,000 | | | Rowan Cos., Inc., 7.875%, 8/01/2019 | | | 27,682,976 | |
| | 587,000 | | | Transocean Ltd., 7.375%, 4/15/2018 | | | 670,467 | |
| | 5,779,000 | | | Weatherford International Ltd., 6.500%, 8/01/2036 | | | 5,778,312 | |
| | 1,644,000 | | | Weatherford International Ltd., 6.800%, 6/15/2037 | | | 1,709,698 | |
| | 5,290,000 | | | Weatherford International Ltd., 7.000%, 3/15/2038 | | | 5,603,046 | |
| | | | | | | | |
| | | | | | | 76,442,290 | |
| | | | | | | | |
See accompanying notes to financial statements.
| 18
Portfolio of Investments – as of March 31, 2011 (Unaudited)
Loomis Sayles Investment Grade Bond Fund – (continued)
| | | | | | | | |
Principal
Amount (‡) | | | Description | | Value (†) | |
| | | | | | | | |
| | | | Paper — 1.0% | | | | |
| $ | 4,365,000 | | | Celulosa Arauco y Constitucion SA, 7.250%, 7/29/2019 | | $ | 5,031,295 | |
| | 563,000 | | | Georgia-Pacific LLC, 7.250%, 6/01/2028 | | | 588,335 | |
| | 2,408,000 | | | Georgia-Pacific LLC, 7.375%, 12/01/2025 | | | 2,540,440 | |
| | 279,000 | | | Georgia-Pacific LLC, 7.750%, 11/15/2029 | | | 306,551 | |
| | 1,311,000 | | | Georgia-Pacific LLC, 8.000%, 1/15/2024 | | | 1,497,818 | |
| | 1,336,000 | | | Georgia-Pacific LLC, 8.875%, 5/15/2031 | | | 1,613,220 | |
| | 6,161,000 | | | International Paper Co., 5.250%, 4/01/2016 | | | 6,568,717 | |
| | 7,611,000 | | | International Paper Co., 8.700%, 6/15/2038 | | | 9,756,914 | |
| | 5,270,000 | | | Mead Corp. (The), 7.550%, 3/01/2047 | | | 5,161,016 | |
| | 5,764,000 | | | Westvaco Corp., 8.200%, 1/15/2030 | | | 6,151,491 | |
| | 24,007,000 | | | Weyerhaeuser Co., 6.875%, 12/15/2033 | | | 24,107,829 | |
| | 7,374,000 | | | Weyerhaeuser Co., 7.375%, 10/01/2019 | | | 8,331,086 | |
| | 20,254,000 | | | Weyerhaeuser Co., 7.375%, 3/15/2032 | | | 21,357,580 | |
| | | | | | | | |
| | | | | | | 93,012,292 | |
| | | | | | | | |
| | | | Pharmaceuticals — 0.7% | | | | |
| | 2,205,000 | | | Elan Finance PLC/Elan Finance Corp., 8.875%, 12/01/2013 | | | 2,279,419 | |
| | 56,052,000 | | | Roche Holdings, Inc., 5.000%, 3/01/2014, 144A | | | 61,104,695 | |
| | 489,000 | | | Schering-Plough Corp., 5.300%, 12/01/2013 | | | 538,737 | |
| | | | | | | | |
| | | | | | | 63,922,851 | |
| | | | | | | | |
| | | | Pipelines — 4.1% | | | | |
| | 5,236,000 | | | CenterPoint Energy Resources Corp., 6.250%, 2/01/2037 | | | 5,324,572 | |
| | 1,967,000 | | | DCP Midstream LP, 6.450%, 11/03/2036, 144A | | | 1,999,593 | |
| | 2,417,000 | | | El Paso Corp., 6.950%, 6/01/2028 | | | 2,448,677 | |
| | 528,000 | | | Energy Transfer Partners LP, 6.125%, 2/15/2017 | | | 589,476 | |
| | 1,571,000 | | | Energy Transfer Partners LP, 6.625%, 10/15/2036 | | | 1,641,511 | |
| | 9,253,000 | | | Enterprise Products Operating LLP, 6.300%, 9/15/2017 | | | 10,432,323 | |
| | 3,328,000 | | | Florida Gas Transmission Co., 7.900%, 5/15/2019, 144A | | | 4,014,160 | |
| | 80,840,000 | | | Kinder Morgan Energy Partners LP, 5.950%, 2/15/2018 | | | 89,014,218 | |
| | 303,000 | | | Kinder Morgan Finance Co., 5.700%, 1/05/2016 | | | 317,771 | |
| | 30,396,888 | | | Maritimes & Northeast Pipeline LLC, 7.500%, 5/31/2014, 144A(c) | | | 32,878,490 | |
| | 8,886,000 | | | NGPL PipeCo LLC, 6.514%, 12/15/2012, 144A | | | 9,519,030 | |
| | 30,760,000 | | | NGPL PipeCo LLC, 7.119%, 12/15/2017, 144A | | | 34,369,163 | |
| | 13,790,000 | | | NiSource Finance Corp., 6.125%, 3/01/2022 | | | 15,005,382 | |
| | 24,110,000 | | | NiSource Finance Corp., 6.400%, 3/15/2018 | | | 26,973,448 | |
| | 21,614,000 | | | NiSource Finance Corp., 6.800%, 1/15/2019 | | | 24,726,956 | |
| | 9,899,000 | | | Panhandle Eastern Pipeline Co., 6.200%, 11/01/2017 | | | 10,976,902 | |
| | 47,594,000 | | | Panhandle Eastern Pipeline Co., 7.000%, 6/15/2018 | | | 53,117,665 | |
| | 1,404,000 | | | Panhandle Eastern Pipeline Co., 8.125%, 6/01/2019 | | | 1,648,080 | |
| | 2,085,000 | | | Plains All American Pipeline LP, 6.125%, 1/15/2017 | | | 2,309,083 | |
| | 15,683,000 | | | Plains All American Pipeline LP, 6.500%, 5/01/2018 | | | 17,629,605 | |
| | 4,497,000 | | | Plains All American Pipeline LP, 6.650%, 1/15/2037 | | | 4,755,195 | |
| | 4,125,000 | | | Southern Natural Gas Co., 5.900%, 4/01/2017, 144A | | | 4,589,521 | |
| | 19,574,000 | | | Texas Eastern Transmission LP, 6.000%, 9/15/2017, 144A | | | 21,855,741 | |
| | | | | | | | |
| | | | | | | 376,136,562 | |
| | | | | | | | |
See accompanying notes to financial statements.
19 |
Portfolio of Investments – as of March 31, 2011 (Unaudited)
Loomis Sayles Investment Grade Bond Fund – (continued)
| | | | | | | | |
Principal
Amount (‡) | | | Description | | Value (†) | |
| | | | | | | | |
| | | | Property & Casualty Insurance — 0.7% | | | | |
| $ | 3,083,000 | | | Hanover Insurance Group, Inc. (The), 7.500%, 3/01/2020 | | $ | 3,277,140 | |
| | 9,038,000 | | | Liberty Mutual Group, Inc., 6.500%, 3/15/2035, 144A | | | 8,496,325 | |
| | 30,349,000 | | | Marsh & McLennan Cos., Inc., 5.875%, 8/01/2033 | | | 28,569,152 | |
| | 944,000 | | | MBIA Insurance Corp., (fixed rate to 1/15/2013, variable rate thereafter), 14.000%, 1/15/2033, 144A | | | 519,200 | |
| | 7,609,000 | | | White Mountains Re Group Ltd., 6.375%, 3/20/2017, 144A | | | 7,786,571 | |
| | 13,521,000 | | | Willis North America, Inc., 7.000%, 9/29/2019 | | | 14,642,824 | |
| | 2,212,000 | | | XL Group PLC, 6.250%, 5/15/2027 | | | 2,196,304 | |
| | 1,463,000 | | | XL Group PLC, 6.375%, 11/15/2024 | | | 1,521,722 | |
| | | | | | | | |
| | | | | | | 67,009,238 | |
| | | | | | | | |
| | | | Property Trust — 0.5% | | | | |
| | 36,192,000 | | | WEA Finance LLC/WT Finance Australia Property Ltd.,
6.750%, 9/02/2019, 144A | | | 41,527,352 | |
| | | | | | | | |
| | | | Railroads — 0.1% | | | | |
| | 9,787,000 | | | Canadian Pacific Railway Co., 7.250%, 5/15/2019 | | | 11,595,550 | |
| | 238,000 | | | Missouri Pacific Railroad Co., 4.750%, 1/01/2030(c) | | | 207,655 | |
| | 1,701,000 | | | Missouri Pacific Railroad Co., 5.000%, 1/01/2045(c) | | | 1,160,932 | |
| | 191,000 | | | Missouri Pacific Railroad Co., Series A, 4.750%, 1/01/2020(c) | | | 177,630 | |
| | | | | | | | |
| | | | | | | 13,141,767 | |
| | | | | | | | |
| | | | Real Estate Operations/Development — 0.1% | | | | |
| | 1,128,000 | | | Colonial Realty LP, 4.800%, 4/01/2011 | | | 1,128,000 | |
| | 10,276,000 | | | First Industrial LP, 5.950%, 5/15/2017 | | | 9,687,062 | |
| | | | | | | | |
| | | | | | | 10,815,062 | |
| | | | | | | | |
| | | | Refining — 0.0% | | | | |
| | 3,660,000 | | | Valero Energy Corp., 6.625%, 6/15/2037 | | | 3,689,112 | |
| | | | | | | | |
| | | | REITs — Apartments — 0.4% | | | | |
| | 12,243,000 | | | Camden Property Trust, 5.000%, 6/15/2015 | | | 13,092,982 | |
| | 16,491,000 | | | Camden Property Trust, 5.700%, 5/15/2017 | | | 18,051,923 | |
| | 988,000 | | | ERP Operating LP, 5.125%, 3/15/2016 | | | 1,060,972 | |
| | 1,762,000 | | | ERP Operating LP, 5.375%, 8/01/2016 | | | 1,916,117 | |
| | 2,368,000 | | | ERP Operating LP, 5.750%, 6/15/2017 | | | 2,607,144 | |
| | | | | | | | |
| | | | | | | 36,729,138 | |
| | | | | | | | |
| | | | REITs — Diversified — 0.3% | | | | |
| | 4,140,000 | | | Duke Realty LP, 5.950%, 2/15/2017 | | | 4,465,888 | |
| | 19,574,000 | | | Duke Realty LP, 6.500%, 1/15/2018 | | | 21,566,516 | |
| | | | | | | | |
| | | | | | | 26,032,404 | |
| | | | | | | | |
| | | | REITs — Office Property — 0.4% | | | | |
| | 20,817,000 | | | Highwoods Properties, Inc., 5.850%, 3/15/2017 | | | 22,154,846 | |
| | 11,306,000 | | | Highwoods Properties, Inc., 7.500%, 4/15/2018 | | | 12,923,222 | |
| | | | | | | | |
| | | | | | | 35,078,068 | |
| | | | | | | | |
| | | | REITs — Regional Malls — 0.3% | | | | |
| | 2,427,000 | | | Simon Property Group LP, 5.250%, 12/01/2016 | | | 2,638,894 | |
| | 12,209,000 | | | Simon Property Group LP, 5.750%, 12/01/2015 | | | 13,578,630 | |
See accompanying notes to financial statements.
| 20
Portfolio of Investments – as of March 31, 2011 (Unaudited)
Loomis Sayles Investment Grade Bond Fund – (continued)
| | | | | | | | |
Principal
Amount (‡) | | | Description | | Value (†) | |
| | | | | | | | |
| | | | REITs — Regional Malls — continued | | | | |
| $ | 1,889,000 | | | Simon Property Group LP, 5.875%, 3/01/2017 | | $ | 2,095,740 | |
| | 4,066,000 | | | Simon Property Group LP, 6.100%, 5/01/2016 | | | 4,594,844 | |
| | | | | | | | |
| | | | | | | 22,908,108 | |
| | | | | | | | |
| | | | REITs — Shopping Centers — 0.1% | | | | |
| | 4,893,000 | | | Equity One, Inc., 6.000%, 9/15/2017 | | | 5,033,116 | |
| | 1,918,000 | | | Federal Realty Investment Trust, 5.650%, 6/01/2016 | | | 2,087,864 | |
| | | | | | | | |
| | | | | | | 7,120,980 | |
| | | | | | | | |
| | | | REITs — Single Tenant — 0.4% | | | | |
| | 5,862,000 | | | Realty Income Corp., 5.750%, 1/15/2021 | | | 6,170,588 | |
| | 25,529,000 | | | Realty Income Corp., 6.750%, 8/15/2019 | | | 29,130,044 | |
| | | | | | | | |
| | | | | | | 35,300,632 | |
| | | | | | | | |
| | | | REITs — Warehouse/Industrials — 0.7% | | | | |
| | 3,873,000 | | | ProLogis, 5.625%, 11/15/2015 | | | 4,110,271 | |
| | 11,179,000 | | | ProLogis, 5.625%, 11/15/2016 | | | 11,710,014 | |
| | 10,889,000 | | | ProLogis, 5.750%, 4/01/2016 | | | 11,695,875 | |
| | 9,698,000 | | | ProLogis, 6.625%, 5/15/2018 | | | 10,504,583 | |
| | 18,869,000 | | | ProLogis, 7.375%, 10/30/2019 | | | 21,370,029 | |
| | | | | | | | |
| | | | | | | 59,390,772 | |
| | | | | | | | |
| | | | Restaurants — 0.1% | | | | |
| | 10,320,000 | | | Darden Restaurants, Inc., 6.000%, 8/15/2035 | | | 9,985,900 | |
| | | | | | | | |
| | | | Retailers — 0.6% | | | | |
| | 7,996,000 | | | J.C. Penney Corp., Inc., 5.750%, 2/15/2018 | | | 8,055,970 | |
| | 8,139,000 | | | J.C. Penney Corp., Inc., 6.375%, 10/15/2036 | | | 7,335,274 | |
| | 12,000 | | | J.C. Penney Corp., Inc., 7.125%, 11/15/2023 | | | 12,420 | |
| | 8,656,000 | | | J.C. Penney Corp., Inc., 7.625%, 3/01/2097 | | | 7,747,120 | |
| | 13,425,000 | | | Macy’s Retail Holdings, Inc., 6.375%, 3/15/2037 | | | 13,425,000 | |
| | 10,467,000 | | | Macy’s Retail Holdings, Inc., 6.790%, 7/15/2027 | | | 10,126,822 | |
| | 2,691,000 | | | Macy’s Retail Holdings, Inc., 6.900%, 4/01/2029 | | | 2,724,638 | |
| | 8,064,000 | | | Marks & Spencer PLC, 7.125%, 12/01/2037, 144A | | | 7,700,273 | |
| | | | | | | | |
| | | | | | | 57,127,517 | |
| | | | | | | | |
| | | | Sovereigns — 1.4% | | | | |
| | 429,200(†††) | | | Mexican Fixed Rate Bonds, Series M-10, 7.250%, 12/15/2016, (MXN) | | | 3,648,477 | |
| | 4,111,400(†††) | | | Mexican Fixed Rate Bonds, Series M-20, 8.000%, 12/07/2023, (MXN) | | | 35,087,643 | |
| | 371,900(†††) | | | Mexican Fixed Rate Bonds, Series MI-10, 9.000%, 12/20/2012, (MXN) | | | 3,305,826 | |
| | 24,178,000 | | | Republic of Brazil, 10.250%, 1/10/2028, (BRL) | | | 14,735,007 | |
| | 6,035,000 | | | Republic of Brazil, 12.500%, 1/05/2022, (BRL) | | | 4,287,876 | |
| | 52,555,000 | | | Republic of Croatia, 6.750%, 11/05/2019, 144A | | | 55,051,362 | |
| | 955,389,437 | | | Republic of Iceland, 4.250%, 8/24/2012, (ISK) | | | 5,011,488 | |
| | 776,294,507 | | | Republic of Iceland, 7.250%, 5/17/2013, (ISK) | | | 4,356,098 | |
| | 987,872,928 | | | Republic of Iceland, 8.000%, 7/22/2011, (ISK) | | | 5,179,884 | |
| | | | | | | | |
| | | | | | | 130,663,661 | |
| | | | | | | | |
| | | | Supermarkets — 0.2% | | | | |
| | 4,130,000 | | | American Stores Co., Series B, MTN, 7.100%, 3/20/2028 | | | 3,118,150 | |
| | 3,269,000 | | | Kroger Co. (The), 6.400%, 8/15/2017 | | | 3,761,190 | |
See accompanying notes to financial statements.
21 |
Portfolio of Investments – as of March 31, 2011 (Unaudited)
Loomis Sayles Investment Grade Bond Fund – (continued)
| | | | | | | | |
Principal
Amount (‡) | | | Description | | Value (†) | |
| | | | | | | | |
| | | | Supermarkets — continued | | | | |
| $ | 1,860,000 | | | New Albertson’s, Inc., 7.450%, 8/01/2029 | | $ | 1,469,400 | |
| | 979,000 | | | New Albertson’s, Inc., Series C, MTN, 6.625%, 6/01/2028 | | | 709,775 | |
| | 10,863,000 | | | Safeway, Inc., 6.350%, 8/15/2017 | | | 12,143,444 | |
| | | | | | | | |
| | | | | | | 21,201,959 | |
| | | | | | | | |
| | | | Supranational — 1.6% | | | | |
| | 11,745,000 | | | European Bank for Reconstruction & Development, GMTN,
9.250%, 9/10/2012, (BRL) | | | 7,190,805 | |
| | 192,350,850,000 | | | European Investment Bank, EMTN, Zero Coupon, 4/24/2013, 144A, (IDR) | | | 19,282,579 | |
| | 28,082,000 | | | European Investment Bank, EMTN, 7.000%, 1/18/2012, (NZD) | | | 22,067,027 | |
| | 329,000,000,000 | | | Inter-American Development Bank, EMTN, Zero Coupon, 5/20/2013, (IDR) | | | 32,208,326 | |
| | 410,030,000,000 | | | Inter-American Development Bank, EMTN, Zero Coupon, 9/23/2013, (IDR) | | | 38,891,045 | |
| | 12,982,000 | | | Inter-American Development Bank, EMTN, 6.000%, 12/15/2017, (NZD) | | | 10,361,077 | |
| | 15,070,000 | | | International Bank for Reconstruction & Development,
1.430%, 3/05/2014, (SGD) | | | 12,004,579 | |
| | | | | | | | |
| | | | | | | 142,005,438 | |
| | | | | | | | |
| | | | Technology — 3.9% | | | | |
| | 8,705,000 | | | Agilent Technologies, Inc., 6.500%, 11/01/2017 | | | 9,711,315 | |
| | 4,600,000 | | | Alcatel-Lucent USA, Inc., 6.450%, 3/15/2029 | | | 3,956,000 | |
| | 1,028,000 | | | Arrow Electronics, Inc., 6.875%, 6/01/2018 | | | 1,120,710 | |
| | 3,059,000 | | | Avnet, Inc., 5.875%, 3/15/2014 | | | 3,288,544 | |
| | 6,097,000 | | | Avnet, Inc., 6.000%, 9/01/2015 | | | 6,549,154 | |
| | 1,507,000 | | | Avnet, Inc., 6.625%, 9/15/2016 | | | 1,649,404 | |
| | 12,444,000 | | | BMC Software, Inc., 7.250%, 6/01/2018(c) | | | 14,157,638 | |
| | 13,457,000 | | | Corning, Inc., 6.750%, 9/15/2013 | | | 14,904,650 | |
| | 1,448,000 | | | Corning, Inc., 6.850%, 3/01/2029 | | | 1,629,743 | |
| | 57,571,000 | | | Corning, Inc., 7.000%, 5/15/2024 | | | 65,907,741 | |
| | 7,487,000 | | | Corning, Inc., 7.250%, 8/15/2036 | | | 8,547,706 | |
| | 55,237,000 | | | Dun & Bradstreet Corp. (The), 6.000%, 4/01/2013 | | | 59,567,139 | |
| | 7,051,000 | | | Equifax, Inc., 7.000%, 7/01/2037 | | | 7,516,613 | |
| | 323,000 | | | Freescale Semiconductor, Inc., 10.125%, 12/15/2016 | | | 343,187 | |
| | 70,969,000 | | | Ingram Micro, Inc., 5.250%, 9/01/2017 | | | 72,150,705 | |
| | 7,795,000 | | | Intuit, Inc., 5.750%, 3/15/2017 | | | 8,534,558 | |
| | 19,078,000 | | | KLA-Tencor Corp., 6.900%, 5/01/2018 | | | 21,040,630 | |
| | 7,398,000 | | | Motorola Solutions, Inc., 6.500%, 9/01/2025 | | | 7,784,516 | |
| | 6,220,000 | | | Motorola Solutions, Inc., 6.500%, 11/15/2028 | | | 6,392,151 | |
| | 11,402,000 | | | Motorola Solutions, Inc., 6.625%, 11/15/2037 | | | 12,234,369 | |
| | 1,590,000 | | | Motorola Solutions, Inc., 8.000%, 11/01/2011 | | | 1,651,872 | |
| | 2,397,000 | | | Samsung Electronics Co. Ltd., 7.700%, 10/01/2027, 144A | | | 2,814,893 | |
| | 5,603,000 | | | Tyco Electronics Group SA, 6.550%, 10/01/2017 | | | 6,412,107 | |
| | 10,951,000 | | | Xerox Capital Trust I, 8.000%, 2/01/2027 | | | 11,142,642 | |
| | 561,000 | | | Xerox Corp., 6.350%, 5/15/2018 | | | 634,309 | |
| | 7,110,000 | | | Xerox Corp., 6.750%, 2/01/2017 | | | 8,163,418 | |
| | | | | | | | |
| | | | | | | 357,805,714 | |
| | | | | | | | |
| | | | Textile — 0.2% | | | | |
| | 3,755,000 | | | Phillips-Van Heusen Corp., 7.750%, 11/15/2023 | | | 4,120,388 | |
| | 14,903,000 | | | VF Corp., 6.450%, 11/01/2037 | | | 17,236,377 | |
| | | | | | | | |
| | | | | | | 21,356,765 | |
| | | | | | | | |
See accompanying notes to financial statements.
| 22
Portfolio of Investments – as of March 31, 2011 (Unaudited)
Loomis Sayles Investment Grade Bond Fund – (continued)
| | | | | | | | |
Principal
Amount (‡) | | | Description | | Value (†) | |
| | | | | | | | |
| | | | Tobacco — 0.1% | | | | |
| $ | 8,128,000 | | | Reynolds American, Inc., 6.750%, 6/15/2017 | | $ | 9,294,791 | |
| | 1,992,000 | | | Reynolds American, Inc., 7.250%, 6/15/2037 | | | 2,108,259 | |
| | | | | | | | |
| | | | | | | 11,403,050 | |
| | | | | | | | |
| | | | Transportation Services — 0.8% | | | | |
| | 8,436,000 | | | Erac USA Finance Co., 6.375%, 10/15/2017, 144A | | | 9,457,439 | |
| | 2,824,000 | | | Erac USA Finance Co., 6.700%, 6/01/2034, 144A | | | 2,917,153 | |
| | 51,504,000 | | | Erac USA Finance Co., 7.000%, 10/15/2037, 144A | | | 56,115,050 | |
| | | | | | | | |
| | | | | | | 68,489,642 | |
| | | | | | | | |
| | | | Treasuries — 18.6% | | | | |
| | 360,010,000 | | | Canadian Government, 2.000%, 9/01/2012, (CAD) | | | 373,418,934 | |
| | 194,485,000 | | | Canadian Government, 3.750%, 6/01/2019, (CAD) | | | 208,055,820 | |
| | 4,159,000 | | | Canadian Government, 4.000%, 6/01/2016, (CAD) | | | 4,548,989 | |
| | 183,949,000 | | | Canadian Government, 4.250%, 6/01/2018, (CAD) | | | 203,911,119 | |
| | 2,905,736 | | | Hellenic Republic Government Bond, 2.300%, 7/25/2030, (EUR) | | | 2,062,626 | |
| | 979,000 | | | Hellenic Republic Government Bond, 4.600%, 7/20/2018, (EUR) | | | 854,801 | |
| | 19,182,000 | | | Hellenic Republic Government Bond, 4.700%, 3/20/2024, (EUR) | | | 16,123,257 | |
| | 82,723,516 | | | Ireland Government Bond, 4.500%, 10/18/2018, (EUR) | | | 82,780,141 | |
| | 18,913,126 | | | Ireland Government Bond, 4.500%, 4/18/2020, (EUR) | | | 18,159,487 | |
| | 4,624,296 | | | Ireland Government Bond, 5.000%, 10/18/2020, (EUR) | | | 4,518,083 | |
| | 49,203,488 | | | Ireland Government Bond, 5.400%, 3/13/2025, (EUR) | | | 46,438,856 | |
| | 12,263,000 | | | New Zealand Government Bond, 6.000%, 12/15/2017, (NZD) | | | 9,788,853 | |
| | 206,733,000 | | | New Zealand Government Bond, 6.500%, 4/15/2013, (NZD) | | | 167,102,140 | |
| | 726,401,000 | | | Norwegian Government, 4.250%, 5/19/2017, (NOK) | | | 136,648,503 | |
| | 118,387,000 | | | Norwegian Government, 5.000%, 5/15/2015, (NOK) | | | 22,777,871 | |
| | 195,679,000 | | | Norwegian Government, 6.000%, 5/16/2011, (NOK) | | | 35,530,232 | |
| | 587,589,000 | | | Norwegian Government, 6.500%, 5/15/2013, (NOK) | | | 114,127,044 | |
| | 18,301,446 | | | Portugal Obrigacoes do Tesouro OT, 3.850%, 4/15/2021, (EUR) | | | 18,202,446 | |
| | 4,599,829 | | | Portugal Obrigacoes do Tesouro OT, 4.800%, 6/15/2020, (EUR) | | | 5,058,451 | |
| | 242,968,800 | | | U.S. Treasury Bond, 4.250%, 11/15/2040 | | | 232,376,818 | |
| | | | | | | | |
| | | | | | | 1,702,484,471 | |
| | | | | | | | |
| | | | Wireless — 0.8% | | | | |
| | 31,416,000 | | | Cellco Partnership/Verizon Wireless Capital LLC, 8.500%, 11/15/2018 | | | 40,363,717 | |
| | 15,375,000 | | | Nextel Communications, Inc., Series C, 5.950%, 3/15/2014 | | | 15,413,437 | |
| | 8,549,000 | | | Nextel Communications, Inc., Series D, 7.375%, 8/01/2015 | | | 8,581,059 | |
| | 279,000 | | | Nextel Communications, Inc., Series E, 6.875%, 10/31/2013 | | | 281,093 | |
| | 6,373,000 | | | Sprint Capital Corp., 6.875%, 11/15/2028 | | | 5,879,093 | |
| | 2,594,000 | | | Sprint Capital Corp., 6.900%, 5/01/2019 | | | 2,678,305 | |
| | 612,000 | | | Sprint Capital Corp., 8.750%, 3/15/2032 | | | 651,015 | |
| | 91,000 | | | Sprint Nextel Corp., 6.000%, 12/01/2016 | | | 91,341 | |
| | 500,000 | | | True Move Co. Ltd., 10.750%, 12/16/2013, 144A | | | 541,250 | |
| | 1,619,000 | | | Vodafone Group PLC, 5.000%, 9/15/2015 | | | 1,754,097 | |
| | | | | | | | |
| | | | | | | 76,234,407 | |
| | | | | | | | |
| | | | Wirelines — 4.1% | | | | |
| | 8,168,000 | | | AT&T Corp., 6.500%, 3/15/2029 | | | 8,642,267 | |
| | 406,000 | | | Bell Canada, MTN, 7.300%, 2/23/2032, (CAD) | | | 473,397 | |
See accompanying notes to financial statements.
23 |
Portfolio of Investments – as of March 31, 2011 (Unaudited)
Loomis Sayles Investment Grade Bond Fund – (continued)
| | | | | | | | |
Principal
Amount (‡) | | | Description | | Value (†) | |
| | | | | | | | |
| | | | Wirelines — continued | | | | |
| $ | 1,874,000 | | | BellSouth Corp., 6.000%, 11/15/2034 | | $ | 1,834,972 | |
| | 2,936,000 | | | BellSouth Telecommunications, Inc., 5.850%, 11/15/2045 | | | 2,630,829 | |
| | 6,665,000 | | | BellSouth Telecommunications, Inc., 7.000%, 12/01/2095 | | | 6,791,828 | |
| | 2,408,000 | | | CenturyLink, Inc., Series P, 7.600%, 9/15/2039 | | | 2,579,466 | |
| | 131,306,000 | | | Deutsche Telekom International Finance BV, 6.000%, 7/08/2019 | | | 150,067,920 | |
| | 3,279,000 | | | GTE Corp., 6.940%, 4/15/2028 | | | 3,635,411 | |
| | 1,440,000 | | | Level 3 Financing, Inc., 8.750%, 2/15/2017 | | | 1,429,200 | |
| | 548,000 | | | Level 3 Financing, Inc., 9.250%, 11/01/2014 | | | 560,330 | |
| | 200,000 | | | Level 3 Financing, Inc., 9.375%, 4/01/2019, 144A | | | 193,500 | |
| | 4,950,000 | | | Portugal Telecom International Finance BV, EMTN,
4.500%, 6/16/2025, (EUR) | | | 5,367,702 | |
| | 9,650,000 | | | Portugal Telecom International Finance BV, EMTN,
5.000%, 11/04/2019, (EUR) | | | 11,743,833 | |
| | 1,698,000 | | | Qwest Capital Funding, Inc., 6.500%, 11/15/2018 | | | 1,731,960 | |
| | 2,755,000 | | | Qwest Capital Funding, Inc., 6.875%, 7/15/2028 | | | 2,734,338 | |
| | 4,370,000 | | | Qwest Capital Funding, Inc., 7.625%, 8/03/2021 | | | 4,544,800 | |
| | 949,000 | | | Qwest Capital Funding, Inc., 7.750%, 2/15/2031 | | | 1,010,685 | |
| | 333,000 | | | Qwest Corp., 6.500%, 6/01/2017 | | | 367,549 | |
| | 14,480,000 | | | Qwest Corp., 6.875%, 9/15/2033 | | | 14,498,100 | |
| | 4,668,000 | | | Qwest Corp., 7.200%, 11/10/2026 | | | 4,691,340 | |
| | 9,077,000 | | | Qwest Corp., 7.250%, 9/15/2025 | | | 9,667,005 | |
| | 9,474,000 | | | Qwest Corp., 7.250%, 10/15/2035 | | | 9,616,110 | |
| | 1,566,000 | | | Qwest Corp., 7.500%, 6/15/2023 | | | 1,569,915 | |
| | 10,976,000 | | | Telecom Italia Capital SA, 6.000%, 9/30/2034 | | | 9,931,700 | |
| | 4,091,000 | | | Telecom Italia Capital SA, 6.375%, 11/15/2033 | | | 3,860,746 | |
| | 14,137,000 | | | Telus Corp., 4.950%, 3/15/2017, (CAD) | | | 15,103,186 | |
| | 54,665,000 | | | Telus Corp., Series CG, 5.050%, 12/04/2019, (CAD) | | | 56,624,370 | |
| | 3,598,000 | | | Verizon Communications, Inc., 6.100%, 4/15/2018 | | | 4,032,552 | |
| | 4,952,000 | | | Verizon Maryland, Inc., Series B, 5.125%, 6/15/2033 | | | 4,469,858 | |
| | 14,230,000 | | | Verizon New England, Inc., 6.500%, 9/15/2011 | | | 14,610,653 | |
| | 2,642,000 | | | Verizon New England, Inc., 7.875%, 11/15/2029 | | | 3,056,400 | |
| | 6,897,000 | | | Verizon New York, Inc., Series B, 7.375%, 4/01/2032 | | | 7,738,062 | |
| | 5,260,000 | | | Verizon Pennsylvania, Inc., 6.000%, 12/01/2028 | | | 4,898,007 | |
| | | | | | | | |
| | | | | | | 370,707,991 | |
| | | | | | | | |
| | | | Total Non-Convertible Bonds
(Identified Cost $7,555,947,232) | | | 8,507,240,438 | |
| | | | | | | | |
| | Convertible Bonds — 4.1% | | | | |
| | | | Automotive — 0.7% | | | | |
| | 34,827,000 | | | Ford Motor Co., 4.250%, 11/15/2016 | | | 63,123,938 | |
| | | | | | | | |
| | | | Life Insurance — 0.8% | | | | |
| | 72,915,000 | | | Old Republic International Corp., 3.750%, 3/15/2018 | | | 73,188,431 | |
| | | | | | | | |
| | | | Media Non-Cable — 0.0% | | | | |
| | 517,178 | | | Liberty Media LLC, 3.500%, 1/15/2031 | | | 289,620 | |
| | | | | | | | |
| | | | REITs — Apartments — 0.0% | | | | |
| | 1,370,000 | | | ERP Operating LP, 3.850%, 8/15/2026 | | | 1,402,606 | |
| | | | | | | | |
See accompanying notes to financial statements.
| 24
Portfolio of Investments – as of March 31, 2011 (Unaudited)
Loomis Sayles Investment Grade Bond Fund – (continued)
| | | | | | | | |
Principal
Amount (‡) | | | Description | | Value (†) | |
| | | | | | | | |
| | | | REITs — Warehouse/Industrials — 0.4% | | | | |
| $ | 27,359,000 | | | ProLogis, 3.250%, 3/15/2015 | | $ | 32,112,626 | |
| | | | | | | | |
| | | | Technology — 2.2% | | | | |
| | 35,120,000 | | | Intel Corp., 2.950%, 12/15/2035 | | | 36,129,700 | |
| | 137,016,000 | | | Intel Corp., 3.250%, 8/01/2039 | | | 161,165,070 | |
| | | | | | | | |
| | | | | | | 197,294,770 | |
| | | | | | | | |
| | | | Wirelines — 0.0% | | | | |
| | 1,129,000 | | | Level 3 Communications, Inc., 3.500%, 6/15/2012 | | | 1,113,476 | |
| | 2,926,000 | | | Level 3 Communications, Inc., 7.000%, 3/15/2015, 144A(c) | | | 3,405,133 | |
| | | | | | | | |
| | | | | | | 4,518,609 | |
| | | | | | | | |
| | | | Total Convertible Bonds
(Identified Cost $312,340,639) | | | 371,930,600 | |
| | | | | | | | |
| | Municipals — 0.7% | | | | |
| | | | California — 0.1% | | | | |
| | 1,275,000 | | | San Jose California Redevelopment Agency Tax Allocation (Merged Area Redevelopment), Series C, (MBIA insured), 3.750%, 8/01/2028 | | | 881,599 | |
| | 470,000 | | | San Jose California Redevelopment Agency Tax Allocation (Merged Area Redevelopment), Series C, (Registered), (MBIA insured), 3.750%, 8/01/2028 | | | 349,920 | |
| | 1,585,000 | | | State of California, (AMBAC insured), 4.500%, 8/01/2027 | | | 1,427,483 | |
| | 4,420,000 | | | State of California, 4.500%, 10/01/2029 | | | 3,841,996 | |
| | 1,285,000 | | | State of California, (AMBAC insured), 4.500%, 8/01/2030 | | | 1,106,244 | |
| | 1,450,000 | | | State of California, 4.500%, 8/01/2030 | | | 1,248,290 | |
| | 820,000 | | | State of California (Various Purpose), (MBIA insured), 3.250%, 12/01/2027 | | | 610,892 | |
| | 3,880,000 | | | State of California (Various Purpose), (AMBAC insured), 4.500%, 12/01/2033 | | | 3,269,753 | |
| | | | | | | | |
| | | | | | | 12,736,177 | |
| | | | | | | | |
| | | | District of Columbia — 0.2% | | | | |
| | 14,680,000 | | | Metropolitan Washington Airports Authority, 7.462%, 10/01/2046 | | | 14,347,792 | |
| | | | | | | | |
| | | | Illinois — 0.2% | | | | |
| | 530,000 | | | Chicago O’Hare International Airport, Series A, (AGMC insured), 4.500%, 1/01/2038 | | | 412,541 | |
| | 24,640,000 | | | State of Illinois, 5.100%, 6/01/2033 | | | 19,979,837 | |
| | | | | | | | |
| | | | | | | 20,392,378 | |
| | | | | | | | |
| | | | Michigan — 0.0% | | | | |
| | 2,530,000 | | | Michigan Tobacco Settlement Finance Authority Taxable Turbo, Series A, 7.309%, 6/01/2034(c) | | | 1,794,554 | |
| | | | | | | | |
| | | | Ohio — 0.1% | | | | |
| | 6,430,000 | | | Buckeye Tobacco Settlement Financing Authority, Series A-2, 5.875%, 6/01/2047(c) | | | 4,265,212 | |
| | | | | | | | |
| | | | Virginia — 0.1% | | | | |
| | 14,240,000 | | | Virginia Tobacco Settlement Financing Corp., Series A-1, 6.706%, 6/01/2046(c) | | | 8,956,248 | |
| | | | | | | | |
| | | | Total Municipals
(Identified Cost $70,030,113) | | | 62,492,361 | |
| | | | | | | | |
| | | | Total Bonds and Notes
(Identified Cost $7,938,317,984) | | | 8,941,663,399 | |
| | | | | | | | |
See accompanying notes to financial statements.
25 |
Portfolio of Investments – as of March 31, 2011 (Unaudited)
Loomis Sayles Investment Grade Bond Fund – (continued)
| | | | | | | | |
Principal
Amount (‡) | | | Description | | Value (†) | |
| | | | | | | | |
| | Bank Loans — 0.2% | | | | |
| | | | Airlines — 0.2% | | | | |
| $ | 17,280,000 | | | AWAS Capital, Inc., New 1st Lien Term Loan, 7.750%, 6/10/2016(e)
(Identified Cost $16,828,537) | | $ | 17,639,942 | |
| | | | | | | | |
| | Short-Term Investments — 1.0% | | | | |
| | 96,946,153 | | | Tri-Party Repurchase Agreement with Fixed Income Clearing Corporation, dated 3/31/2011 at 0.000% to be repurchased at $96,946,153 on 4/01/2011 collateralized by $103,955,000 Federal Home Loan Mortgage Corporation, 3.310% due 11/10/2020 valued at $98,887,194 including accrued interest (Note 2 of Notes to Financial Statements)
(Identified Cost $96,946,153) | | | 96,946,153 | |
| | | | | | | | |
| | | | | | | | |
| | | | Total Investments — 98.9%
(Identified Cost $8,052,092,674)(a) | | | 9,056,249,494 | |
| | | | Other assets less liabilities — 1.1% | | | 98,109,397 | |
| | | | | | | | |
| | | | Net Assets — 100.0% | | $ | 9,154,358,891 | |
| | | | | | | | |
| | | | | | | | |
| | (‡) | | | Principal amount stated in U.S. dollars unless otherwise noted. | |
| | (†) | | | See Note 2 of Notes to Financial Statements. | |
| | (††) | | | Amount shown represents units. One unit represents a principal amount of 25. | |
| | (†††) | | | Amount shown represents units. One unit represents a principal amount of 100. | |
| | (a) | | | Federal Tax Information (Amounts exclude certain adjustments made at the end of the Fund’s fiscal year for tax purposes. Such adjustments are primarily due to wash sales. Amortization of premium on debt securities is excluded for tax purposes.): | |
| | | | At March 31, 2011, the net unrealized appreciation on investments based on a cost of $8,076,330,313 for federal income tax purposes was as follows: | | | | |
| | | | Aggregate gross unrealized appreciation for all investments in which there is an excess of value over tax cost | | $ | 1,039,880,133 | |
| | | | Aggregate gross unrealized depreciation for all investments in which there is an excess of tax cost over value | | | (59,960,952 | ) |
| | | | | | | | |
| | | | Net unrealized appreciation | | $ | 979,919,181 | |
| | | | | | | | |
| | | | | | | | |
| | (b) | | | Variable rate security. Rate as of March 31, 2011 is disclosed. | |
| | (c) | | | Illiquid security. At March 31, 2011, the value of these securities amounted to $137,006,590 or 1.5% of net assets. | |
| | (d) | | | Coupon rate is a fixed rate for an initial period then resets at a specified date and rate. | |
| | (e) | | | Variable rate security. Rate shown represents the weighted average rate at March 31, 2011. | |
| | | | | |
| | 144A | | | All or a portion of these securities are exempt from registration under Rule 144A of the Securities Act of 1933. These securities may be resold in transactions exempt from registration, normally to qualified institutional buyers. At March 31, 2011, the value of Rule 144A holdings amounted to $1,491,721,593 or 16.3% of net assets. | |
| | ABS | | | Asset-Backed Securities | | | | |
| | AGMC | | | Assured Guaranty Municipal Corp. | | | | |
See accompanying notes to financial statements.
| 26
Portfolio of Investments – as of March 31, 2011 (Unaudited)
Loomis Sayles Investment Grade Bond Fund – (continued)
| | | | | | | | |
| | | | | | | |
| | | | | | | | |
| | AMBAC | | | American Municipal Bond Assurance Corp. | | | | |
| | EMTN | | | Euro Medium Term Note | | | | |
| | FHLMC | | | Federal Home Loan Mortgage Corp. | | | | |
| | FNMA | | | Federal National Mortgage Association | | | | |
| | GMTN | | | Global Medium Term Note | | | | |
| | MBIA | | | Municipal Bond Investors Assurance Corp. | | | | |
| | MTN | | | Medium Term Note | | | | |
| | REITs | | | Real Estate Investment Trusts | | | | |
| | | | | | | | |
| | AUD | | | Australian Dollar | | | | |
| | BRL | | | Brazilian Real | | | | |
| | CAD | | | Canadian Dollar | | | | |
| | EUR | | | Euro | | | | |
| | GBP | | | British Pound | | | | |
| | IDR | | | Indonesian Rupiah | | | | |
| | ISK | | | Icelandic Krona | | | | |
| | KRW | | | South Korean Won | | | | |
| | MXN | | | Mexican Peso | | | | |
| | NOK | | | Norwegian Krone | | | | |
| | NZD | | | New Zealand Dollar | | | | |
| | SGD | | | Singapore Dollar | | | | |
Industry Summary at March 31, 2011 (Unaudited)
| | | | |
| Treasuries | | | 18.6 | % |
| Banking | | | 10.5 | |
| Technology | | | 6.1 | |
| Commercial Mortgage-Backed Securities | | | 4.2 | |
| Pipelines | | | 4.1 | |
| Wirelines | | | 4.1 | |
| Non-Captive Diversified | | | 4.0 | |
| Airlines | | | 3.4 | |
| Electric | | | 3.1 | |
| ABS Other | | | 2.0 | |
| Non-Captive Consumer | | | 2.0 | |
| Other Investments, less than 2% each | | | 35.8 | |
| Short-Term Investments | | | 1.0 | |
| | | | |
| Total Investments | | | 98.9 | |
| Other assets less liabilities | | | 1.1 | |
| | | | |
| Net Assets | | | 100.0 | % |
| | | | |
Currency Exposure at March 31, 2011 (Unaudited)
| | | | |
| United States Dollar | | | 73.8 | % |
| Canadian Dollar | | | 10.0 | |
| New Zealand Dollar | | | 3.6 | |
| Norwegian Krone | | | 3.4 | |
| Euro | | | 2.9 | |
| Other, less than 2% each | | | 5.2 | |
| | | | |
| Total Investments | | | 98.9 | |
| Other assets less liabilities | | | 1.1 | |
| | | | |
| Net Assets | | | 100.0 | % |
| | | | |
See accompanying notes to financial statements.
27 |
Statement of Assets and Liabilities
March 31, 2011 (Unaudited)
| | | | |
ASSETS | | | | |
Investments at cost | | $ | 8,052,092,674 | |
Net unrealized appreciation | | | 1,004,156,820 | |
| | | | |
Investments at value | | | 9,056,249,494 | |
Cash | | | 1,111,193 | |
Foreign currency at value (identified cost $5,359,597) | | | 5,205,264 | |
Receivable for Fund shares sold | | | 29,349,509 | |
Receivable for securities sold | | | 1,637,058 | |
Interest receivable | | | 132,012,624 | |
Tax reclaims receivable | | | 889,151 | |
| | | | |
TOTAL ASSETS | | | 9,226,454,293 | |
| | | | |
LIABILITIES | | | | |
Payable for securities purchased | | | 46,755,156 | |
Payable for Fund shares redeemed | | | 20,868,673 | |
Foreign taxes payable (Note 2) | | | 59,512 | |
Management fees payable (Note 5) | | | 3,123,953 | |
Deferred Trustees’ fees (Note 5) | | | 275,690 | |
Administrative fees payable (Note 5) | | | 368,677 | |
Other accounts payable and accrued expenses | | | 643,741 | |
| | | | |
TOTAL LIABILITIES | | | 72,095,402 | |
| | | | |
NET ASSETS | | $ | 9,154,358,891 | |
| | | | |
NET ASSETS CONSIST OF: | | | | |
Paid-in capital | | $ | 8,046,504,825 | |
Undistributed net investment income | | | 22,018,240 | |
Accumulated net realized gain on investments and foreign currency transactions | | | 80,230,155 | |
Net unrealized appreciation on investments and foreign currency translations | | | 1,005,605,671 | |
| | | | |
NET ASSETS | | $ | 9,154,358,891 | |
| | | | |
See accompanying notes to financial statements.
| 28
Statement of Assets and Liabilities (continued)
March 31, 2011 (Unaudited)
| | | | |
COMPUTATION OF NET ASSET VALUE AND OFFERING PRICE: | | | | |
Class A shares: | | | | |
Net assets | | $ | 2,677,919,377 | |
| | | | |
Shares of beneficial interest | | | 217,903,628 | |
| | | | |
Net asset value and redemption price per share | | $ | 12.29 | |
| | | | |
Offering price per share (100/95.50 of net asset value) (Note 1) | | $ | 12.87 | |
| | | | |
Class B shares: (redemption price per share is equal to net asset value less any applicable contingent deferred sales charge) (Note 1) | | | | |
Net assets | | $ | 15,066,570 | |
| | | | |
Shares of beneficial interest | | | 1,231,956 | |
| | | | |
Net asset value and offering price per share | | $ | 12.23 | |
| | | | |
Class C shares: (redemption price per share is equal to net asset value less any applicable contingent deferred sales charge) (Note 1) | | | | |
Net assets | | $ | 2,199,938,808 | |
| | | | |
Shares of beneficial interest | | | 180,383,287 | |
| | | | |
Net asset value and offering price per share | | $ | 12.20 | |
| | | | |
Class Y shares: | | | | |
Net assets | | $ | 4,142,997,406 | |
| | | | |
Shares of beneficial interest | | | 336,905,508 | |
| | | | |
Net asset value, offering and redemption price per share | | $ | 12.30 | |
| | | | |
Admin Class shares: | | | | |
Net assets | | $ | 2,494,592 | |
| | | | |
Shares of beneficial interest | | | 203,221 | |
| | | | |
Net asset value, offering and redemption price per share | | $ | 12.28 | |
| | | | |
Class J shares: | | | | |
Net assets | | $ | 115,942,138 | |
| | | | |
Shares of beneficial interest | | | 9,449,290 | |
| | | | |
Net asset value and redemption price per share | | $ | 12.27 | |
| | | | |
Offering price per share (100/96.50 of net asset value) (Note 1) | | $ | 12.72 | |
| | | | |
See accompanying notes to financial statements.
29 |
Statement of Operations
For the Six Months Ended March 31, 2011 (Unaudited)
| | | | |
INVESTMENT INCOME | |
Interest | | $ | 260,813,273 | |
| | | | |
Expenses | | | | |
Management fees (Note 5) | | | 19,517,332 | |
Service and distribution fees (Note 5) | | | 16,159,504 | |
Administrative fees (Note 5) | | | 2,280,026 | |
Trustees’ fees and expenses (Note 5) | | | 108,938 | |
Transfer agent fees and expenses (Notes 5 and 6) | | | 4,117,302 | |
Audit and tax services fees | | | 31,207 | |
Custodian fees and expenses | | | 234,697 | |
Legal fees (Note 6) | | | 127,147 | |
Registration fees (Note 6) | | | 124,682 | |
Shareholder reporting expenses (Note 6) | | | 359,968 | |
Miscellaneous expenses | | | 150,306 | |
| | | | |
Total expenses | | | 43,211,109 | |
| | | | |
Net investment income | | | 217,602,164 | |
| | | | |
NET REALIZED AND UNREALIZED GAIN (LOSS) ON INVESTMENTS AND FOREIGN CURRENCY TRANSACTIONS | | | | |
Net realized gain on: | | | | |
Investments | | | 123,164,176 | |
Foreign currency transactions | | | 2,285,221 | |
Net change in unrealized appreciation (depreciation) on: | | | | |
Investments | | | (122,131,625 | ) |
Foreign currency translations | | | 330,832 | |
| | | | |
Net realized and unrealized gain on investments and foreign currency transactions | | | 3,648,604 | |
| | | | |
NET INCREASE IN NET ASSETS RESULTING FROM OPERATIONS | | $ | 221,250,768 | |
| | | | |
See accompanying notes to financial statements.
| 30
Statement of Changes in Net Assets
| | | | | | | | |
| | | Six Months Ended
March 31, 2011
(Unaudited) | | | Year Ended
September 30,
2010 | |
FROM OPERATIONS: | |
Net investment income | | $ | 217,602,164 | | | $ | 428,365,635 | |
Net realized gain on investments and foreign currency transactions | | | 125,449,397 | | | | 221,545,263 | |
Net change in unrealized appreciation (depreciation) on investments and foreign currency translations | | | (121,800,793 | ) | | | 549,147,089 | |
| | | | | | | | |
Net increase in net assets resulting from operations | | | 221,250,768 | | | | 1,199,057,987 | |
| | | | | | | | |
FROM DISTRIBUTIONS TO SHAREHOLDERS: | | | | | | | | |
Net investment income | | | | | | | | |
Class A | | | (70,587,051 | ) | | | (141,582,997 | ) |
Class B | | | (334,325 | ) | | | (676,565 | ) |
Class C | | | (50,242,873 | ) | | | (102,299,334 | ) |
Class Y | | | (111,045,597 | ) | | | (192,755,479 | ) |
Admin Class | | | (33,524 | ) | | | (9,090 | ) |
Class J | | | (2,743,509 | ) | | | (5,898,638 | ) |
Net realized capital gains | | | | | | | | |
Class A | | | (60,444,223 | ) | | | (6,651,489 | ) |
Class B | | | (338,411 | ) | | | (39,640 | ) |
Class C | | | (51,169,312 | ) | | | (5,758,632 | ) |
Class Y | | | (92,540,414 | ) | | | (8,463,329 | ) |
Admin Class | | | (26,910 | ) | | | — | |
Class J | | | (2,664,737 | ) | | | (320,597 | ) |
| | | | | | | | |
Total distributions | | | (442,170,886 | ) | | | (464,455,790 | ) |
| | | | | | | | |
NET INCREASE (DECREASE) IN NET ASSETS FROM CAPITAL SHARE TRANSACTIONS (NOTE 10) | | | (935,027,734 | ) | | | 433,617,282 | |
| | | | | | | | |
Net increase (decrease) in net assets | | | (1,155,947,852 | ) | | | 1,168,219,479 | |
NET ASSETS | | | | | | | | |
Beginning of the period | | | 10,310,306,743 | | | | 9,142,087,264 | |
| | | | | | | | |
End of the period | | $ | 9,154,358,891 | | | $ | 10,310,306,743 | |
| | | | | | | | |
UNDISTRIBUTED NET INVESTMENT INCOME | | $ | 22,018,240 | | | $ | 39,402,955 | |
| | | | | | | | |
See accompanying notes to financial statements.
31 |
This Page Intentionally Left Blank
| 32
Financial Highlights
For a share outstanding throughout each period.
| | | | | | | | | | | | | | | | | | | | | | | | | | | | |
| | | | | | Income (Loss) from Investment
Operations: | | | Less Distributions: | |
| | | Net asset
value,
beginning
of the
period | | | Net
investment
income(a) | | | Net realized
and
unrealized
gain (loss) | | | Total from
investment
operations | | | Dividends
from net
investment
income | | | Distributions
from net
realized
capital
gains | | | Total
distributions | |
INVESTMENT GRADE BOND FUND | | | | | | | | | | | | | | | | | | | | | |
Class A | | | | | | | | | | | | | | | | | | | | | | | | | | | | |
3/31/2011(f) | | $ | 12.56 | | | $ | 0.28 | | | $ | 0.01 | | | $ | 0.29 | | | $ | (0.30 | ) | | $ | (0.26 | ) | | $ | (0.56 | ) |
9/30/2010 | | | 11.64 | | | | 0.55 | | | | 0.96 | | | | 1.51 | | | | (0.56 | ) | | | (0.03 | ) | | | (0.59 | ) |
9/30/2009 | | | 10.54 | | | | 0.60 | | | | 1.22 | | | | 1.82 | | | | (0.59 | ) | | | (0.13 | ) | | | (0.72 | ) |
9/30/2008 | | | 11.73 | | | | 0.60 | | | | (1.15 | ) | | | (0.55 | ) | | | (0.64 | ) | | | — | | | | (0.64 | ) |
9/30/2007 | | | 11.35 | | | | 0.58 | | | | 0.42 | | | | 1.00 | | | | (0.62 | ) | | | — | | | | (0.62 | ) |
9/30/2006 | | | 11.71 | | | | 0.51 | | | | 0.10 | | | | 0.61 | | | | (0.75 | ) | | | (0.22 | ) | | | (0.97 | ) |
Class B | | | | | | | | | | | | | | | | | | | | | | | | | | | | |
3/31/2011(f) | | | 12.50 | | | | 0.23 | | | | 0.01 | | | | 0.24 | | | | (0.25 | ) | | | (0.26 | ) | | | (0.51 | ) |
9/30/2010 | | | 11.59 | | | | 0.45 | | | | 0.95 | | | | 1.40 | | | | (0.46 | ) | | | (0.03 | ) | | | (0.49 | ) |
9/30/2009 | | | 10.50 | | | | 0.51 | | | | 1.21 | | | | 1.72 | | | | (0.50 | ) | | | (0.13 | ) | | | (0.63 | ) |
9/30/2008 | | | 11.68 | | | | 0.50 | | | | (1.14 | ) | | | (0.64 | ) | | | (0.54 | ) | | | — | | | | (0.54 | ) |
9/30/2007 | | | 11.31 | | | | 0.47 | | | | 0.43 | | | | 0.90 | | | | (0.53 | ) | | | — | | | | (0.53 | ) |
9/30/2006 | | | 11.67 | | | | 0.42 | | | | 0.10 | | | | 0.52 | | | | (0.66 | ) | | | (0.22 | ) | | | (0.88 | ) |
Class C | | | | | | | | | | | | | | | | | | | | | | | | | | | | |
3/31/2011(f) | | | 12.47 | | | | 0.23 | | | | 0.01 | | | | 0.24 | | | | (0.25 | ) | | | (0.26 | ) | | | (0.51 | ) |
9/30/2010 | | | 11.56 | | | | 0.46 | | | | 0.96 | | | | 1.42 | | | | (0.48 | ) | | | (0.03 | ) | | | (0.51 | ) |
9/30/2009 | | | 10.47 | | | | 0.52 | | | | 1.22 | | | | 1.74 | | | | (0.52 | ) | | | (0.13 | ) | | | (0.65 | ) |
9/30/2008 | | | 11.66 | | | | 0.51 | | | | (1.15 | ) | | | (0.64 | ) | | | (0.55 | ) | | | — | | | | (0.55 | ) |
9/30/2007 | | | 11.30 | | | | 0.49 | | | | 0.42 | | | | 0.91 | | | | (0.55 | ) | | | — | | | | (0.55 | ) |
9/30/2006 | | | 11.66 | | | | 0.42 | | | | 0.11 | | | | 0.53 | | | | (0.67 | ) | | | (0.22 | ) | | | (0.89 | ) |
Class Y | | | | | | | | | | | | | | | | | | | | | | | | | | | | |
3/31/2011(f) | | | 12.56 | | | | 0.30 | | | | 0.02 | | | | 0.32 | | | | (0.32 | ) | | | (0.26 | ) | | | (0.58 | ) |
9/30/2010 | | | 11.65 | | | | 0.58 | | | | 0.95 | | | | 1.53 | | | | (0.59 | ) | | | (0.03 | ) | | | (0.62 | ) |
9/30/2009 | | | 10.55 | | | | 0.62 | | | | 1.23 | | | | 1.85 | | | | (0.62 | ) | | | (0.13 | ) | | | (0.75 | ) |
9/30/2008 | | | 11.73 | | | | 0.64 | | | | (1.15 | ) | | | (0.51 | ) | | | (0.67 | ) | | | — | | | | (0.67 | ) |
9/30/2007 | | | 11.36 | | | | 0.61 | | | | 0.41 | | | | 1.02 | | | | (0.65 | ) | | | — | | | | (0.65 | ) |
9/30/2006 | | | 11.71 | | | | 0.55 | | | | 0.11 | | | | 0.66 | | | | (0.79 | ) | | | (0.22 | ) | | | (1.01 | ) |
Admin Class | | | | | | | | | | | | | | | | | | | | | | | | | | | | |
3/31/2011(f) | | | 12.55 | | | | 0.27 | | | | 0.01 | | | | 0.28 | | | | (0.29 | ) | | | (0.26 | ) | | | (0.55 | ) |
9/30/2010* | | | 11.80 | | | | 0.33 | | | | 0.73 | | | | 1.06 | | | | (0.31 | ) | | | — | | | | (0.31 | ) |
Class J | | | | | | | | | | | | | | | | | | | | | | | | | | | | |
3/31/2011(f) | | | 12.54 | | | | 0.25 | | | | 0.01 | | | | 0.26 | | | | (0.27 | ) | | | (0.26 | ) | | | (0.53 | ) |
9/30/2010 | | | 11.63 | | | | 0.49 | | | | 0.95 | | | | 1.44 | | | | (0.50 | ) | | | (0.03 | ) | | | (0.53 | ) |
9/30/2009 | | | 10.53 | | | | 0.55 | | | | 1.22 | | | | 1.77 | | | | (0.54 | ) | | | (0.13 | ) | | | (0.67 | ) |
9/30/2008 | | | 11.71 | | | | 0.54 | | | | (1.14 | ) | | | (0.60 | ) | | | (0.58 | ) | | | — | | | | (0.58 | ) |
9/30/2007 | | | 11.34 | | | | 0.52 | | | | 0.42 | | | | 0.94 | | | | (0.57 | ) | | | — | | | | (0.57 | ) |
9/30/2006 | | | 11.69 | | | | 0.46 | | | | 0.11 | | | | 0.57 | | | | (0.70 | ) | | | (0.22 | ) | | | (0.92 | ) |
| * | From commencement of Class operations on February 1, 2010 through September 30, 2010. |
| (a) | Per share net investment income has been calculated using the average shares outstanding during the period. |
| (b) | Had certain expenses not been waived/reimbursed during the period, if applicable, total returns would have been lower. |
| (c) | A sales charge for Class A and Class J shares and a contingent deferred sales charge for Class B and Class C shares are not reflected in total return calculations. Periods less than one year, if applicable, are not annualized. |
| (d) | The investment adviser and/or administrator agreed to waive its fees and/or reimburse a portion of the Fund’s expenses during the period. Without this waiver/reimbursement, if applicable, expenses would have been higher. |
See accompanying notes to financial statements.
33 |
| | | | | | | | | | | | | | | | | | | | | | | | | | |
| | | | | | | | | |
Ratios to Average Net Assets: | | | | |
Net asset
value,
end of
the period | | | Total
return
(%)(b)(c) | | | Net assets,
end of
the period
(000’s) | | | Net
expenses
(%)(d)(e) | | | Gross
expenses
(%)(e) | | | Net investment
income
(%)(e) | | | Portfolio
turnover
rate(%) | |
| | | | | | | | | | | | | | | | | | | | | | | | | | |
| | | | | | | | | | | | | | | | | | | | | | | | | | |
| $ | 12.29 | | | | 2.44 | | | $ | 2,677,919 | | | | 0.80 | | | | 0.80 | | | | 4.54 | | | | 6 | |
| | 12.56 | | | | 13.41 | | | | 3,092,956 | | | | 0.81 | | | | 0.81 | | | | 4.58 | | | | 25 | |
| | 11.64 | | | | 18.64 | | | | 2,946,489 | | | | 0.80 | | | | 0.80 | | | | 5.87 | | | | 30 | |
| | 10.54 | | | | (5.12 | ) | | | 1,867,335 | | | | 0.80 | | | | 0.80 | | | | 5.20 | | | | 35 | |
| | 11.73 | | | | 9.14 | | | | 834,736 | | | | 0.83 | | | | 0.83 | | | | 5.05 | | | | 35 | |
| | 11.35 | | | | 5.63 | | | | 152,054 | | | | 0.92 | (g) | | | 0.92 | (g) | | | 4.59 | | | | 35 | |
| | | | | | | | | | | | | | | | | | | | | | | | | | |
| | 12.23 | | | | 2.06 | | | | 15,067 | | | | 1.55 | | | | 1.55 | | | | 3.79 | | | | 6 | |
| | 12.50 | | | | 12.43 | | | | 17,113 | | | | 1.65 | | | | 1.65 | | | | 3.74 | | | | 25 | |
| | 11.59 | | | | 17.59 | | | | 17,489 | | | | 1.67 | | | | 1.67 | | | | 5.07 | | | | 30 | |
| | 10.50 | | | | (5.88 | ) | | | 16,009 | | | | 1.65 | (h) | | | 1.65 | (h) | | | 4.29 | | | | 35 | |
| | 11.68 | | | | 8.17 | | | | 17,082 | | | | 1.70 | | | | 1.71 | | | | 4.16 | | | | 35 | |
| | 11.31 | | | | 4.83 | | | | 5,525 | | | | 1.70 | | | | 1.89 | | | | 3.75 | | | | 35 | |
| | | | | | | | | | | | | | | | | | | | | | | | | | |
| | 12.20 | | | | 2.07 | | | | 2,199,939 | | | | 1.55 | | | | 1.55 | | | | 3.79 | | | | 6 | |
| | 12.47 | | | | 12.58 | | | | 2,593,324 | | | | 1.56 | | | | 1.56 | | | | 3.83 | | | | 25 | |
| | 11.56 | | | | 17.80 | | | | 2,495,305 | | | | 1.56 | | | | 1.56 | | | | 5.09 | | | | 30 | |
| | 10.47 | | | | (5.84 | ) | | | 1,333,421 | | | | 1.55 | | | | 1.55 | | | | 4.45 | | | | 35 | |
| | 11.66 | | | | 8.28 | | | | 605,934 | | | | 1.57 | | | | 1.57 | | | | 4.30 | | | | 35 | |
| | 11.30 | | | | 4.87 | | | | 82,863 | | | | 1.70 | (g) | | | 1.70 | (g) | | | 3.79 | | | | 35 | |
| | | | | | | | | | | | | | | | | | | | | | | | | | |
| | 12.30 | | | | 2.65 | | | | 4,142,997 | | | | 0.55 | | | | 0.55 | | | | 4.80 | | | | 6 | |
| | 12.56 | | | | 13.60 | | | | 4,473,001 | | | | 0.56 | | | | 0.56 | | | | 4.82 | | | | 25 | |
| | 11.65 | | | | 18.94 | | | | 3,531,187 | | | | 0.54 | | | | 0.54 | | | | 6.01 | | | | 30 | |
| | 10.55 | | | | (4.79 | ) | | | 1,044,046 | | | | 0.53 | | | | 0.53 | | | | 5.48 | | | | 35 | |
| | 11.73 | | | | 9.32 | | | | 448,873 | | | | 0.55 | (h) | | | 0.55 | (h) | | | 5.33 | | | | 35 | |
| | 11.36 | | | | 6.09 | | | | 76,548 | | | | 0.55 | | | | 0.63 | | | | 4.94 | | | | 35 | |
| | | | | | | | | | | | | | | | | | | | | | | | | | |
| | 12.28 | | | | 2.33 | | | | 2,495 | | | | 1.06 | | | | 1.06 | | | | 4.40 | | | | 6 | |
| | 12.55 | | | | 9.13 | | | | 879 | | | | 1.08 | | | | 7.68 | | | | 4.06 | | | | 25 | |
| | | | | | | | | | | | | | | | | | | | | | | | | | |
| | 12.27 | | | | 2.19 | | | | 115,942 | | | | 1.30 | | | | 1.30 | | | | 4.05 | | | | 6 | |
| | 12.54 | | | | 12.77 | | | | 133,034 | | | | 1.30 | (i) | | | 1.30 | (i) | | | 4.09 | | | | 25 | |
| | 11.63 | | | | 18.05 | | | | 151,617 | | | | 1.30 | | | | 1.31 | | | | 5.48 | | | | 30 | |
| | 10.53 | | | | (5.50 | ) | | | 167,775 | | | | 1.28 | | | | 1.28 | | | | 4.66 | | | | 35 | |
| | 11.71 | | | | 8.52 | | | | 180,453 | | | | 1.28 | | | | 1.28 | | | | 4.57 | | | | 35 | |
| | 11.34 | | | | 5.29 | | | | 214,894 | | | | 1.30 | (g) | | | 1.30 | (g) | | | 4.09 | | | | 35 | |
| (e) | Computed on an annualized basis for periods less than one year, if applicable. |
| (f) | For the six months ended March 31, 2011 (Unaudited). |
| (g) | Includes fee/expense recovery of 0.06%, 0.09% and 0.03% for Class A, Class C and Class J shares, respectively. |
| (h) | Includes fee/expense recovery of less than 0.01%. |
| (i) | Includes fee/expense recovery of 0.01% for Class J shares. |
See accompanying notes to financial statements.
| 34
Notes to Financial Statements
March 31, 2011 (Unaudited)
1. Organization. Loomis Sayles Funds II (the “Trust”) is organized as a Massachusetts business trust. The Trust is registered under the Investment Company Act of 1940, as amended (the “1940 Act”), as an open-end management investment company. The Declaration of Trust permits the Board of Trustees to authorize the issuance of an unlimited number of shares of the Trust in multiple series. The financial statements for certain funds of the Trust are presented in separate reports. Information presented in these financial statements pertains to Loomis Sayles Investment Grade Bond Fund (the “Fund” or the “Investment Grade Bond Fund”).
The Fund offers Class A, Class C, Class Y, Admin Class and Class J shares. Effective October 12, 2007, Class B shares are no longer offered. Existing Class B shareholders may continue to reinvest dividends into Class B shares and exchange their Class B shares for Class B shares of other Natixis Funds subject to existing exchange privileges as described in the Fund’s prospectus.
Class A shares are sold with a maximum front-end sales charge of 4.50%. Class B shares do not pay a front-end sales charge; however, they are charged higher Rule 12b-1 fees, and are subject to a contingent deferred sales charge (“CDSC”) if such shares are redeemed within six years of purchase. After eight years of ownership, Class B shares convert to Class A shares. Class C shares do not pay a front-end sales charge, do not convert to any other class of shares, pay higher Rule 12b-1 fees than Class A shares and may be subject to a CDSC of 1.00% if those shares are redeemed within one year of acquisition, except for reinvested distributions. Class Y shares do not pay a front-end sales charge, a CDSC or Rule 12b-1 fees. Class Y shares are generally intended for institutional investors with a minimum initial investment of $100,000, though some categories of investors are exempted from the minimum investment amount as outlined in the Fund’s prospectus. Admin Class shares do not pay a front-end sales charge or a CDSC, but do pay a Rule 12b-1 fee. Admin Class shares are offered exclusively through intermediaries. Class J shares are only offered to non-U.S. investors and are sold with a maximum front-end sales charge of 3.50%.
Most expenses of the Trust can be directly attributed to a Fund. Expenses which can not be directly attributed to a Fund are generally apportioned based on the relative net assets of each of the Funds in the Trust. Expenses of the Fund are borne pro rata by the holders of each class of shares, except that each class bears expenses unique to that class (Rule 12b-1 service and distribution fees for Class A, Class B, Class C, Admin Class and Class J, and registration, legal, shareholder reporting and transfer agent fees for Class J). In addition, each class votes as a class only with respect to its own Rule 12b-1 Plan. Shares of each class would receive their pro rata share of the net assets of the Fund if the Fund were liquidated. The Trustees approve separate distributions from net investment income on each class of shares.
2. Significant Accounting Policies. The following is a summary of significant accounting policies consistently followed by the Fund in the preparation of its financial statements.
35 |
Notes to Financial Statements (continued)
March 31, 2011 (Unaudited)
The Fund’s financial statements are prepared in accordance with accounting principles generally accepted in the United States of America which require the use of management estimates that affect the reported amounts and disclosures in the financial statements. Actual results could differ from those estimates. Management has evaluated the events and transactions subsequent to period-end through the date the financial statements were issued and has determined that there were no material events that would require disclosure in the Fund’s financial statements.
a. Valuation. Debt securities (other than short-term obligations purchased with an original or remaining maturity of sixty days or less) are generally valued on the basis of evaluated bids furnished to the Fund by a pricing service recommended by the investment adviser and approved by the Board of Trustees, which service determines valuations for normal, institutional-size trading units of such securities using market information, transactions for comparable securities and various relationships between securities which are generally recognized by institutional traders. Broker-dealer bid quotations may also be used to value debt and equity securities where a pricing service does not price a security or where a pricing service does not provide a reliable price for the security. In instances where broker-dealer bid quotations are not available, certain securities held by the Fund may be valued on the basis of a price provided by a principal market maker. Forward foreign currency contracts are valued utilizing interpolated prices determined from information provided by an independent pricing service. Short-term obligations purchased with an original or remaining maturity of sixty days or less are valued at amortized cost, which approximates market value. Investments in other open-end investment companies are valued at their net asset value each day. Securities for which market quotations are not readily available are valued at fair value as determined in good faith by the Fund’s investment adviser using consistently applied procedures under the general supervision of the Board of Trustees.
The Fund may hold securities traded in foreign markets. Foreign securities are valued at the market price in the foreign market. However, if events occurring after the close of the foreign market (but before the close of regular trading on the New York Stock Exchange) are believed to materially affect the value of those securities, such securities are fair valued pursuant to procedures approved by the Board of Trustees. When fair valuing securities, the Fund may, among other things, use modeling tools or other processes that may take into account factors such as securities market activity and/or significant events that occur after the close of the foreign market and before the Fund calculates its net asset value.
b. Investment Transactions and Related Investment Income. Investment transactions are accounted for on a trade date plus one basis for daily net asset value calculation. However, for financial reporting purposes, investment transactions are reported on trade date. Interest income is recorded on an accrual basis. Interest income is increased by the accretion of discount and decreased by the amortization of premium. Investment income is recorded net of foreign taxes withheld when applicable. In
| 36
Notes to Financial Statements (continued)
March 31, 2011 (Unaudited)
determining net gain or loss on securities sold, the cost of securities has been determined on an identified cost basis. Investment income, non-class specific expenses and realized and unrealized gains and losses are allocated on a pro rata basis to each class based on the relative net assets of each class to the total net assets of the Fund.
c. Foreign Currency Translation. The books and records of the Fund are maintained in U.S. dollars. The values of securities, currencies and other assets and liabilities denominated in currencies other than U.S. dollars are translated into U.S. dollars based upon foreign exchange rates prevailing at the end of the period. Purchases and sales of investment securities, income and expenses are translated on the respective dates of such transactions.
Since the values of investment securities are presented at the foreign exchange rates prevailing at the end of the period, it is not practical to isolate that portion of the results of operations arising from changes in exchange rates from fluctuations which arise due to changes in market prices of investment securities. Such changes are included with the net realized and unrealized gain or loss on investments.
Net realized foreign exchange gains or losses arise from sales of foreign currency, currency gains or losses realized between the trade and settlement dates on securities transactions and the difference between the amounts of interest and foreign withholding taxes recorded on the Fund’s books and the U.S. dollar equivalent of the amounts actually received or paid. Net unrealized foreign exchange gains and losses arise from changes in the value of assets and liabilities, other than investment securities, at the end of the fiscal period, resulting from changes in exchange rates.
The Fund may use foreign currency exchange contracts to facilitate transactions in foreign-denominated investments. Losses may arise from changes in the value of the foreign currency or if the counterparties do not perform under the contracts’ terms.
d. Forward Foreign Currency Contracts. The Fund may enter into forward foreign currency contracts, including forward foreign cross currency contracts. Contracts to buy generally are used to acquire exposure to foreign currencies, while contracts to sell generally are used to hedge the Fund’s investments against currency fluctuation. Also, a contract to buy or sell can offset a previous contract. These contracts involve market risk in excess of the unrealized gain or loss reflected in the Fund’s Statement of Assets and Liabilities. The U.S. dollar value of the currencies the Fund has committed to buy or sell represents the aggregate exposure to each currency the Fund has acquired or hedged through currency contracts outstanding at period end. Gains or losses are recorded for financial statement purposes as unrealized until settlement date. Risks may arise upon entering into these contracts from the potential inability of counterparties to meet the terms of their contracts and from unanticipated movements in the value of a foreign currency relative to the U.S. dollar. Certain contracts may require the movement of cash or securities as collateral for the Fund’s or counterparty’s net obligations under the contracts.
37 |
Notes to Financial Statements (continued)
March 31, 2011 (Unaudited)
There were no forward foreign currency contracts held by the Fund during the six months ended March 31, 2011.
e. Federal and Foreign Income Taxes. The Trust treats each Fund as a separate entity for federal income tax purposes. The Fund intends to meet the requirements of the Internal Revenue Code of 1986, as amended, applicable to regulated investment companies, and to distribute to its shareholders substantially all of its net investment income and any net realized capital gains at least annually. Management has performed an analysis of the Fund’s tax positions for the open tax years as of March 31, 2011 and has concluded that no provisions for income tax are required. The Fund’s federal tax returns for the prior three fiscal years remain subject to examination by the Internal Revenue Service. Management is not aware of any events that are reasonably possible to occur in the next six months that would result in the amounts of any unrecognized tax benefits significantly increasing or decreasing for the Fund. However, management’s conclusions regarding tax positions taken may be subject to review and adjustment at a later date based on factors including, but not limited to, new tax laws and accounting regulations and interpretations thereof.
The Fund may be subject to foreign taxes on income and gains on investments that are accrued based upon the Fund’s understanding of the tax rules and regulations that exist in the countries in which the Fund invests. Foreign governments may also impose taxes or other payments on investments with respect to foreign securities. Such taxes are accrued as applicable, and are reflected as foreign taxes payable on the Statement of Assets and Liabilities.
f. Dividends and Distributions to Shareholders. Dividends and distributions are recorded on ex-dividend date. The timing and characterization of certain income and capital gain distributions are determined annually in accordance with federal tax regulations, which may differ from accounting principles generally accepted in the United States of America. Permanent differences are primarily due to differing treatments for book and tax purposes of items such as defaulted bonds, reclassification of realized capital gain to ordinary income, foreign currency transactions, paydown adjustments and premium amortization. Permanent book and tax basis differences relating to shareholder distributions will result in reclassifications to capital accounts. Temporary differences between book and tax distributable earnings are primarily due to premium amortization, deferred Trustees’ fees, defaulted bond accruals, securities lending collateral gain/loss adjustments, forward contract mark to market, contingent payment debt instruments and wash sales. Distributions from net investment income and short-term capital gains are considered to be distributed from ordinary income for tax purposes.
| 38
Notes to Financial Statements (continued)
March 31, 2011 (Unaudited)
The tax characterization of distributions is determined on an annual basis. The tax character of distributions paid to shareholders during the year ended September 30, 2010 was as follows:
| | | | |
2010 Distributions Paid From: |
Ordinary
Income | | Long-Term
Capital Gains | | Total |
$464,455,790 | | $ — | | $464,455,790 |
Differences between these amounts and those reported in the Statement of Changes in Net Assets are primarily attributable to different book and tax treatment for short-term capital gains.
On December 22, 2010, the Regulated Investment Company Modernization Act of 2010 (the “Act”) was enacted. The Act modernizes several of the federal income and excise tax provisions related to RICs, and, with certain exceptions, is effective for taxable years beginning after December 22, 2010. Among the changes made are changes to the capital loss carryforward rules allowing for capital losses to be carried forward indefinitely. Rules in effect as of the report date limit the carryforward period to eight years. Capital loss carryforwards generated in taxable years beginning after effective date of the Act must be fully used before capital loss carryforwards generated in taxable years prior to effective date of the Act; therefore, under certain circumstances, capital loss carryforwards available as of the report date, if any, may expire unused.
g. Repurchase Agreements. It is the Fund’s policy that the market value of the collateral for repurchase agreements be at least equal to 102% of the repurchase price, including interest. Certain repurchase agreements are tri-party arrangements whereby the collateral is held in a segregated account for the benefit of the Fund and on behalf of the counterparty. Repurchase agreements could involve certain risks in the event of default or insolvency of the counterparty including possible delays or restrictions upon the Fund’s ability to dispose of the underlying securities.
h. Securities Lending. The Fund has entered into an agreement with State Street Bank and Trust Company (“State Street Bank”), as agent of the Fund, to lend securities to certain designated borrowers. The loans are collateralized with cash or securities in an amount equal to at least 105% or 102% of the market value (including accrued interest) of the loaned international or domestic securities, respectively, when the loan is initiated. Thereafter, the value of the collateral must remain at least 102% of the market value (including accrued interest) of loaned securities for U.S. equities and U.S. corporate debt; at least 105% of the market value (including accrued interest) of loaned securities for non-U.S. equities; and at least 100% of the market value (including accrued interest) of loaned securities for U.S. Government securities, sovereign debt issued by non-U.S. Governments and non-U.S. corporate debt. In the event that the market value
39 |
Notes to Financial Statements (continued)
March 31, 2011 (Unaudited)
of the collateral falls below the required percentages described above, the borrower will deliver additional collateral on the next business day. As with other extensions of credit, the Fund may bear the risk of loss with respect to the investment of the collateral. The Fund invests cash collateral in short-term investments, a portion of the income from which is remitted to the borrowers and the remainder allocated between the Fund and State Street Bank as lending agent.
For the six months ended March 31, 2011, the Fund did not loan securities under this agreement.
i. Indemnifications. Under the Trust’s organizational documents, its officers and Trustees are indemnified against certain liabilities arising out of the performance of their duties to the Fund. Additionally, in the normal course of business, the Fund enters into contracts with service providers that contain general indemnification clauses. The Fund’s maximum exposure under these arrangements is unknown as this would involve future claims that may be made against the Fund that have not yet occurred. However, based on experience, the Fund expects the risk of loss to be remote.
3. Fair Value Measurements. In accordance with accounting standards related to fair value measurements and disclosures, the Fund has categorized the inputs utilized in determining the value of the Fund’s assets or liabilities. These inputs are summarized in the three broad levels listed below:
| | • | | Level 1 – quoted prices in active markets for identical assets or liabilities; |
| | • | | Level 2 – prices determined using other significant inputs that are observable either directly, or indirectly through corroboration with observable market data (which could include quoted prices for similar assets or liabilities, interest rates, credit risk, etc.); |
| | • | | Level 3 – prices determined using significant unobservable inputs when quoted prices or observable inputs are unavailable such as when there is little or no market activity for an asset or liability (unobservable inputs reflect the Fund’s own assumptions in determining the fair value of assets or liabilities and would be based on the best information available). |
The inputs or methodology used for valuing securities are not necessarily an indication of the risk associated with investing in those securities.
| 40
Notes to Financial Statements (continued)
March 31, 2011 (Unaudited)
The following is a summary of the inputs used to value the Fund’s investments as of March 31, 2011, at value:
Asset Valuation Inputs
| | | | | | | | | | | | | | | | |
Description | | Level 1 | | | Level 2 | | | Level 3 | | | Total | |
Bonds and Notes | | | | | | | | | | | | | | | | |
Non-Convertible Bonds | | | | | | | | | | | | | | | | |
ABS Car Loan | | $ | — | | | $ | 110,218,319 | | | $ | 5,636,469 | | | $ | 115,854,788 | |
Non-Captive Consumer | | | 1,312,017 | | | | 177,533,715 | | | | — | | | | 178,845,732 | |
Non-Captive Diversified | | | — | | | | 326,067,683 | | | | 42,861,887 | | | | 368,929,570 | |
All Other Non-Convertible Bonds(a) | | | — | | | | 7,843,610,348 | | | | — | | | | 7,843,610,348 | |
| | | | | | | | | | | | | | | | |
Total Non-Convertible Bonds | | | 1,312,017 | | | | 8,457,430,065 | | | | 48,498,356 | | | | 8,507,240,438 | |
| | | | | | | | | | | | | | | | |
Convertible Bonds(a) | | | — | | | | 371,930,600 | | | | — | | | | 371,930,600 | |
Municipals(a) | | | — | | | | 62,492,361 | | | | — | | | | 62,492,361 | |
| | | | | | | | | | | | | | | | |
Total Bonds and Notes | | | 1,312,017 | | | | 8,891,853,026 | | | | 48,498,356 | | | | 8,941,663,399 | |
| | | | | | | | | | | | | | | | |
Bank Loans(a) | | | — | | | | 17,639,942 | | | | — | | | | 17,639,942 | |
Short-Term Investments | | | — | | | | 96,946,153 | | | | — | | | | 96,946,153 | |
| | | | | | | | | | | | | | | | |
Total | | $ | 1,312,017 | | | $ | 9,006,439,121 | | | $ | 48,498,356 | | | $ | 9,056,249,494 | |
| | | | | | | | | | | | | | | | |
| (a) | Major categories of the Fund’s investments are included in the Portfolio of Investments. |
The following is a reconciliation of Level 3 investments for which significant unobservable inputs were used to determine fair value as of March 31, 2011:
Asset Valuation Inputs
| | | | | | | | | | | | | | | | | | | | |
Investments in
Securities | | Balance as of
September 30,
2010 | | | Accrued
Discounts
(Premiums) | | | Realized
Gain
(Loss) | | | Change in
Unrealized
Appreciation
(Depreciation) | | | Purchases | |
Bonds and Notes | | | | | | | | | | | | | | | | | | | | |
Non-Convertible Bonds | | | | | | | | | | | | | | | | | | | | |
ABS Car Loan | | $ | 24,880,941 | | | $ | — | | | $ | 3,254 | | | $ | 309,635 | | | $ | — | |
Banking | | | 9,716,202 | | | | — | | | | — | | | | — | | | | — | |
Non-Captive Diversified | | | — | | | | — | | | | — | | | | 106,887 | | | | 42,755,000 | |
| | | | | | | | | | | | | | | | | | | | |
Total | | $ | 34,597,143 | | | $ | — | | | $ | 3,254 | | | $ | 416,522 | | | $ | 42,755,000 | |
| | | | | | | | | | | | | | | | | | | | |
41 |
Notes to Financial Statements (continued)
March 31, 2011 (Unaudited)
Asset Valuation Inputs (continued)
| | | | | | | | | | | | | | | | | | | | |
Investments in
Securities | | Sales | | | Transfers
into
Level 3 | | | Transfers
out of
Level 3 | | | Balance as of
March 31,
2011 | | | Change in
Unrealized
Appreciation
(Depreciation)
from
Investments
Still Held at
March 31,
2011 | |
Bonds and Notes | | | | | | | | | | | | | | | | | | | | |
Non-Convertible Bonds | | | | | | | | | | | | | | | | | | | | |
ABS Car Loan | | $ | (119,126 | ) | | $ | — | | | $ | (19,438,235 | ) | | $ | 5,636,469 | | | $ | 309,422 | |
Banking | | | — | | | | — | | | | (9,716,202 | ) | | | — | | | | — | |
Non-Captive Diversified | | | — | | | | — | | | | — | | | | 42,861,887 | | | | 106,887 | |
| | | | | | | | | | | | | | | | | | | | |
Total | | $ | (119,126 | ) | | $ | — | | | $ | (29,154,437 | ) | | $ | 48,498,356 | | | $ | 416,309 | |
| | | | | | | | | | | | | | | | | | | | |
Debt securities valued at $29,154,437 were transferred from Level 3 to Level 2 during the period ended March 31, 2011. At September 30, 2010, these securities were valued using broker-dealer bid quotations based on inputs unobservable to the Fund; at March 31, 2011, these securities were valued on the basis of evaluated bids furnished to the Fund by a pricing service where inputs are observable to the Fund.
All transfers are recognized as of the beginning of the reporting period.
4. Purchases and Sales of Securities. For the six months ended March 31, 2011, purchases and sales of securities (excluding short-term investments and U.S. Government/agency securities and including paydowns) were $382,457,256 and $1,493,006,399, respectively. Purchases and sales of U.S. Government/agency securities (excluding short-term investments and including paydowns) were $233,981,844 and $268,075,006, respectively.
5. Management Fees and Other Transactions with Affiliates.
a. Management Fees. Loomis, Sayles & Company, L.P. (“Loomis Sayles”) serves as investment adviser to the Fund. Under the terms of the management agreement, the Fund pays a management fee at the annual rate of 0.40% of average daily net assets, calculated daily and payable monthly.
Loomis Sayles has given a binding undertaking to the Fund to waive management fees and/or reimburse certain expenses to limit the Fund’s operating expenses, exclusive of acquired fund fees and expenses, brokerage expenses, interest expense, taxes and extraordinary expenses. This undertaking is in effect until January 31, 2012 and is
| 42
Notes to Financial Statements (continued)
March 31, 2011 (Unaudited)
reevaluated on an annual basis. Management fees payable, as reflected on the Statement of Assets and Liabilities, is net of waivers and/or expense reimbursements, if any, pursuant to this undertaking.
For the six months ended March 31, 2011, the expense limits as a percentage of average daily net assets under the expense limitation agreement were as follows:
| | | | | | | | | | |
| Expense Limit as a Percentage of Average Daily Net Assets |
Class A | | Class B | | Class C | | Class Y | | Admin Class | | Class J |
| 0.95% | | 1.70% | | 1.70% | | 0.70% | | 1.20% | | 1.30% |
Loomis Sayles shall be permitted to recover expenses it has borne under the expense limitation agreement (whether through waiver of its management fees or otherwise) on a class by class basis in later periods to the extent the expenses of a class fall below a class’ expense limits, provided, however, that a class is not obligated to pay such waived/reimbursed fees or expenses more than one year after the end of the fiscal year in which the fees or expenses were waived/reimbursed.
For the six months ended March 31, 2011, the management fees for the Fund were $19,517,332 (0.40% of average daily net assets).
No expenses were recovered during the six months ended March 31, 2011 under the terms of the expense limitation agreement.
Certain officers and employees of Loomis Sayles are also officers or Trustees of the Trust. Loomis Sayles’ general partner is indirectly owned by Natixis Global Asset Management, L.P. (“Natixis US”), which is part of Natixis Global Asset Management, an international asset management group based in Paris, France.
b. Service and Distribution Fees. Natixis Distributors, L.P. (“Natixis Distributors”), a wholly-owned subsidiary of Natixis US, has entered into a distribution agreement with the Trust. Pursuant to this agreement, Natixis Distributors serves as principal underwriter of the Funds of the Trust, except Class J shares of the Fund. The Fund has entered into a distribution agreement relating to Class J shares with Loomis Sayles Distributors, L.P. (“Loomis Sayles Distributors”), a wholly-owned subsidiary of Natixis US.
Pursuant to Rule 12b-1 under the 1940 Act, the Trust has adopted a Service Plan relating to the Fund’s Class A shares (the “Class A Plan”), a Distribution and Service Plan relating to the Fund’s Class B and Class C shares (the “Class B and Class C Plans”), and a Distribution Plan relating to its Admin Class shares (the “Admin Class Plan”).
Under the Class A Plan, the Fund pays Natixis Distributors a monthly service fee at an annual rate not to exceed 0.25% of the average daily net assets attributable to the Fund’s Class A shares, as reimbursement for expenses incurred by Natixis Distributors in providing personal services to investors in Class A shares and/or the maintenance of shareholder accounts.
43 |
Notes to Financial Statements (continued)
March 31, 2011 (Unaudited)
Under the Class B and Class C Plans, the Fund pays Natixis Distributors a monthly service fee at an annual rate not to exceed 0.25% of the average daily net assets attributable to the Fund’s Class B and Class C shares, as compensation for services provided by Natixis Distributors in providing personal services to investors in Class B and Class C shares and/or the maintenance of shareholder accounts.
Also under the Class B and Class C Plans, the Fund pays Natixis Distributors a monthly distribution fee at an annual rate of 0.75% of the average daily net assets attributable to the Fund’s Class B and Class C shares, as compensation for services provided by Natixis Distributors in connection with the marketing or sale of Class B and Class C shares.
Under the Admin Class Plan, the Fund pays Natixis Distributors a monthly distribution fee at an annual rate not to exceed 0.25% of the average daily net assets attributable to the Fund’s Admin Class shares, as compensation for services provided by Natixis Distributors in connection with the marketing or sale of Admin Class shares or for payments made by Natixis Distributors to securities dealers or other financial intermediaries as commissions, asset-based sales charges or other compensation with respect to the sale of Admin Class shares, or for providing personal services to investors and/or the maintenance of shareholder accounts.
In addition, the Admin Class shares of the Fund may pay Natixis Distributors an administrative service fee, at an annual rate not to exceed 0.25% of the average daily net assets attributable to Admin Class shares. These fees are subsequently paid to securities dealers or financial intermediaries for providing personal services and/or account maintenance for their customers who hold such shares.
Class J shares are subject to a monthly shareholder service fee at an annual rate of 0.25% and a monthly distribution fee at an annual rate of 0.50% of the average daily net assets attributable to the Fund’s Class J shares, both payable to Loomis Sayles Distributors, pursuant to a shareholder service and distribution plan adopted under Rule 12b-1.
For the six months ended March 31, 2011, the Fund paid the following service and distribution fees:
| | | | | | | | | | | | | | | | |
| Service Fees | | Distribution Fees |
Class A | | Class B | | Class C | | Admin
Class | | Class J | | Class B | | Class C | | Admin
Class | | Class J |
| $3,599,077 | | $20,056 | | $3,002,470 | | $1,977 | | $155,455 | | $60,169 | | $9,007,412 | | $1,977 | | $310,911 |
c. Administrative Fees. Natixis Asset Management Advisors, L.P. (“Natixis Advisors”) provides certain administrative services for the Fund and contracts with State Street Bank to serve as sub-administrator. Natixis Advisors is a wholly-owned subsidiary of Natixis US. Pursuant to an agreement among Natixis Funds Trust I, Natixis Funds Trust II, Natixis Funds Trust IV, Natixis Cash Management Trust, Gateway Trust (“Natixis Funds Trusts”), Loomis Sayles Funds I, Loomis Sayles Funds II (“Loomis Sayles Funds
| 44
Notes to Financial Statements (continued)
March 31, 2011 (Unaudited)
Trusts”), Hansberger International Series and Natixis Advisors, the Fund pays Natixis Advisors monthly its pro rata portion of fees equal to an annual rate of 0.0575% of the first $15 billion of the average daily net assets of the Natixis Funds Trusts, Loomis Sayles Funds Trusts and Hansberger International Series, 0.0500% of the next $15 billion, 0.0400% of the next $30 billion and 0.0350% of such assets in excess of $60 billion, subject to an annual aggregate minimum fee for the Natixis Funds Trusts, Loomis Sayles Funds Trusts and Hansberger International Series of $10 million, which is reevaluated on an annual basis. New funds are subject to a fee for the first twelve months of operations of $75,000 plus $12,500 per additional class and an additional $75,000 if managed by multiple subadvisers.
For the six months ended March 31, 2011, the Fund paid $2,280,026 in administrative fees to Natixis Advisors.
d. Sub-Transfer Agent Fees. Natixis Distributors has entered into agreements with financial intermediaries to provide certain recordkeeping, processing, shareholder communications and other services to customers of the intermediaries and has agreed to compensate the intermediaries for providing those services. Certain services would be provided by the Fund if the shares of those customers were registered directly with the Fund’s transfer agent. Accordingly, the Fund agreed to pay a portion of the intermediary fees attributable to shares of the Fund held by intermediaries (which generally are a percentage of the value of shares held) not to exceed what the Fund would have paid its transfer agent had each customer’s shares been registered directly with the transfer agent instead of held through the intermediaries. Natixis Distributors pays the remainder of the fees.
For the six months ended March 31, 2011, the Fund paid the following sub-transfer agent fees which are reflected in transfer agent fees and expenses in the Statement of Operations.
| | | | | | | | | | |
| Sub-Transfer Agent Fees |
Class A | | Class B | | Class C | | Class Y | | Admin Class | | Class J |
| $1,111,477 | | $ 6,174 | | $929,135 | | $1,653,631 | | $ 510 | | $ — |
e. Commissions. Commissions (including CDSCs) on Fund shares retained by Natixis Distributors were $1,250,410 and commissions on Class J shares of the Fund retained by Loomis Sayles Distributors were $12,074 for the six months ended March 31, 2011.
f. Trustees Fees and Expenses. The Trust does not pay any compensation directly to its officers or Trustees who are directors, officers or employees of Natixis Advisors, Natixis Distributors, Natixis US or their affiliates. The Chairperson of the Board receives a retainer fee at the annual rate of $250,000. The Chairperson does not receive any meeting attendance fees for Board of Trustees meetings or committee meetings that she attends. Each Independent Trustee (other than the Chairperson) receives, in the aggregate, a retainer fee at the annual rate of $80,000. Each Independent Trustee also
45 |
Notes to Financial Statements (continued)
March 31, 2011 (Unaudited)
receives a meeting attendance fee of $10,000 for each meeting of the Board of Trustees that he or she attends in person and $5,000 for each meeting of the Board of Trustees that he or she attends telephonically. In addition, each committee chairman receives an additional retainer fee at an annual rate of $15,000. Each Contract Review and Governance Committee member is compensated $6,000 for each Committee meeting that he or she attends in person and $3,000 for each meeting that he or she attends telephonically. Each Audit Committee member is compensated $7,500 for each Committee meeting that he or she attends in person and $3,750 for each meeting that he or she attends telephonically. These fees are allocated among the funds in the Natixis Funds Trusts, Loomis Sayles Funds Trusts and Hansberger International Series based on a formula that takes into account, among other factors, the relative net assets of each fund. Trustees are reimbursed for travel expenses in connection with attendance at meetings.
A deferred compensation plan (the “Plan”) is available to the Trustees on a voluntary basis. Deferred amounts remain in the funds until distributed in accordance with the provisions of the Plan. The value of a participating Trustee’s deferral account is based on theoretical investments of deferred amounts, on the normal payment dates, in certain funds of the Natixis Funds Trusts, Loomis Sayles Funds Trusts and Hansberger International Series as designated by the participating Trustees. Changes in the value of participants’ deferral accounts are allocated pro rata among the funds in the Natixis Funds Trusts, Loomis Sayles Funds Trusts, and Hansberger International Series, and are normally reflected as Trustees’ fees and expenses in the Statement of Operations. The portions of the accrued obligations allocated to the Fund under the Plan are reflected as Deferred Trustees’ fees on the Statement of Assets and Liabilities.
6. Class-Specific Expenses. For the six months ended March 31, 2011, the Fund paid the following class-specific expenses:
| | | | | | | | | | | | | | | | | | | | | | | | |
| | | Class A | | | Class B | | | Class C | | | Class Y | | | Admin Class | | | Class J | |
Transfer Agent Fees and Expenses | | $ | 1,228,631 | | | $ | 6,850 | | | $ | 1,024,877 | | | $ | 1,851,768 | | | $ | 688 | | | $ | 4,488 | |
Registration Fees | | | 37,033 | | | | 206 | | | | 30,886 | | | | 55,444 | | | | 19 | | | | 1,094 | |
Legal Fees | | | 35,243 | | | | 196 | | | | 29,414 | | | | 52,901 | | | | 18 | | | | 9,375 | |
Shareholding Reporting Expenses | | | 95,605 | | | | 532 | | | | 79,765 | | | | 143,785 | | | | 51 | | | | 40,230 | |
Transfer agent, registration, legal, and shareholder reporting fees and expenses attributable to Class A, Class B, Class C, Class Y, and Admin Class are allocated on a pro rata basis to each class based on the relative net assets of each class to the total net assets of those classes.
7. Line of Credit. The Fund, together with certain other funds of Natixis Funds Trusts, Loomis Sayles Funds Trusts and Hansberger International Series, participates in a $200,000,000 committed unsecured line of credit provided by State Street Bank, with an
| 46
Notes to Financial Statements (continued)
March 31, 2011 (Unaudited)
individual limit of $125,000,000 for each fund that participates in the line of credit. Interest is charged to each participating fund based on its borrowings at a rate per annum equal to the greater of the Federal Funds rate or overnight LIBOR, plus 1.25%. In addition, a commitment fee of 0.15% per annum, payable at the end of each calendar quarter, is accrued and apportioned among the participating funds based on their average daily unused portion of the line of credit.
Effective April 21, 2011, the Fund, together with certain other funds of Natixis Funds Trusts, Loomis Sayles Funds Trusts and Hansberger International Series, will participate in a $200,000,000 committed unsecured line of credit provided by State Street Bank, with an individual limit of $125,000,000 for each fund that will participate in the line of credit. Interest will be charged to each participating fund based on its borrowings at a rate per annum equal to the greater of the Federal Funds rate or overnight LIBOR, plus 1.25%. In addition, a commitment fee of 0.125% per annum, payable at the end of each calendar quarter, will be accrued and apportioned among the participating funds based on their average daily unused portion of the line of credit.
For the six months ended March 31, 2011, the Fund had no borrowings under these agreements.
8. Concentration of Risk. The Fund’s investments in foreign securities are subject to foreign currency fluctuations, higher volatility than U.S. securities, varying degrees of regulation and limited liquidity. Greater political, economic, credit and information risks are also associated with foreign securities.
9. Concentration of Ownership. At March 31, 2011, the Loomis Sayles Employees’ Profit Sharing Retirement Plan held 437,418 shares of beneficial interest of Class Y shares.
47 |
Notes to Financial Statements (continued)
March 31, 2011 (Unaudited)
10. Capital Shares. The Fund may issue an unlimited number of shares of beneficial interest, without par value. Transactions in capital shares were as follows:
| | | | | | | | | | | | | | | | |
| |
| Six Months Ended
March 31, 2011 |
| |
| Year Ended
September 30, 2010* |
|
| | | | Shares | | | | Amount | | | | Shares | | | | Amount | |
| Class A | | | | | | | | | | | | | | | | |
Issued from the sale of shares | | | 30,055,284 | | | $ | 370,865,154 | | | | 91,844,109 | | | $ | 1,096,753,290 | |
Issued in connection with the reinvestment of distributions | | | 9,031,964 | | | | 109,756,332 | | | | 10,182,612 | | | | 121,128,395 | |
Redeemed | | | (67,503,712 | ) | | | (830,805,860 | ) | | | (108,792,537 | ) | | | (1,299,578,958 | ) |
| | | | | | | | | | | | | | | | |
Net change | | | (28,416,464 | ) | | $ | (350,184,374 | ) | | | (6,765,816 | ) | | $ | (81,697,273 | ) |
| | | | | | | | | | | | | | | | |
| Class B | | | | | | | | | | | | | | | | |
Issued from the sale of shares | | | 41,570 | | | $ | 507,934 | | | | 105,865 | | | $ | 1,259,480 | |
Issued in connection with the reinvestment of distributions | | | 30,887 | | | | 373,181 | | | | 30,442 | | | | 360,482 | |
Redeemed | | | (209,825 | ) | | | (2,567,973 | ) | | | (276,089 | ) | | | (3,290,669 | ) |
| | | | | | | | | | | | | | | | |
Net change | | | (137,368 | ) | | $ | (1,686,858 | ) | | | (139,782 | ) | | $ | (1,670,707 | ) |
| | | | | | | | | | | | | | | | |
| Class C | | | | | | | | | | | | | | | | |
Issued from the sale of shares | | | 10,988,292 | | | $ | 134,387,222 | | | | 43,761,421 | | | $ | 518,776,270 | |
Issued in connection with the reinvestment of distributions | | | 4,301,307 | | | | 51,841,924 | | | | 4,398,460 | | | | 51,955,271 | |
Redeemed | | | (42,952,636 | ) | | | (524,473,305 | ) | | | (55,937,893 | ) | | | (664,795,170 | ) |
| | | | | | | | | | | | | | | | |
Net change | | | (27,663,037 | ) | | $ | (338,244,159 | ) | | | (7,778,012 | ) | | $ | (94,063,629 | ) |
| | | | | | | | | | | | | | | | |
| Class Y | | | | | | | | | | | | | | | | |
Issued from the sale of shares | | | 75,975,072 | | | $ | 936,855,421 | | | | 174,435,982 | | | $ | 2,089,695,869 | |
Issued in connection with the reinvestment of distributions | | | 12,619,424 | | | | 153,357,091 | | | | 11,822,258 | | | | 140,840,248 | |
Redeemed | | | (90,706,115 | ) | | | (1,116,112,577 | ) | | | (133,376,609 | ) | | | (1,591,510,831 | ) |
Redeemed in-kind (Note 11) | | | (16,974,699 | ) | | | (206,412,335 | ) | | | — | | | | — | |
| | | | | | | | | | | | | | | | |
Net change | | | (19,086,318 | ) | | $ | (232,312,400 | ) | | | 52,881,631 | | | $ | 639,025,286 | |
| | | | | | | | | | | | | | | | |
| Admin Class | | | | | | | | | | | | | | | | |
Issued from the sale of shares | | | 151,463 | | | $ | 1,856,329 | | | | 78,071 | | | $ | 948,013 | |
Issued in connection with the reinvestment of distributions | | | 4,040 | | | | 49,010 | | | | 719 | | | | 8,728 | |
Redeemed | | | (22,313 | ) | | | (273,493 | ) | | | (8,759 | ) | | | (107,600 | ) |
| | | | | | | | | | | | | | | | |
Net change | | | 133,190 | | | $ | 1,631,846 | | | | 70,031 | | | $ | 849,141 | |
| | | | | | | | | | | | | | | | |
| Class J | | | | | | | | | | | | | | | | |
Issued from the sale of shares | | | 195,500 | | | $ | 2,400,004 | | | | 1,179,600 | | | $ | 14,218,250 | |
Issued in connection with the reinvestment of distributions | | | — | | | | — | | | | — | | | | — | |
Redeemed | | | (1,353,050 | ) | | $ | (16,631,793 | ) | | | (3,610,670 | ) | | | (43,043,786 | ) |
| | | | | | | | | | | | | | | | |
Net change | | | (1,157,550 | ) | | $ | (14,231,789 | ) | | | (2,431,070 | ) | | $ | (28,825,536 | ) |
| | | | | | | | | | | | | | | | |
Increase (decrease) from capital share transactions | | | (76,327,547 | ) | | $ | (935,027,734 | ) | | | 35,836,982 | | | $ | 433,617,282 | |
| | | | | | | | | | | | | | | | |
| * | From commencement of operations on February 1, 2010 through September 30, 2010 for Admin Class shares. |
| 48
Notes to Financial Statements (continued)
March 31, 2011 (Unaudited)
11. Redemption In-Kind. In certain circumstances, a Fund may distribute portfolio securities rather than cash as payment for redemption of Fund shares (redemption in-kind). For financial reporting purposes, the Fund will recognize a gain on in-kind redemptions to the extent the value of the distributed securities on the date of redemption exceeds the cost of those securities; the Fund will recognize a loss if the cost exceeds value. Gains and losses realized on redemptions in-kind are not recognized for tax purposes, and are re-classified from realized gain (loss) to paid-in-capital. The Fund realized a gain of $19,158,810 on redemptions in-kind during the six months ended March 31, 2011. This amount is included in realized gain (loss) on the Statement of Operations.
49 |
SEMIANNUAL REPORT
March 31, 2011

Loomis Sayles Disciplined Equity Fund
Loomis, Sayles & Company, L.P.
TABLE OF CONTENTS
Investment Results page 1
Portfolio of Investments page 4
Financial Statements page 6
LOOMIS SAYLES DISCIPLINED EQUITY FUND
Investment Results through March 31, 2011
The charts comparing the fund’s performance to an index provide you with a general sense of how it performed. The fund’s total return for the period shown below appears with and without sales charges and includes fund expenses and fees. An index measures the performance of a theoretical portfolio. Unlike a fund, the index is unmanaged and does not have expenses that affect the results. It is not possible to invest directly in an index. Investors would incur transaction costs and other expenses if they purchased the securities necessary to match the index.
Growth of a $10,000 Investment in Class A Shares1,5
March 31, 2001 through March 31, 2011
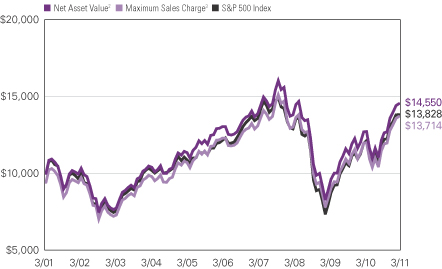
Average Annual Returns — March 31, 20115
| | | | | | | | | | | | | | | | |
| | | | | |
| | | 6 Months | | | 1 Year | | | 5 Years | | | 10 Years | |
| | | | | |
| Class A (Inception 11/30/01)1 | | | | | | | | | | | | | | | | |
| Net Asset Value2 | | | 19.68 | % | | | 14.48 | % | | | 2.20 | % | | | 3.82 | % |
| With Maximum Sales Charge3 | | | 12.74 | | | | 7.97 | | | | 1.01 | | | | 3.20 | |
| | | | | |
| Class B (Inception 9/12/03)1 | | | | | | | | | | | | | | | | |
| Net Asset Value2 | | | 19.34 | | | | 13.83 | | | | 1.45 | | | | 3.00 | |
| With CDSC4 | | | 14.34 | | | | 8.83 | | | | 1.13 | | | | 3.00 | |
| | | | | |
| Class C (Inception 9/12/03)1 | | | | | | | | | | | | | | | | |
| Net Asset Value2 | | | 19.39 | | | | 13.83 | | | | 1.44 | | | | 2.95 | |
| With CDSC4 | | | 18.39 | | | | 12.83 | | | | 1.44 | | | | 2.95 | |
| | | | | |
| Class Y (Inception 7/31/00) | | | | | | | | | | | | | | | | |
| Net Asset Value2 | | | 19.96 | | | | 14.78 | | | | 2.55 | | | | 4.16 | |
| | | | | |
| Comparative Performance | | | | | | | | | | | | | | | | |
| S&P 500 Index | | | 17.31 | | | | 15.65 | | | | 2.62 | | | | 3.29 | |
| Morningstar Large Growth Fund Avg. | | | 17.88 | | | | 16.77 | | | | 3.08 | | | | 2.91 | |
All returns represent past performance and do not guarantee future results. Periods of less than one year are not annualized. Share price and return will vary and you may have a gain or loss when you sell your shares. All results include reinvestment of dividends and capital gains. Current returns may be higher or lower than those shown. For performance current to the most recent month-end, visit ga.natixis.com.
Class Y shares are available to certain investors, as described in the prospectus.
The table and graph do not reflect taxes shareholders might owe on any fund distributions or when they redeem their shares.
| | | | |
| Fund Composition | | % of Net
Assets as of
3/31/11 | |
| Common Stocks | | | 99.1 | |
| Written Options | | | -0.1 | |
| Other | | | 1.0 | |
| |
| Ten Largest Holdings | | % of Net
Assets as of
3/31/11 | |
| Apple, Inc. | | | 4.8 | |
| Chevron Corp. | | | 4.6 | |
| Oracle Corp. | | | 4.2 | |
| JPMorgan Chase & Co. | | | 3.5 | |
| Caterpillar, Inc. | | | 3.4 | |
| QUALCOMM, Inc. | | | 3.3 | |
| UnitedHealth Group, Inc. | | | 3.3 | |
| Parker Hannifin Corp. | | | 3.3 | |
| Coca-Cola Enterprises, Inc. | | | 3.2 | |
| Halliburton Co. | | | 3.1 | |
| |
| Five Largest Industries | | % of Net
Assets as of
3/31/11 | |
| Machinery | | | 11.2 | |
| Oil, Gas & Consumable Fuels | | | 10.7 | |
| Health Care Providers & Services | | | 8.8 | |
| Software | | | 6.8 | |
| Computers & Peripherals | | | 5.8 | |
Portfolio holdings and asset allocations will vary.
Expense Ratios
as stated in the most recent prospectus
| | | | | | | | |
| Share Class | | Gross Expense Ratio6 | | | Net Expense Ratio7 | |
| A | | | 1.45 | % | | | 1.25 | % |
| B | | | 2.20 | | | | 2.00 | |
| C | | | 2.20 | | | | 2.00 | |
| Y | | | 1.20 | | | | 1.00 | |
NOTES TO CHARTS
| See | page 2 for a description of the indices. |
| 1 | Prior to 9/15/03, performance of Class A shares is that of Retail Class shares, which were redesignated as Class A shares, restated to reflect the sales load of Class A shares. Prior to the inception of Retail Class shares (11/30/01) performance is that of Institutional Class shares, restated to reflect the higher net expenses and sales loads of Class A shares. Prior to the inception of Class B and C shares (9/12/03), performance is that of Institutional Class shares, restated to reflect the higher net expenses and sales loads of Class B and C shares. The fund revised its investment strategies on 10/1/09; performance may have been different had the current investment strategies been in place for all periods shown. |
| 2 | At Net Asset Value (NAV) – does not reflect payment of sales charge at time of purchase. |
| 3 | With Maximum Sales Charge (MSC) – reflects maximum sales charge of 5.75% at time of purchase. |
| 4 | Performance for Class B shares assumes a maximum of 5% contingent deferred sales charge (“CDSC”) applied when you sell shares, which declines annually between years 1-6 according to the following schedule: 5, 4, 3, 3, 2, 1, 0%. Class C shares performance assumes a 1% CDSC applied when you sell shares within one year of purchase. |
| 5 | Fund performance has been increased by fee waivers and/or expense reimbursements, if any, without which performance would have been lower. |
| 6 | Before fee waivers and/or expense reimbursements. |
| 7 | After fee waivers and/or expense reimbursements. Waivers/reimbursements are contractual and are set to expire 1/31/12. Contracts are reevaluated on an annual basis. |
1 |
ADDITIONAL INFORMATION
The views expressed in this report reflect those of the portfolio managers as of the dates indicated. The managers’ views are subject to change at any time without notice based on changes in market or other conditions. References to specific securities or industries should not be regarded as investment advice. Because the fund is actively managed, there is no assurance that it will continue to invest in the securities or industries mentioned.
Before investing, consider the fund’s investment objectives, risks, charges and expenses. Visit ga.natixis.com or call 800-225-5478 for a prospectus and/or a summary prospectus, both of which contain this and other information. Read it carefully.
INDEX/AVERAGE DESCRIPTIONS:
Standard & Poor’s 500 Index (“S&P 500”) is a widely recognized measure of U.S. stock market performance. It is an unmanaged index of 500 common stocks chosen for market size, liquidity, and industry group representation, among other factors.
Morningstar Fund Averages are the average performance without sales charges of funds with similar investment objectives, as calculated by Morningstar, Inc.
PROXY VOTING INFORMATION
A description of the fund’s proxy voting policies and procedures is available without charge, upon request, by calling Natixis Funds at 800-225-5478; on the fund’s website at ga.natixis.com; and on the Securities and Exchange Commission’s website at www.sec.gov. Information regarding how the fund voted proxies relating to portfolio securities during the 12-month period ended June 30, 2010 is available from the fund’s website and the SEC’s website.
QUARTERLY PORTFOLIO SCHEDULES
The fund will file a complete schedule of portfolio holdings with the SEC for the first and third quarters of each fiscal year on Form N-Q. The fund’s Forms N-Q are available on the SEC’s website at www.sec.gov and may be reviewed and copied at the SEC’s Public Reference Room in Washington, DC. Information on the operation of the Public Reference Room may be obtained by calling
1-800-SEC-0330.
| 2
UNDERSTANDING FUND EXPENSES
As a mutual fund shareholder, you incur different types of costs: transaction costs, including sales charges (loads) on purchases and contingent deferred sales charges on redemptions, and ongoing costs, including management fees, distribution and/or service fees (12b-1 fees), and other fund expenses. These costs are described in more detail in the funds’ prospectus. The examples below are intended to help you understand the ongoing costs of investing in the funds and help you compare these with the ongoing costs of investing in other mutual funds.
The first line in the table for each class shows the actual amount of fund expenses you would have paid on a $1,000 investment in the fund from October 1, 2010 through March 31, 2011. It also shows how much a $1,000 investment would be worth at the close of the period, assuming actual fund returns and expenses. To estimate the expenses you paid over the period, simply divide your account value by $1,000 (for example, $8,600 account value divided by $1,000 = 8.6) and multiply the result by the number in the Expenses Paid During the Period row as shown below for your class.
The second line in the table for each class provides information about hypothetical account values and hypothetical expenses based on the fund’s actual expense ratios and an assumed rate of return of 5% per year before expenses, which is not the fund’s actual return. The hypothetical account values and expenses may not be used to estimate the actual ending account balance or expenses you paid on your investment for the period. You may use this information to compare the ongoing costs of investing in the fund and other funds. To do so, compare this 5% hypothetical example with the 5% hypothetical examples that appear in the shareholder reports of the other funds.
Please note that the expenses shown reflect ongoing costs only, and do not include any transaction costs. Therefore, the second line in the table of the fund is useful in comparing ongoing costs only, and will not help you determine the relative costs of owning different funds. If transaction costs were included, total costs would be higher.
| | | | | | | | | | | | |
| LOOMIS SAYLES DISCIPLINED EQUITY FUND | | BEGINNING ACCOUNT VALUE
10/1/2010 | | | ENDING ACCOUNT VALUE
3/31/2011 | | | EXPENSES PAID DURING PERIOD*
10/1/2010 – 3/31/2011 | |
Class A | | | | | | | | | | | | |
Actual | | | $1,000.00 | | | | $1,196.80 | | | | $6.85 | |
Hypothetical (5% return before expenses) | | | $1,000.00 | | | | $1,018.70 | | | | $6.29 | |
Class B | | | | | | | | | | | | |
Actual | | | $1,000.00 | | | | $1,193.40 | | | | $10.94 | |
Hypothetical (5% return before expenses) | | | $1,000.00 | | | | $1,014.96 | | | | $10.05 | |
Class C | | | | | | | | | | | | |
Actual | | | $1,000.00 | | | | $1,193.90 | | | | $10.94 | |
Hypothetical (5% return before expenses) | | | $1,000.00 | | | | $1,014.96 | | | | $10.05 | |
Class Y | | | | | | | | | | | | |
Actual | | | $1,000.00 | | | | $1,199.60 | | | | $5.48 | |
Hypothetical (5% return before expenses) | | | $1,000.00 | | | | $1,019.95 | | | | $5.04 | |
| * | Expenses are equal to the Fund’s annualized expense ratio (after waiver/reimbursement): 1.25%, 2.00%, 2.00% and 1.00% for Class A, B, C and Y, respectively, multiplied by the average account value over the period, multiplied by the number of days in the most recent fiscal half-year, divided by 365 (to reflect the half-year period). |
3 |
Portfolio of Investments — as of March 31, 2011 (Unaudited)
Loomis Sayles Disciplined Equity Fund
| | | | | | | | |
| Shares | | | Description | | Value (†) | |
| | | | | | | | |
| | Common Stocks — 99.1% of Net Assets | | | | |
| | | | Aerospace & Defense — 1.8% | | | | |
| | 3,561 | | | Precision Castparts Corp. | | $ | 524,108 | |
| | | | | | | | |
| | | | Automobiles — 1.0% | | | | |
| | 20,191 | | | Ford Motor Co.(b) | | | 301,048 | |
| | | | | | | | |
| | | | Beverages — 3.2% | | | | |
| | 33,198 | | | Coca-Cola Enterprises, Inc. | | | 906,305 | |
| | | | | | | | |
| | | | Capital Markets — 2.6% | | | | |
| | 5,925 | | | Franklin Resources, Inc. | | | 741,099 | |
| | | | | | | | |
| | | | Commercial Banks — 2.0% | | | | |
| | 18,433 | | | Wells Fargo & Co. | | | 584,326 | |
| | | | | | | | |
| | | | Communications Equipment — 3.3% | | | | |
| | 17,507 | | | QUALCOMM, Inc. | | | 959,909 | |
| | | | | | | | |
| | | | Computers & Peripherals — 5.8% | | | | |
| | 3,925 | | | Apple, Inc.(b) | | | 1,367,666 | |
| | 6,258 | | | NetApp, Inc.(b) | | | 301,511 | |
| | | | | | | | |
| | | | | | | 1,669,177 | |
| | | | | | | | |
| | | | Diversified Financial Services — 3.5% | | | | |
| | 21,599 | | | JPMorgan Chase & Co. | | | 995,714 | |
| | | | | | | | |
| | | | Diversified Telecommunication Services — 1.6% | | | | |
| | 15,134 | | | AT&T, Inc. | | | 463,100 | |
| | | | | | | | |
| | | | Electric Utilities — 1.9% | | | | |
| | 15,576 | | | Northeast Utilities | | | 538,930 | |
| | | | | | | | |
| | | | Energy Equipment & Services — 3.1% | | | | |
| | 17,594 | | | Halliburton Co. | | | 876,885 | |
| | | | | | | | |
| | | | Food & Staples Retailing — 2.7% | | | | |
| | 18,977 | | | Walgreen Co. | | | 761,737 | |
| | | | | | | | |
| | | | Food Products — 1.7% | | | | |
| | 28,419 | | | Sara Lee Corp. | | | 502,164 | |
| | | | | | | | |
| | | | Health Care Providers & Services — 8.8% | | | | |
| | 12,090 | | | Express Scripts, Inc.(b)(c) | | | 672,325 | |
| | 9,699 | | | HCA Holdings, Inc.(b) | | | 328,505 | |
| | 7,301 | | | McKesson Corp. | | | 577,144 | |
| | 20,804 | | | UnitedHealth Group, Inc. | | | 940,341 | |
| | | | | | | | |
| | | | | | | 2,518,315 | |
| | | | | | | | |
| | | | Hotels, Restaurants & Leisure — 4.0% | | | | |
| | 8,742 | | | Royal Caribbean Cruises Ltd.(b) | | | 360,695 | |
| | 13,542 | | | Starwood Hotels & Resorts Worldwide, Inc.(c) | | | 787,061 | |
| | | | | | | | |
| | | | | | | 1,147,756 | |
| | | | | | | | |
| | | | Independent Power Producers & Energy Traders — 1.2% | |
| | 21,678 | | | Calpine Corp.(b) | | | 344,030 | |
| | | | | | | | |
| | | | Insurance — 5.6% | | | | |
| | 19,454 | | | MetLife, Inc. | | | 870,178 | |
| | 28,437 | | | Unum Group | | | 746,471 | |
| | | | | | | | |
| | | | | | | 1,616,649 | |
| | | | | | | | |
| | | | Internet & Catalog Retail — 1.8% | | | | |
| | 1,027 | | | Priceline.com, Inc.(b)(c) | | | 520,114 | |
| | | | | | | | |
| | | | Internet Software & Services — 2.2% | | | | |
| | 1,083 | | | Google, Inc., Class A(b) | | | 634,865 | |
| | | | | | | | |
| | | | Machinery — 11.2% | | | | |
| | 8,766 | | | Caterpillar, Inc. | | | 976,094 | |
| | 3,805 | | | Cummins, Inc. | | | 417,104 | |
| | 15,814 | | | Eaton Corp. | | | 876,728 | |
| | 9,915 | | | Parker Hannifin Corp. | | | 938,753 | |
| | | | | | | | |
| | | | | | | 3,208,679 | |
| | | | | | | | |
| | | | Media — 1.5% | | | | |
| | 10,283 | | | Walt Disney Co. (The) | | | 443,094 | |
| | | | | | | | |
| | | | | | | | |
| Shares | | | Description | | Value (†) | |
| | | | | | | | |
| | | | Metals & Mining — 1.7% | | | | |
| | 8,811 | | | Freeport-McMoRan Copper & Gold, Inc.(c) | | $ | 489,451 | |
| | | | | | | | |
| | | | Oil, Gas & Consumable Fuels — 10.7% | | | | |
| | 12,226 | | | Chevron Corp. | | | 1,313,439 | |
| | 43,740 | | | El Paso Corp. | | | 787,320 | |
| | 5,732 | | | EOG Resources, Inc. | | | 679,299 | |
| | 3,132 | | | Noble Energy, Inc.(c) | | | 302,708 | |
| | | | | | | | |
| | | | | | | 3,082,766 | |
| | | | | | | | |
| | | | Paper & Forest Products — 2.0% | | | | |
| | 18,707 | | | International Paper Co. | | | 564,577 | |
| | | | | | | | |
| | | | Personal Products — 2.4% | | | | |
| | 7,187 | | | Estee Lauder Cos., Inc. (The), Class A | | | 692,539 | |
| | | | | | | | |
| | | | Pharmaceuticals — 2.4% | | | | |
| | 9,714 | | | Allergan, Inc. | | | 689,888 | |
| | | | | | | | |
| | | | Software — 6.8% | | | | |
| | 29,627 | | | Microsoft Corp. | | | 751,341 | |
| | 35,771 | | | Oracle Corp. | | | 1,193,678 | |
| | | | | | | | |
| | | | | | | 1,945,019 | |
| | | | | | | | |
| | | | Textiles, Apparel & Luxury Goods — 1.3% | | | | |
| | 3,917 | | | Fossil, Inc.(b) | | | 366,827 | |
| | | | | | | | |
| | | | Wireless Telecommunication Services — 1.3% | | | | |
| | 6,949 | | | American Tower Corp., Class A(b) | | | 360,097 | |
| | | | | | | | |
| | | | Total Common Stocks
(Identified Cost $23,945,850) | | | 28,449,168 | |
| | | | | | | | |
| | | | | | | | |
| | | | Total Investments — 99.1%
(Identified Cost $23,945,850)(a) | | | 28,449,168 | |
| | | | Other assets less liabilities — 0.9% | | | 257,151 | |
| | | | | | | | |
| | | | Net Assets — 100.0% | | $ | 28,706,319 | |
| | | | | | | | |
| Shares | | | | | | |
| | Written Options — (0.1%) | | | | |
| | | | Options on Securities — (0.1%) | | | | |
| | 5,100 | | | Express Scripts, Inc.,
Call expiring May 21, 2011 at 60 | | | (3,162 | ) |
| | 3,700 | | | Freeport-McMoRan Copper & Gold, Inc.,
Call expiring May 21, 2011 at 60 | | | (4,680 | ) |
| | 2,000 | | | Noble Energy, Inc.,
Call expiring May 21, 2011 at 105 | | | (2,750 | ) |
| | 300 | | | Priceline.com, Inc.,
Call expiring April 16, 2011 at 500 | | | (5,070 | ) |
| | 5,700 | | | Starwood Hotels & Resorts Worldwide, Inc.,
Call expiring May 21, 2011 at 65 | | | (3,762 | ) |
| | | | | | | | |
| | | | Total Written Options
(Premiums Received $17,718) | | $ | (19,424 | ) |
| | | | | | | | |
| | | | | | | | |
| | (†) | | | See Note 2 of Notes to Financial Statements. | | | | |
| | (a) | | | Federal Tax Information (Amounts exclude certain adjustments made at the end of the Fund’s fiscal year for tax purposes. Such adjustments are primarily due to wash sales.): | | | | |
| | | | At March 31, 2011, the net unrealized appreciation on investments based on a cost of $23,945,850 for federal income tax purposes was as follows: | | | | |
| | | | Aggregate gross unrealized appreciation for all investments in which there is an excess of value over tax cost | | $ | 4,719,230 | |
| | | | Aggregate gross unrealized depreciation for all investments in which there is an excess of tax
cost over value | | | (215,912 | ) |
| | | | | | | | |
| | | | Net unrealized appreciation | | $ | 4,503,318 | |
| | | | | | | | |
See accompanying notes to financial statements.
| 4
Portfolio of Investments – as of March 31, 2011 (Unaudited)
Loomis Sayles Disciplined Equity Fund – (continued)
| | | | | | | | |
| | (b) | | | Non-income producing security. | | | | |
| | (c) | | | All or a portion of this security has been pledged as collateral for outstanding call options. | | | | |
Industry Summary at March 31, 2011 (Unaudited)
| | | | |
Machinery | | | 11.2 | % |
Oil, Gas & Consumable Fuels | | | 10.7 | |
Health Care Providers & Services | | | 8.8 | |
Software | | | 6.8 | |
Computers & Peripherals | | | 5.8 | |
Insurance | | | 5.6 | |
Hotels, Restaurants & Leisure | | | 4.0 | |
Diversified Financial Services | | | 3.5 | |
Communications Equipment | | | 3.3 | |
Beverages | | | 3.2 | |
Energy Equipment & Services | | | 3.1 | |
Food & Staples Retailing | | | 2.7 | |
Capital Markets | | | 2.6 | |
Personal Products | | | 2.4 | |
Pharmaceuticals | | | 2.4 | |
Internet Software & Services | | | 2.2 | |
Commercial Banks | | | 2.0 | |
Paper & Forest Products | | | 2.0 | |
Other Investments, less than 2% each | | | 16.8 | |
| | | | |
Total Investments | | | 99.1 | |
Other assets less liabilities (including written options) | | | 0.9 | |
| | | | |
Net Assets | | | 100.0 | % |
| | | | |
See accompanying notes to financial statements.
5 |
Statement of Assets and Liabilities
March 31, 2011 (Unaudited)
| | | | |
ASSETS | | | | |
Investments at cost | | $ | 23,945,850 | |
Net unrealized appreciation | | | 4,503,318 | |
| | | | |
Investments at value | | | 28,449,168 | |
Receivable for Fund shares sold | | | 663 | |
Receivable for securities sold | | | 8,462,691 | |
Dividends receivable | | | 2,581 | |
| | | | |
TOTAL ASSETS | | | 36,915,103 | |
| | | | |
LIABILITIES | | | | |
Options written, at value (premiums received $17,718) (Note 2) | | | 19,424 | |
Payable for Fund shares redeemed | | | 32,690 | |
Payable to custodian bank | | | 8,049,116 | |
Management fees payable (Note 6) | | | 4,083 | |
Deferred Trustees’ fees (Note 6) | | | 65,604 | |
Administrative fees payable (Note 6) | | | 1,451 | |
Other accounts payable and accrued expenses | | | 36,416 | |
| | | | |
TOTAL LIABILITIES | | | 8,208,784 | |
| | | | |
NET ASSETS | | $ | 28,706,319 | |
| | | | |
NET ASSETS CONSIST OF: | | | | |
Paid-in capital | | $ | 25,406,455 | |
Distributions in excess of net investment income | | | (53,336 | ) |
Accumulated net realized loss on investments and options written | | | (1,148,412 | ) |
Net unrealized appreciation on investments and options written | | | 4,501,612 | |
| | | | |
NET ASSETS | | $ | 28,706,319 | |
| | | | |
COMPUTATION OF NET ASSET VALUE AND OFFERING PRICE: | | | | |
Class A shares: | | | | |
Net assets | | $ | 2,263,460 | |
| | | | |
Shares of beneficial interest | | | 277,596 | |
| | | | |
Net asset value and redemption price per share | | $ | 8.15 | |
| | | | |
Offering price per share (100/94.25 of net asset value) (Note 1) | | $ | 8.65 | |
| | | | |
Class B shares: (redemption price per share is equal to net asset value less any
applicable contingent deferred sales charge) (Note 1) | | | | |
Net assets | | $ | 149,556 | |
| | | | |
Shares of beneficial interest | | | 18,940 | |
| | | | |
Net asset value and offering price per share | | $ | 7.90 | |
| | | | |
Class C shares: (redemption price per share is equal to net asset value less any
applicable contingent deferred sales charge) (Note 1) | | | | |
Net assets | | $ | 1,666,451 | |
| | | | |
Shares of beneficial interest | | | 213,153 | |
| | | | |
Net asset value and offering price per share | | $ | 7.82 | |
| | | | |
Class Y shares: | | | | |
Net assets | | $ | 24,626,852 | |
| | | | |
Shares of beneficial interest | | | 2,998,960 | |
| | | | |
Net asset value, offering and redemption price per share | | $ | 8.21 | |
| | | | |
See accompanying notes to financial statements.
| 6
Statement of Operations
For the Six Months Ended March 31, 2011 (Unaudited)
| | | | |
INVESTMENT INCOME | | | | |
Dividends | | $ | 248,711 | |
| | | | |
Expenses | | | | |
Management fees (Note 6) | | | 88,863 | |
Service and distribution fees (Note 6) | | | 10,712 | |
Administrative fees (Note 6) | | | 8,304 | |
Trustees’ fees and expenses (Note 6) | | | 19,199 | |
Transfer agent fees and expenses (Note 6) | | | 10,930 | |
Audit and tax services fees | | | 26,510 | |
Custodian fees and expenses | | | 11,872 | |
Legal fees | | | 406 | |
Registration fees | | | 34,580 | |
Shareholder reporting expenses | | | 2,528 | |
Miscellaneous expenses | | | 6,613 | |
| | | | |
Total expenses | | | 220,517 | |
Less waiver and/or expense reimbursement (Note 6) | | | (31,667 | ) |
| | | | |
Net expenses | | | 188,850 | |
| | | | |
Net investment income | | | 59,861 | |
| | | | |
NET REALIZED AND UNREALIZED GAIN (LOSS) ON INVESTMENTS AND OPTIONS WRITTEN | | | | |
Net realized gain (loss) on: | | | | |
Investments | | | 4,447,253 | |
Options written | | | (106,081 | ) |
Net change in unrealized appreciation (depreciation) on: | | | | |
Investments | | | 1,824,629 | |
Options written | | | (1,478 | ) |
| | | | |
Net realized and unrealized gain on investments and options written | | | 6,164,323 | |
| | | | |
NET INCREASE IN NET ASSETS RESULTING FROM OPERATIONS | | $ | 6,224,184 | |
| | | | |
See accompanying notes to financial statements.
7 |
Statement of Changes in Net Assets
| | | | | | | | |
| | | Six Months
Ended
March 31,
2011
(Unaudited) | | | Year Ended
September 30,
2010 | |
FROM OPERATIONS: | | | | | | | | |
Net investment income | | $ | 59,861 | | | $ | 99,248 | |
Net realized gain on investments and options written | | | 4,341,172 | | | | 2,429,778 | |
Net change in unrealized appreciation (depreciation) on investments and options written | | | 1,823,151 | | | | (1,084,251 | ) |
| | | | | | | | |
Net increase in net assets resulting from operations | | | 6,224,184 | | | | 1,444,775 | |
| | | | | | | | |
FROM DISTRIBUTIONS TO SHAREHOLDERS: | | | | | | | | |
Net investment income | | | | | | | | |
Class A | | | (3,047 | ) | | | (6,227 | ) |
Class B | | | — | | | | — | |
Class C | | | — | | | | — | |
Class Y | | | (120,303 | ) | | | (178,902 | ) |
| | | | | | | | |
Total distributions | | | (123,350 | ) | | | (185,129 | ) |
| | | | | | | | |
NET INCREASE (DECREASE) IN NET ASSETS FROM CAPITAL SHARE TRANSACTIONS (NOTE 10) | | | (11,678,612 | ) | | | 2,940,934 | |
| | | | | | | | |
Net increase (decrease) in net assets | | | (5,577,778 | ) | | | 4,200,580 | |
NET ASSETS | | | | | | | | |
Beginning of the period | | | 34,284,097 | | | | 30,083,517 | |
| | | | | | | | |
End of the period | | $ | 28,706,319 | | | $ | 34,284,097 | |
| | | | | | | | |
UNDISTRIBUTED NET INVESTMENT INCOME (DISTRIBUTIONS IN EXCESS OF NET INVESTMENT INCOME) | | $ | (53,336 | ) | | $ | 10,153 | |
| | | | | | | | |
See accompanying notes to financial statements.
| 8
Financial Highlights
For a share outstanding throughout each period.
| | | | | | | | | | | | | | | | | | | | | | | | | | | | |
| | | | | | Income (Loss) From Investment
Operations: | | | Less Distributions: | |
| | |
Net asset
value,
beginning
of
the period | | | Net
investment
income
(loss) (a)(b) | | | Net realized
and unrealized
gain (loss) | | | Total from
investment
operations | | | Dividends
from
net investment
income | | | Distributions
from net
realized
capital gains | | | Total
distributions | |
| | | | | | | | | | | | | | | | | | | | | | | | | | | | |
Class A | | | | | | | | | | | | | | | | | | | | | | | | | | | | |
3/31/2011(g) | | $ | 6.81 | | | $ | 0.00 | | | $ | 1.35 | | | $ | 1.35 | | | $ | (0.01 | ) | | $ | — | | | $ | (0.01 | ) |
9/30/2010 | | | 6.53 | | | | 0.01 | | | | 0.29 | | | | 0.30 | | | | (0.02 | ) | | | — | | | | (0.02 | ) |
9/30/2009 | | | 6.98 | | | | 0.04 | | | | (0.44 | ) | | | (0.40 | ) | | | (0.05 | ) | | | — | | | | (0.05 | ) |
9/30/2008 | | | 9.77 | | | | 0.03 | | | | (1.80 | ) | | | (1.77 | ) | | | (0.05 | ) | | | (0.97 | ) | | | (1.02 | ) |
9/30/2007 | | | 9.42 | | | | 0.02 | | | | 1.53 | | | | 1.55 | | | | (0.07 | ) | | | (1.13 | ) | | | (1.20 | ) |
9/30/2006 | | | 9.22 | | | | 0.05 | | | | 0.64 | | | | 0.69 | | | | (0.03 | ) | | | (0.46 | ) | | | (0.49 | ) |
Class B | | | | | | | | | | | | | | | | | | | | | | | | | | | | |
3/31/2011(g) | | | 6.61 | | | | (0.02 | ) | | | 1.31 | | | | 1.29 | | | | — | | | | — | | | | — | |
9/30/2010 | | | 6.36 | | | | (0.04 | ) | | | 0.29 | | | | 0.25 | | | | — | | | | — | | | | — | |
9/30/2009 | | | 6.80 | | | | (0.00 | ) | | | (0.44 | ) | | | (0.44 | ) | | | — | | | | — | | | | — | |
9/30/2008 | | | 9.56 | | | | (0.03 | ) | | | (1.76 | ) | | | (1.79 | ) | | | — | | | | (0.97 | ) | | | (0.97 | ) |
9/30/2007 | | | 9.25 | | | | (0.05 | ) | | | 1.50 | | | | 1.45 | | | | (0.01 | ) | | | (1.13 | ) | | | (1.14 | ) |
9/30/2006 | | | 9.10 | | | | (0.02 | ) | | | 0.63 | | | | 0.61 | | | | — | | | | (0.46 | ) | | | (0.46 | ) |
Class C | | | | | | | | | | | | | | | | | | | | | | | | | | | | |
3/31/2011(g) | | | 6.55 | | | | (0.02 | ) | | | 1.29 | | | | 1.27 | | | | — | | | | — | | | | — | |
9/30/2010 | | | 6.30 | | | | (0.04 | ) | | | 0.29 | | | | 0.25 | | | | — | | | | — | | | | — | |
9/30/2009 | | | 6.76 | | | | (0.00 | ) | | | (0.44 | ) | | | (0.44 | ) | | | (0.02 | ) | | | — | | | | (0.02 | ) |
9/30/2008 | | | 9.52 | | | | (0.03 | ) | | | (1.76 | ) | | | (1.79 | ) | | | — | | | | (0.97 | ) | | | (0.97 | ) |
9/30/2007 | | | 9.22 | | | | (0.05 | ) | | | 1.50 | | | | 1.45 | | | | (0.02 | ) | | | (1.13 | ) | | | (1.15 | ) |
9/30/2006 | | | 9.08 | | | | (0.02 | ) | | | 0.63 | | | | 0.61 | | | | (0.01 | ) | | | (0.46 | ) | | | (0.47 | ) |
Class Y | | | | | | | | | | | | | | | | | | | | | | | | | | | | |
3/31/2011(g) | | | 6.87 | | | | 0.02 | | | | 1.35 | | | | 1.37 | | | | (0.03 | ) | | | — | | | | (0.03 | ) |
9/30/2010 | | | 6.58 | | | | 0.02 | | | | 0.31 | | | | 0.33 | | | | (0.04 | ) | | | — | | | | (0.04 | ) |
9/30/2009 | | | 7.03 | | | | 0.06 | | | | (0.45 | ) | | | (0.39 | ) | | | (0.06 | ) | | | — | | | | (0.06 | ) |
9/30/2008 | | | 9.85 | | | | 0.07 | | | | (1.82 | ) | | | (1.75 | ) | | | (0.10 | ) | | | (0.97 | ) | | | (1.07 | ) |
9/30/2007 | | | 9.49 | | | | 0.06 | | | | 1.53 | | | | 1.59 | | | | (0.10 | ) | | | (1.13 | ) | | | (1.23 | ) |
9/30/2006 | | | 9.27 | | | | 0.09 | | | | 0.64 | | | | 0.73 | | | | (0.05 | ) | | | (0.46 | ) | | | (0.51 | ) |
| (a) | Per share net investment income (loss) has been calculated using the average shares outstanding during the period. |
| (b) | Amount rounds to less than $0.01 per share, if applicable. |
| (c) | Had certain expenses not been waived/reimbursed during the period, if applicable, total returns would have been lower. |
| (d) | A sales charge for Class A shares and a contingent deferred sales charge for Class B and Class C shares are not reflected in total return calculations. Periods less than one year, if applicable, are not annualized. |
9 |
| | | | | | | | | | | | | | | | | | | | | | | | | | |
| | | | | | | | | |
Ratios to Average Net Asstes: | | | | |
Net asset
value,
end of
the period | | | Total
return
(%) (c)(d) | | | Net assets,
end of
the period
(000’s) | | | Net
expenses
(%) (e)(f) | | | Gross
expenses
(%) (f) | | | Net investment
income (loss)
(%) (f) | | | Portfolio
turnover
rate (%) | |
| | | | | | | | | | | | | | | | | | | | | | | | | | |
| | | | | | | | | | | | | | | | | | | | | | | | | | |
| $ | 8.15 | | | | 19.68 | | | $ | 2,263 | | | | 1.25 | | | | 1.45 | | | | 0.13 | | | | 60 | |
| | 6.81 | | | | 4.81 | | | | 2,025 | | | | 1.20 | | | | 1.45 | | | | 0.12 | | | | 245 | |
| | 6.53 | | | | (5.64 | ) | | | 1,599 | | | | 1.25 | | | | 1.78 | | | | 0.78 | | | | 180 | |
| | 6.98 | | | | (20.40 | ) | | | 736 | | | | 1.25 | | | | 1.55 | | | | 0.38 | | | | 149 | |
| | 9.77 | | | | 17.98 | | | | 1,198 | | | | 1.25 | | | | 1.50 | | | | 0.22 | | | | 148 | |
| | 9.42 | | | | 7.69 | | | | 1,331 | | | | 1.25 | | | | 1.68 | | | | 0.56 | | | | 143 | |
| | | | | | | | | | | | | | | | | | | | | | | | | | |
| | 7.90 | | | | 19.34 | | | | 150 | | | | 2.00 | | | | 2.19 | | | | (0.58 | ) | | | 60 | |
| | 6.61 | | | | 4.09 | | | | 138 | | | | 1.94 | | | | 2.20 | | | | (0.61 | ) | | | 245 | |
| | 6.36 | | | | (6.47 | ) | | | 168 | | | | 2.00 | | | | 2.49 | | | | (0.03 | ) | | | 180 | |
| | 6.80 | | | | (21.01 | ) | | | 227 | | | | 2.00 | | | | 2.30 | | | | (0.37 | ) | | | 149 | |
| | 9.56 | | | | 17.11 | | | | 356 | | | | 2.00 | | | | 2.31 | | | | (0.51 | ) | | | 148 | |
| | 9.25 | | | | 6.90 | | | | 331 | | | | 2.00 | | | | 2.33 | | | | (0.19 | ) | | | 143 | |
| | | | | | | | | | | | | | | | | | | | | | | | | | |
| | 7.82 | | | | 19.39 | | | | 1,666 | | | | 2.00 | | | | 2.20 | | | | (0.64 | ) | | | 60 | |
| | 6.55 | | | | 3.97 | | | | 1,247 | | | | 1.94 | | | | 2.20 | | | | (0.61 | ) | | | 245 | |
| | 6.30 | | | | (6.41 | ) | | | 1,460 | | | | 2.00 | | | | 2.51 | | | | (0.06 | ) | | | 180 | |
| | 6.76 | | | | (21.10 | ) | | | 949 | | | | 2.00 | | | | 2.30 | | | | (0.39 | ) | | | 149 | |
| | 9.52 | | | | 17.17 | | | | 1,164 | | | | 2.00 | | | | 2.29 | | | | (0.54 | ) | | | 148 | |
| | 9.22 | | | | 6.92 | | | | 1,198 | | | | 2.00 | | | | 2.37 | | | | (0.18 | ) | | | 143 | |
| | | | | | | | | | | | | | | | | | | | | | | | | | |
| | 8.21 | | | | 19.96 | | | | 24,627 | | | | 1.00 | | | | 1.18 | | | | 0.40 | | | | 60 | |
| | 6.87 | | | | 5.08 | | | | 30,875 | | | | 0.95 | (h) | | | 1.20 | | | | 0.37 | | | | 245 | |
| | 6.58 | | | | (5.42 | ) | | | 26,857 | | | | 0.85 | | | | 1.38 | | | | 1.09 | | | | 180 | |
| | 7.03 | | | | (20.17 | ) | | | 23,538 | | | | 0.85 | | | | 1.15 | | | | 0.78 | | | | 149 | |
| | 9.85 | | | | 18.39 | | | | 27,400 | | | | 0.85 | | | | 1.11 | | | | 0.62 | | | | 148 | |
| | 9.49 | | | | 8.13 | | | | 23,096 | | | | 0.85 | | | | 1.26 | | | | 0.98 | | | | 143 | |
| (e) | The investment adviser and/or administrator agreed to waive its fees and/or reimburse a portion of the Fund’s expenses during the period. Without this waiver/reimbursement, if applicable, expenses would have been higher. |
| (f) | Computed on an annualized basis for periods less than one year, if applicable. |
| (g) | For the six months ended March 31, 2011 (Unaudited). |
| (h) | Effective February 1, 2010, the expense limit increased to 1.00% for Class Y shares. |
| 10
Notes to Financial Statements
March 31, 2011 (Unaudited)
1. Organization. Loomis Sayles Funds II (the “Trust”) is organized as a Massachusetts business trust. The Trust is registered under the Investment Company Act of 1940, as amended (the “1940 Act”), as an open-end management investment company. The Declaration of Trust permits the Board of Trustees to authorize the issuance of an unlimited number of shares of the Trust in multiple series. The financial statements for certain funds of the Trust are presented in separate reports. Information presented in these financial statements pertains to Loomis Sayles Disciplined Equity Fund (the “Fund” or the “Disciplined Equity Fund”).
The Fund offers Class A, Class C and Class Y shares. Effective October 12, 2007, Class B shares are no longer offered. Existing Class B shareholders may continue to reinvest dividends into Class B shares and exchange their Class B shares for Class B shares of other Natixis Funds subject to existing exchange privileges as described in the Fund’s prospectus.
Class A shares are sold with a maximum front-end sales charge of 5.75%. Class B shares do not pay a front-end sales charge; however, they are charged higher Rule 12b-1 fees, and are subject to a contingent deferred sales charge (“CDSC”) if such shares are redeemed within six years of purchase. After eight years of ownership, Class B shares convert to Class A shares. Class C shares do not pay a front-end sales charge, do not convert to any other class of shares, pay higher Rule 12b-1 fees than Class A shares and may be subject to a CDSC of 1.00% if those shares are redeemed within one year of acquisition, except for reinvested distributions. Class Y shares do not pay a front-end sales charge, a CDSC or Rule 12b-1 fees. Class Y shares are generally intended for institutional investors with a minimum initial investment of $100,000, though some categories of investors are exempted from the minimum investment amount as outlined in the Fund’s prospectus.
Most expenses of the Trust can be directly attributed to a Fund. Expenses which can not be directly attributed to a Fund are generally apportioned based on the relative net assets of each of the Funds in the Trust. Expenses of a Fund are borne pro rata by the holders of each class of shares, except that each class bears expenses unique to that class (including the Rule 12b-1 service and distribution fees). In addition, each class votes as a class only with respect to its own Rule 12b-1 Plan. Shares of each class would receive their pro rata share of the net assets of a Fund if the Fund were liquidated. The Trustees approve separate distributions from net investment income on each class of shares.
2. Significant Accounting Policies. The following is a summary of significant accounting policies consistently followed by the Fund in the preparation of its financial statements. The Fund’s financial statements are prepared in accordance with accounting principles generally accepted in the United States of America which require the use of management estimates that affect the reported amounts and disclosures in the financial statements. Actual results could differ from those estimates. Management has evaluated the events and transactions subsequent to period-end through the date the financial statements were issued and has determined that there were no material events that would require disclosure in the Fund’s financial statements.
a. Valuation. Equity securities, including shares of closed-end investment companies and exchange-traded funds, for which market quotations are readily available are valued at market value, as reported by pricing services recommended by the investment adviser and approved by the Board of Trustees. Such pricing services generally use the security’s last sale price on the exchange or market where the security is primarily traded or, if there is no reported sale during the day, the closing bid price. Securities traded on the NASDAQ Global Select Market, NASDAQ Global Market and NASDAQ Capital Market are valued at the NASDAQ Official Closing Price (“NOCP”), or if lacking a NOCP, at the most recent bid quotation on the applicable NASDAQ Market. Debt securities (other than short-term obligations purchased with an original or remaining maturity of sixty days or less) are generally valued on the basis of evaluated bids furnished to the Fund by a pricing service recommended by the investment adviser and approved by the Board of Trustees, which service determines valuations for normal, institutional-size trading units of such securities using market information, transactions for comparable securities and various relationships between securities which are generally recognized by institutional traders. Broker-dealer bid quotations may also be used to value debt and equity securities where a pricing service does not price a security or where a pricing service does not provide a reliable price for the security. In instances where broker-dealer bid quotations are not available, certain securities held by the Fund may be valued on the basis of a price provided by a principal market maker. Domestic exchange-traded single equity option contracts are valued at the mean of the National Best Bid and Offer quotations. Short-term obligations purchased with an original or remaining maturity of sixty days or less are valued at amortized cost, which approximates market value. Investments in other open-end investment companies are valued at their net asset value each day. Securities for which market quotations are not readily available are valued at fair value as determined in good faith by the Fund’s investment adviser using consistently applied procedures under the general supervision of the Board of Trustees.
The Fund may hold securities traded in foreign markets. Foreign securities are valued at the market price in the foreign market. However, if events occurring after the close of the foreign market (but before the close of regular trading on the New York Stock Exchange) are believed to materially affect the value of those securities, such securities are fair valued pursuant to procedures approved by the Board of Trustees. When fair valuing securities, the Fund may, among other things, use modeling tools or other processes that may
11 |
Notes to Financial Statements (continued)
March 31, 2011 (Unaudited)
take into account factors such as securities market activity and/or significant events that occur after the close of the foreign market and before the Fund calculates its net asset value.
b. Investment Transactions and Related Investment Income. Investment transactions are accounted for on a trade date plus one basis for daily net asset value calculation. However, for financial reporting purposes, investment transactions are reported on trade date. Dividend income is recorded on ex-dividend date, or in the case of certain foreign securities, as soon as a Fund is notified, and interest income is recorded on an accrual basis. Interest income is increased by the accretion of discount and decreased by the amortization of premium. Investment income is recorded net of foreign taxes withheld when applicable. In determining net gain or loss on securities sold, the cost of securities has been determined on an identified cost basis. Investment income, non-class specific expenses and realized and unrealized gains and losses are allocated on a pro rata basis to each class based on the relative net assets of each class to the total net assets of the Fund.
c. Foreign Currency Translation. The books and records of the Fund are maintained in U.S. dollars. The values of securities, currencies and other assets and liabilities denominated in currencies other than U.S. dollars are translated into U.S. dollars based upon foreign exchange rates prevailing at the end of the period. Purchases and sales of investment securities, income and expenses are translated on the respective dates of such transactions.
Since the values of investment securities are presented at the foreign exchange rates prevailing at the end of the period, it is not practical to isolate that portion of the results of operations arising from changes in exchange rates from fluctuations which arise due to changes in market prices of investment securities. Such changes are included with the net realized and unrealized gain or loss on investments.
Net realized foreign exchange gains or losses arise from sales of foreign currency, currency gains or losses realized between the trade and settlement dates on securities transactions and the difference between the amounts of interest and foreign withholding taxes recorded on the Fund’s books and the U.S. dollar equivalent of the amounts actually received or paid. Net unrealized foreign exchange gains and losses arise from changes in the value of assets and liabilities, other than investment securities, at the end of the fiscal period, resulting from changes in exchange rates.
The Fund may use foreign currency exchange contracts to facilitate transactions in foreign-denominated investments. Losses may arise from changes in the value of the foreign currency or if the counterparties do not perform under the contracts’ terms.
d. Forward Foreign Currency Contracts. The Fund may enter into forward foreign currency contracts, including forward foreign cross currency contracts. Contracts to buy generally are used to acquire exposure to foreign currencies, while contracts to sell generally are used to hedge the Fund’s investments against currency fluctuation. Also, a contract to buy or sell can offset a previous contract. These contracts involve market risk in excess of the unrealized gain or loss reflected in the Fund’s Statement of Assets and Liabilities. The U.S. dollar value of the currencies the Fund has committed to buy or sell represents the aggregate exposure to each currency the Fund has acquired or hedged through currency contracts outstanding at period end. Gains or losses are recorded for financial statement purposes as unrealized until settlement date. Risks may arise upon entering into these contracts from the potential inability of counterparties to meet the terms of their contracts and from unanticipated movements in the value of a foreign currency relative to the U.S. dollar. Certain contracts may require the movement of cash or securities as collateral for the Fund’s or counterparty’s net obligations under the contracts.
There were no forward foreign currency contracts held by the Fund during the six months ended March 31, 2011.
e. Option Contracts. The Fund may enter into option contracts. When a Fund purchases an option, it pays a premium and the option is subsequently marked to market to reflect current value. Premiums paid for purchasing options which expire are treated as realized losses. Premiums paid for purchasing options which are exercised or closed are added to the cost or deducted from the proceeds on the underlying instrument to determine the realized gain or loss. The risk associated with purchasing options is limited to the premium paid.
When a Fund writes an option, an amount equal to the net premium received (the premium less commission) is recorded as a liability and is subsequently adjusted to the current value. Net premiums received for written options which expire are treated as realized gains. Net premiums received for written options which are exercised or closed are deducted from the cost or added to the proceeds on the underlying instrument or closing purchase transaction to determine the realized gain or loss. The Fund, as writer of a written option, bears the risk of an unfavorable change in the market value of the instrument underlying the written option.
| 12
Notes to Financial Statements (continued)
March 31, 2011 (Unaudited)
Exchange-traded options have standardized contracts and are settled through a clearing house with fulfillment guaranteed by the credit of the exchange. Therefore, counterparty credit risks to the Fund are limited. Over-the-counter options are subject to the risk that the counterparty is unable or unwilling to meet its obligations under the option. For the six months ended March 31, 2011, the Fund was not party to any over-the-counter options.
f. Federal and Foreign Income Taxes. The Trust treats each Fund as a separate entity for federal income tax purposes. The Fund intends to meet the requirements of the Internal Revenue Code of 1986, as amended, applicable to regulated investment companies, and to distribute to its shareholders substantially all of its net investment income and any net realized capital gains at least annually. Management has performed an analysis of the Fund’s tax positions for the open tax years as of March 31, 2011 and has concluded that no provisions for income tax are required. The Fund’s federal tax returns for the prior three fiscal years remain subject to examination by the Internal Revenue Service. Management is not aware of any events that are reasonably possible to occur in the next six months that would result in the amounts of any unrecognized tax benefits significantly increasing or decreasing for the Fund. However, management’s conclusions regarding tax positions taken may be subject to review and adjustment at a later date based on factors including, but not limited to, new tax laws and accounting regulations and interpretations thereof.
A Fund may be subject to foreign taxes on income and gains on investments that are accrued based upon the Fund’s understanding of the tax rules and regulations that exist in the countries in which the Fund invests. Foreign governments may also impose taxes or other payments on investments with respect to foreign securities. Such taxes are accrued as applicable, and are reflected as foreign taxes payable on the Statement of Assets and Liabilities.
g. Dividends and Distributions to Shareholders. Dividends and distributions are recorded on ex-dividend date. The timing and characterization of certain income and capital gain distributions are determined annually in accordance with federal tax regulations, which may differ from accounting principles generally accepted in the United States of America. Permanent differences are primarily due to differing treatments for book and tax purposes of items such as foreign currency transactions. Permanent book and tax basis differences relating to shareholder distributions will result in reclassifications to capital accounts. Temporary differences between book and tax distributable earnings are primarily due to deferred Trustees’ fees, straddle loss deferrals and wash sales. Distributions from net investment income and short-term capital gains are considered to be distributed from ordinary income for tax purposes.
The tax characterization of distributions is determined on an annual basis. The tax character of distributions paid to shareholders during the year ended September 30, 2010 was as follows:
| | | | | | | | |
2010 Distributions Paid From: | |
Ordinary Income | | Long-Term Capital Gains | | | Total | |
$185,129 | | $ | — | | | $ | 185,129 | |
As of September 30, 2010, the capital loss carryforwards were as follows:
| | | | |
Capital loss carryforward: | | | | |
Expires September 30, 2017 | | $ | (2,229,424 | ) |
Expires September 30, 2018 | | | (3,119,805 | ) |
| | | | |
Total capital loss carryforward | | $ | (5,349,229 | ) |
| | | | |
On December 22, 2010, the Regulated Investment Company Modernization Act of 2010 (the “Act”) was enacted. The Act modernizes several of the federal income and excise tax provisions related to RICs, and, with certain exceptions, is effective for taxable years beginning after December 22, 2010. Among the changes made are changes to the capital loss carryforward rules allowing for capital losses to be carried forward indefinitely. Rules in effect as of the report date limit the carryforward period to eight years. Capital loss carryforwards generated in taxable years beginning after effective date of the Act must be fully used before capital loss carryforwards generated in taxable years prior to effective date of the Act; therefore, under certain circumstances, capital loss carryforwards available as of the report date, if any, may expire unused.
h. Repurchase Agreements. It is the Fund’s policy that the market value of the collateral for repurchase agreements be at least equal to 102% of the repurchase price, including interest. Certain repurchase agreements are tri-party arrangements whereby the collateral is held in a segregated account for the benefit of the Fund and on behalf of the counterparty. Repurchase agreements could involve certain risks in the event of default or insolvency of the counterparty including possible delays or restrictions upon the Fund’s ability to dispose of the underlying securities.
13 |
Notes to Financial Statements (continued)
March 31, 2011 (Unaudited)
i. Securities Lending. The Fund has entered into an agreement with State Street Bank and Trust Company (“State Street Bank”), as agent of the Fund, to lend securities to certain designated borrowers. The loans are collateralized with cash or securities in an amount equal to at least 105% or 102% of the market value (including accrued interest) of the loaned international or domestic securities, respectively, when the loan is initiated. Thereafter, the value of the collateral must remain at least 102% of the market value (including accrued interest) of loaned securities for U.S. equities and U.S. corporate debt; at least 105% of the market value (including accrued interest) of loaned securities for non-U.S. equities; and at least 100% of the market value (including accrued interest) of loaned securities for U.S. Government securities, sovereign debt issued by non-U.S. Governments and non-U.S. corporate debt. In the event that the market value of the collateral falls below the required percentages described above, the borrower will deliver additional collateral on the next business day. As with other extensions of credit, the Fund may bear the risk of loss with respect to the investment of the collateral. The Fund invests cash collateral in short-term investments, a portion of the income from which is remitted to the borrowers and the remainder allocated between the Fund and State Street Bank as lending agent.
For the six months ended March 31, 2011, the Fund did not loan securities under this agreement.
j. Indemnifications. Under the Trust’s organizational documents, its officers and Trustees are indemnified against certain liabilities arising out of the performance of their duties to the Fund. Additionally, in the normal course of business, the Fund enters into contracts with service providers that contain general indemnification clauses. The Fund’s maximum exposure under these arrangements is unknown as this would involve future claims that may be made against the Fund that have not yet occurred. However, based on experience, the Fund expects the risk of loss to be remote.
3. Fair Value Measurements. In accordance with accounting standards related to fair value measurements and disclosures, the Fund has categorized the inputs utilized in determining the value of the Fund’s assets or liabilities. These inputs are summarized in the three broad levels listed below:
| | • | | Level 1 – quoted prices in active markets for identical assets or liabilities; |
| | • | | Level 2 – prices determined using other significant inputs that are observable either directly, or indirectly through corroboration with observable market data (which could include quoted prices for similar assets or liabilities, interest rates, credit risk, etc.); |
| | • | | Level 3 – prices determined using significant unobservable inputs when quoted prices or observable inputs are unavailable such as when there is little or no market activity for an asset or liability (unobservable inputs reflect the Fund’s own assumptions in determining the fair value of assets or liabilities and would be based on the best information available). |
The inputs or methodology used for valuing securities are not necessarily an indication of the risk associated with investing in those securities.
The following is a summary of the inputs used to value the Fund’s investments as of March 31, 2011, at value:
Asset Valuation Inputs
| | | | | | | | | | | | | | | | |
Description(a) | | Level 1 | | | Level 2 | | | Level 3 | | | Total | |
| | | | | | | | | | | | | | | | |
Common Stocks | | $ | 28,449,168 | | | $ | — | | | $ | — | | | $ | 28,449,168 | |
| | | | | | | | | | | | | | | | |
Liability Valuation Inputs
| | | | | | | | | | | | | | | | |
Description(a) | | Level 1 | | | Level 2 | | | Level 3 | | | Total | |
| | | | | | | | | | | | | | | | |
Written Options | | $ | (19,424 | ) | | $ | — | | | $ | — | | | $ | (19,424 | ) |
| | | | | | | | | | | | | | | | |
| (a) | Major categories of the Fund’s investments are included in the Portfolio of Investments. |
4. Derivatives. Derivative instruments are defined as financial instruments whose value and performance are based on the value and performance of another security or financial instrument. Derivative instruments that the Fund currently uses include option contracts.
The Fund is subject to the risk of unpredictable declines in the value of individual equity securities and periods of below-average performance in individual securities or in the equity market as a whole. The Fund may use purchased put options and written call options
| 14
Notes to Financial Statements (continued)
March 31, 2011 (Unaudited)
to hedge against a decline in value of an equity security that it owns. The Fund may also write put options to offset the cost of options used for hedging purposes. During the six months ended March 31, 2011, the Fund engaged in purchased put and written call options for hedging purposes and in written put options to offset the cost of options used for hedging purposes.
The following is a summary of derivative instruments for the Fund as of March 31, 2011:
| | | | |
Statement of Assets and Liabilities Caption | | Equity
Contracts | |
Liabilities | | | | |
Options written, at value | | $ | (19,424 | ) |
Transactions in derivative instruments for the Fund during the six months ended March 31, 2011, was as follows:
| | | | |
Statement of Operations Caption | | Equity
Contracts | |
Net Realized Gain (Loss) on: | | | | |
Investments* | | $ | (21,494 | ) |
Options written | | | (106,081 | ) |
Net Change in Unrealized Appreciation (Depreciation) on: | | | | |
Options written | | | (1,478 | ) |
| * | Represents realized loss for purchased options during the period. |
As the Fund values its derivatives at fair value and recognize changes in fair value through the Statement of Operations, they do not qualify for hedge accounting under authoritative guidance for derivative instruments. The Fund’s investments in derivatives may represent an economic hedge; however, they are considered to be non-hedge transactions for the purpose of these disclosures.
Volume of option activity, as a percentage of net assets, for the Fund, based on month-end (for call options)/daily (for put options) market values of equity securities underlying written options, at absolute value, was as follows for the six months ended March 31, 2011:
| | | | | | | | | | | | |
Disciplined Equity Fund* | | Call Options
Written | | | Put Options
Purchased | | | Put Options
Written | |
Average Market Value of Underlying Securities | | | 9.35% | | | | 0.12% | | | | 0.12% | |
Highest Market Value of Underlying Securities | | | 16.85% | | | | 1.56% | | |
| 1.56%
|
|
Lowest Market Value of Underlying Securities | | | 4.06% | | | | 0.00% | | | | 0.00% | |
Market Value of Underlying Securities as of March 31, 2011 | | | 4.06% | | | | 0.00% | | | | 0.00% | |
| * | Market value of underlying securities is determined by multiplying option shares by the price of the option’s underlying security, as determined by the Fund’s Pricing Policies and Procedures. |
Market value of underlying securities at the end of the prior period are included in the average market value of underlying securities.
The following is a summary of the Fund’s written option activity:
| | | | | | | | |
| | | Number of Contracts | | | Premiums | |
| | | | | | | | |
Outstanding at 9/30/2010 | | | 1,156 | | | $ | 87,891 | |
Options written | | | 2,449 | | | | 247,192 | |
Options terminated in closing purchase transactions | | | (2,858 | ) | | | (264,958 | ) |
Options exercised | | | (75 | ) | | | (4,349 | ) |
Options expired | | | (504 | ) | | | (48,058 | ) |
| | | | | | | | |
Outstanding at 3/31/2011 | | | 168 | | | $ | 17,718 | |
| | | | | | | | |
5. Purchases and Sales of Securities. For the six months ended March 31, 2011, purchases and sales of securities (excluding short-term investments) were $20,172,024 and $31,890,311, respectively.
15 |
Notes to Financial Statements (continued)
March 31, 2011 (Unaudited)
6. Management Fees and Other Transactions with Affiliates.
a. Management Fees. Loomis, Sayles & Company, L.P. (“Loomis Sayles”) serves as investment adviser to the Fund. Under the terms of the management agreement, the Fund pays a management fee at the annual rate of 0.50% of average daily net assets, calculated daily and payable monthly.
Loomis Sayles has given a binding undertaking to the Fund to waive management fees and/or reimburse certain expenses to limit the Fund’s operating expenses, exclusive of acquired fund fees and expenses, brokerage expenses, interest expense, taxes and extraordinary expenses. This undertaking is in effect until January 31, 2012 and is reevaluated on an annual basis. Management fees payable, as reflected on the Statement of Assets and Liabilities, is net of waivers and/or expense reimbursements, if any, pursuant to this undertaking.
For the six months ended March 31, 2011, the expense limits as a percentage of average daily net assets under the expense limitation agreement were as follows:
| | | | | | | | | | | | |
Expense Limit as a Percentage of Average
Daily Net Assets | |
Class A | | Class B | | | Class C | | | Class Y | |
1.25% | | | 2.00% | | | | 2.00% | | | | 1.00% | |
Loomis Sayles shall be permitted to recover expenses it has borne under the expense limitation agreements (whether through waiver of its management fees or otherwise) on a class by class basis in later periods to the extent the expenses of a class fall below a class’ expense limits, provided, however, that a class is not obligated to pay such waived/reimbursed fees or expenses more than one year after the end of the fiscal year in which the fees or expenses were waived/reimbursed.
For the six months ended March 31, 2011, the management fees and waivers of management fees for the Fund were as follows:
| | | | | | | | | | | | | | | | |
Gross
Management
Fees | | Waivers of
Management
Fees1 | | | Net
Management
Fees | | | Percentage of Average
Daily Net Assets | |
| | | | Gross | | | Net | |
$88,863 | | $ | 31,667 | | | $ | 57,196 | | | | 0.50 | % | | | 0.32 | % |
| 1 | Management fee waivers are subject to possible recovery until September 30, 2012. |
No expenses were recovered during the six months ended March 31, 2011 under the terms of the expense limitation agreement.
Certain officers and employees of Loomis Sayles are also officers or Trustees of the Trust. Loomis Sayles’ general partner is indirectly owned by Natixis Global Asset Management, L.P. (“Natixis US”), which is part of Natixis Global Asset Management, an international asset management group based in Paris, France.
b. Service and Distribution Fees. Natixis Distributors, L.P. (“Natixis Distributors”), a wholly owned subsidiary of Natixis US, has entered into a distribution agreement with the Trust. Pursuant to this agreement, Natixis Distributors serves as principal underwriter of the Funds of the Trust.
Pursuant to Rule 12b-1 under the 1940 Act, the Trust has adopted a Service Plan relating to the Fund’s Class A shares (the “Class A Plan”) and a Distribution and Service Plan relating to the Fund’s Class B and Class C shares (the “Class B and Class C Plans”).
Under the Class A Plan, the Fund pays Natixis Distributors a monthly service fee at an annual rate not to exceed 0.25% of the average daily net assets attributable to the Fund’s Class A shares, as reimbursement for expenses incurred by Natixis Distributors in providing personal services to investors in Class A shares and/or the maintenance of shareholder accounts.
Under the Class B and Class C Plans, the Fund pays Natixis Distributors a monthly service fee at an annual rate not to exceed 0.25% of the average daily net assets attributable to the Fund’s Class B and Class C shares, as compensation for services provided by Natixis Distributors in providing personal services to investors in Class B and Class C shares and/or the maintenance of shareholder accounts.
| 16
Notes to Financial Statements (continued)
March 31, 2011 (Unaudited)
Also under the Class B and Class C Plans, the Fund pays Natixis Distributors a monthly distribution fee at an annual rate of 0.75% of the average daily net assets attributable to the Fund’s Class B and Class C shares, as compensation for services provided by Natixis Distributors in connection with the marketing or sale of Class B and Class C shares.
For the six months ended March 31, 2011, the Fund paid the following service and distribution fees:
| | | | | | | | | | | | | | | | |
Service Fees | | | Distribution Fees | |
Class A | | Class B | | | Class C | | | Class B | | | Class C | |
$2,562 | | $ | 177 | | | $ | 1,860 | | | $ | 531 | | | $ | 5,582 | |
c. Administrative Fees. Natixis Asset Management Advisors, L.P. (“Natixis Advisors”) provides certain administrative services for the Funds and contracts with State Street Bank to serve as sub-administrator. Natixis Advisors is a wholly-owned subsidiary of Natixis US. Pursuant to an agreement among Natixis Funds Trust I, Natixis Funds Trust II, Natixis Funds Trust IV, Natixis Cash Management Trust, Gateway Trust (“Natixis Funds Trusts”), Loomis Sayles Funds I, Loomis Sayles Funds II (“Loomis Sayles Funds Trusts”), Hansberger International Series and Natixis Advisors, the Fund pays Natixis Advisors monthly its pro rata portion of fees equal to an annual rate of 0.0575% of the first $15 billion of the average daily net assets of the Natixis Funds Trusts, Loomis Sayles Funds Trusts and Hansberger International Series, 0.0500% of the next $15 billion, 0.0400% of the next $30 billion and 0.0350% of such assets in excess of $60 billion, subject to an annual aggregate minimum fee for the Natixis Funds Trusts, Loomis Sayles Funds Trusts and Hansberger International Series of $10 million, which is reevaluated on an annual basis. New funds are subject to a fee for the first twelve months of operations of $75,000 plus $12,500 per additional class and an additional $75,000 if managed by multiple subadvisers.
For the six months ended March 31, 2011, the Fund paid $8,304 in administrative fees to Natixis Advisors.
d. Sub-Transfer Agent Fees. Natixis Distributors has entered into agreements with financial intermediaries to provide certain recordkeeping, processing, shareholder communications and other services to customers of the intermediaries and has agreed to compensate the intermediaries for providing those services. Certain services would be provided by the Fund if the shares of those customers were registered directly with the Fund’s transfer agent. Accordingly, the Fund agreed to pay a portion of the intermediary fees attributable to shares of the Fund held by the intermediaries (which generally are a percentage of the value of shares held) not to exceed what the Fund would have paid its transfer agent had each customer’s shares been registered directly with the transfer agent instead of held through the intermediaries. Natixis Distributors pays the remainder of the fees.
For the six months ended March 31, 2011, the Fund paid $10,066 in sub-transfer agent fees, which are reflected in transfer agent fees and expenses in the Statement of Operations.
e. Commissions. Commissions (including CDSCs) on Fund shares retained by Natixis Distributors during the six months ended March 31, 2011 amounted to $722.
f. Trustees Fees and Expenses. The Trust does not pay any compensation directly to its officers or Trustees who are directors, officers or employees of Natixis Advisors, Natixis Distributors, Natixis US, or their affiliates. The Chairperson of the Board receives a retainer fee at the annual rate of $250,000. The Chairperson does not receive any meeting attendance fees for Board of Trustees meetings or committee meetings that she attends. Each Independent Trustee (other than the Chairperson) receives, in the aggregate, a retainer fee at the annual rate of $80,000. Each Independent Trustee also receives a meeting attendance fee of $10,000 for each meeting of the Board of Trustees that he or she attends in person and $5,000 for each meeting of the Board of Trustees that he or she attends telephonically. In addition, each committee chairman receives an additional retainer fee at the annual rate of $15,000. Each Contract Review and Governance Committee member is compensated $6,000 for each Committee meeting that he or she attends in person and $3,000 for each meeting that he or she attends telephonically. Each Audit Committee member is compensated $7,500 for each Committee meeting that he or she attends in person and $3,750 for each meeting that he or she attends telephonically. These fees are allocated among the funds in the Natixis Funds Trusts, Loomis Sayles Funds Trusts and Hansberger International Series based on a formula that takes into account, among other factors, the relative net assets of each fund. Trustees are reimbursed for travel expenses in connection with attendance at meetings.
A deferred compensation plan (the “Plan”) is available to the Trustees on a voluntary basis. Deferred amounts remain in the Funds until distributed in accordance with the provisions of the Plan. The value of a participating Trustee’s deferral account is based on theoretical investments of deferred amounts, on the normal payment dates, in certain funds of the Natixis Funds Trusts, Loomis Sayles Funds Trusts and Hansberger International Series as designated by the participating Trustees. Changes in the value of participants’ deferral accounts are allocated pro rata among the funds in the Natixis Funds Trusts, Loomis Sayles Funds Trusts, and Hansberger International
17 |
Notes to Financial Statements (continued)
March 31, 2011 (Unaudited)
Series, and are normally reflected as Trustees’ fees and expenses in the Statement of Operations. The portions of the accrued obligations allocated to the Funds under the Plan are reflected as Deferred Trustees’ fees on the Statement of Assets and Liabilities.
g. Payments by Affiliates. For the six months ended March 31, 2011, Loomis Sayles reimbursed the Fund $1,234 for losses incurred in connection with a trading error.
7. Line of Credit. The Fund, together with certain other funds of Natixis Funds Trusts, Loomis Sayles Funds Trusts and Hansberger International Series, participates in a $200,000,000 committed unsecured line of credit provided by State Street Bank, with an individual limit of $125,000,000 for each fund that participates in the line of credit. Interest is charged to each participating fund based on its borrowings at a rate per annum equal to the greater of the Federal Funds rate or overnight LIBOR, plus 1.25%. In addition, a commitment fee of 0.15% per annum, payable at the end of each calendar quarter, is accrued and apportioned among the participating funds based on their average daily unused portion of the line of credit.
Effective April 21, 2011, the Fund, together with certain other funds of Natixis Funds Trusts, Loomis Sayles Funds Trusts and Hansberger International Series, will participate in a $200,000,000 committed unsecured line of credit provided by State Street Bank, with an individual limit of $125,000,000 for each fund that will participate in the line of credit. Interest will be charged to each participating fund based on its borrowings at a rate per annum equal to the greater of the Federal Funds rate or overnight LIBOR, plus 1.25%. In addition, a commitment fee of 0.125% per annum, payable at the end of each calendar quarter, will be accrued and apportioned among the participating funds based on their average daily unused portion of the line of credit.
For the six months ended March 31, 2011, the Fund had no borrowings under these agreements.
8. Broker Commission Recapture. The Fund has entered into agreements with certain brokers whereby the brokers will rebate a portion of brokerage commissions. All amounts rebated by the brokers are returned to the Fund under such agreements and are included in realized gains on investments in the Statement of Operations.
For the six months ended March 31, 2011, amounts rebated under these agreements amounted to $6,866.
9. Concentration of Ownership. At March 31, 2011, Loomis Sayles Funded Pension Plan and Trust (“Pension Plan”) and the Loomis Sayles Employees’ Profit Sharing Retirement Plan (“Retirement Plan”) held shares of beneficial interest in the Fund as follows:
| | | | |
Pension Plan | | Retirement Plan | |
779,175 | | | 774,386 | |
From time to time, the Fund may have a concentration of several shareholders having a significant percentage of shares outstanding. Investment activities of these shareholders could have material impacts on the Funds. As of March 31, 2011, one shareholder account owned more than 5% of the Fund’s total outstanding shares, representing 5.87% of the Fund’s net assets. Such ownership may be beneficially held by individuals or entities other than the owner of record.
| 18
Notes to Financial Statements (continued)
March 31, 2011 (Unaudited)
10. Capital Shares. The Fund may issue an unlimited number of shares of beneficial interest, without par value. Transactions in capital shares were as follows:
| | | | | | | | | | | | | | | | |
| |
| Six Months Ended
March 31, 2011 |
| |
| Year Ended
September 30, 2010 |
|
| | | Shares | | | | Amount | | | | Shares | | | | Amount | |
| | | | | | | | | | | | | | | | |
| Class A | | | | | | | | | | | | | | | | |
Issued from the sale of shares | | | 118,922 | | | $ | 922,460 | | | | 128,879 | | | $ | 877,104 | |
Issued in connection with the reinvestment of distributions | | | 326 | | | | 2,486 | | | | 878 | | | | 5,881 | |
Redeemed | | | (138,817 | ) | | | (1,044,030 | ) | | | (77,642 | ) | | | (516,404 | ) |
| | | | | | | | | | | | | | | | |
Net change | | | (19,569 | ) | | $ | (119,084 | ) | | | 52,115 | | | $ | 366,581 | |
| | | | | | | | | | | | | | | | |
| Class B | | | | | | | | | | | | | | | | |
Issued from the sale of shares | | | 2,656 | | | $ | 20,337 | | | | 307 | | | $ | 2,003 | |
Issued in connection with the reinvestment of distributions | | | — | | | | — | | | | — | | | | — | |
Redeemed | | | (4,538 | ) | | | (33,196 | ) | | | (5,901 | ) | | | (38,901 | ) |
| | | | | | | | | | | | | | | | |
Net change | | | (1,882 | ) | | $ | (12,859 | ) | | | (5,594 | ) | | $ | (36,898 | ) |
| | | | | | | | | | | | | | | | |
| Class C | | | | | | | | | | | | | | | | |
Issued from the sale of shares | | | 51,751 | | | $ | 378,561 | | | | 45,207 | | | $ | 298,621 | |
Issued in connection with the reinvestment of distributions | | | — | | | | — | | | | — | | | | — | |
Redeemed | | | (29,028 | ) | | | (214,186 | ) | | | (86,665 | ) | | | (557,736 | ) |
| | | | | | | | | | | | | | | | |
Net change | | | 22,723 | | | $ | 164,375 | | | | (41,458 | ) | | $ | (259,115 | ) |
| | | | | | | | | | | | | | | | |
| Class Y | | | | | | | | | | | | | | | | |
Issued from the sale of shares | | | 287,758 | | | $ | 2,218,165 | | | | 904,469 | | | $ | 6,207,958 | |
Issued in connection with the reinvestment of distributions | | | 15,087 | | | | 115,567 | | | | 25,763 | | | | 173,638 | |
Redeemed | | | (1,797,589 | ) | | | (14,044,776 | ) | | | (516,729 | ) | | | (3,511,230 | ) |
| | | | | | | | | | | | | | | | |
Net change | | | (1,494,744 | ) | | $ | (11,711,044 | ) | | | 413,503 | | | $ | 2,870,366 | |
| | | | | | | | | | | | | | | | |
Increase (decrease) from capital share transactions | | | (1,493,472 | ) | | $ | (11,678,612 | ) | | | 418,566 | | | $ | 2,940,934 | |
| | | | | | | | | | | | | | | | |
11. Subsequent Event. On March 11, 2011, the Board of Trustees approved the liquidation and termination of the Fund. It is expected that the sale of the Fund’s assets and the corresponding liquidating distributions to shareholders will be completed on or about May 13, 2011.
19 |
Item 2. Code of Ethics.
Not applicable.
Item 3. Audit Committee Financial Expert.
Not applicable.
Item 4. Principal Accountant Fees and Services.
Not applicable.
Item 5. Audit Committee of Listed Registrants.
Not applicable.
Item 6. Schedule of Investments.
Included as part of the Report to Shareholders filed as Item 1 herewith.
Item 7. Disclosure of Proxy Voting Policies and Procedures for Closed-End Management Investment Companies.
Not applicable.
Item 8. Portfolio Managers of Closed-End Management Investment Companies.
Not applicable.
Item 9. Purchases of Equity Securities by Closed-End Management Investment Companies and Affiliated Purchasers.
Not applicable.
Item 10. Submission of Matters to a Vote of Securities Holders.
There were no material changes to the procedures by which shareholders may recommend nominees to the Trust’s Board of Trustees.
Item 11. Controls and Procedures.
The Registrant’s principal executive officer and principal financial officer have concluded that the Registrant’s disclosure controls and procedures are sufficient to ensure that information required to be disclosed by the Registrant in this Form N-CSR was recorded, processed, summarized and reported within the time periods specified in the Securities and Exchange Commission’s rules and forms, based upon such officers’ evaluation of these controls and procedures as of a date within 90 days of the filing date of the report.
There was no change in the Registrant’s internal control over financial reporting that occurred during the Registrant’s last fiscal quarter of the period covered by the report that has materially affected, or is reasonably likely to materially affect, the Registrant’s internal control over financial reporting.
Item 12. Exhibits.
| | | | |
(a) | | (1) | | Not applicable. |
| | |
(a) | | (2) | | Certifications of Principal Executive Officer and Principal Financial Officer pursuant to Rule 30a-2(a) under the Investment Company Act of 1940 (17 CFR 270.30a-2(a)), filed herewith as Exhibits (a)(2)(1) and a(2)(2), respectively. |
| | |
(a) | | (3) | | Not applicable. |
| | |
(b) | | | | Certifications of Principal Executive Officer and Principal Financial Officer pursuant to Section 906 of Sarbanes-Oxley Act of 2002 are filed herewith as Exhibit (b). |
SIGNATURES
Pursuant to the requirements of the Securities Exchange Act of 1934 and the Investment Company Act of 1940, the Registrant has duly caused this report to be signed on its behalf by the undersigned, thereunto duly authorized.
| | |
| Loomis Sayles Funds II |
| |
| By: | | /s/ ROBERT J. BLANDING |
| Name: | | Robert J. Blanding |
| Title: | | Chief Executive Officer |
| Date: | | May 20, 2011 |
Pursuant to the requirements of the Securities Exchange Act of 1934 and the Investment Company Act of 1940, this report has been signed by the following persons on behalf of the Registrant and in the capacities and on the dates indicated.
| | |
| |
| By: | | /s/ ROBERT J. BLANDING |
| Name: | | Robert J. Blanding |
| Title: | | Chief Executive Officer |
| Date: | | May 20, 2011 |
| | |
| |
| By: | | /s/ MICHAEL C. KARDOK |
| Name: | | Michael C. Kardok |
| Title: | | Treasurer |
| Date: | | May 20, 2011 |